OMB APPROVAL
OMB Number: 3235-0570
Expires: October 31, 2006
Estimated average burden hours per response: 19.3
UNITED STATES
SECURITIES AND EXCHANGE COMMISSION
Washington, D.C. 20549
FORM N-CSR
CERTIFIED SHAREHOLDER REPORT OF
REGISTERED MANAGEMENT INVESTMENT COMPANIES
Investment Company Act file number: 811-07651
ING VP Variable Portfolios, Inc.
(Exact name of registrant as specified in charter)
7337 E. Doubletree Ranch Rd., Scottsdale, AZ | | 85258 |
(Address of principal executive offices) | | (Zip code) |
The Corporation Trust Incorporated, 300 E. Lombard Street, Baltimore, MD 21201
(Name and address of agent for service)
Registrant’s telephone number, including area code: 1-800-992-0180
Date of fiscal year end: | December 31 |
| |
Date of reporting period: | January 1, 2005 to December 31, 2005 |
Item 1. Reports to Stockholders.
The following is a copy of the report transmitted to stockholders pursuant to Rule 30e-1 under the Act (17 CFR 270.30e-1):
Annual Report
December 31, 2005
Classes I and S
ING Variable Product Funds
Domestic Equity and Income Portfolios
§ ING VP Balanced Portfolio
§ ING VP Growth and Income Portfolio
Domestic Equity Growth Portfolios
§ ING VP Growth Portfolio
§ ING VP Small Company Portfolio
Domestic Equity Value Portfolio
§ ING VP Value Opportunity Portfolio
Fixed Income Portfolios
§ ING VP Intermediate Bond Portfolio
§ ING VP Money Market Portfolio
Global and International Equity Portfolios
§ ING VP Global Science and Technology Portfolio
§ ING VP International Equity Portfolio
This report is submitted for general information to shareholders of the ING Funds. It is not authorized for distribution to prospective shareholders unless accompanied or preceded by a prospectus which includes details regarding the funds’ investment objectives, risks, charges, expenses and other information. This information should be read carefully. | 
|
PROXY VOTING INFORMATION
A description of the policies and procedures that the Portfolios use to determine how to vote proxies related to portfolio securities is available (1) without charge, upon request, by calling Shareholder Services toll-free at 1-800-992-0180; (2) on the ING Funds website at www.ingfunds.com and (3) on the Securities and Exchange Commission’s (“SEC”) website at www.sec.gov. Information regarding how the Portfolios voted proxies related to portfolio securities during the most recent 12-month period ended June 30 is available without charge on the ING Funds website at www.ingfunds.com and on the SEC’s website at www.sec.gov.
QUARTERLY PORTFOLIO HOLDINGS
The Registrants file their complete schedule of portfolio holdings with the SEC for the first and third quarters of each fiscal year on Form N-Q. The Registrants’ Forms N-Q are available on the SEC’s website at www.sec.gov. The Registrants’ Forms N-Q may be reviewed and copied at the SEC’s Public Reference Room in Washington, DC, and information on the operation of the Public Reference Room may be obtained by calling 1-800-SEC-0330; and is available upon request from the Registrants by calling Shareholder Services toll-free at 1-800-992-0180.
(THIS PAGE INTENTIONALLY LEFT BLANK)

JAMES M. HENNESSY
| Dear Shareholder, |
|
As you may recall, in my last letter I described the enthusiasm that we were experiencing here at ING Funds as we worked to bring more of the world’s investment opportunities to you, the investor. |
|
That enthusiasm, I am happy to report, is continuing to thrive. With the New Year, we have launched a series of new international mutual funds, each created to bring more of the world’s opportunities to you. |
|
Meanwhile, we have also heard you loud and clear. Our research tells us that many investors report that they find investing an intimidating and overly-complex endeavor. That is why ING is committed to helping investors across the country cut through the confusion and clutter. “Your future. Made easier.SM” is more than words; they represent our promise to you.
Those two objectives — bringing you more of the world’s opportunities and doing it in a way that is easier for you — are behind the development of the new portfolios. |
| |
According to a recent finding, 58 percent of the world market capitalization now lies outside of the U.S.1 In other words, the majority of investment opportunities are now beyond our borders and we think that The ING VP Index Plus International Portfolio — a broad-based international portfolio — is an easy, single-step method to gain exposure to many of those opportunities. |
|
Meanwhile, the ING VP Global Real Estate Portfolio was developed as an easy way to bring global — international and domestic — real estate opportunities to the variable portfolio investor. Real Estate Investment Trusts (REITs) are becoming more and more popular around the world, and this new portfolio seeks to capitalize on that popularity. But again, we’ve made it easy. With just one investment, investors bring the diversification of global real estate to their investment strategy. |
|
One of our goals at ING Funds is to find tomorrow’s opportunities today, and we believe these two portfolios are just the latest examples of that plan in action. |
|
On behalf of everyone at ING Funds, I thank you for your continued support and loyalty. We look forward to serving you in the future. |
Sincerely,

James M. Hennessy
President
ING Funds
January 28, 2006
The views expressed in the President’s Letter reflect those of the President as of the date of the letter. Any such views are subject to change at any time based upon market or other conditions and ING Funds disclaims any responsibility to update such views. These views may not be relied on as investment advice and because investment decisions for an ING Fund are based on numerous factors, may not be relied on as an indication of investment intent on behalf of any ING Fund. Reference to specific company securities should not be construed as recommendations or investment advice.
International investing does pose special risks including currency fluctuation, economic and political risks not found in investments that are solely domestic. Investments in issuers that are principally engaged in real estate, including REITs, may subject the Fund to risks similar to those associated with the direct ownership of real estate, including terrorist attacks, war or other acts that destroy real property (in addition to market risks). These companies are sensitive to factors such as changes in real estate values and property taxes, interest rates, cash flow of underlying real estate assets, supply and demand, and the management skill and creditworthiness of the issuer. REITs may also be affected by tax and regulatory requirements.
1 MSCI December, 2005
1
MARKET PERSPECTIVE: YEAR ENDED DECEMBER 31, 2005
In our semi-annual report, we referred to mixed markets in which the U.S. investor lost on both domestic and international stocks, with gains in the latter trumped by the rebounding U.S. dollar. In the second half, global equities registered solid gains, although foreign markets ended the 2005 year more convincingly. The Morgan Stanley Capital International (“MSCI”) World® Index(1) calculated in dollars, including net reinvested dividends rose 10.3% for the six months ended December 31, 2005, and 9.5% for the full year. As for currencies, the dollar extended its first half run for the six months ended December 31, 2005, rising 2.1% against the euro (12.6% for the full year), 6.2% against the yen (14.7% for the full year), and 3.8% against the pound (10.2% for the full year). Commentators explained the U.S. dollar’s unexpected strength by pointing to relatively high U.S. interest rates, the re-cycling of oil exporters’ burgeoning wealth into dollar securities, the tax-related “repatriation” into dollars of U.S. corporations’ foreign currency balances, and, regarding the yen’s particular weakness, non-Japanese investors pouring money into the stock market but hedging their currency risk. Each dynamic was losing steam by 2005 year-end.
For more than a year, the main issue for US fixed-income investors had been the unexpected flattening of the yield curve, i.e. the shrinking difference between short-term and long-term interest rates. From June 2004 through June 2005 the Federal Open Market Committee (“FOMC”) had raised the Federal Funds Rate by 25 basis points nine times, pulling other short-term rates up. However, the yield on the ten-year U.S. Treasury Note had actually fallen by 0.71% over the same thirteen months. This was put down to an apparently growing perception in the market that inflation was a problem solved, due to a vigilant Federal Reserve, cheap goods and labor abroad, consistent productivity growth at home and foreign investors’ hunger for U.S. investments. Occasionally in the second half, for example when Hurricane Katrina and Rita affected oil prices, having peaked near $70 per barrel at the end of August 2005, there looked to be filtering through to general prices, the trend seemed about to break. Nevertheless, in the end the forces of curve flattening prevailed. By December 31, 2005, the FOMC had raised rates four more times, oil prices and the inflation scare had subsided and foreigners were still buying record amounts of U.S. securities. For the six months ended December 31, 2005, the yield on the ten-year Treasury rose by 45 basis points to 4.39% (17 basis points for the full year), and on 13-week U.S. Treasury Bills by 93 basis points (180 basis points for the full year) to 3.98%. The returns on the broad Lehman Brothers Aggregate Bond Index(2) and the Lehman Brothers High Yield Bond Index(3) was -0.1% and 1.6% for the six months ended December 31, 2005, and 2.4% and 2.7% for the full year, respectively.
The U.S. equities market in the form of the Standard & Poor’s 500 Composite Stock Price Index (“S&P 500 Index”)(4), added 5.8% including dividends in the latter half of 2005 and 4.9% for the full year, thanks to gains of 3.5% in July and November of 2005. Other months were flat to down and by 2005 year-end, the market, trading at a fairly undemanding price-to-earnings level of about 16 times earnings for the current fiscal year, was definitely struggling. Stock investors were initially encouraged by bullish economic reports and even more by second quarter company earnings figures, which were on average up more than 10% year over year. The optimistic mood lasted into early August of 2005, when the S&P 500 Index reached a four-year high, before drifting back as resurgent oil prices made records almost daily. In September and October of 2005 with Hurricanes Katrina and Rita seldom out of the news, two attempted rallies fizzled. High prices at the gas pump were already here. An expensive winter for heating fuel was certain. Sharply rising factory prices started to be found in local Federal Reserve and purchasing managers’ reports and, with consumer confidence slumping, the word “stagflation” was heard more than once. In spite of this, as November approached, an evidently swift recovery from the Hurricanes Katrina and Rita cheered investors and stock prices powered ahead through mid-December 2005, as oil prices fell back below $60 per barrel, inflation moderated, corporate profits remained buoyant and gross domestic product (“GDP”) growth, at 4.1% per annum, was the envy of the developed world. Yet the market gave back nearly 1.6% between Christmas and New Year, when new reports suggested that the end of the bubbling housing market might be at hand. Rising house prices had encouraged the consumer spending that was largely behind robust GDP growth; spending that is, by people who on average were saving little, if anything.
In international markets, Japan was the shining star of the second half, soaring 33.3%, based on the MSCI
2
MARKET PERSPECTIVE: YEAR ENDED DECEMBER 31, 2005
Japan® Index(5) in dollars plus net dividends for the six months ended December 31, 2005, and 25.5% for the full year, as the market repeatedly broke five-year records amid new optimism. Investors, albeit mainly foreign ones, came to the belief that Japan is re-emerging as a balanced economy and less dependent on exports. Japanese corporations and banks have repaired their balance sheets at last. Rising wages are supporting domestic demand, in addition to an expected end to deflation, seems at hand. European ex UK markets leaped 11.8%, according to the MSCI Europe ex UK® Index(6) in dollars including net dividends for the six months ended December 31, 2005 (10.5% for the full year) and 14.7% in local currencies (27.7% for the full year) to the best levels in over four years, despite the first interest rate increase, to 2.5%, in over five years. Mounting evidence of a recovery in local demand, resilient profits and an upsurge of merger and acquisition activity boosted markets that are not particularly expensive. UK equities advanced 6.4% in the six months ended December 31, 2005 (7.4% for the full year) based on the MSCI UK® Index(7) in dollars including net dividends, concealing a more impressive 11.1% increase in pounds (20.1% for the full year), to the highest in four years. The period was dominated by the effect of five interest rate increases to restrain over-stretched consumers and soaring real estate prices. Yet, in the face of mostly miserable economic reports, and despite terrorist attacks in London over two days in July of 2005, investors, encouraged by merger and acquisition activity, supported an inexpensive market yielding over 3%.
(1) The MSCI World® Index is an unmanaged index that measures the performance of over 1,400 securities listed on exchanges in the U.S., Europe, Canada, Australia, New Zealand and the Far East.
(2) The Lehman Brothers Aggregate Bond Index is a widely recognized, unmanaged index of publicly issued investment grade U.S. Government, mortgage-backed, asset-backed and corporate debt securities.
(3) The Lehman Brothers High Yield Bond Index is an unmanaged index that measures the performance of fixed-income securities generally representative of corporate bonds rated below investment-grade.
(4) The Standard & Poor’s 500 Composite Stock Price Index is an unmanaged index that measures the performance of securities of approximately 500 large-capitalization companies whose securities are traded on major U.S. stock markets.
(5) The MSCI Japan® Index is a free float-adjusted market capitalization index that is designed to measure developed market equity performance in Japan.
(6) The MSCI Europe ex UK® Index is a free float-adjusted market capitalization index that is designed to measure developed market equity performance in Europe, excluding the UK.
(7) The MSCI UK® Index is a free float-adjusted market capitalization index that is designed to measure developed market equity performance in the UK.
All indices are unmanaged and investors cannot invest directly in an index.
Past performance does not guarantee future results. The performance quoted represents past performance. Investment return and principal value of an investment will fluctuate, and shares, when redeemed, may be worth more or less than their original cost. The Funds’ performance is subject to change since the period’s end and may be lower or higher than the performance data shown. Please call (800) 992-0180 or log on to www.ingfunds.com to obtain performance data current to the most recent month end.
Market Perspective reflects the views of the Chief Investment Risk Officer only through the end of the period, and is subject to change based on market and other conditions.
3
ING VP BALANCED PORTFOLIO | | PORTFOLIO MANAGERS’ REPORT |
Investment Type Allocation
as of December 31, 2005
(as a percent of net assets)
Common Stock | | 62.8 | % |
Preferred Stock | | 0.7 | % |
Corporate Bonds/Notes | | 8.8 | % |
U.S. Government Agency Obligations | | 10.5 | % |
U.S. Treasury Obligations | | 7.8 | % |
Asset-Backed Securities | | 2.0 | % |
Collateralized Mortgage Obligations | | 5.5 | % |
Municipal Bonds | | 0.1 | % |
Other Bonds | | 0.1 | % |
Commercial Paper | | 1.4 | % |
Repurchase Agreement | | 3.2 | % |
Other Assets and Liabilities, Net* | | (2.9 | )% |
Total | | 100.0 | % |
| | | |
* Includes securities lending collateral. | | | |
Portfolio holdings are subject to change daily.
The ING VP Balanced Portfolio (the “Portfolio”) seeks to maximize investment return consistent with reasonable safety of principal, by investing in a diversified portfolio of one or more of the following asset classes: stocks, bonds and cash equivalents. The Portfolio is managed by a Omar Aguilar*, Portfolio Manager, James B. Kauffmann, Portfolio Manager, Mary Ann Fernandez, Portfolio Manager and Shiv Mehta, Portfolio Manager, ING Investment Management Co. — the Sub-Adviser.
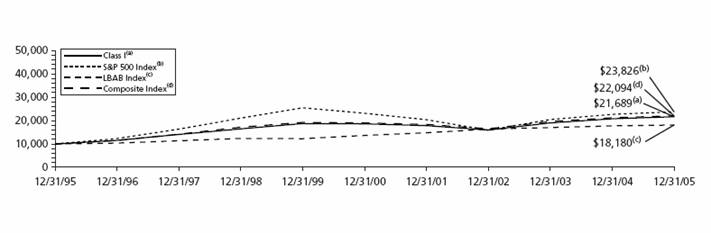
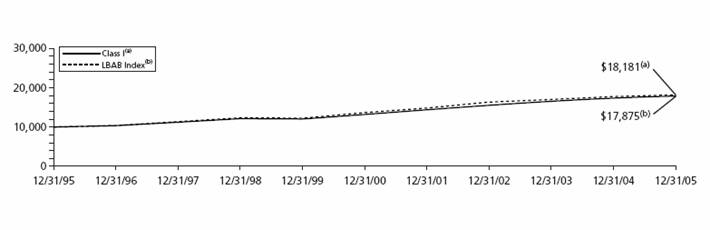
Performance: For the year ended December 31, 2005, the Portfolio’s Class I shares provided a total return of 4.24% compared to 4.91% for the Standard & Poor’s 500 Composite Stock Price Index (“S&P 500 Index”)(1), 2.43% for the Lehman Brothers Aggregate Bond (“LBAB”) Index(2) and 4.00% for the Composite Index (60% S&P 500 Index/40% LBAB Index) for the same period.
Portfolio Specifics: Although the Portfolio exhibited strong stock selection, the equity component slightly underperformed the S&P 500 Index for the year ended December 31, 2005. A modest weighting in small- and mid-cap stocks added to performance, as both groups outperformed large-cap. Stock selection was especially strong in the health care, energy, industrials and consumer discretionary sectors. In the materials and information technology sectors, stock selection was weak and detracted from performance. Sector allocation was slightly negative this year, with gains from an overweight allocation in energy and an underweight in telecommunication services being largely offset by a loss from an overweight in consumer discretionary. While our stock selection in consumer discretionary was strong, our overweight position detracted from performance. The Portfolio benefited from overweights in strong performers Apple Computer Inc. and Valero Energy Corp. Overweight positions in poor performers Dell Inc. and Ford Motor Co. detracted from performance.
The fixed-income component of the Portfolio outperformed its benchmark, the LBAB Index, during the year ended December 31, 2005, with a short duration posture and an underweight to longer maturities. Our underweight to longer-dated corporates was beneficial, as later-dated maturities showed great weakness over the year. An overexposure to asset-backed securities and commercial mortgage-backed securities, at the expense of corporates, was beneficial as both sectors produced excess returns (excess return means the excess over the return from Treasury securities of comparable term). Lack of adequate compensation for credit risk led to an underweight of riskier sectors, industries and issuers. Positions in bank and insurance securities, particularly floating rate preferreds, and lack of exposure in the automotive sectors was a source of positive security selection. As the mortgage sector appeared richly priced, we were largely underweight and our team focused on securities likely to outperform in a rising rate environment and/or an increase in volatility.
Current Strategy and Outlook: As we move into 2006, momentum in the U.S. economy remains strong. Real gross domestic product (“GDP”) growth is likely to decelerate during the year, however, as increases in net exports and capital spending may not fully offset a slowdown in residential investment. Falling gasoline prices have led to lower headline inflation rates, and are likely to take some pressure off core consumer price index (“CPI”) inflation. The risk that core inflation will rise as the expansion puts more pressure on resources, however, still exists. Given this scenario, we believe the Federal Open Market Committee (“FOMC”) will continue raising rates in early 2006. Whether the FOMC stops tightening will depend mainly on its assessment of inflation risk. A sustained expansion and benign wage and price inflation — the most likely scenario for 2006 in our view — should provide a good climate for equity market performance.
While the debate on Wall Street about the relationship of inverted yield curves and recessions is lively, we believe that any sustained inversion will likely be brief and will have fewer implications for the domestic economy than in the past. We have positioned the Portfolio for the potentiality that sentiment will reverse and higher risk premiums will be required by the market. The ING credit team continues to avoid companies with depressed stock prices and underutilized assets on the books. However, we continue to seek out companies that may weaken in sympathy, but have a lower probability of event risk. Moreover, the contribution to duration of the corporate portfolio is less than the LBAB Index. Our mortgage team has constructed a Portfolio designed to offset an increase in volatility and a change in prepayments. Finally, duration is shorter than the LBAB Index.
The equity component of the Portfolio is currently overweight in the information technology, energy and consumer discretionary sectors, and underweight in the health care, consumer staples and telecommunication service sectors. However, overall sector exposures are by design quite close to the S&P 500 Index, so nearly all of our relative performance is driven by individual stock selection.
Top Ten Industries*
as of December 31, 2005
(as a percent of net assets)
Diversified Financial Services | | 8.4 | % |
Oil and Gas | | 6.4 | % |
Federal National Mortgage Association | | 6.4 | % |
Banks | | 5.8 | % |
Insurance | | 4.5 | % |
U.S. Treasury Notes | | 4.4 | % |
Retail | | 4.4 | % |
Telecommunications | | 3.9 | % |
Whole Loan Collateral Collaterized Mortgage Obligation | | 3.6 | % |
Computers | | 3.6 | % |
| | | |
* Excludes securities lending collateral. | | | |
Portfolio holdings are subject to change daily.
* Effective December 2005, Omar Aguilar replaced Hugh Whelan as Portfolio Manager
4
PORTFOLIO MANAGERS’ REPORT | | ING VP BALANCED PORTFOLIO |
| | |
| Average Annual Total Returns for the Periods Ended December 31, 2005 | |
| | | | | | | | | | | |
| | | | | | | | | | Since Inception | |
| | | | | | | | | | of Class S | |
| | 1 Year | | 5 Year | | 10 Year | | May 29, 2003 | |
| Class I | 4.24 | % | | 3.10 | % | | 8.05 | % | | — | | |
| Class S | 3.99 | % | | — | | | — | | | 9.09 | % | |
| S&P 500 Index(1) | 4.91 | % | | 0.54 | % | | 9.07 | % | | 12.53 | %(3) | |
| LBAB Index(2) | 2.43 | % | | 5.87 | % | | 6.16 | % | | 2.59 | %(3) | |
| Composite Index (60% S&P 500 Index/40% LBAB Index) | 4.00 | % | | 2.99 | % | | 8.25 | % | | 8.57 | %(3) | |
| | | | | | | | | | | | | |
| | | | | | | | | | | | | | | | | | |
Based on a $10,000 initial investment, the graph and table above illustrate the total return of ING VP Balanced Portfolio against the S&P 500 Index, the LBAB Index and the Composite Index (60% S&P 500 Index, 40% LBAB Index). The Indices have no cash in their portfolios, impose no sales charges and incur no operating expenses. An investor cannot invest directly in an index. The Portfolio’s performance is shown without the imposition of any expenses or charges which are, or may be, imposed under your annuity contract. Total returns would have been lower if such expenses or charges were included.
The performance graph and table do not reflect the deduction of taxes that a shareholder will pay on portfolio distributions or the redemption of portfolio shares.
The performance shown may include the effect of fee waivers and/or expense reimbursements by the Investment Manager and/or other service providers, which have the effect of increasing total return. Had all fees and expenses been considered, the total returns would have been lower.
The performance update illustrates performance for a variable investment option available through a variable annuity contract. The performance shown indicates past performance and is not a projection or prediction of future results. Actual investment returns and principal value will fluctuate so that shares and/or units, at redemption, may be worth more or less than their original cost. Please call (800) 922-0180 to get performance through the most recent month end.
This report contains statements that may be “forward-looking” statements. Actual results may differ materially from those projected in the “forward-looking” statements.
The views expressed in this report reflect those of the portfolio managers, only through the end of the period as stated on the cover. The portfolio managers’ views are subject to change at any time based on market and other conditions.
Portfolio holdings are subject to change daily.
(1) The S&P 500 Index is an unmanaged index that measures the performance of securities of approximately 500 of the largest companies in the U.S.
(2) The LBAB Index is an unmanaged index composed of securities from the Lehman Brothers Government/Corporate Bond Index, Mortgage-Backed Securities Index and the Asset-Backed Securities Index.
(3) Since inception performance for the index is shown from June 1, 2003.
5
ING VP GROWTH AND INCOME PORTFOLIO | | PORTFOLIO MANAGERS’ REPORT |
Industry Allocation
as of December 31, 2005
(as a percent of net assets)

* Includes securities lending collateral
(1) Includes nine industries, which each represents 2.0%-3.0% of net assets.
(2) Includes twelve industries, which each represents less than 2.0% of net assets.
Portfolio holdings subject to change daily.
The ING VP Growth and Income Portfolio (the “Portfolio”) seeks to maximize total return through investments in a diversified portfolio of common stocks and securities convertible into common stock. The Portfolio is managed by Christopher F. Corapi, Portfolio Manager, and Scott Lewis, Portfolio Manager, ING Investment Management Co. — the Sub-Adviser.
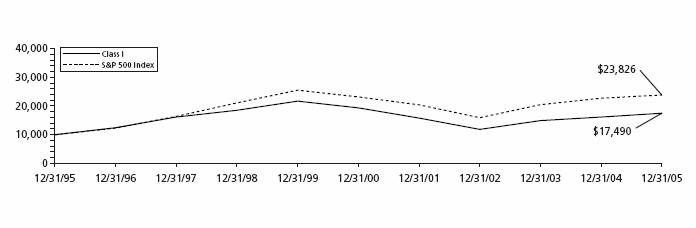
Performance: For the year ended December 31, 2005, the Portfolio’s Class I shares provided a total return of 8.13% compared to the Standard & Poor’s 500 Composite Stock Price Index (“S&P 500 Index”)(1), which returned 4.91% for the same period.
Portfolio Specifics: The Portfolio outperformed the S&P 500 Index over the course of the full year by a wide margin and in 11 out of 12 months. Broad based strength in stock selection, especially within the information technology, energy and consumer staples sectors drove relative performance. Modest value was detracted by our holdings (and lack thereof) in utilities as well as in financials.
Within information technology, the Portfolio benefited from stocks such as Jabil Circuit, Taiwan Semiconductor (“TSM”), Business Objects, and Activision. Jabil and TSM are benefiting from the continuing industry trend towards outsourced manufacturing. Product designers, such as chip companies and packaged product makers (e.g., Hewlett-Packard and Cisco), are increasingly outsourcing their end product manufacturing to foundries and contract manufacturers like these two companies. Activision introduced a series of new video games consistent with the replacement cycle in the video game console arena.
The Portfolio’s energy holdings performed well and confirmed our belief that equipment and service companies were the more attractive business models, the more attractive valuations, and the strongest links to the strength in commodity prices rather than in the large integrated companies like Exxon and Chevron. Halliburton, Schlumberger and ENSCO International provide services and equipment to exploration and production companies and are benefiting from the upswing in capital spending in the sector. Other types of companies we emphasized were independent exploration and production companies, such as EOG Resources, XTO Energy and Plains Exploration & Production. These companies are more focused and niche-like, and more likely to find oil and gas that they can sell at market prices vis-a-vis their larger competitors.
Within financial services, AIG was the biggest drag on performance as it experienced high profile problems with regulators and management teams. The company had to restate earnings in 2005, significantly undermining investor confidence in the stability of the company. The Portfolio was underweight utilities throughout the year as companies in the sector traded at all-time high valuations.
Current Strategy and Outlook: Our current strategy is focused on companies with superior capital allocation, strong competitive position, and operations in industries with very attractive outlooks. We believe key holdings, such as Jabil Circuit, ENSCO International and Halliburton, exhibit strong fundamentals, clear catalysts and attractive valuations.
We believe Halliburton continues to offer upside potential in the energy services space, even after performing strongly in 2005. We believe the stock may benefit greatly in 2006 if management spins off their engineering and construction subsidiary Kellogg, Brown & Root. More broadly, we like other energy services stocks based on our forecast for continued robust spending by producers and refiners on creating new production capacity to meet global demand. This bodes well for drillers like ENSCO, who provide contract drilling services to the oil and gas industry. We believe ENSCO enjoys a strong competitive position due to its state of the art fleet of offshore drilling rigs.
Our technology holdings reflect our belief that the industry is in a maturation cycle and companies are looking to outsource low return-on-capital endeavors such as production and manufacturing. We believe contract manufacturers like Jabil and Taiwan Semiconductor continue to benefit from the growth in outsourcing and are well positioned to increase their already dominant market shares.
Top Ten Holdings*
as of December 31, 2005
(as a percent of net assets)
Citigroup, Inc. | | 3.4 | % |
Exxon Mobil Corp. | | 3.2 | % |
General Electric Co. | | 3.1 | % |
Wells Fargo & Co. | | 2.3 | % |
Wal-Mart Stores, Inc. | | 2.2 | % |
Altria Group, Inc. | | 2.2 | % |
Johnson & Johnson | | 2.2 | % |
Jabil Circuit, Inc. | | 2.1 | % |
Maxim Integrated Products | | 2.0 | % |
United Technologies Corp. | | 2.0 | % |
| | | |
* Excludes securities lending collateral. | | | |
Portfolio holdings are subject to change daily.
6
PORTFOLIO MANAGERS’ REPORT | | ING VP GROWTH AND INCOME PORTFOLIO |
| | |
| Average Annual Total Returns for the Periods Ended December 31, 2005 | |
| | | | | | | | | | | |
| | | | | | | | | | Since Inception | |
| | | | | | | | | | of Class S | |
| | 1 Year | | 5 Year | | 10 Year | | June 11, 2003 | |
| Class I | 8.13 | % | | (1.99 | )% | | 5.75 | % | | — | | |
| Class S | 7.98 | % | | — | | | — | | | 11.00 | % | |
| S&P 500 Index(1) | 4.91 | % | | 0.54 | % | | 9.07 | % | | 12.53 | %(2) | |
| | | | | | | | | | | | | |
| | | | | | | | | | | | | | | | | | |
Based on a $10,000 initial investment, the graph and table above illustrate the total return of ING VP Growth and Income Portfolio against the S&P 500 Index. The Index has no cash in its portfolio, imposes no sales charges and incurs no operating expenses. An investor cannot invest directly in an index. The Portfolio’s performance is shown without the imposition of any expenses or charges which are, or may be, imposed under your annuity contract. Total returns would have been lower if such expenses or charges were included.
The performance graph and table do not reflect the deduction of taxes that a shareholder will pay on portfolio distributions or the redemption of portfolio shares.
The performance shown may include the effect of fee waivers and/or expense reimbursements by the Investment Manager and/or other service providers, which have the effect of increasing total return. Had all fees and expenses been considered, the total returns would have been lower.
The performance update illustrates performance for a variable investment option available through a variable annuity contract. The performance shown indicates past performance and is not a projection or prediction of future results. Actual investment returns and principal value will fluctuate so that shares and/or units, at redemption, may be worth more or less than their original cost. Please call (800) 922-0180 to get performance through the most recent month end.
This report contains statements that may be “forward-looking” statements. Actual results may differ materially from those projected in the “forward-looking” statements.
The views expressed in this report reflect those of the portfolio manager only through the end of the period as stated on the cover. The portfolio manager’s views are subject to change at any time based on market and other conditions.
Portfolio holdings are subject to change daily.
(1) The S&P 500 Index is an unmanaged index that measures the performance of securities of approximately 500 of the largest companies in the U.S.
(2) Since inception performance for the index is shown from June 1, 2003.
7
ING VP GROWTH PORTFOLIO | | PORTFOLIO MANAGERS’ REPORT |
Industry Allocation
as of December 31, 2005
(as a percent of net assets)
Semiconductors | | 8.5 | % |
Healthcare-Products | | 8.1 | % |
Computers | | 7.3 | % |
Software | | 6.8 | % |
Retail | | 6.7 | % |
Pharmaceuticals | | 6.5 | % |
Internet | | 6.3 | % |
Telecommunications | | 5.8 | % |
Miscellaneous Manufacturing | | 4.6 | % |
Oil and Gas Services | | 4.6 | % |
Healthcare-Services | | 4.4 | % |
Biotechnology | | 4.1 | % |
Industries between 2.0%-4.0%(1) | | 20.0 | % |
Industries less than 2.0%(2) | | 6.4 | % |
Other Assets and Liabilities, Net* | | (0.1 | )% |
Total | | 100.0 | % |
| | | |
* Includes securities lending collateral. | | | |
(1) Includes seven industries, which each represents 2.0%-4.0% of net assets. |
(2) Includes six industries, which each represents less than 2.0% of net assets. |
Portfolio holdings subject to change daily.
The ING VP Growth Portfolio (the “Portfolio”) seeks growth of capital through investment in a diversified portfolio consisting primarily of common stock and securities convertible into common stocks believed to offer growth potential. The Portfolio is managed by Kenneth Bragdon, Portfolio Manager and Richard Welsh, Portfolio Manager, ING Investment Management Co. — the Sub-Adviser.
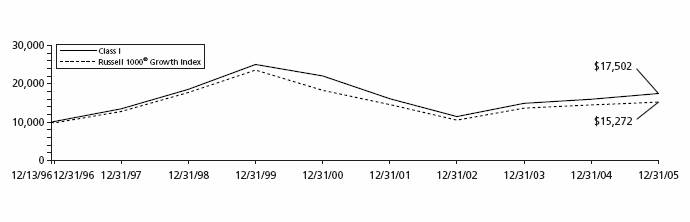
Performance: For the year ended December 31, 2005, the Portfolio’s Class I shares provided a total return of 9.38% compared to the Russell 1000® Growth Index(1), which returned 5.26% for the same period.
Portfolio Specifics: The Portfolio outperformed its benchmark in 2005, due to favorable stock selection in the consumer discretionary and technology sectors. Apple Computer was the Portfolio’s frontrunner, in both the technology sector and from an overall Portfolio perspective. Strong business momentum, derived from innovative iPod products and a derivative “halo effect” impact on iTunes downloads and iMac computer sales, resulted in higher earnings expectations and outstanding relative price performance. The company ended the year with third-party vendor shortages of the iPod nano and surprisingly strong demand for the new, video-enhanced iPod.
The return contribution of the consumer discretionary sector — the Portfolio’s best performing sector — was led by Internet search provider Google. The Portfolio’s position was increased during the summer and fall, an exposure rewarded by ongoing growth in the market for advertising and paid search. Office Depot, an office product store operator, benefited from improved margins, resulting in upside earnings surprises and higher earnings expectations. Gillette was also a strong performer: in addition to increased dominance in razors and the recovery in battery prices, the acquisition of the company by Procter & Gamble contributed to gains.
The multi-industry and financial services sectors detracted from performance. Tyco was largely responsible for poor results in the multi-industry sector, as the new management’s restructuring effort had appeared to run its course mid-year. Lower earnings expectations, higher operating costs and weakness in its European operations adversely affected the company’s outlook. Poor financial services performance was influenced by Doral Financial. The company created significant uncertainty about its earnings growth rate and underlying business prospects with the filing of its 2004 10-K earlier in the year. As a result of this uncertainty, we exited the position.
Current Strategy and Outlook: In 2006, real gross domestic product (“GDP”) growth is likely to slow from above-trend levels during the latter half of the year, potentially growing to around 3.5%, which is in line with consensus expectations. Although energy prices have pushed headline inflation higher, with the consumer price index (“CPI”) averaging nearly 4% year-over-year since July, core inflation is actually exhibiting a mild disinflationary trend. This suggests the Federal Reserve might stop raising interest rates sooner then expected. The ongoing economic expansion should contribute to the realization of mid-single digit earnings growth this year. We believe that growth stocks should continue to outperform value stocks, as seen in the latter three quarters of 2005. We also believe that our bottom-up process of investing in companies with positive business momentum will continue to generate successful performance for our clients.
Top Ten Holdings*
as of December 31, 2005
(as a percent of net assets)
General Electric Co. | | 3.9 | % |
Procter & Gamble Co. | | 3.7 | % |
UnitedHealth Group, Inc. | | 3.3 | % |
Johnson & Johnson | | 2.8 | % |
PepsiCo, Inc. | | 2.8 | % |
Gilead Sciences, Inc. | | 2.8 | % |
Google, Inc. | | 2.8 | % |
Monsanto Co. | | 2.7 | % |
International Business Machines Corp. | | 2.6 | % |
Apple Computer, Inc. | | 2.5 | % |
| | | |
* Excludes securities lending collateral. | | | |
Portfolio holdings are subject to change daily.
8
PORTFOLIO MANAGERS’ REPORT | | ING VP GROWTH PORTFOLIO |
| | |
| Average Annual Total Returns for the Periods Ended December 31, 2005 | |
| | | | | | | | | | | |
| | | | | | | | Since Inception | | Since Inception | |
| | | | | | | | of Class I | | of Class S | |
| | 1 Year | | 5 Year | | December 13, 1996 | | November 1, 2001 | |
| Class I | 9.38 | % | | (4.55 | )% | | 6.38 | % | | — | | |
| Class S | 9.05 | % | | — | | | — | | | 2.97 | % | |
| Russell 1000® Growth Index(1) | 5.26 | % | | (3.58 | )% | | 4.77 | %(2) | | 3.31 | %(3) | |
| | | | | | | | | | | | | |
| | | | | | | | | | | | | | | | | | | |
Based on a $10,000 initial investment, the graph and table above illustrate the total return of ING VP Growth Portfolio against the Russell 1000® Growth Index. The Index has no cash in its portfolio, imposes no sales charges and incurs no operating expenses. An investor cannot invest directly in an index. The Portfolio’s performance is shown without the imposition of any expenses or charges which are, or may be, imposed under your annuity contract. Total returns would have been lower if such expenses or charges were included.
The performance graph and table do not reflect the deduction of taxes that a shareholder will pay on portfolio distributions or the redemption of portfolio shares.
The performance shown may include the effect of fee waivers and/or expense reimbursements by the Investment Manager and/or other service providers, which have the effect of increasing total return. Had all fees and expenses been considered, the total returns would have been lower.
The performance update illustrates performance for a variable investment option available through a variable annuity contract. The performance shown indicates past performance and is not a projection or prediction of future results. Actual investment returns and principal value will fluctuate so that shares and/or units, at redemption, may be worth more or less than their original cost. Please call (800) 922-0180 to get performance through the most recent month end.
This report contains statements that may be “forward-looking” statements. Actual results may differ materially from those projected in the “forward-looking” statements.
The views expressed in this report reflect those of the portfolio manager only through the end of the period as stated on the cover. The portfolio manager’s views are subject to change at any time based on market and other conditions.
Portfolio holdings are subject to change daily.
(1) The Russell 1000® Growth Index measures the performance of the 1,000 largest companies in the Russell 3000 Index with higher price-to-book ratios and higher forecasted growth. The Russell 3000 Index is an unmanaged index that measures the performance of 3,000 U.S. companies based on total market capitalization.
(2) Since inception performance for the index is shown from December 1, 1996.
(3) Since inception performance for the index is shown from November 1, 2001.
9
ING VP SMALL COMPANY PORTFOLIO | | PORTFOLIO MANAGERS’ REPORT |
Industry Allocation
as of December 31, 2005
(as a percent of net assets)
Computers | | 8.3 | % |
Software | | 5.7 | % |
Real Estate Investment Trust | | 5.6 | % |
Retail | | 5.4 | % |
Banks | | 4.5 | % |
Oil and Gas Services | | 4.4 | % |
Pharmaceuticals | | 4.3 | % |
Commercial Services | | 4.2 | % |
Healthcare - Services | | 4.2 | % |
Semiconductors | | 4.0 | % |
Repurchase Agreement | | 3.8 | % |
Industries between 1.0% - 3.5%(1) | | 39.8 | % |
Industries less than 1.0%(2) | | 6.8 | % |
Other Assets and Liabilities, Net* | | (1.0 | )% |
Total | | 100.0 | % |
| | | |
* Includes securities lending collateral | | | |
(1) Includes twenty-five industries, which each represents 1.0% - 3.5% of net assets. |
(2) Includes twelve industries, which each represents less than 1.0% of net assets. |
Portfolio holdings subject to change daily.
The ING VP Small Company Portfolio (the “Portfolio”) seeks growth of capital primarily through investment in a diversified portfolio of common stocks and securities convertible into common stocks of companies with smaller market capitalizations. The Portfolio is managed by a team of equity investment specialists led by Steve Salopek*, Portfolio Manager, ING Investment Management Co. — the Sub-Adviser.
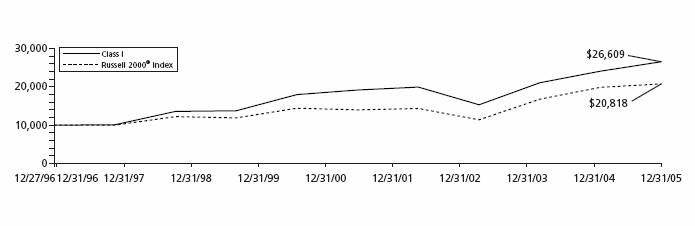
Performance: For the year ended December 31, 2005, the Portfolio’s Class I shares provided a total return of 10.27% compared to the Russell 2000® Index(1), which returned 4.55% for the same period.
Portfolio Specifics: The Portfolio outperformed its Russell 2000® Index benchmark during the past year due primarily to strong stock selection within the financials and energy sectors. Southwestern Energy, Denbury Resources and industrial company Watsco were the largest contributors to performance during the year ended 2005. Southwestern Energy is primarily focused on exploration and production of natural gas, and natural gas as a commodity has been strong. We believe this company will continue to have strong production growth in 2006 and that growth will accelerate. Also, the reassessment of the quality of their acreage in the Fayetteville Shale, which is a promising unconventional gas play, significantly increased the value of the company. Denbury Resources, also a producer of natural gas, has benefited from the strength in the price of natural gas commodity, as well as from improved production. Industrial company Watsco, another significant contributor to results, distributes air conditioning, heating, refrigeration equipment and related parts and materials. The company is expected to experience accelerating revenue and cash flow growth as a result of continued cyclical improvement in the commercial building cycle.
The largest detractors from performance over the year ended 2005 were Avid Technology, Northwest Airlines and InterVoice. Avid Technology, which develops digital media production software, underperformed as a result of a series of earnings disappointments. The company’s acquisition of Pinnacle Systems, which develops digital media software for the consumer market, was also viewed negatively by investors. Northwest Airlines, which we purchased in anticipation of a successful restructuring, eventually declared bankruptcy. The shares were sold well in advance of the bankruptcy filing, but the stock nevertheless detracted from results. We sold out of our entire position well before the stock went to zero. InterVoice, which provides converged voice and data solutions for the network and enterprise markets worldwide, had disappointing results during 2005; however, we continue to hold the stock on a valuation basis.
Current Strategy and Outlook: We believe the Portfolio is positioned well across sectors, with overweights in the industrial, technology, and energy sectors. We believe that our overweight in technology will continue to benefit the Portfolio. We have invested in companies that we think will grow at an accelerated rate in 2006 as a result of strong new product cycles. Our energy holdings are concentrated in the oil and gas drilling and equipment and services groups and are companies whose profitability we expect to remain vibrant even if the price of oil and natural gas declines. Financials, health care and consumer discretionary represent the largest sector underweights. Until there is evidence that the flat yield curve is likely to steepen, we will likely remain modestly underweighted in financials. Our emphasis in the financial sector is likely to continue to be on non-bank financials (insurance and asset management companies) as many small- cap banks, despite the difficulties imposed by a flat yield curve, are trading at significant premiums to book value as a result of an expected consolidation. Although we are currently underweight in the health care sector, we are looking to move to a market neutral stance in this sector as opportunities arise. We are also likely to remain underweighted in sectors driven by consumer spending, such as retail and consumer durables, as the already extended consumer is facing the headwinds of higher interest rates and energy prices.
Top Ten Holdings*
as of December 31, 2005
(as a percent of net assets)
La Quinta Corp. | | 1.7 | % |
Hudson United Bancorp | | 1.6 | % |
Watsco, Inc. | | 1.4 | % |
Electronics for Imaging | | 1.3 | % |
Wabtec Corp. | | 1.3 | % |
Varian Semiconductor Equipment Associates, Inc. | | 1.3 | % |
Denbury Resources, Inc. | | 1.2 | % |
Micros Systems, Inc. | | 1.2 | % |
Southwestern Energy Co. | | 1.2 | % |
Warnaco Group, Inc. | | 1.2 | % |
| | | |
* Excludes repurchase agreements and securities lending collateral. | | | |
Portfolio holdings are subject to change daily.
* The Portfolio has been managed by Steve Salopek since July 2005.
10
PORTFOLIO MANAGERS’ REPORT | | ING VP SMALL COMPANY PORTFOLIO |
| | |
| Average Annual Total Returns for the Periods Ended December 31, 2005 | |
| | | | | | | | | | | |
| | | | | | | | Since Inception | | Since Inception | |
| | | | | | | | of Class I | | of Class S | |
| | 1 Year | | 5 Year | | December 27, 1996 | | November 1, 2001 | |
| Class I | 10.27 | % | | 6.72 | % | | 11.47 | % | | — | % | |
| Class S | 10.05 | % | | — | | | — | | | 9.62 | % | |
| Russell 2000® Index(1) | 4.55 | % | | 8.22 | % | | 8.49 | %(2) | | 12.89 | % | |
| | | | | | | | | | | | | |
| | | | | | | | | | | | | | | | | | | |
Based on a $10,000 initial investment, the graph and table above illustrate the total return of ING VP Small Company Portfolio against the Russell 2000® Index. The Index has no cash in its portfolio, imposes no sales charges and incurs no operating expenses. An investor cannot invest directly in an index. The Portfolio’s performance is shown without the imposition of any expenses or charges which are, or may be, imposed under your annuity contract. Total returns would have been lower if such expenses or charges were included.
The performance graph and table do not reflect the deduction of taxes that a shareholder will pay on portfolio distributions or the redemption of portfolio shares.
The performance shown may include the effect of fee waivers and/or expense reimbursements by the Investment Manager and/or other service providers, which have the effect of increasing total return. Had all fees and expenses been considered, the total returns would have been lower.
The performance update illustrates performance for a variable investment option available through a variable annuity contract. The performance shown indicates past performance and is not a projection or prediction of future results. Actual investment returns and principal value will fluctuate so that shares and/or units, at redemption, may be worth more or less than their original cost. Please call (800) 922-0180 to get performance through the most recent month end.
This report contains statements that may be “forward-looking” statements. Actual results may differ materially from those projected in the “forward-looking” statements.
The views expressed in this report reflect those of the portfolio manager, only through the end of the period as stated on the cover. The portfolio manager’s views are subject to change at any time based on market and other conditions.
Portfolio holdings are subject to change daily.
(1) The Russell 2000® Index measures the performance of the 2,000 smallest companies in the Russell 3000 Index. The Russell 3000 Index is an unmanaged index that measures the performance of 3,000 U.S. companies based on total market capitalization.
(2) Since inception performance for the index is shown from January 1, 1997.
11
ING VP VALUE OPPORTUNITY PORTFOLIO | | PORTFOLIO MANAGERS’ REPORT |
Industry Allocation
as of December 31, 2005
(as a percent of net assets)
Diversified Financial Services | | 15.3 | % |
Oil and Gas | | 11.5 | % |
Banks | | 9.3 | % |
Insurance | | 8.7 | % |
Oil and Gas Services | | 4.8 | % |
Chemicals | | 4.4 | % |
Pharmaceuticals | | 4.2 | % |
Media | | 2.7 | % |
Electric | | 2.7 | % |
Agriculture | | 2.4 | % |
Lodging | | 2.2 | % |
Retail: Total | | 2.1 | % |
Industries between 1.0% - 2.0%(1) | | 22.8 | % |
Industries less than 1.0%(2) | | 7.6 | % |
Other Assets and Liabilities, Net* | | (0.7 | )% |
Total | | 100.0 | % |
| | | |
* Includes securities lending collateral. | | | |
(1) Includes sixteen industries, which each represents 1.0 - 2.1% of net assets. |
(2) Includes eleven industries, which each represents less than 1% of net assets. |
Portfolio holdings subject to change daily.
The ING VP Value Opportunity Portfolio (the “Portfolio”) seeks growth of capital primarily through investment in a diversified portfolio of common stocks. The Portfolio is managed by a team of equity investment specialists led by Scott Lewis, Portfolio Manager, ING Investment Management Co. — the Sub-Adviser.
Performance: For the year ended December 31, 2005, the Portfolio’s Class I shares provided a total return of 6.95% compared to the Russell 1000 Value Index(1) and the Russell 1000® Index(2), which returned 7.05% and 6.27%, respectively, for the same period.
Portfolio Specifics: The Portfolio almost matched its benchmark over the course of the full year, with a substantial improvement in returns coming in the May through December period. Scott Lewis, a senior portfolio manager on the ING Fundamental Equity team with 23 years experience, took over management of the Portfolio in December 2004 and made modest changes to better diversify the holdings and to better utilize the substantial fundamental research effort within ING. Mr. Lewis also repositioned the Portfolio to be more in line with other large-cap value funds.
Underperformance in the first four months of the year was largely attributable to headline-grabbing companies like American International Group, Freddie Mac and Fannie Mae. Each company massively restated their prior year earnings, drew the ire of regulatory bodies, and lost investor confidence. All were sold down either to index weight or to zero. Furthermore, the Portfolio’s holdings in the energy sector in early 2005 did not keep up with some of their industry peers, such as Valero Energy, Marathon Oil, Occidental Petroleum and others.
For the remainder of the year, the Portfolio outperformed by a wide margin almost enough to bring the relative performance for the full year into positive territory. Success was primarily driven by strong stock selection within the consumer discretionary, energy and telecommunication services sectors. Companies such as Abercrombie & Fitch and Best Buy were successful consumer holdings. In both cases, we became very interested after market sentiment turned negative yet, our fundamental research showed us that the catalysts for success were in place and the stocks were underappreciated. Abercrombie & Fitch worked through its inventory issues in the third and fourth quarters and Best Buy was successful with its store reconfigurations and focus on higher-end HDTV and customer service. These gains were partially offset by holdings in two poorly performing publishing companies, Gannett and Tribune. The Portfolio’s holdings in the oil and gas services group (Halliburton, BJ Services) as well as the oil and gas exploration and production industry (Apache, Cabot Oil & Gas) were very significant contributors to results. Valuations and earnings power of companies in these subsectors was, and continues to be, very attractive. Integrated oil companies remain unattractive due to their fixed rate production sharing agreements with host countries.
Modestly detracting from performance over the year was our overweight position in IBM. We continue to believe IBM’s services business is an undervalued asset and will exceed expectations. Additionally, a couple of materials holdings detracted from performance as there were questions about the strength of industrial production during the year.
Current Strategy and Outlook: Our current strategy is focused on companies that feature superior capital allocation, strong competitive position, and operations in industries with attractive outlooks. Key holdings, such as Kerzner International, Plains Exploration & Production, Halliburton, Capital One and Countrywide Financial all feature strong fundamentals, clear catalysts to win market recognition and attractive valuations.
Halliburton continues to offer upside potential in the energy services, even after delivering strong overall performance in 2005. We believe the stock may benefit greatly in 2006 if management spins off their engineering and construction subsidiary Kellogg, Brown & Root. More broadly, we like other oil and gas services stocks based on our forecast for continued robust spending by producers and refiners on creating new production capacity to meet global demand at high current prices. Kerzner International is an owner and operator of high-end luxury casino resorts in the Bahamas, Mexico and Dubai. In targeting the wealthiest customers, they’ve been successful in creating an atmosphere of exclusivity at their key properties and have thus been able to charge premium prices. Additionally, they are unmatched in their ability to negotiate and gain access to the more difficult markets in which to do business around the world, such as Dubai. This provides an enduring competitive advantage for Kerzner.
Top Ten Holdings*
as of December 31, 2005
(as a percent of net assets)
Bank of America Corp. | | 4.0 | % |
Pfizer, Inc. | | 3.4 | % |
Exxon Mobil Corp. | | 3.4 | % |
Wells Fargo & Co. | | 3.0 | % |
Citigroup, Inc. | | 2.8 | % |
JPMorgan Chase & Co. | | 2.5 | % |
Altria Group, Inc. | | 2.4 | % |
Countrywide Financial Corp. | | 2.3 | % |
General Electric Co. | | 2.0 | % |
Metlife, Inc. | | 2.0 | % |
| | | |
* Excludes short-term investments related to securities lending collateral. | | | |
Portfolio holdings are subject to change daily.
12
PORTFOLIO MANAGERS’ REPORT | | ING VP VALUE OPPORTUNITY PORTFOLIO |
| | |
| Average Annual Total Returns for the Periods Ended December 31, 2005 | |
| | | | | | | | | | | |
| | | | | | | | Since Inception | | Since Inception | |
| | | | | | | | of Class I | | of Class S | |
| | 1 Year | | 5 Year | | December 13, 1996 | | July 16, 2001 | |
| Class I | 6.95 | % | | (0.36 | )% | | 9.40 | % | | — | | |
| Class S | 6.76 | % | | — | | | — | | | (0.40 | )% | |
| Russell 1000® Value Index(1) | 7.05 | % | | 5.28 | % | | 9.56 | %(3) | | 6.35 | %(4) | |
�� | Russell 1000® Index(2) | 6.27 | % | | 1.07 | % | | 7.64 | %(3) | | 3.32 | %(4) | |
| | | | | | | | | | | | | |
| | | | | | | | | | | | | | | | | | | |
Based on a $10,000 initial investment, the graph and table above illustrate the total return of ING VP Value Opportunity Portfolio against the Russell 1000® Value and Russell 1000® Indices. The Indices have no cash in their portfolios, imposes no sales charges and incurs no operating expenses. An investor cannot invest directly in the indices. The Portfolio’s performance is shown without the imposition of any expenses or charges which are, or may be, imposed under your annuity contract. Total returns would have been lower if such expenses or charges were included.
The performance graph and table do not reflect the deduction of taxes that a shareholder will pay on portfolio distributions or the redemption of portfolio shares.
The performance shown may include the effect of fee waivers and/or expense reimbursements by the Investment Manager and/or other service providers, which have the effect of increasing total return. Had all fees and expenses been considered, the total returns would have been lower.
The performance update illustrates performance for a variable investment option available through a variable annuity contract. The performance shown indicates past performance and is not a projection or prediction of future results. Actual investment returns and principal value will fluctuate so that shares and/or units, at redemption, may be worth more or less than their original cost. Please call (800) 922-0180 to get performance through the most recent month end.
This report contains statements that may be “forward-looking” statements. Actual results may differ materially from those projected in the “forward-looking” statements.
The views expressed in this report reflect those of the portfolio manager, only through the end of the period as stated on the cover. The portfolio manager’s views are subject to change at any time based on market and other conditions.
Portfolio holdings are subject to change daily.
(1) The Russell 1000® Value Index is an unmanaged index that measures the performance of those Russell 1000 companies with lower price-to-book ratios and lower forecasted growth values, which more closely tracks the types of securities in which the Portfolio invests than the S&P 500 Composite Stock Price Index.
(2) The Russell 1000® Index is a comprehensive large-cap index measuring the performance of the largest 1,000 U.S. incorporated companies.
(3) Since inception performance for the index is shown from December 1, 1996.
(4) Since inception performance for the index is shown from August 1, 2001.
13
ING VP INTERMEDIATE BOND PORTFOLIO | | PORTFOLIO MANAGERS’ REPORT |
Investment Type Allocation
as of December 31, 2005
(as a percent of net assets)
Corporate Bonds/Notes | | 26.1 | % |
U.S. Government Agency Obligations | | 30.1 | % |
U.S. Treasury Obligations | | 21.5 | % |
Asset-Backed Security | | 4.9 | % |
Collateralized Mortgage Obligations | | 19.0 | % |
Municipal Bonds | | 0.3 | % |
Other Bonds | | 0.1 | % |
Preferred Stock | | 2.1 | % |
Commercial Paper | | 1.3 | % |
Repurchase Agreement | | 7.5 | % |
Other Assets and Liabilities, Net* | | (12.9 | )% |
Total | | 100.0 | % |
| | | |
* Includes securities lending collateral. | | | |
Portfolio holdings are subject to change daily.
The ING VP Intermediate Bond Portfolio (the “Portfolio”) seeks to maximize total return consistent with reasonable risk by investing in a diversified portfolio consisting primarily of debt securities. The Portfolio is managed by James B. Kauffmann, Portfolio Manager, ING Investment Management Co. — the Sub-Adviser.
Performance: For the year ended December 31, 2005, the Portfolio’s Class I shares provided a total return of 3.14% compared to 2.43% for the Lehman Brothers Aggregate Bond (“LBAB”) Index(1) for the same period.
Portfolio Specifics: Evidently accommodation has been removed without hobbling the economy; however, whether the terminal rate on Federal Funds Rate is 4.75% or 5.00% is still open to vigorous debate. The yield curve — which represents the yield on U. S. Treasuries from zero to thirty years — is now very flat. The bellwether ten-year note closed at 4.39% nearly matching the two-year note at 4.40%. The largest rise in U.S. yields occurred with shorter maturities; however, the U.S. Treasury yield on the thirty-year bond actually declined. The widely watched LBAB Index returned 2.43% for the year; yet many sectors witnessed some tough performance. Emerging market debt was the strong winner for the year posting 8.71% of excess returns in 2005. High-yield, however, came in with a comparatively modest 0.47% for the year ended December 31, 2005.
Our major investment themes remained effectively constant throughout the year, and we positioned the Portfolio accordingly. Rising short-term rates with a tightening Federal Reserve indicated a shorter duration posture with an underweight to longer maturities, which helped performance through most of the year. Lack of adequate compensation for credit risk led to an underweight of riskier sectors, industries, and issuers coupled with an overweight to the higher quality asset-backed securities and commercial mortgage-backed securities. The mortgage sector also appeared richly priced and/or technically weak. Consequently, we were largely underweight the sector and our mortgage team focused on securities likely to outperform in a rising rate environment and/or an increase in volatility.
Security selection in the mortgage-backed securities sector was particularly positive for performance as we moved up to a 12% exposure to hybrid adjustable rate mortgages (“ARMs”) instead of traditional pass-throughs by year-end. Our continued underweight of longer-dated corporates was beneficial for most months of 2005. Corporates, overall, gave up 1.15% of excess return (excess return means the excess over the return from Treasury securities of comparable term), but the most damage occurred in the longer maturities. Over-exposure to asset-backed securities and commercial mortgage-backed securities at the expense of corporate bonds also proved beneficial to results as both sectors produced positive excess relative returns. Positions in bank and insurance names, particularly floating rate preferreds, and a lack of exposure in the automotive sectors were sources of positive security selection, which led to the Portfolio’s good performance.
Current Strategy and Outlook: Our outlook did not change during the year ended December 31, 2005, with the exception that the end of the tightening phase is now on the horizon, in our opinion. While the debate on Wall Street about the relationship of inverted yield curves and recessions is lively, we believe that any inversion will likely be brief and will have fewer implications for the domestic economy than in the past. We agree with Federal Reserve officials that “global savings gluts” have better explanatory power for the comparatively low yields on 10- and 30-year U.S. Treasuries than a signal that the economy might soon sputter.
We have positioned the Portfolio for the potentiality that sentiment will reverse and higher risk premiums will be required by the market with “an attendant fall in the price of risky assets.” Indeed, we are keenly aware that preserving capital and receiving adequate compensation for risk are essential elements of successful bond management. Specifically, the ING credit team continues to avoid companies with depressed stock prices and under-utilized assets on the books. However, we continue to look to take advantage of companies that weaken in sympathy but have a lower probability of such event risk. Moreover, the maturities of the corporate portfolio are shorter, on balance than those of the corporate bonds in the LBAB Index. Our mortgage team has constructed a portfolio designed to offset an increase in volatility and a change in prepayments. Finally, duration is shorter than the LBAB Index.
Top Ten Industries*
as of December 31, 2005
(as a percent of net assets)
Federal National Mortgage Association | | 20.0 | % |
U.S. Treasury Notes | | 17.7 | % |
Whole Loan Collateral CMO | �� | 13.9 | % |
Diversified Financial Services | | 9.1 | % |
Federal Home Loan Mortgage Corporation | | 8.2 | % |
Banks | | 5.9 | % |
Commercial Mortgage Backed Securities | | 4.9 | % |
U.S. Treasury Bonds | | 3.8 | % |
Electric: Total | | 2.7 | % |
Insurance | | 1.8 | % |
| | | |
* Excludes repurchase agreements and securities lending collateral. | | | |
Portfolio holdings are subject to change daily.
14
PORTFOLIO MANAGERS’ REPORT | | ING VP INTERMEDIATE BOND PORTFOLIO |
| | |
| Average Annual Total Returns for the Periods Ended December 31, 2005 | |
| | | | | | | | | | | |
| | | | | | | | | | Since Inception | |
| | | | | | | | | | of Class S | |
| | 1 Year | | 5 Year | | 10 Year | | May 3, 2002 | |
| Class I | 3.14 | % | | 6.25 | % | | 5.98 | % | | — | | |
| Class S | 2.94 | % | | — | | | — | | | 5.73 | % | |
| LBAB Index(1) | 2.43 | % | | 5.87 | % | | 6.16 | % | | 5.15 | %(2) | |
| | | | | | | | | | | | | |
| | | | | | | | | | | | | | | | | | |
Based on a $10,000 initial investment, the graph and table above illustrate the total return of ING VP Intermediate Bond Portfolio against the LBAB Index. The Index has has no cash in its portfolio, imposes no sales charges and incurs no operating expenses. An investor cannot invest directly in an index. The Portfolio’s performance is shown without the imposition of any expenses or charges which are, or may be, imposed under your annuity contract. Total returns would have been lower if such expenses or charges were included.
The performance graph and table do not reflect the deduction of taxes that a shareholder will pay on portfolio distributions or the redemption of portfolio shares.
The performance shown may include the effect of fee waivers and/or expense reimbursements by the Investment Manager and/or other service providers, which have the effect of increasing total return. Had all fees and expenses been considered, the total returns would have been lower.
The performance update illustrates performance for a variable investment option available through a variable annuity contract. The performance shown indicates past performance and is not a projection or prediction of future results. Actual investment returns and principal value will fluctuate so that shares and/or units, at redemption, may be worth more or less than their original cost. Please call (800) 922-0180 to get performance through the most recent month end.
This report contains statements that may be “forward-looking” statements. Actual results may differ materially from those projected in the “forward-looking” statements.
The views expressed in this report reflect those of the portfolio managers, only through the end of the period as stated on the cover. The portfolio managers’ views are subject to change at any time based on market and other conditions.
Portfolio holdings are subject to change daily.
(1) The LBAB Index is an unmanaged index composed of securities from the Lehman Brothers Government/Corporate Bond Index, Mortgage-Backed Securities Index and the Asset-Backed Securities Index.
(2) Since inception performance for the index is shown from May 1, 2002.
15
ING VP MONEY MARKET PORTFOLIO | | PORTFOLIO MANAGERS’ REPORT |
Investment Types
as of December 31, 2005
(as a percent of net assets)
Corporate Bonds/Notes | | 46.2 | % |
Commercial Paper | | 35.0 | % |
Repurchase Agreement | | 7.6 | % |
Collateralized Mortgage Obligations | | 5.7 | % |
U.S. Government Agency Obligations | | 4.8 | % |
Certificate of Deposits | | 1.0 | % |
Other Assets and Liabilites, Net* | | (0.3 | )% |
Total | | 100.0 | % |
| | | |
* includes securities lending collateral. | | | |
Portfolio holdings are subject to change daily.
The ING VP Money Market Portfolio (the “Portfolio”) seeks to provide high current return, consistent with preservation of capital and liquidity, through investment in high-quality money market instruments. The Portfolio is managed by David S. Yealy, Portfolio Manager, ING Investment Management Co. — the Sub-Adviser.
Portfolio Specifics: The year 2005 was one in which the Federal Reserve Open Market Committee (“FOMC”) continued its “measured” pace of removing monetary accommodation by raising the Federal Funds Rate 0.25% at each of its eight FOMC Meetings. The Federal Funds Rate ended the year at 4.25%, a full 2.00% higher than the previous year-end and 3.25% higher than when the FOMC started tightening in June of 2004. Rising short-term interest rates were the primary driver of investment performance for money market funds and investors. Another key event in 2005 for short-term investors was the nomination of Dr. Ben Bernanke in October to replace Alan Greenspan as chairman of the Federal Reserve in January of 2006. Dr. Bernanke is an advocate of explicit inflation targeting and therefore the FOMC is not expected to diverge significantly from the current FOMC as far as inflation fighting is concerned.
The ING VP Money Market Portfolio was well positioned to take advantage of the rising rate environment. The Portfolio’s primary investment strategy, which was in place throughout the year, of maintaining a high concentration in interest sensitive floating rate securities and focusing new purchases on very short-term maturities which typically matured prior to or just after the next Federal Reserve meeting added to the relative performance of the Portfolio. Within the floating rate security sector, we overweighed floaters that reset either weekly or monthly as opposed to quarterly, thereby capturing the rate increases sooner. The Portfolio had purchased a limited amount of longer-term maturity securities in mid-2004 which originally added to performance in 2004 but were a small drag on performance this year as the FOMC increased rates higher than was priced in at the time of purchase. Those securities matured in April and May and the proceeds were reinvested in better performing floating rate securities and very short-term securities.
Current Strategy and Outlook: Despite the change in the FOMC language in December, we continue to anticipate additional FOMC tightenings in 2006 in response to inflationary pressures due to tightening labor conditions and the effect of higher energy prices post Hurricane Katrina. Current inflation, as measured by the core personal consumption expenditure (“PCE”), is at the high end of what we believe to be the FOMC’s comfort range and could rise further with the unemployment rate moving below 5.0%. In the near-term, we plan on maintaining our current strategy of focusing new purchases to the next FOMC meeting, maintaining a high exposure to floating rate securities, and making selective purchases in the three-month and under maturity sector where yield levels fully price in 25 basis point increases at each of the Federal Reserve meetings in between. We anticipate having to change our strategy to one focusing more on longer-term fixed rate securities at some point in 2006 as we reach the final stage of the FOMC tightening cycle.
16
PORTFOLIO MANAGERS’ REPORT | | ING VP MONEY MARKET PORTFOLIO |
Principal Risk Factor(s): An investment in the Portfolio is not insured or guaranteed by the Federal Deposit Insurance Corporation or any other government agency. Although the Portfolio seeks to preserve the value of your investment, it is possible to lose money by investing in the Portfolio.
The views expressed in this report reflect those of the portfolio managers only through the end of the period as stated on the cover. The portfolio managers’ views are subject to change at any time based on market and other conditions.
Portfolio holdings are subject to change daily.
This report contains statements that may be “forward-looking” statements. Actual results may differ materially from those projected in the “forward-looking” statements.
17
ING VP GLOBAL SCIENCE AND TECHNOLOGY PORTFOLIO | | PORTFOLIO MANAGERS’ REPORT |
Country Allocation
as of December 31, 2005
(as a percent of net assets)

* Includes securities lending collateral
(1) Includes seven countries which each represents less than 1.0% of net assets.
Portfolio holdings subject to change daily
The ING VP Global Science and Technology Portfolio (the “Portfolio”) seeks long-term capital appreciation. The Portfolio is team managed by Thomas P. Callan, CFA, Managing Director and Senior Portfolio Manager, Jean M. Rosenbaum, CFA, Managing Director and Portfolio Manager and Erin Xie, Ph.D., Managing Director and Portfolio Manager, BlackRock Advisors, Inc. — the Sub-Adviser.
Performance: For the year ended December 31, 2005, the Portfolio’s Class I shares provided a total return of 11.78% compared to 4.91% for the Standard & Poor’s 500 Composite Stock Price (“S&P 500 Index”) Index(1) and 7.80% for the Pacific Stock Exchange Technology Index (“PSE Technology”)(2).
Portfolio Specifics: The broader markets were characterized by stronger performance from biotechnology and semiconductor stocks in the second half of the year ended December 31, 2005. The Philadelphia Semiconductor Index experienced strong gains in the second part of the year and finished the period with a return of 11.1% due to stronger than expected PC and handset unit growth. The NASDAQ Biotech Index bottomed in March of 2005, with the removal of Biogen’s Tysabris drug from the market, but made upward progress since that event to finish the 2005 year with a 2.9% return.
During the year ended December 31, 2005, the Portfolio was underweight the information technology and industrials sectors, overweight telecomm services and neutral weight healthcare relative to the PSE Index. Good stock selection in the internet software and services, semiconductors and semiconductor capital equipment industries were significant contributors to yearly performance. Positions in Google, Inc. and aQuantive, Inc. were the primary relative performers, gaining 115% and 182% respectively for the year ended December 31, 2005. Within semiconductors, the Portfolio was underweight the large analog stocks in the PSE Index such as Linear Technology Corp. and Maxim Integrated Products, Inc., which underperformed during the year ended 2005. Positions in semiconductor companies such as MEMC Electronic Materials, Inc., SiRF Technology Holdings, Inc. and Samsung Corp. also contributed significantly to performance during the 2005 year. A zero weight in the early part of 2005 in Apple Computer, Inc. detracted from performance as Apple’s stock rose 123% in the 2005 year.
Elsewhere, strong stock selection and an overweight position in the wireless telecom segment also added to performance. We maintain a positive opinion on the fundamental trends of these companies as we believe wireless substitution is a global phenomenon.
The Portfolio’s positioning in the industrial sector had a neutral impact on performance. An underweight in the sector was offset by good stock selection. Notable contributors were Japanese machinery companies Komatsu and Nabtesco, each of which gained more than 130% for the year ended December 31, 2005.
Despite strong absolute performance in the healthcare sector of the Portfolio, the segment had a negative impact on Portfolio performance relative to the PSE Index. An underweight in biotechnology and poor stock selection in pharmaceuticals contributed to the underperformance. At the stock level, detractors included Incyte Corp, which fell 47% during the year as a result of Food and Drug Administration approval delays, Dyax Corp, which fell 27% but recovered during the second half of the 2005 year and a lack of exposure to Genzyme Corp, which rose 22% after increasing earnings guidance.
Current Strategy and Outlook: With strong earnings growth expected for technology companies, the overweight in the telecomm sector was trimmed during 2005 and the healthcare sector weight was reduced in the fourth quarter 2005. We have also increased exposure to markets outside the U.S., which have been rising due to improving economic growth and the improving health of financial markets. Companies in Japan and Korea have been restructuring and recent global and domestic economic strength has resulted in strong and improving earnings growth. Industrial electronics companies, particularly factory automation, are benefiting notably from these trends. We continue to favor Taiwanese equipment manufacturers due to their significant cost advantages and favorable foreign demand trends. Other global information technology industries of particular interest remain internet services and wireless equipment manufacturers. As we exit the seasonally strong 2005 fourth quarter for technology, which also included very strong performance in Asian equity markets, we are beginning to take profits in some of the positions.
Top Ten Industries
as of December 31, 2005
(as a percent of net assets)
Semiconductors | | 16.8 | % |
Telecommunications | | 15.7 | % |
Software | | 11.4 | % |
Computers | | 11.1 | % |
Pharmaceuticals | | 9.1 | % |
Internet | | 8.0 | % |
Healthcare-Products | | 5.2 | % |
Electronics | | 5.0 | % |
Biotechnology | | 3.3 | % |
Machinery-Construction and Mining | | 2.0 | % |
| | | |
* Excludes short-term investments related to securities lending collateral | | | |
Portfolio holdings are subject to change daily.
18
PORTFOLIO MANAGERS’ REPORT | | ING VP GLOBAL SCIENCE AND TECHNOLOGY PORTFOLIO |
| | |
| Average Annual Total Returns for the Periods Ended December 31, 2005 | |
| | | | | | | | | | | |
| | | | | | | | Since Inception | | Since Inception | |
| | | | | | | | of Class I | | of Class S | |
| | 1 Year | | 5 Year | | May 1, 2000 | | July 20, 2005 | |
| Class I | 11.78 | % | | (6.20 | )% | | (13.93 | )% | | — | | |
| Class S | — | | | — | | | — | | | 9.49 | % | |
| S&P 500 Index(1) | 4.91 | % | | 0.54 | % | | (1.06 | )% | | — | | |
| PSE Technology Index(2) | 7.80 | % | | 0.83 | % | | (2.78 | )% | | — | | |
| | | | | | | | | | | | | |
| | | | | | | | | | | | | | | | | | |
Based on a $10,000 initial investment, the graph and table above illustrate the total return of ING VP Global Science and Technology Portfolio against the S&P 500 Index and the PSE Technology Index. The Indices have no cash in their portfolios, impose no sales charges and incur no operating expenses. An investor cannot invest directly in an index. The Portfolio’s performance is shown without the imposition of any expenses or charges which are, or may be, imposed under your annuity contract. Total returns would have been lower if such expenses or charges were included.
The performance graph and table do not reflect the deduction of taxes that a shareholder will pay on portfolio distributions or the redemption of portfolio shares.
The performance shown may include the effect of fee waivers and/or expense reimbursements by the Investment Manager and/or other service providers, which have the effect of increasing total return. Had all fees and expenses been considered, the total returns would have been lower.
The performance update illustrates performance for a variable investment option available through a variable annuity contract. The performance shown indicates past performance and is not a projection or prediction of future results. Actual investment returns and principal value will fluctuate so that shares and/or units, at redemption, may be worth more or less than their original cost. Please call (800) 922-0180 to get performance through the most recent month end.
This report contains statements that may be “forward-looking” statements. Actual results may differ materially from those projected in the “forward-looking” statements.
The views expressed in this report reflect those of the portfolio managers, only through the end of the period as stated on the cover. The portfolio managers’ views are subject to change at any time based on market and other conditions.
Portfolio holdings are subject to change daily.
(1) The S&P 500 Index is an unmanaged index that measures the performance of securities of approximately 500 of the largest companies in the U.S.
(2) The PSE Technology Index, an unmanaged index published by the Pacific Exchange, is comprised of 100 listed and over-the-counter stocks from 15 different industries including computer hardware, software, semiconductors, telecommunications, data storage and processing, electronics and biotechnology. This Index is included as an additional comparative index for Portfolio performance.
19
ING VP INTERNATIONAL EQUITY PORTFOLIO | | PORTFOLIO MANAGERS’ REPORT |
Country Allocation
as of December 31, 2005
(as a percent of total investments)

(1) Includes thirteen countries which each represents
less than 2.0% of total investments.
Portfolio holdings are subject to change daily.
The ING VP International Equity Portfolio (the “Portfolio”) seeks long-term capital growth primarily through investment in a diversified portfolio of common stocks principally traded in countries outside of the United States. The Portfolio is managed by Martin Jansen, Portfolio Manager and Carl Ghielan, Portfolio Manager, ING Investment Management Co. — the Sub-Adviser.
Performance: For the year ended December 31, 2005, the Portfolio’s Class I shares provided a total return of 16.87% compared to the Morgan Stanley Capital International Europe, Australasia and Far East (“MSCI EAFE®”) Index(1), which returned 14.02% for the same period.
Portfolio Specifics: International markets performed strongly in 2005. Accelerating earnings growth in Japan and solid earnings growth in Europe, Developed Asia and emerging markets, combined with relatively attractive valuations, were the key drivers of this strength. This backdrop proved beneficial for our “growth at a reasonable price” (“GARP”) investment approach, which seeks to identify stocks with a combination of attractive growth and valuation characteristics. This investment strategy proved especially successful in Japan, where economic growth and a watermark election strengthened the conviction of investors that Japan is on a course of multi-year recovery. The steady profit improvement in Europe, despite an anemic domestic backdrop, and increased merger and acquisition activity on the continent likewise benefited the Portfolio. In addition to significantly positive stock selection results in Japan and Europe and the successful modest allocation to emerging markets also contributed materially to performance.
Stock selection within sectors is based on customized sector models in combination with fundamental analysis to identify stocks both scoring well quantitatively versus their peers and in which we have a strong fundamental conviction. Results were positive in all sectors with the exception of information technology and consumer staples. The contribution from the financial services sector was especially strong, and stock selection in the telecommunication services and health care sectors also contributed materially to performance. Sector allocation detracted slightly from the Portfolio’s return due to an underweighting in the strongly performing materials sector and an overweighting in the weak telecommunications sector.
At the stock level, the largest individual contributors were concentrated in Japan, and particularly in the financial services sector, which benefited the most from the nascent domestic revival. Our holdings in Leopalace 21 (property development), kabu.com (on-line brokerage services) and Mizuho Financial Group (banking) were important positive contributors. Takashimaya (department store), Sumitomo Metal Industries (steel producer), and Sumitomo Corp (trading company) were other cyclically sensitive names that helped performance. Elsewhere, Hong Kong Exchanges (the Hong Kong exchange operating company) proved to be a successful play on Greater China, while Swiss pharmaceutical company Roche rose strongly in the wake of its effective avian flu antidote. Impacting negatively were Deutsche Telecom, Oki Electric Industry, and Telecom Italia.
Current Strategy and Outlook: The output of our models, supported by fundamental analysis, has resulted in a Portfolio modestly undervalued versus the benchmark, yet consisting of stocks that have on average grown earnings faster than the benchmark over the past few years and are expected to achieve relatively strong earnings growth over the next three to five years. We maintain a modest allocation to selective emerging markets based on their attractive valuations and sustained strong earnings growth. The Portfolio has an overall cyclically neutral positioning, within which the Japanese component emphasizes stocks expected to benefit from an accelerating domestic economy. A modest but recently reduced defensive tilt is evident in our European holdings. We maintain a benchmark weighting in Japan and have financed our emerging markets allocation by underweighting Europe. In our opinion, with leading economic indicators in Japan and Europe suggesting accelerating growth and markets fairly valued, we expect markets to strengthen in the coming quarters.
Top Ten Industries
as of December 31, 2005
(as a percent of net assets)
Banks | | 19.0 | % |
Oil and Gas | | 7.8 | % |
Pharmaceuticals | | 6.6 | % |
Telecommunications | | 6.4 | % |
Insurance | | 4.5 | % |
Retail | | 3.7 | % |
Transportation | | 3.4 | % |
Chemicals | | 2.8 | % |
Agriculture | | 2.6 | % |
Electronics | | 2.4 | % |
Portfolio holdings are subject to change daily.
20
PORTFOLIO MANAGERS’ REPORT | | ING VP INTERNATIONAL EQUITY PORTFOLIO |
| | |
| Average Annual Total Returns for the Periods Ended December 31, 2005 | |
| | | | | | | | | | | |
| | | | | | | | Since Inception | | Since Inception | |
| | | | | | | | of Class I | | of Class S | |
| | 1 Year | | 5 Year | | December 22, 1997 | | November 1, 2001 | |
| Class I | 16.87 | % | | 0.18 | % | | 5.06 | % | | — | | |
| Class S | 16.53 | % | | — | | | — | | | 8.23 | % | |
| MSCI EAFE® Index(1) | 14.02 | % | | 4.94 | % | | 6.68 | %(2) | | 13.34 | % | |
| | | | | | | | | | | | | |
| | | | | | | | | | | | | | | | | | | |
Based on a $10,000 initial investment, the graph and table above illustrate the total return of ING VP International Equity Portfolio against the MSCI EAFE® Index. The Index has no cash in its portfolio, imposes no sales charges and incurs no operating expenses. An investor cannot invest directly in an index. The Portfolio’s performance is shown without the imposition of any expenses or charges which are, or may be, imposed under your annuity contract. Total returns would have been lower if such expenses or charges were included.
The performance graph and table do not reflect the deduction of taxes that a shareholder will pay on portfolio distributions or the redemption of portfolio shares.
The performance shown may include the effect of fee waivers and/or expense reimbursements by the Investment Manager and/or other service providers, which have the effect of increasing total return. Had all fees and expenses been considered, the total returns would have been lower.
The performance update illustrates performance for a variable investment option available through a variable annuity contract. The performance shown indicates past performance and is not a projection or prediction of future results. Actual investment returns and principal value will fluctuate so that shares and/or units, at redemption, may be worth more or less than their original cost. Please call (800) 922-0181 to get performance through the most recent month end.
This report contains statements that may be “forward-looking” statements. Actual results may differ materially from those projected in the “forward-looking” statements.
The views expressed in this report reflect those of the portfolio manager only through the end of the period as stated on the cover. The portfolio manager’s views are subject to change at any time based on market and other conditions.
Portfolio holdings are subject to change daily.
(1) The MSCI EAFE® Index is an unmanaged index that measures the performance of securities listed on exchanges in markets in Europe, Australasia and the Far East.
(2) Since inception performance for the index is shown from January 1, 1998.
21
SHAREHOLDER EXPENSE EXAMPLE (UNAUDITED)
As a shareholder of a Fund, you incur two types of costs: (1) transaction costs, including sales charges (loads) on purchase payments, redemption fees; and exchange fees; and (2) ongoing costs, including management fees; distribution [and/or service] (12b-1) fees; and other Fund expenses. These Examples are intended to help you understand your ongoing costs (in dollars) of investing in a Fund and to compare these costs with the ongoing costs of investing in other mutual funds.
The Examples are based on an investment of $1,000 invested at the beginning of the period and held for the entire period from July 1, 2005 to December 31, 2005.
Actual Expenses
The first section of the table shown, “Actual Fund Return,” provides information about actual account values and actual expenses. You may use the information in this section, together with the amount you invested, to estimate the expenses that you paid over the period. Simply divide your account value by $1,000 (for example, an $8,600 account value divided by $1,000 = 8.6), then multiply the result by the number in the first section under the heading entitled “Expenses Paid During Period” to estimate the expenses you paid on your account during this period.
Hypothetical Example for Comparison Purposes
The second section of the table shown, “Hypothetical 5% Return,” provides information about hypothetical account values and hypothetical expenses based on the Fund’s actual expense ratio and an assumed rate of return of 5% per year before expenses, which is not the Fund’s actual return. The hypothetical account values and expenses may not be used to estimate the actual ending account balance or expenses you paid for the period. You may use this information to compare the ongoing costs of investing in the Fund and other funds. To do so, compare this 5% hypothetical example with the 5% hypothetical examples that appear in the shareholder reports of the other funds.
Please note that the expenses shown in the table are meant to highlight your ongoing costs only and do not reflect any transactional costs, such as sales charges (loads), redemption fees, or exchange fees. Therefore, the hypothetical lines of the table are useful in comparing ongoing costs only, and will not help you determine the relative total costs of owning different funds. In addition, if these transactional costs were included, your costs would have been higher.
| | | | | | | | | | |
| | | Beginning
Account
Value
July 1, 2005 | | Ending
Account
Value
December 31, 2005 | | Annualized
Expense
Ratio | | Expenses Paid
During the Six
Months Ended
December 31, 2005* | |
| | | | | | | | | | |
| ING VP Balanced Portfolio | | | | | | | | | |
| Actual Fund Return | | | | | | | | | |
| Class I | | $1,000.00 | | | $1,030.10 | | | 0.60 | % | | $3.07 | | |
| Class S | | 1,000.00 | | | 1,028.30 | | | 0.85 | | | 4.35 | | |
| Hypothetical (5% return before expenses) | | | | | | | | | | | | | |
| Class I | | $1,000.00 | | | $1,022.18 | | | 0.60 | % | | $3.06 | | |
| Class S | | 1,000.00 | | | 1,020.92 | | | 0.85 | | | 4.33 | | |
| | | | | | | | | | | | | | |
* Expenses are equal to each Fund’s respective annualized expense ratios multiplied by the average account value over the period, multiplied by 184/365 to reflect the most recent fiscal half-year.
22
SHAREHOLDER EXPENSE EXAMPLE (UNAUDITED) (CONTINUED)
| | | | | | | | | | |
| | | Beginning
Account
Value
July 1, 2005 | | Ending
Account
Value
December 31, 2005 | | Annualized
Expense
Ratio | | Expenses Paid
During the Six
Months Ended
December 31, 2005* | |
| | | | | | | | | | |
| ING VP Growth and Income Portfolio | | | | | | | | | |
| Actual Fund Return | | | | | | | | | | | | |
| Class I | | $1,000.00 | | $1,079.10 | | | 0.59 | % | | $3.09 | | |
| Class S | | 1,000.00 | | 1,078.70 | | | 0.84 | | | 4.40 | | |
| Hypothetical (5% return before expenses) | | | | | | | | | | | | |
| Class I | | $1,000.00 | | $1,022.23 | | | 0.59 | % | | $3.01 | | |
| Class S | | 1,000.00 | | 1,020.97 | | | 0.84 | | | 4.28 | | |
| | | | | | | | | | | | | |
| ING VP Growth Portfolio | | | | | | | | | | | | |
| Actual Fund Return | | | | | | | | | | | | |
| Class I | | $1,000.00 | | $1,106.50 | | | 0.69 | % | | $3.66 | | |
| Class S | | 1,000.00 | | 1,104.40 | | | 0.94 | | | 4.99 | | |
| Hypothetical (5% return before expenses) | | | | | | | | | | | | |
| Class I | | $1,000.00 | | $1,021.73 | | | 0.69 | % | | $3.52 | | |
| Class S | | 1,000.00 | | 1,020.47 | | | 0.94 | | | 4.79 | | |
| | | | | | | | | | | | | |
| ING VP Small Company Portfolio | | | | | | | | | | | | |
| Actual Fund Return | | | | | | | | | | | | |
| Class I | | $1,000.00 | | $1,092.90 | | | 0.85 | % | | $4.48 | | |
| Class S | | 1,000.00 | | 1,091.70 | | | 1.10 | | | 5.80 | | |
| Hypothetical (5% return before expenses) | | | | | | | | | | | | |
| Class I | | $1,000.00 | | $1,020.92 | | | 0.85 | % | | $4.33 | | |
| Class S | | 1,000.00 | | 1,019.66 | | | 1.10 | | | 5.60 | | |
| | | | | | | | | | | | | |
| ING VP Value Opportunity Portfolio | | | | | | | | | | | | |
| Actual Fund Return | | | | | | | | | | | | |
| Class I | | $1,000.00 | | $1,081.80 | | | 0.70 | % | | $3.67 | | |
| Class S | | 1,000.00 | | 1,080.00 | | | 0.95 | | | 4.98 | | |
| Hypothetical (5% return before expenses) | | | | | | | | | | | | |
| Class I | | $1,000.00 | | $1,021.68 | | | 0.70 | % | | $3.57 | | |
| Class S | | 1,000.00 | | 1,020.42 | | | 0.95 | | | 4.84 | | |
| | | | | | | | | | | | | |
| ING VP Intermediate Bond Portfolio | | | | | | | | | | | | |
| Actual Fund Return | | | | | | | | | | | | |
| Class I | | $1,000.00 | | $1,003.20 | | | 0.49 | % | | $2.47 | | |
| Class S | | 1,000.00 | | 1,002.60 | | | 0.74 | | | 3.74 | | |
| Hypothetical (5% return before expenses) | | | | | | | | | | | | |
| Class I | | $1,000.00 | | $1,022.74 | | | 0.49 | % | | $2.50 | | |
| Class S | | 1,000.00 | | 1,021.48 | | | 0.74 | | | 3.77 | | |
| | | | | | | | | | | | | |
* Expenses are equal to each Fund’s respective annualized expense ratios multiplied by the average account value over the period, multiplied by 184/365 to reflect the most recent fiscal half-year.
23
SHAREHOLDER EXPENSE EXAMPLE (UNAUDITED) (CONTINUED)
| | | | | | | | | | |
| | | Beginning
Account
Value
July 1, 2005 | | Ending
Account
Value
December 31, 2005 | | Annualized
Expense
Ratio | | Expenses Paid
During the Six
Months Ended
December 31, 2005* | |
| | | | | | | | | | |
| ING VP Money Market Portfolio | | | | | | | | | |
| Actual Fund Return | | | | | | | | | | | | |
| Class I | | $1,000.00 | | $1,017.70 | | | 0.35 | % | | $1.78 | | |
| Hypothetical (5% return before expenses) | | | | | | | | | | | | |
| Class I | | $1,000.00 | | $1,023.44 | | | 0.35 | % | | $1.79 | | |
| | | | | | | | | | | | | |
| ING VP Global Science and Technology Portfolio | | | | | | | | | | | | |
| Actual Fund Return | | | | | | | | | | | | |
| Class I | | $1,000.00 | | $1,166.70 | | | 1.06 | % | | $5.79 | | |
| Class S | | 1,000.00 | | 1,166.70 | | | 1.31 | | | 7.15 | | |
| Hypothetical (5% return before expenses) | | | | | | | | | | | | |
| Class I | | $1,000.00 | | $1,019.86 | | | 1.06 | % | | $5.40 | | |
| Class S | | 1,000.00 | | 1,018.60 | | | 1.31 | | | 6.67 | | |
| | | | | | | | | | | | | |
| ING VP International Equity Portfolio | | | | | | | | | | | | |
| Actual Fund Return | | | | | | | | | | | | |
| Class I | | $1,000.00 | | $1,183.60 | | | 1.14 | % | | $6.27 | | |
| Class S | | 1,000.00 | | 1,181.60 | | | 1.39 | | | 7.64 | | |
| Hypothetical (5% return before expenses) | | | | | | | | | | | | |
| Class I | | $1,000.00 | | $1,019.46 | | | 1.14 | % | | $5.80 | | |
| Class S | | 1,000.00 | | 1,018.20 | | | 1.39 | | | 7.07 | | |
| | | | | | | | | | | | | |
* Expenses are equal to each Fund’s respective annualized expense ratios multiplied by the average account value over the period, multiplied by 184/365 to reflect the most recent fiscal half-year.
24
REPORT OF INDEPENDENT REGISTERED PUBLIC ACCOUNTING FIRM
The Boards of Directors and Trustees and Shareholders
ING Variable Portfolios, Inc., ING VP Balanced Portfolio, Inc.,
ING Variable Funds, ING VP Intermediate Bond Portfolio, and ING VP Money Market Portfolio
We have audited the accompanying statements of assets and liabilities, including the portfolios of investments, of ING VP International Equity Portfolio, ING VP Growth Portfolio, ING VP Small Company Portfolio, ING VP Global Science and Technology Portfolio, and ING VP Value Opportunity Portfolio, each a series of ING Variable Portfolios, Inc., ING VP Growth and Income Portfolio, a series of ING Variable Funds, ING VP Balanced Portfolio, Inc., ING VP Intermediate Bond Portfolio, and ING VP Money Market Portfolio as of December 31, 2005, and the related statements of operations for the year then ended, the statements of changes in net assets for each of the years in the two-year period then ended, and the financial highlights for each of the years or periods in the five-year period then ended. These financial statements and financial highlights are the responsibility of management. Our responsibility is to express an opinion on these financial statements and financial highlights based on our audits.
We conducted our audits in accordance with the standards of the Public Company Accounting Oversight Board (United States). Those standards require that we plan and perform the audits to obtain reasonable assurance about whether the financial statements and financial highlights are free of material misstatement. An audit includes examining, on a test basis, evidence supporting the amounts and disclosures in the financial statements. Our procedures included confirmation of securities owned as of December 31, 2005 by correspondence with the custodian and brokers, or by other appropriate auditing procedures when replies from brokers were not received. An audit also includes assessing the accounting principles used and significant estimates made by management, as well as evaluating the overall financial statement presentation. We believe that our audits provide a reasonable basis for our opinion.
In our opinion, the financial statements and financial highlights referred to above present fairly, in all material respects, the financial position of the aforementioned portfolios as of December 31, 2005, the results of their operations, the changes in their net assets, and the financial highlights for the periods specified in the first paragraph above, in conformity with U.S. generally accepted accounting principles.

Boston, Massachusetts
February 27, 2006
25
STATEMENTS OF ASSETS AND LIABILITIES AS OF DECEMBER 31, 2005
| | ING
VP Balanced
Portfolio | | ING
VP Growth
and Income
Portfolio | | ING
VP Growth
Portfolio | | ING
VP Small
Company
Portfolio | | ING
VP Value
Opportunity
Portfolio | |
ASSETS: | | | | | | | | | | | |
Investments in securities at value+* | | $ | 1,217,540,580 | | $ | 3,074,909,442 | | $ | 173,754,784 | | $ | 449,491,291 | | $ | 207,741,999 | |
Short-term investments** | | 17,976,240 | | 18,178,508 | | — | | — | | — | |
Short-term investments at amortized cost | | 231,954,000 | | 271,624,000 | | 32,864,000 | | 129,955,000 | | 22,446,000 | |
Repurchase agreement | | 39,424,000 | | 49,621,000 | | 2,010,000 | | 17,552,000 | | 2,825,000 | |
Cash | | 249,149 | | 4,236,081 | | 148 | | 92,501 | | — | |
Cash collateral for futures | | 325,625 | | 1,669,500 | | — | | — | | — | |
Unrealized appreciation on swap agreements | | 138,162 | | — | | — | | — | | — | |
Foreign currencies at value*** | | 5,161 | | — | | — | | — | | — | |
Receivables: | | | | | | | | | | | |
Investment securities sold | | 1,729,950 | | 5,865,660 | | — | | 443,920 | | 1,889,652 | |
Fund shares sold | �� | — | | — | | 3,108,013 | | 159,372 | | 3,786 | |
Dividends and interest | | 3,753,789 | | 3,735,767 | | 103,903 | | 514,768 | | 235,780 | |
Futures variation margin | | 2,890 | | — | | — | | — | | — | |
Prepaid expenses | | 46,608 | | 120,760 | | 6,597 | | 18,086 | | 8,351 | |
Total assets | | 1,513,146,154 | | 3,429,960,718 | | 211,847,445 | | 598,226,938 | | 235,150,568 | |
| | | | | | | | | | | |
LIABILITIES: | | | | | | | | | | | |
Payable for investment securities purchased | | 39,106,765 | | 4,240,000 | | 2,988,965 | | 3,795,580 | | 3,160,066 | |
Payable for fund shares redeemed | | 1,758,372 | | 3,598,774 | | 273,569 | | 1,622,228 | | 379,224 | |
Payable for futures variation margin | | 48,222 | | 140,450 | | — | | — | | — | |
Payable upon receipt of securities loaned | | 231,954,000 | | 271,624,000 | | 32,864,000 | | 129,955,000 | | 22,446,000 | |
Unrealized depreciation on swap agreements | | 1,114 | | — | | — | | — | | — | |
Payable to affiliates | | 592,672 | | 1,515,785 | | 97,870 | | 335,058 | | 125,359 | |
Payable to custodian due to bank overdraft | | — | | — | | — | | — | | 6,901 | |
Payable for director/trustee fees | | 23,649 | | 104,448 | | 5,550 | | 11,255 | | 4,508 | |
Other accrued expenses and liabilities | | 164,477 | | 281,623 | | 35,476 | | 39,717 | | 75,511 | |
Total liabilities | | 273,649,271 | | 281,505,080 | | 36,265,430 | | 135,758,838 | | 26,197,569 | |
NET ASSETS | | $ | 1,239,496,883 | | $ | 3,148,455,638 | | $ | 175,582,015 | | $ | 462,468,100 | | $ | 208,952,999 | |
| | | | | | | | | | | |
NET ASSETS WERE COMPRISED OF: | | | | | | | | | | | |
Paid-in capital | | $ | 1,188,326,188 | | $ | 5,214,150,100 | | $ | 340,499,518 | | $ | 327,213,441 | | $ | 209,787,330 | |
Undistributed net investment income | | 28,943,335 | | 393,853 | | 111,000 | | 1,808,051 | | 2,922,288 | |
Accumulated net realized gain (loss) on investments, foreign currency related transactions, futures, options and swaps | | (28,949,979 | ) | (2,422,233,497 | ) | (188,424,397 | ) | 70,497,517 | | (23,771,699 | ) |
Net unrealized appreciation or depreciation on investments foreign currency related transactions, futures, options and swaps | | 51,177,339 | | 356,145,182 | | 23,395,894 | | 62,949,091 | | 20,015,080 | |
NET ASSETS | | $ | 1,239,496,883 | | $ | 3,148,455,638 | | $ | 175,582,015 | | $ | 462,468,100 | | $ | 208,952,999 | |
+ | | Including securities loaned at value | | $ | 225,842,956 | | $ | 263,362,560 | | $ | 31,996,283 | | $ | 125,678,884 | | $ | 22,025,854 | |
* | | Cost of investments in securities | | $ | 1,166,828,541 | | $ | 2,718,431,748 | | $ | 150,358,890 | | $ | 386,542,199 | | $ | 187,726,919 | |
** | | Cost of short-term investments | | $ | 17,987,226 | | $ | 18,180,755 | | $ | — | | $ | — | | $ | — | |
*** | | Cost of foreign currencies | | $ | 5,214 | | $ | — | | $ | — | | $ | — | | $ | — | |
| | | | | | | | | | | | | | | | | | |
Class I: | | | | | | | | | | | |
Net assets | | $ | 1,236,326,745 | | $ | 3,146,024,847 | | $ | 175,296,839 | | $ | 393,699,896 | | $ | 178,827,825 | |
Shares authorized | | 500,000,000 | | unlimited | | 100,000,000 | | 100,000,000 | | 100,000,000 | |
Par value | | $ | 0.001 | | $ | 1.000 | | $ | 0.001 | | $ | 0.001 | | $ | 0.001 | |
Shares outstanding | | 90,644,696 | | 151,882,994 | | 16,892,011 | | 18,182,650 | | 12,918,340 | |
Net asset value and redemption price per share | | $ | 13.64 | | $ | 20.71 | | $ | 10.38 | | $ | 21.65 | | $ | 13.84 | |
| | | | | | | | | | | | | | | | |
Class S: | | | | | | | | | | | |
Net assets | | $ | 3,170,138 | | $ | 2,430,791 | | $ | 285,176 | | $ | 68,768,204 | | $ | 30,125,174 | |
Shares authorized | | 500,000,000 | | unlimited | | 100,000,000 | | 100,000,000 | | 100,000,000 | |
Par value | | $ | 0.001 | | $ | 1.000 | | $ | 0.001 | | $ | 0.001 | | $ | 0.001 | |
Shares outstanding | | 233,399 | | 117,482 | | 27,663 | | 3,185,337 | | 2,187,880 | |
Net asset value and redemption price per share | | $ | 13.58 | | $ | 20.69 | | $ | 10.31 | | $ | 21.59 | | $ | 13.77 | |
See Accompanying Notes to Financial Statements
26
STATEMENTS OF ASSETS AND LIABILITIES AS OF DECEMBER 31, 2005 (CONTINUED)
| | ING
VP Intermediate
Bond
Portfolio | | ING
VP Money
Market
Portfolio | | ING
VP Global Science
and Technology
Portfolio | | ING
VP International
Equity
Portfolio | |
ASSETS: | | | | | | | | | |
Investments in securities at value+* | | $ | 1,837,844,082 | | $ | — | | $ | 79,766,420 | | $ | 61,047,325 | |
Short-term investments** | | 23,320,236 | | — | | — | | — | |
Short-term investments at amortized cost | | 431,292,000 | | 998,820,669 | | 18,348,000 | | — | |
Repurchase agreement | | 131,457,000 | | 82,133,000 | | — | | 891,000 | |
Cash | | 211,739 | | 1,121,929 | | 4,392,768 | | — | |
Cash collateral for futures | | 857,179 | | — | | — | | — | |
Foreign currencies at value*** | | 17,202 | | — | | 342,653 | | — | |
Unrealized appreciation on swap agreements | | 620,255 | | — | | — | | — | |
Receivables: | | | | | | | | | |
Investment securities sold | | 8,232,458 | | — | | 229,810 | | — | |
Fund shares sold | | 1,719,386 | | 46,562 | | 238 | | 1,387 | |
Dividends and interest | | 10,840,046 | | 2,604,749 | | 38,803 | | 87,652 | |
Futures variation margin | | 16,327 | | — | | — | | — | |
Prepaid expenses | | 63,867 | | 47,534 | | 2,977 | | 2,197 | |
Total assets | | 2,446,491,777 | | 1,084,774,443 | | 103,121,669 | | 62,029,561 | |
| | | | | | | | | |
LIABILITIES: | | | | | | | | | |
Payable for investment securities purchased | | 248,694,215 | | — | | 32,500 | | — | |
Payable for fund shares redeemed | | 4,147 | | 6,740,788 | | 45,857 | | 123,263 | |
Payable for futures variation margin | | 222,720 | | — | | — | | — | |
Payable upon receipt of securities loaned | | 431,292,000 | | 4,600,000 | | 18,348,000 | | — | |
Unrealized depreciation on swap agreements | | 4,362 | | — | | — | | — | |
Payable to affiliates | | 786,980 | | 278,765 | | 71,744 | | 47,870 | |
Payable to custodian due to bank overdraft | | — | | — | | — | | 2,427 | |
Payable for director/trustee fees | | 26,396 | | 25,394 | | 2,232 | | 1,185 | |
Other accrued expenses and liabilities | | 116,866 | | 111,578 | | 20,479 | | 38,478 | |
Total liabilities | | 681,147,686 | | 11,756,525 | | 18,520,812 | | 213,223 | |
NET ASSETS | | $ | 1,765,344,091 | | $ | 1,073,017,918 | | $ | 84,600,857 | | $ | 61,816,338 | |
| | | | | | | | | |
NET ASSETS WERE COMPRISED OF: | | | | | | | | | |
Paid-in capital | | $ | 1,781,744,459 | | $ | 1,045,833,132 | | $ | 123,487,274 | | $ | 71,021,523 | |
Undistributed net investment income (accumulated net investment loss) | | 735,802 | | 31,881,013 | | — | | 1,100,095 | |
Accumulated net realized loss on investments, foreign currency related transactions, futures, options and swaps | | (11,508,839 | ) | (4,696,227 | ) | (53,915,546 | ) | (19,716,111 | ) |
Net unrealized appreciation or depreciation on investments foreign currency related transactions, futures, options and swaps | | (5,627,331 | ) | — | | 15,029,129 | | 9,410,831 | |
NET ASSETS | | $ | 1,765,344,091 | | $ | 1,073,017,918 | | $ | 84,600,857 | | $ | 61,816,338 | |
+ | | Including securities loaned at value | | $ | 422,661,520 | | $ | 4,502,520 | | $ | 17,686,387 | | $ | — | |
* | | Cost of investments in securities | | $ | 1,845,869,449 | | $ | — | | $ | 64,744,008 | | $ | 51,637,706 | |
** | | Cost of short-term investments | | $ | 23,335,059 | | $ | — | | $ | — | | $ | — | |
*** | | Cost of foreign currencies | | $ | 17,442 | | $ | — | | $ | 335,907 | | $ | — | |
| | | | | | | | | | | |
Class I: | | | | | | | | | |
Net assets | | $ | 1,148,075,313 | | $ | 1,073,017,918 | | $ | 84,522,535 | | $ | 61,463,791 | |
Shares authorized | | unlimited | | unlimited | | 100,000,000 | | 100,000,000 | |
Par value | | $ | 1.000 | | $ | 1.000 | | $ | 0.001 | | $ | 0.001 | |
Shares outstanding | | 88,495,897 | | 81,472,556 | | 19,799,045 | | 6,081,548 | |
Net asset value and redemption price per share | | $ | 12.97 | | $ | 13.17 | | $ | 4.27 | | $ | 10.11 | |
| | | | | | | | | |
Class S: | | | | | | | | | |
Net assets | | $ | 617,268,778 | | n/a | | $ | 78,322 | | $ | 352,547 | |
Shares authorized | | unlimited | | unlimited | | 100,000,000 | | 100,000,000 | |
Par value | | $ | 1.000 | | $ | 1.000 | | $ | 0.001 | | $ | 0.001 | |
Shares outstanding | | 47,829,026 | | n/a | | 18,357 | | 35,086 | |
Net asset value and redemption price per share | | $ | 12.91 | | n/a | | $ | 4.27 | | $ | 10.05 | |
See Accompanying Notes to Financial Statements
27
STATEMENTS OF OPERATIONS FOR THE YEAR ENDED DECEMBER 31, 2005
| | ING
VP Balanced
Portfolio | | ING
VP Growth
and Income
Portfolio | | ING
VP Growth
Portfolio | | ING
VP Small
Company
Portfolio | | ING
VP Value
Opportunity
Portfolio | |
INVESTMENT INCOME: | | | | | | | | | | | |
Dividends, net of foreign taxes withheld* | | $ | 13,304,861 | | $ | 48,366,514 | | $ | 1,246,997 | | $ | 5,553,121 | | $ | 4,253,880 | |
Interest | | 22,256,212 | | 3,904,858 | | 56,217 | | 474,928 | | 77,392 | |
Securities lending income | | 445,808 | | 468,597 | | 11,925 | | 109,225 | | 8,101 | |
Total investment income | | 36,006,881 | | 52,739,969 | | 1,315,139 | | 6,137,274 | | 4,339,373 | |
| | | | | | | | | | | |
EXPENSES: | | | | | | | | | | | |
Investment management fees | | 6,472,484 | | 16,269,780 | | 1,047,664 | | 3,570,754 | | 1,200,566 | |
Distribution and service fees: | | | | | | | | | | | |
Class S | | 7,718 | | 4,832 | | 740 | | 165,242 | | 13,830 | |
Transfer agent fees | | 417 | | 7,540 | | 272 | | 469 | | 268 | |
Administrative service fees | | 711,952 | | 1,789,672 | | 96,032 | | 261,847 | | 110,048 | |
Shareholder reporting expense | | 91,365 | | 302,846 | | 3,282 | | 42,075 | | 14,036 | |
Registration fees | | 1,364 | | 3,866 | | 1,565 | | 7,002 | | 1,917 | |
Professional fees | | 90,170 | | 195,638 | | 6,668 | | 29,210 | | 14,237 | |
Custody and accounting expense | | 173,888 | | 347,911 | | 23,910 | | 58,530 | | 29,890 | |
Director/Trustee fees | | 91,905 | | 236,747 | | 8,455 | | 36,790 | | 14,107 | |
Miscellaneous expense | | 78,655 | | 206,060 | | 12,739 | | 31,724 | | 15,432 | |
Total expenses | | 7,719,918 | | 19,364,892 | | 1,201,327 | | 4,203,643 | | 1,414,331 | |
Net investment income | | 28,286,963 | | 33,375,077 | | 113,812 | | 1,933,631 | | 2,925,042 | |
| | | | | | | | | | | |
REALIZED AND UNREALIZED GAIN (LOSS) ON INVESTMENTS, FOREIGN CURRENCY RELATED TRANSACTIONS, FUTURES, OPTIONS AND SWAPS AND INCREASE FROM PAYMENT BY AFFILIATE AND NET LOSSES REALIZED ON DISPOSAL OF INVESTMENTS IN VIOLATION OF RESTRICTIONS: | | | | | | | | | | | |
Net realized gain (loss) on: | | | | | | | | | | | |
Investments | | 63,453,422 | | 287,244,614 | | 16,657,930 | | 70,551,533 | | 16,846,321 | |
Foreign currency related transactions | | (1,648 | ) | — | | — | | 12,123 | | — | |
Futures, options and swaps | | 772,046 | | (410,433 | ) | (45,466 | ) | — | | 34,422 | |
Net realized gain on investments, foreign currency related transactions, futures, options and swaps | | 64,223,820 | | 286,834,181 | | 16,612,464 | | 70,563,656 | | 16,880,743 | |
Increase from payments by affiliates | | — | | — | | 6,044 | | 92,160 | | — | |
Loss realized on disposal of investments in violation of restrictions | | — | | — | | (6,044 | ) | (92,160 | ) | — | |
Net increase from payments by affiliates and net losses realized on disposal of investments in violation of restrictions | | — | | — | | — | | — | | — | |
Net change in unrealized appreciation or depreciation on: | | | | | | | | | | | |
Investments | | (39,547,836 | ) | (72,741,699 | ) | (2,085,933 | ) | (35,170,284 | ) | (7,743,251 | ) |
Foreign currency related transactions | | (53 | ) | (12,512 | ) | — | | 8,674 | | — | |
Futures, options and swaps | | 398,259 | | (1,001,613 | ) | (10,025 | ) | — | | — | |
Net change in unrealized appreciation or depreciation on investments, foreign currency related transactions, futures, options and swaps | | (39,149,630 | ) | (73,755,824 | ) | (2,095,958 | ) | (35,161,610 | ) | (7,743,251 | ) |
Net realized and unrealized gain on investments, foreign currency related transactions, futures, options and swaps and increase from payment by affiliate and net losses realized on disposal of investments in violation of restrictions | | 25,074,190 | | 213,078,357 | | 14,516,506 | | 35,402,046 | | 13,773,332 | |
Increase in net assets resulting from operations | | $ | 53,361,153 | | $ | 246,453,434 | | $ | 14,630,318 | | $ | 37,335,677 | | $ | 12,062,534 | |
*Foreign taxes withheld | | $ | — | | $ | 400,020 | | $ | 17,839 | | $ | 62,466 | | $ | 48,701 | |
See Accompanying Notes to Financial Statements
28
STATEMENTS OF OPERATIONS FOR THE YEAR ENDED DECEMBER 31, 2005
| | ING
VP Intermediate
Bond
Portfolio | | ING
VP Money
Market
Portfolio | | ING
VP Global Science
and Technology
Portfolio | | ING
VP International
Equity
Portfolio | |
INVESTMENT INCOME: | | | | | | | | | |
Dividends, net of foreign taxes withheld* | | | $ | 999,886 | | | $ | — | | | $ | 370,394 | | | | $ | 1,336,873 | | |
Interest | | | 69,579,025 | | | 35,662,427 | | | 40,142 | | | | 140,733 | | |
Securities lending income | | | 1,457,287 | | | 10,348 | | | 27,531 | | | | — | | |
Total investment income | | | 72,036,198 | | | 35,672,775 | | | 438,067 | | | | 1,477,606 | | |
| | | | | | | | | | | | | | | |
EXPENSES: | | | | | | | | | | | | | | | |
Investment management fees/Unified fees | | | 6,204,024 | | | 2,721,032 | | | 727,106 | | | | 474,708 | | |
Distribution and service fees: | | | | | | | | | | | | | | | |
Class S | | | 1,104,567 | | | — | | | 58 | | | | 730 | | |
Transfer agent fees | | | 6,153 | | | 971 | | | 117 | | | | 237 | | |
Administrative service fees | | | 853,026 | | | 598,609 | | | 42,094 | | | | 30,715 | | |
Shareholder reporting expense | | | 74,940 | | | 116,934 | | | 5,763 | | | | 1,903 | | |
Registration fees | | | 17,432 | | | 1,209 | | | 1,488 | | | | 472 | | |
Professional fees | | | 99,495 | | | 80,244 | | | 2,395 | | | | 4,545 | | |
Custody and accounting expense | | | 161,473 | | | 136,650 | | | 18,714 | | | | 39,518 | | |
Director/Trustee fees | | | 91,120 | | | 75,200 | | | 5,330 | | | | 2,562 | | |
Miscellaneous expense | | | 68,639 | | | 51,546 | | | 5,607 | | | | 3,667 | | |
Total expenses | | | 8,680,869 | | | 3,782,395 | | | 808,672 | | | | 559,057 | | |
Net recouped fees | | | — | | | — | | | — | | | | 78,239 | | |
Net expenses | | | 8,680,869 | | | 3,782,395 | | | 808,672 | | | | 637,296 | | |
Net investment income/(loss) | | | 63,355,329 | | | 31,890,380 | | | (370,605 | ) | | | 840,310 | | |
| | | | | | | | | | | | | | | |
REALIZED AND UNREALIZED GAIN (LOSS) ON INVESTMENTS, FOREIGN CURRENCY RELATED TRANSACTIONS, FUTURES, OPTIONS AND SWAPS: | | | | | | | | | | | | | | | |
Net realized gain (loss) on: | | | | | | | | | | | | | | | |
Investments | | | (7,821,913 | ) | | 16,292 | | | 944,382 | | | | 6,824,269 | | |
Foreign currency related transactions | | | (31,543 | ) | | — | | | (73,823 | ) | | | 25,494 | | |
Futures, options and swaps | | | 2,451,751 | | | — | | | — | | | | 24,901 | | |
Net realized gain (loss) on investments, foreign currency related transactions, futures, options and swaps | | | (5,401,705 | ) | | 16,292 | | | 870,559 | | | | 6,874,664 | | |
Net change in unrealized appreciation or depreciation on: | | | | | | | | | | | | | | | |
Investments | | | (13,855,351 | ) | | 232,026 | | | 7,216,426 | | | | 1,175,375 | | |
Foreign currency related transactions | | | (280 | ) | | — | | | 6,567 | | | | (9,571 | ) | |
Futures, options and swaps | | | 2,253,905 | | | — | | | — | | | | — | | |
Net change in unrealized appreciation or depreciation on investments, foreign currency related transactions, futures, options and swaps | | | (11,601,726 | ) | | 232,026 | | | 7,222,993 | | | | 1,165,804 | | |
Net realized and unrealized gain (loss) on investments, foreign currency related transactions, futures, options and swaps | | | (17,003,431 | ) | | 248,318 | | | 8,093,552 | | | | 8,040,468 | | |
Increase in net assets resulting from operations | | | $ | 46,351,898 | | | $ | 32,138,698 | | | $ | 7,722,947 | | | | $ | 8,880,778 | | |
| | | | | | | | | | | | | | | | | | | |
|
*Foreign taxes withheld | | | $ | — | | | $ | — | | | $ | 38,740 | | | | $ | 139,387 | | |
See Accompanying Notes to Financial Statements
29
STATEMENTS OF CHANGES IN NET ASSETS
| | ING VP Balanced Portfolio | | ING VP Growth and
Income Portfolio | |
| | Year
Ended
December 31,
2005 | | Year
Ended
December 31,
2004 | | Year
Ended
December 31,
2005 | | Year
Ended
December 31,
2004 | |
FROM OPERATIONS: | | | | | | | | | |
Net investment income (loss) | | $ | 28,286,963 | | $ | 29,739,087 | | $ | 33,375,077 | | $ | 50,522,560 | |
Net realized gain (loss) on investments, foreign currency related transactions, futures, options and swaps | | 64,223,820 | | 114,097,263 | | 286,834,181 | | 447,317,782 | |
Net change in unrealized appreciation or depreciation on investments, foreign currency related transactions, futures, options and swaps | | (39,149,630 | ) | (24,069,800 | ) | (73,755,824 | ) | (216,790,994 | ) |
Net increase (decrease) in net assets resulting from operations | | 53,361,153 | | 119,766,550 | | 246,453,434 | | 281,049,348 | |
| | | | | | | | | |
FROM DISTRIBUTIONS TO SHAREHOLDERS: | | | | | | | | | |
Net investment income: | | | | | | | | | |
Class I | | (30,561,067 | ) | (28,402,664 | ) | (32,953,759 | ) | (84,513,202 | ) |
Class S | | (64,964 | ) | (45,416 | ) | (22,610 | ) | (36,994 | ) |
Total distributions | | (30,626,031 | ) | (28,448,080 | ) | (32,976,369 | ) | (84,550,196 | ) |
| | | | | | | | | |
FROM CAPITAL SHARE TRANSACTIONS: | | | | | | | | | |
Net proceeds from sale of shares | | 13,329,999 | | 72,475,813 | | 3,779,349 | | 61,659,142 | |
Dividends reinvested | | 30,626,031 | | 28,448,080 | | 32,951,640 | | 84,494,957 | |
| | 43,956,030 | | 100,923,893 | | 36,730,989 | | 146,154,099 | |
Cost of shares redeemed | | (188,164,420 | ) | (207,015,009 | ) | (634,951,531 | ) | (606,618,345 | ) |
Net decrease in net assets resulting from capital share transactions | | (144,208,390 | ) | (106,091,116 | ) | (598,220,542 | ) | (460,464,246 | ) |
Net decrease in net assets | | (121,473,268 | ) | (14,772,646 | ) | (384,743,477 | ) | (263,965,094 | ) |
| | | | | | | | | |
NET ASSETS: | | | | | | | | | |
Beginning of year | | 1,360,970,151 | | 1,375,742,797 | | 3,533,199,115 | | 3,797,164,209 | |
End of year | | $ | 1,239,496,883 | | $ | 1,360,970,151 | | $ | 3,148,455,638 | | $ | 3,533,199,115 | |
Undistributed net investment income (accumulated net investment loss) at end of year | | $ | 28,943,335 | | $ | 30,622,780 | | $ | 393,853 | | $ | (4,855 | ) |
See Accompanying Notes to Financial Statements
30
STATEMENTS OF CHANGES IN NET ASSETS
| | ING VP Growth Portfolio | | ING VP Small Company Portfolio | |
| | Year
Ended
December 31,
2005 | | Year
Ended
December 31,
2004 | | Year
Ended
December 31,
2005 | | Year
Ended
December 31,
2004 | |
FROM OPERATIONS: | | | | | | | | | |
Net investment income | | $ | 113,812 | | $ | 1,271,506 | | $ | 1,933,631 | | $ | 1,040,282 | |
Net realized gain on investments, foreign currency related transactions and futures | | 16,612,464 | | 14,574,755 | | 70,563,656 | | 51,270,584 | |
Net change in unrealized appreciation or depreciation on investments, foreign currency related transactions and futures | | (2,095,958 | ) | (3,535,888 | ) | (35,161,610 | ) | 17,092,665 | |
Net increase in net assets resulting from operations | | 14,630,318 | | 12,310,373 | | 37,335,677 | | 69,403,531 | |
| | | | | | | | | |
FROM DISTRIBUTIONS TO SHAREHOLDERS: | | | | | | | | | |
Net investment income: | | | | | | | | | |
Class I | | (1,254,943 | ) | (268,051 | ) | (629,139 | ) | (1,319,890 | ) |
Class S | | (1,478 | ) | — | | (11,731 | ) | (32,250 | ) |
Net realized gains: | | | | | | | | | |
Class I | | — | | — | | (5,638,130 | ) | — | |
Class S | | — | | — | | (645,187 | ) | — | |
Total distributions | | (1,256,421 | ) | (268,051 | ) | (6,924,187 | ) | (1,352,140 | ) |
| | | | | | | | | |
FROM CAPITAL SHARE TRANSACTIONS: | | | | | | | | | |
Net proceeds from sale of shares | | 5,010,821 | | 5,337,872 | | 84,826,927 | | 128,623,947 | |
Dividends reinvested | | 1,256,421 | | 268,051 | | 6,924,187 | | 1,352,140 | |
| | 6,267,242 | | 5,605,923 | | 91,751,114 | | 129,976,087 | |
Cost of shares redeemed | | (37,695,610 | ) | (48,634,103 | ) | (192,925,770 | ) | (129,864,806 | ) |
Net increase (decrease) in net assets resulting from capital share transactions | | (31,428,368 | ) | (43,028,180 | ) | (101,174,656 | ) | 111,281 | |
Net increase (decrease) in net assets | | (18,054,471 | ) | (30,985,858 | ) | (70,763,166 | ) | 68,162,672 | |
| | | | | | | | | |
NET ASSETS: | | | | | | | | | |
Beginning of year | | 193,636,486 | | 224,622,344 | | 533,231,266 | | 465,068,594 | |
End of year | | $ | 175,582,015 | | $ | 193,636,486 | | $ | 462,468,100 | | $ | 533,231,266 | |
Undistributed net investment income at end of year | | $ | 111,000 | | $ | 1,266,147 | | $ | 1,808,051 | | $ | 818,766 | |
See Accompanying Notes to Financial Statements
31
STATEMENTS OF CHANGES IN NET ASSETS
| | ING VP Value
Opportunity Portfolio | | ING VP Intermediate
Bond Portfolio | |
| | Year
Ended
December 31,
2005 | | Year
Ended
December 31,
2004 | | Year
Ended
December 31,
2005 | | Year
Ended
December 31,
2004 | |
FROM OPERATIONS: | | | | | | | | | |
Net investment income | | $ | 2,925,042 | | $ | 3,871,948 | | $ | 63,355,329 | | $ | 47,873,508 | |
Net realized gain (loss) on investments, foreign currency related transactions, futures, options and swaps | | 16,880,743 | | 494,455 | | (5,401,705 | ) | 26,705,050 | |
Net change in unrealized appreciation or depreciation on investments, foreign currency related transactions, futures, options and swaps | | (7,743,251 | ) | 17,597,293 | | (11,601,726 | ) | (14,331,669 | ) |
Net increase in net assets resulting from operations | | 12,062,534 | | 21,963,696 | | 46,351,898 | | 60,246,889 | |
| | | | | | | | | |
FROM DISTRIBUTIONS TO SHAREHOLDERS: | | | | | | | | | |
Net investment income: | | | | | | | | | |
Class I | | (3,812,050 | ) | (2,050,084 | ) | (43,350,584 | ) | (87,943,133 | ) |
Class S | | (58,891 | ) | (22,234 | ) | (21,220,005 | ) | (15,582,872 | ) |
Net realized gains: | | | | | | | | | |
Class I | | — | | — | | (5,820,859 | ) | (44,509,550 | ) |
Class S | | — | | — | | (2,592,551 | ) | (7,324,711 | ) |
Total distributions | | (3,870,941 | ) | (2,072,318 | ) | (72,983,999 | ) | (155,360,266 | ) |
| | | | | | | | | |
FROM CAPITAL SHARE TRANSACTIONS: | | | | | | | | | |
Net proceeds from sale of shares | | 7,777,950 | | 13,547,407 | | 506,231,158 | | 399,481,829 | |
Net proceeds from shares issued in merger | | 35,824,021 | | — | | — | | — | |
Dividends reinvested | | 3,870,941 | | 2,072,318 | | 72,952,456 | | 155,282,029 | |
| | 47,472,912 | | 15,619,725 | | 579,183,614 | | 554,763,858 | |
Cost of shares redeemed | | (70,105,800 | ) | (71,840,954 | ) | (181,491,451 | ) | (263,169,907 | ) |
Net increase (decrease) in net assets resulting from capital share transactions | | (22,632,888 | ) | (56,221,229 | ) | 397,692,163 | | 291,593,951 | |
Net increase (decrease) in net assets | | (14,441,295 | ) | (36,329,851 | ) | 371,060,062 | | 196,480,574 | |
| | | | | | | | | |
NET ASSETS: | | | | | | | | | |
Beginning of year | | 223,394,294 | | 259,724,145 | | 1,394,284,029 | | 1,197,803,455 | |
End of year | | $ | 208,952,999 | | $ | 223,394,294 | | $ | 1,765,344,091 | | $ | 1,394,284,029 | |
Undistributed net investment income at end of year | | $ | 2,922,288 | | $ | 3,868,187 | | $ | 735,802 | | $ | 277,792 | |
See Accompanying Notes to Financial Statements
32
STATEMENTS OF CHANGES IN NET ASSETS
| | ING VP Money Market Portfolio | | ING VP Global Science and
Technology Portfolio | |
| | Year
Ended
December 31,
2005 | | Year
Ended
December 31,
2004 | | Year
Ended
December 31,
2005 | | Year
Ended
December 31,
2004 | |
FROM OPERATIONS: | | | | | | | | | |
Net investment income (loss) | | $ | 31,890,380 | | $ | 12,793,575 | | $ | (370,605 | ) | $ | (594,321 | ) |
Net realized gain (loss) on investments and foreign currency related transactions | | 16,292 | | (244,520 | ) | 870,559 | | 7,901,963 | |
Net change in unrealized appreciation or depreciation on investments and foreign currency related transactions | | 232,026 | | (473,680 | ) | 7,222,993 | | (9,818,607 | ) |
Net increase (decrease) in net assets resulting from operations | | 32,138,698 | | 12,075,375 | | 7,722,947 | | (2,510,965 | ) |
| | | | | | | | | |
FROM DISTRIBUTIONS TO SHAREHOLDERS: | | | | | | | | | |
Net investment income: | | | | | | | | | |
Class I | | (12,797,898 | ) | (12,932,164 | ) | — | | — | |
Total distributions | | (12,797,898 | ) | (12,932,164 | ) | — | | — | |
| | | | | | | | | |
FROM CAPITAL SHARE TRANSACTIONS: | | | | | | | | | |
Net proceeds from sale of shares | | 229,751,452 | | 327,235,099 | | 14,070,092 | | 22,118,107 | |
Dividends reinvested | | 12,797,898 | | 12,932,164 | | — | | — | |
| | 242,549,350 | | 340,167,263 | | 14,070,092 | | 22,118,107 | |
Cost of shares redeemed | | (290,343,446 | ) | (475,422,886 | ) | (23,483,463 | ) | (31,058,339 | ) |
Net decrease in net assets resulting from capital share transactions | | (47,794,096 | ) | (135,255,623 | ) | (9,413,371 | ) | (8,940,232 | ) |
Net decrease in net assets | | (28,453,296 | ) | (136,112,412 | ) | (1,690,424 | ) | (11,451,197 | ) |
| | | | | | | | | |
NET ASSETS: | | | | | | | | | |
Beginning of year | | 1,101,471,214 | | 1,237,583,626 | | 86,291,281 | | 97,742,478 | |
End of year | | $ | 1,073,017,918 | | $ | 1,101,471,214 | | $ | 84,600,857 | | $ | 86,291,281 | |
Undistributed net investment income (accumulated net investment loss) at end of year | | $ | 31,881,013 | | $ | 12,788,531 | | $ | — | | $ | — | |
See Accompanying Notes to Financial Statements
33
STATEMENTS OF CHANGES IN NET ASSETS
| | ING VP International
Equity Portfolio | |
| | Year
Ended
December 31,
2005 | | Year
Ended
December 31,
2004 | |
FROM OPERATIONS: | | | | | |
Net investment income (loss) | | $ | 840,310 | | $ | 450,758 | |
Net realized gain (loss) on investments, foreign currency related transactions, and futures | | 6,874,664 | | 5,357,182 | |
Net change in unrealized appreciation or depreciation on investments, foreign currency related transactions and futures | | 1,165,804 | | 1,700,251 | |
Net increase in net assets resulting from operations | | 8,880,778 | | 7,508,191 | |
| | | | | |
FROM DISTRIBUTIONS TO SHAREHOLDERS: | | | | | |
Net investment income: | | | | | |
Class I | | (539,401 | ) | (546,129 | ) |
Class S | | (2,439 | ) | (2,180 | ) |
Total distributions | | (541,840 | ) | (548,309 | ) |
| | | | | |
FROM CAPITAL SHARE TRANSACTIONS: | | | | | |
Net proceeds from sale of shares | | 19,109,104 | | 19,056,891 | |
Dividends reinvested | | 541,840 | | 548,309 | |
| | 19,650,944 | | 19,605,200 | |
Cost of shares redeemed | | (18,943,392 | ) | (14,528,943 | ) |
Net increase in net assets resulting from capital share transactions | | 707,552 | | 5,076,257 | |
Net increase in net assets | | 9,046,490 | | 12,036,139 | |
| | | | | |
NET ASSETS: | | | | | |
Beginning of year | | 52,769,848 | | 40,733,709 | |
End of year | | $ | 61,816,338 | | $ | 52,769,848 | |
Undistributed net investment income at end of year | | $ | 1,100,095 | | $ | 538,394 | |
See Accompanying Notes to Financial Statements
34
ING VP BALANCED PORTFOLIO | | FINANCIAL HIGHLIGHTS |
Selected data for a share of beneficial interest outstanding throughout each period.
| | Class I | |
| | Year Ended December 31, | |
| | 2005 | | 2004 | | 2003 | | 2002 | | 2001 | |
Per Share Operating Performance: | | | | | | | | | | | | | | | | |
Net asset value, beginning of year | $ | 13.40 | | | 12.50 | | | 10.73 | | | 12.09 | | | 13.40 | | |
Income (loss) from investment operations: | | | | | | | | | | | | | | | | |
Net investment income | $ | 0.29 | * | | 0.29 | | | 0.25 | | | 0.25 | | | 0.31 | | |
Net realized and unrealized gain (loss) on investments | $ | 0.27 | | | 0.87 | | | 1.76 | | | (1.49 | ) | | (0.87 | ) | |
Total from investment operations | $ | 0.56 | | | 1.16 | | | 2.01 | | | (1.24 | ) | | (0.56 | ) | |
Less distributions from: | | | | | | | | | | | | | | | | |
Net investment income | $ | 0.32 | | | 0.26 | | | 0.24 | | | 0.12 | | | 0.28 | | |
Net realized gains on investments | $ | — | | | — | | | — | | | — | | | 0.47 | | |
Total distributions | $ | 0.32 | | | 0.26 | | | 0.24 | | | 0.12 | | | 0.75 | | |
Net asset value, end of year | $ | 13.64 | | | 13.40 | | | 12.50 | | | 10.73 | | | 12.09 | | |
Total Return(1) | % | 4.24 | | | 9.42 | | | 18.87 | | | (10.31 | ) | | (4.21 | ) | |
| | | | | | | | | | | | | | | | |
Ratios and Supplemental Data: | | | | | | | | | | | | | | | | |
Net assets, end of year (millions) | $ | 1,236 | | | 1,358 | | | 1,375 | | | 1,223 | | | 1,591 | | |
Ratios to average net assets: | | | | | | | | | | | | | | | | |
Expenses | % | 0.60 | | | 0.59 | | | 0.60 | | | 0.60 | | | 0.59 | | |
Net investment income | % | 2.30 | | | 2.15 | | | 2.04 | | | 2.00 | | | 2.46 | | |
Portfolio turnover rate | % | 308 | | | 272 | | | 333 | | | 345 | | | 167 | | |
| | | | | | | | | | | | | | | | |
| | | | | | | | Class S | |
| | | | | | | | | | May 29,
2003(3) to | |
| | | | | | Year Ended December 31, | | December 31, | |
| | | | | | 2005 | | 2004 | | 2003 | |
Per Share Operating Performance: | | | | | | | | | | | | | | | | |
Net asset value, beginning of period | | | | | | | $ | 13.35 | | | 12.49 | | | 11.53 | | |
Income from investment operations: | | | | | | | | | | | | | | | | |
Net investment income | | | | | | | $ | 0.27 | | | 0.22 | | | 0.34 | | |
Net realized and unrealized gain on investments | | | | | | | $ | 0.25 | | | 0.89 | | | 0.85 | | |
Total from investment operations | | | | | | | $ | 0.52 | | | 1.11 | | | 1.19 | | |
Less distributions from: | | | | | | | | | | | | | | | | |
Net investment income | | | | | | | $ | 0.29 | | | 0.25 | | | 0.23 | | |
Total distributions | | | | | | | $ | 0.29 | | | 0.25 | | | 0.23 | | |
Net asset value, end of period | | | | | | | $ | 13.58 | | | 13.35 | | | 12.49 | | |
Total Return(1) | | | | | | | % | 3.99 | | | 9.06 | | | 10.51 | | |
| | | | | | | | | | | | | | | | |
Ratios and Supplemental Data: | | | | | | | | | | | | | | | | |
Net assets, end of period (millions) | | | | | | | $ | 3 | | | 3 | | | 1 | | |
Ratios to average net assets: | | | | | | | | | | | | | | | | |
Expenses(2) | | | | | | | % | 0.85 | | | 0.84 | | | 0.83 | | |
Net investment income(2) | | | | | | | % | 2.06 | | | 1.98 | | | 3.06 | | |
Portfolio turnover rate | | | | | | | % | 308 | | | 272 | | | 333 | | |
(1) Total return is calculated assuming reinvestment of all dividends and capital gain distributions at net asset value and does not reflect the effect of insurance contract charges. Total return for periods less than one year is not annualized.
(2) Annualized for periods less than one year.
(3) Commencement of operations.
* Per share data calculated using average number of shares outstanding throughout the period.
See Accompanying Notes to Financial Statements.
35
ING VP GROWTH AND INCOME PORTFOLIO | | FINANCIAL HIGHLIGHTS |
Selected data for a share of beneficial interest outstanding throughout each period.
| | Class I | |
| | Year Ended December 31, | |
| | 2005 | | 2004 | | 2003 | | 2002 | | 2001 | |
Per Share Operating Performance: | | | | | | | | | | | | | | | | |
Net asset value, beginning of year | $ | 19.35 | | | 18.28 | | | 14.50 | | | 19.54 | | | 24.12 | | |
Income (loss) from investment operations: | | | | | | | | | | | | | | | | |
Net investment income | $ | 0.23 | | | 0.28 | | | 0.16 | | | 0.16 | | | 0.14 | | |
Net realized and unrealized gain (loss) on investments | $ | 1.35 | | | 1.24 | | | 3.62 | | | (5.04 | ) | | (4.58 | ) | |
Total from investment operations | $ | 1.58 | | | 1.52 | | | 3.78 | | | (4.88 | ) | | (4.44 | ) | |
Less distributions from: | | | | | | | | | | | | | | | | |
Net investment income | $ | 0.22 | | | 0.45 | | | — | | | 0.16 | | | 0.14 | | |
Net realized gains on investments | $ | — | | | — | | | — | | | — | | | — | | |
Total distributions | $ | 0.22 | | | 0.45 | | | — | | | 0.16 | | | 0.14 | | |
Net asset value, end of year | $ | 20.71 | | | 19.35 | | | 18.28 | | | 14.50 | | | 19.54 | | |
Total Return(1) | % | 8.13 | | | 8.39 | | | 26.07 | | | (24.99 | ) | | (18.40 | ) | |
| | | | | | | | | | | | | | | | |
Ratios and Supplemental Data: | | | | | | | | | | | | | | | | |
Net assets, end of year (millions) | $ | 3,146 | | | 3,531 | | | 3,795 | | | 3,525 | | | 5,639 | | |
Ratios to average net assets: | | | | | | | | | | | | | | | | |
Expenses | % | 0.59 | | | 0.58 | | | 0.60 | | | 0.59 | | | 0.59 | | |
Net investment income | % | 1.03 | | | 1.41 | | | 0.95 | | | 0.83 | | | 0.62 | | |
Portfolio turnover rate | % | 80 | | | 139 | | | 150 | | | 246 | | | 185 | | |
| | | | | | Class S | |
| | | | | | | | | | June 11,
2003(3) to | |
| | | | | | Year Ended December 31, | | December 31, | |
| | | | | | 2005 | | 2004 | | 2003 | |
Per Share Operating Performance: | | | | | | | | | | | | | | | | |
Net asset value, beginning of period | | | | | | | $ | 19.34 | | | 18.26 | | | 16.32 | | |
Income (loss) from investment operations: | | | | | | | | | | | | | | | | |
Net investment income (loss) | | | | | | | $ | 0.14 | | | 0.21 | | | 0.04 | | |
Net realized and unrealized gain on investments | | | | | | | $ | 1.41 | | | 1.26 | | | 1.90 | | |
Total from investment operations | | | | | | | $ | 1.55 | | | 1.47 | | | 1.94 | | |
Less distributions from: | | | | | | | | | | | | | | | | |
Net investment income | | | | | | | $ | 0.20 | | | 0.39 | | | — | | |
Total distributions | | | | | | | $ | 0.20 | | | 0.39 | | | — | | |
Net asset value, end of period | | | | | | | $ | 20.69 | | | 19.34 | | | 18.26 | | |
Total Return(1) | | | | | | | % | 7.98 | | | 8.10 | | | 11.89 | | |
| | | | | | | | | | | | | | | | |
Ratios and Supplemental Data: | | | | | | | | | | | | | | | | |
Net assets, end of period (millions) | | | | | | | $ | 2 | | | 2 | | | 2 | | |
Ratios to average net assets: | | | | | | | | | | | | | | | | |
Expenses(2) | | | | | | | % | 0.84 | | | 0.83 | | | 0.84 | | |
Net investment income(2) | | | | | | | % | 0.78 | | | 1.18 | | | 0.57 | | |
Portfolio turnover rate | | | | | | | % | 80 | | | 139 | | | 150 | | |
(1) Total return is calculated assuming reinvestment of all dividends and capital gain distributions at net asset value and does not reflect the effect of insurance contract charges. Total return for periods less than one year is not annualized.
(2) Annualized for periods less than one year.
(3) Commencement of operations.
See Accompanying Notes to Financial Statements.
36
ING VP GROWTH PORTFOLIO | | FINANCIAL HIGHLIGHTS |
Selected data for a share of beneficial interest outstanding throughout each period.
| | Class I | |
| | Year Ended December 31, | |
| | 2005 | | 2004 | | 2003 | | 2002 | | 2001 | |
Per Share Operating Performance: | | | | | | | | | | | | | | | | |
Net asset value, beginning of year | $ | 9.56 | | | 8.93 | | | 6.85 | | | 9.64 | | | 14.99 | | |
Income (loss) from investment operations: | | | | | | | | | | | | | | | | |
Net investment income (loss) | $ | 0.02 | | | 0.06 | | | 0.01 | | | (0.01 | ) | | (0.01 | ) | |
Net realized and unrealized gain (loss) on investments | $ | 0.87 | | | 0.58 | | | 2.07 | | | (2.78 | ) | | (3.87 | ) | |
Total from investment operations | $ | 0.89 | | | 0.64 | | | 2.08 | | | (2.79 | ) | | (3.88 | ) | |
Less distributions from: | | | | | | | | | | | | | | | | |
Net investment income | $ | 0.07 | | | 0.01 | | | — | | | — | | | 0.01 | | |
Net realized gains on investments | $ | — | | | — | | | — | | | — | | | 1.46 | | |
Total distributions | $ | 0.07 | | | 0.01 | | | — | | | — | | | 1.47 | | |
Net asset value, end of year | $ | 10.38 | | | 9.56 | | | 8.93 | | | 6.85 | | | 9.64 | | |
Total Return(1) | % | 9.38 | † | | 7.19 | | | 30.36 | | | (28.94 | ) | | (27.06 | ) | |
| | | | | | | | | | | | | | | | |
Ratios and Supplemental Data: | | | | | | | | | | | | | | | | |
Net assets, end of year (000’s) | $ | 175,297 | | | 193,280 | | | 224,330 | | | 181,029 | | | 305,624 | | |
Ratios to average net assets: | | | | | | | | | | | | | | | | |
Expenses | % | 0.69 | | | 0.69 | | | 0.71 | | | 0.72 | | | 0.70 | | |
Net investment income (loss) | % | 0.08 | | | 0.61 | | | 0.13 | | | (0.06 | ) | | (0.08 | ) | |
Portfolio turnover rate | % | 119 | | | 123 | | | 162 | | | 241 | | | 216 | | |
| | Class S | |
| | | | | | | | | | November 1,
2001(3) to | |
| | Year Ended December 31, | | December 31, | |
| | 2005 | | 2004 | | 2003 | | 2002 | | 2001 | |
Per Share Operating Performance: | | | | | | | | | | | | | | | | |
Net asset value, beginning of period | $ | | 9.50 | | | 8.88 | | | 6.83 | | | 9.63 | | | 8.96 | | |
Income (loss) from investment operations: | | | | | | | | | | | | | | | | |
Net investment income (loss) | $ | | (0.00 | )* | | 0.04 | | | 0.00 | * | | (0.01 | ) | | 0.00 | | |
Net realized and unrealized gain (loss) on investments | $ | | 0.85 | | | 0.58 | | | 2.05 | | | (2.79 | ) | | 0.67 | | |
Total from investment operations | $ | | 0.85 | | | 0.62 | | | 2.05 | | | (2.80 | ) | | 0.67 | | |
Less distributions from: | | | | | | | | | | | | | | | | |
Net investment income | $ | | 0.04 | | | — | | | — | | | — | | | — | | |
Total distributions | $ | | 0.04 | | | — | | | — | | | — | | | — | | |
Net asset value, end of period | $ | | 10.31 | | | 9.50 | | | 8.88 | | | 6.83 | | | 9.63 | | |
Total Return(1) | % | 9.05 | † | | 6.98 | | | 30.01 | | | (29.08 | ) | | 7.48 | | |
Ratios and Supplemental Data: | | | | | | | | | | | | | | | | |
Net assets, end of period (000’s) | $ | | 285 | | | 356 | | | 292 | | | 53 | | | 11 | | |
Ratios to average net assets: | | | | | | | | | | | | | | | | |
Expenses(2) | % | 0.94 | | | 0.94 | | | 0.96 | | | 0.97 | | | 0.94 | | |
Net investment income (loss)(2) | % | (0.17 | ) | | 0.44 | | | (0.10 | ) | | (0.31 | ) | | (0.32 | ) | |
Portfolio turnover rate | % | 119 | | | 123 | | | 162 | | | 241 | | | 216 | | |
(1) Total return is calculated assuming reinvestment of all dividends and capital gain distributions at net asset value and does not reflect the effect of insurance contract charges. Total return for periods less than one year is not annualized.
(2) Annualized for periods less than one year.
(3) Commencement of operations.
* Amount is less than $0.01 or $(0.01) per share.
† In 2005, the Investment Manager fully reimbursed the Portfolio for a loss incurred from a transaction not meeting the Portfolio’s investment’s guidelines. There was no impact on total return.
See Accompanying Notes to Financial Statements.
37
ING VP SMALL COMPANY PORTFOLIO | | FINANCIAL HIGHLIGHTS |
Selected data for a share of beneficial interest outstanding throughout each period.
| | Class I | |
| | Year Ended December 31, | |
| | 2005 | | 2004 | | 2003 | | 2002 | | 2001 | |
Per Share Operating Performance: | | | | | | | | | | | | | | | | |
Net asset value, beginning of year | $ | 19.94 | | | 17.48 | | | 12.75 | | | 16.68 | | | 16.65 | | |
Income (loss) from investment operations: | | | | | | | | | | | | | | | | |
Net investment incom | $ | 0.10 | | | 0.04 | | | 0.06 | | | 0.05 | | | 0.06 | | |
Net realized and unrealized gain (loss) on investments | $ | 1.92 | | | 2.47 | | | 4.71 | | | (3.91 | ) | | 0.58 | | |
Total from investment operations | $ | 2.02 | | | 2.51 | | | 4.77 | | | (3.86 | ) | | 0.64 | | |
Less distributions from: | | | | | | | | | | | | | | | | |
Net investment income | $ | 0.03 | | | 0.05 | | | 0.04 | | | 0.07 | | | 0.10 | | |
Net realized gains on investments | $ | 0.28 | | | — | | | — | | | — | | | 0.51 | | |
Total distributions | $ | 0.31 | | | 0.05 | | | 0.04 | | | 0.07 | | | 0.61 | | |
Net asset value, end of year | $ | 21.65 | | | 19.94 | | | 17.48 | | | 12.75 | | | 16.68 | | |
Total Return(1) | % | 10.27 | † | | 14.39 | | | 37.47 | | | (23.23 | ) | | 4.00 | | |
| | | | | | | | | | | | | | | | |
Ratios and Supplemental Data: | | | | | | | | | | | | | | | | |
Net assets, end of year (000’s) | $ | 393,700 | | | 461,014 | | | 464,228 | | | 288,890 | | | 341,332 | | |
Ratios to average net assets: | | | | | | | | | | | | | | | | |
Expenses | % | 0.85 | | | 0.84 | | | 0.85 | | | 0.87 | | | 0.86 | | |
Net investment income | % | 0.43 | | | 0.21 | | | 0.47 | | | 0.39 | | | 0.50 | | |
Portfolio turnover rate | % | 72 | | | 93 | | | 178 | | | 371 | | | 240 | | |
| | Class S | |
| | | | | | | | | | November 1,
2001(3) to | |
| | Year Ended December 31, | | December 31, | |
| | 2005 | | 2004 | | 2003 | | 2002 | | 2001 | |
Per Share Operating Performance: | | | | | | | | | | | | | | | | |
Net asset value, beginning of period | $ | 19.90 | | | 17.49 | | | 12.72 | | | 16.68 | | | 14.90 | | |
Income (loss) from investment operations: | | | | | | | | | | | | | | | | |
Net investment income (loss) | $ | 0.06 | | | 0.03 | * | | 0.01 | | | (0.04 | ) | | 0.00 | ** | |
Net realized and unrealized gain (loss) on investments | $ | 1.92 | | | 2.43 | | | 4.79 | | | (3.86 | ) | | 1.78 | | |
Total from investment operations | $ | 1.98 | | | 2.46 | | | 4.80 | | | (3.90 | ) | | 1.78 | | |
Less distribution from: | | | | | | | | | | | | | | | | |
Net investment income | $ | 0.01 | | | 0.05 | | | 0.03 | | | 0.06 | | | — | | |
Net realized gains on investments | $ | 0.28 | | | — | | | — | | | — | | | — | | |
Total distribution | $ | 0.29 | | | 0.05 | | | 0.03 | | | 0.06 | | | — | | |
Net asset value, end of period | $ | 21.59 | | | 19.90 | | | 17.49 | | | 12.72 | | | 16.68 | | |
Total Return(1) | % | 10.05 | † | | 14.09 | | | 37.76 | | | (23.45 | ) | | 11.95 | | |
| | | | | | | | | | | | | | | | |
Ratios and Supplemental Data: | | | | | | | | | | | | | | | | |
Net assets, end of period (000’s) | $ | 68,768 | | | 72,225 | | | 840 | | | 184 | | | 11 | | |
Ratios to average net assets: | | | | | | | | | | | | | | | | |
Expenses(2) | % | 1.10 | | | 1.09 | | | 1.10 | | | 1.12 | | | 1.10 | | |
Net investment income(2) | % | 0.26 | | | 0.19 | | | 0.22 | | | 0.14 | | | 0.29 | | |
Portfolio turnover rate | % | 72 | | | 93 | | | 178 | | | 371 | | | 240 | | |
(1) Total return is calculated assuming reinvestment of all dividends and capital gain distributions at net asset value and does not reflect the effect of insurance contract charges. Total return for periods less than one year is not annualized.
(2) Annualized for periods less than one year.
(3) Commencement of operations.
* Per share data calculated using average number of shares outstanding throughout the period.
** Amount is less than $0.01 per share.
† In 2005, the Investment Manager fully reimbursed the Portfolio for a loss incurred from a transaction not meeting the Portfolio’s investment guidelines. There was no impact on total return.
See Accompanying Notes to Financial Statements.
38
ING VP VALUE OPPORTUNITY PORTFOLIO | | FINANCIAL HIGHLIGHTS |
Selected data for a share of beneficial interest outstanding throughout each period.
| | Class I | |
| | Year Ended December 31, | |
| | 2005 | | 2004 | | 2003 | | 2002 | | 2001 | |
Per Share Operating Performance: | | | | | | | | | | | | | | | | |
Net asset value, beginning of year | $ | 13.19 | | | 12.08 | | | 9.77 | | | 13.25 | | | 15.34 | | |
Income (loss) from investment operations: | | | | | | | | | | | | | | | | |
Net investment income | $ | 0.19 | * | | 0.24 | | | 0.10 | | | 0.04 | | | 0.03 | | |
Net realized and unrealized gain (loss) on investments | $ | 0.71 | | | 0.98 | | | 2.29 | | | (3.47 | ) | | (1.43 | ) | |
Total from investment operations | $ | 0.90 | | | 1.22 | | | 2.39 | | | (3.43 | ) | | (1.40 | ) | |
Less distributions from: | | | | | | | | | | | | | | | | |
Net investment income | $ | 0.25 | | | 0.11 | | | 0.08 | | | 0.05 | | | 0.05 | | |
Net realized gains on investments | $ | — | | | — | | | — | | | — | | | 0.64 | | |
Total distributions | $ | 0.25 | | | 0.11 | | | 0.08 | | | 0.05 | | | 0.69 | | |
Net asset value, end of year | $ | 13.84 | | | 13.19 | | | 12.08 | | | 9.77 | | | 13.25 | | |
Total Return(1) | % | 6.95 | | | 10.15 | | | 24.59 | | | (25.96 | ) | | (9.62 | ) | |
| | | | | | | | | | | | | | | | |
Ratios and Supplemental Data: | | | | | | | | | | | | | | | | |
Net assets, end of year (000’s) | $ | 178,828 | | | 219,889 | | | 257,448 | | | 211,470 | | | 219,287 | | |
Ratios to average net assets: | | | | | | | | | | | | | | | | |
Expenses | % | 0.70 | | | 0.69 | | | 0.70 | | | 0.72 | | | 0.71 | | |
Net investment income | % | 1.47 | | | 1.61 | | | 0.91 | | | 0.51 | | | 0.54 | | |
Portfolio turnover rate | % | 94 | | | 16 | | | 251 | | | 304 | | | 185 | | |
| | Class S | |
| | | | | | | | | | July 16,
2001(3) to | |
| | Year Ended December 31, | | December 31, | |
| | 2005 | | 2004 | | 2003 | | 2002 | | 2001 | |
Per Share Operating Performance: | | | | | | | | | | | | | | | | |
Net asset value, beginning of period | $ | 13.12 | | | 12.03 | | | 9.75 | | | 13.24 | | | 14.58 | | |
Income (loss) from investment operations: | | | | | | | | | | | | | | | | |
Net investment income | $ | 0.16 | * | | 0.13 | | | 0.04 | | | 0.01 | | | 0.00 | * | |
Net realized and unrealized gain (loss) on investments | $ | 0.71 | | | 1.05 | | | 2.31 | | | (3.46 | ) | | (1.34 | ) | |
Total from investment operations | $ | 0.87 | | | 1.18 | | | 2.35 | | | (3.45 | ) | | (1.34 | ) | |
Less distributions from: | | | | | | | | | | | | | | | | |
Net investment income | $ | 0.22 | | | 0.09 | | | 0.07 | | | 0.04 | | | — | | |
Total distributions | $ | 0.22 | | | 0.09 | | | 0.07 | | | 0.04 | | | — | | |
Net asset value, end of period | $ | 13.77 | | | 13.12 | | | 12.03 | | | 9.75 | | | 13.24 | | |
Total Return(1) | % | 6.76 | | | 9.88 | | | 24.21 | | | (26.12 | ) | | (9.19 | ) | |
| | | | | | | | | | | | | | | | |
Ratios and Supplemental Data: | | | | | | | | | | | | | | | | |
Net assets, end of period (000’s) | $ | 30,125 | | | 3,505 | | | 2,277 | | | 1,092 | | | 307 | | |
Ratios to average net assets: | | | | | | | | | | | | | | | | |
Expenses(2) | % | 0.95 | | | 0.94 | | | 0.95 | | | 0.97 | | | 0.96 | | |
Net investment income(2) | % | 1.18 | | | 1.36 | | | 0.64 | | | 0.26 | | | 0.29 | | |
Portfolio turnover rate | % | 94 | | | 16 | | | 251 | | | 304 | | | 185 | | |
(1) Total return is calculated assuming reinvestment of all dividends and capital gain distributions at net asset value and does not reflect the effect of insurance contract charges. Total return for periods less than one year is not annualized.
(2) Annualized for periods less than one year.
(3) Commencement of operations.
* Amount is less than $0.01 per share.
** Per share data calculated using average number of shares outstanding throughout the period.
See Accompanying Notes to Financial Statements.
39
ING VP INTERMEDIATE BOND PORTFOLIO | | FINANCIAL HIGHLIGHTS |
Selected data for a share of beneficial interest outstanding throughout each period.
| | Class I | |
| | Year Ended December 31, | |
| | 2005 | | 2004 | | 2003 | | 2002 | | 2001 | |
Per Share Operating Performance: | | | | | | | | | | | | | | | | |
Net asset value, beginning of year | $ | 13.14 | | | 14.15 | | | 13.53 | | | 12.95 | | | 12.61 | | |
Income from investment operations: | | | | | | | | | | | | | | | | |
Net investment income | $ | 0.54 | | | 0.53 | | | 0.56 | | | 0.45 | | | 0.59 | | |
Net realized and unrealized gain on investments | $ | (0.13 | ) | | 0.13 | | | 0.29 | | | 0.63 | | | 0.51 | | |
Total from investment operations | $ | 0.41 | | | 0.66 | | | 0.85 | | | 1.08 | | | 1.10 | | |
Less distributions from: | | | | | | | | | | | | | | | | |
Net investment income | $ | 0.51 | | | 1.11 | | | 0.11 | | | 0.43 | | | 0.65 | | |
Net realized gains on investments | $ | 0.07 | | | 0.56 | | | 0.12 | | | 0.07 | | | 0.11 | | |
Total distributions | $ | 0.58 | | | 1.67 | | | 0.23 | | | 0.50 | | | 0.76 | | |
Net asset value, end of year | $ | 12.97 | | | 13.14 | | | 14.15 | | | 13.53 | | | 12.95 | | |
Total Return(1) | % | 3.14 | | | 4.88 | | | 6.30 | | | 8.33 | | | 8.75 | | |
| | | | | | | | | | | | | | | | |
Ratios and Supplemental Data: | | | | | | | | | | | | | | | | |
Net assets, end of year (millions) | $ | 1,148 | | | 1,093 | | | 1,126 | | | 1,206 | | | 1,024 | | |
Ratios to average net assets: | | | | | | | | | | | | | | | | |
Expenses | % | 0.49 | | | 0.48 | | | 0.50 | | | 0.49 | | | 0.50 | | |
Net investment income | % | 4.14 | | | 3.79 | | | 3.77 | | | 3.50 | | | 5.06 | | |
Portfolio turnover rate | % | 589 | | | 407 | | | 521 | | | 565 | | | 219 | | |
| | Class S | |
| | | | | | | | | | May 3,
2002(3) to | |
| | Year Ended December 31, | | December 31, | |
| | | | 2005 | | 2004 | | 2003 | | 2002 | |
Per Share Operating Performance: | | | | | | | | | | | | | | | | |
Net asset value, beginning of period | | | | $ | 13.09 | | | 14.13 | | | 13.53 | | | 13.05 | | |
Income (loss) from investment operations: | | | | | | | | | | | | | | | | |
Net investment income | | | | $ | 0.41 | | | 0.40 | | | 0.49 | | | 0.16 | | |
Net realized and unrealized gain on investments | | | | $ | (0.03 | ) | | 0.22 | | | 0.32 | | | 0.81 | | |
Total from investment operations | | | | $ | 0.38 | | | 0.62 | | | 0.81 | | | 0.97 | | |
Less distributions from: | | | | | | | | | | | | | | | | |
Net investment income | | | | $ | 0.49 | | | 1.10 | | | 0.09 | | | 0.42 | | |
Net realized gains on investments | | | | $ | 0.07 | | | 0.56 | | | 0.12 | | | 0.07 | | |
Total distributions | | | | $ | 0.56 | | | 1.66 | | | 0.21 | | | 0.49 | | |
Net asset value, end of period | | | | $ | 12.91 | | | 13.09 | | | 14.13 | | | 13.53 | | |
Total Return(1) | | | | % | 2.94 | | | 4.58 | | | 6.04 | | | 7.45 | | |
| | | | | | | | | | | | | | | | |
Ratios and Supplemental Data: | | | | | | | | | | | | | | | | |
Net assets, end of period (millions) | | | | $ | 617 | | | 301 | | | 71 | | | 50 | | |
Ratios to average net assets: | | | | | | | | | | | | | | | | |
Expenses(2) | | | | % | 0.74 | | | 0.73 | | | 0.75 | | | 0.74 | | |
Net investment income(2) | | | | % | 3.94 | | | 3.52 | | | 3.52 | | | 3.25 | | |
Portfolio turnover rate | | | | % | 589 | | | 407 | | | 521 | | | 565 | | |
(1) Total return is calculated assuming reinvestment of all dividends and capital gain distributions at net asset value and does not reflect the effect of insurance contract charges. Total return for periods less than one year is not annualized.
(2) Annualized for periods less than one year.
(3) Commencement of operations.
See Accompanying Notes to Financial Statements.
40
ING VP MONEY MARKET PORTFOLIO | | FINANCIAL HIGHLIGHTS |
Selected data for a share of beneficial interest outstanding throughout each period.
| | Class I | |
| | Year Ended December 31, | |
| | 2005 | | 2004 | | 2003 | | 2002 | | 2001 | |
Per Share Operating Performance: | | | | | | | | | | | | | | | | |
Net asset value, beginning of year | $ | 12.94 | | | 12.94 | | | 13.03 | | | 13.33 | | | 13.61 | | |
Income (loss) from investment operations: | | | | | | | | | | | | | | | | |
Net investment income | $ | 0.39 | | | 0.15 | | | 0.08 | | | 0.21 | | | 0.50 | | |
Net realized and unrealized gain (loss) on investments | $ | (0.01 | ) | | (0.01 | ) | | 0.03 | | | — | | | 0.01 | | |
Total from investment operations | $ | 0.38 | | | 0.14 | | | 0.11 | | | 0.21 | | | 0.51 | | |
Less distributions from: | | | | | | | | | | | | | | | | |
Net investment income | $ | 0.15 | | | 0.14 | | | 0.20 | | | 0.51 | | | 0.79 | | |
Total distributions | $ | 0.15 | | | 0.14 | | | 0.20 | | | 0.51 | | | 0.79 | | |
Net asset value, end of year | $ | 13.17 | | | 12.94 | | | 12.94 | | | 13.03 | | | 13.33 | | |
Total Return(1) | % | 2.98 | | | 1.06 | | | 0.92 | | | 1.66 | | | 3.94 | | |
| | | | | | | | | | | | | | | | |
Ratios and Supplemental Data: | | | | | | | | | | | | | | | | |
Net assets, end of year (millions) | $ | 1,073 | | | 1,101 | | | 1,238 | | | 1,552 | | | 1,519 | | |
Ratios to average net assets: | | | | | | | | | | | | | | | | |
Expenses | % | 0.35 | | | 0.34 | | | 0.35 | | | 0.34 | | | 0.34 | | |
Net investment income | % | 2.93 | | | 1.11 | | | 0.91 | | | 1.63 | | | 4.07 | | |
(1) Total return is calculated assuming reinvestment of all dividends and capital gain distributions at net asset value and does not reflect the effect of insurance contract charges.
See Accompanying Notes to Financial Statements.
41
ING VP GLOBAL SCIENCE AND TECHNOLOGY PORTFOLIO | FINANCIAL HIGHLIGHTS |
Selected data for a share of beneficial interest outstanding throughout each period.
| | Class I | |
| | Year Ended December 31, | |
| | 2005 | | 2004 | | 2003 | | 2002 | | 2001 | |
Per Share Operating Performance: | | | | | | | | | | | | | | | | |
Net asset value, beginning of period | $ | 3.82 | | | 3.87 | | | 2.66 | | | 4.53 | | | 5.88 | | |
Income (loss) from investment operations: | | | | | | | | | | | | | | | | |
Net investment loss | $ | (0.02 | ) | | (0.03 | ) | | (0.02 | ) | | (0.03 | ) | | (0.02 | ) | |
Net realized and unrealized gain (loss) on investments | $ | 0.47 | | | (0.02 | ) | | 1.23 | | | (1.84 | ) | | (1.33 | ) | |
Total from investment operations | $ | 0.45 | | | (0.05 | ) | | 1.21 | | | (1.87 | ) | | (1.35 | ) | |
Net asset value, end of period | $ | 4.27 | | | 3.82 | | | 3.87 | | | 2.66 | | | 4.53 | | |
Total Return(1) | % | 11.78 | | | (1.29 | ) | | 45.49 | | | (41.28 | ) | | (22.96 | ) | |
| | | | | | | | | | | | | | | | |
Ratios and Supplemental Data: | | | | | | | | | | | | | | | | |
Net assets, end of period (000’s) | $ | 84,523 | | | 86,291 | | | 97,742 | | | 45,559 | | | 62,878 | | |
Ratios to average net assets: | | | | | | | | | | | | | | | | |
Net expenses after expense | | | | | | | | | | | | | | | | |
reimbursement/recoupment | % | 1.06 | | | 1.05 | | | 1.11 | | | 1.11 | | | 1.11 | | |
Gross expenses prior to expense | | | | | | | | | | | | | | | | |
reimbursement/recoupment(3) | % | 1.06 | | | 1.05 | | | 1.10 | | | 1.12 | | | 1.11 | | |
Net investment loss after expense | | | | | | | | | | | | | | | | |
reimbursement/recoupment(3) | % | (0.48 | ) | | (0.67 | ) | | (0.88 | ) | | (0.89 | ) | | (0.49 | ) | |
Portfolio turnover rate | % | 118 | | | 163 | | | 15 | | | 61 | | | 129 | | |
| | | | | | | | | | Class S | |
| | | | | | | | | | July 20,
2005(4) to | |
| | | | | | | | December 31, | |
| | | | | | | | | | 2005 | |
Per Share Operating Performance: | | | | | | | | | | | | | | | | |
Net asset value, beginning of period | | | | | | | | | | | | $ | | 3.90 | | |
Income (loss) from investment operations: | | | | | | | | | | | | | | | | |
Net investment income | | | | | | | | | | | | $ | | (0.01 | ) | |
Net realized and unrealized gain (loss) on investments | | | | | | | | | | | | $ | | 0.38 | | |
Total from investment operations | | | | | | | | | | | | $ | | 0.37 | | |
Net asset value, end of period | | | | | | | | | | | | $ | | 4.27 | | |
Total Return(1) | | | | | | | | | | | | % | | 9.49 | | |
| | | | | | | | | | | | | | | | |
Ratios and Supplemental Data: | | | | | | | | | | | | | | | | |
Net assets, end of period (000’s) | | | | | | | | | | | | $ | | 78 | | |
Ratios to average net assets: | | | | | | | | | | | | | | | | |
Net expenses after expense reimbursement/recoupment(2)(3) | | | | | | | | | | | | % | | 1.31 | | |
Gross expenses prior to expense reimbursement/recoupment(2) | | | | | | | | | | | | % | | 1.31 | | |
Net investment loss after expense reimbursement/recoupment(2)(3) | | | | | | | | | | | | % | | (0.73 | ) | |
Portfolio turnover rate | | | | | | | | | | | | % | | 118 | | |
(1) Total return is calculated assuming reinvestment of all dividends and capital gain distributions at net asset value and does not reflect the effect of insurance contract charges. Total return for periods less than one year is not annualized.
(2) Annualized for periods less than one year.
(3) The Investment Manager has agreed to limit expenses, (excluding interest, taxes, brokerage and extraordinary expenses) subject to possible recoupment by ING Investments, LLC within three years of being incurred.
(4) Commencement of operations.
See Accompanying Notes to Financial Statements.
42
ING VP INTERNATIONAL EQUITY PORTFOLIO | | FINANCIAL HIGHLIGHTS |
Selected data for a share of beneficial interest outstanding throughout each period.
| | Class I | |
| | Year Ended December 31, | |
| | 2005 | | 2004 | | 2003 | | 2002 | | 2001 | |
Per Share Operating Performance: | | | | | | | | | | | | | | | | |
Net asset value, beginning of year | $ | 8.74 | | | 7.55 | | | 5.78 | | | 7.90 | | | 10.40 | | |
Income (loss) from investment operations: | | | | | | | | | | | | | | | | |
Net investment income (loss) | $ | 0.14 | | | 0.07 | | | 0.06 | | | 0.03 | | | 0.02 | | |
Net realized and unrealized gain (loss) on investments | $ | 1.32 | | | 1.21 | | | 1.78 | | | (2.13 | ) | | (2.51 | ) | |
Total from investment operations | $ | 1.46 | | | 1.28 | | | 1.84 | | | (2.10 | ) | | (2.49 | ) | |
Less distributions from: | | | | | | | | | | | | | | | | |
Net investment income | $ | 0.09 | | | 0.09 | | | 0.07 | | | 0.02 | | | 0.01 | | |
Total distributions | $ | 0.09 | | | 0.09 | | | 0.07 | | | 0.02 | | | 0.01 | | |
Net asset value, end of year | $ | 10.11 | | | 8.74 | | | 7.55 | | | 5.78 | | | 7.90 | | |
Total Return(1) | % | 16.87 | | | 17.17 | | | 32.05 | | | (26.68 | ) | | (23.88 | ) | |
| | | | | | | | | | | | | | | | |
Ratios and Supplemental Data: | | | | | | | | | | | | | | | | |
Net assets, end of year (000’s) | $ | 61,464 | | | 52,505 | | | 40,537 | | | 28,917 | | | 48,652 | | |
Ratios to average net assets: | | | | | | | | | | | | | | | | |
Net expenses after expense reimbursement/recoupment(2) | % | 1.14 | | | 1.15 | | | 1.15 | | | 1.15 | | | 1.15 | | |
Gross expenses prior to expense reimbursement/recoupment(2) | % | 1.00 | | | 0.95 | | | 1.38 | | | 1.46 | | | 1.26 | | |
Net investment income (loss) after expense | | | | | | | | | | | | | | | | |
reimbursement/recoupment(2) | % | 1.51 | | | 1.00 | | | 1.04 | | | 0.40 | | | 0.23 | | |
Portfolio turnover rate | % | 97 | | | 137 | | | 85 | | | 266 | | | 229 | | |
| | Class S | |
| | | | | | | | | | November 1,
2001(4) to | |
| | | Year Ended December 31, | | December 31, | |
| | 2005 | | 2004 | | 2003 | | 2002 | | 2001 | |
Per Share Operating Performance: | | | | | | | | | | | | | | | | |
Net asset value, beginning of period | $ | 8.70 | | | 7.53 | | | 5.78 | | | 7.90 | | | 7.38 | | |
Income (loss) from investment operations: | | | | | | | | | | | | | | | | |
Net investment income (loss) | $ | 0.09 | | | 0.05 | | | (0.01 | ) | | 0.01 | | | — | | |
Net realized and unrealized gain (loss) on investments | $ | 1.33 | | | 1.21 | | | 1.82 | | | (2.13 | ) | | 0.52 | | |
Total from investment operations | $ | 1.42 | | | 1.26 | | | 1.81 | | | (2.12 | ) | | 0.52 | | |
Less distributions from: | | | | | | | | | | | | | | | | |
Net investment income | $ | 0.07 | | | 0.09 | | | 0.06 | | | — | | | — | | |
Total distributions | $ | 0.07 | | | 0.09 | | | 0.06 | | | — | | | — | | |
Net asset value, end of period | $ | 10.05 | | | 8.70 | | | 7.53 | | | 5.78 | | | 7.90 | | |
Total Return(1) | % | 16.53 | | | 16.87 | | | 31.62 | | | (26.84 | ) | | 7.05 | | |
| | | | | | | | | | | | | | | | |
Ratios and Supplemental Data: | | | | | | | | | | | | | | | | |
Net assets, end of period (000’s) | $ | 353 | | | 265 | | | 197 | | | 8 | | | 11 | | |
Ratios to average net assets: | | | | | | | | | | | | | | | | |
Net expenses after expense reimbursement/recoupment(2)(3) | % | 1.39 | | | 1.40 | | | 1.40 | | | 1.40 | | | 1.39 | | |
Gross expenses prior to expense reimbursement/recoupment(3) | % | 1.25 | | | 1.20 | | | 1.63 | | | 1.71 | | | 1.49 | | |
Net investment income after expense reimbursement/recoupment(2)(3) | % | 1.16 | | | 0.68 | | | 0.79 | | | 0.15 | | | 0.01 | | |
Portfolio turnover rate | % | 97 | | | 137 | | | 85 | | | 266 | | | 229 | | |
(1) Total return is calculated assuming reinvestment of all dividends and capital gain distributions at net asset value and does not reflect the effect of insurance contract charges. Total return for periods less than one year is not annualized.
(2) The Investment Manager has agreed to limit expenses, (excluding interest, taxes, brokerage and extraordinary expenses) subject to possible recoupment by ING Investments, LLC within three years of being incurred.
(3) Annualized for periods less than one year.
(4) Commencement of operations.
See Accompanying Notes to Financial Statements.
43
NOTES TO FINANCIAL STATEMENTS AS OF DECEMBER 31, 2005
NOTE 1 — ORGANIZATION
Organization. The ING Variable Product Funds are comprised of ING VP Balanced Portfolio, Inc., ING Variable Funds, ING Variable Portfolios, Inc., ING VP Intermediate Bond Portfolio and ING VP Money Market Portfolio, all of which are open-end investment management companies registered under the Investment Company Act of 1940, as amended.
ING VP Balanced Portfolio, Inc. (“Balanced”) is a company incorporated under the laws of Maryland on December 14, 1988. ING Variable Funds is a business trust formed under the laws of Massachusetts on January 25, 1984 with one portfolio, ING VP Growth and Income Portfolio (“Growth and Income”). ING Variable Portfolios, Inc. is a company incorporated under the laws of Maryland on June 4, 1996 and has eight separate portfolios. The five portfolios that are in this report are: ING VP Growth Portfolio (“Growth”), ING VP Small Company Portfolio (“Small Company”), ING VP Value Opportunity Portfolio (“Value Opportunity”), ING VP Global Science and Technology Portfolio (“Global Science and Technology”) and ING VP International Equity Portfolio (“International Equity”). ING VP Intermediate Bond Portfolio is a business trust formed under the laws of Massachusetts on January 25, 1984 with one portfolio, ING VP Intermediate Bond Portfolio (“Intermediate Bond”). ING VP Money Market Portfolio is a business trust under the laws of Massachusetts on January 25, 1984 with one portfolio, ING VP Money Market Portfolio (“Money Market”).
The following is a brief description of each Portfolio’s investment objective:
• Balanced seeks to maximize investment return consistent with reasonable safety of principal, by investing in a diversified portfolio of one or more of the following asset classes: stocks, bonds, and cash equivalents;
• Growth and Income seeks to maximize total return through investments in a diversified portfolio of common stocks and securities convertible into common stock;
• Growth seeks growth of capital through investment in a diversified portfolio consisting primarily of common stocks and securities convertible into common stock;
• Small Company seeks growth of capital primarily through investment in a diversified portfolio of common stocks of companies with smaller market capitalizations;
• Value Opportunity seeks growth of capital primarily through investment in a diversified portfolio of common stocks;
• Intermediate Bond seeks to maximize total return consistent with reasonable risk by investing in a diversified portfolio consisting primarily of debt securities;
• Money Market seeks to provide high current return, consistent with preservation of capital and liquidity, through investment in high-quality money market instruments;
• Global Science and Technology seeks long-term capital appreciation; and
• International Equity seeks long-term capital growth primarily through investment in a diversified portfolio of common stocks principally traded in countries outside of the United States.
Each Portfolio offers Class I and Class S shares. The two classes differ principally in applicable distribution and service fees. Shareholders of each class also bear certain expenses that pertain to that particular class. All shareholders bear the common expenses of the Portfolios and earn income and realized gains/losses from the Portfolio pro rata based on the average daily net assets of each class, without discrimination between share classes. Differences in per share dividend rates generally result from differences in separate class expenses, including distribution, and shareholder servicing fees.
Shares of the Portfolios may be offered to segregated asset accounts of insurance companies as investment options under variable annuity contracts and variable life insurance policies. Shares may also be offered to qualified pension and retirement plans outside the variable contract and to certain investment advisers and their affiliates. Class I shares may be made available to other investment companies, including series of the Trust under fund-of-funds arrangements.
Participating insurance companies and other designated organizations are authorized to receive purchase orders on the Portfolio’s behalf.
ING Investments, LLC (“ING Investments” or the “Investment Manager”), an Arizona limited liability company, serves as the Investment Manager to the Portfolios. ING Investments has engaged ING Investment Management Co. (“ING IM”), a Connecticut corporation, to serve as the Sub-Adviser to each Portfolio, with the exception of Global Science and Technology. ING Funds Distributor, LLC (“Distributor”) is the principal underwriter of the Portfolios. ING Investments, ING IM and the Distributor are indirect, wholly-owned
44
NOTES TO FINANCIAL STATEMENTS AS OF DECEMBER 31, 2005 (CONTINUED)
NOTE 1 — ORGANIZATION (continued)
subsidiaries of ING Groep N.V. (“ING Groep”). ING Groep is one of the largest financial services organizations in the world, and offers an array of banking, insurance and asset management services to both individuals and institutional investors.
NOTE 2 — SIGNIFICANT ACCOUNTING POLICIES’
The following significant accounting policies are consistently followed by the Portfolios in the preparation of their financial statements. Such policies are in conformity with U.S. generally accepted accounting principles for investment companies.
A. Security Valuation. Investments in equity securities traded on a national securities exchange are valued at the last reported sale price. Securities reported by NASDAQ are valued at the NASDAQ official closing prices. Securities traded on an exchange or NASDAQ for which there has been no sale and securities traded in the over-the-counter-market are valued at the mean between the last reported bid and ask prices. All investments quoted in foreign currencies will be valued daily in U.S. dollars on the basis of the foreign currency exchange rates prevailing at that time. Debt securities are valued at prices obtained from independent services or from one or more dealers making markets in the securities and may be adjusted based on the Portfolios’ valuation procedures. U.S. Government obligations are valued by using market quotations or independent pricing services that use prices provided by market-makers or estimates of market values obtained from yield data relating to instruments or securities with similar characteristics.
Securities and assets for which market quotations are not readily available (which may include certain restricted securities, which are subject to limitations as to their sale) are valued at their fair values as determined in good faith by or under the supervision of the Portfolios’ Board of Directors/Trustees (“Board”), in accordance with methods that are specifically authorized by the Board. Securities traded on exchanges, including foreign exchanges, which close earlier than the time that a Portfolio calculates its net asset value (“NAV”) may also be valued at their fair values as determined in good faith by or under the supervision of a Portfolio’s Board, in accordance with methods that are specifically authorized by the Board. The value of a foreign security traded on an exchange outside the United States is generally based on its price on the principal foreign exchange where it trades as of the time the Portfolio determines its NAV or if the foreign exchange closes prior to the time the Portfolio determines its NAV, the most recent closing price of the foreign security on its principal exchange. Trading in certain non-U.S. securities may not take place on all days on which the New York Stock Exchange (“NYSE”) is open. Further, trading takes place in various foreign markets on days on which the NYSE is not open. Consequently, the calculation of the Portfolio’s NAV may not take place contemporaneously with the determination of the prices of securities held by the Portfolio in foreign securities markets. Further, the value of the Portfolio’s assets may be significantly affected by foreign trading on days when a shareholder cannot purchase or redeem shares of the Portfolio. In calculating the Portfolio’s NAV, foreign securities denominated in foreign currency are converted to U.S. dollar equivalents. If an event occurs after the time at which the market for foreign securities held by the Portfolio closes but before the time that a Portfolio’s NAV is calculated, such event may cause the closing price on the foreign exchange to not represent a readily available reliable market value quotation for such securities at the time a Portfolio determines its NAV. In such a case, the Portfolio will use the fair value of such securities as determined under a Portfolio’s valuation procedures. Events after the close of trading on a foreign market that could require the Portfolio to fair value some or all of its foreign securities include, among others, securities trading in the U.S. and other markets, corporate announcements, natural and other disasters, and political and other events. Among other elements of analysis in the determination of a security’s fair value, the Board has authorized the use of one or more independent research services to assist with such determinations. An independent research service may use statistical analyses and quantitative models to help determine fair value as of the time a Portfolio calculates its NAV. There can be no assurance that such models accurately reflect the behavior of the applicable markets or the effect of the behavior of such markets on the fair value of securities, or that such markets will continue to behave in a fashion that is consistent with such models. Unlike the closing price of a security on an exchange, fair value determinations employ elements of judgment. Consequently, the fair value assigned to a security may not represent the actual value that a Portfolio could obtain if it were to sell the security at the time of the close of
45
NOTES TO FINANCIAL STATEMENTS AS OF DECEMBER 31, 2005 (CONTINUED)
NOTE 2 — SIGNIFICANT ACCOUNTING POLICIES (continued)
the NYSE. Pursuant to procedures adopted by the Board, the Portfolio is not obligated to use the fair valuations suggested by any research service, and valuation recommendations provided by such research services may be overridden if other events have occurred or if other fair valuations are determined in good faith to be more accurate. Unless an event is such that it causes a Portfolio to determine that the closing prices for one or more securities do not represent readily available reliable market value quotations at the time the Portfolio determines its NAV, events that occur between the time of the close of the foreign market on which they are traded and the close of regular trading on the NYSE will not be reflected in the Portfolio’s NAV. Investments in securities maturing in 60 days or less at the date of valuation are valued at amortized cost, which, when combined with accrued interest, approximates market value.
B. Security Transactions and Revenue Recognition. Securities transactions are accounted for on the trade date. Realized gains and losses are reported on the basis of identified cost of securities sold. Interest income is recorded on an accrual basis. Dividend income is recorded on the ex-dividend date, or for certain foreign securities, when the information becomes available to the Portfolios. Premium amortization and discount accretion are determined by the effective yield method.
C. Foreign Currency Translation. The books and records of the Portfolios are maintained in U.S. dollars. Any foreign currency amounts are translated into U.S. dollars on the following basis:
(1) Market value of investment securities, other assets and liabilities — at the exchange rates prevailing at the end of the day.
(2) Purchases and sales of investment securities, income and expenses — at the rates of exchange prevailing on the respective dates of such transactions.
Although the net assets and the market values are presented at the foreign exchange rates at the end of the day, the Portfolios do not isolate the portion of the results of operations resulting from changes in foreign exchange rates on investments from the fluctuations arising from changes in market prices of securities held. Such fluctuations are included with the net realized and unrealized gains or losses from investments. For securities, which are subject to foreign withholding tax upon disposition, liabilities are recorded on the Statements of Assets and Liabilities for the estimated tax withholding based on the securities’ current market value. Upon disposition, realized gains or losses on such securities are recorded net of foreign withholding tax.
Reported net realized foreign exchange gains or losses arise from sales of foreign currencies, currency gains or losses realized between the trade and settlement dates on securities transactions, the difference between the amounts of dividends, interest, and foreign withholding taxes recorded on a Portfolio’s books, and the U.S. dollar equivalent of the amounts actually received or paid. Net unrealized foreign exchange gains and losses arise from changes in the value of assets and liabilities other than investments in securities at fiscal year end, resulting from changes in the exchange rate. Foreign security and currency transactions may involve certain considerations and risks not typically associated with investing in U.S. companies and U.S. Government securities. These risks include, but are not limited to, revaluation of currencies and future adverse political and economic developments, which could cause securities and their markets to be less liquid and prices more volatile than those of comparable U.S. companies and U.S. Government securities.
D. Foreign Currency Transactions and Futures Contracts. Certain Portfolios may enter into foreign currency exchange transactions to convert to and from different foreign currencies and to and from the U.S. dollar in connection with the planned purchases or sales of securities. When entering into a currency forward contract, a Portfolio agrees to receive or deliver a fixed quantity of foreign currency for an agreed-upon price on an agreed future date. The Portfolios either enter into these transactions on a spot basis at the spot rate prevailing in the foreign currency exchange market or use forward foreign currency contracts to purchase or sell foreign currencies. When the contract is fulfilled or closed, gains or losses are realized. Until then, the gain or loss is included in unrealized appreciation or depreciation. Risks may arise upon entering into forward contracts from the potential inability of counterparties to meet the terms of their forward contracts and from unanticipated movements in the value of foreign currencies relative to the U.S. dollar.
Each Portfolio, with the exception of Money Market, may enter into futures contracts involving foreign currency, interest rates, securities and securities indices. A futures contract obligates the seller of the contract to deliver and the purchaser
46
NOTES TO FINANCIAL STATEMENTS AS OF DECEMBER 31, 2005 (CONTINUED)
NOTE 2 — SIGNIFICANT ACCOUNTING POLICIES (continued)
of the contract to take delivery of the type of foreign currency, financial instrument or security called for in the contract at a specified future time for a specified price. Upon entering into such a contract, a Portfolio is required to deposit and maintain as collateral such initial margin as required by the exchange on which the contract is traded. Pursuant to the contract, a Portfolio agrees to receive from or pay to the broker an amount equal to the daily fluctuations in the value of the contract. Such receipts or payments are known as variation margins and are recorded as unrealized gains or losses by the Portfolio. When the contract is closed, the Portfolio records a realized gain or loss equal to the difference between the value of the contract at the time it was opened and the value at the time it was closed.
E. Distributions to Shareholders. The Portfolios record distributions to their shareholders on the ex-dividend date. Balanced, Growth, Small Company, Value Opportunity, Money Market and Global Science and Technology Portfolios declare and pay dividends annually. Growth and Income and Intermediate Bond Portfolios declare and pay dividends semi-annually. The Portfolios may make distributions on a more frequent basis to comply with the distribution requirements of the Internal Revenue Code. The characteristics of income and gains to be distributed are determined in accordance with income tax regulations, which may differ from U.S. generally accepted accounting principles for investment companies.
F. Federal Income Taxes. It is the policy of the Portfolios to comply with subchapter M of the Internal Revenue Code and related excise tax provisions applicable to requlated investment companies and to distribute substantially all of their net investment income and any net realized capital gains to their shareholders. Therefore, no federal income tax provision is required. No capital gain distributions shall be made until any capital loss carryforwards have been fully utilized or expired.
G. Use of Estimates. Management of the Portfolios has made certain estimates and assumptions relating to the reporting of assets, liabilities, income, and expenses to prepare these financial statements in conformity with U.S. generally accepted accounting principles for investment companies. Actual results could differ from these estimates.
H. Repurchase Agreements. Each Portfolio may invest in repurchase agreements only with government securities dealers recognized by the Board of Governors of the Federal Reserve System. Under such agreements, the seller of the security agrees to repurchase it at a mutually agreed upon time and price. The resale price is in excess of the purchase price and reflects an agreed upon interest rate for the period of time the agreement is outstanding. The period of the repurchase agreements is usually short, from overnight to one week, while the underlying securities generally have longer maturities. Each Portfolio will receive as collateral securities acceptable to it whose market value is equal to at least 100% of the carrying amount of the repurchase agreements, plus accrued interest, being invested by the Portfolio. The underlying collateral is valued daily on a mark-to-market basis to assure that the value, including accrued interest is at least equal to the repurchase price. There would be potential loss to the Portfolio in the event the Portfolio is delayed or prevented from exercising its right to dispose of the collateral, and it might incur disposition costs in liquidating the collateral.
I. Securities Lending. Each Portfolio has the option to temporarily loan up to 30% of its total assets to brokers, dealers or other financial institutions in exchange for a negotiated lender’s fee. The borrower is required to fully collateralize the loans with cash or U.S. Government securities. Generally, in the event of counterparty default, a Portfolio has the right to use collateral to offset losses incurred. There would be potential loss to the Portfolio in the event the Portfolio is delayed or prevented from exercising its right to dispose of the collateral. A Portfolio bears the risk of loss with respect to the investment of collateral. Engaging in securities lending could have a leveraging effect, which may intensify the credit, market and other risks associated with investing in a Portfolio.
J. Illiquid and Restricted Securities. The Portfolios may not invest more than 15% (10% for Money Market) of their net assets in illiquid securities. Illiquid securities are not readily marketable. Disposing of illiquid investments may involve time-consuming negotiation and legal expenses, and it may be difficult or impossible for the Portfolios to sell them promptly at an acceptable price. The Portfolios may also invest in restricted securities, which include those sold under Rule 144A of the Securities Act of 1933 (“1933 Act”) or securities offered pursuant to Section 4(2) of the 1933 Act, and/or are subject to legal or contractual restrictions on resale and may not be publicly sold without registration under the 1933 Act. Certain
47
NOTES TO FINANCIAL STATEMENTS AS OF DECEMBER 31, 2005 (CONTINUED)
NOTE 2 — SIGNIFICANT ACCOUNTING POLICIES (continued)
restricted securities may be considered liquid pursuant to guidelines approved by the Board or may be deemed to be illiquid because they may not be readily marketable. Illiquid and restricted securities are valued using market quotations when readily available. In the absence of market quotations, the securities are valued based upon their fair value determined under procedures approved by the Board.
K. Delayed Delivery Transactions. Each Portfolio may purchase or sell securities on a when-issued or forward commitment basis. The price of the underlying securities and date when the securities will be delivered and paid for are fixed at the time the transaction is negotiated. The market value of such is identified in the Portfolios’ Portfolio of Investments. Losses may arise due to changes in the market value of the securities or from the inability of counterparties to meet the terms of the contract. In connection with such purchases, the Portfolios are required to hold liquid assets as collateral with the Portfolios’ custodian sufficient to cover the purchase price.
L. Mortgage Dollar Roll Transactions. Balanced, Growth and Income, Intermediate Bond and Money Market Portfolios may engage in dollar roll transactions with respect to mortgage-backed securities issued by Government National Mortgage Association, Federal National Mortgage Association and Federal Home Loan Mortgage Corp. In a dollar roll transaction, a Portfolio sells a mortgage-backed security to a financial institution, such as a bank or broker/dealer, and simultaneously agrees to repurchase a substantially similar (i.e., same type, coupon, and maturity) security from the institution on a delayed delivery basis at an agreed upon price. The mortgage-backed securities that are repurchased will bear the same interest rate as those sold, but generally will be collateralized by different pools of mortgages with different prepayment histories. The Portfolios account for dollar roll transactions as purchases and sales.
M. Options Contracts. Each Portfolio, with the exception of Money Market, may purchase put and call options and may write (sell) put options and covered call options. The Portfolios may engage in option transactions as a hedge against adverse movements in the value of portfolio holdings or to increase market exposure. Option contracts are valued daily and unrealized gains or losses are recorded based upon the last sales price on the principal exchange on which the options are traded. The Portfolios will realize a gain or loss upon the expiration or closing of the option contract. When an option is exercised, the proceeds on sales of the underlying security for a written call option, the purchase cost of the security for a written put option, or the cost of the security for a purchased put or call option is adjusted by the amount of premium received or paid. Realized and unrealized gains or losses on option contracts are reflected in the accompanying financial statements. The risk in writing a call option is that the Portfolios give up the opportunity for profit if the market price of the security increases and the option is exercised. The risk in writing a put option is that the Portfolios may incur a loss if the market price of the security decreases and the option is exercised. The risk in buying an option is that the Portfolios pay a premium whether or not the option is exercised. Risks may also arise from an illiquid secondary market or from the inability of counterparties to meet the terms of the contract.
N. Swap Contracts. Each Portfolio, with the exception of Money Market, may enter into interest rate swaps, currency swaps and other types of swap agreements, including swaps on securities and indices. A swap is an agreement between two parties pursuant to which each party agrees to make one or more payments to the other on regularly scheduled dates over a stated term, based on different interest rates, currency exchange rates, security prices, the prices or rates of other types of financial instruments or assets or the levels of specified indices. During the term of the swap, changes in the value of the swap are recognized as unrealized appreciation or depreciation.
NOTE 3 — INVESTMENT TRANSACTIONS
For the year ended December 31, 2005, the cost of purchases and proceeds from the sales of securities, excluding short-term securities, were as follows:
| | Purchases | | Sales | |
Balanced | | $1,915,252,825 | | $2,093,608,835 | |
Growth and Income | | 2,522,014,827 | | 3,094,124,694 | |
Growth | | 206,502,768 | | 235,815,360 | |
Small Company | | 330,734,269 | | 426,861,667 | |
Value Opportunity | | 182,863,195 | | 211,250,224 | |
Intermediate Bond | | 1,327,576,797 | | 1,235,838,831 | |
Global Science and Technology | | 88,489,056 | | 102,265,448 | |
International Equity | | 55,562,976 | | 53,076,435 | |
48
NOTES TO FINANCIAL STATEMENTS AS OF DECEMBER 31, 2005 (CONTINUED)
NOTE 3 — INVESTMENT TRANSACTIONS (continued)
U.S. Government securities not included above were as follows:
| | Purchases | | Sales | |
Balanced | | $1,756,406,460 | | $1,765,327,506 | |
Intermediate Bond | | 6,792,757,769 | | 6,549,738,313 | |
NOTE 4 — INVESTMENT MANAGEMENT AND ADMINISTRATIVE FEES
The Portfolios entered into Investment Management Agreements with the Investment Manager. The Investment Management Agreements compensate the Investment Manager with a fee, computed daily and payable monthly, based on the average daily net assets of each Portfolio, at the following annual rates:
Balanced | 0.50 | % |
Growth and Income | 0.50
0.45
0.42 | % on first $10 billion;
% on next $5 billion; and
5% over $15 billion |
Growth | 0.60 | % |
Small Company | 0.75 | % |
Value Opportunity | 0.60 | % |
Intermediate Bond | 0.40 | % |
Money Market | 0.25 | % |
Global Science and Technology | 0.95 | % |
International Equity | 0.85 | % |
The Investment Manager entered into Sub-Advisory Agreements with ING IM. ING IM acts as Sub-Adviser to all Portfolios except for Global Science and Technology. Subject to such policies as the Board or the Investment Manager may determine, ING IM manages the Portfolios’ assets in accordance with the Portfolios’ investment objectives, policies, and limitations.
BlackRock Advisors, Inc., (“BlackRock”), a Delaware Corporation, serves as Sub-Adviser to Global Science and Technology pursuant to a Sub-Advisory Agreement effective April 1, 2004 between the Investment Manager and BlackRock through December 31, 2005. From January 1, 2004 to March 31, 2004, Global Science and Technology was sub-advised by BlackRock under an interim Sub-Advisory Agreement.
Pursuant to Administration Agreements, ING Funds Services, LLC (“IFS”), an indirect, wholly-owned subsidiary of ING Groep, acts as administrator and provides certain administrative and shareholder services necessary for Portfolio operations and is responsible for the supervision of other service providers.
IFS is entitled to receive from each Portfolio a fee at an annual rate of 0.055% on the first $5 billion of daily net assets and 0.03% thereafter.
NOTE 5 — DISTRIBUTION AND SERVICE FEES
Class S shares of the Portfolios have adopted Distribution Plans pursuant to Rule 12b-1 under the 1940 Act (the “12b-1 Plans”), whereby the Distributor is reimbursed or compensated by the Portfolios for expenses incurred in the distribution of each Portfolio’s shares (“Distribution Fees”). Pursuant to the 12b-1 Plans, the Distributor is entitled to a payment each month to reimburse or compensate for expenses incurred in the distribution and promotion of each Portfolio’s shares, including expenses incurred in printing prospectuses and reports used for sales purposes, expenses incurred in preparing and printing sales literature and other such distribution related expenses, including any distribution or shareholder servicing fees (“Service Fees”) paid to securities dealers who have executed a distribution agreement with the Distributor. Under the 12b-1 Plans, Class S shares of the Portfolios pay the Distributor a fee calculated at an annual rate of 0.25% of average daily net assets.
NOTE 6 — OTHER TRANSACTIONS WITH AFFILIATED AND RELATED PARTIES
At December 31, 2005, the Portfolios had the following amounts recorded in payable to affiliates on the accompanying Statements of Assets and Liabilities (see Notes 4 and 5):
| | Accrued
Investment
Management
Fees | | Accrued
Adminitrative
Fees | | Accrued
Shareholder
Service and
Distribution
Fees | | Recoupment | | Total | |
Balanced | | $ 533,328 | | $ 58,664 | | $ 680 | | $ — | | $ 592,672 | |
Growth and Income | | 1,365,103 | | 150,157 | | 525 | | — | | 1,515,785 | |
Growth | | 89,594 | | 8,213 | | 63 | | — | | 97,870 | |
Small Company | | 298,790 | | 21,911 | | 14,357 | | — | | 335,058 | |
Value Opportunity | | 108,921 | | 10,107 | | 6,331 | | — | | 125,359 | |
Intermediate Bond | | 583,763 | | 80,265 | | 122,952 | | — | | 786,980 | |
Money Market | | 228,497 | | 50,268 | | — | | — | | 278,765 | |
Global Science and Technology | | 67,802 | | 3,926 | | 16 | | — | | 71,744 | |
International Equity | | 44,015 | | 2,848 | | 72 | | 935 | | 47,870 | |
The Portfolios have adopted a Deferred Compensation Plan (the “Plan”), which allows eligible non-affiliated directors as described in the Plan to defer the receipt of all or a portion of the directors’ fees payable. Deferred fees are invested in various funds advised by ING Investments, LLC until distribution in accordance with the Plan.
49
NOTES TO FINANCIAL STATEMENTS AS OF DECEMBER 31, 2005 (CONTINUED)
NOTE 6 — OTHER TRANSACTIONS WITH AFFILIATED AND RELATED PARTIES (continued)
At December 31, 2005, the following indirect, wholly owned subsidiaries of ING Groep owned the following Series:
ING Life Insurance and Annuity Company — Balanced (96.68%); Growth and Income (95.51%); Growth (97.88%); Small Company (81.02%); Value Opportunity (82.17%); Intermediate Bond (61.86%); Money Market (97.44%); Global Science and Technology (96.98%); and International Equity (96.37%).
ING USA Annuity and Life Insurance Company — Value Opportunity (13.72%); and Intermediate Bond (17.12%).
ING LifeStyle Aggressive Growth Portfolio — Small Company (5.75%).
ING LifeStyle Growth Portfolio — Small Company (8.80%).
ING LifeStyle Moderate Growth Portfolio — (8.60%).
During the year ended December 31, 2005, the Investment Manager reimbursed Growth and Small Company $6,044 and $92,160, respectively, in connection with an investment transaction loss.
NOTE 7 — EXPENSE LIMITATIONS
ING Investments entered into written Expense Limitation Agreements with each of the following Portfolios whereby the Investment Manager has agreed to limit expenses, excluding interest, taxes, brokerage and extraordinary expenses to the levels listed below:
| | Class I | | Class S | |
Growth | | 0.80 | % | 1.05 | % |
Small Company | | 0.95 | % | 1.20 | % |
Value Opportunity | | 0.80 | % | 1.05 | % |
Global Science and Technology | | 1.15 | % | 1.40 | % |
International Equity | | 1.15 | % | 1.40 | % |
The Investment Manager may at a later date recoup from a Portfolio management fees waived and other expenses assured by the Investment Manager during the previous 36 months, but only if, after such recoupment, the Portfolio’s expense ratio does not exceed the percentage described above. Waived and reimbursed fees net of any recoupment by the Investment Manager of such waived and reimbursed fees are reflected on the accompanying Statements of Operations. Amounts payable by the Investment Manager are reflected on the accompanying Statements of Assets and Liabilities for each Portfolio.
As of December 31, 2005, the Portfolios have no reimbursed fees that are subject to possible recoupment by the Investment Manager.
The Expense Limitation Agreements are contractual and shall renew automatically for one-year terms unless ING Investments provides written notice of the termination of an Expense Limitation Agreement within 90 days of the end of the then current term.
NOTE 8 — LINE OF CREDIT
The Portfolios, in addition to certain other funds managed by the Investment Manager, have entered into an unsecured committed revolving line of credit agreement (the “Credit Agreement “) with a syndicate of banks led by Citibank, N.A. for an aggregate amount of $100,000,000. The proceeds may be used only to: (1) temporarily finance the purchase and sale of securities; (2) finance the redemption of shares of an investor in the funds; and (3) enable the funds to meet other emergency expenses as defined in the Credit Agreement. The funds to which the line of credit is available pay a commitment fee equal to 0.09% per annum on the daily unused portion of the committed line amount. Each of the Portfolios will pay its pro rata share of both the agent and commitment fee. Generally, borrowings under the Credit Agreement accrue interest at the Federal Funds Rate plus a specified margin. Repayments generally must be made within 30 days after the date of a revolving credit advance. The following Portfolios utilized the line of credit during the year ended December 31, 2005:
| | Days
Utilized | | Approximate
Average Daily
Balance for
Days Utilized | | Approximate
Weighted
Average
Interest Rate
for Days Utilized | |
Balanced | | 2 | | $2,065,000 | | | 3.17% | |
Global Science and Technology | | 4 | | 1,150,000 | | | 3.71 | |
Growth | | 2 | | 920,000 | | | 3.78 | |
Intermediate Bond | | 4 | | 1,145,000 | | | 3.25 | |
International Equity | | 5 | | 1,738,000 | | | 3.29 | |
Value Opportunity | | 7 | | 870,000 | | | 3.58 | |
50
NOTES TO FINANCIAL STATEMENTS AS OF DECEMBER 31, 2005 (CONTINUED)
NOTE 9 — CAPITAL SHARES
Transactions in capital shares and dollars were as follows:
| | Class I Shares | | Class S Shares | |
| | Year | | Year | | Year | | Year | |
| | Ended | | Ended | | Ended | | Ended | |
| | December 31, | | December 31, | | December 31, | | December 31, | |
| | 2005 | | 2004 | | 2005 | | 2004 | |
Balanced (Number of Shares) | | | | | | | | | |
Shares sold | | 936,888 | | 5,541,276 | | 59,464 | | 161,044 | |
Dividends reinvested | | 2,304,743 | | 2,277,679 | | 4,914 | | 3,651 | |
Shares redeemed | | (13,966,864 | ) | (16,373,623 | ) | (64,454 | ) | (29,578 | ) |
Net increase (decrease) in shares outstanding | | (10,725,233 | ) | (8,554,668 | ) | (76 | ) | 135,117 | |
| | | | | | | | | |
Balanced ($) | | | | | | | | | |
Shares sold | | $ | 12,534,653 | | $ | 70,448,531 | | $ | 795,346 | | $ | 2,027,282 | |
Dividends reinvested | | 30,561,067 | | 28,402,664 | | 64,964 | | 45,416 | |
Shares redeemed | | (187,304,754 | ) | (206,636,262 | ) | (859,666 | ) | (378,747 | ) |
Net increase (decrease) | | $ | (144,209,034 | ) | $ | (107,785,067 | ) | $ | 644 | | $ | 1,693,951 | |
| | Class I Shares | | Class S Shares |
| | Year
Ended
December 31,
2005 | | Year
Ended
December 31,
2004 | | Year
Ended
December 31,
2005 | | Year
Ended
December 31,
2004 | |
Growth and Income (Number of Shares) | | | | | | | | | |
Shares sold | | 138,694 | | 3,269,845 | | 50,301 | | 20,905 | |
Dividends reinvested | | 1,566,557 | | 4,494,881 | | 1,077 | | 1,972 | |
Shares redeemed | | (32,345,085 | ) | (32,855,572 | ) | (25,742 | ) | (25,390 | ) |
Net increase (decrease) in shares outstanding | | (30,639,834 | ) | (25,090,846 | ) | 25,636 | | (2,513 | ) |
| | | | | | | | | |
Growth and Income ($) | | | | | | | | | |
Shares sold | | $ | 2,773,031 | | $ | 61,270,078 | | $ | 1,006,318 | | $ | 389,064 | |
Dividends reinvested | | 32,929,030 | | 84,457,963 | | 22,610 | | 36,994 | |
Shares redeemed | | (634,438,393 | ) | (606,157,122 | ) | (513,138 | ) | (461,223 | ) |
Net increase (decrease) | | $ | (598,736,332 | ) | $ | (460,429,081 | ) | $ | 515,790 | | $ | (35,165 | ) |
| | Class I Shares | | Class S Shares |
| | Year
Ended
December 31,
2005 | | Year
Ended
December 31,
2004 | | Year
Ended
December 31,
2005 | | Year
Ended
December 31,
2004 | |
Growth (Number of Shares) | | | | | | | | | |
Shares sold | | 489,244 | | 585,684 | | 3,047 | | 6,466 | |
Dividends reinvested | | 133,505 | | 29,983 | | 158 | | — | |
Shares redeemed | | (3,948,289 | ) | (5,512,414 | ) | (13,059 | ) | (1,856 | ) |
Net increase (decrease) in shares outstanding | | (3,325,540 | ) | (4,896,747 | ) | (9,854 | ) | 4,610 | |
| | | | | | | | | |
Growth ($) | | | | | | | | | |
Shares sold | | $ | 4,980,563 | | $ | 5,279,704 | | $ | 30,259 | | $ | 58,168 | |
Dividends reinvested | | 1,254,943 | | 268,051 | | 1,478 | | — | |
Shares redeemed | | (37,571,404 | ) | (48,617,581 | ) | (124,206 | ) | (16,522 | ) |
Net increase (decrease) | | $ | (31,335,899 | ) | $ | (43,069,826 | ) | $ | (92,469 | ) | $ | 41,646 | |
51
NOTES TO FINANCIAL STATEMENTS AS OF DECEMBER 31, 2005 (CONTINUED)
NOTE 9 — CAPITAL SHARES (continued)
| | Class I Shares | | Class S Shares | |
| | Year
Ended
December 31,
2005 | | Year
Ended
December 31,
2004 | | Year
Ended
December 31,
2005 | | Year
Ended
December 31,
2004 | |
Small Company (Number of Shares) | | | | | | | | | |
Shares sold | | 556,621 | | 2,256,129 | | 3,729,805 | | 5,026,850 | |
Dividends reinvested | | 313,991 | | 74,193 | | 32,961 | | 1,814 | |
Shares redeemed | | (5,812,740 | ) | (5,763,081 | ) | (4,206,439 | ) | (1,447,699 | ) |
Net increase (decrease) in shares outstanding | | (4,942,128 | ) | (3,432,759 | ) | (443,673 | ) | 3,580,965 | |
| | | | | | | | | |
Small Company ($) | | | | | | | | | |
Shares sold | | $ | 11,336,135 | | $ | 40,720,939 | | $ | 73,490,792 | | $ | 87,903,008 | |
Dividends reinvested | | 6,267,269 | | 1,319,890 | | 656,918 | | 32,250 | |
Shares redeemed | | (116,180,823 | ) | (103,038,487 | ) | (76,744,947 | ) | (26,826,319 | ) |
Net increase (decrease) | | $ | (98,577,419 | ) | $ | (60,997,658 | ) | $ | (2,597,237 | ) | $ | 61,108,939 | |
| | Class I Shares | | Class S Shares | |
| | Year
Ended
December 31,
2005 | | Year
Ended
December 31,
2004 | | Year
Ended
December 31,
2005 | | Year
Ended
December 31,
2004 | |
Value Opportunity (Number of Shares) | | | | | | | | | |
Shares sold | | 553,896 | | 970,091 | | 37,795 | | 127,023 | |
Shares issued in merger | | 622,495 | | — | | 1,963,304 | | — | |
Dividends reinvested | | 296,197 | | 168,177 | | 4,597 | | 1,831 | |
Shares redeemed | | (5,223,923 | ) | (5,784,691 | ) | (84,894 | ) | (51,003 | ) |
Net increase (decrease) in shares outstanding | | (3,751,335 | ) | (4,646,423 | ) | 1,920,802 | | 77,851 | |
| | | | | | | | | |
Value Opportunity ($) | | | | | | | | | |
Shares sold | | $ | 7,477,383 | | $ | 11,987,060 | | $ | 300,567 | | $ | 1,560,347 | |
Shares issued in merger | | 8,659,509 | | — | | 27,164,512 | | — | |
Dividends reinvested | | 3,812,050 | | 2,050,084 | | 58,891 | | 22,234 | |
Shares redeemed | | (68,980,076 | ) | (71,212,120 | ) | (1,125,724 | ) | (628,834 | ) |
Net increase (decrease) | | $ | (49,031,134 | ) | $ | (57,174,976 | ) | $ | 26,398,246 | | $ | 953,747 | |
| | Class I Shares | | Class S Shares |
| | Year
Ended
December 31,
2005 | | Year
Ended
December 31,
2004 | | Year
Ended
December 31,
2005 | | Year
Ended
December 31,
2004 | |
Intermediate Bond (Number of Shares) | | | | | | | | | |
Shares sold | | 10,413,516 | | 10,565,378 | | 27,761,044 | | 18,424,679 | |
Dividends reinvested | | 3,789,704 | | 9,919,704 | | 1,847,547 | | 1,734,423 | |
Shares redeemed | | (8,854,326 | ) | (16,940,447 | ) | (4,792,299 | ) | (2,197,934 | ) |
Net increase in shares outstanding | | 5,348,894 | | 3,544,635 | | 24,816,292 | | 17,961,168 | |
| | | | | | | | | |
Intermediate Bond ($) | | | | | | | | | |
Shares sold | | $ | 138,846,419 | | $ | 147,968,344 | | $ | 367,384,739 | | $ | 251,513,485 | |
Dividends reinvested | | 49,139,900 | | 132,374,446 | | 23,812,556 | | 22,907,583 | |
Shares redeemed | | (117,871,564 | ) | (233,418,138 | ) | (63,619,887 | ) | (29,751,769 | ) |
Net increase | | $ | 70,114,755 | | $ | 46,924,652 | | $ | 327,577,408 | | $ | 244,669,299 | |
52
NOTES TO FINANCIAL STATEMENTS AS OF DECEMBER 31, 2005 (CONTINUED)
NOTE 9 — CAPITAL SHARES (continued)
| | Class I Shares | | | | | |
| | Year
Ended
December 31,
2005 | | Year
Ended
December 31,
2004 | | | | | |
Money Market (Number of Shares) | | | | | | | | | |
Shares sold | | 17,729,883 | | 25,412,249 | | | | | |
Dividends reinvested | | 999,103 | | 1,009,615 | | | | | |
Shares redeemed | | (22,391,210 | ) | (36,946,032 | ) | | | | |
Net decrease in shares outstanding | | (3,662,224 | ) | (10,524,168 | ) | | | | |
| | | | | | | | | |
Money Market ($) | | | | | | | | | |
Shares sold | | $ | 229,751,452 | | $ | 327,235,099 | | | | | |
Dividends reinvested | | 12,797,898 | | 12,932,164 | | | | | |
Shares redeemed | | (290,343,446 | ) | (475,422,886 | ) | | | | |
Net decrease | | $ | (47,794,096 | ) | $ | (135,255,623 | ) | | | | |
| | Class I Shares | | Class S Shares | |
| | Year
Ended
December 31,
2005 | | Year
Ended
December 31,
2004 | | Year
Ended
December 31,
2005 | | Year
Ended
December 31,
2004(1) | |
Global Science and Technology (Number of Shares) | | | | | | | | | |
Shares sold | | 3,651,130 | | 5,874,957 | | 19,401 | | — | |
Shares redeemed | | (6,412,052 | ) | (8,566,152 | ) | (1,044 | ) | — | |
Net increase (decrease) in shares outstanding | | (2,760,922 | ) | (2,691,195 | ) | 18,357 | | — | |
| | | | | | | | | |
Global Science and Technology ($) | | | | | | | | | |
Shares sold | | $ | 13,994,023 | | $ | 22,118,107 | | $ | 76,069 | | $ | — | |
Shares redeemed | | (23,479,231 | ) | (31,058,339 | ) | (4,232 | ) | — | |
Net increase (decrease) | | $ | (9,485,208 | ) | $ | (8,940,232 | ) | $ | 71,837 | | $ | — | |
| | Class I Shares | | Class S Shares | |
| | Year
Ended
December 31,
2005 | | Year
Ended
December 31,
2004 | | Year
Ended
December 31,
2005 | | Year
Ended
December 31,
2004 | |
International Equity (Number of Shares) | | | | | | | | | |
Shares sold | | 2,069,109 | | 2,386,273 | | 57,552 | | 53,937 | |
Dividends reinvested | | 63,014 | | 70,834 | | 286 | | 284 | |
Shares redeemed | | (2,060,158 | ) | (1,816,473 | ) | (53,252 | ) | (49,868 | ) |
Net increase in shares outstanding | | 71,965 | | 640,634 | | 4,586 | | 4,353 | |
| | | | | | | | | |
International Equity ($) | | | | | | | | | |
Shares sold | | $ | 18,609,378 | | $ | 18,639,301 | | $ | 499,726 | | $ | 417,590 | |
Dividends reinvested | | 539,401 | | 546,129 | | 2,439 | | 2,180 | |
Shares redeemed | | (18,481,796 | ) | (14,143,468 | ) | (461,596 | ) | (385,475 | ) |
Net increase | | $ | 666,983 | | $ | 5,041,962 | | $ | 40,569 | | $ | 34,295 | |
(1) There was no capital activity for Class S during the year ended December 31, 2004.
NOTE 10 — ILLIQUID SECURITIES
Pursuant to guidelines adopted by the Portfolios’ Board, the following securities have been deemed to be illiquid. Each Portfolio may invest up to 15% (10% for Money Market) of its net assets, in illiquid securities. Fair value for these securities was determined by ING Funds Valuation Committee appointed by the Portfolios’ Board of Directors.
Portfolio | | Security | | Principal
Amount | | Initial
Acquision
Portfolio | | Cost | | Value | | Percent
of Net
Assets | |
Balanced | | Alpine III, 4.882%, due 08/16/14 | | $ | 215,000 | | 08/04/2004 | | $ | 215,095 | | $ | 215,579 | | 0.0 | % | |
| | Alpine III, 5.290%, due 08/16/14 | | 215,000 | | 08/04/2004 | | 215,096 | | 215,584 | | 0.0 | % | |
| | Alpine III, 7.090%, due 08/16/14 | | 323,000 | | 08/04/2004 | | 326,682 | | 324,587 | | 0.0 | % | |
| | Alpine III, 10.340%, due 08/16/14 | | 552,000 | | 08/04/2004 | | 552,967 | | 567,706 | | 0.1 | % | |
| | | | | | | | $ | 1,309,840 | | $ | 1,323,456 | | 0.1 | % | |
| | | | | | | | | | | | | | | | | |
53
NOTES TO FINANCIAL STATEMENTS AS OF DECEMBER 31, 2005 (CONTINUED)
NOTE 10 — ILLIQUID SECURITIES (continued)
Portfolio | | Security | | Principal
Amount | | Initial
Acquision
Portfolio | | Cost | | Value | | Percent
of Net
Assets | |
Intermediate Bond | | Alpine III, 4.882%, due 08/16/14 | | $ | 1,005,000 | | 08/04/2004 | | $ | 1,005,449 | | $ | 1,007,707 | | 0.1 | % | |
| | Alpine III, 5.290%, due 08/16/14 | | 1,005,000 | | 08/04/2004 | | 1,005,449 | | 1,007,731 | | 0.1 | % | |
| | Alpine III, 7.090%, due 08/16/14 | | 1,505,000 | | 08/04/2004 | | 1,524,473 | | 1,512,396 | | 0.1 | % | |
| | Alpine III, 10.340%, due 08/16/14 | | 2,572,000 | | 08/04/2004 | | 2,609,449 | | 2,645,181 | | 0.1 | % | |
| | | | | | | | $ | 6,144,820 | | $ | 6,173,015 | | 0.4 | % | |
| | | | | | | | | | | | | | | | | |
NOTE 11 — SECURITIES LENDING
Under an agreement with The Bank of New York (“BNY”), the Portfolios can lend their securities to approved brokers, dealers and other financial institutions. Loans are collateralized by cash and U.S. Government securities. The collateral must be in an amount equal to at least 105% of the market value of non-U.S. securities loaned and 102% of the market value of U.S. securities loaned. The cash collateral received is invested in approved investments as defined in the Securities Lending Agreement with BNY (the “Agreement”). The securities purchased with cash collateral received are reflected in the Portfolio of Investments. Generally, in the event of counterparty default, the Portfolios have the right to use the collateral to offset losses incurred. The Agreement contains certain guarantees by BNY in the event of counterparty default and/or a borrower’s failure to return a loaned security, however there would be a potential loss to the Portfolios in the event the Portfolios are delayed or prevented from exercising their right to dispose of the collateral. The Portfolios bear the risk of loss with respect to the investment of collateral. Engaging in securities lending could have a leveraging effect, which may intensify the credit, market and other risks associated with investing in a Portfolio. At December 31, 2005, the Portfolios had securities on loan with the following market values:
| | Value of
Securities
Loaned | | Value of
Collateral | |
Balanced | | $225,842,956 | | $231,954,000 | |
Growth and Income | | 263,362,560 | | 271,624,000 | |
Growth | | 31,996,283 | | 32,864,000 | |
Small Company | | 125,678,884 | | 129,955,000 | |
Value Opportunity | | 22,025,854 | | 22,446,000 | |
Intermediate Bond | | 422,661,520 | | 431,292,000 | |
Money Market | | 4,502,520 | | 4,600,000 | |
Global Science and Technology | | 17,686,387 | | 18,348,000 | |
NOTE 12 — FEDERAL INCOME TAXES
The amount of distributions from net investment income and net realized capital gains are determined in accordance with federal income tax regulations, which may differ from U.S. generally accepted accounting principles for investment companies. These book/tax differences may be either temporary or permanent. Permanent differences are reclassified within the capital accounts based on their federal tax-basis treatment; temporary differences are not reclassified. Key differences include the treatment of short-term capital gains, foreign currency transactions, and wash sale deferrals. Distributions in excess of net investment income and/or net realized capital gains for tax purposes are reported as distributions of paid-in capital.
The following permanent tax differences have been reclassified as of December 31, 2005:
| | Paid-in
Capital | | Undistributed
Net Investment Income
On Investments | | Accumulated
Net Realized
Gains/(Losses) | |
Balanced | | $ | — | | $ 659,623 | | | $ (659,623 | ) | |
Growth | | — | | (12,538 | ) | | 12,538 | | |
Small Company | | — | | (288,436 | ) | | 288,436 | | |
Value Opportunity | | 31,314 | | — | | | (31,314 | ) | |
Intermediate Bond | | — | | 1,673,270 | | | (1,673,270 | ) | |
Global Science and Technology | | (444,428 | ) | 370,605 | | | 73,823 | | |
International Equity | | (60,179 | ) | 263,231 | | | (203,052 | ) | |
| | | | | | | | | | |
Dividends paid by the Portfolio from net investment income and distributions of net realized short-term capital gains are, for federal income tax purposes, taxable as ordinary income to shareholders.
54
NOTES TO FINANCIAL STATEMENTS AS OF DECEMBER 31, 2005 (CONTINUED)
NOTE 12 — FEDERAL INCOME TAXES (continued)
The tax composition of dividends and distributions to shareholders was as follows:
| | Year Ended
December 31, 2005 | | Year Ended
December 31, 2004 | |
| | Ordinary Income | | Long-Term
Capital Gains | | Ordinary Income | | Long-Term
Capital Gains | |
Balanced | | $ 30,626,031 | | | $ — | | | $ 28,448,080 | | | $ — | | |
| | | | | | | | | | | | | |
Growth and Income | | 32,976,369 | | | — | | | 84,550,196 | | | — | | |
| | | | | | | | | | | | | |
Growth | | 1,256,421 | | | — | | | 268,051 | | | — | | |
| | | | | | | | | | | | | |
Small Company | | 640,870 | | | 6,283,317 | | | 1,352,140 | | | — | | |
| | | | | | | | | | | | | |
Value Opportunity | | 3,870,941 | | | — | | | 2,072,318 | | | — | | |
| | | | | | | | | | | | | |
Intermediate Bond | | 71,996,067 | | | 987,932 | | | 150,191,405 | | | 5,168,861 | | |
| | | | | | | | | | | | | |
Money Market | | 12,797,898 | | | — | | | 12,932,164 | | | — | | |
| | | | | | | | | | | | | |
International Equity | | 541,840 | | | — | | | 548,309 | | | — | | |
The tax-basis components of distributable earnings and the expiration dates of the capital loss carryforwards which may be used to offset future realized capital gains for federal income tax purposes as of December 31, 2005 were:
| | Undistributed
Ordinary
Income | | Undistributed
Long Term
Capital Gains | | Unrealized
Appreciation/
Depreciation | | Post-October
Capital
Losses
Deferred | | Post-October
Currency
Losses
Deferred | | Capital
Loss
Carryforwards | | Expiration
Dates | |
Balanced | | $28,937,305 | | $ — | | $ 33,206,400 | | $ — | | $— | | $ | (10,973,009 | ) | 2010 | | |
Growth and Income | | 393,853 | | — | | 335,781,383 | | — | | — | | $ | (2,338,787,124 | ) | 2010 | | |
| | | | | | | | | | | | (63,082,574 | ) | 2011 | | |
| | | | | | | | | | | | $ | (2,401,869,698 | ) | | | |
Growth | | 111,000 | | — | | 23,032,281 | | — | | — | | $ | (124,853,110 | ) | 2009 | | |
| | | | | | | | | | | | (63,207,672 | ) | 2010 | | |
| | | | | | | | | | | | $ | (188,060,782 | ) | | | |
Small Company | | 6,391,050 | | 66,072,902 | | 62,790,707 | | — | | — | | — | | — | | |
Value Opportunity | | 2,922,288 | | — | | 18,923,363 | | — | | — | | $ | (22,679,982 | ) | 2010 | | |
Intermediate Bond | | 735,809 | | — | | (10,249,543 | ) | (6,886,626 | ) | (7 | ) | — | | — | | |
Money Market | | 31,881,014 | | — | | — | | — | | — | | $ | (735,570 | ) | 2008 | | |
| | | | | | | | | | | | (3,715,968 | ) | 2009 | | |
| | | | | | | | | | | | (169 | ) | 2011 | | |
| | | | | | | | | | | | (244,520 | ) | 2012 | | |
| | | | | | | | | | | | $ | (4,696,227 | ) | | | |
Global Science and Technology | | — | | — | | 14,912,593 | | — | | — | | $ | (33,352,083 | ) | 2009 | | |
| | | | | | | | | | | | (15,534,432 | ) | 2010 | | |
| | | | | | | | | | | | (4,912,495 | ) | 2011 | | |
| | | | | | | | | | | | $ | (53,799,010 | ) | | | |
International Equity | | 1,100,095 | | — | | 9,233,744 | | — | | — | | $ | (10,317,413 | ) | 2009 | | |
| | | | | | | | | | | | (9,221,611 | ) | 2010 | | |
| | | | | | | | | | | | $ | (19,539,024 | ) | | |
NOTE 13 — REORGANIZATIONS
On December 3, 2005, Value Opportunity as listed below (“Acquiring Portfolio”), acquired the assets and certain liabilities of the ING VP MagnaCap Portfolio, also listed below (“Acquired Portfolio”), in a tax-free reorganization in exchange for shares of the Acquiring Portfolio, pursuant to a plan or reorganization approved by the Acquired Portfolio’s shareholders. The number and value of shares issued by the Acquiring Portfolio are presented in Note 9 — Capital Share Transactions. Net assets and unrealized appreciation as of the reorganization dates were as follows:
Acquiring
Portfolio | | Acquired
Portfolio | | Total net assets of
Acquired Portfolio (000’s) | | Total net assets of
Acquiring Portfolio (000’s) | | Acquired Portfolio
Unrealized
Appreciation (000) | | Conversion
Ratio | |
Value
Opportunity | | ING VP MagnaCap Portfolio | | $35,824 | | $178,004 | | $4,586 | | Class I 0.6595
Class S 0.6671 | |
The net assets of Value Opportunity after the acquisition were approximately $213,827,788.
55
NOTES TO FINANCIAL STATEMENTS AS OF DECEMBER 31, 2005 (CONTINUED)
NOTE 14 — INFORMATION REGARDING TRADING OF ING’S U.S. MUTUAL FUNDS
In 2004 ING Investments reported to the Boards of Directors/Trustees (the “Boards”) of the ING Funds that, like many U.S. financial services companies, ING Investments and certain of its U.S. affiliates have received informal and formal requests for information since September 2003 from various governmental and self-regulatory agencies in connection with investigations related to mutual funds and variable insurance products. ING Investments has advised the Boards that it and its affiliates have cooperated fully with each request.
In addition to responding to regulatory and governmental requests, ING Investments reported that management of U.S. affiliates of ING Groep N.V., including ING Investments (collectively, “ING”), on their own initiative, have conducted, through independent special counsel and a national accounting firm, an extensive internal review of trading in ING insurance, retirement, and mutual fund products. The goal of this review was to identify any instances of inappropriate trading in those products by third parties or by ING investment professionals and other ING personnel. ING’s internal review related to mutual fund trading is now substantially completed. ING has reported that, of the millions of customer relationships that ING maintains, the internal review identified several isolated arrangements allowing third parties to engage in frequent trading of mutual funds within ING’s variable insurance and mutual fund products, and identified other circumstances where frequent trading occurred, despite measures taken by ING intended to combat market timing. ING further reported that each of these arrangements has been terminated and fully disclosed to regulators. The results of the internal review were also reported to the independent members of the Board.
ING Investments has advised the Board that most of the identified arrangements were initiated prior to ING’s acquisition of the businesses in question in the U.S. ING Investments further reported that the companies in question did not receive special benefits in return for any of these arrangements, which have all been terminated.
Based on the internal review, ING Investments has advised the Board that the identified arrangements do not represent a systemic problem in any of the companies that were involved.
In September 2005, ING Funds Distributor, LLC (“IFD”), the distributor of certain ING Funds, settled an administrative proceeding with the NASD regarding three arrangements, dating from 1995, 1996 and 1998, under which the administrator to the then-Pilgrim Funds, which subsequently became part of the ING Funds, entered into formal and informal arrangements that permitted frequent trading. Under the terms of the Letter of Acceptance, Waiver and Consent (“AWC”) with the NASD, under which IFD neither admitted nor denied the allegations or findings, IFD consented to the following sanctions: (i) a censure; (ii) a fine of $1.5 million; (iii) restitution of approximately $1.44 million to certain ING Funds for losses attributable to excessive trading described in the AWC; and (iv) agreement to make certification to NASD regarding the review and establishment of certain procedures.
In addition to the arrangements discussed above, in 2004 ING Investments reported to the Board that, at that time, these instances include the following, in addition to the arrangements subject to the AWC discussed above:
• Aeltus Investment Management, Inc. (a predecessor entity to ING Investment Management Co.) has identified two investment professionals who engaged in extensive frequent trading in certain ING Funds. One was subsequently terminated for cause and incurred substantial financial penalties in connection with this conduct and the second has been disciplined.
• ReliaStar Life Insurance Company (“ReliaStar”) entered into agreements seven years ago permitting the owner of policies issued by the insurer to engage in frequent trading and to submit orders until 4pm Central Time. In 2001 ReliaStar also entered into a selling agreement with a broker-dealer that engaged in frequent trading. Employees of ING affiliates were terminated and/or disciplined in connection with these matters.
• In 1998, Golden American Life Insurance Company entered into arrangements permitting a broker-dealer to frequently trade up to certain specific limits in a fund available in an ING variable annuity product. No employee responsible for this arrangement remains at the company.
For additional information regarding these matters, you may consult the Form 8-K and Form 8-K/A for each of four life insurance companies, ING USA Annuity and Life Insurance Company, ING Life Insurance and Annuity Company, ING Insurance Company of
56
NOTES TO FINANCIAL STATEMENTS AS OF DECEMBER 31, 2005 (CONTINUED)
NOTE 14 — INFORMATION REGARDING TRADING OF ING’S U.S. MUTUAL FUNDS (continued)
America, and ReliaStar Life Insurance Company of New York, each filed with the Securities and Exchange Commission (the “SEC”) on October 29, 2004 and September 8, 2004. These Forms 8-K and Forms 8-K/A can be accessed through the SEC’s Web site at http://www.sec.gov. Despite the extensive internal review conducted through independent special counsel and a national accounting firm, there can be no assurance that the instances of inappropriate trading reported to the Board are the only instances of such trading respecting the ING Funds.
ING Investments reported to the Board that ING is committed to conducting its business with the highest standards of ethical conduct with zero tolerance for noncompliance. Accordingly, ING Investments advised the Board that ING management was disappointed that its voluntary internal review identified these situations. Viewed in the context of the breadth and magnitude of its U.S. business as a whole, ING management does not believe that ING’s acquired companies had systemic ethical or compliance issues in these areas. Nonetheless, ING Investments reported that given ING’s refusal to tolerate any lapses, it has taken the steps noted below, and will continue to seek opportunities to further strengthen the internal controls of its affiliates.
• ING has agreed with the ING Funds to indemnify and hold harmless the ING Funds from all damages resulting from wrongful conduct by ING or its employees or from ING’s internal investigation, any investigations conducted by any governmental or self-regulatory agencies, litigation or other formal proceedings, including any proceedings by the Securities and Exchange Commission. ING Investments reported to the Board that ING management believes that the total amount of any indemnification obligations will not be material to ING or its U.S. business.
• ING updated its Code of Conduct for employees reinforcing its employees’ obligation to conduct personal trading activity consistent with the law, disclosed limits, and other requirements.
• The ING Funds, upon a recommendation from ING, updated their respective Codes of Ethics applicable to investment professionals with ING entities and certain other fund personnel, requiring such personnel to pre-clear any purchases or sales of ING Funds that are not systematic in nature (i.e., dividend reinvestment), and imposing minimum holding periods for shares of ING Funds.
• ING instituted excessive trading policies for all customers in its variable insurance and retirement products and for shareholders of the ING Funds sold to the public through financial intermediaries. ING does not make exceptions to these policies.
• ING reorganized and expanded its U.S. Compliance Department, and created an Enterprise Compliance team to enhance controls and consistency in regulatory compliance.
As has been widely reported in the media, the New York Attorney General’s office (“NYAG”) is conducting broad investigations regarding insurance quoting and brokerage practices. ING U.S. has been subpoenaed in this regard, and is cooperating fully with these NYAG requests for information.
ING U.S. believes that its practices are consistent with our business principles and our commitment to our customers.
At this time, in light of the current regulatory factors, ING U.S. is actively engaged in reviewing whether any modifications in our practices are appropriate for the future.
There can be no assurance that these matters, or the adverse publicity associated with them, will not result in increased fund redemptions, reduced sale of fund shares, or other adverse consequences to ING Funds.
NOTE 15 — LITIGATION
On December 12, 2003, ING IM (formerly, Aeltus Investment Management, Inc.,) received a copy of a complaint (the “Complaint”) filed in the United States Bankruptcy Court for the Southern District of New York styled Enron Corp. v. Mass Mutual Life Insurance Co., et al. Among other defendants named in the Complaint are defendants ING VP Balanced Portfolio, and ING VP Bond Portfolio (the “Subject Portfolios”). The Complaint alleges that Enron Corp. (“Enron”) transferred to the defendants, including the Subject Portfolios, over $1 billion in the aggregate for the purpose of prepaying certain commercial paper issued by Enron (the “Notes”) and held by the defendants prior to the filing by Enron for bankruptcy protection under Chapter 11 of Title 11 of the Bankruptcy Code (the “Bankruptcy Code”). The Complaint seeks to hold the defendants, including the Subject Portfolios, liable for these transfers as preferential transfers or as fraudulent transfers under the Bankruptcy Code. Although the Complaint does not specify the amount
57
NOTE 15 — LITIGATION (continued)
of each transfer in dispute, it appears that the sale by ING VP Balanced Portfolio, Inc. of $23,181,757 of the Notes on or about October 29, 2001 and the sale by ING VP Bond Portfolio, Inc. of $24,963,125 of the Notes on or about October 29, 2001 are in dispute. The Complaint seeks to require the Subject Portfolios to repay to Enron the full amounts of these transfers, in which event the Subject Portfolios would be granted unsecured claims against the Enron bankruptcy estate in the amounts of the repayments.
The Subject Portfolios moved to dismiss all counts of the Complaint, contending, among other things, that section 546(e) of the Bankruptcy Code provides a complete defense. The Bankruptcy Court denied the motion on July 1, 2005. Accordingly, the Subject Portfolios filed an answer to the Complaint on July 29, 2005. In addition, the Subject Portfolios have moved for leave to pursue an immediate appeal of the Bankruptcy Court’s decision to the district court. The district court has not yet ruled, and there can be no assurance that leave will be granted to pursue the appeal now. The Bankruptcy Court has set a discovery calendar indicating that discovery is to proceed through 2006. The Subject Portfolios and their counsel have reviewed the Subject Portfolios’ records concerning the factual background of the allegations in the Complaint, and have considered remaining potential defenses to the allegations in the Complaint. Because only limited discovery has taken place, the Subject Portfolios are unable to predict whether Enron will prevail, in whole or in part, in its claims against the Subject Portfolios, and therefore have not recorded a liability in the financial statements for any potential loss. Defendants continue to contend there is an affirmative defense for the claims presented.
NOTE 16 — SUBSEQUENT EVENTS
Subsequent to December 31, 2005, the following Portfolios declared dividends from net investment income:
| | Per Share
Amount | | Payable Date | | Record Date | |
Money Market | | $0.3981 | | February 1, 2006 | | January 27, 2006 | |
58
ING VP BALANCED PORTFOLIO | | PORTFOLIO OF INVESTMENTS
AS OF DECEMBER 31, 2005 |
Shares | | | | | | Value | |
COMMON STOCK: 62.8% | | | | | |
| | | | | |
| | | | Advertising: 0.0% | | | |
9,561 | | L | | Catalina Marketing Corp. | | $ | 242,371 | |
| | | | | | 242,371 | |
| | | | Aerospace/Defense: 2.3% | | | |
5,600 | | @,L | | Alliant Techsystems, Inc. | | 426,552 | |
3,400 | | @,L | | Armor Holdings, Inc. | | 145,010 | |
118,650 | | | | Boeing Co. | | 8,333,976 | |
1,390 | | | | Engineered Support Systems, Inc. | | 57,880 | |
41,800 | | | | General Dynamics Corp. | | 4,767,290 | |
3,867 | | | | Kaman Corp. | | 76,141 | |
78,750 | | | | Lockheed Martin Corp. | | 5,010,863 | |
109,040 | | | | Raytheon Co. | | 4,377,956 | |
52,100 | | L | | Rockwell Collins, Inc. | | 2,421,087 | |
4,430 | | @ | | Teledyne Technologies, Inc. | | 128,913 | |
58,500 | | | | United Technologies Corp. | | 3,270,735 | |
| | | | | | 29,016,403 | |
| | | | Agriculture: 1.2% | | | |
120,000 | | | | Altria Group, Inc. | | 8,966,400 | |
156,350 | | L | | Archer-Daniels-Midland Co. | | 3,855,591 | |
25,600 | | L | | Reynolds America, Inc. | | 2,440,448 | |
| | | | | | 15,262,439 | |
| | | | Airlines: 0.3% | | | |
4,926 | | @,L | | Mesa Air Group, Inc. | | 51,526 | |
6,095 | | | | Skywest, Inc. | | 163,712 | |
200,400 | | | | Southwest Airlines Co. | | 3,292,572 | |
| | | | | | 3,507,810 | |
| | | | Apparel: 0.5% | | | |
106,200 | | @ | | Coach, Inc. | | 3,540,708 | |
4,600 | | @,L | | Gymboree Corp. | | 107,640 | |
3,480 | | | | K-Swiss, Inc. | | 112,891 | |
8,600 | | | | Polo Ralph Lauren Corp. | | 482,804 | |
3,720 | | @ | | Quiksilver, Inc. | | 51,485 | |
10,500 | | @ | | Timberland Co. | | 341,775 | |
28,400 | | | | VF Corp. | | 1,571,656 | |
1,800 | | | | Wolverine World Wide, Inc. | | 40,428 | |
| | | | | | 6,249,387 | |
| | | | Auto Manufacturers: 0.3% | | | |
474,000 | | L | | Ford Motor Co. | | 3,659,280 | |
2,494 | | L | | Oshkosh Truck Corp. | | 111,207 | |
| | | | | | 3,770,487 | |
| | | | Auto Parts & Equipment: 0.1% | | | |
47,200 | | @,L | | Goodyear Tire & Rubber Co. | | 820,336 | |
8,200 | | | | Modine Manufacturing Co. | | 267,238 | |
| | | | | | 1,087,574 | |
| | | | Banks: 3.8% | | | |
393,100 | | | | Bank of America Corp. | | 18,141,565 | |
8,100 | | | | Bank of Hawaii Corp. | | 417,474 | |
116,700 | | | | BB&T Corp. | | 4,890,897 | |
3,809 | | | | Central Pacific Financial Corp. | | 136,819 | |
5,300 | | L | | Chittenden Corp. | | 147,393 | |
47,800 | | | | Comerica, Inc. | | 2,713,128 | |
1,892 | | L | | East-West Bancorp, Inc. | | 69,039 | |
6,845 | | | | Fremont General Corp. | | 159,009 | |
11,000 | | | | Greater Bay Bancorp | | 281,820 | |
1,500 | | | | Hudson United Bancorp | | 62,520 | |
9,931 | | | | Mercantile Bankshares Corp. | | $ | 560,506 | |
69,145 | | | | PNC Financial Services Group, Inc. | | 4,275,235 | |
2,529 | | | | South Financial Group, Inc. | | 69,649 | |
107,700 | | | | US BanCorp. | | 3,219,153 | |
94,550 | | | | Wachovia Corp. | | 4,997,913 | |
99,550 | | | | Wells Fargo & Co. | | 6,254,727 | |
2,200 | | | | Whitney Holding Corp. | | 60,632 | |
10,623 | | | | Wilmington Trust Corp. | | 413,341 | |
| | | | | | 46,870,820 | |
| | | | Beverages: 1.9% | | | |
256,150 | | | | Coca-Cola Co. | | 10,325,407 | |
41,100 | | | | Pepsi Bottling Group, Inc. | | 1,175,871 | |
196,850 | | | | PepsiCo, Inc. | | 11,629,898 | |
| | | | | | 23,131,176 | |
| | | | Biotechnology: 0.5% | | | |
69,500 | | @ | | Amgen, Inc. | | 5,480,770 | |
11,977 | | @ | | Savient Pharmaceuticals, Inc. | | 44,794 | |
| | | | | | 5,525,564 | |
| | | | Building Materials: 0.1% | | | |
2,500 | | @,L | | Drew Industries, Inc. | | 70,475 | |
4,082 | | | | Florida Rock Industries, Inc. | | 200,263 | |
2,000 | | | | Lennox International, Inc. | | 56,400 | |
8,200 | | | | Martin Marietta Materials, Inc. | | 629,104 | |
| | | | | | 956,242 | |
| | | | Chemicals: 0.8% | | | |
14,500 | | | | Chemtura Corp. | | 184,150 | |
70,000 | | | | Dow Chemical Co. | | 3,067,400 | |
66,700 | | L | | EI Du Pont de Nemours & Co. | | 2,834,750 | |
31,687 | | L | | Lyondell Chemical Co. | | 754,784 | |
1,600 | | | | Penford Corp. | | 19,520 | |
61,700 | | | | PPG Industries, Inc. | | 3,572,430 | |
| | | | | | 10,433,034 | |
| | | | Coal: 0.0% | | | |
6,200 | | | | Peabody Energy Corp. | | 511,004 | |
| | | | | | 511,004 | |
| | | | Commercial Services: 0.9% | | | |
2,900 | | L | | Administaff, Inc. | | 121,945 | |
9,100 | | @,L | | Alliance Data Systems Corp. | | 323,960 | |
14,000 | | @,L | | Career Education Corp. | | 472,080 | |
1,990 | | @,L | | Consolidated Graphics, Inc. | | 94,207 | |
5,407 | | L | | Corporate Executive Board Co. | | 485,008 | |
1,100 | | | | CPI Corp. | | 20,581 | |
11,704 | | @ | | Education Management Corp. | | 392,201 | |
37,750 | | | | Equifax, Inc. | | 1,435,255 | |
91,500 | | L | | H&R Block, Inc. | | 2,246,325 | |
4,100 | | | | Manpower, Inc. | | 190,650 | |
82,900 | | | | McKesson Corp. | | 4,276,811 | |
3,894 | | | | Pharmaceutical Product Development, Inc. | | 241,233 | |
1,640 | | | | Pre-Paid Legal Services, Inc. | | 62,664 | |
10,400 | | @ | | Spherion Corp. | | 104,104 | |
1,610 | | @ | | Vertrue, Inc. | | 56,881 | |
| | | | | | 10,523,905 | |
See Accompanying Notes to Financial Statements
59
ING VP BALANCED PORTFOLIO | | PORTFOLIO OF INVESTMENTS
AS OF DECEMBER 31, 2005 (CONTINUED) |
Shares | | | | | | Value | |
| | | | Computers: 3.6% | | | |
5,300 | | | | Agilysys, Inc. | | $ | 96,566 | |
111,000 | | @ | | Apple Computer, Inc. | | 7,979,790 | |
990 | | @,L | | CACI International, Inc. | | 56,806 | |
27,400 | | @,L | | Cadence Design Systems, Inc. | | 463,608 | |
16,200 | | @ | | Ceridian Corp. | | 402,570 | |
5,330 | | @ | | Cognizant Technology Solutions Corp. | | 268,366 | |
295,150 | | @ | | Dell, Inc. | | 8,851,549 | |
6,800 | | @,L | | DST Systems, Inc. | | 407,388 | |
408,000 | | @ | | EMC Corp. | | 5,556,960 | |
1,200 | | L | | Factset Research Systems, Inc. | | 49,392 | |
341,300 | | | | Hewlett-Packard Co. | | 9,771,419 | |
5,600 | | L | | Imation Corp. | | 257,992 | |
89,950 | | | | International Business Machines Corp. | | 7,393,890 | |
1,165 | | @,L | | Kronos, Inc. | | 48,767 | |
4,700 | | @ | | Manhattan Associates, Inc. | | 96,256 | |
3,737 | | @,L | | Micros Systems, Inc. | | 180,572 | |
3,120 | | | | MTS Systems Corp. | | 108,077 | |
8,900 | | | | Reynolds & Reynolds Co. | | 249,823 | |
13,525 | | @,L | | Sandisk Corp. | | 849,641 | |
17,400 | | @,L | | Synopsys, Inc. | | 349,044 | |
2,900 | | | | Talx Corp. | | 132,559 | |
24,966 | | @,L | | Western Digital Corp. | | 464,617 | |
| | | | | | 44,035,652 | |
| | | | Cosmetics/Personal Care: 0.9% | | | |
198,800 | | L | | Procter & Gamble Co. | | 11,506,544 | |
| | | | | | 11,506,544 | |
| | | | Distribution/Wholesale: 0.2% | | | |
4,000 | | @,L | | Brightpoint, Inc. | | 110,920 | |
1,645 | | L | | Building Materials Holding Corp. | | 112,205 | |
50,700 | | | | Genuine Parts Co. | | 2,226,744 | |
2,300 | | L | | Hughes Supply, Inc. | | 82,455 | |
1,750 | | | | SCP Pool Corp. | | 65,135 | |
3,400 | | L | | United Stationers, Inc. | | 164,900 | |
| | | | | | 2,762,359 | |
| | | | Diversified Financial Services: 5.3% | | | |
74,500 | | | | American Express Co. | | 3,833,770 | |
257,100 | | L | | Charles Schwab Corp. | | 3,771,657 | |
305,900 | | | | Citigroup, Inc. | | 14,845,327 | |
57,100 | | | | Fannie Mae | | 2,787,051 | |
65,400 | | | | Goldman Sachs Group, Inc. | | 8,352,234 | |
10,200 | | L | | IndyMac Bancorp, Inc. | | 398,004 | |
207,900 | | | | JPMorgan Chase & Co. | | 8,251,551 | |
5,272 | | | | Legg Mason, Inc. | | 631,006 | |
47,400 | | | | Lehman Brothers Holdings, Inc. | | 6,075,258 | |
125,050 | | | | Merrill Lynch & Co., Inc. | | 8,469,637 | |
152,300 | | | | Morgan Stanley | | 8,641,502 | |
2,400 | | @,L | | Portfolio Recovery Associates, Inc. | | 111,456 | |
3,200 | | @,L | | World Acceptance, Corp. | | 91,200 | |
| | | | | | 66,259,653 | |
| | | | Electric: 1.3% | | | |
54,200 | | | | Constellation Energy Group, Inc. | | 3,121,920 | |
22,700 | | L | | Dominion Resources, Inc. | | 1,752,440 | |
88,600 | | | | Edison Intl. | | 3,863,846 | |
8,910 | | | | SCANA Corp. | | $ | 350,876 | |
47,600 | | L | | Southern Co. | | 1,643,628 | |
100,900 | | L | | TXU Corp. | | 5,064,171 | |
9,100 | | | | Wisconsin Energy Corp. | | 355,446 | |
| | | | | | 16,152,327 | |
| | | | Electrical Components & Equipment: 0.5% | | | |
10,300 | | | | Ametek, Inc. | | 438,162 | |
75,400 | | | | Emerson Electric Co. | | 5,632,381 | |
| | | | | | 6,070,543 | |
| | | | Electronics: 0.6% | | | |
119,000 | | @ | | Agilent Technologies, Inc. | | 3,961,510 | |
3,400 | | | | Amphenol Corp. | | 150,484 | |
12,991 | | | | Arrow Electronics, Inc. | | 416,102 | |
16,417 | | @ | | Avnet, Inc. | | 393,023 | |
1,700 | | | | Brady Corp. | | 61,506 | |
4,090 | | @,L | | Coherent, Inc. | | 121,391 | |
4,000 | | @,L | | Cymer, Inc. | | 142,040 | |
2,690 | | @,L | | Flir Systems, Inc. | | 60,068 | |
3,113 | | @,L | | Itron, Inc. | | 124,645 | |
291,524 | | @,L | | Solectron Corp. | | 1,066,978 | |
1,990 | | @,L | | Trimble Navigation Ltd. | | 70,625 | |
7,185 | | @ | | Varian, Inc. | | 285,891 | |
| | | | | | 6,854,262 | |
| | | | Energy-Alternate Sources: 0.0% | | | |
4,500 | | @,L | | Headwaters, Inc. | | 159,480 | |
| | | | | | 159,480 | |
| | | | Engineering & Construction: 0.2% | | | |
25,700 | | | | Fluor Corp. | | 1,985,582 | |
2,700 | | @,L | | Shaw Group, Inc. | | 78,543 | |
1,600 | | @ | | URS Corp. | | 60,176 | |
| | | | | | 2,124,301 | |
| | | | Environmental Control: 0.0% | | | |
6,120 | | | | Republic Services, Inc. | | 229,806 | |
1,600 | | @,L | | Waste Connections, Inc. | | 55,136 | |
| | | | | | 284,942 | |
| | | | Food: 0.5% | | | |
2,190 | | | | Corn Products Intl., Inc. | | 52,319 | |
6,800 | | @ | | Dean Foods Co. | | 256,088 | |
4,850 | | L | | Flowers Foods, Inc. | | 133,666 | |
85,617 | | | | General Mills, Inc. | | 4,222,630 | |
12,879 | | | | Hormel Foods Corp. | | 420,886 | |
1,880 | | L | | Nash Finch Co. | | 47,902 | |
3,900 | | @,L | | Performance Food Group Co. | | 110,643 | |
2,912 | | @ | | Ralcorp Holdings, Inc. | | 116,218 | |
35,777 | | | | Supervalu, Inc. | | 1,162,037 | |
| | | | | | 6,522,390 | |
| | | | Forest Products & Paper: 0.1% | | | |
40,214 | | L | | Louisiana-Pacific Corp. | | 1,104,679 | |
| | | | | | 1,104,689 | |
| | | | Gas: 0.4% | | | |
10,298 | | | | Atmos Energy Corp. | | 269,396 | |
3,550 | | | | Energen Corp. | | 128,936 | |
13,200 | | | | Nicor, Inc. | | 518,892 | |
80,757 | | | | Sempra Energy | | 3,621,144 | |
13,230 | | | | UGI Corp. | | 272,538 | |
See Accompanying Notes to Financial Statements
60
ING VP BALANCED PORTFOLIO | | PORTFOLIO OF INVESTMENTS
AS OF DECEMBER 31, 2005 (CONTINUED) |
Shares | | | | | | Value | |
| | | | Gas (continued) | | | |
16,600 | | | | WGL Holdings, Inc. | | $ | 498,996 | |
| | | | | | 5,309,902 | |
| | | | Healthcare-Products: 1.4% | | | |
8,700 | | | | Beckman Coulter, Inc. | | 495,030 | |
1,655 | | | | Cooper Cos., Inc. | | 84,902 | |
9,772 | | | | Dentsply Intl., Inc. | | 524,659 | |
3,000 | | @ | | Haemonetics Corp. | | 146,580 | |
4,534 | | @ | | Hologic, Inc. | | 171,929 | |
1,086 | | @ | | Idexx Laboratories, Inc. | | 78,170 | |
5,700 | | @,L | | Immucor, Inc. | | 133,152 | |
172,900 | | | | Johnson & Johnson | | 10,391,290 | |
72,550 | | | | Medtronic, Inc. | | 4,176,704 | |
1,300 | | | | Mentor Corp. | | 59,904 | |
2,420 | | @ | | Resmed, Inc. | | 92,710 | |
6,057 | | @ | | Respironics, Inc. | | 224,533 | |
6,200 | | L | | Varian Medical Systems, Inc. | | 312,108 | |
1,040 | | | | Vital Signs, Inc. | | 44,533 | |
| | | | | | 16,936,204 | |
| | | | Healthcare-Services: 2.0% | | | |
56,200 | | | | Aetna, Inc. | | 5,300,222 | |
12,100 | | @ | | Community Health Systems, Inc. | | 463,914 | |
48,350 | | @ | | Coventry Health Care, Inc. | | 2,754,016 | |
12,700 | | @ | | Health Net, Inc. | | 654,685 | |
48,600 | | @,L | | Humana, Inc. | | 2,640,438 | |
12,525 | | @,L | | Lincare Holdings, Inc. | | 524,923 | |
5,546 | | @,L | | Odyssey HealthCare, Inc. | | 103,377 | |
2,200 | | @ | | Pediatrix Medical Group, Inc. | | 194,854 | |
2,410 | | @,L | | Sierra Health Services | | 192,704 | |
4,800 | | @ | | United Surgical Partners Intl., Inc. | | 154,320 | |
74,700 | | | | UnitedHealth Group, Inc. | | 4,641,858 | |
93,900 | | @ | | WellPoint, Inc. | | 7,492,281 | |
| | | | | | 25,117,592 | |
| | | | Home Builders: 0.1% | | | |
1,180 | | L | | MDC Holdings, Inc. | | 73,136 | |
800 | | @,L | | Meritage Homes Corp. | | 50,336 | |
340 | | @,L | | NVR, Inc. | | 238,680 | |
2,160 | | L | | Standard-Pacific Corp. | | 79,488 | |
5,600 | | @,L | | Toll Brothers, Inc. | | 193,984 | |
| | | | | | 635,624 | |
| | | | Home Furnishings: 0.0% | | | |
3,135 | | @,L | | Audiovox Corp. | | 43,451 | |
1,100 | | | | Ethan Allen Interiors, Inc. | | 40,183 | |
3,160 | | L | | Harman Intl. Industries, Inc. | | 309,206 | |
| | | | | | 392,840 | |
| | | | Household Products/Wares: 0.0% | | | |
13,650 | | L | | American Greetings | | 299,891 | |
2,400 | | | | CNS, Inc. | | 52,584 | |
| | | | | | 352,475 | |
| | | | Housewares: 0.0% | | | |
4,090 | | | | Toro Co. | | 179,019 | |
| | | | | | 179,019 | |
| | | | Insurance: 3.9% | | | |
9,050 | | L | | American Financial Group, Inc. | | 346,706 | |
150,800 | | | | American Intl. Group, Inc. | | 10,289,084 | |
6,500 | | L | | AmerUs Group Co. | | $ | 368,355 | |
46,550 | | | | Chubb Corp. | | 4,545,608 | |
2,815 | | @@ | | Everest Re Group Ltd. | | 282,485 | |
18,618 | | | | Fidelity National Financial, Inc. | | 684,956 | |
11,900 | | | | First American Corp. | | 539,070 | |
60,700 | | L | | Hartford Financial Services Group, Inc. | | 5,213,523 | |
10,601 | | L | | Horace Mann Educators Corp. | | 200,995 | |
3,100 | | | | Infinity Property & Casualty Corp. | | 115,351 | |
2,170 | | L | | Landamerica Financial Group, Inc. | | 135,408 | |
50,800 | | | | Lincoln National Corp. | | 2,693,924 | |
128,050 | | L | | Metlife, Inc. | | 6,274,450 | |
12,000 | | | | Ohio Casualty Corp. | | 339,840 | |
9,045 | | | | Old Republic International Corp. | | 237,522 | |
1,830 | | @,L | | Philadelphia Consolidated Holding Co. | | 176,943 | |
74,687 | | | | Principal Financial Group | | 3,542,404 | |
10,030 | | | | Protective Life Corp. | | 439,013 | |
85,736 | | S | | Prudential Financial, Inc. | | 6,275,018 | |
10,000 | | L | | Radian Group, Inc. | | 585,900 | |
35,764 | | | | Safeco Corp. | | 2,020,666 | |
3,030 | | L | | Selective Insurance Group | | 160,893 | |
8,400 | | | | Stancorp Financial Group, Inc. | | 419,580 | |
2,533 | | L | | Stewart Information Services Corp. | | 123,281 | |
30,900 | | | | Torchmark Corp. | | 1,718,040 | |
3,900 | | | | UICI | | 138,489 | |
13,100 | | | | WR Berkley Corp. | | 623,822 | |
3,820 | | | | Zenith National Insurance Corp. | | 176,178 | |
| | | | | | 48,667,504 | |
| | | | Internet: 0.5% | | | |
3,800 | | @,L | | Checkfree Corp. | | 174,420 | |
62,600 | | @,L | | eBay, Inc. | | 2,707,450 | |
16,875 | | @,L | | McAfee, Inc. | | 457,819 | |
6,300 | | @,L | | Secure Computing Corp. | | 77,238 | |
900 | | @,L | | Websense, Inc. | | 59,076 | |
68,000 | | @,L | | Yahoo!, Inc. | | 2,664,240 | |
| | | | | | 6,140,243 | |
| | | | Iron/Steel: 0.3% | | | |
2,100 | | L | | Cleveland-Cliffs, Inc. | | 185,997 | |
56,700 | | | | Nucor Corp. | | 3,783,024 | |
1,000 | | | | Reliance Steel & Aluminum Co. | | 61,120 | |
| | | | | | 4,030,141 | |
| | | | Leisure Time: 0.4% | | | |
24,350 | | L | | Carnival Corp. | | 1,301,995 | |
75,200 | | L | | Harley-Davidson, Inc. | | 3,872,048 | |
4,365 | | @,L | | Multimedia Games, Inc. | | 40,376 | |
1,450 | | L | | Polaris Industries, Inc. | | 72,790 | |
| | | | | | 5,287,209 | |
| | | | Lodging: 0.0% | | | |
1 | | | | Harrah’s Entertainment, Inc. | | 71 | |
| | | | | | 71 | |
See Accompanying Notes to Financial Statements
61
ING VP BALANCED PORTFOLIO | | PORTFOLIO OF INVESTMENTS
AS OF DECEMBER 31, 2005 (CONTINUED) |
Shares | | | | | | Value | |
| | | | Machinery-Construction & Mining: 0.0% | | | |
4,500 | | L | | JLG Industries, Inc. | | $ | 205,470 | |
5,700 | | | | Joy Global, Inc. | | 228,000 | |
| | | | | | 433,470 | |
| | | | Machinery-Diversified: 0.1% | | | |
3,435 | | L | | Applied Industrial Technologies, Inc. | | 115,725 | |
1,800 | | L | | Briggs & Stratton Corp. | | 69,822 | |
5,100 | | L | | Cognex Corp. | | 153,459 | |
1,789 | | | | IDEX Corp. | | 73,546 | |
7,300 | | | | Nordson Corp. | | 295,723 | |
| | | | | | 708,275 | |
| | | | Media: 1.5% | | | |
129,600 | | @,L | | Comcast Corp. | | 3,364,416 | |
88,100 | | | | McGraw-Hill Cos, Inc. | | 4,548,603 | |
145,900 | | L | | News Corp., Inc. | | 2,268,745 | |
279,450 | | | | Time Warner, Inc. | | 4,873,608 | |
94,800 | | | | Viacom, Inc. | | 3,090,480 | |
230 | | L | | Washington Post | | 175,950 | |
| | | | | | 18,321,802 | |
| | | | Metal Fabricate/Hardware: 0.1% | | | |
1,700 | | L | | AM Castle & Co. | | 37,128 | |
5,380 | | | | Commercial Metals Co. | | 201,965 | |
3,900 | | L | | Kaydon Corp. | | 125,346 | |
14,150 | | | | Precision Castparts Corp. | | 733,112 | |
2,991 | | L | | Quanex Corp. | | 149,460 | |
2,800 | | | | Valmont Industries, Inc. | | 93,688 | |
| | | | | | 1,340,699 | |
| | | | Mining: 0.3% | | | |
64,400 | | L | | Freeport-McMoRan Copper & Gold, Inc. | | 3,464,720 | |
| | | | | | 3,464,720 | |
| | | | Miscellaneous Manufacturing: 2.5% | | | |
105,650 | | | | 3M Co. | | 8,187,875 | |
5,000 | | L | | Acuity Brands, Inc. | | 159,000 | |
3,100 | | | | AO Smith Corp. | | 108,810 | |
3,472 | | | | Aptargroup, Inc. | | 181,238 | |
3,500 | | @ | | EnPro Industries, Inc. | | 94,325 | |
627,300 | | | | General Electric Co. | | 21,986,865 | |
2,920 | | | | Roper Industries, Inc. | | 115,369 | |
6,367 | | | | Teleflex, Inc. | | 413,728 | |
| | | | | | 31,247,210 | |
| | | | Office Furnishings: 0.0% | | | |
11,902 | | | | Herman Miller, Inc. | | 335,517 | |
| | | | | | 335,517 | |
| | | | Oil & Gas: 6.0% | | | |
66,900 | | L | | Burlington Resources, Inc. | | 5,766,780 | |
133,286 | | L | | ChevronTexaco Corp. | | 7,566,646 | |
6,860 | | L | | Cimarex Energy Co. | | 295,049 | |
170,600 | | L | | ConocoPhillips | | 9,925,508 | |
86,150 | | L | | Devon Energy Corp. | | 5,387,821 | |
57,300 | | | | EOG Resources, Inc. | | 4,204,101 | |
526,650 | | | | Exxon Mobil Corp. | | 29,582,013 | |
5,500 | | | | Frontier Oil Corp. | | 206,415 | |
7,500 | | | | Helmerich & Payne, Inc. | | 464,325 | |
18,300 | | | | Noble Energy, Inc. | | 737,490 | |
3,070 | | @ | | Petroleum Development Corp. | | $ | 102,354 | |
8,800 | | | | Pogo Producing Co. | | 438,328 | |
19,100 | | @ | | Pride International, Inc. | | 587,325 | |
40,400 | | L | | Sunoco, Inc. | | 3,166,552 | |
3,550 | | @,L | | Swift Energy Co. | | 159,999 | |
111,700 | | L | | Valero Energy Corp. | | 5,763,720 | |
4,800 | | | | Vintage Petroleum, Inc. | | 255,984 | |
| | | | | | 74,610,410 | |
| | | | Oil & Gas Services: 0.4% | | | |
300 | | @ | | Cal Dive International, Inc. | | 10,767 | |
13,800 | | @,L | | Cooper Cameron Corp. | | 571,320 | |
34,800 | | L | | Schlumberger Ltd. | | 3,380,820 | |
9,200 | | L | | Tidewater, Inc. | | 409,032 | |
4,400 | | @,L | | Veritas DGC, Inc. | | 156,156 | |
�� | | | | | | 4,528,095 | |
| | | | Pharmaceuticals: 2.8% | | | |
93,200 | | | | Abbott Laboratories | | 3,674,876 | |
4,900 | | | | Alpharma, Inc. | | 139,699 | |
62,200 | | L | | AmerisourceBergen Corp. | | 2,575,080 | |
11,450 | | @ | | Barr Pharmaceuticals, Inc. | | 713,221 | |
42,500 | | @,L | | Express Scripts, Inc. | | 3,561,500 | |
45,300 | | @ | | Hospira, Inc. | | 1,937,934 | |
10,100 | | @ | | IVAX Corp. | | 316,433 | |
70,300 | | @ | | King Pharmaceuticals, Inc. | | 1,189,476 | |
1,900 | | | | Medicis Pharmaceutical | | 60,895 | |
301,900 | | | | Merck & Co., Inc. | | 9,603,439 | |
5,600 | | L | | Omnicare, Inc. | | 320,432 | |
436,150 | | | | Pfizer, Inc. | | 10,171,018 | |
5,600 | | @ | | Theragenics Corp. | | 16,912 | |
1,500 | | @,L | | USANA Health Sciences, Inc. | | 57,540 | |
| | | | | | 34,338,455 | |
| | | | Pipelines: 0.1% | | | |
9,400 | | | | Equitable Resources, Inc. | | 344,886 | |
14,750 | | | | Questar Corp. | | 1,116,575 | |
| | | | | | 1,461,461 | |
| | | | Real Estate Investment Trust: 0.1% | | | |
1,500 | | L | | Colonial Properties Trust | | 62,970 | |
5,350 | | | | Developers Diversified Realty Corp. | | 251,557 | |
3,300 | | | | Entertainment Properties Trust | | 134,475 | |
780 | | | | Essex Property Trust, Inc. | | 71,916 | |
200 | | | | Kilroy Realty Corp. | | 12,380 | |
1,910 | | | | New Century Financial Corp. | | 68,894 | |
11,700 | | | | Weingarten Realty Investors | | 442,377 | |
| | | | | | 1,044,569 | |
| | | | Retail: 4.3% | | | |
4,150 | | L | | Abercrombie & Fitch Co. | | 270,497 | |
5,250 | | @,L | | Advance Auto Parts | | 228,165 | |
19,370 | | L | | American Eagle Outfitters | | 445,123 | |
8,890 | | L | | Barnes & Noble, Inc. | | 379,336 | |
92,425 | | | | Best Buy Co., Inc. | | 4,018,639 | |
2,500 | | L | | Burlington Coat Factory Warehouse Corp. | | 100,525 | |
5,083 | | | | Casey’s General Stores, Inc. | | 126,058 | |
4,784 | | L | | Cato Corp. | | 102,617 | |
4,000 | | @,L | | CEC Entertainment, Inc. | | 136,160 | |
17,800 | | @,L | | Chico’s FAS, Inc. | | 781,954 | |
See Accompanying Notes to Financial Statements
62
ING VP BALANCED PORTFOLIO | | PORTFOLIO OF INVESTMENTS
AS OF DECEMBER 31, 2005 (CONTINUED) |
Shares | | | | | | Value | |
| | | | Retail (continued) | | | |
2,577 | | @,L | | Childrens Place | | $ | 127,355 | |
15,060 | | | | Claire’s Stores, Inc. | | 440,053 | |
37,950 | | | | Darden Restaurants, Inc. | | 1,475,496 | |
3,000 | | @ | | Dress Barn, Inc. | | 115,830 | |
171,400 | | | | Gap, Inc. | | 3,023,496 | |
3,000 | | @,L | | Genesco, Inc. | | 116,370 | |
900 | | @,L | | Guitar Center, Inc. | | 45,009 | |
4,352 | | @,L | | Hibbett Sporting Goods, Inc. | | 123,945 | |
125,500 | | | | Home Depot, Inc. | | 5,080,240 | |
2,400 | | L | | IHOP Corp. | | 112,584 | |
68,750 | | | | JC Penney Co., Inc. | | 3,822,500 | |
2,700 | | L | | Landry’s Restaurants, Inc. | | 72,117 | |
2,800 | | | | Longs Drug Stores Corp. | | 101,892 | |
44,100 | | | | Lowe’s Cos., Inc. | | 2,939,706 | |
200,500 | | | | McDonald’s Corp. | | 6,760,860 | |
5,100 | | @,L | | Men’s Wearhouse, Inc. | | 150,144 | |
6,440 | | | | Michaels Stores, Inc. | | 227,783 | |
67,000 | | L | | Nordstrom, Inc. | | 2,505,800 | |
15,200 | | @ | | O’Reilly Automotive, Inc. | | 486,552 | |
14,000 | | @ | | Pacific Sunwear of California | | 348,880 | |
2,780 | | @,L | | Panera Bread Co. | | 182,590 | |
1,667 | | @,L | | Papa John’s Intl., Inc. | | 98,870 | |
13,175 | | @,L | | Payless Shoesource, Inc. | | 330,693 | |
800 | | @ | | PF Chang’s China Bistro, Inc. | | 39,704 | |
6,800 | | | | Ross Stores, Inc. | | 196,520 | |
4,305 | | @,L | | Select Comfort Corp. | | 117,742 | |
4,385 | | L | | Sonic Automotive, Inc. | | 97,698 | |
1,840 | | @ | | Sonic Corp. | | 54,280 | |
174,500 | | | | Staples, Inc. | | 3,962,895 | |
45,800 | | @ | | Starbucks Corp. | | 1,374,458 | |
52,100 | | | | Target Corp. | | 2,863,937 | |
4,110 | | @ | | Too, Inc. | | 115,943 | |
1,200 | | @,L | | Tractor Supply Co. | | 63,528 | |
147,750 | | | | Wal-Mart Stores, Inc. | | 6,914,700 | |
33,400 | | L | | Wendy’s Intl., Inc. | | 1,845,684 | |
5,500 | | @,L | | Williams-Sonoma, Inc. | | 237,325 | |
| | | | | | 53,162,253 | |
| | | | Savings & Loans: 0.0% | | | |
4,000 | | @ | | Franklin Bank Corp. | | 71,960 | |
| | | | | | 71,960 | |
| | | | Semiconductors: 2.4% | | | |
4,165 | | @,L | | DSP Group, Inc. | | 104,375 | |
115,000 | | @ | | Freescale Semiconductor, Inc. | | 2,894,550 | |
592,150 | | | | Intel Corp. | | 14,780,064 | |
13,300 | | @,L | | Lam Research Corp. | | 474,544 | |
13,900 | | @,L | | Micrel, Inc. | | 161,240 | |
18,110 | | L | | Microchip Technology, Inc. | | 582,237 | |
2,100 | | L | | Microsemi Corp. | | 58,086 | |
103,000 | | L | | National Semiconductor Corp. | | 2,675,940 | |
7,100 | | @ | | Silicon Laboratories, Inc. | | 260,286 | |
1,973 | | @ | | Supertex, Inc. | | 87,305 | |
232,450 | | | | Texas Instruments, Inc. | | 7,454,672 | |
29,553 | | @ | | Triquint Semiconductor, Inc. | | 131,511 | |
1,380 | | @,L | | Varian Semiconductor Equipment Associates, Inc. | | 60,623 | |
| | | | | | 29,725,433 | |
| | | | Software: 2.6% | | | |
3,116 | | @,L | | Advent Software, Inc. | | 90,084 | |
3,500 | | @,L | | Ansys, Inc. | | 149,415 | |
65,500 | | L | | Autodesk, Inc. | | $ | 2,813,225 | |
109,300 | | | | Automatic Data Processing, Inc. | | 5,015,777 | |
65,400 | | @,L | | BMC Software, Inc. | | 1,340,046 | |
1,080 | | @,L | | Cerner Corp. | | 98,183 | |
49,500 | | @,L | | Citrix Systems, Inc. | | 1,424,610 | |
107,150 | | @ | | Compuware Corp. | | 961,136 | |
8,429 | | @ | | D&B Corp. | | 564,406 | |
5,204 | | @ | | Filenet Corp. | | 134,523 | |
5,360 | | | | Global Payments, Inc. | | 249,830 | |
5,572 | | @ | | Hyperion Solutions Corp. | | 199,589 | |
54,300 | | @,L | | Intuit, Inc. | | 2,894,190 | |
532,750 | | | | Microsoft Corp. | | 13,931,413 | |
4,069 | | @ | | MRO Software, Inc. | | 57,129 | |
104,200 | | @ | | Novell, Inc. | | 920,086 | |
59,100 | | @ | | Parametric Technology Corp. | | 360,510 | |
1,300 | | @,L | | Quality Systems, Inc. | | 99,788 | |
4,763 | | @ | | Serena Software, Inc. | | 111,645 | |
2,773 | | @ | | SPSS, Inc. | | 85,769 | |
13,400 | | @ | | Sybase, Inc. | | 292,924 | |
7,100 | | @,L | | Transaction Systems Architects, Inc. | | 204,409 | |
| | | | | | 31,998,687 | |
| | | | Telecommunications: 3.5% | | | |
730,600 | | | | AT&T, Inc. | | 17,892,394 | |
707,050 | | @ | | Cisco Systems, Inc. | | 12,104,696 | |
4,725 | | L | | Commonwealth Telephone Enterprises, Inc. | | 159,563 | |
12,383 | | L | | Harris Corp. | | 532,593 | |
3,100 | | @,L | | Intrado, Inc. | | 71,362 | |
341,850 | | | | Motorola, Inc. | | 7,722,392 | |
96,000 | | | | Qualcomm, Inc. | | 4,135,680 | |
6,775 | | L | | Telephone & Data Systems, Inc. | | 244,103 | |
2,300 | | @ | | Tollgrade Communications, Inc. | | 25,139 | |
| | | | | | 42,887,922 | |
| | | | Toys/Games/Hobbies: 0.1% | | | |
53,247 | | L | | Hasbro, Inc. | | 1,074,524 | |
4,297 | | @,L | | Jakks Pacific, Inc. | | 89,979 | |
| | | | | | 1,164,503 | |
| | | | Transportation: 1.1% | | | |
3,200 | | L | | Arkansas Best Corp. | | 139,776 | |
7,950 | | L | | CH Robinson Worldwide, Inc. | | 294,389 | |
64,200 | | | | CSX Corp. | | 3,259,434 | |
5,127 | | | | Landstar System, Inc. | | 214,001 | |
95,875 | | | | Norfolk Southern Corp. | | 4,298,076 | |
6,105 | | L | | Overseas Shipholding Group | | 307,631 | |
62,400 | | L | | United Parcel Service, Inc. | | 4,689,360 | |
| | | | | | 13,202,667 | |
| | | | Trucking & Leasing: 0.0% | | | |
9,202 | | L | | GATX Corp. | | 332,008 | |
| | | | | | 332,008 | |
| | | | Total Common Stock
(Cost $725,488,844) | | 778,354,287 | |
PREFERRED STOCK: 0.7% | | | |
| | | | Banks: 0.2% | | | |
186 | | | | DG Funding Trust | | 1,982,063 | |
| | | | | | 1,982,063 | |
See Accompanying Notes to Financial Statements
63
ING VP BALANCED PORTFOLIO | | PORTFOLIO OF INVESTMENTS
AS OF DECEMBER 31, 2005 (CONTINUED) |
Shares | | | | | | Value | |
| | | | Diversified Financial Services: 0.1% | | | |
59,000 | | C | | Merrill Lynch & Co., Inc. | | $ | 1,504,500 | |
17,125 | | C | | National Rural Utilities Cooperative Finance Corp. | | 404,150 | |
| | | | | | 1,908,650 | |
| | | | Insurance: 0.3% | | | |
22,000 | | @@ | | Aegon NV | | 548,900 | |
60,178 | | @@ | | Aegon NV | | 1,520,096 | |
59,875 | | C | | Metlife, Inc. | | 1,551,960 | |
| | | | | | 3,620,956 | |
| | | | Telecommunications: 0.1% | | | |
604 | | @@,# | | Centaur Funding Corp. | | 782,558 | |
| | | | | | 782,558 | |
| | | | Total Preferred Stock | | | |
| | | | (Cost $8,275,535) | | 8,294,227 | |
WARRANTS: 0.0% | | | | | |
| | | | Aerospace/Defense: 0.0% | | | |
2,978 | | | | Timco Aviation Services, 0.000%, due 12/31/07 | | 89 | |
| | | | Total Warrant
(Cost $0) | | 89 | |
| | | | | | | | |
Principal
Amount | | | | | | Value | |
CORPORATE BONDS/NOTES: 8.8% | | | |
| | | |
| | | | Aerospace/Defense: 0.1% | | | |
$ 740,000 | | | | Northrop Grumman Corp., 7.000%, due 03/01/06 | | 742,571 | |
490,000 | | | | Northrop Grumman Space & Mission Systems Corp., 7.625%, due 03/15/06 | | 491,744 | |
| | | | | | 1,234,315 | |
| | | | Airlines: 0.0% | | | |
253,075 | | **,L | | United Airlines, Inc., 6.602%, due 09/01/13 | | 250,039 | |
| | | | | | 250,039 | |
| | | | Banks: 1.8% | | | |
1,460,000 | | @@,L | | Australia & New Zealand Banking Group Ltd., 4.588%, due 10/29/49 | | 1,250,693 | |
671,034 | | @@,# | | Banco Itau SA/Cayman Islands, 4.320%, due 09/20/08 | | 666,807 | |
903,000 | | @@,#,S | | Banco Santander Chile SA, 4.810%, due 12/09/09 | | 900,836 | |
820,000 | | @@,S | | Banco Santander Chile SA, 7.375%, due 07/18/12 | | 914,089 | |
480,000 | | @@ | | Bank of Ireland, 4.750%, due 12/29/49 | | 416,581 | |
520,000 | | @@ | | Bank of Nova Scotia, 4.250%, due 08/21/85 | | 440,114 | |
220,000 | | @@ | | Bank of Scotland, 3.750%, due 11/30/49 | | 190,300 | |
94,000 | | | | BankAmerica Capital II, 8.000%, due 12/15/26 | | 99,859 | |
$ 446,000 | | @@,S | | Barclays Bank PLC, 6.278%, due 12/15/49 | | $ | 449,073 | |
817,000 | | @@,# | | Chuo Mitsui Trust & Banking Co., Ltd./The, 5.506%, due 04/15/49 | | 793,097 | |
404,000 | | @@,# | | Danske Bank A/S, 5.914%, due 12/29/49 | | 423,391 | |
730,000 | | @@ | | Den Norske Bank ASA, 4.186%, due 08/29/49 | | 615,025 | |
694,000 | | #,S | | Dresdner Funding Trust I, 8.151%, due 06/30/31 | | 855,826 | |
351,000 | | # | | First Chicago NBD Institutional Capital A, 7.950%, due 12/01/26 | | 371,494 | |
540,000 | | @@,S | | First Citizens St Lucia Ltd., 5.460%, due 02/01/12 | | 537,531 | |
1,000 | | S | | Fleet Capital Trust II, 7.920%, due 12/11/26 | | 1,061 | |
1,551,000 | | @@,# | | HBOS PLC, 5.375%, due 11/29/49 | | 1,550,474 | |
1,280,000 | | @@ | | HSBC Bank PLC, 4.788%, due 06/29/49 | | 1,075,200 | |
692,000 | | | | Huntington Capital Trust I, 4.943%, due 02/01/27 | | 658,640 | |
700,000 | | @@ | | Lloyds TSB Bank PLC, 4.160%, due 08/29/49 | | 609,085 | |
701,000 | | S | | M&T Bank Corp., 3.850%, due 04/01/13 | | 685,211 | |
474,000 | | S | | Mellon Capital I, 7.720%, due 12/01/26 | | 502,196 | |
455,000 | | @@,L | | Mizuho Financial Group Cayman Ltd., 8.375%, due 12/31/49 | | 493,279 | |
490,000 | | @@ | | National Australia Bank Ltd., 4.525%, due 10/29/49 | | 418,310 | |
595,000 | | S | | PNC Funding Corp., 4.500%, due 03/10/10 | | 584,192 | |
368,000 | | # | | Rabobank Capital Funding Trust, 5.254%, due 12/29/49 | | 361,568 | |
5,000 | | @@,#,L | | Resona Bank Ltd., 5.850%, due 09/01/49 | | 4,988 | |
1,500,000 | | @@ | | Royal Bank of Scotland Group PLC, 4.875%, due 12/29/49 | | 1,305,869 | |
500,000 | | @@ | | Societe Generale, 4.656%, due 11/29/49 | | 428,799 | |
1,040,000 | | @@ | | Standard Chartered PLC, 4.813%, due 07/29/49 | | 834,600 | |
2,260,000 | | @@,L | | Standard Chartered PLC, 4.875%, due 11/29/49 | | 1,808,000 | |
732,000 | | @@ | | Sumitomo Mitsui Banking Corp., 8.150%, due 08/01/49 | | 776,877 | |
116,000 | | | | Wachovia Corp., 5.500%, due 08/01/35 | | 113,426 | |
650,000 | | @@ | | Westpac Banking Corp., 4.369%, due 09/30/49 | | 546,517 | |
| | | | | | 21,683,008 | |
| | | | Beverages: 0.1% | | | |
814,000 | | @@,S | | Cia Brasileira de Bebidas, 8.750%, due 09/15/13 | | 955,433 | |
| | | | | | 955,433 | |
| | | | | | | | |
See Accompanying Notes to Financial Statements
64
| PORTFOLIO OF INVESTMENTS |
ING VP BALANCED PORTFOLIO | AS OF DECEMBER 31, 2005 (CONTINUED) |
Principal
Amount | | | | Value | |
| | Building Materials: 0.1% | | | |
$ | 830,000 | | Masco Corp., 6.750%, due 03/15/06 | | $ | 832,971 | |
| | | | 832,971 | |
| | Chemicals: 0.2% | | | |
183,000 | @@,#,S | Sociedad Quimica y Minera de Chile SA, 7.700%, due 09/15/06 | | 185,922 | |
200,000 | | Stauffer Chemical, 5.250%, due 04/15/10 | | 160,602 | |
440,000 | | Stauffer Chemical, 7.540%, due 04/15/17 | | 236,095 | |
1,321,000 | | Union Carbide Corp., 7.750%, due 10/01/96 | | 1,419,117 | |
| | | | 2,001,736 | |
| | Commercial Services: 0.1% | | | |
1,700,000 | | Tulane University of Louisiana, 5.168%, due 11/15/12 | | 1,705,950 | |
| | | | 1,705,950 | |
| | Diversified Financial Services: 2.9% | | | |
552,000 | @@,#,I,S | Alpine III, 10.340%, due 08/16/14 | | 567,706 | |
215,000 | @@,#,I,S | Alpine III, 4.882%, due 08/16/14 | | 215,579 | |
215,000 | @@,#,I,S | Alpine III, 5.290%, due 08/16/14 | | 215,584 | |
323,000 | @@,#,I,S | Alpine III, 7.090%, due 08/16/14 | | 324,587 | |
247,831 | @@,#,S | Arcel Finance Ltd., 5.984%, due 02/01/09 | | 250,743 | |
429,000 | @@,#,S | Arcel Finance Ltd., 6.361%, due 05/01/12 | | 422,731 | |
440,510 | @@,#,S | Arcel Finance Ltd., 7.048%, due 09/01/11 | | 472,244 | |
360,000 | # | Army Hawaii Family Housing Trust Certificates, 5.524%, due 06/15/50 | | 371,354 | |
260,000 | # | Army Hawaii Family Housing Trust Certificates, 5.624%, due 06/15/50 | | 268,512 | |
1,371,316 | #,S | Astoria Depositor Corp., 7.902%, due 05/01/21 | | 1,406,223 | |
2,263,000 | #,S | Astoria Depositor Corp., 8.144%, due 05/01/21 | | 2,349,118 | |
987,993 | @@,#,S | Brazilian Merchant Voucher Receivables Ltd., 5.911%, due 06/15/11 | | 991,698 | |
1,125,000 | @@,# | BTM Curacao Holdings NV, 4.760%, due 07/21/15 | | 1,104,631 | |
703,000 | S | Citigroup Capital II, 7.750%, due 12/01/36 | | 739,788 | |
1,116,000 | #,S | Corestates Capital Trust I, 8.000%, due 12/15/26 | | 1,183,338 | |
2,960,000 | | Countrywide Financial Corp., 4.720%, due 04/11/07 | | 2,962,951 | |
635,000 | @@ | Financiere CSFB NV, 4.688%, due 03/29/49 | | 530,225 | |
679,000 | | Fund American Cos, Inc., 5.875%, due 05/15/13 | | 686,168 | |
$ | 1,762,000 | | General Motors Acceptance Corp., 7.000%, due 02/01/12 | | $ | 1,599,912 | |
1,323,000 | | General Motors Acceptance Corp., 8.000%, due 11/01/31 | | 1,270,634 | |
625,000 | L,S | Goldman Sachs Group, Inc., 4.620%, due 03/02/10 | | 625,721 | |
702,000 | #,S | HVB Funding Trust III, 9.000%, due 10/22/31 | | 949,775 | |
345,000 | | International Lease Finance Corp., 5.000%, due 04/15/10 | | 343,479 | |
560,000 | S | JPM Capital Trust I, 7.540%, due 01/15/27 | | 591,526 | |
621,000 | S | JPM Capital Trust II, 7.950%, due 02/01/27 | | 661,769 | |
1,362,000 | #,S | Mangrove Bay Pass-Through Trust, 6.102%, due 07/15/33 | | 1,356,094 | |
749,000 | @@,#,S | Mantis Reef Ltd., 4.799%, due 11/03/09 | | 734,527 | |
1,960,000 | | Morgan Stanley, 4.465%, due 02/15/07 | | 1,962,560 | |
984,000 | @@ | Paribas, 4.625%, due 12/31/49 | | 850,527 | |
441,000 | @@,S | Petroleum Export Ltd., 4.623%, due 06/15/10 | | 437,090 | |
635,000 | @@,#,S | Petroleum Export Ltd/ Cayman SPV, 5.265%, due 06/15/11 | | 629,702 | |
1,305,489 | @@,#,S | PF Export Receivables Master Trust, 6.436%, due 06/01/15 | | 1,304,294 | |
1,338,000 | # | Piper Jaffray Equipment Trust Securities, 7.000%, due 09/10/13 | | 1,251,030 | |
283,000 | | Residential Capital Corp., 6.375%, due 06/30/10 | | 287,838 | |
277,000 | L | Residential Capital Corp., 6.875%, due 06/30/15 | | 294,851 | |
JPY | 500,000,000 | @@ | Takefuji Corp., 1.000%, due 03/01/34 | | 2,249,428 | |
$ | 4,600,000 | # | Toll Road Investment, 18.110%, due 02/15/45 | | 561,784 | |
574,000 | # | Twin Reefs Pass-Through Trust, 5.420%, due 12/10/49 | | 574,614 | |
755,000 | @@,L | UFJ Finance Aruba AEC, 8.750%, due 12/31/49 | | 820,559 | |
459,000 | # | Wachovia Capital Trust V, 7.965%, due 06/01/27 | | 492,134 | |
1,330,000 | #,L | ZFS Finance USA Trust I, 6.450%, due 12/15/65 | | 1,351,033 | |
| | | | 36,264,061 | |
| | Electric: 0.9% | | | |
959,445 | S | CE Generation LLC, 7.416%, due 12/15/18 | | 1,031,950 | |
955,000 | S | Consumers Energy Co., 4.250%, due 04/15/08 | | 935,843 | |
1,277,000 | @@,L,S | Empresa Nacional de Electricidad SA, 8.625%, due 08/01/15 | | 1,498,364 | |
| | | | | | | | |
See Accompanying Notes to Financial Statements
65
| | PORTFOLIO OF INVESTMENTS |
ING VP BALANCED PORTFOLIO | | AS OF DECEMBER 31, 2005 (CONTINUED) |
Principal
Amount | | | | Value | |
| | Electric (continued) | | | |
$ | 871,000 | S | Entergy Gulf States, Inc., 5.120%, due 08/01/10 | | $ | 850,490 | |
775,000 | S | Enterprise Capital Trust II, 5.747%, due 06/30/28 | | 769,181 | |
647,000 | L | FirstEnergy Corp., 6.450%, due 11/15/11 | | 686,655 | |
1,115,000 | | FirstEnergy Corp., 7.375%, due 11/15/31 | | 1,319,804 | |
709,990 | # | Juniper Generation, 6.790%, due 12/31/14 | | 692,844 | |
557,000 | @@,+ | Korea Electric Power Corp., 0.560%, due 04/01/96 | | 336,985 | |
658,000 | #,L | Mirant North America LLC, 7.375%, due 12/31/13 | | 668,693 | |
727,000 | | NorthWestern Corp., 5.875%, due 11/01/14 | | 732,002 | |
594,000 | S | Potomac Edison Co., 5.000%, due 11/01/06 | | 594,921 | |
362,000 | #,S | Power Contract Financing LLC, 6.256%, due 02/01/10 | | 367,529 | |
144,076 | S | PPL Montana LLC, 8.903%, due 07/02/20 | | 166,188 | |
191,000 | S | Sierra Pacific Power Co., 6.250%, due 04/15/12 | | 194,820 | |
251,121 | # | Tenaska Virginia Partners LP, 6.119%, due 03/30/24 | | 261,106 | |
| | | | 11,107,375 | |
| | Food: 0.1% | | | |
218,000 | S | Delhaize America, Inc., 8.050%, due 04/15/27 | | 224,756 | |
278,000 | S | Delhaize America, Inc., 8.125%, due 04/15/11 | | 304,429 | |
1,003,000 | S | Tyson Foods, Inc., 7.250%, due 10/01/06 | | 1,019,244 | |
| | | | 1,548,429 | |
| | Foreign Government Bonds: 0.2% | | | |
3,000,000 | @@ | KAUP BANK, 6.600%, due 12/28/15 | | 3,015,000 | |
| | | | 3,015,000 | |
| | Forest Products & Paper: 0.0% | | | |
514,000 | | Georgia-Pacific Corp., 7.250%, due 06/01/28 | | 458,103 | |
| | | | 458,103 | |
| | Gas: 0.1% | | | |
1,289,000 | #,S | Williams Gas Pipelines Central, Inc., 7.375%, due 11/15/06 | | 1,320,601 | |
| | | | 1,320,601 | |
| | Home Builders: 0.0% | | | |
50,000 | S | Technical Olympic USA, Inc., 9.000%, due 07/01/10 | | 50,813 | |
| | | | 50,813 | |
| | Insurance: 0.3% | | | |
899,000 | L,S | AON Capital Trust, 8.205%, due 01/01/27 | | 1,070,772 | |
368,000 | # | North Front Pass - Thru, 5.810%, due 12/15/24 | | 368,977 | |
$ | 462,000 | + | Prudential Financial, Inc., 4.104%, due 11/15/06 | | $ | 459,062 | |
1,568,000 | # | Zurich Capital Trust I, 8.376%, due 06/01/37 | | 1,697,547 | |
| | | | 3,596,358 | |
| | Media: 0.2% | | | |
555,000 | L | Comcast Corp., 5.650%, due 06/15/35 | | 512,424 | |
497,000 | S | Cox Communications, Inc., 6.850%, due 01/15/18 | | 522,584 | |
1,439,000 | # | News America, Inc., 6.400%, due 12/15/35 | | 1,455,262 | |
| | | | 2,490,270 | |
| | Mining: 0.1% | | | |
616,000 | @@ | Vale Overseas Ltd., 8.250%, due 01/17/34 | | 712,250 | |
| | | | 712,250 | |
| | Multi-National: 0.0% | | | |
483,000 | @@,S | Corp Andina de Fomento, 5.125%, due 05/05/15 | | 476,594 | |
| | | | 476,594 | |
| | Oil & Gas: 0.4% | | | |
498,000 | S | Amerada Hess Corp., 6.650%, due 08/15/11 | | 535,755 | |
490,000 | @@,#,S | Empresa Nacional de Petroleo ENAP, 4.875%, due 03/15/14 | | 471,038 | |
397,000 | @@,#,S | Empresa Nacional de Petroleo ENAP, 6.750%, due 11/15/12 | | 428,157 | |
557,000 | @@ | Husky Oil Co., 8.900%, due 08/15/28 | | 600,216 | |
249,000 | #,L | Pemex Project Funding Master Trust, 5.750%, due 12/15/15 | | 248,066 | |
988,000 | #,S | Pemex Project Funding Master Trust, 5.791%, due 06/15/10 | | 1,025,050 | |
809,000 | @@,#,S | Ras Laffan Liquefied Natural Gas Co. Ltd. II, 5.298%, due 09/30/20 | | 804,360 | |
430,000 | @@,# | Ras Laffan LNG III, 5.838%, due 09/30/27 | | 432,700 | |
682,000 | @@,#,S | Tengizchevroil, 6.124%, due 11/15/14 | | 697,004 | |
| | | | 5,242,346 | |
| | Pharmaceuticals: 0.1% | | | |
750,000 | S | AmerisourceBergen Corp., 5.625%, due 09/15/12 | | 753,750 | |
238,000 | #,S | AmerisourceBergen Corp., 5.875%, due 09/15/15 | | 241,273 | |
| | | | 995,023 | |
| | Pipelines: 0.2% | | | |
2,051,000 | # | Cameron Highway Oil Pipeline, 5.860%, due 12/15/17 | | 2,071,510 | |
861,000 | # | Kinder Morgan Finance Co. ULC, 5.350%, due 01/05/11 | | 863,169 | |
| | | | 2,934,679 | |
See Accompanying Notes to Financial Statements
66
| | PORTFOLIO OF INVESTMENTS |
ING VP BALANCED PORTFOLIO | | AS OF DECEMBER 31, 2005 (CONTINUED) |
Principal
Amount | | | | Value | |
| | Real Estate: 0.1% | | | |
$ | 677,000 | L,S | EOP Operating LP, 7.750%, due 11/15/07 | | $ | 709,480 | |
| | | | 709,480 | |
| | Real Estate Investment Trust: 0.2% | | | |
127,000 | S | Liberty Property LP, 6.375%, due 08/15/12 | | 134,059 | |
646,000 | S | Liberty Property LP, 7.750%, due 04/15/09 | | 694,809 | |
572,000 | S | Simon Property Group LP, 4.875%, due 03/18/10 | | 565,115 | |
894,000 | S | Simon Property Group LP, 6.375%, due 11/15/07 | | 913,926 | |
| | | | 2,307,909 | |
| | Retail: 0.1% | | | |
765,000 | S | May Department Stores Co., 3.950%, due 07/15/07 | | 752,516 | |
| | | | 752,516 | |
| | Savings & Loans: 0.0% | | | |
507,000 | S | Great Western Financial, 8.206%, due 02/01/27 | | 541,547 | |
| | | | 541,547 | |
| | Telecommunications: 0.3% | | | |
543,000 | S | AT&T Corp., 9.750%, due 11/15/31 | | 684,098 | |
628,000 | S | BellSouth Corp., 4.200%, due 09/15/09 | | 610,544 | |
466,000 | @@,S | Deutsche Telekom International Finance BV, 8.000%, due 06/15/10 | | 528,832 | |
204,000 | | New Cingular Wireless Services, Inc., 8.125%, due 05/01/12 | | 236,005 | |
336,000 | +,S | Sprint Capital Corp., 4.780%, due 08/17/06 | | 335,781 | |
487,000 | @@,S | Telefonos de Mexico SA de CV, 4.750%, due 01/27/10 | | 480,864 | |
831,000 | L | Verizon Global Funding Corp., 5.850%, due 09/15/35 | | 803,569 | |
| | | | 3,679,693 | |
| | Transportation: 0.2% | | | |
1,523,000 | L | BNSF Funding Trust I, 6.613%, due 12/15/55 | | 1,591,428 | |
496,000 | @@,#,S | MISC Capital Ltd., 5.000%, due 07/01/09 | | 494,476 | |
| | | | 2,085,905 | |
| | Total Corporate Bonds/Notes
(Cost $109,291,466) | | 108,952,404 | |
| | | | | |
U.S. GOVERNMENT AGENCY OBLIGATIONS: 10.4% | | | |
| | | |
| | Federal Home Loan Bank: 0.5% | | | |
4,335,000 | L,S | 3.250%, due 12/17/07 | | 4,219,008 | |
2,155,000 | L | 4.125%, due 10/19/07 | | 2,133,536 | |
| | | | 6,352,544 | |
| | Federal Home Loan Mortgage Corporation: 3.3% | | | |
$ | 2,136,000 | | 3.875%, due 06/15/08 | | $ | 2,094,897 | |
2,134,000 | | 4.000%, due 08/17/07 | | 2,109,860 | |
4,378,000 | | 4.375%, due 11/16/07 | | 4,350,843 | |
2,047,000 | | 4.500%, due 02/15/20 | | 1,938,642 | |
222,586 | S | 4.500%, due 12/15/16 | | 219,904 | |
4,266,000 | | 4.625%, due 12/19/08 | | 4,258,714 | |
2,387,000 | S | 5.000%, due 04/15/23 | | 2,335,732 | |
937,000 | | 5.000%, due 05/15/20 | | 924,548 | |
2,417,139 | | 5.000%, due 08/15/16 | | 2,400,082 | |
2,761,869 | S | 5.000%, due 08/15/21 | | 2,745,015 | |
427,743 | | 5.038%, due 04/01/35 | | 420,356 | |
1,428,112 | | 5.220%, due 06/01/35 | | 1,413,840 | |
2,362,647 | S | 5.500%, due 11/15/18 | | 2,389,048 | |
410 | | 5.500%, due 05/01/23 | | 411 | |
1,707,000 | W | 5.500%, due 01/01/34 | | 1,691,531 | |
1,628,000 | S | 5.875%, due 03/21/11 | | 1,698,338 | |
8,913,383 | S | 6.000%, due 01/15/29 | | 9,088,853 | |
408,982 | S | 6.500%, due 11/01/28 | | 420,977 | |
| | | | 40,501,591 | |
| | Federal National Mortgage Association: 6.3% | | | |
4,293,000 | | 3.875%, due 07/15/08 | | 4,209,016 | |
1,280,000 | L | 4.250%, due 09/15/07 | | 1,270,068 | |
622,000 | W | 4.500%, due 01/15/19 | | 605,284 | |
128,000 | W | 4.500%, due 11/15/36 | | 120,560 | |
482,080 | | 4.519%, due 04/25/35 | | 482,771 | |
879,049 | | 4.639%, due 08/01/35 | | 860,906 | |
2,403,000 | | 4.750%, due 12/25/42 | | 2,393,084 | |
2,237,230 | | 4.818%, due 08/01/35 | | 2,202,302 | |
5,390,000 | W | 5.000%, due 01/15/20 | | 5,332,731 | |
10,095,000 | W | 5.000%, due 01/15/36 | | 9,782,681 | |
2,086,000 | S | 5.250%, due 08/01/12 | | 2,108,913 | |
5,355,000 | W | 5.500%, due 01/12/36 | | 5,303,121 | |
4,855,000 | W | 5.500%, due 01/15/20 | | 4,885,344 | |
1,719,765 | | 5.500%, due 11/01/32 | | 1,708,194 | |
8,993,929 | | 5.500%, due 11/01/33 | | 8,932,084 | |
4,861,000 | W | 6.000%, due 01/15/34 | | 4,906,572 | |
613,954 | S | 6.000%, due 03/01/17 | | 627,782 | |
305,734 | S | 6.000%, due 04/01/17 | | 312,624 | |
118,083 | S | 6.000%, due 06/01/16 | | 120,744 | |
396,706 | S | 6.000%, due 06/01/17 | | 405,641 | |
586,774 | S | 6.000%, due 07/01/16 | | 599,996 | |
210,428 | S | 6.000%, due 08/01/16 | | 215,170 | |
81,611 | S | 6.000%, due 09/01/17 | | 83,449 | |
149,975 | S | 6.000%, due 10/01/16 | | 153,354 | |
84,044 | S | 6.000%, due 10/01/17 | | 85,937 | |
393,345 | | 6.000%, due 11/01/17 | | 402,208 | |
423,597 | S | 6.000%, due 12/01/17 | | 433,138 | |
404,098 | S | 6.000%, due 12/01/18 | | 413,190 | |
4,879,115 | S | 6.000%, due 07/25/29 | | 4,978,366 | |
2,534,056 | S | 6.000%, due 04/25/31 | | 2,603,047 | |
57,000 | W | 6.000%, due 01/15/36 | | 57,570 | |
2,631,000 | W | 6.500%, due 01/15/35 | | 2,699,243 | |
2,932,908 | | 6.500%, due 04/01/30 | | 3,021,283 | |
1,922,000 | | 6.625%, due 11/15/10 | | 2,079,193 | |
128,923 | | 7.000%, due 01/01/30 | | 134,695 | |
198,067 | | 7.000%, due 03/01/30 | | 206,936 | |
93,505 | | 7.000%, due 01/01/31 | | 97,639 | |
75,091 | | 7.000%, due 01/01/32 | | 78,411 | |
10,322 | | 7.000%, due 04/01/32 | | 10,775 | |
21,842 | | 7.000%, due 05/01/32 | | 22,800 | |
152,898 | | 7.000%, due 06/01/29 | | 159,793 | |
See Accompanying Notes to Financial Statements
67
| | PORTFOLIO OF INVESTMENTS |
ING VP BALANCED PORTFOLIO | | AS OF DECEMBER 31, 2005 (CONTINUED) |
Principal
Amount | | | | Value | |
| | Federal National Mortgage Association (continued) | | | |
$ | 1,504,994 | | 7.000%, due 06/01/31 | | $ | 1,573,481 | |
55,318 | | 7.000%, due 07/01/32 | | 57,745 | |
839 | | 7.000%, due 08/01/29 | | 876 | |
291,216 | | 7.000%, due 08/01/31 | | 304,091 | |
7,787 | | 7.000%, due 10/01/29 | | 8,136 | |
12,381 | | 7.000%, due 10/01/31 | | 12,929 | |
209,417 | | 7.000%, due 11/01/29 | | 218,794 | |
219,091 | | 7.500%, due 10/01/30 | | 229,679 | |
113,093 | | 7.500%, due 11/01/30 | | 118,558 | |
945,034 | | 7.500%, due 01/25/48 | | 985,478 | |
| | | | 78,616,382 | |
| | Government National Mortgage Association: 0.3% | | | |
49,448 | | 4.125%, due 12/20/29 | | 49,217 | |
190,579 | S | 4.375%, due 04/20/28 | | 191,349 | |
215,042 | | 6.500%, due 10/15/31 | | 224,829 | |
631,174 | S | 7.000%, due 09/15/24 | | 664,808 | |
1,050,234 | S | 7.000%, due 10/15/24 | | 1,106,205 | |
185,480 | S | 7.000%, due 11/15/24 | | 195,331 | |
1,692,927 | S | 7.500%, due 12/15/23 | | 1,793,509 | |
| | | | 4,225,248 | |
| | Total U.S. Government Agency Obligations
(Cost $130,606,955) | | 129,695,765 | |
| | | | | |
U.S. TREASURY OBLIGATIONS: 7.8% | | | |
| | | | | |
| | U.S. Treasury Bonds: 3.4% | | | |
3,424,000 | | 4.600%, due 05/15/16 | | 2,147,461 | |
20,339,000 | L | 4.500%, due 11/15/15 | | 20,512,207 | |
6,348,000 | L | 5.375%, due 02/15/31 | | 7,132,575 | |
3,044,000 | L | 6.000%, due 02/15/26 | | 3,590,495 | |
3,595,000 | L | 7.250%, due 05/15/16 | | 4,415,393 | |
3,138,000 | L | 9.250%, due 02/15/16 | | 4,349,685 | |
| | | | 42,147,816 | |
| | U.S. Treasury Notes: 4.4% | | | |
536,000 | L | 4.250%, due 11/30/07 | | 534,597 | |
2,617,000 | L | 4.375%, due 11/15/08 | | 2,618,227 | |
51,284,000 | L | 4.375%, due 12/15/10 | | 51,340,105 | |
| | | | 54,492,929 | |
| | Total U.S. Treasury Obligations
(Cost $96,238,496) | | 96,640,745 | |
| | | | | |
ASSET-BACKED SECURITIES: 2.0% | | | |
| | | | | |
| | Automobile Asset Backed Securities: 0.3% | | | |
127,613 | | Capital Auto Receivables Asset Trust, 2.750%, due 04/16/07 | | 126,858 | |
221,321 | | Household Automotive Trust, 2.310%, due 04/17/08 | | 220,202 | |
1,400,000 | | Nissan Auto Receivables Owner Trust, 2.050%, due 03/16/09 | | 1,367,135 | |
1,500,485 | S | Nissan Auto Receivables Owner Trust, 2.610%, due 07/15/08 | | 1,481,464 | |
| | | | 3,195,659 | |
| | Credit Card Asset Backed Securities: 0.2% | | | |
$ | 285,000 | S | Citibank Credit Card Issuance Trust, 3.100%, due 03/10/10 | | $ | 275,065 | |
775,000 | | Citibank Credit Card Issuance Trust, 5.650%, due 06/16/08 | | 778,383 | |
1,270,000 | | Fleet Credit Card Master Trust II, 2.400%, due 07/15/08 | | 1,269,638 | |
| | | | 2,323,086 | |
| | Home Equity Asset Backed Securities: 0.7% | | | |
1,648,534 | | Bayview Financial Acquisition Trust, 4.879%, due 09/28/43 | | 1,651,004 | |
198,807 | S | GMAC Mortgage Corp. Loan Trust, 4.609%, due 12/25/20 | | 198,956 | |
4,664,000 | | GSAA Trust, 5.242%, due 06/25/34 | | 4,642,224 | |
475,040 | S | Merrill Lynch Mortgage Investors, Inc., 4.739%, due 07/25/34 | | 477,105 | |
507,648 | | New Century Home Equity Loan Trust, 4.629%, due 08/25/34 | | 508,018 | |
762,905 | | QFA Royalties LLC, 7.300%, due 02/20/25 | | 765,080 | |
593,094 | | Saxon Asset Securities Trust, 3.960%, due 06/25/33 | | 591,625 | |
| | | | 8,834,012 | |
| | Other Asset Backed Securities: 0.8% | | | |
328,723 | | Amortizing Residential Collateral Trust, 4.879%, due 05/25/32 | | 329,089 | |
327,590 | | Chase Funding Mortgage Loan, 4.679%, due 07/25/33 | | 328,422 | |
5,095,886 | S | PP&L Transition Bond Co. LLC, 7.050%, due 06/25/09 | | 5,195,715 | |
206,833 | | Residential Asset Mortgage Products, Inc., 4.689%, due 06/25/33 | | 207,266 | |
3,974,709 | + | Structured Asset Securities Corp., 6.000%, due 03/25/34 | | 3,977,495 | |
| | | | 10,037,986 | |
| | Total Asset-Backed Securities
(Cost $24,481,547) | | 24,390,744 | |
| | | | | |
COLLATERALIZED MORTGAGE OBLIGATIONS: 5.5% | | | |
| | | | | |
| | Commercial Mortgage Backed Securities: 1.9% | | | |
1,412,000 | | Bear Stearns Commercial Mortgage Securities, 4.170%, due 01/12/41 | | 1,380,367 | |
2,060,000 | S | Chase Manhattan Bank-First Union National Bank, 7.439%, due 08/15/31 | | 2,212,023 | |
See Accompanying Notes to Financial Statements
68
| | PORTFOLIO OF INVESTMENTS |
ING VP BALANCED PORTFOLIO | | AS OF DECEMBER 31, 2005 (CONTINUED) |
Principal
Amount | | | | Value | |
| | Commercial Mortgage Backed Securities (continued) | | | |
$ | 2,187,000 | | Commercial Mortgage Pass Through Certificates, 3.600%, due 03/10/39 | | $ | 2,102,964 | |
1,199,028 | | CS First Boston Mortgage Securities Corp., 3.727%, due 03/15/35 | | 1,155,095 | |
1,600,000 | S | DLJ Commercial Mortgage Corp., 6.460%, due 03/10/32 | | 1,666,148 | |
1,394,984 | | Ge Capital Commercial Mortgage Corp., 3.752%, due 07/10/39 | | 1,362,384 | |
1,000,000 | | JP Morgan Chase Commercial Mortgage Securities Corp., 4.262%, due 08/12/40 | | 980,796 | |
547,477 | | JP Morgan Chase Commercial Mortgage Securities Corp., 4.275%, due 01/12/37 | | 533,913 | |
2,925,160 | | JP Morgan Chase Commercial Mortgage Securities Corp., 6.244%, due 04/15/35 | | 2,988,494 | |
3,150,000 | | LB-UBS Commercial Mortgage Trust, 6.226%, due 03/15/26 | | 3,268,442 | |
3,000,000 | | LB-UBS Commercial Mortgage Trust, 7.370%, due 08/15/26 | | 3,258,998 | |
2,505,662 | S | Mortgage Capital Funding, Inc., 6.663%, due 03/18/30 | | 2,573,693 | |
178,920 | | Prudential Commercial Mortgage Trust, 3.669%, due 02/11/36 | | 171,884 | |
600,000 | | Prudential Securities Secured Financing Corp., 6.649%, due 07/15/08 | | 623,114 | |
| | | | 24,278,315 | |
| | Whole Loan Collateral CMO: 3.6% | | | |
1,870,755 | | Bank of America Funding Corp., 5.278%, due 09/20/35 | | 1,839,139 | |
3,167,325 | | Bank of America Funding Corp., 5.750%, due 09/20/34 | | 3,143,332 | |
1,001,343 | S | Bank of America Mortgage Securities, 5.250%, due 11/25/19 | | 999,482 | |
937,233 | | Bank of America Mortgage Securities, 5.500%, due 11/25/33 | | 905,583 | |
2,258,878 | | Bank of America Mortgage Securities, 5.500%, due 06/25/35 | | 2,255,277 | |
453,833 | | Bear Stearns Alt-A Trust, 4.699%, due 07/25/34 | | 454,627 | |
629,638 | | Citigroup Mortgage Loan Trust, Inc., 4.499%, due 02/25/35 | | 630,103 | |
493,825 | | Countrywide Alternative Loan Trust, 4.679%, due 02/25/35 | | 494,265 | |
$ | 2,600,340 | S | Countrywide Alternative Loan Trust, 5.500%, due 02/25/25 | | $ | 2,603,497 | |
6,830,934 | | Countrywide Home Loan Mortgage Pass Through Trust, 4.721%, due 02/25/35 | | 6,862,957 | |
1,793,511 | S | Countrywide Home Loan Mortgage Pass Through Trust, 5.000%, due 11/25/18 | | 1,765,511 | |
693,698 | | First Horizon Asset Securities, Inc., 5.403%, due 10/25/35 | | 691,701 | |
2,097,824 | | GMAC Mortgage Corp. Loan Trust, 5.264%, due 03/18/35 | | 2,072,257 | |
713,814 | # | GSMPS Mortgage Loan Trust, 4.729%, due 01/25/35 | | 715,598 | |
452,068 | S | GSR Mortgage Loan Trust, 4.500%, due 08/25/19 | | 444,503 | |
752,493 | | Harborview Mortgage Loan Trust, 4.720%, due 01/19/35 | | 751,614 | |
1,110,081 | S | Homebanc Mortgage Trust, 4.809%, due 08/25/29 | | 1,115,555 | |
3,233,810 | | Mastr Adjustable Rate Mortgages Trust, 5.367%, due 06/25/35 | | 3,179,255 | |
2,651,352 | S | MASTR Alternative Loans Trust, 5.500%, due 01/25/20 | | 2,663,764 | |
508,510 | | MASTR Alternative Loans Trust, 6.500%, due 05/25/33 | | 513,802 | |
847,271 | | MASTR Alternative Loans Trust, 8.500%, due 05/25/33 | | 865,839 | |
443,708 | | MLCC Mortgage Investors, Inc., 4.699%, due 01/25/29 | | 444,266 | |
401,327 | | Sequoia Mortgage Trust, 4.640%, due 01/20/35 | | 401,713 | |
910,161 | | Structured Asset Mortgage Investments, Inc., 4.610%, due 04/19/35 | | 909,592 | |
1,183,000 | | Suntrust Alternative Loan Trust, 6.500%, due 12/25/35 | | 1,205,122 | |
770,209 | | Washington Mutual, Inc., 4.629%, due 01/25/45 | | 770,828 | |
209,168 | | Washington Mutual, Inc., 4.670%, due 06/25/44 | | 209,414 | |
1,149,558 | | Washington Mutual, Inc., 4.689%, due 01/25/45 | | 1,150,713 | |
2,096,305 | | Washington Mutual, Inc., 6.000%, due 06/25/34 | | 2,100,892 | |
2,225,000 | | Wells Fargo Mortgage Backed Securities Trust, 4.500%, due 08/25/18 | | 2,122,902 | |
| | | | 44,283,103 | |
| | Total Collateralized Mortgage Obligations
(Cost $69,941,994) | | 68,561,418 | |
See Accompanying Notes to Financial Statements
69
| | PORTFOLIO OF INVESTMENTS |
ING VP BALANCED PORTFOLIO | | AS OF DECEMBER 31, 2005 (CONTINUED) |
Principal
Amount | | | | Value | |
MUNICIPAL BONDS: 0.1% | | | |
| | | |
| | Municipal: 0.1% | | | |
$ | 215,000 | | New York, 5.000%, due 04/01/35 | | $ | 221,398 | |
510,000 | S | New York, 5.000%, due 11/01/08 | | 531,201 | |
510,000 | S | New York, 5.000%, due 11/01/11 | | 545,792 | |
510,000 | S | New York, 5.000%, due 11/01/15 | | 549,535 | |
| | | | 1,847,926 | |
| | Total Municipal Bonds
(Cost $1,873,323) | | 1,847,926 | |
| | | | | |
OTHER BONDS: 0.1% | | | |
| | | | | |
| | Foreign Government Bonds: 0.1% | | | |
237,000 | @@,L | Mexico Government Bond, 6.625%, due 03/03/15 | | 260,108 | |
359,322 | @@ | Republica Orient Uruguay, 10.500%, due 10/20/06 | | 542,872 | |
| | | | 802,980 | |
| | Total Other Bonds
(Cost $630,381) | | 802,976 | |
| | Total Long-Term Investments
(Cost $1,166,828,541) | | 1,217,540,580 | |
| | | | | |
SHORT-TERM INVESTMENTS: 23.4% | | | |
| | | | | |
| | Commercial Paper: 1.5% | | | |
12,000,000 | #,S | Concord Minutemen Capital Co. LLC, 4.669%, due 01/10/07 | | 11,989,560 | |
6,000,000 | S | Daimler Chrysler, 4.450%, due 01/18/06 | | 5,986,680 | |
| | Total Commercial Papers (Cost $17,987,226) | | 17,976,240 | |
| | | | | |
| | Repurchase Agreement: 3.2% | | | |
39,424,000 | | Morgan Stanley Repurchase Agreement dated 12/30/05, 4.230%, due 01/03/06, $39,442,529 to be received upon repurchase (Collateralized by $40,700,000 Federal Credit Savings Bureau, 2.580%-5.875%, Market Value plus accrued interest $40,216,995 due 03/01/07-06/22/20) | | 39,424,000 | |
| | Total Repurchase Agreement
(Cost $39,424,000) | | 39,424,000 | |
| | | | | |
Shares | | | | Value | |
| | Securities Lending Collateralcc: 18.7% | | | |
231,954,000 | | The Bank of New York Institutional Cash Reserve Fund | | | | $ | 231,954,000 | |
| | Total Securities Lending Collateral
(Cost $231,954,000) | | | | | 231,954,000 | |
| | Total Short-Term Investments
(Cost $289,365,226) | | | | | 289,354,240 | |
| | Total Investments In Securities
(Cost $1,456,193,767)* | | 121.6 | % | | $ | 1,506,894,820 | |
| | Other Assets and Liabilities-Net | | (21.6 | ) | | (267,397,937 | ) |
| | Net Assets | | 100.0 | % | | $ | 1,239,496,883 | |
| | | | | | | | | | |
@ | Non-income producing security |
@@ | Foreign Issuer |
+ | Step-up basis bonds. Interest rates shown reflect current coupon rates. |
# | Securities with purchases pursuant to Rule 144A, under the Securities Act of 1933 and may not be resold subject to that rule except to qualified institutional buyers. These securities have been determined to be liquid under the guidelines established by the Funds’ Board of Directors/Trustees. |
C | Bond may be called prior to maturity date. |
cc | Securities purchased with cash collateral for securities loaned. |
W | When-issued or delayed delivery security. |
S | Segregated securities for certain derivatives, when-issued or delayed delivery securities and forward currency exchange contracts. |
I | Illiquid security |
L | Loaned security, a portion or all of the security is on loan at December 31, 2005. |
** | Defaulted security |
* | Cost for federal income tax purposes is $1,473,810,851 |
| Net unrealized appreciation consists of: |
| | Gross Unrealized Appreciation | | $ | 53,930,253 | |
| | Gross Unrealized Depreciation | | (20,846,284 | ) |
| | Net Unrealized Appreciation | | $ | 33,083,969 | |
Information concerning open futures contracts at December 31, 2005 is shown below:
Long Contracts | | No. of
Contracts | | Notional
Market Value | | Expiration
Date | | Unrealized
Gain (Loss) | |
S&P MID 400 EMINI MAR06 | | 6 | | $ | 445,920 | | 03/17/06 | | $ | (5,866 | ) |
US 10YR NOTE FUT MAR06 | | 81 | | 8,861,906 | | 03/22/06 | | 78,064 | |
USH6 FUTURE US 30YR CBT | | 124 | | 14,159,250 | | 03/31/06 | | 282,952 | |
| | | | $ | 23,467,076 | | | | $ | 355,150 | |
| | | | | | | | | |
Short Contracts | | | | | | | | | |
U.S. 2 year Note | | 37 | | $ | (7,591,938 | ) | 03/31/06 | | $ | (5,576 | ) |
See Accompanying Notes to Financial Statements
70
| | PORTFOLIO OF INVESTMENTS |
ING VP BALANCED PORTFOLIO | | AS OF DECEMBER 31, 2005 (CONTINUED) |
Information concerning the Interest Rate Swap Agreements outstanding for the ING VP Balanced Portfolio at December 31, 2005, is shown below:
| | Termination
Date | | Unrealized
Appreciation
(Depreciation) | |
Receive a floating rate equal to 3-month USD-LIBOR plus 2.51% on $793,400 and pay a floating rate equal to 3-month JPY-LIBOR plus 1.7% on ¥87,584,000. Upon termination of the contract, receive $793,400 and pay ¥87,584,000. Counterparty: UBS AG | | 03/01/34 | | $ | 61,207 | |
Receive a floating rate equal to 3-month JPY-LIBOR plus 1.7% on ¥158,550,000 and pay a fixed rate equal to 1.0% on ¥300,000,000. Upon termination of the contract, receive ¥158,550,000 and pay ¥300,000,000. Counterparty: UBS AG | | 03/01/34 | | 17,797 | |
Receive a floating rate equal to 6-month USD-LIBOR plus 2.62% on $472,273 and pay a fixed rate equal to 1.0% on ¥100,000,000. Upon termination of the contract, receive $472,273 and pay ¥100,000,000. Counterparty: UBS AG | | 03/01/34 | | 45,901 | |
Receive a floating rate equal to 3-month USD-LIBOR plus 2.48% on $457,333.25 and pay a fixed rate equal to 1.0% on ¥100,000,000. Upon termination of the contract, receive $457,333.25 and pay ¥100,000,000. Counterparty: UBS AG | | 03/01/34 | | 8,294 | |
| | | | $ | 133,199 | |
Information concerning the Credit Default Agreements outstanding for the ING VP Balanced Portfolio at December 31, 2005 is shown below:
| | Termination
Date | | Notional
Principal | | Unrealized
Appreciation
(Depreciation) | |
Albertson’s Inc. Receive $655,000 in the event of default and pay 1.850% Counterparty: UBS AG | | 03/20/11 | | $ | 655,000 | | $ | 4,963 | |
Georgia Pacific Receive $263,000 in the event of default and pay 3.550% Counterparty: Citigroup | | 12/20/10 | | 263,000 | | (1,114 | ) |
| | | | | | $ | 3,849 | |
| | | | | | | | | |
See Accompanying Notes to Financial Statements
71
| | PORTFOLIO OF INVESTMENTS |
ING VP GROWTH AND INCOME PORTFOLIO | | AS OF DECEMBER 31, 2005 |
Shares | | | | Value | |
COMMON STOCK: 96.5% | | | |
| | | | | |
| | Aerospace/Defense: 2.0% | | | |
1,110,800 | | United Technologies Corp. | | $ | 62,104,828 | |
| | | | 62,104,828 | |
| | Agriculture: 2.2% | | | |
927,950 | | Altria Group, Inc. | | 69,336,424 | |
| | | | 69,336,424 | |
| | Apparel: 0.4% | | | |
130,200 | L | Nike, Inc. | | 11,300,058 | |
| | | | 11,300,058 | |
| | Banks: 5.4% | | | |
1,109,200 | L | Bank of America Corp. | | 51,189,580 | |
134,900 | | City National Corp. | | 9,772,156 | |
1,263,418 | | US BanCorp. | | 37,763,564 | |
1,155,100 | L | Wells Fargo & Co. | | 72,574,933 | |
| | | | 171,300,233 | |
| | Beverages: 0.9% | | | |
464,900 | | PepsiCo, Inc. | | 27,466,292 | |
| | | | 27,466,292 | |
| | Biotechnology: 1.2% | | | |
483,300 | @,L | Amgen, Inc. | | 38,113,038 | |
| | | | 38,113,038 | |
| | Chemicals: 0.8% | | | |
397,400 | | Dow Chemical Co. | | 17,414,068 | |
215,000 | L | EI Du Pont de Nemours & Co. | | 9,137,500 | |
| | | | 26,551,568 | |
| | Computers: 2.7% | | | |
3,035,450 | @ | EMC Corp. | | 41,342,829 | |
526,600 | | International Business Machines Corp. | | 43,286,520 | |
| | | | 84,629,349 | |
| | Cosmetics/Personal Care: 3.8% | | | |
912,700 | L | Avon Products, Inc. | | 26,057,585 | |
618,800 | | Colgate-Palmolive Co. | | 33,941,180 | |
1,004,997 | L | Procter & Gamble Co. | | 58,169,226 | |
| | | | 118,167,991 | |
| | Distribution/Wholesale: 1.5% | | | |
1,138,150 | @,L | Wesco International, Inc. | | 48,633,150 | |
| | | | 48,633,150 | |
| | Diversified Financial Services: 10.2% | | | |
581,600 | | Capital One Financial Corp. | | 50,250,240 | |
2,175,400 | L | Citigroup, Inc. | | 105,572,162 | |
1,481,506 | | Countrywide Financial Corp. | | 50,652,690 | |
253,000 | | Franklin Resources, Inc. | | 23,784,530 | |
361,300 | | Goldman Sachs Group, Inc. | | 46,141,623 | |
341,800 | | Merrill Lynch & Co., Inc. | | 23,150,114 | |
408,200 | | Morgan Stanley | | 23,161,268 | |
| | | | 322,712,627 | |
| | Electric: 1.0% | | | |
463,400 | L | Public Service Enterprise Group, Inc. | | 30,107,098 | |
| | | | 30,107,098 | |
| | Electronics: 3.0% | | | |
1,793,500 | @,L | Jabil Circuit, Inc. | | $ | 66,520,915 | |
1,315,400 | | Symbol Technologies, Inc. | | 16,863,428 | |
300,000 | @ | Thomas & Betts Corp. | | 12,588,000 | |
| | | | 95,972,343 | |
| | Food: 1.0% | | | |
597,900 | L | Hershey Foods Corp. | | 33,033,975 | |
| | | | 33,033,975 | |
| | Healthcare-Products: 4.1% | | | |
532,300 | | Baxter International, Inc. | | 20,041,095 | |
1,140,400 | | Johnson & Johnson | | 68,538,040 | |
676,700 | | Medtronic, Inc. | | 38,957,619 | |
| | | | 127,536,754 | |
| | Healthcare-Services: 2.0% | | | |
652,700 | @,L | Health Net, Inc. | | 33,646,685 | |
738,550 | @ | Triad Hospitals, Inc. | | 28,973,317 | |
| | | | 62,620,002 | |
| | Insurance: 4.8% | | | |
710,800 | @@ | ACE Ltd. | | 37,985,152 | |
595,000 | | American International Group, Inc. | | 40,596,850 | |
1,192,000 | @@ | Axis Capital Holdings Ltd. | | 37,285,760 | |
679,000 | | St. Paul Cos. | | 30,330,930 | |
81,900 | @@,L | XL Capital Ltd | | 5,518,422 | |
| | | | 151,717,114 | |
| | Internet: 1.9% | | | |
375,200 | @,L | eBay, Inc. | | 16,227,400 | |
17,150 | @,L | Google, Inc. | | 7,114,849 | |
895,300 | @,L | Yahoo!, Inc. | | 35,077,854 | |
| | | | 58,420,103 | |
| | Investment Companies: 0.5% | | | |
548,900 | L | Materials Select Sector SPDR Fund | | 16,626,181 | |
| | | | 16,626,181 | |
| | Leisure Time: 0.4% | | | |
249,599 | @,L | Royal Caribbean Cruises Ltd. | | 11,246,931 | |
| | | | 11,246,931 | |
| | Lodging: 2.5% | | | |
690,200 | L | Harrah’s Entertainment, Inc. | | 49,204,358 | |
1,288,273 | | Hilton Hotels Corp. | | 31,060,262 | |
| | | | 80,264,620 | |
| | Media: 3.0% | | | |
283,300 | @,L | Cablevision Systems Corp. | | 6,649,051 | |
2,670,300 | | Time Warner, Inc. | | 46,570,032 | |
1,262,715 | @ | Viacom, Inc. | | 41,164,509 | |
| | | | 94,383,592 | |
| | Mining: 0.4% | | | |
456,900 | | Alcoa, Inc. | | 13,510,533 | |
| | | | 13,510,533 | |
| | Miscellaneous Manufacturing: 6.1% | | | |
454,500 | | Cooper Industries Ltd. | | 33,178,500 | |
736,100 | | Danaher Corp. | | 41,059,658 | |
2,760,076 | | General Electric Co. | | 96,740,664 | |
See Accompanying Notes to Financial Statements
72
| | PORTFOLIO OF INVESTMENTS |
ING VP GROWTH AND INCOME PORTFOLIO | | AS OF DECEMBER 31, 2005 (CONTINUED) |
Shares | | | | Value | |
| | Miscellaneous Manufacturing (continued) | | | |
512,200 | | Roper Industries, Inc. | | $ | 20,237,022 | |
| | | | 191,215,844 | |
| | Oil & Gas: 8.0% | | | |
1,005,800 | L | ENSCO International, Inc. | | 44,607,230 | |
1,818,900 | L | Exxon Mobil Corp. | | 102,167,613 | |
390,100 | @ | Newfield Exploration Co. | | 19,532,307 | |
558,100 | @,L | Plains Exploration & Production Co. | | 22,173,313 | |
591,400 | @,L,S | Southwestern Energy Co. | | 21,254,916 | |
975,233 | | XTO Energy, Inc. | | 42,851,738 | |
| | | | 252,587,117 | |
| | Oil & Gas Services: 2.8% | | | |
405,700 | @ | Dresser-Rand Group, Inc. | | 9,809,826 | |
720,900 | | Halliburton Co. | | 44,666,964 | |
350,400 | L | Schlumberger Ltd. | | 34,041,360 | |
| | | | 88,518,150 | |
| | Pharmaceuticals: 5.9% | | | |
201,399 | @,L | Gilead Sciences, Inc. | | 10,599,629 | |
822,300 | @ | Medco Health Solutions, Inc. | | 45,884,340 | |
2,620,224 | | Pfizer, Inc. | | 61,103,624 | |
763,100 | @@,L | Teva Pharmaceutical Industries Ltd. ADR | | 32,820,931 | |
762,300 | | Wyeth | | 35,119,161 | |
| | | | 185,527,685 | |
| | Retail: 5.2% | | | |
1,440,100 | | CVS Corp. | | 38,047,442 | |
627,500 | | Home Depot, Inc. | | 25,401,200 | |
1,180,000 | @,L | Urban Outfitters, Inc. | | 29,865,800 | |
1,488,400 | | Wal-Mart Stores, Inc. | | 69,657,120 | |
| | | | 162,971,562 | |
| | Semiconductors: 5.4% | | | |
907,200 | @,L | Broadcom Corp. | | 42,774,480 | |
866,000 | | Intel Corp. | | 21,615,360 | |
1,716,100 | | Maxim Integrated Products | | 62,191,464 | |
4,597,318 | @@,L | Taiwan Semiconductor Manufacturing Co., Ltd. ADR | | 45,559,421 | |
| | | | 172,140,725 | |
| | Software: 3.5% | | | |
1,857,700 | | Microsoft Corp. | | 48,578,855 | |
4,952,400 | @ | Oracle Corp. | | 60,468,804 | |
| | | | 109,047,659 | |
| | Telecommunications: 3.9% | | | |
1,750,200 | | BellSouth Corp. | | 47,430,420 | |
2,841,437 | @ | Cisco Systems, Inc. | | 48,645,400 | |
672,450 | | Motorola, Inc. | | 15,190,646 | |
502,116 | L | Sprint Corp. - FON Group | | 11,729,430 | |
| | | | 122,995,896 | |
| | Total Common Stock
(Cost $2,684,881,749) | | 3,040,759,442 | |
| | | | | |
CONVERTIBLE BOND: 0.7% | | | |
| | | |
| �� | Electric: 0.7% | | | |
20,000,000 | L | Mirant Corp., 2.500%, due 06/15/21 | | $ | 21,500,000 | |
| | | | 21,500,000 | |
| | Total Convertible Bond
(Cost $21,150,000) | | 21,500,000 | |
| | | | | |
CORPORATE BOND/NOTE: 0.4% | | | |
| | | | | |
| | Electric: 0.4% | | | |
10,000,000 | #,L | Mirant Corp., 7.900%, due 07/15/09 | | 12,650,000 | |
| | | | 12,650,000 | |
| | Total Corporate Bond/Note
(Cost $12,400,000) | | 12,650,000 | |
| | Total Long-Term Investments
(Cost $2,718,431,748) | | 3,074,909,442 | |
Principal Amount/Shares | | | | Value | |
| | | | | |
SHORT-TERM INVESTMENT: 10.8% | | | |
| | | |
| | Commercial Paper: 0.6% | | | |
$ | 9,000,000 | | Commercial Paper Direct, 4.450%, due 01/05/06 | | $ | 8,996,663 | |
9,200,000 | | Daimler Chrysler NA, 4.450%, due 01/18/06 | | 9,181,845 | |
| | | | 18,178,508 | |
| | Total Commercial Paper
(Cost $18,180,755) | | 18,178,508 | |
| | | | | |
| | Repurchase Agreement: 1.6% | | | |
49,621,000 | | Morgan Stanley Repurchase Agreement dated 12/30/05, 4.230%, due 01/03/06, $49,644,322 to be received upon repurchase (Collateralized by $51,940,000 various U.S.Government Agency Obligations, 1.880%-5.650%, Market Value plus accrued interest $51,150,934 due 06/16/06-05/30/18) | | 49,621,000 | |
| | Total Repurchase Agreement
(Cost $49,621,000) | | 49,621,000 | |
| | | | | |
| | Securities Lending Collateralcc: 8.6% | | | |
271,624,000 | | The Bank of New York Institutional Cash Reserves Fund | | 271,624,000 | |
| | Total Securities Lending Collateral
(Cost $271,624,000) | | 271,624,000 | |
| | Total Short-Term Investments
(Cost $339,425,755) | | 339,423,508 | |
| | | | | | | |
See Accompanying Notes to Financial Statements
73
| | PORTFOLIO OF INVESTMENTS |
ING VP GROWTH AND INCOME PORTFOLIO | | AS OF DECEMBER 31, 2005 (CONTINUED) |
| | | | Value | |
| | Total Investments In Securities (Cost $3,057,857,503)* | 108.4 | % | | $ | 3,414,332,950 | |
| | Other Assets and Liabilities-Net | (8.4 | ) | | (265,877,312 | ) |
| | Net Assets | 100.0 | % | | $ | 3,148,455,638 | |
@ | Non-income producing security |
@@ | Foreign Issuer |
ADR | American Depositary Receipt |
# | Securities with purchases pursuant to Rule 144A, under the Securities Act of 1933 and may not be resold subject to that rule except to qualified institutional buyers. These securities have been determined to be liquid under the guidelines established by the Funds’ Board of Directors/Trustees. |
cc | Securities purchased with cash collateral for securities loaned. |
S | Segregated securities for certain derivatives, when-issued or delayed delivery securities and forward currency exchange contracts. |
L | Loaned security, a portion or all of the security is on loan at December 31, 2005. |
* | Cost for federal income tax purposes is $3,078,555,195. |
| Net unrealized appreciation consists of: |
| | Gross Unrealized Appreciation | | $ | 381,346,541 | |
| | Gross Unrealized Depreciation | | (45,568,786 | ) |
| | Net Unrealized Appreciation | | $ | 335,777,755 | |
Information concerning open futures contracts at December 31, 2005 is shown below:
Long Contracts | | No. of
Contracts | | Notional
Market Value | | Expiration
Date | | Unrealized
Loss | |
S&P 500 Future | | 106 | | $33,252,200 | | 03/16/06 | | $(333,892) | |
See Accompanying Notes to Financial Statements
74
| PORTFOLIO OF INVESTMENTS |
ING VP GROWTH PORTFOLIO | AS OF DECEMBER 31, 2005 |
Shares | | | | Value | |
COMMON STOCK: 98.9% | | | |
| | Agriculture: 2.7% | | | |
60,620 | | Monsanto Co. | | $ | 4,699,869 | |
| | | | 4,699,869 | |
| | Apparel: 1.1% | | | |
60,700 | @ | Coach, Inc. | | 2,023,738 | |
| | | | 2,023,738 | |
| | Beverages: 4.0% | | | |
51,500 | | Coca-Cola Co. | | 2,075,965 | |
82,800 | | PepsiCo, Inc. | | 4,891,824 | |
| | | | 6,967,789 | |
| | Biotechnology: 4.1% | | | |
40,000 | @ | Amgen, Inc. | | 3,154,400 | |
44,600 | @,L | Genentech, Inc. | | 4,125,500 | |
| | | | 7,279,900 | |
| | Computers: 7.3% | | | |
59,900 | @ | Apple Computer, Inc. | | 4,306,211 | |
290,500 | @ | EMC Corp. | | 3,956,610 | |
54,800 | | International Business
Machines Corp. | | 4,504,560 | |
| | | | 12,767,381 | |
| | Cosmetics/Personal Care: 3.6% | | | |
110,865 | | Procter & Gamble Co. | | 6,416,866 | |
| | | | 6,416,866 | |
| | Diversified Financial Services: 2.2% | | | |
30,100 | | Goldman Sachs Group, Inc. | | 3,844,071 | |
| | | | 3,844,071 | |
| | Electronics: 2.4% | | | |
113,300 | @, L | Jabil Circuit, Inc. | | 4,202,297 | |
| | | | 4,202,297 | |
| | Food: 0.9% | | | |
23,000 | | WM Wrigley Jr. Co. | | 1,529,270 | |
| | | | 1,529,270 | |
| | Healthcare-Products: 8.1% | | | |
21,084 | @@,L | Alcon, Inc. | | 2,732,486 | |
48,400 | @ | Gen-Probe, Inc. | | 2,361,436 | |
82,400 | | Johnson & Johnson | | 4,952,240 | |
83,600 | @ | St. Jude Medical, Inc. | | 4,196,720 | |
| | | | 14,242,882 | |
| | Healthcare-Services: 4.4% | | | |
34,570 | @ | Coventry Health Care, Inc. | | 1,969,107 | |
92,000 | | UnitedHealth Group, Inc. | | 5,716,880 | |
| | | | 7,685,987 | |
| | Home Furnishings: 1.1% | | | |
20,600 | L | Harman Intl. Industries, Inc. | | 2,015,710 | |
| | | | 2,015,710 | |
| | Insurance: 1.0% | | | |
20,700 | | Hartford Financial Services
Group, Inc. | | 1,777,923 | |
| | | | 1,777,923 | |
| | | | | |
| | Internet: 6.3% | | | |
45,000 | @,L | eBay, Inc. | | $ | 1,946,250 | |
11,700 | @,L | Google, Inc. | | 4,853,862 | |
107,100 | @,L | Yahoo!, Inc. | | 4,196,178 | |
| | | | 10,996,290 | |
| | Lodging: 2.3% | | | |
21,000 | | Harrah’s Entertainment, Inc. | | 1,497,090 | |
39,100 | | Marriott Intl., Inc. | | 2,618,527 | |
| | | | 4,115,617 | |
| | Machinery-Diversified: 1.1% | | | |
31,700 | | Rockwell Automation, Inc. | | 1,875,372 | |
| | | | 1,875,372 | |
| | Miscellaneous Manufacturing: 4.6% | | | |
24,494 | | Danaher Corp. | | 1,366,275 | |
193,860 | | General Electric Co. | | 6,794,793 | |
| | | | 8,161,068 | |
| | Oil & Gas: 2.8% | | | |
44,752 | @,L | Transocean, Inc. | | 3,118,767 | |
42,000 | | XTO Energy, Inc. | | 1,845,480 | |
| | | | 4,964,247 | |
| | Oil & Gas Services: 4.6% | | | |
68,700 | | Halliburton Co. | | 4,256,652 | |
38,700 | L | Schlumberger Ltd. | | 3,759,705 | |
| | | | 8,016,357 | |
| | Pharmaceuticals: 6.5% | | | |
45,800 | @ | Barr Pharmaceuticals, Inc. | | 2,852,882 | |
92,400 | @ | Gilead Sciences, Inc. | | 4,863,012 | |
33,200 | @ | Medco Health Solutions, Inc. | | 1,852,560 | |
42,800 | @@,L | Teva Pharmaceutical
Industries Ltd. ADR | | 1,840,828 | |
| | | | 11,409,282 | |
| | Retail: 6.7% | | | |
110,400 | | CVS Corp. | | 2,916,768 | |
78,700 | | Home Depot, Inc. | | 3,185,776 | |
70,300 | @ | Office Depot, Inc. | | 2,207,420 | |
36,400 | | Staples, Inc. | | 826,644 | |
58,200 | L | Walgreen Co. | | 2,575,932 | |
| | | | 11,712,540 | |
| | Semiconductors: 8.5% | | | |
93,500 | @,@@,L | ASML Holding NV | | 1,877,480 | |
39,900 | @ | Broadcom Corp. | | 1,881,285 | |
94,400 | | Intel Corp. | | 2,356,224 | |
52,800 | | Linear Technology Corp. | | 1,904,496 | |
54,900 | @,@@ | Marvell Technology Group Ltd. | | 3,079,341 | |
62,800 | | National Semiconductor Corp. | | 1,631,544 | |
219,500 | @@,L | Taiwan Semiconductor
Manufacturing Co., Ltd. ADR | | 2,175,245 | |
| | | | 14,905,615 | |
| | Software: 6.8% | | | |
62,900 | L | Adobe Systems, Inc. | | 2,324,784 | |
56,900 | L | Autodesk, Inc. | | 2,443,855 | |
138,900 | S | Microsoft Corp. | | 3,632,235 | |
292,400 | @ | Oracle Corp. | | 3,570,204 | |
| | | | 11,971,078 | |
See Accompanying Notes to Financial Statements
75
| PORTFOLIO OF INVESTMENTS |
ING VP GROWTH PORTFOLIO | AS OF DECEMBER 31, 2005 (CONTINUED) |
Shares | | | | Value | |
| | Telecommunications: 5.8% | | | |
62,700 | @ | Comverse Technology, Inc. | | $ | 1,667,193 | |
163,500 | | Motorola, Inc. | | 3,693,466 | |
51,200 | | Qualcomm, Inc. | | 2,205,696 | |
239,200 | @ | Tellabs, Inc. | | 2,607,280 | |
| | | | 10,173,635 | |
| | Total Common Stock
(Cost $150,358,890) | | 173,754,784 | |
| | | | | |
| | | | | |
Principal
Amount/Shares | | | | Value | |
| | | | | |
SHORT-TERM INVESTMENT: 19.9% | | | |
| | | | | |
| | Repurchase Agreement: 1.2% | | | | | | |
$ | 2,010,000 | | Morgan Stanley Repurchase | | | | | | |
| | Agreement dated 12/30/05, 4.230%, | | | | | | |
| | due 01/03/06, $2,010,945 to be | | | | | | |
| | received upon repurchase | | | | | | |
| | (Collateralized by $2,050,000 Federal | | | | | | |
| | Farm Credit Bank, 5.650%, | | | | | | |
| | Market Value plus accrued interest | | | | | | |
| | $2,055,159 due 12/06/12) | | | | | 2,010,000 | |
| | | | | | | | |
| | Total Repurchase Agreement
(Cost $2,010,000) | | | | | 2,010,000 | |
| | | | | | | | |
| | Securities Lending CollateralCC: 18.7% | | | | | | |
32,864,000 | | The Bank of New York Institutional | | | | | | |
| | Cash Reserve Fund | | | | | 32,864,000 | |
| | | | | | | | |
| | Total Securities Lending | | | | | | |
| | Collateral (Cost $32,864,000) | | | | | 32,864,000 | |
| | | | | | | | |
| | Total Short-Term Investments: | | | | | | |
| | (Cost $34,874,000) | | | | | $ | 34,874,000 | |
| | | | | | | | |
| | Total Investments In Securities
(Cost $185,232,890)* | | 118.8 | % | | $ | 208,628,784 | |
| | Other Assets and Liabilities-Net | | (18.8 | ) | | (33,046,769 | ) |
| | Net Assets | | 100.0 | % | | 175,582,015 | |
| | | | | | | | | | | |
@ | | Non-income producing security | | | | | | |
@@ | | Foreign Issuer | | | | | | |
ADR | | American Depositary Receipt | | | | | | |
cc | | Securities purchased with cash collateral for securities loaned. | | | | | | |
S | | Segregated securities for certain derivatives, when-issued or delayed delivery securities and forward currency exchange contracts. | | | | | | |
L | | Loaned security, a portion or all of the security is on loan at December 31, 2005. | | | | | | |
* | | Cost for federal income tax purposes is $185,596,503. Net unrealized appreciation consists of: | | | | | | |
| | | | | | | | |
| | Gross Unrealized Appreciation | | | | | $ | 24,309,895 | |
| | Gross Unrealized Depreciation | | | | | (1,277,614 | ) |
| | Net Unrealized Appreciation | | | | | $ | 23,032,281 | |
See Accompanying Notes to Financial Statements
76
| PORTFOLIO OF INVESTMENTS |
ING VP SMALL COMPANY PORTFOLIO | AS OF DECEMBER 31, 2005 |
Shares | | | | Value | |
COMMON STOCK: 97.2% | | | |
| | | |
| | Aerospace/Defense: 3.5% | | | |
80,000 | L | DRS Technologies, Inc. | | $ | 4,113,600 | |
103,550 | | Engineered Support Systems, Inc. | | 4,311,822 | |
86,775 | @,L | Innovative Solutions & Support, Inc. | | 1,108,985 | |
66,000 | @,L | MTC Technologies, Inc. | | 1,807,080 | |
167,650 | @ | Teledyne Technologies, Inc. | | 4,878,615 | |
| | | | 16,220,102 | |
| | Apparel: 2.1% | | | |
96,300 | @,@@ | Gildan Activewear, Inc. | | 4,126,455 | |
206,800 | @,L | Warnaco Group, Inc. | | 5,525,696 | |
| | | | 9,652,151 | |
| | Banks: 4.5% | | | |
22,500 | L | Bancorpsouth, Inc. | | 496,575 | |
226,200 | | Bank Mutual Corp. | | 2,397,720 | |
54,800 | L | Chemical Financial Corp. | | 1,740,448 | |
74,900 | L | First Republic Bank | | 2,772,049 | |
173,000 | | Hudson United Bancorp | | 7,210,640 | |
67,475 | | Iberiabank Corp. | | 3,441,900 | |
95,300 | | Texas Regional Bancshares, Inc. | | 2,696,990 | |
| | | | 20,756,322 | |
| | Building Materials: 1.4% | | | |
28,000 | L | Eagle Materials, Inc. | | 3,426,080 | |
54,000 | @,L | Genlyte Group, Inc. | | 2,892,780 | |
| | | | 6,318,860 | |
| | Chemicals: 0.9% | | | |
74,000 | | Olin Corp. | | 1,456,320 | |
150,000 | @,L | Terra Industries, Inc. | | 840,000 | |
93,000 | L | UAP Holding Corp. | | 1,899,060 | |
| | | | 4,195,380 | |
| | Coal: 0.2% | | | |
31,800 | @ | Westmoreland Coal Co. | | 728,220 | |
| | | | 728,220 | |
| | Commercial Services: 4.2% | | | |
92,400 | | Arbitron, Inc. | | 3,509,352 | |
105,400 | @,L | Bright Horizons Family Solutions, Inc. | | 3,905,070 | |
301,798 | @ | DiamondCluster Intl., Inc. | | 2,396,276 | |
65,000 | @,L | Exponent, Inc. | | 1,844,700 | |
138,200 | @,L | Labor Ready, Inc. | | 2,877,324 | |
190,000 | @,L | Resources Connection, Inc. | | 4,951,400 | |
| | | | 19,484,122 | |
| | Computers: 8.3% | | | |
113,000 | | Agilysys, Inc. | | 2,058,860 | |
98,000 | @ | Anteon Intl. Corp. | | 5,326,300 | |
230,900 | @,L | Electronics for Imaging | | 6,144,249 | |
248,850 | @,L | InterVoice, Inc. | | 1,980,846 | |
226,300 | | Jack Henry & Associates, Inc. | | 4,317,804 | |
124,500 | @,L | Kronos, Inc. | | 5,211,570 | |
117,800 | @,L | Micros Systems, Inc. | | 5,692,096 | |
98,850 | | MTS Systems Corp. | | 3,424,164 | |
130,500 | @,L | Palm, Inc. | | 4,149,900 | |
| | | | 38,305,789 | |
| | | | | |
110,000 | | Watsco, Inc. | | $ | 6,579,100 | |
109,400 | @,L | Wesco Intl., Inc. | | 4,674,662 | |
| | | | 11,253,762 | |
| | Diversified Financial Services: 1.4% | | | |
300,000 | @,L | Knight Capital Group, Inc. | | 2,967,000 | |
63,000 | L | National Financial
Partners Corp. | | 3,310,650 | |
| | | | 6,277,650 | |
| | Electric: 0.3% | | | |
55,900 | L | ITC Holdings Corp. | | 1,570,231 | |
| | | | 1,570,231 | |
| | Electrical Components & Equipment: 1.3% | | | |
120,000 | | Ametek, Inc. | | 5,104,800 | |
109,000 | @,L | Artesyn Technologies, Inc. | | 1,122,700 | |
| | | | 6,227,500 | |
| | Electronics: 1.8% | | | |
165,000 | | CTS Corp. | | 1,824,900 | |
56,300 | @ | SBS Technologies, Inc. | | 566,941 | |
62,100 | @ | Thomas & Betts Corp. | | 2,605,716 | |
87,350 | @ | Trimble Navigation Ltd. | | 3,100,052 | |
| | | | 8,097,609 | |
| | Energy-Alternate Sources: 1.0% | | | |
133,300 | @,L | Headwaters, Inc. | | 4,724,152 | |
| | | | 4,724,152 | |
| | Engineering & Construction: 0.9% | | | |
16,000 | @ | Infrasource Services, Inc. | | 209,280 | |
75,000 | @ | Washington Group Intl., Inc. | | 3,972,750 | |
| | | | 4,182,030 | |
| | Entertainment: 1.0% | | | |
130,700 | @,L | Macrovision Corp. | | 2,186,611 | |
165,000 | @,L | Sunterra Corp. | | 2,346,300 | |
| | | | 4,532,911 | |
| | Environmental Control: 0.5% | | | |
98,000 | L | Metal Management, Inc. | | 2,279,480 | |
| | | | 2,279,480 | |
| | Food: 1.4% | | | |
120,000 | | Corn Products Intl., Inc. | | 2,866,800 | |
48,000 | L | Sanderson Farms, Inc. | | 1,465,440 | |
1,330 | | Seaboard Corp. | | 2,009,630 | |
| | | | 6,341,870 | |
| | Gas: 1.4% | | | |
90,000 | L | New Jersey Resources Corp. | | 3,770,100 | |
80,000 | L | Peoples Energy Corp. | | 2,805,600 | |
| | | | 6,575,700 | |
| | Healthcare-Products: 0.6% | | | |
29,000 | @,L | Arthrocare Corp. | | 1,222,060 | |
37,500 | @ | Kyphon, Inc. | | 1,531,125 | |
| | | | 2,753,185 | |
See Accompanying Notes to Financial Statements
77
| PORTFOLIO OF INVESTMENTS |
ING VP SMALL COMPANY PORTFOLIO | AS OF DECEMBER 31, 2005 (CONTINUED) |
Shares | | | | Value | |
| | Healthcare-Services: 4.2% | | | |
91,600 | @,L | Amedisys, Inc. | | $ | 3,869,184 | |
61,900 | @,L | Kindred Healthcare, Inc. | | 1,594,544 | |
19,600 | @,L | Matria Healthcare, Inc. | | 759,696 | |
77,600 | @,L | Psychiatric Solutions, Inc. | | 4,558,224 | |
46,300 | @,L | Sierra Health Services | | 3,702,148 | |
154,000 | @,L | United Surgical Partners Intl., Inc. | | 4,951,100 | |
| | | | 19,434,896 | |
| | Household Products/Wares: 0.8% | | | |
36,520 | @ | Central Garden & Pet Co. | | 1,677,729 | |
98,200 | @,L | Fossil, Inc. | | 2,112,282 | |
| | | | 3,790,011 | |
| | Housewares: 1.0% | | | |
105,900 | | Toro Co. | | 4,635,243 | |
| | | | 4,635,243 | |
| | Insurance: 1.9% | | | |
69,500 | | Commerce Group, Inc. | | 3,980,960 | |
91,500 | | Horace Mann Educators Corp. | | 1,734,840 | |
108,700 | L | Ohio Casualty Corp. | | 3,078,384 | |
| | | | 8,794,184 | |
| | Internet: 1.0% | | | |
233,000 | @,L | Sapient Corp. | | 1,325,770 | |
188,000 | @,L | Valueclick, Inc. | | 3,404,680 | |
| | | | 4,730,450 | |
| | Investment Companies: 1.3% | | | |
208,400 | | Apollo Investment Corp. | | 3,736,612 | |
34,500 | L | iShares Russell 2000 Index Fund | | 2,300,805 | |
| | | | 6,037,417 | |
| | Iron/Steel: 1.5% | | | |
32,000 | L | Carpenter Technology | | 2,255,040 | |
29,500 | L | Cleveland-Cliffs, Inc. | | 2,612,815 | |
374,500 | @@ | Gerdau AmeriSteel Corp. | | 2,112,180 | |
| | | | 6,980,035 | |
| | Leisure Time: 0.4% | | | |
189,000 | @,L | K2, Inc. | | 1,910,790 | |
| | | | 1,910,790 | |
| | Lodging: 1.8% | | | |
172,650 | @ | Interstate Hotels & Resorts, Inc. | | 754,481 | |
687,000 | @ | La Quinta Corp. | | 7,653,180 | |
| | | | 8,407,661 | |
| | Machinery-Construction & Mining: 0.7% | | | |
55,000 | @ | Terex Corp. | | 3,267,000 | |
| | | | 3,267,000 | |
| | Machinery-Diversified: 1.8% | | | |
27,500 | @,L | Middleby Corp. | | 2,378,750 | |
223,000 | L | Wabtec Corp. | | 5,998,700 | |
| | | | 8,377,450 | |
| | Media: 1.1% | | | |
194,700 | @,L | 4Kids Entertainment, Inc. | | $ | 3,054,843 | |
43,650 | | Liberty Corp. | | 2,043,257 | |
| | | | 5,098,100 | |
| | Mining: 0.5% | | | |
97,000 | @@ | Inmet Mining Corp. | | 2,449,600 | |
| | | | 2,449,600 | |
| | Miscellaneous Manufacturing: 0.9% | | | |
93,025 | @,L | Ceradyne, Inc. | | 4,074,495 | |
| | | | 4,074,495 | |
| | Oil & Gas: 3.2% | | | |
250,800 | @ | Denbury Resources, Inc. | | 5,713,224 | |
69,000 | @,L | Giant Industries, Inc. | | 3,585,240 | |
156,000 | @ | Southwestern Energy Co. | | 5,606,640 | |
| | | | 14,905,104 | |
| | Oil & Gas Services: 4.4% | | | |
114,500 | @,L | Core Laboratories N.V. | | 4,277,720 | |
4,600 | @ | Dresser-Rand Group, Inc. | | 111,228 | |
61,700 | @,L | FMC Technologies, Inc. | | 2,648,164 | |
147,000 | @ | Global Industries Ltd. | | 1,668,450 | |
86,500 | @ | Hydril | | 5,414,900 | |
152,400 | @,L | Oil States Intl., Inc. | | 4,828,032 | |
74,600 | @,L | Superior Energy Services | | 1,570,330 | |
| | | | 20,518,824 | |
| | Packaging & Containers: 0.1% | | | |
9,600 | L | Greif, Inc. | | 636,288 | |
| | | | 636,288 | |
| | Pharmaceuticals: 4.3% | | | |
225,000 | @,L | Alkermes, Inc. | | 4,302,000 | |
91,450 | @,L | Amylin Pharmaceuticals, Inc. | | 3,650,684 | |
202,200 | @,L | Critical Therapeutics, Inc. | | 1,451,796 | |
90,000 | @,L | Discovery Laboratories, Inc. | | 601,200 | |
189,900 | @,L | First Horizon Pharmaceutical Corp. | | 3,275,775 | |
83,000 | @,L | Idenix Pharmaceuticals, Inc. | | 1,420,130 | |
42,200 | @,L | Neurocrine Biosciences, Inc. | | 2,647,206 | |
39,800 | @ | United Therapeutics Corp. | | 2,750,976 | |
| | | | 20,099,767 | |
| | Real Estate Investment Trust: 5.6% | | | |
210,000 | | Acadia Realty Trust | | 4,210,500 | |
37,500 | | Alexandria Real Estate Equities, Inc. | | 3,018,750 | |
79,400 | | Corporate Office Properties Trust SBI MD | | 2,821,876 | |
65,627 | | Gramercy Capital Corp. | | 1,494,983 | |
244,600 | | Innkeepers USA Trust | | 3,913,600 | |
104,050 | | LaSalle Hotel Properties | | 3,820,716 | |
129,181 | | National Health Investors, Inc. | | 3,353,539 | |
25,000 | | Newcastle Investment Corp. | | 621,250 | |
29,850 | | SL Green Realty Corp. | | 2,280,242 | |
9,000 | | Sunstone Hotel Investors, Inc. | | 239,130 | |
| | | | 25,774,586 | |
| | Retail: 5.4% | | | |
75,800 | @,L | Aeropostale, Inc. | | 1,993,540 | |
137,200 | | Claire’s Stores, Inc. | | 4,008,984 | |
105,629 | @,L | GameStop Corp. | | 3,361,115 | |
See Accompanying Notes to Financial Statements
78
| PORTFOLIO OF INVESTMENTS |
ING VP SMALL COMPANY PORTFOLIO | AS OF DECEMBER 31, 2005 (CONTINUED) |
Shares | | | | Value | |
| | Retail (continued) | | | |
87,700 | | Lone Star Steakhouse & Saloon | | $ | 2,081,998 | |
72,000 | @,L | Pantry, Inc. | | 3,383,280 | |
100,100 | L | Regis Corp. | | 3,860,857 | |
160,900 | | Stage Stores, Inc. | | 4,791,602 | |
94,644 | L | Syms Corp. | | 1,366,659 | |
| | | | 24,848,035 | |
| | Savings & Loans: 2.0% | | | |
339,000 | | First Niagara Financial Group, Inc. | | 4,905,330 | |
114,400 | L | NewAlliance Bancshares, Inc. | | 1,663,376 | |
40,000 | L | WSFS Financial Corp. | | 2,450,000 | |
| | | | 9,018,706 | |
| | Semiconductors: 4.0% | | | |
190,000 | @,L | Actel Corp. | | 2,418,700 | |
113,300 | @,L | ADE Corp. | | 2,725,998 | |
75,000 | @,L | Formfactor, Inc. | | 1,832,250 | |
260,000 | @,L | Integrated Device Technology, Inc. | | 3,426,800 | |
170,700 | @,L | Micrel, Inc. | | 1,980,120 | |
132,300 | @,L | Varian Semiconductor Equipment Associates, Inc. | | 5,811,939 | |
| | | | 18,195,807 | |
| | Software: 5.7% | | | |
128,000 | @,L | Ansys, Inc. | | 5,464,320 | |
120,600 | @,L | Filenet Corp. | | 3,117,510 | |
428,100 | @ | Informatica Corp. | | 5,137,200 | |
114,500 | | MoneyGram Intl., Inc. | | 2,986,160 | |
167,000 | @ | Progress Software Corp. | | 4,739,460 | |
204,450 | @,L | THQ, Inc. | | 4,876,133 | |
| | | | 26,320,783 | |
| | Telecommunications: 1.1% | | | |
40,000 | @ | Arris Group, Inc. | | 378,800 | |
172,500 | @,L | Netgear, Inc. | | 3,320,625 | |
77,000 | L | Otelco, Inc. | | 1,215,830 | |
| | | | 4,915,255 | |
| | Textiles: 1.0% | | | |
114,700 | | G&K Services, Inc. | | 4,501,975 | |
| | | | 4,501,975 | |
| | Transportation: 1.4% | | | |
78,250 | | Forward Air Corp. | | 2,867,863 | |
104,800 | @ | HUB Group, Inc. | | 3,704,680 | |
| | | | 6,572,543 | |
| | Trucking & Leasing: 1.0% | | | |
130,800 | | GATX Corp. | | 4,719,260 | |
| | | | 4,719,260 | |
| | Total Common Stock
(Cost $386,542,199) | | 449,491,291 | |
| | | | | | |
Principal
Amount/Shares | | | | Value | |
SHORT-TERM INVESTMENT: 31.9% | | | |
| | | | | | | | |
| | Repurchase Agreement: 3.8% | | | | | | |
$ | 17,552,000 | | Goldman Sachs Repurchase
Agreement dated
12/30/05, 4.250%,
due 01/03/06, $17,560,288
to be received upon repurchase
(Collateralized by $18,340,000
Federal National Mortgage
Association, 4.610%,
Market Value plus accrued
interest $17,903,223
due 10/10/13) | | | | | $ | 17,552,000 | |
| | Total Repurchase Agreement
(Cost $17,552,000) | | | | | 17,552,000 | |
| | Securities Lending CollateralCC: 28.1% | | | | | | |
129,955,000 | | The Bank of New York Institutional Cash Reserves Fund | | | | | 129,955,000 | |
| | Total Securities Lending Collateral
(Cost $129,955,000 | | | | | 129,955,000 | |
| | Total Short-Term Investments
(Cost $147,507,000) | | | | | 147,507,000 | |
| | Total Investments In Securities
(Cost $534,049,199)* | | 129.1 | % | | $ | 596,998,291 | |
| | Other Assets and Liabilities-Net | | (29.1 | ) | | (134,530,191 | ) |
| | Net Assets | | 100.0 | % | | $ | 462,468,100 | |
| | | | | | | | | | | |
@ | | Non-income producing security | | | | | | |
@@ | | Foreign Issuer | | | | | | |
cc | | Securities purchased with cash collateral for securities loaned. | | | | | | |
L | | Loaned security, a portion or all of the security is on loan at December 31, 2005. | | | | | | |
* | | Cost for federal income tax purposes is $534,207,583. | | | | | | |
| | Net unrealized appreciation consists of: | | | | | | |
| | Gross Unrealized Appreciation | | | | | $ | 77,200,326 | |
| | Gross Unrealized Depreciation | | | | | (14,409,618 | ) |
| | Net Unrealized Appreciation | | | | | $ | 62,790,708 | |
See Accompanying Notes to Financial Statements
79
| PORTFOLIO OF INVESTMENTS |
ING VP VALUE OPPORTUNITY PORTFOLIO | AS OF DECEMBER 31, 2005 |
Shares | | | | Value | |
COMMON STOCK: 99.4% | | | |
| | | |
| | Aerospace/Defense: 1.2% | | | |
43,200 | | United Technologies Corp. | | $ | 2,415,312 | |
| | | | 2,415,312 | |
| | Agriculture: 2.4% | | | |
67,700 | | Altria Group, Inc. | | 5,058,544 | |
| | | | 5,058,544 | |
| | Apparel: 0.5% | | | |
11,000 | | Nike, Inc. | | 954,690 | |
| | | | 954,690 | |
| | Banks: 9.3% | | | |
183,100 | S | Bank of America Corp. | | 8,450,065 | |
75,000 | | Bank of New York | | 2,388,750 | |
100,500 | | Wells Fargo & Co. | | 6,314,415 | |
30,200 | | Zions Bancorporation | | 2,281,912 | |
| | | | 19,435,142 | |
| | Beverages: 1.8% | | | |
50,900 | | Coca-Cola Co. | | 2,051,779 | |
26,000 | L | Molson Coors Brewing Co. | | 1,741,740 | |
| | | | 3,793,519 | |
| | Biotechnology: 0.7% | | | |
35,600 | @,L | Charles River Laboratories Intl., Inc. | | 1,508,372 | |
| | | | 1,508,372 | |
| | Building Materials: 0.5% | | | |
22,700 | | Florida Rock Industries, Inc. | | 1,113,662 | |
| | | | 1,113,662 | |
| | Chemicals: 4.4% | | | |
85,300 | | Dow Chemical Co. | | 3,737,846 | |
52,100 | | EI Du Pont de Nemours & Co. | | 2,214,250 | |
55,400 | L | Lyondell Chemical Co. | | 1,319,628 | |
34,500 | | Praxair, Inc. | | 1,827,120 | |
| | | | 9,098,844 | |
| | Coal: 1.8% | | | |
45,200 | | Peabody Energy Corp. | | 3,725,384 | |
| | | | 3,725,384 | |
| | Computers: 1.6% | | | |
41,900 | | International Business Machines Corp. | | 3,444,180 | |
| | | | 3,444,180 | |
| | Cosmetics/Personal Care: 0.8% | | | |
57,600 | | Avon Products, Inc. | | 1,644,480 | |
| | | | 1,644,480 | |
| | Distribution/Wholesale: 0.6% | | | |
31,300 | @,L | Wesco Intl., Inc. | | 1,337,449 | |
| | | | 1,337,449 | |
| | Diversified Financial Services: 15.3% | | | |
40,025 | L | Capital One Financial Corp. | | 3,458,160 | |
120,700 | | Citigroup, Inc. | | 5,857,571 | |
138,600 | | Countrywide Financial Corp. | | 4,738,734 | |
59,300 | | Freddie Mac | | 3,875,255 | |
130,300 | | JPMorgan Chase & Co. | | 5,171,607 | |
13,700 | | Lehman Brothers Holdings, Inc. | | $ | 1,755,929 | |
57,700 | | Merrill Lynch & Co., Inc. | | 3,908,021 | |
57,000 | | Morgan Stanley | | 3,234,180 | |
| | | | 31,999,457 | |
| | Electric: 2.7% | | | |
117,500 | @ | Mirant Corp. | | 2,643,750 | |
77,700 | | Pacific Gas & Electric Co. | | 2,884,224 | |
| | | | 5,527,974 | |
| | Electronics: 1.4% | | | |
185,500 | @,@@,L | Flextronics Intl. Ltd. | | 1,936,620 | |
22,100 | @ | Thomas & Betts Corp. | | 927,316 | |
| | | | 2,863,936 | |
| | Energy-Alternate Sources: 1.3% | | | |
115,500 | @,L | KFX, Inc. | | 2,645,858 | |
| | | | 2,645,858 | |
| | Entertainment: 0.7% | | | |
81,700 | L | Regal Entertainment Group | | 1,553,934 | |
| | | | 1,553,934 | |
| | Food: 1.6% | | | |
33,200 | | McCormick & Co., Inc. | | 1,026,544 | |
73,696 | @ | Smithfield Foods, Inc. | | 2,255,098 | |
| | | | 3,281,642 | |
| | Forest Products & Paper: 1.4% | | | |
88,500 | | International Paper Co. | | 2,974,485 | |
| | | | 2,974,485 | |
| | Gas: 1.0% | | | |
45,900 | | Sempra Energy | | 2,058,156 | |
| | | | 2,058,156 | |
| | Healthcare-Services: 1.0% | | | |
54,800 | @,L | LifePoint Hospitals, Inc. | | 2,055,000 | |
| | | | 2,055,000 | |
| | Household Products/Wares: 1.0% | | | |
35,400 | | Kimberly-Clark Corp. | | 2,111,610 | |
| | | | 2,111,610 | |
| | Insurance: 8.7% | | | |
45,300 | @@ | ACE Ltd. | | 2,420,832 | |
53,600 | | American International Group, Inc. | | 3,657,128 | |
77,000 | @@,L | Axis Capital Holdings Ltd. | | 2,408,560 | |
38,000 | @@ | IPC Holdings Ltd. | | 1,040,440 | |
83,800 | | Metlife, Inc. | | 4,106,200 | |
47,300 | | St. Paul Cos. | | 2,112,891 | |
36,400 | @@ | XL Capital Ltd. | | 2,452,632 | |
| | | | 18,198,683 | |
| | Leisure Time: 1.1% | | | |
52,900 | L | Royal Caribbean Cruises Ltd. | | 2,383,674 | |
| | | | 2,383,674 | |
| | Lodging: 2.2% | | | |
32,100 | | Harrah’s Entertainment, Inc. | | 2,288,409 | |
33,400 | @,@@,L | Kerzner International Ltd. | | 2,296,250 | |
| | | | 4,584,659 | |
See Accompanying Notes to Financial Statements
80
| PORTFOLIO OF INVESTMENTS |
ING VP VALUE OPPORTUNITY PORTFOLIO | AS OF DECEMBER 31, 2005 (CONTINUED) |
Shares | | | | Value | |
| | | |
| | Media: 2.7% | | | |
18,000 | | Gannett Co., Inc. | | $ | 1,090,260 | |
62,200 | | Time Warner, Inc. | | 1,084,768 | |
63,900 | L | Tribune Co. | | 1,933,614 | |
48,800 | | Viacom, Inc. | | 1,590,880 | |
| | | | 5,699,522 | |
| | Mining: 0.8% | | | |
55,600 | | Alcoa, Inc. | | 1,644,092 | |
| | | | 1,644,092 | |
| | Miscellaneous Manufacturing: 2.0% | | | |
119,700 | | General Electric Co. | | 4,195,485 | |
| | | | 4,195,485 | |
| | Office/Business Equipment: 0.9% | | | |
127,200 | @,L | Xerox Corp. | | 1,863,480 | |
| | | | 1,863,480 | |
| | Oil & Gas: 11.5% | | | |
16,200 | | Amerada Hess Corp. | | 2,054,484 | |
30,800 | | Apache Corp. | | 2,110,416 | |
49,800 | | Cabot Oil & Gas Corp. | | 2,245,980 | |
124,900 | | Exxon Mobil Corp. | | 7,015,633 | |
43,200 | L | Global Santa Fe Corp. | | 2,080,080 | |
46,000 | @ | Newfield Exploration Co. | | 2,303,220 | |
100,000 | @ | Plains Exploration & Production Co. | | 3,973,000 | |
51,700 | | XTO Energy, Inc. | | 2,271,698 | |
| | | | 24,054,511 | |
| | Oil & Gas Services: 4.8% | | | |
81,700 | | BJ Services Co. | | 2,995,939 | |
128,700 | @ | Dresser-Rand Group, Inc. | | 3,111,966 | |
61,900 | | Halliburton Co. | | 3,835,324 | |
| | | | 9,943,230 | |
| | Pharmaceuticals: 4.2% | | | |
309,200 | | Pfizer, Inc. | | 7,210,544 | |
35,200 | | Wyeth | | 1,621,664 | |
| | | | 8,832,208 | |
| | Real Estate: 0.5% | | | |
16,100 | L | St. Joe Co. | | 1,082,242 | |
| | | | 1,082,242 | |
| | Real Estate Investment Trust: 0.8% | | | |
67,800 | | KKR Financial Corp. | | 1,626,522 | |
| | | | 1,626,522 | |
| | Retail: 2.1% | | | |
36,900 | L | Abercrombie & Fitch Co. | | 2,405,142 | |
60,600 | | McDonald’s Corp. | | 2,043,432 | |
| | | | 4,448,574 | |
| | Semiconductors: 0.8% | | | |
163,600 | @@ | Taiwan Semiconductor Manufacturing Co., Ltd. ADR | | 1,621,276 | |
| | | | 1,621,276 | |
| | Software: 1.8% | | | |
83,600 | | Microsoft Corp. | | 2,186,140 | |
125,000 | @ | Oracle Corp. | | 1,526,250 | |
| | | | 3,712,390 | |
| | Telecommunications: 1.6% | | | |
132,700 | | AT&T, Inc. | | $ | 3,249,822 | |
| | | | 3,249,822 | |
| | Total Common Stock
(Cost $187,726,919) | | 207,741,999 | |
Principal
Amount/Shares | | | | Value | |
| | | | | |
SHORT-TERM INVESTMENT: 12.1% | | | |
| | | | | | | | |
| | Repurchase Agreement: 1.4% | | | | | | |
$ | 2,825,000 | | Morgan Stanley Repurchase | | | | | | |
| | Agreement dated 12/30/05, 4.230%, | | | | | | |
| | due 01/03/06, $2,826,328 to be | | | | | | |
| | received upon repurchase | | | | | | |
| | (Collateralized by $2,875,000 Federal | | | | | | |
| | Credit Savings Bureau, 5.650%, | | | | | | |
| | Market Value plus accrued interest | | | | | | |
| | $ 2,882,235 due 12/06/12) | | | | | 2,825,000 | |
| | Total Repurchase Agreement
(Cost $2,825,000) | | | | | 2,825,000 | |
| | Securities Lending Collateralcc: 10.7% | | | | | | |
22,446,000 | | The Bank of New York Institutional
Cash Reserves Fund | | | | | 22,446,000 | |
| | Total Securities Lending
Collateral (Cost $22,446,000) | | | | | 22,446,000 | |
| | Total Short-Term Investments:
(Cost $25,271,000) | | | | | 25,271,000 | |
| | Total Investments In Securities
(Cost $212,997,919)* | | 111.5 | % | | $ | 233,012,999 | |
| | Other Assets and Liabilities-Net | | (11.5 | ) | | (24,060,000 | ) |
| | Net Assets | | 100.0 | % | | $ | 208,952,999 | |
| | | | | | | | | | | |
@ | | Non-income producing security | | | | | | |
@@ | | Foreign Issuer | | | | | | |
ADR | | American Depositary Receipt | | | | | | |
cc | | Securities purchased with cash collateral for securities loaned. | | | | | | |
S | | Segregated securities for certain derivatives, when-issued or delayed delivery securities and forward currency exchange contracts. | | | | | | |
L | | Loaned security, a portion or all of the security is on loan at December 31, 2005. | | | | | | |
* | | Cost for federal income tax purposes is $214,089,636. | | | | | | |
| | Net unrealized appreciation consists of: | | | | | | |
| | Gross Unrealized Appreciation | | | | | $ | 23,855,055 | |
| | Gross Unrealized Depreciation | | | | | (4,931,692 | ) |
| | Net Unrealized Appreciation | | | | | $ | 18,923,363 | |
See Accompanying Notes to Financial Statements
81
| PORTFOLIO OF INVESTMENTS |
ING VP INTERMEDIATE BOND PORTFOLIO | AS OF DECEMBER 31, 2005 |
Principal
Amount | | | | Value | |
CORPORATE BONDS/NOTES: 26.1% | | | |
| | | |
| | Aerospace/Defense: 0.3% | | | |
$ | 2,760,000 | | Northrop Grumman Corp.,
7.000%, due 03/01/06 | | $ | 2,769,589 | |
1,830,000 | | Northrop Grumman
Space & Mission Systems
Corp., 7.625%,
due 03/15/06 | | 1,836,513 | |
| | | | 4,606,102 | |
| | Airlines: 0.0% | | | |
976,965 | L,** | United Airlines, Inc.,
6.602%, due 09/01/13 | | 965,245 | |
| | | | 965,245 | |
| | Banks: 5.4% | | | |
5,760,000 | @@,L | Australia & New Zealand
Banking Group Ltd.,
4.588%, due 10/29/49 | | 4,934,241 | |
2,628,138 | @@,# | Banco Itau SA/Cayman
Islands, 4.320%, due
09/20/08 | | 2,611,581 | |
2,377,000 | @@,#,S | Banco Santander Chile SA,
4.810%, due 12/09/09 | | 2,371,302 | |
3,662,000 | @@,S | Banco Santander Chile SA,
7.375%, due 07/18/12 | | 4,082,189 | |
2,270,000 | @@ | Bank of Ireland, 4.750%,
due 12/29/49 | | 1,970,081 | |
2,440,000 | @@ | Bank of Nova Scotia,
4.250%, due 08/21/85 | | 2,065,150 | |
1,030,000 | @@ | Bank of Scotland, 3.750%,
due 11/30/49 | | 890,950 | |
342,000 | S | BankAmerica Capital II,
8.000%, due 12/15/26 | | 363,317 | |
2,089,000 | @@,S | Barclays Bank PLC, 6.278%,
due 12/15/49 | | 2,103,393 | |
3,692,000 | @@,# | Chuo Mitsui Trust &
Banking Co., Ltd./The,
5.506%, due 04/15/49 | | 3,583,983 | |
1,877,000 | @@,# | Danske Bank A/S, 5.914%,
due 12/29/49 | | 1,967,092 | |
3,310,000 | @@,L | Den Norske Bank ASA,
4.186%, due 08/29/49 | | 2,788,675 | |
3,174,000 | # | Dresdner Funding Trust I,
8.151%, due 06/30/31 | | 3,914,110 | |
1,667,000 | # | First Chicago NBD
Institutional Capital A,
7.950%, due 12/01/26 | | 1,764,333 | |
2,388,000 | @@,S | First Citizens St Lucia Ltd.,
5.460%, due 02/01/12 | | 2,377,082 | |
2,000 | S | Fleet Capital Trust II,
7.920%, due 12/11/26 | | 2,122 | |
7,282,000 | @@,# | HBOS PLC, 5.375%, due
11/29/49 | | 7,279,531 | |
5,930,000 | @@ | HSBC Bank PLC, 4.788%,
due 06/29/49 | | 4,981,200 | |
3,216,000 | | Huntington Capital Trust I,
4.943%, due 02/01/27 | | 3,060,963 | |
3,250,000 | @@ | Lloyds TSB Bank PLC,
4.160%, due 08/29/49 | | 2,827,893 | |
3,023,000 | S | M&T Bank Corp., 3.850%,
due 04/01/13 | | 2,954,910 | |
2,208,000 | | Mellon Capital I, 7.720%,
due 12/01/26 | | 2,339,343 | |
$ | 2,110,000 | @@,L | Mizuho Financial Group
Cayman Ltd., 8.375%,
due 12/31/49 | | $ | 2,287,514 | |
2,280,000 | @@ | National Australia Bank
Ltd., 4.525%,
due 10/29/49 | | 1,946,422 | |
2,766,000 | S | PNC Funding Corp.,
4.500%, due 03/10/10 | | 2,715,758 | |
1,763,000 | # | Rabobank Capital Funding
Trust, 5.254%,
due 12/29/49 | | 1,732,185 | |
24,000 | @@,# | Resona Bank Ltd., 5.850%,
due 09/01/49 | | 23,944 | |
6,990,000 | @@ | Royal Bank of Scotland
Group PLC, 4.875%,
due 12/29/49 | | 6,085,347 | |
2,300,000 | @@ | Societe Generale, 4.656%,
due 11/29/49 | | 1,972,475 | |
4,080,000 | @@ | Standard Chartered PLC,
4.813%, due 07/29/49 | | 3,274,200 | |
8,890,000 | @@,L | Standard Chartered PLC,
4.875%, due 11/29/49 | | 7,112,000 | |
3,401,000 | @@ | Sumitomo Mitsui Banking
Corp., 8.150%,
due 08/01/49 | | 3,609,505 | |
542,000 | S | Wachovia Corp., 5.500%,
due 08/01/35 | | 529,974 | |
2,580,000 | @@ | Westpac Banking Corp.,
4.369%, due 09/30/49 | | 2,169,254 | |
| | | | 94,692,019 | |
| | Beverages: 0.2% | | | |
3,740,000 | @@,S | Cia Brasileira de Bebidas,
8.750%, due 09/15/13 | | 4,389,825 | |
| | | | 4,389,825 | |
| | Building Materials: 0.2% | | | |
3,260,000 | | Masco Corp., 6.750%,
due 03/15/06 | | 3,271,671 | |
| | | | 3,271,671 | |
| | Chemicals: 0.5% | | | |
846,000 | @@,#,S | Sociedad Quimica y
Minera de Chile SA,
7.700%, due 09/15/06 | | 859,507 | |
900,000 | | Stauffer Chemical,
0.000%, due 04/15/10 | | 722,709 | |
1,950,000 | | Stauffer Chemical,
0.000%, due 04/15/17 | | 1,046,331 | |
6,171,000 | | Union Carbide Corp.,
7.750%, due 10/01/96 | | 6,629,351 | |
| | | | 9,257,898 | |
| | Commercial Services: 0.4% | | | |
6,900,000 | | Tulane University of
Louisiana, 5.168%,
due 11/15/12 | | 6,924,150 | |
| | | | 6,924,150 | |
| | Diversified Financial Services: 8.6% | | | |
2,572,000 | @@,#,I,S | Alpine III, 10.340%,
due 08/16/14 | | 2,645,181 | |
1,005,000 | @@,#,I,S | Alpine III, 4.882%,
due 08/16/14 | | 1,007,707 | |
See Accompanying Notes to Financial Statements
82
| PORTFOLIO OF INVESTMENTS |
ING VP INTERMEDIATE BOND PORTFOLIO | AS OF DECEMBER 31, 2005 (CONTINUED) |
Principal
Amount | | | | Value | |
| | Diversified Financial
Services (continued) | | | |
$ | 1,005,000 | @@,#,I,S | Alpine III, 5.290%,
due 08/16/14 | | $ | 1,007,731 | |
1,505,000 | @@,#,I,S | Alpine III, 7.090%,
due 08/16/14 | | 1,512,396 | |
1,125,065 | @@,#,S | Arcel Finance Ltd.,
5.984%, due 02/01/09 | | 1,138,284 | |
1,885,000 | @@,#,S | Arcel Finance Ltd.,
6.361%, due 05/01/12 | | 1,857,453 | |
2,060,754 | @@,# | Arcel Finance Ltd.,
7.048%, due 09/01/11 | | 2,209,209 | |
1,020,000 | #,S | Army Hawaii Family
Housing Trust
Certificates, 5.524%,
due 06/15/50 | | 1,052,171 | |
745,000 | #,S | Army Hawaii Family
Housing Trust
Certificates, 5.624%,
due 06/15/50 | | 769,391 | |
8,867,000 | # | Astoria Depositor Corp.,
8.144%, due 05/01/21 | | 9,204,434 | |
5,386,871 | #,S | Astoria Depositor Corp.,
7.902%, due 05/01/21 | | 5,523,993 | |
4,641,986 | @@,#,S | Brazilian Merchant
Voucher Receivables Ltd.,
5.911%, due 06/15/11 | | 4,659,393 | |
5,031,000 | @@,#,S | BTM Curacao Holdings NV,
4.760%, due 07/21/15 | | 4,939,909 | |
3,288,000 | S | Citigroup Capital II,
7.750%, due 12/01/36 | | 3,460,061 | |
4,538,000 | #,S | Corestates Capital Trust I,
8.000%, due 12/15/26 | | 4,811,818 | |
11,550,000 | L | Countrywide Financial
Corp., 4.720%,
due 04/11/07 | | 11,561,515 | |
2,555,000 | @@ | Financiere CSFB NV,
4.688%, due 03/29/49 | | 2,133,425 | |
3,151,000 | | Fund American Cos, Inc.,
5.875%, due 05/15/13 | | 3,184,265 | |
6,827,000 | | General Motors Acceptance
Corp., 7.000%,
due 02/01/12 | | 6,198,977 | |
5,152,000 | | General Motors Acceptance
Corp., 8.000%,
due 11/01/31 | | 4,948,079 | |
2,895,000 | S | Goldman Sachs Group, Inc.,
4.620%, due 03/02/10 | | 2,898,338 | |
3,231,000 | #,S | HVB Funding Trust III,
9.000%, due 10/22/31 | | 4,371,401 | |
1,371,000 | S | International Lease
Finance Corp., 5.000%,
due 04/15/10 | | 1,364,957 | |
2,581,000 | | JPM Capital Trust I,
7.540%, due 01/15/27 | | 2,726,300 | |
2,861,000 | | JPM Capital Trust II,
7.950%, due 02/01/27 | | 3,048,828 | |
6,383,000 | #,S | Mangrove Bay
Pass-Through Trust,
6.102%, due 07/15/33 | | 6,355,323 | |
3,544,000 | @@,#,S | Mantis Reef Ltd., 4.799%,
due 11/03/09 | | 3,475,519 | |
7,703,000 | | Morgan Stanley, 4.465%,
due 02/15/07 | | 7,713,060 | |
$ | 3,900,000 | @@ | Paribas, 4.625%,
due 12/31/49 | | $ | 3,370,992 | |
1,987,000 | @@,S | Petroleum Export Ltd.,
4.623%, due 06/15/10 | | 1,969,381 | |
2,430,000 | @@,#,S | Petroleum Export Ltd/
Cayman SPV, 5.265%,
due 06/15/11 | | 2,409,724 | |
6,073,628 | @@,#,S | PF Export Receivables
Master Trust, 6.436%,
due 06/01/15 | | 6,068,070 | |
5,154,000 | # | Piper Jaffray Equipment
Trust Securities, 7.000%,
due 09/10/13 | | 4,818,990 | |
1,113,000 | | Residential Capital Corp.,
6.375%, due 06/30/10 | | 1,132,029 | |
1,085,000 | L | Residential Capital Corp.,
6.875%, due 06/30/15 | | 1,154,922 | |
JPY1,900,000,000 | @@ | Takefuji Corp., 1.000%,
due 03/01/34 | | 8,547,827 | |
$ | 18,000,000 | # | Toll Road Investment,
0.000%, due 02/15/45 | | 2,198,286 | |
2,400,000 | # | Twin Reefs Pass-Through
Trust, 5.420%,
due 12/10/49 | | 2,402,568 | |
3,505,000 | @@,L | UFJ Finance Aruba AEC,
8.750%, due 12/31/49 | | 3,809,350 | |
2,105,000 | # | Wachovia Capital Trust V,
7.965%, due 06/01/27 | | 2,256,956 | |
5,157,000 | #,L | ZFS Finance USA Trust I,
6.450%, due 12/15/65 | | 5,238,553 | |
| | | | 151,156,766 | |
| | Electric: 2.7% | | | |
4,374,668 | S | CE Generation LLC,
7.416%, due 12/15/18 | | 4,705,261 | |
4,440,000 | S | Consumers Energy Co.,
4.250%, due 04/15/08 | | 4,350,934 | |
5,021,000 | @@,L,S | Empresa Nacional de
Electricidad SA, 8.625%,
due 08/01/15 | | 5,891,375 | |
3,892,000 | S | Entergy Gulf States, Inc.,
5.120%, due 08/01/10 | | 3,800,351 | |
3,409,000 | | Enterprise Capital Trust II,
5.747%, due 06/30/28 | | 3,383,402 | |
3,012,000 | L | FirstEnergy Corp., 6.450%,
due 11/15/11 | | 3,196,605 | |
5,193,000 | S | FirstEnergy Corp., 7.375%,
due 11/15/31 | | 6,146,855 | |
1,878,771 | #,S | Juniper Generation,
6.790%, due 12/31/14 | | 1,833,399 | |
2,534,000 | @@,+ | Korea Electric Power Corp.,
0.000%, due 04/01/96 | | 1,533,070 | |
2,580,000 | #,L | Mirant North America LLC,
7.375%, due 12/31/13 | | 2,621,925 | |
2,687,000 | | NorthWestern Corp.,
5.875%, due 11/01/14 | | 2,705,487 | |
2,284,000 | S | Potomac Edison Co.,
5.000%, due 11/01/06 | | 2,287,540 | |
1,687,000 | #,S | Power Contract Financing
LLC, 6.256%,
due 02/01/10 | | 1,712,766 | |
672,615 | S | PPL Montana LLC, 8.903%,
due 07/02/20 | | 775,844 | |
See Accompanying Notes to Financial Statements
83
| PORTFOLIO OF INVESTMENTS |
ING VP INTERMEDIATE BOND PORTFOLIO | AS OF DECEMBER 31, 2005 (CONTINUED) |
Principal
Amount | | | | Value | |
| | Electric (continued) | | | |
$ | 878,000 | S | Sierra Pacific Power Co.,
6.250%, due 04/15/12 | | $ | 895,560 | |
1,169,952 | # | Tenaska Virginia Partners
LP, 6.119%, due 03/30/24 | | 1,216,481 | |
| | | | 47,056,855 | |
| | Food: 0.4% | | | |
996,000 | | Delhaize America, Inc.,
8.050%, due 04/15/27 | | 1,026,866 | |
1,303,000 | | Delhaize America, Inc.,
8.125%, due 04/15/11 | | 1,426,872 | |
4,678,000 | S | Tyson Foods, Inc., 7.250%,
due 10/01/06 | | 4,753,760 | |
| | | | 7,207,498 | |
| | Foreign Government Bonds: 0.7% | | | |
11,900,000 | @@ | KAUP BANK, 6.600%,
due 12/28/15 | | 11,959,832 | |
| | | | 11,959,832 | |
| | Forest Products & Paper: 0.1% | | | |
2,020,000 | | Georgia-Pacific Corp.,
7.250%, due 06/01/28 | | 1,800,325 | |
| | | | 1,800,325 | |
| | Gas: 0.2% | | | |
2,895,000 | #,S | Williams Gas Pipelines
Central, Inc., 7.375%,
due 11/15/06 | | 2,965,974 | |
| | | | 2,965,974 | |
| | Home Builders: 0.0% | | | |
117,000 | S | Technical Olympic USA, Inc.,
9.000%, due 07/01/10 | | 118,901 | |
| | | | 118,901 | |
| | Insurance: 0.9% | | | |
4,180,000 | L | AON Capital Trust,
8.205%, due 01/01/27 | | 4,978,673 | |
1,741,000 | # | North Front Pass - Thru,
5.810%, due 12/15/24 | | 1,745,622 | |
2,144,000 | +,S | Prudential Financial, Inc.,
4.104%, due 11/15/06 | | 2,130,366 | |
6,033,000 | # | Zurich Capital Trust I,
8.376%, due 06/01/37 | | 6,531,440 | |
| | | | 15,386,101 | |
| | Media: 0.6% | | | |
2,154,000 | L | Comcast Corp., 5.650%,
due 06/15/35 | | 1,988,758 | |
2,308,000 | S | Cox Communications, Inc.,
6.850%, due 01/15/18 | | 2,426,807 | |
5,644,000 | # | News America, Inc.,
6.400%, due 12/15/35 | | 5,707,783 | |
| | | | 10,123,348 | |
| | Mining: 0.2% | | | |
2,435,000 | @@ | Vale Overseas Ltd.,
8.250%, due 01/17/34 | | 2,815,469 | |
| | | | 2,815,469 | |
| | Multi-National: 0.1% | | | |
$ | 2,250,000 | @@,S | Corp Andina de Fomento,
5.125%, due 05/05/15 | | $ | 2,220,158 | |
| | | | 2,220,158 | |
| | Oil & Gas: 1.3% | | | |
2,311,000 | S | Amerada Hess Corp.,
6.650%, due 08/15/11 | | 2,486,204 | |
2,282,000 | @@,#,S | Empresa Nacional de
Petroleo ENAP, 4.875%,
due 03/15/14 | | 2,193,691 | |
1,583,000 | @@,#,S | Empresa Nacional de
Petroleo ENAP, 6.750%,
due 11/15/12 | | 1,707,235 | |
2,568,000 | @@ | Husky Oil Co., 8.900%,
due 08/15/28 | | 2,767,243 | |
1,000 | @@ | Nexen, Inc., 5.200%,
due 03/10/15 | | 993 | |
1,156,000 | #,L,S | Pemex Project Funding
Master Trust, 5.750%,
due 12/15/15 | | 1,151,665 | |
4,600,000 | #,S | Pemex Project Funding
Master Trust, 5.791%,
due 06/15/10 | | 4,772,500 | |
3,777,000 | @@,# | Ras Laffan Liquefied Natural Gas Co. Ltd. II, 5.298%, due 09/30/20 | | 3,755,339 | |
1,648,000 | @@,# | Ras Laffan LNG III, 5.838%,
due 09/30/27 | | 1,658,346 | |
3,046,000 | @@,#,S | Tengizchevroil, 6.124%,
due 11/15/14 | | 3,113,012 | |
| | | | 23,606,228 | |
| | Pharmaceuticals: 0.2% | | | |
2,923,000 | S | AmerisourceBergen Corp.,
5.625%, due 09/15/12 | | 2,937,615 | |
1,073,000 | #,S | AmerisourceBergen Corp.,
5.875%, due 09/15/15 | | 1,087,754 | |
| | | | 4,025,369 | |
| | Pipelines: 0.6% | | | |
7,975,000 | # | Cameron Highway Oil
Pipeline, 5.860%,
due 12/15/17 | | 8,054,750 | |
3,340,000 | # | Kinder Morgan Finance
Co. ULC, 5.350%,
due 01/05/11 | | 3,348,413 | |
| | | | 11,403,163 | |
| | Real Estate: 0.2% | | | |
3,162,000 | S | EOP Operating LP, 7.750%,
due 11/15/07 | | 3,313,700 | |
| | | | 3,313,700 | |
| | Real Estate Investment Trust: 0.6% | | | |
590,000 | S | Liberty Property LP,
6.375%, due 08/15/12 | | 622,795 | |
3,011,000 | S | Liberty Property LP,
7.750%, due 04/15/09 | | 3,238,496 | |
2,651,000 | S | Simon Property Group LP,
4.875%, due 03/18/10 | | 2,619,090 | |
4,162,000 | S | Simon Property Group LP,
6.375%, due 11/15/07 | | 4,254,767 | |
| | | | 10,735,148 | |
See Accompanying Notes to Financial Statements
84
| PORTFOLIO OF INVESTMENTS |
ING VP INTERMEDIATE BOND PORTFOLIO | AS OF DECEMBER 31, 2005 (CONTINUED) |
Principal
Amount | | | | Value | |
| | Retail: 0.2% | | | |
$ | 3,550,000 | S | May Department Stores
Co., 3.950%,
due 07/15/07 | | $ | 3,492,068 | |
| | | | 3,492,068 | |
| | Savings & Loans: 0.1% | | | |
2,343,000 | | Great Western Financial,
8.206%, due 02/01/27 | | 2,502,652 | |
| | | | 2,502,652 | |
| | Telecommunications: 0.9% | | | |
2,243,000 | S | AT&T Corp., 9.750%,
due 11/15/31 | | 2,825,841 | |
2,913,000 | S | BellSouth Corp., 4.200%,
due 09/15/09 | | 2,832,030 | |
1,892,000 | @@,L,S | Deutsche Telekom
International Finance BV,
8.000%, due 06/15/10 | | 2,147,104 | |
948,000 | S | New Cingular Wireless
Services, Inc., 8.125%,
due 05/01/12 | | 1,096,727 | |
1,563,000 | +,S | Sprint Capital Corp.,
4.780%, due 08/17/06 | | 1,561,981 | |
2,258,000 | @@,S | Telefonos de Mexico SA de
CV, 4.750%, due 01/27/10 | | 2,229,549 | |
3,191,000 | L | Verizon Global Funding
Corp., 5.850%,
due 09/15/35 | | 3,085,665 | |
| | | | 15,778,897 | |
| | Transportation: 0.5% | | | |
5,932,000 | L | BNSF Funding Trust I,
6.613%, due 12/15/55 | | 6,198,525 | |
2,421,000 | @@,#,S | MISC Capital Ltd., 5.000%,
due 07/01/09 | | 2,413,563 | |
| | | | 8,612,088 | |
| | Total Corporate Bonds/Notes
(Cost $461,621,969) | | 460,387,450 | |
U.S. GOVERNMENT AGENCY OBLIGATIONS: 30.1% | | | |
| | Federal Home Loan Bank: 1.4% | | | |
16,965,000 | L | 3.250%, due 12/17/07 | | 16,511,068 | |
8,440,000 | L | 4.125%, due 10/19/07 | | 8,355,938 | |
| | | | 24,867,006 | |
| | Federal Home Loan
Mortgage Corporation: 8.2% | | | |
8,386,000 | L | 3.875%, due 06/15/08 | | 8,224,628 | |
8,370,000 | L | 4.000%, due 08/17/07 | | 8,275,319 | |
17,411,000 | | 4.375%, due 11/16/07 | | 17,303,000 | |
7,571,000 | | 4.500%, due 02/15/20 | | 7,170,228 | |
3,171,854 | S | 4.500%, due 12/15/16 | | 3,133,632 | |
16,594,000 | L | 4.625%, due 12/19/08 | | 16,565,657 | |
7,682,000 | | 5.000%, due 04/15/23 | | 7,517,008 | |
1,615,000 | | 5.000%, due 05/15/20 | | 1,593,538 | |
9,697,865 | | 5.000%, due 08/15/16 | | 9,629,430 | |
8,885,183 | | 5.000%, due 08/15/21 | | 8,830,963 | |
7,634,587 | | 5.019%, due 04/15/32 | | 7,700,544 | |
1,571,297 | | 5.038%, due 04/01/35 | | 1,544,163 | |
5,289,052 | | 5.220%, due 06/01/35 | | 5,236,196 | |
4,549,802 | | 5.500%, due 11/15/18 | | 4,600,644 | |
10,131,000 | S,W | 5.500%, due 01/01/34 | | 10,039,193 | |
$ | 6,385,000 | | 5.875%, due 03/21/11 | | $ | 6,660,864 | |
6,717,261 | S | 6.000%, due 01/15/29 | | 6,810,856 | |
5,136,000 | S | 6.000%, due 01/15/29 | | 5,244,298 | |
8,687,239 | S | 6.000%, due 01/15/29 | | 8,888,506 | |
695,011 | | 7.500%, due 11/01/28 | | 731,098 | |
| | | | 145,699,765 | |
| | Federal National Mortgage
Association: 20.0% | | | |
16,841,000 | | 3.875%, due 07/15/08 | | 16,511,540 | |
5,014,000 | L | 4.250%, due 09/15/07 | | 4,975,096 | |
10,852,000 | S,W | 4.500%, due 01/15/19 | | 10,560,353 | |
497,000 | S,W | 4.500%, due 11/15/36 | | 468,112 | |
2,330,474 | | 4.519%, due 04/25/35 | | 2,333,815 | |
3,677,446 | | 4.639%, due 08/01/35 | | 3,601,547 | |
6,474,000 | | 4.750%, due 12/25/42 | | 6,447,284 | |
5,024,420 | | 4.818%, due 08/01/35 | | 4,945,979 | |
11,988,000 | S,W | 5.000%, due 01/15/20 | | 11,860,628 | |
104,001,000 | S,W | 5.000%, due 01/15/36 | | 100,783,417 | |
2,023,835 | | 5.048%, due 04/01/35 | | 2,027,616 | |
1,828,495 | | 5.093%, due 07/01/35 | | 1,805,613 | |
7,560,608 | | 5.148%, due 09/01/35 | | 7,539,952 | |
8,187,000 | | 5.250%, due 08/01/12 | | 8,276,926 | |
1,597,250 | | 5.306%, due 08/01/35 | | 1,585,876 | |
23,222,000 | S,W | 5.500%, due 01/12/36 | | 22,997,025 | |
16,893,130 | S,W | 5.500%, due 01/15/20 | | 16,998,712 | |
53,958 | | 5.500%, due 02/01/18 | | 54,348 | |
20,443 | | 5.500%, due 04/01/17 | | 20,590 | |
14,156 | | 5.500%, due 06/01/18 | | 14,255 | |
88,397 | | 5.500%, due 10/01/18 | | 89,036 | |
31,541 | | 5.500%, due 11/01/16 | | 31,782 | |
4,866,910 | | 5.500%, due 11/01/32 | | 4,834,161 | |
16,285,375 | | 5.500%, due 11/01/33 | | 16,175,795 | |
12,850,533 | L | 5.500%, due 11/01/33 | | 12,760,310 | |
140,876 | | 5.500%, due 12/01/16 | | 141,952 | |
170,372 | | 6.000%, due 01/01/17 | | 174,211 | |
276,297 | | 6.000%, due 01/01/17 | | 282,520 | |
818,000 | S,W | 6.000%, due 01/15/19 | | 835,638 | |
34,104,000 | S,W | 6.000%, due 01/15/34 | | 34,423,725 | |
157,300 | | 6.000%, due 02/01/17 | | 160,843 | |
11,882 | | 6.000%, due 02/01/17 | | 12,150 | |
3,660 | | 6.000%, due 02/01/17 | | 3,742 | |
11,153 | | 6.000%, due 02/01/18 | | 11,404 | |
201,639 | | 6.000%, due 04/01/17 | | 206,180 | |
227,352 | | 6.000%, due 04/01/17 | | 232,472 | |
176,602 | | 6.000%, due 04/01/17 | | 180,580 | |
276,361 | | 6.000%, due 04/01/17 | | 282,586 | |
551,563 | | 6.000%, due 04/01/18 | | 563,952 | |
175,845 | | 6.000%, due 05/01/17 | | 179,805 | |
141,575 | | 6.000%, due 05/01/17 | | 144,764 | |
143,318 | | 6.000%, due 05/01/17 | | 146,546 | |
130,730 | | 6.000%, due 05/01/17 | | 133,674 | |
191,630 | | 6.000%, due 06/01/16 | | 195,948 | |
237,414 | | 6.000%, due 06/01/17 | | 242,761 | |
56,487 | | 6.000%, due 06/01/17 | | 57,760 | |
248,440 | | 6.000%, due 07/01/17 | | 254,036 | |
240,796 | | 6.000%, due 07/01/17 | | 246,219 | |
6,785 | | 6.000%, due 08/01/16 | | 6,938 | |
19,389 | | 6.000%, due 08/01/16 | | 19,826 | |
154,823 | | 6.000%, due 08/01/17 | | 158,310 | |
138,844 | | 6.000%, due 08/01/17 | | 141,964 | |
267,013 | | 6.000%, due 08/01/17 | | 273,027 | |
163,463 | | 6.000%, due 08/01/17 | | 167,145 | |
549,720 | | 6.000%, due 09/01/17 | | 562,101 | |
1,838,345 | | 6.000%, due 09/01/17 | | 1,879,750 | |
See Accompanying Notes to Financial Statements
85
| PORTFOLIO OF INVESTMENTS |
ING VP INTERMEDIATE BOND PORTFOLIO | AS OF DECEMBER 31, 2005 (CONTINUED) |
Principal
Amount | | | | Value | |
| | Federal National Mortgage
Association (continued) | | | |
$ | 159,289 | | 6.000%, due 09/01/18 | | $ | 162,873 | |
133,219 | | 6.000%, due 10/01/16 | | 136,221 | |
239,291 | | 6.000%, due 10/01/16 | | 244,682 | |
10,844 | | 6.000%, due 10/01/17 | | 11,088 | |
599,396 | | 6.000%, due 11/01/17 | | 612,902 | |
169,583 | | 6.000%, due 11/01/18 | | 173,398 | |
235,682 | | 6.000%, due 12/01/18 | | 240,993 | |
5,756,440 | S | 6.000%, due 04/25/31 | | 5,913,163 | |
3,346,056 | S | 6.000%, due 07/25/29 | | 3,414,676 | |
7,870,741 | S | 6.000%, due 07/25/29 | | 8,030,294 | |
1,042,000 | S,W | 6.000%, due 01/15/36 | | 1,052,420 | |
320,156 | | 6.500%, due 01/01/32 | | 329,197 | |
11,805,000 | S,W | 6.500%, due 01/15/35 | | 12,111,198 | |
3,323,098 | | 6.500%, due 08/01/29 | | 3,423,231 | |
219,199 | | 6.500%, due 09/01/32 | | 225,346 | |
170,150 | | 6.500%, due 10/01/32 | | 174,921 | |
365,886 | | 6.500%, due 10/01/32 | | 376,146 | |
7,511,000 | L | 6.625%, due 11/15/10 | | 8,125,295 | |
275,043 | | 7.000%, due 01/01/30 | | 287,358 | |
73,265 | | 7.000%, due 02/01/26 | | 76,684 | |
30,770 | | 7.000%, due 02/01/26 | | 32,205 | |
27,380 | | 7.000%, due 03/01/26 | | 28,658 | |
41,607 | | 7.000%, due 03/01/26 | | 43,545 | |
56,558 | | 7.000%, due 03/01/26 | | 59,197 | |
22,196 | | 7.000%, due 03/01/26 | | 23,230 | |
90,603 | | 7.000%, due 03/01/26 | | 94,824 | |
3,329,445 | | 7.000%, due 06/01/31 | | 3,480,955 | |
24,820 | | 7.000%, due 08/01/25 | | 25,978 | |
179,025 | | 7.000%, due 08/01/35 | | 186,838 | |
13,584 | | 7.000%, due 10/01/25 | | 14,218 | |
4,443 | | 7.000%, due 11/01/25 | | 4,650 | |
45,552 | | 7.000%, due 12/01/25 | | 47,678 | |
15,663 | | 7.000%, due 12/01/25 | | 16,394 | |
35,253 | | 7.000%, due 12/01/25 | | 36,898 | |
181,301 | | 7.500%, due 10/01/30 | | 190,063 | |
69,566 | | 7.500%, due 11/01/30 | | 72,928 | |
38,416 | | 7.500%, due 11/01/30 | | 40,273 | |
2,339,606 | | 7.500%, due 01/25/48 | | 2,439,732 | |
306,899 | S | 10.000%, due 02/25/19 | | 337,727 | |
| | | | 352,320,374 | |
| | Government National
Mortgage Association: 0.5% | | | |
138,965 | | 4.125%, due 12/20/29 | | 138,314 | |
203,361 | | 4.375%, due 04/20/28 | | 204,184 | |
3,774,920 | | 6.500%, due 10/15/31 | | 3,946,724 | |
103,088 | | 7.000%, due 04/15/26 | | 108,553 | |
127,832 | | 7.000%, due 04/15/26 | | 134,608 | |
129,465 | | 7.000%, due 04/15/26 | | 136,328 | |
228,319 | | 7.000%, due 04/15/26 | | 240,422 | |
270,678 | | 7.000%, due 05/15/32 | | 284,249 | |
19,570 | | 7.500%, due 01/15/26 | | 20,638 | |
47,313 | | 7.500%, due 01/15/30 | | 49,782 | |
1,124 | | 7.500%, due 01/15/31 | | 1,183 | |
1,178 | | 7.500%, due 01/15/31 | | 1,239 | |
100,968 | | 7.500%, due 01/15/32 | | 106,243 | |
720 | | 7.500%, due 02/15/30 | | 757 | |
94,331 | | 7.500%, due 02/15/30 | | 99,253 | |
23,202 | | 7.500%, due 02/15/31 | | 24,406 | |
633 | | 7.500%, due 02/15/31 | | 666 | |
2,869 | | 7.500%, due 02/15/31 | | 3,018 | |
842 | | 7.500%, due 02/15/31 | | 885 | |
1,013 | | 7.500%, due 02/15/31 | | 1,066 | |
41,922 | | 7.500%, due 03/15/29 | | 44,126 | |
$ | 18,159 | | 7.500%, due 03/15/31 | | $ | 19,101 | |
4,782 | | 7.500%, due 03/15/31 | | 5,030 | |
18,974 | | 7.500%, due 03/15/32 | | 19,958 | |
85,124 | | 7.500%, due 03/15/32 | | 89,571 | |
36,328 | | 7.500%, due 04/15/22 | | 38,490 | |
62,271 | | 7.500%, due 04/15/29 | | 65,546 | |
15,877 | | 7.500%, due 04/15/31 | | 16,701 | |
2,161 | | 7.500%, due 04/15/32 | | 2,273 | |
11,673 | | 7.500%, due 05/15/22 | | 12,368 | |
78,943 | | 7.500%, due 05/15/30 | | 83,063 | |
47,096 | | 7.500%, due 05/15/32 | | 49,540 | |
6,351 | | 7.500%, due 06/15/22 | | 6,729 | |
3,166 | | 7.500%, due 06/15/22 | | 3,355 | |
6,261 | | 7.500%, due 06/15/24 | | 6,619 | |
5,119 | | 7.500%, due 06/15/24 | | 5,411 | |
10,811 | | 7.500%, due 06/15/30 | | 11,375 | |
18,777 | | 7.500%, due 06/15/30 | | 19,757 | |
8,277 | | 7.500%, due 06/15/32 | | 8,706 | |
105,418 | | 7.500%, due 06/15/32 | | 110,886 | |
2,201 | | 7.500%, due 07/15/26 | | 2,322 | |
1,829 | | 7.500%, due 07/15/30 | | 1,924 | |
885 | | 7.500%, due 07/15/30 | | 932 | |
37,268 | | 7.500%, due 07/15/30 | | 39,213 | |
67,476 | | 7.500%, due 07/15/32 | | 70,976 | |
6,356 | | 7.500%, due 08/15/22 | | 6,734 | |
178,173 | | 7.500%, due 08/15/29 | | 187,541 | |
881 | | 7.500%, due 08/15/30 | | 927 | |
426 | | 7.500%, due 08/15/30 | | 448 | |
43,404 | | 7.500%, due 08/15/30 | | 45,668 | |
90,450 | | 7.500%, due 08/15/32 | | 95,142 | |
14,793 | | 7.500%, due 09/15/29 | | 15,571 | |
2,996 | | 7.500%, due 09/15/31 | | 3,152 | |
803,524 | | 7.500%, due 09/15/32 | | 845,210 | |
39,259 | | 7.500%, due 10/15/29 | | 41,323 | |
43,645 | | 7.500%, due 10/15/30 | | 45,923 | |
861 | | 7.500%, due 11/15/30 | | 906 | |
2,304 | | 7.500%, due 11/15/30 | | 2,424 | |
1,043 | | 7.500%, due 11/15/30 | | 1,098 | |
1,009 | | 7.500%, due 11/15/30 | | 1,061 | |
58,357 | | 7.500%, due 12/15/29 | | 61,433 | |
652,702 | | 7.500%, due 12/15/31 | | 686,730 | |
| | | | 8,277,778 | |
| | Total U.S. Government
Agency Obligations
(Cost $533,098,980) | | 531,164,923 | |
U.S. TREASURY OBLIGATIONS: 21.5% | | | |
| | U.S. Treasury Bonds: 3.8% | | | |
15,048,000 | L | 5.375%, due 02/15/31 | | 16,907,843 | |
14,216,000 | L | 6.000%, due 02/15/26 | | 16,768,227 | |
13,808,000 | L | 7.250%, due 05/15/16 | | 16,959,041 | |
12,016,000 | L,S | 9.250%, due 02/15/16 | | 16,655,774 | |
| | | | 67,290,885 | |
| | U.S. Treasury Notes: 17.7% | | | |
65,857,000 | L | 4.250%, due 11/30/07 | | 65,684,652 | |
19,336,000 | L | 4.375%, due 11/15/08 | | 19,345,069 | |
162,545,000 | L | 4.375%, due 12/15/10 | | 162,722,824 | |
55,750,000 | L | 4.500%, due 11/15/15 | | 56,224,767 | |
12,740,000 | S | 0.000%, due 05/15/16 | | 7,990,260 | |
| | | | 311,967,572 | |
| | Total U.S. Treasury
Obligations (Cost
$378,126,608) | | 379,258,457 | |
See Accompanying Notes to Financial Statements
86
| PORTFOLIO OF INVESTMENTS |
ING VP INTERMEDIATE BOND PORTFOLIO | AS OF DECEMBER 31, 2005 (CONTINUED) |
Principal
Amount | | | | Value | |
ASSET-BACKED SECURITIES: 4.9% | | | |
| | Automobile Asset Backed Securities: 1.2% | | | |
$ | 3,913,464 | | Capital Auto Receivables
Asset Trust, 2.750%,
due 04/16/07 | | $ | 3,890,315 | |
5,858,000 | | Carmax Auto Owner Trust,
4.210%, due 01/15/10 | | 5,796,654 | |
888,000 | | Honda Auto Receivables
Owner Trust, 2.790%, due 03/16/09 | | 869,004 | |
1,851,000 | | Honda Auto Receivables
Owner Trust, 3.820%, due 05/21/10 | | 1,809,125 | |
4,076,790 | | Nissan Auto Receivables
Owner Trust, 2.610%,
due 07/15/08 | | 4,025,109 | |
4,773,000 | | Nissan Auto Receivables
Owner Trust, 4.190%,
due 07/15/09 | | 4,725,729 | |
| | | | 21,115,936 | |
| | Credit Card Asset Backed Securities: 0.8% | | | |
8,800,000 | | Citibank Credit Card
Issuance Trust, 5.650%,
due 06/16/08 | | 8,838,418 | |
374,000 | | Citibank Credit Card
Master Trust I, 5.875%,
due 03/10/11 | | 385,650 | |
3,460,000 | | Fleet Credit Card Master
Trust II, 2.400%,
due 07/15/08 | | 3,459,014 | |
1,190,000 | | MBNA Master Credit Card
Trust USA, 5.900%,
due 08/15/11 | | 1,230,245 | |
| | | | 13,913,327 | |
| | Home Equity Asset Backed Securities: 1.5% | | | |
3,805,248 | | Bayview Financial
Acquisition Trust,
4.879%, due 09/28/43 | | 3,810,949 | |
133,423 | | Centex Home Equity,
4.659%, due 01/25/34 | | 133,528 | |
1,131,226 | | GMAC Mortgage Corp.
Loan Trust, 4.609%,
due 12/25/20 | | 1,132,071 | |
10,569,000 | | GSAA Trust, 5.242%,
due 06/25/34 | | 10,519,653 | |
1,087,183 | | Merrill Lynch Mortgage
Investors, Inc., 4.739%,
due 07/25/34 | | 1,091,911 | |
618,751 | | New Century Home Equity
Loan Trust, 4.629%,
due 08/25/34 | | 619,201 | |
2,920,544 | | QFA Royalties LLC, 7.300%,
due 02/20/25 | | 2,928,872 | |
1,114,000 | + | Renaissance Home Equity
Loan Trust, 4.456%,
due 05/25/35 | | 1,096,041 | |
1,977,000 | + | Renaissance Home Equity
Loan Trust, 4.723%,
due 11/25/35 | | 1,957,514 | |
$ | 1,686,648 | | Saxon Asset Securities
Trust, 3.960%,
due 06/25/33 | | $ | 1,682,469 | |
1,990,000 | | Wells Fargo Home Equity
Trust, 3.970%,
due 09/25/24 | | 1,949,323 | |
| | | | 26,921,532 | |
| | Other Asset Backed Securities: 1.4% | | | |
752,513 | S | Amortizing Residential
Collateral Trust, 4.879%,
due 05/25/32 | | 753,351 | |
1,896,263 | | Chase Funding Mortgage
Loan, 4.679%,
due 07/25/33 | | 1,901,077 | |
2,310,000 | | Countrywide Asset-Backed
Certificates, 4.493%,
due 02/25/36 | | 2,282,501 | |
8,011,241 | | Lehman XS Trust, 4.659%,
due 08/25/35 | | 8,018,225 | |
1,695,000 | | Popular ABS Mortgage Pass-Through Trust, 4.596%, due 11/25/35 | | 1,676,553 | |
473,511 | | Residential Asset
Mortgage Products, Inc.,
4.689%, due 06/25/33 | | 474,500 | |
10,282,400 | + | Structured Asset Securities
Corp., 6.000%,
due 03/25/34 | | 10,289,606 | |
| | | | 25,395,813 | |
| | Total Asset-Backed Securities
(Cost $88,419,038) | | 87,346,608 | |
| | | | | |
COLLATERALIZED MORTGAGE OBLIGATIONS: 19.0% | | | |
| | Commercial Mortgage Backed Securities: 4.9% | | | |
3,941,000 | | Banc of America
Commercial Mortgage,
Inc., 4.502%,
due 07/10/42 | | 3,826,484 | |
5,657,000 | | Banc of America
Commercial Mortgage,
Inc., 4.611%,
due 07/10/43 | | 5,562,848 | |
2,735,000 | | Banc of America
Commercial Mortgage,
Inc., 4.764%,
due 07/10/45 | | 2,699,645 | |
3,080,000 | | Bear Stearns Commercial
Mortgage Securities,
3.880%, due 08/13/39 | | 2,966,411 | |
195,000 | | Bear Stearns Commercial
Mortgage Securities,
4.030%, due 02/13/46 | | 187,998 | |
3,372,000 | | Bear Stearns Commercial
Mortgage Securities,
4.170%, due 01/12/41 | | 3,296,456 | |
777,000 | L | Capco America
Securitization Corp.,
6.260%, due 10/15/30 | | 800,872 | |
279,000 | | Capco America
Securitization Corp.,
6.460%, due 10/15/30 | | 290,600 | |
See Accompanying Notes to Financial Statements
87
| PORTFOLIO OF INVESTMENTS |
ING VP INTERMEDIATE BOND PORTFOLIO | AS OF DECEMBER 31, 2005 (CONTINUED) |
Principal
Amount | | | | Value | |
| | Commercial Mortgage Backed
Securities (continued) | | | |
$ | 6,167,579 | S | Chase Manhattan Bank-First
Union National Bank,
7.439%, due 08/15/31 | | $ | 6,622,732 | |
811,000 | | Commercial Mortgage Pass
Through Certificates,
3.600%, due 03/10/39 | | 779,837 | |
3,326,759 | | CS First Boston Mortgage
Securities Corp., 3.727%,
due 03/15/35 | | 3,204,864 | |
3,500,000 | | DLJ Commercial Mortgage
Corp., 6.460%,
due 03/10/32 | | 3,644,700 | |
3,220,378 | | Ge Capital Commercial
Mortgage Corp.,
3.752%, due 07/10/39 | | 3,145,119 | |
793,000 | | Ge Capital Commercial
Mortgage Corp.,
4.371%, due 01/10/38 | | 772,006 | |
301,000 | | Ge Capital Commercial
Mortgage Corp.,
4.865%, due 07/10/39 | | 297,152 | |
3,880,000 | | JP Morgan Chase
Commercial Mortgage
Securities Corp., 4.223%,
due 01/15/42 | | 3,772,831 | |
6,935,563 | | JP Morgan Chase
Commercial Mortgage
Securities Corp., 4.275%,
due 01/12/37 | | 6,763,737 | |
10,000 | | JP Morgan Chase
Commercial Mortgage
Securities Corp.,
4.449%, due 01/12/38 | | 9,725 | |
4,589,000 | | JP Morgan Chase
Commercial Mortgage
Securities Corp.,
5.857%, due 10/12/35 | | 4,751,935 | |
8,794,230 | | JP Morgan Chase
Commercial Mortgage
Securities Corp.,
6.244%, due 04/15/35 | | 8,984,638 | |
1,794,000 | | LB-UBS Commercial
Mortgage Trust,
3.992%, due 10/15/29 | | 1,729,828 | |
10,000 | S | LB-UBS Commercial
Mortgage Trust,
4.201%, due 12/15/29 | | 9,719 | |
499,000 | | LB-UBS Commercial
Mortgage Trust,
4.310%, due 02/15/30 | | 485,250 | |
567,000 | | LB-UBS Commercial
Mortgage Trust,
4.510%, due 12/15/29 | | 550,634 | |
176,000 | S | LB-UBS Commercial
Mortgage Trust,
4.567%, due 06/15/29 | | 174,128 | |
5,220,000 | S | LB-UBS Commercial
Mortgage Trust,
6.226%, due 03/15/26 | | 5,416,275 | |
4,500,000 | | LB-UBS Commercial
Mortgage Trust,
7.370%, due 08/15/26 | | 4,888,498 | |
$ | 7,379,311 | S | Mortgage Capital Funding,
Inc., 6.663%,
due 03/18/30 | | $ | 7,579,667 | |
3,902,160 | | Prudential Commercial
Mortgage Trust,
3.669%, due 02/11/36 | | 3,748,716 | |
| | | | 86,963,305 | |
| | Whole Loan Collateral PAC: 0.1% | | | |
2,174,268 | S | MASTR Alternative
Loans Trust, 8.500%,
due 05/25/33 | | 2,221,918 | |
| | | | 2,221,918 | |
| | Whole Loan Collateral CMO: 13.9% | | | |
9,818,064 | | American Home Mortgage
Investment Trust,
4.669%, due 11/25/45 | | 9,795,687 | |
3,456,326 | | Banc of America Funding
Corp., 4.770%,
due 09/20/35 | | 3,459,774 | |
13,639,737 | | Banc of America Funding
Corp., 5.278%,
due 09/20/35 | | 13,409,225 | |
7,138,988 | | Banc of America Funding
Corp., 5.750%,
due 09/20/34 | | 7,084,910 | |
8,356,412 | | Banc of America Funding
Corp., 5.871%,|
due 06/20/35 | | 8,477,982 | |
2,546,271 | S | Banc of America Mortgage
Securities, 5.250%,
due 11/25/19 | | 2,541,541 | |
5,812,264 | | Banc of America Mortgage
Securities, 5.500%,
due 06/25/35 | | 5,802,997 | |
2,627,783 | | Bear Stearns Alt-A Trust,
4.699%, due 07/25/34 | | 2,632,376 | |
12,294,336 | | Bear Stearns Asset Backed
Securities, Inc., 4.709%,
due 11/25/35 | | 12,254,816 | |
3,923,580 | | Citigroup Mortgage Loan
Trust, Inc., 4.499%,
due 02/25/35 | | 3,926,476 | |
1,922,479 | | Countrywide Alternative
Loan Trust, 4.679%,
due 02/25/35 | | 1,924,192 | |
15,002,673 | | Countrywide Alternative
Loan Trust, 5.414%,
due 10/25/35 | | 14,913,707 | |
2,319,026 | | Countrywide Alternative
Loan Trust, 5.500%,
due 02/25/25 | | 2,321,842 | |
25,805,750 | | Countrywide Home Loan
Mortgage Pass Through
Trust, 4.721%,
due 02/25/35 | | 25,926,728 | |
4,067,368 | | Countrywide Home Loan
Mortgage Pass Through
Trust, 5.000%,
due 11/25/18 | | 4,003,868 | |
9,923,427 | | GMAC Mortgage Corp.
Loan Trust, 5.264%,
due 03/18/35 | | 9,802,485 | |
See Accompanying Notes to Financial Statements
88
| PORTFOLIO OF INVESTMENTS |
ING VP INTERMEDIATE BOND PORTFOLIO | AS OF DECEMBER 31, 2005 (CONTINUED) |
Principal
Amount | | | | Value | |
| | Whole Loan Collateral
CMO (continued) | | | |
$ | 1,928,988 | # | GSMPS Mortgage Loan
Trust, 4.729%,
due 01/25/35 | | $ | 1,933,810 | |
2,061,233 | S | GSR Mortgage Loan Trust,
4.500%, due 08/25/19 | | 2,026,739 | |
3,449,914 | | Harborview Mortgage
Loan Trust, 4.720%,
due 01/19/35 | | 3,445,886 | |
2,490,913 | S | Homebanc Mortgage Trust,
4.809%, due 08/25/29 | | 2,503,196 | |
13,467,957 | | Mastr Adjustable Rate
Mortgages Trust,
5.367%, due 06/25/35 | | 13,240,753 | |
6,895,100 | | MASTR Alternative Loans
Trust, 5.500%,
due 01/25/20 | | 6,927,379 | |
1,497,964 | | MASTR Alternative Loans
Trust, 6.500%,
due 05/25/33 | | 1,513,553 | |
3,800,951 | S | MLCC Mortgage Investors,
Inc., 4.609%,
due 04/25/29 | | 3,806,975 | |
1,812,092 | S | MLCC Mortgage Investors,
Inc., 4.699%, due 01/25/29 | | 1,814,372 | |
6,299,326 | | Residential Accredit Loans,
Inc., 4.779%, due 04/25/35 | | 6,300,459 | |
9,050,652 | | Residential Accredit Loans,
Inc., 4.879%, due 08/25/35 | | 9,079,067 | |
1,676,199 | | Residential Funding
Mtg Sec I, 4.829%,
due 05/25/33 | | 1,679,732 | |
2,126,783 | | Sequoia Mortgage Trust,
4.640%, due 01/20/35 | | 2,128,832 | |
2,573,209 | | Structured Adjustable Rate
Mortgage Loan Trust,
4.689%, due 07/25/35 | | 2,571,193 | |
5,671,633 | | Structured Asset Mortgage
Investments, Inc.,
4.610%, due 04/19/35 | | 5,668,088 | |
2,286,751 | | Structured Asset Securities
Corp., 5.500%,
due 07/25/33 | | 2,249,591 | |
7,493,000 | | Suntrust Alternative Loan
Trust, 6.500%,
due 12/25/35 | | 7,633,119 | |
4,204,621 | | Thornburg Mortgage
Securities Trust, 4.729%,
due 12/25/33 | | 4,214,025 | |
4,402,980 | | Thornburg Mortgage
Securities Trust,
4.749%, due 09/25/34 | | 4,413,202 | |
4,074,059 | | Washington Mutual, Inc.,
4.629%, due 01/25/45 | | 4,077,329 | |
3,029,840 | | Washington Mutual, Inc.,
4.670%, due 06/25/44 | | 3,033,409 | |
3,106,702 | | Washington Mutual, Inc.,
4.689%, due 01/25/45 | | 3,109,823 | |
5,285,044 | | Washington Mutual, Inc.,
4.779%, due 08/25/45 | | 5,294,450 | |
4,790,194 | | Washington Mutual, Inc.,
6.000%, due 06/25/34 | | 4,800,675 | |
$ | 5,950,000 | | Wells Fargo Mortgage
Backed Securities Trust,
4.500%, due 08/25/18 | | $ | 5,676,973 | |
7,339,602 | | Wells Fargo Mortgage
Backed Securities Trust,
5.000%, due 12/25/33 | | 7,062,077 | |
| | | | 244,483,313 | |
| | Whole Loan Collateral
Support CMO: 0.1% | | | |
2,456,457 | | Banc of America Mortgage
Securities, 5.500%,
due 11/25/33 | | 2,373,502 | |
| | | | 2,373,502 | |
| | Total Collateralized
Mortgage Obligations
(Cost $341,269,397) | | 336,042,038 | |
MUNICIPAL BONDS: 0.3% | | | |
| | Municipal: 0.3% | | | |
615,000 | S | City of New York NY,
5.000%, due 04/01/35 | | 633,302 | |
1,325,000 | S | New York, 5.000%,
due 11/01/08 | | 1,380,080 | |
1,325,000 | S | New York, 5.000%,
due 11/01/11 | | 1,417,989 | |
1,315,000 | S | New York, 5.000%,
due 11/01/15 | | 1,416,939 | |
| | Total Municipal Bonds
(Cost $4,913,822) | | 4,848,310 | |
OTHER BONDS: 0.1% | | | |
| | Sovereign 0.1% | | | |
1,102,000 | @@,L | Mexico Government Bond,
6.625%, due 03/03/15 | | 1,209,445 | |
840,678 | @@ | Republica Orient Uruguay,
10.500%, due 10/20/06 | | 1,270,116 | |
| | Total Other Bonds
(Cost $2,077,602) | | 2,479,561 | |
Shares | | | | Value | |
| | | | | |
PREFERRED STOCK: 2.1% | | | |
| | Banks: 0.5% | | | |
844 | # | DG Funding Trust | | 8,993,875 | |
| | | | 8,993,875 | |
| | Diversified Financial Services: 0.5% | | | |
231,000 | C | Merrill Lynch & Co., Inc. | | 5,890,500 | |
80,100 | C | National Rural Utilities
Cooperative Finance Corp. | | 1,890,360 | |
| | | | 7,780,860 | |
| | Insurance: 0.9% | | | |
269,299 | @@ | Aegon NV | | 6,802,493 | |
90,000 | @@ | Aegon NV | | 2,245,500 | |
271,450 | C | Metlife, Inc. | | 7,035,984 | |
| | | | 16,083,977 | |
See Accompanying Notes to Financial Statements
89
| PORTFOLIO OF INVESTMENTS |
ING VP INTERMEDIATE BOND PORTFOLIO | AS OF DECEMBER 31, 2005 (CONTINUED) |
Shares | | | | Value | |
| | Telecommunications: 0.2% | | | |
2,669 | @@,# | Centaur Funding Corp. | | $ | 3,458,023 | |
| | | | 3,458,023 | |
| | Total Preferred Stock
(Cost $36,335,908) | | 36,316,735 | |
| | Total Long-Term Investments
(Cost $1,845,869,449) | | 1,837,844,082 | |
| | | | | | |
Principal
Amount/Shares | | | | Value | |
| | | |
SHORT-TERM INVESTMENTS: 33.2% | | | |
| | Commercial Paper: 1.3% | | | |
$ | 7,000,000 | S | Daimler Chrysler, 0.000%,
due 01/18/06 | | 6,984,460 | |
16,350,000 | #,S | Concord Minutemen
Capital Co. LLC, 4.669%,
due 01/10/07 | | 16,335,776 | |
| | Total Commercial Papers
(Cost $23,335,059) | | 23,320,236 | |
| | | | | | | | |
| | Repurchase Agreement: 7.5% | | | | | | |
131,457,000 | | Morgan Stanley Repurchase Agreement dated 12/30/05, 4.230%, due 01/03/06, $131,518,785 to be received upon repurchase (Collateralized by $135,730,000 Various U.S. Government Agency Obligations, 1.880%-5.650%, Market Value plus accrued interest $134,090,909 due 06/16/06-07/21/20) | | | | | 131,457,000 | |
| | Total Repurchase Agreement
(Cost $131,457,000) | | | | | 131,457,000 | |
| | Securities Lending Collateralcc: 24.4% | | | | | | |
431,292,000 | | The Bank of New York Institutional Cash Reserve Fund | | | | | 431,292,000 | |
| | Total Securities Lending Collateral
(Cost $431,292,000) | | | | | 431,292,000 | |
| | Total Short-Term Investments
(Cost $586,084,059) | | | | | 586,069,236 | |
| | Total Investments In Securities (Cost $2,431,953,508)* | | 137.3 | % | | $ | 2,423,913,318 | |
| | Other Assets and Liabilities-Net | | (37.3 | ) | | (658,569,227 | ) |
| | Net Assets | | 100.0 | % | | $ | 1,765,344,091 | |
| | | | | | | | | | | | | |
@@ | | Foreign issuer |
+ | | Step-up basis bonds. Interest rates shown reflect current coupon rates. |
# | | Securities with purchases pursuant to Rule 144A, under the Securities Act of 1933 and may not be resold subject to that rule except to qualified institutional buyers. These securities have been determined to be liquid under the guidelines established by the Funds’ Board of Directors. |
C | | Bond may be called prior to maturity date. |
cc | | Securities purchased with cash collateral for securities loaned. |
W | | When-issued or delayed delivery security. |
S | | Segregated securities for certain derivatives, when-issued or delayed delivery securities and forward currency exchange contracts. |
I | | Illiquid security |
L | | Loaned security, a portion or all of the security is on loan at December 31, 2005. |
** | | Defaulted security |
* | | Cost for federal income tax purposes is $2,434,773,071. |
| | Net unrealized depreciation consists of: |
| | Gross Unrealized Appreciation | | | | | $ | 4,524,213 | |
| | Gross Unrealized Depreciation | | | | | (15,383,966 | ) |
| | Net Unrealized Depreciation | | | | | $ | (10,859,753 | ) |
Information concerning open futures contracts at December 31, 2005 is shown below:
Long Contracts | | No. of
Contracts | | Notional
Market Value | | Expiration
Date | | Unrealized
Gain (Loss) | |
U.S. 10 Year Note | | 314 | | $ | 34,353,563 | | 03/22/2006 | | $ | 302,618 | |
U.S. 30 Year Future | | 675 | | 77,076,563 | | 03/31/2006 | | 1,540,264 | |
| | | | $ | 111,430,125 | | | | $ | 1,842,882 | |
Short Contracts | | | | | | | | | |
U.S. 2 Year Note | | 209 | | $ | (42,884,188 | ) | 03/31/2006 | | $ | (40,233 | ) |
Information concerning the Interest Rate Swap Agreements outstanding for the ING VP Intermediate Bond Portfolio at December 31, 2005, is shown below:
| | Termination
Date | | Unrealized
Appreciation
(Depreciation) | |
Receive a floating rate equal to 3-month USD-LIBOR plus 2.51% on $2,645,000 and pay a floating rate equal to 3-month JPY-LIBOR plus 1.7% on ¥291,945,000. Upon termination of the contract, receive $2,645,000 and pay ¥291,945,000. Counterparty: UBS AG | | 03/01/34 | | $ | 204,021 | |
Receive a floating rate equal to 3-month JPY-LIBOR plus 1.7% on ¥528,500,000 and pay a fixed rate equal to 1.0% on ¥1,000,000,000. Upon termination of the contract, receive ¥528,500,000 and pay ¥1,000,000,000. Counterparty: UBS AG | | 03/01/34 | | 59,324 | |
Receive a floating rate equal to 6-month USD-LIBOR plus 2.62% on $3,305,909 and pay a fixed rate equal to 1.0% on ¥700,000,000. Upon termination of the contract, receive $3,305,909 and pay ¥700,000,000. Counterparty: UBS AG | | 03/01/34 | | 320,726 | |
Receive a floating rate equal to 3-month USD-LIBOR plus 2.48% on $914,666.50 and pay a fixed rate equal to 1.0% on ¥200,000,000. Upon termination of the contract, receive $914,666.50 and pay ¥200,000,000. Counterparty: UBS AG | | 03/01/34 | | 16,588 | |
| | | | $ | 600,659 | |
See Accompanying Notes to Financial Statements
90
| PORTFOLIO OF INVESTMENTS |
ING VP INTERMEDIATE BOND PORTFOLIO | AS OF DECEMBER 31, 2005 (CONTINUED) |
Information concerning the Credit Default Agreements outstanding for the ING VP Intermediate Bond Portfolio at December 31, 2005 is shown below:
| | Termination
Date | | Notional
Principal | | Unrealized
Appreciation
(Depreciation) | |
Albertson’s Inc. Receive $2,586,000 in the event of default and pay 1.850% Counterparty: UBS AG | | 03/20/01 | | 2,586,000 | | | $ 19,596 | | |
Georgia Pacific Receive $1,030,000 in the event of default and pay 3.550% Counterparty: Citigroup | | 12/20/10 | | 1,030,000 | | | (4,362) | | |
| | | | | | | $ 15,234 | | |
See Accompanying Notes to Financial Statements
91
| PORTFOLIO OF INVESTMENTS |
ING VP MONEY MARKET PORTFOLIO(1) | AS OF DECEMBER 31, 2005 |
Principal
Amount | | | | Value | |
CERTIFICATE OF DEPOSIT: 1.0% | | | |
$ 10,710,000 | | Dexia, 4.335%, due 02/01/06 | | $ | 10,709,589 | |
| | Total Certificate of Deposit
(Cost $10,709,589) | | 10,709,589 | |
COLLATERALIZED MORTGAGE OBLIGATIONS: 5.7% | | | |
10,750,000 | @@,# | Cheyne High Grade ABS
CDO Ltd., 4.330%,
due 11/10/06 | | 10,750,000 | |
13,900,000 | @@,# | Newcastle CDO I Ltd.,
4.409%, due 09/24/38 | | 13,900,000 | |
13,900,000 | @@,# | Newcastle CDO III Corp.,
4.409%, due 09/24/38 | | 13,900,000 | |
13,700,000 | @@,# | Putnam Structured
Product CDO, 4.490%,
due 10/15/38 | | 13,700,000 | |
8,500,000 | @@,# | Whitehawk CDO
Funding Ltd., 4.511%,
due 09/15/06 | | 8,500,000 | |
| | Total Collateralized
Mortgage Obligations
(Cost $60,750,000) | | 60,750,000 | |
COMMERCIAL PAPER: 35.0% | | | |
2,400,000 | | Alliance & Leicester,
3.750%, due 01/13/06 | | 2,393,517 | |
10,000,000 | @@ | ASB Bank Ltd., 4.110%,
due 01/24/06 | | 9,972,656 | |
24,800,000 | | American Express Bank FSB,
4.430%, due 03/16/06 | | 24,800,000 | |
3,164,000 | | Barton Capital Corp.,
3.340%, due 01/05/06 | | 3,162,534 | |
10,000,000 | | Cafco LLC, 3.690%,
due 01/09/06 | | 9,990,778 | |
2,500,000 | | Concord Minutemen,
3.520% due 01/06/06 | | 2,498,534 | |
2,000,000 | | Concord Minutemen,
3.710% due 01/11/06 | | 1,997,733 | |
22,000,000 | | Goldman Sachs Group,
2.503%, due 2/13/06 | | 22,000,000 | |
17,600,000 | | Jupiter Securities,
4.210%, due 01/30/06 | | 17,538,539 | |
26,000,000 | | Master Funding LLC,
3.780%, due 01/13/06 | | 25,964,597 | |
15,000,000 | | Master Funding LLC,
4.190%, due 01/31/06 | | 14,946,125 | |
9,000,000 | | Master Funding LLC,
4.200%, due 01/26/06 | | 8,972,813 | |
3,000,000 | | Master Funding LLC,
4.230%, due 01/30/06 | | 2,989,463 | |
9,000,000 | | Monument Gardens,
3.620%, due 01/09/06 | | 8,991,860 | |
14,700,000 | | Monument Gardens,
4.030%, due 01/19/06 | | 14,668,763 | |
27,000,000 | | Monument Gardens,
4.110%, due 01/24/06 | | 26,926,170 | |
5,000,000 | | St. Germain Holdings Ltd.,
2.780%, due 01/03/06 | | 4,998,842 | |
21,700,000 | | St. Germain Holdings Ltd.,
2.870%, due 01/13/06 | | 21,669,678 | |
21,000,000 | | St. Germain Holdings Ltd.,
4.030%, due 01/19/06 | | 20,955,375 | |
5,000,000 | | Three Pillars Funding Corp.,
3.860%, due 01/09/06 | | 4,995,178 | |
$ 7,952,000 | # | Three Pillars Funding Corp.,
3.980%, due 01/17/06 | | $ | 7,937,086 | |
36,000,000 | | Three Pillars Funding Corp.,
4.150%, due 01/23/06 | | 35,904,740 | |
14,000,000 | | Thunder Bay Funding,
4.100%, due 01/17/06 | | 13,972,933 | |
14,000,000 | | Tulip Funding Co.,
4.100%, due 01/17/06 | | 13,972,933 | |
19,400,000 | | Tulip Funding Co.,
4.110%, due 01/19/06 | | 19,358,026 | |
1,600,000 | | UBS Finance,
4.050%, due 01/19/06 | | 1,596,584 | |
2,400,000 | | UBS Finance,
4.320%, due 03/02/06 | | 2,382,560 | |
24,600,000 | # | Verizon Global
Funding Corp.,
4.601%, due 01/12/07 | | 24,600,000 | |
5,370,000 | | Windmill Funding Corp.,
4.170%, due 02/02/06 | | 5,349,546 | |
| | Total Commercial Paper
(Cost $375,507,563) | | 375,507,563 | |
CORPORATE BONDS/NOTES: 46.2% | | | |
1,500,000 | | American Express Bank
FSB/Salt Lake City UT,
4.442%, due 06/13/06 | | 1,500,131 | |
8,000,000 | | American Express
Centurion Bank,
4.415%, due 03/03/06 | | 8,000,670 | |
17,200,000 | # | American General
Finance Corp.,
4.500%, due 02/15/07 | | 17,199,786 | |
15,000,000 | | American General
Finance Corp.,
4.551%, due 03/29/06 | | 14,999,296 | |
6,239,000 | | American General
Finance Corp.,
5.875%, due 07/14/06 | | 6,297,453 | |
7,000,000 | # | American Honda
Finance Corp.,
4.340%, due 02/16/06 | | 6,999,979 | |
5,000,000 | # | American Honda
Finance Corp.,
4.530%, due 09/21/06 | | 5,001,525 | |
17,100,000 | # | American Honda
Finance Corp.,
4.557%, due 09/18/06 | | 17,100,000 | |
9,500,000 | # | Bank of New York,
4.419%, due 01/26/07 | | 9,500,000 | |
4,500,000 | | Bank One Corp.,
6.500%, due 02/01/06 | | 4,506,950 | |
25,000,000 | | Banque Nationale
de Paris/New York,
4.420%, due 06/21/06 | | 24,996,066 | |
14,500,000 | | Barclays Bank PLC,
4.433%, due 06/21/06 | | 14,498,577 | |
12,750,000 | | Bear Stearns Cos, Inc.,
4.419%, due 11/28/06 | | 12,750,000 | |
12,300,000 | | Bear Stearns Cos, Inc.,
4.448%, due 12/05/06 | | 12,300,000 | |
11,630,000 | # | Cargill, Inc., 6.250%,
due 05/01/06 | | 11,692,454 | |
2,500,000 | | Caterpillar Financial
Services Corp., 2.650%,
due 01/30/06 | | 2,496,644 | |
8,100,000 | # | Concord Minutemen
Capital Co. LLC,
4.669%, due 01/10/07 | | 8,099,869 | |
See Accompanying Notes to Financial Statements
92
| PORTFOLIO OF INVESTMENTS |
ING VP MONEY MARKET PORTFOLIO(1) | AS OF DECEMBER 31, 2005 (CONTINUED) |
Principal
Amount | | | | Value | |
CORPORATE BONDS/NOTES (continued) | | | |
$ 35,900,000 | # | Concord Minutemen
Capital Co. LLC,
4.687%, due 01/11/07 | | $ | 35,899,790 | |
7,800,000 | L | General Electric Capital Corp.,
4.457%, due 12/08/06 | | 7,801,922 | |
3,500,000 | | General Electric Capital Corp.,
4.491%, due 02/06/06 | | 3,500,789 | |
16,000,000 | | General Electric Capital Corp.,
4.519%, due 02/09/07 | | 16,000,000 | |
16,000,000 | L | General Electric Capital Corp.,
4.627%, due 09/18/06 | | 16,015,902 | |
5,000,000 | | General Electric Corp.,
2.850%, due 01/30/06 | | 4,994,047 | |
12,050,000 | # | Goldman Sachs Group LP,
4.490%, due 12/15/06 | | 12,050,000 | |
8,275,000 | | Goldman Sachs Group, Inc.,
4.386%, due 10/27/06 | | 8,286,927 | |
7,800,000 | @@,# | HBOS Treasury Services PLC,
4.435%, due 12/29/06 | | 7,800,000 | |
19,500,000 | @@,# | HBOS Treasury Services PLC,
4.569%, due 01/24/07 | | 19,500,000 | |
18,200,000 | | HSBC Finance Corp.,
6.500%, due 01/24/06 | | 18,225,166 | |
31,400,000 | # | Money Market Trust Series,
4.515, due 03/12/07 | | 31,400,000 | |
10,380,000 | | Morgan Stanley Group, Inc.,
4.540%, due 11/24/06 | | 10,394,039 | |
15,000,000 | | Morgan Stanley Group, Inc.,
4.709%, due 01/12/07 | | 15,017,903 | |
19,070,000 | | Morgan Stanley Group, Inc.,
4.799%, due 03/27/06 | | 19,082,158 | |
6,800,000 | | PNC Bank NA, 4.430%,
due 03/21/06 | | 6,799,329 | |
12,400,000 | | Societe Generale/New York,
4.319%, due 03/30/06 | | 12,399,057 | |
1,500,000 | | Suntrust Bank, 4.369%,
due 06/09/06 | | 1,499,769 | |
52,400,000 | | Washington Mutual Bank,
4.380%, due 05/31/06 | | 52,400,489 | |
10,800,000 | | Wells Fargo & Co., 4.435%,
due 02/02/07 | | 10,800,000 | |
7,800,000 | | Westpac Banking Corp./NY,
4.490%, due 01/11/07 | | 7,800,000 | |
| | Total Corporate Bonds/Notes
(Cost $495,606,687) | | 495,606,687 | |
| | | | | |
U.S. GOVERNMENT AGENCY OBLIGATIONS: 4.8% | | | |
29,650,000 | | Federal Home Loan Bank,
4.427%, due 06/14/06 | | 29,646,830 | |
22,000,000 | | Federal Home Loan Bank,
4.477%, due 07/21/06 | | 22,000,000 | |
| | Total U.S. Government
Agency Obligations
(Cost $51,646,830) | | 51,646,830 | |
| | | | | | |
Principal
Amount/Shares | | | | Value | |
REPURCHASE AGREEMENT: 7.6% | | | |
$ 71,132,000 | | Goldman Sachs Repurchase Agreement dated 12/30/05, 4.250%, due 01/03/06, $71,165,590 to be received upon repurchase (Collateralized by $72,347,000 various U.S. Government Agency Obligations, 4.250%-4.500%, Market Value plus accrued interest $72,554,778, due 04/05/07-01/15/14). | | $ | 71,132,000 | |
11,001,000 | | Goldman Sachs Repurchase Agreement dated 12/30/05, 4.25%, due 01/03/06, $11,006,195 to be received upon repurchase (Collateralized by $11,153,000 U.S. Government Agency Obligation, 4.25%, Market Value plus accrued interest $11,221,390, due 08/15/14). | | 11,001,000 | |
| | Total Repurchase Agreement
(Cost $82,133,000) | | 82,133,000 | |
SECURITIES LENDING COLLATERALcc: 0.4% | | | |
4,600,000 | | The Bank of New York
Institutional Cash
Reserves Fund | | 4,600,000 | |
| | Total Securities
Lending Collateral
(Cost $4,600,000) | | 4,600,000 | |
| | Total Investments
In Securities (Cost
$1,080,953,669)* | | 100.7 | % | | $ | 1,080,953,669 | |
| | Other Assets and
Liabilities-Net | | (0.7) | | | (7,935,751) | |
| | Net Assets | | 100.0 | % | | $ | 1,073,017,918 | |
| | | | | | | | | | | |
(1) | | All securities with a maturity date greater than one year have either a variable rate, a demand feature, are prerefunded, or an optional or mandatory put resulting in an effective maturity of one year or less. Rate shown reflects current rate. |
@@ | | Foreign Issuer |
# | | Securities with purchases pursuant to Rule 144A, under the Securities Act of 1933 and may not be resold subject to that rule except to qualified institutional buyers. These securities have been determined to be liquid under the guidelines established by the Funds’ Board of Directors/Trustees. |
cc | | Securities purchased with cash collateral for securities loaned. |
L | | Loaned security, a portion or all of the security is on loan at December 31, 2005. |
* | | Cost for federal income tax purposes is the same for financial statement purposes. |
See Accompanying Notes to Financial Statements
93
ING VP GLOBAL SCIENCE AND
TECHNOLOGY PORTFOLIO | PORTFOLIO OF INVESTMENTS |
AS OF DECEMBER 31, 2005 |
Shares | | | | Value | |
COMMON STOCK: 94.3% | | | |
| | Belgium: 1.3% | | | |
15,000 | @,L | Option Intl. | | $ | 1,110,378 | |
| | | | 1,110,378 | |
| | Bermuda: 2.2% | | | |
29,400 | | Accenture Ltd. | | 848,778 | |
17,300 | @ | Marvell Technology Group Ltd. | | 970,357 | |
| | | | 1,819,135 | |
| | Brazil: 0.5% | | | |
16,000 | | Tim Participacoes SA ADR | | 404,480 | |
| | | | 404,480 | |
| | Canada: 0.6% | | | |
46,000 | @ | Cardiome Pharma Corp. | | 464,600 | |
| | | | 464,600 | |
| | China: 1.0% | | | |
541,000 | @ | Foxconn Intl. Holdings Ltd. | | 883,198 | |
| | | | 883,198 | |
| | Finland: 1.2% | | | |
55,200 | | Nokia OYJ ADR | | 1,010,160 | |
| | | | 1,010,160 | |
| | Germany: 0.7% | | | |
13,900 | L | SAP AG ADR | | 626,473 | |
| | | | 626,473 | |
| | Guernsey: 0.6% | | | |
17,500 | @ | Amdocs Ltd. | | 481,250 | |
| | | | 481,250 | |
| | Italy: 0.7% | | | |
12,800 | @,L | e.Biscom | | 582,748 | |
| | | | 582,748 | |
| | Japan: 8.6% | | | |
41,200 | | Hitachi Construction Machinery Co., Ltd. | | 962,135 | |
22,900 | | Hoya Corp. | | 822,450 | |
16,400 | | Ibiden Co., Ltd. | | 877,568 | |
41,600 | | Komatsu Ltd. | | 687,115 | |
28,200 | | Matsushita Electric Industrial Co., Ltd. | | 543,076 | |
87,500 | | Nabtesco Corp. | | 1,131,488 | |
23,100 | | Nippon System Development Co., Ltd. | | 754,562 | |
8,500 | | Otsuka Corp. | | 936,784 | |
79,000 | | Shimadzu Corp. | | 557,605 | |
| | | | 7,272,783 | |
| | Mexico: 0.9% | | | |
27,000 | | America Movil SA de CV ADR | | 790,020 | |
| | | | 790,020 | |
| | Norway: 0.4% | | | |
98,500 | @ | Fast Search & Transfer ASA | | 359,875 | |
| | | | 359,875 | |
| | South Korea: 2.3% | | | |
2,200 | @ | NHN Corp. | | 579,373 | |
2,100 | | Samsung Electronics Co., Ltd. | | 1,351,054 | |
| | | | 1,930,427 | |
| | Switzerland: 3.3% | | | |
5,600 | | Alcon, Inc. | | $ | 725,760 | |
10,700 | L | Novartis AG ADR | | 561,536 | |
10,000 | | Roche Holding AG | | 1,494,965 | |
| | | | 2,782,261 | |
| | Taiwan: 4.8% | | | |
198,000 | | Asustek Computer, Inc. | | 607,255 | |
34,200 | | High Tech Computer Corp. | | 638,479 | |
164,461 | | HON HAI Precision Industry Co., Ltd. | | 903,215 | |
795,640 | | Lite-On Technology Corp. | | 1,081,035 | |
439,000 | | Mitac Technology Corp. | | 320,319 | |
380,000 | @ | Wistron Corp. | | 479,404 | |
| | | | 4,029,707 | |
| | United Kingdom: 1.3% | | | |
112,100 | | Meggitt PLC | | 696,743 | |
11,000 | L | Shire Pharmaceuticals PLC ADR | | 426,689 | |
| | | | 1,123,432 | |
| | United States: 63.9% | | | |
29,900 | @ | Abgenix, Inc. | | 643,149 | |
15,600 | @,L | ADC Telecommunications, Inc. | | 348,504 | |
28,900 | L | Adobe Systems, Inc. | | 1,068,144 | |
11,400 | L | Adtran, Inc. | | 339,036 | |
41,600 | @,L | Advanced Micro Devices, Inc. | | 1,272,960 | |
20,000 | @ | Agilent Technologies, Inc. | | 665,800 | |
28,300 | @,L | Akamai Technologies, Inc. | | 564,019 | |
39,800 | @,L | Alamosa Holdings, Inc. | | 740,678 | |
9,050 | @ | Amgen, Inc. | | 713,683 | |
17,000 | @,L | Amylin Pharmaceuticals, Inc. | | 678,640 | |
14,800 | | Analog Devices, Inc. | | 530,876 | |
22,800 | @ | Apple Computer, Inc. | | 1,639,092 | |
56,300 | | Applied Materials, Inc. | | 1,010,022 | |
37,800 | @,L | aQuantive, Inc. | | 954,072 | |
35,200 | @,L | Atheros Communications, Inc. | | 457,600 | |
9,200 | L | Autodesk, Inc. | | 395,140 | |
11,400 | | Automatic Data Processing, Inc. | | 523,146 | |
58,800 | @,L | BEA Systems, Inc. | | 552,720 | |
6,800 | | Becton Dickinson & Co. | | 408,544 | |
8 | @ | Boston Scientific Corp. | | 196 | |
28,000 | @ | Broadcom Corp. | | 1,320,200 | |
35,000 | @,L | Cadence Design Systems, Inc. | | 592,200 | |
7,900 | @ | Caremark Rx, Inc. | | 409,141 | |
25,100 | @ | Ceridian Corp. | | 623,735 | |
3,500 | | Cigna Corp. | | 390,950 | |
12,900 | @,L | Coherent, Inc. | | 382,872 | |
84,200 | @ | Compuware Corp. | | 755,274 | |
30,200 | @ | Comverse Technology, Inc. | | 803,018 | |
21,600 | @,L | Cytyc Corp. | | 609,768 | |
12,600 | @ | eBay, Inc. | | 544,950 | |
9,900 | @,L | Electronic Arts, Inc. | | 517,869 | |
42,300 | @ | EMC Corp. | | 576,126 | |
6,656 | @ | Emdeon Corp. | | 56,310 | |
5,900 | @,L | Express Scripts, Inc. | | 494,420 | |
12,434 | @,L | Genentech, Inc. | | 1,150,145 | |
6,300 | @ | Gilead Sciences, Inc. | | 331,569 | |
14,000 | | Global Payments, Inc. | | 652,540 | |
12,600 | | Goodrich Corp. | | 517,860 | |
3,200 | @ | Google, Inc. | | 1,327,552 | |
28,800 | | Harris Corp. | | 1,238,688 | |
40,800 | | Hewlett-Packard Co. | | 1,168,104 | |
37,100 | @,L | Informatica Corp. | | 445,200 | |
See Accompanying Notes to Financial Statements
94
ING VP GLOBAL SCIENCE AND
TECHNOLOGY PORTFOLIO | | PORTFOLIO OF INVESTMENTS
AS OF DECEMBER 31, 2005 (CONTINUED) |
Shares | | | | Value | |
| | United States (continued) | | | |
22,850 | | Intel Corp. | | $ | 570,336 | |
16,000 | | International Business Machines Corp. | | 1,315,200 | |
32,200 | | Intersil Corp. | | 801,136 | |
26,800 | @,L | Juniper Networks, Inc. | | 597,640 | |
22,500 | @ | Keryx Biopharmaceuticals, Inc. | | 329,400 | |
23,700 | | Kla-Tencor Corp. | | 1,169,121 | |
26,850 | @,L | Lam Research Corp. | | 958,008 | |
11,260 | @ | Medco Health Solutions, Inc. | | 628,308 | |
6,700 | | Medtronic, Inc. | | 385,719 | |
36,600 | @,L | MEMC Electronic Materials, Inc. | | 811,422 | |
42,600 | | Microsoft Corp. | | 1,113,990 | |
15,400 | @,L | Monster Worldwide, Inc. | | 628,628 | |
37,000 | | Motorola, Inc. | | 835,830 | |
24,700 | L | National Semiconductor Corp. | | 641,706 | |
28,200 | @ | Nvidia Corp. | | 1,030,992 | |
46,300 | @ | Oracle Corp. | | 565,323 | |
76,500 | @,L | Powerwave Technologies, Inc. | | 961,605 | |
17,500 | @ | Progress Software Corp. | | 496,650 | |
24,200 | | Qualcomm, Inc. | | 1,042,536 | |
35,286 | @,L | Renovis, Inc. | | 539,876 | |
26,800 | | Schering-Plough Corp. | | 558,780 | |
14,500 | | Scientific-Atlanta, Inc. | | 624,515 | |
8,700 | @ | St. Jude Medical, Inc. | | 436,740 | |
22,900 | @,L | Sybase, Inc. | | 500,594 | |
18,300 | @ | Symantec Corp. | | 320,250 | |
26,450 | | Texas Instruments, Inc. | | 848,252 | |
23,500 | @,L | Unica Corp. | | 283,175 | |
16,500 | | UnitedHealth Group, Inc. | | 1,025,310 | |
27,800 | @ | Valueclick, Inc. | | 503,458 | |
13,000 | @,L | Varian Medical Systems, Inc. | | 654,420 | |
20,100 | @,L | Varian Semiconductor Equipment Associates, Inc. | | 882,993 | |
20,700 | @,L | Vertex Pharmaceuticals, Inc. | | 572,769 | |
26,600 | @,L | Viropharma, Inc. | | 493,430 | |
7,600 | @ | WellPoint, Inc. | | 606,404 | |
33,500 | @,L | Yahoo!, Inc. | | 1,312,530 | |
9,400 | @ | Zimmer Holdings, Inc. | | 633,935 | |
| | | | 54,095,493 | |
| | Total Common Stock
(Cost $64,744,008) | | 79,766,420 | |
| | | | | |
SHORT-TERM INVESTMENT: 21.7% | | | |
| | | | | | |
| | Securities Lending Collateralcc: 21.7% | | | | |
$ | 18,348,000 | | The Bank of New York Institutional Cash Reserves Fund | | | $ | 18,348,000 | |
| | Total Short-Term Investments
(Cost $18,348,000) | | | 18,348,000 | |
| | Total Investments In Securities
(Cost $83,092,008)* | 116.0 | % | | $ | 98,114,420 | |
| | Other Assets and Liabilities-Net | (16.0 | ) | | (13,513,563) | |
| | Net Assets | 100.0 | % | | $ | 84,600,857 | |
| | | | | | | | | |
Certain foreign securities have been fair valued in accordance with procedures approved by the Board (Note 2A).
@ | | Non-income producing security |
ADR | | American Depositary Receipt |
cc | | Securities purchased with cash collateral for securities loaned. |
L | | Loaned security, a portion or all of the security is on loan at December 31, 2005. |
* | | Cost for federal income tax purposes is $83,208,544. |
| | Net unrealized appreciation consists of: |
Gross Unrealized Appreciation | | $ | 15,606,146 | |
Gross Unrealized Depreciation | | (700,270 | ) |
Net Unrealized Appreciation | | $ | 14,905,876 | |
| | | | | | |
Industry | | Percentage of Net Assets | |
Aerospace/Defense | | | 1.4 | % |
Biotechnology | | | 3.3 | |
Commercial Services | | | 1.0 | |
Computers | | | 11.1 | |
Electronics | | | 5.0 | |
Healthcare-Products | | | 5.2 | |
Healthcare-Services | | | 1.9 | |
Home Furnishings | | | 0.6 | |
Insurance | | | 0.5 | |
Internet | | | 8.0 | |
Machinery-Construction and Mining | | | 2.0 | |
Machinery-Diversified | | | 1.3 | |
Pharmaceuticals | | | 9.1 | |
Semiconductors | | | 16.8 | |
Software | | | 11.4 | |
Telecommunications | | | 15.7 | |
Securities Lending Collateral | | | 21.7 | |
Other Assets and Liabilities, Net | | | (16.0 | ) |
Net Assets | | | 100.0 | % |
| | | | | |
See Accompanying Notes to Financial Statements
95
ING VP INTERNATIONAL EQUITY PORTFOLIO | | PORTFOLIO OF INVESTMENTS
AS OF DECEMBER 31, 2005 |
Shares | | | | Value | |
COMMON STOCK: 98.1% | | | | |
| | Australia: 3.8% | | | |
61,523 | | Aristocrat Leisure Ltd. | | $ | 552,986 | |
42,001 | | BHP Billiton Ltd. | | 699,943 | |
44,100 | | QBE Insurance Group Ltd. | | 630,257 | |
31,800 | | SunCorp. - Metway Ltd. | | 466,419 | |
| | | | 2,349,605 | |
| | Austria: 0.9% | | | |
25,300 | | Telekom Austria AG | | 565,638 | |
| | | | 565,638 | |
| | Belgium: 2.3% | | | |
8,600 | | KBC Bancassurance Holding | | 797,683 | |
5,400 | | Umicore | | 635,530 | |
| | | | 1,433,213 | |
| | Brazil: 1.0% | | | |
13,400 | | Banco Itau Holding Financeira SA ADR | | 321,868 | |
3,900 | | Petroleo Brasileiro SA ADR | | 277,953 | |
| | | | 599,821 | |
| | Canada: 0.6% | | | |
5,300 | | Magna International, Inc. | | 381,115 | |
| | | | 381,115 | |
| | China: 0.8% | | | |
543,000 | @ | China Life Insurance Co. Ltd. | | 478,695 | |
| | | | 478,695 | |
| | Finland: 2.8% | | | |
24,181 | | Elisa Corp. | | 445,943 | |
25,400 | | Fortum OYJ | | 474,516 | |
21,834 | | Tietoenator OYJ | | 795,040 | |
| | | | 1,715,499 | |
| | France: 8.0% | | | |
11,100 | | BNP Paribas | | 893,393 | |
10,800 | | Bouygues | | 525,878 | |
6,100 | | Lafarge SA | | 546,522 | |
5,000 | | Total SA | | 1,256,243 | |
15,138 | | Veolia Environnement | | 682,165 | |
5,600 | | Vinci SA | | 480,563 | |
17,597 | | Vivendi Universal SA | | 549,156 | |
| | | | 4,933,920 | |
| | Germany: 9.5% | | | |
19,800 | | Commerzbank AG | | 610,560 | |
14,329 | | DaimlerChrysler AG | | 726,630 | |
6,616 | | Deutsche Bank AG | | 637,901 | |
29,500 | | Deutsche Post AG | | 712,484 | |
48,600 | | Deutsche Telekom AG | | 805,010 | |
6,900 | | Fresenius Medical Care AG | | 723,179 | |
5,000 | | Merck KGaA | | 413,137 | |
4,469 | | Muenchener Rueckversicherungs AG | | 603,557 | |
8,700 | | RWE AG | | 637,837 | |
| | | | 5,870,295 | |
| | Hong Kong: 2.0% | | | |
51,000 | | Cheung Kong Holdings Ltd. | | 522,043 | |
172,000 | | Hong Kong Exchanges and Clearing Ltd. | | 713,179 | |
| | | | 1,235,222 | |
| | Hungary: 0.4% | | | |
3,530 | | OTP Bank Rt GDR | | $ | 231,568 | |
| | | | 231,568 | |
| | India: 1.4% | | | |
13,400 | | ICICI Bank Ltd. ADR | | 385,920 | |
12,200 | # | Reliance Industries Ltd. GDR | | 482,266 | |
| | | | 868,186 | |
| | Indonesia: 0.7% | | | |
17,600 | | Telekomunikasi Indonesia Tbk PT ADR | | 419,936 | |
| | | | 419,936 | |
| | Ireland: 0.9% | | | |
37,400 | | Bank of Ireland | | 585,760 | |
| | | | 585,760 | |
| | Italy: 4.0% | | | |
105,735 | | Banca Intesa S.p.A. | | 558,604 | |
30,600 | | ENI-Ente Nazionale Idrocarburi S.p.A. | | 851,898 | |
46,500 | | Mediaset S.p.A. | | 491,542 | |
228,600 | | Telecom Italia S.p.A. | | 565,157 | |
| | | | 2,467,201 | |
| | Japan: 25.8% | | | |
37,000 | | Asahi Glass Co. Ltd. | | 476,302 | |
11,500 | | Canon, Inc. | | 674,508 | |
8,600 | | Don Quijote Co., Ltd. | | 719,882 | |
141 | | East Japan Railway Co. | | 967,121 | |
16,400 | | Hoya Corp. | | 589,003 | |
45 | | Japan Tobacco, Inc. | | 657,424 | |
200 | @ | kabu.com Securities Co., Ltd. | | 692,895 | |
72,000 | | Kawasaki Kisen Kaisha Ltd. | | 451,627 | |
17,800 | | Leopalace21 Corp. | | 643,606 | |
72 | | Mitsubishi Tokyo Financial Group, Inc. | | 979,689 | |
103 | | Mizuho Financial Group, Inc. | | 816,870 | |
106 | | Nippon Telegraph & Telephone Corp. | | 480,674 | |
15,300 | | NOK Corp. | | 414,297 | |
132,000 | | Osaka Gas Co. Ltd | | 454,785 | |
8,800 | | Sankyo Co. Ltd | | 508,955 | |
2,370 | | SFCG Co,. Ltd. | | 573,025 | |
87,000 | | Sumitomo Chemical Co., Ltd. | | 596,635 | |
61,000 | | Sumitomo Corp. | | 788,805 | |
41,000 | | Sumitomo Electric Industries Ltd. | | 622,261 | |
122,000 | | Sumitomo Metal Industries Ltd. | | 466,982 | |
30,000 | | Sumitomo Rubber Industries, Inc. | | 427,526 | |
56,000 | | Sumitomo Trust & Banking Co., Ltd. | | 570,541 | |
110,000 | | Taisei Corp. | | 497,540 | |
39,000 | | Takashimaya Co. Ltd. | | 622,443 | |
14,900 | | Takeda Chemical Industries Ltd. | | 806,691 | |
18,300 | | Yamaha Motor Co., Ltd. | | 477,914 | |
| | | | 15,978,001 | |
| | Netherlands: 4.9% | | | |
33,400 | @ | ASML Holding NV | | 666,970 | |
29,300 | | Koninklijke Philips Electronics NV | | 906,652 | |
46,295 | | Royal Dutch Shell PLC | | 1,480,130 | |
| | | | 3,053,752 | |
See Accompanying Notes to Financial Statements
96
ING VP INTERNATIONAL EQUITY PORTFOLIO | | PORTFOLIO OF INVESTMENTS
AS OF DECEMBER 31, 2005 (CONTINUED) |
Shares | | | | Value | |
| | Norway: 1.4% | | | |
4,260 | | Norsk Hydro ASA | | $ | 436,916 | |
13,150 | @ | Petroleum Geo-Services ASA | | 404,728 | |
| | | | 841,644 | |
| | Singapore: 0.8% | | | |
52,000 | | DBS Group Holdings Ltd. | | 515,150 | |
| | | | 515,150 | |
| | South Korea: 0.6% | | | |
1,040 | # | Samsung Electronics Co., Ltd. GDR | | 343,142 | |
| | | | 343,142 | |
| | Spain: 0.9% | | | |
18,600 | | Repsol YPF SA | | 542,471 | |
| | | | 542,471 | |
| | Sweden: 3.3% | | | |
24,700 | @ | Capio AB | | 439,025 | |
34,500 | | Swedish Match AB | | 405,057 | |
192,000 | | Telefonaktiebolaget LM Ericsson | | 660,361 | |
11,600 | | Volvo AB | | 546,287 | |
| | | | 2,050,730 | |
| | Switzerland: 5.0% | | | |
8,910 | | Roche Holding AG | | 1,332,014 | |
11,990 | | UBS AG | | 1,136,286 | |
2,952 | @ | Zurich Financial Services AG | | 626,368 | |
| | | | 3,094,668 | |
| | United Kingdom: 16.3% | | | |
18,500 | | Anglo American PLC | | 629,785 | |
23,721 | | British American Tobacco PLC | | 528,923 | |
168,100 | | Centrica PLC | | 734,904 | |
56,000 | | Diageo PLC | | 807,521 | |
30,100 | | Enterprise Inns PLC | | 484,715 | |
60,000 | | GlaxoSmithKline PLC | | 1,511,374 | |
65,069 | | HBOS PLC | | 1,107,735 | |
93,700 | | Hilton Group PLC | | 584,069 | |
116,290 | | Kingfisher PLC | | 473,201 | |
201,600 | | Legal & General Group PLC | | 421,871 | |
135,900 | | Rentokil Initial PLC | | 382,267 | |
38,403 | | Royal Bank of Scotland Group PLC | | 1,156,376 | |
32,735 | | SABMiller PLC | | 595,192 | |
65,900 | | Unilever PLC | | 653,635 | |
| | | | 10,071,568 | |
| | Total Common Stock
(Cost $51,240,955) | | 60,626,800 | |
| | | | | | |
Principal
Amount | | | | Value | |
PREFERRED STOCK: 0.7% | | | | |
| | Germany 0.7% | | | |
$ | 4,200 | | Henkel KGaA | | $ | 420,525 | |
| | Total Preferred Stock
(Cost $396,751) | | 420,525 | |
| | Total Long-Term Investments
(Cost $51,637,706) | | 61,047,325 | |
| | | | | |
SHORT-TERM INVESTMENT: 1.4% | | | |
| | | | | |
| | Repurchase Agreement: 1.4% | | | |
891,000 | | Morgan Stanley Repurchase Agreement dated 12/30/05, 4.230%, due 01/03/06, $891,419 to be received upon repurchase (Collateralized by $910,000 Federal Credit Savings Bureau, 5.650%, Market Value plus accrued interest $912,290 due 12/06/12) | | 891,000 | |
| | Total Short-Term Investments
(Cost $891,000) | | | 891,000 | |
| | Total Investments In Securities
(Cost $52,528,706)* | 100.2 | % | | $ | 61,938,325 | |
| | Other Assets and Liabilities-Net | (0.2 | ) | | (121,987) | |
| | Net Assets | 100.0 | % | | $ | 61,816,338 | |
| | | | | | | | | |
@ | | Non-income producing security |
ADR | | American Depositary Receipt |
GDR | | Global Depositary Receipt |
# | | Securities with purchases pursuant to Rule 144A, under the Securities Act of 1933 and may not be resold subject to that rule except to qualified institutional buyers. These securities have been determined to be liquid under the guidelines established by the Funds’ Board of Directors/Trustees. |
* | | Cost for federal income tax purposes is $52,705,793. |
| | Net unrealized appreciation consists of: |
Gross Unrealized Appreciation | | $ | 9,752,860 | |
Gross Unrealized Depreciation | | (520,328 | ) |
Net Unrealized Appreciation | | $ | 9,232,532 | |
| | | | | | |
See Accompanying Notes to Financial Statements
97
ING VP INTERNATIONAL EQUITY PORTFOLIO | | PORTFOLIO OF INVESTMENTS
AS OF DECEMBER 31, 2005 (CONTINUED) |
Industry | | Percentage of Net Assets | |
Agriculture | | | 2.6 | % |
Auto Manufacturers | | | 2.1 | |
Auto Parts and Equipment | | | 2.0 | |
Banks | | | 19.0 | |
Beverages | | | 2.3 | |
Building Materials | | | 1.6 | |
Chemicals | | | 2.8 | |
Commercial Services | | | 0.6 | |
Computers | | | 1.3 | |
Distribution/Wholesale | | | 1.3 | |
Diversified Financial Services | | | 2.1 | |
Electric | | | 1.8 | |
Electrical Components and Equipment | | | 1.0 | |
Electronics | | | 2.4 | |
Engineering and Construction | | | 2.4 | |
Entertainment | | | 1.8 | |
Food | | | 1.1 | |
Gas | | | 1.9 | |
Healthcare-Services | | | 1.9 | |
Housedhold Products/Wares | | | 0.7 | |
Insurance | | | 4.5 | |
Internet | | | 1.1 | |
Leisure | | | 1.6 | |
Iron/Steel | | | 0.8 | |
Media | | | 1.7 | |
Mining | | | 2.1 | |
Office/Business Equipment | | | 1.1 | |
Oil and Gas | | | 7.8 | |
Oil and Gas Services | | | 0.7 | |
Pharmaceuticals | | | 6.6 | |
Real Estate | | | 1.9 | |
Retail | | | 3.7 | |
Semiconductors | | | 1.6 | |
Telecommunications | | | 6.4 | |
Transportation | | | 3.4 | |
Water | | | 1.1 | |
Repurchase Agreement | | | 1.4 | |
Other Assets and Liabilities, Net | | | (0.2 | ) |
Net Assets | | | 100.0 | % |
| | | | | |
See Accompanying Notes to Financial Statements
98
TAX INFORMATION (UNAUDITED)
Dividends paid during the year ended December 31, 2005 were as follows:
Fund Name | | Type | | Per Share Amount | |
ING VP Balanced Portfolio | | | | | |
Class I | | NII | | | $0.3196 | |
Class S | | NII | | | $0.2941 | |
ING VP Growth and Income Portfolio | | | | | | |
Class I | | NII | | | $0.2173 | |
Class S | | NII | | | $0.1957 | |
ING VP Growth Portfolio | | | | | | |
Class I | | NII | | | $0.0694 | |
Class S | | NII | | | $0.0447 | |
ING VP Small Company Portfolio | | | | | | |
Class I | | NII | | | $0.0313 | |
Class S | | NII | | | $0.0051 | |
All Classes | | LTCG | | | $0.2805 | |
ING VP Value Opportunity Portfolio | | | | | | |
Class I | | NII | | | $0.2484 | |
Class S | | NII | | | $0.2205 | |
ING VP Intermediate Bond Portfolio | | | | | | |
Class I | | NII | | | $0.5112 | |
Class S | | NII | | | $0.4932 | |
All Classes | | STCG | | | $0.0611 | |
All Classes | | LTCG | | | $0.0085 | |
ING VP Money Market Portfolio | | | | | | |
Class I | | NII | | | $0.1514 | |
ING VP International Equity Portfolio | | | | | | |
Class I | | NII | | | $0.0881 | |
Class S | | NII | | | $0.0744 | |
NII - Net investment income
STCG - Short-term capital gain
LTCG - Long-term capital gain
Of the ordinary distributions made during the year ended December 31, 2005, the following percentages qualify for the dividends received deduction (DRD) available to corporate shareholders:
ING VP Balanced Portfolio | | 43.95% |
ING VP Growth and Income Portfolio | | 100.00% |
ING VP Growth Portfolio | | 100.00% |
ING VP Small Company Portfolio | | 99.69% |
ING VP Value Opportunity Portfolio | | 100.00% |
ING VP Intermediate Bond Portfolio | | 0.42% |
For the year ended December 31, 2005, the following are percentages of net investment income dividends paid by the Funds that are designated as qualifying dividend income (QDI) subject to reduced income tax rates for individuals:
ING VP Growth and Income Portfolio | | 100.00% |
ING VP Intermediate Bond Portfolio | | 0.71% |
Pursuant to Section 853 of the Internal Revenue Code, the Portfolios designate the following amounts as foreign taxes paid for the year ended December 31, 2005:
| | Foreign Taxes Paid | | Per Share Amount | |
ING VP International Equity Portfolio | | $135,406 | | $0.0221 | |
Above figures may differ from those cited elsewhere in this report due to differences in the calculation of income and gains under accounting principles generally accepted in the United States of America (book) purposes and Internal Revenue Service (tax) purposes.
Shareholders are strongly advised to consult their own tax advisers with respect to the tax consequences of their investments in the Funds. In January, shareholders, excluding corporate shareholders, receive an IRS 1099-DIV regarding the federal tax status of the dividends and distributions they received in the calendar year.
99
DIRECTOR/TRUSTEE AND OFFICER INFORMATION (UNAUDITED)
The business and affairs of the Funds are managed under the direction of the Funds’ Boards of Directors/Trustees. A director/trustee who is not an interested person of the Funds, as defined in the 1940 Act, is an independent director/trustee (“Non-Interested Director/Trustee”). The Directors/Trustee of the Funds are listed below. The Statement of Additional Information includes additional information about directors/trustee of the Registrant and is available, without charge, upon request at 1-800-992-0180.
Name, Address
and Age | | Position(s)
held with
the Company/
Trust | | Term of
Office and
Length of
Time Served(1) | | Principal
Occupation(s)
during the
Past Five Years | | Number of
Portfolios in
Fund Complex
Overseen
by Director/
Trustee | | Other
Directorships
held by
Director/
Trustee |
Non-Interested Directors/Trustees: | | | | | | | | |
| | | | | | | | | | |
Albert E. DePrince, Jr.
7337 E. Doubletree Ranch Rd.
Scottsdale, Arizona 85258
Age: 64 | | Director/
Trustee | | June 1998 - Present | | Professor of Economics and Finance, Middle Tennessee State University (August 1991 - Present) and Director, Business and Economic Research Center (August 1999 - August 2002). | | 40 | | President-Elect, Academy of Economics and Finance (February 2005 - Present). |
| | | | | | | | | | |
Maria Teresa Fighetti
7337 E. Doubletree Ranch Rd.
Scottsdale, Arizona 85258
Age: 62 | | Director/
Trustee | | April 1994 - Present | | Retired. Formerly, Attorney, New York City Department of Mental Health (June 1973 - October 2002) and Associate Commissioner (1995 - 2002). | | 40 | | None |
| | | | | | | | | | |
Sidney Koch 7337
E. Doubletree Ranch Rd.
Scottsdale, Arizona 85258
Age: 70 | | Director/
Trustee | | April 1994 - Present | | Self-Employed Consultant (January 1993 - Present). | | 40 | | Northwest Center for the Arts, Torrington, CT. |
| | | | | | | | | | |
Dr. Corine T. Norgaard
7337 E. Doubletree Ranch Rd.
Scottsdale, Arizona 85258
Age: 68 | | Director/
Trustee | | June 1991 - Present | | President, Thompson Enterprises (October 2004 - Present). Formerly, Dean, Barney School of Business, University of Hartford (August 1996 - June 2004). | | 40 | | Mass Mutual Corporate and Participation Investors (April 1997 - Present); Advest Trust Company (1998 - Present); and Connecticut Health Foundation (2002 - Present). |
| | | | | | | | | | |
Edward T. O’Dell
7337 E. Doubletree Ranch Rd.
Scottsdale, Arizona 85258
Age: 70 | | Director/
Trustee | | June 2002 - Present | | Retired. | | 40 | | None |
| | | | | | | | | | |
Joseph E. Obermeyer
7337 E. Doubletree Ranch Rd.
Scottsdale, Arizona 85258
Age: 48 | | Director/
Trustee | | January 2003 - Present | | President, Obermeyer & Associates, Inc. (November 1999 - Present). | | 40 | | None |
100
DIRECTOR/TRUSTEE AND OFFICER INFORMATION (UNAUDITED) (CONTINUED)
Name, Address
and Age | | Position(s)
held with
the Company/
Trust | | Term of
Office and
Length of
Time
Served(1) | | Principal
Occupation(s)
during the
Past Five Years | | Number of
Portfolios in
Fund Complex
Overseen
by Director/
Trustee | | Other
Directorships
held by
Director/
Trustee |
Directors/Trustees who are “Interested Persons” | | | | | | |
| | | | | | | | | | |
J. Scott Fox(2)
7337 E. Doubletree Ranch Rd.
Scottsdale, Arizona 85258
Age: 50 | | Director/
Trustee | | December 1997 - Present | | Vice Chairman and Chief Operating Officer, ING Investment Management LLC (September 2002 - Present); President and Chief Executive Officer (April 2001 - Present). Formerly, Managing Director and Chief Operating Officer, ING Investment Management Co. (April 1994 - April 2001). | | 40 | | The Greater Hartford Arts Council (July 2002 - Present). |
| | | | | | | | | | |
Thomas J. McInerney(3)
ING Investment
Management Co.
10 State House Square
Hartford, Connecticut
Age: 49 | | Director/
Trustee | | April 2002 - Present | | Chief Executive Officer, ING U.S. Financial Services (January 2005 - Present); General Manager and Chief Executive Officer, U.S. Financial Services (December 2003 - December 2004); Chief Executive Officer, ING U.S. Financial Services (September 2001 - December 2003); and General Manager and Chief Executive Officer, U.S. Worksite Financial Services (December 2000 - September 2001). | | 212 | | Equitable Life Insurance Co., Golden American Life Insurance Co., Life Insurance Company of Georgia, Midwestern United Life Insurance Co., ReliaStar Life Insurance Co., Security Life of Denver, Security Connecticut Life Insurance Co., Southland Life Insurance Co., USG Annuity and Life Company, and United Life and Annuity Insurance Co., Inc; Ameribest Life Insurance Co.; First Columbine Life Insurance Co.; and Metro Atlanta Chamber of Commerce (January 2003 - Present) |
(1) Directors/Trustees serve until their successors are duly elected and qualified, subject to the Board’s retirement policy.
(2) Mr. Fox is an “interested person,” as defined under the 1940 Act, because of his relationship with ING Investment Management Co., an affiliate of ING Investments.
(3) Mr. McInerney is an “interested person,” as defined under the 1940 Act, because of his affiliation with ING Groep N.V., the parent corporation of the Investment Manager, ING Investments, LLC and the Distributor, ING Funds Distributor, LLC.
101
DIRECTOR AND OFFICER INFORMATION (UNAUDITED) (CONTINUED)
Name, Address
and Age | | Position(s)
Held with the Company/
Trust | | Term of Office and
Length of Time Served(1) | | Principal Occupation(s) during the
Past Five Years |
James M. Hennessy
7337 E. Doubletree Ranch Rd.
Scottsdale, Arizona 85258
Age: 56 | | President, Chief Executive Officer and Chief Operating Officer | | March 2002 - Present | | President, Chief Executive Officer and Chief Operating Officer, ING Investments, LLC (December 2000 - Present). Formerly, Senior Executive Vice President and Chief Operating Officer, ING Investments, LLC (April 1995 - December 2000). |
| | | | | | |
Michael J. Roland
7337 E. Doubletree Ranch Rd.
Scottsdale, Arizona 85258
Age: 47 | | Executive Vice President | | April 2002 - Present | | Executive Vice President (December 2001 - Present) and Formerly Chief Compliance Officer (October 2004 - December 2005), ING Investments, LLC.; Chief Financial Officer and Treasurer, ING Investments, LLC (December 2001 - March 2005); and Senior Vice President, ING Investments, LLC (June 1998 - December 2001). |
| | | | | | |
Stanley D. Vyner
7337 E. Doubletree Ranch Rd.
Scottsdale, Arizona 85258
Age: 55 | | Executive Vice President | | March 2002 - Present | | Executive Vice President, (July 2000 - Present) and Chief Investment Risk Officer ING Investments, LLC (January 2003 - Present); Formerly, Chief Investment Officer of the International Portfolios, ING Investments, LLC (August 2000 - January 2003). |
| | | | | | |
Joseph M. O’Donnell
7337 E. Doubletree Ranch Rd.
Scottsdale, Arizona 85258
Age: 51 | | Chief Compliance Officer | | November 2004 - Present | | Chief Compliance Officer of the ING Funds (November 2004 - Present) and ING Investments, LLC and Directed Services, Inc. (January 2006 - Present). Formerly, Vice President, Chief Legal Counsel, Chief Compliance Officer and Secretary of Atlas Securities, Inc., Atlas Advisers, Inc. and Atlas Funds (October 2001 - October 2004); and Chief Operating Officer and General Counsel of Matthews International Capital Management LLC and Vice President and Secretary of Matthews International Funds (August 1999 - May 2001). |
| | | | | | |
Todd Modic
7337 E. Doubletree Ranch Rd.
Scottsdale, Arizona 85258
Age: 38 | | Senior/Principal Vice President, Chief Financial Officer and Assistant Secretary | | March 2005 - Present | | Senior Vice President, ING Funds Services, LLC (April 2005 - Present). Formerly, Vice President, ING Funds Services, LLC (September 2002 - March 2005); Director of Financial Reporting, ING Investments, LLC (March 2001 - September 2002) and Director of Financial Reporting, Axient Communications, Inc. (May 2000 - January 2001). |
| | | | | | |
Robert S. Naka
7337 E. Doubletree Ranch Rd.
Scottsdale, Arizona 85258
Age: 42 | | Senior Vice President and Assistant Secretary | | March 2002 - Present | | Senior Vice President (August 1999 - Present) and Assistant Secretary (October 2001 - Present) ING Funds Services, LLC. |
| | | | | | |
Kimberly A. Anderson
7337 E. Doubletree Ranch Rd.
Scottsdale, Arizona 85258
Age: 41 | | Senior Vice President | | December 2003 - Present | | Senior Vice President and Assistant Secretary, ING Investments, LLC (October 2003 - Present). Formerly, Vice President and Assistant Secretary, ING Investments, LLC (January 2001 - October 2003) and Assistant Vice President, ING Funds Services, LLC (November 1999 - January 2001). |
| | | | | | |
Robyn L. Ichilov
7337 E. Doubletree Ranch Rd.
Scottsdale, Arizona 85258
Age: 38 | | Vice President and Treasurer | | March 2002 - Present | | Vice President and Treasurer, ING Funds Services, LLC (October 2001 - Present) and ING Investments, LLC (August 1997 - Present). |
| | | | | | |
Lauren D. Bensinger
7337 E. Doubletree Ranch Rd.
Scottsdale, Arizona 85258
Age: 51 | | Vice President | | March 2003 - Present | | Vice President and Chief Compliance Officer, ING Funds Distributor, LLC (July 1995 - Present) and Vice President ING Investments, LLC (February 2003 - Present). Formerly, Chief Compliance Officer, ING Investments, LLC (October 2001 - October 2004). |
102
DIRECTOR AND OFFICER INFORMATION (UNAUDITED) (CONTINUED)
Name, Address
and Age | | Position(s)
Held with the Company | | Term of Office and
Length of Time Served(1) | | Principal Occupation(s) during the
Past Five Years |
Maria M. Anderson
7337 E. Doubletree Ranch Rd.
Scottsdale, Arizona 85258
Age: 47 | | Vice President | | September 2004 - Present | | Vice President, ING Funds Services, LLC (September 2004 - Present). Formerly, Assistant Vice President, ING Funds Services, LLC (October 2001 - September 2004) and Manager of Fund Accounting and Fund Compliance, ING Investments, LLC (September 1999 - October 2001). |
| | | | | | |
Mary A. Gaston
7337 E. Doubletree Ranch Rd.
Scottsdale, Arizona 85258
Age: 39 | | Vice President | | March 2005 - Present | | Vice President, ING Funds Services, LLC (April 2005 - Present). Formerly, Assistant Vice President, Financial Reporting, ING Funds, LLC (April 2004 - April 2005); Manager, Financial Reporting, ING Services, LLC (August 2002 - April 2004); and Controller, Z Seven Fund, Inc. and Ziskin Asset Management, Inc. (January 2000 - March 2002). |
| | | | | | |
Susan P. Kinens
7337 E. Doubletree Ranch Rd.
Scottsdale, Arizona 85258
Age: 29 | | Assistant Vice President | | March 2003 - Present | | Assistant Vice President, ING Funds Services, LLC (December 2002 - Present); and has held various other positions with ING Funds Services, LLC for more than the last five years. |
| | | | | | |
Kimberly K. Palmer
7337 E. Doubletree Ranch Rd.
Scottsdale, Arizona 85258
Age: 48 | | Assistant Vice President | | September 2004 - Present | | Assistant Vice President, ING Funds Services, LLC (August 2004 - Present). Formerly, Manager, Registration Statements, ING Funds Services, LLC (May 2003 - August 2004); Associate Partner, AMVESCAP PL (October 2000 - May 2003) and Director of Federal Filings and Blue Sky Filings, INVESCO Funds Group, Inc. (March 1994 - May 2003). |
| | | | | | |
Theresa K. Kelety
7337 E. Doubletree Ranch Rd.
Scottsdale, Arizona 85258
Age: 42 | | Secretary | | September 2003 - Present | | Counsel, ING Americas, U.S. Legal Services (April 2003 - Present). Formerly, Senior Associate with Shearman & Sterling (February 2000 - April 2003). |
| | | | | | |
Huey P. Falgout, Jr.
7337 E. Doubletree Ranch Rd.
Scottsdale, Arizona 85258
Age: 42 | | Assistant Secretary | | September 2003 - Present | | Chief Counsel, ING Americas, U.S. Legal Services (September 2003 - Present). Formerly, Counsel, ING Americas, U.S. Legal Services (November 2002 - September 2003); and Associate General Counsel of AIG American General (January 1999 - November 2002). |
| | | | | | |
Robin R. Nesbitt
7337 E. Doubletree Ranch Rd.
Scottsdale, Arizona 85258
Age: 32 | | Assistant Secretary | | September 2004 - Present | | Supervisor, Board Operations, ING Funds Services, LLC (August 2003 - Present). Formerly, Senior Legal Analyst, ING Funds Services, LLC (August 2002 - August 2003); Associate, PricewaterhouseCoopers (January 2001 - August 2001); and Paralegal, McManis, Faulkner & Morgan (May 2000 - December 2000). |
(1) The officers hold office until the next annual meeting of the Directors/Trustees and until their successors have been elected and qualified.
103
ADVISORY CONTRACT APPROVAL DISCUSSION (UNAUDITED)
The Investment Company Act of 1940, as amended (the “1940 Act”), provides, in substance, that each investment advisory agreement and sub-advisory agreement for a Fund will terminate automatically after the initial term of the agreement (which term may not exceed two years), unless continuation of the agreement is approved annually by the Board of Trustees (the “Board”) of the Fund, including a majority of the Trustees who have no direct or indirect interest in the agreement and who are not “interested persons” of the Fund (the “Independent Trustees”). Consistent with this requirement of the 1940 Act, the Board has established a process for considering on an annual basis approval of the continuation of the Investment Management Agreement for each Fund (the “Advisory Agreement”) with ING Investments, LLC (the “Adviser”) and the sub-advisory agreement for each Fund (collectively, the “Sub-Advisory Agreements”) with each sub-adviser of the Funds (the “Sub-Advisers”). Set forth below is a description of the process followed by the Board in considering approval of the continuation of each Advisory and Sub-Advisory Agreement (collectively, the “Agreements”), together with an explanation of many of the factors considered and related conclusions reached by the Board in voting to approve the continuation of each Agreement for an additional one-year period commencing January 1, 2006.
Overview of the Review Process
At a meeting of the Board held on December 14, 2005, the Board, including all of the Independent Trustees, voted to approve continuation of each of the existing Advisory and Sub-Advisory Agreements for the Funds. Prior to voting such approvals, the Board received the affirmative recommendation of the Contracts Committee of the Board, which is a Committee of the Board comprised of all of the Independent Trustees and exclusively of the Independent Trustees. The Contracts Committee recommended approval of the Advisory and Sub-Advisory Agreements after completing an extensive review of information requested by the Committee from the Adviser and each Sub-Adviser, including the following: (1) comparative performance data for each Fund for various time periods; (2) comparative data regarding management fees, including data regarding the fees charged by the Adviser and Sub-Advisers for managing other mutual funds and institutional accounts using investment strategies and techniques similar to those used in managing the Funds; (3) comparative data regarding the total expenses of each Fund; (4) copies of each form of Advisory Agreement and Sub-Advisory Agreement; (5) copies of the codes of ethics of the Adviser and each Sub-Adviser, together with information relating to the manner in which each code is administered; (6) financial statements of the Adviser and each Sub-Adviser; (7) profitability analyses for the Adviser and each Sub-Adviser with respect to each Fund, and all Funds as a group; (8) descriptions of the qualifications of the investment personnel responsible for managing each Fund, their compensation and their responsibilities with respect to managing other accounts or mutual funds; (9) descriptions of the services provided to the Funds, including the investment strategies and techniques used by each Sub-Adviser in managing the Funds; (10) data relating to portfolio turnover and brokerage practices, including practices with respect to the acquisition of research through “soft dollar” benefits received in connection with the Funds’ brokerage; (11) data comparing the performance of certain Funds against “static portfolios” of the Funds over various time periods; (12) descriptions of the business continuity and disaster recovery plans of the Adviser and each Sub-Adviser; (13) descriptions of various compliance programs of the Adviser and Sub-Advisers, including the Adviser’s programs for monitoring and enforcing compliance with the Funds’ policies with respect to market-timing, late trading and selective portfolio disclosure; and (14) other information relevant to an evaluation of the nature, extent and quality of the services provided by the Adviser and each Sub-Adviser in response to a series of detailed questions presented by independent legal counsel on behalf of the Independent Trustees.
The Contracts Committee began the formal review process in July 2005 when it met separately with independent legal counsel to review the information to be requested from management and the methodology to be used in determining the selected peer groups for comparing performance and expenses. The Contracts Committee then held meetings on November 1 and 2, 2005 and December 13, 2005, during which the Independent Trustees, meeting separately with independent legal counsel, reviewed and evaluated the information described above. As part of the review process, the Contracts Committee also met with representatives from the Adviser and the Sub-Advisers to discuss the information provided to the Committee. The Contracts Committee also considered information that had been provided by the Adviser and Sub-Advisers throughout the year at other meetings of the Contracts Committee, the Audit Committee, the Compliance Committee and the Board.
104
ADVISORY CONTRACT APPROVAL DISCUSSION (UNAUDITED) (CONTINUED)
The Independent Trustees were assisted by Goodwin Procter LLP, their independent legal counsel, throughout the contract review process. The Independent Trustees relied upon the advice of such counsel and their own business judgment in determining the material factors to be considered in evaluating each Advisory and Sub-Advisory Agreement and the weight to be given to each such factor. The conclusions reached by the Independent Trustees were based on a comprehensive evaluation of all of the information provided and was not the result of any one factor. Moreover, each Independent Trustee may have afforded different weight to the various factors in reaching his or her conclusions with respect to each Advisory and Sub-Advisory Agreement.
Nature, Extent and Quality of Services
In considering whether to approve the Advisory and Sub-Advisory Agreements for the Funds for the year commencing January 1, 2006, the Board evaluated the nature, extent and quality of services provided to the Funds by the Adviser and Sub-Advisers. The Board considered the investment management and related services provided by the Adviser and Sub-Advisers, including the quantity and quality of the resources available to provide such services. Among other things, the Board considered the qualifications of the individuals responsible for performing various investment related services. With respect to Funds sub-advised by an affiliate of the Adviser, the Board also received information regarding the compensation paid by the Sub-Adviser to attract and retain individuals to perform these services on both an absolute basis and relative to amounts paid by others in the investment management industry.
The Board also considered the quality of the compliance programs of the Adviser and each Sub-Adviser, including the manner in which the Adviser and each Sub-Adviser monitor for compliance with the investment policies and restrictions of a Fund, the Codes of Ethics of the Adviser and Sub-Advisers with respect to personal trading by employees with access to portfolio information, and other compliance related matters. The Board also considered the actions taken by the Adviser and Sub-Advisers to establish and maintain effective disaster recovery and business continuity plans.
The Board considered the actions taken by the Adviser and its affiliated companies to administer the Funds’ policies and procedures for voting proxies, valuing the Funds’ assets, selective disclosure of portfolio holdings and preventing late-trading and frequent trading of Fund shares. With respect to these and related compliance matters, the Board also considered the responsiveness of the Adviser and its affiliated companies over the course of the past several years to the inquiries of various regulatory authorities, including the Securities and Exchange Commission and the National Association of Securities Dealers, Inc.
The Board also took into account the efforts of the Adviser and its affiliated companies to reduce the expenses of the Funds, including fees and expenses for transfer agency, custody and audit services. With respect to those Funds that are sub-advised by an affiliate of the Adviser, the Board specifically noted that the Adviser and its affiliated companies have significantly reduced the Funds’ brokerage costs and portfolio turnover rates, as well as the quantity of research acquired through the use of soft dollars from the Funds’ brokerage. The Board also noted the efforts of the Adviser to optimize the number of Funds in the ING complex of mutual funds and to standardize the asset management characteristics and policies across the ING mutual fund platform. Consideration was also given to the benefits that shareholders of the Funds realize because the Funds are part of a larger ING family of mutual funds, including, in most cases, the ability of shareholders to exchange or transfer investments within the same class of shares among a wide variety of mutual funds without incurring additional sales charges.
The Board concluded that the nature, extent and quality of advisory and related services provided by the Adviser and each of the Sub-Advisers, taken as a whole, are consistent with the terms of the respective Advisory and Sub-Advisory Agreements and justify the fees paid by the Funds for such services.
Fund Performance
The Board reviewed each Fund’s investment performance over various time periods on an absolute basis and relative to the performance of (i) one or more appropriate benchmark indexes (such as the S&P 500 Composite Stock Price Index), (ii) a group of similarly managed mutual funds identified by Lipper, Inc. and/or Morningstar, Inc., and (iii) similarly managed mutual funds within a specified peer group based upon a methodology approved by the Contracts Committee (each, a “Selected Peer Group”). The Board reviewed comparative performance data for the one-, three-, five-, and ten-year periods, where applicable, ending June 30, 2005 and September 30, 2005.
105
ADVISORY CONTRACT APPROVAL DISCUSSION (UNAUDITED) (CONTINUED)
Summaries of selected portions of the performance information reviewed by the Board, together with the Board’s conclusions regarding the performance of each Fund, is set forth below under “Fund-by-Fund Analysis.”
Management Fees, Sub-Advisory Fees and Expenses
Consideration was given to the contractual investment advisory fee rates, inclusive of administrative fee rates, payable by the Funds to the Adviser and its affiliated companies (referred to collectively as “management fees”) and the contractual sub-advisory fee rates payable by the Adviser to each Sub-Adviser for sub-advisory services. As part of its review, the Board considered each Fund’s management fee and total expense ratio, as compared to its Selected Peer Group, both before and after giving effect to any undertaking by the Adviser to waive fees and/or limit the total expenses of a Fund. In addition, the Trustees received information regarding the fees charged by each Sub-Adviser to similarly-managed institutional accounts and other mutual funds, if any, and the comparability (or lack thereof) of the services provided by the Sub-Adviser in managing such accounts and other mutual funds to the services provided in managing the Funds. With respect to the Funds sub-advised by an affiliate of the Adviser, the Board evaluated the reasonableness of the fees payable under the Advisory and Sub-Advisory Agreements as a whole. With respect to the Funds sub-advised by Sub-Advisers that are not affiliated with the Adviser, the Board considered the reasonableness of the fees payable to the Sub-Advisers by the Adviser in light of the ability of the Adviser to negotiate such fees on an arms-length basis. Summaries of selected portions of the fee and expense information reviewed are set forth below under “Fund-by-Fund Analysis.” After reviewing the foregoing information, and in light of the nature extent and quality of the services provided by the Adviser and each Sub-Adviser, the Board concluded with respect to each Fund that the management fee charged to the Fund for advisory, sub-advisory and related services is fair and reasonable and that the total expense ratio of the Fund is reasonable.
Profitability
The Board considered information relating to revenues, expenses, and profits realized by the Adviser and each Sub-Adviser attributable to performing advisory, sub-advisory and administrative services for the Funds. With respect to Funds sub-advised by an unaffiliated Sub-Adviser, the Board did not consider the profitability of the Sub-Adviser to be a material factor because the Board believes that the Adviser negotiates sub-advisory fees with the unaffiliated Sub-Adviser on an arms-length basis. The Board reviewed profitability data for the Adviser and its affiliated companies, including the distributor of the Funds, relating to (i) each Fund separately, (ii) all Funds as a group, (iii) all “retail” Funds as a group, and (iv) all variable insurance product Funds as a group, in each case for the one-year periods ended December 31, 2004 and December 31, 2003, the nine-month period ended September 30, 2005 and the six-month period ended June 30, 2005. With respect to the Adviser and its affiliated companies, such information was prepared in accordance with a methodology approved by the Contracts Committee. The Board considered the profitability of the Adviser and its affiliated companies attributable to managing and operating each Fund both with and without the profitability of the distributor of the Funds and both before and after giving effect to any expenses incurred by the Adviser or any affiliated company in making revenue sharing or other payments to third parties, including affiliated insurance companies, for distribution and administrative services. With respect to Funds sub-advised by an affiliate of the Adviser, the Board considered the profitability of the Adviser and the Sub-Adviser attributable to managing and operating each Fund as a whole. The Board also considered other direct or indirect benefits that the Adviser and Sub-Advisers, and any affiliated companies thereof, derive from their relationships with the Funds, including the receipt by ING U.S. Financial Services, an affiliate of the Adviser, of fees relating to the offering of bundled financial products, such as annuity contracts, and the receipt by Sub-Advisers of “soft dollar” benefits from the Funds’ brokerage. The Board concluded that, in light of the nature, extent and quality of the services provided, the profits realized by the Adviser and its affiliated companies, taken as a whole, with respect to providing advisory, sub-advisory and administrative services for each Fund are reasonable.
Economies of Scale
In considering the reasonableness of the management fee of each Fund, the Board considered the extent to which economies of scale can be expected to be realized by a Fund’s Adviser and its affiliated companies, on the one hand, and by the Fund, on the other hand, as the assets of the Fund increase. The Board noted that the advisory fee for certain Funds includes breakpoints such that, as the assets of the Fund increase, the Fund’s management
106
ADVISORY CONTRACT APPROVAL DISCUSSION (UNAUDITED) (CONTINUED)
fee will decrease as a percentage of the Fund’s total assets. The Board recognized the inherent difficulties in measuring precisely the impact of any economies of scale being realized by the Adviser and its affiliated companies with respect to their management of any one or more Funds. In an effort to determine the extent to which economies of scale, if any, will be realized by the Adviser and its affiliated companies as the assets of the Funds grow, the Board considered the profitability data described above relating to the Adviser and its affiliated companies in light of changes in the assets of the Funds over various time periods. The Board noted that the total assets under management of many Funds have decreased during the past several years and concluded that the economies of scale realized by the Adviser and its affiliated companies from managing the Funds have not increased with respect to such Funds. The Board also reviewed information regarding the expense ratio of each Fund in light of changes in the assets of the Funds over various time periods, noting that, as the assets of a Fund increase, the fixed expenses of the Fund, as a percentage of the total assets of the Fund, can be expected to decrease. The Board considered such expense information in light of projections provided by the Adviser with respect to the future growth of assets of the Funds. Based upon the foregoing, the Board concluded that the economies of scale being realized by the Adviser and its affiliated companies do not mandate the implementation of breakpoints or additional breakpoints, as the case may be, with respect to any Fund at this time.
Fund-by-Fund Analysis
In deciding to approve the continuation of each Advisory and Sub-Advisory Agreement for an additional one-year period beginning January 1, 2006, the Board took into account the specific data and factors identified below relating to the performance, fees and expenses of each Fund and actions being taken by the Adviser or Sub-Adviser, as the case may be, with respect to these matters. Except as otherwise indicated, the performance data described below for each Fund is for periods ended September 30, 2005 and the management fees and expense data described below are as of June 30, 2005.
ING VP Balanced Portfolio
In evaluating the investment performance of ING VP Balanced Portfolio, the Board noted that the Portfolio outperformed its Morningstar category median for the year-to-date, one-, three- and ten-year periods, but underperformed for the most recent calendar quarter and five-year periods. The Board received performance information relating to a benchmark index of fixed income securities (the “FISB”) and equity securities (the “ESB”) from which the Board could calculate a composite benchmark index (the “Composite Benchmark”) comprised of 60% ESB and 40% FISB. The Fund outperformed the Composite Benchmark for all periods presented. The Board considered the fact that the Portfolio is ranked in its Morningstar category in the second quintile for the year-to-date,
one-and ten-year periods and in the third quintile for the most recent calendar quarter, three- and five-year periods. The Board noted that the portfolio manager for the domestic equity component of the Portfolio was replaced in April 2004 and that the individuals with primary responsibility for asset allocation decisions were replaced in April 2005. The Board concluded that the performance of the Portfolio is satisfactory and that appropriate actions are being taken to maintain and improve such performance.
In assessing the reasonableness of the management fee and expense ratio of ING VP Balanced Portfolio, the Board noted that the management fee for the Portfolio is equal to the median and one basis point above the average management fees of the funds in its Selected Peer Group and that the expense ratio for the Portfolio is below the median and average expense ratios of the funds in its Selected Peer Group.
ING VP Growth and Income Portfolio
In evaluating the investment performance of ING VP Growth and Income Portfolio, the Board noted that: (1) the Portfolio outperformed its Morningstar category median and its benchmark for the most recent calendar quarter, year-to-date and the one-year periods, but underperformed for the three-, five- and ten-year periods; and (2) the Portfolio is ranked in its Morningstar category in the second quintile for the most recent calendar quarter, year-to-date and one-year periods and in the fifth (lowest) quintile for the three-, five- and ten-year periods. The Board noted that, in an effort to address concerns about the Portfolio’s performance, in April 2004 the Sub-Adviser put in place a new team of portfolio managers and research analysts with primary responsibility for managing the Portfolio and that the Sub-Adviser has hired additional sector analysts to improve stock screenings and analysis since that time. The Board considered the fact that the performance of the Portfolio has improved
107
ADVISORY CONTRACT APPROVAL DISCUSSION (UNAUDITED) (CONTINUED)
subsequent to such actions. The Board concluded that appropriate actions are being taken to improve performance and that additional time is needed to evaluate the effectiveness of these actions.
In assessing the reasonableness of the management fee and expense ratio for ING VP Growth and Income Portfolio, the Board noted that the management fee for the Portfolio is below the median and average management fees of the funds in its Selected Peer Group and that the expense ratio for the Portfolio is below the median and average expense ratios of the funds in its Selected Peer Group.
ING VP Growth Portfolio
In evaluating the investment performance of ING VP Growth Portfolio, the Board noted that: (1) the Portfolio outperformed its Morningstar category median for the year-to-date and one-year periods, but underperformed for the most recent calendar quarter, three-, and five-year periods; (2) the Portfolio outperformed its benchmark for the most recent calendar quarter, year-to-date and one-year periods and underperformed for the three- and five-year periods; and (3) the Portfolio is ranked in its Morningstar category in the third quintile for the most recent calendar quarter, year-to-date, and one-year periods and in the fourth quintile for the three- and five-year periods. The Board further noted that, in an effort to address concerns regarding the Portfolio’s performance, the Sub-Adviser has hired a staff of senior sector analysts to improve stock screenings and analysis and that the performance of the Portfolio has improved. The Board concluded that appropriate actions are being taken to improve performance and that additional time is needed to evaluate the effectiveness of these actions.
In assessing the reasonableness of the management fee and expense ratio for ING VP Growth Portfolio, the Board noted that the management fee for the Portfolio is below the median and average management fees of the funds in its Selected Peer Group and that the expense ratio for the Portfolio is below the median and average expense ratios of the funds in its Selected Peer Group.
ING VP Small Company Portfolio
In evaluating the investment performance of ING VP Small Company Portfolio, the Board noted that: (1) the Portfolio outperformed its Morningstar category median and its benchmark for the most recent calendar quarter, year-to-date and one-year periods, but underperformed for the three- and five-year periods; and (2) the Portfolio is ranked in its Morningstar category in the first (highest) quintile for the most recent calendar quarter, year-to-date and one-year periods, in the fourth quintile for the three-year period and in the fifth (lowest) quintile for the five-year period. The Board further noted that, in an effort to address concerns regarding the Portfolio’s performance, in July 2005 the Sub-Adviser changed the portfolio manager of the Portfolio and that the performance of the Portfolio has improved. The Board concluded that appropriate actions are being taken to improve performance and that additional time is needed to evaluate the effectiveness of these actions.
In assessing the reasonableness of the management fee and expense ratio for ING VP Small Company Portfolio, the Board noted that the management fee for the Portfolio is equal to the median and below the average management fees of the funds in its Selected Peer Group, and that the expense ratio for the Portfolio is below the median and average expense ratios of the funds in its Selected Peer Group.
ING VP Value Opportunity Portfolio
In evaluating the investment performance of ING VP Value Opportunity Portfolio, the Board noted that: (1) the Portfolio outperformed its Morningstar category median for the most recent calendar quarter and year-to-date periods, but underperformed for the one-, three- and five-year periods; (2) the Portfolio underperformed its benchmark for all periods presented except it outperformed for the most recent calendar quarter; and (3) the Portfolio is ranked in its Morningstar category in the first (highest) quintile for the most recent calendar quarter, in the third quintile for the year-to-date period, in the fourth quintile for the one-year period, and in the fifth (lowest) quintile for the three- and five-year periods. The Board also noted that, in an effort to address concerns regarding the Portfolio’s performance, in October 2004 the Adviser and Sub-Adviser recommended changes to certain of the investment strategies used in managing the Portfolio to allow for greater flexibility and in April 2005 the Sub-Adviser replaced the portfolio manager of the Portfolio and that performance of the Portfolio has improved. The Board concluded that appropriate actions are being taken to improve performance and that additional time is needed to evaluate the effectiveness of these actions.
108
ADVISORY CONTRACT APPROVAL DISCUSSION (UNAUDITED) (CONTINUED)
In assessing the reasonableness of the management fee and expense ratio for ING VP Value Opportunity Portfolio, the Board noted that the management fee for the Portfolio is below the median and average management fees of the funds in its Selected Peer Group, and that the expense ratio for the Portfolio is below the median and average expense ratios of the funds in its Selected Peer Group.
ING VP Intermediate Bond Portfolio
In evaluating the investment performance of ING VP Intermediate Bond Portfolio, the Board noted that: (1) the Portfolio outperformed its Morningstar category median for all periods presented; (2) the Portfolio outperformed its benchmark for all periods presented, except it underperformed for the ten-year period; and (3) the Portfolio is ranked in its Morningstar category in the first (highest) quintile for the most recent calendar quarter, year-to-date, one- and five-year periods and in the second quintile for three- and ten-year periods. The Board concluded that the investment performance of the Fund is satisfactory.
In assessing the reasonableness of the management fee and expense ratio for ING VP Intermediate Bond Portfolio, the Board noted that the management fee for the Portfolio is below the median and average management fees of the funds in its Selected Peer Group, and that the expense ratio for the Portfolio is below the median and average expense ratios of the funds in its Selected Peer Group.
ING VP Money Market Portfolio
In evaluating the investment performance of ING VP Money Market Portfolio, the Board noted that: (1) the Portfolio outperformed its Morningstar category median and its benchmark for all periods presented; and (2) the Portfolio is ranked in its Morningstar category in the first (highest) quintile for all periods presented. The Board concluded that the investment performance of the Fund is satisfactory.
In assessing the reasonableness of the management fee and expense ratio for ING VP Money Market Portfolio, the Board noted that the management fee for the Portfolio is below the median and average management fees of the funds in its Selected Peer Group, and that the expense ratio for the Portfolio is below the median and average expense ratios of the funds in its Selected Peer Group.
ING VP Global Science and Technology Portfolio
In evaluating the investment performance of ING VP Global Science and Technology Portfolio, the Board noted that: (1) the Portfolio outperformed its Morningstar category median for the most recent calendar quarter, year-to-date, one-year and five-year periods, but underperformed for the three-year period; (2) the Portfolio outperformed its benchmark for the most recent calendar quarter and year-to-date periods, but underperformed for the one-, three- and five-year periods; and (3) the Portfolio is ranked in its Morningstar category in the first (highest) quintile for the most recent calendar quarter and year-to-date periods, in the second quintile for the one- and five-year periods and the fifth quintile for the three-year period. The Board further noted that, in an effort to address concerns regarding the Portfolio’s performance, in February 2004 the Adviser retained BlackRock Advisors, Inc. to replace the previous Sub-Adviser and, in connection with this change, modified the Portfolio’s investment strategy to permit exposure to science and technology companies on a global basis. The Board noted that the Portfolio’s performance has improved since changing the Portfolio’s Sub-Adviser and concluded that additional time is needed to evaluate the effectiveness of the change.
In assessing the reasonableness of the management fee and expense ratio for ING VP Global Science and Technology Portfolio, the Board noted that the management fee for the Portfolio is above the median and average management fees of the funds in its Selected Peer Group and that the expense ratio for the Portfolio is above the median and equal to the average expense ratios of the portfolios in its Selected Peer Group.
ING VP International Equity Portfolio
In evaluating the investment performance of ING VP International Equity Portfolio, the Board noted that: (1) the Portfolio outperformed its Morningstar category median for all periods presented except it underperformed for the five-year period; (2) the Portfolio outperformed its benchmark for the most recent calendar quarter, year-to-date and one-year periods, but underperformed for the three- and five-year periods; and (3) the Portfolio is ranked in the first (highest) quintile for the most recent calendar quarter, in the second quintile for the
109
ADVISORY CONTRACT APPROVAL DISCUSSION (UNAUDITED) (CONTINUED)
year-to-date and one-year periods, in the third quintile for the three-year period and in the fifth (lowest) quintile for the five-year period. The Board further noted that, to address concerns regarding the Fund’s performance, the Sub-Adviser has taken corrective actions, including the use of a new quantitative ranking model to measure the relative attractiveness of stocks within their economic sectors, and that performance has improved. The Board concluded that appropriate actions are being taken to improve performance and that additional time is needed to evaluate the effectiveness of these actions.
In assessing the reasonableness of the management fee and expense ratio for ING VP International Equity Portfolio, the Board noted that the management fee for the Portfolio is equal to the median and below the average management fees of the funds in its Selected Peer Group, and that the expense ratio for the Portfolio is equal to the median and below the average expense ratios of the funds in its Selected Peer Group.
110
Investment Manager
ING Investments, LLC
7337 East Doubletree Ranch Road
Scottsdale, Arizona 85258
Administrator
ING Funds Services, LLC
7337 East Doubletree Ranch Road
Scottsdale, Arizona 85258
Distributor
ING Funds Distributor, LLC
7337 East Doubletree Ranch Road
Scottsdale, Arizona 85258
1-800-334-3444
Transfer Agent
DST Systems, Inc.
P.O. Box 419368
Kansas City, Missouri 64141
Custodian
The Bank of New York
100 Colonial Center Parkway, Suite 300
Lake Mary, Florida 32746
Legal Counsel
Goodwin Procter LLP
Exchange Place
53 State Street
Boston, Massachusetts 02109
Independent Registered Public Accounting Firm
KPMG LLP
99 High Street
Boston, Massachusetts 02110
Before investing, carefully consider the investment objectives, risks, charges and expenses of the variable annuity contract and the underlying variable investment options. This and other information is contained in the prospectus for the variable annuity contract and the underlying variable investment options. Obtain these prospectuses from your agent/registered representative and read them carefully before investing.

| VPAR-ACAPAPPIS | (1205-022406) |

| Funds |
Annual Report
December 31, 2005
Classes I and S
DOMESTIC EQUITY INDEX PORTFOLIOS
§ ING VP Index Plus LargeCap Portfolio
§ ING VP Index Plus MidCap Portfolio
§ ING VP Index Plus SmallCap Portfolio
STRATEGIC ALLOCATION PORTFOLIOS
§ ING VP Strategic Allocation Balanced Portfolio
§ ING VP Strategic Allocation Growth Portfolio
§ ING VP Strategic Allocation Income Portfolio
This report is submitted for general information to shareholders of the ING Funds. It is not authorized for distribution to prospective shareholders unless accompanied or preceded by a prospectus which includes details regarding the funds’ investment objectives, risks, charges, expenses and other information. This information should be read carefully. | 
|
PROXY VOTING INFORMATION
A description of the policies and procedures that the Portfolios use to determine how to vote proxies related to portfolio securities is available (1) without charge, upon request, by calling Shareholder Services toll-free at 1-800-992-0180; (2) on the ING Funds website at www.ingfunds.com and (3) on the Securities and Exchange Commissions (“SEC”) website at www.sec.gov. Information regarding how the Portfolios voted proxies related to portfolio securities during the most recent 12-month period ended June 30 is available without charge on the ING Funds website at www.ingfunds.com and on the SEC’s website at www.sec.gov.
QUARTERLY PORTFOLIO HOLDINGS
The Registrants file their complete schedule of portfolio holdings with the SEC for the first and third quarters of each fiscal year on Form N-Q. The Registrants’ Forms N-Q are available on the SEC’s website at www.sec.gov. The Registrants’ Forms N-Q may be reviewed and copied at the SEC’s Public Reference Room in Washington, DC, and information on the operation of the Public Reference Room may be obtained by calling 1-800-SEC-0330; and is available upon request from the Registrants by calling Shareholder Services toll-free at 1-800-992-0180.
(THIS PAGE INTENTIONALLY LEFT BLANK)

| Dear Shareholder, |
|
As you may recall, in my last letter I described the enthusiasm that we were experiencing here at ING Funds as we worked to bring more of the world’s investment opportunities to you, the investor. |
|
That enthusiasm, I am happy to report, is continuing to thrive. With the New Year, we have launched a series of new international mutual funds, each created to bring more of the world’s opportunities to you. |
|
Meanwhile, we have also heard you loud and clear. Our research tells us that many investors report that they find investing an intimidating and overly-complex endeavor. That is why ING is committed to helping investors across the country cut through the confusion and clutter. “Your future. Made easier.SM” is more than words; they represent our promise to you. |
JAMES M. HENNESSY | |
Those two objectives — bringing you more of the world’s opportunities and doing it in a way that is easier for you — are behind the development of the new portfolios. |
| |
| According to a recent finding, 58 percent of the world market capitalization now lies outside of the U.S.1 |
In other words, the majority of investment opportunities are now beyond our borders and we think that the ING VP Index Plus International Portfolio — a broad-based international portfolio — is an easy, single-step method to gain exposure to many of those opportunities. |
|
Meanwhile, the ING VP Global Real Estate Portfolio was developed as an easy way to bring global — international and domestic — real estate opportunities to the variable portfolio investor. Real Estate Investment Trusts (REITs) are becoming more and more popular around the world, and this new portfolio seeks to capitalize on that popularity. But again, we’ve made it easy. With just one investment, investors bring the diversification of global real estate to their investment strategy. |
|
One of our goals at ING Funds is to find tomorrow’s opportunities today, and we believe these two portfolios are just the latest examples of that plan in action. |
|
On behalf of everyone at ING Funds, I thank you for your continued support and loyalty. We look forward to serving you in the future. |
Sincerely,

James M. Hennessy President ING Funds |
January 28, 2006 | |
The views expressed in the President’s Letter reflect those of the President as of the date of the letter. Any such views are subject to change at any time based upon market or other conditions and ING Funds disclaims any responsibility to update such views. These views may not be relied on as investment advice and because investment decisions for an ING Fund are based on numerous factors, may not be relied on as an indication of investment intent on behalf of any ING Fund. Reference to specific company securities should not be construed as recommendations or investment advice.
International investing does pose special risks including currency fluctuation, economic and political risks not found in investments that are solely domestic. Investments in issuers that are principally engaged in real estate, including REITs, may subject the Fund to risks similar to those associated with the direct ownership of real estate, including terrorist attacks, war or other acts that destroy real property (in addition to market risks). These companies are sensitive to factors such as changes in real estate values and property taxes, interest rates, cash flow of underlying real estate assets, supply and demand, and the management skill and creditworthiness of the issuer. REITs may also be affected by tax and regulatory requirements.
1 MSCI December, 2005
1
MARKET PERSPECTIVE: | YEAR ENDED DECEMBER 31, 2005 |
In our semi-annual report, we referred to mixed markets in which the U.S. investor lost on both domestic and international stocks, with gains in the latter trumped by the rebounding U.S. dollar. In the second half, global equities registered solid gains, although foreign markets ended the 2005 year more convincingly. The Morgan Stanley Capital International (“MSCI”) World® Index(1) calculated in dollars, including net reinvested dividends rose 10.3% for the six months ended December 31, 2005, and 9.5% for the full year. As for currencies, the dollar extended its first half run for the six months ended December 31, 2005, rising 2.1% against the euro (12.6% for the full year), 6.2% against the yen (14.7% for the full year), and 3.8% against the pound (10.2% for the full year). Commentators explained the U.S. dollar’s unexpected strength by pointing to relatively high U.S. interest rates, the re-cycling of oil exporters’ burgeoning wealth into dollar securities, the tax-related “repatriation” into dollars of U.S. corporations’ foreign currency balances, and, regarding the yen’s particular weakness, non-Japanese investors pouring money into the stock market but hedging their currency risk. Each dynamic was losing steam by 2005 year-end.
For more than a year, the main issue for US fixed income investors had been the unexpected flattening of the yield curve, i.e. the shrinking difference between short-term and long-term interest rates. From June 2004 through June 2005 the Federal Open Market Committee (“FOMC”) had raised the Federal Funds Rate by 25 basis points nine times, pulling other short-term rates up. However, the yield on the ten-year U.S. Treasury Note had actually fallen by 0.71% over the same thirteen months. This was put down to an apparently growing perception in the market that inflation was a problem solved, due to a vigilant Federal Reserve, cheap goods and labor abroad, consistent productivity growth at home and foreign investors’ hunger for U.S. investments. Occasionally in the second half, for example when Hurricane Katrina and Rita affected oil prices, having peaked near $70 per barrel at the end of August 2005, there looked to be filtering through to general prices, and the trend seemed about to break. Nevertheless, in the end the forces of curve flattening prevailed. By December 31, 2005, the FOMC had raised rates four more times, oil prices and the inflation scare had subsided and foreigners were still buying record amounts of U.S. securities. For the six months ended December 31, 2005, the yield on the ten-year Treasury rose by 45 basis points to 4.39% (17 basis points for the full year), and on 13-week U.S. Treasury Bills by 93 basis points (180 basis points for the full year) to 3.98%. The returns on the broad Lehman Brothers Aggregate Bond Index(2) and the Lehman Brothers High Yield Bond Index(3) was -0.1% and 1.6% for the six months ended December 31, 2005, and 2.4% and 2.7% for the full year, respectively.
The U.S. equities market in the form of the Standard & Poor’s 500 Composite Stock Price (“S&P 500”) Index(4), added 5.8% including dividends in the latter half of 2005 and 4.9% for the full year, thanks to gains of 3.5% in July and November of 2005. Other months were flat to down and by 2005 year-end, the market, trading at a fairly undemanding price-to-earnings level of about 16 times earnings for the current fiscal year, was definitely struggling. Stock investors were initially encouraged by bullish economic reports and even more by second quarter company earnings figures, which were on average up more than 10% year over year. The optimistic mood lasted into early August of 2005, when the S&P 500 reached a four-year high, before drifting back as resurgent oil prices made records almost daily. In September and October of 2005 with Hurricanes Katrina and Rita seldom out of the news, two attempted rallies fizzled. High prices at the gas pump were already here. An expensive winter for heating fuel was certain. Sharply rising factory prices started to be found in local Federal Reserve and purchasing managers’ reports and, with consumer confidence slumping, the word “stagflation” was heard more than once. In spite of this, as November approached, an evidently swift recovery from the Hurricanes Katrina and Rita cheered investors and stock prices powered ahead through mid-December 2005, as oil prices fell back below $60 per barrel, inflation moderated, corporate profits remained buoyant and gross domestic product (“GDP”) growth, at 4.1% per annum, was the envy of the developed world. Yet the market gave back nearly 1.6% between Christmas and New Year, when new reports suggested that the end of the bubbling housing market might be at hand. Rising house prices had encouraged the consumer spending that was largely behind robust GDP growth; spending that is, by people who on average were saving little, if anything.
In international markets Japan was the shining star of the second half, soaring 33.3%, based on the MSCI Japan® Index(5) in dollars plus net dividends for the six months ended December 31, 2005, and 25.5% for
2
MARKET PERSPECTIVE: | YEAR ENDED DECEMBER 31, 2005 |
the full year, as the market repeatedly broke five-year records amid new optimism. Investors, albeit mainly foreign ones, came to the belief that Japan is re-emerging as a balanced economy and less dependent on exports. Japanese corporations and banks have repaired their balance sheets at last. Rising wages are supporting domestic demand, in addition to an expected end to deflation, seems at hand. European ex UK markets leaped 11.8%, according to the MSCI Europe ex UK® Index(6) in dollars including net dividends for the six months ended December 31, 2005 (10.5% for the full year) and 14.7% in local currencies (27.7% for the full year) to the best levels in over four years, despite the first interest rate increase, to 2.5%, in over five years. Mounting evidence of a recovery in local demand, resilient profits and an upsurge of merger and acquisition activity boosted markets that are not particularly expensive. UK equities advanced 6.4% in the six months ended December 31, 2005 (7.4% for the full year) based on the MSCI UK® Index(7) in dollars including net dividends, concealing a more impressive 11.1% increase in pounds (20.1% for the full year), to the highest in four years. The period was dominated by the effect of five interest rate increases to restrain over-stretched consumers and soaring real estate prices. Yet, in the face of mostly miserable economic reports, and despite terrorist attacks in London over two days in July of 2005, investors, encouraged by merger and acquisition activity, supported an inexpensive market yielding over 3%.
(1) The MSCI World® Index is an unmanaged index that measures the performance of over 1,400 securities listed on exchanges in the U.S., Europe, Canada, Australia, New Zealand and the Far East.
(2) The Lehman Brothers Aggregate Bond Index is a widely recognized, unmanaged index of publicly issued investment grade U.S. Government, mortgage-backed, asset-backed and corporate debt securities.
(3) The Lehman Brothers High Yield Bond Index is an unmanaged index that measures the performance of fixed-income securities generally representative of corporate bonds rated below investment-grade.
(4) The Standard & Poor’s 500 Composite Stock Price Index is an unmanaged index that measures the performance of securities of approximately 500 large-capitalization companies whose securities are traded on major U.S. stock markets.
(5) The MSCI Japan® Index is a free float-adjusted market capitalization index that is designed to measure developed market equity performance in Japan.
(6) The MSCI Europe ex UK® Index is a free float-adjusted market capitalization index that is designed to measure developed market equity performance in Europe, excluding the UK.
(7) The MSCI UK® Index is a free float-adjusted market capitalization index that is designed to measure developed market equity performance in the UK.
All indices are unmanaged and investors cannot invest directly in an index.
Past performance does not guarantee future results. The performance quoted represents past performance. Investment return and principal value of an investment will fluctuate, and shares, when redeemed, may be worth more or less than their original cost. The Funds’ performance is subject to change since the period’s end and may be lower or higher than the performance data shown. Please call (800) 992-0180 or log on to www.ingfunds.com to obtain performance data current to the most recent month end.
Market Perspective reflects the views of the Chief Investment Risk Officer only through the end of the period, and is subject to change based on market and other conditions.
3
ING VP INDEX PLUS LARGECAP PORTFOLIO | | PORTFOLIO MANAGERS’ REPORT |
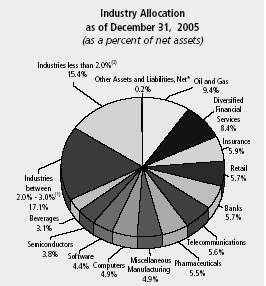
* Includes Securities lending collateral |
(1) Includes seven Industries, which each represents 2.0% - 3.0% of net assets |
(2) Includes thirty-eight Industries, which each represents less than 1.0% of net |
Portfolio holdings are subject to change daily.
The ING VP Index Plus LargeCap Portfolio (the “Portfolio”) seeks to outperform the total return performance of the Standard & Poor’s 500 Composite Stock Price Index (“S&P 500 Index”), while maintaining a market level of risk. The Portfolio is managed by Omar Aguilar*, Portfolio Manager, and Douglas Coté, Portfolio Manager, ING Investment Management Co. — the Sub-Adviser.
Performance: For the year ended December 31, 2005, the Portfolio’s Class I shares provided a total return of 5.38% compared to the S&P 500 Index, which returned 4.91% for the same period.
Portfolio Specifics: The Portfolio outperformed its benchmark, the S&P 500 Index, due to strong security selection, especially in the health care and consumer staples sectors. Stock selection in the telecommunications and information technology sectors somewhat detracted from performance. Our overweight in Apple Computer was among one of the largest positive contributors to performance. Our overweight in Dell was one of the largest detractors from performance.
Apple Computer is a dominating player in the digital music world with its iPod and iTunes store front. This year the company continued its strong sales momentum and used its brand recognition and product development to grow sales. It used brand recognition to gain market share in its computer division for the iMac. We continue to overweight the stock as the company has reported quality earnings supported by better estimates. We believe given the strength of the earnings that the company can continue to grow.
Dell disappointed investors with consecutive revenue misses after it used an aggressive pricing strategy to gain market share. In addition, during the third quarter, the company attempted to move into the higher end PC market, which actually resulted in lower sales when faced with declining demand for the product and tough competition. We continue to own this stock due to business fundamentals and find today’s price to cash flow to be attractive.
Individual security selection was helped by the effectiveness of factors historically successful at identifying outperforming stocks, especially free cash flow to price, price momentum and relative price to earnings. Change in accruals, analyst estimate revision and change in capital expenditures to depreciation were not helpful in our stock selection process.
Current Strategy and Outlook: Momentum in the U.S. economy remains strong going into 2006. Real gross domestic product (“GDP”) growth is likely to decelerate during the year. However, increases in net exports and capital spending may not fully offset a slowdown in residential investment. On the inflation front, falling gasoline prices have led to lower headline inflation rates, and are likely to take some pressure off of core consumer price index (“CPI”) inflation. The risk that core inflation rises as the expansion puts more pressure on resources, however, still exists. Given this scenario, we believe the Federal Open Market Committee (“FOMC”) will continue raising rates in early 2006. Whether it stops tightening will depend mainly on its assessment of inflation risk. A sustained expansion and benign wage and price inflation — the most likely scenario for 2006 in our view — should provide a good climate for equity market performance.
The Portfolio is overweight in the energy, and information technology sectors and underweight in the consumer discretionary, utilities and health care sectors. However, our overall sector exposures are a function of our stock selection process and by design quite close to the S&P 500 Index so that nearly all of our relative performance is driven by individual stocks.
Top Ten Holdings*
as of December 31, 2005
(as a percent of net assets)
Exxon Mobil Corp. | | 3.7% |
General Electric Co. | | 3.0% |
Microsoft Corp. | | 2.3% |
Citigroup, Inc. | | 2.0% |
Intel Corp. | | 1.8% |
Procter & Gamble Co. | | 1.7% |
Bank of America Corp. | | 1.7% |
Johnson & Johnson | | 1.5% |
American International Group, Inc. | | 1.4% |
PepsiCo, Inc. | | 1.4% |
* Excludes short-term investments. |
|
Portfolio holdings are subject to change daily. |
* Effective December 2005, Omar Aguilar replaced Hugh Whelan as Portfolio Manager.
4
PORTFOLIO MANAGERS’ REPORT | | ING VP INDEX PLUS LARGECAP PORTFOLIO |
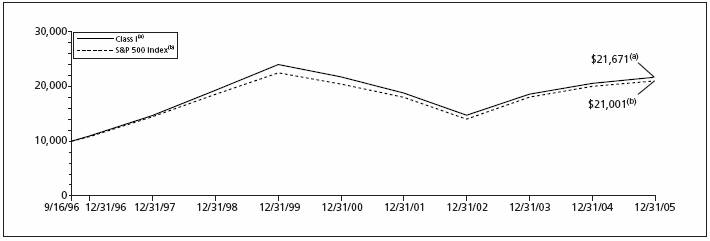
|
| Average Annual Total Returns for the Periods Ended December 31, 2005 | |
| | | | | | | | | | |
| | | 1 Year | | 5 Year | | Since Inception
of Class I
September 16, 1996 | | Since Inception
of Class S
July 16, 2001 | |
| Class I | | 5.38 | % | | (0.07) | % | | 8.68 | % | | — | | |
| Class S | | 5.15 | % | | — | | | — | | | 1.92 | % | |
| S&P 500 Index(1) | | 4.91 | % | | 0.54 | % | | 8.35 | %(2) | | 2.44 | %(3)s | |
| | | | | | | | | | | |
Based on a $10,000 initial investment, the graph and table above illustrate the total return of ING VP Index Plus LargeCap Portfolio against the S&P 500 Index. The Index is unmanaged and has no cash in its portfolio, imposes no sales charges and incurs no operating expenses. An investor cannot invest directly in an index. The Portfolio’s performance is shown without the imposition of any expenses or charges which are, or may be, imposed under your annuity contract or life insurance policy. Total returns would have been lower if such expenses or charges were included.
The performance graph and table do not reflect the deduction of taxes that a shareholder will pay on Portfolio distributions or the redemption of Portfolio shares.
The performance shown may include the effect of fee waivers and/or expense reimbursements by the Investment Manager and/or other service providers, which have the effect of increasing total return. Had all fees and expenses been considered, the total returns would have been lower.
The performance update illustrates performance for a variable investment option available through a variable annuity contract and/or a variable universal life policy. The performance shown indicates past performance and is not a projection or prediction of future results. Actual investment returns and principal value will fluctuate so that shares and/or units, at redemption, may be worth more or less than their original cost. For variable annuity contracts, please call (800) 922-0181 to get performance through the most recent month end. For variable universal life policies, please log on to www.ing.com/us to get performance through the most recent month end.
This report contains statements that may be “forward-looking” statements. Actual results may differ materially from those projected in the “forward-looking” statements.
The views expressed in this report reflect those of the portfolio managers, only through the end of the period as stated on the cover. The portfolio managers’ views are subject to change at any time based on market and other conditions.
Portfolio holdings are subject to change daily.
(1) The S&P 500 Index is an unmanaged index that measures the performance of securities of approximately 500 of the largest companies in the United States.
(2) Since inception performance for the index is shown from October 1, 1996.
(3) Since inception performance for the index is shown from August 1, 2001.
5
ING VP INDEX PLUS MIDCAP PORTFOLIO | | PORTFOLIO MANAGERS’ REPORT |

*Includes securities lending collateral |
(1) Includes eleven industries, which each represents 1.5% - 2.7% of net assets. |
(2) Includes thirty-six industries, which each represents less than 1.5% of net assets. |
Portfolio holdings are subject to change daily. |
The ING VP Index Plus MidCap Portfolio (the “Portfolio”) seeks to outperform the total return performance of the Standard & Poor’s MidCap 400 Index (“S&P MidCap 400 Index”), while maintaining a market level of risk. The Portfolio is managed by Omar Aguilar*, Portfolio Manager, and Douglas Coté, Portfolio Manager, ING Investment Management Co. — the Sub-Adviser.
Performance: For the year ended December 31, 2005, the Portfolio’s Class I shares provided a total return of 11.14% compared to the S&P MidCap 400 Index, which returned 12.56% for the same period.
Portfolio Specifics: The Portfolio underperformed its benchmark, the S&P MidCap 400 Index, due to adverse security selection. Stock selection in the information technology and financial sectors contributed positively, partially offsetting negative results from security selection in energy and industrials. Our overweight in Abercrombie & Fitch was among one of the largest positive contributors to performance, while our underweight in Arch Coal Inc. was one of the largest detractors from performance.
Shares of Abercrombie & Fitch, the clothing retailer, experienced some significant swings in 2005 but ended the year as one of the best performing stocks in the consumer discretionary sector. We found this stock attractive for several reasons, including its strong earnings quality and cashflow, and for part of the year, earnings estimate revision and price momentum. Over the summer, weaker than expected sales and concerns that consumers would curtail spending sent the stock lower; but an improving retail picture and a strong Christmas season for Abercrombie & Fitch led the stock upward in the fourth quarter. While we decreased our position in this stock during the year, we continue to own Abercrombie & Fitch based mainly on strong business momentum and earnings estimate revisions.
We were underweight Arch Coal Inc. for the year. The company ranked poorly throughout much of the year on poor valuation factors, such as price to book and cash flow to price. The company also ranked poorly in the overall quality of its earnings. Arch Coal is a story of a soaring commodity for energy use. The demand for coal is expected to double in the next twenty years as power producers switch from natural gas to coal-fired plants. President Bush has put his backing behind coal as a source to meet the increased electricity demands. Although the company forecasted lower second quarter earnings in the middle of the year due to weather related production issues, the stock soared on the coal story.
Individual security selection was helped by the effectiveness of factors historically successful at identifying outperforming stocks, especially analyst estimate revision, price momentum and relative price-to-earnings. Change in accruals, free cash flow to price and change in capital expenditures to depreciation were not helpful in our stock selection process.
Current Strategy and Outlook: Momentum in the U.S. economy remains strong going into 2006. Real gross domestic product (“GDP”) growth is likely to decelerate during the year, however, increases in net exports and capital spending may not fully offset a slowdown in residential investment. On the inflation front, falling gasoline prices have led to lower headline inflation rates, and are likely to take some pressure off of core consumer price index (“CPI”) inflation. The risk that core inflation rises as the expansion puts more pressure on resources, however, still exists. Given this scenario, we believe the Federal Open Market Committee (“FOMC”) will continue raising rates in early 2006. Whether it stops tightening will depend mainly on its assessment of inflation risk. A sustained expansion and benign wage and price inflation — the most likely scenario for 2006 in our view — should provide a good climate for equity market performance.
The Portfolio is overweight in the information technology and financials and underweight in the utilities and industrial sectors. However, our overall sector exposures are by design quite close to the S&P 400 Index so that nearly all of our relative performance is driven by individual stock selection.
Top Ten Holdings*
as of December 31, 2005
(as a percent of net assets)
Sandisk Corp. | | 1.3% |
Chico’s FAS, Inc. | | 1.2% |
Legg Mason, Inc. | | 1.2% |
Barr Pharmaceuticals, Inc. | | 1.1% |
Fidelity National Financial, Inc. | | 1.1% |
Health Net, Inc. | | 1.0% |
Harris Corp. | | 1.0% |
WR Berkley Corp. | | 0.9% |
Radian Group, Inc. | | 0.9% |
Peabody Energy Corp. | | 0.9% |
* Excludes short-term investments. |
|
Portfolio holdings are subject to change daily. |
* Effective December 2005, Omar Aguilar replaced Hugh Whelan as Portfolio Manager.
6
PORTFOLIO MANAGERS’ REPORT | | ING VP INDEX PLUS MIDCAP PORTFOLIO |

|
| Average Annual Total Returns for the Periods Ended December 31, 2005 | |
| | | | | | | | | | |
| | | 1 Year | | 5 Year | | Since Inception
of Class I
December 16, 1997 | | Since Inception
of Class S
July 16, 2001 | |
| Class I | | 11.14 | % | | 8.28 | % | | 12.92 | % | | — | | |
| Class S | | 10.84 | % | | — | | | — | | | 9.65 | % | |
| S&P MidCap 500 Index(1) | | 12.56 | % | | 8.60 | % | | 11.71 | %(2) | | 9.95 | %(3) | |
| | | | | | | | | | | |
Based on a $10,000 initial investment, the graph and table above illustrate the total return of ING VP Index Plus MidCap Portfolio against the S&P MidCap 400 Index. The Index is unmanaged and has no cash in its portfolio, imposes no sales charges and incurs no operating expenses. An investor cannot invest directly in an index. The Portfolio’s performance is shown without the imposition of any expenses or charges which are, or may be, imposed under your annuity contract or life insurance policy. Total returns would have been lower if such expenses or charges were included.
The performance graph and table do not reflect the deduction of taxes that a shareholder will pay on Portfolio distributions or the redemption of Portfolio shares.
The performance shown may include the effect of fee waivers and/or expense reimbursements by the Investment Manager and/or other service providers, which have the effect of increasing total return. Had all fees and expenses been considered, the total returns would have been lower.
The performance update illustrates performance for a variable investment option available through a variable annuity contract and/or a variable universal life policy. The performance shown indicates past performance and is not a projection or prediction of future results. Actual investment returns and principal value will fluctuate so that shares and/or units, at redemption, may be worth more or less than their original cost. For variable annuity contracts, please call (800) 922-0181 to get performance through the most recent month end. For variable universal life policies, please log on to www.ing.com/us to get performance through the most recent month end.
This report contains statements that may be “forward-looking” statements. Actual results may differ materially from those projected in the “forward-looking” statements.
The views expressed in this report reflect those of the portfolio managers, only through the end of the period as stated on the cover. The portfolio managers’ views are subject to change at any time based on market and other conditions.
Portfolio holdings are subject to change daily.
(1) The S&P MidCap 400 Index is an unmanaged index that measures the performance of the mid-size company segment of the U.S. market.
(2) Since inception performance for the index is shown from January 1, 1998.
(3) Since inception performance for the index is shown from August 1, 2001.
7
ING VP INDEX PLUS SMALLCAP PORTFOLIO | | PORTFOLIO MANAGERS’ REPORT |

*Includes securities lending collateral |
(1) Includes twelve industries, which each represents 1.5% - 3.0% of net assets. |
(2) Includes thirty-nine industries, which each represents less than 1.5% of net assets. |
Portfolio holdings are subject to change daily.
The ING VP Index Plus SmallCap Portfolio (the “Portfolio”) seeks to outperform the total return performance of the Standard & Poor’s SmallCap 600 Index (“S&P SmallCap 600 Index”), while maintaining a market level of risk. The Portfolio is managed by a team of equity investment specialists led by Omar Aguilar*, Portfolio Manager, and Douglas Coté, Portfolio Manager, ING Investment Management Co. — the Sub-Adviser.
Performance: For the year ended December 31, 2005, the Portfolio’s Class I shares provided a total return of 7.62% compared to the S&P SmallCap 600 Index, which returned 7.68% for the same period.
Portfolio Specifics: The Portfolio underperformed its benchmark, the S&P 600 Index, due to adverse security selection, especially in the financial and materials sectors. Positive performance in the health care and information technology sectors added to performance. Our overweight in Frontier Oil was among one of the largest positive contributors to performance while our overweight in Polaris was one of the largest detractors from performance.
With the big run-up in energy prices this year, Frontier Oil had the fourth best return of all stocks in the S&P 600 Index for 2005 and was the best performer in the small cap energy sector. Frontier Oil, which conducts crude oil refining in the Rocky Mountains, rose alongside other refiners, peaking in early October, not long after oil prices weakened. We were drawn to this stock by its strong business momentum and attractive relative valuation, e.g. its appealing relative price-to-earnings ratio, and we continue to like this security.
Polaris Industries is a leading manufacturer of ATVs, snowmobiles and motorcycles that saw its stock price decline through the first ten months of the year on concerns that consumers would delay purchasing big-ticket leisure items. This stock looked attractive to us from an earnings quality perspective, and although actual earnings continued to grow throughout the year, the share price was punished alongside many other consumer discretionary stocks (especially those in the leisure industry) as investors feared that higher energy prices and rising inflation would curb spending. We continue to hold a position in Polaris as earnings quality remains sound and earnings estimates as well as valuation have improved.
Individual security selection was helped by the effectiveness of factors historically successful at identifying outperforming stocks, especially free cash flow to price, price momentum, relative price-to-earnings, change in accruals and analyst estimate revision. Change in capital expenditures to depreciation was not helpful in our stock selection process.
Current Strategy and Outlook: Momentum in the U.S. economy remains strong going into 2006. Real gross domestic product (“GDP”) growth is likely to decelerate during the year, however, increases in net exports and capital spending may not fully offset a slowdown in residential investment. On the inflation front, falling gasoline prices have led to lower headline inflation rates, and are likely to take some pressure off of core consumer price index (“CPI”) inflation. The risk that core inflation rises as the expansion puts more pressure on resources, however, still exists. Given this scenario, we believe the Federal Open Market Committee (“FOMC”) will continue raising rates in early 2006. Whether it stops tightening will depend mainly on its assessment of inflation risk. A sustained expansion and benign wage and price inflation — the most likely scenario for 2006 in our view — should provide a good climate for equity market performance.
The Portfolio is overweight in the consumer discretionaries and energy and underweight in the information technology and healthcare sectors. However, our overall sector exposures are by design quite close to the S&P SmallCap 600 Index so that nearly all of our relative performance is driven by individual stock selection.
Top Ten Holdings*
as of December 31, 2005
(as a percent of net assets)
NVR, Inc. | | 1.2% |
Cimarex Energy Co. | | 1.1% |
Pharmaceutical Product Development, Inc. | | 1.0% |
Global Payments, Inc. | | 1.0% |
JLG Industries, Inc. | | 0.9% |
Sierra Health Services | | 0.8% |
Oshkosh Truck Corp. | | 0.8% |
Frontier Oil Corp. | | 0.8% |
Florida Rock Industries, Inc. | | 0.8% |
Micros Systems, Inc. | | 0.8% |
Portfolio holdings are subject to change daily.
* Effective December 2005, Omar Aguilar replaced Hugh Whelan as Portfolio Manager.
8
PORTFOLIO MANAGERS’ REPORT | | ING VP INDEX PLUS SMALLCAP PORTFOLIO |
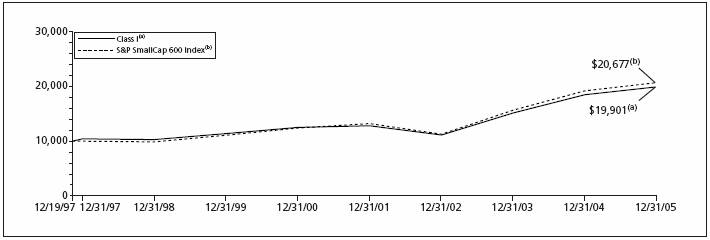
|
| Average Annual Total Returns for the Periods Ended December 31, 2005 | |
| | | | | | | | | | |
| | | 1 Year | | 5 Year | | Since Inception
of Class I
December 19, 1997 | | Since Inception
of Class S
July 16, 2001 | |
| Class I | | 7.62 | % | | 9.71 | % | | 8.94 | % | | — | | |
| Class S | | 7.36 | % | | — | | | — | | | 10.70 | % | |
| S&P SmallCap 600 Index(1) | | 7.68 | % | | 10.76 | % | | 9.51 | %(2) | | 11.17 | %(3) | |
| | | | | | | | | | | |
Based on a $10,000 initial investment, the graph and table above illustrate the total return of ING VP Index Plus SmallCap Portfolio against the S&P SmallCap 600 Index. The Index is unmanaged and has no cash in its portfolio, imposes no sales charges and incurs no operating expenses. An investor cannot invest directly in an index. The Portfolio’s performance is shown without the imposition of any expenses or charges which are, or may be, imposed under your annuity contract or life insurance policy. Total returns would have been lower if such expenses or charges were included.
The performance graph and table do not reflect the deduction of taxes that a shareholder will pay on Portfolio distributions or the redemption of Portfolio shares.
The performance shown may include the effect of fee waivers and/or expense reimbursements by the Investment Manager and/or other service providers, which have the effect of increasing total return. Had all fees and expenses been considered, the total returns would have been lower.
The performance update illustrates performance for a variable investment option available through a variable annuity contract and/or a variable universal life policy. The performance shown indicates past performance and is not a projection or prediction of future results. Actual investment returns and principal value will fluctuate so that shares and/or units, at redemption, may be worth more or less than their original cost. For variable annuity contracts, please call (800) 922-0181 to get performance through the most recent month end. For variable universal life policies, please log on to www.ing.com/us to get performance through the most recent month end.
This report contains statements that may be “forward-looking” statements. Actual results may differ materially from those projected in the “forward-looking” statements.
The views expressed in this report reflect those of the portfolio managers, only through the end of the period as stated on the cover. The portfolio managers’ views are subject to change at any time based on market and other conditions.
Portfolio holdings are subject to change daily.
(1) The S&P SmallCap 600 Index is an unmanaged index used to measure stock market performance composed of companies with a weighted average market value of approximately $630 million.
(2) Since inception performance for the index is shown from January 1, 1998.
(3) Since inception performance for the index is shown from August 1, 2001.
9
ING VP STRATEGIC ALLOCATION BALANCED PORTFOLIO | | PORTFOLIO MANAGERS’ REPORT |

Other Assets and Liabilities, Net* -6.1% |
*Includes securities lending. |
Portfolio holdings are subject to change daily.
The ING VP Strategic Allocation Balanced Portfolio (the “Portfolio”) seeks to provide total return (i.e., income and capital appreciation, both realized and unrealized). The Portfolio is managed by Mary Ann Fernandez, Portfolio Manager, and Shiv Mehta, Portfolio Manager ING Investment Management Co. — the Sub-Adviser.
Performance: For the year ended December 31, 2005, the Portfolio’s Class I shares provided a total return of 4.70% compared to 6.12% for the Russell 3000® Index and 5.13% for the Strategic Allocation Balanced Composite Index.
Portfolio Specifics: The Portfolio’s asset allocation had a positive impact on performance for 2005. Our overweight in international equities and underweight in fixed income securities, positions that we maintained in varying degrees throughout the year, each helped results. Our exposure to domestic equities fluctuated between overweight and neutral over the course of the period, however the overall equity position had a negative impact on results. The equity component performed roughly in line with its sub-benchmark, the Russell 3000® Index, due to effective security selection and positive sector allocation. Stock selection was particularly strong among health care stocks, though it was weaker in technology and telecom. Our overweight to the energy sector helped results, and was by far the best performing market segment for the year. The international equity component outperformed the Morgan Stanley Capital International Europe, Australasia, and Far East (“MSCI EAFE®”) Index for the period, due to robust security selection and positive regional allocation, especially an underweight in the U.K. Security selection was strongest in financials, materials and telecom, though weaker in technology.
The fixed-income component of the Portfolio underperformed the Lehman Brothers Aggregate Bond (“LBAB”) Index for the year ended 2005. Rising short-term rates, coupled with a tightening Federal Reserve, led us to maintain a shorter duration posture with an underweight to shorter maturities, which helped performance through most of the year. Security selection in the mortgage-backed securities sector produced positive performance, and our continued underweight to longer-dated corporates was beneficial for most of 2005. Results among corporates lagged, with most of the damage occurring in the longer-dated maturities. An overexposure to asset-backed securities and commercial mortgage-backed securities, at the expense of corporates, was beneficial as both sectors produced excess returns (excess return means the excess over the return from Treasury securities of comparable term). Positions in bank and insurance securities, particularly floating rate preferreds, and lack of exposure in the automotive sectors were sources of positive security selection.
Current Strategy and Outlook: As we move into 2006, momentum in the U.S. economy remains strong. Real gross domestic product (“GDP”) growth is likely to decelerate during the year, however, increases in net exports and capital spending may not fully offset a slowdown in residential investment. On the inflation front, falling gasoline prices have led to lower headline inflation rates, and are likely to take some pressure off of core consumer price index (“CPI”) inflation. The risk that core inflation rises as the expansion puts more pressure on resources, however, still exists. Given this scenario, we believe the Federal Open Market Committee (“FOMC”) will continue raising rates in early 2006. Whether it stops tightening will depend mainly on its assessment of inflation risk. A sustained expansion and benign wage and price inflation — the most likely scenario for 2006 in our view — should provide a good climate for equity market performance.
We remain modestly overweight in equities, favoring large-cap stocks. We expect bond yields will rise from current levels as the Federal Reserve continues to tighten the supply of credit, and so we are modestly underweight in bonds. Although valuations on international stocks are no longer relatively inexpensive, we believe overseas markets will continue to benefit from the expansion in global industrial production and strong price momentum, and therefore maintain our overweight position.
Top Ten Industries*
as of December 31, 2005
(as a percent of net assets)
Federal National Mortgage Association | | 8.4% |
Banks | | 7.0% |
Diversified Financial Services | | 6.9% |
Oil & Gas | | 6.5% |
U.S. Treasury Note | | 5.9% |
Retail | | 4.2% |
Insurance | | 4.1% |
Telecommunications | | 4.0% |
Computers | | 3.3% |
Pharmaceuticals | | 3.1% |
* Excludes short-term investments related to commercial paper, repurchase agreement, and securities lending. |
Portfolio holdings are subject to change daily.
10
PORTFOLIO MANAGERS’ REPORT | | ING VP STRATEGIC ALLOCATION BALANCED PORTFOLIO |

|
| Average Annual Total Returns for the Periods Ended December 31, 2005 | |
| | | | | | | | | | |
| | | 1 Year | | 5 Year | | 10 Year | | Since Inception
of Class S
June 7, 2005 | |
| Class I | | 4.70 | % | | 3.01 | % | | 6.62 | % | | — | | |
| Class S | | — | | | — | | | — | | | 3.81 | % | |
| Russell 3000® Index(1) | | 6.12 | % | | 1.58 | % | | 9.20 | % | | 6.87 | %(3) | |
| Strategic Allocation Balanced Composite Index(2) | | 5.13 | % | | 3.62 | % | | 8.06 | % | | 5.15 | %(3) | |
| | | | | | | | | | | |
Based on a $10,000 initial investment, the graph and table above illustrate the total return of ING VP Strategic Allocation Balanced Portfolio against the Russell 3000® Index and the Strategic Allocation Balanced Composite Index. The Indices are unmanaged and have no cash in their portfolios, impose no sales charges and incur no operating expenses. An investor cannot invest directly in an index. The Portfolio’s performance is shown without the imposition of any expenses or charges which are, or may be, imposed under your annuity contract. Total returns would have been lower if such expenses or charges were included.
The performance graph and table do not reflect the deduction of taxes that a shareholder will pay on Portfolio distributions or the redemption of Portfolio shares.
The performance shown may include the effect of fee waivers and/or expense reimbursements by the Investment Manager and/or other service providers, which have the effect of increasing total return. Had all fees and expenses been considered, the total returns would have been lower.
The performance update illustrates performance for a variable investment option available through a variable annuity contract. The performance shown indicates past performance and is not a projection or prediction of future results. Actual investment returns and principal value will fluctuate so that shares and/or units, at redemption, may be worth more or less than their original cost. Please call (800) 922-0181 to get performance through the most recent month end.
This report contains statements that may be “forward-looking” statements. Actual results may differ materially from those projected in the “forward-looking” statements.
The views expressed in this report reflect those of the portfolio managers, only through the end of the period as stated on the cover. The portfolio managers’ views are subject to change at any time based on market and other conditions.
Portfolio holdings are subject to change daily.
(1) The Russell 3000® Index is an unmanaged index that measures the performance of 3000 U.S. companies based on total market capitalization.
(2) The Strategic Allocation Balanced Composite Index is comprised of the asset class indices that correspond to the particular asset classes in which the Portfolio invests and their benchmark weightings. From time to time, adjustments have been made in the asset classes and/or weightings applicable to the Portfolio, and corresponding adjustments have been made to the composite. See page 16 for additional information.
(3) Since inception performance for the index is shown from June 1, 2005.
11
ING VP STRATEGIC ALLOCATION GROWTH PORTFOLIO | | PORTFOLIO MANAGERS’ REPORT |
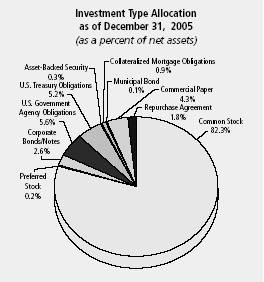
Other Assets and Liabilities, Net* -3.3% |
*Includes securities lending collateral. |
Portfolio holdings are subject to change daily.
The ING VP Strategic Allocation Growth Portfolio (the “Portfolio”) seeks to provide capital appreciation. The Portfolio is managed by Mary Ann Fernandez, Portfolio Manager, and Shiv Mehta, Portfolio Manager ING Investment Management Co. — the Sub-Adviser.
Performance: For the year ended December 31, 2005, the Portfolio’s Class I shares provided a total return of 6.20% compared to 6.12% for the Russell 3000® Index and 6.22% for the Strategic Allocation Growth Composite Index.
Portfolio Specifics: The Portfolio’s asset allocation had a positive impact on performance for 2005. Our overweight in international equities and underweight in fixed-income securities, positions that we maintained in varying degrees throughout the year, each helped results. Our exposure to domestic equities fluctuated between overweight and neutral over the course of the period, however the overall equity position had a negative impact on results. The equity component performed roughly in line with its sub-benchmark, the Russell 3000 Index, due to effective security selection and positive sector allocation. Stock selection was particularly strong among health care stocks, though it was weaker in technology and telecom. Our overweight to the energy sector helped results, and was by far the best performing market segment for the year. The international equity component outperformed the Morgan Stanley Capital International Europe, Australasia, and Far East (“MSCI EAFE®”) Index for the period, due to robust security selection and positive regional allocation, especially an underweight in the U.K. Security selection was strongest in financials, materials and telecom, though weaker in technology.
The fixed-income component of the Portfolio underperformed the Lehman Brothers Aggregate Bond (“LBAB”) Index for the year ended 2005. Rising short term rates, coupled with a tightening Federal Reserve, led us to maintain a shorter duration posture with an underweight to shorter maturities, which helped performance through most of the year. Security selection in the mortgage-backed securities sector produced positive performance, and our continued underweight to longer-dated corporates was beneficial for most of 2005. Results among corporates lagged, with most of the damage occurring in the longer-dated maturities. An overexposure to asset-backed securities and commercial mortgage-backed securities, at the expense of corporates, was beneficial as both sectors produced excess returns (excess return means the excess over the return from Treasury securities of comparable term). Positions in bank and insurance securities, particularly floating rate preferreds, and lack of exposure in the automotive sectors were sources of positive security selection.
Current Strategy and Outlook: As we move into 2006, momentum in the U.S. economy remains strong. Real gross domestic product (“GDP”) growth is likely to decelerate during the year, however, increases in net exports and capital spending may not fully offset a slowdown in residential investment. On the inflation front, falling gasoline prices have led to lower headline inflation rates, and are likely to take some pressure off of core consumer price index (“CPI”) inflation. The risk that core inflation rises as the expansion puts more pressure on resources, however, still exists. Given this scenario, we believe the Federal Open Market Committee (“FOMC”) will continue raising rates in early 2006. Whether it stops tightening will depend mainly on its assessment of inflation risk. A sustained expansion and benign wage and price inflation — the most likely scenario for 2006 in our view — should provide a good climate for equity market performance.
We remain modestly overweight in equities, favoring large-cap stocks. We expect bond yields will rise from current levels as the Federal Reserve continues to tighten the supply of credit, and so we are modestly underweight in bonds. Although valuations on international stocks are no longer relatively inexpensive, we believe overseas markets will continue to benefit from the expansion in global industrial production and strong price momentum, and therefore maintain our overweight position.
Top Ten Industries*
as of December 31, 2005
(as a percent of net assets)
Oil and Gas | | 7.8% |
Banks | | 7.6% |
Diversified Financial Services | | 6.8% |
Retail | | 5.2% |
Insurance | | 5.0% |
Telecommunications | | 4.8% |
Federal National Mortgage Association | | 4.5% |
Commercial Paper | | 4.3% |
Computers | | 4.1% |
Pharmaceuticals | | 4.0% |
* Excludes short-term investments related to securities lending. |
Portfolio holdings are subject to change daily.
12
PORTFOLIO MANAGERS’ REPORT | | ING VP STRATEGIC ALLOCATION GROWTH PORTFOLIO |
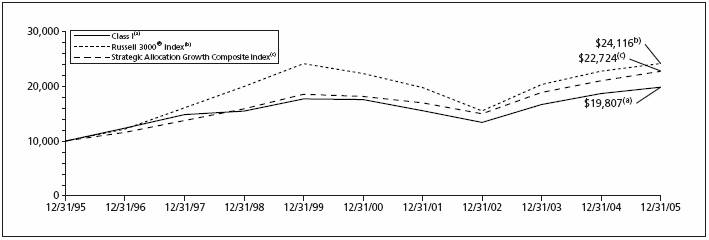
|
| Average Annual Total Returns for the Periods Ended December 31, 2005 | |
| | | | | | | | | | |
| | | 1 Year | | 5 Year | | 10 Year | | Since Inception
of Class S
August 5, 2005 | |
| Class I | | 6.20 | % | | 2.44 | % | | 7.06 | % | | — | | |
| Class S | | — | | | — | | | — | | | 3.20 | % | |
| Russell 3000® Index(1) | | 6.12 | % | | 1.58 | % | | 9.20 | % | | 1.95 | %(3) | |
| Strategic Allocation Growth Composite Index(2) | | 6.22 | % | | 3.02 | % | | 8.56 | % | | 2.68 | %(3) | |
| | | | | | | | | | | |
Based on a $10,000 initial investment, the graph and table above illustrate the total return of ING VP Strategic Allocation Growth Portfolio against the Russell 3000® Index and the Strategic Allocation Growth Composite Index. The Indices are unmanaged and have no cash in their portfolios, impose no sales charges and incur no operating expenses. An investor cannot invest directly in an index. The Portfolio’s performance is shown without the imposition of any expenses or charges which are, or may be, imposed under your annuity contract. Total returns would have been lower if such expenses or charges were included.
The performance graph and table do not reflect the deduction of taxes that a shareholder will pay on Portfolio distributions or the redemption of Portfolio shares.
The performance shown may include the effect of fee waivers and/or expense reimbursements by the Investment Manager and/or other service providers, which have the effect of increasing total return. Had all fees and expenses been considered, the total returns would have been lower.
The performance update illustrates performance for a variable investment option available through a variable annuity contract. The performance shown indicates past performance and is not a projection or prediction of future results. Actual investment returns and principal value will fluctuate so that shares and/or units, at redemption, may be worth more or less than their original cost. Please call (800) 922-0181 to get performance through the most recent month end.
This report contains statements that may be “forward-looking” statements. Actual results may differ materially from those projected in the “forward-looking” statements.
The views expressed in this report reflect those of the portfolio managers, only through the end of the period as stated on the cover. The portfolio managers’ views are subject to change at any time based on market and other conditions.
Portfolio holdings are subject to change daily.
(1) The Russell 3000® Index is an unmanaged index that measures the performance of 3000 U.S. companies based on total market capitalization.
(2) The Strategic Allocation Growth Composite is comprised of the asset class indices that correspond to the particular asset classes in which the Portfolio invests and their benchmark weightings. From time to time, adjustments have been made in the asset classes and/or weightings applicable to the Portfolio, and corresponding adjustments have been made to the composite. See page 16 for additional information.
(3) Since inception performance for the index is shown from August 1, 2005.
13
ING VP STRATEGIC ALLOCATION INCOME PORTFOLIO | | PORTFOLIO MANAGERS’ REPORT |

Other Assets and Liabilities, Net* -9.1% |
*Includes securities lending collateral. |
��
Portfolio holdings are subject to change daily.
The ING VP Strategic Allocation Income Portfolio (the “Portfolio”) seeks to provide total return consistent with preservation of capital. The Portfolio is managed by Mary Ann Fernandez, Portfolio Manager, and Shiv Mehta, Portfolio Manager ING Investment Management Co. — the Sub-Adviser.
Performance: For the year ended December 31, 2005, the Portfolio’s Class I shares provided a total return of 3.83% compared to 2.43% for Lehman Brothers Aggregate Bond (“LBAB”) Index and 3.83% for the Strategic Allocation Income Composite Index.
Portfolio Specifics: The Portfolio’s asset allocation had a positive impact on performance for 2005. Our overweight in international equities and underweight in fixed income securities, positions that we maintained in varying degrees throughout the year, each helped results. Our exposure to domestic equities fluctuated between overweight and neutral over the course of the period, however the overall equity position had a negative impact on results. The equity component performed roughly in line with its sub-benchmark, the Russell 3000® Index, due to effective security selection and positive sector allocation. Stock selection was particularly strong among health care stocks, though it was weaker in technology and telecom. Our overweight to the energy sector helped results, and was by far the best performing market segment for the year. The international equity component outperformed the Morgan Stanley Capital International Europe, Australasia, and Far East (“MSCI EAFE®”) Index for the period, due to robust security selection and positive regional allocation, especially an underweight in the U.K. Security selection was strongest in financials, materials and telecom, though weaker in technology.
The fixed-income component of the Portfolio underperformed the LBAB Index for the year ended 2005. Rising short-term rates, coupled with a tightening Federal Reserve, led us to maintain a shorter duration posture with an underweight to shorter maturities, which helped performance through most of the year. Security selection in the mortgage-backed securities sector produced positive performance, and our continued underweight to longer-dated corporates was beneficial for most of 2005. Results among corporates lagged, with most of the damage occurring in the longer-dated maturities. An overexposure to asset-backed securities and commercial mortgage-backed securities, at the expense of corporates, was beneficial as both sectors produced excess returns (excess return means the excess over the return from Treasury securities of comparable term). Positions in bank and insurance securities, particularly floating rate preferreds, and lack of exposure in the automotive sectors were sources of positive security selection.
Current Strategy and Outlook: As we move into 2006, momentum in the U.S. economy remains strong. Real gross domestic product (“GDP”) growth is likely to decelerate during the year, however, increases in net exports and capital spending may not fully offset a slowdown in residential investment. On the inflation front, falling gasoline prices have led to lower headline inflation rates, and are likely to take some pressure off of core consumer price index (“CPI”) inflation. The risk that core inflation rises as the expansion puts more pressure on resources, however, still exists. Given this scenario, we believe the Federal Open Market Committee (“FOMC”) will continue raising rates in early 2006. Whether it stops tightening will depend mainly on its assessment of inflation risk. A sustained expansion and benign wage and price inflation — the most likely scenario for 2006 in our view — should provide a good climate for equity market performance.
We remain modestly overweight in equities, favoring large-cap stocks. We expect bond yields will rise from current levels as the Federal Reserve continues to tighten the supply of credit, and so we are modestly underweight in bonds. Although valuations on international stocks are no longer relatively inexpensive, we believe overseas markets will continue to benefit from the expansion in global industrial production and strong price momentum, and therefore maintain our overweight position.
Top Ten Industries*
as of December 31, 2005
(as a percent of net assets)
Federal National Mortgage Association | | 12.9% |
U.S. Treasury Note | | 9.5% |
Diversified Financial Services | | 6.5% |
Banks | | 6.3% |
Oil & Gas | | 4.6% |
U.S. Treasury Bond | | 4.0% |
Federal Home Loan Mortgage Corporation | | 3.9% |
Insurance | | 3.0% |
Telecommunications | | 2.9% |
Retail | | 2.7% |
* Excludes short-term investments related to repurchase agreement and securities lending. |
Portfolio holdings are subject to change daily.
14
PORTFOLIO MANAGERS’ REPORT | | ING VP STRATEGIC ALLOCATION INCOME PORTFOLIO |
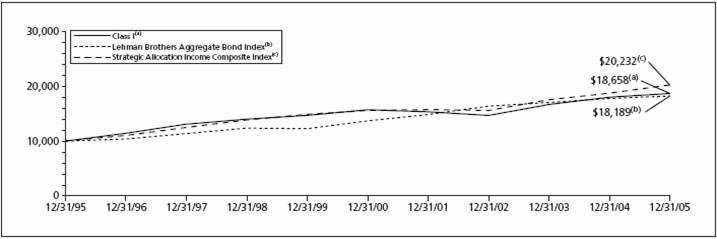
|
| Average Annual Total Returns for the Periods Ended December 31, 2005 | |
| | | | | | | | | | |
| | | 1 Year | | 5 Year | | 10 Year | | Since Inception
of Class S
August 5, 2005 | |
| Class I | | 3.83 | % | | 5.54 | % | | 6.44 | % | | — | | |
| Class S | | — | | | — | | | — | | | 1.45 | % | |
| Lehman Brothers Aggregate Bond Index(1) | | 2.43 | % | | 5.82 | % | | 6.16 | % | | 0.83 | %(3) | |
| Strategic Allocation Income Composite Index(2) | | 3.83 | % | | 4.32 | % | | 7.30 | % | | 1.31 | %(3) | |
| | | | | | | | | | | |
Based on a $10,000 initial investment, the graph and table above illustrate the total return of ING VP Strategic Allocation Income Portfolio against the Lehman Brothers Aggregate Bond Index and the Strategic Allocation Income Composite Index. The Indices are unmanaged and have no cash in their portfolios, impose no sales charges and incur no operating expenses. An investor cannot invest directly in an index. The Portfolio’s performance is shown without the imposition of any expenses or charges which are, or may be, imposed under your annuity contract. Total returns would have been lower if such expenses or charges were included.
The performance graph and table do not reflect the deduction of taxes that a shareholder will pay on Portfolio distributions or the redemption of Portfolio shares.
The performance shown may include the effect of fee waivers and/or expense reimbursements by the Investment Manager and/or other service providers, which have the effect of increasing total return. Had all fees and expenses been considered, the total returns would have been lower.
The performance update illustrates performance for a variable investment option available through a variable annuity contract. The performance shown indicates past performance and is not a projection or prediction of future results. Actual investment returns and principal value will fluctuate so that shares and/or units, at redemption, may be worth more or less than their original cost. Please call (800) 922-0181 to get performance through the most recent month end.
This report contains statements that may be “forward-looking” statements. Actual results may differ materially from those projected in the “forward-looking” statements.
The views expressed in this report reflect those of the portfolio managers, only through the end of the period as stated on the cover. The portfolio managers’ views are subject to change at any time based on market and other conditions.
Portfolio holdings are subject to change daily.
(1) The Lehman Brothers Aggregate Bond Index is a widely recognized, unmanaged index of publicly issued fixed rate U.S. Government, investment grade, mortgaged-backed and corporate debt securities.
(2) The Strategic Allocation Income Composite is comprised of the asset class indices that correspond to the particular asset classes in which the Portfolio invests and their benchmark weightings. From time to time, adjustments have been made in the asset classes and/or weightings applicable to the Portfolio, and corresponding adjustments have been made to the composite. See page 16 for additional information.
(3) Since inception performance for the index is shown from August 1, 2005.
15
Portfolio Managers’ Report | ADDITIONAL INFORMATION |
Asset Class
| | ING VP
Strategic
Allocation
Balanced Portfolio(1) | | ING VP
Strategic
Allocation
Growth Portfolio | | ING VP
Strategic
Allocation
Income Portfolio(2) |
Equities | | | | | | |
Domestic Stocks | | | | | | |
Range | | 0-75% | | 10-100% | | 0-70% |
International Stocks | | | | | | |
Range | | 0-10% | | 0-20% | | 0-10% |
Fixed Income | | | | | | |
Range | | 0-70% | | 0-40% | | 0-100% |
Money Market Instruments | | | | | | |
Range | | 0-30% | | 0-30% | | 0-30% |
(1) ING Strategic Allocation Balanced Portfolio will invest no more than 60% of its assets in any combination of the following asset sub-classes: small-/mid-capitalization stocks, high-yield bonds, international stocks and international fixed-income securities.
(2) ING Strategic Allocation Income Portfolio will invest no more than 35% of its assets in any combination of the following asset sub-classes: small-/mid-capitalization stocks, high-yield bonds, international stocks and international fixed-income securities.
The Sub-Adviser uses the Strategic Allocation Balanced Composite, Strategic Allocation Growth Composite, and Strategic Allocation Income Composite indices as benchmarks to which it compares the performance of ING VP Strategic Allocation Balanced Portfolio, ING VP Strategic Allocation Growth Portfolio and ING VP Strategic Allocation Income Portfolio, respectively. Each of these Composite indices is a blended index that is derived from the asset class comparative indices set out in the chart below. The chart shows the weightings for each asset class comparative index represented in each benchmark Composite Index, as a percentage of the Composite Index.
Composite Index | | Russell 3000
Index(3) | | Morgan Stanley
Capital International
Europe, Australasia and
Far East Index(4) | | Lehman Brothers
Aggregate Bond Index(5) | | 91-Day U.S.
Treasury
Bill Rate |
Strategic Allocation Balanced Composite(6) | | 55% | | 5% | | 35% | | 5% |
Strategic Allocation Growth Composite(7) | | 70% | | 10% | | 20% | | 0% |
Strategic Allocation Income Composite(8) | | 35% | | 0% | | 55% | | 10% |
(3) The Russell 3000 Index measures performance of the 3,000 largest U.S. companies based on total market capitalization.
(4) The Morgan Stanley Capital International Europe, Australasia and Far East (MSCI EAFE) Index measures the performance of securities listed on exchanges in markets in Europe, Australasia and the Far East.
(5) The Lehman Brothers Aggregate Bond Index is composed of publicly issued, fixed-rate U.S. Government, investment grade, mortgaged-backed and corporate debt securities.
(6) The Strategic Allocation Balanced Composite is comprised of the asset class indices that correspond to the particular asset classes in which the Fund invests and their benchmark weightings. From time to time, adjustments have been made in the asset classes and/or weightings applicable to the Fund, and corresponding adjustments have been made to the composite. Prior to March 1, 2000, the benchmark weightings for the Fund and the composite were 15% in large capitalization stocks, 15% for small-/mid-cap stocks, 15% in international stocks, 15% in real estate stocks, 25% in U.S. dollar bonds, and 10% in international bonds and 5% in money market instruments. The composite for the period March 1, 2000 through December 31, 2001 reflects benchmark weightings of 25% in large cap stocks, 15% in small-/mid-cap stocks, 15% in international stocks, 5% in real estate stocks, 30% in U.S. dollar bonds, and 5% in international bonds and 5% in money market instruments. Effective October 1, 2002 a single category of domestic stocks replaced the group of categories of large cap stocks, small-/mid-cap stocks, and real estate stocks, and the category of international bonds was removed.
(7) The Strategic Allocation Growth Composite is comprised of the asset class indices that correspond to the particular asset classes in which the Fund invests and their benchmark weightings. From time to time, adjustments have been made in the asset classes and/or weightings applicable to the Fund, and corresponding adjustments have been made to the composite. Prior to March 1, 2000, the benchmark weightings for the Fund and the composite were 20% in large capitalization stocks, 20% for small-/mid-cap stocks, 20% in international stocks, 20% in real estate stocks, 10% in U.S. dollar bonds, and 10% in international bonds. The composite for the period March 1, 2000 through December 31, 2001 reflects benchmark weightings of 35% in large cap stocks, 20% in small-/mid-cap stocks, 20% in international stocks, 5% in real estate stocks, 15% in U.S. dollar bonds, and 5% in international bonds. Effective October 1, 2002 a single category of domestic stocks replaced the group of categories of large cap stocks, small-/mid-cap stocks, and real estate stocks, and the category of international bonds was removed.
(8) The Strategic Allocation Income Composite is comprised of the asset class indices that correspond to the particular asset classes in which the Fund invests and their benchmark weightings. From time to time, adjustments have been made in the asset classes and/or weightings applicable to the Fund, and corresponding adjustments have been made to the composite. Prior to March 1, 2000, the benchmark weightings for the Fund and the composite were 10% in large capitalization stocks, 10% for small-/mid-cap stocks, 10% in international stocks, 10% in real estate stocks, 40% in U.S. dollar bonds, and 10% in international bonds and 10% in money market instruments. The composite for the period March 1, 2000 through December 31, 2001 reflects benchmark weightings of 15% in large cap stocks, 10% in small-/mid-cap stocks, 10% in international stocks, 5% in real estate stocks, 45% in U.S. dollar bonds, and 5% in international bonds and 10% in money market instruments. Effective October 1, 2002 a single category of domestic stocks replaced the group of categories of large cap stocks, small-/mid-cap stocks, and real estate stocks, and the category of international bonds was removed.
All indices are unmanaged.
An investor cannot invest directly in an index.
16
SHAREHOLDER EXPENSE EXAMPLES (UNAUDITED) |
As a shareholder of a Fund, you incur two types of costs: (1) transaction costs, including sales charges (loads) on purchase payments; redemption fees; and exchange fees; and (2) ongoing costs, including management fees; distribution [and/or service] (12b-1) fees; and other Fund expenses. These Examples are intended to help you understand your ongoing costs (in dollars) of investing in a Fund and to compare these costs with the ongoing costs of investing in other mutual funds.
The Examples are based on an investment of $1,000 invested at the beginning of the period and held for the entire period from July 1, 2005 to December 31, 2005.
Actual Expenses
The first section of the table shown, “Actual Fund Return,” provides information about actual account values and actual expenses. You may use the information in this section, together with the amount you invested, to estimate the expenses that you paid over the period. Simply divide your account value by $1,000 (for example, an $8,600 account value divided by $1,000 = 8.6), then multiply the result by the number in the first section under the heading entitled “Expenses Paid During Period” to estimate the expenses you paid on your account during this period.
Hypothetical Example for Comparison Purposes
The second section of the table shown, “Hypothetical 5% Return,” provides information about hypothetical account values and hypothetical expenses based on the Fund’s actual expense ratio and an assumed rate of return of 5% per year before expenses, which is not the Fund’s actual return. The hypothetical account values and expenses may not be used to estimate the actual ending account balance or expenses you paid for the period. You may use this information to compare the ongoing costs of investing in the Fund and other funds. To do so, compare this 5% hypothetical example with the 5% hypothetical examples that appear in the shareholder reports of the other funds.
Please note that the expenses shown in the table are meant to highlight your ongoing costs only and do not reflect any transactional costs, such as sales charges (loads), redemption fees, or exchange fees. Therefore, the hypothetical lines of the table are useful in comparing ongoing costs only, and will not help you determine the relative total costs of owning different funds. In addition, if these transactional costs were included, your costs would have been higher.
| | | Beginning
Account
Value
July 1, 2005 | | Ending
Account
Value
December 31, 2005 | | Annualized
Expense
Ratio | | Expenses Paid
During the
Six Months Ended
December 31, 2005* | |
| | | | | | | | | | |
| ING VP Index Plus LargeCap Portfolio | | | | | | | | | |
| Actual Fund Return | | | | | | | | | |
| Class I | | $1,000.00 | | | $1,056.00 | | | 0.45 | % | | $2.33 | | |
| Class S | | 1,000.00 | | | 1,054.40 | | | 0.70 | | | 3.62 | | |
| Hypothetical (5% return before expenses) | | | | | | | | | | | | | |
| Class I | | $1,000.00 | | | $1,022.94 | | | 0.45 | % | | $2.29 | | |
| Class S | | 1,000.00 | | | 1,021.68 | | | 0.70 | | | 3.57 | | |
| | | | | | | | | | | | | | |
| ING VP Index Plus MidCap Portfolio | | | | | | | | | | | | | |
| Actual Fund Return | | | | | | | | | | | | | |
| Class I | | $1,000.00 | | | $1,075.80 | | | 0.49 | % | | $2.56 | | |
| Class S | | 1,000.00 | | | 1,074.40 | | | 0.74 | | | 3.87 | | |
| Hypothetical (5% return before expenses) | | | | | | | | | | | | | |
| Class I | | $1,000.00 | | | $1,022.74 | | | 0.49 | % | | $2.50 | | |
| Class S | | 1,000.00 | | | 1,021.48 | | | 0.74 | | | 3.77 | | |
* Except as noted, expenses are equal to each Fund’s respective annualized expense ratios multiplied by the average account value over the period, multiplied by 184/365 to reflect the most recent fiscal half-year.
17
SHAREHOLDER EXPENSE EXAMPLES (UNAUDITED) |
| | | Beginning
Account
Value
July 1, 2005 | | Ending
Account
Value
December 31, 2005 | | Annualized
Expense
Ratio | | Expenses Paid
During the
Six Months Ended
December 31, 2005* | |
| | | | | | | | | | |
| ING VP Index Plus SmallCap Portfolio | | | | | | | | | |
| Actual Fund Return | | | | | | | | | |
| Class S | | $1,000.00 | | $1,056.80 | | 0.49 | % | | $2.54 | | |
| Class I | | 1,000.00 | | 1,055.50 | | 0.74 | | | 3.83 | | |
| Hypothetical (5% return before expenses) | | | | | | | | | | | |
| Class I | | $1,000.00 | | $1,022.74 | | 0.49 | % | | $2.50 | | |
| Class S | | 1,000.00 | | 1,021.48 | | 0.74 | | | 3.77 | | |
| | | | | | | | | | | | |
| ING VP Strategic Allocation Balanced Portfolio | | | | | | | | | | | |
| Actual Fund Return | | | | | | | | | | | |
| Class I | | $1,000.00 | | $1,040.30 | | 0.70 | % | | $3.60 | | |
| Class S | | 1,000.00 | | 1,039.60 | | 0.95 | | | 4.88 | | |
| Hypothetical (5% return before expenses) | | | | | | | | | | | |
| Class I | | $1,000.00 | | $1,021.68 | | 0.70 | % | | $3.57 | | |
| Class S | | 1,000.00 | | 1,020.42 | | 0.95 | | | 4.84 | | |
| | | | | | | | | | | | |
| ING VP Strategic Allocation Growth Portfolio | | | | | | | | | | | |
| Actual Fund Return | | | | | | | | | | | |
| Class I | | $1,000.00 | | $1,060.60 | | 0.73 | % | | $3.79 | | |
| Class S | | 1,000.00 | | 1,032.00 | | 0.98 | | | 4.04 | ** | |
| Hypothetical (5% return before expenses) | | | | | | | | | | | |
| Class I | | $1,000.00 | | $1,021.53 | | 0.73 | % | | $3.72 | | |
| Class S | | 1,000.00 | | 1,020.27 | | 0.98 | | | 4.99 | | |
| | | | | | | | | | | | |
| ING VP Strategic Allocation Income Portfolio | | | | | | | | | | | |
| Actual Fund Return | | | | | | | | | | | |
| Class I | | $1,000.00 | | $1,025.70 | | 0.65 | % | | $3.32 | | |
| Class S | | 1,000.00 | | 1,014.50 | | 0.90 | | | 3.68 | ** | |
| Hypothetical (5% return before expenses) | | | | | | | | | | | |
| Class I | | $1,000.00 | | $1,021.93 | | 0.65 | % | | $3.31 | | |
| Class S | | 1,000.00 | | 1,020.67 | | 0.90 | | | 4.58 | | |
* Except as noted, expenses are equal to each Fund’s respective annualized expense ratios multiplied by the average account value over the period, multiplied by 184/365 to reflect the most recent fiscal half-year.
** Expenses indicated for Actual Fund Return are equal to each Fund’s respective annualized expense ratios multiplied by the average account value over the period, multiplied by 148/365 to reflect the period since commencement of operations (August 5, 2005).
18
REPORT OF INDEPENDENT REGISTERED PUBLIC ACCOUNTING FIRM |
The Board of Directors and Shareholders
ING Variable Portfolios, Inc. and ING Strategic Allocation Portfolios, Inc.
We have audited the accompanying statements of assets and liabilities, including the portfolios of investments, of ING VP Index Plus LargeCap Portfolio, ING VP Index Plus MidCap Portfolio and ING VP Index Plus SmallCap Portfolio, each a series of ING Variable Portfolios, Inc., and ING VP Strategic Allocation Balanced Portfolio, ING VP Strategic Allocation Growth Portfolio, and ING VP Strategic Allocation Income Portfolio, each a series of ING Strategic Allocation Portfolios, Inc., as of December 31, 2005, and the related statements of operations for the year then ended, statements of changes in net assets for each of the years in the two-year period then ended, and the financial highlights for each of the years or periods in the five-year period then ended. These financial statements and financial highlights are the responsibility of management. Our responsibility is to express an opinion on these financial statements and financial highlights based on our audits.
We conducted our audits in accordance with the standards of the Public Company Accounting Oversight Board (United States). Those standards require that we plan and perform the audits to obtain reasonable assurance about whether the financial statements and financial highlights are free of material misstatement. An audit includes examining, on a test basis, evidence supporting the amounts and disclosures in the financial statements. Our procedures included confirmation of securities owned as of December 31, 2005 by correspondence with the custodian and brokers, or by other appropriate auditing procedures when replies from brokers were not received. An audit also includes assessing the accounting principles used and significant estimates made by management, as well as evaluating the overall financial statement presentation. We believe that our audits provide a reasonable basis for our opinion.
In our opinion, the financial statements and financial highlights referred to above present fairly, in all material respects, the financial position of the aforementioned portfolios as of December 31, 2005, the results of their operations, the changes in their net assets, and the financial highlights for the periods specified in the first paragraph above, in conformity with U.S. generally accepted accounting principles.
Boston, Massachusetts
February 27, 2006
19
STATEMENTS OF ASSETS AND LIABILITIES AS OF DECEMBER 31, 2005 |
| | ING
VP Index Plus
LargeCap
Portfolio | | ING
VP Index Plus
MidCap
Portfolio | | ING
VP Index Plus
SmallCap
Portfolio | |
ASSETS: | | | | | | | |
Investments in securities at value+* | | $ | 1,922,943,031 | | $ | 1,109,515,432 | | $ | 705,747,461 | |
Short-term investments at amortized cost | | 233,245,000 | | 236,034,000 | | 179,673,000 | |
Repurchase agreements | | 20,077,000 | | 6,294,000 | | 7,475,000 | |
Cash | | 866 | | — | | — | |
Cash collateral for futures | | 567,000 | | — | | — | |
Receivables: | | | | | | | |
Investment securities sold | | — | | 20,673,938 | | 3,227,010 | |
Fund shares sold | | 3,394,276 | | 4,165,072 | | 2,799,748 | |
Dividends and interest | | 2,448,315 | | 678,657 | | 767,588 | |
Prepaid expenses | | 71,689 | | 39,519 | | 24,145 | |
Total assets | | 2,182,747,177 | | 1,377,400,618 | | 899,713,952 | |
| | | | | | | |
LIABILITIES: | | | | | | | |
Payable for investment securities purchased | | — | | 13,778,876 | | 8,432,013 | |
Payable for fund shares redeemed | | 2,200,994 | | 379,606 | | 13 | |
Payable for futures variation margin | | 36,803 | | 4,293 | | — | |
Payable upon receipt of securities loaned | | 233,245,000 | | 236,034,000 | | 179,673,000 | |
Payable to affiliates | | 791,466 | | 488,675 | | 345,469 | |
Payable to custodian due to bank overdraft | | — | | 3,375,259 | | 340 | |
Payable for director fees | | 21,850 | | 4,389 | | 2,583 | |
Other accrued expenses and liabilities | | 178,454 | | 79,121 | | 47,502 | |
Total liabilities | | 236,474,567 | | 254,144,219 | | 188,500,920 | |
NET ASSETS | | $ | 1,946,272,610 | | $ | 1,123,256,399 | | $ | 711,213,032 | |
| | | | | | | |
NET ASSETS WERE COMPRISED OF: | | | | | | | |
Paid-in capital | | $ | 2,022,373,512 | | $ | 930,347,230 | | $ | 614,882,818 | |
Undistributed net investment income | | 22,117,371 | | 7,256,615 | | 2,868,688 | |
Accumulated net realized gain (loss) on investments and futures | | (238,725,738 | ) | 82,890,736 | | 40,227,059 | |
Net unrealized appreciation on investments and futures | | 140,507,465 | | 102,761,818 | | 53,234,467 | |
NET ASSETS | | $ | 1,946,272,610 | | $ | 1,123,256,399 | | $ | 711,213,032 | |
+Including securities loaned at value | | $ | 226,202,319 | | $ | 228,364,897 | | $ | 173,756,433 | |
*Cost of investments in securities | | $ | 1,782,342,570 | | $ | 1,006,749,321 | | $ | 652,512,994 | |
| | | | | | | | | | |
Class I: | | | | | | | |
Net assets | | $ | 1,389,138,592 | | $ | 844,702,715 | | $ | 378,120,859 | |
Shares authorized | | 200,000,000 | | 200,000,000 | | 200,000,000 | |
Par value | | $ | 0.001 | | $ | 0.001 | | $ | 0.001 | |
Shares outstanding | | 90,079,394 | | 45,197,568 | | 22,667,876 | |
Net asset value and redemption price per share | | $ | 15.42 | | $ | 18.69 | | $ | 16.68 | |
| | | | | | | |
Class S: | | | | | | | |
Net assets | | $ | 557,134,018 | | $ | 278,553,684 | | $ | 333,092,173 | |
Shares authorized | | 100,000,000 | | 100,000,000 | | 100,000,000 | |
Par value | | $ | 0.001 | | $ | 0.001 | | $ | 0.001 | |
Shares outstanding | | 36,408,046 | | 15,033,650 | | 20,154,607 | |
Net asset value and redemption price per share | | $ | 15.30 | | $ | 18.53 | | $ | 16.53 | |
See Accompanying Notes to Financial Statements
20
STATEMENTS OF ASSETS AND LIABILITIES AS OF DECEMBER 31, 2005 |
| | ING
VP Strategic
Allocation
Balanced
Portfolio | | ING
VP Strategic
Allocation
Growth
Portfolio | | ING
VP Strategic
Allocation
Income
Portfolio |
| | | | | | |
ASSETS: | | | | | | |
Investments in securities at value+* | | $ | 275,119,616 | | $ | 279,477,444 | | $ | 138,142,409 |
Short-term investments** | | 24,731,436 | | 12,456,426 | | 14,672,627 |
Short-term investments at amortized cost | | 46,303,000 | | 39,924,000 | | 33,501,000 |
Repurchase agreements | | 7,950,000 | | 5,246,000 | | 12,724,000 |
Cash | | 22,146 | | 28,626 | | 11,660 |
Cash collateral for futures | | 15,700 | | 43,405 | | 14,113 |
Receivables: | | | | | | |
Investment securities sold | | 383,385 | | 239,528 | | 331,292 |
Fund shares sold | | 4,087 | | 33,408 | | 304 |
Dividends and interest | | 778,538 | | 559,701 | | 565,956 |
Prepaid expenses | | 11,172 | | 10,709 | | 5,978 |
Reimbursement due from manager | | — | | — | | 17,593 |
Total assets | | 355,319,080 | | 338,019,247 | | 199,986,932 |
| | | | | | |
LIABILITIES: | | | | | | |
Payable for investment securities purchased | | 17,866,645 | | 9,859,630 | | 14,659,821 |
Payable for fund shares redeemed | | 877,549 | | 423,837 | | — |
Payable for futures variation margin | | 3,300 | | 5,125 | | 3,156 |
Payable upon receipt of securities loaned | | 46,303,000 | | 39,924,000 | | 33,501,000 |
Payable to affiliates | | 168,888 | | 161,304 | | 85,283 |
Payable for director fees | | 14,182 | | 4,587 | | 4,953 |
Other accrued expenses and liabilities | | 50,467 | | 45,807 | | 49,667 |
Total liabilities | | 65,284,031 | | 50,424,290 | | 48,303,880 |
NET ASSETS | | $ | 290,035,049 | | $ | 287,594,957 | | $ | 151,683,052 |
| | | | | | |
NET ASSETS WERE COMPRISED OF: | | | | | | |
Paid-in capital | | $ | 255,866,647 | | $ | 249,680,473 | | $ | 135,536,506 |
Undistributed net investment income | | 5,454,318 | | 4,042,457 | | 3,938,007 |
Accumulated net realized gain on investments, foreign currency
related transactions and futures | | 3,047,810 | | 97,710 | | 3,432,178 |
Net unrealized appreciation on investments, foreign currency
related transactions and futures | | 25,666,274 | | 33,774,317 | | 8,776,361 |
NET ASSETS | | $ | 290,035,049 | | $ | 287,594,957 | | $ | 151,683,052 |
+ Including securities loaned at value | | $ | 45,041,735 | | $ | 38,779,302 | | $ | 32,649,374 |
* Cost of investments in securities | | $ | 249,464,465 | | $ | 245,692,013 | | $ | 129,384,702 |
** Cost of short-term investments | | $ | 24,733,808 | | $ | 12,457,940 | | $ | 14,674,045 |
| | | | | | |
Class I: | | | | | | |
Net assets | | $ | 289,673,481 | | $ | 287,566,233 | | $ | 151,564,982 |
Shares authorized | | 100,000,000 | | 100,000,000 | | 100,000,000 |
Par value | | $ | 0.001 | | $ | 0.001 | | $ | 0.001 |
Shares outstanding | | 20,181,322 | | 18,576,927 | | 11,424,098 |
Net asset value and redemption price per share | | $ | 14.35 | | $ | 15.48 | | $ | 13.27 |
| | | | | | |
Class S: | | | | | | |
Net assets | | $ | 361,568 | | $ | 28,724 | | $ | 118,070 |
Shares authorized | | 100,000,000 | | 100,000,000 | | 100,000,000 |
Par value | | $ | 0.001 | | $ | 0.001 | | $ | 0.001 |
Shares outstanding | | 25,220 | | 1,858 | | 8,909 |
Net asset value and redemption price per share | | $ | 14.34 | | $ | 15.46 | | $ | 13.25 |
See Accompanying Notes to Financial Statements
21
STATEMENTS OF OPERATIONS FOR THE SIX YEAR ENDED DECEMBER 31, 2005 |
| | ING
VP Index Plus
LargeCap
Portfolio | | ING
VP Index Plus
MidCap
Portfolio | | ING
VP Index Plus
SmallCap
Portfolio | |
| | | | | | | |
INVESTMENT INCOME: | | | | | | | |
Dividends, net of foreign taxes withheld* | | $ | 30,272,231 | | $ | 12,480,260 | | $ | 5,924,488 | |
Interest | | 587,492 | | 290,948 | | 250,145 | |
Securities lending income | | 100,164 | | 72,868 | | 224,178 | |
Total investment income | | 30,959,887 | | 12,844,076 | | 6,398,811 | |
| | | | | | | |
EXPENSES: | | | | | | | |
Investment management fees | | 6,164,505 | | 3,777,373 | | 2,203,160 | |
Distribution and service fees | | 842,981 | | 510,882 | | 551,234 | |
Transfer agent fees | | 462 | | 901 | | 365 | |
Administrative service fees | | 968,680 | | 519,372 | | 302,925 | |
Shareholder reporting expense | | 156,955 | | 71,431 | | 37,195 | |
Registration fees | | 21,987 | | 10,766 | | 5,565 | |
Professional fees | | 119,491 | | 74,140 | | 40,077 | |
Custody and accounting expense | | 197,475 | | 102,995 | | 78,750 | |
Director’s fees | | 137,705 | | 59,321 | | 29,946 | |
Insurance expense | | 5,347 | | 2,447 | | 1,084 | |
Miscellaneous expense | | 89,415 | | 40,001 | | 17,901 | |
Total expenses | | 8,705,003 | | 5,169,629 | | 3,268,202 | |
Net investment income | | 22,254,884 | | 7,674,447 | | 3,130,609 | |
| | | | | | | |
REALIZED AND UNREALIZED GAIN (LOSS) ON
ON INVESTMENTS AND FUTURES | | | | | | | |
Net realized gain on: | | | | | | | |
Investments | | 132,837,706 | | 88,473,082 | | 44,380,246 | |
Futures | | 246,559 | | 20,393 | | — | |
Net realized gain on investments and futures | | 133,084,265 | | 88,493,475 | | 44,380,246 | |
Net change in unrealized appreciation or depreciation on: | | | | | | | |
Investments | | (50,737,505 | ) | 9,437,769 | | (2,412,384 | ) |
Futures | | (92,996 | ) | (25,041 | ) | — | |
Net change in unrealized appreciation or depreciation
on investments and futures | | (50,830,501 | ) | 9,412,728 | | (2,412,384 | ) |
Net realized and unrealized gain on investments and futures | | 82,253,764 | | 97,906,203 | | 41,967,862 | |
Increase in net assets resulting from operations | | $ | 104,508,648 | | $ | 105,580,650 | | $ | 45,098,471 | |
*Foreign taxes withheld | | $ | — | | $ | — | | $ | 4,280 | |
See Accompanying Notes to Financial Statements
22
STATEMENTS OF OPERATIONS FOR THE YEAR ENDED DECEMBER 31, 2005 |
| | ING
VP Strategic
Allocation
Balanced
Portfolio | | ING
VP Strategic
Allocation
Growth
Portfolio | | ING
VP Strategic
Allocation
Income
Portfolio | |
INVESTMENT INCOME: | | | | | | | |
Dividends, net of foreign taxes withheld* | | $ | 3,336,952 | | $ | 4,144,118 | | $ | 1,226,863 | |
Interest | | 3,910,151 | | 1,721,782 | | 3,559,759 | |
Securities lending income | | 105,627 | | 48,699 | | 85,202 | |
Total investment income | | 7,352,730 | | 5,914,599 | | 4,871,824 | |
| | | | | | | |
EXPENSES: | | | | | | | |
Investment management fees | | 1,701,116 | | 1,642,269 | | 918,506 | |
Distribution and service fees | | 258 | | 18 | | 42 | |
Transfer agent fees | | 560 | | 519 | | 167 | |
Administrative service fees | | 155,930 | | 150,536 | | 84,194 | |
Shareholder reporting expense | | 91,106 | | 78,000 | | 61,421 | |
Registration fees | | 2,858 | | 2,586 | | 1,362 | |
Professional fees | | 21,248 | | 19,846 | | 9,208 | |
Custody and accounting expense | | 73,730 | | 75,310 | | 52,580 | |
Director’s fees | | 27,008 | | 14,136 | | 9,697 | |
Insurance expense | | 876 | | 844 | | 506 | |
Miscellaneous expense | | 15,801 | | 14,449 | | 11,112 | |
Total expenses | | 2,090,491 | | 1,998,513 | | 1,148,795 | |
Net waived and reimbursed fees | | (102,846 | ) | — | | (152,215 | ) |
Net expenses | | 1,987,645 | | 1,998,513 | | 996,580 | |
Net investment income | | 5,365,085 | | 3,916,086 | | 3,875,244 | |
REALIZED AND UNREALIZED GAIN (LOSS) ON INVESTMENTS, FOREIGN CURRENCY RELATED TRANSACTIONS, AND FUTURES: | | | | | | | |
Net realized gain (loss) on: | | | | | | | |
Investments | | 12,501,607 | | 16,287,123 | | 5,706,669 | |
Foreign currency related transactions | | (17,094 | ) | (15,700 | ) | (483 | ) |
Futures | | 129,890 | | 62,251 | | 318,351 | |
Net realized gain on investments, foreign currency
related transactions and futures | | 12,614,403 | | 16,333,674 | | 6,024,537 | |
Net change in unrealized appreciation or depreciation on: | | | | | | | |
Investments | | (4,539,485 | ) | (3,391,241 | ) | (4,200,002 | ) |
Foreign currency related transactions | | (2,308 | ) | (5,777 | ) | (1,082 | ) |
Futures | | 15,035 | | (10,908 | ) | 61,376 | |
Net change in unrealized appreciation or depreciation on investments,
foreign currency related transactions and futures | | (4,526,758 | ) | (3,407,926 | ) | (4,139,708 | ) |
Net realized and unrealized gain on investments,
foreign currency related transactions and futures | | 8,087,645 | | 12,925,748 | | 1,884,829 | |
Increase in net assets resulting from operations | | $ | 13,452,730 | | $ | 16,841,834 | | $ | 5,760,073 | |
* Foreign taxes withheld | | $ | 52,465 | | $ | 92,886 | | $ | 20,321 | |
See Accompanying Notes to Financial Statements
23
STATEMENTS OF CHANGES IN NET ASSETS |
| | ING VP Index Plus LargeCap Portfolio | | ING VP Index Plus MidCap Portfolio | |
| | Year ended
December 31,
2005 | | Year Ended
December 31,
2004 | | Year ended
December 31,
2005 | | Year Ended
December 31,
2004 | |
FROM OPERATIONS: | | | | | | | | | |
Net investment income | | $ | 22,254,884 | | $ | 23,455,428 | | $ | 7,674,447 | | $ | 4,299,094 | |
Net realized gain on investments and futures | | 133,084,265 | | 121,117,187 | | 88,493,475 | | 69,894,427 | |
Net change in unrealized appreciation or
depreciation on investments and futures | | (50,830,501 | ) | 10,595,631 | | 9,412,728 | | 29,913,921 | |
Net increase in net assets resulting from operations | | 104,508,648 | | 155,168,246 | | 105,580,650 | | 104,107,442 | |
| | | | | | | | | |
FROM DISTRIBUTIONS TO SHAREHOLDERS: | | | | | | | | | |
Net investment income: | | | | | | | | | |
Class I | | (18,365,964 | ) | (14,620,495 | ) | (3,361,948 | ) | (2,309,221 | ) |
Class S | | (4,990,903 | ) | (956,759 | ) | (773,217 | ) | (201,138 | ) |
Net realized gains: | | | | | | | | | |
Class I | | — | | — | | (51,641,723 | ) | — | |
Class S | | — | | — | | (14,146,533 | ) | — | |
Total distributions | | (23,356,867 | ) | (15,577,254 | ) | (69,923,421 | ) | (2,510,359 | ) |
| | | | | | | | | |
FROM CAPITAL SHARE TRANSACTIONS: | | | | | | | | | |
Net proceeds from sale of shares | | 487,133,637 | | 191,210,173 | | 293,235,680 | | 282,702,113 | |
Dividends reinvested | | 23,356,867 | | 15,577,254 | | 69,923,421 | | 2,510,359 | |
| | 510,490,504 | | 206,787,427 | | 363,159,101 | | 285,212,472 | |
Cost of shares redeemed | | (285,443,027 | ) | (155,103,522 | ) | (76,581,417 | ) | (56,961,651 | ) |
Net increase in net assets resulting from capital
share transactions | | 225,047,477 | | 51,683,905 | | 286,577,684 | | 228,250,821 | |
Net increase in net assets | | 306,199,258 | | 191,274,897 | | 322,234,913 | | 329,847,904 | |
| | | | | | | | | |
NET ASSETS: | | | | | | | | | |
Beginning of year | | 1,640,073,352 | | 1,448,798,455 | | 801,021,486 | | 471,173,582 | |
End of year | | $ | 1,946,272,610 | | $ | 1,640,073,352 | | $ | 1,123,256,399 | | $ | 801,021,486 | |
Undistributed net investment income at end of year | | $ | 22,117,371 | | $ | 23,376,687 | | $ | 7,256,615 | | $ | 4,183,244 | |
See Accompanying Notes to Financial Statements
24
STATEMENTS OF CHANGES IN NET ASSETS |
| | ING VP Index Plus
SmallCap Portfolio | | ING VP Strategic Allocation
Balanced Portfolio | |
| | Year Ended
December 31,
2005 | | Year Ended
December 31,
2004 | | Year Ended
December 31,
2005 | | Year Ended
December 31,
2004 | |
FROM OPERATIONS: | | | | | | | | | |
Net investment income | | $ | 3,130,609 | | $ | 1,604,197 | | $ | 5,365,085 | | $ | 4,209,887 | |
Net realized gain on investments, foreign currency
related transactions and futures | | 44,380,246 | | 28,787,822 | | 12,614,403 | | 14,679,073 | |
Net change in unrealized appreciation or depreciation on investments, foreign currency related transactions and futures | | (2,412,384 | ) | 28,521,333 | | (4,526,758 | ) | 5,481,991 | |
Net increase in net assets resulting from operations | | 45,098,471 | | 58,913,352 | | 13,452,730 | | 24,370,951 | |
| | | | | | | | | |
FROM DISTRIBUTIONS TO SHAREHOLDERS: | | | | | | | | | |
Net investment income: | | | | | | | | | |
Class I | | (1,005,229 | ) | (344,735 | ) | (4,230,268 | ) | (2,985,052 | ) |
Class S | | (617,095 | ) | (35,479 | ) | (1,684 | ) | — | |
Net realized gains: | | | | | | | | | |
Class I | | (16,794,162 | ) | (1,191,454 | ) | — | | — | |
Class S | | (12,347,644 | ) | (185,150 | ) | — | | — | |
Total distributions | | (30,764,130 | ) | (1,756,818 | ) | (4,231,952 | ) | (2,985,052 | ) |
| | | | | | | | | |
FROM CAPITAL SHARE TRANSACTIONS: | | | | | | | | | |
Net proceeds from sale of shares | | 307,363,456 | | 185,074,686 | | 39,779,060 | | 54,922,497 | |
Dividends reinvested | | 30,764,130 | | 1,756,818 | | 4,231,952 | | 2,985,052 | |
| | 338,857,924 | | 186,831,504 | | 44,011,012 | | 57,907,549 | |
Cost of shares redeemed | | (54,582,141 | ) | (15,108,969 | ) | (31,488,536 | ) | (19,838,875 | ) |
Net increase in net assets resulting from capital
share transactions | | 283,545,445 | | 171,722,535 | | 12,522,476 | | 38,068,674 | |
Net increase in net assets | | 297,879,786 | | 228,879,069 | | 21,743,254 | | 59,454,573 | |
| | | | | | | | | |
NET ASSETS: | | | | | | | | | |
Beginning of year | | 413,333,246 | | 184,454,177 | | 268,291,795 | | 208,837,222 | |
End of year | | $ | 711,213,032 | | $ | 413,333,246 | | $ | 290,035,049 | | $ | 268,291,795 | |
Undistributed net investment income at end of year | | $ | 2,868,688 | | $ | 1,572,119 | | $ | 5,454,318 | | $ | 4,244,044 | |
See Accompanying Notes to Financial Statements
25
STATEMENTS OF CHANGES IN NET ASSETS |
| | ING VP Strategic Allocation
Growth Portfolio | | ING VP Strategic Allocation
Income Portfolio | |
| | Year Ended
December 31,
2005 | | Year Ended
December 31,
2004 | | Year Ended
December 31,
2005 | | Year Ended
December 31,
2004 | |
FROM OPERATIONS: | | | | | | | | | |
Net investment income | | $ | 3,916,086 | | $ | 3,394,460 | | $ | 3,875,244 | | $ | 3,065,545 | |
Net realized gain on investments, foreign currency related transactions and futures | | 16,333,674 | | 18,661,170 | | 6,024,537 | | 6,969,341 | |
Net change in unrealized appreciation or depreciation investments, foreign currency related transactions and futures | | (3,407,926 | ) | 5,775,066 | | (4,139,708 | ) | 1,162,931 | |
Net increase in net assets resulting from operations | | 16,841,834 | | 27,830,696 | | 5,760,073 | | 11,197,817 | |
| | | | | | | | | |
FROM DISTRIBUTIONS TO SHAREHOLDERS: | | | | | | | | | |
Net investment income: | | | | | | | | | |
Class I | | (3,375,749 | ) | (2,501,616 | ) | (3,088,074 | ) | (2,661,534 | ) |
Total distributions | | (3,375,749 | ) | (2,501,616 | ) | (3,088,074 | ) | (2,661,534 | ) |
| | | | | | | | | |
FROM CAPITAL SHARE TRANSACTIONS: | | | | | | | | | |
Net proceeds from sale of shares | | 38,357,026 | | 32,322,543 | | 22,558,625 | | 30,670,847 | |
Dividends reinvested | | 3,375,749 | | 2,501,616 | | 3,088,074 | | 2,661,534 | |
| | 41,732,775 | | 34,824,159 | | 25,646,699 | | 33,332,381 | |
Cost of shares redeemed | | (31,098,364 | ) | (15,918,306 | ) | (28,124,159 | ) | (26,008,253 | ) |
Net increase (decrease) in net assets resulting from capital share transactions | | 10,634,411 | | 18,905,853 | | (2,477,460 | ) | 7,324,128 | |
Net increase in net assets | | 24,100,496 | | 44,234,933 | | 194,539 | | 15,860,411 | |
| | | | | | | | | |
NET ASSETS: | | | | | | | | | |
Beginning of year | | 263,494,461 | | 219,259,528 | | 151,488,513 | | 135,628,102 | |
End of year | | $ | 287,594,957 | | $ | 263,494,461 | | $ | 151,683,052 | | $ | 151,488,513 | |
Undistributed net investment income at end of year | | $ | 4,042,457 | | $ | 3,371,539 | | $ | 3,938,007 | | $ | 3,103,317 | |
See Accompanying Notes to Financial Statements
26
ING VP INDEX PLUS LARGECAP PORTFOLIO | FINANCIAL HIGHLIGHTS |
Selected data for a share of beneficial interest outstanding throughout each period.
| | Class I | |
| | Year Ended December 31, | |
| | 2005 | | 2004 | | 2003 | | 2002 | | 2001 | |
Per Share Operating Performance: | | |
Net asset value, beginning of year | $ | 14.82 | | 13.54 | | 10.85 | | 13.86 | | 16.73 | |
Income (loss) from investment operations: | | | | | | | | | | | |
Net investment income | $ | 0.19 | * | 0.22 | | 0.14 | | 0.14 | | 0.15 | |
Net realized and unrealized gain (loss) on investments | $ | 0.60 | | 1.20 | | 2.68 | | (3.12 | ) | (2.40 | ) |
Total from investment operations | $ | 0.79 | | 1.42 | | 2.82 | | (2.98 | ) | (2.25 | ) |
Less distributions from: | | | | | | | | | | | |
Net investment income | $ | 0.19 | | 0.14 | | 0.13 | | 0.03 | | 0.13 | |
Net realized gain on investments | $ | — | | — | | — | | — | | 0.49 | |
Total distributions | $ | 0.19 | | 0.14 | | 0.13 | | 0.03 | | 0.62 | |
Net asset value, end of year | $ | 15.42 | | 14.82 | | 13.54 | | 10.85 | | 13.86 | |
Total Return(1) | % | 5.38 | | 10.58 | | 26.14 | | (21.53 | ) | (13.62 | ) |
| | | | | | | | | | | |
Ratios and Supplemental Data: | | | | | | | | | | | |
Net assets, end of year (000’s) | $ | 1,389,139 | | 1,511,946 | | 1,389,298 | | 943,520 | | 1,165,893 | |
Ratios to average net assets: | | | | | | | | | | | |
Expenses | % | 0.45 | | 0.44 | | 0.43 | | 0.45 | | 0.45 | |
Net investment income | % | 1.30 | | 1.55 | | 1.33 | | 1.18 | | 1.05 | |
Portfolio turnover rate | % | 89 | | 70 | | 88 | | 139 | | 125 | |
| | | | | | | | | | | | | | | | |
| | Class S | |
| | | | July 16, | |
| | | | 2001(2) to | |
| | Year Ended December 31, | | December 31, | |
| | 2005 | | 2004 | | 2003 | | 2002 | | 2001 | |
Per Share Operating Performance: | | | | | | | | | | | |
Net asset value, beginning of period | $ | 14.73 | | | 13.49 | | | 10.83 | | | 13.86 | | | 14.80 | | |
Income (loss) from investment operations: | | | | | | | | | | | | | | | | |
Net investment income | $ | 0.16 | * | | 0.19 | * | | 0.15 | | | 0.12 | | | — | * | |
Net realized and unrealized gain (loss) on investments | $ | 0.59 | | | 1.18 | | | 2.63 | | | (3.13 | ) | | (0.83 | ) | |
Total from investment operations | $ | 0.75 | | | 1.37 | | | 2.78 | | | (3.01 | ) | | (0.83 | ) | |
Less distributions from: | | | | | | | | | | | | | | | | |
Net investment income | $ | 0.18 | | | 0.13 | | | 0.12 | | | 0.02 | | | 0.11 | | |
Total distributions | $ | 0.18 | | | 0.13 | | | 0.12 | | | 0.02 | | | 0.11 | | |
Net asset value, end of period | $ | 15.30 | | | 14.73 | | | 13.49 | | | 10.83 | | | 13.86 | | |
Total Return(1) | % | 5.15 | | | 10.26 | | | 25.84 | | | (21.74 | ) | | (5.56 | ) | |
| | | | | | | | | | | | | | | | |
Ratios and Supplemental Data: | | | | | | | | | | | | | | | | |
Net assets, end of period (000’s) | $ | 557,134 | | | 128,127 | | | 59,500 | �� | | 4,597 | | | 821 | | |
Ratios to average net assets: | | | | | | | | | | | | | | | | |
Expenses(2) | % | 0.70 | | | 0.69 | | | 0.68 | | | 0.71 | | | 0.69 | | |
Net investment income(2) | % | 1.10 | | | 1.39 | | | 1.11 | | | 0.93 | | | 0.80 | | |
Portfolio turnover rate | % | 89 | | | 70 | | | 88 | | | 139 | | | 125 | | |
(1) Total return is calculated assuming reinvestment of all dividends and capital gain distributions at net asset value and does not reflect the effect of insurance contract charges. Total return for periods less than one year is not annualized.
(2) Annualized for periods less than one year.
(3) Commencement of operations.
* Per share data calculated using average number of shares outstanding throughout the period.
See Accompanying Notes to Financial Statements.
27
ING VP INDEX PLUS MIDCAP PORTFOLIO | FINANCIAL HIGHLIGHTS |
Selected data for a share of beneficial interest outstanding throughout each period.
| | Class I | |
| | Year Ended December 31, | |
| | 2005 | | 2004 | | 2003 | | 2002 | | 2001 | |
Per Share Operating Performance: | | | | | | | | | | | |
Net asset value, beginning of year | $ | 18.16 | | | 15.64 | | | 11.86 | | | 13.54 | | | 14.67 | | |
Income (loss) from investment operations: | | | | | | | | | | | | | | | | |
Net investment income | $ | 0.16 | * | | 0.09 | | | 0.09 | | | 0.04 | | | 0.07 | | |
Net realized and unrealized gain (loss) on investments | $ | 1.77 | | | 2.50 | | | 3.75 | | | (1.67 | ) | | (0.26 | ) | |
Total from investment operations | $ | 1.93 | | | 2.59 | | | 3.84 | | | (1.63 | ) | | (0.19 | ) | |
Less distributions from: | | | | | | | | | | | | | | | | |
Net investment income | $ | 0.09 | | | 0.07 | | | 0.06 | | | 0.05 | | | 0.03 | | |
Net realized gain on investments | $ | 1.31 | | | — | | �� | — | | | — | | | 0.91 | | |
Total distributions | $ | 1.40 | | | 0.07 | | | 0.06 | | | 0.05 | | | 0.94 | | |
Net asset value, end of year | $ | 18.69 | | | 18.16 | | | 15.64 | | | 11.86 | | | 13.54 | | |
Total Return(1) | % | 11.14 | | | 16.59 | | | 32.45 | | | (12.09 | ) | | (1.32 | ) | |
| | | | | | | | | | | | | | | | |
Ratios and Supplemental Data: | | | | | | | | | | | | | | | | |
Net assets, end of year (000’s) | $ | 844,703 | | | 678,869 | | | 451,213 | | | 251,674 | | | 161,663 | | |
Ratios to average net assets: | | | | | | | | | | | | | | | | |
Expenses | % | 0.49 | | | 0.49 | | | 0.50 | | | 0.53 | | | 0.55 | | |
Net investment income(2) | % | 0.87 | | | 0.73 | | | 0.78 | | | 0.61 | | | 0.77 | | |
Portfolio turnover rate | % | 100 | | | 108 | | | 113 | | | 139 | | | 189 | | |
| | Class S | |
| | | | July 16, | |
| | | | 2001(3) to | |
| | Year Ended December 31, | | December 31, | |
| | 2005 | | 2004 | | 2003 | | 2002 | | 2001 | |
Per Share Operating Performance: | | | | | | | | | | | |
Net asset value, beginning of period | $ | 18.05 | | | 15.57 | | | 11.83 | | | 13.52 | | | 13.58 | | |
Income (loss) from investment operations: | | | | | | | | | | | | | | | | |
Net investment income | $ | 0.11 | * | | 0.07 | * | | 0.04 | | | 0.01 | | | — | | |
Net realized and unrealized gain (loss) on investments | $ | 1.75 | | | 2.47 | | | 3.74 | | | (1.66 | ) | | (0.06 | ) | |
Total from investment operations | $ | 1.86 | | | 2.54 | | | 3.78 | | | (1.65 | ) | | (0.06 | ) | |
Less distributions from: | | | | | | | | | | | | | | | | |
Net investment income | $ | 0.07 | | | 0.06 | | | 0.04 | | | 0.04 | | | — | | |
Net realized gain on investments | $ | 1.31 | | | — | | | — | | | — | | | — | | |
Total distributions | $ | 1.38 | | | 0.06 | | | 0.04 | | | 0.04 | | | — | | |
Net asset value, end of period | $ | 18.53 | | | 18.05 | | | 15.57 | | | 11.83 | | | 13.52 | | |
Total Return(1) | % | 10.84 | | | 16.35 | | | 32.06 | | | (12.26 | ) | | (0.44 | ) | |
| | | | | | | | | | | | | | | | |
Ratios and Supplemental Data: | | | | | | | | | | | | | | | | |
Net assets, end of period (000’s) | $ | 278,554 | | | 122,153 | | | 19,960 | | | 5,917 | | | 830 | | |
Ratios to average net assets: | | | | | | | | | | | | | | | | |
Expenses(2) | % | 0.74 | | | 0.74 | | | 0.75 | | | 0.78 | | | 0.80 | | |
Net investment income(2) | % | 0.62 | | | 0.45 | | | 0.54 | | | 0.37 | | | 0.51 | | |
Portfolio turnover rate | % | 100 | | | 108 | | | 113 | | | 139 | | | 189 | | |
(1) Total return is calculated assuming reinvestment of all dividends and capital gain distributions at net asset value and does not reflect the effect of insurance contract charges. Total return for periods less than one year is not annualized.
(2) Annualized for periods less than one year.
(3) Commencement of operations.
* Per share data calculated using average number of shares outstanding throughout the period.
See Accompanying Notes to Financial Statements
28
ING VP INDEX PLUS SMALLCAP PORTFOLIO | FINANCIAL HIGHLIGHTS |
Selected data for a share of beneficial interest outstanding throughout each period.
| | Class I | |
| | Year Ended December 31, | |
| | 2005 | | 2004 | | 2003 | | 2002 | | 2001 | |
Per Share Operating Performance: | | | | | | | | | | | |
Net asset value, beginning of year | $ | 16.39 | | | 13.52 | | | 9.95 | | | 11.60 | | | 11.97 | | |
Income (loss) from investment operations: | | | | | | | | | | | | | | | | |
Net investment income | $ | 0.11 | ** | | 0.07 | | | 0.03 | | | 0.01 | | | 0.02 | | |
Net realized and unrealized gain (loss) on investments | $ | 1.09 | | | 2.90 | | | 3.56 | | | (1.53 | ) | | 0.25 | | |
Total from investment operations | $ | 1.20 | | | 2.97 | | | 3.59 | | | (1.52 | ) | | 0.27 | | |
Less distributions from: | | | | | | | | | | | | | | | | |
Net investment income | $ | 0.05 | | | 0.02 | | | 0.02 | | | 0.01 | | | 0.02 | | |
Net realized gain on investments | $ | 0.86 | | | 0.08 | | | — | | | 0.12 | | | 0.62 | | |
Total distributions | $ | 0.91 | | | 0.10 | | | 0.02 | | | 0.13 | | | 0.64 | | |
Net asset value, end of year | $ | 16.68 | | | 16.39 | | | 13.52 | | | 9.95 | | | 11.60 | | |
Total Return(1) | % | 7.62 | | | 22.07 | | | 36.15 | | | (13.21 | ) | | 2.41 | | |
| | | | | | | | | | | | | | | | |
Ratios and Supplemental Data: | | | | | | | | | | | | | | | | |
Net assets, end of year (000’s) | $ | 378,121 | | | 303,041 | | | 168,035 | | | 86,494 | | | 46,547 | | |
Ratios to average net assets: | % | | | | | | | | | | | | | | | |
Net expenses after expense reimbursement(2) | % | 0.49 | | | 0.49 | | | 0.56 | | | 0.58 | | | 0.60 | | |
Gross expenses prior to expense reimbursement | % | 0.49 | | | 0.49 | | | 0.56 | | | 0.63 | | | 0.71 | | |
Net investment income after expense reimbursement(2) | % | 0.66 | | | 0.64 | | | 0.37 | | | 0.30 | | | 0.35 | | |
Portfolio turnover rate | % | 71 | | | 94 | | | 120 | | | 134 | | | 134 | | |
| | Class S | |
| | | | July 16, | |
| | | | 2001(4) to | |
| | Year Ended December 31, | | December 31, | |
| | 2005 | | 2004 | | 2003 | | 2002 | | 2001 | |
Per Share Operating Performance: | | | | | | | | | | | | |
Net asset value, beginning of period | $ | 16.28 | | | 13.46 | | | 9.92 | | | 11.58 | | | 11.40 | | |
Income (loss) from investment operations: | | | | | | | | | | | | | | | | |
Net investment income (loss) | $ | 0.07 | ** | | 0.06 | ** | | 0.01 | | | 0.00 | * | | — | | |
Net realized and unrealized gain (loss) on investments | $ | 1.08 | | | 2.86 | | | 3.54 | | | (1.53 | ) | | 0.18 | | |
Total from investment operations | $ | 1.15 | | | 2.92 | | | 3.55 | | | (1.53 | ) | | 0.18 | | |
Less distributions from: | | | | | | | | | | | | | | | | |
Net investment income | $ | 0.04 | | | 0.02 | | | 0.01 | | | 0.01 | | | — | | |
Net realized gain on investments | $ | 0.86 | | | 0.08 | | | — | | | 0.12 | | | — | | |
Total distributions | $ | 0.90 | | | 0.10 | | | 0.01 | | | 0.13 | | | — | | |
Net asset value, end of period | $ | 16.53 | | | 16.28 | | | 13.46 | | | 9.92 | | | 11.58 | | |
Total Return(1) | % | 7.36 | | | 21.74 | | | 35.83 | | | (13.39 | ) | | 1.58 | | |
| | | | | | | | | | | | | | | | |
Ratios and Supplemental Data: | | | | | | | | | | | | | | | | |
Net assets, end of period (000’s) | $ | 333,092 | | | 110,292 | | | 16,419 | | | 4,014 | | | 690 | | |
Ratios to average net assets: | % | | | | | | | | | | | | | | | |
Net expenses after expense
reimbursement(2)(3) | % | 0.74 | | | 0.74 | | | 0.80 | | | 0.84 | | | 0.85 | | |
Gross expenses prior to expense
reimbursement(3) | % | 0.74 | | | 0.74 | | | 0.80 | | | 0.88 | | | 0.96 | | |
Net investment income after expense reimbursement(2)(3) | % | 0.43 | | | 0.45 | | | 0.13 | | | 0.05 | | | 0.10 | | |
Portfolio turnover rate | % | 71 | | | 94 | | | 120 | | | 134 | | | 134 | | |
(1) | Total return is calculated assuming reinvestment of all dividends and capital gain distributions at net asset value and does not reflect the effect of insurance contract charges. Total return for periods less than one year is not annualized. |
(2) | The Investment Manager has agreed to limit expenses (excluding interest, taxes, brokerage and extraordinary expenses) subject to possible recoupment by ING Investments, LLC within three years of being incurred. |
(3) | Annualized for periods less than one year. |
(4) | Commencement of operations. |
* | Amount represents less than $0.00 per share. |
** | Per share data calculated using average number of shares outstanding throughout the period. |
See Accompanying Notes to Financial Statements.
29
ING VP STRATEGIC ALLOCATION BALANCED PORTFOLIO | FINANCIAL HIGHLIGHTS |
Selected data for a share of beneficial interest outstanding throughout each period.
| | Class I | |
| | Year Ended December 31, | |
| | 2005 | | 2004 | | 2003 | | 2002 | | 2001 | |
Per Share Operating Performance: | | | | | | | | | | | |
Net asset value, beginning of year | $ | 13.91 | | | 12.78 | | | 10.86 | | | 12.31 | | | 13.58 | | |
Income (loss) from investment operations: | | | | | | | | | | | | | | | | |
Net investment income | $ | 0.26 | * | | 0.20 | | | 0.18 | | | 0.20 | | | 0.29 | | |
Net realized and unrealized gain (loss) on investments | $ | 0.39 | | | 1.09 | | | 1.92 | | | (1.36 | ) | | (1.23 | ) | |
Total from investment operations | $ | 0.65 | | | 1.29 | | | 2.10 | | | (1.16 | ) | | (0.94 | ) | |
Less distributions from: | | | | | | | | | | | | | | | | |
Net investment income | $ | 0.21 | | | 0.16 | | | 0.18 | | | 0.29 | | | 0.33 | | |
Total distributions | $ | 0.21 | | | 0.16 | | | 0.18 | | | 0.29 | | | 0.33 | | |
Net asset value, end of year | $ | 14.35 | | | 13.91 | | | 12.78 | | | 10.86 | | | 12.31 | | |
Total Return(1) | % | 4.70 | | | 10.23 | | | 19.47 | | | (9.54 | ) | | (6.99 | ) | |
| | | | | | | | | | | | | | | | |
Ratios and Supplemental Data: | | | | | | | | | | | | | | | | |
Net assets, end of year (000’s) | $ | 289,673 | | | 268,292 | | | 208,837 | | | 158,169 | | | 181,296 | | |
Ratios to average net assets: | | | | | | | | | | | | | | | | |
Net expenses after expense reimbursement(2) | % | 0.70 | | | 0.70 | | | 0.70 | | | 0.70 | | | 0.70 | | |
Gross expenses prior to expense reimbursement | % | 0.74 | | | 0.70 | | | 0.74 | | | 0.77 | | | 0.74 | | |
Net investment income after expense reimbursement(2) | % | 1.89 | | | 1.77 | | | 1.75 | | | 1.71 | | | 2.39 | | |
Portfolio turnover rate | % | 301 | | | 262 | | | 278 | | | 267 | | | 195 | | |
| | Class S | |
| | June 7,
2005(4) to
December 31,
2005 | |
Per Share Operating Performance: | | | |
Net asset value, beginning of period | $ | | 14.02 | | |
Income (loss) from investment operations: | | | | |
Net investment income | $ | | 0.17 | * | |
Net realized and unrealized gain on investments | $ | | 0.36 | | |
Total from investment operations | $ | | 0.53 | | |
Less distributions from: | | | | |
Net investment income | $ | | 0.21 | | |
Total distributions | $ | | 0.21 | | |
Net asset value, end of period | $ | | 14.34 | | |
Total Return(1) | % | 3.81 | | |
| | | | |
Ratios and Supplemental Data: | | | | |
Net assets, end of period (000’s) | $ | | 362 | | |
Ratios to average net assets: | | | | |
Net expenses after expense reimbursement(2)(3) | % | 0.95 | | |
Gross expenses prior to expense reimbursement(3) | % | 0.99 | | |
Net investment income after expense reimbursement(2)(3) | % | 1.80 | | |
Portfolio turnover rate | % | 301 | | |
(1) | | Total return is calculated assuming reinvestment of all dividends and capital gain distributions at net asset value and does not reflect the effect of insurance contract charges. |
(2) | | The Investment Manager has agreed to limit expenses (excluding interest, taxes, brokerage and extraordinary expenses) subject to possible recoupment by ING Investments, LLC within three years of being incurred. |
(3) | | Annualized for periods less than one year. |
(4) | | Commencement of operations. |
* | | Per share data calculated using average number of shares outstanding throughout the period. |
See Accompanying Notes to Financial Statements.
30
ING VP STRATEGIC ALLOCATION GROWTH PORTFOLIO | FINANCIAL HIGHLIGHTS |
Selected data for a share of beneficial interest outstanding throughout each period.
| | Class I | |
| | Year Ended December 31, | |
| | 2005 | | 2004 | | 2003 | | 2002 | | 2001 | |
Per Share Operating Performance: | | | | | | | | | | | |
Net asset value, beginning of year | $ | 14.76 | | | 13.32 | | | 10.81 | | | 12.75 | | | 14.65 | | |
Income (loss) from investment operations: | | | | | | | | | | | | | | | | |
Net investment income | $ | 0.22 | | | 0.18 | | | 0.15 | | | 0.13 | | | 0.20 | | |
Net realized and unrealized gain (loss) on investments | $ | 0.68 | | | 1.41 | | | 2.47 | | | (1.87 | ) | | (1.88 | ) | |
Total from investment operations | $ | 0.90 | | | 1.59 | | | 2.62 | | | (1.74 | ) | | (1.68 | ) | |
Less distributions from: | | | | | | | | | | | | | | | | |
Net investment income | $ | 0.18 | | | 0.15 | | | 0.11 | | | 0.20 | | | 0.22 | | |
Total distributions | $ | 0.18 | | | 0.15 | | | 0.11 | | | 0.20 | | | 0.22 | | |
Net asset value, end of year | $ | 15.48 | | | 14.76 | | | 13.32 | | | 10.81 | | | 12.75 | | |
Total Return(1) | % | 6.20 | | | 12.01 | | | 24.34 | | | (13.76 | ) | | (11.54 | ) | |
| | | | | | | | | | | | | | | | |
Ratios and Supplemental Data: | | | | | | | | | | | | | | | | |
Net assets, end of year (000’s) | $ | 287,566 | | | 263,494 | | | 219,260 | | | 165,733 | | | 197,038 | | |
Ratios to average net assets: | | | | | | | | | | | | | | | | |
Net expenses after expense reimbursement/recoupment(2) | % | 0.73 | | | 0.70 | | | 0.75 | | | 0.75 | | | 0.74 | | |
Gross expenses prior to expense reimbursement/recoupment | % | 0.73 | | | 0.70 | | | 0.74 | | | 0.77 | | | 0.74 | | |
Net investment income after expense reimbursement(2) | % | 1.43 | | | 1.46 | | | 1.32 | | | 1.14 | | | 1.58 | | |
Portfolio turnover rate | % | 232 | | | 205 | | | 232 | | | 271 | | | 247 | | |
| | Class S | |
| | August 5,
2005(4) to
December 31,
2005 | |
Per Share Operating Performance: | | | |
Net asset value, beginning of period | $ | 14.98 | |
Income (loss) from investment operations: | | | |
Net investment loss | $ | 0.06 | |
Net realized and unrealized gain on investments | $ | 0.42 | |
Total from investment operations | $ | 0.48 | |
Net asset value, end of period | $ | 15.46 | |
Total Return(1) | % | 3.20 | |
| | | |
Ratios and Supplemental Data: | | | |
Net assets, end of period (000’s) | $ | 29 | |
Ratios to average net assets: | | | |
Net expenses after expense reimbursement/recoupment(2)(3) | % | 0.98 | |
Gross expenses prior to expense reimbursement/recoupment(3) | % | 0.98 | |
Net investment income after expense reimbursement(2) | % | 1.27 | |
Portfolio turnover rate | % | 232 | |
(1) Total return is calculated assuming reinvestment of all dividends and capital gain distributions at net asset value and does not reflect the effect of insurance contract charges.
(2) The Investment Manager has agreed to limit expenses (excluding interest, taxes, brokerage and extraordinary expenses) subject to possible recoupment by ING Investments, LLC within three years of being incurred.
(3) Annualized for periods less than one year.
(4) Commencement of operations.
See Accompanying Notes to Financial Statements.
31
ING VP STRATEGIC ALLOCATION INCOME PORTFOLIO | FINANCIAL HIGHLIGHTS |
Selected data for a share of beneficial interest outstanding throughout each period.
| | Class I | |
| | Year Ended December 31, | |
| | 2005 | | 2004 | | 2003 | | 2002 | | 2001 | |
Per Share Operating Performance: | | | | | | | | | | | |
Net asset value, beginning of year | $ | 13.04 | | | 12.31 | | | 11.09 | | | 11.99 | | | 12.84 | | |
Income (loss) from investment operations: | | | | | | | | | | | | | | | | |
Net investment income | $ | 0.34 | | | 0.25 | | | 0.25 | | | 0.27 | | | 0.38 | | |
Net realized and unrealized gain (loss) on investments | $ | 0.15 | | | 0.72 | | | 1.25 | | | (0.78 | ) | | (0.68 | ) | |
Total from investment operations | $ | 0.49 | | | 0.97 | | | 1.50 | | | (0.51 | ) | | (0.30 | ) | |
Less distributions from: | | | | | | | | | | | | | | | | |
Net investment income | $ | 0.26 | | | 0.24 | | | 0.28 | | | 0.39 | | | 0.46 | | |
Net realized gain on investments | $ | — | | | — | | | — | | | — | | | 0.09 | | |
Total distributions | $ | 0.26 | | | 0.24 | | | 0.28 | | | 0.39 | | | 0.55 | | |
Net asset value, end of year | $ | 13.27 | | | 13.04 | | | 12.31 | | | 11.09 | | | 11.99 | | |
Total Return(1) | % | 3.83 | | | 7.99 | | | 13.65 | | | (4.34 | ) | | (2.37 | ) | |
| | | | | | | | | | | | | | | | |
Ratios and Supplemental Data: | | | | | | | | | | | | | | | | |
Net assets, end of year (000’s) | $ | 151,565 | | | 151,489 | | | 135,628 | | | 120,615 | | | 129,998 | | |
Ratios to average net assets: | | | | | | | | | | | | | | | | |
Net expenses after expense reimbursement(2) | % | 0.65 | | | 0.65 | | | 0.65 | | | 0.65 | | | 0.65 | | |
Gross expenses prior to expense reimbursement | % | 0.75 | | | 0.70 | | | 0.74 | | | 0.77 | | | 0.76 | | |
Net investment income after expense reimbursement(2) | % | 2.53 | | | 2.16 | | | 2.18 | | | 2.36 | | | 3.30 | | |
Portfolio turnover rate | % | 364 | | | 317 | | | 332 | | | 248 | | | 155 | | |
| | Class S | |
| | August 5,
2005(4) to
December 31,
2005 | |
Per Share Operating Performance: | | | |
Net asset value, beginning of period | $ | 13.06 | |
Income (loss) from investment operations: | | | |
Net investment income | $ | 0.06 | |
Net realized and unrealized loss on investments | $ | 0.13 | |
Total from investment operations | $ | 0.19 | |
Net asset value, end of period | $ | 13.25 | |
Total Return(1) | % | 1.45 | |
| | | |
Ratios and Supplemental Data: | | | |
Net assets, end of period (000’s) | $ | 118 | |
Ratios to average net assets: | | | |
Net expenses after expense reimbursement/recoupment(2)(3) | % | 0.90 | |
Gross expenses prior to expense reimbursement/recoupment(3) | % | 1.00 | |
Net investment income after expense reimbursement(2) | % | 2.68 | |
Portfolio turnover rate | % | 364 | |
(1) Total return is calculated assuming reinvestment of all dividends and capital gain distributions at net asset value and does not reflect the effect of insurance contract charges.
(2) The Investment Manager has agreed to limit expenses (excluding interest, taxes, brokerage and extraordinary expenses) subject to possible recoupment by ING Investments, LLC within three years.
(3) Annualized for periods less than one year.
(4) Commencement of operations.
See Accompanying Notes to Financial Statements.
32
NOTE TO FINANCIAL STATEMENTS AS OF DECEMBER 31, 2005 |
NOTE 1 — ORGANIZATION
Organization. The ING Variable Portfolios, Inc. and the ING Strategic Allocation Portfolios, Inc. are each registered under the Investment Company Act of 1940 as an open-end management investment company.
The ING Variable Portfolios, Inc. is a company incorporated under the laws of Maryland on June 4, 1996. There are eight separate investment portfolios that comprise the ING Variable Portfolios, Inc. The three portfolios (each a “Portfolio”, collectively the “Portfolios”) that are in this report are: ING VP Index Plus LargeCap Portfolio (“VP Index Plus LargeCap”), ING VP Index Plus MidCap Portfolio (“VP Index Plus MidCap”) and ING VP Index Plus SmallCap Portfolio (“VP Index Plus SmallCap”).
The ING Strategic Allocation Portfolios, Inc. is a company incorporated under the laws of Maryland on October 14, 1994. There are three separate investment portfolios (each a “Portfolio”, collectively the “Portfolios”) that comprise the ING Strategic Allocation Portfolios: ING VP Strategic Allocation Balanced Portfolio (“VP Strategic Allocation Balanced”), ING VP Strategic Allocation Growth Portfolio (“VP Strategic Allocation Growth”) and ING VP Strategic Allocation Income Portfolio (“VP Strategic Allocation Income”).
Each Portfolio offers Class I and Class S shares. The two classes differ principally in the applicable shareholder service fees. Shareholders of each class also bear certain expenses that pertain to that particular class. All shareholders bear the common expenses of the Portfolio and earn income and realized gains/losses from the portfolio pro rata based on the average daily net assets of each class, without distinction between share classes. Differences in per share dividend rates generally result from differences in separate class expenses, including shareholder servicing fees.
Shares of the Portfolios may be offered to segregated asset accounts of insurance companies as investment options under variable annuity contracts and variable life insurance policies. Shares may also be offered to qualified pension and retirement plans outside the Variable Contract and to certain investment advisers and their affiliates. Class I shares may be made available to other investment companies, including series of the Trust under fund-of-funds arrangements.
Participating insurance companies and other designated organizations are authorized to receive purchase orders on the Portfolio’s behalf.
ING Investments, LLC (“ING Investments” or the “Investment Manager”), an Arizona limited liability company, serves as the Investment Manager to the Portfolios. ING Investments has engaged ING Investment Management Co. (“ING IM”), a Connecticut corporation, to serve as the Sub-Adviser to the Portfolios. ING Funds Distributor, LLC (the “Distributor”) is the principal underwriter of the Portfolios. ING Investments, ING IM and the Distributor are indirect, wholly-owned subsidiaries of ING Groep N.V. (“ING Groep”). ING Groep is one of the largest financial services organizations in the world, and offers an array of banking, insurance and asset management services to both individuals and institutional investors.
NOTE 2 — SIGNIFICANT ACCOUNTING POLICIES
The following significant accounting policies are consistently followed by the Portfolios in the preparation of their financial statements. Such policies are in conformity with U.S. generally accepted accounting principles for investment companies.
A. Security Valuation. Investments in equity securities traded on a national securities exchange are valued at the last reported sale price. Securities reported by NASDAQ are valued at the NASDAQ official closing prices. Securities traded on an exchange or NASDAQ for which there has been no sale and securities traded in the over-the-counter-market are valued at the mean between the last reported bid and ask prices. All investments quoted in foreign currencies will be valued daily in U.S. dollars on the basis of the foreign currency exchange rates prevailing at that time. Debt securities are valued at prices obtained from independent services or from one or more dealers making markets in the securities and may be adjusted based on the Portfolios’ valuation procedures. U.S. Government obligations are valued by using market quotations or independent pricing services that use prices provided by market-makers or estimates of market values obtained from yield data relating to instruments or securities with similar characteristics.
Securities and assets for which market quotations are not readily available (which may include certain restricted securities which are subject to limitations as to their sale) are valued at their fair values as determined in good faith by or under the supervision of the Portfolio’s Board of Directors (“Board”), in accordance with methods that are specifically authorized by the Board.
33
NOTE TO FINANCIAL STATEMENTS AS OF DECEMBER 31, 2005 (CONTINUED) |
NOTE 2 — SIGNIFICANT ACCOUNTING POLICIES (continued)
Securities traded on exchanges, including foreign exchanges, which close earlier than the time that a Portfolio calculates its net asset value (“NAV”) may also be valued at their fair values as determined in good faith by or under the supervision of a Portfolio’s Board, in accordance with methods that are specifically authorized by the Board. The value of a foreign security traded on an exchange outside the United States is generally based on its price on the principal foreign exchange where it trades as of the time the Portfolio determines its NAV or if the foreign exchange closes prior to the time the Portfolio determines its NAV, the most recent closing price of the foreign security on its principal exchange. Trading in certain non-U.S. securities may not take place on all days on which the New York Stock Exchange (“NYSE”) is open. Further, trading takes place in various foreign markets on days on which the NYSE is not open. Consequently, the calculation of the Portfolio’s NAV may not take place contemporaneously with the determination of the prices of securities held by the Portfolio in foreign securities markets. Further, the value of the Portfolio’s assets may be significantly affected by foreign trading on days when a shareholder cannot purchase or redeem shares of the Portfolio. In calculating the Portfolio’s NAV, foreign securities denominated in foreign currency are converted to U.S. dollar equivalents. If an event occurs after the time at which the market for foreign securities held by the Portfolio closes but before the time that the Portfolio’s NAV is calculated, such event may cause the closing price on the foreign exchange to not represent a readily available reliable market value quotation for such securities at the time the Portfolio determines its NAV. In such a case, the Portfolio will use the fair value of such securities as determined under the Portfolio’s valuation procedures. Events after the close of trading on a foreign market that could require the Portfolio to fair value some or all of its foreign securities include, among others, securities trading in the U.S. and other markets, corporate announcements, natural and other disasters, and political and other events. Among other elements of analysis in the determination of a security’s fair value, the Board has authorized the use of one or more independent research services to assist with such determinations. An independent research service may use statistical analyses and quantitative models to help determine fair value as of the time a Portfolio calculates its NAV. There can be no assurance that such models accurately reflect the behavior of the applicable markets or the effect of the behavior of such markets on the fair value of securities, or that such markets will continue to behave in a fashion that is consistent with such models. Unlike the closing price of a security on an exchange, fair value determinations employ elements of judgment. Consequently, the fair value assigned to a security may not represent the actual value that a Portfolio could obtain if it were to sell the security at the time of the close of the NYSE. Pursuant to procedures adopted by the Board, a Portfolio is not obligated to use the fair valuations suggested by any research service, and valuation recommendations provided by such research services may be overridden if other events have occurred or if other fair valuations are determined in good faith to be more accurate. Unless an event is such that it causes a Portfolio to determine that the closing prices for one or more securities do not represent readily available reliable market value quotations at the time the Portfolio determines its NAV, events that occur between the time of the close of the foreign market on which they are traded and the close of regular trading on the NYSE will not be reflected in the Portfolio’s NAV. Investments in securities maturing in 60 days or less at the date of valuation are valued at amortized cost, which, when combined with accrued interest approximates market value.
B. Security Transactions and Revenue Recognition. Securities transactions are accounted for on the trade date. Realized gains and losses are reported on the basis of identified cost of securities sold. Interest income is recorded on an accrual basis. Dividend income is recorded on the ex-dividend date, or for certain foreign securities, when the information becomes available to the Portfolios. Premium amortization and discount accretion are determined by the effective yield method.
C. Foreign Currency Translation. The books and records of the Portfolios are maintained in U.S. dollars. Any foreign currency amounts are translated into U.S. dollars on the following basis:
(1) Market value of investment securities, other assets and liabilities — at the exchange rates prevailing at the end of the day.
(2) Purchases and sales of investment securities, income and expenses — at the rates of exchange prevailing on the respective dates of such transactions.
34
NOTE TO FINANCIAL STATEMENTS AS OF DECEMBER 31, 2005 (CONTINUED) |
NOTE 2 — SIGNIFICANT ACCOUNTING POLICIES (continued)
Although the net assets and the market values are presented at the foreign exchange rates at the end of the day, the Portfolios do not isolate the portion of the results of operations resulting from changes in foreign exchange rates on investments from the fluctuations arising from changes in market prices of securities held. Such fluctuations are included with the net realized and unrealized gains or losses from investments. For securities, which are subject to foreign withholding tax upon disposition, liabilities are recorded on the Statement of Assets and Liabilities for the estimated tax withholding based on the securities’ current market value. Upon disposition, realized gains or losses on such securities are recorded net of foreign withholding tax.
Reported net realized foreign exchange gains or losses arise from sales of foreign currencies, currency gains or losses realized between the trade and settlement dates on securities transactions, the difference between the amounts of dividends, interest, and foreign withholding taxes recorded on the Portfolio’s books, and the U.S. dollar equivalent of the amounts actually received or paid. Net unrealized foreign exchange gains and losses arise from changes in the value of assets and liabilities other than investments in securities at fiscal year end, resulting from changes in the exchange rate. Foreign security and currency transactions may involve certain considerations and risks not typically associated with investing in U.S. companies and U.S. Government securities. These risks include, but are not limited to, revaluation of currencies and future adverse political and economic developments which could cause securities and their markets to be less liquid and prices more volatile than those of comparable U.S. companies and U.S. Government securities.
D. Foreign Currency Transactions and Futures Contracts. Certain Portfolios may enter into foreign currency exchange transactions to convert to and from different foreign currencies and to and from the U.S. dollar in connection with the planned purchases or sales of securities. When entering into a currency forward contract, a Portfolio agrees to receive or deliver a fixed quantity of foreign currency for an agreed-upon price on an agreed upon date. The Portfolios either enter into these transactions on a spot basis at the spot rate prevailing in the foreign currency exchange market or use forward foreign currency contracts to purchase or sell foreign currencies. When the contract is fulfilled or closed, gains or losses are realized. Until then, the gain or loss is included in unrealized appreciation or depreciation. Risks may arise upon entering into forward contracts from the potential inability of counterparties to meet the terms of their forward contracts and from unanticipated movements in the value of foreign currencies relative to the U.S. dollar.
Each Portfolio may enter into futures contracts involving foreign currency, interest rates, securities and security indices. A futures contract obligates the seller of the contract to deliver and the purchaser of the contract to take delivery of the type of foreign currency, financial instrument or security called for in the contract at a specified future time for a specified price. Upon entering into such a contract, a Portfolio is required to deposit and maintain as collateral such initial margin as required by the exchange on which the contract is traded. Pursuant to the contract, a Portfolio agrees to receive from or pay to the broker an amount equal to the daily fluctuations in the value of the contract. Such receipts or payments are known as variation margins and are recorded as unrealized gains or losses by the Portfolio. When the contract is closed, the Portfolio records a realized gain or loss equal to the difference between the value of the contract at the time it was opened and the value at the time it was closed.
E. Distributions to Shareholders. The Portfolios record distributions to their shareholders on ex-dividend date. Dividends from net investment income and capital gains, if any, are declared and paid annually by the Portfolios. The Portfolios may make distributions on a more frequent basis to comply with the distribution requirements of the Internal Revenue Code. The characteristics of income and gains to be distributed are determined in accordance with income tax regulations, which may differ from U.S. generally accepted accounting principles for investment companies.
F. Federal Income Taxes. It is the policy of the Portfolios to comply with subchapter M of the Internal Revenue Code and related excise tax provisions applicable to regulated investment companies and to distribute substantially all of their net investment income and any net realized
35
NOTE TO FINANCIAL STATEMENTS AS OF DECEMBER 31, 2005 (CONTINUED) |
NOTE 2 — SIGNIFICANT ACCOUNTING POLICIES (continued)
capital gains to their shareholders. Therefore, no federal income tax provision is required. No capital gain distributions shall be made until any capital loss carryforwards have been fully utilized or expired.
G. Use of Estimates. Management of the Portfolios has made certain estimates and assumptions relating to the reporting of assets, liabilities, income, and expenses to prepare these financial statements in conformity with U.S. generally accepted accounting principles for investment companies. Actual results could differ from these estimates.
H. Repurchase Agreements. Each Portfolio may invest in repurchase agreements only with government securities dealers recognized by the Board of Governors of the Federal Reserve System. Under such agreements, the seller of the security agrees to repurchase it at a mutually agreed upon time and price. The resale price is in excess of the purchase price and reflects an agreed upon interest rate for the period of time the agreement is outstanding. The period of the repurchase agreements is usually short, from overnight to one week, while the underlying securities generally have longer maturities. Each Portfolio will receive as collateral securities acceptable to it whose market value is equal to at least 100% of the carrying amount of the repurchase agreements, plus accrued interest, being invested by the Portfolio. The underlying collateral is valued daily on a mark to market basis to assure that the value, including accrued interest is at least equal to the repurchase price. There would be potential loss to the Portfolio in the event the Fund is delayed or prevented from exercising its right to dispose of the collateral, and it might incur disposition costs in liquidating the collateral.
I. Securities Lending. Each Portfolio has the option to temporarily loan up to 30% of its total assets to brokers, dealers or other financial institutions in exchange for a negotiated lender’s fee. The borrower is required to fully collateralize the loans with cash or U.S. Government securities. Generally, in the event of counterparty default, the Portfolio has the right to use collateral to offset losses incurred. There would be potential loss to the Portfolio in the event the Portfolio is delayed or prevented from exercising its right to dispose of the collateral. The Portfolio bears the risk of loss with respect to the investment of collateral. Engaging in securities lending could have a leveraging effect, which may intensify the credit, market and other risks associated with investing in a Portfolio.
J. Illiquid and Restricted Securities. VP Index Plus LargeCap, VP Index Plus MidCap and VP Index Plus SmallCap each may not invest more than 10% of its net assets in illiquid securities. VP Strategic Allocation Balanced, VP Strategic Allocation Growth and VP Strategic Allocation Income each may not invest more than 15% of its net assets in illiquid securities. Illiquid securities are not readily marketable. Disposing of illiquid investments may involve time-consuming negotiation and legal expenses, and it may be difficult or impossible for the Portfolios to sell them promptly at an acceptable price. Each Portfolio may also invest in restricted securities, which include those sold under Rule 144A of the Securities Act of 1933 (“1933 Act”) or securities offered pursuant to Section 4(2) of the 1933 Act, and/or are subject to legal or contractual restrictions on resale and may not be publicly sold without registration under the 1933 Act. Certain restricted securities may be considered liquid pursuant to procedures adopted by the Board or may be deemed to be illiquid because they may not be readily marketable. Illiquid and restricted securities are valued using market quotations when readily available. In the absence of market quotations, the securities are valued based upon their fair value determined under procedures approved by the Board.
K. Delayed Delivery Transactions. Each Portfolio may purchase or sell securities on a when-issued or forward commitment basis. The price of the underlying securities and date when the securities will be delivered and paid for are fixed at the time the transaction is negotiated. The market value of such is identified in each Portfolio’s Portfolio of Investments. Losses may arise due to changes in the market value of the securities or from the inability of counterparties to meet the terms of the contract. In connection with such purchases, the Portfolios are required to segregate liquid assets sufficient to cover the purchase price.
L. Mortgage Dollar Roll Transactions. In connection with a Portfolio’s ability to purchase or sell securities on a when-issued basis, VP Strategic Allocation Balanced, VP Strategic Allocation Growth and VP Strategic Allocation Income Portfolios may engage in dollar roll transactions with respect to mortgage-backed securities issued
36
NOTE TO FINANCIAL STATEMENTS AS OF DECEMBER 31, 2005 (CONTINUED) |
NOTE 2 — SIGNIFICANT ACCOUNTING POLICIES (continued)
by Government National Mortgage Association, Federal National Mortgage Association and Federal Home Loan Mortgage Corp. In a dollar roll transaction, a Portfolio sells a mortgage-backed security to a financial institution, such as a bank or broker/dealer, and simultaneously agrees to repurchase a substantially similar (i.e., same type, coupon, and maturity) security from the institution on a delayed delivery basis at an agreed upon price. The mortgage-backed securities that are repurchased will bear the same interest rate as those sold, but generally will be collateralized by different pools of mortgages with different prepayment histories. The Portfolios account for dollar roll transactions as purchases and sales.
M. Swap Contracts. Each Portfolio may enter into interest rate swaps, currency swaps and other types of swap agreements, including swaps on securities and indices. A swap is an agreement between two parties pursuant to which each party agrees to make one or more payments to the other on regularly scheduled dates over a stated term, based on different interest rates, currency exchange rates, security prices, the prices or rates of other types of financial instruments or assets or the levels of specified indices. During the term of the swap, changes in the value of the swap are recognized as unrealized appreciation or depreciation.
NOTE 3 — INVESTMENT TRANSACTIONS
For the year ended December 31, 2005, the cost of purchases and the proceeds from the sales of securities, excluding short-term securities, were as follows:
| | Purchases | | Sales | |
VP Index Plus LargeCap | | $ | 1,768,355,636 | | $ | 1,556,252,300 | |
VP Index Plus MidCap | | 1,165,809,408 | | 940,587,814 | |
VP Index Plus SmallCap | | 640,834,451 | | 388,139,085 | |
VP Strategic Allocation Balanced | | 389,386,906 | | 396,701,974 | |
VP Strategic Allocation Growth | | 421,733,935 | | 423,670,504 | |
VP Strategic Allocation Income | | 152,800,656 | | 172,334,385 | |
| | | | | | | |
U.S. Government securities not included above were as follows:
| | Purchases | | Sales | |
VP Strategic Allocation Balanced | | $ | 392,469,995 | | $ | 377,193,132 | |
VP Strategic Allocation Growth | | 195,131,775 | | 178,203,033 | |
VP Strategic Allocation Income | | 324,378,049 | | 317,601,241 | |
| | | | | | | | | |
NOTE 4 — INVESTMENT MANAGEMENT AND ADMINISTRATIVE FEES
The Portfolios entered into Investment Management Agreements with the Investment Manager. The Investment Management Agreement compensates the Investment Manager with a fee, computed daily and payable monthly, based on the average daily net assets of each Portfolio, at the following annual rates:
VP Index Plus LargeCap | | 0.35 | % |
VP Index Plus MidCap | | 0.40 | % |
VP Index Plus SmallCap | | 0.40 | % |
VP Strategic Allocation Balanced | | 0.60 | % |
VP Strategic Allocation Growth | | 0.60 | % |
VP Strategic Allocation Income | | 0.60 | % |
The Investment Manager entered into a Sub-Advisory Agreement with ING IM. Subject to such policies as the Board or the Investment Manager may determine, ING IM manages the Portfolios’ assets in accordance with the Portfolios’ investment objectives, policies, and limitations.
Pursuant to the Administration Agreements ING Funds Services, LLC (“IFS”), an indirect wholly-owned subsidiary of ING Groep, acts as administrator and provides certain administrative and shareholder services necessary for Portfolio operations and is responsible for the supervision of other service providers. IFS is entitled to receive from each Portfolio a fee at an annual rate of 0.055% on the first $5 billion of daily net assets and 0.03% thereafter.
NOTE 5 — DISTRIBUTION FEES
Each Class S share of the Portfolios has adopted Distribution Plans pursuant to Rule 12b-1 under the 1940 Act (the “12b-1 Plans”), whereby the Distributor is compensated by the Portfolios for expenses incurred in the distribution of the Portfolio’s Class S shares (“Distribution Fees”). Pursuant to the 12b-1 Plans, the Distributor is entitled to a payment each month to compensate for expenses incurred in the distribution and promotion of the Portfolio’s S shares, including expenses incurred in printing prospectuses and reports used for sales purposes, expenses incurred in preparing and printing sales literature and other such distribution related expenses, including any distribution or shareholder servicing fees (“Service Fees”) paid to securities dealers who have executed a distribution agreement with the Distributor. Under the 12b-1 Plans, Class S of the Portfolios pays the Distributor a Distribution Fee at a rate of 0.25% based on average daily net assets.
NOTE 6 — OTHER TRANSACTIONS WITH AFFILIATED AND RELATED PARTIES
At December 31, 2005, the Portfolios had the following amounts recorded in payable to affiliates on
37
NOTE TO FINANCIAL STATEMENTS AS OF DECEMBER 31, 2005 (CONTINUED) |
NOTE 6 — OTHER TRANSACTIONS WITH AFFILIATED AND RELATED PARTIES (continued)
the accompanying Statements of Assets and Liabilities (see Notes 4 and 5):
| | Accrued
Investment
Management
Fees | | Accrued
Administrative
Fees | | Accrued
Shareholder
Service and
Distribution Fees | | Reimburse-
ment/
Recoupment
Payable | | Total | |
VP Index Plus LargeCap | | $582,585 | | $91,547 | | $117,334 | | — | | $791,466 | |
VP Index Plus MidCap | | 378,445 | | 52,035 | | 58,195 | | — | | 488,675 | |
VP Index Plus SmallCap | | 241,913 | | 33,262 | | 70,294 | | — | | 345,469 | |
VP Strategic Allocation Balanced | | 149,395 | | 13,694 | | 73 | | 5,726 | | 168,888 | |
VP Strategic Allocation Growth | | 147,754 | | 13,544 | | 6 | | — | | 161,304 | |
VP Strategic Allocation Income | | 78,099 | | 7,159 | | 25 | | — | | 85,283 | |
| | | | | | | | | | | |
At December 31, 2005, the following ING Portfolios or indirect, wholly-owned subsidiaries of ING Groep owned more than 5% of the following Portfolios:
ING Life Insurance & Annuity Co — VP Index Plus LargeCap (68.60%); VP Index Plus MidCap (70.68%); VP Index Plus SmallCap (48.61%); VP Strategic Allocation Balanced (96.20%); VP Strategic Allocation Growth (95.07%); and VP Strategic Allocation Income (97.20%);
ING Lifestyle Aggressive Growth Portfolio — VP Index Plus SmallCap (5.60%);
ING Lifestyle Growth Portfolio — VP Index Plus LargeCap (7.04%); ING VP Index Plus SmallCap (11.42%);
ING Lifestyle Moderate Growth Portfolio — VP Index Plus LargeCap (6.36%); ING VP Index Plus SmallCap (6.88%); and
ING USA Annuity and Life Insurance — VP Index Plus LargeCap (8.99%); VP Index Plus MidCap (15.96%), and VP Index Plus SmallCap (20.57%).
The Portfolios have adopted a Deferred Compensation Plan (the “Plan”), which allows eligible non-affiliated directors as described in the Plan to defer the receipt of all or a portion of the directors’ fees payable. Deferred fees are invested in various funds advised by ING Investments until distribution in accordance with the Plan.
NOTE 7 — EXPENSE LIMITATIONS
ING Investments entered into written Expense Limitation Agreements with each of the Portfolios whereby the Investment Manager has agreed to limit expenses, excluding interest, taxes, brokerage and extraordinary expenses to the levels listed below:
| | Class I | | Class S | |
VP Index Plus LargeCap | | 0.55% | | 0.80% | |
VP Index Plus MidCap | | 0.60% | | 0.85% | |
VP Index Plus SmallCap | | 0.60% | | 0.85% | |
VP Strategic Allocation Balanced | | 0.70% | | 0.95% | |
VP Strategic Allocation Growth | | 0.75% | | 1.00% | |
VP Strategic Allocation Income | | 0.65% | | 0.90% | |
The Investment Manager may at a later date recoup from a Portfolio for management fees waived and other expenses assumed by the Investment Manager during the previous 36 months, but only if, after such recoupment, the Portfolio’s expense ratio does not exceed the percentage described above. Waived and reimbursed fees and any recoupment by the Investment Manager of such waived and reimbursed fees are reflected on the accompanying Statements of Operations for each Portfolio. Amounts payable by the Investment Manager are reflected on the accompanying Statements of Assets and Liabilities for each Portfolio.
As of December 31, 2005, the amounts of waived and reimbursed fees that are subject to possible recoupment by the Investment Manager, and the related expiration dates are as follows:
| | December 31, | | | |
| | 2006 | | 2007 | | 2008 | | Total | |
VP Strategic Allocation Balanced | | $ 68,373 | | $ — | | $102,846 | | $171,219 | |
VP Strategic Allocation Income | | 116,429 | | 69,974 | | 152,215 | | 338,618 | |
The Expense Limitation Agreements are contractual and shall renew automatically for one-year terms unless ING Investments provides written notice of the termination of an Expense Limitation Agreement within 90 days of the end of the then current term.
NOTE 8 — LINE OF CREDIT
All of the Portfolios included in this report, in addition to certain other Portfolios managed by the Investment Manager, have entered into an unsecured committed revolving line of credit agreement (the “Credit Agreement”) with Citibank, N.A. for an aggregate amount of $100,000,000. The proceeds may be used only to: (1) temporarily finance the purchase and sale of securities; (2) finance the redemption of shares of an investor in the Portfolios; and (3) enable the Portfolios to meet other emergency expenses as defined in the Credit Agreement. The Portfolios to which the line of credit is available pay a commitment fee equal to 0.09% per annum on the daily unused portion of the committed line amount. Each of the Portfolios will pay its pro rata share of both the agent and commitment fee. Generally, borrowings under the Credit Agreement accrue interest at the Federal Funds Rate plus a specified margin. Repayments generally must be made within 30 days after the date of a revolving credit advance. VP Strategic Allocation Balanced Portfolio utilized the line of credit for two days during the year ended December 31, 2005, with an approximate average daily balance of 1,235,000 for those days and as approximate weighted average interest rate of 3.99%. Interest expense is included in miscellaneous expense on the Statement of Operations.
38
NOTE 9 — CAPITAL SHARES
Transactions in capital shares and dollars were as follows:
| | Class I Shares | | Class S Shares | |
| | Year
Ended
December 31,
2005 | | Year
Ended
December 31,
2004 | | Year
Ended
December 31,
2005 | | Year
Ended
December 31,
2004 | |
VP Index Plus LargeCap (Number of Shares) | | | | | | | | | |
Shares sold | | 3,590,508 | | 8,889,677 | | 29,741,139 | | 5,001,173 | |
Dividends reinvested | | 1,253,649 | | 1,068,765 | | 343,017 | | 70,247 | |
Shares redeemed | | (16,787,302 | ) | (7,643,602 | ) | (2,371,711 | ) | (787,541 | ) |
Shares redeemed in-kind | | — | | (2,913,370 | ) | — | | — | |
Net increase (decrease) in shares outstanding | | (11,943,145 | ) | (598,530 | ) | 27,712,445 | | 4,283,879 | |
VP Index Plus LargeCap ($) | | | | | | | | | |
Shares sold | | $ | 53,622,071 | | $ | 122,481,161 | | $ | 433,511,566 | | $ | 68,729,012 | |
Dividends reinvested | | 18,365,964 | | 14,620,495 | | 4,990,903 | | 956,759 | |
Shares redeemed | | (250,210,644 | ) | (105,248,123 | ) | (35,232,383 | ) | (10,524,903 | ) |
Shares redeemed in-kind | | — | | (39,330,496 | ) | — | | — | |
Net increase (decrease) | | $ | (178,222,609 | ) | $ | (7,476,963 | ) | $ | 403,270,086 | | $ | 59,160,868 | |
| | Class I Shares | | Class S Shares | |
| | Year
Ended
December 31,
2005 | | Year
Ended
December 31,
2004 | | Year
Ended
December 31,
2005 | | Year
Ended
December 31,
2004 | |
VP Index Plus MidCap (Number of Shares) | | | | | | | | | |
Shares sold | | 6,394,060 | | 9,619,199 | | 9,895,517 | | 7,750,137 | |
Dividends reinvested | | 3,143,066 | | 140,464 | | 858,938 | | 12,294 | |
Shares redeemed | | (1,712,781 | ) | (1,236,358 | ) | (2,488,298 | ) | (2,276,603 | ) |
Net increase in shares outstanding | | 7,824,345 | | 8,523,305 | | 8,266,157 | | 5,485,828 | |
VP Index Plus MidCap ($) | | | | | | | | | |
Shares sold | | $ | 115,852,699 | | $ | 157,026,093 | | $ | 177,382,980 | | $ | 125,676,020 | |
Dividends reinvested | | 55,003,671 | | 2,309,221 | | 14,919,751 | | 201,138 | |
Shares redeemed | | (30,993,911 | ) | (19,918,167 | ) | (45,587,506 | ) | (37,043,484 | ) |
Net increase | | $ | 139,862,459 | | $ | 139,417,147 | | $ | 146,715,225 | | $ | 88,833,674 | |
| | Class I Shares | | Class S Shares | |
| | Year
Ended
December 31,
2005 | | Year
Ended
December 31,
2004 | | Year
Ended
December 31,
2005 | | Year
Ended
December 31,
2004 | |
VP Index Plus SmallCap (Number of Shares) | | | | | | | | | |
Shares sold | | 4,648,726 | | 6,523,878 | | 14,354,375 | | 6,055,432 | |
Dividends reinvested | | 1,121,575 | | 105,653 | | 823,681 | | 15,258 | |
Shares redeemed | | (1,588,865 | ) | (568,096 | ) | (1,797,724 | ) | (516,330 | ) |
Net increase in shares outstanding | | 4,181,436 | | 6,061,435 | | 13,380,332 | | 5,554,360 | |
VP Index Plus SmallCap ($) | | | | | | | | | |
Shares sold | | $ | 75,728,185 | | $ | 95,485,625 | | $ | 231,635,271 | | $ | 89,589,061 | |
Dividends reinvested | | 17,799,391 | | 1,536,189 | | 12,964,739 | | 220,629 | |
Shares redeemed | | (25,657,658 | ) | (8,064,552 | ) | (28,924,483 | ) | (7,044,417 | ) |
Net increase | | $ | 67,869,918 | | $ | 88,957,262 | | $ | 215,675,527 | | $ | 82,765,273 | |
| | Class I Shares | | Class S Shares | |
| | Year
Ended
December 31,
2005 | | Year
Ended
December 31,
2004 | | June 7, 2005(1)
to
December 31,
2005 | |
VP Strategic Allocation Balanced (Number of Shares) | | | | | | | |
Shares sold | | 2,832,525 | | 4,211,659 | | 25,739 | |
Dividends reinvested | | 306,098 | | 231,939 | | 122 | |
Shares redeemed | | (2,238,074 | ) | (1,498,108 | ) | (641 | ) |
Net increase in shares outstanding | | 900,549 | | 2,945,490 | | 25,220 | |
VP Strategic Allocation Balanced ($) | | | | | | | |
Shares sold | | $ | 39,418,403 | | $ | 54,922,497 | | $ | 360,657 | |
Dividends reinvested | | 4,230,268 | | 2,985,052 | | 1,684 | |
Shares redeemed | | (31,479,642 | ) | (19,838,875 | ) | (8,894 | ) |
Net increase | | $ | 12,169,029 | | $ | 38,068,674 | | $ | 353,447 | |
(1) Commencement of operations
39
NOTES TO FINANCIAL STATEMENTS AS OF DECEMBER 31, 2005 (CONTINUED)
NOTE 9 — CAPITAL SHARES (continued)
| | Class I Shares | | Class S Shares | |
| | Year
Ended
December 31,
2005 | | Year
Ended
December 31,
2004 | | August 5, 2005(1)
to
December 31,
2005 | |
VP Strategic Allocation Growth (Number of Shares) | | | | | | | |
Shares sold | | 2,575,090 | | 2,372,286 | | 1,863 | |
Dividends reinvested | | 230,584 | | 185,718 | | — | |
Shares redeemed | | (2,084,826 | ) | (1,166,698 | ) | (5 | ) |
Net increase in shares outstanding | | 720,848 | | 1,391,306 | | 1,858 | |
| | | | | | | |
VP Strategic Allocation Growth ($) | | | | | | | |
Shares sold | | $ | 38,329,234 | | $ | 32,322,543 | | $ | 27,792 | |
Dividends reinvested | | 3,375,749 | | 2,501,616 | | — | |
Shares redeemed | | (31,098,285 | ) | (15,918,306 | ) | (79 | ) |
Net increase | | $ | 10,606,698 | | $ | 18,905,853 | | $ | 27,713 | |
| | | | | | | | | | | | | | |
| | Class I Shares | | Class S Shares | |
| | Year
Ended
December 31,
2005 | | Year
Ended
December 31,
2004 | | August 5, 2005(1)
to
December 31,
2005 | |
VP Strategic Allocation Income (Number of Shares) | | | | | | | |
Shares sold | | 1,721,918 | | 2,441,577 | | 8,958 | |
Dividends reinvested | | 238,646 | | 217,268 | | — | |
Shares redeemed | | (2,152,919 | ) | (2,058,477 | ) | (49 | ) |
Net increase (decrease) in shares outstanding | | (192,355 | ) | 600,368 | | 8,909 | |
| | | | | | | |
VP Strategic Allocation Income ($) | | | | | | | |
Shares sold | | $ | 22,441,531 | | $ | 30,670,847 | | $ | 117,094 | |
Dividends reinvested | | 3,088,074 | | 2,661,534 | | — | |
Shares redeemed | | (28,123,509 | ) | (26,008,253 | ) | (650 | ) |
Net increase (decrease) | | $ | (2,593,904 | ) | $ | 7,324,128 | | $ | 116,444 | |
| | | | | | | | | | | | | | |
(1) Commencement of operations
NOTE 10 — SECURITIES LENDING
Under an agreement with The Bank of New York (“BNY”), the Portfolios can lend their securities to approved brokers, dealers and other financial institutions. Loans are collateralized by cash and U.S. Government securities. The collateral must be in an amount equal to at least 105% of the market value of non-U.S. securities loaned and 102% of the market value of U.S. securities loaned. The cash collateral received is invested in approved investments as defined in the Securities Lending Agreement with BNY (the “Agreement”). The securities purchased with cash collateral received are reflected in the Portfolio of Investments. Generally, in the event of counterparty default, the Portfolios have the right to use the collateral to offset losses incurred. The Agreement contains certain guarantees by BNY in the event of counterparty default and/or a borrower’s failure to return a loaned security, however there would be a potential loss to the Portfolios in the event the Portfolios are delayed or prevented from exercising their right to dispose of the collateral. The Portfolios bear the risk of loss with respect to the investment of collateral. Engaging in securities lending could have a leveraging effect, which may intensify the credit, market and other risks associated with investing in a Portfolio. At December 31, 2005, the Portfolios had securities on loan and received collateral with the following market values:
| | Value of
Securities
Loaned | | Value of
Collateral | |
VP Index Plus LargeCap | | 226,202,319 | | 233,245,000 | |
VP Index Plus MidCap | | 228,364,897 | | 236,034,000 | |
VP Index Plus SmallCap | | 173,756,433 | | 179,673,000 | |
VP Strategic Allocation Balanced | | 45,041,735 | | 46,303,000 | |
VP Strategic Allocation Growth | | 38,779,302 | | 39,924,000 | |
VP Strategic Allocation Income | | 32,649,374 | | 33,501,000 | |
NOTE 11 — FEDERAL INCOME TAXES
The amount of distributions from net investment income and net realized capital gains are determined in accordance with federal income tax regulations, which may differ from U.S. generally accepted accounting principles for investment companies. These book/tax differences may be either temporary or permanent. Permanent differences are reclassified within the capital accounts based on their federal tax-basis treatment; temporary differences are not
40
NOTES TO FINANCIAL STATEMENTS AS OF DECEMBER 31, 2005 (CONTINUED)
NOTE 11 — FEDERAL INCOME TAXES (continued)
reclassified. Key differences include the treatment of short-term capital gains, foreign currency transactions, and wash sale deferrals. Distributions in excess of net investment income and/or net realized capital gains for tax purposes are reported as distributions of paid-in capital.
The following permanent tax differences have been reclassified as of December 31, 2005:
| | Paid-in
Capital | | Undistributed
Net Investment Income
On Investments | | Accumulated
Net Realized
Gains / (Losses) | |
VP Index Plus LargeCap | | $8,168,897 | | $(157,333 | ) | $(8,011,564 | ) |
VP Index Plus MidCap | | — | | (465,911 | ) | 465,911 | |
VP Index Plus SmallCap | | — | | (211,716 | ) | 211,716 | |
VP Strategic Allocation Balanced | | (3,457 | ) | 77,141 | | (73,684 | ) |
VP Strategic Allocation Growth | | (3,979 | ) | 130,581 | | (126,602 | ) |
VP Strategic Allocation Income | | — | | 47,520 | | (47,520 | ) |
| | | | | | | | | | | | |
Dividends paid by the Portfolios from net investment income and distributions of net realized short-term capital gains are, for federal income tax purposes, taxable as ordinary income to shareholders.
The tax composition of dividends and distributions to shareholders was as follows:
| | Year Ended
December 31, 2005 | | Year Ended
December 31, 2004 | |
| | Ordinary
Income | | Long-Term
Capital Gains | | Ordinary
Income | | Long-Term
Capital Gains | |
VP Index Plus LargeCap | | $23,356,867 | | $ — | | | $15,577,254 | | $ — | | |
VP Index Plus MidCap | | 35,539,804 | | 34,383,617 | | | 2,510,359 | | — | | |
VP Index Plus SmallCap | | 20,247,474 | | 10,516,656 | | | 1,133,154 | | 623,664 | | |
VP Strategic Allocation Balanced | | 4,231,952 | | — | | | 2,985,052 | | — | | |
VP Strategic Allocation Growth | | 3,375,749 | | — | | | 2,501,616 | | — | | |
VP Strategic Allocation Income | | 3,088,074 | | — | | | 2,661,534 | | — | | |
| | | | | | | | | | | | |
The tax-basis components of distributable earnings and the expiration dates of the capital loss carryforwards which may be used to offset future realized capital gains for federal income tax purposes as of December 31, 2005 were:
| | Undistributed
Ordinary
Income | | Undistributed
Long Term
Capital Gains | | Unrealized
Appreciation/
Depreciation | | Capital
Loss
Carryforwards | | Expiration
Dates | |
VP Index Plus LargeCap | | $22,102,186 | | $ — | | $71,142,527 | | $(117,913,650 | ) | 2010 | |
| | | | | | | | (51,431,965 | ) | 2011 | |
| | | | | | | | $(169,345,615 | ) | | |
VP Index Plus MidCap | | 55,239,784 | | 44,566,518 | | 93,102,867 | | — | | — | |
VP Index Plus SmallCap | | 20,350,598 | | 26,564,264 | | 49,415,352 | | — | | — | |
VP Strategic Allocation Balanced | | 5,449,874 | | 6,441,122 | | 22,277,406 | | — | | — | |
VP Strategic Allocation Growth | | 4,036,897 | | 3,895,940 | | 29,981,647 | | — | | — | |
VP Strategic Allocation Income | | 4,637,493 | | 4,100,042 | | 7,409,011 | | — | | — | |
| | | | | | | | | | | | | | | |
NOTE 12 — ILLIQUID SECURITIES
Pursuant to guidelines adopted by the Portfolios’ Board, the following securities have been deemed to be illiquid. The VP Index Plus LargeCap, VP Index Plus MidCap and VP Index Plus LargeCap Portfolios may invest up to 10% of its net assets, in illiquid securities. The VP Strategic Allocation Balanced, VP Strategic Allocation Growth and VP Strategic Allocation Income Portfolios limit investments in illiquid securities to 15%. Fair value for certain of securities was determined by ING Funds Valuation Committee appointed by the Portfolio’s Board of Directors/Trustees.
Portfolio | | Security | | Shares | | Initial
Acquisition
Date | | Cost | | Value | | Percent
of Net
Assets | |
VP Index Plus SmallCap | | MascoTech, Inc. | | 2,000 | | 11/29/00 | | $— | | $— | | 0.0% | |
41
NOTES TO FINANCIAL STATEMENTS AS OF DECEMBER 31, 2005 (CONTINUED)
NOTE 13 — INFORMATION REGARDING TRADING OF ING’S U.S. MUTUAL FUNDS
In 2004 ING Investments reported to the Boards of Directors/Trustees (the “Boards”) of the ING Funds that, like many U.S. financial services companies, ING Investments and certain of its U.S. affiliates have received informal and formal requests for information since September 2003 from various governmental and self-regulatory agencies in connection with investigations related to mutual funds and variable insurance products. ING Investments has advised the Boards that it and its affiliates have cooperated fully with each request.
In addition to responding to regulatory and governmental requests, ING Investments reported that management of U.S. affiliates of ING Groep N.V., including ING Investments (collectively, “ING”), on their own initiative, have conducted, through independent special counsel and a national accounting firm, an extensive internal review of trading in ING insurance, retirement, and mutual fund products. The goal of this review was to identify any instances of inappropriate trading in those products by third parties or by ING investment professionals and other ING personnel. ING’s internal review related to mutual fund trading is now substantially completed. ING has reported that, of the millions of customer relationships that ING maintains, the internal review identified several isolated arrangements allowing third parties to engage in frequent trading of mutual funds within ING’s variable insurance and mutual fund products, and identified other circumstances where frequent trading occurred, despite measures taken by ING intended to combat market timing. ING further reported that each of these arrangements has been terminated and fully disclosed to regulators. The results of the internal review were also reported to the independent members of the Board.
ING Investments has advised the Board that most of the identified arrangements were initiated prior to ING’s acquisition of the businesses in question in the U.S. ING Investments further reported that the companies in question did not receive special benefits in return for any of these arrangements, which have all been terminated.
Based on the internal review, ING Investments has advised the Board that the identified arrangements do not represent a systemic problem in any of the companies that were involved.
In September 2005, ING Funds Distributor, LLC (“IFD”), the distributor of certain ING Funds, settled an administrative proceeding with the NASD regarding three arrangements, dating from 1995, 1996 and 1998, under which the administrator to the then-Pilgrim Funds, which subsequently became part of the ING Funds, entered into formal and informal arrangements that permitted frequent trading. Under the terms of the Letter of Acceptance, Waiver and Consent (“AWC”) with the NASD, under which IFD neither admitted nor denied the allegations or findings, IFD consented to the following sanctions: (i) a censure; (ii) a fine of $1.5 million; (iii) restitution of approximately $1.44 million to certain ING Funds for losses attributable to excessive trading described in the AWC; and (iv) agreement to make certification to NASD regarding the review and establishment of certain procedures.
In addition to the arrangements discussed above, in 2004 ING Investments reported to the Board that, at that time, these instances include the following, in addition to the arrangements subject to the AWC discussed above:
• Aeltus Investment Management, Inc. (a predecessor entity to ING Investment Management Co.) has identified two investment professionals who engaged in extensive frequent trading in certain ING Funds. One was subsequently terminated for cause and incurred substantial financial penalties in connection with this conduct and the second has been disciplined.
• ReliaStar Life Insurance Company (“ReliaStar”) entered into agreements seven years ago permitting the owner of policies issued by the insurer to engage in frequent trading and to submit orders until 4pm Central Time. In 2001 ReliaStar also entered into a selling agreement with a broker-dealer that engaged in frequent trading. Employees of ING affiliates were terminated and/or disciplined in connection with these matters.
• In 1998, Golden American Life Insurance Company entered into arrangements permitting a broker-dealer to frequently trade up to certain specific limits in a fund available in an ING variable annuity product. No employee responsible for this arrangement remains at the company.
For additional information regarding these matters, you may consult the Form 8-K and Form 8-K/A for each of four life insurance companies, ING USA Annuity and Life Insurance Company, ING Life Insurance and Annuity Company, ING Insurance Company of America, and ReliaStar Life Insurance Company of New York, each filed with the Securities and Exchange Commission (the “SEC”) on October 29, 2004 and September 8, 2004. These Forms 8-K and Forms 8-K/A
42
NOTES TO FINANCIAL STATEMENTS AS OF DECEMBER 31, 2005 (CONTINUED)
NOTE 13 — INFORMATION REGARDING TRADING OF ING’S U.S. MUTUAL FUNDS (continued)
can be accessed through the SEC’s Web site at http://www.sec.gov. Despite the extensive internal review conducted through independent special counsel and a national accounting firm, there can be no assurance that the instances of inappropriate trading reported to the Board are the only instances of such trading respecting the ING Funds.
ING Investments reported to the Board that ING is committed to conducting its business with the highest standards of ethical conduct with zero tolerance for noncompliance. Accordingly, ING Investments advised the Board that ING management was disappointed that its voluntary internal review identified these situations. Viewed in the context of the breadth and magnitude of its U.S. business as a whole, ING management does not believe that ING’s acquired companies had systemic ethical or compliance issues in these areas. Nonetheless, ING Investments reported that given ING’s refusal to tolerate any lapses, it has taken the steps noted below, and will continue to seek opportunities to further strengthen the internal controls of its affiliates.
• ING has agreed with the ING Funds to indemnify and hold harmless the ING Funds from all damages resulting from wrongful conduct by ING or its employees or from ING’s internal investigation, any investigations conducted by any governmental or self-regulatory agencies, litigation or other formal proceedings, including any proceedings by the Securities and Exchange Commission. ING Investments reported to the Board that ING management believes that the total amount of any indemnification obligations will not be material to ING or its U.S. business.
• ING updated its Code of Conduct for employees reinforcing its employees’ obligation to conduct personal trading activity consistent with the law, disclosed limits, and other requirements.
• The ING Funds, upon a recommendation from ING, updated their respective Codes of Ethics applicable to investment professionals with ING entities and certain other fund personnel, requiring such personnel to pre-clear any purchases or sales of ING Funds that are not systematic in nature (i.e., dividend reinvestment), and imposing minimum holding periods for shares of ING Funds.
• ING instituted excessive trading policies for all customers in its variable insurance and retirement products and for shareholders of the ING Funds sold to the public through financial intermediaries. ING does not make exceptions to these policies.
• ING reorganized and expanded its U.S. Compliance Department, and created an Enterprise Compliance team to enhance controls and consistency in regulatory compliance.
As has been widely reported in the media, the New York Attorney General’s office (“NYAG”) is conducting broad investigations regarding insurance quoting and brokerage practices. ING U.S. has been subpoenaed in this regard, and is cooperating fully with these NYAG requests for information.
ING U.S. believes that its practices are consistent with our business principles and our commitment to our customers.
At this time, in light of the current regulatory factors, ING U.S. is actively engaged in reviewing whether any modifications in our practices are appropriate for the future.
There can be no assurance that these matters, or the adverse publicity associated with them, will not result in increased fund redemptions, reduced sale of fund shares, or other adverse consequences to ING Funds.
43
ING VP INDEX PLUS | | PORTFOLIO OF INVESTMENTS |
LARGECAP PORTFOLIO | | AS OF DECEMBER 31, 2005 |
Shares | | | | | | Value | |
COMMON STOCK: 98.8% | | | | |
| | | | Advertising: 0.2% | | | |
56,050 | | @,L | | Interpublic Group of Cos., Inc. | | $ | 540,882 | |
30,500 | | L | | Omnicom Group | | 2,596,465 | |
| | | | | | 3,137,347 | |
| | | | Aerospace/Defense: 2.6% | | | |
203,500 | | | | Boeing Co. | | 14,293,840 | |
54,550 | | | | General Dynamics Corp. | | 6,221,427 | |
2,000 | | | | Goodrich Corp. | | 82,200 | |
9,550 | | | | L-3 Communications Holdings, Inc. | | 710,042 | |
96,450 | | L | | Lockheed Martin Corp. | | 6,137,113 | |
57,431 | | L | | Northrop Grumman Corp. | | 3,452,177 | |
179,550 | | | | Raytheon Co. | | 7,208,932 | |
48,728 | | | | Rockwell Collins, Inc. | | 2,264,390 | |
170,000 | | | | United Technologies Corp. | | 9,504,700 | |
| | | | | | 49,874,821 | |
| | | | Agriculture: 2.1% | | | |
363,100 | | L | | Altria Group, Inc. | | 27,130,832 | |
261,877 | | | | Archer-Daniels-Midland Co. | | 6,457,887 | |
44,100 | | | | Monsanto Co. | | 3,419,073 | |
23,200 | | L | | Reynolds America, Inc. | | 2,211,656 | |
28,640 | | L | | UST, Inc. | | 1,169,371 | |
| | | | | | 40,388,819 | |
| | | | Airlines: 0.2% | | | |
277,000 | | | | Southwest Airlines Co. | | 4,551,110 | |
| | | | | | 4,551,110 | |
| | | | Apparel: 0.6% | | | |
145,600 | | @ | | Coach, Inc. | | 4,854,304 | |
16,400 | | L | | Jones Apparel Group, Inc. | | 503,808 | |
16,550 | | L | | Liz Claiborne, Inc. | | 592,821 | |
52,300 | | | | Nike, Inc. | | 4,539,117 | |
10,100 | | | | Reebok International Ltd. | | 588,123 | |
24,200 | | | | VF Corp. | | 1,339,228 | |
| | | | | | 12,417,401 | |
| | | | Auto Manufacturers: 0.2% | | | |
501,400 | | L | | Ford Motor Co. | | 3,870,808 | |
700 | | @,L | | Navistar International Corp. | | 20,034 | |
| | | | | | 3,890,842 | |
| | | | Auto Parts & Equipment: 0.2% | | | |
70,800 | | @,L | | Goodyear Tire & Rubber Co. | | 1,230,504 | |
30,750 | | | | Johnson Controls, Inc. | | 2,241,982 | |
| | | | | | 3,472,486 | |
| | | | Banks: 5.7% | | | |
47,900 | | L | | AmSouth Bancorp | | 1,255,459 | |
701,424 | | L | | Bank of America Corp. | | 32,370,718 | |
128,550 | | | | Bank of New York | | 4,094,317 | |
148,026 | | | | BB&T Corp. | | 6,203,770 | |
41,600 | | | | Comerica, Inc. | | 2,361,216 | |
18,900 | | | | Compass Bancshares, Inc. | | 912,681 | |
14,400 | | L | | First Horizon National Corp. | | 553,536 | |
35,110 | | L | | Huntington Bancshares, Inc. | | 833,862 | |
71,900 | | L | | Keycorp | | 2,367,667 | |
16,550 | | L | | M&T Bank Corp. | | 1,804,777 | |
26,800 | | L | | Marshall & Ilsley Corp. | | 1,153,472 | |
69,100 | | | | Mellon Financial Corp. | | 2,366,675 | |
99,937 | | L | | National City Corp. | | 3,354,885 | |
30,500 | | | | Northern Trust Corp. | | $ | 1,580,510 | |
116,050 | | | | PNC Financial Services Group, Inc. | | 7,175,371 | |
73,300 | | L | | Regions Financial Corp. | | 2,503,928 | |
52,850 | | | | State Street Corp. | | 2,930,004 | |
59,900 | | L | | SunTrust Banks, Inc. | | 4,358,324 | |
39,494 | | | | Synovus Financial Corp. | | 1,066,733 | |
301,847 | | | | US BanCorp. | | 9,022,207 | |
246,586 | | L | | Wachovia Corp. | | 13,034,536 | |
134,250 | | | | Wells Fargo & Co. | | 8,434,927 | |
12,050 | | | | Zions Bancorporation | | 910,498 | |
| | | | | | 110,650,073 | |
| | | | Beverages: 3.1% | | | |
123,600 | | L | | Anheuser-Busch Cos., Inc. | | 5,309,856 | |
15,600 | | L | | Brown-Forman Corp. | | 1,081,392 | |
607,450 | | | | Coca-Cola Co. | | 24,486,309 | |
53,350 | | | | Coca-Cola Enterprises, Inc. | | 1,022,719 | |
3,100 | | @,L | | Constellation Brands, Inc. | | 81,313 | |
35,850 | | L | | Pepsi Bottling Group, Inc. | | 1,025,668 | |
475,300 | | | | PepsiCo, Inc. | | 28,080,724 | |
| | | | | | 61,087,981 | |
| | | | Biotechnology: 1.0% | | | |
196,240 | | @ | | Amgen, Inc. | | 15,475,486 | |
5,400 | | @,L | | Biogen Idec, Inc. | | 244,782 | |
41,650 | | @ | | Genzyme Corp. | | 2,947,987 | |
8,300 | | @,L | | Millipore Corp. | | 548,132 | |
| | | | | | 19,216,387 | |
| | | | Building Materials: 0.2% | | | |
32,050 | | | | American Standard Cos, Inc. | | 1,280,397 | |
69,822 | | | | Masco Corp. | | 2,107,926 | |
16,850 | | | | Vulcan Materials Co. | | 1,141,587 | |
| | | | | | 4,529,910 | |
| | | | Chemicals: 1.4% | | | |
18,050 | | | | Air Products & Chemicals, Inc. | | 1,068,379 | |
154,850 | | | | Dow Chemical Co. | | 6,785,527 | |
12,550 | | L | | Eastman Chemical Co. | | 647,454 | |
35,700 | | L | | Ecolab, Inc. | | 1,294,839 | |
147,550 | | L | | EI Du Pont de Nemours & Co. | | 6,270,875 | |
18,050 | | | | Engelhard Corp. | | 544,207 | |
1,100 | | @,L | | Hercules, Inc. | | 12,430 | |
9,500 | | | | International Flavors & Fragrances, Inc. | | 318,250 | |
68,250 | | | | PPG Industries, Inc. | | 3,951,675 | |
49,700 | | | | Praxair, Inc. | | 2,632,112 | |
32,400 | | | | Rohm & Haas Co. | | 1,568,808 | |
18,450 | | | | Sherwin-Williams Co. | | 837,999 | |
9,900 | | L | | Sigma-Aldrich Corp. | | 626,571 | |
| | | | | | 26,559,126 | |
| | | | Commercial Services: 1.0% | | | |
23,200 | | @,L | | Apollo Group, Inc. | | 1,402,672 | |
182,974 | | | | Cendant Corp. | | 3,156,301 | |
800 | | @ | | Convergys Corp. | | 12,680 | |
55,737 | | | | Equifax, Inc. | | 2,119,121 | |
57,400 | | L | | H&R Block, Inc. | | 1,409,170 | |
114,750 | | | | McKesson Corp. | | 5,919,952 | |
19,400 | | L | | Moody’s Corp. | | 1,191,548 | |
59,450 | | | | Paychex, Inc. | | 2,266,234 | |
29,650 | | | | Robert Half International, Inc. | | 1,123,438 | |
32,750 | | | | RR Donnelley & Sons Co. | | 1,120,377 | |
| | | | | | 19,721,493 | |
See Accompanying Notes to Financial Statements
44
ING VP INDEX PLUS | | PORTFOLIO OF INVESTMENTS |
LARGECAP PORTFOLIO | | AS OF DECEMBER 31, 2005 (CONTINUED) |
Shares | | | | | | Value | |
| | | | Computers: 4.9% | | | |
20,200 | | @,L | | Affiliated Computer Services, Inc. | | $ | 1,195,436 | |
263,200 | | @ | | Apple Computer, Inc. | | 18,921,448 | |
14,650 | | @,L | | Computer Sciences Corp. | | 741,876 | |
528,600 | | @ | | Dell, Inc. | | 15,852,714 | |
7,950 | | L | | Electronic Data Systems Corp. | | 191,118 | |
658,750 | | @ | | EMC Corp. | | 8,972,175 | |
816,068 | | | | Hewlett-Packard Co. | | 23,364,027 | |
268,450 | | | | International Business Machines Corp. | | 22,066,590 | |
9,450 | | @ | | Lexmark International, Inc. | | 423,644 | |
30,900 | | @ | | NCR Corp. | | 1,048,746 | |
55,600 | | @,L | | Network Appliance, Inc. | | 1,501,200 | |
65,377 | | @ | | Unisys Corp. | | 381,148 | |
| | | | | | 94,660,122 | |
| | | | Cosmetics/Personal Care: 2.2% | | | |
13,650 | | | | Alberto-Culver Co. | | 624,488 | |
140,150 | | | | Colgate-Palmolive Co. | | 7,687,228 | |
585,392 | | L | | Procter & Gamble Co. | | 33,882,489 | |
| | | | | | 42,194,205 | |
| | | | Distribution/Wholesale: 0.2% | | | |
46,650 | | | | Genuine Parts Co. | | 2,048,868 | |
12,050 | | | | WW Grainger, Inc. | | 856,755 | |
| | | | | | 2,905,623 | |
| | | | Diversified Financial Services: 8.4% | | | |
201,300 | | | | American Express Co. | | 10,358,898 | |
45,080 | | L | | Ameriprise Financial, Inc. | | 1,848,280 | |
19,700 | | | | Bear Stearns Cos, Inc. | | 2,275,941 | |
23,800 | | | | Capital One Financial Corp. | | 2,056,320 | |
182,650 | | | | Charles Schwab Corp. | | 2,679,476 | |
35,300 | | | | CIT Group, Inc. | | 1,827,834 | |
803,200 | | | | Citigroup, Inc. | | 38,979,296 | |
9,400 | | | | Countrywide Financial Corp. | | 321,386 | |
56,000 | | @ | | E*Trade Financial Corp. | | 1,168,160 | |
159,800 | | | | Fannie Mae | | 7,799,838 | |
13,150 | | L | | Federated Investors, Inc. | | 487,076 | |
26,550 | | | | Franklin Resources, Inc. | | 2,495,966 | |
151,950 | | | | Goldman Sachs Group, Inc. | | 19,405,535 | |
556,700 | | | | JPMorgan Chase & Co. | | 22,095,423 | |
110,350 | | | | Lehman Brothers Holdings, Inc. | | 14,143,560 | |
192,500 | | | | MBNA Corp. | | 5,226,375 | |
223,350 | | L | | Merrill Lynch & Co., Inc. | | 15,127,496 | |
189,600 | | | | Morgan Stanley | | 10,757,904 | |
67,750 | | L | | SLM Corp. | | 3,732,348 | |
18,700 | | | | T. Rowe Price Group, Inc. | | 1,346,961 | |
| | | | | | 164,134,073 | |
| | | | Electric: 2.5% | | | |
94,650 | | @,L | | AES Corp. | | 1,498,310 | |
44,500 | | @,L | | Allegheny Energy, Inc. | | 1,408,425 | |
3,550 | | L | | Ameren Corp. | | 181,902 | |
58,700 | | L | | American Electric Power Co., Inc. | | 2,177,183 | |
40,000 | | L | | CenterPoint Energy Resources Corp. | | 514,000 | |
63,400 | | @,L | | CMS Energy Corp. | | 919,934 | |
32,900 | | L | | Consolidated Edison, Inc. | | 1,524,257 | |
33,399 | | | | Constellation Energy Group, Inc. | | 1,923,782 | |
29,400 | | L | | Dominion Resources, Inc. | | 2,269,680 | |
27,100 | | | | DTE Energy Co. | | 1,170,449 | |
168,200 | | L | | Duke Energy Corp. | | 4,617,090 | |
95,550 | | | | Edison International | | $ | 4,166,936 | |
47,950 | | L | | FirstEnergy Corp. | | 2,349,071 | |
63,400 | | | | FPL Group, Inc. | | 2,634,904 | |
4,650 | | L | | NiSource, Inc. | | 96,999 | |
58,350 | | | | Pacific Gas & Electric Co. | | 2,165,952 | |
16,800 | | L | | Pinnacle West Capital Corp. | | 694,680 | |
53,700 | | | | PPL Corp. | | 1,578,780 | |
21,700 | | | | Progress Energy, Inc. | | 953,064 | |
21,350 | | L | | Public Service Enterprise Group, Inc. | | 1,387,110 | |
126,100 | | L | | Southern Co. | | 4,354,233 | |
33,900 | | L | | TECO Energy, Inc. | | 582,402 | |
202,600 | | L | | TXU Corp. | | 10,168,494 | |
12,200 | | | | Xcel Energy, Inc. | | 225,212 | |
| | | | | | 49,562,849 | |
| | | | Electrical Components & Equipment: 0.4% | | | |
111,429 | | | | Emerson Electric Co. | | 8,323,746 | |
| | | | | | 8,323,746 | |
| | | | Electronics: 0.5% | | | |
158,450 | | @ | | Agilent Technologies, Inc. | | 5,274,801 | |
28,700 | | L | | Applera Corp. - Applied Biosystems Group | | 762,272 | |
23,350 | | @ | | Jabil Circuit, Inc. | | 866,052 | |
27,000 | | | | PerkinElmer, Inc. | | 636,120 | |
381,950 | | @,L | | Solectron Corp. | | 1,397,937 | |
23,250 | | @ | | Thermo Electron Corp. | | 700,523 | |
18,750 | | @ | | Waters Corp. | | 708,750 | |
| | | | | | 10,346,455 | |
| | | | Engineering & Construction: 0.1% | | | |
13,800 | | L | | Fluor Corp. | | 1,066,188 | |
| | | | | | 1,066,188 | |
| | | | Entertainment: 0.1% | | | |
53,600 | | | | International Game Technology | | 1,649,808 | |
| | | | | | 1,649,808 | |
| | | | Environmental Control: 0.1% | | | |
85,450 | | | | Waste Management, Inc. | | 2,593,408 | |
| | | | | | 2,593,408 | |
| | | | Food: 1.2% | | | |
58,500 | | | | Albertson’s, Inc. | | 1,248,975 | |
14,700 | | | | Campbell Soup Co. | | 437,619 | |
41,150 | | L | | ConAgra Foods, Inc. | | 834,522 | |
140,950 | | | | General Mills, Inc. | | 6,951,654 | |
2,900 | | L | | Hershey Foods Corp. | | 160,225 | |
59,500 | | | | HJ Heinz Co. | | 2,006,340 | |
44,750 | | | | Kellogg Co. | | 1,934,095 | |
109,450 | | @ | | Kroger Co. | | 2,066,416 | |
18,050 | | | | McCormick & Co., Inc. | | 558,106 | |
65,350 | | | | Safeway, Inc. | | 1,546,181 | |
120,538 | | L | | Sara Lee Corp. | | 2,278,168 | |
52,850 | | | | Supervalu, Inc. | | 1,716,568 | |
31,407 | | | | WM Wrigley Jr. Co. | | 2,088,251 | |
| | | | | | 23,827,120 | |
| | | | Forest Products & Paper: 0.4% | | | |
40,300 | | | | International Paper Co. | | 1,354,483 | |
18,800 | | L | | Louisiana-Pacific Corp. | | 516,436 | |
29,700 | | | | MeadWestvaco Corp. | | 832,491 | |
See Accompanying Notes to Financial Statements
45
ING VP INDEX PLUS | | PORTFOLIO OF INVESTMENTS |
LARGECAP PORTFOLIO | | AS OF DECEMBER 31, 2005 (CONTINUED) |
Shares | | | | | | Value | |
| | | | Forest Products & Paper (continued) | | | |
29,200 | | L | | Plum Creek Timber Co., Inc. | | $ | 1,052,660 | |
26,100 | | | | Temple-Inland, Inc. | | 1,170,585 | |
40,300 | | L | | Weyerhaeuser Co. | | 2,673,502 | |
| | | | | | 7,600,157 | |
| | | | Gas: 0.2% | | | |
69,200 | | | | Sempra Energy | | 3,102,928 | |
| | | | | | 3,102,928 | |
| | | | Hand/Machine Tools: 0.1% | | | |
21,350 | | L | | Black & Decker Corp. | | 1,856,596 | |
5,000 | | | | Snap-On, Inc. | | 187,800 | |
10,750 | | | | Stanley Works | | 516,430 | |
| | | | | | 2,560,826 | |
| | | | Healthcare-Products: 2.9% | | | |
6,700 | | L | | Bausch & Lomb, Inc. | | 454,930 | |
93,600 | | | | Baxter International, Inc. | | 3,524,040 | |
43,750 | | | | Becton Dickinson & Co. | | 2,628,500 | |
114,850 | | @ | | Boston Scientific Corp. | | 2,812,677 | |
13,900 | | | | CR Bard, Inc. | | 916,288 | |
54,000 | | | | Guidant Corp. | | 3,496,500 | |
478,150 | | | | Johnson & Johnson | | 28,736,815 | |
192,600 | | | | Medtronic, Inc. | | 11,087,982 | |
49,550 | | | | St. Jude Medical, Inc. | | 2,487,410 | |
23,000 | | | | Stryker Corp. | | 1,021,890 | |
| | | | | | 57,167,032 | |
| | | | Healthcare-Services: 2.6% | | | |
115,500 | | | | Aetna, Inc. | | 10,892,805 | |
43,850 | | @ | | Coventry Health Care, Inc. | | 2,497,696 | |
65,350 | | @ | | Humana, Inc. | | 3,550,466 | |
2,200 | | @ | | Laboratory Corp. of America Holdings | | 118,470 | |
13,700 | | | | Quest Diagnostics | | 705,276 | |
238,900 | | | | UnitedHealth Group, Inc. | | 14,845,246 | |
222,600 | | @ | | WellPoint, Inc. | | 17,761,254 | |
| | | | | | 50,371,213 | |
| | | | Home Furnishings: 0.0% | | | |
10,600 | | L | | Whirlpool Corp. | | 887,856 | |
| | | | | | 887,856 | |
| | | | Household Products/Wares: 0.4% | | | |
2,400 | | | | Clorox Co. | | 136,536 | |
23,200 | | | | Fortune Brands, Inc. | | 1,810,064 | |
82,800 | | | | Kimberly-Clark Corp. | | 4,939,020 | |
| | | | | | 6,885,620 | |
| | | | Housewares: 0.1% | | | |
74,350 | | L | | Newell Rubbermaid, Inc. | | 1,768,043 | |
| | | | | | 1,768,043 | |
| | | | Insurance: 5.9% | | | |
25,600 | | @@ | | ACE Ltd. | | 1,368,064 | |
81,400 | | | | Aflac, Inc. | | 3,778,588 | |
106,550 | | | | Allstate Corp. | | 5,761,159 | |
13,700 | | L | | AMBAC Financial Group, Inc. | | 1,055,722 | |
412,124 | | | | American International Group, Inc. | | 28,119,221 | |
52,450 | | L | | AON Corp. | | 1,885,578 | |
53,950 | | | | Chubb Corp. | | 5,268,218 | |
22,650 | | | | Cigna Corp. | | 2,530,005 | |
22,818 | | | | Cincinnati Financial Corp. | | 1,019,508 | |
65,700 | | | | Genworth Financial, Inc. | | $ | 2,271,906 | |
81,050 | | L | | Hartford Financial Services Group, Inc. | | 6,961,385 | |
21,375 | | | | Jefferson-Pilot Corp. | | 1,216,879 | |
46,750 | | | | Lincoln National Corp. | | 2,479,153 | |
23,706 | | | | Loews Corp. | | 2,248,514 | |
8,700 | | | | Marsh & McLennan Cos., Inc. | | 276,312 | |
19,700 | | L | | MBIA, Inc. | | 1,185,152 | |
293,700 | | | | Metlife, Inc. | | 14,391,300 | |
14,500 | | L | | MGIC Investment Corp. | | 954,390 | |
76,600 | | L | | Principal Financial Group | | 3,633,138 | |
35,850 | | L | | Progressive Corp. | | 4,186,563 | |
197,500 | | | | Prudential Financial, Inc. | | 14,455,025 | |
49,027 | | | | Safeco Corp. | | 2,770,026 | |
118,700 | | | | St. Paul Cos. | | 5,302,329 | |
19,600 | | | | Torchmark Corp. | | 1,089,760 | |
45,350 | | L | | UnumProvident Corp. | | 1,031,713 | |
| | | | | | 115,239,608 | |
| | | | Internet: 0.8% | | | |
53,600 | | @,L | | Amazon.com, Inc. | | 2,527,240 | |
180,100 | | @,L | | eBay, Inc. | | 7,789,325 | |
18,300 | | @,L | | Monster Worldwide, Inc. | | 747,006 | |
171,910 | | @,L | | Symantec Corp. | | 3,008,425 | |
20,150 | | @,L | | Yahoo!, Inc. | | 789,477 | |
| | | | | | 14,861,473 | |
| | | | Iron/Steel: 0.2% | | | |
63,600 | | | | Nucor Corp. | | 4,243,392 | |
1,850 | | L | | United States Steel Corp. | | 88,930 | |
| | | | | | 4,332,322 | |
| | | | Leisure Time: 0.4% | | | |
14,800 | | L | | Brunswick Corp. | | 601,768 | |
69,350 | | L | | Carnival Corp. | | 3,708,145 | |
74,150 | | L | | Harley-Davidson, Inc. | | 3,817,984 | |
21,250 | | L | | Sabre Holdings Corp. | | 512,338 | |
| | | | | | 8,640,235 | |
| | | | Lodging: 0.3% | | | |
58,800 | | | | Hilton Hotels Corp. | | 1,417,668 | |
33,050 | | L | | Marriott International, Inc. | | 2,213,359 | |
35,050 | | | | Starwood Hotels & Resorts Worldwide, Inc. | | 2,238,293 | |
| | | | | | 5,869,320 | |
| | | | Machinery-Diversified: 0.1% | | | |
6,450 | | L | | Cummins, Inc. | | 578,759 | |
26,150 | | | | Rockwell Automation, Inc. | | 1,547,034 | |
| | | | | | 2,125,793 | |
| | | | Media: 2.2% | | | |
43,600 | | | | Clear Channel Communications, Inc. | | 1,371,220 | |
174,250 | | @,L | | Comcast Corp. | | 4,523,530 | |
100 | | L | | Dow Jones & Co., Inc. | | 3,549 | |
4,000 | | | | Gannett Co., Inc. | | 242,280 | |
146,500 | | | | McGraw-Hill Cos, Inc. | | 7,563,795 | |
10,400 | | L | | Meredith Corp. | | 544,336 | |
17,150 | | L | | New York Times Co. | | 453,618 | |
387,450 | | | | News Corp., Inc. | | 6,024,848 | |
730,400 | | | | Time Warner, Inc. | | 12,738,176 | |
17,700 | | L | | Tribune Co. | | 535,602 | |
254,800 | | | | Viacom, Inc. | | 8,306,480 | |
32,100 | | | | Walt Disney Co. | | 769,437 | |
| | | | | | 43,076,871 | |
See Accompanying Notes to Financial Statements
46
ING VP INDEX PLUS | | PORTFOLIO OF INVESTMENTS |
LARGECAP PORTFOLIO | | AS OF DECEMBER 31, 2005 (CONTINUED) |
Shares | | | | | | Value | |
| | | | Mining: 0.3% | | | |
77,700 | | L | | Freeport-McMoRan Copper & Gold, Inc. | | $ | 4,180,260 | |
17,400 | | L | | Phelps Dodge Corp. | | 2,503,338 | |
| | | | | | 6,683,598 | |
| | | | Miscellaneous Manufacturing: 4.9% | | | |
186,300 | | | | 3M Co. | | 14,438,250 | |
11,050 | | @ | | Cooper Industries Ltd. | | 806,650 | |
41,600 | | | | Danaher Corp. | | 2,320,448 | |
30,800 | | | | Dover Corp. | | 1,247,092 | |
21,200 | | L | | Eaton Corp. | | 1,422,308 | |
1,679,900 | | S | | General Electric Co. | | 58,880,495 | |
143,950 | | | | Honeywell International, Inc. | | 5,362,138 | |
32,650 | | | | Illinois Tool Works, Inc. | | 2,872,874 | |
59,000 | | @@ | | Ingersoll-Rand Co. | | 2,381,830 | |
10,800 | | | | ITT Industries, Inc. | | 1,110,456 | |
19,200 | | | | Parker Hannifin Corp. | | 1,266,432 | |
23,650 | | | | Textron, Inc. | | 1,820,577 | |
32,100 | | @@ | | Tyco International Ltd. | | 926,406 | |
| | | | | | 94,855,956 | |
| | | | Office/Business Equipment: 0.2% | | | |
33,550 | | | | Pitney Bowes, Inc. | | 1,417,488 | |
141,250 | | @,L | | Xerox Corp. | | 2,069,313 | |
| | | | | | 3,486,801 | |
| | | | Oil & Gas: 9.4% | | | |
12,100 | | | | Amerada Hess Corp. | | 1,534,522 | |
37,550 | | | | Anadarko Petroleum Corp. | | 3,557,863 | |
24,304 | | | | Apache Corp. | | 1,665,310 | |
144,300 | | | | Burlington Resources, Inc. | | 12,438,660 | |
390,518 | | | | ChevronTexaco Corp. | | 22,169,707 | |
311,788 | | | | ConocoPhillips | | 18,139,826 | |
166,800 | | L | | Devon Energy Corp. | | 10,431,672 | |
60,300 | | | | EOG Resources, Inc. | | 4,424,211 | |
1,292,500 | | S | | Exxon Mobil Corp. | | 72,599,775 | |
20,750 | | | | Kerr-McGee Corp. | | 1,885,345 | |
60,900 | | | | Marathon Oil Corp. | | 3,713,073 | |
25,900 | | L | | Murphy Oil Corp. | | 1,398,341 | |
21,100 | | @,@@,L | | Nabors Industries Ltd. | | 1,598,325 | |
3,550 | | @,L | | Noble Corp. | | 250,417 | |
69,350 | | L | | Occidental Petroleum Corp. | | 5,539,678 | |
14,200 | | @,L | | Rowan Cos., Inc. | | 506,088 | |
49,900 | | L | | Sunoco, Inc. | | 3,911,162 | |
46,600 | | @,L | | Transocean, Inc. | | 3,247,554 | |
240,800 | | L | | Valero Energy Corp. | | 12,425,280 | |
28,500 | | | | XTO Energy, Inc. | | 1,252,290 | |
| | | | | | 182,689,099 | |
| | | | Oil & Gas Services: 0.6% | | | |
5,100 | | L | | Baker Hughes, Inc. | | 309,978 | |
38,350 | | L | | Halliburton Co. | | 2,376,166 | |
89,000 | | L | | Schlumberger Ltd. | | 8,646,350 | |
| | | | | | 11,332,494 | |
| | | | Packaging & Containers: 0.1% | | | |
26,650 | | L | | Ball Corp. | | 1,058,538 | |
12,100 | | @,L | | Sealed Air Corp. | | 679,657 | |
| | | | | | 1,738,195 | |
| | | | Pharmaceuticals: 5.5% | | | |
248,400 | | | | Abbott Laboratories | | 9,794,412 | |
10,450 | | L | | Allergan, Inc. | | 1,128,182 | |
83,900 | | | | AmerisourceBergen Corp. | | 3,473,460 | |
74,500 | | | | Cardinal Health, Inc. | | 5,121,875 | |
74,750 | | @ | | Caremark Rx, Inc. | | 3,871,302 | |
59,100 | | @,L | | Express Scripts, Inc. | | $ | 4,952,580 | |
51,050 | | @,L | | Forest Laboratories, Inc. | | 2,076,714 | |
79,800 | | @,L | | Gilead Sciences, Inc. | | 4,199,874 | |
62,486 | | @ | | Hospira, Inc. | | 2,673,151 | |
95,066 | | @ | | King Pharmaceuticals, Inc. | | 1,608,517 | |
48,904 | | @,L | | Medco Health Solutions, Inc. | | 2,728,843 | |
698,950 | | | | Merck & Co., Inc. | | 22,233,599 | |
1,184,750 | | | | Pfizer, Inc. | | 27,628,370 | |
243,700 | | L | | Schering-Plough Corp. | | 5,081,145 | |
28,200 | | @,L | | Watson Pharmaceuticals, Inc. | | 916,782 | |
217,550 | | | | Wyeth | | 10,022,528 | |
| | | | | | 107,511,334 | |
| | | | Pipelines: 0.2% | | | |
14,100 | | L | | Kinder Morgan, Inc. | | 1,296,495 | |
69,350 | | | | Williams Cos., Inc. | | 1,606,839 | |
| | | | | | 2,903,334 | |
| | | | Real Estate Investment Trust: 0.3% | | | |
13,550 | | | | Apartment Investment & Management Co. | | 513,138 | |
16,500 | | L | | Archstone-Smith Trust | | 691,185 | |
65,600 | | L | | Equity Office Properties Trust | | 1,989,648 | |
3,900 | | | | Prologis | | 182,208 | |
8,100 | | L | | Public Storage, Inc. | | 548,532 | |
32,900 | | L | | Simon Property Group LP | | 2,521,127 | |
1,900 | | @ | | Vornado Realty Trust | | 158,593 | |
| | | | | | 6,604,431 | |
| | | | Retail: 5.7% | | | |
29,000 | | @,L | | Autonation, Inc. | | 630,170 | |
8,900 | | @ | | Autozone, Inc. | | 816,575 | |
39,800 | | @ | | Bed Bath & Beyond, Inc. | | 1,438,770 | |
111,600 | | | | Best Buy Co., Inc. | | 4,852,368 | |
31,750 | | | | Circuit City Stores, Inc. | | 717,232 | |
69,150 | | L | | Costco Wholesale Corp. | | 3,420,850 | |
58,150 | | L | | Darden Restaurants, Inc. | | 2,260,872 | |
46,900 | | | | Dollar General Corp. | | 894,383 | |
25,000 | | | | Family Dollar Stores, Inc. | | 619,750 | |
47,570 | | | | Federated Department Stores | | 3,155,318 | |
125,450 | | | | Gap, Inc. | | 2,212,938 | |
370,950 | | | | Home Depot, Inc. | | 15,016,056 | |
99,550 | | | | JC Penney Co., Inc. | | 5,534,980 | |
5,500 | | @,L | | Kohl’s Corp. | | 267,300 | |
5,550 | | L | | Limited Brands | | 124,042 | |
136,950 | | | | Lowe’s Cos., Inc. | | 9,129,087 | |
333,950 | | | | McDonald’s Corp. | | 11,260,794 | |
59,700 | | | | Nordstrom, Inc. | | 2,232,780 | |
55,600 | | @ | | Office Depot, Inc. | | 1,745,840 | |
17,100 | | @,L | | Sears Holding Corp. | | 1,975,563 | |
199,625 | | | | Staples, Inc. | | 4,533,484 | |
133,300 | | @,L | | Starbucks Corp. | | 4,000,333 | |
70,200 | | | | Target Corp. | | 3,858,894 | |
22,900 | | | | Tiffany & Co. | | 876,841 | |
36,650 | | | | TJX Cos., Inc. | | 851,379 | |
397,240 | | | | Wal-Mart Stores, Inc. | | 18,590,832 | |
162,600 | | L | | Walgreen Co. | | 7,196,676 | |
20,350 | | L | | Wendy’s International, Inc. | | 1,124,541 | |
49,400 | | | | Yum! Brands, Inc. | | 2,315,872 | |
| | | | | | 111,654,520 | |
| | | | Savings & Loans: 0.3% | | | |
39,400 | | | | Golden West Financial Corp. | | 2,600,400 | |
78,347 | | | | Washington Mutual, Inc. | | 3,408,094 | |
| | | | | | 6,008,494 | |
See Accompanying Notes to Financial Statements
47
ING VP INDEX PLUS | | PORTFOLIO OF INVESTMENTS |
LARGECAP PORTFOLIO | | AS OF DECEMBER 31, 2005 (CONTINUED) |
Shares | | | | | | Value | |
| | | | Semiconductors: 3.8% | | | |
5,950 | | @,L | | Altera Corp. | | $ | 110,253 | |
55,500 | | | | Analog Devices, Inc. | | 1,990,785 | |
265,250 | | | | Applied Materials, Inc. | | 4,758,585 | |
49,300 | | @,L | | Broadcom Corp. | | 2,324,495 | |
105,334 | | @,L | | Freescale Semiconductor, Inc. | | 2,651,257 | |
1,438,900 | | | | Intel Corp. | | 35,914,944 | |
15,200 | | L | | Kla-Tencor Corp. | | 749,816 | |
40,100 | | L | | Linear Technology Corp. | | 1,446,407 | |
58,600 | | @,L | | LSI Logic Corp. | | 468,800 | |
48,800 | | | | Maxim Integrated Products | | 1,768,512 | |
136,450 | | | | National Semiconductor Corp. | | 3,544,971 | |
800 | | @,L | | Novellus Systems, Inc. | | 19,296 | |
25,100 | | @,L | | Nvidia Corp. | | 917,656 | |
16,100 | | @,L | | QLogic Corp. | | 523,411 | |
530,300 | | | | Texas Instruments, Inc. | | 17,006,721 | |
| | | | | | 74,195,909 | |
| | | | Software: 4.4% | | | |
86,900 | | L | | Adobe Systems, Inc. | | 3,211,824 | |
88,950 | | L | | Autodesk, Inc. | | 3,820,402 | |
156,900 | | | | Automatic Data Processing, Inc. | | 7,200,141 | |
87,500 | | @,L | | BMC Software, Inc. | | 1,792,875 | |
45,500 | | @,L | | Citrix Systems, Inc. | | 1,309,490 | |
78,687 | | L | | Computer Associates International, Inc. | | 2,218,187 | |
171,750 | | @ | | Compuware Corp. | | 1,540,597 | |
4,600 | | @,L | | Electronic Arts, Inc. | | 240,626 | |
122,589 | | | | First Data Corp. | | 5,272,553 | |
24,700 | | @ | | Fiserv, Inc. | | 1,068,769 | |
31,000 | | | | IMS Health, Inc. | | 772,520 | |
48,400 | | @,L | | Intuit, Inc. | | 2,579,720 | |
13,250 | | @,L | | Mercury Interactive Corp. | | 368,217 | |
1,707,150 | | | | Microsoft Corp. | | 44,641,973 | |
136,313 | | @ | | Novell, Inc. | | 1,203,644 | |
576,800 | | @ | | Oracle Corp. | | 7,042,728 | |
78,400 | | @ | | Parametric Technology Corp. | | 478,240 | |
65,750 | | | | Siebel Systems, Inc. | | 695,635 | |
| | | | | | 85,458,141 | |
| | | | Telecommunications: 5.6% | | | |
6,100 | | L | | Alltel Corp. | | 384,910 | |
864,896 | | | | AT&T, Inc. | | 21,181,303 | |
67,300 | | @,L | | Avaya, Inc. | | 718,091 | |
290,800 | | | | BellSouth Corp. | | 7,880,680 | |
20,900 | | | | CenturyTel, Inc. | | 693,044 | |
1,291,800 | | @ | | Cisco Systems, Inc. | | 22,115,616 | |
31,050 | | @,L | | Comverse Technology, Inc. | | 825,619 | |
236,650 | | @ | | Corning, Inc. | | 4,652,539 | |
600,600 | | | | Motorola, Inc. | | 13,567,554 | |
262,100 | | | | Qualcomm, Inc. | | 11,291,268 | |
27,100 | | L | | Scientific-Atlanta, Inc. | | 1,167,197 | |
465,503 | | | | Sprint Corp. - FON Group | | 10,874,150 | |
58,200 | | @ | | Tellabs, Inc. | | 634,380 | |
438,850 | | | | Verizon Communications, Inc. | | 13,218,162 | |
| | | | | | 109,204,513 | |
| | | | Textiles: 0.1% | | | |
22,200 | | L | | Cintas Corp. | | 914,196 | |
| | | | | | 914,196 | |
| | | | Toys/Games/Hobbies: 0.1% | | | |
64,250 | | L | | Hasbro, Inc. | | 1,296,565 | |
6,450 | | | | Mattel, Inc. | | 102,039 | |
| | | | | | 1,398,604 | |
| | | | Transportation: 1.6% | | | |
66,050 | | | | Burlington Northern Santa Fe Corp. | | 4,677,661 | |
58,500 | | | | CSX Corp. | | 2,970,045 | |
47,950 | | | | FedEx Corp. | | 4,957,550 | |
109,850 | | | | Norfolk Southern Corp. | | 4,924,575 | |
4,150 | | L | | Union Pacific Corp. | | $ | 334,091 | |
175,500 | | L | | United Parcel Service, Inc. | | 13,188,800 | |
| | | | | | 31,052,722 | |
| | | | Total Common Stock
(Cost $1,782,342,570) | | 1,922,943,031 | |
Principal
Amount | | | | | | Value | |
SHORT-TERM INVESTMENTS: 13.0% | | | |
| | | | Repurchase Agreement 1.0% | | | |
$ | 20,077,000 | | S | | Goldman Sachs Repurchase Agreement dated, 12/30/05, 4.250%, due 01/03/06, $20,086,481 to be received upon repurchase (Collateralized by $20,814,000 Federal National Mortgage Association, 3.125%, Market Value plus accrued interest $20,479,344, due 05/04/07) | | 20,077,000 | |
| | | | Total Repurchase Agreements
(Cost $20,077,000) | | 20,077,000 | |
| | | | Securities Lending CollateralCC: 12.0% | | | |
233,245,000 | | | | The Bank of New York Institutional
Cash Reserves Fund | | 233,245,000 | |
| | | | Total Securities Lending Collateral
(Cost $233,245,000) | | 233,245,000 | |
| | | | Total Short-Term Investments
(Cost $253,322,000) | | 253,322,000 | |
| | | | Total Investments in Securities
(Cost $2,035,664,570)* | 111.8 | % | | | $ | 2,176,265,031 | |
| | | | Other Assets and Liabilities-Net | (11.8 | ) | | | (229,992,421 | ) |
| | | | Net Assets | 100.0 | % | | | $ | 1,946,272,610 | |
| | | | | | | | | | | | |
@ Non-income producing security
@@ Foreign Issuer
S Segregated securities for certain derivatives, when-issued or delayed delivery securities and forward currency exchange contracts.
cc Securities purchased with cash collateral for securities loaned.
L Loaned security, a portion or all of the security is on loan at December 31, 2005.
* Cost for federal income tax purposes is $2,105,122,504. Net unrealized appreciation consists of:
| | | | Gross Unrealized Appreciation | | $ | 120,008,662 | |
| | | | Gross Unrealized Depreciation | | | (48,866,135 | ) |
| | | | Net Unrealized Appreciation | | $ | 71,142,527 | |
Information concerning open futures contracts at December 31, 2005 is shown below:
Long Contracts | | No. of
Contracts | | Notional
Market Value | | Expiration
Date | | Unrealized
(Loss) | |
S&P 500 Composite Stock Price Future | | 53 | | $ | 16,626,100 | | 03/16/2006 | | | $ | (92,996) | |
| | | | | | | | | | | | |
See Accompanying Notes to Financial Statements
48
ING VP INDEX PLUS | PORTFOLIO OF INVESTMENTS |
MIDCAP PORTFOLIO | AS OF DECEMBER 31, 2005 |
Shares | | | | Value | |
COMMON STOCK: 98.8% | | | |
| | Advertising: 0.3% | | | |
65,468 | L | Catalina Marketing Corp. | | $ | 1,659,614 | |
57,950 | | Harte-Hanks, Inc. | | 1,529,300 | |
| | | | 3,188,914 | |
| | Aerospace/Defense: 0.6% | | | |
88,697 | @,L | Alliant Techsystems, Inc. | | 6,756,050 | |
5,200 | @ | Sequa Corp. | | 359,060 | |
| | | | 7,115,110 | |
| | Agriculture: 0.0% | | | |
9,300 | | Universal Corp. | | 403,248 | |
| | | | 403,248 | |
| | Airlines: 0.2% | | | |
78,100 | @,L | Airtran Holdings, Inc. | | 1,251,943 | |
24,500 | @,L | Alaska Air Group, Inc. | | 875,140 | |
| | | | 2,127,083 | |
| | Apparel: 1.0% | | | |
141,132 | | Polo Ralph Lauren Corp. | | 7,923,150 | |
93,658 | @ | Timberland Co. | | 3,048,568 | |
| | | | 10,971,718 | |
| | Auto Parts & Equipment: 0.5% | | | |
25,300 | L | ArvinMeritor, Inc. | | 364,067 | |
10,000 | L | Bandag, Inc. | | 426,700 | |
52,793 | L | BorgWarner, Inc. | | 3,200,840 | |
54,112 | | Modine Manufacturing Co. | | 1,763,510 | |
| | | | 5,755,117 | |
| | Banks: 3.7% | | | |
121,005 | | Associated Banc-Corp. | | 3,938,713 | |
82,586 | | Bank of Hawaii Corp. | | 4,256,482 | |
38,711 | L | Cathay General Bancorp | | 1,391,273 | |
40,328 | | City National Corp. | | 2,921,360 | |
142,325 | | Colonial BancGroup, Inc. | | 3,390,181 | |
41,309 | L | Cullen/Frost Bankers, Inc. | | 2,217,467 | |
84,976 | | FirstMerit Corp. | | 2,201,728 | |
41,400 | | Greater Bay Bancorp | | 1,060,668 | |
60,877 | L | Investors Financial Services Corp. | | 2,242,100 | |
122,547 | | Mercantile Bankshares Corp. | | 6,916,553 | |
28,600 | @,L | SVB Financial Group | | 1,339,624 | |
105,043 | L | TCF Financial Corp. | | 2,850,867 | |
7,745 | L | Westamerica Bancorporation | | 411,027 | |
161,328 | | Wilmington Trust Corp. | | 6,277,272 | |
| | | | 41,415,315 | |
| | Beverages: 0.1% | | | |
57,901 | | PepsiAmericas, Inc. | | 1,346,777 | |
| | | | 1,346,777 | |
| | Biotechnology: 1.2% | | | |
62,624 | @ | Charles River Laboratories International, Inc. | | 2,653,379 | |
81,650 | @,L | Invitrogen Corp. | | 5,441,156 | |
282,900 | @,L | Millennium Pharmaceuticals, Inc. | | 2,744,130 | |
107,050 | @,L | Protein Design Labs, Inc. | | 3,042,361 | |
| | | | 13,881,026 | |
| | | | | |
| | Building Materials: 0.7% | | | |
107,595 | | Martin Marietta Materials, Inc. | | $ | 8,254,688 | |
| | | | 8,254,688 | |
| | Chemicals: 2.6% | | | |
56,800 | | Airgas, Inc. | | 1,868,720 | |
34,569 | | Albemarle Corp. | | 1,325,721 | |
221,000 | | Chemtura Corp. | | 2,806,700 | |
36,078 | L | Cytec Industries, Inc. | | 1,718,395 | |
33,849 | | Ferro Corp. | | 635,007 | |
34,229 | @ | FMC Corp. | | 1,819,956 | |
106,529 | | Lubrizol Corp. | | 4,626,554 | |
311,173 | | Lyondell Chemical Co. | | 7,412,141 | |
17,300 | | Minerals Technologies, Inc. | | 966,897 | |
55,300 | | Olin Corp. | | 1,088,304 | |
101,000 | | RPM International, Inc. | | 1,754,370 | |
35,600 | L | Sensient Technologies Corp. | | 637,240 | |
93,104 | | Valspar Corp. | | 2,296,876 | |
| | | | 28,956,881 | |
| | Coal: 1.3% | | | |
58,900 | L | Arch Coal, Inc. | | 4,682,550 | |
122,800 | | Peabody Energy Corp. | | 10,121,176 | |
| | | | 14,803,726 | |
| | Commercial Services: 3.9% | | | |
142,508 | | Adesa, Inc. | | 3,480,047 | |
63,093 | @,L | Alliance Data Systems Corp. | | 2,246,111 | |
19,400 | | Banta Corp. | | 966,120 | |
163,800 | @,L | Career Education Corp. | | 5,523,336 | |
82,300 | @ | ChoicePoint, Inc. | | 3,663,173 | |
32,224 | @,L | Corinthian Colleges, Inc. | | 379,599 | |
63,477 | | Corporate Executive Board Co. | | 5,693,887 | |
18,288 | L | Deluxe Corp. | | 551,200 | |
50,228 | @,L | DeVry, Inc. | | 1,004,560 | |
106,230 | @ | Education Management Corp. | | 3,559,767 | |
76,000 | @ | Gartner, Inc. | | 980,400 | |
36,848 | @ | ITT Educational Services, Inc. | | 2,178,085 | |
17,085 | L | Kelly Services, Inc. | | 447,969 | |
36,100 | @,L | Korn/Ferry Intl. | | 674,709 | |
41,971 | @,L | Laureate Education, Inc. | | 2,203,897 | |
78,700 | | Manpower, Inc. | | 3,659,550 | |
79,513 | @,L | MPS Group, Inc. | | 1,086,943 | |
113,843 | @,L | Quanta Services, Inc. | | 1,499,312 | |
24,300 | @,L | Rent - A - Center, Inc. | | 458,298 | |
31,531 | L | Rollins, Inc. | | 621,476 | |
44,254 | @,L | Sotheby’s Holdings | | 812,503 | |
58,000 | @,L | United Rentals, Inc. | | 1,356,620 | |
44,750 | @,L | Valassis Communications, Inc. | | 1,300,882 | |
| | | | 44,348,444 | |
| | Computers: 6.2% | | | |
28,883 | @ | Anteon International Corp. | | 1,569,791 | |
97,400 | @ | BISYS Group, Inc. | | 1,364,574 | |
257,325 | @,L | Cadence Design Systems, Inc. | | 4,353,939 | |
229,293 | @ | Ceridian Corp. | | 5,697,931 | |
127,900 | @ | Cognizant Technology Solutions Corp. | | 6,439,765 | |
61,600 | | Diebold, Inc. | | 2,340,800 | |
137,412 | @,L | DST Systems, Inc. | | 8,232,353 | |
79,699 | L | Imation Corp. | | 3,671,733 | |
71,627 | | Jack Henry & Associates, Inc. | | 1,366,643 | |
133,700 | @,L | McData Corp. | | 508,060 | |
117,035 | | Reynolds & Reynolds Co. | | 3,285,172 | |
See Accompanying Notes to Financial Statements
49
ING VP INDEX PLUS | PORTFOLIO OF INVESTMENTS |
MIDCAP PORTFOLIO | AS OF DECEMBER 31, 2005 (CONTINUED) |
Shares | | | | Value | |
| | Computers (continued) | | | |
234,250 | @,L | Sandisk Corp. | | $ | 14,715,585 | |
31,500 | @ | SRA International, Inc. | | 962,010 | |
337,611 | @,L | Synopsys, Inc. | | 6,772,477 | |
472,178 | @,L | Western Digital Corp. | | 8,787,233 | |
| | | | 70,068,066 | |
| | Distribution/Wholesale: 0.5% | | | |
21,750 | | CDW Corp. | | 1,252,147 | |
102,331 | @ | Ingram Micro, Inc. | | 2,039,457 | |
52,717 | @ | Tech Data Corp. | | 2,091,810 | |
| | | | 5,383,414 | |
| | Diversified Financial Services: 2.8% | | | |
67,044 | | AG Edwards, Inc. | | 3,141,682 | |
126,240 | @,L | AmeriCredit Corp. | | 3,235,531 | |
47,189 | L | Eaton Vance Corp. | | 1,291,091 | |
99,333 | L | IndyMac Bancorp, Inc. | | 3,875,974 | |
44,666 | L | Jefferies Group, Inc. | | 2,009,077 | |
41,214 | @,L | LaBranche & Co., Inc. | | 416,674 | |
115,650 | | Legg Mason, Inc. | | 13,842,147 | |
88,754 | | Raymond James Financial, Inc. | | 3,343,363 | |
31,300 | | Waddell & Reed Financial, Inc. | | 656,361 | |
| | | | 31,811,900 | |
| | Electric: 4.2% | | | |
106,712 | | Alliant Energy Corp. | | 2,992,204 | |
219,339 | @ | Aquila, Inc. | | 789,620 | |
28,901 | | Black Hills Corp. | | 1,000,264 | |
118,060 | L | DPL, Inc. | | 3,070,741 | |
41,881 | L | Duquesne Light Holdings, Inc. | | 683,498 | |
137,393 | L | Energy East Corp. | | 3,132,560 | |
66,086 | L | Great Plains Energy, Inc. | | 1,847,765 | |
74,330 | L | Hawaiian Electric Industries | | 1,925,147 | |
39,922 | L | Idacorp, Inc. | | 1,169,715 | |
108,369 | L | MDU Resources Group, Inc. | | 3,548,001 | |
55,000 | | Northeast Utilities | | 1,082,950 | |
97,600 | L | NSTAR | | 2,801,120 | |
82,955 | | OGE Energy Corp. | | 2,222,364 | |
169,978 | | Pepco Holdings, Inc. | | 3,802,408 | |
66,314 | | PNM Resources, Inc. | | 1,624,030 | |
42,186 | L | Puget Energy, Inc. | | 861,438 | |
103,850 | | SCANA Corp. | | 4,089,613 | |
168,000 | @ | Sierra Pacific Resources | | 2,190,720 | |
73,719 | | Westar Energy, Inc. | | 1,584,958 | |
106,950 | | Wisconsin Energy Corp. | | 4,177,467 | |
40,307 | L | WPS Resources Corp. | | 2,229,380 | |
| | | | 46,825,963 | |
| | Electrical Components & Equipment: 1.1% | | | |
165,342 | | Ametek, Inc. | | 7,033,649 | |
64,289 | @,L | Energizer Holdings, Inc. | | 3,200,949 | |
54,483 | | Hubbell, Inc. | | 2,458,273 | |
| | | | 12,692,871 | |
| | | | | |
| | Electronics: 2.5% | | | |
80,500 | | Amphenol Corp. | | 3,562,930 | |
264,707 | @ | Arrow Electronics, Inc. | | 8,478,565 | |
134,121 | @,L | Avnet, Inc. | | 3,210,857 | |
144,531 | | Gentex Corp. | | 2,818,354 | |
58,425 | | National Instruments Corp. | | 1,872,521 | |
28,036 | @,L | Plexus Corp. | | 637,539 | |
79,606 | @ | Thomas & Betts Corp. | | $ | 3,340,268 | |
49,412 | @,L | Varian, Inc. | | 1,966,103 | |
154,853 | @,L | Vishay Intertechnology, Inc. | | 2,130,777 | |
| | | | 28,017,914 | |
| | Engineering & Construction: 0.4% | | | |
31,700 | | Granite Construction, Inc. | | 1,138,347 | |
50,481 | @,L | Jacobs Engineering Group, Inc. | | 3,426,145 | |
| | | | 4,564,492 | |
| | Entertainment: 0.5% | | | |
111,300 | @ | GTECH Holdings Corp. | | 3,532,662 | |
31,149 | | International Speedway Corp. | | 1,492,037 | |
37,350 | @,L | Macrovision Corp. | | 624,865 | |
| | | | 5,649,564 | |
| | Environmental Control: 0.7% | | | |
23,900 | L | Mine Safety Appliances Co. | | 865,419 | |
112,475 | | Republic Services, Inc. | | 4,223,436 | |
40,500 | @,L | Stericycle, Inc. | | 2,384,640 | |
| | | | 7,473,495 | |
| | Food: 1.5% | | | |
138,100 | @,L | Dean Foods Co. | | 5,200,846 | |
173,961 | | Hormel Foods Corp. | | 5,685,045 | |
50,210 | | JM Smucker Co. | | 2,209,240 | |
35,073 | | Ruddick Corp. | | 746,353 | |
86,400 | @ | Smithfield Foods, Inc. | | 2,643,840 | |
28,127 | | Tootsie Roll Industries, Inc. | | 813,714 | |
| | | | 17,299,038 | |
| | Forest Products & Paper: 0.4% | | | |
41,566 | | Glatfelter | | 589,822 | |
43,150 | | Longview Fibre Co. | | 897,951 | |
10,000 | L | Potlatch Corp. | | 509,800 | |
69,965 | L | Rayonier, Inc. | | 2,788,105 | |
| | | | 4,785,678 | |
| | Gas: 0.7% | | | |
69,048 | | AGL Resources, Inc. | | 2,403,561 | |
87,150 | L | Oneok, Inc. | | 2,320,804 | |
62,312 | | Vectren Corp. | | 1,692,394 | |
44,575 | | WGL Holdings, Inc. | | 1,339,924 | |
| | | | 7,756,683 | |
| | Hand/Machine Tools: 0.0% | | | |
10,188 | L | Kennametal, Inc. | | 519,996 | |
| | | | 519,996 | |
| | Healthcare-Products: 3.8% | | | |
100,203 | | Beckman Coulter, Inc. | | 5,701,551 | |
102,200 | @,L | Cytyc Corp. | | 2,885,106 | |
121,277 | | Dentsply International, Inc. | | 6,511,362 | |
53,650 | @ | Edwards Lifesciences Corp. | | 2,232,376 | |
43,376 | @ | Gen-Probe, Inc. | | 2,116,315 | |
75,400 | @,L | Henry Schein, Inc. | | 3,290,456 | |
53,548 | | Hillenbrand Industries, Inc. | | 2,645,807 | |
31,400 | @ | Inamed Corp. | | 2,753,152 | |
33,600 | @,L | Intuitive Surgical, Inc. | | 3,940,272 | |
102,983 | | Steris Corp. | | 2,576,635 | |
32,250 | @,L | Techne Corp. | | 1,810,837 | |
120,900 | @,L | Varian Medical Systems, Inc. | | 6,086,105 | |
| | | | 42,549,974 | |
See Accompanying Notes to Financial Statements
50
ING VP INDEX PLUS | PORTFOLIO OF INVESTMENTS |
MIDCAP PORTFOLIO | AS OF DECEMBER 31, 2005 (CONTINUED) |
Shares | | | | Value | |
| | Healthcare-Services: 3.1% | | | |
205,427 | @ | Community Health Systems, Inc. | | $ | 7,876,071 | |
54,461 | @ | Covance, Inc. | | 2,644,082 | |
1 | @ | Coventry Health Care, Inc. | | 57 | |
217,059 | @ | Health Net, Inc. | | 11,189,391 | |
20,500 | @,L | LifePoint Hospitals, Inc. | | 768,750 | |
148,382 | @,L | Lincare Holdings, Inc. | | 6,218,690 | |
59,200 | @ | Renal Care Group, Inc. | | 2,800,752 | |
30,488 | @ | Triad Hospitals, Inc. | | 1,196,044 | |
49,428 | L | Universal Health Services, Inc. | | 2,310,265 | |
| | | | 35,004,102 | |
| | Holding Companies-Diversified: 0.3% | | | |
80,608 | L | Leucadia National Corp. | | 3,825,656 | |
| | | | 3,825,656 | |
| | Home Builders: 0.5% | | | |
38,300 | L | Thor Industries, Inc. | | 1,534,681 | |
109,400 | @,L | Toll Brothers, Inc. | | 3,789,616 | |
| | | | 5,324,297 | |
| | Home Furnishings: 0.6% | | | |
42,950 | L | Furniture Brands International, Inc. | | 959,073 | |
59,853 | L,S | Harman International Industries, Inc. | | 5,856,616 | |
| | | | 6,815,689 | |
| | Household Products/Wares: 0.8% | | | |
153,150 | L | American Greetings | | 3,364,705 | |
28,050 | L | Blyth, Inc. | | 587,647 | |
54,893 | L | Church & Dwight, Inc. | | 1,813,116 | |
38,884 | | Scotts Co. | | 1,759,112 | |
41,650 | | Tupperware Corp. | | 932,960 | |
| | | | 8,457,540 | |
| | Insurance: 8.1% | | | |
112,965 | L | American Financial Group, Inc. | | 4,327,689 | |
58,379 | L | AmerUs Group Co. | | 3,308,338 | |
88,634 | | Arthur J Gallagher & Co. | | 2,737,018 | |
100,400 | L | Brown & Brown, Inc. | | 3,066,216 | |
55,964 | @@ | Everest Re Group Ltd. | | 5,615,987 | |
322,816 | | Fidelity National Financial, Inc. | | 11,876,401 | |
199,137 | | First American Corp. | | 9,020,906 | |
44,530 | | Hanover Insurance Group, Inc./The | | 1,860,018 | |
93,496 | | HCC Insurance Holdings, Inc. | | 2,774,961 | |
38,776 | | Horace Mann Educators Corp. | | 735,193 | |
31,888 | | Mercury General Corp. | | 1,856,519 | |
100,069 | | Ohio Casualty Corp. | | 2,833,954 | |
279,851 | | Old Republic International Corp. | | 7,348,887 | |
83,259 | | PMI Group, Inc. | | 3,419,447 | |
109,589 | | Protective Life Corp. | | 4,796,711 | |
174,514 | | Radian Group, Inc. | | 10,224,775 | |
50,560 | | Stancorp Financial Group, Inc. | | 2,525,472 | |
39,944 | L | Unitrin, Inc. | | 1,799,477 | |
222,187 | | WR Berkley Corp. | | 10,580,545 | |
| | | | 90,708,514 | |
| | Internet: 1.5% | | | |
42,200 | @,L | Avocent Corp. | | 1,147,418 | |
80,600 | @,L | Checkfree Corp. | | 3,699,540 | |
32,800 | @ | F5 Networks, Inc. | | 1,875,832 | |
| | | | | |
341,500 | @,L | McAfee, Inc. | | $ | 9,264,895 | |
63,000 | @ | RSA Security, Inc. | | 707,490 | |
| | | | 16,695,175 | |
| | Iron/Steel: 0.1% | | | |
32,464 | | Steel Dynamics, Inc. | | 1,152,797 | |
| | | | 1,152,797 | |
| | Leisure Time: 0.1% | | | |
58,700 | | Callaway Golf Co. | | 812,408 | |
| | | | 812,408 | |
| | Lodging: 0.2% | | | |
37,848 | | Boyd Gaming Corp. | | 1,803,836 | |
| | | | 1,803,836 | |
| | Machinery-Construction & Mining: 0.4% | | | |
112,200 | | Joy Global, Inc. | | 4,488,000 | |
| | | | 4,488,000 | |
| | Machinery-Diversified: 0.6% | | | |
46,950 | @ | Flowserve Corp. | | 1,857,342 | |
25,085 | | Graco, Inc. | | 915,101 | |
80,558 | L | Nordson Corp. | | 3,263,404 | |
25,700 | @ | Zebra Technologies Corp. | | 1,101,245 | |
| | | | 7,137,092 | |
| | Media: 1.1% | | | |
88,111 | | Belo Corp. | | 1,886,457 | |
13,100 | @ | Emmis Communications Corp. | | 260,821 | |
34,495 | @,L | Entercom Communications Corp. | | 1,023,467 | |
38,129 | | Lee Enterprises, Inc. | | 1,407,341 | |
15,903 | | Media General, Inc. | | 806,282 | |
85,500 | L | Reader’s Digest Association, Inc. | | 1,301,310 | |
14,406 | @,L | Scholastic Corp. | | 410,715 | |
5,373 | | Washington Post | | 4,110,345 | |
70,195 | L | Westwood One, Inc. | | 1,144,178 | |
| | | | 12,350,916 | |
| | Metal Fabricate/Hardware: 0.8% | | | |
120,281 | L | Precision Castparts Corp. | | 6,231,759 | |
31,300 | | Timken Co. | | 1,002,226 | |
66,302 | | Worthington Industries | | 1,273,661 | |
| | | | 8,507,646 | |
| | Miscellaneous Manufacturing: 1.9% | | | |
48,850 | | Brink’s Co. | | 2,340,404 | |
27,650 | | Carlisle Cos., Inc. | | 1,911,998 | |
47,490 | L | Crane Co. | | 1,674,972 | |
71,610 | | Donaldson Co., Inc. | | 2,277,198 | |
43,944 | | Federal Signal Corp. | | 659,599 | |
65,435 | | Harsco Corp. | | 4,417,517 | |
23,127 | | Lancaster Colony Corp. | | 856,855 | |
37,100 | | Pentair, Inc. | | 1,280,692 | |
98,112 | | Teleflex, Inc. | | 6,375,318 | |
| | | | 21,794,553 | |
| | Office Furnishings: 0.7% | | | |
167,177 | | Herman Miller, Inc. | | 4,712,719 | |
51,707 | | HNI, Corp. | | 2,840,266 | |
| | | | 7,552,985 | |
See Accompanying Notes to Financial Statements
51
ING VP INDEX PLUS | PORTFOLIO OF INVESTMENTS |
MIDCAP PORTFOLIO | AS OF DECEMBER 31, 2005 (CONTINUED) |
Shares | | | | Value | |
| | Oil & Gas: 5.1% | | | |
42,130 | @ | Denbury Resources, Inc. | | $ | 959,721 | |
56,949 | | ENSCO International, Inc. | | 2,525,688 | |
50,450 | @ | Forest Oil Corp. | | 2,299,007 | |
123,600 | | Helmerich & Payne, Inc. | | 7,652,076 | |
115,100 | @ | Newfield Exploration Co. | | 5,763,057 | |
240,393 | | Noble Energy, Inc. | | 9,687,838 | |
155,900 | | Patterson-UTI Energy, Inc. | | 5,136,905 | |
117,900 | | Pioneer Natural Resources Co. | | 6,044,732 | |
94,958 | | Pogo Producing Co. | | 4,729,858 | |
237,850 | @,L | Pride International, Inc. | | 7,313,888 | |
154,200 | @ | Southwestern Energy Co. | | 5,541,948 | |
| | | | 57,654,718 | |
| | Oil & Gas Services: 2.4% | | | |
234,382 | @,L | Cooper Cameron Corp. | | 9,703,415 | |
62,100 | @,L | FMC Technologies, Inc. | | 2,665,332 | |
115,300 | @ | Grant Prideco, Inc. | | 5,087,036 | |
75,676 | L | Smith International, Inc. | | 2,808,336 | |
145,400 | L | Tidewater, Inc. | | 6,464,484 | |
| | | | 26,728,603 | |
| | Packaging & Containers: 0.4% | | | |
66,017 | L | Packaging Corp. of America | | 1,515,090 | |
85,680 | | Sonoco Products Co. | | 2,518,992 | |
| | | | 4,034,082 | |
| | Pharmaceuticals: 3.2% | | | |
199,867 | @ | Barr Pharmaceuticals, Inc. | | 12,449,715 | |
21,211 | @,L | Cephalon, Inc. | | 1,373,200 | |
207,798 | @ | IVAX Corp. | | 6,510,311 | |
108,535 | L | Omnicare, Inc. | | 6,210,373 | |
75,705 | | Perrigo Co. | | 1,128,762 | |
97,350 | @,L | Sepracor, Inc. | | 5,023,260 | |
34,600 | L | Valeant Pharmaceuticals International | | 625,568 | |
73,850 | @,L | VCA Antech, Inc. | | 2,082,570 | |
| | | | 35,403,759 | |
| | Pipelines: 1.6% | | | |
110,198 | | Equitable Resources, Inc. | | 4,043,165 | |
76,214 | | National Fuel Gas Co. | | 2,377,115 | |
117,700 | | Questar Corp. | | 8,909,890 | |
52,300 | | Western Gas Resources, Inc. | | 2,462,807 | |
| | | | 17,792,977 | |
| | Real Estate Investment Trust: 2.7% | | | |
77,250 | | AMB Property Corp. | | 3,798,383 | |
98,700 | L | Developers Diversified Realty Corp. | | 4,640,874 | |
43,150 | L | Highwoods Properties, Inc. | | 1,227,618 | |
63,000 | L | Hospitality Properties Trust | | 2,526,300 | |
77,650 | | Liberty Property Trust | | 3,327,303 | |
57,000 | | Macerich Co. | | 3,826,980 | |
54,050 | | Mack-Cali Realty Corp. | | 2,334,960 | |
94,453 | | New Plan Excel Realty Trust | | 2,189,421 | |
62,200 | L | Regency Centers Corp. | | 3,666,690 | |
75,135 | L | Weingarten Realty Investors | | 2,840,854 | |
| | | | 30,379,383 | |
| | Retail: 9.3% | | | |
49,300 | @,L | 99 Cents Only Stores | | 515,678 | |
80,946 | L | Abercrombie & Fitch Co. | | 5,276,060 | |
99,275 | @ | Advance Auto Parts | | 4,314,492 | |
| | | | | |
47,100 | @,L | Aeropostale, Inc. | | $ | 1,238,730 | |
321,900 | L | American Eagle Outfitters | | 7,397,262 | |
64,200 | @,L | AnnTaylor Stores Corp. | | 2,216,184 | |
62,650 | | Applebees International, Inc. | | 1,415,264 | |
133,500 | | Barnes & Noble, Inc. | | 5,696,445 | |
62,150 | @,L | BJ’s Wholesale Club, Inc. | | 1,837,154 | |
25,497 | | Borders Group, Inc. | | 552,520 | |
79,713 | | Brinker International, Inc. | | 3,081,705 | |
37,750 | | CBRL Group, Inc. | | 1,326,913 | |
66,350 | @ | Cheesecake Factory | | 2,480,827 | |
315,166 | @,L | Chico’s FAS, Inc. | | 13,845,242 | |
238,576 | | Claire’s Stores, Inc. | | 6,971,191 | |
62,864 | @,L | Copart, Inc. | | 1,449,644 | |
91,700 | @,L | Dollar Tree Stores, Inc. | | 2,195,298 | |
58,000 | | Foot Locker, Inc. | | 1,368,220 | |
20,600 | @,L | GameStop Corp. | | 655,492 | |
125,300 | | Michaels Stores, Inc. | | 4,431,861 | |
47,700 | | MSC Industrial Direct Co. | | 1,918,494 | |
261,193 | @ | O’Reilly Automotive, Inc. | | 8,360,788 | |
23,600 | L | Outback Steakhouse, Inc. | | 981,996 | |
116,250 | @ | Pacific Sunwear of California | | 2,896,950 | |
163,850 | @,L | Payless Shoesource, Inc. | | 4,112,635 | |
132,350 | | Petsmart, Inc. | | 3,396,101 | |
37,650 | L | Regis Corp. | | 1,452,161 | |
128,386 | L | Ross Stores, Inc. | | 3,710,355 | |
123,996 | @,L | Saks, Inc. | | 2,090,573 | |
96,200 | @,L | Urban Outfitters, Inc. | | 2,434,822 | |
107,500 | @,L | Williams-Sonoma, Inc. | | 4,638,625 | |
| | | | 104,259,682 | |
| | Savings & Loans: 0.6% | | | |
85,475 | | Astoria Financial Corp. | | 2,512,965 | |
69,050 | | Independence Community Bank Corp. | | 2,743,357 | |
75,729 | | Washington Federal, Inc. | | 1,741,010 | |
| | | | 6,997,332 | |
| | Semiconductors: 3.3% | | | |
107,400 | @,L | Fairchild Semiconductor International, Inc. | | 1,816,134 | |
173,760 | @,L | Integrated Device Technology, Inc. | | 2,290,157 | |
25,450 | @,L | International Rectifier Corp. | | 811,855 | |
129,950 | | Intersil Corp. | | 3,233,156 | |
270,872 | @,L | Lam Research Corp. | | 9,664,713 | |
61,451 | @ | Lattice Semiconductor Corp. | | 265,468 | |
139,000 | @ | MEMC Electronic Materials, Inc. | | 3,081,630 | |
99,800 | @,L | Micrel, Inc. | | 1,157,680 | |
285,950 | L | Microchip Technology, Inc. | | 9,193,293 | |
64,250 | @,L | Semtech Corp. | | 1,173,205 | |
68,850 | @,L | Silicon Laboratories, Inc. | | 2,524,041 | |
295,090 | @ | Triquint Semiconductor, Inc. | | 1,313,151 | |
| | | | 36,524,483 | |
| | Software: 2.7% | | | |
247,020 | @ | Activision, Inc. | | 3,394,055 | |
75,650 | | Acxiom Corp. | | 1,739,950 | |
33,064 | @,L | Advent Software, Inc. | | 955,880 | |
53,814 | | Certegy, Inc. | | 2,182,696 | |
43,400 | @,L | CSG Systems International | | 968,688 | |
102,009 | @ | D&B Corp. | | 6,830,522 | |
57,312 | L | Fair Isaac Corp. | | 2,531,471 | |
72,622 | | MoneyGram International, Inc. | | 1,893,982 | |
56,007 | | SEI Investments Co. | | 2,072,259 | |
See Accompanying Notes to Financial Statements
52
ING VP INDEX PLUS | PORTFOLIO OF INVESTMENTS |
MIDCAP PORTFOLIO | AS OF DECEMBER 31, 2005 (CONTINUED) |
Shares | | | | Value | |
| | Software (continued) | | | |
213,545 | @,L | Sybase, Inc. | | $ | 4,668,094 | |
87,680 | @,L | Transaction Systems Architects, Inc. | | 2,524,307 | |
69,553 | @ | Wind River Systems, Inc. | | 1,027,298 | |
| | | | 30,789,202 | |
| | Telecommunications: 2.2% | | | |
346,500 | @ | 3Com Corp. | | 1,247,400 | |
103,050 | | Adtran, Inc. | | 3,064,707 | |
195,473 | @ | Cincinnati Bell, Inc. | | 686,110 | |
42,094 | @,L | CommScope, Inc. | | 847,352 | |
252,587 | L | Harris Corp. | | 10,863,773 | |
33,250 | @ | Newport Corp. | | 450,205 | |
41,900 | L | Plantronics, Inc. | | 1,185,770 | |
84,150 | @,L | Polycom, Inc. | | 1,287,495 | |
96,200 | @,L | Powerwave Technologies, Inc. | | 1,209,234 | |
94,099 | | Telephone & Data Systems, Inc. | | 3,390,387 | |
| | | | 24,232,433 | |
| | Textiles: 0.2% | | | |
19,800 | @ | Mohawk Industries, Inc. | | 1,722,204 | |
| | | | 1,722,204 | |
| | Transportation: 2.4% | | | |
39,631 | L | Alexander & Baldwin, Inc. | | 2,149,585 | |
156,100 | | CH Robinson Worldwide, Inc. | | 5,780,383 | |
49,092 | | CNF, Inc. | | 2,743,752 | |
98,450 | L | Expeditors International Washington, Inc. | | 6,646,360 | |
121,200 | L | JB Hunt Transport Services, Inc. | | 2,743,968 | |
67,200 | | Overseas Shipholding Group | | 3,386,208 | |
47,200 | @,L | Swift Transportation Co., Inc. | | 958,160 | |
50,725 | @,L | Yellow Roadway Corp. | | 2,262,842 | |
| | | | 26,671,258 | |
| | Trucking & Leasing: 0.2% | | | |
73,445 | L | GATX Corp. | | 2,649,896 | |
| | | | 2,649,896 | |
| | Water: 0.3% | | | |
120,041 | L | Aqua America, Inc. | | 3,277,119 | |
| | | | 3,277,119 | |
| | Total Common Stock
(Cost $1,006,749,321) | | 1,109,515,432 | |
| | | | | | |
Principal
Amount | | | | | | Value | |
| | | | | | | |
SHORT-TERM INVESTMENTS: 21.6% | | | | | | |
| Repurchase Agreement 0.6% | | | | | | |
$ | 6,294,000 | S | Goldman Sachs Repurchase | | | | | | |
| | Agreement dated, 12/30/05, | | | | | | |
| | 4.250%, due 01/03/06, $6,296,972 | | | | | | |
| | to be received upon repurchase | | | | | | |
| | (Collateralized by $6,468,000 | | | | | | |
| | various U.S. Government | | | | | | |
| | Obligations, 3.625%-3.875%, | | | | | | |
| | Market value plus accrued | | | | | | |
| | interest $6,420,856, due | | | | | | |
| | 05/15/07-09/15/08) | | | | | $ | 6,294,000 | |
| | Total Repurchase Agreements
(Cost $6,294,000) | | | | | 6,294,000 | |
| | Securities Lending Collateralcc: 21.0% | | | | | | |
236,034,000 | | The Bank of New York Institutional
Cash Reserves Fund | | | | | 236,034,000 | |
| | Total Securities Lending Collateral
(Cost $236,034,000) | | | | | 236,034,000 | |
| | Total Short-Term Investments
(Cost $242,328,000) | | | | | 242,328,000 | |
| | Total Investments in | | | | | | |
| | Securities (Cost $1,249,077,321)* | | 120.4 | % | | $ | 1,351,843,432 | |
| | Other Assets and | | | | | | |
| | Liabilities-Net | | (20.4 | ) | | (228,587,033 | ) |
| | Net Assets | | 100.0 | % | | $ | 1,123,256,399 | |
| | | | | | | | | | | |
@ | | Non-income producing security |
@@ | | Foreign Issuer |
cc | | Securities purchased with cash collateral for securities loaned. |
L | | Loaned security, a portion or all of the security is on loan at December 31, 2005. |
S | | Segregated securities for certain derivatives, when-issued or delayed delivery securities and forward currency exchange contracts. |
* | | Cost for federal income tax purposes is $1,258,740,565. Net unrealized appreciation consists of: |
| | Gross Unrealized Appreciation | | | | | $ | 115,659,588 | |
| | Gross Unrealized Depreciation | | | | | (22,556,721 | ) |
| | Net Unrealized Appreciation | | | | | $ | 93,102,867 | |
| | | | | | | | | | | |
Information concerning open futures contracts at December 31, 2005 is shown below:
Long Contracts | | No. of
Contracts | | Notional
Market Value | | Expiration
Date | | Unrealized
Gain (Loss) | |
S&P MidCap
400 Future | | 27 | | $10,033,200 | | 03/16/2006 | | | $(4,293) | | |
| | | | | | | | | | | |
See Accompanying Notes to Financial Statements
53
ING VP INDEX PLUS | PORTFOLIO OF INVESTMENTS |
SMALLCAP PORTFOLIO | AS OF DECEMBER 31, 2005 (CONTINUED) |
Shares | | | | Value | |
COMMON STOCK: 99.2% | | | | |
| | Advertising: 0.1% | | | |
34,326 | L | Advo, Inc. | | $ | 967,307 | |
| | | | 967,307 | |
| | Aerospace/Defense: 2.2% | | | |
34,300 | @,L | AAR Corp. | | 821,485 | |
37,275 | @,L | Armor Holdings, Inc. | | 1,589,779 | |
23,275 | | Curtiss-Wright Corp. | | 1,270,815 | |
56,886 | L | DRS Technologies, Inc. | | 2,925,078 | |
16,000 | L | EDO Corp. | | 432,960 | |
49,856 | | Engineered Support Systems, Inc. | | 2,076,004 | |
28,150 | @ | Esterline Technologies Corp. | | 1,046,899 | |
37,070 | | Kaman Corp. | | 729,908 | |
40,916 | @ | Moog, Inc. | | 1,161,196 | |
101,400 | @ | Teledyne Technologies, Inc. | | 2,950,740 | |
14,025 | @ | Triumph Group, Inc. | | 513,455 | |
| | | | 15,518,319 | |
| | Agriculture: 0.1% | | | |
44,028 | | Delta & Pine Land Co. | | 1,013,084 | |
| | | | 1,013,084 | |
| | Airlines: 0.8% | | | |
77,397 | @,L | Mesa Air Group, Inc. | | 809,573 | |
176,868 | | Skywest, Inc. | | 4,750,674 | |
| | | | 5,560,247 | |
| | Apparel: 1.5% | | | |
16,850 | @ | Ashworth, Inc. | | 142,383 | |
31,600 | @,L | Gymboree Corp. | | 739,440 | |
77,837 | | K-Swiss, Inc. | | 2,525,032 | |
30,425 | L | Kellwood Co. | | 726,549 | |
14,125 | L | Oxford Industries, Inc. | | 772,638 | |
37,800 | | Phillips-Van Heusen | | 1,224,720 | |
139,750 | @,L | Quiksilver, Inc. | | 1,934,140 | |
29,700 | L | Russell Corp. | | 399,762 | |
48,312 | | Stride Rite Corp. | | 655,111 | |
63,608 | | Wolverine World Wide, Inc. | | 1,428,636 | |
| | | | 10,548,411 | |
| | Auto Manufacturers: 0.8% | | | |
129,711 | | Oshkosh Truck Corp. | | 5,783,813 | |
13,900 | | Wabash National Corp. | | 264,795 | |
| | | | 6,048,608 | |
| | Auto Parts & Equipment: 0.1% | | | |
23,850 | | Superior Industries International | | 530,901 | |
| | | | 530,901 | |
| | Banks: 5.8% | | | |
34,800 | L | Boston Private Financial Holdings, Inc. | | 1,058,616 | |
93,981 | | Central Pacific Financial Corp. | | 3,375,798 | |
92,489 | L | Chittenden Corp. | | 2,572,119 | |
31,711 | | Community Bank System, Inc. | | 715,083 | |
67,900 | | East-West Bancorp, Inc. | | 2,477,671 | |
157,993 | @@,L | First Bancorp Puerto Rico | | 1,960,693 | |
55,787 | | First Midwest Bancorp, Inc. | | 1,955,892 | |
46,228 | L | First Republic Bank | | 1,710,898 | |
200,700 | | Fremont General Corp. | | 4,662,261 | |
35,947 | L | Glacier Bancorp, Inc. | | 1,080,207 | |
43,692 | | Gold Banc Corp., Inc. | | 796,068 | |
53,175 | | Hudson United Bancorp | | $ | 2,216,334 | |
14,268 | | Irwin Financial Corp. | | 305,621 | |
21,471 | | Nara Bancorp, Inc. | | 381,754 | |
7,750 | L | PrivateBancorp, Inc. | | 275,668 | |
22,556 | L | Prosperity Bancshares, Inc. | | 648,259 | |
35,314 | | Provident Bankshares Corp. | | 1,192,554 | |
85,082 | L | Republic Bancorp, Inc. | | 1,012,476 | |
90,547 | | South Financial Group, Inc. | | 2,493,664 | |
46,929 | | Sterling Bancshares, Inc. | | 724,584 | |
48,323 | L | Susquehanna Bancshares, Inc. | | 1,144,289 | |
74,117 | L | Trustco Bank Corp. | | 920,533 | |
104,446 | | UCBH Holdings, Inc. | | 1,867,494 | |
50,286 | | Umpqua Holdings Corp. | | 1,434,660 | |
42,724 | | United Bankshares, Inc. | | 1,505,594 | |
84,764 | | Whitney Holding Corp. | | 2,336,096 | |
10,475 | L | Wintrust Financial Corp. | | 575,078 | |
| | | | 41,399,964 | |
| | Beverages: 0.1% | | | |
12,900 | @,L | Hansen Natural Corp. | | 1,016,649 | |
| | | | 1,016,649 | |
| | Biotechnology: 0.4% | | | |
59,725 | @,L | Arqule, Inc. | | 365,517 | |
29,250 | @,L | Enzo Biochem, Inc. | | 363,285 | |
18,675 | @,L | Integra LifeSciences Holdings Corp. | | 662,216 | |
62,925 | @,L | Regeneron Pharmaceuticals, Inc. | | 1,003,654 | |
129,064 | @ | Savient Pharmaceuticals, Inc. | | 482,699 | |
| | | | 2,877,371 | |
| | Building Materials: 2.1% | | | |
21,600 | | Apogee Enterprises, Inc. | | 350,352 | |
41,925 | @ | Drew Industries, Inc. | | 1,181,866 | |
16,250 | | ElkCorp | | 546,975 | |
113,812 | | Florida Rock Industries, Inc. | | 5,583,617 | |
59,781 | | Lennox International, Inc. | | 1,685,824 | |
22,369 | @,L | NCI Building Systems, Inc. | | 950,235 | |
41,900 | | Simpson Manufacturing Co., Inc. | | 1,523,065 | |
23,400 | L | Texas Industries, Inc. | | 1,166,256 | |
31,824 | | Universal Forest Products, Inc. | | 1,758,276 | |
| | | | 14,746,466 | |
| | Chemicals: 0.7% | | | |
25,597 | | Arch Chemicals, Inc. | | 765,350 | |
29,954 | | HB Fuller Co. | | 960,625 | |
30,805 | | MacDermid, Inc. | | 859,460 | |
28,969 | @,L | OM Group, Inc. | | 543,458 | |
8,500 | | Penford Corp. | | 103,700 | |
85,900 | @,L | PolyOne Corp. | | 552,337 | |
5,900 | | Quaker Chemical Corp. | | 113,457 | |
31,230 | | Schulman A, Inc. | | 672,070 | |
45,351 | L | Wellman, Inc. | | 307,480 | |
| | | | 4,877,937 | |
| | Coal: 0.2% | | | |
35,050 | L | Massey Energy Co. | | 1,327,344 | |
| | | | 1,327,344 | |
| | Commercial Services: 4.3% | | | |
44,187 | | Aaron Rents, Inc. | | 931,462 | |
43,375 | | ABM Industries, Inc. | | 847,981 | |
72,340 | L | Administaff, Inc. | | 3,041,897 | |
See Accompanying Notes to Financial Statements
54
ING VP INDEX PLUS | PORTFOLIO OF INVESTMENTS |
SMALLCAP PORTFOLIO | AS OF DECEMBER 31, 2005 (CONTINUED) |
Shares | | | | Value | |
| | Commercial Services (continued) | | | |
35,000 | L | Arbitron, Inc. | | $ | 1,329,300 | |
26,600 | | Bowne & Co., Inc. | | 394,744 | |
64,552 | @ | CCE Spinco, Inc. | | 845,631 | |
27,050 | | Central Parking Corp. | | 371,126 | |
26,994 | | Chemed Corp. | | 1,341,062 | |
19,981 | @ | Consolidated Graphics, Inc. | | 945,901 | |
10,450 | | CPI Corp. | | 195,520 | |
21,525 | @ | Cross Country Healthcare, Inc. | | 382,715 | |
29,900 | | Gevity HR, Inc. | | 769,028 | |
30,912 | L | Healthcare Services Group | | 640,188 | |
23,022 | @,L | Heidrick & Struggles International, Inc. | | 737,855 | |
44,950 | | Hooper Holmes, Inc. | | 114,623 | |
10,200 | @,L | iPayment, Inc. | | 423,504 | |
60,717 | @ | Labor Ready, Inc. | | 1,264,128 | |
18,200 | | MAXIMUS, Inc. | | 667,758 | |
13,875 | @,L | Midas, Inc. | | 254,745 | |
29,847 | @,L | NCO Group, Inc. | | 505,011 | |
22,395 | @ | On Assignment, Inc. | | 244,329 | |
21,300 | @,L | Parexel International Corp. | | 431,538 | |
120,417 | | Pharmaceutical Product Development, Inc. | | 7,459,833 | |
34,769 | | Pre-Paid Legal Services, Inc. | | 1,328,523 | |
18,700 | @,L | SFBC International, Inc. | | 299,387 | |
12,812 | @,L | SourceCorp. | | 307,232 | |
115,324 | @,L | Spherion Corp. | | 1,154,393 | |
11,900 | L | Startek, Inc. | | 214,200 | |
24,525 | @,L | Vertrue, Inc. | | 866,468 | |
22,825 | L | Viad Corp. | | 669,457 | |
11,650 | @ | Volt Information Sciences, Inc. | | 221,583 | |
45,371 | | Watson Wyatt & Co. Holdings | | 1,265,851 | |
| | | | 30,466,973 | |
| | Computers: 3.0% | | | |
47,713 | | Agilysys, Inc. | | 869,331 | |
62,285 | @,L | CACI International, Inc. | | 3,573,913 | |
30,375 | @ | Carreker Corp. | | 151,571 | |
9,700 | @ | Catapult Communications Corp. | | 143,463 | |
46,500 | @,L | Ciber, Inc. | | 306,900 | |
44,337 | | Factset Research Systems, Inc. | | 1,824,911 | |
59,800 | @,L | Komag, Inc. | | 2,072,668 | |
38,387 | @,L | Kronos, Inc. | | 1,606,880 | |
27,875 | @,L | Manhattan Associates, Inc. | | 570,880 | |
22,006 | @,L | Mercury Computer Systems, Inc. | | 453,984 | |
114,980 | @ | Micros Systems, Inc. | | 5,555,834 | |
65,275 | L | MTS Systems Corp. | | 2,261,126 | |
26,135 | @,L | Radiant Systems, Inc. | | 317,802 | |
19,300 | @,L | Radisys Corp. | | 334,662 | |
25,465 | @,L | Synaptics, Inc. | | 629,495 | |
21,658 | L | Talx Corp. | | 989,987 | |
| | | | 21,663,407 | |
| | Distribution/Wholesale: 2.1% | | | |
31,400 | @ | Brightpoint, Inc. | | 870,722 | |
42,634 | L | Building Materials Holding Corp. | | 2,908,065 | |
79,385 | | Hughes Supply, Inc. | | 2,845,952 | |
44,411 | | Owens & Minor, Inc. | | 1,222,635 | |
62,693 | L | SCP Pool Corp. | | 2,333,433 | |
68,370 | @ | United Stationers, Inc. | | 3,315,945 | |
25,068 | | Watsco, Inc. | | 1,499,317 | |
| | | | 14,996,069 | |
| | Diversified Financial Services: 0.9% | | | |
16,650 | | Financial Federal Corp. | | $ | 740,093 | |
50,725 | @ | Investment Technology Group, Inc. | | 1,797,694 | |
21,100 | @,L | Piper Jaffray Cos | | 852,440 | |
42,332 | @,L | Portfolio Recovery Associates, Inc. | | 1,965,898 | |
24,797 | L | SWS Group, Inc. | | 519,249 | |
27,464 | @,L | World Acceptance, Corp. | | 782,724 | |
| | | | 6,658,098 | |
| | Electric: 0.9% | | | |
13,886 | | Allete, Inc. | | 610,984 | |
46,500 | | Avista Corp. | | 823,515 | |
8,525 | | Central Vermont Public Service Corp. | | 153,535 | |
15,200 | | CH Energy Group, Inc. | | 697,680 | |
58,785 | | Cleco Corp. | | 1,225,667 | |
53,026 | @,L | El Paso Electric Co. | | 1,115,667 | |
4,700 | | Green Mountain Power Corp. | | 135,219 | |
14,880 | L | UIL Holdings Corp. | | 684,331 | |
37,525 | L | Unisource Energy Corp. | | 1,170,780 | |
| | | | 6,617,378 | |
| | Electrical Components & Equipment: 0.5% | | | |
24,300 | @,L | Advanced Energy Industries, Inc. | | 287,469 | |
48,357 | | Belden Cdt, Inc. | | 1,181,362 | |
11,064 | | C&D Technologies, Inc. | | 84,308 | |
40,750 | @,L | Greatbatch, Inc. | | 1,059,908 | |
16,077 | @,L | Intermagnetics General Corp. | | 512,856 | |
7,705 | @,L | Littelfuse, Inc. | | 209,961 | |
22,384 | L | Vicor Corp. | | 353,891 | |
| | | | 3,689,755 | |
| | Electronics: 3.8% | | | |
12,369 | | Analogic Corp. | | 591,857 | |
12,953 | L | Bel Fuse, Inc. | | 411,905 | |
64,344 | | Brady Corp. | | 2,327,966 | |
42,276 | @ | Checkpoint Systems, Inc. | | 1,042,103 | |
94,810 | @ | Coherent, Inc. | | 2,813,961 | |
31,075 | | CTS Corp. | | 343,690 | |
108,600 | @,L | Cymer, Inc. | | 3,856,386 | |
16,063 | L | Daktronics, Inc. | | 474,983 | |
20,011 | @ | Dionex Corp. | | 982,140 | |
26,922 | @,L | Electro Scientific Industries, Inc. | | 650,166 | |
27,359 | @,L | FEI Co. | | 524,472 | |
79,600 | @,L | Flir Systems, Inc. | | 1,777,468 | |
75,900 | @ | Itron, Inc. | | 3,039,036 | |
20,950 | | Keithley Instruments, Inc. | | 292,881 | |
35,200 | | Methode Electronics, Inc. | | 350,944 | |
18,625 | | Park Electrochemical Corp. | | 483,878 | |
38,375 | @,L | Paxar Corp. | | 753,301 | |
14,079 | @,L | Photon Dynamics, Inc. | | 257,364 | |
5,645 | @,L | Planar Systems, Inc. | | 47,249 | |
6,400 | @,L | Rogers Corp. | | 250,752 | |
9,475 | @ | SBS Technologies, Inc. | | 95,413 | |
25,175 | @,L | Sonic Solutions, Inc. | | 380,394 | |
40,305 | | Technitrol, Inc. | | 689,216 | |
65,600 | @ | Trimble Navigation Ltd. | | 2,328,144 | |
26,350 | L | Watts Water Technologies, Inc. | | 798,142 | |
18,953 | | Woodward Governor Co. | | 1,630,148 | |
6,108 | | X-Rite, Inc. | | 61,080 | |
| | | | 27,255,039 | |
See Accompanying Notes to Financial Statements
55
ING VP INDEX PLUS | PORTFOLIO OF INVESTMENTS |
SMALLCAP PORTFOLIO | AS OF DECEMBER 31, 2005 (CONTINUED) |
Shares | | | | Value | |
| | Energy-Alternate Sources: 0.4% | | | |
80,340 | @,L | Headwaters, Inc. | | $ | 2,847,250 | |
| | | | 2,847,250 | |
| | Engineering & Construction: 1.0% | | | |
31,349 | @,L | EMCOR Group, Inc. | | 2,116,998 | |
22,180 | @,L | Insituform Technologies, Inc. | | 429,627 | |
90,772 | @,L | Shaw Group, Inc. | | 2,640,557 | |
49,608 | @ | URS Corp. | | 1,865,757 | |
| | | | 7,052,939 | |
| | Entertainment: 0.1% | | | |
32,875 | @,L | Shuffle Master, Inc. | | 826,478 | |
| | | | 826,478 | |
| | Environmental Control: 0.6% | | | |
36,894 | @,L | Aleris International, Inc. | | 1,189,463 | |
58,376 | @,L | Tetra Tech, Inc. | | 914,752 | |
57,250 | @,L | Waste Connections, Inc. | | 1,972,835 | |
| | | | 4,077,050 | |
| | Food: 1.9% | | | |
13,461 | L | American Italian Pasta Co. | | 91,535 | |
93,739 | | Corn Products International, Inc. | | 2,239,425 | |
108,365 | L | Flowers Foods, Inc. | | 2,986,539 | |
20,700 | @,L | Great Atlantic & Pacific Tea Co. | | 657,846 | |
34,655 | @,L | Hain Celestial Group, Inc. | | 733,300 | |
10,773 | L | J&J Snack Foods Corp. | | 640,024 | |
32,015 | | Lance, Inc. | | 596,439 | |
24,755 | L | Nash Finch Co. | | 630,757 | |
37,900 | @,L | Performance Food Group Co. | | 1,075,223 | |
61,073 | @ | Ralcorp Holdings, Inc. | | 2,437,423 | |
15,525 | L | Sanderson Farms, Inc. | | 473,978 | |
30,024 | @,L | TreeHouse Foods, Inc. | | 562,049 | |
17,500 | @,L | United Natural Foods, Inc. | | 462,000 | |
| | | | 13,586,538 | |
| | Forest Products & Paper: 0.4% | | | |
22,325 | @ | Buckeye Technologies, Inc. | | 179,716 | |
26,225 | @,L | Caraustar Industries, Inc. | | 227,895 | |
12,521 | L | Deltic Timber Corp. | | 649,339 | |
15,100 | L | Neenah Paper, Inc. | | 422,800 | |
32,725 | | Rock-Tenn Co. | | 446,696 | |
48,373 | | Wausau-Mosinee Paper Corp. | | 573,220 | |
| | | | 2,499,666 | |
| | Gas: 3.2% | | | |
165,463 | | Atmos Energy Corp. | | 4,328,512 | |
9,084 | L | Cascade Natural Gas Corp. | | 177,229 | |
91,083 | | Energen Corp. | | 3,308,135 | |
22,550 | | Laclede Group, Inc. | | 658,686 | |
30,000 | | New Jersey Resources Corp. | | 1,256,700 | |
36,716 | L | Northwest Natural Gas Co. | | 1,254,953 | |
96,575 | L | Piedmont Natural Gas Co. | | 2,333,252 | |
34,169 | | South Jersey Industries, Inc. | | 995,685 | |
132,502 | | Southern Union Co. | | 3,131,022 | |
43,095 | | Southwest Gas Corp. | | 1,137,708 | |
204,772 | | UGI Corp. | | 4,218,303 | |
| | | | 22,800,185 | |
| | Hand/Machine Tools: 0.2% | | | |
6,292 | L | Baldor Electric Co. | | 161,390 | |
29,853 | | Regal-Beloit Corp. | | 1,056,796 | |
| | | | 1,218,186 | |
| | Healthcare-Products: 5.2% | | | |
79,900 | @,L | American Medical Systems Holdings, Inc. | | $ | 1,424,617 | |
18,050 | @,L | Biosite, Inc. | | 1,016,035 | |
15,875 | @,L | Conmed Corp. | | 375,603 | |
51,975 | L | Cooper Cos., Inc. | | 2,666,318 | |
9,750 | @,L | Cyberonics | | 314,925 | |
13,626 | | Datascope Corp. | | 450,339 | |
10,417 | L | Diagnostic Products Corp. | | 505,745 | |
22,376 | @,L | DJ Orthopedics, Inc. | | 617,130 | |
29,000 | @ | Haemonetics Corp. | | 1,416,940 | |
135,820 | @,L | Hologic, Inc. | | 5,150,294 | |
12,225 | @,L | ICU Medical, Inc. | | 479,342 | |
39,136 | @,L | Idexx Laboratories, Inc. | | 2,817,009 | |
140,187 | @ | Immucor, Inc. | | 3,274,768 | |
12,514 | | Invacare Corp. | | 394,066 | |
21,615 | L | LCA-Vision, Inc. | | 1,026,929 | |
45,300 | | Mentor Corp. | | 2,087,424 | |
25,175 | @,L | Merit Medical Systems, Inc. | | 305,625 | |
10,700 | L | PolyMedica Corp. | | 358,129 | |
11,250 | @ | Possis Medical, Inc. | | 111,938 | |
82,200 | @ | Resmed, Inc. | | 3,149,082 | |
136,719 | @ | Respironics, Inc. | | 5,068,173 | |
16,050 | @,L | SurModics, Inc. | | 593,690 | |
49,050 | @ | Sybron Dental Specialties, Inc. | | 1,952,681 | |
36,100 | @,L | Viasys Healthcare, Inc. | | 927,770 | |
10,253 | | Vital Signs, Inc. | | 439,033 | |
| | | | 36,923,605 | |
| | Healthcare-Services: 2.9% | | | |
6,550 | @,L | Amedisys, Inc. | | 276,672 | |
53,373 | @ | Ameri Group Corp. | | 1,038,639 | |
35,000 | @,L | American Healthways, Inc. | | 1,583,750 | |
26,225 | @,L | Amsurg Corp. | | 599,504 | |
44,866 | @,L | Centene Corp. | | 1,179,527 | |
25,875 | @ | Gentiva Health Services, Inc. | | 381,398 | |
105,884 | @,L | Odyssey HealthCare, Inc. | | 1,973,678 | |
49,300 | @ | Pediatrix Medical Group, Inc. | | 4,366,501 | |
26,025 | @,L | RehabCare Group, Inc. | | 525,705 | |
73,784 | @,L | Sierra Health Services | | 5,899,769 | |
35,650 | @,L | Sunrise Senior Living, Inc. | | 1,201,762 | |
50,127 | @,L | United Surgical Partners International, Inc. | | 1,611,583 | |
| | | | 20,638,488 | |
| | Home Builders: 2.7% | | | |
72,660 | @,L | Champion Enterprises, Inc. | | 989,629 | |
59,800 | @,L | Fleetwood Enterprises, Inc. | | 738,530 | |
10,432 | | M/I Homes, Inc. | | 423,748 | |
37,950 | L | MDC Holdings, Inc. | | 2,352,141 | |
26,700 | @,L | Meritage Homes Corp. | | 1,679,964 | |
11,725 | @,L | NVR, Inc. | | 8,230,950 | |
8,975 | L | Skyline Corp. | | 326,690 | |
81,550 | L | Standard-Pacific Corp. | | 3,001,040 | |
35,700 | L | Winnebago Industries | | 1,188,096 | |
| | | | 18,930,788 | |
| | Home Furnishings: 0.4% | | | |
54,193 | @,L | Audiovox Corp. | | 751,115 | |
37,175 | | Ethan Allen Interiors, Inc. | | 1,358,003 | |
45,930 | L | La-Z-Boy, Inc. | | 622,811 | |
| | | | 2,731,929 | |
| | Household Products/Wares: 0.7% | | | |
34,286 | L | CNS, Inc. | | 751,206 | |
21,659 | @,L | Fossil, Inc. | | 465,885 | |
31,811 | | Harland John H. Co. | | 1,196,094 | |
See Accompanying Notes to Financial Statements
56
ING VP INDEX PLUS | PORTFOLIO OF INVESTMENTS |
SMALLCAP PORTFOLIO | AS OF DECEMBER 31, 2005 (CONTINUED) |
Shares | | | | Value | |
| | Household Products/Wares (continued) | | | |
74,400 | @ | Playtex Products, Inc. | | $ | 1,017,048 | |
42,925 | @,L | Spectrum Brands, Inc. | | 871,807 | |
18,579 | L | Standard Register Co. | | 293,734 | |
16,425 | | WD-40 Co. | | 431,321 | |
| | | | 5,027,095 | |
| | Housewares: 0.8% | | | |
9,175 | | Libbey, Inc. | | 93,769 | |
122,385 | | Toro Co. | | 5,356,791 | |
| | | | 5,450,560 | |
| | Insurance: 4.9% | | | |
33,410 | L | Delphi Financial Group | | 1,537,194 | |
42,650 | | Hilb Rogal & Hamilton Co. | | 1,642,452 | |
22,387 | L | Infinity Property & Casualty Corp. | | 833,020 | |
58,975 | L | Landamerica Financial Group, Inc. | | 3,680,040 | |
52,953 | @,L | Philadelphia Consolidated Holding Co. | | 5,120,026 | |
34,629 | | Presidential Life Corp. | | 659,336 | |
36,452 | @,L | ProAssurance Corp. | | 1,773,025 | |
43,166 | | RLI Corp. | | 2,152,688 | |
90,032 | L | Selective Insurance Group | | 4,780,699 | |
55,871 | L | Stewart Information Services Corp. | | 2,719,242 | |
111,452 | | UICI | | 3,957,661 | |
33,055 | | United Fire & Casualty Co. | | 1,336,414 | |
107,100 | | Zenith National Insurance Corp. | | 4,939,452 | |
| | | | 35,131,249 | |
| | Internet: 1.1% | | | |
32,900 | @ | Digital Insight Corp. | | 1,053,458 | |
30,800 | @,L | Infospace, Inc. | | 795,256 | |
76,359 | @,L | Internet Security Systems | | 1,599,721 | |
25,925 | @,L | j2 Global Communications, Inc. | | 1,108,035 | |
30,121 | @,L | Secure Computing Corp. | | 369,283 | |
36,775 | @,L | WebEx Communications, Inc. | | 795,443 | |
28,150 | @,L | Websense, Inc. | | 1,847,766 | |
| | | | 7,568,962 | |
| | Iron/Steel: 1.3% | | | |
23,640 | L | Carpenter Technology | | 1,665,911 | |
21,100 | @,L | Chaparral Steel Co. | | 638,275 | |
41,127 | L | Cleveland-Cliffs, Inc. | | 3,642,618 | |
7,300 | @ | Material Sciences Corp. | | 102,930 | |
35,075 | | Reliance Steel & Aluminum Co. | | 2,143,784 | |
20,781 | | Ryerson Tull, Inc. | | 505,394 | |
8,850 | L | Steel Technologies, Inc. | | 247,712 | |
| | | | 8,946,624 | |
| | Leisure Time: 0.6% | | | |
24,385 | | Arctic Cat, Inc. | | 489,163 | |
47,400 | @ | Bally Total Fitness Holding Corp. | | 297,672 | |
17,600 | @,L | K2, Inc. | | 177,936 | |
70,700 | @,L | Multimedia Games, Inc. | | 653,975 | |
11,600 | @,L | Pegasus Solutions, Inc. | | 104,052 | |
49,225 | L | Polaris Industries, Inc. | | 2,471,095 | |
| | | | 4,193,893 | |
| | Lodging: 0.1% | | | |
34,000 | @,L | Aztar Corp. | | 1,033,260 | |
| | | | 1,033,260 | |
| | Machinery-Construction & Mining: 1.0% | | | |
14,649 | @ | Astec Industries, Inc. | | $ | 478,436 | |
139,276 | | JLG Industries, Inc. | | 6,359,342 | |
| | | | 6,837,778 | |
| | Machinery-Diversified: 1.9% | | | |
40,229 | | Albany International Corp. | | 1,454,681 | |
48,584 | | Applied Industrial Technologies, Inc. | | 1,636,795 | |
59,100 | | Briggs & Stratton Corp. | | 2,292,489 | |
55,675 | | Cognex Corp. | | 1,675,261 | |
26,400 | @,L | Gardner Denver, Inc. | | 1,301,520 | |
49,402 | @ | Gerber Scientific, Inc. | | 472,777 | |
63,652 | | IDEX Corp. | | 2,616,734 | |
7,500 | L | Lindsay Manufacturing Co. | | 144,225 | |
33,075 | L | Manitowoc Co. | | 1,661,027 | |
12,933 | | Stewart & Stevenson Services | | 273,274 | |
| | | | 13,528,783 | |
| | Media: 0.0% | | | |
8,725 | | Thomas Nelson, Inc. | | 215,071 | |
| | | | 215,071 | |
| | Metal Fabricate/Hardware: 1.8% | | | |
9,066 | @,L | AM Castle & Co. | | 198,001 | |
110,150 | | Commercial Metals Co. | | 4,135,031 | |
56,355 | L | Kaydon Corp. | | 1,811,250 | |
9,742 | | Lawson Products | | 367,663 | |
40,750 | | Mueller Industries, Inc. | | 1,117,365 | |
22,308 | @ | NS Group, Inc. | | 932,697 | |
71,957 | | Quanex Corp. | | 3,595,691 | |
18,297 | | Valmont Industries, Inc. | | 612,218 | |
| | | | 12,769,916 | |
| | Mining: 0.3% | | | |
8,893 | | Amcol International Corp. | | 182,484 | |
9,896 | @ | Brush Engineered Materials, Inc. | | 157,346 | |
25,025 | @ | Century Aluminum Co. | | 655,905 | |
24,433 | @,L | RTI International Metals, Inc. | | 927,232 | |
| | | | 1,922,967 | |
| | Miscellaneous Manufacturing: 2.9% | | | |
89,075 | L | Acuity Brands, Inc. | | 2,832,585 | |
39,175 | | AO Smith Corp. | | 1,375,043 | |
98,492 | | Aptargroup, Inc. | | 5,141,282 | |
19,975 | L | Barnes Group, Inc. | | 659,175 | |
27,325 | @,L | Ceradyne, Inc. | | 1,196,835 | |
63,200 | | Clarcor, Inc. | | 1,877,672 | |
62,300 | @,L | EnPro Industries, Inc. | | 1,678,985 | |
26,573 | @,L | Griffon Corp. | | 632,703 | |
5,800 | @ | Lydall, Inc. | | 47,270 | |
2,000 | @,I,L,X | Mascotech, Inc. | | - | |
25,337 | | Myers Industries, Inc. | | 369,413 | |
105,800 | | Roper Industries, Inc. | | 4,180,158 | |
10,565 | L | Standex International Corp. | | 293,284 | |
22,400 | L | Sturm Ruger & Co., Inc. | | 157,024 | |
| | | | 20,441,429 | |
| | Office Furnishings: 0.1% | | | |
82,582 | @,L | Interface, Inc. | | 678,824 | |
| | | | 678,824 | |
| | Office/Business Equipment: 0.1% | | | |
23,964 | @,L | Global Imaging Systems, Inc. | | 829,873 | |
| | | | 829,873 | |
See Accompanying Notes to Financial Statements
57
ING VP INDEX PLUS | PORTFOLIO OF INVESTMENTS |
SMALLCAP PORTFOLIO | AS OF DECEMBER 31, 2005 (CONTINUED) |
Shares | | | | Value | |
| | Oil & Gas: 5.3% | | | |
5,100 | @,L | Atwood Oceanics, Inc. | | $ | 397,953 | |
54,200 | L | Cabot Oil & Gas Corp. | | 2,444,420 | |
187,542 | L | Cimarex Energy Co. | | 8,066,181 | |
152,950 | | Frontier Oil Corp. | | 5,740,214 | |
20,883 | L | Penn Virginia Corp. | | 1,198,684 | |
46,150 | @,L | Petroleum Development Corp. | | 1,538,641 | |
52,522 | @,L | Remington Oil & Gas Corp. | | 1,917,053 | |
74,382 | L | St. Mary Land & Exploration Co. | | 2,738,001 | |
31,293 | @,L | Stone Energy Corp. | | 1,424,770 | |
84,844 | @,L | Swift Energy Co. | | 3,823,919 | |
54,450 | @ | Unit Corp. | | 2,996,384 | |
102,573 | | Vintage Petroleum, Inc. | | 5,470,218 | |
| | | | 37,756,438 | |
| | Oil & Gas Services: 2.4% | | | |
90,956 | @ | Cal Dive International, Inc. | | 3,264,411 | |
7,572 | @ | Dril-Quip, Inc. | | 357,398 | |
22,300 | @ | Hydril | | 1,395,980 | |
33,304 | @,L | Lone Star Technologies | | 1,720,485 | |
14,533 | L | Lufkin Industries, Inc. | | 724,761 | |
51,825 | @,L | Maverick Tube Corp. | | 2,065,745 | |
30,150 | @ | Oceaneering International, Inc. | | 1,500,867 | |
22,025 | @,L | Seacor Smit, Inc. | | 1,499,903 | |
38,049 | @ | Tetra Technologies, Inc. | | 1,161,255 | |
68,450 | @,L | Veritas DGC, Inc. | | 2,429,291 | |
31,725 | @ | W-H Energy Services, Inc. | | 1,049,463 | |
| | | | 17,169,559 | |
| | Packaging & Containers: 0.0% | | | |
17,400 | | Chesapeake Energy Corp. | | 295,452 | |
| | | | 295,452 | |
| | Pharmaceuticals: 1.0% | | | |
124,169 | | Alpharma, Inc. | | 3,540,058 | |
10,175 | @,L | Bradley Pharmaceuticals, Inc. | | 96,663 | |
32,292 | @,L | Connetics Corp. | | 466,619 | |
62,079 | | Medicis Pharmaceutical | | 1,989,632 | |
12,376 | | Natures Sunshine Prods, Inc. | | 223,758 | |
19,300 | @ | Theragenics Corp. | | 58,286 | |
18,300 | @,L | USANA Health Sciences, Inc. | | 701,988 | |
| | | | 7,077,004 | |
| | Real Estate Investment Trust: 2.0% | | | |
28,616 | | Acadia Realty Trust | | 573,751 | |
19,716 | L | Colonial Properties Trust | | 827,678 | |
56,250 | L | Commercial Net Lease Realty | | 1,145,812 | |
21,361 | L | EastGroup Properties, Inc. | | 964,663 | |
25,300 | | Entertainment Properties Trust | | 1,030,975 | |
28,600 | | Essex Property Trust, Inc. | | 2,636,920 | |
19,450 | | Glenborough Realty Trust, Inc. | | 352,045 | |
33,785 | | Kilroy Realty Corp. | | 2,091,291 | |
56,057 | L | Lexington Corporate Properties Trust | | 1,194,014 | |
66,200 | | New Century Financial Corp. | | 2,387,834 | |
6,300 | L | Parkway Properties, Inc./Md | | 252,882 | |
18,334 | | Sovran Self Storage, Inc. | | 861,148 | |
5,470 | | Town & Country Trust/The | | 184,941 | |
| | | | 14,503,954 | |
| | Retail: 9.5% | | | |
16,650 | | Brown Shoe Co., Inc. | | 706,459 | |
50,350 | | Burlington Coat Factory Warehouse Corp. | | 2,024,573 | |
99,483 | | Casey’s General Stores, Inc. | | $ | 2,467,178 | |
25,300 | | Cash America International, Inc. | | 586,707 | |
57,678 | | Cato Corp. | | 1,237,193 | |
71,568 | @ | CEC Entertainment, Inc. | | 2,436,175 | |
66,812 | @,L | Childrens Place | | 3,301,849 | |
34,975 | L | Christopher & Banks Corp. | | 656,830 | |
42,195 | @,L | Dress Barn, Inc. | | 1,629,149 | |
45,900 | | Finish Line | | 799,578 | |
37,900 | L | Fred’s, Inc. | | 616,633 | |
69,231 | @,L | Genesco, Inc. | | 2,685,470 | |
23,025 | @,L | Group 1 Automotive, Inc. | | 723,676 | |
28,200 | @,L | Guitar Center, Inc. | | 1,410,282 | |
14,125 | L | Haverty Furniture Cos., Inc. | | 182,071 | |
116,267 | @,L | Hibbett Sporting Goods, Inc. | | 3,311,284 | |
43,100 | @,L | HOT Topic, Inc. | | 614,175 | |
39,333 | L | IHOP Corp. | | 1,845,111 | |
49,400 | @,L | Insight Enterprises, Inc. | | 968,734 | |
22,400 | @ | J Jill Group, Inc. | | 426,272 | |
71,998 | @,L | Jack in the Box, Inc. | | 2,514,890 | |
26,597 | @,L | Jo-Ann Stores, Inc. | | 313,845 | |
12,500 | @,L | JOS A Bank Clothiers, Inc. | | 542,625 | |
47,780 | L | Landry’s Restaurants, Inc. | | 1,276,204 | |
46,000 | @,L | Linens ‘N Things, Inc. | | 1,223,600 | |
22,634 | | Lone Star Steakhouse & Saloon | | 537,331 | |
54,114 | | Longs Drug Stores Corp. | | 1,969,208 | |
62,670 | @ | Men’s Wearhouse, Inc. | | 1,845,005 | |
44,325 | L | Movie Gallery, Inc. | | 248,663 | |
19,100 | @,L | O’Charleys, Inc. | | 296,241 | |
83,317 | @,L | Panera Bread Co. | | 5,472,261 | |
36,655 | @,L | Papa John’s International, Inc. | | 2,174,008 | |
21,800 | | PEP Boys-Manny Moe & Jack | | 324,602 | |
28,600 | @,L | PF Chang’s China Bistro, Inc. | | 1,419,418 | |
32,475 | @,L | Rare Hospitality International, Inc. | | 986,915 | |
13,400 | @,L | Red Robin Gourmet Burgers, Inc. | | 682,864 | |
38,275 | @,L | Ryan’s Restaurant Group | | 461,596 | |
25,400 | @,L | School Specialty, Inc. | | 925,576 | |
103,458 | @,L | Select Comfort Corp. | | 2,829,576 | |
91,163 | L | Sonic Automotive, Inc. | | 2,031,112 | |
69,793 | @,L | Sonic Corp. | | 2,058,893 | |
26,450 | | Stage Stores, Inc. | | 787,681 | |
25,400 | @,L | Steak N Shake Co. | | 430,530 | |
32,805 | | Stein Mart, Inc. | | 595,411 | |
96,826 | @ | Too, Inc. | | 2,731,461 | |
39,600 | @,L | Tractor Supply Co. | | 2,096,424 | |
28,500 | | World Fuel Services Corp. | | 961,020 | |
53,225 | @,L | Zale Corp. | | 1,338,609 | |
| | | | 67,704,968 | |
| | Savings & Loans: 1.4% | | | |
31,682 | L | Anchor Bancorp Wisconsin, Inc. | | 961,232 | |
48,900 | | BankAtlantic Bancorp, Inc. | | 684,600 | |
25,955 | L | Bankunited Financial Corp. | | 689,624 | |
32,050 | L | Dime Community Bancshares | | 468,250 | |
23,177 | L | Downey Financial Corp. | | 1,585,075 | |
22,772 | L | Fidelity Bankshares, Inc. | | 744,644 | |
18,400 | @,L | FirstFed Financial Corp. | | 1,003,168 | |
45,097 | | Flagstar Bancorp, Inc. | | 649,397 | |
42,314 | @ | Franklin Bank Corp. | | 761,229 | |
31,775 | | MAF Bancorp, Inc. | | 1,314,849 | |
45,831 | | Sterling Financial Corp. | | 1,144,858 | |
| | | | 10,006,926 | |
See Accompanying Notes to Financial Statements
58
ING VP INDEX PLUS | PORTFOLIO OF INVESTMENTS |
SMALLCAP PORTFOLIO | AS OF DECEMBER 31, 2005 (CONTINUED) |
Shares | | | | Value | |
| | Semiconductors: 1.7% | | | |
21,817 | @,L | Actel Corp. | | $ | 277,730 | |
99,674 | @ | Axcelis Technologies, Inc. | | 475,445 | |
88,994 | @ | Brooks Automation, Inc. | | 1,115,095 | |
20,950 | L | Cohu, Inc. | | 479,126 | |
59,235 | @ | DSP Group, Inc. | | 1,484,429 | |
22,639 | @ | ESS Technology | | 77,652 | |
42,517 | @ | Exar Corp. | | 532,313 | |
112,085 | @ | Kopin Corp. | | 599,655 | |
45,875 | @,L | Kulicke & Soffa Industries, Inc. | | 405,535 | |
73,450 | @,L | Microsemi Corp. | | 2,031,627 | |
19,575 | @,L | Pericom Semiconductor Corp. | | 156,013 | |
18,350 | @,L | Photronics, Inc. | | 276,351 | |
27,100 | @,L | Power Integrations, Inc. | | 645,251 | |
14,100 | @ | Rudolph Technologies, Inc. | | 181,608 | |
71,000 | @,L | Skyworks Solutions, Inc. | | 361,390 | |
24,750 | @ | Standard Microsystems Corp. | | 710,077 | |
34,725 | @,L | Supertex, Inc. | | 1,536,581 | |
16,575 | @,L | Varian Semiconductor Equipment Associates, Inc. | | 728,140 | |
| | | | 12,074,018 | |
| | Software: 5.1% | | | |
21,025 | @,L | Altiris, Inc. | | 355,112 | |
98,973 | @,L | Ansys, Inc. | | 4,225,157 | |
16,908 | @,L | Avid Technology, Inc. | | 925,882 | |
39,107 | @ | Captaris, Inc. | | 144,305 | |
38,025 | @,L | Cerner Corp. | | 3,456,853 | |
42,975 | @,L | Dendrite International, Inc. | | 619,270 | |
32,050 | @,L | Digi International, Inc. | | 336,204 | |
63,899 | @,L | eFunds Corp. | | 1,497,793 | |
19,605 | @ | EPIQ Systems, Inc. | | 363,477 | |
45,830 | @ | Filenet Corp. | | 1,184,705 | |
155,747 | | Global Payments, Inc. | | 7,259,368 | |
117,922 | @ | Hyperion Solutions Corp. | | 4,223,966 | |
21,499 | | Inter-Tel, Inc. | | 420,735 | |
45,718 | @ | JDA Software Group, Inc. | | 777,663 | |
47,233 | @,L | Keane, Inc. | | 520,035 | |
23,878 | @,L | Mantech International Corp. | | 665,241 | |
20,817 | @,L | Mapinfo Corp. | | 262,502 | |
31,644 | @ | MRO Software, Inc. | | 444,282 | |
35,852 | @,L | NDCHealth Corp. | | 689,434 | |
21,100 | @,L | Open Solutions, Inc. | | 483,612 | |
25,184 | @,L | Phoenix Technologies Ltd. | | 157,652 | |
87,174 | @,L | Progress Software Corp. | | 2,473,998 | |
9,100 | @,L | Quality Systems, Inc. | | 698,516 | |
82,616 | @ | Serena Software, Inc. | | 1,936,519 | |
44,053 | @ | SPSS, Inc. | | 1,362,559 | |
25,900 | @,L | THQ, Inc. | | 617,715 | |
| | | | 36,102,555 | |
| | Storage/Warehousing: 0.1% | | | |
9,148 | @,L | Mobile Mini, Inc. | | 433,615 | |
| | | | 433,615 | |
| | Telecommunications: 1.1% | | | |
73,550 | @ | Aeroflex, Inc. | | 790,662 | |
35,901 | L | Anixter International, Inc. | | 1,404,447 | |
21,191 | | Black Box Corp. | | 1,004,030 | |
25,325 | | Commonwealth Telephone Enterprises, Inc. | | 855,225 | |
21,600 | @,L | Comtech Telecommunications | | 659,664 | |
29,800 | @,L | Ditech Communications Corp. | | 248,830 | |
44,816 | @ | General Communication | | 462,949 | |
17,350 | @,L | Intrado, Inc. | | 399,397 | |
33,300 | @,L | Netgear, Inc. | | 641,025 | |
15,775 | @ | Network Equipment Technologies, Inc. | | $ | 69,410 | |
33,600 | @,L | Novatel Wireless, Inc. | | 406,896 | |
42,561 | @,L | Symmetricom, Inc. | | 360,492 | |
20,600 | @ | Tollgrade Communications, Inc. | | 225,158 | |
8,773 | @,L | Viasat, Inc. | | 234,502 | |
| | | | 7,762,687 | |
| | Textiles: 0.1% | | | |
23,842 | | G&K Services, Inc. | | 935,798 | |
| | | | 935,798 | |
| | Toys/Games/Hobbies: 0.2% | | | |
58,170 | @,L | Jakks Pacific, Inc. | | 1,218,080 | |
29,475 | @ | Lenox Group, Inc. | | 390,249 | |
| | | | 1,608,329 | |
| | Transportation: 2.2% | | | |
49,250 | L | Arkansas Best Corp. | | 2,151,240 | |
36,300 | @ | EGL, Inc. | | 1,363,791 | |
32,462 | | Forward Air Corp. | | 1,189,732 | |
59,694 | | Heartland Express, Inc. | | 1,211,191 | |
38,413 | @ | HUB Group, Inc. | | 1,357,900 | |
29,550 | @,L | Kirby Corp. | | 1,541,623 | |
29,070 | L | Knight Transportation, Inc. | | 602,621 | |
110,814 | | Landstar System, Inc. | | 4,625,377 | |
22,142 | @ | Offshore Logistics, Inc. | | 646,546 | |
26,170 | @,L | Old Dominion Freight Line | | 706,067 | |
| | | | 15,396,088 | |
| | Water: 0.1% | | | |
14,005 | L | American States Water Co. | | 431,354 | |
| | | | 431,354 | |
| | Total Common Stock
(Cost $652,512,994) | | 705,747,458 | |
WARRANTS: 0.0% | | | | |
| | Aerospace/Defense: 0.0% | | | |
116 | @,X | Timco Aviation Services | | 3 | |
| | Total Warrants (Cost $0) | | 3 | |
| | Total Long-Term Investments:
(Cost $652,512,994) | | 705,747,461 | |
Principal
Amount | | | | Value | |
| | | | | |
SHORT-TERM INVESTMENTS: 26.3% | | | |
| | Repurchase Agreement 1.0% | | | |
$ | 7,475,000 | | Goldman Sachs Repurchase Agreement dated, 12/30/05, 4.250%, due 01/03/06, $7,478,530 to be received upon repurchase (Collateralized by $7,677,000 Federal National Mortgage Association, 3.875%, Market Value plus accrued interest $7,625,439, due 05/15/07) | | $ | 7,475,000 | |
| | Total Repurchase Agreements
(Cost $7,475,000) | | 7,475,000 | |
| | | | | | | | | |
See Accompanying Notes to Financial Statements
59
ING VP INDEX PLUS | PORTFOLIO OF INVESTMENTS |
SMALLCAP PORTFOLIO | AS OF DECEMBER 31, 2005 (CONTINUED) |
Principal
Amount | | | | Value | |
| | Securities Lending Collateralcc: 25.3% | | | | | | |
$ | 179,673,000 | | The Bank of New York
Institutional Cash Reserves Fund | | | | | $ | 179,673,000 | |
| | Total Securities Lending Collateral
(Cost $179,673,000) | | | | | | 179,673,000 | |
| | Total Short-Term Investments
(Cost $187,148,000) | | | | | 187,148,000 | |
| | Total Investments in
Securities (Cost $839,660,994)* | | 125.5 | % | | $ | 892,895,461 | |
| | Other Assets and
Liabilities-Net | | (25.5 | ) | | (181,682,429 | ) |
| | Net Assets | | 100.0 | % | | $ | 711,213,032 | |
@ | | Non-income producing security |
@@ | | Foreign Issuer |
cc | | Securities purchased with cash collateral for securities loaned. |
I | | Illiquid security |
L | | Loaned security, a portion or all of the security is on loan at December 31, 2005. |
X | | Fair value determined by ING Funds Valuation Committee appointed by the Funds’ Board of Directors. |
* | | Cost for federal income tax purposes is $843,480,109. Net unrealized appreciation consists of: |
| Gross Unrealized Appreciation | | $ | 75,203,906 | |
| Gross Unrealized Depreciation | | (25,788,554 | ) |
| Net Unrealized Appreciation | | $ | 49,415,352 | |
| | | | | | | | | | | | |
See Accompanying Notes to Financial Statements
60
ING VP STRATEGIC ALLOCATION | PORTFOLIO OF INVESTMENTS |
BALANCED PORTFOLIO | AS OF DECEMBER 31, 2005 |
Shares | | | | Value | |
COMMON STOCK: 65.0% | | | |
| | Advertising: 0.0% | | | |
1,465 | L | Catalina Marketing Corp. | | $ | 37,138 | |
| | | | 37,138 | |
| | Aerospace/Defense: 2.1% | | | |
910 | @,L | Alliant Techsystems, Inc. | | 69,315 | |
510 | @,L | Armor Holdings, Inc. | | 21,752 | |
24,600 | | Boeing Co. | | 1,727,904 | |
215 | | Engineered Support Systems, Inc. | | 8,953 | |
9,200 | | General Dynamics Corp. | | 1,049,260 | |
585 | | Kaman Corp. | | 11,519 | |
17,300 | | Lockheed Martin Corp. | | 1,100,799 | |
23,082 | | Raytheon Co. | | 926,742 | |
11,300 | | Rockwell Collins, Inc. | | 525,111 | |
660 | @,L | Teledyne Technologies, Inc. | | 19,206 | |
13,400 | | United Technologies Corp. | | 749,194 | |
| | | | 6,209,755 | |
| | Agriculture: 1.4% | | | |
25,450 | | Altria Group, Inc. | | 1,901,624 | |
35,900 | | Archer-Daniels-Midland Co. | | 885,294 | |
10,237 | @@ | British American Tobacco PLC | | 228,261 | |
19 | @@ | Japan Tobacco, Inc. | | 277,579 | |
5,500 | L | Reynolds America, Inc. | | 524,315 | |
14,900 | @@ | Swedish Match AB | | 174,938 | |
| | | | 3,992,011 | |
| | Airlines: 0.3% | | | |
746 | @,L | Mesa Air Group, Inc. | | 7,803 | |
923 | | Skywest, Inc. | | 24,792 | |
42,500 | | Southwest Airlines Co. | | 698,275 | |
| | | | 730,870 | |
| | Apparel: 0.4% | | | |
22,800 | @ | Coach, Inc. | | 760,152 | |
690 | @,L | Gymboree Corp. | | 16,146 | |
524 | | K-Swiss, Inc. | | 16,999 | |
1,420 | | Polo Ralph Lauren Corp. | | 79,719 | |
640 | @ | Quiksilver, Inc. | | 8,858 | |
1,760 | @ | Timberland Co. | | 57,288 | |
5,850 | | VF Corp. | | 323,739 | |
270 | | Wolverine World Wide, Inc. | | 6,064 | |
| | | | 1,268,965 | |
| | Auto Manufacturers: 0.5% | | | |
5,927 | @@ | DaimlerChrysler AG | | 300,561 | |
103,700 | L | Ford Motor Co. | | 800,564 | |
390 | L | Oshkosh Truck Corp. | | 17,390 | |
5,200 | @@ | Volvo AB | | 244,888 | |
| | | | 1,363,403 | |
| | Auto Parts & Equipment: 0.3% | | | |
11,500 | @,L | Goodyear Tire & Rubber Co. | | 199,870 | |
2,300 | @@ | Magna International, Inc. | | 165,390 | |
1,390 | L | Modine Manufacturing Co. | | 45,300 | |
6,600 | @@ | NOK Corp. | | 178,717 | |
13,000 | @@ | Sumitomo Rubber Industries, Inc. | | 185,261 | |
| | | | 774,538 | |
| | Banks: 5.1% | | | |
45,249 | @@ | Banca Intesa S.p.A. | | $ | 239,053 | |
5,600 | @@,L | Banco Itau Holding Financeira SA ADR | | 134,512 | |
83,450 | L | Bank of America Corp. | | 3,851,235 | |
1,300 | | Bank of Hawaii Corp. | | 67,002 | |
16,100 | @@ | Bank of Ireland | | 252,173 | |
24,800 | | BB&T Corp. | | 1,039,368 | |
4,800 | @@ | BNP Paribas | | 386,332 | |
566 | L | Central Pacific Financial Corp. | | 20,331 | |
800 | L | Chittenden Corp. | | 22,248 | |
10,400 | | Comerica, Inc. | | 590,304 | |
8,600 | @@ | Commerzbank AG | | 265,193 | |
22,000 | @@ | DBS Group Holdings Ltd. | | 217,948 | |
2,908 | @@ | Deutsche Bank AG | | 280,383 | |
286 | L | East-West Bancorp, Inc. | | 10,436 | |
1,045 | | Fremont General Corp. | | 24,275 | |
1,800 | | Greater Bay Bancorp | | 46,116 | |
28,220 | @@ | HBOS PLC | | 480,418 | |
250 | | Hudson United Bancorp | | 10,420 | |
5,800 | @@ | ICICI Bank Ltd. ADR | | 167,040 | |
3,700 | @@ | KBC Bancassurance Holding | | 343,189 | |
1,660 | | Mercantile Bankshares Corp. | | 93,690 | |
31 | @@ | Mitsubishi Tokyo Financial Group, Inc. | | 421,810 | |
45 | @@ | Mizuho Financial Group, Inc. | | 356,885 | |
1,560 | @@ | OTP Bank Rt GDR | | 102,336 | |
14,646 | | PNC Financial Services Group, Inc. | | 905,562 | |
16,515 | @@ | Royal Bank of Scotland Group PLC | | 497,293 | |
381 | | South Financial Group, Inc. | | 10,493 | |
24,000 | @@ | Sumitomo Trust & Banking Co., Ltd. | | 244,517 | |
13,200 | @@ | SunCorp.-Metway Ltd. | | 193,608 | |
5,150 | @@ | UBS AG | | 488,063 | |
23,100 | | US BanCorp. | | 690,459 | |
20,450 | | Wachovia Corp. | | 1,080,987 | |
20,650 | | Wells Fargo & Co. | | 1,297,440 | |
100 | | Whitney Holding Corp. | | 2,756 | |
1,736 | | Wilmington Trust Corp. | | 67,548 | |
| | | | 14,901,423 | |
| | Beverages: 1.9% | | | |
53,300 | | Coca-Cola Co. | | 2,148,523 | |
24,300 | @@ | Diageo PLC | | 350,406 | |
8,700 | | Pepsi Bottling Group, Inc. | | 248,907 | |
41,450 | | PepsiCo, Inc. | | 2,448,866 | |
13,804 | @@ | SABMiller PLC | | 250,986 | |
| | | | 5,447,688 | |
| | Biotechnology: 0.4% | | | |
15,050 | @ | Amgen, Inc. | | 1,186,843 | |
1,816 | @ | Savient Pharmaceuticals, Inc. | | 6,792 | |
| | | | 1,193,635 | |
| | Building Materials: 0.2% | | | |
16,000 | @@,L | Asahi Glass Co. Ltd | | 205,969 | |
370 | @,L | Drew Industries, Inc. | | 10,430 | |
620 | | Florida Rock Industries, Inc. | | 30,417 | |
2,600 | @@ | Lafarge SA | | 232,944 | |
300 | L | Lennox International, Inc. | | 8,460 | |
1,340 | | Martin Marietta Materials, Inc. | | 102,805 | |
| | | | 591,025 | |
See Accompanying Notes to Financial Statements
61
ING VP STRATEGIC ALLOCATION | PORTFOLIO OF INVESTMENTS |
BALANCED PORTFOLIO | AS OF DECEMBER 31, 2005 (CONTINUED) |
Shares | | | | Value | |
| | Chemicals: 1.0% | | | |
2,400 | | Chemtura Corp. | | $ | 30,480 | |
14,900 | | Dow Chemical Co. | | 652,918 | |
14,150 | L | EI Du Pont de Nemours & Co. | | 601,375 | |
5,249 | | Lyondell Chemical Co. | | 125,031 | |
230 | | Penford Corp. | | 2,806 | |
13,050 | | PPG Industries, Inc. | | 755,595 | |
5,300 | @@,# | Reliance Industries Ltd. GDR | | 209,509 | |
37,000 | @@ | Sumitomo Chemical Co., Ltd. | | 253,741 | |
2,400 | @@ | Umicore | | 282,458 | |
| | | | 2,913,913 | |
| | Coal: 0.0% | | | |
1,060 | | Peabody Energy Corp. | | 87,365 | |
| | | | 87,365 | |
| | Commercial Services: 0.8% | | | |
450 | L | Administaff, Inc. | | 18,923 | |
1,500 | @,L | Alliance Data Systems Corp. | | 53,400 | |
2,320 | @,L | Career Education Corp. | | 78,230 | |
300 | @ | Consolidated Graphics, Inc. | | 14,202 | |
915 | | Corporate Executive Board Co. | | 82,076 | |
170 | | CPI Corp. | | 3,181 | |
1,881 | @ | Education Management Corp. | | 63,032 | |
8,800 | | Equifax, Inc. | | 334,576 | |
19,900 | | H&R Block, Inc. | | 488,545 | |
700 | | Manpower, Inc. | | 32,550 | |
16,750 | | McKesson Corp. | | 864,133 | |
598 | | Pharmaceutical Product Development, Inc. | | 37,046 | |
270 | | Pre-Paid Legal Services, Inc. | | 10,317 | |
60,500 | @@ | Rentokil Initial Plc | | 170,178 | |
1,570 | @,L | Spherion Corp. | | 15,716 | |
265 | @ | Vertrue, Inc. | | 9,362 | |
| | | | 2,275,467 | |
| | Computers: 3.3% | | | |
800 | | Agilysys, Inc. | | 14,576 | |
23,600 | @ | Apple Computer, Inc. | | 1,696,604 | |
155 | @,L | CACI International, Inc. | | 8,894 | |
4,575 | @ | Cadence Design Systems, Inc. | | 77,409 | |
2,700 | @ | Ceridian Corp. | | 67,095 | |
920 | @ | Cognizant Technology Solutions Corp. | | 46,322 | |
62,650 | @ | Dell, Inc. | | 1,878,874 | |
1,130 | @,L | DST Systems, Inc. | | 67,698 | |
88,600 | @ | EMC Corp. | | 1,206,732 | |
180 | L | Factset Research Systems, Inc. | | 7,409 | |
74,100 | | Hewlett-Packard Co. | | 2,121,483 | |
900 | L | Imation Corp. | | 41,463 | |
19,450 | | International Business Machines Corp. | | 1,598,790 | |
175 | @,L | Kronos, Inc. | | 7,326 | |
710 | @,L | Manhattan Associates, Inc. | | 14,541 | |
576 | @,L | Micros Systems, Inc. | | 27,832 | |
460 | L | MTS Systems Corp. | | 15,934 | |
1,500 | | Reynolds & Reynolds Co. | | 42,105 | |
2,250 | @,L | Sandisk Corp. | | 141,345 | |
2,910 | @ | Synopsys, Inc. | | 58,375 | |
440 | L | Talx Corp. | | 20,112 | |
9,344 | @@ | Tietoenator OYJ | | 340,242 | |
4,150 | @,L | Western Digital Corp. | | 77,232 | |
| | | | 9,578,393 | |
| | Cosmetics/Personal Care: 0.9% | | | |
43,100 | | Procter & Gamble Co. | | $ | 2,494,628 | |
| | | | 2,494,628 | |
| | Distribution/Wholesale: 0.3% | | | |
600 | @,L | Brightpoint, Inc. | | 16,638 | |
248 | L | Building Materials Holding Corp. | | 16,916 | |
11,000 | | Genuine Parts Co. | | 483,120 | |
350 | L | Hughes Supply, Inc. | | 12,548 | |
255 | | SCP Pool Corp. | | 9,491 | |
26,000 | @@ | Sumitomo Corp. | | 336,212 | |
515 | @,L | United Stationers, Inc. | | 24,978 | |
| | | | 899,903 | |
| | Diversified Financial Services: 5.0% | | | |
16,150 | S | American Express Co. | | 831,079 | |
55,900 | L | Charles Schwab Corp. | | 820,053 | |
64,900 | | Citigroup, Inc. | | 3,149,597 | |
12,100 | | Fannie Mae | | 590,601 | |
13,700 | | Goldman Sachs Group, Inc. | | 1,749,627 | |
74,000 | @@ | Hong Kong Exchanges and Clearing Ltd. | | 306,833 | |
1,670 | L | IndyMac Bancorp, Inc. | | 65,163 | |
44,000 | | JPMorgan Chase & Co. | | 1,746,360 | |
962 | | Legg Mason, Inc. | | 115,142 | |
9,800 | | Lehman Brothers Holdings, Inc. | | 1,256,066 | |
26,600 | | Merrill Lynch & Co., Inc. | | 1,801,618 | |
31,350 | | Morgan Stanley | | 1,778,799 | |
360 | @,L | Portfolio Recovery Associates, Inc. | | 16,718 | |
1,040 | @@ | SFCG Co,. Ltd. | | 251,454 | |
480 | @,L | World Acceptance, Corp. | | 13,680 | |
| | | | 14,492,790 | |
| | Electric: 1.3% | | | |
11,500 | | Constellation Energy Group, Inc. | | 662,400 | |
5,000 | | Dominion Resources, Inc. | | 386,000 | |
18,800 | | Edison International | | 819,868 | |
11,000 | @@ | Fortum OYJ | | 205,499 | |
3,700 | @@ | RWE AG | | 271,264 | |
1,440 | | SCANA Corp. | | 56,707 | |
8,900 | L | Southern Co. | | 307,317 | |
21,400 | | TXU Corp. | | 1,074,066 | |
1,480 | | Wisconsin Energy Corp. | | 57,809 | |
| | | | 3,840,930 | |
| | Electrical Components & Equipment: 0.5% | | | |
1,700 | | Ametek, Inc. | | 72,318 | |
16,223 | | Emerson Electric Co. | | 1,211,858 | |
18,000 | @@ | Sumitomo Electric Industries Ltd. | | 273,188 | |
| | | | 1,557,364 | |
| | Electronics: 0.7% | | | |
25,800 | @ | Agilent Technologies, Inc. | | 858,882 | |
600 | | Amphenol Corp. | | 26,556 | |
2,194 | @ | Arrow Electronics, Inc. | | 70,274 | |
2,779 | @ | Avnet, Inc. | | 66,529 | |
260 | | Brady Corp. | | 9,407 | |
615 | @ | Coherent, Inc. | | 18,253 | |
610 | @,L | Cymer, Inc. | | 21,661 | |
390 | @,L | Flir Systems, Inc. | | 8,709 | |
7,200 | @@ | Hoya Corp. | | 258,587 | |
475 | @,L | Itron, Inc. | | 19,019 | |
See Accompanying Notes to Financial Statements
62
ING VP STRATEGIC ALLOCATION | PORTFOLIO OF INVESTMENTS |
BALANCED PORTFOLIO | AS OF DECEMBER 31, 2005 (CONTINUED) |
Shares | | | | Value | |
| | Electronics (continued) | | | |
12,600 | @@ | Koninklijke Philips Electronics NV | | $ | 389,891 | |
60,474 | @,L | Solectron Corp. | | 221,335 | |
300 | @ | Trimble Navigation Ltd. | | 10,647 | |
1,235 | @,L | Varian, Inc. | | 49,141 | |
| | | | 2,028,891 | |
| | Energy-Alternate Sources: 0.0% | | | |
690 | @,L | Headwaters, Inc. | | 24,454 | |
| | | | 24,454 | |
| | Engineering & Construction: 0.4% | | | |
4,600 | @@ | Bouygues | | 223,985 | |
5,400 | | Fluor Corp. | | 417,204 | |
440 | @,L | Shaw Group, Inc./The | | 12,800 | |
48,000 | @@ | Taisei Corp. | | 217,108 | |
240 | @ | URS Corp. | | 9,026 | |
2,400 | @@ | Vinci SA | | 205,956 | |
| | | | 1,086,079 | |
| | Entertainment: 0.2% | | | |
27,021 | @@ | Aristocrat Leisure Ltd. | | 242,872 | |
40,700 | @@ | Hilton Group PLC | | 253,699 | |
| | | | 496,571 | |
| | Environmental Control: 0.0% | | | |
965 | | Republic Services, Inc. | | 36,236 | |
240 | @,L | Waste Connections, Inc. | | 8,270 | |
| | | | 44,506 | |
| | Food: 0.6% | | | |
320 | | Corn Products International, Inc. | | 7,645 | |
1,100 | @ | Dean Foods Co. | | 41,426 | |
735 | L | Flowers Foods, Inc. | | 20,257 | |
18,777 | | General Mills, Inc. | | 926,082 | |
2,169 | | Hormel Foods Corp. | | 70,883 | |
281 | L | Nash Finch Co. | | 7,160 | |
580 | @ | Performance Food Group Co. | | 16,455 | |
436 | @,L | Ralcorp Holdings, Inc. | | 17,401 | |
7,915 | | Supervalu, Inc. | | 257,079 | |
28,400 | @@ | Unilever PLC | | 281,687 | |
| | | | 1,646,075 | |
| | Forest Products & Paper: 0.1% | | | |
8,515 | L | Louisiana-Pacific Corp. | | 233,907 | |
| | | | 233,907 | |
| | Gas: 0.5% | | | |
1,561 | | Atmos Energy Corp. | | 40,836 | |
73,500 | @@ | Centrica PLC | | 321,329 | |
530 | | Energen Corp. | | 19,250 | |
2,900 | | Nicor, Inc. | | 113,999 | |
57,000 | @@ | Osaka Gas Co. Ltd | | 196,385 | |
17,190 | | Sempra Energy | | 770,800 | |
2,000 | | UGI Corp. | | 41,200 | |
2,800 | | WGL Holdings, Inc. | | 84,168 | |
| | | | 1,587,967 | |
| | Healthcare-Products: 1.2% | | | |
1,420 | | Beckman Coulter, Inc. | | 80,798 | |
230 | | Cooper Cos., Inc. | | 11,799 | |
1,612 | | Dentsply International, Inc. | | 86,548 | |
460 | @ | Haemonetics Corp. | | 22,476 | |
684 | @ | Hologic, Inc. | | $ | 25,937 | |
167 | @ | Idexx Laboratories, Inc. | | 12,021 | |
860 | @,L | Immucor, Inc. | | 20,090 | |
36,450 | | Johnson & Johnson | | 2,190,645 | |
15,800 | | Medtronic, Inc. | | 909,606 | |
200 | | Mentor Corp. | | 9,216 | |
370 | @,L | Resmed, Inc. | | 14,175 | |
915 | @ | Respironics, Inc. | | 33,919 | |
1,000 | L | Varian Medical Systems, Inc. | | 50,340 | |
157 | | Vital Signs, Inc. | | 6,723 | |
| | | | 3,474,293 | |
| | Healthcare-Services: 2.0% | | | |
12,200 | | Aetna, Inc. | | 1,150,582 | |
10,700 | @,@@ | Capio AB | | 190,185 | |
2,080 | @ | Community Health Systems, Inc. | | 79,747 | |
10,550 | @ | Coventry Health Care, Inc. | | 600,928 | |
2,900 | @@,L | Fresenius Medical Care AG | | 303,945 | |
2,120 | @ | Health Net, Inc. | | 109,286 | |
10,350 | @ | Humana, Inc. | | 562,316 | |
2,055 | @,L | Lincare Holdings, Inc. | | 86,125 | |
838 | @,L | Odyssey HealthCare, Inc. | | 15,620 | |
330 | @ | Pediatrix Medical Group, Inc. | | 29,228 | |
355 | @,L | Sierra Health Services | | 28,386 | |
730 | @,L | United Surgical Partners International, Inc. | | 23,470 | |
15,900 | | UnitedHealth Group, Inc. | | 988,026 | |
20,300 | @ | WellPoint, Inc. | | 1,619,737 | |
| | | | 5,787,581 | |
| | Home Builders: 0.0% | | | |
155 | | MDC Holdings, Inc. | | 9,607 | |
120 | @,L | Meritage Homes Corp. | | 7,550 | |
55 | @,L | NVR, Inc. | | 38,610 | |
340 | L | Standard-Pacific Corp. | | 12,512 | |
910 | @,L | Toll Brothers, Inc. | | 31,522 | |
| | | | 99,801 | |
| | Home Furnishings: 0.0% | | | |
468 | @,L | Audiovox Corp. | | 6,486 | |
160 | | Ethan Allen Interiors, Inc. | | 5,845 | |
480 | L | Harman International Industries, Inc. | | 46,968 | |
| | | | 59,299 | |
| | Household Products/Wares: 0.0% | | | |
2,160 | L | American Greetings | | 47,455 | |
360 | L | CNS, Inc. | | 7,888 | |
| | | | 55,343 | |
| | Housewares: 0.0% | | | |
645 | | Toro Co. | | 28,232 | |
| | | | 28,232 | |
| | Insurance: 3.8% | | | |
1,450 | | American Financial Group, Inc. | | 55,550 | |
31,750 | | American International Group, Inc. | | 2,166,303 | |
1,100 | L | AmerUs Group Co. | | 62,337 | |
232,000 | @,@@ | China Life Insurance Co. Ltd. | | 204,525 | |
9,650 | | Chubb Corp. | | 942,323 | |
470 | @@ | Everest Re Group Ltd. | | 47,165 | |
3,101 | | Fidelity National Financial, Inc. | | 114,086 | |
2,000 | | First American Corp. | | 90,600 | |
See Accompanying Notes to Financial Statements
63
ING VP STRATEGIC ALLOCATION | PORTFOLIO OF INVESTMENTS |
BALANCED PORTFOLIO | AS OF DECEMBER 31, 2005 (CONTINUED) |
Shares | | | | Value | |
| | Insurance (continued) | | | |
12,900 | | Hartford Financial Services Group, Inc. | | $ | 1,107,981 | |
1,723 | | Horace Mann Educators Corp. | | 32,668 | |
470 | L | Infinity Property & Casualty Corp. | | 17,489 | |
320 | | Landamerica Financial Group, Inc. | | 19,968 | |
84,900 | @@ | Legal & General Group PLC | | 177,663 | |
11,000 | | Lincoln National Corp. | | 583,330 | |
26,450 | | Metlife, Inc. | | 1,296,050 | |
1,929 | @@ | Muenchener Rueckversicherungs AG | | 260,520 | |
2,000 | | Ohio Casualty Corp. | | 56,640 | |
1,464 | | Old Republic International Corp. | | 38,445 | |
280 | @,L | Philadelphia Consolidated Holding Co. | | 27,073 | |
15,894 | | Principal Financial Group | | 753,852 | |
1,734 | | Protective Life Corp. | | 75,897 | |
17,781 | S | Prudential Financial, Inc. | | 1,301,391 | |
19,000 | @@,L | QBE Insurance Group Ltd. | | 271,540 | |
1,710 | | Radian Group, Inc. | | 100,189 | |
7,648 | | Safeco Corp. | | 432,112 | |
445 | L | Selective Insurance Group | | 23,630 | |
1,400 | | Stancorp Financial Group, Inc. | | 69,930 | |
382 | L | Stewart Information Services Corp. | | 18,592 | |
6,600 | | Torchmark Corp. | | 366,960 | |
590 | | UICI | | 20,951 | |
2,145 | | WR Berkley Corp. | | 102,145 | |
567 | | Zenith National Insurance Corp. | | 26,150 | |
1,260 | @,@@ | Zurich Financial Services AG | | 267,352 | |
| | | | 11,131,407 | |
| | Internet: 0.4% | | | |
600 | @ | Checkfree Corp. | | 27,540 | |
13,600 | @,L | eBay, Inc. | | 588,200 | |
86 | @,@@,L | kabu.com Securities Co., Ltd. | | 297,945 | |
2,890 | @,L | McAfee, Inc. | | 78,406 | |
950 | @,L | Secure Computing Corp. | | 11,647 | |
120 | @,L | Websense, Inc. | | 7,877 | |
4,600 | @ | Yahoo!, Inc. | | 180,228 | |
| | | | 1,191,843 | |
| | Iron/Steel: 0.4% | | | |
320 | L | Cleveland-Cliffs, Inc. | | 28,342 | |
12,000 | | Nucor Corp. | | 800,640 | |
140 | | Reliance Steel & Aluminum Co. | | 8,557 | |
52,000 | @@ | Sumitomo Metal Industries Ltd. | | 199,041 | |
| | | | 1,036,580 | |
| | Leisure Time: 0.5% | | | |
6,200 | L | Carnival Corp. | | 331,514 | |
16,000 | L | Harley-Davidson, Inc. | | 823,840 | |
657 | @,L | Multimedia Games, Inc. | | 6,077 | |
210 | L | Polaris Industries, Inc. | | 10,542 | |
3,700 | @@ | Sankyo Co. Ltd | | 213,993 | |
7,900 | @@ | Yamaha Motor Co., Ltd. | | 206,313 | |
| | | | 1,592,279 | |
| | Machinery-Construction & Mining: 0.0% | | | |
680 | L | JLG Industries, Inc. | | 31,049 | |
1,000 | L | Joy Global, Inc. | | 40,000 | |
| | | | 71,049 | |
| | Machinery-Diversified: 0.0% | | | |
515 | L | Applied Industrial Technologies, Inc. | | $ | 17,350 | |
290 | L | Briggs & Stratton Corp. | | 11,249 | |
770 | L | Cognex Corp. | | 23,169 | |
267 | | IDEX Corp. | | 10,976 | |
1,200 | L | Nordson Corp. | | 48,612 | |
| | | | 111,356 | |
| | Media: 1.5% | | | |
28,800 | @,L | Comcast Corp. | | 747,648 | |
17,900 | | McGraw-Hill Cos, Inc. | | 924,177 | |
19,900 | @@ | Mediaset S.p.A. | | 210,359 | |
31,600 | L | News Corp., Inc. | | 491,380 | |
59,750 | | Time Warner, Inc. | | 1,042,040 | |
20,150 | | Viacom, Inc. | | 656,890 | |
7,783 | @@ | Vivendi Universal SA | | 242,887 | |
10 | | Washington Post | | 7,650 | |
| | | | 4,323,031 | |
| | Metal Fabricate/Hardware: 0.1% | | | |
250 | @ | AM Castle & Co. | | 5,460 | |
830 | | Commercial Metals Co. | | 31,158 | |
580 | L | Kaydon Corp. | | 18,641 | |
2,340 | | Precision Castparts Corp. | | 121,235 | |
448 | L | Quanex Corp. | | 22,387 | |
430 | | Valmont Industries, Inc. | | 14,388 | |
| | | | 213,269 | |
| | Mining: 0.5% | | | |
8,000 | @@ | Anglo American PLC | | 272,340 | |
17,922 | @@ | BHP Billiton Ltd. | | 298,669 | |
13,700 | L | Freeport-McMoRan Copper & Gold, Inc. | | 737,060 | |
| | | | 1,308,069 | |
| | Miscellaneous Manufacturing: 2.3% | | | |
22,450 | | 3M Co. | | 1,739,875 | |
750 | L | Acuity Brands, Inc. | | 23,850 | |
470 | L | AO Smith Corp. | | 16,497 | |
499 | | Aptargroup, Inc. | | 26,048 | |
520 | @,L | EnPro Industries, Inc. | | 14,014 | |
133,153 | | General Electric Co. | | 4,667,013 | |
440 | | Roper Industries, Inc. | | 17,384 | |
1,089 | | Teleflex, Inc. | | 70,763 | |
| | | | 6,575,444 | |
| | Office Furnishings: 0.0% | | | |
2,072 | | Herman Miller, Inc. | | 58,410 | |
| | | | 58,410 | |
| | Office/Business Equipment: 0.1% | | | |
4,900 | @@,L | Canon, Inc. | | 287,399 | |
| | | | 287,399 | |
| | Oil & Gas: 6.1% | | | |
13,950 | | Burlington Resources, Inc. | | 1,202,490 | |
28,281 | | ChevronTexaco Corp. | | 1,605,512 | |
1,045 | L | Cimarex Energy Co. | | 44,945 | |
36,200 | | ConocoPhillips | | 2,106,116 | |
18,300 | | Devon Energy Corp. | | 1,144,482 | |
13,200 | @@ | ENI-Ente Nazionale Idrocarburi S.p.A. | | 367,486 | |
See Accompanying Notes to Financial Statements
64
ING VP STRATEGIC ALLOCATION | PORTFOLIO OF INVESTMENTS |
BALANCED PORTFOLIO | AS OF DECEMBER 31, 2005 (CONTINUED) |
Shares | | | | Value | |
| | Oil & Gas (continued) | | | |
12,200 | | EOG Resources, Inc. | | $ | 895,114 | |
111,850 | | Exxon Mobil Corp. | | 6,282,615 | |
830 | | Frontier Oil Corp. | | 31,150 | |
1,255 | | Helmerich & Payne, Inc. | | 77,697 | |
2,980 | | Noble Energy, Inc. | | 120,094 | |
1,860 | @@ | Norsk Hydro ASA | | 190,766 | |
1,700 | @@ | Petroleo Brasileiro SA ADR | | 121,159 | |
470 | @,L | Petroleum Development Corp. | | 15,670 | |
1,490 | | Pogo Producing Co. | | 74,217 | |
3,100 | @ | Pride International, Inc. | | 95,325 | |
8,100 | @@ | Repsol YPF SA | | 236,238 | |
20,250 | @@ | Royal Dutch Shell PLC | | 647,427 | |
8,600 | | Sunoco, Inc. | | 674,068 | |
532 | @,L | Swift Energy Co. | | 23,977 | |
2,100 | @@ | Total SA | | 527,622 | |
23,800 | S | Valero Energy Corp. | | 1,228,080 | |
730 | | Vintage Petroleum, Inc. | | 38,931 | |
| | | | 17,751,181 | |
| | Oil & Gas Services: 0.4% | | | |
2,240 | @ | Cooper Cameron Corp. | | 92,736 | |
5,650 | @,@@ | Petroleum Geo-Services ASA | | 173,895 | |
7,400 | L | Schlumberger Ltd. | | 718,910 | |
1,530 | L | Tidewater, Inc. | | 68,024 | |
670 | @,L | Veritas DGC, Inc. | | 23,778 | |
| | | | 1,077,343 | |
| | Pharmaceuticals: 3.1% | | | |
19,600 | | Abbott Laboratories | | 772,828 | |
740 | | Alpharma, Inc. | | 21,097 | |
13,700 | L | AmerisourceBergen Corp. | | 567,180 | |
1,865 | @ | Barr Pharmaceuticals, Inc. | | 116,171 | |
9,300 | @,L | Express Scripts, Inc. | | 779,340 | |
25,600 | @@ | GlaxoSmithKline PLC | | 644,853 | |
9,900 | @ | Hospira, Inc. | | 423,522 | |
1,700 | @ | IVAX Corp. | | 53,261 | |
15,300 | @ | King Pharmaceuticals, Inc. | | 258,876 | |
280 | | Medicis Pharmaceutical | | 8,974 | |
62,800 | | Merck & Co., Inc. | | 1,997,668 | |
2,200 | @@ | Merck KGaA | | 181,780 | |
910 | L | Omnicare, Inc. | | 52,070 | |
90,150 | | Pfizer, Inc. | | 2,102,298 | |
3,900 | @@ | Roche Holding AG | | 583,036 | |
6,500 | @@ | Takeda Chemical Industries Ltd. | | 351,912 | |
840 | @ | Theragenics Corp. | | 2,537 | |
220 | @,L | USANA Health Sciences, Inc. | | 8,439 | |
| | | | 8,925,842 | |
| | Pipelines: 0.1% | | | |
1,520 | | Equitable Resources, Inc. | | 55,769 | |
2,430 | | Questar Corp. | | 183,951 | |
| | | | 239,720 | |
| | Real Estate: 0.2% | | | |
22,000 | @@ | Cheung Kong Holdings Ltd. | | 225,195 | |
7,700 | @@ | Leopalace21 Corp. | | 278,414 | |
| | | | 503,609 | |
| | Real Estate Investment Trust: 0.1% | | | |
250 | L | Colonial Properties Trust | | 10,495 | |
835 | | Developers Diversified Realty Corp. | | 39,262 | |
490 | | Entertainment Properties Trust | | 19,968 | |
115 | | Essex Property Trust, Inc. | | $ | 10,603 | |
295 | | New Century Financial Corp. | | 10,641 | |
2,000 | | Weingarten Realty Investors | | 75,620 | |
| | | | 166,589 | |
| | Retail: 4.2% | | | |
735 | L | Abercrombie & Fitch Co. | | 47,907 | |
800 | @ | Advance Auto Parts | | 34,768 | |
3,365 | L | American Eagle Outfitters | | 77,328 | |
1,475 | | Barnes & Noble, Inc. | | 62,938 | |
20,200 | | Best Buy Co., Inc. | | 878,296 | |
380 | | Burlington Coat Factory Warehouse Corp. | | 15,280 | |
760 | L | Casey’s General Stores, Inc. | | 18,848 | |
714 | L | Cato Corp. | | 15,315 | |
600 | @ | CEC Entertainment, Inc. | | 20,424 | |
2,980 | @,L | Chico’s FAS, Inc. | | 130,911 | |
394 | @,L | Childrens Place | | 19,471 | |
2,360 | | Claire’s Stores, Inc. | | 68,959 | |
9,150 | | Darden Restaurants, Inc. | | 355,752 | |
3,700 | @@,L | Don Quijote Co., Ltd. | | 309,717 | |
450 | @,L | Dress Barn, Inc. | | 17,375 | |
13,200 | @@ | Enterprise Inns PLC | | 212,566 | |
36,400 | | Gap, Inc. | | 642,096 | |
450 | @,L | Genesco, Inc. | | 17,456 | |
140 | @,L | Guitar Center, Inc. | | 7,001 | |
671 | @,L | Hibbett Sporting Goods, Inc. | | 19,110 | |
27,250 | | Home Depot, Inc. | | 1,103,080 | |
360 | L | IHOP Corp. | | 16,888 | |
14,750 | | JC Penney Co., Inc. | | 820,100 | |
49,622 | @@ | Kingfisher PLC | | 201,919 | |
410 | L | Landry’s Restaurants, Inc. | | 10,951 | |
430 | L | Longs Drug Stores Corp. | | 15,648 | |
10,100 | | Lowe’s Cos., Inc. | | 673,266 | |
41,800 | | McDonald’s Corp. | | 1,409,491 | |
782 | @,L | Men’s Wearhouse, Inc. | | 23,022 | |
1,045 | | Michaels Stores, Inc. | | 36,962 | |
13,600 | | Nordstrom, Inc. | | 508,640 | |
2,590 | @ | O’Reilly Automotive, Inc. | | 82,906 | |
2,340 | @,L | Pacific Sunwear of California | | 58,313 | |
405 | @ | Panera Bread Co. | | 26,600 | |
259 | @,L | Papa John’s International, Inc. | | 15,361 | |
2,175 | @,L | Payless Shoesource, Inc. | | 54,593 | |
130 | @ | PF Chang’s China Bistro, Inc. | | 6,452 | |
1,100 | L | Ross Stores, Inc. | | 31,790 | |
652 | @,L | Select Comfort Corp. | | 17,832 | |
668 | L | Sonic Automotive, Inc. | | 14,883 | |
285 | @,L | Sonic Corp. | | 8,408 | |
37,600 | | Staples, Inc. | | 853,896 | |
9,700 | @ | Starbucks Corp. | | 291,097 | |
17,000 | @@,L | Takashimaya Co. Ltd. | | 271,321 | |
11,700 | | Target Corp. | | 643,149 | |
620 | @,L | Too, Inc. | | 17,490 | |
180 | @,L | Tractor Supply Co. | | 9,529 | |
30,500 | | Wal-Mart Stores, Inc. | | 1,427,400 | |
7,100 | L | Wendy’s International, Inc. | | 392,346 | |
900 | @,L | Williams-Sonoma, Inc. | | 38,835 | |
| | | | 12,053,686 | |
| | Savings & Loans: 0.0% | | | |
610 | @,L | Franklin Bank Corp. | | 10,974 | |
1 | | Sterling Financial Corp. | | 25 | |
1 | | Washington Mutual, Inc. | | 44 | |
| | | | 11,043 | |
See Accompanying Notes to Financial Statements
65
ING VP STRATEGIC ALLOCATION | PORTFOLIO OF INVESTMENTS |
BALANCED PORTFOLIO | AS OF DECEMBER 31, 2005 (CONTINUED) |
Shares | | | | Value | |
| | Semiconductors: 2.3% | | | |
13,900 | @,@@ | ASML Holding NV | | $ | 277,571 | |
635 | @,L | DSP Group, Inc. | | 15,913 | |
24,400 | @ | Freescale Semiconductor, Inc. | | 614,148 | |
127,950 | | Intel Corp. | | 3,193,627 | |
2,265 | @,L | Lam Research Corp. | | 80,815 | |
2,300 | @,L | Micrel, Inc. | | 26,680 | |
3,060 | | Microchip Technology, Inc. | | 98,379 | |
350 | @,L | Microsemi Corp. | | 9,681 | |
21,800 | L | National Semiconductor Corp. | | 566,364 | |
430 | @@,# | Samsung Electronics Co., Ltd. GDR | | 141,876 | |
1,200 | @,L | Silicon Laboratories, Inc. | | 43,992 | |
296 | @,L | Supertex, Inc. | | 13,098 | |
50,250 | | Texas Instruments, Inc. | | 1,611,518 | |
4,847 | @ | Triquint Semiconductor, Inc. | | 21,569 | |
215 | @,L | Varian Semiconductor Equipment Associates, Inc. | | 9,445 | |
| | | | 6,724,676 | |
| | Software: 2.3% | | | |
562 | @,L | Advent Software, Inc. | | 16,247 | |
530 | @,L | Ansys, Inc. | | 22,626 | |
14,400 | | Autodesk, Inc. | | 618,480 | |
24,000 | | Automatic Data Processing, Inc. | | 1,101,360 | |
13,600 | @ | BMC Software, Inc. | | 278,664 | |
170 | @,L | Cerner Corp. | | 15,455 | |
10,700 | @,L | Citrix Systems, Inc. | | 307,946 | |
24,650 | @ | Compuware Corp. | | 221,111 | |
1,418 | @,L | D&B Corp. | | 94,949 | |
778 | @,L | Filenet Corp. | | 20,111 | |
820 | | Global Payments, Inc. | | 38,220 | |
847 | @ | Hyperion Solutions Corp. | | 30,340 | |
11,800 | @,L | Intuit, Inc. | | 628,940 | |
113,150 | | Microsoft Corp. | | 2,958,873 | |
616 | @,L | MRO Software, Inc. | | 8,649 | |
23,800 | @ | Novell, Inc. | | 210,154 | |
12,300 | @ | Parametric Technology Corp. | | 75,030 | |
200 | @,L | Quality Systems, Inc. | | 15,352 | |
726 | @ | Serena Software, Inc. | | 17,017 | |
412 | @,L | SPSS, Inc. | | 12,743 | |
2,205 | @,L | Sybase, Inc. | | 48,201 | |
1,175 | @,L | Transaction Systems
Architects, Inc. | | 33,828 | |
| | | | 6,774,296 | |
| | Telecommunications: 3.7% | | | |
155,100 | | AT&T, Inc. | | 3,798,399 | |
150,100 | @ | Cisco Systems, Inc. | | 2,569,712 | |
1,075 | L | Commonwealth Telephone Enterprises, Inc. | | 36,303 | |
21,000 | @@ | Deutsche Telekom AG | | 347,844 | |
10,293 | @@ | Elisa Corp. | | 189,822 | |
2,106 | L | Harris Corp. | | 90,579 | |
470 | @,L | Intrado, Inc. | | 10,819 | |
71,800 | | Motorola, Inc. | | 1,621,956 | |
47 | @@ | Nippon Telegraph & Telephone Corp. | | 213,129 | |
20,450 | | Qualcomm, Inc. | | 880,986 | |
98,000 | @@ | Telecom Italia S.p.A. | | 242,281 | |
83,000 | @@ | Telefonaktiebolaget LM Ericsson | | 285,468 | |
10,900 | @@ | Telekom Austria AG | | 243,694 | |
7,400 | @@ | Telekomunikasi Indonesia Tbk PT ADR | | 176,564 | |
1,435 | | Telephone & Data Systems, Inc. | | $ | 51,703 | |
350 | @ | Tollgrade Communications, Inc. | | 3,826 | |
| | | | 10,763,085 | |
| | Toys/Games/Hobbies: 0.1% | | | |
10,126 | | Hasbro, Inc. | | 204,343 | |
656 | @,L | Jakks Pacific, Inc. | | 13,737 | |
| | | | 218,080 | |
| | Transportation: 1.3% | | | |
480 | L | Arkansas Best Corp. | | 20,966 | |
1,310 | | CH Robinson Worldwide, Inc. | | 48,509 | |
13,600 | | CSX Corp. | | 690,472 | |
12,900 | @@ | Deutsche Post AG | | 311,561 | |
61 | @@ | East Japan Railway Co. | | 418,400 | |
300 | L | Expeditors International Washington, Inc. | | 20,253 | |
31,000 | @@ | Kawasaki Kisen Kaisha Ltd. | | 194,450 | |
772 | | Landstar System, Inc. | | 32,223 | |
20,375 | | Norfolk Southern Corp. | | 913,411 | |
980 | L | Overseas Shipholding Group | | 49,382 | |
13,600 | | United Parcel Service, Inc. | | 1,022,040 | |
| | | | 3,721,667 | |
| | Trucking & Leasing: 0.0% | | | |
1,594 | | GATX Corp. | | 57,512 | |
| | | | 57,512 | |
| | Water: 0.1% | | | |
6,420 | @@ | Veolia Environnement | | 289,305 | |
| | | | 289,305 | |
| | Total Common Stock
(Cost $162,683,970) | | 188,481,973 | |
PREFERRED STOCK: 0.4% | | | |
| | Banks: 0.1% | | | |
38 | @,#,XX | DG Funding Trust | | 404,938 | |
| | | | 404,938 | |
| | Diversified Financial
Services: 0.0% | | | |
4,400 | C | National Rural Utilities Cooperative Finance Corp. | | 103,840 | |
| | | | 103,840 | |
| | Household Products/Wares 0.1% | | | |
1,800 | @@ | Henkel KGaA | | 180,225 | |
| | | | 180,225 | |
| | Insurance: 0.1% | | | |
4,000 | @@ | Aegon NV | | 99,800 | |
13,100 | C | Metlife, Inc. | | 339,552 | |
| | | | 439,352 | |
| | Telecommunications: 0.1% | | | |
122 | @@,# | Centaur Funding Corp. | | 158,066 | |
| | | | 158,066 | |
| | Total Preferred Stock
(Cost $1,284,110) | | 1,286,421 | |
See Accompanying Notes to Financial Statements
66
ING VP STRATEGIC ALLOCATION | PORTFOLIO OF INVESTMENTS |
BALANCED PORTFOLIO | AS OF DECEMBER 31, 2005 (CONTINUED) |
Principal
Amount | | | | Value | |
CORPORATE BONDS/NOTES: 6.5% | | | |
| | Aerospace/Defense: 0.1% | | | |
$ | 150,000 | | Northrop Grumman Corp., 7.000%,due 03/01/06 | | $ | 150,521 | |
100,000 | | Northrop Grumman Space & Mission Systems Corp., 7.625%, due 03/15/06 | | 100,356 | |
| | | | 250,877 | |
| | Banks: 1.7% | | | |
340,000 | @@,L | Australia & New Zealand Banking Group Ltd., 4.588%, due 10/29/49 | | 291,257 | |
123,000 | @@,# | Banco Santander Chile SA, 4.810%, due 12/09/09 | | 122,705 | |
104,000 | @@ | Banco Santander Chile SA, 7.375%, due 07/18/12 | | 115,933 | |
150,000 | @@ | Bank of Ireland, 4.750%, due 12/29/49 | | 130,182 | |
130,000 | @@ | Bank of Nova Scotia, 4.250%, due 08/21/85 | | 110,028 | |
60,000 | @@ | Bank of Scotland, 3.750%, due 11/30/49 | | 51,900 | |
57,000 | | BankAmerica Capital II, 8.000%, due 12/15/26 | | 60,553 | |
110,000 | @@ | Barclays Bank PLC, 6.278%, due 12/15/49 | | 110,758 | |
150,000 | @@,# | Chuo Mitsui Trust & Banking Co., Ltd., 5.506%, due 04/15/49 | | 145,611 | |
93,000 | @@ | Corp Andina de Fomento, 5.125%, due 05/05/15 | | 91,767 | |
98,000 | @@, # | Danske Bank A/S, 5.914%, due 12/29/49 | | 102,704 | |
130,000 | @@ | Den Norske Bank ASA, 4.186%, due 08/29/49 | | 109,525 | |
169,000 | # | Dresdner Funding Trust I, 8.151%, due 06/30/31 | | 208,407 | |
317,000 | @@,# | HBOS PLC, 5.375%, due 11/29/49 | | 316,893 | |
400,000 | @@ | HSBC Bank PLC, 4.788%, due 06/29/49 | | 336,000 | |
141,000 | | Huntington Capital Trust I, 4.943%, due 02/01/27 | | 134,203 | |
190,000 | @@ | Lloyds TSB Bank PLC, 4.160%, due 08/29/49 | | 165,323 | |
189,000 | | M&T Bank Corp., 3.850%, due 04/01/13 | | 184,743 | |
131,000 | | Mellon Capital I, 7.720%, due 12/01/26 | | 138,793 | |
95,000 | @@,L | Mizuho Financial Group Cayman Ltd., 8.375%, due 12/31/49 | | 102,992 | |
140,000 | @@ | National Australia Bank Ltd., 4.525%, due 10/29/49 | | 119,517 | |
154,000 | | PNC Funding Corp., 4.500%, due 03/10/10 | | 151,203 | |
74,000 | # | Rabobank Capital Funding Trust, 5.254%, due 12/29/49 | | 72,707 | |
132,000 | @@,#,L | Resona Bank Ltd., 5.850%, due 09/01/49 | | 131,693 | |
340,000 | @@ | Royal Bank of Scotland Group PLC, 4.875%, due 12/29/49 | | 295,997 | |
140,000 | @@ | Societe Generale, 4.656%, due 11/29/49 | | 120,064 | |
$ | 240,000 | @@ | Standard Chartered PLC, 4.813%, due 07/29/49 | | $ | 192,600 | |
450,000 | @@ | Standard Chartered PLC, 4.875%, due 11/29/49 | | 360,000 | |
83,000 | @@ | Sumitomo Mitsui Banking Corp., 8.150%, due 08/01/49 | | 88,088 | |
50,000 | | Wachovia Corp., 5.500%, due 08/01/35 | | 48,891 | |
150,000 | @@ | Westpac Banking Corp., 4.369%, due 09/30/49 | | 126,119 | |
106,000 | # | Westpac Capital Trust IV, 5.256%, due 12/29/49 | | 104,028 | |
| | | | 4,841,184 | |
| | Beverages: 0.1% | | | |
235,000 | @@,L | Cia Brasileira de Bebidas, 8.750%, due 09/15/13 | | 275,831 | |
65,000 | @@,L | Coca-Cola HBC Finance BV, 5.125%, due 09/17/13 | | 65,441 | |
| | | | 341,272 | |
| | Building Materials: 0.1% | | | |
160,000 | | Masco Corp., 6.750%, due 03/15/06 | | 160,573 | |
| | | | 160,573 | |
| | Chemicals: 0.0% | | | |
47,000 | @@,#,S | Sociedad Quimica y Minera de Chile SA, 7.700%, due 09/15/06 | | 47,750 | |
40,000 | | Stauffer Chemical, 5.250%, due 04/15/10 | | 32,120 | |
110,000 | | Stauffer Chemical, 7.540%, due 04/15/17 | | 59,024 | |
| | | | 138,894 | |
| | Commercial Services: 0.1% | | | |
300,000 | | Tulane University of Louisiana, 5.168%, due 11/15/12 | | 301,050 | |
| | | | 301,050 | |
| | Diversified Financial Services: 1.9% | | | |
57,679 | @@,#,S | Arcel Finance Ltd., 5.984%, due 02/01/09 | | 58,357 | |
162,592 | @@,# | Arcel Finance Ltd., 7.048%, due 09/01/11 | | 174,305 | |
100,000 | # | Army Hawaii Family Housing Trust Certificates, 5.524%, due 06/15/50 | | 103,154 | |
100,000 | # | Army Hawaii Family Housing Trust Certificates, 5.624%, due 06/15/50 | | 103,274 | |
230,935 | @@,# | Brazilian Merchant Voucher Receivables Ltd., 5.911%, due 06/15/11 | | 231,801 | |
231,000 | @@,# | BTM Curacao Holdings NV, 4.760%, due 07/21/15 | | 226,818 | |
151,000 | | Citigroup Capital II, 7.750%, due 12/01/36 | | 158,902 | |
256,000 | # | Corestates Capital Trust I, 8.000%, due 12/15/26 | | 271,447 | |
580,000 | | Countrywide Financial Corp., 4.720%, due 04/11/07 | | 580,578 | |
See Accompanying Notes to Financial Statements
67
ING VP STRATEGIC ALLOCATION | PORTFOLIO OF INVESTMENTS |
BALANCED PORTFOLIO | AS OF DECEMBER 31, 2005 (CONTINUED) |
Principal
Amount | | | | Value | |
| | Diversified Financial Services (continued) | | | |
$ | 120,000 | @@ | Financiere CSFB NV, 4.688%, due 03/29/49 | | $ | 100,200 | |
138,000 | | Fund American Cos, Inc., 5.875%, due 05/15/13 | | 139,457 | |
150,000 | L | Goldman Sachs Group, Inc., 4.620%, due 03/02/10 | | 150,173 | |
143,000 | | HSBC Finance Corp., 5.000%, due 06/30/15 | | 139,314 | |
108,000 | # | HVB Funding Trust III, 9.000%, due 10/22/31 | | 146,119 | |
77,000 | | International Lease Finance Corp., 5.000%, due 04/15/10 | | 76,661 | |
134,000 | L | JPM Capital Trust I, 7.540%, due 01/15/27 | | 141,544 | |
150,000 | | JPM Capital Trust II, 7.950%, due 02/01/27 | | 159,848 | |
272,000 | # | Mangrove Bay Pass-Through Trust, 6.102%, due 07/15/33 | | 270,821 | |
390,000 | | Morgan Stanley, 4.465%, due 02/15/07 | | 390,509 | |
211,000 | @@ | Paribas, 4.625%, due 12/31/49 | | 182,379 | |
93,000 | @@ | Petroleum Export Ltd., 4.623%, due 06/15/10 | | 92,175 | |
127,000 | @@,# | Petroleum Export Ltd/Cayman SPV, 5.265%, due 06/15/11 | | 125,940 | |
317,365 | @@,# | PF Export Receivables Master Trust, 6.436%, due 06/01/15 | | 317,074 | |
279,000 | @@,# | Prefered Term Services, 4.991%, due 03/23/35 | | 279,698 | |
56,000 | | Residential Capital Corp., 6.375%, due 06/30/10 | | 56,957 | |
147,000 | L | Residential Capital Corp., 6.875%, due 06/30/15 | | 156,473 | |
1,000,000 | # | Toll Road Investment, 18.110%, due 02/15/45 | | 122,127 | |
100,000 | # | Twin Reefs Pass-Through Trust, 5.420%, due 12/10/49 | | 100,107 | |
189,000 | @@ | UFJ Finance Aruba AEC, 8.750%, due 12/31/49 | | 205,411 | |
108,000 | # | Wachovia Capital Trust V, 7.965%, due 06/01/27 | | 115,796 | |
| | | | 5,377,419 | |
| | Electric: 0.5% | | | |
232,000 | S | Consumers Energy Co., 4.250%, due 04/15/08 | | 227,346 | |
275,000 | @@,L | Empresa Nacional de Electricidad SA, 8.625%, due 08/01/15 | | 322,671 | |
178,000 | | Entergy Gulf States, Inc., 5.120%, due 08/01/10 | | 173,808 | |
169,000 | | Enterprise Capital Trust II, 5.747%, due 06/30/28 | | 167,731 | |
290,000 | # | Orcal Geothermal, 6.210%, due 12/30/20 | | 291,514 | |
117,000 | # | Power Contract Financing LLC, 6.256%, due 02/01/10 | | 118,787 | |
34,453 | | PPL Montana LLC, 8.903%, due 07/02/20 | | 39,741 | |
71,054 | # | Tenaska Virginia Partners LP, 6.119%, due 03/30/24 | | 73,879 | |
| | | | 1,415,477 | |
| | Food: 0.1% | | | |
$ | 281,000 | | Tyson Foods, Inc., 7.250%, due 10/01/06 | | $ | 285,551 | |
| | | | 285,551 | |
| | Foreign Government Bonds: 0.2% | | | |
600,000 | @@ | KAUP BANK, 6.600%, due 12/28/15 | | 603,000 | |
| | | | 603,000 | |
| | Insurance: 0.2% | | | |
134,000 | + | Prudential Financial, Inc., 4.104%, due 11/15/06 | | 133,148 | |
383,000 | # | Zurich Capital Trust I, 8.376%, due 06/01/37 | | 414,643 | |
| | | | 547,791 | |
| | Media: 0.2% | | | |
110,000 | L | Comcast Corp., 5.650%, due 06/15/35 | | 101,561 | |
133,000 | | Cox Communications, Inc., 6.850%, due 01/15/18 | | 139,846 | |
287,000 | # | News America, Inc., 6.400%, due 12/15/35 | | 290,243 | |
| | | | 531,650 | |
| | Oil & Gas: 0.4% | | | |
120,000 | L | Amerada Hess Corp., 6.650%, due 08/15/11 | | 129,098 | |
148,000 | @@,#,L | Empresa Nacional de Petroleo ENAP, 4.875%, due 03/15/14 | | 142,273 | |
30,000 | @@,# | Empresa Nacional de Petroleo ENAP, 6.750%, due 11/15/12 | | 32,354 | |
101,000 | @@,L | Nexen, Inc., 5.200%, due 03/10/15 | | 100,330 | |
243,000 | # | Pemex Project Funding Master Trust, 5.791%, due 06/15/10 | | 252,113 | |
239,000 | @@,# | Ras Laffan Liquefied Natural Gas Co. Ltd. II, 5.298%, due 09/30/20 | | 237,629 | |
139,000 | @@,# | Tengizchevroil, 6.124%, due 11/15/14 | | 142,058 | |
92,000 | | Valero Energy Corp., 6.125%, due 04/15/07 | | 93,163 | |
| | | | 1,129,018 | |
| | Pipelines: 0.2% | | | |
408,000 | # | Cameron Highway Oil Pipeline, 5.860%, due 12/15/17 | | 412,080 | |
171,000 | # | Kinder Morgan Finance Co. ULC, 5.350%, due 01/05/11 | | 171,431 | |
| | | | 583,511 | |
| | Real Estate: 0.1% | | | |
200,000 | S,L | EOP Operating LP, 7.750%, due 11/15/07 | | 209,595 | |
| | | | 209,595 | |
| | Real Estate Investment Trust: 0.3% | | | |
183,000 | | Health Care Property Investors, Inc., 4.875%, due 09/15/10 | | 178,471 | |
57,000 | S | Liberty Property LP, 6.375%, due 08/15/12 | | 60,168 | |
See Accompanying Notes to Financial Statements
68
ING VP STRATEGIC ALLOCATION | PORTFOLIO OF INVESTMENTS |
BALANCED PORTFOLIO | AS OF DECEMBER 31, 2005 (CONTINUED) |
Principal
Amount | | | | Value | |
| | Real Estate Investment Trust (continued) | | | |
$ | 156,000 | | Liberty Property LP, 7.750%, due 04/15/09 | | $ | 167,787 | |
149,000 | | Simon Property Group LP, 4.875%, due 03/18/10 | | 147,207 | |
276,000 | | Simon Property Group LP, 6.375%, due 11/15/07 | | 282,152 | |
| | | | 835,785 | |
| | Retail: 0.1% | | | |
196,000 | S | May Department Stores Co., 3.950%, due 07/15/07 | | 192,801 | |
| | | | 192,801 | |
| | Savings & Loans: 0.0% | | | |
125,000 | | Great Western Financial, 8.206%, due 02/01/27 | | 133,518 | |
| | | | 133,518 | |
| | Telecommunications: 0.2% | | | |
180,000 | S | BellSouth Corp., 4.200%, due 09/15/09 | | 174,998 | |
96,000 | @@ | Deutsche Telekom International Finance BV, 8.000%, due 06/15/10 | | 108,944 | |
57,000 | | New Cingular Wireless Services, Inc., 8.125%, due 05/01/12 | | 65,942 | |
88,000 | +, S | Sprint Capital Corp., 4.780%, due 08/17/06 | | 87,943 | |
133,000 | @@,L | Telefonos de Mexico SA de CV, 4.750%, due 01/27/10 | | 131,324 | |
163,000 | L | Verizon Global Funding Corp., 5.850%, due 09/15/35 | | 157,619 | |
| | | | 726,770 | |
| | Transportation: 0.0% | | | |
100,000 | @@,#,S | MISC Capital Ltd., 5.000%, due 07/01/09 | | 99,693 | |
| | | | 99,693 | |
| | Total Corporate Bonds/Notes
(Cost $18,763,097) | | 18,705,429 | |
| | | | | |
U.S. GOVERNMENT AGENCY OBLIGATION: 11.0% | | | |
| | Federal Home Loan Bank: 0.4% | | | |
890,000 | | 3.250%, due 12/17/07 | | 866,186 | |
440,000 | L | 4.125%, due 10/19/07 | | 435,618 | |
| | | | 1,301,804 | |
| | Federal Home Loan Mortgage Corporation: 2.1% | | | |
432,000 | L | 3.875%, due 06/15/08 | | 423,687 | |
424,000 | | 4.000%, due 08/17/07 | | 419,204 | |
582,731 | | 4.500%, due 12/15/16 | | 575,709 | |
845,000 | | 4.625%, due 12/19/08 | | 843,557 | |
480,692 | | 5.000%, due 08/15/16 | | 477,300 | |
429,000 | | 5.000%, due 05/15/20 | | 423,299 | |
1,080,610 | | 5.500%, due 11/15/18 | | 1,092,686 | |
91,000 | W | 5.500%, due 01/15/19 | | 91,540 | |
625,000 | W | 5.500%, due 01/01/34 | | 619,336 | |
323,000 | | 5.875%, due 03/21/11 | | 336,955 | |
457,976 | | 6.000%, due 01/15/29 | | 468,587 | |
$ | 141,203 | | 6.000%, due 02/01/29 | | $ | 143,120 | |
206,303 | | 7.000%, due 11/01/31 | | 214,999 | |
| | | | 6,129,979 | |
| | Federal National Mortgage Association: 8.4% | | | |
1,324,000 | | 3.875%, due 02/01/08 | | 1,302,239 | |
858,000 | | 3.875%, due 07/15/08 | | 841,215 | |
254,000 | L | 4.250%, due 09/15/07 | | 252,029 | |
763,000 | W | 4.500%, due 01/15/19 | | 742,494 | |
75,000 | W | 4.500%, due 11/15/36 | | 70,641 | |
852,000 | L | 4.625%, due 10/15/13 | | 843,171 | |
276,456 | | 4.818%, due 08/01/35 | | 272,140 | |
2,775,000 | W | 5.000%, due 01/15/20 | | 2,745,516 | |
5,217,000 | W | 5.000%, due 01/15/36 | | 5,055,596 | |
830,000 | | 5.250%, due 08/01/12 | | 839,117 | |
279,202 | | 5.500%, due 02/01/18 | | 281,109 | |
1,959,000 | W | 5.500%, due 01/15/20 | | 1,971,244 | |
1,957,000 | W | 5.500%, due 01/12/36 | | 1,938,041 | |
529,659 | | 5.500%, due 11/01/33 | | 526,095 | |
4,258 | | 6.000%, due 03/01/17 | | 4,354 | |
125,195 | | 6.000%, due 10/01/18 | | 128,012 | |
399,489 | | 6.000%, due 12/01/18 | | 408,490 | |
71,000 | W | 6.000%, due 01/15/19 | | 72,531 | |
294,998 | | 6.000%, due 04/25/31 | | 303,029 | |
3,397,000 | W | 6.000%, due 01/15/34 | | 3,428,847 | |
94,903 | | 6.500%, due 02/01/28 | | 97,791 | |
229,889 | | 6.500%, due 09/01/32 | | 236,336 | |
828,000 | W | 6.500%, due 01/15/35 | | 849,477 | |
383,000 | | 6.625%, due 11/15/10 | | 414,324 | |
113,940 | | 7.000%, due 02/01/31 | | 118,978 | |
131,050 | | 7.000%, due 06/01/31 | | 136,844 | |
10,310 | | 7.000%, due 08/01/35 | | 10,760 | |
77,930 | | 7.500%, due 09/01/31 | | 81,666 | |
| | | | 23,972,086 | |
| | Government National Mortgage Association: 0.1% | | | |
93,057 | | 7.500%, due 12/15/23 | | 98,585 | |
4,184 | | 7.000%, due 12/15/27 | | 4,401 | |
16,141 | | 7.000%, due 01/15/28 | | 17,284 | |
103,825 | | 7.000%, due 02/15/28 | | 109,147 | |
39,801 | | 6.500%, due 01/15/29 | | 41,662 | |
102,106 | | 6.500%, due 01/15/32 | | 106,725 | |
| | | | 377,804 | |
| | Total U.S. Government Agency Obligations
(Cost $31,830,142) | | 31,781,673 | |
| | | | | |
U.S. TREASURY OBLIGATION: 8.6% | | | |
| | U.S. Treasury Bond: 2.6% | | | |
2,772,000 | L | 5.375%, due 02/15/31 | | 3,114,603 | |
286,000 | L | 5.500%, due 08/15/28 | | 321,672 | |
754,000 | L | 6.000%, due 02/15/26 | | 889,367 | |
1,208,000 | S,L | 6.250%, due 08/15/23 | | 1,442,900 | |
717,000 | L | 7.250%, due 05/15/16 | | 880,622 | |
626,000 | L | 9.250%, due 02/15/16 | | 867,719 | |
| | | | 7,516,883 | |
| | U.S. Treasury Note: 5.9% | | | |
1,045,000 | L | 4.375%, due 11/15/08 | | 1,045,490 | |
12,459,000 | L | 4.375%, due 12/15/10 | | 12,472,630 | |
2,406,000 | L | 4.500%, due 11/15/15 | | 2,426,490 | |
1,107,000 | L | 4.250%, due 11/30/07 | | 1,104,103 | |
| | | | 17,048,713 | |
See Accompanying Notes to Financial Statements
69
ING VP STRATEGIC ALLOCATION | PORTFOLIO OF INVESTMENTS |
BALANCED PORTFOLIO | AS OF DECEMBER 31, 2005 (CONTINUED) |
Principal
Amount | | | | Value | |
| | U.S. Treasury STRIP: 0.1% | | | |
$ | 572,000 | S | 4.600%, due 05/15/16 | | $ | 358,745 | |
| | | | 358,745 | |
| | Total U.S. Treasury Obligations
(Cost $24,731,320) | | 24,924,341 | |
| | | |
ASSET-BACKED SECURITY: 0.9% | | | |
| | Automobile Asset Backed Securities: 0.3% | | | |
83,000 | | Carmax Auto Owner Trust, 4.210%, due 01/15/10 | | 82,131 | |
44,000 | | Honda Auto Receivables Owner Trust, 2.790%, due 03/16/09 | | 43,059 | |
100,000 | | Honda Auto Receivables Owner Trust, 3.820%, due 05/21/10 | | 97,738 | |
81,889 | | Household Automotive Trust, 2.310%, due 04/17/08 | | 81,475 | |
180,000 | | Nissan Auto Receivables Owner Trust, 2.050%, due 03/16/09 | | 175,775 | |
68,000 | | Nissan Auto Receivables Owner Trust, 4.190%, due 07/15/09 | | 67,327 | |
270,000 | | USAA Auto Owner Trust, 2.040%, due 02/16/10 | | 266,269 | |
| | | | 813,774 | |
| | Credit Card Asset Backed Securities: 0.4% | | | |
95,000 | | Bank One Issuance Trust, 4.540%, due 09/15/10 | | 94,123 | |
95,000 | | Capital One Master Trust, 4.900%, due 03/15/10 | | 95,178 | |
640,000 | | Chemical Master Credit Card Trust 1, 7.090%, due 02/15/09 | | 646,940 | |
325,000 | | Citibank Credit Card Issuance Trust, 5.650%, due 06/16/08 | | 326,419 | |
21,000 | | Citibank Credit Card Master Trust I, 5.875%, due 03/10/11 | | 21,654 | |
64,000 | | MBNA Master Credit Card Trust USA, 5.900%, due 08/15/11 | | 66,164 | |
| | | | 1,250,478 | |
| | Home Equity Asset Backed Securities: 0.1% | | | |
29,000 | + | Renaissance Home Equity Loan Trust, 4.456%, due 05/25/35 | | 28,532 | |
28,000 | + | Renaissance Home Equity Loan Trust, 4.723%, due 11/25/35 | | 27,724 | |
110,000 | | Wells Fargo Home Equity Trust, 3.970%, due 09/25/24 | | 107,752 | |
| | | | 164,008 | |
| | Other Asset Backed Securities: 0.1% | | | |
16,012 | | Chase Funding Mortgage Loan, 2.734%, due 09/25/24 | | 15,920 | |
24,000 | | Chase Funding Mortgage Loan, 4.045%, due 05/25/33 | | 23,680 | |
33,000 | | Countrywide Asset-Backed Certificates, 4.493%, due 02/25/36 | | 32,607 | |
73,000 | | Popular ABS Mortgage Pass-Through Trust, 3.735%, due 12/25/34 | | 72,126 | |
$ | 73,000 | | Popular ABS Mortgage Pass-Through Trust, 4.000%, due 12/25/34 | | $ | 71,696 | |
24,000 | | Popular ABS Mortgage Pass-Through Trust, 4.596%, due 11/25/35 | | 23,739 | |
| | | | 239,768 | |
| | Total Asset-Backed Securities
(Cost $2,513,684) | | 2,468,028 | |
| | | | | |
COLLATERALIZED MORTGAGE OBLIGATION: 2.4% | | | |
| | Commercial Mortgage Backed Securities: 1.4% | | | |
33,000 | | Banc of America Commercial Mortgage, Inc., 4.502%, due 07/10/42 | | 32,041 | |
23,000 | | Banc of America Commercial Mortgage, Inc., 4.764%, due 07/10/45 | | 22,703 | |
143,000 | | Banc of America Commercial Mortgage, Inc., 4.877%, due 11/10/42 | | 142,003 | |
7,000 | | Bear Stearns Commercial Mortgage Securities, 4.030%, due 02/13/46 | | 6,749 | |
9,000 | | Capco America Securitization Corp., 6.460%, due 10/15/30 | | 9,374 | |
200,000 | | Commercial Mortgage Pass Through Certificates, 3.600%, due 03/10/39 | | 192,315 | |
795,000 | | CS First Boston Mortgage Securities Corp., 3.861%, due 03/15/36 | | 776,498 | |
68,000 | | CS First Boston Mortgage Securities Corp., 7.528%, due 04/15/62 | | 74,942 | |
380,000 | | DLJ Commercial Mortgage Corp., 6.240%, due 11/12/31 | | 391,888 | |
220,000 | | DLJ Commercial Mortgage Corp., 6.460%, due 03/10/32 | | 229,095 | |
905,000 | | DLJ Commercial Mortgage Corp., 7.300%, due 06/10/32 | | 967,769 | |
197,778 | | GE Capital Commercial Mortgage Corp., 3.752%, due 07/10/39 | | 193,156 | |
10,000 | | GE Capital Commercial Mortgage Corp., 4.865%, due 07/10/39 | | 9,872 | |
199,000 | | JP Morgan Chase Commercial Mortgage Securities Corp., 4.223%, due 01/15/42 | | 193,503 | |
87,000 | | JP Morgan Chase Commercial Mortgage Securities Corp., 4.449%, due 01/12/38 | | 84,609 | |
51,000 | | LB-UBS Commercial Mortgage Trust, 3.992%, due 10/15/29 | | 49,176 | |
57,000 | | LB-UBS Commercial Mortgage Trust, 4.201%, due 12/15/29 | | 55,396 | |
10,000 | | LB-UBS Commercial Mortgage Trust, 4.310%, due 02/15/30 | | 9,724 | |
10,000 | | LB-UBS Commercial Mortgage Trust, 4.510%, due 12/15/29 | | 9,711 | |
See Accompanying Notes to Financial Statements
70
ING VP STRATEGIC ALLOCATION | PORTFOLIO OF INVESTMENTS |
BALANCED PORTFOLIO | AS OF DECEMBER 31, 2005 (CONTINUED) |
Principal
Amount | | | | Value | |
| | Commercial Mortgage Backed Securities (continued) | | | |
$ | 6,000 | | LB-UBS Commercial Mortgage Trust, 4.567%, due 06/15/29 | | $ | 5,936 | |
244,000 | | LB-UBS Commercial Mortgage Trust, 6.226%, due 03/15/26 | | 253,175 | |
232,000 | | LB-UBS Commercial Mortgage Trust, 7.370%, due 08/15/26 | | 252,029 | |
| | | | 3,961,664 | |
| | Whole Loan Collateral CMO: 1.0% | | | |
132,508 | | Banc of America Mortgage Securities, 5.250%, due 11/25/19 | | 132,262 | |
416,796 | | Countrywide Alternative Loan Trust, 5.414%, due 10/25/35 | | 414,324 | |
436,883 | | Countrywide Alternative Loan Trust, 5.500%, due 02/25/25 | | 437,413 | |
219,402 | | Countrywide Home Loan Mortgage Pass Through Trust, 5.000%, due 11/25/18 | | 215,976 | |
97,375 | # | GSMPS Mortgage Loan Trust, 4.729%, due 01/25/35 | | 97,618 | |
359,147 | | MASTR Alternative Loans Trust, 5.500%, due 01/25/20 | | 360,829 | |
907,164 | | MASTR Asset Securitization Trust, 5.500%, due 06/25/33 | | 892,423 | |
280,000 | | Suntrust Alternative Loan Trust, 6.500%, due 12/25/35 | | 285,236 | |
195,180 | | Thornburg Mortgage Securities Trust, 4.749%, due 09/25/34 | | 195,633 | |
| | | | 3,031,714 | |
| | Whole Loan Collateral Support CMO: 0.0% | | | |
101,007 | | Banc of America Mortgage Securities, 5.500%, due 11/25/33 | | 97,596 | |
| | | | 97,596 | |
| | Total Collateralized Mortgage Obligation
(Cost $7,270,384) | | 7,090,974 | |
| | | | | |
MUNICIPAL BOND: 0.1% | | | |
| | Municipal: 0.1% | | | |
70,000 | S | City of New York, 5.000%, due 11/01/08 | | 72,910 | |
70,000 | | City of New York, 5.000%, due 11/01/11 | | 74,913 | |
70,000 | | City of New York, 5.000%, due 11/01/15 | | 75,426 | |
35,000 | | City of New York, 5.000%, due 04/01/35 | | 36,042 | |
65,000 | | Sales Tax Asset Receivables Corp., 4.060%, due 10/15/10 | | 62,884 | |
60,000 | | Sales Tax Asset Receivables Corp., 4.660%, due 10/15/14 | | 58,602 | |
| | Total Municipal Bonds
(Cost $387,758) | | 380,777 | |
| | Total Long-Term Investments:
(Cost $249,464,465) | | 275,119,616 | |
| | | | | |
SHORT-TERM INVESTMENTS: 27.2% | | | |
| | Commercial Paper: 8.5% | | | |
$ | 2,600,000 | | American Express Bank, 4.330%, due 03/16/06 | | $ | 2,600,309 | |
6,500,000 | S | Master Fund LLC, 4.380%, due 1/30/06 | | 6,476,383 | |
3,000,000 | S | Monument Gardens, 4.370%, due 1/23/06 | | 2,991,643 | |
6,700,000 | S | Old Line Funding, 4.340%, due 01/17/06 | | 6,686,301 | |
6,000,000 | | St. Germain Holding Ltd., 4.370%, due 02/01/06 | | 5,976,800 | |
| | Total Commercial Paper(Cost $24,733,808) | | 24,731,436 | |
| | Repurchase Agreement 2.7% | | | |
7,950,000 | S | Goldman Sachs RepurchaseAgreement dated, 12/30/05, 4.250%, due 01/03/06, $7,953,754 to be received upon repurchase (Collateralized by $8,164,000 Federal National Mortgage Association, 3.875%, Market Value plus accrued interest $8,109,169, due 05/15/07) | | 7,950,000 | |
| | Total Repurchase Agreements
(Cost $7,950,000) | | 7,950,000 | |
| | Securities Lending Collateralcc: 16.0% | | | |
46,303,000 | | The Bank of New York Institutional Cash Reserves Fund | | 46,303,000 | |
| | Total Securities Lending
Collateral (Cost $46,303,000) | | 46,303,000 | |
| | Total Short-Term Investments
(Cost $78,986,808) | | 78,984,436 | |
| | Total Investments
In Securities (Cost $328,451,273)* | | 122.1 | % | | | $ | 354,104,052 | |
| | Other Assets and Liabilities-Net | | (22.1 | ) | | | (64,069,003 | ) |
| | Net Assets | | 100.0 | % | | | $ | 290,035,049 | |
| | Certain foreign securities have been fair valued in accordance with procedures approved by the Board of Directors/Trustees (Note 2A). |
@ | | Non-income producing security |
@@ | | Foreign Issuer |
ADR | | American Depositary Receipt |
GDR | | Global Depositary Receipt |
STRIP | | Separate Trading of Registered Interest and Principal of Securities |
+ | | Step-up basis bonds. Interest rates shown reflect current coupon rates. |
# | | Securities with purchases pursuant to Rule 144A, under the Securities Act of 1933 and may not be resold subject to that rule except to qualified institutional buyers. These securities have been determined to be liquid under the guidelines established by the Funds’ Board of Directors/Trustees. |
C | | Bond may be called prior to maturity date. |
cc | | Securities purchased with cash collateral for securities loaned. |
See Accompanying Notes to Financial Statements
71
ING VP STRATEGIC ALLOCATION | PORTFOLIO OF INVESTMENTS |
BALANCED PORTFOLIO | AS OF DECEMBER 31, 2005 (CONTINUED) |
W | | When-issued or delayed delivery security. |
S | | Segregated securities for certain derivatives, when-issued or delayed delivery securities and forward currency exchange contracts. |
L | | Loaned security, a portion or all of the security is on loan at December 31, 2005. |
XX | | Value of securities obtained from one or more dealers making markets in the securities in accordance with the Fund’s valuation procedures. |
* | | Cost for federal income tax purposes is $331,825,699. |
| | Net unrealized appreciation consists of: |
| | Gross Unrealized Appreciation | | $ | 25,141,846 | |
| | Gross Unrealized Depreciation | | (2,863,493 | ) |
| | Net Unrealized Appreciation | | $ | 22,278,353 | |
| | | | | | | | |
Information concerning open futures contracts at December 31, 2005 is shown below:
Long Contracts | | No. of
Contracts | | Notional
Market Value | | Expiration
Date | | Unrealized
Gain (Loss) | |
S&P MidCap 400 | | 1 | | | $ | 74,320 | | 03/17/2006 | | | $ | (978 | ) | |
U.S. Year Treasury Note | | 16 | | | 1,750,500 | | 03/22/2006 | | | | 15,420 | | |
| | | | | $ | 1,824,820 | | | | | $ | 14,442 | | |
| | | | | | | | | | | | | | | | |
See Accompanying Notes to Financial Statements
72
ING VP STRATEGIC ALLOCATION | PORTFOLIO OF INVESTMENTS | |
GROWTH PORTFOLIO | AS OF DECEMBER 31, 2005 | |
Shares | | | | Value | |
COMMON STOCK: 82.3% | | | |
| | Advertising: 0.0% | | | |
2,139 | L | Catalina Marketing Corp. | | $ | 54,224 | |
| | | | 54,224 | |
| | Aerospace/Defense: 2.5% | | | |
1,300 | @,L | Alliant Techsystems, Inc. | | 99,021 | |
780 | @,L | Armor Holdings, Inc. | | 33,267 | |
29,700 | | Boeing Co. | | 2,086,128 | |
318 | | Engineered Support Systems, Inc. | | 13,242 | |
11,000 | | General Dynamics Corp. | | 1,254,550 | |
885 | | Kaman Corp. | | 17,426 | |
19,650 | | Lockheed Martin Corp. | | 1,250,330 | |
27,343 | | Raytheon Co. | | 1,097,821 | |
12,700 | | Rockwell Collins, Inc. | | 590,169 | |
1,015 | @,L | Teledyne Technologies, Inc. | | 29,537 | |
15,200 | | United Technologies Corp. | | 849,832 | |
| | | | 7,321,323 | |
| | Agriculture: 1.8% | | | |
31,050 | | Altria Group, Inc. | | 2,320,056 | |
41,200 | | Archer-Daniels-Midland Co. | | 1,015,992 | |
16,343 | @@ | British American Tobacco PLC | | 364,411 | |
31 | @@ | Japan Tobacco, Inc. | | 452,892 | |
6,200 | L | Reynolds America, Inc. | | 591,046 | |
24,000 | @@ | Swedish Match AB | | 281,779 | |
| | | | 5,026,176 | |
| | Airlines: 0.3% | | | |
1,116 | @,L | Mesa Air Group, Inc. | | 11,673 | |
1,405 | | Skywest, Inc. | | 37,738 | |
50,300 | | Southwest Airlines Co. | | 826,429 | |
| | | | 875,840 | |
| | Apparel: 0.5% | | | |
26,800 | @ | Coach, Inc. | | 893,512 | |
1,050 | @,L | Gymboree Corp. | | 24,570 | |
792 | | K-Swiss, Inc. | | 25,692 | |
2,000 | | Polo Ralph Lauren Corp. | | 112,280 | |
985 | @ | Quiksilver, Inc. | | 13,632 | |
2,400 | @ | Timberland Co. | | 78,120 | |
6,800 | | VF Corp. | | 376,312 | |
420 | | Wolverine World Wide, Inc. | | 9,433 | |
| | | | 1,533,551 | |
| | Auto Manufacturers: 0.7% | | | |
9,694 | @@ | DaimlerChrysler AG | | 491,587 | |
123,600 | L | Ford Motor Co. | | 954,192 | |
588 | | Oshkosh Truck Corp. | | 26,219 | |
8,100 | @@ | Volvo AB | | 381,459 | |
| | | | 1,853,457 | |
| | Auto Parts & Equipment: 0.4% | | | |
13,200 | @,L | Goodyear Tire & Rubber Co. | | 229,416 | |
3,700 | @@ | Magna International, Inc. | | 266,062 | |
1,900 | L | Modine Manufacturing Co. | | 61,921 | |
10,800 | @@ | NOK Corp. | | 292,445 | |
20,000 | @@ | Sumitomo Rubber Industries, Inc. | | 285,017 | |
| | | | 1,134,861 | |
| | Banks: 6.9% | | | |
72,418 | @@ | Banca Intesa S.p.A. | | $ | 382,588 | |
8,900 | @@,L | Banco Itau Holding Financeira SA ADR | | 213,778 | |
99,400 | L | Bank of America Corp. | | 4,587,310 | |
1,800 | | Bank of Hawaii Corp. | | 92,772 | |
23,400 | @@ | Bank of Ireland | | 366,492 | |
2,500 | @@ | Bank of Ireland | | 39,171 | |
29,500 | | BB&T Corp. | | 1,236,345 | |
7,800 | @@ | BNP Paribas | | 627,790 | |
856 | L | Central Pacific Financial Corp. | | 30,748 | |
1,210 | L | Chittenden Corp. | | 33,650 | |
11,900 | | Comerica, Inc. | | 675,444 | |
13,700 | @@ | Commerzbank AG | | 422,458 | |
37,000 | @@ | DBS Group Holdings Ltd. | | 366,549 | |
4,622 | @@ | Deutsche Bank AG | | 445,644 | |
431 | L | East-West Bancorp, Inc. | | 15,727 | |
1,560 | | Fremont General Corp. | | 36,239 | |
2,500 | | Greater Bay Bancorp | | 64,050 | |
45,165 | @@ | HBOS PLC | | 768,889 | |
340 | | Hudson United Bancorp | | 14,171 | |
9,400 | @@ | ICICI Bank Ltd. ADR | | 270,720 | |
5,900 | @@ | KBC Bancassurance Holding | | 547,248 | |
2,312 | | Mercantile Bankshares Corp. | | 130,489 | |
49 | @@ | Mitsubishi Tokyo Financial Group, Inc. | | 666,733 | |
72 | @@ | Mizuho Financial Group, Inc. | | 571,016 | |
2,530 | @@ | OTP Bank Rt GDR | | 165,968 | |
17,508 | | PNC Financial Services Group, Inc. | | 1,082,520 | |
26,325 | @@ | Royal Bank of Scotland Group PLC | | 792,688 | |
578 | | South Financial Group, Inc. | | 15,918 | |
38,000 | @@ | Sumitomo Trust & Banking Co., Ltd. | | 387,152 | |
21,900 | @@ | SunCorp.-Metway Ltd. | | 321,213 | |
8,240 | @@ | UBS AG | | 780,901 | |
26,350 | | US BanCorp. | | 787,602 | |
22,600 | | Wachovia Corp. | | 1,194,636 | |
25,250 | | Wells Fargo & Co. | | 1,586,457 | |
500 | L | Whitney Holding Corp. | | 13,780 | |
2,340 | | Wilmington Trust Corp. | | 91,049 | |
| | | | 19,825,905 | |
| | Beverages: 2.4% | | | |
64,800 | | Coca-Cola Co. | | 2,612,088 | |
38,800 | @@ | Diageo PLC | | 559,496 | |
10,400 | | Pepsi Bottling Group, Inc. | | 297,544 | |
49,800 | | PepsiCo, Inc. | | 2,942,184 | |
22,221 | @@ | SABMiller PLC | | 404,025 | |
| | | | 6,815,337 | |
| | Biotechnology: 0.5% | | | |
18,450 | @ | Amgen, Inc. | | 1,454,967 | |
2,730 | @ | Savient Pharmaceuticals, Inc. | | 10,210 | |
| | | | 1,465,177 | |
| | Building Materials: 0.3% | | | |
26,000 | @@ | Asahi Glass Co. Ltd. | | 334,699 | |
570 | @,L | Drew Industries, Inc. | | 16,068 | |
935 | | Florida Rock Industries, Inc. | | 45,871 | |
4,200 | @@ | Lafarge SA | | 376,294 | |
See Accompanying Notes to Financial Statements
73
ING VP STRATEGIC ALLOCATION | PORTFOLIO OF INVESTMENTS | |
GROWTH PORTFOLIO | AS OF DECEMBER 31, 2005 (CONTINUED) | |
Shares | | | | Value | |
| | Building Materials: (continued) | | | |
450 | L | Lennox International, Inc. | | $ | 12,690 | |
1,900 | | Martin Marietta Materials, Inc. | | 145,768 | |
| | | | 931,390 | |
| | Chemicals: 1.3% | | | |
3,300 | | Chemtura Corp. | | 41,910 | |
17,750 | | Dow Chemical Co. | | 777,805 | |
16,850 | | EI Du Pont de Nemours & Co. | | 716,125 | |
7,310 | | Lyondell Chemical Co. | | 174,124 | |
360 | | Penford Corp. | | 4,392 | |
15,600 | | PPG Industries, Inc. | | 903,240 | |
8,500 | @@,# | Reliance Industries Ltd. GDR | | 336,005 | |
60,000 | @@ | Sumitomo Chemical Co., Ltd. | | 411,472 | |
3,800 | @@ | Umicore | | 447,225 | |
| | | | 3,812,298 | |
| | Coal: 0.0% | | | |
200 | L | Massey Energy Co. | | 7,574 | |
1,400 | | Peabody Energy Corp. | | 115,388 | |
| | | | 122,962 | |
| | Commercial Services: 1.0% | | | |
670 | L | Administaff, Inc. | | 28,174 | |
2,200 | @,L | Alliance Data Systems Corp. | | 78,320 | |
3,130 | @,L | Career Education Corp. | | 105,544 | |
460 | @ | Consolidated Graphics, Inc. | | 21,776 | |
1,234 | | Corporate Executive Board Co. | | 110,690 | |
260 | | CPI Corp. | | 4,865 | |
2,615 | @ | Education Management Corp. | | 87,629 | |
10,200 | | Equifax, Inc. | | 387,804 | |
22,600 | | H&R Block, Inc. | | 554,830 | |
900 | | Manpower, Inc. | | 41,850 | |
19,750 | | McKesson Corp. | | 1,018,903 | |
932 | | Pharmaceutical Product Development, Inc. | | 57,737 | |
375 | | Pre-Paid Legal Services, Inc. | | 14,329 | |
95,400 | @@ | Rentokil Initial Plc | | 268,347 | |
2,360 | @,L | Spherion Corp. | | 23,624 | |
360 | @ | Vertrue, Inc. | | 12,719 | |
| | | | 2,817,141 | |
| | Computers: 4.1% | | | |
1,210 | | Agilysys, Inc. | | 22,046 | |
28,100 | @ | Apple Computer, Inc. | | 2,020,109 | |
235 | @,L | CACI International, Inc. | | 13,484 | |
6,299 | @ | Cadence Design Systems, Inc. | | 106,579 | |
3,700 | @ | Ceridian Corp. | | 91,945 | |
1,175 | @ | Cognizant Technology Solutions Corp. | | 59,161 | |
76,250 | @ | Dell, Inc. | | 2,286,738 | |
1,600 | @,L | DST Systems, Inc. | | 95,856 | |
101,400 | | EMC Corp. | | 1,381,068 | |
270 | L | Factset Research Systems, Inc. | | 11,113 | |
86,750 | | Hewlett-Packard Co. | | 2,483,653 | |
1,300 | L | Imation Corp. | | 59,891 | |
23,000 | | International Business Machines Corp. | | 1,890,600 | |
275 | @,L | Kronos, Inc. | | 11,512 | |
1,090 | @,L | Manhattan Associates, Inc. | | 22,323 | |
859 | @,L | Micros Systems, Inc. | | 41,507 | |
705 | L | MTS Systems Corp. | | 24,421 | |
2,000 | | Reynolds & Reynolds Co. | | 56,140 | |
3,120 | @,L | Sandisk Corp. | | $ | 195,998 | |
4,020 | @,L | Synopsys, Inc. | | 80,641 | |
650 | L | Talx Corp. | | 29,712 | |
15,034 | @@ | Tietoenator OYJ | | 547,432 | |
5,682 | @,L | Western Digital Corp. | | 105,742 | |
| | | | 11,637,671 | |
| | Cosmetics/Personal Care: 1.0% | | | |
51,450 | | Procter & Gamble Co. | | 2,977,926 | |
| | | | 2,977,926 | |
| | Distribution/Wholesale: 0.4% | | | |
920 | @,L | Brightpoint, Inc. | | 25,512 | |
366 | L | Building Materials Holding Corp. | | 24,965 | |
12,300 | | Genuine Parts Co. | | 540,216 | |
530 | L | Hughes Supply, Inc. | | 19,001 | |
385 | | SCP Pool Corp. | | 14,330 | |
41,000 | @@ | Sumitomo Corp. | | 530,181 | |
760 | @,L | United Stationers, Inc. | | 36,860 | |
| | | | 1,191,065 | |
| | Diversified Financial Services: 6.1% | | | |
18,100 | | American Express Co. | | 931,426 | |
68,400 | | Charles Schwab Corp. | | 1,003,428 | |
77,400 | | Citigroup, Inc. | | 3,756,222 | |
13,800 | | Fannie Mae | | 673,578 | |
16,500 | | Goldman Sachs Group, Inc. | | 2,107,215 | |
118,000 | @@ | Hong Kong Exchanges and Clearing Ltd. | | 489,274 | |
2,400 | L | IndyMac Bancorp, Inc. | | 93,648 | |
51,300 | | JPMorgan Chase & Co. | | 2,036,097 | |
1,252 | | Legg Mason, Inc. | | 149,852 | |
12,200 | | Lehman Brothers Holdings, Inc. | | 1,563,674 | |
32,450 | | Merrill Lynch & Co., Inc. | | 2,197,839 | |
38,550 | | Morgan Stanley | | 2,187,327 | |
550 | @,L | Portfolio Recovery Associates, Inc. | | 25,542 | |
1 | | Raymond James Financial, Inc. | | 38 | |
1,670 | @@ | SFCG Co,. Ltd. | | 403,777 | |
720 | @,L | World Acceptance, Corp. | | 20,520 | |
| | | | 17,639,457 | |
| | Electric: 1.7% | | | |
13,700 | | Constellation Energy Group, Inc. | | 789,120 | |
5,600 | | Dominion Resources, Inc. | | 432,320 | |
22,400 | | Edison International | | 976,864 | |
17,000 | @@ | Fortum OYJ | | 317,589 | |
6,000 | @@ | RWE AG | | 439,888 | |
2,035 | | SCANA Corp. | | 80,138 | |
12,500 | | Southern Co. | | 431,625 | |
25,500 | | TXU Corp. | | 1,279,845 | |
2,100 | | Wisconsin Energy Corp. | | 82,026 | |
| | | | 4,829,415 | |
| | Electrical Components & Equipment: 0.7% | | | |
2,400 | | Ametek, Inc. | | 102,096 | |
18,895 | | Emerson Electric Co. | | 1,411,457 | |
28,000 | @@ | Sumitomo Electric Industries Ltd. | | 424,958 | |
| | | | 1,938,511 | |
| | Electronics: 0.9% | | | |
29,400 | @ | Agilent Technologies, Inc. | | 978,726 | |
800 | | Amphenol Corp. | | 35,408 | |
See Accompanying Notes to Financial Statements
74
ING VP STRATEGIC ALLOCATION | PORTFOLIO OF INVESTMENTS | |
GROWTH PORTFOLIO | AS OF DECEMBER 31, 2005 (CONTINUED) | |
Shares | | | | Value | |
| | Electronics: (continued) | | | |
2,974 | @ | Arrow Electronics, Inc. | | $ | 95,257 | |
3,786 | @,L | Avnet, Inc. | | 90,637 | |
390 | | Brady Corp. | | 14,110 | |
940 | @,L | Coherent, Inc. | | 27,899 | |
920 | @,L | Cymer, Inc. | | 32,669 | |
605 | @,L | Flir Systems, Inc. | | 13,510 | |
11,600 | @@ | Hoya Corp. | | 416,612 | |
704 | @,L | Itron, Inc. | | 28,188 | |
20,100 | @@ | Koninklijke Philips Electronics NV | | 621,970 | |
69,305 | @,L | Solectron Corp. | | 253,656 | |
470 | @ | Trimble Navigation Ltd. | | 16,680 | |
1,574 | @,L | Varian, Inc. | | 62,629 | |
| | | | 2,687,951 | |
| | Energy-Alternate Sources: 0.0% | | | |
1,030 | @,L | Headwaters, Inc. | | 36,503 | |
| | | | 36,503 | |
| | Engineering & Construction: 0.5% | | | |
7,300 | @@ | Bouygues | | 355,455 | |
6,500 | | Fluor Corp. | | 502,190 | |
610 | @,L | Shaw Group, Inc. | | 17,745 | |
77,000 | @@ | Taisei Corp. | | 348,278 | |
370 | @ | URS Corp. | | 13,916 | |
3,800 | @@ | Vinci SA | | 326,097 | |
| | | | 1,563,681 | |
| | Entertainment: 0.3% | | | |
42,742 | @@ | Aristocrat Leisure Ltd. | | 384,177 | |
65,000 | @@ | Hilton Group PLC | | 405,171 | |
| | | | 789,348 | |
| | Environmental Control: 0.0% | | | |
1,410 | | Republic Services, Inc. | | 52,946 | |
370 | @,L | Waste Connections, Inc. | | 12,750 | |
| | | | 65,696 | |
| | Food: 0.7% | | | |
485 | | Corn Products International, Inc. | | 11,587 | |
1,700 | @ | Dean Foods Co. | | 64,022 | |
1,115 | L | Flowers Foods, Inc. | | 30,729 | |
22,629 | | General Mills, Inc. | | 1,116,062 | |
2,949 | | Hormel Foods Corp. | | 96,373 | |
414 | L | Nash Finch Co. | | 10,549 | |
890 | @,L | Performance Food Group Co. | | 25,249 | |
657 | @,L | Ralcorp Holdings, Inc. | | 26,221 | |
9,155 | | Supervalu, Inc. | | 297,354 | |
45,300 | @@ | Unilever PLC | | 449,310 | |
| | | | 2,127,456 | |
| | Forest Products & Paper: 0.1% | | | |
10,154 | L | Louisiana-Pacific Corp. | | 278,930 | |
| | | | 278,930 | |
| | Gas: 0.7% | | | |
2,388 | | Atmos Energy Corp. | | 62,470 | |
117,600 | @@ | Centrica PLC | | 514,126 | |
810 | | Energen Corp. | | 29,419 | |
3,300 | | Nicor, Inc. | | 129,723 | |
91,000 | @@ | Osaka Gas Co. Ltd | | 313,526 | |
20,307 | | Sempra Energy | | 910,566 | |
3,040 | | UGI Corp. | | $ | 62,624 | |
3,800 | | WGL Holdings, Inc. | | 114,228 | |
| | | | 2,136,682 | |
| | Healthcare-Products: 1.5% | | | |
1,900 | | Beckman Coulter, Inc. | | 108,110 | |
345 | | Cooper Cos., Inc. | | 17,698 | |
2,308 | | Dentsply International, Inc. | | 123,917 | |
685 | @ | Haemonetics Corp. | | 33,469 | |
1,040 | @,L | Hologic, Inc. | | 39,437 | |
257 | @ | Idexx Laboratories, Inc. | | 18,499 | |
1,300 | @,L | Immucor, Inc. | | 30,368 | |
44,550 | | Johnson & Johnson | | 2,677,455 | |
17,800 | | Medtronic, Inc. | | 1,024,746 | |
300 | | Mentor Corp. | | 13,824 | |
550 | @,L | Resmed, Inc. | | 21,070 | |
1,386 | @ | Respironics, Inc. | | 51,379 | |
1,400 | L | Varian Medical Systems, Inc. | | 70,476 | |
248 | | Vital Signs, Inc. | | 10,619 | |
| | | | 4,241,067 | |
| | Healthcare-Services: 2.4% | | | |
13,900 | | Aetna, Inc. | | 1,310,909 | |
17,200 | @,@@ | Capio AB | | 305,718 | |
2,700 | @ | Community Health Systems, Inc. | | 103,518 | |
11,650 | @ | Coventry Health Care, Inc. | | 663,584 | |
4,700 | @@ | Fresenius Medical Care AG | | 492,600 | |
2,900 | @ | Health Net, Inc. | | 149,495 | |
11,500 | @ | Humana, Inc. | | 624,795 | |
2,880 | @,L | Lincare Holdings, Inc. | | 120,701 | |
1,355 | @,L | Odyssey HealthCare, Inc. | | 25,257 | |
520 | @,L | Pediatrix Medical Group, Inc. | | 46,056 | |
550 | @,L | Sierra Health Services | | 43,978 | |
1,110 | @,L | United Surgical Partners International, Inc. | | 35,686 | |
18,900 | | UnitedHealth Group, Inc. | | 1,174,446 | |
23,200 | @ | WellPoint, Inc. | | 1,851,128 | |
| | | | 6,947,871 | |
| | Home Builders: 0.1% | | | |
240 | | MDC Holdings, Inc. | | 14,875 | |
190 | @,L | Meritage Homes Corp. | | 11,955 | |
80 | @,L | NVR, Inc. | | 56,160 | |
500 | L | Standard-Pacific Corp. | | 18,400 | |
1,300 | @,L | Toll Brothers, Inc. | | 45,032 | |
| | | | 146,422 | |
| | Home Furnishings: 0.0% | | | |
708 | @,L | Audiovox Corp. | | 9,813 | |
240 | | Ethan Allen Interiors, Inc. | | 8,767 | |
725 | L | Harman International Industries, Inc. | | 70,941 | |
| | | | 89,521 | |
| | Household Products/Wares: 0.0% | | | |
3,120 | L | American Greetings | | 68,546 | |
550 | L | CNS, Inc. | | 12,050 | |
| | | | 80,596 | |
| | Housewares: 0.0% | | | |
970 | | Toro Co. | | 42,457 | |
| | | | 42,457 | |
See Accompanying Notes to Financial Statements
75
ING VP STRATEGIC ALLOCATION | PORTFOLIO OF INVESTMENTS | |
GROWTH PORTFOLIO | AS OF DECEMBER 31, 2005 (CONTINUED) | |
Shares | | | | Value | |
| | Insurance: 4.9% | | | |
1,955 | | American Financial Group, Inc. | | $ | 74,896 | |
38,850 | | American International Group, Inc. | | 2,650,735 | |
1,500 | | AmerUs Group Co. | | 85,005 | |
371,000 | @,@@ | China Life Insurance Co. Ltd. | | 327,064 | |
11,500 | | Chubb Corp. | | 1,122,975 | |
655 | @@ | Everest Re Group Ltd. | | 65,729 | |
4,173 | | Fidelity National Financial, Inc. | | 153,525 | |
2,700 | | First American Corp. | | 122,310 | |
15,300 | | Hartford Financial Services Group, Inc. | | 1,314,117 | |
2,372 | | Horace Mann Educators Corp. | | 44,973 | |
710 | L | Infinity Property & Casualty Corp. | | 26,419 | |
505 | | Landamerica Financial Group, Inc. | | 31,512 | |
135,900 | @@ | Legal & General Group PLC | | 284,386 | |
12,300 | | Lincoln National Corp. | | 652,269 | |
32,400 | @ | Metlife, Inc. | | 1,587,600 | |
3,079 | @@ | Muenchener Rueckversicherungs AG | | 415,832 | |
2,700 | | Ohio Casualty Corp. | | 76,464 | |
1,864 | | Old Republic International Corp. | | 48,949 | |
425 | @,L | Philadelphia Consolidated Holding Co. | | 41,093 | |
18,784 | | Principal Financial Group | | 890,925 | |
2,379 | | Protective Life Corp. | | 104,129 | |
21,228 | | Prudential Financial, Inc. | | 1,553,677 | |
31,700 | @@ | QBE Insurance Group Ltd. | | 453,042 | |
2,300 | | Radian Group, Inc. | | 134,757 | |
8,900 | | Safeco Corp. | | 502,850 | |
665 | L | Selective Insurance Group | | 35,311 | |
1,900 | | Stancorp Financial Group, Inc. | | 94,905 | |
575 | L | Stewart Information Services Corp. | | 27,985 | |
7,800 | | Torchmark Corp. | | 433,680 | |
945 | | UICI | | 33,557 | |
2,957 | | WR Berkley Corp. | | 140,812 | |
872 | | Zenith National Insurance Corp. | | 40,217 | |
2,020 | @,@@ | Zurich Financial Services AG | | 428,612 | |
| | | | 14,000,312 | |
| | Internet: 0.7% | | | |
800 | @,L | Checkfree Corp. | | 36,720 | |
15,400 | @,L | eBay, Inc. | | 666,050 | |
137 | @,@@ | kabu.com Securities Co., Ltd. | | 474,633 | |
3,880 | @,L | McAfee, Inc. | | 105,264 | |
1,430 | @,L | Secure Computing Corp. | | 17,532 | |
210 | @,L | Websense, Inc. | | 13,784 | |
18,000 | @,L | Yahoo!, Inc. | | 705,240 | |
| | | | 2,019,223 | |
| | Iron/Steel: 0.5% | | | |
480 | L | Cleveland-Cliffs, Inc. | | 42,514 | |
14,300 | | Nucor Corp. | | 954,096 | |
220 | | Reliance Steel & Aluminum Co. | | 13,446 | |
83,000 | @@ | Sumitomo Metal Industries Ltd. | | 317,701 | |
| | | | 1,327,757 | |
| | Leisure Time: 0.7% | | | |
7,400 | L | Carnival Corp. | | $ | 395,678 | |
19,000 | L | Harley-Davidson, Inc. | | 978,310 | |
1,000 | @,L | Multimedia Games, Inc. | | 9,250 | |
325 | L | Polaris Industries, Inc. | | 16,315 | |
6,000 | @@ | Sankyo Co. Ltd | | 347,015 | |
12,600 | @@ | Yamaha Motor Co., Ltd. | | 329,056 | |
| | | | 2,075,624 | |
| | Machinery-Construction & Mining: 0.0% | | | |
1,020 | L | JLG Industries, Inc. | | 46,573 | |
1,350 | | Joy Global, Inc. | | 54,000 | |
| | | | 100,573 | |
| | Machinery-Diversified: 0.1% | | | |
775 | L | Applied Industrial Technologies, Inc. | | 26,110 | |
400 | L | Briggs & Stratton Corp. | | 15,516 | |
1,180 | L | Cognex Corp. | | 35,506 | |
395 | | IDEX Corp. | | 16,238 | |
1,600 | L | Nordson Corp. | | 64,816 | |
| | | | 158,186 | |
| | Media: 1.8% | | | |
32,000 | @,L | Comcast Corp. | | 830,720 | |
21,200 | | McGraw-Hill Cos, Inc. | | 1,094,556 | |
31,800 | @@ | Mediaset S.p.A. | | 336,152 | |
35,700 | L | News Corp., Inc. | | 555,135 | |
68,450 | | Time Warner, Inc. | | 1,193,768 | |
23,050 | | Viacom, Inc. | | 751,430 | |
12,467 | @@ | Vivendi Universal SA | | 389,062 | |
50 | | Washington Post | | 38,250 | |
| | | | 5,189,073 | |
| | Metal Fabricate/Hardware: 0.1% | | | |
380 | @ | AM Castle & Co. | | 8,299 | |
1,260 | | Commercial Metals Co. | | 47,300 | |
890 | L | Kaydon Corp. | | 28,605 | |
3,260 | | Precision Castparts Corp. | | 168,901 | |
678 | L | Quanex Corp. | | 33,880 | |
660 | | Valmont Industries, Inc. | | 22,084 | |
| | | | 309,069 | |
| | Mining: 0.6% | | | |
13,500 | @@ | Anglo American PLC | | 459,573 | |
28,676 | @@ | BHP Billiton Ltd. | | 477,883 | |
16,300 | L | Freeport-McMoRan Copper & Gold, Inc. | | 876,940 | |
| | | | 1,814,396 | |
| | Miscellaneous Manufacturing: 2.8% | | | |
27,300 | | 3M Co. | | 2,115,750 | |
1,130 | L | Acuity Brands, Inc. | | 35,934 | |
720 | | AO Smith Corp. | | 25,272 | |
797 | | Aptargroup, Inc. | | 41,603 | |
790 | @,L | EnPro Industries, Inc. | | 21,290 | |
158,650 | | General Electric Co. | | 5,560,682 | |
660 | | Roper Industries, Inc. | | 26,077 | |
1,403 | | Teleflex, Inc. | | 91,167 | |
| | | | 7,917,775 | |
See Accompanying Notes to Financial Statements
76
ING VP STRATEGIC ALLOCATION | PORTFOLIO OF INVESTMENTS | |
GROWTH PORTFOLIO | AS OF DECEMBER 31, 2005 (CONTINUED) | |
Shares | | | | Value | |
| | Office Furnishings: 0.0% | | | |
2,678 | | Herman Miller, Inc. | | $ | 75,493 | |
| | | | 75,493 | |
| | Office/Business Equipment: 0.2% | | | |
7,800 | @@ | Canon, Inc. | | 457,492 | |
| | | | 457,492 | |
| | Oil & Gas: 7.7% | | | |
16,100 | | Burlington Resources, Inc. | | 1,387,820 | |
33,702 | | ChevronTexaco Corp. | | 1,913,263 | |
1,590 | L | Cimarex Energy Co. | | 68,386 | |
43,200 | | ConocoPhillips | | 2,513,376 | |
21,750 | | Devon Energy Corp. | | 1,360,245 | |
21,000 | @@ | ENI-Ente Nazionale Idrocarburi S.p.A. | | 584,636 | |
14,500 | | EOG Resources, Inc. | | 1,063,865 | |
133,200 | | Exxon Mobil Corp. | | 7,481,844 | |
1,260 | | Frontier Oil Corp. | | 47,288 | |
1,740 | | Helmerich & Payne, Inc. | | 107,723 | |
4,100 | | Noble Energy, Inc. | | 165,230 | |
3,060 | @@ | Norsk Hydro ASA | | 313,841 | |
2,700 | @@ | Petroleo Brasileiro SA ADR | | 192,429 | |
715 | @,L | Petroleum Development Corp. | | 23,838 | |
2,000 | | Pogo Producing Co. | | 99,620 | |
4,300 | @ | Pride International, Inc. | | 132,225 | |
13,100 | @@ | Repsol YPF SA | | 382,063 | |
31,509 | @@ | Royal Dutch Shell PLC | | 1,007,396 | |
10,200 | L | Sunoco, Inc. | | 799,476 | |
812 | @,L | Swift Energy Co. | | 36,597 | |
3,400 | @@ | Total SA | | 854,245 | |
28,300 | | Valero Energy Corp. | | 1,460,280 | |
1,110 | | Vintage Petroleum, Inc. | | 59,196 | |
| | | | 22,054,882 | |
| | Oil & Gas Services: 0.5% | | | |
100 | @ | Cal Dive International, Inc. | | 3,589 | |
3,100 | @ | Cooper Cameron Corp. | | 128,340 | |
9,050 | @,@@ | Petroleum Geo-Services ASA | | 278,539 | |
8,800 | L | Schlumberger Ltd. | | 854,920 | |
2,100 | L | Tidewater, Inc. | | 93,366 | |
1,020 | @,L | Veritas DGC, Inc. | | 36,200 | |
| | | | 1,394,954 | |
| | Pharmaceuticals: 4.0% | | | |
22,000 | | Abbott Laboratories | | 867,460 | |
1,170 | | Alpharma, Inc. | | 33,357 | |
15,700 | | AmerisourceBergen Corp. | | 649,980 | |
2,600 | @ | Barr Pharmaceuticals, Inc. | | 161,954 | |
10,600 | @,L | Express Scripts, Inc. | | 888,280 | |
41,800 | @@ | GlaxoSmithKline PLC | | 1,052,924 | |
11,400 | @ | Hospira, Inc. | | 487,692 | |
2,300 | @ | IVAX Corp. | | 72,059 | |
17,100 | @ | King Pharmaceuticals, Inc. | | 289,332 | |
430 | | Medicis Pharmaceutical | | 13,782 | |
76,400 | | Merck & Co., Inc. | | 2,430,284 | |
3,400 | @@ | Merck KGaA | | 280,933 | |
1,300 | L | Omnicare, Inc. | | 74,386 | |
110,350 | | Pfizer, Inc. | | 2,573,362 | |
6,320 | @@ | Roche Holding AG | | 944,818 | |
10,400 | @@ | Takeda Chemical Industries Ltd. | | 563,059 | |
1,280 | @ | Theragenics Corp. | | $ | 3,866 | |
330 | @,L | USANA Health Sciences, Inc. | | 12,659 | |
| | | | 11,400,187 | |
| | Pipelines: 0.1% | | | |
2,100 | | Equitable Resources, Inc. | | 77,049 | |
3,420 | | Questar Corp. | | 258,894 | |
| | | | 335,943 | |
| | Real Estate: 0.3% | | | |
35,000 | @@ | Cheung Kong Holdings Ltd. | | 358,265 | |
12,300 | @@ | Leopalace21 Corp. | | 444,739 | |
| | | | 803,004 | |
| | Real Estate Investment Trust: 0.1% | | | |
340 | L | Colonial Properties Trust | | 14,273 | |
1,190 | | Developers Diversified Realty Corp. | | 55,954 | |
750 | | Entertainment Properties Trust | | 30,562 | |
180 | | Essex Property Trust, Inc. | | 16,596 | |
230 | | Kilroy Realty Corp. | | 14,237 | |
445 | | New Century Financial Corp. | | 16,051 | |
2,700 | | Weingarten Realty Investors | | 102,087 | |
| | | | 249,760 | |
| | Retail: 5.2% | | | |
895 | L | Abercrombie & Fitch Co. | | 58,336 | |
1,150 | @,L | Advance Auto Parts | | 49,979 | |
4,640 | L | American Eagle Outfitters | | 106,627 | |
2,055 | | Barnes & Noble, Inc. | | 87,687 | |
23,300 | | Best Buy Co., Inc. | | 1,013,084 | |
570 | | Burlington Coat Factory Warehouse Corp. | | 22,920 | |
1,150 | L | Casey’s General Stores, Inc. | | 28,520 | |
1,080 | L | Cato Corp. | | 23,166 | |
910 | @ | CEC Entertainment, Inc. | | 30,976 | |
4,170 | @,L | Chico’s FAS, Inc. | | 183,188 | |
597 | @,L | Childrens Place | | 29,504 | |
3,465 | | Claire’s Stores, Inc. | | 101,247 | |
10,350 | | Darden Restaurants, Inc. | | 402,408 | |
6,000 | @@ | Don Quijote Co., Ltd. | | 502,243 | |
690 | @,L | Dress Barn, Inc. | | 26,641 | |
21,400 | @@ | Enterprise Inns PLC | | 344,615 | |
43,400 | | Gap, Inc. | | 765,576 | |
680 | @,L | Genesco, Inc. | | 26,377 | |
190 | @,L | Guitar Center, Inc. | | 9,502 | |
1,003 | @,L | Hibbett Sporting Goods, Inc. | | 28,565 | |
32,000 | | Home Depot, Inc. | | 1,295,360 | |
550 | L | IHOP Corp. | | 25,800 | |
16,650 | | JC Penney Co., Inc. | | 925,740 | |
80,707 | @@ | Kingfisher PLC | | 328,409 | |
610 | L | Landry’s Restaurants, Inc. | | 16,293 | |
650 | L | Longs Drug Stores Corp. | | 23,653 | |
11,450 | | Lowe’s Cos., Inc. | | 763,257 | |
50,100 | | McDonald’s Corp. | | 1,689,372 | |
1,187 | @,L | Men’s Wearhouse, Inc. | | 34,945 | |
1,310 | | Michaels Stores, Inc. | | 46,335 | |
15,400 | | Nordstrom, Inc. | | 575,960 | |
3,400 | @ | O’Reilly Automotive, Inc. | | 108,834 | |
3,200 | @,L | Pacific Sunwear of California | | 79,744 | |
610 | @ | Panera Bread Co. | | 40,065 | |
419 | @,L | Papa John’s International, Inc. | | 24,851 | |
3,040 | @,L | Payless Shoesource, Inc. | | 76,304 | |
190 | @ | PF Chang’s China Bistro, Inc. | | 9,430 | |
1,600 | L | Ross Stores, Inc. | | 46,240 | |
See Accompanying Notes to Financial Statements
77
ING VP STRATEGIC ALLOCATION | PORTFOLIO OF INVESTMENTS | |
GROWTH PORTFOLIO | AS OF DECEMBER 31, 2005 (CONTINUED) | |
Shares | | | | Value | |
| | Retail: (continued) | | | |
987 | @,L | Select Comfort Corp. | | $ | 26,994 | |
1,016 | L | Sonic Automotive, Inc. | | 22,636 | |
445 | @,L | Sonic Corp. | | 13,127 | |
46,900 | | Staples, Inc. | | 1,065,099 | |
11,200 | @ | Starbucks Corp. | | 336,112 | |
27,000 | @@ | Takashimaya Co. Ltd. | | 430,922 | |
13,350 | | Target Corp. | | 733,850 | |
935 | @,L | Too, Inc. | | 26,376 | |
280 | @,L | Tractor Supply Co. | | 14,823 | |
36,300 | | Wal-Mart Stores, Inc. | | 1,698,840 | |
8,400 | L | Wendy’s International, Inc. | | 464,184 | |
1,200 | @,L | Williams-Sonoma, Inc. | | 51,780 | |
| | | | 14,836,496 | |
| | Savings & Loans: 0.0% | | | |
920 | @,L | Franklin Bank Corp. | | 16,551 | |
| | | | 16,551 | |
| | Semiconductors: 2.8% | | | |
22,300 | @,@@ | ASML Holding NV | | 445,313 | |
1,020 | @,L | DSP Group, Inc. | | 25,561 | |
29,100 | @ | Freescale Semiconductor, Inc. | | 732,447 | |
150,850 | | Intel Corp. | | 3,765,216 | |
3,190 | @,L | Lam Research Corp. | | 113,819 | |
3,100 | @,L | Micrel, Inc. | | 35,960 | |
4,190 | | Microchip Technology, Inc. | | 134,709 | |
550 | @,L | Microsemi Corp. | | 15,213 | |
25,000 | L | National Semiconductor Corp. | | 649,500 | |
680 | @@,# | Samsung Electronics Co., Ltd. GDR | | 224,362 | |
1,600 | @,L | Silicon Laboratories, Inc. | | 58,656 | |
450 | @,L | Supertex, Inc. | | 19,913 | |
57,800 | | Texas Instruments, Inc. | | 1,853,646 | |
6,708 | @ | Triquint Semiconductor, Inc. | | 29,851 | |
290 | @,L | Varian Semiconductor Equipment Associates, Inc. | | 12,740 | |
| | | | 8,116,906 | |
| | Software: 2.7% | | | |
850 | @,L | Advent Software, Inc. | | 24,574 | |
805 | @,L | Ansys, Inc. | | 34,365 | |
16,400 | | Autodesk, Inc. | | 704,380 | |
27,300 | | Automatic Data Processing, Inc. | | 1,252,797 | |
15,800 | @ | BMC Software, Inc. | | 323,742 | |
240 | @,L | Cerner Corp. | | 21,818 | |
12,000 | @,L | Citrix Systems, Inc. | | 345,360 | |
25,200 | @ | Compuware Corp. | | 226,044 | |
1,892 | @ | D&B Corp. | | 126,688 | |
1,188 | @,L | Filenet Corp. | | 30,710 | |
1,250 | | Global Payments, Inc. | | 58,263 | |
1,282 | @ | Hyperion Solutions Corp. | | 45,921 | |
13,300 | @,L | Intuit, Inc. | | 708,890 | |
131,950 | | Microsoft Corp. | | 3,450,493 | |
839 | @,L | MRO Software, Inc. | | 11,780 | |
27,400 | @ | Novell, Inc. | | 241,942 | |
14,800 | @ | Parametric Technology Corp. | | 90,280 | |
300 | @,L | Quality Systems, Inc. | | 23,028 | |
1,085 | @ | Serena Software, Inc. | | 25,432 | |
625 | @,L | SPSS, Inc. | | 19,331 | |
3,100 | @ | Sybase, Inc. | | 67,766 | |
1,630 | @,L | Transaction Systems Architects, Inc. | | 46,928 | |
| | | | 7,880,532 | |
| | Telecommunications: 4.7% | | | |
260 | L | Anixter International, Inc. | | $ | 10,171 | |
184,800 | | AT&T, Inc. | | 4,525,752 | |
177,500 | @ | Cisco Systems, Inc. | | 3,038,800 | |
815 | L | Commonwealth Telephone Enterprises, Inc. | | 27,523 | |
33,600 | @@ | Deutsche Telekom AG | | 556,550 | |
16,210 | @@ | Elisa Corp. | | 298,943 | |
2,807 | | Harris Corp. | | 120,729 | |
710 | @,L | Intrado, Inc. | | 16,344 | |
87,200 | | Motorola, Inc. | | 1,969,848 | |
76 | @@ | Nippon Telegraph & Telephone Corp. | | 344,635 | |
23,550 | | Qualcomm, Inc. | | 1,014,534 | |
156,900 | @@ | Telecom Italia S.p.A. | | 387,897 | |
133,000 | @@ | Telefonaktiebolaget LM Ericsson | | 457,437 | |
17,400 | @@ | Telekom Austria AG | | 389,016 | |
11,800 | @@ | Telekomunikasi Indonesia Tbk PT ADR | | 281,548 | |
1,450 | | Telephone & Data Systems, Inc. | | 52,244 | |
530 | @ | Tollgrade Communications, Inc. | | 5,793 | |
| | | | 13,497,764 | |
| | Toys/Games/Hobbies: 0.1% | | | |
11,551 | L | Hasbro, Inc. | | 233,099 | |
984 | @,L | Jakks Pacific, Inc. | | 20,605 | |
| | | | 253,704 | |
| | Transportation: 1.7% | | | |
730 | L | Arkansas Best Corp. | | 31,886 | |
1,820 | | CH Robinson Worldwide, Inc. | | 67,395 | |
16,200 | | CSX Corp. | | 822,474 | |
20,400 | @@ | Deutsche Post AG | | 492,701 | |
95 | @@ | East Japan Railway Co. | | 651,606 | |
200 | L | Expeditors International Washington, Inc. | | 13,502 | |
50,000 | @@ | Kawasaki Kisen Kaisha Ltd. | | 313,630 | |
1,163 | | Landstar System, Inc. | | 48,544 | |
24,009 | | Norfolk Southern Corp. | | 1,076,323 | |
1,385 | L | Overseas Shipholding Group | | 69,790 | |
16,300 | | United Parcel Service, Inc. | | 1,224,945 | |
| | | | 4,812,796 | |
| | Trucking & Leasing: 0.0% | | | |
2,154 | | GATX Corp. | | 77,716 | |
| | | | 77,716 | |
| | Water: 0.2% | | | |
10,059 | @@ | Veolia Environnement | | 453,290 | |
| | | | 453,290 | |
| | Total Common Stock
(Cost $202,916,923) | | 236,667,326 | |
| | | |
PREFERRED STOCK 0.2% | | | |
| | Banks: 0.0% | | | |
14 | @ | DG Funding Trust | | 149,188 | |
| | | | 149,188 | |
See Accompanying Notes to Financial Statements
78
ING VP STRATEGIC ALLOCATION | PORTFOLIO OF INVESTMENTS | |
GROWTH PORTFOLIO | AS OF DECEMBER 31, 2005 (CONTINUED) | |
Shares | | | | Value | |
| | Diversified Financial Services: 0.0% | | | |
1,500 | C | National Rural Utilities Cooperative Finance Corp. | | $ | 35,400 | |
| | | | 35,400 | |
| | Household Products/Wares: 0.1% | | | |
2,800 | @@ | Henkel KGaA | | 280,350 | |
| | | | 280,350 | |
| | Insurance: 0.1% | | | |
2,000 | @@ | Aegon NV | | 49,900 | |
5,100 | C | Metlife, Inc. | | 132,192 | |
| | | | 182,092 | |
| | Telecommunications: 0.0% | | | |
46 | @@,# | Centaur Funding Corp. | | 59,599 | |
| | | | 59,599 | |
| | Total Preferred Stock
(Cost $693,181) | | 706,629 | |
| | | | | | |
Principal
Amount | | | | Value | |
| | | | | |
CORPORATE BONDS/NOTES: 2.6% | | | |
| | Aerospace/Defense: 0.1% | | | |
$ | 70,000 | | Northrop Grumman Corp., 7.000%, due 03/01/06 | | $ | 70,243 | |
50,000 | | Northrop Grumman Space & Mission Systems Corp., 7.625%, due 03/15/06 | | 50,178 | |
| | | | 120,421 | |
| | Banks: 0.7% | | | |
160,000 | @@ | Australia & New Zealand Banking Group Ltd., 4.588%, due 10/29/49 | | 137,062 | |
42,000 | @@,# | Banco Santander Chile SA, 4.810%, due 12/09/09 | | 41,899 | |
40,000 | @@ | Banco Santander Chile SA, 7.375%, due 07/18/12 | | 44,590 | |
60,000 | @@ | Bank of Ireland, 4.750%, due 12/29/49 | | 52,073 | |
50,000 | @@ | Bank of Nova Scotia, 4.250%, due 08/21/85 | | 42,319 | |
20,000 | @@ | Bank of Scotland, 3.750%, due 11/30/49 | | 17,300 | |
29,000 | | BankAmerica Capital II, 8.000%, due 12/15/26 | | 30,808 | |
40,000 | @@ | Barclays Bank PLC, 6.278%, due 12/15/49 | | 40,276 | |
58,000 | @@,# | Chuo Mitsui Trust & Banking Co., Ltd./The, 5.506%, due 04/15/49 | | 56,303 | |
36,000 | @@ | Corp Andina de Fomento, 5.125%, due 05/05/15 | | 35,523 | |
34,000 | @@,# | Danske Bank A/S, 5.914%, due 12/29/49 | | 35,632 | |
60,000 | @@ | Den Norske Bank ASA, 4.186%, due 08/29/49 | | 50,550 | |
66,000 | # | Dresdner Funding Trust I, 8.151%, due 06/30/31 | | 81,390 | |
123,000 | @@,# | HBOS PLC, 5.375%, due 11/29/49 | | 122,958 | |
$ | 200,000 | @@ | HSBC Bank PLC, 4.788%, due 06/29/49 | | $ | 168,000 | |
54,000 | | Huntington Capital Trust I, 4.943%, due 02/01/27 | | 51,397 | |
70,000 | @@ | Lloyds TSB Bank PLC, 4.160%, due 08/29/49 | | 60,908 | |
69,000 | | M&T Bank Corp., 3.850%, due 04/01/13 | | 67,446 | |
45,000 | L | Mellon Capital I, 7.720%, due 12/01/26 | | 47,677 | |
40,000 | @@ | Mizuho Financial Group Cayman Ltd., 8.375%, due 12/31/49 | | 43,365 | |
50,000 | @@ | National Australia Bank Ltd., 4.525%, due 10/29/49 | | 42,685 | |
59,000 | | PNC Funding Corp., 4.500%, due 03/10/10 | | 57,928 | |
30,000 | # | Rabobank Capital Funding Trust, 5.254%, due 12/29/49 | | 29,476 | |
51,000 | @@,#,L | Resona Bank Ltd., 5.850%, due 09/01/49 | | 50,882 | |
130,000 | @@ | Royal Bank of Scotland Group PLC, 4.875%, due 12/29/49 | | 113,175 | |
50,000 | @@ | Societe Generale, 4.656%, due 11/29/49 | | 42,880 | |
110,000 | @@ | Standard Chartered PLC, 4.813%, due 07/29/49 | | 88,275 | |
220,000 | @@ | Standard Chartered PLC, 4.875%, due 11/29/49 | | 176,000 | |
32,000 | @@ | Sumitomo Mitsui Banking Corp., 8.150%, due 08/01/49 | | 33,962 | |
19,000 | | Wachovia Corp., 5.500%, due 08/01/35 | | 18,578 | |
70,000 | @@ | Westpac Banking Corp., 4.369%, due 09/30/49 | | 58,856 | |
41,000 | # | Westpac Capital Trust IV, 5.256%, due 12/29/49 | | 40,237 | |
| | | | 1,980,410 | |
| | Beverages: 0.1% | | | |
80,000 | @@ | Cia Brasileira de Bebidas, 8.750%, due 09/15/13 | | 93,900 | |
25,000 | @@ | Coca-Cola HBC Finance BV, 5.125%, due 09/17/13 | | 25,170 | |
| | | | 119,070 | |
| | Building Materials: 0.0% | | | |
80,000 | | Masco Corp., 6.750%, due 03/15/06 | | 80,286 | |
| | | | 80,286 | |
| | Chemicals: 0.0% | | | |
18,000 | @@,#,S | Sociedad Quimica y Minera de Chile SA, 7.700%, due 09/15/06 | | 18,287 | |
10,000 | | Stauffer Chemical, 5.250%, due 04/15/10 | | 8,030 | |
40,000 | | Stauffer Chemical, 7.540%, due 04/15/17 | | 21,463 | |
| | | | 47,780 | |
See Accompanying Notes to Financial Statements
79
ING VP STRATEGIC ALLOCATION | PORTFOLIO OF INVESTMENTS | |
GROWTH PORTFOLIO | AS OF DECEMBER 31, 2005 (CONTINUED) | |
Principal
Amount | | | | Value | |
| | Commercial Services: 0.0% | | | |
$ | 100,000 | | Tulane University of Louisiana, 5.168%, due 11/15/12 | | $ | 100,350 | |
| | | | 100,350 | |
| | Diversified Financial Services: 0.7% | | | |
21,551 | @@,# | Arcel Finance Ltd., 5.984%, due 02/01/09 | | 21,804 | |
62,390 | @@,# | Arcel Finance Ltd., 7.048%, due 09/01/11 | | 66,885 | |
83,807 | @@,# | Brazilian Merchant Voucher Receivables Ltd., 5.911%, due 06/15/11 | | 84,122 | |
90,000 | @@,# | BTM Curacao Holdings NV, 4.760%, due 07/21/15 | | 88,371 | |
58,000 | | Citigroup Capital II, 7.750%, due 12/01/36 | | 61,035 | |
88,000 | # | Corestates Capital Trust I, 8.000%, due 12/15/26 | | 93,310 | |
290,000 | | Countrywide Financial Corp., 4.720%, due 04/11/07 | | 290,289 | |
60,000 | @@ | Financiere CSFB NV, 4.688%, due 03/29/49 | | 50,100 | |
54,000 | | Fund American Cos, Inc., 5.875%, due 05/15/13 | | 54,570 | |
57,000 | L | Goldman Sachs Group, Inc., 4.620%, due 03/02/10 | | 57,066 | |
54,000 | | HSBC Finance Corp., 5.000%, due 06/30/15 | | 52,608 | |
41,000 | # | HVB Funding Trust III, 9.000%, due 10/22/31 | | 55,471 | |
30,000 | | International Lease Finance Corp., 5.000%, due 04/15/10 | | 29,868 | |
52,000 | L | JPM Capital Trust I, 7.540%, due 01/15/27 | | 54,928 | |
58,000 | L | JPM Capital Trust II, 7.950%, due 02/01/27 | | 61,808 | |
104,000 | # | Mangrove Bay Pass-Through Trust, 6.102%, due 07/15/33 | | 103,549 | |
190,000 | | Morgan Stanley, 4.465%, due 02/15/07 | | 190,248 | |
105,000 | @@ | Paribas, 4.625%, due 12/31/49 | | 90,758 | |
36,000 | @@ | Petroleum Export Ltd., 4.623%, due 06/15/10 | | 35,681 | |
63,000 | @@,# | Petroleum Export Ltd/Cayman SPV, 5.265%, due 06/15/11 | | 62,474 | |
122,653 | @@,# | PF Export Receivables Master Trust, 6.436%, due 06/01/15 | | 122,541 | |
100,000 | @@,# | Prefered Term Services, 4.991%, due 03/23/35 | | 100,250 | |
27,000 | | Residential Capital Corp., 6.375%, due 06/30/10 | | 27,462 | |
71,000 | L | Residential Capital Corp., 6.875%, due 06/30/15 | | 75,576 | |
400,000 | # | Toll Road Investment, 18.110%, due 02/15/45 | | 48,851 | |
73,000 | @@ | UFJ Finance Aruba AEC, 8.750%, due 12/31/49 | | 79,339 | |
| | | | 2,058,964 | |
| | Electric: 0.2% | | | |
90,000 | | Consumers Energy Co., 4.250%, due 04/15/08 | | 88,195 | |
$ | 133,000 | @@,L | Empresa Nacional de Electricidad SA, 8.625%, due 08/01/15 | | $ | 156,055 | |
69,000 | | Entergy Gulf States, Inc., 5.120%, due 08/01/10 | | 67,375 | |
66,000 | | Enterprise Capital Trust II, 5.747%, due 06/30/28 | | 65,504 | |
143,000 | # | Orcal Geothermal, 6.210%, due 12/30/20 | | 143,746 | |
40,000 | # | Power Contract Financing LLC, 6.256%, due 02/01/10 | | 40,611 | |
14,094 | | PPL Montana LLC, 8.903%, due 07/02/20 | | 16,258 | |
25,307 | # | Tenaska Virginia Partners LP, 6.119%, due 03/30/24 | | 26,313 | |
| | | | 604,057 | |
| | Food: 0.1% | | | |
110,000 | S | Tyson Foods, Inc., 7.250%, due 10/01/06 | | 111,781 | |
| | | | 111,781 | |
| | Foreign Government Bonds: 0.1% | | | |
300,000 | @@ | KAUP BANK, 6.600%, due 12/28/15 | | 301,500 | |
| | | | 301,500 | |
| | Insurance: 0.1% | | | |
51,000 | + | Prudential Financial, Inc., 4.104%, due 11/15/06 | | 50,676 | |
189,000 | # | Zurich Capital Trust I, 8.376%, due 06/01/37 | | 204,615 | |
| | | | 255,291 | |
| | Media: 0.1% | | | |
53,000 | L | Comcast Corp., 5.650%, due 06/15/35 | | 48,934 | |
52,000 | | Cox Communications, Inc., 6.850%, due 01/15/18 | | 54,677 | |
143,000 | # | News America, Inc., 6.400%, due 12/15/35 | | 144,616 | |
| | | | 248,227 | |
| | Oil & Gas: 0.1% | | | |
47,000 | L | Amerada Hess Corp., 6.650%, due 08/15/11 | | 50,563 | |
56,000 | @@,#,L | Empresa Nacional de Petroleo ENAP, 4.875%, due 03/15/14 | | 53,833 | |
12,000 | @@,# | Empresa Nacional de Petroleo ENAP, 6.750%, due 11/15/12 | | 12,942 | |
39,000 | @@,L | Nexen, Inc., 5.200%, due 03/10/15 | | 38,741 | |
94,000 | # | Pemex Project Funding Master Trust, 5.791%, due 06/15/10 | | 97,525 | |
47,000 | @@,# | Ras Laffan Liquefied Natural Gas Co. Ltd. II, 5.298%, due 09/30/20 | | 46,730 | |
53,000 | @@,# | Tengizchevroil, 6.124%, due 11/15/14 | | 54,166 | |
36,000 | | Valero Energy Corp., 6.125%, due 04/15/07 | | 36,455 | |
| | | | 390,955 | |
See Accompanying Notes to Financial Statements
80
ING VP STRATEGIC ALLOCATION | PORTFOLIO OF INVESTMENTS | |
GROWTH PORTFOLIO | AS OF DECEMBER 31, 2005 (CONTINUED) | |
Principal
Amount | | | | Value | |
| | Pipelines: 0.1% | | | |
$ | 202,000 | # | Cameron Highway Oil Pipeline, 5.860%, due 12/15/17 | | $ | 204,020 | |
84,000 | # | Kinder Morgan Finance Co. ULC, 5.350%, due 01/05/11 | | 84,212 | |
| | | | 288,232 | |
| | Real Estate: 0.0% | | | |
78,000 | L | EOP Operating LP, 7.750%, due 11/15/07 | | 81,742 | |
| | | | 81,742 | |
| | Real Estate Investment Trust: 0.1% | | | |
72,000 | | Health Care Property Investors, Inc., 4.875%, due 09/15/10 | | 70,218 | |
19,000 | | Liberty Property LP, 6.375%, due 08/15/12 | | 20,056 | |
61,000 | | Liberty Property LP, 7.750%, due 04/15/09 | | 65,609 | |
58,000 | | Simon Property Group LP, 4.875%, due 03/18/10 | | 57,302 | |
107,000 | | Simon Property Group LP, 6.375%, due 11/15/07 | | 109,385 | |
| | | | 322,570 | |
| | Retail: 0.0% | | | |
76,000 | | May Department Stores Co., 3.950%, due 07/15/07 | | 74,760 | |
| | | | 74,760 | |
| | Savings & Loans: 0.0% | | | |
47,000 | | Great Western Financial, 8.206%, due 02/01/27 | | 50,203 | |
| | | | 50,203 | |
| | Telecommunications: 0.1% | | | |
68,000 | | BellSouth Corp., 4.200%, due 09/15/09 | | 66,110 | |
37,000 | @@ | Deutsche Telekom International Finance BV, 8.000%, due 06/15/10 | | 41,989 | |
21,000 | | New Cingular Wireless Services, Inc., 8.125%, due 05/01/12 | | 24,295 | |
33,000 | +, S | Sprint Capital Corp., 4.780%, due 08/17/06 | | 32,979 | |
51,000 | @@,L | Telefonos de Mexico SA de CV, 4.750%, due 01/27/10 | | 50,360 | |
79,000 | L | Verizon Global Funding Corp., 5.850%, due 09/15/35 | | 76,392 | |
| | | | 292,125 | |
| | Transportation: 0.0% | | | |
56,000 | @@,#,L | MISC Capital Ltd., 5.000%, due 07/01/09 | | 55,828 | |
| | | | 55,828 | |
| | Total Corporate Bonds/Notes
(Cost $7,603,144) | | 7,584,552 | |
| | | | | |
U.S. GOVERNMENT AGENCY OBLIGATIONS: 5.6% | | | |
| | | | | |
| | Federal Home Loan Bank: 0.2% | | | |
$ | 440,000 | L | 3.250%, due 12/17/07 | | $ | 428,227 | |
220,000 | L | 4.125%, due 10/19/07 | | 217,809 | |
| | | | 646,036 | |
| | Federal Home Loan Mortgage Corporation: 0.8% | | | |
199,882 | | 4.500%, due 12/15/16 | | 197,474 | |
185,000 | | 5.000%, due 05/15/20 | | 182,542 | |
232,530 | | 5.000%, due 08/15/16 | | 230,889 | |
466,824 | | 5.500%, due 11/15/18 | | 472,040 | |
200,365 | | 6.000%, due 01/15/29 | | 205,007 | |
209,000 | L | 3.875%, due 06/15/08 | | 204,978 | |
206,000 | | 4.000%, due 08/17/07 | | 203,670 | |
409,000 | | 4.625%, due 12/19/08 | | 408,301 | |
156,000 | | 5.875%, due 03/21/11 | | 162,740 | |
35,000 | W | 6.000%, due 01/15/36 | | 35,350 | |
| | | | 2,302,991 | |
| | Federal National Mortgage Association: 4.5% | | | |
652,000 | | 3.875%, due 02/01/08 | | 641,284 | |
416,000 | | 3.875%, due 07/15/08 | | 407,862 | |
123,000 | L | 4.250%, due 09/15/07 | | 122,046 | |
847,000 | W | 4.500%, due 01/15/19 | | 824,237 | |
32,000 | W | 4.500%, due 11/15/36 | | 30,140 | |
414,000 | L | 4.625%, due 10/15/13 | | 409,710 | |
97,399 | | 4.818%, due 08/01/35 | | 95,879 | |
1,947,000 | W | 5.000%, due 01/15/20 | | 1,926,313 | |
2,075,000 | W | 5.000%, due 01/15/36 | | 2,010,804 | |
403,000 | | 5.250%, due 08/01/12 | | 407,427 | |
1,870,000 | W | 5.500%, due 01/12/36 | | 1,851,883 | |
1,507,860 | W | 5.500%, due 01/15/20 | | 1,517,284 | |
118,124 | | 5.500%, due 02/01/18 | | 118,931 | |
157,350 | | 5.500%, due 11/01/33 | | 156,291 | |
93,000 | W | 6.000%, due 01/15/19 | | 95,005 | |
131,553 | | 6.000%, due 04/25/31 | | 135,134 | |
1,119,000 | W | 6.000%, due 01/15/34 | | 1,129,491 | |
145,421 | | 6.000%, due 08/01/16 | | 148,698 | |
123,517 | | 6.000%, due 10/01/08 | | 125,444 | |
369,000 | W | 6.500%, due 01/15/35 | | 378,571 | |
53,497 | | 6.500%, due 04/01/27 | | 55,141 | |
186,000 | | 6.625%, due 11/15/10 | | 201,212 | |
171,227 | | 7.000%, due 02/01/31 | | 178,797 | |
2,812 | | 7.000%, due 08/01/35 | | 2,935 | |
13,000 | | 7.000%, due 12/01/27 | | 13,596 | |
36,182 | | 7.500%, due 09/01/31 | | 37,914 | |
| | | | 13,022,029 | |
| | Government National Mortgage Association: 0.1% | | | |
31,597 | | 6.500%, due 01/15/29 | | 33,074 | |
26,803 | | 6.500%, due 01/15/32 | | 28,015 | |
1,432 | | 7.000%, due 01/15/28 | | 1,506 | |
33,381 | | 7.000%, due 02/15/28 | | 35,092 | |
9,930 | | 7.000%, due 04/15/26 | | 10,457 | |
9,855 | | 7.000%, due 04/15/26 | | 10,377 | |
| | | | 118,521 | |
| | Total U.S. Government Agency Obligations
(Cost $16,096,965) | | 16,089,577 | |
See Accompanying Notes to Financial Statements
81
ING VP STRATEGIC ALLOCATION | PORTFOLIO OF INVESTMENTS | |
GROWTH PORTFOLIO | AS OF DECEMBER 31, 2005 (CONTINUED) | |
Principal
Amount | | | | Value | |
U.S. TREASURY OBLIGATIONS: 5.2% | | | |
| | U.S. Treasury Bond: 1.4% | | | |
$ | 2,213,000 | S,L | 5.375%, due 02/15/31 | | $ | 2,486,514 | |
114,000 | L | 5.500%, due 08/15/28 | | 128,219 | |
258,000 | L | 6.000%, due 02/15/26 | | 304,319 | |
245,000 | L | 6.250%, due 08/15/23 | | 292,641 | |
354,000 | L | 7.250%, due 05/15/16 | | 434,784 | |
310,000 | L | 9.250%, due 02/15/16 | | 429,701 | |
| | | | 4,076,178 | |
| | U.S. Treasury Note: 3.7% | | | |
287,000 | L | 4.250%, due 11/30/07 | | 286,249 | |
2,847,000 | L | 4.375%, due 11/15/08 | | 2,848,335 | |
6,419,000 | L | 4.375%, due 12/15/10 | | 6,426,022 | |
1,033,000 | L | 4.500%, due 11/15/15 | | 1,041,797 | |
| | | | 10,602,403 | |
| | U.S. Treasury STRIP: 0.1% | | | |
219,000 | S | 4.600%, due 05/15/16 | | 137,352 | |
| | | | 137,352 | |
| | Total U.S. Treasury Obligations
(Cost $14,679,571) | | 14,815,933 | |
| | | | | |
ASSET-BACKED SECURITIES: 0.3% | | |
| | Automobile Asset Backed Securities: 0.1% | | | |
64,000 | | Carmax Auto Owner Trust, 4.210%, due 01/15/10 | | 63,330 | |
39,000 | | Honda Auto Receivables Owner Trust, 3.820%, due 05/21/10 | | 38,118 | |
52,000 | | Nissan Auto Receivables Owner Trust, 4.190%, due 07/15/09 | | 51,485 | |
120,000 | | USAA Auto Owner Trust, 2.040%, due 02/16/10 | | 118,342 | |
| | | | 271,275 | |
| | Credit Card Asset Backed Securities: 0.1% | | | |
45,000 | | Bank One Issuance Trust, 4.540%, due 09/15/10 | | 44,585 | |
42,000 | | Capital One Master Trust, 4.900%, due 03/15/10 | | 42,079 | |
130,000 | | Chemical Master Credit Card Trust 1, 7.090%, due 02/15/09 | | 131,410 | |
140,000 | | Citibank Credit Card Issuance Trust, 5.650%, due 06/16/08 | | 140,611 | |
12,000 | | Citibank Credit Card Master Trust I, 5.875%, due 03/10/11 | | 12,374 | |
25,000 | | MBNA Master Credit Card Trust USA, 5.900%, due 08/15/11 | | 25,845 | |
| | | | 396,904 | |
| | Home Equity Asset Backed Securities: 0.0% | | | |
16,000 | + | Renaissance Home Equity Loan Trust, 4.456%, due 05/25/35 | | 15,742 | |
$25,000 | + | Renaissance Home Equity Loan Trust, 4.723%, due 11/25/35 | | $24,754 | |
45,000 | | Wells Fargo Home Equity Trust, 3.970%, due 09/25/24 | | 44,080 | |
| | | | 84,576 | |
| | Other Asset Backed Securities: 0.1% | | | |
46,863 | | Chase Funding Mortgage Loan, 2.734%, due 09/25/24 | | 46,596 | |
70,000 | | Chase Funding Mortgage Loan, 4.045%, due 05/25/33 | | 69,065 | |
25,000 | | Countrywide Asset-Backed Certificates, 4.493%, due 02/25/36 | | 24,702 | |
6,000 | | Popular ABS Mortgage Pass-Through Trust, 3.735%, due 12/25/34 | | 5,928 | |
6,000 | | Popular ABS Mortgage Pass-Through Trust, 4.000%, due 12/25/34 | | 5,893 | |
19,000 | | Popular ABS Mortgage Pass-Through Trust, 4.596%, due 11/25/35 | | 18,793 | |
| | | | 170,977 | |
| | Total Asset-Backed Securities
(Cost $942,255) | | 923,732 | |
| | | | | |
COLLATERALIZED MORTGAGE OBLIGATIONS: 0.9% | | | |
| | Commercial Mortgage Backed Securities: 0.5% | | | |
36,000 | | Banc of America Commercial Mortgage, Inc., 4.502%, due 07/10/42 | | 34,954 | |
11,000 | | Banc of America Commercial Mortgage, Inc., 4.611%, due 07/10/43 | | 10,817 | |
25,000 | | Banc of America Commercial Mortgage, Inc., 4.764%, due 07/10/45 | | 24,677 | |
53,000 | | Banc of America Commercial Mortgage, Inc., 4.877%, due 11/10/42 | | 52,630 | |
69,000 | | Bear Stearns Commercial Mortgage Securities, 3.880%, due 08/13/39 | | 66,455 | |
73,000 | | Commercial Mortgage Pass Through Certificates, 3.600%, due 03/10/39 | | 70,195 | |
350,000 | | CS First Boston Mortgage Securities Corp., 3.861%, due 03/15/36 | | 341,855 | |
30,000 | | CS First Boston Mortgage Securities Corp., 7.528%, due 04/15/62 | | 33,063 | |
166,000 | | DLJ Commercial Mortgage Corp., 6.240%, due 11/12/31 | | 171,193 | |
50,000 | | DLJ Commercial Mortgage Corp., 6.460%, due 03/10/32 | | 52,067 | |
400,000 | | DLJ Commercial Mortgage Corp., 7.300%, due 06/10/32 | | 427,743 | |
| | | | | | | |
See Accompanying Notes to Financial Statements
82
ING VP STRATEGIC ALLOCATION | PORTFOLIO OF INVESTMENTS | |
GROWTH PORTFOLIO | AS OF DECEMBER 31, 2005 (CONTINUED) | |
Principal
Amount | | | | Value | |
| | Commercial Mortgage Backed Securities (continued) | | | |
$ | 69,709 | | GE Capital Commercial Mortgage Corp., 3.752%, due 07/10/39 | | $ | 68,080 | |
10,000 | | GE Capital Commercial Mortgage Corp., 4.371%, due 01/10/38 | | 9,735 | |
54,000 | | JP Morgan Chase Commercial Mortgage Securities Corp., 4.223%, due 01/15/42 | | 52,508 | |
28,000 | | JP Morgan Chase Commercial Mortgage Securities Corp., 4.449%, due 01/12/38 | | 27,231 | |
11,000 | | JP Morgan Chase Commercial Mortgage Securities Corp., 5.857%, due 10/12/35 | | 11,391 | |
28,000 | | LB-UBS Commercial Mortgage Trust, 3.992%, due 10/15/29 | | 26,998 | |
19,000 | | LB-UBS Commercial Mortgage Trust, 4.201%, due 12/15/29 | | 18,465 | |
| | | | 1,500,057 | |
| | Whole Loan Collateral CMO: 0.4% | | | |
45,926 | | Banc of America MortgageSecurities, 5.250%, due 11/25/19 | | 45,841 | |
110,619 | | Countrywide Alternative Loan Trust, 5.414%, due 10/25/35 | | 109,963 | |
144,284 | | Countrywide Alternative Loan Trust, 5.500%, due 02/25/25 | | 144,459 | |
77,245 | | Countrywide Home Loan Mortgage Pass Through Trust, 5.000%, due 11/25/18 | | 76,039 | |
32,995 | # | GSMPS Mortgage Loan Trust, 4.729%, due 01/25/35 | | 33,077 | |
122,357 | | MASTR Alternative Loans Trust, 5.500%, due 01/25/20 | | 122,929 | |
310,298 | | MASTR Asset Securitization Trust, 5.500%, due 06/25/33 | | 305,255 | |
110,000 | | Suntrust Alternative Loan Trust, 6.500%, due 12/25/35 | | 112,057 | |
66,630 | | Thornburg Mortgage Securities Trust, 4.749%, due 09/25/34 | | 66,785 | |
| | | | 1,016,405 | |
| | Whole Loan Collateral Support CMO: 0.0% | | | |
40,540 | | Banc of America Mortgage Securities, 5.500%, due 11/25/33 | | 39,171 | |
| | | | 39,171 | |
| | Total Collateralized Mortgage Obligations
(Cost $2,623,574) | | 2,555,633 | |
MUNICIPAL BONDS: 0.1% | | | |
| | Municipal: 0.1% | | | |
15,000 | | City of New York, 5.000%, due 04/01/35 | | 15,447 | |
$ | 25,000 | | City of New York, 5.000%, due 11/01/08 | | $ | 26,039 | |
25,000 | | City of New York, 5.000%, due 11/01/11 | | 26,755 | |
25,000 | | City of New York, 5.000%, due 11/01/15 | | 26,938 | |
20,000 | | Sales Tax Asset Receivables Corp., 4.060%, due 10/15/10 | | 19,349 | |
20,000 | | Sales Tax Asset Receivables Corp., 4.660%, due 10/15/14 | | 19,534 | |
| | Total Municipal Bond
(Cost $136,400) | | 134,062 | |
| | Total Long-Term Investments:
(Cost $245,692,013) | | 279,477,444 | |
SHORT-TERM INVESTMENTS: 20.0% | | | |
| | Commercial Paper: 4.3% | | | |
6,500,000 | S | Master Fund LLC, 4.380%, due 01/30/06 | | 6,476,383 | |
3,000,000 | S | Monument Gardens, 4.370%, due 01/23/06 | | 2,991,643 | |
3,000,000 | | St. Germain Holding Ltd.,4.370%, due 02/01/06 | | 2,988,400 | |
| | Total Commercial Paper
(Cost $12,457,940) | | 12,456,426 | |
| | Repurchase Agreement: 1.8% | | | |
5,246,000 | | Goldman Sachs Repurchase Agreement dated, 12/30/05, 4.250%, due 01/03/06, $5,248,477 to be received upon repurchase (Collaterallized by $5,442,000 Federal Home Loan Mortgage Corporation, 3.625%, Market Value plus accrued interest $5,351,570, due 09/15/08) | | 5,246,000 | |
| | Total Repurchase Agreement
(Cost $5,246,000) | | 5,246,000 | |
| | Securities Lending CollateralCC: 13.9% | | | |
39,924,000 | | The Bank of New York Institutional Cash Reserves Fund | | 39,924,000 | |
| | Total Securities Lending
Collateral (Cost $39,924,000) | | 39,924,000 | |
| | Total Short-Term Investments:
(Cost $57,627,940) | | 57,626,426 | |
| | Total Investments in
Securities (Cost
$303,319,953)* | 117.2 | % | | $ | 337,103,870 | |
| | Other Assets and
Liabilities-Net | (17.2 | ) | | (49,508,913 | ) |
| | Net Assets | 100.0 | % | | $ | 287,594,957 | |
| | Certain foreign securities have been fair valued in accordance with procedures approved by the Board of Directors/Trustees (Note 2A). |
@ | | Non-income producing security |
@@ | | Foreign Issuer |
ADR | | American Depositary Receipt |
See Accompanying Notes to Financial Statements
83
ING VP STRATEGIC ALLOCATION | PORTFOLIO OF INVESTMENTS | |
GROWTH PORTFOLIO | AS OF DECEMBER 31, 2005 (CONTINUED) | |
GDR | | Global Depositary Receipt |
STRIP | | Separate Trading of Registered Interest and Principal of Securities |
+ | | Step-up basis bonds. Interest rates shown reflect current coupon rates. |
# | | Securities with purchases pursuant to Rule 144A, under the Securities Act of 1933 and may not be resold subject to that rule except to qualified institutional buyers. These securities have been determined to be liquid under the guidelines established by the Funds’ Board of Directors/Trustees. |
C | | Bond may be called prior to maturity date. |
cc | | Securities purchased with cash collateral for securities loaned. |
W | | When-issued or delayed delivery security. |
S | | Segregated securities for certain derivatives, when-issued or delayed delivery securities and forward currency exchange contracts. |
L | | Loaned security, a portion or all of the security is on loan at December 31, 2005. |
* | | Cost for federal income tax purposes is $307,120,511. Net unrealized appreciation consists of: |
| | Gross Unrealized Appreciation | | $ | 33,205,722 | |
| | Gross Unrealized Depreciation | | (3,222,363 | ) |
| | Net Unrealized Appreciation | | $ | 29,983,359 | |
| | | | | | | | |
Information concerning open futures contracts at December 31, 2005 is shown below:
Long Contracts | | No. of
Contracts | | Notional
Market Value | | Expiration
Date | | Unrealized
Gain (Loss) |
S&P 500 | | 2 | | | $ 627,400 | | 03/16/2006 | | | $(13,643 | ) |
S&P MidCap 400 | | 2 | | 148,640 | | 03/17/2006 | | (1,955 | ) |
U.S. 10 Year
Treasury Note | | 8 | | | 875,250 | | 03/22/2006 | | | 7,710 | |
| | | | | $1,651,290 | | | | | $ (7,888 | ) |
| | | | | | | | | | | | |
See Accompanying Notes to Financial Statements
84
| PORTFOLIO OF INVESTMENTS | |
ING VP STRATEGIC ALLOCATION INCOME PORTFOLIO | AS OF DECEMBER 31, 2005 | |
Shares | | | | Value | |
COMMON STOCK: 41.0% | | | |
| | | | | |
| | Advertising: 0.0% | | | |
240 | L | Catalina Marketing Corp. | | $ | 6,084 | |
| | | | 6,084 | |
| | Aerospace/Defense: 1.4% | | | |
140 | @,L | Alliant Techsystems, Inc. | | 10,664 | |
200 | @,L | Armor Holdings, Inc. | | 8,530 | |
8,500 | | Boeing Co. | | 597,040 | |
82 | | Engineered Support Systems, Inc. | | 3,414 | |
3,200 | | General Dynamics Corp. | | 364,960 | |
235 | | Kaman Corp. | | 4,627 | |
6,050 | | Lockheed Martin Corp. | | 384,961 | |
8,045 | | Raytheon Co. | | 323,007 | |
3,900 | | Rockwell Collins, Inc. | | 181,233 | |
250 | @,L | Teledyne Technologies, Inc. | | 7,275 | |
4,700 | | United Technologies Corp. | | 262,777 | |
| | | | 2,148,488 | |
| | Agriculture: 0.9% | | | |
8,800 | L | Altria Group, Inc. | | 657,536 | |
12,650 | | Archer-Daniels-Midland Co. | | 311,949 | |
2,878 | @@ | British American Tobacco PLC | | 64,173 | |
6 | @@ | Japan Tobacco, Inc. | | 87,656 | |
1,900 | L | Reynolds America, Inc. | | 181,127 | |
4,200 | @@ | Swedish Match AB | | 49,311 | |
| | | | 1,351,752 | |
| | Airlines: 0.2% | | | |
297 | @,L | Mesa Air Group, Inc. | | 3,107 | |
366 | | Skywest, Inc. | | 9,831 | |
14,700 | | Southwest Airlines Co. | | 241,521 | |
| | | | 254,459 | |
| | Apparel: 0.3% | | | |
8,000 | @ | Coach, Inc. | | 266,720 | |
270 | @,L | Gymboree Corp. | | 6,318 | |
209 | | K-Swiss, Inc. | | 6,780 | |
220 | | Polo Ralph Lauren Corp. | | 12,351 | |
257 | @ | Quiksilver, Inc. | | 3,557 | |
270 | @ | Timberland Co. | | 8,788 | |
2,000 | | VF Corp. | | 110,680 | |
110 | | Wolverine World Wide, Inc. | | 2,471 | |
| | | | 417,665 | |
| | Auto Manufacturers: 0.3% | | | |
1,715 | @@ | DaimlerChrysler AG | | 86,968 | |
35,300 | L | Ford Motor Co. | | 272,516 | |
158 | L | Oshkosh Truck Corp. | | 7,045 | |
1,400 | @@ | Volvo AB | | 65,931 | |
| | | | 432,460 | |
| | Auto Parts & Equipment: 0.1% | | | |
4,100 | @,L | Goodyear Tire & Rubber Co. | | 71,258 | |
600 | @@ | Magna International, Inc. | | 43,145 | |
210 | L | Modine Manufacturing Co. | | 6,844 | |
1,800 | @@ | NOK Corp. | | 48,741 | |
3,306 | @@ | Sumitomo Rubber Industries, Inc. | | 47,113 | |
| | | | 217,101 | |
| | Banks: 3.1% | | | |
12,838 | @@ | Banca Intesa S.p.A. | | 67,824 | |
1,500 | @@,L | Banco Itau Holding Financeira SA ADR | | $ | 36,030 | |
28,550 | L | Bank of America Corp. | | 1,317,582 | |
200 | | Bank of Hawaii Corp. | | 10,308 | |
4,500 | @@ | Bank of Ireland | | 70,503 | |
8,600 | | BB&T Corp. | | 360,426 | |
1,300 | @@ | BNP Paribas | | 104,632 | |
231 | L | Central Pacific Financial Corp. | | 8,298 | |
310 | L | Chittenden Corp. | | 8,621 | |
3,600 | | Comerica, Inc. | | 204,336 | |
2,400 | @@ | Commerzbank AG | | 74,007 | |
6,000 | @@ | DBS Group Holdings Ltd. | | 59,440 | |
819 | @@ | Deutsche Bank AG | | 78,966 | |
120 | L | East-West Bancorp, Inc. | | 4,379 | |
414 | | Fremont General Corp. | | 9,617 | |
280 | | Greater Bay Bancorp | | 7,174 | |
8,028 | @@ | HBOS PLC | | 136,669 | |
100 | | Hudson United Bancorp | | 4,168 | |
1,600 | @@,L | ICICI Bank Ltd. ADR | | 46,080 | |
1,000 | @@ | KBC Bancassurance Holding | | 92,754 | |
251 | | Mercantile Bankshares Corp. | | 14,166 | |
8 | @@ | Mitsubishi Tokyo Financial Group, Inc. | | 108,854 | |
13 | @@ | Mizuho Financial Group, Inc. | | 103,100 | |
470 | @@ | OTP Bank Rt GDR | | 30,832 | |
4,736 | | PNC Financial Services Group, Inc. | | 292,827 | |
4,600 | @@ | Royal Bank of Scotland Group PLC | | 138,513 | |
155 | | South Financial Group, Inc. | | 4,269 | |
7,000 | @@ | Sumitomo Trust & Banking Co., Ltd. | | 71,318 | |
3,900 | @@ | SunCorp.-Metway Ltd. | | 57,202 | |
1,460 | @@ | UBS AG | | 138,363 | |
8,100 | | US BanCorp. | | 242,109 | |
6,750 | | Wachovia Corp. | | 356,805 | |
7,400 | | Wells Fargo & Co. | | 464,942 | |
268 | | Wilmington Trust Corp. | | 10,428 | |
| | | | 4,735,542 | |
| | Beverages: 1.2% | | | |
18,850 | | Coca-Cola Co. | | 759,843 | |
6,900 | @@ | Diageo PLC | | 99,498 | |
3,000 | | Pepsi Bottling Group, Inc. | | 85,830 | |
14,150 | | PepsiCo, Inc. | | 835,982 | |
3,875 | @@ | SABMiller PLC | | 70,456 | |
| | | | 1,851,609 | |
| | Biotechnology: 0.3% | | | |
5,300 | @ | Amgen, Inc. | | 417,958 | |
727 | @ | Savient Pharmaceuticals, Inc. | | 2,719 | |
| | | | 420,677 | |
| | Building Materials: 0.1% | | | |
5,000 | @@,L | Asahi Glass Co. Ltd. | | 64,365 | |
150 | @,L | Drew Industries, Inc. | | 4,229 | |
245 | | Florida Rock Industries, Inc. | | 12,020 | |
700 | @@ | Lafarge SA | | 62,716 | |
210 | | Martin Marietta Materials, Inc. | | 16,111 | |
| | | | 159,441 | |
| | Chemicals: 0.6% | | | |
370 | | Chemtura Corp. | | 4,699 | |
5,150 | | Dow Chemical Co. | | 225,673 | |
4,900 | | EI Du Pont de Nemours & Co. | | 208,250 | |
See Accompanying Notes to Financial Statements
85
| PORTFOLIO OF INVESTMENTS | |
ING VP STRATEGIC ALLOCATION INCOME PORTFOLIO | AS OF DECEMBER 31, 2005 | |
Shares | | | | Value | |
| | Chemicals: (continued) | | | |
811 | | Lyondell Chemical Co. | | $ | 19,318 | |
90 | | Penford Corp. | | 1,098 | |
4,550 | | PPG Industries, Inc. | | 263,445 | |
1,500 | @@,# | Reliance Industries Ltd. GDR | | 59,295 | |
10,000 | @@ | Sumitomo Chemical Co., Ltd. | | 68,579 | |
700 | @@ | Umicore | | 82,384 | |
| | | | 932,741 | |
| | Coal: 0.0% | | | |
160 | | Peabody Energy Corp. | | 13,187 | |
| | | | 13,187 | |
| | Commercial Services: 0.5% | | | |
190 | L | Administaff, Inc. | | 7,990 | |
230 | @,L | Alliance Data Systems Corp. | | 8,188 | |
360 | @,L | Career Education Corp. | | 12,139 | |
122 | @ | Consolidated Graphics, Inc. | | 5,775 | |
143 | | Corporate Executive Board Co. | | 12,827 | |
70 | | CPI Corp. | | 1,310 | |
286 | @ | Education Management Corp. | | 9,584 | |
2,850 | | Equifax, Inc. | | 108,357 | |
6,900 | | H&R Block, Inc. | | 169,395 | |
100 | | Manpower, Inc. | | 4,650 | |
5,800 | | McKesson Corp. | | 299,222 | |
237 | | Pharmaceutical Product Development, Inc. | | 14,682 | |
104 | | Pre-Paid Legal Services, Inc. | | 3,974 | |
16,100 | @@ | Rentokil Initial Plc | | 45,287 | |
630 | @,L | Spherion Corp. | | 6,306 | |
90 | @ | Vertrue, Inc. | | 3,180 | |
| | | | 712,866 | |
| | Computers: 2.1% | | | |
310 | | Agilysys, Inc. | | 5,648 | |
8,100 | @ | Apple Computer, Inc. | | 582,309 | |
67 | @,L | CACI International, Inc. | | 3,844 | |
702 | @ | Cadence Design Systems, Inc. | | 11,878 | |
410 | @ | Ceridian Corp. | | 10,189 | |
137 | @ | Cognizant Technology Solutions Corp. | | 6,898 | |
21,700 | @ | Dell, Inc. | | 650,783 | |
170 | @,L | DST Systems, Inc. | | 10,185 | |
31,000 | | EMC Corp. | | 422,220 | |
70 | L | Factset Research Systems, Inc. | | 2,881 | |
24,950 | | Hewlett-Packard Co. | | 714,319 | |
140 | L | Imation Corp. | | 6,450 | |
6,650 | | International Business Machines Corp. | | 546,630 | |
70 | @,L | Kronos, Inc. | | 2,930 | |
280 | @,L | Manhattan Associates, Inc. | | 5,734 | |
225 | @,L | Micros Systems, Inc. | | 10,872 | |
187 | L | MTS Systems Corp. | | 6,478 | |
230 | L | Reynolds & Reynolds Co. | | 6,456 | |
342 | @,L | Sandisk Corp. | | 21,484 | |
447 | @ | Synopsys, Inc. | | 8,967 | |
170 | | Talx Corp. | | 7,771 | |
2,601 | @@,L | Tietoenator OYJ | | 94,710 | |
641 | @,L | Western Digital Corp. | | 11,929 | |
| | | | 3,151,565 | |
| | Cosmetics/Personal Care: 0.6% | | | |
14,750 | | Procter & Gamble Co. | | 853,730 | |
| | | | 853,730 | |
| | Distribution/Wholesale: 0.2% | | | |
240 | @,L | Brightpoint, Inc. | | $ | 6,655 | |
100 | L | Building Materials Holding Corp. | | 6,821 | |
3,900 | | Genuine Parts Co. | | 171,288 | |
140 | L | Hughes Supply, Inc. | | 5,019 | |
112 | | SCP Pool Corp. | | 4,169 | |
7,000 | @@ | Sumitomo Corp. | | 90,519 | |
200 | @,L | United Stationers, Inc. | | 9,700 | |
| | | | 294,171 | |
| | Diversified Financial Services: 3.3% | | | |
5,600 | S | American Express Co. | | 288,176 | |
19,500 | L | Charles Schwab Corp. | | 286,065 | |
22,500 | | Citigroup, Inc. | | 1,091,925 | |
4,300 | | Fannie Mae | | 209,883 | |
4,700 | | Goldman Sachs Group, Inc. | | 600,237 | |
20,000 | @@ | Hong Kong Exchanges and Clearing Ltd. | | 82,928 | |
270 | L | IndyMac Bancorp, Inc. | | 10,535 | |
15,300 | | JPMorgan Chase & Co. | | 607,257 | |
135 | | Legg Mason, Inc. | | 16,158 | |
3,400 | | Lehman Brothers Holdings, Inc. | | 435,778 | |
9,250 | | Merrill Lynch & Co., Inc. | | 626,503 | |
10,900 | | Morgan Stanley | | 618,466 | |
140 | @,L | Portfolio Recovery Associates, Inc. | | 6,502 | |
290 | @@ | SFCG Co,. Ltd. | | 70,117 | |
190 | @,L | World Acceptance, Corp. | | 5,415 | |
| | | | 4,955,945 | |
| | Electric: 0.8% | | | |
4,000 | | Constellation Energy Group, Inc. | | 230,400 | |
1,700 | | Dominion Resources, Inc. | | 131,240 | |
6,500 | | Edison International | | 283,465 | |
3,000 | @@ | Fortum OYJ | | 56,045 | |
1,000 | @@ | RWE AG | | 73,315 | |
228 | | SCANA Corp. | | 8,979 | |
500 | L | Southern Co. | | 17,265 | |
7,400 | L | TXU Corp. | | 371,406 | |
230 | | Wisconsin Energy Corp. | | 8,984 | |
| | | | 1,181,099 | |
| | Electrical Components & Equipment: 0.3% | | | |
260 | | Ametek, Inc. | | 11,060 | |
5,566 | | Emerson Electric Co. | | 415,780 | |
5,000 | @@ | Sumitomo Electric Industries Ltd. | | 75,885 | |
| | | | 502,725 | |
| | Electronics: 0.4% | | | |
9,000 | @ | Agilent Technologies, Inc. | | 299,610 | |
90 | | Amphenol Corp. | | 3,983 | |
336 | @ | Arrow Electronics, Inc. | | 10,762 | |
419 | @ | Avnet, Inc. | | 10,031 | |
100 | | Brady Corp. | | 3,618 | |
250 | @,L | Coherent, Inc. | | 7,420 | |
250 | @,L | Cymer, Inc. | | 8,878 | |
156 | @,L | Flir Systems, Inc. | | 3,483 | |
2,000 | @@ | Hoya Corp. | | 71,830 | |
176 | @,L | Itron, Inc. | | 7,047 | |
3,500 | @@ | Koninklijke Philips Electronics NV | | 108,303 | |
21,298 | @,L | Solectron Corp. | | 77,951 | |
See Accompanying Notes to Financial Statements
86
| PORTFOLIO OF INVESTMENTS | |
ING VP STRATEGIC ALLOCATION INCOME PORTFOLIO | AS OF DECEMBER 31, 2005 | |
Shares | | | | Value | |
| | Electronics: (continued) | | | |
120 | @ | Trimble Navigation Ltd. | | $ | 4,259 | |
177 | @,L | Varian, Inc. | | 7,043 | |
| | | | 624,218 | |
| | Energy-Alternate Sources: 0.0% | | | |
270 | @,L | Headwaters, Inc. | | 9,569 | |
| | | | 9,569 | |
| | Engineering & Construction: 0.2% | | | |
1,300 | @@ | Bouygues | | 63,300 | |
1,900 | | Fluor Corp. | | 146,794 | |
160 | @,L | Shaw Group, Inc. | | 4,654 | |
13,000 | @@ | Taisei Corp. | | 58,800 | |
100 | @ | URS Corp. | | 3,761 | |
700 | @@,L | Vinci SA | | 60,070 | |
| | | | 337,379 | |
| | Entertainment: 0.1% | | | |
7,680 | @@ | Aristocrat Leisure Ltd. | | 69,030 | |
11,100 | @@ | Hilton Group PLC | | 69,191 | |
| | | | 138,221 | |
| | Environmental Control: 0.0% | | | |
157 | | Republic Services, Inc. | | 5,895 | |
| | | | 5,895 | |
| | Food: 0.4% | | | |
134 | | Corn Products International, Inc. | | 3,201 | |
170 | @ | Dean Foods Co. | | 6,402 | |
295 | L | Flowers Foods, Inc. | | 8,130 | |
6,526 | | General Mills, Inc. | | 321,862 | |
332 | | Hormel Foods Corp. | | 10,850 | |
112 | L | Nash Finch Co. | | 2,854 | |
230 | @ | Performance Food Group Co. | | 6,525 | |
173 | @,L | Ralcorp Holdings, Inc. | | 6,904 | |
3,021 | | Supervalu, Inc. | | 98,122 | |
7,900 | @@ | Unilever PLC | | 78,357 | |
| | | | 543,207 | |
| | Forest Products & Paper: 0.1% | | | |
2,976 | L | Louisiana-Pacific Corp. | | 81,751 | |
| | | | 81,751 | |
| | Gas: 0.3% | | | |
615 | | Atmos Energy Corp. | | 16,088 | |
20,500 | @@ | Centrica PLC | | 89,622 | |
207 | | Energen Corp. | | 7,518 | |
1,000 | | Nicor, Inc. | | 39,310 | |
16,000 | @@ | Osaka Gas Co. Ltd | | 55,125 | |
5,951 | | Sempra Energy | | 266,843 | |
789 | | UGI Corp. | | 16,253 | |
420 | | WGL Holdings, Inc. | | 12,625 | |
| | | | 503,384 | |
| | Healthcare-Products: 0.8% | | | |
220 | | Beckman Coulter, Inc. | | 12,518 | |
90 | | Cooper Cos., Inc. | | 4,617 | |
254 | | Dentsply International, Inc. | | 13,637 | |
182 | @ | Haemonetics Corp. | | 8,893 | |
282 | @,L | Hologic, Inc. | | 10,693 | |
67 | @ | Idexx Laboratories, Inc. | | 4,823 | |
340 | @,L | Immucor, Inc. | | 7,942 | |
12,700 | | Johnson & Johnson | | 763,270 | |
5,500 | | Medtronic, Inc. | | $ | 316,635 | |
80 | | Mentor Corp. | | 3,686 | |
160 | @,L | Resmed, Inc. | | 6,130 | |
350 | @ | Respironics, Inc. | | 12,975 | |
160 | L | Varian Medical Systems, Inc. | | 8,054 | |
57 | | Vital Signs, Inc. | | 2,441 | |
| | | | 1,176,314 | |
| | Healthcare-Services: 1.3% | | | |
4,300 | | Aetna, Inc. | | 405,533 | |
3,000 | @,@@ | Capio AB | | 53,323 | |
320 | @ | Community Health Systems, Inc. | | 12,269 | |
3,750 | @ | Coventry Health Care, Inc. | | 213,600 | |
800 | @@,L | Fresenius Medical Care AG | | 83,847 | |
330 | @ | Health Net, Inc. | | 17,012 | |
3,700 | @ | Humana, Inc. | | 201,021 | |
314 | @ | Lincare Holdings, Inc. | | 13,160 | |
332 | @,L | Odyssey HealthCare, Inc. | | 6,188 | |
130 | @ | Pediatrix Medical Group, Inc. | | 11,514 | |
141 | @,L | Sierra Health Services | | 11,274 | |
290 | @,L | United Surgical Partners International, Inc. | | 9,324 | |
5,501 | | UnitedHealth Group, Inc. | | 341,820 | |
6,900 | @ | WellPoint, Inc. | | 550,551 | |
| | | | 1,930,436 | |
| | Home Builders: 0.0% | | | |
60 | L | MDC Holdings, Inc. | | 3,719 | |
40 | @,L | Meritage Homes Corp. | | 2,517 | |
25 | @,L | NVR, Inc. | | 17,550 | |
130 | L | Standard-Pacific Corp. | | 4,784 | |
140 | @,L | Toll Brothers, Inc. | | 4,850 | |
| | | | 33,420 | |
| | Home Furnishings: 0.0% | | | |
187 | @,L | Audiovox Corp. | | 2,592 | |
60 | | Ethan Allen Interiors, Inc. | | 2,192 | |
82 | L | Harman International Industries, Inc. | | 8,024 | |
| | | | 12,808 | |
| | Household Products/Wares: 0.0% | | | |
349 | L | American Greetings | | 7,668 | |
140 | L | CNS, Inc. | | 3,067 | |
| | | | 10,735 | |
| | Housewares: 0.0% | | | |
257 | | Toro Co. | | 11,249 | |
| | | | 11,249 | |
| | Insurance: 2.4% | | | |
224 | | American Financial Group, Inc. | | 8,581 | |
11,150 | | American International Group, Inc. | | 760,765 | |
170 | L | AmerUs Group Co. | | 9,634 | |
66,000 | @,@@ | China Life Insurance Co. Ltd. | | 58,184 | |
3,400 | | Chubb Corp. | | 332,010 | |
72 | @@ | Everest Re Group Ltd. | | 7,225 | |
476 | | Fidelity National Financial, Inc. | | 17,512 | |
300 | | First American Corp. | | 13,590 | |
4,500 | | Hartford Financial Services Group, Inc. | | 386,505 | |
267 | | Horace Mann Educators Corp. | | 5,062 | |
180 | L | Infinity Property & Casualty Corp. | | 6,698 | |
See Accompanying Notes to Financial Statements
87
| PORTFOLIO OF INVESTMENTS | |
ING VP STRATEGIC ALLOCATION INCOME PORTFOLIO | AS OF DECEMBER 31, 2005 | |
Shares | | | | Value | |
| | Insurance (continued) | | | |
132 | | Landamerica Financial Group, Inc. | | $ | 8,237 | |
24,100 | @@ | Legal & General Group PLC | | 50,432 | |
3,800 | | Lincoln National Corp. | | 201,514 | |
9,350 | L | Metlife, Inc. | | 458,150 | |
542 | @@ | Muenchener Rueckversicherungs AG | | 73,199 | |
310 | L | Ohio Casualty Corp. | | 8,779 | |
224 | | Old Republic International Corp. | | 5,882 | |
112 | @,L | Philadelphia Consolidated Holding Co. | | 10,829 | |
5,531 | | Principal Financial Group | | 262,335 | |
268 | | Protective Life Corp. | | 11,730 | |
6,205 | S | Prudential Financial, Inc. | | 454,144 | |
5,300 | @@,L | QBE Insurance Group Ltd. | | 75,745 | |
260 | L | Radian Group, Inc. | | 15,233 | |
2,727 | | Safeco Corp. | | 154,076 | |
182 | | Selective Insurance Group | | 9,664 | |
210 | | Stancorp Financial Group, Inc. | | 10,490 | |
153 | L | Stewart Information Services Corp. | | 7,447 | |
2,300 | | Torchmark Corp. | | 127,880 | |
238 | | UICI | | 8,451 | |
331 | | WR Berkley Corp. | | 15,762 | |
221 | | Zenith National Insurance Corp. | | 10,193 | |
360 | @,@@ | Zurich Financial Services AG | | 76,386 | |
| | | | 3,662,324 | |
| | Internet: 0.2% | | | |
90 | @ | Checkfree Corp. | | 4,131 | |
4,700 | @,L | eBay, Inc. | | 203,275 | |
24 | @,@@,L | kabu.com Securities Co., Ltd. | | 83,147 | |
427 | @,L | McAfee, Inc. | | 11,585 | |
380 | @,L | Secure Computing Corp. | | 4,659 | |
50 | @,L | Websense, Inc. | | 3,282 | |
| | | | 310,079 | |
| | Iron/Steel: 0.2% | | | |
120 | L | Cleveland-Cliffs, Inc. | | 10,628 | |
4,200 | | Nucor Corp. | | 280,224 | |
60 | | Reliance Steel & Aluminum Co. | | 3,667 | |
14,000 | @@ | Sumitomo Metal Industries Ltd. | | 53,588 | |
| | | | 348,107 | |
| | Leisure Time: 0.3% | | | |
2,100 | L | Carnival Corp. | | 112,287 | |
5,500 | L | Harley-Davidson, Inc. | | 283,195 | |
261 | @,L | Multimedia Games, Inc. | | 2,414 | |
83 | L | Polaris Industries, Inc. | | 4,167 | |
1,000 | @@ | Sankyo Co. Ltd | | 57,836 | |
2,200 | @@ | Yamaha Motor Co., Ltd. | | 57,454 | |
| | | | 517,353 | |
| | Machinery-Construction & Mining: 0.0% | | | |
270 | L | JLG Industries, Inc. | | 12,328 | |
| | | | 12,328 | |
| | Machinery-Diversified: 0.0% | | | |
205 | L | Applied Industrial Technologies, Inc. | | 6,906 | |
120 | L | Briggs & Stratton Corp. | | 4,655 | |
310 | L | Cognex Corp. | | 9,328 | |
113 | | IDEX Corp. | | $ | 4,645 | |
190 | L | Nordson Corp. | | 7,697 | |
| | | | 33,231 | |
| | Media: 1.0% | | | |
9,900 | @,L | Comcast Corp. | | 257,004 | |
6,300 | | McGraw-Hill Cos, Inc. | | 325,269 | |
5,600 | @@ | Mediaset S.p.A. | | 59,197 | |
11,000 | | News Corp., Inc. | | 171,050 | |
20,950 | | Time Warner, Inc. | | 365,368 | |
7,050 | | Viacom, Inc. | | 229,830 | |
2,143 | @@ | Vivendi Universal SA | | 66,877 | |
10 | | Washington Post | | 7,650 | |
| | | | 1,482,245 | |
| | Metal Fabricate/Hardware: 0.0% | | | |
100 | @,L | AM Castle & Co. | | 2,184 | |
330 | | Commercial Metals Co. | | 12,388 | |
230 | L | Kaydon Corp. | | 7,392 | |
364 | | Precision Castparts Corp. | | 18,859 | |
179 | L | Quanex Corp. | | 8,945 | |
170 | | Valmont Industries, Inc. | | 5,688 | |
| | | | 55,456 | |
| | Mining: 0.3% | | | |
2,400 | @@ | Anglo American PLC | | 81,702 | |
4,924 | @@ | BHP Billiton Ltd. | | 82,058 | |
4,700 | L | Freeport-McMoRan Copper & Gold, Inc. | | 252,860 | |
| | | | 416,620 | |
| | Miscellaneous Manufacturing: 1.5% | | | |
7,800 | | 3M Co. | | 604,500 | |
300 | L | Acuity Brands, Inc. | | 9,540 | |
190 | L | AO Smith Corp. | | 6,669 | |
201 | | Aptargroup, Inc. | | 10,492 | |
210 | @,L | EnPro Industries, Inc. | | 5,660 | |
46,050 | | General Electric Co. | | 1,614,053 | |
190 | | Roper Industries, Inc. | | 7,507 | |
163 | | Teleflex, Inc. | | 10,592 | |
| | | | 2,269,013 | |
| | Office Furnishings: 0.0% | | | |
311 | | Herman Miller, Inc. | | 8,767 | |
| | | | 8,767 | |
| | Office/Business Equipment: 0.1% | | | |
1,400 | @@,L | Canon, Inc. | | 82,114 | |
| | | | 82,114 | |
| | Oil & Gas: 3.9% | | | |
4,950 | | Burlington Resources, Inc. | | 426,690 | |
9,827 | | ChevronTexaco Corp. | | 557,879 | |
411 | L | Cimarex Energy Co. | | 17,677 | |
12,500 | | ConocoPhillips | | 727,250 | |
6,300 | | Devon Energy Corp. | | 394,002 | |
3,700 | @@ | ENI-Ente Nazionale Idrocarburi S.p.A. | | 103,007 | |
4,200 | | EOG Resources, Inc. | | 308,154 | |
38,700 | | Exxon Mobil Corp. | | 2,173,779 | |
328 | | Frontier Oil Corp. | | 12,310 | |
193 | | Helmerich & Payne, Inc. | | 11,949 | |
470 | | Noble Energy, Inc. | | 18,941 | |
520 | @@ | Norsk Hydro ASA | | 53,332 | |
500 | @@ | Petroleo Brasileiro SA ADR | | 35,635 | |
See Accompanying Notes to Financial Statements
88
| PORTFOLIO OF INVESTMENTS | |
ING VP STRATEGIC ALLOCATION INCOME PORTFOLIO | AS OF DECEMBER 31, 2005 | |
Shares | | | | Value | |
| | Oil & Gas: (continued) | | | |
196 | @,L | Petroleum Development Corp. | | $ | 6,535 | |
230 | | Pogo Producing Co. | | 11,456 | |
490 | @ | Pride International, Inc. | | 15,068 | |
2,400 | @@,L | Repsol YPF SA | | 69,996 | |
5,609 | @@ | Royal Dutch Shell PLC | | 179,329 | |
3,000 | L | Sunoco, Inc. | | 235,140 | |
213 | @,L | Swift Energy Co. | | 9,600 | |
600 | @@ | Total SA | | 150,749 | |
8,200 | | Valero Energy Corp. | | 423,120 | |
290 | | Vintage Petroleum, Inc. | | 15,466 | |
| | | | 5,957,064 | |
| | Oil & Gas Services: 0.2% | | | |
360 | @ | Cooper Cameron Corp. | | 14,904 | |
1,550 | @,@@ | Petroleum Geo-Services ASA | | 47,706 | |
2,600 | L | Schlumberger Ltd. | | 252,590 | |
240 | L | Tidewater, Inc. | | 10,670 | |
260 | @,L | Veritas DGC, Inc. | | 9,227 | |
| | | | 335,097 | |
| | Pharmaceuticals: 2.0% | | | |
6,900 | | Abbott Laboratories | | 272,067 | |
290 | | Alpharma, Inc. | | 8,268 | |
4,800 | L | AmerisourceBergen Corp. | | 198,720 | |
289 | @ | Barr Pharmaceuticals, Inc. | | 18,002 | |
3,300 | @,L | Express Scripts, Inc. | | 276,540 | |
7,200 | @@ | GlaxoSmithKline PLC | | 181,365 | |
3,500 | @ | Hospira, Inc. | | 149,730 | |
5,300 | @ | King Pharmaceuticals, Inc. | | 89,676 | |
110 | | Medicis Pharmaceutical | | 3,526 | |
22,200 | | Merck & Co., Inc. | | 706,182 | |
600 | @@ | Merck KGaA | | 49,576 | |
140 | L | Omnicare, Inc. | | 8,011 | |
31,600 | | Pfizer, Inc. | | 736,912 | |
1,100 | @@ | Roche Holding AG | | 164,446 | |
1,800 | @@ | Takeda Chemical Industries Ltd. | | 97,453 | |
330 | @ | Theragenics Corp. | | 997 | |
90 | @,L | USANA Health Sciences, Inc. | | 3,452 | |
| | | | 2,964,923 | |
| | Pipelines: 0.0% | | | |
190 | | Equitable Resources, Inc. | | 6,971 | |
372 | | Questar Corp. | | 28,160 | |
| | | | 35,131 | |
| | Real Estate: 0.1% | | | |
6,000 | @@ | Cheung Kong Holdings Ltd. | | 61,417 | |
2,100 | @@ | Leopalace21 Corp. | | 75,931 | |
| | | | 137,348 | |
| | Real Estate Investment Trust: 0.0% | | | |
90 | L | Colonial Properties Trust | | 3,778 | |
130 | | Developers Diversified Realty Corp. | | 6,113 | |
190 | | Entertainment Properties Trust | | 7,743 | |
50 | | Essex Property Trust, Inc. | | 4,610 | |
118 | | New Century Financial Corp. | | 4,256 | |
300 | | Weingarten Realty Investors | | 11,343 | |
| | | | 37,843 | |
| | Retail: 2.6% | | | |
108 | L | Abercrombie & Fitch Co. | | 7,039 | |
135 | @,L | Advance Auto Parts | | 5,867 | |
496 | L | American Eagle Outfitters | | 11,398 | |
239 | | Barnes & Noble, Inc. | | $ | 10,198 | |
6,650 | | Best Buy Co., Inc. | | 289,142 | |
150 | | Burlington Coat Factory Warehouse Corp. | | 6,032 | |
288 | L | Casey’s General Stores, Inc. | | 7,142 | |
281 | L | Cato Corp. | | 6,027 | |
223 | @ | CEC Entertainment, Inc. | | 7,591 | |
453 | @ | Chico’s FAS, Inc. | | 19,900 | |
149 | @,L | Childrens Place | | 7,364 | |
386 | | Claire’s Stores, Inc. | | 11,279 | |
3,200 | L | Darden Restaurants, Inc. | | 124,416 | |
1,000 | @@,L | Don Quijote Co., Ltd. | | 83,707 | |
180 | @,L | Dress Barn, Inc. | | 6,950 | |
3,600 | @@ | Enterprise Inns PLC | | 57,973 | |
12,600 | | Gap, Inc. | | 222,264 | |
180 | @,L | Genesco, Inc. | | 6,982 | |
50 | @,L | Guitar Center, Inc. | | 2,501 | |
266 | @,L | Hibbett Sporting Goods, Inc. | | 7,576 | |
9,550 | | Home Depot, Inc. | | 386,584 | |
140 | L | IHOP Corp. | | 6,567 | |
5,100 | | JC Penney Co., Inc. | | 283,560 | |
13,968 | @@ | Kingfisher PLC | | 56,838 | |
160 | L | Landry’s Restaurants, Inc. | | 4,274 | |
173 | L | Longs Drug Stores Corp. | | 6,295 | |
3,300 | | Lowe’s Cos., Inc. | | 219,978 | |
14,700 | | McDonald’s Corp. | | 495,684 | |
302 | @,L | Men’s Wearhouse, Inc. | | 8,891 | |
160 | | Michaels Stores, Inc. | | 5,659 | |
4,700 | | Nordstrom, Inc. | | 175,780 | |
390 | @ | O’Reilly Automotive, Inc. | | 12,484 | |
360 | @,L | Pacific Sunwear of California | | 8,971 | |
160 | @ | Panera Bread Co. | | 10,509 | |
101 | @,L | Papa John’s International, Inc. | | 5,990 | |
341 | @,L | Payless Shoesource, Inc. | | 8,559 | |
50 | @ | PF Chang’s China Bistro, Inc. | | 2,482 | |
170 | L | Ross Stores, Inc. | | 4,913 | |
253 | @,L | Select Comfort Corp. | | 6,920 | |
273 | L | Sonic Automotive, Inc. | | 6,082 | |
112 | @ | Sonic Corp. | | 3,304 | |
13,300 | | Staples, Inc. | | 302,043 | |
3,400 | @,L | Starbucks Corp. | | 102,034 | |
4,000 | @@ | Takashimaya Co. Ltd. | | 63,840 | |
3,800 | | Target Corp. | | 208,886 | |
252 | @,L | Too, Inc. | | 7,109 | |
60 | @,L | Tractor Supply Co. | | 3,176 | |
10,750 | | Wal-Mart Stores, Inc. | | 503,100 | |
2,500 | | Wendy’s International, Inc. | | 138,150 | |
140 | @,L | Williams-Sonoma, Inc. | | 6,041 | |
| | | | 3,956,051 | |
| | Savings & Loans: 0.0% | | | |
240 | @,L | Franklin Bank Corp. | | 4,318 | |
| | | | 4,318 | |
| | Semiconductors: 1.5% | | | |
4,100 | @,@@ | ASML Holding NV | | 81,874 | |
250 | @,L | DSP Group, Inc. | | 6,265 | |
8,400 | @ | Freescale Semiconductor, Inc. | | 211,428 | |
43,450 | | Intel Corp. | | 1,084,512 | |
346 | @,L | Lam Research Corp. | | 12,345 | |
350 | @,L | Micrel, Inc. | | 4,060 | |
463 | | Microchip Technology, Inc. | | 14,885 | |
140 | @,L | Microsemi Corp. | | 3,872 | |
7,600 | L | National Semiconductor Corp. | | 197,448 | |
See Accompanying Notes to Financial Statements
89
| PORTFOLIO OF INVESTMENTS | |
ING VP STRATEGIC ALLOCATION INCOME PORTFOLIO | AS OF DECEMBER 31, 2005 | |
Shares | | | | Value | |
| | Semiconductors: (continued) | | | |
130 | @@,# | Samsung Electronics Co., Ltd. GDR | | $ | 42,893 | |
180 | @,L | Silicon Laboratories, Inc. | | 6,599 | |
128 | @,L | Supertex, Inc. | | 5,664 | |
16,750 | | Texas Instruments, Inc. | | 537,173 | |
689 | @ | Triquint Semiconductor, Inc. | | 3,066 | |
80 | @,L | Varian Semiconductor Equipment Associates, Inc. | | 3,514 | |
| | | | 2,215,598 | |
| | Software: 1.5% | | | |
94 | @,L | Advent Software, Inc. | | 2,718 | |
220 | @,L | Ansys, Inc. | | 9,392 | |
5,000 | | Autodesk, Inc. | | 214,750 | |
8,300 | | Automatic Data Processing, Inc. | | 380,887 | |
5,000 | @ | BMC Software, Inc. | | 102,450 | |
60 | @,L | Cerner Corp. | | 5,455 | |
3,700 | @,L | Citrix Systems, Inc. | | 106,486 | |
8,800 | @ | Compuware Corp. | | 78,936 | |
214 | @,L | D&B Corp. | | 14,329 | |
297 | @,L | Filenet Corp. | | 7,677 | |
320 | | Global Payments, Inc. | | 14,915 | |
340 | @ | Hyperion Solutions Corp. | | 12,179 | |
3,800 | @,L | Intuit, Inc. | | 202,540 | |
38,450 | | Microsoft Corp. | | 1,005,468 | |
219 | @,L | MRO Software, Inc. | | 3,075 | |
8,300 | @ | Novell, Inc. | | 73,289 | |
5,100 | @ | Parametric Technology Corp. | | 31,110 | |
80 | @,L | Quality Systems, Inc. | | 6,141 | |
271 | @ | Serena Software, Inc. | | 6,352 | |
178 | @,L | SPSS, Inc. | | 5,506 | |
346 | @ | Sybase, Inc. | | 7,564 | |
183 | @,L | Transaction Systems Architects, Inc. | | 5,269 | |
| | | | 2,296,488 | |
| | Telecommunications: 2.4% | | | |
53,600 | | AT&T, Inc. | | 1,312,664 | |
52,050 | @ | Cisco Systems, Inc. | | 891,096 | |
410 | L | Commonwealth Telephone Enterprises, Inc. | | 13,846 | |
6,000 | @@ | Deutsche Telekom AG | | 99,384 | |
2,842 | @@ | Elisa Corp. | | 52,412 | |
318 | | Harris Corp. | | 13,677 | |
180 | @,L | Intrado, Inc. | | 4,144 | |
24,900 | | Motorola, Inc. | | 562,491 | |
13 | @@ | Nippon Telegraph & Telephone Corp. | | 58,951 | |
7,100 | | Qualcomm, Inc. | | 305,868 | |
29,100 | @@ | Telecom Italia S.p.A. | | 71,943 | |
23,000 | @@ | Telefonaktiebolaget LM Ericsson | | 79,106 | |
3,000 | @@ | Telekom Austria AG | | 67,072 | |
2,000 | @@ | Telekomunikasi Indonesia Tbk PT ADR | | 47,720 | |
445 | | Telephone & Data Systems, Inc. | | 16,033 | |
140 | @ | Tollgrade Communications, Inc. | | 1,530 | |
| | | | 3,597,937 | |
| | Toys/Games/Hobbies: 0.0% | | | |
3,629 | L | Hasbro, Inc. | | 73,233 | |
265 | @,L | Jakks Pacific, Inc. | | 5,549 | |
| | | | 78,782 | |
| | Transportation: 0.8% | | | |
190 | L | Arkansas Best Corp. | | $ | 8,299 | |
210 | | CH Robinson Worldwide, Inc. | | 7,776 | |
4,700 | | CSX Corp. | | 238,619 | |
3,700 | @@ | Deutsche Post AG | | 89,362 | |
17 | @@ | East Japan Railway Co. | | 116,603 | |
9,000 | @@ | Kawasaki Kisen Kaisha Ltd. | | 56,453 | |
307 | | Landstar System, Inc. | | 12,814 | |
7,098 | | Norfolk Southern Corp. | | 318,203 | |
157 | L | Overseas Shipholding Group | | 7,911 | |
4,700 | | United Parcel Service, Inc. | | 353,205 | |
| | | | 1,209,245 | |
| | Trucking & Leasing: 0.0% | | | |
231 | | GATX Corp. | | 8,334 | |
| | | | 8,334 | |
| | Water: 0.1% | | | |
1,778 | @@ | Veolia Environnement | | 80,122 | |
| | | | 80,122 | |
| | Total Common Stock
(Cost $53,180,224) | | 62,123,811 | |
| | | | | |
PREFERRED STOCK: 0.7% | | | |
| | Banks: 0.2% | | | |
34 | | DG Funding Trust | | 362,313 | |
| | | | 362,313 | |
| | Diversified Financial Services: 0.1% | | | |
4,450 | C | National Rural Utilities Cooperative Finance Corp. | | 105,020 | |
| | | | 105,020 | |
| | Household Products/ Wares: 0.0% | | | |
500 | @@ | Henkel KGaA | | 50,062 | |
| | | | 50,062 | |
| | Insurance: 0.3% | | | |
4,000 | @@ | Aegon NV | | 99,800 | |
11,900 | C | Metlife, Inc. | | 308,448 | |
| | | | 408,248 | |
| | Telecommunications: 0.1% | | | |
110 | @@,# | Centaur Funding Corp. | | 142,519 | |
| | | | 142,519 | |
| | Total Preferred Stock
(Cost $1,072,720) | | 1,068,162 | |
| | | | | |
Principal
Amount | | | | Value | |
| | | |
CORPORATE BOND/NOTE: 11.1% | | | |
| | | |
| | Aerospace/Defense: 0.1% | | | |
$ | 130,000 | | Northrop Grumman Corp., 7.000%, due 03/01/06 | | $ | 130,452 | |
90,000 | | Northrop Grumman Space & Mission Systems Corp., 7.625%, due 03/15/06 | | 90,320 | |
| | | | 220,772 | |
| | | | | | | |
See Accompanying Notes to Financial Statements
90
| PORTFOLIO OF INVESTMENTS | |
ING VP STRATEGIC ALLOCATION INCOME PORTFOLIO | AS OF DECEMBER 31, 2005 | |
Principal
Amount | | | | Value | |
| | Banks: 2.9% | | | |
$ | 290,000 | @@,L | Australia & New Zealand Banking Group Ltd., 4.588%, due 10/29/49 | | $ | 248,425 | |
131,000 | @@,# | Banco Santander Chile SA, 4.810%, due 12/09/09 | | 130,686 | |
94,000 | @@ | Banco Santander Chile SA, 7.375%, due 07/18/12 | | 104,786 | |
140,000 | @@ | Bank of Ireland, 4.750%, due 12/29/49 | | 121,503 | |
120,000 | @@ | Bank of Nova Scotia, 4.250%, due 08/21/85 | | 101,565 | |
50,000 | @@ | Bank of Scotland, 3.750%, due 11/30/49 | | 43,250 | |
51,000 | | BankAmerica Capital II, 8.000%, due 12/15/26 | | 54,179 | |
100,000 | @@ | Barclays Bank PLC, 6.278%, due 12/15/49 | | 100,689 | |
136,000 | @@,# | Chuo Mitsui Trust & Banking Co., Ltd./The, 5.506%, due 04/15/49 | | 132,021 | |
85,000 | @@ | Corp Andina de Fomento, 5.125%, due 05/05/15 | | 83,873 | |
90,000 | @@,# | Danske Bank A/S, 5.914%, due 12/29/49 | | 94,320 | |
120,000 | @@ | Den Norske Bank ASA, 4.186%, due 08/29/49 | | 101,100 | |
154,000 | # | Dresdner Funding Trust I, 8.151%, due 06/30/31 | | 189,909 | |
289,000 | @@,# | HBOS PLC, 5.375%, due 11/29/49 | | 288,902 | |
350,000 | @@ | HSBC Bank PLC, 4.788%, due 06/29/49 | | 294,000 | |
127,000 | | Huntington Capital Trust I, 4.943%, due 02/01/27 | | 120,877 | |
170,000 | @@ | Lloyds TSB Bank PLC, 4.160%, due 08/29/49 | | 147,921 | |
181,000 | | M&T Bank Corp., 3.850%, due 04/01/13 | | 176,923 | |
123,000 | | Mellon Capital I, 7.720%, due 12/01/26 | | 130,317 | |
90,000 | @@,L | Mizuho Financial Group Cayman Ltd., 8.375%, due 12/31/49 | | 97,572 | |
120,000 | @@ | National Australia Bank Ltd., 4.525%, due 10/29/49 | | 102,443 | |
138,000 | | PNC Funding Corp., 4.500%, due 03/10/10 | | 135,493 | |
67,000 | # | Rabobank Capital Funding Trust, 5.254%, due 12/29/49 | | 65,829 | |
120,000 | @@,#,L | Resona Bank Ltd., 5.850%, due 09/01/49 | | 119,721 | |
300,000 | @@ | Royal Bank of Scotland Group PLC, 4.875%, due 12/29/49 | | 261,174 | |
120,000 | @@ | Societe Generale, 4.656%, due 11/29/49 | | 102,912 | |
210,000 | @@ | Standard Chartered PLC, 4.813%, due 07/29/49 | | 168,525 | |
390,000 | @@,L | Standard Chartered PLC, 4.875%, due 11/29/49 | | 312,000 | |
75,000 | @@ | Sumitomo Mitsui Banking Corp., 8.150%, due 08/01/49 | | 79,598 | |
46,000 | | Wachovia Corp., 5.500%, due 08/01/35 | | 44,979 | |
$ | 130,000 | @@ | Westpac Banking Corp., 4.369%, due 09/30/49 | | $ | 109,303 | |
96,000 | # | Westpac Capital Trust IV, 5.256%, due 12/29/49 | | 94,214 | |
| | | | 4,359,009 | |
| | Beverages: 0.2% | | | |
189,000 | @@,L | Cia Brasileira de Bebidas, 8.750%, due 09/15/13 | | 221,839 | |
59,000 | @@ | Coca-Cola HBC Finance BV, 5.125%, due 09/17/13 | | 59,400 | |
| | | | 281,239 | |
| | Building Materials: 0.1% | | | |
150,000 | | Masco Corp., 6.750%, due 03/15/06 | | 150,537 | |
| | | | 150,537 | |
| | Chemicals: 0.1% | | | |
42,000 | @@,#,S | Sociedad Quimica y Minera de Chile SA, 7.700%, due 09/15/06 | | 42,671 | |
50,000 | | Stauffer Chemical, 5.250%, due 04/15/10 | | 40,150 | |
90,000 | | Stauffer Chemical, 7.540%, due 04/15/17 | | 48,292 | |
| | | | 131,113 | |
| | Commercial Services: 0.2% | | | |
300,000 | | Tulane University of Louisiana, 5.168%, due 11/15/12 | | 301,050 | |
| | | | 301,050 | |
| | Diversified Financial Services: 3.2% | | | |
151,248 | @@,# | Arcel Finance Ltd., 7.048%, due 09/01/11 | | 162,144 | |
53,243 | @@,# | Arcel Finance Ltd., 5.984%, due 02/01/09 | | 53,868 | |
100,000 | # | Army Hawaii Family Housing Trust Certificates, 5.524%, due 06/15/50 | | 103,154 | |
100,000 | # | Army Hawaii Family Housing Trust Certificates, 5.624%, due 06/15/50 | | 103,274 | |
249,559 | @@,# | Brazilian Merchant Voucher Receivables Ltd., 5.911%, due 06/15/11 | | 250,495 | |
212,000 | @@,# | BTM Curacao Holdings NV, 4.760%, due 07/21/15 | | 208,162 | |
137,000 | | Citigroup Capital II, 7.750%, due 12/01/36 | | 144,169 | |
232,000 | # | Corestates Capital Trust I, 8.000%, due 12/15/26 | | 245,999 | |
510,000 | | Countrywide Financial Corp., 4.720%, due 04/11/07 | | 510,508 | |
105,000 | @@ | Financiere CSFB NV, 4.688%, due 03/29/49 | | 87,675 | |
125,000 | | Fund American Cos, Inc., 5.875%, due 05/15/13 | | 126,320 | |
135,000 | | Goldman Sachs Group, Inc., 4.620%, due 03/02/10 | | 135,156 | |
132,000 | | HSBC Finance Corp., 5.000%, due 06/30/15 | | 128,598 | |
99,000 | # | HVB Funding Trust III, 9.000%, due 10/22/31 | | 133,943 | |
See Accompanying Notes to Financial Statements
91
| PORTFOLIO OF INVESTMENTS | |
ING VP STRATEGIC ALLOCATION INCOME PORTFOLIO | AS OF DECEMBER 31, 2005 | |
Principal
Amount | | | | Value | |
| | Diversified Financial Services (continued) | | | |
$ | 70,000 | | International Lease Finance Corp., 5000%, due 04/15/10 | | $ | 69,691 | |
127,000 | L | JPM Capital Trust I, 7.540%, due 01/15/27 | | 134,150 | |
147,000 | | JPM Capital Trust II, 7.950%, due 02/01/27 | | 156,651 | |
246,000 | # | Mangrove Bay Pass-Through Trust, 6.102%, due 07/15/33 | | 244,933 | |
340,000 | | Morgan Stanley, 4.465%, due 02/15/07 | | 340,444 | |
185,000 | @@ | Paribas, 4.625%, due 12/31/49 | | 159,906 | |
84,000 | @@ | Petroleum Export Ltd., 4.623%, due 06/15/10 | | 83,255 | |
111,000 | @@,# | Petroleum Export Ltd/Cayman SPV, 5.265%, due 06/15/11 | | 110,074 | |
289,768 | @@,# | PF Export Receivables Master Trust, 6.436%, due 06/01/15 | | 289,503 | |
299,000 | @@,# | Prefered Term Services, 4.991%, due 03/23/35 | | 299,748 | |
50,000 | | Residential Capital Corp., 6.375%, due 06/30/10 | | 50,855 | |
131,000 | L | Residential Capital Corp., 6.875%, due 06/30/15 | | 139,442 | |
900,000 | # | Toll Road Investment, 18.110%, due 02/15/45 | | 109,914 | |
100,000 | # | Twin Reefs Pass-Through Trust, 5.420%, due 12/10/49 | | 100,107 | |
171,000 | @@ | UFJ Finance Aruba AEC, 8.750%, due 12/31/49 | | 185,848 | |
| | | | 4,867,986 | |
| | Electric: 0.9% | | | |
210,000 | | Consumers Energy Co., 4.250%, due 04/15/08 | | 205,787 | |
245,000 | @@,L | Empresa Nacional de Electricidad SA, 8.625%, due 08/01/15 | | 287,470 | |
163,000 | | Entergy Gulf States, Inc., 5.120%, due 08/01/10 | | 159,162 | |
154,000 | | Enterprise Capital Trust II, 5.747%, due 06/30/28 | | 152,844 | |
254,000 | # | Orcal Geothermal, 6.210%, due 12/30/20 | | 255,326 | |
115,000 | # | Power Contract Financing LLC, 6.256%, due 02/01/10 | | 116,756 | |
33,670 | | PPL Montana LLC, 8.903%, due 07/02/20 | | 38,837 | |
66,187 | # | Tenaska Virginia Partners LP, 6.119%, due 03/30/24 | | 68,819 | |
| | | | 1,285,001 | |
| | Food: 0.2% | | | |
256,000 | S | Tyson Foods, Inc., 7.250%, due 10/01/06 | | 260,146 | |
| | | | 260,146 | |
| | Foreign Government Bonds: 0.3% | | | |
500,000 | @@ | KAUP BANK, 6.600%, due 12/28/15 | | 502,500 | |
| | | | 502,500 | |
| | Insurance: 0.3% | | | |
$ | 121,000 | + | Prudential Financial, Inc., 4.104%, due 11/15/06 | | $ | 120,231 | |
336,000 | # | Zurich Capital Trust I, 8.376%, due 06/01/37 | | 363,760 | |
| | | | 483,991 | |
| | Media: 0.3% | | | |
98,000 | L | Comcast Corp., 5.650%, due 06/15/35 | | 90,482 | |
121,000 | | Cox Communications, Inc., 6.850%, due 01/15/18 | | 127,229 | |
251,000 | # | News America, Inc., 6.400%, due 12/15/35 | | 253,837 | |
| | | | 471,548 | |
| | Oil & Gas: 0.7% | | | |
109,000 | L | Amerada Hess Corp., 6.650%, due 08/15/11 | | 117,263 | |
133,000 | @@,# | Empresa Nacional de Petroleo ENAP, 4.875%, due 03/15/14 | | 127,853 | |
27,000 | @@,# | Empresa Nacional de Petroleo ENAP, 6.750%, due 11/15/12 | | 29,119 | |
92,000 | @@,L | Nexen, Inc., 5.200%, due 03/10/15 | | 91,390 | |
221,000 | # | Pemex Project Funding Master Trust, 5.791%, due 06/15/10 | | 229,288 | |
215,000 | @@,# | Ras Laffan Liquefied Natural Gas Co. Ltd. II, 5.298%, due 09/30/20 | | 213,767 | |
128,000 | @@,# | Tengizchevroil, 6.124%, due 11/15/14 | | 130,816 | |
81,000 | | Valero Energy Corp., 6.125%, due 04/15/07 | | 82,024 | |
| | | | 1,021,520 | |
| | Pipelines: 0.3% | | | |
357,000 | # | Cameron Highway Oil Pipeline, 5.860%, due 12/15/17 | | 360,570 | |
150,000 | # | Kinder Morgan Finance Co. ULC, 5.350%, due 01/05/11 | | 150,378 | |
| | | | 510,948 | |
| | Real Estate: 0.1% | | | |
182,000 | L | EOP Operating LP, 7.750%, due 11/15/07 | | 190,732 | |
| | | | 190,732 | |
| | Real Estate Investment Trust: 0.5% | | | |
166,000 | | Health Care Property Investors, Inc., 4.875%, due 09/15/10 | | 161,892 | |
55,000 | | Liberty Property LP, 6.375%, due 08/15/12 | | 58,057 | |
144,000 | | Liberty Property LP, 7.750%, due 04/15/09 | | 154,880 | |
137,000 | | Simon Property Group LP, 4.875%, due 03/18/10 | | 135,351 | |
251,000 | | Simon Property Group LP, 6.375%, due 11/15/07 | | 256,595 | |
| | | | 766,775 | |
| | Retail: 0.1% | | | |
178,000 | | May Department Stores Co., 3.950%, due 07/15/07 | | 175,095 | |
| | | | 175,095 | |
See Accompanying Notes to Financial Statements
92
| PORTFOLIO OF INVESTMENTS | |
ING VP STRATEGIC ALLOCATION INCOME PORTFOLIO | AS OF DECEMBER 31, 2005 | |
Principal
Amount | | | | Value | |
| | Savings & Loans: 0.1% | | | |
$ | 118,000 | | Great Western Financial, 8.206%, due 02/01/27 | | $ | 126,041 | |
| | | | 126,041 | |
| | Telecommunications: 0.4% | | | |
161,000 | | BellSouth Corp., 4.200%, due 09/15/09 | | 156,525 | |
87,000 | @@ | Deutsche Telekom International Finance BV, 8.000%, due 06/15/10 | | 98,730 | |
51,000 | | New Cingular Wireless Services, Inc., 8.125%, due 05/01/12 | | 59,001 | |
79,000 | +, S | Sprint Capital Corp., 4.780%, due 08/17/06 | | 78,948 | |
120,000 | @@,L | Telefonos de Mexico SA de CV, 4.750%, due 01/27/10 | | 118,488 | |
147,000 | L | Verizon Global Funding Corp., 5.850%, due 09/15/35 | | 142,148 | |
| | | | 653,840 | |
| | Transportation: 0.1% | | | |
106,000 | @@,#,L | MISC Capital Ltd., 5.000%, due 07/01/09 | | 105,674 | |
| | | | 105,674 | |
| | Total Corporate Bonds/Notes
(Cost $16,909,661) | | 16,865,517 | |
| | | | | |
U.S. GOVERNMENT AGENCY OBLIGATION: 18.0% | | | |
| | Federal Home Loan Bank: 0.7% | | | |
780,000 | L | 3.250%, due 12/17/07 | | 759,130 | |
390,000 | L | 4.125%, due 10/19/07 | | 386,116 | |
| | | | 1,145,246 | |
| | Federal Home Loan Mortgage Corporation: 3.9% | | | |
385,000 | L | 3.875%, due 06/15/08 | | 377,592 | |
378,000 | | 4.000%, due 08/17/07 | | 373,724 | |
628,138 | | 4.500%, due 12/15/16 | | 620,569 | |
754,000 | | 4.625%, due 12/19/08 | | 752,712 | |
427,933 | | 5.000%, due 08/15/16 | | 424,913 | |
477,000 | | 5.000%, due 05/15/20 | | 470,661 | |
1,203,368 | | 5.500%, due 11/15/18 | | 1,216,815 | |
618,000 | W | 5.500%, due 01/01/34 | | 612,400 | |
287,000 | | 5.875%, due 03/21/11 | | 299,400 | |
493,756 | | 6.000%, due 01/15/29 | | 505,195 | |
296,655 | | 7.000%, due 11/01/31 | | 309,159 | |
| | | | 5,963,140 | |
| | Federal National Mortgage Association: 12.9% | | | |
1,158,000 | | 3.875%, due 02/01/08 | | 1,138,967 | |
765,000 | | 3.875%, due 07/15/08 | | 750,034 | |
226,000 | L | 4.250%, due 09/15/07 | | 224,247 | |
271,000 | W | 4.500%, due 01/15/19 | | 263,717 | |
78,000 | W | 4.500%, due 11/15/36 | | 73,466 | |
759,000 | L | 4.625%, due 10/15/13 | | 751,135 | |
286,295 | | 4.818%, due 08/01/35 | | 281,825 | |
2,299,000 | W | 5.000%, due 01/15/20 | | 2,274,573 | |
4,772,000 | W | 5.000%, due 01/15/36 | | 4,624,364 | |
739,000 | | 5.250%, due 08/01/12 | | 747,117 | |
17,923 | | 5.500%, due 01/01/18 | | 18,052 | |
876,000 | W | 5.500%, due 01/12/36 | | 867,513 | |
1,508,000 | W | 5.500%, due 01/15/20 | | 1,517,425 | |
$ | 301,963 | | 5.500%, due 02/01/18 | | $ | 304,026 | |
323,298 | | 5.500%, due 11/01/33 | | 321,123 | |
317,588 | | 6.000%, due 04/25/31 | | 326,234 | |
2,838,000 | W | 6.000%, due 01/15/34 | | 2,864,616 | |
387,789 | | 6.000%, due 08/01/16 | | 396,527 | |
794,000 | W | 6.500%, due 01/15/35 | | 814,595 | |
438,518 | | 6.500%, due 07/01/29 | | 450,050 | |
342,000 | | 6.625%, due 11/15/10 | | 369,971 | |
84,965 | | 7.000%, due 02/01/31 | | 88,722 | |
41,748 | | 7.500%, due 09/01/31 | | 43,749 | |
10,506 | | 7.500%, due 11/01/30 | | 11,013 | |
| | | | 19,523,061 | |
| | Government National Mortgage Association: 0.5% | | | |
49,933 | | 6.500%, due 01/15/29 | | 52,267 | |
93,172 | | 6.500%, due 01/15/32 | | 97,387 | |
41,178 | | 6.500%, due 10/15/31 | | 43,052 | |
27,472 | | 7.000%, due 01/15/28 | | 28,880 | |
217,107 | | 7.000%, due 02/15/28 | | 228,235 | |
30,113 | | 7.000%, due 02/15/28 | | 31,657 | |
211,962 | | 7.500%, due 12/15/23 | | 224,555 | |
| | | | 706,033 | |
| | Total U.S. Government Agency Obligations
(Cost $26,711,060) | | 27,337,480 | |
| | | | | |
U.S. TREASURY OBLIGATION: 13.7% | | | |
| | U.S. Treasury Bond: 4.0% | | | |
2,071,000 | L | 5.375%, due 02/15/31 | | 2,326,963 | |
266,000 | L | 5.500%, due 08/15/28 | | 299,177 | |
763,000 | L | 6.000%, due 02/15/26 | | 899,983 | |
864,000 | L | 6.250%, due 08/15/23 | | 1,032,008 | |
628,000 | L | 7.250%, due 05/15/16 | | 771,312 | |
548,000 | L | 9.250%, due 02/15/16 | | 759,601 | |
| | | | 6,089,044 | |
| | U.S. Treasury Note: 9.5% | | | |
1,016,000 | L | 4.250%, due 11/30/07 | | 1,013,341 | |
526,000 | L | 4.375%, due 11/15/08 | | 526,247 | |
10,376,000 | L | 4.375%, due 12/15/10 | | 10,387,351 | |
2,464,000 | L | 4.500%, due 11/15/15 | | 2,484,983 | |
| | | | 14,411,922 | |
| | U.S. Treasury STRIP 0.2% | | | |
520,000 | S | 4.600%, due 05/15/16 | | 326,133 | |
| | | | 326,133 | |
| | Total U.S. Treasury Obligations
(Cost $21,340,530) | | 20,827,099 | |
| | | | | |
ASSET-BACKED SECURITY: 1.5% | | | |
| | Automobile Asset Backed Securities: 0.3% | | | |
39,000 | | Honda Auto Receivables Owner Trust, 2.790%, due 03/16/09 | | 38,166 | |
90,000 | | Honda Auto Receivables Owner Trust, 3.820%, due 05/21/10 | | 87,964 | |
61,969 | | Household Automotive Trust, 2.310%, due 04/17/08 | | 61,656 | |
325,000 | | USAA Auto Owner Trust, 2.040%, due 02/16/10 | | 320,509 | |
| | | | 508,295 | |
See Accompanying Notes to Financial Statements
93
| PORTFOLIO OF INVESTMENTS | |
ING VP STRATEGIC ALLOCATION INCOME PORTFOLIO | AS OF DECEMBER 31, 2005 | |
Principal
Amount | | | | Value | |
| | Credit Card Asset Backed Securities: 1.0% | | | |
$ | 115,000 | | Bank One Issuance Trust, 4.540%, due 09/15/10 | | $ | 113,939 | |
115,000 | | Capital One Master Trust, 4.900%, due 03/15/10 | | 115,216 | |
855,000 | | Chemical Master Credit Card Trust 1, 7.090%, due 02/15/09 | | 864,272 | |
390,000 | | Citibank Credit Card Issuance Trust, 5.650%, due 06/16/08 | | 391,703 | |
13,000 | | Citibank Credit Card Master Trust I, 5.875%, due 03/10/11 | | 13,405 | |
58,000 | | MBNA Master Credit Card Trust USA, 5.900%, due 08/15/11 | | 59,962 | |
| | | | 1,558,497 | |
| | Home Equity Asset Backed Securities: 0.1% | | | |
18,000 | + | Renaissance Home Equity Loan Trust, 4.456%, due 05/25/35 | | 17,710 | |
100,000 | | Wells Fargo Home Equity Trust, 3.970%, due 09/25/24 | | 97,956 | |
| | | | 115,666 | |
| | Other Asset Backed Securities: 0.1% | | | |
41,000 | | Popular ABS Mortgage Pass-Through Trust, 3.735%, due 12/25/34 | | 40,509 | |
41,000 | | Popular ABS Mortgage Pass-Through Trust, 4.000%, due 12/25/34 | | 40,268 | |
| | | | 80,777 | |
| | Total Asset-Backed Securities
(Cost $2,311,451) | | 2,263,235 | |
| | | |
COLLATERALIZED MORTGAGE OBLIGATION: 4.8% | | | |
| | Commercial Mortgage Backed Securities: 2.5% | | | |
38,000 | | Banc of America Commercial Mortgage, Inc., 4.877%, due 11/10/42 | | 37,735 | |
26,000 | | Bear Stearns Commercial Mortgage Securities, 4.030%, due 02/13/46 | | 25,066 | |
37,000 | | Capco America Securitization Corp., 6.460%, due 10/15/30 | | 38,538 | |
230,000 | | Commercial Mortgage Pass-Through Certificates, 3.600%, due 03/10/39 | | 221,162 | |
975,000 | | CS First Boston Mortgage Securities Corp., 3.861%, due 03/15/36 | | 952,309 | |
82,000 | | CS First Boston Mortgage Securities Corp., 7.528%, due 04/15/62 | | 90,371 | |
460,000 | | DLJ Commercial Mortgage Corp., 6.240%, due 11/12/31 | | 474,390 | |
180,000 | | DLJ Commercial Mortgage Corp., 6.460%, due 03/10/32 | | 187,442 | |
1,090,000 | | DLJ Commercial Mortgage Corp., 7.300%, due 06/10/32 | | 1,165,600 | |
$ | 205,884 | | GE Capital Commercial Mortgage Corp., 3.752%, due 07/10/39 | | $ | 201,072 | |
40,000 | | GE Capital Commercial Mortgage Corp., 4.865%, due 07/10/39 | | 39,489 | |
212,000 | | JP Morgan Chase Commercial Mortgage Securities Corp., 4.223%,
due 01/15/42 | | 206,145 | |
30,000 | | JP Morgan Chase Commercial Mortgage Securities Corp., 4.449%,
due 01/12/38 | | 29,176 | |
21,000 | | LB-UBS Commercial Mortgage Trust, 4.201%, due 12/15/29 | | 20,409 | |
23,000 | | LB-UBS Commercial Mortgage Trust, 4.567%, due 06/15/29 | | 22,755 | |
121,000 | | LB-UBS Commercial Mortgage Trust, 7.370%, due 08/15/26 | | 131,446 | |
| | | | 3,843,105 | |
| | Whole Loan Collateral CMO: 2.2% | | | |
137,779 | | Banc of America Mortgage Securities, 5.250%, due 11/25/19 | | 137,523 | |
423,709 | | Countrywide Alternative Loan Trust, 5.414%, due 10/25/35 | | 421,197 | |
580,361 | | Countrywide Alternative Loan Trust, 5.500%, due 02/25/25 | | 581,066 | |
228,489 | | Countrywide Home Loan Mortgage Pass-Through Trust, 5.000%, due 11/25/18 | | 224,922 | |
100,594 | # | GSMPS Mortgage Loan Trust, 4.729%, due 01/25/35 | | 100,845 | |
369,710 | | MASTR Alternative Loans Trust, 5.500%, due 01/25/20 | | 371,441 | |
988,206 | | MASTR Asset Securitization Trust, 5.500%, due 06/25/33 | | 972,148 | |
310,000 | | Suntrust Alternative Loan Trust, 6.500%, due 12/25/35 | | 315,797 | |
201,237 | | Thornburg Mortgage Securities Trust, 4.749%, due 09/25/34 | | 201,704 | |
| | | | 3,326,643 | |
| | Whole Loan Collateral Support CMO: 0.1% | | | |
110,626 | | Banc of America Mortgage Securities, 5.500%, due 11/25/33 | | 106,891 | |
| | | | 106,891 | |
| | Total Collateralized Mortgage Obligations
(Cost $7,468,239) | | 7,276,639 | |
| | | | | |
MUNICIPAL BOND: 0.3% | | | |
| | Municipal: 0.3% | | | |
30,000 | | City of New York, 5.000%, due 04/01/35 | | 30,893 | |
70,000 | | City of New York, 5.000%, due 11/01/08 | | 72,910 | |
70,000 | | City of New York, 5.000%, due 11/01/11 | | 74,913 | |
70,000 | | City of New York, 5.000%, due 11/01/15 | | 75,427 | |
See Accompanying Notes to Financial Statements
94
| PORTFOLIO OF INVESTMENTS | |
ING VP STRATEGIC ALLOCATION INCOME PORTFOLIO | AS OF DECEMBER 31, 2005 | |
Principal
Amount | | | | Value | |
$ | 70,000 | | Sales Tax Asset Receivables Corp., 4.060%, due 10/15/10 | | $ | 67,721 | |
60,000 | | Sales Tax Asset Receivables Corp., 4.660%, due 10/15/14 | | 58,602 | |
| | | | 380,466 | |
| | Total Municipal Bond
(Cost $387,624) | | 380,466 | |
| | Total Long-Term Investments
(Cost $129,384,702) | | 138,142,409 | |
| | | |
SHORT-TERM INVESTMENTS: 40.1% | | | |
| | Commercial Paper: 9.6% | | | |
$ | 1,500,000 | | American Express Bank, 4.330%, due 03/16/06 | | 1,500,179 | |
3,500,000 | | Master Fund LLC, 3.180%, due 1/30/06 | | 3,487,283 | |
4,500,000 | S | Monument Gardens, 4.370%, due 1/23/06 | | 4,487,465 | |
3,212,000 | S | Old Line Funding, 4.340%, due 01/17/06 | | 3,205,433 | |
2,000,000 | | St. Germaine Holding Ltd., 4.370%, due 02/01/06 | | 1,992,267 | |
| | Total Commercial Paper
(Cost $14,674,045) | | 14,672,627 | |
| | | |
| | Repurchase Agreement: 8.4% | | | |
12,724,000 | S | Goldman Sachs Repurchase Agreement dated, 12/30/05, 4.250%, due 01/03/06, $12,730,009 to be received upon repurchase (Collaterallized by $13,290,000 Federal Home Loan Mortgage Corporation, 3.625%, Market Value plus accrued interest $12,981,964, due 11/14/08) | | 12,724,000 | |
| | Total Repurchase Agreements
(Cost $12,724,000) | | 12,724,000 | |
| | Securities Lending CollateralCC: 22.1% | | | |
46,303,000 | | The Bank of New York Institutional Cash Reserves Fund | | 33,501,000 | |
| | Total Securities Lending Collateral
(Cost $33,501,000) | | 33,501,000 | |
| | Total Short-Term Investments:
(Cost $60,899,045) | | $ | 60,897,627 | |
| | Total Investments in Securities (Cost $190,283,747)* | 131.2 | % | | $ | 199,040,036 | |
| | Other Assets and Liabilities-Net | (31.2 | ) | | (47,356,984 | ) |
| | Net Assets | 100.0 | % | | $ | 151,683,052 | |
| | Certain foreign securities have been fair valued in accordance with procedures approved by the Board of Directors/Trustees (Note 2A). |
@ | | Non-income producing security |
@@ | | Foreign Issuer |
& | | Payment-in-kind |
ADR | | American Depositary Receipt |
GDR | | Global Depositary Receipt |
STRIP | | Separate Trading of Registered Interest and Principal of Securities |
+ | | Step-up basis bonds. Interest rates shown reflect current coupon rates. |
# | | Securities with purchases pursuant to Rule 144A, under the Securities Act of 1933 and may not be resold subject to that rule except to qualified institutional buyers. These securities have been determined to be liquid under the guidelines established by the Funds’ Board of Directors/Trustees. |
## | | Illiquid and restricted securities |
A | | Related Party |
B | | Represents investments in an affiliated fund. |
C | | Bond may be called prior to maturity date. |
cc | | Securities purchased with cash collateral for securities loaned. |
W | | When-issued or delayed delivery security. |
S | | Segregated securities for certain derivatives, when-issued or delayed delivery securities and forward currency exchange contracts. |
I | | Illiquid security |
L | | Loaned security, a portion or all of the security is on loan at December 31, 2005. |
** | | Defaulted security |
^ | | Interest Only (IO) Security |
X | | Fair value determined by ING Funds Valuation Committee appointed by the Funds’ Board of Directors/Trustees. |
XX | | Value of securities obtained from one or more dealers making markets in the securities in accordance with the Fund’s valuation procedures. |
* | | Cost for federal income tax purposes is $191,630,759. |
| | Net unrealized appreciation consists of: |
| | Gross Unrealized Appreciation | | $ | 8,725,170 | |
| | Gross Unrealized Depreciation | | (1,315,893 | ) |
| | Net Unrealized Appreciation | | $ | 7,409,277 | |
| | | | | | | | |
Information concerning open futures contracts at December 31, 2005 is shown below:
Long Contracts | | No. of
Contracts | | Notional
Market Value | | Expiration
Date | | Unrealized
Gain |
U.S. 10 Year Treasury Note | | 14 | | $ | 1,531,688 | | 03/22/2006 | | $ | 13,493 | |
U.S. 30 Year Treasury Note | | 3 | | 342,563 | | 03/31/2006 | | 6,846 | |
| | | | $ | 1,874,250 | | | | $ | 20,338 | |
| | | | | | | | | | | | |
See Accompanying Notes to Financial Statements
95
TAX INFORMATION (UNAUDITED)
Dividends paid during the year ended December 31, 2005 were as follows:
Fund Name | | Type | | Per Share Amount | |
ING VP Index Plus LargeCap Portfolio | | | | |
Class I | NII | | $0.1879 | |
Class S | NII | | $0.1795 | |
ING VP Index Plus MidCap Portfolio | | | | |
Class I | NII | | $0.0854 | |
Class S | NII | | $0.0717 | |
All Classes | STCG | | $0.6262 | |
All Classes | LTCG | | $0.6856 | |
ING VP Index Plus SmallCap Portfolio | | | | |
Class I | NII | | $0.0515 | |
Class S | NII | | $0.0430 | |
All Classes | STCG | | $0.5499 | |
All Classes | LTCG | | $0.3105 | |
ING VP Strategic Allocation Balanced Portfolio | | | | |
Class I | NII | | $0.2064 | |
Class S | NII | | $0.2064 | |
ING VP Strategic Allocation Growth Portfolio | | | | |
Class I | NII | | $0.1846 | |
ING VP Strategic Allocation Income Portfolio | | | | |
Class I | NII | | $0.2630 | |
NII - Net investment income
STCG - Short-term capital gain
LTCG - Long-term capital gain
Of the ordinary distributions made during the year ended December 31, 2005, the following percentages qualify for the dividends received deduction (DRD) available to corporate shareholders:
ING VP Index Plus LargeCap Portfolio | | 100.00 | % |
ING VP Index Plus MidCap Portfolio | | 99.98 | % |
ING VP Index Plus SmallCap Portfolio | | 12.61 | % |
ING VP Strategic Allocation Balanced Portfolio | | 57.36 | % |
ING VP Strategic Allocation Growth Portfolio | | 88.56 | % |
ING VP Strategic Allocation Income Portfolio | | 33.44 | % |
Above figures may differ from those cited elsewhere in this report due to differences in the calculation of income and gains under U.S. generally accepted accounting principles (book) purposes and Internal Revenue Service (tax) purposes.
Shareholders are strongly advised to consult their own tax advisers with respect to the tax consequences of their investments in the Funds. In January, shareholders, excluding corporate shareholders, receive an IRS 1099-DIV regarding the federal tax status of the dividends and distributions they received in the calendar year.
96
DIRECTOR AND OFFICER INFORMATION (UNAUDITED)
The business and affairs of the Funds are managed under the direction of the Funds’ Board of Directors. A director who is not an interested person of the Funds, as defined in the 1940 Act, is an independent director (“Non-Interested Director”). The Directors of the Funds are listed below. The Statement of Additional Information includes additional information about directors of the Registrant and is available, without charge, upon request at 1-800-992-0180.
| | | | Term of | | | | Number of | | |
| | | | Office and | | Principal | | Portfolios in | | Other |
| | Position(s) | | Length of | | Occupation(s) | | Fund Complex | | Directorships |
Name, Address
and Age | | held with
the Company | | Time
Served(1) | | during the
Past Five Years | | Overseen
by Director | | held by
Director |
Non-Interested Directors: | | | | | | | | | | |
| | | | | | | | | | |
Albert E. DePrince, Jr.
7337 E. Doubletree Ranch Rd.
Scottsdale, Arizona 85258
Age: 64 | | Director | | June 1998 -
Present | | Professor of Economics and Finance, Middle Tennessee State University (August 1991 - Present) and Director, Business and Economic Research Center (August 1999 - August 2002). | | 40 | | President-Elect, Academy of Economics and Finance (February 2005 - Present). |
| | | | | | | | | | |
Maria Teresa Fighetti
7337 E. Doubletree Ranch Rd.
Scottsdale, Arizona 85258
Age: 62 | | Director | | April 1994 -
Present | | Retired. Formerly, Attorney, New York City Department of Mental Health (June 1973 - October 2002) and Associate Commissioner (1995 - 2002). | | 40 | | None |
| | | | | | | | | | |
Sidney Koch
7337 E. Doubletree Ranch Rd.
Scottsdale, Arizona 85258
Age: 70 | | Director | | April 1994 -
Present | | Self-Employed Consultant (January 1993 - Present). | | 40 | | Northwest Center for the Arts, Torrington, CT. |
| | | | | | | | | | |
Dr. Corine T. Norgaard
7337 E. Doubletree Ranch Rd. Scottsdale, Arizona 85258 Age: 68 | | Director | | June 1991 - Present | | President, Thompson Enterprises (October 2004 - Present). Formerly, Dean, Barney School of Business, University of Hartford (August 1996 - June 2004). | | 40 | | Mass Mutual Corporate and Participation Investors (April 1997 - Present); Advest Trust Company (1998 - Present); and Connecticut Health Foundation (2002 - Present). |
| | | | | | | | | | |
Edward T. O’Dell
7337 E. Doubletree Ranch Rd. Scottsdale, Arizona 85258 Age: 70 | | Director | | June 2002 -
Present | | Retired. | | 40 | | None |
| | | | | | | | | | |
Joseph E. Obermeyer
7337 E. Doubletree Ranch Rd.
Scottsdale, Arizona 85258
Age: 48 | | Director | | January 2003 -
Present | | President, Obermeyer & Associates, Inc. (November 1999 - Present). | | 40 | | None |
| | | | | | | | | | |
J. Scott Fox(2)
7337 E. Doubletree Ranch Rd.
Scottsdale, Arizona 85258
Age: 50 | | Director | | December 1997 - Present | | Vice Chairman and Chief Operating Officer, ING Investment Management, LLC (September 2002 -Present); President and Chief Executive Officer (April 2001 - Present). Formerly, Managing Director and Chief Operating Officer, ING Investment Management Co. (April 1994 - April 2001). | | 40 | | The Greater Hartford Arts Council (July 2002 - Present). |
97
DIRECTOR AND OFFICER INFORMATION (UNAUDITED) (CONTINUED)
Name, Address
and Age | | Position(s)
held with
the Company | | Term of
Office and
Length of
Time
Served(1) | | Principal
Occupation(s)
during the
Past Five Years | | Number of
Portfolios in
Fund Complex
Overseen
by Director | | Other
Directorships
held by
Director |
Directors who are “Interested Persons” | | | | | | | | |
| | | | | | | | |
Thomas J. McInerney(3)
7337 E. Doubletree Ranch Rd. Scottsdale, Arizona 85258
Age: 49 | | Director | | April 2002 - Present | | Chief Executive Officer, ING U.S. Financial Services (January 2005 - Present); General Manager and Chief Executive Officer, U.S. Financial Services (December 2003 - December 2004); Chief Executive Officer, ING U.S. Financial Services (September 2001 - December 2003); and General Manager and Chief Executive Officer, U.S. Worksite Financial Services (December 2000 - September 2001). | | 212 | | Equitable Life Insurance Co., Golden American Life Insurance Co., Life Insurance Company of Georgia, Midwestern United Life Insurance Co., ReliaStar Life Insurance Co., Security Life of Denver, Security Connecticut Life Insurance Co., Southland Life Insurance Co., USG Annuity and Life Company, and United Life and Annuity Insurance Co., Inc; Ameribest Life Insurance Co.; First Columbine Life Insurance Co.; and Metro Atlanta Chamber of Commerce (January 2003 - Present) |
(1) Directors serve until their successors are duly elected and qualified, subject to the Board’s retirement policy.
(2) Mr. Fox is an “interested person,” as defined under the 1940 Act, because of his relationship with ING Investment Management Co., an affiliate of ING Investments LLC.
(3) Mr. McInerney is an “interested person,” as defined under the 1940 Act, because of his affiliation with ING Groep N.V., the parent corporation of the Investment Manager, ING Investments, LLC and the Distributor, ING Funds Distributor, LLC.
98
DIRECTOR AND OFFICER INFORMATION (UNAUDITED) (CONTINUED)
Name, Address
and Age | | Position(s)
Held with the Company | | Term of Office and
Length of Time Served(1) | | Principal Occupation(s) during the
Past Five Years |
James M. Hennessy
7337 E. Doubletree Ranch Rd. Scottsdale, Arizona 85258
Age: 56 | | President, Chief Executive Officer and Chief Operating Officer | | March 2002 - Present | | President, Chief Executive Officer and Chief Operating Officer, ING Investments, LLC (December 2000 - Present). Formerly, Senior Executive Vice President and Chief Operating Officer, ING Investments, LLC (April 1995 - December 2000). |
| | | | | | |
Michael J. Roland
7337 E. Doubletree Ranch Rd. Scottsdale, Arizona 85258
Age: 47 | | Executive Vice President | | April 2002 - Present | | Executive Vice President (December 2001 - Present) and formerly Chief Compliance Officer, ING Investments, LLC (October 2004 - December 2005), ING Investments, LLC. Formerly, Chief Financial Officer and Treasurer, ING Investments, LLC (December 2001 - March 2005) and Senior Vice President, ING Investments, LLC (June 1998 - December 2001). |
| | | | | | |
Stanley D. Vyner
7337 E. Doubletree Ranch Rd. Scottsdale, Arizona 85258
Age: 55 | | Executive Vice President | | March 2002 - Present | | Executive Vice President, ING Investments, LLC (July 2000 - Present) and Chief Investment Risk Officer ING Investments, LLC (January 2003 - Present); Formerly, Chief Investment Officer of the International Portfolios, ING Investments, LLC (August 2000 - January 2003). |
| | | | | | |
Joseph M. O’Donnell
7337 E. Doubletree Ranch Rd. Scottsdale, Arizona 85258
Age: 51 | | Chief Compliance Officer | | November 2004 - Present | | Chief Compliance Officer of the ING Funds (November 2004 - Present) and ING Investment, LLC and Directed Services, Inc. (January 2006 - Present). Formerly, Vice President, Chief Legal Counsel, Chief Compliance Officer and Secretary of Atlas Securities, Inc., Atlas Advisers, Inc. and Atlas Funds (October 2001 - October 2004); and Chief Operating Officer and General Counsel of Matthews International Capital Management LLC and Vice President and Secretary of Matthews International Funds (August 1999 - May 2001). |
| | | | | | |
Todd Modic
7337 E. Doubletree Ranch Rd. Scottsdale, Arizona 85258
Age: 38 | | Senior Vice President, Chief/Principal Financial Officer and Assistant Secretary | | March 2005 - Present | | Senior Vice President, ING Funds Services, LLC (April 2005 - Present). Formerly, Vice President, ING Funds Services, LLC (September 2002 - March 2005); Director of Financial Reporting, ING Investments, LLC (March 2001 - September 2002) and Director of Financial Reporting, Axient Communications, Inc. (May 2000 - January 2001). |
| | | | | | |
Robert S. Naka
7337 E. Doubletree Ranch Rd. Scottsdale, Arizona 85258
Age: 42 | | Senior Vice President and Assistant Secretary | | March 2002 - Present | | Senior Vice President (August 1999 - Present) and Assistant Secretary (October 2001 - Present) ING Funds Services, LLC. |
| | | | | | |
Kimberly A. Anderson
7337 E. Doubletree Ranch Rd. Scottsdale, Arizona 85258
Age: 41 | | Senior Vice President | | December 2003 - Present | | Senior Vice President and Assistant Secretary, ING Investments, LLC (October 2003 - Present). Formerly, Vice President and Assistant Secretary, ING Investments, LLC (January 2001 - October 2003) and Assistant Vice President, ING Funds Services, LLC (November 1999 - January 2001). |
| | | | | | |
Robyn L. Ichilov
7337 E. Doubletree Ranch Rd. Scottsdale, Arizona 85258
Age: 38 | | Vice President and Treasurer | | March 2002 - Present | | Vice President and Treasurer, ING Funds Services, LLC (October 2001 - Present) and ING Investments, LLC (August 1997 - Present). |
| | | | | | |
Lauren D. Bensinger
7337 E. Doubletree Ranch Rd. Scottsdale, Arizona 85258
Age: 51 | | Vice President | | March 2003 - Present | | Vice President and Chief Compliance Officer, ING Funds Distributor, LLC (July 1995 - Present) and Vice President ING Investments, LLC (February 2003 - Present). Formerly, Chief Compliance Officer, ING Investments, LLC (October 2001 - October 2004). |
99
DIRECTOR AND OFFICER INFORMATION (UNAUDITED) (CONTINUED)
Name, Address
and Age | | Position(s)
Held with the Company | | Term of Office and
Length of Time Served(1) | | Principal Occupation(s) during the
Past Five Years |
Maria M. Anderson
7337 E. Doubletree Ranch Rd. Scottsdale, Arizona 85258
Age: 47 | | Vice President | | September 2004 - Present | | Vice President, ING Funds Services, LLC (September 2004 - Present). Formerly, Assistant Vice President, ING Funds Services, LLC (October 2001 - September 2004) and Manager of Fund Accounting and Fund Compliance, ING Investments, LLC (September 1999 - October 2001). |
| | | | | | |
Mary A. Gaston
7337 E. Doubletree Ranch Rd. Scottsdale, Arizona 85258
Age: 39 | | Vice President | | March 2005 - Present | | Vice President, ING Funds Services, LLC (April 2005 - Present). Formerly, Assistant Vice President, Financial Reporting, ING Fund Services, LLC (April 2004 - April 2005); Manager, Financial Reporting, ING Fund Services, LLC (August 2002 - April 2004); and Controller, Z Seven Fund, Inc. and Ziskin Asset Management, Inc. (January 2000 - March 2002). |
| | | | | | |
Susan P. Kinens
7337 E. Doubletree Ranch Rd. Scottsdale, Arizona 85258
Age: 29 | | Assistant Vice President | | March 2003 - Present | | Assistant Vice President, ING Funds Services, LLC (December 2002 - Present); and has held various other positions with ING Funds Services, LLC for more than the last five years. |
| | | | | | |
Kimberly K. Palmer
7337 E. Doubletree Ranch Rd. Scottsdale, Arizona 85258
Age: 48 | | Assistant Vice President | | September 2004 - Present | | Assistant Vice President, ING Funds Services, LLC (August 2004 - Present). Formerly, Manager, Registration Statements, ING Funds Services, LLC (May 2003 - August 2004); Associate Partner, AMVESCAP PL (October 2000 - May 2003) and Director of Federal Filings and Blue Sky Filings, INVESCO Funds Group, Inc. (March 1994 - May 2003). |
| | | | | | |
Theresa K. Kelety
7337 E. Doubletree Ranch Rd. Scottsdale, Arizona 85258
Age: 42 | | Secretary | | September 2003 - Present | | Counsel, ING Americas, U.S. Legal Services (April 2003 - Present). Formerly, Senior Associate with Shearman & Sterling (February 2000 - April 2003). |
| | | | | | |
Huey P. Falgout, Jr.
7337 E. Doubletree Ranch Rd. Scottsdale, Arizona 85258
Age: 42 | | Assistant Secretary | | September 2003 - Present | | Chief Counsel, ING Americas, U.S. Legal Services (September 2003 - Present). Formerly, Counsel, ING Americas, U.S. Legal Services (November 2002 - September 2003); and Associate General Counsel of AIG American General (January 1999 - November 2002). |
| | | | | | |
Robin R. Nesbitt
7337 E. Doubletree Ranch Rd. Scottsdale, Arizona 85258
Age: 32 | | Assistant Secretary | | September 2004 - Present | | Supervisor, Board Operations, ING Funds Services, LLC (August 2003 - Present). Formerly, Senior Legal Analyst, ING Funds Services, LLC (August 2002 - August 2003); Associate, PricewaterhouseCoopers (January 2001 - August 2001); and Paralegal, McManis, Faulkner & Morgan (May 2000 - December 2000). |
(1) The officers hold office until the next annual meeting of the Directors and until their successors have been elected and qualified.
100
ADVISORY CONTRACT APPROVAL DISCUSSION (UNAUDITED)
The Investment Company Act of 1940, as amended (the “1940 Act”), provides, in substance, that each investment advisory agreement and sub-advisory agreement for a Fund will terminate automatically after the initial term of the agreement (which term may not exceed two years), unless continuation of the agreement is approved annually by the Board of Trustees (the “Board”) of the Fund, including a majority of the Trustees who have no direct or indirect interest in the agreement and who are not “interested persons” of the Fund (the “Independent Trustees”). Consistent with this requirement of the 1940 Act, the Board has established a process for considering on an annual basis approval of the continuation of the Investment Management Agreement for each Fund (the “Advisory Agreement”) with ING Investments, LLC (the “Adviser”) and the sub-advisory agreement for each Fund (collectively, the “Sub-Advisory Agreements”) with each sub-adviser of the Funds (the “Sub-Advisers”). Set forth below is a description of the process followed by the Board in considering approval of the continuation of each Advisory and Sub-Advisory Agreement (collectively, the “Agreements”), together with an explanation of many of the factors considered and related conclusions reached by the Board in voting to approve the continuation of each Agreement for an additional one-year period commencing January 1, 2006.
Overview of the Review Process
At a meeting of the Board held on December 14, 2005, the Board, including all of the Independent Trustees, voted to approve continuation of each of the existing Advisory and Sub-Advisory Agreements for the Funds. Prior to voting such approvals, the Board received the affirmative recommendation of the Contracts Committee of the Board, which is a Committee of the Board comprised of all of the Independent Trustees and exclusively of the Independent Trustees. The Contracts Committee recommended approval of the Advisory and Sub-Advisory Agreements after completing an extensive review of information requested by the Committee from the Adviser and each Sub-Adviser, including the following: (1) comparative performance data for each Fund for various time periods; (2) comparative data regarding management fees, including data regarding the fees charged by the Adviser and Sub-Advisers for managing other mutual funds and institutional accounts using investment strategies and techniques similar to those used in managing the Funds; (3) comparative data regarding the total expenses of each Fund; (4) copies of each form of Advisory Agreement and Sub-Advisory Agreement; (5) copies of the codes of ethics of the Adviser and each Sub-Adviser, together with information relating to the manner in which each code is administered; (6) financial statements of the Adviser and each Sub-Adviser; (7) profitability analyses for the Adviser and each Sub-Adviser with respect to each Fund, and all Funds as a group; (8) descriptions of the qualifications of the investment personnel responsible for managing each Fund, their compensation and their responsibilities with respect to managing other accounts or mutual funds; (9) descriptions of the services provided to the Funds, including the investment strategies and techniques used by each Sub-Adviser in managing the Funds; (10) data relating to portfolio turnover and brokerage practices, including practices with respect to the acquisition of research through “soft dollar” benefits received in connection with the Funds’ brokerage; (11) data comparing the performance of certain Funds against “static portfolios” of the Funds over various time periods; (12) descriptions of the business continuity and disaster recovery plans of the Adviser and each Sub-Adviser; (13) descriptions of various compliance programs of the Adviser and Sub-Advisers, including the Adviser’s programs for monitoring and enforcing compliance with the Funds’ policies with respect to market-timing, late trading and selective portfolio disclosure; and (14) other information relevant to an evaluation of the nature, extent and quality of the services provided by the Adviser and each Sub-Adviser in response to a series of detailed questions presented by independent legal counsel on behalf of the Independent Trustees.
The Contracts Committee began the formal review process in July 2005 when it met separately with independent legal counsel to review the information to be requested from management and the methodology to be used in determining the selected peer groups for comparing performance and expenses. The Contracts Committee then held meetings on November 1 and 2, 2005 and December 13, 2005, during which the Independent Trustees, meeting separately with independent legal counsel, reviewed and evaluated the information described above. As part of the review process, the Contracts Committee also met with representatives from the Adviser and the Sub-Advisers to discuss the information provided to the Committee. The Contracts Committee also considered information that had been provided by the Adviser and Sub-Advisers throughout the year at other meetings of the Contracts Committee, the Audit Committee, the Compliance Committee and the Board.
The Independent Trustees were assisted by Goodwin Procter LLP, their independent legal counsel, throughout the contract review process. The Independent Trustees relied upon the advice of such counsel and their own business
101
ADVISORY CONTRACT APPROVAL DISCUSSION (UNAUDITED) (CONTINUED)
judgment in determining the material factors to be considered in evaluating each Advisory and Sub-Advisory Agreement and the weight to be given to each such factor. The conclusions reached by the Independent Trustees were based on a comprehensive evaluation of all of the information provided and was not the result of any one factor. Moreover, each Independent Trustee may have afforded different weight to the various factors in reaching his or her conclusions with respect to each Advisory and Sub-Advisory Agreement.
Nature, Extent and Quality of Services
In considering whether to approve the Advisory and Sub-Advisory Agreements for the Funds for the year commencing January 1, 2006, the Board evaluated the nature, extent and quality of services provided to the Funds by the Adviser and Sub-Advisers. The Board considered the investment management and related services provided by the Adviser and Sub-Advisers, including the quantity and quality of the resources available to provide such services. Among other things, the Board considered the qualifications of the individuals responsible for performing various investment related services. With respect to Funds sub-advised by an affiliate of the Adviser, the Board also received information regarding the compensation paid by the Sub-Adviser to attract and retain individuals to perform these services on both an absolute basis and relative to amounts paid by others in the investment management industry.
The Board also considered the quality of the compliance programs of the Adviser and each Sub-Adviser, including the manner in which the Adviser and each Sub-Adviser monitor for compliance with the investment policies and restrictions of a Fund, the Codes of Ethics of the Adviser and Sub-Advisers with respect to personal trading by employees with access to portfolio information, and other compliance related matters. The Board also considered the actions taken by the Adviser and Sub-Advisers to establish and maintain effective disaster recovery and business continuity plans.
The Board considered the actions taken by the Adviser and its affiliated companies to administer the Funds’ policies and procedures for voting proxies, valuing the Funds’ assets, selective disclosure of portfolio holdings and preventing late-trading and frequent trading of Fund shares. With respect to these and related compliance matters, the Board also considered the responsiveness of the Adviser and its affiliated companies over the course of the past several years to the inquiries of various regulatory authorities, including the Securities and Exchange Commission and the National Association of Securities Dealers, Inc.
The Board also took into account the efforts of the Adviser and its affiliated companies to reduce the expenses of the Funds, including fees and expenses for transfer agency, custody and audit services. With respect to those Funds that are sub-advised by an affiliate of the Adviser, the Board specifically noted that the Adviser and its affiliated companies have significantly reduced the Funds’ brokerage costs and portfolio turnover rates, as well as the quantity of research acquired through the use of soft dollars from the Funds’ brokerage. The Board also noted the efforts of the Adviser to optimize the number of Funds in the ING complex of mutual funds and to standardize the asset management characteristics and policies across the ING mutual fund platform. Consideration was also given to the benefits that shareholders of the Funds realize because the Funds are part of a larger ING family of mutual funds, including, in most cases, the ability of shareholders to exchange or transfer investments within the same class of shares among a wide variety of mutual funds without incurring additional sales charges.
The Board concluded that the nature, extent and quality of advisory and related services provided by the Adviser and each of the Sub-Advisers, taken as a whole, are consistent with the terms of the respective Advisory and Sub-Advisory Agreements and justify the fees paid by the Funds for such services.
Fund Performance
The Board reviewed each Fund’s investment performance over various time periods on an absolute basis and relative to the performance of (i) one or more appropriate benchmark indexes (such as the S&P 500 Composite Stock Price Index), (ii) a group of similarly managed mutual funds identified by Lipper, Inc. and/or Morningstar, Inc., and (iii) similarly managed mutual funds within a specified peer group based upon a methodology approved by the Contracts Committee (each, a “Selected Peer Group”). The Board reviewed comparative performance data for the one-, three-, five-, and ten-year periods, where applicable, ending June 30, 2005 and September 30, 2005. Summaries of selected portions of the performance information reviewed by the Board, together with the Board’s conclusions regarding the performance of each Fund, is set forth below under “Fund-by-Fund Analysis.”
102
ADVISORY CONTRACT APPROVAL DISCUSSION (UNAUDITED) (CONTINUED)
Management Fees, Sub-Advisory Fees and Expenses
Consideration was given to the contractual investment advisory fee rates, inclusive of administrative fee rates, payable by the Funds to the Adviser and its affiliated companies (referred to collectively as “management fees”) and the contractual sub-advisory fee rates payable by the Adviser to each Sub-Adviser for sub-advisory services. As part of its review, the Board considered each Fund’s management fee and total expense ratio, as compared to its Selected Peer Group, both before and after giving effect to any undertaking by the Adviser to waive fees and/or limit the total expenses of a Fund. In addition, the Trustees received information regarding the fees charged by each Sub-Adviser to similarly-managed institutional accounts and other mutual funds, if any, and the comparability (or lack thereof) of the services provided by the Sub-Adviser in managing such accounts and other mutual funds to the services provided in managing the Funds. With respect to the Funds sub-advised by an affiliate of the Adviser, the Board evaluated the reasonableness of the fees payable under the Advisory and Sub-Advisory Agreements as a whole. With respect to the Funds sub-advised by Sub-Advisers that are not affiliated with the Adviser, the Board considered the reasonableness of the fees payable to the Sub-Advisers by the Adviser in light of the ability of the Adviser to negotiate such fees on an arms-length basis. Summaries of selected portions of the fee and expense information reviewed are set forth below under “Fund-by-Fund Analysis.” After reviewing the foregoing information, and in light of the nature extent and quality of the services provided by the Adviser and each Sub-Adviser, the Board concluded with respect to each Fund that the management fee charged to the Fund for advisory, sub-advisory and related services is fair and reasonable and that the total expense ratio of the Fund is reasonable.
Profitability
The Board considered information relating to revenues, expenses, and profits realized by the Adviser and each Sub-Adviser attributable to performing advisory, sub-advisory and administrative services for the Funds. With respect to Funds sub-advised by an unaffiliated Sub-Adviser, the Board did not consider the profitability of the Sub-Adviser to be a material factor because the Board believes that the Adviser negotiates sub-advisory fees with the unaffiliated Sub-Adviser on an arms-length basis. The Board reviewed profitability data for the Adviser and its affiliated companies, including the distributor of the Funds, relating to (i) each Fund separately, (ii) all Funds as a group, (iii) all “retail” Funds as a group, and (iv) all variable insurance product Funds as a group, in each case for the one-year periods ended December 31, 2004 and December 31, 2003, the nine-month period ended September 30, 2005 and the six-month period ended June 30, 2005. With respect to the Adviser and its affiliated companies, such information was prepared in accordance with a methodology approved by the Contracts Committee. The Board considered the profitability of the Adviser and its affiliated companies attributable to managing and operating each Fund both with and without the profitability of the distributor of the Funds and both before and after giving effect to any expenses incurred by the Adviser or any affiliated company in making revenue sharing or other payments to third parties, including affiliated insurance companies, for distribution and administrative services. With respect to Funds sub-advised by an affiliate of the Adviser, the Board considered the profitability of the Adviser and the Sub-Adviser attributable to managing and operating each Fund as a whole. The Board also considered other direct or indirect benefits that the Adviser and Sub-Advisers, and any affiliated companies thereof, derive from their relationships with the Funds, including the receipt by ING U.S. Financial Services, an affiliate of the Adviser, of fees relating to the offering of bundled financial products, such as annuity contracts, and the receipt by Sub-Advisers of “soft dollar” benefits from the Funds’ brokerage. The Board concluded that, in light of the nature, extent and quality of the services provided, the profits realized by the Adviser and its affiliated companies, taken as a whole, with respect to providing advisory, sub-advisory and administrative services for each Fund are reasonable.
Economies of Scale
In considering the reasonableness of the management fee of each Fund, the Board considered the extent to which economies of scale can be expected to be realized by a Fund’s Adviser and its affiliated companies, on the one hand, and by the Fund, on the other hand, as the assets of the Fund increase. The Board noted that the advisory fee for certain Funds includes breakpoints such that, as the assets of the Fund increase, the Fund’s management fee will decrease as a percentage of the Fund’s total assets. The Board recognized the inherent difficulties in measuring precisely the impact of any economies of scale being realized by the Adviser and its affiliated
103
ADVISORY CONTRACT APPROVAL DISCUSSION (UNAUDITED) (CONTINUED)
companies with respect to their management of any one or more Funds. In an effort to determine the extent to which economies of scale, if any, will be realized by the Adviser and its affiliated companies as the assets of the Funds grow, the Board considered the profitability data described above relating to the Adviser and its affiliated companies in light of changes in the assets of the Funds over various time periods. The Board noted that the total assets under management of many Funds have decreased during the past several years and concluded that the economies of scale realized by the Adviser and its affiliated companies from managing the Funds have not increased with respect to such Funds. The Board also reviewed information regarding the expense ratio of each Fund in light of changes in the assets of the Funds over various time periods, noting that, as the assets of a Fund increase, the fixed expenses of the Fund, as a percentage of the total assets of the Fund, can be expected to decrease. The Board considered such expense information in light of projections provided by the Adviser with respect to the future growth of assets of the Funds. Based upon the foregoing, the Board concluded that the economies of scale being realized by the Adviser and its affiliated companies do not mandate the implementation of breakpoints or additional breakpoints, as the case may be, with respect to any Fund at this time.
Fund-by-Fund Analysis
In deciding to approve the continuation of each Advisory and Sub-Advisory Agreement for an additional one-year period beginning January 1, 2006, the Board took into account the specific data and factors identified below relating to the performance, fees and expenses of each Fund and actions being taken by the Adviser or Sub-Adviser, as the case may be, with respect to these matters. Except as otherwise indicated, the performance data described below for each Fund is for periods ended September 30, 2005 and the management fees and expense data described below are as of June 30, 2005.
ING VP Index Plus LargeCap Portfolio
In evaluating the investment performance of ING VP Index Plus LargeCap Portfolio, the Board noted that: (1) the Portfolio outperformed its Morningstar category median and its benchmark for the most recent calendar quarter, year-to-date and one-year periods, but underperformed for the three- and five-year periods; and (2) the Portfolio is ranked in its Morningstar category in the third quintile for the most recent calendar quarter, year-to-date, one- and three-year periods and in the fourth quintile for the five-year period. The Board further noted that, in an effort to address concerns regarding the Portfolio’s performance, in July 2004 the Sub-Adviser hired a new Director of Quantitative Research and a new team of analysts within this department with responsibility for developing and administering the models used for identifying and selecting appropriate weighting of securities in the Portfolio and that the performance of the Portfolio has improved. The Board concluded that appropriate actions are being taken to improve performance and that additional time is needed to evaluate the effectiveness of these actions.
In assessing the reasonableness of the management fee and expense ratio for ING VP Index Plus LargeCap Portfolio, the Board noted that the management fee for the Portfolio is below the median and average management fees of the funds in its Selected Peer Group and that the expense ratio for the Portfolio is below the median and average expense ratios of the funds in its Selected Peer Group.
ING VP Index Plus MidCap Portfolio
In evaluating the investment performance of ING VP Index Plus MidCap Portfolio, the Board noted that: (1) the Portfolio outperformed its Morningstar category median for the year-to-date, one- and five-year periods, but underperformed for the most recent calendar quarter and three-year periods; (2) the Portfolio underperformed its benchmark for all periods presented; and (3) the Portfolio is ranked in its Morningstar category in the second quintile for the year-to-date and one-year periods, the third quintile for the five-year period and in the fourth quintile for the most recent calendar quarter and three-year periods. The Board further noted that, in an effort to address concerns regarding the Portfolio’s performance, in July 2004 the Sub-Adviser hired a new Director of Quantitative Research and a new team of analysts within this department with responsibility for developing and administering the models used for identifying and selecting appropriate weighting of securities in the Portfolio and that the performance of the Portfolio has improved. The Board concluded that appropriate actions are being taken to improve performance and that additional time is needed to evaluate the effectiveness of these actions.
104
ADVISORY CONTRACT APPROVAL DISCUSSION (UNAUDITED) (CONTINUED)
In assessing the reasonableness of the management fee and expense ratio for ING VP Index Plus MidCap Portfolio, the Board noted that the management fee for the Portfolio is below the median and average management fees of the funds in its Selected Peer Group and that the expense ratio for the Portfolio is below the median and average expense ratios of the funds in its Selected Peer Group.
ING VP Index Plus SmallCap Portfolio
In evaluating the investment performance of ING VP Index Plus SmallCap Portfolio, the Board noted that: (1) the Fund outperformed its Morningstar category median for the most recent calendar quarter, year-to-date and one-year periods, but underperformed for the three- and five-year periods; (2) the Fund underperformed its benchmark for all periods presented; and (3) the Fund is ranked in its Morningstar category in the second quintile for the year-to-date and one-year periods and in the third quintile for the most recent calendar quarter, three- and five-year periods. The Board further noted that, in an effort to address concerns regarding the Portfolio’s performance, in July 2004 the Sub-Adviser hired a new Director of Quantitative Research and a new team of analysts within this department with responsibility for developing and administering the models used for identifying and selecting appropriate weighting of securities in the Portfolio and that the performance of the Portfolio has improved. The Board concluded that appropriate actions are being taken to improve performance and that additional time is needed to evaluate the effectiveness of these actions.
In assessing the reasonableness of the management fee and expense ratio for ING VP Index Plus SmallCap Portfolio, the Board noted that the management fee for the Portfolio is below the median and average management fees of the funds in its Selected Peer Group, and that the expense ratio for the Portfolio is below the median and average expense ratios of the funds in its Selected Peer Group.
ING VP Strategic Allocation Balanced Portfolio
In evaluating the investment performance of ING VP Strategic Allocation Balanced Portfolio, the Board noted that: (1) the Portfolio outperformed its Morningstar category median for all periods presented except it underperformed for the ten-year period; (2) the Portfolio outperformed its benchmark for the most recent calendar quarter, year-to-date and one-year periods, but underperformed for the three-, five- and ten-year periods; and (3) the Portfolio is ranked in its Morningstar category in the second quintile for the most recent calendar quarter, year-to-date and one-year periods, in the third quintile for the three- and five-year periods and in the fourth quintile for the ten-year period. The Board further noted that, in an effort to address concerns regarding the Portfolio’s performance, in July 2004 the Adviser and Sub-Adviser recommended a change in the investment strategy for the Portfolio to add small and mid-sized stocks in the Portfolio’s asset mix and that the performance of the Portfolio has improved. The Board also noted that the Sub-Adviser has hired a new head of asset allocation strategies. The Board concluded that appropriate actions are being taken to improve performance and that additional time is needed to evaluate the effectiveness of these actions.
In assessing the reasonableness of the management fee and expense ratio for ING VP Strategic Allocation Balanced Portfolio, the Board noted that the management fee for the Portfolio is above the median and the average management fees of the funds in its Selected Peer Group, and that the expense ratio for the Portfolio is one basis point above the median and equal to the average expense ratios of the funds in its Selected Peer Group.
ING VP Strategic Allocation Growth Portfolio
In evaluating the investment performance of ING VP Strategic Allocation Growth Portfolio, the Board noted that: (1) the Portfolio outperformed its Morningstar category median for the most recent calendar quarter, year-to-date, one- and five-year periods, but underperformed for the three- and ten-year periods; (2) the Portfolio outperformed its benchmark for the most recent calendar quarter, year-to-date and one-year periods, but underperformed for the three-, five- and ten-year periods; and (3) the Portfolio is ranked in its Morningstar category in the first highest quintile for the five-year period, in the second quintile for the most recent calendar quarter, year-to-date and one-year periods and in the fourth quintile for the three- and ten-year periods. The Board further noted that, in an effort to address concerns regarding the Portfolio’s performance, in July 2004 the Adviser and Sub-Adviser recommended a change in the investment strategy for the Fund to add small and mid-sized stocks in the Portfolio’s asset mix and that the performance of the Portfolio has improved. The Board also noted that the Sub-Adviser has hired a new head of asset allocation strategies. The Board concluded that
105
ADVISORY CONTRACT APPROVAL DISCUSSION (UNAUDITED) (CONTINUED)
appropriate actions are being taken to improve performance and that additional time is needed to evaluate the effectiveness of these actions.
In assessing the reasonableness of the management fee and expense ratio for ING VP Strategic Allocation Growth Portfolio, the Board noted that the management fee for the Portfolio is above the median and the average management fees of the funds in its Selected Peer Group, and that the expense ratio for the Portfolio is only one basis point above the median and equal to the average expense ratios of the funds in its Selected Peer Group.
ING VP Strategic Allocation Income Portfolio
In evaluating the investment performance of ING VP Strategic Allocation Income Portfolio the Board noted that: (1) the Portfolio outperformed its Morningstar category median and its benchmark for the most recent calendar quarter, year-to-date, one- and three-year periods, but underperformed for the five- and ten-year periods; and (2) the Portfolio is ranked in its Morningstar category in the second quintile for the most recent calendar quarter, year-to-date and one-year periods, in the third quintile for the three- and ten-year periods and in the fourth quintile for the five-year period. The Board further noted that, in an effort to address concerns regarding the Portfolio’s performance, in July 2004 the Adviser and Sub-Adviser recommended a change in the investment strategy for the Fund to add small and mid-sized stocks in the Portfolio’s asset mix. The Board also noted that the Sub-Adviser has hired a new head of asset allocation strategies. The Board concluded that appropriate actions are being taken to improve performance and that additional time is needed to evaluate the effectiveness of these actions.
In assessing the reasonableness of the management fee and expense ratio for ING VP Strategic Allocation Income Portfolio, the Board noted that the management the Portfolio is above the median and the average management fees of the funds in its Selected Peer Group, and that the expense ratio for the Portfolio is below the median and average expense ratios of the funds in its Selected Peer Group.
106
Investment Manager
ING Investments, LLC
7337 East Doubletree Ranch Road
Scottsdale, Arizona 85258
Administrator
ING Funds Services, LLC
7337 East Doubletree Ranch Road
Scottsdale, Arizona 85258
Transfer Agent
DST Systems, Inc.
P.O. Box 419368
Kansas City, Missouri 64141
Custodian
The Bank of New York
100 Colonial Center Parkway, Suite 300
Lake Mary, Florida 32746
Legal Counsel
Goodwin Procter LLP
Exchange Place
53 State Street
Boston, Massachusetts 02109
Independent Registered Public Accounting Firm
KPMG LLP
99 High Street
Boston, Massachusetts 02110
Before investing, carefully consider the investment objectives, risks, charges and expenses of the variable universal life insurance policy or variable annuity contract and the underlying variable investment options. This and other information is contained in the prospectus for the variable universal life policy or variable annuity contract and the underlying variable investment options. Obtain these prospectuses from your agent/registered representative and read them carefully before investing.

| VAR-AIP/SAIS | (1205-022306) |
Item 2. Code of Ethics.
As of the end of the period covered by this report, Registrant had adopted a code of ethics, as defined in Item 2 of Form N-CSR, that applies to the Registrant’s principal executive officer and principal financial officer. There were no amendments to the Code during the period covered by the report. The Registrant did not grant any waivers, including implicit waivers, from any provisions of the Code during the period covered by this report. The code of ethics is filed herewith pursuant to Item 10(a)(1), Exhibit 99.CODE ETH.
Item 3. Audit Committee Financial Expert.
The Board of Trustees has determined that Corine Norgaard and Joseph Obermeyer are each audit committee financial experts, as defined in Item 3 of Form N-CSR. Ms. Norgaard and Mr. Obermeyer are both “independent” for purposes of Item 3 of Form N-CSR.
Item 4. Principal Accountant Fees and Services.
(a) Audit Fees: The aggregate fees billed for each of the last two fiscal years for professional services rendered by KPMG LLP (“KPMG”), the principal accountant for the audit of the registrant’s annual financial statements, for services that are normally provided by the accountant in connection with statutory and regulatory filings or engagements for those fiscal years were $90,321 for year ended December 31, 2005 and $90,679 for year ended December 31, 2004.
(b) Audit-Related Fees: The aggregate fees billed in each of the last two fiscal years for assurance and related services by KPMG that are reasonably related to the performance of the audit of the registrant’s financial statements and are not reported under paragraph (a) of this Item were $15,200 for year ended December 31, 2005 and $0 for year ended December 31, 2004.
(c) Tax Fees: The aggregate fees billed in each of the last two fiscal years for professional services rendered by KPMG for tax compliance, tax advice, and tax planning were $24,960 in the year ended December 31, 2005 and $46,674 in the year ended December 31, 2004. Such services included review of excise distribution calculations (if applicable), preparation of the Funds’ federal, state and excise tax returns, tax services related to mergers and routine consulting.
(d) All Other Fees: The aggregate fees billed in each of the last two fiscal years for products and services provided by KPMG, other than the services reported in paragraphs (a) through (c) of this Item.
None
(e) (1) Audit Committee Pre-Approval Policies and Procedures
2
AUDIT AND NON-AUDIT SERVICES
PRE-APPROVAL POLICY
I. Statement of Principles
Under the Sarbanes-Oxley Act of 2002 (the “Act”), the Audit Committee of the Board of Directors or Trustees (the “Committee”) of the ING Funds (each a “Fund,” collectively, the “Funds”) set out under Paragraph I on Exhibit A to this Audit and Non-Audit Services Pre-Approval Policy (“Policy”) is responsible for the oversight of the work of the Funds’ independent auditors. As part of its responsibilities, the Committee must pre-approve the audit and non-audit services performed by the auditors in order to assure that the provision of these services does not impair the auditors’ independence from the Funds. The Committee has adopted, and the Board has ratified, this Policy, which sets out the procedures and conditions under which the services of the independent auditors may be pre-approved.
Under Securities and Exchange Commission (“SEC”) rules promulgated in accordance with the Act, the Funds’ may establish two different approaches to pre-approving audit and non-audit services. The Committee may approve services without consideration of specific case-by-case services (“general pre-approval”) or it may pre-approve specific services (“specific pre-approval”). The Committee believes that the combination of these approaches contemplated in this Policy results in an effective and efficient method for pre-approving audit and non-audit services to be performed by the Funds’ independent auditors. Under this Policy, services that are not of a type that may receive general pre-approval require specific pre-approval by the Committee. Any proposed services that exceed pre-approved cost levels or budgeted amounts will also require the Committee’s specific pre-approval.
For both types of approval, the Committee considers whether the subject services are consistent with the SEC’s rules on auditor independence and that such services are compatible with maintaining the auditors’ independence. The Committee also considers whether a particular audit firm is in the best position to provide effective and efficient services to the Funds. Reasons that the auditors are in the best position include the auditors’ familiarity with the Funds’ business, personnel, culture, accounting systems, risk profile, and other factors, and whether the services will enhance the Funds’ ability to manage and control risk or improve audit quality. Such factors will be considered as a whole, with no one factor being determinative.
The appendices attached to this Policy describe the audit, audit-related, tax-related, and other services that have the Committee’s general pre-approval. For any service that has been approved through general pre-approval, the general pre-approval will remain in place for a period 12 months from the date of pre-approval, unless the Committee determines that a different period is appropriate. The Committee will annually review and pre-approve the services that may be provided by the independent auditors without specific pre-approval. The Committee will revise the list of services subject to general pre-approval as appropriate. This Policy does not serve as a delegation to Fund management of the Committee’s duty to pre-approve services performed by the Funds’ independent auditors.
3
II. Audit Services
The annual audit services engagement terms and fees are subject to the Committee’s specific pre-approval. Audit services are those services that are normally provided by auditors in connection with statutory and regulatory filings or engagements or those that generally only independent auditors can reasonably provide. They include the Funds’ annual financial statement audit and procedures that the independent auditors must perform in order to form an opinion on the Funds’ financial statements (e.g., information systems and procedural reviews and testing). The Committee will monitor the audit services engagement and approve any changes in terms, conditions or fees deemed by the Committee to be necessary or appropriate.
The Committee may grant general pre-approval to other audit services, such as statutory audits and services associated with SEC registration statements, periodic reports and other documents filed with the SEC or issued in connection with securities offerings.
The Committee has pre-approved the audit services listed on Appendix A. The Committee must specifically approve all audit services not listed on Appendix A.
III. Audit-related Services
Audit-related services are assurance and related services that are reasonably related to the performance of the audit or the review of the Funds’ financial statements or are traditionally performed by the independent auditors. The Committee believes that the provision of audit-related services will not impair the independent auditors’ independence, and therefore may grant pre-approval to audit-related services. Audit-related services include accounting consultations related to accounting, financial reporting or disclosure matters not classified as “audit services;” assistance with understanding and implementing new accounting and financial reporting guidance from rulemaking authorities; agreed-upon or expanded audit procedures relating to accounting and/or billing records required to respond to or comply with financial, accounting or regulatory reporting matters; and assistance with internal control reporting requirements under Form N-SAR or Form N-CSR.
The Committee has pre-approved the audit-related services listed on Appendix B. The Committee must specifically approve all audit-related services not listed on Appendix B.
IV. Tax Services
The Committee believes the independent auditors can provide tax services to the Funds, including tax compliance, tax planning, and tax advice, without compromising the auditors’ independence. Therefore, the Committee may grant general pre-approval with respect to tax services historically provided by the Funds’ independent auditors that do not, in the Committee’s view, impair auditor independence and that are consistent with the SEC’s rules on auditor independence.
The Committee will not grant pre-approval if the independent auditors initially recommends a transaction the sole business purpose of which is tax avoidance and the tax treatment of which may
4
not be supported in the Internal Revenue Code and related regulations. The Committee may consult outside counsel to determine that tax planning and reporting positions are consistent with this Policy.
The Committee has pre-approved the tax-related services listed on Appendix C. The Committee must specifically approve all tax-related services not listed on Appendix C.
V. Other Services
The Committee believes it may grant approval of non-audit services that are permissible services for independent auditors to a Fund. The Committee has determined to grant general pre-approval to other services that it believes are routine and recurring, do not impair auditor independence, and are consistent with SEC rules on auditor independence.
The Committee has pre-approved the non-audit services listed on Appendix D. The Committee must specifically approve all non-audit services not listed on Appendix D.
A list of the SEC’s prohibited non-audit services is attached to this Policy as Appendix E. The SEC’s rules and relevant guidance should be consulted to determine the precise definitions of these impermissible services and the applicability of exceptions to certain of the SEC’s prohibitions.
VI. Pre-approval of Fee levels and Budgeted Amounts
The Committee will annually establish pre-approval fee levels or budgeted amounts for audit, audit-related, tax and non-audit services to be provided to the Funds by the independent auditors. Any proposed services exceeding these levels or amounts require the Committee’s specific pre-approval. The Committee considers fees for audit and non-audit services when deciding whether to pre-approve services. The Committee may determine, for a pre-approval period of 12 months, the appropriate ratio between the total amount of fees for the Fund’s audit, audit-related, and tax services (including fees for services provided to Fund affiliates that are subject to pre-approval), and the total amount of fees for certain permissible non-audit services for the Fund classified as other services (including any such services provided to Fund affiliates that are subject to pre-approval).
VII. Procedures
Requests or applications for services to be provided by the independent auditors will be submitted to management. If management determines that the services do not fall within those services generally pre-approved by the Committee and set out in the appendices to these procedures, management will submit the services to the Committee or its delagee. Any such submission will include a detailed description of the services to be rendered.
Notwithstanding this paragraph, the Committee will, on quarterly basis, receive from the independent auditors a list of services provided to date by the auditors during Pre-Approval Period.
5
VIII. Delegation
The Committee may delegate pre-approval authority to one or more of the Committee’s members. Any member or members to whom such pre-approval authority is delegated must report any pre-approval decisions, including any pre-approved services, to the Committee at its next scheduled meeting. The Committee will identify any member to whom pre-approval authority is delegated in writing. The member will retain such authority for a period of 12 months from the date of pre-approval unless the Committee determines that a different period is appropriate. The period of delegated authority may be terminated by the Committee or at the option of the member.
IX. Additional Requirements
The Committee will take any measures the Committee deems necessary or appropriate to oversee the work of the independent auditors and to assure the auditors’ independence from the Funds. This may include reviewing a formal written statement from the independent auditors delineating all relationships between the auditors and the Funds, consistent with Independence Standards Board No. 1, and discussing with the auditors their methods and procedures for ensuring independence.
Date last approved: December 13, 2005
6
Appendix A
Pre-Approved Audit Services for the Pre-Approval Period January 1, 2006 through December 31, 2006
Service
| | The Fund(s) | | Fee Range |
Statutory audits or financial audits (including tax services associated with audit services) | | ý | | As presented to Audit Committee(1) |
| | | | |
Services associated with SEC registration statements, periodic reports and other documents filed with the SEC or other documents issued in connection with securities offerings (e.g., consents), and assistance in responding to SEC comment letters. | | ý | | Not to exceed $9,300per filing |
| | | | |
Consultations by Fund management with respect to accounting or disclosure treatment of transactions or events and/or the actual or potential effect of final or proposed rules, standards or interpretations by the SEC, Financial Accounting Standards Board, or other regulatory or standard setting bodies. | | ý | | Not to exceed $8,000 during the Pre-Approval Period |
(1) For new Funds launched during the Pre-Approval Period, the fee ranges pre-approved will be the same as those for existing Funds, pro-rated in accordance with inception dates as provided in KPMG’s Proposal or any Engagement Letter covering the period at issue. Fees in the Engagement Letter will be controlling.
7
Appendix B
Pre-Approved Audit-Related Services for the Pre-Approval Period January 1, 2006 through December 31, 2006
Service
| | The
Fund(s) | | Fund Affiliates | | Fee Range |
Services related to Fund mergers (Excluding tax services – See Appendix C for tax services associated with fund mergers)
| | ý | | ý | | Not to exceed $10,000 per merger |
| | | | | | |
Consultations by Fund management with respect to accounting or disclosure treatment of transactions or events and/or the actual or potential effect of final or proposed rules, standards or interpretations by the SEC, Financial Accounting Standards Board, or other regulatory or standard setting bodies. [Note: Under SEC rules some consultations may be “audit” services and others may be “audit-related” services.] | | ý | | | | Not to exceed $5,000 per occurrence during the Pre-Approval Period |
| | | | | | |
Review of the Funds’ semi-annual financial statements | | ý | | | | Not to exceed $2,100 per set of financial statements per fund |
| | | | | | |
Reports to regulatory or government agencies related to the annual engagement | | ý | | | | Up to $5,000 per occurrence during the Pre-Approval Period |
| | | | | | |
Regulatory compliance assistance | | ý | | ý | | Not to exceed $5,000 per quarter |
| | | | | | |
Training courses | | ý | | ý | | Not to exceed $2,000 per course |
8
Appendix C
Pre-Approved Tax Services for the Pre-Approval Period January 1, 2006 through December 31, 2006
Service
| | The Fund(s) | | Fund
Affiliates | | Fee Range |
Preparation of federal and state income tax returns and federal excise tax returns for the Funds including assistance and review with excise tax distributions. | | ý | | | | As presented to Audit Committee(2) |
| | | | | | |
Review of IRC Sections 851(b) and 817(h) diversification testing on a real-time basis | | ý | | | | As presented to Audit Committee(2) |
| | | | | | |
Assistance and advice regarding year-end reporting for 1099’s | | ý | | | | As presented to Audit Committee(2) |
| | | | | | |
Tax assistance and advice regarding statutory, regulatory or administrative developments | | ý | | ý | | Not to exceed $5,000 in aggregate for the Funds or for the Funds’ investment adviser during the Pre-Approval Period |
| | | | | | |
Tax training courses | | ý | | ý | | Not to exceed $2,000 per course during the Pre-Approval Period |
| | | | | | |
Loan Staff Services | | | | ý | | Not to exceed $15,000 during the Pre-Approval Period |
(2) For new Funds launched during the Pre-Approval Period, the fee ranges pre-approved will be the same as those for existing Funds, as provided in KPMG’s Proposal or any Engagement Letter covering the period at issue. Fees in the Engagement Letter will be controlling.
9
Service
| | The Fund(s) | | Fund
Affiliates | | Fee Range |
Tax services associated with Fund mergers | | ý | | ý | | Not to exceed $4,000 per fund per merger during the Pre-Approval Period |
| | | | | | |
Other tax-related assistance and consultation, including, without limitation, assistance in evaluating derivative financial instruments and international tax issues, qualification and distribution issues, and similar routine tax consultations | | ý | | | | Not to exceed $50,000 during the Pre-Approval Period |
10
Appendix D
Pre-Approved Other Services for the Pre-Approval Period January 1, 2006 through December 31, 2006
Service
| | The Fund(s) | | Fund Affiliates | | Fee Range |
Agreed-upon procedures for Class B share 12b-1 programs | | | | ý | | Not to exceed $50,000 during the Pre-Approval Period |
| | | | | | |
Security counts performed pursuant to Rule 17f-2 of the 1940 Act (i.e., counts for Funds holding securities with affiliated sub-custodians) | | ý | | | | Not to exceed $5,000 per Fund during the Pre-Approval Period |
11
Appendix E
Prohibited Non-Audit Services
Dated: 2006
• Bookkeeping or other services related to the accounting records or financial statements of the Funds
• Financial information systems design and implementation
• Appraisal or valuation services, fairness opinions, or contribution-in-kind reports
• Actuarial services
• Internal audit outsourcing services
• Management functions
• Human resources
• Broker-dealer, investment adviser, or investment banking services
• Legal services
• Expert services unrelated to the audit
• Any other service that the Public Company Accounting Oversight Board determines, by regulation, is impermissible
12
(e) (2) Percentage of services referred to in 4(b) — (4)(d) that were approved by the audit committee
100% of the services were approved by the audit committee.
(f) Percentage of hours expended attributable to work performed by other than full time employees of KPMG if greater than 50%.
Not applicable.
(g) Non-Audit Fees: The non-audit fees billed by the registrant’s accountant for services rendered to the registrant, and rendered to the registrant’s investment adviser, and any entity controlling, controlled by, or under common control with the adviser that provides ongoing services to the registrant for each of the last two fiscal years of the registrant were $301,599 for year ended December 31, 2005 and $474,004 for year ended December 31, 2004.
(h) Principal Accountants Independence: The Registrant’s Audit committee has considered whether the provision of non-audit services that were rendered to the registrant’s investment adviser and any entity controlling, controlled by, or under common control with the investment adviser that provides ongoing services to the registrant that were not pre-approved pursuant to Rule 2-01(c)(7)(ii) of Regulation S-X is compatible with maintaining KPMG’s independence.
Item 5. Audit Committee of Listed Registrants.
Not applicable.
Item 6. Schedule of Investments
Schedule is included as part of the report to shareholders filed under Item 1 of this Form.
Item 7. Disclosure of Proxy Voting Policies and Procedures for Closed-End Management Investment Companies.
Not applicable.
Item 8. Portfolio Managers of Closed-End Management Investment Companies.
Not applicable.
Item 9. Purchases of Equity Securities by Closed-End Management Investment Company and Affiliated Purchasers
Not applicable.
Item 10. Submission of Matters to a Vote of Security Holders.
The Nominating Committee operates pursuant to a Charter approved by the Board. The primary purpose of the Nominating Committee is to consider, evaluate and make recommendations to the Board with respect to the nomination and selection of Independent Trustees. In evaluating candidates, the Nominating Committee may consider a variety of factors, but specific qualifications of candidates for Board membership will be based on the needs of the Board at the time of nomination.
The Nominating Committee is willing to consider nominations received from shareholders and shall assess shareholder nominees in the same manner as it reviews nominees it identifies. A shareholder nominee for director should be submitted in writing to the Fund’s Secretary. Any such shareholder nomination should include sufficient background information concerning the candidate and should be received in a timely manner. At a minimum, the following information as to each individual proposed for nomination as director should be included: the individual’s written consent to be named in the proxy statement as a nominee (if nominated) and to serve as a director (if elected), and all information relating to such individual that is required to be disclosed in a solicitation of proxies for election of directors, or is otherwise required, in each case under applicable federal securities laws, rules and regulations.
The Secretary shall submit all nominations received in a timely manner to the Nominating Committee. To be timely, any such submission must be delivered to the Fund’s Secretary not earlier than the 90th day prior to such meeting and not later than the close of business on the later of the 60th day prior to such meeting or the 10th day following the day on which public announcement of the date of the meeting is first made, by either disclosure in a press release or in a document publicly filed by the Fund with the SEC.
In evaluating a candidate for the position of Independent Trustee, including any candidate recommended by shareholders of the Fund, the Nominating Committee shall consider the following: (i) the candidate’s knowledge in matters relating to the mutual fund industry; (ii) any experience possessed by the candidate as a director or senior officer of other public companies; (iii) the candidate’s educational background, reputation for high ethical standards and professional integrity; (iv) any specific financial, technical or other expertise possessed by the candidate, and the extent to which such expertise would complement the Board’s existing mix of skills, core competencies and qualifications; (v) the candidate’s perceived ability to contribute to the ongoing functions of the Board, including the candidate’s ability and commitment to attend meetings regularly and work collaboratively with other members of the Board; (vi) the candidate’s ability to qualify as an Independent Trustee for purposes of the 1940 Act; and (vii) such other factors as the Committee determines to be relevant in light of the existing composition of the Board and any anticipated vacancies. Prior to making a final recommendation to the Board, the Committee shall conduct personal interviews with those candidates it concludes are the most qualified candidates.
13
Item 11. Controls and Procedures.
(a) Based on our evaluation conducted within 90 days of the filing date, hereof, the design and operation of the registrant’s disclosure controls and procedures are effective to ensure that material information relating to the registrant is made known to the certifying officers by others within the appropriate entities, particularly during the period in which Forms N-CSR are being prepared, and the registrant’s disclosure controls and procedures allow timely preparation and review of the information for the registrant’s Form N-CSR and the officer certifications of such Form N-CSR.
(b) There were no significant changes in the registrant’s internal controls that occurred during the second fiscal quarter of the period covered by this report that has materially affected, or is reasonably likely to materially affect, the registrant’s internal control over financial reporting.
Item 12. Exhibits.
(a)(1) | | Code of Ethics pursuant to Item 2 of Form N-CSR is filed and attached hereto as |
| | EX-99.CODE ETH. |
| | |
(a)(2) | | A separate certification for each principal executive officer and principal financial officer of the registrant as required by Rule 30a-2 under the Act (17 CFR 270.30a-2) is attached hereto as EX-99.CERT. |
| | |
(b) | | The officer certifications required by Section 906 of the Sarbanes-Oxley Act of 2002 are attached hereto as EX-99.906CERT |
| | |
(3) | | Not applicable. |
| | |
14
SIGNATURES
Pursuant to the requirements of the Securities Exchange Act of 1934 and the Investment Company Act of 1940, the registrant has duly caused this report to be signed on its behalf by the undersigned, thereunto duly authorized.
(Registrant): ING VP Variable Portfolios, Inc.
By | /s/ James M. Hennessy |
| James M. Hennessy |
| President and Chief Executive Officer |
Date: March 10, 2006
Pursuant to the requirements of the Securities Exchange Act of 1934 and the Investment Company Act of 1940, this report has been signed below by the following persons on behalf of the registrant and in the capacities and on the dates indicated.
By | /s/ James M. Hennessy |
| James M. Hennessy |
| President and Chief Executive Officer |
Date: March 10, 2006
By | /s/ Todd Modic |
| Todd Modic |
| Senior Vice President and Chief Financial Officer |
Date: March 10, 2006
15