| | OMB APPROVAL |
| | OMB Number: | 3235-0570 |
| | Expires: | October 31, 2006 |
| UNITED STATES | Estimated average burden hours per response. . . . . . . . . . . . . . . . .19.3 |
| SECURITIES AND EXCHANGE COMMISSION | |
| Washington, D.C. 20549 | |
| | | | |
FORM N-CSR
CERTIFIED SHAREHOLDER REPORT OF REGISTERED
MANAGEMENT INVESTMENT COMPANIES
Investment Company Act file number | 811-07651 |
|
ING Variable Portfolios, Inc. |
(Exact name of registrant as specified in charter) |
|
7337 E. Doubletree Ranch Rd., Scottsdale, AZ | | 85258 |
(Address of principal executive offices) | | (Zip code) |
|
The Corporation Trust Incorporated, 300 E. Lombard Street, Baltimore, MD 21202 |
(Name and address of agent for service) |
|
Registrant’s telephone number, including area code: | 1-800-992-0180 | |
|
Date of fiscal year end: | December 31 | |
|
Date of reporting period: | December 31, 2004 | |
| | | | | | | | |
Item 1. Reports to Stockholders.
The following is a copy of the report transmitted to stockholders pursuant to Rule 30e-1 under the Act (17 CFR 270.30e-1):
SIGNATURES
Pursuant to the requirements of the Securities Exchange Act of 1934 and the Investment Company Act of 1940, the registrant has duly caused this report to be signed on its behalf by the undersigned, thereunto duly authorized.
(Registrant): ING Variable Portfolios, Inc.
By | /s/ James M. Hennessy | |
| James M. Hennessy |
| President and Chief Executive Officer |
|
Date: | March 4, 2005 | |
| | | | | |
Pursuant to the requirements of the Securities Exchange Act of 1934 and the Investment Company Act of 1940, this report has been signed below by the following persons on behalf of the registrant and in the capacities and on the dates indicated.
1
By | /s/ James M. Hennessy | |
| James M. Hennessy |
| President and Chief Executive Officer |
|
Date: | March 4, 2005 | |
|
|
By | /s/ Michael J. Roland | |
| Michael J. Roland |
| Executive Vice President and Chief Financial Officer |
|
Date: | March 4, 2005 | |
| | | | | | | | | | |
2

Annual Report
December 31, 2004
Classes I and S
ING Variable Product Funds
Domestic Equity and Income Portfolios
§ ING VP Balanced Portfolio
§ ING VP Growth and Income Portfolio
Domestic Equity Growth Portfolios
§ ING VP Growth Portfolio
§ ING VP Small Company Portfolio
Domestic Equity Value Portfolio
§ ING VP Value Opportunity Portfolio
Fixed Income Portfolios
§ ING VP Intermediate Bond Portfolio
(formerly, ING VP Bond Portfolio)
§ ING VP Money Market Portfolio
Global and International Equity Portfolios
§ ING VP Global Science and Technology Portfolio
§ ING VP International Equity Portfolio
This report is submitted for general information to shareholders of the ING Funds. It is not authorized for distribution to prospective shareholders unless accompanied or preceded by a prospectus which includes details regarding the funds’ investment objectives, risks, charges, expenses and other information. This information should be read carefully. | 
|
PROXY VOTING INFORMATION
A description of the policies and procedures that the Registrants use to determine how to vote proxies related to portfolio securities is available (1) without charge, upon request, by calling Shareholder Services toll-free at 800-992-0180; (2) on the Registrants’ website at www.ingfunds.com and (3) on the SEC’s website at www.sec.gov. Information regarding how the Registrants voted proxies related to portfolio securities during the most recent 12-month period ended June 30 is available without charge on the Registrants’ website at www.ingfunds.com and on the SEC’s website at www.sec.gov.
QUARTERLY PORTFOLIO HOLDINGS
The Registrants file their complete schedule of portfolio holdings with the Commission for the first and third quarters of each fiscal year on Form N-Q. The Registrants’ Forms N-Q are available on the SEC’s website at www.sec.gov. The Registrants’ Forms N-Q may be reviewed and copied at the Commission’s Public Reference Room in Washington, DC, and information on the operation of the Public Reference Room may be obtained by calling 1-800-SEC-0330; and is available upon request from the Registrants by calling Shareholder Services toll-free at 800-992-0180.
(THIS PAGE INTENTIONALLY LEFT BLANK)

| Dear Shareholder: |
|
The past year has brought about numerous changes in the mutual funds industry, including requests for additional disclosures. I would like to draw your attention to some additional information you will now see in the reports due, in part, to these new requirements: |
|
• You will see a new section entitled “Shareholder Expense Examples”. These examples are intended to illustrate for you the ongoing costs of investing in a mutual fund and to provide a method to compare those costs with the ongoing costs of investing in other mutual funds. |
|
• In addition to the normal performance tables included in the Portfolio Managers’ Reports, there are now additional graphical or tabular presentations, which illustrate the current holdings of the funds as of the period-end. |
• Each fund now also files its complete schedule of portfolio holdings with the Securities Exchange Commission (“SEC”) for the first and third quarters of each fiscal year on Form N-Q. These Forms are available for shareholders to view on the SEC’s website at www.sec.gov.
We welcome these changes and believe that they will provide valuable information to our shareholders. We hope you will find these additional disclosures beneficial and easy to understand.
On behalf of ING Funds, I thank you for your continued support and confidence and look forward to serving you in 2005 and beyond.
Sincerely,

James M. Hennessy
President
ING Funds
January 25, 2005
1
In our semi-annual report, we referred to sharp swings in sentiment as investors took stock after the handsome gains of 2003. By the middle of the year, the markets had not done much of anything; however, over the next six months sentiment would change twice more and in the end major asset classes posted respectable returns for the year, if not better.
Global equities gained 10.8% in the six months ended December 31, 2004, according to the Morgan Stanley Capital International (“MSCI”) World Index(1), including net reinvested dividends, and 14.7% for entire year. Nearly one quarter of the annual gain was due to dollar weakness, the main story in the currency markets. The dollar was ahead for most of the year, but by mid October had succumbed to continuing concern over the United States twin budget and trade deficits and whether overseas investors would continue to finance them, raising the nightmare of a disorderly slide in the dollar. In 2004, the euro gained 7.6%, a new record. The yen rose 4.5% to a level not seen since early 2000, while the pound stood 7.4% higher, at a remarkable 12-year peak.
Perhaps the most notable feature in investment grade U.S. fixed income markets in the second six months was the curious “curve flattening” trend. Short-term interest rates drifted up as the Federal Open Market Committee (“FOMC”) raised the Federal Funds rate four times, by 1% in all, while bond yields ignored this and fell in the face of weak economic data and continued foreign central bank purchases. Contrary to earlier fears, tame inflation was a backdrop throughout, while the influential employment reports were weak in July, August, October and December. On December 15, the spread between the yields on the 10-year Note and the 90-day Treasury Bill fell to a three-year low. For the six months, the yield on 10-year Treasury Notes fell by 40 basis points to 4.22%, but the yield on 13-week Treasury Bills soared 88 basis points to 2.18%. More broadly, the Lehman Brothers Aggregate Bond Index(2) gained 4.18% for the six months. For the whole year, the Index returned 4.34%, underscoring the dominance of the second half in driving market movement, and implying not much underlying price change over the year.
Prices rose on riskier asset classes, however, as investors chased more attractive returns than investment grade bonds were offering. The Lehman Brothers U.S. Corporate High Yield Bond Index(3) for example, returned a robust 9.64% in the six months through December and 11.13% for the year.
U.S. equities in the form of the Standard & Poor’s (“S&P”) 500 Index(4), rose 7.2% including dividends for the six months ended December 31, 2004, breaching and holding levels not seen since before September 11, 2001. By year end, the market was trading at a price to earnings level of just under 16½ times 2005 estimated earnings. For the entire year, the Index returned 10.88%. From the middle of the year, equity investors were disappointed by the weak employment reports referred to above and distracted by surging oil prices as well as bad news affecting individual stocks. The market reached its lowest point in mid-August. But after oil prices climbed over $56 per barrel on October 22, and then slumped, equities squeezed out a narrow gain for the month in the last few days. In November, oil prices continued their retreat and the market powered ahead, cheered by this, the clear presidential election result, perceived as business and shareholder friendly, and at last a powerful employment report. By month end, sentiment was further bolstered by an upward revision to third quarter gross domestic product (“GDP”) growth to 4%, which was doubtless encouraging. But the data released also showed that the engine of growth, the U.S. consumer, was only saving at the rate of 0.5% per annum, which many regard as unsustainable. In addition, the rate of corporate profits growth was already falling and in 2005 may not reach double digits. It is hard to see then what dynamic propelled the S&P 500 Index to another 3.5% gain in December. And while many commentators celebrated this break out and the fact that smaller-cap indices had by then scaled all-time high levels, others feared a reversal before 2005 was very old.
International markets had mixed returns in the second half, but all were inflated in dollar terms by the weakness of that currency. Nonetheless even in local currency terms, Europe’s markets regained mid-2002 levels. Japan equities rose 4.6% in dollar terms during the period, based on the MSCI Japan Index(5) plus net dividends, but fell 1.7% in yen. For the year, Japan returned 15.9% in dollars. First half optimism about
2
MARKET PERSPECTIVE: YEAR ENDED DECEMBER 31, 2004
GDP growth was dashed as growth collapsed or was revised down as the year wore on.
European excluding (“ex”) UK markets advanced 18.2% in the second half of 2004, according to the MSCI Europe ex UK Index(6) (in dollars including net dividends), about one third due to currency. For all of 2004, the region returned 21.6% in dollars. Profits did grow strongly and markets remain cheap, but given all the issues surrounding low domestic demand, unemployment at 8.9% for the last 20 months and inflexible labor markets, arguably they deserve to be.
The UK market returned 15.7% in the six months through December, based on the MSCI UK Index(7) including net dividends, about 40% due to currency. For the whole year, the UK rose 19.6% in dollars. Contrary to the rest of Europe, the Bank of England has been trying to cool consumer demand and a property boom with five interest rate increases in 12 months. They seem to be succeeding for the most part.
(1) The MSCI World Index measures the performance of over 1,400 securities listed on exchanges in the United States, Europe, Canada, Australia, New Zealand and the Far East.
(2) The Lehman Brothers Aggregate Bond Index is composed of securities from the Lehman Brothers Government/Corporate Bond Index, Mortgage-Backed Securities Index, and the Asset-Backed Securities Index. Total return comprises price appreciation/depreciation and income as a percentage of the original investment.
(3) The Lehman Brothers U.S. Corporate High Yield Bond Index is generally representative of corporate bonds rated below investment-grade.
(4) The Standard & Poor’s 500 Index is a capitalization-weighted index of 500 stocks designed to measure performance of the broad domestic economy through changes in the aggregate market value of 500 stocks representing all major industries.
(5) The MSCI Japan Index is a free float-adjusted market capitalization index that is designed to measure developed market equity performance in Japan.
(6) The MSCI Europe ex UK Index is a free float-adjusted market capitalization index that is designed to measure developed market equity performance in Europe, excluding the UK.
(7) The MSCI UK Index is a free float-adjusted market capitalization index that is designed to measure developed market equity performance in the UK.
All indices are unmanaged and investors cannot invest directly in an index.
Past performance does not guarantee future results. The performance quoted represents past performance. Investment return and principal value of an investment will fluctuate, and shares, when redeemed, may be worth more or less than their original cost. The Portfolio’s performance is subject to change since the period’s end and may be lower or higher than the performance data shown. Please call (800) 366-0066 or log on to www.ingfunds.com to obtain performance data current to the most recent month end.
Market Perspective reflects the views of the Chief Investment Risk Officer only through the end of the period, and is subject to change based on market and other conditions.
3
Investment Types*
as of December 31, 2004
(as a percent of net assets)

* Excludes other assets and liabilities of - -16.3% of net assets and 11.2%
of net assets for short-term investments related to securities lending.
Portolio holdings are subject to change daily.
The ING VP Balanced Portfolio (the “Portfolio”) seeks to maximize investment return consistent with reasonable safety of principal, by investing in a diversified portfolio of one or more of the following asset classes: stocks, bonds and cash equivalents. The Portfolio is managed by a team of equity investment specialists led by Hugh T.M. Whelan, Portfolio Manager, and James B. Kauffmann, Portfolio Manager, ING Investment Management Co. — the Sub-Adviser.
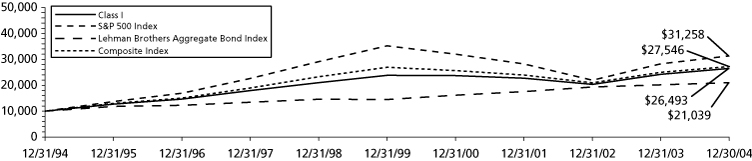
Performance: For the year ended December 31, 2004, the Portfolio’s Class I shares provided a total return of 9.42% compared to 10.88% for the Standard & Poor’s (“S&P”) 500 Index(1), 4.34% for the Lehman Brothers Aggregate Bond (“LBAB”) Index(2) and 8.30% for the Composite Index (60% S&P 500/40% LBAB).
Portfolio Specifics: The equity component of the Portfolio outperformed the S&P 500 Index due to security selection as well as our usual, modest exposure to small- and mid-cap stocks, which outperformed large-cap stocks as a group. Stock selection was strongest in the health care and technology sectors but was weaker in consumer staples and industrials. Sector allocation had a positive impact, with gains from overweights in energy and industrials and an underweight in consumer staples only partially offset by losses from an overweight in technology and an underweight in financials. The Portfolio benefited in particular from overweight positions in TXU Corp., Apple Computer, Inc. and Aetna, Inc., which returned 178%, 201%, and 85%, respectively, for the year. Securities that detracted from results were AT&T Wireless, which we did not own, rose 87%, and Walgreen Co. and Paychex, Inc., two stocks we overweighted and previously held that turned in disappointing results of 6% and -7%, respectively.
The fixed income component of the Portfolio outperformed its benchmark, the Lehman Brothers Aggregate Bond Index during the period as a short duration posture and yield curve exposure proved beneficial. For most of the year, we were well positioned for a rising rate environment in which the yields on shorter maturities rise more than those of longer maturities. Our underweight in five-year maturities was particularly helpful. Nevertheless, we brought the fixed income component back to a neutral duration stance as the year came to a close. Overweights in the outperforming securitized sectors — mortgage-backed securities, asset-backed securities, and commercial mortgage-backed securities — also enhanced performance. We maintained our increased allocation to credit, and this sector posted the highest excess returns during the period. Exposure to high yield and emerging markets debt were also significant sources of outperformance.
Current Strategy and Outlook: Our outlook for 2005 is positive for equities. We believe inflation should continue to be benign and oil prices should continue to moderate early in 2005. The Federal Reserve (“Fed”) is likely to continue to raise short-term interest rates, while leaving itself latitude to pause. Earnings are still rising, although at a slower pace in 2005. We expect to see job creation pick up after the impacts of higher oil prices percolate through the economy. Given all these economic factors, gross domestic product is likely to decelerate over the next few months to a trend-like growth rate in 2005. Despite increases to the Fed funds rate, longer-term fixed income issues have shown resilience through this period. Looking to 2005, however, we do project rising longer-term rates for the bond market.
The equity portfolio is overweight in the consumer discretionary and energy sectors and underweight in the information technology and financials sectors. However, our overall sector exposures are by design quite close to the S&P 500 Index so that nearly all of our relative performance is driven by individual stock selection.
Tactically, the fixed income portfolio was neutral duration as the year came to a close; however, we continue to believe that the improving domestic economy, signs of increasing inflation, and enduring dollar weakness point to higher rates in the near future. We are neutral home mortgages, overweight asset-backed and commercial mortgage-backed securities, and underweight the intermediate and front ends of the yield curve, which appear most vulnerable in a tightening cycle. We are also underweight agencies, which had witnessed intense regulatory criticism. While stretched valuations in investment-grade credit still warrant caution, credit continues to post positive excess returns, and we have moved closer to neutral credit on a contribution-to-duration basis. Exposures to emerging markets debt and crossover high yield remain intact.
Top Ten Industries*
as of December 31, 2004
(as a percent of net assets)
Federal National Mortgage Association | | 8.4 | % |
Whole Loan Collaterized Mortgage Obligation | | 7.3 | % |
Banks | | 6.3 | % |
Diversified Financial Services | | 5.7 | % |
Oil and Gas | | 5.5 | % |
Retail | | 4.8 | % |
Insurance | | 4.4 | % |
U.S. Treasury Bonds | | 4.1 | % |
Computers | | 3.4 | % |
Electric | | 3.1 | % |
* Excludes short-term investments related to securities lending.
Portfolio holdings are subject to change daily.
4
PORTFOLIO MANAGERS’ REPORT | ING VP BALANCED PORTFOLIO |
| Average Annual Total Returns for the Periods Ended December 31, 2004 | |
| | | 1 Year | | 5 Year | | 10 Year | | Since Inception
of Class S
May 29, 2003 | |
| Class I | | 9.42 | % | 2.13 | % | 10.22 | % | — | |
| Class S | | 9.06 | % | — | | — | | 12.42 | % |
| S&P 500 Index(1) | | 10.88 | % | (2.30 | )% | 12.07 | % | 17.61 | %(3) |
| Lehman Brothers Aggregate Bond Index(2) | | 4.34 | % | 7.71 | % | 7.72 | % | 2.70 | %(3) |
| Composite Index (60% S&P 500 Index/40% Lehman
Brothers Aggregate Bond Index) | | 8.30 | % | 1.98 | % | 10.66 | % | 11.54 | %(3) |
| | | | | | | | | | |
Based on a $10,000 initial investment, the graph and table above illustrate the total return of ING VP Balanced Portfolio against the S&P 500 Index, the Lehman Brothers Aggregate Bond Index and the Composite Index (60% S&P 500 Index, 40% Lehman Brothers Aggregate Bond Index). The Indices have no cash in their portfolios, impose no sales charges and incur no operating expenses. An investor cannot invest directly in an index. The Portfolio’s performance is shown without the imposition of any expenses or charges which are, or may be, imposed under your annuity contract. Total returns would have been lower if such expenses or charges were included.
The performance graph and table do not reflect the deduction of taxes that a shareholder will pay on portfolio distributions or the redemption of portfolio shares.
Total returns reflect that the Investment Manager may have waived or recouped fees and expenses otherwise payable by the Portfolio.
The performance update illustrates performance for a variable investment option available through a variable annuity contract. The performance shown indicates past performance and is not a projection or prediction of future results. Actual investment returns and principal value will fluctuate so that shares and/or units, at redemption, may be worth more or less than their original cost. Please call (800) 366-0066 to get performance through the most recent month end.
This report contains statements that may be “forward-looking” statements. Actual results may differ materially from those projected in the “forward-looking” statements.
The views expressed in this report reflect those of the portfolio managers, only through the end of the period as stated on the cover. The portfolio managers’ views are subject to change at any time based on market and other conditions.
Portfolio holdings are subject to change daily.
(1) The S&P 500 Index is an unmanaged index that measures the performance of securities of approximately 500 large-capitalization companies whose securities are traded on major U.S. stock markets.
(2) The Lehman Brothers Aggregate Bond Index is an unmanaged index composed of securities from the Lehman Brothers Government/Corporate Bond Index, Mortgage-Backed Securities Index and the Asset-Backed Securities Index.
(3) Since inception performance for the index is shown from June 1, 2003.
5
ING VP GROWTH AND INCOME PORTFOLIO | PORTFOLIO MANAGERS’ REPORT |
Industry Allocation*
as of December 31, 2004
(as a percent of net assets)

* Excludes other assets and liabilities of -6.5% of net assets and 6.2% of
net assets for short-term investments related to securities lending.
Portolio holdings are subject to change daily.
The ING VP Growth and Income Portfolio (the “Portfolio”) seeks to maximize total return through investments in a diversified portfolio of common stocks and securities convertible into common stock. The Portfolio is managed by a team of equity investment specialists led by Christopher F. Corapi, Portfolio Manager and Director of Fundamental Equity Research, and Scott Lewis, Portfolio Manager, ING Investment Management Co. — the Sub-Adviser.
Performance: For the year ended December 31, 2004, the Portfolio’s Class I shares provided a total return of 8.39% compared to the Standard & Poor’s (“S&P”) 500 Index(1), which returned 10.88% for the same period.
Portfolio Specifics: The Portfolio modestly underperformed the S&P 500 Index benchmark during 2004, but it should be noted that a new investment team took over the management of the Portfolio in May of 2004. While there were areas of both strength and weakness with respect to sector allocation and stock selection, poor stock selection in the technology sector was by far the most negative factor impacting full year performance. The Portfolio was slightly overweighted in the poorly performing technology sector during most of the year and relatively poor stock selection caused further negative impact. The stock positions that detracted from performance included Cisco Systems, Inc., Intel Corp., as well as previously held Hewlett Packard Co., Siebel Systems, Inc. and JDS Uniphase Corp. On the other hand, many stocks contributed to performance across many different sectors such as Aetna, Inc. and Countrywide Financial Corp. in the financial sector, Altria Group, Inc. in consumer staples, Exxon Mobil Corp. in energy and Motorola, Inc. in technology.
Entering 2005, the technology sector remains the most relatively overweighted sector while consumer staples remains the most relatively underweighted versus the benchmark. Overall, the Portfolio is positioned to benefit from those areas where we believe that valuation is attractive, above average earnings growth is forecast and our investment team has a high level of conviction with respect to future price performance. Presently, the three largest sector weightings in the Portfolio are the consumer discretionary, health care and technology sectors.
Current Strategy and Outlook: Despite the strong market advance during the final quarter of 2004, we continue to believe that the markets are moderately attractive. While we expect that interest rates and inflation will rise gradually as 2005 progresses, improving corporate profits, lower energy prices, and reasonable equity valuations all suggest that positive stock market returns are likely this year. During the past several years, value stocks have generally provided better returns than growth stocks, while small capitalization stocks have consistently outperformed their larger cap brethren. Looking ahead, we continue to believe that these areas should generate positive returns; however, we think that portfolios should be gradually tilted toward larger cap and growth oriented names.
Top Ten Holdings*
as of December 31, 2004
(as a percent of net assets)
General Electric Co. | | 4.1 | % |
Altria Group, Inc. | | 3.2 | % |
Microsoft Corp. | | 3.1 | % |
Citigroup, Inc. | | 3.0 | % |
Tyco International Ltd. | | 3.0 | % |
Johnson & Johnson | | 3.0 | % |
Wells Fargo & Co. | | 2.3 | % |
Intel Corp. | | 2.1 | % |
Exxon Mobil Corp. | | 1.9 | % |
PepsiCo, Inc. | | 1.7 | % |
* Excludes short-term investments related to securities lending.
Portfolio holdings are subject to change daily.
6
PORTFOLIO MANAGERS’ REPORT | ING VP GROWTH AND INCOME PORTFOLIO |
| Average Annual Total Returns for the Periods Ended December 31, 2004 | |
| | | 1 Year | | 5 Year | | 10Year | | Since Inception
of Class S
June 11, 2003 | |
| Class I | | 8.39 | % | (5.72 | )% | 7.90 | % | — | |
| Class S | | 8.10 | % | — | | — | | 12.98 | % |
| S&P 500 Index(1) | | 10.88 | % | (2.30 | )% | 12.07 | % | 17.61 | %(2) |
| | | | | | | | | | |
Based on a $10,000 initial investment, the graph and table above illustrate the total return of ING VP Growth and Income Portfolio against the S&P 500 Index. The Index has no cash in its portfolio, imposes no sales charges and incurs no operating expenses. An investor cannot invest directly in an index. The Portfolio’s performance is shown without the imposition of any expenses or charges which are, or may be, imposed under your annuity contract. Total returns would have been lower if such expenses or charges were included.
The performance graph and table do not reflect the deduction of taxes that a shareholder will pay on portfolio distributions or the redemption of portfolio shares.
Total returns reflect that the Investment Manager may have waived or recouped fees and expenses otherwise payable by the Portfolio.
The performance update illustrates performance for a variable investment option available through a variable annuity contract. The performance shown indicates past performance and is not a projection or prediction of future results. Actual investment returns and principal value will fluctuate so that shares and/or units, at redemption, may be worth more or less than their original cost. Please call (800) 366-0066 to get performance through the most recent month end.
This report contains statements that may be “forward-looking” statements. Actual results may differ materially from those projected in the “forward-looking” statements.
The views expressed in this report reflect those of the portfolio manager only through the end of the period as stated on the cover. The portfolio manager’s views are subject to change at any time based on market and other conditions.
Portfolio holdings are subject to change daily.
(1) The S&P 500 Index is an unmanaged index that measures the performance of securities of approximately 500 large-capitalization companies whose securities are traded on major U.S. stock markets.
(2) Since inception performance for the index is shown from June 1, 2003.
7
ING VP GROWTH PORTFOLIO | PORTFOLIO MANAGERS’ REPORT |
Industry Allocation*
as of December 31, 2004
(as a percent of net assets)

* Excludes other assets and liabilities of - -5.9% of net assets and 5.9%
of net assets for short-term investments related to securities lending.
Portfolio holdings are subject to change daily.
The ING VP Growth Portfolio (the “Portfolio”) seeks growth of capital through investment in a diversified portfolio consisting primarily of common stocks and securities convertible into common stocks believed to offer growth potential. The Portfolio is managed by a team of equity investment specialists led by Kenneth Bragdon, Portfolio Manager, ING Investment Management Co. — the Sub-Adviser.
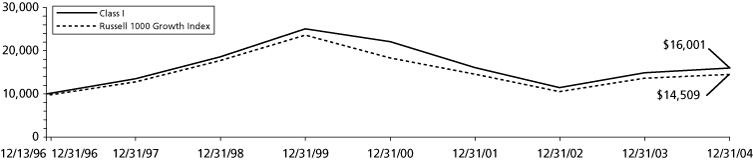
Performance: For the year ended December 31, 2004, the Portfolio’s Class I shares provided a total return of 7.19% compared to the Russell 1000 Growth Index(1), which returned 6.30% for the same period.
Portfolio Specifics: During the year ended December 31, 2004, the Portfolio benefited from strong stock selection in the “other” (multi-industry) and health care sectors. In addition, positive stock and sector selection due to an overweight position in the energy sector added to relative returns. In the multi-industry sector, Tyco Intl. Ltd. outperformed the market due to the global economic upturn. In addition, the company began to reap the benefits of the restructuring initiated by its new management. Within health care, Gilead Sciences, Inc. and DaVita, Inc. contributed most to relative returns. Gilead’s AIDS drug franchise grew quite strongly in 2004 aided by its new drug Truvada. DaVita gained after announcing their intention to purchase Gambro Healthcare’s dialysis assets. This pending announcement is expected to have material earnings accretion. In the energy sector, Halliburton Co. and Transocean, Inc. benefited from strong commodity prices and the increased demand for oil services and equipment.
The financial services and technology sectors detracted from relative returns. American Intl. Group, Inc. sold off following the widespread investigation into the selling and commission practices of the property and casualty insurance industry. This was partially offset by the absence of insurance brokerage holdings in the portfolio. Capital market sensitive companies, such as previously held Morgan Stanley and Merrill Lynch & Co., underperformed on weak trading results. The outlook for Countrywide Financial Corp., which was previously held, was disappointing following the release of third-quarter earnings due to a slowdown in mortgage activity. Within the technology sector, bellwether Cisco Systems, Inc. was the largest detractor from results. Weak pricing and rising inventories raised concerns that demand forecasts for the company were too optimistic. Similar factors lead to the negative contribution of Intel Corp and Sandisk Corp., which was held during the period.
Current Strategy and Outlook: The beginning of 2005 has seen lessened political and energy concerns in the U.S., which should allow the market to focus on other factors. We expect the expansion phase of the economic recovery to continue unabated in the near term. This should be accompanied by increased pricing power and corporate profit growth. Barring significantly higher inflation expectations, or a surprisingly weak dollar, large-capitalization growth stocks should perform relatively well, in our view. In addition, we would expect the performance gap between large- and small-capitalization stocks to narrow if not reverse at some point in the future. In that environment, we will continue to invest the portfolio in companies that are demonstrating positive underlying fundamentals at reasonable prices to seek positive results.
Top Ten Holdings*
as of December 31, 2004
(as a percent of net assets)
Microsoft Corp. | | 4.3 | % |
Johnson & Johnson | | 4.0 | % |
Monsanto Co. | | 3.4 | % |
International Business Machines Corp. | | 3.3 | % |
Dell, Inc. | | 2.8 | % |
Qualcomm, Inc. | | 2.8 | % |
Gilead Sciences, Inc. | | 2.8 | % |
Procter & Gamble Co. | | 2.6 | % |
General Electric Co. | | 2.6 | % |
Tyco Intl. Ltd. | | 2.5 | % |
* Excludes short-term investments related to securities lending.
Portfolio holdings are subject to change daily.
8
PORTFOLIO MANAGERS’ REPORT | ING VP GROWTH PORTFOLIO |
| Average Annual Total Returns for the Periods Ended December 31, 2004 | |
| | 1 Year | | 5 Year | | Since Inception
of Class I
December 13, 1996 | | Since Inception
of Class S
November 1, 2001 | |
| Class I | | 7.19 | % | (8.60 | )% | 6.01 | % | — | |
| Class S | | 6.98 | % | — | | — | | 1.12 | % |
| Russell 1000 Growth Index(1) | | 6.30 | % | (9.29 | )% | 4.71 | %(2) | 2.70 | % |
| | | | | | | | | | |
Based on a $10,000 initial investment, the graph and table above illustrate the total return of ING VP Growth Portfolio against the Russell 1000 Growth Index. The Index has no cash in its portfolio, imposes no sales charges and incurs no operating expenses. An investor cannot invest directly in an index. The Portfolio’s performance is shown without the imposition of any expenses or charges which are, or may be, imposed under your annuity contract. Total returns would have been lower if such expenses or charges were included.
The performance graph and table do not reflect the deduction of taxes that a shareholder will pay on portfolio distributions or the redemption of portfolio shares.
Total returns reflect that the Investment Manager may have waived or recouped fees and expenses otherwise payable by the Portfolio.
The performance update illustrates performance for a variable investment option available through a variable annuity contract. The performance shown indicates past performance and is not a projection or prediction of future results. Actual investment returns and principal value will fluctuate so that shares and/or units, at redemption, may be worth more or less than their original cost. Please call (800) 366-0066 to get performance through the most recent month end.
This report contains statements that may be “forward-looking” statements. Actual results may differ materially from those projected in the “forward-looking” statements.
The views expressed in this report reflect those of the portfolio manager only through the end of the period as stated on the cover. The portfolio manager’s views are subject to change at any time based on market and other conditions.
Portfolio holdings are subject to change daily.
(1) The Russell 1000 Growth Index measures the performance of the 1,000 largest companies in the Russell 3000 Index with higher price-to-book ratios and higher forecasted growth. The Russell 3000 Index is an unmanaged index that measures the performance of 3,000 U.S. companies based on total market capitalization.
(2) Since inception performance for the index is shown from December 1, 1996.
9
ING VP SMALL COMPANY PORTFOLIO | PORTFOLIO MANAGERS’ REPORT |
Industry Allocation*
as of December 31, 2004
(as a percent of net assets)

* Excludes other assets and liabilities of 0.4% of net assets.
(1) Includes eleven industries, which each represent 2 - 3% of net assets.
(2) Includes nine industries, which each represent 1 - 2% of net assets.
(3) Includes twelve industries, which each represent less than 1% of net assets.
Portfolio holdings are subject to change daily.
The ING VP Small Company Portfolio (the “Portfolio”) seeks growth of capital primarily through investment in a diversified portfolio of common stocks and securities convertible into common stocks of companies with smaller market capitalizations. The Portfolio is managed by a team of equity investment specialists led by Carolie Burroughs, Portfolio Manager, ING Investment Management Co. — the Sub-Adviser.
Performance: For the year ended December 31, 2004, the Portfolio’s Class I shares provided a total return of 14.39% compared to the Russell 2000 Index(1), which returned 18.33% for the same period.
Portfolio Specifics: Sector rotation prevailed in the market, as investors flocked to or fled from groups of stocks based on underlying macro trends — oil prices, commodity prices, and chip prices (semiconductors); dividend yields and cash flow yields; interest rates and cap rates; and even the outcome of the presidential election. Our stock selection in the producer durables and utilities sectors contributed positively to the Portfolio’s performance. Stock selection in the consumer staples and health care sectors contributed negatively. The largest individual positive contributors to performance during the period were Southwestern Energy Co., Louisiana Pacific Corp., and Terex Corp. The most disappointing holdings were Lexar Media, Inc., which was held during the period, Knight Trading Group, Inc., and Cumulus Media, Inc. Our underweight position in health care contributed positively to the Portfolio’s performance, while our 2 - 4% average cash position in a rising market was a drag on returns.
During the year, we moved from an underweight position in the autos and transportation sector to a slight overweight. We trimmed back to a market weight position at the end of the year as this sector rose almost 20% during the fourth quarter. In the energy and financial services sectors, we added stocks that are less impacted by the direction of oil prices and interest rates, respectively. We reduced our position in the technology sector by more than 200 basis points, effectively emphasizing the more defensive technology stocks. Toward the end of the period, we trimmed our exposure in producer durables, our best performing sector, as investors began to take profits. We continued to maintain the plus or minus 5% over- or underweighting limit for all of our sector weights and a style neutral position to mitigate harm caused by market swings.
Current Strategy and Outlook: We are encouraged by the economic data presented in 2004, and expect the U.S. economy to continue its gradual pace of expansion in 2005. Although we expect the U.S. equities market to finish 2005 in positive territory, we anticipate a rocky first half. We expect ongoing sector rotation, especially if the Federal Reserve voices greater concern over inflation. We also anticipate further shifts in asset allocation, which may cause the smaller capitalization benchmarks to underperform, despite improving fundamentals. However, this will likely set the stage for the second half of 2005, during which we expect the market to reward those stocks with stronger fundamentals.
We expect the small-cap cycle to complete its final phase. First of all, multiples of smaller capitalization stocks relative to large-cap stocks are still below historical averages, yet forward earnings expectations for large-cap stocks are only at a slight discount to those for small-cap stocks. Although productivity gains and a weak dollar have contributed to near-term profitability for large-cap stocks, in the long run, expectations for large-cap stocks are still too high. Second, access to capital for small-cap stocks has improved, particularly in the convertible debt and high yield markets. Growth in commercial lending by the banking industry benefits smaller companies. Finally, merger and acquisition activity remains strong. On a price-to-cash basis, large-cap companies still trump their smaller capitalization counterparts. We expect consolidation to continue with most deals continuing to occur in the small-cap space.
Looking forward, we are optimistic on the economic recovery and U.S. equities market. Whatever challenges the market presents in the short term, we continue to follow our discipline and focus on stocks that have the best fundamentals to outperform over the long run. We believe the Portfolio is well positioned to benefit as the small-cap cycle continues to move up the market cap spectrum and better quality stocks begin to consistently outperform.
Top Ten Holdings
as of December 31, 2004
(as a percent of net assets)
Avid Technology, Inc. | | 2.2 | % |
Terex Corp. | | 1.8 | % |
Corn Products Intl., Inc. | | 1.8 | % |
Select Medical Corp. | | 1.6 | % |
Southwestern Energy Co. | | 1.6 | % |
Kindred Healthcare, Inc. | | 1.6 | % |
Ametek, Inc. | | 1.6 | % |
Hudson United BanCorp | | 1.6 | % |
Denbury Resources, Inc. | | 1.5 | % |
Potlatch Corp. | | 1.5 | % |
Portfolio holdings are subject to change daily.
10
PORTFOLIO MANAGERS’ REPORT | ING VP SMALL COMPANY PORTFOLIO |

| Average Annual Total Returns for the Periods Ended December 31, 2004 | |
| | 1 Year | | 5 Year | | Since Inception
of Class I
December 27, 1996 | | Since Inception
of Class S
November 1, 2001 | |
| Class I | | 14.39 | % | 6.02 | % | 11.62 | % | — | |
| Class S | | 14.09 | % | — | | — | | 9.49 | % |
| Russell 2000 Index(1) | | 18.33 | % | 6.61 | % | 8.99 | %(2) | 15.65 | % |
| | | | | | | | | | |
Based on a $10,000 initial investment, the graph and table above illustrate the total return of ING VP Small Company Portfolio against the Russell 2000 Index. The Index has no cash in its portfolio, imposes no sales charges and incurs no operating expenses. An investor cannot invest directly in an index. The Portfolio’s performance is shown without the imposition of any expenses or charges which are, or may be, imposed under your annuity contract. Total returns would have been lower if such expenses or charges were included.
The performance graph and table do not reflect the deduction of taxes that a shareholder will pay on portfolio distributions or the redemption of portfolio shares.
Total returns reflect that the Investment Manager may have waived or recouped fees and expenses otherwise payable by the Portfolio.
The performance update illustrates performance for a variable investment option available through a variable annuity contract. The performance shown indicates past performance and is not a projection or prediction of future results. Actual investment returns and principal value will fluctuate so that shares and/or units, at redemption, may be worth more or less than their original cost. Please call (800) 366-0066 to get performance through the most recent month end.
This report contains statements that may be “forward-looking” statements. Actual results may differ materially from those projected in the “forward-looking” statements.
The views expressed in this report reflect those of the portfolio manager, only through the end of the period as stated on the cover. The portfolio manager’s views are subject to change at any time based on market and other conditions.
Portfolio holdings are subject to change daily.
(1) The Russell 2000 Index measures the performance of the 2,000 smallest companies in the Russell 3000 Index. The Russell 3000 Index is an unmanaged index that measures the performance of 3,000 U.S. companies based on total market capitalization.
(2) Since inception performance for the index is shown from January 1, 1997.
11
ING VP VALUE OPPORTUNITY PORTFOLIO | PORTFOLIO MANAGERS’ REPORT |
Industry Allocation
as of December 31, 2004
(as a percent of net assets)

Portfolio holdings are subject to change daily.
The ING VP Value Opportunity Portfolio (the “Portfolio”) seeks growth of capital primarily through investment in a diversified portfolio of common stocks and securities convertible into common stock. The Portfolio is managed by a team of equity investment specialists led by William F. Coughlin, Portfolio Manager, ING Investment Management Co. — the Sub-Adviser.
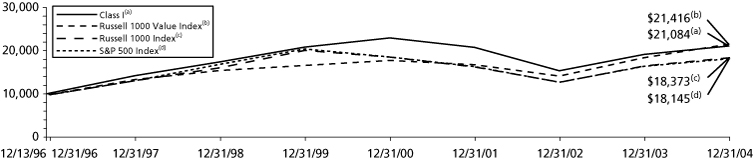
Performance: For the year ended December 31, 2004, the Portfolio’s Class I shares provided a total return of 10.15% compared to the Russell 1000 Value Index(1) and the Russell 1000 Index(2), which returned 16.49% and 11.40%, respectively, for the same period.
Portfolio Specifics: The investment team focuses on high quality companies selling at low price to earnings multiples. The Portfolio is well diversified, with exposure to all the major economic sectors and remains sensitive to the sector weighting of its Russell 1000 Value Index benchmark. During 2004, both sector allocation and stock selection combined to cause the Portfolio to underperform its benchmark. The Portfolio underperformed the benchmark’s return in all sectors. The worst performing stock was Koninklijke Philips Electronics NV. The Portfolio’s largest sector exposure was a 31.1% average weighting in financial services, somewhat below the 34.0% benchmark weighting. While this underweighting had a reasonably neutral allocation impact on results, the poor price performance of the Portfolio’s financial services positions, especially American Intl. Group, Inc. and Fannie Mae, had a decidedly more negative overall effect. The health care sector also negatively impacted overall results from both a sector allocation and stock selection perspective as overweighting this poorly performing sector severely reduced the sector allocation contribution, while several positions, including previously held Bristol-Myers Squibb Co. and Merck & Co., as well as Pfizer, Inc., all suffered price declines in 2004. This had a negative impact on Portfolio results. The strongest contribution from sector allocation was the result of overweighting the energy sector, but while the Portfolio’s stocks performed very well as a group (+26.0%), this was below the benchmark energy sector return of 30.6%. Several stocks in this sector were particularly strong, including Exxon Mobil Corp., ChevronTexaco Corp. and Halliburton Co. Overall, this sector was a positive contributor from a sector allocation perspective, but negative when considering specific stock selection.
Current Strategy and Outlook: Despite the strong market advance during the final quarter of 2004, we continue to believe that the markets are moderately attractive. While we expect that interest rates and inflation will rise gradually as 2005 progresses, improving corporate profits, lower energy prices, and reasonable equity valuations all suggest that positive stock market returns are likely this year. During the past several years, value stocks have generally provided better returns than growth stocks, while small capitalization has consistently outperformed larger cap stocks. Looking ahead, we continue to believe that these areas should generate positive returns; however, we think that portfolios should be gradually tilted toward larger cap, growth-oriented names.
Top Ten Holdings
as of December 31, 2004
(as a percent of net assets)
Bank of America Corp. | | 3.8 | % |
BP PLC ADR | | 3.6 | % |
ChevronTexaco Corp. | | 3.5 | % |
Washington Mutual, Inc. | | 3.4 | % |
Emerson Electric Co. | | 3.4 | % |
Nestle SA ADR | | 3.1 | % |
General Dynamics Corp. | | 3.1 | % |
Exxon Mobil Corp. | | 3.1 | % |
Wells Fargo & Co. | | 3.1 | % |
American Intl. Group, Inc. | | 3.1 | % |
Portfolio holdings are subject to change daily.
12
PORTFOLIO MANAGERS’ REPORT | ING VP VALUE OPPORTUNITY PORTFOLIO |
| Average Annual Total Returns for the Periods Ended December 31, 2004 | |
| | 1 Year | | 5 Year | | Since Inception
of Class I
December 13, 1996 | | Since Inception
of Class S
July 16, 2001 | |
| Class I | | 10.15 | % | 0.24 | % | 9.70 | % | — | |
| Class S | | 9.88 | % | — | | — | | (2.38 | )% |
| Russell 1000 Value Index(1) | | 16.49 | % | 5.27 | % | 9.88 | %(4) | 6.15 | %(5) |
| Russell 1000 Index(2) | | 11.40 | % | (1.76 | )% | 7.82 | %(4) | 2.35 | %(5) |
| S&P 500 Index(3) | | 10.88 | % | (2.30 | )% | 7.65 | %(4) | 1.72 | %(5) |
| | | | | | | | | | |
Based on a $10,000 initial investment, the graph and table above illustrate the total return of ING VP Value Opportunity Portfolio against the S&P 500 Index. The Index has no cash in its portfolio, imposes no sales charges and incurs no operating expenses. An investor cannot invest directly in an index. The Portfolio’s performance is shown without the imposition of any expenses or charges which are, or may be, imposed under your annuity contract. Total returns would have been lower if such expenses or charges were included.
The performance graph and table do not reflect the deduction of taxes that a shareholder will pay on portfolio distributions or the redemption of portfolio shares.
Total returns reflect that the Investment Manager may have waived or recouped fees and expenses otherwise payable by the Portfolio.
The performance update illustrates performance for a variable investment option available through a variable annuity contract. The performance shown indicates past performance and is not a projection or prediction of future results. Actual investment returns and principal value will fluctuate so that shares and/or units, at redemption, may be worth more or less than their original cost. Please call (800) 366-0066 to get performance through the most recent month end.
This report contains statements that may be “forward-looking” statements. Actual results may differ materially from those projected in the “forward-looking” statements.
The views expressed in this report reflect those of the portfolio manager, only through the end of the period as stated on the cover. The portfolio manager’s views are subject to change at any time based on market and other conditions.
Portfolio holdings are subject to change daily.
(1) The Russell 1000 Value Index is an unmanaged index that measures the performance of those Russell 1000 companies with lower price-to-book ratios and lower forecasted growth values, which more closely tracks the types of securities in which the Portfolio invests than the S&P 500 Index.
(2) The Russell 1000 Index is a comprehensive large-cap index measuring the performance of the largest 1,000 U.S. incorporated companies.
(3) The S&P 500 Index is an unmanaged index that measures the performance of securities of approximately 500 large-capitalization companies whose securities are traded on major U.S. stock markets.
(4) Since inception performance for the index is shown from December 1, 1996.
(5) Since inception performance for the index is shown from August 1, 2001.
13
ING VP INTERMEDIATE BOND PORTFOLIO | PORTFOLIO MANAGERS’ REPORT |
Investment Types*
as of December 31, 2004
(as a percent of net assets)

* Excludes other assets and liabilities of -14.5% of net assets.
Portfolio holdings are subject to change daily.
The ING VP Intermediate Bond Portfolio (formerly, ING VP Bond Portfolio, the “Portfolio”) seeks to maximize total return consistent with reasonable risk by investing in investment-grade corporate bonds and debt securities issued or guaranteed by the U.S. Government, its agencies or instrumentalities. While the Portfolio invests in securities guaranteed by the U.S. Government as to timely payment of interest and principal, the Portfolio shares are not insured or guaranteed. The Portfolio is managed primarily by James B. Kauffmann, Portfolio Manager, ING Investment Management Co. — the Sub-Adviser.
Performance: For the year ended December 31, 2004, the Portfolio’s Class I shares provided a total return of 4.88% compared to 4.34% for the Lehman Brothers Aggregate Bond (LBAB) Index(1).
Portfolio Specifics: Throughout the year ended December 31, 2004, the Federal Open Market Committee (“FOMC”) was true to its oft-stated “measured pace” guidance, with 25 basis points moves starting in June. The Committee continues to focus on developing economic releases, which will influence the timing and size of future tightenings. Yields on shorter-term Treasuries moved higher, while those of 10- and 30-year bonds dropped. In fact, the benchmark 10-year bond closed at 4.22%, despite being as high as 4.50%. The growth in employment lagged past recoveries even as domestic economic news brightened. The dollar dropped against most major currencies, and oil and gold headed higher. Concerns about the twin U. S. deficits continue to vex the currency markets, and the re-election of George Bush has done little to allay fears of the burgeoning costs of social security and Medicare.
Performance benefited during the period from a short duration posture and yield curve exposure. For most of the year, the Portfolio was well positioned for a rising rate environment in which yields on shorter maturities rise more than those of longer maturities. Our underweight in five-year maturities was particularly helpful. Nevertheless, we brought the Portfolio back to a neutral duration stance as the year came to a close. Overweights in the outperforming securitized sectors — mortgage-backed securities, asset-backed securities, and commercial mortgage-backed securities — also helped. We maintained our increased allocation to credit, and this sector posted the highest excess returns during the period. Exposure to high yield and emerging markets debt also contributed positively to performance.
Current Strategy and Outlook: While the bond market has renewed its focus on the improving economic releases, we do not believe that the yields on shorter maturity Treasuries fully reflect the pace of economic activity nor likely Federal Reserve tightenings. Some projections place a neutral overnight rate around 4% or 5%, indicating that monetary policy is still highly accommodative.
Tactically, the Portfolio was neutral duration as the year came to a close; however, we continue to believe that the improving domestic economy, signs of increasing inflation and enduring dollar weakness point to higher rates in the near future. We are neutral home mortgages, overweight asset-backed and commercial mortgage-backed securities, and underweight the intermediate and front ends of the yield curve, which appear most vulnerable in a tightening cycle. We are also underweight agencies, which have witnessed intense regulatory criticism. While stretched valuations in investment-grade credit still warrant caution, credit continues to post positive excess returns, and we have moved closer to neutral credit on a contribution-to-duration basis. Exposures to emerging markets debt and crossover high yield remain intact.
Top Ten Industries
as of December 31, 2004
(as a percent of net assets)
Federal National Mortgage Association | | 22.3 | % |
Whole Loan Collaterized Mortgage Obligation | | 19.9 | % |
U.S. Treasury Bonds | | 11.4 | % |
Banks | | 6.6 | % |
U.S. Treasury Notes | | 6.3 | % |
Federal Home Loan Mortgage Corporation | | 5.7 | % |
Commercial Mortgage-Backed | | 5.2 | % |
Diversified Financial Services | | 4.6 | % |
Home Equity Asset-Backed | | 3.8 | % |
Electric | | 3.5 | % |
Portfolio holdings are subject to change daily.
14
PORTFOLIO MANAGERS’ REPORT | ING VP INTERMEDIATE BOND PORTFOLIO |

| Average Annual Total Returns for the Periods Ended December 31, 2004 | |
| | 1 Year | | 5 Year | | 10 Year | | Since Inception
of Class S
May 3, 2002 | |
| Class I | | 4.88 | % | 7.56 | % | 7.44 | % | — | |
| Class S | | 4.58 | % | — | | — | | 6.80 | % |
| Lehman Brothers Aggregate Bond Index(1) | | 4.34 | % | 7.71 | % | 7.72 | % | 6.19 | %(2) |
| | | | | | | | | | |
Based on a $10,000 initial investment, the graph and table above illustrate the total return of ING VP Intermediate Bond Portfolio against the Lehman Brothers Aggregate Bond Index. The Index has has no cash in its portfolio, imposes no sales charges and incurs no operating expenses. An investor cannot invest directly in an index. The Portfolio’s performance is shown without the imposition of any expenses or charges which are, or may be, imposed under your annuity contract. Total returns would have been lower if such expenses or charges were included.
The performance graph and table do not reflect the deduction of taxes that a shareholder will pay on portfolio distributions or the redemption of portfolio shares.
Total returns reflect that the Investment Manager may have waived or recouped fees and expenses otherwise payable by the Portfolio.
The performance update illustrates performance for a variable investment option available through a variable annuity contract. The performance shown indicates past performance and is not a projection or prediction of future results. Actual investment returns and principal value will fluctuate so that shares and/or units, at redemption, may be worth more or less than their original cost. Please call (800) 366-0066 to get performance through the most recent month end.
This report contains statements that may be “forward-looking” statements. Actual results may differ materially from those projected in the “forward-looking” statements.
The views expressed in this report reflect those of the portfolio managers, only through the end of the period as stated on the cover. The portfolio managers’ views are subject to change at any time based on market and other conditions.
Portfolio holdings are subject to change daily.
(1) The Lehman Brothers Aggregate Bond Index is an unmanaged index composed of securities from the Lehman Brothers Government/Corporate Bond Index, Mortgage-Backed Securities Index and the Asset-Backed Securities Index.
(2) Since inception performance for the index is shown from May 1, 2002.
15
ING VP MONEY MARKET PORTFOLIO | PORTFOLIO MANAGERS’ REPORT |
Investment Types*
as of December 31, 2004
(as a percent of net assets)
* Excludes other assets and liabilities of -0.2% of net assets.
Portfolio holdings are subject to change daily.
The ING VP Money Market Portfolio (the “Portfolio”) seeks to provide high current return, consistent with preservation of capital and liquidity, through investment in high-quality money market instruments. The Portfolio is managed by a team of fixed-income specialists led by David S. Yealy, Portfolio Manager, ING Investment Management Co. — the Sub-Adviser.
Portfolio Specifics: The market for money market securities as represented by the LIBOR (London InterBank Offered Rate) curve started the year pricing in very modest expectations for the Federal Open Market Committee (“FOMC”) to start raising the Federal Reserve (“Fed”) funds rate and discount rate in the later part of the year. Our strategy of maintaining a slightly long weighted average maturity and barbell structure early in the year enhanced the yield for the Portfolio.
The non-farm payroll numbers released in early April indicated an improving labor market. The improvement in the labor market was confirmed by the early May non-farm payroll data release. The markets quickly started to anticipate that the FOMC might act sooner and more aggressively than previously expected. The LIBOR one-month to twelve-month curve steepened to over 100 basis points by mid-June from only 34 basis points at the beginning of the year.
We restructured the Portfolio in May by reducing our holdings of longer maturity securities, shortening the weighted average maturity, eliminating the barbell, increasing our holding of interest sensitive floating rate securities and shifting new purchases to very short maturity securities. This strategy shift worked well during the second half of the year as the FOMC raised the Fed funds rate by 25 basis points five times starting at the end of June. The Fed funds rate ended the year at 2.25% up from 1.00% at the start of the year.
Current Strategy and Outlook: The market as of the end of December was building in significant additional rate increases for 2005. The consensus expectation is for the Fed funds rate to be at 3.50% at the end of 2005. Our strategy heading into 2005 is similar to that employed since May of 2004. We are continuing to focus new purchases to the next FOMC meeting, maintaining a high exposure to floating rate notes, and making selective purchases in the three-month and under maturity sector where yield levels fully price in 25 basis point increases at each of the Fed meetings in between the purchase date and the maturity date. To the extent that the markets start to price in a more aggressive Fed, we are prepared to extend the weighted average maturity of the Portfolio by purchasing longer maturity corporate securities in the nine-month to thirteen-month sector. We will maintain a weighted average maturity shorter than the majority of our competitors until that time.
16
PORTFOLIO MANAGERS’ REPORT | ING VP MONEY MARKET PORTFOLIO |
Principal Risk Factor(s): An investment in the Portfolio is not insured or guaranteed by the Federal Deposit Insurance Corporation or any other government agency. Although the Portfolio seeks to preserve the value of your investment, it is possible to lose money by investing in the Portfolio.
The views expressed in this report reflect those of the portfolio managers only through the end of the period as stated on the cover. The portfolio managers’ views are subject to change at any time based on market and other conditions.
Portfolio holdings are subject to change daily.
This report contains statements that may be “forward-looking” statements. Actual results may differ materially from those projected in the “forward-looking” statements.
17
ING VP GLOBAL SCIENCE AND TECHNOLOGY PORTFOLIO | PORTFOLIO MANAGERS’ REPORT |
Industry Allocation*
as of December 31, 2004
(as a percent of net assets)
* Excludes other assets and liabilities of 2.6% of net assets.
Portfolio holdings are subject to change daily.
The ING VP Global Science and Technology Portfolio (the ‘‘Portfolio”) seeks long-term capital appreciation by investing primarily in equity securities issued by science and technology companies in all market capitalization ranges. The Portfolio is managed by Thomas P. Callan, CFA, Managing Director and Senior Portfolio Manager, and Daniel M. Rea, Vice President and Portfolio Manager, BlackRock Advisors, Inc. — the Sub-Adviser†.
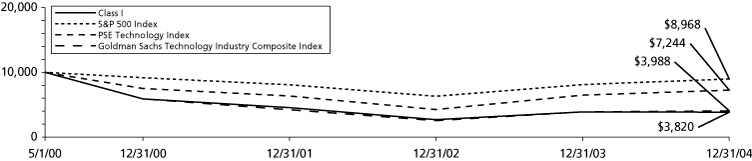
Performance: During the year ended December 31, 2004, the Portfolio provided a total return of -1.29% compared to 10.88% for the Standard & Poor’s (“S&P”) 500 Index(1) and 12.09% for the Pacific Stock Exchange (“PSE”) Technology Index(2).
Portfolio Specifics: For the year ended December 31, 2004, the Portfolio underperformed its benchmark. During the first half of the year, investors became concerned about the sustainability of the recovery of capital spending on information technology. During the third quarter, negative earnings guidance from software companies fed these persistent concerns, and it appeared that excess inventories were building throughout the entire technology sector. Wall Street reaction to this news was negative, and analysts following these companies lowered their expectations. This trend temporarily reversed in the fourth quarter as investors took advantage of more reasonable valuations. Healthcare sector performance was generally driven by capital flows into companies with greater revenue and earnings visibility. As a result, medical device companies outperformed biotechnology companies. Overall, information technology and healthcare stocks were the two worst performing sectors of the S&P 500 Index during the period.
During the year, the Portfolio had less exposure to information technology and healthcare stocks than the benchmark while having heavier exposure to telecommunication services companies. When BlackRock took responsibility for the Portfolio at the beginning of the year, the prior Sub-adviser’s sector allocations tilted the Portfolio toward companies with cyclical earnings growth, especially semiconductor devices. This sub-industry encountered challenging supply/demand dynamics, and caused much of the Portfolio’s underperformance early in the period. Over time, we moderated this exposure as the Portfolio’s mandate evolved to include a broader group of investment opportunities.
The primary sources of underperformance during the year were an underweight in computer hardware combined with negative stock selection and an overweight position in semiconductor devices. In the computer hardware space, lack of exposure to Apple Computer, Inc. and NCR Corp. were the key detractors. In the semiconductors sector, a meaningful overweight to the relatively weak devices sub-industry and poor performance tied to company-specific inventory issues negatively impacted returns. In the healthcare sector, capitalization had a meaningful effect on relative performance as the larger-capitalization biotechnology companies in the benchmark outperformed the smaller companies held by the Portfolio.
On the positive side, relative value was added in wireless telecommunication services, systems software, and Internet retail stocks. Wireless telecom companies levered to improving economies in Russia, Turkey and Indonesia outperformed as subscriber growth and utilization remained robust. In the software group, opportunistic purchases of Veritas Software Corp. and BMC Software, Inc., added value. Finally, category-dominant Internet companies such as eBay, Inc, benefited from increasing on-line traffic and transaction volumes as well as an acceleration in on-line advertising and gained significantly during the period as a result.
Current Strategy and Outlook: Despite the prospects for rising short-term interest rates, we believe low interest rates and high corporate cash balances may support additional capital spending. As a result, we maintain a favorable outlook on the technology sector, despite the recent weakness. In fact, we believe this gives us the opportunity to increase our exposure to select segments of the market, as some valuations have become attractive.
† Subsequent to the period end, Erin Xie, Director and Portfolio Manager, replaced Daniel M. Rea.
Top Ten Holdings
as of December 31, 2004
(as a percent of net assets)
Microsoft Corp. | | 2.0 | % |
Oracle Corp. | | 1.7 | % |
International Business Machines Corp. | | 1.6 | % |
SAP AG ADR | | 1.6 | % |
Electronic Arts, Inc. | | 1.5 | % |
Boston Scientific Corp. | | 1.5 | % |
Samsung Electronics Co. Ltd. | | 1.5 | % |
Cisco Systems, Inc. | | 1.5 | % |
Genentech, Inc. | | 1.5 | % |
Agilent Technologies, Inc. | | 1.4 | % |
Portfolio holdings are subject to change daily.
18
PORTFOLIO MANAGERS’ REPORT | ING VP GLOBAL SCIENCE AND TECHNOLOGY PORTFOLIO |
| Average Annual Total Returns for the Periods Ended December 31, 2004 | |
| | 1 Year | | Since Inception
of Class I
May 1, 2000 | |
| Class I | | (1.29 | )% | (18.62 | )% |
| S&P 500 Index(1) | | 10.88 | % | (2.31 | )% |
| PSE Technology Index(2) | | 12.09 | % | (6.66 | )% |
| Goldman Sachs Technology Industry Composite Index(3) | | 2.91 | % | (17.87 | )% |
| | | | | | |
Based on a $10,000 initial investment, the graph and table above illustrate the total return of ING VP Global Science and Technology Portfolio against the S&P 500 Index, the PSE Technology Index and the Goldman Sachs Technology Industry Composite Index. The Indices have no cash in their portfolios, impose no sales charges and incur no operating expenses. An investor cannot invest directly in an index. The Portfolio’s performance is shown without the imposition of any expenses or charges which are, or may be, imposed under your annuity contract. Total returns would have been lower if such expenses or charges were included.
The performance graph and table do not reflect the deduction of taxes that a shareholder will pay on portfolio distributions or the redemption of portfolio shares.
Total returns reflect that the Investment Manager may have waived or recouped fees and expenses otherwise payable by the Portfolio.
The performance update illustrates performance for a variable investment option available through a variable annuity contract. The performance shown indicates past performance and is not a projection or prediction of future results. Actual investment returns and principal value will fluctuate so that shares and/or units, at redemption, may be worth more or less than their original cost. Please call (800) 366-0066 to get performance through the most recent month end.
This report contains statements that may be “forward-looking” statements. Actual results may differ materially from those projected in the “forward-looking” statements.
The views expressed in this report reflect those of the portfolio managers, only through the end of the period as stated on the cover. The portfolio managers’ views are subject to change at any time based on market and other conditions.
Portfolio holdings are subject to change daily.
(1) The S&P 500 Index is an unmanaged index that measures the performance of securities of approximately 500 large-capitalization companies whose securities are traded on major U.S. stock markets.
(2) The PSE Technology Index, an unmanaged index published by the Pacific Exchange, is comprised of 100 listed and over-the-counter stocks from 15 different industries including computer hardware, software, semiconductors, telecommunications, data storage and processing, electronics and biotechnology. This Index is included as an additional comparative index for Portfolio performance.
(3) The Goldman Sachs Technology Industry Composite Index is a widely recognized, unmanaged index of technology stocks.
19
ING VP INTERNATIONAL EQUITY PORTFOLIO | PORTFOLIO MANAGERS’ REPORT |
Country Allocation
as of December 31, 2004
(as a percent of net assets)

Portolio holdings are subject to change daily.
The ING VP International Equity Portfolio (the “Portfolio”) seeks long-term capital growth primarily through investment in a diversified portfolio of common stocks principally traded in countries outside of the United States. The Portfolio is managed by a team of equity investment specialists led by Martin Jansen, Portfolio Manager, ING Investment Management Co. — the Sub-Adviser.
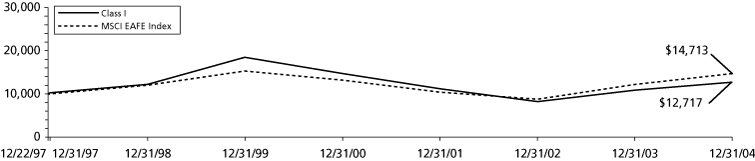
Performance: For the year ended December 31, 2004, the Portfolio’s Class I shares provided a total return of 17.17% compared to the Morgan Stanley Capital International Europe, Australasia and Far East (“MSCI EAFE”) Index(1), which returned 20.70% for the same period.
Portfolio Specifics: In a continuation of the trends manifest in 2003, larger capitalization issues and the growth segment of the investment spectrum performed considerably weaker than the MSCI EAFE Index average. Our “growth at a reasonable price” investment philosophy, with its modest accent on growth and quality, consequently experienced a constant headwind during the year ended December 31, 2004. This was most prevalent in the period through mid-February, after which markets turned more cautious and were more inclined to focus on the integral growth/valuation relationship, which is the core of our investment process.
By design, our process allows for only modest regional over- or under-weightings. Within this context, our regional allocation result for the year was negative, due largely to our underweight in the strongly performing Developed Asia region and the opportunity cost of holding residual cash in a rising market. The bulk of the performance shortfall was attributable to stock selection in Europe and Developed Asia (excluding Japan). Sector positioning (excluding cash) added modest value, with the successful decisions to underweight a weak technology sector and overweight the strong energy sector. However, this was somewhat offset by an underweight position in consumer staples, which performed relatively strongly in the first part of the year.
Within sectors, stock selection proved most disappointing in the consumer discretionary, information technology, industrials and health care sectors. This was partly offset by positive contributions from our holdings in the materials, financials and telecommunication services sectors. At the security level, the worst performers were French technology services company Capgemini, which fell on substantially reduced earnings prospects, and Nokia Oyj, which had disappointing performance due to negative business trends. The most significant positive contribution came from our holdings in the Shell Transport & Trading Co. PLC and Japanese banks Mitsui Trust Holdings, Inc. and Sumitomo Trust & Banking Co., Ltd. The Portfolio also benefited from positions in Telecom Italia S.p.A. and France Telecom SA.
Current Strategy and Outlook: After strong recovery growth in 2003 and the first half of 2004, earnings growth in international markets is expected to decline to approximately 10% in 2005. With international markets in aggregate still undervalued, this would allow for further, albeit more modest, market gains. Given this expectation, our process indicates that stocks with relative earnings sustainability and visibility, which are trading at the low end of their historic premium range, are attractive. We maintain a modest positive exposure to Japan as we expect earnings growth here to exceed expectations, especially in the domestically oriented consumer discretionary sector. A small allocation was made to emerging market securities recently, as there are selective opportunities for above average growth trading at a discount to peers in the developed markets. Our largest active exposure remains the energy sector, which in our opinion remains undervalued. In the defensive growth segment, we prefer healthcare to consumer staples, which have less pricing power and increasing cost pressures. We are underweight in the information technology and industrial sectors.
Top Ten Industries
as of December 31, 2004
(as a percent of net assets)
Banks | | 21.4 | % |
Telecommunications | | 11.4 | % |
Oil and Gas | | 9.6 | % |
Pharmaceuticals | | 6.7 | % |
Insurance | | 6.0 | % |
Electric | | 5.3 | % |
Food | | 3.4 | % |
Home Furnishings | | 2.8 | % |
Retail | | 2.6 | % |
Electrical Components and Equipment | | 2.1 | % |
Portfolio holdings are subject to change daily.
20
PORTFOLIO MANAGERS’ REPORT | ING VP INTERNATIONAL EQUITY PORTFOLIO |
| Average Annual Total Returns for the Periods Ended December 31, 2004 | |
| | 1 Year | | 5 Year | | Since Inception
of Class I
December 22, 1997 | | Since Inception
of Class S
November 1, 2001 | |
| Class I | | 17.17 | % | (7.20 | )% | 3.48 | % | — | |
| Class S | | 16.87 | % | — | | — | | 5.74 | % |
| MSCI EAFE Index(1) | | 20.70 | % | (0.80 | )% | 5.67 | %(2) | 13.13 | % |
| | | | | | | | | | |
| | | | | | | | | | | |
Based on a $10,000 initial investment, the graph and table above illustrate the total return of ING VP International Equity Portfolio against the MSCI EAFE Index. The Index has no cash in its portfolio, imposes no sales charges and incurs no operating expenses. An investor cannot invest directly in an index. The Portfolio’s performance is shown without the imposition of any expenses or charges which are, or may be, imposed under your annuity contract. Total returns would have been lower if such expenses or charges were included.
The performance graph and table do not reflect the deduction of taxes that a shareholder will pay on portfolio distributions or the redemption of portfolio shares.
Total returns reflect that the Investment Manager may have waived or recouped fees and expenses otherwise payable by the Portfolio.
The performance update illustrates performance for a variable investment option available through a variable annuity contract. The performance shown indicates past performance and is not a projection or prediction of future results. Actual investment returns and principal value will fluctuate so that shares and/or units, at redemption, may be worth more or less than their original cost. Please call (800) 366-0066 to get performance through the most recent month end.
This report contains statements that may be “forward-looking” statements. Actual results may differ materially from those projected in the “forward-looking” statements.
The views expressed in this report reflect those of the portfolio manager only through the end of the period as stated on the cover. The portfolio manager’s views are subject to change at any time based on market and other conditions.
Portfolio holdings are subject to change daily.
(1) The MSCI EAFE Index is an unmanaged index that measures the performance of securities listed on exchanges in markets in Europe, Australasia and the Far East.
(2) Since inception performance for the index is shown from January 1, 1998.
21
As a shareholder of a Fund, you incur two types of costs: (1) transaction costs, including sales charges (loads) on purchase payments, reinvested dividends, or other distributions; redemption fees; and exchange fees; and (2) ongoing costs, including management fees; distribution [and/or service] (12b–1) fees; and other Fund expenses. These Examples are intended to help you understand your ongoing costs (in dollars) of investing in a Fund and to compare these costs with the ongoing costs of investing in other mutual funds.
The Examples are based on an investment of $1,000 invested at the beginning of the period and held for the entire period from July 1, 2004 to December 31, 2004.
Actual Expenses
The first section of the table shown, “Actual Fund Return,” provides information about actual account values and actual expenses. You may use the information in this section, together with the amount you invested, to estimate the expenses that you paid over the period. Simply divide your account value by $1,000 (for example, an $8,600 account value divided by $1,000 = 8.6), then multiply the result by the number in the first section under the heading entitled “Expenses Paid During Period” to estimate the expenses you paid on your account during this period.
Hypothetical Example for Comparison Purposes
The second section of the table shown, “Hypothetical 5% Return,” provides information about hypothetical account values and hypothetical expenses based on the Fund’s actual expense ratio and an assumed rate of return of 5% per year before expenses, which is not the Fund’s actual return. The hypothetical account values and expenses may not be used to estimate the actual ending account balance or expenses you paid for the period. You may use this information to compare the ongoing costs of investing in the Fund and other funds. To do so, compare this 5% hypothetical example with the 5% hypothetical examples that appear in the shareholder reports of the other funds.
Please note that the expenses shown in the table are meant to highlight your ongoing costs only and do not reflect any transactional costs, such as sales charges (loads), redemption fees, or exchange fees. Therefore, the hypothetical lines of the table are useful in comparing ongoing costs only, and will not help you determine the relative total costs of owning different funds. In addition, if these transactional costs were included, your costs would have been higher.
ING VP Balanced Portfolio |
|
| | Beginning
Account
Value
July 1, 2004 | | Ending
Account
Value
December 31, 2004 | | Annualized
Expense
Ratio | | Expenses Paid
During the Six
Months Ended
December 31, 2004* | |
Actual Fund Return | | | | | | | | | |
Class I | | $ | 1,000.00 | | $ | 1,069.40 | | 0.59 | % | $ | 3.07 | |
Class S | | 1,000.00 | | 1,067.60 | | 0.84 | | 4.37 | |
Hypothetical (5% return before expenses) | | | | | | | | | |
Class I | | $ | 1,000.00 | | $ | 1,022.17 | | 0.59 | % | $ | 3.00 | |
Class S | | 1,000.00 | | 1,020.91 | | 0.84 | | 4.27 | |
* Expenses are equal to each Fund’s respective annualized expense ratios multiplied by the average account value over the period, multiplied by 184/366 (to reflect the one-half year period).
22
SHAREHOLDER EXPENSE EXAMPLES (UNAUDITED)
ING VP Growth and Income Portfolio | | | | | | | | | |
| | | | | | | | | |
| | Beginning
Account
Value
July 1, 2004 | | Ending
Account
Value
December 31, 2004 | | Annualized
Expense
Ratio | | Expenses Paid
During the Six
Months Ended
December 31, 2004* | |
Actual Fund Return | | | | | | | | | |
Class I | | $ | 1,000.00 | | $ | 1,051.90 | | 0.58 | % | $ | 2.99 | |
Class S | | 1,000.00 | | 1,050.40 | | 0.83 | | 4.28 | |
Hypothetical (5% return before expenses) | | | | | | | | | |
Class I | | $ | 1,000.00 | | $ | 1,022.22 | | 0.58 | % | $ | 2.95 | |
Class S | | 1,000.00 | | 1,020.96 | | 0.83 | | 4.22 | |
ING VP Growth Portfolio | | | | | | | | | |
| | | | | | | | | |
| | Beginning
Account
Value
July 1, 2004 | | Ending
Account
Value
December 31, 2004 | | Annualized
Expense
Ratio | | Expenses Paid
During the Six
Months Ended
December 31, 2004* | |
Actual Fund Return | | | | | | | | | |
Class I | | $ | 1,000.00 | | $ | 1,057.70 | | 0.68 | % | $ | 3.52 | |
Class S | | 1,000.00 | | 1,056.70 | | 0.93 | | 4.81 | |
Hypothetical (5% return before expenses) | | | | | | | | | |
Class I | | $ | 1,000.00 | | $ | 1,021.72 | | 0.68 | % | $ | 3.46 | |
Class S | | 1,000.00 | | 1,020.46 | | 0.93 | | 4.72 | |
ING VP Small Company Portfolio | | | | | | | | | |
| | | | | | | | | |
| | Beginning
Account
Value
July 1, 2004 | | Ending
Account
Value
December 31, 2004 | | Annualized
Expense
Ratio | | Expenses Paid
During the Six
Months Ended
December 31, 2004* | |
Actual Fund Return | | | | | | | | | |
Class I | | $ | 1,000.00 | | $ | 1,112.10 | | 0.83 | % | $ | 4.41 | |
Class S | | 1,000.00 | | 1,110.40 | | 1.08 | | 5.73 | |
Hypothetical (5% return before expenses) | | | | | | | | | |
Class I | | $ | 1,000.00 | | $ | 1,020.96 | | 0.83 | % | $ | 4.22 | |
Class S | | 1,000.00 | | 1,019.71 | | 1.08 | | 5.48 | |
ING VP Value Opportunity Portfolio | | | | | | | | | |
| | | | | | | | | |
| | Beginning
Account
Value
July 1, 2004 | | Ending
Account
Value
December 31, 2004 | | Annualized
Expense
Ratio | | Expenses Paid
During the Six
Months Ended
December 31, 2004* | |
Actual Fund Return | | | | | | | | | |
Class I | | $ | 1,000.00 | | $ | 1,073.00 | | 0.69 | % | $ | 3.60 | |
Class S | | 1,000.00 | | 1,072.10 | | 0.94 | | 4.90 | |
Hypothetical (5% return before expenses) | | | | | | | | | |
Class I | | $ | 1,000.00 | | $ | 1,021.67 | | 0.69 | % | $ | 3.51 | |
Class S | | 1,000.00 | | 1,020.41 | | 0.94 | | 4.77 | |
* Expenses are equal to each Fund’s respective annualized expense ratios multiplied by the average account value over the period, multiplied by 184/366 (to reflect the one-half year period).
23
SHAREHOLDER EXPENSE EXAMPLES (UNAUDITED)
ING VP Intermediate Bond Portfolio | | | | | | | | | |
| | | | | | | | | |
| | Beginning
Account
Value
July 1, 2004 | | Ending
Account
Value
December 31, 2004 | | Annualized
Expense
Ratio | | Expenses Paid
During the Six
Months Ended
December 31, 2004* | |
Actual Fund Return | | | | | | | | | |
Class I | | $ | 1,000.00 | | $ | 1,044.90 | | 0.48 | % | $ | 2.47 | |
Class S | | 1,000.00 | | 1,043.50 | | 0.73 | | 3.75 | |
Hypothetical (5% return before expenses) | | | | | | | | | |
Class I | | $ | 1,000.00 | | $ | 1,022.72 | | 0.48 | % | $ | 2.44 | |
Class S | | 1,000.00 | | 1,021.47 | | 0.73 | | 3.71 | |
ING VP Money Market Portfolio | | | | | | | | | |
| | | | | | | | | |
| | Beginning
Account
Value
July 1, 2004 | | Ending
Account
Value
December 31, 2004 | | Annualized
Expense
Ratio | | Expenses Paid
During the Six
Months Ended
December 31, 2004* | |
Actual Fund Return | | | | | | | | | |
Class I | | $ | 1,000.00 | | $ | 1,007.80 | | 0.32 | % | $ | 1.62 | |
Hypothetical (5% return before expenses) | | | | | | | | | |
Class I | | $ | 1,000.00 | | $ | 1,023.53 | | 0.32 | % | $ | 1.63 | |
ING VP Global Science and Technology Portfolio | | | | | | | |
| | | | | | | | | |
| | Beginning
Account
Value
July 1, 2004 | | Ending
Account
Value
December 31, 2004 | | Annualized
Expense
Ratio | | Expenses Paid
During the Six
Months Ended
December 31, 2004* | |
Actual Fund Return | | | | | | | | | |
Class I | | $ | 1,000.00 | | $ | 1,043.70 | | 1.02 | % | $ | 5.24 | |
Hypothetical (5% return before expenses) | | | | | | | | | |
Class I | | $ | 1,000.00 | | $ | 1,020.01 | | 1.02 | % | $ | 5.18 | |
ING VP International Equity Portfolio | | | | | | | | | |
| | | | | | | | | |
| | Beginning
Account
Value
July 1, 2004 | | Ending
Account
Value
December 31, 2004 | | Annualized
Expense
Ratio | | Expenses Paid
During the Six
Months Ended
December 31, 2004* | |
Actual Fund Return | | | | | | | | | |
Class I | | $ | 1,000.00 | | $ | 1,129.80 | | 1.15 | % | $ | 6.16 | |
Class S | | 1,000.00 | | 1,128.20 | | 1.40 | | 7.49 | |
Hypothetical (5% return before expenses) | | | | | | | | | |
Class I | | $ | 1,000.00 | | $ | 1,019.36 | | 1.15 | % | $ | 5.84 | |
Class S | | 1,000.00 | | 1,018.10 | | 1.40 | | 7.10 | |
* Expenses are equal to each Fund’s respective annualized expense ratios multiplied by the average account value over the period, multiplied by 184/366 (to reflect the one-half year period).
24
The Board of Directors, Board of Trustees and Shareholders
ING Variable Portfolios, Inc., ING VP Balanced Portfolio, Inc.,
ING Variable Funds, ING VP Bond Portfolio, and ING VP Money Market Portfolio
We have audited the accompanying statements of assets and liabilities of ING VP International Equity Portfolio, ING VP Growth Portfolio, ING VP Small Company Portfolio, ING VP Global Science and Technology Portfolio, and ING VP Value Opportunity Portfolio, each a series of ING Variable Portfolios Inc., ING VP Balanced Portfolio, Inc., ING VP Growth and Income Portfolio, a series of ING Variable Funds, ING VP Intermediate Bond Portfolio (formerly ING VP Bond Portfolio), and ING VP Money Market Portfolio, including the portfolios of investments, as of December 31, 2004, and the related statements of operations for the year then ended, the statements of changes in net assets for each of the years in the two-year period then ended, and the financial highlights for each of the years or periods in the five-year period then ended. These financial statements and financial highlights are the responsibility of management. Our responsibility is to express an opinion on these financial statements and financial highlights based on our audits.
We conducted our audits in accordance with the standards of the Public Company Accounting Oversight Board (United States). Those standards require that we plan and perform the audits to obtain reasonable assurance about whether the financial statements and financial highlights are free of material misstatement. An audit includes examining, on a test basis, evidence supporting the amounts and disclosures in the financial statements. Our procedures included confirmation of securities owned as of December 31, 2004 by correspondence with the custodian and brokers, or by other appropriate auditing procedures. An audit also includes assessing the accounting principles used and significant estimates made by management, as well as evaluating the overall financial statement presentation. We believe that our audits provide a reasonable basis for our opinion.
In our opinion, the financial statements and financial highlights referred to above present fairly, in all material respects, the financial position of the aforementioned portfolios as of December 31, 2004, the results of their operations, the changes in their net assets, and the financial highlights for the periods specified in the first paragraph above, in conformity with accounting principles generally accepted in the United States of America.

Boston, Massachusetts
February 11, 2005
25
| | ING
VP Balanced
Portfolio | | ING
VP Growth and
Income
Portfolio | | ING
VP Growth
Portfolio | | ING
VP Small
Company
Portfolio | | ING
VP Value
Opportunity
Portfolio | |
ASSETS: | | | | | | | | | | | |
Investments in securities at value+* | | $ | 1,371,905,512 | | $ | 3,433,237,921 | | $ | 188,522,267 | | $ | 509,788,029 | | $ | 222,198,773 | |
Short-term investments** | | 193,799,053 | | 219,680,000 | | 11,536,000 | | — | | 86,000 | |
Repurchase agreement | | 17,688,000 | | 111,321,000 | | 4,960,000 | | 20,380,000 | | 1,152,000 | |
Cash | | 1,103,413 | | 208 | | — | | 785 | | 320 | |
Cash collateral for futures | | 402,998 | | 2,880,000 | | 224,000 | | — | | — | |
Receivables: | | | | | | | | | | | |
Investment securities sold | | 7,592,730 | | 9,890,201 | | — | | 12,935,147 | | — | |
Dividends and interest | | 4,631,535 | | 5,586,990 | | 113,543 | | 542,008 | | 216,664 | |
Variation margin | | 63,385 | | — | | — | | — | | — | |
Prepaid expenses | | 45,435 | | 112,845 | | 6,401 | | 17,831 | | 7,737 | |
Total assets | | 1,597,232,061 | | 3,782,709,165 | | 205,362,211 | | 543,663,800 | | 223,661,494 | |
| | | | | | | | | | | |
LIABILITIES: | | | | | | | | | | | |
Payable for investment securities purchased | | 82,196,079 | | 27,497,641 | | — | | 10,000,929 | | — | |
Payable for futures variation margin | | — | | 45,000 | | 3,500 | | — | | — | |
Payable upon receipt of securities loaned | | 153,224,000 | | 219,680,000 | | 11,536,000 | | — | | 86,000 | |
Payable to affiliates | | 636,624 | | 1,650,067 | | 107,129 | | 371,278 | | 124,335 | |
Payable for director fees | | 18,330 | | 94,010 | | 6,229 | | 1,151 | | 958 | |
Other accrued expenses and liabilities | | 186,877 | | 543,332 | | 72,867 | | 59,176 | | 55,907 | |
Total liabilities | | 236,261,910 | | 249,510,050 | | 11,725,725 | | 10,432,534 | | 267,200 | |
NET ASSETS | | $ | 1,360,970,151 | | $ | 3,533,199,115 | | $ | 193,636,486 | | $ | 533,231,266 | | $ | 223,394,294 | |
| | | | | | | | | | | |
NET ASSETS WERE COMPRISED OF: | | | | | | | | | | | |
Paid-in capital | | $ | 1,332,534,578 | | $ | 5,812,370,642 | | $ | 371,927,886 | | $ | 428,388,097 | | $ | 236,975,194 | |
Undistributed net investment income (accumulated net investment loss) | | 30,622,780 | | (4,855 | ) | 1,266,147 | | 803,726 | | 3,868,187 | |
Accumulated net realized gain (loss) on investments, foreign currency related transactions and futures | | (92,514,176 | ) | (2,709,067,678 | ) | (205,049,399 | ) | 5,928,742 | | (40,621,128 | ) |
Net unrealized appreciation or depreciation on investments, foreign currency related transactions and futures | | 90,326,969 | | 429,901,006 | | 25,491,852 | | 98,110,701 | | 23,172,041 | |
NET ASSETS | | $ | 1,360,970,151 | | $ | 3,533,199,115 | | $ | 193,636,486 | | $ | 533,231,266 | | $ | 223,394,294 | |
+ | Including securities loaned at value | | $ | 149,277,954 | | $ | 211,090,291 | | $ | 11,239,921 | | $ | — | | $ | 82,511 | |
* | Cost of investments in securities | | $ | 1,281,654,647 | | $ | 3,004,020,775 | | $ | 163,040,440 | | $ | 411,668,653 | | $ | 199,026,732 | |
** | Cost of short-term investments | | $ | 193,801,029 | | $ | 219,680,000 | | $ | 11,536,000 | | $ | — | | $ | 86,000 | |
Class I: | | | | | | | | | | | |
Net Assets | | $ | 1,357,853,676 | | $ | 3,531,422,704 | | $ | 193,280,199 | | $ | 461,006,212 | | $ | 219,889,276 | |
Shares authorized | | 2,000,000,000 | | unlimited | | 100,000,000 | | 100,000,000 | | 100,000,000 | |
Par value | | $ | 0.001 | | $ | 1.000 | | $ | 0.001 | | $ | 0.001 | | $ | 0.001 | |
Shares outstanding | | 101,369,929 | | 182,522,828 | | 20,217,551 | | 23,124,778 | | 16,669,675 | |
Net asset value and redemption price per share | | $ | 13.40 | | $ | 19.35 | | $ | 9.56 | | $ | 19.94 | | $ | 13.19 | |
| | | | | | | | | | | |
Class S: | | | | | | | | | | | |
Net Assets | | $ | 3,116,475 | | $ | 1,776,411 | | $ | 356,287 | | $ | 72,225,054 | | $ | 3,505,018 | |
Shares authorized | | 2,000,000,000 | | unlimited | | 100,000,000 | | 100,000,000 | | 100,000,000 | |
Par value | | $ | 0.001 | | $ | 1.000 | | $ | 0.001 | | $ | 0.001 | | $ | 0.001 | |
Shares outstanding | | 233,475 | | 91,846 | | 37,517 | | 3,629,010 | | 267,078 | |
Net asset value and redemption price per share | | $ | 13.35 | | $ | 19.34 | | $ | 9.50 | | $ | 19.90 | | $ | 13.12 | |
See Accompanying Notes to Financial Statements
26
STATEMENTS OF ASSETS AND LIABILITIES AS OF DECEMBER 31, 2004
| | ING
VP Intermediate
Bond
Portfolio | | ING
VP Money
Market
Portfolio | | ING
VP Global Science
and Technology
Portfolio | | ING
VP International
Equity
Portfolio | |
ASSETS: | | | | | | | | | |
Investments in securities at value* | | $ | 1,511,350,700 | | $ | — | | $ | 84,020,382 | | $ | 50,561,140 | |
Short-term investments** | | 70,155,987 | | 1,020,204,946 | | — | | — | |
Repurchase agreement | | 15,302,000 | | 79,545,000 | | — | | 2,203,000 | |
Cash | | 237,193 | | 47,247 | | 1,375,686 | | 341 | |
Cash collateral for futures | | 980,936 | | — | | — | | — | |
Foreign currencies at value*** | | 201 | | — | | 153 | | 50,758 | |
Receivables: | | | | | | | | | |
Investment securities sold | | 19,483,389 | | — | | 995,182 | | — | |
Dividends and interest | | 9,221,029 | | 2,185,141 | | 8,010 | | 97,880 | |
Variation margin | | 134,064 | | — | | — | | — | |
Prepaid expenses | | 43,013 | | 37,988 | | 3,343 | | 1,678 | |
Total assets | | 1,626,908,512 | | 1,102,020,322 | | 86,402,756 | | 52,914,797 | |
| | | | | | | | | |
LIABILITIES: | | | | | | | | | |
Payable for investment securities purchased | | 231,813,929 | | — | | — | | — | |
Payable to affiliates | | 593,449 | | 284,152 | | 72,988 | | 96,032 | |
Payable for director fees | | 30,075 | | 52,772 | | 1,166 | | 1,169 | |
Other accrued expenses and liabilities | | 187,030 | | 212,184 | | 37,321 | | 47,748 | |
Total liabilities | | 232,624,483 | | 549,108 | | 111,475 | | 144,949 | |
NET ASSETS | | $ | 1,394,284,029 | | $ | 1,101,471,214 | | $ | 86,291,281 | | $ | 52,769,848 | |
| | | | | | | | | |
NET ASSETS WERE COMPRISED OF: | | | | | | | | | |
Paid-in capital | | $ | 1,384,052,296 | | $ | 1,093,627,228 | | $ | 133,345,073 | | $ | 70,374,150 | |
Undistributed net investment income | | 277,792 | | 12,788,531 | | — | | 538,394 | |
Accumulated net realized gain (loss) on investments, foreign currency related transactions and futures | | 3,979,546 | | (4,712,519 | ) | (54,859,928 | ) | (26,387,723 | ) |
Net unrealized appreciation or depreciation on investments, foreign currency related transactions and futures | | 5,974,395 | | (232,026 | ) | 7,806,136 | | 8,245,027 | |
NET ASSETS | | $ | 1,394,284,029 | | $ | 1,101,471,214 | | $ | 86,291,281 | | $ | 52,769,848 | |
* Cost of investments in securities | | $ | 1,505,532,659 | | $ | — | | $ | 76,214,396 | | $ | 42,326,896 | |
** Cost of short-term investments | | $ | 70,158,867 | | $ | 1,020,436,972 | | $ | — | | $ | — | |
*** Cost of foreign currencies | | $ | 161 | | $ | — | | $ | 3 | | $ | 50,192 | |
Class I: | | | | | | | | | |
Net Assets | | $ | 1,092,938,139 | | $ | 1,101,471,214 | | $ | 86,291,281 | | $ | 52,504,595 | |
Shares authorized | | unlimited | | unlimited | | 100,000,000 | | 100,000,000 | |
Par value | | $ | 1.000 | | $ | 1.000 | | $ | 0.001 | | $ | 0.001 | |
Shares outstanding | | 83,147,003 | | 85,134,780 | | 22,559,967 | | 6,009,583 | |
Net asset value and redemption price per share | | $ | 13.14 | | $ | 12.94 | | $ | 3.82 | | $ | 8.74 | |
| | | | | | | | | |
Class S: | | | | | | | | | |
Net Assets | | $ | 301,345,890 | | n/a | | n/a | | $ | 265,253 | |
Shares authorized | | unlimited | | unlimited | | 100,000,000 | | 100,000,000 | |
Par value | | $ | 1.000 | | $ | 1.000 | | $ | 0.001 | | $ | 0.001 | |
Shares outstanding | | 23,012,734 | | n/a | | n/a | | 30,500 | |
Net asset value and redemption price per share | | $ | 13.09 | | n/a | | n/a | | $ | 8.70 | |
See Accompanying Notes to Financial Statements
27
| | ING
VP Balanced
Portfolio | | ING
VP Growth and
Income
Portfolio | | ING
VP Growth
Portfolio | | ING
VP Small
Company
Portfolio | | ING
VP Value
Opportunity
Portfolio | |
INVESTMENT INCOME: | | | | | | | | | | | |
Dividends, net of foreign taxes withheld* | | $ | 14,403,554 | | $ | 69,397,577 | | $ | 2,634,311 | | $ | 4,561,677 | | $ | 5,498,391 | |
Interest | | 23,187,552 | | 1,404,213 | | 59,244 | | 415,184 | | 45,193 | |
Securities lending income | | 244,172 | | 654,490 | | 13,484 | | 202,599 | | 4,634 | |
Total investment income | | 37,835,278 | | 71,456,280 | | 2,707,039 | | 5,179,460 | | 5,548,218 | |
| | | | | | | | | | | |
EXPENSES: | | | | | | | | | | | |
Investment management fees | | 6,905,210 | | 17,953,307 | | 1,242,189 | | 3,658,965 | | 1,443,302 | |
Distribution and service fees: | | | | | | | | | | | |
Class S | | 5,628 | | 4,588 | | 816 | | 60,093 | | 7,452 | |
Transfer agent fees | | 2,476 | | 12,636 | | 1,856 | | 2,152 | | 1,232 | |
Administrative service fees | | 759,557 | | 1,974,822 | | 113,865 | | 268,319 | | 132,300 | |
Shareholder reporting expense | | 56,805 | | 153,649 | | 10,724 | | 16,640 | | 22,811 | |
Registration fees | | 1,412 | | 4,244 | | — | | 7,289 | | 1,371 | |
Professional fees | | 71,527 | | 199,678 | | 13,725 | | 22,577 | | 17,838 | |
Custody and accounting expense | | 165,335 | | 259,739 | | 29,694 | | 62,394 | | 26,733 | |
Director’s fees | | 66,894 | | 207,346 | | 12,444 | | 20,130 | | 10,093 | |
Miscellaneous expense | | 61,347 | | 163,711 | | 10,220 | | 20,619 | | 13,138 | |
Total expenses | | 8,096,191 | | 20,933,720 | | 1,435,533 | | 4,139,178 | | 1,676,270 | |
Net investment income | | 29,739,087 | | 50,522,560 | | 1,271,506 | | 1,040,282 | | 3,871,948 | |
| | | | | | | | | | | |
REALIZED AND UNREALIZED GAIN (LOSS) ON INVESTMENTS, FOREIGN CURRENCY RELATED TRANSACTIONS AND FUTURES: | | | | | | | | | | | |
Net realized gain on: | | | | | | | | | | | |
Investments | | 113,664,841 | | 442,808,069 | | 14,294,649 | | 49,887,064 | | 494,455 | |
Foreign currency related transactions | | — | | 46,159 | | — | | — | | — | |
Futures | | 432,422 | | 4,463,554 | | 280,106 | | 1,383,520 | | — | |
Net realized gain on investments, foreign currency related transactions and futures | | 114,097,263 | | 447,317,782 | | 14,574,755 | | 51,270,584 | | 494,455 | |
Net change in unrealized appreciation or depreciation on: | | | | | | | | | | | |
Investments | | (24,430,678 | ) | (217,414,248 | ) | (3,497,625 | ) | 17,332,667 | | 17,597,293 | |
Foreign currency related transactions | | — | | (44,467 | ) | — | | (8,675 | ) | — | |
Futures | | 360,878 | | 667,721 | | (38,263 | ) | (231,327 | ) | — | |
Net change in unrealized appreciation or depreciation on investments, foreign currency related transactions and futures | | (24,069,800 | ) | (216,790,994 | ) | (3,535,888 | ) | 17,092,665 | | 17,597,293 | |
Net realized and unrealized gain on investments, foreign currency related transactions and futures | | 90,027,463 | | 230,526,788 | | 11,038,867 | | 68,363,249 | | 18,091,748 | |
Increase in net assets resulting from operations | | $ | 119,766,550 | | $ | 281,049,348 | | $ | 12,310,373 | | $ | 69,403,531 | | $ | 21,963,696 | |
* Foreign taxes withheld | | $ | — | | $ | 208,549 | | $ | 4,509 | | $ | 2,234 | | $ | 70,611 | |
See Accompanying Notes to Financial Statements
28
STATEMENTS OF OPERATIONS FOR THE YEAR ENDED DECEMBER 31, 2004
| | ING
VP Intermediate
Bond
Portfolio | | ING
VP Money
Market
Portfolio | | ING
VP Global Science
and Technology
Portfolio | | ING
VP International
Equity
Portfolio | |
INVESTMENT INCOME: | | | | | | | | | |
Dividends, net of foreign taxes withheld* | | $ | 374,088 | | $ | — | | $ | 310,812 | | $ | 857,977 | |
Interest | | 53,708,047 | | 16,659,244 | | 2,164 | | 113,853 | |
Securities lending income | | 401,358 | | 9,805 | | 22,771 | | — | |
Total investment income | | 54,483,493 | | 16,669,049 | | 335,747 | | 971,830 | |
| | | | | | | | | |
EXPENSES: | | | | | | | | | |
Investment management fees | | 5,104,847 | | 2,874,118 | | 840,414 | | 385,383 | |
Distribution and service fees: | | | | | | | | | |
Class S | | 428,822 | | — | | — | | 450 | |
Transfer agent fees | | 8,227 | | 1,358 | | 1,546 | | 379 | |
Administrative service fees | | 701,899 | | 632,293 | | 48,654 | | 24,936 | |
Shareholder reporting expense | | 46,136 | | 62,844 | | 9,462 | | 2,176 | |
Registration fees | | 6,095 | | 3,463 | | 3,059 | | 206 | |
Professional fees | | 65,349 | | 73,702 | | 5,310 | | 2,848 | |
Custody and accounting expense | | 97,849 | | 85,330 | | 12,589 | | 10,553 | |
Director’s fees | | 74,669 | | 84,491 | | 4,538 | | 1,196 | |
Miscellaneous expense | | 76,092 | | 57,875 | | 4,496 | | 1,945 | |
Total expenses | | 6,609,985 | | 3,875,474 | | 930,068 | | 430,072 | |
Recouped fees | | — | | — | | — | | 91,000 | |
Net expenses | | 6,609,985 | | 3,875,474 | | 930,068 | | 521,072 | |
Net investment income (loss) | | 47,873,508 | | 12,793,575 | | (594,321 | ) | 450,758 | |
| | | | | | | | | |
REALIZED AND UNREALIZED GAIN (LOSS) ON INVESTMENTS, FOREIGN CURRENCY RELATED TRANSACTIONS AND FUTURES: | | | | | | | | | |
Net realized gain (loss) on: | | | | | | | | | |
Investments | | 25,814,946 | | (244,520 | ) | 7,894,580 | | 5,330,007 | |
Foreign currency related transactions | | — | | — | | 39,708 | | 10,739 | |
Futures | | 890,104 | | — | | (32,325 | ) | 16,436 | |
Net realized gain (loss) on investments, foreign currency related transactions and futures | | 26,705,050 | | (244,520 | ) | 7,901,963 | | 5,357,182 | |
Net change in unrealized appreciation or depreciation on: | | | | | | | | | |
Investments | | (15,252,608 | ) | (473,680 | ) | (9,818,757 | ) | 1,696,755 | |
Foreign currency related transactions | | 15 | | — | | 150 | | 3,496 | |
Futures | | 920,924 | | — | | — | | — | |
Net change in unrealized appreciation or depreciation on investments, foreign currency related transactions and futures | | (14,331,669 | ) | (473,680 | ) | (9,818,607 | ) | 1,700,251 | |
Net realized and unrealized gain (loss) on investments, foreign currency related transactions and futures | | 12,373,381 | | (718,200 | ) | (1,916,644 | ) | 7,057,433 | |
Increase (decrease) in net assets resulting from operations | | $ | 60,246,889 | | $ | 12,075,375 | | $ | (2,510,965 | ) | $ | 7,508,191 | |
* Foreign taxes withheld | | $ | — | | $ | — | | $ | 4,199 | | $ | 110,399 | |
See Accompanying Notes to Financial Statements
29
| | ING VP Balanced Portfolio | | ING VP Growth and Income Portfolio | |
| | Year
Ended
December 31,
2004 | | Year
Ended
December 31,
2003 | | Year
Ended
December 31,
2004 | | Year
Ended
December 31,
2003 | |
FROM OPERATIONS: | | | | | | | | | |
Net investment income | | $ | 29,739,087 | | $ | 25,882,905 | | $ | 50,522,560 | | $ | 33,181,040 | |
Net realized gain on investments, foreign currency related transactions and futures | | 114,097,263 | | 46,751,111 | | 447,317,782 | | 89,606,751 | |
Net change in unrealized appreciation or depreciation on investments, foreign currency related transactions and futures | | (24,069,800 | ) | 148,117,399 | | (216,790,994 | ) | 694,994,792 | |
Net increase in net assets resulting from operations | | 119,766,550 | | 220,751,415 | | 281,049,348 | | 817,782,583 | |
| | | | | | | | | |
FROM DISTRIBUTIONS TO SHAREHOLDERS: | | | | | | | | | |
Net investment income: | | | | | | | | | |
Class I | | (28,402,664 | ) | (25,549,004 | ) | (84,513,202 | ) | — | |
Class S | | (45,416 | ) | (288 | ) | (36,994 | ) | — | |
Total distributions | | (28,448,080 | ) | (25,549,292 | ) | (84,550,196 | ) | — | |
| | | | | | | | | |
FROM CAPITAL SHARE TRANSACTIONS: | | | | | | | | | |
Net proceeds from sale of shares | | 72,475,813 | | 38,550,583 | | 61,659,142 | | 14,108,788 | |
Dividends reinvested | | 28,448,080 | | 25,549,292 | | 84,494,957 | | — | |
| | 100,923,893 | | 64,099,875 | | 146,154,099 | | 14,108,788 | |
Cost of shares redeemed | | (207,015,009 | ) | (106,333,010 | ) | (606,618,345 | ) | (559,975,741 | ) |
Net decrease in net assets resulting from capital share transactions | | (106,091,116 | ) | (42,233,135 | ) | (460,464,246 | ) | (545,866,953 | ) |
Net increase (decrease) in net assets | | (14,772,646 | ) | 152,968,988 | | (263,965,094 | ) | 271,915,630 | |
| | | | | | | | | |
NET ASSETS: | | | | | | | | | |
Beginning of year | | 1,375,742,797 | | 1,222,773,809 | | 3,797,164,209 | | 3,525,248,579 | |
End of year | | $ | 1,360,970,151 | | $ | 1,375,742,797 | | $ | 3,533,199,115 | | $ | 3,797,164,209 | |
| | | | | | | | | |
Undistributed net investment income (accumulated net investment loss) at end of year | | $ | 30,622,780 | | $ | 28,837,175 | | $ | (4,855 | ) | $ | 33,190,956 | |
See Accompanying Notes to Financial Statements
30
STATEMENTS OF CHANGES IN NET ASSETS
| | ING VP Growth Portfolio | | ING VP Small Company Portfolio | |
| | Year
Ended
December 31,
2004 | | Year
Ended
December 31,
2003 | | Year
Ended
December 31,
2004 | | Year
Ended
December 31,
2003 | |
FROM OPERATIONS: | | | | | | | | | |
Net investment income | | $ | 1,271,506 | | $ | 265,408 | | $ | 1,040,282 | | $ | 1,659,651 | |
Net realized gain on investments, foreign currency related transactions and futures | | 14,574,755 | | 12,843,906 | | 51,270,584 | | 27,374,998 | |
Net change in unrealized appreciation or depreciation on investments, foreign currency related transactions and futures | | (3,535,888 | ) | 40,849,949 | | 17,092,665 | | 85,411,831 | |
Net increase in net assets resulting from operations | | 12,310,373 | | 53,959,263 | | 69,403,531 | | 114,446,480 | |
| | | | | | | | | |
FROM DISTRIBUTIONS TO SHAREHOLDERS: | | | | | | | | | |
Net investment income: | | | | | | | | | |
Class I | | (268,051 | ) | — | | (1,319,890 | ) | (922,009 | ) |
Class S | | — | | — | | (32,250 | ) | (698 | ) |
Total distributions | | (268,051 | ) | — | | (1,352,140 | ) | (922,707 | ) |
| | | | | | | | | |
FROM CAPITAL SHARE TRANSACTIONS: | | | | | | | | | |
Net proceeds from sale of shares | | 5,337,872 | | 12,590,272 | | 128,623,947 | | 156,127,616 | |
Dividends reinvested | | 268,051 | | — | | 1,352,140 | | 922,707 | |
| | 5,605,923 | | 12,590,272 | | 129,976,087 | | 157,050,323 | |
Cost of shares redeemed | | (48,634,103 | ) | (23,009,289 | ) | (129,864,806 | ) | (94,578,973 | ) |
Net increase (decrease) in net assets resulting from capital share transactions | | (43,028,180 | ) | (10,419,017 | ) | 111,281 | | 62,471,350 | |
Net increase (decrease) in net assets | | (30,985,858 | ) | 43,540,246 | | 68,162,672 | | 175,995,123 | |
| | | | | | | | | |
NET ASSETS: | | | | | | | | | |
Beginning of year | | 224,622,344 | | 181,082,098 | | 465,068,594 | | 289,073,471 | |
End of year | | $ | 193,636,486 | | $ | 224,622,344 | | $ | 533,231,266 | | $ | 465,068,594 | |
Undistributed net investment income at end of year | | $ | 1,266,147 | | $ | 265,408 | | $ | 818,766 | | $ | 1,457,156 | |
See Accompanying Notes to Financial Statements
31
STATEMENTS OF CHANGES IN NET ASSETS
| | ING VP Value Opportunity Portfolio | | ING VP Intermediate Bond Portfolio | |
| | Year
Ended
December 31,
2004 | | Year
Ended
December 31,
2003 | | Year
Ended
December 31,
2004 | | Year
Ended
December 31,
2003 | |
FROM OPERATIONS: | | | | | | | | | |
Net investment income | | $ | 3,871,948 | | $ | 2,072,095 | | $ | 47,873,508 | | $ | 48,262,109 | |
Net realized gain on investments, foreign currency related transactions and futures | | 494,455 | | 37,412,990 | | 26,705,050 | | 39,308,980 | |
Net change in unrealized appreciation or depreciation on investments, foreign currency related transactions and futures | | 17,597,293 | | 12,066,267 | | (14,331,669 | ) | (10,863,858 | ) |
Net increase in net assets resulting from operations | | 21,963,696 | | 51,551,352 | | 60,246,889 | | 76,707,231 | |
| | | | | | | | | |
FROM DISTRIBUTIONS TO SHAREHOLDERS: | | | | | | | | | |
Net investment income: | | | | | | | | | |
Class I | | (2,050,084 | ) | (1,764,212 | ) | (87,943,133 | ) | (9,725,157 | ) |
Class S | | (22,234 | ) | (9,646 | ) | (15,582,872 | ) | (564,795 | ) |
Net realized gains: | | | | | | | | | |
Class I | | — | | — | | (44,509,550 | ) | (10,936,141 | ) |
Class S | | — | | — | | (7,324,711 | ) | (736,552 | ) |
Total distributions | | (2,072,318 | ) | (1,773,858 | ) | (155,360,266 | ) | (21,962,645 | ) |
| | | | | | | | | |
FROM CAPITAL SHARE TRANSACTIONS: | | | | | | | | | |
Net proceeds from sale of shares | | 13,547,407 | | 21,198,747 | | 399,481,829 | | 184,777,059 | |
Dividends reinvested | | 2,072,318 | | 1,773,858 | | 155,282,029 | | 21,950,695 | |
| | 15,619,725 | | 22,972,605 | | 554,763,858 | | 206,727,754 | |
Cost of shares redeemed | | (71,840,954 | ) | (25,587,631 | ) | (263,169,907 | ) | (319,226,990 | ) |
Net increase (decrease) in net assets resulting from capital share transactions | | (56,221,229 | ) | (2,615,026 | ) | 291,593,951 | | (112,499,236 | ) |
Net increase (decrease) in net assets | | (36,329,851 | ) | 47,162,468 | | 196,480,574 | | (57,754,650 | ) |
| | | | | | | | | |
NET ASSETS: | | | | | | | | | |
Beginning of year | | 259,724,145 | | 212,561,677 | | 1,197,803,455 | | 1,255,558,105 | |
End of year | | $ | 223,394,294 | | $ | 259,724,145 | | $ | 1,394,284,029 | | $ | 1,197,803,455 | |
Undistributed net investment income at end of year | | $ | 3,868,187 | | $ | 2,068,557 | | $ | 277,792 | | $ | 54,279,546 | |
See Accompanying Notes to Financial Statements
32
STATEMENTS OF CHANGES IN NET ASSETS
| | ING VP Money Market Portfolio | | ING VP Global Science and
Technology Portfolio | |
| | Year
Ended
December 31,
2004 | | Year
Ended
December 31,
2003 | | Year
Ended
December 31,
2004 | | Year
Ended
December 31,
2003 | |
FROM OPERATIONS: | | | | | | | | | |
Net investment income (loss) | | $ | 12,793,575 | | $ | 12,932,100 | | $ | (594,321 | ) | $ | (570,560 | ) |
Net realized gain (loss) on investments and foreign currency related transactions | | (244,520 | ) | (169 | ) | 7,901,963 | | (4,912,495 | ) |
Net change in unrealized appreciation or depreciation on investments and foreign currency related transactions | | (473,680 | ) | (56,131 | ) | (9,818,607 | ) | 29,432,822 | |
Net increase (decrease) in net assets resulting from operations | | 12,075,375 | | 12,875,800 | | (2,510,965 | ) | 23,949,767 | |
| | | | | | | | | |
FROM DISTRIBUTIONS TO SHAREHOLDERS: | | | | | | | | | |
Net investment income: | | | | | | | | | |
Class I | | (12,932,164 | ) | (24,741,578 | ) | — | | — | |
Total distributions | | (12,932,164 | ) | (24,741,578 | ) | — | | — | |
| | | | | | | | | |
FROM CAPITAL SHARE TRANSACTIONS: | | | | | | | | | |
Net proceeds from sale of shares | | 327,235,099 | | 1,899,695,014 | | 22,118,107 | | 71,880,902 | |
Dividends reinvested | | 12,932,164 | | 24,741,578 | | — | | — | |
| | 340,167,263 | | 1,924,436,592 | | 22,118,107 | | 71,880,902 | |
Cost of shares redeemed | | (475,422,886 | ) | (2,226,653,637 | ) | (31,058,339 | ) | (43,653,684 | ) |
Net increase (decrease) in net assets resulting from capital share transactions | | (135,255,623 | ) | (302,217,045 | ) | (8,940,232 | ) | 28,227,218 | |
Net increase (decrease) in net assets | | (136,112,412 | ) | (314,082,823 | ) | (11,451,197 | ) | 52,176,985 | |
| | | | | | | | | |
NET ASSETS: | | | | | | | | | |
Beginning of year | | 1,237,583,626 | | 1,551,666,449 | | 97,742,478 | | 45,565,493 | |
End of year | | $ | 1,101,471,214 | | $ | 1,237,583,626 | | $ | 86,291,281 | | $ | 97,742,478 | |
Undistributed net investment income at end of year | | $ | 12,788,531 | | $ | 12,927,120 | | $ | — | | $ | — | |
See Accompanying Notes to Financial Statements
33
STATEMENTS OF CHANGES IN NET ASSETS
| | ING VP International
Equity Portfolio | |
| | Year
Ended
December 31,
2004 | | Year
Ended
December 31,
2003 | |
FROM OPERATIONS: | | | | | |
Net investment income | | $ | 450,758 | | $ | 347,432 | |
Net realized gain on investments and foreign currency related transactions | | 5,357,182 | | 680,469 | |
Net change in unrealized appreciation or depreciation on investments and foreign currency related transactions | | 1,700,251 | | 8,992,547 | |
Net increase in net assets resulting from operations | | 7,508,191 | | 10,020,448 | |
| | | | | |
FROM DISTRIBUTIONS TO SHAREHOLDERS: | | | | | |
Net investment income: | | | | | |
Class I | | (546,129 | ) | (358,677 | ) |
Class S | | (2,180 | ) | (496 | ) |
Total distributions | | (548,309 | ) | (359,173 | ) |
| | | | | |
FROM CAPITAL SHARE TRANSACTIONS: | | | | | |
Net proceeds from sale of shares | | 19,056,891 | | 72,160,848 | |
Dividends reinvested | | 548,309 | | 359,173 | |
| | 19,605,200 | | 72,520,021 | |
Cost of shares redeemed | | (14,528,943 | ) | (70,372,573 | ) |
Net increase in net assets resulting from capital share transactions | | 5,076,257 | | 2,147,448 | |
Net increase in net assets | | 12,036,139 | | 11,808,723 | |
| | | | | |
NET ASSETS: | | | | | |
Beginning of year | | 40,733,709 | | 28,924,986 | |
End of year | | $ | 52,769,848 | | $ | 40,733,709 | |
Undistributed net investment income at end of year | | $ | 538,394 | | $ | 423,613 | |
See Accompanying Notes to Financial Statements
34
Selected data for a share of beneficial interest outstanding throughout each period.
| | Class I | |
| | Year Ended December 31, | |
| | 2004 | | 2003 | | 2002 | | 2001 | | 2000 | |
Per Share Operating Performance: | | | | | | | | | | | |
Net asset value, beginning of year | | $ | 12.50 | | 10.73 | | 12.09 | | 13.40 | | 15.57 | |
Income (loss) from investment operations: | | | | | | | | | | | |
Net investment income | | $ | 0.29 | | 0.25 | | 0.25 | | 0.31 | | 0.43 | |
Net realized and unrealized gain (loss) on investments | | $ | 0.87 | | 1.76 | | (1.49 | ) | (0.87 | ) | (0.49 | ) |
Total from investment operations | | $ | 1.16 | | 2.01 | | (1.24 | ) | (0.56 | ) | (0.06 | ) |
Less distributions from: | | | | | | | | | | | |
Net investment income | | $ | 0.26 | | 0.24 | | 0.12 | | 0.28 | | 0.46 | |
Net realized gains on investments | | $ | — | | — | | — | | 0.47 | | 1.65 | |
Total distributions | | $ | 0.26 | | 0.24 | | 0.12 | | 0.75 | | 2.11 | |
Net asset value, end of year | | $ | 13.40 | | 12.50 | | 10.73 | | 12.09 | | 13.40 | |
Total Return(1) | | % | 9.42 | | 18.87 | | (10.31 | ) | (4.21 | ) | (0.56 | ) |
| | | | | | | | | | | |
Ratios and Supplemental Data: | | | | | | | | | | | |
Net assets, end of year (millions) | | $ | 1,358 | | 1,375 | | 1,223 | | 1,591 | | 1,777 | |
Ratios to average net assets: | | | | | | | | | | | |
Expenses | | % | 0.59 | | 0.60 | | 0.60 | | 0.59 | | 0.59 | |
Net investment income | | % | 2.15 | | 2.04 | | 2.00 | | 2.46 | | 2.72 | |
Portfolio turnover rate | | % | 272 | | 333 | | 345 | | 167 | | 182 | |
| | Class S | |
| | Year
Ended
December 31,
2004 | | May 29,
2003(2) to
December 31,
2003 | |
Per Share Operating Performance: | | | | | |
Net asset value, beginning of period | | $ | 12.49 | | 11.53 | |
Income from investment operations: | | | | | |
Net investment income | | $ | 0.22 | | 0.34 | |
Net realized and unrealized gain on investments | | $ | 0.89 | | 0.85 | |
Total from investment operations | | $ | 1.11 | | 1.19 | |
Less distributions from: | | | | | |
Net investment income | | $ | 0.25 | | 0.23 | |
Total distributions | | $ | 0.25 | | 0.23 | |
Net asset value, end of period | | $ | 13.35 | | 12.49 | |
Total Return(1) | | % | 9.06 | | 10.51 | |
| | | | | |
Ratios and Supplemental Data: | | | | | |
Net assets, end of period (millions) | | $ | 3 | | 1 | |
Ratios to average net assets: | | | | | |
Expenses(3) | | % | 0.84 | | 0.83 | |
Net investment income(3) | | % | 1.98 | | 3.06 | |
Portfolio turnover rate | | % | 272 | | 333 | |
(1) Total return is calculated assuming reinvestment of all dividends and capital gain distributions at net asset value and does not reflect the effect of insurance contract charges. Total return for periods less than one year is not annualized.
(2) Commencement of operations.
(3) Annualized for periods less than one year.
See Accompanying Notes to Financial Statements.
35
ING VP GROWTH AND INCOME PORTFOLIO | FINANCIAL HIGHLIGHTS |
Selected data for a share of beneficial interest outstanding throughout each period.
| | Class I | |
| | Year Ended December 31, | |
| | 2004 | | 2003 | | 2002 | | 2001 | | 2000 | |
Per Share Operating Performance: | | | | | | | | | | | |
Net asset value, beginning of year | | $ | 18.28 | | 14.50 | | 19.54 | | 24.12 | | 30.69 | |
Income (loss) from investment operations: | | | | | | | | | | | |
Net investment income | | $ | 0.28 | | 0.16 | | 0.16 | | 0.14 | | 0.17 | |
Net realized and unrealized gain (loss) on investments | | $ | 1.24 | | 3.62 | | (5.04 | ) | (4.58 | ) | (3.46 | ) |
Total from investment operations | | $ | 1.52 | | 3.78 | | (4.88 | ) | (4.44 | ) | (3.29 | ) |
Less distributions from: | | | | | | | | | | | |
Net investment income | | $ | 0.45 | | — | | 0.16 | | 0.14 | | 0.16 | |
Net realized gains on investments | | $ | — | | — | | — | | — | | 3.12 | |
Total distributions | | $ | 0.45 | | — | | 0.16 | | 0.14 | | 3.28 | |
Net asset value, end of year | | $ | 19.35 | | 18.28 | | 14.50 | | 19.54 | | 24.12 | |
Total Return(1) | | % | 8.39 | | 26.07 | | (24.99 | ) | (18.40 | ) | (10.97 | ) |
| | | | | | | | | | | |
Ratios and Supplemental Data: | | | | | | | | | | | |
Net assets, end of year (millions) | | $ | 3,531 | | 3,795 | | 3,525 | | 5,639 | | 7,797 | |
Ratios to average net assets: | | | | | | | | | | | |
Expenses | | % | 0.58 | | 0.60 | | 0.59 | | 0.59 | | 0.58 | |
Net investment income | | % | 1.41 | | 0.95 | | 0.83 | | 0.62 | | 0.55 | |
Portfolio turnover rate | | % | 139 | | 150 | | 246 | | 185 | | 149 | |
| | Class S | |
| | Year
Ended
December 31,
2004 | | June 11,
2003(2) to
December 31,
2003 | |
Per Share Operating Performance: | | | | | |
Net asset value, beginning of period | | $ | 18.26 | | 16.32 | |
Income from investment operations: | | | | | |
Net investment income | | $ | 0.21 | | 0.04 | |
Net realized and unrealized gain on investments | | $ | 1.26 | | 1.90 | |
Total from investment operations | | $ | 1.47 | | 1.94 | |
Less distributions from: | | | | | |
Net investment income | | $ | 0.39 | | — | |
Total distributions | | $ | 0.39 | | — | |
Net asset value, end of period | | $ | 19.34 | | 18.26 | |
Total Return(1) | | % | 8.10 | | 11.89 | |
| | | | | |
Ratios and Supplemental Data: | | | | | |
Net assets, end of period (millions) | | $ | 2 | | 2 | |
Ratios to average net assets: | | | | | |
Expenses(3) | | % | 0.83 | | 0.84 | |
Net investment income(3) | | % | 1.18 | | 0.57 | |
Portfolio turnover rate | | % | 139 | | 150 | |
(1) Total return is calculated assuming reinvestment of all dividends and capital gain distributions at net asset value and does not reflect the effect of insurance contract charges. Total return for periods less than one year is not annualized.
(2) Commencement of operations.
(3) Annualized for periods less than one year.
See Accompanying Notes to Financial Statements.
36
ING VP GROWTH PORTFOLIO | FINANCIAL HIGHLIGHTS |
Selected data for a share of beneficial interest outstanding throughout each period.
| | Class I | |
| | Year Ended December 31, | |
| | 2004 | | 2003 | | 2002 | | 2001 | | 2000 | |
Per Share Operating Performance: | | | | | | | | | | | |
Net asset value, beginning of year | | $ | 8.93 | | 6.85 | | 9.64 | | 14.99 | | 17.32 | |
Income (loss) from investment operations: | | | | | | | | | | | |
Net investment income (loss) | | $ | 0.06 | | 0.01 | | (0.01 | ) | (0.01 | ) | 0.01 | |
Net realized and unrealized gain (loss) on investments | | $ | 0.58 | | 2.07 | | (2.78 | ) | (3.87 | ) | (2.02 | ) |
Total from investment operations | | $ | 0.64 | | 2.08 | | (2.79 | ) | (3.88 | ) | (2.01 | ) |
Less distributions from: | | | | | | | | | | | |
Net investment income | | $ | 0.01 | | — | | — | | 0.01 | | 0.01 | |
Net realized gains on investments | | $ | — | | — | | — | | 1.46 | | 0.31 | |
Total distributions | | $ | 0.01 | | — | | — | | 1.47 | | 0.32 | |
Net asset value, end of year | | $ | 9.56 | | 8.93 | | 6.85 | | 9.64 | | 14.99 | |
Total Return(1) | | % | 7.19 | | 30.36 | | (28.94 | ) | (27.06 | ) | (11.95 | ) |
| | | | | | | | | | | |
Ratios and Supplemental Data: | | | | | | | | | | | |
Net assets, end of year (000’s) | | $ | 193,280 | | 224,330 | | 181,029 | | 305,624 | | 460,578 | |
Ratios to average net assets: | | | | | | | | | | | |
Expenses | | % | 0.69 | | 0.71 | | 0.72 | | 0.70 | | 0.70 | |
Net investment income (loss) | | % | 0.61 | | 0.13 | | (0.06 | ) | (0.08 | ) | 0.06 | |
Portfolio turnover rate | | % | 123 | | 162 | | 241 | | 216 | | 179 | |
| | Class S | |
| | Year Ended December 31, | | November 1,
2001(2) to
December 31,
2001 | |
| | 2004 | | 2003 | | 2002 | | |
Per Share Operating Performance: | | | | | | | | | |
Net asset value, beginning of period | | $ | 8.88 | | 6.83 | | 9.63 | | 8.96 | |
Income (loss) from investment operations: | | | | | | | | | |
Net investment income (loss) | | $ | 0.04 | | 0.00 | * | (0.01 | ) | 0.00 | * |
Net realized and unrealized gain (loss) on investments | | $ | 0.58 | | 2.05 | | (2.79 | ) | 0.67 | |
Total from investment operations | | $ | 0.62 | | 2.05 | | (2.80 | ) | 0.67 | |
Net asset value, end of period | | $ | 9.50 | | 8.88 | | 6.83 | | 9.63 | |
Total Return(1) | | % | 6.98 | | 30.01 | | (29.08 | ) | 7.48 | |
| | | | | | | | | |
Ratios and Supplemental Data: | | | | | | | | | |
Net assets, end of period (000’s) | | $ | 356 | | 292 | | 53 | | 11 | |
Ratios to average net assets: | | | | | | | | | |
Expenses(3) | | % | 0.94 | | 0.96 | | 0.97 | | 0.94 | |
Net investment income (loss)(3) | | % | 0.44 | | (0.10 | ) | (0.31 | ) | (0.32 | ) |
Portfolio turnover rate | | % | 123 | | 162 | | 241 | | 216 | |
(1) Total return is calculated assuming reinvestment of all dividends and capital gain distributions at net asset value and does not reflect the effect of insurance contract charges. Total return for periods less than one year is not annualized.
(2) Commencement of operations.
(3) Annualized for periods less than one year.
* Amount is less than $0.01 per share.
See Accompanying Notes to Financial Statements.
37
ING VP SMALL COMPANY PORTFOLIO | FINANCIAL HIGHLIGHTS |
Selected data for a share of beneficial interest outstanding throughout each period.
| | Class I | |
| | Year Ended December 31, | |
| | 2004 | | 2003 | | 2002 | | 2001 | | 2000 | |
Per Share Operating Performance: | | | | | | | | | | | |
Net asset value, beginning of year | | $ | 17.48 | | 12.75 | | 16.68 | | 16.65 | | 16.52 | |
Income (loss) from investment operations: | | | | | | | | | | | |
Net investment income | | $ | 0.04 | | 0.06 | | 0.05 | | 0.06 | | 0.11 | |
Net realized and unrealized gain (loss) on investments | | $ | 2.47 | | 4.71 | | (3.91 | ) | 0.58 | | 1.09 | |
Total from investment operations | | $ | 2.51 | | 4.77 | | (3.86 | ) | 0.64 | | 1.20 | |
Less distributions from: | | | | | | | | | | | |
Net investment income | | $ | 0.05 | | 0.04 | | 0.07 | | 0.10 | | 0.02 | |
Net realized gains on investments | | $ | — | | — | | — | | 0.51 | | 1.05 | |
Total distributions | | $ | 0.05 | | 0.04 | | 0.07 | | 0.61 | | 1.07 | |
Net asset value, end of year | | $ | 19.94 | | 17.48 | | 12.75 | | 16.68 | | 16.65 | |
Total Return(1) | | % | 14.39 | | 37.47 | | (23.23 | ) | 4.00 | | 6.72 | |
| | | | | | | | | | | |
Ratios and Supplemental Data: | | | | | | | | | | | |
Net assets, end of year (000’s) | | $ | 461,014 | | 464,228 | | 288,890 | | 341,332 | | 273,617 | |
Ratios to average net assets: | | | | | | | | | | | |
Expenses | | % | 0.84 | | 0.85 | | 0.87 | | 0.86 | | 0.87 | |
Net investment income | | % | 0.21 | | 0.47 | | 0.39 | | 0.50 | | 0.80 | |
Portfolio turnover rate | | % | 93 | | 178 | | 371 | | 240 | | 330 | |
| | Class S | |
| | Year Ended December 31, | | November 1,
2001(2) to
December 31,
2001 | |
| | 2004 | | 2003 | | 2002 | | |
Per Share Operating Performance: | | | | | | | | | |
Net asset value, beginning of period | | $ | 17.49 | | 12.72 | | 16.68 | | 14.90 | |
Income (loss) from investment operations: | | | | | | | | | |
Net investment income (loss) | | $ | 0.03 | ** | 0.01 | | (0.04 | ) | 0.00 | * |
Net realized and unrealized gain (loss) on investments | | $ | 2.43 | | 4.79 | | (3.86 | ) | 1.78 | |
Total from investment operations | | $ | 2.46 | | 4.80 | | (3.90 | ) | 1.78 | |
Less distribution from: | | | | | | | | | |
Net investment income | | $ | 0.05 | | 0.03 | | 0.06 | | — | |
Total distribution | | $ | 0.05 | | 0.03 | | 0.06 | | — | |
Net asset value, end of period | | $ | 19.90 | | 17.49 | | 12.72 | | 16.68 | |
Total Return(1) | | % | 14.09 | | 37.76 | | (23.45 | ) | 11.95 | |
| | | | | | | | | |
Ratios and Supplemental Data: | | | | | | | | | |
Net assets, end of period (000’s) | | $ | 72,225 | | 840 | | 184 | | 11 | |
Ratios to average net assets: | | | | | | | | | |
Expenses(3) | | % | 1.09 | | 1.10 | | 1.12 | | 1.10 | |
Net investment income(3) | | % | 0.19 | | 0.22 | | 0.14 | | 0.29 | |
Portfolio turnover rate | | % | 93 | | 178 | | 371 | | 240 | |
(1) Total return is calculated assuming reinvestment of all dividends and capital gain distributions at net asset value and does not reflect the effect of insurance contract charges. Total return for periods less than one year is not annualized.
(2) Commencement of operations.
(3) Annualized for periods less than one year.
* Amount is less than $0.01 per share.
** Per share data calculated using average number of shares outstanding throughout the period.
See Accompanying Notes to Financial Statements.
38
ING VP VALUE OPPORTUNITY PORTFOLIO | FINANCIAL HIGHLIGHTS |
Selected data for a share of beneficial interest outstanding throughout each period.
| | Class I | |
| | Year Ended December 31, | |
| | 2004 | | 2003 | | 2002 | | 2001 | | 2000 | |
Per Share Operating Performance: | | | | | | | | | | | |
Net asset value, beginning of year | | $ | 12.08 | | 9.77 | | 13.25 | | 15.34 | | 16.42 | |
Income (loss) from investment operations: | | | | | | | | | | | |
Net investment income | | $ | 0.24 | | 0.10 | | 0.04 | | 0.03 | | 0.07 | |
Net realized and unrealized gain (loss) on investments | | $ | 0.98 | | 2.29 | | (3.47 | ) | (1.43 | ) | 1.49 | |
Total from investment operations | | $ | 1.22 | | 2.39 | | (3.43 | ) | (1.40 | ) | 1.56 | |
Less distributions from: | | | | | | | | | | | |
Net investment income | | $ | 0.11 | | 0.08 | | 0.05 | | 0.05 | | 0.03 | |
Net realized gains on investments | | $ | — | | — | | — | | 0.64 | | 2.61 | |
Total distributions | | $ | 0.11 | | 0.08 | | 0.05 | | 0.69 | | 2.64 | |
Net asset value, end of year | | $ | 13.19 | | 12.08 | | 9.77 | | 13.25 | | 15.34 | |
Total Return(1) | | % | 10.15 | | 24.59 | | (25.96 | ) | (9.62 | ) | 10.19 | |
| | | | | | | | | | | |
Ratios and Supplemental Data: | | | | | | | | | | | |
Net assets, end of year (000’s) | | $ | 219,889 | | 257,448 | | 211,470 | | 219,287 | | 116,029 | |
Ratios to average net assets: | | | | | | | | | | | |
Expenses | | % | 0.69 | | 0.70 | | 0.72 | | 0.71 | | 0.75 | |
Net investment income | | % | 1.61 | | 0.91 | | 0.51 | | 0.54 | | 0.58 | |
Portfolio turnover rate | | % | 16 | | 251 | | 304 | | 185 | | 171 | |
| | Class S | |
| | Year Ended December 31, | | July 16,
2001(2) to
December 31,
2001 | |
| | 2004 | | 2003 | | 2002 | | |
Per Share Operating Performance: | | | | | | | | | |
Net asset value, beginning of period | | $ | 12.03 | | 9.75 | | 13.24 | | 14.58 | |
Income (loss) from investment operations: | | | | | | | | | |
Net investment income | | $ | 0.13 | | 0.04 | | 0.01 | | 0.00 | * |
Net realized and unrealized gain (loss) on investments | | $ | 1.05 | | 2.31 | | (3.46 | ) | (1.34 | ) |
Total from investment operations | | $ | 1.18 | | 2.35 | | (3.45 | ) | (1.34 | ) |
Less distributions from: | | | | | | | | | |
Net investment income | | $ | 0.09 | | 0.07 | | 0.04 | | — | |
Total distributions | | $ | 0.09 | | 0.07 | | 0.04 | | — | |
Net asset value, end of period | | $ | 13.12 | | 12.03 | | 9.75 | | 13.24 | |
Total Return(1) | | % | 9.88 | | 24.21 | | (26.12 | ) | (9.19 | ) |
| | | | | | | | | |
Ratios and Supplemental Data: | | | | | | | | | |
Net assets, end of period (000’s) | | $ | 3,505 | | 2,277 | | 1,092 | | 307 | |
Ratios to average net assets: | | | | | | | | | |
Expenses(3) | | % | 0.94 | | 0.95 | | 0.97 | | 0.96 | |
Net investment income(3) | | % | 1.36 | | 0.64 | | 0.26 | | 0.29 | |
Portfolio turnover rate | | % | 16 | | 251 | | 304 | | 185 | |
(1) Total return is calculated assuming reinvestment of all dividends and capital gain distributions at net asset value and does not reflect the effect of insurance contract charges. Total return for periods less than one year is not annualized.
(2) Commencement of operations.
(3) Annualized for periods less than one year.
* Amount is less than $0.01 per share.
See Accompanying Notes to Financial Statements.
39
ING VP INTERMEDIATE BOND PORTFOLIO | FINANCIAL HIGHLIGHTS |
Selected data for a share of beneficial interest outstanding throughout each period.
| | Class I | |
| | Year Ended December 31, | |
| | 2004 | | 2003 | | 2002 | | 2001 | | 2000 | |
Per Share Operating Performance: | | | | | | | | | | | |
Net asset value, beginning of year | | $ | 14.15 | | 13.53 | | 12.95 | | 12.61 | | 12.17 | |
Income from investment operations: | | | | | | | | | | | |
Net investment income | | $ | 0.53 | | 0.56 | | 0.45 | | 0.59 | | 0.79 | |
Net realized and unrealized gain on investments | | $ | 0.13 | | 0.29 | | 0.63 | | 0.51 | | 0.37 | |
Total from investment operations | | $ | 0.66 | | 0.85 | | 1.08 | | 1.10 | | 1.16 | |
Less distributions from: | | | | | | | | | | | |
Net investment income | | $ | 1.11 | | 0.11 | | 0.43 | | 0.65 | | 0.72 | |
Net realized gains on investments | | $ | 0.56 | | 0.12 | | 0.07 | | 0.11 | | — | |
Total distributions | | $ | 1.67 | | 0.23 | | 0.50 | | 0.76 | | 0.72 | |
Net asset value, end of year | | $ | 13.14 | | 14.15 | | 13.53 | | 12.95 | | 12.61 | |
Total Return(1) | | % | 4.88 | | 6.30 | | 8.33 | | 8.75 | | 9.64 | |
| | | | | | | | | | | |
Ratios and Supplemental Data: | | | | | | | | | | | |
Net assets, end of year (millions) | | $ | 1,093 | | 1,126 | | 1,206 | | 1,024 | | 711 | |
Ratios to average net assets: | | | | | | | | | | | |
Expenses | | % | 0.48 | | 0.50 | | 0.49 | | 0.50 | | 0.50 | |
Net investment income | | % | 3.79 | | 3.77 | | 3.50 | | 5.06 | | 6.29 | |
Portfolio turnover rate | | % | 407 | | 521 | | 565 | | 219 | | 334 | |
| | Class S | |
| | Year Ended December 31, | | May 3,
2002(2) to
December 31,
2002 | |
| | 2004 | | 2003 | | |
Per Share Operating Performance: | | | | | | | |
Net asset value, beginning of period | | $ | 14.13 | | 13.53 | | 13.05 | |
Income (loss) from investment operations: | | | | | | | |
Net investment income | | $ | 0.40 | | 0.49 | | 0.16 | |
Net realized and unrealized gain on investments | | $ | 0.22 | | 0.32 | | 0.81 | |
Total from investment operations | | $ | 0.62 | | 0.81 | | 0.97 | |
Less distributions from: | | | | | | | |
Net investment income | | $ | 1.10 | | 0.09 | | 0.42 | |
Net realized gains on investments | | $ | 0.56 | | 0.12 | | 0.07 | |
Total distributions | | $ | 1.66 | | 0.21 | | 0.49 | |
Net asset value, end of period | | $ | 13.09 | | 14.13 | | 13.53 | |
Total Return(1) | | % | 4.58 | | 6.04 | | 7.45 | |
| | | | | | | |
Ratios and Supplemental Data: | | | | | | | |
Net assets, end of period (millions) | | $ | 301 | | 71 | | 50 | |
Ratios to average net assets: | | | | | | | |
Expenses(3) | | % | 0.73 | | 0.75 | | 0.74 | |
Net investment income(3) | | % | 3.52 | | 3.52 | | 3.25 | |
Portfolio turnover rate | | % | 407 | | 521 | | 565 | |
(1) Total return is calculated assuming reinvestment of all dividends and capital gain distributions at net asset value and does not reflect the effect of insurance contract charges. Total return for periods less than one year is not annualized.
(2) Commencement of operations.
(3) Annualized for periods less than one year.
See Accompanying Notes to Financial Statements.
40
ING VP MONEY MARKET PORTFOLIO | FINANCIAL HIGHLIGHTS |
Selected data for a share of beneficial interest outstanding throughout each period.
| | Class I | |
| | Year Ended December 31, | |
| | 2004 | | 2003 | | 2002 | | 2001 | | 2000 | |
Per Share Operating Performance: | | | | | | | | | | | |
Net asset value, beginning of year | | $ | 12.94 | | 13.03 | | 13.33 | | 13.61 | | 13.42 | |
Income (loss) from investment operations: | | | | | | | | | | | |
Net investment income | | $ | 0.15 | | 0.08 | | 0.21 | | 0.50 | | 0.83 | |
Net realized and unrealized gain (loss) on investments | | $ | (0.01 | ) | 0.03 | | — | | 0.01 | | (0.02 | ) |
Total from investment operations | | $ | 0.14 | | 0.11 | | 0.21 | | 0.51 | | 0.81 | |
Less distributions from: | | | | | | | | | | | |
Net investment income | | $ | 0.14 | | 0.20 | | 0.51 | | 0.79 | | 0.62 | |
Total distributions | | $ | 0.14 | | 0.20 | | 0.51 | | 0.79 | | 0.62 | |
Net asset value, end of year | | $ | 12.94 | | 12.94 | | 13.03 | | 13.33 | | 13.61 | |
Total Return(1) | | % | 1.06 | | 0.92 | | 1.66 | | 3.94 | | 6.38 | |
| | | | | | | | | | | |
Ratios and Supplemental Data: | | | | | | | | | | | |
Net assets, end of year (millions) | | $ | 1,101 | | 1,238 | | 1,552 | | 1,519 | | 1,196 | |
Ratios to average net assets: | | | | | | | | | | | |
Expenses | | % | 0.34 | | 0.35 | | 0.34 | | 0.34 | | 0.34 | |
Net investment income | | % | 1.11 | | 0.91 | | 1.63 | | 4.07 | | 6.20 | |
(1) Total return is calculated assuming reinvestment of all dividends and capital gain distributions at net asset value and does not reflect the effect of insurance contract charges.
See Accompanying Notes to Financial Statements.
41
ING VP GLOBAL SCIENCE AND TECHNOLOGY PORTFOLIO | FINANCIAL HIGHLIGHTS |
Selected data for a share of beneficial interest outstanding throughout each period.
| | Class I | |
| | Year Ended December 31, | | May 1,
2000(1) to
December 31, 2000 | |
| | 2004 | | 2003 | | 2002 | | 2001 | | |
Per Share Operating Performance: | | | | | | | | | | | |
Net asset value, beginning of period | | $ | 3.87 | | 2.66 | | 4.53 | | 5.88 | | 10.00 | |
Income (loss) from investment operations: | | | | | | | | | | | |
Net investment loss | | $ | (0.03 | ) | (0.02 | ) | (0.03 | ) | (0.02 | ) | (0.02 | ) |
Net realized and unrealized gain (loss) on investments | | $ | (0.02 | ) | 1.23 | | (1.84 | ) | (1.33 | ) | (4.10 | ) |
Total from investment operations | | $ | (0.05 | ) | 1.21 | | (1.87 | ) | (1.35 | ) | (4.12 | ) |
Net asset value, end of period | | $ | 3.82 | | 3.87 | | 2.66 | | 4.53 | | 5.88 | |
Total Return(2) | | % | (1.29 | ) | 45.49 | | (41.28 | ) | (22.96 | ) | (41.20 | ) |
| | | | | | | | | | | |
Ratios and Supplemental Data: | | | | | | | | | | | |
Net assets, end of period (000’s) | | $ | 86,291 | | 97,742 | | 45,559 | | 62,878 | | 44,621 | |
Ratios to average net assets: | | | | | | | | | | | |
Net expenses after expense reimbursement/recoupment(3)(4) | | % | 1.05 | | 1.11 | | 1.11 | | 1.11 | | 1.15 | |
Gross expenses prior to expense reimbursement/recoupment(3) | | % | 1.05 | | 1.10 | | 1.12 | | 1.11 | | 1.20 | |
Net investment loss after expense reimbursement/recoupment(3)(4) | | % | (0.67 | ) | (0.88 | ) | (0.89 | ) | (0.49 | ) | (0.61 | ) |
Portfolio turnover rate | | % | 163 | | 15 | | 61 | | 129 | | 150 | |
(1) Commencement of operations.
(2) Total return is calculated assuming reinvestment of all dividends and capital gain distributions at net asset value and does not reflect the effect of insurance contract charges. Total return for periods less than one year is not annualized.
(3) Annualized for periods less than one year.
(4) The Investment Manager has agreed to limit expenses, (excluding interest, taxes, brokerage and extraordinary expenses) subject to possible recoupment by ING Investments, LLC within three years.
See Accompanying Notes to Financial Statements.
42
ING VP INTERNATIONAL EQUITY PORTFOLIO | FINANCIAL HIGHLIGHTS |
Selected data for a share of beneficial interest outstanding throughout each period.
| | Class I | |
| | Year Ended December 31, | |
| | 2004 | | 2003 | | 2002 | | 2001 | | 2000 | |
Per Share Operating Performance: | | | | | | | | | | | |
Net asset value, beginning of year | | $ | 7.55 | | 5.78 | | 7.90 | | 10.40 | | 15.92 | |
Income (loss) from investment operations: | | | | | | | | | | | |
Net investment income (loss) | | $ | 0.07 | | 0.06 | | 0.03 | | 0.02 | | (0.02 | ) |
Net realized and unrealized gain (loss) on investments | | $ | 1.21 | | 1.78 | | (2.13 | ) | (2.51 | ) | (3.17 | ) |
Total from investment operations | | $ | 1.28 | | 1.84 | | (2.10 | ) | (2.49 | ) | (3.19 | ) |
Less distributions from: | | | | | | | | | | | |
Net investment income | | $ | 0.09 | | 0.07 | | 0.02 | | 0.01 | | 0.01 | |
Net realized gains on investments | | $ | — | | — | | — | | — | | 2.32 | |
Total distributions | | $ | 0.09 | | 0.07 | | 0.02 | | 0.01 | | 2.33 | |
Net asset value, end of year | | $ | 8.74 | | 7.55 | | 5.78 | | 7.90 | | 10.40 | |
Total Return(1) | | % | 17.17 | | 32.05 | | (26.68 | ) | (23.88 | ) | (20.33 | ) |
| | | | | | | | | | | |
Ratios and Supplemental Data: | | | | | | | | | | | |
Net assets, end of year (000’s) | | $ | 52,505 | | 40,537 | | 28,917 | | 48,652 | | 52,210 | |
Ratios to average net assets: | | | | | | | | | | | |
Net expenses after expense reimbursement/recoupment(2) | | % | 1.15 | | 1.15 | | 1.15 | | 1.15 | | 1.15 | |
Gross expenses prior to expense reimbursement/recoupment(2) | | % | 0.95 | | 1.38 | | 1.46 | | 1.26 | | 1.34 | |
Net investment income (loss) after expense reimbursement/recoupment(2) | | % | 1.00 | | 1.04 | | 0.40 | | 0.23 | | (0.18 | ) |
Portfolio turnover rate | | % | 137 | | 85 | | 266 | | 229 | | 212 | |
| | Class S | |
| | Year Ended December 31, | | November 1,
2001(3) to
December 31,
2001 | |
| | 2004 | | 2003 | | 2002 | | |
Per Share Operating Performance: | | | | | | | | | |
Net asset value, beginning of period | | $ | 7.53 | | 5.78 | | 7.90 | | 7.38 | |
Income (loss) from investment operations: | | | | | | | | | |
Net investment income (loss) | | $ | 0.05 | | (0.01 | ) | 0.01 | | — | |
Net realized and unrealized gain (loss) on investments | | $ | 1.21 | | 1.82 | | (2.13 | ) | 0.52 | |
Total from investment operations | | $ | 1.26 | | 1.81 | | (2.12 | ) | 0.52 | |
Less distributions from: | | | | | | | | | |
Net investment income | | $ | 0.09 | | 0.06 | | — | | — | |
Total distributions | | $ | 0.09 | | 0.06 | | — | | — | |
Net asset value, end of period | | $ | 8.70 | | 7.53 | | 5.78 | | 7.90 | |
Total Return(1) | | % | 16.87 | | 31.62 | | (26.84 | ) | 7.05 | |
| | | | | | | | | |
Ratios and Supplemental Data: | | | | | | | | | |
Net assets, end of period (000’s) | | $ | 265 | | 197 | | 8 | | 11 | |
Ratios to average net assets: | | | | | | | | | |
Net expenses after expense
reimbursement/recoupment(2)(4) | | % | 1.40 | | 1.40 | | 1.40 | | 1.39 | |
Gross expenses prior to expense reimbursement/recoupment(2) | | % | 1.20 | | 1.63 | | 1.71 | | 1.49 | |
Net investment income after expense reimbursement/recoupment(2)(4) | | % | 0.68 | | 0.79 | | 0.15 | | 0.01 | |
Portfolio turnover rate | | % | 137 | | 85 | | 266 | | 229 | |
(1) Total return is calculated assuming reinvestment of all dividends and capital gain distributions at net asset value and does not reflect the effect of insurance contract charges. Total return for periods less than one year is not annualized.
(2) The Investment Manager has agreed to limit expenses, (excluding interest, taxes, brokerage and extraordinary expenses) subject to possible recoupment by ING Investments, LLC within three years.
(3) Commencement of operations.
(4) Annualized for periods less than one year.
See Accompanying Notes to Financial Statements.
43
NOTE 1 — ORGANIZATION
Organization. The ING Variable Product Funds are comprised of ING VP Balanced Portfolio, Inc., ING Variable Funds d/b/a ING VP Growth and Income Portfolio, ING Variable Portfolios, Inc., ING VP Intermediate Bond Portfolio and ING VP Money Market Portfolio, all of which are open-end investment management companies registered under the Investment Company Act of 1940, as amended.
ING VP Balanced Portfolio, Inc. (“Balanced”) is a company incorporated under the laws of Maryland on December 14, 1988. ING Variable Funds is a business trust formed under the laws of Massachusetts on January 25, 1984 with one portfolio, ING VP Growth and Income Portfolio (“Growth and Income”). ING Variable Portfolios, Inc. is a company incorporated under the laws of Maryland on June 4, 1996 and has eight separate portfolios. The five portfolios that are in this report are: ING VP Growth Portfolio (“Growth”), ING VP Small Company Portfolio (“Small Company”), ING VP Value Opportunity Portfolio (“Value Opportunity”), ING VP Global Science and Technology (“Global Science and Technology”) and ING VP International Equity Portfolio (“International”). ING VP Intermediate Bond Portfolio is a business trust formed under the laws of Massachusetts on January 25, 1984 with one portfolio, ING VP Intermediate Bond Portfolio (“Intermediate Bond”, formerly, ING VP Bond Portfolio). ING VP Money Market Portfolio is a business trust under the laws of Massachusetts on January 25, 1984 with one portfolio, ING VP Money Market Portfolio (“Money Market”).
Each Portfolio offers Class I shares. Balanced, Growth and Income, Growth, Small Company, Value Opportunity, Intermediate Bond, Global Science and Technology and International also offer Class S shares. The two classes differ principally in applicable distribution and service fees. Shareholders of each class also bear certain expenses that pertain to that particular class. All shareholders bear the common expenses of the Portfolios and earn income and realized gains/losses from the Portfolio pro rata based on the average daily net assets of each class, without discrimination between share classes. No class has preferential dividend rights. Differences in per share dividend rates generally result from the relative weighting of pro rata income and realized gain allocations and from differences in separate class expenses, including distribution, and shareholder servicing fees.
ING Investments, LLC (“ING Investments’’ or the ”Investment Manager”), an Arizona limited liability company, serves as the Investment Manager to the Portfolios. ING Investments has engaged ING Investment Management Co. (“ING IM’’), a Connecticut corporation, to serve as the Sub-Adviser to each Portfolio, with the exception of the Global Science and Technology Portfolio. ING Funds Distributor, LLC (the ”Distributor”) is the principal underwriter of the Portfolios. ING Investments, ING IM and the Distributor are indirect wholly-owned subsidiaries of ING Groep N.V. (“ING Groep”). ING Groep is a global financial institution active in the fields of banking, insurance and asset management.
NOTE 2 — SIGNIFICANT ACCOUNTING POLICIES
The following significant accounting policies are consistently followed by the Portfolios in the preparation of their financial statements. Such policies are in conformity with accounting principles generally accepted in the United States of America for investment companies.
A. Security Valuation. Investments in equity securities traded on a national securities exchange are valued at the last reported sale price. Securities reported by NASDAQ are valued at the NASDAQ official closing prices. Securities traded on an exchange or NASDAQ for which there has been no sale and securities traded in the over-the-counter-market are valued at the mean between the last reported bid and ask prices. All investments quoted in foreign currencies will be valued daily in U.S. dollars on the basis of the foreign currency exchange rates prevailing at that time. Debt securities are valued at prices obtained from independent services or from one or more dealers making markets in the securities and may be adjusted based on the Portfolios’ valuation procedures. U.S. Government obligations are valued by using market quotations or independent pricing services that use prices provided by market-makers or estimates of market values obtained from yield data relating to instruments or securities with similar characteristics.
Securities and assets for which market quotations are not readily available (which may include certain restricted securities, which are subject to limitations as to their sale) are valued at their fair values as determined in good faith by or under the supervision of the Portfolios’ Board of Directors (“Board”), in accordance with methods that are specifically authorized by the Board.
Securities traded on exchanges, including foreign exchanges, which close earlier than the time that a Portfolio calculates its net asset value may also be valued at their fair values as determined in good faith by or under the supervision of a Portfolio’s Board, in accordance with methods that are specifically authorized by the Board. If a
44
NOTES TO FINANCIAL STATEMENTS AS OF DECEMBER 31, 2004 (CONTINUED)
NOTE 2 — SIGNIFICANT ACCOUNTING POLICIES (continued)
significant event which is likely to impact the value of one or more foreign securities held by a Portfolio occurs after the time at which the foreign market for such security(ies) closes but before the time that the Portfolio’s net asset value is calculated on any business day, such event may be taken into account in determining the fair value of such security(ies) at the time the Portfolio calculates its net asset value. For these purposes, significant events after the close of trading on a foreign market may include, among others, securities trading in the U.S. and other markets, corporate announcements, natural and other disasters, and political and other events. Among other elements of analysis, the Board has authorized the use of one or more research services to assist with the determination of the fair value of foreign securities. Research services use statistical analyses and quantitative models to help determine fair value as of the time a Portfolio calculates its net asset value. Unlike the closing price of a security on an exchange, fair value determinations employ elements of judgment, and the fair value assigned to a security may not represent the actual value that a Portfolio could obtain if it were to sell the security at the time of the close of the NYSE. Investments in securities maturing in 60 days or less at the date of valuation are valued at amortized cost, which, when combined with accrued interest, approximates market value.
B. Security Transactions and Revenue Recognition. Securities transactions are accounted for on the trade date. Realized gains and losses are reported on the basis of identified cost of securities sold. Interest income is recorded on an accrual basis. Dividend income is recorded on the ex-dividend date, or for certain foreign securities, when the information becomes available to the Portfolios. Premium amortization and discount accretion are determined by the effective yield method.
C. Foreign Currency Translation. The books and records of the portfolios are maintained in U.S. dollars. Any foreign currency amounts are translated into U.S. dollars on the following basis:
(1) Market value of investment securities, other assets and liabilities — at the exchange rates prevailing at the end of the day.
(2) �� Purchases and sales of investment securities, income and expenses — at the rates of exchange prevailing on the respective dates of such transactions.
Although the net assets and the market values are presented at the foreign exchange rates at the end of the day, the Portfolios do not isolate the portion of the results of operations resulting from changes in foreign exchange rates on investments from the fluctuations arising from changes in market prices of securities held. Such fluctuations are included with the net realized and unrealized gains or losses from investments. For securities, which are subject to foreign withholding tax upon disposition, liabilities are recorded on the Statements of Assets and Liabilities for the estimated tax withholding based on the securities’ current market value. Upon disposition, realized gains or losses on such securities are recorded net of foreign withholding tax.
Reported net realized foreign exchange gains or losses arise from sales of foreign currencies, currency gains or losses realized between the trade and settlement dates on securities transactions, the difference between the amounts of dividends, interest, and foreign withholding taxes recorded on the Portfolio’s books, and the U.S. dollar equivalent of the amounts actually received or paid. Net unrealized foreign exchange gains and losses arise from changes in the value of assets and liabilities other than investments in securities at fiscal year end, resulting from changes in the exchange rate. Foreign security and currency transactions may involve certain considerations and risks not typically associated with investing in U.S. companies and U.S. Government securities. These risks include, but are not limited to, revaluation of currencies and future adverse political and economic developments, which could cause securities and their markets to be less liquid and prices more volatile than those of comparable U.S. companies and U.S. Government securities.
D. Foreign Currency Transactions and Futures Contracts. Certain Portfolios may enter into foreign currency exchange transactions to convert to and from different foreign currencies and to and from the U.S. dollar in connection with the planned purchases or sales of securities. When entering into a currency forward contract, a Portfolio agrees to receive or deliver a fixed quantity of foreign currency for an agreed-upon price on an agreed future date. The Portfolios either enter into these transactions on a spot basis at the spot rate prevailing in the foreign currency exchange market or use forward foreign currency contracts to purchase or sell foreign currencies. When the contract is fulfilled or closed, gains or losses are realized. Until then, the gain or loss is included in unrealized appreciation or depreciation.
45
NOTES TO FINANCIAL STATEMENTS AS OF DECEMBER 31, 2004 (CONTINUED)
NOTE 2 — SIGNIFICANT ACCOUNTING POLICIES (continued)
Risks may arise upon entering into forward contracts from the potential inability of counterparties to meet the terms of their forward contracts and from unanticipated movements in the value of foreign currencies relative to the U.S. dollar.
Each Portfolio, with the exception of Money Market, may enter into futures contracts involving foreign currency, interest rates, securities and securities indices. A futures contract obligates the seller of the contract to deliver and the purchaser of the contract to take delivery of the type of foreign currency, financial instrument or security called for in the contract at a specified future time for a specified price. Upon entering into such a contract, a Portfolio is required to deposit and maintain as collateral such initial margin as required by the exchange on which the contract is traded. Pursuant to the contract, a Portfolio agrees to receive from or pay to the broker an amount equal to the daily fluctuations in the value of the contract. Such receipts or payments are known as variation margins and are recorded as unrealized gains or losses by the Portfolio. When the contract is closed, the Portfolio records a realized gain or loss equal to the difference between the value of the contract at the time it was opened and the value at the time it was closed.
E. Distributions to Shareholders. The Portfolios record distributions to their shareholders on the ex-dividend date. Balanced, Growth, Small Company, Value Opportunity, Money Market and Global Science and Technology Portfolios declare and pay dividends annually. Growth and Income and Intermediate Bond Portfolios declare and pay dividends semi-annually. The Portfolios may make distributions on a more frequent basis to comply with the distribution requirements of the Internal Revenue Code. The characteristics of income and gains to be distributed are determined in accordance with income tax regulations, which may differ from accounting principles generally accepted in the United States of America for investment companies.
F. Federal Income Taxes. It is the policy of the Portfolios to comply with subchapter M of the Internal Revenue Code and related excise tax provisions applicable to requlated investment companies and to distribute substantially all of their net investment income and any net realized capital gains to their shareholders. Therefore, no federal income tax provision is required. No capital gain distributions shall be made until any capital loss carryforwards have been fully utilized or expired.
G. Use of Estimates. Management of the Portfolios has made certain estimates and assumptions relating to the reporting of assets, liabilities, income, and expenses to prepare these financial statements in conformity with accounting principles generally accepted in the United States of America for investment companies. Actual results could differ from these estimates.
H. Repurchase Agreements. Each Portfolio may invest in repurchase agreements only with government securities dealers recognized by the Board of Governors of the Federal Reserve System. Under such agreements, the seller of the security agrees to repurchase it at a mutually agreed upon time and price. The resale price is in excess of the purchase price and reflects an agreed upon interest rate for the period of time the agreement is outstanding. The period of the repurchase agreements is usually short, from overnight to one week, while the underlying securities generally have longer maturities. Each Portfolio will receive as collateral securities acceptable to it whose market value is equal to at least 100% of the carrying amount of the repurchase agreements, plus accrued interest, being invested by the Portfolio. The underlying collateral is valued daily on a mark-to-market basis to assure that the value, including accrued interest is at least equal to the repurchase price. If the seller defaults, a Portfolio might incur a loss or delay in the realization of proceeds if the value of the security collateralizing the repurchase agreement declines, and it might incur disposition costs in liquidating the collateral.
I. Securities Lending. Each Portfolio has the option to temporarily loan up to 30% of its total assets to brokers, dealers or other financial institutions in exchange for a negotiated lender’s fee. The borrower is required to fully collateralize the loans with cash or U.S. Government securities. Generally, in the event of counterparty default, the Portfolio has the right to use collateral to offset losses incurred. There would be potential loss to the Portfolio in the event the Portfolio is delayed or prevented from exercising its right to dispose of the collateral. The Portfolio bears the risk of loss with respect to the investment of collateral. Engaging in securities lending could have a leveraging effect, which may intensify the credit, market and other risks associated with investing in a Portfolio.
J. Illiquid and Restricted Securities. The Portfolios may not invest more than 15% (10% for Money Market) of their net assets in illiquid securities. Illiquid securities are not readily marketable.
46
NOTES TO FINANCIAL STATEMENTS AS OF DECEMBER 31, 2004 (CONTINUED)
NOTE 2 — SIGNIFICANT ACCOUNTING POLICIES (continued)
Disposing of illiquid investments may involve time-consuming negotiation and legal expenses, and it may be difficult or impossible for the Portfolios to sell them promptly at an acceptable price. The Portfolios may also invest in restricted securities, which include those sold under Rule 144A of the Securities Act of 1933 (“1933 Act”) or securities offered pursuant to Section 4(2) of the 1933 Act, and/or are subject to legal or contractual restrictions on resale and may not be publicly sold without registration under the 1933 Act. Certain restricted securities may be considered liquid pursuant to guidelines approved by the Board or may be deemed to be illiquid because they may not be readily marketable. Illiquid and restricted securities are valued using market quotations when readily available. In the absence of market quotations, the securities are valued based upon their fair value determined under procedures approved by the Board.
K. Delayed Delivery Transactions. Each Portfolio may purchase or sell securities on a when-issued or forward commitment basis. The price of the underlying securities and date when the securities will be delivered and paid for are fixed at the time the transaction is negotiated. The market value of such is identified in the Portfolios’ Portfolio of Investments. Losses may arise due to changes in the market value of the securities or from the inability of counterparties to meet the terms of the contract. In connection with such purchases, the Portfolios are required to hold liquid assets as collateral with the Portfolios’ custodian sufficient to cover the purchase price.
L. Mortgage Dollar Roll Transactions. In connection with a portfolio’s ability to purchase or sell securities on a when-issued basis, Balanced, Growth and Income, Intermediate Bond and Money Market Portfolios may engage in dollar roll transactions with respect to mortgage-backed securities issued by Government National Mortgage Association, Federal National Mortgage Association and Federal Home Loan Mortgage Corp. In a dollar roll transaction, a Portfolio sells a mortgage-backed security to a financial institution, such as a bank or broker/dealer, and simultaneously agrees to repurchase a substantially similar (i.e., same type, coupon, and maturity) security from the institution on a delayed delivery basis at an agreed upon price. The mortgage-backed securities that are repurchased will bear the same interest rate as those sold, but generally will be collateralized by different pools of mortgages with different prepayment histories. The Portfolios account for dollar roll transactions as purchases and sales.
M. Options Contracts. Each Portfolio, with the exception of Money Market, may purchase put and call options and may write (sell) put options and covered call options. The Portfolios may engage in option transactions as a hedge against adverse movements in the value of portfolio holdings or to increase market exposure. Option contracts are valued daily and unrealized gains or losses are recorded based upon the last sales price on the principal exchange on which the options are traded. The Portfolios will realize a gain or loss upon the expiration or closing of the option contract. When an option is exercised, the proceeds on sales of the underlying security for a written call option, the purchase cost of the security for a written put option, or the cost of the security for a purchased put or call option is adjusted by the amount of premium received or paid. Realized and unrealized gains or losses on option contracts are reflected in the accompanying financial statements. The risk in writing a call option is that the Portfolios give up the opportunity for profit if the market price of the security increases and the option is exercised. The risk in writing a put option is that the Portfolios may incur a loss if the market price of the security decreases and the option is exercised. The risk in buying an option is that the Portfolios pay a premium whether or not the option is exercised. Risks may also arise from an illiquid secondary market or from the inability of counterparties to meet the terms of the contract.
N. Swap Contracts. Each Portfolio, with the exception of Money Market, may enter into interest rate swaps, currency swaps and other types of swap agreements, including swaps on securities and indices. A swap is an agreement between two parties pursuant to which each party agrees to make one or more payments to the other on regularly scheduled dates over a stated term, based on different interest rates, currency exchange rates, security prices, the prices or rates of other types of financial instruments or assets or the levels of specified indices. During the term of the swap, changes in the value of the swap are recognized as unrealized appreciation or depreciation.
47
NOTES TO FINANCIAL STATEMENTS AS OF DECEMBER 31, 2004 (CONTINUED)
NOTE 3 — INVESTMENT TRANSACTIONS
For the year ended December 31, 2004, the cost of purchases and proceeds from the sales of securities, excluding short-term securities, were as follows:
| | Purchases | | Sales | |
Balanced | | $ | 1,757,333,780 | | $ | 1,882,740,598 | |
Growth and Income | | 4,879,579,210 | | 5,436,160,441 | |
Growth | | 249,646,748 | | 293,817,913 | |
Small Company | | 425,188,696 | | 425,762,918 | |
Value Opportunity | | 37,285,732 | | 78,741,530 | |
Intermediate Bond | | 787,418,955 | | 846,452,213 | |
Global Science and Technology | | 140,916,930 | | 152,828,146 | |
International | | 64,634,389 | | 59,370,617 | |
| | | | | | | |
U.S. Government securities not included above were as follows:
| | Purchases | | Sales | |
Balanced | | $ | 2,028,350,409 | | $ | 2,019,894,980 | |
Intermediate Bond | | 5,030,941,616 | | 4,792,217,729 | |
| | | | | | | |
NOTE 4 — INVESTMENT MANAGEMENT AND ADMINISTRATIVE FEES
The Portfolios entered into Investment Management Agreements with the Investment Manager. The Investment Management Agreements compensate the Investment Manager with a fee, computed daily and payable monthly, based on the average daily net assets of each Portfolio, at the following annual rates:
Balanced | | 0.50% |
Growth and Income | | 0.50% on first $10 billion; |
| | 0.45% on next $5 billion; and |
| | 0.425% over $15 billion |
Growth | | 0.60% |
Small Company | | 0.75% |
Value Opportunity | | 0.60% |
Intermediate Bond | | 0.40% |
Money Market | | 0.25% |
Global Science and Technology | | 0.95% |
International | | 0.85% |
The Investment Manager entered into Sub-Advisory Agreements with ING IM. ING IM acts as Sub-Adviser to all Portfolios except for the Global Science and Technology Portfolio. Subject to such policies as the Board or the Investment Manager may determine, ING IM manages the Portfolios’ assets in accordance with the Portfolios’ investment objectives, policies, and limitations.
BlackRock Advisors, Inc., (“BlackRock”), a Delaware Corporation, serves as Sub-Adviser to the Global Science and Technology Portfolio pursuant to a Sub-Advisory Agreement effective April 1, 2004 between the Investment Manager and BlackRock through December 31, 2005. From January 1, 2004 to March 31, 2004, the Global Science and Technology Portfolio was sub-advised by BlackRock under an interim Sub-Advisory Agreement.
Pursuant to Administration Agreements, ING Funds Services, LLC (“IFS”), an indirect wholly-owned subsidiary of ING Groep, acts as administrator and provides certain administrative and shareholder services necessary for Portfolio operations and is responsible for the supervision of other service providers.
IFS is entitled to receive from each Portfolio a fee at an annual rate of 0.055% on the first $5 billion of daily net assets and 0.03% thereafter.
NOTE 5 — DISTRIBUTION AND SERVICE FEES
Class S shares of the Portfolios have adopted Distribution Plans pursuant to Rule 12b-1 under the 1940 Act (the “12b-1 Plans”), whereby the Distributor is reimbursed or compensated by the Portfolios for expenses incurred in the distribution of each Portfolio’s shares (“Distribution Fees”). Pursuant to the 12b-1 Plans, the Distributor is entitled to a payment each month to reimburse or compensate for expenses incurred in the distribution and promotion of each Portfolio’s shares, including expenses incurred in printing prospectuses and reports used for sales purposes, expenses incurred in preparing and printing sales literature and other such distribution related expenses, including any distribution or shareholder servicing fees (“Service Fees”) paid to securities dealers who have executed a distribution agreement with the Distributor. Under the 12b-1 Plans, Class S shares of the Portfolios pay the Distributor a fee calculated at an annual rate of 0.25% of average daily net assets.
NOTE 6 — OTHER TRANSACTIONS WITH AFFILIATED AND RELATED PARTIES
At December 31, 2004, the Portfolios had the following amounts recorded in payable to affiliates on the accompanying Statements of Assets and Liabilities (see Notes 4 and 5):
| | Accrued
Investment
Management
Fees | | Accrued
Administrative
Fees | | Accrued
Shareholder
Service and
Distribution
Fees | | Total | |
Balanced | | $ | 572,955 | | $ | 63,009 | | $ | 660 | | $ | 636,624 | |
Growth and Income | | 1,486,254 | | 163,441 | | 372 | | 1,650,067 | |
Growth | | 98,070 | | 8,985 | | 74 | | 107,129 | |
Small Company | | 333,010 | | 24,412 | | 13,856 | | 371,278 | |
Value Opportunity | | 113,231 | | 10,375 | | 729 | | 124,335 | |
Intermediate Bond | | 467,731 | | 64,285 | | 61,433 | | 593,449 | |
Money Market | | 232,931 | | 51,221 | | — | | 284,152 | |
Global Science and Technology | | 68,995 | | 3,993 | | — | | 72,988 | |
International | | 93,617 | | 2,363 | | 52 | | 96,032 | |
| | | | | | | | | | | | | |
The Portfolios have adopted a Deferred Compensation Plan (the “Plan”), which allows eligible non-affiliated directors as described in the Plan to defer the receipt of all or a portion of the directors’ fees payable. Deferred fees are invested in various funds advised by ING Investments, LLC until distribution in accordance with the Plan.
48
NOTES TO FINANCIAL STATEMENTS AS OF DECEMBER 31, 2004 (CONTINUED)
NOTE 7 — EXPENSE LIMITATIONS
ING Investments entered into written Expense Limitation Agreements with each of the following Portfolios whereby the Investment Manager has agreed to limit expenses, excluding interest, taxes, brokerage and extraordinary expenses to the levels listed below:
| | Class I | | Class S | |
Growth | | 0.80 | % | 1.05 | % |
Small Company | | 0.95 | % | 1.20 | % |
Value Opportunity | | 0.80 | % | 1.05 | % |
Global Science and Technology | | 1.15 | % | 1.40 | % |
International | | 1.15 | % | 1.40 | % |
The Investment Manager may at a later date recoup from a Portfolio management fees waived and other expenses assured by the Investment Manager during the previous 36 months, but only if, after such recoupment, the Portfolio’s expense ratio does not exceed the percentage described above. Waived and reimbursed fees net of any recoupment by the Investment Manager of such waived and reimbursed fees are reflected on the accompanying Statements of Operations. Amounts payable by the Investment Manager are reflected on the accompanying Statements of Assets and Liabilities for each Portfolio.
As of December 31, 2004, the amounts of waived and reimbursed fees that are subject to possible recoupment by the Investment Manager, and the related expiration dates are as follows:
| | December 31, | | | |
| | 2005 | | 2006 | | 2007 | | Total | |
International | | $ | — | | $ | 78,239 | | $ | — | | $ | 78,239 | |
| | | | | | | | | | | | | |
The Expense Limitation Agreements are contractual and shall renew automatically for one-year terms unless ING Investments provides written notice of the termination of an Expense Limitation Agreement within 90 days of the end of the then current term.
NOTE 8 — LINE OF CREDIT
The Portfolios, in addition to certain other funds managed by the Investment Manager, have entered into an unsecured committed revolving line of credit agreement (the “Credit Agreement “) with a syndicate of banks led by Citibank, N.A. for an aggregate amount of $100,000,000. The proceeds may be used only to: (1) temporarily finance the purchase and sale of securities; (2) finance the redemption of shares of an investor in the funds; and (3) enable the funds to meet other emergency expenses as defined in the Credit Agreement. The funds to which the line of credit is available pay a commitment fee equal to 0.09% per annum on the daily unused portion of the committed line amount. Each of the Portfolios will pay its pro rata share of both the agent and commitment fee. Generally, borrowings under the Credit Agreement accrue interest at the Federal Funds Rate plus a specified margin. Repayments generally must be made within 30 days after the date of a revolving credit advance. The following Portfolios utilized the line of credit during the year ended December 31, 2004:
| | Days
Utilized | | Approximate
Average Daily
Balance | | Approximate
Weighted
Average
Interest Rate | |
Balanced | | 1 | | $ | 520,000 | | 2.00 | % |
Growth and Income | | 5 | | 2,506,000 | | 2.41 | % |
Value Opportunity | | 6 | | 5,808,000 | | 1.51 | % |
Intermediate Bond | | 1 | | 1,200,000 | | 1.75 | % |
| | | | | | | | |
NOTE 9 — CAPITAL SHARES
Transactions in capital shares and dollars were as follows:
| | Class I Shares | | Class S Shares | |
| | Year
Ended
December 31,
2004 | | Year
Ended
December 31,
2003 | | Year
Ended
December 31,
2004 | | May 29,
2003(1) to
December 31,
2003 | |
Balanced (Number of Shares) | | | | | | | | | |
Shares sold | | 5,541,276 | | 3,154,493 | | 161,044 | | 101,813 | |
Dividends reinvested | | 2,277,679 | | 2,206,304 | | 3,651 | | 25 | |
Shares redeemed | | (16,373,623 | ) | (9,380,661 | ) | (29,578 | ) | (3,480 | ) |
Net increase (decrease) in shares outstanding | | (8,554,668 | ) | (4,019,864 | ) | 135,117 | | 98,358 | |
| | | | | | | | | |
Balanced ($) | | | | | | | | | |
Shares sold | | $ | 70,448,531 | | $ | 37,356,123 | | $ | 2,027,282 | | $ | 1,194,460 | |
Dividends reinvested | | 28,402,664 | | 25,549,004 | | 45,416 | | 288 | |
Shares redeemed | | (206,636,262 | ) | (106,290,993 | ) | (378,747 | ) | (42,017 | ) |
Net increase (decrease) | | $ | (107,785,067 | ) | $ | (43,385,866 | ) | $ | 1,693,951 | | $ | 1,152,731 | |
(1) Commencement of operations.
49
NOTES TO FINANCIAL STATEMENTS AS OF DECEMBER 31, 2004 (CONTINUED)
NOTE 9 — CAPITAL SHARES (continued)
| | Class I Shares | | Class S Shares | |
| | Year
Ended
December 31,
2004 | | Year
Ended
December 31,
2003 | | Year
Ended
December 31,
2004 | | June 11,
2003(1) to
December 31,
2003 | |
Growth and Income (Number of Shares) | | | | | | | | | |
Shares sold | | 3,269,845 | | 801,513 | | 20,905 | | 98,693 | |
Dividends reinvested | | 4,494,881 | | — | | 1,972 | | — | |
Shares redeemed | | (32,855,572 | ) | (36,272,651 | ) | (25,390 | ) | (4,334 | ) |
Net increase (decrease) in shares outstanding | | (25,090,846 | ) | (35,471,138 | ) | (2,513 | ) | 94,359 | |
| | | | | | | | | |
Growth and Income ($) | | | | | | | | | |
Shares sold | | $ | 61,270,078 | | $ | 12,502,845 | | $ | 389,064 | | $ | 1,605,943 | |
Dividends reinvested | | 84,457,963 | | — | | 36,994 | | — | |
Shares redeemed | | (606,157,122 | ) | (559,904,868 | ) | (461,223 | ) | (70,873 | ) |
Net increase (decrease) | | $ | (460,429,081 | ) | $ | (547,402,023 | ) | $ | (35,165 | ) | $ | 1,535,070 | |
| | Class I Shares | | Class S Shares | |
| | Year
Ended
December 31,
2004 | | Year
Ended
December 31,
2003 | | Year
Ended
December 31,
2004 | | Year
Ended
December 31,
2003 | |
Growth (Number of Shares) | | | | | | | | | |
Shares sold | | 585,684 | | 2,152,470 | | 6,466 | | 32,996 | |
Dividends reinvested | | 29,983 | | — | | — | | — | |
Shares redeemed | | (5,512,414 | ) | (3,481,590 | ) | (1,856 | ) | (7,885 | ) |
Net increase (decrease) in shares outstanding | | (4,896,747 | ) | (1,329,120 | ) | 4,610 | | 25,111 | |
| | | | | | | | | |
Growth ($) | | | | | | | | | |
Shares sold | | $ | 5,279,704 | | $ | 12,336,815 | | $ | 58,168 | | $ | 253,457 | |
Dividends reinvested | | 268,051 | | — | | — | | — | |
Shares redeemed | | (48,617,581 | ) | (22,951,012 | ) | (16,522 | ) | (58,277 | ) |
Net increase (decrease) | | $ | (43,069,826 | ) | $ | (10,614,197 | ) | $ | 41,646 | | $ | 195,180 | |
| | Class I Shares | | Class S Shares | |
| | Year
Ended
December 31,
2004 | | Year
Ended
December 31,
2003 | | Year
Ended
December 31,
2004 | | Year
Ended
December 31,
2003 | |
Small Company (Number of Shares) | | | | | | | | | |
Shares sold | | 2,256,129 | | 10,395,221 | | 5,026,850 | | 40,070 | |
Dividends reinvested | | 74,193 | | 63,065 | | 1,814 | | 48 | |
Shares redeemed | | (5,763,081 | ) | (6,562,287 | ) | (1,447,699 | ) | (6,503 | ) |
Net increase (decrease) in shares outstanding | | (3,432,759 | ) | 3,895,999 | | 3,580,965 | | 33,615 | |
| | | | | | | | | |
Small Company ($) | | | | | | | | | |
Shares sold | | $ | 40,720,939 | | $ | 155,510,623 | | $ | 87,903,008 | | $ | 616,993 | |
Dividends reinvested | | 1,319,890 | | 922,009 | | 32,250 | | 698 | |
Shares redeemed | | (103,038,487 | ) | (94,475,400 | ) | (26,826,319 | ) | (103,573 | ) |
Net increase (decrease) | | $ | (60,997,658 | ) | $ | 61,957,232 | | $ | 61,108,939 | | $ | 514,118 | |
(1) Commencement of operations.
50
NOTES TO FINANCIAL STATEMENTS AS OF DECEMBER 31, 2004 (CONTINUED)
NOTE 9 — CAPITAL SHARES (continued)
| | Class I Shares | | Class S Shares | |
| | Year
Ended
December 31,
2004 | | Year
Ended
December 31,
2003 | | Year
Ended
December 31,
2004 | | Year
Ended
December 31,
2003 | |
Value Opportunity (Number of Shares) | | | | | | | | | |
Shares sold | | 970,091 | | 2,108,112 | | 127,023 | | 92,628 | |
Dividends reinvested | | 168,177 | | 164,266 | | 1,831 | | 901 | |
Shares redeemed | | (5,784,691 | ) | (2,598,835 | ) | (51,003 | ) | (16,336 | ) |
Net increase (decrease) in shares outstanding | | (4,646,423 | ) | (326,457 | ) | 77,851 | | 77,193 | |
| | | | | | | | | |
Value Opportunity ($) | | | | | | | | | |
Shares sold | | $ | 11,987,060 | | $ | 20,200,109 | | $ | 1,560,347 | | $ | 998,638 | |
Dividends reinvested | | 2,050,084 | | 1,764,212 | | 22,234 | | 9,646 | |
Shares redeemed | | (71,212,120 | ) | (25,416,002 | ) | (628,834 | ) | (171,629 | ) |
Net increase (decrease) | | $ | (57,174,976 | ) | $ | (3,451,681 | ) | $ | 953,747 | | $ | 836,655 | |
| | Class I Shares | | Class S Shares | |
| | Year
Ended
December 31,
2004 | | Year
Ended
December 31,
2003 | | Year
Ended
December 31,
2004 | | Year
Ended
December 31,
2003 | |
Intermediate Bond (Number of Shares) | | | | | | | | | |
Shares sold | | 10,565,378 | | 8,501,280 | | 18,424,679 | | 6,385,067 | |
Dividends reinvested | | 9,919,704 | | 1,474,950 | | 1,734,423 | | 93,017 | |
Shares redeemed | | (16,940,447 | ) | (19,495,518 | ) | (2,197,934 | ) | (5,092,213 | ) |
Net increase (decrease) in shares outstanding | | 3,544,635 | | (9,519,288 | ) | 17,961,168 | | 1,385,871 | |
| | | | | | | | | |
Intermediate Bond ($) | | | | | | | | | |
Shares sold | | $ | 147,968,344 | | $ | 103,976,909 | | $ | 251,513,485 | | $ | 80,800,150 | |
Dividends reinvested | | 132,374,446 | | 20,649,302 | | 22,907,583 | | 1,301,393 | |
Shares redeemed | | (233,418,138 | ) | (256,344,288 | ) | (29,751,769 | ) | (62,882,702 | ) |
Net increase (decrease) | | $ | 46,924,652 | | $ | (131,718,077 | ) | $ | 244,669,299 | | $ | 19,218,841 | |
| | Class I Shares | |
| | Year
Ended
December 31,
2004 | | Year
Ended
December 31,
2003 | |
Money Market (Number of Shares) | | | | | |
Shares sold | | 25,412,249 | | 168,980,560 | |
Dividends reinvested | | 1,009,615 | | 1,928,116 | |
Shares redeemed | | (36,946,032 | ) | (194,376,129 | ) |
Net decrease in shares outstanding | | (10,524,168 | ) | (23,467,453 | ) |
| | | | | |
Money Market ($) | | | | | |
Shares sold | | $ | 327,235,099 | | $ | 1,899,695,014 | |
Dividends reinvested | | 12,932,164 | | 24,741,578 | |
Shares redeemed | | (475,422,886 | ) | (2,226,653,637 | ) |
Net decrease | | $ | (135,255,623 | ) | $ | (302,217,045 | ) |
51
NOTES TO FINANCIAL STATEMENTS AS OF DECEMBER 31, 2004 (CONTINUED)
NOTE 9 — CAPITAL SHARES (continued)
| | Class I Shares | | Class S Shares | |
| | Year
Ended
December 31,
2004 | | Year
Ended
December 31,
2003 | | Year
Ended
December 31,
2004(1) | | Year
Ended
December 31,
2003 | |
Global Science and Technology (Number of Shares) | | | | | | | | | |
Shares sold | | 5,874,957 | | 22,057,248 | | — | | — | |
Shares redeemed | | (8,566,152 | ) | (13,940,003 | ) | — | | (2,551 | ) |
Net increase (decrease) in shares outstanding | | (2,691,195 | ) | 8,117,245 | | — | | (2,551 | ) |
| | | | | | | | | |
Global Science and Technology ($) | | | | | | | | | |
Shares sold | | $ | 22,118,107 | | $ | 71,880,902 | | $ | — | | $ | — | |
Shares redeemed | | (31,058,339 | ) | (43,644,308 | ) | — | | (9,376 | ) |
Net increase (decrease) | | $ | (8,940,232 | ) | $ | 28,236,594 | | $ | — | | $ | (9,376 | ) |
| | Class I Shares | | Class S Shares | |
| | Year
Ended
December 31,
2004 | | Year
Ended
December 31,
2003 | | Year
Ended
December 31,
2004 | | Year
Ended
December 31,
2003 | |
International (Number of Shares) | | | | | | | | | |
Shares sold | | 2,386,273 | | 11,733,163 | | 53,937 | | 27,260 | |
Dividends reinvested | | 70,834 | | 58,321 | | 284 | | 81 | |
Shares redeemed | | (1,816,473 | ) | (11,428,928 | ) | (49,868 | ) | (2,549 | ) |
Net increase in shares outstanding | | 640,634 | | 362,556 | | 4,353 | | 24,792 | |
| | | | | | | | | |
International ($) | | | | | | | | | |
Shares sold | | $ | 18,639,301 | | $ | 71,979,031 | | $ | 417,590 | | $ | 181,817 | |
Dividends reinvested | | 546,129 | | 358,677 | | 2,180 | | 496 | |
Shares redeemed | | (14,143,468 | ) | (70,356,174 | ) | (385,475 | ) | (16,399 | ) |
Net increase | | $ | 5,041,962 | | $ | 1,981,534 | | $ | 34,295 | | $ | 165,914 | |
(1) There was no capital activity for Class S during the year ended December 31, 2004.
NOTE 10 — ILLIQUID SECURITIES
Pursuant to guidelines adopted by the Portfolios’ Board, the following securities have been deemed to be illiquid. Each Portfolio currently limits investment in illiquid securities to 15% (10% for Money Market) of the Portfolios’ net assets, at market value, at time of purchase.
Portfolio | | Security | | Principal
Amount | | Initial
Acquisition
Date | | Cost | | Value | | Percent
of Net
Assets | |
Balanced | | Alpine III, 2.840%, due 08/16/14 | | $ | 418,000 | | 08/04/04 | | $ | 418,000 | | $ | 418,749 | | 0.0 | % |
| | Alpine III, 3.240%, due 08/16/14 | | 418,000 | | 08/04/04 | | 418,000 | | 418,644 | | 0.0 | % |
| | Alpine III, 5.040%, due 08/16/14 | | 222,000 | | 08/04/04 | | 222,000 | | 222,286 | | 0.0 | % |
| | Alpine III, 8.290%, due 08/16/14 | | 645,000 | | 08/16/04 | | 645,000 | | 646,034 | | 0.0 | % |
| | | | | | | | $ | 1,703,000 | | $ | 1,705,713 | | 0.1 | % |
Intermediate Bond | | Alpine III, 2.840%, due 08/16/14 | | 948,000 | | 08/04/04 | | $ | 948,000 | | $ | 949,698 | | 0.1 | % |
| | Alpine III, 3.240%, due 08/16/14 | | 948,000 | | 08/04/04 | | 948,000 | | 949,460 | | 0.1 | % |
| | Alpine III, 5.040%, due 08/16/14 | | 502,000 | | 08/04/04 | | 502,000 | | 502,647 | | 0.0 | % |
| | Alpine III, 8.290%, due 08/16/14 | | 1,460,000 | | 08/16/04 | | 1,460,000 | | 1,462,340 | | 0.1 | % |
| | | | | | | | $ | 3,858,000 | | $ | 3,864,145 | | 0.3 | % |
Money | | | | | | | | | | | | | | | |
Market | | Money Market Trust, LLY, 1.175%, due 06/03/05 | | 13,500,000 | | 05/15/03 | | $ | 13,500,000 | | $ | 13,499,960 | | 1.2 | % |
| | Money Market Trust Series A, 2.480%, 12/07/05 | | 31,400,000 | | 05/15/03 | | 31,400,000 | | 31,406,907 | | 2.9 | % |
| | Newcastle CDO I Ltd., 1.321% due 10/24/05 | | 13,900,000 | | 10/23/03 | | 13,900,000 | | 13,900,000 | | 1.3 | % |
| | | | | | | | $ | 58,800,000 | | $ | 58,806,867 | | 5.4 | % |
| | | | | | | | | | | | | | | | |
52
NOTES TO FINANCIAL STATEMENTS AS OF DECEMBER 31, 2004 (CONTINUED)
NOTE 11 — SECURITIES LENDING
Under an agreement with The Bank of New York (“BNY”), the Portfolios can lend their securities to approved brokers, dealers and other financial institutions. Loans are collateralized by cash and U.S. Government securities. The collateral must be in an amount equal to at least 105% of the market value of non-U.S. securities loaned and 102% of the market value of U.S. securities loaned. The cash collateral received is invested in approved investments as defined in the Securities Lending Agreement with BNY (the “Agreement”). The securities purchased with cash collateral received are reflected in the Portfolio of Investments. Generally, in the event of counterparty default, the Portfolios have the right to use the collateral to offset losses incurred. The Agreement contains certain guarantees by BNY in the event of counterparty default and/or a borrower’s failure to return a loaned security, however there would be a potential loss to the Portfolios in the event the Portfolios are delayed or prevented from exercising their right to dispose of the collateral. The Portfolios bear the risk of loss with respect to the investment of collateral. Engaging in securities lending could have a leveraging effect, which may intensify the credit, market and other risks associated with investing in a Portfolio. At December 31, 2004, the Portfolios had securities on loan with the following market values:
| | Value of
Securities
Loaned | | Value of
Collateral | |
Balanced | | $ | 149,277,954 | | $ | 153,224,000 | |
Growth and Income | | 211,090,291 | | 219,680,000 | |
Growth | | 11,239,921 | | 11,536,000 | |
Value Opportunity | | 82,511 | | 86,000 | |
| | | | | | | |
NOTE 12 — FEDERAL INCOME TAXES
The amount of distributions from net investment income and net realized capital gains are determined in accordance with federal income tax regulations, which may differ from accounting principles generally accepted in the United States of America for investment companies. These book/tax differences may be either temporary or permanent. Permanent differences are reclassified within the capital accounts based on their federal tax-basis treatment; temporary differences are not reclassified. Key differences include the treatment of short-term capital gains, foreign currency transactions, and wash sale deferrals. Distributions in excess of available earnings and profits, current and accumulated, for tax purposes are reported as distributions of paid-in capital.
The following permanent tax differences have been reclassified as of December 31, 2004:
| | Paid-in
Capital | | Undistributed
Net Investment
Income On
Investments | | Accumulated
Net Realized
Gains
(Losses) | |
Balanced | | $ | — | | $ | 494,598 | | $ | (494,598 | ) |
Growth and Income | | (4,264,806 | ) | 831,825 | | 3,432,981 | |
Growth | | — | | (2,716 | ) | 2,716 | |
Small Company | | — | | (341,572 | ) | 341,572 | |
Intermediate Bond | | — | | 1,650,743 | | (1,650,743 | ) |
Money Market | | (39,149 | ) | — | | 39,149 | |
Global Science and Technology | | (555,894 | ) | 594,321 | | (38,427 | ) |
International Equity | | — | | 212,332 | | (212,332 | ) |
| | | | | | | | | | |
The tax composition of dividends and distributions to shareholders was as follows:
| | Year Ended
December 31, 2004 | | Year Ended
December 31, 2003 | |
| | Ordinary Income | | Long-Term
Capital Gain | | Ordinary Income | |
Balanced | | $ | 28,448,079 | | $ | — | | $ | 25,549,292 | |
Growth and Income | | 84,550,196 | | — | | — | |
Growth | | 268,051 | | — | | — | |
Small Company | | 1,352,140 | | — | | 922,707 | |
Value Opportunity | | 2,072,318 | | — | | 1,773,858 | |
Intermediate Bond | | 150,191,405 | | 5,168,861 | | 21,962,645 | |
Money Market | | 12,932,164 | | — | | 24,741,578 | |
International Equity | | 548,309 | | — | | 359,173 | |
| | | | | | | | | | |
53
NOTES TO FINANCIAL STATEMENTS AS OF DECEMBER 31, 2004 (CONTINUED)
NOTE 12 — FEDERAL INCOME TAXES (continued)
The tax-basis components of distributable earnings and the expiration dates of the capital loss carryforwards which may be used to offset future realized capital gains for federal income tax purposes as of December 31, 2004 are as follows:
| | Undistributed
Ordinary
Income | | Undistributed
Long-term
Capital Gain | | Unrealized
Appreciation
(Depreciation) | | Post October
Capital Losses
Deferred | | Capital
Loss
Carryforwards | | Expiration
Dates | |
Balanced | | $ | 30,617,051 | | $ | — | | $ | 69,492,918 | | $ | — | | $ | (71,674,395 | ) | 2010 | |
| | | | | | | | | | | | | | | | | | |
Growth and Income | | — | | — | | 408,871,050 | | (4,855 | ) | $ | (223,910,727 | ) | 2009 | |
| | | | | | | | | | (2,401,044,421 | ) | 2010 | |
| | | | | | | | | | (63,082,574 | ) | 2011 | |
| | | | | | | | | | $ | (2,688,037,722 | ) | | |
| | | | | | | | | | | | | | |
Growth | | 1,253,609 | | — | | 20,993,544 | | — | | $ | (137,330,879 | ) | 2009 | |
| | | | | | | | | | (63,207,672 | ) | 2010 | |
| | | | | | | | | | $ | (200,538,551 | ) | | |
Small Company | | 637,301 | | 6,278,078 | | 97,927,790 | | — | | — | | | |
| | | | | | | | | | | | | |
Value Opportunity | | 3,868,187 | | — | | 22,207,958 | | — | | (39,657,046 | ) | 2010 | |
| | | | | | | | | | | | | |
Intermediate Bond | | 4,128,083 | | 986,159 | | 5,117,529 | | (37 | ) | — | | | |
| | | | | | | | | | | | | |
Money Market | | 12,788,532 | | — | | (232,026 | ) | — | | $ | (751,862 | ) | 2008 | |
| | | | | | | | | | (3,715,968 | ) | 2009 | |
| | | | | | | | | | (169 | ) | 2011 | |
| | | | | | | | | | (244,520 | ) | 2012 | |
| | | | | | | | | | $ | (4,712,519 | ) | | |
Global Science and Technology | | — | | — | | 7,198,758 | | — | | $ | (33,805,623 | ) | 2009 | |
| | | | | | | | | | (15,534,432 | ) | 2010 | |
| | | | | | | | | | (4,912,495 | ) | 2011 | |
| | | | | | | | | | $ | (54,252,550 | ) | | |
International Equity | | 538,930 | | — | | 8,088,309 | | — | | $ | (16,949,751 | ) | 2009 | |
| | | | | | | | | | (9,221,611 | ) | 2010 | |
| | | | | | | | | | $ | (26,171,362 | ) | | |
NOTE 13 — INFORMATION REGARDING TRADING OF ING’S U.S. MUTUAL FUNDS
ING Investments, LLC (“Investments”), the adviser to the ING Funds, has reported to the Boards of Directors/Trustees (the “Board”) of the ING Funds that, like many U.S. financial services companies, Investments and certain of its U.S. affiliates have received informal and formal requests for information since September 2003 from various governmental and self-regulatory agencies in connection with investigations related to mutual funds and variable insurance products. Investments has advised the Board that it and its affiliates have cooperated fully with each request.
In addition to responding to regulatory and governmental requests, Investments reported that management of U.S. affiliates of ING Groep N.V., including Investments (collectively, “ING”), on their own initiative, have conducted, through independent special counsel and a national accounting firm, an extensive internal review of trading in ING insurance, retirement, and mutual fund products. The goal of this review was to identify any instances of inappropriate trading in those products by third parties or by ING investment professionals and other ING personnel. ING’s internal review related to mutual fund trading is now substantially completed. ING has reported that, of the millions of customer relationships that ING maintains, the internal review identified several isolated arrangements allowing third parties to engage in frequent trading of mutual funds within ING’s variable insurance and mutual fund products, and identified other circumstances where frequent trading occurred, despite measures taken by ING intended to combat market timing. ING further reported that each of these arrangements has been terminated and fully disclosed to regulators. The results of the internal review were also reported to the independent members of the Board.
Investments has advised the Board that most of the identified arrangements were initiated prior to ING’s acquisition of the businesses in question in the U.S. Investments further reported that the companies in question did not receive special benefits in return for any of these arrangements, which have all been terminated. Based on the internal review, Investments has advised the Board that the identified arrangements do not represent a systemic problem in any of the companies that were involved.
54
NOTES TO FINANCIAL STATEMENTS AS OF DECEMBER 31, 2004 (CONTINUED)
NOTE 13 — INFORMATION REGARDING TRADING OF ING’S U.S. MUTUAL FUNDS (continued)
More specifically, Investments reported to the Board that, at this time, these instances include the following:
• ING has identified three arrangements, dating from 1995, 1996 and 1998, under which the administrator to the then-Pilgrim Funds, which subsequently became part of the ING Funds, entered formal and informal arrangements that permitted frequent trading. ING Funds Distributor, LLC (“IFD”) has received a notice from the staff of the NASD informing IFD that it has made a preliminary determination to recommend that disciplinary action be brought against IFD and one of its registered persons for violations of the NASD Conduct Rules and certain provisions of the federal securities laws in connection with these arrangements.
• Aeltus Investment Management, Inc. (a predecessor entity to ING Investment Management Co.) has identified two investment professionals who engaged in extensive frequent trading in certain ING Funds. One was subsequently terminated for cause and incurred substantial financial penalties in connection with this conduct and the second has been disciplined.
• ReliaStar Life Insurance Company (“ReliaStar”) entered into agreements seven years ago permitting the owner of policies issued by the insurer to engage in frequent trading and to submit orders until 4pm Central Time. In 2001 ReliaStar also entered into a selling agreement with a broker-dealer that engaged in frequent trading. Employees of ING affiliates were terminated and/or disciplined in connection with these matters.
• In 1998, Golden American Life Insurance Company entered into arrangements permitting a broker-dealer to frequently trade up to certain specific limits in a fund available in an ING variable annuity product. No employee responsible for this arrangement remains at the company.
For additional information regarding these matters, you may consult the Form 8-K for each of four life insurance companies, ING USA Annuity and Life Insurance Company, ING Life Insurance and Annuity Company, ING Insurance Company of America, and ReliaStar Life Insurance Company of New York, each filed with the Securities and Exchange Commission (the “SEC”) on September 9, 2004. These Forms 8-K can be accessed through the SEC’s Web site at http://www.sec.gov. Despite the extensive internal review conducted through independent special counsel and a national accounting firm, there can be no assurance that the instances of inappropriate trading reported to the Board are the only instances of such trading respecting the ING Funds. Investments reported to the Board that ING is committed to conducting its business with the highest standards of ethical conduct with zero tolerance for noncompliance.
Accordingly, Investments advised the Board that ING management was disappointed that its voluntary internal review identified these situations. Viewed in the context of the breadth and magnitude of its U.S. business as a whole, ING management does not believe that ING’s acquired companies had systemic ethical or compliance issues in these areas. Nonetheless, Investments reported that given ING’s refusal to tolerate any lapses, it has taken the steps noted below, and will continue to seek opportunities to further strengthen the internal controls of its affiliates.
• ING has agreed with the ING Funds to indemnify and hold harmless the ING Funds from all damages resulting from wrongful conduct by ING or its employees or from ING’s internal investigation, any investigations conducted by any governmental or self-regulatory agencies, litigation or other formal proceedings, including any proceedings by the Securities and Exchange Commission. Investments reported to the Board that ING management believes that the total amount of any indemnification obligations will not be material to ING or its U.S. business.
• ING updated its Code of Conduct for employees reinforcing its employees’ obligation to conduct personal trading activity consistent with the law, disclosed limits, and other requirements.
• The ING Funds, upon a recommendation from ING, updated their respective Codes of Ethics applicable to investment professionals with ING entities and certain other fund personnel, requiring such personnel to pre-clear any purchases or sales of ING Funds that are not systematic in nature (i.e., dividend reinvestment), and imposing minimum holding periods for shares of ING Funds.
• ING instituted excessive trading policies for all customers in its variable insurance and retirement products and for shareholders of the ING Funds sold to the public through financial intermediaries. ING does not make exceptions to these policies.
• ING reorganized and expanded its U.S. Compliance Department, and created an Enterprise Compliance team to enhance controls and consistency in regulatory compliance.
55
Shares | | | | | | Value | |
COMMON STOCK: 59.4% | | | |
| | | | Advertising: 0.1% | | | |
9,450 | | | | ADVO, Inc. | | $ | 336,893 | |
25,350 | | L | | Catalina Marketing Corp. | | 751,120 | |
| | | | | | 1,088,013 | |
| | | | Aerospace/Defense: 1.8% | | | |
13,650 | | @ | | Alliant Techsystems, Inc. | | 892,437 | |
8,650 | | @,L | | Armor Holdings, Inc. | | 406,723 | |
124,250 | | | | Boeing Co. | | 6,432,422 | |
7,850 | | @,L | | DRS Technologies, Inc. | | 335,274 | |
41,300 | | | | General Dynamics Corp. | | 4,319,980 | |
86,250 | | | | Lockheed Martin Corp. | | 4,791,187 | |
8,224 | | @ | | Moog, Inc. | | 372,958 | |
101,200 | | | | Raytheon Co. | | 3,929,596 | |
10,900 | | @ | | Teledyne Technologies, Inc. | | 320,787 | |
28,350 | | | | United Technologies Corp. | | 2,929,973 | |
| | | | | | 24,731,337 | |
| | | | Agriculture: 0.7% | | | |
117,950 | | | | Altria Group, Inc. | | 7,206,745 | |
45,482 | | | | UST, Inc. | | 2,188,139 | |
| | | | | | 9,394,884 | |
| | | | Airlines: 0.0% | | | |
15,050 | | @ | | Alaska Air Group, Inc. | | 504,025 | |
| | | | | | 504,025 | |
| | | | Apparel: 0.8% | | | |
52,550 | | @ | | Coach, Inc. | | 2,963,820 | |
11,145 | | | | K-Swiss, Inc. | | 324,542 | |
8,850 | | | | Kellwood Co. | | 305,325 | |
52,400 | | | | Nike, Inc. | | 4,752,157 | |
10,690 | | | | Phillips-Van Heusen Corp. | | 288,630 | |
4,880 | | @ | | Quiksilver, Inc. | | 145,375 | |
30,200 | | | | VF Corp. | | 1,672,476 | |
11,700 | | | | Wolverine World Wide, Inc. | | 367,614 | |
| | | | | | 10,819,939 | |
| | | | Auto Manufacturers: 0.6% | | | |
342,150 | | L | | Ford Motor Co. | | 5,009,076 | |
3,035 | | | | Oshkosh Truck Corp. | | 207,533 | |
45,000 | | | | PACCAR, Inc. | | 3,621,600 | |
| | | | | | 8,838,209 | |
| | | | Auto Parts and Equipment: 0.0% | | | |
19,250 | | | | Modine Manufacturing Co. | | 650,073 | |
| | | | | | 650,073 | |
| | | | Banks: 3.6% | | | |
36,899 | | | | Associated Banc-Corp. | | 1,225,416 | |
230,500 | | | | Bank of America Corp. | | 10,831,194 | |
18,905 | | | | Bank of Hawaii Corp. | | 959,240 | |
19,100 | | | | Banknorth Group, Inc. | | 699,060 | |
45,225 | | | | Colonial Bancgroup, Inc. | | 960,127 | |
45,750 | | L | | Comerica, Inc. | | 2,791,665 | |
8,700 | | | | Commerce Bancorp, Inc. | | 560,280 | |
4,600 | | | | East-West Bancorp, Inc. | | 193,016 | |
8,575 | | @@ | | First Bancorp Puerto Rico | | 544,598 | |
18,765 | | | | Fremont General Corp. | | 472,503 | |
44,300 | | | | Hibernia Corp. | | 1,307,293 | |
3,800 | | | | Hudson United BanCorp | | 149,644 | |
104,200 | | | | KeyCorp. | | 3,532,380 | |
129,288 | | | | National City Corp. | | 4,854,764 | |
7,950 | | L | | PrivateBancorp, Inc. | | | 256,229 | |
21,340 | | | | Republic Bancorp, Inc. | | 326,075 | |
15,950 | | | | South Financial Group, Inc. | | 518,854 | |
17,257 | | | | Sterling Bancshares, Inc. | | 246,257 | |
105,750 | | | | U.S. Bancorp | | 3,312,090 | |
3,860 | | | | UCBH Holdings, Inc. | | 176,865 | |
158,900 | | | | Wachovia Corp. | | 8,358,139 | |
95,950 | | | | Wells Fargo & Co. | | 5,963,293 | |
3,550 | | | | Whitney Holding Corp. | | 159,715 | |
| | | | | | 48,398,697 | |
| | | | Beverages: 0.8% | | | |
8,400 | | L | | Adolph Coors Co. | | 635,628 | |
134,500 | | L | | Coca-Cola Co. | | 5,599,235 | |
97,550 | | | | PepsiCo, Inc. | | 5,092,110 | |
| | | | | | 11,326,973 | |
| | | | Biotechnology: 0.4% | | | |
71,750 | | @ | | Amgen, Inc. | | 4,602,763 | |
13,200 | | @ | | Arqule, Inc. | | 76,428 | |
21,730 | | @,L | | Charles River Laboratories Intl., Inc. | | 999,797 | |
| | | | | | 5,678,988 | |
| | | | Building Materials: 0.1% | | | |
3,795 | | L | | Florida Rock Industries, Inc. | | 225,916 | |
4,450 | | | | Simpson Manufacturing Co., Inc. | | 155,305 | |
6,200 | | | | Texas Industries, Inc. | | 386,756 | |
| | | | | | 767,977 | |
| | | | Chemicals: 1.0% | | | |
23,375 | | | | Cabot Corp. | | 904,145 | |
50,950 | | | | Dow Chemical Co. | | 2,522,535 | |
57,250 | | | | E.I. du Pont EI de Nemours & Co. | | 2,808,113 | |
15,610 | | @ | | FMC Corp. | | 753,963 | |
8,400 | | L | | Georgia Gulf Corp. | | 418,320 | |
26,750 | | | | Lyondell Chemical Co. | | 773,610 | |
9,725 | | @ | | OM Group, Inc. | | 315,285 | |
15,900 | | @ | | Omnova Solutions, Inc. | | 89,358 | |
33,100 | | @ | | PolyOne Corp. | | 299,886 | |
46,750 | | | | PPG Industries, Inc. | | 3,186,479 | |
41,200 | | L | | Sherwin-Williams Co. | | 1,838,756 | |
| | | | | | 13,910,450 | |
| | | | Coal: 0.1% | | | |
6,520 | | | | Massey Energy Co. | | 227,874 | |
7,115 | | | | Peabody Energy Corp. | | 575,675 | |
| | | | | | 803,549 | |
| | | | Commercial Services: 0.9% | | | |
38,800 | | | | Adesa, Inc. | | 823,336 | |
12,050 | | @ | | Administaff, Inc. | | 151,951 | |
25,450 | | @,L | | Alliance Data Systems Corp. | | 1,208,366 | |
4,650 | | | | Chemed Corp. | | 312,062 | |
5,350 | | @ | | Consolidated Graphics, Inc. | | 245,565 | |
34,200 | | | | Equifax, Inc. | | 961,020 | |
49,700 | | L | | H&R Block, Inc. | | 2,435,299 | |
17,280 | | @ | | ITT Educational Services, Inc. | | 821,664 | |
20,270 | | @,L | | Korn/Ferry Intl. | | 420,603 | |
17,050 | | @,L | | Labor Ready, Inc. | | 288,486 | |
9,965 | | | | Manpower, Inc. | | 481,310 | |
See Accompanying Notes to Financial Statements
56
| PORTFOLIO OF INVESTMENTS |
ING VP BALANCED PORTFOLIO | AS OF DECEMBER 31, 2004 (CONTINUED) |
Shares | | | | | | Value | |
| | | | Commercial Services (continued) | | | |
87,000 | | | | McKesson Corp. | | $ | 2,737,019 | |
4,875 | | @,L | | Pharmaceutical Product Development, Inc. | | 201,289 | |
24,394 | | | | Rollins, Inc. | | 642,050 | |
34,225 | | @,L | | Sotheby’s Holdings | | 621,526 | |
4,720 | | @ | | Vertrue, Inc. | | 178,274 | |
| | | | | | 12,529,820 | |
| | | | Computers: 3.4% | | | |
13,400 | | L | | Agilysys, Inc. | | 229,676 | |
77,550 | | @ | | Apple Computer, Inc. | | 4,994,220 | |
38,521 | | @,L | | BISYS Group, Inc. | | 633,670 | |
6,850 | | @,L | | CACI Intl., Inc. | | 466,691 | |
6,360 | | @ | | Catapult Communications Corp. | | 153,658 | |
14,680 | | @,L | | Cognizant Technology Solutions Corp. | | 621,404 | |
271,050 | | @ | | Dell, Inc. | | 11,422,047 | |
7,915 | | | | Diebold, Inc. | | 441,103 | |
9,400 | | @,L | | DST Systems, Inc. | | 489,928 | |
2,690 | | L | | FactSet Research Systems, Inc. | | 157,204 | |
167,900 | | | | Hewlett-Packard Co. | | 3,520,863 | |
159,050 | | | | International Business Machines Corp. | | 15,679,148 | |
37,910 | | | | Jack Henry Associates, Inc. | | 754,788 | |
2,635 | | @,L | | Kronos, Inc. | | 134,728 | |
5,075 | | @ | | Micros Systems, Inc. | | 396,155 | |
5,300 | | @ | | SanDisk Corp. | | 132,341 | |
34,495 | | @,L | | Storage Technology Corp. | | 1,090,387 | |
805,500 | | @ | | Sun Microsystems, Inc. | | 4,333,590 | |
| | | | | | 45,651,601 | |
| | | | Cosmetics/Personal Care: 1.5% | | | |
151,350 | | | | Gillette Co. | | 6,777,453 | |
251,500 | | | | Procter & Gamble Co. | | 13,852,620 | |
| | | | | | 20,630,073 | |
| | | | Distribution/Wholesale: 0.4% | | | |
9,435 | | | | CDW Corp. | | 626,012 | |
49,700 | | | | Genuine Parts Co. | | 2,189,782 | |
5,360 | | | | Hughes Supply, Inc. | | 173,396 | |
4,970 | | | | SCP Pool Corp. | | 158,543 | |
20,500 | | @,L | | Tech Data Corp. | | 930,700 | |
25,950 | | | | W.W. Grainger, Inc. | | 1,728,789 | |
| | | | | | 5,807,222 | |
| | | | Diversified Financial Services: 3.8% | | | |
156,050 | | | | American Express Co. | | 8,796,538 | |
50,830 | | @,L | | AmeriCredit Corp. | | 1,242,794 | |
29,400 | | | �� | Bear Stearns Cos., Inc. | | 3,007,914 | |
53,250 | | L | | Capital One Financial Corp. | | 4,484,183 | |
61,600 | | | | CIT Group, Inc. | | 2,822,512 | |
295,200 | | | | Citigroup, Inc. | | 14,222,735 | |
52,300 | | | | Fannie Mae | | 3,724,283 | |
11,122 | | L | | Legg Mason, Inc. | | 814,798 | |
55,850 | | | | Lehman Brothers Holdings, Inc. | | 4,885,757 | |
55,450 | | | | Merrill Lynch & Co., Inc. | | 3,314,247 | |
63,250 | | | | Morgan Stanley | | 3,511,640 | |
79,850 | | @,L | | Providian Financial Corp. | | 1,315,130 | |
| | | | | | 52,142,531 | |
| | | | Electric: 1.7% | | | |
168,250 | | @ | | AES Corp. | | | 2,299,978 | |
46,800 | | | | Constellation Energy Group, Inc. | | 2,045,628 | |
185,750 | | L | | Duke Energy Corp. | | 4,705,047 | |
82,550 | | | | Edison Intl. | | 2,644,077 | |
32,800 | | L | | Exelon Corp. | | 1,445,496 | |
32,900 | | | | Pepco Holdings, Inc. | | 701,428 | |
51,598 | | | | PPL Corp. | | 2,749,141 | |
19,810 | | L | | Scana Corp. | | 780,514 | |
36,600 | | L | | Southern Co. | | 1,226,832 | |
57,950 | | L,S | | TXU Corp. | | 3,741,251 | |
21,150 | | | | Wisconsin Energy Corp. | | 712,967 | |
| | | | | | 23,052,359 | |
| | | | Electrical Components and Equipment: 0.2% | | | |
25,350 | | | | AMETEK, Inc. | | 904,235 | |
23,993 | | @,L | | Energizer Holdings, Inc. | | 1,192,212 | |
10,054 | | @ | | Rayovac Corp. | | 307,250 | |
| | | | | | 2,403,697 | |
| | | | Electronics: 0.4% | | | |
6,140 | | | | BEI Technologies, Inc. | | 189,603 | |
5,225 | | | | Bel Fuse, Inc. | | 176,553 | |
3,800 | | @,L | | Benchmark Electronics, Inc. | | 129,580 | |
6,350 | | | | Brady Corp. | | 397,320 | |
1,950 | | @ | | Dionex Corp. | | 110,507 | |
3,050 | | @ | | FLIR Systems, Inc. | | 194,560 | |
6,999 | | | | Keithley Instruments, Inc. | | 137,880 | |
13,350 | | @ | | Paxar Corp. | | 295,970 | |
44,200 | | | | PerkinElmer, Inc. | | 994,058 | |
41,200 | | @ | | Thermo Electron Corp. | | 1,243,827 | |
25,000 | | @ | | Thomas & Betts Corp. | | 768,750 | |
4,350 | | @ | | Trimble Navigation Ltd. | | 143,724 | |
17,325 | | @ | | Varian, Inc. | | 710,498 | |
| | | | | | 5,492,830 | |
| | | | Engineering and Construction: 0.0% | | | |
5,900 | | @ | | Emcor Group, Inc. | | 266,562 | |
| | | | | | 266,562 | |
| | | | Entertainment: 0.1% | | | |
7,900 | | @ | | Argosy Gaming Co. | | 368,930 | |
18,625 | | | | International Speedway Corp. | | 983,400 | |
| | | | | | 1,352,330 | |
| | | | Environmental Control: 0.1% | | | |
16,795 | | | | Republic Services, Inc. | | 563,305 | |
4,345 | | @ | | Waste Connections, Inc. | | 148,816 | |
| | | | | | 712,121 | |
| | | | Food: 0.6% | | | |
7,910 | | | | Corn Products Intl., Inc. | | 423,660 | |
3,550 | | | | Flowers Foods, Inc. | | 112,109 | |
11,806 | | | | Lance, Inc. | | 224,668 | |
5,150 | | | | Nash Finch Co. | | 194,464 | |
25,750 | | | | Ruddick Corp. | | 558,518 | |
6,705 | | L | | Sanderson Farms, Inc. | | 290,192 | |
42,200 | | S | | SUPERVALU, Inc. | | 1,456,744 | |
38,210 | | S | | Tyson Foods, Inc. | | 703,064 | |
7,175 | | | | Whole Foods Market, Inc. | | 684,136 | |
See Accompanying Notes to Financial Statements
57
| PORTFOLIO OF INVESTMENTS |
ING VP BALANCED PORTFOLIO | AS OF DECEMBER 31, 2004 (CONTINUED) |
Shares | | | | | | Value | |
| | | | Food (continued) | | | |
55,443 | | | | Wm. Wrigley Jr. Co. | | $ | 3,836,101 | |
| | | | | | 8,483,656 | |
| | | | Forest Products and Paper: 0.6% | | | |
28,150 | | | | International Paper Co. | | 1,182,300 | |
58,250 | | | | MeadWestvaco Corp. | | 1,974,093 | |
13,835 | | | | Potlatch Corp. | | 699,774 | |
17,286 | | | | Wausau-Mosinee Paper Corp. | | 308,728 | |
57,050 | | | | Weyerhaeuser Co. | | 3,834,901 | |
| | | | | | 7,999,796 | |
| | | | Gas: 0.4% | | | |
8,500 | | | | Atmos Energy Corp. | | 232,475 | |
10,655 | | | | Energen Corp. | | 628,112 | |
64,900 | | | | Sempra Energy | | 2,380,532 | |
15,005 | | | | UGI Corp. | | 613,855 | |
37,055 | | | | WGL Holdings, Inc. | | 1,142,776 | |
| | | | | | 4,997,750 | |
| | | | Hand/Machine Tools: 0.2% | | | |
23,400 | | L | | Black & Decker Corp. | | 2,066,922 | |
| | | | | | 2,066,922 | |
| | | | Healthcare-Products: 2.2% | | | |
64,400 | | | | Becton Dickinson & Co. | | 3,657,920 | |
2,795 | | | | Cooper Cos., Inc. | | 197,299 | |
38,350 | | @ | | Cytyc Corp. | | 1,057,310 | |
8,700 | | | | Dentsply Intl., Inc. | | 488,940 | |
8,180 | | @ | | Haemonetics Corp. | | 296,198 | |
2,960 | | @,L | | Idexx Laboratories, Inc. | | 161,586 | |
14,775 | | @ | | Immucor, Inc. | | 347,360 | |
2,100 | | | | Invacare Corp. | | 97,146 | |
272,000 | | | | Johnson & Johnson | | 17,250,239 | |
68,200 | | | | Medtronic, Inc. | | 3,387,494 | |
15,020 | | @ | | Patterson Cos., Inc. | | 651,718 | |
2,880 | | @,L | | ResMed, Inc. | | 147,168 | |
8,280 | | @ | | Respironics, Inc. | | 450,101 | |
10,964 | | @ | | Sola Intl., Inc. | | 301,949 | |
10,600 | | @ | | Sybron Dental Specialties, Inc. | | 375,028 | |
34,415 | | @ | | Varian Medical Systems, Inc. | | 1,488,105 | |
5,450 | | | | Vital Signs, Inc. | | 212,114 | |
| | | | | | 30,567,675 | |
| | | | Healthcare-Services: 1.9% | | | |
34,450 | | | | Aetna, Inc. | | 4,297,638 | |
6,100 | | @,L | | Amedisys, Inc. | | 197,579 | |
6,135 | | @ | | AMERIGROUP Corp. | | 464,174 | |
12,370 | | @ | | Centene Corp. | | 350,690 | |
23,375 | | @ | | Covance, Inc. | | 905,781 | |
25,725 | | @,L | | Coventry Health Care, Inc. | | 1,365,483 | |
48,500 | | @ | | Humana, Inc. | | 1,439,965 | |
29,625 | | @ | | Lincare Holdings, Inc. | | 1,263,506 | |
25,305 | | @,L | | PacifiCare Health Systems, Inc. | | 1,430,239 | |
7,385 | | @ | | RehabCare Group, Inc. | | 206,706 | |
7,190 | | @ | | Sierra Health Services, Inc. | | 396,241 | |
90,650 | | | | UnitedHealth Group, Inc. | | 7,979,919 | |
49,450 | | @ | | WellPoint Inc | | 5,686,750 | |
| | | | | | 25,984,671 | |
| | | | Home Builders: 0.1% | | | |
4,200 | | L | | DR Horton, Inc. | | | 169,302 | |
17,230 | | L | | Lennar Corp. | | 976,596 | |
1,090 | | @ | | NVR, Inc. | | 838,646 | |
| | | | | | 1,984,544 | |
| | | | Home Furnishings: 0.2% | | | |
3,575 | | | | Ethan Allen Interiors, Inc. | | 143,072 | |
15,306 | | | | Fedders Corp. | | 55,408 | |
14,660 | | | | Harman Intl. Industries, Inc. | | 1,861,819 | |
| | | | | | 2,060,299 | |
| | | | Household Products/ Wares: 0.3% | | | |
28,025 | | | | American Greetings Corp. | | 710,434 | |
7,323 | | L | | lyth, Inc. | | 216,468 | |
24,800 | | | | Church & Dwight, Inc. | | 833,776 | |
43,900 | | | | Clorox Co. | | 2,587,026 | |
6,145 | | @ | | Fossil, Inc. | | 157,558 | |
| | | | | | 4,505,262 | |
| | | | Housewares: 0.0% | | | |
5,655 | | | | Toro Co. | | 460,034 | |
| | | | | | 460,034 | |
| | | | Insurance: 3.9% | | | |
27,700 | | | | American Financial Group, Inc. | | 867,287 | |
146,100 | | | | American Intl. Group, Inc. | | 9,594,386 | |
17,325 | | | | AmerUs Group Co. | | 784,823 | |
49,150 | | | | Chubb Corp. | | 3,779,635 | |
40,550 | | L | | CIGNA Corp. | | 3,307,664 | |
8,570 | | | | Delphi Financial Group, Inc. | | 395,506 | |
15,440 | | @@ | | Everest Re Group Ltd. | | 1,382,806 | |
19,150 | | | | Fidelity National Financial, Inc. | | 874,581 | |
29,375 | | | | First American Corp. | | 1,032,238 | |
66,600 | | | | Hartford Financial Services Group, Inc. | | 4,616,045 | |
5,750 | | L | | LandAmerica Financial Group, Inc. | | 310,098 | |
47,500 | | | | Lincoln National Corp. | | 2,217,300 | |
49,495 | | | | Loews Corp. | | 3,479,499 | |
131,800 | | | | MetLife, Inc. | | 5,339,217 | |
27,500 | | | | MGIC Investment Corp. | | 1,895,025 | |
31,750 | | @,L | | Ohio Casualty Corp. | | 736,918 | |
5,730 | | @ | | Philadelphia Consolidated Holding Co. | | 378,982 | |
8,650 | | @ | | ProAssurance Corp. | | 338,302 | |
96,550 | | S | | Prudential Financial, Inc. | | 5,306,387 | |
25,350 | | | | Radian Group, Inc. | | 1,349,634 | |
37,200 | | | | Safeco Corp. | | 1,943,328 | |
8,110 | | | | Selective Insurance Group, Inc. | | 358,786 | |
10,825 | | L | | StanCorp Financial Group, Inc. | | 893,063 | |
6,450 | | | | Stewart Information Services Corp. | | 268,643 | |
12,110 | | | | UICI | | 410,529 | |
25,525 | | | | W.R. Berkley Corp. | | 1,204,014 | |
6,560 | | L | | Zenith National Insurance Corp. | | 326,950 | |
| | | | | | 53,391,646 | |
See Accompanying Notes to Financial Statements
58
| PORTFOLIO OF INVESTMENTS |
ING VP BALANCED PORTFOLIO | AS OF DECEMBER 31, 2004 (CONTINUED) |
Shares | | | | | | Value | |
| | | | Internet: 1.0% | | | |
38,050 | | @,L | | eBay, Inc. | | $ | 4,424,454 | |
42,700 | | @,L | | McAfee, Inc. | | 1,235,311 | |
29,965 | | @ | | RSA Security, Inc. | | 601,098 | |
152,750 | | @,L | | Symantec Corp. | | 3,934,840 | |
16,350 | | @ | | Verity, Inc. | | 214,512 | |
7,100 | | @ | | Websense, Inc. | | 360,112 | |
78,650 | | @ | | Yahoo!, Inc. | | 2,963,532 | |
| | | | | | 13,733,859 | |
| | | | Iron/Steel: 0.0% | | | |
2,050 | | L | | Carpenter Technology Corp. | | 119,843 | |
| | | | | | 119,843 | |
| | | | Leisure Time: 0.2% | | | |
8,550 | | | | Arctic Cat, Inc. | | 226,746 | |
34,750 | | L | | Carnival Corp. | | 2,002,642 | |
11,850 | | L | | Nautilus Group, Inc. | | 286,415 | |
3,680 | | | | Polaris Industries, Inc. | | 250,314 | |
| | | | | | 2,766,117 | |
| | | | Lodging: 0.5% | | | |
28,175 | | L | | Boyd Gaming Corp. | | 1,173,489 | |
33,420 | | @ | | Caesars Entertainment, Inc. | | 673,079 | |
7,550 | | @,L | | Mandalay Resort Group | | 531,747 | |
60,150 | | | | Marriott Intl., Inc. | | 3,788,246 | |
| | | | | | 6,166,561 | |
| | | | Machinery-Construction and Mining: 0.0% | | | |
8,215 | | @ | | Astec Industries, Inc. | | 141,380 | |
| | | | | | 141,380 | |
| | | | Machinery-Diversified: 0.3% | | | |
10,425 | | | | Applied Industrial Technologies, Inc. | | 285,645 | |
4,255 | | | | Cognex Corp. | | 118,715 | |
12,550 | | | | Cummins, Inc. | | 1,051,564 | |
8,600 | | @ | | Gerber Scientific, Inc. | | 65,446 | |
24,575 | | | | Graco, Inc. | | 917,876 | |
4,685 | | | | IDEX Corp. | | 189,743 | |
21,802 | | @ | | Zebra Technologies Corp. | | 1,227,016 | |
| | | | | | 3,856,005 | |
| | | | Media: 1.6% | | | |
125,900 | | @ | | Comcast Corp. | | 4,189,952 | |
45,050 | | | | McGraw-Hill Cos., Inc. | | 4,123,877 | |
11,350 | | | | Meredith Corp. | | 615,170 | |
200 | | | | News Corp. | | 3,732 | |
6,045 | | | | Thomas Nelson, Inc. | | 136,617 | |
249,050 | | @ | | Time Warner, Inc. | | 4,841,531 | |
95,750 | | | | Viacom, Inc. | | 3,484,343 | |
117,650 | | | | Walt Disney Co. | | 3,270,670 | |
1,030 | | | | Washington Post Co. | | 1,012,511 | |
| | | | | | 21,678,403 | |
| | | | Metal Fabricate/Hardware: 0.1% | | | |
9,190 | | | | Kaydon Corp. | | 303,454 | |
4,105 | | | | Lawson Products, Inc. | | 207,015 | |
11,020 | | | | Mueller Industries, Inc. | | 354,844 | |
7,250 | | | | Precision Castparts Corp. | | 476,179 | |
8,285 | | | | Timken Co. | | 215,576 | |
7,250 | | @ | | Wolverine Tube, Inc. | | 93,598 | |
| | | | | | 1,650,666 | |
| | | | Mining: 0.2% | | | |
26,850 | | L | | Phelps Dodge Corp. | | | 2,656,002 | |
9,225 | | @ | | RTI Intl. Metals, Inc. | | 189,482 | |
| | | | | | 2,845,484 | |
| | | | Miscellaneous Manufacturing: 2.5% | | | |
43,450 | | | | 3M Co. | | 3,565,942 | |
3,215 | | | | AptarGroup, Inc. | | 169,688 | |
75,600 | | L | | Eastman Kodak Co. | | 2,438,100 | |
591,550 | | | | General Electric Co. | | 21,591,574 | |
16,075 | | | | Lancaster Colony Corp. | | 689,135 | |
29,850 | | @ | | Pentair, Inc. | | 1,300,266 | |
3,650 | | | | Roper Industries, Inc. | | 221,811 | |
109,950 | | @@ | | Tyco Intl. Ltd. | | 3,929,613 | |
| | | | | | 33,906,129 | |
| | | | Office/Business Equipment: 0.3% | | | |
8,000 | | @,L | | Global Imaging Systems, Inc. | | 316,000 | |
234,050 | | @ | | Xerox Corp. | | 3,981,191 | |
| | | | | | 4,297,191 | |
| | | | Oil and Gas: 4.7% | | | |
23,950 | | | | Amerada Hess Corp. | | 1,973,001 | |
82,850 | | | | Burlington Resources, Inc. | | 3,603,975 | |
110,000 | | | | ChevronTexaco Corp. | | 5,776,099 | |
9,700 | | @ | | Cimarex Energy Co. | | 367,630 | |
84,050 | | | | ConocoPhillips | | 7,298,061 | |
96,050 | | | | Devon Energy Corp. | | 3,738,266 | |
478,800 | | | | Exxon Mobil Corp. | | 24,543,287 | |
9,300 | | | | Frontier Oil Corp. | | 247,938 | |
20,929 | | | | Murphy Oil Corp. | | 1,683,738 | |
18,485 | | @ | | Newfield Exploration Co. | | 1,091,539 | |
17,675 | | L | | Noble Energy, Inc. | | 1,089,841 | |
73,650 | | | | Occidental Petroleum Corp. | | 4,298,214 | |
6,130 | | | | Patina Oil & Gas Corp. | | 229,875 | |
5,950 | | @ | | Petroleum Development Corp. | | 229,492 | |
20,500 | | | | Pogo Producing Co. | | 994,045 | |
9,035 | | @ | | Remington Oil & Gas Corp. | | 246,204 | |
3,100 | | @,L | | Southwestern Energy Co. | | 157,139 | |
7,050 | | @,L | | Stone Energy Corp. | | 317,885 | |
15,350 | | L | | Sunoco, Inc. | | 1,254,249 | |
8,900 | | @ | | Swift Energy Co. | | 257,566 | |
63,250 | | | | Valero Energy Corp. | | 2,871,550 | |
| | | | | | 62,269,594 | |
| | | | Oil and Gas Services: 0.2% | | | |
9,050 | | @ | | Cal Dive Intl., Inc. | | 368,788 | |
6,650 | | @ | | Hydril Co. | | 302,642 | |
31,800 | | @,L | | Weatherford Intl. Ltd. | | 1,631,339 | |
| | | | | | 2,302,769 | |
| | | | Packaging and Containers: 0.1% | | | |
28,250 | | | | Ball Corp. | | 1,242,435 | |
10,700 | | | | Sonoco Products Co. | | 317,255 | |
| | | | | | 1,559,690 | |
| | | | Pharmaceuticals: 2.2% | | | |
87,850 | | | | Abbott Laboratories | | 4,098,203 | |
17,800 | | | | Alpharma, Inc. | | 301,710 | |
32,350 | | L | | Amerisourcebergen Corp. | | 1,898,298 | |
47,700 | | | | Cardinal Health, Inc. | | 2,773,755 | |
See Accompanying Notes to Financial Statements
59
| PORTFOLIO OF INVESTMENTS |
ING VP BALANCED PORTFOLIO | AS OF DECEMBER 31, 2004 (CONTINUED) |
Shares | | | | | | Value | |
| | | | Pharmaceuticals (continued) | | | |
107,500 | | @ | | Caremark Rx, Inc. | | $ | 4,238,725 | |
4,805 | | | | Medicis Pharmaceutical Corp. | | 168,704 | |
126,000 | | | | Merck & Co., Inc. | | 4,049,640 | |
6,295 | | | | Natures Sunshine Products, Inc. | | 128,166 | |
5,905 | | @,L | | NBTY, Inc. | | 141,779 | |
10,140 | | @ | | Noven Pharmaceuticals, Inc. | | 172,988 | |
431,250 | | | | Pfizer, Inc. | | 11,596,312 | |
11,375 | | @,L | | Sepracor, Inc. | | 675,334 | |
| | | | | | 30,243,614 | |
| | | | Pipelines: 0.2% | | | |
50,622 | | | | National Fuel Gas Co. | | 1,434,627 | |
14,950 | | | | Questar Corp. | | 761,852 | |
| | | | | | 2,196,479 | |
| | | | Real Estate Investment Trusts: 0.0% | | | |
300 | | | | Essex Property Trust, Inc. | | 25,140 | |
9,230 | | | | New Century Financial Corp. | | 589,889 | |
| | | | | | 615,029 | |
| | | | Retail: 4.7% | | | |
26,675 | | L | | Abercrombie & Fitch Co. | | 1,252,391 | |
23,710 | | L | | American Eagle Outfitters, Inc. | | 1,116,741 | |
29,440 | | @,L | | Barnes & Noble, Inc. | | 950,029 | |
27,550 | | @ | | BJ’s Wholesale Club, Inc. | | 802,532 | |
8,950 | | | | Cato Corp. | | 257,939 | |
9,750 | | @ | | CEC Entertainment, Inc. | | 389,708 | |
39,110 | | | | Claire’s Stores, Inc. | | 831,088 | |
98,900 | | L | | Costco Wholesale Corp. | | 4,787,748 | |
15,700 | | @ | | GameStop Corp | | 351,837 | |
242,450 | | | | Home Depot, Inc. | | 10,362,312 | |
9,095 | | @ | | J. Jill Group, Inc. | | 135,425 | |
76,350 | | | | J.C. Penney Co., Inc. Holding Co. | | 3,160,890 | |
10,340 | | @,L | | Jack in The Box, Inc. | | 381,236 | |
115,750 | | @,L | | Limited Brands, Inc. | | 2,664,565 | |
191,250 | | | | McDonald’s Corp. | | 6,131,474 | |
39,765 | | | | Michaels Stores, Inc. | | 1,191,757 | |
16,305 | | L | | PETsMART, Inc. | | 579,317 | |
2,250 | | @,L | | PF Chang’s China Bistro, Inc. | | 126,788 | |
5,220 | | @ | | Sonic Corp. | | 159,210 | |
118,300 | | | | Staples, Inc. | | 3,987,893 | |
77,200 | | @ | | Starbucks Corp. | | 4,814,191 | |
16,365 | | @ | | Stein Mart, Inc. | | 279,187 | |
51,800 | | | | Target Corp. | | 2,689,974 | |
11,800 | | @ | | Too, Inc. | | 288,628 | |
53,850 | | @ | | Toys R US, Inc. | | 1,102,310 | |
24,675 | | @,L | | Urban Outfitters, Inc. | | 1,095,570 | |
236,500 | | | | Wal-Mart Stores, Inc. | | 12,491,929 | |
12,675 | | @,L | | Williams-Sonoma, Inc. | | 444,132 | |
4,355 | | @,L | | Zale Corp. | | 130,084 | |
| | | | | | 62,956,885 | |
| | | | Savings and Loans: 0.0% | | | |
9,844 | | @ | | BankUnited Financial Corp. | | 314,515 | |
10,650 | | @ | | Waypoint Financial Corp. | | 301,928 | |
| | | | | | 616,443 | |
| | | | Semiconductors: 0.9% | | | |
25,400 | | @,L | | Cree, Inc. | | | 1,018,032 | |
11,255 | | @ | | DSP Group, Inc. | | 251,324 | |
353,200 | | | | Intel Corp. | | 8,261,348 | |
23,160 | | | | Microchip Technology, Inc. | | 617,446 | |
99,400 | | | | Texas Instruments, Inc. | | 2,447,228 | |
1,000 | | @,L | | Varian Semiconductor Equipment Associates, Inc. | | 36,850 | |
| | | | | | 12,632,228 | |
| | | | Software: 2.7% | | | |
17,849 | | @,L | | Advent Software, Inc. | | 365,548 | |
10,100 | | @ | | Ansys, Inc. | | 323,806 | |
62,000 | | | | Autodesk, Inc. | | 2,352,899 | |
3,055 | | @,L | | Avid Technology, Inc. | | 188,646 | |
61,150 | | @ | | BMC Software, Inc. | | 1,137,390 | |
3,250 | | @,L | | Cerner Corp. | | 172,803 | |
114,300 | | @ | | Compuware Corp. | | 739,521 | |
9,187 | | @,L | | CSG Systems Intl., Inc. | | 171,797 | |
10,100 | | @ | | Digi Intl., Inc. | | 173,619 | |
20,550 | | @ | | Dun & Bradstreet Corp. | | 1,225,808 | |
14,350 | | @ | | eFunds Corp. | | 344,544 | |
25,600 | | L | | Fair Isaac Corp. | | 939,008 | |
12,455 | | @ | | FileNet Corp. | | 320,841 | |
3,315 | | @,L | | Hyperion Solutions Corp. | | 154,545 | |
8,205 | | @ | | MapInfo Corp. | | 98,296 | |
608,050 | | | | Microsoft Corp. | | 16,241,015 | |
644,650 | | @ | | Oracle Corp. | | 8,844,597 | |
63,000 | | @,L | | Parametric Technology Corp. | | 371,070 | |
11,700 | | @ | | Phoenix Technologies Ltd. | | 96,642 | |
12,350 | | @ | | Progress Software Corp. | | 288,373 | |
30,625 | | | | SEI Investments Co. | | 1,284,106 | |
42,700 | | @ | | Sybase, Inc. | | 851,865 | |
43,550 | | @,L | | Wind River Systems, Inc. | | 590,103 | |
| | | | | | 37,276,842 | |
| | | | Telecommunications: 2.6% | | | |
39,335 | | @ | | Adaptec, Inc. | | 298,553 | |
119,200 | | | | Alltel Corp. | | 7,004,192 | |
3,200 | | @,L | | Anixter Intl., Inc. | | 115,168 | |
369,950 | | @ | | Cisco Systems, Inc. | | 7,140,035 | |
3,545 | | @ | | Commonwealth Telephone Enterprises, Inc. | | 176,045 | |
30,665 | | @ | | Commscope, Inc. | | 579,569 | |
18,660 | | | | Harris Corp. | | 1,153,001 | |
137,800 | | | | Motorola, Inc. | | 2,370,160 | |
37,195 | | @,L | | Polycom, Inc. | | 867,387 | |
88,950 | | | | QUALCOMM, Inc. | | 3,771,480 | |
7,550 | | L | | Telephone & Data Systems, Inc. | | 580,973 | |
265,150 | | | | Verizon Communications, Inc. | | 10,741,226 | |
| | | | | | 34,797,789 | |
| | | | Textiles: 0.1% | | | |
7,000 | | | | G&K Services, Inc. | | 303,940 | |
7,100 | | @,L | | Mohawk Industries, Inc. | | 647,875 | |
| | | | | | 951,815 | |
| | | | Toys/Games/Hobbies: 0.0% | | | |
5,780 | | @ | | Department 56, Inc. | | 96,237 | |
11,900 | | @,L | | Jakks Pacific, Inc. | | 263,109 | |
| | | | | | 359,346 | |
See Accompanying Notes to Financial Statements
60
| PORTFOLIO OF INVESTMENTS |
ING VP BALANCED PORTFOLIO | AS OF DECEMBER 31, 2004 (CONTINUED) |
Shares | | | | | | Value | |
| | | | Transportation: 1.4% | | | |
9,500 | | | | C.H. Robinson Worldwide, Inc. | | $ | 527,440 | |
18,795 | | | | CNF, Inc. | | 941,630 | |
11,850 | | @,L | | EGL, Inc. | | 354,197 | |
11,810 | | | | Expeditors Intl. Washington, Inc. | | 659,943 | |
54,750 | | | | FedEx Corp. | | 5,392,328 | |
6,850 | | @ | | Forward Air Corp. | | 306,195 | |
6,475 | | | | Heartland Express, Inc. | | 145,493 | |
6,985 | | @ | | Landstar System, Inc. | | 514,375 | |
102,500 | | | | Norfolk Southern Corp. | | 3,709,475 | |
7,715 | | @ | | Offshore Logistics, Inc. | | 250,506 | |
14,580 | | | | Overseas Shipholding Group, Inc. | | 804,816 | |
63,950 | | | | United Parcel Service, Inc. | | 5,465,166 | |
4,220 | | @,L | | Yellow Roadway Corp. | | 235,096 | |
| | | | | | 19,306,660 | |
| | | | Total Common Stock
(Cost $721,738,611) | | 808,703,336 | |
PREFERRED STOCK: 0.2% | | | |
| | | | Banks: 0.2% | | | |
191 | | @,#,XX | | DG Funding Trust | | 2,049,073 | |
| | | | | | 2,049,073 | |
| | | | Electric: 0.0% | | | |
19,650 | | @,S | | TECO Energy, Inc. | | 507,830 | |
| | | | | | 507,830 | |
| | | | Total Preferred Stock
(Cost $2,573,045) | | 2,556,903 | |
WARRANTS: 0.0% | | | |
| | | | Distribution/Wholesale: 0.0% | | | |
2,978 | | @,XX | | Timco Aviation Services | | 30 | |
| | | | | | 30 | |
| | | | Telecommunications: 0.0% | | | |
11,283 | | @ | | Lucent Technologies, Inc. | | 17,827 | |
| | | | | | 17,827 | |
| | | | Total Warrants
(Cost $-) | | 17,857 | |
| | | | | | | |
Principal
Amount | | | | | | Value | |
| | | | | | | |
CORPORATE BONDS/NOTES: 10.3% | | | |
| | | | Airlines: 0.1% | | | |
$ | 421,000 | | S | | American Airlines, Inc., 7.250%, due 02/05/09 | | 412,580 | |
1,803,000 | | | | American Airlines, Inc., 7.324%, due 10/15/09 | | 1,532,930 | |
| | | | | | 1,945,510 | |
| | | | Auto Manufacturers: 0.2% | | | |
461,000 | | | | Ford Motor Co., 6.625%, due 10/01/28 | | 431,233 | |
1,377,000 | | L | | Ford Motor Co., 7.450%, due 07/16/31 | | 1,388,904 | |
| 1,442,000 | | L | | General Motors Corp., 8.375%, due 07/15/33 | | | 1,498,169 | |
| | | | | | 3,318,306 | |
| | | | Banks: 2.5% | | | |
630,000 | | @@ | | Australia & New Zealand Banking Group Ltd., 2.405%, due 10/29/49 | | 550,313 | |
912,000 | | | | Banco Bradesco SA/ Cayman Islands, 8.750%, due 10/24/13 | | 998,640 | |
903,000 | | | | Banco Santander Chile/Pre-merger with Banco Santiago SA, 2.800%, due 12/09/09 | | 905,194 | |
1,331,000 | | @@ | | Banco Santander Santiago Chile SA, 7.375%, due 07/18/12 | | 1,531,308 | |
920,000 | | @@ | | Bank of Ireland, 2.770%, due 12/29/49 | | 800,406 | |
470,000 | | @@ | | Bank of Nova Scotia, 2.115%, due 08/31/85 | | 392,818 | |
953,000 | | | | BankAmerica Capital II, 8.000%, due 12/15/26 | | 1,047,720 | |
815,000 | | @@,# | | Danske Bank A/S, 5.914%, due 12/29/49 | | 864,527 | |
1,000,000 | | @@ | | Den Norske Bank ASA, 2.115%, due 08/29/49 | | 833,750 | |
539,000 | | # | | Dresdner Funding Trust I, 8.151%, due 06/30/31 | | 668,267 | |
1,000 | | | | Fleet Capital Trust II, 7.920%, due 12/11/26 | | 1,085 | |
854,000 | | @@,# | | HBOS Capital Funding LP, 6.071%, due 06/30/49 | | 916,942 | |
3,010,000 | | @@,C,L | | HSBC Bank PLC, 2.839%, due 06/29/49 | | 2,616,920 | |
1,570,000 | | @@ | | Lloyds TSB Bank PLC, 2.090%, due 08/29/49 | | 1,346,773 | |
1,510,000 | | @@ | | Lloyds TSB Bank PLC, 2.938%, due 06/29/49 | | 1,346,724 | |
1,356,000 | | | | M&T Bank Corp., 3.850%, due 04/01/13 | | 1,342,832 | |
955,000 | | | | Mellon Capital I, 7.720%, due 12/01/26 | | 1,037,134 | |
970,000 | | @@ | | National Australia Bank Ltd., 2.361%, due 10/29/49 | | 847,388 | |
1,690,000 | | @@ | | National Westminster Bank PLC, 2.563%, due 11/29/49 | | 1,442,538 | |
1,098,000 | | # | | Rabobank Capital Funding II, 5.260%, due 12/29/49 | | 1,119,193 | |
2,074,000 | | | | Rabobank Capital Funding Trust, 5.254%, due 12/29/49 | | 2,067,218 | |
1,540,000 | | @@ | | Royal Bank of Canada, 2.750%, due 06/29/85 | | 1,316,628 | |
690,000 | | @@ | | Royal Bank of Scotland Group PLC, 2.938%, due 12/29/49 | | 609,429 | |
420,000 | | @@,C | | Societe Generale, 2.705%, due 11/29/49 | | 361,593 | |
3,180,000 | | @@,C | | Standard Chartered PLC, 2.813%, due 11/29/49 | | 2,535,306 | |
See Accompanying Notes to Financial Statements
61
| PORTFOLIO OF INVESTMENTS |
ING VP BALANCED PORTFOLIO | AS OF DECEMBER 31, 2004 (CONTINUED) |
Principal
Amount | | | | | | Value | |
| | | | Banks (continued) | | | |
$ | 2,460,000 | | @@,C | | Standard Chartered PLC, 2.838%, due 12/29/49 | | $ | 1,980,300 | |
989,000 | | | | U.S. Bankcorp, 8.090%, due 11/15/26 | | 1,079,405 | |
912,000 | | | | Wells Fargo Capital I, 7.960%, due 12/15/26 | | 993,248 | |
570,000 | | @@ | | Westpac Banking Corp., 2.338%, due 09/29/49 | | 494,448 | |
2,954,000 | | # | | Westpac Capital Trust IV, 5.256%, due 12/29/49 | | 2,931,752 | |
| | | | | | 34,979,799 | |
| | | | Beverages: 0.4% | | | |
2,733,000 | | @@,# | | Cia Brasileira de Bebidas, 8.750%, due 09/15/13 | | 3,197,610 | |
201,000 | | @@ | | Cia Brasileira de Bebidas, 10.500%, due 12/15/11 | | 253,260 | |
1,523,000 | | # | | Miller Brewing Co., 4.250%, due 08/15/08 | | 1,538,122 | |
| | | | | | 4,988,992 | |
| | | | Chemicals: 0.1% | | | |
424,000 | | | | Dow Chemical Co., 5.750%, due 11/15/09 | | 454,029 | |
381,000 | | @@,# | | Sociedad Quimica y Minera de Chile SA, 7.700%, due 09/15/06 | | 404,072 | |
| | | | | | 858,101 | |
| | | | Distribution/Wholesale: 0.0% | | | |
3,104 | | X | | Timco Aviation Services, 8.000%, due 01/02/07 | | — | |
| | | | | | — | |
| | | | Diversified Financial Services: 1.9% | | | |
418,000 | | @@,#,I,XX,L | | Alpine III, 2.840%, due 08/16/14 | | 418,749 | |
418,000 | | @@,#,I,XX | | Alpine III, 3.240%, due 08/16/14 | | 418,644 | |
222,000 | | @@,#,I,XX | | Alpine III, 5.040%, due 08/16/14 | | 222,286 | |
645,000 | | @@,#,I,XX | | Alpine III, 8.290%, due 08/16/14 | | 646,034 | |
446,190 | | @@,# | | Arcel Finance Ltd., 5.984%, due 02/01/09 | | 461,247 | |
858,000 | | @@,# | | Arcel Finance Ltd., 6.361%, due 05/01/12 | | 869,843 | |
855,000 | | @@,# | | Arcel Finance Ltd., 7.048%, due 09/01/11 | | 878,052 | |
2,061,000 | | @@,# | | Brazilian Merchant Voucher Receivables Ltd., 5.911%, due 06/15/11 | | 2,050,694 | |
10,060 | | | | Canwest Media, Inc., 8.000%, due 09/15/12 | | 10,840 | |
963,000 | | | | Citigroup Capital II, 7.750%, due 12/01/36 | | 1,048,166 | |
1,014,000 | | # | | Corestates Capital Trust I, 8.000%, due 12/15/26 | | 1,108,794 | |
1,298,000 | | # | | Farmers Exchange Capital, 7.200%, due 07/15/48 | | 1,324,979 | |
520,000 | | @@ | | Financiere CSFB NV, 2.125%, due 03/29/49 | | 433,681 | |
| 1,353,000 | | L | | Ford Motor Credit Co., 5.700%, due 01/15/10 | | | 1,366,794 | |
469,000 | | L | | Ford Motor Credit Co., 7.000%, due 10/01/13 | | 498,017 | |
2,052,000 | | # | | HVB Funding Trust III, 9.000%, due 10/22/31 | | 2,718,441 | |
232,000 | | | | JPM Capital Trust I, 7.540%, due 01/15/27 | | 250,089 | |
1,054,000 | | | | JPM Capital Trust II, 7.950%, due 02/01/27 | | 1,153,165 | |
2,489,000 | | # | | Mangrove Bay Pass-Through Trust, 6.102%, due 07/15/33 | | 2,478,018 | |
1,548,000 | | | | Mantis Reef Ltd., 4.799%, due 11/03/09 | | 1,546,382 | |
1,214,760 | | @@,# | | PF Export Receivables Master Trust, 3.748%, due 06/01/13 | | 1,179,502 | |
1,847,055 | | @@,# | | PF Export Receivables Master Trust, 6.436%, due 06/01/15 | | 1,836,960 | |
1,100,000 | | | | Twin Reefs Pass-Through Trust, 3.370%, due 12/10/49 | | 1,106,259 | |
1,264,000 | | @@ | | UFJ Finance Aruba AEC, 8.750%, due 11/29/49 | | 1,412,442 | |
15,000 | | | | Universal City Development Partners, 11.750%, due 04/01/10 | | 17,794 | |
| | | | | | 25,455,872 | |
| | | | Electric: 1.4% | | | |
2,849,000 | | @@,#,L | | AES Gener SA, 7.500%, due 03/25/14 | | 3,005,695 | |
1,440,380 | | #,S | | Allegheny Energy Supply Statutory Trust 2001, 10.250%, due 11/15/07 | | 1,642,033 | |
151,947 | | #,S | | Allegheny Energy Supply Statutory Trust 2001, 13.000%, due 11/15/07 | | 166,382 | |
1,750,949 | | | | CE Generation LLC, 7.416%, due 12/15/18 | | 1,891,572 | |
1,543,000 | | S | | Consumers Energy Co., 4.250%, due 04/15/08 | | 1,559,294 | |
408,000 | | @@,L | | Empresa Nacional de Electricidad SA/Chile, 7.750%, due 07/15/08 | | 450,704 | |
912,000 | | | | FirstEnergy Corp., 6.450%, due 11/15/11 | | 992,242 | |
912,000 | | | | FirstEnergy Corp., 7.375%, due 11/15/31 | | 1,044,759 | |
749,000 | | | | Juniper Generation LLC, 6.790%, due 12/31/14 | | 750,329 | |
1,332,000 | | | | Monongahela Power Co., 7.360%, due 01/15/10 | | 1,474,068 | |
2,013,000 | | | | Ohio Power Co., 6.375%, due 07/15/33 | | 2,122,586 | |
337,150 | | #,S | | Power Contract Financing LLC, 5.200%, due 02/01/06 | | 340,370 | |
899,000 | | # | | Power Contract Financing LLC, 6.256%, due 02/01/10 | | 941,922 | |
See Accompanying Notes to Financial Statements
62
| PORTFOLIO OF INVESTMENTS |
ING VP BALANCED PORTFOLIO | AS OF DECEMBER 31, 2004 (CONTINUED) |
Principal
Amount | | | | | | Value | |
| | | | Electric (continued) | | | |
$ | 312,538 | | | | PPL Montana LLC, 8.903%, due 07/02/20 | | $ | 353,363 | |
598,420 | | # | | Tenaska Virginia Partners LP, 6.119%, due 03/30/24 | | 629,840 | |
1,252,000 | | | | TXU Corp, 4.446%, due 11/16/06 | | 1,265,140 | |
1,000 | | # | | TXU Energy Co. LLC, 2.838%, due 01/17/06 | | 1,003 | |
| | | | | | 18,631,302 | |
| | | | Food: 0.4% | | | |
662,000 | | | | Kroger Co., 7.250%, due 06/01/09 | | 742,215 | |
1,242,000 | | S | | Safeway, Inc., 4.800%, due 07/16/07 | | 1,272,168 | |
839,000 | | | | SUPERVALU, Inc., 7.875%, due 08/01/09 | | 963,070 | |
1,687,000 | | | | Tyson Foods, Inc., 7.250%, due 10/01/06 | | 1,789,313 | |
| | | | | | 4,766,766 | |
| | | | Gas: 0.1% | | | |
1,289,000 | | #,S | | Williams Gas Pipelines Central, Inc., 7.375%, due 11/15/06 | | 1,372,785 | |
| | | | | | 1,372,785 | |
| | | | Healthcare-Services: 0.1% | | | |
966,000 | | | | HCA, Inc., 5.500%, due 12/01/09 | | 967,343 | |
| | | | | | 967,343 | |
| | | | Home Builders: 0.0% | | | |
50,000 | | | | Technical Olympic USA, Inc., 9.000%, due 07/01/10 | | 53,750 | |
| | | | | | 53,750 | |
| | | | Insurance: 0.5% | | | |
340,000 | | # | | Farmers Insurance Exchange, 6.000%, due 08/01/14 | | 345,425 | |
447,000 | | # | | Farmers Insurance Exchange, 8.625%, due 05/01/24 | | 528,599 | |
1,016,000 | | #,S | | Monumental Global Funding II, 3.850%, due 03/03/08 | | 1,019,399 | |
1,533,000 | | | | North Front Pass-Through Trust, 5.810%, due 12/15/24 | | 1,563,539 | |
1,043,000 | | | | Prudential Financial, Inc., 4.104%, due 11/15/06 | | 1,054,893 | |
1,647,000 | | # | | Zurich Capital Trust I, 8.376%, due 06/01/37 | | 1,854,775 | |
| | | | | | 6,366,630 | |
| | | | Media: 0.2% | | | |
1,459,000 | | | | Clear Channel Communications, Inc.,
3.125%, due 02/01/07 | | 1,437,839 | |
| 930,000 | | | | COX Communications, Inc., 6.850%, due 01/15/18 | | | 992,476 | |
193,000 | | L | | Rogers Cable, Inc., 6.750%, due 03/15/15 | | 198,308 | |
| | | | | | 2,628,623 | |
| | | | Mining: 0.2% | | | |
900,000 | | @@,# | | Corp Nacional del Cobre de Chile, 5.500%, due 10/15/13 | | 938,924 | |
373,000 | | | | Vale Overseas Ltd., 8.250%, due 01/17/34 | | 394,448 | |
878,000 | | | | WMC Finance USA, 5.125%, due 05/15/13 | | 876,939 | |
| | | | | | 2,210,311 | |
| | | | Multi-National: 0.2% | | | |
2,439,000 | | @@ | | Corp Andina de Fomento CAF, 6.875%, due 03/15/12 | | 2,745,655 | |
| | | | | | 2,745,655 | |
| | | | Oil and Gas: 0.8% | | | |
1,057,000 | | L | | Amerada Hess Corp., 6.650%, due 08/15/11 | | 1,163,923 | |
1,284,000 | | @@,# | | Empresa Nacional de Petroleo, 4.875%, due 03/15/14 | | 1,256,738 | |
20,000 | | | | Energy Partners Ltd., 8.750%, due 08/01/10 | | 21,900 | |
1,561,000 | | @@,# | | Gazprom Intl. SA, 7.201%, due 02/01/20 | | 1,654,660 | |
992,000 | | | | Husky Energy, Inc., 6.150%, due 06/15/19 | | 1,061,594 | |
1,940,000 | | # | | Pemex Project Funding Master Trust, 3.790%, due 06/15/10 | | 1,995,289 | |
306,000 | | | | Pemex Project Funding Master Trust, 7.375%, due 12/15/14 | | 340,884 | |
691,000 | | @@ | | Petroleos Mexicanos, 9.250%, due 03/30/18 | | 858,568 | |
1,344,000 | | L | | Tengizchevroil Finance Co S.ar.1, 6.124%, due 11/15/14 | | 1,354,080 | |
782,000 | | L | | Valero Energy Corp., 8.750%, due 06/15/30 | | 1,049,905 | |
| | | | | | 10,757,541 | |
| | | | Packaging and Containers: 0.0% | | | |
596,000 | | #,S | | Sealed Air Corp., 5.375%, due 04/15/08 | | 619,714 | |
| | | | | | 619,714 | |
| | | | Real Estate: 0.2% | | | |
1,331,000 | | S | | EOP Operating LP, 7.750%, due 11/15/07 | | 1,469,930 | |
199,000 | | | | Liberty Property LP, 6.375%, due 08/15/12 | | 216,129 | |
146,000 | | | | Liberty Property LP, 6.950%, due 12/01/06 | | 155,800 | |
1,192,000 | | | | Liberty Property LP, 7.750%, due 04/15/09 | | 1,339,925 | |
| | | | | | 3,181,784 | |
See Accompanying Notes to Financial Statements
63
| PORTFOLIO OF INVESTMENTS |
ING VP BALANCED PORTFOLIO | AS OF DECEMBER 31, 2004 (CONTINUED) |
Principal
Amount | | | | | | Value | |
| | | | Real Estate Investment Trusts: 0.4% | | | |
$ | 1,925,000 | | | | Rouse Co., 7.200%, due 09/15/12 | | $ | 2,084,466 | |
960,000 | | | | Rouse Co., 8.000%, due 04/30/09 | | 1,057,375 | |
1,014,000 | | S | | Simon Property Group LP, 4.875%, due 03/18/10 | | 1,034,234 | |
1,776,000 | | | | Simon Property Group LP, 6.375%, due 11/15/07 | | 1,896,043 | |
| | | | | | 6,072,118 | |
| | | | Retail: 0.1% | | | |
40,000 | | | | Dollar General Corp., 8.625%, due 06/15/10 | | 46,700 | |
1,399,000 | | | | May Department Stores Co., 3.950%, due 07/15/07 | | 1,402,200 | |
| | | | | | 1,448,900 | |
| | | | Savings and Loans: 0.1% | | | |
914,000 | | | | Great Western Financial, 8.206%, due 02/01/27 | | 998,831 | |
| | | | | | 998,831 | |
| | | | Telecommunications: 0.3% | | | |
930,000 | | | | AT&T Corp., 9.750%, due 11/15/31 | | 1,114,838 | |
1,236,000 | | S | | BellSouth Corp., 4.200%, due 09/15/09 | | 1,240,536 | |
800,000 | | + | | Sprint Capital Corp., 4.780%, due 08/17/06 | | 815,650 | |
264,000 | | L,S | | Sprint Capital Corp., 8.375%, due 03/15/12 | | 322,040 | |
1,014,000 | | L | | Verizon Virginia, Inc., 4.625%, due 03/15/13 | | 990,485 | |
| | | | | | 4,483,549 | |
| | | | Transportation: 0.1% | | | |
830,000 | | #,L | | MISC Capital Ltd., 5.000%, due 07/01/09 | | 857,110 | |
| | | | | | 857,110 | |
| | | | Total Corporate Bonds/Notes
(Cost $137,692,953) | | 139,709,292 | |
U.S. GOVERNMENT AGENCY OBLIGATIONS: 11.5% | | | |
| | | | Federal Home Loan Bank: 0.4% | | | |
5,235,000 | | L | | 3.250%, due 12/17/07 | | 5,205,014 | |
| | | | | | 5,205,014 | |
| | | | Federal Home Loan Mortgage Corporation: 2.2% | | | |
10,503,000 | | | | 2.700%, due 03/16/07 | | 10,376,406 | |
7,355,164 | | | | 3.053%, due 04/15/32 | | 7,411,299 | |
510 | | | | 5.500%, due 05/01/23 | | 522 | |
1,977,000 | | L | | 5.875%, due 03/21/11 | | 2,137,256 | |
3,307,239 | | | | 6.000%, due 01/15/29 | | 3,460,638 | |
3,773,187 | | | | 6.000%, due 01/15/29 | | 3,941,480 | |
2,276,000 | | | | 6.000%, due 01/15/29 | | 2,383,101 | |
654,477 | | | | 6.500%, due 11/01/28 | | 688,267 | |
| | | | | | 30,398,969 | |
| | | | Federal National Mortgage Association: 8.4% | | | |
| 760,164 | | | | 2.490%, due 04/25/35 | | | 759,480 | |
2,490,961 | | | | 2.668%, due 08/25/33 | | 2,502,537 | |
173,735 | | | | 2.859%, due 12/26/29 | | 173,597 | |
5,345,000 | | | | 2.875%, due 05/19/08 | | 5,223,567 | |
2,403,000 | | | | 4.750%, due 12/25/42 | | 2,421,870 | |
41,778,000 | | | | 5.000%, due 01/15/34 | | 41,451,631 | |
2,336,000 | | | | 5.000%, due 01/15/20 | | 2,373,231 | |
2,705,000 | | | | 5.250%, due 08/01/12 | | 2,811,163 | |
13,743,000 | | | | 5.500%, due 01/01/33 | | 13,953,434 | |
4,184,980 | | | | 5.500%, due 01/15/20 | | 4,324,917 | |
2,386,841 | | | | 6.000%, due 04/25/31 | | 2,502,169 | |
6,645,000 | | | | 6.000%, due 01/15/34 | | 6,871,343 | |
142,561 | | | | 6.000%, due 06/01/16 | | 149,524 | |
127,474 | | | | 6.000%, due 07/01/16 | | 133,700 | |
682,453 | | | | 6.000%, due 07/01/16 | | 715,786 | |
104,176 | | | | 6.000%, due 08/01/16 | | 109,265 | |
150,898 | | | | 6.000%, due 08/01/16 | | 158,268 | |
111,660 | | | | 6.000%, due 10/01/16 | | 117,114 | |
120,216 | | | | 6.000%, due 10/01/16 | | 126,088 | |
2,327 | | | | 6.000%, due 10/01/16 | | 2,441 | |
1,006,002 | | | | 6.000%, due 03/01/17 | | 1,055,080 | |
150,662 | | | | 6.000%, due 04/01/17 | | 158,012 | |
98,955 | | | | 6.000%, due 04/01/17 | | 103,783 | |
178,796 | | | | 6.000%, due 04/01/17 | | 187,519 | |
511,245 | | | | 6.000%, due 06/01/17 | | 536,186 | |
109,406 | | | | 6.000%, due 09/01/17 | | 114,743 | |
115,179 | | | | 6.000%, due 10/01/17 | | 120,798 | |
541,917 | | | | 6.000%, due 11/01/17 | | 568,386 | |
576,342 | | | | 6.000%, due 12/01/17 | | 604,459 | |
584,390 | | | | 6.000%, due 12/01/18 | | 612,871 | |
3,961,001 | | | | 6.000%, due 07/25/29 | | 4,142,791 | |
1,683,078 | | | | 6.000%, due 07/25/29 | | 1,760,810 | |
4,048,414 | | | | 6.500%, due 04/01/30 | | 4,253,868 | |
3,814,000 | | | | 6.500%, due 01/15/35 | | 3,999,933 | |
2,320,000 | | | | 6.625%, due 11/15/10 | | 2,625,085 | |
200,689 | | | | 7.000%, due 01/01/30 | | 212,982 | |
1,003 | | | | 7.000%, due 01/01/30 | | 1,063 | |
320,190 | | | | 7.000%, due 03/01/30 | | 339,804 | |
247,819 | | | | 7.000%, due 01/01/31 | | 262,869 | |
1,978,600 | | | | 7.000%, due 06/01/31 | | 2,101,023 | |
450,965 | | | | 7.000%, due 08/01/31 | | 478,208 | |
12,526 | | | | 7.000%, due 10/01/31 | | 13,283 | |
63,980 | | | | 7.000%, due 01/01/32 | | 67,845 | |
49,730 | | | | 7.000%, due 01/01/32 | | 52,734 | |
16,761 | | | | 7.000%, due 04/01/32 | | 17,773 | |
30,950 | | | | 7.000%, due 05/01/32 | | 32,819 | |
60,938 | | | | 7.000%, due 07/01/32 | | 64,618 | |
57,576 | | | | 7.000%, due 06/01/29 | | 61,177 | |
12,590 | | | | 7.000%, due 06/01/29 | | 13,361 | |
134,932 | | | | 7.000%, due 06/01/29 | | 143,197 | |
1,352 | | | | 7.000%, due 08/01/29 | | 1,435 | |
11,571 | | | | 7.000%, due 10/01/29 | | 12,280 | |
324,834 | | | | 7.000%, due 11/01/29 | | 344,733 | |
85,240 | | | | 7.500%, due 10/01/30 | | 91,361 | |
163,524 | | | | 7.500%, due 10/01/30 | | 175,266 | |
74,545 | | | | 7.500%, due 11/01/30 | | 79,898 | |
104,265 | | | | 7.500%, due 11/01/30 | | 111,752 | |
1,039,225 | | | | 7.500%, due 06/25/32 | | 1,113,474 | |
1,333,596 | | | | 7.500%, due 01/25/48 | | 1,425,615 | |
| | | | | | 114,944,019 | |
See Accompanying Notes to Financial Statements
64
| PORTFOLIO OF INVESTMENTS |
ING VP BALANCED PORTFOLIO | AS OF DECEMBER 31, 2004 (CONTINUED) |
Principal
Amount | | | | | | Value | |
| | | | Government National Mortgage Association: 0.5% | | | |
$ | 267,094 | | | | 3.375%, due 04/20/28 | | $ | 272,244 | |
73,843 | | | | 4.000%, due 12/20/29 | | 74,689 | |
341,709 | | | | 6.500%, due 10/15/31 | | 360,129 | |
947,980 | | | | 7.000%, due 09/15/24 | | 1,013,101 | |
439,406 | | | | 7.000%, due 10/15/24 | | 469,542 | |
993,900 | | | | 7.000%, due 10/15/24 | | 1,062,066 | |
252,660 | | | | 7.000%, due 11/15/24 | | 270,024 | |
2,412,930 | | | | 7.500%, due 12/15/23 | | 2,610,525 | |
| | | | | | 6,132,320 | |
| | | | Total U.S. Government Agency Obligations
(Cost $156,015,807) | | 156,680,322 | |
U.S. TREASURY OBLIGATIONS: 6.0% | | | |
| | | | U.S. Treasury Bonds: 4.1% | | | |
16,854,000 | | W,L | | 4.250%, due 11/15/14 | | 16,903,382 | |
24,786,000 | | L,S | | 5.375%, due 02/15/31 | | 26,809,554 | |
4,045,000 | | S | | 10.375%, due 11/15/12 | | 4,823,982 | |
4,860,000 | | L,S | | 13.250%, due 05/15/14 | | 6,754,642 | |
| | | | | | 55,291,560 | |
| | | | U.S. Treasury Notes: 1.6% | | | |
1,292,000 | | | | 1.125%, due 06/30/05 | | 1,283,723 | |
7,048,000 | | L,S | | 3.000%, due 11/15/07 | | 7,024,493 | |
14,086,000 | | L,S | | 3.500%, due 12/15/09 | | 14,022,177 | |
| | | | | | 22,330,393 | |
| | | | U.S. Treasury STRIP: 0.3% | | | |
6,372,000 | | S | | 4.690%, due 05/15/16 | | 3,783,031 | |
| | | | | | 3,783,031 | |
| | | | Total U.S. Treasury Obligations
(Cost $81,711,818) | | 81,404,984 | |
ASSET-BACKED SECURITIES: 2.8% | | | |
| | | | Automobile Asset-Backed Securities: 0.3% | | | |
300,000 | | | | Capital Auto Receivables Asset Trust, 2.750%, due 04/16/07 | | 299,155 | |
500,000 | | | | Household Automotive Trust, 2.310%, due 04/17/08 | | 496,703 | |
1,400,000 | | | | Nissan Auto Receivables Owner Trust, 2.050%, due 03/16/09 | | 1,365,966 | |
1,590,000 | | | | Nissan Auto Receivables Owner Trust, 2.610%, due 07/15/08 | | 1,575,196 | |
| | | | | | 3,737,020 | |
| | | | Credit Card Asset-Backed Securities: 0.2% | | | |
285,000 | | | | Citibank Credit Card Issuance Trust, 3.100%, due 03/10/10 | | 280,108 | |
775,000 | | | | Citibank Credit Card Issuance Trust, 5.650%, due 06/16/08 | | 801,361 | |
| 1,270,000 | | | | Fleet Credit Card Master Trust II, 2.400%, due 07/15/08 | | | 1,261,491 | |
| | | | | | 2,342,960 | |
| | | | Home Equity Asset-Backed Securities: 1.6% | | | |
658,844 | | | | Argent Securities, Inc., 2.740%, due 03/25/34 | | 658,559 | |
773,718 | | | | Asset Backed Funding Certificates, 2.698%, due 11/25/33 | | 774,056 | |
2,475,732 | | XX | | Bayview Financial Acquisition Trust, 2.918%, due 09/28/43 | | 2,481,147 | |
127,173 | | | | Equity One ABS, Inc., 2.976%, due 09/25/33 | | 127,041 | |
642,588 | | | | GMAC Mortgage Corp Loan Trust, 2.360%, due 12/25/20 | | 642,492 | |
4,664,000 | | XX | | GSAA Trust, 5.242%, due 05/25/35 | | 4,674,731 | |
1,654,100 | | | | Merrill Lynch Mortgage Investors, Inc., 2.778%, due 07/25/34 | | 1,655,984 | |
2,474,107 | | | | New Century Home Equity Loan Trust, 2.668%, due 04/25/34 | | 2,475,699 | |
613,052 | | | | Residential Asset Mortgage Products, Inc., 2.728%, due 06/25/33 | | 613,036 | |
4,614,712 | | | | Residential Asset Securities Corp., 2.728%, due 12/25/33 | | 4,624,736 | |
940,000 | | | | Residential Funding Mortgage Securities II, 3.450%, due 01/25/16 | | 939,843 | |
2,625,000 | | | | Saxon Asset Securities Trust, 3.960%, due 06/25/33 | | 2,634,385 | |
| | | | | | 22,301,709 | |
| | | | Other Asset-Backed Securities: 0.7% | | | |
528,762 | | XX | | Amortizing Residential Collateral Trust, 2.918%, due 05/25/32 | | 528,431 | |
799,407 | | | | Chase Funding Mortgage Loan Asset-Backed Certificates, 2.718%, due 07/25/33 | | 800,400 | |
1,841,000 | | | | First Horizon Asset Back Trust, 2.420%, due 10/25/34 | | 1,842,151 | |
5,290,000 | | | | PP&L Transition Bond Co LLC, 7.050%, due 06/25/09 | | 5,631,561 | |
1,190,000 | | | | Residential Asset Mortgage Products, Inc., 2.140%, due 02/25/30 | | 1,182,578 | |
| | | | | | 9,985,121 | |
| | | | Total Asset-Backed Securities
(Cost $42,767,771) | | 38,366,810 | |
See Accompanying Notes to Financial Statements
65
| PORTFOLIO OF INVESTMENTS |
ING VP BALANCED PORTFOLIO | AS OF DECEMBER 31, 2004 (CONTINUED) |
Principal
Amount | | | | | | Value | |
COLLATERALIZED MORTGAGE OBLIGATIONS: 10.0% | | | |
| | | | Commercial Mortgage- Backed Securities: 2.2% | | | |
$ | 1,412,000 | | L | | Bear Stearns Commercial Mortgage Securities, 4.170%, due 01/12/41 | | $ | 1,421,754 | |
2,060,000 | | | | Chase Manhattan Bank-First Union National Bank, 7.439%, due 08/15/31 | | 2,331,238 | |
2,187,000 | | | | COMM, 3.600%, due 03/10/39 | | 2,155,314 | |
1,284,040 | | | | CS First Boston Mortgage Securities Corp, 3.727%, due 03/15/35 | | 1,264,685 | |
1,600,000 | | C | | DLJ Commercial Mortgage Corp., 6.460%, due 03/10/32 | | 1,736,540 | |
1,633,876 | | | | Ge Capital Commercial Mortgage Corp, 3.752%, due 07/10/39 | | 1,631,209 | |
1,000,000 | | | | JP Morgan Chase Commercial Mortgage Securities Corp, 4.262%, due 08/12/40 | | 1,010,001 | |
4,341,575 | | | | JP Morgan Chase Commercial Mortgage Securities Corp, 4.275%, due 01/12/37 | | 4,363,930 | |
3,120,000 | | | | JP Morgan Chase Commercial Mortgage Securities Corp, 6.244%, due 04/15/35 | | 3,339,374 | |
3,150,000 | | | | LB-UBS Commercial Mortgage Trust, 6.226%, due 03/15/26 | | 3,413,836 | |
3,000,000 | | L | | LB-UBS Commercial Mortgage Trust, 7.370%, due 08/15/26 | | 3,429,634 | |
3,148,214 | | | | Mortgage Capital Funding Inc, 6.663%, due 03/18/30 | | 3,369,339 | |
188,966 | | | | Prudential Commercial Mortgage Trust, 3.669%, due 02/11/36 | | 186,032 | |
600,000 | | | | Prudential Securities Secured Financing Corp, 6.649%, due 07/15/08 | | 652,252 | |
| | | | | | 30,305,138 | |
| | | | Whole Loan Collateral PAC: 0.4% | | | |
2,158,919 | | | | GSR Mortgage Loan Trust, 2.818%, due 10/25/32 | | 2,159,625 | |
807,332 | | | | MASTR Alternative Loans Trust, 2.818%, due 11/25/33 | | 807,617 | |
1,817,513 | | | | MASTR Alternative Loans Trust, 8.500%, due 05/25/33 | | 1,848,017 | |
714,144 | | | | Washington Mutual, 2.818%, due 03/25/34 | | 715,740 | |
| | | | | | 5,530,999 | |
| | | | Whole Loan Collaterallized Mortgage Obligations: 7.3% | | | |
| 3,935,286 | | | | Banc of America Funding Corp., 5.750%, due 09/20/34 | | | 4,003,858 | |
290,316 | | | | Bank of America Alternative Loan Trust, 2.868%, due 12/25/33 | | 290,796 | |
4,775,304 | | | | Bank of America Mortgage Securities, 2.868%, due 12/25/33 | | 4,782,496 | |
2,121,095 | | | | Bank of America Mortgage Securities, 5.000%, due 06/25/33 | | 2,133,370 | |
2,164,759 | | | | Bank of America Mortgage Securities, 5.000%, due 12/25/18 | | 2,185,054 | |
1,286,042 | | | | Bank of America Mortgage Securities, 5.250%, due 11/25/19 | | 1,310,089 | |
759,742 | | | | Bear Stearns Alt-A Trust, 2.738%, due 07/25/34 | | 759,612 | |
1,964,789 | | | | Citicorp Mortgage Securities, Inc., 2.918%, due 10/25/33 | | 1,961,677 | |
1,271,748 | | | | Countrywide Alternative Loan Trust, 2.530%, due 09/25/34 | | 1,272,146 | |
991,000 | | | | Countrywide Alternative Loan Trust, 2.720%, due 02/25/35 | | 991,000 | |
1,138,856 | | | | Countrywide Alternative Loan Trust, 2.818%, due 07/25/18 | | 1,141,169 | |
2,049,608 | | | | Countrywide Alternative Loan Trust, 5.000%, due 10/25/18 | | 2,068,823 | |
542,565 | | | | Countrywide Alternative Loan Trust, 5.000%, due 08/25/19 | | 547,494 | |
2,228,213 | | | | Countrywide Home Loan Mortgage Pass Through Trust, 5.000%, due 11/25/18 | | 2,249,103 | |
1,990,000 | | XX | | Countrywide Home Loan Mortgage Pass Through Trust, 6.000%, due 11/25/34 | | 2,084,360 | |
5,530,000 | | | | CS First Boston Mortgage Securities Corp., 4.140%, due 10/25/33 | | 5,533,729 | |
5,913,387 | | | | First Horizon Alternative Mortgage Securities, 4.835%, due 06/25/34 | | 5,927,719 | |
639,964 | | C | | First Horizon Alternative Mortgage Securities, 5.362%, due 09/25/34 | | 648,871 | |
2,354,654 | | | | GMAC Mortgage Corp Loan Trust, 5.250%, due 04/25/34 | | 2,373,024 | |
4,000,000 | | | | GMAC Mortgage Corp. Loan Trust, 5.500%, due 01/25/34 | | 4,094,306 | |
See Accompanying Notes to Financial Statements
66
| PORTFOLIO OF INVESTMENTS |
ING VP BALANCED PORTFOLIO | AS OF DECEMBER 31, 2004 (CONTINUED) |
Principal
Amount | | | | | | Value | |
| | | | Whole Loan Collaterallized Mortgage Obligations (continued) | | | |
$ | 528,143 | | | | GSR Mortgage Loan Trust, 4.500%, due 08/25/19 | | $ | 532,237 | |
467,011 | | | | GSR Mortgage Loan Trust, 6.500%, due 01/25/34 | | 486,713 | |
1,016,000 | | | | Harborview Mortgage Loan Trust, 2.770%, due 01/19/35 | | 1,016,000 | |
1,947,299 | | | | Homebanc Mortgage Trust, 2.848%, due 08/25/29 | | 1,945,831 | |
4,169,051 | | | | JP Morgan Mortgage Trust, 6.500%, due 11/25/34 | | 4,357,416 | |
3,012,000 | | | | MASTR Alternative Loans Trust, 5.500%, due 01/25/20 | | 3,091,065 | |
2,184,000 | | | | MASTR Alternative Loans Trust, 5.750%, due 09/25/34 | | 2,252,904 | |
3,812,447 | | | | MASTR Alternative Loans Trust, 6.000%, due 09/25/34 | | 3,917,290 | |
964,864 | | | | MASTR Alternative Loans Trust, 6.500%, due 05/25/33 | | 986,591 | |
1,628,707 | | | | MASTR Asset Securitization Trust, 2.868%, due 11/25/33 | | 1,632,875 | |
1,979,000 | | | | MASTR Asset Securitization Trust, 5.500%, due 09/25/34 | | 1,987,927 | |
784,387 | | | | MLCC Mortgage Investors, Inc., 2.738%, due 01/25/29 | | 785,395 | |
2,204,421 | | | | MLCC Mortgage Investors, Inc., 2.778%, due 04/25/29 | | 2,206,761 | |
2,541,510 | | | | Prime Mortgage Trust, 5.250%, due 11/25/19 | | 2,594,578 | |
2,310,149 | | | | Residential Accredit Loans, Inc., 2.868%, due 03/25/18 | | 2,315,275 | |
1,819,000 | | XX | | Residential Asset Securitization Trust, 5.500%, due 11/25/34 | | 1,826,815 | |
575,848 | | | | Residential Funding Sec I, 2.918%, due 12/25/33 | | 575,967 | |
2,887,000 | | XX | | Residential Funding Sec I, 5.750%, due 09/25/34 | | 2,951,573 | |
648,000 | | | | Sequoia Mortgage Trust, 2.683%, due 01/20/35 | | 648,000 | |
4,600,000 | | | | Structured Asset Securities Corp., 6.000%, due 03/25/34 | | 4,726,796 | |
1,414,014 | | | | Thornburg Mortgage Securities Trust, 2.788%, due 09/25/34 | | 1,417,350 | |
1,081,000 | | | | Washington Mutual, 0.000%, due 01/25/35 | | 1,081,000 | |
| 324,014 | | | | Washington Mutual, 2.838%, due 06/25/44 | | | 324,202 | |
3,248,692 | | | | Washington Mutual, 5.000%, due 06/25/18 | | 3,281,179 | |
2,743,458 | | | | Washington Mutual, 6.000%, due 06/25/34 | | 2,818,903 | |
533,699 | | | | Wells Fargo Mortgage Backed Securities Trust, 2.918%, due 02/25/34 | | 533,270 | |
2,225,000 | | | | Wells Fargo Mortgage Backed Securities Trust, 4.500%, due 08/25/18 | | 2,144,112 | |
| | | | | | 98,796,721 | |
| | | | Whole Loan Collateralized Support CMO: 0.1% | | | |
1,166,727 | | | | Bank of America Mortgage Securities, 5.500%, due 11/25/33 | | 1,170,509 | |
| | | | | | 1,170,509 | |
| | | | Total Collateralized Mortgage Obligations
(Cost $131,081,135) | | 135,803,367 | |
MUNICIPAL BONDS: 0.1% | | | |
| | | | Municipal: 0.1% | | | |
510,000 | | | | City of New York, 5.000%, due 11/01/08 | | 551,346 | |
510,000 | | | | City of New York, 5.000%, due 11/01/11 | | 562,881 | |
510,000 | | | | City of New York, 5.000%, due 11/01/15 | | 559,751 | |
| | | | Total Municipal Bonds
(Cost $1,675,160) | | 1,673,978 | |
OTHER BONDS: 0.5% | | | |
| | | | Sovereign: 0.5% | | | |
486,180 | | @@ | | Brazilian Government Intl. Bond, 3.125%, due 04/15/12 | | 466,074 | |
431,000 | | @@ | | Brazilian Government Intl. Bond, 12.250%, due 03/06/30 | | 571,075 | |
691,000 | | @@ | | Columbia Government Intl. Bond, 10.000%, due 01/23/12 | | 801,560 | |
989,000 | | @@ | | Dominican Republic Intl. Bond, 9.040%, due 01/23/13 | | 843,123 | |
1,309,000 | | @@ | | Russia Government Intl. Bond, 5.000%, due 03/31/30 | | 1,355,338 | |
558,000 | | @@ | | Turkey Government Intl. Bond, 12.375%, due 06/15/09 | | 703,080 | |
443,000 | | @@ | | Ukraine Government Intl. Bond, 5.330%, due 08/05/09 | | 470,112 | |
464,000 | | @@,#,L | | Ukraine Government Intl. Bond, 7.650%, due 06/11/13 | | 496,480 | |
See Accompanying Notes to Financial Statements
67
| PORTFOLIO OF INVESTMENTS |
ING VP BALANCED PORTFOLIO | AS OF DECEMBER 31, 2004 (CONTINUED) |
Principal
Amount | | | | | | Value | |
| | | | Sovereign (continued) | | | |
$ | 823,729 | | @@,XX,S | | Uruguay Government Intl. Bond, 10.500%, due 10/20/06 | | $ | 967,321 | |
296,000 | | | | Venezuela Government Intl. Bond, 8.500%, due 10/08/14 | | 314,500 | |
| | | | Total Other Bonds
(Cost $6,398,347) | | 6,988,663 | |
| | | | Total Long-Term Investments
(Cost $1,281,654,647) | | 1,371,905,512 | |
SHORT-TERM INVESTMENTS: 15.5% | | | |
| | | | Commercial Paper: 3.0% | | | |
4,200,000 | | | | BellSouth Corp., 1.990%, due 01/05/05 | | 4,198,840 | |
8,000,000 | | | | Concord Minuteman Cap B, 2.380%, due 01/11/06 | | 8,000,000 | |
1,500,000 | | | | Daimler Chrysler, 2.410%, due 01/07/05 | | 1,499,297 | |
2,500,000 | | | | Daimler Chrysler, 2.450%, due 01/12/05 | | 2,497,958 | |
6,700,000 | | S | | Daimler Chrysler, 2.490%, due 01/03/05 | | 6,698,610 | |
2,500,000 | | | | Daimler Chrysler, 2.580%, due 01/31/05 | | 2,494,467 | |
10,200,000 | | | | Guidant Corp., 2.400%, due 01/10/05 | | 10,193,201 | |
2,000,000 | | S | | Kellogg Co., 2.420%, due 01/18/05 | | 1,997,580 | |
3,000,000 | | | | Kraft Foods, Inc., 2.450%, due 01/24/05 | | 2,995,100 | |
| | | | Total Commercial Paper
(Cost $40,577,029) | | 40,575,053 | |
| | | | Repurchase Agreement: 1.3% | | | |
17,688,000 | | S | | Goldman Sachs Repurchase Agreement dated 12/31/04, 2.230%, due 01/03/05, $17,691,287 to be received upon repurchase (Collateralized by $17,738,000 Federal Home Loan Mortgage Corporation, 5.125%, Market Value plus accrued interest $18,042,229, due 01/28/19) | | | |
| | | | | | 17,688,000 | |
| | | | Total Repurchase Agreement
(Cost $17,688,000) | | 17,688,000 | |
| | | | Securities Lending CollateralCC: 11.2% | | | |
| 153,224,000 | | | | The Bank of New York Institutional Cash Reserve Fund | | | 153,224,000 | |
| | | | Total Securities Lending Collateral
(Cost $153,224,000) | | 153,224,000 | |
| | | | Total Short-Term Investments
(Cost $211,489,029) | | 211,487,053 | |
| | | | Total Investments In Securities
(Cost $1,493,143,676)* | | 116.3 | % | | $ | 1,583,392,565 | |
| | | | Other Assets and Liabilities-Net | | (16.3 | ) | | (222,422,414 | ) |
| | | | Net Assets | | 100.0 | % | | $ | 1,360,970,151 | |
@ Non-income producing security
@@ Foreign issuer
STRIP Separate Trading of Registered Interest and Principal of Securities
+ Step-up basis bonds. Interest rates shown reflect current and future coupon rates.
# Securities with purchases pursuant to Rule 144A, under the Securities Act of 1933 and may not be resold subject to that rule except to qualified institutional buyers. Unless otherwise indicated, these securities have been determined to be liquid under the guidelines established by the Funds’ Board of Directors/Trustees.
C Bond may be called prior to maturity date.
cc Securities purchased with cash collateral for securities loaned.
W When-issued or delayed delivery security.
S Segregated securities for futures, when-issued or delayed delivery securities held at December 31, 2004.
I Illiquid security
L Loaned security, a portion or all of the security is on loan at December 31, 2004.
X Fair value determined by ING Funds Valuation Committee appointed by the Funds’ Board of Directors/Trustees.
XX Value of securities obtained from one or more dealers making markets in the securities in accordance with the Fund’s valuation procedures.
* Cost for federal income tax purposes is $1,513,899,647. Net unrealized appreciation consists of:
| | Gross Unrealized Appreciation | | $ | 84,697,385 | |
| | Gross Unrealized Depreciation | | (15,204,467 | ) |
| | Net Unrealized Appreciation | | $ | 69,492,918 | |
Information concerning open futures contracts at December 31, 2004 is shown below:
Short Contracts | | No. of
Contracts | | Notional
Market Value | | Expiration
Date | | Unrealized
Gain (Loss) | |
U.S. 5 Year Treasury Note | | 209 | | $ | (22,892,031 | ) | 03/31/2005 | | $ | (32,068 | ) |
| | | | | | | | | |
Long Contracts | | | | | | | | | |
U.S. Long Bond | | 120 | | $ | 998,025 | | 03/31/2005 | | 5,748 | |
MIDCAP 400 | | 3 | | 13,500,000 | | 03/18/2005 | | 104,400 | |
| | | | $ | 14,498,025 | | | | $ | 110,148 | |
See Accompanying Notes to Financial Statements
68
| PORTFOLIO OF INVESTMENTS |
ING VP GROWTH AND INCOME PORTFOLIO | AS OF DECEMBER 31, 2004 |
Shares | | | | | | Value | |
COMMON STOCK: 97.1% | | | |
| | | | Aerospace/Defense: 1.3% | | | |
913,800 | | | | Boeing Co. | | $ | 47,307,426 | |
| | | | | | 47,307,426 | |
| | | | Agriculture: 3.2% | | | |
1,870,600 | | | | Altria Group, Inc. | | 114,293,660 | |
| | | | | | 114,293,660 | |
| | | | Auto Parts and Equipment: 1.1% | | | |
596,000 | | | | Johnson Controls, Inc. | | 37,810,240 | |
| | | | | | 37,810,240 | |
| | | | Banks: 5.2% | | | |
473,900 | | | | City National Corp. | | 33,481,035 | |
638,333 | | L | | Northern Trust Corp. | | 31,010,217 | |
1,277,078 | | | | U.S. Bancorp | | 39,998,083 | |
1,300,100 | | | | Wells Fargo & Co. | | 80,801,215 | |
| | | | | | 185,290,550 | |
| | | | Beverages: 1.7% | | | |
1,176,800 | | L | | PepsiCo, Inc. | | 61,428,960 | |
| | | | | | 61,428,960 | |
| | | | Biotechnology: 1.0% | | | |
550,900 | | @ | | Amgen, Inc. | | 35,340,235 | |
| | | | | | 35,340,235 | |
| | | | Building Materials: 0.9% | | | |
760,100 | | @ | | American Standard Cos., Inc. | | 31,407,332 | |
| | | | | | 31,407,332 | |
| | | | Cosmetics/Personal Care: 1.4% | | | |
904,000 | | | | Procter & Gamble Co. | | 49,792,320 | |
| | | | | | 49,792,320 | |
| | | | Diversified Financial Services: 11.9% | | | |
483,100 | | L | | Capital One Financial Corp. | | 40,681,851 | |
2,203,500 | | | | Citigroup, Inc. | | 106,164,631 | |
1,410,206 | | L | | Countrywide Financial Corp. | | 52,191,724 | |
3,069,400 | | @ | | E*TRADE Financial Corp. | | 45,887,530 | |
408,000 | | | | Fannie Mae | | 29,053,680 | |
321,936 | | | | Franklin Resources, Inc. | | 22,422,842 | |
172,000 | | | | Freddie Mac | | 12,676,400 | |
97,500 | | | | Goldman Sachs Group, Inc. | | 10,143,900 | |
622,500 | | | | Lehman Brothers Holdings, Inc. | | 54,456,300 | |
789,100 | | | | Morgan Stanley | | 43,810,832 | |
| | | | | | 417,489,690 | |
| | | | Electric: 2.5% | | | |
6,717,200 | | @,L | | Calpine Corp. | | 26,465,768 | |
700,000 | | | | Edison Intl. | | 22,421,000 | |
401,900 | | | | Entergy Corp. | | 27,164,421 | |
278,300 | | L | | Exelon Corp. | | 12,264,681 | |
| | | | | | 88,315,870 | |
| | | | Electronics: 2.5% | | | |
1,311,200 | | @,L | | Agilent Technologies, Inc. | | 31,599,920 | |
2,212,100 | | @,L | | Jabil Circuit, Inc. | | 56,585,518 | |
| | | | | | 88,185,438 | |
| | | | Engineering and Construction: 1.2% | | | |
861,500 | | @ | | Jacobs Engineering Group, Inc. | | | 41,171,085 | |
| | | | | | 41,171,085 | |
| | | | Entertainment: 1.0% | | | |
648,600 | | @,L | | DreamWorks Animation SKG, Inc. | | 24,328,986 | |
471,800 | | L | | Regal Entertainment Group | | 9,789,850 | |
| | | | | | 34,118,836 | |
| | | | Environmental Control: 0.9% | | | |
713,700 | | @,L | | Stericycle, Inc. | | 32,794,515 | |
| | | | | | 32,794,515 | |
| | | | Hand/Machine Tools: 0.8% | | | |
608,300 | | L | | Stanley Works | | 29,800,617 | |
| | | | | | 29,800,617 | |
| | | | Healthcare-Products: 4.7% | | | |
1,093,700 | | | | Baxter Intl., Inc. | | 37,776,398 | |
314,200 | | | | Guidant Corp. | | 22,653,820 | |
1,650,100 | | | | Johnson & Johnson | | 104,649,342 | |
| | | | | | 165,079,560 | |
| | | | Healthcare-Services: 0.6% | | | |
159,600 | | | | Aetna, Inc. | | 19,910,100 | |
| | | | | | 19,910,100 | |
| | | | Insurance: 2.1% | | | |
870,800 | | | | Allstate Corp. | | 45,037,776 | |
436,100 | | | | Hartford Financial Services Group, Inc. | | 30,226,091 | |
| | | | | | 75,263,867 | |
| | | | Internet: 1.3% | | | |
380,600 | | @,L | | eBay, Inc. | | 44,256,168 | |
| | | | | | 44,256,168 | |
| | | | Investment Companies: 2.6% | | | |
1,550,000 | | @,L | | Consumer Staples Select Sector SPDR Fund | | 35,774,000 | |
1,873,900 | | @,L | | Materials Select Sector SPDR Fund | | 55,767,264 | |
| | | | | | 91,541,264 | |
| | | | Leisure Time: 1.5% | | | |
1,002,100 | | L | | Royal Caribbean Cruises Ltd. | | 54,554,324 | |
| | | | | | 54,554,324 | |
| | | | Lodging: 1.7% | | | |
2,379,559 | | | | Hilton Hotels Corp. | | 54,111,172 | |
78,000 | | @,L | | MGM Mirage | | 5,673,720 | |
| | | | | | 59,784,892 | |
| | | | Media: 3.2% | | | |
2,798,300 | | @ | | Time Warner, Inc. | | 54,398,952 | |
1,227,365 | | | | Viacom, Inc. | | 44,663,812 | |
500,000 | | | | Walt Disney Co. | | 13,900,000 | |
| | | | | | 112,962,764 | |
| | | | Mining: 0.4% | | | |
491,740 | | | | Alcoa, Inc. | | 15,450,471 | |
| | | | | | 15,450,471 | |
See Accompanying Notes to Financial Statements
69
| PORTFOLIO OF INVESTMENTS |
ING VP GROWTH AND INCOME PORTFOLIO | AS OF DECEMBER 31, 2004 (CONTINUED) |
Shares | | | | | | Value | |
| | | | Miscellaneous Manufacturing: 8.0% | | | |
537,800 | | | | Danaher Corp. | | $ | 30,875,098 | |
3,983,500 | | | | General Electric Co. | | 145,397,750 | |
2,942,500 | | @@ | | Tyco Intl. Ltd. | | 105,164,950 | |
| | | | | | 281,437,798 | |
| | | | Oil and Gas: 6.6% | | | |
168,619 | | | | Anadarko Petroleum Corp. | | 10,928,197 | |
584,500 | | L | | Ensco Intl., Inc. | | 18,552,030 | |
1,336,300 | | | | Exxon Mobil Corp. | | 68,498,739 | |
583,700 | | @ | | Houston Exploration Co. | | 32,868,147 | |
944,100 | | @ | | Plains Exploration & Production Co | | 24,546,600 | |
794,696 | | @@,L | | Royal Dutch Petroleum Co. | | 45,599,656 | |
958,600 | | | | XTO Energy, Inc. | | 33,915,268 | |
| | | | | | 234,908,637 | |
| | | | Oil and Gas Services: 2.3% | | | |
1,268,000 | | L | | Halliburton Co. | | 49,756,320 | |
476,500 | | L | | Schlumberger Ltd. | | 31,901,675 | |
| | | | | | 81,657,995 | |
| | | | Pharmaceuticals: 3.9% | | | |
739,500 | | @ | | Gilead Sciences, Inc. | | 25,875,105 | |
1,615,300 | | | | Pfizer, Inc. | | 43,435,417 | |
834,000 | | @ | | Watson Pharmaceuticals, Inc. | | 27,363,540 | |
982,500 | | L | | Wyeth | | 41,844,675 | |
| | | | | | 138,518,737 | |
| | | | Retail: 3.9% | | | |
354,378 | | | | CVS Corp. | | 15,971,816 | |
1,633,900 | | L | | Gap, Inc. | | 34,507,968 | |
684,100 | | | | Home Depot, Inc. | | 29,238,434 | |
305,000 | | L | | Sears Roebuck and Co. | | 15,564,150 | |
210,000 | | | | Target Corp. | | 10,905,300 | |
588,300 | | | | Wal-Mart Stores, Inc. | | 31,074,006 | |
| | | | | | 137,261,674 | |
| | | | Semiconductors: 5.4% | | | |
3,185,800 | | | | Intel Corp. | | 74,515,862 | |
1,123,200 | | | | Maxim Integrated Products, Inc. | | 47,612,448 | |
4,434,500 | | @@ | | Taiwan Semiconductor Manufacturing Co. Ltd. ADR | | 37,648,905 | |
1,213,600 | | | | Texas Instruments, Inc. | | 29,878,832 | |
| | | | | | 189,656,047 | |
| | | | Software: 5.6% | | | |
551,900 | | @ | | Cognos, Inc. | | 24,316,714 | |
1,179,900 | | L | | Computer Associates Intl., Inc. | | 36,647,694 | |
440,900 | | @,L | | Electronic Arts, Inc. | | 27,194,712 | |
4,110,900 | | | | Microsoft Corp. | | 109,802,139 | |
| | | | | | 197,961,259 | |
| | | | Telecommunications: 6.7% | | | |
2,881,600 | | @ | | Cisco Systems, Inc. | | 55,614,880 | |
1,278,400 | | | | Motorola, Inc. | | 21,988,480 | |
1,016,200 | | @ | | Nextel Communications, Inc. | | 30,486,000 | |
925,000 | | | | QUALCOMM, Inc. | | 39,220,000 | |
1,145,500 | | | | SBC Communications, Inc. | | 29,519,535 | |
1,780,800 | | L | | Sprint Corp. | | 44,252,880 | |
416,000 | | | | Verizon Communications, Inc. | | 16,852,160 | |
| | | | | | 237,933,935 | |
| | | | Total Common Stock
(Cost $3,004,020,775) | | 3,432,686,266 | |
WARRANTS: 0.0% | | | |
| | | | Telecommunications: 0.0% | | | |
349,149 | | @ | | Lucent Technologies, Inc. | | | 551,655 | |
| | | | Total Warrants
(Cost $-) | | 551,655 | |
| | | | Total Long-Term Investments
(Cost $3,004,020,775) | | 3,433,237,921 | |
| | | | | | | |
Principal
Amount | | | | | | Value | |
| | | | | |
SHORT-TERM INVESTMENTS: 9.4% | | | | | |
| | | | Repurchase Agreement: 3.2% | | | | | |
$ | 111,321,000 | | S | | Goldman Sachs Repurchase Agreement dated 12/31/04, 2.230%, due 01/03/05, $111,341,687 to be received upon repurchase(Collateralized by $114,168,000 Various U.S. Government Agency Obligations, 0.000%-4.750%, Market Value plus accrued interest $113,547,511, due 10/11/12-02/07/19) | | | | 111,321,000 | |
| | | | Total Repurchase Agreement
(Cost $111,321,000) | | | | 111,321,000 | |
| | | | | | | | | |
| | | | Securities Lending CollateralCC: 6.2% | | | | | |
219,680,000 | | | | The Bank of New York | | | | | |
| | | | Institutional Cash | | | | | |
| | | | Reserve Fund | | | | 219,680,000 | |
| | | | Total Securities Lending Collateral
(Cost $219,680,000) | | | | 219,680,000 | |
| | | | Total Short-Term Investments
(Cost $331,001,000) | | | | 331,001,000 | |
| | | | Total Investments In Securities
(Cost $3,335,021,775)* | | 106.5 | % | $ | 3,764,238,921 | |
| | | | Other Assets and Liabilities-Net | | (6.5 | ) | (231,039,806 | ) |
| | | | Net Assets | | 100.0 | % | $ | 3,533,199,115 | |
| | | | | | | | | | | | | |
@ Non-income producing security
@@ Foreign issuer
ADR American Depositary Receipt
cc Securities purchased with cash collateral for securities loaned.
S Segregated securities for futures, when-issued or delayed delivery securities held at December 31, 2004.
L Loaned security, a portion or all of the security is on loan at December 31, 2004.
* Cost for federal income tax purposes is $3,355,384,010. Net unrealized appreciation consists of:
Gross Unrealized Appreciation | | $ | 424,447,649 | |
Gross Unrealized Depreciation | | (15,592,738 | ) |
Net Unrealized Appreciation | | $ | 408,854,911 | |
Information concerning open futures contracts at December 31, 2004 is shown below:
Long Contracts | | No. of
Contracts | | Notional
Market Value | | Expiration
Date | | Unrealized
Gain (Loss) | |
S&P 500 Future | | 180 | | $ | 54,616,500 | | 03/21/2005 | | $ | 667,721 | |
| | | | | | | | | | | |
See Accompanying Notes to Financial Statements
70
| PORTFOLIO OF INVESTMENTS |
ING VP GROWTH PORTFOLIO | AS OF DECEMBER 31, 2004 |
Shares | | | | | | Value | |
COMMON STOCK: 97.4% | | | |
| | | | Aerospace/Defense: 4.7% | | | |
80,800 | | | | Boeing Co. | | $ | 4,183,016 | |
57,100 | | | | Goodrich Corp. | | 1,863,744 | |
29,300 | | | | United Technologies Corp. | | 3,028,155 | |
| | | | | | 9,074,915 | |
| | | | Agriculture: 3.4% | | | |
117,820 | | | | Monsanto Co. | | 6,544,901 | |
| | | | | | 6,544,901 | |
| | | | Apparel: 3.0% | | | |
29,100 | | @ | | Coach, Inc. | | 1,641,240 | |
45,000 | | | | Nike, Inc. | | 4,081,050 | |
| | | | | | 5,722,290 | |
| | | | Banks: 1.3% | | | |
47,906 | | | | Wachovia Corp. | | 2,519,856 | |
| | | | | | 2,519,856 | |
| | | | Biotechnology: 1.5% | | | |
42,400 | | @ | | Biogen Idec, Inc. | | 2,824,264 | |
| | | | | | 2,824,264 | |
| | | | Computers: 7.4% | | | |
40,300 | | @ | | Apple Computer, Inc. | | 2,595,320 | |
130,500 | | @ | | Dell, Inc. | | 5,499,270 | |
65,600 | | | | International Business Machines Corp. | | 6,466,848 | |
| | | | | | 14,561,438 | |
| | | | Cosmetics/Personal Care: 4.3% | | | |
71,500 | | | | Gillette Co. | | 3,201,770 | |
91,900 | | | | Procter & Gamble Co. | | 5,061,852 | |
| | | | | | 8,263,622 | |
| | | | Diversified Financial Services: 4.1% | | | |
46,200 | | L | | Capital One Financial Corp. | | 3,890,502 | |
38,800 | | | | Goldman Sachs Group, Inc. | | 4,036,752 | |
| | | | | | 7,927,254 | |
| | | | Hand/Machine Tools: 1.4% | | | |
54,500 | | L | | Stanley Works | | 2,669,955 | |
| | | | | | 2,669,955 | |
| | | | Healthcare-Products: 12.0% | | | |
37,400 | | @@,L | | Alcon, Inc. | | 3,014,440 | |
120,800 | | | | Johnson & Johnson | | 7,661,135 | |
39,300 | | @ | | Kinetic Concepts, Inc. | | 2,998,590 | |
91,500 | | @,L | | St. Jude Medical, Inc. | | 3,836,595 | |
75,918 | | @ | | Varian Medical Systems, Inc. | | 3,282,694 | |
31,876 | | @ | | Zimmer Holdings, Inc. | | 2,553,905 | |
| | | | | | 23,347,359 | |
| | | | Healthcare-Services: 3.8% | | | |
33,900 | | @ | | Covance, Inc. | | 1,313,625 | |
97,557 | | @ | | DaVita, Inc. | | 3,856,428 | |
25,900 | | | | UnitedHealth Group, Inc. | | 2,279,977 | |
| | | | | | 7,450,030 | |
| | | | Home Furnishings: 0.5% | | | |
7,800 | | | | Harman Intl. Industries, Inc. | | 990,600 | |
| | | | | | 990,600 | |
| | | | Insurance: 1.7% | | | |
50,200 | | | | American Intl. Group, Inc. | | | 3,296,634 | |
| | | | | | 3,296,634 | |
| | | | Internet: 5.0% | | | |
34,200 | | @ | | eBay, Inc. | | 3,976,776 | |
41,929 | | @ | | McAfee, Inc. | | 1,213,006 | |
80,500 | | @,L | | Symantec Corp. | | 2,073,680 | |
61,800 | | @ | | Yahoo!, Inc. | | 2,328,624 | |
| | | | | | 9,592,086 | |
| | | | Leisure Time: 1.1% | | | |
37,400 | | | | Royal Caribbean Cruises Ltd. | | 2,036,056 | |
| | | | | | 2,036,056 | |
| | | | Lodging: 1.5% | | | |
47,000 | | | | Marriott Intl., Inc. | | 2,960,060 | |
| | | | | | 2,960,060 | |
| | | | Machinery-Diversified: 1.7% | | | |
43,500 | | | | Deere & Co. | | 3,236,400 | |
| | | | | | 3,236,400 | |
| | | | Media: 1.1% | | | |
76,900 | | | | Walt Disney Co. | | 2,137,820 | |
| | | | | | 2,137,820 | |
| | | | Miscellaneous Manufacturing: 6.0% | | | |
32,294 | | | | Danaher Corp. | | 1,853,999 | |
135,360 | | | | General Electric Co. | | 4,940,640 | |
133,300 | | @@ | | Tyco Intl., Ltd. | | 4,764,142 | |
| | | | | | 11,558,781 | |
| | | | Oil and Gas: 1.6% | | | |
15,700 | | @ | | Houston Exploration Co. | | 884,067 | |
50,600 | | @ | | Transocean, Inc. | | 2,144,934 | |
| | | | | | 3,029,001 | |
| | | | Oil and Gas Services: 1.9% | | | |
93,000 | | | | Halliburton Co. | | 3,649,320 | |
| | | | | | 3,649,320 | |
| | | | Packaging and Containers: 0.5% | | | |
40,357 | | @ | | Owens-Illinois, Inc. | | 914,086 | |
| | | | | | 914,086 | |
| | | | Pharmaceuticals: 4.8% | | | |
34,200 | | @,@@,L | | Elan Corp. PLC ADR | | 931,950 | |
68,200 | | @ | | Endo Pharmaceuticals Holdings, Inc. | | 1,433,564 | |
152,700 | | @ | | Gilead Sciences, Inc. | | 5,342,973 | |
58,710 | | | | Pfizer, Inc. | | 1,578,712 | |
| | | | | | 9,287,199 | |
| | | | Retail: 6.9% | | | |
78,300 | | | | CVS Corp. | | 3,528,981 | |
108,400 | | | | Home Depot, Inc. | | 4,633,016 | |
82,600 | | | | J.C. Penney Co., Inc. Holding Co. | | 3,419,640 | |
59,300 | | | | Staples, Inc. | | 1,999,003 | |
| | | | | | 13,580,640 | |
| | | | Semiconductors: 2.2% | | | |
41,100 | | @ | | Advanced Micro Devices, Inc. | | 905,022 | |
140,300 | | | | Intel Corp. | | 3,281,617 | |
| | | | | | 4,186,639 | |
See Accompanying Notes to Financial Statements
71
| PORTFOLIO OF INVESTMENTS |
ING VP GROWTH PORTFOLIO | AS OF DECEMBER 31, 2004 (CONTINUED) |
Shares | | | | | | Value | |
| | | | Software: 6.5% | | | |
313,500 | | S | | Microsoft Corp. | | $ | 8,373,585 | |
308,900 | | @ | | Oracle Corp. | | 4,238,108 | |
| | | | | | 12,611,693 | |
| | | | Telecommunications: 6.4% | | | |
134,100 | | @ | | Cisco Systems, Inc. | | 2,588,130 | |
149,600 | | @@ | | Nokia Oyj ADR | | 2,344,232 | |
127,500 | | | | QUALCOMM, Inc. | | 5,406,000 | |
85,400 | | | | Sprint Corp. | | 2,122,190 | |
| | | | | | 12,460,552 | |
| | | | Transportation: 1.1% | | | |
21,000 | | | | FedEx Corp. | | 2,068,290 | |
| | | | | | 2,068,290 | |
| | | | Total Common Stock
(Cost $163,018,875) | | 188,501,741 | |
WARRANTS: 0.0% | | | |
| | | | Telecommunications: 0.0% | | | |
12,991 | | @ | | Lucent Technologies, Inc. | | 20,526 | |
| | | | Total Warrants
(Cost $21,565) | | 20,526 | |
| | | | Total Long-Term Investments
(Cost $163,040,440) | | 188,522,267 | |
| | | | | | | |
Principal
Amount | | | | | | Value | |
| | | | | |
SHORT-TERM INVESTMENTS: 8.5% | | | | | |
| | | | Repurchase Agreement: 2.6% | | | | | |
$ | 4,960,000 | | | | Goldman Sachs Repurchase Agreement dated 12/31/04, 2.230%, due 01/03/05, $4,960,922 to be received upon repurchase (Collateralized by $4,954,000 Federal Home Loan Mortgage Corporation, 5.125%, Market Value plus accrued interest $5,059,438, due 02/04/19) | | | | 4,960,000 | |
| | | | Total Repurchase Agreement
(Cost $4,960,000) | | | | 4,960,000 | |
| | | | | | | | | |
| | | | Securities Lending CollateralCC: 5.9% | | | | | |
11,536,000 | | | | The Bank of New York | | | | | |
| | | | Institutional Cash | | | | | |
| | | | Reserve Fund | | | | 11,536,000 | |
| | | | Total Securities Lending Collateral
(Cost $11,536,000) | | | | 11,536,000 | |
| | | | Total Short-Term Investments
(Cost $16,496,000) | | | | 16,496,000 | |
| | | | Total Investments In Securities
(Cost $179,536,440)* | | 105.9 | % | $ | 205,018,267 | |
| | | | Other Assets and Liabilities-Net | | (5.9 | ) | (11,381,781 | ) |
| | | | Net Assets | | 100.0 | % | $ | 193,636,486 | |
| | | | | | | | | | | | |
@ Non-income producing security
@@ Foreign issuer
ADR American Depositary Receipt
cc Securities purchased with cash collateral for securities loaned.
S Segregated securities for futures, when-issued or delayed delivery securities held at December 31, 2004.
L Loaned security, a portion or all of the security is on loan at December 31, 2004.
* Cost for federal income tax purposes is $184,024,724. Net unrealized appreciation consists of:
Gross Unrealized Appreciation | | $ | 23,147,916 | |
Gross Unrealized Depreciation | | (2,154,373 | ) |
Net Unrealized Appreciation | | $ | 20,993,543 | |
Information concerning open futures contracts at December 31, 2004 is shown below:
Long Contracts | | No. of
Contracts | | Notional
Market Value | | Expiration
Date | | Unrealized
Gain (Loss) | |
S&P 500 Future | | 14 | | $ | 4,247,950 | | 03/21/2005 | | $ | 10,024 | |
| | | | | | | | | | | |
See Accompanying Notes to Financial Statements
72
| PORTFOLIO OF INVESTMENTS |
ING VP SMALL COMPANY PORTFOLIO | AS OF DECEMBER 31, 2004 |
Shares | | | | | | Value | |
COMMON STOCK: 95.6% | | | |
| | | | Aerospace/Defense: 4.4% | | | |
127,500 | | | | Engineered Support Systems, Inc. | | $ | 7,550,550 | |
57,850 | | @ | | Innovative Solutions & Support, Inc. | | 1,929,876 | |
61,200 | | @ | | MTC Technologies, Inc. | | 2,054,484 | |
143,850 | | @ | | Teledyne Technologies, Inc. | | 4,233,506 | |
162,200 | | @ | | United Defense Industries, Inc. | | 7,663,950 | |
| | | | | | 23,432,366 | |
| | | | Airlines: 0.7% | | | |
351,300 | | @ | | Northwest Airlines Corp. | | 3,839,709 | |
| | | | | | 3,839,709 | |
| | | | Apparel: 2.2% | | | |
233,700 | | @ | | Quiksilver, Inc. | | 6,961,923 | |
227,600 | | @ | | Warnaco Group, Inc. | | 4,916,160 | |
| | | | | | 11,878,083 | |
| | | | Banks: 4.8% | | | |
88,360 | | | | Banco Latinoamericano de Exportaciones SA | | 1,761,898 | |
137,850 | | | | Chittenden Corp. | | 3,960,431 | |
206,250 | | | | Greater Bay BanCorp | | 5,750,250 | |
210,400 | | | | Hudson United BanCorp | | 8,285,552 | |
47,100 | | | | IBERIABANK Corp. | | 3,125,556 | |
81,080 | | | | Texas Regional Bancshares, Inc. | | 2,649,694 | |
| | | | | | 25,533,381 | |
| | | | Biotechnology: 0.9% | | | |
49,100 | | @ | | Martek Biosciences Corp. | | 2,513,920 | |
107,500 | | @ | | Telik, Inc. | | 2,057,550 | |
| | | | | | 4,571,470 | |
| | | | Coal: 0.4% | | | |
69,700 | | @ | | Westmoreland Coal Co. | | 2,123,062 | |
| | | | | | 2,123,062 | |
| | | | Commercial Services: 2.4% | | | |
64,250 | | @ | | Advisory Board Co. | | 2,369,540 | |
97,450 | | @ | | Exponent, Inc. | | 2,678,901 | |
17,750 | | | | Gevity HR, Inc. | | 364,940 | |
133,500 | | @ | | Resources Connection, Inc. | | 7,250,385 | |
| | | | | | 12,663,766 | |
| | | | Computers: 4.1% | | | |
204,700 | | | | Agilysys, Inc. | | 3,508,558 | |
97,900 | | @ | | AMX Corp. | | 1,612,413 | |
158,900 | | @ | | Brooktrout, Inc. | | 1,908,389 | |
255,600 | | @ | | Covansys Corp. | | 3,910,680 | |
337,400 | | @ | | InterVoice, Inc. | | 4,504,290 | |
185,850 | | | | MTS Systems Corp. | | 6,283,589 | |
| | | | | | 21,727,919 | |
| | | | Distribution/Wholesale: 1.5% | | | |
163,350 | | @ | | Brightpoint, Inc. | | 3,191,859 | |
136,400 | | | | Watsco, Inc. | | 4,804,008 | |
| | | | | | 7,995,867 | |
| | | | Diversified Financial Services: 1.1% | | | |
554,900 | | @ | | Knight Trading Group, Inc. | | 6,076,155 | |
| | | | | | 6,076,155 | |
| | | | Electrical Components and Equipment: 2.0% | | | |
232,450 | | | | Ametek, Inc. | | | 8,291,492 | |
219,000 | | @ | | Artesyn Technologies, Inc. | | 2,474,700 | |
| | | | | | 10,766,192 | |
| | | | Electronics: 4.2% | | | |
167,100 | | @ | | Benchmark Electronics, Inc. | | 5,698,110 | |
253,400 | | @ | | Checkpoint Systems, Inc. | | 4,573,870 | |
48,050 | | @ | | NVE Corp. | | 1,338,193 | |
203,300 | | @ | | SBS Technologies, Inc. | | 2,838,068 | |
232,300 | | @ | | Trimble Navigation Ltd. | | 7,675,192 | |
| | | | | | 22,123,433 | |
| | | | Energy-Alternate Sources: 0.8% | | | |
145,950 | | @ | | Headwaters, Inc. | | 4,159,575 | |
| | | | | | 4,159,575 | |
| | | | Engineering and Construction: 1.7% | | | |
102,750 | | @ | | URS Corp. | | 3,298,275 | |
136,500 | | @ | | Washington Group Intl., Inc. | | 5,630,625 | |
| | | | | | 8,928,900 | |
| | | | Entertainment: 0.7% | | | |
110,000 | | @ | | Macrovision Corp. | | 2,829,200 | |
183,600 | | @ | | Youbet.com, Inc. | | 929,016 | |
| | | | | | 3,758,216 | |
| | | | Food: 2.5% | | | |
178,200 | | | | Corn Products Intl., Inc. | | 9,544,392 | |
85,000 | | | | Sanderson Farms, Inc. | | 3,678,800 | |
| | | | | | 13,223,192 | |
| | | | Forest Products and Paper: 2.2% | | | |
147,500 | | | | Louisiana-Pacific Corp. | | 3,944,150 | |
153,100 | | | | Potlatch Corp. | | 7,743,798 | |
| | | | | | 11,687,948 | |
| | | | Healthcare-Products: 1.3% | | | |
52,870 | | @ | | Biosite, Inc. | | 3,253,620 | |
68,000 | | @ | | Epix Medical, Inc. | | 1,217,880 | |
84,300 | | @ | | Wright Medical Group, Inc. | | 2,402,550 | |
| | | | | | 6,874,050 | |
| | | | Healthcare-Services: 4.3% | | | |
284,150 | | @ | | Kindred Healthcare, Inc. | | 8,510,293 | |
496,950 | | | | Select Medical Corp. | | 8,746,320 | |
102,900 | | @ | | Sierra Health Services, Inc. | | 5,670,819 | |
| | | | | | 22,927,432 | |
| | | | Household Products/Wares: 0.9% | | | |
114,150 | | @ | | Central Garden & Pet Co. | | 4,764,621 | |
| | | | | | 4,764,621 | |
| | | | Insurance: 0.7% | | | |
83,200 | | | | AmerUs Group Co. | | 3,768,960 | |
| | | | | | 3,768,960 | |
| | | | Internet: 2.5% | | | |
64,100 | | @ | | Equinix, Inc. | | 2,739,634 | |
134,300 | | @ | | Imergent, Inc. | | 2,034,645 | |
409,200 | | @ | | ValueClick, Inc. | | 5,454,636 | |
59,000 | | @ | | Websense, Inc. | | 2,992,480 | |
| | | | | | 13,221,395 | |
See Accompanying Notes to Financial Statements
73
| PORTFOLIO OF INVESTMENTS |
ING VP SMALL COMPANY PORTFOLIO | AS OF DECEMBER 31, 2004 (CONTINUED) |
Shares | | | | | | Value | |
| | | | Investment Companies: 0.5% | | | |
186,550 | | @ | | Apollo Investment Corp. | | $ | 2,816,905 | |
| | | | | | 2,816,905 | |
| | | | Iron/Steel: 1.0% | | | |
91,450 | | | | Carpenter Technology Corp. | | 5,346,167 | |
| | | | | | 5,346,167 | |
| | | | Leisure Time: 0.6% | | | |
206,900 | | @ | | K2, Inc. | | 3,285,572 | |
| | | | | | 3,285,572 | |
| | | | Lodging: 1.2% | | | |
294,450 | | @ | | Interstate Hotels & Resorts, Inc. | | 1,578,252 | |
548,350 | | @ | | La Quinta Corp. | | 4,984,502 | |
| | | | | | 6,562,754 | |
| | | | Machinery-Construction and Mining: 1.8% | | | |
205,900 | | @ | | Terex Corp. | | 9,811,135 | |
| | | | | | 9,811,135 | |
| | | | Machinery-Diversified: 3.0% | | | |
104,500 | | | | Briggs & Stratton Corp. | | 4,345,110 | |
140,500 | | | | Cognex Corp. | | 3,919,950 | |
56,200 | | @ | | Middleby Corp. | | 2,850,464 | |
236,000 | | | | Washington Air Break Technologies Corp. | | 5,031,520 | |
| | | | | | 16,147,044 | |
| | | | Media: 2.4% | | | |
273,300 | | @ | | 4Kids Entertainment, Inc. | | 5,744,766 | |
185,500 | | @ | | Cumulus Media, Inc. | | 2,797,340 | |
94,150 | | | | Liberty Corp. | | 4,138,834 | |
| | | | | | 12,680,940 | |
| | | | Mining: 0.3% | | | |
76,500 | | @ | | Inmet Mining Corp. | | 1,375,295 | |
| | | | | | 1,375,295 | |
| | | | Miscellaneous Manufacturing: 0.9% | | | |
81,423 | | @ | | Ceradyne, Inc. | | 4,658,210 | |
| | | | | | 4,658,210 | |
| | | | Oil and Gas: 5.1% | | | |
292,900 | | @ | | Denbury Resources, Inc. | | 8,040,105 | |
145,000 | | @ | | KCS Energy, Inc. | | 2,143,100 | |
123,700 | | | | Patina Oil & Gas Corp. | | 4,638,750 | |
134,700 | | @ | | Plains Exploration & Production Co. | | 3,502,200 | |
171,100 | | @ | | Southwestern Energy Co. | | 8,673,058 | |
| | | | | | 26,997,213 | |
| | | | Oil and Gas Services: 1.9% | | | |
112,250 | | @, @@ | | Core Laboratories NV | | 2,621,038 | |
109,100 | | @ | | Hydril Co. | | 4,965,141 | |
144,900 | | @ | | Oil States Intl., Inc. | | 2,795,121 | |
| | | | | | 10,381,300 | |
| | | | Pharmaceuticals: 3.6% | | | |
241,700 | | @ | | Alkermes, Inc. | | 3,405,553 | |
180,950 | | @ | | Amylin Pharmaceuticals, Inc. | | 4,226,992 | |
100,000 | | @ | | Atherogenics, Inc. | | 2,356,000 | |
202,200 | | @ | | Critical Therapeutics, Inc. | | 1,617,600 | |
60,400 | | @ | | MGI Pharma, Inc. | | | 1,691,804 | |
120,100 | | @ | | Nabi Biopharmaceuticals | | 1,759,465 | |
33,300 | | @ | | OSI Pharmaceuticals, Inc. | | 2,492,505 | |
61,700 | | @ | | Rigel Pharmaceuticals, Inc. | | 1,506,714 | |
| | | | | | 19,056,633 | |
| | | | Real Estate: 0.7% | | | |
114,100 | | @ | | CB Richard Ellis Group, Inc. | | 3,828,055 | |
| | | | | | 3,828,055 | |
| | | | Real Estate Investment Trusts: 8.6% | | | |
218,500 | | | | Acadia Realty Trust | | 3,561,550 | |
80,100 | | | | Alexandria Real Estate Equities, Inc. | | 5,961,041 | |
131,800 | | | | Corporate Office Properties Trust | | 3,868,330 | |
175,100 | | @ | | Felcor Lodging Trust, Inc. | | 2,565,215 | |
139,817 | | | | Gramercy Capital Corp. | | 2,880,230 | |
206,400 | | | | Innkeepers USA Trust | | 2,930,880 | |
144,600 | | | | LaSalle Hotel Properties | | 4,602,618 | |
243,550 | | @ | | Meristar Hospitality Corp. | | 2,033,643 | |
238,700 | | | | Newcastle Investment Corp. | | 7,585,885 | |
164,700 | | | | Reckson Associates Realty Corp. | | 5,403,807 | |
46,450 | | | | SL Green Realty Corp. | | 2,812,548 | |
54,900 | | | | Washington Real Estate Investment Trust | | 1,859,463 | |
| | | | | | 46,065,210 | |
| | | | Retail: 2.9% | | | |
193,500 | | @ | | Aeropostale, Inc. | | 5,694,705 | |
201,100 | | | | Claire’s Stores, Inc. | | 4,273,375 | |
122,500 | | @ | | Electronics Boutique Holdings Corp. | | 5,260,150 | |
6,783 | | @ | | Syms Corp. | | 82,413 | |
| | | | | | 15,310,643 | |
| | | | Savings and Loans: 1.5% | | | |
416,150 | | | | First Niagara Financial Group, Inc. | | 5,805,293 | |
33,800 | | | | WSFS Financial Corp. | | 2,038,816 | |
| | | | | | 7,844,109 | |
| | | | Semiconductors: 2.4% | | | |
103,400 | | @ | | ADE Corp. | | 1,935,648 | |
181,300 | | @ | | Cypress Semiconductor Corp. | | 2,126,649 | |
273,100 | | @ | | Pericom Semiconductor Corp. | | 2,575,333 | |
91,958 | | @ | | Photronics, Inc. | | 1,517,307 | |
132,300 | | @ | | Varian Semiconductor Equipment Associates, Inc. | | 4,875,255 | |
| | | | | | 13,030,192 | |
| | | | Software: 5.6% | | | |
169,230 | | @ | | Activision, Inc. | | 3,415,061 | |
193,550 | | @ | | Avid Technology, Inc. | | 11,951,712 | |
617,500 | | @ | | Informatica Corp. | | 5,014,099 | |
141,800 | | @ | | Progress Software Corp. | | 3,311,030 | |
99,050 | | @ | | Take-Two Interactive Software, Inc. | | 3,445,950 | |
128,825 | | @ | | THQ, Inc. | | 2,955,246 | |
| | | | | | 30,093,098 | |
| | | | Telecommunications: 2.5% | | | |
214,900 | | @ | | Aspect Communications Corp. | | 2,393,986 | |
102,956 | | @ | | Comtech Telecommunications | | 3,872,175 | |
146,900 | | @ | | Intrado, Inc. | | 1,777,490 | |
See Accompanying Notes to Financial Statements
74
| PORTFOLIO OF INVESTMENTS |
ING VP SMALL COMPANY PORTFOLIO | AS OF DECEMBER 31, 2004 (CONTINUED) |
Shares | | | | | | Value | |
| | | | Telecommunications (continued) | | | |
231,900 | | @ | | Netgear, Inc. | | $ | 4,218,261 | |
80,500 | | @ | | Otelco, Inc. | | 1,279,950 | |
| | | | | | 13,541,862 | |
| | | | Transportation: 2.8% | | | |
85,100 | | @ | | Landstar System, Inc. | | 6,266,764 | |
108,600 | | | | Overseas Shipholding Group, Inc. | | 5,994,720 | |
137,800 | | @ | | Sirva, Inc. | | 2,648,516 | |
| | | | | | 14,910,000 | |
| | | | Total Common Stock
(Cost $411,668,653) | | 509,788,029 | |
| | | | | | | | |
Principal
Amount | | | | | | Value | |
| | | | | |
SHORT-TERM INVESTMENTS: 3.8% | | | | | |
| | | | Repurchase Agreement: 3.8% | | | | | |
$20,380,000 | | S | | Goldman Sachs Repurchase Agreement dated 12/31/04, 2.230%, due 01/03/05, $20,383,787 to be received upon repurchase (Collateralized by $20,541,000 Federal Home Loan Mortgage Corporation, 5.080%, Market Value plus accrued interest $20,787,697, due 02/25/19) | | | | $ | 20,380,000 | |
| | | | Total Short-Term Investments
(Cost $20,380,000) | | | | 20,380,000 | |
| | | | Total Investments In Securities
(Cost $432,048,653)* | | 99.4 | % | $ | 530,168,029 | |
| | | | Other Assets and Liabilities-Net | | 0.6 | | 3,063,237 | |
| | | | Net Assets | | 100.0 | % | $ | 533,231,266 | |
| | | | | | | | | | | |
@ Non-income producing security
@@ Foreign issuer
S Segregated securities for futures, when-issued or delayed delivery securities held at December 31, 2004.
* Cost for federal income tax purposes is $432,231,564. Net unrealized appreciation consists of:
Gross Unrealized Appreciation | | $ | 106,911,077 | |
Gross Unrealized Depreciation | | (8,974,612 | ) |
Net Unrealized Appreciation | | $ | 97,936,465 | |
See Accompanying Notes to Financial Statements
75
| PORTFOLIO OF INVESTMENTS |
ING VP VALUE OPPORTUNITY PORTFOLIO | AS OF DECEMBER 31, 2004 |
Shares | | | | | | Value | |
COMMON STOCK: 99.5% | | | |
| | | | Aerospace/Defense: 3.1% | | | |
66,600 | | | | General Dynamics Corp. | | $ | 6,966,360 | |
| | | | | | 6,966,360 | |
| | | | Agriculture: 3.1% | | | |
112,000 | | | | Altria Group, Inc. | | 6,843,200 | |
| | | | | | 6,843,200 | |
| | | | Apparel: 2.3% | | | |
56,800 | | | | Nike, Inc. | | 5,151,192 | |
| | | | | | 5,151,192 | |
| | | | Banks: 6.9% | | | |
180,700 | | | | Bank of America Corp. | | 8,491,093 | |
111,200 | | | | Wells Fargo & Co. | | 6,911,080 | |
| | | | | | 15,402,173 | |
| | | | Building Materials: 1.6% | | | |
96,900 | | | | Masco Corp. | | 3,539,757 | |
| | | | | | 3,539,757 | |
| | | | Chemicals: 4.6% | | | |
113,500 | | | | Dow Chemical Co. | | 5,619,385 | |
106,500 | | | | Praxair, Inc. | | 4,701,975 | |
| | | | | | 10,321,360 | |
| | | | Computers: 2.1% | | | |
47,200 | | | | International Business Machines Corp. | | 4,652,976 | |
| | | | | | 4,652,976 | |
| | | | Cosmetics/Personal Care: 2.5% | | | |
84,400 | | | | Kimberly-Clark Corp. | | 5,554,364 | |
| | | | | | 5,554,364 | |
| | | | Diversified Financial Services: 13.0% | | | |
118,500 | | | | Citigroup, Inc. | | 5,709,330 | |
96,500 | | | | Fannie Mae | | 6,871,766 | |
64,800 | | | | Freddie Mac | | 4,775,760 | |
108,000 | | | | Merrill Lynch & Co., Inc. | | 6,455,160 | |
99,200 | | | | Morgan Stanley | | 5,507,584 | |
| | | | | | 29,319,600 | |
| | | | Electrical Components and Equipment: 3.4% | | | |
107,300 | | | | Emerson Electric Co. | | 7,521,730 | |
| | | | | | 7,521,730 | |
| | | | Electronics: 3.1% | | | |
258,800 | | @@ | | Koninklijke Philips Electronics NV | | 6,858,200 | |
| | | | | | 6,858,200 | |
| | | | Food: 4.7% | | | |
107,300 | | @@ | | Nestle SA ADR | | 7,018,235 | |
51,500 | | @@ | | Unilever NV | | 3,435,565 | |
| | | | | | 10,453,800 | |
| | | | Forest Products and Paper: 2.3% | | | |
120,500 | | | | International Paper Co. | | 5,061,000 | |
2,557 | | @,L | | Neenah Paper, Inc. | | 83,358 | |
| | | | | | 5,144,358 | |
| | | | Healthcare-Products: 2.3% | | | |
77,900 | | | | Beckman Coulter, Inc. | | | 5,218,521 | |
| | | | | | 5,218,521 | |
| | | | Healthcare-Services: 2.2% | | | |
52,300 | | | | Quest Diagnostics, Inc. | | 4,997,265 | |
| | | | | | 4,997,265 | |
| | | | Insurance: 8.3% | | | |
111,400 | | | | Allstate Corp. | | 5,761,608 | |
104,700 | | | | American Intl. Group, Inc. | | 6,875,649 | |
147,200 | | | | MetLife, Inc. | | 5,963,072 | |
| | | | | | 18,600,329 | |
| | | | Media: 2.4% | | | |
65,400 | | �� | | Gannett Co., Inc. | | 5,343,180 | |
| | | | | | 5,343,180 | |
| | | | Miscellaneous Manufacturing: 2.9% | | | |
180,600 | | | | Honeywell Intl., Inc. | | 6,395,046 | |
| | | | | | 6,395,046 | |
| | | | Oil and Gas: 12.2% | | | |
91,000 | | | | Apache Corp. | | 4,601,870 | |
135,800 | | @@ | | BP PLC ADR | | 7,930,720 | |
147,100 | | | | ChevronTexaco Corp. | | 7,724,221 | |
135,900 | | | | Exxon Mobil Corp. | | 6,966,234 | |
| | | | | | 27,223,045 | |
| | | | Oil and Gas Services: 2.0% | | | |
112,630 | | | | Halliburton Co. | | 4,419,601 | |
| | | | | | 4,419,601 | |
| | | | Pharmaceuticals: 1.8% | | | |
146,500 | | | | Pfizer, Inc. | | 3,939,385 | |
| | | | | | 3,939,385 | |
| | | | Retail: 2.3% | | | |
159,200 | | | | McDonald’s Corp. | | 5,103,952 | |
| | | | | | 5,103,952 | |
| | | | Savings and Loans: 6.4% | | | |
297,100 | | | | Sovereign Bancorp, Inc. | | 6,699,605 | |
178,400 | | | | Washington Mutual, Inc. | | 7,542,752 | |
| | | | | | 14,242,357 | |
| | | | Telecommunications: 4.0% | | | |
177,400 | | | | SBC Communications, Inc. | | 4,571,598 | |
108,900 | | | | Verizon Communications, Inc. | | 4,411,539 | |
| | | | | | 8,983,137 | |
| | | | Total Common Stock (Cost $199,026,732) | | 222,194,888 | |
WARRANTS: 0.0% | | | | | |
| | | | Telecommunications: 0.0% | | | |
2,459 | | @ | | Lucent Technologies, Inc. | | 3,885 | |
| | | | Total Warrants (Cost $-) | | 3,885 | |
| | | | Total Long-Term Investments
(Cost $199,026,732) | | 222,198,773 | |
See Accompanying Notes to Financial Statements
76
| PORTFOLIO OF INVESTMENTS |
ING VP VALUE OPPORTUNITY PORTFOLIO | AS OF DECEMBER 31, 2004 (CONTINUED) |
Principal
Amount | | | | | | Value | |
SHORT-TERM INVESTMENTS: 0.5% | | | |
| | Repurchase Agreement: 0.5% | | | |
$ | 1,152,000 | | Goldman Sachs Repurchase Agreement dated 12/31/04, 2.230%, due 01/03/05, $1,152,214 to be received upon repurchase (Collateralized by $1,162,000 Federal Home Loan Mortgage Corporation, 4.300%, Market Value plus accrued interest $1,175,116, due 02/03/11) | | $ | 1,152,000 | |
| | Total Repurchase Agreement
(Cost $1,152,000) | | 1,152,000 | |
| | Securities Lending CollateralCC: 0.0% | | | |
86,000 | | The Bank of New York Institutional Cash Reserve Fund | | 86,000 | |
| | Total Securities Lending Collateral
(Cost $86,000) | | 86,000 | |
| | Total Short-Term Investments
(Cost $1,238,000) | | 1,238,000 | |
| | Total Investments In Securities (Cost $200,264,732)* | | 100.0 | % | $ | 223,436,773 | |
| | Other Assets and Liabilities-Net | | (0.0 | ) | (42,479 | ) |
| | Net Assets | | 100.0 | % | $ | 223,394,294 | |
| | | | | | | | | | | |
@ Non-income producing security
@@ Foreign issuer
ADR American Depositary Receipt
cc Securities purchased with cash collateral for securities loaned.
L Loaned security, a portion or all of the security is on loan at December 31, 2004.
* Cost for federal income tax purposes is $201,228,815. Net unrealized appreciation consists of:
Gross Unrealized Appreciation | | $ | 24,878,588 | |
Gross Unrealized Depreciation | | (2,670,630 | ) |
Net Unrealized Appreciation | | $ | 22,207,958 | |
See Accompanying Notes to Financial Statements
77
| PORTFOLIO OF INVESTMENTS |
ING VP INTERMEDIATE BOND PORTFOLIO | AS OF DECEMBER 31, 2004 |
Principal
Amount | | | | | | Value | |
CORPORATE BONDS/NOTES: 25.2% | | | |
| | | | Airlines: 0.3% | | | |
$ | 1,065,000 | | | | American Airlines, Inc., 7.250%, due 02/05/09 | | $ | 1,043,700 | |
4,120,000 | | | | American Airlines, Inc., 7.324%, due 10/15/09 | | 3,502,867 | |
| | | | | | 4,546,567 | |
| | | | Auto Manufacturers: 0.6% | | | |
1,040,000 | | | | Ford Motor Co., 6.625%, due 10/01/28 | | 972,847 | |
3,543,000 | | | | Ford Motor Co., 7.450%, due 07/16/31 | | 3,573,629 | |
3,711,000 | | | | General Motors Corp., 8.375%, due 07/15/33 | | 3,855,551 | |
| | | | | | 8,402,027 | |
| | | | Banks: 6.2% | | | |
1,430,000 | | @@ | | Australia & New Zealand Banking Group Ltd., 2.405%, due | | 1,249,124 | |
2,340,000 | | | | Banco Bradesco SA/Cayman Islands, 8.750%, due 10/24/13 | | 2,562,300 | |
2,377,000 | | @@,# | | Banco Santander Chile/Pre-merger with Banco Santiago SA, 2.800%, due 12/09/09 | | 2,382,776 | |
3,510,000 | | @@ | | Banco Santander Santiago Chile SA, 7.375%, due 07/18/12 | | 4,038,234 | |
2,120,000 | | @@ | | Bank of Ireland, 2.770%, due 12/29/49 | | 1,844,415 | |
1,060,000 | | @@ | | Bank of Nova Scotia, 2.115%, due 08/31/85 | | 885,929 | |
2,469,000 | | | | BankAmerica Capital II, 8.000%, due 12/15/26 | | 2,714,396 | |
2,134,000 | | @@,# | | Danske Bank A/S, 5.914%, due 12/29/49 | | 2,263,681 | |
2,660,000 | | @@ | | Den Norske Bank ASA, 2.115%, due 08/29/49 | | 2,217,775 | |
1,423,000 | | # | | Dresdner Funding Trust I, 8.151%, due 06/30/31 | | 1,764,274 | |
2,000 | | | | Fleet Capital Trust II, 7.920%, due 12/11/26 | | 2,169 | |
2,237,000 | | @@,# | | HBOS Capital Funding LP, 6.071%, due 06/30/49 | | 2,401,871 | |
7,150,000 | | @@, C | | HSBC Bank PLC, 2.839%, due 06/29/49 | | 6,216,274 | |
3,580,000 | | @@ | | Lloyds TSB Bank PLC, 2.090%, due 08/29/49 | | 3,070,985 | |
3,400,000 | | @@ | | Lloyds TSB Bank PLC, 2.938%, due 06/29/49 | | 3,032,358 | |
3,519,000 | | # | | M&T Bank Corp., 3.850%, due 04/01/13 | | 3,484,827 | |
2,480,000 | | | | Mellon Capital I, 7.720%, due 12/01/26 | | 2,693,290 | |
2,550,000 | | @@ | | National Australia Bank Ltd., 2.361%, due 10/29/49 | | 2,227,670 | |
3,960,000 | | @@ | | National Westminster Bank PLC, 2.563%, due 11/29/49 | | 3,380,149 | |
2,856,000 | | # | | Rabobank Capital Funding II, 5.260%, due 12/29/49 | | 2,911,124 | |
| 5,528,000 | | #,C,+ | | Rabobank Capital Funding Trust, 5.254%, due 12/29/49 | | | 5,509,923 | |
3,560,000 | | @@ | | Royal Bank of Canada, 2.750%, due 06/29/85 | | 3,043,633 | |
1,510,000 | | @@ | | Royal Bank of Scotland Group PLC, 2.938%, due 12/29/49 | | 1,333,679 | |
950,000 | | @@,C | | Societe Generale, 2.705%, due 11/29/49 | | 817,888 | |
7,540,000 | | @@,C | | Standard Chartered PLC, 2.813%, due 11/29/49 | | 6,011,386 | |
5,330,000 | | @@,C | | Standard Chartered PLC, 2.838%, due 12/29/49 | | 4,290,650 | |
2,599,000 | | | | U.S. Bancorp, 8.090%, due 11/15/26 | | 2,836,577 | |
2,406,000 | | | | Wells Fargo Capital I, 7.960%, due 12/15/26 | | 2,620,346 | |
1,290,000 | | @@ | | Westpac Banking Corp., 2.338%, due 09/29/49 | | 1,119,013 | |
7,614,000 | | # | | Westpac Capital Trust IV, 5.256%, due 12/29/49 | | 7,556,660 | |
| | | | | | 86,483,376 | |
| | | | Beverages: 0.9% | | | |
7,122,000 | | @@ | | Cia Brasileira de Bebidas, 8.750%, due 09/15/13 | | 8,332,740 | |
482,000 | | @@ | | Cia Brasileira de Bebidas, 10.500%, due 12/15/11 | | 607,320 | |
2,000 | | @@ | | Coca-Cola HBC Finance BV, 5.125%, due 09/17/13 | | 2,055 | |
3,956,000 | | # | | Miller Brewing Co., 4.250%, due 08/15/08 | | 3,995,279 | |
| | | | | | 12,937,394 | |
| | | | Chemicals: 0.1% | | | |
948,000 | | | | Dow Chemical Co., 5.750%, due 11/15/09 | | 1,015,140 | |
874,000 | | @@,#,S | | Sociedad Quimica y Minera de Chile SA, 7.700%, due 09/15/06 | | 926,926 | |
| | | | | | 1,942,066 | |
| | | | Diversified Financial Services: 4.6% | | | |
26,410 | | @@,# | | Canwest Media, Inc., 8.000%, due 09/15/12 | | 28,457 | |
948,000 | | @@,#,I,XX | | Alpine III, 2.840%, due 08/16/14 | | 949,698 | |
948,000 | | @@,#,I,XX | | Alpine III, 3.240%, due 08/16/14 | | 949,460 | |
502,000 | | @@,#,I,XX | | Alpine III, 5.040%, due 08/16/14 | | 502,647 | |
1,460,000 | | @@,#,I,XX | | Alpine III, 8.290%, due 08/16/14 | | 1,462,340 | |
1,090,872 | | @@,# | | Arcel Finance Ltd., 5.984%, due 02/01/09 | | 1,127,683 | |
1,959,000 | | @@,# | | Arcel Finance Ltd., 6.361%, due 05/01/12 | | 1,986,040 | |
2,174,000 | | @@,# | | Arcel Finance Ltd., 7.048%, due 09/01/11 | | 2,232,613 | |
4,840,000 | | @@,# | | Brazilian Merchant Voucher Receivables Ltd., 5.911%, due 06/15/11 | | 4,815,800 | |
2,516,000 | | | | Citigroup Capital II, 7.750%, due 12/01/36 | | 2,738,510 | |
See Accompanying Notes to Financial Statements
78
| PORTFOLIO OF INVESTMENTS |
ING VP INTERMEDIATE BOND PORTFOLIO | AS OF DECEMBER 31, 2004 (CONTINUED) |
Principal
Amount | | | | | | Value | |
| | | | Diversified Financial Services (continued) | | | |
$ | 2,713,000 | | # | | Corestates Capital Trust I, 8.000%, due 12/15/26 | | $ | 2,966,625 | |
3,331,000 | | # | | Farmers Exchange Capital, 7.200%, due 07/15/48 | | 3,400,235 | |
1,225,000 | | @@ | | Financiere CSFB NV, 2.125%, due 03/29/49 | | 1,021,652 | |
3,560,000 | | | | Ford Motor Credit Co., 5.700%, due 01/15/10 | | 3,596,294 | |
1,210,000 | | | | Ford Motor Credit Co., 7.000%, due 10/01/13 | | 1,284,863 | |
5,317,000 | | # | | HVB Funding Trust III, 9.000%, due 10/22/31 | | 7,043,840 | |
600,000 | | | | JPM Capital Trust I, 7.540%, due 01/15/27 | | 646,781 | |
2,850,000 | | | | JPM Capital Trust II, 7.950%, due 02/01/27 | | 3,118,139 | |
6,367,000 | | # | | Mangrove Bay Pass-Through Trust, 6.102%, due 07/15/33 | | 6,338,909 | |
3,978,000 | | @@ | | Mantis Reef Ltd., 4.799%, due 11/03/09 | | 3,973,843 | |
2,715,796 | | @@,# | | PF Export Receivables Master Trust, 3.748%, due 06/01/13 | | 2,636,970 | |
4,723,545 | | @@,# | | PF Export Receivables Master Trust, 6.436%, due 06/01/15 | | 4,697,731 | |
2,900,000 | | # | | Twin Reefs Pass-Through Trust, 3.370%, due 12/10/49 | | 2,916,501 | |
3,290,000 | | @@ | | UFJ Finance Aruba AEC, 8.750%, due 11/29/49 | | 3,676,371 | |
50,000 | | | | Universal City Development Partners, 11.750%, due 04/01/10 | | 59,313 | |
| | | | | | 64,171,315 | |
| | | | Electric: 3.3% | | | |
7,441,000 | | @@,# | | AES Gener SA, 7.500%, due 03/25/14 | | 7,850,256 | |
3,315,670 | | # | | Allegheny Energy Supply Statutory Trust, 10.250%, due 11/15/07 | | 3,779,864 | |
349,441 | | # | | Allegheny Energy Supply Statutory Trust, 13.000%, due 11/15/07 | | 382,638 | |
3,942,265 | | | | CE Generation LLC, 7.416%, due 12/15/18 | | 4,258,880 | |
3,989,000 | | | | Consumers Energy Co., 4.250%, due 04/15/08 | | 4,031,124 | |
1,077,000 | | @@ | | Empresa Nacional de Electricidad SA, 7.750%, due 07/15/08 | | 1,189,726 | |
2,407,000 | | | | FirstEnergy Corp., 6.450%, due 11/15/11 | | 2,618,780 | |
2,407,000 | | | | FirstEnergy Corp., 7.375%, due 11/15/31 | | 2,757,385 | |
1,982,000 | | # | | Juniper Generation LLC, 6.790%, due 12/31/14 | | 1,985,516 | |
3,470,000 | | | | Monongahela Power Co., 7.360%, due 01/15/10 | | 3,840,103 | |
5,242,000 | | | | Ohio Power Co., 6.375%, due 07/15/33 | | 5,527,369 | |
807,962 | | #,S | | Power Contract Financing LLC, 5.200%, due 02/01/06 | | 815,679 | |
| 2,331,000 | | # | | Power Contract Financing LLC, 6.256%, due 02/01/10 | | | 2,442,291 | |
704,032 | | | | PPL Montana LLC, 8.903%, due 07/02/20 | | 795,996 | |
1,359,865 | | # | | Tenaska Virginia Partners LP, 6.119%, due 03/30/24 | | 1,431,264 | |
2,836,000 | | S | | TXU Corp., 4.446%, due 11/16/06 | | 2,865,764 | |
3,000 | | #,S | | TXU Energy Co. LLC, 2.838%, due 01/17/06 | | 3,009 | |
| | | | | | 46,575,644 | |
| | | | Food: 0.9% | | | |
1,750,000 | | | | Kroger Co., 7.250%, due 06/01/09 | | 1,962,049 | |
3,241,000 | | S | | Safeway, Inc., 4.800%, due 07/16/07 | | 3,319,724 | |
2,163,000 | | | | SUPERVALU, Inc., 7.875%, due 08/01/09 | | 2,482,860 | |
4,318,000 | | S | | Tyson Foods, Inc., 7.250%, due 10/01/06 | | 4,579,878 | |
| | | | | | 12,344,511 | |
| | | | Gas: 0.2% | | | |
2,895,000 | | #,S | | Williams Gas Pipelines Central, Inc., 7.375%, due 11/15/06 | | 3,083,175 | |
| | | | | | 3,083,175 | |
| | | | Healthcare-Services: 0.2% | | | |
2,514,000 | | | | HCA, Inc., 5.500%, due 12/01/09 | | 2,517,494 | |
| | | | | | 2,517,494 | |
| | | | Home Builders: 0.0% | | | |
117,000 | | | | Technical Olympic USA, Inc., 9.000%, due 07/01/10 | | 125,775 | |
| | | | | | 125,775 | |
| | | | Insurance: 1.2% | | | |
875,000 | | # | | Farmers Insurance Exchange, 6.000%, due 08/01/14 | | 888,962 | |
1,193,000 | | # | | Farmers Insurance Exchange, 8.625%, due 05/01/24 | | 1,410,780 | |
2,637,000 | | # | | Monumental Global Funding II, 3.850%, due 03/03/08 | | 2,645,821 | |
4,082,000 | | | | North Front Pass-Through Trust, 5.810%, due 12/15/24 | | 4,163,318 | |
2,361,000 | | S | | Prudential Financial, Inc., 4.104%, due 11/15/06 | | 2,387,922 | |
4,283,000 | | # | | Zurich Capital Trust I, 8.376%, due 06/01/37 | | 4,823,317 | |
| | | | | | 16,320,120 | |
| | | | Media: 0.5% | | | |
3,829,000 | | S | | Clear Channel Communications, Inc., 3.125%, due 02/01/07 | | 3,773,468 | |
2,398,000 | | | | COX Communications, Inc., 6.850%, due 01/15/18 | | 2,559,093 | |
504,000 | | @@,# | | Rogers Cable, Inc., 6.750%, due 03/15/15 | | 517,860 | |
| | | | | | 6,850,421 | |
See Accompanying Notes to Financial Statements
79
| PORTFOLIO OF INVESTMENTS |
ING VP INTERMEDIATE BOND PORTFOLIO | AS OF DECEMBER 31, 2004 (CONTINUED) |
Principal
Amount | | | | | | Value | |
| | | | Mining: 0.4% | | | |
$ | 2,341,000 | | @@,# | | Corp Nacional del Cobre de Chile, 5.500%, due 10/15/13 | | $ | 2,442,248 | |
987,000 | | | | Vale Overseas Ltd., 8.250%, due 01/17/34 | | 1,043,753 | |
2,339,000 | | | | WMC Finance USA, 5.125%, due 05/15/13 | | 2,336,172 | |
| | | | | | 5,822,173 | |
| | | | Multi-National: 0.5% | | | |
5,601,000 | | @@ | | Corp Andina de Fomento, 6.875%, due 03/15/12 | | 6,305,214 | |
| | | | | | 6,305,214 | |
| | | | Oil and Gas: 2.0% | | | |
2,386,000 | | | | Amerada Hess Corp., 6.650%, due 08/15/11 | | 2,627,361 | |
3,317,000 | | @@,# | | Empresa Nacional de Petroleo, 4.875%, due 03/15/14 | | 3,246,573 | |
50,000 | | | | Energy Partners Ltd., 8.750%, due 08/01/10 | | 54,750 | |
4,063,000 | | @@,# | | Gazprom Intl. SA, 7.201%, due 02/01/20 | | 4,306,780 | |
2,523,000 | | | | Husky Energy, Inc., 6.150%, due 06/15/19 | | 2,700,001 | |
4,943,000 | | # | | Pemex Project Funding Master Trust, 3.790%, due 06/15/10 | | 5,083,875 | |
812,000 | | | | Pemex Project Funding Master Trust, 7.375%, due 12/15/14 | | 904,568 | |
1,755,000 | | @@ | | Petroleos Mexicanos, 9.250%, due 03/30/18 | | 2,180,588 | |
3,497,000 | | @@,# | | Tengizchevroil Finance Co S.ar.1, 6.124%, due 11/15/14 | | 3,523,228 | |
1,000 | | S | | Valero Energy Corp., 6.125%, due 04/15/07 | | 1,054 | |
2,016,000 | | | | Valero Energy Corp., 8.750%, due 06/15/30 | | 2,706,659 | |
| | | | | | 27,335,437 | |
| | | | Packaging and Containers: 0.1% | | | |
1,444,000 | | # | | Sealed Air Corp., 5.375%, due 04/15/08 | | 1,501,455 | |
| | | | | | 1,501,455 | |
| | | | Real Estate: 0.6% | | | |
3,513,000 | | | | EOP Operating LP, 7.750%, due 11/15/07 | | 3,879,686 | |
501,000 | | | | Liberty Property LP, 6.375%, due 08/15/12 | | 544,125 | |
385,000 | | S | | Liberty Property LP, 6.950%, due 12/01/06 | | 410,842 | |
3,026,000 | | | | Liberty Property LP, 7.750%, due 04/15/09 | | 3,401,521 | |
| | | | | | 8,236,174 | |
| | | | Real Estate Investment Trusts: 1.1% | | | |
5,005,000 | | | | Rouse Co., 7.200%, due 09/15/12 | | 5,419,609 | |
| 2,515,000 | | | | Rouse Co., 8.000%, due 04/30/09 | | | 2,770,101 | |
2,663,000 | | | | Simon Property Group LP, 4.875%, due 03/18/10 | | 2,716,140 | |
4,636,000 | | | | Simon Property Group LP, 6.375%, due 11/15/07 | | 4,949,357 | |
| | | | | | 15,855,207 | |
| | | | Retail: 0.3% | | | |
115,000 | | | | Dollar General Corp., 8.625%, due 06/15/10 | | 134,263 | |
3,730,000 | | | | May Department Stores Co., 3.950%, due 07/15/07 | | 3,738,530 | |
| | | | | | 3,872,793 | |
| | | | Savings and Loans: 0.2% | | | |
2,398,000 | | | | Great Western Financial, 8.206%, due 02/01/27 | | 2,620,566 | |
| | | | | | 2,620,566 | |
| | | | Telecommunications: 0.8% | | | |
2,460,000 | | | | AT&T Corp., 9.750%, due 11/15/31 | | 2,948,925 | |
3,206,000 | | S | | BellSouth Corp., 4.200%, due 09/15/09 | | 3,217,769 | |
1,808,000 | | +,S | | Sprint Capital Corp., 4.780%, due 08/17/06 | | 1,843,368 | |
714,000 | | | | Sprint Capital Corp., 8.375%, due 03/15/12 | | 870,971 | |
2,571,000 | | | | Verizon Virginia, Inc., 4.625%, due 03/15/13 | | 2,511,379 | |
| | | | | | 11,392,412 | |
| | | | Transportation: 0.2% | | | |
1,910,000 | | @@,# | | MISC Capital Ltd., 5.000%, due 07/01/09 | | 1,972,386 | |
| | | | | | 1,972,386 | |
| | | | Total Corporate Bonds/Notes
(Cost $346,143,234) | | 351,213,702 | |
| | | | | | | |
U.S. GOVERNMENT AGENCY OBLIGATIONS: 30.0% | | | |
| | | | Federal Home Loan Bank: 1.0% | | | |
13,620,000 | | | | 3.250%, due 12/17/07 | | 13,541,985 | |
| | | | | | 13,541,985 | |
| | | | Federal Home Loan Mortgage Corporation: 5.7% | | | |
27,620,000 | | | | 2.700%, due 03/16/07 | | 27,287,096 | |
16,836,917 | | | | 3.053%, due 04/15/32 | | 16,965,416 | |
4,072,290 | | | | 4.500%, due 04/01/14 | | 4,073,338 | |
5,018,000 | | | | 5.875%, due 03/21/11 | | 5,424,759 | |
7,801,435 | | | | 6.000%, due 01/15/29 | | 8,163,288 | |
5,136,000 | | | | 6.000%, due 01/15/29 | | 5,377,683 | |
8,649,262 | | | | 6.000%, due 01/15/29 | | 9,035,039 | |
1,750,000 | | | | 6.500%, due 01/15/34 | | 1,836,406 | |
853,500 | | | | 7.500%, due 11/01/28 | | 916,536 | |
| | | | | | 79,079,561 | |
| | | | Federal National Mortgage Association: 22.3% | | | |
3,703,000 | | | | 2.490%, due 04/25/35 | | 3,699,667 | |
5,639,426 | | | | 2.668%, due 08/25/33 | | 5,665,633 | |
503,109 | | | | 2.859%, due 12/26/29 | | 502,709 | |
See Accompanying Notes to Financial Statements
80
| PORTFOLIO OF INVESTMENTS |
ING VP INTERMEDIATE BOND PORTFOLIO | AS OF DECEMBER 31, 2004 (CONTINUED) |
Principal
Amount | | | | | | Value | |
| | | | Federal National Mortgage Association (continued) | | | |
$ | 13,144,000 | | | | 2.875%, due 05/19/08 | | $ | 12,845,381 | |
6,474,000 | | | | 4.750%, due 12/25/42 | | 6,524,839 | |
103,354,000 | | | | 5.000%, due 01/15/34 | | 102,546,598 | |
19,471,000 | | | | 5.000%, due 01/15/20 | | 19,781,328 | |
7,140,000 | | | | 5.250%, due 08/01/12 | | 7,420,224 | |
36,194,000 | | | | 5.500%, due 01/01/33 | | 36,748,202 | |
39,505 | | | | 5.500%, due 11/01/16 | | 40,906 | |
214,958 | | | | 5.500%, due 12/01/16 | | 222,581 | |
25,349 | | | | 5.500%, due 04/01/17 | | 26,234 | |
73,300 | | | | 5.500%, due 02/01/18 | | 75,859 | |
20,266 | | | | 5.500%, due 06/01/18 | | 20,969 | |
118,342 | | | | 5.500%, due 10/01/18 | | 122,473 | |
9,836,270 | | | | 5.500%, due 01/15/20 | | 10,165,175 | |
5,422,021 | | | | 6.000%, due 04/25/31 | | 5,684,004 | |
30,669,000 | | | | 6.000%, due 01/15/34 | | 31,713,646 | |
255,166 | | | | 6.000%, due 06/01/16 | | 267,629 | |
9,481 | | | | 6.000%, due 08/01/16 | | 9,944 | |
26,712 | | | | 6.000%, due 08/01/16 | | 28,017 | |
182,553 | | | | 6.000%, due 10/01/16 | | 191,469 | |
337,841 | | | | 6.000%, due 10/01/16 | | 354,342 | |
209,075 | | | | 6.000%, due 01/01/17 | | 219,286 | |
346,979 | | | | 6.000%, due 01/01/17 | | 363,906 | |
5,306 | | | | 6.000%, due 02/01/17 | | 5,565 | |
14,734 | | | | 6.000%, due 02/01/17 | | 15,453 | |
186,849 | | | | 6.000%, due 02/01/17 | | 195,964 | |
211,907 | | | | 6.000%, due 04/01/17 | | 222,245 | |
386,902 | | | | 6.000%, due 04/01/17 | | 405,778 | |
385,143 | | | | 6.000%, due 04/01/17 | | 403,932 | |
326,461 | | | | 6.000%, due 04/01/17 | | 342,388 | |
290,441 | | | | 6.000%, due 05/01/17 | | 304,610 | |
236,601 | | | | 6.000%, due 05/01/17 | | 248,144 | |
208,849 | | | | 6.000%, due 05/01/17 | | 219,038 | |
228,071 | | | | 6.000%, due 05/01/17 | | 239,198 | |
106,412 | | | | 6.000%, due 06/01/17 | | 111,603 | |
273,538 | | | | 6.000%, due 06/01/17 | | 286,882 | |
378,363 | | | | 6.000%, due 07/01/17 | | 396,822 | |
371,734 | | | | 6.000%, due 07/01/17 | | 389,869 | |
238,016 | | | | 6.000%, due 08/01/17 | | 249,628 | |
194,294 | | | | 6.000%, due 08/01/17 | | 203,846 | |
302,180 | | | | 6.000%, due 08/01/17 | | 316,922 | |
217,408 | | | | 6.000%, due 08/01/17 | | 228,014 | |
785,214 | | | | 6.000%, due 09/01/17 | | 823,521 | |
2,642,692 | | | | 6.000%, due 09/01/17 | | 2,771,617 | |
15,672 | | | | 6.000%, due 10/01/17 | | 16,437 | |
831,256 | | | | 6.000%, due 11/01/17 | | 871,856 | |
17,147 | | | | 6.000%, due 02/01/18 | | 17,983 | |
761,929 | | | | 6.000%, due 04/01/18 | | 799,143 | |
232,850 | | | | 6.000%, due 09/01/18 | | 244,198 | |
228,509 | | | | 6.000%, due 11/01/18 | | 239,645 | |
328,682 | | | | 6.000%, due 12/01/18 | | 344,736 | |
3,870,662 | | | | 6.000%, due 07/25/29 | | 4,049,427 | |
9,104,743 | | | | 6.000%, due 07/25/29 | | 9,522,605 | |
421,657 | | | | 6.500%, due 01/01/32 | | 442,777 | |
341,982 | | | | 6.500%, due 09/01/32 | | 359,058 | |
687,843 | | | | 6.500%, due 10/01/32 | | 722,189 | |
225,496 | | | | 6.500%, due 10/01/32 | | 236,756 | |
15,313,000 | | | | 6.500%, due 01/15/35 | | 16,059,509 | |
4,771,798 | | | | 6.500%, due 08/01/29 | | 5,013,964 | |
6,035,000 | | | | 6.625%, due 11/15/10 | | 6,828,615 | |
361,770 | | | | 7.000%, due 01/01/30 | | 383,932 | |
4,377,187 | | | | 7.000%, due 06/01/31 | | 4,648,019 | |
38,192 | | | | 7.000%, due 08/01/25 | | 40,687 | |
| 35,738 | | | | 7.000%, due 10/01/25 | | | 38,073 | |
7,195 | | | | 7.000%, due 11/01/25 | | 7,665 | |
71,866 | | | | 7.000%, due 12/01/25 | | 76,560 | |
36,248 | | | | 7.000%, due 12/01/25 | | 38,616 | |
32,138 | | | | 7.000%, due 12/01/25 | | 34,237 | |
46,029 | | | | 7.000%, due 02/01/26 | | 49,036 | |
85,541 | | | | 7.000%, due 02/01/26 | | 91,129 | |
43,753 | | | | 7.000%, due 03/01/26 | | 46,586 | |
58,116 | | | | 7.000%, due 03/01/26 | | 61,912 | |
41,369 | | | | 7.000%, due 03/01/26 | | 44,047 | |
122,966 | | | | 7.000%, due 03/01/26 | | 130,927 | |
56,408 | | | | 7.000%, due 03/01/26 | | 60,093 | |
203,507 | | | | 7.500%, due 10/01/30 | | 218,120 | |
183,815 | | | | 7.500%, due 11/01/30 | | 197,014 | |
126,305 | | | | 7.500%, due 11/01/30 | | 135,374 | |
2,572,922 | | | | 7.500%, due 06/25/32 | | 2,756,751 | |
3,301,563 | | | | 7.500%, due 01/25/48 | | 3,529,373 | |
493,094 | | | | 10.000%, due 02/25/19 | | 551,015 | |
| | | | | | 312,530,124 | |
| | | | Government National Mortgage Association: 1.0% | | | |
285,009 | | | | 3.375%, due 04/20/28 | | 290,505 | |
207,521 | | | | 4.000%, due 12/20/29 | | 209,898 | |
5,998,480 | | | | 6.500%, due 10/15/31 | | 6,321,825 | |
432,026 | | | | 7.000%, due 05/15/32 | | 459,292 | |
270,810 | | | | 7.000%, due 04/15/26 | | 288,838 | |
199,328 | | | | 7.000%, due 04/15/26 | | 212,597 | |
192,682 | | | | 7.000%, due 04/15/26 | | 205,508 | |
188,704 | | | | 7.000%, due 04/15/26 | | 201,266 | |
78,883 | | | | 7.500%, due 01/15/30 | | 84,754 | |
171,791 | | | | 7.500%, due 02/15/30 | | 184,577 | |
738 | | | | 7.500%, due 02/15/30 | | 793 | |
155,545 | | | | 7.500%, due 05/15/30 | | 167,122 | |
11,021 | | | | 7.500%, due 06/15/30 | | 11,841 | |
30,994 | | | | 7.500%, due 06/15/30 | | 33,301 | |
1,477 | | | | 7.500%, due 07/15/30 | | 1,587 | |
48,002 | | | | 7.500%, due 07/15/30 | | 51,575 | |
2,189 | | | | 7.500%, due 07/15/30 | | 2,352 | |
1,801 | | | | 7.500%, due 08/15/30 | | 1,935 | |
1,482 | | | | 7.500%, due 08/15/30 | | 1,592 | |
43,958 | | | | 7.500%, due 08/15/30 | | 47,230 | |
66,101 | | | | 7.500%, due 10/15/30 | | 71,021 | |
1,441 | | | | 7.500%, due 11/15/30 | | 1,549 | |
1,829 | | | | 7.500%, due 11/15/30 | | 1,965 | |
2,006 | | | | 7.500%, due 11/15/30 | | 2,155 | |
2,568 | | | | 7.500%, due 11/15/30 | | 2,759 | |
39,838 | | | | 7.500%, due 12/15/30 | | 42,803 | |
1,596 | | | | 7.500%, due 01/15/31 | | 1,715 | |
1,549 | | | | 7.500%, due 01/15/31 | | 1,664 | |
641 | | | | 7.500%, due 02/15/31 | | 689 | |
3,889 | | | | 7.500%, due 02/15/31 | | 4,178 | |
1,461 | | | | 7.500%, due 02/15/31 | | 1,570 | |
1,659 | | | | 7.500%, due 02/15/31 | | 1,783 | |
37,011 | | | | 7.500%, due 02/15/31 | | 39,762 | |
51,321 | | | | 7.500%, due 03/15/31 | | 55,136 | |
4,839 | | | | 7.500%, due 03/15/31 | | 5,199 | |
35,824 | | | | 7.500%, due 04/15/31 | | 38,487 | |
8,416 | | | | 7.500%, due 09/15/31 | | 9,042 | |
1,086,943 | | | | 7.500%, due 12/15/31 | | 1,167,824 | |
167,902 | | | | 7.500%, due 01/15/32 | | 180,403 | |
72,314 | | | | 7.500%, due 02/15/32 | | 77,684 | |
44,583 | | | | 7.500%, due 03/15/32 | | 47,894 | |
140,584 | | | | 7.500%, due 03/15/32 | | 151,051 | |
See Accompanying Notes to Financial Statements
81
| PORTFOLIO OF INVESTMENTS |
ING VP INTERMEDIATE BOND PORTFOLIO | AS OF DECEMBER 31, 2004 (CONTINUED) |
Principal
Amount | | | | | | Value | |
| | | | Government National Mortgage Association (continued) | | | |
$ | 5,607 | | | | 7.500%, due 04/15/32 | | $ | 6,024 | |
76,685 | | | | 7.500%, due 05/15/32 | | 82,380 | |
27,745 | | | | 7.500%, due 06/15/32 | | 29,806 | |
169,711 | | | | 7.500%, due 06/15/32 | | 182,316 | |
109,957 | | | | 7.500%, due 07/15/32 | | 118,124 | |
369,964 | | | | 7.500%, due 08/15/32 | | 397,442 | |
1,031,600 | | | | 7.500%, due 09/15/32 | | 1,108,218 | |
61,111 | | | | 7.500%, due 04/15/22 | | 66,125 | |
12,009 | | | | 7.500%, due 05/15/22 | | 12,994 | |
5,567 | | | | 7.500%, due 06/15/22 | | 6,024 | |
6,638 | | | | 7.500%, due 06/15/22 | | 7,183 | |
8,557 | | | | 7.500%, due 08/15/22 | | 9,259 | |
7,657 | | | | 7.500%, due 06/15/24 | | 8,263 | |
7,022 | | | | 7.500%, due 06/15/24 | | 7,578 | |
37,730 | | | | 7.500%, due 01/15/26 | | 40,647 | |
3,163 | | | | 7.500%, due 07/15/26 | | 3,408 | |
56,875 | | | | 7.500%, due 03/15/29 | | 61,116 | |
108,899 | | | | 7.500%, due 04/15/29 | | 117,019 | |
183,565 | | | | 7.500%, due 08/15/29 | | 197,253 | |
54,186 | | | | 7.500%, due 09/15/29 | | 58,226 | |
53,968 | | | | 7.500%, due 10/15/29 | | 57,992 | |
87,821 | | | | 7.500%, due 12/15/29 | | 94,376 | |
| | | | | | 13,356,494 | |
| | | | Total U.S. Government Agency Obligations
(Cost $417,046,862) | | 418,508,164 | |
| | | | | | | |
U.S. TREASURY OBLIGATIONS: 18.3% | | | |
| | | | U.S. Treasury Bonds: 11.4% | | | |
50,334,000 | | W,S | | 4.250%, due 11/15/14 | | 50,481,479 | |
68,111,000 | | S | | 5.375%, due 02/15/31 | | 73,671,649 | |
2,321,000 | | S | | 6.250%, due 08/15/23 | | 2,718,019 | |
10,340,000 | | S | | 10.375%, due 11/15/12 | | 12,331,267 | |
13,481,000 | | S | | 13.250%, due 05/15/14 | | 18,736,487 | |
| | | | | | 157,938,901 | |
| | | | U.S. Treasury Notes: 6.3% | | | |
15,827,000 | | S | | 1.125%, due 06/30/05 | | 15,725,612 | |
8,837,000 | | S | | 3.000%, due 11/15/07 | | 8,785,224 | |
23,025,000 | | S | | 3.000%, due 11/15/07 | | 23,001,630 | |
40,791,000 | | S | | 3.500%, due 12/15/09 | | 40,606,176 | |
| | | | | | 88,118,642 | |
| | | | U.S. Treasury STRIP: 0.6% | | | |
14,659,000 | | S | | 4.690%, due 05/15/16 | | 8,702,990 | |
| | | | | | 8,702,990 | |
| | | | Total U.S. Treasury Obligations
(Cost $255,808,981) | | 254,760,533 | |
| | | | | | | |
ASSET-BACKED SECURITIES: 6.7% | | | |
| | | | Automobile Asset-Backed Securities: 1.0% | | | |
9,200,000 | | | | Capital Auto Receivables Asset Trust, 2.750%, due 04/16/07 | | 9,174,076 | |
4,320,000 | | | | Nissan Auto Receivables Owner Trust, 2.610%, due 07/15/08 | | 4,279,781 | |
| | | | | | 13,453,857 | |
| | | | Credit Card Asset-Backed Securities: 0.9% | | | |
| 8,800,000 | | | | Citibank Credit Card Issuance Trust, 5.650%, due 06/16/08 | | | 9,099,329 | |
3,460,000 | | | | Fleet Credit Card Master Trust II, 2.400%, due 07/15/08 | | 3,436,817 | |
| | | | | | 12,536,146 | |
| | | | Home Equity Asset-Backed Securities: 3.8% | | | |
1,976,532 | | | | Argent Securities, Inc., 2.740%, due 03/25/34 | | 1,975,677 | |
1,749,277 | | | | Asset Backed Funding Certificates, 2.698%, due 11/25/33 | | 1,750,042 | |
5,714,635 | | XX | | Bayview Financial Acquisition Trust, 2.918%, due 09/28/43 | | 5,727,136 | |
2,190,488 | | | | Centex Home Equity, 2.698%, due 01/25/34 | | 2,192,544 | |
368,272 | | | | Equity One ABS, Inc., 2.976%, due 09/25/33 | | 367,891 | |
3,656,363 | | | | GMAC Mortgage Corp Loan Trust, 2.360%, due 12/25/20 | | 3,655,817 | |
10,569,000 | | XX | | GSAA Trust, 5.242%, due 05/25/35 | | 10,593,316 | |
3,785,601 | | | | Merrill Lynch Mortgage Investors, Inc., 2.778%, due 07/25/34 | | 3,789,913 | |
3,015,584 | | | | New Century Home Equity Loan Trust, 2.668%, due 04/25/34 | | 3,017,524 | |
1,403,482 | | | | Residential Asset Mortgage Products, Inc., 2.728%, due 06/25/33 | | 1,403,445 | |
2,871,000 | | | | Residential Asset Securities Corp., 2.540%, due 01/25/35 | | 2,871,000 | |
5,027,728 | | + | | Residential Asset Securities Corp., 2.728%, due 12/25/33 | | 5,038,650 | |
2,602,000 | | | | Residential Funding Mortgage Securities II, 3.450%, due 01/25/16 | | 2,601,566 | |
7,465,000 | | | | Saxon Asset Securities Trust, 3.960%, due 06/25/33 | | 7,491,688 | |
| | | | | | 52,476,209 | |
| | | | Other Asset-Backed Securities: 1.0% | | | |
540,900 | | | | Ameriquest Mortgage Securities, Inc., 2.720%, due 02/25/34 | | 541,494 | |
1,210,441 | | XX | | Amortizing Residential Collateral Trust, 2.918%, due 05/25/32 | | 1,209,684 | |
4,627,385 | | | | Chase Funding Mortgage Loan Asset-Backed Certificates, 2.718%, due 07/25/33 | | 4,633,136 | |
4,788,000 | | | | First Horizon Asset Back Trust, 2.420%, due 10/25/34 | | 4,790,993 | |
See Accompanying Notes to Financial Statements
82
| PORTFOLIO OF INVESTMENTS |
ING VP INTERMEDIATE BOND PORTFOLIO | AS OF DECEMBER 31, 2004 (CONTINUED) |
Principal
Amount | | | | | | Value | |
| | | | Other Asset-Backed Securities (continued) | | | |
$ | 3,256,000 | | | | Residential Asset Mortgage Products, Inc., 2.140%, due 02/25/30 | | $ | 3,235,691 | |
| | | | | | 14,410,998 | |
| | | | Total Asset-Backed Securities (Cost $93,055,359) | | 92,877,210 | |
| | | | | | | |
COLLATERALIZED MORTGAGE OBLIGATIONS: 26.3% | | | |
| | | | Commercial Mortgage-Backed Securities: 5.2% | | | |
195,000 | | | | Bear Stearns Commercial Mortgage Securities, 4.030%, due 02/13/46 | | 193,572 | |
3,372,000 | | | | Bear Stearns Commercial Mortgage Securities, 4.170%, due 01/12/41 | | 3,395,294 | |
777,000 | | | | Capco America Securitization Corp., 6.260%, due 10/15/30 | | 837,663 | |
279,000 | | | | Capco America Securitization Corp., 6.460%, due 10/15/30 | | 303,560 | |
6,167,579 | | | | Chase Manhattan Bank-First Union National Bank, 7.439%, due 08/15/31 | | 6,979,658 | |
3,111,000 | | | | COMM, 3.600%, due 03/10/39 | | 3,065,926 | |
3,562,628 | | | | CS First Boston Mortgage Securities Corp., 3.727%, due 03/15/35 | | 3,508,925 | |
3,500,000 | | | | DLJ Commercial Mortgage Corp., 6.460%, due 03/10/32 | | 3,798,681 | |
3,771,872 | | | | GE Capital Commercial Mortgage Corp., 3.752%, due 07/10/39 | | 3,765,713 | |
421,000 | | | | GE Capital Commercial Mortgage Corp., 3.915%, due 11/10/38 | | 416,560 | |
301,000 | | | | GE Capital Commercial Mortgage Corp., 4.865%, due 07/10/39 | | 307,435 | |
3,880,000 | | | | JP Morgan Chase Commercial Mortgage Securities Corp., 4.223%, due 01/15/42 | | 3,883,919 | |
7,385,994 | | | | JP Morgan Chase Commercial Mortgage Securities Corp., 4.275%, due 01/12/37 | | 7,424,026 | |
9,380,000 | | | | JP Morgan Chase Commercial Mortgage Securities Corp., 6.244%, due 04/15/35 | | 10,039,529 | |
176,000 | | | | LB-UBS Commercial Mortgage Trust, 4.567%, due 06/15/29 | | 179,458 | |
5,220,000 | | | | LB-UBS Commercial Mortgage Trust, 6.226%, due 03/15/26 | | 5,657,214 | |
4,500,000 | | | | LB-UBS Commercial Mortgage Trust, 7.370%, due 08/15/26 | | 5,144,451 | |
| 9,271,662 | | | | Mortgage Capital Funding, Inc., 6.663%, due 03/18/30 | | | 9,922,889 | |
4,121,250 | | | | Prudential Commercial Mortgage Trust, 3.669%, due 02/11/36 | | 4,057,280 | |
| | | | | | 72,881,753 | |
| | | | Whole Loan Collateral PAC: 1.0% | | | |
4,983,864 | | | | GSR Mortgage Loan Trust, 2.818%, due 10/25/32 | | 4,985,495 | |
3,027,495 | | | | MASTR Alternative Loans Trust, 2.818%, due 11/25/33 | | 3,028,562 | |
4,664,104 | | | | MASTR Alternative Loans Trust, 8.500%, due 05/25/33 | | 4,742,384 | |
1,428,288 | | | | Washington Mutual, 2.818%, due 03/25/34 | | 1,431,480 | |
| | | | | | 14,187,921 | |
| | | | Whole Loan Collateralized Mortgage Obligations: 19.9% | | | |
8,869,934 | | | | Banc of America Funding Corp., 5.750%, due 09/20/34 | | 9,024,493 | |
3,197,401 | | | | Bank of America Alternative Loan Trust, 2.868%, due 12/25/33 | | 3,202,681 | |
1,007,706 | | | | Bank of America Alternative Loan Trust, 5.500%, due 02/25/33 | | 1,024,595 | |
4,997,355 | | | | Bank of America Mortgage Securities, 2.868%, due 12/25/33 | | 5,004,882 | |
4,819,585 | | | | Bank of America Mortgage Securities, 5.000%, due 06/25/33 | | 4,847,477 | |
4,861,947 | | | | Bank of America Mortgage Securities, 5.000%, due 12/25/18 | | 4,907,528 | |
3,270,220 | | | | Bank of America Mortgage Securities, 5.250%, due 11/25/19 | | 3,331,368 | |
4,399,053 | | | | Bear Stearns Alt-A Trust, 2.738%, due 07/25/34 | | 4,398,302 | |
545,084 | | | | Bear Stearns Asset Backed Securities, Inc., 5.625%, due 11/25/32 | | 544,021 | |
4,541,951 | | | | Citicorp Mortgage Securities, Inc., 2.918%, due 10/25/33 | | 4,534,757 | |
5,272,682 | | | | Countrywide Alternative Loan Trust, 2.530%, due 09/25/34 | | 5,274,330 | |
3,858,000 | | | | Countrywide Alternative Loan Trust, 2.720%, due 02/25/35 | | 3,858,000 | |
2,596,058 | | | | Countrywide Alternative Loan Trust, 2.818%, due 07/25/18 | | 2,601,331 | |
4,603,321 | | | | Countrywide Alternative Loan Trust, 5.000%, due 10/25/18 | | 4,646,477 | |
3,793,237 | | | | Countrywide Alternative Loan Trust, 5.000%, due 08/25/19 | | 3,827,698 | |
See Accompanying Notes to Financial Statements
83
| PORTFOLIO OF INVESTMENTS |
ING VP INTERMEDIATE BOND PORTFOLIO | AS OF DECEMBER 31, 2004 (CONTINUED) |
Principal
Amount | | | | | | Value | |
| | | | Whole Loan Collateralized Mortgage Obligations (continued) | | | |
$ | 5,053,197 | | | | Countrywide Home Loan Mortgage Pass Through Trust, 5.000%, due 11/25/18 | | $ | 5,100,571 | |
4,715,000 | | XX | | Countrywide Home Loan Mortgage Pass Through Trust, 6.000%, due 11/25/34 | | 4,938,573 | |
7,810,000 | | | | CS First Boston Mortgage Securities Corp., 4.140%, due 10/25/33 | | 7,815,267 | |
8,683,511 | | | | First Horizon Alternative Mortgage Securities, 4.835%, due 06/25/34 | | 8,704,556 | |
5,672,905 | | | | GMAC Mortgage Corp. Loan Trust, 5.250%, due 04/25/34 | | 5,717,163 | |
9,269,000 | | | | GMAC Mortgage Corp. Loan Trust, 5.500%, due 01/25/34 | | 9,487,530 | |
2,408,103 | | | | GSR Mortgage Loan Trust, 4.500%, due 08/25/19 | | 2,426,771 | |
5,654,169 | | | | GSR Mortgage Loan Trust, 6.500%, due 01/25/34 | | 5,892,707 | |
4,658,000 | | | | Harborview Mortgage Loan Trust, 2.770%, due 01/19/35 | | 4,658,000 | |
4,369,548 | | | | Homebanc Mortgage Trust, 2.848%, due 08/25/29 | | 4,366,256 | |
10,999,782 | | | | JP Morgan Mortgage Trust, 6.500%, due 11/25/34 | | 11,496,772 | |
7,833,000 | | | | MASTR Alternative Loans Trust, 5.500%, due 01/25/20 | | 8,038,616 | |
5,196,000 | | | | MASTR Alternative Loans Trust, 5.750%, due 09/25/34 | | 5,359,930 | |
8,593,044 | | | | MASTR Alternative Loans Trust, 6.000%, due 09/25/34 | | 8,829,353 | |
2,842,287 | | | | MASTR Alternative Loans Trust, 6.500%, due 05/25/33 | | 2,906,291 | |
3,763,779 | | | | MASTR Asset Securitization Trust, 2.868%, due 11/25/33 | | 3,773,410 | |
4,689,000 | | | | MASTR Asset Securitization Trust, 5.500%, due 09/25/34 | | 4,710,151 | |
6,531,059 | | | | MLCC Mortgage Investors, Inc., 2.648%, due 04/25/29 | | 6,511,489 | |
3,203,420 | | | | MLCC Mortgage Investors, Inc., 2.738%, due 01/25/29 | | 3,207,537 | |
4,707,387 | | | | MLCC Mortgage Investors, Inc., 2.778%, due 04/25/29 | | 4,712,383 | |
6,459,313 | | | | Prime Mortgage Trust, 5.250%, due 11/25/19 | | 6,594,188 | |
5,338,520 | | | | Residential Accredit Loans, Inc., 2.868%, due 03/25/18 | | 5,350,368 | |
4,611,000 | | XX | | Residential Asset Securitization Trust, 5.500%, due 11/25/34 | | 4,630,810 | |
2,118,833 | | | | Residential Funding Mtg. Sec. I, 2.868%, due 05/25/33 | | 2,123,226 | |
1,439,620 | | | | Residential Funding Mtg. Sec. I, 2.918%, due 12/25/33 | | 1,439,918 | |
6,837,000 | | XX | | Residential Funding Mtg. Sec. I, 5.750%, due 09/25/34 | | 6,989,921 | |
3,434,000 | | | | Sequoia Mortgage Trust, 2.683%, due 01/20/35 | | 3,434,000 | |
| 3,536,299 | | | | Structured Asset Securities Corp., 5.500%, due 07/25/33 | | | 3,567,242 | |
11,900,000 | | | | Structured Asset Securities Corp., 6.000%, due 03/25/34 | | 12,228,015 | |
5,882,832 | | | | Thornburg Mortgage Securities Trust, 2.768%, due 12/25/33 | | 5,882,317 | |
5,558,139 | | | | Thornburg Mortgage Securities Trust, 2.788%, due 09/25/34 | | 5,571,254 | |
5,718,000 | | | | Washington Mutual, 2.510%, due 01/25/35 | | 5,718,000 | |
4,693,414 | | | | Washington Mutual, 2.838%, due 06/25/44 | | 4,696,127 | |
2,898,049 | | | | Washington Mutual, 5.000%, due 06/25/18 | | 2,927,029 | |
6,268,979 | | | | Washington Mutual, 6.000%, due 06/25/34 | | 6,441,376 | |
1,067,398 | | | | Wells Fargo Mortgage Backed Securities Trust, 2.918%, due 02/25/34 | | 1,066,539 | |
4,154,000 | | | | Wells Fargo Mortgage Backed Securities Trust, 3.989%, due 01/25/35 | | 4,131,121 | |
5,950,000 | | | | Wells Fargo Mortgage Backed Securities Trust, 4.500%, due 08/25/18 | | 5,733,694 | |
8,550,735 | | | | Wells Fargo Mortgage Backed Securities Trust, 5.000%, due 12/25/33 | | 8,430,494 | |
| | | | | | 276,636,905 | |
| | | | Whole Loan Collateralized Support CMO: 0.2% | | | |
3,057,953 | | | | Bank of America Mortgage Securities, 5.500%, due 11/25/33 | | 3,067,866 | |
| | | | | | 3,067,866 | |
| | | | Total Collateralized Mortgage Obligations (Cost $367,477,941) | | 366,774,445 | |
| | | | | | | |
MUNICIPAL BONDS: 0.3% | | | |
| | | | Municipal: 0.3% | | | |
1,325,000 | | | | City of New York NY, 5.000%, due 11/01/08 | | 1,432,418 | |
1,325,000 | | | | City of New York NY, 5.000%, due 11/01/11 | | 1,462,389 | |
1,315,000 | | | | City of New York NY, 5.000%, due 11/01/15 | | 1,443,278 | |
| | | | Total Municipal Bonds (Cost $4,341,178) | | 4,338,085 | |
| | | | | | | |
OTHER BONDS: 1.1% | | | |
| | | | Sovereign: 1.1% | | | |
1,108,240 | | @@ | | Brazilian Government Intl. Bond, 3.125%, due 04/15/12 | | 1,062,407 | |
977,000 | | @@ | | Brazilian Government Intl. Bond, 12.250%, due 03/06/30 | | 1,294,525 | |
1,558,000 | | @@ | | Columbia Government Intl. Bond, 10.000%, due 01/23/12 | | 1,807,280 | |
| | | | | | | | | | | | | | |
See Accompanying Notes to Financial Statements
84
| PORTFOLIO OF INVESTMENTS |
ING VP INTERMEDIATE BOND PORTFOLIO | AS OF DECEMBER 31, 2004 (CONTINUED) |
Principal
Amount | | | | | | Value | |
| | | | Sovereign (continued) | | | |
$ | 2,322,000 | | @@ | | Dominican Republic Intl. Bond, 9.040%, due 01/23/13 | | $ | 1,979,505 | |
2,961,000 | | @@,+ | | Russia Government Intl. Bond, 5.000%, due 03/31/30 | | 3,065,819 | |
1,270,000 | | @@ | | Turkey Government Intl. Bond, 12.375%, due 06/15/09 | | 1,600,200 | |
999,000 | | @@ | | Ukraine Government Intl. Bond, 5.330%, due 08/05/09 | | 1,060,139 | |
1,107,000 | | @@,# | | Ukraine Government Intl. Bond, 7.650%, due 06/11/13 | | 1,184,490 | |
1,918,644 | | @@,XX,S | | Uruguay Government Intl. Bond, 10.500%, due 10/20/06 | | 2,253,102 | |
753,000 | | @@ | | Venezuela Government Intl. Bond, 8.500%, due 10/08/14 | | 800,063 | |
| | | | Total Other Bonds
(Cost $14,842,849) | | 16,107,530 | |
| | | | | | | | | | | | |
Shares | | | | | | Value | |
| | | | | | | |
PREFERRED STOCK: 0.5% | | | |
| | | | Banks: 0.4% | | | |
511 | | @,#,XX | | DG Funding Trust | | 5,482,074 | |
| | | | | | 5,482,074 | |
| | | | Electric: 0.1% | | | |
49,875 | | @,S | | TECO Energy, Inc. | | 1,288,957 | |
| | | | | | 1,288,957 | |
| | | | Total Preferred Stock
(Cost $6,816,254) | | 6,771,031 | |
| | | | Total Long-Term Investments (Cost $1,505,532,659) | | 1,511,350,700 | |
| | | | | | | | |
Principal
Amount | | | | | | Value | |
| | | | | | | |
SHORT-TERM INVESTMENTS: 6.1% | | | |
| | | |
| | | | Commercial Paper: 5.0% | | | |
$ | 5,000,000 | | | | BellSouth Corp., 1.990%, due 01/05/05 | | 4,998,619 | |
13,400,000 | | S | | Concord Minuteman Cap B, 2.380%, due 01/11/06 | | 13,400,000 | |
10,000,000 | | S | | Concord Minuteman, 2.390%, due 01/13/06 | | 9,999,500 | |
1,500,000 | | | | Daimler Chrystler, 0.000%, due 01/07/05 | | 1,499,297 | |
8,000,000 | | S | | Daimler Chrysler, 0.000%, due 01/31/05 | | 7,982,296 | |
2,500,000 | | | | Daimler Chrysler, 2.450%, due 01/12/05 | | 2,497,958 | |
2,500,000 | | | | Daimler Chrysler, 2.580%, due 01/03/05 | | 2,499,481 | |
14,000,000 | | S | | Guidant Corp., 2.400%, due 01/10/05 | | 13,990,667 | |
4,500,000 | | S | | Kellogg Co., 2.420%, due 01/18/05 | | 4,494,555 | |
| 8,808,000 | | S | | Kraft Foods, Inc., 2.450%, due 01/24/05 | | | 8,793,614 | |
| | | | Total Commercial Paper
(Cost $70,158,867) | | 70,155,987 | |
| | | |
REPURCHASE AGREEMENT: 1.1% | | | |
15,302,000 | | Goldman Sachs Repurchase Agreement dated 12/31/04, 2.230%, due 01/03/05, $15,304,844 to be received upon repurchase (Collateralized by $15,345,000 Federal Home Loan Mortgage Corporation, 5.125%, Market Value plus accrued interest $15,608,186, due 01/28/19) | | 15,302,000 | |
| | Total Repurchase Agreement
(Cost $15,302,000) | | 15,302,000 | |
| | Total Short-Term Investments
(Cost $85,460,867) | | 85,457,987 | |
| | Total Investments In
Securities (Cost
$1,590,993,526)* | 114.5 | % | $ | 1,596,808,687 | |
| | Other Assets and
Liabilities-Net | (14.5 | ) | (202,524,658 | ) |
| | Net Assets | 100.0 | % | $ | 1,394,284,029 | |
| | | | | | | | | | | | |
@ Non-income producing security
@@ Foreign issuer
STRIP Separate Trading of Registered Interest and Principal of Securities
+ Step-up basis bonds. Interest rates shown reflect current and future coupon rates.
# Securities with purchases pursuant to Rule 144A, under the Securities Act of 1933 and may not be resold subject to that rule except to qualified institutional buyers. Unless otherwise indicated, these securities have been determined to be liquid under the guidelines established by the Funds’ Board of Directors/Trustees.
C Bond may be called prior to maturity date.
W When-issued or delayed delivery security.
S Segregated securities for futures, when issued on delayed delivery securities held at December 31, 2004.
I Illiquid security
XX Value of securities obtained from one or more dealers making markets in the securities in accordance with the Fund’s valuation procedures.
* Cost for federal income tax purposes is $1,591,691,158. Net unrealized appreciation consists of:
Gross Unrealized Appreciation | | $ | 11,823,234 | |
Gross Unrealized Depreciation | | (6,705,705 | ) |
Net Unrealized Appreciation | | $ | 5,117,529 | |
Information concerning open futures contracts at December 31, 2004 is shown below:
| | No. of
Contracts | | Notional
Market Value | | Expiration
Date | | Unrealized
Gain (Loss) | |
Long Contracts | | | | | | | | | |
U.S. Long Bond | | 250 | | $ | 28,125,000 | | 03/31/2005 | | $ | 217,500 | |
| | | | | | | | | |
Short Contracts | | | | | | | | | |
U.S. 5 Year Note | | 380 | | $ | 41,621,875 | | 03/31/2005 | | $ | (58,306 | ) |
See Accompanying Notes to Financial Statements
85
| PORTFOLIO OF INVESTMENTS |
ING VP MONEY MARKET PORTFOLIO(1) | AS OF DECEMBER 31, 2004 |
Principal
Amount | | | | | | Value | |
CORPORATE BONDS/NOTES: 36.5% | | | |
$ | 9,000,000 | | | | ABN AMRO Bank NV, 1.170%, due 01/03/05 | | $ | 8,999,177 | |
9,000,000 | | | | American General Financial, 2.403%, due 01/06/06 | | 9,000,000 | |
5,150,000 | | | | American Honda Finance, 2.140%, due 04/11/05 | | 5,150,000 | |
6,300,000 | | | | American Honda Finance, 2.370%, due 05/16/05 | | 6,300,000 | |
13,200,000 | | | | Associates Corp. NA, 2.649%, due 06/27/05 | | 13,216,500 | |
15,800,000 | | | | Bank One Corp., 7.625%, due 08/01/05 | | 16,234,500 | |
13,500,000 | | | | Bank One NA, 2.558%, due 07/26/05 | | 13,516,875 | |
12,300,000 | | | | Bear Stearns Cos., Inc., 2.351%, due 01/05/06 | | 12,300,000 | |
12,750,000 | | | | Bear Stearns Cos., Inc., 2.428%, due 01/28/06 | | 12,750,000 | |
13,500,000 | | | | Bear Stearns Cos., Inc., 2.460%, due 11/28/05 | | 13,516,875 | |
12,500,000 | | | | Credit Suisse First Boston USA, Inc., 2.508%, due 01/14/05 | | 12,500,000 | |
8,600,000 | | | | Credit Suisse First Boston USA, Inc., 2.510%, due 02/08/05 | | 8,600,000 | |
16,000,000 | | | | General Electric Capital Corp., 2.460%, due 01/09/06 | | 16,020,000 | |
16,007,000 | | | | General Electric Capital Corp., 2.615%, due 03/15/05 | | 16,007,000 | |
12,050,000 | | # | | Goldman Sachs Group LP, 2.393%, due 01/13/06 | | 12,050,000 | |
7,800,000 | | @@,# | | HBOS Treasury Services PLC, 2.270%, due 12/30/05 | | 7,808,315 | |
19,500,000 | | @@,# | | HBOS Treasury Services PLC, 2.550%, due 01/24/06 | | 19,503,120 | |
6,500,000 | | | | JPMorgan Chase & Co., 2.769%, due 03/29/05 | | 6,508,125 | |
11,400,000 | | | | Merrill Lynch & Co., Inc., 1.978%, due 01/05/05 | | 11,400,000 | |
13,500,000 | | #,I | | Money Market Trust LLY, 2.356%, due 06/03/05 | | 13,499,460 | |
31,400,000 | | #,I | | Money Market Trust Series A, 2.478%, due 01/09/06 | | 31,406,907 | |
12,200,000 | | | | Morgan Stanley, 2.523%, due 08/15/05 | | 12,212,993 | |
3,800,000 | | | | PNC Bank NA, 2.510%, due 05/18/05 | | 3,804,750 | |
9,500,000 | | # | | The Bank of New York Co., Inc., 2.438%, due 01/27/06 | | 9,500,000 | |
9,900,000 | | | | Toyota Motor Credit Corp., 2.200%, due 02/07/05 | | 9,900,000 | |
20,475,000 | | | | Verizon Global Funding Corp., 6.750%, due 12/01/05 | | 21,140,438 | |
9,500,000 | | | | Wachovia Corp., 2.840%, due 03/31/05 | | 9,508,645 | |
31,200,000 | | | | Wal-Mart Stores, Inc., 2.296%, due 02/22/05 | | 31,200,000 | |
5,400,000 | | | | Washington Mutual Bank, 2.060%, due 07/18/05 | | 5,400,000 | |
10,800,000 | | | | Wells Fargo & Co., 2.310%, due 02/02/06 | | 10,800,000 | |
14,300,000 | | | | Wells Fargo & Co., 2.579%, due 09/29/05 | | | 14,317,875 | |
7,800,000 | | | | Westpac Banking Corp., 2.450%, due 01/11/06 | | 7,799,493 | |
| | | | Total Corporate Bonds/Notes
(Cost $401,887,509) | | 401,871,048 | |
COMMERCIAL PAPER: 33.1% | | | |
7,220,000 | | | | ASB Bank Ltd., 2.360%, due 02/02/05 | | 7,204,447 | |
29,550,000 | | | | BellSouth Corp., 1.990%, due 01/05/05 | | 29,541,837 | |
19,000,000 | | | | Concord Minutemen Cap, 2.350%, due 01/09/06 | | 19,000,000 | |
18,200,000 | | | | Concord Minuteman Cap B, 2.380%, due 01/11/06 | | 18,200,000 | |
12,800,000 | | | | Concord Minutemen Cap, 2.390%, due 01/13/05 | | 12,788,953 | |
11,000,000 | | | | Credit Suisse First Boston Corp., 2.050%, due 01/10/05 | | 10,993,725 | |
11,400,000 | | | | Credit Suisse First Boston Corp., 2.070%, due 01/12/05 | | 11,392,151 | |
22,200,000 | | | | Corporate Asset Funding Corp., 2.150%, due 01/06/05 | | 22,192,045 | |
36,300,000 | | | | Crown Point Capital Co., 2.370%, due 03/08/05 | | 36,140,280 | |
11,400,000 | | | | Galaxy Funding, 2.140%, due 01/13/05 | | 11,391,181 | |
11,400,000 | | # | | Goldman Sachs Group, 2.388%, due 07/29/05 | | 11,404,321 | |
11,400,000 | | @@ | | Greenwich Capital Holdings, Inc., 2.358%, due 01/14/05 | | 11,400,000 | |
16,000,000 | | | | Houshold Financial Corp., 2.200%, due 01/11/05 | | 15,989,244 | |
11,000,000 | | | | Monument Gardens, 2.250%, due 01/18/05 | | 10,987,625 | |
9,000,000 | | | | Monument Gardens, 2.390%, due 01/24/05 | | 8,985,660 | |
15,400,000 | | | | Monument Gardens, 2.400%, due 01/24/05 | | 15,375,361 | |
7,700,000 | | | | St. Germain Holdings Ltd., 2.310%, due 01/28/05 | | 7,686,166 | |
11,200,000 | | | | St. Germain Holdings Ltd., 2.360%, due 01/18/05 | | 11,186,784 | |
5,900,000 | | | | St. Germain Holdings Ltd., 2.460%, due 02/14/05 | | 5,881,931 | |
11,000,000 | | | | Thunder Bay Funding, 2.240%, due 01/10/05 | | 10,993,155 | |
14,400,000 | | | | Thunder Bay Funding, 2.350%, due 01/25/05 | | 14,376,501 | |
9,000,000 | | | | Thunder Bay Funding, 2.350%, due 01/26/05 | | 8,984,725 | |
10,900,000 | | | | Tulip Funding Corp., 2.290%, due 01/10/05 | | 10,893,078 | |
11,000,000 | | | | Tulip Funding Corp., 2.290%, due 01/19/05 | | 10,986,702 | |
5,443,000 | | | | Tulip Funding Corp., 2.380%, due 01/07/05 | | 5,440,481 | |
24,600,000 | | | | Verizon Global Funding, 2.600%, due 01/13/06 | | 24,630,750 | |
| | | | Total Commercial Paper
(Cost $364,050,293) | | 364,047,103 | |
| | | | | | | | | | | |
See Accompanying Notes to Financial Statements
86
| PORTFOLIO OF INVESTMENTS |
ING VP MONEY MARKET PORTFOLIO(1) | AS OF DECEMBER 31, 2004 (CONTINUED) |
Principal
Amount | | | | | | Value | |
U.S. GOVERNMENT AGENCY OBLIGATIONS: 9.8% | | | |
| | | | Federal Home Loan Bank: 5.3% | | | |
$ | 12,100,000 | | | | 1.400%, due 02/25/05 | | $ | 12,080,760 | |
11,700,000 | | | | 1.425%, due 04/04/05 | | 11,670,096 | |
7,900,000 | | | | 1.470%, due 02/28/05 | | 7,887,858 | |
7,900,000 | | | | 1.500%, due 03/01/05 | | 7,887,676 | |
11,600,000 | | | | 1.600%, due 03/01/05 | | 11,585,738 | |
7,200,000 | | | | 1.600%, due 05/16/05 | | 7,173,000 | |
| | | | | | 58,285,128 | |
| | | | Federal Home Loan Mortgage Corporation: 1.1% | | | |
11,900,000 | | | | 1.500%, due 02/14/05 | | 11,889,026 | |
| | | | | | 11,889,026 | |
| | | | Federal National Mortgage Association: 3.4% | | | |
13,300,000 | | | | 1.400%, due 02/25/05 | | 13,278,852 | |
11,500,000 | | | | 1.550%, due 05/04/05 | | 11,465,144 | |
5,400,000 | | | | 1.610%, due 05/13/05 | | 5,386,500 | |
8,000,000 | | | | 1.630%, due 01/03/05 | | 7,999,508 | |
| | | | | | 38,130,004 | |
| | | | Total U.S. Government Agency Obligations
(Cost $108,500,000) | | 108,304,158 | |
| | | | | | | |
CERTIFICATE OF DEPOSIT: 5.8% | | | |
11,400,000 | | | | ABN Amro Bank NV, 2.335%, due 03/18/05 | | 11,400,000 | |
16,800,000 | | @@ | | Barclays Bank PLC, 1.913%, due 02/03/05 | | 16,800,079 | |
5,700,000 | | | | HSBC Bank, 1.555%, due 04/22/05 | | 5,683,071 | |
11,500,000 | | | | Royal Bank of Canada, 2.350%, due 03/30/05 | | 11,500,000 | |
8,000,000 | | | | Wells Fargo Bank, 2.350%, due 01/27/05 | | 8,000,000 | |
11,000,000 | | | | Wells Fargo Bank, 2.420%, due 01/07/05 | | 11,000,000 | |
| | | | Total Certificate of Deposit
(Cost $64,399,170) | | 64,383,150 | |
| | | | | | | |
COLLATERALIZED MORTGAGE OBLIGATIONS: 7.4% | | | |
11,000,000 | | #,XX | | Blue Heron Funding Ltd., 2.443%, due 05/18/05 | | 11,000,000 | |
11,500,000 | | #,XX | | Blue Heron Funding Ltd., 2.443%, due 03/18/05 | | 11,500,000 | |
11,600,000 | | #,XX | | Blue Heron Funding Ltd., 2.448%, due 02/23/05 | | 11,599,487 | |
11,400,000 | | | | CHEYNE 2004-1A, 2.280%, due 11/10/05 | | 11,400,000 | |
13,900,000 | | #,I,XX | | Newcastle CDO I Ltd., 2.447%, due 10/24/05 | | 13,900,000 | |
13,700,000 | | #,XX | | Putnam Structured Product CDO, 2.423%, due 02/15/05 | | 13,700,000 | |
8,500,000 | | # | | Whitehawk CDO Funding Ltd., 2.520%, due 03/15/05 | | 8,500,000 | |
| | | | Total Collateralized Mortgage Obligations
(Cost $81,600,000) | | 81,599,487 | |
| | | |
REPURCHASE AGREEMENT: 7.2% | | | |
$ | 79,545,000 | | Goldman Sachs Repurchase Agreement dated 12/31/04, 2.230%, due 01/03/05, $79,559,782 to be received upon repurchase (Collateralized by $81,499,000 various U.S. Government Agency Obligations, 2.600% - 4.750%, Market Value plus accrued interest $81,135,908, due 08/07/06 - 03/29/19) | | $ | 79,545,000 | |
| | Total Repurchase Agreement
(Cost $79,545,000) | | 79,545,000 | |
| | Total Investments In Securities
(Cost $1,099,981,972)* | 99.8 | % | $ | 1,099,749,946 | |
| | Other Assets and Liabilities-Net | 0.2 | | 1,721,268 | |
| | Net Assets | 100.0 | % | $ | 1,101,471,214 | |
| | | | | | | | | | | | | | | | | | | | | | | | | | | | |
(1) All securities with a maturity date greater than 13 months have either a variable rate, demand feature, prerefunded, optional or mandatory put resulting in an effective maturity of one year or less. Rate shown reflects current rate.
@@ Foreign issuer
# Securities with purchases pursuant to Rule 144A, under the Securities Act of 1933 and may not be resold subject to that rule except to qualified institutional buyers. Unless otherwise indicated, these securities have been determined to be liquid under the guidelines established by the Funds’ Board of Directors/Trustees.
I Illiquid security
XX Value of securities obtained from one or more dealers making markets in the securities in accordance with the Fund’s valuation procedures.
* Cost for federal income tax purposes is the same as for financial statement purposes. Net unrealized depreciation consists of:
Gross Unrealized Appreciation | | $ | 112,530 | |
Gross Unrealized Depreciation | | (344,556 | ) |
Net Unrealized Depreciation | | $ | (232,026 | ) |
Industry | | Percentage of
Net Assets | |
Commercial Banks - Central U.S. | | 6.1% | |
Commercial Banks - Eastern U.S. | | 2.3 | |
Commercial Banks - Non-U.S. | | 2.6 | |
Diversified Financial Services | | 4.1 | |
Federal Home Loan Bank | | 5.3 | |
Federal Home Loan Mortgage Corporation | | 1.1 | |
Federal National Mortgage Association | | 3.5 | |
Fiduciary Banks | | 0.9 | |
Finance - Auto Loans | | 1.9 | |
Finance - Investment Banker/Broker | | 7.1 | |
Insurance | | 0.8 | |
Investment Companies | | 1.9 | |
Money Center Banks | | 2.5 | |
Retail | | 2.8 | |
Retail Nurseries And Garden Stores | | 1.2 | |
S&L/Thrifts - Western U.S. | | 0.5 | |
Special Purpose Entity | | 34.7 | |
Super-Regional Banks - U.S. | | 6.4 | |
Telecom Services | | 4.2 | |
Telephone - Integrated | | 2.7 | |
Repurchase Agreement | | 7.2 | |
Other Assets and Liabilities, Net | | 0.2 | |
Net Assets | | 100.0% | |
See Accompanying Notes to Financial Statements
87
ING VP GLOBAL SCIENCE AND
TECHNOLOGY PORTFOLIO | PORTFOLIO OF INVESTMENTS
AS OF DECEMBER 31, 2004 |
Shares | | | | | | Value | |
COMMON STOCK: 97.4% | | | |
| | | | Biotechnology: 7.7% | | | |
77,242 | | @ | | Arqule, Inc. | | $ | 447,231 | |
15,400 | | @ | | Celgene Corp. | | 408,562 | |
20,500 | | @ | | Chiron Corp. | | 683,265 | |
23,500 | | @ | | Genentech, Inc. | | 1,279,340 | |
46,000 | | @ | | Incyte Corp. | | 459,540 | |
6,500 | | @ | | Invitrogen Corp. | | 436,345 | |
21,800 | | @ | | MedImmune, Inc. | | 590,998 | |
38,000 | | @ | | Millennium Pharmaceuticals, Inc. | | 460,560 | |
31,600 | | @ | | Protein Design Labs, Inc. | | 652,856 | |
29,500 | | @ | | Telik, Inc. | | 564,630 | |
26,000 | | @ | | Transkaryotic Therapies, Inc. | | 660,140 | |
| | | | | | 6,643,467 | |
| | | | Commercial Services: 1.3% | | | |
41,900 | | @,@@ | | Accenture Ltd. - Class A | | 1,131,300 | |
| | | | | | 1,131,300 | |
| | | | Computers: 8.3% | | | |
41,900 | | @ | | Cadence Design Systems, Inc. | | 578,639 | |
26,650 | | @ | | Dell, Inc. | | 1,123,031 | |
80,300 | | @ | | EMC Corp. | | 1,194,061 | |
42,100 | | | | Hewlett-Packard Co. | | 882,837 | |
160,000 | | @@ | | Hon Hai Precision Industry Co. Ltd. | | 743,138 | |
14,100 | | | | International Business Machines Corp. | | 1,389,979 | |
582,000 | | @@ | | Lite-On Technology Corp. | | 623,439 | |
364,000 | | @@ | | Quanta Computer, Inc. | | 655,016 | |
| | | | | | 7,190,140 | |
| | | | Electrical Components and Equipment: 2.1% | | | |
38,400 | | @ | | General Cable Corp. | | 531,840 | |
3,000 | | @@ | | Samsung Electronics Co. Ltd. | | 1,303,503 | |
| | | | | | 1,835,343 | |
| | | | Electronics: 3.1% | | | |
50,200 | | @ | | Agilent Technologies, Inc. | | 1,209,820 | |
28,300 | | @ | | Thermo Electron Corp. | | 854,377 | |
52,300 | | @ | | TTM Technologies, Inc. | | 617,140 | |
| | | | | | 2,681,337 | |
| | | | Healthcare-Products: 6.2% | | | |
11,300 | | | | Alcon, Inc. | | 910,780 | |
19,300 | | | | Biomet, Inc. | | 837,427 | |
36,800 | | @ | | Boston Scientific Corp. | | 1,308,240 | |
80,200 | | @ | | Caliper Life Sciences, Inc. | | 603,906 | |
9,300 | | | | Guidant Corp. | | 670,530 | |
25,100 | | @ | | St. Jude Medical, Inc. | | 1,052,443 | |
| | | | | | 5,383,326 | |
| | | | Internet: 7.3% | | | |
59,800 | | @ | | aQuantive, Inc. | | 534,612 | |
17,000 | | @ | | Ask Jeeves, Inc. | | 454,750 | |
5,400 | | @ | | eBay, Inc. | | 627,912 | |
89,300 | | @ | | iVillage, Inc. | | 551,874 | |
32,600 | | @ | | McAfee, Inc. | | 943,118 | |
35,000 | | @ | | Symantec Corp. | | 901,600 | |
47,700 | | @ | | TIBCO Software, Inc. | | 636,318 | |
14,200 | | @ | | VeriSign, Inc. | | 475,984 | |
32,000 | | @ | | Yahoo!, Inc. | | 1,205,760 | |
| | | | | | 6,331,928 | |
| | | | Leisure Time: 0.7% | | | |
17,000 | | @ | | WMS Industries, Inc. | | $ | 570,180 | |
| | | | | | 570,180 | |
| | | | Pharmaceuticals: 8.8% | | | |
44,900 | | @ | | Auxilium Pharmaceuticals, Inc. | | 392,875 | |
82,000 | | @ | | Dyax Corp. | | 592,040 | |
7,500 | | @ | | Eyetech Pharmaceuticals, Inc. | | 341,250 | |
43,400 | | @ | | First Horizon Pharmaceutical Corp. | | 993,426 | |
13,200 | | @ | | Forest Laboratories, Inc. | | 592,152 | |
17,400 | | @ | | Gilead Sciences, Inc. | | 608,826 | |
12,600 | | @ | | Medco Health Solutions, Inc. | | 524,160 | |
12,800 | | @ | | Neurocrine Biosciences, Inc. | | 631,040 | |
20,710 | | @ | | NitroMed, Inc. | | 551,922 | |
21,200 | | @ | | Noven Pharmaceuticals, Inc. | | 361,672 | |
27,700 | | @ | | NPS Pharmaceuticals, Inc. | | 506,356 | |
42,200 | | @ | | Nuvelo, Inc. | | 415,670 | |
32,900 | | @ | | Salix Pharmaceuticals Ltd. | | 578,711 | |
30,600 | | @ | | Vicuron Pharmaceuticals, Inc. | | 532,746 | |
| | | | | | 7,622,846 | |
| | | | Semiconductors: 19.4% | | | |
23,750 | | | | Analog Devices, Inc. | | 876,850 | |
63,400 | | @ | | Applied Materials, Inc. | | 1,084,140 | |
39,620 | | @ | | Bookham, Inc. | | 191,761 | |
30,000 | | @ | | Broadcom Corp. | | 968,400 | |
43,800 | | @ | | Emulex Corp. | | 737,592 | |
38,500 | | @ | | Fairchild Semiconductor Intl., Inc. | | 626,010 | |
34,300 | | @ | | Integrated Circuit Systems, Inc. | | 717,556 | |
51,350 | | | | Intel Corp. | | 1,201,076 | |
9,900 | | @ | | International Rectifier Corp. | | 441,243 | |
36,700 | | | | Intersil Corp. | | 614,358 | |
18,300 | | @ | | KLA-Tencor Corp. | | 852,414 | |
21,750 | | @ | | Lam Research Corp. | | 628,793 | |
16,800 | | | | Linear Technology Corp. | | 651,168 | |
15,200 | | | | Maxim Integrated Products, Inc. | | 644,328 | |
48,100 | | @ | | MEMC Electronic Materials, Inc. | | 637,325 | |
29,000 | | | | National Semiconductor Corp. | | 520,550 | |
540,000 | | @,@@ | | Powerchip Semiconductor Corp. | | 450,137 | |
65,100 | | @ | | Skyworks Solutions, Inc. | | 613,893 | |
112,878 | | @@ | | Taiwan Semiconductor Manufacturing Co. Ltd. ADR | | 958,334 | |
37,100 | | @ | | Teradyne, Inc. | | 633,297 | |
43,350 | | | | Texas Instruments, Inc. | | 1,067,277 | |
17,400 | | @ | | Varian Semiconductor Equipment Associates, Inc. | | 641,190 | |
29,800 | | | | Xilinx, Inc. | | 883,570 | |
| | | | | | 16,641,262 | |
| | | | Software: 18.1% | | | |
17,000 | | | | Adobe Systems, Inc. | | 1,066,580 | |
28,300 | | @ | | Ascential Software Corp. | | 461,573 | |
37,800 | | @ | | BMC Software, Inc. | | 703,080 | |
24,200 | | @ | | Citrix Systems, Inc. | | 593,626 | |
31,000 | | | | Computer Associates Intl., Inc. | | 962,860 | |
104,300 | | @ | | Compuware Corp. | | 674,821 | |
27,300 | | @ | | Digi Intl., Inc. | | 469,287 | |
21,500 | | @ | | Electronic Arts, Inc. | | 1,326,120 | |
77,600 | | @ | | Informatica Corp. | | 630,112 | |
8,750 | | @ | | Intuit, Inc. | | 385,088 | |
67,800 | | @ | | Lawson Software, Inc. | | 465,786 | |
64,300 | | | | Microsoft Corp. | | 1,717,452 | |
146,400 | | @ | | OpenTV Corp. | | 562,176 | |
106,000 | | @ | | Oracle Corp. | | 1,454,320 | |
See Accompanying Notes to Financial Statements
88
ING VP GLOBAL SCIENCE AND
TECHNOLOGY PORTFOLIO |
PORTFOLIO OF INVESTMENTS
AS OF DECEMBER 31, 2004 (CONTINUED)
|
Shares | | | | | | Value | |
| | | | Software (continued) | | | |
30,400 | | @@ | | SAP AG ADR | | $ | 1,343,984 | |
35,600 | | @@ | | Satyam Computer Services Ltd. ADR | | 859,028 | |
59,500 | | @ | | Siebel Systems, Inc. | | 624,750 | |
80,100 | | | | Travelsky Technology LTD | | 64,984 | |
41,700 | | @ | | Veritas Software Corp. | | 1,190,535 | |
| | | | | | 15,556,162 | |
| | | | Telecommunications: 14.4% | | | |
228,800 | | @ | | ADC Telecommunications, Inc. | | 613,184 | |
29,400 | | | | Adtran, Inc. | | 562,716 | |
52,200 | | @ | | Alamosa Holdings, Inc. | | 650,934 | |
26,500 | | @ | | Andrew Corp. | | 361,195 | |
37,800 | | @ | | Avaya, Inc. | | 650,160 | |
67,300 | | @ | | Cisco Systems, Inc. | | 1,298,889 | |
13,800 | | | | Harris Corp. | | 852,702 | |
32,500 | | @ | | Juniper Networks, Inc. | | 883,675 | |
4,100 | | @@ | | Mobile TeleSystems SP ADR | | 567,891 | |
38,000 | | @ | | Netgear, Inc. | | 691,220 | |
19,900 | | @ | | Nextel Communications, Inc. | | 597,000 | |
69,500 | | @ | | Powerwave Technologies, Inc. | | 589,360 | |
19,700 | | | | QUALCOMM, Inc. | | 835,280 | |
31,300 | | | | Scientific-Atlanta, Inc. | | 1,033,213 | |
20,178 | | @@ | | Telekomunikasi Indonesia Tbk PT ADR | | 424,142 | |
87,786 | | @ | | Telesp Celular Participacoes SA ADR | | | 596,945 | |
29,132 | | @,@@ | | Telesystem Intl. Wireless, Inc. | | 325,987 | |
24,717 | | @@ | | Turkcell Iletisim Hizmet AS ADR | | 447,378 | |
15,400 | | @ | | Western Wireless Corp. | | 451,220 | |
| | | | | | 12,433,091 | |
| | | | Total Common Stock
(Cost $76,214,396) | | 84,020,382 | |
| | | | Total Investments In Securities
(Cost $76,214,396)* | 97.4 | % | $ | 84,020,382 | |
| | | | Other Assets and Liabilities-Net | 2.6 | | 2,270,899 | |
| | | | Net Assets | 100.0 | % | $ | 86,291,281 | |
@ Non-income producing security
@@ Foreign issuer
ADR American Depositary Receipt
* Cost for federal income tax purposes is $76,821,774. Net unrealized appreciation consists of:
Gross Unrealized Appreciation | | $ | 10,520,363 | |
Gross Unrealized Depreciation | | (3,321,755 | ) |
Net Unrealized Depreciation | | $ | 7,198,608 | |
See Accompanying Notes to Financial Statements
89
| | PORTFOLIO OF INVESTMENTS |
ING VP INTERNATIONAL EQUITY PORTFOLIO | | AS OF DECEMBER 31, 2004 |
Shares | | | | | | Value | |
COMMON STOCK: 95.8% | | | |
| | | |
| | | | Australia: 3.1% | | | |
39,700 | | @ | | BHP Billiton Ltd. | | $ | 476,431 | |
63,700 | | | | Boral Ltd. | | 344,342 | |
42,900 | | @ | | QBE Insurance Group Ltd. | | 517,574 | |
14,100 | | | | St. George Bank Ltd. | | 279,310 | |
| | | | | | 1,617,657 | |
| | | | Austria: 0.9% | | | |
24,100 | | | | Telekom Austria AG | | 456,917 | |
| | | | | | 456,917 | |
| | | | Belgium: 1.9% | | | |
18,000 | | | | Fortis | | 497,303 | |
9,600 | | | | UCB SA | | 488,025 | |
| | | | | | 985,328 | |
| | | | Brazil: 0.4% | | | |
3,100 | | | | Banco Itau Holding Financeira SA ADR | | 233,027 | |
| | | | | | 233,027 | |
| | | | Denmark: 1.3% | | | |
15,700 | | | | TDC A/S | | 665,208 | |
| | | | | | 665,208 | |
| | | | Finland: 1.2% | | | |
38,900 | | | | Nokia Oyj | | 609,171 | |
| | | | | | 609,171 | |
| | | | France: 7.0% | | | |
18,100 | | | | Credit Agricole SA | | 546,366 | |
21,700 | | @ | | France Telecom SA | | 716,960 | |
6,000 | | | | Peugeot SA | | 380,634 | |
12,420 | | | | Sanofi-Aventis | | 992,996 | |
4,800 | | | | Total SA | | 1,051,261 | |
| | | | | | 3,688,217 | |
| | | | Germany: 9.6% | | | |
49,200 | | | | Deutsche Telekom AG | | 1,111,850 | |
8,800 | | | | E.ON AG | | 801,332 | |
6,500 | | | | Fresenius Medical Care AG | | 523,449 | |
7,700 | | | | Metro AG | | 424,441 | |
9,300 | | | | RWE AG | | 513,536 | |
3,300 | | | | SAP AG | | 584,325 | |
7,900 | | | | Siemens AG | | 668,761 | |
20,900 | | | | ThyssenKrupp AG | | 460,350 | |
| | | | | | 5,088,044 | |
| | | | Greece: 1.4% | | | |
9,600 | | | | Alpha Bank AE | | 334,870 | |
22,010 | | | | Hellenic Telecommunications Organization SA | | 396,009 | |
| | | | | | 730,879 | |
| | | | Hong Kong: 1.6% | | | |
48,000 | | @ | | Cheung Kong Holdings Ltd. | | 478,953 | |
127,000 | | | | Citic Pacific Ltd. | | 361,736 | |
| | | | | | 840,689 | |
| | | | India: 0.3% | | | |
6,200 | | # | | Reliance Industries Ltd. GDR | | 159,712 | |
| | | | | | 159,712 | |
| | | | Indonesia: 0.4% | | | |
11,000 | | | | Telekomunikasi Indonesia Tbk PT ADR | | | 231,220 | |
| | | | | | 231,220 | |
| | | | Ireland: 1.8% | | | |
30,000 | | | | Bank of Ireland | | 495,677 | |
26,600 | | | | Depfa Bank PLC | | 448,058 | |
| | | | | | 943,735 | |
| | | | Italy: 5.1% | | | |
69,500 | | @ | | Enel S.p.A. | | 683,196 | |
30,600 | | | | Mediaset S.p.A. | | 387,412 | |
252,900 | | | | Telecom Italia S.p.A. | | 1,032,436 | |
98,400 | | | | UniCredito Italiano S.p.A. | | 565,989 | |
| | | | | | 2,669,033 | |
| | | | Japan: 22.1% | | | |
17,800 | | | | Chubu Electric Power Co., Inc. | | 427,325 | |
19,000 | | | | Dai Nippon Printing Co., Ltd. | | 305,889 | |
76 | | | | East Japan Railway Co. | | 423,357 | |
140,000 | | @ | | Isuzu Motors Ltd. | | 413,917 | |
19,800 | | | | JFE Holdings, Inc. | | 565,730 | |
17,500 | | | | Kyushu Electric Power Co., Inc. | | 353,518 | |
10,600 | | | | Lawson, Inc. | | 391,635 | |
29,600 | | | | Marui Co. Ltd. | | 397,851 | |
43,000 | | | | Matsushita Electric Industrial Co., Ltd. | | 688,997 | |
59,000 | | | | Meiji Dairies Corp. | | 351,220 | |
177,000 | | | | Mitsubishi Chemical Corp. | | 538,596 | |
54,000 | | | | Mitsui OSK Lines Ltd. | | 324,221 | |
45,000 | | @ | | Mitsui Sumitomo Insurance Co., Ltd. | | 392,376 | |
70,000 | | | | Mitsui Trust Holdings, Inc. | | 704,190 | |
168 | | | | Mizuho Financial Group, Inc. | | 851,463 | |
106 | | | | Nippon Telegraph & Telephone Corp. | | 479,763 | |
79,000 | | @ | | Oki Electric Industry Co. Ltd. | | 340,717 | |
22,000 | | | | Onward Kashiyama Co. Ltd. | | 319,999 | |
17,600 | | @ | | Sankyo Co., Ltd. | | 398,503 | |
8,400 | | | | Seiko Epson Corp. | | 374,527 | |
38,000 | | | | Sumitomo Electric Industries Ltd. | | 415,778 | |
68,000 | | | | Sumitomo Trust & Banking Co., Ltd. | | 492,978 | |
9,700 | | @ | | Takeda Pharmaceutical Co., Ltd. | | 489,767 | |
5,630 | | | | Takefuji Corp. | | 380,746 | |
109,000 | | | | Toshiba Corp. | | 469,365 | |
28,200 | | | | Yamaha Corp. | | 432,110 | |
| | | | | | 11,724,538 | |
| | | | Netherlands: 3.5% | | | |
35,600 | | @ | | Aegon NV | | 484,578 | |
5,400 | | | | DSM NV | | 349,214 | |
52,400 | | @ | | Koninklijke Ahold NV | | 406,052 | |
22,500 | | | | Koninklijke Philips Electronics NV | | 596,272 | |
| | | | | | 1,836,116 | |
| | | | Norway: 0.6% | | | |
4,000 | | | | Norsk Hydro ASA | | 314,562 | |
| | | | | | 314,562 | |
| | | | Russia: 0.5% | | | |
2,200 | | | | LUKOIL ADR | | 269,500 | |
| | | | | | 269,500 | |
See Accompanying Notes to Financial Statements
90
PORTFOLIO OF INVESTMENTS |
ING VP INTERNATIONAL EQUITY PORTFOLIO | AS OF DECEMBER 31, 2004 (CONTINUED) |
Shares | | | | | | Value | |
| | | | Singapore: 0.7% | | | |
39,000 | | | | DBS Group Holdings Ltd. | | $ | 384,468 | |
| | | | | | 384,468 | |
| | | | South Korea: 0.8% | | | |
5,400 | | @ | | Kookmin Bank ADR | | 211,032 | |
1,000 | | @ | | Samsung Electronics Co. Ltd. GDR | | 219,436 | |
| | | | | | 430,468 | |
| | | | Spain: 3.7% | | | |
7,700 | | | | Banco Popular Espanol SA | | 506,995 | |
53,800 | | @ | | Banco Santander Central Hispano SA | | 667,136 | |
29,200 | | @ | | Repsol YPF SA | | 759,555 | |
| | | | | | 1,933,686 | |
| | | | Sweden: 3.2% | | | |
14,500 | | | | Electrolux AB | | 332,199 | |
57,900 | | | | Nordea Bank AB | | 583,680 | |
80,600 | | | | Skandia Forsakrings AB | | 401,029 | |
33,500 | | | | Swedish Match AB | | 387,516 | |
| | | | | | 1,704,424 | |
| | | | Switzerland: 5.5% | | | |
9,960 | | | | Roche Holding AG | | 1,143,242 | |
4,610 | | | | Swiss Reinsurance Co. | | 328,011 | |
11,490 | | | | UBS AG | | 963,167 | |
2,792 | | @ | | Zurich Financial Services AG | | 464,900 | |
| | | | | | 2,899,320 | |
| | | | Taiwan: 0.4% | | | |
26,600 | | | | Taiwan Semiconductor Manufacturing Co. Ltd. ADR | | 225,834 | |
| | | | | | 225,834 | |
| | | | United Kingdom: 18.8% | | | |
18,400 | | | | Anglo American PLC | | 434,166 | |
107,500 | | | | BAE Systems PLC | | 474,903 | |
130,533 | | | | BP PLC | | 1,270,148 | |
85,500 | | @ | | British Airways PLC | | 385,285 | |
38,800 | | | | Enterprise Inns PLC | | 590,425 | |
83,200 | | @ | | HSBC Holdings PLC | | 1,401,748 | |
266,900 | | | | Legal & General Group PLC | | 562,363 | |
47,900 | | @ | | Reed Elsevier PLC | | 441,519 | |
127,900 | | | | Rentokil Initial PLC | | 361,806 | |
33,903 | | @ | | Royal Bank of Scotland Group PLC | | 1,138,625 | |
28,000 | | | | Severn Trent PLC | | 519,062 | |
164,400 | | | | Shell Transport & Trading Co. PLC | | 1,406,605 | |
32,000 | | | | Smith and Nephew PLC | | 327,431 | |
61,700 | | @ | | Unilever PLC | | 605,301 | |
| | | | | | 9,919,387 | |
| | | | Total Common Stock
(Cost $42,326,896) | | 50,561,140 | |
| | | | | | | | |
Principal
Amount | | | | | | Value | |
SHORT-TERM INVESTMENTS: 4.2% | | | | | |
| | | | | |
| | Repurchase Agreement: 4.2% | | | | | |
$ | 2,203,000 | | Goldman Sachs Repurchase Agreement dated 12/31/04, 2.230%, due 01/03/05, $2,203,409 to be received upon repurchase (Collateralized by $2,071,000 Various U.S. Government Agency Obligations, 1.625%-5.750%, Market Value plus accrued interest $2,247,837, due 04/15/05-12/15/09) | | | | $ | 2,203,000 | |
| | Total Short-Term Investments
(Cost $2,203,000) | | | | 2,203,000 | |
| | Total Investments In Securities
(Cost $44,529,896)* | | 100.0 | % | $ | 52,764,140 | |
| | Other Assets and Liabilities-Net | | 0.0 | | 5,708 | |
| | Net Assets | | 100.0 | % | $ | 52,769,848 | |
| | | | | | | | | | |
@ Non-income producing security
ADR American Depositary Receipt
GDR Global Depositary Receipt
# Securities with purchases pursuant to Rule 144A, under the Securities Act of 1933 and may not be resold subject to that rule except to qualified institutional buyers. These securities have been determined to be liquid under the guidelines established by the Funds’ Board of Directors/Trustees.
* Cost for federal income tax purposes is $44,686,078. Net unrealized appreciation consists of:
Gross Unrealized Appreciation | | $ | 8,176,231 | |
Gross Unrealized Depreciation | | (98,169 | ) |
Net Unrealized Appreciation | | $ | 8,078,062 | |
See Accompanying Notes to Financial Statements
91
| PORTFOLIO OF INVESTMENTS |
ING VP INTERNATIONAL EQUITY PORTFOLIO | AS OF DECEMBER 31, 2004 (CONTINUED) |
Industry | | Percentage of
Net Assets | |
Aerospace/Defense | | 0.9% | |
Agriculture | | 0.7 | |
Airlines | | 0.7 | |
Apparel | | 0.6 | |
Auto Manufacturers | | 1.5 | |
Banks | | 21.4 | |
Building Materials | | 0.7 | |
Chemicals | | 2.0 | |
Commercial Services | | 1.3 | |
Diversified Financial Services | | 0.7 | |
Electric | | 5.3 | |
Electrical Components and Equipment | | 2.1 | |
Electronics | | 1.1 | |
Food | | 3.4 | |
Healthcare-Products | | 1.6 | |
Holding Companies-Diversified | | 0.7 | |
Home Furnishings | | 2.8 | |
Insurance | | 6.0 | |
Iron/Steel | | 1.9 | |
Media | | 1.6 | |
Mining | | 1.7 | |
Miscellaneous Manufacturing | | 1.3 | |
Office/Business Equipment | | 0.7 | |
Oil and Gas | | 9.6 | |
Pharmaceuticals | | 6.7 | |
Real Estate | | 0.9 | |
Retail | | 2.6 | |
Semiconductors | | 0.4 | |
Software | | 1.1 | |
Telecommunications | | 11.4 | |
Transportation | | 1.4 | |
Water | | 1.0 | |
Repurchase Agreement | | 4.2 | |
Other Assets and Liabilities, Net | | 0.0 | |
Net Assets | | 100.0% | |
See Accompanying Notes to Financial Statements
92
Dividends paid during the year ended December 31, 2004 were as follows:
Fund Name | | Type | | Per Share Amount | |
ING VP Balanced Portfolio | | | | | |
Class I | | NII | | $ | 0.2583 | |
Class S | | NII | | $ | 0.2536 | |
ING VP Growth and Income Portfolio | | | | | |
Class I | | NII | | $ | 0.4487 | |
Class S | | NII | | $ | 0.3855 | |
ING VP Growth Portfolio | | | | | |
Class I | | NII | | $ | 0.0113 | |
Class S | | NII | | $ | — | |
ING VP Small Company Portfolio | | | | | |
Class I | | NII | | $ | 0.0494 | |
Class S | | NII | | $ | 0.0478 | |
ING VP Value Opportunity Portfolio | | | | | |
Class I | | NII | | $ | 0.1070 | |
Class S | | NII | | $ | 0.0915 | |
ING VP Intermediate Bond Portfolio | | | | | |
Class I | | NII | | $ | 1.1120 | |
Class S | | NII | | $ | 1.1016 | |
Class I | | STCG | | $ | 0.5100 | |
Class S | | STCG | | $ | 0.5100 | |
Class I | | LTCG | | $ | 0.0529 | |
Class S | | LTCG | | $ | 0.0529 | |
ING VP Money Market Portfolio | | | | | |
Class I | | NII | | $ | 0.1358 | |
ING VP International Equity Portfolio | | | | | |
Class I | | NII | | $ | 0.0940 | |
Class S | | NII | | $ | 0.0883 | |
NII - Net investment income
STCG - Short-term capital gain
LTCG - Long-term capital gain
Of the ordinary distributions made during the year ended December 31, 2004, the following percentages qualify for the dividends received deduction available to corporate shareholders:
ING VP Balanced Portfolio: | | 36.11 | % |
ING VP Growth and Income Portfolio: | | 100.00 | % |
ING VP Growth Portfolio: | | 100.00 | % |
ING VP Small Company Portfolio: | | 100.00 | % |
ING VP Value Opportunity Portfolio: | | 100.00 | % |
For the year ended December 31, 2004, the following are percentages of net investment income dividends paid by the Funds that are designated as qualifying dividend income subject to reduced income tax rates for individuals:
ING VP Growth and Income Portfolio: | | 100.00 | % |
During the year ended December 31, 2004, the foreign taxes paid or withheld were $110,399 in total and $0.02 per share for the VP International Equity Portfolio.
Above figures may differ from those cited elsewhere in this report due to differences in the calculation of income and gains under accounting principles generally accepted in the United States of America (book) purposes and Internal Revenue Service (tax) purposes.
Shareholders are strongly advised to consult their own tax advisers with respect to the tax consequences of their investments in the Funds. In January, shareholders, excluding corporate shareholders, receive an IRS 1099-DIV regarding the federal tax status of the dividends and distributions they received in the calendar year.
93
The business and affairs of the Funds are managed under the direction of the Fund’s Board of Directors. A director who is not an interested person of the Funds, as defined in the 1940 Act, is an independent director (“Non-Interested Director”). The Directors of the Funds are listed below. The Statement of Additional Information includes additional information about directors of the Registrant and is available, without charge, upon request at 1-800-992-0180.
Name, Address
and Age | | Position(s)
held with
the Company | | Term of
Office and
Length of
Time Served(1) | | Principal
Occupation(s)
during the
Past Five Years | | Number of
Portfolios in
Fund Complex
Overseen
by Director | | Other
Directorships
held by
Director |
Non-Interested Directors: | | | | | | | | | | |
| | | | | | | | | | |
Albert E. DePrince, Jr.
7337 E. Doubletree Ranch Rd.
Scottsdale, Arizona 85258
Born: 1941 | | Director | | June 1998 - present | | Professor of Economics and Finance, Middle Tennessee State University (August 1991 to Present). Formerly, Director, Business and Economic Research Center (August 1999 - August 2002). | | 48 | | Director, International Atlantic Economic Society (October 2002 - Present); Academy of Economics and Finance (February 2001 - Present). |
| | | | | | | | | | |
Maria T. Fighetti
7337 E. Doubletree Ranch Rd.
Scottsdale, Arizona 85258
Born: 1943 | | Director | | April 1994 - present | | Retired. Formerly, Attorney, New York City Department of Mental Health (June 1973 - October 2002) and Associate Commissioner (1995 - 2002). | | 48 | | None |
| | | | | | | | | | |
Sidney Koch
7337 E. Doubletree Ranch Rd.
Scottsdale, Arizona 85258
Born: 1935 | | Director | | April 1994 - present | | Financial Adviser, Self-Employed (January 1993 - Present). | | 48 | | Director, Northwest Center for the Arts, Torrington, CT. |
| | | | | | | | | | |
Corine T. Norgaard
7337 E. Doubletree Ranch Rd.
Scottsdale, Arizona 85258
Born: 1937 | | Director | | June 1991 - present | | Retired. Formerly, Dean, Barney School of Business, University of Hartford (August 1996 - May 2004). | | 48 | | Director/Trustee, Mass Mutual Corporate and Participation Investors (April 1997 - Present) Director, Advest Trust Company (1998 - Present); Director, Connecticut Health Foundation (2002 - Present). |
| | | | | | | | | | |
Edward T. O’Dell
7337 E. Doubletree Ranch Rd.
Scottsdale, Arizona 85258
Born: 1935 | | Director | | June 2002 - present | | Retired. Formerly, Partner/Chairman of Financial Service Group, Goodwin Procter LLP (June 1966 - September 2000); | | 48 | | None |
| | | | | | | | | | |
Joseph E. Obermeyer(2)
7337 E. Doubletree Ranch Rd.
Scottsdale, Arizona 85258
Born: 1957 | | Director | | January 2003 - present | | President, Obermeyer & Associates, Inc. (Consulting firm) (November 1999 - Present). Formerly, Senior Manager, Arthur Andersen LLP (1995 - October 1999). | | 48 | | None |
94
DIRECTOR AND OFFICER INFORMATION (UNAUDITED) (CONTINUED)
Name, Address
and Age | | Position(s)
held with
the Company | | Term of
Office and
Length of
Time Served(1) | | Principal
Occupation(s)
during the
Past Five Years | | Number of
Portfolios in
Fund Complex
Overseen
by Director | | Other
Directorships
held by
Director |
| | | | | | | | |
Directors who are “Interested Persons” | | | | | | | | |
| | | | | | | | | | |
J. Scott Fox(3)
ING Investment
Management Co.
10 State House Square
Hartford, Connecticut
Born: 1955 | | Director | | December 1997 - present | | Vice Chairman and Chief Operating Officer, ING Investment Management (September 2002 - Present); President and Chief Executive Officer (April 2001 - Present). Formerly, Managing Director and Chief Operating Officer (April 1994 - April 2001), ING Investment Management Co. | | 48 | | Director of IPC Financial Network, Inc. (January 2001 - Present); Director, Metro Hartford Chamber of Commmerce and The Greater Hartford Arts Council. |
| | | | | | | | | | |
Thomas J. McInerney(4)
7337 E. Doubletree Ranch Rd.
Scottsdale, Arizona 85258
Born: 1956 | | Director | | April 2002 – present | | Chief Executive Officer, ING U.S. Financial Services (September 2001 - Present); Member, ING Americas Executive Committee (2001 - Present); ING Aeltus Holding Company, Inc. (2000 - Present), ING Retail Holding Company (1998 - Present), and ING Retirement Holdings, Inc. (1997 - Present). Formerly, President, ING Life Insurance Annuity Company (September 1997 - November 2002); President, Chief Executive Officer and Director of Northern Life Insurance Company (March 2001 - October 2002); General Manager and Chief Executive Officer, ING Worksite Division (December 2000 - October 2001), President, ING-SCI, Inc. (August 1997 - December 2000); President, Aetna Financial Services (August 1997 - December 2000). | | 161 | | Director, Equitable Life Insurance Co., Golden American Life Insurance Co., Life Insurance Company of Georgia, Midwestern United Life Insurance Co., ReliaStar Life Insurance Co., Security Life of Denver, Security Connecticut Life Insurance Co., Southland Life Insurance Co., USG Annuity and Life Company, and United Life and Annuity Insurance Co., Inc. (March 2001 - Present); Member of the Board, Bushnell Performing Arts Center; St. Francis Hospital; National Conference for Community Justice; and Metro Atlanta Chamber of Commerce. |
(1) Directors serve until their successors are duly elected and qualified, subject to the Board’s retirement policy.
(2) Mr. Obermeyer was elected to the Board on January 1, 2003.
(3) Mr. Fox is an “interested person,” as defined under the 1940 Act, because of his relationship with ING Investment Management Co., an affiliate of ING Investments.
(4) Mr. McInerney is an “interested person,” as defined under the 1940 Act, because of his affiliation with ING Groep N.V., the parent corporation of the Investment Manager, ING Investments, LLC and the Distributor, ING Funds Distributor, LLC.
95
DIRECTOR AND OFFICER INFORMATION (UNAUDITED) (CONTINUED)
Name, Address
and Age | | Position(s)
Held with the Company | | Term of Office and
Length of Time Served(1) | | Principal Occupation(s) during the
Past Five Years |
James M. Hennessy
7337 E. Doubletree Ranch Rd.
Scottsdale, Arizona 85258
Born: 1949 | | President, Chief Executive
Officer and Chief
Operating Officer | | March 2002 - present | | President and Chief Executive Officer, ING Investments, LLC (December 2000 - Present). Formerly, Senior Executive Vice President and Chief Operating Officer, ING Investments, LLC (April 1995 - December 2000); and Executive Vice President, ING Investments, LLC (May 1998 - June 2000). |
| | | | | | |
Michael J. Roland
7337 E. Doubletree Ranch Rd.
Scottsdale, Arizona 85258
Born: 1958 | | Executive Vice President
and Assistant Secretary
Principal Financial Officer
| | April 2002 - present
March 2002 - present
| | Executive Vice President, Chief Financial Officer and Treasurer, (December 2001 - Present) and Chief Compliance Officer (October 2004 - Present), ING Investments, LLC. Formerly, Senior Vice President, ING Investments, LLC (June 1998 - December 2001). |
| | | | | | |
Stanley D. Vyner
7337 E. Doubletree Ranch Rd.
Scottsdale, Arizona 85258
Born: 1950 | | Executive Vice President | | March 2002 - present | | Executive Vice President, ING Investments, LLC (July 2000 - Present) and Chief Investment Risk Officer (January 2003 - Present); Formerly, Chief Investment Officer of the International Portfolios, ING Investments, LLC (August 2000 - January 2003); and Chief Executive Officer, ING Investments, LLC (August 1996 - August 2000). |
| | | | | | |
Joseph M. O’Donnell
7337 E. Doubletree Ranch Rd.
Scottsdale, Arizona 85258
Born: 1954 | | Chief Compliance Officer | | November 2004 - present | | Chief Compliance Officer of the ING Funds (November 2004 - Present). Formerly, Vice President, Chief Legal Counsel, Chief Compliance Officer and Secretary of Atlas Securities, Inc., Atlas Advisers, Inc. and Atlas Funds (October 2001 - October 1004); and Chief Operating Officer and General Counsel of Matthews International Capital Management LLC and Vice President and Secretary of Matthews International Funds (August 1999 - May 2001). |
| | | | | | |
Robert S. Naka
7337 E. Doubletree Ranch Rd.
Scottsdale, Arizona 85258
Born: 1963 | | Senior Vice President and
Assistant Secretary | | March 2002 - present | | Senior Vice President and Assistant Secretary, ING Funds Services, LLC (October 2001 - Present). Formerly, Senior Vice President, ING Funds Services, LLC (August 1999 - October 2001). |
| | | | | | |
Kimberly A. Anderson
7337 E. Doubletree Ranch Rd.
Scottsdale, Arizona 85258
Born: 1964 | | Senior Vice President | | December 2003 - present | | Senior Vice President, ING Investments, LLC (October 2003 - Present). Formerly, Vice President and Assistant Secretary, ING Investments, LLC (October 2001 - October 2003); Assistant Vice President, ING Funds Services, LLC (November 1999 - January 2001). |
| | | | | | |
Robyn L. Ichilov
7337 E. Doubletree Ranch Rd.
Scottsdale, Arizona 85258
Born: 1967 | | Vice President and
Treasurer | | March 2002 - present | | Vice President, ING Funds Services, LLC (October 2001 - Present) and ING Investments, LLC (August 1997 - Present). |
| | | | | | |
Lauren D. Bensinger
7337 E. Doubletree Ranch Rd.
Scottsdale, Arizona 85258
Born: 1954 | | Vice President | | March 2003 - present | | Vice President and Chief Compliance Officer, ING Funds Distributor, LLC (July 1995 - Present) and Vice President ING Investments, LLC (February 1996 - Present). Formerly, Chief Compliance Officer (October 2001 - October 2004), ING Investments, LLC. |
| | | | | | |
Todd Modic
7337 E. Doubletree Ranch Rd.
Scottsdale, Arizona 85258
Born: 1967 | | Vice President | | September 2003 - present | | Vice President, Financial Reporting, Fund Accounting, ING Funds Services, LLC (September 2002 - Present). Formerly, Director of Financial Reporting, ING Investments, LLC (March 2001 - September 2002); Director of Financial Reporting, Axient Communications, Inc. (May 2000 - January 2001); and Director of Finance, Rural/Metro Corporation (March 1995 - May 2000). |
96
DIRECTOR AND OFFICER INFORMATION (UNAUDITED) (CONTINUED)
Name, Address
and Age | | Position(s)
Held with the Company | | Term of Office and
Length of Time Served(1) | | Principal Occupation(s) during the
Past Five Years |
Maria M. Anderson
7337 E. Doubletree Ranch Rd.
Scottsdale, Arizona 85258
Born: 1958 | | Vice President | | September 2004 - present | | Vice President, Compliance, ING Funds Services, LLC (September 2004 - Present). Formerly, Assistant Vice President, ING Funds Services, LLC (October 2001 - September 2004); Manager of Fund Accounting and Fund Compliance, ING Investments, LLC (September 1999 - October 2001). |
| | | | | | |
Theresa K. Kelety
7337 E. Doubletree Ranch Rd.
Scottsdale, Arizona 85258
Born: 1963 | | Secretary | | September 2003 - present | | Counsel, ING U.S. Legal Services (April 2003 - Present). Formerly, Senior Associate with Shearman & Sterling (February 2000 - April 2003); and Associate with Sutherland Asbill & Brennan (1996 - February 2000). |
| | | | | | |
Susan P. Kinens
7337 E. Doubletree Ranch Rd.
Scottsdale, Arizona 85258
Born: 1976 | | Assistant Vice President | | March 2003 - present | | Assistant Vice President, ING Funds Services, LLC (December 2002 - Present); and has held various other positions with ING Funds Services, LLC for more than the last five years. |
| | | | | | |
Kimberly K. Palmer
7337 E. Doubletree Ranch Rd.
Scottsdale, Arizona 85258
Born: 1957 | | Assistant Vice President | | September 2004 - present | | Assistant Vice President, ING Funds Services, LLC (August 2004 - Present). Formerly, Manager, Registration Statements, ING Funds Services, LLC (May 2003 - August 2004); Associate Partner, AMVESCAP PL (October 2000 - May 2003); Director of Federal Filings and Blue Sky Filings, INVESCO Funds Group, Inc. (March 1994 - May 2003). |
| | | | | | |
Huey P. Falgout, Jr.
7337 E. Doubletree Ranch Rd.
Scottsdale, Arizona 85258
Born: 1963 | | Assistant Secretary | | September 2003 - present | | Chief Counsel, ING U.S. Legal Services (September 2003 - Present). Formerly, Counsel, ING U.S. Legal Services (November 2002 - September 2003); and Associate General Counsel of AIG American General (January 1999 - November 2002). |
| | | | | | |
Robin R. Nesbitt
7337 E. Doubletree Ranch Rd.
Scottsdale, Arizona 85258
Born: 1973 | | Assistant Secretary | | September 2004 - present | | Supervisor, Board Operations, ING Funds Services, LLC (August 2003 - Present). Formerly, Senior Legal Analyst, ING Funds Services, LLC (August 2002 - August 2003); Associate, PricewaterhouseCoopers (January 2001 - August 2001); and Paralegal, McManis, Faulkner & Morgan (May 2000 - December 2000). |
(1) The officers hold office until the next annual meeting of the Directors and until their successors have been elected and qualified.
97
(THIS PAGE INTENTIONALLY LEFT BLANK)
Investment Manager
ING Investments, LLC
7337 E. Doubletree Ranch Road
Scottsdale, Arizona 85258
Administrator
ING Funds Services, LLC
7337 E. Doubletree Ranch Road
Scottsdale, Arizona 85258
Distributor
ING Funds Distributor, LLC
7337 E. Doubletree Ranch Road
Scottsdale, Arizona 85258
1-800-334-3444
Transfer Agent
DST Systems, Inc.
P.O. Box 419368
Kansas City, Missouri 64141
Custodian
The Bank of New York
100 Colonial Center Parkway, Suite 300
Lake Mary, Florida 32746
Legal Counsel
Goodwin Procter LLP
Exchange Place
53 State Street
Boston, Massachusetts 02109
Independent Registered Public Accounting Firm
KPMG LLP
99 High Street
Boston, Massachusetts 02110
Before investing, carefully consider the investment objectives, risks, charges and expenses of the variable annuity contract and the underlying variable investment options. This and other information is contained in the prospectus for the variable annuity contract and the underlying variable investment options. Obtain these prospectuses from your agent/registered representative and read them carefully before investing. Information regarding how the Portfolios voted proxies related to portfolio securities during the most recent 12-month period ended June 30 is available without charge on the Portfolios’ website at www.ingfunds.com and on the SEC’s website at www.sec.gov.

| VPAR-AFCAPAPPIS | | (1204-021805) |

Annual Report
December 31, 2004
Classes I and S
DOMESTIC EQUITY INDEX PORTFOLIOS
§ ING VP Index Plus LargeCap Portfolio
§ ING VP Index Plus MidCap Portfolio
§ ING VP Index Plus SmallCap Portfolio
STRATEGIC ALLOCATION PORTFOLIOS
§ ING VP Strategic Allocation Balanced Portfolio
§ ING VP Strategic Allocation Growth Portfolio
§ ING VP Strategic Allocation Income Portfolio
This report is submitted for general information to shareholders of the ING Funds. It is not authorized for distribution to prospective shareholders unless accompanied or preceded by a prospectus which includes details regarding the funds’ investment objectives, risks, charges, expenses and other information. This information should be read carefully. | 
|
TABLE OF CONTENTS
PROXY VOTING INFORMATION
A description of the policies and procedures that the Registrants use to determine how to vote proxies related to portfolio securities is available (1) without charge, upon request, by calling Shareholder Services toll-free at 800-992-0180; (2) on the Registrants’ website at www.ingfunds.com and (3) on the SEC’s website at www.sec.gov. Information regarding how the Registrants voted proxies related to portfolio securities during the most recent 12-month period ended June 30 is available without charge on the Registrants’ website at www.ingfunds.com and on the SEC’s website at www.sec.gov.
QUARTERLY PORTFOLIO HOLDINGS
The Registrants file their complete schedule of portfolio holdings with the Commission for the first and third quarters of each fiscal year on Form N-Q. The Registrants’ Forms N-Q are available on the SEC’s website at www.sec.gov. The Registrants’ Forms N-Q may be reviewed and copied at the Commission’s Public Reference Room in Washington, DC, and information on the operation of the Public Reference Room may be obtained by calling 1-800-SEC-0330; and is available upon request from the Registrants by calling Shareholder Services toll-free at 800-992-0180.
(THIS PAGE INTENTIONALLY LEFT BLANK)

| Dear Shareholder: |
|
The past year has brought about numerous changes in the mutual funds industry, including requests for additional disclosures. I would like to draw your attention to some additional information you will now see in the reports due, in part, to these new requirements: |
|
• You will see a new section entitled “Shareholder Expense Examples”. These examples are intended to illustrate for you the ongoing costs of investing in a mutual fund and to provide a method to compare those costs with the ongoing costs of investing in other mutual funds. |
|
• In addition to the normal performance tables included in the Portfolio Managers’ Reports, there are now additional graphical or tabular presentations, which illustrate the current holdings of the funds as of the period-end. |
• Each fund now also files its complete schedule of portfolio holdings with the Securities Exchange Commission (“SEC”) for the first and third quarters of each fiscal year on Form N-Q. These Forms are available for shareholders to view on the SEC’s website at www.sec.gov.
We welcome these changes and believe that they will provide valuable information to our shareholders. We hope you will find these additional disclosures beneficial and easy to understand.
On behalf of ING Funds, I thank you for your continued support and confidence and look forward to serving you in 2005 and beyond.
Sincerely, |
|

|
|
James M. Hennessy |
President |
ING Funds |
January 25, 2005 |
1
In our semi-annual report, we referred to sharp swings in sentiment as investors took stock after the handsome gains of 2003. By the middle of the year, the markets had not done much of anything; however, over the next six months sentiment would change twice more and in the end major asset classes posted respectable returns for the year, if not better.
Global equities gained 10.8% in the six months ended December 31, 2004, according to the Morgan Stanley Capital International (“MSCI”) World Index(1), including net reinvested dividends, and 14.7% for entire year. Nearly one quarter of the annual gain was due to dollar weakness, the main story in the currency markets. The dollar was ahead for most of the year, but by mid October had succumbed to continuing concern over the United States twin budget and trade deficits and whether overseas investors would continue to finance them, raising the nightmare of a disorderly slide in the dollar. In 2004, the euro gained 7.6%, a new record. The yen rose 4.5% to a level not seen since early 2000, while the pound stood 7.4% higher, at a remarkable 12-year peak.
Perhaps the most notable feature in investment grade U.S. fixed income markets in the second six months was the curious “curve flattening” trend. Short-term interest rates drifted up as the Federal Open Market Committee (“FOMC”) raised the Federal Funds rate four times, by 1% in all, while bond yields ignored this and fell in the face of weak economic data and continued foreign central bank purchases. Contrary to earlier fears, tame inflation was a backdrop throughout, while the influential employment reports were weak in July, August, October and December. On December 15, the spread between the yields on the 10-year Note and the 90-day Treasury Bill fell to a three-year low. For the six months, the yield on 10-year Treasury Notes fell by 40 basis points to 4.22%, but the yield on 13-week Treasury Bills soared 88 basis points to 2.18%. More broadly, the Lehman Brothers Aggregate Bond Index(2) gained 4.18% for the six months. For the whole year, the Index returned 4.34%, underscoring the dominance of the second half in driving market movement, and implying not much underlying price change over the year.
Prices rose on riskier asset classes, however, as investors chased more attractive returns than investment grade bonds were offering. The Lehman Brothers U.S. Corporate High Yield Bond Index(3) for example, returned a robust 9.64% in the six months through December and 11.13% for the year.
U.S. equities in the form of the Standard & Poor’s (“S&P”) 500 Index(4), rose 7.2% including dividends for the six months ended December 31, 2004, breaching and holding levels not seen since before September 11, 2001. By year end, the market was trading at a price to earnings level of just under 161/2 times 2005 estimated earnings. For the entire year, the Index returned 10.88%. From the middle of the year, equity investors were disappointed by the weak employment reports referred to above and distracted by surging oil prices as well as bad news affecting individual stocks. The market reached its lowest point in mid-August. But after oil prices climbed over $56 per barrel on October 22, and then slumped, equities squeezed out a narrow gain for the month in the last few days. In November, oil prices continued their retreat and the market powered ahead, cheered by this, the clear presidential election result, perceived as business and shareholder friendly, and at last a powerful employment report. By month end, sentiment was further bolstered by an upward revision to third quarter gross domestic product (“GDP”) growth to 4%, which was doubtless encouraging. But the data released also showed that the engine of growth, the U.S. consumer, was only saving at the rate of 0.5% per annum, which many regard as unsustainable. In addition, the rate of corporate profits growth was already falling and in 2005 may not reach double digits. It is hard to see then what dynamic propelled the S&P 500 Index to another 3.5% gain in December. And while many commentators celebrated this break out and the fact that smaller-cap indices had by then scaled all-time high levels, others feared a reversal before 2005 was very old.
International markets had mixed returns in the second half, but all were inflated in dollar terms by the weakness of that currency. Nonetheless even in local currency terms, Europe’s markets regained mid-2002 levels. Japan equities rose 4.6% in dollar terms during the period, based on the MSCI Japan Index(5) plus net dividends, but fell 1.7% in yen. For the year, Japan returned 15.9% in dollars. First half optimism about GDP growth was dashed as growth collapsed or was revised down as the year wore on.
European excluding (“ex”) UK markets advanced 18.2% in the second half of 2004, according to the MSCI Europe ex UK Index(6) (in dollars including net dividends), about one third due to currency. For all of 2004, the region returned 21.6% in dollars. Profits did grow strongly and markets remain cheap, but given all the issues surrounding low domestic demand,
2
MARKET PERSPECTIVE: YEAR ENDED DECEMBER 31, 2004
unemployment at 8.9% for the last 20 months and inflexible labor markets, arguably they deserve to be.
The UK market returned 15.7% in the six months through December, based on the MSCI UK Index(7) including net dividends, about 40% due to currency. For the whole year, the UK rose 19.6% in dollars. Contrary to the rest of Europe, the Bank of England has been trying to cool consumer demand and a property boom with five interest rate increases in 12 months. They seem to be succeeding for the most part.
(1) The MSCI World Index measures the performance of over 1,400 securities listed on exchanges in the United States, Europe, Canada, Australia, New Zealand and the Far East.
(2) The Lehman Brothers Aggregate Bond Index is composed of securities from the Lehman Brothers Government/Corporate Bond Index, Mortgage-Backed Securities Index, and the Asset-Backed Securities Index. Total return comprises price appreciation/depreciation and income as a percentage of the original investment.
(3) The Lehman Brothers U.S. Corporate High Yield Bond Index is generally representative of corporate bonds rated below investment-grade.
(4) The Standard & Poor’s 500 Index is a capitalization-weighted index of 500 stocks designed to measure performance of the broad domestic economy through changes in the aggregate market value of 500 stocks representing all major industries.
(5) The MSCI Japan Index is a free float-adjusted market capitalization index that is designed to measure developed market equity performance in Japan.
(6) The MSCI Europe ex UK Index is a free float-adjusted market capitalization index that is designed to measure developed market equity performance in Europe, excluding the UK.
(7) The MSCI UK Index is a free float-adjusted market capitalization index that is designed to measure developed market equity performance in the UK.
All indices are unmanaged and investors cannot invest directly in an index.
Past performance does not guarantee future results. The performance quoted represents past performance. Investment return and principal value of an investment will fluctuate, and shares, when redeemed, may be worth more or less than their original cost. The Portfolios’ performance is subject to change since the period’s end and may be lower or higher than the performance data shown. Please call (800) 366-0066 or log on to www.ingfunds.com to obtain performance data current to the most recent month end.
Market Perspective reflects the views of the Chief Investment Risk Officer only through the end of the period, and is subject to change based on market and other conditions.
3
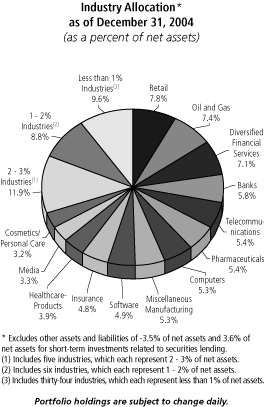
The ING VP Index Plus LargeCap Portfolio (the “Portfolio”) seeks to outperform the total return performance of the Standard & Poor’s (“S&P”) 500 Index(1), while maintaining a market level of risk. The Portfolio is managed by a team of equity investment specialists led by Hugh T.M. Whelan, Portfolio Manager, and Douglas Coté, Portfolio Manager, ING Investment Management Co. — the Sub-Adviser.
Performance: For the year ended December 31, 2004, the Portfolio’s Class I shares provided a total return of 10.58% compared to the S&P 500 Index, which returned 10.88% for the same period.
Portfolio Specifics: The Portfolio slightly underperformed its benchmark, the S&P 500 Index for the year ended December 31, 2004. Strong security selection, especially in the health care, utility and information technology sectors benefited performance. Stock selection in the telecommunication and industrial sectors somewhat detracted from performance. The largest positive contributors to performance came from overweight positions in TXU Corp., UnitedHealth Group, Inc. and Apple Computer, Inc. The largest detractors from performance were our overweight position in Ford Motor Co. and underweight in Yahoo!, Inc. and AT&T Wireless, which was sold prior to year end.
Apple Computer, Inc. continued to benefit from outstanding product sales led by its “iPod” product and rising earnings forecasts, which boosted the stock up nearly 200% for the year. UnitedHealth Group, Inc. was helped by its leadership position in the industry, strong earnings growth, and new growth supporting developments such as their partnership with Harvard Pilgrim, the purchase of Oxford Health Plans and Definity Health Corp., and increasing health savings accounts. TXU Corp., the largest Texas power supplier, rallied over the course of the year as business restructuring and strong earnings growth caused its shares to rise. Ford Motor Co. showed promise in the spring and early summer as it announced outstanding earnings and investors looked favorably on its new line of cars and plans to reduce costly incentives. However, the financing of vehicles, not the sale of them, drove earnings. As a result, Ford’s earnings strength did not last as car sales fell off, incentives continued, capacity remained high, and the outlook for future demand weakened. Our underweight in Yahoo!, Inc. hurt performance as it rose 68% over the year. Despite an extremely high valuation, the stock enjoyed strong growth over the year as earnings continued to expand on increased advertising revenue. AT&T Wireless, in which we were underweight, rose on news of its acquisition by Cingular Wireless.
Individual security selection was helped by the effectiveness of factors historically successful at identifying outperforming stocks, especially free cash flow to price, change in accruals, and analyst estimate revisions. Long-term price reversal, price momentum, and trailing price-to-earnings ratios were not helpful in our stock selection process.
Current Strategy and Outlook: Our outlook for 2005 is positive for equities. Inflation is expected to be benign and oil prices should continue to be moderate early in 2005. We believe the Federal Reserve is likely to continue to raise short-term interest rates, while leaving itself latitude to pause. We expect earnings to continue rising, although at a slower pace in 2005. Job creation should pick up after the impacts of higher oil prices percolate through the economy. Given all these economic factors, gross domestic product is likely to decelerate over the next few months to a trend-like growth rate in 2005.
The Portfolio is overweight in the energy and consumer sectors and underweight in the financials and information technology sectors. However, our overall sector exposures are by design quite close to the S&P 500 Index, so that nearly all of our relative performance is driven by individual stock selection.
Top Ten Holdings*
as of December 31, 2004
(as a percent of net assets)
General Electric Co. | | 3.1 | % |
Exxon Mobil Corp. | | 3.0 | % |
Microsoft Corp. | | 2.4 | % |
Johnson & Johnson | | 2.2 | % |
Citigroup, Inc. | | 2.0 | % |
Wal-Mart Stores, Inc. | | 1.8 | % |
Procter & Gamble Co. | | 1.8 | % |
International Business Machines Corp. | | 1.7 | % |
Pfizer, Inc. | | 1.6 | % |
Bank of America Corp. | | 1.5 | % |
* Excludes short-term investments related to securities lending.
Portfolio holdings are subject to change daily.
4
PORTFOLIO MANAGERS’ REPORT | ING VP INDEX PLUS LARGECAP PORTFOLIO |
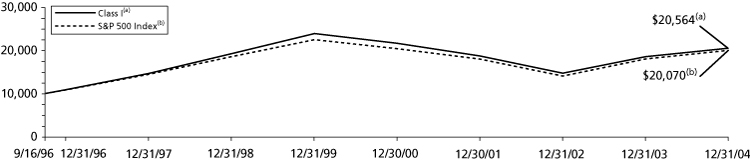
| Average Annual Total Returns for the Periods Ended December 31, 2004 | |
| | | 1 Year | | 5 Year | | Since Inception
of Class I
September 16, 1996 | | Since Inception
of Class S
July 16, 2001 | |
| Class I | | 10.58 | % | (3.05 | )% | 9.08 | % | — | |
| Class S | | 10.26 | % | — | | — | | 1.01 | % |
| S&P 500 Index(1) | | 10.88 | % | (2.30 | )% | 8.81 | %(2) | 1.72 | %(3) |
Based on a $10,000 initial investment, the graph and table above illustrate the total return of ING VP Index Plus LargeCap Portfolio against the S&P 500 Index. The Index is unmanaged and has no cash in its portfolio, imposes no sales charges and incurs no operating expenses. An investor cannot invest directly in an index. The Portfolio’s performance is shown without the imposition of any expenses or charges which are, or may be, imposed under your annuity contract or life insurance policy. Total returns would have been lower if such expenses or charges were included.
The performance graph and table do not reflect the deduction of taxes that a shareholder will pay on Portfolio distributions or the redemption of Portfolio shares.
Total returns reflect that the Investment Manager may have waived or recouped fees and expenses otherwise payable by the Portfolio.
The performance update illustrates performance for a variable investment option available through a variable annuity contract and/or a variable universal life policy. The performance shown indicates past performance and is not a projection or prediction of future results. Actual investment returns and principal value will fluctuate so that shares and/or units, at redemption, may be worth more or less than their original cost. For variable annuity contracts, please call (800) 366-0066 to get performance through the most recent month end. For variable universal life policies, please log on to www.ing.com/us to get performance through the most recent month end.
This report contains statements that may be “forward-looking” statements. Actual results may differ materially from those projected in the “forward-looking” statements.
The views expressed in this report reflect those of the portfolio managers, only through the end of the period as stated on the cover. The portfolio managers’ views are subject to change at any time based on market and other conditions.
Portfolio holdings are subject to change daily.
(1) The S&P 500 Index is an unmanaged index that measures the performance of securities of approximately 500 large-capitalization companies whose securities are traded on major U.S. stock markets.
(2) Since inception performance for the index is shown from October 1, 1996.
(3) Since inception performance for the index is shown from August 1, 2001.
5
ING VP INDEX PLUS MIDCAP PORTFOLIO | PORTFOLIO MANAGERS’ REPORT |

The ING VP Index Plus MidCap Portfolio (the “Portfolio”) seeks to outperform the total return performance of the Standard & Poor’s (“S&P”) MidCap 400 Index(1), while maintaining a market level of risk. The Portfolio is managed by a team of equity investment specialists led by Hugh T.M. Whelan, Portfolio Manager, and Douglas Coté, Portfolio Manager, ING Investment Management Co. — the Sub-Adviser.
Performance: For the year ended December 31, 2004, the Portfolio’s Class I shares provided a total return of 16.59% compared to the S&P MidCap 400 Index, which returned 16.48% for the same period.
Portfolio Specifics: The Fund outperformed the S&P MidCap 400 Index for the year ended December 31, 2004, primarily due to security selection, especially in information technology and consumer discretionary sectors. Stock selection produced negative relative returns in utilities and financials sectors. The largest positive contributors to performance were our overweight positions in Harman Intl. Industries, Inc. and McAffe, Inc. The largest detraction from performance came from our overweight positions in Atmel Corp. and underweight position in Sepracor, Inc.
Harman Intl. Industries, Inc. rose on record earnings and sales of its high-fidelity audio and video products, which are used in recording studios, concert halls, homes and cars. Shares of anti-virus software maker McAfee, Inc. climbed during the year as the firm continued to make progress in its turnaround plan, posted strong earnings, and announced high profile deals with AOL and Dell.
Atmel Corp. fell along with most of the semiconductor industry, as demand remained soft, margins stayed flat, and earnings disappointed throughout the year. Shares of pharmaceutical firm Sepracor, Inc. rose on the development and final FDA approval of its sleeping pill, Lunesta, which analysts feel will compete strongly with Sanofi-Aventis’s Ambien, a drug with well over $1 billion in annual sales.
Our individual security selection was helped by the effectiveness of factors historically successful at identifying outperforming stocks, especially capital expenditure intensity and relative value. Some of the factors that did not contribute to our performance included price momentum and long-term price reversal.
Current Strategy and Outlook: Our outlook for 2005 is positive for equities. We believe inflation should continue to be benign and oil prices should continue to be moderate early in 2005. The Federal Reserve is likely to continue to raise short-term interest rates, while leaving itself latitude to pause. We expect earnings to continue rising, although at a slower pace in 2005. We expect to see job creation pick up after the impacts of higher oil prices percolate through the economy. Given all these economic factors, gross domestic product is likely to decelerate over the next few months to a trend-like growth rate in 2005.
The Portfolio is modestly overweight in the energy and health care sectors and underweight in the utilities and consumer discretionary sectors. However, our overall sector exposures are by design quite close to the S&P MidCap 400 Index so that nearly all of our relative performance is driven by individual stock selection.
Top Ten Holdings*
as of December 31, 2004
(as a percent of net assets)
Harman Intl. Industries, Inc. | | 1.3 | % |
Murphy Oil Corp. | | 1.1 | % |
Weatherford Intl. Ltd. | | 1.1 | % |
Pacificare Health Systems, Inc. | | 0.9 | % |
Coventry Health Care, Inc. | | 0.9 | % |
McAfee, Inc. | | 0.9 | % |
Lyondell Chemical Co. | | 0.9 | % |
Abercrombie & Fitch Co. | | 0.9 | % |
Lincare Holdings, Inc. | | 0.8 | % |
Associated Bancorp. | | 0.8 | % |
*Excludes short-term investments related to securities lending.
Portfolio holdings are subject to change daily.
6
PORTFOLIO MANAGERS’ REPORT | ING VP INDEX PLUS MIDCAP PORTFOLIO |

| Average Annual Total Returns for the Periods Ended December 31, 2004 | |
| | | 1 Year | | 5 Year | | Since Inception
of Class I
December 16, 1997 | | Since Inception
of Class S
July 16, 2001 | |
| Class I | | 16.59 | % | 9.93 | % | 13.18 | % | — | |
| Class S | | 16.35 | % | — | | — | | 9.31 | % |
| S&P MidCap 400 Index(1) | | 16.48 | % | 9.54 | % | 11.60 | %(2) | 9.17 | %(3) |
Based on a $10,000 initial investment, the graph and table above illustrate the total return of ING VP Index Plus MidCap Portfolio against the S&P MidCap 400 Index. The Index is unmanaged and has no cash in its portfolio, imposes no sales charges and incurs no operating expenses. An investor cannot invest directly in an index. The Portfolio’s performance is shown without the imposition of any expenses or charges which are, or may be, imposed under your annuity contract or life insurance policy. Total returns would have been lower if such expenses or charges were included.
The performance graph and table do not reflect the deduction of taxes that a shareholder will pay on Portfolio distributions or the redemption of Portfolio shares.
Total returns reflect that the Investment Manager may have waived or recouped fees and expenses otherwise payable by the Portfolio.
The performance update illustrates performance for a variable investment option available through a variable annuity contract and/or a variable universal life policy. The performance shown indicates past performance and is not a projection or prediction of future results. Actual investment returns and principal value will fluctuate so that shares and/or units, at redemption, may be worth more or less than their original cost. For variable annuity contracts, please call (800) 366-0066 to get performance through the most recent month end. For variable universal life policies, please log on to www.ing.com/us to get performance through the most recent month end.
This report contains statements that may be “forward-looking” statements. Actual results may differ materially from those projected in the “forward-looking” statements.
The views expressed in this report reflect those of the portfolio managers, only through the end of the period as stated on the cover. The portfolio managers’ views are subject to change at any time based on market and other conditions.
Portfolio holdings are subject to change daily.
(1) The S&P MidCap 400 Index is an unmanaged index that measures the performance of the mid-size company segment of the U.S. market.
(2) Since inception performance for the index is shown from January 1, 1998.
(3) Since inception performance for the index is shown from August 1, 2001.
7
ING VP INDEX PLUS SMALLCAP PORTFOLIO | PORTFOLIO MANAGERS’ REPORT |
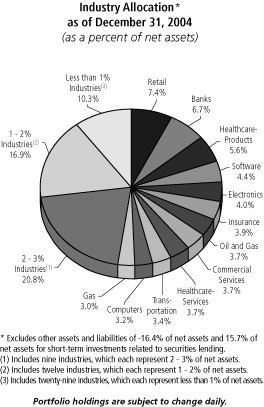
The ING VP Index Plus SmallCap Portfolio (the “Portfolio”) seeks to outperform the total return performance of the Standard & Poor’s (“S&P”) SmallCap 600 Index(1), while maintaining a market level of risk. The Portfolio is managed by a team of equity investment specialists led by Hugh T.M. Whelan, Portfolio Manager, and Douglas Coté, Portfolio Manager, ING Investment Management Co. — the Sub-Adviser.
Performance: For the year ended December 31, 2004, the Portfolio’s Class I shares provided a total return of 22.07% compared to the S&P SmallCap 600 Index, which returned 22.65% for the same period.
Portfolio Specifics: The Portfolio slightly underperformed the S&P SmallCap 600 Index for the year ended December 31, 2004. Security selection, especially in the health care and consumer discretionary sectors benefited performance; however, stock selection in the information technology and energy sectors somewhat detracted from performance. The largest positive contributors to performance came from our overweight positions in UICI and NVR, Inc. The largest detractors from performance were our overweight positions in Filenet Corp. and previously held ESS Technology.
Diversified financial services firm UICI posted an astounding quarterly report that was almost 75% above analysts’ expectations, and the stock soared just about as much in reaction to the news. NVR, Inc. continued with its stunning earnings growth history in the third quarter, as a result of continued robust home sales and low mortgage rates. Our underweight in Lone Star Technologies, Inc. benefited our results when it missed Wall Street earnings estimates for the third quarter due to higher steel prices and subsequently plummeted.
Our overweight of ESS Technology continued to disappoint for three consecutive quarters in 2004 and was punished severely by investors. Our overweight of Filenet Corp. hurt returns as it reported a significant negative earnings surprise — 50% below expectations in the second quarter.
Individual security selection was helped by the effectiveness of factors historically successful at identifying outperforming stocks, especially free cash flow to price, change in accruals, and analyst estimate revision. Long-term price reversal and price momentum did not contribute to our stock selection process. Performance was also negatively impacted by our cash holdings, which although small, had a relatively large effect in these strong markets.
Current Strategy and Outlook: Our outlook for 2005 is positive for equities. We believe inflation should continue to be benign and oil prices should continue to be moderate early in 2005. We expect the Federal Reserve will likely continue to raise short-term interest rates, while leaving itself latitude to pause. We expect earnings to continue rising, although at a slower pace in 2005. We expect to see job creation pick up after the impacts of higher oil prices percolate through the economy. Given all these economic factors, gross domestic product is likely to decelerate over the next few months to a trend like growth rate in 2005.
The Portfolio is overweight in the financials and health care sectors and underweight in the industrials and consumer discretionary sectors. However, our overall sector exposures are by design quite close to the S&P SmallCap 600 Index so that nearly all of our relative performance is driven by individual stock selection.
Top Ten Holdings*
as of December 31, 2004
(as a percent of net assets)
NVR, Inc. | | 1.5 | % |
New Century Financial Corp. | | 1.1 | % |
First Bancorp Puerto Rico | | 0.9 | % |
UGI Corp. | | 0.8 | % |
Fremont General Corp. | | 0.8 | % |
Amerigroup Corp. | | 0.8 | % |
Toro Co. | | 0.8 | % |
Corn Products Intl., Inc. | | 0.8 | % |
UICI | | 0.7 | % |
Georgia Gulf Corp. | | 0.7 | % |
*Excludes short-term investments related to securities lending.
Portfolio holdings are subject to change daily.
8
PORTFOLIO MANAGERS’ REPORT | ING VP INDEX PLUS SMALLCAP PORTFOLIO |
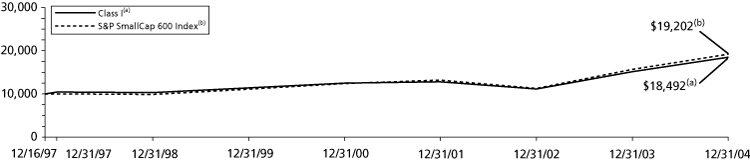
| Average Annual Total Returns for the Periods Ended December 31, 2004 | |
| | | 1 Year | | 5 Year | | Since Inception
of Class I
December 19, 1997 | | Since Inception
of Class S
July 16, 2001 | |
| Class I | | 22.07 | % | 10.15 | % | 9.13 | % | — | |
| Class S | | 21.74 | % | — | | — | | 11.69 | % |
| S&P SmallCap 600 Index(1) | | 22.65 | % | 11.60 | % | 9.77 | %(2) | 12.21 | %(3) |
Based on a $10,000 initial investment, the graph and table above illustrate the total return of ING VP Index Plus SmallCap Portfolio against the S&P SmallCap 600 Index. The Index is unmanaged and has no cash in its portfolio, imposes no sales charges and incurs no operating expenses. An investor cannot invest directly in an index. The Portfolio’s performance is shown without the imposition of any expenses or charges which are, or may be, imposed under your annuity contract or life insurance policy. Total returns would have been lower if such expenses or charges were included.
The performance graph and table do not reflect the deduction of taxes that a shareholder will pay on Portfolio distributions or the redemption of Portfolio shares.
Total returns reflect that the Investment Manager may have waived or recouped fees and expenses otherwise payable by the Portfolio.
The performance update illustrates performance for a variable investment option available through a variable annuity contract and/or a variable universal life policy. The performance shown indicates past performance and is not a projection or prediction of future results. Actual investment returns and principal value will fluctuate so that shares and/or units, at redemption, may be worth more or less than their original cost. For variable annuity contracts, please call (800) 366-0066 to get performance through the most recent month end. For variable universal life policies, please log on to www.ing.com/us to get performance through the most recent month end.
This report contains statements that may be “forward-looking” statements. Actual results may differ materially from those projected in the “forward-looking” statements.
The views expressed in this report reflect those of the portfolio managers, only through the end of the period as stated on the cover. The portfolio managers’ views are subject to change at any time based on market and other conditions.
Portfolio holdings are subject to change daily.
(1) The S&P SmallCap 600 Index is an unmanaged index used to measure stock market performance composed of companies with a weighted average market value of approximately $630 million.
(2) Since inception performance for the index is shown from January 1, 1998.
(3) Since inception performance for the index is shown from August 1, 2001.
9
ING VP STRATEGIC ALLOCATION BALANCED PORTFOLIO | PORTFOLIO MANAGERS’ REPORT |
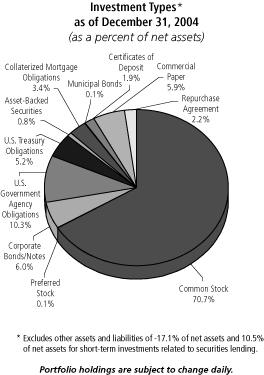
The ING VP Strategic Allocation Balanced Portfolio (the “Portfolio”) seeks to provide total return. The Portfolio is managed by a team of investment specialists led by Mary Ann Fernandez, Portfolio Manager, ING Investment Management Co. — the Sub-Adviser.
Performance: For the year ended December 31, 2004, the Portfolio provided a total return of 10.23% compared to 11.95% for the Russell 3000 Index(1) and 9.16% for the Strategic Allocation Balanced Composite Index(2).
Portfolio Specifics: The Portfolio’s asset allocation had a positive impact on performance for the year ended December 31, 2004, as overweights in domestic and international equities and an underweight in fixed income securities each helped results. The equity component outperformed its sub-benchmark, the Russell 3000 Index, due to security selection. Stock selection was strongest in the health care and technology sectors, but was weaker in consumer staples and financials. Sector allocation had a positive impact, with gains from an overweight in energy and an underweight in health care only partially offset by losses from an overweight in technology and an underweight in financials.
The international equity component lagged the MSCI EAFE Index for the year, largely due to disappointing security selection, notably in the consumer goods and technology sectors. Offsetting this somewhat was strong sector allocation, as an overweight in energy and an underweight in technology both added to performance results. Regional allocations were slightly negative as the gain from an overweight of Japan was offset by the loss from an underweight of Australia/New Zealand.
The fixed income component of the Portfolio performed roughly in line with the Lehman Brothers Aggregate Bond Index during the year as a short duration posture and yield curve exposure proved beneficial. For most of the period we were well positioned for a rising rate environment in which the yields on shorter maturities rise more than those of longer maturities. Our underweight in five-year maturities was particularly helpful. Nevertheless, we brought the fixed income component back to a neutral duration stance as the year came to a close. Overweights in the outperforming securitized sectors — mortgage-backed securities, asset-backed securities, and commercial mortgage-backed securities — also helped. We maintained our increased allocation to credit, and this sector posted the highest excess returns during the period.
Current Strategy and Outlook: Our outlook for 2005 is positive for equities. We believe inflation should continue to be benign and oil prices should continue to be moderate early in 2005. The Federal Reserve (“Fed”) is likely to continue to raise short-term interest rates, while leaving itself latitude to pause. We expect earnings to continue rising, although at a slower pace in 2005. We expect to see job creation pick up after the impacts of higher oil prices percolate through the economy. Given all these economic factors, gross domestic product is likely to decelerate over the next few months to a trend-like growth rate in 2005. Despite increases to the Fed funds rate, longer-term fixed income issues have shown resilience through this period. Looking to 2005, however, we do project rising longer-term rates for the bond market. We remain overweight in equities due to our positive outlook for stocks and are underweight fixed income securities, principally for valuation reasons.
Top Ten Industries*
as of December 31, 2004
(as a percent of net assets)
Federal National Mortgage Association | | 7.6 | % |
Banks | | 7.1 | % |
Oil and Gas | | 6.0 | % |
Diversified Financial Services | | 5.3 | % |
Retail | | 5.2 | % |
Insurance | | 4.8 | % |
U.S. Treasury Bonds | | 3.7 | % |
Telecommunications | | 3.7 | % |
Computers | | 3.6 | % |
Software | | 2.9 | % |
* Excludes short-term investments related to securities lending.
Portfolio holdings are subject to change daily.
See additional information on page 16.
10
PORTFOLIO MANAGERS’ REPORT | ING VP STRATEGIC ALLOCATION BALANCED PORTFOLIO |

| Average Annual Total Returns for the Periods Ended December 31, 2004 | |
| | | 1 Year | | 5 Year | | Since Inception
of Class I
July 5, 1995 | |
| Class I | | 10.23 | % | 2.15 | % | 7.47 | % |
| Russell 3000 Index(1) | | 11.95 | % | (1.16 | )% | 10.61 | %(3) |
| Strategic Allocation Balanced Composite Index(2) | | 9.16 | % | 3.86 | % | 8.63 | %(3) |
Based on a $10,000 initial investment, the graph and table above illustrate the total return of ING VP Strategic Allocation Balanced Portfolio against the Russell 3000 Index and the Strategic Allocation Balanced Composite Index. The Indices are unmanaged and have no cash in their portfolios, impose no sales charges and incur no operating expenses. An investor cannot invest directly in an index. The Portfolio’s performance is shown without the imposition of any expenses or charges which are, or may be, imposed under your annuity contract. Total returns would have been lower if such expenses or charges were included.
The performance graph and table do not reflect the deduction of taxes that a shareholder will pay on Portfolio distributions or the redemption of Portfolio shares.
Total returns reflect that the Investment Manager may have waived or recouped fees and expenses otherwise payable by the Portfolio.
The performance update illustrates performance for a variable investment option available through a variable annuity contract. The performance shown indicates past performance and is not a projection or prediction of future results. Actual investment returns and principal value will fluctuate so that shares and/or units, at redemption, may be worth more or less than their original cost. Please call (800) 366-0066 to get performance through the most recent month end.
This report contains statements that may be “forward-looking” statements. Actual results may differ materially from those projected in the “forward-looking” statements.
The views expressed in this report reflect those of the portfolio managers, only through the end of the period as stated on the cover. The portfolio managers’ views are subject to change at any time based on market and other conditions.
Portfolio holdings are subject to change daily.
(1) The Russell 3000 Index is an unmanaged index that measures the performance of 3000 U.S. companies based on total market capitalization.
(2) The Strategic Allocation Balanced Composite is comprised of the asset class indices that correspond to the particular asset classes in which the Portfolio invests and their benchmark weightings. From time to time, adjustments have been made in the asset classes and/or weightings applicable to the Portfolio, and corresponding adjustments have been made to the composite. See page 16 for additional information.
(3) Since inception performance for the index is shown from July 1, 1995.
11
ING VP STRATEGIC ALLOCATION GROWTH PORTFOLIO | PORTFOLIO MANAGERS’ REPORT |

The ING VP Strategic Allocation Growth Portfolio (the “Portfolio”) seeks to provide capital appreciation. The Portfolio is managed by a team of equity investment specialists led by Mary Ann Fernandez, Portfolio Manager, ING Investment Management Co. — the Sub-Adviser.
Performance: For the year ended December 31, 2004, the Portfolio provided a total return of 12.01% compared to 11.95% for the Russell 3000 Index(1) and 11.28% for the Strategic Allocation Growth Composite Index(2).
Portfolio Specifics: The Portfolio’s asset allocation had a positive impact on performance for the year ended December 31, 2004, as overweights in domestic and international equities and an underweight in fixed income securities each helped results. The equity component outperformed its sub-benchmark, the Russell 3000 Index, due to security selection. Stock selection was strongest in the health care and technology sectors, but was weaker in consumer staples and financials. Sector allocation had a positive impact, with gains from an overweight in energy and an underweight in health care only partially offset by losses from an overweight in technology and an underweight in financials.
The international equity component lagged the MSCI EAFE Index for the year, largely due to disappointing security selection, notably in the consumer goods and technology sectors. Offsetting this somewhat was strong sector allocation, as an overweight in energy and an underweight in technology both added to performance results. Regional allocations were slightly negative as the gain from an overweight of Japan was offset by the loss from an underweight of Australia/New Zealand.
The fixed income component of the Portfolio performed roughly in line with the Lehman Brothers Aggregate Bond Index during the year as a short duration posture and yield curve exposure proved beneficial. For most of the period we were well positioned for a rising rate environment in which the yields on shorter maturities rise more than those of longer maturities. Our underweight in five-year maturities was particularly helpful. Nevertheless, we brought the fixed income component back to a neutral duration stance as the year came to a close. Overweights in the outperforming securitized sectors — mortgage-backed securities, asset-backed securities, and commercial mortgage-backed securities — also helped. We maintained our increased allocation to credit, and this sector posted the highest excess returns during the period.
Current Strategy and Outlook: Our outlook for 2005 is positive for equities. We believe inflation should continue to be benign and oil prices should continue to be moderate early in 2005. The Federal Reserve (“Fed”) is likely to continue to raise short-term interest rates, while leaving itself latitude to pause. We expect earnings to continue rising, although at a slower pace in 2005. We expect to see job creation pick up after the impacts of higher oil prices percolate through the economy. Given all these economic factors, gross domestic product is likely to decelerate over the next few months to a trend-like growth rate in 2005. Despite increases to the Fed funds rate, longer-term fixed income issues have shown resilience through this period. Looking to 2005, however, we do project rising longer-term rates for the bond market. We remain overweight in equities due to our positive outlook for stocks and are underweight fixed income securities, principally for valuation reasons.
Top Ten Industries*
as of December 31, 2004
(as a percent of net assets)
Banks | | 7.9 | % |
Oil and Gas | | 7.2 | % |
Retail | | 6.2 | % |
Insurance | | 5.6 | % |
Diversified Financial Services | | 5.4 | % |
Telecommunications | | 4.8 | % |
Computers | | 4.2 | % |
Pharmaceuticals | | 3.8 | % |
Software | | 3.6 | % |
Miscellaneous Manufacturing | | 3.4 | % |
* Excludes short-term investments related to securities lending.
Portfolio holdings are subject to change daily.
See additional information on page 16.
12
PORTFOLIO MANAGERS’ REPORT | ING VP STRATEGIC ALLOCATION GROWTH PORTFOLIO |
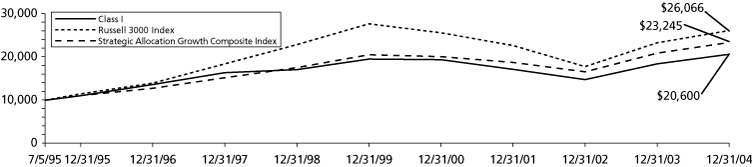
| Average Annual Total Returns for the Periods Ended December 31, 2004 | |
| | | 1 Year | | 5 Year | | Since Inception of Class I
July 5, 1995 | |
| Class I | | 12.01 | % | 1.08 | % | 7.91 | % |
| Russell 3000 Index(1) | | 11.95 | % | (1.16 | )% | 10.61 | %(3) |
| Strategic Allocation Growth Composite Index(2) | | 11.28 | % | 2.54 | % | 9.28 | %(3) |
Based on a $10,000 initial investment, the graph and table above illustrate the total return of ING VP Strategic Allocation Growth Portfolio against the Russell 3000 Index and the Strategic Allocation Growth Composite Index. The Indices are unmanaged and have no cash in their portfolios, impose no sales charges and incur no operating expenses. An investor cannot invest directly in an index. The Portfolio’s performance is shown without the imposition of any expenses or charges which are, or may be, imposed under your annuity contract. Total returns would have been lower if such expenses or charges were included.
The performance graph and table do not reflect the deduction of taxes that a shareholder will pay on Portfolio distributions or the redemption of Portfolio shares.
Total returns reflect that the Investment Manager may have waived or recouped fees and expenses otherwise payable by the Portfolio.
The performance update illustrates performance for a variable investment option available through a variable annuity contract. The performance shown indicates past performance and is not a projection or prediction of future results. Actual investment returns and principal value will fluctuate so that shares and/or units, at redemption, may be worth more or less than their original cost. Please call (800) 366-0066 to get performance through the most recent month end.
This report contains statements that may be “forward-looking” statements. Actual results may differ materially from those projected in the “forward-looking” statements.
The views expressed in this report reflect those of the portfolio managers, only through the end of the period as stated on the cover. The portfolio managers’ views are subject to change at any time based on market and other conditions.
Portfolio holdings are subject to change daily.
(1) The Russell 3000 Index is an unmanaged index that measures the performance of 3000 U.S. companies based on total market capitalization.
(2) The Strategic Allocation Growth Composite is comprised of the asset class indices that correspond to the particular asset classes in which the Portfolio invests and their benchmark weightings. From time to time, adjustments have been made in the asset classes and/or weightings applicable to the Portfolio, and corresponding adjustments have been made to the composite. See page 16 for additional information.
(3) Since inception performance for the index is shown from July 1, 1995.
13
ING VP STRATEGIC ALLOCATION INCOME PORTFOLIO | PORTFOLIO MANAGERS’ REPORT |

The ING VP Strategic Allocation Income Portfolio (the “Portfolio”) seeks to provide total return consistent with preservation of capital. The Portfolio is managed by a team of investment specialists led by Mary Ann Fernandez, Portfolio Manager, ING Investment Management Co. — the Sub-Adviser.
Performance: For the year ended December 31, 2004, the Portfolio provided a total return of 7.99% compared to 4.34% for the Lehman Brothers Aggregate Bond (“LBAB”) Index(1) and 6.71% for the Strategic Allocation Income Composite Index(2).
Portfolio Specifics: The Portfolio’s asset allocation had a positive impact on performance for the year ended December 31, 2004, as an overweight in equities and an underweight in fixed income securities each helped results. The equity component outperformed its sub-benchmark, the Russell 3000 Index, due primarily to security selection. Stock selection was strongest in the health care and technology sectors, but was weaker in consumer staples and financials. Sector allocation had a positive impact, with gains from an overweight in energy and an underweight in health care only partially offset by losses from an overweight in technology and an underweight in financials.
The fixed income component of the Portfolio performed roughly in line with the Lehman Brothers Aggregate Bond Index during the year as a short duration posture and yield curve exposure proved beneficial. For most of the period we were well positioned for a rising rate environment in which the yields on shorter maturities rise more than those of longer maturities. Our underweight in five-year maturities was particularly helpful. Nevertheless, we brought the fixed income component back to a neutral duration stance as the year came to a close. Overweights in the outperforming securitized sectors — mortgage-backed securities, asset-backed securities, and commercial mortgage-backed securities — also helped. We maintained our increased allocation to credit, and this sector posted the highest excess returns during the period.
Current Strategy and Outlook: Our outlook for 2005 is positive for equities. We believe inflation should continue to be benign and oil prices should continue to be moderate early in 2005. The Federal Reserve (“Fed”) is likely to continue to raise short-term interest rates, while leaving itself latitude to pause. We expect earnings to continue rising, although at a slower pace in 2005. We expect to see job creation pick up after the impacts of higher oil prices percolate through the economy. Given all these economic factors, gross domestic product is likely to decelerate over the next few months to a trend-like growth rate in 2005. Despite increases to the Fed funds rate, longer-term fixed income issues have shown resilience through this period. Looking to 2005, however, we do project rising longer-term rates for the bond market. We remain overweight in equities due to our positive outlook for stocks and are underweight fixed income securities, principally for valuation reasons.
Top Ten Industries*
as of December 31, 2004
(as a percent of net assets)
Federal National Mortgage Association | | 13.6 | % |
Banks | | 7.4 | % |
U.S. Treasury Bonds | | 6.4 | % |
Diversified Financial Services | | 5.2 | % |
Oil and Gas | | 5.1 | % |
Federal Home Loan Mortgage Corporation | | 4.2 | % |
Insurance | | 3.9 | % |
Retail | | 3.9 | % |
Whole Loan Collaterized Mortgage Obligations | | 3.7 | % |
Telecommunications | | 2.9 | % |
* Excludes short-term investments related to securities lending.
Portfolio holdings are subject to change daily.
See additional information on page 16.
14
PORTFOLIO MANAGERS’ REPORT | ING VP STRATEGIC ALLOCATION INCOME PORTFOLIO |
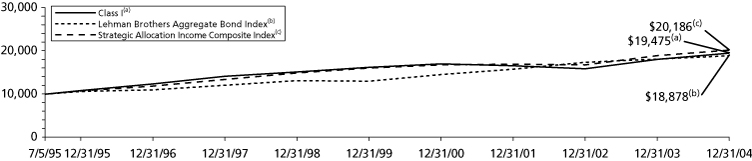
| Average Annual Total Returns for the Periods Ended December 31, 2004 | |
| | | 1 Year | | 5 Year | | Since Inception
of Class I
July 5, 1995 | |
| Class I | | 7.99 | % | 3.73 | % | 7.27 | % |
| Lehman Brothers Aggregate Bond Index(1) | | 4.34 | % | 7.71 | % | 6.92 | %(3) |
| Strategic Allocation Income Composite Index(2) | | 6.71 | % | 4.71 | % | 7.67 | %(3) |
Based on a $10,000 initial investment, the graph and table above illustrate the total return of ING VP Strategic Allocation Income Portfolio against the Lehman Brothers Aggregate Bond Index and the Strategic Allocation Income Composite Index. The Indices are unmanaged and have no cash in their portfolios, impose no sales charges and incur no operating expenses. An investor cannot invest directly in an index. The Portfolio’s performance is shown without the imposition of any expenses or charges which are, or may be, imposed under your annuity contract. Total returns would have been lower if such expenses or charges were included.
The performance graph and table do not reflect the deduction of taxes that a shareholder will pay on Portfolio distributions or the redemption of Portfolio shares.
Total returns reflect that the Investment Manager may have waived or recouped fees and expenses otherwise payable by the Portfolio.
The performance update illustrates performance for a variable investment option available through a variable annuity contract. The performance shown indicates past performance and is not a projection or prediction of future results. Actual investment returns and principal value will fluctuate so that shares and/or units, at redemption, may be worth more or less than their original cost. Please call (800) 366-0066 to get performance through the most recent month end.
This report contains statements that may be “forward-looking” statements. Actual results may differ materially from those projected in the “forward-looking” statements.
The views expressed in this report reflect those of the portfolio managers, only through the end of the period as stated on the cover. The portfolio managers’ views are subject to change at any time based on market and other conditions.
Portfolio holdings are subject to change daily.
(1) The Lehman Brothers Aggregate Bond Index is a widely recognized, unmanaged index of publicly issued fixed rate
U.S. Government, investment grade, mortgaged-backed and corporate debt securities.
(2) The Strategic Allocation Income Composite is comprised of the asset class indices that correspond to the particular asset classes in which the Portfolio invests and their benchmark weightings. From time to time, adjustments have been made in the asset classes and/or weightings applicable to the Portfolio, and corresponding adjustments have been made to the composite. See page 16 for additional information.
(3) Since inception performance for the index is shown from July 1, 1995.
15
PORTFOLIO MANAGERS’ REPORT | ADDITIONAL INFORMATION |
Asset Class
| | ING VP
Strategic
Allocation
Balanced Portfolio(1) | | ING VP
Strategic
Allocation
Growth Portfolio | | ING VP
Strategic
Allocation
Income Portfolio(2) | |
Equities | | | | | | | |
Domestic Stocks | | | | | | | |
Range | | 0-80 | % | 10-100 | % | 0-70 | % |
| | | | | | | |
International Stocks | | | | | | | |
Range | | 0-10 | % | 0-20 | % | 0-10 | % |
| | | | | | | |
Fixed Income | | | | | | | |
Range | | 0-70 | % | 0-40 | % | 0-100 | % |
| | | | | | | |
Money Market Instruments | | | | | | | |
Range | | 0-30 | % | 0-30 | % | 0-30 | % |
(1) ING VP Strategic Allocation Balanced Portfolio will invest no more than 60% of its assets in any combination of the following asset sub-classes: small-/mid-capitalization stocks, high-yield bonds, international stocks and international fixed-income securities.
(2) ING VP Strategic Allocation Income Portfolio will invest no more than 35% of its assets in any combination of the following asset sub-classes: small-/mid-capitalization stocks, high-yield bonds, international stocks and international fixed-income securities.
The Sub-Adviser uses the Strategic Allocation Balanced Composite, Strategic Allocation Growth Composite, and Strategic Allocation Income Composite indices as benchmarks to which it compares the performance of ING VP Strategic Allocation Balanced Portfolio, ING VP Strategic Allocation Growth Portfolio and ING VP Strategic Allocation Income Portfolio, respectively. Each Composite index is a blended index that is derived from the asset class comparative indices set out in the chart below. The chart shows the weightings for each asset class comparative index represented in each benchmark Composite Index, as a percentage of the Composite Index.
Composite Index | | Russell 3000 Index(3) | | Morgan Stanley
Capital International
Europe, Australasia and
Far East Index(4) | | Lehman Brothers Aggregate Bond Index(5) | | 91-Day U.S.
Treasury
Bill Rate | |
Strategic Allocation Balanced Composite(6) | | 55 | % | 5 | % | 35 | % | 5 | % |
Strategic Allocation Growth Composite(7) | | 70 | % | 10 | % | 20 | % | 0 | % |
Strategic Allocation Income Composite(8) | | 35 | % | 0 | % | 55 | % | 10 | % |
(3) The Russell 3000 Index measures performance of the 3,000 largest U.S. companies based on total market capitalization, which represents approximately 98% of the investable U.S. equity market.
(4) The Morgan Stanley Capital International Europe, Australasia and Far East (MSCI EAFE) Index measures the performance of securities listed on exchanges in markets in Europe, Australasia and the Far East.
(5) The Lehman Brothers Aggregate Bond Index is composed of publicly issued, fixed-rate U.S. Government, investment grade, mortgaged-backed and corporate debt securities.
(6) The Strategic Allocation Balanced Composite is comprised of the asset class indices that correspond to the particular asset classes in which the Portfolio invests and their benchmark weightings. From time to time, adjustments have been made in the asset classes and/or weightings applicable to the Portfolio, and corresponding adjustments have been made to the composite. Prior to March 1, 2000, the benchmark weightings for the Portfolio and the composite were 15% in large capitalization stocks, 15% for small-/mid-cap stocks, 15% in international stocks, 15% in real estate stocks, 25% in U.S. dollar bonds, and 10% in international bonds and 5% in money market instruments. The composite for the period March 1, 2000 through September 30, 2002 reflects benchmark weightings of 25% in large cap stocks, 15% in small-/mid-cap stocks, 15% in international stocks, 5% in real estate stocks, 30% in U.S. dollar bonds, and 5% in international bonds and 5% in money market instruments. Effective October 1, 2002, a single category of domestic stocks replaced the group of categories of large cap stocks, small-/mid-cap stocks, and real estate stocks, and the category of international bonds was removed.
(7) The Strategic Allocation Growth Composite is comprised of the asset class indices that correspond to the particular asset classes in which the Portfolio invests and their benchmark weightings. From time to time, adjustments have been made in the asset classes and/or weightings applicable to the Portfolio, and corresponding adjustments have been made to the composite. Prior to March 1, 2000, the benchmark weightings for the Portfolio and the composite were 20% in large capitalization stocks, 20% for small-/mid-cap stocks, 20% in international stocks, 20% in real estate stocks, 10% in U.S. dollar bonds, and 10% in international bonds. The composite for the period March 1, 2000 through September 30, 2002 reflects benchmark weightings of 35% in large cap stocks, 20% in small-/mid-cap stocks, 20% in international stocks, 5% in real estate stocks, 15% in U.S. dollar bonds, and 5% in international bonds. Effective October 1, 2002, a single category of domestic stocks replaced the group of categories of large cap stocks, small-/mid-cap stocks, and real estate stocks, and the category of international bonds was removed.
(8) The Strategic Allocation Income Composite is comprised of the asset class indices that correspond to the particular asset classes in which the Portfolio invests and their benchmark weightings. From time to time, adjustments have been made in the asset classes and/or weightings applicable to the Portfolio, and corresponding adjustments have been made to the composite. Prior to March 1, 2000, the benchmark weightings for the Portfolio and the composite were 10% in large capitalization stocks, 10% for small-/mid-cap stocks, 10% in international stocks, 10% in real estate stocks, 40% in U.S. dollar bonds, and 10% in international bonds and 10% in money market instruments. The composite for the period March 1, 2000 through December 31, 2001 reflects benchmark weightings of 15% in large cap stocks, 10% in small-/mid-cap stocks, 10% in international stocks, 5% in real estate stocks, 45% in U.S. dollar bonds, and 5% in international bonds and 10% in money market instruments. Effective October 1, 2002, a single category of domestic stocks replaced the group of categories of large cap stocks, small-/mid-cap stocks, and real estate stocks, and the category of international bonds was removed.
All indices are unmanaged.
An investor cannot invest directly in an index.
16
As a shareholder of a Fund, you incur two types of costs: (1) transaction costs, including sales charges (loads) on purchase payments, reinvested dividends, or other distributions; redemption fees; and exchange fees; and (2) ongoing costs, including management fees; distribution [and/or service] (12b–1) fees; and other Fund expenses. These Examples are intended to help you understand your ongoing costs (in dollars) of investing in a Fund and to compare these costs with the ongoing costs of investing in other mutual funds.
The Examples are based on an investment of $1,000 invested at the beginning of the period and held for the entire period from July 1, 2004 to December 31, 2004.
Actual Expenses
The first section of the table shown, “Actual Fund Return,” provides information about actual account values and actual expenses. You may use the information in this section, together with the amount you invested, to estimate the expenses that you paid over the period. Simply divide your account value by $1,000 (for example, an $8,600 account value divided by $1,000 = 8.6), then multiply the result by the number in the first section under the heading entitled “Expenses Paid During Period” to estimate the expenses you paid on your account during this period.
Hypothetical Example for Comparison Purposes
The second section of the table shown, “Hypothetical 5% Return,” provides information about hypothetical account values and hypothetical expenses based on the Fund’s actual expense ratio and an assumed rate of return of 5% per year before expenses, which is not the Fund’s actual return. The hypothetical account values and expenses may not be used to estimate the actual ending account balance or expenses you paid for the period. You may use this information to compare the ongoing costs of investing in the Fund and other funds. To do so, compare this 5% hypothetical example with the 5% hypothetical examples that appear in the shareholder reports of the other funds.
Please note that the expenses shown in the table are meant to highlight your ongoing costs only and do not reflect any transactional costs, such as sales charges (loads), redemption fees, or exchange fees. Therefore, the hypothetical lines of the table are useful in comparing ongoing costs only, and will not help you determine the relative total costs of owning different funds. In addition, if these transactional costs were included, your costs would have been higher.
| ING VP Index Plus LargeCap Portfolio | | Beginning
Account
Value
July 1, 2004 | | Ending
Account
Value
December 31, 2004 | | Annualized
Expense
Ratio | | Expenses Paid
During the
Six Months Ended
December 31, 2004* | |
| Actual Fund Return | | | | | | | | | |
| Class I | | $ | 1,000.00 | | $ | 1,072.50 | | 0.45 | % | $ | 2.34 | |
| Class S | | 1,000.00 | | 1,070.80 | | 0.70 | | 3.64 | |
| Hypothetical (5% return before expenses) | | | | | | | | | |
| Class I | | $ | 1,000.00 | | $ | 1,022.87 | | 0.45 | % | $ | 2.29 | |
| Class S | | 1,000.00 | | 1,021.62 | | 0.70 | | 3.56 | |
* Expenses are equal to each Fund’s respective annualized expense ratios multiplied by the average account value over the period, multiplied by 184/366 (to reflect the one-half year period).
17
SHAREHOLDER EXPENSE EXAMPLES (UNAUDITED)
| ING VP Index Plus MidCap Portfolio | | Beginning
Account
Value
July 1, 2004 | | Ending
Account
Value
December 31, 2004 | | Annualized
Expense
Ratio | | Expenses Paid
During the
Six Months Ended
December 31, 2004* | |
| Actual Fund Return | | | | | | | | | |
| Class I | | $ | 1,000.00 | | $ | 1,091.20 | | 0.49 | % | $ | 2.58 | |
| Class S | | 1,000.00 | | 1,090.00 | | 0.74 | | 3.89 | |
| Hypothetical (5% return before expenses) | | | | | | | | | |
| Class I | | $ | 1,000.00 | | $ | 1,022.67 | | 0.49 | % | $ | 2.49 | |
| Class S | | 1,000.00 | | 1,021.42 | | 0.74 | | 3.76 | |
| | | | | | | | | | |
| ING VP Index Plus SmallCap Portfolio | | Beginning
Account
Value
July 1, 2004 | | Ending
Account
Value
December 31, 2004 | | Annualized
Expense
Ratio | | Expenses Paid
During the
Six Months Ended
December 31, 2004* | |
| Actual Fund Return | | | | | | | | | |
| Class I | | $ | 1,000.00 | | $ | 1,113.70 | | 0.48 | % | $ | 2.55 | |
| Class S | | 1,000.00 | | 1,112.40 | | 0.73 | | 3.88 | |
| Hypothetical (5% return before expenses) | | | | | | | | | |
| Class I | | $ | 1,000.00 | | $ | 1,021.47 | | 0.48 | % | $ | 2.44 | |
| Class S | | 1,000.00 | | 1,022.72 | | 0.73 | | 3.71 | |
| | | | | | | | | | |
| ING VP Strategic Allocation Balanced Portfolio | | Beginning
Account
Value
July 1, 2004 | | Ending
Account
Value
December 31, 2004 | | Annualized
Expense
Ratio | | Expenses Paid
During the
Six Months Ended
December 31, 2004* | |
| Actual Fund Return | | | | | | | | | |
| Class I | | $ | 1,000.00 | | $ | 1,075.30 | | 0.70 | % | $ | 3.65 | |
| Hypothetical (5% return before expenses) | | | | | | | | | |
| Class I | | $ | 1,000.00 | | $ | 1,021.62 | | 0.70 | % | $ | 3.56 | |
| | | | | | | | | | |
| ING VP Strategic Allocation Growth Portfolio | | Beginning
Account
Value
July 1, 2004 | | Ending
Account
Value
December 31, 2004 | | Annualized
Expense
Ratio | | Expenses Paid
During the
Six Months Ended
December 31, 2004* | |
| Actual Fund Return | | | | | | | | | |
| Class I | | $ | 1,000.00 | | $ | 1,088.20 | | 0.71 | % | $ | 3.73 | |
| Hypothetical (5% return before expenses) | | | | | | | | | |
| Class I | | $ | 1,000.00 | | $ | 1,021.57 | | 0.71 | % | $ | 3.61 | |
| | | | | | | | | | |
| ING VP Strategic Allocation Income Portfolio | | Beginning
Account
Value
July 1, 2004 | | Ending
Account
Value
December 31, 2004 | | Annualized
Expense
Ratio | | Expenses Paid
During the
Six Months Ended
December 31, 2004* | |
| Actual Fund Return | | | | | | | | | |
| Class I | | $ | 1,000.00 | | $ | 1,060.90 | | 0.65 | % | $ | 3.37 | |
| Hypothetical (5% return before expenses) | | | | | | | | | |
| Class I | | $ | 1,000.00 | | $ | 1,021.87 | | 0.65 | % | $ | 3.30 | |
* Expenses are equal to each Fund’s respective annualized expense ratios multiplied by the average account value over the period, multiplied by 184/366 (to reflect the one-half year period).
18
The Board of Directors and Shareholders
ING Variable Portfolios, Inc. and ING Strategic Allocation Portfolios, Inc.
We have audited the accompanying statements of assets and liabilities of ING VP Index Plus LargeCap Portfolio, ING VP Index Plus MidCap Portfolio and ING VP Index Plus SmallCap Portfolio, each a series of ING Variable Portfolios, Inc., and ING VP Strategic Allocation Growth Portfolio, ING VP Strategic Allocation Balanced Portfolio, and ING VP Strategic Allocation Income Portfolio, each a series of ING Strategic Allocation Portfolios, Inc., including the portfolios of investments, as of December 31, 2004, and the related statements of operations for the year then ended, statements of changes in net assets for each of the years in the two-year period then ended, and the financial highlights for each of the years or periods in the five-year period then ended. These financial statements and financial highlights are the responsibility of management. Our responsibility is to express an opinion on these financial statements and financial highlights based on our audits.
We conducted our audits in accordance with the standards of the Public Company Accounting Oversight Board (United States). Those standards require that we plan and perform the audits to obtain reasonable assurance about whether the financial statements and financial highlights are free of material misstatement. An audit includes examining, on a test basis, evidence supporting the amounts and disclosures in the financial statements. Our procedures included confirmation of securities owned as of December 31, 2004 by correspondence with the custodian and brokers, or by other appropriate auditing procedures. An audit also includes assessing the accounting principles used and significant estimates made by management, as well as evaluating the overall financial statement presentation. We believe that our audits provide a reasonable basis for our opinion.
In our opinion, the financial statements and financial highlights referred to above present fairly, in all material respects, the financial position of the aforementioned portfolios as of December 31, 2004, the results of their operations, the changes in their net assets, and the financial highlights for the periods specified in the first paragraph above, in conformity with accounting principles generally accepted in the United States of America.

Boston, Massachusetts
February 11, 2005
19
| | ING
VP Index Plus
LargeCap
Portfolio | | ING
VP Index Plus
MidCap
Portfolio | | ING
VP Index Plus
SmallCap
Portfolio | |
ASSETS: | | | | | | | |
Investments in securities at value+* | | $ | 1,628,752,487 | | $ | 786,405,498 | | $ | 411,085,801 | |
Short-term investments at amortized cost | | 58,326,000 | | 83,609,000 | | 65,009,000 | |
Repurchase agreement | | 9,917,000 | | 14,078,000 | | 5,226,000 | |
Cash | | 863 | | 328 | | 26,167 | |
Cash collateral for futures | | — | | 392,000 | | — | |
Receivables: | | | | | | | |
Fund shares sold | | — | | — | | 154,550 | |
Dividends and interest | | 2,067,714 | | 475,330 | | 268,616 | |
Variation margin | | — | | 25,900 | | — | |
Prepaid expenses | | 57,064 | | 24,512 | | 10,327 | |
Total assets | | 1,699,121,128 | | 885,010,568 | | 481,780,461 | |
| | | | | | | |
LIABILITIES: | | | | | | | |
Payable for investment securities purchased | | — | | — | | 2,646,406 | |
Payable for fund shares redeemed | | — | | — | | 575,788 | |
Payable upon receipt of securities loaned | | 58,326,000 | | 83,609,000 | | 65,009,000 | |
Payable to affiliates | | 581,091 | | 321,912 | | 174,547 | |
Payable for director fees | | 1,409 | | 1,141 | | 986 | |
Other accrued expenses and liabilities | | 139,276 | | 57,029 | | 40,488 | |
Total liabilities | | 59,047,776 | | 83,989,082 | | 68,447,215 | |
NET ASSETS | | $ | 1,640,073,352 | | $ | 801,021,486 | | $ | 413,333,246 | |
| | | | | | | |
NET ASSETS WERE COMPRISED OF: | | | | | | | |
Paid-in capital | | $ | 1,789,157,138 | | $ | 643,769,546 | | $ | 331,337,373 | |
Undistributed net investment income | | 23,376,687 | | 4,183,244 | | 1,572,119 | |
Accumulated net realized gain (loss) on investments and futures | | (363,798,439 | ) | 59,719,606 | | 24,776,903 | |
Net unrealized appreciation on investments and futures | | 191,337,966 | | 93,349,090 | | 55,646,851 | |
NET ASSETS | | $ | 1,640,073,352 | | $ | 801,021,486 | | $ | 413,333,246 | |
| | | | | | | | | | |
| |
+ Including securities loaned at value | | $ | 56,324,571 | | $ | 80,941,850 | | $ | 62,909,919 | |
* Cost of investments in securities | | $ | 1,437,414,521 | | $ | 693,077,156 | | $ | 355,438,950 | |
| | | | | | | |
Class I: | | | | | | | |
Net assets | | $ | 1,511,946,415 | | $ | 678,868,532 | | $ | 303,040,775 | |
Shares authorized | | 2,000,000,000 | | 2,000,000,000 | | 2,000,000,000 | |
Par value | | $ | 0.001 | | $ | 0.001 | | $ | 0.001 | |
Shares outstanding | | 102,022,539 | | 37,373,223 | | 18,486,440 | |
Net asset value and redemption price per share | | $ | 14.82 | | $ | 18.16 | | $ | 16.39 | |
| | | | | | | |
Class S: | | | | | | | |
Net assets | | $ | 128,126,937 | | $ | 122,152,954 | | $ | 110,292,471 | |
Shares authorized | | 100,000,000 | | 100,000,000 | | 100,000,000 | |
Par value | | $ | 0.001 | | $ | 0.001 | | $ | 0.001 | |
Shares outstanding | | 8,695,601 | | 6,767,493 | | 6,774,275 | |
Net asset value and redemption price per share | | $ | 14.73 | | $ | 18.05 | | $ | 16.28 | |
See Accompanying Notes to Financial Statements
20
STATEMENTS OF ASSETS AND LIABILITIES as of December 31, 2004
| | ING
VP Strategic
Allocation
Balanced
Portfolio | | ING
VP Strategic
Allocation
Growth
Portfolio | | ING
VP Strategic
Allocation
Income
Portfolio | |
ASSETS: | | | | | | | |
Investments in securities at value+* | | $ | 259,177,256 | | $ | 255,749,538 | | $ | 149,132,264 | |
Short-term investments** | | 49,200,229 | | 22,133,015 | | 33,781,481 | |
Repurchase agreement | | 5,906,000 | | 9,381,000 | | 5,216,000 | |
Cash | | 107,663 | | 44,778 | | 110,297 | |
Cash collateral for futures | | 4,500 | | 6,676 | | 355,400 | |
Foreign currencies at value*** | | 8,896 | | 12,605 | | 3,473 | |
Receivables: | | | | | | | |
Fund shares sold | | 181 | | 41,372 | | — | |
Dividends and interest | | 744,332 | | 515,785 | | 588,022 | |
Variation margin | | — | | 2,578 | | 8,313 | |
Prepaid expenses | | 8,463 | | 8,066 | | 4,658 | |
Reimbursement due from manager | | — | | — | | 6,228 | |
Total assets | | 315,157,520 | | 287,895,413 | | 189,206,136 | |
| | | | | | | |
LIABILITIES: | | | | | | | |
Payable for investment securities purchased | | 16,143,046 | | 5,372,246 | | 16,763,323 | |
Payable for fund shares redeemed | | 2,400,676 | | 1,277,034 | | — | |
Payable for futures variation margin | | 844 | | — | | — | |
Payable upon receipt of securities loaned | | 28,110,000 | | 17,535,000 | | 20,813,000 | |
Payable to affiliates | | 148,699 | | 144,420 | | 86,175 | |
Payable for director fees | | 5,927 | | 2,268 | | 3,495 | |
Other accrued expenses and liabilities | | 56,533 | | 69,984 | | 51,630 | |
Total liabilities | | 46,865,725 | | 24,400,952 | | 37,717,623 | |
NET ASSETS | | $ | 268,291,795 | | $ | 263,494,461 | | $ | 151,488,513 | |
| | | | | | | |
NET ASSETS WERE COMPRISED OF: | | | | | | | |
Paid-in capital | | $ | 243,347,628 | | $ | 239,050,041 | | $ | 138,013,966 | |
Undistributed net investment income | | 4,244,044 | | 3,371,539 | | 3,103,317 | |
Accumulated net realized loss on investments, foreign currency related transactions and futures | | (9,492,909 | ) | (16,109,362 | ) | (2,544,839 | ) |
Net unrealized appreciation on investments, foreign currency related transactions and futures | | 30,193,032 | | 37,182,243 | | 12,916,069 | |
NET ASSETS | | $ | 268,291,795 | | $ | 263,494,461 | | $ | 151,488,513 | |
| | | | | | | | | | |
| |
+ | Including securities loaned at value | | $ | 27,459,757 | | $ | 16,995,991 | | $ | 20,361,643 | |
* | Cost of investments in securities | | $ | 228,984,114 | | $ | 218,574,227 | | $ | 136,175,337 | |
** | Cost of short-term investments | | $ | 49,201,107 | | $ | 22,133,168 | | $ | 33,782,117 | |
*** | Cost of foreign currencies | | $ | 8,797 | | $ | 12,446 | | $ | 3,330 | |
| | | | | | | |
Class I: | | | | | | | |
Net assets | | $ | 268,291,795 | | $ | 263,494,461 | | $ | 151,488,513 | |
Shares authorized | | 2,000,000,000 | | 2,000,000,000 | | 2,000,000,000 | |
Par value | | $ | 0.001 | | $ | 0.001 | | $ | 0.001 | |
Shares outstanding | | 19,280,773 | | 17,856,079 | | 11,616,453 | |
Net asset value and redemption price per share | | $ | 13.91 | | $ | 14.76 | | $ | 13.04 | |
| | | | | | | |
Class S: | | | | | | | |
Net assets | | n/a | | n/a | | n/a | |
Shares authorized | | 100,000,000 | | 100,000,000 | | 100,000,000 | |
Par value | | $ | 0.001 | | $ | 0.001 | | $ | 0.001 | |
Shares outstanding | | n/a | | n/a | | n/a | |
Net asset value and redemption price per share | | n/a | | n/a | | n/a | |
See Accompanying Notes to Financial Statements
21
| | ING
ING VP
Index Plus
LargeCap
Portfolio | | ING
ING VP
Index Plus
MidCap
Portfolio | | ING
ING VP
Index Plus
SmallCap
Portfolio | |
INVESTMENT INCOME: | | | | | | | |
Dividends | | $ | 30,112,909 | | $ | 7,273,196 | | $ | 2,849,992 | |
Interest | | 181,642 | | 109,706 | | 63,090 | |
Securities lending income | | 96,248 | | 59,549 | | 76,420 | |
Total investment income | | 30,390,799 | | 7,442,451 | | 2,989,502 | |
| | | | | | | |
EXPENSES: | | | | | | | |
Investment management fees | | 5,330,565 | | 2,454,995 | | 1,046,533 | |
Distribution and service fees: | | | | | | | |
Class S | | 231,693 | | 147,874 | | 102,921 | |
Transfer agent fees | | 2,796 | | 2,366 | | 2,392 | |
Administrative service fees | | 837,646 | | 337,553 | | 143,895 | |
Shareholder reporting expense | | 77,254 | | 28,184 | | 9,150 | |
Registration fees | | 23,978 | | 14,329 | | 6,512 | |
Professional fees | | 117,749 | | 42,880 | | 13,336 | |
Custody and accounting expense | | 180,262 | | 78,066 | | 43,480 | |
Director’s fees | | 65,868 | | 17,370 | | 7,857 | |
Miscellaneous expense | | 67,560 | | 19,740 | | 9,229 | |
Total expenses | | 6,935,371 | | 3,143,357 | | 1,385,305 | |
Net investment income | | 23,455,428 | | 4,299,094 | | 1,604,197 | |
| | | | | | | |
REALIZED AND UNREALIZED GAIN (LOSS) ON INVESTMENTS AND FUTURES: | | | | | | | |
Net realized gain on: | | | | | | | |
Investments | | 120,911,619 | | 69,287,426 | | 28,787,822 | |
Futures | | 205,568 | | 607,001 | | — | |
Net realized gain on investments and futures | | 121,117,187 | | 69,894,427 | | 28,787,822 | |
Net change in unrealized appreciation or depreciation on: | | | | | | | |
Investments | | 10,748,420 | | 29,915,833 | | 28,521,333 | |
Futures | | (152,789 | ) | (1,912 | ) | — | |
Net change in unrealized appreciation or depreciation on investments and futures | | 10,595,631 | | 29,913,921 | | 28,521,333 | |
Net realized and unrealized gain on investments and futures | | 131,712,818 | | 99,808,348 | | 57,309,155 | |
Increase in net assets resulting from operations | | $ | 155,168,246 | | $ | 104,107,442 | | $ | 58,913,352 | |
See Accompanying Notes to Financial Statements
22
STATEMENTS OF OPERATIONS FOR THE YEAR ENDED DECEMBER 31, 2004
| | ING
VP Strategic
Allocation
Balanced
Portfolio | | ING
VP Strategic
Allocation
Growth
Portfolio | | ING
VP Strategic
Allocation
Income
Portfolio | |
INVESTMENT INCOME: | | | | | | | |
Dividends, net of foreign taxes withheld* | | $ | 3,175,106 | | $ | 4,003,278 | | $ | 1,320,677 | |
Interest | | 2,664,290 | | 1,031,519 | | 2,637,180 | |
Securities lending income | | 38,648 | | 21,774 | | 31,964 | |
Total investment income | | 5,878,044 | | 5,056,571 | | 3,989,821 | |
| | | | | | | |
EXPENSES: | | | | | | | |
Investment management fees | | 1,429,520 | | 1,414,839 | | 850,962 | |
Transfer agent fees | | 1,186 | | 1,386 | | 1,490 | |
Administrative service fees | | 131,037 | | 129,691 | | 78,003 | |
Shareholder reporting expense | | 10,614 | | 11,739 | | 9,712 | |
Registration fees | | 2,002 | | 1,305 | | 166 | |
Professional fees | | 15,959 | | 16,452 | | 9,556 | |
Custody and accounting expense | | 61,235 | | 54,789 | | 29,604 | |
Director’s fees | | 7,576 | | 11,712 | | 8,418 | |
Miscellaneous expense | | 9,028 | | 11,345 | | 6,339 | |
Total expenses | | 1,668,157 | | 1,653,258 | | 994,250 | |
Net recouped (waived and reimbursed) fees | | — | | 8,853 | | (69,974 | ) |
Net expenses | | 1,668,157 | | 1,662,111 | | 924,276 | |
Net investment income | | 4,209,887 | | 3,394,460 | | 3,065,545 | |
| | | | | | | |
REALIZED AND UNREALIZED GAIN (LOSS) ON INVESTMENTS, FOREIGN CURRENCY RELATED TRANSACTIONS AND FUTURES: | | | | | | | |
Net realized gain (loss) on: | | | | | | | |
Investments | | 14,594,799 | | 18,639,756 | | 7,398,587 | |
Foreign currency related transactions | | 7,750 | | 6,186 | | (25,034 | ) |
Futures | | 76,524 | | 15,228 | | (404,212 | ) |
Net realized gain on investments, foreign currency related transactions and futures | | 14,679,073 | | 18,661,170 | | 6,969,341 | |
Net change in unrealized appreciation or depreciation on: | | | | | | | |
Investments | | 5,488,763 | | 5,781,547 | | 1,207,314 | |
Foreign currency related transactions | | (6,179 | ) | (9,501 | ) | (3,345 | ) |
Futures | | (593 | ) | 3,020 | | (41,038 | ) |
Net change in unrealized appreciation or depreciation on investments, foreign currency related transactions and futures | | 5,481,991 | | 5,775,066 | | 1,162,931 | |
Net realized and unrealized gain on investments, foreign currency related transactions and futures | | 20,161,064 | | 24,436,236 | | 8,132,272 | |
Increase in net assets resulting from operations | | $ | 24,370,951 | | $ | 27,830,696 | | $ | 11,197,817 | |
| | | | | | | |
| |
* Foreign taxes withheld | | $ | 39,318 | | $ | 59,045 | | $ | 1,908 | |
See Accompanying Notes to Financial Statements
23
| | ING VP Index Plus
LargeCap Portfolio | | ING VP Index Plus
MidCap Portfolio | |
| | Year Ended
December 31,
2004 | | Year Ended
December 31,
2003 | | Year Ended
December 31,
2004 | | Year Ended
December 31,
2003 | |
FROM OPERATIONS: | | | | | | | | | |
Net investment income | | $ | 23,455,428 | | $ | 15,642,091 | | $ | 4,299,094 | | $ | 2,557,072 | |
Net realized gain (loss) on investments and futures | | 121,117,187 | | (21,820,234 | ) | 69,894,427 | | 14,450,365 | |
Net change in unrealized appreciation or depreciation on investments and futures | | 10,595,631 | | 288,630,476 | | 29,913,921 | | 81,403,828 | |
Net increase in net assets resulting from operations | | 155,168,246 | | 282,452,333 | | 104,107,442 | | 98,411,265 | |
| | | | | | | | | |
FROM DISTRIBUTIONS TO SHAREHOLDERS: | | | | | | | | | |
Net investment income: | | | | | | | | | |
Class I | | (14,620,495 | ) | (12,348,811 | ) | (2,309,221 | ) | (1,377,191 | ) |
Class S | | (956,759 | ) | (156,715 | ) | (201,138 | ) | (27,291 | ) |
Total distributions | | (15,577,254 | ) | (12,505,526 | ) | (2,510,359 | ) | (1,404,482 | ) |
| | | | | | | | | |
FROM CAPITAL SHARE TRANSACTIONS: | | | | | | | | | |
Net proceeds from sale of shares | | 191,210,173 | | 1,567,948,548 | | 282,702,113 | | 138,161,411 | |
Dividends reinvested | | 15,577,254 | | 12,505,526 | | 2,510,359 | | 1,404,482 | |
| | 206,787,427 | | 1,580,454,074 | | 285,212,472 | | 139,565,893 | |
Cost of shares redeemed | | (155,103,522 | ) | (1,349,719,284 | ) | (56,961,651 | ) | (22,990,593 | ) |
Net increase in net assets resulting from capital share transactions | | 51,683,905 | | 230,734,790 | | 228,250,821 | | 116,575,300 | |
Net increase in net assets | | 191,274,897 | | 500,681,597 | | 329,847,904 | | 213,582,083 | |
| | | | | | | | | |
NET ASSETS: | | | | | | | | | |
Beginning of year | | 1,448,798,455 | | 948,116,858 | | 471,173,582 | | 257,591,499 | |
End of year | | $ | 1,640,073,352 | | $ | 1,448,798,455 | | $ | 801,021,486 | | $ | 471,173,582 | |
Undistributed net investment income at end of year | | $ | 23,379,704 | | $ | 15,569,822 | | $ | 4,183,244 | | $ | 2,512,854 | |
See Accompanying Notes to Financial Statements
24
STATEMENTS OF CHANGES IN NET ASSETS
| | ING VP Index Plus
SmallCap Portfolio | | ING VP Strategic
Allocation Balanced Portfolio | |
| | Year Ended
December 31,
2004 | | Year Ended
December 31,
2003 | | Year Ended
December 31,
2004 | | Year Ended
December 31,
2003 | |
FROM OPERATIONS: | | | | | | | | | |
Net investment income | | $ | 1,604,197 | | $ | 426,372 | | $ | 4,209,887 | | $ | 3,101,737 | |
Net realized gain on investments, foreign currency related transactions and futures | | 28,787,822 | | 6,040,106 | | 14,679,073 | | 4,796,268 | |
Net change in unrealized appreciation or depreciation on investments, foreign currency related transactions and futures | | 28,521,333 | | 33,092,580 | | 5,481,991 | | 24,406,773 | |
Net increase in net assets resulting from operations | | 58,913,352 | | 39,559,058 | | 24,370,951 | | 32,304,778 | |
| | | | | | | | | |
FROM DISTRIBUTIONS TO SHAREHOLDERS: | | | | | | | | | |
Net investment income: | | | | | | | | | |
Class I | | (344,735 | ) | (212,503 | ) | (2,985,052 | ) | (2,679,069 | ) |
Class S | | (35,479 | ) | (6,458 | ) | — | | — | |
Net realized gains: | | | | | | | | | |
Class I | | (1,191,454 | ) | — | | — | | — | |
Class S | | (185,150 | ) | — | | — | | — | |
Total distributions | | (1,756,818 | ) | (218,961 | ) | (2,985,052 | ) | (2,679,069 | ) |
| | | | | | | | | |
FROM CAPITAL SHARE TRANSACTIONS: | | | | | | | | | |
Net proceeds from sale of shares | | 185,074,686 | | 77,170,982 | | 54,922,497 | | 29,723,305 | |
Dividends reinvested | | 1,756,818 | | 218,960 | | 2,985,052 | | 2,679,069 | |
| | 186,831,504 | | 77,389,942 | | 57,907,549 | | 32,402,374 | |
Cost of shares redeemed | | (15,108,969 | ) | (22,784,198 | ) | (19,838,875 | ) | (11,359,470 | ) |
Net increase in net assets resulting from capital share transactions | | 171,722,535 | | 54,605,744 | | 38,068,674 | | 21,042,904 | |
Net increase in net assets | | 228,879,069 | | 93,945,841 | | 59,454,573 | | 50,668,613 | |
| | | | | | | | | |
NET ASSETS: | | | | | | | | | |
Beginning of year | | 184,454,177 | | 90,508,336 | | 208,837,222 | | 158,168,609 | |
End of year | | $ | 413,333,246 | | $ | 184,454,177 | | $ | 268,291,795 | | $ | 208,837,222 | |
Undistributed net investment income at end of year | | $ | 1,572,119 | | $ | 402,928 | | $ | 4,244,044 | | $ | 3,041,453 | |
See Accompanying Notes to Financial Statements
25
STATEMENTS OF CHANGES IN NET ASSETS
| | ING VP Strategic
Allocation Growth Portfolio | | ING VP Strategic
Allocation Income Portfolio | |
| | Year Ended
December 31,
2004 | | Year Ended
December 31,
2003 | | Year Ended
December 31,
2004 | | Year Ended
December 31,
2003 | |
FROM OPERATIONS: | | | | | | | | | |
Net investment income | | $ | 3,394,460 | | $ | 2,462,819 | | $ | 3,065,545 | | $ | 2,737,295 | |
Net realized gain on investments, foreign currency related transactions and futures | | 18,661,170 | | 4,775,617 | | 6,969,341 | | 3,808,774 | |
Net change in unrealized appreciation or depreciation on investments, foreign currency related transactions and futures | | 5,775,066 | | 34,258,082 | | 1,162,931 | | 9,681,310 | |
Net increase in net assets resulting from operations | | 27,830,696 | | 41,496,518 | | 11,197,817 | | 16,227,379 | |
| | | | | | | | | |
FROM DISTRIBUTIONS TO SHAREHOLDERS: | | | | | | | | | |
Net investment income: | | | | | | | | | |
Class I | | (2,501,616 | ) | (1,692,396 | ) | (2,661,534 | ) | (2,954,235 | ) |
Total distributions | | (2,501,616 | ) | (1,692,396 | ) | (2,661,534 | ) | (2,954,235 | ) |
FROM CAPITAL SHARE TRANSACTIONS: | | | | | | | | | |
Net proceeds from sale of shares | | 32,322,543 | | 23,016,183 | | 30,670,847 | | 15,209,893 | |
Dividends reinvested | | 2,501,616 | | 1,692,396 | | 2,661,534 | | 2,954,235 | |
| | 34,824,159 | | 24,708,579 | | 33,332,381 | | 18,164,128 | |
Cost of shares redeemed | | (15,918,306 | ) | (10,985,790 | ) | (26,008,253 | ) | (16,424,023 | ) |
Net increase in net assets resulting from capital share transactions | | 18,905,853 | | 13,722,789 | | 7,324,128 | | 1,740,105 | |
Net increase in net assets | | 44,234,933 | | 53,526,911 | | 15,860,411 | | 15,013,249 | |
| | | | | | | | | |
NET ASSETS: | | | | | | | | | |
Beginning of year | | 219,259,528 | | 165,732,617 | | 135,628,102 | | 120,614,853 | |
End of year | | $ | 263,494,461 | | $ | 219,259,528 | | $ | 151,488,513 | | $ | 135,628,102 | |
Undistributed net investment income at end of year | | $ | 3,371,539 | | $ | 2,537,489 | | $ | 3,103,317 | | $ | 2,697,184 | |
See Accompanying Notes to Financial Statements
26
Selected data for a share of beneficial interest outstanding throughout each period.
| | Class I | |
| | Year Ended December 31, | |
| | 2004 | | 2003 | | 2002 | | 2001 | | 2000 | |
Per Share Operating Performance: | | | | | | | | | | | |
Net asset value, beginning of year | $ | 13.54 | | 10.85 | | 13.86 | | 16.73 | | 20.87 | |
Income (loss) from investment operations: | | | | | | | | | | | |
Net investment income | $ | 0.22 | | 0.14 | | 0.14 | | 0.15 | | 0.13 | |
Net realized and unrealized gain (loss) on investments | $ | 1.20 | | 2.68 | | (3.12 | ) | (2.40 | ) | (1.99 | ) |
Total from investment operations | $ | 1.42 | | 2.82 | | (2.98 | ) | (2.25 | ) | (1.86 | ) |
Less distributions from: | | | | | | | | | | | |
Net investment income | $ | 0.14 | | 0.13 | | 0.03 | | 0.13 | | 0.14 | |
Net realized gain on investments | $ | — | | — | | — | | 0.49 | | 2.14 | |
Total distributions | $ | 0.14 | | 0.13 | | 0.03 | | 0.62 | | 2.28 | |
Net asset value, end of year | $ | 14.82 | | 13.54 | | 10.85 | | 13.86 | | 16.73 | |
Total Return(1) | % | 10.58 | | 26.14 | | (21.53 | ) | (13.62 | ) | (9.41 | ) |
| | | | | | | | | | | |
Ratios and Supplemental Data: | | | | | | | | | | | |
Net assets, end of year (000’s) | $ | 1,511,946 | | 1,389,298 | | 943,520 | | 1,165,893 | | 1,248,768 | |
Ratios to average net assets: | | | | | | | | | | | |
Expenses | % | 0.44 | | 0.43 | | 0.45 | | 0.45 | | 0.44 | |
Net investment income | % | 1.55 | | 1.33 | | 1.18 | | 1.05 | | 0.73 | |
Portfolio turnover rate | % | 70 | | 88 | | 139 | | 125 | | 111 | |
| | Class S | |
| | | | | | | | July 16, | |
| | | | | | | | 2001(2) to | |
| | Year Ended December 31, | | December 31, | |
| | 2004 | | 2003 | | 2002 | | 2001 | |
Per Share Operating Performance: | | | | | | | | | |
Net asset value, beginning of period | $ | 13.49 | | 10.83 | | 13.86 | | 14.80 | |
Income (loss) from investment operations: | | | | | | | | | |
Net investment income | $ | 0.19 | * | 0.15 | | 0.12 | | — | * |
Net realized and unrealized gain (loss) on investments | $ | 1.18 | | 2.63 | | (3.13 | ) | (0.83 | ) |
Total from investment operations | $ | 1.37 | | 2.78 | | (3.01 | ) | (0.83 | ) |
Less distributions from: | | | | | | | | | |
Net investment income | $ | 0.13 | | 0.12 | | 0.02 | | 0.11 | |
Net realized gain on investments | $ | — | | — | | — | | — | |
Total distributions | $ | 0.13 | | 0.12 | | 0.02 | | 0.11 | |
Net asset value, end of period | $ | 14.73 | | 13.49 | | 10.83 | | 13.86 | |
Total Return(1) | % | 10.26 | | 25.84 | | (21.74 | ) | (5.56 | ) |
| | | | | | | | | |
Ratios and Supplemental Data: | | | | | | | | | |
Net assets, end of period (000’s) | $ | 128,127 | | 59,500 | | 4,597 | | 821 | |
Ratios to average net assets: | | | | | | | | | |
Expenses(3) | % | 0.69 | | 0.68 | | 0.71 | | 0.69 | |
Net investment income(3) | % | 1.39 | | 1.11 | | 0.93 | | 0.80 | |
Portfolio turnover rate | % | 70 | | 88 | | 139 | | 125 | |
(1) Total return is calculated assuming reinvestment of all dividends and capital gain distributions at net asset value and does not reflect the effect of insurance contract charges. Total return for periods less than one year is not annualized.
(2) Commencement of operations.
(3) Annualized for periods less than one year.
* Per share data calculated using average number of shares outstanding throughout the period.
See Accompanying Notes to Financial Statements.
27
ING VP INDEX PLUS MIDCAP PORTFOLIO | FINANCIAL HIGHLIGHTS |
Selected data for a share of beneficial interest outstanding throughout each period.
| | Class I | |
| | Year Ended December 31, | |
| | 2004 | | 2003 | | 2002 | | 2001 | | 2000 | |
Per Share Operating Performance: | | | | | | | | | | | |
Net asset value, beginning of year | $ | 15.64 | | 11.86 | | 13.54 | | 14.67 | | 12.40 | |
Income (loss) from investment operations: | | | | | | | | | | | |
Net investment income | $ | 0.09 | | 0.09 | | 0.04 | | 0.07 | | 0.04 | |
Net realized and unrealized gain (loss) on investments | $ | 2.50 | | 3.75 | | (1.67 | ) | (0.26 | ) | 2.43 | |
Total from investment operations | $ | 2.59 | | 3.84 | | (1.63 | ) | (0.19 | ) | 2.47 | |
Less distributions from: | | | | | | | | | | | |
Net investment income | $ | 0.07 | | 0.06 | | 0.05 | | 0.03 | | — | |
Net realized gain on investments | $ | — | | — | | — | | 0.91 | | 0.20 | |
Total distributions | $ | 0.07 | | 0.06 | | 0.05 | | 0.94 | | 0.20 | |
Net asset value, end of year | $ | 18.16 | | 15.64 | | 11.86 | | 13.54 | | 14.67 | |
Total Return(1) | % | 16.59 | | 32.45 | | (12.09 | ) | (1.32 | ) | 19.91 | |
| | | | | | | | | | | |
Ratios and Supplemental Data: | | | | | | | | | | | |
Net assets, end of year (000’s) | $ | 678,869 | | 451,213 | | 251,674 | | 161,663 | | 94,727 | |
Ratios to average net assets: | | | | | | | | | | | |
Net expenses after expense reimbursement(2) | % | 0.49 | | 0.50 | | 0.53 | | 0.55 | | 0.58 | |
Gross expenses prior to expense reimbursement(2) | % | 0.49 | | 0.50 | | 0.53 | | 0.55 | | 0.62 | |
Net investment income after expense reimbursement(2) | % | 0.73 | | 0.78 | | 0.61 | | 0.77 | | 0.66 | |
Portfolio turnover rate | % | 108 | | 113 | | 139 | | 189 | | 154 | |
| | Class S | |
| | | | | | | | July 16, | |
| | | | | | | | 2001(3) to | |
| | Year Ended December 31, | | December 31, | |
| | 2004 | | 2003 | | 2002 | | 2001 | |
Per Share Operating Performance: | | | | | | | | | |
Net asset value, beginning of period | $ | 15.57 | | 11.83 | | 13.52 | | 13.58 | |
Income (loss) from investment operations: | | | | | | | | | |
Net investment income | $ | 0.07 | * | 0.04 | | 0.01 | | — | |
Net realized and unrealized gain (loss) on investments | $ | 2.47 | | 3.74 | | (1.66 | ) | (0.06 | ) |
Total from investment operations | $ | 2.54 | | 3.78 | | (1.65 | ) | (0.06 | ) |
Less distributions from: | | | | | | | | | |
Net investment income | $ | 0.06 | | 0.04 | | 0.04 | | — | |
Net realized gain on investments | $ | — | | — | | — | | — | |
Total distributions | $ | 0.06 | | 0.04 | | 0.04 | | — | |
Net asset value, end of period | $ | 18.05 | | 15.57 | | 11.83 | | 13.52 | |
Total Return(1) | % | 16.35 | | 32.06 | | (12.26 | ) | (0.44 | ) |
| | | | | | | | | |
Ratios and Supplemental Data: | | | | | | | | | |
Net assets, end of period (000’s) | $ | 122,153 | | 19,960 | | 5,917 | | 830 | |
Ratios to average net assets: | | | | | | | | | |
Net expenses after expense reimbursement(2)(4) | % | 0.74 | | 0.75 | | 0.78 | | 0.80 | |
Gross expenses prior to expense
reimbursement(2) | % | 0.74 | | 0.75 | | 0.78 | | 0.80 | |
Net investment income after expense
reimbursement(2)(4) | % | 0.45 | | 0.54 | | 0.37 | | 0.51 | |
Portfolio turnover rate | % | 108 | | 113 | | 139 | | 189 | |
(1) Total return is calculated assuming reinvestment of all dividends and capital gain distributions at net asset value and does not reflect the effect of insurance contract charges. Total return for periods less than one year is not annualized.
(2) The Investment Manager has agreed to limit expenses (excluding interest, taxes, brokerage and extraordinary expenses) subject to possible recoupment by ING Investments, LLC within three years.
(3) Commencement of operations.
(4) Annualized for periods less than one year.
* Per share data calculated using average number of shares outstanding throughout the period.
See Accompanying Notes to Financial Statements.
28
ING VP INDEX PLUS SMALLCAP PORTFOLIO | FINANCIAL HIGHLIGHTS |
Selected data for a share of beneficial interest outstanding throughout each period.
| | Class I | |
| | Year Ended December 31, | |
| | 2004 | | 2003 | | 2002 | | 2001 | | 2000 | |
Per Share Operating Performance: | | | | | | | | | | | |
Net asset value, beginning of year | $ | 13.52 | | 9.95 | | 11.60 | | 11.97 | | 10.90 | |
Income (loss) from investment operations: | | | | | | | | | | | |
Net investment income | $ | 0.07 | | 0.03 | | 0.01 | | 0.02 | | 0.02 | |
Net realized and unrealized gain (loss) on investments | $ | 2.90 | | 3.56 | | (1.53 | ) | 0.25 | | 1.05 | |
Total from investment operations | $ | 2.97 | | 3.59 | | (1.52 | ) | 0.27 | | 1.07 | |
Less distributions from: | | | | | | | | | | | |
Net investment income | $ | 0.02 | | 0.02 | | 0.01 | | 0.02 | | — | |
Net realized gain on investments | $ | 0.08 | | — | | 0.12 | | 0.62 | | — | |
Total distributions | $ | 0.10 | | 0.02 | | 0.13 | | 0.64 | | — | |
Net asset value, end of year | $ | 16.39 | | 13.52 | | 9.95 | | 11.60 | | 11.97 | |
Total Return(1) | % | 22.07 | | 36.15 | | (13.21 | ) | 2.41 | | 9.82 | |
| | | | | | | | | | | |
Ratios and Supplemental Data: | | | | | | | | | | | |
Net assets, end of year (000’s) | $ | 303,041 | | 168,035 | | 86,494 | | 46,547 | | 20,484 | |
Ratios to average net assets: | | | | | | | | | | | |
Net expenses after expense reimbursement(2) | % | 0.49 | | 0.56 | | 0.58 | | 0.60 | | 0.60 | |
Gross expenses prior to expense reimbursement(2) | % | 0.49 | | 0.56 | | 0.63 | | 0.71 | | 0.86 | |
Net investment income after expense reimbursement(2) | % | 0.64 | | 0.37 | | 0.30 | | 0.35 | | 0.28 | |
Portfolio turnover rate | % | 94 | | 120 | | 134 | | 134 | | 142 | |
| | Class S | |
| | | | July 16, | |
| | | | 2001(3) to | |
| | Year Ended December 31, | | December 31, | |
| | 2004 | | 2003 | | 2002 | | 2001 | |
Per Share Operating Performance: | | | | | | | | | |
Net asset value, beginning of period | $ | 13.46 | | 9.92 | | 11.58 | | 11.40 | |
Income (loss) from investment operations: | | | | | | | | | |
Net investment income (loss) | $ | 0.06 | ** | 0.01 | | 0.00 | * | — | |
Net realized and unrealized gain (loss) on investments | $ | 2.86 | | 3.54 | | (1.53 | ) | 0.18 | |
Total from investment operations | $ | 2.92 | | 3.55 | | (1.53 | ) | 0.18 | |
Less distributions from: | | | | | | | | | |
Net investment income | $ | 0.02 | | 0.01 | | 0.01 | | — | |
Net realized gain on investments | $ | 0.08 | | — | | 0.12 | | — | |
Total distributions | $ | 0.10 | | 0.01 | | 0.13 | | — | |
Net asset value, end of period | $ | 16.28 | | 13.46 | | 9.92 | | 11.58 | |
Total Return(1) | % | 21.74 | | 35.83 | | (13.39 | ) | 1.58 | |
| | | | | | | | | |
Ratios and Supplemental Data: | | | | | | | | | |
Net assets, end of period (000’s) | $ | 110,292 | | 16,419 | | 4,014 | | 690 | |
Ratios to average net assets: | | | | | | | | | |
Net expenses after expense reimbursement(2)(4) | % | 0.74 | | 0.80 | | 0.84 | | 0.85 | |
Gross expenses prior to expense reimbursement(2) | % | 0.74 | | 0.80 | | 0.88 | | 0.96 | |
Net investment income after expense
reimbursement(2)(4) | % | 0.45 | | 0.13 | | 0.05 | | 0.10 | |
Portfolio turnover rate | % | 94 | | 120 | | 134 | | 134 | |
(1) Total return is calculated assuming reinvestment of all dividends and capital gain distributions at net asset value and does not reflect the effect of insurance contract charges. Total return for periods less than one year is not annualized.
(2) The Investment Manager has agreed to limit expenses (excluding interest, taxes, brokerage and extraordinary expenses) subject to possible recoupment by ING Investments, LLC within three years.
(3) Commencement of operations.
(4) Annualized for periods less than one year.
* Amount represents less than $0.01.
** Per share data calculated using average number of shares outstanding throughout the period.
See Accompanying Notes to Financial Statements.
29
ING VP STRATEGIC ALLOCATION BALANCED PORTFOLIO | FINANCIAL HIGHLIGHTS |
Selected data for a share of beneficial interest outstanding throughout each period.
| | Class I | |
| | Year Ended December 31, | |
| | 2004 | | 2003 | | 2002 | | 2001 | | 2000 | |
Per Share Operating Performance: | | | | | | | | | | | |
Net asset value, beginning of year | $ | 12.78 | | 10.86 | | 12.31 | | 13.58 | | 13.77 | |
Income (loss) from investment operations: | | | | | | | | | | | |
Net investment income | $ | 0.20 | | 0.18 | | 0.20 | | 0.29 | | 0.35 | |
Net realized and unrealized gain (loss) on investments | $ | 1.09 | | 1.92 | | (1.36 | ) | (1.23 | ) | (0.29 | ) |
Total from investment operations | $ | 1.29 | | 2.10 | | (1.16 | ) | (0.94 | ) | 0.06 | |
Less distributions from: | | | | | | | | | | | |
Net investment income | $ | 0.16 | | 0.18 | | 0.29 | | 0.33 | | 0.09 | |
Net realized gain on investments | $ | — | | — | | — | | — | | 0.16 | |
Total distributions | $ | 0.16 | | 0.18 | | 0.29 | | 0.33 | | 0.25 | |
Net asset value, end of year | $ | 13.91 | | 12.78 | | 10.86 | | 12.31 | | 13.58 | |
Total Return(1) | % | 10.23 | | 19.47 | | (9.54 | ) | (6.99 | ) | 0.41 | |
| | | | | | | | | | | |
Ratios and Supplemental Data: | | | | | | | | | | | |
Net assets, end of year (000’s) | $ | 268,292 | | 208,837 | | 158,169 | | 181,296 | | 189,109 | |
Ratios to average net assets: | | | | | | | | | | | |
Net expenses after expense reimbursement(2) | % | 0.70 | | 0.70 | | 0.70 | | 0.70 | | 0.70 | |
Gross expenses prior to expense reimbursement | % | 0.70 | | 0.74 | | 0.77 | | 0.74 | | 0.75 | |
Net investment income after expense reimbursement(2) | % | 1.77 | | 1.75 | | 1.71 | | 2.39 | | 2.53 | |
Portfolio turnover rate | % | 262 | | 278 | | 267 | | 195 | | 213 | |
(1) Total return is calculated assuming reinvestment of all dividends and capital gain distributions at net asset value and does not reflect the effect of insurance contract charges.
(2) The Investment Manager has agreed to limit expenses (excluding interest, taxes, brokerage and extraordinary expenses) subject to possible recoupment by ING Investments, LLC within three years.
See Accompanying Notes to Financial Statements.
30
ING VP STRATEGIC ALLOCATION GROWTH PORTFOLIO | FINANCIAL HIGHLIGHTS |
Selected data for a share of beneficial interest outstanding throughout each period.
| | Class I | |
| | Year Ended December 31, | |
| | 2004 | | 2003 | | 2002 | | 2001 | | 2000 | |
Per Share Operating Performance: | | | | | | | | | | | |
Net asset value, beginning of year | $ | 13.32 | | 10.81 | | 12.75 | | 14.65 | | 14.92 | |
Income (loss) from investment operations: | | | | | | | | | | | |
Net investment income | $ | 0.18 | | 0.15 | | 0.13 | | 0.20 | | 0.23 | |
Net realized and unrealized gain (loss) on investments | $ | 1.41 | | 2.47 | | (1.87 | ) | (1.88 | ) | (0.32 | ) |
Total from investment operations | $ | 1.59 | | 2.62 | | (1.74 | ) | (1.68 | ) | (0.09 | ) |
Less distributions from: | | | | | | | | | | | |
Net investment income | $ | 0.15 | | 0.11 | | 0.20 | | 0.22 | | 0.06 | |
Net realized gain on investments | $ | — | | — | | — | | — | | 0.12 | |
Total distributions | $ | 0.15 | | 0.11 | | 0.20 | | 0.22 | | 0.18 | |
Net asset value, end of year | $ | 14.76 | | 13.32 | | 10.81 | | 12.75 | | 14.65 | |
Total Return(1) | % | 12.01 | | 24.34 | | (13.76 | ) | (11.54 | ) | (0.67 | ) |
| | | | | | | | | | | |
Ratios and Supplemental Data: | | | | | | | | | | | |
Net assets, end of year (000’s) | $ | 263,494 | | 219,260 | | 165,733 | | 197,038 | | 216,319 | |
Ratios to average net assets: | | | | | | | | | | | |
Net expenses after expense reimbursement/
recoupment(2) | $ | 0.70 | | 0.75 | | 0.75 | | 0.74 | | 0.75 | |
Gross expenses prior to expense reimbursement/recoupment | $ | 0.70 | | 0.74 | | 0.77 | | 0.74 | | 0.75 | |
Net investment income after expense reimbursement(2) | $ | 1.46 | | 1.32 | | 1.14 | | 1.58 | | 1.59 | |
Portfolio turnover rate | % | 205 | | 232 | | 271 | | 247 | | 215 | |
(1) Total return is calculated assuming reinvestment of all dividends and capital gain distributions at net asset value and does not reflect the effect of insurance contract charges.
(2) The Investment Manager has agreed to limit expenses (excluding interest, taxes, brokerage and extraordinary expenses) subject to possible recoupment by ING Investments, LLC within three years.
See Accompanying Notes to Financial Statements.
31
ING VP STRATEGIC ALLOCATION INCOME PORTFOLIO | FINANCIAL HIGHLIGHTS |
Selected data for a share of beneficial interest outstanding throughout each period.
| | Class I | |
| | Year Ended December 31, | |
| | 2004 | | 2003 | | 2002 | | 2001 | | 2000 | |
Per Share Operating Performance: | | | | | | | | | | | |
Net asset value, beginning of year | $ | 12.31 | | 11.09 | | 11.99 | | 12.84 | | 12.49 | |
Income (loss) from investment operations: | | | | | | | | | | | |
Net investment income | $ | 0.25 | | 0.25 | | 0.27 | | 0.38 | | 0.49 | |
Net realized and unrealized gain (loss) on investments | $ | 0.72 | | 1.25 | | (0.78 | ) | (0.68 | ) | 0.11 | |
Total from investment operations | $ | 0.97 | | 1.50 | | (0.51 | ) | (0.30 | ) | 0.60 | |
Less distributions from: | | | | | | | | | | | |
Net investment income | $ | 0.24 | | 0.28 | | 0.39 | | 0.46 | | 0.11 | |
Net realized gain on investments | $ | — | | — | | — | | 0.09 | | 0.14 | |
Total distributions | $ | 0.24 | | 0.28 | | 0.39 | | 0.55 | | 0.25 | |
Net asset value, end of year | $ | 13.04 | | 12.31 | | 11.09 | | 11.99 | | 12.84 | |
Total Return(1) | % | 7.99 | | 13.65 | | (4.34 | ) | (2.37 | ) | 4.81 | |
| | | | | | | | | | | |
Ratios and Supplemental Data: | | | | | | | | | | | |
Net assets, end of year (000’s) | $ | 151,489 | | 135,628 | | 120,615 | | 129,998 | | 128,379 | |
Ratios to average net assets: | | | | | | | | | | | |
Net expenses after expense reimbursement(2) | % | 0.65 | | 0.65 | | 0.65 | | 0.65 | | 0.65 | |
Gross expenses prior to expense reimbursement(2) | % | 0.70 | | 0.74 | | 0.77 | | 0.76 | | 0.76 | |
Net investment income after expense reimbursement(2) | % | 2.16 | | 2.18 | | 2.36 | | 3.30 | | 3.81 | |
Portfolio turnover rate | % | 317 | | 332 | | 248 | | 155 | | 180 | |
(1) Total return is calculated assuming reinvestment of all dividends and capital gain distributions at net asset value and does not reflect the effect of insurance contract charges.
(2) The Investment Manager has agreed to limit expenses (excluding interest, taxes, brokerage and extraordinary expenses) subject to possible recoupment by ING Investments, LLC within three years.
See Accompanying Notes to Financial Statements.
32
NOTE 1 — ORGANIZATION
Organization. The ING Variable Portfolios, Inc. and the ING Strategic Allocation Portfolios, Inc. are each registered under the Investment Company Act of 1940 as an open-end management investment company.
The ING Variable Portfolios, Inc. is a company incorporated under the laws of Maryland on June 4, 1996. There are eight separate investment portfolios that comprise the ING Variable Portfolios, Inc. The three portfolios (each a “Portfolio”, collectively the “Portfolios”) that are in this report are: ING VP Index Plus LargeCap Portfolio (“VP Index Plus LargeCap”), ING VP Index Plus MidCap Portfolio (“VP Index Plus MidCap”) and ING VP Index Plus SmallCap Portfolio (“VP Index Plus SmallCap”).
The ING Strategic Allocation Portfolios, Inc. is a company incorporated under the laws of Maryland on October 14, 1994. There are three separate investment portfolios (each a “Portfolio”, collectively the “Portfolios”) that comprise the ING Strategic Allocation Portfolios: ING VP Strategic Allocation Balanced Portfolio (“VP Strategic Allocation Balanced”), ING VP Strategic Allocation Growth Portfolio (“VP Strategic Allocation Growth”) and ING VP Strategic Allocation Income Portfolio (“VP Strategic Allocation Income”).
Each Portfolio offers Class I shares. VP Index Plus LargeCap, VP Index Plus MidCap and VP Index Plus SmallCap also offer Class S. The two classes differ principally in the applicable shareholder service fees. Shareholders of each class also bear certain expenses that pertain to that particular class. All shareholders bear the common expenses of the Portfolio and earn income and realized gains/losses from the portfolio pro rata based on the average daily net assets of each class, without distinction between share classes. No class has preferential dividend rights. Differences in per share dividend rates generally result from the relative weighting of pro rata income and realized gain allocations and from differences in separate class expenses, including shareholder servicing fees.
ING Investments, LLC (“ING Investments” or the ”Investment Manager”), an Arizona limited liability company, serves as the Investment Manager to the Portfolios. ING Investments has engaged ING Investment Management Co. (“ING IM”), a Connecticut corporation, to serve as the Sub-Adviser to the Portfolios. ING Funds Distributor, LLC (the ”Distributor”) is the principal underwriter of the Portfolios. ING Investments, ING IM and the Distributor are indirect wholly-owned subsidiaries of ING Groep N.V. (“ING Groep”). ING Groep is a global financial institution active in the fields of banking, insurance and asset management.
NOTE 2 — SIGNIFICANT ACCOUNTING POLICIES
The following significant accounting policies are consistently followed by the Portfolios in the preparation of their financial statements. Such policies are in conformity with accounting principles generally accepted in the United States of America for investment companies.
A. Security Valuation. Investments in equity securities traded on a national securities exchange are valued at the last reported sale price. Securities reported by NASDAQ are valued at the NASDAQ official closing prices. Securities traded on an exchange or NASDAQ for which there has been no sale and securities traded in the over-the-counter-market are valued at the mean between the last reported bid and ask prices. All investments quoted in foreign currencies will be valued daily in U.S. dollars on the basis of the foreign currency exchange rates prevailing at that time. Debt securities are valued at prices obtained from independent services or from one or more dealers making markets in the securities and may be adjusted based on the Portfolios’ valuation procedures. U.S. Government obligations are valued by using market quotations or independent pricing services that use prices provided by market-makers or estimates of market values obtained from yield data relating to instruments or securities with similar characteristics.
Securities and assets for which market quotations are not readily available (which may include certain restricted securities which are subject to limitations as to their sale) are valued at their fair values as determined in good faith by or under the supervision of the Portfolio’s Board of Directors (“Board”), in accordance with methods that are specifically authorized by the Board. Securities traded on exchanges, including foreign exchanges, which close earlier than the time that a Portfolio calculates its net asset value may also be valued at their fair values as determined in good faith by or under the supervision of a Portfolio’s Board, in accordance with methods that are specifically authorized by the Board. If a significant event which is likely to impact the value of one or more foreign securities held by a Portfolio occurs after the time at which the foreign market for such security(ies) closes but before the time that the Portfolio’s net asset value
33
NOTES TO FINANCIAL STATEMENTS AS OF DECEMBER 31, 2004 (CONTINUED)
2 — SIGNIFICANT ACCOUNTING POLICIES (continued)
is calculated on any business day, such event may be taken into account in determining the fair value of such security(ies) at the time the Portfolio calculates its net asset value. For these purposes, significant events after the close of trading on a foreign market may include, among others, securities trading in the U.S. and other markets, corporate announcements, natural and other disasters, and political and other events. Among other elements of analysis, the Board has authorized the use of one or more research services to assist with the determination of the fair value of foreign securities. Research services use statistical analyses and quantitative models to help determine fair value as of the time a Portfolio calculates its net asset value. Unlike the closing price of a security on an exchange, fair value determinations employ elements of judgment, and the fair value assigned to a security may not represent the actual value that a Portfolio could obtain if it were to sell the security at the time of the close of the NYSE. Investments in securities maturing in 60 days or less are valued at amortized cost, which, when combined with accrued interest, approximates market value.
B. Security Transactions and Revenue Recognition. Securities transactions are accounted for on the trade date. Realized gains and losses are reported on the basis of identified cost of securities sold. Interest income is recorded on an accrual basis. Dividend income is recorded on the ex-dividend date, or for certain foreign securities, when the information becomes available to the Portfolios. Premium amortization and discount accretion are determined by the effective yield method.
C. Foreign Currency Translation. The books and records of the Portfolios are maintained in U.S. dollars. Any foreign currency amounts are translated into U.S. dollars on the following basis:
(1) Market value of investment securities, other assets and liabilities — at the exchange rates prevailing at the end of the day.
(2) Purchases and sales of investment securities, income and expenses — at the rates of exchange prevailing on the respective dates of such transactions.
Although the net assets and the market values are presented at the foreign exchange rates at the end of the day, the Portfolios do not isolate the portion of the results of operations resulting from changes in foreign exchange rates on investments from the fluctuations arising from changes in market prices of securities held. Such fluctuations are included with the net realized and unrealized gains or losses from investments. For securities, which are subject to foreign withholding tax upon disposition, liabilities are recorded on the Statement of Assets and Liabilities for the estimated tax withholding based on the securities’ current market value. Upon disposition, realized gains or losses on such securities are recorded net of foreign withholding tax.
Reported net realized foreign exchange gains or losses arise from sales of foreign currencies, currency gains or losses realized between the trade and settlement dates on securities transactions, the difference between the amounts of dividends, interest, and foreign withholding taxes recorded on the Portfolio’s books, and the U.S. dollar equivalent of the amounts actually received or paid. Net unrealized foreign exchange gains and losses arise from changes in the value of assets and liabilities other than investments in securities at fiscal year end, resulting from changes in the exchange rate. Foreign security and currency transactions may involve certain considerations and risks not typically associated with investing in U.S. companies and U.S. Government securities. These risks include, but are not limited to, revaluation of currencies and future adverse political and economic developments which could cause securities and their markets to be less liquid and prices more volatile than those of comparable U.S. companies and U.S. Government securities.
D. Foreign Currency Transactions and Futures Contracts. Certain Portfolios may enter into foreign currency exchange transactions to convert to and from different foreign currencies and to and from the U.S. dollar in connection with the planned purchases or sales of securities. When entering into a currency forward contract, a Portfolio agrees to receive or deliver a fixed quantity of foreign currency for an agreed-upon price on an agreed upon date. The Portfolios either enter into these transactions on a spot basis at the spot rate prevailing in the foreign currency exchange market or use forward foreign currency contracts to purchase or sell foreign currencies. When the contract is fulfilled or closed, gains or losses are realized. Until then, the gain or loss is included in unrealized appreciation or
34
NOTES TO FINANCIAL STATEMENTS AS OF DECEMBER 31, 2004 (CONTINUED)
2 — SIGNIFICANT ACCOUNTING POLICIES (continued)
depreciation. Risks may arise upon entering into forward contracts from the potential inability of counterparties to meet the terms of their forward contracts and from unanticipated movements in the value of foreign currencies relative to the U.S. dollar.
Each Portfolio may enter into futures contracts involving foreign currency, interest rates, securities and security indices. A futures contract obligates the seller of the contract to deliver and the purchaser of the contract to take delivery of the type of foreign currency, financial instrument or security called for in the contract at a specified future time for a specified price. Upon entering into such a contract, a Portfolio is required to deposit and maintain as collateral such initial margin as required by the exchange on which the contract is traded. Pursuant to the contract, a Portfolio agrees to receive from or pay to the broker an amount equal to the daily fluctuations in the value of the contract. Such receipts or payments are known as variation margins and are recorded as unrealized gains or losses by the Portfolio. When the contract is closed, the Portfolio records a realized gain or loss equal to the difference between the value of the contract at the time it was opened and the value at the time it was closed.
E. Distributions to Shareholders. The Portfolios record distributions to their shareholders on ex-dividend date. Dividends from net investment income and capital gains, if any, are declared and paid annually by the Portfolios. The Portfolios may make distributions on a more frequent basis to comply with the distribution requirements of the Internal Revenue Code. The characteristics of income and gains to be distributed are determined in accordance with income tax regulations, which may differ from accounting principles generally accepted in the United States of America for investment companies.
F. Federal Income Taxes. It is the policy of the Portfolios to comply with subchapter M of the Internal Revenue Code and related excise tax provisions applicable to regulated investment companies and to distribute substantially all of their net investment income and any net realized capital gains to their shareholders. Therefore, no federal income tax provision is required. No capital gain distributions shall be made until any capital loss carryforwards have been fully utilized or expired.
G. Use of Estimates. Management of the Portfolios has made certain estimates and assumptions relating to the reporting of assets, liabilities, income, and expenses to prepare these financial statements in conformity with accounting principles generally accepted in the United States of America for investment companies. Actual results could differ from these estimates.
H. Repurchase Agreements. Each Portfolio may invest in repurchase agreements only with government securities dealers recognized by the Board of Governors of the Federal Reserve System. Under such agreements, the seller of the security agrees to repurchase it at a mutually agreed upon time and price. The resale price is in excess of the purchase price and reflects an agreed upon interest rate for the period of time the agreement is outstanding. The period of the repurchase agreements is usually short, from overnight to one week, while the underlying securities generally have longer maturities. Each Portfolio will receive as collateral securities acceptable to it whose market value is equal to at least 100% of the carrying amount of the repurchase agreements, plus accrued interest, being invested by the Portfolio. The underlying collateral is valued daily on a mark to market basis to assure that the value, including accrued interest is at least equal to the repurchase price. If the seller defaults, a Portfolio might incur a loss or delay in the realization of proceeds if the value of the securities collateralizing the repurchase agreement declines, and it might incur disposition costs in liquidating the collateral.
I. Securities Lending. Each Portfolio has the option to temporarily loan up to 30% of its total assets to brokers, dealers or other financial institutions in exchange for a negotiated lender’s fee. The borrower is required to fully collateralize the loans with cash or U.S. Government securities. Generally, in the event of counterparty default, the Portfolio has the right to use collateral to offset losses incurred. There would be potential loss to the Portfolio in the event the Portfolio is delayed or prevented from exercising its right to dispose of the collateral. The Portfolio bears the risk of loss with respect to the investment of collateral. Engaging in securities lending could have a leveraging effect, which may intensify the credit, market and other risks associated with investing in a Portfolio.
35
NOTES TO FINANCIAL STATEMENTS AS OF DECEMBER 31, 2004 (CONTINUED)
2 — SIGNIFICANT ACCOUNTING POLICIES (continued)
J. Swap Contracts. VP Strategic Allocation Balanced, VP Strategic Allocation Growth and VP Strategic Allocation Income may enter into interest rate swaps, currency swaps and other types of swap agreements, including swaps on securities and indices. A swap is an agreement between two parties pursuant to which each party agrees to make one or more payments to the other on regularly scheduled dates over a stated term, based on different interest rates, currency exchange rates, security prices, the prices or rates of other types of financial instruments or assets or the levels of specified indices. During the term of the swap, changes in the value of the swap are recognized as unrealized appreciation or depreciation.
K. Illiquid and Restricted Securities. VP Index Plus LargeCap, VP Index Plus MidCap and VP Index Plus SmallCap each may not invest more than 10% of its net assets in illiquid securities. VP Strategic Allocation Balanced, VP Strategic Allocation Growth and VP Strategic Allocation Income each may not invest more than 15% of its net assets in illiquid securities. Illiquid securities are not readily marketable. Disposing of illiquid investments may involve time-consuming negotiation and legal expenses, and it may be difficult or impossible for the Portfolios to sell them promptly at an acceptable price. Each Portfolio may also invest in restricted securities, which include those sold under Rule 144A of the Securities Act of 1933 (“1933 Act”) or securities offered pursuant to Section 4(2) of the 1933 Act, and/or are subject to legal or contractual restrictions on resale and may not be publicly sold without registration under the 1933 Act. Certain restricted securities may be considered liquid pursuant to procedures adopted by the Board or may be deemed to be illiquid because they may not be readily marketable. Illiquid and restricted securities are valued using market quotations when readily available. In the absence of market quotations, the securities are valued based upon their fair value determined under procedures approved by the Board.
L. Delayed Delivery Transactions. VP Strategic Allocation Balanced, VP Strategic Allocation Growth and VP Strategic Allocation Income Portfolios may purchase or sell securities on a when-issued or forward commitment basis. The price of the underlying securities and date when the securities will be delivered and paid for are fixed at the time the transaction is negotiated. The market value of such is identified in each Portfolio’s Portfolio of Investments. Losses may arise due to changes in the market value of the securities or from the inability of counterparties to meet the terms of the contract. In connection with such purchases, the Portfolios are required to segregate liquid assets sufficient to cover the purchase price.
M. Mortgage Dollar Roll Transactions. In connection with a Portfolio’s ability to purchase or sell securities on a when-issued basis, VP Strategic Allocation Balanced, VP Strategic Allocation Growth and VP Strategic Allocation Income Portfolios may engage in dollar roll transactions with respect to mortgage-backed securities issued by Government National Mortgage Association, Federal National Mortgage Association and Federal Home Loan Mortgage Corp. In a dollar roll transaction, a Portfolio sells a mortgage-backed security to a financial institution, such as a bank or broker/dealer, and simultaneously agrees to repurchase a substantially similar (i.e., same type, coupon, and maturity) security from the institution on a delayed delivery basis at an agreed upon price. The mortgage-backed securities that are repurchased will bear the same interest rate as those sold, but generally will be collateralized by different pools of mortgages with different prepayment histories. The Portfolios account for dollar roll transactions as purchases and sales.
NOTE 3 — INVESTMENT TRANSACTIONS
For the year ended December 31, 2004, the cost of purchases and the proceeds from the sales of securities, excluding short-term securities, were as follows:
| | Purchases | | Sales | |
VP Index Plus LargeCap | | $ | 1,122,805,989 | | $ | 1,057,016,003 | |
VP Index Plus MidCap | | 884,596,327 | | 661,892,937 | |
VP Index Plus SmallCap | | 417,213,941 | | 246,405,670 | |
VP Strategic Allocation Balanced | | 345,621,558 | | 310,855,105 | |
VP Strategic Allocation Growth | | 387,549,833 | | 363,016,637 | |
VP Strategic Allocation Income | | 163,339,023 | | 154,282,047 | |
| | | | | | | |
U.S. Government securities not included above were as follows:
| | Purchases | | Sales | |
VP Strategic Allocation Balanced | | $ | 283,713,006 | | $ | 275,042,303 | |
VP Strategic Allocation Growth | | 99,974,409 | | 101,094,414 | |
VP Strategic Allocation Income | | 279,062,492 | | 272,256,260 | |
| | | | | | | |
36
NOTES TO FINANCIAL STATEMENTS AS OF DECEMBER 31, 2004 (CONTINUED)
NOTE 4 — INVESTMENT MANAGEMENT AND ADMINISTRATIVE FEES
The Portfolios entered into Investment Management Agreements with the Investment Manager. The Investment Management Agreement compensates the Investment Manager with a fee, computed daily and payable monthly, based on the average daily net assets of each Portfolio, at the following annual rates:
VP Index Plus LargeCap | | 0.35 | % |
VP Index Plus MidCap | | 0.40 | % |
VP Index Plus SmallCap | | 0.40 | % |
VP Strategic Allocation Balanced | | 0.60 | % |
VP Strategic Allocation Growth | | 0.60 | % |
VP Strategic Allocation Income | | 0.60 | % |
The Investment Manager entered into a Sub-Advisory Agreement with ING IM. Subject to such policies as the Board or the Investment Manager may determine, ING IM manages the Portfolios’ assets in accordance with the Portfolios’ investment objectives, policies, and limitations.
Pursuant to the Administration Agreements ING Funds Services, LLC (“IFS”), an indirect wholly-owned subsidiary of ING Groep, acts as administrator and provides certain administrative and shareholder services necessary for Portfolio operations and is responsible for the supervision of other service providers. IFS is entitled to receive from each Portfolio a fee at an annual rate of 0.055% on the first $5 billion of daily net assets and 0.03% thereafter.
NOTE 5 — DISTRIBUTION FEES
Each Class S share of the Portfolios has adopted Distribution Plans pursuant to Rule 12b-1 under the 1940 Act (the “12b-1 Plans”), whereby the Distributor is reimbursed or compensated by the Portfolios for expenses incurred in the distribution of the Portfolio’s Class S shares (“Distribution Fees”). Pursuant to the 12b–1 Plans, the Distributor is entitled to a payment each month to reimburse or compensate for expenses incurred in the distribution and promotion of the Portfolio’s S shares, including expenses incurred in printing prospectuses and reports used for sales purposes, expenses incurred in preparing and printing sales literature and other such distribution related expenses, including any distribution or shareholder servicing fees (“Service Fees”) paid to securities dealers who have executed a distribution agreement with the Distributor. Under the 12b-1 Plans, Class S of the Portfolios pays the Distributor a Distribution Fee at a rate of 0.25% based on average daily net assets.
NOTE 6 — OTHER TRANSACTIONS WITH AFFILIATED AND RELATED PARTIES
At December 31, 2004, the Portfolios had the following amounts recorded in payable to affiliates on the accompanying Statements of Assets and Liabilities (see Notes 4 and 5):
| | Accrued
Investment
Management
Fees | | Accrued
Administrative
Fees | | Accrued
Shareholder
Service and
Distribution Fees | | Total | |
VP Index Plus LargeCap | | $ | 479,537 | | $ | 75,351 | | $ | 26,203 | | $ | 581,091 | |
VP Index Plus MidCap | | 262,040 | | 36,019 | | 23,853 | | 321,912 | |
VP Index Plus SmallCap | | 134,395 | | 18,475 | | 21,677 | | 174,547 | |
VP Strategic Allocation Balanced | | 136,217 | | 12,482 | | — | | 148,699 | |
VP Strategic Allocation Growth | | 132,297 | | 12,123 | | — | | 144,420 | |
VP Strategic Allocation Income | | 78,941 | | 7,234 | | — | | 86,175 | |
| | | | | | | | | | | | | |
The Portfolios have adopted a Deferred Compensation Plan (the “Plan”), which allows eligible non-affiliated directors as described in the Plan to defer the receipt of all or a portion of the directors’ fees payable. Deferred fees are invested in various funds advised by ING Investments until distribution in accordance with the Plan.
NOTE 7 — OTHER ACCRUED EXPENSES AND LIABILITIES
At December 31, 2004, the Portfolios had the following payables included in Other Accrued Expenses and Liabilities that exceeded 5% of total liabilities on the Statements of Assets and Liabilities:
| | Payable for
Custody
Fees | | Payable for
Professional
Fees | | Payable for
Shareholder
Reporting
Expense | | Total | |
VP Index Plus LargeCap | | $ | 73,255 | | $ | 64,487 | | $ | — | | $ | 137,742 | |
VP Index Plus MidCap | | 32,937 | | 21,618 | | — | | 54,555 | |
VP Index Plus SmallCap | | 20,539 | | 15,604 | | — | | 36,143 | |
VP Strategic Allocation Balanced | | 25,433 | | 18,933 | | — | | 44,366 | |
VP Strategic Allocation Growth | | 29,095 | | 21,618 | | 13,153 | | 63,866 | |
VP Strategic Allocation Income | | 18,951 | | 20,055 | | 11,321 | | 50,327 | |
| | | | | | | | | | | | | |
37
NOTES TO FINANCIAL STATEMENTS AS OF DECEMBER 31, 2004 (CONTINUED)
NOTE 8 — EXPENSE LIMITATIONS
ING Investments entered into written Expense Limitation Agreements with each of the Portfolios whereby the Investment Manager has agreed to limit expenses, excluding interest, taxes, brokerage and extraordinary expenses to the levels listed below:
| | Class I | | Class S | |
VP Index Plus LargeCap | | 0.55 | % | 0.80 | % |
VP Index Plus MidCap | | 0.60 | % | 0.85 | % |
VP Index Plus SmallCap | | 0.60 | % | 0.85 | % |
VP Strategic Allocation Balanced | | 0.70 | % | N/A | |
VP Strategic Allocation Growth | | 0.75 | % | N/A | |
VP Strategic Allocation Income | | 0.65 | % | N/A | |
The Investment Manager may at a later date recoup from a Portfolio for management fees waived and other expenses assumed by the Investment Manager during the previous 36 months, but only if, after such recoupment, the Portfolio’s expense ratio does not exceed the percentage described above. Waived and reimbursed fees and any recoupment by the Investment Manager of such waived and reimbursed fees are reflected on the accompanying Statements of Operations for each Portfolio. Amounts payable by the Investment Manager are reflected on the accompanying Statements of Assets and Liabilities for each Portfolio.
As of December 31, 2004, the amounts of waived and reimbursed fees that are subject to possible recoupment by the Investment Manager, and the related expiration dates are as follows:
| | December 31, | | | |
| | 2005 | | 2006 | | 2007 | | Total | |
VP Index Plus SmallCap | | $ | 35,300 | | $ | — | | $ | — | | $ | 35,300 | |
VP Strategic Allocation Balanced | | 111,102 | | 68,373 | | — | | 179,475 | |
VP Strategic Allocation Income | | 130,342 | | 116,429 | | 69,974 | | 316,745 | |
| | | | | | | | | | | | | |
The Expense Limitation Agreements are contractual and shall renew automatically for one-year terms unless ING Investments provides written notice of the termination of an Expense Limitation Agreement within 90 days of the end of the then current term.
NOTE 9 — LINE OF CREDIT
All of the Portfolios included in this report, in addition to certain other Portfolios managed by the Investment Manager, have entered into an unsecured committed revolving line of credit agreement (the “Credit Agreement”) with a syndicate of banks led by Citibank, N.A. for an aggregate amount of $100,000,000. The proceeds may be used only to: (1) temporarily finance the purchase and sale of securities; (2) finance the redemption of shares of an investor in the Portfolios; and (3) enable the Portfolios to meet other emergency expenses as defined in the Credit Agreement. The Portfolios to which the line of credit is available pay a commitment fee equal to 0.09% per annum on the daily unused portion of the committed line amount. Each of the Portfolios will pay its pro rata share of both the agent and commitment fee. Generally, borrowings under the Credit Agreement accrue interest at the Federal Funds Rate plus a specified margin. Repayments generally must be made within 30 days after the date of a revolving credit advance.
The following Portfolios utilized the line of credit during the year ended December 31, 2004:
| | Days
Utilized | | Approximate
Average Daily
Balance | | Approximate
Weighted
Average
Interest Rate | |
VP Index Plus LargeCap | | 1 | | $ | 550,000 | | 2.25 | % |
VP Index Plus MidCap | | 3 | | 11,947,000 | | 2.33 | % |
| | | | | | | | |
NOTE 10 — CAPITAL SHARES
Transactions in capital shares and dollars were as follows:
| | Class I Shares | | Class S Shares | |
| | Year
Ended
December 31,
2004 | | Year
Ended
December 31,
2003 | | Year
Ended
December 31,
2004 | | Year
Ended
December 31,
2003 | |
VP Index Plus LargeCap (Number of Shares) | | | | | | | | | |
Shares sold | | 8,889,677 | | 22,640,138 | | 5,001,173 | | 5,101,101 | |
Dividends reinvested | | 1,068,765 | | 932,690 | | 70,247 | | 13,158 | |
Shares redeemed | | (7,643,602 | ) | (7,924,422 | ) | (787,541 | ) | (1,127,031 | ) |
Shares redeemed in-kind | | (2,913,370 | ) | — | | — | | — | |
Net increase (decrease) in shares outstanding | | (598,530 | ) | 15,648,406 | | 4,283,879 | | 3,987,228 | |
| | | | | | | | | |
VP Index Plus LargeCap ($) | | | | | | | | | |
Shares sold | | $ | 122,481,161 | | $ | 1,506,879,350 | | $ | 68,729,012 | | $ | 61,069,198 | |
Dividends reinvested | | 14,620,495 | | 12,348,811 | | 956,759 | | 156,715 | |
Shares redeemed | | (105,248,123 | ) | (1,337,529,687 | ) | (10,524,903 | ) | (12,189,597 | ) |
Shares redeemed in-kind | | (39,330,496 | ) | — | | — | | — | |
Net increase (decrease) | | $ | (7,476,963 | ) | $ | 181,698,474 | | $ | 59,160,868 | | $ | 49,036,316 | |
38
NOTES TO FINANCIAL STATEMENTS AS OF DECEMBER 31, 2004 (CONTINUED)
NOTE 10 — CAPITAL SHARES (continued)
| | Class I Shares | | Class S Shares | |
| | Year
Ended
December 31,
2004 | | Year
Ended
December 31,
2003 | | Year
Ended
December 31,
2004 | | Year
Ended
December 31,
2003 | |
VP Index Plus MidCap (Number of Shares) | | | | | | | | | |
Shares sold | | 9,619,199 | | 8,999,559 | | 7,750,137 | | 1,219,454 | |
Dividends reinvested | | 140,464 | | 104,017 | | 12,294 | | 2,068 | |
Shares redeemed | | (1,236,358 | ) | (1,471,636 | ) | (2,276,603 | ) | (440,135 | ) |
Net increase in shares outstanding | | 8,523,305 | | 7,631,940 | | 5,485,828 | | 781,387 | |
| | | | | | | | | |
VP Index Plus MidCap ($) | | | | | | | | | |
Shares sold | | $ | 157,026,093 | | $ | 121,968,447 | | $ | 125,676,020 | | $ | 16,192,964 | |
Dividends reinvested | | 2,309,221 | | 1,377,191 | | 201,138 | | 27,291 | |
Shares redeemed | | (19,918,167 | ) | (17,897,180 | ) | (37,043,484 | ) | (5,093,413 | ) |
Net increase | | $ | 139,417,147 | | $ | 105,448,458 | | $ | 88,833,674 | | $ | 11,126,842 | |
| | | | | | | | | |
| | Class I Shares | | Class S Shares | |
| | Year
Ended
December 31,
2004 | | Year
Ended
December 31,
2003 | | Year
Ended
December 31,
2004 | | Year
Ended
December 31,
2003 | |
VP Index Plus SmallCap (Number of Shares) | | | | | | | | | |
Shares sold | | 6,523,878 | | 5,422,840 | | 6,055,432 | | 1,184,635 | |
Dividends reinvested | | 105,653 | | 19,041 | | 15,258 | | 581 | |
Shares redeemed | | (568,096 | ) | (1,712,672 | ) | (516,330 | ) | (370,022 | ) |
Net increase in shares outstanding | | 6,061,435 | | 3,729,209 | | 5,554,360 | | 815,194 | |
| | | | | | | | | |
VP Index Plus SmallCap ($) | | | | | | | | | |
Shares sold | | $ | 95,485,625 | | $ | 63,427,915 | | $ | 89,589,061 | | $ | 13,743,067 | |
Dividends reinvested | | 1,536,189 | | 212,503 | | 220,629 | | 6,457 | |
Shares redeemed | | (8,064,552 | ) | (19,025,127 | ) | (7,044,417 | ) | (3,759,071 | ) |
Net increase | | $ | 88,957,262 | | $ | 44,615,291 | | $ | 82,765,273 | | $ | 9,990,453 | |
| | Class I Shares | | | | | |
| | Year
Ended
December 31,
2004 | | Year
Ended
December 31,
2003 | | | | | |
VP Strategic Allocation Balanced (Number of Shares) | | | | | | | | | |
Shares sold | | 4,211,659 | | 2,725,924 | | | | | |
Dividends reinvested | | 231,939 | | 228,713 | | | | | |
Shares redeemed | | (1,498,108 | ) | (1,180,144 | ) | | | | |
Net increase in shares outstanding | | 2,945,490 | | 1,774,493 | | | | | |
| | | | | | | | | |
VP Strategic Allocation Balanced ($) | | | | | | | | | |
Shares sold | | $ | 54,922,497 | | $ | 29,723,305 | | | | | |
Dividends reinvested | | 2,985,052 | | 2,679,069 | | | | | |
Shares redeemed | | (19,838,875 | ) | (11,359,470 | ) | | | | |
Net increase | | $ | 38,068,674 | | $ | 21,042,904 | | | | | |
39
NOTES TO FINANCIAL STATEMENTS AS OF DECEMBER 31, 2004 (CONTINUED)
NOTE 10 — CAPITAL SHARES (continued)
| | Class I Shares | | | | | |
| | Year
Ended
December 31,
2004 | | Year
Ended
December 31,
2003 | | | | | |
VP Strategic Allocation Growth (Number of Shares) | | | | | | | | | |
Shares sold | | 2,372,286 | | 2,058,284 | | | | | |
Dividends reinvested | | 185,718 | | 141,946 | | | | | |
Shares redeemed | | (1,166,698 | ) | (1,070,683 | ) | | | | |
Net increase in shares outstanding | | 1,391,306 | | 1,129,547 | | | | | |
| | | | | | | | | |
VP Strategic Allocation Growth ($) | | | | | | | | | |
Shares sold | | $ | 32,322,543 | | $ | 23,016,183 | | | | | |
Dividends reinvested | | 2,501,616 | | 1,692,396 | | | | | |
Shares redeemed | | (15,918,306 | ) | (10,985,790 | ) | | | | |
Net increase | | $ | 18,905,853 | | $ | 13,722,789 | | | | | |
| | | | | | | | | |
| | Class I Shares | | | | | |
| | Year
Ended
December 31,
2004 | | Year
Ended
December 31,
2003 | | | | | |
VP Strategic Allocation Income (Number of Shares) | | | | | | | | | |
Shares sold | | 2,441,577 | | 1,584,623 | | | | | |
Dividends reinvested | | 217,268 | | 255,069 | | | | | |
Shares redeemed | | (2,058,477 | ) | (1,702,803 | ) | | | | |
Net increase in shares outstanding | | 600,368 | | 136,889 | | | | | |
| | | | | | | | | |
VP Strategic Allocation Income ($) | | | | | | | | | |
Shares sold | | $ | 30,670,847 | | $ | 15,209,893 | | | | | |
Dividends reinvested | | 2,661,534 | | 2,954,235 | | | | | |
Shares redeemed | | (26,008,253 | ) | (16,424,023 | ) | | | | |
Net increase | | $ | 7,324,128 | | $ | 1,740,105 | | | | | |
NOTE 11 — SECURITIES LENDING
Under an agreement with The Bank of New York (“BNY”), the Portfolios can lend their securities to approved brokers, dealers and other financial institutions. Loans are collateralized by cash and U.S. Government securities. The collateral must be in an amount equal to at least 105% of the market value of non-U.S. securities loaned and 102% of the market value of U.S. securities loaned. The cash collateral received is invested in approved investments as defined in the Securities Lending Agreement with BNY (the “Agreement”). The securities purchased with cash collateral received are reflected in the Portfolio of Investments. Generally, in the event of counterparty default, the Portfolios have the right to use the collateral to offset losses incurred. The Agreement contains certain guarantees by BNY in the event of counterparty default and/or a borrower’s failure to return a loaned security, however there would be a potential loss to the Portfolios in the event the Portfolios are delayed or prevented from exercising their right to dispose of the collateral. The Portfolios bear the risk of loss with respect to the investment of collateral. Engaging in securities lending could have a leveraging effect, which may intensify the credit, market and other risks associated with investing in a Portfolio. At December 31, 2004, the Portfolios had securities on loan and received collateral with the following market values:
| | Value of
Securities
Loaned | | Value of
Collateral | |
VP Index Plus LargeCap | | $56,324,571 | | $58,326,000 | |
VP Index Plus MidCap | | 80,941,850 | | 83,609,000 | |
VP Index Plus SmallCap | | 62,909,919 | | 65,009,000 | |
VP Strategic Allocation Balanced | | 27,459,757 | | 28,110,000 | |
VP Strategic Allocation Growth | | 16,995,991 | | 17,535,000 | |
VP Strategic Allocation Income | | 20,361,643 | | 20,813,000 | |
NOTE 12 — FEDERAL INCOME TAXES
The amount of distributions from net investment income and net realized capital gains are determined in accordance with federal income tax regulations, which may differ from accounting principles generally accepted in the United States of America for investment companies. These book/tax differences may be either temporary or permanent. Permanent differences are reclassified within the capital accounts based on their federal tax-basis treatment; temporary differences are not reclassified. Key differences
40
NOTES TO FINANCIAL STATEMENTS AS OF DECEMBER 31, 2004 (CONTINUED)
NOTE 12 — FEDERAL INCOME TAXES (continued)
include the treatment of short-term capital gains, foreign currency transactions, and wash sale deferrals. Distributions in excess of available earnings and profits, current and accumulated, for tax purposes are reported as distributions of paid-in capital.
The following permanent tax differences have been reclassified as of December 31, 2004:
| | Paid-in
Capital | | Undistributed
Net Investment
Income On
Investments | | Accumulated
Net Realized
Gains
(Losses) | |
VP Index Plus LargeCap | | $4,928,673 | | $ (71,309 | ) | $(4,857,364 | ) |
VP Index Plus MidCap | | — | | (118,345 | ) | 118,345 | |
VP Index Plus SmallCap | | — | | (54,792 | ) | 54,792 | |
VP Strategic Allocation Balanced | | — | | (22,244 | ) | 22,244 | |
VP Strategic Allocation Growth | | — | | (58,794 | ) | 58,794 | |
VP Strategic Allocation Income | | — | | 2,122 | | (2,122 | ) |
The tax composition of dividends and distributions to shareholders was as follows:
| | Year Ended
December 31, 2004 | | Year Ended
December 31, 2003 | |
| | Ordinary Income | | Long-Term
Capital Gains | | Ordinary Income | |
VP Index Plus LargeCap | | $15,577,254 | | $ — | | $12,505,526 | |
VP Index Plus MidCap | | 2,510,359 | | — | | 1,404,482 | |
VP Index Plus SmallCap | | 1,133,154 | | 623,664 | | 218,961 | |
VP Strategic Allocation Balanced | | 2,985,052 | | — | | 2,679,069 | |
VP Strategic Allocation Growth | | 2,501,616 | | — | | 1,692,396 | |
VP Strategic Allocation Income | | 2,661,534 | | — | | 2,954,235 | |
The tax-basis components of distributable earnings and the expiration dates of the capital loss carryforwards which may be used to offset future realized capital gains for federal income tax purposes as of December 31, 2004 are as follows:
| | Undistributed
Ordinary
Income | | Undistributed
Long-term
Capital Gain | | Unrealized
Appreciation
(Depreciation) | | Capital
Loss
Carryforwards | | Expiration
Dates | |
VP Index Plus LargeCap | | $ | 23,352,911 | | $ | — | | $ | 106,752,485 | | $ | (46,238,036 | ) | 2009 | |
| | | | | | | | (181,519,180 | ) | 2010 | |
| | | | | | | | (51,431,965 | ) | 2011 | |
| | | | | | | | $ | (279,189,181 | ) | | |
| | | | | | | | | | | |
VP Index Plus MidCap | | 35,530,346 | | 34,379,827 | | 87,341,767 | | $ | — | | | |
| | | | | | | | | | | |
VP Index Plus SmallCap | | 18,935,012 | | 9,828,822 | | 53,232,039 | | $ | — | | | |
| | | | | | | | | | | |
VP Strategic Allocation Balanced | | 4,228,888 | | — | | 27,548,763 | | $ | (6,833,484 | ) | 2010 | |
| | | | | | | | | | | |
VP Strategic Allocation Growth | | 3,373,413 | | — | | 34,356,165 | | $ | (1,869,622 | ) | 2009 | |
| | | | | | | | (11,415,536 | ) | 2010 | |
| | | | | | | | $ | (13,285,158 | ) | | |
| | | | | | | | | | | |
VP Strategic Allocation Income | | 3,086,463 | | — | | 11,656,146 | | $ | (1,268,062 | ) | 2010 | |
| | | | | | | | | | | | | | | |
NOTE 13 — ILLIQUID SECURITIES
Pursuant to guidelines adopted by the Portfolios’ Board, the following securities have been deemed to be illiquid. The VP Index Plus LargeCap, VP Index Plus MidCap and VP Index Plus LargeCap Portfolios currently limit investment in illiquid securities to 10% of the Portfolios’ net assets, at market value, at time of purchase. The VP Strategic Allocation Balanced, VP Strategic Allocation Growth and VP Strategic Allocation Income Portfolios limit investments in illiquid securities to 15%.
Portfolio | | Security | | Principal
Amount | | Initial
Acquisition
Date | | Cost | | Value | | Percent
of Net
Assets | |
VP Index Plus SmallCap | | MascoTech, Inc. | | $2,000 | | 11/29/00 | | $— | | $— | | 0.0 | % |
41
NOTES TO FINANCIAL STATEMENTS AS OF DECEMBER 31, 2004 (CONTINUED)
NOTE 14 — INFORMATION REGARDING TRADING OF ING’S U.S. MUTUAL FUNDS
ING Investments, LLC (“Investments”), the adviser to the ING Funds, has reported to the Boards of Directors/Trustees (the “Board”) of the ING Funds that, like many U.S. financial services companies, Investments and certain of its U.S. affiliates have received informal and formal requests for information since September 2003 from various governmental and self-regulatory agencies in connection with investigations related to mutual funds and variable insurance products. Investments has advised the Board that it and its affiliates have cooperated fully with each request.
In addition to responding to regulatory and governmental requests, Investments reported that management of U.S. affiliates of ING Groep N.V., including Investments (collectively, “ING”), on their own initiative, have conducted, through independent special counsel and a national accounting firm, an extensive internal review of trading in ING insurance, retirement, and mutual fund products. The goal of this review was to identify any instances of inappropriate trading in those products by third parties or by ING investment professionals and other ING personnel. ING’s internal review related to mutual fund trading is now substantially completed. ING has reported that, of the millions of customer relationships that ING maintains, the internal review identified several isolated arrangements allowing third parties to engage in frequent trading of mutual funds within ING’s variable insurance and mutual fund products, and identified other circumstances where frequent trading occurred, despite measures taken by ING intended to combat market timing. ING further reported that each of these arrangements has been terminated and fully disclosed to regulators. The results of the internal review were also reported to the independent members of the Board.
Investments has advised the Board that most of the identified arrangements were initiated prior to ING’s acquisition of the businesses in question in the U.S. Investments further reported that the companies in question did not receive special benefits in return for any of these arrangements, which have all been terminated.
Based on the internal review, Investments has advised the Board that the identified arrangements do not represent a systemic problem in any of the companies that were involved.
More specifically, Investments reported to the Board that, at this time, these instances include the following:
• ING has identified three arrangements, dating from 1995, 1996 and 1998, under which the administrator to the then-Pilgrim Funds, which subsequently became part of the ING Funds, entered formal and informal arrangements that permitted frequent trading. ING Funds Distributor, LLC (“IFD”) has received a notice from the staff of the NASD informing IFD that it has made a preliminary determination to recommend that disciplinary action be brought against IFD and one of its registered persons for violations of the NASD Conduct Rules and certain provisions of the federal securities laws in connection with these arrangements.
• Aeltus Investment Management, Inc. (a predecessor entity to ING Investment Management Co.) has identified two investment professionals who engaged in extensive frequent trading in certain ING Funds. One was subsequently terminated for cause and incurred substantial financial penalties in connection with this conduct and the second has been disciplined.
• ReliaStar Life Insurance Company (“ReliaStar”) entered into agreements seven years ago permitting the owner of policies issued by the insurer to engage in frequent trading and to submit orders until 4pm Central Time. In 2001 ReliaStar also entered into a selling agreement with a broker-dealer that engaged in frequent trading. Employees of ING affiliates were terminated and/or disciplined in connection with these matters.
• In 1998, Golden American Life Insurance Company entered into arrangements permitting a broker-dealer to frequently trade up to certain specific limits in a fund available in an ING variable annuity product. No employee responsible for this arrangement remains at the company.
For additional information regarding these matters, you may consult the Form 8-K for each of four life insurance companies, ING USA Annuity and Life Insurance Company, ING Life Insurance and Annuity Company, ING Insurance Company of America, and ReliaStar Life Insurance Company of New York, each filed with the Securities and Exchange Commission (the “SEC”) on September 9, 2004. These Forms 8-K can be accessed through the SEC’s Web site at http://www.sec.gov. Despite the extensive internal review conducted through independent special counsel and a national accounting firm, there can be no assurance that the instances of inappropriate trading reported to the Board are the only instances of such trading respecting the ING Funds. Investments reported to the Board that ING is committed to conducting its business with the highest standards of ethical conduct with zero tolerance for noncompliance.
Accordingly, Investments advised the Board that ING management was disappointed that its voluntary internal review identified these situations. Viewed in the context of the breadth and magnitude of its U.S. business as a whole, ING management does not believe that ING’s acquired companies had systemic ethical or
42
NOTES TO FINANCIAL STATEMENTS AS OF DECEMBER 31, 2004 (CONTINUED)
NOTE 14 — INFORMATION REGARDING TRADING OF ING’S U.S. MUTUAL FUNDS (continued)
compliance issues in these areas. Nonetheless, Investments reported that given ING’s refusal to tolerate any lapses, it has taken the steps noted below, and will continue to seek opportunities to further strengthen the internal controls of its affiliates.
• ING has agreed with the ING Funds to indemnify and hold harmless the ING Funds from all damages resulting from wrongful conduct by ING or its employees or from ING’s internal investigation, any investigations conducted by any governmental or self-regulatory agencies, litigation or other formal proceedings, including any proceedings by the Securities and Exchange Commission. Investments reported to the Board that ING management believes that the total amount of any indemnification obligations will not be material to ING or its U.S. business.
• ING updated its Code of Conduct for employees reinforcing its employees’ obligation to conduct personal trading activity consistent with the law, disclosed limits, and other requirements.
• The ING Funds, upon a recommendation from ING, updated their respective Codes of Ethics applicable to investment professionals with ING entities and certain other fund personnel, requiring such personnel to pre-clear any purchases or sales of ING Funds that are not systematic in nature (i.e., dividend reinvestment), and imposing minimum holding periods for shares of ING Funds.
• ING instituted excessive trading policies for all customers in its variable insurance and retirement products and for shareholders of the ING Funds sold to the public through financial intermediaries. ING does not make exceptions to these policies.
• ING reorganized and expanded its U.S. Compliance Department, and created an Enterprise Compliance team to enhance controls and consistency in regulatory compliance.
43
Shares | | | | | | Value | |
COMMON STOCK: 99.3% | | | |
| | | | Advertising: 0.2% | | | |
53,450 | | @,L | | Interpublic Group of Cos., Inc. | | $ | 716,230 | |
23,900 | | | | Omnicom Group, Inc. | | 2,015,248 | |
| | | | | | 2,731,478 | |
| | | | Aerospace/Defense: 2.7% | | | |
249,400 | | | | Boeing Co. | | 12,911,438 | |
65,300 | | | | General Dynamics Corp. | | 6,830,380 | |
23,350 | | | | Goodrich Corp. | | 762,144 | |
13,650 | | | | L-3 Communications Holdings, Inc. | | 999,726 | |
100,150 | | | | Lockheed Martin Corp. | | 5,563,333 | |
49,100 | | | | Northrop Grumman Corp. | | 2,669,076 | |
152,000 | | | | Raytheon Co. | | 5,902,160 | |
23,550 | | | | Rockwell Collins, Inc. | | 928,812 | |
67,200 | | | | United Technologies Corp. | | 6,945,120 | |
| | | | | | 43,512,189 | |
| | | | Agriculture: 1.4% | | | |
270,100 | | | | Altria Group, Inc. | | 16,503,109 | |
83,777 | | | | Archer-Daniels-Midland Co. | | 1,869,065 | |
33,300 | | | | Monsanto Co. | | 1,849,815 | |
20,000 | | L | | Reynolds American, Inc. | | 1,572,000 | |
36,650 | | | | UST, Inc. | | 1,763,232 | |
| | | | | | 23,557,221 | |
| | | | Apparel: 0.8% | | | |
40,300 | | @ | | Coach, Inc. | | 2,272,920 | |
15,000 | | | | Jones Apparel Group, Inc. | | 548,550 | |
14,250 | | | | Liz Claiborne, Inc. | | 601,493 | |
84,100 | | | | Nike, Inc. | | 7,627,029 | |
9,400 | | L | | Reebok Intl., Ltd. | | 413,600 | |
36,300 | | | | VF Corp. | | 2,010,294 | |
| | | | | | 13,473,886 | |
| | | | Auto Manufacturers: 0.9% | | | |
604,500 | | L | | Ford Motor Co. | | 8,849,880 | |
73,650 | | L | | General Motors Corp. | | 2,950,419 | |
37,937 | | | | PACCAR, Inc. | | 3,053,170 | |
| | | | | | 14,853,469 | |
| | | | Auto Parts and Equipment: 0.1% | | | |
33,700 | | @,L | | Goodyear Tire & Rubber Co. | | 494,042 | |
23,650 | | | | Johnson Controls, Inc. | | 1,500,356 | |
| | | | | | 1,994,398 | |
| | | | Banks: 5.8% | | | |
43,800 | | L | | AmSouth Bancorporation | | 1,134,420 | |
522,724 | | | | Bank of America Corp. | | 24,562,800 | |
71,950 | | | | BB&T Corp. | | 3,025,498 | |
37,200 | | | | Comerica, Inc. | | 2,269,944 | |
18,000 | | | | Compass Bancshares, Inc. | | 876,060 | |
30,150 | | | | Fifth Third Bancorp | | 1,425,492 | |
13,100 | | | | First Horizon National Corp. | | 564,741 | |
30,210 | | | | Huntington Bancshares, Inc. | | 748,604 | |
91,900 | | | | KeyCorp | | 3,115,410 | |
15,350 | | | | M & T Bank Corp. | | 1,655,344 | |
24,400 | | | | Marshall & Ilsley Corp. | | 1,078,480 | |
47,400 | | | | Mellon Financial Corp. | | 1,474,614 | |
150,187 | | L | | National City Corp. | | 5,639,522 | |
61,125 | | | | North Fork Bancorporation, Inc. | | 1,763,456 | |
24,100 | | | | Northern Trust Corp. | | 1,170,778 | |
14,800 | | | | PNC Financial Services Group, Inc. | | $ | 850,112 | |
57,708 | | | | Regions Financial Corp. | | 2,053,828 | |
44,050 | | | | State Street Corp. | | 2,163,736 | |
47,600 | | | | SunTrust Banks, Inc. | | 3,516,688 | |
99,350 | | | | The Bank of New York Co., Inc. | | 3,320,277 | |
244,747 | | | | U.S. Bancorp | | 7,665,476 | |
210,386 | | | | Wachovia Corp. | | 11,066,303 | |
225,150 | | | | Wells Fargo & Co. | | 13,993,072 | |
10,950 | | | | Zions Bancorporation | | 744,929 | |
| | | | | | 95,879,584 | |
| | | | Beverages: 2.2% | | | |
9,900 | | | | Adolph Coors Co. | | 749,133 | |
41,500 | | | | Anheuser-Busch Cos., Inc. | | 2,105,295 | |
17,700 | | | | Brown-Forman Corp. | | 861,636 | |
317,150 | | | | Coca-Cola Co. | | 13,202,955 | |
62,250 | | | | Coca-Cola Enterprises, Inc. | | 1,297,913 | |
33,350 | | | | Pepsi Bottling Group, Inc. | | 901,784 | |
312,450 | | | | PepsiCo, Inc. | | 16,309,889 | |
| | | | | | 35,428,605 | |
| | | | Biotechnology: 1.0% | | | |
165,640 | | @ | | Amgen, Inc. | | 10,625,805 | |
44,050 | | @,L | | Biogen Idec, Inc. | | 2,934,171 | |
29,150 | | @ | | Genzyme Corp. | | 1,692,741 | |
14,250 | | @ | | MedImmune, Inc. | | 386,318 | |
| | | | | | 15,639,035 | |
| | | | Building Materials: 0.2% | | | |
28,900 | | @ | | American Standard Cos., Inc. | | 1,194,148 | |
56,572 | | | | Masco Corp. | | 2,066,575 | |
13,950 | | | | Vulcan Materials Co. | | 761,810 | |
| | | | | | 4,022,533 | |
| | | | Chemicals: 1.6% | | | |
30,450 | | | | Air Products & Chemicals, Inc. | | 1,765,187 | |
8,500 | | | | Ashland, Inc. | | 496,230 | |
121,200 | | | | Dow Chemical Co. | | 6,000,611 | |
132,200 | | | | E.I. du Pont de Nemours & Co. | | 6,484,409 | |
11,750 | | | | Eastman Chemical Co. | | 678,328 | |
13,900 | | L | | Ecolab, Inc. | | 488,307 | |
17,850 | | | | Engelhard Corp. | | 547,460 | |
9,000 | | | | International Flavors & Fragrances, Inc. | | 385,560 | |
58,550 | | | | PPG Industries, Inc. | | 3,990,768 | |
46,000 | | | | Praxair, Inc. | | 2,030,900 | |
27,700 | | | | Rohm & Haas Co. | | 1,225,171 | |
33,850 | | | | Sherwin-Williams Co. | | 1,510,726 | |
9,400 | | L | | Sigma-Aldrich Corp. | | 568,324 | |
| | | | | | 26,171,981 | |
| | | | Commercial Services: 0.9% | | | |
26,350 | | @,L | | Apollo Group, Inc. | | 2,126,708 | |
139,950 | | | | Cendant Corp. | | 3,272,030 | |
25,787 | | | | Equifax, Inc. | | 724,615 | |
35,600 | | L | | H&R Block, Inc. | | 1,744,400 | |
36,450 | | | | McKesson Corp. | | 1,146,717 | |
18,600 | | | | Moody’s Corp. | | 1,615,410 | |
49,050 | | | | Paychex, Inc. | | 1,671,624 | |
30,350 | | | | R.R. Donnelley & Sons Co. | | 1,071,052 | |
20,350 | | | | Robert Half Intl., Inc. | | 598,901 | |
| | | | | | 13,971,457 | |
See Accompanying Notes to Financial Statements
44
| PORTFOLIO OF INVESTMENTS |
ING VP INDEX PLUS LARGECAP PORTFOLIO | AS OF DECEMBER 31, 2004 (CONTINUED) |
Shares | | | | | | Value | |
| | | | Computers: 5.3% | | | |
17,500 | | @,L | | Affiliated Computer Services, Inc. | | $ | 1,053,325 | |
128,900 | | @ | | Apple Computer, Inc. | | 8,301,159 | |
24,950 | | @ | | Computer Sciences Corp. | | 1,406,432 | |
559,500 | | @ | | Dell, Inc. | | 23,577,329 | |
64,250 | | | | Electronic Data Systems Corp. | | 1,484,175 | |
309,250 | | @ | | EMC Corp. | | 4,598,548 | |
20,950 | | @ | | Gateway, Inc. | | 125,910 | |
388,418 | | | | Hewlett-Packard Co. | | 8,145,125 | |
277,300 | | | | International Business Machines Corp. | | 27,336,233 | |
16,950 | | @ | | Lexmark Intl., Inc. | | 1,440,750 | |
11,300 | | @ | | NCR Corp. | | 782,299 | |
42,250 | | @ | | Network Appliance, Inc. | | 1,403,545 | |
1,085,750 | | @ | | Sun Microsystems, Inc. | | 5,841,335 | |
36,250 | | @ | | Sungard Data Systems, Inc. | | 1,026,963 | |
60,977 | | @ | | Unisys Corp. | | 620,746 | |
| | | | | | 87,143,874 | |
| | | | Cosmetics/Personal Care: 3.2% | | | |
12,650 | | | | Alberto-Culver Co. | | 614,411 | |
25,250 | | | | Avon Products, Inc. | | 977,175 | |
72,750 | | | | Colgate-Palmolive Co. | | 3,721,890 | |
303,050 | | | | Gillette Co. | | 13,570,579 | |
66,100 | | | | Kimberly-Clark Corp. | | 4,350,041 | |
529,200 | | | | Procter & Gamble Co. | | 29,148,336 | |
| | | | | | 52,382,432 | |
| | | | Distribution/Wholesale: 0.2% | | | |
59,200 | | | | Genuine Parts Co. | | 2,608,352 | |
19,850 | | | | W.W. Grainger, Inc. | | 1,322,407 | |
| | | | | | 3,930,759 | |
| | | | Diversified Financial Services: 7.1% | | | |
242,000 | | | | American Express Co. | | 13,641,539 | |
23,450 | | | | Bear Stearns Cos., Inc. | | 2,399,170 | |
80,050 | | | | Capital One Financial Corp. | | 6,741,011 | |
44,600 | | | | CIT Group, Inc. | | 2,043,572 | |
678,000 | | L | | Citigroup, Inc. | | 32,666,039 | |
72,900 | | | | Countrywide Financial Corp. | | 2,698,029 | |
53,450 | | @ | | E*TRADE Financial Corp. | | 799,078 | |
126,800 | | | | Fannie Mae | | 9,029,427 | |
12,850 | | | | Federated Investors, Inc. | | 390,640 | |
33,050 | | | | Franklin Resources, Inc. | | 2,301,933 | |
92,000 | | | | Freddie Mac | | 6,780,400 | |
63,050 | | | | Goldman Sachs Group, Inc. | | 6,559,722 | |
34,350 | | | | Janus Capital Group, Inc. | | 577,424 | |
61,750 | | | | Lehman Brothers Holdings, Inc. | | 5,401,890 | |
160,175 | | | | MBNA Corp. | | 4,515,333 | |
119,750 | | | | Merrill Lynch & Co., Inc. | | 7,157,458 | |
142,800 | | | | Morgan Stanley | | 7,928,255 | |
35,800 | | @ | | Providian Financial Corp. | | 589,626 | |
59,250 | | | | SLM Corp. | | 3,163,358 | |
16,400 | | | | T. Rowe Price Group, Inc. | | 1,020,080 | |
| | | | | | 116,403,984 | |
| | | | Electric: 2.7% | | | |
136,850 | | @ | | AES Corp. | | 1,870,740 | |
10,500 | | | | Ameren Corp. | | 526,470 | |
54,100 | | | | American Electric Power Co., Inc. | | 1,857,794 | |
36,600 | | | | CenterPoint Energy, Inc. | | 413,580 | |
9,650 | | L | | Cinergy Corp. | | $ | 401,730 | |
30,000 | | L | | Consolidated Edison, Inc. | | 1,312,500 | |
23,599 | | | | Constellation Energy Group, Inc. | | 1,031,512 | |
17,050 | | | | Dominion Resources, Inc. | | 1,154,967 | |
23,350 | | L | | DTE Energy Co. | | 1,007,086 | |
307,700 | | L | | Duke Energy Corp. | | 7,794,040 | |
41,850 | | | | Edison Intl. | | 1,340,456 | |
30,200 | | | | Entergy Corp. | | 2,041,218 | |
86,250 | | L | | Exelon Corp. | | 3,801,037 | |
42,200 | | | | FirstEnergy Corp. | | 1,667,322 | |
23,450 | | L | | FPL Group, Inc. | | 1,752,888 | |
22,900 | | | | NiSource, Inc. | | 521,662 | |
51,850 | | @ | | PG&E Corp. | | 1,725,568 | |
13,250 | | | | Pinnacle West Capital Corp. | | 588,433 | |
44,750 | | | | PPL Corp. | | 2,384,280 | |
32,250 | | L | | Public Service Enterprise Group, Inc. | | 1,669,583 | |
95,200 | | L | | Southern Co. | | 3,191,103 | |
31,300 | | L | | TECO Energy, Inc. | | 480,142 | |
79,200 | | L | | TXU Corp. | | 5,113,151 | |
49,900 | | | | Xcel Energy, Inc. | | 908,180 | |
| | | | | | 44,555,442 | |
| | | | Electrical Components and Equipment: 0.4% | | | |
91,879 | | | | Emerson Electric Co. | | 6,440,718 | |
| | | | | | 6,440,718 | |
| | | | Electronics: 0.5% | | | |
54,150 | | @ | | Agilent Technologies, Inc. | | 1,305,014 | |
26,300 | | | | Applera Corp. - Applied Biosystems Group | | 549,933 | |
15,900 | | @,L | | Fisher Scientific Intl. | | 991,842 | |
21,250 | | @ | | Jabil Circuit, Inc. | | 543,575 | |
16,700 | | | | Parker Hannifin Corp. | | 1,264,858 | |
25,100 | | | | PerkinElmer, Inc. | | 564,499 | |
100 | | @ | | Sanmina-SCI Corp. | | 847 | |
48,050 | | @,L | | Solectron Corp. | | 256,107 | |
17,800 | | | | Tektronix, Inc. | | 537,738 | |
40,600 | | @ | | Thermo Electron Corp. | | 1,225,714 | |
17,350 | | @ | | Waters Corp. | | 811,807 | |
| | | | | | 8,051,934 | |
| | | | Engineering and Construction: 0.0% | | | |
4,400 | | | | Fluor Corp. | | 239,844 | |
| | | | | | 239,844 | |
| | | | Entertainment: 0.1% | | | |
42,600 | | | | International Game Technology | | 1,464,588 | |
| | | | | | 1,464,588 | |
| | | | Environmental Control: 0.1% | | | |
75,050 | | | | Waste Management, Inc. | | 2,246,997 | |
| | | | | | 2,246,997 | |
| | | | Food: 1.5% | | | |
45,100 | | | | Albertson’s, Inc. | | 1,076,988 | |
51,600 | | | | Campbell Soup Co. | | 1,542,324 | |
67,250 | | | | ConAgra Foods, Inc. | | 1,980,513 | |
49,150 | | | | General Mills, Inc. | | 2,443,247 | |
43,300 | | | | H.J. Heinz Co. | | 1,688,267 | |
32,500 | | | | Hershey Foods Corp. | | 1,805,050 | |
See Accompanying Notes to Financial Statements
45
| PORTFOLIO OF INVESTMENTS |
ING VP INDEX PLUS LARGECAP PORTFOLIO | AS OF DECEMBER 31, 2004 (CONTINUED) |
Shares | | | | | | Value | |
| | | | Food (continued) | | | |
56,250 | | | | Kellogg Co. | | $ | 2,512,124 | |
39,650 | | @ | | Kroger Co. | | 695,461 | |
16,350 | | | | McCormick & Co., Inc. | | 631,110 | |
59,750 | | @ | | Safeway, Inc. | | 1,179,465 | |
103,925 | | | | Sara Lee Corp. | | 2,508,750 | |
50,050 | | | | SUPERVALU, Inc. | | 1,727,726 | |
74,457 | | | | Wm. Wrigley Jr. Co. | | 5,151,679 | |
| | | | | | 24,942,704 | |
| | | | Forest Products and Paper: 0.7% | | | |
36,250 | | | | Georgia-Pacific Corp. | | 1,358,650 | |
65,800 | | | | International Paper Co. | | 2,763,600 | |
17,500 | | | | Louisiana-Pacific Corp. | | 467,950 | |
46,700 | | | | MeadWestvaco Corp. | | 1,582,663 | |
21,200 | | L | | Plum Creek Timber Co., Inc. | | 814,928 | |
12,250 | | | | Temple-Inland, Inc. | | 837,900 | |
54,550 | | | | Weyerhaeuser Co. | | 3,666,851 | |
| | | | | | 11,492,542 | |
| | | | Gas: 0.1% | | | |
20,450 | | | | KeySpan Corp. | | 806,753 | |
44,650 | | | | Sempra Energy | | 1,637,762 | |
| | | | | | 2,444,515 | |
| | | | Hand/Machine Tools: 0.2% | | | |
27,950 | | | | Black & Decker Corp. | | 2,468,823 | |
5,000 | | L | | Snap-On, Inc. | | 171,800 | |
9,850 | | | | Stanley Works | | 482,552 | |
| | | | | | 3,123,175 | |
| | | | Healthcare-Products: 3.9% | | | |
6,100 | | L | | Bausch & Lomb, Inc. | | 393,206 | |
31,200 | | | | Baxter Intl., Inc. | | 1,077,648 | |
80,150 | | | | Becton Dickinson & Co. | | 4,552,520 | |
31,950 | | | | Biomet, Inc. | | 1,386,311 | |
106,150 | | @ | | Boston Scientific Corp. | | 3,773,633 | |
12,800 | | | | C.R. Bard, Inc. | | 818,944 | |
16,250 | | | | Guidant Corp. | | 1,171,625 | |
578,850 | | | | Johnson & Johnson | | 36,710,666 | |
157,200 | | | | Medtronic, Inc. | | 7,808,123 | |
45,050 | | @ | | St. Jude Medical, Inc. | | 1,888,947 | |
20,950 | | | | Stryker Corp. | | 1,010,838 | |
32,950 | | @ | | Zimmer Holdings, Inc. | | 2,639,954 | |
| | | | | | 63,232,415 | |
| | | | Healthcare-Services: 2.2% | | | |
46,850 | | | | Aetna, Inc. | | 5,844,538 | |
48,850 | | @ | | Humana, Inc. | | 1,450,357 | |
18,400 | | @ | | Laboratory Corp. Of America Holdings | | 916,688 | |
11,500 | | | | Manor Care, Inc. | | 407,445 | |
5,200 | | | | Quest Diagnostics, Inc. | | 496,860 | |
178,750 | | | | UnitedHealth Group, Inc. | | 15,735,362 | |
97,300 | | @ | | WellPoint, Inc. | | 11,189,500 | |
| | | | | | 36,040,750 | |
| | | | Home Builders: 0.0% | | | |
6,050 | | | | Centex Corp. | | 360,459 | |
| | | | | | 360,459 | |
| | | | Home Furnishings: 0.1% | | | |
22,300 | | | | Leggett & Platt, Inc. | | 633,989 | |
8,900 | | L | | Whirlpool Corp. | | 615,969 | |
| | | | | | 1,249,958 | |
| | | | Household Products/Wares: 0.3% | | | |
13,450 | | L | | Avery Dennison Corp. | | $ | 806,597 | |
35,450 | | | | Clorox Co. | | 2,089,068 | |
18,900 | | | | Fortune Brands, Inc. | | 1,458,702 | |
| | | | | | 4,354,367 | |
| | | | Housewares: 0.1% | | | |
36,750 | | L | | Newell Rubbermaid, Inc. | | 888,983 | |
| | | | | | 888,983 | |
| | | | Insurance: 4.8% | | | |
36,400 | | @@ | | ACE Ltd. | | 1,556,100 | |
67,100 | | | | AFLAC, Inc. | | 2,673,264 | |
89,950 | | | | Allstate Corp. | | 4,652,214 | |
12,400 | | | | AMBAC Financial Group, Inc. | | 1,018,412 | |
338,024 | | | | American Intl. Group, Inc. | | 22,198,035 | |
43,700 | | L | | AON Corp. | | 1,042,682 | |
62,850 | | | | Chubb Corp. | | 4,833,165 | |
44,250 | | | | CIGNA Corp. | | 3,609,473 | |
19,922 | | | | Cincinnati Financial Corp. | | 881,748 | |
66,250 | | | | Hartford Financial Services Group, Inc. | | 4,591,788 | |
18,525 | | | | Jefferson-Pilot Corp. | | 962,559 | |
21,700 | | | | Lincoln National Corp. | | 1,012,956 | |
57,856 | | | | Loews Corp. | | 4,067,277 | |
27,400 | | | | Marsh & McLennan Cos., Inc. | | 901,460 | |
18,100 | | | | MBIA, Inc. | | 1,145,368 | |
96,300 | | | | MetLife, Inc. | | 3,901,113 | |
12,700 | | | | MGIC Investment Corp. | | 875,157 | |
40,600 | | | | Principal Financial Group | | 1,662,164 | |
26,850 | | | | Progressive Corp. | | 2,277,954 | |
169,600 | | | | Prudential Financial, Inc. | | 9,321,215 | |
29,050 | | | | Safeco Corp. | | 1,517,572 | |
35,200 | | | | St. Paul Travelers Cos., Inc. | | 1,304,864 | |
18,200 | | | | Torchmark Corp. | | 1,039,948 | |
41,950 | | L | | UnumProvident Corp. | | 752,583 | |
18,550 | | @@,L | | XL Capital Ltd. | | 1,440,408 | |
| | | | | | 79,239,479 | |
| | | | Internet: 1.4% | | | |
88,550 | | @ | | eBay, Inc. | | 10,296,594 | |
213,000 | | @ | | Symantec Corp. | | 5,486,880 | |
197,100 | | @,L | | Yahoo!, Inc. | | 7,426,728 | |
| | | | | | 23,210,202 | |
| | | | Iron/Steel: 0.1% | | | |
19,100 | | | | Nucor Corp. | | 999,694 | |
14,650 | | L | | United States Steel Corp. | | 750,813 | |
| | | | | | 1,750,507 | |
| | | | Leisure Time: 0.5% | | | |
13,400 | | | | Brunswick Corp. | | 663,300 | |
78,650 | | | | Carnival Corp. | | 4,532,599 | |
39,250 | | | | Harley-Davidson, Inc. | | 2,384,438 | |
19,750 | | | | Sabre Holdings Corp. | | 437,660 | |
| | | | | | 8,017,997 | |
| | | | Lodging: 0.4% | | | |
15,100 | | L | | Harrah’s Entertainment, Inc. | | 1,010,039 | |
52,850 | | | | Hilton Hotels Corp. | | 1,201,809 | |
51,650 | | | | Marriott Intl., Inc. | | 3,252,917 | |
23,050 | | | | Starwood Hotels & Resorts Worldwide, Inc. | | 1,346,120 | |
| | | | | | 6,810,885 | |
See Accompanying Notes to Financial Statements
46
| PORTFOLIO OF INVESTMENTS |
ING VP INDEX PLUS LARGECAP PORTFOLIO | AS OF DECEMBER 31, 2004 (CONTINUED) |
Shares | | | | | | Value | |
| | | | Machinery-Construction and Mining: 0.1% | | | |
17,200 | | | | Caterpillar, Inc. | | $ | 1,677,172 | |
| | | | | | 1,677,172 | |
| | | | Machinery-Diversified: 0.2% | | | |
5,800 | | | | Cummins, Inc. | | 485,982 | |
31,650 | | | | Deere & Co. | | 2,354,760 | |
24,350 | | | | Rockwell Automation, Inc. | | 1,206,543 | |
| | | | | | 4,047,285 | |
| | | | Media: 3.3% | | | |
291,650 | | @ | | Comcast Corp. | | 9,706,112 | |
33,550 | | | | Gannett Co., Inc. | | 2,741,035 | |
10,100 | | | | Knight-Ridder, Inc. | | 676,094 | |
61,250 | | | | McGraw-Hill Cos., Inc. | | 5,606,825 | |
9,700 | | | | Meredith Corp. | | 525,740 | |
16,850 | | | | New York Times Co. | | 687,480 | |
336,000 | | | | News Corp. | | 6,269,760 | |
602,300 | | @ | | Time Warner, Inc. | | 11,708,712 | |
17,400 | | | | Tribune Co. | | 733,236 | |
222,700 | | | | Viacom, Inc. | | 8,104,053 | |
265,900 | | | | Walt Disney Co. | | 7,392,020 | |
| | | | | | 54,151,067 | |
| | | | Mining: 0.1% | | | |
22,250 | | | | Phelps Dodge Corp. | | 2,200,970 | |
| | | | | | 2,200,970 | |
| | | | Miscellaneous Manufacturing: 5.3% | | | |
104,550 | | | | 3M Co. | | 8,580,418 | |
10,050 | | | | Cooper Industries Ltd. | | 682,295 | |
41,200 | | | | Danaher Corp. | | 2,365,292 | |
11,150 | | | | Dover Corp. | | 467,631 | |
61,750 | | | | Eastman Kodak Co. | | 1,991,438 | |
19,400 | | | | Eaton Corp. | | 1,403,784 | |
1,376,450 | | | | General Electric Co. | | 50,240,424 | |
108,250 | | | | Honeywell Intl., Inc. | | 3,833,133 | |
37,550 | | | | Illinois Tool Works, Inc. | | 3,480,134 | |
22,250 | | @@ | | Ingersoll-Rand Co. | | 1,786,675 | |
9,800 | | | | ITT Industries, Inc. | | 827,610 | |
15,800 | | | | Pall Corp. | | 457,410 | |
18,300 | | | | Textron, Inc. | | 1,350,540 | |
267,200 | | @@ | | Tyco Intl., Ltd. | | 9,549,727 | |
| | | | | | 87,016,511 | |
| | | | Office/Business Equipment: 0.3% | | | |
28,500 | | | | Pitney Bowes, Inc. | | 1,318,980 | |
209,650 | | @,L | | Xerox Corp. | | 3,566,147 | |
| | | | | | 4,885,127 | |
| | | | Oil and Gas: 7.4% | | | |
29,650 | | | | Amerada Hess Corp. | | 2,442,567 | |
55,150 | | | | Anadarko Petroleum Corp. | | 3,574,272 | |
40,204 | | | | Apache Corp. | | 2,033,116 | |
128,000 | | L | | Burlington Resources, Inc. | | 5,568,000 | |
364,800 | | | | ChevronTexaco Corp. | | 19,155,647 | |
182,444 | | | | ConocoPhillips | | 15,841,612 | |
157,500 | | | | Devon Energy Corp. | | 6,129,900 | |
14,300 | | | | EOG Resources, Inc. | | 1,020,448 | |
963,150 | | | | Exxon Mobil Corp. | | 49,371,068 | |
18,950 | | | | Kerr-McGee Corp. | | 1,095,121 | |
45,200 | | L | | Marathon Oil Corp. | | 1,699,972 | |
7,800 | | @,@@ | | Nabors Industries, Ltd. | | 400,062 | |
17,750 | | @,L | | Noble Corp. | | $ | 882,885 | |
50,750 | | | | Occidental Petroleum Corp. | | 2,961,770 | |
17,650 | | L | | Sunoco, Inc. | | 1,442,182 | |
43,100 | | @,L | | Transocean, Inc. | | 1,827,009 | |
33,100 | | | | Unocal Corp. | | 1,431,244 | |
85,300 | | | | Valero Energy Corp. | | 3,872,620 | |
| | | | | | 120,749,495 | |
| | | | Oil and Gas Services: 0.3% | | | |
44,050 | | | | Baker Hughes, Inc. | | 1,879,614 | |
18,050 | | | | BJ Services Co. | | 840,047 | |
57,950 | | | | Halliburton Co. | | 2,273,958 | |
| | | | | | 4,993,619 | |
| | | | Packaging and Containers: 0.1% | | | |
13,500 | | | | Ball Corp. | | 593,730 | |
11,500 | | | | Bemis Co. | | 334,535 | |
27,750 | | @ | | Pactiv Corp. | | 701,798 | |
11,200 | | @ | | Sealed Air Corp. | | 596,624 | |
| | | | | | 2,226,687 | |
| | | | Pharmaceuticals: 5.4% | | | |
201,800 | | | | Abbott Laboratories | | 9,413,969 | |
16,850 | | | | Allergan, Inc. | | 1,366,030 | |
15,650 | | L | | AmerisourceBergen Corp. | | 918,342 | |
259,850 | | | | Bristol-Myers Squibb Co. | | 6,657,357 | |
94,150 | | | | Cardinal Health, Inc. | | 5,474,823 | |
153,050 | | @ | | Caremark Rx, Inc. | | 6,034,762 | |
58,800 | | L | | Eli Lilly & Co. | | 3,336,900 | |
9,600 | | @ | | Express Scripts, Inc. | | 733,824 | |
45,000 | | @ | | Forest Laboratories, Inc. | | 2,018,700 | |
54,800 | | @ | | Gilead Sciences, Inc. | | 1,917,452 | |
20,200 | | @ | | Hospira, Inc. | | 676,700 | |
51,866 | | @ | | King Pharmaceuticals, Inc. | | 643,138 | |
34,504 | | @ | | Medco Health Solutions, Inc. | | 1,435,366 | |
294,650 | | | | Merck & Co., Inc. | | 9,470,050 | |
984,150 | | | | Pfizer, Inc. | | 26,463,793 | |
198,300 | | | | Schering-Plough Corp. | | 4,140,504 | |
172,550 | | | | Wyeth | | 7,348,905 | |
| | | | | | 88,050,615 | |
| | | | Pipelines: 0.1% | | | |
63,650 | | @,L | | Dynegy, Inc. | | 294,063 | |
54,900 | | L | | El Paso Corp. | | 570,960 | |
6,200 | | L | | Kinder Morgan, Inc. | | 453,406 | |
63,150 | | L | | Williams Cos., Inc. | | 1,028,714 | |
| | | | | | 2,347,143 | |
| | | | Real Estate Investment Trusts: 0.2% | | | |
22,150 | | | | Equity Office Properties Trust | | 645,008 | |
22,450 | | | | ProLogis | | 972,759 | |
28,200 | | | | Simon Property Group, Inc. | | 1,823,694 | |
| | | | | | 3,441,461 | |
| | | | Retail: 7.8% | | | |
36,400 | | @ | | Bed Bath & Beyond, Inc. | | 1,449,812 | |
41,350 | | | | Best Buy Co., Inc. | | 2,457,017 | |
28,650 | | | | Circuit City Stores, Inc. | | 448,086 | |
150,100 | | | | Costco Wholesale Corp. | | 7,266,341 | |
52,300 | | | | CVS Corp. | | 2,357,161 | |
22,200 | | | | Darden Restaurants, Inc. | | 615,828 | |
23,200 | | | | Federated Department Stores, Inc. | | 1,340,728 | |
205,400 | | | | Gap, Inc. | | 4,338,048 | |
See Accompanying Notes to Financial Statements
47
| PORTFOLIO OF INVESTMENTS |
ING VP INDEX PLUS LARGECAP PORTFOLIO | AS OF DECEMBER 31, 2004 (CONTINUED) |
Shares | | | | | | Value | |
| | | | Retail (continued) | | | |
514,300 | | | | Home Depot, Inc. | | $ | 21,981,181 | |
93,250 | | | | J.C. Penney Co., Inc. Holding Co. | | 3,860,550 | |
17,700 | | @ | | Kohl’s Corp. | | 870,309 | |
86,750 | | | | Limited Brands, Inc. | | 1,996,985 | |
102,850 | | | | Lowe’s Cos., Inc. | | 5,923,132 | |
37,950 | | | | May Department Stores Co. | | 1,115,730 | |
387,750 | | | | McDonald’s Corp. | | 12,431,264 | |
17,050 | | | | Nordstrom, Inc. | | 796,747 | |
42,450 | | @ | | Office Depot, Inc. | | 736,932 | |
19,550 | | | | RadioShack Corp. | | 642,804 | |
165,350 | | | | Staples, Inc. | | 5,573,949 | |
90,000 | | @,L | | Starbucks Corp. | | 5,612,400 | |
120,200 | | | | Target Corp. | | 6,241,986 | |
62,950 | | | | TJX Cos., Inc. | | 1,581,934 | |
47,900 | | @,L | | Toys R US, Inc. | | 980,513 | |
548,390 | | | | Wal-Mart Stores, Inc. | | 28,965,959 | |
135,400 | | | | Walgreen Co. | | 5,195,298 | |
15,150 | | | | Wendy’s Intl., Inc. | | 594,789 | |
36,400 | | | | Yum! Brands, Inc. | | 1,717,352 | |
| | | | | | 127,092,835 | |
| | | | Savings and Loans: 0.5% | | | |
36,100 | | | | Golden West Financial Corp. | | 2,217,262 | |
18,650 | | | | Sovereign Bancorp, Inc. | | 420,558 | |
112,200 | | | | Washington Mutual, Inc. | | 4,743,816 | |
| | | | | | 7,381,636 | |
| | | | Semiconductors: 2.1% | | | |
49,750 | | @ | | Altera Corp. | | 1,029,825 | |
51,300 | | | | Analog Devices, Inc. | | 1,893,996 | |
245,950 | | @ | | Applied Materials, Inc. | | 4,205,745 | |
55,577 | | @,L | | Freescale Semiconductor Inc. | | 1,020,394 | |
819,050 | | | | Intel Corp. | | 19,157,579 | |
24,650 | | @ | | KLA-Tencor Corp. | | 1,148,197 | |
36,700 | | | | Linear Technology Corp. | | 1,422,492 | |
16,800 | | | | Maxim Integrated Products, Inc. | | 712,152 | |
54,450 | | L | | National Semiconductor Corp. | | 977,378 | |
14,200 | | @,L | | Qlogic Corp. | | 521,566 | |
88,250 | | | | Texas Instruments, Inc. | | 2,172,715 | |
| | | | | | 34,262,039 | |
| | | | Software: 4.9% | | | |
30,800 | | | | Adobe Systems, Inc. | | 1,932,392 | |
49,900 | | | | Autodesk, Inc. | | 1,893,705 | |
77,400 | | | | Automatic Data Processing, Inc. | | 3,432,690 | |
78,900 | | @ | | BMC Software, Inc. | | 1,467,540 | |
20,200 | | @ | | Citrix Systems, Inc. | | 495,506 | |
74,000 | | L | | Computer Associates Intl., Inc. | | 2,298,440 | |
87,000 | | @ | | Compuware Corp. | | 562,890 | |
15,800 | | @,L | | Electronic Arts, Inc. | | 974,544 | |
110,689 | | | | First Data Corp. | | 4,708,710 | |
22,500 | | @ | | Fiserv, Inc. | | $ | 904,275 | |
28,100 | | | | IMS Health, Inc. | | 652,201 | |
22,900 | | @ | | Intuit, Inc. | | 1,007,829 | |
1,464,350 | | | | Microsoft Corp. | | 39,112,789 | |
40,600 | | @ | | Novell, Inc. | | 274,050 | |
1,297,700 | | @ | | Oracle Corp. | | 17,804,444 | |
68,300 | | @ | | Parametric Technology Corp. | | 402,287 | |
35,450 | | @,L | | PeopleSoft, Inc. | | 938,716 | |
59,950 | | @ | | Siebel Systems, Inc. | | 629,475 | |
55,600 | | @ | | Veritas Software Corp. | | 1,587,380 | |
| | | | | | 81,079,863 | |
| | | | Telecommunications: 5.4% | | | |
67,500 | | | | Alltel Corp. | | 3,966,300 | |
61,800 | | @ | | Avaya, Inc. | | 1,062,960 | |
247,950 | | | | BellSouth Corp. | | 6,890,531 | |
17,000 | | | | CenturyTel, Inc. | | 602,990 | |
852,550 | | @ | | Cisco Systems, Inc. | | 16,454,214 | |
33,050 | | L | | Citizens Communications Co. | | 455,760 | |
28,750 | | @,L | | Comverse Technology, Inc. | | 702,938 | |
69,950 | | @ | | Corning, Inc. | | 823,312 | |
562,371 | | @,L | | Lucent Technologies, Inc. | | 2,114,515 | |
304,900 | | | | Motorola, Inc. | | 5,244,280 | |
144,850 | | @ | | Nextel Communications, Inc. | | 4,345,500 | |
214,600 | | | | QUALCOMM, Inc. | | 9,099,039 | |
97,500 | | @ | | Qwest Communications Intl., Inc. | | 432,900 | |
427,500 | | | | SBC Communications, Inc. | | 11,016,674 | |
20,400 | | | | Scientific-Atlanta, Inc. | | 673,404 | |
190,750 | | | | Sprint Corp. | | 4,740,138 | |
52,900 | | @,L | | Tellabs, Inc. | | 454,411 | |
486,300 | | | | Verizon Communications, Inc. | | 19,700,012 | |
| | | | | | 88,779,878 | |
| | | | Textiles: 0.1% | | | |
20,500 | | | | Cintas Corp. | | 899,130 | |
| | | | | | 899,130 | |
| | | | Toys/Games/Hobbies: 0.1% | | | |
22,200 | | | | Hasbro, Inc. | | 430,236 | |
53,650 | | | | Mattel, Inc. | | 1,045,639 | |
| | | | | | 1,475,875 | |
| | | | Transportation: 1.9% | | | |
80,000 | | | | Burlington Northern Santa Fe Corp. | | 3,784,800 | |
28,700 | | | | CSX Corp. | | 1,150,296 | |
96,800 | | | | FedEx Corp. | | 9,533,832 | |
90,500 | | | | Norfolk Southern Corp. | | 3,275,195 | |
12,800 | | | | Ryder System, Inc. | | 611,456 | |
144,900 | | | | United Parcel Service, Inc. | | 12,383,154 | |
| | | | | | 30,738,733 | |
| | | | Total Common Stock (Cost $1,437,414,521) | | 1,628,752,487 | |
See Accompanying Notes to Financial Statements
48
| PORTFOLIO OF INVESTMENTS |
ING VP INDEX PLUS LARGECAP PORTFOLIO | AS OF DECEMBER 31, 2004 (CONTINUED) |
Principal
Amount | | | | | | Value | |
SHORT-TERM INVESTMENTS: 4.2% | | | | | |
| | Repurchase Agreement: 0.6% | | | | | |
$ | 9,917,000 | | Goldman Sachs Repurchase Agreement dated 12/31/04, 2.230%, due 01/03/05, $9,918,843 to be received upon repurchase (Collateralized by $9,926,000 Federal National Mortgage Association, 0.000-4.300%, Market Value plus accrued interest $10,115,501, due 07/30/09-02/04/19) | | | | $ | 9,917,000 | |
| | Total Short-Term Investments (Cost $9,917,000) | | | | 9,917,000 | |
| | Securities Lending Collateralcc: 3.6% | | | | | |
58,326,000 | | The Bank of New York Institutional Cash Reserve Fund | | | | 58,326,000 | |
| | Total Securities Lending Collateral (Cost $58,326,000) | | | | 58,326,000 | |
| | Total Short-Term Investments (Cost $68,243,000) | | | | 68,243,000 | |
| | Total Investments In Securities (Cost $1,505,657,521)* | | 103.5 | % | $ | 1,696,995,487 | |
| | Other Assets and Liabilities-Net | | (3.5 | ) | (56,922,135 | ) |
| | Net Assets | | 100.0 | % | $ | 1,640,073,352 | |
| | | | | | | | | |
@ Non-income producing security
@@ Foreign issuer
cc Securities purchased with cash collateral for securities loaned.
L Loaned security, a portion or all of the security is on loan at December 31, 2004.
* Cost for federal income tax purposes is $1,590,243,002. Net unrealized appreciation consists of:
Gross Unrealized Appreciation | | $ | 134,915,212 | |
Gross Unrealized Depreciation | | (28,162,727 | ) |
Net Unrealized Appreciation | | $ | 106,752,485 | |
See Accompanying Notes to Financial Statements
49
| PORTFOLIO OF INVESTMENTS |
ING VP INDEX PLUS MIDCAP PORTFOLIO | AS OF DECEMBER 31, 2004 |
Shares | | | | | | Value | |
COMMON STOCK: 98.2% | | | |
| | | | Advertising: 0.5% | | | |
90,950 | | | | Catalina Marketing Corp. | | $ | 2,694,849 | |
55,950 | | | | Harte-Hanks, Inc. | | 1,453,581 | |
| | | | | | 4,148,430 | |
| | | | Aerospace/Defense: 0.4% | | | |
41,900 | | @ | | Alliant Techsystems, Inc. | | 2,739,422 | |
5,200 | | @ | | Sequa Corp. | | 317,980 | |
| | | | | | 3,057,402 | |
| | | | Agriculture: 0.0% | | | |
6,600 | | | | Universal Corp. | | 315,744 | |
| | | | | | 315,744 | |
| | | | Airlines: 0.2% | | | |
46,900 | | @ | | Alaska Air Group, Inc. | | 1,570,681 | |
| | | | | | 1,570,681 | |
| | | | Apparel: 0.3% | | | |
40,450 | | @ | | Timberland Co. | | 2,535,002 | |
| | | | | | 2,535,002 | |
| | | | Auto Parts and Equipment: 1.0% | | | |
18,850 | | | | ArvinMeritor, Inc. | | 421,675 | |
10,000 | | | | Bandag, Inc. | | 498,100 | |
38,350 | | | | BorgWarner, Inc. | | 2,077,420 | |
43,650 | | | | Lear Corp. | | 2,663,086 | |
57,665 | | | | Modine Manufacturing Co. | | 1,947,347 | |
| | | | | | 7,607,628 | |
| | | | Banks: 5.4% | | | |
199,928 | | | | Associated Banc-Corp | | 6,639,608 | |
95,700 | | | | Bank of Hawaii Corp. | | 4,855,818 | |
119,050 | | | | Banknorth Group, Inc. | | 4,357,230 | |
32,800 | | | | City National Corp. | | 2,317,320 | |
237,375 | | | | Colonial BancGroup, Inc. | | 5,039,471 | |
52,300 | | | | Commerce Bancorp, Inc. | | 3,368,120 | |
33,834 | | | | Cullen/Frost Bankers, Inc. | | 1,644,332 | |
21,500 | | L | | FirstMerit Corp. | | 612,535 | |
167,250 | | | | Hibernia Corp. | | 4,935,548 | |
42,700 | | L | | Investors Financial Services Corp. | | 2,134,146 | |
49,978 | | | | Mercantile Bankshares Corp. | | 2,608,852 | |
9,000 | | @ | | Silicon Valley Bancshares | | 403,380 | |
91,350 | | | | TCF Financial Corp. | | 2,935,989 | |
19,530 | | | | Westamerica Bancorporation | | 1,138,794 | |
| | | | | | 42,991,143 | |
| | | | Beverages: 0.6% | | | |
71,050 | | @ | | Constellation Brands, Inc. | | 3,304,536 | |
86,350 | | | | PepsiAmericas, Inc. | | 1,834,074 | |
| | | | | | 5,138,610 | |
| | | | Biotechnology: 1.4% | | | |
111,050 | | @ | | Charles River Laboratories Intl., Inc. | | 5,109,410 | |
32,450 | | @,L | | Invitrogen Corp. | | 2,178,369 | |
199,400 | | @ | | Millennium Pharmaceuticals, Inc. | | 2,416,728 | |
55,650 | | @ | | Protein Design Labs, Inc. | | 1,149,729 | |
39,400 | | @ | | Vertex Pharmaceuticals, Inc. | | 416,458 | |
| | | | | | 11,270,694 | |
| | | | Building Materials: 0.2% | | | |
30,550 | | | | Martin Marietta Materials, Inc. | | $ | 1,639,313 | |
| | | | | | 1,639,313 | |
| | | | Chemicals: 2.8% | | | |
43,350 | | | | Airgas, Inc. | | 1,149,209 | |
25,650 | | | | Albemarle Corp. | | 992,912 | |
42,783 | | | | Cabot Corp. | | 1,654,846 | |
6,750 | | @,L | | Cabot Microelectronics Corp. | | 270,338 | |
72,000 | | | | Crompton Corp. | | 849,600 | |
24,750 | | | | Cytec Industries, Inc. | | 1,272,645 | |
21,850 | | | | Ferro Corp. | | 506,702 | |
67,100 | | @ | | FMC Corp. | | 3,240,929 | |
44,050 | | | | Lubrizol Corp. | | 1,623,683 | |
238,150 | | L | | Lyondell Chemical Co. | | 6,887,297 | |
5,000 | | | | Minerals Technologies, Inc. | | 333,500 | |
71,950 | | | | RPM Intl., Inc. | | 1,414,537 | |
28,500 | | | | Sensient Technologies Corp. | | 683,715 | |
35,202 | | | | Valspar Corp. | | 1,760,452 | |
| | | | | | 22,640,365 | |
| | | | Coal: 0.4% | | | |
42,450 | | | | Peabody Energy Corp. | | 3,434,630 | |
| | | | | | 3,434,630 | |
| | | | Commercial Services: 4.4% | | | |
146,639 | | | | Adesa, Inc. | | 3,111,679 | |
133,650 | | @ | | Alliance Data Systems Corp. | | 6,345,701 | |
13,800 | | | | Banta Corp. | | 617,688 | |
67,300 | | @ | | Career Education Corp. | | 2,692,000 | |
57,950 | | @ | | ChoicePoint, Inc. | | 2,665,121 | |
33,900 | | | | Deluxe Corp. | | 1,265,487 | |
84,900 | | @ | | Education Management Corp. | | 2,802,549 | |
61,950 | | @ | | First Health Group Corp. | | 1,159,085 | |
73,400 | | @,L | | Gartner, Inc. | | 914,564 | |
31,900 | | @ | | ITT Educational Services, Inc. | | 1,516,845 | |
22,050 | | | | Kelly Services, Inc. | | 665,469 | |
39,200 | | @ | | Korn/Ferry Intl. | | 813,400 | |
11,900 | | @ | | Laureate Education, Inc. | | 524,671 | |
59,650 | | | | Manpower, Inc. | | 2,881,094 | |
60,850 | | | | MoneyGram Intl., Inc. | | 1,286,369 | |
27,000 | | @ | | MPS Group, Inc. | | 331,020 | |
80,350 | | @ | | Quanta Services, Inc. | | 642,800 | |
48,300 | | @ | | Rent-A-Center, Inc. | | 1,279,950 | |
30,260 | | | | Rollins, Inc. | | 796,443 | |
69,600 | | @ | | Sotheby’s Holdings, Inc. | | 1,263,936 | |
58,350 | | @ | | Valassis Communications, Inc. | | 2,042,834 | |
| | | | | | 35,618,705 | |
| | | | Computers: 4.1% | | | |
81,600 | | @,L | | BISYS Group, Inc. | | 1,342,320 | |
180,550 | | @,L | | Cadence Design Systems, Inc. | | 2,493,396 | |
93,650 | | @ | | Ceridian Corp. | | 1,711,922 | |
91,700 | | @ | | Cognizant Technology Solutions Corp. | | 3,881,660 | |
47,900 | | | | Diebold, Inc. | | 2,669,467 | |
55,650 | | @ | | DST Systems, Inc. | | 2,900,478 | |
23,950 | | | | Imation Corp. | | 762,329 | |
162,875 | | | | Jack Henry & Associates, Inc. | | 3,242,840 | |
81,100 | | @,L | | McData Corp. | | 483,356 | |
47,675 | | | | National Instruments Corp. | | 1,299,144 | |
45,450 | | | | Reynolds & Reynolds Co. | | 1,204,880 | |
112,850 | | @ | | Sandisk Corp. | | 2,817,865 | |
188,100 | | @ | | Storage Technology Corp. | | 5,945,840 | |
See Accompanying Notes to Financial Statements
50
| PORTFOLIO OF INVESTMENTS |
ING VP INDEX PLUS MIDCAP PORTFOLIO | AS OF DECEMBER 31, 2004 (CONTINUED) |
Shares | | | | | | Value | |
| | | | Computers (continued) | | | |
106,600 | | @,L | | Synopsys, Inc. | | $ | 2,091,492 | |
| | | | | | 32,846,989 | |
| | | | Distribution/Wholesale: 1.0% | | | |
56,450 | | | | CDW Corp. | | 3,745,458 | |
18,800 | | | | Fastenal Co. | | 1,157,328 | |
68,800 | | @ | | Tech Data Corp. | | 3,123,520 | |
| | | | | | 8,026,306 | |
| | | | Diversified Financial Services: 2.7% | | | |
52,000 | | | | AG Edwards, Inc. | | 2,246,920 | |
253,050 | | @ | | AmeriCredit Corp. | | 6,187,072 | |
45,600 | | | | Eaton Vance Corp. | | 2,378,040 | |
36,750 | | | | IndyMac Bancorp, Inc. | | 1,266,038 | |
38,487 | | | | Jefferies Group, Inc. | | 1,550,256 | |
68,450 | | L | | Legg Mason, Inc. | | 5,014,647 | |
44,200 | | | | Raymond James Financial, Inc. | | 1,369,316 | |
55,100 | | | | Waddell & Reed Financial, Inc. | | 1,316,339 | |
| | | | | | 21,328,628 | |
| | | | Electric: 3.8% | | | |
75,900 | | | | Alliant Energy Corp. | | 2,170,740 | |
8,450 | | | | Black Hills Corp. | | 259,246 | |
142,650 | | | | DPL, Inc. | | 3,581,941 | |
21,200 | | L | | Duquesne Light Holdings, Inc. | | 399,620 | |
101,950 | | | | Energy East Corp. | | 2,720,025 | |
20,300 | | | | Great Plains Energy, Inc. | | 614,684 | |
51,150 | | | | Hawaiian Electric Industries, Inc. | | 1,491,023 | |
25,550 | | | | Idacorp, Inc. | | 781,064 | |
73,804 | | | | MDU Resources Group, Inc. | | 1,969,091 | |
77,200 | | | | Northeast Utilities | | 1,455,220 | |
33,400 | | | | NSTAR | | 1,812,952 | |
54,405 | | | | OGE Energy Corp. | | 1,442,277 | |
50,900 | | | | Pepco Holdings, Inc. | | 1,085,188 | |
37,750 | | | | PNM Resources, Inc. | | 954,698 | |
62,400 | | | | Puget Energy, Inc. | | 1,541,280 | |
77,250 | | L | | SCANA Corp. | | 3,043,649 | |
30,300 | | @,L | | Sierra Pacific Resources | | 318,150 | |
52,550 | | | | Westar Energy, Inc. | | 1,201,819 | |
77,100 | | | | Wisconsin Energy Corp. | | 2,599,040 | |
23,250 | | | | WPS Resources Corp. | | 1,161,570 | |
| | | | | | 30,603,277 | |
| | | | Electrical Components and Equipment: 1.0% | | | |
76,900 | | | | Ametek, Inc. | | 2,743,023 | |
57,139 | | @ | | Energizer Holdings, Inc. | | 2,839,237 | |
38,783 | | | | Hubbell, Inc. | | 2,028,351 | |
| | | | | | 7,610,611 | |
| | | | Electronics: 1.6% | | | |
58,600 | | @ | | Amphenol Corp. | | 2,152,964 | |
79,326 | | @,L | | Arrow Electronics, Inc. | | 1,927,622 | |
31,250 | | @ | | Avnet, Inc. | | 570,000 | |
50,300 | | | | Gentex Corp. | | 1,862,106 | |
99,625 | | @ | | Thomas & Betts Corp. | | 3,063,469 | |
37,239 | | @ | | Varian, Inc. | | 1,527,171 | |
113,050 | | @ | | Vishay Intertechnology, Inc. | | 1,698,011 | |
| | | | | | 12,801,343 | |
| | | | Engineering and Construction: 0.4% | | | |
31,250 | | @ | | Dycom Industries, Inc. | | 953,750 | |
25,600 | | | | Granite Construction, Inc. | | $ | 680,960 | |
35,150 | | @ | | Jacobs Engineering Group, Inc. | | 1,679,819 | |
| | | | | | 3,314,529 | |
| | | | Entertainment: 0.7% | | | |
77,800 | | | | GTECH Holdings Corp. | | 2,018,910 | |
59,200 | | | | International Speedway Corp. | | 3,125,760 | |
26,450 | | @ | | Macrovision Corp. | | 680,294 | |
| | | | | | 5,824,964 | |
| | | | Environmental Control: 0.4% | | | |
101,150 | | | | Republic Services, Inc. | | 3,392,571 | |
| | | | | | 3,392,571 | |
| | | | Food: 2.7% | | | |
39,950 | | @ | | Dean Foods Co. | | 1,316,353 | |
157,939 | | | | Hormel Foods Corp. | | 4,951,388 | |
14,960 | | L | | JM Smucker Co. | | 704,167 | |
37,273 | | | | Ruddick Corp. | | 808,451 | |
72,950 | | @ | | Smithfield Foods, Inc. | | 2,158,591 | |
30,393 | | | | Tootsie Roll Industries, Inc. | | 1,052,510 | |
359,855 | | | | Tyson Foods, Inc. | | 6,621,331 | |
42,800 | | | | Whole Foods Market, Inc. | | 4,080,980 | |
| | | | | | 21,693,771 | |
| | | | Forest Products and Paper: 0.4% | | | |
32,450 | | | | Longview Fibre Co. | | 588,643 | |
25,550 | | | | P. H. Glatfelter Co. | | 390,404 | |
50,950 | | | | Potlatch Corp. | | 2,577,051 | |
| | | | | | 3,556,098 | |
| | | | Gas: 0.7% | | | |
44,198 | | | | AGL Resources, Inc. | | 1,469,142 | |
66,400 | | L | | Oneok, Inc. | | 1,887,087 | |
17,181 | | | | Vectren Corp. | | 460,451 | |
50,800 | | | | WGL Holdings, Inc. | | 1,566,672 | |
| | | | | | 5,383,352 | |
| | | | Hand/Machine Tools: 0.1% | | | |
23,800 | | | | Kennametal, Inc. | | 1,184,526 | |
| | | | | | 1,184,526 | |
| | | | Healthcare-Products: 3.7% | | | |
41,050 | | | | Beckman Coulter, Inc. | | 2,749,940 | |
128,950 | | @ | | Cytyc Corp. | | 3,555,152 | |
52,950 | | | | Dentsply Intl., Inc. | | 2,975,790 | |
36,700 | | @ | | Edwards Lifesciences Corp. | | 1,514,242 | |
28,300 | | @ | | Henry Schein, Inc. | | 1,970,812 | |
69,536 | | | | Hillenbrand Industries, Inc. | | 3,862,028 | |
21,700 | | @ | | Inamed Corp. | | 1,372,525 | |
89,000 | | @,L | | Patterson Cos., Inc. | | 3,861,710 | |
41,250 | | @ | | Steris Corp. | | 978,450 | |
27,450 | | @ | | Techne Corp. | | 1,067,805 | |
139,150 | | @ | | Varian Medical Systems, Inc. | | 6,016,845 | |
| | | | | | 29,925,299 | |
| | | | Healthcare-Services: 4.1% | | | |
34,000 | | @ | | Apria Healthcare Group, Inc. | | 1,120,300 | |
53,950 | | @ | | Community Health Systems, Inc. | | 1,504,126 | |
71,395 | | @ | | Covance, Inc. | | 2,766,556 | |
132,475 | | @ | | Coventry Health Care, Inc. | | 7,031,773 | |
71,450 | | @,L | | Health Net, Inc. | | 2,062,762 | |
24,900 | | @ | | LifePoint Hospitals, Inc. | | 867,018 | |
158,300 | | @ | | Lincare Holdings, Inc. | | 6,751,495 | |
See Accompanying Notes to Financial Statements
51
| PORTFOLIO OF INVESTMENTS |
ING VP INDEX PLUS MIDCAP PORTFOLIO | AS OF DECEMBER 31, 2004 (CONTINUED) |
Shares | | | | | | Value | |
| | | | Healthcare-Services (continued) | | | |
124,850 | | @,L | | Pacificare Health Systems, Inc. | | $ | 7,056,521 | |
46,100 | | @ | | Renal Care Group, Inc. | | 1,659,139 | |
37,150 | | | | Universal Health Services, Inc. | | 1,653,175 | |
| | | | | | 32,472,865 | |
| | | | Holding Companies-Diversified: 0.4% | | | |
46,400 | | | | Leucadia National Corp. | | 3,223,872 | |
| | | | | | 3,223,872 | |
| | | | Home Builders: 1.4% | | | |
154,600 | | L | | DR Horton, Inc. | | 6,231,926 | |
42,100 | | L | | Lennar Corp.-Class A | | 2,386,228 | |
38,200 | | | | Thor Industries, Inc. | | 1,415,310 | |
20,200 | | @ | | Toll Brothers, Inc. | | 1,385,922 | |
| | | | | | 11,419,386 | |
| | | | Home Furnishings: 1.4% | | | |
36,150 | | | | Furniture Brands Intl., Inc. | | 905,558 | |
82,450 | | L,S | | Harman Intl. Industries, Inc. | | 10,471,150 | |
| | | | | | 11,376,708 | |
| | | | Household Products/Wares: 1.2% | | | |
123,850 | | | | American Greetings Corp. | | 3,139,598 | |
28,050 | | | | Blyth, Inc. | | 829,158 | |
106,350 | | | | Church & Dwight, Inc. | | 3,575,487 | |
21,150 | | @ | | Scotts Co. | | 1,554,948 | |
41,050 | | | | Tupperware Corp. | | 850,556 | |
| | | | | | 9,949,747 | |
| | | | Insurance: 6.4% | | | |
61,500 | | @ | | Allmerica Financial Corp. | | 2,019,045 | |
82,485 | | | | American Financial Group, Inc. | | 2,582,605 | |
26,800 | | | | AmerUs Group Co. | | 1,214,040 | |
61,550 | | | | Arthur J Gallagher & Co. | | 2,000,375 | |
47,350 | | L | | Brown & Brown, Inc. | | 2,062,093 | |
60,200 | | @@ | | Everest Re Group Ltd. | | 5,391,512 | |
118,082 | | | | Fidelity National Financial, Inc. | | 5,392,804 | |
60,900 | | | | First American Corp. | | 2,140,026 | |
39,300 | | | | HCC Insurance Holdings, Inc. | | 1,301,616 | |
29,600 | | | | Horace Mann Educators Corp. | | 564,768 | |
71,500 | | @ | | Ohio Casualty Corp. | | 1,659,515 | |
121,125 | | | | Old Republic Intl. Corp. | | 3,064,463 | |
108,250 | | | | PMI Group, Inc. | | 4,519,438 | |
46,900 | | | | Protective Life Corp. | | 2,002,161 | |
62,250 | | | | Radian Group, Inc. | | 3,314,190 | |
48,200 | | L | | Stancorp Financial Group, Inc. | | 3,976,500 | |
44,144 | | | | Unitrin, Inc. | | 2,006,345 | |
134,425 | | | | WR Berkley Corp. | | 6,340,826 | |
| | | | | | 51,552,322 | |
| | | | Internet: 1.6% | | | |
34,100 | | @ | | Avocent Corp. | | 1,381,732 | |
56,250 | | @,L | | Checkfree Corp. | | 2,142,000 | |
44,750 | | @ | | Macromedia, Inc. | | 1,392,620 | |
239,850 | | @ | | McAfee, Inc. | | 6,938,861 | |
41,200 | | @ | | RSA Security, Inc. | | 826,472 | |
| | | | | | 12,681,685 | |
| | | | Iron/Steel: 0.3% | | | |
53,250 | | | | Steel Dynamics, Inc. | | 2,017,110 | |
| | | | | | 2,017,110 | |
| | | | Lodging: 1.5% | | | |
59,150 | | | | Boyd Gaming Corp. | | $ | 2,463,598 | |
205,500 | | @ | | Caesars Entertainment, Inc. | | 4,138,770 | |
72,300 | | | | Mandalay Resort Group | | 5,092,089 | |
| | | | | | 11,694,457 | |
| | | | Machinery-Diversified: 1.2% | | | |
56,100 | | @,L | | AGCO Corp. | | 1,228,029 | |
32,550 | | @ | | Flowserve Corp. | | 896,427 | |
82,141 | | | | Graco, Inc. | | 3,067,966 | |
22,800 | | | | Nordson, Corp. | | 913,596 | |
10,150 | | | | Tecumseh Products Co. | | 485,170 | |
48,050 | | @ | | Zebra Technologies Corp. | | 2,704,254 | |
| | | | | | 9,295,442 | |
| | | | Media: 1.8% | | | |
72,750 | | | | Belo Corp. | | 1,908,960 | |
13,750 | | @ | | Emmis Communications Corp. | | 263,863 | |
12,200 | | @ | | Entercom Communications Corp. | | 437,858 | |
28,500 | | | | Lee Enterprises, Inc. | | 1,313,280 | |
15,700 | | | | Media General, Inc. | | 1,017,517 | |
54,100 | | | | Reader’s Digest Association, Inc. | | 752,531 | |
24,850 | | @ | | Scholastic Corp. | | 918,456 | |
6,400 | | | | Washington Post Co. | | 6,291,327 | |
59,950 | | @ | | Westwood One, Inc. | | 1,614,454 | |
| | | | | | 14,518,246 | |
| | | | Metal Fabricate/Hardware: 0.5% | | | |
45,400 | | | | Precision Castparts Corp. | | 2,981,872 | |
55,100 | | | | Worthington Industries, Inc. | | 1,078,858 | |
| | | | | | 4,060,730 | |
| | | | Miscellaneous Manufacturing: 2.3% | | | |
35,000 | | | | Brink’s Co. | | 1,383,200 | |
20,650 | | | | Carlisle Cos., Inc. | | 1,340,598 | |
35,600 | | | | Crane Co. | | 1,026,704 | |
56,900 | | | | Donaldson Co., Inc. | | 1,853,802 | |
27,150 | | | | Harsco Corp. | | 1,513,341 | |
63,069 | | | | Lancaster Colony Corp. | | 2,703,768 | |
111,150 | | | | Pentair, Inc. | | 4,841,694 | |
46,650 | | L | | SPX Corp. | | 1,868,799 | |
24,100 | | | | Teleflex, Inc. | | 1,251,754 | |
12,650 | | | | Trinity Industries, Inc. | | 431,112 | |
| | | | | | 18,214,772 | |
| | | | Office Furnishings: 0.4% | | | |
44,000 | | L | | Herman Miller, Inc. | | 1,215,720 | |
37,121 | | | | HNI Corp. | | 1,598,059 | |
| | | | | | 2,813,779 | |
| | | | Oil and Gas: 4.2% | | | |
97,750 | | | | ENSCO Intl., Inc. | | 3,102,585 | |
36,400 | | @ | | Forest Oil Corp. | | 1,154,608 | |
34,200 | | | | Helmerich & Payne, Inc. | | 1,164,168 | |
114,350 | | | | Murphy Oil Corp. | | 9,199,457 | |
67,350 | | @ | | Newfield Exploration Co. | | 3,977,018 | |
95,000 | | L | | Noble Energy, Inc. | | 5,857,699 | |
41,800 | | | | Patterson-UTI Energy, Inc. | | 813,010 | |
96,800 | | | | Pioneer Natural Resources Co. | | 3,397,680 | |
50,650 | | @ | | Plains Exploration & Production Co. | | 1,316,900 | |
41,750 | | | | Pogo Producing Co. | | 2,024,458 | |
87,650 | | @,L | | Pride Intl., Inc. | | 1,800,331 | |
| | | | | | 33,807,914 | |
See Accompanying Notes to Financial Statements
52
| PORTFOLIO OF INVESTMENTS |
ING VP INDEX PLUS MIDCAP PORTFOLIO | AS OF DECEMBER 31, 2004 (CONTINUED) |
Shares | | | | | | Value | |
| | | | Oil and Gas Services: 2.9% | | | |
33,200 | | @ | | Cooper Cameron Corp. | | $ | 1,786,492 | |
44,100 | | @ | | FMC Technologies, Inc. | | 1,420,020 | |
75,450 | | @ | | Grant Prideco, Inc. | | 1,512,773 | |
48,650 | | @ | | Hanover Compressor Co. | | 687,425 | |
56,500 | | @,L | | National-Oilwell, Inc. | | 1,993,885 | |
68,900 | | @ | | Smith Intl., Inc. | | 3,748,849 | |
39,600 | | L | | Tidewater, Inc. | | 1,410,156 | |
59,250 | | @ | | Varco Intl., Inc. | | 1,727,138 | |
175,350 | | @,L | | Weatherford Intl. Ltd. | | 8,995,454 | |
| | | | | | 23,282,192 | |
| | | | Packaging and Containers: 0.4% | | | |
63,650 | | | | Packaging Corp. of America | | 1,498,958 | |
66,980 | | | | Sonoco Products Co. | | 1,985,957 | |
| | | | | | 3,484,915 | |
| | | | Pharmaceuticals: 1.8% | | | |
111,250 | | @ | | Barr Pharmaceuticals, Inc. | | 5,066,324 | |
37,300 | | @,L | | Cephalon, Inc. | | 1,897,824 | |
9,000 | | @ | | Par Pharmaceutical Cos., Inc. | | 372,420 | |
45,950 | | | | Perrigo Co. | | 793,557 | |
72,550 | | @,L | | Sepracor, Inc. | | 4,307,294 | |
22,150 | | | | Valeant Pharmaceuticals Intl. | | 583,653 | |
54,250 | | @ | | VCA Antech, Inc. | | 1,063,300 | |
| | | | | | 14,084,372 | |
| | | | Pipelines: 1.3% | | | |
38,750 | | L | | Equitable Resources, Inc. | | 2,350,575 | |
146,665 | | | | National Fuel Gas Co. | | 4,156,486 | |
57,800 | | | | Questar Corp. | | 2,945,488 | |
19,450 | | | | Western Gas Resources, Inc. | | 568,913 | |
| | | | | | 10,021,462 | |
| | | | Real Estate Investment Trusts: 2.3% | | | |
56,450 | | | | AMB Property Corp. | | 2,280,016 | |
71,850 | | | | Developers Diversified Realty Corp. | | 3,187,984 | |
35,950 | | | | Highwoods Properties, Inc. | | 995,815 | |
41,800 | | | | Hospitality Properties Trust | | 1,922,800 | |
57,150 | | | | Liberty Property Trust | | 2,468,880 | |
40,050 | | | | Mack-Cali Realty Corp. | | 1,843,502 | |
27,800 | | | | New Plan Excel Realty Trust | | 752,824 | |
31,063 | | | | Rayonier, Inc. | | 1,519,291 | |
33,050 | | | | United Dominion Realty Trust, Inc. | | 819,640 | |
57,400 | | | | Weingarten Realty Investors | | 2,301,740 | |
| | | | | | 18,092,492 | |
| | | | Retail: 8.3% | | | |
48,300 | | @ | | 99 Cents Only Stores | | 780,528 | |
146,100 | | | | Abercrombie & Fitch Co. | | 6,859,394 | |
34,350 | | @ | | Aeropostale, Inc. | | 1,010,921 | |
124,250 | | | | American Eagle Outfitters, Inc. | | 5,852,174 | |
45,400 | | @,L | | AnnTaylor Stores Corp. | | 977,462 | |
22,350 | | | | Applebees Intl., Inc. | | 591,158 | |
124,400 | | @,L | | Barnes & Noble, Inc. | | 4,014,387 | |
77,850 | | @ | | BJ’s Wholesale Club, Inc. | | 2,267,771 | |
9,450 | | | | Bob Evans Farms, Inc. | | 247,023 | |
49,550 | | | | Borders Group, Inc. | | 1,258,570 | |
58,350 | | @,L | | Brinker Intl., Inc. | | 2,046,335 | |
33,150 | | | | CBRL Group, Inc. | | 1,387,328 | |
16,800 | | @ | | Cheesecake Factory, Inc. | | 545,496 | |
60,400 | | @,L | | Chico’s FAS, Inc. | | 2,750,012 | |
114,100 | | | | Claire’s Stores, Inc. | | $ | 2,424,625 | |
60,400 | | @ | | Copart, Inc. | | 1,589,728 | |
75,500 | | @,L | | Dollar Tree Stores, Inc. | | 2,165,340 | |
99,200 | | | | Foot Locker, Inc. | | 2,671,456 | |
216,000 | | | | Michaels Stores, Inc. | | 6,473,519 | |
36,000 | | @ | | O’Reilly Automotive, Inc. | | 1,621,800 | |
47,050 | | | | Outback Steakhouse, Inc. | | 2,153,949 | |
45,650 | | @ | | Pacific Sunwear of California, Inc. | | 1,016,169 | |
79,600 | | @ | | Payless Shoesource, Inc. | | 979,080 | |
98,250 | | L | | PETsMART, Inc. | | 3,490,823 | |
51,200 | | | | Regis Corp. | | 2,362,880 | |
97,350 | | | | Ross Stores, Inc. | | 2,810,495 | |
40,550 | | | | Ruby Tuesday, Inc. | | 1,057,544 | |
55,800 | | @,L | | Urban Outfitters, Inc. | | 2,477,520 | |
75,800 | | @,L | | Williams-Sonoma, Inc. | | 2,656,032 | |
| | | | | | 66,539,519 | |
| | | | Savings and Loans: 0.8% | | | |
48,000 | | | | Astoria Financial Corp. | | 1,918,560 | |
54,050 | | | | Independence Community Bank Corp. | | 2,301,449 | |
49,100 | | | | Washington Federal, Inc. | | 1,303,114 | |
12,950 | | | | Webster Financial Corp. | | 655,788 | |
| | | | | | 6,178,911 | |
| | | | Semiconductors: 2.5% | | | |
135,900 | | @ | | Atmel Corp. | | 532,728 | |
131,150 | | @,L | | Cree, Inc. | | 5,256,491 | |
31,650 | | @,L | | Fairchild Semiconductor Intl., Inc. | | 514,629 | |
45,600 | | @ | | Integrated Circuit Systems, Inc. | | 953,952 | |
64,250 | | @ | | Integrated Device Technology, Inc. | | 742,730 | |
45,650 | | @ | | International Rectifier Corp. | | 2,034,621 | |
97,850 | | | | Intersil Corp. | | 1,638,009 | |
92,250 | | @,L | | Lam Research Corp. | | 2,666,948 | |
54,150 | | @ | | Lattice Semiconductor Corp. | | 308,655 | |
48,100 | | @ | | Micrel, Inc. | | 530,062 | |
142,750 | | | | Microchip Technology, Inc. | | 3,805,715 | |
18,900 | | @,L | | Semtech Corp. | | 413,343 | |
13,400 | | @ | | Silicon Laboratories, Inc. | | 473,154 | |
85,700 | | @ | | Triquint Semiconductor, Inc. | | 381,365 | |
| | | | | | 20,252,402 | |
| | | | Software: 2.9% | | | |
89,200 | | @ | | Activision, Inc. | | 1,800,056 | |
56,750 | | | | Acxiom Corp. | | 1,492,525 | |
55,500 | | @ | | Advent Software, Inc. | | 1,136,640 | |
39,450 | | | | Certegy, Inc. | | 1,401,659 | |
34,100 | | @ | | CSG Systems Intl., Inc. | | 637,670 | |
76,717 | | @ | | Dun & Bradstreet Corp. | | 4,576,168 | |
77,100 | | L | | Fair Isaac Corp. | | 2,828,028 | |
36,300 | | @,L | | Keane, Inc. | | 533,610 | |
68,000 | | | | SEI Investments Co. | | 2,851,240 | |
157,650 | | @ | | Sybase, Inc. | | 3,145,118 | |
43,280 | | @ | | Transaction Systems Architects, Inc. | | 859,108 | |
140,550 | | @ | | Wind River Systems, Inc. | | 1,904,453 | |
| | | | | | 23,166,275 | |
| | | | Telecommunications: 1.9% | | | |
20,950 | | | | Adtran, Inc. | | 400,983 | |
60,350 | | @ | | Cincinnati Bell, Inc. | | 250,453 | |
See Accompanying Notes to Financial Statements
53
| PORTFOLIO OF INVESTMENTS |
ING VP INDEX PLUS MIDCAP PORTFOLIO | AS OF DECEMBER 31, 2004 (CONTINUED) |
Shares | | | | | | Value | |
| | | | Telecommunications (continued) | | | |
94,350 | | @ | | CommScope, Inc. | | $ | 1,783,215 | |
45,350 | | | | Harris Corp. | | 2,802,176 | |
19,150 | | @ | | Newport Corp. | | 270,015 | |
30,450 | | | | Plantronics, Inc. | | 1,262,762 | |
114,400 | | @ | | Polycom, Inc. | | 2,667,808 | |
66,850 | | @,L | | Powerwave Technologies, Inc. | | 566,888 | |
106,850 | | @ | | RF Micro Devices, Inc. | | 730,854 | |
56,250 | | L | | Telephone & Data Systems, Inc. | | 4,328,437 | |
| | | | | | 15,063,591 | |
| | | | Textiles: 0.5% | | | |
43,400 | | @ | | Mohawk Industries, Inc. | | 3,960,250 | |
| | | | | | 3,960,250 | |
| | | | Transportation: 2.7% | | | |
28,200 | | | | Alexander & Baldwin, Inc. | | 1,196,244 | |
55,550 | | | | CH Robinson Worldwide, Inc. | | 3,084,136 | |
92,800 | | | | CNF, Inc. | | 4,649,280 | |
73,350 | | | | Expeditors Intl. Washington, Inc. | | 4,098,798 | |
52,200 | | | | J.B. Hunt Transport Services, Inc. | | 2,341,170 | |
67,850 | | | | Overseas Shipholding Group, Inc. | | 3,745,320 | |
48,500 | | @ | | Swift Transportation Co., Inc. | | 1,041,780 | |
49,237 | | | | Werner Enterprises, Inc. | | 1,114,726 | |
| | | | | | 21,271,454 | |
| | | | Trucking and Leasing: 0.1% | | | |
29,950 | | | | GATX Corp. | | 885,322 | |
| | | | | | 885,322 | |
| | | | Water: 0.2% | | | |
63,550 | | | | Aqua America, Inc. | | 1,562,695 | |
| | | | | | 1,562,695 | |
| | | | Total Common Stock (Cost $693,077,156) | | 786,405,498 | |
| | | | | | | | |
Principal
Amount | | | | | | Value | |
SHORT-TERM INVESTMENTS: 12.2% | | | | | |
| | Repurchase Agreement: 1.8% | | | | | |
$ | 14,078,000 | | Goldman Sachs Repurchase Agreement dated 12/31/04, 2.230%, due 01/03/05, $14,080,616 to be received upon repurchase (Collateralized by $14,118,000 Federal Home Loan Mortgage Corporation, 5.125%, Market Value plus accrued interest $14,360,141, due 01/28/19) | | | | 14,078,000 | |
| | Total Repurchase Agreement (Cost $14,078,000) | | | | 14,078,000 | |
| | Securities Lending Collateralcc: 10.4% | | | | | |
$ | 83,609,000 | | The Bank of New York Institutional Cash Reserve Fund | | | | $ | 83,609,000 | |
| | Total Securities Lending Collateral (Cost $83,609,000) | | | | 83,609,000 | |
| | Total Short-Term Investments (Cost $97,687,000) | | | | 97,687,000 | |
| | Total Investments In Securities
(Cost $790,764,156)* | | 110.4 | % | $ | 884,092,498 | |
| | Other Assets and Liabilities-Net | | (10.4 | ) | (83,071,012 | ) |
| | Net Assets | | 100.0 | % | $ | 801,021,486 | |
@ Non-income producing security
@@ Foreign issuer
cc Securities purchased with cash collateral for securities loaned.
S Segregated securities for futures, when-issued or delayed delivery securities held at December 31, 2004.
L Loaned security, a portion or all of the security is on loan at December 31, 2004.
* Cost for federal income tax purposes is $796,750,731. Net unrealized appreciation consists of:
Gross Unrealized Appreciation | | $ | 95,972,084 | |
Gross Unrealized Depreciation | | (8,630,317 | ) |
Net Unrealized Appreciation | | $ | 87,341,767 | |
Information concerning open futures contracts at December 31, 2004 is shown below:
Long Contracts | | No. of
Contracts | | Notional
Market Value | | Expiration
Date | | Unrealized
Gain | |
MidCap 400 Future | | 28 | | $9,314,900 | | 03/18/2005 | | $20,748 | |
See Accompanying Notes to Financial Statements
54
| PORTFOLIO OF INVESTMENTS |
ING VP INDEX PLUS SMALLCAP PORTFOLIO | AS OF DECEMBER 31, 2004 |
Shares | | | | | | Value | |
COMMON STOCK: 99.4% | | | |
| | | | Advertising: 0.3% | | | |
35,600 | | | | Advo, Inc. | | $ | 1,269,140 | |
| | | | | | 1,269,140 | |
| | | | Aerospace/Defense: 2.5% | | | |
18,550 | | @ | | AAR Corp. | | 252,651 | |
38,825 | | @,L | | Armor Holdings, Inc. | | 1,825,552 | |
14,925 | | | | Curtiss-Wright Corp. | | 856,844 | |
53,300 | | @,L | | DRS Technologies, Inc. | | 2,276,442 | |
12,800 | | | | EDO Corp. | | 406,400 | |
17,750 | | @ | | Esterline Technologies Corp. | | 579,538 | |
14,225 | | | | Kaman Corp. | | 179,946 | |
48,550 | | @ | | Moog, Inc. | | 2,201,743 | |
39,800 | | @ | | Teledyne Technologies, Inc. | | 1,171,314 | |
10,025 | | @ | | Triumph Group, Inc. | | 395,988 | |
| | | | | | 10,146,418 | |
| | | | Agriculture: 0.2% | | | |
25,275 | | | | Delta & Pine Land Co. | | 689,502 | |
26,625 | | | | Dimon, Inc. | | 178,920 | |
| | | | | | 868,422 | |
| | | | Airlines: 0.2% | | | |
29,350 | | @,L | | Mesa Air Group, Inc. | | 233,039 | |
38,775 | | | | Skywest, Inc. | | 777,827 | |
| | | | | | 1,010,866 | |
| | | | Apparel: 2.4% | | | |
16,050 | | @ | | Ashworth, Inc. | | 174,785 | |
18,100 | | @ | | Gymboree Corp. | | 232,042 | |
8,675 | | | | Haggar Corp. | | 203,680 | |
66,225 | | | | K-Swiss, Inc. | | 1,928,471 | |
32,975 | | | | Kellwood Co. | | 1,137,638 | |
7,329 | | | | Oshkosh B’Gosh, Inc. | | 156,841 | |
9,575 | | L | | Oxford Industries, Inc. | | 395,448 | |
56,550 | | | | Phillips-Van Heusen Corp. | | 1,526,850 | |
38,875 | | @ | | Quiksilver, Inc. | | 1,158,086 | |
18,700 | | | | Russell Corp. | | 364,276 | |
23,650 | | | | Stride Rite Corp. | | 264,171 | |
70,550 | | | | Wolverine World Wide, Inc. | | 2,216,680 | |
| | | | | | 9,758,968 | |
| | | | Auto Manufacturers: 0.5% | | | |
24,625 | | | | Oshkosh Truck Corp. | | 1,683,857 | |
21,750 | | @ | | Wabash National Corp. | | 585,728 | |
| | | | | | 2,269,585 | |
| | | | Auto Parts and Equipment: 0.2% | | | |
13,325 | | | | Standard Motor Products, Inc. | | 210,535 | |
16,550 | | | | Superior Industries Intl., Inc. | | 480,778 | |
| | | | | | 691,313 | |
| | | | Banks: 6.7% | | | |
31,487 | | | | Chittenden Corp. | | 904,622 | |
20,275 | | | | Community Bank System, Inc. | | 572,769 | |
35,900 | | | | East-West Bancorp, Inc. | | 1,506,363 | |
58,950 | | @@ | | First Bancorp Puerto Rico | | 3,743,914 | |
31,237 | | | | First Midwest Bancorp, Inc. | | 1,133,591 | |
9,794 | | L | | First Republic Bank | | 519,082 | |
132,750 | | | | Fremont General Corp. | | 3,342,644 | |
24,250 | | | | Gold Banc Corp., Inc. | | 354,535 | |
32,575 | | | | Hudson United BanCorp | | 1,282,804 | |
22,947 | | | | Irwin Financial Corp. | | 651,465 | |
13,975 | | | | Nara Bancorp, Inc. | | $ | 297,248 | |
24,550 | | | | PrivateBancorp, Inc. | | 791,247 | |
21,714 | | | | Provident Bankshares Corp. | | 789,738 | |
53,342 | | | | Republic Bancorp, Inc. | | 815,066 | |
80,350 | | | | South Financial Group, Inc. | | 2,613,785 | |
45,900 | | | | Southwest Bancorp of Texas, Inc. | | 1,069,011 | |
50,813 | | | | Sterling Bancshares, Inc. | | 725,102 | |
30,575 | | | | Susquehanna Bancshares, Inc. | | 762,846 | |
48,173 | | L | | Trustco Bank Corp. | | 664,306 | |
32,225 | | | | UCBH Holdings, Inc. | | 1,476,549 | |
29,900 | | | | Umpqua Holdings Corp. | | 753,779 | |
29,900 | | | | United Bankshares, Inc. | | 1,140,685 | |
27,201 | | | | Whitney Holding Corp. | | 1,223,773 | |
13,575 | | | | Wintrust Financial Corp. | | 773,232 | |
| | | | | | 27,908,156 | |
| | | | Biotechnology: 0.5% | | | |
49,625 | | @ | | Arqule, Inc. | | 287,329 | |
16,750 | | | | Cambrex Corp. | | 453,925 | |
19,875 | | @,L | | Integra LifeSciences Holdings Corp. | | 733,983 | |
38,475 | | @ | | Regeneron Pharmaceuticals, Inc. | | 354,355 | |
21,025 | | @,L | | Savient Pharmaceuticals, Inc. | | 56,978 | |
| | | | | | 1,886,570 | |
| | | | Building Materials: 1.5% | | | |
6,150 | | | | Apogee Enterprises, Inc. | | 82,472 | |
31,125 | | L | | Florida Rock Industries, Inc. | | 1,852,871 | |
15,652 | | | | Lennox Intl., Inc. | | 318,518 | |
32,603 | | | | Simpson Manufacturing Co., Inc. | | 1,137,845 | |
39,450 | | | | Texas Industries, Inc. | | 2,460,891 | |
12,300 | | | | Universal Forest Products, Inc. | | 533,820 | |
| | | | | | 6,386,417 | |
| | | | Chemicals: 2.0% | | | |
17,360 | | | | A. Schulman, Inc. | | 371,678 | |
16,350 | | L | | Arch Chemicals, Inc. | | 470,553 | |
55,325 | | | | Georgia Gulf Corp. | | 2,755,184 | |
18,800 | | | | HB Fuller Co. | | 535,988 | |
20,525 | | | | Macdermid, Inc. | | 740,953 | |
51,450 | | @ | | OM Group, Inc. | | 1,668,008 | |
60,877 | | @ | | Omnova Solutions, Inc. | | 342,129 | |
6,850 | | | | Penford Corp. | | 107,751 | |
105,000 | | @ | | PolyOne Corp. | | 951,300 | |
5,700 | | | | Quaker Chemical Corp. | | 141,588 | |
| | | | | | 8,085,132 | |
| | | | Coal: 0.4% | | | |
52,100 | | | | Massey Energy Co. | | 1,820,895 | |
| | | | | | 1,820,895 | |
| | | | Commercial Services: 3.7% | | | |
32,387 | | | | Aaron Rents, Inc. | | 809,675 | |
31,375 | | | | ABM Industries, Inc. | | 618,715 | |
46,900 | | @,L | | Administaff, Inc. | | 591,409 | |
21,525 | | @ | | Arbitron, Inc. | | 843,349 | |
22,800 | | L | | Bowne & Co., Inc. | | 370,728 | |
23,050 | | | | Central Parking Corp. | | 349,208 | |
13,875 | | | | Chemed Corp. | | 931,150 | |
13,675 | | @ | | Coinstar, Inc. | | 366,900 | |
26,425 | | @ | | Consolidated Graphics, Inc. | | 1,212,907 | |
See Accompanying Notes to Financial Statements
55
| PORTFOLIO OF INVESTMENTS |
ING VP INDEX PLUS SMALLCAP PORTFOLIO | AS OF DECEMBER 31, 2004 (CONTINUED) |
Shares | | | | | | Value | |
| | | | Commercial Services (continued) | | | |
10,150 | | | | CPI Corp. | | $ | 137,939 | |
19,325 | | @ | | Cross Country Healthcare, Inc. | | 349,396 | |
11,650 | | @ | | Heidrick & Struggles Intl., Inc. | | 399,246 | |
40,750 | | | | Hooper Holmes, Inc. | | 241,240 | |
7,625 | | @ | | Insurance Auto Auctions, Inc. | | 170,953 | |
74,650 | | @,L | | Labor Ready, Inc. | | 1,263,077 | |
16,400 | | @ | | Maximus, Inc. | | 510,368 | |
14,725 | | @ | | Midas, Inc. | | 294,500 | |
19,425 | | @ | | NCO Group, Inc. | | 502,136 | |
9,025 | | @ | | On Assignment, Inc. | | 46,840 | |
16,900 | | @,L | | Parexel Intl. Corp. | | 343,070 | |
41,300 | | @,L | | Pharmaceutical Product Development, Inc. | | 1,705,276 | |
10,550 | | L | | Pre-Paid Legal Services, Inc. | | 396,153 | |
40,000 | | @,L | | PRG-Schultz Intl., Inc. | | 201,200 | |
10,550 | | @,L | | SFBC Intl., Inc. | | 416,725 | |
9,125 | | @ | | SourceCorp., Inc. | | 174,379 | |
3,575 | | L | | Startek, Inc. | | 101,709 | |
20,475 | | @,L | | Vertrue, Inc. | | 773,341 | |
13,075 | | | | Viad Corp. | | 372,507 | |
10,250 | | @ | | Volt Information Sciences, Inc. | | 301,248 | |
20,925 | | | | Watson Wyatt & Co. Holdings | | 563,929 | |
| | | | | | 15,359,273 | |
| | | | Computers: 3.2% | | | |
59,975 | | L | | Agilysys, Inc. | | 1,027,972 | |
17,600 | | @ | | Brooktrout, Inc. | | 211,376 | |
38,175 | | @ | | CACI Intl., Inc. | | 2,600,862 | |
26,975 | | @ | | Carreker Corp. | | 231,985 | |
28,750 | | @ | | Catapult Communications Corp. | | 694,600 | |
38,950 | | @,L | | Ciber, Inc. | | 375,478 | |
24,100 | | L | | Factset Research Systems, Inc. | | 1,408,404 | |
19,575 | | @,L | | Hutchinson Technology, Inc. | | 676,708 | |
22,087 | | @,L | | Kronos, Inc. | | 1,129,308 | |
20,025 | | @,L | | Manhattan Associates, Inc. | | 478,197 | |
13,000 | | @,L | | Mercury Computer Systems, Inc. | | 385,840 | |
25,175 | | @ | | Micros Systems, Inc. | | 1,965,161 | |
15,725 | | | | MTS Systems Corp. | | 531,662 | |
14,225 | | @,L | | Nyfix, Inc. | | 88,053 | |
12,700 | | @ | | Radiant Systems, Inc. | | 82,677 | |
17,300 | | @ | | Radisys Corp. | | 338,215 | |
18,050 | | @,L | | Synaptics, Inc. | | 551,969 | |
9,875 | | | | Talx Corp. | | 254,676 | |
| | | | | | 13,033,143 | |
| | | | Distribution/Wholesale: 1.5% | | | |
11,900 | | | | Advanced Marketing Services | | 119,714 | |
7,425 | | | | Building Material Holding Corp. | | 284,303 | |
44,900 | | | | Hughes Supply, Inc. | | 1,452,515 | |
26,275 | | | | Owens & Minor, Inc. | | 740,167 | |
8,825 | | @,L | | Scansource, Inc. | | 548,562 | |
38,837 | | | | SCP Pool Corp. | | 1,238,900 | |
23,000 | | @ | | United Stationers, Inc. | | 1,062,600 | |
18,200 | | | | Watsco, Inc. | | 641,004 | |
| | | | | | 6,087,765 | |
| | | | Diversified Financial Services: 0.5% | | | |
11,750 | | | | Financial Federal Corp. | | 460,600 | |
25,825 | | @ | | Investment Technology Group, Inc. | | 516,500 | |
13,125 | | @,L | | Piper Jaffray Cos. | | 629,343 | |
9,225 | | | | SWS Group, Inc. | | $ | 202,212 | |
11,850 | | @ | | World Acceptance Corp. | | 325,994 | |
| | | | | | 2,134,649 | |
| | | | Electric: 1.0% | | | |
35,900 | | | | Avista Corp. | | 634,353 | |
8,225 | | | | Central Vermont Public Service Corp. | | 191,314 | |
11,350 | | | | CH Energy Group, Inc. | | 545,368 | |
35,335 | | | | Cleco Corp. | | 715,886 | |
34,400 | | @ | | El Paso Electric Co. | | 651,536 | |
4,500 | | | | Green Mountain Power Corp. | | 129,735 | |
11,500 | | L | | UIL Holdings Corp. | | 589,950 | |
26,425 | | L | | Unisource Energy Corp. | | 637,107 | |
| | | | | | 4,095,249 | |
| | | | Electrical Components and Equipment: 1.0% | | | |
30,125 | | @ | | Artesyn Technologies, Inc. | | 340,413 | |
33,062 | | L | | Belden CDT, Inc. | | 767,038 | |
15,900 | | | | C&D Technologies, Inc. | | 270,936 | |
15,850 | | @ | | Intermagnetics General Corp. | | 402,749 | |
17,300 | | @ | | Littelfuse, Inc. | | 590,968 | |
37,325 | | @,L | | Rayovac Corp. | | 1,140,651 | |
11,997 | | | | Vicor Corp. | | 157,281 | |
14,725 | | @,L | | Wilson Greatbatch Technologies, Inc. | | 330,135 | |
| | | | | | 4,000,171 | |
| | | | Electronics: 4.0% | | | |
10,975 | | | | Analogic Corp. | | 491,570 | |
19,675 | | | | BEI Technologies, Inc. | | 607,564 | |
14,775 | | | | Bel Fuse, Inc. | | 499,247 | |
12,700 | | @ | | Benchmark Electronics, Inc. | | 433,070 | |
43,794 | | | | Brady Corp. | | 2,740,191 | |
22,668 | | @ | | Checkpoint Systems, Inc. | | 409,157 | |
22,400 | | @ | | Coherent, Inc. | | 681,856 | |
8,475 | | | | CTS Corp. | | 112,633 | |
16,800 | | L | | Cubic Corp. | | 422,856 | |
10,100 | | @ | | Cymer, Inc. | | 298,354 | |
12,300 | | @ | | Daktronics, Inc. | | 306,147 | |
16,505 | | @ | | Dionex Corp. | | 935,338 | |
22,375 | | @ | | Electro Scientific Industries, Inc. | | 442,130 | |
9,075 | | @,L | | FEI Co. | | 190,575 | |
26,325 | | @,L | | Flir Systems, Inc. | | 1,679,272 | |
6,200 | | @,L | | Itron, Inc. | | 148,242 | |
18,650 | | | | Keithley Instruments, Inc. | | 367,405 | |
8,425 | | @ | | Meade Instruments Corp. | | 28,898 | |
29,250 | | | | Methode Electronics, Inc. | | 375,863 | |
15,225 | | | | Park Electrochemical Corp. | | 330,078 | |
52,300 | | @ | | Paxar Corp. | | 1,159,491 | |
4,850 | | @ | | Rogers Corp. | | 209,035 | |
9,075 | | @ | | SBS Technologies, Inc. | | 126,687 | |
14,775 | | @,L | | Sonic Solutions, Inc. | | 331,551 | |
25,475 | | @ | | Technitrol, Inc. | | 463,645 | |
39,750 | | @ | | Trimble Navigation Ltd. | | 1,313,340 | |
22,550 | | | | Watts Industries, Inc. | | 727,012 | |
7,281 | | | | Woodward Governor Co. | | 521,392 | |
17,225 | | | | X-Rite, Inc. | | 275,772 | |
| | | | | | 16,628,371 | |
| | | | Energy-Alternate Sources: 0.1% | | | |
21,625 | | @,L | | Headwaters, Inc. | | 616,313 | |
| | | | | | 616,313 | |
See Accompanying Notes to Financial Statements
56
| PORTFOLIO OF INVESTMENTS |
ING VP INDEX PLUS SMALLCAP PORTFOLIO | AS OF DECEMBER 31, 2004 (CONTINUED) |
Shares | | | | | | Value | |
| | | | Engineering and Construction: 0.5% | | | |
17,900 | | @ | | Emcor Group, Inc. | | $ | 808,722 | |
17,300 | | @ | | Insituform Technologies, Inc. | | 392,191 | |
29,650 | | @ | | URS Corp. | | 951,765 | |
| | | | | | 2,152,678 | |
| | | | Entertainment: 0.6% | | | |
36,675 | | @ | | Argosy Gaming Co. | | 1,712,722 | |
21,275 | | @ | | Pinnacle Entertainment, Inc. | | 420,820 | |
5,550 | | @,L | | Shuffle Master, Inc. | | 261,405 | |
| | | | | | 2,394,947 | |
| | | | Environmental Control: 0.4% | | | |
32,572 | | @,L | | Aleris Intl., Inc. | | 551,118 | |
33,800 | | @.L | | Waste Connections, Inc. | | 1,157,650 | |
| | | | | | 1,708,768 | |
| | | | Food: 2.3% | | | |
58,150 | | | | Corn Products Intl., Inc. | | 3,114,513 | |
29,925 | | | | Flowers Foods, Inc. | | 945,032 | |
10,250 | | @,L | | Great Atlantic & Pacific Tea Co. | | 105,063 | |
22,000 | | @ | | Hain Celestial Group, Inc. | | 454,740 | |
6,807 | | | | J&J Snack Foods Corp. | | 333,747 | |
35,074 | | | | Lance, Inc. | | 667,458 | |
20,925 | | | | Nash Finch Co. | | 790,128 | |
29,650 | | @ | | Performance Food Group Co. | | 797,882 | |
20,325 | | | | Ralcorp Holdings, Inc. | | 852,227 | |
24,775 | | L | | Sanderson Farms, Inc. | | 1,072,262 | |
10,450 | | @,L | | United Natural Foods, Inc. | | 324,995 | |
| | | | | | 9,458,047 | |
| | | | Forest Products and Paper: 0.9% | | | |
21,025 | | @ | | Buckeye Technologies, Inc. | | 273,535 | |
15,175 | | @ | | Caraustar Industries, Inc. | | 255,244 | |
8,121 | | | | Deltic Timber Corp. | | 344,736 | |
10,850 | | @,L | | Neenah Paper, Inc. | | 353,710 | |
14,675 | | | | Pope & Talbot, Inc. | | 251,089 | |
20,525 | | | | Rock-Tenn Co. | | 311,159 | |
10,450 | | | | Schweitzer-Mauduit Intl., Inc. | | 354,778 | |
88,475 | | | | Wausau-Mosinee Paper Corp. | | 1,580,163 | |
| | | | | | 3,724,414 | |
| | | | Gas: 3.0% | | | |
59,100 | | | | Atmos Energy Corp. | | 1,616,385 | |
42,675 | | | | Energen Corp. | | 2,515,691 | |
16,250 | | | | Laclede Group, Inc. | | 506,188 | |
7,050 | | L | | New Jersey Resources Corp. | | 305,547 | |
19,225 | | | | Northwest Natural Gas Co. | | 648,652 | |
54,175 | | L | | Piedmont Natural Gas Co. | | 1,259,027 | |
63,552 | | @ | | Southern Union Co. | | 1,523,977 | |
26,325 | | | | Southwest Gas Corp. | | 668,655 | |
82,936 | | | | UGI Corp. | | 3,392,911 | |
| | | | | | 12,437,033 | |
| | | | Hand/Machine Tools: 0.3% | | | |
20,275 | | | | Baldor Electric Co. | | 558,171 | |
16,850 | | | | Regal-Beloit Corp. | | 481,910 | |
| | | | | | 1,040,081 | |
| | | | Healthcare-Products: 5.6% | | | |
25,175 | | @,L | | Advanced Medical Optics, Inc. | | 1,035,700 | |
23,150 | | @ | | American Medical Systems Holdings, Inc. | | 967,902 | |
15,575 | | @,L | | Arthrocare Corp. | | 499,335 | |
11,200 | | @,L | | Biosite, Inc. | | $ | 689,248 | |
19,175 | | @,L | | Conmed Corp. | | 544,954 | |
22,550 | | L | | Cooper Cos., Inc. | | 1,591,804 | |
10,201 | | | | Datascope Corp. | | 404,878 | |
20,375 | | | | Diagnostic Products Corp. | | 1,121,644 | |
15,725 | | @,L | | DJ Orthopedics, Inc. | | 336,830 | |
46,700 | | @ | | Haemonetics Corp. | | 1,691,006 | |
11,700 | | @ | | Hologic, Inc. | | 321,399 | |
7,625 | | @,L | | ICU Medical, Inc. | | 208,468 | |
24,925 | | @ | | Idexx Laboratories, Inc. | | 1,360,655 | |
54,937 | | @ | | Immucor, Inc. | | 1,291,568 | |
21,900 | | | | Invacare Corp. | | 1,013,094 | |
6,950 | | @,L | | Kensey Nash Corp. | | 239,984 | |
15,700 | | | | LCA-Vision, Inc. | | 367,223 | |
28,450 | | | | Mentor Corp. | | 959,903 | |
14,275 | | @ | | Merit Medical Systems, Inc. | | 218,122 | |
6,700 | | | | PolyMedica Corp. | | 249,843 | |
10,850 | | @ | | Possis Medical, Inc. | | 146,258 | |
23,800 | | @,L | | Resmed, Inc. | | 1,216,179 | |
41,250 | | @ | | Respironics, Inc. | | 2,242,349 | |
37,125 | | @ | | Sola Intl., Inc. | | 1,022,423 | |
11,650 | | @,L | | Surmodics, Inc. | | 378,742 | |
45,900 | | @ | | Sybron Dental Specialties, Inc. | | 1,623,941 | |
22,600 | | @ | | Viasys Healthcare, Inc. | | 429,400 | |
24,550 | | | | Vital Signs, Inc. | | 955,486 | |
| | | | | | 23,128,338 | |
| | | | Healthcare-Services: 3.7% | | | |
28,500 | | @,L | | Amedisys, Inc. | | 923,115 | |
22,800 | | @,L | | American Healthways, Inc. | | 753,312 | |
43,525 | | @ | | Amerigroup Corp. | | 3,293,101 | |
18,875 | | @,L | | Amsurg Corp. | | 557,568 | |
75,400 | | @,L | | Centene Corp. | | 2,137,590 | |
15,325 | | @ | | Gentiva Health Services, Inc. | | 256,234 | |
10,400 | | @,L | | LabOne, Inc. | | 333,216 | |
16,700 | | @ | | Pediatrix Medical Group, Inc. | | 1,069,635 | |
31,825 | | @ | | Province Healthcare Co. | | 711,289 | |
31,125 | | @ | | Rehabcare Group, Inc. | | 871,189 | |
48,825 | | @ | | Sierra Health Services, Inc. | | 2,690,745 | |
14,425 | | @,L | | Sunrise Senior Living, Inc. | | 668,743 | |
21,025 | | @ | | United Surgical Partners Intl., Inc. | | 876,743 | |
| | | | | | 15,142,480 | |
| | | | Home Builders: 2.6% | | | |
41,825 | | @,L | | Champion Enterprises, Inc. | | 494,372 | |
8,660 | | | | Mdc Holdings, Inc. | | 748,570 | |
8,875 | | @ | | Meritage Homes Corp. | | 1,000,213 | |
19,225 | | | | Monaco Coach Corp. | | 395,458 | |
8,125 | | @,L | | NVR, Inc. | | 6,251,374 | |
7,975 | | | | Skyline Corp. | | 325,380 | |
9,825 | | | | Standard-Pacific Corp. | | 630,176 | |
23,750 | | | | Winnebago Industries, Inc. | | 927,675 | |
| | | | | | 10,773,218 | |
| | | | Home Furnishings: 0.4% | | | |
9,657 | | | | Bassett Furniture Industries, Inc. | | 189,519 | |
27,375 | | | | Ethan Allen Interiors, Inc. | | 1,095,547 | |
29,821 | | | | Fedders Corp. | | 107,952 | |
12,300 | | | | La-Z-Boy, Inc. | | 189,051 | |
| | | | | | 1,582,069 | |
See Accompanying Notes to Financial Statements
| PORTFOLIO OF INVESTMENTS |
ING VP INDEX PLUS SMALLCAP PORTFOLIO | AS OF DECEMBER 31, 2004 (CONTINUED) |
Shares | | | | | | Value | |
| | | | Household Products/Wares: 0.6% | | | |
52,900 | | @ | | Fossil, Inc. | | $ | 1,356,356 | |
17,650 | | L | | Harland John H. Co. | | 637,165 | |
13,125 | | | | Russ Berrie & Co., Inc. | | 299,775 | |
9,975 | | | | WD-40 Co. | | 283,390 | |
| | | | | | 2,576,686 | |
| | | | Housewares: 0.9% | | | |
9,325 | | @ | | Enesco Group, Inc. | | 75,346 | |
8,775 | | | | Libbey, Inc. | | 194,893 | |
3,917 | | | | National Presto Industries, Inc. | | 178,224 | |
39,550 | | | | Toro Co. | | 3,217,392 | |
| | | | | | 3,665,855 | |
| | | | Insurance: 3.9% | | | |
38,251 | | | | Delphi Financial Group, Inc. | | 1,765,284 | |
23,750 | | L | | Hilb Rogal & Hamilton Co. | | 860,700 | |
32,125 | | L | | Landamerica Financial Group, Inc. | | 1,732,501 | |
26,042 | | @ | | Philadelphia Consolidated Holding Co. | | 1,722,418 | |
19,375 | | | | Presidential Life Corp. | | 328,600 | |
33,850 | | @ | | Proassurance Corp. | | 1,323,874 | |
16,850 | | | | RLI Corp. | | 700,455 | |
934 | | @ | | SCPIE Holdings, Inc. | | 9,247 | |
49,378 | | | | Selective Insurance Group, Inc. | | 2,184,482 | |
20,425 | | | | Stewart Information Services Corp. | | 850,701 | |
82,200 | | | | UICI | | 2,786,579 | |
34,800 | | L | | Zenith National Insurance Corp. | | 1,734,432 | |
| | | | | | 15,999,273 | |
| | | | Internet: 1.2% | | | |
27,900 | | @,L | | Digital Insight Corp. | | 513,360 | |
34,700 | | @ | | Internet Security Systems, Inc. | | 806,775 | |
15,375 | | @,L | | j2 Global Communications, Inc. | | 530,438 | |
21,075 | | @ | | PC-Tel, Inc. | | 167,125 | |
47,550 | | @ | | Verity, Inc. | | 623,856 | |
31,275 | | @,L | | Webex Communications, Inc. | | 743,720 | |
30,150 | | @ | | Websense, Inc. | | 1,529,207 | |
| | | | | | 4,914,481 | |
| | | | Iron/Steel: 0.7% | | | |
16,250 | | L | | Carpenter Technology Corp. | | 949,975 | |
6,750 | | L | | Cleveland-Cliffs, Inc. | | 701,055 | |
7,100 | | @ | | Material Sciences Corp. | | 127,729 | |
21,675 | | | | Reliance Steel & Aluminum Co. | | 844,458 | |
15,025 | | | | Ryerson Tull, Inc. | | 236,644 | |
| | | | | | 2,859,861 | |
| | | | Leisure Time: 1.1% | | | |
27,025 | | | | Arctic Cat, Inc. | | 716,703 | |
9,675 | | @,L | | K2, Inc. | | 153,639 | |
59,825 | | L | | Nautilus Group, Inc. | | 1,445,970 | |
5,800 | | @ | | Pegasus Solutions, Inc. | | 73,080 | |
31,475 | | | | Polaris Industries, Inc. | | 2,140,930 | |
| | | | | | 4,530,322 | |
| | | | Lodging: 0.3% | | | |
23,000 | | @ | | Aztar Corp. | | 803,160 | |
20,125 | | | | Marcus Corp. | | 505,943 | |
| | | | | | 1,309,103 | |
| | | | Machinery-Construction and Mining: 0.1% | | | |
21,074 | | @ | | Astec Industries, Inc. | | $ | 362,684 | |
| | | | | | 362,684 | |
| | | | Machinery-Diversified: 1.7% | | | |
21,645 | | | | Albany Intl. Corp. | | 761,038 | |
35,825 | | | | Applied Industrial Technologies, Inc. | | 981,605 | |
14,287 | | L | | Briggs & Stratton Corp. | | 594,053 | |
32,575 | | L | | Cognex Corp. | | 908,843 | |
12,000 | | @ | | Gardner Denver, Inc. | | 435,480 | |
19,475 | | @ | | Gerber Scientific, Inc. | | 148,205 | |
35,075 | | | | IDEX Corp. | | 1,420,537 | |
6,000 | | | | Lindsay Manufacturing Co. | | 155,280 | |
19,075 | | | | Manitowoc Co. | | 718,174 | |
16,750 | | | | Stewart & Stevenson Services, Inc. | | 338,853 | |
11,050 | | | | Thomas Industries, Inc. | | 441,116 | |
| | | | | | 6,903,184 | |
| | | | Media: 0.2% | | | |
8,875 | | @,L | | 4Kids Entertainment, Inc. | | 186,553 | |
25,675 | | | | Thomas Nelson, Inc. | | 580,255 | |
| | | | | | 766,808 | |
| | | | Metal Fabricate/Hardware: 2.0% | | | |
8,566 | | @ | | AM Castle & Co. | | 102,278 | |
18,875 | | | | Commercial Metals Co. | | 954,320 | |
32,295 | | | | Kaydon Corp. | | 1,066,381 | |
16,959 | | | | Lawson Products, Inc. | | 855,242 | |
32,025 | | @,L | | Maverick Tube Corp. | | 970,358 | |
41,250 | | | | Mueller Industries, Inc. | | 1,328,250 | |
10,600 | | | | Quanex Corp. | | 726,842 | |
67,125 | | | | Timken Co. | | 1,746,592 | |
16,397 | | | | Valmont Industries, Inc. | | 411,729 | |
24,525 | | @ | | Wolverine Tube, Inc. | | 316,618 | |
| | | | | | 8,478,610 | |
| | | | Mining: 0.4% | | | |
16,750 | | | | AMCOL Intl. Corp. | | 336,508 | |
11,600 | | @ | | Brush Engineered Materials, Inc. | | 214,600 | |
20,775 | | @ | | Century Aluminum Co. | | 545,552 | |
36,275 | | @ | | RTI International Metals, Inc. | | 745,088 | |
| | | | | | 1,841,748 | |
| | | | Miscellaneous Manufacturing: 2.1% | | | |
28,500 | | | | Acuity Brands, Inc. | | 906,300 | |
7,775 | | | | AO Smith Corp. | | 232,784 | |
24,625 | | | | AptarGroup, Inc. | | 1,299,707 | |
14,075 | | | | Barnes Group, Inc. | | 373,128 | |
11,550 | | @,L | | Ceradyne, Inc. | | 660,776 | |
17,400 | | | | Clarcor, Inc. | | 952,998 | |
11,500 | | @ | | Cuno, Inc. | | 683,100 | |
19,270 | | @ | | Griffon Corp. | | 520,290 | |
5,500 | | @ | | Lydall, Inc. | | 65,230 | |
2,000 | | @,I,X | | Masco Tech, Inc. | | — | |
18,387 | | | | Myers Industries, Inc. | | 235,354 | |
30,200 | | | | Roper Industries, Inc. | | 1,835,253 | |
9,465 | | | | Standex Intl. Corp. | | 269,658 | |
17,300 | | | | Sturm Ruger & Co., Inc. | | 156,219 | |
24,050 | | | | Tredegar Corp. | | 486,051 | |
| | | | | | 8,676,848 | |
See Accompanying Notes to Financial Statements
58
| PORTFOLIO OF INVESTMENTS |
ING VP INDEX PLUS SMALLCAP PORTFOLIO | AS OF DECEMBER 31, 2004 (CONTINUED) |
Shares | | | | | | Value | |
| | | | Office Furnishings: 0.1% | | | |
29,500 | | @ | | Interface, Inc. | | $ | 294,115 | |
| | | | | | 294,115 | |
| | | | Office/Business Equipment: 0.3% | | | |
29,650 | | @,L | | Global Imaging Systems, Inc. | | 1,171,175 | |
4,700 | | @ | | Imagistics Intl., Inc. | | 158,202 | |
| | | | | | 1,329,377 | |
| | | | Oil and Gas: 3.7% | | | |
11,500 | | @ | | Atwood Oceanics, Inc. | | 599,150 | |
24,200 | | | | Cabot Oil & Gas Corp. | | 1,070,850 | |
49,625 | | @ | | Cimarex Energy Co. | | 1,880,787 | |
32,625 | | | | Frontier Oil Corp. | | 869,783 | |
52,036 | | | | Patina Oil & Gas Corp. | | 1,951,349 | |
29,300 | | @ | | Petroleum Development Corp. | | 1,130,101 | |
53,575 | | @ | | Remington Oil & Gas Corp. | | 1,459,919 | |
26,475 | | @ | | Southwestern Energy Co. | | 1,342,018 | |
25,225 | | @ | | Spinnaker Exploration Co. | | 884,641 | |
20,625 | | | | St. Mary Land & Exploration Co. | | 860,888 | |
32,425 | | @,L | | Stone Energy Corp. | | 1,462,042 | |
33,125 | | @ | | Swift Energy Co. | | 958,638 | |
12,750 | | @ | | Unit Corp. | | 487,178 | |
18,400 | | | | Vintage Petroleum, Inc. | | 417,496 | |
| | | | | | 15,374,840 | |
| | | | Oil and Gas Services: 1.8% | | | |
46,100 | | @ | | Cal Dive Intl., Inc. | | 1,878,574 | |
11,950 | | | | Carbo Ceramics, Inc. | | 824,550 | |
11,700 | | @ | | Dril-Quip, Inc. | | 283,842 | |
27,950 | | @ | | Hydril Co. | | 1,272,005 | |
20,725 | | @ | | Lone Star Technologies, Inc. | | 693,459 | |
18,550 | | @,L | | Oceaneering Intl., Inc. | | 692,286 | |
13,725 | | @,L | | Seacor Smit, Inc. | | 732,915 | |
5,750 | | @ | | Tetra Technologies, Inc. | | 162,725 | |
22,850 | | @ | | Veritas DGC, Inc. | | 512,069 | |
19,425 | | @ | | W-H Energy Services, Inc. | | 434,343 | |
| | | | | | 7,486,768 | |
| | | | Packaging and Containers: 0.1% | | | |
11,350 | | | | Chesapeake Corp. | | 308,266 | |
| | | | | | 308,266 | |
| | | | Pharmaceuticals: 1.5% | | | |
34,200 | | @ | | Accredo Health, Inc. | | 948,024 | |
60,875 | | | | Alpharma, Inc. | | 1,031,831 | |
9,675 | | @,L | | Bradley Pharmaceuticals, Inc. | | 187,695 | |
40,850 | | | | Medicis Pharmaceutical Corp. | | 1,434,244 | |
26,175 | | | | Natures Sunshine Prods, Inc. | | 532,923 | |
47,700 | | @,L | | NBTY, Inc. | | 1,145,277 | |
27,400 | | @ | | Noven Pharmaceuticals, Inc. | | 467,444 | |
12,133 | | @,L | | Priority Healthcare Corp. | | 264,135 | |
18,300 | | @ | | Theragenics Corp. | | 74,298 | |
| | | | | | 6,085,871 | |
| | | | Real Estate Investment Trusts: 2.9% | | | |
25,925 | | L | | Capital Automotive | | 920,985 | |
18,650 | | L | | Colonial Properties Trust | | 732,386 | |
35,250 | | | | Commercial Net Lease Realty | | 726,150 | |
16,950 | | | | Entertainment Properties Trust | | 755,123 | |
16,000 | | | | Essex Property Trust, Inc. | | 1,340,799 | |
7,775 | | | | Gables Residential Trust | | 278,267 | |
21,125 | | | | Glenborough Realty Trust, Inc. | | 449,540 | |
19,825 | | | | Kilroy Realty Corp. | | 847,519 | |
30,675 | | L | | Lexington Corporate Properties Trust | | $ | 692,642 | |
68,350 | | | | New Century Financial Corp. | | 4,368,248 | |
2,975 | | | | Parkway Properties, Inc. | | 150,981 | |
11,250 | | L | | Shurgard Storage Centers, Inc. | | 495,113 | |
9,775 | | | | Sovran Self Storage, Inc. | | 411,919 | |
| | | | | | 12,169,672 | |
| | | | Retail: 7.4% | | | |
11,100 | | | | Brown Shoe Co., Inc. | | 331,113 | |
29,450 | | | | Burlington Coat Factory Warehouse Corp. | | 668,515 | |
36,050 | | | | Casey’s General Stores, Inc. | | 654,308 | |
18,250 | | | | Cash America Intl., Inc. | | 542,573 | |
36,775 | | | | Cato Corp. | | 1,059,855 | |
46,500 | | @ | | CEC Entertainment, Inc. | | 1,858,604 | |
18,925 | | @,L | | Childrens Place Retail Stores, Inc. | | 700,793 | |
23,675 | | | | Christopher & Banks Corp. | | 436,804 | |
20,375 | | @ | | Dress Barn, Inc. | | 358,600 | |
17,183 | | @ | | Electronics Boutique Holdings Corp. | | 737,838 | |
59,775 | | @ | | GameStop Corp. | | 1,339,557 | |
13,575 | | @,L | | Genesco, Inc. | | 422,726 | |
31,425 | | | | Goody’s Family Clothing, Inc. | | 287,225 | |
14,925 | | @ | | Group 1 Automotive, Inc. | | 470,138 | |
17,250 | | @,L | | Guitar Center, Inc. | | 908,903 | |
13,725 | | | | Haverty Furniture Cos., Inc. | | 253,913 | |
14,325 | | @,L | | Hibbett Sporting Goods, Inc. | | 381,188 | |
11,525 | | @,L | | HOT Topic, Inc. | | 198,115 | |
13,725 | | | | Ihop Corp. | | 574,940 | |
11,750 | | @,L | | Insight Enterprises, Inc. | | 241,110 | |
35,450 | | @ | | J Jill Group, Inc. | | 527,851 | |
66,375 | | @ | | Jack in The Box, Inc. | | 2,447,245 | |
12,757 | | @ | | Jo-Ann Stores, Inc. | | 351,328 | |
19,225 | | L | | Landry’s Restaurants, Inc. | | 558,679 | |
12,450 | | @,L | | Linens ‘N Things, Inc. | | 308,760 | |
14,475 | | | | Lone Star Steakhouse & Saloon, Inc. | | 405,300 | |
25,225 | | | | Longs Drug Stores Corp. | | 695,453 | |
25,075 | | @,L | | Men’s Wearhouse, Inc. | | 801,397 | |
20,425 | | L | | Movie Gallery, Inc. | | 389,505 | |
11,250 | | @ | | O’Charleys, Inc. | | 219,938 | |
11,470 | | @ | | Papa John’s Intl., Inc. | | 395,027 | |
17,950 | | @ | | PF Chang’s China Bistro, Inc. | | 1,011,482 | |
22,675 | | @ | | Rare Hospitality Intl., Inc. | | 722,426 | |
25,875 | | @ | | Ryan’s Restaurant Group, Inc. | | 398,993 | |
15,125 | | @ | | School Specialty, Inc. | | 583,220 | |
24,350 | | @,L | | Select Comfort Corp. | | 436,839 | |
18,550 | | @ | | Shopko Stores, Inc. | | 346,514 | |
29,300 | | | | Sonic Automotive, Inc. | | 726,640 | |
40,793 | | @ | | Sonic Corp. | | 1,244,186 | |
12,700 | | @,L | | Stage Stores, Inc. | | 527,304 | |
17,250 | | @ | | Steak N Shake Co. | | 346,380 | |
76,750 | | @ | | Stein Mart, Inc. | | 1,309,354 | |
5,350 | | @ | | TBC Corp | | 148,730 | |
40,650 | | @ | | Too, Inc. | | 994,298 | |
27,950 | | @,L | | Tractor Supply Co. | | 1,040,019 | |
39,938 | | L | | Triarc Cos. | | 489,640 | |
36,375 | | @ | | Zale Corp. | | 1,086,520 | |
| | | | | | 30,939,846 | |
| | | | Savings and Loans: 2.0% | | | |
14,376 | | | | Anchor Bancorp Wisconsin, Inc. | | 419,060 | |
39,750 | | | | BankAtlantic Bancorp, Inc. | | 791,025 | |
See Accompanying Notes to Financial Statements
59
Shares | | Value | |
| | | | Savings and Loans (continued) | | | |
52,533 | | @ | | Bankunited Financial Corp. | | $ | 1,678,429 | |
26,575 | | | | Commercial Federal Corp. | | 789,543 | |
21,850 | | | | Dime Community Bancshares, Inc. | | 391,334 | |
19,125 | | | | Downey Financial Corp. | | 1,090,125 | |
11,400 | | @ | | Firstfed Financial Corp. | | 591,318 | |
16,600 | | | | Flagstar Bancorp, Inc. | | 375,160 | |
8,675 | | | | MAF Bancorp, Inc. | | 388,814 | |
14,300 | | @ | | Sterling Financial Corp. | | 561,418 | |
38,987 | | | | Waypoint Financial Corp. | | 1,105,281 | |
| | | | | | 8,181,507 | |
| | | | Semiconductors: 1.7% | | | |
19,450 | | @,L | | Actel Corp. | | 341,153 | |
46,550 | | @ | | Alliance Semiconductor Corp. | | 172,235 | |
23,200 | | @,L | | ATMI, Inc. | | 522,696 | |
74,400 | | @,L | | Axcelis Technologies, Inc. | | 604,872 | |
36,603 | | @ | | DSP Group, Inc. | | 817,344 | |
5,050 | | @,L | | Dupont Photomasks, Inc. | | 133,371 | |
32,225 | | @ | | Exar Corp. | | 457,273 | |
15,225 | | L | | Helix Technology Corp. | | 264,763 | |
37,725 | | @,L | | Kulicke & Soffa Industries, Inc. | | 325,190 | |
40,400 | | @,L | | Microsemi Corp. | | 701,343 | |
18,975 | | @,L | | Pericom Semiconductor Corp. | | 178,934 | |
25,150 | | @,L | | Photronics, Inc. | | 414,975 | |
40,450 | | @,L | | Skyworks Solutions, Inc. | | 381,444 | |
12,800 | | @ | | Standard Microsystems Corp. | | 228,224 | |
15,425 | | @ | | Supertex, Inc. | | 334,723 | |
26,975 | | @,L | | Varian Semiconductor Equipment Associates, Inc. | | 994,028 | |
7,725 | | @ | | Veeco Instruments, Inc. | | 162,766 | |
| | | | | | 7,035,334 | |
| | | | Software: 4.4% | | | |
20,125 | | @,L | | Altiris, Inc. | | 713,029 | |
60,275 | | @ | | Ansys, Inc. | | 1,932,416 | |
24,875 | | @,L | | Avid Technology, Inc. | | 1,536,031 | |
34,757 | | @ | | Captaris, Inc. | | 179,346 | |
25,275 | | @,L | | Cerner Corp. | | 1,343,872 | |
21,125 | | @,L | | Concord Communications, Inc. | | 234,065 | |
25,475 | | @ | | Dendrite Intl., Inc. | | 494,215 | |
40,850 | | @ | | Digi Intl., Inc. | | 702,212 | |
63,350 | | @ | | eFunds Corp. | | 1,521,034 | |
11,850 | | @,L | | EPIQ Systems, Inc. | | 173,484 | |
51,800 | | @ | | Filenet Corp. | | 1,334,368 | |
11,560 | | L | | Global Payments, Inc. | | 676,722 | |
28,100 | | @,L | | Hyperion Solutions Corp. | | 1,310,022 | |
20,850 | | | | Inter-Tel, Inc. | | 570,873 | |
19,975 | | @ | | JDA Software Group, Inc. | | 272,060 | |
24,400 | | @,L | | Mantech Intl. Corp. | | 579,256 | |
28,300 | | @ | | Mapinfo Corp. | | 339,034 | |
17,750 | | @ | | MRO Software, Inc. | | 231,105 | |
24,400 | | | | NDCHealth Corp. | | 453,596 | |
50,850 | | @ | | Phoenix Technologies Ltd. | | 420,021 | |
19,325 | | @ | | Pinnacle Systems, Inc. | | 117,883 | |
67,675 | | @ | | Progress Software Corp. | | 1,580,210 | |
29,300 | | @,L | | Serena Software, Inc. | | 634,052 | |
11,050 | | @ | | SPSS, Inc. | | 172,822 | |
28,600 | | @ | | THQ, Inc. | | 656,084 | |
| | | | | | 18,177,812 | |
| | | | Storage/Warehousing: 0.0% | | | |
3,725 | | @,L | | Mobile Mini, Inc. | | $ | 123,074 | |
| | | | | | 123,074 | |
| | | | Telecommunications: 1.6% | | | |
151,063 | | @,L | | Adaptec, Inc. | | 1,146,567 | |
53,000 | | @ | | Aeroflex, Inc. | | 642,360 | |
27,700 | | L | | Anixter Intl., Inc. | | 996,923 | |
8,250 | | | | Applied Signal Technology, Inc. | | 290,813 | |
12,050 | | | | Black Box Corp. | | 578,641 | |
5,400 | | @,L | | Boston Communications Group, Inc. | | 49,896 | |
34,950 | | @ | | C-COR.net Corp. | | 325,035 | |
26,525 | | @ | | Commonwealth Telephone Enterprises, Inc. | | 1,317,231 | |
8,625 | | @ | | General Communication, Inc. | | 95,220 | |
16,450 | | @ | | Intrado, Inc. | | 199,045 | |
15,175 | | @ | | Network Equipment Technologies, Inc. | | 149,019 | |
33,275 | | @ | | Symmetricom, Inc. | | 323,100 | |
6,600 | | @ | | Tollgrade Communications, Inc. | | 80,784 | |
21,550 | | @ | | Viasat, Inc. | | 523,019 | |
| | | | | | 6,717,653 | |
| | | | Textiles: 0.3% | | | |
5,750 | | | | Angelica Corp. | | 155,538 | |
23,687 | | | | G&K Services, Inc. | | 1,028,489 | |
| | | | | | 1,184,027 | |
| | | | Toys/Games/Hobbies: 0.3% | | | |
21,475 | | @ | | Department 56, Inc. | | 357,559 | |
31,225 | | @,L | | Jakks Pacific, Inc. | | 690,385 | |
| | | | | | 1,047,944 | |
| | | | Transportation: 3.4% | | | |
17,200 | | L | | Arkansas Best Corp. | | 772,108 | |
80,750 | | @,L | | EGL, Inc. | | 2,413,618 | |
25,325 | | @ | | Forward Air Corp. | | 1,132,028 | |
52,600 | | | | Heartland Express, Inc. | | 1,181,922 | |
15,025 | | @,L | | Kansas City Southern | | 266,393 | |
16,500 | | @ | | Kirby Corp. | | 732,270 | |
38,525 | | L | | Knight Transportation, Inc. | | 955,420 | |
35,850 | | @ | | Landstar System, Inc. | | 2,639,993 | |
43,525 | | @ | | Offshore Logistics, Inc. | | 1,413,257 | |
18,100 | | | | USF Corp. | | 686,895 | |
32,695 | | @,L | | Yellow Roadway Corp. | | 1,821,438 | |
| | | | | | 14,015,342 | |
| | | | Water: 0.0% | | | |
5,000 | | | | American States Water Co. | | 130,000 | |
| | | | | | 130,000 | |
| | | | Total Common Stock
(Cost $355,438,941) | | 411,085,800 | |
WARRANTS: 0.0% | | | | | |
| | | | Distribution/Wholesale: 0.0% | | | |
120 | | @,X | | Timco Aviation Services | | — | |
| | | | Total Warrants
(Cost $9) | | — | |
See Accompanying Notes to Financial Statements
60
Principal
Amount | | | | | | Value | |
CORPORATE BONDS/NOTES: 0.0% | | | |
| | | | Distribution/Wholesale: 0.0% | | | |
$ | 116 | | X | | Timco Aviation Services,
8.000%, due 01/02/07 | | $ | 1 | |
| | | | Total Corporate Bonds/Notes
(Cost $-) | | 1 | |
| | | | Total Long-Term Investments
(Cost $355,438,950) | | 411,085,801 | |
SHORT-TERM INVESTMENTS: 17.0% | | | |
| | | | Repurchase Agreement: 1.3% | | | | | |
5,226,000 | | | | Goldman Sachs Repurchase Agreement dated 12/31/04, 2.230%, due 01/03/05, $5,226,971 to be received upon repurchase (Collateralized by $5,220,000 Federal Home Loan Mortgage Corporation, 5.200%, Market Value plus accrued interest $5,331,099, due 02/04/19) | | | | 5,226,000 | |
| | | | Total Repurchase Agreement
(Cost $5,226,000) | | | | 5,226,000 | |
| | | | Securities Lending Collateralcc: 15.7% | | | | | |
65,009,000 | | | | The Bank of New York Institutional Cash Reserve Fund | | | | 65,009,000 | |
| | | | Total Securities Lending Collateral
(Cost $65,009,000) | | | | 65,009,000 | |
| | | | Total Short-Term Investments
(Cost $70,235,000) | | | | 70,235,000 | |
| | | | Total Investments In Securities (Cost $425,673,950)* | | 116.4 | % | $ | 481,320,801 | |
| | | | Other Assets and Liabilities-Net | | (16.4 | ) | (67,987,555 | ) |
| | | | Net Assets | | 100.0 | % | $ | 413,333,246 | |
| | | | | | | | | | | |
@ Non-income producing security
@@ Foreign issuer
cc Securities purchased with cash collateral for securities loaned.
I Illiquid security
L Loaned security, a portion or all of the security is on loan at December 31, 2004.
X Fair value determined by ING Funds Valuation Committee appointed by the Funds’ Board of Directors/Trustees.
* Cost for federal income tax purposes is $428,088,762. Net unrealized depreciation consists of:
| | | | Gross Unrealized Appreciation | | | | $ | 58,269,590 | |
| | | | Gross Unrealized Depreciation | | | | (5,037,551 | ) |
| | | | Net Unrealized Appreciation | | | | $ | 53,232,039 | |
See Accompanying Notes to Financial Statements
61
ING VP STRATEGIC ALLOCATION | PORTFOLIO OF INVESTMENTS |
BALANCED PORTFOLIO | AS OF DECEMBER 31, 2004 |
Shares | | Value | |
COMMON STOCK: 70.7% | | | |
| | | | Advertising: 0.1% | | | |
2,290 | | | | ADVO, Inc. | | $ | 81,639 | |
3,830 | | | | Catalina Marketing Corp. | | 113,482 | |
| | | | | | 195,121 | |
| | | | Aerospace/Defense: 2.0% | | | |
2,160 | | @ | | Alliant Techsystems, Inc. | | 141,221 | |
2,170 | | @ | | Armor Holdings, Inc. | | 102,033 | |
39,700 | | @,@@ | | BAE Systems PLC | | 175,383 | |
26,450 | | | | Boeing Co. | | 1,369,316 | |
1,980 | | @ | | DRS Technologies, Inc. | | 84,566 | |
8,800 | | | | General Dynamics Corp. | | 920,480 | |
18,150 | | | | Lockheed Martin Corp. | | 1,008,233 | |
1,889 | | @ | | Moog, Inc. | | 85,666 | |
21,650 | | | | Raytheon Co. | | 840,670 | |
2,515 | | @ | | Teledyne Technologies, Inc. | | 74,016 | |
5,900 | | | | United Technologies Corp. | | 609,765 | |
| | | | | | 5,411,349 | |
| | | | Agriculture: 0.8% | | | |
24,600 | | | | Altria Group, Inc. | | 1,503,060 | |
11,900 | | @@ | | Swedish Match AB | | 137,655 | |
10,345 | | | | UST, Inc. | | 497,698 | |
| | | | | | 2,138,413 | |
| | | | Airlines: 0.1% | | | |
2,300 | | @,L | | Alaska Air Group, Inc. | | 77,027 | |
30,300 | | @,@@ | | British Airways PLC | | 136,540 | |
| | | | | | 213,567 | |
| | | | Apparel: 0.9% | | | |
10,350 | | @ | | Coach, Inc. | | 583,740 | |
2,715 | | | | K-Swiss, Inc. | | 79,061 | |
2,130 | | | | Kellwood Co. | | 73,485 | |
10,750 | | | | Nike, Inc. | | 974,917 | |
8,000 | | @@ | | Onward Kashiyama Co., Ltd. | | 116,363 | |
2,620 | | | | Phillips-Van Heusen Corp. | | 70,740 | |
1,085 | | @ | | Quiksilver, Inc. | | 32,322 | |
5,900 | | | | VF Corp. | | 326,742 | |
2,775 | | | | Wolverine World Wide, Inc. | | 87,191 | |
| | | | | | 2,344,561 | |
| | | | Auto Manufacturers: 0.8% | | | |
71,750 | | L | | Ford Motor Co. | | 1,050,420 | |
49,000 | | @,@@,L | | Isuzu Motors Ltd. | | 144,871 | |
735 | | | | Oshkosh Truck Corp. | | 50,259 | |
9,700 | | | | PACCAR, Inc. | | 780,656 | |
2,200 | | @@ | | Peugeot SA | | 139,566 | |
| | | | | | 2,165,772 | |
| | | | Auto Parts and Equipment: 0.0% | | | |
3,050 | | | | Modine Manufacturing Co. | | 102,999 | |
| | | | | | 102,999 | |
| | | | Banks: 5.3% | | | |
3,450 | | @@ | | Alpha Bank AE | | 120,344 | |
5,796 | | | | Associated Banc-Corp. | | 192,485 | |
1,100 | | @@ | | Banco Itau Holding Financeira SA ADR | | 82,687 | |
2,700 | | @@ | | Banco Popular Espanol SA | | 177,777 | |
18,800 | | @@ | | Banco Santander Central Hispano SA | | 233,126 | |
47,800 | | | | Bank of America Corp. | | 2,246,123 | |
2,960 | | | | Bank of Hawaii Corp. | | 150,190 | |
10,500 | | @@ | | Bank of Ireland | | $ | 173,822 | |
3,040 | | | | Banknorth Group, Inc. | | 111,264 | |
7,090 | | | | Colonial Bancgroup, Inc. | | 150,521 | |
10,500 | | L | | Comerica, Inc. | | 640,710 | |
1,360 | | | | Commerce Bancorp, Inc. | | 87,584 | |
6,600 | | @@ | | Credit Agricole SA | | 199,227 | |
14,000 | | @@ | | DBS Group Holdings Ltd. | | 138,014 | |
9,400 | | @@ | | Depfa Bank PLC | | 158,336 | |
1,065 | | | | East-West Bancorp, Inc. | | 44,687 | |
2,085 | | @@ | | First Bancorp Puerto Rico | | 132,418 | |
6,200 | | @@ | | Fortis | | 171,293 | |
4,455 | | | | Fremont General Corp. | | 112,177 | |
6,920 | | | | Hibernia Corp. | | 204,209 | |
29,700 | | @,@@ | | HSBC Holdings PLC | | 500,383 | |
860 | | | | Hudson United BanCorp | | 33,867 | |
22,750 | | | | KeyCorp. | | 771,225 | |
1,800 | | @,@@,L | | Kookmin Bank ADR | | 70,344 | |
26,000 | | @@ | | Mitsui Trust Holdings, Inc. | | 261,556 | |
60 | | @@ | | Mizuho Financial Group, Inc. | | 304,094 | |
27,382 | | | | National City Corp. | | 1,028,194 | |
20,400 | | @@ | | Nordea AB | | 205,649 | |
1,940 | | | | PrivateBancorp, Inc. | | 62,526 | |
5,043 | | | | Republic Bancorp, Inc. | | 77,057 | |
11,915 | | @,@@ | | Royal Bank of Scotland Group PLC | | 400,163 | |
3,865 | | | | South Financial Group, Inc. | | 125,728 | |
5,000 | | @@ | | St. George Bank Ltd. | | 99,046 | |
4,461 | | | | Sterling Bancshares, Inc. | | 63,658 | |
24,000 | | @@ | | Sumitomo Trust & Banking Co. Ltd. | | 173,992 | |
22,800 | | | | U.S. Bancorp | | 714,096 | |
3,980 | | @@ | | UBS AG | | 333,630 | |
955 | | | | UCBH Holdings, Inc. | | 43,758 | |
34,700 | | @@ | | UniCredito Italiano S.p.A. | | 199,592 | |
36,800 | | | | Wachovia Corp. | | 1,935,681 | |
20,200 | | | | Wells Fargo & Co. | | 1,255,431 | |
880 | | | | Whitney Holding Corp. | | 39,591 | |
| | | | | | 14,226,255 | |
| | | | Beverages: 0.9% | | | |
1,750 | | L | | Adolph Coors Co. | | 132,423 | |
28,300 | | | | Coca-Cola Co. | | 1,178,129 | |
20,550 | | | | PepsiCo, Inc. | | 1,072,710 | |
| | | | | | 2,383,262 | |
| | | | Biotechnology: 0.4% | | | |
15,100 | | @ | | Amgen, Inc. | | 968,665 | |
3,080 | | @ | | Arqule, Inc. | | 17,833 | |
3,390 | | @,L | | Charles River Laboratories Intl., Inc. | | 155,974 | |
| | | | | | 1,142,472 | |
| | | | Building Materials: 0.1% | | | |
22,900 | | @@ | | Boral Ltd. | | 123,790 | |
915 | | | | Florida Rock Industries, Inc. | | 54,470 | |
890 | | | | Simpson Manufacturing Co., Inc. | | 31,061 | |
1,490 | | | | Texas Industries, Inc. | | 92,946 | |
| | | | | | 302,267 | |
| | | | Chemicals: 1.2% | | | |
3,670 | | | | Cabot Corp. | | 141,956 | |
11,250 | | | | Dow Chemical Co. | | 556,987 | |
1,900 | | @@ | | DSM NV | | 122,872 | |
11,300 | | | | E.I. du Pont EI de Nemours & Co. | | 554,265 | |
2,560 | | @ | | FMC Corp. | | 123,648 | |
See Accompanying Notes to Financial Statements
62
ING VP STRATEGIC ALLOCATION | PORTFOLIO OF INVESTMENTS |
BALANCED PORTFOLIO | AS OF DECEMBER 31, 2004 (CONTINUED) |
Shares | | Value | |
| | | | Chemicals (continued) | | | |
2,050 | | | | Georgia Gulf Corp. | | $ | 102,090 | |
4,210 | | | | Lyondell Chemical Co. | | 121,753 | |
64,000 | | @@ | | Mitsubishi Chemical Corp. | | 194,747 | |
2,360 | | @ | | OM Group, Inc. | | 76,511 | |
3,440 | | @ | | Omnova Solutions, Inc. | | 19,333 | |
7,530 | | @ | | PolyOne Corp. | | 68,222 | |
10,350 | | | | PPG Industries, Inc. | | 705,455 | |
1,800 | | # | | Reliance Industries Ltd. GDR | | 46,368 | |
8,200 | | | | Sherwin-Williams Co. | | 365,966 | |
| | | | | | 3,200,173 | |
| | | | Coal: 0.1% | | | |
1,560 | | | | Massey Energy Co. | | 54,522 | |
1,120 | | | | Peabody Energy Corp. | | 90,619 | |
| | | | | | 145,141 | |
| | | | Commercial Services: 1.0% | | | |
5,980 | | | | Adesa, Inc. | | 126,896 | |
2,905 | | @ | | Administaff, Inc. | | 36,632 | |
4,020 | | @ | | Alliance Data Systems Corp. | | 190,870 | |
1,120 | | | | Chemed Corp. | | 75,163 | |
1,315 | | @ | | Consolidated Graphics, Inc. | | 60,359 | |
7,000 | | @@ | | Dai Nippon Printing Co., Ltd. | | 112,696 | |
7,200 | | | | Equifax, Inc. | | 202,320 | |
9,250 | | L | | H&R Block, Inc. | | 453,249 | |
2,730 | | @ | | ITT Educational Services, Inc. | | 129,812 | |
3,495 | | @ | | Korn/Ferry Intl. | | 72,521 | |
4,055 | | @,L | | Labor Ready, Inc. | | 68,611 | |
1,575 | | | | Manpower, Inc. | | 76,073 | |
18,350 | | | | McKesson Corp. | | 577,290 | |
1,170 | | @ | | Pharmaceutical Product Development, Inc. | | 48,309 | |
47,200 | | @,@@ | | Rentokil Initial PLC | | 133,520 | |
3,795 | | | | Rollins, Inc. | | 99,884 | |
5,110 | | @ | | Sotheby’s Holdings | | 92,798 | |
1,100 | | @,L | | Vertrue, Inc. | | 41,547 | |
| | | | | | 2,598,550 | |
| | | | Computers: 3.6% | | | |
3,455 | | | | Agilysys, Inc. | | 59,219 | |
16,800 | | @ | | Apple Computer, Inc. | | 1,081,920 | |
6,071 | | @ | | BISYS Group, Inc. | | 99,868 | |
1,725 | | @ | | CACI Intl., Inc. | | 117,524 | |
1,460 | | @ | | Catapult Communications Corp. | | 35,274 | |
2,290 | | @ | | Cognizant Technology Solutions Corp. | | 96,936 | |
58,350 | | @ | | Dell, Inc. | | 2,458,868 | |
1,275 | | | | Diebold, Inc. | | 71,056 | |
1,465 | | @,L | | DST Systems, Inc. | | 76,356 | |
590 | | | | FactSet Research Systems, Inc. | | 34,480 | |
35,000 | | | | Hewlett-Packard Co. | | 733,950 | |
34,050 | | | | International Business Machines Corp. | | 3,356,648 | |
6,215 | | | | Jack Henry Associates, Inc. | | 123,741 | |
590 | | @ | | Kronos, Inc. | | 30,167 | |
1,240 | | @ | | Micros Systems, Inc. | | 96,794 | |
910 | | @,L | | SanDisk Corp. | | 22,723 | |
5,540 | | @ | | Storage Technology Corp. | | 175,119 | |
164,650 | | @ | | Sun Microsystems, Inc. | | 885,817 | |
| | | | | | 9,556,460 | |
| | | | Cosmetics/Personal Care: 1.7% | | | |
32,400 | | | | Gillette Co. | | $ | 1,450,872 | |
53,850 | | | | Procter & Gamble Co. | | 2,966,058 | |
| | | | | | 4,416,930 | |
| | | | Distribution/Wholesale: 0.4% | | | |
1,440 | | | | CDW Corp. | | 95,544 | |
10,400 | | | | Genuine Parts Co. | | 458,223 | |
1,365 | | | | Hughes Supply, Inc. | | 44,158 | |
1,015 | | | | SCP Pool Corp. | | 32,379 | |
3,230 | | @ | | Tech Data Corp. | | 146,642 | |
620 | | @ | | United Stationers, Inc. | | 28,644 | |
5,600 | | | | W.W. Grainger, Inc. | | 373,072 | |
| | | | | | 1,178,662 | |
| | | | Diversified Financial Services: 4.1% | | | |
32,950 | | | | American Express Co. | | 1,857,391 | |
8,210 | | @ | | AmeriCredit Corp. | | 200,735 | |
5,800 | | | | Bear Stearns Cos., Inc. | | 593,398 | |
11,150 | | | | Capital One Financial Corp. | | 938,942 | |
12,700 | | | | CIT Group, Inc. | | 581,914 | |
61,300 | | | | Citigroup, Inc. | | 2,953,433 | |
11,150 | | | | Fannie Mae | | 793,992 | |
1,757 | | L | | Legg Mason, Inc. | | 128,718 | |
11,700 | | | | Lehman Brothers Holdings, Inc. | | 1,023,516 | |
10,800 | | | | Merrill Lynch & Co., Inc. | | 645,516 | |
13,350 | | | | Morgan Stanley | | 741,192 | |
16,750 | | @ | | Providian Financial Corp. | | 275,873 | |
1,970 | | @@ | | Takefuji Corp. | | 133,227 | |
| | | | | | 10,867,847 | |
| | | | Diversified Operations: 0.0% | | | |
400 | | @@,# | | Reliance Industries Ltd. GDR | | 10,304 | |
| | | | | | 10,304 | |
| | | | Electric: 2.2% | | | |
36,350 | | @ | | AES Corp. | | 496,905 | |
6,500 | | @@ | | Chubu Electric Power Co., Inc. | | 156,046 | |
9,650 | | | | Constellation Energy Group, Inc. | | 421,802 | |
39,150 | | L | | Duke Energy Corp. | | 991,669 | |
3,100 | | @@ | | E.ON AG | | 282,287 | |
19,050 | | | | Edison Intl. | | 610,172 | |
24,400 | | @,@@ | | Enel S.p.A. | | 239,856 | |
8,000 | | L | | Exelon Corp. | | 352,560 | |
6,200 | | | | Kyushu Electric Power Co., Inc. | | 125,246 | |
5,190 | | | | Pepco Holdings, Inc. | | 110,651 | |
11,594 | | | | PPL Corp. | | 617,728 | |
3,300 | | @@ | | RWE AG | | 182,223 | |
3,120 | | L | | Scana Corp. | | 122,928 | |
7,650 | | L | | Southern Co. | | 256,428 | |
12,200 | | L | | TXU Corp. | | 787,631 | |
3,320 | | | | Wisconsin Energy Corp. | | 111,917 | |
| | | | | | 5,866,049 | |
| | | | Electrical Components and
Equipment: 0.3% | | | |
4,100 | | | | AMETEK, Inc. | | 146,247 | |
3,813 | | @ | | Energizer Holdings, Inc. | | 189,468 | |
2,440 | | @ | | Rayovac Corp. | | 74,566 | |
350 | | @@ | | Samsung Electronics Co. Ltd. GDR | | 76,803 | |
14,000 | | @@ | | Sumitomo Electric Industries Ltd. | | 153,181 | |
40,000 | | @@ | | Toshiba Corp. | | 172,244 | |
| | | | | | 812,509 | |
See Accompanying Notes to Financial Statements
63
ING VP STRATEGIC ALLOCATION | PORTFOLIO OF INVESTMENTS |
BALANCED PORTFOLIO | AS OF DECEMBER 31, 2004 (CONTINUED) |
Shares | | Value | |
| | | | Electronics: 0.5% | | | |
1,490 | | | | BEI Technologies, Inc. | | $ | 46,011 | |
1,235 | | | | Bel Fuse, Inc. | | 41,731 | |
790 | | @,L | | Benchmark Electronics, Inc. | | 26,939 | |
1,540 | | | | Brady Corp. | | 96,358 | |
400 | | @ | | Dionex Corp. | | 22,668 | |
725 | | @ | | FLIR Systems, Inc. | | 46,248 | |
1,680 | | | | Keithley Instruments, Inc. | | 33,096 | |
7,900 | | @@ | | Koninklijke Philips Electronics NV | | 209,357 | |
3,240 | | @,@ | | Paxar Corp. | | 71,831 | |
9,300 | | | | PerkinElmer, Inc. | | 209,157 | |
8,750 | | @ | | Thermo Electron Corp. | | 264,162 | |
3,860 | | @ | | Thomas & Betts Corp. | | 118,695 | |
1,105 | | @ | | Trimble Navigation Ltd. | | 36,509 | |
2,750 | | @ | | Varian, Inc. | | 112,778 | |
| | | | | | 1,335,540 | |
| | | | Engineering and Construction: 0.0% | | | |
1,420 | | @ | | Emcor Group, Inc. | | 64,156 | |
| | | | | | 64,156 | |
| | | | Entertainment: 0.1% | | | |
1,995 | | @ | | Argosy Gaming Co. | | 93,167 | |
3,000 | | | | International Speedway Corp. | | 158,400 | |
| | | | | | 251,567 | |
| | | | Environmental Control: 0.1% | | | |
2,645 | | | | Republic Services, Inc. | | 88,713 | |
1,030 | | @ | | Waste Connections, Inc. | | 35,278 | |
| | | | | | 123,991 | |
| | | | Food: 0.9% | | | |
1,925 | | | | Corn Products Intl., Inc. | | 103,103 | |
840 | | | | Flowers Foods, Inc. | | 26,527 | |
18,200 | | @,@@ | | Koninklijke Ahold NV | | 141,033 | |
2,861 | | | | Lance, Inc. | | 54,445 | |
21,000 | | | | Meiji Dairies Corp | | 125,010 | |
2,800 | | @@ | | Metro AG | | 154,342 | |
1,185 | | | | Nash Finch Co. | | 44,746 | |
4,140 | | | | Ruddick Corp. | | 89,797 | |
1,630 | | L | | Sanderson Farms, Inc. | | 70,546 | |
8,400 | | | | SUPERVALU, Inc. | | 289,968 | |
5,980 | | | | Tyson Foods, Inc. | | 110,032 | |
22,500 | | @,@@ | | Unilever PLC | | 220,734 | |
1,040 | | | | Whole Foods Market, Inc. | | 99,164 | |
11,804 | | | | Wm. Wrigley Jr. Co. | | 816,719 | |
| | | | | | 2,346,166 | |
| | | | Forest Products and Paper: 0.6% | | | |
5,950 | | | | International Paper Co. | | 249,900 | |
12,250 | | | | MeadWestvaco Corp. | | 415,153 | |
2,170 | | | | Potlatch Corp. | | 109,759 | |
4,142 | | | | Wausau-Mosinee Paper Corp. | | 73,976 | |
11,750 | | | | Weyerhaeuser Co. | | 789,834 | |
| | | | | | 1,638,622 | |
| | | | Gas: 0.4% | | | |
2,060 | | | | Atmos Energy Corp. | | 56,341 | |
2,575 | | | | Energen Corp. | | 151,796 | |
13,350 | | | | Sempra Energy | | 489,678 | |
3,625 | | | | UGI Corp. | | 148,299 | |
5,846 | | | | WGL Holdings, Inc. | | 180,291 | |
| | | | | | 1,026,405 | |
| | | | Hand/Machine Tools: 0.1% | | | |
4,400 | | | | Black & Decker Corp. | | $ | 388,652 | |
| | | | | | 388,652 | |
| | | | Healthcare-Products: 2.5% | | | |
14,000 | | | | Becton Dickinson & Co. | | 795,200 | |
675 | | L | | Cooper Cos., Inc. | | 47,648 | |
5,880 | | @ | | Cytyc Corp. | | 162,112 | |
1,350 | | | | Dentsply Intl., Inc. | | 75,870 | |
2,300 | | @@ | | Fresenius Medical Care AG | | 185,221 | |
2,045 | | @ | | Haemonetics Corp. | | 74,049 | |
725 | | @ | | Idexx Laboratories, Inc. | | 39,578 | |
3,570 | | @ | | Immucor, Inc. | | 83,931 | |
200 | | | | Invacare Corp. | | 9,252 | |
57,450 | | | | Johnson & Johnson | | 3,643,478 | |
14,500 | | | | Medtronic, Inc. | | 720,215 | |
2,400 | | @ | | Patterson Cos., Inc. | | 104,136 | |
650 | | @ | | ResMed, Inc. | | 33,215 | |
2,050 | | @ | | Respironics, Inc. | | 111,438 | |
11,300 | | @,@@ | | Smith & Nephew PLC | | 115,624 | |
2,673 | | @ | | Sola Intl., Inc. | | 73,614 | |
2,555 | | @ | | Sybron Dental Specialties, Inc. | | 90,396 | |
5,520 | | @ | | Varian Medical Systems, Inc. | | 238,685 | |
1,262 | | | | Vital Signs, Inc. | | 49,117 | |
| | | | | | 6,652,779 | |
| | | | Healthcare-Services: 1.9% | | | |
6,900 | | | | Aetna, Inc. | | 860,775 | |
1,490 | | @ | | Amedisys, Inc. | | 48,261 | |
1,505 | | @ | | AMERIGROUP Corp. | | 113,868 | |
2,980 | | @ | | Centene Corp. | | 84,483 | |
3,560 | | @ | | Covance, Inc. | | 137,950 | |
3,965 | | @,L | | Coventry Health Care, Inc. | | 210,462 | |
9,200 | | @ | | Humana, Inc. | | 273,148 | |
4,660 | | @ | | Lincare Holdings, Inc. | | 198,749 | |
3,905 | | @ | | PacifiCare Health Systems, Inc. | | 220,711 | |
1,710 | | @ | | RehabCare Group, Inc. | | 47,863 | |
1,745 | | @ | | Sierra Health Services, Inc. | | 96,167 | |
19,350 | | | | UnitedHealth Group, Inc. | | 1,703,381 | |
10,450 | | @ | | WellPoint Inc | | 1,201,750 | |
| | | | | | 5,197,568 | |
| | | | Holding Companies-Diversified: 0.1% | | | |
45,000 | | @@ | | Citic Pacific Ltd. | | 128,174 | |
| | | | | | 128,174 | |
| | | | Home Builders: 0.1% | | | |
2,730 | | | | Lennar Corp. | | 154,736 | |
265 | | @,L | | NVR, Inc. | | 203,891 | |
| | | | | | 358,627 | |
| | | | Home Furnishings: 0.3% | | | |
5,100 | | @@ | | Electrolux AB | | 116,843 | |
710 | | | | Ethan Allen Interiors, Inc. | | 28,414 | |
2,495 | | | | Fedders Corp. | | 9,032 | |
2,340 | | | | Harman Intl. Industries, Inc. | | 297,179 | |
16,000 | | @@ | | Matsushita Electric Industrial Co., Ltd. | | 256,371 | |
10,100 | | @@ | | Yamaha Corp. | | 154,763 | |
| | | | | | 862,602 | |
| | | | Household Products/Wares: 0.3% | | | |
4,490 | | | | American Greetings Corp. | | 113,822 | |
1,093 | | | | Blyth, Inc. | | 32,309 | |
See Accompanying Notes to Financial Statements
64
ING VP STRATEGIC ALLOCATION | PORTFOLIO OF INVESTMENTS |
BALANCED PORTFOLIO | AS OF DECEMBER 31, 2004 (CONTINUED) |
Shares | | Value | |
| | | | Household Products/Wares (continued) | | | |
4,090 | | | | Church & Dwight, Inc. | | $ | 137,506 | |
9,250 | | | | Clorox Co. | | 545,102 | |
1,520 | | @ | | Fossil, Inc. | | 38,973 | |
| | | | | | 867,712 | |
| | | | Housewares: 0.0% | | | |
1,370 | | | | Toro Co. | | 111,450 | |
| | | | | | 111,450 | |
| | | | Insurance: 4.5% | | | |
12,944 | | @@ | | AEGON NV | | 176,190 | |
4,465 | | | | American Financial Group, Inc. | | 139,799 | |
30,850 | | | | American Intl. Group, Inc. | | 2,025,919 | |
2,730 | | L | | AmerUs Group Co. | | 123,669 | |
10,000 | | | | Chubb Corp. | | 768,999 | |
8,000 | | | | CIGNA Corp. | | 652,560 | |
2,090 | | | | Delphi Financial Group, Inc. | | 96,454 | |
2,410 | | @@ | | Everest Re Group Ltd. | | 215,840 | |
2,995 | | | | Fidelity National Financial, Inc. | | 136,782 | |
4,640 | | | | First American Corp. | | 163,050 | |
14,050 | | | | Hartford Financial Services Group, Inc. | | 973,805 | |
1,420 | | L | | LandAmerica Financial Group, Inc. | | 76,581 | |
94,500 | | @,@@ | | Legal & General Group PLC | | 199,113 | |
10,050 | | | | Lincoln National Corp. | | 469,134 | |
10,860 | | | | Loews Corp. | | 763,458 | |
27,850 | | | | MetLife, Inc. | | 1,128,203 | |
5,800 | | | | MGIC Investment Corp. | | 399,678 | |
16,000 | | @@ | | Mitsui Sumitomo Insurance Co. Ltd. | | 139,512 | |
4,850 | | @ | | Ohio Casualty Corp. | | 112,569 | |
1,445 | | @ | | Philadelphia Consolidated Holding Co. | | 95,572 | |
2,090 | | @,L | | ProAssurance Corp. | | 81,740 | |
20,300 | | | | Prudential Financial, Inc. | | 1,115,687 | |
15,100 | | @@ | | QBE Insurance Group Ltd. | | 182,177 | |
4,000 | | | | Radian Group, Inc. | | 212,960 | |
7,550 | | | | Safeco Corp. | | 394,412 | |
1,945 | | | | Selective Insurance Group, Inc. | | 86,047 | |
28,700 | | @@ | | Skandia Forsakrings AB | | 142,798 | |
1,750 | | L | | StanCorp Financial Group, Inc. | | 144,375 | |
1,610 | | | | Stewart Information Services Corp. | | 67,057 | |
1,640 | | @@ | | Swiss Reinsurance Co. | | 116,689 | |
2,850 | | | | UICI | | 96,615 | |
3,980 | | | | W.R. Berkley Corp. | | 187,737 | |
1,535 | | L | | Zenith National Insurance Corp. | | 76,504 | |
1,000 | | @,@@ | | Zurich Financial Services AG | | 166,512 | |
| | | | | | 11,928,197 | |
| | | | Internet: 1.0% | | | |
7,500 | | @,L | | eBay, Inc. | | 872,100 | |
700 | | @ | | Internet Security Systems | | 16,275 | |
6,740 | | @ | | McAfee, Inc. | | 194,988 | |
4,960 | | @ | | RSA Security, Inc. | | 99,498 | |
32,250 | | @ | | Symantec Corp. | | 830,760 | |
3,960 | | @ | | Verity, Inc. | | 51,955 | |
1,720 | | @ | | Websense, Inc. | | 87,238 | |
16,250 | | @ | | Yahoo!, Inc. | | 612,300 | |
| | | | | | 2,765,114 | |
| | | | Iron/Steel: 0.2% | | | |
460 | | L | | Carpenter Technology Corp. | | $ | 26,892 | |
7,100 | | @@ | | JFE Holdings, Inc. | | 202,863 | |
7,500 | | @@ | | ThyssenKrupp AG | | 165,197 | |
| | | | | | 394,952 | |
| | | | Leisure Time: 0.2% | | | |
2,270 | | | | Arctic Cat, Inc. | | 60,200 | |
7,350 | | L | | Carnival Corp. | | 423,581 | |
3,185 | | L | | Nautilus Group, Inc. | | 76,981 | |
875 | | | | Polaris Industries, Inc. | | 59,518 | |
| | | | | | 620,280 | |
| | | | Lodging: 0.5% | | | |
4,460 | | | | Boyd Gaming Corp. | | 185,759 | |
5,415 | | @ | | Caesars Entertainment, Inc. | | 109,058 | |
1,190 | | @,L | | Mandalay Resort Group | | 83,812 | |
12,600 | | | | Marriott Intl., Inc. | | 793,548 | |
3,125 | | | | Starwood Hotels & Resorts Worldwide, Inc. | | 182,500 | |
| | | | | | 1,354,677 | |
| | | | Machinery-Construction and Mining: 0.0% | | | |
2,160 | | @ | | Astec Industries, Inc. | | 37,174 | |
| | | | | | 37,174 | |
| | | | Machinery-Diversified: 0.3% | | | |
2,520 | | | | Applied Industrial Technologies, Inc. | | 69,048 | |
875 | | | | Cognex Corp. | | 24,413 | |
2,600 | | | | Cummins, Inc. | | 217,853 | |
2,080 | | @ | | Gerber Scientific, Inc. | | 15,829 | |
4,020 | | | | Graco, Inc. | | 150,147 | |
1,065 | | | | IDEX Corp. | | 43,133 | |
3,437 | | @ | | Zebra Technologies Corp. | | 193,434 | |
| | | | | | 713,857 | |
| | | | Media: 1.8% | | | |
24,600 | | @ | | Comcast Corp. | | 818,688 | |
9,400 | | | | McGraw-Hill Cos., Inc. | | 860,476 | |
10,900 | | @@ | | Mediaset S.p.A. | | 138,000 | |
2,400 | | | | Meredith Corp. | | 130,080 | |
100 | | | | News Corp. | | 1,866 | |
17,500 | | @,@@ | | Reed Elsevier PLC | | 161,307 | |
1,620 | | | | Thomas Nelson, Inc. | | 36,612 | |
52,100 | | @ | | Time Warner, Inc. | | 1,012,823 | |
20,150 | | | | Viacom, Inc. | | 733,259 | |
23,350 | | | | Walt Disney Co. | | 649,130 | |
170 | | | | Washington Post Co. | | 167,113 | |
| | | | | | 4,709,354 | |
| | | | Metal Fabricate/Hardware: 0.1% | | | |
2,260 | | | | Kaydon Corp. | | 74,625 | |
930 | | | | Lawson Products, Inc. | | 46,900 | |
2,585 | | | | Mueller Industries, Inc. | | 83,237 | |
1,120 | | | | Precision Castparts Corp. | | 73,562 | |
1,920 | | | | Timken Co. | | 49,958 | |
1,360 | | @ | | Wolverine Tube, Inc. | | 17,558 | |
| | | | | | 345,840 | |
| | | | Mining: 0.3% | | | |
6,500 | | @,@@ | | Anglo American PLC | | 153,374 | |
13,900 | | @@ | | BHP Billiton Ltd. | | 166,811 | |
See Accompanying Notes to Financial Statements
65
ING VP STRATEGIC ALLOCATION | PORTFOLIO OF INVESTMENTS |
BALANCED PORTFOLIO | AS OF DECEMBER 31, 2004 (CONTINUED) |
Shares | | Value | |
| | | | Mining (continued) | | | |
5,500 | | L | | Phelps Dodge Corp. | | $ | 544,059 | |
2,190 | | @ | | RTI Intl. Metals, Inc. | | 44,983 | |
| | | | | | 909,227 | |
| | | | Miscellaneous Manufacturing: 2.7% | | | |
9,350 | | | | 3M Co. | | 767,355 | |
770 | | | | AptarGroup, Inc. | | 40,641 | |
15,500 | | L | | Eastman Kodak Co. | | 499,875 | |
124,953 | | | | General Electric Co. | | 4,560,784 | |
2,520 | | | | Lancaster Colony Corp. | | 108,032 | |
4,675 | | @ | | Pentair, Inc. | | 203,643 | |
890 | | | | Roper Industries, Inc. | | 54,085 | |
2,700 | | @@ | | Siemens AG | | 228,564 | |
23,650 | | @@ | | Tyco Intl. Ltd. | | 845,251 | |
| | | | | | 7,308,230 | |
| | | | | | | |
| | | | Office/Business Equipment: 0.4% | | | |
1,940 | | @ | | Global Imaging Systems, Inc. | | 76,630 | |
3,000 | | | | Seiko Epson Corp. | | 133,760 | |
49,450 | | @ | | Xerox Corp. | | 841,144 | |
| | | | | | 1,051,534 | |
| | | | Oil and Gas: 5.5% | | | |
5,050 | | | | Amerada Hess Corp. | | 416,019 | |
46,863 | | @,@@ | | BP PLC | | 455,999 | |
17,500 | | | | Burlington Resources, Inc. | | 761,250 | |
23,250 | | | | ChevronTexaco Corp. | | 1,220,857 | |
2,350 | | @ | | Cimarex Energy Co. | | 89,065 | |
17,750 | | | | ConocoPhillips | | 1,541,232 | |
20,300 | | | | Devon Energy Corp. | | 790,076 | |
101,100 | | | | Exxon Mobil Corp. | | 5,182,385 | |
2,430 | | | | Frontier Oil Corp. | | 64,784 | |
750 | | | | LUKOIL ADR | | 91,875 | |
3,286 | | | | Murphy Oil Corp. | | 264,359 | |
2,915 | | @ | | Newfield Exploration Co. | | 172,131 | |
2,790 | | L | | Noble Energy, Inc. | | 172,031 | |
1,400 | | @@ | | Norsk Hydro ASA | | 110,097 | |
15,550 | | | | Occidental Petroleum Corp. | | 907,497 | |
1,350 | | | | Patina Oil & Gas Corp. | | 50,625 | |
1,430 | | @ | | Petroleum Development Corp. | | 55,155 | |
3,230 | | | | Pogo Producing Co. | | 156,623 | |
2,185 | | @ | | Remington Oil & Gas Corp. | | 59,541 | |
10,300 | | @@ | | Repsol YPF SA | | 267,925 | |
57,600 | | @,@@ | | Shell Transport & Trading Co. PLC | | 492,825 | |
685 | | @,L | | Southwestern Energy Co. | | 34,723 | |
1,720 | | @ | | Stone Energy Corp. | | 77,555 | |
3,250 | | L | | Sunoco, Inc. | | 265,558 | |
2,160 | | @ | | Swift Energy Co. | | 62,510 | |
1,700 | | @@ | | Total SA | | 372,322 | |
13,350 | | L | | Valero Energy Corp. | | 606,090 | |
| | | | | | 14,741,109 | |
| | | | Oil and Gas Services: 0.2% | | | |
2,180 | | @ | | Cal Dive Intl., Inc. | | 88,835 | |
1,600 | | @ | | Hydril Co. | | 72,816 | |
4,900 | | @,L | | Weatherford Intl. Ltd. | | 251,370 | |
| | | | | | 413,021 | |
| | | | Packaging and Containers: 0.1% | | | |
5,950 | | | | Ball Corp. | | 261,681 | |
1,690 | | | | Sonoco Products Co. | | 50,109 | |
| | | | | | 311,790 | |
| | | | Pharmaceuticals: 2.9% | | | |
18,650 | | | | Abbott Laboratories | | $ | 870,023 | |
4,510 | | | | Alpharma, Inc. | | 76,445 | |
6,800 | | L | | Amerisourcebergen Corp. | | 399,024 | |
13,100 | | | | Cardinal Health, Inc. | | 761,765 | |
22,850 | | @ | | Caremark Rx, Inc. | | 900,975 | |
1,220 | | | | Medicis Pharmaceutical Corp. | | 42,834 | |
26,500 | | | | Merck & Co., Inc. | | 851,710 | |
1,430 | | | | Natures Sunshine Products, Inc. | | 29,115 | |
1,320 | | @ | | NBTY, Inc. | | 31,693 | |
2,595 | | @ | | Noven Pharmaceuticals, Inc. | | 44,271 | |
90,850 | | | | Pfizer, Inc. | | 2,442,956 | |
3,490 | | @@ | | Roche Holding AG | | 400,594 | |
6,300 | | @@ | | Sankyo Co., Ltd. | | 142,646 | |
4,404 | | @@ | | Sanofi-Aventis | | 352,106 | |
1,410 | | @,L | | Sepracor, Inc. | | 83,712 | |
3,400 | | @@ | | Takeda Pharmaceutical Co. Ltd. | | 171,671 | |
3,400 | | | | UCB SA | | 172,842 | |
| | | | | | 7,774,382 | |
| | | | Pipelines: 0.1% | | | |
7,966 | | | | National Fuel Gas Co. | | 225,756 | |
2,350 | | | | Questar Corp. | | 119,756 | |
| | | | | | 345,512 | |
| | | | Real Estate: 0.1% | | | |
17,000 | | @@ | | Cheung Kong Holdings Ltd. | | 169,629 | |
| | | | | | 169,629 | |
| | | | Real Estate Investment Trusts: 1.9% | | | |
16,625 | | | | Acadia Realty Trust | | 270,987 | |
500 | | @ | | Alexander’s, Inc. | | 107,500 | |
2,600 | | | | Alexandria Real Estate Equities, Inc. | | 193,492 | |
3,051 | | @ | | Archstone-Smith Trust | | 116,853 | |
2,150 | | | | Avalonbay Communities, Inc. | | 161,895 | |
3,025 | | | | Boston Properties, Inc. | | 195,627 | |
2,325 | | | | CBL & Associates Properties, Inc. | | 177,514 | |
3,400 | | L | | CenterPoint Properties Trust | | 162,826 | |
7,950 | | | | Corporate Office Properties Trust Sbi MD | | 233,332 | |
3,150 | | | | Developers Diversified Realty Corp. | | 139,766 | |
4,300 | | | | Equity Office Properties Trust | | 125,216 | |
4,575 | | L | | Equity Residential | | 165,524 | |
1,225 | | | | Essex Property Trust, Inc. | | 102,655 | |
5,225 | | @ | | FelCor Lodging Trust, Inc. | | 76,546 | |
3,875 | | | | General Growth Properties, Inc. | | 140,120 | |
2,552 | | | | Gramercy Capital Corp. | | 52,571 | |
13,100 | | L | | Host Marriott Corp. | | 226,629 | |
2,075 | | | | iStar Financial, Inc. | | 93,915 | |
2,825 | | | | Kimco Realty Corp. | | 163,822 | |
5,150 | | | | LaSalle Hotel Properties | | 163,925 | |
6,475 | | @ | | Meristar Hospitality Corp. | | 54,066 | |
4,400 | | | | National Health Investors, Inc. | | 128,392 | |
6,950 | | L | | Nationwide Health Properties, Inc. | | 165,063 | |
2,285 | | | | New Century Financial Corp. | | 146,034 | |
4,575 | | | | Newcastle Investment Corp. | | 145,394 | |
4,650 | | | | ProLogis | | 201,484 | |
1,750 | | | | PS Business Parks, Inc. | | 78,925 | |
3,425 | | | | Public Storage, Inc. | | 190,944 | |
2,175 | | | | Rayonier, Inc. | | 106,379 | |
4,950 | | | | Reckson Associates Realty Corp. | | 162,410 | |
See Accompanying Notes to Financial Statements
66
ING VP STRATEGIC ALLOCATION | PORTFOLIO OF INVESTMENTS |
BALANCED PORTFOLIO | AS OF DECEMBER 31, 2004 (CONTINUED) |
Shares | | Value | |
| | | | Real Estate Investment Trusts (continued) | | | |
3,100 | | L | | Regency Centers Corp. | | $ | 171,740 | |
2,675 | | | | Simon Property Group, Inc. | | 172,992 | |
2,925 | | | | SL Green Realty Corp. | | 177,109 | |
4,825 | | | | United Dominion Realty Trust, Inc. | | 119,660 | |
| | | | | | 5,091,307 | |
| | | | Retail: 5.1% | | | |
4,210 | | | | Abercrombie & Fitch Co. | | 197,660 | |
3,830 | | | | American Eagle Outfitters, Inc. | | 180,393 | |
4,650 | | @ | | Barnes & Noble, Inc. | | 150,056 | |
4,340 | | @ | | BJ’s Wholesale Club, Inc. | | 126,424 | |
2,070 | | | | Cato Corp. | | 59,657 | |
2,410 | | @ | | CEC Entertainment, Inc. | | 96,328 | |
6,165 | | | | Claire’s Stores, Inc. | | 131,006 | |
20,850 | | L | | Costco Wholesale Corp. | | 1,009,349 | |
13,900 | | @@ | | Enterprise Inns PLC | | 211,518 | |
3,800 | | @ | | GameStop Corp | | 85,158 | |
51,250 | | | | Home Depot, Inc. | | 2,190,425 | |
2,010 | | @ | | J. Jill Group, Inc. | | 29,929 | |
16,500 | | | | J.C. Penney Co., Inc. Holding Co. | | 683,100 | |
2,425 | | @ | | Jack in The Box, Inc. | | 89,410 | |
3,700 | | | | Lawson, Inc. | | 136,703 | |
25,000 | | @ | | Limited Brands, Inc. | | 575,500 | |
10,300 | | @@ | | Marui Co. Ltd. | | 138,441 | |
41,850 | | | | McDonald’s Corp. | | 1,341,711 | |
6,320 | | | | Michaels Stores, Inc. | | 189,410 | |
2,555 | | L | | PETsMART, Inc. | | 90,779 | |
495 | | @,L | | PF Chang’s China Bistro, Inc. | | 27,893 | |
1,120 | | @ | | Sonic Corp. | | 34,160 | |
23,500 | | | | Staples, Inc. | | 792,185 | |
16,950 | | @ | | Starbucks Corp. | | 1,057,002 | |
4,005 | | @ | | Stein Mart, Inc. | | 68,325 | |
10,500 | | | | Target Corp. | | 545,265 | |
3,040 | | @ | | Too, Inc. | | 74,358 | |
13,350 | | @ | | Toys R US, Inc. | | 273,275 | |
3,960 | | @ | | Urban Outfitters, Inc. | | 175,824 | |
50,650 | | | | Wal-Mart Stores, Inc. | | 2,675,333 | |
2,030 | | @,L | | Williams-Sonoma, Inc. | | 71,131 | |
980 | | @ | | Zale Corp. | | 29,273 | |
| | | | | | 13,536,981 | |
| | | | Savings and Loans: 0.1% | | | |
2,317 | | @ | | BankUnited Financial Corp. | | 74,028 | |
2,695 | | @ | | Waypoint Financial Corp. | | 76,403 | |
| | | | | | 150,431 | |
| | | | Semiconductors: 1.0% | | | |
3,980 | | @,L | | Cree, Inc. | | 159,518 | |
2,790 | | @ | | DSP Group, Inc. | | 62,301 | |
76,400 | | | | Intel Corp. | | 1,786,996 | |
3,615 | | | | Microchip Technology, Inc. | | 96,376 | |
8,800 | | @@ | | Taiwan Semiconductor Manufacturing Co. Ltd. ADR | | 74,712 | |
20,950 | | | | Texas Instruments, Inc. | | 515,789 | |
700 | | @ | | Varian Semiconductor Equipment Associates, Inc. | | 25,795 | |
| | | | | | 2,721,487 | |
| | | | Software: 2.9% | | | |
2,800 | | @ | | Advent Software, Inc. | | 57,344 | |
2,415 | | @ | | Ansys, Inc. | | 77,425 | |
12,900 | | | | Autodesk, Inc. | | 489,554 | |
720 | | @ | | Avid Technology, Inc. | | $ | 44,460 | |
14,700 | | @ | | BMC Software, Inc. | | 273,419 | |
695 | | @,L | | Cerner Corp. | | 36,953 | |
20,050 | | @ | | Compuware Corp. | | 129,724 | |
1,435 | | @,L | | CSG Systems Intl., Inc. | | 26,835 | |
2,445 | | @ | | Digi Intl., Inc. | | 42,030 | |
3,150 | | @ | | Dun & Bradstreet Corp. | | 187,898 | |
3,480 | | @ | | eFunds Corp. | | 83,555 | |
4,040 | | L | | Fair Isaac Corp. | | 148,187 | |
2,985 | | @ | | FileNet Corp. | | 76,894 | |
790 | | L | | Global Payments, Inc. | | 46,247 | |
840 | | @,L | | Hyperion Solutions Corp. | | 39,161 | |
2,375 | | @ | | MapInfo Corp. | | 28,453 | |
128,450 | | | | Microsoft Corp. | | 3,430,899 | |
135,900 | | @ | | Oracle Corp. | | 1,864,547 | |
12,500 | | @ | | Parametric Technology Corp. | | 73,625 | |
2,920 | | @ | | Phoenix Technologies Ltd. | | 24,119 | |
3,115 | | @ | | Progress Software Corp. | | 72,735 | |
1,200 | | @@ | | SAP AG | | 212,482 | |
4,660 | | | | SEI Investments Co. | | 195,394 | |
6,880 | | @ | | Sybase, Inc. | | 137,256 | |
6,990 | | @ | | Wind River Systems, Inc. | | 94,715 | |
| | | | | | 7,893,911 | |
| | | | Telecommunications: 3.5% | | | |
9,305 | | @,L | | Adaptec, Inc. | | 70,625 | |
25,200 | | | | Alltel Corp. | | 1,480,752 | |
780 | | @,L | | Anixter Intl., Inc. | | 28,072 | |
78,150 | | @ | | Cisco Systems, Inc. | | 1,508,295 | |
850 | | @ | | Commonwealth Telephone Enterprises, Inc. | | 42,211 | |
4,800 | | @ | | Commscope, Inc. | | 90,720 | |
17,500 | | @,@@ | | Deutsche Telekom AG | | 395,475 | |
7,700 | | @,@@ | | France Telecom SA | | 254,405 | |
2,930 | | | | Harris Corp. | | 181,045 | |
7,800 | | @@ | | Hellenic Telecommunications Organization SA | | 140,339 | |
29,100 | | | | Motorola, Inc. | | 500,520 | |
38 | | @@ | | Nippon Telegraph & Telephone Corp. | | 171,990 | |
13,700 | | @@ | | Nokia Oyj | | 214,541 | |
28,000 | | @ | | Oki Electric Industry Co Ltd | | 120,760 | |
5,870 | | @ | | Polycom, Inc. | | 136,888 | |
19,650 | | | | QUALCOMM, Inc. | | 833,160 | |
5,700 | | @@ | | TDC A/S | | 241,508 | |
90,100 | | @@ | | Telecom Italia S.p.A. | | 367,823 | |
8,400 | | @@ | | Telekom Austria AG | | 159,258 | |
3,900 | | | | Telekomunikasi Indonesia Tbk PT ADR | | 81,978 | |
1,170 | | | | Telephone & Data Systems, Inc. | | 90,032 | |
56,000 | | | | Verizon Communications, Inc. | | 2,268,561 | |
| | | | | | 9,378,958 | |
| | | | Textiles: 0.1% | | | |
1,670 | | | | G&K Services, Inc. | | 72,511 | |
1,170 | | @,L | | Mohawk Industries, Inc. | | 106,763 | |
| | | | | | 179,274 | |
| | | | Toys/Games/Hobbies: 0.0% | | | |
1,565 | | @ | | Department 56, Inc. | | 26,057 | |
2,725 | | @,L | | Jakks Pacific, Inc. | | 60,250 | |
| | | | | | 86,307 | |
See Accompanying Notes to Financial Statements
67
ING VP STRATEGIC ALLOCATION | PORTFOLIO OF INVESTMENTS |
BALANCED PORTFOLIO | AS OF DECEMBER 31, 2004 (CONTINUED) |
Shares | | Value | |
| | | | Transportation: 1.6% | | | |
1,500 | | | | C.H. Robinson Worldwide, Inc. | | $ | 83,280 | |
3,095 | | | | CNF, Inc. | | 155,060 | |
28 | | @@ | | East Japan Railway Co. | | 155,974 | |
2,905 | | @,L | | EGL, Inc. | | 86,830 | |
1,850 | | | | Expeditors Intl. Washington, Inc. | | 103,378 | |
11,500 | | | | FedEx Corp. | | 1,132,635 | |
1,690 | | @ | | Forward Air Corp. | | 75,543 | |
1,580 | | | | Heartland Express, Inc. | | 35,503 | |
1,705 | | @ | | Landstar System, Inc. | | 125,556 | |
19,000 | | @@ | | Mitsui O.S.K. Lines Ltd. | | 114,078 | |
21,100 | | | | Norfolk Southern Corp. | | 763,609 | |
1,775 | | @ | | Offshore Logistics, Inc. | | 57,634 | |
2,200 | | | | Overseas Shipholding Group, Inc. | | 121,440 | |
13,400 | | | | United Parcel Service, Inc. | | 1,145,164 | |
1,000 | | @,L | | Yellow Roadway Corp. | | 55,710 | |
| | | | | | 4,211,394 | |
| | | | Water: 0.1% | | | |
9,900 | | @,@@ | | Severn Trent PLC | | 183,525 | |
| | | | | | 183,525 | |
| | | | Total Common Stock
(Cost $160,274,143) | | 189,960,128 | |
PREFERRED STOCK: 0.1% | | | |
| | | | Banks: 0.1% | | | |
29 | | @,#,XX | | DG Funding Trust | | 311,116 | |
| | | | Total Preferred Stock
(Cost $315,328) | | 311,116 | |
| | | | | | | |
Principal
Amount | | | | | | Value | |
CORPORATE BONDS/NOTES: 6.0% | | | |
| | | | Auto Manufacturers: 0.2% | | | |
$ | 57,000 | | | | Ford Motor Co., 6.625%, due 10/01/28 | | 53,320 | |
187,000 | | L | | Ford Motor Co., 7.450%, due 07/16/31 | | 188,617 | |
195,000 | | L | | General Motors Corp., 8.375%, due 07/15/33 | | 202,595 | |
| | | | | | 444,532 | |
| | | | Banks: 1.7% | | | |
80,000 | | @@ | | Australia & New Zealand Banking Group Ltd., 2.405%, due 10/29/49 | | 69,881 | |
120,000 | | | | Banco Bradesco SA/Cayman Islands, 8.750%, due 10/24/13 | | 131,400 | |
123,000 | | #,L | | Banco Santander Chile/Pre-merger with Banco Santiago SA, 2.800%, due 12/09/09 | | 123,299 | |
207,000 | | @@ | | Banco Santander Santiago Chile SA, 7.375%, due 07/18/12 | | 238,152 | |
120,000 | | @@ | | Bank of Ireland, 2.770%, due 12/29/49 | | 104,401 | |
60,000 | | @@ | | Bank of Nova Scotia, 2.115%, due 08/31/85 | | 50,147 | |
$ | 131,000 | | | | BankAmerica Capital II, 8.000%, due 12/15/26 | | $ | 144,020 | |
98,000 | | @@,# | | Danske Bank A/S, 5.914%, due 12/29/49 | | 103,955 | |
140,000 | | @@ | | Den Norske Bank ASA, 2.115%, due 08/29/49 | | 116,725 | |
93,000 | | # | | Dresdner Funding Trust I, 8.151%, due 06/30/31 | | 115,304 | |
124,000 | | @@,# | | HBOS Capital Funding LP, 6.071%, due 06/30/49 | | 133,139 | |
370,000 | | @@,C | | HSBC Bank PLC, 2.839%, due 06/29/49 | | 321,682 | |
190,000 | | @@ | | Lloyds TSB Bank PLC, 2.090%, due 08/29/49 | | 162,985 | |
190,000 | | @@ | | Lloyds TSB Bank PLC, 2.938%, due 06/29/49 | | 169,455 | |
189,000 | | # | | M&T Bank Corp., 3.850%, due 04/01/13 | | 187,165 | |
131,000 | | | | Mellon Capital I, 7.720%, due 12/01/26 | | 142,267 | |
140,000 | | @@ | | National Australia Bank Ltd., 2.361%, due 10/29/49 | | 122,303 | |
70,000 | | | | National Westminster Bank PLC, 1.375%, due 08/29/49 | | 61,798 | |
170,000 | | @@ | | National Westminster Bank PLC, 2.563%, due 11/29/49 | | 145,107 | |
160,000 | | @@,# | | Rabobank Capital Funding II, 5.260%, due 12/29/49 | | 163,088 | |
291,000 | | @@,# | | Rabobank Capital Funding Trust, 5.254%, due 12/29/49 | | 290,048 | |
190,000 | | @@ | | Royal Bank of Canada, 2.750%, due 06/29/85 | | 162,441 | |
50,000 | | @@ | | Royal Bank of Scotland Group PLC, 2.938%, due 12/29/49 | | 44,162 | |
50,000 | | @@,C | | Societe Generale, 2.705%, due 11/29/49 | | 43,047 | |
440,000 | | @@,C | | Standard Chartered PLC, 2.813%, due 11/29/49 | | 350,798 | |
250,000 | | @@,C | | Standard Chartered PLC, 2.838%, due 12/29/49 | | 201,250 | |
135,000 | | | | U.S. Bankcorp, 8.090%, due 11/15/26 | | 147,340 | |
117,000 | | | | Wells Fargo Capital I, 7.960%, due 12/15/26 | | 127,423 | |
70,000 | | @@ | | Westpac Banking Corp., 2.338%, due 09/29/49 | | 60,722 | |
404,000 | | # | | Westpac Capital Trust IV, 5.256%, due 12/29/49 | | 400,958 | |
| | | | | | 4,634,462 | |
| | | | Beverages: 0.2% | | | |
214,000 | | @@,# | | Cia Brasileira de Bebidas, 8.750%, due 09/15/13 | | 250,380 | |
64,000 | | @@ | | Coca-Cola HBC Finance BV, 5.125%, due 09/17/13 | | 65,758 | |
220,000 | | # | | Miller Brewing Co., 4.250%, due 08/15/08 | | 222,184 | |
| | | | | | 538,322 | |
| | | | Chemicals: 0.0% | | | |
51,000 | | | | Dow Chemical Co., 5.750%, due 11/15/09 | | 54,612 | |
See Accompanying Notes to Financial Statements
68
ING VP STRATEGIC ALLOCATION | PORTFOLIO OF INVESTMENTS |
BALANCED PORTFOLIO | AS OF DECEMBER 31, 2004 (CONTINUED) |
Principal
Amount | | | | | | Value | |
$ | 48,000 | | @@,# | | Chemicals (continued) | | $ | 50,907 | |
| | | | Sociedad Quimica y Minera de Chile SA, 7.700%, due 09/15/06 | | 105,519 | |
| | | | | | | |
60,882 | | @@,# | | Diversified Financial Services: 1.2% | | | |
146,000 | | @@,# | | Arcel Finance Ltd., 5.984%, due 02/01/09 | | 62,936 | |
248,000 | | @@,# | | Arcel Finance Ltd., 7.048%, due 09/01/11 | | 149,936 | |
132,000 | | | | Brazilian Merchant Voucher Receivables Ltd., 5.911%, due 06/15/11 | | 246,760 | |
140,000 | | # | | Citigroup Capital II, 7.750%, due 12/01/36 | | 143,674 | |
177,000 | | # | | Corestates Capital Trust I, 8.000%, due 12/15/26 | | 153,088 | |
60,000 | | @@ | | Farmers Exchange Capital, 7.200%, due 07/15/48 | | 180,679 | |
184,000 | | | | Financiere CSFB NV, 2.125%, due 03/29/49 | | 50,040 | |
60,000 | | L | | Ford Motor Credit Co., 5.700%, due 01/15/10 | | 185,876 | |
287,000 | | # | | Ford Motor Credit Co., 7.000%, due 10/01/13 | | 63,712 | |
28,000 | | | | HVB Funding Trust III, 9.000%, due 10/22/31 | | 380,211 | |
146,000 | | | | JPM Capital Trust I, 7.540%, due 01/15/27 | | 30,183 | |
384,000 | | # | | JPM Capital Trust II, 7.950%, due 02/01/27 | | 159,736 | |
150,772 | | @@,# | | Mangrove Bay Pass-Through Trust, 6.102%, due 07/15/33 | | 382,307 | |
247,404 | | @@,# | | PF Export Receivables Master Trust, 3.748%, due 06/01/13 | | 146,395 | |
279,000 | | # | | PF Export Receivables Master Trust, 6.436%, due 06/01/15 | | 246,052 | |
200,000 | | # | | Preferred Term Securities XII, 2.960%, due 03/23/35 | | 278,303 | |
130,000 | | @@ | | Twin Reefs Pass-Through Trust, 3.370%, due 12/10/49 | | 201,138 | |
| | | | UFJ Finance Aruba AEC, 8.750%, due 11/29/49 | | 145,267 | |
| | | | | | 3,206,293 | |
216,000 | | | | Electric: 0.4% | | | |
311,000 | | | | Consumers Energy Co., 4.250%, due 04/15/08 | | 218,281 | |
103,000 | | | | Ohio Power Co., 6.375%, due 07/15/33 | | 327,930 | |
33,249 | | # | | Pacific Gas & Electric Co., 2.720%, due 04/03/06 | | 103,092 | |
142,000 | | # | | Power Contract Financing LLC, 5.200%, due 02/01/06 | | 33,567 | |
37,011 | | | | Power Contract Financing LLC, 6.256%, due 02/01/10 | | 148,780 | |
72,566 | | # | | PPL Montana LLC, 8.903%, due 07/02/20 | | 41,846 | |
111,000 | | # | | Tenaska Virginia Partners LP, 6.119%, due 03/30/24 | | 76,376 | |
| | | | TXU Energy Co. LLC, 2.838%, due 01/17/06 | | 111,338 | |
| | | | | | 1,061,210 | |
| | | | Food: 0.3% | | | |
$ | 98,000 | | | | Kroger Co., 7.250%, due 06/01/09 | | $ | 109,875 | |
180,000 | | | | Safeway, Inc., 4.800%, due 07/16/07 | | 184,372 | |
114,000 | | | | SUPERVALU, Inc., 7.875%, due 08/01/09 | | 130,858 | |
246,000 | | | | Tyson Foods, Inc., 7.250%, due 10/01/06 | | 260,919 | |
| | | | | | 686,024 | |
| | | | Insurance: 0.3% | | | |
55,000 | | # | | Farmers Insurance Exchange, 6.000%, due 08/01/14 | | 55,878 | |
62,000 | | # | | Farmers Insurance Exchange, 8.625%, due 05/01/24 | | 73,318 | |
145,000 | | # | | Monumental Global Funding II, 3.850%, due 03/03/08 | | 145,485 | |
264,000 | | # | | North Front Pass-Through Trust, 5.810%, due 12/15/24 | | 269,258 | |
129,000 | | | | Prudential Financial, Inc., 4.104%, due 11/15/06 | | 130,471 | |
224,000 | | # | | Zurich Capital Trust I, 8.376%, due 06/01/37 | | 252,259 | |
| | | | | | 926,669 | |
| | | | Media: 0.1% | | | |
199,000 | | | | Clear Channel Communications,Inc., 3.125%, due 02/01/07 | | 196,114 | |
126,000 | | | | COX Communications, Inc., 6.850%, due 01/15/18 | | 134,464 | |
| | | | | | 330,578 | |
| | | | Mining: 0.1% | | | |
122,000 | | @@,# | | Corp Nacional del Cobre de Chile, 5.500%, due 10/15/13 | | 127,276 | |
120,000 | | | | WMC Finance USA, 5.125%, due 05/15/13 | | 119,855 | |
| | | | | | 247,131 | |
| | | | Multi-National: 0.1% | | | |
303,000 | | @@ | | Corp Andina de Fomento CAF, 6.875%, due 03/15/12 | | 341,096 | |
| | | | | | 341,096 | |
| | | | Oil and Gas: 0.5% | | | |
182,000 | | @@,# | | Empresa Nacional de Petroleo, 4.875%, due 03/15/14 | | 178,136 | |
212,000 | | @@,# | | Gazprom Intl. SA, 7.201%, due 02/01/20 | | 224,720 | |
132,000 | | | | Husky Energy, Inc., 6.150%, due 06/15/19 | | 141,260 | |
253,000 | | # | | Pemex Project Funding Master Trust, 3.790%, due 06/15/10 | | 260,210 | |
50,000 | | | | Pemex Project Funding Master Trust, 7.375%, due 12/15/14 | | 55,700 | |
102,000 | | @@ | | Petroleos Mexicanos, 9.250%, due 03/30/18 | | 126,735 | |
185,000 | | #,L | | Tengizchevroil Finance Co. SARL, 6.124%, due 11/15/14 | | 186,388 | |
100,000 | | | | Valero Energy Corp., 6.125%, due 04/15/07 | | 105,444 | |
111,000 | | | | Valero Energy Corp., 8.750%, due 06/15/30 | | 149,027 | |
| | | | | | 1,427,620 | |
See Accompanying Notes to Financial Statements
69
ING VP STRATEGIC ALLOCATION | PORTFOLIO OF INVESTMENTS |
BALANCED PORTFOLIO | AS OF DECEMBER 31, 2004 (CONTINUED) |
Principal
Amount | | | | | s | Value | |
| | | | Packaging and Containers: 0.0% | | | | |
$ | 81,000 | | # | | Sealed Air Corp., 5.375%, due 04/15/08 | | $ | 84,223 | |
| | | | | | 84,223 | |
| | | | Pipelines: 0.1% | | | |
166,000 | | | | Duke Capital LLC, 4.331%, due 11/16/06 | | 168,158 | |
| | | | | | 168,158 | |
| | | | Real Estate: 0.2% | | | |
199,000 | | | | EOP Operating LP, 7.750%, due 11/15/07 | | 219,772 | |
57,000 | | | | Liberty Property LP, 6.375%, due 08/15/12 | | 61,906 | |
12,000 | | | | Liberty Property LP, 6.950%, due 12/01/06 | | 12,805 | |
153,000 | | | | Liberty Property LP, 7.750%, due 04/15/09 | | 171,987 | |
| | | | | | 466,470 | |
| | | | Real Estate Investment Trusts: 0.2% | | | |
144,000 | | | | Simon Property Group LP, 4.875%, due 03/18/10 | | 146,874 | |
276,000 | | | | Simon Property Group LP, 6.375%, due 11/15/07 | | 294,655 | |
| | | | | | 441,529 | |
| | | | Retail: 0.1% | | | |
192,000 | | L | | May Department Stores Co., 3.950%, due 07/15/07 | | 192,439 | |
| | | | | | 192,439 | |
| | | | Savings and Loans: 0.1% | | | |
125,000 | | | | Great Western Financial, 8.206%, due 02/01/27 | | 136,602 | |
| | | | | | 136,602 | |
| | | | Telecommunications: 0.2% | | | |
174,000 | | | | BellSouth Corp., 4.200%, due 09/15/09 | | 174,639 | |
92,000 | | + | | Sprint Capital Corp., 4.780%, due 08/17/06 | | 93,800 | |
31,000 | | L | | Sprint Capital Corp., 8.375%, due 03/15/12 | | 37,815 | |
115,000 | | | | Verizon Virginia, Inc., 4.625%, due 03/15/13 | | 112,333 | |
| | | | | | 418,587 | |
| | | | Transportation: 0.0% | | | |
100,000 | | @@,# | | MISC Capital Ltd., 5.000%, due 07/01/09 | | 103,266 | |
7,000 | | @@,# | | MISC Capital Ltd., 6.125%, due 07/01/14 | | 7,558 | |
| | | | | | 110,824 | |
| | | | Total Corporate Bonds/Notes
(Cost $15,715,040) | | 15,968,288 | |
U.S. GOVERNMENT AGENCY OBLIGATIONS: 10.3% | | | |
| | | | Federal Home Loan Bank: 0.3% | | | |
705,000 | | | | 3.250%, due 12/17/07 | | 700,962 | |
| | | | | | 700,962 | |
| | | | Federal Home Loan Mortgage Corporation: 2.2% | | | |
1,411,000 | | | | 2.700%, due 03/16/07 | | $ | 1,393,993 | |
961,000 | | | | 4.500%, due 10/15/12 | | 976,298 | |
435,220 | | | | 4.500%, due 04/01/14 | | 435,332 | |
91,000 | | W | | 5.500%, due 01/15/19 | | 93,986 | |
240,000 | | L | | 5.875%, due 03/21/11 | | 259,454 | |
455,974 | | | | 6.000%, due 01/15/29 | | 476,312 | |
219,535 | | | | 6.000%, due 02/01/29 | | 227,631 | |
1,511,000 | | | | 6.500%, due 01/15/34 | | 1,585,606 | |
320,846 | | | | 7.000%, due 11/01/31 | | 340,143 | |
| | | | | | 5,788,755 | |
| | | | Federal National Mortgage Association: 7.6% | | | |
1,094,000 | | L | | 3.000%, due 08/15/07 | | 1,083,827 | |
615,000 | | L | | 3.500%, due 01/28/08 | | 613,284 | |
705,000 | | L | | 4.625%, due 10/15/13 | | 712,840 | |
1,286,000 | | W | | 5.000%, due 01/15/20 | | 1,306,496 | |
6,401,000 | | W | | 5.000%, due 01/15/34 | | 6,350,994 | |
690,000 | | | | 5.250%, due 08/01/12 | | 717,080 | |
361,962 | | | | 5.500%, due 02/01/18 | | 374,488 | |
250,000 | | W | | 5.500%, due 01/15/20 | | 258,360 | |
1,706,000 | | W | | 5.500%, due 01/01/33 | | 1,732,122 | |
6,032 | | | | 6.000%, due 03/01/17 | | 6,326 | |
171,318 | | | | 6.000%, due 10/01/18 | | 179,667 | |
557,127 | | | | 6.000%, due 12/01/18 | | 584,338 | |
277,860 | | | | 6.000%, due 04/25/31 | | 291,286 | |
3,174,000 | | | | 6.000%, due 01/15/34 | | 3,282,113 | |
161,183 | | | | 6.500%, due 02/01/28 | | 169,427 | |
355,499 | | | | 6.500%, due 09/01/32 | | 373,250 | |
944,000 | | W | | 6.500%, due 01/15/35 | | 990,020 | |
581,000 | | | | 6.500%, due 02/15/35 | | 608,598 | |
315,000 | | | | 6.625%, due 11/15/10 | | 356,423 | |
185,838 | | | | 7.000%, due 02/01/31 | | 197,124 | |
154,482 | | | | 7.000%, due 06/01/31 | | 163,863 | |
120,492 | | | | 7.500%, due 09/01/31 | | 129,138 | |
| | | | | | 20,481,064 | |
| | | | Government National Mortgage Association: 0.2% | | | |
66,660 | | | | 6.500%, due 01/15/29 | | 70,279 | |
166,572 | | | | 6.500%, due 01/15/32 | | 175,553 | |
10,040 | | | | 7.000%, due 12/15/27 | | 10,696 | |
20,506 | | | | 7.000%, due 01/15/28 | | 21,836 | |
15,936 | | | | 7.000%, due 01/15/28 | | 16,969 | |
48,136 | | | | 7.000%, due 02/15/28 | | 51,257 | |
17,136 | | | | 7.000%, due 02/15/28 | | 18,248 | |
50,763 | | | | 7.000%, due 02/15/28 | | 54,054 | |
132,633 | | | | 7.500%, due 12/15/23 | | 143,495 | |
| | | | | | 562,387 | |
| | | | Total U.S. Government
Agency Obligations
(Cost $27,453,821) | | 27,533,168 | |
U.S. TREASURY OBLIGATIONS: 5.2% | | | |
| | | | U.S. Treasury Bonds: 3.7% | | | |
3,210,000 | | W,L | | 4.250%, due 11/15/14 | | 3,219,405 | |
3,781,000 | | L | | 5.375%, due 02/15/31 | | 4,089,685 | |
977,000 | | L | | 6.250%, due 08/15/23 | | 1,144,121 | |
539,000 | | L | | 10.375%, due 11/15/12 | | 642,800 | |
739,000 | | L | | 13.250%, due 05/15/14 | | 1,027,095 | |
| | | | | | 10,123,106 | |
| | | | | | | | | |
See Accompanying Notes to Financial Statements
70
ING VP STRATEGIC ALLOCATION | PORTFOLIO OF INVESTMENTS |
BALANCED PORTFOLIO | AS OF DECEMBER 31, 2004 (CONTINUED) |
Principal
Amount | | | | | | Value | |
| | | | U.S. Treasury Notes: 1.3% | | | |
$ | 325,000 | | L | | 1.125%, due 06/30/05 | | $ | 322,918 | |
1,119,000 | | L | | 3.000%, due 11/15/07 | | 1,114,928 | |
1,956,000 | | L | | 3.500%, due 12/15/09 | | 1,947,138 | |
| | | | | | 3,384,984 | |
| | | | U.S. Treasury STRIP: 0.2% | | | |
795,000 | | | | 4.690%, due 05/15/16 | | 471,988 | |
| | | | | | 471,988 | |
| | | | Total U.S. Treasury Obligations
(Cost $13,787,030) | | 13,980,078 | |
ASSET-BACKED SECURITIES: 0.8% | | | |
| | | | Automobile Asset-Backed Securities: 0.2% | | | |
185,000 | | | | Household Automotive Trust, 2.310%, due 04/17/08 | | 183,780 | |
180,000 | | | | Nissan Auto Receivables Owner Trust, 2.050%, due 03/16/09 | | 175,624 | |
270,000 | | | | USAA Auto Owner Trust, 2.040%, due 02/16/10 | | 265,417 | |
| | | | | | 624,821 | |
| | | | Credit Card Asset-Backed Securities: 0.5% | | | |
95,000 | | | | Bank One Issuance Trust, 4.540%, due 09/15/10 | | 96,464 | |
95,000 | | | | Capital One Master Trust, 4.900%, due 03/15/10 | | 98,123 | |
640,000 | | | | Chemical Master Credit Card Trust 1, 7.090%, due 02/15/09 | | 674,563 | |
325,000 | | | | Citibank Credit Card Issuance Trust, 5.650%, due 06/16/08 | | 336,055 | |
| | | | | | 1,205,205 | |
| | | | Other Asset-Backed Securities: 0.1% | | | |
41,000 | | | | Chase Funding Mortgage Loan Asset-Backed Certificates, 2.734%, due 09/25/24 | | 40,695 | |
24,000 | | | | Chase Funding Mortgage Loan Asset-Backed Certificates, 4.045%, due 05/25/33 | | 24,060 | |
73,000 | | | | Popular ABS Mortgage Pass-Through Trust, 3.735%, due 12/25/34 | | 72,757 | |
73,000 | | | | Popular ABS Mortgage Pass-Through Trust, 4.000%, due 12/25/34 | | 72,788 | |
| | | | | | 210,300 | |
| | | | Total Asset-Backed Securities
(Cost $2,049,635) | | 2,040,326 | |
COLLATERALIZED MORTGAGE OBLIGATIONS: 3.4% | | | |
| | | | Commercial Mortgage-Backed Securities: 1.4% | | | |
7,000 | | | | Bear Stearns Commercial Mortgage Securities, 4.030%, due 02/13/46 | | 6,949 | |
9,000 | | | | Capco America Securitization Corp., 6.460%, due 10/15/30 | | 9,792 | |
200,000 | | | | COMM, 3.600%, due 03/10/39 | | 197,102 | |
$ | 795,000 | | | | CS First Boston Mortgage Securities Corp., 3.861%, due 03/15/36 | | $ | 794,697 | |
68,000 | | | | CS First Boston Mortgage Securities Corp., 7.560%, due 04/14/62 | | 78,632 | |
380,000 | | | | DLJ Commercial Mortgage Corp., 6.240%, due 11/12/31 | | 409,339 | |
220,000 | | C | | DLJ Commercial Mortgage Corp., 6.460%, due 03/10/32 | | 238,774 | |
905,000 | | | | DLJ Commercial Mortgage Corp., 7.300%, due 06/10/32 | | 1,018,399 | |
231,648 | | | | GE Capital Commercial Mortgage Corp, 3.752%, due 07/10/39 | | 231,270 | |
14,000 | | | | GE Capital Commercial Mortgage Corp., 3.915%, due 11/10/38 | | 13,852 | |
10,000 | | | | GE Capital Commercial Mortgage Corp., 4.865%, due 07/10/39 | | 10,214 | |
199,000 | | | | JP Morgan Chase Commercial Mortgage Securities Corp., 4.223%, due 01/15/42 | | 199,201 | |
6,000 | | | | LB-UBS Commercial Mortgage Trust, 4.567%, due 06/15/29 | | 6,118 | |
244,000 | | | | LB-UBS Commercial Mortgage Trust, 6.226%, due 03/15/26 | | 264,437 | |
232,000 | | | | LB-UBS Commercial Mortgage Trust, 7.370%, due 08/15/26 | | 265,225 | |
| | | | | | 3,744,001 | |
| | | | Whole Loan Collateralized Mortgage Obligations: 1.9% | | | |
267,705 | | | | Bank of America Mortgage Securities, 5.000%, due 12/25/18 | | 270,215 | |
170,183 | | | | Bank of America Mortgage Securities, 5.250%, due 11/25/19 | | 173,365 | |
253,465 | | | | Countrywide Alternative Loan Trust, 5.000%, due 10/25/18 | | 255,841 | |
272,579 | | | | Countrywide Home Loan Mortgage Pass Through Trust, 5.000%, due 11/25/18 | | 275,135 | |
571,000 | | | | CS First Boston Mortgage Securities Corp., 4.140%, due 10/25/33 | | 571,385 | |
469,000 | | | | GMAC Mortgage Corp. Loan Trust, 5.500%, due 01/25/34 | | 480,057 | |
60,965 | | | | GSR Mortgage Loan Trust, 6.500%, due 01/25/34 | | 63,536 | |
569,800 | | | | JP Morgan Mortgage Trust, 6.500%, due 11/25/34 | | 595,544 | |
408,000 | | | | MASTR Alternative Loans Trust, 5.500%, due 01/25/20 | | 418,710 | |
1,148,924 | | | | MASTR Asset Securitization Trust, 5.500%, due 06/25/33 | | 1,158,978 | |
337,149 | | | | Prime Mortgage Trust, 5.250%, due 11/25/19 | | 344,189 | |
545,445 | | | | Washington Mutual, 5.000%, due 06/25/18 | | 550,899 | |
| | | | | | 5,157,854 | |
See Accompanying Notes to Financial Statements
71
ING VP STRATEGIC ALLOCATION | PORTFOLIO OF INVESTMENTS |
BALANCED PORTFOLIO | AS OF DECEMBER 31, 2004 (CONTINUED) |
Principal
Amount | | | | | | Value | |
$125,740 | | | | Whole Loan Collateralized Support CMO: 0.1% | | | |
| | | | Bank of America Mortgage Securities, 5.500%, due 11/25/33 | | $126,147 | |
| | | | | | 126,147 | |
| | | | Total Collateralized
Mortgage Obligations
(Cost $9,031,193) | | 9,028,002 | |
MUNICIPAL BONDS: 0.1% | | | |
| | | | Municipal: 0.1% | | | |
70,000 | | | | City of New York, 5.000%, due 11/01/08 | | 75,675 | |
70,000 | | | | City of New York, 5.000%, due 11/01/11 | | 77,258 | |
70,000 | | | | City of New York, 5.000%, due 11/01/15 | | 76,829 | |
68,000 | | | | Sales Tax Asset Receivables Corp., 4.060%, due 10/15/10 | | 67,041 | |
60,000 | | | | Sales Tax Asset Receivables Corp., 4.660%, due 10/15/14 | | 59,347 | |
| | | | Total Municipal Bonds
(Cost $357,924) | | 356,150 | |
| | | | Total Long-Term Investments
(Cost $228,984,114) | | 259,177,256 | |
SHORT-TERM INVESTMENTS: 20.5% | | | |
| | | | Certificates of Deposit: 1.9% | | | |
2,600,000 | | | | Wells Fargo Bank, 2.350%, due 01/27/05 | | 2,600,000 | |
2,600,000 | | | | Wells Fargo Bank, 2.420%, due 01/07/05 | | 2,600,000 | |
| | | | | | 5,200,000 | |
| | | | Total Certificates of Deposit
(Cost $5,200,000) | | 5,200,000 | |
| | | | Commercial Paper: 5.9% | | | |
900,000 | | S | | Ciesco L.P., 2.200%, due 01/05/05 | | 899,725 | |
2,300,000 | | S | | Concord Minutemen Capital, 2.390%, due 01/13/05 | | 2,298,015 | |
2,300,000 | | S | | Concord Minutemen Capital, 2.350%, due 01/09/06 | | 2,300,000 | |
2,600,000 | | S | | Houshold Financial Corp., 2.200%, due 01/11/05 | | 2,598,252 | |
2,600,000 | | S | | Preferred Receivable Funding Corp., 2.340%, due 01/26/05 | | 2,595,606 | |
5,200,000 | | S | | Tulip Funding Corp., 2.370%, due 01/04/05 | | 5,198,631 | |
| | | | | | 15,890,229 | |
| | | | Total Commercial Paper
(Cost $15,891,107) | | 15,890,229 | |
Principal
Amount | | | | | | Value | |
| | | | Repurchase Agreement: 2.2% | | | | | |
$ | 5,906,000 | | S | | Goldman Sachs Repurchase Agreement dated 12/31/04, 2.230%, due 01/03/05, $5,907,098 to be received upon repurchase (Collateralized by $5,899,000 Federal Home Loan Mortgage Corporation, 5.200%, Market Value plus accrued interest $6,024,550, due 02/04/19) | | | | $5,906,000 | |
| | | | Total Repurchase Agreement
(Cost $5,906,000) | | | | 5,906,000 | |
| | | | Securities Lending Collateralcc: 10.5% | | | | | |
28,110,000 | | | | The Bank of New York Institutional Cash Reserve Fund | | | | | |
| | | | Total Securities Lending Collateral
(Cost $28,110,000) | | | | 28,110,000 | |
| | | | Total Short-Term Investments
(Cost $55,107,107) | | | | 28,110,000 | |
| | | | Total Investments In Securities
(Cost $284,091,221)* | | | | 55,106,229 | |
| | | | Other Assets and
Liabilities-Net | | 117.1 | % | $ | 314,283,485 | |
| | | | Net Assets | | (17.1 | ) | (45,991,690 | ) |
| | | | | | 100.0 | % | $ | 268,291,795 | |
| | | | | | | | | | | |
@ Non-income producing security
@@ Foreign issuer
ADR American Depositary Receipt
GDR Global Depositary Receipt
STRIP Separate Trading of Registered Interest and Principal of Securities
+ Step-up basis bonds. Interest rates shown reflect current and future coupon rates.
# Securities with purchases pursuant to Rule 144A, under the Securities Act of 1933 and may not be resold subject to that rule except to qualified institutional buyers. These securities have been determined to be liquid under the guidelines established by the Funds’ Board of Directors/Trustees.
C Bond may be called prior to maturity date.
cc Securities purchased with cash collateral for securities loaned.
W When-issued or delayed delivery security.
S Segregated securities for futures, when-issued or delayed delivery securities held at December 31, 2004.
L Loaned security, a portion or all of the security is on loan at December 31, 2004.
XX Value of securities obtained from one or more dealers making markets in the securities in accordance with the Fund’s valuation procedures.
* Cost for federal income tax purposes is $286,735,993. Net unrealized appreciation consists of:
| | | | Gross Unrealized Appreciation | | | | $ | 29,044,942 | |
| | | | Gross Unrealized Depreciation | | | | (1,497,450 | ) |
| | | | Net Unrealized Appreciation | | | | $ | 27,547,492 | |
Information concerning open futures contracts at December 31, 2004 is shown below:
| | No. of | | Notional | | Expiration | | Unrealized | |
Short Contracts | | Contracts | | Market Value | | Date | | Loss | |
U.S. 5 Year Treasury Note | | 6 | | $(657,188 | ) | 03/31/2005 | | $(593 | ) |
See Accompanying Notes to Financial Statements
72
ING VP STRATEGIC ALLOCATION | PORTFOLIO OF INVESTMENTS |
GROWTH PORTFOLIO | AS OF DECEMBER 31, 2004 |
Shares | | Value | |
COMMON STOCK: 88.2% | | | |
| | | | Advertising: 0.1% | | | |
2,350 | | @ | | ADVO, Inc. | | $ | 83,778 | |
3,940 | | | | Catalina Marketing Corp. | | 116,742 | |
| | | | | | 200,520 | |
| | | | Aerospace/Defense: 2.5% | | | |
2,170 | | @ | | Alliant Techsystems, Inc. | | 141,875 | |
2,170 | | @,L | | Armor Holdings, Inc. | | 102,033 | |
69,900 | | @,@@ | | BAE Systems PLC | | 308,797 | |
32,500 | | | | Boeing Co. | | 1,682,524 | |
1,950 | | @ | | DRS Technologies, Inc. | | 83,285 | |
10,550 | | | | General Dynamics Corp. | | 1,103,530 | |
21,850 | | | | Lockheed Martin Corp. | | 1,213,768 | |
1,947 | | @ | | Moog, Inc. | | 88,296 | |
26,900 | | | | Raytheon Co. | | 1,044,527 | |
2,630 | | @ | | Teledyne Technologies, Inc. | | 77,401 | |
7,150 | | | | United Technologies Corp. | | 738,953 | |
| | | | | | 6,584,989 | |
| | | | Agriculture: 1.0% | | | |
29,350 | | | | Altria Group, Inc. | | 1,793,285 | |
21,000 | | @@ | | Swedish Match AB | | 242,921 | |
12,603 | | | | UST, Inc. | | 606,330 | |
| | | | | | 2,642,536 | |
| | | | Airlines: 0.1% | | | |
2,330 | | @ | | Alaska Air Group, Inc. | | 78,032 | |
53,300 | | @,@@ | | British Airways PLC | | 240,183 | |
| | | | | | 318,215 | |
| | | | Apparel: 1.1% | | | |
12,850 | | @ | | Coach, Inc. | | 724,740 | |
2,765 | | | | K-Swiss, Inc. | | 80,517 | |
2,200 | | | | Kellwood Co. | | 75,900 | |
13,450 | | | | Nike, Inc. | | 1,219,780 | |
14,000 | | @@ | | Onward Kashiyama Co.,Ltd. | | 203,636 | |
2,720 | | | | Phillips-Van Heusen Corp. | | 73,440 | |
1,215 | | @ | | Quiksilver, Inc. | | 36,195 | |
7,050 | | | | VF Corp. | | 390,429 | |
2,860 | | | | Wolverine World Wide, Inc. | | 89,861 | |
| | | | | | 2,894,498 | |
| | | | Auto Manufacturers: 1.0% | | | |
83,500 | | L | | Ford Motor Co. | | 1,222,441 | |
87,000 | | @,@@ | | Isuzu Motors Ltd. | | 257,220 | |
750 | | | | Oshkosh Truck Corp. | | 51,285 | |
11,200 | | | | PACCAR, Inc. | | 901,376 | |
3,900 | | @@ | | Peugeot SA | | 247,412 | |
| | | | | | 2,679,734 | |
| | | | Auto Parts and Equipment: 0.0% | | | |
3,090 | | | | Modine Manufacturing Co. | | 104,349 | |
| | | | | | 104,349 | |
| | | | Banks: 7.2% | | | |
6,090 | | @@ | | Alpha Bank AE | | 212,433 | |
5,882 | | | | Associated Banc-Corp. | | 195,341 | |
1,900 | | @@ | | Banco Itau Holding Financeira SA ADR | | 142,823 | |
4,700 | | @@ | | Banco Popular Espanol SA | | 309,464 | |
33,100 | | @@ | | Banco Santander Central Hispano SA | | 410,450 | |
57,550 | | | | Bank of America Corp. | | 2,704,275 | |
2,995 | | | | Bank of Hawaii Corp. | | $ | 151,966 | |
18,600 | | @@ | | Bank of Ireland | | 307,683 | |
3,015 | | | | Banknorth Group, Inc. | | 110,349 | |
7,170 | | | | Colonial Bancgroup, Inc. | | 152,219 | |
12,150 | | | | Comerica, Inc. | | 741,393 | |
1,360 | | | | Commerce Bancorp, Inc. | | 87,584 | |
11,600 | | @@ | | Credit Agricole SA | | 350,157 | |
24,000 | | @@ | | DBS Group Holdings Ltd. | | 236,596 | |
16,600 | | @@ | | Depfa Bank PLC | | 279,615 | |
1,080 | | | | East-West Bancorp, Inc. | | 45,317 | |
2,130 | | @@ | | First Bancorp Puerto Rico | | 135,276 | |
11,000 | | @@ | | Fortis | | 303,907 | |
4,610 | | | | Fremont General Corp. | | 116,080 | |
6,960 | | | | Hibernia Corp. | | 205,390 | |
52,300 | | @@ | | HSBC Holdings PLC | | 881,146 | |
960 | | | | Hudson United BanCorp | | 37,805 | |
25,950 | | | | KeyCorp. | | 879,705 | |
3,300 | | @,@@,L | | Kookmin Bank ADR | | 128,964 | |
46,000 | | @@ | | Mitsui Trust Holdings, Inc. | | 462,753 | |
106 | | @@ | | Mizuho Financial Group, Inc. | | 537,232 | |
33,723 | | | | National City Corp. | | 1,266,299 | |
36,000 | | @@ | | Nordea AB | | 362,910 | |
1,960 | | | | PrivateBancorp, Inc. | | 63,171 | |
5,181 | | | | Republic Bancorp, Inc. | | 79,166 | |
21,125 | | @,@@ | | Royal Bank of Scotland Group PLC | | 709,478 | |
3,825 | | | | South Financial Group, Inc. | | 124,427 | |
8,700 | | @@ | | St. George Bank Ltd. | | 172,340 | |
4,525 | | | | Sterling Bancshares, Inc. | | 64,572 | |
42,000 | | @@ | | Sumitomo Trust & Banking Co. Ltd. | | 304,486 | |
25,950 | | | | U.S. Bancorp | | 812,754 | |
7,020 | | @@ | | UBS AG | | 588,462 | |
955 | | | | UCBH Holdings, Inc. | | 43,758 | |
61,700 | | @@ | | UniCredito Italiano S.p.A. | | 354,894 | |
47,400 | | | | Wachovia Corp. | | 2,493,240 | |
24,650 | | | | Wells Fargo & Co. | | 1,531,998 | |
880 | | | | Whitney Holding Corp. | | 39,591 | |
| | | | | | 19,137,469 | |
2,150 | | L | | Beverages: 1.1% | | | |
34,800 | | | | Adolph Coors Co. | | 162,691 | |
24,700 | | | | Coca-Cola Co. | | 1,448,724 | |
| | | | PepsiCo, Inc. | | 1,289,340 | |
| | | | | | 2,900,755 | |
18,050 | | @ | | Biotechnology: 0.5% | | | |
3,060 | | @ | | Amgen, Inc. | | 1,157,908 | |
3,430 | | @ | | Arqule, Inc. | | 17,717 | |
| | | | Charles River Laboratories Intl., Inc. | | 157,814 | |
| | | | | | 1,333,439 | |
40,400 | | @@ | | Building Materials: 0.1% | | | |
540 | | | | Boral Ltd. | | 218,390 | |
1,010 | | | | Florida Rock Industries, Inc. | | 32,146 | |
1,530 | | | | Simpson Manufacturing Co., Inc. | | 35,249 | |
| | | | Texas Industries, Inc. | | 95,441 | |
| | | | | | 381,226 | |
3,730 | | | | Chemicals: 1.5% | | | |
13,900 | | | | Cabot Corp. | | 144,276 | |
| | | | Dow Chemical Co. | | 688,189 | |
See Accompanying Notes to Financial Statements
73
ING VP STRATEGIC ALLOCATION | PORTFOLIO OF INVESTMENTS |
GROWTH PORTFOLIO | AS OF DECEMBER 31, 2004 (CONTINUED) |
Shares | | | | | | Value | |
| | | | Chemicals (continued) | | | |
3,400 | | @@ | | DSM NV | | $ | 219,876 | |
14,100 | | | | E.I. du Pont EI de Nemours & Co. | | 691,605 | |
2,605 | | @ | | FMC Corp. | | 125,822 | |
2,080 | | | | Georgia Gulf Corp. | | 103,584 | |
4,260 | | | | Lyondell Chemical Co. | | 123,199 | |
112,000 | | @@ | | Mitsubishi Chemical Corp. | | 340,806 | |
2,375 | | @ | | OM Group, Inc. | | 76,998 | |
3,860 | | @ | | Omnova Solutions, Inc. | | 21,693 | |
7,890 | | @ | | PolyOne Corp. | | 71,483 | |
12,000 | | | | PPG Industries, Inc. | | 817,920 | |
3,400 | | # | | Reliance Industries Ltd. GDR | | 87,584 | |
10,100 | | | | Sherwin-Williams Co. | | 450,763 | |
| | | | | | 3,963,798 | |
| | | | Coal: 0.1% | | | |
1,605 | | | | Massey Energy Co. | | 56,095 | |
1,155 | | | | Peabody Energy Corp. | | 93,451 | |
| | | | | | 149,546 | |
| | | | Commercial Services: 1.2% | | | |
6,250 | | | | Adesa, Inc. | | 132,625 | |
2,940 | | @ | | Administaff, Inc. | | 37,073 | |
4,080 | | @ | | Alliance Data Systems Corp. | | 193,718 | |
1,080 | | | | Chemed Corp. | | 72,479 | |
1,325 | | @ | | Consolidated Graphics, Inc. | | 60,818 | |
12,000 | | @@ | | Dai Nippon Printing Co.,Ltd. | | 193,193 | |
8,600 | | | | Equifax, Inc. | | 241,660 | |
12,400 | | L | | H&R Block, Inc. | | 607,600 | |
2,765 | | @ | | ITT Educational Services, Inc. | | 131,476 | |
3,510 | | @ | | Korn/Ferry Intl. | | 72,833 | |
4,105 | | @,L | | Labor Ready, Inc. | | 69,457 | |
1,595 | | | | Manpower, Inc. | | 77,039 | |
22,100 | | | | McKesson Corp. | | 695,265 | |
1,220 | | @ | | Pharmaceutical Product Development, Inc. | | 50,374 | |
83,200 | | @@ | | Rentokil Initial PLC | | 235,357 | |
3,835 | | | | Rollins, Inc. | | 100,937 | |
5,180 | | @,L | | Sotheby’s Holdings | | 94,069 | |
1,040 | | @,L | | Vertrue, Inc. | | 39,281 | |
| | | | | | 3,105,254 | |
| | | | Computers: 4.2% | | | |
3,320 | | L | | Agilysys, Inc. | | 56,905 | |
19,250 | | @ | | Apple Computer, Inc. | | 1,239,700 | |
6,138 | | @ | | BISYS Group, Inc. | | 100,970 | |
1,700 | | @ | | CACI Intl., Inc. | | 115,821 | |
1,635 | | @ | | Catapult Communications Corp. | | 39,502 | |
2,325 | | @ | | Cognizant Technology Solutions Corp. | | 98,417 | |
69,900 | | @ | | Dell, Inc. | | 2,945,586 | |
1,240 | | | | Diebold, Inc. | | 69,105 | |
1,495 | | @ | | DST Systems, Inc. | | 77,919 | |
665 | | | | FactSet Research Systems, Inc. | | 38,863 | |
42,250 | | | | Hewlett-Packard Co. | | 885,983 | |
40,400 | | | | International Business Machines Corp. | | 3,982,631 | |
6,270 | | | | Jack Henry Associates, Inc. | | 124,836 | |
655 | | @ | | Kronos, Inc. | | 33,490 | |
1,255 | | @ | | Micros Systems, Inc. | | 97,965 | |
100 | | @ | | SanDisk Corp. | | 2,497 | |
5,615 | | @ | | Storage Technology Corp. | | 177,490 | |
200,200 | | @ | | Sun Microsystems, Inc. | | 1,077,076 | |
| | | | | | 11,164,756 | |
| | | | Cosmetics/Personal Care: 2.0% | | | |
38,050 | | | | Gillette Co. | | $ | 1,703,879 | |
63,900 | | | | Procter & Gamble Co. | | 3,519,612 | |
| | | | | | 5,223,491 | |
| | | | Distribution/Wholesale: 0.5% | | | |
1,470 | | | | CDW Corp. | | 97,535 | |
12,500 | | | | Genuine Parts Co. | | 550,750 | |
1,380 | | | | Hughes Supply, Inc. | | 44,643 | |
1,140 | | | | SCP Pool Corp. | | 36,366 | |
3,270 | | @ | | Tech Data Corp. | | 148,458 | |
700 | | @ | | United Stationers, Inc. | | 32,340 | |
6,900 | | | | W.W. Grainger, Inc. | | 459,678 | |
| | | | | | 1,369,770 | |
| | | | Diversified Financial Services: 5.0% | | | |
39,650 | | | | American Express Co. | | 2,235,070 | |
8,300 | | @ | | AmeriCredit Corp. | | 202,935 | |
7,000 | | | | Bear Stearns Cos., Inc. | | 716,170 | |
13,400 | | | | Capital One Financial Corp. | | 1,128,414 | |
15,350 | | | | CIT Group, Inc. | | 703,337 | |
73,750 | | | | Citigroup, Inc. | | 3,553,274 | |
13,500 | | | | Fannie Mae | | 961,335 | |
1,792 | | | | Legg Mason, Inc. | | 131,282 | |
14,050 | | | | Lehman Brothers Holdings, Inc. | | 1,229,094 | |
13,400 | | | | Merrill Lynch & Co., Inc. | | 800,918 | |
16,050 | | | | Morgan Stanley | | 891,096 | |
20,050 | | @ | | Providian Financial Corp. | | 330,224 | |
3,480 | | @@ | | Takefuji Corp. | | 235,346 | |
| | | | | | 13,118,495 | |
| | | | Diversified Operations: 0.0% | | | |
500 | | @@,# | | Reliance Industries Ltd. GDR | | 12,880 | |
| | | | | | 12,880 | |
| | | | Electric: 2.8% | | | |
44,850 | | @ | | AES Corp. | | 613,100 | |
11,500 | | @@ | | Chubu Electric Power Co., Inc. | | 276,081 | |
11,650 | | | | Constellation Energy Group, Inc. | | 509,222 | |
47,050 | | L | | Duke Energy Corp. | | 1,191,776 | |
5,500 | | @@ | | E.ON AG | | 500,832 | |
22,900 | | | | Edison Intl. | | 733,487 | |
42,900 | | @,@@ | | Enel S.p.A. | | 421,714 | |
9,100 | | L | | Exelon Corp. | | 401,037 | |
10,900 | | | | Kyushu Electric Power Co., Inc. | | 220,191 | |
5,260 | | | | Pepco Holdings, Inc. | | 112,143 | |
13,943 | | | | PPL Corp. | | 742,883 | |
5,800 | | @@ | | RWE AG | | 320,270 | |
3,155 | | L | | Scana Corp. | | 124,307 | |
9,200 | | L | | Southern Co. | | 308,384 | |
14,600 | | | | TXU Corp. | | 942,576 | |
3,370 | | | | Wisconsin Energy Corp. | | 113,603 | |
| | | | | | 7,531,606 | |
| | | | Electrical Components and Equipment: 0.4% | | | |
4,160 | | | | AMETEK, Inc. | | 148,387 | |
3,838 | | @ | | Energizer Holdings, Inc. | | 190,710 | |
2,450 | | @ | | Rayovac Corp. | | 74,872 | |
600 | | @@ | | Samsung Electronics Co. Ltd. GDR | | 131,662 | |
24,000 | | @@ | | Sumitomo Electric Industries Ltd. | | 262,596 | |
71,000 | | @@ | | Toshiba Corp. | | 305,734 | |
| | | | | | 1,113,961 | |
See Accompanying Notes to Financial Statements
74
ING VP STRATEGIC ALLOCATION | PORTFOLIO OF INVESTMENTS |
GROWTH PORTFOLIO | AS OF DECEMBER 31, 2004 (CONTINUED) |
Shares | | | | | | Value | |
| | | | Electronics: 0.6% | | | |
1,520 | | | | BEI Technologies, Inc. | | $ | 46,938 | |
1,200 | | | | Bel Fuse, Inc. | | 40,548 | |
890 | | @,L | | Benchmark Electronics, Inc. | | 30,349 | |
1,590 | | | | Brady Corp. | | 99,486 | |
450 | | @ | | Dionex Corp. | | 25,502 | |
720 | | @ | | FLIR Systems, Inc. | | 45,929 | |
1,713 | | | | Keithley Instruments, Inc. | | 33,746 | |
14,000 | | @@ | | Koninklijke Philips Electronics NV | | 371,013 | |
3,260 | | @ | | Paxar Corp. | | 72,274 | |
11,200 | | | | PerkinElmer, Inc. | | 251,888 | |
11,050 | | @ | | Thermo Electron Corp. | | 333,599 | |
3,900 | | @ | | Thomas & Betts Corp. | | 119,925 | |
1,090 | | @ | | Trimble Navigation Ltd. | | 36,014 | |
2,760 | | @ | | Varian, Inc. | | 113,188 | |
| | | | | | 1,620,399 | |
| | | | Engineering and Construction: 0.0% | | �� | |
1,440 | | @ | | Emcor Group, Inc. | | 65,059 | |
| | | | | | 65,059 | |
| | | | Entertainment: 0.1% | | | |
1,960 | | @ | | Argosy Gaming Co. | | 91,532 | |
3,050 | | | | International Speedway Corp. | | 161,040 | |
| | | | | | 252,572 | |
| | | | Environmental Control: 0.1% | | | |
2,660 | | | | Republic Services, Inc. | | 89,217 | |
1,025 | | @ | | Waste Connections, Inc. | | 35,106 | |
| | | | | | 124,323 | |
| | | | Food: 1.2% | | | |
1,940 | | | | Corn Products Intl., Inc. | | 103,906 | |
880 | | | | Flowers Foods, Inc. | | 27,790 | |
32,100 | | @,@@ | | Koninklijke Ahold NV | | 248,745 | |
2,886 | | | | Lance, Inc. | | 54,921 | |
37,000 | | | | Meiji Dairies Corp | | 220,256 | |
4,900 | | @@ | | Metro AG | | 270,099 | |
1,260 | | | | Nash Finch Co. | | 47,578 | |
4,205 | | | | Ruddick Corp. | | 91,206 | |
1,635 | | L | | Sanderson Farms, Inc. | | 70,763 | |
10,400 | | | | SUPERVALU, Inc. | | 359,008 | |
6,065 | | | | Tyson Foods, Inc. | | 111,596 | |
39,700 | | @,@@ | | Unilever PLC | | 389,473 | |
1,060 | | | | Whole Foods Market, Inc. | | 101,071 | |
13,901 | | | | Wm. Wrigley Jr. Co. | | 961,811 | |
| | | | | | 3,058,223 | |
| | | | Forest Products and Paper: 0.7% | | | |
7,150 | | | | International Paper Co. | | 300,300 | |
14,750 | | | | MeadWestvaco Corp. | | 499,878 | |
2,210 | | | | Potlatch Corp. | | 111,782 | |
4,311 | | | | Wausau-Mosinee Paper Corp. | | 76,994 | |
14,200 | | | | Weyerhaeuser Co. | | 954,524 | |
| | | | | | 1,943,478 | |
| | | | Gas: 0.4% | | | |
2,070 | | | | Atmos Energy Corp. | | 56,615 | |
2,605 | | | | Energen Corp. | | 153,565 | |
16,200 | | | | Sempra Energy | | 594,215 | |
3,670 | | | | UGI Corp. | | 150,140 | |
5,934 | | | | WGL Holdings, Inc. | | 183,005 | |
| | | | | | 1,137,540 | |
| | | | Hand/Machine Tools: 0.2% | | | |
5,500 | | | | Black & Decker Corp. | | $ | 485,815 | |
| | | | | | 485,815 | |
| | | | Healthcare-Products: 3.0% | | | |
15,750 | | | | Becton Dickinson & Co. | | 894,600 | |
705 | | | | Cooper Cos., Inc. | | 49,766 | |
5,940 | | @ | | Cytyc Corp. | | 163,766 | |
1,380 | | | | Dentsply Intl., Inc. | | 77,556 | |
4,000 | | @@ | | Fresenius Medical Care AG | | 322,123 | |
2,110 | | @ | | Haemonetics Corp. | | 76,403 | |
730 | | @ | | Idexx Laboratories, Inc. | | 39,851 | |
3,600 | | @ | | Immucor, Inc. | | 84,636 | |
69,100 | | | | Johnson & Johnson | | 4,382,321 | |
16,900 | | | | Medtronic, Inc. | | 839,423 | |
2,430 | | @ | | Patterson Cos., Inc. | | 105,438 | |
725 | | @,L | | ResMed, Inc. | | 37,048 | |
2,015 | | @ | | Respironics, Inc. | | 109,535 | |
19,900 | | @,@@ | | Smith & Nephew PLC | | 203,621 | |
2,713 | | @ | | Sola Intl., Inc. | | 74,716 | |
2,630 | | @ | | Sybron Dental Specialties, Inc. | | 93,049 | |
5,570 | | @ | | Varian Medical Systems, Inc. | | 240,847 | |
1,313 | | | | Vital Signs, Inc. | | 51,102 | |
| | | | | | 7,845,801 | |
| | | | Healthcare-Services: 2.3% | | | |
8,300 | | | | Aetna, Inc. | | 1,035,424 | |
1,550 | | @,L | | Amedisys, Inc. | | 50,205 | |
1,490 | | @ | | AMERIGROUP Corp. | | 112,733 | |
3,010 | | @ | | Centene Corp. | | 85,334 | |
3,590 | | @ | | Covance, Inc. | | 139,113 | |
4,020 | | @ | | Coventry Health Care, Inc. | | 213,382 | |
11,800 | | @ | | Humana, Inc. | | 350,342 | |
4,730 | | @ | | Lincare Holdings, Inc. | | 201,735 | |
3,950 | | @ | | PacifiCare Health Systems, Inc. | | 223,254 | |
1,750 | | @ | | RehabCare Group, Inc. | | 48,983 | |
1,715 | | @ | | Sierra Health Services, Inc. | | 94,514 | |
23,100 | | | | UnitedHealth Group, Inc. | | 2,033,492 | |
12,550 | | @ | | WellPoint Inc | | 1,443,249 | |
| | | | | | 6,031,760 | |
| | | | Holding Companies-Diversified: 0.1% | | | |
79,000 | | @@ | | Citic Pacific Ltd. | | 225,017 | |
| | | | | | 225,017 | |
| | | | Home Builders: 0.2% | | | |
1,020 | | L | | DR Horton, Inc. | | 41,116 | |
2,680 | | | | Lennar Corp. | | 151,902 | |
270 | | @,L | | NVR, Inc. | | 207,739 | |
| | | | | | 400,757 | |
| | | | Home Furnishings: 0.5% | | | |
9,100 | | @@ | | Electrolux AB | | 208,484 | |
790 | | | | Ethan Allen Interiors, Inc. | | 31,616 | |
2,797 | | | | Fedders Corp. | | 10,125 | |
2,375 | | | | Harman Intl. Industries, Inc. | | 301,625 | |
27,000 | | @@ | | Matsushita Electric Industrial Co.,Ltd. | | 432,626 | |
17,800 | | @@ | | Yamaha Corp. | | 272,750 | |
| | | | | | 1,257,226 | |
| | | | Household Products/Wares: 0.4% | | | |
4,540 | | | | American Greetings Corp. | | 115,089 | |
1,113 | | | | Blyth, Inc. | | 32,900 | |
See Accompanying Notes to Financial Statements
75
ING VP STRATEGIC ALLOCATION | PORTFOLIO OF INVESTMENTS |
GROWTH PORTFOLIO | AS OF DECEMBER 31, 2004 (CONTINUED) |
Shares | | | | | | Value | |
| | | | Household Products/Wares (continued) | | | |
4,140 | | | | Church & Dwight, Inc. | | $ | 139,187 | |
11,150 | | | | Clorox Co. | | 657,070 | |
1,530 | | @ | | Fossil, Inc. | | 39,229 | |
| | | | | | 983,475 | |
| | | | Housewares: 0.0% | | | |
1,405 | | | | Toro Co. | | 114,297 | |
| | | | | | 114,297 | |
| | | | Insurance: 5.5% | | | |
22,900 | | @@ | | AEGON NV | | 311,709 | |
4,525 | | | | American Financial Group, Inc. | | 141,678 | |
37,100 | | | | American Intl. Group, Inc. | | 2,436,356 | |
2,760 | | L | | AmerUs Group Co. | | 125,028 | |
12,400 | | | | Chubb Corp. | | 953,560 | |
9,550 | | | | CIGNA Corp. | | 778,994 | |
2,100 | | | | Delphi Financial Group, Inc. | | 96,915 | |
2,455 | | @@ | | Everest Re Group Ltd. | | 219,870 | |
3,010 | | | | Fidelity National Financial, Inc. | | 137,467 | |
4,690 | | | | First American Corp. | | 164,807 | |
16,850 | | | | Hartford Financial Services Group, Inc. | | 1,167,874 | |
1,450 | | L | | LandAmerica Financial Group, Inc. | | 78,199 | |
166,600 | | @@ | | Legal & General Group PLC | | 351,029 | |
12,050 | | | | Lincoln National Corp. | | 562,494 | |
13,304 | | | | Loews Corp. | | 935,271 | |
33,500 | | | | MetLife, Inc. | | 1,357,084 | |
7,000 | | | | MGIC Investment Corp. | | 482,370 | |
28,000 | | @@ | | Mitsui Sumitomo Insurance Co. Ltd. | | 244,145 | |
4,920 | | @ | | Ohio Casualty Corp. | | 114,193 | |
1,445 | | @ | | Philadelphia Consolidated Holding Co. | | 95,572 | |
2,150 | | @ | | ProAssurance Corp. | | 84,087 | |
24,150 | | | | Prudential Financial, Inc. | | 1,327,283 | |
26,600 | | @@ | | QBE Insurance Group Ltd. | | 320,920 | |
4,040 | | | | Radian Group, Inc. | | 215,090 | |
9,250 | | | | Safeco Corp. | | 483,220 | |
2,010 | | | | Selective Insurance Group, Inc. | | 88,922 | |
50,600 | | @@ | | Skandia Forsakrings AB | | 251,763 | |
1,770 | | L | | StanCorp Financial Group, Inc. | | 146,025 | |
1,560 | | | | Stewart Information Services Corp. | | 64,974 | |
2,890 | | @@ | | Swiss Reinsurance Co. | | 205,629 | |
2,910 | | | | UICI | | 98,649 | |
4,045 | | | | W.R. Berkley Corp. | | 190,803 | |
1,570 | | L | | Zenith National Insurance Corp. | | 78,249 | |
1,760 | | @,@@ | | Zurich Financial Services AG | | 293,060 | |
| | | | | | 14,603,289 | |
| | | | Internet: 1.2% | | | |
9,250 | | @ | | eBay, Inc. | | 1,075,589 | |
6,820 | | @ | | McAfee, Inc. | | 197,303 | |
5,025 | | @ | | RSA Security, Inc. | | 100,802 | |
38,800 | | @,L | | Symantec Corp. | | 999,488 | |
4,000 | | @ | | Verity, Inc. | | 52,480 | |
1,740 | | @ | | Websense, Inc. | | 88,253 | |
18,600 | | @ | | Yahoo!, Inc. | | 700,848 | |
| | | | | | 3,214,763 | |
515 | | | | Iron/Steel: 0.3% | | | |
| | @@ | | Carpenter Technology Corp. | | $ | 30,107 | |
12,400 | | @@ | | JFE Holdings, Inc. | | 354,296 | |
13,200 | | | | ThyssenKrupp AG | | 290,747 | |
| | | | | | 675,150 | |
| | | | Leisure Time: 0.3% | | | |
2,170 | | L | | Arctic Cat, Inc. | | 57,548 | |
7,950 | | L | | Carnival Corp. | | 458,160 | |
3,120 | | | | Nautilus Group, Inc. | | 75,410 | |
920 | | | | Polaris Industries, Inc. | | 62,578 | |
| | | | | | 653,696 | |
| | | | Lodging: 0.6% | | | |
4,480 | | @ | | Boyd Gaming Corp. | | 186,592 | |
5,480 | | @,L | | Caesars Entertainment, Inc. | | 110,367 | |
1,200 | | | | Mandalay Resort Group | | 84,516 | |
15,150 | | | | Marriott Intl., Inc. | | 954,147 | |
3,050 | | | | Starwood Hotels & Resorts Worldwide, Inc. | | 178,120 | |
| | | | | | 1,513,742 | |
| | @ | | Machinery-Construction and Mining: 0.0% | | | |
2,085 | | | | Astec Industries, Inc. | | 35,883 | |
| | | | | | 35,883 | |
| | | | Machinery-Diversified: 0.3% | | | |
2,550 | | | | Applied Industrial Technologies, Inc. | | 69,870 | |
985 | | | | Cognex Corp. | | 27,482 | |
3,100 | | @ | | Cummins, Inc. | | 259,748 | |
2,100 | | | | Gerber Scientific, Inc. | | 15,981 | |
4,060 | | | | Graco, Inc. | | 151,641 | |
1,065 | | @ | | IDEX Corp. | | 43,133 | |
3,477 | | | | Zebra Technologies Corp. | | 195,686 | |
| | | | | | 763,541 | |
| | @,L | | Media: 2.2% | | | |
30,950 | | | | Comcast Corp. | | 1,030,016 | |
10,750 | | @@ | | McGraw-Hill Cos., Inc. | | 984,055 | |
19,300 | | | | Mediaset S.p.A. | | 244,348 | |
2,900 | | @ | | Meredith Corp. | | 157,180 | |
2,000 | | @@ | | News Corp. | | 37,320 | |
30,900 | | | | Reed Elsevier PLC | | 284,821 | |
1,590 | | @ | | Thomas Nelson, Inc. | | 35,934 | |
64,550 | | | | Time Warner, Inc. | | 1,254,852 | |
24,250 | | | | Viacom, Inc. | | 882,458 | |
28,750 | | | | Walt Disney Co. | | 799,250 | |
170 | | | | Washington Post Co. | | 167,113 | |
| | | | | | 5,877,347 | |
| | | | Metal Fabricate/Hardware: 0.1% | | | |
2,340 | | | | Kaydon Corp. | | 77,267 | |
960 | | | | Lawson Products, Inc. | | 48,413 | |
2,605 | | | | Mueller Industries, Inc. | | 83,881 | |
1,140 | | | | Precision Castparts Corp. | | 74,875 | |
1,930 | | @ | | Timken Co. | | 50,219 | |
1,520 | | | | Wolverine Tube, Inc. | | 19,623 | |
| | | | | | 354,278 | |
| | @@ | | Mining: 0.5% | | | |
11,500 | | @@ | | Anglo American PLC | | 271,354 | |
24,500 | | | | BHP Billiton Ltd. | | 294,019 | |
See Accompanying Notes to Financial Statements
76
ING VP STRATEGIC ALLOCATION
GROWTH PORTFOLIO | PORTFOLIO OF INVESTMENTS
AS OF DECEMBER 31, 2004 (CONTINUED) |
Shares | | | | | | Value | |
| | | | Mining (continued) | | | |
6,700 | | L | | Phelps Dodge Corp. | | $ | 662,764 | |
2,265 | | @ | | RTI Intl. Metals, Inc. | | 46,523 | |
| | | | | | 1,274,660 | |
| | | | Miscellaneous Manufacturing: 3.4% | | | |
10,800 | | | | 3M Co. | | 886,356 | |
775 | | | | AptarGroup, Inc. | | 40,905 | |
18,800 | | L | | Eastman Kodak Co. | | 606,300 | |
150,300 | | | | General Electric Co. | | 5,485,950 | |
2,530 | | | | Lancaster Colony Corp. | | 108,461 | |
4,720 | | @ | | Pentair, Inc. | | 205,603 | |
900 | | | | Roper Industries, Inc. | | 54,693 | |
4,800 | | @@ | | Siemens AG | | 406,336 | |
29,550 | | @@ | | Tyco Intl. Ltd. | | 1,056,117 | |
| | | | | | 8,850,721 | |
| | | | Office/Business Equipment: 0.5% | | | |
1,960 | | @ | | Global Imaging Systems, Inc. | | 77,420 | |
5,200 | | | | Seiko Epson Corp | | 231,850 | |
59,500 | | @ | | Xerox Corp. | | 1,012,095 | |
| | | | | | 1,321,365 | |
| | | | Oil and Gas: 7.0% | | | |
6,100 | | | | Amerada Hess Corp. | | 502,518 | |
82,507 | | @@ | | BP PLC | | 802,832 | |
21,050 | | | | Burlington Resources, Inc. | | 915,675 | |
27,950 | | | | ChevronTexaco Corp. | | 1,467,654 | |
2,370 | | @ | | Cimarex Energy Co. | | 89,823 | |
21,350 | | | | ConocoPhillips | | 1,853,820 | |
24,400 | | | | Devon Energy Corp. | | 949,648 | |
121,650 | | | | Exxon Mobil Corp. | | 6,235,778 | |
2,310 | | | | Frontier Oil Corp. | | 61,585 | |
1,350 | | | | LUKOIL ADR | | 165,375 | |
3,328 | | | | Murphy Oil Corp. | | 267,738 | |
2,945 | | @ | | Newfield Exploration Co. | | 173,902 | |
2,830 | | L | | Noble Energy, Inc. | | 174,498 | |
2,500 | | @@ | | Norsk Hydro ASA | | 196,601 | |
18,700 | | | | Occidental Petroleum Corp. | | 1,091,331 | |
1,515 | | | | Patina Oil & Gas Corp. | | 56,813 | |
1,450 | | @ | | Petroleum Development Corp. | | 55,927 | |
3,330 | | | | Pogo Producing Co. | | 161,472 | |
2,205 | | @ | | Remington Oil & Gas Corp. | | 60,086 | |
18,200 | | @@ | | Repsol YPF SA | | 473,421 | |
101,500 | | @@ | | Shell Transport & Trading Co. PLC | | 868,433 | |
770 | | @ | | Southwestern Energy Co. | | 39,031 | |
1,740 | | @ | | Stone Energy Corp. | | 78,457 | |
3,900 | | L | | Sunoco, Inc. | | 318,669 | |
2,180 | | @ | | Swift Energy Co. | | 63,089 | |
3,000 | | @@ | | Total SA | | 657,038 | |
16,050 | | L | | Valero Energy Corp. | | 728,670 | |
| | | | | | 18,509,884 | |
| | | | Oil and Gas Services: 0.2% | | | |
2,200 | | @ | | Cal Dive Intl., Inc. | | 89,650 | |
1,620 | | @ | | Hydril Co. | | 73,726 | |
4,960 | | @ | | Weatherford Intl. Ltd. | | 254,448 | |
| | | | | | 417,824 | |
| | | | Packaging and Containers: 0.1% | | | |
7,150 | | | | Ball Corp. | | 314,457 | |
1,710 | | | | Sonoco Products Co. | | 50,702 | |
| | | | | | 365,159 | |
| | | | Pharmaceuticals: 3.8% | | | |
21,600 | | | | Abbott Laboratories | | $ | 1,007,640 | |
4,580 | | | | Alpharma, Inc. | | 77,631 | |
8,100 | | | | Amerisourcebergen Corp. | | 475,308 | |
14,400 | | | | Cardinal Health, Inc. | | 837,360 | |
28,150 | | @ | | Caremark Rx, Inc. | | 1,109,955 | |
1,215 | | | | Medicis Pharmaceutical Corp. | | 42,659 | |
32,550 | | | | Merck & Co., Inc. | | 1,046,157 | |
1,610 | | | | Natures Sunshine Products, Inc. | | 32,780 | |
1,335 | | @ | | NBTY, Inc. | | 32,053 | |
2,420 | | @ | | Noven Pharmaceuticals, Inc. | | 41,285 | |
108,150 | | | | Pfizer, Inc. | | 2,908,153 | |
6,190 | | @@ | | Roche Holding AG | | 710,509 | |
11,100 | | @@ | | Sankyo Co.,Ltd. | | 251,328 | |
7,892 | | @@ | | Sanofi-Aventis | | 630,977 | |
1,220 | | @,L | | Sepracor, Inc. | | 72,431 | |
6,100 | | @@ | | Takeda Pharmaceutical Co. Ltd. | | 307,998 | |
6,000 | | | | UCB SA | | 305,016 | |
| | | | | | 9,889,240 | |
| | | | Pipelines: 0.1% | | | |
8,082 | | | | National Fuel Gas Co. | | 229,044 | |
2,370 | | | | Questar Corp. | | 120,775 | |
| | | | | | 349,819 | |
| | | | Real Estate: 0.1% | | | |
30,000 | | @@ | | Cheung Kong Holdings Ltd. | | 299,346 | |
| | | | | | 299,346 | |
| | | | Real Estate Investment Trusts: 1.9% | | | |
16,175 | | | | Acadia Realty Trust | | 263,652 | |
500 | | @ | | Alexander’s, Inc. | | 107,500 | |
2,525 | | | | Alexandria Real Estate Equities, Inc. | | 187,910 | |
2,950 | | @ | | Archstone-Smith Trust | | 112,985 | |
2,100 | | | | Avalonbay Communities, Inc. | | 158,130 | |
2,950 | | | | Boston Properties, Inc. | | 190,776 | |
2,260 | | | | CBL & Associates Properties, Inc. | | 172,551 | |
3,250 | | L | | CenterPoint Properties Trust | | 155,643 | |
7,750 | | | | Corporate Office Properties Trust Sbi MD | | 227,462 | |
3,050 | | | | Developers Diversified Realty Corp. | | 135,329 | |
4,175 | | | | Equity Office Properties Trust | | 121,576 | |
4,450 | | L | | Equity Residential | | 161,001 | |
1,100 | | | | Essex Property Trust, Inc. | | 92,180 | |
5,075 | | @ | | FelCor Lodging Trust, Inc. | | 74,349 | |
3,775 | | | | General Growth Properties, Inc. | | 136,504 | |
2,467 | | | | Gramercy Capital Corp. | | 50,820 | |
12,750 | | | | Host Marriott Corp. | | 220,574 | |
2,000 | | | | iStar Financial, Inc. | | 90,520 | |
2,750 | | | | Kimco Realty Corp. | | 159,473 | |
5,000 | | | | LaSalle Hotel Properties | | 159,150 | |
6,300 | | @ | | Meristar Hospitality Corp. | | 52,605 | |
4,275 | | | | National Health Investors, Inc. | | 124,745 | |
6,750 | | | | Nationwide Health Properties, Inc. | | 160,313 | |
2,305 | | | | New Century Financial Corp. | | 147,313 | |
4,475 | | | | Newcastle Investment Corp. | | 142,216 | |
4,525 | | | | ProLogis | | 196,067 | |
1,725 | | | | PS Business Parks, Inc. | | 77,798 | |
3,350 | | | | Public Storage, Inc. | | 186,763 | |
2,100 | | | | Rayonier, Inc. | | 102,711 | |
4,725 | | | | Reckson Associates Realty Corp. | | 155,027 | |
See Accompanying Notes to Financial Statements
77
ING VP STRATEGIC ALLOCATION
GROWTH PORTFOLIO | PORTFOLIO OF INVESTMENTS
AS OF DECEMBER 31, 2004 (CONTINUED) |
Shares | | | | | | Value | |
| | | | Real Estate Investment Trusts (continued) | | | |
3,025 | | L | | Regency Centers Corp. | | $ | 167,585 | |
2,550 | | | | Simon Property Group, Inc. | | 164,909 | |
2,800 | | | | SL Green Realty Corp. | | 169,540 | |
4,700 | | | | United Dominion Realty Trust, Inc. | | 116,560 | |
| | | | | | 4,942,237 | |
| | | | Retail: 6.2% | | | |
4,265 | | | | Abercrombie & Fitch Co. | | 200,242 | |
3,875 | | | | American Eagle Outfitters, Inc. | | 182,513 | |
4,705 | | @ | | Barnes & Noble, Inc. | | 151,830 | |
4,380 | | @ | | BJ’s Wholesale Club, Inc. | | 127,589 | |
2,190 | | | | Cato Corp. | | 63,116 | |
2,390 | | @ | | CEC Entertainment, Inc. | | 95,528 | |
6,245 | | | | Claire’s Stores, Inc. | | 132,706 | |
24,350 | | L | | Costco Wholesale Corp. | | 1,178,784 | |
24,000 | | @@ | | Enterprise Inns PLC | | 365,211 | |
3,840 | | @ | | GameStop Corp | | 86,054 | |
62,100 | | | | Home Depot, Inc. | | 2,654,154 | |
2,000 | | @ | | J. Jill Group, Inc. | | 29,780 | |
20,650 | | | | J.C. Penney Co., Inc. Holding Co. | | 854,910 | |
2,515 | | @ | | Jack in The Box, Inc. | | 92,728 | |
6,600 | | | | Lawson, Inc. | | 243,848 | |
31,000 | | @ | | Limited Brands, Inc. | | 713,620 | |
18,200 | | @@ | | Marui Co. Ltd. | | 244,624 | |
50,200 | | | | McDonald’s Corp. | | 1,609,412 | |
6,400 | | | | Michaels Stores, Inc. | | 191,808 | |
2,430 | | | | PETsMART, Inc. | | 86,338 | |
550 | | @ | | PF Chang’s China Bistro, Inc. | | 30,993 | |
1,260 | | @ | | Sonic Corp. | | 38,430 | |
28,950 | | | | Staples, Inc. | | 975,905 | |
20,500 | | @ | | Starbucks Corp. | | 1,278,380 | |
4,005 | | @ | | Stein Mart, Inc. | | 68,325 | |
12,250 | | @ | | Target Corp. | | 636,143 | |
3,080 | | @ | | Too, Inc. | | 75,337 | |
16,500 | | @ | | Toys R US, Inc. | | 337,755 | |
4,000 | | @ | | Urban Outfitters, Inc. | | 177,600 | |
60,100 | | | | Wal-Mart Stores, Inc. | | 3,174,481 | |
2,070 | | @,L | | Williams-Sonoma, Inc. | | 72,533 | |
1,090 | | @,L | | Zale Corp. | | 32,558 | |
| | | | | | 16,203,235 | |
| | | | Savings and Loans: 0.1% | | | |
2,396 | | @ | | BankUnited Financial Corp. | | 76,552 | |
2,750 | | @ | | Waypoint Financial Corp. | | 77,963 | |
| | | | | | 154,515 | |
| | | | Semiconductors: 1.2% | | | |
4,020 | | @,L | | Cree, Inc. | | 161,122 | |
2,865 | | @ | | DSP Group, Inc. | | 63,975 | |
92,000 | | | | Intel Corp. | | 2,151,880 | |
3,640 | | | | Microchip Technology, Inc. | | 97,042 | |
15,500 | | @@ | | Taiwan Semiconductor Manufacturing Co. Ltd. ADR | | 131,595 | |
23,600 | | | | Texas Instruments, Inc. | | 581,032 | |
790 | | @ | | Varian Semiconductor Equipment Associates, Inc. | | 29,112 | |
| | | | | | 3,215,758 | |
| | | | Software: 3.6% | | | |
2,835 | | @ | | Advent Software, Inc. | | 58,061 | |
2,530 | | @ | | Ansys, Inc. | | 81,112 | |
16,600 | | | | Autodesk, Inc. | | 629,970 | |
725 | | @,L | | Avid Technology, Inc. | | $ | 44,769 | |
14,300 | | @ | | BMC Software, Inc. | | 265,980 | |
780 | | @,L | | Cerner Corp. | | 41,473 | |
26,100 | | @ | | Compuware Corp. | | 168,867 | |
1,452 | | @,L | | CSG Systems Intl., Inc. | | 27,152 | |
2,210 | | @ | | Digi Intl., Inc. | | 37,990 | |
3,290 | | @ | | Dun & Bradstreet Corp. | | 196,249 | |
3,500 | | @ | | eFunds Corp. | | 84,035 | |
4,080 | | | | Fair Isaac Corp. | | 149,654 | |
3,050 | | @ | | FileNet Corp. | | 78,568 | |
810 | | L | | Global Payments, Inc. | | 47,417 | |
825 | | @,L | | Hyperion Solutions Corp. | | 38,462 | |
2,035 | | @ | | MapInfo Corp. | | 24,379 | |
154,500 | | | | Microsoft Corp. | | 4,126,694 | |
167,750 | | @ | | Oracle Corp. | | 2,301,530 | |
15,400 | | @ | | Parametric Technology Corp. | | 90,706 | |
2,780 | | @ | | Phoenix Technologies Ltd. | | 22,963 | |
3,180 | | @ | | Progress Software Corp. | | 74,253 | |
2,100 | | @@ | | SAP AG | | 371,843 | |
4,870 | | | | SEI Investments Co. | | 204,199 | |
6,940 | | @ | | Sybase, Inc. | | 138,453 | |
7,090 | | @ | | Wind River Systems, Inc. | | 96,070 | |
| | | | | | 9,400,849 | |
| | | | Telecommunications: 4.7% | | | |
9,690 | | @ | | Adaptec, Inc. | | 73,547 | |
30,300 | | | | Alltel Corp. | | 1,780,428 | |
780 | | @ | | Anixter Intl., Inc. | | 28,072 | |
94,000 | | @ | | Cisco Systems, Inc. | | 1,814,200 | |
865 | | @ | | Commonwealth Telephone Enterprises, Inc. | | 42,956 | |
4,850 | | @ | | Commscope, Inc. | | 91,665 | |
30,800 | | @,@@ | | Deutsche Telekom AG | | 696,036 | |
13,600 | | @,@@ | | France Telecom SA | | 449,339 | |
2,980 | | | | Harris Corp. | | 184,134 | |
13,750 | | @@ | | Hellenic Telecommunications Organization SA | | 247,393 | |
35,000 | | | | Motorola, Inc. | | 602,000 | |
67 | | @@ | | Nippon Telegraph & Telephone Corp. | | 303,246 | |
24,100 | | @@ | | Nokia Oyj | | 377,404 | |
49,000 | | @ | | Oki Electric Industry Co Ltd | | 211,331 | |
5,930 | | @ | | Polycom, Inc. | | 138,288 | |
23,750 | | | | QUALCOMM, Inc. | | 1,007,000 | |
10,000 | | @@ | | TDC A/S | | 423,699 | |
158,800 | | @@ | | Telecom Italia S.p.A. | | 648,283 | |
14,700 | | @@ | | Telekom Austria AG | | 278,701 | |
6,800 | | | | Telekomunikasi Indonesia Tbk PT ADR | | 142,936 | |
1,200 | | | | Telephone & Data Systems, Inc. | | 92,340 | |
67,400 | | | | Verizon Communications, Inc. | | 2,730,373 | |
| | | | | | 12,363,371 | |
| | | | Textiles: 0.1% | | | |
1,710 | | | | G&K Services, Inc. | | 74,248 | |
1,140 | | @ | | Mohawk Industries, Inc. | | 104,025 | |
| | | | | | 178,273 | |
| | | | Toys/Games/Hobbies: 0.0% | | | |
1,335 | | @ | | Department 56, Inc. | | 22,228 | |
2,720 | | @,L | | Jakks Pacific, Inc. | | 60,139 | |
| | | | | | 82,367 | |
See Accompanying Notes to Financial Statements
78
ING VP STRATEGIC ALLOCATION
GROWTH PORTFOLIO | PORTFOLIO OF INVESTMENTS
AS OF DECEMBER 31, 2004 (CONTINUED) |
Shares | | | | | | Value | |
| | | | Transportation: 1.9% | | | |
1,500 | | | | C.H. Robinson Worldwide, Inc. | | $ | 83,280 | |
3,125 | | | | CNF, Inc. | | 156,563 | |
50 | | @@ | | East Japan Railway Co. | | 278,525 | |
2,985 | | @,L | | EGL, Inc. | | 89,222 | |
1,870 | | | | Expeditors Intl. Washington, Inc. | | 104,496 | |
13,400 | | | | FedEx Corp. | | 1,319,765 | |
1,730 | | @ | | Forward Air Corp. | | 77,331 | |
1,587 | | | | Heartland Express, Inc. | | 35,660 | |
1,665 | | @ | | Landstar System, Inc. | | 122,611 | |
33,000 | | @@ | | Mitsui O.S.K. Lines Ltd. | | 198,135 | |
25,550 | | | | Norfolk Southern Corp. | | 924,654 | |
1,800 | | @ | | Offshore Logistics, Inc. | | 58,446 | |
2,255 | | | | Overseas Shipholding Group, Inc. | | 124,476 | |
16,400 | | | | United Parcel Service, Inc. | | 1,401,543 | |
1,025 | | @,L | | Yellow Roadway Corp. | | 57,103 | |
| | | | | | 5,031,810 | |
| | | | Water: 0.1% | | | |
17,400 | | @@ | | Severn Trent PLC | | 322,560 | |
| | | | | | 322,560 | |
| | | | Total Common Stock
(Cost $195,300,535) | | 232,341,711 | |
| | | | | | | |
PREFERRED STOCK: 0.0% | | | |
| | | | | | | |
| | | | Banks: 0.0% | | | |
9 | | @,#,XX | | DG Funding Trust | | 96,553 | |
| | | | Total Preferred Stock
(Cost $97,876) | | 96,553 | |
| | | | | | | | |
Principal
Amount | | | | | | Value | |
| | | | | | | |
CORPORATE BONDS/NOTES: 2.1% | | | |
| | | | | | | |
| | | | Auto Manufacturers: 0.1% | | | |
$ | 21,000 | | | | Ford Motor Co., 6.625%, due 10/01/28 | | 19,644 | |
63,000 | | L | | Ford Motor Co., 7.450%, due 07/16/31 | | 63,545 | |
66,000 | | L | | General Motors Corp., 8.375%, due 07/15/33 | | 68,571 | |
| | | | | | 151,760 | |
| | | | Banks: 0.7% | | | |
30,000 | | @@ | | Australia & New Zealand Banking Group Ltd., 2.405%, due 10/29/49 | | 26,205 | |
40,000 | | @@ | | Banco Bradesco SA/Cayman Islands, 8.750%, due 10/24/13 | | 43,800 | |
42,000 | | @@,# | | Banco Santander Chile/ Pre-merger with Banco Santiago SA, 2.800%, due 12/09/09 | | 42,102 | |
70,000 | | @@ | | Banco Santander Santiago Chile SA, 7.375%, due 07/18/12 | | 80,535 | |
40,000 | | @@ | | Bank of Ireland, 2.770%, due 12/29/49 | | 34,800 | |
20,000 | | @@ | | Bank of Nova Scotia, 2.115%, due 08/31/85 | | 16,716 | |
45,000 | | | | BankAmerica Capital II, 8.000%, due 12/15/26 | | 49,473 | |
$ | 34,000 | | @@,# | | Danske Bank A/S, 5.914%, due 12/29/49 | | $ | 36,066 | |
50,000 | | @@ | | Den Norske Bank ASA, 2.115%, due 08/29/49 | | 41,688 | |
32,000 | | # | | Dresdner Funding Trust I, 8.151%, due 06/30/31 | | 39,674 | |
42,000 | | @@,# | | HBOS Capital Funding LP, 6.071%, due 06/30/49 | | 45,095 | |
130,000 | | @@,C | | HSBC Bank PLC, 2.839%, due 06/29/49 | | 113,023 | |
70,000 | | @@ | | Lloyds TSB Bank PLC, 2.090%, due 08/29/49 | | 60,047 | |
60,000 | | @@ | | Lloyds TSB Bank PLC, 2.938%, due 06/29/49 | | 53,512 | |
66,000 | | # | | M&T Bank Corp., 3.850%, due 04/01/13 | | 65,359 | |
45,000 | | | | Mellon Capital I, 7.720%, due 12/01/26 | | 48,870 | |
50,000 | | @@ | | National Australia Bank Ltd., 2.361%, due 10/29/49 | | 43,680 | |
60,000 | | @@ | | National Westminster Bank PLC, 2.563%, due 11/29/49 | | 51,214 | |
56,000 | | @@,# | | Rabobank Capital Funding II, 5.260%, due 12/29/49 | | 57,081 | |
100,000 | | @@,# | | Rabobank Capital Funding Trust, 5.254%, due 12/29/49 | | 99,673 | |
70,000 | | @@ | | Royal Bank of Canada, 2.750%, due 06/29/85 | | 59,847 | |
40,000 | | @@ | | Royal Bank of Scotland Group PLC, 2.938%, due 12/29/49 | | 35,329 | |
20,000 | | @@,C | | Societe Generale, 2.705%, due 11/29/49 | | 17,219 | |
90,000 | | @@,C | | Standard Chartered PLC, 2.813%, due 11/29/49 | | 71,754 | |
160,000 | | @@,C | | Standard Chartered PLC, 2.838%, due 12/29/49 | | 128,800 | |
46,000 | | | | U.S. Bankcorp, 8.090%, due 11/15/26 | | 50,205 | |
40,000 | | | | Wells Fargo Capital I, 7.960%, due 12/15/26 | | 43,564 | |
30,000 | | @@ | | Westpac Banking Corp., 2.338%, due 09/29/49 | | 26,024 | |
138,000 | | # | | Westpac Capital Trust IV, 5.256%, due 12/29/49 | | 136,960 | |
| | | | | | 1,618,315 | |
| | | | Beverages: 0.1% | | | |
75,000 | | @@,# | | Cia Brasileira de Bebidas, 8.750%, due 09/15/13 | | 87,749 | |
23,000 | | @@ | | Coca-Cola HBC Finance BV, 5.125%, due 09/17/13 | | 23,632 | |
75,000 | | # | | Miller Brewing Co., 4.250%, due 08/15/08 | | 75,745 | |
| | | | | | 187,126 | |
| | | | Chemicals: 0.0% | | | |
20,000 | | | | Dow Chemical Co., 5.750%, due 11/15/09 | | 21,417 | |
17,000 | | @@,# | | Sociedad Quimica y Minera de Chile SA, 7.700%, due 09/15/06 | | 18,029 | |
| | | | | | 39,446 | |
| | | | | | | | | |
See Accompanying Notes to Financial Statements
79
ING VP STRATEGIC ALLOCATION
GROWTH PORTFOLIO | PORTFOLIO OF INVESTMENTS
AS OF DECEMBER 31, 2004 (CONTINUED) |
Principal
Amount | | | | | | Value | |
| | | | Diversified Financial Services: 0.4% | | | |
$ | 20,850 | | @@,# | | Arcel Finance Ltd., 5.984%, due 02/01/09 | | $ | 21,554 | |
54,000 | | @@,# | | Arcel Finance Ltd., 7.048%, due 09/01/11 | | 55,456 | |
90,000 | | @@,# | | Brazilian Merchant Voucher Receivables Ltd., 5.911%, due 06/15/11 | | 89,550 | |
45,000 | | | | Citigroup Capital II, 7.750%, due 12/01/36 | | 48,980 | |
47,000 | | # | | Corestates Capital Trust I, 8.000%, due 12/15/26 | | 51,394 | |
61,000 | | # | | Farmers Exchange Capital, 7.200%, due 07/15/48 | | 62,268 | |
20,000 | | @@ | | Financiere CSFB NV, 2.125%, due 03/29/49 | | 16,680 | |
63,000 | | | | Ford Motor Credit Co., 5.700%, due 01/15/10 | | 63,642 | |
20,000 | | L | | Ford Motor Credit Co., 7.000%, due 10/01/13 | | 21,237 | |
98,000 | | # | | HVB Funding Trust III, 9.000%, due 10/22/31 | | 129,828 | |
10,000 | | | | JPM Capital Trust I, 7.540%, due 01/15/27 | | 10,780 | |
50,000 | | | | JPM Capital Trust II, 7.950%, due 02/01/27 | | 54,704 | |
133,000 | | # | | Mangrove Bay Pass-Through Trust, 6.102%, due 07/15/33 | | 132,413 | |
52,484 | | @@,# | | PF Export Receivables Master Trust, 3.748%, due 06/01/13 | | 50,960 | |
85,575 | | @@,# | | PF Export Receivables Master Trust, 6.436%, due 06/01/15 | | 85,107 | |
100,000 | | # | | Preferred Term Securities XII, 2.960%, due 03/23/35 | | 99,750 | |
100,000 | | # | | Twin Reefs Pass-Through Trust, 3.370%, due 12/10/49 | | 100,569 | |
45,000 | | @@ | | UFJ Finance Aruba AEC, 8.750%, due 11/29/49 | | 50,285 | |
| | | | | | 1,145,157 | |
| | | | Electric: 0.1% | | | |
73,000 | | | | Consumers Energy Co., 4.250%, due 04/15/08 | | 73,771 | |
106,000 | | | | Ohio Power Co., 6.375%, due 07/15/33 | | 111,772 | |
38,000 | | | | Pacific Gas & Electric Co., 2.720%, due 04/03/06 | | 38,034 | |
9,975 | | # | | Power Contract Financing LLC, 5.200%, due 02/01/06 | | 10,070 | |
49,000 | | # | | Power Contract Financing LLC, 6.256%, due 02/01/10 | | 51,339 | |
15,627 | | | | PPL Montana LLC, 8.903%, due 07/02/20 | | 17,668 | |
25,845 | | # | | Tenaska Virginia Partners LP, 6.119%, due 03/30/24 | | 27,202 | |
33,000 | | #,L | | TXU Energy Co. LLC, 2.838%, due 01/17/06 | | 33,100 | |
| | | | | | 362,956 | |
| | | | Food: 0.1% | | | |
34,000 | | | | Kroger Co., 7.250%, due 06/01/09 | | 38,120 | |
63,000 | | | | Safeway, Inc., 4.800%, due 07/16/07 | | 64,530 | |
$ | 39,000 | | | | SUPERVALU, Inc., 7.875%, due 08/01/09 | | $ | 44,767 | |
84,000 | | | | Tyson Foods, Inc., 7.250%, due 10/01/06 | | 89,095 | |
| | | | | | 236,512 | |
| | | | Insurance: 0.1% | | | |
19,000 | | # | | Farmers Insurance Exchange, 6.000%, due 08/01/14 | | 19,303 | |
22,000 | | # | | Farmers Insurance Exchange, 8.625%, due 05/01/24 | | 26,016 | |
50,000 | | # | | Monumental Global Funding II, 3.850%, due 03/03/08 | | 50,167 | |
45,000 | | | | Prudential Financial, Inc., 4.104%, due 11/15/06 | | 45,513 | |
76,000 | | # | | Zurich Capital Trust I, 8.376%, due 06/01/37 | | 85,588 | |
| | | | | | 226,587 | |
| | | | Media: 0.0% | | | |
67,000 | | | | Clear Channel Communications, Inc., 3.125%, due 02/01/07 | | 66,029 | |
42,000 | | | | COX Communications, Inc., 6.850%, due 01/15/18 | | 44,821 | |
| | | | | | 110,850 | |
| | | | Mining: 0.0% | | | |
41,000 | | @@,# | | Corp Nacional del Cobre de Chile, 5.500%, due 10/15/13 | | 42,773 | |
40,000 | | | | WMC Finance USA, 5.125%, due 05/15/13 | | 39,952 | |
| | | | | | 82,725 | |
| | | | Multi-National: 0.0% | | | |
106,000 | | @@ | | Corp Andina de Fomento CAF, 6.875%, due 03/15/12 | | 119,327 | |
| | | | | | 119,327 | |
| | | | Oil and Gas: 0.2% | | | |
64,000 | | @@,# | | Empresa Nacional de Petroleo, 4.875%, due 03/15/14 | | 62,641 | |
72,000 | | @@,# | | Gazprom Intl. SA, 7.201%, due 02/01/20 | | 76,320 | |
45,000 | | | | Husky Energy, Inc., 6.150%, due 06/15/19 | | 48,157 | |
88,000 | | #,L | | Pemex Project Funding Master Trust, 3.790%, due 06/15/10 | | 90,508 | |
17,000 | | | | Pemex Project Funding Master Trust, 7.375%, due 12/15/14 | | 18,938 | |
36,000 | | @@ | | Petroleos Mexicanos, 9.250%, due 03/30/18 | | 44,730 | |
60,000 | | # | | Tengizchevroil Finance Co. SARL, 6.124%, due 11/15/14 | | 60,450 | |
36,000 | | | | Valero Energy Corp., 6.125%, due 04/15/07 | | 37,960 | |
37,000 | | | | Valero Energy Corp., 8.750%, due 06/15/30 | | 49,676 | |
| | | | | | 489,380 | |
| | | | Packaging and Containers: 0.0% | | | |
27,000 | | # | | Sealed Air Corp., 5.375%, due 04/15/08 | | 28,074 | |
| | | | | | 28,074 | |
See Accompanying Notes to Financial Statements
80
ING VP STRATEGIC ALLOCATION | | PORTFOLIO OF INVESTMENTS |
GROWTH PORTFOLIO | | AS OF DECEMBER 31, 2004 (CONTINUED) |
Principal
Amount | | Value | |
| | | | Pipelines: 0.0% | | | |
$ | 58,000 | | | | Duke Capital LLC, 4.331%, due 11/16/06 | | $ | 58,754 | |
| | | | | | 58,754 | |
| | | | Real Estate: 0.1% | | | |
69,000 | | | | EOP Operating LP, 7.750%, due 11/15/07 | | 76,202 | |
19,000 | | | | Liberty Property LP, 6.375%, due 08/15/12 | | 20,635 | |
5,000 | | | | Liberty Property LP, 6.950%, due 12/01/06 | | 5,336 | |
52,000 | | | | Liberty Property LP, 7.750%, due 04/15/09 | | 58,453 | |
| | | | | | 160,626 | |
| | | | Real Estate Investment Trusts: 0.1% | | | |
49,000 | | | | Simon Property Group LP, 4.875%, due 03/18/10 | | 49,978 | |
94,000 | | | | Simon Property Group LP, 6.375%, due 11/15/07 | | 100,353 | |
| | | | | | 150,331 | |
| | | | Retail: 0.0% | | | |
68,000 | | | | May Department Stores Co., 3.950%, due 07/15/07 | | 68,156 | |
| | | | | | 68,156 | |
| | | | Savings and Loans: 0.0% | | | |
43,000 | | | | Great Western Financial, 8.206%, due 02/01/27 | | 46,991 | |
| | | | | | 46,991 | |
| | | | Telecommunications: 0.1% | | | |
60,000 | | | | BellSouth Corp., 4.200%, due 09/15/09 | | 60,220 | |
33,000 | | + | | Sprint Capital Corp., 4.780%, due 08/17/06 | | 33,646 | |
11,000 | | L | | Sprint Capital Corp., 8.375%, due 03/15/12 | | 13,418 | |
39,000 | | | | Verizon Virginia, Inc., 4.625%, due 03/15/13 | | 38,096 | |
| | | | | | 145,380 | |
| | | | Transportation: 0.0% | | | |
38,000 | | @@,# | | MISC Capital Ltd., 6.125%, due 07/01/14 | | 41,029 | |
| | | | | | 41,029 | |
| | | | Total Corporate Bonds/Notes
(Cost $5,378,621) | | 5,469,482 | |
| | | |
U.S. GOVERNMENT AGENCY OBLIGATIONS: 3.6% | | | |
| | | |
| | | | Federal Home Loan Bank: 0.1% | | | |
240,000 | | | | 3.250%, due 12/17/07 | | 238,625 | |
| | | | | | 238,625 | |
| | | | Federal Home Loan Mortgage Corporation: 0.8% | | | |
486,000 | | | | 2.700%, due 03/16/07 | | 480,142 | |
406,000 | | | | 4.500%, due 10/15/12 | | 412,463 | |
67,416 | | | | 4.500%, due 04/01/14 | | 67,434 | |
77,000 | | L | | 5.875%, due 03/21/11 | | 83,242 | |
$ | 199,489 | | | | 6.000%, due 01/15/29 | | $ | 208,386 | |
681,000 | | | | 6.500%, due 01/15/34 | | 714,625 | |
| | | | | | 1,966,292 | |
| | | | Federal National Mortgage Association: 2.6% | | | |
375,000 | | | | 3.000%, due 08/15/07 | | 371,513 | |
230,000 | | L | | 3.500%, due 01/28/08 | | 229,358 | |
251,000 | | L | | 4.625%, due 10/15/13 | | 253,791 | |
370,000 | | W | | 5.000%, due 01/15/20 | | 375,897 | |
2,141,000 | | W | | 5.000%, due 01/15/34 | | 2,124,276 | |
245,000 | | | | 5.250%, due 08/01/12 | | 254,616 | |
153,138 | | | | 5.500%, due 02/01/18 | | 158,437 | |
104,860 | | W | | 5.500%, due 01/15/20 | | 108,366 | |
603,000 | | W | | 5.500%, due 01/01/33 | | 612,233 | |
172,631 | | | | 6.000%, due 10/01/08 | | 179,829 | |
200,340 | | | | 6.000%, due 08/01/16 | | 210,124 | |
123,910 | | | | 6.000%, due 04/25/31 | | 129,898 | |
825,000 | | | | 6.000%, due 01/15/34 | | 853,101 | |
97,305 | | | | 6.500%, due 04/01/27 | | 102,339 | |
210,000 | | W | | 6.500%, due 01/15/35 | | 220,238 | |
276,000 | | | | 6.500%, due 02/15/35 | | 289,110 | |
110,000 | | | | 6.625%, due 11/15/10 | | 124,465 | |
18,692 | | | | 7.000%, due 12/01/27 | | 19,861 | |
279,274 | | | | 7.000%, due 02/01/31 | | 296,234 | |
55,943 | | | | 7.500%, due 09/01/31 | | 59,957 | |
| | | | | | 6,973,643 | |
| | | | Government National Mortgage Association: 0.1% | | | |
52,920 | | | | 6.500%, due 01/15/29 | | 55,793 | |
43,725 | | | | 6.500%, due 01/15/32 | | 46,083 | |
15,289 | | | | 7.000%, due 04/15/26 | | 16,307 | |
12,868 | | | | 7.000%, due 04/15/26 | | 13,725 | |
1,911 | | | | 7.000%, due 01/15/28 | | 2,035 | |
56,652 | | | | 7.000%, due 02/15/28 | | 60,324 | |
| | | | | | 194,267 | |
| | | | Total U.S. Government Agency Obligations
(Cost $9,352,473) | | 9,372,827 | |
| | | |
U.S. TREASURY OBLIGATIONS: 1.7% | | | |
| | | | | | | |
| | | | U.S. Treasury Bonds: 1.1% | | | |
995,000 | | W,L,S | | 4.250%, due 11/15/14 | | 997,915 | |
1,254,000 | | L,S | | 5.375%, due 02/15/31 | | 1,356,377 | |
82,000 | | S | | 6.250%, due 08/15/23 | | 96,027 | |
186,000 | | L,S | | 10.375%, due 11/15/12 | | 221,820 | |
259,000 | | L,S | | 13.250%, due 05/15/14 | | 359,970 | |
| | | | | | 3,032,109 | |
| | | | U.S. Treasury Notes: 0.5% | | | |
150,000 | | S | | 1.125%, due 06/30/05 | | 149,039 | |
456,000 | | L,S | | 3.000%, due 11/15/07 | | 454,104 | |
683,000 | | L,S | | 3.500%, due 12/15/09 | | 679,905 | |
| | | | | | 1,283,048 | |
| | | | U.S. Treasury STRIP: 0.1% | | | |
279,000 | | | | 4.690%, due 05/15/16 | | 165,641 | |
| | | | | | 165,641 | |
| | | | Total U.S. Treasury Obligations
(Cost $4,440,034) | | 4,480,798 | |
See Accompanying Notes to Financial Statements
81
ING VP STRATEGIC ALLOCATION | PORTFOLIO OF INVESTMENTS |
GROWTH PORTFOLIO | AS OF DECEMBER 31, 2004 (CONTINUED) |
Principal
Amount | | Value | |
ASSET-BACKED SECURITIES: 0.3% | | | |
| | | | | | | |
| | | | Automobile Asset-Backed Securities: 0.0% | | | |
$ | 120,000 | | | | USAA Auto Owner Trust, 2.040%, due 02/16/10 | | $ | 117,963 | |
| | | | | | 117,963 | |
| | | | Credit Card Asset-Backed Securities: 0.2% | | | |
45,000 | | | | Bank One Issuance Trust, 4.540%, due 09/15/10 | | 45,694 | |
42,000 | | | | Capital One Master Trust, 4.900%, due 03/15/10 | | 43,381 | |
130,000 | | | | Chemical Master Credit Card Trust 1, 7.090%, due 02/15/09 | | 137,021 | |
140,000 | | | | Citibank Credit Card Issuance Trust, 5.650%, due 06/16/08 | | 144,761 | |
| | | | | | 370,857 | |
| | | | Other Asset-Backed Securities: 0.1% | | | |
120,000 | | | | Chase Funding Mortgage Loan Asset-Backed Certificates, 2.734%, due 09/25/24 | | 119,107 | |
70,000 | | | | Chase Funding Mortgage Loan Asset-Backed Certificates, 4.045%, due 05/25/33 | | 70,175 | |
6,000 | | | | Popular ABS Mortgage Pass-Through Trust, 3.735%, due 12/25/34 | | 5,980 | |
6,000 | | | | Popular ABS Mortgage Pass-Through Trust, 4.000%, due 12/25/34 | | 5,983 | |
| | | | | | 201,245 | |
| | | | Total Asset-Backed Securities
(Cost $697,290) | | 690,065 | |
| | | |
COLLATERALIZED MORTGAGE OBLIGATIONS: 1.2% | | | |
| | | | | | | |
| | | | Commercial Mortgage-Backed Securities: 0.5% | | | |
73,000 | | | | COMM, 3.600%, due 03/10/39 | | 71,942 | |
350,000 | | | | CS First Boston Mortgage Securities Corp., 3.861%, due 03/15/36 | | 349,867 | |
30,000 | | | | CS First Boston Mortgage Securities Corp., 7.560%, due 04/14/62 | | 34,691 | |
166,000 | | | | DLJ Commercial Mortgage Corp., 6.240%, due 11/12/31 | | 178,817 | |
50,000 | | C | | DLJ Commercial Mortgage Corp., 6.460%, due 03/10/32 | | 54,267 | |
400,000 | | | | DLJ Commercial Mortgage Corp., 7.300%, due 06/10/32 | | 450,120 | |
81,646 | | | | GE Capital Commercial Mortgage Corp, 3.752%, due 07/10/39 | | 81,513 | |
54,000 | | | | JP Morgan Chase Commercial Mortgage Securities Corp., 4.223%, due 01/15/42 | | 54,055 | |
| | | | | | 1,275,272 | |
| | | | Whole Loan Collateralized Mortgage Obligations: 0.7% | | | |
$ | 94,704 | | | | Bank of America Mortgage Securities, 5.000%, due 12/25/18 | | $ | 95,591 | |
58,984 | | | | Bank of America Mortgage Securities, 5.250%, due 11/25/19 | | 60,087 | |
89,666 | | | | Countrywide Alternative Loan Trust, 5.000%, due 10/25/18 | | 90,507 | |
95,967 | | | | Countrywide Home Loan Mortgage Pass Through Trust, 5.000%, due 11/25/18 | | 96,867 | |
251,000 | | | | CS First Boston Mortgage Securities Corp., 4.140%, due 10/25/33 | | 251,168 | |
206,000 | | | | GMAC Mortgage Corp. Loan Trust, 5.500%, due 01/25/34 | | 210,857 | |
194,183 | | | | JP Morgan Mortgage Trust, 6.500%, due 11/25/34 | | 202,957 | |
139,000 | | | | MASTR Alternative Loans Trust, 5.500%, due 01/25/20 | | 142,649 | |
392,992 | | | | MASTR Asset Securitization Trust, 5.500%, due 06/25/33 | | 396,430 | |
116,522 | | | | Prime Mortgage Trust, 5.250%, due 11/25/19 | | 118,955 | |
179,817 | | | | Washington Mutual, 5.000%, due 06/25/18 | | 181,615 | |
| | | | | | 1,847,683 | |
| | | | Whole Loan Collateralized Support CMO: 0.0% | | | |
50,467 | | | | Bank of America Mortgage Securities, 5.500%, due 11/25/33 | | 50,631 | |
| | | | | | 50,631 | |
| | | | Total Collateralized Mortgage Obligations
(Cost $3,182,282) | | 3,173,586 | |
| | | |
MUNICIPAL BONDS: 0.0% | | | |
| | | | | | | |
| | | | Municipal: 0.0% | | | |
25,000 | | | | City of New York, 5.000%, due 11/01/08 | | 27,027 | |
25,000 | | | | City of New York, 5.000%, due 11/01/11 | | 27,592 | |
25,000 | | | | City of New York, 5.000%, due 11/01/15 | | 27,439 | |
23,000 | | | | New York Sales Tax Asset Receivables Corp., 4.060%, due 10/15/10 | | 22,676 | |
20,000 | | | | New York Sales Tax Asset Receivables Corp., 4.660%, due 10/15/14 | | 19,782 | |
| | | | Total Municipal Bonds
(Cost $125,116) | | 124,516 | |
| | | | Total Long-Term Investments
(Cost $218,574,227) | | 255,749,538 | |
See Accompanying Notes to Financial Statements
82
ING VP STRATEGIC ALLOCATION | PORTFOLIO OF INVESTMENTS |
GROWTH PORTFOLIO | AS OF DECEMBER 31, 2004 (CONTINUED) |
Principal
Amount | | Value | |
SHORT-TERM INVESTMENTS: 11.9% | | | |
| | | | | | | |
| | | | Commercial Paper: 1.8% | | | |
$ | 2,300,000 | | | | Concord Minutemen Capital, 2.350%, due 01/09/06 | | $ | 2,300,000 | |
2,300,000 | | | | Concord Minutemen Capital, 2.390%, due 01/13/05 | | 2,298,015 | |
| | | | Total Commercial Paper
(Cost $4,598,168) | | 4,598,015 | |
| | | | Repurchase Agreement: 3.5% | | | | | |
9,381,000 | | S | | Goldman Sachs Repurchase Agreement dated 12/31/04, 2.230%, due 01/03/05, $9,382,743 to be received upon repurchase (Collateralized by $9,370,000 Federal Home Loan Mortgage Corporation, 5.200%, Market Value plus accrued interest $9,569,425, due 02/04/19) | | | | 9,381,000 | |
| | | | Total Repurchase Agreement
(Cost $9,381,000) | | | | 9,381,000 | |
| | | | Securities Lending Collateralcc: 6.6% | | | | | |
17,535,000 | | | | The Bank of New York Institutional Cash Reserve Fund | | | | 17,535,000 | |
| | | | Total Securities Lending Collateral
(Cost $17,535,000) | | | | 17,535,000 | |
| | | | Total Short-Term Investments
(Cost $31,514,168) | | | | 31,514,015 | |
| | | | Total Investments In Securities
(Cost $250,088,395)* | | 109.0 | % | $ | 287,263,553 | |
| | | | Other Assets and Liabilities-Net | | (9.0 | ) | (23,769,092 | ) |
| | | | Net Assets | | 100.0 | % | $ | 263,494,461 | |
| | | | | | | | | | | |
@ Non-income producing security
@@ Foreign issuer
ADR American Depositary Receipt
GDR Global Depositary Receipt
STRIP Separate Trading of Registered Interest and Principal of Securities
+ Step-up basis bonds. Interest rates shown reflect current and future coupon rates.
# Securities with purchases pursuant to Rule 144A, under the Securities Act of 1933 and may not be resold subject to that rule except to qualified institutional buyers. These securities have been determined to be liquid under the guidelines established by the Funds’ Board of Directors/Trustees.
C Bond may be called prior to maturity date.
cc Securities purchased with cash collateral for securities loaned.
W When-issued or delayed delivery security.
S Segregated securities for futures, when-issued or delayed delivery securities held at December 31, 2004.
L Loaned security, a portion or all of the security is on loan at December 31, 2004.
XX Value of securities obtained from one or more dealers making markets in the securities in accordance with the Fund’s valuation procedures.
* Cost for federal income tax purposes is $252,911,307. Net unrealized appreciation consists of:
| | | | Gross Unrealized Appreciation | | | | $ | 36,055,064 | |
| | | | Gross Unrealized Depreciation | | | | (1,702,818 | ) |
| | | | Net Unrealized Appreciation | | | | $ | 34,352,246 | |
Information concerning open futures contracts at December 31, 2004 is shown below:
| | No. of | | Notional | | Expiration | | Unrealized | |
Short Contracts | | Contracts | | Market Value | | Date | | Gain (Loss) | |
U.S. 5 Year Treasury Note | | 3 | | $ | (328,594 | ) | 03/31/2005 | | $ | (460 | ) |
Long Contracts | | | | | | | | | |
U.S. Long Bond | | 4 | | 450,000 | | 03/31/2005 | | 3,480 | |
| | | | | | | | | | | |
See Accompanying Notes to Financial Statements
83
ING VP STRATEGIC ALLOCATION | PORTFOLIO OF INVESTMENTS |
INCOME PORTFOLIO | AS OF DECEMBER 31, 2004 (CONTINUED) |
Shares | | Value | |
COMMON STOCK: 52.0% | | | |
| | | | | | | |
| | | | Advertising: 0.0% | | | |
800 | | | | ADVO, Inc. | | $ | 28,520 | |
1,380 | | | | Catalina Marketing Corp. | | 40,889 | |
| | | | | | 69,409 | |
| | | | Aerospace/Defense: 1.5% | | | |
780 | | @ | | Alliant Techsystems, Inc. | | 50,996 | |
780 | | @,L | | Armor Holdings, Inc. | | 36,676 | |
15,700 | | @,@@ | | BAE Systems PLC | | 69,358 | |
11,200 | | | | Boeing Co. | | 579,823 | |
710 | | @,L | | DRS Technologies, Inc. | | 30,324 | |
3,550 | | | | General Dynamics Corp. | | 371,330 | |
7,550 | | | | Lockheed Martin Corp. | | 419,402 | |
703 | | @ | | Moog, Inc. | | 31,881 | |
9,250 | | | | Raytheon Co. | | 359,178 | |
930 | | @ | | Teledyne Technologies, Inc. | | 27,370 | |
2,350 | | | | United Technologies Corp. | | 242,873 | |
| | | | | | 2,219,211 | |
| | | | Agriculture: 0.6% | | | |
10,300 | | | | Altria Group, Inc. | | 629,330 | |
4,700 | | @@ | | Swedish Match AB | | 54,368 | |
4,388 | | | | UST, Inc. | | 211,107 | |
| | | | | | 894,805 | |
| | | | Airlines: 0.1% | | | |
820 | | @ | | Alaska Air Group, Inc. | | 27,462 | |
12,000 | | @,@@ | | British Airways PLC | | 54,075 | |
| | | | | | 81,537 | |
| | | | | | | |
| | | | Apparel: 0.6% | | | |
4,400 | | @ | | Coach, Inc. | | 248,160 | |
975 | | | | K-Swiss, Inc. | | 28,392 | |
760 | | | | Kellwood Co. | | 26,220 | |
4,550 | | | | Nike, Inc. | | 412,639 | |
3,000 | | @@ | | Onward Kashiyama Co., Ltd. | | 43,636 | |
970 | | | | Phillips-Van Heusen Corp. | | 26,190 | |
415 | | @ | | Quiksilver, Inc. | | 12,363 | |
2,500 | | | | VF Corp. | | 138,450 | |
980 | | | | Wolverine World Wide, Inc. | | 30,792 | |
| | | | | | 966,842 | |
| | | | Auto Manufacturers: 0.6% | | | |
28,750 | | L | | Ford Motor Co. | | 420,899 | |
19,000 | | @,@@,L | | Isuzu Motors Ltd. | | 56,175 | |
270 | | | | Oshkosh Truck Corp. | | 18,463 | |
4,100 | | | | PACCAR, Inc. | | 329,968 | |
900 | | @@ | | Peugeot SA | | 57,095 | |
| | | | | | 882,600 | |
| | | | Auto Parts and Equipment: 0.0% | | | |
1,080 | | | | Modine Manufacturing Co. | | 36,472 | |
| | | | | | 36,472 | |
| | | | Banks: 4.0% | | | |
1,340 | | @@ | | Alpha Bank AE | | 46,742 | |
2,097 | | | | Associated Banc-Corp. | | 69,641 | |
400 | | @@,L | | Banco Itau Holding Financeira SA ADR | | 30,068 | |
1,100 | | @@ | | Banco Popular Espanol SA | | 72,428 | |
7,400 | | @@ | | Banco Santander Central Hispano SA | | 91,762 | |
20,250 | | | | Bank of America Corp. | | 951,547 | |
1,050 | | | | Bank of Hawaii Corp. | | $ | 53,277 | |
4,200 | | @@ | | Bank of Ireland | | 70,006 | |
1,075 | | | | Banknorth Group, Inc. | | 39,345 | |
2,500 | | | | Colonial Bancgroup, Inc. | | 53,075 | |
4,200 | | | | Comerica, Inc. | | 256,284 | |
490 | | | | Commerce Bancorp, Inc. | | 31,556 | |
2,600 | | @@ | | Credit Agricole SA | | 78,484 | |
6,000 | | @@ | | DBS Group Holdings Ltd. | | 59,149 | |
3,700 | | @@ | | Depfa Bank PLC | | 62,324 | |
380 | | L | | East-West Bancorp, Inc. | | 15,945 | |
755 | | @@ | | First Bancorp Puerto Rico | | 47,950 | |
2,500 | | @@ | | Fortis | | 69,070 | |
1,655 | | | | Fremont General Corp. | | 41,673 | |
2,440 | | | | Hibernia Corp. | | 72,004 | |
11,800 | | @@ | | HSBC Holdings PLC | | 198,805 | |
330 | | | | Hudson United BanCorp | | 12,995 | |
9,150 | | | | KeyCorp. | | 310,185 | |
700 | | @,@@,L | | Kookmin Bank ADR | | 27,356 | |
10,000 | | @@ | | Mitsui Trust Holdings, Inc. | | 100,599 | |
24 | | @@ | | Mizuho Financial Group, Inc. | | 121,637 | |
11,830 | | | | National City Corp. | | 444,217 | |
8,100 | | @@ | | Nordea AB | | 81,655 | |
700 | | | | PrivateBancorp, Inc. | | 22,561 | |
1,769 | | | | Republic Bancorp, Inc. | | 27,030 | |
4,800 | | @,@@ | | Royal Bank of Scotland Group PLC | | 161,207 | |
1,355 | | | | South Financial Group, Inc. | | 44,078 | |
2,000 | | @@ | | St. George Bank Ltd. | | 39,618 | |
1,566 | | | | Sterling Bancshares, Inc. | | 22,347 | |
10,000 | | @@ | | Sumitomo Trust & Banking Co. Ltd. | | 72,497 | |
9,750 | | | | U.S. Bancorp | | 305,370 | |
1,580 | | @@ | | UBS AG | | 132,446 | |
335 | | | | UCBH Holdings, Inc. | | 15,350 | |
13,900 | | @@ | | UniCredito Italiano S.p.A. | | 79,952 | |
16,650 | | | | Wachovia Corp. | | 875,789 | |
8,500 | | | | Wells Fargo & Co. | | 528,275 | |
300 | | | | Whitney Holding Corp. | | 13,497 | |
| | | | | | 5,849,796 | |
| | | | Beverages: 0.7% | | | |
750 | | | | Adolph Coors Co. | | 56,753 | |
12,250 | | | | Coca-Cola Co. | | 509,967 | |
8,500 | | | | PepsiCo, Inc. | | 443,700 | |
| | | | | | 1,010,420 | |
| | | | Biotechnology: 0.3% | | | |
6,450 | | @ | | Amgen, Inc. | | 413,768 | |
1,090 | | @ | | Arqule, Inc. | | 6,311 | |
1,215 | | @ | | Charles River Laboratories Intl., Inc. | | 55,902 | |
| | | | | | 475,981 | |
| | | | Building Materials: 0.1% | | | |
9,100 | | @@ | | Boral Ltd. | | 49,192 | |
340 | | | | Florida Rock Industries, Inc. | | 20,240 | |
350 | | | | Simpson Manufacturing Co., Inc. | | 12,215 | |
530 | | | | Texas Industries, Inc. | | 33,061 | |
| | | | | | 114,708 | |
| | | | Chemicals: 0.8% | | | |
1,330 | | | | Cabot Corp. | | 51,444 | |
4,800 | | | | Dow Chemical Co. | | 237,648 | |
800 | | @@ | | DSM NV | | 51,735 | |
See Accompanying Notes to Financial Statements
84
ING VP STRATEGIC ALLOCATION | PORTFOLIO OF INVESTMENTS |
INCOME PORTFOLIO | AS OF DECEMBER 31, 2004 (CONTINUED) |
Shares | | | | | | Value | |
| | | | Chemicals (continued) | | | |
4,800 | | | | E.I. du Pont EI de Nemours & Co. | | $ | 235,440 | |
905 | | @ | | FMC Corp. | | 43,712 | |
740 | | | | Georgia Gulf Corp. | | 36,852 | |
1,520 | | | | Lyondell Chemical Co. | | 43,958 | |
25,000 | | @@ | | Mitsubishi Chemical Corp. | | 76,073 | |
830 | | @ | | OM Group, Inc. | | 26,909 | |
1,310 | | @ | | Omnova Solutions, Inc. | | 7,362 | |
2,810 | | @ | | PolyOne Corp. | | 25,459 | |
4,150 | | | | PPG Industries, Inc. | | 282,864 | |
3,450 | | | | Sherwin-Williams Co. | | 153,974 | |
| | | | | | 1,273,430 | |
| | | | Coal: 0.0% | | | |
545 | | | | Massey Energy Co. | | 19,048 | |
405 | | | | Peabody Energy Corp. | | 32,768 | |
| | | | | | 51,816 | |
| | | | Commercial Services: 0.7% | | | |
2,200 | | | | Adesa, Inc. | | 46,684 | |
1,035 | | @ | | Administaff, Inc. | | 13,051 | |
1,430 | | @ | | Alliance Data Systems Corp. | | 67,896 | |
410 | | | | Chemed Corp. | | 27,515 | |
460 | | @ | | Consolidated Graphics, Inc. | | 21,114 | |
3,000 | | @@ | | Dai Nippon Printing Co., Ltd. | | 48,298 | |
2,950 | | | | Equifax, Inc. | | 82,895 | |
4,200 | | L | | H&R Block, Inc. | | 205,800 | |
1,005 | | @ | | ITT Educational Services, Inc. | | 47,788 | |
1,225 | | @,L | | Korn/Ferry Intl. | | 25,419 | |
1,400 | | @,L | | Labor Ready, Inc. | | 23,688 | |
555 | | | | Manpower, Inc. | | 26,807 | |
7,750 | | | | McKesson Corp. | | 243,816 | |
415 | | @ | | Pharmaceutical Product Development, Inc. | | 17,135 | |
18,700 | | @@ | | Rentokil Initial PLC | | 52,899 | |
1,345 | | | | Rollins, Inc. | | 35,400 | |
1,840 | | @,L | | Sotheby’s Holdings | | 33,414 | |
390 | | @,L | | Vertrue, Inc. | | 14,730 | |
| | | | | | 1,034,349 | |
| | | | Computers: 2.6% | | | |
1,130 | | | | Agilysys, Inc. | | 19,368 | |
7,000 | | @ | | Apple Computer, Inc. | | 450,800 | |
2,185 | | @,L | | BISYS Group, Inc. | | 35,943 | |
610 | | @ | | CACI Intl., Inc. | | 41,559 | |
570 | | @ | | Catapult Communications Corp. | | 13,771 | |
815 | | @ | | Cognizant Technology Solutions Corp. | | 34,499 | |
24,550 | | @ | | Dell, Inc. | | 1,034,537 | |
455 | | | | Diebold, Inc. | | 25,357 | |
520 | | @ | | DST Systems, Inc. | | 27,102 | |
225 | | | | FactSet Research Systems, Inc. | | 13,149 | |
14,900 | | | | Hewlett-Packard Co. | | 312,453 | |
14,200 | | L | | International Business Machines Corp. | | 1,399,837 | |
2,190 | | | | Jack Henry Associates, Inc. | | 43,603 | |
230 | | @ | | Kronos, Inc. | | 11,760 | |
435 | | @ | | Micros Systems, Inc. | | 33,956 | |
980 | | @,L | | SanDisk Corp. | | 24,471 | |
1,955 | | @ | | Storage Technology Corp. | | 61,798 | |
68,000 | | @ | | Sun Microsystems, Inc. | | 365,840 | |
| | | | | | 3,949,803 | |
| | | | Cosmetics/Personal Care: 1.2% | | | |
13,250 | | | | Gillette Co. | | $ | 593,335 | |
22,450 | | | | Procter & Gamble Co. | | 1,236,546 | |
| | | | | | 1,829,881 | |
| | | | Distribution/Wholesale: 0.3% | | | |
520 | | | | CDW Corp. | | 34,502 | |
4,300 | | | | Genuine Parts Co. | | 189,457 | |
470 | | | | Hughes Supply, Inc. | | 15,205 | |
392 | | | | SCP Pool Corp. | | 12,505 | |
1,170 | | @ | | Tech Data Corp. | | 53,118 | |
250 | | @ | | United Stationers, Inc. | | 11,550 | |
2,050 | | | | W.W. Grainger, Inc. | | 136,571 | |
| | | | | | 452,908 | |
| | | | Diversified Financial Services: 3.0% | | | |
13,950 | | | | American Express Co. | | 786,362 | |
2,765 | | @ | | AmeriCredit Corp. | | 67,604 | |
2,450 | | | | Bear Stearns Cos., Inc. | | 250,660 | |
4,600 | | | | Capital One Financial Corp. | | 387,366 | |
5,250 | | | | CIT Group, Inc. | | 240,555 | |
25,950 | | | | Citigroup, Inc. | | 1,250,270 | |
4,700 | | | | Fannie Mae | | 334,687 | |
630 | | L | | Legg Mason, Inc. | | 46,154 | |
4,800 | | | | Lehman Brothers Holdings, Inc. | | 419,904 | |
4,650 | | | | Merrill Lynch & Co., Inc. | | 277,931 | |
5,500 | | | | Morgan Stanley | | 305,360 | |
6,900 | | @ | | Providian Financial Corp. | | 113,643 | |
780 | | @@ | | Takefuji Corp. | | 52,750 | |
| | | | | | 4,533,246 | |
| | | | Diversified Operations: 0.0% | | | |
900 | | @@,# | | Reliance Industries Ltd. GDR | | 23,184 | |
| | | | | | 23,184 | |
| | | | Electric: 1.6% | | | |
13,800 | | @ | | AES Corp. | | 188,646 | |
2,600 | | @@ | | Chubu Electric Power Co., Inc. | | 62,418 | |
4,000 | | | | Constellation Energy Group, Inc. | | 174,840 | |
16,200 | | L | | Duke Energy Corp. | | 410,346 | |
1,200 | | @@ | | E.ON AG | | 109,273 | |
7,900 | | | | Edison Intl. | | 253,037 | |
9,800 | | @,@@ | | Enel S.p.A. | | 96,336 | |
3,250 | | L | | Exelon Corp. | | 143,228 | |
2,400 | | | | Kyushu Electric Power Co., Inc. | | 48,482 | |
1,870 | | | | Pepco Holdings, Inc. | | 39,868 | |
4,810 | | | | PPL Corp. | | 256,277 | |
1,300 | | @@ | | RWE AG | | 71,785 | |
1,130 | | L | | Scana Corp. | | 44,522 | |
3,150 | | L | | Southern Co. | | 105,588 | |
5,050 | | S | | TXU Corp. | | 326,028 | |
1,195 | | | | Wisconsin Energy Corp. | | 40,283 | |
| | | | | | 2,370,957 | |
| | | | Electrical Components and Equipment: 0.2% | | | |
1,460 | | | | AMETEK, Inc. | | 52,078 | |
1,305 | | @ | | Energizer Holdings, Inc. | | 64,845 | |
850 | | @ | | Rayovac Corp. | | 25,976 | |
150 | | @@ | | Samsung Electronics Co. Ltd. GDR | | 32,915 | |
5,000 | | @@ | | Sumitomo Electric Industries Ltd. | | 54,708 | |
16,000 | | @@ | | Toshiba Corp. | | 68,898 | |
| | | | | | 299,420 | |
See Accompanying Notes to Financial Statements
85
ING VP STRATEGIC ALLOCATION | PORTFOLIO OF INVESTMENTS |
INCOME PORTFOLIO | AS OF DECEMBER 31, 2004 (CONTINUED) |
Shares | | Value | |
| | | | Electronics: 0.3% | | | |
580 | | | | BEI Technologies, Inc. | | $ | 17,910 | |
460 | | | | Bel Fuse, Inc. | | 15,543 | |
305 | | @ | | Benchmark Electronics, Inc. | | 10,401 | |
570 | | | | Brady Corp. | | 35,665 | |
160 | | @,L | | Dionex Corp. | | 9,067 | |
260 | | @ | | FLIR Systems, Inc. | | 16,585 | |
605 | | | | Keithley Instruments, Inc. | | 11,919 | |
3,200 | | @@ | | Koninklijke Philips Electronics NV | | 84,803 | |
1,150 | | @ | | Paxar Corp. | | 25,496 | |
3,850 | | | | PerkinElmer, Inc. | | 86,587 | |
3,600 | | @ | | Thermo Electron Corp. | | 108,683 | |
1,360 | | @ | | Thomas & Betts Corp. | | 41,820 | |
380 | | @ | | Trimble Navigation Ltd. | | 12,555 | |
980 | | @ | | Varian, Inc. | | 40,190 | |
| | | | | | 517,224 | |
| | | | Engineering and Construction: 0.0% | | | |
510 | | @ | | Emcor Group, Inc. | | 23,042 | |
| | | | | | 23,042 | |
| | | | Entertainment: 0.1% | | | |
710 | | @ | | Argosy Gaming Co. | | 33,157 | |
1,070 | | | | International Speedway Corp. | | 56,496 | |
| | | | | | 89,653 | |
| | | | Environmental Control: 0.0% | | | |
940 | | | | Republic Services, Inc. | | 31,528 | |
345 | | @ | | Waste Connections, Inc. | | 11,816 | |
| | | | | | 43,344 | |
| | | | Food: 0.6% | | | |
690 | | | | Corn Products Intl., Inc. | | 36,956 | |
310 | | | | Flowers Foods, Inc. | | 9,790 | |
7,200 | | @,@@ | | Koninklijke Ahold NV | | 55,793 | |
1,021 | | | | Lance, Inc. | | 19,430 | |
9,000 | | | | Meiji Dairies Corp | | 53,576 | |
1,100 | | @@ | | Metro AG | | 60,635 | |
440 | | | | Nash Finch Co. | | 16,614 | |
1,470 | | | | Ruddick Corp. | | 31,884 | |
575 | | L | | Sanderson Farms, Inc. | | 24,886 | |
3,550 | | | | SUPERVALU, Inc. | | 122,546 | |
2,110 | | | | Tyson Foods, Inc. | | 38,824 | |
8,900 | | @,@@ | | Unilever PLC | | 87,312 | |
380 | | | | Whole Foods Market, Inc. | | 36,233 | |
4,698 | | | | Wm. Wrigley Jr. Co. | | 325,055 | |
| | | | | | 919,534 | |
| | | | Forest Products and Paper: 0.5% | | | |
2,450 | | | | International Paper Co. | | 102,900 | |
5,100 | | | | MeadWestvaco Corp. | | 172,839 | |
790 | | | | Potlatch Corp. | | 39,958 | |
1,472 | | | | Wausau-Mosinee Paper Corp. | | 26,290 | |
5,200 | | | | Weyerhaeuser Co. | | 349,544 | |
| | | | | | 691,531 | |
| | | | Gas: 0.3% | | | |
740 | | | | Atmos Energy Corp. | | 20,239 | |
930 | | | | Energen Corp. | | 54,824 | |
5,500 | | | | Sempra Energy | | 201,740 | |
1,300 | | | | UGI Corp. | | 53,183 | |
2,100 | | | | WGL Holdings, Inc. | | 64,764 | |
| | | | | | 394,750 | |
| | | | Hand/Machine Tools: 0.1% | | | |
1,950 | | | | Black & Decker Corp. | | $ | 172,244 | |
| | | | | | 172,244 | |
| | | | Healthcare-Products: 1.8% | | | |
5,900 | | | | Becton Dickinson & Co. | | 335,120 | |
250 | | | | Cooper Cos., Inc. | | 17,648 | |
2,080 | | @ | | Cytyc Corp. | | 57,346 | |
480 | | | | Dentsply Intl., Inc. | | 26,976 | |
900 | | @@ | | Fresenius Medical Care AG | | 72,478 | |
715 | | @ | | Haemonetics Corp. | | 25,890 | |
260 | | @ | | Idexx Laboratories, Inc. | | 14,193 | |
1,265 | | @ | | Immucor, Inc. | | 29,740 | |
24,300 | | | | Johnson & Johnson | | 1,541,105 | |
6,250 | | | | Medtronic, Inc. | | 310,438 | |
850 | | @ | | Patterson Cos., Inc. | | 36,882 | |
260 | | @ | | ResMed, Inc. | | 13,286 | |
740 | | @ | | Respironics, Inc. | | 40,226 | |
4,500 | | @,@@ | | Smith & Nephew PLC | | 46,045 | |
972 | | @ | | Sola Intl., Inc. | | 26,769 | |
950 | | @ | | Sybron Dental Specialties, Inc. | | 33,611 | |
1,980 | | @ | | Varian Medical Systems, Inc. | | 85,615 | |
445 | | | | Vital Signs, Inc. | | 17,319 | |
| | | | | | 2,730,687 | |
| | | | Healthcare-Services: 1.4% | | | |
3,050 | | | | Aetna, Inc. | | 380,488 | |
580 | | @ | | Amedisys, Inc. | | 18,786 | |
540 | | @ | | AMERIGROUP Corp. | | 40,856 | |
1,100 | | @ | | Centene Corp. | | 31,185 | |
1,255 | | @ | | Covance, Inc. | | 48,631 | |
1,450 | | @,L | | Coventry Health Care, Inc. | | 76,966 | |
3,900 | | @ | | Humana, Inc. | | 115,791 | |
1,680 | | @ | | Lincare Holdings, Inc. | | 71,652 | |
1,430 | | @ | | PacifiCare Health Systems, Inc. | | 80,824 | |
595 | | @ | | RehabCare Group, Inc. | | 16,654 | |
615 | | @ | | Sierra Health Services, Inc. | | 33,893 | |
8,000 | | | | UnitedHealth Group, Inc. | | 704,240 | |
4,550 | | @ | | WellPoint Inc | | 523,250 | |
| | | | | | 2,143,216 | |
| | | | Holding Companies-Diversified: 0.0% | | | |
18,000 | | @@ | | Citic Pacific Ltd. | | 51,270 | |
| | | | | | 51,270 | |
| | | | Home Builders: 0.1% | | | |
1,440 | | L | | DR Horton, Inc. | | 58,046 | |
980 | | L | | Lennar Corp. | | 55,546 | |
100 | | @ | | Meritage Homes Corp | | 11,270 | |
105 | | @ | | NVR, Inc. | | 80,788 | |
| | | | | | 205,650 | |
| | | | Home Furnishings: 0.2% | | | |
2,000 | | @@ | | Electrolux AB | | 45,821 | |
270 | | | | Ethan Allen Interiors, Inc. | | 10,805 | |
963 | | | | Fedders Corp. | | 3,486 | |
835 | | | | Harman Intl. Industries, Inc. | | 106,045 | |
6,000 | | @@ | | Matsushita Electric Industrial Co., Ltd. | | 96,139 | |
4,000 | | @@ | | Yamaha Corp. | | 61,292 | |
| | | | | | 323,588 | |
See Accompanying Notes to Financial Statements
86
ING VP STRATEGIC ALLOCATION | PORTFOLIO OF INVESTMENTS |
INCOME PORTFOLIO | AS OF DECEMBER 31, 2004 (CONTINUED) |
Shares | | | | | | Value | |
| | | | Household Products/Wares: 0.2% | | | |
1,590 | | | | American Greetings Corp. | | $ | 40,307 | |
399 | | | | Blyth, Inc. | | 11,794 | |
1,450 | | | | Church & Dwight, Inc. | | 48,749 | |
3,850 | | | | Clorox Co. | | 226,881 | |
530 | | @ | | Fossil, Inc. | | 13,589 | |
| | | | | | 341,320 | |
| | | | Housewares: 0.0% | | | |
510 | | | | Toro Co. | | 41,489 | |
| | | | | | 41,489 | |
| | | | Insurance: 3.3% | | | |
5,100 | | @@ | | AEGON NV | | 69,420 | |
1,505 | | | | American Financial Group, Inc. | | 47,122 | |
13,150 | | | | American Intl. Group, Inc. | | 863,560 | |
980 | | | | AmerUs Group Co. | | 44,394 | |
4,350 | | | | Chubb Corp. | | 334,515 | |
3,500 | | | | CIGNA Corp. | | 285,495 | |
715 | | | | Delphi Financial Group, Inc. | | 32,997 | |
865 | | @@ | | Everest Re Group Ltd. | | 77,469 | |
1,040 | | | | Fidelity National Financial, Inc. | | 47,497 | |
1,640 | | | | First American Corp. | | 57,630 | |
5,800 | | | | Hartford Financial Services Group, Inc. | | 401,998 | |
500 | | | | LandAmerica Financial Group, Inc. | | 26,965 | |
37,400 | | @@ | | Legal & General Group PLC | | 78,802 | |
4,250 | | | | Lincoln National Corp. | | 198,390 | |
4,617 | | | | Loews Corp. | | 324,575 | |
11,750 | | | | MetLife, Inc. | | 475,992 | |
2,450 | | | | MGIC Investment Corp. | | 168,830 | |
6,000 | | @@ | | Mitsui Sumitomo Insurance Co. Ltd. | | 52,317 | |
1,720 | | @ | | Ohio Casualty Corp. | | 39,921 | |
515 | | @ | | Philadelphia Consolidated Holding Co. | | 34,062 | |
780 | | @ | | ProAssurance Corp. | | 30,506 | |
8,700 | | | | Prudential Financial, Inc. | | 478,151 | |
6,000 | | @@ | | QBE Insurance Group Ltd. | | 72,388 | |
1,440 | | | | Radian Group, Inc. | | 76,666 | |
3,150 | | | | Safeco Corp. | | 164,556 | |
695 | | | | Selective Insurance Group, Inc. | | 30,747 | |
11,400 | | @@ | | Skandia Forsakrings AB | | 56,721 | |
630 | | L | | StanCorp Financial Group, Inc. | | 51,975 | |
560 | | | | Stewart Information Services Corp. | | 23,324 | |
650 | | @@ | | Swiss Reinsurance Co. | | 46,249 | |
1,035 | | | | UICI | | 35,087 | |
1,425 | | | | W.R. Berkley Corp. | | 67,217 | |
540 | | L | | Zenith National Insurance Corp. | | 26,914 | |
390 | | @,@@ | | Zurich Financial Services AG | | 64,940 | |
| | | | | | 4,887,392 | |
| | | | Internet: 0.8% | | | |
3,200 | | @ | | eBay, Inc. | | 372,096 | |
360 | | @ | | Internet Security Systems | | 8,370 | |
2,420 | | @ | | McAfee, Inc. | | 70,011 | |
1,760 | | @,L | | RSA Security, Inc. | | 35,306 | |
13,650 | | @ | | Symantec Corp. | | 351,624 | |
1,410 | | @ | | Verity, Inc. | | 18,499 | |
610 | | @ | | Websense, Inc. | | 30,939 | |
6,600 | | @ | | Yahoo!, Inc. | | 248,688 | |
| | | | | | 1,135,533 | |
| | | | Iron/Steel: 0.1% | | | |
180 | | L | | Carpenter Technology Corp. | | $ | 10,523 | |
2,800 | | @@ | | JFE Holdings, Inc. | | 80,002 | |
3,000 | | @@ | | ThyssenKrupp AG | | 66,079 | |
| | | | | | 156,604 | |
| | | | Leisure Time: 0.2% | | | |
800 | | | | Arctic Cat, Inc. | | 21,216 | |
2,800 | | L | | Carnival Corp. | | 161,364 | |
1,070 | | L | | Nautilus Group, Inc. | | 25,862 | |
315 | | | | Polaris Industries, Inc. | | 21,426 | |
| | | | | | 229,868 | |
| | | | Lodging: 0.4% | | | |
1,570 | | L | | Boyd Gaming Corp. | | 65,391 | |
1,915 | | @ | | Caesars Entertainment, Inc. | | 38,568 | |
425 | | @ | | Mandalay Resort Group | | 29,933 | |
5,200 | | | | Marriott Intl., Inc. | | 327,495 | |
1,825 | | | | Starwood Hotels & Resorts Worldwide, Inc. | | 106,580 | |
| | | | | | 567,967 | |
| | | | Machinery-Construction and Mining: 0.0% | | | |
720 | | @ | | Astec Industries, Inc. | | 12,391 | |
| | | | | | 12,391 | |
| | | | Machinery-Diversified: 0.2% | | | |
895 | | | | Applied Industrial Technologies, Inc. | | 24,523 | |
345 | | | | Cognex Corp. | | 9,626 | |
1,050 | | | | Cummins, Inc. | | 87,979 | |
750 | | @ | | Gerber Scientific, Inc. | | 5,708 | |
1,360 | | | | Graco, Inc. | | 50,796 | |
365 | | | | IDEX Corp. | | 14,783 | |
1,237 | | @ | | Zebra Technologies Corp. | | 69,617 | |
| | | | | | 263,032 | |
| | | | Media: 1.4% | | | |
10,600 | | @,L | | Comcast Corp. | | 352,768 | |
3,750 | | | | McGraw-Hill Cos., Inc. | | 343,275 | |
4,300 | | @@ | | Mediaset S.p.A. | | 54,440 | |
1,000 | | | | Meredith Corp. | | 54,200 | |
12,950 | | | | News Corp. | | 241,647 | |
6,900 | | @@ | | Reed Elsevier PLC | | 63,601 | |
545 | | | | Thomas Nelson, Inc. | | 12,317 | |
22,350 | | @ | | Time Warner, Inc. | | 434,484 | |
8,350 | | | | Viacom, Inc. | | 303,857 | |
9,900 | | | | Walt Disney Co. | | 275,220 | |
60 | | | | Washington Post Co. | | 58,981 | |
| | | | | | 2,194,790 | |
| | | | Metal Fabricate/Hardware: 0.1% | | | |
800 | | | | Kaydon Corp. | | 26,416 | |
335 | | | | Lawson Products, Inc. | | 16,894 | |
945 | | | | Mueller Industries, Inc. | | 30,429 | |
410 | | | | Precision Castparts Corp. | | 26,929 | |
660 | | | | Timken Co. | | 17,173 | |
520 | | @ | | Wolverine Tube, Inc. | | 6,713 | |
| | | | | | 124,554 | |
| | | | Mining: 0.2% | | | |
2,600 | | @@ | | Anglo American PLC | | 61,350 | |
5,500 | | @@ | | BHP Billiton Ltd. | | 66,004 | |
See Accompanying Notes to Financial Statements
87
ING VP STRATEGIC ALLOCATION | PORTFOLIO OF INVESTMENTS |
INCOME PORTFOLIO | AS OF DECEMBER 31, 2004 (CONTINUED) |
Shares | | | | | | Value | |
| | | | Mining (continued) | | | |
2,300 | | L | | Phelps Dodge Corp. | | $ | 227,515 | |
775 | | @ | | RTI Intl. Metals, Inc. | | 15,919 | |
| | | | | | 370,788 | |
| | | | Miscellaneous Manufacturing: 2.0% | | | |
3,950 | | | | 3M Co. | | 324,177 | |
265 | | | | AptarGroup, Inc. | | 13,987 | |
6,450 | | | | Eastman Kodak Co. | | 208,013 | |
52,850 | | | | General Electric Co. | | 1,929,024 | |
900 | | | | Lancaster Colony Corp. | | 38,583 | |
1,625 | | @,L | | Pentair, Inc. | | 70,785 | |
330 | | | | Roper Industries, Inc. | | 20,054 | |
1,100 | | @@ | | Siemens AG | | 93,119 | |
10,200 | | @@ | | Tyco Intl. Ltd. | | 364,547 | |
| | | | | | 3,062,289 | |
| | | | Office/Business Equipment: 0.3% | | | |
700 | | @,L | | Global Imaging Systems, Inc. | | 27,650 | |
1,200 | | | | Seiko Epson Corp | | 53,504 | |
20,900 | | @ | | Xerox Corp. | | 355,509 | |
| | | | | | 436,663 | |
| | | | Oil and Gas: 4.1% | | | |
2,150 | | | | Amerada Hess Corp. | | 177,117 | |
18,600 | | @@ | | BP PLC | | 180,987 | |
7,400 | | | | Burlington Resources, Inc. | | 321,900 | |
9,850 | | | | ChevronTexaco Corp. | | 517,223 | |
840 | | @ | | Cimarex Energy Co. | | 31,836 | |
7,500 | | | | ConocoPhillips | | 651,224 | |
8,600 | | | | Devon Energy Corp. | | 334,712 | |
42,750 | | | | Exxon Mobil Corp. | | 2,191,364 | |
850 | | | | Frontier Oil Corp. | | 22,661 | |
400 | | | | LUKOIL ADR | | 49,000 | |
1,195 | | | | Murphy Oil Corp. | | 96,138 | |
1,075 | | @ | | Newfield Exploration Co. | | 63,479 | |
1,000 | | L | | Noble Energy, Inc. | | 61,660 | |
600 | | @@ | | Norsk Hydro ASA | | 47,184 | |
6,600 | | | | Occidental Petroleum Corp. | | 385,176 | |
515 | | | | Patina Oil & Gas Corp. | | 19,313 | |
520 | | @ | | Petroleum Development Corp. | | 20,056 | |
1,170 | | | | Pogo Producing Co. | | 56,733 | |
780 | | @ | | Remington Oil & Gas Corp. | | 21,255 | |
4,100 | | @@ | | Repsol YPF SA | | 106,650 | |
22,800 | | @@ | | Shell Transport & Trading Co. PLC | | 195,077 | |
270 | | @,L | | Southwestern Energy Co. | | 13,686 | |
610 | | @ | | Stone Energy Corp. | | 27,505 | |
1,350 | | L | | Sunoco, Inc. | | 110,309 | |
780 | | @ | | Swift Energy Co. | | 22,573 | |
700 | | @@ | | Total SA | | 153,309 | |
5,650 | | L | | Valero Energy Corp. | | 256,510 | |
| | | | | | 6,134,637 | |
| | | | Oil and Gas Services: 0.1% | | | |
780 | | @ | | Cal Dive Intl., Inc. | | 31,785 | |
590 | | @ | | Hydril Co. | | 26,851 | |
1,810 | | @,L | | Weatherford Intl. Ltd. | | 92,853 | |
| | | | | | 151,489 | |
| | | | Packaging and Containers: 0.1% | | | |
2,500 | | | | Ball Corp. | | 109,950 | |
610 | | | | Sonoco Products Co. | | 18,087 | |
| | | | | | 128,037 | |
| | | | Pharmaceuticals: 1.9% | | | |
7,850 | | | | Abbott Laboratories | | $ | 366,203 | |
1,560 | | | | Alpharma, Inc. | | 26,442 | |
2,800 | | | | Amerisourcebergen Corp. | | 164,304 | |
700 | | | | Cardinal Health, Inc. | | 40,705 | |
9,700 | | @ | | Caremark Rx, Inc. | | 382,470 | |
420 | | | | Medicis Pharmaceutical Corp. | | 14,746 | |
10,700 | | | | Merck & Co., Inc. | | 343,898 | |
560 | | | | Natures Sunshine Products, Inc. | | 11,402 | |
470 | | @ | | NBTY, Inc. | | 11,285 | |
940 | | @ | | Noven Pharmaceuticals, Inc. | | 16,036 | |
37,950 | | | | Pfizer, Inc. | | 1,020,475 | |
1,420 | | @@ | | Roche Holding AG | | 162,992 | |
2,500 | | @@ | | Sankyo Co., Ltd. | | 56,606 | |
1,700 | | @@ | | Sanofi-Aventis | | 135,917 | |
650 | | @ | | Sepracor, Inc. | | 38,591 | |
1,400 | | @@ | | Takeda Pharmaceutical Co. Ltd. | | 70,688 | |
1,300 | | | | UCB SA | | 66,087 | |
| | | | | | 2,928,847 | |
| | | | Pipelines: 0.1% | | | |
2,867 | | | | National Fuel Gas Co. | | 81,251 | |
850 | | | | Questar Corp. | | 43,316 | |
| | | | | | 124,567 | |
| | | | Real Estate: 0.0% | | | |
7,000 | | @@ | | Cheung Kong Holdings Ltd. | | 69,847 | |
| | | | | | 69,847 | |
| | | | Real Estate Investment Trusts: 1.9% | | | |
9,650 | | | | Acadia Realty Trust | | 157,294 | |
300 | | @ | | Alexander’s, Inc. | | 64,500 | |
1,500 | | | | Alexandria Real Estate Equities, Inc. | | 111,630 | |
1,764 | | @ | | Archstone-Smith Trust | | 67,561 | |
1,250 | | | | Avalonbay Communities, Inc. | | 94,125 | |
1,750 | | | | Boston Properties, Inc. | | 113,173 | |
1,375 | | | | CBL & Associates Properties, Inc. | | 104,981 | |
1,900 | | | | CenterPoint Properties Trust | | 90,991 | |
4,625 | | | | Corporate Office Properties Trust Sbi MD | | 135,743 | |
1,825 | | | | Developers Diversified Realty Corp. | | 80,975 | |
2,500 | | | | Equity Office Properties Trust | | 72,800 | |
2,661 | | | | Equity Residential | | 96,275 | |
840 | | | | Essex Property Trust, Inc. | | 70,392 | |
3,025 | | @ | | FelCor Lodging Trust, Inc. | | 44,316 | |
2,250 | | | | General Growth Properties, Inc. | | 81,360 | |
1,465 | | | | Gramercy Capital Corp. | | 30,179 | |
7,600 | | L | | Host Marriott Corp. | | 131,480 | |
1,200 | | | | iStar Financial, Inc. | | 54,312 | |
1,550 | | | | Kimco Realty Corp. | | 89,885 | |
3,000 | | | | LaSalle Hotel Properties | | 95,490 | |
3,750 | | @ | | Meristar Hospitality Corp. | | 31,313 | |
2,575 | | | | National Health Investors, Inc. | | 75,139 | |
4,025 | | L | | Nationwide Health Properties, Inc. | | 95,594 | |
810 | | | | New Century Financial Corp. | | 51,767 | |
2,675 | | | | Newcastle Investment Corp. | | 85,012 | |
2,700 | | | | ProLogis | | 116,991 | |
1,000 | | | | PS Business Parks, Inc. | | 45,100 | |
2,000 | | | | Public Storage, Inc. | | 111,500 | |
1,250 | | | | Rayonier, Inc. | | 61,138 | |
2,825 | | | | Reckson Associates Realty Corp. | | 92,688 | |
See Accompanying Notes to Financial Statements
88
ING VP STRATEGIC ALLOCATION
INCOME PORTFOLIO | PORTFOLIO OF INVESTMENTS
AS OF DECEMBER 31, 2004 (CONTINUED) |
Shares | | | | | | Value | |
| | | | Real Estate Investment Trusts (continued) | | | |
1,800 | | L | | Regency Centers Corp. | | $ | 99,720 | |
1,550 | | | | Simon Property Group, Inc. | | 100,239 | |
1,675 | | | | SL Green Realty Corp. | | 101,421 | |
2,800 | | | | United Dominion Realty Trust, Inc. | | 69,440 | |
| | | | | | 2,924,524 | |
| | | | Retail: 3.8% | | | |
1,515 | | | | Abercrombie & Fitch Co. | | 71,129 | |
1,355 | | | | American Eagle Outfitters, Inc. | | 63,821 | |
1,645 | | @ | | Barnes & Noble, Inc. | | 53,084 | |
1,560 | | @ | | BJ’s Wholesale Club, Inc. | | 45,443 | |
750 | | | | Cato Corp. | | 21,615 | |
880 | | @ | | CEC Entertainment, Inc. | | 35,174 | |
2,215 | | | | Claire’s Stores, Inc. | | 47,069 | |
8,400 | | L | | Costco Wholesale Corp. | | 406,644 | |
5,500 | | @@ | | Enterprise Inns PLC | | 83,694 | |
1,360 | | @ | | GameStop Corp | | 30,478 | |
22,150 | | | | Home Depot, Inc. | | 946,690 | |
780 | | @ | | J. Jill Group, Inc. | | 11,614 | |
6,600 | | | | J.C. Penney Co., Inc. Holding Co. | | 273,240 | |
850 | | @ | | Jack in The Box, Inc. | | 31,340 | |
1,500 | | | | Lawson, Inc. | | 55,420 | |
10,100 | | @ | | Limited Brands, Inc. | | 232,502 | |
4,100 | | @@ | | Marui Co. Ltd. | | 55,108 | |
17,200 | | | | McDonald’s Corp. | | 551,432 | |
2,340 | | | | Michaels Stores, Inc. | | 70,130 | |
895 | | | | PETsMART, Inc. | | 31,799 | |
200 | | @,L | | PF Chang’s China Bistro, Inc. | | 11,270 | |
440 | | @ | | Sonic Corp. | | 13,420 | |
10,300 | | | | Staples, Inc. | | 347,213 | |
7,000 | | @ | | Starbucks Corp. | | 436,520 | |
1,420 | | @ | | Stein Mart, Inc. | | 24,225 | |
4,300 | | | | Target Corp. | | 223,299 | |
1,100 | | @ | | Too, Inc. | | 26,906 | |
5,650 | | @ | | Toys R US, Inc. | | 115,656 | |
1,380 | | @ | | Urban Outfitters, Inc. | | 61,272 | |
21,400 | | | | Wal-Mart Stores, Inc. | | 1,130,347 | |
720 | | @,L | | Williams-Sonoma, Inc. | | 25,229 | |
380 | | @ | | Zale Corp. | | 11,351 | |
| | | | | | 5,544,134 | |
| | | | Savings and Loans: 0.0% | | | |
818 | | @ | | BankUnited Financial Corp. | | 26,135 | |
950 | | @ | | Waypoint Financial Corp. | | 26,933 | |
| | | | | | 53,068 | |
| | | | Semiconductors: 0.7% | | | |
1,450 | | @,L | | Cree, Inc. | | 58,116 | |
980 | | @ | | DSP Group, Inc. | | 21,883 | |
31,550 | | | | Intel Corp. | | 737,954 | |
1,275 | | | | Microchip Technology, Inc. | | 33,992 | |
3,500 | | @@ | | Taiwan Semiconductor Manufacturing Co. Ltd. ADR | | 29,715 | |
8,650 | | | | Texas Instruments, Inc. | | 212,963 | |
270 | | @,L | | Varian Semiconductor Equipment Associates, Inc. | | 9,950 | |
| | | | | | 1,104,573 | |
| | | | Software: 2.1% | | | |
968 | | @ | | Advent Software, Inc. | | 19,825 | |
860 | | @ | | Ansys, Inc. | | 27,572 | |
5,800 | | | | Autodesk, Inc. | | 220,109 | |
245 | | @ | | Avid Technology, Inc. | | $ | 15,129 | |
5,000 | | @ | | BMC Software, Inc. | | 93,000 | |
270 | | @,L | | Cerner Corp. | | 14,356 | |
9,200 | | @ | | Compuware Corp. | | 59,524 | |
540 | | @ | | CSG Systems Intl., Inc. | | 10,098 | |
880 | | @ | | Digi Intl., Inc. | | 15,127 | |
1,140 | | @ | | Dun & Bradstreet Corp. | | 68,001 | |
1,250 | | @ | | eFunds Corp. | | 30,013 | |
1,510 | | L | | Fair Isaac Corp. | | 55,387 | |
1,050 | | @ | | FileNet Corp. | | 27,048 | |
280 | | L | | Global Payments, Inc. | | 16,391 | |
290 | | @,L | | Hyperion Solutions Corp. | | 13,520 | |
700 | | @ | | MapInfo Corp. | | 8,386 | |
54,300 | | | | Microsoft Corp. | | 1,450,352 | |
57,500 | | @ | | Oracle Corp. | | 788,899 | |
5,300 | | @ | | Parametric Technology Corp. | | 31,217 | |
1,030 | | @ | | Phoenix Technologies Ltd. | | 8,508 | |
1,090 | | @ | | Progress Software Corp. | | 25,452 | |
500 | | @@ | | SAP AG | | 88,534 | |
1,710 | | | | SEI Investments Co. | | 71,700 | |
2,430 | | @ | | Sybase, Inc. | | 48,479 | |
2,470 | | @ | | Wind River Systems, Inc. | | 33,469 | |
| | | | | | 3,240,096 | |
| | | | Telecommunications: 2.6% | | | |
3,265 | | @ | | Adaptec, Inc. | | 24,781 | |
10,650 | | | | Alltel Corp. | | 625,794 | |
280 | | @ | | Anixter Intl., Inc. | | 10,077 | |
33,050 | | @ | | Cisco Systems, Inc. | | 637,865 | |
300 | | @ | | Commonwealth Telephone Enterprises, Inc. | | 14,898 | |
1,700 | | @ | | Commscope, Inc. | | 32,130 | |
6,900 | | @,@@ | | Deutsche Telekom AG | | 155,930 | |
3,100 | | @,@@ | | France Telecom SA | | 102,423 | |
1,030 | | | | Harris Corp. | | 63,644 | |
3,090 | | @@ | | Hellenic Telecommunications Organization SA | | 55,596 | |
12,300 | | | | Motorola, Inc. | | 211,560 | |
15 | | @@ | | Nippon Telegraph & Telephone Corp. | | 67,891 | |
5,400 | | @@ | | Nokia Oyj | | 84,564 | |
11,000 | | @ | | Oki Electric Industry Co Ltd | | 47,442 | |
2,110 | | @ | | Polycom, Inc. | | 49,205 | |
8,200 | | | | QUALCOMM, Inc. | | 347,680 | |
2,300 | | @@ | | TDC A/S | | 97,451 | |
35,700 | | @@ | | Telecom Italia S.p.A. | | 145,741 | |
3,400 | | @@ | | Telekom Austria AG | | 64,461 | |
1,600 | | | | Telekomunikasi Indonesia Tbk PT ADR | | 33,632 | |
420 | | | | Telephone & Data Systems, Inc. | | 32,319 | |
23,700 | | | | Verizon Communications, Inc. | | 960,087 | |
| | | | | | 3,865,171 | |
| | | | Textiles: 0.0% | | | |
630 | | | | G&K Services, Inc. | | 27,355 | |
420 | | @,L | | Mohawk Industries, Inc. | | 38,325 | |
| | | | | | 65,680 | |
| | | | Toys/Games/Hobbies: 0.0% | | | |
560 | | @ | | Department 56, Inc. | | 9,324 | |
960 | | @,L | | Jakks Pacific, Inc. | | 21,226 | |
| | | | | | 30,550 | |
See Accompanying Notes to Financial Statements
89
ING VP STRATEGIC ALLOCATION
INCOME PORTFOLIO | PORTFOLIO OF INVESTMENTS
AS OF DECEMBER 31, 2004 (CONTINUED) |
Shares | | | | | | Value | |
| | | | Transportation: 1.1% | | | |
540 | | | | C.H. Robinson Worldwide, Inc. | | $ | 29,981 | |
1,105 | | | | CNF, Inc. | | 55,361 | |
11 | | @@ | | East Japan Railway Co. | | 61,275 | |
1,035 | | @,L | | EGL, Inc. | | 30,936 | |
660 | | | | Expeditors Intl. Washington, Inc. | | 36,881 | |
4,850 | | | | FedEx Corp. | | 477,676 | |
600 | | @ | | Forward Air Corp. | | 26,820 | |
565 | | | | Heartland Express, Inc. | | 12,696 | |
595 | | @ | | Landstar System, Inc. | | 43,816 | |
8,000 | | @@ | | Mitsui O.S.K. Lines Ltd. | | 48,033 | |
9,400 | | | | Norfolk Southern Corp. | | 340,186 | |
660 | | @ | | Offshore Logistics, Inc. | | 21,430 | |
810 | | | | Overseas Shipholding Group, Inc. | | 44,712 | |
5,650 | | | | United Parcel Service, Inc. | | 482,848 | |
345 | | @,L | | Yellow Roadway Corp. | | 19,220 | |
| | | | | | 1,731,871 | |
| | | | Water: 0.0% | | | |
3,900 | | @@ | | Severn Trent PLC | | 72,298 | |
| | | | | | 72,298 | |
| | | | Total Common Stock
(Cost $66,233,772) | | 78,720,577 | |
| | | |
PREFERRED STOCK: 0.2% | | | |
| | | | | | | |
| | | | Banks: 0.2% | | | |
30 | | @,#,XX | | DG Funding Trust | | 321,844 | |
| | | | Total Preferred Stock
(Cost $326,211) | | 321,844 | |
| | | | | | | | |
Principal
Amount | | | | | | Value | |
| | | | | | | |
CORPORATE BONDS/NOTES: 11.0% | | | |
| | | | | | | |
| | | | Auto Manufacturers: 0.3% | | | |
$ | 59,000 | | | | Ford Motor Co., 6.625%, due 10/01/28 | | $ | 55,190 | |
191,000 | | L | | Ford Motor Co., 7.450%, due 07/16/31 | | 192,651 | |
201,000 | | L | | General Motors Corp., 8.375%, due 07/15/33 | | 208,830 | |
| | | | | | 456,671 | |
| | | | Banks: 3.2% | | | |
80,000 | | @@ | | Australia & New Zealand Banking Group Ltd., 2.405%, due 10/29/49 | | 69,881 | |
127,000 | | | | Banco Bradesco SA/Cayman Islands, 8.750%, due 10/24/13 | | 139,065 | |
131,000 | | # | | Banco Santander Chile/Pre-merger with Banco Santiago SA, 2.800%, due 12/09/09 | | 131,318 | |
222,000 | | @@ | | Banco Santander Santiago Chile SA, 7.375%, due 07/18/12 | | 255,410 | |
120,000 | | @@ | | Bank of Ireland, 2.770%, due 12/29/49 | | 104,401 | |
60,000 | | @@ | | Bank of Nova Scotia, 2.115%, due 08/31/85 | | 50,147 | |
134,000 | | | | BankAmerica Capital II, 8.000%, due 12/15/26 | | 147,318 | |
101,000 | | @@,# | | Danske Bank A/S, 5.914%, due 12/29/49 | | 107,138 | |
$ | 140,000 | | @@ | | Den Norske Bank ASA, 2.115%, due 08/29/49 | | $ | 116,725 | |
101,000 | | # | | Dresdner Funding Trust I, 8.151%, due 06/30/31 | | 125,223 | |
127,000 | | @@,# | | HBOS Capital Funding LP, 6.071%, due 06/30/49 | | 136,360 | |
390,000 | | @@,C | | HSBC Bank PLC, 2.839%, due 06/29/49 | | 339,070 | |
200,000 | | @@ | | Lloyds TSB Bank PLC, 2.090%, due 08/29/49 | | 171,563 | |
190,000 | | @@ | | Lloyds TSB Bank PLC, 2.938%, due 06/29/49 | | 169,455 | |
198,000 | | # | | M&T Bank Corp., 3.850%, due 04/01/13 | | 196,077 | |
139,000 | | | | Mellon Capital I, 7.720%, due 12/01/26 | | 150,955 | |
150,000 | | @@ | | National Australia Bank Ltd., 2.361%, due 10/29/49 | | 131,039 | |
190,000 | | @@ | | National Westminster Bank PLC, 2.563%, due 11/29/49 | | 162,179 | |
169,000 | | # | | Rabobank Capital Funding II, 5.260%, due 12/29/49 | | 172,262 | |
300,000 | | # | | Rabobank Capital Funding Trust, 5.254%, due 12/29/49 | | 299,019 | |
200,000 | | @@ | | Royal Bank of Canada, 2.750%, due 06/29/85 | | 170,991 | |
110,000 | | @@ | | Royal Bank of Scotland Group PLC, 2.938%, due 12/29/49 | | 97,155 | |
50,000 | | @@,C | | Societe Generale, 2.705%, due 11/29/49 | | 43,047 | |
450,000 | | @@,C | | Standard Chartered PLC, 2.813%, due 11/29/49 | | 358,769 | |
260,000 | | @@,C | | Standard Chartered PLC, 2.838%, due 12/29/49 | | 209,300 | |
139,000 | | | | U.S. Bankcorp, 8.090%, due 11/15/26 | | 151,706 | |
124,000 | | | | Wells Fargo Capital I, 7.960%, due 12/15/26 | | 135,047 | |
80,000 | | @@ | | Westpac Banking Corp., 2.338%, due 09/29/49 | | 69,396 | |
431,000 | | # | | Westpac Capital Trust IV, 5.256%, due 12/29/49 | | 427,753 | |
| | | | | | 4,837,769 | |
| | | | Beverages: 0.4% | | | |
220,000 | | @@,# | | Cia Brasileira de Bebidas, 8.750%, due 09/15/13 | | 257,400 | |
66,000 | | @@ | | Coca-Cola HBC Finance BV, 5.125%, due 09/17/13 | | 67,813 | |
229,000 | | # | | Miller Brewing Co., 4.250%, due 08/15/08 | | 231,274 | |
| | | | | | 556,487 | |
| | | | Chemicals: 0.1% | | | |
53,000 | | | | Dow Chemical Co., 5.750%, due 11/15/09 | | 56,754 | |
49,000 | | @@,#,S | | Sociedad Quimica y Minera de Chile SA, 7.700%, due 09/15/06 | | 51,967 | |
| | | | | | 108,721 | |
| | | | Diversified Financial Services: 2.2% | | | |
60,882 | | @@,# | | Arcel Finance Ltd., 5.984%, due 02/01/09 | | 62,936 | |
See Accompanying Notes to Financial Statements
90
ING VP STRATEGIC ALLOCATION
INCOME PORTFOLIO | PORTFOLIO OF INVESTMENTS
AS OF DECEMBER 31, 2004 (CONTINUED) |
Principal
Amount | | | | | | Value | |
| | | | Diversified Financial Services (continued) | | | |
$ | 164,000 | | @@,# | | Arcel Finance Ltd., 7.048%, due 09/01/11 | | $ | 168,422 | |
268,000 | | @@,# | | Brazilian Merchant Voucher Receivables Ltd., 5.911%, due 06/15/11 | | 266,660 | |
135,000 | | | | Citigroup Capital II, 7.750%, due 12/01/36 | | 146,939 | |
150,000 | | # | | Corestates Capital Trust I, 8.000%, due 12/15/26 | | 164,023 | |
182,000 | | # | | Farmers Exchange Capital, 7.200%, due 07/15/48 | | 185,783 | |
65,000 | | @@ | | Financiere CSFB NV, 2.125%, due 03/29/49 | | 54,210 | |
196,000 | | | | Ford Motor Credit Co., 5.700%, due 01/15/10 | | 197,998 | |
64,000 | | L | | Ford Motor Credit Co., 7.000%, due 10/01/13 | | 67,960 | |
298,000 | | # | | HVB Funding Trust III, 9.000%, due 10/22/31 | | 394,783 | |
31,000 | | | | JPM Capital Trust I, 7.540%, due 01/15/27 | | 33,417 | |
156,000 | | | | JPM Capital Trust II, 7.950%, due 02/01/27 | | 170,677 | |
395,000 | | # | | Mangrove Bay Pass-Through Trust, 6.102%, due 07/15/33 | | 393,257 | |
154,589 | | @@,# | | PF Export Receivables Master Trust, 3.748%, due 06/01/13 | | 150,102 | |
257,571 | | @@,# | | PF Export Receivables Master Trust, 6.436%, due 06/01/15 | | 256,163 | |
299,000 | | # | | Preferred Term Securities XII, 2.960%, due 03/23/35 | | 298,253 | |
200,000 | | # | | Twin Reefs Pass-Through Trust, 3.370%, due 12/10/49 | | 201,138 | |
133,000 | | @@ | | UFJ Finance Aruba AEC, 8.750%, due 11/29/49 | | 148,619 | |
| | | | | | 3,361,340 | |
| | | | Electric: 0.7% | | | |
221,000 | | | | Consumers Energy Co., 4.250%, due 04/15/08 | | 223,334 | |
327,000 | | | | Ohio Power Co., 6.375%, due 07/15/33 | | 344,801 | |
118,000 | | S | | Pacific Gas & Electric Co., 2.720%, due 04/03/06 | | 118,106 | |
35,244 | | #,S | | Power Contract Financing LLC, 5.200%, due 02/01/06 | | 35,581 | |
146,000 | | # | | Power Contract Financing LLC, 6.256%, due 02/01/10 | | 152,971 | |
40,301 | | | | PPL Montana LLC, 8.903%, due 07/02/20 | | 45,565 | |
76,542 | | # | | Tenaska Virginia Partners LP, 6.119%, due 03/30/24 | | 80,561 | |
113,000 | | #,L | | TXU Energy Co. LLC, 2.838%, due 01/17/06 | | 113,344 | |
| | | | | | 1,114,263 | |
| | | | Food: 0.5% | | | |
102,000 | | | | Kroger Co., 7.250%, due 06/01/09 | | 114,359 | |
187,000 | | | | Safeway, Inc., 4.800%, due 07/16/07 | | 191,542 | |
$ | 117,000 | | | | SUPERVALU, Inc., 7.875%, due 08/01/09 | | $ | 134,302 | |
260,000 | | S | | Tyson Foods, Inc., 7.250%, due 10/01/06 | | 275,769 | |
| | | | | | 715,972 | |
| | | | Insurance: 0.6% | | | |
59,000 | | # | | Farmers Insurance Exchange, 6.000%, due 08/01/14 | | 59,941 | |
64,000 | | # | | Farmers Insurance Exchange, 8.625%, due 05/01/24 | | 75,683 | |
149,000 | | # | | Monumental Global Funding II, 3.850%, due 03/03/08 | | 149,498 | |
264,000 | | | | North Front Pass-Through Trust, 5.810%, due 12/15/24 | | 269,259 | |
133,000 | | S | | Prudential Financial, Inc., 4.104%, due 11/15/06 | | 134,517 | |
232,000 | | # | | Zurich Capital Trust I, 8.376%, due 06/01/37 | | 261,268 | |
| | | | | | 950,166 | |
| | | | Media: 0.2% | | | |
212,000 | | | | Clear Channel Communications, Inc., 3.125%, due 02/01/07 | | 208,925 | |
128,000 | | | | COX Communications, Inc., 6.850%, due 01/15/18 | | 136,599 | |
| | | | | | 345,524 | |
| | | | Mining: 0.2% | | | |
125,000 | | @@,# | | Corp Nacional del Cobre de Chile, 5.500%, due 10/15/13 | | 130,407 | |
128,000 | | | | WMC Finance USA, 5.125%, due 05/15/13 | | 127,845 | |
| | | | | | 258,252 | |
| | | | Multi-National: 0.2% | | | |
312,000 | | @@ | | Corp Andina de Fomento CAF, 6.875%, due 03/15/12 | | 351,228 | |
| | | | | | 351,228 | |
| | | | Oil and Gas: 1.0% | | | |
189,000 | | @@,# | | Empresa Nacional de Petroleo, 4.875%, due 03/15/14 | | 184,987 | |
221,000 | | @@,# | | Gazprom Intl. SA, 7.201%, due 02/01/20 | | 234,260 | |
139,000 | | | | Husky Energy, Inc., 6.150%, due 06/15/19 | | 148,752 | |
261,000 | | # | | Pemex Project Funding Master Trust, 3.790%, due 06/15/10 | | 268,438 | |
53,000 | | | | Pemex Project Funding Master Trust, 7.375%, due 12/15/14 | | 59,042 | |
105,000 | | @@ | | Petroleos Mexicanos, 9.250%, due 03/30/18 | | 130,463 | |
193,000 | | #,L | | Tengizchevroil Finance Co. SARL, 6.124%, due 11/15/14 | | 194,448 | |
104,000 | | | | Valero Energy Corp., 6.125%, due 04/15/07 | | 109,661 | |
112,000 | | | | Valero Energy Corp., 8.750%, due 06/15/30 | | 150,370 | |
| | | | | | 1,480,421 | |
See Accompanying Notes to Financial Statements
91
ING VP STRATEGIC ALLOCATION
INCOME PORTFOLIO | PORTFOLIO OF INVESTMENTS
AS OF DECEMBER 31, 2004 (CONTINUED) |
Principal
Amount | | | | | | Value | |
| | | | Packaging and Containers: 0.1% | | | |
$ | 86,000 | | # | | Sealed Air Corp., 5.375%, due 04/15/08 | | $ | 89,422 | |
| | | | | | 89,422 | |
| | | | Pipelines: 0.1% | | | |
172,000 | | S | | Duke Capital LLC, 4.331%, due 11/16/06 | | 174,235 | |
| | | | | | 174,235 | |
| | | | Real Estate: 0.3% | | | |
209,000 | | | | EOP Operating LP, 7.750%, due 11/15/07 | | 230,816 | |
61,000 | | | | Liberty Property LP, 6.375%, due 08/15/12 | | 66,251 | |
12,000 | | | | Liberty Property LP, 6.950%, due 12/01/06 | | 12,805 | |
158,000 | | | | Liberty Property LP, 7.750%, due 04/15/09 | | 177,607 | |
| | | | | | 487,479 | |
| | | | Real Estate Investment Trusts: 0.3% | | | |
148,000 | | | | Simon Property Group LP, 4.875%, due 03/18/10 | | 150,953 | |
288,000 | | | | Simon Property Group LP, 6.375%, due 11/15/07 | | 307,467 | |
| | | | | | 458,420 | |
| | | | Retail: 0.1% | | | |
201,000 | | | | May Department Stores Co., 3.950%, due 07/15/07 | | 201,460 | |
| | | | | | 201,460 | |
| | | | Savings and Loans: 0.1% | | | |
129,000 | | | | Great Western Financial, 8.206%, due 02/01/27 | | 140,973 | |
| | | | | | 140,973 | |
| | | | Telecommunications: 0.3% | | | |
179,000 | | | | BellSouth Corp., 4.200%, due 09/15/09 | | 179,658 | |
95,000 | | +,S | | Sprint Capital Corp., 4.780%, due 08/17/06 | | 96,858 | |
31,000 | | L | | Sprint Capital Corp., 8.375%, due 03/15/12 | | 37,815 | |
119,000 | | | | Verizon Virginia, Inc., 4.625%, due 03/15/13 | | 116,240 | |
| | | | | | 430,571 | |
| | | | Transportation: 0.1% | | | |
106,000 | | @@,# | | MISC Capital Ltd., 5.000%, due 07/01/09 | | 109,462 | |
5,000 | | @@,# | | MISC Capital Ltd., 6.125%, due 07/01/14 | | 5,399 | |
| | | | | | 114,861 | |
| | | | Total Corporate Bonds/Notes
(Cost $16,372,818) | | 16,634,235 | |
| | | | | | | |
U.S. GOVERNMENT AGENCY OBLIGATIONS: 19.1% | | | |
| | | | | | | |
| | | | Federal Home Loan Bank: 0.5% | | | |
730,000 | | L | | 3.250%, due 12/17/07 | | 725,819 | |
| | | | | | 725,819 | |
| | | | Federal Home Loan Mortgage Corporation: 4.2% | | | |
$ | 1,445,000 | | | | 2.700%, due 03/16/07 | | $ | 1,427,583 | |
1,103,000 | | | | 4.500%, due 10/15/12 | | 1,120,559 | |
396,818 | | | | 4.500%, due 04/01/14 | | 396,920 | |
248,000 | | L | | 5.875%, due 03/21/11 | | 268,103 | |
491,597 | | | | 6.000%, due 01/15/29 | | 513,524 | |
1,984,000 | | | | 6.500%, due 01/15/34 | | 2,081,960 | |
461,362 | | | | 7.000%, due 11/01/31 | | 489,111 | |
| | | | | | 6,297,760 | |
| | | | Federal National Mortgage Association: 13.6% | | | |
1,120,000 | | L | | 3.000%, due 08/15/07 | | 1,109,585 | |
695,000 | | L | | 3.500%, due 01/28/08 | | 693,061 | |
732,000 | | L | | 4.625%, due 10/15/13 | | 740,140 | |
1,344,000 | | W | | 5.000%, due 01/15/20 | | 1,365,421 | |
6,834,000 | | W | | 5.000%, due 01/15/34 | | 6,780,612 | |
715,000 | | | | 5.250%, due 08/01/12 | | 743,062 | |
25,753 | | | | 5.500%, due 01/01/18 | | 26,652 | |
391,471 | | | | 5.500%, due 02/01/18 | | 405,017 | |
393,000 | | W | | 5.500%, due 01/15/20 | | 406,141 | |
1,778,000 | | W | | 5.500%, due 01/01/33 | | 1,805,225 | |
534,239 | | | | 6.000%, due 08/01/16 | | 560,332 | |
299,137 | | | | 6.000%, due 04/25/31 | | 313,591 | |
2,661,000 | | | | 6.000%, due 01/15/34 | | 2,751,638 | |
644,993 | | | | 6.500%, due 07/01/29 | | 676,841 | |
630,000 | | W | | 6.500%, due 01/15/35 | | 660,713 | |
934,000 | | | | 6.500%, due 02/15/35 | | 978,365 | |
325,000 | | | | 6.625%, due 11/15/10 | | 367,738 | |
138,579 | | | | 7.000%, due 02/01/31 | | 146,995 | |
25,452 | | | | 7.500%, due 11/01/30 | | 27,279 | |
64,549 | | | | 7.500%, due 09/01/31 | | 69,181 | |
| | | | | | 20,627,589 | |
| | | | Government National Mortgage Association: 0.8% | | | |
83,628 | | | | 6.500%, due 01/15/29 | | 88,169 | |
65,434 | | | | 6.500%, due 10/15/31 | | 68,961 | |
151,997 | | | | 6.500%, due 01/15/32 | | 160,192 | |
48,470 | | | | 7.000%, due 01/15/28 | | 51,613 | |
299,171 | | | | 7.000%, due 02/15/28 | | 318,570 | |
30,689 | | | | 7.000%, due 02/15/28 | | 32,679 | |
171,389 | | | | 7.000%, due 02/15/28 | | 182,503 | |
302,109 | | | | 7.500%, due 12/15/23 | | 326,850 | |
| | | | | | 1,229,537 | |
| | | | Total U.S. Government Agency Obligations
(Cost $28,787,559) | | 28,880,705 | |
| | | | | | | |
U.S. TREASURY OBLIGATIONS: 8.2% | | | |
| | | | | | | |
| | | | U.S. Treasury Bonds: 6.4% | | | |
2,924,000 | | L,S | | 4.250%, due 11/15/14 | | 2,932,567 | |
3,819,000 | | L,S | | 5.375%, due 02/15/31 | | 4,130,787 | |
699,000 | | S | | 6.250%, due 08/15/23 | | 818,567 | |
559,000 | | L,S | | 10.375%, due 11/15/12 | | 666,652 | |
766,000 | | L,S | | 13.250%, due 05/15/14 | | 1,064,621 | |
| | | | | | 9,613,194 | |
| | | | U.S. Treasury Notes: 1.5% | | | |
930,000 | | L,S | | 3.000%, due 11/15/07 | | 926,726 | |
1,394,000 | | L,S | | 3.500%, due 12/15/09 | | 1,387,684 | |
| | | | | | 2,314,410 | |
See Accompanying Notes to Financial Statements
92
ING VP STRATEGIC ALLOCATION
INCOME PORTFOLIO | PORTFOLIO OF INVESTMENTS
AS OF DECEMBER 31, 2004 (CONTINUED) |
Principal
Amount | | | | | | Value | |
| | | | U.S. Treasury STRIP: 0.3% | | | |
$ | 823,000 | | | | 4.690%, due 05/15/16 | | $ | 488,612 | |
| | | | | | 488,612 | |
| | | | Total U.S. Treasury Obligations
(Cost $12,268,960) | | 12,416,216 | |
| | | | | | | |
ASSET-BACKED SECURITIES: 1.4% | | | |
| | | |
| | | | Automobile Asset-Backed Securities: 0.3% | | | |
140,000 | | | | Household Automotive Trust, 2.310%, due 04/17/08 | | 139,077 | |
325,000 | | | | USAA Auto Owner Trust, 2.040%, due 02/16/10 | | 319,483 | |
| | | | | | 458,560 | |
| | | | Credit Card Asset-Backed Securities: 1.0% | | | |
115,000 | | | | Bank One Issuance Trust, 4.540%, due 09/15/10 | | 116,772 | |
115,000 | | | | Capital One Master Trust, 4.900%, due 03/15/10 | | 118,781 | |
855,000 | | | | Chemical Master Credit Card Trust 1, 7.090%, due 02/15/09 | | 901,175 | |
390,000 | | | | Citibank Credit Card Issuance Trust, 5.650%, due 06/16/08 | | 403,266 | |
| | | | | | 1,539,994 | |
| | | | Other Asset-Backed Securities: 0.1% | | | |
41,000 | | | | Popular ABS Mortgage Pass-Through Trust, 3.735%, due 12/25/34 | | 40,864 | |
41,000 | | | | Popular ABS Mortgage Pass-Through Trust, 4.000%, due 12/25/34 | | 40,880 | |
| | | | | | 81,744 | |
| | | | Total Asset-Backed Securities
(Cost $2,087,602) | | 2,080,298 | |
| | | | | | | |
COLLATERALIZED MORTGAGE OBLIGATIONS: 6.4% | | | |
| | | |
| | | | Commercial Mortgage-Backed Securities: 2.6% | | | |
26,000 | | | | Bear Stearns Commercial Mortgage Securities, 4.030%, due 02/13/46 | | 25,810 | |
37,000 | | | | Capco America Securitization Corp., 6.460%, due 10/15/30 | | 40,257 | |
230,000 | | | | COMM, 3.600%, due 03/10/39 | | 226,668 | |
975,000 | | | | CS First Boston Mortgage Securities Corp., 3.861%, due 03/15/36 | | 974,627 | |
82,000 | | | | CS First Boston Mortgage Securities Corp., 7.560%, due 04/14/62 | | 94,821 | |
460,000 | | | | DLJ Commercial Mortgage Corp., 6.240%, due 11/12/31 | | 495,516 | |
180,000 | | C | | DLJ Commercial Mortgage Corp., 6.460%, due 03/10/32 | | 195,361 | |
1,090,000 | | | | DLJ Commercial Mortgage Corp., 7.300%, due 06/10/32 | | 1,226,579 | |
241,142 | | | | GE Capital Commercial Mortgage Corp, 3.752%, due 07/10/39 | | 240,748 | |
$ | 55,000 | | | | GE Capital Commercial Mortgage Corp., 3.915%, due 11/10/38 | | $ | 54,420 | |
40,000 | | | | GE Capital Commercial Mortgage Corp., 4.865%, due 07/10/39 | | 40,855 | |
212,000 | | | | JP Morgan Chase Commercial Mortgage Securities Corp., 4.223%, due 01/15/42 | | 212,214 | |
23,000 | | | | LB-UBS Commercial Mortgage Trust, 4.567%, due 06/15/29 | | 23,452 | |
121,000 | | | | LB-UBS Commercial Mortgage Trust, 7.370%, due 08/15/26 | | 138,329 | |
| | | | | | 3,989,657 | |
| | | | Whole Loan Collateralized Mortgage Obligations: 3.7% | | | |
276,654 | | | | Bank of America Mortgage Securities, 5.000%, due 12/25/18 | | 279,247 | |
176,952 | | | | Bank of America Mortgage Securities, 5.250%, due 11/25/19 | | 180,260 | |
261,937 | | | | Countrywide Alternative Loan Trust, 5.000%, due 10/25/18 | | 264,393 | |
283,869 | | | | Countrywide Home Loan Mortgage Pass Through Trust, 5.000%, due 11/25/18 | | 286,531 | |
629,000 | | | | CS First Boston Mortgage Securities Corp., 4.140%, due 10/25/33 | | 629,424 | |
507,000 | | | | GMAC Mortgage Corp. Loan Trust, 5.500%, due 01/25/34 | | 518,953 | |
12,653 | | | | GSR Mortgage Loan Trust, 6.500%, due 01/25/34 | | 13,187 | |
609,029 | | | | JP Morgan Mortgage Trust, 6.500%, due 11/25/34 | | 636,546 | |
420,000 | | | | MASTR Alternative Loans Trust, 5.500%, due 01/25/20 | | 431,025 | |
1,251,564 | | | | MASTR Asset Securitization Trust, 5.500%, due 06/25/33 | | 1,262,516 | |
349,565 | | | | Prime Mortgage Trust, 5.250%, due 11/25/19 | | 356,864 | |
725,261 | | | | Washington Mutual, 5.000%, due 06/25/18 | | 732,515 | |
| | | | | | 5,591,461 | |
| | | | Whole Loan Collateralized Support CMO: 0.1% | | | |
137,715 | | | | Bank of America Mortgage Securities, 5.500%, due 11/25/33 | | 138,161 | |
| | | | | | 138,161 | |
| | | | Total Collateralized Mortgage
Obligations (Cost $9,737,491) | | 9,719,279 | |
| | | | | | | |
MUNICIPAL BONDS: 0.2% | | | |
| | | |
| | | | Municipal: 0.2% | | | |
70,000 | | | | City of New York, 5.000%, due 11/01/08 | | 75,675 | |
70,000 | | | | City of New York, 5.000%, due 11/01/11 | | 77,257 | |
70,000 | | | | City of New York, 5.000%, due 11/01/15 | | 76,829 | |
See Accompanying Notes to Financial Statements
93
ING VP STRATEGIC ALLOCATION
INCOME PORTFOLIO | PORTFOLIO OF INVESTMENTS
AS OF DECEMBER 31, 2004 (CONTINUED) |
Principal
Amount | | | | | | Value | |
| | | | Municipal (continued) | | | |
$ | 70,000 | | | | Sales Tax Asset Receivables Corp., 4.060%, due 10/15/10 | | $ | 69,013 | |
61,000 | | | | Sales Tax Asset Receivables Corp., 4.660%, due 10/15/14 | | 60,336 | |
| | | | Total Municipal Bonds (Cost $360,924) | | 359,110 | |
| | | | Total Long-Term Investments
(Cost $136,175,337) | | 149,132,264 | |
| | | | | | | |
SHORT-TERM INVESTMENTS: 25.7% | | | |
| | | |
| | | | Certificate of Deposit: 1.0% | | | |
1,500,000 | | | | Wells Fargo Bank, 2.420%, due 01/07/05 | | 1,500,000 | |
| | | | Total Certificate of Deposit (Cost $1,500,000) | | 1,500,000 | |
| | | | Commercial Paper: 7.6% | | | |
1,400,000 | | S | | Ciesco L.P., 2.200%, due 01/05/05 | | 1,399,572 | |
1,500,000 | | | | Concord Minutemen Capital, 2.350%, due 01/09/06 | | 1,500,000 | |
1,500,000 | | S | | Concord Minutemen Capital, 2.390%, due 01/13/05 | | 1,498,705 | |
1,375,000 | | S | | Corporate Asset Funding Co., 2.180%, due 01/07/05 | | 1,374,417 | |
1,400,000 | | S | | Household Financial Corp., 2.200%, due 01/11/05 | | 1,399,059 | |
1,500,000 | | S | | Preferred Receivable Funding Corp., 2.340%, due 01/26/05 | | 1,497,465 | |
2,800,000 | | S | | Tulip Funding Corp., 2.370%, due 01/04/05 | | 2,799,263 | |
| | | | Total Commercial Paper (Cost $11,469,117) | | 11,468,481 | |
| | | | Repurchase Agreement: 3.4% | | | |
5,216,000 | | S | | Goldman Sachs Repurchase Agreement dated 12/31/04, 2.230%, due 01/03/05, $5,216,969 to be received upon repurchase (Collateralized by $5,210,000 Federal Home Loan Mortgage Corporation, 5.200%, Market Value plus accrued interest $5,320,886, due 02/04/19) | | 5,216,000 | |
| | | | Total Repurchase Agreement
(Cost $5,216,000) | | 5,216,000 | |
| | | | Securities Lending Collateralcc: 13.7% | | | |
$ | 20,813,000 | | | | The Bank of New York | | | |
| | | | Institutional Cash | | | |
| | | | Reserve Fund | | $ | 20,813,000 | |
| | | | Total Securities Lending Collateral
(Cost $20,813,000) | | 20,813,000 | |
| | | | Total Short-Term Investments
(Cost $38,998,117) | | | | 38,997,481 | |
| | | | Total Investments In Securities (Cost $175,173,454)* | | 124.2 | % | $ | 188,129,745 | |
| | | | Other Assets and Liabilities-Net | | (24.2 | ) | (36,641,232 | ) |
| | | | Net Assets | | 100.0% | | $ | 151,488,513 | |
| | | | | | | | | | | | | | |
@ Non-income producing security
@@ Foreign issuer
ADR American Depositary Receipt
GDR Global Depositary Receipt
REITs Real Estate Investment Trusts
STRIP Separate Trading of Registered Interest and Principal of Securities
+ Step-up basis bonds. Interest rates shown reflect current and future coupon rates.
# Securities with purchases pursuant to Rule 144A, under the Securities Act of 1933 and may not be resold subject to that rule except to qualified institutional buyers. These securities have been determined to be liquid under the guidelines established by the Funds’ Board of Directors/Trustees.
C Bond may be called prior to maturity date.
cc Securities purchased with cash collateral for securities loaned.
W When-issued or delayed delivery security.
S Segregated securities for futures, when-issued or delayed delivery securities held at December 31, 2004.
L Loaned security, a portion or all of the security is on loan at December 31, 2004.
XX Value of securities obtained from one or more dealers making markets in the securities in accordance with the Fund’s valuation procedures.
* Cost for federal income tax purposes is $176,474,275. Net unrealized appreciation consists of:
Gross Unrealized Appreciation | | $ | 12,534,480 | |
Gross Unrealized Depreciation | | (879,010 | ) |
Net Unrealized Appreciation | | $ | 11,655,470 | |
Information concerning open futures contracts at December 31, 2004 is shown below:
Short Contracts | | No. of
Contracts | | Notional
Market Value | | Expiration
Date | | Unrealized
Gain (Loss) | |
S&P 500 Future | | 22 | | $ | (6,675,350 | ) | 03/21/2005 | | $ | (45,573 | ) |
U.S. 2 Year Treasury Note | | 2 | | (419,188 | ) | 04/05/2005 | | 490 | |
U.S. 5 Year Treasury Note | | 10 | | (1,095,313 | ) | 03/31/2005 | | (988 | ) |
| | | | $ | (8,189,850 | ) | | | $ | (46,071 | ) |
Long Contracts | | | | | | | | | |
U.S. Long Bond | | 6 | | $ | 675,000 | | 03/31/2005 | | $ | 5,033 | |
See Accompanying Notes to Financial Statements
94
Dividends paid during the year ended December 31, 2004 were as follows:
Fund Name | | Type | | Per Share Amount | |
| | | | | |
ING VP Index Plus LargeCap Portfolio | | | | | |
Class I | | NII | | $ | 0.1404 | |
Class S | | NII | | $ | 0.1327 | |
| | | | | |
ING VP Index Plus MidCap Portfolio | | | | | |
Class I | | NII | | $ | 0.0670 | |
Class S | | NII | | $ | 0.0597 | |
| | | | | | |
ING VP Index Plus SmallCap Portfolio | | | | | |
Class I | | NII | | $ | 0.0228 | |
Class S | | NII | | $ | 0.0151 | |
Class I | | STCG | | $ | 0.0431 | |
Class S | | STCG | | $ | 0.0431 | |
Class I | | LTCG | | $ | 0.0357 | |
Class S | | LTCG | | $ | 0.0357 | |
| | | | | |
ING VP Strategic Allocation Balanced Portfolio
Class I | | NII | | $ | 0.1638 | |
ING VP Strategic Allocation Growth Portfolio
Class I | | NII | | $ | 0.1456 | |
ING VP Strategic Allocation Income Portfolio
Class I | | NII | | $ | 0.2378 | |
NII - - Net investment income
STCG - - Short-term capital gain
LTCG - - Long-term capital gain
Of the ordinary distributions made during the year ended December 31, 2004, the following percentage qualifies for the dividends received deduction available to corporate shareholders:
ING VP Index Plus LargeCap Portfolio: | | 100.00 | % |
ING VP Index Plus MidCap Portfolio: | | 100.00 | % |
ING VP Index Plus SmallCap Portfolio: | | 71.09 | % |
ING VP Strategic Allocation Balanced Portfolio: | | 49.55 | % |
ING VP Strategic Allocation Growth Portfolio: | | 94.10 | % |
ING VP Strategic Allocation Income Portfolio: | | 27.02 | % |
Above figures may differ from those cited elsewhere in this report due to differences in the calculation of income and gains under accounting principles generally accepted in the United States of America (book) purposes and Internal Revenue Service (tax) purposes.
Shareholders are strongly advised to consult their own tax advisers with respect to the tax consequences of their investments in the Funds. In January, shareholders, excluding corporate shareholders, receive an IRS 1099-DIV regarding the federal tax status of the dividends and distributions they received in the calendar year.
95
The business and affairs of the Funds are managed under the direction of the Fund’s Board of Directors. A director who is not an interested person of the Funds, as defined in the 1940 Act, is an independent director (“Non-Interested Director”). The Directors of the Funds are listed below. The Statement of Additional Information includes additional information about directors of the Registrant and is available, without charge, upon request at 1-800-992-0180.
Name, Address
and Age | | Position(s)
held with
the Company | | Term of
Office and
Length of
Time Served(1) | | Principal
Occupation(s)
during the
Past Five Years | | Number of
Portfolios in
Fund Complex
Overseen
by Director | | Other
Directorships
held by
Director | |
Non-Interested Directors: | | | | | | | | | | | |
| | | | | | | | | | | |
Albert E. DePrince, Jr.
7337 E. Doubletree Ranch Rd.
Scottsdale, Arizona 85258
Born: 1941 | | Director | | June 1998 - present | | Professor of Economics and Finance, Middle Tennessee State University (August 1991 to Present). Formerly, Director, Business and Economic Research Center (August 1999 - August 2002). | | 48 | | Director, International Atlantic Economic Society (October 2002 - Present); Academy of Economics and Finance (February 2001 - Present). | |
| | | | | | | | | | | |
Maria T. Fighetti
7337 E. Doubletree Ranch Rd.
Scottsdale, Arizona 85258
Born: 1943 | | Director | | April 1994 - present | | Retired. Formerly, Attorney, New York City Department of Mental Health (June 1973 - October 2002) and Associate Commissioner (1995 - 2002). | | 48 | | None | |
| | | | | | | | | | | |
Sidney Koch
7337 E. Doubletree Ranch Rd.
Scottsdale, Arizona 85258
Born: 1935 | | Director | | April 1994 - present | | Financial Adviser, Self-Employed (January 1993 - Present). | | 48 | | Director, Northwest Center for the Arts, Torrington, CT. | |
| | | | | | | | | | | |
Corine T. Norgaard
7337 E. Doubletree Ranch Rd.
Scottsdale, Arizona 85258
Born: 1937 | | Director | | June 1991 - present | | Retired. Formerly, Dean, Barney School of Business, University of Hartford (August 1996 - May 2004). | | 48 | | Director/Trustee, Mass Mutual Corporate and Participation Investors (April 1997 - Present); Director, Advest Trust Company (1998 - Present); Director, Connecticut Health Foundation (2002 - Present). | |
| | | | | | | | | | | |
Edward T. O’Dell
7337 E. Doubletree Ranch Rd.
Scottsdale, Arizona 85258
Born: 1935 | | Director | | June 2002 - present | | Retired. Formerly, Partner/Chairman of Financial Service Group, Goodwin Procter LLP (June 1966 - September 2000) | | 48 | | None | |
| | | | | | | | | | | |
Joseph E. Obermeyer(2)
7337 E. Doubletree Ranch Rd.
Scottsdale, Arizona 85258
Born: 1957 | | Director | | January 2003 - present | | President, Obermeyer & Associates, Inc. (Consulting firm) (November 1999 - Present). Formerly, Senior Manager, Arthur Andersen LLP (1995 - October 1999). | | 48 | | None | |
96
DIRECTOR AND OFFICER INFORMATION (UNAUDITED) (CONTINUED)
Name, Address
and Age | | Position(s)
held with
the Company | | Term of
Office and
Length of
Time Served(1) | | Principal
Occupation(s)
during the
Past Five Years | | Number of
Portfolios in
Fund Complex
Overseen
by Director | | Other
Directorships
held by
Director | |
Directors who are “Interested Persons” | | | | | | | | | |
| | | | | | | | | | | |
J. Scott Fox(3)
ING Investment
Management Co. Inc.
10 State House Square
Hartford, Connecticut
Born: 1955 | | Director | | December
1997 - present | | Vice Chairman and Chief Operating Officer, ING Investment Management Co. (September 2002 - Present); President and Chief Executive Officer (April 2001 - Present). Formerly, Managing Director and Chief Operating Officer (April 1994 - April 2001), ING Investment Management Co. | | 48 | | Director of IPC Financial Network, Inc. (January 2001 - Present); Director, Metro Hartford Chamber of Commerce and The Greater Hartford Arts Council. | |
| | | | | | | | | | | |
Thomas J. McInerney(4)
7337 E. Doubletree Ranch Rd.
Scottsdale, Arizona 85258
Born: 1956 | | Director | | April 2002 - present | | Chief Executive Officer, ING U.S. Financial Services (September 2001 - Present); Member, ING Americas Executive Committee (2001 - Present), ING Aeltus Holding Company, Inc. (2000 - Present), ING Retail Holding Company (1998 - Present), and ING Retirement Holdings, Inc. (1997 - Present). Formerly, President, ING Life Insurance Annuity Company (September 1997 - November 2002); President, Chief Executive Officer and Director of Northern Life Insurance Company (March 2001 - October 2002); General Manager and Chief Executive Officer, ING Worksite Division (December 2000 - October 2001); President, ING-SCI, Inc. (August 1997 - December 2000); President, Aetna Financial Services (August 1997 - December 2000). | | 161 | | Director, Equitable Life Insurance Co., Golden American Life Insurance Co., Life Insurance Company of Georgia, Midwestern United Life Insurance Co., ReliaStar Life Insurance Co., Security Life of Denver, Security Connecticut Life Insurance Co., Southland Life Insurance Co., USG Annuity and Life Company, and United Life and Annuity Insurance Co., Inc. (March 2001 - Present); Member of the Board, Bushnell Performing Arts Center; St. Francis Hospital; National Conference for Community Justice; and Metro Atlanta Chamber of Commerce. | |
(1) Directors serve until their successors are duly elected and qualified, subject to the Board’s retirement policy.
(2) Mr. Obermeyer was elected to the Board on January 1, 2003.
(3) Mr. Fox is an “interested person,” as defined under the 1940 Act, because of his relationship with ING Investment Management Co., an affiliate of ING Investments.
(4) Mr. McInerney is an “interested person,” as defined under the 1940 Act, because of his affiliation with ING Groep N.V., the parent corporation of the Investment Manager, ING Investments, LLC and the Distributor, ING Funds Distributor, LLC.
97
DIRECTOR AND OFFICER INFORMATION (UNAUDITED) (CONTINUED)
Name, Address
and Age | | Position(s)
Held with the Company | | Term of Office and
Length of Time Served(1) | | Principal Occupation(s) during the
Past Five Years | |
| | | | | | | |
James M. Hennessy
7337 E. Doubletree Ranch Rd.
Scottsdale, Arizona 85258
Born: 1949 | | President, Chief Executive Officer and Chief Operating Officer | | March 2002 - present | | President and Chief Executive Officer, ING Investments, LLC (December 2000 - Present). Formerly, Senior Executive Vice President and Chief Operating Officer, ING Investments, LLC (April 1995 - December 2000); and Executive Vice President, ING Investments, LLC (May 1998 - June 2000). | |
| | | | | | | |
Michael J. Roland
7337 E. Doubletree Ranch Rd.
Scottsdale, Arizona 85258
Born: 1958 | | Executive Vice President and Assistant Secretary
Principal Financial Officer | | April 2002 - present
March 2002 - present | | Executive Vice President, Chief Financial Officer and Treasurer, (December 2001 - Present) and Chief Compliance Officer (October 2004 - Present), ING Investments, LLC. Formerly, Senior Vice President, ING Investments, LLC (June 1998 - December 2001). | |
| | | | | | | |
Stanley D. Vyner
7337 E. Doubletree Ranch Rd.
Scottsdale, Arizona 85258
Born: 1950 | | Executive Vice President | | March 2002 - present | | Executive Vice President, ING Investments, LLC (July 2000 - Present) and Chief Investment Risk Officer (January 2003 - Present). Formerly, Chief Investment Officer of the International Portfolios, ING Investments, LLC (August 2000 - January 2003); and Chief Executive Officer, ING Investments, LLC (August 1996 - August 2000). | |
| | | | | | | |
Joseph M. O’Donnell
7337 E. Doubletree Ranch Rd.
Scottsdale, Arizona 85258
Born: 1954 | | Chief Compliance Officer | | November 2004 - present | | Chief Compliance Officer of the ING Funds (November 2004 - Present). Formerly, Vice President, Chief Legal Counsel, Chief Compliance Officer and Secretary of Atlas Securities, Inc., Atlas Advisers, Inc. and Atlas Funds (October 2001 - October 2004); and Chief Operating Officer and General Counsel of Matthews International Capital Management LLC and Vice President and Secretary of Matthews International Funds (August 1999 - May 2001). | |
| | | | | | | |
Robert S. Naka
7337 E. Doubletree Ranch Rd.
Scottsdale, Arizona 85258
Born: 1963 | | Senior Vice President and Assistant Secretary | | March 2002 - present | | Senior Vice President and Assistant Secretary, ING Funds Services, LLC (October 2001 - Present). Formerly, Senior Vice President, ING Funds Services, LLC (August 1999 - October 2001). | |
| | | | | | | |
Kimberly A. Anderson
7337 E. Doubletree Ranch Rd.
Scottsdale, Arizona 85258
Born: 1964 | | Senior Vice President | | December 2003 - present | | Senior Vice President, ING Investments, LLC (October 2003 - Present). Formerly, Vice President and Assistant Secretary, ING Investments, LLC (October 2001 - October 2003); Assistant Vice President, ING Funds Services, LLC (November 1999 - January 2001). | |
| | | | | | | |
Robyn L. Ichilov
7337 E. Doubletree Ranch Rd.
Scottsdale, Arizona 85258
Born: 1967 | | Vice President and Treasurer | | March 2002 - present | | Vice President, ING Funds Services, LLC (October 2001 - Present) and ING Investments, LLC (August 1997 - Present). | |
| | | | | | | |
Lauren D. Bensinger
7337 E. Doubletree Ranch Rd.
Scottsdale, Arizona 85258
Born: 1954 | | Vice President | | March 2003 - present | | Vice President and Chief Compliance Officer, ING Funds Distributor, LLC (July 1995 - Present) and Vice President, ING Investments, LLC (February 1996 - Present). Formerly, Chief Compliance Officer (October 2001 - October 2004), ING Investments, LLC. | |
| | | | | | | |
Todd Modic
7337 E. Doubletree Ranch Rd.
Scottsdale, Arizona 85258
Born: 1967 | | Vice President | | September 2003 - present | | Vice President, Financial Reporting, Fund Accounting, ING Funds Services, LLC (September 2002 - Present). Formerly, Director of Financial Reporting, ING Investments, LLC (March 2001 - September 2002); Director of Financial Reporting, Axient Communications, Inc. (May 2000 - January 2001); and Director of Finance, Rural/Metro Corporation (March 1995 - May 2000). | |
98
DIRECTOR AND OFFICER INFORMATION (UNAUDITED) (CONTINUED)
Name, Address
and Age | | Position(s)
Held with the Company | | Term of Office and
Length of Time Served(1) | | Principal Occupation(s) during the
Past Five Years | |
Maria M. Anderson
7337 E. Doubletree Ranch Rd.
Scottsdale, Arizona 85258
Born: 1958 | | Vice President | | September 2004 - present | | Vice President, Compliance, ING Funds Services, LLC (September 2004 - Present). Formerly, Assistant Vice President, ING Funds Services, LLC (October 2001 - September 2004); Manager of Fund Accounting and Fund Compliance, ING Investments, LLC (September 1999 - October 2001). | |
| | | | | | | |
Theresa K. Kelety
7337 E. Doubletree Ranch Rd.
Scottsdale, Arizona 85258
Born: 1963 | | Secretary | | September 2003 - present | | Counsel, ING U.S. Legal Services (April 2003 - Present). Formerly, Senior Associate with Shearman & Sterling (February 2000 - April 2003); and Associate with Sutherland Asbill & Brennan (1996 - February 2000). | |
| | | | | | | |
Susan P. Kinens
7337 E. Doubletree Ranch Rd.
Scottsdale, Arizona 85258
Born: 1976 | | Assistant Vice President | | March 2003 - present | | Assistant Vice President, ING Funds Services, LLC (December 2002 - Present); and has held various other positions with ING Funds Services, LLC for more than the last five years. | |
| | | | | | | |
Kimberly K. Palmer
7337 E. Doubletree Ranch Rd.
Scottsdale, Arizona 85258
Born: 1957 | | Assistant Vice President | | September 2004 - present | | Assistant Vice President, ING Funds Services, LLC (August 2004 - Present). Formerly, Manager, Registration Statements, ING Funds Services, LLC (May 2003 - August 2004); Associate Partner, AMVESCAP PL (October 2000 - May 2003); Director of Federal Filings and Blue Sky Filings, INVESCO Funds Group, Inc. (March 1994 - May 2003). | |
| | | | | | | |
Huey P. Falgout, Jr.
7337 E. Doubletree Ranch Rd.
Scottsdale, Arizona 85258
Born: 1963 | | Assistant Secretary | | September 2003 - present | | Chief Counsel, ING U.S. Legal Services (September 2003 - Present). Formerly, Counsel, ING U.S. Legal Services (November 2002 - September 2003); and Associate General Counsel of AIG American General (January 1999 - November 2002). | |
| | | | | | | |
Robin R. Nesbitt
7337 E. Doubletree Ranch Rd.
Scottsdale, Arizona 85258
Born: 1973 | | Assistant Secretary | | September 2004 - present | | Supervisor, Board Operations, ING Funds Services, LLC (August 2003 - Present). Formerly, Senior Legal Analyst, ING Funds Services, LLC (August 2002 - August 2003); Associate, PricewaterhouseCoopers (January 2001 - August 2001); and Paralegal, McManis, Faulkner & Morgan (May 2000 - December 2000). | |
(1) The officers hold office until the next annual meeting of the Directors and until their successors have been elected and qualified.
99
Investment Manager
ING Investments, LLC
7337 E. Doubletree Ranch Road
Scottsdale, Arizona 85258
Administrator
ING Funds Services, LLC
7337 E. Doubletree Ranch Road
Scottsdale, Arizona 85258
Distributor
ING Funds Distributor, LLC
7337 E. Doubletree Ranch Road
Scottsdale, Arizona 85258
1-800-334-3444
Transfer Agent
DST Systems, Inc.
P.O. Box 419368
Kansas City, Missouri 64141
Custodian
The Bank of New York
100 Colonial Center Parkway, Suite 300
Lake Mary, Florida 32746
Legal Counsel
Goodwin Procter LLP
Exchange Place
53 State Street
Boston, Massachusetts 02109
Independent Registered Public Accounting Firm
KPMG LLP
99 High Street
Boston, Massachusetts 02110
Before investing, carefully consider the investment objectives, risks, charges and expenses of the variable universal life insurance policy or variable annuity contract and the underlying variable investment options. This and other information is contained in the prospectus for the variable universal life policy or variable annuity contract and the underlying variable investment options. Obtain these prospectuses from your agent/registered representative and read them carefully before investing. Information regarding how the Portfolios voted proxies related to portfolio securities during the most recent 12-month period ended June 30 is available without charge on the Portfolios’ website at www.ingfunds.com and on the SEC’s website at www.sec.gov.

| VPAR-AFIP/SAIS | (1204-021805) |
Item 2. Code of Ethics.
As of the end of the period covered by this report, Registrant had adopted a code of ethics, as defined in Item 2 of Form N-CSR, that applies to the Registrant’s principal executive officer and principal financial officer. There were no amendments to the Code during the period covered by the report. The Registrant did not grant any waivers, including implicit waivers, from any provisions of the Code during the period covered by this report. The code of ethics is filed herewith pursuant to Item 10(a)(1), Exhibit 99.CODE ETH.
Item 3. Audit Committee Financial Expert.
The Board of Trustees has determined that Corine Norgaard and Joseph Obermeyer are each audit committee financial experts, as defined in Item 3 of Form N-CSR. Ms. Norgaard and Mr. Obermeyer are both “independent” for purposes of Item 3 of Form N-CSR.
Item 4. Principal Accountant Fees and Services.
(a) Audit Fees: The aggregate fees billed for each of the last two fiscal years for professional services rendered by KPMG LLP (“KPMG”), the principal accountant for the audit of the registrant’s annual financial statements, for services that are normally provided by the accountant in connection with statutory and regulatory filings or engagements for those fiscal years were $90,679 for year ended December 31, 2004 and $125,025 for year ended December 31, 2003.
(b) Audit-Related Fees: The aggregate fees billed in each of the last two fiscal years for assurance and related services by KPMG that are reasonably related to the performance of the audit of the registrant’s financial statements and are not reported under paragraph (a) of this Item.
None
(c) Tax Fees: The aggregate fees billed in each of the last two fiscal years for professional services rendered by KPMG for tax compliance, tax advice, and tax planning were $46,674 in the year ended December 31, 2004 and $24,000 in the year ended December 31, 2003. Such services included review of excise distribution calculations (if applicable), preparation of the Funds’ federal, state and excise tax returns, tax services related to mergers and routine consulting.
(d) All Other Fees: The aggregate fees billed in each of the last two fiscal years for products and services provided by KPMG, other than the services reported in paragraphs (a) through (c) of this Item.
None
(e) (1) Audit Committee Pre-Approval Policies and Procedures
1
AUDIT AND NON-AUDIT SERVICES
PRE-APPROVAL POLICY
I. Statement of Principles
Under the Sarbanes-Oxley Act of 2002 (the “Act”), the Audit Committee of the Board of Directors or Trustees (the “Committee”) of the ING Funds (each a “Fund,” collectively, the “Funds”) set out under Paragraph I on Exhibit A to this Audit and Non-Audit Services Pre-Approval Policy (“Policy”) is responsible for the oversight of the work of the Funds’ independent auditors. As part of its responsibilities, the Committee must pre-approve the audit and non-audit services performed by the auditors in order to assure that the provision of these services does not impair the auditors’ independence from the Funds. The Committee has adopted, and the Board has ratified, this Policy, which sets out the procedures and conditions under which the services of the independent auditors may be pre-approved.
Under Securities and Exchange Commission (“SEC”) rules promulgated in accordance with the Act, the Funds’ may establish two different approaches to pre-approving audit and non-audit services. The Committee may approve services without consideration of specific case-by-case services (“general pre-approval”) or it may pre-approve specific services (“specific pre-approval”). The Committee believes that the combination of these approaches contemplated in this Policy results in an effective and efficient method for pre-approving audit and non-audit services to be performed by the Funds’ independent auditors. Under this Policy, services that are not of a type that may receive general pre-approval require specific pre-approval by the Committee. Any proposed services that exceed pre-approved cost levels or budgeted amounts will also require the Committee’s specific pre-approval.
For both types of approval, the Committee considers whether the subject services are consistent with the SEC’s rules on auditor independence and that such services are compatible with maintaining the auditors’ independence. The Committee also considers whether a particular audit firm is in the best position to provide effective and efficient services to the Funds. Reasons that the auditors are in the best position include the auditors’ familiarity with the Funds’ business, personnel, culture, accounting systems, risk profile, and other factors, and whether the services will enhance the Funds’ ability to manage and control risk or improve audit quality. Such factors will be considered as a whole, with no one factor being determinative.
The appendices attached to this Policy describe the audit, audit-related, tax-related, and other services that have the Committee’s general pre-approval. For any service that has been approved through general pre-approval, the general pre-approval will remain in place for a period 12 months from the date of pre-approval, unless the Committee determines that a different period is appropriate. The Committee will annually review and pre-approve the services that may be provided by the independent auditors without specific pre-approval. The Committee will revise the list of services subject to general pre-approval as appropriate. This Policy does not serve as a delegation to Fund management of the Committee’s duty to pre-approve services performed by the Funds’ independent auditors.
2
II. Audit Services
The annual audit services engagement terms and fees are subject to the Committee’s specific pre-approval. Audit services are those services that are normally provided by auditors in connection with statutory and regulatory filings or engagements or those that generally only independent auditors can reasonably provide. They include the Funds’ annual financial statement audit and procedures that the independent auditors must perform in order to form an opinion on the Funds’ financial statements (e.g., information systems and procedural reviews and testing). The Committee will monitor the audit services engagement and approve any changes in terms, conditions or fees deemed by the Committee to be necessary or appropriate.
The Committee may grant general pre-approval to other audit services, such as statutory audits and services associated with SEC registration statements, periodic reports and other documents filed with the SEC or issued in connection with securities offerings.
The Committee has pre-approved the audit services listed on Appendix A. The Committee must specifically approve all audit services not listed on Appendix A.
III. Audit-related Services
Audit-related services are assurance and related services that are reasonably related to the performance of the audit or the review of the Funds’ financial statements or are traditionally performed by the independent auditors. The Committee believes that the provision of audit-related services will not impair the independent auditors’ independence, and therefore may grant pre-approval to audit-related services. Audit-related services include accounting consultations related to accounting, financial reporting or disclosure matters not classified as “audit services;” assistance with understanding and implementing new accounting and financial reporting guidance from rulemaking authorities; agreed-upon or expanded audit procedures relating to accounting and/or billing records required to respond to or comply with financial, accounting or regulatory reporting matters; and assistance with internal control reporting requirements under Form N-SAR or Form N-CSR.
The Committee has pre-approved the audit-related services listed on Appendix B. The Committee must specifically approve all audit-related services not listed on Appendix B.
IV. Tax Services
The Committee believes the independent auditors can provide tax services to the Funds, including tax compliance, tax planning, and tax advice, without compromising the auditors’ independence. Therefore, the Committee may grant general pre-approval with respect to tax services historically provided by the Funds’ independent auditors that do not, in the Committee’s view, impair auditor independence and that are consistent with the SEC’s rules on auditor independence.
The Committee will not grant pre-approval if the independent auditors initially recommends a transaction the sole business purpose of which is tax avoidance and the tax treatment of which may not be supported in the Internal Revenue Code and related regulations. The Committee may consult
3
outside counsel to determine that tax planning and reporting positions are consistent with this Policy.
The Committee has pre-approved the tax-related services listed on Appendix C. The Committee must specifically approve all tax-related services not listed on Appendix C.
V. Other Services
The Committee believes it may grant approval of non-audit services that are permissible services for independent auditors to a Fund. The Committee has determined to grant general pre-approval to other services that it believes are routine and recurring, do not impair auditor independence, and are consistent with SEC rules on auditor independence.
The Committee has pre-approved the non-audit services listed on Appendix D. The Committee must specifically approve all non-audit services not listed on Appendix D.
A list of the SEC’s prohibited non-audit services is attached to this Policy as Appendix E. The SEC’s rules and relevant guidance should be consulted to determine the precise definitions of these impermissible services and the applicability of exceptions to certain of the SEC’s prohibitions.
VI. Pre-approval of Fee levels and Budgeted Amounts
The Committee will annually establish pre-approval fee levels or budgeted amounts for audit, audit-related, tax and non-audit services to be provided to the Funds by the independent auditors. Any proposed services exceeding these levels or amounts require the Committee’s specific pre-approval. The Committee considers fees for audit and non-audit services when deciding whether to pre-approve services. The Committee may determine, for a pre-approval period of 12 months, the appropriate ratio between the total amount of fees for the Fund’s audit, audit-related, and tax services (including fees for services provided to Fund affiliates that are subject to pre-approval), and the total amount of fees for certain permissible non-audit services for the Fund classified as other services (including any such services provided to Fund affiliates that are subject to pre-approval).
VII. Procedures
Requests or applications for services to be provided by the independent auditors will be submitted to management. If management determines that the services do not fall within those services generally pre-approved by the Committee and set out in the appendices to these procedures, management will submit the services to the Committee or its delagee. Any such submission will include a detailed description of the services to be rendered.
Notwithstanding this paragraph, the Committee will, on quarterly basis, receive from the independent auditors a list of services provided to date by the auditors during Pre-Approval Period.
4
VIII. Delegation
The Committee may delegate pre-approval authority to one or more of the Committee’s members. Any member or members to whom such pre-approval authority is delegated must report any pre-approval decisions, including any pre-approved services, to the Committee at its next scheduled meeting. The Committee will identify any member to whom pre-approval authority is delegated in writing. The member will retain such authority for a period of 12 months from the date of pre-approval unless the Committee determines that a different period is appropriate. The period of delegated authority may be terminated by the Committee or at the option of the member.
IX. Additional Requirements
The Committee will take any measures the Committee deems necessary or appropriate to oversee the work of the independent auditors and to assure the auditors’ independence from the Funds. This may include reviewing a formal written statement from the independent auditors delineating all relationships between the auditors and the Funds, consistent with Independence Standards Board No. 1, and discussing with the auditors their methods and procedures for ensuring independence.
5
Appendix A
Pre-Approved Audit Services for the Pre-Approval Period June 1, 2004 through December 31, 2004
Service
| | The Fund(s) | | Fee Range |
Statutory audits or financial audits (including tax services associated with audit services) | | ü | | As presented to Audit Committee(1) |
| | | | |
Services associated with SEC registration statements, periodic reports and other documents filed with the SEC or other documents issued in connection with securities offerings (e.g., consents), and assistance in responding to SEC comment letters. | | ü | | Not to exceed $8,500 per filing |
| | | | |
Consultations by Fund management with respect to accounting or disclosure treatment of transactions or events and/or the actual or potential effect of final or proposed rules, standards or interpretations by the SEC, Financial Accounting Standards Board, or other regulatory or standard setting bodies. | | ü | | Not to exceed $8,000 during the
Pre-Approval Period |
(1) For new Funds launched during the Pre-Approval Period, the fee ranges pre-approved will be the same as those for existing Funds, pro-rated in accordance with inception dates as provided in KPMG’s Proposal or any Engagement Letter covering the period at issue. Fees in the Engagement Letter will be controlling.
6
Appendix B
Pre-Approved Audit-Related Services for the Pre-Approval Period June 1, 2004 through December 31, 2004
Service
| | The
Fund(s) | | Fund Affiliates | | Fee Range |
Services related to Fund mergers | | ü | | ü | | Not to exceed $10,000 per merger |
| | | | | | |
Consultations by Fund management with respect to accounting or disclosure treatment of transactions or events and/or the actual or potential effect of final or proposed rules, standards or interpretations by the SEC, Financial Accounting Standards Board, or other regulatory or standard setting bodies. [Note: Under SEC rules some consultations may be “audit” services and others may be “audit-related” services.] | | ü | | | | Not to exceed $5,000 per occurrence during the Pre-Approval Period |
| | | | | | |
Review of the Funds’ semi-annual financial statements | | ü | | | | Not to exceed $5,000 for each set of financial statements |
| | | | | | |
Reports to regulatory or government agencies related to the annual engagement | | ü | | | | Up to $5,000 per occurrence during the Pre-Approval Period |
| | | | | | |
Regulatory compliance assistance | | ü | | ü | | Not to exceed $5,000 per quarter |
| | | | | | |
Training courses | | ü | | ü | | Not to exceed $2,000 per course |
7
Appendix C
Pre-Approved Tax Services for the Pre-Approval Period June 1, 2004 through December 31, 2004
Service
| | The Fund(s) | | Fund
Affiliates | | Fee Range |
Preparation of federal and state income tax returns and federal excise tax returns for the Funds including assistance and review with excise tax distributions. | | ü | | | | As presented to Audit Committee(2) |
| | | | | | |
Review of IRC Sections 851(b) and 817(h) diversification testing on a real-time basis | | ü | | | | As presented to Audit Committee(2) |
| | | | | | |
Review of year-end reporting for 1099’s | | ü | | | | As presented to Audit Committee(2) |
| | | | | | |
Tax assistance and advice regarding statutory, regulatory or administrative developments | | ü | | ü | | Not to exceed $5,000 for the Funds or for the Funds’ investment adviser during the Pre-Approval Period |
| | | | | | |
International tax services (e.g., Taiwan and India) | | ü | | | | Not to exceed $5,000 per Fund during the Pre-Approval Period |
| | | | | | |
Tax training courses | | ü | | ü | | Not to exceed $2,000 per course during the Pre-Approval Period |
| | | | | | |
Loan Staff Services | | ü | | ü | | Not to exceed $15,000 during the Pre-Approval Period |
(2) For new Funds launched during the Pre-Approval Period, the fee ranges pre-approved will be the same as those for existing Funds, as provided in KPMG’s Proposal or any Engagement Letter covering the period at issue. Fees in the Engagement Letter will be controlling.
8
Service
| | The Fund(s) | | Fund
Affiliates | | Fee Range |
Tax services associated with Fund mergers | | ü | | | | Not to exceed $8,000 per merger during the Pre-Approval Period |
| | | | | | |
Other tax-related assistance and consultation, including, without limitation, assistance in evaluating the tax treatment of swaps, swaptions, mortgage-backed securities and other derivatives. | | ü | | | | Not to exceed $25,000 during the Pre-Approval Period |
9
Appendix D
Pre-Approved Other Services for the Pre-Approval Period June 1, 2004 through December 31, 2004
Service
| | The Fund(s) | | Fund Affiliates | | Fee Range |
Agreed-upon procedures for Class B share 12b-1 programs | | | | ü | | Not to exceed $25,000 during the Pre-Approval Period |
10
Appendix E
Prohibited Non-Audit Services
Dated: 2004
• Bookkeeping or other services related to the accounting records or financial statements of the Funds
• Financial information systems design and implementation
• Appraisal or valuation services, fairness opinions, or contribution-in-kind reports
• Actuarial services
• Internal audit outsourcing services
• Management functions
• Human resources
• Broker-dealer, investment adviser, or investment banking services
• Legal services
• Expert services unrelated to the audit
• Any other service that the Public Company Accounting Oversight Board determines, by regulation, is impermissible
11
EXHIBIT A
ING Alger Aggressive Growth Portfolio
ING Alger Capital Appreciation Portfolio
ING Alger Growth Portfolio
ING American Century Small Cap Value Portfolio
ING Baron Small Cap Growth Portfolio
ING Aeltus Enhanced Index Portfolio
ING Goldman Sachs Capital Growth Portfolio
ING Goldman Sachs Core Equity Portfolio
ING JPMorgan Fleming International Portfolio
ING JPMorgan Mid Cap Value Portfolio
ING MFS Capital Opportunities Portfolio
ING MFS Global Growth Portfolio
ING UBS U.S. Large Cap Equity Portfolio
ING OpCap Balanced Value Portfolio
ING PIMCO Total Return Portfolio
ING Salomon Brothers Aggressive Growth Portfolio
ING Salomon Brothers Fundamental Value Portfolio
ING Salomon Brothers Investors Value Portfolio
ING T. Rowe Price Growth Equity Portfolio
ING UBS U.S. Allocation Portfolio
ING Van Kampen Comstock Portfolio
12
(e) (2) Percentage of services referred to in 4(b) – (4)(d) that were approved by the audit committee
100% of the services were approved by the audit committee.
(f) Percentage of hours expended attributable to work performed by other than full time employees of KPMG if greater than 50%.
Not applicable.
(g) Non-Audit Fees: The non-audit fees billed by the registrant’s accountant for services rendered to the registrant, and rendered to the registrant’s investment adviser, and any entity controlling, controlled by, or under common control with the adviser that provides ongoing services to the registrant for each of the last two fiscal years of the registrant were $474,004 for year ended December 31, 2004 and $364,873 for fiscal year ended December 31, 2003.
(h) Principal Accountants Independence: The Registrant’s Audit committee has considered whether the provision of non-audit services that were rendered to the registrant’s investment adviser and any entity controlling, controlled by, or under common control with the investment adviser that provides ongoing services to the registrant that were not pre-approved pursuant to Rule 2-01(c)(7)(ii) of Regulation S-X is compatible with maintaining KPMG’s independence.
Item 5. Audit Committee of Listed Registrants.
Not applicable.
Item 6. Schedule of Investments
Schedule is included as part of the report to shareholders filed under Item 1 of this Form.
Item 7. Disclosure of Proxy Voting Policies and Procedures for Closed-End Management Investment companies.
Not applicable.
Item 8. Purchases of Equity Securities by Closed-End Management Investment Company and Affiliated Purchasers
Not applicable.
Item 9. Submission of Matters to a Vote of Security Holders.
Nominating Committee. The Nominating Committee operates pursuant to a Charter approved by the Board and is comprised of persons who are not “interested persons” of the Fund within the meaning of the Investment Company Act of 1940, as amended. The primary purpose of the Nominating Committee is to consider, evaluate and make recommendations to the Board with respect to the nomination and selection of Independent Trustees. In evaluating candidates, the Nominating Committee may consider a variety of factors, but specific qualifications of candidates for Board membership will be based on the needs of the Board at the time of nomination.
The Nominating Committee is willing to consider nominations received from shareholders and shall assess shareholder nominees in the same manner as it reviews nominees it identifies. A shareholder nominee for director should be submitted in writing to the Fund’s Secretary and must be received in a timely manner in order to be considered. Any such shareholder nomination should include: sufficient background information concerning the candidate; the individual’s written consent to be named in the proxy statement as a nominee (if nominated) and to serve as a director (if elected); and all information relating to such individual that is required to be disclosed in a solicitation of proxies for election of directors, or is otherwise required, in each case under applicable federal securities laws, rules and regulations. To be timely, any such submission must be delivered to the Fund’s Secretary not earlier than the 90th day prior to such meeting and not later than the close of business on the later of the 60th day prior to such meeting or the 10th day following the day on which public announcement of the date of the meeting is first made, by either disclosure in a press release or in a document publicly filed by the Fund with the SEC.
13
Item 10. Controls and Procedures.
(a) Based on our evaluation conducted within 90 days of the filing date, hereof, the design and operation of the registrant’s disclosure controls and procedures are effective to ensure that material information relating to the registrant is made known to the certifying officers by others within the appropriate entities, particularly during the period in which Forms N-CSR are being prepared, and the registrant’s disclosure controls and procedures allow timely preparation and review of the information for the registrant’s Form N-CSR and the officer certifications of such Form N-CSR.
(b) There were no significant changes in the registrant’s internal controls that occurred during the second fiscal quarter of the period covered by this report that has materially affected, or is reasonably likely to materially affect, the registrant’s internal control over financial reporting.
Item 11. Exhibits.
(a)(1) Code of Ethics pursuant to Item 2 of Form N-CSR is filed and attached hereto as
EX-99.CODE ETH.
(a)(2) A separate certification for each principal executive officer and principal financial officer of the registrant as required by Rule 30a-2 under the Act (17 CFR 270.30a-2) is attached hereto as EX-99.CERT.
(b) The officer certifications required by Section 906 of the Sarbanes-Oxley Act of 2002 are attached hereto as EX-99.906CERT
(3) Not applicable.
14
SIGNATURES
Pursuant to the requirements of the Securities Exchange Act of 1934 and the Investment Company Act of 1940, the registrant has duly caused this report to be signed on its behalf by the undersigned, thereunto duly authorized.
(Registrant): ING Variable Portfolios, Inc.
By | /s/ James M. Hennessy |
| James M. Hennessy |
| President and Chief Executive Officer |
Date: March 7, 2005
Pursuant to the requirements of the Securities Exchange Act of 1934 and the Investment Company Act of 1940, this report has been signed below by the following persons on behalf of the registrant and in the capacities and on the dates indicated.
By | /s/ James M. Hennessy |
| James M. Hennessy |
| President and Chief Executive Officer |
Date: March 7, 2005
By | /s/ Michael J. Roland |
| Michael J. Roland |
| Executive Vice President and Chief Financial Officer |
Date: March 7, 2005
1