OMB APPROVAL
OMB Number: 3235-0570
Expires: September 30, 2007
Estimated average burden hours per response: 19.3
UNITED STATES
SECURITIES AND EXCHANGE COMMISSION
Washington, D.C. 20549
FORM N-CSR
CERTIFIED SHAREHOLDER REPORT OF
REGISTERED MANAGEMENT INVESTMENT COMPANIES
Investment Company Act file number: 811-07651
ING VP Variable Portfolios, Inc.
(Exact name of registrant as specified in charter)
7337 E. Doubletree Ranch Rd., Scottsdale, AZ | | 85258 |
(Address of principal executive offices) | | (Zip code) |
The Corporation Trust Incorporated, 300 E. Lombard Street, Baltimore, MD 21201
(Name and address of agent for service)
Registrant’s telephone number, including area code: 1-800-992-0180
Date of fiscal year end: | December 31 |
| |
Date of reporting period: | January 1, 2006 to December 31, 2006 |
Item 1. Reports to Stockholders.
The following is a copy of the report transmitted to stockholders pursuant to Rule 30e-1 under the Act (17 CFR 270.30e-1):

Funds
Annual Report
December 31, 2006
Classes ADV, I and S
ING Variable Product Funds
Domestic Equity and Income Portfolios
n ING VP Balanced Portfolio
n ING VP Growth and Income Portfolio
Fixed Income Portfolios
n ING VP Intermediate Bond Portfolio
n ING VP Money Market Portfolio
Domestic Equity Growth Portfolios
n ING VP Growth Portfolio
n ING VP Small Company Portfolio
Global and International Equity Portfolios
n ING VP Global Science and Technology Portfolio
n ING VP International Equity Portfolio
Domestic Equity Value Portfolio
n ING VP Value Opportunity Portfolio
This report is submitted for general information to shareholders of the ING Funds. It is not authorized for distribution to prospective shareholders unless accompanied or preceded by a prospectus which includes details regarding the funds' investment objectives, risks, charges, expenses and other information. This information should be read carefully.

TABLE OF CONTENTS
| President's Letter | | | 1 | | |
|
| Market Perspective | | | 2 | | |
|
| Portfolio Managers' Report | | | 4 | | |
|
| Shareholder Expense Examples | | | 21 | | |
|
| Report of Independent Registered Public Accounting Firm | | | 24 | | |
|
| Statements of Assets and Liabilities | | | 25 | | |
|
| Statements of Operations | | | 28 | | |
|
| Statements of Changes in Net Assets | | | 31 | | |
|
| Financial Highlights | | | 36 | | |
|
| Notes to Financial Statements | | | 45 | | |
|
| Portfolios of Investments | | | 62 | | |
|
| Tax Information | | | 112 | | |
|
| Director/Trustee and Officer Information | | | 113 | | |
|
| Advisory Contract Approval Discussion | | | 116 | | |
|
| Shareholder Meeting Information | | | 123 | | |
|
PROXY VOTING INFORMATION
A description of the policies and procedures that the Portfolios use to determine how to vote proxies related to portfolio securities is available (1) without charge, upon request, by calling Shareholder Services toll-free at 1-800-992-0180; (2) on the ING Funds' website at www.ingfunds.com; and (3) on the SEC's website at www.sec.gov. Information regarding how the Portfolios voted proxies related to portfolio securities during the most recent 12-month period ended June 30 is available without charge on the ING Funds' website at www.ingfunds.com and on the SEC's website at www.sec.gov.
QUARTERLY PORTFOLIO HOLDINGS
The Portfolios file their complete schedule of portfolio holdings with the SEC for the first and third quarters of each fiscal year on Form N-Q. The Portfolios' Forms N-Q are available on the SEC's website at www.sec.gov. The Portfolios' Forms N-Q may be reviewed and copied at the SEC's Public Reference Room in Washington, DC, and information on the operation of the Public Reference Room may be obtained by calling 1-800-SEC-0330; and is available upon request from the Portfolios by calling Shareholder Services toll-free at 1-800-992-0180.
(THIS PAGE INTENTIONALLY LEFT BLANK)
PRESIDENT'S LETTER

Dear Shareholder,
In its recent meetings, the U.S. Federal Reserve Board (the "Fed") ceased what was a two-year trend. That trend — a string of 17 consecutive interest rate hikes that ended last fall — was seen by many analysts as a sign that the Fed was concerned about containing inflation.
Now, the Fed is neither raising nor lowering interest rates, which puts us in the midst of what economists refer to as a "plateau." Historically, there have been six similar plateaus since 1982 and during four of those periods the Standard & Poor's 500® Composite Stock Price Index(1) ("S&P 500® Index") rose significantly.
Of course, the Fed's actions impact economies and market performance around the world. For instance, the current interest rate climate has been cited as one reason for a decline in the value of the dollar. Last year, that drop in the dollar meant that international stocks — which are often determined in foreign currencies — generally experienced strong performance as foreign currencies climbed and world stock markets continued to produce strong results.
Meanwhile, here at home, 2006 was an interesting year for equity investors. In May of 2006, the S&P 500® Index hit a five-year high followed by a market correction and several months of non-directional returns. A strong rally occurred in the second half of the year driven in part by the aforementioned dollar decline and the interest rate plateau. The good news is many economists believe that these conditions may continue in the months to come.
At ING Funds, we are committed to providing you, the investor, with an array of investment choices that enables you to build a diversified portfolio across a variety of asset classes. We do so, with a view that the globalization of markets is an initial consideration in the products we offer.
We take the confidence you place in us with your investments very seriously — everyone in our firm is committed to renewing this trust each and every day.

Shaun Mathews
President
ING Funds
January 31, 2007
The views expressed in the President's Letter reflect those of the President as of the date of the letter. Any such views are subject to change at any time based upon market or other conditions and ING Funds disclaims any responsibility to update such views. These views may not be relied on as investment advice and because investment decisions for an ING Fund are based on numerous factors, may not be relied on as an indication of investment intent on behalf of any ING Fund. Reference to specific company securities should not be construed as recommendations or investment advice.
(1) The S&P 500® Index is an unmanaged index that measures the performance of the securities of approximately 500 of the largest companies in the U.S.
1
MARKET PERSPECTIVE: YEAR ENDED DECEMBER 31, 2006
In our semi-annual report, we described how the feast of the first quarter had turned to famine in the second quarter for global equity markets on concerns that rising interest rates would freeze out global growth. Indeed as late as June 27, 2006, the year-to-date return on the Morgan Stanley Capital International ("MSCI") World IndexSM(1) measured in local currencies, including net reinvested dividends had been precisely 0%. However, the second half of the year ended December 31, 2006, was much healthier and the same index powered ahead 12.3% and for the year ended December 31, 2006, returned 20.07%. The return to dollar based in vestors was a little better at 13.2%, as late in the year a slowing economy and hints that central banks would be diversifying out of dollars weighed on that currency. For the six months ended December 31, 2006, the dollar fell 3.1% against the euro and 5.6% against the pound, but gained 4.1% on the yen due to stumbling growth and miniscule interest rates in Japan. For the year ended December 31, 2006, the dollar fell 10.6% against the euro and 12.4% against the pound, but gained 1.3% against the yen.
As the first half of 2006 ended, the Federal Open Market Committee ("FOMC") had just raised the federal funds rate for the seventeenth time since June 2004, to 5.25%. The relatively mild accompanying language led many in the fixed income market to hope that the tightening cycle was now over. Not everyone believed it, especially when new Middle East conflict pushed the price of oil to another record on July 14, 2006. But data, especially on housing, had mostly pointed to cooling demand and a tame employment report on August 4, 2006 probably decided the matter. Four days later the FOMC met and left rates unchanged. The booming housing market had been a powerful driver of growth in recent years through new construction and demand created by mortgage loan refinancing. This boom was deteriorating a ppreciably with housing prices and the key new building permits measure falling sharply. Only in the last few days of 2006 did the slump show some signs of bottoming out with unexpectedly good new and existing home sales figures reported, along with rebounding consumer confidence. For the six months ended December 31, 2006, the Lehman Brothers® Aggregate Bond ("LBAB") Index(2) of investment grade bonds gained 5.09% and for the year ended December 31, 2006 it gained 4.33%. The most important dynamic was the broad yield curve inversion, suggestive of an expected fall in interest rates and a further economic slow down. The ten-year Treasury yield fell 43 basis points (0.43%) to 4.71%, while the yield on the three-month Bill rose by 3 basis points (0.03%) to 4.89%. Since mid-August, with the exception of two days, August bond investors had been prepared to lend money to the government for ten years at a lower interest rate than for three months.
Faced with fading business activity, as the key housing engine seized up, and a yield curve inverted to the point of recession according to some commentators, investors in U.S. equities must have been in the mood to sell. Not so fast. Those investors saw things differently and indeed the apparent "disagreement" between the bond market and global stock markets was a well discussed feature of the second half of the year. For one thing, the oil price, having hit its record, fell back, as surly calm returned to the Middle East, as the summer driving and hurricane seasons came and went and as winter got off to a mild start in the key North East region. The price of oil averaged 22% less in the fourth quarter than at its peak, boosting consumers' spending power and confidence. And if longer-term int erest rates were falling then stocks looked more attractive as bonds provided less competition and the present value of future corporate profits rose. Speaking of which, Standard & Poor's 500® Composite Stock Price ("S&P 500®") Index(3) companies duly reported their 13th straight double-digit quarterly percentage earnings gain. Gross domestic product ("GDP") growth may have slowed, but the share of corporate profits, reported at 12.4%, was the highest since the 1950's. The next merger or acquisition to get investors in the mood never seemed far away. Five of them were even announced in one day on November 6, 2006, sending markets up about 1%. For the six months ended December 31, 2006, the S&P 500® Index, including dividends, rose 12.7% and for the year ended December 31, 2006, the S&P 500&r eg; Index, including dividends, rose 15.8%. All but 30 basis points (0.30%) of the gain came after August 8, 2006, making six-year highs as the year ended.
International markets, based on MSCI local currency indices, as in the U.S., finished near their best levels for the year. In Japan the market advanced 8.7%, in 2006, after a late surge. The long awaited increase in interest rates from 0.0% to 0.25% took place in July just as the economic recovery was losing impetus. Third quarter growth was estimated at only 0.8% and generated by exports and capital spending alone. Consumer spending was lagging despite low
2
MARKET PERSPECTIVE: YEAR ENDED DECEMBER 31, 2006
unemployment and almost flat prices, yet business confidence remained high and profit growth healthy. Elsewhere, Asian markets ex Japan rose 28.2% in 2006, but with wide disparities, ranging from -2.0% in Thailand to 83.4% in China. In Thailand the uncertainty caused by a military coup was compounded when the junta imposed exchange controls to hold back the strong baht, only to rescind them the next day. China's market soared in surely speculative excess, and in the absence of attractive alternatives, as investors sought a piece of the world's fourth largest economy. By the end of 2006 the Chinese market had become the third biggest emerging market after South Korea and Taiwan. European ex UK markets surged 16.1%, in 2006. The Eurozone's GDP growth had recorded its best first half of a year since 2000, 1.7%, and the lowest unemployment rate, 7.8%, since the start of the Eurozone itself. But as the second half of 2006, wore on there were signs that the best news was behind it and the third quarter's annualized growth fell to 2.0%. Business confidence, however, stayed buoyant and cheered by extensive merger and acquisition activity despite headwinds in the form of a strengthening euro, a hawkish European Central Bank that raised rates three times and the looming rise in German sales tax. UK equities added 8.6% in the six months ended December 31, 2006. The Bank of England raised rates twice as GDP growth accelerated to 2.9% year over year, inflation climbed above target and house prices, an important d emand generator, continued their recovery with average prices up more than 10% in 2006. Again, however, it was widespread, large scale mergers and acquisitions energizing the market.
(1) The MSCI World IndexSM is an unmanaged index that measures the performance of over 1,400 securities listed on exchanges in the U.S., Europe, Canada, Australia, New Zealand and the Far East.
(2) The LBAB Index is a widely recognized, unmanaged index of publicly issued investment grade U.S. Government, mortgage-backed, asset-backed and corporate debt securities.
(3) The S&P 500® Index is an unmanaged index that measures the performance of securities of approximately 500 of the largest companies in the U.S.
All indices are unmanaged and investors cannot invest directly in an index.
Past performance does not guarantee future results. The performance quoted represents past performance. Investment return and principal value of an investment will fluctuate, and shares, when redeemed, may be worth more or less than their original cost. The Portfolios' performance is subject to change since the period's end and may be lower or higher than the performance data shown. Please call (800) 992-0180 or log on to www.ingfunds.com to obtain performance data current to the most recent month end.
Market Perspective reflects the views of the Chief Investment Risk Officer only through the end of the period, and is subject to change based on market and other conditions.
3
ING VP BALANCED PORTFOLIO
PORTFOLIO MANAGERS' REPORT
The ING VP Balanced Portfolio (the "Portfolio") seeks to maximize investment return consistent with reasonable safety of principal, by investing in a diversified portfolio of one or more of the following asset classes: stocks, bonds and cash equivalents, based on the judgment of the Portfolio's management, of which of those sectors or mix thereof offers the best investment prospects. The Portfolio is managed by Omar Aguilar, Ph.D., James B. Kauffmann and Mary Ann Fernandez, Portfolio Managers, of ING Investment Management Co. — the Sub-Adviser.
Performance: For the year ended December 31, 2006, the Portfolio's Class I shares provided a total return of 9.99% compared to the Standard & Poor's 500® Composite Stock Price Index(1) ("S&P 500® Index"), the Lehman Brothers® Aggregate Bond Index(2) ("LBAB Index") and the Composite Index(3) (60% S&P 500® Index/40% LBAB Index), which returned 15.79%, 4.33% and 13.68%, respectively, for the same period.
Portfolio Specifics: Over the period, domestic equities and fixed income markets generally performed well. The Portfolio's asset allocation was positive, mainly due to its underweight in fixed income. However, this was somewhat offset by an overweight position in cash. After 17 rate hikes, the Federal Open Market Committee appears to be on hold and the futures markets have priced in a rate cut sometime in 2007. Our view is that the U.S. Federal Reserve Board ("Fed") is unlikely to raise rates in the near term unless the economy shows signs of rapid growth or inflation pressures significantly increase. With the yield curve inverted, we continue to hold an underweight position in fixed income and have reduced our overweight position in cash.
The domestic equity portion of the Portfolio underperformed its benchmark, the S&P 500® Index, mainly due to adverse security selection. We were hurt by stock selection in energy, consumer discretionary, and healthcare. In contrast, selection in information technology and telecommunication services was beneficial. Security selection was the strongest in large-cap stocks, while mid- and small-caps acted as a major drag.
Stocks that added to performance included an overweight position in Cisco Systems, Inc. and Goldman Sachs Group, Inc. By comparison, underweight positions in Verizon Communications, Inc. and Time Warner, Inc. negatively impacted performance.
The fixed income portion of the Portfolio underperformed the LBAB Index. Our short duration positioning hurt the Portfolio at the beginning of the period, but was beneficial in December. A relative underweight in corporate bonds acted as a drag as the sector outperformed Treasuries. While exposure to high yield fixed income helped the Portfolio, its zero position in emerging market debt was a missed opportunity to enhance yield. Security selection in mortgage-backed securities was largely beneficial with our adjustable-rate mortgages adding to relative performance. In December, our long position in corporate bonds and subordinated paper with maturities of 10 and 30 years was positive. In contrast, our exposure to a telecommunication company bond hindered results when spreads widened after the company missed earnings estimates following its merger with another wireless company.
Current Strategy and Outlook: A weak housing market coupled with the lagged effects of 17 rate hikes by the Fed has slowed the U.S. economy. Going forward, we expect gross domestic product growth to be moderate, with output expanding at a slightly below-trend rate. We believe as residential investment continues to decline, lower gasoline prices and credit conditions should help mitigate the spill over effects from the weakening housing market. Our view is that the economy is in a mid-cycle slowdown with a low likelihood of recession. Yields have fallen, and the inversion of U.S. Treasury yield curve has become much more pronounced between one and three years suggesting growing confidence in eventual Fed easing.
There are still some contradicting signals affecting the capital markets. The equities market has reached its post 9/11 highs while at the same time slower growth and lower inflation metrics have sent interest rates to their lowest levels in almost 11 months. In our opinion, stocks appear to be signaling an expansion while bonds are not. As our short duration position indicates, we are inclined to believe that some inflation pressures will still emerge and long-term rates will edge up. Overall, we remain underweight fixed income and overweight equities.
Portfolio holdings and characteristics are subject to change and may not be representative of current holdings and characteristics. The outlook for this Portfolio may differ from that presented for other ING Funds. Performance for the different classes of shares will vary based on differences in fees associated with each class.
Top Ten Holdings*
as of December 31, 2006
(as a percent of net assets)
| ExxonMobil Corp. | | | 2.6 | % | |
| General Electric Co. | | | 1.7 | % | |
| Citigroup, Inc. | | | 1.7 | % | |
| Bank of America Corp. | | | 1.5 | % | |
| JPMorgan Chase & Co. | | | 1.2 | % | |
Federal National Mortgage Association,
5.000%, due 01/12/36 | | | 1.1 | % | |
| Cisco Systems, Inc. | | | 1.1 | % | |
| Microsoft Corp. | | | 1.1 | % | |
| Chevron Corp. | | | 1.1 | % | |
| International Business Machines Corp. | | | 1.0 | % | |
* Excludes short-term investments related to ING Institutional Prime Money Market Fund, repurchase agreement and securities lending collateral.
Portfolio holdings are subject to change daily.
4
ING VP BALANCED PORTFOLIO
PORTFOLIO MANAGERS' REPORT
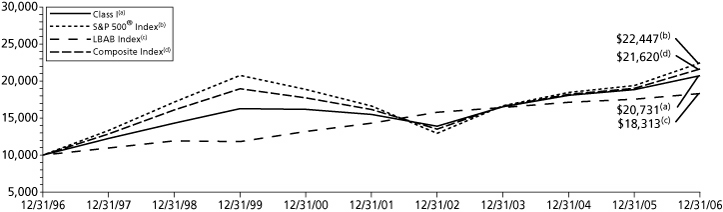
| Average Annual Total Returns for the Periods Ended December 31, 2006* | |
| | | 1 Year | | 5 Year | | 10 Year | | Since Inception
of Class S
May 29, 2003 | |
| Class I | | | 9.99 | % | | | 5.99 | % | | | 7.56 | % | | | — | | |
| Class S | | | 9.62 | % | | | — | | | | — | | | | 9.24 | % | |
| S&P 500® Index(1) | | | 15.79 | % | | | 6.19 | % | | | 8.42 | % | | | — | (4) | |
| LBAB Index(2) | | | 4.33 | % | | | 5.06 | % | | | 6.24 | % | | | 3.08 | %(4) | |
| Composite Index(3) | | | 13.68 | % | | | 5.99 | % | | | 8.02 | % | | | 11.33 | %(4) | |
Based on a $10,000 initial investment, the graph and table above illustrate the total return of ING VP Balanced Portfolio against the indices indicated. An index has no cash in its portfolio, imposes no sales charges and incurs no operating expenses. An investor cannot invest directly in an index. The Portfolio's performance is shown without the imposition of any expenses or charges which are, or may be, imposed under your annuity contract. Total returns would have been lower if such expenses or charges were included.
The performance graph and table do not reflect the deduction of taxes that a shareholder will pay on portfolio distributions or the redemption of portfolio shares.
The performance shown may include the effect of fee waivers and/or expense reimbursements by the Investment Adviser and/or other service providers, which have the effect of increasing total return. Had all fees and expenses been considered, the total returns would have been lower.
The performance update illustrates performance for a variable investment option available through a variable annuity contract. The performance shown indicates past performance and is not a projection or prediction of future results. Actual investment returns and principal value will fluctuate so that shares and/or units, at redemption, may be worth more or less than their original cost. Please call (800) 992-0180 to get performance through the most recent month end.
This report contains statements that may be "forward-looking" statements. Actual results may differ materially from those projected in the "forward-looking" statements.
The views expressed in this report reflect those of the portfolio managers, only through the end of the period as stated on the cover. The portfolio managers' views are subject to change at any time based on market and other conditions.
Portfolio holdings are subject to change daily.
* ADV Class commenced operations on December 29, 2006, therefore, there is no performance information for the period ended December 31, 2006.
(1) The S&P 500® Index is an unmanaged index that measures the performance of securities of approximately 500 of the largest companies in the U.S.
(2) The LBAB Index is an unmanaged index composed of securities from the Lehman Brothers Government/Corporate Bond Index, Mortgage-Backed Securities Index and the Asset-Backed Securities Index.
(3) The Composite Index consists of 60% of return of (securities included in) the S&P 500® Index and 40% of the return of (securities included in) the LBAB Index.
(4) Since inception performance for the indices is shown from June 1, 2003.
Effective March 1, 2002, ING Investments, LLC began serving as investment adviser and ING Investment Management Co., the former investment adviser, began serving as sub-adviser to the Portfolio.
5
ING VP GROWTH AND INCOME PORTFOLIO
PORTFOLIO MANAGERS' REPORT
The ING VP Growth and Income Portfolio (the "Portfolio") seeks to maximize total return through investments in a diversified portfolio of common stocks and securities convertible into common stock. It is anticipated that capital appreciation and investment income will both be major factors in acheiving total return. The Portfolio is managed by Christopher F. Corapi, Portfolio Manager, and Scott Lewis, Portfolio Manager of ING Investment Management Co. — the Sub-Adviser.
Performance: For the year ended December 31, 2006, the Portfolio's Class I shares provided a total return of 14.20% compared to the Standard & Poor's 500® Composite Stock Price Index(1) ("S&P 500® Index"), which returned 15.79% for the same period.
Portfolio Specifics: The Portfolio benefited from favorable stock selection in industrials and telecommunication services and, to a lesser extent in materials.
Wesco International and ABB Ltd. ADR were the strongest performers within the industrial sector. Both companies benefited from utility company spending on electricity transmission and distribution upgrades. We believe ABB Ltd. ADR still has significant upside potential given strong demand and pricing in transmission and distribution and continued capital spending in the global energy markets. In the telecommunication sector, AT&T, Inc. helped performance as it benefited from improved wireline performance and margin recovery at Cingular Wireless. Finally, in the materials sector, our position in Allegheny Technologies, Inc. benefited from strong demand within the commercial aerospace industry. New contracts with Boeing and Airbus for commercial and military projects should continue to fuel growth in the company's titanium business in 2007.
The Portfolio's underperformance versus the S&P 500® Index can largely be attributed to stock selection in technology and energy. Within energy, the Portfolio was hurt by our decision to underweight integrated oil and gas companies in favor of exploration and production companies. Energy experienced a flight to quality in the second half of this year caused partly by a sharp and unanticipated decline in natural gas prices.
Maxim Integrated Products and Yahoo!, Inc. were two technology holdings that detracted from performance. Yahoo!, Inc. was hurt by weakness in search and brand advertising, as well as concerns over the delayed launch of its new search system. Due to a lack of positive catalysts for the stock, we have decided to replace it with Google, Inc., which we believe is a better long-term investment in the on-line advertising space. Maxim Integrated Products declined as a result of an inventory correction in the analog chip market. Our investment in Evergreen Energy, Inc., a company with a potentially revolutionary coal cleaning process, underperformed as management failed to meet milestones which we had viewed as well within reach. This position was eliminated in December.
Current Strategy and Outlook: Currently, the Portfolio is positioned in companies which we believe have strong or improving competitive positions, robust end markets and/or superior capital allocation opportunities. Furthermore, we believe, each stock possesses an attractive valuation and a clear catalyst to improve it. Top holdings include AT&T, Inc., News Corp., Inc., ABB Ltd. ADR, Microsoft Corp., Intel Corp, Cooper Industries Ltd. and St. Jude Medical, Inc.
We believe continued strength from AT&T's Cingular Wireless and Enterprise business, as well as synergies from its merger with BellSouth, should be positive catalysts for the stock next year. We also see upside potential in Microsoft Corp. and Intel Corp. as new product launches, such as Microsoft Vista and Office 2007, should lead to stronger than expected PC growth in 2007. Within media, we find News Corp. Inc. attractive based on our view that advertising spending growth will remain robust and that internet advertising will continue to grow more rapidly than the industry as a whole. We believe News Corp., Inc. is well positioned due to a number of key strategic acquisitions, such as MySpace and Scout. Additionally, News Corp., Inc. should benefit from the renegotiation of its affiliate rates which are currently much lower than its competitors. We believe General Cable will exceed expectations given the robust end markets in transmissi on and distribution infrastructure, power and communications. We also expect that lower copper prices will drive margin expansion going forward. Finally, we believe that a recovery in the implantable cardioverter defibrillator ("ICD") market will be a significant growth driver for St. Jude Medical, Inc. as their sales growth is highly levered to this segment. In our opinion, St. Jude Medical, Inc. should also benefit from a robust product line that continues to take market share in the ICD market.
Portfolio holdings and characteristics are subject to change and may not be representative of current holdings and characteristics. The outlook for this Portfolio may differ from that presented for other ING Funds. Performance for the different classes of shares will vary based on differences in fees associated with each class.

Top Ten Holdings*
as of December 31, 2006
(as a percent of net assets)
| ExxonMobil Corp. | | | 3.9 | % | |
| Microsoft Corp. | | | 3.6 | % | |
| Citigroup, Inc. | | | 2.8 | % | |
| AT&T, Inc. | | | 2.7 | % | |
| General Electric Co. | | | 2.6 | % | |
| Altria Group, Inc. | | | 2.6 | % | |
| Bank of America Corp. | | | 2.5 | % | |
| American International Group, Inc. | | | 2.3 | % | |
| Intel Corp. | | | 2.3 | % | |
| Procter & Gamble Co. | | | 2.3 | % | |
* Excludes short-term investments related to ING Institutional Prime Money Market Fund and securities lending collateral.
Portfolio holdings are subject to change daily.
6
ING VP GROWTH AND INCOME PORTFOLIO
PORTFOLIO MANAGERS' REPORT

| Average Annual Total Returns for the Periods Ended December 31, 2006 | |
| | | 1 Year | | 5 Year | | 10 Year | | Since Inception
of Class ADV
December 20, 2006 | | Since Inception
of Class S
June 11, 2003 | |
| Class ADV | | | — | | | | — | | | | — | | | | (0.23 | )% | | | — | | |
| Class I | | | 14.20 | % | | | 4.82 | % | | | 4.85 | % | | | — | | | | — | | |
| Class S | | | 13.72 | % | | | — | | | | — | | | | — | | | | 11.75 | % | |
| S&P 500® Index(1) | | | 15.79 | % | | | 6.19 | % | | | 8.42 | % | | | N/A(2) | | | | 13.43 | %(3) | |
Based on a $10,000 initial investment, the graph and table above illustrate the total return of ING VP Growth and Income Portfolio against the index indicated. An index has no cash in its portfolio, imposes no sales charges and incurs no operating expenses. An investor cannot invest directly in an index. The Portfolio's performance is shown without the imposition of any expenses or charges which are, or may be, imposed under your annuity contract. Total returns would have been lower if such expenses or charges were included.
The performance graph and table do not reflect the deduction of taxes that a shareholder will pay on portfolio distributions or the redemption of portfolio shares.
The performance shown may include the effect of fee waivers and/or expense reimbursements by the Investment Adviser and/or other service providers, which have the effect of increasing total return. Had all fees and expenses been considered, the total returns would have been lower.
The performance update illustrates performance for a variable investment option available through a variable annuity contract. The performance shown indicates past performance and is not a projection or prediction of future results. Actual investment returns and principal value will fluctuate so that shares and/or units, at redemption, may be worth more or less than their original cost. Please call (800) 992-0180 to get performance through the most recent month end.
This report contains statements that may be "forward-looking" statements. Actual results may differ materially from those projected in the "forward-looking" statements.
The views expressed in this report reflect those of the portfolio manager only through the end of the period as stated on the cover. The portfolio manager's views are subject to change at any time based on market and other conditions.
Portfolio holdings are subject to change daily.
(1) The S&P 500® Index is an unmanaged index that measures the performance of securities of approximately 500 of the largest companies in the U.S.
(2) Since inception performance for the index is not shown.
(3) Since inception performance for the index is shown from June 1, 2003.
Effective March 1, 2002, ING Investments, LLC began serving as investment adviser and ING Investment Management Co., the former investment adviser, began serving as sub-adviser to the Portfolio.
7
ING VP GROWTH PORTFOLIO
PORTFOLIO MANAGERS' REPORT
The ING VP Growth Portfolio (the "Portfolio") seeks growth of capital through investment in a diversified portfolio consisting primarily of common stock and securities convertible into common stocks believed to offer growth potential. The Portfolio is managed by Richard Welsh, CFA, Portfolio Manager and Jeff Bianchi,* Portfolio Manager of ING Investment Management Co. — the Sub-Adviser.
Performance: For the year ended December 31, 2006, the Portfolio's Class I shares provided a total return of 2.65% compared to the Russell 1000® Growth Index(1), which returned 9.07% for the same period.
Portfolio Specifics: From a sector perspective, all sectors had positive results with value tilting sectors leading the market advance. Telecommunications services and financials were the best-performing sectors for the full year. The telecom services sector was up 21% and was led by the wireless segment. Financials had a 17% gain with several industries contributing, including diversified financial services, real estate investment Trusts, thrifts and mortgage finance, and capital markets. The materials sector was up 16%, aided by strong gains from metals and mining and construction materials.
The energy sector had the weakest result, a 3.7% increase, followed by growth tilting sectors, health care and information technology. The weak pricing environment, reflecting ample supplies and warm weather conditions, weighed on energy shares. The health care sector was up only 3.8% due to valuation and other concerns that impacted the biotechnology and health care services industries. Investor risk aversion contributed to a sub par gain of 7.4% for technology. Key lagging industries included internet software and semiconductors.
Impact of Key Portfolio Holdings and Sector Concentration — Main reasons for under performance were stock selection in health care and technology, as well as sector underweight allocation to industrials. From a stock selection standpoint, UnitedHealth Group, Inc., Citrix Systems, Inc., and Legg Mason, Inc. hurt results the most. The shares of UnitedHealth Group, Inc. were affected by a stock option backdating probe involving top officers including CEO William McGuire who ultimately resigned. The company was subjected to Federal prosecutor and U.S. Securities and Exchange Commission inquiries and shareholder lawsuits. Citrix Systems, Inc., a supplier of information software services, missed third quarter consensus earnings estimates due to weak licensing growth in core presentation products. As a result of underlying business deterioration, we eliminated the Citrix Systems, Inc. position. Legg Mason, Inc., a global asset manager, underpe rformed due to an earnings shortfall from weaker-than-expected asset flows and a delay in merger-related savings from the acquisition of Citigroup's asset management business. We also sold the Legg Mason, Inc. holding.
Luxury retailer Coach, Inc. made the biggest contribution to returns. The magnitude of earnings surprises grew in recent quarters due to new style features. As the largest pharmacy benefit manager in the country, Medco Health Solutions, Inc. benefited from the new Medicare Prescription Drug Program. The revenue outlook was enhanced by certification as the designated provider for HP Policy Assurance which covers over 250 corporations. Cisco Systems, Inc. performed well as the company exhibited across-the-board strength in basic data networking products as well as newer areas such as Voice over Internet Protocol and wireless communications.
Current Strategy and Outlook: We believe that economic growth will continue to moderate with benign inflation and interest rate implications. Consistent with an economy and market that are transitioning to slower growth, we are focusing on companies whose business momentum prospects are both attractive and reasonably certain. We are avoiding stocks that require a big earnings surprise to justify price to earnings multiples. We are overweight low beta information technology, health care services and select retail stocks. We are increasing capital markets exposure and are comfortably underweight regional banks.
* Effective December 31, 2006, Jeff Bianchi was named co-portfolio manager to the Portfolio. Kenneth Bragdon was removed as portfolio manager of the Portfolio
Portfolio holdings and characteristics are subject to change and may not be representative of current holdings and characteristics. The outlook for this Portfolio may differ from that presented for other ING Funds. Performance for the different classes of shares will vary based on differences in fees associated with each class.

Top Ten Holdings*
as of December 31, 2006
(as a percent of net assets)
| Cisco Systems, Inc. | | | 4.6 | % | |
| Microsoft Corp. | | | 3.9 | % | |
| Hewlett-Packard Co. | | | 3.0 | % | |
| Altria Group, Inc. | | | 2.8 | % | |
| Google, Inc. | | | 2.7 | % | |
| International Game Technology | | | 2.7 | % | |
| Danaher Corp. | | | 2.5 | % | |
| Accenture Ltd. | | | 2.4 | % | |
| American Express Co. | | | 2.2 | % | |
| Baxter International, Inc. | | | 2.1 | % | |
* Excludes short-term investments related to securities lending collateral.
Portfolio holdings are subject to change daily.
8
ING VP GROWTH PORTFOLIO
PORTFOLIO MANAGERS' REPORT

| Average Annual Total Returns for the Periods Ended December 31, 2006* | |
| | | 1 Year | | 5 Year | | 10 Year | | Since Inception
of Class S
November 1, 2001 | |
| Class I | | | 2.65 | % | | | 2.20 | % | | | 5.87 | % | | | — | | |
| Class S | | | 2.42 | % | | | 1.96 | % | | | — | | | | 2.86 | % | |
| Russell 1000® Growth Index(1) | | | 9.07 | % | | | 2.69 | % | | | 5.44 | % | | | 4.40 | % | |
Based on a $10,000 initial investment, the graph and table above illustrate the total return of ING VP Growth Portfolio against the index indicated. An index has no cash in its portfolio, imposes no sales charges and incurs no operating expenses. An investor cannot invest directly in an index. The Portfolio's performance is shown without the imposition of any expenses or charges which are, or may be, imposed under your annuity contract. Total returns would have been lower if such expenses or charges were included.
The performance graph and table do not reflect the deduction of taxes that a shareholder will pay on portfolio distributions or the redemption of portfolio shares.
The performance shown may include the effect of fee waivers and/or expense reimbursements by the Investment Adviser and/or other service providers, which have the effect of increasing total return. Had all fees and expenses been considered, the total returns would have been lower.
The performance update illustrates performance for a variable investment option available through a variable annuity contract. The performance shown indicates past performance and is not a projection or prediction of future results. Actual investment returns and principal value will fluctuate so that shares and/or units, at redemption, may be worth more or less than their original cost. Please call (800) 992-0180 to get performance through the most recent month end.
This report contains statements that may be "forward-looking" statements. Actual results may differ materially from those projected in the "forward-looking" statements.
The views expressed in this report reflect those of the portfolio manager only through the end of the period as stated on the cover. The portfolio manager's views are subject to change at any time based on market and other conditions.
Portfolio holdings are subject to change daily.
* ADV Class commenced operations on December 29, 2006, therefore, there is no performance information for the period ended December 31, 2006.
(1) The Russell 1000® Growth Index measures the performance of the 1,000 largest companies in the Russell 3000 Index with higher price-to-book ratios and higher forecasted growth. The Russell 3000 Index is an unmanaged index that measures the performance of 3,000 U.S. companies based on total market capitalization.
Effective March 1, 2002, ING Investments, LLC began serving as investment adviser and ING Investment Management Co., the former investment adviser, began serving as sub-adviser to the Portfolio.
9
ING VP SMALL COMPANY PORTFOLIO
PORTFOLIO MANAGERS' REPORT
The ING VP Small Company Portfolio (the "Portfolio") seeks growth of capital primarily through investment in a diversified portfolio of common stocks of companies with smaller market capitalizations. The Portfolio is managed by Joseph Basset, CFA, and Steve Salopek, Portfolio Managers of ING Investment Management Co. — the Sub Adviser.
Performance: For the year ended December 31, 2006, the Portfolio's Class I shares provided a total return of 16.79% compared to the Russell 2000® Index(1), which returned 18.37% for the same period.
Portfolio Specifics: Small-cap stocks performed well in 2006, generally outperforming both mid- and large-caps. The Russell 2000® Index gained 18.4% in 2006, outperforming the large-cap Russell 1000® Index for the seventh year out of eight. Economic strength propelled small-cap corporate earnings to record highs, and acquisitions of smaller firms by private equity buyers also aided results. Despite strong overall performance, this year proved to be a volatile ride for small-caps. During the first quarter, the market favored mid- and small-sized companies within the s mall-cap universe, and this trend continued as the market sold off during the summer. Larger sized companies declined, with the highest liquidity stocks selling down the most. Larger capitalization companies declined the most, with the highest liquidity stocks suffering the most. During the third quarter, cyclical companies corrected significantly, affecting the transportation, energy and capital goods areas. During this sell-off, financials showed resiliency, which provided support for the Russell 2000® Index. Although volatility was at an all time low, it was a difficult year for stock selection, as the market did not differentiate between high- and low-quality companies.
Strong stock selection in the energy, materials and financials sectors contributed most to results. Our underweight in health care and overweight in industrials and materials also positively impacted performance. In contrast, stock selection in health care and consumer discretionary hurt results. Unfavorable stock selection in information technology, coupled with our slight overweight also negatively impacted performance. Our overweight in energy and our slight underweight in telecommunication services acted as a drag.
Core Laboratories NV and Albemarle Corp. significantly benefited the Portfolio over the period. Core Laboratories NV, which is in the energy equipment and services business, was helped by a strengthening in the energy sector in the last few months of the year. Albemarle Corp. is in the catalyst and specialty chemicals businesses. Favorable performance can be attributed to a significant improvement in the operations of both of these businesses, as well as leverage from increased pricing, which led to higher cash flow growth than was expected.
Chemed Corp. and HealthExtras Inc. were two of the largest detractors from performance over the period. Chemed Corp. is primarily a hospice provider with meaningful exposure to Medicare reimbursement. Chemed Corp. lowered guidance as a result of Medicare reimbursement issues that capped revenue from certain markets and the company was unable to offset this negative development with a reduction in costs to service patients. HealthExtras Inc. is a mid-market pharmacy benefit management company. The company lowered expectations for the year, as a large contract for the state of Maryland awarded in the beginning of the year has not yet started up due to appeals by the previous provider. We continue to own the stock because we believe the delay in the initiation of this contract will not have a significant impact on the company's fundamentals.
Current Strategy and Outlook: We believe that economic growth will continue to slow. We continue to focus on companies with strong balance sheets and cash flow generation capabilities that can show stable growth despite a moderating economy. Our largest overweight in the Portfolio is energy. The valuations of the companies in this sector are at or below long-term averages. Also, the implied volatility from futures contracts for oil and gas are low, which is beneficial for smaller, less liquid shares. Our largest underweight is consumer discretionary, as this sector is heavily reliant on consumer spending. Although the impact of rising interest rates and gas prices have been somewhat alleviated, we believe that the weakness in the housing market and the absence of mortgage equity withdrawals will continue to be a headwind for the consumer. In capital goods, we have positioned the Portfolio away from deeply cyclical companies. We are likely to increase our weighting in consumer services, especially in companies that can show stable growth despite a slowing economy.
Portfolio holdings and characteristics are subject to change and may not be representative of current holdings and characteristics. The outlook for this Portfolio may differ from that presented for other ING Funds. Performance for the different classes of shares will vary based on differences in fees associated with each class.
Top Ten Holdings*
as of December 31, 2006
(as a percent of net assets)
| UAP Holding Corp. | | | 1.4 | % | |
| ITC Holdings Corp. | | | 1.3 | % | |
| Ansys, Inc. | | | 1.2 | % | |
| Bank Mutual Corp. | | | 1.2 | % | |
| Toro Co. | | | 1.2 | % | |
| Albemarle Corp. | | | 1.1 | % | |
| NewAlliance Bancshares, Inc. | | | 1.1 | % | |
| Psychiatric Solutions, Inc. | | | 1.1 | % | |
| Landamerica Financial Group, Inc. | | | 1.1 | % | |
| Teledyne Technologies, Inc. | | | 1.1 | % | |
* Excludes short-term investments related to ING Institutional Prime Money Market Fund and securities lending collateral.
Portfolio holdings are subject to change daily.
10
ING VP SMALL COMPANY PORTFOLIO
PORTFOLIO MANAGERS' REPORT

| Average Annual Total Returns for the Periods Ended December 31, 2006 | |
| | | 1 Year | | 5 Year | | 10 Year | | Since Inception
of Class S
November 1, 2001 | |
| Class I | | | 16.79 | % | | | 9.22 | % | | | 11.87 | % | | | — | | |
| Class S | | | 16.07 | % | | | 8.97 | % | | | — | | | | 10.84 | % | |
| Russell 2000® Index(1) | | | 18.37 | % | | | 11.39 | % | | | 9.44 | % | | | 13.93 | % | |
Based on a $10,000 initial investment, the graph and table above illustrate the total return of ING VP Small Company Portfolio against the index indicated. An index has no cash in its portfolio, imposes no sales charges and incurs no operating expenses. An investor cannot invest directly in an index. The Portfolio's performance is shown without the imposition of any expenses or charges which are, or may be, imposed under your annuity contract. Total returns would have been lower if such expenses or charges were included.
The performance graph and table do not reflect the deduction of taxes that a shareholder will pay on portfolio distributions or the redemption of portfolio shares.
The performance shown may include the effect of fee waivers and/or expense reimbursements by the Investment Adviser and/or other service providers, which have the effect of increasing total return. Had all fees and expenses been considered, the total returns would have been lower.
The performance update illustrates performance for a variable investment option available through a variable annuity contract. The performance shown indicates past performance and is not a projection or prediction of future results. Actual investment returns and principal value will fluctuate so that shares and/or units, at redemption, may be worth more or less than their original cost. Please call (800) 992-0180 to get performance through the most recent month end.
This report contains statements that may be "forward-looking" statements. Actual results may differ materially from those projected in the "forward-looking" statements.
The views expressed in this report reflect those of the portfolio manager, only through the end of the period as stated on the cover. The portfolio manager's views are subject to change at any time based on market and other conditions.
Portfolio holdings are subject to change daily.
(1) The Russell 2000® Index measures the performance of the 2,000 smallest companies in the Russell 3000 Index. The Russell 3000 Index is an unmanaged index that measures the performance of 3,000 U.S. companies based on total market capitalization.
Effective March 1, 2002, ING Investments, LLC began serving as investment adviser and ING Investment Management Co., the former investment adviser, began serving as sub-adviser to the Portfolio.
11
ING VP VALUE OPPORTUNITY PORTFOLIO
PORTFOLIO MANAGERS' REPORT
The ING VP Value Opportunity Portfolio (the "Portfolio") seeks growth of capital primarily through investment in a diversified portfolio of common stocks. The Portfolio is managed by a team of equity investment specialists led by Scott Lewis, Portfolio Manager of ING Investment Management Co. — the Sub-Adviser.
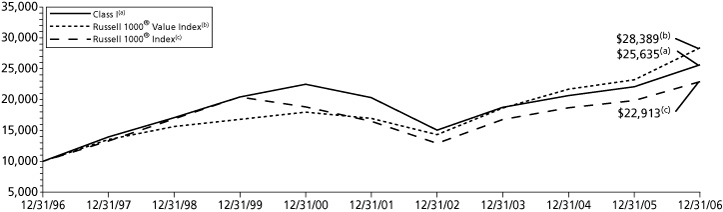
Performance: For the year ended December 31, 2006, the Portfolio's Class I shares provided a total return of 16.10% compared to the Russell 1000® Value Index(1) and the Russell 1000® Index(2), which returned 22.25% and 15.46%, respectively, for the same period.
Portfolio Specifics: The Portfolio benefited from favorable stock selection in telecommunications, utilities and consumer discretionary. In contrast, our decision to underweight telecommunications acted as a drag as the sector rose 40% in 2006.
The Portfolio underperformed the Russell 1000® Value Index primarily as a result of weak stock selection within the energy and financial sectors. To a lesser extent, our holdings within materials and technology detracted from performance. Within energy, the Portfolio was hurt by our decision to underweight integrated oils in favor of exploration and production companies. The energy sector experienced a flight to quality in the second half of this year caused partly by a sharp and unanticipated decline in natural gas. Within financials, adverse stock selection effects were compounded by an unfavorable underweighting real estate investment trusts, which continue to trade at high valuations.
In telecommunications, our decision to underweight Sprint Nextel Corp. early in the year contributed meaningfully to returns. The stock declined during the first eight months of 2006 due to concerns over its integration with Nextel. We took advantage of this weakness in September and initiated a position. Over the last four months, the stock performed well due to the company's successful launch of a faster cellular internet service. AT&T, Inc. was another telecommunication stock that helped performance. AT&T, Inc. benefited from improved wireline performance and margin recovery at Cingular Wireless. Our utility holdings such as Mirant Corp., PG&E Corp. and Sempra Energy also helped. Within consumer discretionary, Boyd Gaming Corp. was a positive contributor to returns. We bought Boyd Gaming Corp. in August based on our belief that the Street had significantly undervalued its residential property. We believe the company will conti nue to benefit from its prime real estate and see it as a likely leveraged buyout candidate.
By comparison, our investment in Evergreen Energy, Inc. a company with a potentially revolutionary coal cleaning process, was the largest single stock detractor from performance as management failed to reach its performance milestones during the period. We eliminated this position in December. In financials, our positions in Capital One Financial Corp. and Conseco, Inc. hurt the Portfolio. Capital One Financial Corp. declined on fears of credit deterioration and consumer spending. We see significant upside in Capital One Financial Corp. given its attractive valuation, and believe the company will see synergies from its integration with North Fork Bankcorp. Our position in Conseco, Inc. underperformed as expected ratings upgrade did not occur, due in part to disappointing third-quarter results.
Current Strategy and Outlook: Currently, the Portfolio is positioned in companies which have strong or improving competitive positions, robust end markets and/or superior capital allocation opportunities. Furthermore, we believe each stock possesses an attractive valuation and a clear catalyst to improve it. Some examples of high-conviction holdings include Peabody Energy Corp., Union Pacific Corp., ABB Ltd. ADR, The Bank of New York Co., Inc., and Hudson City Bancorp, Inc.
We believe there is meaningful upside in Peabody Energy Corp. and Union Pacific Corp., both of which will continue to play important roles in the development of the Powder River Basin in Wyoming. This region contains one of the largest coal deposits in the world and activity there will continue to expand as mines in Appalachia increasingly become cost prohibitive. The Bank of New York Co., Inc. which recently agreed to acquire Mellon Financial Corp., is trading at a meaningful discount to competitors Northern Trust Corp. and State Street Corp. We believe that when the transaction is completed and integration proves successful, this valuation gap will close. We further believe that the combined company will achieve greater synergies than Wall Street is currently expecting, leading to additional upside. Hudson City Bancorp, Inc. another regional bank holding company is, in our view, poised to outperform as the significant excess capital it has put to work could benefit from an expected steepening of the yield curve and a possible Federal Reserve Board rate hike by mid-2007.
Portfolio holdings and characteristics are subject to change and may not be representative of current holdings and characteristics. The outlook for this Portfolio may differ from that presented for other ING Funds. Performance for the different classes of shares will vary based on differences in fees associated with each class.
Top Ten Holdings*
as of December 31, 2006
(as a percent of net assets)
| ExxonMobil Corp. | | | 4.8 | % | |
| Bank of America Corp. | | | 4.0 | % | |
| Citigroup, Inc. | | | 3.9 | % | |
| JPMorgan Chase & Co. | | | 3.5 | % | |
| AT&T, Inc. | | | 3.4 | % | |
| Pfizer, Inc. | | | 3.2 | % | |
| Procter & Gamble Co. | | | 3.1 | % | |
| Altria Group, Inc. | | | 2.7 | % | |
| Wells Fargo & Co. | | | 2.6 | % | |
| Mirant Corp. | | | 2.3 | % | |
* Excludes short-term investments related to securities lending collateral.
Portfolio holdings are subject to change daily.
12
ING VP VALUE OPPORTUNITY PORTFOLIO
PORTFOLIO MANAGERS' REPORT
| Average Annual Total Returns for the Periods Ended December 31, 2006* | |
| | | 1 Year | | 5 Year | | 10 Year | | Since Inception
of Class S
July 16, 2001 | |
| Class I | | | 16.10 | % | | | 4.76 | % | | | 9.86 | % | | | — | | |
| Class S | | | 15.77 | % | | | 4.50 | % | | | — | | | | 2.38 | % | |
| Russell 1000® Value Index(1) | | | 22.25 | % | | | 10.86 | % | | | 11.00 | % | | | 9.12 | %(3) | |
| Russell 1000® Index(2) | | | 15.46 | % | | | 6.82 | % | | | 8.64 | % | | | 5.38 | %(3) | |
Based on a $10,000 initial investment, the graph and table above illustrate the total return of ING VP Value Opportunity Portfolio against the indices indicated. An index has no cash in its portfolio, imposes no sales charges and incurs no operating expenses. An investor cannot invest directly in the indices. The Portfolio's performance is shown without the imposition of any expenses or charges which are, or may be, imposed under your annuity contract. Total returns would have been lower if such expenses or charges were included.
The performance graph and table do not reflect the deduction of taxes that a shareholder will pay on portfolio distributions or the redemption of portfolio shares.
The performance shown may include the effect of fee waivers and/or expense reimbursements by the Investment Adviser and/or other service providers, which have the effect of increasing total return. Had all fees and expenses been considered, the total returns would have been lower.
The performance update illustrates performance for a variable investment option available through a variable annuity contract. The performance shown indicates past performance and is not a projection or prediction of future results. Actual investment returns and principal value will fluctuate so that shares and/or units, at redemption, may be worth more or less than their original cost. Please call (800) 992-0180 to get performance through the most recent month end.
This report contains statements that may be "forward-looking" statements. Actual results may differ materially from those projected in the "forward-looking" statements.
The views expressed in this report reflect those of the portfolio manager, only through the end of the period as stated on the cover. The portfolio manager's views are subject to change at any time based on market and other conditions.
Portfolio holdings are subject to change daily.
* ADV Class commenced operations on December 29, 2006, therefore, there is no performance information for the period ended December 31, 2006.
(1) The Russell 1000® Value Index is an unmanaged index that measures the performance of those Russell 1000 companies with lower price-to-book ratios and lower forecasted growth values, which more closely tracks the types of securities in which the Portfolio invests than the S&P 500® Composite Stock Price Index.
(2) The Russell 1000® Index is a comprehensive large-cap index measuring the performance of the largest 1,000 U.S. incorporated companies.
(3) Since inception performance for the indices is shown from August 1, 2001.
Effective March 1, 2002, ING Investments, LLC began serving as investment adviser and ING Investment Management Co., the former investment adviser, began serving as sub-adviser to the Portfolio.
13
ING VP INTERMEDIATE BOND PORTFOLIO
PORTFOLIO MANAGERS' REPORT
The ING VP Intermediate Bond Portfolio (the "Portfolio") seeks to maximize total return consistent with reasonable risk by investing in a diversified portfolio consisting primarily of debt securities. It is anticipated that capital appreciation and investment income will both be major factors in achieving total return. The Portfolio is managed by James B. Kauffmann, Portfolio Manager of ING Investment Management Co. — the Sub-Adviser.
Performance: For the year ended December 31, 2006, the Portfolio's Class I shares provided a total return of 4.06% compared to the Lehman Brothers® Aggregate Bond Index(1) ("LBAB"), which returned 4.33% for the same period.
Portfolio Specifics: 2006 was supposed to be the year that synchronized global growth led to capacity constraints in labor and manufacturing and rising commodity prices. This combination was expected to produce inflation rates that would have been unacceptable to the U.S. Federal Reserve Board ("Fed") and global investors in general. A repudiation of U.S. dollar-based assets and a Fed bent on draining liquidity from the market was expected to lead to rising interest rates and a decline in prices of high risk assets relative to their low risk counterparts. As the carry trade was unwound, volatility was expected to re-emerge. Investors were also expected to come to the realization that the Fed was behind this steepening of the yield curve and that it could not control inflation.
However, capital markets rarely serve up what is expected. Although we did in fact experience the greatest surge in global growth since the 1970s, and the longest string of 6% plus gross domestic product ("GDP") growth since the 1980s, the economy could not deal with a simultaneous slowdown in housing and manufacturing. Even though there was a brief inflation scare as the core consumer price index reached a peak of 2.9%, a level not seen since 1996, unit labor cost increases were offset by falling goods prices. The market correctly predicted that growth and inflation would moderate and these robust economic statistics would be fleeting.
Overall, last year's bond market can best be described as a battle of two halves. In the first half of 2006, the market battled inflation and oil fears. In the second half of 2006, the market dealt with a housing- and automotive-induced slowdown, as well as a benign Fed. Throughout the year, leveraged buyouts ("LBOs") vexed the investment corporate bond market, as the re-levering of corporate balance sheets reached new highs. The Fed continued its tightening regime until late into the summer when the Federal Open Market Committee ("FOMC") paused and held the key overnight steady at 5.25% for the remainder of the year. The yield curve inverted for the first time in many years, and it stayed in this inherently unstable shape for the rest of the period. All sectors of the LBAB Index outperformed Treasuries, although the sub-prime mortgage market languished in the second half as the domestic residential real estate market slumped.
Impact of Key Portfolio Holdings and Sector Concentration: While the Portfolio largely avoided the deleterious effects that LBOs can bring to bond portfolios, performance relative to our peers was not as strong as in the past. In general, our defensive posture towards credit hurt the Portfolio, although exposures were re-calibrated frequently through the course of the year. We remained uncomfortable with the limited compensation for risk provided by credit-sensitive bonds. Low volatility further impacted our security selection process, and our small allocations to high-yield and emerging-market debt were helpful but too modest given the strong outperformance of those two high risk sectors. Yet, timely allocations to 10/1 adjustable rate mortgages ("ARMs") in lieu of fixed-rate fifteen year mortgage-backed securities ("MBS") proved beneficial as were tactica l overweights to the MBS sector in general. Our security selection process did produce some wins in the areas of financial debt and floating rate notes. Ultimately, the greatest drag on performance proved to be our short duration posture in the second half of the year. Investors quickly — and we believe, incorrectly — viewed the Fed's pause as a sign of imminent easing.
Current Strategy and Outlook: We expect slow growth to persist early in 2007. We expect, housing and auto-related manufacturing to continue to be weak during the first part of the year, but we predict they will to recover as the year progresses. We believe, the economy may experience sub-trend growth for a couple of quarters until consumers adjust their spending patterns in the new environment. Long-term, we view the economy as resilient despite market signals (such as an inverted yield curve) that predict a hard landing. Our view is that this pessimistic outlook is not warranted given the strength in the service sector, export growth and the labor market. Housing is already showing signs of stabilization. We see limited risk based on the variables that would further negatively affect this sector, such as higher mortgage rates and lower personal income.
The effects of a global capital market with easy money have had an impact beyond the artificially low long-term rates in the U.S. Investors flush with cash and seeking high-paying investment opportunities continue to demand stockholder-friendly transactions. Leveraged buyout targets are rumored to include Alltel Corp., Western Union Co., Anheuser-Busch Cos., Inc. and JC Penney Co., Inc. We are cautiously bullish on credit in the very short term. Strategically, we remain defensive on credit as we are concerned that issue specific risk may not be compensated appropriately. Our mortgage allocation is slightly overweight on a contribution-to-duration basis, and we continue to benefit from exposure to off-index mortgage-backed securities such as ARMs. Our exposure to high-yield and emerging-market debt is limited and we maintain a slight overweight exposure in high yield on a contribution-to-duration basis. We have zero exposure to emerging marke t debt. The interest rate strategy team has targeted a duration position slightly shorter than the benchmark with a bias toward long-term rates rising more than short-term rates.
Portfolio holdings and characteristics are subject to change and may not be representative of current holdings and characteristics. The outlook for this Portfolio may differ from that presented for other ING Funds. Performance for the different classes of shares will vary based on differences in fees associated with each class.
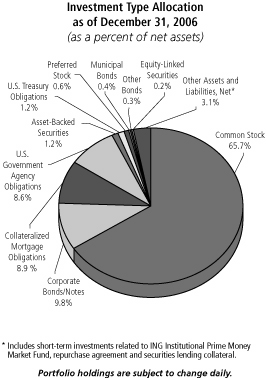
Investment Type Allocation
as of December 31, 2006
(as a percent of net assets)
| Collateralized Mortgage Obligations | | | 33.4 | % | |
| Corporate Bonds/Notes | | | 28.1 | % | |
| U.S. Government Agency Obligations | | | 27.8 | % | |
| U.S. Treasury Obligations | | | 11.2 | % | |
| Asset-Backed Securities | | | 3.0 | % | |
| Preferred Stock | | | 1.8 | % | |
| Mutual Fund | | | 1.4 | % | |
| Municipal Bonds | | | 1.0 | % | |
| Other Bonds | | | 0.8 | % | |
| Equity-Linked Securities | | | 0.4 | % | |
| Repurchase Agreement | | | 1.2 | % | |
| Other Assets and Liabilities, Net* | | | (10.1 | )% | |
| Net Assets | | | 100.0 | % | |
* Includes securities lending collateral.
Portfolio holdings are subject to change daily.
Top Ten Holdings*
as of December 31, 2006
(as a percent of net assets)
Federal National Mortgage Association,
5.000%, due 01/12/36 | | | 8.0 | % | |
| U.S. Treasury Note, 4.625%, due 11/30/08 | | | 4.4 | % | |
| U.S. Treasury Bond, 4.500%, due 02/15/36 | | | 1.9 | % | |
Federal National Mortgage Association,
5.250%, due 08/01/12 | | | 1.2 | % | |
Citigroup Mortgage Loan Trust, Inc.,
6.096%, due 08/25/36 | | | 1.1 | % | |
| U.S. Treasury Note, 4.625%, due 11/15/09 | | | 1.0 | % | |
| JP Morgan Mortgage Trust, 5.408%, due 11/25/35 | | | 1.0 | % | |
Federal Home Loan Mortgage Corporation,
6.625%, due 09/15/09 | | | 1.0 | % | |
Federal National Mortgage Association,
5.500%, due 11/01/33 | | | 1.0 | % | |
Federal Home Loan Mortgage Corporation,
5.500%, due 04/24/09 | | | 1.0 | % | |
* Excludes short-term investments related to ING Institutional Prime Money Market Fund, repurchase agreement and securities lending collateral.
Portfolio holdings are subject to change daily.
14
ING VP INTERMEDIATE BOND PORTFOLIO
PORTFOLIO MANAGERS' REPORT

| Average Annual Total Returns for the Periods Ended December 31, 2006 | |
| | | 1 Year | | 5 Year | | 10 Year | | Since Inception
of Class ADV
December 20, 2006 | | Since Inception
of Class S
May 3, 2002 | |
| Class ADV | | | — | | | | — | | | | — | | | | (0.30 | )% | | | — | | |
| Class I | | | 4.06 | % | | | 5.32 | % | | | 6.03 | % | | | — | | | | — | | |
| Class S | | | 3.77 | % | | | — | | | | — | | | | — | | | | 5.31 | % | |
| LBAB Index(1) | | | 4.33 | % | | | 5.06 | % | | | 6.24 | % | | | N/A(2) | | | | 4.98 | %(3) | |
Based on a $10,000 initial investment, the graph and table above illustrate the total return of ING VP Intermediate Bond Portfolio against the index indicated. An index has has no cash in its portfolio, imposes no sales charges and incurs no operating expenses. An investor cannot invest directly in an index. The Portfolio's performance is shown without the imposition of any expenses or charges which are, or may be, imposed under your annuity contract. Total returns would have been lower if such expenses or charges were included.
The performance graph and table do not reflect the deduction of taxes that a shareholder will pay on portfolio distributions or the redemption of portfolio shares.
The performance shown may include the effect of fee waivers and/or expense reimbursements by the Investment Adviser and/or other service providers, which have the effect of increasing total return. Had all fees and expenses been considered, the total returns would have been lower.
The performance update illustrates performance for a variable investment option available through a variable annuity contract. The performance shown indicates past performance and is not a projection or prediction of future results. Actual investment returns and principal value will fluctuate so that shares and/or units, at redemption, may be worth more or less than their original cost. Please call (800) 992-0180 to get performance through the most recent month end.
This report contains statements that may be "forward-looking" statements. Actual results may differ materially from those projected in the "forward-looking" statements.
The views expressed in this report reflect those of the portfolio managers, only through the end of the period as stated on the cover. The portfolio managers' views are subject to change at any time based on market and other conditions.
Portfolio holdings are subject to change daily.
(1) The LBAB Index is an unmanaged index composed of securities from the Lehman Brothers Government/Corporate Bond Index, Mortgage-Backed Securities Index and the Asset-Backed Securities Index.
(2) Since inception performance for the the index is not shown.
(3) Since inception performance for the index is shown from May 1, 2002.
Effective March 1, 2002, ING Investments, LLC began serving as investment adviser and ING Investment Management Co., the former investment adviser, began serving as sub-adviser to the Portfolio.
15
ING VP MONEY MARKET PORTFOLIO
PORTFOLIO MANAGERS' REPORT
The ING VP Money Market Portfolio (the "Portfolio") seeks to provide high current return, consistent with preservation of capital and liquidity, through investment in high-quality money market instruments. The Portfolio is managed by David S. Yealy, Portfolio Manager of ING Investment Management Co. — the Sub-Adviser.
Performance: For the year ended December 31, 2006, the Portfolio's Class I shares provided a total return of 4.88% compared to the iMoneyNet First Tier Retail Index, which returned 4.30% for the same period.
Portfolio Specifics: The calendar year 2006 can be separated into two distinct halves. During the first half of the year, the Federal Open Market Committee ("FOMC") raised rates 0.25% at each of its four meetings. Short-term money market rates increased in response to the FOMC's rate actions. The markets priced in expectations for continued U.S. Federal Reserve Board's ("Fed") rate increases after each meeting during the period. The FOMC did not increase rates at all during the second half of the year, as economic growth slowed to a more moderate level due primarily to a slowdown in the housing market. Despite inflation remaining above the Fed's 1%-2% comfort level and a tight labor market, the markets shifted from expecting future rate increases to pricing in future rate cuts.
Our primary investment strategy, which we had in place since the second half of 2004, did not change significantly during the first half of the year. The Portfolio benefited from a large amount of interest sensitive floating rate securities. In addition to our emphasis on floating rate securities, we continued to focus new purchases on very short maturity securities that typically matured prior to a forthcoming FOMC meeting. These performed well during the rising rate environment. We made selective purchases in the two- to three-month maturity range only when they fully priced in future Fed rate increases. For a brief period in June, the market priced in a more aggressive Fed with 1-Year LIBOR nearing 5.80%. We took the opportunity to extend the Portfolio's weighted average maturity ("WAM") from approximately 20 days to approximately 40 days, by investing approximately 5% of the Portfolio in fixed rate securities with maturities greater than six months. This maturity extension positioned the Portfolio to take advantage of the shift in the FOMC's rate posture during the second half of the year and the markets' reaction to such shift. The fixed rate securities with maturities longer than six months added a yield premium over shorter securities. We elected to sell a portion of the longer-term fixed rate securities at a gain during the third and fourth quarters when the market priced in significant future Fed rate cuts. We added longer-term securities when yields increased as rate cut expectations moderated. We ended the year with a WAM of 42 days.
Current Strategy and Outlook: The short-term market as represented by the trading of federal funds futures has been pricing in as much as four 0.25% rate cuts by the Fed in 2007. We are not in agreement with this outlook, and therefore have been cautious in extending our WAM too much. The market has mostly ignored inflation indicators and recent Fed rhetoric outlining their inflation concerns, and instead focused on slower growth. We anticipate that upcoming economic data will be mixed or potentially surprise to the upside as it relates to growth and or inflation leading to higher yields for longer-term money market securities. This will also allow the FOMC plenty of room to keep rates fixed at their current levels for a prolonged period. We expect more opportunities in the near-term to add additional days to our WAM at yields above what is currently priced into the market for short-term money market securities.
Portfolio holdings and characteristics are subject to change and may not be representative of current holdings and characteristics. The outlook for this Portfolio may differ from that presented for other ING Funds. Performance for the different classes of shares will vary based on differences in fees associated with each class.
Investment Type Allocation
as of December 31, 2006
(as a percent of net assets) | |
| Corporate Bonds/Notes | | | 50.2 | % | |
| Commercial Paper | | | 38.4 | % | |
| Collateralized Mortgage Obligations | | | 4.0 | % | |
| Repurchase Agreement | | | 2.6 | % | |
| Certificates of Deposit | | | 2.5 | % | |
| U.S. Government Agency Obligations | | | 2.5 | % | |
| Other Assets and Liabilities, Net | | | (0.2 | )% | |
| Net Assets | | | 100.0 | % | |
Portfolio holdings are subject to change daily.
16
ING VP GLOBAL SCIENCE AND TECHNOLOGY PORTFOLIO
PORTFOLIO MANAGERS' REPORT
ING VP Global Science and Technology Portfolio (the "Portfolio") seeks long-term capital appreciation. The Portfolio is managed by Thomas P. Callan, CFA, Managing Director and Senior Portfolio Manager, Erin Xie, PhD, Managing Director and Portfolio Manager and Jean M. Rosenbaum, Managing Director and Portfolio Manager of BlackRock Advisors, LLC* — the Sub-Adviser.
Performance: For the year ended December 31, 2006, the Portfolio's Class I shares provided a total return of 7.26% compared to the Standard & Poor's 500® Composite Stock Price Index(1) ("S&P 500® Index") and the NYSE Arca Tech 100 IndexSM(2), which return ed 15.79% and 5.20%, respectively, for the same period.
Portfolio Specifics: U.S. equity markets generated strong gains during this period as demonstrated by the 15.79% return registered by the S&P 500® Index. The broad market rally was due mainly to stabilizing interest rates and solid global economic growth. The U.S. Federal Reserve Board ("Fed") chose to maintain the Fed funds target at 5.25% and end its streak of 17 consecutive 25 basis point increases on June 29, and has held rates steady since. This policy decision was further validated as moderating economic fundamentals and falling crude oil prices eased investor concern over potentially accelerating inflationary pressures.
Relative to the NYSE Arca Tech 100 IndexSM, strong stock selection in information technology and health care bolstered portfolio returns, while the negative selection effect in industrials hurt relative performance. Stock selection in the semiconductor and internet software & services industries was a significant positive contributor, outweighing the negative allocation effect from these two underperforming industries. Internet software & services stocks such as Akamai Technologies, Inc. and NHN Corp. were both significant contributors to the Portfolio's return during the period. In the communications equipment and electronic equipment & instruments industries, Cisco Systems, Inc. and HON HAI Precision Industries Co., Ltd. were the most notable positive contributors. Conversely , an underweight in Network Appliance, Inc. and Apple Computer, Inc. as well as the avoidance of strong-performing index holdings such as QLogic Corp. and BMC Software, Inc. hurt relative performance.
Strength in the health care segment of the Portfolio was the result of quality stock selection in the biotechnology industry as well as an underweight to health care equipment and supplies. In particular, a significant underweight to St. Jude Medical, Inc. throughout the period contributed positively to relative returns as the stock declined significantly throughout the first and second quarters of 2006. In contrast, the Portfolio's underweight in the life sciences tools & services industry dampened returns. This was primarily a result of the exclusion of Thermo Fisher Scientific, Inc. from our holdings.
Lastly, the negative stock selection effect in industrials dampened relative returns over the past year. The most significant negative impact was the result of a meaningful underweight to Lockheed Martin Corp. The Aerospace & Defense Company rose 47% during the period, while maintaining a sizable weight within the benchmark over the past 12 months.
Current Strategy and Outlook: With about 64% of the Portfolio invested in information technology at the end of December, we remain overweight in communications equipment names in order to capitalize on the demand for mobility and broadband access. Moreover, we look to increase our exposure to Taiwan based companies as favorable market conditions make them prime targets to be acquired by U.S. companies looking to increase their exposure in Asia. Sector positioning regarding healthcare is currently neutral to the benchmark due to the uncertainty created by the newly elected U.S. Democratic Congress. The Portfolio maintains an underweight in information technology due to pockets of weakness within the sector.
* Effective September 30, 2006, BlackRock Advisors, LLC began serving as sub-adviser to the Portfolio. On September 29, 2006, BlackRock, Inc. consummated a transaction with Merrill Lynch & Co., Inc. whereby Merrill Lynch & Co., Inc.'s investment management businesses combined with that of BlackRock, Inc. to create a new independent company and on September 29, 2006, BlackRock Advisors, Inc. reorganized into BlackRock Advisors, LLC. Prior to September 30, 2006, BlackRock Advisors, Inc. served as sub-adviser to the Portfolio.
Portfolio holdings and characteristics are subject to change and may not be representative of current holdings and characteristics. The outlook for this Portfolio may differ from that presented for other ING Funds. Performance for the different classes of shares will vary based on differences in fees associated with each class.
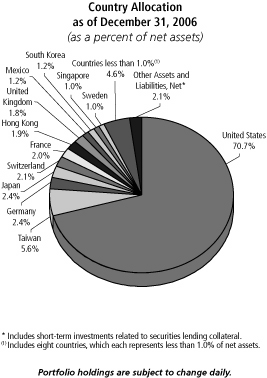
Top Ten Holdings*
as of December 31, 2006
(as a percent of net assets) | |
| Cisco Systems, Inc. | | | 2.6 | % | |
| Alexion Pharmaceuticals, Inc. | | | 2.2 | % | |
| Google, Inc. | | | 2.0 | % | |
| Apple Computer, Inc. | | | 2.0 | % | |
| International Business Machines Corp. | | | 1.8 | % | |
| Lockheed Martin Corp. | | | 1.8 | % | |
| Akamai Technologies, Inc. | | | 1.6 | % | |
| Microsoft Corp. | | | 1.6 | % | |
| Network Appliance, Inc. | | | 1.4 | % | |
| Adobe Systems, Inc. | | | 1.4 | % | |
* Excludes short-term investments related to securities lending collateral.
Portfolio holdings are subject to change daily.
17
ING VP GLOBAL SCIENCE AND TECHNOLOGY PORTFOLIO
PORTFOLIO MANAGERS' REPORT

| Average Annual Total Returns for the Periods Ended December 31, 2006 | |
| | | 1 Year | | 5 Year | | Since Inception
of Class I
May 1, 2000 | | Since Inception
of Class S
November 1, 2001 | |
| Class I | | | 7.26 | % | | | 0.22 | % | | | (11.05 | )% | | | — | | |
| Class S | | | 6.79 | % | | | 0.13 | % | | | — | | | | 2.22 | % | |
| S&P 500® Index(1) | | | 15.79 | % | | | 6.19 | % | | | 1.30 | % | | | 7.69 | % | |
| NYSE Arca Tech 100 IndexSM(2) | | | 5.20 | % | | | 5.34 | % | | | (2.90 | )% | | | 8.01 | % | |
Based on a $10,000 initial investment, the graph and table above illustrate the total return of ING VP Global Science and Technology Portfolio against the indices indicated. An index has no cash in its portfolio, imposes no sales charges and incurs no operating expenses. An investor cannot invest directly in an index. The Portfolio's performance is shown without the imposition of any expenses or charges which are, or may be, imposed under your annuity contract. Total returns would have been lower if such expenses or charges were included.
The performance graph and table do not reflect the deduction of taxes that a shareholder will pay on portfolio distributions or the redemption of portfolio shares.
The performance shown may include the effect of fee waivers and/or expense reimbursements by the Investment Adviser and/or other service providers, which have the effect of increasing total return. Had all fees and expenses been considered, the total returns would have been lower.
The performance update illustrates performance for a variable investment option available through a variable annuity contract. The performance shown indicates past performance and is not a projection or prediction of future results. Actual investment returns and principal value will fluctuate so that shares and/or units, at redemption, may be worth more or less than their original cost. Please call (800) 992-0180 to get performance through the most recent month end.
This report contains statements that may be "forward-looking" statements. Actual results may differ materially from those projected in the "forward-looking" statements.
The views expressed in this report reflect those of the portfolio managers, only through the end of the period as stated on the cover. The portfolio managers' views are subject to change at any time based on market and other conditions.
Portfolio holdings are subject to change daily.
(1) The S&P 500® Index is an unmanaged index that measures the performance of the securities of approximately 500 of the largest companies in the U.S.
(2) The NYSE Arca Tech 100 IndexSM is a multi-industry technology index measuring the performance of companies using technology innovation across a broad spectrum of industries. It is comprised of 100 listed and over-the-counter stocks from 14 different subsectors including computer hardware, software, semiconductors, telecommunications, data storage and processing, electronics and biotechnology.
Effective March 1, 2002, ING Investments, LLC began serving as investment adviser. Formerly, ING Investment Management Co. served as the investment adviser. Prior to January 1, 2004, the Portfolio was sub-advised by a different sub-adviser.
18
ING VP INTERNATIONAL EQUITY PORTFOLIO
PORTFOLIO MANAGERS' REPORT
The ING VP International Equity Portfolio (the "Portfolio") seeks long term capital growth primarily through investment in a diversified portfolio of common stocks principally traded in countries outside of the United States. The Portfolio will not target any given level of current income. The Portfolio is managed by Martin Jansen, Portfolio Manager and Carl Ghielen, Portfolio Manager of ING Investment Management Co. — the Sub-Adviser.
Performance: For the year ended December 31, 2006, the Portfolio's Class I shares provided a total return of 23.48% compared to the Morgan Stanley Capital International-Europe, Australasia and Far East® Index(1) ("MSCI EAFE® Index"), which returned 26.86% for the same period.
Portfolio Specifics: International markets got off to an exceptional start during the first five months of the year. However, a market correction in May and June proved costly. Specifically, emerging markets suffered a sharp sell off in what the market perceived to be riskier assets. During the third quarter, markets seemed to recoup much of the losses amid an increase in merger and acquisition activity, a decline in oil prices, and improved consumer sentiment across Europe. The upward trend continued through the end of the year with improved consumer spending and industrial production.
During the period, the strategy realized gains from its regional positioning, in which we maintained a modest out-of-benchmark allocation to emerging markets. Positive contributions came from security in developed Asia ex-Japan, while this was offset by selection in Europe.
In contrast, security selection acted as the biggest drag. While selection in consumer staples and energy was particularly beneficial, on the whole, these positives where outweighted by selection in consumer discretionary and information technology, which significantly hurt the the Portfolio. Other notable detractors included selection in financials and industrials.
On a sector allocation basis, positive contributions stemmed from overweight positions in telecommunication services and utilities. By comparison, a modest underweight in materials acted as a drag.
China Life Insurance Co., Ltd. rose strongly after raising $3.62 billion from a stock sale. Petroleum-Geo Services, a Norwegian oil field service company, was bid up as a result of several new marine contracts. Veolia Environment, a world leader in environmental services, reported increased operating profits and revenue.
In contrast, Tandberg Television ASA, a Norwegian manufacturer of television broadcast systems, declined in price after it announced that sales and profits would be lower than estimated. Don Quijote Co., a Japanese operator of discount stores, also suffered from sluggish sales. European Aeronautic Defence & Space Co. NV, a French aeronautical manufacturer, was hurt by development delays.
Current Strategy and Outlook: We are currently overweight energy, health care, telecommunication services, and consumer staples largely at the expense of financials, materials and consumer discretionary. We maintain a modest emerging market exposure, financed by a modest underweight in Europe and Asia Pacific ex-Japan. The Portfolio is valued slightly cheaper than the benchmark, but its stocks, in aggregate, have generated a higher historic growth rate. Embedded in our selection is the expectation that a combination of defensive growth stocks and undervalued cyclical stocks should perform relatively well in an environment of interest rate uncertainty and steady but lower earnings growth.
Portfolio holdings and characteristics are subject to change and may not be representative of current holdings and characteristics. The outlook for this Portfolio may differ from that presented for other ING Funds. Performance for the different classes of shares will vary based on differences in fees associated with each class.

Top Ten Holdings*
as of December 31, 2006
(as a percent of net assets) | |
| HSBC Holdings PLC | | | 2.9 | % | |
| Royal Dutch Shell PLC - Class B | | | 2.2 | % | |
| Roche Holding AG | | | 2.1 | % | |
| GlaxoSmithKline PLC | | | 2.1 | % | |
| UBS AG | | | 1.9 | % | |
| Mitsubishi UFJ Financial Group, Inc. | | | 1.9 | % | |
| Total SA | | | 1.9 | % | |
| Barclays PLC | | | 1.9 | % | |
| Unilever PLC | | | 1.8 | % | |
| Alcatel SA | | | 1.7 | % | |
* Excludes short-term investments related to securities lending collateral.
Portfolio holdings are subject to change daily.
19
ING VP INTERNATIONAL EQUITY PORTFOLIO
PORTFOLIO MANAGERS' REPORT

| Average Annual Total Returns for the Periods Ended December 31, 2006* | |
| | | 1 Year | | 5 Year | | Since Inception
of Class I
December 22, 1997 | | Since Inception
of Class S
November 1, 2001 | |
| Class I | | | 23.48 | % | | | 10.36 | % | | | 6.96 | % | | | — | | |
| Class S | | | 23.24 | % | | | 10.07 | % | | | — | | | | 10.99 | % | |
| MSCI EAFE® Index(1) | | | 26.86 | % | | | 15.43 | % | | | 8.75 | %(2) | | | 15.84 | % | |
Based on a $10,000 initial investment, the graph and table above illustrate the total return of ING VP International Equity Portfolio against the index indicated. An index has no cash in its portfolio, imposes no sales charges and incurs no operating expenses. An investor cannot invest directly in an index. The Portfolio's performance is shown without the imposition of any expenses or charges which are, or may be, imposed under your annuity contract. Total returns would have been lower if such expenses or charges were included.
The performance graph and table do not reflect the deduction of taxes that a shareholder will pay on portfolio distributions or the redemption of portfolio shares.
The performance shown may include the effect of fee waivers and/or expense reimbursements by the Investment Adviser and/or other service providers, which have the effect of increasing total return. Had all fees and expenses been considered, the total returns would have been lower.
The performance update illustrates performance for a variable investment option available through a variable annuity contract. The performance shown indicates past performance and is not a projection or prediction of future results. Actual investment returns and principal value will fluctuate so that shares and/or units, at redemption, may be worth more or less than their original cost. Please call (800) 992-0181 to get performance through the most recent month end.
This report contains statements that may be "forward-looking" statements. Actual results may differ materially from those projected in the "forward-looking" statements.
The views expressed in this report reflect those of the portfolio manager only through the end of the period as stated on the cover. The portfolio manager's views are subject to change at any time based on market and other conditions.
Portfolio holdings are subject to change daily.
* ADV Class commenced operations on December 29, 2006, therefore, there is no performance information for the period ended December 31, 2006.
(1) The MSCI EAFE® Index is an unmanaged index that measures the performance of securities listed on exchanges in markets in Europe, Australasia and the Far East.
(2) Since inception performance for the index is shown from January 1, 1998.
Effective March 1, 2002, ING Investments, LLC began serving as investment adviser and ING Investment Management Co., the former investment adviser, began serving as sub-adviser to the Portfolio.
20
SHAREHOLDER EXPENSE EXAMPLES (UNAUDITED)
As a shareholder of a Portfolio, you incur two types of costs: (1) transaction costs, including redemption fees; and exchange fees; and (2) ongoing costs, including management fees; distribution and/or service (12b-1) fees; and other Portfolio expenses. These Examples are intended to help you understand your ongoing costs (in dollars) of investing in a Portfolio and to compare these costs with the ongoing costs of investing in other mutual funds.
The Examples are based on an investment of $1,000 invested at the beginning of the period and held for the entire period from July 1, 2006 to December 31, 2006. The Portfolios' expenses are shown without the imposition of any charges which are, or may be, imposed under your annuity contract. Expenses would have been higher if such charges were included.
Actual Expenses
The first section of the table shown, "Actual Portfolio Return," provides information about actual account values and actual expenses. You may use the information in this section, together with the amount you invested, to estimate the expenses that you paid over the period. Simply divide your account value by $1,000 (for example, an $8,600 account value divided by $1,000 = 8.6), then multiply the result by the number in the first section under the heading entitled "Expenses Paid During Period" to estimate the expenses you paid on your account during this period.
Hypothetical Example for Comparison Purposes
The second section of the table shown, "Hypothetical 5% Return," provides information about hypothetical account values and hypothetical expenses based on the Portfolio's actual expense ratio and an assumed rate of return of 5% per year before expenses, which is not the Portfolio's actual return. The hypothetical account values and expenses may not be used to estimate the actual ending account balance or expenses you paid for the period. You may use this information to compare the ongoing costs of investing in the Portfolio and other mutual funds. To do so, compare this 5% hypothetical example with the 5% hypothetical examples that appear in the shareholder reports of the other mutual funds.
Please note that the expenses shown in the table are meant to highlight your ongoing costs only and do not reflect any transactional costs, such as redemption fees or exchange fees. Therefore, the hypothetical lines of the table are useful in comparing ongoing costs only, and will not help you determine the relative total costs of owning different mutual funds. In addition, if these transactional costs were included, your costs would have been higher.
| ING VP Balanced Portfolio | | Beginning
Account
Value
July 1, 2006 | | Ending
Account
Value
December 31, 2006 | | Annualized
Expense
Ratio | | Expenses Paid
During the Six
Months Ended
December 31, 2006* | |
| Actual Portfolio Return | |
| Class ADV(a) | | $ | 1,000.00 | | | $ | 1,000.00 | | | | 1.10 | % | | $ | 0.09 | | |
| Class I | | | 1,000.00 | | | | 1,082.80 | | | | 0.60 | | | | 3.15 | | |
| Class S | | | 1,000.00 | | | | 1,081.70 | | | | 0.85 | | | | 4.46 | | |
| Hypothetical (5% return before expenses) | |
| Class ADV | | $ | 1,000.00 | | | $ | 1,019.66 | | | | 1.10 | % | | $ | 5.60 | | |
| Class I | | | 1,000.00 | | | | 1,022.18 | | | | 0.60 | | | | 3.06 | | |
| Class S | | | 1,000.00 | | | | 1,020.92 | | | | 0.85 | | | | 4.33 | | |
* Expenses are equal to each Portfolio's respective annualized expense ratios multiplied by the average account value over the period, multiplied by 184/365 to reflect the most recent fiscal half-year (except "Actual Portfolio Return" information for share class footnoted above).
(a) Commencement of operations for Class ADV was December 29, 2006. Expenses paid reflect the three day period ended December 31, 2006 with 0.00% return.
21
SHAREHOLDER EXPENSE EXAMPLES (UNAUDITED) (CONTINUED)
| ING VP Growth and Income Portfolio | | Beginning
Account
Value
July 1, 2006 | | Ending
Account
Value
December 31, 2006 | | Annualized
Expense
Ratio | | Expenses Paid
During the Six
Months Ended
December 31, 2006* | |
| Actual Portfolio Return | |
| Class ADV(a) | | $ | 1,000.00 | | | $ | 997.70 | | | | 1.09 | % | | $ | 0.36 | | |
| Class I | | | 1,000.00 | | | | 1,116.00 | | | | 0.59 | | | | 3.15 | | |
| Class S | | | 1,000.00 | | | | 1,113.40 | | | | 0.84 | | | | 4.47 | | |
| Hypothetical (5% return before expenses) | |
| Class ADV | | $ | 1,000.00 | | | $ | 1,019.71 | | | | 1.09 | % | | $ | 5.55 | | |
| Class I | | | 1,000.00 | | | | 1,022.23 | | | | 0.59 | | | | 3.01 | | |
| Class S | | | 1,000.00 | | | | 1,020.97 | | | | 0.84 | | | | 4.28 | | |
| ING VP Growth Portfolio | |
| Actual Portfolio Return | |
| Class ADV(b) | | $ | 1,000.00 | | | $ | 1,000.00 | | | | 1.19 | % | | $ | 0.10 | | |
| Class I | | | 1,000.00 | | | | 1,066.10 | | | | 0.69 | | | | 3.59 | | |
| Class S | | | 1,000.00 | | | | 1,064.50 | | | | 0.94 | | | | 4.89 | | |
| Hypothetical (5% return before expenses) | |
| Class ADV | | $ | 1,000.00 | | | $ | 1,019.21 | | | | 1.19 | % | | $ | 6.06 | | |
| Class I | | | 1,000.00 | | | | 1,021.73 | | | | 0.69 | | | | 3.52 | | |
| Class S | | | 1,000.00 | | | | 1,020.47 | | | | 0.94 | | | | 4.79 | | |
| ING VP Small Company Portfolio | |
| Actual Portfolio Return | |
| Class I | | $ | 1,000.00 | | | $ | 1,073.90 | | | | 0.85 | % | | $ | 4.44 | | |
| Class S | | | 1,000.00 | | | | 1,069.20 | | | | 1.10 | | | | 5.74 | | |
| Hypothetical (5% return before expenses) | |
| Class I | | $ | 1,000.00 | | | $ | 1,020.92 | | | | 0.85 | % | | $ | 4.33 | | |
| Class S | | | 1,000.00 | | | | 1,019.66 | | | | 1.10 | | | | 5.60 | | |
| ING VP Value Opportunity Portfolio | |
| Actual Portfolio Return | |
| Class ADV(b) | | $ | 1,000.00 | | | $ | 1,000.00 | | | | 1.19 | % | | $ | 0.10 | | |
| Class I | | | 1,000.00 | | | | 1,116.30 | | | | 0.69 | | | | 3.68 | | |
| Class S | | | 1,000.00 | | | | 1,114.90 | | | | 0.94 | | | | 5.01 | | |
| Hypothetical (5% return before expenses) | |
| Class ADV | | $ | 1,000.00 | | | $ | 1,019.21 | | | | 1.19 | % | | $ | 6.06 | | |
| Class I | | | 1,000.00 | | | | 1,021.73 | | | | 0.69 | | | | 3.52 | | |
| Class S | | | 1,000.00 | | | | 1,020.47 | | | | 0.94 | | | | 4.79 | | |
* Expenses are equal to each Portfolio's respective annualized expense ratios multiplied by the average account value over the period, multiplied by 184/365 to reflect the most recent fiscal half-year (except "Actual Portfolio Return" information for share class footnoted above).
(a) Commencement of operations for Class ADV was December 20, 2006. Expenses paid reflect the 12 day period ended December 31, 2006.
(b) Commencement of operations for Class ADV of ING VP Growth Portfolio and ING VP Value Opportunity Portfolio was December 29, 2006. Expenses paid reflect the three-day period ended December 31, 2006 with 0.00% return.
22
SHAREHOLDER EXPENSE EXAMPLES (UNAUDITED) (CONTINUED)
| ING VP Intermediate Bond Portfolio | | Beginning
Account
Value
July 1, 2006 | | Ending
Account
Value
December 31, 2006 | | Annualized
Expense
Ratio | | Expenses Paid
During the Six
Months Ended
December 31, 2006* | |
| Actual Portfolio Return | |
| Class ADV(a) | | $ | 1,000.00 | | | $ | 997.00 | | | | 0.99 | % | | $ | 0.32 | | |
| Class I | | | 1,000.00 | | | | 1,045.80 | | | | 0.49 | | | | 2.53 | | |
| Class S | | | 1,000.00 | | | | 1,044.60 | | | | 0.74 | | | | 3.81 | | |
| Hypothetical (5% return before expenses) | |
| Class ADV | | $ | 1,000.00 | | | $ | 1,020.21 | | | | 0.99 | % | | $ | 5.04 | | |
| Class I | | | 1,000.00 | | | | 1,022.74 | | | | 0.49 | | | | 2.50 | | |
| Class S | | | 1,000.00 | | | | 1,021.48 | | | | 0.74 | | | | 3.77 | | |
| ING VP Money Market Portfolio | |
| Actual Portfolio Return | |
| Class I | | $ | 1,000.00 | | | $ | 1,025.80 | | | | 0.34 | % | | $ | 1.74 | | |
| Hypothetical (5% return before expenses) | |
| Class I | | $ | 1,000.00 | | | $ | 1,023.49 | | | | 0.34 | % | | $ | 1.73 | | |
| ING VP Global Science and Technology Portfolio | |
| Actual Portfolio Return | |
| Class I | | $ | 1,000.00 | | | $ | 1,080.20 | | | | 1.08 | % | | $ | 5.66 | | |
| Class S | | | 1,000.00 | | | | 1,078.00 | | | | 1.33 | | | | 6.97 | | |
| Hypothetical (5% return before expenses) | |
| Class I | | $ | 1,000.00 | | | $ | 1,019.76 | | | | 1.08 | % | | $ | 5.50 | | |
| Class S | | | 1,000.00 | | | | 1,018.50 | | | | 1.33 | | | | 6.77 | | |
| ING VP International Equity Portfolio | |
| Actual Portfolio Return | |
| Class ADV(b) | | $ | 1,000.00 | | | $ | 1,000.00 | | | | 1.49 | % | | $ | 0.12 | | |
| Class I | | | 1,000.00 | | | | 1,135.90 | | | | 0.99 | | | | 5.33 | | |
| Class S | | | 1,000.00 | | | | 1,135.80 | | | | 1.24 | | | | 6.68 | | |
| Hypothetical (5% return before expenses) | |
| Class ADV | | $ | 1,000.00 | | | $ | 1,017.69 | | | | 1.49 | % | | $ | 7.58 | | |
| Class I | | | 1,000.00 | | | | 1,020.21 | | | | 0.99 | | | | 5.04 | | |
| Class S | | | 1,000.00 | | | | 1,018.95 | | | | 1.24 | | | | 6.31 | | |
* Expenses are equal to each Portfolio's respective annualized expense ratios multiplied by the average account value over the period, multiplied by 184/365 to reflect the most recent fiscal half-year (except "Actual Portfolio Return" information for share class footnoted above).
(a) Commencement of operations for Class ADV was December 20, 2006. Expenses paid reflect the 12 day period ended December 31, 2006.
(b) Commencement of operations for Class ADV was December 29, 2006. Expenses paid reflect the three day period ended December 31, 2006 with 0.00% return.
23
REPORT OF INDEPENDENT REGISTERED PUBLIC ACCOUNTING FIRM
The Shareholders, Board of Directors and Board of Trustees
ING Variable Funds, ING Variable Portfolios, Inc., ING VP Balanced Portfolio, Inc.,
ING VP Intermediate Bond Portfolio, and ING VP Money Market Portfolio
We have audited the accompanying statements of assets and liabilities, including the portfolios of investments, of ING VP Growth and Income Portfolio, a series of ING Variable Funds, ING VP Growth Portfolio, ING VP Small Company Portfolio, ING VP Value Opportunity Portfolio, ING VP Global Science and Technology Portfolio, and ING VP International Equity Portfolio, each a series of ING Variable Portfolios, Inc., ING VP Balanced Portfolio, a series of ING VP Balanced Portfolio, Inc., ING VP Intermediate Bond Portfolio, a series of ING VP Intermediate Bond Portfolio, and ING VP Money Market Portfolio, a series of ING VP Money Market Portfolio, as of December 31, 2006, the related statements of operations for the year then ended, the statements of changes in net assets for each of the years in the two-year period then ended, and the financial highlights for each of the years or periods in the five-year period then ended. These financial statemen ts and financial highlights are the responsibility of management. Our responsibility is to express an opinion on these financial statements and financial highlights based on our audits.
We conducted our audits in accordance with the standards of the Public Company Accounting Oversight Board (United States). Those standards require that we plan and perform the audits to obtain reasonable assurance about whether the financial statements and financial highlights are free of material misstatement. An audit includes examining, on a test basis, evidence supporting the amounts and disclosures in the financial statements. Our procedures included confirmation of securities owned as of December 31, 2006, by correspondence with the custodian and brokers, or by other appropriate auditing procedures when replies from brokers were not received. An audit also includes assessing the accounting principles used and significant estimates made by management, as well as evaluating the overall financial statement presentation. We believe that our audits provide a reasonable basis for our opinion.
In our opinion, the financial statements and financial highlights referred to above present fairly, in all material respects, the financial position of the aforementioned portfolios as of December 31, 2006, the results of their operations, the changes in their net assets, and the financial highlights for the periods specified in the first paragraph above, in conformity with U.S. generally accepted accounting principles.

Boston, Massachusetts
February 26, 2007
24
STATEMENTS OF ASSETS AND LIABILITIES AS OF DECEMBER 31, 2006
| | | ING
VP Balanced
Portfolio | | ING
VP Growth and
Income
Portfolio | | ING
VP Growth
Portfolio | |
| ASSETS: | |
| Investments in securities at value+* | | $ | 1,158,165,990 | | | $ | 2,961,778,763 | | | $ | 184,527,868 | | |
| Short-term investments at amortized cost | | | 130,738,157 | | | | 330,362,437 | | | | 30,346,014 | | |
| Short-term investments in affiliates at amortized cost | | | 40,000,000 | | | | 138,000,000 | | | | — | | |
| Cash | | | 156,601 | | | | — | | | | 1,174 | | |
| Cash collateral for futures | | | 594,791 | | | | 3,645,250 | | | | — | | |
| Receivables: | |
| Investment securities sold | | | 11,212,610 | | | | — | | | | 1,978,443 | | |
| Fund shares sold | | | 49,517 | | | | 2,640 | | | | 1,000 | | |
| Dividends and interest | | | 4,094,177 | | | | 4,183,760 | | | | 181,115 | | |
| Variation margin | | | 13,625 | | | | — | | | | — | | |
| Unrealized appreciation on swap agreements | | | 80,399 | | | | — | | | | — | | |
| Prepaid expenses | | | 35,571 | | | | 85,070 | | | | 5,328 | | |
| Total assets | | $ | 1,345,141,438 | | | $ | 3,438,057,920 | | | $ | 217,040,942 | | |
| LIABILITIES: | |
| Payable for investment securities purchased | | | 25,937,208 | | | | 4,121,290 | | | | 187,205 | | |
| Payable for fund shares redeemed | | | 3,921,821 | | | | 4,694,026 | | | | 1,417,820 | | |
| Payable for futures variation margin | | | 45,723 | | | | 310,500 | | | | — | | |
| Payable upon receipt of securities loaned | | | 119,642,157 | | | | 324,265,437 | | | | 28,535,014 | | |
| Upfront payments received on swap agreements | | | 32,867 | | | | — | | | | — | | |
| Unrealized depreciation on swap agreements | | | 247,612 | | | | — | | | | — | | |
| Payable to affiliates | | | 571,042 | | | | 1,461,992 | | | | 105,494 | | |
| Payable to custodian due to bank overdraft | | | — | | | | 13,098 | | | | — | | |
| Payable to custodian due to foreign currency overdraft** | | | 15,215 | | | | — | | | | — | | |
| Payable for trustee fees | | | 13,939 | | | | 43,890 | | | | 2,403 | | |
| Other accrued expenses and liabilities | | | 101,775 | | | | 264,801 | | | | 23,656 | | |
| Options written (premium received $178,500) | | | — | | | | 4,200 | | | | — | | |
| Total liabilities | | | 150,529,359 | | | | 335,179,234 | | | | 30,271,592 | | |
| NET ASSETS | | $ | 1,194,612,079 | | | $ | 3,102,878,686 | | | $ | 186,769,350 | | |
| NET ASSETS WERE COMPRISED OF: | |
| Paid-in capital | | $ | 1,057,912,277 | | | $ | 4,794,356,001 | | | $ | 347,989,497 | | |
| Undistributed net investment income | | | 30,641,694 | | | | 161,526 | | | | 362,892 | | |
Accumulated net realized gain (loss) on investments, foreign
currency related transactions, futures, swaps, and written options | | | 33,382,736 | | | | (2,137,563,606 | ) | | | (175,349,045 | ) | |
Net unrealized appreciation on investments, foreign currency
related transactions, futures, swaps, and written options | | | 72,675,372 | | | | 445,924,765 | | | | 13,766,006 | | |
| NET ASSETS | | $ | 1,194,612,079 | | | $ | 3,102,878,686 | | | $ | 186,769,350 | | |
| + Including securities loaned at value | | $ | 116,092,130 | | | $ | 313,410,855 | | | $ | 27,638,784 | | |
| * Cost of investments in securities | | $ | 1,085,035,643 | | | $ | 2,516,186,591 | | | $ | 170,761,862 | | |
| ** Cost of foreign currency overdraft | | $ | 15,245 | | | $ | — | | | $ | — | | |
| Class ADV: | |
| Net assets | | $ | 1,000 | | | $ | 1,005 | | | $ | 1,000 | | |
| Shares authorized | | $ | 500,000,000 | | | | unlimited | | | $ | 100,000,000 | | |
| Par value | | $ | 0.001 | | | $ | 0.001 | | | $ | 0.001 | | |
| Shares outstanding | | | 68 | | | | 43 | | | | 94 | | |
| Net asset value and redemption price per share | | $ | 14.65 | | | $ | 23.38 | | | $ | 10.65 | | |
| Class I: | |
| Net assets | | $ | 1,183,927,604 | | | $ | 3,098,119,852 | | | $ | 186,494,865 | | |
| Shares authorized | | | 500,000,000 | | | | unlimited | | | | 100,000,000 | | |
| Par value | | $ | 0.001 | | | $ | 1.00 | | | $ | 0.001 | | |
| Shares outstanding | | | 80,833,167 | | | | 132,507,754 | | | | 17,509,690 | | |
| Net asset value and redemption price per share | | $ | 14.65 | | | $ | 23.38 | | | $ | 10.65 | | |
| Class S: | |
| Net assets | | $ | 10,683,475 | | | $ | 4,757,829 | | | $ | 273,485 | | |
| Shares authorized | | | 500,000,000 | | | | unlimited | | | | 100,000,000 | | |
| Par value | | $ | 0.001 | | | $ | 1.00 | | | $ | 0.001 | | |
| Shares outstanding | | | 733,384 | | | | 204,190 | | | | 25,896 | | |
| Net asset value and redemption price per share | | $ | 14.57 | | | $ | 23.30 | | | $ | 10.56 | | |
See Accompanying Notes to Financial Statements
25
STATEMENTS OF ASSETS AND LIABILITIES AS OF DECEMBER 31, 2006
| | | ING
VP Small
Company
Portfolio | | ING
VP Value
Opportunity
Portfolio | | ING
VP Intermediate
Bond
Portfolio | |
| ASSETS: | |
| Investments in securities at value+* | | $ | 503,214,075 | | | $ | 199,602,327 | | | $ | 2,720,557,085 | | |
| Short-term investments at amortized cost | | | 132,944,883 | | | | 34,602,880 | | | | 435,930,535 | | |
| Short-term investments in affiliates at amortized cost | | | 15,000,000 | | | | — | | | | 35,000,000 | | |
| Cash | | | 671 | | | | 739 | | | | 10,181,152 | | |
| Cash collateral for futures | | | — | | | | — | | | | 2,114,481 | | |
| Receivables: | |
| Investment securities sold | | | 3,929,092 | | | | 1,611,215 | | | | 8,092,992 | | |
| Fund shares sold | | | 180,033 | | | | 1,126 | | | | 2,782,252 | | |
| Dividends and interest | | | 684,013 | | | | 192,570 | | | | 19,998,666 | | |
| Variation margin | | | — | | | | — | | | | 210,281 | | |
| Unrealized appreciation on swap agreements | | | — | | | | — | | | | 407,056 | | |
| Prepaid expenses | | | 13,905 | | | | 5,568 | | | | 72,245 | | |
| Total assets | | $ | 655,966,672 | | | $ | 236,016,425 | | | $ | 3,235,346,745 | | |
| LIABILITIES: | |
| Payable for investment securities purchased | | | 6,560,894 | | | | — | | | | 292,697,530 | | |
| Payable for fund shares redeemed | | | 4,054,510 | | | | 1,916,995 | | | | 4,631,896 | | |
| Payable for futures variation margin | | | — | | | | — | | | | 338,599 | | |
| Payable upon receipt of securities loaned | | | 130,322,883 | | | | 32,518,880 | | | | 404,474,535 | | |
| Upfront payments received on swap agreements | | | — | | | | — | | | | 208,657 | | |
| Unrealized depreciation on swap agreements | | | — | | | | — | | | | 1,345,145 | | |
| Payable to affiliates | | | 358,592 | | | | 120,140 | | | | 1,092,144 | | |
| Payable to custodian due to foreign currency overdraft** | | | — | | | | — | | | | 149,219 | | |
| Payable for trustee fees | | | 10,926 | | | | 6,348 | | | | 43,429 | | |
| Other accrued expenses and liabilities | | | 51,422 | | | | 48,009 | | | | 139,639 | | |
| Total liabilities | | | 141,359,227 | | | | 34,610,372 | | | | 705,120,793 | | |
| NET ASSETS | | $ | 514,607,445 | | | $ | 201,406,053 | | | $ | 2,530,225,952 | | |
| NET ASSETS WERE COMPRISED OF: | |
| Paid-in capital | | $ | 375,066,954 | | | $ | 174,818,871 | | | $ | 2,558,604,986 | | |
| Undistributed net investment income | | | 970,883 | | | | 3,112,822 | | | | 914,743 | | |
Accumulated net realized gain (loss) on investments, foreign
currency related transactions, futures, and swaps | | | 76,286,117 | | | | (5,840,298 | ) | | | (22,633,737 | ) | |
Net unrealized appreciation or depreciation on investments, foreign
currency related transactions, futures, and swaps | | | 62,283,491 | | | | 29,314,658 | | | | (6,660,040 | ) | |
| NET ASSETS | | $ | 514,607,445 | | | $ | 201,406,053 | | | $ | 2,530,225,952 | | |
| + Including securities loaned at value | | $ | 125,585,492 | | | $ | 31,476,731 | | | $ | 394,980,010 | | |
| * Cost of investments in securities | | $ | 440,930,584 | | | $ | 170,287,669 | | | $ | 2,725,871,599 | | |
| ** Cost of foreign currency overdraft | | $ | — | | | $ | — | | | $ | 149,521 | | |
| Class ADV: | |
| Net assets | | | n/a | | | $ | 1,000 | | | $ | 972 | | |
| Shares authorized | | | n/a | | | $ | 100,000,000 | | | | unlimited | | |
| Par value | | | n/a | | | $ | 0.001 | | | $ | 1.00 | | |
| Shares outstanding | | | n/a | | | | 64 | | | | 75 | | |
| Net asset value and redemption price per share | | | n/a | | | $ | 15.72 | | | $ | 12.96 | | |
| Class I: | |
| Net assets | | $ | 512,445,694 | | | $ | 173,014,208 | | | $ | 1,909,375,838 | | |
| Shares authorized | | $ | 100,000,000 | | | $ | 100,000,000 | | | | unlimited | | |
| Par value | | $ | 0.001 | | | $ | 0.001 | | | $ | 1.00 | | |
| Shares outstanding | | | 23,617,231 | | | | 10,919,924 | | | | 147,277,268 | | |
| Net asset value and redemption price per share | | $ | 21.70 | | | $ | 15.84 | | | $ | 12.96 | | |
| Class S: | |
| Net assets | | $ | 2,161,751 | | | $ | 28,390,845 | | | $ | 620,849,142 | | |
| Shares authorized | | $ | 100,000,000 | | | $ | 100,000,000 | | | | unlimited | | |
| Par value | | $ | 0.001 | | | $ | 0.001 | | | $ | 1.00 | | |
| Shares outstanding | | | 100,352 | | | | 1,805,742 | | | | 48,174,514 | | |
| Net asset value and redemption price per share | | $ | 21.54 | | | $ | 15.72 | | | $ | 12.89 | | |
See Accompanying Notes to Financial Statements
26
STATEMENTS OF ASSETS AND LIABILITIES AS OF DECEMBER 31, 2006
| | | ING
VP Money
Market
Portfolio | | ING
VP Global Science
and Technology
Portfolio | | ING
VP International
Equity
Portfolio | |
| ASSETS: | |
| Investments in securities at value+* | | $ | — | | | $ | 80,459,165 | | | $ | 79,049,579 | | |
| Short-term investments at amortized cost | | | 1,358,123,691 | | | | 20,519,212 | | | | 3,228,095 | | |
| Cash | | | 55,018 | | | | 642,467 | | | | 660 | | |
| Foreign currencies at value** | | | — | | | | 1,079,714 | | | | 58 | | |
| Receivables: | |
| Fund shares sold | | | 1,008,428 | | | | 105,672 | | | | 1,000 | | |
| Dividends and interest | | | 5,272,507 | | | | 32,482 | | | | 156,191 | | |
| Unrealized appreciation on forward foreign currency contracts | | | — | | | | 722,146 | | | | — | | |
| Prepaid expenses | | | 37,039 | | | | 2,323 | | | | 2,040 | | |
| Total assets | | $ | 1,364,496,683 | | | $ | 103,563,181 | | | $ | 82,437,623 | | |
| LIABILITIES: | |
| Payable for fund shares redeemed | | | 8,135,890 | | | | 5,404 | | | | 110,459 | | |
| Payable upon receipt of securities loaned | | | — | | | | 20,519,212 | | | | 2,781,095 | | |
| Unrealized depreciation on forward currency contracts | | | — | | | | 762,458 | | | | — | | |
| Payable to affiliates | | | 352,263 | | | | 71,522 | | | | 60,545 | | |
| Payable for trustee fees | | | 33,983 | | | | 2,703 | | | | 2,636 | | |
| Other accrued expenses and liabilities | | | 124,464 | | | | 28,075 | | | | 33,751 | | |
| Accrued foreign taxes on capital gains | | | — | | | | 23,584 | | | | — | | |
| Total liabilities | | | 8,646,600 | | | | 21,412,958 | | | | 2,988,486 | | |
| NET ASSETS | | $ | 1,355,850,083 | | | $ | 82,150,223 | | | $ | 79,449,137 | | |
| NET ASSETS WERE COMPRISED OF: | |
| Paid-in capital | | $ | 1,303,349,353 | | | $ | 114,883,870 | | | $ | 74,897,946 | | |
| Undistributed net investment income | | | 57,121,312 | | | | 21,353 | | | | 1,627,816 | | |
Accumulated net realized loss on
investments and foreign currency related transactions | | | (4,620,582 | ) | | | (42,592,253 | ) | | | (10,820,603 | ) | |
Net unrealized appreciation on
investments and foreign currency related transactions | | | — | | | | 9,837,253 | | | | 13,743,978 | | |
| NET ASSETS | | $ | 1,355,850,083 | | | $ | 82,150,223 | | | $ | 79,449,137 | | |
| + Including securities loaned at value | | $ | — | | | $ | 19,800,685 | | | $ | 2,634,993 | | |
| * Cost of investments in securities | | $ | — | | | $ | 70,582,699 | | | $ | 65,311,349 | | |
| ** Cost of foreign currencies | | $ | — | | | $ | 1,078,787 | | | $ | 58 | | |
| Class ADV: | |
| Net assets | | | n/a | | | | n/a | | | $ | 1,000 | | |
| Shares authorized | | | n/a | | | | n/a | | | $ | 100,000,000 | | |
| Par value | | | n/a | | | | n/a | | | $ | 0.001 | | |
| Shares outstanding | | | n/a | | | | n/a | | | | 82 | | |
| Net asset value and redemption price per share | | | n/a | | | | n/a | | | $ | 12.21 | | |
| Class I: | |
| Net assets | | $ | 1,355,850,083 | | | $ | 81,599,426 | | | $ | 78,572,931 | | |
| Shares authorized | | | unlimited | | | $ | 100,000,000 | | | $ | 100,000,000 | | |
| Par value | | $ | 1.000 | | | $ | 0.001 | | | $ | 0.001 | | |
| Shares outstanding | | | 101,206,360 | | | | 17,814,969 | | | | 6,392,041 | | |
| Net asset value and redemption price per share | | $ | 13.40 | | | $ | 4.58 | | | $ | 12.29 | | |
| Class S: | |
| Net assets | | | n/a | | | $ | 550,797 | | | $ | 875,206 | | |
| Shares authorized | | | n/a | | | $ | 100,000,000 | | | $ | 100,000,000 | | |
| Par value | | | n/a | | | $ | 0.001 | | | $ | 0.001 | | |
| Shares outstanding | | | n/a | | | | 120,690 | | | | 71,706 | | |
| Net asset value and redemption price per share | | | n/a | | | $ | 4.56 | | | $ | 12.21 | | |
See Accompanying Notes to Financial Statements
27
STATEMENTS OF OPERATIONS FOR THE YEAR ENDED DECEMBER 31, 2006
| | | ING
VP Balanced
Portfolio | | ING
VP Growth and
Income
Portfolio | | ING
VP Growth
Portfolio | |
| INVESTMENT INCOME: | |
| Dividends, net of foreign taxes withheld* | | $ | 13,893,410 | | | $ | 47,395,033 | | | $ | 1,529,406 | | |
| Interest(1) | | | 23,456,276 | | | | 6,264,961 | | | | 152,366 | | |
| Securities lending income | | | 257,478 | | | | 324,263 | | | | 7,164 | | |
| Total investment income | | | 37,607,164 | | | | 53,984,257 | | | | 1,688,936 | | |
| EXPENSES: | |
| Investment management fees | | | 6,188,000 | | | | 15,476,271 | | | | 1,145,714 | | |
| Distribution and service fees | | | 20,914 | | | | 8,520 | | | | 706 | | |
| Transfer agent fees | | | 365 | | | | 9,200 | | | | 183 | | |
| Administrative service fees | | | 680,659 | | | | 1,702,338 | | | | 105,020 | | |
| Shareholder reporting expense | | | 117,637 | | | | 81,045 | | | | 5,868 | | |
| Registration fees | | | 1,285 | | | | 8,155 | | | | 491 | | |
| Professional fees | | | 97,588 | | | | 206,604 | | | | 15,235 | | |
| Custody and accounting expense | | | 161,568 | | | | 317,520 | | | | 27,840 | | |
| Trustee fees | | | 68,517 | | | | 191,709 | | | | 8,547 | | |
| Miscellaneous expense | | | 114,829 | | | | 269,615 | | | | 13,171 | | |
| Interest expense | | | — | | | | — | | | | 920 | | |
| Interest expense on reverse repurchase agreements | | | 29,415 | | | | — | | | | — | | |
| Total expenses | | | 7,480,777 | | | | 18,270,977 | | | | 1,323,695 | | |
| Net waived and reimbursed fees | | | (3,167 | ) | | | (12,752 | ) | | | — | | |
| Net expenses | | | 7,477,610 | | | | 18,258,225 | | | | 1,323,695 | | |
| Net investment income | | | 30,129,554 | | | | 35,726,032 | | | | 365,241 | | |
REALIZED AND UNREALIZED GAIN (LOSS)
ON INVESTMENTS, FOREIGN CURRENCY
RELATED TRANSACTIONS, FUTURES, AND SWAPS: | |
| Net realized gain (loss) on: | |
| Investments | | | 65,325,630 | | | | 275,359,277 | | | | 13,075,352 | | |
| Foreign currency related transactions | | | (268,830 | ) | | | — | | | | — | | |
| Futures, swaps, and written options | | | (82,991 | ) | | | 9,310,614 | | | | — | | |
Net realized gain on investments, foreign currency
related transactions, futures, swaps, and written options | | | 64,973,809 | | | | 284,669,891 | | | | 13,075,352 | | |
| Net change in unrealized appreciation or depreciation on: | |
| Investments | | | 21,566,306 | | | | 89,116,725 | | | | (9,629,888 | ) | |
| Foreign currency related transactions | | | 296 | | | | 8,751 | | | | — | | |
| Futures, swaps, and written options | | | (931,557 | ) | | | 654,107 | | | | — | | |
Net change in unrealized appreciation or depreciation on
investments, foreign currency related transactions,
futures, swaps, and written options | | | 20,635,045 | | | | 89,779,583 | | | | (9,629,888 | ) | |
Net realized and unrealized gain on
investments, foreign currency related transactions,
futures, and swaps | | | 85,608,854 | | | | 374,449,474 | | | | 3,445,464 | | |
| Increase in net assets resulting from operations | | $ | 115,738,408 | | | $ | 410,175,506 | | | $ | 3,810,705 | | |
| * Foreign taxes withheld | | $ | 1,150 | | | $ | 358,627 | | | $ | 2,724 | | |
| (1) Affiliated income | | $ | 223,590 | | | $ | 890,365 | | | $ | — | | |
See Accompanying Notes to Financial Statements
28
STATEMENTS OF OPERATIONS FOR THE YEAR ENDED DECEMBER 31, 2006
| | | ING
VP Small
Company
Portfolio | | ING
VP Value
Opportunity
Portfolio | | ING
VP Intermediate
Bond
Portfolio | |
| INVESTMENT INCOME: | |
| Dividends, net of foreign taxes withheld* | | $ | 4,374,048 | | | $ | 4,357,874 | | | $ | 2,527,804 | | |
| Interest(1) | | | 917,191 | | | | 176,386 | | | | 109,246,030 | | |
| Securities lending income | | | 150,459 | | | | 69,568 | | | | 970,896 | | |
| Total investment income | | | 5,441,698 | | | | 4,603,828 | | | | 112,744,730 | | |
| EXPENSES: | |
| Investment management fees | | | 3,730,684 | | | | 1,216,393 | | | | 8,259,214 | | |
| Distribution and service fees | | | 70,503 | | | | 71,881 | | | | 1,336,025 | | |
| Transfer agent fees | | | 365 | | | | 373 | | | | 10,390 | | |
| Administrative service fees | | | 273,575 | | | | 111,499 | | | | 1,135,605 | | |
| Shareholder reporting expense | | | 53,865 | | | | 7,749 | | | | 70,438 | | |
| Registration fees | | | 1,720 | | | | 634 | | | | 38,715 | | |
| Professional fees | | | 48,290 | | | | 9,527 | | | | 206,052 | | |
| Custody and accounting expense | | | 60,755 | | | | 25,400 | | | | 225,400 | | |
| Trustee fees | | | 34,200 | | | | 14,495 | | | | 136,890 | | |
| Miscellaneous expense | | | 39,115 | | | | 15,004 | | | | 129,146 | | |
| Interest expense | | | — | | | | 969 | | | | 552 | | |
| Total expenses | | | 4,313,072 | | | | 1,473,924 | | | | 11,548,427 | | |
| Net waived and reimbursed fees | | | (1,019 | ) | | | — | | | | (6,604 | ) | |
| Net expenses | | | 4,312,053 | | | | 1,473,924 | | | | 11,541,823 | | |
| Net investment income | | | 1,129,645 | | | | 3,129,904 | | | | 101,202,907 | | |
REALIZED AND UNREALIZED GAIN (LOSS)
ON INVESTMENTS, FOREIGN CURRENCY
RELATED TRANSACTIONS, FUTURES, AND SWAPS: | |
| Net realized gain (loss) on: | |
| Investments | | | 76,296,063 | | | | 17,917,306 | | | | (4,067,570 | ) | |
| Foreign currency related transactions | | | (4,829 | ) | | | — | | | | (1,267,463 | ) | |
| Futures and swaps | | | — | | | | — | | | | (7,690,954 | ) | |
Net realized gain (loss) on investments, foreign currency
related transactions, futures, and swaps | | | 76,291,234 | | | | 17,917,306 | | | | (13,025,987 | ) | |
| Net change in unrealized appreciation or depreciation on: | |
| Investments | | | (665,601 | ) | | | 9,299,578 | | | | 2,785,334 | | |
| Foreign currency related transactions | | | — | | | | — | | | | 5,984 | | |
| Futures and swaps | | | — | | | | — | | | | (3,764,369 | ) | |
Net change in unrealized appreciation or depreciation on
investments, foreign currency related transactions,
futures, and swaps | | | (665,601 | ) | | | 9,299,578 | | | | (973,051 | ) | |
Net realized and unrealized gain (loss) on investments,
foreign currency related transactions, futures, and swaps | | | 75,625,633 | | | | 27,216,884 | | | | (13,999,038 | ) | |
| Increase in net assets resulting from operations | | $ | 76,755,278 | | | $ | 30,346,788 | | | $ | 87,203,869 | | |
| * Foreign taxes withheld | | $ | 20,605 | | | $ | 19,350 | | | $ | 30,699 | | |
| (1) Affiliated income | | $ | 72,915 | | | $ | — | | | $ | 445,141 | | |
See Accompanying Notes to Financial Statements
29
STATEMENTS OF OPERATIONS FOR THE YEAR ENDED DECEMBER 31, 2006
| | | ING
VP Money
Market
Portfolio | | ING
VP Global Science
and Technology
Portfolio | | ING
VP International
Equity
Portfolio | |
| INVESTMENT INCOME: | |
| Dividends, net of foreign taxes withheld* | | $ | — | | | $ | 553,890 | | | $ | 2,202,046 | | |
| Interest | | | 61,182,745 | | | | 92,904 | | | | 82,929 | | |
| Securities lending income | | | 1,086 | | | | 39,486 | | | | 51,279 | | |
| Total investment income | | | 61,183,831 | | | | 686,280 | | | | 2,336,254 | | |
| EXPENSES: | |
| Investment management fees | | | 2,980,838 | | | | 823,368 | | | | 610,686 | | |
| Distribution and service fees | | | — | | | | 1,057 | | | | 1,748 | | |
| Transfer agent fees | | | 710 | | | | 1,117 | | | | 342 | | |
| Administrative service fees | | | 655,764 | | | | 47,667 | | | | 39,541 | | |
| Shareholder reporting expense | | | 41,326 | | | | 4,335 | | | | 365 | | |
| Registration fees | | | 803 | | | | 217 | | | | 130 | | |
| Professional fees | | | 68,092 | | | | 12,592 | | | | 10,311 | | |
| Custody and accounting expense | | | 125,115 | | | | 29,671 | | | | 36,332 | | |
| Trustee fees | | | 91,326 | | | | 5,812 | | | | 5,734 | | |
| Miscellaneous expense | | | 83,694 | | | | 9,090 | | | | 5,395 | | |
| Interest expense | | | — | | | | 213 | | | | 103 | | |
| Total expenses | | | 4,047,668 | | | | 935,139 | | | | 710,687 | | |
| Net investment income (loss) | | | 57,136,163 | | | | (248,859 | ) | | | 1,625,567 | | |
REALIZED AND UNREALIZED GAIN (LOSS)
ON INVESTMENTS AND FOREIGN CURRENCY
RELATED TRANSACTIONS: | |
| Net realized gain (loss) on: | |
| Investments | | | 75,645 | | | | 11,324,306 | | | | 8,895,508 | | |
| Foreign currency related transactions | | | — | | | | (121,828 | ) | | | 5,165 | | |
Net realized gain on investments and foreign currency
related transactions | | | 75,645 | | | | 11,202,478 | | | | 8,900,673 | | |
| Net change in unrealized appreciation or depreciation on: | |
| Investments | | | — | | | | (5,145,946 | ) | | | 4,328,611 | | |
| Foreign currency related transactions | | | — | | | | (45,930 | ) | | | 4,536 | | |
Net change in unrealized appreciation or depreciation
on investments | | | — | | | | (5,191,876 | ) | | | 4,333,147 | | |
Net realized and unrealized gain on investments
and foreign currency related transactions | | | 75,645 | | | | 6,010,602 | | | | 13,233,820 | | |
| Increase in net assets resulting from operations | | $ | 57,211,808 | | | $ | 5,761,743 | | | $ | 14,859,387 | | |
| * Foreign taxes withheld | | $ | — | | | $ | 40,538 | | | $ | 137,903 | | |
See Accompanying Notes to Financial Statements
30
STATEMENTS OF CHANGES IN NET ASSETS
| | | ING VP Balanced Portfolio | | ING VP Growth and
Income Portfolio | |
| | | Year Ended
December 31,
2006 | | Year Ended
December 31,
2005 | | Year Ended
December 31,
2006 | | Year Ended
December 31,
2005 | |
| FROM OPERATIONS: | |
| Net investment income | | $ | 30,129,554 | | | $ | 28,286,963 | | | $ | 35,726,032 | | | $ | 33,375,077 | | |
Net realized gain on investments, investments in
underlying affiliated funds, foreign currency
related transactions, futures, swaps,
and written options | | | 64,973,809 | | | | 64,223,820 | | | | 284,669,891 | | | | 286,834,181 | | |
Net change in unrealized appreciation or
depreciation on investments, foreign currency
related transactions, futures, swaps,
and written options | | | 20,635,045 | | | | (39,149,630 | ) | | | 89,779,583 | | | | (73,755,824 | ) | |
| Net increase in net assets resulting from operations | | | 115,738,408 | | | | 53,361,153 | | | | 410,175,506 | | | | 246,453,434 | | |
| FROM DISTRIBUTIONS TO SHAREHOLDERS: | |
| Net investment income: | |
| Class ADV | | | — | | | | — | | | | (12 | ) | | | — | | |
| Class I | | | (28,870,646 | ) | | | (30,561,067 | ) | | | (35,978,959 | ) | | | (32,953,759 | ) | |
| Class S | | | (70,509 | ) | | | (64,964 | ) | | | (46,207 | ) | | | (22,610 | ) | |
| Total distributions | | | (28,941,155 | ) | | | (30,626,031 | ) | | | (36,025,178 | ) | | | (32,976,369 | ) | |
| FROM CAPITAL SHARE TRANSACTIONS: | |
| Net proceeds from sale of shares | | | 68,843,823 | | | | 13,329,999 | | | | 26,744,895 | | | | 3,779,349 | | |
| Proceeds issued in merger | | | 21,745,814 | | | | — | | | | — | | | | — | | |
| Dividends reinvested | | | 28,941,155 | | | | 30,626,031 | | | | 35,997,107 | | | | 32,951,640 | | |
| | | | 119,530,792 | | | | 43,956,030 | | | | 62,742,002 | | | | 36,730,989 | | |
| Cost of shares redeemed | | | (251,212,849 | ) | | | (188,164,420 | ) | | | (482,469,282 | ) | | | (634,951,531 | ) | |
Net decrease in net assets resulting from
capital share transactions | | | (131,682,057 | ) | | | (144,208,390 | ) | | | (419,727,280 | ) | | | (598,220,542 | ) | |
| Net decrease in net assets | | | (44,884,804 | ) | | | (121,473,268 | ) | | | (45,576,952 | ) | | | (384,743,477 | ) | |
| NET ASSETS: | |
| Beginning of year | | | 1,239,496,883 | | | | 1,360,970,151 | | | | 3,148,455,638 | | | | 3,533,199,115 | | |
| End of year | | $ | 1,194,612,079 | | | $ | 1,239,496,883 | | | $ | 3,102,878,686 | | | $ | 3,148,455,638 | | |
| Undistributed net investment income at end of year | | $ | 30,641,694 | | | $ | 28,943,335 | | | $ | 161,526 | | | $ | 393,853 | | |
See Accompanying Notes to Financial Statements
31
STATEMENTS OF CHANGES IN NET ASSETS
| | | ING VP Growth Portfolio | | ING VP Small Company Portfolio | |
| | | Year Ended
December 31,
2006 | | Year Ended
December 31,
2005 | | Year Ended
December 31,
2006 | | Year Ended
December 31,
2005 | |
| FROM OPERATIONS: | |
| Net investment income | | $ | 365,241 | | | $ | 113,812 | | | $ | 1,129,645 | | | $ | 1,933,631 | | |
Net realized gain on investments, investments in
underlying affiliated funds, and foreign currency
related transactions | | | 13,075,352 | | | | 16,612,464 | | | | 76,291,234 | | | | 70,563,656 | | |
Net change in unrealized appreciation or depreciation
on investments | | | (9,629,888 | ) | | | (2,095,958 | ) | | | (665,601 | ) | | | (35,161,610 | ) | |
| Net increase in net assets resulting from operations | | | 3,810,705 | | | | 14,630,318 | | | | 76,755,278 | | | | 37,335,677 | | |
| FROM DISTRIBUTIONS TO SHAREHOLDERS: | |
| Net investment income: | |
| Class I | | | (113,349 | ) | | | (1,254,943 | ) | | | (1,544,649 | ) | | | (629,139 | ) | |
| Class S | | | — | | | | (1,478 | ) | | | (154,077 | ) | | | (11,731 | ) | |
| Net realized gains: | |
| Class I | | | — | | | | — | | | | (58,647,564 | ) | | | (5,638,130 | ) | |
| Class S | | | — | | | | — | | | | (12,123,157 | ) | | | (645,187 | ) | |
| Total distributions | | | (113,349 | ) | | | (1,256,421 | ) | | | (72,469,447 | ) | | | (6,924,187 | ) | |
| FROM CAPITAL SHARE TRANSACTIONS: | |
| Net proceeds from sale of shares | | | 51,217,584 | | | | 5,010,821 | | | | 161,701,457 | | | | 84,826,927 | | |
| Dividends reinvested | | | 113,349 | | | | 1,256,421 | | | | 72,469,447 | | | | 6,924,187 | | |
| | | | 51,330,933 | | | | 6,267,242 | | | | 234,170,904 | | | | 91,751,114 | | |
| Cost of shares redeemed | | | (43,840,954 | ) | | | (37,695,610 | ) | | | (186,317,390 | ) | | | (192,925,770 | ) | |
Net increase (decrease) in net assets resulting from
capital share transactions | | | 7,489,979 | | | | (31,428,368 | ) | | | 47,853,514 | | | | (101,174,656 | ) | |
| Net increase (decrease) in net assets | | | 11,187,335 | | | | (18,054,471 | ) | | | 52,139,345 | | | | (70,763,166 | ) | |
| NET ASSETS: | |
| Beginning of year | | | 175,582,015 | | | | 193,636,486 | | | | 462,468,100 | | | | 533,231,266 | | |
| End of year | | $ | 186,769,350 | | | $ | 175,582,015 | | | $ | 514,607,445 | | | $ | 462,468,100 | | |
| Undistributed net investment income at end of year | | $ | 362,892 | | | $ | 111,000 | | | $ | 970,883 | | | $ | 1,808,051 | | |
See Accompanying Notes to Financial Statements
32
STATEMENTS OF CHANGES IN NET ASSETS
| | | ING VP Value
Opportunity Portfolio | | ING VP Intermediate
Bond Portfolio | |
| | | Year Ended
December 31,
2006 | | Year Ended
December 31,
2005 | | Year Ended
December 31,
2006 | | Year Ended
December 31,
2005 | |
| FROM OPERATIONS: | |
| Net investment income | | $ | 3,129,904 | | | $ | 2,925,042 | | | $ | 101,202,907 | | | $ | 63,355,329 | | |
Net realized gain (loss) on investments, investments in
underlying affiliated funds, foreign currency
related transactions, futures, and swaps | | | 17,917,306 | | | | 16,880,743 | | | | (13,025,987 | ) | | | (5,401,705 | ) | |
Net change in unrealized appreciation or depreciation
on investments, foreign currency related transactions,
futures, and swaps | | | 9,299,578 | | | | (7,743,251 | ) | | | (973,051 | ) | | | (11,601,726 | ) | |
| Net increase in net assets resulting from operations | | | 30,346,788 | | | | 12,062,534 | | | | 87,203,869 | | | | 46,351,898 | | |
| FROM DISTRIBUTIONS TO SHAREHOLDERS: | |
| Net investment income: | |
| Class ADV | | | — | | | | — | | | | (40 | ) | | | — | | |
| Class I | | | (2,514,028 | ) | | | (3,812,050 | ) | | | (75,863,165 | ) | | | (43,350,584 | ) | |
| Class S | | | (411,247 | ) | | | (58,891 | ) | | | (23,433,812 | ) | | | (21,220,005 | ) | |
| Net realized gains: | |
| Class I | | | — | | | | — | | | | — | | | | (5,820,859 | ) | |
| Class S | | | — | | | | — | | | | — | | | | (2,592,551 | ) | |
| Total distributions | | | (2,925,275 | ) | | | (3,870,941 | ) | | | (99,297,017 | ) | | | (72,983,999 | ) | |
| FROM CAPITAL SHARE TRANSACTIONS: | |
| Net proceeds from sale of shares | | | 2,493,673 | | | | 7,777,950 | | | | 1,313,238,729 | | | | 506,231,158 | | |
| Proceeds issued in merger | | | — | | | | 35,824,021 | | | | 2,862,609 | | | | — | | |
| Dividends reinvested | | | 2,925,275 | | | | 3,870,941 | | | | 99,270,730 | | | | 72,952,456 | | |
| | | | 5,418,948 | | | | 47,472,912 | | | | 1,415,372,068 | | | | 579,183,614 | | |
| Cost of shares redeemed | | | (40,387,407 | ) | | | (70,105,800 | ) | | | (638,397,059 | ) | | | (181,491,451 | ) | |
Net increase (decrease) in net assets resulting from
capital share transactions | | | (34,968,459 | ) | | | (22,632,888 | ) | | | 776,975,009 | | | | 397,692,163 | | |
| Net increase (decrease) in net assets | | | (7,546,946 | ) | | | (14,441,295 | ) | | | 764,881,861 | | | | 371,060,062 | | |
| NET ASSETS: | |
| Beginning of year | | | 208,952,999 | | | | 223,394,294 | | | | 1,765,344,091 | | | | 1,394,284,029 | | |
| End of year | | $ | 201,406,053 | | | $ | 208,952,999 | | | $ | 2,530,225,952 | | | $ | 1,765,344,091 | | |
| Undistributed net investment income at end of year | | $ | 3,112,822 | | | $ | 2,922,288 | | | $ | 914,743 | | | $ | 735,802 | | |
See Accompanying Notes to Financial Statements
33
STATEMENTS OF CHANGES IN NET ASSETS
| | | ING VP Money Market Portfolio | | ING VP Global Science and
Technology Portfolio | |
| | | Year Ended
December 31,
2006 | | Year Ended
December 31,
2005 | | Year Ended
December 31,
2006 | | Year Ended
December 31,
2005 | |
| FROM OPERATIONS: | |
| Net investment income (loss) | | $ | 57,136,163 | | | $ | 31,890,380 | | | $ | (248,859 | ) | | $ | (370,605 | ) | |
Net realized gain on investments and foreign currency
related transactions | | | 75,645 | | | | 16,292 | | | | 11,202,478 | | | | 870,559 | | |
Net change in unrealized appreciation or depreciation on
investments and foreign currency related transactions | | | — | | | | 232,026 | | | | (5,191,876 | ) | | | 7,222,993 | | |
| Net increase in net assets resulting from operations | | | 57,211,808 | | | | 32,138,698 | | | | 5,761,743 | | | | 7,722,947 | | |
| FROM DISTRIBUTIONS TO SHAREHOLDERS: | |
| Net investment income | | | (31,895,864 | ) | | | (12,797,898 | ) | | | — | | | | — | | |
| Total distributions | | | (31,895,864 | ) | | | (12,797,898 | ) | | | — | | | | — | | |
| FROM CAPITAL SHARE TRANSACTIONS: | |
| Net proceeds from sale of shares | | | 428,969,203 | | | | 229,751,452 | | | | 13,780,858 | | | | 14,070,092 | | |
| Dividends reinvested | | | 31,895,864 | | | | 12,797,898 | | | | — | | | | — | | |
| | | | 460,865,067 | | | | 242,549,350 | | | | 13,780,858 | | | | 14,070,092 | | |
| Cost of shares redeemed | | | (203,348,846 | ) | | | (290,343,446 | ) | | | (21,993,235 | ) | | | (23,483,463 | ) | |
Net increase (decrease) in net assets resulting from
capital share transactions | | | 257,516,221 | | | | (47,794,096 | ) | | | (8,212,377 | ) | | | (9,413,371 | ) | |
| Net increase (decrease) in net assets | | | 282,832,165 | | | | (28,453,296 | ) | | | (2,450,634 | ) | | | (1,690,424 | ) | |
| NET ASSETS: | |
| Beginning of year | | | 1,073,017,918 | | | | 1,101,471,214 | | | | 84,600,857 | | | | 86,291,281 | | |
| End of year | | $ | 1,355,850,083 | | | $ | 1,073,017,918 | | | $ | 82,150,223 | | | $ | 84,600,857 | | |
Undistributed net investment income (accumulated
net investment loss) at end of year | | $ | 57,121,312 | | | $ | 31,881,013 | | | $ | 21,353 | | | $ | — | | |
See Accompanying Notes to Financial Statements
34
STATEMENTS OF CHANGES IN NET ASSETS
| | | ING VP International
Equity Portfolio | |
| | | Year Ended
December 31,
2006 | | Year Ended
December 31,
2005 | |
| FROM OPERATIONS: | |
| Net investment income | | $ | 1,625,567 | | | $ | 840,310 | | |
| Net realized gain on investments and foreign currency related transactions | | | 8,900,673 | | | | 6,874,664 | | |
Net change in unrealized appreciation or depreciation on investments
and foreign currency related transactions | | | 4,333,147 | | | | 1,165,804 | | |
| Net increase in net assets resulting from operations | | | 14,859,387 | | | | 8,880,778 | | |
| FROM DISTRIBUTIONS TO SHAREHOLDERS: | |
| Net investment income: | | | | | | | | | |
| Class I | | | (1,095,926 | ) | | | (539,401 | ) | |
| Class S | | | (7,085 | ) | | | (2,439 | ) | |
| Total distributions | | | (1,103,011 | ) | | | (541,840 | ) | |
| FROM CAPITAL SHARE TRANSACTIONS: | |
| Net proceeds from sale of shares | | | 17,382,229 | | | | 19,109,104 | | |
| Dividends reinvested | | | 1,103,011 | | | | 541,840 | | |
| | | | 18,485,240 | | | | 19,650,944 | | |
| Cost of shares redeemed | | | (14,608,817 | ) | | | (18,943,392 | ) | |
| Net increase in net assets resulting from capital share transactions | | | 3,876,423 | | | | 707,552 | | |
| Net increase in net assets | | | 17,632,799 | | | | 9,046,490 | | |
| NET ASSETS: | |
| Beginning of year | | | 61,816,338 | | | | 52,769,848 | | |
| End of year | | $ | 79,449,137 | | | $ | 61,816,338 | | |
| Undistributed net investment income at end of year | | $ | 1,627,816 | | | $ | 1,100,095 | | |
See Accompanying Notes to Financial Statements
35
ING VP BALANCED PORTFOLIO
FINANCIAL HIGHLIGHTS
Selected data for a share of beneficial interest outstanding throughout each period.
| | | Class ADV | | Class I | |
| | | December 29,
2006(1) to
December 31, | | Year Ended December 31, | |
| | | 2006 | | 2006 | | 2005 | | 2004 | | 2003 | | 2002 | |
| Per Share Operating Performance: | |
| Net asset value, beginning of period | | $ | 14.65 | | | | 13.64 | | | | 13.40 | | | | 12.50 | | | | 10.73 | | | | 12.09 | | |
| Income (loss) from investment operations: | |
| Net investment income (loss) | | $ | (0.00 | )** | | | 0.34 | * | | | 0.29 | * | | | 0.29 | | | | 0.25 | | | | 0.25 | | |
Net realized and unrealized gain (loss)
on investments | | $ | — | | | | 1.00 | | | | 0.27 | | | | 0.87 | | | | 1.76 | | | | (1.49 | ) | |
| Total from investment operations | | $ | (0.00 | )** | | | 1.34 | | | | 0.56 | | | | 1.16 | | | | 2.01 | | | | (1.24 | ) | |
| Less distributions from: | |
| Net investment income | | $ | — | | | | 0.33 | | | | 0.32 | | | | 0.26 | | | | 0.24 | | | | 0.12 | | |
| Total distributions | | $ | — | | | | 0.33 | | | | 0.32 | | | | 0.26 | | | | 0.24 | | | | 0.12 | | |
| Net asset value, end of period | | $ | 14.65 | | | | 14.65 | | | | 13.64 | | | | 13.40 | | | | 12.50 | | | | 10.73 | | |
| Total Return(2) | | % | — | | | | 9.99 | | | | 4.24 | | | | 9.42 | | | | 18.87 | | | | (10.31 | ) | |
| Ratios and Supplemental Data: | |
| Net assets, end of period (millions) | | $ | 0 | *** | | | 1,184 | | | | 1,236 | | | | 1,358 | | | | 1,375 | | | | 1,223 | | |
| Ratios to average net assets: | |
| Net expenses after expense waiver(3) | | % | 1.10 | (4) | | | 0.60 | (4) | | | 0.60 | | | | 0.59 | | | | 0.60 | | | | 0.60 | | |
| Gross expenses prior to expense waiver(3) | | % | 1.10 | | | | 0.60 | | | | 0.60 | | | | 0.59 | | | | 0.60 | | | | 0.60 | | |
| Net investment income (loss) after expense waiver(3) | | % | (1.10 | )(4) | | | 2.44 | (4) | | | 2.30 | | | | 2.15 | | | | 2.04 | | | | 2.00 | | |
| Portfolio turnover rate | | % | 236 | | | | 236 | | | | 308 | | | | 272 | | | | 333 | | | | 345 | | |
| | | Class S | |
| | |
Year Ended December 31, | | May 29,
2003(1) to
December 31, | |
| | | 2006 | | 2005 | | 2004 | | 2003 | |
| Per Share Operating Performance: | |
| Net asset value, beginning of period | | $ | 13.58 | | | | 13.35 | | | | 12.49 | | | | 11.53 | | |
| Income from investment operations: | |
| Net investment income | | $ | 0.32 | * | | | 0.27 | | | | 0.22 | | | | 0.34 | | |
| Net realized and unrealized gain on investments | | $ | 0.97 | | | | 0.25 | | | | 0.89 | | | | 0.85 | | |
| Total from investment operations | | $ | 1.29 | | | | 0.52 | | | | 1.11 | | | | 1.19 | | |
| Less distributions from: | |
| Net investment income | | $ | 0.30 | | | | 0.29 | | | | 0.25 | | | | 0.23 | | |
| Total distributions | | $ | 0.30 | | | | 0.29 | | | | 0.25 | | | | 0.23 | | |
| Net asset value, end of period | | $ | 14.57 | | | | 13.58 | | | | 13.35 | | | | 12.49 | | |
| Total Return(2) | | % | 9.62 | | | | 3.99 | | | | 9.06 | | | | 10.51 | | |
| Ratios and Supplemental Data: | |
| Net assets, end of period (millions) | | $ | 11 | | | | 3 | | | | 3 | | | | 1 | | |
| Ratios to average net assets: | |
| Net expenses after expense waiver(3) | | % | 0.85 | (4) | | | 0.85 | | | | 0.84 | | | | 0.83 | | |
| Gross expenses prior to expense waiver(3) | | % | 0.85 | | | | 0.85 | | | | 0.84 | | | | 0.83 | | |
| Net investment income after expense waiver(3) | | % | 2.29 | (4) | | | 2.06 | | | | 1.98 | | | | 3.06 | | |
| Portfolio turnover rate | | % | 236 | | | | 308 | | | | 272 | | | | 333 | | |
(1) Commencement of operations.
(2) Total return is calculated assuming reinvestment of all dividends and capital gain distributions at net asset value and does not reflect the effect of insurance contract charges. Total return for periods less than one year is not annualized.
(3) Annualized for periods less than one year.
(4) Impact of wa iving the advisory fee for the ING Institutional Prime Money Market Fund holding has less than 0.01% impact on the expense ratio.
* Per share data calculated using average number of shares outstanding throughout the period.
** Amount is more than $(0.005).
*** Amount is less than $500,000.
See Accompanying Notes to Financial Statements
36
ING VP GROWTH AND INCOME PORTFOLIO
FINANCIAL HIGHLIGHTS
Selected data for a share of beneficial interest outstanding throughout each period.
| | | Class ADV | | Class I | |
| | | December 20,
2006(1) to
December 31, | | Year Ended December 31, | |
| | | 2006 | | 2006 | | 2005 | | 2004 | | 2003 | | 2002 | |
| Per Share Operating Performance: | |
| Net asset value, beginning of period | | $ | 23.70 | | | | 20.71 | | | | 19.35 | | | | 18.28 | | | | 14.50 | | | | 19.54 | | |
| Income (loss) from investment operations: | |
| Net investment income | | $ | 0.01 | ** | | | 0.25 | ** | | | 0.23 | | | | 0.28 | | | | 0.16 | | | | 0.16 | | |
Net realized and unrealized gain (loss)
on investments | | $ | (0.06 | ) | | | 2.69 | | | | 1.35 | | | | 1.24 | | | | 3.62 | | | | (5.04 | ) | |
| Total from investment operations | | $ | (0.05 | ) | | | 2.94 | | | | 1.58 | | | | 1.52 | | | | 3.78 | | | | (4.88 | ) | |
| Less distributions from: | |
| Net investment income | | $ | 0.27 | | | | 0.27 | | | | 0.22 | | | | 0.45 | | | | — | | | | 0.16 | | |
| Total distributions | | $ | 0.27 | | | | 0.27 | | | | 0.22 | | | | 0.45 | | | | — | | | | 0.16 | | |
| Net asset value, end of period | | $ | 23.38 | | | | 23.38 | | | | 20.71 | | | | 19.35 | | | | 18.28 | | | | 14.50 | | |
| Total Return(2) | | % | (0.23 | ) | | | 14.20 | | | | 8.13 | | | | 8.39 | | | | 26.07 | | | | (24.99 | ) | |
| Ratios and Supplemental Data: | |
| Net assets, end of period (millions) | | $ | 0 | * | | | 3,098 | | | | 3,146 | | | | 3,531 | | | | 3,795 | | | | 3,525 | | |
| Ratios to average net assets: | |
| Net expenses after expense waiver(3) | | % | 1.09 | (4) | | | 0.59 | (4) | | | 0.59 | | | | 0.58 | | | | 0.60 | | | | 0.59 | | |
| Gross expenses prior to expense waiver(3) | | % | 1.09 | | | | 0.59 | | | | 0.59 | | | | 0.58 | | | | 0.60 | | | | 0.59 | | |
| Net investment income after expense waiver(3) | | % | 1.08 | (4) | | | 1.15 | (4) | | | 1.03 | | | | 1.41 | | | | 0.95 | | | | 0.83 | | |
| Portfolio turnover rate | | % | 103 | | | | 103 | | | | 80 | | | | 139 | | | | 150 | | | | 246 | | |
| | | Class S | |
| | | Year Ended December 31, | | June 11,
2003(1) to
December 31, | |
| | | 2006 | | 2005 | | 2004 | | 2003 | |
| Per Share Operating Performance: | |
| Net asset value, beginning of period | | $ | 20.69 | | | | 19.34 | | | | 18.26 | | | | 16.32 | | |
| Income from investment operations: | |
| Net investment income | | $ | 0.20 | ** | | | 0.14 | | | | 0.21 | | | | 0.04 | | |
| Net realized and unrealized gain on investments | | $ | 2.64 | | | | 1.41 | | | | 1.26 | | | | 1.90 | | |
| Total from investment operations | | $ | 2.84 | | | | 1.55 | | | | 1.47 | | | | 1.94 | | |
| Less distributions from: | |
| Net investment income | | $ | 0.23 | | | | 0.20 | | | | 0.39 | | | | — | | |
| Total distributions | | $ | 0.23 | | | | 0.20 | | | | 0.39 | | | | — | | |
| Net asset value, end of period | | $ | 23.30 | | | | 20.69 | | | | 19.34 | | | | 18.26 | | |
| Total Return(2) | | % | 13.72 | | | | 7.98 | | | | 8.10 | | | | 11.89 | | |
| Ratios and Supplemental Data: | |
| Net assets, end of period (millions) | | $ | 5 | | | | 2 | | | | 2 | | | | 2 | | |
| Ratios to average net assets: | |
| Net expenses after expense waiver(3) | | % | 0.84 | (4) | | | 0.84 | | | | 0.83 | | | | 0.84 | | |
| Gross expenses prior to expense waiver(3) | | % | 0.84 | | | | 0.84 | | | | 0.83 | | | | 0.84 | | |
| Net investment income after expense waiver(3) | | % | 0.94 | (4) | | | 0.78 | | | | 1.18 | | | | 0.57 | | |
| Portfolio turnover rate | | % | 103 | | | | 80 | | | | 139 | | | | 150 | | |
(1) Commencement of operations.
(2) Total return is calculated assuming reinvestment of all dividends and capital gain distributions at net asset value and does not reflect the effect of insurance contract charges. Total return for periods less than one year is not annualized.
(3) Annualized for periods less than one year.
(4) Impact of waiving the advisory fee for the ING Institutional Prime Money Market Fund holding has less than 0.01% impact on the expense ratio.
* Amount is less than $500,000.
** Per share data calculated using average shares outstanding throughout the period.
See Accompanying Notes to Financial Statements
37
ING VP GROWTH PORTFOLIO
FINANCIAL HIGHLIGHTS
Selected data for a share of beneficial interest outstanding throughout each period.
| | | Class ADV | | Class I | |
| | | December 29,
2006(1) to
December 31, | | Year Ended December 31, | |
| | | 2006 | | 2006 | | 2005 | | 2004 | | 2003 | | 2002 | |
| Per Share Operating Performance: | |
| Net asset value, beginning of period | | $ | 10.65 | | | | 10.38 | | | | 9.56 | | | | 8.93 | | | | 6.85 | | | | 9.64 | | |
| Income (loss) from investment operations: | |
| Net investment income (loss) | | $ | (0.00 | )* | | | 0.02 | | | | 0.02 | | | | 0.06 | | | | 0.01 | | | | (0.01 | ) | |
Net realized and unrealized gain (loss)
on investments | | $ | — | | | | 0.26 | | | | 0.87 | | | | 0.58 | | | | 2.07 | | | | (2.78 | ) | |
| Total from investment operations | | $ | (0.00 | )* | | | 0.28 | | | | 0.89 | | | | 0.64 | | | | 2.08 | | | | (2.79 | ) | |
| Less distributions from: | |
| Net investment income | | $ | — | | | | 0.01 | | | | 0.07 | | | | 0.01 | | | | — | | | | — | | |
| Total distributions | | $ | — | | | | 0.01 | | | | 0.07 | | | | 0.01 | | | | — | | | | — | | |
| Net asset value, end of period | | $ | 10.65 | | | | 10.65 | | | | 10.38 | | | | 9.56 | | | | 8.93 | | | | 6.85 | | |
| Total Return(2) | | % | — | | | | 2.65 | | | | 9.38 | † | | | 7.19 | | | | 30.36 | | | | (28.94 | ) | |
| Ratios and Supplemental Data: | |
| Net assets, end of period (000's) | | $ | 1 | | | | 186,495 | | | | 175,297 | | | | 193,280 | | | | 224,330 | | | | 181,029 | | |
| Ratios to average net assets: | |
| Expenses(3) | | % | 1.19 | | | | 0.69 | | | | 0.69 | | | | 0.69 | | | | 0.71 | | | | 0.72 | | |
| Net investment income (loss)(3) | | % | (1.19 | ) | | | 0.19 | | | | 0.08 | | | | 0.61 | | | | 0.13 | | | | (0.06 | ) | |
| Portfolio turnover rate | | % | 188 | | | | 188 | | | | 119 | | | | 123 | | | | 162 | | | | 241 | | |
| | | Class S | |
| | | Year Ended December 31, | |
| | | 2006 | | 2005 | | 2004 | | 2003 | | 2002 | |
| Per Share Operating Performance: | |
| Net asset value, beginning of year | | $ | 10.31 | | | | 9.50 | | | | 8.88 | | | | 6.83 | | | | 9.63 | | |
| Income (loss) from investment operations: | |
| Net investment income (loss) | | $ | (0.01 | ) | | | (0.00 | )* | | | 0.04 | | | | 0.00 | * | | | (0.01 | ) | |
Net realized and unrealized gain (loss)
on investments | | $ | 0.26 | | | | 0.85 | | | | 0.58 | | | | 2.05 | | | | (2.79 | ) | |
| Total from investment operations | | $ | 0.25 | | | | 0.85 | | | | 0.62 | | | | 2.05 | | | | (2.80 | ) | |
| Less distributions from: | |
| Net investment income | | $ | — | | | | 0.04 | | | | — | | | | — | | | | — | | |
| Total distributions | | $ | — | | | | 0.04 | | | | — | | | | — | | | | — | | |
| Net asset value, end of year | | $ | 10.56 | | | | 10.31 | | | | 9.50 | | | | 8.88 | | | | 6.83 | | |
| Total Return(2) | | % | 2.42 | | | | 9.05 | † | | | 6.98 | | | | 30.01 | | | | (29.08 | ) | |
| Ratios and Supplemental Data: | |
| Net assets, end of year (000's) | | $ | 273 | | | | 285 | | | | 356 | | | | 292 | | | | 53 | | |
| Ratios to average net assets: | |
| Expenses | | % | 0.94 | | | | 0.94 | | | | 0.94 | | | | 0.96 | | | | 0.97 | | |
| Net investment income (loss) | | % | (0.06 | ) | | | (0.17 | ) | | | 0.44 | | | | (0.10 | ) | | | (0.31 | ) | |
| Portfolio turnover rate | | % | 188 | | | | 119 | | | | 123 | | | | 162 | | | | 241 | | |
(1) Commencement of operations.
(2) Total return is calculated assuming reinvestment of all dividends and capital gain distributions at net asset value and does not reflect the effect of insurance contract charges. Total return for periods less than one year is not annualized.
(3) Annualized for periods less than one year.
* Amount is less than $0.005 or more than $(0.005) per share or less than 0.005%.
† In 2005, the Investment Adviser fully reimbursed the Portfolio for a loss incurred from a transaction not meeting the Portfolio's investment's guidelines. There was no impact on total return.
See Accompanying Notes to Financial Statements
38
ING VP SMALL COMPANY PORTFOLIO
FINANCIAL HIGHLIGHTS
Selected data for a share of beneficial interest outstanding throughout each year.
| | | Class I | |
| | | Year Ended December 31, | |
| | | 2006 | | 2005 | | 2004 | | 2003 | | 2002 | |
| Per Share Operating Performance: | |
| Net asset value, beginning of year | | $ | 21.65 | | | | 19.94 | | | | 17.48 | | | | 12.75 | | | | 16.68 | | |
| Income (loss) from investment operations: | |
| Net investment income | | $ | 0.05 | | | | 0.10 | | | | 0.04 | | | | 0.06 | | | | 0.05 | | |
Net realized and unrealized gain (loss)
on investments | | $ | 3.46 | | | | 1.92 | | | | 2.47 | | | | 4.71 | | | | (3.91 | ) | |
| Total from investment operations | | $ | 3.51 | | | | 2.02 | | | | 2.51 | | | | 4.77 | | | | (3.86 | ) | |
| Less distributions from: | |
| Net investment income | | $ | 0.09 | | | | 0.03 | | | | 0.05 | | | | 0.04 | | | | 0.07 | | |
| Net realized gains on investments | | $ | 3.37 | | | | 0.28 | | | | — | | | | — | | | | — | | |
| Total distributions | | $ | 3.46 | | | | 0.31 | | | | 0.05 | | | | 0.04 | | | | 0.07 | | |
| Net asset value, end of year | | $ | 21.70 | | | | 21.65 | | | | 19.94 | | | | 17.48 | | | | 12.75 | | |
| Total Return(1) | | % | 16.79 | | | | 10.27 | † | | | 14.39 | | | | 37.47 | | | | (23.23 | ) | |
| Ratios and Supplemental Data: | |
| Net assets, end of year (000's) | | $ | 512,446 | | | | 393,700 | | | | 461,014 | | | | 464,228 | | | | 288,890 | | |
| Ratios to average net assets: | |
| Net expenses after expense waiver | | % | 0.85 | (2) | | | 0.85 | | | | 0.84 | | | | 0.85 | | | | 0.87 | | |
| Gross expenses prior to expense waiver | | % | 0.85 | | | | 0.85 | | | | 0.84 | | | | 0.85 | | | | 0.87 | | |
| Net investment income after expense waiver | | % | 0.26 | (2) | | | 0.43 | | | | 0.21 | | | | 0.47 | | | | 0.39 | | |
| Portfolio turnover rate | | % | 83 | | | | 72 | | | | 93 | | | | 178 | | | | 371 | | |
| | | Class S | |
| | | Year Ended December 31, | |
| | | 2006 | | 2005 | | 2004 | | 2003 | | 2002 | |
| Per Share Operating Performance: | |
| Net asset value, beginning of year | | $ | 21.59 | | | | 19.90 | | | | 17.49 | | | | 12.72 | | | | 16.68 | | |
| Income (loss) from investment operations: | |
| Net investment income (loss) | | $ | (0.05 | )* | | | 0.06 | | | | 0.03 | * | | | 0.01 | | | | (0.04 | ) | |
Net realized and unrealized gain (loss)
on investments | | $ | 3.41 | | | | 1.92 | | | | 2.43 | | | | 4.79 | | | | (3.86 | ) | |
| Total from investment operations | | $ | 3.36 | | | | 1.98 | | | | 2.46 | | | | 4.80 | | | | (3.90 | ) | |
| Less distribution from: | |
| Net investment income | | $ | 0.04 | | | | 0.01 | | | | 0.05 | | | | 0.03 | | | | 0.06 | | |
| Net realized gains on investments | | $ | 3.37 | | | | 0.28 | | | | — | | | | — | | | | — | | |
| Total distribution | | $ | 3.41 | | | | 0.29 | | | | 0.05 | | | | 0.03 | | | | 0.06 | | |
| Net asset value, end of year | | $ | 21.54 | | | | 21.59 | | | | 19.90 | | | | 17.49 | | | | 12.72 | | |
| Total Return(1) | | % | 16.07 | | | | 10.05 | † | | | 14.09 | | | | 37.76 | | | | (23.45 | ) | |
| Ratios and Supplemental Data: | |
| Net assets, end of year (000's) | | $ | 2,162 | | | | 68,768 | | | | 72,225 | | | | 840 | | | | 184 | | |
| Ratios to average net assets: | |
| Net expenses after expense waiver | | % | 1.10 | (2) | | | 1.10 | | | | 1.09 | | | | 1.10 | | | | 1.12 | | |
| Gross expenses prior to expense waiver | | % | 1.10 | | | | 1.10 | | | | 1.09 | | | | 1.10 | | | | 1.12 | | |
| Net investment income after expense waiver | | % | (0.24 | )(2) | | | 0.26 | | | | 0.19 | | | | 0.22 | | | | 0.14 | | |
| Portfolio turnover rate | | % | 83 | | | | 72 | | | | 93 | | | | 178 | | | | 371 | | |
(1) Total return is calculated assuming reinvestment of all dividends and capital gain distributions at net asset value and does not reflect the effect of insurance contract charges.
(2) Impact of waiving the advisory fee for the ING Institutional Prime Money Market Fund holding has less than 0.01% impact on the expense ratio.
* Per share data calculated using average number of shares outstanding throughout the period.
† In 2005, the Investment Adviser fully reimbursed the Portfolio for a loss incurred from a transaction not meeting the Portfolio's investment guidelines. There was no impact on total return.
See Accompanying Notes to Financial Statements
39
ING VP VALUE OPPORTUNITY PORTFOLIO
FINANCIAL HIGHLIGHTS
Selected data for a share of beneficial interest outstanding throughout each period.
| | | Class ADV | | Class I | |
| | | December 29,
2006(1) to
December 31, | | Year Ended December 31, | |
| | | 2006 | | 2006 | | 2005 | | 2004 | | 2003 | | 2002 | |
| Per Share Operating Performance: | |
| Net asset value, beginning of period | | $ | 15.72 | | | | 13.84 | | | | 13.19 | | | | 12.08 | | | | 9.77 | | | | 13.25 | | |
| Income (loss) from investment operations: | |
| Net investment income (loss) | | $ | (0.00 | )** | | | 0.23 | * | | | 0.19 | * | | | 0.24 | | | | 0.10 | | | | 0.04 | | |
Net realized and unrealized gain (loss)
on investments | | $ | — | | | | 1.98 | | | | 0.71 | | | | 0.98 | | | | 2.29 | | | | (3.47 | ) | |
| Total from investment operations | | $ | (0.00 | )** | | | 2.21 | | | | 0.90 | | | | 1.22 | | | | 2.39 | | | | (3.43 | ) | |
| Less distributions from: | |
| Net investment income | | $ | — | | | | 0.21 | | | | 0.25 | | | | 0.11 | | | | 0.08 | | | | 0.05 | | |
| Total distributions | | $ | — | | | | 0.21 | | | | 0.25 | | | | 0.11 | | | | 0.08 | | | | 0.05 | | |
| Net asset value, end of period | | $ | 15.72 | | | | 15.84 | | | | 13.84 | | | | 13.19 | | | | 12.08 | | | | 9.77 | | |
| Total Return(2) | | % | — | | | | 16.10 | | | | 6.95 | | | | 10.15 | | | | 24.59 | | | | (25.96 | ) | |
| Ratios and Supplemental Data: | |
| Net assets, end of period (000's) | | $ | 1 | | | | 173,014 | | | | 178,828 | | | | 219,889 | | | | 257,448 | | | | 211,470 | | |
| Ratios to average net assets: | |
| Expenses(3) | | % | 1.19 | | | | 0.69 | | | | 0.70 | | | | 0.69 | | | | 0.70 | | | | 0.72 | | |
| Net investment income (loss)(3) | | % | (1.19 | ) | | | 1.58 | | | | 1.47 | | | | 1.61 | | | | 0.91 | | | | 0.51 | | |
| Portfolio turnover rate | | % | 83 | | | | 83 | | | | 94 | | | | 16 | | | | 251 | | | | 304 | | |
| | | Class S | |
| | | Year Ended December 31, | |
| | | 2006 | | 2005 | | 2004 | | 2003 | | 2002 | |
| Per Share Operating Performance: | |
| Net asset value, beginning of year | | $ | 13.77 | | | | 13.12 | | | | 12.03 | | | | 9.75 | | | | 13.24 | | |
| Income (loss) from investment operations: | |
| Net investment income | | $ | 0.19 | * | | | 0.16 | * | | | 0.13 | | | | 0.04 | | | | 0.01 | | |
Net realized and unrealized gain (loss)
on investments | | $ | 1.96 | | | | 0.71 | | | | 1.05 | | | | 2.31 | | | | (3.46 | ) | |
| Total from investment operations | | $ | 2.15 | | | | 0.87 | | | | 1.18 | | | | 2.35 | | | | (3.45 | ) | |
| Less distributions from: | |
| Net investment income | | $ | 0.20 | | | | 0.22 | | | | 0.09 | | | | 0.07 | | | | 0.04 | | |
| Total distributions | | $ | 0.20 | | | | 0.22 | | | | 0.09 | | | | 0.07 | | | | 0.04 | | |
| Net asset value, end of year | | $ | 15.72 | | | | 13.77 | | | | 13.12 | | | | 12.03 | | | | 9.75 | | |
| Total Return(2) | | % | 15.77 | | | | 6.76 | | | | 9.88 | | | | 24.21 | | | | (26.12 | ) | |
| Ratios and Supplemental Data: | |
| Net assets, end of year (000's) | | $ | 28,391 | | | | 30,125 | | | | 3,505 | | | | 2,277 | | | | 1,092 | | |
| Ratios to average net assets: | |
| Expenses | | % | 0.94 | | | | 0.95 | | | | 0.94 | | | | 0.95 | | | | 0.97 | | |
| Net investment income | | % | 1.32 | | | | 1.18 | | | | 1.36 | | | | 0.64 | | | | 0.26 | | |
| Portfolio turnover rate | | % | 83 | | | | 94 | | | | 16 | | | | 251 | | | | 304 | | |
(1) Commencement of operations.
(2) Total return is calculated assuming reinvestment of all dividends and capital gain distributions at net asset value and does not reflect the effect of insurance contract charges. Total return for periods less than one year is not annualized.
(3) Annualized for periods less than one year.
* Per share data calculated using average number of shares outstanding throughout the period.
** Amount is more than $(0.005).
See Accompanying Notes to Financial Statements
40
ING VP INTERMEDIATE BOND PORTFOLIO
FINANCIAL HIGHLIGHTS
Selected data for a share of beneficial interest outstanding throughout each period.
| | | Class ADV | | Class I | |
| | | December 20,
2006(1) to
December 31, | | Year Ended December 31, | |
| | | 2006 | | 2006 | | 2005 | | 2004 | | 2003 | | 2002 | |
| Per Share Operating Performance: | |
| Net asset value, beginning of period | | $ | 13.53 | | | | 12.97 | | | | 13.14 | | | | 14.15 | | | | 13.53 | | | | 12.95 | | |
| Income (loss) from investment operations: | |
| Net investment income | | $ | 0.02 | | | | 0.65 | * | | | 0.54 | | | | 0.53 | | | | 0.56 | | | | 0.45 | | |
Net realized and unrealized gain (loss)
on investments | | $ | (0.06 | ) | | | (0.12 | ) | | | (0.13 | ) | | | 0.13 | | | | 0.29 | | | | 0.63 | | |
| Total from investment operations | | $ | (0.04 | ) | | | 0.53 | | | | 0.41 | | | | 0.66 | | | | 0.85 | | | | 1.08 | | |
| Less distributions from: | |
| Net investment income | | $ | 0.53 | | | | 0.54 | | | | 0.51 | | | | 1.11 | | | | 0.11 | | | | 0.43 | | |
| Net realized gains on investments | | $ | — | | | | — | | | | 0.07 | | | | 0.56 | | | | 0.12 | | | | 0.07 | | |
| Total distributions | | $ | 0.53 | | | | 0.54 | | | | 0.58 | | | | 1.67 | | | | 0.23 | | | | 0.50 | | |
| Net asset value, end of period | | $ | 12.96 | | | | 12.96 | | | | 12.97 | | | | 13.14 | | | | 14.15 | | | | 13.53 | | |
| Total Return(2) | | % | (0.30 | ) | | | 4.06 | | | | 3.14 | | | | 4.88 | | | | 6.30 | | | | 8.33 | | |
| Ratios and Supplemental Data: | |
| Net assets, end of period (millions) | | $ | 0 | ** | | | 1,909 | | | | 1,148 | | | | 1,093 | | | | 1,126 | | | | 1,206 | | |
| Ratios to average net assets: | |
| Net expenses after expense waiver(3) | | % | 0.99 | (4) | | | 0.49 | (4) | | | 0.49 | | | | 0.48 | | | | 0.50 | | | | 0.49 | | |
| Gross expenses prior to expense waiver(3) | | % | 0.99 | | | | 0.49 | | | | 0.49 | | | | 0.48 | | | | 0.50 | | | | 0.49 | | |
| Net investment income after expense waiver(3) | | % | 6.82 | (4) | | | 4.97 | (4) | | | 4.14 | | | | 3.79 | | | | 3.77 | | | | 3.50 | | |
| Portfolio turnover rate | | % | 390 | | | | 390 | | | | 589 | | | | 407 | | | | 521 | | | | 565 | | |
| | | Class S | |
| | | Year Ended December 31, | | May 3,
2002(1) to
December 31, | |
| | | 2006 | | 2005 | | 2004 | | 2003 | | 2002 | |
| Per Share Operating Performance: | |
| Net asset value, beginning of period | | $ | 12.91 | | | | 13.09 | | | | 14.13 | | | | 13.53 | | | | 13.05 | | |
| Income (loss) from investment operations: | |
| Net investment income | | $ | 0.61 | * | | | 0.41 | | | | 0.40 | | | | 0.49 | | | | 0.16 | | |
Net realized and unrealized gain (loss)
on investments | | $ | (0.12 | ) | | | (0.03 | ) | | | 0.22 | | | | 0.32 | | | | 0.81 | | |
| Total from investment operations | | $ | 0.49 | | | | 0.38 | | | | 0.62 | | | | 0.81 | | | | 0.97 | | |
| Less distributions from: | |
| Net investment income | | $ | 0.51 | | | | 0.49 | | | | 1.10 | | | | 0.09 | | | | 0.42 | | |
| Net realized gains on investments | | $ | — | | | | 0.07 | | | | 0.56 | | | | 0.12 | | | | 0.07 | | |
| Total distributions | | $ | 0.51 | | | | 0.56 | | | | 1.66 | | | | 0.21 | | | | 0.49 | | |
| Net asset value, end of period | | $ | 12.89 | | | | 12.91 | | | | 13.09 | | | | 14.13 | | | | 13.53 | | |
| Total Return(2) | | % | 3.77 | | | | 2.94 | | | | 4.58 | | | | 6.04 | | | | 7.45 | | |
| Ratios and Supplemental Data: | |
| Net assets, end of period (millions) | | $ | 621 | | | | 617 | | | | 301 | | | | 71 | | | | 50 | | |
| Ratios to average net assets: | |
| Net expenses after expense waiver(3) | | % | 0.74 | (4) | | | 0.74 | | | | 0.73 | | | | 0.75 | | | | 0.74 | | |
| Gross expenses prior to expense waiver(3) | | % | 0.74 | | | | 0.74 | | | | 0.73 | | | | 0.75 | | | | 0.74 | | |
| Net investment income after expense waiver(3) | | % | 4.69 | (4) | | | 3.94 | | | | 3.52 | | | | 3.52 | | | | 3.25 | | |
| Portfolio turnover rate | | % | 390 | | | | 589 | | | | 407 | | | | 521 | | | | 565 | | |
(1) Commencement of operations.
(2) Total return is calculated assuming reinvestment of all dividends and capital gain distributions at net asset value and does not reflect the effect of insurance contract charges. Total return for periods less than one year is not annualized.
(3) Annualized for periods less than one year.
(4) Impact of waiving the advisory fee for the ING Institutional Prime Money Market Fund holding has less than 0.01% impact on the expense ratio.
* Per share data calculated using average number of shares outstanding throughout the period.
** Amount is less than $500,000.
See Accompanying Notes to Financial Statements
41
ING VP MONEY MARKET PORTFOLIO
FINANCIAL HIGHLIGHTS
Selected data for a share of beneficial interest outstanding throughout each year.
| | | Class I | |
| | | Year Ended December 31, | |
| | | 2006 | | 2005 | | 2004 | | 2003 | | 2002 | |
| Per Share Operating Performance: | |
| Net asset value, beginning of year | | $ | 13.17 | | | | 12.94 | | | | 12.94 | | | | 13.03 | | | | 13.33 | | |
| Income (loss) from investment operations: | |
| Net investment income | | $ | 0.63 | * | | | 0.39 | | | | 0.15 | | | | 0.08 | | | | 0.21 | | |
Net realized and unrealized gain (loss)
on investments | | $ | 0.00 | ** | | | (0.01 | ) | | | (0.01 | ) | | | 0.03 | | | | — | | |
| Total from investment operations | | $ | 0.63 | | | | 0.38 | | | | 0.14 | | | | 0.11 | | | | 0.21 | | |
| Less distributions from: | |
| Net investment income | | $ | 0.40 | | | | 0.15 | | | | 0.14 | | | | 0.20 | | | | 0.51 | | |
| Total distributions | | $ | 0.40 | | | | 0.15 | | | | 0.14 | | | | 0.20 | | | | 0.51 | | |
| Net asset value, end of year | | $ | 13.40 | | | | 13.17 | | | | 12.94 | | | | 12.94 | | | | 13.03 | | |
| Total Return(1) | | % | 4.88 | | | | 2.98 | | | | 1.06 | | | | 0.92 | | | | 1.66 | | |
| Ratios and Supplemental Data: | |
| Net assets, end of year (millions) | | $ | 1,356 | | | | 1,073 | | | | 1,101 | | | | 1,238 | | | | 1,552 | | |
| Ratios to average net assets: | |
| Expenses | | % | 0.34 | | | | 0.35 | | | | 0.34 | | | | 0.35 | | | | 0.34 | | |
| Net investment income | | % | 4.79 | | | | 2.93 | | | | 1.11 | | | | 0.91 | | | | 1.63 | | |
(1) Total return is calculated assuming reinvestment of all dividends and capital gain distributions at net asset value and does not reflect the effect of insurance contract charges.
* Per share data calculated using average number of shares outstanding throughout the period.
** Amount is less than $0.005.
See Accompanying Notes to Financial Statements
42
ING VP GLOBAL SCIENCE AND TECHNOLOGY PORTFOLIO
FINANCIAL HIGHLIGHTS
Selected data for a share of beneficial interest outstanding throughout each period.
| | | Class I | |
| | | Year Ended December 31, | |
| | | 2006 | | 2005 | | 2004 | | 2003 | | 2002 | |
| Per Share Operating Performance: | |
| Net asset value, beginning of year | | $ | 4.27 | | | | 3.82 | | | | 3.87 | | | | 2.66 | | | | 4.53 | | |
| Income (loss) from investment operations: | |
| Net investment loss | | $ | (0.01 | ) | | | (0.02 | ) | | | (0.03 | ) | | | (0.02 | ) | | | (0.03 | ) | |
Net realized and unrealized gain (loss)
on investments | | $ | 0.32 | | | | 0.47 | | | | (0.02 | ) | | | 1.23 | | | | (1.84 | ) | |
| Total from investment operations | | $ | 0.31 | | | | 0.45 | | | | (0.05 | ) | | | 1.21 | | | | (1.87 | ) | |
| Net asset value, end of year | | $ | 4.58 | | | | 4.27 | | | | 3.82 | | | | 3.87 | | | | 2.66 | | |
| Total Return(1) | | % | 7.26 | | | | 11.78 | | | | (1.29 | ) | | | 45.49 | | | | (41.28 | ) | |
| Ratios and Supplemental Data: | |
| Net assets, end of year (000's) | | $ | 81,599 | | | | 84,523 | | | | 86,291 | | | | 97,742 | | | | 45,559 | | |
| Ratios to average net assets: | |
Net expenses after expense
reimbursement/recoupment(2) | | % | 1.08 | | | | 1.06 | | | | 1.05 | | | | 1.11 | | | | 1.11 | | |
Gross expenses prior to expense
reimbursement/recoupment | | % | 1.08 | | | | 1.06 | | | | 1.05 | | | | 1.10 | | | | 1.12 | | |
Net investment loss after expense
reimbursement/recoupment(2) | | % | (0.29 | ) | | | (0.48 | ) | | | (0.67 | ) | | | (0.88 | ) | | | (0.89 | ) | |
| Portfolio turnover rate | | % | 129 | | | | 118 | | | | 163 | | | | 15 | | | | 61 | | |
| | | Class S | |
| | | Year
Ended
December 31,
2006 | | July 20,
2005(3) to
December 31,
2005 | |
| Per Share Operating Performance: | |
| Net asset value, beginning of period | | $ | 4.27 | | | | 3.90 | | |
| Income (loss) from investment operations: | |
| Net investment loss | | $ | (0.02 | ) | | | (0.01 | ) | |
Net realized and unrealized gain (loss)
on investments | | $ | 0.31 | | | | 0.38 | | |
| Total from investment operations | | $ | 0.29 | | | | 0.37 | | |
| Net asset value, end of period | | $ | 4.56 | | | | 4.27 | | |
| Total Return(1) | | % | 6.79 | | | | 9.49 | | |
| Ratios and Supplemental Data: | |
| Net assets, end of period (000's) | | $ | 551 | | | | 78 | | |
| Ratios to average net assets: | |
Net expenses after expense
reimbursement(2)(4) | | % | 1.33 | | | | 1.31 | | |
Gross expenses prior to expense
reimbursement(4) | | % | 1.33 | | | | 1.31 | | |
Net investment loss after expense
reimbursement(2)(4) | | % | (0.51 | ) | | | (0.73 | ) | |
| Portfolio turnover rate | | % | 129 | | | | 118 | | |
(1) Total return is calculated assuming reinvestment of all dividends and capital gain distributions at net asset value and does not reflect the effect of insurance contract charges. Total return for periods less than one year is not annualized.
(2) The Investment Adviser has agreed to limit expenses, (excluding interest, taxes, brokerage and extraordinary expenses) subject to possible recoupment by ING Investments, LLC within three years of being incurred.
(3) Commencement of operations.
(4) Annualized for periods less than one year.
See Accompanying Notes to Financial Statements
43
ING VP INTERNATIONAL EQUITY PORTFOLIO
FINANCIAL HIGHLIGHTS
Selected data for a share of beneficial interest outstanding throughout each period.
| | | Class ADV | | Class I | |
| | | December 29,
2006(1) to
December 31, | | Year Ended December 31, | |
| | | 2006 | | 2006 | | 2005 | | 2004 | | 2003 | | 2002 | |
| Per Share Operating Performance: | |
| Net asset value, beginning of period | | $ | 12.21 | | | | 10.11 | | | | 8.74 | | | | 7.55 | | | | 5.78 | | | | 7.90 | | |
| Income (loss) from investment operations: | |
| Net investment income (loss) | | $ | (0.00 | )* | | | 0.24 | | | | 0.14 | | | | 0.07 | | | | 0.06 | | | | 0.03 | | |
Net realized and unrealized gain (loss)
on investments | | $ | — | | | | 2.11 | | | | 1.32 | | | | 1.21 | | | | 1.78 | | | | (2.13 | ) | |
| Total from investment operations | | $ | (0.00 | )* | | | 2.35 | | | | 1.46 | | | | 1.28 | | | | 1.84 | | | | (2.10 | ) | |
| Less distributions from: | |
| Net investment income | | $ | — | | | | 0.17 | | | | 0.09 | | | | 0.09 | | | | 0.07 | | | | 0.02 | | |
| Total distributions | | $ | — | | | | 0.17 | | | | 0.09 | | | | 0.09 | | | | 0.07 | | | | 0.02 | | |
| Net asset value, end of period | | $ | 12.21 | | | | 12.29 | | | | 10.11 | | | | 8.74 | | | | 7.55 | | | | 5.78 | | |
| Total Return(2) | | % | — | | | | 23.48 | | | | 16.87 | | | | 17.17 | | | | 32.05 | | | | (26.68 | ) | |
| Ratios and Supplemental Data: | |
| Net assets, end of period (000's) | | $ | 1 | | | | 78,573 | | | | 61,464 | | | | 52,505 | | | | 40,537 | | | | 28,917 | | |
| Ratios to average net assets: | |
Net expenses after expense
reimbursement/recoupment(3)(4) | | % | 1.49 | | | | 0.99 | | | | 1.14 | | | | 1.15 | | | | 1.15 | | | | 1.15 | | |
Gross expenses prior to expense
reimbursement/recoupment(4) | | % | 1.49 | | | | 0.99 | | | | 1.00 | | | | 0.95 | | | | 1.38 | | | | 1.46 | | |
Net investment income (loss) after expense
reimbursement/recoupment(3)(4) | | % | (1.49 | ) | | | 2.27 | | | | 1.51 | | | | 1.00 | | | | 1.04 | | | | 0.40 | | |
| Portfolio turnover rate | | % | 79 | | | | 79 | | | | 97 | | | | 137 | | | | 85 | | | | 266 | | |
| | | Class S | |
| | | Year Ended December 31, | |
| | | 2006 | | 2005 | | 2004 | | 2003 | | 2002 | |
| Per Share Operating Performance: | |
| Net asset value, beginning of year | | $ | 10.05 | | | | 8.70 | | | | 7.53 | | | | 5.78 | | | | 7.90 | | |
| Income (loss) from investment operations: | |
| Net investment income (loss) | | $ | 0.19 | ** | | | 0.09 | | | | 0.05 | | | | (0.01 | ) | | | 0.01 | | |
Net realized and unrealized gain (loss)
on investments | | $ | 2.13 | | | | 1.33 | | | | 1.21 | | | | 1.82 | | | | (2.13 | ) | |
| Total from investment operations | | $ | 2.32 | | | | 1.42 | | | | 1.26 | | | | 1.81 | | | | (2.12 | ) | |
| Less distributions from: | |
| Net investment income | | $ | 0.16 | | | | 0.07 | | | | 0.09 | | | | 0.06 | | | | — | | |
| Total distributions | | $ | 0.16 | | | | 0.07 | | | | 0.09 | | | | 0.06 | | | | — | | |
| Net asset value, end of year | | $ | 12.21 | | | | 10.05 | | | | 8.70 | | | | 7.53 | | | | 5.78 | | |
| Total Return(2) | | % | 23.24 | | | | 16.53 | | | | 16.87 | | | | 31.62 | | | | (26.84 | ) | |
| Ratios and Supplemental Data: | |
| Net assets, end of year (000's) | | $ | 875 | | | | 353 | | | | 265 | | | | 197 | | | | 8 | | |
| Ratios to average net assets: | |
Net expenses after expense
reimbursement/recoupment(3) | | % | 1.24 | | | | 1.39 | | | | 1.40 | | | | 1.40 | | | | 1.40 | | |
Gross expenses prior to expense
reimbursement/recoupment | | % | 1.24 | | | | 1.25 | | | | 1.20 | | | | 1.63 | | | | 1.71 | | |
Net investment income after expense
reimbursement/recoupment(3) | | % | 1.70 | | | | 1.16 | | | | 0.68 | | | | 0.79 | | | | 0.15 | | |
| Portfolio turnover rate | | % | 79 | | | | 97 | | | | 137 | | | | 85 | | | | 266 | | |
(1) Commencement of operations.
(2) Total return is calculated assuming reinvestment of all dividends and capital gain distributions at net asset value and does not reflect the effect of insurance contract charges. Total return for periods less than one year is not annualized.
(3) The Investment Adviser has agreed to limit expenses, (excluding interest, taxes, brokerage and extraordinary expenses) subject to possible recoupment by ING Investments, LLC within three years of being incurred.
(4) Annualized for periods less than one year.
* Amount is more than $(0.005).
** Per share data calculated using average number of shares outstanding throughout the period.
See Accompanying Notes to Financial Statements
44
NOTES TO FINANCIAL STATEMENTS AS OF DECEMBER 31, 2006
NOTE 1 — ORGANIZATION
Organization. The ING Variable Product Funds are comprised of ING VP Balanced Portfolio, Inc., ING Variable Funds, ING Variable Portfolios, Inc., ING VP Intermediate Bond Portfolio and ING VP Money Market Portfolio (collectively, "Registrants"), all of which are open-end investment management companies registered under the Investment Company Act of 1940, as amended ("1940 Act").
ING VP Balanced Portfolio, Inc. is a company incorporated under the laws of Maryland on December 14, 1988 with one portfolio, ING VP Balanced Portfolio ("Balanced"). ING Variable Funds is a business trust formed under the laws of Massachusetts on January 25, 1984 with one portfolio, ING VP Growth and Income Portfolio ("Growth and Income"). ING Variable Portfolios, Inc. is a company incorporated under the laws of Maryland on June 4, 1996 and has eight separate portfolios. The five portfolios that are in this report are: ING VP Growth Portfolio ("Growth"), ING VP Small Company Portfolio ("Small Company"), ING VP Value Opportunity Portfolio ("Value Opportunity"), ING VP Global Science and Technology Portfolio ("Global Science and Technology") and ING VP International Equity Portfolio ("International Equity"). ING VP Intermediate Bond Portfolio is a business trust formed under the laws of Massachusetts on January 25, 1984 with one portfolio, ING VP Intermediate Bond Portfolio ("Intermediate Bond"). ING VP Money Market Portfolio is a business trust under the laws of Massachusetts on January 25, 1984 with one portfolio, ING VP Money Market Portfolio ("Money Market"). Each of the portfolios is a "Portfolio" and collectively, they are the "Portfolios".
The following is a brief description of each Portfolio's investment objective:
• Balanced seeks to maximize investment return consistent with reasonable safety of principal, by investing in a diversified portfolio of one or more of the following asset classes: stocks, bonds, and cash equivalents;
• Growth and Income seeks to maximize total return through investments in a diversified portfolio of common stocks and securities convertible into common stock;
• Growth seeks growth of capital through investment in a diversified portfolio consisting primarily of common stocks and securities convertible into common stock;
• Small Company seeks growth of capital primarily through investment in a diversified portfolio of common stocks and securities of companies with smaller market capitalizations;
• Value Opportunity seeks growth of capital primarily through investment in a diversified portfolio of common stocks;
• Intermediate Bond seeks to maximize total return consistent with reasonable risk by investing in a diversified portfolio consisting primarily of debt securities;
• Money Market seeks to provide high current return, consistent with preservation of capital and liquidity, through investment in high-quality money market instruments;
• Global Science and Technology seeks long-term capital appreciation; and
• International Equity seeks long-term capital growth primarily through investment in a diversified portfolio of common stocks principally traded in countries outside of the United States.
Each Portfolio offers Class I and Class S shares. Each Portfolio except, Small Company, Money Market and Global Science and Technology offers Adviser ("ADV") Class shares. The three classes differ principally in applicable distribution and service fees. Shareholders of each class also bear certain expenses that pertain to that particular class. All shareholders bear the common expenses of the Portfolios and earn income and realized gains/losses from the Portfolio pro rata based on the average daily net assets of each class, without discrimination between share classes. Differences in per share dividend rates generally result from differences in separate class expenses, including distribution, and shareholder servicing fees.
Shares of the Portfolios may be offered to segregated asset accounts of insurance companies as investment options under variable annuity contracts and variable life insurance policies. Shares may also be offered to qualified pension and retirement plans outside the variable contract and to certain investment advisers and their affiliates. Class I shares may be made available to other investment companies, including series of the companies under fund-of-funds arrangements.
Participating insurance companies and other designated organizations are authorized to receive purchase orders on the Portfolio's behalf.
ING Investments, LLC ("ING Investments'' or the "Investment Adviser"), an Arizona limited liability company, serves as the investment adviser to the Portfolios. ING Investments has engaged ING Investment Management Co. ("ING IM''), a Connecticut corporation, to serve as the Sub-Adviser to each Portfolio, with the exception of Global Science and Technology. ING Funds Distributor, LLC ("Distributor") is the principal underwriter of the Portfolios. ING Investments, ING IM and the Distributor are indirect, wholly-owned subsidiaries of ING Groep N.V. ("ING Groep"). ING Groep
45
NOTES TO FINANCIAL STATEMENTS AS OF DECEMBER 31, 2006 (CONTINUED)
NOTE 1 — ORGANIZATION (continued)
is one of the largest financial services organizations in the world, and offers an array of banking, insurance and asset management services to both individuals and institutional investors.
NOTE 2 — SIGNIFICANT ACCOUNTING POLICIES`
The following significant accounting policies are consistently followed by the Portfolios in the preparation of their financial statements. Such policies are in conformity with U.S. generally accepted accounting principles for investment companies.
A. Security Valuation. Investments in equity securities traded on a national securities exchange are valued at the last reported sale price. Securities reported by NASDAQ are valued at the NASDAQ official closing prices. Securities traded on an exchange or NASDAQ for which there has been no sale and securities traded in the over-the-counter-market are valued at the mean between the last reported bid and ask prices. All investments quoted in foreign currencies will be valued daily in U.S. dollars on the basis of the foreign currency exchange rates prevailing at that time. Debt securities are valued at prices obtained from independent services or from one or more dealers making markets in the securities and may be adjusted based on the Portfolios' valuation procedures. U.S. government obligations are valued by using market quotations or independent pricing services that use prices provided by market-makers or estimates of market values obtained from yield data relating to instruments or securities with similar characteristics.
Securities and assets for which market quotations are not readily available (which may include certain restricted securities, which are subject to limitations as to their sale) are valued at their fair values as determined in good faith by or under the supervision of the Portfolios' Board of Directors/Trustees ("Board"), in accordance with methods that are specifically authorized by the Board. Securities traded on exchanges, including foreign exchanges, which close earlier than the time that a Portfolio calculates its net asset value ("NAV") may also be valued at their fair values as determined in good faith by or under the supervision of a Portfolio's Board, in accordance with methods that are specifically authorized by the Board. The value of a foreign security traded on an exchange outside the United States is generally based on its price on the principal foreign exchange where it trades as of the time the Portfolio determines its NAV or if the foreign exchange closes prior to the time the Portfolio determines its NAV, the most recent closing price of the foreign security on its principal exchange. Trading in certain non-U.S. securities may not take
place on all days on which the New York Stock Exchange ("NYSE") is open. Further, trading takes place in various foreign markets on days on which the NYSE is not open. Consequently, the calculation of the Portfolio's NAV may not take place contemporaneously with the determination of the prices of securities held by the Portfolio in foreign securities markets. Further, the value of the Portfolio's assets may be significantly affected by foreign trading on days when a shareholder cannot purchase or redeem shares of the Portfolio. In calculating the Portfolio's NAV, foreign securities denominated in foreign currency are converted to U.S. dollar equivalents. If an event occurs after the time at which the market for foreign securities held by the Portfolio closes but before the time that a Portfolio's NAV is calculated, such event may cause the closing price on the foreign exchange to not represent a readily available reliable market value quotat ion for such securities at the time a Portfolio determines its NAV. In such a case, the Portfolio will use the fair value of such securities as determined under a Portfolio's valuation procedures. Events after the close of trading on a foreign market that could require the Portfolio to fair value some or all of its foreign securities include, among others, securities trading in the U.S. and other markets, corporate announcements, natural and other disasters, and political and other events. Among other elements of analysis in the determination of a security's fair value, the Board has authorized the use of one or more independent research services to assist with such determinations. An independent research service may use statistical analyses and quantitative models to help determine fair value as of the time a Portfolio calculates its NAV. There can be no assurance that such models accurately reflect the behavior of the applicable markets or the effect of the behavior of such markets on the fair value of sec urities, or that such markets will continue to behave in a fashion that is consistent with such models. Unlike the closing price of a security on an exchange, fair value determinations employ elements of judgment. Consequently, the fair value assigned to a security may not represent the actual value that a Portfolio could obtain if it were to sell the security at the time of the close of the NYSE. Pursuant to procedures adopted by the Board, the Portfolio is not obligated to use the fair valuations suggested by any research service, and valuation recommendations provided by such research services may be overridden if other events have occurred or if other fair valuations are determined in good faith to be more accurate. Unless an event is such that it causes a Portfolio to determine that the closing prices for one or more securities do not represent readily available reliable market value quotations at the time the
46
NOTES TO FINANCIAL STATEMENTS AS OF DECEMBER 31, 2006 (CONTINUED)
NOTE 2 — SIGNIFICANT ACCOUNTING POLICIES (continued)
Portfolio determines its NAV, events that occur between the time of the close of the foreign market on which they are traded and the close of regular trading on the NYSE will not be reflected in the Portfolio's NAV. Investments in securities maturing in 60 days or less at the date of valuation are valued at amortized cost, which, when combined with accrued interest, approximates market value.
B. Security Transactions and Revenue Recognition. Securities transactions are accounted for on the trade date. Realized gains and losses are reported on the basis of identified cost of securities sold. Interest income is recorded on an accrual basis. Dividend income is recorded on the ex-dividend date, or for certain foreign securities, when the information becomes available to the Portfolios. Premium amortization and discount accretion are determined by the effective yield method.
C. Foreign Currency Translation. The books and records of the Portfolios are maintained in U.S. dollars. Any foreign currency amounts are translated into U.S. dollars on the following basis:
(1) Market value of investment securities, other assets and liabilities — at the exchange rates prevailing at the end of the day.
(2) Purchases and sales of investment securities, income and expenses — at the rates of exchange prevailing on the respective dates of such transactions.
Although the net assets and the market values are presented at the foreign exchange rates at the end of the day, the Portfolios do not isolate the portion of the results of operations resulting from changes in foreign exchange rates on investments from the fluctuations arising from changes in market prices of securities held. Such fluctuations are included with the net realized and unrealized gains or losses from investments. For securities, which are subject to foreign withholding tax upon disposition, liabilities are recorded on the Statements of Assets and Liabilities for the estimated tax withholding based on the securities' current market value. Upon disposition, realized gains or losses on such securities are recorded net of foreign withholding tax.
Reported net realized foreign exchange gains or losses arise from sales of foreign currencies, currency gains or losses realized between the trade and settlement dates on securities transactions, the difference between the amounts of dividends, interest, and foreign withholding taxes recorded on a Portfolio's books, and the U.S.
dollar equivalent of the amounts actually received or paid. Net unrealized foreign exchange gains and losses arise from changes in the value of assets and liabilities other than investments in securities at fiscal year end, resulting from changes in the exchange rate. Foreign security and currency transactions may involve certain considerations and risks not typically associated with investing in U.S. companies and U.S. government securities. These risks include, but are not limited to, revaluation of currencies and future adverse political and economic developments, which could cause securities and their markets to be less liquid and prices more volatile than those of comparable U.S. companies and U.S. government securities.
D. Foreign Currency Transactions and Futures Contracts. Certain Portfolios may enter into foreign currency exchange transactions to convert to and from different foreign currencies and to and from the U.S. dollar in connection with the planned purchases or sales of securities. When entering into a currency forward contract, a Portfolio agrees to receive or deliver a fixed quantity of foreign currency for an agreed-upon price on an agreed future date. The Portfolios either enter into these transactions on a spot basis at the spot rate prevailing in the foreign currency exchange market or use forward foreign currency contracts to purchase or sell foreign currencies. When the contract is fulfilled or closed, gains or losses are realized. Until then, the gain or loss is included in unre alized appreciation or depreciation. Risks may arise upon entering into forward contracts from the potential inability of counterparties to meet the terms of their forward contracts and from unanticipated movements in the value of foreign currencies relative to the U.S. dollar.
Each Portfolio, with the exception of Money Market, may enter into futures contracts involving foreign currency, interest rates, securities and securities indices. A futures contract obligates the seller of the contract to deliver and the purchaser of the contract to take delivery of the type of foreign currency, financial instrument or security called for in the contract at a specified future time for a specified price. Upon entering into such a contract, a Portfolio is required to deposit and maintain as collateral such initial margin as required by the exchange on which the contract is traded. Pursuant to the contract, a Portfolio agrees to receive from or pay to the broker an amount equal to the daily fluctuations in the value of the contract. Such receipts or payments are known as variation margins and are recorded as unrealized gains or losses by the Portfolio. When the contract is closed, the Portfolio records a realized gain or loss equal to the difference between the value of
47
NOTES TO FINANCIAL STATEMENTS AS OF DECEMBER 31, 2006 (CONTINUED)
NOTE 2 — SIGNIFICANT ACCOUNTING POLICIES (continued)
the contract at the time it was opened and the value at the time it was closed.
E. Distributions to Shareholders. The Portfolios record distributions to their shareholders on the ex-dividend date. Balanced, Growth, Small Company, Value Opportunity, Money Market and Global Science and Technology declare and pay dividends annually. Growth and Income and Intermediate Bond declare and pay dividends semi-annually. The Portfolios may make distributions on a more frequent basis to comply with the distribution requirements of the Internal Revenue Code. The characteristics of income and gains to be distributed are determined in accordance with income tax regulations, which may differ from U.S. generally accepted accounting principles for investment companies.
F. Federal Income Taxes. It is the policy of the Portfolios to comply with subchapter M of the Internal Revenue Code and related excise tax provisions applicable to requlated investment companies and to distribute substantially all of their net investment income and any net realized capital gains to their shareholders. Therefore, no federal income tax provision is required. No capital gain distributions shall be made until any capital loss carryforwards have been fully utilized or expired.
G. Use of Estimates. The preparation of financial statements in conformity with U.S. generally accepted accounting principles requires management to make estimates and assumptions that affect the reported amounts of assets and liabilities and disclosure of contingent assets and liabilities at the date of the financial statements and the reported amounts of increases and decreases in net assets from operations during the reporting period. Actual results could differ from those estimates.
H. Repurchase Agreements. Each Portfolio may invest in repurchase agreements only with government securities dealers recognized by the Board of Governors of the Federal Reserve System. Under such agreements, the seller of the security agrees to repurchase it at a mutually agreed upon time and price. The resale price is in excess of the purchase price and reflects an agreed upon interest rate for the period of time the agreement is outstanding. The period of the repurchase agreements is usually short, from overnight to one week, while the underlying securities generally have longer maturities. Each Portfolio will receive as collateral securities acceptable to it whose market value is equal to at least 100% of the carrying amount of the repurchase agreements, plus accrued interest, be ing invested by the Portfolio. The underlying collateral is valued daily on a mark-to-market basis
to assure that the value, including accrued interest is at least equal to the repurchase price. There would be potential loss to the Portfolio in the event the Portfolio is delayed or prevented from exercising its right to dispose of the collateral, and it might incur disposition costs in liquidating the collateral.
I. Securities Lending. Each Portfolio has the option to temporarily loan up to 30% of its total assets to brokers, dealers or other financial institutions in exchange for a negotiated lender's fee. The borrower is required to fully collateralize the loans with cash or U.S. government securities. Generally, in the event of counterparty default, a Portfolio has the right to use collateral to offset losses incurred. There would be potential loss to the Portfolio in the event the Portfolio is delayed or prevented from exercising its right to dispose of the collateral. A Portfolio bears the risk of loss with respect to the investment of collateral. Engaging in securities lending could have a leveraging effect, which may intensify the credit, market and other risks associated with investi ng in a Portfolio.
J. Illiquid and Restricted Securities. The Portfolios may not invest more than 15% (10% for Money Market) of their net assets in illiquid securities. Illiquid securities are not readily marketable. Disposing of illiquid investments may involve time-consuming negotiation and legal expenses, and it may be difficult or impossible for the Portfolios to sell them promptly at an acceptable price. The Portfolios may also invest in restricted securities, which include those sold under Rule 144A of the Securities Act of 1933 ("1933 Act") or securities offered pursuant to Section 4(2) of the 1933 Act, and/or are subject to legal or contractual restrictions on resale and may not be publicly sold without registration under the 1933 Act. Certain restricted securities may be considered liquid pur suant to guidelines approved by the Board or may be deemed to be illiquid because they may not be readily marketable. Illiquid and restricted securities are valued using market quotations when readily available. In the absence of market quotations, the securities are valued based upon their fair value determined under procedures approved by the Board.
K. Delayed Delivery Transactions. Each Portfolio may purchase or sell securities on a when-issued or forward commitment basis. The price of the underlying securities and date when the securities will be delivered and paid for are fixed at the time the transaction is negotiated. The market value of such is identified in the Portfolios' Portfolio of Investments. Losses may arise due to changes in the market value of the securities or from the inability of counterparties to meet the terms of the contract. In connection with such purchases,
48
NOTES TO FINANCIAL STATEMENTS AS OF DECEMBER 31, 2006 (CONTINUED)
NOTE 2 — SIGNIFICANT ACCOUNTING POLICIES (continued)
the Portfolios are required to hold liquid assets as collateral with the Portfolios' custodian sufficient to cover the purchase price.
L. Mortgage Dollar Roll Transactions. Balanced, Growth and Income, Value Opportunity, Global Science and Technology, International Equity and Money Market Portfolios may engage in dollar roll transactions with respect to mortgage-backed securities issued by Government National Mortgage Association, Federal National Mortgage Association and Federal Home Loan Mortgage Corp. In a dollar roll transaction, a Portfolio sells a mortgage-backed security to a financial institution, such as a bank or broker/dealer, and simultaneously agrees to repurchase a substantially similar (i.e., same type, coupon, and maturity) security from the institution on a delayed delivery basis at an agreed upon price. The mortgage-backed securities that are repurchased will bear the same interest rate as those s old, but generally will be collateralized by different pools of mortgages with different prepayment histories. The Portfolios account for dollar roll transactions as purchases and sales.
M. Options Contracts. Each Portfolio, with the exception of Money Market, may purchase put and call options and may write (sell) put options and covered call options. The Portfolios may engage in option transactions as a hedge against adverse movements in the value of portfolio holdings or to increase market exposure. Option contracts are valued daily and unrealized gains or losses are recorded based upon the last sales price on the principal exchange on which the options are traded. The Portfolios will realize a gain or loss upon the expiration or closing of the option contract. When an option is exercised, the proceeds on sales of the underlying security for a written call option, the purchase cost of the security for a written put option, or the cost of the security for a purchas ed put or call option is adjusted by the amount of premium received or paid. Realized and unrealized gains or losses on option contracts are reflected in the accompanying financial statements. The risk in writing a call option is that the Portfolios give up the opportunity for profit if the market price of the security increases and the option is exercised. The risk in writing a put option is that the Portfolios may incur a loss if the market price of the security decreases and the option is exercised. The risk in buying an option is that the Portfolios pay a premium whether or not the option is exercised. Risks may also arise from an illiquid secondary market or from the inability of counterparties to meet the terms of the contract.
N. Swap Contracts. Each Portfolio, with the exception of Money Market, may enter into interest rate swaps, currency swaps and other types of swap agreements, including swaps on securities and indices. A swap is an agreement between two parties pursuant to which each party agrees to make one or more payments to the other on regularly scheduled dates over a stated term, based on different interest rates, currency exchange rates, security prices, the prices or rates of other types of financial instruments or assets or the levels of specified indices. During the term of the swap, changes in the value of the swap are recognized as unrealized appreciation or depreciation.
O. Reverse Repurchase Agreements. A reverse repurchase agreement involves the sale of a security, with an agreement to repurchase the same or substantially similar securities at an agreed upon price and date. Whether such a transaction produces a gain for a Portfolio depends upon the costs of the agreements and the income and gains of the securities purchased with the proceeds received from the sale of the security. If the income and gains on the securities purchased fail to exceed the costs, net asset value will decline faster than otherwise would be the case. Reverse repurchase agreements, as a leveraging technique, may increase a Portfolio's yield; however, such transactions also increase a Portfolio's risk to capital and may result in a shareholder's loss of principal.
P. Indemnifications. In the normal course of business, the Registrants may enter into contracts that provide certain indemnifications. The Registrants' maximum exposure under these arrangements is dependent on future claims that may be made against the Portfolios and, therefore, cannot be estimated; however, based on experience, the risk of loss from such claims is considered remote.
NOTE 3 — INVESTMENT TRANSACTIONS
For the year ended December 31, 2006, the cost of purchases and the proceeds from the sales of securities, excluding short-term securities, were as follows:
| | | Purchases | | Sales | |
| Balanced | | $ | 1,748,600,425 | | | $ | 1,787,490,239 | | |
| Growth and Income | | | 3,084,548,431 | | | | 3,561,439,166 | | |
| Growth | | | 362,247,623 | | | | 354,774,986 | | |
| Small Company | | | 400,606,509 | | | | 422,361,671 | | |
| Value Opportunity | | | 165,033,104 | | | | 200,196,422 | | |
| Intermediate Bond | | | 2,054,455,948 | | | | 1,275,214,526 | | |
| Global Science and Technology | | | 107,745,289 | | | | 113,254,527 | | |
| International Equity | | | 60,525,412 | | | | 55,709,540 | | |
U.S. Government securities not included above were as follows:
| | | Purchases | | Sales | |
| Balanced | | $ | 1,031,743,719 | | | $ | 1,140,091,275 | | |
| Intermediate Bond | | | 7,381,365,616 | | | | 7,289,120,484 | | |
49
NOTES TO FINANCIAL STATEMENTS AS OF DECEMBER 31, 2006 (CONTINUED)
NOTE 4 — INVESTMENT MANAGEMENT AND ADMINISTRATIVE FEES
The Portfolios entered into Investment Management Agreements with the Investment Manager. The Investment Management Agreements compensate the Investment Manager with a fee, computed daily and payable monthly, based on the average daily net assets of each Portfolio, at the following annual rates:
| Balanced | | 0.500% | |
| Growth and Income | | 0.500% on first $10 billion;
0.450% on next $5 billion; and
0.425% over $15 billion | |
| Growth | | 0.600% | |
| Small Company | | 0.750% | |
| Value Opportunity | | 0.600% | |
| Intermediate Bond | | 0.400% | |
| Money Market | | 0.250% | |
| Global Science and Technology | | 0.950% | |
| International Equity | | 0.850% | |
The Investment Adviser entered into a sub-advisory agreements with ING IM. ING IM acts as sub-adviser to all Portfolios except for Global Science and Technology. Subject to such policies as the Board or the Investment Manager may determine, ING IM manages the Portfolios' assets in accordance with the Portfolios' investment objectives, policies, and limitations.
BlackRock Advisors, Inc., ("BlackRock"), a Delaware Corporation, serves as Sub-Adviser to Global Science and Technology pursuant to a Sub-Advisory Agreement effective April 1, 2004 between the Investment Adviser and BlackRock.
Effective November 1, 2006, all ING Portfolios sub-advised by ING IM are permitted to invest end-of-day cash balances into affiliated ING Money Market Funds, including ING Institutional Prime Money Market Fund. Investment management fees paid by the Portfolios will be reduced by an amount equal to the management fees paid indirectly to the ING Institutional Prime Money Market Fund with respect to assets invested by the Portfolios. As of December 31, 2006, Balanced, Growth and Income, Small Company and Intermediate Bond have waived $3,167, $12,752, $1,019 and $6,604, respectively. These fees are not subject to recoupment.
Pursuant to administration agreements, ING Funds Services, LLC ("IFS"), an indirect, wholly-owned subsidiary of ING Groep, acts as administrator and provides certain administrative and shareholder services necessary for Portfolio operations and is responsible for the supervision of other service providers.
IFS is entitled to receive from each Portfolio a fee at an annual rate of 0.055% on the first $5 billion of daily net assets and 0.03% thereafter.
NOTE 5 — DISTRIBUTION AND SERVICE FEES
Each ADV Class shares of the respective Portfolios are subject to a Shareholder Service and Distribution Plan (the "Plan"). Under the Plan, the Distributor is paid an annual shareholder service fee at the rate of 0.25% and an annual distribution fee at the rate of 0.25% of the average daily net assets attributable to its ADV Class shares.
Class S shares of the Portfolios have adopted Distribution Plans pursuant to Rule 12b-1 under the 1940 Act (the "12b-1 Plans"), whereby the Distributor is compensated by the Portfolios for expenses incurred in the distribution of each Portfolio's shares ("Distribution Fees"). Pursuant to the 12b-1 Plans, the Distributor is entitled to a payment each month compensate for expenses incurred in the distribution and promotion of each Portfolio's shares, including expenses incurred in printing prospectuses and reports used for sales purposes, expenses incurred in preparing and printing sales literature and other such distribution related expenses, including any distribution or shareholder servicing fees ("Service Fees") paid to securities dealers who have executed a distribution agreement with the Distributor. Under the 12b-1 Plans, Class S shares of the Portfolios pay the Distributor a fee calculated at an annual rate of 0.25% of average daily ne t assets.
NOTE 6 — OTHER TRANSACTIONS WITH AFFILIATED AND RELATED PARTIES
At December 31, 2006, the Portfolios had the following amounts recorded in payable to affiliates on the accompanying Statements of Assets and Liabilities (see Notes 4 and 5):
| | | Accrued
Investment
Management
Fees | | Accrued
Administrative
Fees | | Accrued
Shareholder
Service and
Distribution
Fees | | Total | |
| Balanced | | $ | 512,181 | | | $ | 56,582 | | | $ | 2,279 | | | $ | 571,042 | | |
| Growth and Income | | | 1,315,277 | | | | 145,712 | | | | 1,003 | | | | 1,461,992 | | |
| Growth | | | 96,578 | | | | 8,853 | | | | 63 | | | | 105,494 | | |
| Small Company | | | 333,631 | | | | 24,518 | | | | 443 | | | | 358,592 | | |
| Value Opportunity | | | 104,517 | | | | 9,580 | | | | 6,043 | | | | 120,140 | | |
| Intermediate Bond | | | 847,366 | | | | 116,959 | | | | 127,819 | | | | 1,092,144 | | |
| Money Market | | | 288,742 | | | | 63,521 | | | | — | | | | 352,263 | | |
Global Science and
Technology | | | 67,496 | | | | 3,908 | | | | 118 | | | | 71,522 | | |
| International Equity | | | 56,694 | | | | 3,668 | | | | 183 | | | | 60,545 | | |
The Portfolios have adopted a Deferred Compensation Plan (the "Policy"), which allows eligible non-affiliated directors as described in the Policy to defer the receipt of all or a portion of the directors' fees payable. Deferred fees are invested in various funds advised by ING Investments until distribution in accordance with the Policy.
50
NOTES TO FINANCIAL STATEMENTS AS OF DECEMBER 31, 2006 (CONTINUED)
NOTE 6 — OTHER TRANSACTIONS WITH AFFILIATED AND RELATED PARTIES (continued)
At December 31, 2006, the following indirect, wholly owned subsidiaries of ING Groep owned more than 5% of the following Portfolios:
ING Life Insurance and Annuity Company — Balanced (92.31%); Growth and Income (95.99%); Growth (77.38%); Small Company (76.70%); Value Opportunity (83.02%); Intermediate Bond (42.57%); Money Market (97.91%); Global Science and Technology (97.08%); International Equity (98.87%).
ING USA Annuity and Life Insurance Company — Value Opportunity (13.40%); Intermediate Bond (24.41%).
ING Lifestyle Aggressive Growth Portfolio — Small Company (6.60%).
ING Lifestyle Growth Portfolio — Small Company (15.85%); Intermediate Bond (6.56%).
ING Lifestyle Moderate Growth Portfolio — Intermediate Bond (11.20%).
ING Lifestyle Moderate Portfolio — Intermediate Bond (5.90%).
ING National Trust — Growth (22.47%).
NOTE 7 — EXPENSE LIMITATIONS
ING Investments entered into written expense limitation agreements ("Expense Limitation Agreements") with each of the following Portfolios whereby the Investment Adviser has agreed to limit expenses, excluding interest, taxes, brokerage and extraordinary expenses to the levels listed below:
| | | Class ADV | | Class I | | Class S | |
| Growth | | | 1.30 | % | | | 0.80 | % | | | 1.05 | % | |
| Small Company | | | N/A | | | | 0.95 | % | | | 1.20 | % | |
| Value Opportunity | | | 1.30 | % | | | 0.80 | % | | | 1.05 | % | |
| Global Science and Technology | | | N/A | | | | 1.15 | % | | | 1.40 | % | |
| International Equity | | | 1.65 | % | | | 1.15 | % | | | 1.40 | % | |
The Investment Adviser may at a later date recoup from a Portfolio management fees waived and other expenses assured by the Investment Adviser during the previous 36 months, but only if, after such recoupment, the Portfolio's expense ratio does not exceed the percentage described above. Waived and reimbursed fees net of any recoupment by the Investment Adviser of such waived and reimbursed fees are reflected on the accompanying Statements of Operations. Amounts payable by the Investment Manager are reflected on the accompanying Statements of Assets and Liabilities for each Portfolio.
As of December 31, 2006, the Portfolios have no reimbursed fees that are subject to possible recoupment by the Investment Adviser.
The Expense Limitation Agreements are contractual and shall renew automatically for one-year terms unless ING Investments provides written notice of the
termination of an Expense Limitation Agreement within 90 days of the end of the then current term.
NOTE 8 — BORROWINGS
The Portfolios, in addition to certain other funds managed by the Investment Adviser, have entered into an unsecured committed revolving line of credit agreement (the "Credit Agreement ") with a syndicate of banks led by Citibank, N.A. for an aggregate amount of $100,000,000. The proceeds may be used only to: (1) temporarily finance the purchase and sale of securities; (2) finance the redemption of shares of an investor in the portfolios; and (3) enable the portfolios to meet other emergency expenses as defined in the Credit Agreement. The portfolios to which the line of credit is available pay a commitment fee equal to 0.09% per annum on the daily unused portion of the committed line amount. Each of the Portfolios will pay its pro rata share of both the agent and commitment fee. Generally, borrowings under the Credit Agreement accrue interest at the federal funds rate plus a specified margin. Repayments generally must be made within 30 days after the date of a revolving credit advance. The following Portfolios utilized the line of credit during the year ended December 31, 2006:
| Portfolio | | Days
Utilized | | Approximate
Average Daily
Balance | | Approximate
Weighted
Average
Interest Rate | |
| Growth | | | 6 | | | $ | 980,000 | | | | 5.71 | % | |
| Value Opportunity | | | 4 | | | | 1,870,000 | | | | 4.73 | | |
| Intermediate Bond | | | 1 | | | | 4,020,000 | | | | 5.01 | | |
Global Science and
Technology | | | 2 | | | | 775,000 | | | | 5.01 | | |
| International Equity | | | 1 | | | | 660,000 | | | | 5.72 | | |
During the year ended December 31, 2006, Balanced entered into reverse repurchase agreements that had an average daily balance outstanding of $7,400,000 with an average interest rate of 5.300% and paid interest of $29,415. There were no outstanding reverse repurchase agreements as of December 31, 2006.
NOTE 9 — OPTIONS WRITTEN
Transactions in written options for Growth & Income for the year ended December 31, 2006 were as follows:
| | | # of
Contracts | | Premium | |
| Balance at 12/31/05 | | | — | | | $ | — | | |
| Options Written | | | 360,000 | | | | 448,000 | | |
Options Terminated in
Closing Purchase
Transactions | | | (70,000 | ) | | | (79,800 | ) | |
| Options Expirations | | | (140,000 | ) | | | (189,700 | ) | |
| Options Exercised | | | — | | | | — | | |
| Balance at 12/31/06 | | | 150,000 | | | $ | 178,500 | | |
51
NOTES TO FINANCIAL STATEMENTS AS OF DECEMBER 31, 2006 (CONTINUED)
NOTE 10 — CAPITAL SHARES
Transactions in capital shares and dollars were as follows:
| | | Class ADV | | Class I | | Class S | |
| | | December 29,
2006(1) to
December 31,
2006 | | Year
Ended
December 31,
2006 | | Year
Ended
December 31,
2005 | | Year
Ended
December 31,
2006 | | Year
Ended
December 31,
2005 | |
| Balanced (Number of Shares) | |
| Shares sold | | | 68 | | | | 4,878,404 | | | | 936,888 | | | | 102,380 | | | | 59,464 | | |
| Shares issued from merger | | | — | | | | 974,709 | | | | — | | | | 599,724 | | | | — | | |
| Dividends reinvested | | | — | | | | 2,095,112 | | | | 2,304,743 | | | | 5,132 | | | | 4,914 | | |
| Shares redeemed | | | — | | | | (17,759,754 | ) | | | (13,966,864 | ) | | | (207,251 | ) | | | (64,454 | ) | |
| Net increase (decrease) in shares outstanding | | | 68 | | | | (9,811,529 | ) | | | (10,725,233 | ) | | | 499,985 | | | | (76 | ) | |
| Balanced ($) | |
| Shares sold | | $ | 1,000 | | | $ | 67,433,818 | | | $ | 12,534,653 | | | $ | 1,409,005 | | | $ | 795,346 | | |
| Shares issued from merger | | | — | | | | 13,476,644 | | | | — | | | | 8,269,170 | | | | — | | |
| Dividends reinvested | | | — | | | | 28,870,646 | | | | 30,561,067 | | | | 70,509 | | | | 64,964 | | |
| Shares redeemed | | | — | | | | (248,353,965 | ) | | | (187,304,754 | ) | | | (2,858,884 | ) | | | (859,666 | ) | |
| Net increase (decrease) | | $ | 1,000 | | | $ | (138,572,857 | ) | | $ | (144,209,034 | ) | | $ | 6,889,800 | | | $ | 644 | | |
| | | Class ADV | | Class I | | Class S | |
| | | December 20,
2006(1) to
December 31,
2006 | | Year
Ended
December 31,
2006 | | Year
Ended
December 31,
2005 | | Year
Ended
December 31,
2006 | | Year
Ended
December 31,
2005 | |
| Growth and Income (Number of Shares) | |
| Shares sold | | | 43 | | | | 1,044,630 | | | | 138,694 | | | | 112,415 | | | | 50,301 | | |
| Dividends reinvested | | | — | | | | 1,528,513 | | | | 1,566,557 | | | | 1,970 | | | | 1,077 | | |
| Shares redeemed | | | — | | | | (21,948,383 | ) | | | (32,345,085 | ) | | | (27,677 | ) | | | (25,742 | ) | |
| Net increase (decrease) in shares outstanding | | | 43 | | | | (19,375,240 | ) | | | (30,639,834 | ) | | | 86,708 | | | | 25,636 | | |
| Growth and Income ($) | |
| Shares sold | | $ | 1,000 | | | $ | 24,293,092 | | | $ | 2,773,031 | | | $ | 2,450,803 | | | $ | 1,006,318 | | |
| Dividends reinvested | | | — | | | | 35,950,900 | | | | 32,929,030 | | | | 46,207 | | | | 22,610 | | |
| Shares redeemed | | | — | | | | (481,867,035 | ) | | | (634,438,393 | ) | | | (602,247 | ) | | | (513,138 | ) | |
| Net increase (decrease) | | $ | 1,000 | | | $ | (421,623,043 | ) | | $ | (598,736,332 | ) | | $ | 1,894,763 | | | $ | 515,790 | | |
| | | Class ADV | | Class I | | Class S | |
| | | December 29,
2006(1) to
December 31,
2006 | | Year
Ended
December 31,
2006 | | Year
Ended
December 31,
2005 | | Year
Ended
December 31,
2006 | | Year
Ended
December 31,
2005 | |
| Growth (Number of Shares) | |
| Shares sold | | | 94 | | | | 4,813,793 | | | | 489,244 | | | | 5,711 | | | | 3,047 | | |
| Dividends reinvested | | | — | | | | 10,584 | | | | 133,505 | | | | — | | | | 158 | | |
| Shares redeemed | | | — | | | | (4,206,698 | ) | | | (3,948,289 | ) | | | (7,478 | ) | | | (13,059 | ) | |
| Net increase (decrease) in shares outstanding | | | 94 | | | | 617,679 | | | | (3,325,540 | ) | | | (1,767 | ) | | | (9,854 | ) | |
| Growth ($) | |
| Shares sold | | $ | 1,000 | | | $ | 51,157,509 | | | $ | 4,980,563 | | | $ | 59,075 | | | $ | 30,259 | | |
| Dividends reinvested | | | — | | | | 113,349 | | | | 1,254,943 | | | | — | | | | 1,478 | | |
| Shares redeemed | | | — | | | | (43,763,130 | ) | | | (37,571,404 | ) | | | (77,824 | ) | | | (124,206 | ) | |
| Net increase (decrease) | | $ | 1,000 | | | $ | 7,507,728 | | | $ | (31,335,898 | ) | | $ | (18,749 | ) | | $ | (92,469 | ) | |
(1) Commencement of operations.
52
NOTES TO FINANCIAL STATEMENTS AS OF DECEMBER 31, 2006 (CONTINUED)
NOTE 10 — CAPITAL SHARES (continued)
| | | Class I | | Class S | |
| | | Year
Ended
December 31,
2006 | | Year
Ended
December 31,
2005 | | Year
Ended
December 31,
2006 | | Year
Ended
December 31,
2005 | |
| Small Company (Number of Shares) | |
| Shares sold | | | 6,746,441 | | | | 556,621 | | | | 822,424 | | | | 3,729,805 | | |
| Dividends reinvested | | | 2,874,293 | | | | 313,991 | | | | 587,427 | | | | 32,961 | | |
| Shares redeemed | | | (4,186,153 | ) | | | (5,812,740 | ) | | | (4,494,836 | ) | | | (4,206,439 | ) | |
| Net increase (decrease) in shares outstanding | | | 5,434,581 | | | | (4,942,128 | ) | | | (3,084,985 | ) | | | (443,673 | ) | |
| Small Company ($) | |
| Shares sold | | $ | 143,089,598 | | | $ | 11,336,135 | | | $ | 18,611,859 | | | $ | 73,490,792 | | |
| Dividends reinvested | | | 60,192,208 | | | | 6,267,269 | | | | 12,277,239 | | | | 656,918 | | |
| Shares redeemed | | | (90,027,948 | ) | | | (116,180,823 | ) | | | (96,289,442 | ) | | | (76,744,947 | ) | |
| Net increase (decrease) | | $ | 113,253,858 | | | $ | (98,577,419 | ) | | $ | (65,400,344 | ) | | $ | (2,597,237 | ) | |
| | | Class ADV | | Class I | | Class S | |
| | | December 29,
2006(1) to
December 31,
2006 | | Year
Ended
December 31,
2006 | | Year
Ended
December 31,
2005 | | Year
Ended
December 31,
2006 | | Year
Ended
December 31,
2005 | |
| Value Opportunity (Number of Shares) | |
| Shares sold | | | 64 | | | | 163,605 | | | | 553,896 | | | | 10,706 | | | | 37,795 | | |
| Shares issued from merger | | | — | | | | — | | | | 622,495 | | | | — | | | | 1,963,304 | | |
| Dividends reinvested | | | — | | | | 176,547 | | | | 296,197 | | | | 29,063 | | | | 4,597 | | |
| Shares redeemed | | | — | | | | (2,338,568 | ) | | | (5,223,923 | ) | | | (421,907 | ) | | | (84,894 | ) | |
| Net increase (decrease) in shares outstanding | | | 64 | | | | (1,998,416 | ) | | | (3,751,335 | ) | | | (382,138 | ) | | | 1,920,802 | | |
| Value Opportunity ($) | |
| Shares sold | | $ | 1,000 | | | $ | 2,340,296 | | | $ | 7,477,383 | | | $ | 152,377 | | | $ | 300,567 | | |
| Shares issued from merger | | | — | | | | — | | | | 8,659,509 | | | | — | | | | 27,164,512 | | |
| Dividends reinvested | | | — | | | | 2,514,028 | | | | 3,812,050 | | | | 411,247 | | | | 58,891 | | |
| Shares redeemed | | | — | | | | (34,295,707 | ) | | | (68,980,076 | ) | | | (6,091,700 | ) | | | (1,125,724 | ) | |
| Net increase (decrease) | | $ | 1,000 | | | $ | (29,441,383 | ) | | $ | (49,031,134 | ) | | $ | (5,528,076 | ) | | $ | 26,398,246 | | |
| | | Class ADV | | Class I | | Class S | |
| | | December 20,
2006(1) to
December 31,
2006 | | Year
Ended
December 31,
2006 | | Year
Ended
December 31,
2005 | | Year
Ended
December 31,
2006 | | Year
Ended
December 31,
2005 | |
| Intermediate Bond (Number of Shares) | |
| Shares sold | | | 75 | | | | 68,647,762 | | | | 10,413,516 | | | | 31,962,510 | | | | 27,761,044 | | |
| Shares issued from merger | | | — | | | | 222,036 | | | | — | | | | — | | | | — | | |
| Dividends reinvested | | | — | | | | 5,842,808 | | | | 3,789,704 | | | | 1,815,268 | | | | 1,847,547 | | |
| Shares redeemed | | | — | | | | (15,931,235 | ) | | | (8,854,326 | ) | | | (33,432,290 | ) | | | (4,792,299 | ) | |
| Net increase in shares outstanding | | | 75 | | | | 58,781,371 | | | | 5,348,894 | | | | 345,488 | | | | 24,816,292 | | |
| Intermediate Bond ($) | |
| Shares sold | | $ | 1,000 | | | $ | 896,296,588 | | | $ | 138,846,419 | | | $ | 416,941,141 | | | $ | 367,384,739 | | |
| Shares issued from merger | | | — | | | | 2,862,609 | | | | — | | | | — | | | | — | | |
| Dividends reinvested | | | — | | | | 75,836,918 | | | | 49,139,900 | | | | 23,433,812 | | | | 23,812,556 | | |
| Shares redeemed | | | — | | | | (209,279,344 | ) | | | (117,871,564 | ) | | | (429,117,715 | ) | | | (63,619,887 | ) | |
| Net increase | | $ | 1,000 | | | $ | 765,716,771 | | | $ | 70,114,755 | | | $ | 11,257,238 | | | $ | 327,577,408 | | |
(1) Commencement of operations.
53
NOTES TO FINANCIAL STATEMENTS AS OF DECEMBER 31, 2006 (CONTINUED)
NOTE 10 — CAPITAL SHARES (continued)
| | | Class I | | | |
| | | Year
Ended
December 31,
2006 | | Year
Ended
December 31,
2005 | | | | | |
| Money Market (Number of Shares) | |
| Shares sold | | | 32,751,915 | | | | 17,729,883 | | | | | | | | | | |
| Dividends reinvested | | | 2,488,618 | | | | 999,103 | | | | | | | | | | |
| Shares redeemed | | | (15,506,729 | ) | | | (22,391,210 | ) | | | | | | | | | |
| Net increase (decrease) in shares outstanding | | | 19,733,804 | | | | (3,662,224 | ) | | | | | | | | | |
| Money Market ($) | |
| Shares sold | | $ | 428,969,203 | | | $ | 229,751,452 | | | | | | | | | | |
| Dividends reinvested | | | 31,895,864 | | | | 12,797,898 | | | | | | | | | | |
| Shares redeemed | | | (203,348,846 | ) | | | (290,343,446 | ) | | | | | | | | | |
| Net increase (decrease) | | $ | 257,516,221 | | | $ | (47,794,096 | ) | | | | | | | | | |
| | | Class I | | Class S | |
| | | Year
Ended
December 31,
2006 | | Year
Ended
December 31,
2005 | | Year
Ended
December 31,
2006 | | July 20,
2005(1) to
December 31,
2005 | |
| Global Science and Technology (Number of Shares) | |
| Shares sold | | | 2,971,865 | | | | 3,651,130 | | | | 127,341 | | | | 19,401 | | |
| Shares redeemed | | | (4,955,941 | ) | | | (6,412,052 | ) | | | (25,008 | ) | | | (1,044 | ) | |
| Net increase (decrease) in shares outstanding | | | (1,984,076 | ) | | | (2,760,922 | ) | | | 102,333 | | | | 18,357 | | |
| Global Science and Technology ($) | |
| Shares sold | | $ | 13,210,390 | | | $ | 13,994,023 | | | $ | 570,468 | | | $ | 76,069 | | |
| Shares redeemed | | | (21,885,263 | ) | | | (23,479,231 | ) | | | (107,972 | ) | | | (4,232 | ) | |
| Net increase (decrease) | | $ | (8,674,873 | ) | | $ | (9,485,208 | ) | | $ | 462,496 | | | $ | 71,837 | | |
| | | Class ADV | | Class I | | Class S | |
| | | December 29,
2006(1) to
December 31,
2006 | | Year
Ended
December 31,
2006 | | Year
Ended
December 31,
2005 | | Year
Ended
December 31,
2006 | | Year
Ended
December 31,
2005 | |
| International Equity (Number of Shares) | |
| Shares sold | | | 82 | | | | 1,515,345 | | | | 2,069,109 | | | | 54,667 | | | | 57,552 | | |
| Dividends reinvested | | | — | | | | 100,359 | | | | 63,014 | | | | 652 | | | | 286 | | |
| Shares redeemed | | | — | | | | (1,305,211 | ) | | | (2,060,158 | ) | | | (18,699 | ) | | | (53,252 | ) | |
| Net increase in shares outstanding | | | 82 | | | | 310,493 | | | | 71,965 | | | | 36,620 | | | | 4,586 | | |
| International Equity ($) | |
| Shares sold | | $ | 1,000 | | | $ | 16,604,593 | | | $ | 18,609,378 | | | $ | 776,636 | | | $ | 499,726 | | |
| Dividends reinvested | | | — | | | | 1,095,926 | | | | 539,401 | | | | 7,085 | | | | 2,439 | | |
| Shares redeemed | | | — | | | | (14,409,328 | ) | | | (18,481,796 | ) | | | (199,489 | ) | | | (461,596 | ) | |
| Net increase | | $ | 1,000 | | | $ | 3,291,191 | | | $ | 666,983 | | | $ | 584,232 | | | $ | 40,569 | | |
(1) Commencement of operations.
54
NOTES TO FINANCIAL STATEMENTS AS OF DECEMBER 31, 2006 (CONTINUED)
NOTE 11 — ILLIQUID SECURITIES
Pursuant to guidelines adopted by the Portfolios' Board, the following securities have been deemed to be illiquid. Each Portfolio may invest up to 15% (10% for Money Market) of its net assets, in illiquid securities. Fair value for these securities was determined by ING Funds Valuation Committee appointed by the Portfolios' Board.
| Portfolio | | Security | | Principal
Amount | | Initial
Acquision
Date | | Cost | | Value | | Percent
of Net
Assets | |
| Balanced | | Abu Dhabi National Energy Co.,
6.500%, due 10/27/36 | | $ | 623,000 | | | 10/26/06 | | $ | 652,179 | | | $ | 644,728 | | | | 0.1 | % | |
| | | Alpine III, 5.925%, due 08/16/14 | | | 218,000 | | | 08/04/04 | | | 218,091 | | | | 218,621 | | | | 0.0 | % | |
| | | Alpine III, 6.325%, due 08/16/14 | | | 218,000 | | | 08/04/04 | | | 218,091 | | | | 218,757 | | | | 0.0 | % | |
| | | Alpine III, 8.125%, due 08/16/14 | | | 328,000 | | | 08/04/04 | | | 331,268 | | | | 330,109 | | | | 0.0 | % | |
| | | Alpine III, 11.375%, due 08/16/14 | | | 560,000 | | | 08/17/04 | | | 561,011 | | | | 574,697 | | | | 0.0 | % | |
| | | Cameron Highway Oil Pipelines,
5.860%, due 12/15/17 | | | 2,075,000 | | | 12/05/05 | | | 2,075,000 | | | | 2,028,962 | | | | 0.2 | % | |
| | | FNMA, 7.125%, due 07/01/27 | | | 4,247 | | | 04/30/06 | | | 4,292 | | | | 4,319 | | | | 0.0 | % | |
| | | FNMA, 7.180%, due 07/01/27 | | | 28,066 | | | 04/30/06 | | | 28,405 | | | | 28,715 | | | | 0.0 | % | |
| | | | | | | | | | | $ | 4,088,337 | | | $ | 4,048,908 | | | | 0.3 | % | |
| Intermediate Bond | | Abu Dhabi National Energy Co.,
6.500%, due 10/27/36 | | $ | 4,151,000 | | | 10/26/06 | | $ | 4,348,004 | | | $ | 4,295,774 | | | | 0.2 | % | |
| | | Alpine III, 5.925%, due 08/16/14 | | | 1,006,000 | | | 08/04/04 | | | 1,006,400 | | | | 1,008,867 | | | | 0.0 | % | |
| | | Alpine III, 6.325%, due 08/16/14 | | | 1,006,000 | | | 08/04/04 | | | 1,006,400 | | | | 1,009,492 | | | | 0.0 | % | |
| | | Alpine III, 8.125%, due 08/16/14 | | | 1,507,000 | | | 08/04/04 | | | 1,524,232 | | | | 1,516,689 | | | | 0.1 | % | |
| | | Alpine III, 11.375%, due 08/16/14 | | | 2,576,000 | | | 08/17/04 | | | 2,609,207 | | | | 2,643,605 | | | | 0.1 | % | |
| | | Cameron Highway Oil Pipelines,
5.860%, due 12/15/17 | | | 7,988,000 | | | 12/05/05 | | | 7,988,000 | | | | 7,810,770 | | | | 0.3 | % | |
| | | FNMA, 7.125%, due 07/01/27 | | | 849 | | | 04/30/06 | | | 860 | | | | 864 | | | | 0.0 | % | |
| | | FNMA, 7.180%, due 07/01/27 | | | 10,551 | | | 04/30/06 | | | 10,704 | | | | 10,795 | | | | 0.0 | % | |
| | | | | | | | | | | $ | 18,493,807 | | | $ | 18,296,856 | | | | 0.7 | % | |
| Money Market | | Goldman Sachs Group LP, 5.390%,
due 02/14/07 | | $ | 11,000,000 | | | 02/13/06 | | $ | 11,000,000 | | | $ | 11,000,000 | | | | 0.8 | % | |
| | | Goldman Sachs Group LP, 5.390%,
due 05/11/07 | | | 10,500,000 | | | 04/11/06 | | | 10,500,000 | | | | 10,500,000 | | | | 0.8 | % | |
| | | Money Market Trust Series A,
5.425%, due 11/09/07 | | | 31,400,000 | | | 07/30/04 | | | 31,400,000 | | | | 31,400,000 | | | | 2.3 | % | |
| | | Newcastle CDO Ltd., 5.380%,
due 10/24/07 | | | 13,900,000 | | | 10/23/03 | | | 13,900,000 | | | | 13,900,000 | | | | 1.0 | % | |
| | | Newcastle CDO III Ltd., 5.380%,
due 9/24/07 | | | 13,900,000 | | | 09/22/05 | | | 13,900,000 | | | | 13,900,000 | | | | 1.0 | % | |
| | | | | | | | | | | $ | 80,700,000 | | | $ | 80,700,000 | | | | 5.9 | % | |
NOTE 12 — SECURITIES LENDING
Under an agreement with The Bank of New York ("BNY"), the Portfolios can lend their securities to approved brokers, dealers and other financial institutions. Loans are collateralized by cash and U.S. Government securities. The collateral must be in an amount equal to at least 105% of the market value of non-U.S. securities loaned and 102% of the market value of U.S. securities loaned. The cash collateral received is invested in approved investments as defined in the Securities Lending Agreement with BNY (the "Agreement"). The securities purchased with cash collateral received are reflected in the Portfolio of Investments. Generally, in the event of counterparty default, the Portfolios have the right to use the collateral to offset losses incurred. The Agreement contains certain guarantees by BNY in the event of counterparty default and/or a borrower's failure to return a loaned security, however there would be a
potential loss to the Portfolios in the event the Portfolios are delayed or prevented from exercising their right to dispose of the collateral. The Portfolios bear the risk of loss with respect to the investment of collateral. Engaging in securities lending could have a leveraging effect, which may intensify the credit, market and other risks associated with investing in a Portfolio. At December 31, 2006, the Portfolios had securities on loan with the following market values:
| | | Value of
Securities
Loaned | | Value of
Collateral | |
| Balanced | | $ | 116,092,130 | | | $ | 119,642,157 | | |
| Growth and Income | | | 313,410,855 | | | | 324,265,437 | | |
| Growth | | | 27,638,784 | | | | 28,535,014 | | |
| Small Company | | | 125,585,492 | | | | 130,322,883 | | |
| Value Opportunity | | | 31,476,731 | | | | 32,518,880 | | |
| Intermediate Bond | | | 394,980,010 | | | | 404,474,535 | | |
| Global Science and Technology | | | 19,800,685 | | | | 20,519,212 | | |
| International Equity | | | 2,634,993 | | | | 2,781,095 | | |
55
NOTES TO FINANCIAL STATEMENTS AS OF DECEMBER 31, 2006 (CONTINUED)
NOTE 13 — CONCENTRATION OF INVESTMENT RISKS
Concentration (Global Science and Technology). The Portfolio concentrates (for purposes of the 1940 Act) its assets in securities related to a particular industry, which means that at least 25% of its assets will be invested in that particular industry at all times. As a result, the Portfolio may be subject to greater market fluctuation than a portfolio which has securities representing a broader range of investment alternatives.
Foreign Securities (All Portfolios). Investments in foreign securities may entail risks not present in domestic investments. Since securities in which the Portfolios may invest are denominated in foreign currencies, changes in the relationship of these foreign currencies to the U.S. dollar can significantly affect the value of the investments and earnings of the Portfolios. Foreign investments may also subject the Portfolios to foreign government exchange restrictions, expropriation, taxation or other political, social or economic developments, as well as changes vis-a-vis the U.S. dollar from movements in currency, and changes in security value and interest rate, all of which could affect the market and/or credit risk of the Portfolios investments.
Emerging Markets Investments (Intermediate Bond, Global Science and Technology and International Equity). Because of less developed markets and economies and, in some countries, less mature governments and governmental institutions, the risks of investing in foreign securities can be intensified in the case of investments in issuers domiciled or doing substantial business in emerging market countries.
NOTE 14 — FEDERAL INCOME TAXES AND OTHER TAX MATTERS
The amount of distributions from net investment income and net realized capital gains are determined in accordance with federal income tax regulations, which may differ from U.S. generally accepted accounting principles for investment companies. These book/tax differences may be either temporary or permanent. Permanent differences are reclassified within the capital accounts based on their federal tax-basis treatment; temporary differences are not reclassified. Key differences include the treatment of short-term capital gains, foreign currency transactions, and wash sale deferrals. Distributions in excess of net investment income and/or net realized capital gains for tax purposes are reported as distributions of paid-in capital.
The following permanent tax differences have been reclassified as of December 31, 2006:
| | | Paid-in
Capital | | Undistributed
Net Investment
Income | | Accumulated
Net Realized
Gains/
(Losses) | |
| Balanced | | $ | (1,408,393 | ) | | $ | 509,960 | | | $ | 898,433 | | |
| Growth and Income | | | (66,819 | ) | | | 66,819 | | | | — | | |
| Small Company | | | — | | | | (268,087 | ) | | | 268,087 | | |
| Value Opportunity | | | — | | | | (14,095 | ) | | | 14,095 | | |
| Intermediate Bond | | | (277,825 | ) | | | (1,726,949 | ) | | | 2,004,774 | | |
Global Science and
Technology | | | (391,027 | ) | | | 270,212 | | | | 120,185 | | |
| International Equity | | | — | | | | 5,165 | | | | (5,165 | ) | |
Dividends paid by the Portfolios from net investment income and distributions of net realized short-term capital gains are, for federal income tax purposes, taxable as ordinary income to shareholders. The tax composition of dividends and distributions to shareholders was as follows:
| | | Year Ended
December 31, 2006 | | Year Ended
December 31, 2005 | |
| | | Ordinary
Income | | Long-Term
Capital Gains | | Ordinary
Income | | Long-Term
Capital Gains | |
| Balanced | | $ | 28,941,155 | | | $ | — | | | $ | 30,626,031 | | | $ | — | | |
| Growth and Income | | | 36,025,178 | | | | — | | | | 32,976,369 | | | | — | | |
| Growth | | | 113,349 | | | | — | | | | 1,256,421 | | | | — | | |
| Small Company | | | 6,394,186 | | | | 66,075,261 | | | | 640,870 | | | | 6,283,317 | | |
| Value Opportunity | | | 2,925,275 | | | | — | | | | 3,870,941 | | | | — | | |
| Intermediate Bond | | | 99,297,017 | | | | — | | | | 71,996,067 | | | | 987,932 | | |
| Money Market | | | 31,895,864 | | | | — | | | | 12,797,898 | | | | — | | |
| International Equity | | | 1,103,011 | | | | — | | | | 541,840 | | | | — | | |
56
NOTES TO FINANCIAL STATEMENTS AS OF DECEMBER 31, 2006 (CONTINUED)
NOTE 14 — FEDERAL INCOME TAXES AND OTHER TAX MATTERS (continued)
The tax-basis components of distributable earnings and the expiration dates of the capital loss carryforwards which may be used to offset future realized capital gains for federal income tax purposes as of December 31, 2006 were:
| | | Undistributed
Ordinary
Income | | Undistributed
Long Term
Capital Gains | | Unrealized
Appreciation/
(Depreciation) | | Post-October
Capital
Losses
Deferred | | Post-October
Currency
Losses
Deferred | | Capital
Loss
Carryforwards | | Expiration
Dates | |
| Balanced | | $ | 42,482,628 | | | $ | 33,095,937 | | | $ | 62,843,492 | | | $ | — | | | $ | — | | | $ | (1,148,170 | ) | | | 2008 | | |
| | | | | | | | | | | | | | | | | | | | | | | | (574,085 | ) | | | 2009 | | |
| | | | | | | | | | | | | | | | | | | | | | | $ | (1,722,255 | ) | | | | | |
| Growth and Income | | | 161,526 | | | | — | | | | 434,102,939 | | | | — | | | | — | | | | (2,062,659,206 | ) | | | 2010 | | |
| | | | | | | | | | | | | | | | | | | | | | | | (63,082,574 | ) | | | 2011 | | |
| | | | | | | | | | | | | | | | | | | | | | | $ | (2,125,741,780 | ) | | | | | |
| Growth | | | 362,892 | | | | — | | | | 13,625,486 | | | | — | | | | — | | | | (112,000,851 | ) | | | 2009 | | |
| | | | | | | | | | | | | | | | | | | | | | | | (63,207,672 | ) | | | 2010 | | |
| | | | | | | | | | | | | | | | | | | | | | | $ | (175,208,523 | ) | | | | | |
| Small Company | | | 10,259,128 | | | | 67,410,628 | | | | 61,870,735 | | | | — | | | | — | | | | — | | | | — | | |
| Value Opportunity | | | 3,112,822 | | | | — | | | | 28,930,128 | | | | — | | | | — | | | | (5,455,768 | ) | | | 2010 | | |
| Intermediate Bond | | | — | | | | — | | | | (6,180,870 | ) | | | (1,765,163 | ) | | | (23,346 | ) | | | (47,445 | ) | | | 2008 | | |
| | | | | | | | | | | | | | | | | | | | | | | | (14,250 | ) | | | 2009 | | |
| | | | | | | | | | | | | | | | | | | | | | | | (41,990 | ) | | | 2013 | | |
| | | | | | | | | | | | | | | | | | | | | | | | (20,305,969 | ) | | | 2014 | | |
| | | | | | | | | | | | | | | | | | | | | | | $ | (20,409,654 | ) | | | | | |
| Money Market | | | 57,121,313 | | | | — | | | | (119 | ) | | | — | | | | — | | | | (659,806 | ) | | | 2008 | | |
| | | | | | | | | | | | | | | | | | | | | | | | (3,715,968 | ) | | | 2009 | | |
| | | | | | | | | | | | | | | | | | | | | | | | (169 | ) | | | 2011 | | |
| | | | | | | | | | | | | | | | | | | | | | | | (244,520 | ) | | | 2012 | | |
| | | | | | | | | | | | | | | | | | | | | | | $ | (4,620,463 | ) | | | | | |
| Global Science and Technology | | | — | | | | — | | | | 9,656,972 | | | | — | | | | — | | | | (21,943,692 | ) | | | 2009 | | |
| | | | | | | | | | | | | | | | | | | | | | | | (15,534,432 | ) | | | 2010 | | |
| | | | | | | | | | | | | | | | | | | | | | | | (4,912,495 | ) | | | 2011 | | |
| | | | | | | | | | | | | | | | | | | | | | | $ | (42,390,619 | ) | | | | | |
| International Equity | | | 1,627,816 | | | | — | | | | 13,658,216 | | | | — | | | | — | | | | (1,513,230 | ) | | | 2009 | | |
| | | | | | | | | | | | | | | | | | | | | | | | (9,221,611 | ) | | | 2010 | | |
| | | | | | | | | | | | | | | | | | | | | | | $ | (10,734,841 | ) | | | | | |
Under U.S. federal income tax law, as specified in the Internal Revenue Code (the "Code") and U.S. Treasury regulations, the Portfolios must meet various technical requirements relating to fund administration, portfolio investments, and "eligible investors" in the Portfolios. Complying with these requirements is a condition for beneficial tax treatment of certain insurance products that offer the Portfolios as investment options. The failure of the Portfolios to meet any of these complex requirements could result in an excise tax, administrative penalties imposed by the Internal Revenue Service, potential liability to insurers whose products include the Portfolios as investment options, and unanticipated costs associated with remedying a failure. We are aware that an affiliate of a Portfolio's investment adviser may have failed to limit the availability of ING VP Intermediate Bond Portfolio for investment to "eligible investors" under the Co de. The legal and tax consequences, if any, of this are currently under active review, but we do not believe that it is probable that any liability has been incurred by the Portfolio. Although it is not probable that any liability has been incurred, ING has agreed to indemnify the Portfolio from and against economic consequences of any such failure incurred either (i) directly or (ii) by virtue of any indemnification by the Portfolio resulting from such failure.
NOTE 15 — REORGANIZATIONS
On April 29, 2006, Balanced and Intermediate Bond as listed below (each "Acquiring Portfolio" and collectively, "Acquiring Portfolios"), acquired the assets and certain liabilities of the ING VP Convertible Portfolio, The Asset Allocation Portfolio and The Bond Portfolio, also listed below (each "Acquired Portfolio"and collectively, "Acquired Portfolios"), in a tax-free reorganization in exchange for shares of the Acquiring Portfolios, pursuant to a plan or reorganization approved by the Acquired Portfolios' shareholders. The number and value of shares
57
NOTES TO FINANCIAL STATEMENTS AS OF DECEMBER 31, 2006 (CONTINUED)
NOTE 15 — REORGANIZATIONS (continued)
issued by the Acquiring Portfolios are presented in Note 10 — Capital Share Transactions. Net assets and unrealized appreciation/depreciation as of the reorganization date were as follows:
Acquiring
Portfolio | | Acquired
Portfolio | | Total Net Assets of
Acquired Portfolio (000's) | | Total Net Assets of
Acquiring Portfolio (000's) | | Acquired Portfolio
Unrealized
Appreciation/
(Depreciation) (000's) | | Conversion
Ratio | |
| Balanced | | ING VP
Convertible Portfolio | | $8,269 | | $1,224,744 | | $231 | | 0.81 | |
| Balanced | | The Asset
Allocation Portfolio | | 13,477 | | 1,224,744 | | 632 | | 0.72 | |
| Intermediate Bond | | The Bond Portfolio | | | 2,863 | | | | 1,890,564 | | | | (60 | ) | | | 0.74 | | |
The net assets of Balanced and Intermediate Bond after the acquisition were approximately $1,246,490,241 and $1,893,426,244, respectively.
NOTE 16 — OTHER ACCOUNTING PRONOUNCEMENTS
In June 2006, the Financial Accounting Standards Board ("FASB") issued FASB Interpretation No. 48 ("FIN 48"), "Accounting for Uncertainty in Income Taxes." This standard defines the threshold for recognizing the benefits of tax-return positions in the financial statements as "more-likely-than-not" to be sustained upon challenge by the taxing authority and requires measurement of a tax position meeting the more-likely-than-not criterion, based on the largest benefit that is more than 50 percent likely to be realized. FIN 48 is effective for fiscal years beginning after December 15, 2006, with early application permitted if no interim financial statements have been issued. However, acknowledging the unique issues that FIN 48 presents for investment companies that calculate NAVs, the Securities and Exchange Commission (the "SEC") has indicated that they would not object if a fund implements FIN 48 in its NAV calculation as late as its last NAV calculation in the first required financial statement reporting period for its fiscal year beginning after December 15, 2006. For calendar-year open-end funds, this would be no later than their June 29, 2007 NAV and the effects of FIN 48 would be reflected in the funds' semi-annual financial statements contained in their Form N-CSR filing. At adoption, companies must adjust their financial statements to reflect only those tax positions that are more likely-than-not to be sustained as of the adoption date. Management is currently analyzing the tax positions of the Portfolios. To date, this analysis reflects an uncertain tax position in the ING VP Intermediate Bond Portfolio that has the potential to result in a liability upon adoption of FIN 48. Management of the Portfolio is presently determining whether the tax benefits recorded by the Portfolio is more likely-than-not to be sustained if challenged by taxing authorities. To the extent that, in Management's judgment, the more likely-than-not threshold cannot be achieved, ING has agreed to indemnify the Portfolio and will bear any taxes and other costs related to this position that may occur. As a result, in Management's opinion, the adoption of FIN 48 is not expected to have a material impact on the financial statements of the Portfolios.
On September 15, 2006, the FASB issued Statement of Financial Accounting Standards No. 157 ("SFAS No. 157"), "Fair Value Measurements." The new accounting statement defines fair value, establishes a framework for measuring fair value in generally accepted accounting principles ("GAAP"), and expands disclosures about fair value measurements. SFAS No. 157 defines fair value as the price that would be received to sell an asset or paid to transfer a liability in an orderly transaction between market participants at the measurement date (an exit price). SFAS No. 157 also stipulates that, as a market-based measurement, fair value measurement should be determined based on the assumptions that market participants would use in pricing the asset or liability, and establishes a fair value hierarchy that distinguishes between (a) market participant assumptions developed based on market data obtained from sources independent of the reporting entity (obse rvable inputs) and (b) the reporting entity's own assumptions about market participant assumptions developed based on the best information available in the circumstances (unobservable inputs). SFAS No. 157 is effective for financial statements issued for fiscal years beginning after November 15, 2007. As of December 31, 2006, management of the Portfolios is currently assessing the impact, if any, that will result from adopting SFAS No. 157.
NOTE 17 — INFORMATION REGARDING TRADING OF ING'S U.S. MUTUAL FUNDS
In 2004, ING Investments reported to the Boards of Directors/Trustees (the "Boards") of the ING Funds
58
NOTES TO FINANCIAL STATEMENTS AS OF DECEMBER 31, 2006 (CONTINUED)
NOTE 17 — INFORMATION REGARDING TRADING OF ING'S U.S. MUTUAL FUNDS (continued)
that, like many U.S. financial services companies, ING Investments and certain of its U.S. affiliates have received informal and formal requests for information since September 2003 from various governmental and self-regulatory agencies in connection with investigations related to mutual funds and variable insurance products. ING Investments has advised the Boards that it and its affiliates have cooperated fully with each request.
In addition to responding to regulatory and governmental requests, ING Investments reported that management of U.S. affiliates of ING Groep, including ING Investments (collectively, "ING"), on their own initiative, have conducted, through independent special counsel and a national accounting firm, an extensive internal review of trading in ING insurance, retirement, and mutual fund products. The goal of this review was to identify any instances of inappropriate trading in those products by third parties or by ING investment professionals and other ING personnel. ING's internal review related to mutual fund trading is now substantially completed. ING has reported that, of the millions of customer relationships that ING maintains, the internal review identified several isolated arrangements allowing third parties to engage in frequent trading of mutual funds within ING's variable insurance and mutual fund products, and identified other circums tances where frequent trading occurred, despite measures taken by ING intended to combat market timing. ING further reported that each of these arrangements has been terminated and fully disclosed to regulators. The results of the internal review were also reported to the independent members of the Boards.
ING Investments has advised the Boards that most of the identified arrangements were initiated prior to ING's acquisition of the businesses in question in the U.S. ING Investments further reported that the companies in question did not receive special benefits in return for any of these arrangements, which have all been terminated.
Based on the internal review, ING Investments has advised the Boards that the identified arrangements do not represent a systemic problem in any of the companies that were involved.
In September 2005, ING Funds Distributor, LLC ("IFD"), the distributor of certain ING Funds, settled an administrative proceeding with the NASD regarding
three arrangements, dating from 1995, 1996 and 1998, under which the administrator to the then-Pilgrim Funds, which subsequently became part of the ING Funds, entered into formal and informal arrangements that permitted frequent trading. Under the terms of the Letter of Acceptance, Waiver and Consent ("AWC") with the NASD, under which IFD neither admitted nor denied the allegations or findings, IFD consented to the following sanctions: (i) a censure; (ii) a fine of $1.5 million; (iii) restitution of approximately $1.44 million to certain ING Funds for losses attributable to excessive trading described in the AWC; and (iv) agreement to make certification to NASD regarding the review and establishment of certain procedures.
In addition to the arrangements discussed above, in 2004 ING Investments reported to the Boards that, at that time, these instances include the following, in addition to the arrangements subject to the AWC discussed above:
• Aeltus Investment Management, Inc. (a predecessor entity to ING Investment Management Co.) identified two investment professionals who engaged in extensive frequent trading in certain ING Funds. One was subsequently terminated for cause and incurred substantial financial penalties in connection with this conduct and the second has been disciplined.
• ReliaStar Life Insurance Company ("ReliaStar") entered into agreements seven years ago permitting the owner of policies issued by the insurer to engage in frequent trading and to submit orders until 4pm Central Time. In 2001 ReliaStar also entered into a selling agreement with a broker-dealer that engaged in frequent trading. Employees of ING affiliates were terminated and/or disciplined in connection with these matters.
• In 1998, Golden American Life Insurance Company entered into arrangements permitting a broker-dealer to frequently trade up to certain specific limits in a fund available in an ING variable annuity product. No employee responsible for this arrangement remains at the company.
For additional information regarding these matters, you may consult the Form 8-K and Form 8-K/A for each of four life insurance companies, ING USA Annuity and Life Insurance Company, ING Life Insurance and Annuity Company, ING Insurance Company of
59
NOTES TO FINANCIAL STATEMENTS AS OF DECEMBER 31, 2006 (CONTINUED)
NOTE 17 — INFORMATION REGARDING TRADING OF ING'S U.S. MUTUAL FUNDS (continued)
America, and ReliaStar Life Insurance Company of New York, each filed with the Securities and Exchange Commission (the "SEC") on October 29, 2004 and September 8, 2004. These Forms 8-K and Forms 8-K/A can be accessed through the SEC's Web site at http://www.sec.gov. Despite the extensive internal review conducted through independent special counsel and a national accounting firm, there can be no assurance that the instances of inappropriate trading reported to the Board are the only instances of such trading respecting the ING Funds.
ING Investments reported to the Board that ING is committed to conducting its business with the highest standards of ethical conduct with zero tolerance for noncompliance. Accordingly, ING Investments advised the Board that ING management was disappointed that its voluntary internal review identified these situations. Viewed in the context of the breadth and magnitude of its U.S. business as a whole, ING management does not believe that ING's acquired companies had systemic ethical or compliance issues in these areas. Nonetheless, ING Investments reported that given ING's refusal to tolerate any lapses, it has taken the steps noted below, and will continue to seek opportunities to further strengthen the internal controls of its affiliates.
• ING has agreed with the ING Funds to indemnify and hold harmless the ING Funds from all damages resulting from wrongful conduct by ING or its employees or from ING's internal investigation, any investigations conducted by any governmental or self-regulatory agencies, litigation or other formal proceedings, including any proceedings by the Securities and Exchange Commission. ING Investments reported to the Board that ING management believes that the total amount of any indemnification obligations will not be material to ING or its U.S. business.
• ING updated its Code of Conduct for employees reinforcing its employees' obligation to conduct personal trading activity consistent with the law, disclosed limits, and other requirements.
• The ING Funds, upon a recommendation from ING, updated their respective Codes of Ethics applicable to investment professionals with ING entities and certain other fund personnel, requiring such personnel to pre-clear any purchases or sales of ING Funds that are not
systematic in nature (i.e., dividend reinvestment), and imposing minimum holding periods for shares of ING Funds.
• ING instituted excessive trading policies for all customers in its variable insurance and retirement products and for shareholders of the ING Funds sold to the public through financial intermediaries. ING does not make exceptions to these policies.
• ING reorganized and expanded its U.S. Compliance Department, and created an Enterprise Compliance team to enhance controls and consistency in regulatory compliance.
Other Regulatory Matters
The New York Attorney General (the "NYAG") and other federal and state regulators are also conducting broad inquiries and investigations involving the insurance industry. These initiatives currently focus on, among other things, compensation and other sales incentives; potential conflicts of interest; potential anti-competitive activity; reinsurance; marketing practices (including suitability); specific product types (including group annuities and indexed annuities); fund selection for investment products and brokerage sales; and disclosure. It is likely that the scope of these industry investigations will further broaden before they conclude. ING has received formal and informal requests in connection with such investigations, and is cooperating fully with each request. In connection with one such investigation, affiliates of ING Investments were named in a petition for relief and cease and desist order filed by the New Hampshire Bureau of Securities Regulation (the "NH Bureau") concerning their administration of the New Hampshire state employees deferred compensation plan.
On October 10, 2006, an affiliate of ING Investments entered into an assurance of discontinuance with the NYAG (the "NYAG Agreement") regarding the endorsement of its products by the New York State United Teachers Union Member Benefits Trust ("NYSUT") and the sale of their products to NYSUT members. Under the terms of the NYAG Agreement, the affiliate of ING Investments, without admitting or denying the NYAG's findings, will distribute $30 million to NYSUT members, and/or former NYSUT members, who participated in the NYSUT-endorsed products at any point between January 1, 2001 and June 30, 2006. The affiliate also agreed with the NYAG's office to develop a one-page disclosure that will further improve
60
NOTES TO FINANCIAL STATEMENTS AS OF DECEMBER 31, 2006 (CONTINUED)
NOTE 17 — INFORMATION REGARDING TRADING OF ING'S U.S. MUTUAL FUNDS (continued)
transparency and disclosure regarding retirement product fees (the "One-Page Disclosure"). Pursuant to the terms of the NYAG Agreement, the affiliate has agreed for a five year period to provide its retirement product customers with the One-Page Disclosure.
In addition, on the same date, these affiliates of ING Investments entered into a consent agreement with the NH Bureau (the "NH Agreement") to resolve this petition for relief and cease and desist order. Under the terms of the NH Agreement, these affiliates of ING Investments, without admitting or denying the NH Bureau's claims, have agreed to pay $3 million to resolve the matter, and for a five year period to provide their retirement product customers with the One-Page Disclosure described above.
Other federal and state regulators could initiate similar actions in this or other areas of ING's businesses.
These regulatory initiatives may result in new legislation and regulation that could significantly affect the financial services industry, including businesses in which ING is engaged.
In light of these and other developments, ING continuously reviews whether modifications to its business practices are appropriate.
At this time, in light of the current regulatory factors, ING U.S. is actively engaged in reviewing whether any modifications in our practices are appropriate for the future.
There can be no assurance that these matters, or the adverse publicity associated with them, will not result in increased fund redemptions, reduced sale of fund shares, or other adverse consequences to ING Funds.
NOTE 18 — LITIGATION
On December 12, 2003, ING IM received a copy of a complaint (the "Complaint") filed in the United States Bankruptcy Court for the Southern District of New York styled Enron Corp. v. Mass Mutual Life Insurance Co., et al. Among other defendants named in the Complaint are defendants Balanced, and Intermediate Bond (the "Subject Portfolios"). The Complaint alleges that Enron Corp. ("Enron") transferred to the defendants, including the Subject Portfolios, over $1 billion in the aggregate for the purpose of prepaying certain commercial paper issued by Enron (the "Notes") and held by the defendants
prior to the filing by Enron for bankruptcy protection under Chapter 11 of Title 11 of the Bankruptcy Code (the "Bankruptcy Code"). The Complaint seeks to hold the defendants, including the Subject Portfolios, liable for these transfers as preferential transfers or as fraudulent transfers under the Bankruptcy Code. Although the Complaint does not specify the amount of each transfer in dispute, it appears that the sale by ING VP Balanced Portfolio, Inc. of $23,181,757 of the Notes on or about October 29, 2001 and the sale by ING VP Bond Portfolio, Inc. of $24,963,125 of the Notes on or about October 29, 2001 are in dispute. The Complaint seeks to require the Subject Portfolios to repay to Enron the full amounts of these transfers, in which event the Subject Portfolios would be granted unsecured claims against the Enron bankruptcy estate in the amounts of the repayments.
The Subject Portfolios moved to dismiss all counts of the Complaint, contending, among other things, that section 546(e) of the Bankruptcy Code provides a complete defense. The Bankruptcy Court denied the motion on July 1, 2005. Accordingly, the Subject Portfolios filed an answer to the Complaint on July 29, 2005. In addition, the Subject Portfolios have moved for leave to pursue an immediate appeal of the Bankruptcy Court's decision to the district court. The district court has not yet ruled, and there can be no assurance that leave will be granted to pursue the appeal now. The Bankruptcy Court has set a discovery calendar indicating that discovery is to proceed through 2007. The Subject Portfolios and their counsel have reviewed the Subject Portfolios' records concerning the factual background of the allegations in the Complaint, and have considered remaining potential defenses to the allegations in the Complaint. Because only limited disc overy has taken place, the Subject Portfolios are unable to predict whether Enron will prevail, in whole or in part, in its claims against the Subject Portfolios, and therefore have not recorded a liability in the financial statements for any potential loss. Defendants continue to contend there is an affirmative defense for the claims presented.
NOTE 19 — SUBSEQUENT EVENTS
Subsequent to December 31, 2006, the following Portfolio declared dividends from net investment income:
| | | Per Share
Amount | | Payable Date | | Record Date | |
| Money Market | |
| Class I | | $ | 0.5534 | | | February 2, 2007 | | January 30, 2007 | |
61
PORTFOLIO OF INVESTMENTS
ING VP BALANCED PORTFOLIO AS OF DECEMBER 31, 2006
| Shares | | | | | | Value | |
| COMMON STOCK: 65.7% | | | |
| | | | | Advertising: 0.3% | |
| | 2,000 | | | | | Advo, Inc. | | $ | 65,200 | | |
| | 35,500 | | | L | | Omnicom Group | | | 3,711,170 | | |
| | | | 3,776,370 | | |
| | | | | Aerospace/Defense: 1.1% | |
| | 43,150 | | | | | Boeing Co. | | | 3,833,446 | | |
| | 2,000 | | | | | Kaman Corp. | | | 44,780 | | |
| | 106,940 | | | | | Raytheon Co. | | | 5,646,432 | | |
| | 63,810 | | | | | United Technologies Corp. | | | 3,989,401 | | |
| | | | 13,514,059 | | |
| | | | | Agriculture: 0.8% | |
| | 21,500 | | | @ | | Alliance One
International, Inc. | | | 151,790 | | |
| | 108,105 | | | | | Altria Group, Inc. | | | 9,277,571 | | |
| | 2,300 | | | | | Delta & Pine Land Co. | | | 93,035 | | |
| | | | 9,522,396 | | |
| | | | | Airlines: 0.0% | |
| | 5,900 | | | @ | | Airtran Holdings, Inc. | | | 69,266 | | |
| | 1,000 | | | @ | | Alaska Air Group, Inc. | | | 39,500 | | |
| | 2,500 | | | @ | | JetBlue Airways Corp. | | | 35,500 | | |
| | 10,995 | | | | | Skywest, Inc. | | | 280,482 | | |
| | | | 424,748 | | |
| | | | | Apparel: 0.6% | |
| | 4,700 | | | @ | | Ashworth, Inc. | | | 34,122 | | |
| | 77,900 | | | @ | | Coach, Inc. | | | 3,346,584 | | |
| | 2,400 | | | @,L | | Deckers Outdoor Corp. | | | 143,880 | | |
| | 5,700 | | | @,L | | Gymboree Corp. | | | 217,512 | | |
| | 21,800 | | | @ | | Hanesbrands, Inc. | | | 514,916 | | |
| | 28,900 | | | | | Jones Apparel Group, Inc. | | | 966,127 | | |
| | 7,500 | | | | | Kellwood Co. | | | 243,900 | | |
| | 7,000 | | | | | K-Swiss, Inc. | | | 215,180 | | |
| | 8,900 | | | L | | Phillips-Van Heusen | | | 446,513 | | |
| | 7,300 | | | | | Polo Ralph Lauren Corp. | | | 566,918 | | |
| | 11,300 | | | | | Wolverine World Wide, Inc. | | | 322,276 | | |
| | | | 7,017,928 | | |
| | | | | Auto Manufacturers: 0.3% | |
| | 398,900 | | | L | | Ford Motor Co. | | | 2,995,739 | | |
| | | | 2,995,739 | | |
| | | | | Auto Parts & Equipment: 0.0% | |
| | 22,500 | | | L | | ArvinMeritor, Inc. | | | 410,175 | | |
| | 600 | | | | | Bandag, Inc. | | | 30,258 | | |
| | 3,600 | | | | | Standard Motor
Products, Inc. | | | 53,928 | | |
| | | | 494,361 | | |
| | | | | Banks: 4.0% | |
| | 337,735 | | | | | Bank of America Corp. | | | 18,031,672 | | |
| | 9,800 | | | L | | Chittenden Corp. | | | 300,762 | | |
| | 25,400 | | | | | Colonial BancGroup, Inc. | | | 653,796 | | |
| | 41,900 | | | | | Comerica, Inc. | | | 2,458,692 | | |
| | 10,792 | | | | | East-West Bancorp., Inc. | | | 382,253 | | |
| | 23,100 | | | @@,L | | First Bancorp. | | | 220,143 | | |
| | 2,400 | | | | | First Indiana Corp. | | | 60,864 | | |
| | 3,400 | | | | | First Midwest Bancorp., Inc. | | | 131,512 | | |
| | 17,800 | | | L | | FirstMerit Corp. | | | 429,692 | | |
| | 11,200 | | | | | Hanmi Financial Corp. | | | 252,336 | | |
| | 6,400 | | | | | Independent Bank Corp. | | | 161,856 | | |
| Shares | | | | | | Value | |
| | 6,700 | | | | | Mercantile
Bankshares Corp. | | $ | 313,493 | | |
| | 113,200 | | | L | | National City Corp. | | | 4,138,592 | | |
| | 126,200 | | | | | Regions Financial Corp. | | | 4,719,880 | | |
| | 4,700 | | | | | South Financial Group, Inc. | | | 124,973 | | |
| | 20,600 | | | L | | TCF Financial Corp. | | | 564,852 | | |
| | 3,700 | | | | | Umpqua Holdings Corp. | | | 108,891 | | |
| | 90,170 | | | | | US Bancorp. | | | 3,263,252 | | |
| | 91,350 | | | | | Wachovia Corp. | | | 5,202,383 | | |
| | 10,900 | | | | | Webster Financial Corp. | | | 531,048 | | |
| | 160,700 | | | | | Wells Fargo & Co. | | | 5,714,492 | | |
| | 11,900 | | | | | Whitney Holding Corp. | | | 388,178 | | |
| | | | 48,153,612 | | |
| | | | | Beverages: 1.0% | |
| | 103,050 | | | | | Coca-Cola Co. | | | 4,972,163 | | |
| | 400 | | | @ | | Hansen Natural Corp. | | | 13,472 | | |
| | 34,700 | | | | | Pepsi Bottling Group, Inc. | | | 1,072,577 | | |
| | 19,400 | | | | | PepsiAmericas, Inc. | | | 407,012 | | |
| | 83,325 | | | | | PepsiCo, Inc. | | | 5,211,979 | | |
| | | | 11,677,203 | | |
| | | | | Biotechnology: 0.4% | |
| | 60,195 | | | @ | | Amgen, Inc. | | | 4,111,920 | | |
| | 1,400 | | | @ | | Digene Corp. | | | 67,088 | | |
| | 300 | | | @ | | Invitrogen Corp. | | | 16,977 | | |
| | 40,500 | | | @,L | | Millennium
Pharmaceuticals, Inc. | | | 441,450 | | |
| | 8,700 | | | @ | | PDL BioPharma, Inc. | | | 175,218 | | |
| | 14,800 | | | @,L | | Savient
Pharmaceuticals, Inc. | | | 165,908 | | |
| | 8,300 | | | @,L | | Vertex
Pharmaceuticals, Inc. | | | 310,586 | | |
| | | | 5,289,147 | | |
| | | | | Building Materials: 0.0% | |
| | 1,300 | | | L | | ElkCorp | | | 53,417 | | |
| | | | 53,417 | | |
| | | | | Chemicals: 0.9% | |
| | 4,100 | | | | | Airgas, Inc. | | | 166,132 | | |
| | 7,700 | | | | | Chemtura Corp. | | | 74,151 | | |
| | 44,700 | | | | | Dow Chemical Co. | | | 1,785,318 | | |
| | 46,200 | | | | | EI DuPont de
Nemours & Co. | | | 2,250,402 | | |
| | 900 | | | | | FMC Corp. | | | 68,895 | | |
| | 8,900 | | | | | Georgia Gulf Corp. | | | 171,859 | | |
| | 10,700 | | | | | HB Fuller Co. | | | 276,274 | | |
| | 13,500 | | | | | Lubrizol Corp. | | | 676,755 | | |
| | 27,187 | | | L | | Lyondell Chemical Co. | | | 695,172 | | |
| | 1,500 | | | L | | MacDermid, Inc. | | | 51,150 | | |
| | 29,400 | | | | | Monsanto Co. | | | 1,544,382 | | |
| | 23,900 | | | L | | Olin Corp. | | | 394,828 | | |
| | 10,100 | | | @ | | Omnova Solutions, Inc. | | | 46,258 | | |
| | 24,000 | | | @,L | | PolyOne Corp. | | | 180,000 | | |
| | 2,000 | | | | | Quaker Chemical Corp. | | | 44,140 | | |
| | 28,000 | | | | | Sherwin-Williams Co. | | | 1,780,240 | | |
| | 21,100 | | | | | Valspar Corp. | | | 583,204 | | |
| | | | 10,789,160 | | |
| | | | | Commercial Services: 1.2% | |
| | 2,800 | | | @ | | Alliance Data Systems
Corp. | | | 174,916 | | |
| | 34,300 | | | @,L | | Apollo Group, Inc. | | | 1,336,671 | | |
See Accompanying Notes to Financial Statements
62
PORTFOLIO OF INVESTMENTS
ING VP BALANCED PORTFOLIO AS OF DECEMBER 31, 2006 (CONTINUED)
| Shares | | | | | | Value | |
| | | | | Commercial Services (continued) | |
| | 1,300 | | | | | Banta Corp. | | $ | 47,320 | | |
| | 5,000 | | | @ | | Career Education Corp. | | | 123,900 | | |
| | 5,100 | | | | | Central Parking Corp. | | | 91,800 | | |
| | 2,890 | | | @,L | | Consolidated Graphics, Inc. | | | 170,712 | | |
| | 37,600 | | | @ | | Convergys Corp. | | | 894,128 | | |
| | 1,700 | | | L | | CPI Corp. | | | 79,033 | | |
| | 16,000 | | | | | DeVry, Inc. | | | 448,000 | | |
| | 4,300 | | | @,L | | Heidrick & Struggles
International, Inc. | | | 182,148 | | |
| | 16,300 | | | @ | | Hooper Holmes, Inc. | | | 53,953 | | |
| | 4,300 | | | @ | | ITT Educational
Services, Inc. | | | 285,391 | | |
| | 3,900 | | | @,L | | Kendle International, Inc. | | | 122,655 | | |
| | 16,100 | | | @,L | | Korn/Ferry International | | | 369,656 | | |
| | 13,600 | | | @,L | | Labor Ready, Inc. | | | 249,288 | | |
| | 11,300 | | | | | Manpower, Inc. | | | 846,709 | | |
| | 74,600 | | | | | McKesson Corp. | | | 3,782,220 | | |
| | 50,100 | | | | | Moody's Corp. | | | 3,459,906 | | |
| | 22,100 | | | @ | | MPS Group, Inc. | | | 313,378 | | |
| | 9,100 | | | @ | | Quanta Services, Inc. | | | 178,997 | | |
| | 15,600 | | | @ | | Valassis
Communications, Inc. | | | 226,200 | | |
| | 3,010 | | | @,L | | Vertrue, Inc. | | | 115,614 | | |
| | 6,300 | | | W | | Viad Corp. | | | 255,780 | | |
| | 2,700 | | | @ | | Volt Information
Sciences, Inc. | | | 135,567 | | |
| | 8,000 | | | | | Watson Wyatt
Worldwide, Inc. | | | 361,200 | | |
| | | | 14,305,142 | | |
| | | | | Computers: 2.7% | |
| | 3,300 | | | | | Agilysys, Inc. | | | 55,242 | | |
| | 2,090 | | | @ | | CACI International, Inc. | | | 118,085 | | |
| | 17,200 | | | @,L | | Cadence Design
Systems, Inc. | | | 308,052 | | |
| | 3,400 | | | @ | | Catapult
Communications Corp. | | | 30,532 | | |
| | 7,100 | | | @,L | | Ceridian Corp. | | | 198,658 | | |
| | 263,600 | | | @ | | Dell, Inc. | | | 6,613,724 | | |
| | 6,200 | | | | | Factset Research
Systems, Inc. | | | 350,176 | | |
| | 250,900 | | | | | Hewlett-Packard Co. | | | 10,334,571 | | |
| | 8,300 | | | | | Imation Corp. | | | 385,369 | | |
| | 126,050 | | | L | | International Business
Machines Corp. | | | 12,245,758 | | |
| | 3,800 | | | @ | | Mercury Computer
Systems, Inc. | | | 50,768 | | |
| | 6,237 | | | @,L | | Micros Systems, Inc. | | | 328,690 | | |
| | 10,600 | | | @,L | | Palm, Inc. | | | 149,354 | | |
| | 7,200 | | | @,L | | Radisys Corp. | | | 120,024 | | |
| | 9,300 | | | @ | | SRA International, Inc. | | | 248,682 | | |
| | 9,700 | | | @ | | SYKES Enterprises, Inc. | | | 171,108 | | |
| | 17,800 | | | @ | | Synopsys, Inc. | | | 475,794 | | |
| | 12,600 | | | @ | | Western Digital Corp. | | | 257,796 | | |
| | | | 32,442,383 | | |
| | | | | Cosmetics/Personal Care: 1.0% | |
| | 35,100 | | | L | | Estee Lauder Cos., Inc. | | | 1,432,782 | | |
| | 163,992 | | | | | Procter & Gamble Co. | | | 10,539,766 | | |
| | | | 11,972,548 | | |
| Shares | | | | | | Value | |
| | | | | Distribution/Wholesale: 0.1% | |
| | 8,600 | | | | | Building Materials
Holding Corp. | | $ | 212,334 | | |
| | 3,700 | | | | | CDW Corp. | | | 260,184 | | |
| | 3,250 | | | L | | Pool Corp. | | | 127,303 | | |
| | 11,200 | | | @,L | | Tech Data Corp. | | | 424,144 | | |
| | | | 1,023,965 | | |
| | | | | Diversified Financial Services: 6.2% | |
| | 11,600 | | | | | AG Edwards, Inc. | | | 734,164 | | |
| | 58,000 | | | | | American Express Co. | | | 3,518,860 | | |
| | 18,400 | | | @,L | | AmeriCredit Corp. | | | 463,128 | | |
| | 50,500 | | | | | CIT Group, Inc. | | | 2,816,385 | | |
| | 359,665 | | | | | Citigroup, Inc. | | | 20,033,341 | | |
| | 50,700 | | | | | Fannie Mae | | | 3,011,073 | | |
| | 44,450 | | | | | Goldman Sachs Group, Inc. | | | 8,861,108 | | |
| | 9,900 | | | | | IndyMac Bancorp., Inc. | | | 447,084 | | |
| | 6,700 | | | @ | | Investment Technology
Group, Inc. | | | 287,296 | | |
| | 291,200 | | | | | JPMorgan Chase & Co. | | | 14,064,960 | | |
| | 74,500 | | | | | Lehman Brothers
Holdings, Inc. | | | 5,819,940 | | |
| | 43,710 | | | | | Merrill Lynch & Co., Inc. | | | 4,069,401 | | |
| | 111,700 | | | | | Morgan Stanley | | | 9,095,731 | | |
| | 17,100 | | | | | Raymond James
Financial, Inc. | | | 518,301 | | |
| | 3,900 | | | L | | SWS Group, Inc. | | | 139,230 | | |
| | 8,000 | | | @,L | | TradeStation Group, Inc. | | | 110,000 | | |
| | | | 73,990,002 | | |
| | | | | Electric: 1.5% | |
| | 259,300 | | | @ | | AES Corp. | | | 5,714,972 | | |
| | 2,500 | | | | | Central Vermont Public
Service Corp. | | | 58,875 | | |
| | 4,700 | | | L | | Duquesne Light
Holdings, Inc. | | | 93,295 | | |
| | 4,384 | | | @ | | Dynegy, Inc. | | | 31,740 | | |
| | 17,100 | | | | | Idacorp, Inc. | | | 660,915 | | |
| | 3,700 | | | | | Northeast Utilities | | | 104,192 | | |
| | 23,100 | | | | | OGE Energy Corp. | | | 924,000 | | |
| | 17,700 | | | | | Pepco Holdings, Inc. | | | 460,377 | | |
| | 141,400 | | | | | PG&E Corp. | | | 6,692,462 | | |
| | 24,900 | | | | | PNM Resources, Inc. | | | 774,390 | | |
| | 66,000 | | | | | Southern Co. | | | 2,432,760 | | |
| | 11,200 | | | | | Wisconsin Energy Corp. | | | 531,552 | | |
| | | | 18,479,530 | | |
| | | | | | | Electrical Components &
Equipment: 0.0% | | | | | |
| | 8,900 | | | L | | Belden CDT, Inc. | | | 347,901 | | |
| | 5,500 | | | @,L | | Littelfuse, Inc. | | | 175,340 | | |
| | | | 523,241 | | |
| | | | | Electronics: 0.3% | |
| | 5,100 | | | | | Amphenol Corp. | | | 316,608 | | |
| | 1,400 | | | @ | | Avnet, Inc. | | | 35,742 | | |
| | 4,200 | | | @,L | | Benchmark Electronics, Inc. | | | 102,312 | | |
| | 8,190 | | | @,L | | Coherent, Inc. | | | 258,558 | | |
| | 4,900 | | | | | Cubic Corp. | | | 106,330 | | |
| | 1,900 | | | | | Gentex Corp. | | | 29,564 | | |
| | 12,100 | | | | | Methode Electronics, Inc. | | | 131,043 | | |
| | 4,900 | | | @ | | Planar Systems, Inc. | | | 47,383 | | |
| | 8,900 | | | @,L | | Plexus Corp. | | | 212,532 | | |
| | 1,200 | | | @ | | Rogers Corp. | | | 70,980 | | |
See Accompanying Notes to Financial Statements
63
PORTFOLIO OF INVESTMENTS
ING VP BALANCED PORTFOLIO AS OF DECEMBER 31, 2006 (CONTINUED)
| Shares | | | | | | Value | |
| | | | | Electronics (continued) | |
| | 14,600 | | | @ | | Thomas & Betts Corp. | | $ | 690,288 | | |
| | 3,590 | | | @,L | | Trimble Navigation Ltd. | | | 182,121 | | |
| | 9,300 | | | @ | | Varian, Inc. | | | 416,547 | | |
| | 33,500 | | | @,L | | Vishay Intertechnology, Inc. | | | 453,590 | | |
| | | | 3,053,598 | | |
| | | | | Engineering & Construction: 0.2% | |
| | 6,200 | | | @ | | EMCOR Group, Inc. | | | 352,470 | | |
| | 11,200 | | | | | Granite Construction, Inc. | | | 563,584 | | |
| | 11,500 | | | @ | | Jacobs Engineering
Group, Inc. | | | 937,710 | | |
| | 2,200 | | | @ | | Shaw Group, Inc. | | | 73,700 | | |
| | 3,300 | | | @ | | URS Corp. | | | 141,405 | | |
| | | | 2,068,869 | | |
| | | | | Entertainment: 0.0% | |
| | 2,900 | | | @,L | | Pinnacle
Entertainment, Inc. | | | 96,106 | | |
| | | | 96,106 | | |
| | | | | Environmental Control: 0.4% | |
| | 138,700 | | | | | Waste Management, Inc. | | | 5,099,999 | | |
| | | | 5,099,999 | | |
| | | | | Exchange Traded Fund: 0.1% | |
| | 19,400 | | | @@,L | | iShares S&P SmallCap 600
Index Fund | | | 1,280,206 | | |
| | | | 1,280,206 | | |
| | | | | Food: 1.0% | |
| | 62,500 | | | | | Campbell Soup Co. | | | 2,430,625 | | |
| | 135,000 | | | | | ConAgra Foods, Inc. | | | 3,645,000 | | |
| | 11,590 | | | | | Corn Products
International, Inc. | | | 400,319 | | |
| | 76,517 | | | | | General Mills, Inc. | | | 4,407,379 | | |
| | 15,979 | | | | | Hormel Foods Corp. | | | 596,656 | | |
| | 5,600 | | | @,L | | Ralcorp Holdings, Inc. | | | 284,984 | | |
| | 3,800 | | | @ | | Smithfield Foods, Inc. | | | 97,508 | | |
| | 2,600 | | | @,L | | United Natural Foods, Inc. | | | 93,392 | | |
| | | | 11,955,863 | | |
| | | | | Forest Products & Paper: 0.2% | |
| | 7,100 | | | @ | | Caraustar Industries, Inc. | | | 57,439 | | |
| | 25,400 | | | | | Louisiana-Pacific Corp. | | | 546,862 | | |
| | 7,400 | | | L | | Rock-Tenn Co. | | | 200,614 | | |
| | 3,800 | | | | | Schweitzer-Mauduit
International, Inc. | | | 98,990 | | |
| | 27,000 | | | L | | Temple-Inland, Inc. | | | 1,242,810 | | |
| | | | 2,146,715 | | |
| | | | | Gas: 0.1% | |
| | 700 | | | | | Cascade Natural Gas Corp. | | | 18,144 | | |
| | 14,146 | | | | | Energen Corp. | | | 664,013 | | |
| | 22,130 | | | | | UGI Corp. | | | 603,706 | | |
| | | | 1,285,863 | | |
| | | | | Hand/Machine Tools: 0.1% | |
| | 15,000 | | | | | Snap-On, Inc. | | | 714,600 | | |
| | | | 714,600 | | |
| Shares | | | | | | Value | |
| | | | | Healthcare-Products: 1.5% | |
| | 3,700 | | | @ | | Advanced Medical
Optics, Inc. | | $ | 130,240 | | |
| | 2,900 | | | L | | Cooper Cos., Inc. | | | 129,050 | | |
| | 19,800 | | | @,L | | Cytyc Corp. | | | 560,340 | | |
| | 26,144 | | | | | Dentsply International, Inc. | | | 780,398 | | |
| | 13,000 | | | @,L | | Edwards Lifesciences Corp. | | | 611,520 | | |
| | 6,300 | | | @ | | Haemonetics Corp. | | | 283,626 | | |
| | 3,434 | | | @,L | | Hologic, Inc. | | | 162,360 | | |
| | 1,986 | | | @ | | Idexx Laboratories, Inc. | | | 157,490 | | |
| | 4,400 | | | @,L | | Immucor, Inc. | | | 128,612 | | |
| | 1,000 | | | @ | | Intuitive Surgical, Inc. | | | 95,900 | | |
| | 148,815 | | | | | Johnson & Johnson | | | 9,824,766 | | |
| | 62,300 | | | | | Medtronic, Inc. | | | 3,333,673 | | |
| | 5,700 | | | | | Mentor Corp. | | | 278,559 | | |
| | 5,700 | | | @ | | Osteotech, Inc. | | | 32,205 | | |
| | 5,500 | | | @ | | Possis Medical, Inc. | | | 74,140 | | |
| | 4,657 | | | @ | | Respironics, Inc. | | | 175,802 | | |
| | 9,500 | | | @,L | | Techne Corp. | | | 526,775 | | |
| | 8,700 | | | @ | | Varian Medical
Systems, Inc. | | | 413,859 | | |
| | | | 17,699,315 | | |
| | | | | Healthcare-Services: 2.4% | |
| | 107,300 | | | | | Aetna, Inc. | | | 4,633,214 | | |
| | 5,600 | | | @ | | Amerigroup Corp. | | | 200,984 | | |
| | 6,200 | | | @,L | | Centene Corp. | | | 152,334 | | |
| | 42,250 | | | @ | | Coventry Health Care, Inc. | | | 2,114,613 | | |
| | 8,700 | | | @ | | Gentiva Health
Services, Inc. | | | 165,822 | | |
| | 7,600 | | | @ | | Health Net, Inc. | | | 369,816 | | |
| | 5,400 | | | @,L | | Healthways, Inc. | | | 257,634 | | |
| | 43,100 | | | @ | | Humana, Inc. | | | 2,383,861 | | |
| | 33,900 | | | @,L | | Laboratory Corp. of
America Holdings | | | 2,490,633 | | |
| | 1,900 | | | @ | | Lincare Holdings, Inc. | | | 75,696 | | |
| | 11,046 | | | @ | | Odyssey HealthCare, Inc. | | | 146,470 | | |
| | 5,400 | | | @,L | | Pediatrix Medical
Group, Inc. | | | 264,060 | | |
| | 5,020 | | | @,L | | Sierra Health Services, Inc. | | | 180,921 | | |
| | 157,900 | | | | | UnitedHealth Group, Inc. | | | 8,483,967 | | |
| | 85,040 | | | @ | | WellPoint, Inc. | | | 6,691,798 | | |
| | | | 28,611,823 | | |
| | | | | Holding Companies-Diversified: 0.0% | |
| | 20,800 | | | | | Leucadia National Corp. | | | 586,560 | | |
| | | | 586,560 | | |
| | | | | Home Builders: 0.0% | |
| | 340 | | | @,L | | NVR, Inc. | | | 219,300 | | |
| | 7,500 | | | L | | Winnebago Industries | | | 246,825 | | |
| | | | 466,125 | | |
| | | | | Home Furnishings: 0.0% | |
| | 3,600 | | | @ | | Audiovox Corp. | | | 50,724 | | |
| | 7,900 | | | | | Ethan Allen Interiors, Inc. | | | 285,269 | | |
| | | | 335,993 | | |
| | | | | Household Products/Wares: 0.0% | |
| | 3,700 | | | | | American Greetings Corp. | | | 88,319 | | |
| | 7,600 | | | L | | Blyth, Inc. | | | 157,700 | | |
| | | | 246,019 | | |
See Accompanying Notes to Financial Statements
64
PORTFOLIO OF INVESTMENTS
ING VP BALANCED PORTFOLIO AS OF DECEMBER 31, 2006 (CONTINUED)
| Shares | | | | | | Value | |
| | | | | Housewares: 0.0% | |
| | 7,090 | | | | | Toro Co. | | $ | 330,607 | | |
| | | | 330,607 | | |
| | | | | Insurance: 5.5% | |
| | 65,000 | | | @@ | | ACE Ltd. | | | 3,937,050 | | |
| | 88,200 | | | | | Allstate Corp. | | | 5,742,702 | | |
| | 25,300 | | | | | AMBAC Financial
Group, Inc. | | | 2,253,471 | | |
| | 14,175 | | | L | | American Financial
Group, Inc. | | | 509,024 | | |
| | 124,100 | | | | | American International
Group, Inc. | | | 8,893,006 | | |
| | 2,300 | | | | | Brown & Brown, Inc. | | | 64,883 | | |
| | 77,300 | | | | | Chubb Corp. | | | 4,089,943 | | |
| | 25,900 | | | | | Cigna Corp. | | | 3,407,663 | | |
| | 8,400 | | | | | Delphi Financial Group | | | 339,864 | | |
| | 8,300 | | | @@ | | Everest Re Group Ltd. | | | 814,313 | | |
| | 10,805 | | | | | Fidelity National Title
Group, Inc. | | | 258,023 | | |
| | 99,000 | | | | | Genworth Financial, Inc. | | | 3,386,790 | | |
| | 51,427 | | | | | Hartford Financial Services
Group, Inc. | | | 4,798,653 | | |
| | 18,500 | | | | | HCC Insurance
Holdings, Inc. | | | 593,665 | | |
| | 12,800 | | | | | Horace Mann
Educators Corp. | | | 258,560 | | |
| | 4,270 | | | L | | Landamerica Financial
Group, Inc. | | | 269,480 | | |
| | 90,800 | | | | | Loews Corp. | | | 3,765,476 | | |
| | 102,350 | | | | | Metlife, Inc. | | | 6,039,674 | | |
| | 14,306 | | | | | Old Republic
International Corp. | | | 333,044 | | |
| | 9,290 | | | @,L | | Philadelphia Consolidated
Holding Co. | | | 413,962 | | |
| | 4,500 | | | | | PMI Group, Inc. | | | 212,265 | | |
| | 7,200 | | | | | Presidential Life Corp. | | | 158,040 | | |
| | 6,700 | | | @,L | | ProAssurance Corp. | | | 334,464 | | |
| | 152,500 | | | | | Progressive Corp. | | | 3,693,550 | | |
| | 11,800 | | | | | Protective Life Corp. | | | 560,500 | | |
| | 66,936 | | | L | | Prudential Financial, Inc. | | | 5,747,125 | | |
| | 6,400 | | | | | Radian Group, Inc. | | | 345,024 | | |
| | 25,398 | | | | | Safeco Corp. | | | 1,588,645 | | |
| | 4,200 | | | L | | Safety Insurance
Group, Inc. | | | 212,982 | | |
| | 1,600 | | | @ | | SCPIE Holdings, Inc. | | | 41,824 | | |
| | 5,930 | | | L | | Selective Insurance Group | | | 339,730 | | |
| | 10,600 | | | | | Stancorp Financial
Group, Inc. | | | 477,530 | | |
| | 9,200 | | | | | Unitrin, Inc. | | | 461,012 | | |
| | 22,850 | | | | | WR Berkley Corp. | | | 788,554 | | |
| | 7,100 | | | | | Zenith National
Insurance Corp. | | | 333,061 | | |
| | | | 65,463,552 | | |
| | | | | Internet: 0.6% | |
| | 2,000 | | | @ | | Digital Insight Corp. | | | 76,980 | | |
| | 9,900 | | | @ | | Google, Inc. | | | 4,558,752 | | |
| | 3,200 | | | @,L | | j2 Global
Communications, Inc. | | | 87,200 | | |
| | 9,575 | | | @ | | McAfee, Inc. | | | 271,739 | | |
| | 14,500 | | | @ | | Napster, Inc. | | | 52,635 | | |
| | 7,600 | | | @ | | PC-Tel, Inc. | | | 71,060 | | |
| | 6,100 | | | @,L | | Stamps.com, Inc. | | | 96,075 | | |
| Shares | | | | | | Value | |
| | 18,000 | | | L | | United Online, Inc. | | $ | 239,040 | | |
| | 56,900 | | | @ | | VeriSign, Inc. | | | 1,368,445 | | |
| | 1,400 | | | @ | | WebEx
Communications, Inc. | | | 48,846 | | |
| | | | 6,870,772 | | |
| | | | | Iron/Steel: 0.5% | |
| | 1,400 | | | | | Carpenter Technology Corp. | | | 143,528 | | |
| | 4,700 | | | | | Chaparral Steel Co. | | | 208,069 | | |
| | 2,200 | | | L | | Cleveland-Cliffs, Inc. | | | 106,568 | | |
| | 61,300 | | | | | Nucor Corp. | | | 3,350,658 | | |
| | 7,400 | | | | | Ryerson, Inc. | | | 185,666 | | |
| | 3,400 | | | | | Steel Dynamics, Inc. | | | 110,330 | | |
| | 2,700 | | | L | | Steel Technologies, Inc. | | | 47,385 | | |
| | 32,100 | | | L | | United States Steel Corp. | | | 2,347,794 | | |
| | | | 6,499,998 | | |
| | | | | Leisure Time: 0.1% | |
| | 2,550 | | | L | | Polaris Industries, Inc. | | | 119,417 | | |
| | 35,700 | | | | | Sabre Holdings Corp. | | | 1,138,473 | | |
| | | | 1,257,890 | | |
| | | | | Lodging: 0.1% | |
| | 2,400 | | | @ | | Aztar Corp. | | | 130,608 | | |
| | 10,100 | | | | | Harrah's Entertainment, Inc. | | | 835,472 | | |
| | | | 966,080 | | |
| | | | | | | Machinery-Construction &
Mining: 0.2% | | | | | |
| | 33,600 | | | | | Caterpillar, Inc. | | | 2,060,688 | | |
| | 8,700 | | | | | Joy Global, Inc. | | | 420,558 | | |
| | | | 2,481,246 | | |
| | | | | Machinery-Diversified: 0.2% | |
| | 800 | | | @ | | AGCO Corp. | | | 24,752 | | |
| | 13,300 | | | L | | Cummins, Inc. | | | 1,571,794 | | |
| | 10,200 | | | @,L | | Gardner Denver, Inc. | | | 380,562 | | |
| | 3,589 | | | | | IDEX Corp. | | | 170,154 | | |
| | 4,000 | | | L | | Manitowoc Co., Inc. | | | 237,720 | | |
| | | | 2,384,982 | | |
| | | | | Media: 2.0% | |
| | 35,900 | | | | | CBS Corp. | | | 1,119,362 | | |
| | 27,000 | | | | | Clear Channel
Communications, Inc. | | | 959,580 | | |
| | 97,100 | | | @,L | | Comcast Corp. | | | 4,110,243 | | |
| | 146,400 | | | @,L | | DIRECTV Group, Inc. | | | 3,651,216 | | |
| | 59,900 | | | | | McGraw-Hill Cos., Inc. | | | 4,074,398 | | |
| | 110,800 | | | | | News Corp., Inc. | | | 2,379,984 | | |
| | 5,100 | | | L | | Reader's Digest
Association, Inc. | | | 85,170 | | |
| | 226,800 | | | | | Walt Disney Co. | | | 7,772,436 | | |
| | 330 | | | | | Washington Post | | | 246,048 | | |
| | | | 24,398,437 | | |
| | | | | Metal Fabricate/Hardware: 0.1% | |
| | 3,500 | | | | | AM Castle & Co. | | | 89,075 | | |
| | 11,100 | | | | | Commercial Metals Co. | | | 286,380 | | |
| | 7,036 | | | L | | Quanex Corp. | | | 243,375 | | |
| | | | 618,830 | | |
| | | | | Mining: 0.1% | |
| | 11,000 | | | L | | Phelps Dodge Corp. | | | 1,316,920 | | |
| | | | 1,316,920 | | |
See Accompanying Notes to Financial Statements
65
PORTFOLIO OF INVESTMENTS
ING VP BALANCED PORTFOLIO AS OF DECEMBER 31, 2006 (CONTINUED)
| Shares | | | | | | Value | |
| | | | | Miscellaneous Manufacturing: 4.0% | |
| | 40,050 | | | | | 3M Co. | | $ | 3,121,097 | | |
| | 7,800 | | | | | Acuity Brands, Inc. | | | 405,912 | | |
| | 6,600 | | | L | | AO Smith Corp. | | | 247,896 | | |
| | 1,972 | | | | | Aptargroup, Inc. | | | 116,427 | | |
| | 1,000 | | | @ | | Ceradyne, Inc. | | | 56,500 | | |
| | 28,900 | | | | | Cooper Industries Ltd. | | | 2,613,427 | | |
| | 16,800 | | | | | Crane Co. | | | 615,552 | | |
| | 66,600 | | | L | | Eastman Kodak Co. | | | 1,718,280 | | |
| | 45,900 | | | | | Eaton Corp. | | | 3,448,926 | | |
| | 5,200 | | | @,L | | EnPro Industries, Inc. | | | 172,692 | | |
| | 557,715 | | | | | General Electric Co. | | | 20,752,575 | | |
| | 600 | | | | | Harsco Corp. | | | 45,660 | | |
| | 162,700 | | | | | Honeywell
International, Inc. | | | 7,360,548 | | |
| | 32,600 | | | | | Parker Hannifin Corp. | | | 2,506,288 | | |
| | 5,700 | | | | | Pentair, Inc. | | | 178,980 | | |
| | 1,900 | | | | | Roper Industries, Inc. | | | 95,456 | | |
| | 4,200 | | | | | Standex International Corp. | | | 126,546 | | |
| | 6,800 | | | @,L | | Sturm Ruger & Co., Inc. | | | 65,280 | | |
| | 11,467 | | | | | Teleflex, Inc. | | | 740,310 | | |
| | 2,900 | | | | | Tredegar Corp. | | | 65,569 | | |
| | 109,400 | | | @@ | | Tyco International Ltd. | | | 3,325,760 | | |
| | | | 47,779,681 | | |
| | | | | Office Furnishings: 0.1% | |
| | 17,402 | | | L | | Herman Miller, Inc. | | | 632,737 | | |
| | | | 632,737 | | |
| | | | | Office/Business Equipment: 0.3% | |
| | 202,600 | | | @ | | Xerox Corp. | | | 3,434,070 | | |
| | | | 3,434,070 | | |
| | | | | Oil & Gas: 6.0% | |
| | 80,600 | | | | | Anadarko Petroleum Corp. | | | 3,507,712 | | |
| | 171,186 | | | | | Chevron Corp. | | | 12,587,307 | | |
| | 5,260 | | | | | Cimarex Energy Co. | | | 191,990 | | |
| | 73,900 | | | | | ConocoPhillips | | | 5,317,105 | | |
| | 13,800 | | | | | ENSCO International, Inc. | | | 690,828 | | |
| | 405,840 | | | | | ExxonMobil Corp. | | | 31,099,519 | | |
| | 4,300 | | | @ | | Forest Oil Corp. | | | 140,524 | | |
| | 16,200 | | | | | Frontier Oil Corp. | | | 465,588 | | |
| | 31,200 | | | | | Helmerich & Payne, Inc. | | | 763,464 | | |
| | 51,900 | | | | | Marathon Oil Corp. | | | 4,800,750 | | |
| | 12,900 | | | @ | | Newfield Exploration Co. | | | 592,755 | | |
| | 15,800 | | | | | Noble Energy, Inc. | | | 775,306 | | |
| | 111,200 | | | | | Occidental Petroleum Corp. | | | 5,429,896 | | |
| | 4,000 | | | L | | Penn Virginia Corp. | | | 280,160 | | |
| | 800 | | | | | Pioneer Natural
Resources Co. | | | 31,752 | | |
| �� | 200 | | | @ | | Plains Exploration &
Production Co. | | | 9,506 | | |
| | 5,900 | | | @ | | Southwestern Energy Co. | | | 206,795 | | |
| | 9,600 | | | L | | St. Mary Land &
Exploration Co. | | | 353,664 | | |
| | 1,900 | | | @,L | | Stone Energy Corp. | | | 67,165 | | |
| | 88,200 | | | | | Valero Energy Corp. | | | 4,512,312 | | |
| | | | 71,824,098 | | |
| | | | | Oil & Gas Services: 0.8% | |
| | 6,700 | | | @ | | Grant Prideco, Inc. | | | 266,459 | | |
| | 147,400 | | | L | | Halliburton Co. | | | 4,576,770 | | |
| | 5,800 | | | @,L | | Helix Energy Solutions
Group, Inc. | | | 181,946 | | |
| | 1,400 | | | @ | | Lone Star Technologies | | | 67,774 | | |
| Shares | | | | | | Value | |
| | 53,160 | | | L | | Schlumberger Ltd. | | $ | 3,357,586 | | |
| | 3,800 | | | @,L | | SEACOR Holdings, Inc. | | | 376,732 | | |
| | 16,300 | | | | | Tidewater, Inc. | | | 788,268 | | |
| | 2,300 | | | @,L | | Veritas DGC, Inc. | | | 196,949 | | |
| | | | 9,812,484 | | |
| | | | | Packaging & Containers: 0.2% | |
| | 35,600 | | | @,L | | Pactiv Corp. | | | 1,270,564 | | |
| | 18,800 | | | | | Sonoco Products Co. | | | 715,528 | | |
| | | | 1,986,092 | | |
| | | | | Pharmaceuticals: 3.6% | |
| | 78,100 | | | | | Abbott Laboratories | | | 3,804,251 | | |
| | 54,800 | | | | | AmerisourceBergen Corp. | | | 2,463,808 | | |
| | 2,200 | | | @ | | Cephalon, Inc. | | | 154,902 | | |
| | 75,900 | | | @ | | Forest Laboratories, Inc. | | | 3,840,540 | | |
| | 63,800 | | | @,L | | King Pharmaceuticals, Inc. | | | 1,015,696 | | |
| | 4,200 | | | | | Medicis
Pharmaceutical Corp. | | | 147,546 | | |
| | 234,500 | | | | | Merck & Co., Inc. | | | 10,224,200 | | |
| | 53,100 | | | | | Mylan Laboratories | | | 1,059,876 | | |
| | 5,500 | | | @,L | | NBTY, Inc. | | | 228,635 | | |
| | 7,700 | | | @,L | | Noven Pharmaceuticals, Inc. | | | 195,965 | | |
| | 2,000 | | | | | Omnicare, Inc. | | | 77,260 | | |
| | 371,090 | | | | | Pfizer, Inc. | | | 9,611,231 | | |
| | 240,700 | | | | | Schering-Plough Corp. | | | 5,690,148 | | |
| | 6,800 | | | @,L | | Sepracor, Inc. | | | 418,744 | | |
| | 10,700 | | | @ | | Theragenics Corp. | | | 33,170 | | |
| | 2,800 | | | @,L | | USANA Health
Sciences, Inc. | | | 144,648 | | |
| | 69,110 | | | | | Wyeth | | | 3,519,081 | | |
| | | | 42,629,701 | | |
| | | | | Pipelines: 0.3% | |
| | 38,100 | | | | | Questar Corp. | | | 3,164,205 | | |
| | | | 3,164,205 | | |
| | | | | Real Estate Investment Trusts: 0.3% | |
| | 7,900 | | | | | AMB Property Corp. | | | 463,019 | | |
| | 3,000 | | | L | | Colonial Properties Trust | | | 140,640 | | |
| | 20,760 | | | | | Equity Office Properties
Trust | | | 1,000,009 | | |
| | 1,580 | | | | | Essex Property Trust, Inc. | | | 204,215 | | |
| | 3,000 | | | | | Highwoods Properties, Inc. | | | 122,280 | | |
| | 16,900 | | | | | Hospitality Properties Trust | | | 803,257 | | |
| | 3,500 | | | | | Longview Fibre Co. | | | 76,825 | | |
| | 2,100 | | | | | LTC Properties, Inc. | | | 57,351 | | |
| | 4,200 | | | | | Macerich Co. | | | 363,594 | | |
| | 4,200 | | | | | Regency Centers Corp. | | | 328,314 | | |
| | | | 3,559,504 | | |
| | | | | Retail: 4.3% | |
| | 1,400 | | | @ | | 99 Cents Only Stores | | | 17,038 | | |
| | 4,450 | | | | | Abercrombie & Fitch Co. | | | 309,854 | | |
| | 6,400 | | | | | Advance Auto Parts, Inc. | | | 227,584 | | |
| | 11,500 | | | @,L | | Aeropostale, Inc. | | | 355,005 | | |
| | 20,355 | | | L | | American Eagle Outfitters | | | 635,280 | | |
| | 14,500 | | | @ | | AnnTaylor Stores Corp. | | | 476,180 | | |
| | 1,600 | | | | | Barnes & Noble, Inc. | | | 63,536 | | |
| | 27,800 | | | @,L | | Big Lots, Inc. | | | 637,176 | | |
| | 3,300 | | | | | Brinker International, Inc. | | | 99,528 | | |
| | 6,750 | | | | | Brown Shoe Co., Inc. | | | 322,245 | | |
| | 23,300 | | | @,L | | Charming Shoppes, Inc. | | | 315,249 | | |
| | 9,200 | | | @,L | | Chico's FAS, Inc. | | | 190,348 | | |
See Accompanying Notes to Financial Statements
66
PORTFOLIO OF INVESTMENTS
ING VP BALANCED PORTFOLIO AS OF DECEMBER 31, 2006 (CONTINUED)
| Shares | | | | | | Value | |
| | | | | Retail (continued) | |
| | 1,500 | | | @,L | | Childrens Place Retail
Stores, Inc. | | $ | 95,280 | | |
| | 10,600 | | | L | | Christopher & Banks Corp. | | | 197,796 | | |
| | 11,160 | | | L | | Claire's Stores, Inc. | | | 369,842 | | |
| | 18,100 | | | @,L | | Dollar Tree Stores, Inc. | | | 544,810 | | |
| | 11,700 | | | @,L | | Dress Barn, Inc. | | | 272,961 | | |
| | 39,900 | | | L | | Family Dollar Stores, Inc. | | | 1,170,267 | | |
| | 92,800 | | | | | Federated Department
Stores, Inc. | | | 3,538,464 | | |
| | 119,900 | | | | | Gap, Inc. | | | 2,338,050 | | |
| | 5,400 | | | L | | Group 1 Automotive, Inc. | | | 279,288 | | |
| | 95,810 | | | L | | Home Depot, Inc. | | | 3,847,730 | | |
| | 6,300 | | | @,L | | Jack in the Box, Inc. | | | 384,552 | | |
| | 57,200 | | | @ | | Kohl's Corp. | | | 3,914,196 | | |
| | 76,700 | | | | | Lowe's Cos., Inc. | | | 2,389,205 | | |
| | 148,500 | | | | | McDonald's Corp. | | | 6,583,005 | | |
| | 9,700 | | | L | | Men's Wearhouse, Inc. | | | 371,122 | | |
| | 52,700 | | | L | | Nordstrom, Inc. | | | 2,600,218 | | |
| | 65,700 | | | @ | | Office Depot, Inc. | | | 2,507,769 | | |
| | 16,800 | | | | | OfficeMax, Inc. | | | 834,120 | | |
| | 4,000 | | | | | OSI Restaurant
Partners, Inc. | | | 156,800 | | |
| | 2,080 | | | @,L | | Panera Bread Co. | | | 116,293 | | |
| | 12,075 | | | @ | | Payless Shoesource, Inc. | | | 396,302 | | |
| | 16,600 | | | | | Petsmart, Inc. | | | 479,076 | | |
| | 23,800 | | | | | Ross Stores, Inc. | | | 697,340 | | |
| | 5,100 | | | @ | | Saks, Inc. | | | 90,882 | | |
| | 4,500 | | | @,L | | School Specialty, Inc. | | | 168,705 | | |
| | 12,907 | | | @,L | | Select Comfort Corp. | | | 224,453 | | |
| | 14,060 | | | @,L | | Sonic Corp. | | | 336,737 | | |
| | 35,900 | | | @,L | | Starbucks Corp. | | | 1,271,578 | | |
| | 42,200 | | | | | Target Corp. | | | 2,407,510 | | |
| | 103,900 | | | | | TJX Cos., Inc. | | | 2,963,228 | | |
| | 5,010 | | | @,L | | Tween Brands, Inc. | | | 200,049 | | |
| | 124,345 | | | | | Wal-Mart Stores, Inc. | | | 5,742,252 | | |
| | | | 51,138,903 | | |
| | | | | Savings & Loans: 0.1% | |
| | 4,400 | | | | | Anchor Bancorp.
Wisconsin, Inc. | | | 126,808 | | |
| | 8,998 | | | L | | Bankunited Financial Corp. | | | 251,584 | | |
| | 1,500 | | | L | | Fidelity Bankshares, Inc. | | | 59,505 | | |
| | 4,300 | | | @,L | | FirstFed Financial Corp. | | | 287,971 | | |
| | | | 725,868 | | |
| | | | | Semiconductors: 1.2% | |
| | 8,700 | | | @,L | | Actel Corp. | | | 157,992 | | |
| | 83,400 | | | @,L | | Altera Corp. | | | 1,641,312 | | |
| | 53,000 | | | @,L | | Atmel Corp. | | | 320,650 | | |
| | 19,600 | | | @,L | | Brooks Automation, Inc. | | | 282,240 | | |
| | 2,800 | | | @ | | Cree, Inc. | | | 48,496 | | |
| | 7,100 | | | @,L | | DSP Group, Inc. | | | 154,070 | | |
| | 25,600 | | | @,L | | Fairchild Semiconductor
International, Inc. | | | 430,336 | | |
| | 31,400 | | | @ | | Integrated Device
Technology, Inc. | | | 486,072 | | |
| | 267,500 | | | | | Intel Corp. | | | 5,416,875 | | |
| | 8,300 | | | @,L | | Lam Research Corp. | | | 420,146 | | |
| | 93,900 | | | @,L | | LSI Logic Corp. | | | 845,100 | | |
| | 11,200 | | | @ | | MEMC Electronic
Materials, Inc. | | | 438,368 | | |
| | 11,910 | | | L | | Microchip Technology, Inc. | | | 389,457 | | |
| | 166,100 | | | @,L | | Micron Technology, Inc. | | | 2,318,756 | | |
| Shares | | | | | | Value | |
| | 28,400 | | | @ | | Novellus Systems, Inc. | | $ | 977,528 | | |
| | 8,800 | | | @ | | Pericom
Semiconductor Corp. | | | 100,936 | | |
| | 22,200 | | | @ | | Semtech Corp. | | | 290,154 | | |
| | 500 | | | @,L | | Teradyne, Inc. | | | 7,480 | | |
| | 3,770 | | | @,L | | Varian Semiconductor
Equipment
Associates, Inc. | | | 171,610 | | |
| | | | 14,897,578 | | |
| | | | | Software: 2.2% | |
| | 10,200 | | | | | Acxiom Corp. | | | 261,630 | | |
| | 5,900 | | | @,L | | Altiris, Inc. | | | 149,742 | | |
| | 2,500 | | | @,L | | Ansys, Inc. | | | 108,725 | | |
| | 47,500 | | | @ | | BMC Software, Inc. | | | 1,529,500 | | |
| | 10,000 | | | @ | | Captaris, Inc. | | | 77,700 | | |
| | 4,160 | | | @,L | | Cerner Corp. | | | 189,280 | | |
| | 97,450 | | | @ | | Compuware Corp. | | | 811,759 | | |
| | 9,900 | | | @,L | | CSG Systems International | | | 264,627 | | |
| | 14,100 | | | @,L | | Dendrite International, Inc. | | | 151,011 | | |
| | 4,729 | | | @ | | Dun & Bradstreet Corp. | | | 391,514 | | |
| | 8,300 | | | | | Fair Isaac Corp. | | | 337,395 | | |
| | 147,600 | | | | | First Data Corp. | | | 3,766,752 | | |
| | 4,460 | | | | | Global Payments, Inc. | | | 206,498 | | |
| | 3,972 | | | @ | | Hyperion Solutions Corp. | | | 142,754 | | |
| | 1,500 | | | | | Inter-Tel, Inc. | | | 33,240 | | |
| | 7,100 | | | @ | | Mapinfo Corp. | | | 92,655 | | |
| | 447,375 | | | | | Microsoft Corp. | | | 13,358,618 | | |
| | 1,300 | | | @ | | Open Solutions, Inc. | | | 48,932 | | |
| | 187,100 | | | @ | | Oracle Corp. | | | 3,206,894 | | |
| | 2,100 | | | @,L | | Per-Se Technologies, Inc. | | | 58,338 | | |
| | 1,800 | | | @ | | SPSS, Inc. | | | 54,126 | | |
| | 19,400 | | | @,L | | Sybase, Inc. | | | 479,180 | | |
| | | | 25,720,870 | | |
| | | | | Telecommunications: 3.9% | |
| | 9,300 | | | @ | | 3 Com Corp. | | | 38,223 | | |
| | 10,100 | | | @ | | Adaptec, Inc. | | | 47,066 | | |
| | 2,300 | | | @ | | Andrew Corp. | | | 23,529 | | |
| | 2,300 | | | @,L | | Anixter International, Inc. | | | 124,890 | | |
| | 214,500 | | | | | AT&T, Inc. | | | 7,668,375 | | |
| | 105,900 | | | @,L | | Avaya, Inc. | | | 1,480,482 | | |
| | 100,330 | | | | | BellSouth Corp. | | | 4,726,546 | | |
| | 8,100 | | | @ | | C-COR, Inc. | | | 90,234 | | |
| | 34,900 | | | @ | | Cincinnati Bell, Inc. | | | 159,493 | | |
| | 496,660 | | | @ | | Cisco Systems, Inc. | | | 13,573,698 | | |
| | 1,325 | | | L | | Commonwealth Telephone
Enterprises, Inc. | | | 55,465 | | |
| | 11,200 | | | @,L | | Ditech Networks, Inc. | | | 77,504 | | |
| | 7,383 | | | L | | Harris Corp. | | | 338,584 | | |
| | 297,350 | | | | | Motorola, Inc. | | | 6,113,516 | | |
| | 8,600 | | | @ | | Network Equipment
Technologies, Inc. | | | 50,052 | | |
| | 76,600 | | | | | Qualcomm, Inc. | | | 2,894,714 | | |
| | 165,000 | | | | | Sprint Nextel Corp. | | | 3,116,850 | | |
| | 5,675 | | | L | | Telephone & Data
Systems, Inc. | | | 308,323 | | |
| | 16,500 | | | @,L | | Utstarcom, Inc. | | | 144,375 | | |
| | 160,100 | | | | | Verizon
Communications, Inc. | | | 5,962,124 | | |
| | | | 46,994,043 | | |
See Accompanying Notes to Financial Statements
67
PORTFOLIO OF INVESTMENTS
ING VP BALANCED PORTFOLIO AS OF DECEMBER 31, 2006 (CONTINUED)
| Shares | | | | | | Value | |
| | | | | Textiles: 0.1% | |
| | 3,200 | | | | | Angelica Corp. | | $ | 82,560 | | |
| | 9,500 | | | @,L | | Mohawk Industries, Inc. | | | 711,170 | | |
| | | | 793,730 | | |
| | | | | Toys/Games/Hobbies: 0.3% | |
| | 42,200 | | | L | | Hasbro, Inc. | | | 1,149,950 | | |
| | 86,900 | | | | | Mattel, Inc. | | | 1,969,154 | | |
| | | | 3,119,104 | | |
| | | | | Transportation: 0.2% | |
| | 14,350 | | | L | | CH Robinson
Worldwide, Inc. | | | 586,772 | | |
| | 1,500 | | | | | Expeditors International
Washington, Inc. | | | 60,750 | | |
| | 8,000 | | | @,L | | HUB Group, Inc. | | | 220,400 | | |
| | 5,100 | | | @,L | | Kansas City Southern | | | 147,798 | | |
| | 3,600 | | | @,L | | Kirby Corp. | | | 122,868 | | |
| | 3,927 | | | | | Landstar System, Inc. | | | 149,933 | | |
| | 8,400 | | | @,L | | Old Dominion Freight Line | | | 202,188 | | |
| | 10,705 | | | L | | Overseas Shipholding
Group | | | 602,692 | | |
| | 2,900 | | | @ | | Swift Transportation
Co., Inc. | | | 76,183 | | |
| | 700 | | | @ | | YRC Worldwide, Inc. | | | 26,411 | | |
| | | | 2,195,995 | | |
| | | Total Common Stock
(Cost $710,567,102) | | | 785,090,582 | | |
| EQUITY-LINKED SECURITIES: 0.2% | | | |
| | | | | Equity Linked Securities: 0.2% | |
| | 3,000,000 | | | | | KAUP Bank | | | 2,816,439 | | |
| | | Total Equity-Linked
Securities
(Cost $3,000,000) | | | 2,816,439 | | |
| PREFERRED STOCK: 0.6% | | | |
| | | | | Banks: 0.2% | |
| | 78,720 | | | P | | Bank of American Corp. | | | 1,964,064 | | |
| | | | 1,964,064 | | |
| | | | | Diversified Financial Services: 0.1% | |
| | 53,175 | | | P | | Merrill Lynch & Co., Inc. | | | 1,386,804 | | |
| | | | 1,386,804 | | |
| | | | | Insurance: 0.2% | |
| | 67,174 | | | @@,P | | Aegon NV | | | 1,744,874 | | |
| | 51,650 | | | P | | Metlife, Inc. | | | 1,358,912 | | |
| | | | 3,103,786 | | |
| | | | | Real Estate Investment Trusts: 0.1% | |
| | 43,041 | | | P | | Duke Realty Corp. | | | 1,118,205 | | |
| | | | 1,118,205 | | |
| | | Total Preferred Stock
(Cost $7,362,193) | | | 7,572,859 | | |
| WARRANTS: 0.0% | | | |
| | | | | Airlines: 0.0% | |
| | 2,978 | | | | | Timco Aviation | | | — | | |
| | | Total Warrants
(Cost $—) | | | — | | |
Principal
Amount | | | | | | Value | |
| CONVERTIBLE BONDS: 0.0% | | | |
| | | | | Biotechnology: 0.0% | |
| $ | 215,000 | | | C,L | | Millennium
Pharmaceuticals, Inc.,
5.500%, due 01/15/07 | | $ | 215,066 | | |
| | | Total Convertible Bonds
(Cost $215,057) | | | 215,066 | | |
| CORPORATE BONDS/NOTES: 9.8% | | | |
| | | | | Airlines: 0.1% | |
| | 177,436 | | | C | | Continental Airlines, Inc.,
8.312%, due 04/02/11 | | | 178,434 | | |
| | 756,000 | | | | | United AirLines, Inc.,
6.932%, due 09/01/11 | | | 850,973 | | |
| | | | 1,029,407 | | |
| | | | | Auto Manufacturers: 0.0% | |
| | 37,000 | | | L | | Ford Motor Co.,
7.450%, due 07/16/31 | | | 29,230 | | |
| | 429,000 | | | | | General Motors Corp.,
7.400%, due 09/01/25 | | | 364,650 | | |
| | 153,000 | | | C,L | | General Motors Corp.,
8.375%, due 07/15/33 | | | 142,290 | | |
| | | | 536,170 | | |
| | | | | Banks: 2.1% | |
| | 980,000 | | | @@,C,L | | Australia & New Zealand
Banking Group Ltd.,
5.556%, due 10/29/49 | | | 853,244 | | |
| | 488,897 | | | @@,# | | Banco Itau SA, 5.739%,
due 09/20/08 | | | 489,781 | | |
| | 757,000 | | | @@,#,C | | Banco Mercantil del
Norte SA, 6.135%,
due 10/13/16 | | | 761,039 | | |
| | 703,000 | | | @@ | | Banco Santander Chile SA,
7.375%, due 07/18/12 | | | 769,572 | | |
| | 360,000 | | | @@,C | | Bank of Ireland, 5.625%,
due 12/29/49 | | | 313,531 | | |
| | 400,000 | | | @@,C | | Bank of Nova Scotia,
5.625%, due 08/21/85 | | | 339,559 | | |
| | 210,000 | | | | | Bank of Scotland, 5.563%,
due 11/30/49 | | | 180,722 | | |
| | 77,000 | | | C | | BankAmerica Capital II,
8.000%, due 12/15/26 | | | 80,166 | | |
| | 240,000 | | | @@,C | | Barclays Bank PLC,
5.750%, due 12/31/49 | | | 209,934 | | |
| | 710,000 | | | @@,C | | BNP Paribas, 5.445%,
due 09/29/49 | | | 608,916 | | |
| | 933,000 | | | @@,#,C | | Chuo Mitsui Trust &
Banking Co., Ltd.,
5.506%, due 04/15/49 | | | 892,597 | | |
| | 377,000 | | | @@,#,C | | Danske Bank A/S, 5.914%,
due 12/29/49 | | | 379,356 | | |
| | 500,000 | | | @@,C | | Den Norske Bank ASA,
5.563%, due 08/29/49 | | | 425,000 | | |
| | 80,000 | | | @@,C | | Den Norske Bank ASA,
5.625%, due 11/29/49 | | | 69,158 | | |
| | 723,000 | | | #,C | | Dresdner Funding Trust I,
8.151%, due 06/30/31 | | | 873,367 | | |
| | 356,000 | | | #,C | | First Chicago NBD
Institutional Capital A,
7.950%, due 12/01/26 | | | 370,514 | | |
See Accompanying Notes to Financial Statements
68
PORTFOLIO OF INVESTMENTS
ING VP BALANCED PORTFOLIO AS OF DECEMBER 31, 2006 (CONTINUED)
Principal
Amount | | | | | | Value | |
| | | | | Banks (continued) | |
| $ | 1,000 | | | C | | Fleet Capital Trust II,
7.920%, due 12/11/26 | | $ | 1,040 | | |
| | 1,290,000 | | | @@,#,C | | HBOS PLC, 5.375%,
due 11/29/49 | | | 1,272,135 | | |
| | 270,000 | | | @@,C | | Hongkong & Shanghai
Banking Corp., Ltd.,
5.563%, due 07/01/49 | | | 228,060 | | |
| | 1,120,000 | | | @@,C | | HSBC Bank PLC, 5.475%,
due 06/29/49 | | | 952,000 | | |
| | 1,040,000 | | | @@,C | | HSBC Bank PLC, 5.688%,
due 06/29/49 | | | 902,200 | | |
| | 1,030,000 | | | @@,C | | Lloyds TSB Bank PLC,
5.560%, due 08/29/49 | | | 889,185 | | |
| | 100,000 | | | @@,C | | Lloyds TSB Bank PLC,
5.563%, due 11/29/49 | | | 87,032 | | |
| | 240,000 | | | @@,C | | Lloyds TSB Bank PLC,
5.625%, due 06/29/49 | | | 211,164 | | |
| | 23,000 | | | C | | M&I Capital Trust A,
7.650%, due 12/01/26 | | | 23,808 | | |
| | 648,000 | | | C | | Mellon Capital I, 7.720%,
due 12/01/26 | | | 674,711 | | |
| | 680,000 | | | @@,C | | Mizuho Financial Group
Cayman Ltd., 8.375%,
due 12/31/49 | | | 718,791 | | |
| | 370,000 | | | @@,C | | National Australia
Bank Ltd., 5.556%,
due 10/29/49 | | | 321,173 | | |
| | 130,000 | | | @@,C | | National Westminster
Bank PLC, 5.500%,
due 11/29/49 | | | 111,486 | | |
| | 640,000 | | | #,C | | Rabobank Capital
Funding II, 5.260%,
due 12/29/49 | | | 626,787 | | |
| | 612,000 | | | #,C | | Rabobank Capital Funding
Trust, 5.254%,
due 12/31/49 | | | 591,174 | | |
| | 531,000 | | | C,L | | RBS Capital Trust I, 5.512%,
due 09/30/49 | | | 525,656 | | |
| | 962,000 | | | @@,#,C | | Resona Bank Ltd., 5.850%,
due 09/29/49 | | | 941,008 | | |
| | 1,540,000 | | | @@,C | | Royal Bank of Scotland
Group PLC, 5.563%,
due 12/29/49 | | | 1,321,382 | | |
| | 370,000 | | | @@,C | | Societe Generale, 5.438%,
due 11/29/49 | | | 319,735 | | |
| | 1,400,000 | | | @@,C,L | | Standard Chartered PLC,
5.500%, due 07/29/49 | | | 1,158,500 | | |
| | 1,800,000 | | | @@,C | | Standard Chartered PLC,
5.625%, due 11/29/49 | | | 1,512,000 | | |
| | 230,000 | | | @@,C | | Standard Chartered PLC,
5.730%, due 01/29/49 | | | 190,325 | | |
| | 873,000 | | | @@,C | | Sumitomo Mitsui Banking
Corp., 8.150%,
due 08/01/49 | | | 905,610 | | |
| | 472,000 | | | C | | Wachovia Capital Trust III,
5.800%, due 12/31/49 | | | 476,335 | | |
| | 420,000 | | | @@,C | | Westpac Banking Corp.,
5.525%, due 09/30/49 | | | 359,452 | | |
| | 372,000 | | | #,C | | Westpac Capital Trust IV,
5.256%, due 12/29/49 | | | 354,194 | | |
| | 1,220,000 | | | @@,#,C | | Woori Bank, 6.125%,
due 05/03/16 | | | 1,247,016 | | |
| | | | 24,538,415 | | |
Principal
Amount | | | | | | Value | |
| | | | | Beverages: 0.1% | |
| $ | 770,000 | | | @@ | | Cia Brasileira de Bebidas,
8.750%, due 09/15/13 | | $ | 900,900 | | |
| | | | 900,900 | | |
| | | | | Chemicals: 0.3% | |
| | 687,000 | | | C | | Lyondell Chemical Co.,
8.000%, due 09/15/14 | | | 716,198 | | |
| | 378,000 | | | C | | Lyondell Chemical Co.,
8.250%, due 09/15/16 | | | 398,790 | | |
| | 260,000 | | | | | Stauffer Chemical, 5.620%,
due 04/15/10 | | | 217,238 | | |
| | 450,000 | | | | | Stauffer Chemical, 5.890%,
due 04/15/18 | | | 235,796 | | |
| | 570,000 | | | | | Stauffer Chemical, 7.670%,
due 04/15/17 | | | 316,601 | | |
| | 1,227,000 | | | | | Union Carbide Corp.,
7.750%, due 10/01/96 | | | 1,288,273 | | |
| | | | 3,172,896 | | |
| | | | | Diversified Financial Services: 2.7% | |
| | 1,268,000 | | | @@,#,C,L | | Aiful Corp., 4.450%,
due 02/16/10 | | | 1,217,047 | | |
| | 218,000 | | | @@,#,I | | Alpine III, 5.925%,
due 08/16/14 | | | 218,621 | | |
| | 218,000 | | | @@,#,I | | Alpine III, 6.325%,
due 08/16/14 | | | 218,757 | | |
| | 328,000 | | | @@,#,I | | Alpine III, 8.125%,
due 08/16/14 | | | 330,109 | | |
| | 560,000 | | | @@,#,I | | Alpine III, 11.375%,
due 08/16/14 | | | 574,697 | | |
| | 1,191,617 | | | # | | Astoria Depositor Corp.,
7.902%, due 05/01/21 | | | 1,247,784 | | |
| | 3,322,000 | | | # | | Astoria Depositor Corp.,
8.144%, due 05/01/21 | | | 3,631,926 | | |
| | 846,881 | | | @@,# | | Brazilian Merchant
Voucher Receivables Ltd.,
5.911%, due 06/15/11 | | | 834,178 | | |
| | 643,000 | | | C | | Citigroup Capital II,
7.750%, due 12/01/36 | | | 664,887 | | |
| | 1,131,000 | | | #,C | | Corestates Capital Trust I,
8.000%, due 12/15/26 | | | 1,177,823 | | |
| | 762,000 | | | @@ | | Eksportfinans A/S, 5.125%,
due 10/26/11 | | | 763,743 | | |
| | 420,000 | | | @@,C | | Financiere CSFB NV,
5.485%, due 03/29/49 | | | 360,150 | | |
| | 967,000 | | | | | Ford Motor Credit Co.,
0.000%, due 11/29/13 | | | 970,099 | | |
| | 1,180,000 | | | | | Ford Motor Credit Co.,
8.000%, due 12/15/16 | | | 1,167,986 | | |
| | 492,000 | | | | | Ford Motor Credit Co.,
8.110%, due 01/13/12 | | | 488,130 | | |
| | 1,007,000 | | | | | Ford Motor Credit Co.,
9.824%, due 04/15/12 | | | 1,068,483 | | |
| | 73,000 | | | | | Ford Motor Credit Co.,
9.875%, due 08/10/11 | | | 78,147 | | |
| | 825,000 | | | C | | Fund American Cos., Inc.,
5.875%, due 05/15/13 | | | 821,146 | | |
| | 1,227,000 | | | | | General Motors
Acceptance Corp.,
7.250%, due 03/02/11 | | | 1,277,138 | | |
| | 523,000 | | | #,C | | HVB Funding Trust III,
9.000%, due 10/22/31 | | | 682,099 | | |
| | 515,000 | | | C | | JPM Capital Trust I,
7.540%, due 01/15/27 | | | 534,340 | | |
See Accompanying Notes to Financial Statements
69
PORTFOLIO OF INVESTMENTS
ING VP BALANCED PORTFOLIO AS OF DECEMBER 31, 2006 (CONTINUED)
Principal
Amount | | | | | | Value | |
| | | | | | | Diversified Financial
Services (continued) | | | | | |
| $ | 569,000 | | | C | | JPM Capital Trust II,
7.950%, due 02/01/27 | | $ | 592,129 | | |
| | 1,412,000 | | | #,C | | Mangrove Bay
Pass-Through Trust,
6.102%, due 07/15/33 | | | 1,381,773 | | |
| | 1,131,000 | | | @@,# | | Mantis Reef Ltd., 4.799%,
due 11/03/09 | | | 1,103,811 | | |
| | 848,000 | | | @@,C | | MUFG Capital
Finance 1 Ltd., 6.346%,
due 12/31/49 | | | 862,157 | | |
| | 485,000 | | | @@,C | | Paribas, 5.500%,
due 12/31/49 | | | 418,421 | | |
| | 269,889 | | | @@,#,C | | Petroleum Export Ltd.,
4.623%, due 06/15/10 | | | 265,774 | | |
| | 416,214 | | | @@,#,C | | Petroleum Export Ltd.,
5.265%, due 06/15/11 | | | 405,275 | | |
| | 1,141,322 | | | @@,#,C | | PF Export Receivables
Master Trust, 6.436%,
due 06/01/15 | | | 1,164,862 | | |
| | 1,491,000 | | | #,C | | Piper Jaffray Equipment
Trust Securities, 6.000%,
due 09/10/11 | | | 1,453,725 | | |
| | 1,392,328 | | | #,C | | Piper Jaffray Equipment
Trust Securities, 6.750%,
due 04/01/11 | | | 1,385,367 | | |
| | 1,341,000 | | | C | | Southern Star Central
Corp., 6.750%,
due 03/01/16 | | | 1,344,353 | | |
| | 1,122,000 | | | @@,# | | TNK-BP Finance SA,
7.500%, due 07/18/16 | | | 1,196,333 | | |
| | 4,916,865 | | | # | | Toll Road Investors
Partnership II LP,
17.590%, due 02/15/45 | | | 630,111 | | |
| | 430,000 | | | #,C | | Twin Reefs Pass-Through
Trust, 6.350%,
due 12/10/49 | | | 430,818 | | |
| | 807,000 | | | @@,C,L | | UFJ Finance Aruba AEC,
8.750%, due 12/31/49 | | | 852,126 | | |
| | 446,000 | | | #,C | | Wachovia Capital Trust V,
7.965%, due 06/01/27 | | | 466,834 | | |
| | | | 32,281,159 | | |
| | | | | Electric: 1.3% | |
| | 623,000 | | | @@,#,I,L | | Abu Dhabi National
Energy Co., 6.500%,
due 10/27/36 | | | 644,728 | | |
| | 563,000 | | | #,C | | Baltimore Gas & Electric,
6.350%, due 10/01/36 | | | 576,661 | | |
| | 1,532,318 | | | C | | CE Generation, LLC,
7.416%, due 12/15/18 | | | 1,605,176 | | |
| | 609,000 | | | C | | Cleveland Electric Illum,
5.950%, due 12/15/36 | | | 582,785 | | |
| | 1,404,000 | | | C,L | | Commonwealth Edison Co.,
6.950%, due 07/15/18 | | | 1,450,864 | | |
| | 157,000 | | | @@ | | Empresa Nacional de
Electricidad SA, 7.325%,
due 02/01/37 | | | 171,022 | | |
| | 1,108,000 | | | @@,L | | Empresa Nacional de
Electricidad SA, 8.625%,
due 08/01/15 | | | 1,306,497 | | |
| | 800,000 | | | C,L | | FirstEnergy Corp., 6.450%,
due 11/15/11 | | | 835,115 | | |
Principal
Amount | | | | | | Value | |
| $ | 744,000 | | | #,C | | ITC Holdings Corp.,
5.875%, due 09/30/16 | | $ | 739,678 | | |
| | 239,000 | | | #,C | | ITC Holdings Corp.,
6.375%, due 09/30/36 | | | 239,129 | | |
| | 631,008 | | | #,C | | Juniper Generation, LLC,
6.790%, due 12/31/14 | | | 611,480 | | |
| | 1,040,000 | | | C | | Nevada Power Co.,
5.950%, due 03/15/16 | | | 1,043,054 | | |
| | 1,181,000 | | | C | | NorthWestern Corp.,
5.875%, due 11/01/14 | | | 1,162,171 | | |
| | 525,000 | | | #,C | | Potomac Edison Co.,
5.800%, due 10/15/16 | | | 527,552 | | |
| | 266,881 | | | # | | Power Contract Financing,
LLC, 6.256%,
due 02/01/10 | | | 268,419 | | |
| | 138,481 | | | | | PPL Montana, LLC, 8.903%,
due 07/02/20 | | | 152,832 | | |
| | 1,105,000 | | | C | | Sierra Pacific Power Co.,
6.000%, due 05/15/16 | | | 1,112,936 | | |
| | 194,000 | | | C | | Sierra Pacific Power Co.,
6.250%, due 04/15/12 | | | 197,955 | | |
| | 1,015,000 | | | C | | Southern Co. CAP Trust I,
8.190%, due 02/01/37 | | | 1,058,576 | | |
| | 805,000 | | | C | | Southern Power Co.,
6.375%, due 11/15/36 | | | 790,689 | | |
| | 469,000 | | | C | | Toledo Edison Co., 6.150%,
due 05/15/37 | | | 463,238 | | |
| | | | 15,540,557 | | |
| | | | | Energy-Alternate Sources: 0.1% | |
| | 752,884 | | | | | Salton Sea Funding Corp.,
7.840%, due 05/30/10 | | | 775,832 | | |
| | | | 775,832 | | |
| | | | | Food: 0.3% | |
| | 3,460,000 | | | C | | Heinz Finance Co., 6.625%,
due 07/15/11 | | | 3,602,209 | | |
| | | | 3,602,209 | | |
| | | | | Gas: 0.1% | |
| | 993,000 | | | @@,#,C | | Nakilat, Inc., 6.067%,
due 12/31/33 | | | 988,740 | | |
| | 528,000 | | | @@,#,C | | Nakilat, Inc., 6.267%,
due 12/31/33 | | | 524,820 | | |
| | | | 1,513,560 | | |
| | | | | Healthcare-Products: 0.1% | |
| | 545,000 | | | C | | Boston Scientific Corp.,
7.000%, due 11/15/35 | | | 544,599 | | |
| | | | 544,599 | | |
| | | | | Home Builders: 0.1% | |
| | 628,000 | | | | | D.R. Horton, Inc., 5.625%,
due 09/15/14 | | | 607,506 | | |
| | | | 607,506 | | |
| | | | | Insurance: 0.1% | |
| | 1,355,000 | | | @@,C | | Aegon NV, 5.413%,
due 12/31/49 | | | 1,165,300 | | |
| | 368,000 | | | #,C | | North Front Pass-Through
Trust, 5.810%,
due 12/15/24 | | | 362,865 | | |
| | | | 1,528,165 | | |
See Accompanying Notes to Financial Statements
70
PORTFOLIO OF INVESTMENTS
ING VP BALANCED PORTFOLIO AS OF DECEMBER 31, 2006 (CONTINUED)
Principal
Amount | | | | | | Value | |
| | | | | Media: 0.1% | |
| $ | 248,000 | | | C | | CBS Corp., 5.500%,
due 05/15/33 | | $ | 206,617 | | |
| | 1,456,000 | | | #,C | | Charter Communications
Operating, LLC, 8.375%,
due 04/30/14 | | | 1,526,980 | | |
| | | | 1,733,597 | | |
| | | | | Mining: 0.1% | |
| | 1,174,000 | | | C | | Southern Copper Corp.,
7.500%, due 07/27/35 | | | 1,278,823 | | |
| | | | 1,278,823 | | |
| | | | | Multi-National: 0.1% | |
| | 618,000 | | | @@ | | Corp. Andina de Fomento
CAF, 5.125%,
due 05/05/15 | | | 595,907 | | |
| | | | 595,907 | | |
| | | | | Oil & Gas: 0.7% | |
| | 459,000 | | | @@,# | | EMP Nacional Del Petrole,
4.875%, due 03/15/14 | | | 436,659 | | |
| | 331,000 | | | @@,# | | Empresa Nacional de
Petroleo ENAP, 6.750%,
due 11/15/12 | | | 349,192 | | |
| | 1,139,000 | | | @@,#,L | | Gaz Capital SA, 6.212%,
due 11/22/16 | | | 1,149,821 | | |
| | 600,000 | | | | | Greater Ohio Ethanol, LLC,
0.000%, due 12/31/13 | | | 594,750 | | |
| | 700,000 | | | | | Greater Ohio Ethanol, LLC,
12.630%, due 12/31/13 | | | 681,240 | | |
| | 845,000 | | | C | | Hess Corp., 7.300%,
due 08/15/31 | | | 945,901 | | |
| | 878,000 | | | C | | Pemex Project Funding
Master Trust, 6.625%,
due 06/15/35 | | | 899,292 | | |
| | 1,003,000 | | | # | | Pemex Project Funding
Master Trust, 6.660%,
due 06/15/10 | | | 1,032,087 | | |
| | 930,000 | | | @@,#,C | | Ras Laffan Liquefied
Natural Gas Co., Ltd. II,
5.298%, due 09/30/20 | | | 893,149 | | |
| | 1,094,000 | | | # | | Sabine Pass LP, 7.250%,
due 11/30/13 | | | 1,089,898 | | |
| | 688,000 | | | # | | Sabine Pass LP, 7.500%,
due 11/30/16 | | | 687,140 | | |
| | | | 8,759,129 | | |
| | | | | Pipelines: 0.3% | |
| | 2,075,000 | | | #,C | | Cameron Highway Oil
Pipelines, 5.860%,
due 12/15/17 | | | 2,028,962 | | |
| | 345,000 | | | C | | Northwest Pipeline Corp.,
7.000%, due 06/15/16 | | | 362,250 | | |
| | 460,000 | | | C | | Transcontinental Gas Pipe
Line Corp., 6.400%,
due 04/15/16 | | | 466,900 | | |
| | 491,000 | | | # | | Williams Partners LP,
7.250%, due 02/01/17 | | | 503,275 | | |
| | 346,000 | | | #,C | | Williams Partners LP,
7.500%, due 06/15/11 | | | 362,435 | | |
| | | | 3,723,822 | | |
Principal
Amount | | | | | | Value | |
| | | | | Real Estate Investment Trusts: 0.2% | |
| $ | 162,000 | | | C | | Liberty Property LP,
6.375%, due 08/15/12 | | $ | 168,969 | | |
| | 532,000 | | | C | | Liberty Property LP,
7.750%, due 04/15/09 | | | 556,711 | | |
| | 1,287,000 | | | #,C | | Rouse Co. LP, 6.750%,
due 05/01/13 | | | 1,298,907 | | |
| | 798,000 | | | C | | Simon Property Group LP,
5.000%, due 03/01/12 | | | 784,831 | | |
| | | | 2,809,418 | | |
| | | | | Retail: 0.2% | |
| | 954,000 | | | C | | Home Depot, Inc., 5.250%,
due 12/16/13 | | | 948,268 | | |
| | 1,344,000 | | | C | | Home Depot, Inc., 5.875%,
due 12/16/36 | | | 1,323,487 | | |
| | | | 2,271,755 | | |
| | | | | Savings & Loans: 0.0% | |
| | 465,000 | | | C | | Great Western Financial,
8.206%, due 02/01/27 | | | 484,864 | | |
| | | | 484,864 | | |
| | | | | Sovereign: 0.4% | |
| | 1,287,000 | | | | | Fannie Mae, 7.250%,
due 01/15/10 | | | 1,370,165 | | |
| JPY | 410,000,000 | | | @@ | | Japan Treasury Bill,
0.490%, due 06/11/07 | | | 3,437,681 | | |
| | | | 4,807,846 | | |
| | | | | Telecommunications: 0.3% | |
| $ | 1,312,000 | | | @@,C | | Rogers Wireless, Inc.,
7.250%, due 12/15/12 | | | 1,397,280 | | |
| | 731,000 | | | C | | Sprint Capital Corp.,
6.875%, due 11/15/28 | | | 733,796 | | |
| | 330,000 | | | C | | Sprint Nextel Corp.,
6.000%, due 12/01/16 | | | 322,218 | | |
| | 499,000 | | | @@,C,L | | Telecom Italia Capital SA,
7.200%, due 07/18/36 | | | 522,948 | | |
| | 989,000 | | | @@,C | | TELUS Corp., 8.000%,
due 06/01/11 | | | 1,082,517 | | |
| | | | 4,058,759 | | |
| | | Total Corporate
Bonds/Notes
(Cost $116,966,833) | | | 117,095,295 | | |
| U.S. GOVERNMENT AGENCY OBLIGATIONS: 8.6% | | | |
| | | | | Federal Home Loan Bank: 0.4% | |
| | 1,840,000 | | | | | 5.000%, due 10/02/09 | | | 1,841,963 | | |
| | 890,000 | | | L | | 5.375%, due 08/19/11 | | | 906,144 | | |
| | 1,786,000 | | | L | | 5.625%, due 06/13/16 | | | 1,841,479 | | |
| | | | 4,589,586 | | |
| | | | | | | Federal Home Loan Mortgage
Corporation: 3.0% | | | | | |
| | 190,532 | | | C | | 4.500%, due 12/15/16 | | | 187,071 | | |
| | 2,072,000 | | | C | | 4.500%, due 02/15/20 | | | 1,933,991 | | |
| | 2,267,940 | | | C | | 5.000%, due 08/15/16 | | | 2,235,876 | | |
| | 1,441,000 | | | C | | 5.000%, due 12/15/17 | | | 1,414,862 | | |
| | 948,000 | | | C | | 5.000%, due 05/15/20 | | | 919,345 | | |
| | 2,280,991 | | | C | | 5.000%, due 08/15/21 | | | 2,255,068 | | |
| | 2,410,000 | | | C | | 5.000%, due 04/15/23 | | | 2,307,096 | | |
| | 388,235 | | | | | 5.042%, due 04/01/35 | | | 381,058 | | |
| | 2,071,000 | | | L | | 5.125%, due 04/18/08 | | | 2,071,118 | | |
See Accompanying Notes to Financial Statements
71
PORTFOLIO OF INVESTMENTS
ING VP BALANCED PORTFOLIO AS OF DECEMBER 31, 2006 (CONTINUED)
Principal
Amount | | | | | | Value | |
| | | | | | | Federal Home Loan Mortgage
Corporation (continued) | | | | | |
| $ | 499,000 | | | | | 5.125%, due 04/18/11 | | $ | 502,936 | | |
| | 26,000 | | | C | | 5.150%, due 01/24/11 | | | 26,019 | | |
| | 3,679,000 | | | C | | 5.500%, due 04/24/09 | | | 3,679,879 | | |
| | 4,289,649 | | | C | | 5.500%, due 08/15/20 | | | 4,127,272 | | |
| | 351 | | | | | 5.500%, due 05/01/23 | | | 349 | | |
| | 543,581 | | | | | 5.500%, due 06/01/36 | | | 538,308 | | |
| | 1,771,000 | | | | | 5.750%, due 06/27/16 | | | 1,846,592 | | |
| | 7,896,975 | | | C | | 6.000%, due 01/15/29 | | | 7,967,401 | | |
| | 323,719 | | | | | 6.500%, due 11/01/28 | | | 332,223 | | |
| | 67,267 | | | | | 6.500%, due 12/01/31 | | | 68,866 | | |
| | 3,567,000 | | | L | | 6.625%, due 09/15/09 | | | 3,717,317 | | |
| | | | 36,512,647 | | |
| | | | | | | Federal National Mortgage
Association: 4.9% | | | | | |
| | 137,000 | | | | | 4.500%, due 11/15/36 | | | 128,395 | | |
| | 676,000 | | | W | | 4.500%, due 01/00/00 | | | 652,129 | | |
| | 800,084 | | | | | 4.606%, due 08/01/35 | | | 784,180 | | |
| | 924,035 | | | C | | 4.750%, due 12/25/42 | | | 918,802 | | |
| | 2,053,459 | | | | | 4.806%, due 08/01/35 | | | 2,026,685 | | |
| | 1,853,000 | | | L | | 4.875%, due 12/15/16 | | | 1,835,839 | | |
| | 14,171,000 | | | W | | 5.000%, due 01/12/36 | | | 13,683,872 | | |
| | 1,388,925 | | | | | 5.000%, due 02/25/29 | | | 1,370,316 | | |
| | 4,634,000 | | | L | | 5.250%, due 08/01/12 | | | 4,662,110 | | |
| | 2,208,000 | | | | | 5.250%, due 09/15/16 | | | 2,252,169 | | |
| | 1,853,000 | | | | | 5.500%, due 05/25/30 | | | 1,822,586 | | |
| | 1,475,840 | | | | | 5.500%, due 11/01/32 | | | 1,461,560 | | |
| | 7,785,651 | | | | | 5.500%, due 11/01/33 | | | 7,709,514 | | |
| | 508,611 | | | | | 5.500%, due 06/01/36 | | | 503,048 | | |
| | 538,827 | | | | | 5.500%, due 07/01/36 | | | 532,934 | | |
| | 489,088 | | | | | 5.500%, due 10/01/36 | | | 480,606 | | |
| | 2,782,000 | | | C | | 5.600%, due 03/29/11 | | | 2,782,938 | | |
| | 90,703 | | | | | 6.000%, due 06/01/16 | | | 92,081 | | |
| | 460,321 | | | | | 6.000%, due 07/01/16 | | | 467,316 | | |
| | 157,868 | | | | | 6.000%, due 08/01/16 | | | 160,267 | | |
| | 116,050 | | | | | 6.000%, due 10/01/16 | | | 117,814 | | |
| | 500,575 | | | | | 6.000%, due 03/01/17 | | | 508,087 | | |
| | 213,360 | | | | | 6.000%, due 04/01/17 | | | 216,562 | | |
| | 324,932 | | | | | 6.000%, due 06/01/17 | | | 329,808 | | |
| | 62,005 | | | | | 6.000%, due 09/01/17 | | | 62,936 | | |
| | 78,932 | | | | | 6.000%, due 10/01/17 | | | 80,116 | | |
| | 311,808 | | | | | 6.000%, due 11/01/17 | | | 316,546 | | |
| | 313,437 | | | | | 6.000%, due 12/01/17 | | | 318,140 | | |
| | 289,635 | | | | | 6.000%, due 12/01/18 | | | 293,851 | | |
| | 4,207,156 | | | | | 6.000%, due 07/25/29 | | | 4,260,343 | | |
| | 2,278,535 | | | | | 6.000%, due 04/25/31 | | | 2,321,974 | | |
| | 2,458,711 | | | | | 6.500%, due 04/01/30 | | | 2,522,590 | | |
| | 112,641 | | | | | 7.000%, due 06/01/29 | | | 116,227 | | |
| | 823 | | | | | 7.000%, due 08/01/29 | | | 848 | | |
| | 6,064 | | | | | 7.000%, due 10/01/29 | | | 6,253 | | |
| | 179,009 | | | | | 7.000%, due 11/01/29 | | | 184,605 | | |
| | 84,704 | | | | | 7.000%, due 01/01/30 | | | 87,352 | | |
| | 150,562 | | | | | 7.000%, due 03/01/30 | | | 155,268 | | |
| | 91,424 | | | | | 7.000%, due 01/01/31 | | | 94,163 | | |
| | 1,238,951 | | | | | 7.000%, due 06/01/31 | | | 1,279,380 | | |
| | 214,383 | | | | | 7.000%, due 08/01/31 | | | 220,671 | | |
| | 12,225 | | | | | 7.000%, due 10/01/31 | | | 12,583 | | |
| | 54,956 | | | | | 7.000%, due 01/01/32 | | | 56,567 | | |
| | 8,445 | | | | | 7.000%, due 04/01/32 | | | 8,690 | | |
| | 17,620 | | | | | 7.000%, due 05/01/32 | | | 18,131 | | |
| | 41,338 | | | | | 7.000%, due 07/01/32 | | | 42,537 | | |
| | 4,247 | | | I | | 7.125%, due 07/01/27 | | | 4,319 | | |
| | 28,066 | | | I | | 7.180%, due 07/01/27 | | | 28,715 | | |
Principal
Amount | | | | | | Value | |
| $ | 14,919 | | | | | 7.500%, due 11/01/29 | | $ | 15,575 | | |
| | 141,046 | | | | | 7.500%, due 10/01/30 | | | 146,915 | | |
| | 111,401 | | | | | 7.500%, due 11/01/30 | | | 116,037 | | |
| | 727,958 | | | C | | 7.500%, due 01/25/48 | | | 754,089 | | |
| | | | 59,025,039 | | |
| | | | | | | Government National
Mortgage Association: 0.3% | | | | | |
| | 37,375 | | | | | 5.125%, due 12/20/29 | | | 37,433 | | |
| | 136,929 | | | | | 5.375%, due 04/20/28 | | | 138,173 | | |
| | 164,282 | | | | | 6.500%, due 10/15/31 | | | 168,882 | | |
| | 499,355 | | | | | 7.000%, due 09/15/24 | | | 515,952 | | |
| | 840,931 | | | | | 7.000%, due 10/15/24 | | | 868,954 | | |
| | 145,366 | | | | | 7.000%, due 11/15/24 | | | 150,192 | | |
| | 1,324,190 | | | | | 7.500%, due 12/15/23 | | | 1,381,359 | | |
| | | | 3,260,945 | | |
| | | Total U.S. Government
Agency Obligations
(Cost $104,419,719) | | | 103,388,217 | | |
| U.S. TREASURY OBLIGATIONS: 1.2% | | | |
| | | | | U.S. Treasury Bonds: 0.2% | |
| | 852,000 | | | L | | 4.500%, due 11/30/11 | | | 844,679 | | |
| | 900,000 | | | L | | 4.500%, due 02/15/36 | | | 856,126 | | |
| | 838,000 | | | L | | 4.625%, due 11/15/16 | | | 832,763 | | |
| | | | 2,533,568 | | |
| | | | | | | Treasury Inflation Protected
Securities: 0.5% | | | | | |
| | 2,038,000 | | | | | 2.000%, due 01/15/16 | | | 2,001,374 | | |
| | 3,973,000 | | | L | | 2.375%, due 04/15/11 | | | 4,024,481 | | |
| | | | 6,025,855 | | |
| | | | | U.S. Treasury Notes: 0.3% | |
| | 2,856,000 | | | L | | 4.625%, due 11/30/08 | | | 2,846,518 | | |
| | 799,000 | | | L | | 4.625%, due 11/15/09 | | | 796,753 | | |
| | | | 3,643,271 | | |
| | | | | U.S. Treasury STRIP: 0.2% | |
| | 7,438,000 | | | L | | Discount Note,
due 02/15/36 | | | 1,884,722 | | |
| | | | 1,884,722 | | |
| | | Total U.S. Treasury
Obligations
(Cost $14,130,460) | | | 14,087,416 | | |
| ASSET-BACKED SECURITIES: 1.2% | | | |
| | | | | | | Automobile Asset-Backed
Securities: 0.1% | | | | | |
| | 182,000 | | | C | | AmeriCredit Automobile
Receivables Trust,
4.220%, due 07/06/09 | | | 180,677 | | |
| | 1,201 | | | C | | Honda Auto Receivables
Owner Trust, 2.790%,
due 03/16/09 | | | 1,190 | | |
| | 650,605 | | | C | | Nissan Auto Receivables
Owner Trust, 2.050%,
due 03/16/09 | | | 643,980 | | |
| | 437,406 | | | C | | Nissan Auto Receivables
Owner Trust, 2.610%,
due 07/15/08 | | | 434,180 | | |
| | | | 1,260,027 | | |
See Accompanying Notes to Financial Statements
72
PORTFOLIO OF INVESTMENTS
ING VP BALANCED PORTFOLIO AS OF DECEMBER 31, 2006 (CONTINUED)
Principal
Amount | | | | | | Value | |
| | | | | | | | | Credit Card Asset-Backed
Securities: 0.0% | | | | | |
| $ | 12,000 | | | C | | Bank One Issuance Trust,
4.540%, due 09/15/10 | | $ | 11,891 | | |
| | 12,000 | | | C | | MBNA Credit Card Master
Note Trust, 4.950%,
due 06/15/09 | | | 12,008 | | |
| | | | 23,899 | | |
| | | | | | | | | Home Equity Asset-Backed
Securities: 0.6% | | | | | |
| | 1,013,100 | | | C | | Bayview Financial
Revolving Mortgage
Loan Trust, 5.850%,
due 09/28/43 | | | 1,014,109 | | |
| | 4,707,000 | | | C | | GSAA Trust, 5.242%,
due 06/25/34 | | | 4,655,587 | | |
| | 850,000 | | | C | | GSAA Trust, 6.040%,
due 07/25/36 | | | 858,235 | | |
| | 153,044 | | | +,C | | Merrill Lynch Mortgage
Investors, Inc., 5.710%,
(step rate 6.040%),
due 07/25/34 | | | 153,568 | | |
| | 1,000 | | | +,C | | Renaissance Home Equity
Loan Trust, 4.456%,
(step rate 4.956%),
due 05/25/35 | | | 991 | | |
| | | | 6,682,490 | | |
| | | | | Other Asset-Backed Securities: 0.5% | |
| | 160,707 | | | C | | Amortizing Residential
Collateral Trust, 5.850%,
due 05/25/32 | | | 160,958 | | |
| | 79,000 | | | C | | Caterpillar Financial Asset
Trust, 5.590%,
due 02/25/09 | | | 78,988 | | |
| | 4,008 | | | C | | Chase Funding Mortgage
Loan, 4.045%,
due 05/25/33 | | | 3,955 | | |
| | 144,872 | | | +,C | | Chase Funding Mortgage
Loan, 5.650%,
(step rate 5.920%),
due 07/25/33 | | | 145,261 | | |
| | 98,125 | | | C | | Citigroup Mortgage Loan
Trust, Inc., 5.470%,
due 02/25/35 | | | 98,199 | | |
| | 4,000 | | | C | | Countrywide Asset-Backed
Certificates, 4.493%,
due 02/25/36 | | | 3,965 | | |
| | 761,000 | | | C | | Countrywide Asset-Backed
Certificates, 5.683%,
due 10/25/46 | | | 760,763 | | |
| | 104,000 | | | C | | Countrywide Asset-Backed
Certificates, 5.689%,
due 10/25/46 | | | 104,228 | | |
| | 1,583,000 | | | +,C | | Credit-Based Asset
Servicing and
Securitization, 5.501%,
(step rate 6.001%),
due 12/25/36 | | | 1,579,495 | | |
| | 748,000 | | | C | | Equity One, Inc., 5.050%,
due 09/25/33 | | | 737,991 | | |
| | 242,534 | | | +,C | | Fannie Mae Grantor Trust,
5.490%, (step rate
5.600%), due 04/25/35 | | | 242,906 | | |
Principal
Amount | | | | | | Value | |
| $ | 719,000 | | | +,C | | Merrill Lynch Mortgage
Investors, Inc., 5.609%,
(step rate 6.109%),
due 03/25/37 | | $ | 718,099 | | |
| | 543 | | | C | | Popular Mortgage
Pass-Through Trust,
3.735%, due 12/25/34 | | | 542 | | |
| | 8,000 | | | C | | Popular Mortgage
Pass-Through Trust,
4.000%, due 12/25/34 | | | 7,919 | | |
| | 3,000 | | | C | | Popular Mortgage
Pass-Through Trust,
4.596%, due 11/25/35 | | | 2,972 | | |
| | 796,000 | | | +,C | | Renaissance Home Equity
Loan Trust, 5.608%,
(step rate 6.108%)
due 05/25/36 | | | 795,965 | | |
| | 96,723 | | | C | | Residential Asset
Mortgage Products, Inc.,
5.660%, due 06/25/33 | | | 96,831 | | |
| | 1,082,132 | | | +,C | | Structured Asset Securities
Corp., 6.000%,
(step rate 6.500%),
due 03/25/34 | | | 1,079,725 | | |
| | | | 6,618,762 | | |
| | | Total Asset-Backed
Securities
(Cost $14,669,950) | | | 14,585,178 | | |
| COLLATERALIZED MORTGAGE OBLIGATIONS: 8.9% | | | |
| | 60,000 | | | C | | Banc of America
Commercial Mortgage,
Inc., 4.429%,
due 11/10/39 | | | 57,997 | | |
| | 10,000 | | | C | | Banc of America
Commercial Mortgage,
Inc., 4.502%,
due 07/10/42 | | | 9,708 | | |
| | 10,000 | | | C | | Banc of America
Commercial Mortgage,
Inc., 4.772%,
due 07/11/43 | | | 9,888 | | |
| | 10,000 | | | C | | Banc of America
Commercial Mortgage,
Inc., 4.877%,
due 11/10/42 | | | 9,900 | | |
| | 10,000 | | | C | | Banc of America
Commercial Mortgage,
Inc., 4.891%,
due 07/10/45 | | | 9,834 | | |
| | 204,325 | | | C | | Banc of America
Commercial Mortgage,
Inc., 5.363%,
due 07/10/46 | | | 205,258 | | |
| | 516,000 | | | C | | Banc of America
Commercial Mortgage,
Inc., 5.463%,
due 09/10/47 | | | 515,568 | | |
| | 377,404 | | | C | | Banc of America
Commercial Mortgage,
Inc., 5.685%,
due 07/10/44 | | | 380,574 | | |
See Accompanying Notes to Financial Statements
73
PORTFOLIO OF INVESTMENTS
ING VP BALANCED PORTFOLIO AS OF DECEMBER 31, 2006 (CONTINUED)
Principal
Amount | | | | | | Value | |
| COLLATERALIZED MORTGAGE OBLIGATIONS (continued) | | | |
| $ | 160,000 | | | C | | Banc of America
Commercial Mortgage,
Inc., 6.186%,
due 06/11/35 | | $ | 166,497 | | |
| | 1,723,141 | | | C | | Banc of America Funding
Corp., 5.281%,
due 09/20/35 | | | 1,695,274 | | |
| | 2,713,530 | | | C | | Banc of America Funding
Corp., 5.750%,
due 09/20/34 | | | 2,700,546 | | |
| | 892,922 | | | C | | Banc of America Funding
Corp., 5.858%,
due 05/20/36 | | | 891,414 | | |
| | 1,176,000 | | | C | | Banc of America Mortgage
Securities, 4.147%,
due 07/25/34 | | | 1,145,189 | | |
| | 1,047,373 | | | C | | Banc of America Mortgage
Securities, 5.181%,
due 09/25/35 | | | 1,030,435 | | |
| | 905,502 | | | C | | Banc of America Mortgage
Securities, 5.250%,
due 11/25/19 | | | 896,295 | | |
| | 857,712 | | | C | | Banc of America Mortgage
Securities, 5.500%,
due 11/25/33 | | | 845,352 | | |
| | 1,935,125 | | | C | | Banc of America Mortgage
Securities, 5.500%,
due 06/25/35 | | | 1,923,267 | | |
| | 165,596 | | | C | | Bank of America
Alternative Loan Trust,
6.500%, due 04/25/36 | | | 167,718 | | |
| | 2,461,374 | | | C | | Bank of America
Alternative Loan Trust,
6.500%, due 05/25/46 | | | 2,490,661 | | |
| | 312,614 | | | | +, | C | | Bear Stearns Alternative-A
Trust, 5.670%,
(step rate 5.960%),
due 07/25/34 | | | 313,009 | | |
| | 7,000 | | | C | | Bear Stearns Commercial
Mortgage Securities,
3.880%, due 08/13/39 | | | 6,801 | | |
| | 26,000 | | | C | | Bear Stearns Commercial
Mortgage Securities,
4.030%, due 02/13/46 | | | 25,158 | | |
| | 1,427,000 | | | C | | Bear Stearns Commercial
Mortgage Securities,
4.170%, due 01/12/41 | | | 1,396,435 | | |
| | 126,708 | | | C | | Bear Stearns Commercial
Mortgage Securities,
5.294%, due 09/11/41 | | | 126,844 | | |
| | 1,000 | | | C | | Capco America
Securitization Corp.,
6.460%, due 10/15/30 | | | 1,019 | | |
| | 2,060,000 | | | C | | Chase Manhattan
Bank-First Union
National Bank, 7.439%,
due 08/15/31 | | | 2,154,868 | | |
| | 2,512,343 | | | C | | Chase Mortgage Finance
Corp., 5.414%,
due 12/25/35 | | | 2,480,939 | | |
| | 1,548,924 | | | C | | Chase Mortgage Finance
Corp., 5.500%,
due 11/25/35 | | | 1,538,724 | | |
Principal
Amount | | | | | | Value | |
| $ | 190,000 | | | C | | Citigroup Commercial
Mortgage Trust, 4.639%,
due 05/15/43 | | $ | 186,464 | | |
| | 361,192 | | | C | | Citigroup Commercial
Mortgage Trust, 5.720%,
due 03/15/49 | | | 366,034 | | |
| | 189,197 | | | C | | Citigroup Mortgage Loan
Trust, Inc., 5.949%,
due 06/25/36 | | | 189,729 | | |
| | 2,846,696 | | | C | | Citigroup Mortgage Loan
Trust, Inc., 6.000%,
due 11/25/35 | | | 2,847,986 | | |
| | 15,000 | | | C | | Commercial Mortgage
Pass-Through
Certificates, 3.600%,
due 03/10/39 | | | 14,533 | | |
| | 27,928 | | | C | | Countrywide Alternative
Loan Trust, 5.416%,
due 10/25/35 | | | 27,579 | | |
| | 2,211,834 | | | C | | Countrywide Alternative
Loan Trust, 5.500%,
due 02/25/25 | | | 2,203,086 | | |
| | 782,739 | | | C | | Countrywide Alternative
Loan Trust, 5.638%,
due 11/25/46 | | | 782,739 | | |
| | 208,729 | | | C | | Countrywide Alternative
Loan Trust, 5.650%,
due 02/25/35 | | | 208,930 | | |
| | 106,385 | | | C | | Countrywide Alternative
Loan Trust, 6.000%,
due 05/25/36 | | | 107,121 | | |
| | 1,112,867 | | | C | | Credit Suisse First Boston
Mortgage Securities
Corp., 3.727%,
due 03/15/35 | | | 1,075,566 | | |
| | 423,423 | | | C | | Credit Suisse First Boston
Mortgage Securities
Corp., 3.819%,
due 05/15/36 | | | 405,512 | | |
| | 32,000 | | | C | | Credit Suisse First Boston
Mortgage Securities
Corp., 3.861%,
due 03/15/36 | | | 31,325 | | |
| | 10,000 | | | C | | Credit Suisse First Boston
Mortgage Securities
Corp., 4.321%,
due 01/15/37 | | | 9,673 | | |
| | 10,000 | | | C | | Credit Suisse First Boston
Mortgage Securities
Corp., 4.801%,
due 03/15/36 | | | 9,749 | | |
| | 8,000 | | | C | | Credit Suisse First Boston
Mortgage Securities
Corp., 7.544%,
due 04/15/62 | | | 8,620 | | |
| | 353,755 | | | C | | Credit Suisse Mortgage
Capital Certificates,
4.991%, due 06/15/38 | | | 351,313 | | |
| | 1,500,611 | | | C | | Credit Suisse Mortgage
Capital Certificates,
7.000%, due 08/25/36 | | | 1,521,209 | | |
| | 40,652 | | | C | | DLJ Commercial Mortgage
Corp., 6.240%,
due 11/12/31 | | | 41,121 | | |
See Accompanying Notes to Financial Statements
74
PORTFOLIO OF INVESTMENTS
ING VP BALANCED PORTFOLIO AS OF DECEMBER 31, 2006 (CONTINUED)
Principal
Amount | | | | | | Value | |
| COLLATERALIZED MORTGAGE OBLIGATIONS (continued) | | | |
| $ | 115,000 | | | C | | DLJ Commercial Mortgage
Corp., 7.300%,
due 06/10/32 | | $ | 119,495 | | |
| | 1,122,049 | | | C | | First Horizon Alternative
Mortgage Securities,
5.500%, due 08/25/35 | | | 1,107,872 | | |
| | 617,710 | | | C | | First Horizon Asset
Securities, Inc., 5.390%,
due 10/25/35 | | | 613,364 | | |
| | 932,051 | | | C | | First Horizon Asset
Securities, Inc., 5.500%,
due 12/25/35 | | | 924,737 | | |
| | 1,500,000 | | | C | | First Union National Bank
Commercial Mortgage,
6.663%, due 01/12/43 | | | 1,574,675 | | |
| | 896,788 | | | C | | GE Capital Commercial
Mortgage Corp.,
3.752%, due 07/10/39 | | | 878,629 | | |
| | 1,000 | | | C | | GE Capital Commercial
Mortgage Corp., 4.865%,
due 07/10/39 | | | 985 | | |
| | 282,185 | | | C | | GE Capital Commercial
Mortgage Corp., 5.560%,
due 06/10/38 | | | 284,087 | | |
| | 1,664,990 | | | C | | GMAC Mortgage Corp.
Loan Trust, 4.604%,
due 10/19/33 | | | 1,614,813 | | |
| | 1,901,304 | | | C | | GMAC Mortgage Corp.
Loan Trust, 5.265%,
due 03/18/35 | | | 1,870,556 | | |
| | 870,000 | | | C | | Greenwich Capital
Commercial Funding
Corp., 5.117%,
due 04/10/37 | | | 867,450 | | |
| | 300,000 | | | C | | Greenwich Capital
Commercial Funding
Corp., 5.912%,
due 07/10/38 | | | 308,588 | | |
| | 684,000 | | | C | | GS Mortgage Securities
Corp. II, 5.626%,
due 04/10/38 | | | 693,032 | | |
| | 548,228 | | | #,C | | GSMPS Mortgage Loan
Trust, 5.700%,
due 01/25/35 | | | 550,801 | | |
| | 954,721 | | | #,C | | GSMPS Mortgage Loan
Trust, 5.720%,
due 04/25/36 | | | 957,171 | | |
| | 440,423 | | | +, C | | Harborview Mortgage
Loan Trust, 5.700%,
(step rate 6.020%),
due 01/19/35 | | | 442,532 | | |
| | 522,799 | | | +, C | | Homebanc Mortgage
Trust, 5.780%,
(step rate 6.180%),
due 08/25/29 | | | 523,656 | | |
| | 327,566 | | | | | JP Morgan Alternative
Loan Trust, 5.515%,
due 01/25/36 | | | 326,150 | | |
| | 62,348,969 | | | C | | JP Morgan Chase
Commercial Mortgage
Securities Corp., 0.070%,
due 01/12/43 | | | 155,180 | | |
Principal
Amount | | | | | | Value | |
| $ | 15,000 | | | C | | JP Morgan Chase
Commercial Mortgage
Securities Corp., 4.223%,
due 01/15/42 | | $ | 14,596 | | |
| | 1,000,000 | | | C | | JP Morgan Chase
Commercial Mortgage
Securities Corp., 4.262%,
due 08/12/40 | | | 981,197 | | |
| | 475,734 | | | C | | JP Morgan Chase
Commercial Mortgage
Securities Corp., 4.275%,
due 01/12/37 | | | 464,088 | | |
| | 116,332 | | | C | | JP Morgan Chase
Commercial Mortgage
Securities Corp., 5.338%,
due 05/12/45 | | | 116,572 | | |
| | 152,000 | | | C | | JP Morgan Chase
Commercial Mortgage
Securities Corp., 5.455%,
due 05/15/47 | | | 152,167 | | |
| | 304,000 | | | C | | JP Morgan Chase
Commercial Mortgage
Securities Corp., 5.495%,
due 05/15/47 | | | 303,644 | | |
| | 168,493 | | | C | | JP Morgan Chase
Commercial Mortgage
Securities Corp., 5.833%,
due 04/15/45 | | | 170,583 | | |
| | 877,000 | | | C | | JP Morgan Chase
Commercial Mortgage
Securities Corp., 5.861%,
due 04/15/45 | | | 901,280 | | |
| | 4,300,680 | | | C | | JP Morgan Mortgage Trust,
5.408%, due 11/25/35 | | | 4,246,922 | | |
| | 258,000 | | | C | | LB-UBS Commercial
Mortgage Trust, 4.547%,
due 08/15/29 | | | 251,842 | | |
| | 1,000 | | | C | | LB-UBS Commercial
Mortgage Trust, 4.567%,
due 06/15/29 | | | 986 | | |
| | 288,000 | | | C | | LB-UBS Commercial
Mortgage Trust, 4.583%,
due 08/15/29 | | | 280,851 | | |
| | 776,000 | | | C | | LB-UBS Commercial
Mortgage Trust, 4.821%,
due 04/15/30 | | | 766,543 | | |
| | 231,000 | | | C | | LB-UBS Commercial
Mortgage Trust, 4.836%,
due 02/15/40 | | | 222,125 | | |
| | 250,000 | | | C | | LB-UBS Commercial
Mortgage Trust, 4.885%,
due 09/15/30 | | | 247,747 | | |
| | 10,000 | | | C | | LB-UBS Commercial
Mortgage Trust, 4.998%,
due 04/15/30 | | | 9,893 | | |
| | 340,000 | | | C | | LB-UBS Commercial
Mortgage Trust, 5.103%,
due 11/15/30 | | | 338,955 | | |
| | 170,000 | | | C | | LB-UBS Commercial
Mortgage Trust, 5.207%,
due 02/15/31 | | | 169,456 | | |
| | 620,000 | | | C | | LB-UBS Commercial
Mortgage Trust, 5.227%,
due 04/15/40 | | | 615,450 | | |
See Accompanying Notes to Financial Statements
75
PORTFOLIO OF INVESTMENTS
ING VP BALANCED PORTFOLIO AS OF DECEMBER 31, 2006 (CONTINUED)
Principal
Amount | | | | | | Value | |
| COLLATERALIZED MORTGAGE OBLIGATIONS (continued) | | | |
| $ | 357,769 | | | C | | LB-UBS Commercial
Mortgage Trust, 5.741%,
due 06/15/32 | | $ | 362,646 | | |
| | 776,000 | | | C | | LB-UBS Commercial
Mortgage Trust, 6.365%,
due 12/15/28 | | | 810,485 | | |
| | 3,000,000 | | | C | | LB-UBS Commercial
Mortgage Trust, 7.370%,
due 08/15/26 | | | 3,178,869 | | |
| | 927,000 | | | | | MASTR Alternative Loans
Trust, Discount Note,
due 04/12/42 | | | 927,000 | | |
| | 2,290,589 | | | C | | MASTR Alternative Loans
Trust, 5.500%,
due 01/25/20 | | | 2,287,194 | | |
| | 162,369 | | | C | | MASTR Alternative Loans
Trust, 6.500%,
due 05/25/33 | | | 163,061 | | |
| | 515,428 | | | C | | MASTR Alternative Loans
Trust, 8.500%,
due 05/25/33 | | | 520,773 | | |
| | 14,393,560 | | | #,C | | Merrill Lynch Mortgage
Trust, 0.193%,
due 11/12/35 | | | 114,620 | | |
| | 213,000 | | | C | | Merrill Lynch Mortgage
Trust, 5.660%,
due 05/12/39 | | | 217,640 | | |
| | 375,000 | | | C | | Merrill Lynch/Countrywide
Commercial Mortgage
Trust, 5.439%,
due 02/12/39 | | | 377,749 | | |
| | 209,353 | | | +, C | | MLCC Mortgage Investors,
Inc., 5.670%,
(step rate 5.960%),
due 01/25/29 | | | 209,600 | | |
| | 360,000 | | | C | | Morgan Stanley Capital I,
4.827%, due 06/12/47 | | | 353,571 | | |
| | 160,000 | | | C | | Morgan Stanley Capital I,
5.007%, due 01/14/42 | | | 158,298 | | |
| | 1,074,334 | | | C | | Morgan Stanley Capital I,
5.490%, due 07/12/44 | | | 1,082,393 | | |
| | 1,010,000 | | | C | | Morgan Stanley Capital I,
5.741%, due 08/12/41 | | | 1,033,406 | | |
| | 1,314,167 | | | C | | Morgan Stanley Dean
Witter Capital I, 4.180%,
due 03/12/35 | | | 1,270,360 | | |
| | 1,790,970 | | | C | | Mortgage Capital Funding,
Inc., 6.663%,
due 03/18/30 | | | 1,806,264 | | |
| | 176,817 | | | C | | MortgageIT Trust, 5.690%,
due 11/25/35 | | | 177,037 | | |
| | 168,259 | | | C | | Prudential Commercial
Mortgage Trust, 3.669%,
due 02/11/36 | | | 161,645 | | |
| | 600,000 | | | C | | Prudential Securities
Secured Financing Corp.,
6.649%, due 07/15/08 | | | 609,895 | | |
| | 1,173,479 | | | C | | RAAC Series, 5.250%,
due 09/25/34 | | | 1,159,708 | | |
| | 861,959 | | | C | | RAST 2006-A10 A5,
6.500%, due 09/25/36 | | | 867,273 | | |
Principal
Amount | | | | | | Value | |
| $ | 205,240 | | | +,C | | Sequoia Mortgage Trust,
5.620%, (step rate
5.860%), due 01/20/35 | | $ | 205,673 | | |
| | 6,734 | | | C | | Structured Adjustable Rate
Mortgage Loan Trust,
5.660%, due 07/25/35 | | | 6,765 | | |
| | 371,123 | | | +,C | | Structured Asset Mortgage
Investments, Inc.,
5.590%, (step rate
5.800%), due 04/19/35 | | | 371,939 | | |
| | 70,000 | | | C | | Wachovia Bank
Commercial Mortgage
Trust, 5.223%,
due 07/15/42 | | | 69,972 | | |
| | 347,905 | | | C | | Wachovia Bank
Commercial Mortgage
Trust, 5.726%,
due 06/15/45 | | | 351,239 | | |
| | 370,000 | | | C | | Wachovia Bank
Commercial Mortgage
Trust, 5.935%,
due 06/15/45 | | | 379,911 | | |
| | 324,706 | | | C | | Washington Mutual
Alternative Mortgage
Pass-Through
Certificates, 5.000%,
due 12/25/18 | | | 318,108 | | |
| | 3,834,986 | | | C | | Washington Mutual
Alternative Mortgage
Pass-Through
Certificates, 5.678%,
due 09/25/46 | | | 3,837,784 | | |
| | 89,326 | | | C | | Washington Mutual
Alternative Mortgage
Pass-Through
Certificates, 5.728%,
due 05/25/46 | | | 89,403 | | |
| | 735,288 | | | C | | Washington Mutual
Alternative Mortgage
Pass-Through
Certificates, 5.750%,
due 02/25/36 | | | 737,997 | | |
| | 784,000 | | | +,C | | Washington Mutual
Alternative Mortgage
Pass-Through
Certificates, 5.764%,
(step rate 6.264%),
due 10/25/36 | | | 778,296 | | |
| | 1,241,987 | | | C | | Washington Mutual
Alternative Mortgage
Pass-Through
Certificates, 6.000%,
due 07/25/36 | | | 1,242,321 | | |
| | 867,000 | | | +,C | | Washington Mutual
Alternative Mortgage
Pass-Through
Certificates, 6.081%,
(step rate 6.581%),
due 09/25/36 | | | 867,724 | | |
| | 213,027 | | | C | | Washington Mutual, Inc.,
5.600%, due 01/25/45 | | | 213,459 | | |
| | 940,351 | | | C | | Washington Mutual, Inc.,
5.638%, due 10/25/46 | | | 940,682 | | |
See Accompanying Notes to Financial Statements
76
PORTFOLIO OF INVESTMENTS
ING VP BALANCED PORTFOLIO AS OF DECEMBER 31, 2006 (CONTINUED)
Principal
Amount | | | | | | Value | |
| COLLATERALIZED MORTGAGE OBLIGATIONS (continued) | | | |
| $ | 649,802 | | | C | | Washington Mutual, Inc.,
5.660%, due 01/25/45 | | $ | 651,373 | | |
| | 120,921 | | | +,C | | Washington Mutual, Inc.,
5.795%, (step rate 6.160%),
due 06/25/44 | | | 121,411 | | |
| | 1,799,272 | | | C | | Washington Mutual, Inc.,
6.000%, due 06/25/34 | | | 1,799,836 | | |
| | 1,445,000 | | | C | | Wells Fargo
Mortgage-Backed
Securities Trust, 3.499%,
due 06/25/35 | | | 1,407,867 | | |
| | 1,059,000 | | | C | | Wells Fargo
Mortgage-Backed
Securities Trust, 4.109%,
due 06/25/35 | | | 1,035,143 | | |
| | 2,225,000 | | | C | | Wells Fargo
Mortgage-Backed
Securities Trust, 4.500%,
due 08/25/18 | | | 2,111,655 | | |
| | 2,667,538 | | | C | | Wells Fargo
Mortgage-Backed
Securities Trust, 5.387%,
due 08/25/35 | | | 2,632,318 | | |
| | 1,168,794 | | | C | | Wells Fargo
Mortgage-Backed
Securities Trust, 5.500%,
due 12/25/35 | | | 1,145,053 | | |
| | 1,750,314 | | | C | | Wells Fargo
Mortgage-Backed
Securities Trust, 5.500%,
due 01/25/36 | | | 1,712,026 | | |
| | 2,454,177 | | | C | | Wells Fargo
Mortgage-Backed
Securities Trust, 5.690%,
due 12/25/36 | | | 2,443,047 | | |
| | 2,799,998 | | | C | | Wells Fargo
Mortgage-Backed
Securities Trust, 5.989%,
due 10/25/36 | | | 2,806,116 | | |
| | 273,320 | | | C | | Wells Fargo
Mortgage-Backed
Securities Trust, 6.000%,
due 06/25/36 | | | 273,458 | | |
| | 1,885,694 | | | C | | Wells Fargo
Mortgage-Backed
Securities Trust, 6.001%,
due 11/25/36 | | | 1,889,814 | | |
| | | Total Collateralized
Mortgage Obligations
(Cost $106,521,344) | | | 105,942,008 | | |
| MUNICIPAL BONDS: 0.4% | | | |
| | | | | California: 0.1% | |
| | 900,000 | | | C | | City of San Diego, 7.125%,
due 06/01/32 | | | 927,981 | | |
| | | | 927,981 | | |
| | | | | Louisiana: 0.2% | |
| | 1,700,000 | | | #,C | | Tulane University of
Louisiana, 6.174%,
due 11/15/12 | | | 1,700,000 | | |
| | | | 1,700,000 | | |
Principal
Amount | | | | | | Value | |
| | | | | Michigan: 0.1% | |
| $ | 1,570,000 | | | | | Michigan Tobacco
Settlement Finance
Authority, 7.309%,
due 06/01/34 | | $ | 1,629,629 | | |
| | | | 1,629,629 | | |
| | | Total Municipal Bonds
(Cost $4,185,552) | | | 4,257,610 | | |
| OTHER BONDS: 0.3% | | | |
| | | | | Foreign Government Bonds: 0.3% | |
| ARS | 4,422,200 | | | @@ | | Argentina Bonos,
Discount Note,
due 09/30/14 | | | 1,592,111 | | |
| TRY | 2,945,000 | | | @@ | | Turkey Government
International Bond,
21.280%, due 08/13/08 | | | 1,523,209 | | |
| | | Total Other Bonds
(Cost $2,997,433) | | | 3,115,320 | | |
| | | Total Long-Term
Investments
(Cost $1,085,035,643) | | | 1,158,165,990 | | |
| SHORT-TERM INVESTMENTS: 14.3% | | | |
| | | | | Mutual Fund: 3.4% | |
| $ | 40,000,000 | | | ** | | ING Institutional Prime
Money Market Fund | | | 40,000,000 | | |
| | | Total Mutual Fund
(Cost $40,000,000) | | | 40,000,000 | | |
| | | Repurchase Agreement: 0.9% | |
| | 11,096,000 | | | Deutsche Bank Repurchase
Agreement dated 12/29/06,
5.250%, due 01/02/07,
$11,102,473 to be received
upon repurchase
(Collateralized by
$11,226,000 Federal
Home Loan Mortgage
Corporation, 5.125%,
Market Value plus
accrued interest
$11,318,653,
due 10/24/07 | | | 11,096,000 | | |
Total Repurchase Agreement
(Cost $11,096,000) | | | 11,096,000 | | |
| | | Securities Lending CollateralCC: 10.0% | |
| | 119,642,157 | | | The Bank of New York
Institutional Cash
Reserves Fund | | | 119,642,157 | | |
Total Securities Lending
Collateral (Cost
$119,642,157) | | | 119,642,157 | | |
Total Short-Term Investments
(Cost $170,738,157) | | | 170,738,157 | | |
Total Investments in
Securities (Cost
$1,255,773,800)* | | | 111.2 | % | | $ | 1,328,904,147 | | |
Other Assets and
Liabilities - Net | | | (11.2 | ) | | | (134,292,068 | ) | |
| Net Assets | | | 100.0 | % | | $ | 1,194,612,079 | | |
See Accompanying Notes to Financial Statements
77
PORTFOLIO OF INVESTMENTS
ING VP BALANCED PORTFOLIO AS OF DECEMBER 31, 2006 (CONTINUED)
@ Non-income producing security
@@ Foreign Issuer
STRIP Separate Trading of Registered Interest and Principal of Securities
MASTR Mortgage Asset Securitization Transaction, Inc.
+ Step-up basis bonds. Interest rates shown reflect current and future coupon rates.
# Securities with purchases pursuant to Rule 144A, under the Securities Act of 1933 and may not be resold subject to that rule except to qualified institutional buyers. These securities have been determined to be liquid under the guidelines established by the Funds' Board of Directors/Trustees.
C Bond may be called prior to maturity date.
P Preferred Stock may be called prior to convertible date.
cc Securities purchased with cash collateral for securities loaned.
W When-issued or delayed delivery security
I Illiquid security
L Loaned security, a portion or all of the security is on loan at December 31, 2006.
ARS Argentine Peso
JPY Japanese Yen
TRY Turkish Lira
** Investment in affiliate
* Cost for federal income tax purposes is $1,266,053,534.
Net unrealized appreciation consists of:
| Gross Unrealized Appreciation | | $ | 74,423,934 | | |
| Gross Unrealized Depreciation | | | (11,573,321 | ) | |
| Net Unrealized Appreciation | | $ | 62,850,613 | | |
ING VP Balanced Portfolio Credit Default Swap Agreements Outstanding on December 31, 2006:
| Counterparty | | Reference
Entity/Obligation | | Buy/Sell
Protection | | (Pay)/Receive
Fixed Rate | | Termination
Date | | Notional
Amount | | Unrealized
Appreciation/
(Depreciation) | |
Morgan Stanley
| |
| Capital Services Inc. | | Domtar Inc. 7.875% due 10/15/2011 | | Buy | | | (2.65 | )% | | 9/20/11 | | USD | 543,500 | | | $ | (23,687 | ) | |
| UBS AG | | Domtar Inc. 7.875% due 10/15/2011 | | Sell | | | 2.60 | % | | 9/20/11 | | USD | 542,000 | | | | 20,692 | | |
| Citibank N.A., New York Dow Jones CDX.NA.IG.6 Index | | (3-7% Tranche) | | Buy | | | (4.66)% | | | 6/20/16 | | | USD994,250 | | | | (42,232) | | |
| Citibank N.A., New York Dow Jones CDX.NA.IG.6 Index | | (7-10% Tranche) | | Sell | | | 1.0025% | | | 6/20/16 | | | USD2,952,000 | | | | 1,374 | | |
| Citibank N.A., New York | | Dow Jones CDX.NA.XO.7 Index | | Buy | | | (1.65)% | | | 12/20/11 | | | USD4,111,000 | | | | (10,675) | | |
| Citibank N.A., New York Entergy Corporation 7.75% | | due 12/15/2009 | | Sell | | | 0.38% | | | 12/20/11 | | | USD1,816,000 | | | | 4,128 | | |
| Citibank N.A., New York Glitnir Banki HF Floating Rate | | Note due 1/27/2010 | | Buy | | | (0.60)% | | | 9/20/11 | | | USD1,025,000 | | | | (11,681) | | |
| UBS AG Glitnir Banki HF Floating Rate | | Note due 1/27/2010 | | Buy | | | (0.61)% | | | 9/20/11 | | | USD1,025,000 | | | | (13,401) | | |
| Morgan Stanley Capital Services Inc. | | H.J. Heinz Co.6% due 3/15/2008 | | Buy | | | (0.35)% | | | 9/20/11 | | | USD3,075,000 | | | | (3,703) | | |
| Morgan Stanley Capital Services Inc. | | H.J. Heinz Co.6% due 3/15/2008 | | Buy | | | (0.41)% | | | 9/20/11 | | | USD3,587,500 | | | | (13,425) | | |
| Morgan Stanley Capital Services Inc. | | HCA Inc. LN Tranche Number: LN300285 | | Buy | | | (1.70)% | | | 12/20/11 | | | USD953,000 | | | | (19,442) | | |
| Barclays Bank PLC | | Kinder Morgan Inc. 6.5% due 9/1/2012 | | Sell | | | 1.70 | % | | 9/20/11 | | USD | 217,000 | | | | 4,968 | | |
| Merrill Lynch International | | Kinder Morgan Inc. 6.5% due 9/1/2012 | | Buy | | | (1.90)% | | | 9/20/11 | | | USD542,000 | | | | (17,407) | | |
| UBS AG | | Kinder Morgan Inc. 6.5% due 9/1/2012 | | Buy | | | (1.90 | )% | | 9/20/11 | | USD | 542,000 | | | | (18,104 | ) | |
| UBS AG Rogers Wireless Inc. 7.25% | | due 12/15/2012 | | Sell | | | 1.30% | | | 9/20/11 | | | USD1,121,000 | | | | 35,910 | | |
| UBS AG Russian Federation 5% Step | | due 3/31/2030 | | Sell | | | 0.31% | | | 8/20/07 | | | USD4,485,000 | | | | 8,531 | | |
| UBS AG Russian Federation 5% Step | | due 3/31/2030 | | Sell | | | 0.24% | | | 8/20/07 | | | USD2,104,000 | | | | 290 | | |
| Citibank N.A., New York | | Telus Corporation 8% due 6/1/2011 | | Sell | | | 0.45% | | | 12/20/11 | | | USD180,000 | | | | 412 | | |
| Goldman Sachs International | | Telus Corporation 8% due 6/1/2011 | | Sell | | | 0.47% | | | 12/20/11 | | | USD963,000 | | | | 4,094 | | |
| Citibank N.A., New York United States Steel Corporation 9.75% | | due 5/15/2010 | | Buy | | | (1.70)% | | | 12/20/16 | | | USD202,000 | | | | (2,284) | | |
| Citibank N.A., New York United States Steel Corporation 9.75% | | due 5/15/2010 | | Buy | | | (1.68)% | | | 12/20/16 | | | USD278,000 | | | | (2,739) | | |
| UBS AG | | XL Capital Ltd. 5.25% due 9/15/2014 | | Buy | | | (0.61 | )% | | 9/20/16 | | USD | 1,025,000 | | | | (22,944 | ) | |
| UBS AG | | XL Capital Ltd. 5.25% due 9/15/2014 | | Buy | | | (0.61 | )% | | 9/20/16 | | USD | 2,050,000 | | | | (45,888 | ) | |
| | | | | | | $ | (167,213 | ) | |
See Accompanying Notes to Financial Statements
78
PORTFOLIO OF INVESTMENTS
ING VP BALANCED PORTFOLIO AS OF DECEMBER 31, 2006
ING VP Balanced Portfolio Open Futures Contracts on December 31, 2006
| Contract Description | | Number
of Contracts | | Notional
Market Value ($) | | Expiration Date | | Unrealized
Appreciation/
(Depreciation) | |
| Long Contracts | |
| MidCap400 | | | 2 | | | | 811,300 | | | 3/15/07 | | $ | (10,501 | ) | |
| S&P 500 | | | 1 | | | | 357,100 | | | 3/15/07 | | | 776 | | |
| U.S. Treasury 2-Year Note | | | 380 | | | | 77,531,879 | | | 3/30/07 | | | (282,413 | ) | |
| U.S. Treasury 5-Year Note | | | 147 | | | | 15,444,188 | | | 3/30/07 | | | (195,056 | ) | |
| | | | | | | | | | | | | $ | (487,194 | ) | |
| Short Contracts | |
| 90-Day Eurodollar | | | 376 | | | | (88,999,200 | ) | | 3/19/07 | | $ | 22,282 | | |
| U.S. Treasury 10-Year Note | | | 76 | | | | (8,167,625 | ) | | 3/21/07 | | | 89,882 | | |
| U.S. Treasury Long Bond | | | 44 | | | | (4,903,250 | ) | | 3/21/07 | | | 87,238 | | |
| | | | | | | | | | | | | $ | 199,402 | | |
See Accompanying Notes to Financial Statements
79
PORTFOLIO OF INVESTMENTS
ING VP GROWTH AND INCOME PORTFOLIO AS OF DECEMBER 31, 2006
| Shares | | | | | | Value | |
| COMMON STOCK: 95.4% | | | |
| | | | | Agriculture: 2.6% | |
| | 931,350 | | | | | Altria Group, Inc. | | $ | 79,928,457 | | |
| | | | 79,928,457 | | |
| | | | | Apparel: 0.7% | |
| | 493,600 | | | @,L | | Coach, Inc. | | | 21,205,056 | | |
| | | | 21,205,056 | | |
| | | | | Banks: 7.3% | |
| | 1,450,700 | | | | | Bank of America Corp. | | | 77,452,873 | | |
| | 986,950 | | | | | Bank of New York Co., Inc. | | | 38,856,222 | | |
| | 424,350 | | | | | Capital One Financial Corp. | | | 32,598,567 | | |
| | 1,324,450 | | | | | US Bancorp. | | | 47,931,846 | | |
| | 853,100 | | | | | Wells Fargo & Co. | | | 30,336,236 | | |
| | | | 227,175,744 | | |
| | | | | Beverages: 1.1% | |
| | 538,805 | | | | | PepsiCo, Inc. | | | 33,702,253 | | |
| | | | 33,702,253 | | |
| | | | | Biotechnology: 0.8% | |
| | 381,900 | | | @ | | Genzyme Corp. | | | 23,517,402 | | |
| | | | 23,517,402 | | |
| | | | | Chemicals: 1.0% | |
| | 425,050 | | | | | Air Products & Chemicals, Inc. | | | 29,872,514 | | |
| | | | 29,872,514 | | |
| | | | | Computers: 3.6% | |
| | 112,500 | | | @,L | | CACI International, Inc. | | | 6,356,250 | | |
| | 1,134,700 | | | | | Hewlett-Packard Co. | | | 46,738,293 | | |
| | 274,300 | | | | | International Business
Machines Corp. | | | 26,648,245 | | |
| | 149,450 | | | @ | | Isilon Systems, Inc. | | | 4,124,820 | | |
| | 1,019,150 | | | @@,L | | Seagate Technology, Inc. | | | 27,007,475 | | |
| | | | 110,875,083 | | |
| | | | | Cosmetics/Personal Care: 2.3% | |
| | 1,104,896 | | | | | Procter & Gamble Co. | | | 71,011,666 | | |
| | | | 71,011,666 | | |
| | | | | | | Diversified Financial
Services: 8.1% | | | | | |
| | 1,582,300 | | | | | Citigroup, Inc. | | | 88,134,110 | | |
| | 983,506 | | | L | | Countrywide Financial Corp. | | | 41,749,830 | | |
| | 1,169,917 | | | @,L | | E*Trade Financial Corp. | | | 26,229,539 | | |
| | 90,100 | | | | | Franklin Resources, Inc. | | | 9,926,317 | | |
| | 47,700 | | | | | Goldman Sachs Group, Inc. | | | 9,508,995 | | |
| | 724,500 | | | | | JPMorgan Chase & Co. | | | 34,993,350 | | |
| | 342,700 | | | | | Merrill Lynch & Co., Inc. | | | 31,905,370 | | |
| | 643,000 | | | @,L | | TD Ameritrade Holding Corp. | | | 10,403,740 | | |
| | | | 252,851,251 | | |
| | | | | Electric: 1.3% | |
| | 1,803 | | | @ | | Dynegy, Inc. | | | 13,054 | | |
| | 1,305,777 | | | @,L | | Mirant Corp. | | | 41,223,380 | | |
| | | | 41,236,434 | | |
| | | | | | | Electrical Components &
Equipment: 1.7% | | | | | |
| | 763,800 | | | | | Emerson Electric Co. | | | 33,675,942 | | |
| | 433,500 | | | @,L | | General Cable Corp. | | | 18,948,285 | | |
| | | | 52,624,227 | | |
| Shares | | | | | | Value | |
| | | | | Electronics: 1.3% | |
| | 2,302,500 | | | @,@@,L | | Flextronics
International Ltd. | | $ | 26,432,700 | | |
| | 300,000 | | | @ | | Thomas & Betts Corp. | | | 14,184,000 | | |
| | | | 40,616,700 | | |
| | | | | | | Engineering &
Construction: 1.2% | | | | | |
| | 2,080,700 | | | @@,L | | ABB Ltd. ADR | | | 37,410,986 | | |
| | | | 37,410,986 | | |
| | | | | Entertainment: 1.5% | |
| | 673,400 | | | | | International Game
Technology | | | 31,111,080 | | |
| | 706,400 | | | L | | Regal Entertainment Group | | | 15,060,448 | | |
| | | | 46,171,528 | | |
| | | | | Healthcare-Products: 3.5% | |
| | 288,100 | | | | | Baxter International, Inc. | | | 13,364,959 | | |
| | 799,800 | | | | | Johnson & Johnson | | | 52,802,796 | | |
| | 1,169,600 | | | @ | | St. Jude Medical, Inc. | | | 42,760,576 | | |
| | | | 108,928,331 | | |
| | | | | Healthcare-Services: 0.8% | |
| | 553,500 | | | | | Aetna, Inc. | | | 23,900,130 | | |
| | | | 23,900,130 | | |
| | | | | Household Products/Wares: 0.9% | |
| | 452,600 | | | | | Clorox Co. | | | 29,034,290 | | |
| | | | 29,034,290 | | |
| | | | | Insurance: 6.0% | |
| | 1,006,800 | | | | | American International
Group, Inc. | | | 72,147,288 | | |
| | 758,400 | | | L | | AON Corp. | | | 26,801,856 | | |
| | 668,800 | | | L | | Metlife, Inc. | | | 39,465,888 | | |
| | 664,650 | | | | | St. Paul Travelers Cos., Inc. | | | 35,685,059 | | |
| | 293,250 | | | | | Stancorp Financial
Group, Inc. | | | 13,210,913 | | |
| | | | 187,311,004 | | |
| | | | | Internet: 1.0% | |
| | 65,200 | | | @ | | Google, Inc. | | | 30,023,296 | | |
| | | | 30,023,296 | | |
| | | | | Investment Companies: 2.6% | |
| | 2,276,583 | | | @,@@ | | KKR Private Equity
Investors LP | | | 52,019,922 | | |
| | 785,000 | | | L | | Utilities Select Sector SPDR | | | 28,825,200 | | |
| | | | 80,845,122 | | |
| | | | | Iron/Steel: 1.2% | |
| | 420,600 | | | | | Allegheny Technologies, Inc. | | | 38,140,008 | | |
| | | | 38,140,008 | | |
| | | | | Lodging: 0.3% | |
| | 210,900 | | | L | | Boyd Gaming Corp. | | | 9,555,879 | | |
| | | | 9,555,879 | | |
| | | | | Media: 2.3% | |
| | 2,398,200 | | | | | News Corp., Inc. | | | 51,513,336 | | |
| | 540,000 | | | | | Walt Disney Co. | | | 18,505,800 | | |
| | | | 70,019,136 | | |
See Accompanying Notes to Financial Statements
80
PORTFOLIO OF INVESTMENTS
ING VP GROWTH AND INCOME PORTFOLIO AS OF DECEMBER 31, 2006 (CONTINUED)
| Shares | | | | | | Value | |
| | | | | Metal Fabricate/Hardware: 0.8% | |
| | 328,400 | | | L | | Precision Castparts Corp. | | $ | 25,707,152 | | |
| | | | 25,707,152 | | |
| | | | | Mining: 1.2% | |
| | 388,600 | | | L | | Freeport-McMoRan
Copper & Gold, Inc. | | | 21,656,678 | | |
| | 73,900 | | | @@,L | | Rio Tinto PLC ADR | | | 15,703,011 | | |
| | | | 37,359,689 | | |
| | | | | Miscellaneous Manufacturing: 5.4% | |
| | 584,700 | | | | | Cooper Industries Ltd. | | | 52,874,421 | | |
| | 173,800 | | | L | | Dover Corp. | | | 8,519,676 | | |
| | 2,177,726 | | | | | General Electric Co. | | | 81,033,184 | | |
| | 498,100 | | | | | Roper Industries, Inc. | | | 25,024,544 | | |
| | | | 167,451,825 | | |
| | | | | Oil & Gas: 7.2% | |
| | 1,583,500 | | | | | ExxonMobil Corp. | | | 121,343,605 | | |
| | 832,250 | | | @ | | Newfield Exploration Co. | | | 38,241,888 | | |
| | 518,100 | | | @,L | | Plains Exploration &
Production Co. | | | 24,625,293 | | |
| | 795,600 | | | L | | Rowan Cos., Inc. | | | 26,413,920 | | |
| | 387,000 | | | @,L | | Southwestern Energy Co. | | | 13,564,350 | | |
| | | | 224,189,056 | | |
| | | | | Oil & Gas Services: 1.8% | |
| | 620,404 | | | L | | Schlumberger Ltd. | | | 39,184,717 | | |
| | 387,000 | | | @,L | | Weatherford
International Ltd. | | | 16,172,730 | | |
| | | | 55,357,447 | | |
| | | | | Pharmaceuticals: 7.1% | |
| | 846,850 | | | | | Abbott Laboratories | | | 41,250,064 | | |
| | 890,000 | | | | | Caremark Rx, Inc. | | | 50,827,900 | | |
| | 161,399 | | | @ | | Gilead Sciences, Inc. | | | 10,479,637 | | |
| | 722,940 | | | @,L | | Medco Health Solutions, Inc. | | | 38,633,914 | | |
| | 1,634,874 | | | | | Pfizer, Inc. | | | 42,343,237 | | |
| | 708,500 | | | | | Wyeth | | | 36,076,820 | | |
| | | | 219,611,572 | | |
| | | | | Retail: 4.6% | |
| | 577,700 | | | | | Best Buy Co., Inc. | | | 28,417,063 | | |
| | 1,371,700 | | | L | | CVS Corp. | | | 42,399,247 | | |
| | 452,600 | | | L | | Home Depot, Inc. | | | 18,176,416 | | |
| | 2,056,550 | | | L | | Staples, Inc. | | | 54,909,885 | | |
| | | | 143,902,611 | | |
| | | | | Semiconductors: 3.0% | |
| | 3,522,700 | | | | | Intel Corp. | | | 71,334,670 | | |
| | 1,904,586 | | | @@ | | Taiwan Semiconductor
Manufacturing Co.,
Ltd. ADR | | | 20,817,125 | | |
| | | | 92,151,795 | | |
| | | | | Software: 4.8% | |
| | 610,000 | | | @,L | | Activision, Inc. | | | 10,516,400 | | |
| | 506,550 | | | @@ | | Infosys Technologies
Ltd. ADR | | | 27,637,368 | | |
| | 3,760,532 | | | | | Microsoft Corp. | | | 112,289,486 | | |
| | | | 150,443,254 | | |
| Shares | | | | | | Value | |
| | | | | Telecommunications: 6.4% | |
| | 2,355,400 | | | L | | AT&T, Inc. | | $ | 84,205,550 | | |
| | 441,200 | | | @ | | Cisco Systems, Inc. | | | 12,057,996 | | |
| | 2,534,300 | | | | | Motorola, Inc. | | | 52,105,208 | | |
| | 750,900 | | | | | Qualcomm, Inc. | | | 28,376,511 | | |
| | 615,000 | | | | | Verizon Communications, Inc. | | | 22,902,600 | | |
| | | | 199,647,865 | | |
| | | Total Common Stock
(Cost $2,516,186,591) | | | 2,961,778,763 | | |
Principal
Amount | | Value | |
| SHORT-TERM INVESTMENTS: 15.1% | |
| | | | | Mutual Fund: 4.4% | |
| $ | 138,000,000 | | | ** | | ING Institutional Prime
Money Market Fund | | | 138,000,000 | | |
| | | Total Mutual Fund
(Cost $138,000,000) | | | 138,000,000 | | |
| | | Repurchase Agreement: 0.2% | |
| | 6,097,000 | | | Goldman Sachs Repurchase
Agreement dated 12/29/06,
5.220%, due 01/02/07,
$6,100,536 to be received
upon repurchase
(Collateralized by
$6,150,000 Federal Home
Loan Bank, 4.625%,
Market Value plus
accrued interest
$6,222,967,
due 02/08/08) | | | 6,097,000 | | |
Total Repurchase Agreement
(Cost $6,097,000) | | | 6,097,000 | | |
| | | Securities Lending Collateralcc: 10.5% | |
| | 324,265,437 | | | The Bank of New York
Institutional Cash
Reserves Fund | | | 324,265,437 | | |
| | | | 324,265,437 | | |
Total Securities Lending
Collateral (Cost
$324,265,437) | | | 324,265,437 | | |
Total Short-Term Investments
(Cost $468,362,437) | | | 468,362,437 | | |
Total Investments in
Securities (Cost
$2,984,549,028)* | | | 110.5 | % | | $ | 3,430,141,200 | | |
Other Assets and
Liabilities - Net | | | (10.5 | ) | | | (327,262,514 | ) | |
| Net Assets | | | 100.0 | % | | $ | 3,102,878,686 | | |
@ Non-income producing security
@@ Foreign Issuer
ADR American Depositary Receipt
cc Securities purchased with cash collateral for securities loaned.
L Loaned security, a portion or all of the security is on loan at December 31, 2006.
** Investment in affiliate
* Cost for federal income tax purposes is $2,996,224,939.
Net unrealized appreciation consists of:
| Gross Unrealized Appreciation | | $ | 453,040,494 | | |
| Gross Unrealized Depreciation | | | (19,124,233 | ) | |
| Net Unrealized Appreciation | | $ | 433,916,261 | | |
See Accompanying Notes to Financial Statements
81
PORTFOLIO OF INVESTMENTS
ING VP GROWTH AND INCOME PORTFOLIO AS OF DECEMBER 31, 2006 (CONTINUED)
ING VP Growth and Income Portfolio Open Futures Contracts on December 31, 2006
| Contract Description | | Number
of Contracts | | Notional
Market Value ($) | | Expiration Date | | Unrealized
Appreciation/
(Depreciation) | |
| Long Contracts | |
| S&P 500 | | | 230 | | | | 82,133,000 | | | 3/15/07 | | $ | 145,915 | | |
| | | | | | | | | $ | 145,915 | | |
ING VP Growth and Income Portfolio Written Options Outstanding on December 31, 2006:
| Description/Name of Issuer | | Exercise
Price | | Expiration
Date | | # of
Contracts | | Premium
Received | | Value | |
| European Style Call - Rowan Companies, Inc. | | $ | 40 | | | | 1/19/07 | | | | 150,000 | | | $ | 178,500 | | | $ | (4,200 | ) | |
| | | | | | | | | | | | | | | $ | 178,500 | | | $ | (4,200 | ) | |
See Accompanying Notes to Financial Statements
82
PORTFOLIO OF INVESTMENTS
ING VP GROWTH PORTFOLIO AS OF DECEMBER 31, 2006
| Shares | | | | | | Value | |
| COMMON STOCK: 98.8% | | | |
| | | | | Advertising: 1.0% | |
| | 18,400 | | | L | | Omnicom Group | | $ | 1,923,536 | | |
| | | | 1,923,536 | | |
| | | | | Aerospace/Defense: 1.8% | |
| | 22,600 | | | | | L-3 Communications
Holdings, Inc. | | | 1,848,228 | | |
| | 16,100 | | | | | Lockheed Martin Corp. | | | 1,482,327 | | |
| | | | 3,330,555 | | |
| | | | | Agriculture: 2.8% | |
| | 61,600 | | | | | Altria Group, Inc. | | | 5,286,512 | | |
| | | | 5,286,512 | | |
| | | | | Airlines: 1.9% | |
| | 28,900 | | | @,L | | AMR Corp. | | | 873,647 | | |
| | 21,300 | | | @,L | | Continental Airlines, Inc. | | | 878,625 | | |
| | 21,300 | | | @,L | | UAL Corp. | | | 937,200 | | |
| | 16,000 | | | @,L | | US Airways Group, Inc. | | | 861,600 | | |
| | | | 3,551,072 | | |
| | | | | Apparel: 2.0% | |
| | 87,100 | | | @,L | | Coach, Inc. | | | 3,741,816 | | |
| | | | 3,741,816 | | |
| | | | | Banks: 1.4% | |
| | 65,900 | | | | | Bank of New York Co., Inc. | | | 2,594,483 | | |
| | | | 2,594,483 | | |
| | | | | Beverages: 1.8% | |
| | 52,600 | | | | | PepsiCo, Inc. | | | 3,290,130 | | |
| | | | 3,290,130 | | |
| | | | | Chemicals: 1.9% | |
| | 68,740 | | | | | Monsanto Co. | | | 3,610,912 | | |
| | | | 3,610,912 | | |
| | | | | Commercial Services: 3.9% | |
| | 123,700 | | | @@ | | Accenture Ltd. | | | 4,568,241 | | |
| | 52,100 | | | | | McKesson Corp. | | | 2,641,470 | | |
| | | | 7,209,711 | | |
| | | | | Computers: 3.0% | |
| | 133,800 | | | | | Hewlett-Packard Co. | | | 5,511,222 | | |
| | | | 5,511,222 | | |
| | | | | Cosmetics/Personal Care: 2.0% | |
| | 59,065 | | | | | Procter & Gamble Co. | | | 3,796,108 | | |
| | | | 3,796,108 | | |
| | | | | Diversified Financial Services: 9.7% | |
| | 68,400 | | | | | American Express Co. | | | 4,149,828 | | |
| | 9,900 | | | | | Blackrock, Inc. | | | 1,503,810 | | |
| | 153,500 | | | | | Charles Schwab Corp. | | | 2,968,690 | | |
| | 87,400 | | | @ | | E*Trade Financial Corp. | | | 1,959,508 | | |
| | 18,600 | | | | | Goldman Sachs Group, Inc. | | | 3,707,910 | | |
| | 40,200 | | | | | Merrill Lynch & Co., Inc. | | | 3,742,620 | | |
| | | | 18,032,366 | | |
| | | | | Electronics: 0.8% | |
| | 32,100 | | | @ | | Thermo Electron Corp. | | | 1,453,809 | | |
| | | | 1,453,809 | | |
| | | | | Engineering & Construction: 1.1% | |
| | 40,600 | | | @ | | McDermott International, Inc. | | | 2,064,916 | | |
| | | | 2,064,916 | | |
| Shares | | | | | | Value | |
| | | | | Entertainment: 2.7% | |
| | 109,000 | | | L | | International Game
Technology | | $ | 5,035,800 | | |
| | | | 5,035,800 | | |
| | | | | Environmental Control: 1.2% | |
| | 62,600 | | | | | Waste Management, Inc. | | | 2,301,802 | | |
| | | | 2,301,802 | | |
| | | | | Healthcare-Products: 6.2% | |
| | 84,600 | | | | | Baxter International, Inc. | | | 3,924,594 | | |
| | 46,067 | | | @,L | | Gen-Probe, Inc. | | | 2,412,529 | | |
| | 70,700 | | | | | Medtronic, Inc. | | | 3,783,157 | | |
| | 18,300 | | | @ | | Zimmer Holdings, Inc. | | | 1,434,354 | | |
| | | | 11,554,634 | | |
| | | | | Healthcare-Services: 1.5% | |
| | 65,400 | | | | | Aetna, Inc. | | | 2,823,972 | | |
| | | | 2,823,972 | | |
| | | | | Home Furnishings: 1.6% | |
| | 29,100 | | | | | Harman International
Industries, Inc. | | | 2,907,381 | | |
| | | | 2,907,381 | | |
| | | | | Insurance: 1.0% | |
| | 27,000 | | | | | American International
Group, Inc. | | | 1,934,820 | | |
| | | | 1,934,820 | | |
| | | | | Internet: 4.9% | |
| | 37,900 | | | @,L | | Akamai Technologies, Inc. | | | 2,013,248 | | |
| | 11,100 | | | @,L | | Google, Inc. | | | 5,111,328 | | |
| | 88,000 | | | @ | | VeriSign, Inc. | | | 2,116,400 | | |
| | | | 9,240,976 | | |
| | | | | Media: 2.3% | |
| | 40,400 | | | | | McGraw-Hill Cos., Inc. | | | 2,748,008 | | |
| | 66,100 | | | L | | News Corp., Inc. | | | 1,471,386 | | |
| | | | 4,219,394 | | |
| | | | | Metal Fabricate/Hardware: 1.1% | |
| | 25,400 | | | | | Precision Castparts Corp. | | | 1,988,312 | | |
| | | | 1,988,312 | | |
| | | | | Miscellaneous Manufacturing: 3.8% | |
| | 63,794 | | | | | Danaher Corp. | | | 4,621,237 | | |
| | 49,100 | | | | | Roper Industries, Inc. | | | 2,466,784 | | |
| | | | 7,088,021 | | |
| | | | | Oil & Gas: 3.0% | |
| | 38,100 | | | | | ExxonMobil Corp. | | | 2,919,603 | | |
| | 58,800 | | | @ | | Newfield Exploration Co. | | | 2,701,860 | | |
| | | | 5,621,463 | | |
| | | | | Oil & Gas Services: 1.8% | |
| | 25,500 | | | @ | | Cameron International Corp. | | | 1,352,775 | | |
| | 31,400 | | | L | | Schlumberger Ltd. | | | 1,983,224 | | |
| | | | 3,335,999 | | |
| | | | | Pharmaceuticals: 9.6% | |
| | 72,100 | | | | | Abbott Laboratories | | | 3,511,991 | | |
| | 58,400 | | | | | Caremark Rx, Inc. | | | 3,335,224 | | |
| | 56,800 | | | @ | | Gilead Sciences, Inc. | | | 3,688,024 | | |
See Accompanying Notes to Financial Statements
83
PORTFOLIO OF INVESTMENTS
ING VP GROWTH PORTFOLIO AS OF DECEMBER 31, 2006 (CONTINUED)
| Shares | | | | | | Value | |
| | | | | Pharmaceuticals (continued) | |
| | 66,000 | | | @ | | Medco Health Solutions, Inc. | | $ | 3,527,040 | | |
| | 76,700 | | | | | Wyeth | | | 3,905,564 | | |
| | | | 17,967,843 | | |
| | | | | Retail: 2.8% | |
| | 57,100 | | | | | Best Buy Co., Inc. | | | 2,808,749 | | |
| | 54,600 | | | L | | McDonald's Corp. | | | 2,420,418 | | |
| | | | 5,229,167 | | |
| | | | | Semiconductors: 3.5% | |
| | 182,400 | | | | | Intel Corp. | | | 3,693,600 | | |
| | 79,200 | | | @,L | | Nvidia Corp. | | | 2,931,192 | | |
| | | | 6,624,792 | | |
| | | | | Software: 8.9% | |
| | 83,700 | | | @,L | | Activision, Inc. | | | 1,442,988 | | |
| | 69,500 | | | @,L | | Adobe Systems, Inc. | | | 2,857,840 | | |
| | 55,700 | | | @,L | | Intuit, Inc. | | | 1,699,407 | | |
| | 241,000 | | | | | Microsoft Corp. | | | 7,196,260 | | |
| | 198,800 | | | @ | | Oracle Corp. | | | 3,407,432 | | |
| | | | 16,603,927 | | |
| | | | | Telecommunications: 6.8% | |
| | 42,600 | | | | | AT&T, Inc. | | | 1,522,950 | | |
| | 317,100 | | | @ | | Cisco Systems, Inc. | | | 8,666,343 | | |
| | 39,300 | | | @,L | | NII Holdings, Inc. | | | 2,532,492 | | |
| | | | 12,721,785 | | |
| | | | | Toys/Games/Hobbies: 1.0% | |
| | 85,200 | | | | | Mattel, Inc. | | | 1,930,632 | | |
| | | | 1,930,632 | | |
Total Common Stock
(Cost $170,761,862) | | | 184,527,868 | | |
Principal
Amount | | | | | | Value | |
| SHORT-TERM INVESTMENTS: 16.2% | | | |
| | | | | Repurchase Agreement: 0.9% | |
| $ | 1,811,000 | | | | | Morgan Stanley Repurchase
Agreement dated 12/29/06,
5.250%, due 01/02/07,
$1,812,056 to be received
upon repurchase
(Collateralized by
$5,830,000 Resolution
Funding Corporation,
Discount Note, Market
Value $1,848,052,
due 04/15/30) | | | 1,811,000 | | |
| | | | | | | Total Repurchase Agreement
(Cost $1,811,000) | | | 1,811,000 | | |
Principal
Amount | | | | | | Value | |
| | | | | Securities Lending Collateralcc: 15.3% | |
| $ | 28,535,014 | | | | | The Bank of New York
Institutional Cash
Reserves Fund | | $28,535,014 | |
| | | | | | | Total Securities Lending
Collateral
(Cost $28,535,014) | | | 28,535,014 | | |
| | | | | | | Total Short-Term Investments
(Cost $30,346,014) | | | 30,346,014 | | |
| | | Total Investments in
Securities
(Cost $201,107,876)* | | | 115.0 | % | | $ | 214,873,882 | | |
| | | Other Assets and
Liabilities - Net | | (15.0) | | (28,104,532) | |
| | | | Net Assets | | | 100.0 | % | | $ | 186,769,350 | | |
@ Non-income producing security
@@ Foreign Issuer
cc Securities purchased with cash collateral for securities loaned.
L Loaned security, a portion or all of the security is on loan at December 31, 2006.
* Cost for federal income tax purposes is $201,248,396.
Net unrealized appreciation consists of:
| Gross Unrealized Appreciation | | $ | 15,101,286 | | |
| Gross Unrealized Depreciation | | | (1,475,800 | ) | |
| Net Unrealized Appreciation | | $ | 13,625,486 | | |
See Accompanying Notes to Financial Statements
84
PORTFOLIO OF INVESTMENTS
ING VP SMALL COMPANY PORTFOLIO AS OF DECEMBER 31, 2006
| Shares | | | | | | Value | |
| COMMON STOCK: 97.8% | | | |
| | | | | Aerospace/Defense: 2.7% | |
| | 72,300 | | | | | DRS Technologies, Inc. | | $ | 3,808,764 | | |
| | 92,900 | | | @ | | Moog, Inc. | | | 3,547,851 | | |
| | 135,650 | | | @ | | Teledyne Technologies, Inc. | | | 5,443,635 | | |
| | 46,700 | | | @,L | | TransDigm Group, Inc. | | | 1,238,017 | | |
| | | | 14,038,267 | | |
| | | | | Apparel: 2.6% | |
| | 87,200 | | | @,@@,L | | Gildan Activewear, Inc. | | | 4,066,136 | | |
| | 90,800 | | | | | Phillips-Van Heusen | | | 4,555,436 | | |
| | 128,900 | | | @,L | | Steven Madden Ltd. | | | 4,523,101 | | |
| | | | 13,144,673 | | |
| | | | | Banks: 4.5% | |
| | 502,000 | | | | | Bank Mutual Corp. | | | 6,079,220 | | |
| | 188,100 | | | L | | Citizens Banking Corp. | | | 4,984,650 | | |
| | 111,600 | | | | | Provident Bankshares Corp. | | | 3,972,960 | | |
| | 116,300 | | | @ | | Signature Bank | | | 3,602,974 | | |
| | 121,310 | | | | | UMB Financial Corp. | | | 4,429,028 | | |
| | | | 23,068,832 | | |
| | | | | Biotechnology: 0.9% | |
| | 69,900 | | | @,L | | Alexion Pharmaceuticals, Inc. | | | 2,823,261 | | |
| | 135,800 | | | @,L | | Human Genome Sciences, Inc. | | | 1,689,352 | | |
| | | | 4,512,613 | | |
| | | | | Building Materials: 1.2% | |
| | 223,100 | | | @,L | | Dayton Superior Corp. | | | 2,619,194 | | |
| | 14,900 | | | @,L | | Genlyte Group, Inc. | | | 1,163,839 | | |
| | 146,400 | | | @,L | | Goodman Global, Inc. | | | 2,518,080 | | |
| | | | 6,301,113 | | |
| | | | | Chemicals: 3.8% | |
| | 80,700 | | | | | Albemarle Corp. | | | 5,794,260 | | |
| | 174,282 | | | @ | | Innophos, Inc. | | | 2,558,460 | | |
| | 112,500 | | | L | | Olin Corp. | | | 1,858,500 | | |
| | 170,000 | | | @,L | | Terra Industries, Inc. | | | 2,036,600 | | |
| | 288,000 | | | L | | UAP Holding Corp. | | | 7,251,840 | | |
| | | | 19,499,660 | | |
| | | | | Commercial Services: 2.4% | |
| | 35,000 | | | @,L | | Advisory Board Co. | | | 1,873,900 | | |
| | 86,200 | | | L | | Arbitron, Inc. | | | 3,744,528 | | |
| | 188,398 | | | L | | Diamond Management &
Technology Consultants, Inc. | | | 2,343,671 | | |
| | 122,200 | | | @,L | | Exponent, Inc. | | | 2,280,252 | | |
| | 33,000 | | | @ | | Geo Group, Inc. | | | 1,238,160 | | |
| | 23,500 | | | @,L | | Huron Consulting Group, Inc. | | | 1,065,490 | | |
| | | | 12,546,001 | | |
| | | | | Computers: 4.1% | |
| | 46,500 | | | L | | Agilysys, Inc. | | | 778,410 | | |
| | 27,700 | | | @ | | CACI International, Inc. | | | 1,565,050 | | |
| | 179,300 | | | @,L | | Electronics for Imaging | | | 4,765,794 | | |
| | 115,400 | | | @,L | | Komag, Inc. | | | 4,371,352 | | |
| | 73,100 | | | @,L | | Micros Systems, Inc. | | | 3,852,370 | | |
| | 61,236 | | | L | | MTS Systems Corp. | | | 2,364,934 | | |
| | 232,200 | | | @,L | | Palm, Inc. | | | 3,271,698 | | |
| | | | 20,969,608 | | |
| | | | | Distribution/Wholesale: 1.1% | |
| | 247,760 | | | @,L | | Brightpoint, Inc. | | | 3,332,372 | | |
| | 71,000 | | | L | | Owens & Minor, Inc. | | | 2,220,170 | | |
| | | | 5,552,542 | | |
| Shares | | | | | | Value | |
| | | | | Diversified Financial Services: 1.9% | |
| | 106,934 | | | @,L | | CompuCredit Corp. | | $ | 4,257,043 | | |
| | 36,205 | | | @,L | | GFI Group, Inc. | | | 2,254,123 | | |
| | 76,400 | | | @ | | Investment Technology
Group, Inc. | | | 3,276,032 | | |
| | | | 9,787,198 | | |
| | | | | Electric: 1.3% | |
| | 166,800 | | | L | | ITC Holdings Corp. | | | 6,655,320 | | |
| | | | 6,655,320 | | |
| | | | | Electrical Components & Equipment: 0.4% | |
| | 67,050 | | | | | Ametek, Inc. | | | 2,134,872 | | |
| | | | 2,134,872 | | |
| | | | | Electronics: 3.7% | |
| | 140,000 | | | | | CTS Corp. | | | 2,198,000 | | |
| | 44,000 | | | @,L | | Cymer, Inc. | | | 1,933,800 | | |
| | 69,800 | | | @,L | | Itron, Inc. | | | 3,618,432 | | |
| | 222,200 | | | @,L | | Kemet Corp. | | | 1,622,060 | | |
| | 58,100 | | | @,L | | Plexus Corp. | | | 1,387,428 | | |
| | 90,700 | | | @ | | Thomas & Betts Corp. | | | 4,288,296 | | |
| | 86,800 | | | @ | | Varian, Inc. | | | 3,887,772 | | |
| | | | 18,935,788 | | |
| | | | | Engineering & Construction: 0.6% | |
| | 51,300 | | | | | Washington Group
International, Inc. | | | 3,067,227 | | |
| | | | 3,067,227 | | |
| | | | | Entertainment: 0.6% | |
| | 111,600 | | | @,L | | Macrovision Corp. | | | 3,153,816 | | |
| | | | 3,153,816 | | |
| | | | | Environmental Control: 0.7% | |
| | 101,500 | | | L | | Metal Management, Inc. | | | 3,841,775 | | |
| | | | 3,841,775 | | |
| | | | | Exchange Traded Fund: 0.5% | |
| | 34,500 | | | @@,L | | iShares Russell 2000 Index Fund | | | 2,694,105 | | |
| | | | 2,694,105 | | |
| | | | | Food: 1.1% | |
| | 100,800 | | | | | Corn Products International, Inc. | | | 3,481,632 | | |
| | 1,330 | | | | | Seaboard Corp. | | | 2,347,450 | | |
| | | | 5,829,082 | | |
| | | | | Gas: 1.6% | |
| | 105,000 | | | L | | New Jersey Resources Corp. | | | 5,100,900 | | |
| | 94,900 | | | | | WGL Holdings, Inc. | | | 3,091,842 | | |
| | | | 8,192,742 | | |
| | | | | Healthcare-Products: 2.5% | |
| | 78,200 | | | @,L | | Arthrocare Corp. | | | 3,121,744 | | |
| | 99,800 | | | @,L | | DJO, Inc. | | | 4,273,436 | | |
| | 40,200 | | | @ | | Haemonetics Corp. | | | 1,809,804 | | |
| | 26,500 | | | @,L | | Kyphon, Inc. | | | 1,070,600 | | |
| | 132,379 | | | @,L | | PSS World Medical, Inc. | | | 2,585,362 | | |
| | | | 12,860,946 | | |
| | | | | Healthcare-Services: 3.2% | |
| | 136,259 | | | @,L | | Amedisys, Inc. | | | 4,478,833 | | |
| | 96,300 | | | @,L | | Magellan Health Services, Inc. | | | 4,162,086 | | |
| | 148,100 | | | @,L | | Psychiatric Solutions, Inc. | | | 5,556,712 | | |
See Accompanying Notes to Financial Statements
85
PORTFOLIO OF INVESTMENTS
ING VP SMALL COMPANY PORTFOLIO AS OF DECEMBER 31, 2006 (CONTINUED)
| Shares | | | | | | Value | |
| | | | | Healthcare-Services (continued) | |
| | 56,600 | | | @,L | | Sierra Health Services, Inc. | | $ | 2,039,864 | | |
| | | | 16,237,495 | | |
| | | | | Household Products/Wares: 0.7% | |
| | 70,720 | | | @ | | Central Garden & Pet Co. | | | 3,424,262 | | |
| | | | 3,424,262 | | |
| | | | | Housewares: 1.2% | |
| | 129,500 | | | | | Toro Co. | | | 6,038,585 | | |
| | | | 6,038,585 | | |
| | | | | Insurance: 5.9% | |
| | 201,800 | | | L | | American Equity Investment
Life Holding Co. | | | 2,629,454 | | |
| | 183,436 | | | @@ | | Aspen Insurance Holdings Ltd. | | | 4,835,373 | | |
| | 150,598 | | | @ | | First Mercury Financial Corp. | | | 3,542,065 | | |
| | 87,400 | | | L | | Landamerica Financial Group, Inc. | | | 5,515,814 | | |
| | 85,100 | | | L | | Ohio Casualty Corp. | | | 2,536,831 | | |
| | 62,900 | | | | | PMI Group, Inc. | | | 2,966,993 | | |
| | 64,600 | | | | | Radian Group, Inc. | | | 3,482,586 | | |
| | 332,000 | | | @,@@ | | RAM Holdings Ltd. | | | 4,744,280 | | |
| | | | 30,253,396 | | |
| | | | | Internet: 0.7% | |
| | 141,500 | | | @,L | | Valueclick, Inc. | | | 3,343,645 | | |
| | | | 3,343,645 | | |
| | | | | Iron/Steel: 1.7% | |
| | 24,700 | | | | | Carpenter Technology Corp. | | | 2,532,244 | | |
| | 84,100 | | | L | | Cleveland-Cliffs, Inc. | | | 4,073,804 | | |
| | 82,200 | | | | | Gibraltar Industries, Inc. | | | 1,932,522 | | |
| | | | 8,538,570 | | |
| | | | | Leisure Time: 0.4% | |
| | 174,500 | | | @,L | | K2, Inc. | | | 2,301,655 | | |
| | | | 2,301,655 | | |
| | | | | Machinery-Diversified: 1.6% | |
| | 14,300 | | | @ | | Middleby Corp. | | | 1,496,781 | | |
| | 46,500 | | | | | Nordson Corp. | | | 2,317,095 | | |
| | 147,000 | | | L | | Wabtec Corp. | | | 4,465,860 | | |
| | | | 8,279,736 | | |
| | | | | Media: 0.6% | |
| | 167,500 | | | | | GateHouse Media, Inc. | | | 3,108,800 | | |
| | | | 3,108,800 | | |
| | | | | Metal Fabricate/Hardware: 0.9% | |
| | 182,500 | | | | | Commercial Metals Co. | | | 4,708,500 | | |
| | | | 4,708,500 | | |
| | | | | Mining: 0.4% | |
| | 37,400 | | | @@ | | Inmet Mining Corp. | | | 2,001,573 | | |
| | | | 2,001,573 | | |
| | | | | Miscellaneous Manufacturing: 0.6% | |
| | 152,900 | | | L | | Barnes Group, Inc. | | | 3,325,575 | | |
| | | | 3,325,575 | | |
| | | | | Oil & Gas: 3.3% | |
| | 126,100 | | | @,L | | Carrizo Oil & Gas, Inc. | | | 3,659,422 | | |
| | 165,300 | | | @,L | | Denbury Resources, Inc. | | | 4,593,687 | | |
| | 199,400 | | | @,L | | EXCO Resources, Inc. | | | 3,371,854 | | |
| | 31,000 | | | @ | | Giant Industries, Inc. | | | 2,323,450 | | |
| | 172,800 | | | @,L | | Parallel Petroleum Corp. | | | 3,036,096 | | |
| | | | 16,984,509 | | |
| Shares | | | | | | Value | |
| | | | | Oil & Gas Services: 4.8% | |
| | 53,000 | | | @,@@,L | | Core Laboratories NV | | $ | 4,293,000 | | |
| | 49,600 | | | @ | | FMC Technologies, Inc. | | | 3,056,848 | | |
| | 263,700 | | | @,L | | Global Industries Ltd. | | | 3,438,648 | | |
| | 71,100 | | | @,L | | Hydril | | | 5,346,009 | | |
| | 164,800 | | | @,@@,L | | North American Energy Partners | | | 2,682,944 | | |
| | 74,200 | | | @,L | | Oil States International, Inc. | | | 2,391,466 | | |
| | 107,500 | | | @,L | | Superior Energy Services | | | 3,513,100 | | |
| | | | 24,722,015 | | |
| | | | | Pharmaceuticals: 2.5% | |
| | 131,900 | | | @,L | | Alkermes, Inc. | | | 1,763,503 | | |
| | 150,900 | | | @,L | | BioMarin Pharmaceuticals, Inc. | | | 2,473,251 | | |
| | 87,500 | | | @,L | | Cubist Pharmaceuticals, Inc. | | | 1,584,625 | | |
| | 129,200 | | | @,L | | HealthExtras, Inc. | | | 3,113,720 | | |
| | 85,700 | | | @,L | | Sciele Pharma, Inc. | | | 2,056,800 | | |
| | 36,200 | | | @,L | | United Therapeutics Corp. | | | 1,968,194 | | |
| | | | 12,960,093 | | |
| | | | | Real Estate Investment Trusts: 4.4% | |
| | 16,300 | | | | | Alexandria Real Estate
Equities, Inc. | | | 1,636,520 | | |
| | 293,200 | | | | | American Financial Realty Trust | | | 3,354,208 | | |
| | 100,200 | | | | | BioMed Realty Trust, Inc. | | | 2,865,720 | | |
| | 244,100 | | | L | | DCT Industrial Trust, Inc. | | | 2,880,380 | | |
| | 181,200 | | | | | Innkeepers USA Trust | | | 2,808,600 | | |
| | 75,900 | | | | | Lexington Corporate
Properties Trust | | | 1,701,678 | | |
| | 147,181 | | | | | National Health Investors, Inc. | | | 4,856,973 | | |
| | 92,100 | | | L | | Nationwide Health
Properties, Inc. | | | 2,783,262 | | |
| | | | 22,887,341 | | |
| | | | | Retail: 6.0% | |
| | 188,200 | | | | | Casey's General Stores, Inc. | | | 4,432,110 | | |
| | 49,790 | | | | | Cash America International, Inc. | | | 2,335,151 | | |
| | 111,500 | | | | | Domino's Pizza, Inc. | | | 3,122,000 | | |
| | 129,100 | | | @,L | | Jos A Bank Clothiers, Inc. | | | 3,789,085 | | |
| | 62,900 | | | @,L | | Pantry, Inc. | | | 2,946,236 | | |
| | 104,300 | | | L | | Regis Corp. | | | 4,124,022 | | |
| | 132,500 | | | L | | Stage Stores, Inc. | | | 4,026,675 | | |
| | 67,400 | | | @,L | | Tractor Supply Co. | | | 3,013,454 | | |
| | 79,000 | | | @ | | Tween Brands, Inc. | | | 3,154,470 | | |
| | | | 30,943,203 | | |
| | | | | Savings & Loans: 4.7% | |
| | 218,600 | | | | | BankAtlantic Bancorp., Inc. | | | 3,018,866 | | |
| | 247,800 | | | L | | Brookline Bancorp., Inc. | | | 3,263,526 | | |
| | 248,803 | | | | | First Niagara Financial Group, Inc. | | | 3,697,213 | | |
| | 150,261 | | | | | Flagstar Bancorp., Inc. | | | 2,229,873 | | |
| | 346,900 | | | L | | NewAlliance Bancshares, Inc. | | | 5,689,160 | | |
| | 199,100 | | | | | Provident Financial Services, Inc. | | | 3,609,683 | | |
| | 38,400 | | | L | | WSFS Financial Corp. | | | 2,570,112 | | |
| | | | 24,078,433 | | |
| | | | | Semiconductors: 4.2% | |
| | 91,900 | | | @ | | Actel Corp. | | | 1,668,904 | | |
| | 487,300 | | | @,L | | Axcelis Technologies, Inc. | | | 2,840,959 | | |
| | 151,500 | | | @,@@,L | | Chartered Semiconductor
Manufacturing Ltd. | | | 1,265,025 | | |
| | 406,200 | | | @,L | | Entegris, Inc. | | | 4,395,084 | | |
| | 152,000 | | | @,L | | Fairchild Semiconductor
International, Inc. | | | 2,555,120 | | |
| | 100,100 | | | @,L | | Formfactor, Inc. | | | 3,728,725 | | |
| | 162,600 | | | @,L | | Micrel, Inc. | | | 1,752,828 | | |
See Accompanying Notes to Financial Statements
86
PORTFOLIO OF INVESTMENTS
ING VP SMALL COMPANY PORTFOLIO AS OF DECEMBER 31, 2006 (CONTINUED)
| Shares | | | | | | Value | |
| | | | | Semiconductors (continued) | |
| | 128,700 | | | @,L | | Microsemi Corp. | | $ | 2,528,955 | | |
| | 18,900 | | | @,L | | Varian Semiconductor
Equipment Associates, Inc. | | | 860,328 | | |
| | | | 21,595,928 | | |
| | | | | Software: 3.4% | |
| | 142,700 | | | @,L | | Ansys, Inc. | | | 6,206,023 | | |
| | 19,000 | | | L | | Computer Programs & Systems, Inc. | | | 645,810 | | |
| | 374,300 | | | @,L | | Informatica Corp. | | | 4,570,203 | | |
| | 76,500 | | | @,L | | Progress Software Corp. | | | 2,136,645 | | |
| | 116,750 | | | @,L | | THQ, Inc. | | | 3,796,710 | | |
| | | | 17,355,391 | | |
| | | | | Storage/Warehousing: 0.7% | |
| | 134,500 | | | @,L | | Mobile Mini, Inc. | | | 3,623,430 | | |
| | | | 3,623,430 | | |
| | | | | Telecommunications: 3.7% | |
| | 110,000 | | | L | | Adtran, Inc. | | | 2,497,000 | | |
| | 268,700 | | | | | Alaska Communications Systems
Group, Inc. | | | 4,081,553 | | |
| | 278,000 | | | @,L | | Arris Group, Inc. | | | 3,477,780 | | |
| | 71,000 | | | | | Otelco, Inc. | | | 1,513,720 | | |
| | 122,700 | | | @,L | | RCN Corp. | | | 3,699,405 | | |
| | 133,300 | | | @,L | | SBA Communications Corp. | | | 3,665,750 | | |
| | | | 18,935,208 | | |
| | | | | Textiles: 0.5% | |
| | 71,500 | | | | | G&K Services, Inc. | | | 2,780,635 | | |
| | | | 2,780,635 | | |
| | | | | Transportation: 1.3% | |
| | 57,500 | | | L | | Forward Air Corp. | | | 1,663,475 | | |
| | 181,800 | | | @ | | HUB Group, Inc. | | | 5,008,590 | | |
| | | | 6,672,065 | | |
| | | | | Trucking & Leasing: 2.2% | |
| | 114,400 | | | L | | GATX Corp. | | | 4,956,952 | | |
| | 213,400 | | | @@,L | | Genesis Lease, Ltd. ADR | | | 5,014,900 | | |
| | 45,200 | | | L | | Greenbrier Cos., Inc. | | | 1,356,000 | | |
| | | | 11,327,852 | | |
Total Common Stock
(Cost $440,930,584) | | | 503,214,075 | | |
Principal
Amount | | | | | | Value | |
| SHORT-TERM INVESTMENTS: 28.7% | |
| | | | | Mutual Fund: 2.9% | |
| $ | 15,000,000 | | | ** | | ING Institutional Prime
Money Market Fund | | $ | 15,000,000 | | |
Total Mutual Fund
(Cost $15,000,000) | | | 15,000,000 | | |
| | | | | Repurchase Agreement: 0.5% | |
| | 2,622,000 | | | | | Morgan Stanley Repurchase
Agreement dated 12/29/06,
5.250%, due 01/02/07,
$2,623,530 to be received
upon repurchase
(Collateralized by $8,440,000
Resolution Funding
Corporation, Discount Note,
Market Value $2,675,396,
due 04/15/30) | | | 2,622,000 | | |
| | | | | Total Repurchase Agreement
(Cost $2,622,000) | | | 2,622,000 | | |
| | | | | Securities Lending Collateralcc: 25.3% | |
| | 130,322,883 | | | | | The Bank of New York
Institutional Cash
Reserves Fund | | | 130,322,883 | | |
| | | | | Total Securities Lending
Collateral
(Cost $130,322,883) | | | 130,322,883 | | |
| | | | | Total Short-Term Investments
(Cost $147,944,883) | | | 147,944,883 | | |
Total Investments in
Securities
(Cost $588,875,467)* | | | 126.5 | % | | $ | 651,158,958 | | |
Other Assets and
Liabilities - Net | | | (26.5 | ) | | | (136,551,513 | ) | |
| Net Assets | | | 100.0 | % | | $ | 514,607,445 | | |
@ Non-income producing security
@@ Foreign Issuer
ADR American Depositary Receipt
cc Securities purchased with cash collateral for securities loaned.
L Loaned security, a portion or all of the security is on loan at December 31, 2006.
** Investment in affiliate
* Cost for federal income tax purposes is $589,288,223.
Net unrealized appreciation consists of:
| Gross Unrealized Appreciation | | $ | 68,943,168 | | |
| Gross Unrealized Depreciation | | | (7,072,433 | ) | |
| Net Unrealized Appreciation | | $ | 61,870,735 | | |
See Accompanying Notes to Financial Statements
87
PORTFOLIO OF INVESTMENTS
ING VP VALUE OPPORTUNITY PORTFOLIO AS OF DECEMBER 31, 2006
| Shares | | | | | | Value | |
| COMMON STOCK: 99.1% | | | |
| | | | | Aerospace/Defense: 1.7% | |
| | 11,800 | | | | | Boeing Co. | | $ | 1,048,312 | | |
| | 38,100 | | | | | United Technologies Corp. | | | 2,382,012 | | |
| | | | 3,430,324 | | |
| | | | | Agriculture: 4.1% | |
| | 63,000 | | | | | Altria Group, Inc. | | | 5,406,660 | | |
| | 44,000 | | | | | Loews Corp. | | | 2,847,680 | | |
| | | | 8,254,340 | | |
| | | | | Banks: 9.6% | |
| | 150,000 | | | | | Bank of America Corp. | | | 8,008,500 | | |
| | 102,600 | | | | | Bank of New York Co., Inc. | | | 4,039,362 | | |
| | 26,525 | | | | | Capital One Financial Corp. | | | 2,037,651 | | |
| | 150,000 | | | | | Wells Fargo & Co. | | | 5,334,000 | | |
| | | | 19,419,513 | | |
| | | | | Beverages: 2.0% | |
| | 43,700 | | | | | Coca-Cola Co. | | | 2,108,525 | | |
| | 26,000 | | | | | Molson Coors Brewing Co. | | | 1,987,440 | | |
| | | | 4,095,965 | | |
| | | | | Chemicals: 2.3% | |
| | 36,200 | | | | | Air Products & Chemicals, Inc. | | | 2,544,136 | | |
| | 31,100 | | | | | Ashland, Inc. | | | 2,151,498 | | |
| | | | 4,695,634 | | |
| | | | | Coal: 0.7% | |
| | 37,000 | | | L | | Peabody Energy Corp. | | | 1,495,170 | | |
| | | | 1,495,170 | | |
| | | | | Computers: 1.4% | |
| | 69,800 | | | | | Hewlett-Packard Co. | | | 2,875,062 | | |
| | | | 2,875,062 | | |
| | | | | Cosmetics/Personal Care: 3.1% | |
| | 96,700 | | | | | Procter & Gamble Co. | | | 6,214,909 | | |
| | | | 6,214,909 | | |
| | | | | Diversified Financial Services: 14.3% | |
| | 21,300 | | | @,L | | Affiliated Managers Group, Inc. | | | 2,239,269 | | |
| | 142,000 | | | | | Citigroup, Inc. | | | 7,909,400 | | |
| | 94,763 | | | @ | | E*Trade Financial Corp. | | | 2,124,586 | | |
| | 37,500 | | | L | | Freddie Mac | | | 2,546,250 | | |
| | 146,900 | | | | | JPMorgan Chase & Co. | | | 7,095,270 | | |
| | 46,000 | | | | | Merrill Lynch & Co., Inc. | | | 4,282,600 | | |
| | 32,500 | | | | | Morgan Stanley | | | 2,646,475 | | |
| | | | 28,843,850 | | |
| | | | | Electric: 3.7% | |
| | 1,016 | | | @ | | Dynegy, Inc. | | | 7,356 | | |
| | 143,600 | | | @,L | | Mirant Corp. | | | 4,533,452 | | |
| | 63,500 | | | | | PG&E Corp. | | | 3,005,455 | | |
| | | | 7,546,263 | | |
| | | | | Electrical Components & Equipment: 1.0% | |
| | 47,200 | | | @,L | | General Cable Corp. | | | 2,063,112 | | |
| | | | 2,063,112 | | |
| | | | | Electronics: 1.3% | |
| | 218,900 | | | @,@@ | | Flextronics International Ltd. | | | 2,512,972 | | |
| | | | 2,512,972 | | |
| Shares | | Value | |
| | | Engineering & Construction: 1.3% | |
| | 140,500 | | | @@ | | ABB Ltd. ADR | | $ | 2,526,190 | | |
| | | | 2,526,190 | | |
| | | | | Entertainment: 1.2% | |
| | 115,300 | | | L | | Regal Entertainment Group | | | 2,458,196 | | |
| | | | 2,458,196 | | |
| | | | | Food: 0.9% | |
| | 73,696 | | | @ | | Smithfield Foods, Inc. | | | 1,891,039 | | |
| | | | 1,891,039 | | |
| | | | | Gas: 1.3% | |
| | 45,900 | | | | | Sempra Energy | | | 2,572,236 | | |
| | | | 2,572,236 | | |
| | | | | Healthcare-Products: 0.8% | |
| | 24,700 | | | | | Johnson & Johnson | | | 1,630,694 | | |
| | | | 1,630,694 | | |
| | | | | Healthcare-Services: 1.1% | |
| | 49,300 | | | | | Aetna, Inc. | | | 2,128,774 | | |
| | | | 2,128,774 | | |
| | | | | Insurance: 8.5% | |
| | 57,300 | | | | | American International Group, Inc. | | | 4,106,118 | | |
| | 125,900 | | | @,L | | Conseco, Inc. | | | 2,515,482 | | |
| | 49,500 | | | | | Genworth Financial, Inc. | | | 1,693,395 | | |
| | 63,300 | | | L | | Metlife, Inc. | | | 3,735,333 | | |
| | 22,000 | | | | | Protective Life Corp. | | | 1,045,000 | | |
| | 46,200 | | | | | St. Paul Travelers Cos., Inc. | | | 2,480,478 | | |
| | 34,525 | | | | | Stancorp Financial Group, Inc. | | | 1,555,351 | | |
| | | | 17,131,157 | | |
| | | | | Iron/Steel: 0.6% | |
| | 12,500 | | | | | Allegheny Technologies, Inc. | | | 1,133,500 | | |
| | | | 1,133,500 | | |
| | | | | Lodging: 1.0% | |
| | 43,200 | | | L | | Boyd Gaming Corp. | | | 1,957,392 | | |
| | | | 1,957,392 | | |
| | | | | Media: 1.7% | |
| | 58,000 | | | L | | Time Warner, Inc. | | | 1,263,240 | | |
| | 61,600 | | | | | Walt Disney Co. | | | 2,111,032 | | |
| | | | 3,374,272 | | |
| | | | | Mining: 0.8% | |
| | 27,600 | | | L | | Freeport-McMoRan Copper &
Gold, Inc. | | | 1,538,148 | | |
| | | | 1,538,148 | | |
| | | | | Miscellaneous Manufacturing: 1.9% | |
| | 45,600 | | | | | Dover Corp. | | | 2,235,312 | | |
| | 43,100 | | | | | General Electric Co. | | | 1,603,751 | | |
| | | | 3,839,063 | | |
| | | | | Oil & Gas: 12.9% | |
| | 22,700 | | | | | Chevron Corp. | | | 1,669,131 | | |
| | 31,200 | | | | | ConocoPhillips | | | 2,244,840 | | |
| | 124,900 | | | L | | ExxonMobil Corp. | | | 9,571,087 | | |
| | 88,400 | | | @ | | Newfield Exploration Co. | | | 4,061,980 | | |
| | 76,300 | | | @,L | | Plains Exploration & Production Co. | | | 3,626,539 | | |
| | 87,900 | | | L | | Rowan Cos., Inc. | | | 2,918,280 | | |
| | 38,700 | | | | | Valero Energy Corp. | | | 1,979,892 | | |
| | | | 26,071,749 | | |
See Accompanying Notes to Financial Statements
88
PORTFOLIO OF INVESTMENTS
ING VP VALUE OPPORTUNITY PORTFOLIO AS OF DECEMBER 31, 2006 (CONTINUED)
| Shares | | | | | | Value | |
| | | | | Oil & Gas Services: 1.1% | |
| | 51,900 | | | @ | | Weatherford International Ltd. | | $ | 2,168,901 | | |
| | | | 2,168,901 | | |
| | | | | Pharmaceuticals: 5.4% | |
| | 41,495 | | | @ | | Medco Health Solutions, Inc. | | | 2,217,493 | | |
| | 248,900 | | | L | | Pfizer, Inc. | | | 6,446,510 | | |
| | 42,100 | | | | | Wyeth | | | 2,143,732 | | |
| | | | 10,807,735 | | |
| | | | | Real Estate Investment Trusts: 2.3% | |
| | 15,500 | | | L | | DCT Industrial Trust, Inc. | | | 182,900 | | |
| | 41,700 | | | L | | KKR Financial Corp. | | | 1,117,143 | | |
| | 37,000 | | | | | Liberty Property Trust | | | 1,818,180 | | |
| | 57,500 | | | | | Sunstone Hotel Investors, Inc. | | | 1,536,975 | | |
| | | | 4,655,198 | | |
| | | | | Retail: 1.1% | |
| | 48,700 | | | L | | McDonald's Corp. | | | 2,158,871 | | |
| | | | 2,158,871 | | |
| | | | | Savings & Loans: 1.4% | |
| | 209,600 | | | L | | Hudson City Bancorp., Inc. | | | 2,909,248 | | |
| | | | 2,909,248 | | |
| | | | | Telecommunications: 7.8% | |
| | 189,300 | | | | | AT&T, Inc. | | | 6,767,475 | | |
| | 176,300 | | | | | Motorola, Inc. | | | 3,624,728 | | |
| | 188,700 | | | @,L | | Qwest Communications
International, Inc. | | | 1,579,419 | | |
| | | | | | 111,400 | | | Sprint Nextel Corp. | | | 2,104,346 | | |
| | 42,700 | | | | | Verizon Communications, Inc. | | | 1,590,148 | | |
| | | | 15,666,116 | | |
| | | | | Transportation: 0.8% | |
| | 16,700 | | | | | Union Pacific Corp. | | | 1,536,734 | | |
| | | | 1,536,734 | | |
Total Common Stock
(Cost $170,287,669) | | | 199,602,327 | | |
Principal
Amount | | | | | | Value | |
| SHORT-TERM INVESTMENTS: 17.2% | | | |
| | | | | Repurchase Agreement: 1.0% | |
| $ | 2,084,000 | | | | | Morgan Stanley Repurchase
Agreement dated 12/29/06,
5.250%, due 01/02/07,
$2,085,216 to be received
upon repurchase
(Collateralized by $6,710,000
Resolution Funding
Corporation, Discount Note,
Market Value $2,127,003,
due 04/15/30) | | | 2,084,000 | | |
| | | | | | | Total Repurchase Agreement
(Cost $2,084,000) | | | 2,084,000 | | |
Principal
Amount | | Value | |
| | | Securities Lending Collateralcc: 16.2% | |
| | 32,518,880 | | | | | The Bank of New York
Institutional Cash
Reserves Fund | | $ | 32,518,880 | | |
| | | | | | | Total Securities Lending
Collateral
(Cost $32,518,880) | | | 32,518,880 | | |
| | | | | | | Total Short-Term Investments
(Cost $34,602,880) | | | 34,602,880 | | |
Total Investments in
Securities
(Cost $204,890,549)* | | | 116.3 | % | | $ | 234,205,207 | | |
Other Assets and
Liabilities - Net | | | (16.3 | ) | | | (32,799,154 | ) | |
| Net Assets | | | 100.0 | % | | $ | 201,406,053 | | |
@ Non-income producing security
@@ Foreign Issuer
ADR American Depositary Receipt
cc Securities purchased with cash collateral for securities loaned.
L Loaned security, a portion or all of the security is on loan at December 31, 2006.
* Cost for federal income tax purposes is $205,275,079.
Net unrealized appreciation consists of:
| Gross Unrealized Appreciation | | $ | 30,728,468 | | |
| Gross Unrealized Depreciation | | | (1,798,340 | ) | |
| Net Unrealized Appreciation | | $ | 28,930,128 | | |
See Accompanying Notes to Financial Statements
89
PORTFOLIO OF INVESTMENTS
ING VP INTERMEDIATE BOND PORTFOLIO AS OF DECEMBER 31, 2006
Principal
Amount | | | | | | Value | |
| CORPORATE BONDS/NOTES: 28.1% | | | |
| | | Airlines: 0.2% | |
| $ | 936,921 | | | C | | Continental Airlines, Inc.,
8.312%, due 04/02/11 | | $ | 942,191 | | |
| | 3,733,000 | | | | | United Airlines, Inc., 6.932%,
due 09/01/11 | | | 4,201,958 | | |
| | | | 5,144,149 | | |
| | | Auto Manufacturers: 0.2% | |
| | 244,000 | | | L | | Ford Motor Co., 7.450%,
due 07/16/31 | | | 192,760 | | |
| | 3,027,000 | | | | | General Motors Corp.,
7.400%, due 09/01/25 | | | 2,572,950 | | |
| | 1,012,000 | | | C,L | | General Motors Corp.,
8.375%, due 07/15/33 | | | 941,160 | | |
| | | | 3,706,870 | | |
| | | Banks: 6.2% | |
| | 6,260,000 | | | @@,C | | Australia & New Zealand
Banking Group Ltd.,
5.556%, due 10/29/49 | | | 5,450,313 | | |
| | 1,914,786 | | | @@,# | | Banco Itau SA, 5.739%,
due 09/20/08 | | | 1,918,252 | | |
| | 4,844,000 | | | @@,#,C | | Banco Mercantil del Norte
SA, 6.135%, due 10/13/16 | | | 4,869,843 | | |
| | 3,700,000 | | | @@,L | | Banco Santander Chile SA,
7.375%, due 07/18/12 | | | 4,050,379 | | |
| | 2,100,000 | | | @@,C | | Bank of Ireland, 5.625%,
due 12/29/49 | | | 1,828,930 | | |
| | 2,330,000 | | | @@,C | | Bank of Nova Scotia, 5.625%,
due 08/21/85 | | | 1,977,932 | | |
| | 1,110,000 | | | | | Bank of Scotland, 5.563%,
due 11/30/49 | | | 955,243 | | |
| | 379,000 | | | C | | BankAmerica Capital II, 8.000%,
due 12/15/26 | | | 394,584 | | |
| | 1,580,000 | | | @@,C | | Barclays Bank PLC, 5.750%,
due 12/31/49 | | | 1,382,067 | | |
| | 4,870,000 | | | @@,C,L | | BNP Paribas, 5.445%,
due 09/29/49 | | | 4,176,648 | | |
| | 6,464,000 | | | @@,#,C | | Chuo Mitsui Trust & Banking
Co., Ltd., 5.506%, due 04/15/49 | | | 6,184,083 | | |
| | 2,218,000 | | �� | @@,#,C | | Danske Bank A/S, 5.914%,
due 12/29/49 | | | 2,231,863 | | |
| | 3,080,000 | | | @@,C,L | | Den Norske Bank ASA, 5.563%,
due 08/29/49 | | | 2,618,000 | | |
| | 510,000 | | | @@,C | | Den Norske Bank ASA, 5.625%,
due 11/29/49 | | | 440,879 | | |
| | 4,805,000 | | | #,C | | Dresdner Funding Trust I,
8.151%, due 06/30/31 | | | 5,804,325 | | |
| | 1,669,000 | | | #,C | | First Chicago NBD Institutional
Capital A, 7.950%,
due 12/01/26 | | | 1,737,045 | | |
| | 2,000 | | | C | | Fleet Capital Trust II, 7.920%,
due 12/11/26 | | | 2,080 | | |
| | 8,656,000 | | | @@,#,C,L | | HBOS PLC, 5.375%, due 11/29/49 | | | 8,536,123 | | |
| | 3,970,000 | | | @@,C | | Hongkong & Shanghai Banking
Corp., Ltd., 5.563%,
due 07/01/49 | | | 3,353,320 | | |
| | 6,650,000 | | | @@,C | | HSBC Bank PLC, 5.475%,
due 06/29/49 | | | 5,652,500 | | |
| | 5,300,000 | | | @@,C | | HSBC Bank PLC, 5.688%,
due 06/29/49 | | | 4,597,750 | | |
| | 5,240,000 | | | @@,C | | Lloyds TSB Bank PLC, 5.560%,
due 08/29/49 | | | 4,523,619 | | |
Principal
Amount | | | | | | Value | |
| $ | 510,000 | | | @@,C,L | | Lloyds TSB Bank PLC, 5.563%,
due 11/29/49 | | $ | 443,865 | | |
| | 3,330,000 | | | @@,C | | Lloyds TSB Group PLC, 5.625%,
due 06/29/49 | | | 2,929,901 | | |
| | 126,000 | | | C | | M&I Capital Trust A, 7.650%,
due 12/01/26 | | | 130,427 | | |
| | 3,490,000 | | | C | | Mellon Capital I, 7.720%,
due 12/01/26 | | | 3,633,858 | | |
| | 4,640,000 | | | @@,C,L | | Mizuho Financial Group
Cayman Ltd., 8.375%,
due 12/31/49 | | | 4,904,689 | | |
| | 2,530,000 | | | @@,C,L | | National Australia Bank Ltd.,
5.556%, due 10/29/49 | | | 2,196,126 | | |
| | 710,000 | | | @@,C | | National Westminster Bank PLC,
5.500%, due 11/29/49 | | | 608,884 | | |
| | 1,140,000 | | | @@,C,L | | National Westminster Bank PLC,
5.688%, due 08/29/49 | | | 985,266 | | |
| | 4,329,000 | | | #,C | | Rabobank Capital Funding II,
5.260%, due 12/29/49 | | | 4,239,623 | | |
| | 3,667,000 | | | #,C,L | | Rabobank Capital Funding Trust,
5.254%, due 12/31/49 | | | 3,542,212 | | |
| | 3,567,000 | | | C,L | | RBS Capital Trust I, 5.512%,
due 09/30/49 | | | 3,531,102 | | |
| | 6,338,000 | | | @@,#,C | | Resona Bank Ltd., 5.850%,
due 09/29/49 | | | 6,199,699 | | |
| | 9,870,000 | | | @@,C,L | | Royal Bank of Scotland Group
PLC, 5.563%, due 12/29/49 | | | 8,468,855 | | |
| | 2,250,000 | | | @@,C | | Societe Generale, 5.438%,
due 11/29/49 | | | 1,944,335 | | |
| | 7,140,000 | | | @@,C,L | | Standard Chartered PLC,
5.500%, due 07/29/49 | | | 5,908,350 | | |
| | 2,350,000 | | | @@,C | | Standard Chartered PLC,
5.525%, due 12/29/49 | | | 1,956,375 | | |
| | 11,400,000 | | | @@,C,L | | Standard Chartered PLC,
5.625%, due 11/29/49 | | | 9,576,000 | | |
| | 1,150,000 | | | @@,C,L | | Standard Chartered PLC,
5.730%, due 01/29/49 | | | 951,625 | | |
| | 5,987,000 | | | @@,C | | Sumitomo Mitsui Banking
Corp., 8.150%, due 08/01/49 | | | 6,210,638 | | |
| | 3,119,000 | | | C | | Wachovia Capital Trust III,
5.800%, due 12/31/49 | | | 3,147,645 | | |
| | 2,470,000 | | | @@,C | | Westpac Banking Corp.,
5.525%, due 09/30/49 | | | 2,113,920 | | |
| | 2,498,000 | | | #,C | | Westpac Capital Trust IV,
5.256%, due 12/29/49 | | | 2,378,431 | | |
| | 8,124,000 | | | @@,#,C,L | | Woori Bank, 6.125%,
due 05/03/16 | | | 8,303,898 | | |
| | | | 156,991,502 | | |
| | | Beverages: 0.2% | |
| | 4,142,000 | | | @@ | | Cia Brasileira de Bebidas,
8.750%, due 09/15/13 | | | 4,846,140 | | |
| | | | 4,846,140 | | |
| | | Chemicals: 0.7% | |
| | 3,655,000 | | | C | | Lyondell Chemical Co.,
8.000%, due 09/15/14 | | | 3,810,338 | | |
| | 2,011,000 | | | C,L | | Lyondell Chemical Co.,
8.250%, due 09/15/16 | | | 2,121,605 | | |
| | 1,410,000 | | | | | Stauffer Chemical, 5.620%,
due 04/15/10 | | | 1,178,097 | | |
| | 2,420,000 | | | | | Stauffer Chemical, 5.890%,
due 04/15/18 | | | 1,268,056 | | |
See Accompanying Notes to Financial Statements
90
PORTFOLIO OF INVESTMENTS
ING VP INTERMEDIATE BOND PORTFOLIO AS OF DECEMBER 31, 2006 (CONTINUED)
Principal
Amount | | | | | | Value | |
| | | Chemicals (continued) | |
| $ | 2,970,000 | | | | | Stauffer Chemical, 7.670%,
due 04/15/17 | | $ | 1,649,657 | | |
| | 8,105,000 | | | L | | Union Carbide Corp., 7.750%,
due 10/01/96 | | | 8,509,739 | | |
| | | | 18,537,492 | | |
| | | Diversified Financial Services: 7.5% | |
| | 8,532,000 | | | @@,#,C,L | | Aiful Corp., 4.450%,
due 02/16/10 | | | 8,189,150 | | |
| | 1,006,000 | | | @@,#,I | | Alpine III, 5.925%, due 08/16/14 | | | 1,008,867 | | |
| | 1,006,000 | | | @@,#,I | | Alpine III, 6.325%, due 08/16/14 | | | 1,009,492 | | |
| | 1,507,000 | | | @@,#,I | | Alpine III, 8.125%, due 08/16/14 | | | 1,516,689 | | |
| | 2,576,000 | | | @@,#,I | | Alpine III, 11.375%,
due 08/16/14 | | | 2,643,605 | | |
| | 6,184,395 | | | # | | Astoria Depositor Corp.,
7.902%, due 05/01/21 | | | 6,475,896 | | |
| | 17,659,000 | | | # | | Astoria Depositor Corp.,
8.144%, due 05/01/21 | | | 19,306,496 | | |
| | 3,907,538 | | | @@,# | | Brazilian Merchant Voucher
Receivables Ltd., 5.911%,
due 06/15/11 | | | 3,848,925 | | |
| | 3,293,000 | | | C | | Citigroup Capital II, 7.750%,
due 12/01/36 | | | 3,405,090 | | |
| | 4,546,000 | | | #,C | | Corestates Capital Trust I,
8.000%, due 12/15/26 | | | 4,734,204 | | |
| | 6,814,000 | | | @@ | | Eksportfinans A/S, 5.125%,
due 10/26/11 | | | 6,829,590 | | |
| | 2,650,000 | | | @@,C | | Financiere CSFB NV, 5.485%,
due 03/29/49 | | | 2,272,375 | | |
| | 6,285,000 | | | | | Ford Motor Credit Co.,
0.000%, due 11/29/13 | | | 6,305,143 | | |
| | 8,121,000 | | | | | Ford Motor Credit Co.,
8.000%, due 12/15/16 | | | 8,038,320 | | |
| | 3,322,000 | | | | | Ford Motor Credit Co.,
8.110%, due 01/13/12 | | | 3,295,872 | | |
| | 6,714,000 | | | | | Ford Motor Credit Co.,
9.824%, due 04/15/12 | | | 7,123,930 | | |
| | 382,000 | | | | | Ford Motor Credit Co.,
9.875%, due 08/10/11 | | | 408,936 | | |
| | 5,542,000 | | | C | | Fund American Cos., Inc.,
5.875%, due 05/15/13 | | | 5,516,113 | | |
| | 8,442,000 | | | | | General Motors Acceptance
Corp., 7.250%, due 03/02/11 | | | 8,786,957 | | |
| | 3,907,000 | | | #,C | | HVB Funding Trust III, 9.000%,
due 10/22/31 | | | 5,095,529 | | |
| | 2,586,000 | | | C | | JPM Capital Trust I, 7.540%,
due 01/15/27 | | | 2,683,112 | | |
| | 2,866,000 | | | C | | JPM Capital Trust II, 7.950%,
due 02/01/27 | | | 2,982,500 | | |
| | 8,159,000 | | | #,C | | Mangrove Bay Pass-Through
Trust, 6.102%, due 07/15/33 | | | 7,984,340 | | |
| | 6,907,000 | | | @@,# | | Mantis Reef Ltd., 4.799%,
due 11/03/09 | | | 6,740,956 | | |
| | 5,401,000 | | | @@,C | | MUFG Capital Finance 1 Ltd.,
6.346%, due 12/31/49 | | | 5,491,164 | | |
| | 2,560,000 | | | @@,C | | Paribas, 5.500%, due 12/31/49 | | | 2,208,571 | | |
| | 1,505,778 | | | @@,#,C | | Petroleum Export Ltd., 4.623%,
due 06/15/10 | | | 1,482,819 | | |
| | 2,646,695 | | | @@,#,C | | Petroleum Export Ltd., 5.265%,
due 06/15/11 | | | 2,577,132 | | |
| | 5,437,057 | | | @@,#,C | | PF Export Receivables Master
Trust, 6.436%, due 06/01/15 | | | 5,549,197 | | |
Principal
Amount | | | | | | Value | |
| $ | 9,535,000 | | | #,C | | Piper Jaffray Equipment Trust
Securities, 6.000%,
due 09/10/11 | | $ | 9,296,625 | | |
| | 7,332,930 | | | #,C | | Piper Jaffray Equipment Trust
Securities, 6.750%,
due 04/01/11 | | | 7,296,265 | | |
| | 8,607,000 | | | C | | Southern Star Central Corp.,
6.750%, due 03/01/16 | | | 8,628,518 | | |
| | 7,223,000 | | | @@,# | | TNK-BP Finance SA, 7.500%,
due 07/18/16 | | | 7,701,524 | | |
| | 32,419,496 | | | # | | Toll Road Investors
Partnership II LP,
17.590%, due 02/15/45 | | | 4,154,656 | | |
| | 2,681,000 | | | #,C | | Twin Reefs Pass-Through Trust,
6.350%, due 12/10/49 | | | 2,686,099 | | |
| | 5,086,000 | | | @@,C,L | | UFJ Finance Aruba AEC, 8.750%,
due 12/31/49 | | | 5,370,399 | | |
| | 2,105,000 | | | #,C | | Wachovia Capital Trust V,
7.965%, due 06/01/27 | | | 2,203,333 | | |
| | | | 190,848,389 | | |
| | | Electric: 3.6% | |
| | 4,151,000 | | | @@,#,I,L | | Abu Dhabi National Energy
Co., 6.500%, due 10/27/36 | | | 4,295,774 | | |
| | 3,654,000 | | | #,C | | Baltimore Gas & Electric,
6.350%, due 10/01/36 | | | 3,742,664 | | |
| | 8,139,033 | | | C | | CE Generation, LLC, 7.416%,
due 12/15/18 | | | 8,526,028 | | |
| | 4,024,000 | | | C | | Cleveland Electric Illum,
5.950%, due 12/15/36 | | | 3,850,783 | | |
| | 8,581,000 | | | C,L | | Commonwealth Edison Co.,
6.950%, due 07/15/18 | | | 8,867,425 | | |
| | 1,081,000 | | | @@ | | Empresa Nacional de
Electricidad SA, 7.325%,
due 02/01/37 | | | 1,177,548 | | |
| | 7,680,000 | | | @@,L | | Empresa Nacional de
Electricidad SA, 8.625%,
due 08/01/15 | | | 9,055,864 | | |
| | 5,367,000 | | | C | | FirstEnergy Corp., 6.450%,
due 11/15/11 | | | 5,602,579 | | |
| | 4,971,000 | | | #,C | | ITC Holdings Corp., 5.875%,
due 09/30/16 | | | 4,942,123 | | |
| | 1,537,000 | | | #,C | | ITC Holdings Corp., 6.375%,
due 09/30/36 | | | 1,537,828 | | |
| | 1,657,649 | | | #,C | | Juniper Generation, LLC,
6.790%, due 12/31/14 | | | 1,606,348 | | |
| | 5,310,000 | | | C | | Nevada Power Co., 5.950%,
due 03/15/16 | | | 5,325,595 | | |
| | 8,066,000 | | | C | | NorthWestern Corp., 5.875%,
due 11/01/14 | | | 7,937,404 | | |
| | 3,302,000 | | | #,C | | Potomac Edison Co., 5.800%,
due 10/15/16 | | | 3,318,051 | | |
| | 1,403,409 | | | # | | Power Contract Financing, LLC,
6.256%, due 02/01/10 | | | 1,411,498 | | |
| | 637,604 | | | | | PPL Montana, LLC, 8.903%,
due 07/02/20 | | | 703,682 | | |
| | 5,185,000 | | | C | | Sierra Pacific Power Co.,
6.000%, due 05/15/16 | | | 5,222,239 | | |
| | 880,000 | | | C | | Sierra Pacific Power Co.,
6.250%, due 04/15/12 | | | 897,938 | | |
| | 4,929,000 | | | C | | Southern Co. CAP Trust I,
8.190%, due 02/01/37 | | | 5,140,612 | | |
| | 5,208,000 | | | C | | Southern Power Co., 6.375%,
due 11/15/36 | | | 5,115,412 | | |
See Accompanying Notes to Financial Statements
91
PORTFOLIO OF INVESTMENTS
ING VP INTERMEDIATE BOND PORTFOLIO AS OF DECEMBER 31, 2006 (CONTINUED)
Principal
Amount | | | | | | Value | |
| | | Electric (continued) | |
| $ | 3,004,000 | | | C | | Toledo Edison Co., 6.150%,
due 05/15/37 | | $ | 2,967,096 | | |
| | | | 91,244,491 | | |
| | | Energy-Alternate Sources: 0.2% | |
| | 4,074,231 | | | | | Salton Sea Funding Corp.,
7.840%, due 05/30/10 | | | 4,198,413 | | |
| | | | 4,198,413 | | |
| | | Food: 1.0% | |
| | 23,045,000 | | | C | | Heinz Finance Co., 6.625%,
due 07/15/11 | | | 23,992,173 | | |
| | | | 23,992,173 | | |
| | | Gas: 0.4% | |
| | 6,669,000 | | | @@,#,C,L | | Nakilat, Inc., 6.067%,
due 12/31/33 | | | 6,640,390 | | |
| | 3,547,000 | | | @@,#,C | | Nakilat, Inc., 6.267%,
due 12/31/33 | | | 3,525,636 | | |
| | | | 10,166,026 | | |
| | | Healthcare-Products: 0.1% | |
| | 3,533,000 | | | C | | Boston Scientific Corp.,
7.000%, due 11/15/35 | | | 3,530,403 | | |
| | | | 3,530,403 | | |
| | | Home Builders: 0.2% | |
| | 4,313,000 | | | L | | D.R. Horton, Inc., 5.625%,
due 09/15/14 | | | 4,172,250 | | |
| | | | 4,172,250 | | |
| | | Insurance: 0.4% | |
| | 7,282,000 | | | @@,C,L | | Aegon NV, 5.413%,
due 12/31/49 | | | 6,262,520 | | |
| | 3,142,000 | | | C | | Metlife, Inc., 6.400%,
due 12/15/36 | | | 3,166,995 | | |
| | 1,741,000 | | | #,C,L | | North Front Pass-Through
Trust, 5.810%, due 12/15/24 | | | 1,716,706 | | |
| | | | 11,146,221 | | |
| | | Media: 0.4% | |
| | 1,666,000 | | | C | | CBS Corp., 5.500%,
due 05/15/33 | | | 1,387,998 | | |
| | 9,090,000 | | | #,C,L | | Charter Communications
Operating, LLC, 8.375%,
due 04/30/14 | | | 9,533,138 | | |
| | | | 10,921,136 | | |
| | | Mining: 0.3% | |
| | 8,015,000 | | | C | | Southern Copper Corp.,
7.500%, due 07/27/35 | | | 8,730,635 | | |
| | | | 8,730,635 | | |
| | | Multi-National: 0.2% | |
| | 4,246,000 | | | @@ | | Corp. Andina de Fomento CAF,
5.125%, due 05/05/15 | | | 4,094,206 | | |
| | | | 4,094,206 | | |
| | | Oil & Gas: 2.1% | |
| | 2,475,000 | | | @@,# | | EMP Nacional Del Petrole,
4.875%, due 03/15/14 | | | 2,354,534 | | |
| | 1,588,000 | | | @@,# | | Empresa Nacional de Petroleo
ENAP, 6.750%, due 11/15/12 | | | 1,675,280 | | |
Principal
Amount | | | | | | Value | |
| $ | 7,392,000 | | | @@,# | | Gaz Capital SA, 6.212%,
due 11/22/16 | | $ | 7,462,224 | | |
| | 4,000,000 | | | | | Greater Ohio Ethanol, LLC,
0.000%, due 12/31/13 | | | 3,985,000 | | |
| | 4,900,000 | | | | | Greater Ohio Ethanol, LLC,
12.630%, due 12/31/13 | | | 4,910,721 | | |
| | 5,677,000 | | | C | | Hess Corp., 7.300%,
due 08/15/31 | | | 6,354,891 | | |
| | 4,129,000 | | | C,L | | Pemex Project Funding Master
Trust, 6.625%, due 06/15/35 | | | 4,229,128 | | |
| | 4,608,000 | | | # | | Pemex Project Funding Master
Trust, 6.660%, due 06/15/10 | | | 4,741,632 | | |
| | 4,908,000 | | | @@,#,C | | Ras Laffan Liquefied Natural
Gas Co., Ltd. II, 5.298%,
due 09/30/20 | | | 4,713,521 | | |
| | 7,064,000 | | | # | | Sabine Pass LP, 7.250%,
due 11/30/13 | | | 7,037,510 | | |
| | 4,396,000 | | | # | | Sabine Pass LP, 7.500%,
due 11/30/16 | | | 4,390,505 | | |
| | | | 51,854,946 | | |
| | | Pipelines: 0.7% | |
| | 7,988,000 | | | #,C,I | | Cameron Highway Oil
Pipelines, 5.860%,
due 12/15/17 | | | 7,810,770 | | |
| | 1,893,000 | | | C,L | | Northwest Pipeline Corp.,
7.000%, due 06/15/16 | | | 1,987,650 | | |
| | 2,528,000 | | | C | | Transcontinental Gas Pipe
Line Corp., 6.400%,
due 04/15/16 | | | 2,565,920 | | |
| | 3,371,000 | | | # | | Williams Partners LP,
7.250%, due 02/01/17 | | | 3,455,275 | | |
| | 2,153,000 | | | #,C | | Williams Partners LP, 7.500%,
due 06/15/11 | | | 2,255,268 | | |
| | | | 18,074,883 | | |
| | | Real Estate Investment Trusts: 0.7% | |
| | 874,000 | | | C | | Liberty Property LP, 6.375%,
due 08/15/12 | | | 911,597 | | |
| | 3,533,000 | | | C | | Liberty Property LP, 7.750%,
due 04/15/09 | | | 3,697,108 | | |
| | 8,019,000 | | | #,C | | Rouse Co. LP, 6.750%,
due 05/01/13 | | | 8,093,192 | | |
| | 5,322,000 | | | C | | Simon Property Group LP,
5.000%, due 03/01/12 | | | 5,234,171 | | |
| | | | 17,936,068 | | |
| | | Retail: 0.6% | |
| | 6,388,000 | | | C | | Home Depot, Inc., 5.250%,
due 12/16/13 | | | 6,349,621 | | |
| | 9,166,000 | | | C | | Home Depot, Inc., 5.875%,
due 12/16/36 | | | 9,026,099 | | |
| | | | 15,375,720 | | |
| | | Savings & Loans: 0.1% | |
| | 2,347,000 | | | C | | Great Western Financial,
8.206%, due 02/01/27 | | | 2,447,261 | | |
| | | | 2,447,261 | | |
| | | Sovereign: 1.1% | |
| | 7,853,000 | | | L | | Fannie Mae, 7.250%,
due 01/15/10 | | | 8,360,453 | | |
| JPY | 2,410,000,000 | | | @@ | | Japan Treasury Bill, 0.490%,
due 06/11/07 | | | 20,206,859 | | |
| | | | 28,567,312 | | |
See Accompanying Notes to Financial Statements
92
PORTFOLIO OF INVESTMENTS
ING VP INTERMEDIATE BOND PORTFOLIO AS OF DECEMBER 31, 2006 (CONTINUED)
Principal
Amount | | | | | | Value | |
| | | Telecommunications: 1.0% | |
| $ | 7,394,000 | | | @@,C,L | | Rogers Wireless, Inc., 7.250%,
due 12/15/12 | | $ | 7,874,610 | | |
| | 4,922,000 | | | C | | Sprint Capital Corp., 6.875%,
due 11/15/28 | | | 4,940,827 | | |
| | 2,225,000 | | | C | | Sprint Nextel Corp., 6.000%,
due 12/01/16 | | | 2,172,530 | | |
| | 3,294,000 | | | @@,C,L | | Telecom Italia Capital SA,
7.200%, due 07/18/36 | | | 3,452,082 | | |
| | 6,600,000 | | | @@,C | | TELUS Corp., 8.000%,
due 06/01/11 | | | 7,224,076 | | |
| | | | 25,664,125 | | |
Total Corporate Bonds/Notes
(Cost $710,835,543) | | | 712,190,811 | | |
| U.S. GOVERNMENT AGENCY OBLIGATIONS: 27.8% | | | |
| | | Federal Home Loan Bank: 1.2% | |
| | 12,555,000 | | | | | 5.000%, due 10/02/09 | | | 12,568,396 | | |
| | 6,010,000 | | | L | | 5.375%, due 08/19/11 | | | 6,119,015 | | |
| | 11,123,000 | | | | | 5.625%, due 06/13/16 | | | 11,468,514 | | |
| | | | 30,155,925 | | |
| | | Federal Home Loan Mortgage
Corporation: 8.0% | |
| | 2,509,547 | | | C | | 4.500%, due 12/15/16 | | | 2,463,966 | | |
| | 7,583,000 | | | C | | 4.500%, due 02/15/20 | | | 7,077,921 | | |
| | 9,005,644 | | | C | | 5.000%, due 08/15/16 | | | 8,878,322 | | |
| | 9,369,000 | | | C | | 5.000%, due 12/15/17 | | | 9,199,059 | | |
| | 1,621,000 | | | C | | 5.000%, due 05/15/20 | | | 1,572,002 | | |
| | 7,279,442 | | | C | | 5.000%, due 08/15/21 | | | 7,196,711 | | |
| | 7,694,000 | | | C | | 5.000%, due 04/15/23 | | | 7,365,475 | | |
| | 6,800,471 | | | C | | 5.000%, due 02/15/35 | | | 6,656,101 | | |
| | 1,410,201 | | | | | 5.042%, due 04/01/35 | | | 1,384,130 | | |
| | 12,375,000 | | | L | | 5.125%, due 04/18/08 | | | 12,375,705 | | |
| | 3,438,000 | | | | | 5.125%, due 04/18/11 | | | 3,465,119 | | |
| | 9,158,000 | | | C | | 5.150%, due 01/24/11 | | | 9,164,768 | | |
| | 24,804,000 | | | C | | 5.500%, due 04/24/09 | | | 24,809,928 | | |
| | 20,345,383 | | | C | | 5.500%, due 08/15/20 | | | 19,575,246 | | |
| | 2,792,205 | | | | | 5.500%, due 06/01/36 | | | 2,765,121 | | |
| | 16,596,000 | | | W | | 5.500%, due 01/00/00 | | | 16,414,473 | | |
| | 5,000,000 | | | C | | 5.750%, due 05/11/11 | | | 5,005,360 | | |
| | 10,996,000 | | | | | 5.750%, due 06/27/16 | | | 11,465,342 | | |
| | 18,074,342 | | | C | | 6.000%, due 01/15/29 | | | 18,233,708 | | |
| | 24,040,000 | | | L | | 6.625%, due 09/15/09 | | | 25,053,070 | | |
| | 1,897,580 | | | | | 7.000%, due 09/01/26 | | | 1,954,898 | | |
| | 520,128 | | | | | 7.500%, due 11/01/28 | | | 543,261 | | |
| | | | 202,619,686 | | |
| | | Federal National Mortgage
Association: 18.4% | |
| | 502,000 | | | | | 4.500%, due 11/15/36 | | | 470,468 | | |
| | 9,080,000 | | | W | | 4.500%, due 01/00/00 | | | 8,759,367 | | |
| | 3,347,101 | | | | | 4.606%, due 08/01/35 | | | 3,280,569 | | |
| | 2,469,167 | | | C | | 4.750%, due 12/25/42 | | | 2,455,184 | | |
| | 4,580,242 | | | | | 4.806%, due 08/01/35 | | | 4,520,524 | | |
| | 12,368,000 | | | L | | 4.875%, due 12/15/16 | | | 12,253,460 | | |
| | 1,363,172 | | | | | 4.947%, due 04/01/35 | | | 1,359,648 | | |
| | 210,455,000 | | | W | | 5.000%, due 01/12/36 | | | 203,220,609 | | |
| | 6,541,671 | | | | | 5.000%, due 02/25/29 | | | 6,454,021 | | |
| | 1,543,976 | | | | | 5.069%, due 07/01/35 | | | 1,520,118 | | |
| | 6,564,919 | | | | | 5.154%, due 09/01/35 | | | 6,560,945 | | |
| | 30,347,000 | | | L | | 5.250%, due 08/01/12 | | | 30,531,085 | | |
| | 13,680,000 | | | | | 5.250%, due 09/15/16 | | | 13,953,655 | | |
| | 1,262,206 | | | | | 5.253%, due 08/01/35 | | | 1,246,782 | | |
Principal
Amount | | | | | | Value | |
| $ | 15,739,000 | | | W | | 5.500%, due 01/12/36 | | $ | 15,557,026 | | |
| | 23,824 | | | | | 5.500%, due 11/01/16 | | | 23,900 | | |
| | 116,109 | | | | | 5.500%, due 12/01/16 | | | 116,479 | | |
| | 19,007 | | | | | 5.500%, due 04/01/17 | | | 19,058 | | |
| | 41,851 | | | | | 5.500%, due 02/01/18 | | | 41,964 | | |
| | 13,315 | | | | | 5.500%, due 06/01/18 | | | 13,345 | | |
| | 64,514 | | | | | 5.500%, due 10/01/18 | | | 64,689 | | |
| | 236,000 | | | W | | 5.500%, due 01/15/20 | | | 236,000 | | |
| | 3,538,000 | | | | | 5.500%, due 05/25/30 | | | 3,479,929 | | |
| | 4,176,603 | | | | | 5.500%, due 11/01/32 | | | 4,136,192 | | |
| | 25,170,645 | | | | | 5.500%, due 11/01/33 | | | 24,924,821 | | |
| | 2,618,402 | | | | | 5.500%, due 06/01/36 | | | 2,589,764 | | |
| | 2,787,712 | | | | | 5.500%, due 07/01/36 | | | 2,757,223 | | |
| | 16,132,922 | | | | | 5.500%, due 10/01/36 | | | 15,853,117 | | |
| | 8,575,192 | | | | | 5.500%, due 11/01/36 | | | 8,426,466 | | |
| | 15,792,057 | | | | | 5.500%, due 12/25/36 | | | 15,366,918 | | |
| | 18,528,000 | | | C | | 5.600%, due 03/29/11 | | | 18,534,244 | | |
| | 2,845,431 | | | | | 5.600%, due 07/25/36 | | | 2,844,907 | | |
| | 156,671 | | | | | 6.000%, due 06/01/16 | | | 159,052 | | |
| | 20,219 | | | | | 6.000%, due 08/01/16 | | | 20,527 | | |
| | 298,917 | | | | | 6.000%, due 10/01/16 | | | 303,459 | | |
| | 361,105 | | | | | 6.000%, due 01/01/17 | | | 366,551 | | |
| | 138,180 | | | | | 6.000%, due 02/01/17 | | | 140,254 | | |
| | 715,020 | | | | | 6.000%, due 04/01/17 | | | 725,749 | | |
| | 464,884 | | | | | 6.000%, due 05/01/17 | | | 471,861 | | |
| | 214,584 | | | | | 6.000%, due 06/01/17 | | | 217,804 | | |
| | 391,002 | | | | | 6.000%, due 07/01/17 | | | 396,870 | | |
| | 597,661 | | | | | 6.000%, due 08/01/17 | | | 606,674 | | |
| | 1,945,308 | | | | | 6.000%, due 09/01/17 | | | 1,974,499 | | |
| | 9,266 | | | | | 6.000%, due 10/01/17 | | | 9,406 | | |
| | 458,157 | | | | | 6.000%, due 11/01/17 | | | 465,119 | | |
| | 10,013 | | | | | 6.000%, due 02/01/18 | | | 10,163 | | |
| | 433,568 | | | | | 6.000%, due 04/01/18 | | | 439,876 | | |
| | 110,249 | | | | | 6.000%, due 09/01/18 | | | 111,854 | | |
| | 154,787 | | | | | 6.000%, due 11/01/18 | | | 157,041 | | |
| | 186,353 | | | | | 6.000%, due 12/01/18 | | | 189,185 | | |
| | 9,590,881 | | | | | 6.000%, due 07/25/29 | | | 9,712,131 | | |
| | 5,132,615 | | | | | 6.000%, due 04/25/31 | | | 5,230,465 | | |
| | 21,754,000 | | | W | | 6.500%, due 01/15/35 | | | 22,168,675 | | |
| | 2,687,328 | | | | | 6.500%, due 08/01/29 | | | 2,757,146 | | |
| | 238,590 | | | | | 6.500%, due 01/01/32 | | | 244,333 | | |
| | 199,396 | | | | | 6.500%, due 09/01/32 | | | 204,028 | | |
| | 431,242 | | | | | 6.500%, due 10/01/32 | | | 441,262 | | |
| | 18,276 | | | | | 7.000%, due 08/01/25 | | | 18,874 | | |
| | 12,480 | | | | | 7.000%, due 10/01/25 | | | 12,889 | | |
| | 4,345 | | | | | 7.000%, due 11/01/25 | | | 4,488 | | |
| | 74,058 | | | | | 7.000%, due 12/01/25 | | | 76,485 | | |
| | 98,755 | | | | | 7.000%, due 02/01/26 | | | 101,990 | | |
| | 208,187 | | | | | 7.000%, due 03/01/26 | | | 215,050 | | |
| | 131,098 | | | | | 7.000%, due 01/01/30 | | | 135,196 | | |
| | 2,740,887 | | | | | 7.000%, due 06/01/31 | | | 2,830,326 | | |
| | 123,954 | | | | | 7.000%, due 08/01/35 | | | 127,286 | | |
| | 849 | | | I | | 7.125%, due 07/01/27 | | | 864 | | |
| | 10,551 | | | I | | 7.180%, due 07/01/27 | | | 10,795 | | |
| | 14,919 | | | | | 7.500%, due 11/01/29 | | | 15,575 | | |
| | 97,802 | | | | | 7.500%, due 10/01/30 | | | 101,871 | | |
| | 106,431 | | | | | 7.500%, due 11/01/30 | | | 110,860 | | |
| | 1,786,309 | | | C | | 7.500%, due 01/25/48 | | | 1,850,431 | | |
| | 272,700 | | �� | | | 10.000%, due 02/25/19 | | | 300,276 | | |
| | | | 465,009,717 | | |
| | | Government National
Mortgage Association: 0.2% | |
| | 105,036 | | | | | 5.125%, due 12/20/29 | | | 105,198 | | |
| | 146,114 | | | | | 5.375%, due 04/20/28 | | | 147,440 | | |
See Accompanying Notes to Financial Statements
93
PORTFOLIO OF INVESTMENTS
ING VP INTERMEDIATE BOND PORTFOLIO AS OF DECEMBER 31, 2006 (CONTINUED)
Principal
Amount | | | | | | Value | |
| | | Government National
Mortgage Association (continued) | |
| $ | 2,883,866 | | | | | 6.500%, due 10/15/31 | | $ | 2,964,618 | | |
| | 462,479 | | | | | 7.000%, due 04/15/26 | | | 478,480 | | |
| | 197,772 | | | | | 7.000%, due 05/15/32 | | | 204,423 | | |
| | 28,073 | | | | | 7.500%, due 04/15/22 | | | 29,288 | | |
| | 6,373 | | | | | 7.500%, due 05/15/22 | | | 6,648 | | |
| | 6,697 | | | | | 7.500%, due 06/15/22 | | | 6,987 | | |
| | 3,281 | | | | | 7.500%, due 08/15/22 | | | 3,423 | | |
| | 8,648 | | | | | 7.500%, due 06/15/24 | | | 9,033 | | |
| | 8,327 | | | | | 7.500%, due 01/15/26 | | | 8,706 | | |
| | 2,091 | | | | | 7.500%, due 07/15/26 | | | 2,187 | | |
| | 29,592 | | | | | 7.500%, due 03/15/29 | | | 30,887 | | |
| | 51,304 | | | | | 7.500%, due 04/15/29 | | | 53,548 | | |
| | 128,745 | | | | | 7.500%, due 08/15/29 | | | 134,377 | | |
| | 9,933 | | | | | 7.500%, due 09/15/29 | | | 10,367 | | |
| | 23,187 | | | | | 7.500%, due 10/15/29 | | | 24,201 | | |
| | 44,835 | | | | | 7.500%, due 12/15/29 | | | 46,809 | | |
| | 40,049 | | | | | 7.500%, due 01/15/30 | | | 41,812 | | |
| | 88,150 | | | | | 7.500%, due 02/15/30 | | | 92,030 | | |
| | 44,017 | | | | | 7.500%, due 05/15/30 | | | 45,954 | | |
| | 25,385 | | | | | 7.500%, due 06/15/30 | | | 26,503 | | |
| | 26,320 | | | | | 7.500%, due 07/15/30 | | | 27,478 | | |
| | 43,363 | | | | | 7.500%, due 08/15/30 | | | 45,272 | | |
| | 21,481 | | | | | 7.500%, due 10/15/30 | | | 22,427 | | |
| | 3,902 | | | | | 7.500%, due 11/15/30 | | | 4,072 | | |
| | 1,833 | | | | | 7.500%, due 01/15/31 | | | 1,914 | | |
| | 25,428 | | | | | 7.500%, due 02/15/31 | | | 26,554 | | |
| | 17,908 | | | | | 7.500%, due 03/15/31 | | | 18,700 | | |
| | 12,640 | | | | | 7.500%, due 04/15/31 | | | 13,200 | | |
| | 1,621 | | | | | 7.500%, due 09/15/31 | | | 1,693 | | |
| | 482,767 | | | | | 7.500%, due 12/15/31 | | | 504,033 | | |
| | 72,428 | | | | | 7.500%, due 01/15/32 | | | 75,613 | | |
| | 79,825 | | | | | 7.500%, due 03/15/32 | | | 83,344 | | |
| | 1,222 | | | | | 7.500%, due 04/15/32 | | | 1,276 | | |
| | 45,770 | | | | | 7.500%, due 05/15/32 | | | 47,806 | | |
| | 95,739 | | | | | 7.500%, due 06/15/32 | | | 99,998 | | |
| | 34,576 | | | | | 7.500%, due 07/15/32 | | | 36,114 | | |
| | 49,114 | | | | | 7.500%, due 08/15/32 | | | 51,298 | | |
| | 507,977 | | | | | 7.500%, due 09/15/32 | | | 530,575 | | |
| | | | 6,064,286 | | |
Total U.S. Government Agency
Obligations
(Cost $708,463,497) | | | 703,849,614 | | |
| U.S. TREASURY OBLIGATIONS: 11.2% | | | |
| | | U.S. Treasury Bonds: 4.1% | |
| | 878,000 | | | L | | 4.500%, due 11/30/11 | | | 870,455 | | |
| | 51,485,000 | | | L | | 4.500%, due 02/15/36 | | | 48,975,158 | | |
| | 18,460,000 | | | L | | 4.625%, due 11/15/16 | | | 18,344,643 | | |
| | 20,782,000 | | | L | | 6.000%, due 02/15/26 | | | 23,576,223 | | |
| | 10,211,000 | | | L | | 6.250%, due 08/15/23 | | | 11,756,220 | | |
| | | | 103,522,699 | | |
| | | Treasury Inflation Protected
Securities: 1.3% | |
| | 11,043,000 | | | | | 2.000%, due 01/15/16 | | | 10,844,541 | | |
| | 21,298,000 | | | L | | 2.375%, due 04/15/11 | | | 21,573,974 | | |
| | | | 32,418,515 | | |
| | | U.S. Treasury Notes: 5.4% | |
| | 111,616,000 | | | L | | 4.625%, due 11/30/08 | | | 111,245,435 | | |
| | 26,592,000 | | | L | | 4.625%, due 11/15/09 | | | 26,517,223 | | |
| | | | 137,762,658 | | |
Principal
Amount | | | | | | Value | |
| | | U.S. Treasury Principal
Only STRIP: 0.4% | | | |
| $ | 41,606,000 | | | L | | Discount Note, due 02/15/36 | | $ | 10,542,586 | | |
| | | | 10,542,586 | | |
Total U.S. Treasury Obligations
(Cost $285,931,584) | | | 284,246,458 | | |
| ASSET-BACKED SECURITIES: 3.0% | | | |
| | | Automobile Asset-Backed
Securities: 0.1% | | | |
| | 842,000 | | | C | | AmeriCredit Automobile
Receivables Trust, 4.220%,
due 07/06/09 | | | 835,880 | | |
| | 534,287 | | | C | | Honda Auto Receivables
Owner Trust, 2.790%,
due 03/16/09 | | | 529,636 | | |
| | 1,188,423 | | | C | | Nissan Auto Receivables
Owner Trust, 2.610%,
due 07/15/08 | | | 1,179,658 | | |
| | | | 2,545,174 | | |
| | | Credit Card Asset-Backed
Securities: 0.0% | | | |
| | 6,000 | | | C | | Bank One Issuance Trust,
4.540%, due 09/15/10 | | | 5,946 | | |
| | 8,000 | | | C | | MBNA Credit Card Master
Note Trust, 4.950%,
due 06/15/09 | | | 8,005 | | |
| | | | 13,951 | | |
| | | Home Equity Asset-Backed
Securities: 1.5% | | | |
| | 2,338,500 | | | C | | Bayview Financial Revolving
Mortgage Loan Trust,
5.850%, due 09/28/43 | | | 2,340,829 | | |
| | 10,593,000 | | | C | | GSAA Trust, 5.242%,
due 06/25/34 | | | 10,477,296 | | |
| | 2,021,000 | | | C | | GSAA Trust, 5.882%,
due 09/25/36 | | | 2,036,473 | | |
| | 9,441,000 | | | C | | GSAA Trust, 6.040%,
due 07/25/36 | | | 9,532,464 | | |
| | 350,262 | | | +,C | | Merrill Lynch Mortgage
Investors, Inc., 5.710%,
(step rate 6.040%),
due 07/25/34 | | | 351,461 | | |
| | 1,114,000 | | | +,C | | Renaissance Home Equity
Loan Trust, 4.456%,
(step rate 4.956%),
due 05/25/35 | | | 1,103,700 | | |
| | ,977,000 | | | +, C | | Renaissance Home Equity
Loan Trust, 4.723%,
(step rate 5.223%),
due 11/25/35 | | | 4,948,072 | | |
| | 4,000,000 | | | C | | Specialty Underwriting &
Residential Finance, 5.550%,
due 12/25/36 | | | 4,009,333 | | |
| | 1,990,000 | | | C | | Wells Fargo Home Equity Trust,
3.970%, due 05/25/34 | | | 1,948,622 | | |
| | 500,000 | | | C | | Wells Fargo Home Equity Trust,
4.430%, due 05/25/34 | | | 487,324 | | |
| | | | 37,235,574 | | |
See Accompanying Notes to Financial Statements
94
PORTFOLIO OF INVESTMENTS
ING VP INTERMEDIATE BOND PORTFOLIO AS OF DECEMBER 31, 2006 (CONTINUED)
Principal
Amount | | | | | | Value | |
| | | Other Asset-Backed Securities: 1.4% | | | |
| $ | 391,065 | | | C | | Amortizing Residential
Collateral Trust, 5.850%,
due 05/25/32 | | $ | 391,677 | | |
| | 996,000 | | | C | | Caterpillar Financial Asset Trust,
5.590%, due 02/25/09 | | | 995,845 | | |
| | 3,206 | | | C | | Chase Funding Mortgage Loan,
4.045%, due 05/25/33 | | | 3,164 | | |
| | 838,597 | | | +,C | | Chase Funding Mortgage Loan,
5.650%, (step rate 5.820%),
due 07/25/33 | | | 840,846 | | |
| | 611,467 | | | C | | Citigroup Mortgage Loan
Trust, Inc., 5.470%,
due 02/25/35 | | | 611,924 | | |
| | 2,312,000 | | | C | | Countrywide Asset-Backed
Certificates, 4.493%,
due 02/25/36 | | | 2,291,737 | | |
| | 4,266,000 | | | +,C | | Credit-Based Asset Servicing and
Securitization, 5.501%,
(step rate 6.001%),
due 12/25/36 | | | 4,256,554 | | |
| | 3,375,000 | | | C | | Equity One, Inc., 5.050%,
due 09/25/33 | | | 3,329,838 | | |
| | 1,172,459 | | | +,C | | Fannie Mae Grantor Trust,
5.490%, (step rate 5.600%),
due 04/25/35 | | | 1,174,257 | | |
| | 4,893,362 | | | +,C | | Lehman XS Trust, 5.630%,
(step rate 5.880%),
due 08/25/35 | | | 4,908,612 | | |
| | 666,179 | | | +,C | | Long Beach Mortgage Loan
Trust, 5.680%,
(step rate 5.980%),
due 01/25/36 | | | 668,411 | | |
| | 2,496,023 | | | C | | Merrill Lynch Mortgage
Investors, Inc., 5.530%,
due 09/25/36 | | | 2,498,357 | | |
| | 5,845,000 | | | C | | Merrill Lynch Mortgage
Investors, Inc., 5.550%,
due 01/25/37 | | | 5,850,753 | | |
| | 2,065,000 | | | +,C | | Merrill Lynch Mortgage
Investors, Inc., 5.609%,
(step rate 6.109%),
due 03/25/37 | | | 2,062,413 | | |
| | 204 | | | C | | Popular Mortgage Pass-Through
Trust, 3.735%, due 12/25/34 | | | 203 | | |
| | 3,000 | | | C | | Popular Mortgage Pass-Through
Trust, 4.000%, due 12/25/34 | | | 2,970 | | |
| | 1,697,000 | | | C | | Popular Mortgage Pass-Through
Trust, 4.596%, due 11/25/35 | | | 1,681,385 | | |
| | 1,380,000 | | | +,C | | Renaissance Home Equity
Loan Trust, 5.608%,
(step rate 6.180%),
due 05/25/36 | | | 1,379,940 | | |
| | 221,432 | | | C | | Residential Asset Mortgage
Products, Inc., 5.660%,
due 06/25/33 | | | 221,679 | | |
| | 2,799,429 | | | +,C | | Structured Asset Securities Corp.,
6.000%, (step rate 6.500%),
due 03/25/34 | | | 2,793,201 | | |
| | | | 35,963,766 | | |
Total Asset-Backed Securities
(Cost $75,880,475) | | | 75,758,465 | | |
Principal
Amount | | | | | | Value | |
| COLLATERALIZED MORTGAGE OBLIGATIONS: 33.4% | | | |
| $ | 5,753,825 | | | C | | American Home Mortgage
Assets, 5.758%,
due 09/25/46 | | $ | 5,747,530 | | |
| | 7,305,836 | | | +,C | | American Home Mortgage
Investment Trust, 5.640%,
(step rate 5.900%),
due 11/25/45 | | | 7,339,933 | | |
| | 6,027,315 | | | C | | American Home Mortgage
Investment Trust, 5.790%,
due 11/25/45 | | | 6,048,485 | | |
| | 385,000 | | | C | | Banc of America Commercial
Mortgage, Inc., 4.429%,
due 11/10/39 | | | 372,148 | | |
| | 3,941,000 | | | C | | Banc of America Commercial
Mortgage, Inc., 4.502%,
due 07/10/42 | | | 3,825,909 | | |
| | 7,612,000 | | | C | | Banc of America Commercial
Mortgage, Inc., 4.611%,
due 07/10/43 | | | 7,481,721 | | |
| | 2,735,000 | | | C | | Banc of America Commercial
Mortgage, Inc., 4.764%,
due 07/10/45 | | | 2,699,443 | | |
| | 4,720,000 | | | C | | Banc of America Commercial
Mortgage, Inc., 4.772%,
due 07/11/43 | | | 4,667,042 | | |
| | 4,150,000 | | | C | | Banc of America Commercial
Mortgage, Inc., 4.891%,
due 07/10/45 | | | 4,081,269 | | |
| | 783,772 | | | C | | Banc of America Commercial
Mortgage, Inc., 5.226%,
due 10/10/45 | | | 783,635 | | |
| | 710,000 | | | C | | Banc of America Commercial
Mortgage, Inc., 5.309%,
due 10/10/45 | | | 712,078 | | |
| | 525,408 | | | C | | Banc of America Commercial
Mortgage, Inc., 5.363%,
due 07/10/46 | | | 527,807 | | |
| | 3,295,000 | | | C | | Banc of America Commercial
Mortgage, Inc., 5.463%,
due 09/10/47 | | | 3,292,243 | | |
| | 235,878 | | | C | | Banc of America Commercial
Mortgage, Inc., 5.685%,
due 07/10/44 | | | 237,859 | | |
| | 970,000 | | | C | | Banc of America Commercial
Mortgage, Inc., 6.186%,
due 06/11/35 | | | 1,009,391 | | |
| | 12,267,562 | | | C | | Banc of America Funding
Corp., 5.281%, due 09/20/35 | | | 12,069,172 | | |
| | 2,210,508 | | | C | | Banc of America Funding
Corp., 5.720%, due 09/20/35 | | | 2,222,274 | | |
| | 6,116,158 | | | C | | Banc of America Funding
Corp., 5.750%, due 09/20/34 | | | 6,086,893 | | |
| | 837,523 | | | C | | Banc of America Funding
Corp., 5.850%, due 07/25/36 | | | 837,293 | | |
| | 5,901,998 | | | C | | Banc of America Funding
Corp., 5.858%, due 05/20/36 | | | 5,892,028 | | |
| | 4,848,764 | | | C | | Banc of America Funding
Corp., 7.240%, due 06/20/35 | | | 4,962,727 | | |
| | 5,430,000 | | | C | | Banc of America Mortgage
Securities, 4.147%,
due 07/25/34 | | | 5,287,734 | | |
| | 6,027,456 | | | C | | Banc of America Mortgage
Securities, 5.181%,
due 09/25/35 | | | 5,929,980 | | |
See Accompanying Notes to Financial Statements
95
PORTFOLIO OF INVESTMENTS
ING VP INTERMEDIATE BOND PORTFOLIO AS OF DECEMBER 31, 2006 (CONTINUED)
Principal
Amount | | | | | | Value | |
| COLLATERALIZED MORTGAGE OBLIGATIONS (continued) | | | |
| $ | 2,284,993 | | | C | | Banc of America Mortgage
Securities, 5.250%,
due 11/25/19 | | $ | 2,261,760 | | |
| | 2,238,436 | | | C | | Banc of America Mortgage
Securities, 5.500%,
due 11/25/33 | | | 2,206,178 | | |
| | 4,979,222 | | | C | | Banc of America Mortgage
Securities, 5.500%,
due 06/25/35 | | | 4,948,710 | | |
| | 12,112,404 | | | C,L | | Bank of America Alternative
Loan Trust, 6.290%,
due 11/25/21 | | | 12,231,823 | | |
| | 3,135,532 | | | C | | Bank of America Alternative
Loan Trust, 6.500%,
due 04/25/36 | | | 3,175,708 | | |
| | 11,072,489 | | | C | | Bank of America Alternative
Loan Trust, 6.500%,
due 05/25/46 | | | 11,204,234 | | |
| | 1,810,094 | | | +,C | | Bear Stearns Alternative-A Trust,
5.670%, (step rate 5.960%),
due 07/25/34 | | | 1,812,381 | | |
| | 3,083,000 | | | C | | Bear Stearns Commercial
Mortgage Securities, 3.880%,
due 08/13/39 | | | 2,995,572 | | |
| | 405,000 | | | C | | Bear Stearns Commercial
Mortgage Securities, 4.030%,
due 02/13/46 | | | 391,881 | | |
| | 3,380,000 | | | C | | Bear Stearns Commercial
Mortgage Securities, 4.170%,
due 01/12/41 | | | 3,307,604 | | |
| | 1,206,000 | | | C | | Bear Stearns Commercial
Mortgage Securities, 4.565%,
due 07/11/42 | | | 1,173,823 | | |
| | 1,189,102 | | | C | | Bear Stearns Commercial
Mortgage Securities, 5.294%,
due 09/11/41 | | | 1,190,381 | | |
| | 1,048,256 | | | C | | Bear Stearns Commercial
Mortgage Securities, 5.415%,
due 04/12/38 | | | 1,052,272 | | |
| | 777,000 | | | C | | Capco America Securitization
Corp., 6.260%, due 10/15/30 | | | 786,564 | | |
| | 279,000 | | | C | | Capco America Securitization
Corp., 6.460%, due 10/15/30 | | | 284,407 | | |
| | 6,167,579 | | | C | | Chase Manhattan Bank-First
Union National Bank, 7.439%,
due 08/15/31 | | | 6,451,610 | | |
| | 12,272,626 | | | C | | Chase Mortgage Finance Corp.,
5.414%, due 12/25/35 | | | 12,119,219 | | |
| | 8,232,974 | | | C | | Chase Mortgage Finance Corp.,
5.500%, due 11/25/35 | | | 8,178,757 | | |
| | 1,600,000 | | | C | | Citigroup Commercial Mortgage
Trust, 4.639%, due 05/15/43 | | | 1,570,224 | | |
| | 1,463,777 | | | C | | Citigroup Commercial Mortgage
Trust, 5.720%, due 03/15/49 | | | 1,483,400 | | |
| | 6,722,726 | | | C | | Citigroup Mortgage Loan Trust,
Inc., 5.949%, due 06/25/36 | | | 6,741,650 | | |
| | 13,371,911 | | | C | | Citigroup Mortgage Loan Trust,
Inc., 6.000%, due 11/25/35 | | | 13,377,973 | | |
| | 28,085,002 | | | C | | Citigroup Mortgage Loan Trust,
Inc., 6.096%, due 08/25/36 | | | 28,155,355 | | |
| | 819,000 | | | C | | Commercial Mortgage
Pass-Through Certificates,
3.600%, due 03/10/39 | | | 793,504 | | |
Principal
Amount | | | | | | Value | |
| $ | 13,699,208 | | | C | | Countrywide Alternative Loan
Trust, 5.416%, due 10/25/35 | | $ | 13,527,968 | | |
| | 1,972,550 | | | C | | Countrywide Alternative Loan
Trust, 5.500%, due 02/25/25 | | | 1,964,748 | | |
| | 3,545,845 | | | C | | Countrywide Alternative Loan
Trust, 5.560%, due 11/25/46 | | | 3,557,976 | | |
| | 9,053,315 | | | C | | Countrywide Alternative Loan
Trust, 5.638%, due 11/25/46 | | | 9,053,315 | | |
| | 812,588 | | | C | | Countrywide Alternative Loan
Trust, 5.650%, due 02/25/35 | | | 813,371 | | |
| | 7,919,183 | | | C | | Countrywide Alternative Loan
Trust, 5.678%, due 11/25/46 | | | 7,919,183 | | |
| | 1,745,427 | | | C | | Countrywide Alternative Loan
Trust, 6.000%, due 05/25/36 | | | 1,757,518 | | |
| | 13,202,768 | | | C | | Countrywide Alternative Loan
Trust, 6.020%, due 09/25/36 | | | 13,234,460 | | |
| | 16,409,144 | | | C | | Countrywide Home Loan
Mortgage Pass-Through
Trust, 6.142%, due 02/25/35 | | | 16,501,035 | | |
| | 3,087,699 | | | C | | Credit Suisse First Boston
Mortgage Securities Corp.,
3.727%, due 03/15/35 | | | 2,984,208 | | |
| | 1,140,650 | | | C | | Credit Suisse First Boston
Mortgage Securities Corp.,
3.819%, due 05/15/36 | | | 1,092,399 | | |
| | 17,000 | | | C | | Credit Suisse First Boston
Mortgage Securities Corp.,
3.861%, due 03/15/36 | | | 16,642 | | |
| | 745,000 | | | C | | Credit Suisse First Boston
Mortgage Securities Corp.,
4.321%, due 01/15/37 | | | 720,624 | | |
| | 2,328,000 | | | C | | Credit Suisse First Boston
Mortgage Securities Corp.,
4.801%, due 03/15/36 | | | 2,269,590 | | |
| | 1,700,758 | | | C | | Credit Suisse First Boston
Mortgage Securities Corp.,
5.000%, due 08/25/20 | | | 1,679,270 | | |
| | 1,777,000 | | | C | | Credit Suisse First Boston
Mortgage Securities Corp.,
5.183%, due 11/15/36 | | | 1,769,348 | | |
| | 4,000 | | | C | | Credit Suisse First Boston
Mortgage Securities Corp.,
7.544%, due 04/15/62 | | | 4,310 | | |
| | 1,405,458 | | | C | | Credit Suisse Mortgage Capital
Certificates, 4.991%,
due 06/15/38 | | | 1,395,755 | | |
| | 4,528,095 | | | C | | Credit Suisse Mortgage Capital
Certificates, 7.000%,
due 08/25/36 | | | 4,590,249 | | |
| | 21,813 | | | C | | DLJ Commercial Mortgage
Corp., 6.240%, due 11/12/31 | | | 22,065 | | |
| | 63,000 | | | C | | DLJ Commercial Mortgage
Corp., 7.300%, due 06/10/32 | | | 65,462 | | |
| | 5,699,960 | | | C | | FHR 2707 FH, 6.000%,
due 04/15/32 | | | 5,764,973 | | |
| | 14,116,655 | | | C | | First Horizon Alternative
Mortgage Securities, 5.500%,
due 08/25/35 | | | 13,938,281 | | |
| | 4,953,626 | | | C | | First Horizon Asset Securities,
Inc., 5.500%, due 12/25/35 | | | 4,914,757 | | |
| | 3,400,000 | | | C | | First Union National Bank
Commercial Mortgage,
6.663%, due 01/12/43 | | | 3,569,263 | | |
See Accompanying Notes to Financial Statements
96
PORTFOLIO OF INVESTMENTS
ING VP INTERMEDIATE BOND PORTFOLIO AS OF DECEMBER 31, 2006 (CONTINUED)
Principal
Amount | | | | | | Value | |
| COLLATERALIZED MORTGAGE OBLIGATIONS (continued) | | | |
| $ | 2,073,400 | | | C | | GE Capital Commercial
Mortgage Corp., 3.752%,
due 07/10/39 | | $ | 2,031,414 | | |
| | 793,000 | | | C | | GE Capital Commercial
Mortgage Corp., 4.371%,
due 01/10/38 | | | 773,025 | | |
| | 301,000 | | | C | | GE Capital Commercial
Mortgage Corp., 4.865%,
due 07/10/39 | | | 296,454 | | |
| | 1,115,324 | | | C | | GE Capital Commercial
Mortgage Corp., 5.560%,
due 06/10/38 | | | 1,122,838 | | |
| | 3,750,615 | | | C | | GMAC Mortgage Corp. Loan
Trust, 4.604%, due 10/19/33 | | | 3,637,585 | | |
| | 8,993,818 | | | C | | GMAC Mortgage Corp. Loan
Trust, 5.265%, due 03/18/35 | | | 8,848,371 | | |
| | 6,606,000 | | | C | | Greenwich Capital Commercial
Funding Corp., 5.117%,
due 04/10/37 | | | 6,586,638 | | |
| | 1,800,000 | | | C | | Greenwich Capital Commercial
Funding Corp., 5.912%,
due 07/10/38 | | | 1,851,526 | | |
| | 4,390,000 | | | C | | GS Mortgage Securities Corp. II,
5.626%, due 04/10/38 | | | 4,447,966 | | |
| | 1,481,514 | | | #,C | | GSMPS Mortgage Loan Trust,
5.700%, due 01/25/35 | | | 1,488,466 | | |
| | 2,019,185 | | | +,C | | Harborview Mortgage Loan
Trust, 5.700%, (step rate
6.020%), due 01/19/35 | | | 2,028,853 | | |
| | 1,173,110 | | | +,C | | Homebanc Mortgage Trust,
5.780%, (step rate 6.180%),
due 08/25/29 | | | 1,175,032 | | |
| | 6,265,000 | | | | | HUDMZ 2006-2A B, 6.100%,
due 06/12/42 | | | 6,265,000 | | |
| | 15,000,000 | | | C | | JP Morgan Alternative Loan
Trust, 5.490%, due 08/25/36 | | | 15,048,306 | | |
| | 1,494,878 | | | | | JP Morgan Alternative Loan
Trust, 5.515%, due 01/25/36 | | | 1,488,416 | | |
| | 399,869,617 | | | C,^ | | JP Morgan Chase Commercial
Mortgage Securities Corp.,
0.070%, due 01/12/43 | | | 995,235 | | |
| | 969,384 | | | C | | JP Morgan Chase Commercial
Mortgage Securities Corp.,
4.200%, due 07/12/35 | | | 943,999 | | |
| | 3,890,000 | | | C | | JP Morgan Chase Commercial
Mortgage Securities Corp.,
4.223%, due 01/15/42 | | | 3,785,159 | | |
| | 6,026,713 | | | C | | JP Morgan Chase Commercial
Mortgage Securities Corp.,
4.275%, due 01/12/37 | | | 5,879,174 | | |
| | 10,000 | | | C | | JP Morgan Chase Commercial
Mortgage Securities Corp.,
4.449%, due 01/12/38 | | | 9,728 | | |
| | 580,000 | | | C | | JP Morgan Chase Commercial
Mortgage Securities Corp.,
4.879%, due 01/12/38 | | | 566,524 | | |
| | 1,630,000 | | | C | | JP Morgan Chase Commercial
Mortgage Securities Corp.,
5.289%, due 05/15/45 | | | 1,633,223 | | |
| | 1,056,684 | | | C | | JP Morgan Chase Commercial
Mortgage Securities Corp.,
5.338%, due 05/12/45 | | | 1,058,867 | | |
Principal
Amount | | | | | | Value | |
| $ | 978,000 | | | C | | JP Morgan Chase Commercial
Mortgage Securities Corp.,
5.455%, due 05/15/47 | | $ | 979,076 | | |
| | 1,951,000 | | | C | | JP Morgan Chase Commercial
Mortgage Securities Corp.,
5.495%, due 05/15/47 | | | 1,948,717 | | |
| | 758,218 | | | C | | JP Morgan Chase Commercial
Mortgage Securities Corp.,
5.833%, due 04/15/45 | | | 767,625 | | |
| | 4,589,000 | | | C | | JP Morgan Chase Commercial
Mortgage Securities Corp.,
5.857%, due 10/12/35 | | | 4,700,532 | | |
| | 4,005,000 | | | C | | JP Morgan Chase Commercial
Mortgage Securities Corp.,
5.861%, due 04/15/45 | | | 4,115,879 | | |
| | 26,243,458 | | | C | | JP Morgan Mortgage Trust,
5.408%, due 11/25/35 | | | 25,915,415 | | |
| | 1,794,000 | | | C | | LB-UBS Commercial Mortgage
Trust, 3.992%, due 10/15/29 | | | 1,737,828 | | |
| | 10,000 | | | C | | LB-UBS Commercial Mortgage
Trust, 4.201%, due 12/15/29 | | | 9,736 | | |
| | 499,000 | | | C | | LB-UBS Commercial Mortgage
Trust, 4.310%, due 02/15/30 | | | 486,226 | | |
| | 1,707,000 | | | C | | LB-UBS Commercial Mortgage
Trust, 4.510%, due 12/15/29 | | | 1,655,568 | | |
| | 2,520,000 | | | C | | LB-UBS Commercial Mortgage
Trust, 4.547%, due 08/15/29 | | | 2,459,853 | | |
| | 2,276,000 | | | C | | LB-UBS Commercial Mortgage
Trust, 4.567%, due 06/15/29 | | | 2,243,245 | | |
| | 2,807,000 | | | C | | LB-UBS Commercial Mortgage
Trust, 4.583%, due 08/15/29 | | | 2,737,319 | | |
| | 3,638,000 | | | C | | LB-UBS Commercial Mortgage
Trust, 4.821%, due 04/15/30 | | | 3,593,662 | | |
| | 1,066,000 | | | C | | LB-UBS Commercial Mortgage
Trust, 4.836%, due 02/15/40 | | | 1,025,044 | | |
| | 2,050,000 | | | C | | LB-UBS Commercial Mortgage
Trust, 4.885%, due 09/15/30 | | | 2,031,522 | | |
| | 2,416,000 | | | C | | LB-UBS Commercial Mortgage
Trust, 4.998%, due 04/15/30 | | | 2,390,065 | | |
| | 3,322,000 | | | C | | LB-UBS Commercial Mortgage
Trust, 5.103%, due 11/15/30 | | | 3,311,794 | | |
| | 1,661,000 | | | C | | LB-UBS Commercial Mortgage
Trust, 5.207%, due 02/15/31 | | | 1,655,682 | | |
| | 4,256,000 | | | C | | LB-UBS Commercial Mortgage
Trust, 5.227%, due 04/15/40 | | | 4,224,764 | | |
| | 1,421,408 | | | C | | LB-UBS Commercial Mortgage
Trust, 5.741%, due 06/15/32 | | | 1,440,783 | | |
| | 5,220,000 | | | C | | LB-UBS Commercial Mortgage
Trust, 6.226%, due 03/15/26 | | | 5,316,568 | | |
| | 3,638,000 | | | C | | LB-UBS Commercial Mortgage
Trust, 6.365%, due 12/15/28 | | | 3,799,671 | | |
| | 4,500,000 | | | C | | LB-UBS Commercial Mortgage
Trust, 7.370%, due 08/15/26 | | | 4,768,304 | | |
| | 5,910,955 | | | C | | MASTR Alternative Loans Trust,
5.500%, due 01/25/20 | | | 5,902,193 | | |
| | 478,305 | | | C | | MASTR Alternative Loans Trust,
6.500%, due 05/25/33 | | | 480,343 | | |
| | 1,310,336 | | | C | | MASTR Alternative Loans Trust,
8.500%, due 05/25/33 | | | 1,323,924 | | |
| | 3,789,301 | | | C | | MASTR Seasoned Securities
Trust, 5.750%, due 10/25/32 | | | 3,793,885 | | |
| | 92,309,229 | | | #,C,^ | | Merrill Lynch Mortgage Trust,
0.193%, due 11/12/35 | | | 735,086 | | |
See Accompanying Notes to Financial Statements
97
PORTFOLIO OF INVESTMENTS
ING VP INTERMEDIATE BOND PORTFOLIO AS OF DECEMBER 31, 2006 (CONTINUED)
Principal
Amount | | | | | | Value | |
| COLLATERALIZED MORTGAGE OBLIGATIONS (continued) | | | |
| $ | 2,725,000 | | | C | | Merrill Lynch Mortgage Trust,
4.892%, due 02/12/42 | | $ | 2,683,231 | | |
| | 2,076,000 | | | C | | Merrill Lynch Mortgage Trust,
5.660%, due 05/12/39 | | | 2,121,228 | | |
| | 1,360,397 | | | C | | Merrill Lynch/Countrywide
Commercial Mortgage Trust,
4.711%, due 07/12/46 | | | 1,341,593 | | |
| | 1,475,000 | | | C | | Merrill Lynch/Countrywide
Commercial Mortgage Trust,
5.439%, due 02/12/39 | | | 1,485,814 | | |
| | 1,992,035 | | | C | | MLCC Mortgage Investors, Inc.,
5.580%, due 04/25/29 | | | 1,994,274 | | |
| | 854,993 | | | +,C | | MLCC Mortgage Investors, Inc.,
5.670%, (step rate 5.960%),
due 01/25/29 | | | 856,000 | | |
| | 2,920,000 | | | C | | Morgan Stanley Capital I,
4.827%, due 06/12/47 | | | 2,867,856 | | |
| | 8,245,000 | | | C | | Morgan Stanley Capital I,
5.007%, due 01/14/42 | | | 8,157,309 | | |
| | 2,004,338 | | | C | | Morgan Stanley Capital I,
5.124%, due 03/12/44 | | | 1,997,565 | | |
| | 2,227,326 | | | C | | Morgan Stanley Capital I,
5.131%, due 11/12/41 | | | 2,220,936 | | |
| | 1,519,553 | | | C | | Morgan Stanley Capital I,
5.490%, due 07/12/44 | | | 1,530,953 | | |
| | 560,000 | | | C | | Morgan Stanley Capital I,
5.741%, due 08/12/41 | | | 572,978 | | |
| | 1,493,663 | | | C | | Morgan Stanley Dean Witter
Capital I, 4.180%,
due 03/12/35 | | | 1,443,873 | | |
| | 5,274,505 | | | C | | Mortgage Capital Funding, Inc.,
6.663%, due 03/18/30 | | | 5,319,548 | | |
| | 98,990 | | | C | | MortgageIT Trust, 5.690%,
due 11/25/35 | | | 99,120 | | |
| | 1,804,000 | | | C | | Nomura Asset Securities Corp.,
6.690%, due 03/15/30 | | | 1,913,012 | | |
| | 3,669,650 | | | C | | Prudential Commercial
Mortgage Trust, 3.669%,
due 02/11/36 | | | 3,525,396 | | |
| | 16,056,624 | | | C | | RAAC Series, 5.250%,
due 09/25/34 | | | 15,868,198 | | |
| | 5,385,218 | | | C | | RAST 2006-A10 A5, 6.500%,
due 09/25/36 | | | 5,418,420 | | |
| | 13,251,267 | | | C | | Residential Accredit Loans, Inc.,
5.500%, due 05/25/34 | | | 12,791,529 | | |
| | 1,916,812 | | | C | | Residential Accredit Loans, Inc.,
5.510%, due 09/25/36 | | | 1,919,734 | | |
| | 1,915,945 | | | C | | Residential Accredit Loans, Inc.,
5.580%, due 05/25/46 | | | 1,913,587 | | |
| | 4,817,423 | | | C | | Residential Accredit Loans, Inc.,
5.720%, due 04/25/35 | | | 4,836,172 | | |
| | 7,247,692 | | | C | | Residential Accredit Loans, Inc.,
5.795%, due 08/25/35 | | | 7,270,650 | | |
| | 1,483,669 | | | C | | Residential Funding Mortgage
Security I, 5.800%,
due 05/25/33 | | | 1,490,206 | | |
| | 10,181,692 | | | C | | Residential Funding Mortgage
Security I, 6.000%,
due 06/25/36 | | | 10,207,727 | | |
| | 1,087,644 | | | +,C | | Sequoia Mortgage Trust,
5.620%, (step rate 5.860%),
due 01/20/35 | | | 1,089,938 | | |
Principal
Amount | | | | | | Value | |
| $ | 1,533,345 | | | C | | Structured Adjustable Rate
Mortgage Loan Trust,
5.660%, due 07/25/35 | | $ | 1,540,271 | | |
| | 2,312,638 | | | +,C | | Structured Asset Mortgage
Investments, Inc., 5.590%,
(step rate 5.800%),
due 04/19/35 | | | 2,317,724 | | |
| | 11,252,803 | | | C | | Structured Asset Mortgage
Investments, Inc., 7.141%,
due 12/27/35 | | | 11,440,955 | | |
| | 1,696,699 | | | C | | Structured Asset Securities
Corp., 5.500%, due 07/25/33 | | | 1,665,946 | | |
| | 2,871,665 | | | C | | Thornburg Mortgage Securities
Trust, 5.700%, due 12/25/33 | | | 2,875,080 | | |
| | 3,293,020 | | | +,C | | Thornburg Mortgage Securities
Trust, 5.720%, (step rate
6.060%), due 09/25/34 | | | 3,310,665 | | |
| | 610,000 | | | C | | Wachovia Bank Commercial
Mortgage Trust, 5.223%,
due 07/15/42 | | | 609,757 | | |
| | 1,382,218 | | | C | | Wachovia Bank Commercial
Mortgage Trust, 5.726%,
due 06/15/45 | | | 1,395,462 | | |
| | 1,470,000 | | | C | | Wachovia Bank Commercial
Mortgage Trust, 5.935%,
due 06/15/45 | | | 1,509,375 | | |
| | 4,604,772 | | | C | | Washington Mutual Alternative
Mortgage Pass-Through
Certificates, 5.000%,
due 12/25/18 | | | 4,511,200 | | |
| | 3,591,399 | | | C | | Washington Mutual Alternative
Mortgage Pass-Through
Certificates, 5.620%,
due 10/25/46 | | | 3,608,200 | | |
| | 8,664,661 | | | C | | Washington Mutual Alternative
Mortgage Pass-Through
Certificates, 5.728%,
due 05/25/46 | | | 8,672,104 | | |
| | 2,744,737 | | | C | | Washington Mutual Alternative
Mortgage Pass-Through
Certificates, 5.728%,
due 06/25/46 | | | 2,749,991 | | |
| | 14,719,460 | | | C | | Washington Mutual Alternative
Mortgage Pass-Through
Certificates, 5.750%,
due 02/25/36 | | | 14,773,685 | | |
| | 4,256,000 | | | +,C | | Washington Mutual Alternative
Mortgage Pass-Through
Certificates, 5.764%,
(step rate 6.264%),
due 10/25/36 | | | 4,225,036 | | |
| | 8,048,488 | | | C | | Washington Mutual Alternative
Mortgage Pass-Through
Certificates, 6.000%,
due 07/25/36 | | | 8,050,656 | | |
| | 4,366,000 | | | +,C | | Washington Mutual Alternative
Mortgage Pass-Through
Certificates, 6.081%,
(step rate 6.581%),
due 09/25/36 | | | 4,369,645 | | |
| | 14,559,727 | | | C | | Washington Mutual Alternative
Mortgage Pass-Through
Certificates, 6.200%,
due 10/25/46 | | | 14,533,563 | | |
See Accompanying Notes to Financial Statements
98
PORTFOLIO OF INVESTMENTS
ING VP INTERMEDIATE BOND PORTFOLIO AS OF DECEMBER 31, 2006 (CONTINUED)
Principal
Amount | | | | | | Value | |
| COLLATERALIZED MORTGAGE OBLIGATIONS (continued) | | | |
| $ | 12,516,817 | | | C | | Washington Mutual Alternative
Mortgage Pass-Through
Certifications, 5.630%,
due 07/25/46 | | $ | 12,552,378 | | |
| | 1,826,162 | | | C | | Washington Mutual Alternative
Mortgage Pass-Through
Certifications, 5.920%,
due 07/25/36 | | | 1,823,710 | | |
| | 1,126,819 | | | C | | Washington Mutual, Inc.,
5.600%, due 01/25/45 | | | 1,129,103 | | |
| | 9,716,452 | | | C | | Washington Mutual, Inc.,
5.610%, due 09/25/46 | | | 9,746,860 | | |
| | 4,701,757 | | | C | | Washington Mutual, Inc.,
5.638%, due 10/25/46 | | | 4,703,412 | | |
| | 1,756,103 | | | C | | Washington Mutual, Inc.,
5.660%, due 01/25/45 | | | 1,760,348 | | |
| | 3,073,048 | | | C | | Washington Mutual, Inc.,
5.750%, due 08/25/45 | | | 3,088,602 | | |
| | 1,960,972 | | | C | | Washington Mutual, Inc.,
5.777%, due 10/25/46 | | | 1,973,609 | | |
| | 1,930,440 | | | +,C | | Washington Mutual, Inc.,
5.795%, (step rate 6.160%),
due 06/25/44 | | | 1,938,261 | | |
| | 4,082,364 | | | C | | Washington Mutual, Inc.,
6.000%, due 06/25/34 | | | 4,083,641 | | |
| | 6,671,000 | | | C | | Wells Fargo Mortgage-Backed
Securities Trust, 3.499%,
due 06/25/35 | | | 6,499,572 | | |
| | 6,791,000 | | | C | | Wells Fargo Mortgage-Backed
Securities Trust, 4.109%,
due 06/25/35 | | | 6,638,012 | | |
| | 5,950,000 | | | C | | Wells Fargo Mortgage-Backed
Securities Trust, 4.500%,
due 08/25/18 | | | 5,646,899 | | |
| | 6,771,591 | | | C | | Wells Fargo Mortgage-Backed
Securities Trust, 5.000%,
due 12/25/33 | | | 6,492,263 | | |
| | 10,684,090 | | | C | | Wells Fargo Mortgage-Backed
Securities Trust, 5.387%,
due 08/25/35 | | | 10,543,027 | | |
| | 5,888,342 | | | C | | Wells Fargo Mortgage-Backed
Securities Trust, 5.500%,
due 12/25/35 | | | 5,768,735 | | |
| | 6,590,516 | | | C | | Wells Fargo Mortgage-Backed
Securities Trust, 5.500%,
due 01/25/36 | | | 6,446,348 | | |
| | 24,378,546 | | | C | | Wells Fargo Mortgage-Backed
Securities Trust, 5.690%,
due 12/25/36 | | | 24,267,989 | | |
| | 11,653,208 | | | C | | Wells Fargo Mortgage-Backed
Securities Trust, 5.989%,
due 10/25/36 | | | 11,678,670 | | |
| | 11,461,952 | | | C | | Wells Fargo Mortgage-Backed
Securities Trust, 6.000%,
due 06/25/36 | | | 11,467,717 | | |
| | 10,210,641 | | | C | | Wells Fargo Mortgage-Backed
Securities Trust, 6.001%,
due 11/25/36 | | | 10,232,952 | | |
Total Collateralized Mortgage
Obligations
(Cost $845,981,805) | | | 844,226,732 | | |
Principal
Amount | | | | | | Value | |
| MUNICIPAL BONDS: 1.0% | | | |
| | | California: 0.3% | |
| $ | 5,944,000 | | | C | | City of San Diego, 7.125%,
due 06/01/32 | | $ | 6,128,799 | | |
| | | | 6,128,799 | | |
| | | Louisiana: 0.3% | |
| | 8,010,000 | | | #,C | | Tulane University of Louisiana,
6.174%, due 11/15/12 | | | 8,010,000 | | |
| | | | 8,010,000 | | |
| | | Michigan: 0.4% | |
| | 10,230,000 | | | | | Michigan Tobacco Settlement
Finance Authority, 7.309%,
due 06/01/34 | | | 10,618,535 | | |
| | | | 10,618,535 | | |
Total Municipal Bonds
(Cost $24,316,710) | | | 24,757,334 | | |
| OTHER BONDS: 0.8% | | | |
| | | Foreign Government Bonds: 0.8% | |
| ARS | 27,615,300 | | | @@,L | | Argentina Bonos, 0.000%,
due 09/30/14 | | | 9,942,248 | | |
| TRY | 19,627,000 | | | @@ | | Turkey Government
International Bond, 21.280%,
due 08/13/08 | | | 10,151,451 | | |
Total Other Bonds
(Cost $19,351,287) | | | 20,093,699 | | |
| Shares | | | | | | Value | |
| EQUITY-LINKED SECURITIES: 0.4% | | | |
| | | Equity Linked Securities: 0.4% | |
| | 11,900,000 | | | | | KAUP Bank | | | 11,171,875 | | |
Total Equity-Linked Securities
(Cost $11,900,000) | | | 11,171,875 | | |
| PREFERRED STOCK: 1.8% | | | |
| | | Banks: 0.5% | |
| | 497,280 | | | P | | Bank of American Corp. | | | 12,407,136 | | |
| | | | 12,407,136 | | |
| | | Diversified Financial Services: 0.4% | |
| | 319,705 | | | P | | Merrill Lynch & Co., Inc. | | | 8,337,906 | | |
| | | | 8,337,906 | | |
| | | Insurance: 0.7% | |
| | 411,692 | | | @@,P | | Aegon NV | | | 10,693,951 | | |
| | 285,147 | | | P | | Metlife, Inc. | | | 7,502,218 | | |
| | | | 18,196,169 | | |
| | | Real Estate Investment Trusts: 0.2% | |
| | 204,807 | | | P | | Duke Realty Corp. | | | 5,320,886 | | |
| | | | 5,320,886 | | |
Total Preferred Stock
(Cost $43,210,698) | | | 44,262,097 | | |
Total Long-Term Investments
(Cost $2,725,871,599) | | | 2,720,557,085 | | |
See Accompanying Notes to Financial Statements
99
PORTFOLIO OF INVESTMENTS
ING VP INTERMEDIATE BOND PORTFOLIO AS OF DECEMBER 31, 2006 (CONTINUED)
Principal
Amount | | | | | | Value | |
| SHORT-TERM INVESTMENTS: 18.6% | |
| | | Mutual Fund: 1.4% | |
| $ | 35,000,000 | | | ** | | ING Institutional Prime Money
Market Fund | | $ | 35,000,000 | | |
Total Mutual Fund
(Cost $35,000,000) | | | 35,000,000 | | |
| | | | | | | Repurchase Agreement: 1.2% | |
| | 31,456,000 | | | Deutsche Bank Repurchase
Agreement dated 12/29/06,
5.250%, due 01/02/07,
$31,474,349 to be received
upon repurchase
(Collateralized by
$30,179,000 v arious U.S.
Government Agency
Obligations, 3.375%-6.875%,
Market Value plus accrued
interest $32,085,236,
due 07/15/08-09/15/10) | | | 31,456,000 | | |
Total Repurchase Agreement
(Cost $31,456,000) | | | 31,456,000 | | |
| Securities Lending Collateralcc: 16.0% | |
| | 404,474,535 | | | | | The Bank of New York
Institutional Cash Reserves
Fund | | | 404,474,535 | | |
| | | | | | | Total Securities Lending
Collateral
(Cost $404,474,535) | | | 404,474,535 | | |
| | | | | | | Total Short-Term Investments
(Cost $470,930,535) | | | 470,930,535 | | |
Total Investments in
Securities
(Cost $3,196,802,134)* | | | 126.1 | % | | $ | 3,191,487,620 | | |
Other Assets and
Liabilities - Net | | | (26.1 | ) | | | (661,261,668 | ) | |
| Net Assets | | | 100.0 | % | | $ | 2,530,225,952 | | |
@@ Foreign Issuer
STRIP Separate Trading of Registered Interest and Principal of Securities
MASTR Mortgage Asset Securitization Transaction, Inc.
+ Step-up basis bonds. Interest rates shown reflect current and future coupon rates.
# Securities with purchases pursuant to Rule 144A, under the Securities Act of 1933 and may not be resold subject to that rule except to qualified institutional buyers. These securities have been determined to be liquid under the guidelines established by the Funds' Board of Directors/Trustees.
C Bond may be called prior to maturity date.
P Preferred Stock may be called prior to convertible date.
cc Securities purchased with cash collateral for securities loaned.
W When-issued or delayed delivery security
I Illiquid security
L Loaned security, a portion or all of the security is on loan at December 31, 2006.
ARS Argentine Peso
JPY Japanese Yen
TRY Turkish Lira
^ Interest Only (IO) Security
** Investment in affiliate
* Cost for federal income tax purposes is $3,197,459,593.
Net unrealized depreciation consists of:
| Gross Unrealized Appreciation | | $ | 14,424,136 | | |
| Gross Unrealized Depreciation | | | (20,396,109 | ) | |
| Net Unrealized Depreciation | | $ | (5,971,973 | ) | |
See Accompanying Notes to Financial Statements
100
PORTFOLIO OF INVESTMENTS
ING VP INTERMEDIATE BOND PORTFOLIO AS OF DECEMBER 31, 2006 (CONTINUED)
ING VP Intermediate Bond Portfolio Credit Default Swap Agreements Outstanding on December 31, 2006:
| Counterparty | | Reference
Entity/Obligation | | Buy/Sell
Protection | | (Pay)/Receive
Fixed Rate | | Termination
Date | | Notional
Amount | | Unrealized
Appreciation/
(Depreciation) | |
Morgan Stanley
| |
| Capital Services Inc. | | Domtar Inc. 7.875% due 10/15/2011 | | Buy | | | (2.65 | )% | | 9/20/11 | | USD | 2,758,500 | | | $ | (120,223 | ) | |
| UBS AG | | Domtar Inc. 7.875% due 10/15/2011 | | Sell | | | 2.60 | % | | 9/20/11 | | USD | 2,761,000 | | | | 105,407 | | |
| Citibank N.A., New York Dow Jones CDX.NA.IG.6 Index | | (3-7% Tranche) | | Buy | | | (4.66)% | | | 6/20/16 | | | USD5,335,970 | | | | (226,652) | | |
| Citibank N.A., New York Dow Jones CDX.NA.IG.6 Index | | (7-10% Tranche) | | Sell | | | 1.0025% | | | 6/20/16 | | | USD16,142,880 | | | | 7,514 | | |
| Citibank N.A., New York | | Dow Jones CDX.NA.XO.7 Index | | Buy | | | (1.65)% | | | 12/20/11 | | | USD26,099,000 | | | | (67,770) | | |
| Citibank N.A., New York Entergy Corporation 7.75% | | due 12/15/2009 | | Sell | | | 0.38% | | | 12/20/11 | | | USD9,466,000 | | | | 21,519 | | |
| Citibank N.A., New York Glitnir Banki HF Floating Rate Note | | due 1/27/2010 | | Buy | | | (0.60)% | | | 9/20/11 | | | USD5,501,000 | | | | (62,690) | | |
| UBS AG Glitnir Banki HF Floating Rate Note | | due 1/27/2010 | | Buy | | | (0.61)% | | | 9/20/11 | | | USD5,501,000 | | | | (71,920) | | |
| Morgan Stanley Capital Services Inc. | | H.J. Heinz Co.6% due 3/15/2008 | | Buy | | | (0.35)% | | | 9/20/11 | | | USD16,503,000 | | | | (19,873) | | |
| Morgan Stanley Capital Services Inc. | | H.J. Heinz Co.6% due 3/15/2008 | | Buy | | | (0.41)% | | | 9/20/11 | | | USD19,253,500 | | | | (72,050) | | |
| Morgan Stanley Capital Services Inc. | | HCA Inc. LN Tranche Number: LN300285 | | Buy | | | (1.70)% | | | 12/20/11 | | | USD6,090,000 | | | | (124,243) | | |
| Barclays Bank PLC | | Kinder Morgan Inc. 6.5% due 9/1/2012 | | Sell | | | 1.70 | % | | 9/20/11 | | USD | 1,104,000 | | | | 25,273 | | |
| Merrill Lynch International | | Kinder Morgan Inc. 6.5% due 9/1/2012 | | Buy | | | (1.90)% | | | 9/20/11 | | | USD2,761,000 | | | | (88,673) | | |
| UBS AG | | Kinder Morgan Inc. 6.5% due 9/1/2012 | | Buy | | | (1.90 | )% | | 9/20/11 | | USD | 2,761,000 | | | | (92,222 | ) | |
| UBS AG Rogers Wireless Inc. 7.25% | | due 12/15/2012 | | Sell | | | 1.30% | | | 12/15/12 | | | USD5,454,000 | | | | 175,353 | | |
| UBS AG Russian Federation 5% Step | | due 3/31/2030 | | Sell | | | 0.31% | | | 8/20/07 | | | USD21,897,000 | | | | 41,651 | | |
| UBS AG Russian Federation 5% Step | �� | due 3/31/2030 | | Sell | | | 0.24% | | | 8/20/07 | | | USD14,485,000 | | | | 1,997 | | |
| Citibank N.A., New York | | Telus Corporation 8% due 6/1/2011 | | Sell | | | 0.45% | | | 12/20/11 | | | USD1,133,000 | | | | 2,591 | | |
| Goldman Sachs International | | Telus Corporation 8% due 6/1/2011 | | Sell | | | 0.47% | | | 12/20/11 | | | USD6,057,000 | | | | 25,751 | | |
| Citibank N.A., New York United States Steel Corporation 9.75% | | due 5/15/2010 | | Buy | | | (1.70)% | | | 12/20/16 | | | USD1,130,000 | | | | (12,777) | | |
| Citibank N.A., New York United States Steel Corporation 9.75% | | due 5/15/2010 | | Buy | | | (1.68)% | | | 12/20/16 | | | USD1,689,000 | | | | (16,639) | | |
| UBS AG | | XL Capital Ltd. 5.25% due 9/15/2014 | | Buy | | | (0.61 | )% | | 9/20/16 | | USD | 5,501,000 | | | | (123,138 | ) | |
| UBS AG | | XL Capital Ltd. 5.25% due 9/15/2014 | | Buy | | | (0.61 | )% | | 9/20/16 | | USD | 11,002,000 | | | | (246,275 | ) | |
| | | | | | | $ | (938,089 | ) | |
ING VP Intermediate Bond Portfolio Open Futures Contracts on December 31, 2006
| Contract Description | | Number
of Contracts | | Notional
Market Value ($) | | Expiration Date | | Unrealized
Appreciation/
(Depreciation) | |
| Long Contracts | |
| U.S. Treasury 2-Year Note | | | 2,055 | | | | 419,284,239 | | | 3/30/07 | | $ | (1,427,037 | ) | |
| U.S. Treasury 5-Year Note | | | 2,849 | | | | 299,323,063 | | | 3/30/07 | | | (3,014,724 | ) | |
| | | | | | | | | | | | | $ | (4,441,761 | ) | |
| Short Contracts | |
| 90-Day Eurodollar | | | 2,288 | | | | (541,569,600 | ) | | 3/19/07 | | $ | 118,870 | | |
| U.S. Treasury 10-Year Note | | | 789 | | | | (84,792,844 | ) | | 3/21/07 | | | 933,111 | | |
| U.S. Treasury Long Bond | | | 1,191 | | | | (132,722,063 | ) | | 3/21/07 | | | 2,982,041 | | |
| | | | | | | | | | | | | $ | 4,034,022 | | |
See Accompanying Notes to Financial Statements
101
PORTFOLIO OF INVESTMENTS
ING VP MONEY MARKET PORTFOLIO(1) AS OF DECEMBER 31, 2006
Principal
Amount | | | | | | Value | |
| CERTIFICATES OF DEPOSIT: 2.5% | | | |
| $ | 17,500,000 | | | C | | ABN Amro Bank, 5.350%,
due 12/11/07 | | $ | 17,500,000 | | |
| | 6,000,000 | | | | | Canadian Imperial Bank of
Commerce, 5.350%,
due 04/11/07 | | | 5,995,269 | | |
| | 8,000,000 | | | | | Credit Suisse, 5.506%,
due 02/02/07 | | | 7,995,060 | | |
| | 3,000,000 | | | | | HBOS Treasury Services PLC,
5.350%, due 04/11/07 | | | 2,997,634 | | |
Total Certificates of Deposit
(Cost $34,487,963) | | | 34,487,963 | | |
| COLLATERALIZED MORTGAGE OBLIGATIONS: 4.0% | | | |
| | 10,750,000 | | | @@,#,C | | Cheyne High Grade CDO Ltd.,
5.380%, due 11/13/07 | | | 10,750,000 | | |
| | 15,200,000 | | | @@,#,C | | Newcastle CDO Ltd., 5.380%,
due 03/26/07 | | | 15,200,000 | | |
| | 13,900,000 | | | @@,#,C,I | | Newcastle CDO Ltd., 5.380%,
due 09/24/07 | | | 13,900,000 | | |
| | 13,900,000 | | | @@,#,C,I | | Newcastle CDO Ltd., 5.380%,
due 10/24/07 | | | 13,900,000 | | |
Total Collateralized Mortgage
Obligations
(Cost $53,750,000) | | | 53,750,000 | | |
| COMMERCIAL PAPER: 38.4% | | | |
| | 35,000,000 | | | | | Alliance & Leicester PLC,
5.280%, due 03/20/07 | | | 34,599,600 | | |
| | 3,000,000 | | | | | ANZ National, 5.170%,
due 04/04/07 | | | 2,959,932 | | |
| | 24,500,000 | | | | | ASB Finance Ltd., 5.280%,
due 02/01/07 | | | 24,408,408 | | |
| | 65,000,000 | | | @@,# | | BHP Billiton Financial USA
Ltd., 5.330%, due 01/25/07 | | | 64,818,997 | | |
| | 21,000,000 | | | | | Cafco LLC, 5.285%,
due 01/05/07 | | | 20,987,668 | | |
| | 8,000,000 | | | @@,# | | Caisse Nationale, 5.295%,
due 01/04/07 | | | 7,996,470 | | |
| | 64,000,000 | | | | | Concord Minutemen Capital
Co., LLC, 5.290%,
due 02/06/07 | | | 63,605,040 | | |
| | 1,500,000 | | | # | | Concord Minutemen Capital
Co., LLC, 5.360%,
due 01/22/07 | | | 1,495,310 | | |
| | 2,000,000 | | | # | | Crown Point Capital Corp.,
5.290%, due 01/10/07 | | | 1,997,355 | | |
| | 49,000,000 | | | | | Crown Point Capital Corp.,
5.330%, due 01/18/07 | | | 48,876,670 | | |
| | 31,000,000 | | | | | Duke Funding High Grade I
Ltd., 5.320%, due 01/12/07 | | | 30,919,702 | | |
| | 59,000,000 | | | | | Monument Gardens Funding,
LLC, 5.290%, due 01/22/07 | | | 58,851,647 | | |
| | 40,307,000 | | | # | | Old Line Funding, 5.320%,
due 01/19/07 | | | 40,147,991 | | |
| | 16,000,000 | | | | | Park Avenue Receivables
Corp., 5.295%, due 02/21/07 | | | 15,879,980 | | |
| | 6,000,000 | | | | | St. Germain Holdings Ltd.,
5.300%, due 01/11/07 | | | 5,991,167 | | |
| | 6,000,000 | | | | | Three Pillars Funding Corp.,
5.260%, due 03/15/07 | | | 5,936,003 | | |
| | 15,346,000 | | | # | | Thunder Bay Funding, LLC,
5.330%, due 01/18/07 | | | 15,271,546 | | |
Principal
Amount | | | | | | Value | |
| $ | 57,000,000 | | | | | Tulip Funding Corp., 5.320%,
due 01/02/07 | | $ | 56,991,577 | | |
| | 9,500,000 | | | | | UBS Finance, 5.215%,
due 05/11/07 | | | 9,321,096 | | |
| | 3,000,000 | | | | | Westpac Trust, 5.400%,
due 01/08/07 | | | 2,996,850 | | |
| | 5,978,000 | | | | | Yorktown Capital, LLC,
5.350%, due 01/22/07 | | | 5,960,827 | | |
Total Commercial Paper
(Cost $520,013,836) | | | 520,013,836 | | |
| CORPORATE BONDS/NOTES: 50.2% | | | |
| | 3,500,000 | | | @@ | | Alliance & Leicester PLC,
5.449%, due 01/14/08 | | | 3,502,602 | | |
| | 15,000,000 | | | # | | Allstate Life Global Funding II,
5.430%, due 04/02/07 | | | 15,002,968 | | |
| | 5,500,000 | | | | | American Express Bank FSB,
5.350%, due 10/18/07 | | | 5,500,988 | | |
| | 4,500,000 | | | | | American Express Bank FSB,
5.430%, due 11/16/07 | | | 4,503,853 | | |
| | 13,000,000 | | | | | American Express Bank FSB,
5.440%, due 07/19/07 | | | 13,007,761 | | |
| | 5,000,000 | | | | | American Express Bank FSB,
5.440%, due 09/14/07 | | | 5,003,799 | | |
| | 13,690,000 | | | | | American General Finance
Corp., 5.292%, due 11/15/07 | | | 13,598,073 | | |
| | 17,200,000 | | | | | American General Finance
Corp., 5.400%, due 01/15/08 | | | 17,199,885 | | |
| | 6,700,000 | | | # | | American Honda Finance
Corp., 5.476%, due 05/11/07 | | | 6,703,119 | | |
| | 24,000,000 | | | | | Bank of America N.A., 5.315%,
due 02/23/07 | | | 23,999,427 | | |
| | 17,000,000 | | | | | Bank of America N.A., 5.315%,
due 04/18/07 | | | 16,999,580 | | |
| | 9,500,000 | | | # | | Bank of New York, Inc.,
5.410%, due 01/25/08 | | | 9,500,000 | | |
| | 13,000,000 | | | | | Bear Stearns Cos., Inc.,
5.370%, due 08/01/07 | | | 13,002,794 | | |
| | 12,750,000 | | | | | Bear Stearns Cos., Inc.,
5.410%, due 01/28/08 | | | 12,750,000 | | |
| | 12,300,000 | | | | | Bear Stearns Cos., Inc.,
5.430%, due 01/04/08 | | | 12,300,000 | | |
| | 6,000,000 | | | | | Bear Stearns Cos., Inc.,
5.486%, due 03/01/07 | | | 6,001,788 | | |
| | 17,000,000 | | | @@ | | BNP Paribas, 5.312%,
due 01/26/07 | | | 17,000,000 | | |
| | 24,000,000 | | | | | Credit Suisse, 5.342%,
due 01/12/07 | | | 23,999,597 | | |
| | 5,000,000 | | | | | Credit Suisse, 5.356%,
due 03/27/07 | | | 4,999,920 | | |
| | 32,000,000 | | | # | | Duke Funding High Grade I
Ltd., 5.330%, due 06/06/07 | | | 31,998,629 | | |
| | 18,500,000 | | | | | General Electric Capital Corp.,
5.425%, due 06/22/07 | | | 18,507,591 | | |
| | 16,000,000 | | | | | General Electric Capital Corp.,
5.475%, due 07/09/07 | | | 16,000,000 | | |
| | 11,000,000 | | | I | | Goldman Sachs Group, Inc.,
5.390%, due 02/14/07 | | | 11,000,000 | | |
| | 10,500,000 | | | I | | Goldman Sachs Group, Inc.,
5.390%, due 05/11/07 | | | 10,500,000 | | |
| | 12,050,000 | | | # | | Goldman Sachs Group, Inc.,
5.400%, due 01/15/08 | | | 12,050,000 | | |
| | 18,500,000 | | | # | | Goldman Sachs Group, Inc.,
5.475%, due 09/14/07 | | | 18,514,109 | | |
See Accompanying Notes to Financial Statements
102
PORTFOLIO OF INVESTMENTS
ING VP MONEY MARKET PORTFOLIO(1) AS OF DECEMBER 31, 2006 (CONTINUED)
Principal
Amount | | | | | | Value | |
| CORPORATE BONDS/NOTES (continued) | | | |
| $ | 3,500,000 | | | | | Goldman Sachs Group, Inc.,
5.510%, due 01/09/07 | | $ | 3,503,945 | | |
| | 7,800,000 | | | @@,# | | HBOS Treasury Services PLC,
5.396%, due 02/01/08 | | | 7,800,000 | | |
| | 27,000,000 | | | @@,# | | HBOS Treasury Services PLC,
5.436%, due 01/24/08 | | | 27,004,325 | | |
| | 27,000,000 | | | @@,# | | HBOS Treasury Services PLC,
5.452%, due 01/12/07 | | | 27,000,861 | | |
| | 2,000,000 | | | | | HSBC Finance Corp., 5.461%,
due 06/15/07 | | | 2,001,105 | | |
| | 8,700,000 | | | | | JPMorgan Chase & Co.,
5.378%, due 05/30/07 | | | 8,695,182 | | |
| | 11,000,000 | | | | | Lehman Brothers Holdings,
Inc., 5.415%, due 07/19/07 | | | 11,005,712 | | |
| | 11,000,000 | | | | | Lehman Brothers Holdings,
Inc., 5.494%, due 04/20/07 | | | 11,005,002 | | |
| | 32,000,000 | | | | | Merrill Lynch & Co., Inc.,
5.320%, due 07/27/07 | | | 32,000,000 | | |
| | 5,000,000 | | | | | Merrill Lynch & Co., Inc.,
5.390%, due 08/22/07 | | | 5,002,259 | | |
| | 31,400,000 | | | #,I | | Money Market Trust Series A,
5.425%, due 11/09/07 | | | 31,400,000 | | |
| | 1,047,000 | | | | | Morgan Stanley, 4.037%,
due 03/01/07 | | | 1,049,341 | | |
| | 2,400,000 | | | C | | Morgan Stanley, 5.445%,
due 04/01/07 | | | 2,401,979 | | |
| | 8,000,000 | | | | | Morgan Stanley, 5.499%,
due 02/15/07 | | | 8,001,617 | | |
| | 15,000,000 | | | | | Morgan Stanley, 5.512%,
due 01/12/07 | | | 15,000,524 | | |
| | 14,000,000 | | | | | Natixis SA, 5.310%,
due 12/05/07 | | | 13,997,464 | | |
| | 3,500,000 | | | | | Suntrust Bank, 5.320%,
due 11/19/07 | | | 3,500,000 | | |
| | 27,000,000 | | | | | Toronto Dominion Bank,
5.320%, due 04/27/07 | | | 27,000,000 | | |
| | 15,000,000 | | | | | Toyota Motor Credit Corp.,
5.302%, due 04/26/07 | | | 15,000,000 | | |
| | 24,600,000 | | | | | Verizon Global Funding Corp.,
5.470%, due 01/12/07 | | | 24,600,000 | | |
| | 4,500,000 | | | | | Washington Mutual Bank,
5.355%, due 09/17/07 | | | 4,499,765 | | |
| | 23,500,000 | | | | | Washington Mutual Bank,
5.410%, due 02/28/07 | | | 23,502,402 | | |
| | 13,500,000 | | | | | Washington Mutual Bank,
5.415%, due 11/16/07 | | | 13,504,926 | | |
| | 10,800,000 | | | | | Wells Fargo & Co., 5.386%,
due 01/02/08 | | | 10,800,000 | | |
| | 7,800,000 | | | | | Westpac Banking Corp.,
5.393%, due 01/11/08 | | | 7,800,000 | | |
Total Corporate Bonds/Notes
(Cost $680,222,892) | | | 680,222,892 | | |
| U.S. GOVERNMENT AGENCY OBLIGATIONS: 2.5% | | | |
| | | Federal Home Loan Bank: 2.5% | |
| | 34,000,000 | | | C | | 5.555%, due 08/15/07 | | | 34,000,000 | | |
Total U.S. Government
Agency Obligations
(Cost $34,000,000) | | | 34,000,000 | | |
Principal
Amount | | Value | |
| REPURCHASE AGREEMENT: 2.6% | |
| $ | 35,649,000 | | | Morgan Stanley Repurchase
Agreement dated 12/29/06,
5.250%, due 01/02/07,
$35,669,795 to be received
upon repurchase
(Collateralized by
$70,075,000 Resolution
Funding Corp., 8.125%-
9.375%, Market Value plus
accrued interest $36,362,594,
due 10/15/19-10/15/20). | | $ | 35,649,000 | | |
Total Repurchase Agreement
(Cost $35,649,000) | | | 35,649,000 | | |
Total Investments in
Securities
(Cost $1,358,123,691)* | | | 100.2 | % | | $ | 1,358,123,691 | | |
Other Assets and
Liabilities - Net | | | (0.2 | ) | | | (2,273,608 | ) | |
| Net Assets | | | 100.0 | % | | $ | 1,355,850,083 | | |
(1) All securities with a maturity date greater than one year have either a variable rate. a demand feature, are prerefunded, or an optional or mandatory put resulting in an effective maturity of one year or less. Rate shown reflects current rate.
@@ Foreign Issuer
# Securities with purchases pursuant to Rule 144A, under the Securities Act of 1933 and may not be resold subject to that rule except to qualified institutional buyers. These securities have been determined to be liquid under the guidelines established by the Funds' Board of Directors/Trustees.
C Bond may be called prior to maturity date.
I Illiquid security
* Cost for federal income tax purposes is $1,358,123,810.
Net unrealized depreciation consists of:
| Gross Unrealized Appreciation | | $ | 0 | | |
| Gross Unrealized Depreciation | | | (119 | ) | |
| Net Unrealized Depreciation | | $ | (119 | ) | |
See Accompanying Notes to Financial Statements
103
ING VP GLOBAL SCIENCE AND PORTFOLIO OF INVESTMENTS
TECHNOLOGY PORTFOLIO AS OF DECEMBER 31, 2006
| Shares | | | | | | Value | |
| COMMON STOCK: 97.9% | | | |
| | | | | Bermuda: 0.8% | |
| | 33,100 | | | @,L | | Marvell Technology Group Ltd. | | $ | 635,189 | | |
| | | | 635,189 | | |
| | | | | Brazil: 0.4% | |
| | 30,200 | | | L | | Net Servicos de
Comunicacao SA ADR | | | 361,796 | | |
| | | | 361,796 | | |
| | | | | Canada: 0.6% | |
| | 4,000 | | | @,L | | Research In Motion Ltd. | | | 511,120 | | |
| | | | 511,120 | | |
| | | | | Cayman Islands: 0.7% | |
| | 22,800 | | | L | | Seagate Technology, Inc. | | | 604,200 | | |
| | | | 604,200 | | |
| | | | | China: 0.0% | |
| | 1,400 | | | @ | | China Communications Services | | | 799 | | |
| | | | 799 | | |
| | | | | France: 2.0% | |
| | 39,800 | | | L | | Alcatel SA ADR | | | 565,956 | | |
| | 4,700 | | | @ | | Alstom | | | 634,339 | | |
| | 3,400 | | | | | Neopost SA | | | 426,556 | | |
| | | | 1,626,851 | | |
| | | | | Germany: 2.4% | |
| | 33,800 | | | @ | | Infineon Technologies AG | | | 474,214 | | |
| | 15,700 | | | L | | SAP AG ADR | | | 833,670 | | |
| | 8,200 | | | | | Software AG | | | 638,904 | | |
| | | | 1,946,788 | | |
| | | | | Guernsey: 0.6% | |
| | 13,400 | | | @ | | Amdocs Ltd. | | | 519,250 | | |
| | | | 519,250 | | |
| | | | | Hong Kong: 1.9% | |
| | 135,000 | | | L | | ASM Pacific Technology | | | 750,566 | | |
| | 92,400 | | | | | China Mobile Ltd. | | | 796,483 | | |
| | | | 1,547,049 | | |
| | | | | India: 0.9% | |
| | 51,000 | | | @ | | Bharti Airtel Ltd. | | | 726,053 | | |
| | | | 726,053 | | |
| | | | | Japan: 2.4% | |
| | 7,000 | | | | | Disco Corp. | | | 492,216 | | |
| | 18,000 | | | | | Kurita Water Industries Ltd. | | | 388,238 | | |
| | 18,000 | | | | | NSD CO., Ltd. | | | 572,069 | | |
| | 2,500 | | | | | Obic Co., Ltd. | | | 518,131 | | |
| | | | 1,970,654 | | | | | | |
| | | | | Mexico: 1.2% | |
| | 21,500 | | | | | America Movil SA de CV | | | 972,230 | | |
| | | | 972,230 | | |
| | | | | Netherlands: 0.6% | |
| | 20,200 | | | @,L | | ASML Holding NV | | | 497,526 | | |
| | | | 497,526 | | |
| | | | | Singapore: 1.0% | |
| | 653,900 | | | @,L | | STATS ChipPAC Ltd. | | | 502,408 | | |
| | 17,771 | | | @ | | Verigy Ltd. | | | 315,435 | | |
| | | | 817,843 | | |
| Shares | | Value | |
| | | South Korea: 1.2% | |
| | 4,500 | | | @ | | NHN Corp. | | $ | 547,355 | | |
| | 700 | | | | | Samsung Electronics Co., Ltd. | | | 459,206 | | |
| | | | 1,006,561 | | |
| | | | | Sweden: 1.0% | |
| | 20,600 | | | | | Telefonaktiebolaget LM
Ericsson ADR | | | 828,738 | | |
| | | | 828,738 | | |
| | | | | Switzerland: 2.1% | |
| | 3,700 | | | L | | Alcon, Inc. | | | 413,549 | | |
| | 3,600 | | | | | Roche Holding AG | | | 644,089 | | |
| | 7,500 | | | | | Roche Holding AG ADR | | | 671,234 | | |
| | | | 1,728,872 | | |
| | | | | Taiwan: 5.6% | |
| | 109,660 | | | | | Cheng Uei Precision
Industry Co., Ltd. | | | 390,786 | | |
| | 170,000 | | | @ | | Gemtek Technology Corp. | | | 368,768 | | |
| | 132,433 | | | @ | | HON HAI Precision Industry Co., Ltd. | | | 942,275 | | |
| | 66,135 | | | | | Lite-On Technology Corp. | | | 89,217 | | |
| | 32,000 | | | | | MediaTek, Inc. | | | 329,546 | | |
| | 660,000 | | | | | Powerchip Semiconductor Corp. | | | 443,390 | | |
| | 250,000 | | | | | Realtek Semiconductor Corp. | | | 429,113 | | |
| | 65,600 | | | | | Taiwan Semiconductor
Manufacturing Co., Ltd. ADR | | | 717,008 | | |
| | 597,728 | | | | | Wistron Corp. | | | 884,938 | | |
| | | | 4,595,041 | | |
| | | | | United Kingdom: 1.8% | |
| | 79,500 | | | @ | | Autonomy Corp. PLC | | | 790,353 | | |
| | 117,800 | | | | | Meggitt PLC | | | 713,010 | | |
| | | | 1,503,363 | | |
| | | | | United States: 70.7% | |
| | 81,000 | | | @,L | | | 3 | Com Corp. | | | 332,910 | | |
| | 27,300 | | | @ | | Adobe Systems, Inc. | | | 1,122,576 | | |
| | 5,300 | | | @,L | | Affymax, Inc. | | | 180,412 | | |
| | 33,300 | | | @ | | Agere Systems, Inc. | | | 638,361 | | |
| | 21,000 | | | @ | | Agilent Technologies, Inc. | | | 731,850 | | |
| | 25,400 | | | @,L | | Akamai Technologies, Inc. | | | 1,349,248 | | |
| | 45,600 | | | @,L | | Alexion Pharmaceuticals, Inc. | | | 1,841,784 | | |
| | 7,500 | | | L | | Allergan, Inc. | | | 898,050 | | |
| | 8,900 | | | @ | | Amgen, Inc. | | | 607,959 | | |
| | 12,300 | | | | | Amphenol Corp. | | | 763,584 | | |
| | 19,200 | | | @ | | Apple Computer, Inc. | | | 1,628,928 | | |
| | 30,700 | | | @ | | Applera Corp. - Celera
Genomics Group | | | 429,493 | | |
| | 35,500 | | | L | | Applied Materials, Inc. | | | 654,975 | | |
| | 13,500 | | | @,L | | aQuantive, Inc. | | | 332,910 | | |
| | 26,800 | | | | | AT&T, Inc. | | | 958,100 | | |
| | 20,700 | | | @,L | | Atheros Communications, Inc. | | | 441,324 | | |
| | 16,900 | | | @ | | Autodesk, Inc. | | | 683,774 | | |
| | 40,500 | | | @,L | | BEA Systems, Inc. | | | 509,490 | | |
| | 13,300 | | | @,L | | Biogen Idec, Inc. | | | 654,227 | | |
| | 49,700 | | | @,L | | BioMarin Pharmaceuticals, Inc. | | | 814,583 | | |
| | 10,800 | | | | | Biomet, Inc. | | | 445,716 | | |
| | 24,800 | | | @,L | | Broadcom Corp. | | | 801,288 | | |
| | 17,400 | | | @,L | | Ciena Corp. | | | 482,154 | | |
| | 77,400 | | | @ | | Cisco Systems, Inc. | | | 2,115,343 | | |
| | 16,600 | | | @,L | | Comcast Corp. | | | 702,678 | | |
| | 29,000 | | | @ | | Corning, Inc. | | | 542,590 | | |
| | 15,800 | | | @,L | | Cyberonics | | | 326,112 | | |
See Accompanying Notes to Financial Statements
104
ING VP GLOBAL SCIENCE AND PORTFOLIO OF INVESTMENTS
TECHNOLOGY PORTFOLIO AS OF DECEMBER 31, 2006 (CONTINUED)
| Shares | | | | | | Value | |
| | | | | United States (continued) | |
| | 4,700 | | | @,L | | Cymer, Inc. | | $ | 206,565 | | |
| | 16,000 | | | @ | | Dell, Inc. | | | 401,440 | | |
| | 10,100 | | | @,L | | Double-Take Software, Inc. | | | 130,088 | | |
| | 10,300 | | | @ | | Electronic Arts, Inc. | | | 518,708 | | |
| | 12,000 | | | @ | | Eschelon Telecom, Inc. | | | 237,720 | | |
| | 19,400 | | | @ | | Fiserv, Inc. | | | 1,016,948 | | |
| | 31,700 | | | @,L | | Foundry Networks, Inc. | | | 474,866 | | |
| | 13,100 | | | @,L | | Genentech, Inc. | | | 1,062,803 | | |
| | 12,800 | | | @ | | Gilead Sciences, Inc. | | | 831,104 | | |
| | 15,300 | | | | | Goodrich Corp. | | | 696,915 | | |
| | 3,600 | | | @ | | Google, Inc. | | | 1,657,728 | | |
| | 10,100 | | | L | | Harris Corp. | | | 463,186 | | |
| | 26,800 | | | | | Hewlett-Packard Co. | | | 1,103,892 | | |
| | 11,400 | | | @ | | Huron Consulting Group, Inc. | | | 516,876 | | |
| | 14,000 | | | @ | | Hyperion Solutions Corp. | | | 503,160 | | |
| | 47,400 | | | @ | | Integrated Device Technology, Inc. | | | 733,752 | | |
| | 48,700 | | | | | Intel Corp. | | | 986,175 | | |
| | 8,000 | | | @,L | | Intermune, Inc. | | | 246,000 | | |
| | 15,300 | | | | | International Business
Machines Corp. | | | 1,486,395 | | |
| | 3,400 | | | @,L | | Isilon Systems, Inc. | | | 93,840 | | |
| | 9,300 | | | | | Johnson & Johnson | | | 613,986 | | |
| | 27,300 | | | @,L | | Juniper Networks, Inc. | | | 517,062 | | |
| | 20,600 | | | L | | KLA-Tencor Corp. | | | 1,024,850 | | |
| | 13,500 | | | @,L | | Lam Research Corp. | | | 683,370 | | |
| | 15,900 | | | | | Lockheed Martin Corp. | | | 1,463,913 | | |
| | 18,200 | | | | | Maxim Integrated Products | | | 557,284 | | |
| | 16,400 | | | | | Medtronic, Inc. | | | 877,564 | | |
| | 13,600 | | | @ | | MEMC Electronic Materials, Inc. | | | 532,304 | | |
| | 9,800 | | | | | Merck & Co., Inc. | | | 427,280 | | |
| | 28,600 | | | @,L | | Micron Technology, Inc. | | | 399,256 | | |
| | 44,200 | | | | | Microsoft Corp. | | | 1,319,812 | | |
| | 10,900 | | | | | Molex, Inc. | | | 344,767 | | |
| | 23,200 | | | | | Motorola, Inc. | | | 476,992 | | |
| | 32,200 | | | @ | | Netlist, Inc. | | | 312,984 | | |
| | 29,900 | | | @,L | | Network Appliance, Inc. | | | 1,174,472 | | |
| | 13,100 | | | @,L | | NeuStar, Inc. | | | 424,964 | | |
| | 10,100 | | | @,L | | Northstar Neuroscience, Inc. | | | 145,238 | | |
| | 14,500 | | | @,L | | Nvidia Corp. | | | 536,645 | | |
| | 37,800 | | | @,L | | Oplink Communications, Inc. | | | 777,168 | | |
| | 4,300 | | | @,L | | Optium Corp. | | | 107,242 | | |
| | 58,200 | | | @ | | Oracle Corp. | | | 997,548 | | |
| | 15,000 | | | | | Pfizer, Inc. | | | 388,500 | | |
| | 16,700 | | | @,L | | Pharmion Corp. | | | 429,858 | | |
| | 21,300 | | | | | Qualcomm, Inc. | | | 804,927 | | |
| | 26,400 | | | @ | | Regeneron Pharmaceuticals, Inc. | | | 529,848 | | |
| | 13,000 | | | @ | | SI International, Inc. | | | 421,460 | | |
| | 19,400 | | | @ | | Spansion, LLC | | | 288,284 | | |
| | 11,200 | | | @,L | | Stanley, Inc. | | | 189,392 | | |
| | 10,500 | | | | | Stryker Corp. | | | 578,655 | | |
| | 60,000 | | | @ | | Sun Microsystems, Inc. | | | 325,200 | | |
| | 34,500 | | | @,L | | Sybase, Inc. | | | 852,150 | | |
| | 30,500 | | | @,L | | Symantec Corp. | | | 635,925 | | |
| | 78,400 | | | @ | | TIBCO Software, Inc. | | | 740,096 | | |
| | 32,600 | | | @,L | | TTM Technologies, Inc. | | | 369,358 | | |
| | 17,207 | | | @ | | Varian Medical Systems, Inc. | | | 818,537 | | |
| | 20,200 | | | @ | | VeriSign, Inc. | | | 485,810 | | |
| | 11,895 | | | @,L | | Waters Corp. | | | 582,498 | | |
| | 31,441 | | | | | Windstream Corp. | | | 447,091 | | |
| | 29,000 | | | @,L | | Wright Medical Group, Inc. | | | 675,120 | | |
| | 5,400 | | | @ | | Zimmer Holdings, Inc. | | | 423,252 | | |
| | | | 58,059,242 | | |
Total Common Stock
(Cost $70,582,699) | | | 80,459,165 | | |
Principal
Amount | | Value | |
| SHORT-TERM INVESTMENTS: 25.0% | |
| | | Securities Lending Collateralcc: 25.0% | |
| $ | 20,519,212 | | | The Bank of New York
Institutional Cash
Reserves Fund | | $ | 20,519,212 | | |
Total Short-Term Investments
(Cost $20,519,212) | | | 20,519,212 | | |
Total Investments in
Securities
(Cost $91,101,911)* | | | 122.9 | % | | $ | 100,978,377 | | |
Other Assets and
Liabilities - Net | | | (22.9 | ) | | | (18,828,154 | ) | |
| Net Assets | | | 100.0 | % | | $ | 82,150,223 | | |
Certain foreign securities may have been fair valued in accordance with procedures approved by the Board of Directors/Trustees (note 2A).
@ Non-income producing security
ADR American Depositary Receipt
cc Securities purchased with cash collateral for securities loaned.
L Loaned security, a portion or all of the security is on loan at December 31, 2006.
* Cost for federal income tax purposes is $91,303,545.
Net unrealized appreciation consists of:
| Gross Unrealized Appreciation | | $ | 10,946,767 | | |
| Gross Unrealized Depreciation | | | (1,271,935 | ) | |
| Net Unrealized Appreciation | | $ | 9,674,832 | | |
See Accompanying Notes to Financial Statements
105
ING VP GLOBAL SCIENCE AND PORTFOLIO OF INVESTMENTS
TECHNOLOGY PORTFOLIO AS OF DECEMBER 31, 2006 (CONTINUED)
| Industry | | Percentage of
Net Assets | |
| Aerospace/Defense | | | 3.5 | % | |
| Biotechnology | | | 6.5 | | |
| Commercial Services | | | 0.8 | | |
| Computers | | | 11.6 | | |
| Electrical Components & Equipment | | | 0.4 | | |
| Electronics | | | 4.9 | | |
| Engineering & Construction | | | 0.2 | | |
| Environmental Control | | | 0.5 | | |
| Hand/Machine Tools | | | 0.6 | | |
| Healthcare-Products | | | 6.5 | | |
| Internet | | | 7.0 | | |
| Machinery-Diversified | | | 0.8 | | |
| Media | | | 1.3 | | |
| Office/Business Equipment | | | 0.5 | | |
| Pharmaceuticals | | | 6.2 | | |
| Semiconductors | | | 16.3 | | |
| Software | | | 12.8 | | |
| Telecommunications | | | 17.5 | | |
| Short-Term Investments | | | 25.0 | | |
| Other Assets and Liabilities - Net | | | (22.9 | ) | |
| Net Assets | | | 100.0 | % | |
See Accompanying Notes to Financial Statements
106
ING VP GLOBAL SCIENCE AND PORTFOLIO OF INVESTMENTS
TECHNOLOGY PORTFOLIO AS OF DECEMBER 31, 2006 (CONTINUED)
At December 31, 2006 the following forward currency contracts were outstanding for the ING VP Global Science and Technology Portfolio:
| Currency | | Buy/Sell | | Settlement Date | | In Exchange For | | Value | | Unrealized
Appreciation
(Depreciation) | |
| | | | | | | | | | | | | | | | | USD | | | |
| Australia Dollars | |
| AUD | 940,000 | | | Buy | | 1/10/07 | | NZD | 1,092,496 | | | | 741,777 | | | $ | (27,452 | ) | |
| Australia Dollars | |
| AUD | 935,000 | | | Buy | | 1/10/07 | | NZD | 1,077,485 | | | | 737,832 | | | | (20,827 | ) | |
| Brazil Real | |
| BRL | 455,000 | | | Buy | | 1/12/07 | | USD | 210,162 | | | | 212,470 | | | | 2,308 | | |
| Brazil Real | |
| BRL | 2,030,000 | | | Buy | | 1/12/07 | | USD | 937,211 | | | | 947,941 | | | | 10,730 | | |
| Canada Dollars | |
| CAD | 1,100,000 | | | Buy | | 1/10/07 | | USD | 985,125 | | | | 943,561 | | | | (41,564 | ) | |
| Canada Dollars | |
| CAD | 1,085,000 | | | Buy | | 1/10/07 | | USD | 962,810 | | | | 930,694 | | | | (32,116 | ) | |
| EURO | |
| EUR | 564,000 | | | Buy | | 1/10/07 | | USD | 720,079 | | | | 744,890 | | | | 24,811 | | |
| EURO | |
| EUR | 204,000 | | | Buy | | 1/10/07 | | USD | 261,218 | | | | 269,428 | | | | 8,210 | | |
| EURO | |
| EUR | 685,000 | | | Buy | | 1/10/07 | | USD | 875,142 | | | | 904,697 | | | | 29,555 | | |
| EURO | |
| EUR | 446,000 | | | Buy | | 1/10/07 | | USD | 569,976 | | | | 589,044 | | | | 19,068 | | |
| EURO | |
| EUR | 250,000 | | | Buy | | 1/10/07 | | USD | 320,197 | | | | 330,181 | | | | 9,984 | | |
| EURO | |
| EUR | 960,000 | | | Buy | | 1/10/07 | | USD | 1,224,509 | | | | 1,267,897 | | | | 43,388 | | |
| EURO | |
| EUR | 281,000 | | | Buy | | 1/10/07 | | USD | 372,595 | | | | 371,124 | | | | (1,471 | ) | |
| EURO | |
| EUR | 148,000 | | | Buy | | 1/10/07 | | USD | 195,540 | | | | 195,467 | | | | (73 | ) | |
| Japanese Yen | |
| JPY | 6,424,000 | | | Buy | | 1/10/07 | | USD | 55,237 | | | | 54,056 | | | | (1,181 | ) | |
| Japanese Yen | |
| JPY | 234,405,000 | | | Buy | | 1/11/07 | | USD | 1,991,090 | | | | 1,972,726 | | | | (18,364 | ) | |
| Japanese Yen | |
| JPY | 235,980,000 | | | Buy | | 1/11/07 | | USD | 2,002,750 | | | | 1,985,981 | | | | (16,769 | ) | |
| Japanese Yen | |
| JPY | 117,990,000 | | | Buy | | 1/11/07 | | USD | 1,006,337 | | | | 992,990 | | | | (13,347 | ) | |
| Japanese Yen | |
| JPY | 117,990,000 | | | Buy | | 1/11/07 | | USD | 1,005,304 | | | | 992,990 | | | | (12,314 | ) | |
| Japanese Yen | |
| JPY | 50,853,000 | | | Buy | | 1/10/07 | | USD | 433,566 | | | | 427,913 | | | | (5,653 | ) | |
| Japanese Yen | |
| JPY | 113,215,000 | | | Buy | | 1/10/07 | | USD | 978,536 | | | | 952,671 | | | | (25,865 | ) | |
| New Zealand Dollars | |
| NZD | 2,161,538 | | | Buy | | 1/10/07 | | AUD | 1,875,000 | | | | 1,521,943 | | | | 42,334 | | |
| Norway Krone | |
| NOK | 6,510,000 | | | Buy | | 1/10/07 | | USD | 977,874 | | | | 1,044,582 | | | | 66,708 | | |
| Norway Krone | |
| NOK | 3,745,000 | | | Buy | | 1/10/07 | | SEK | 4,170,807 | | | | 600,916 | | | | (8,739 | ) | |
| Norway Krone | |
| NOK | 3,745,000 | | | Buy | | 1/10/07 | | SEK | 4,168,859 | | | | 600,916 | | | | (8,455 | ) | |
| Norway Krone | |
| NOK | 3,745,000 | | | Buy | | 1/10/07 | | SEK | 4,170,058 | | | | 600,916 | | | | (8,630 | ) | |
| Sweden Kronor | |
| SEK | 4,120,062 | | | Buy | | 1/10/07 | | NOK | 3,745,000 | | | | 602,237 | | | | 1,322 | | |
| Sweden Kronor | |
| SEK | 8,233,083 | | | Buy | | 1/10/07 | | NOK | 7,490,000 | | | | 1,203,445 | | | | 1,614 | | |
| | | | | | | $ | 17,212 | | |
| Brazil Real | |
| BRL | 820,000 | | | Sell | | 1/12/07 | | USD | 370,238 | | | | 382,913 | | | | (12,675 | ) | |
| Brazil Real | |
| BRL | 900,000 | | | Sell | | 1/12/07 | | USD | 406,780 | | | | 420,270 | | | | (13,490 | ) | |
| Brazil Real | |
| BRL | 765,000 | | | Sell | | 1/12/07 | | USD | 350,034 | | | | 357,229 | | | | (7,195 | ) | |
See Accompanying Notes to Financial Statements
107
ING VP GLOBAL SCIENCE AND PORTFOLIO OF INVESTMENTS
TECHNOLOGY PORTFOLIO AS OF DECEMBER 31, 2006 (CONTINUED)
| Currency | | Buy/Sell | | Settlement Date | | In Exchange For | | Value | | Unrealized
Appreciation
(Depreciation) | |
| | | | | | | | | | | | | | | | | USD | | | |
| Canada Dollars | |
| CAD | 1,105,000 | | | Sell | | 1/10/07 | | USD | 974,624 | | | | 947,849 | | | $ | 26,775 | | |
| Canada Dollars | |
| CAD | 1,085,000 | | | Sell | | 1/10/07 | | USD | 961,590 | | | | 930,695 | | | | 30,895 | | |
| Switzerland Francs | |
| CHF | 780,000 | | | Sell | | 1/10/07 | | USD | 638,631 | | | | 640,746 | | | | (2,115 | ) | |
| EURO | |
| EUR | 2,780,000 | | | Sell | | 1/10/07 | | USD | 3,576,804 | | | | 3,671,617 | | | | (94,813 | ) | |
| EURO | |
| EUR | 400,000 | | | Sell | | 1/10/07 | | USD | 506,608 | | | | 528,290 | | | | (21,682 | ) | |
| EURO | |
| EUR | 500,000 | | | Sell | | 1/10/07 | | USD | 637,542 | | | | 660,363 | | | | (22,821 | ) | |
| EURO | |
| EUR | 960,000 | | | Sell | | 1/10/07 | | USD | 1,224,551 | | | | 1,267,896 | | | | (43,345 | ) | |
| EURO | |
| EUR | 257,000 | | | Sell | | 1/10/07 | | USD | 343,375 | | | | 339,426 | | | | 3,949 | | |
| British Pound Sterling | |
| GBP | 567,000 | | | Sell | | 1/10/07 | | USD | 1,079,888 | | | | 1,110,255 | | | | (30,367 | ) | |
| British Pound Sterling | |
| GBP | 93,500 | | | Sell | | 1/10/07 | | USD | 175,218 | | | | 183,085 | | | | (7,867 | ) | |
| Hong Kong Dollars | |
| HKD | 9,410,000 | | | Sell | | 1/10/07 | | USD | 1,213,412 | | | | 1,210,295 | | | | 3,117 | | |
| Japanese Yen | |
| JPY | 330,557,500 | | | Sell | | 1/10/07 | | USD | 2,866,934 | | | | 2,781,546 | | | | 85,388 | | |
| Japanese Yen | |
| JPY | 60,000,000 | | | Sell | | 1/10/07 | | USD | 520,544 | | | | 504,883 | | | | 15,661 | | |
| Japanese Yen | |
| JPY | 117,990,000 | | | Sell | | 1/11/07 | | USD | 1,003,060 | | | | 992,990 | | | | 10,070 | | |
| Japanese Yen | |
| JPY | 235,980,000 | | | Sell | | 1/11/07 | | USD | 2,006,121 | | | | 1,985,980 | | | | 20,141 | | |
| Japanese Yen | |
| JPY | 151,165,000 | | | Sell | | 1/11/07 | | USD | 1,280,256 | | | | 1,272,187 | | | | 8,069 | | |
| Japanese Yen | |
| JPY | 101,360,000 | | | Sell | | 1/10/07 | | USD | 860,059 | | | | 852,915 | | | | 7,144 | | |
| Japanese Yen | |
| JPY | 135,000,000 | | | Sell | | 1/11/07 | | USD | 1,159,241 | | | | 1,136,144 | | | | 23,097 | | |
| Japanese Yen | |
| JPY | 58,375,000 | | | Sell | | 1/10/07 | | USD | 509,203 | | | | 491,209 | | | | 17,994 | | |
| Korea (South) Won | |
| KRW | 794,675,000 | | | Sell | | 1/11/07 | | USD | 838,176 | | | | 854,691 | | | | (16,515 | ) | |
| Korea (South) Won | |
| KRW | 1,600,000,000 | | | Sell | | 1/12/07 | | USD | 1,744,383 | | | | 1,720,876 | | | | 23,507 | | |
| Norway Krone | |
| NOK | 5,695,000 | | | Sell | | 1/10/07 | | USD | 875,440 | | | | 913,809 | | | | (38,369 | ) | |
| Singapore Dollars | |
| SGD | 870,000 | | | Sell | | 1/10/07 | | USD | 555,201 | | | | 567,532 | | | | (12,331 | ) | |
| Taiwan New Dollars | |
| TWD | 90,000,000 | | | Sell | | 1/10/07 | | USD | 2,755,664 | | | | 2,765,410 | | | | (9,746 | ) | |
| | | | | | | $ | (57,524 | ) | |
See Accompanying Notes to Financial Statements
108
PORTFOLIO OF INVESTMENTS
ING VP INTERNATIONAL EQUITY PORTFOLIO AS OF DECEMBER 31, 2006
| Shares | | | | | | Value | |
| COMMON STOCK: 99.5% | | | |
| | | | | Australia: 4.4% | |
| | 55,410 | | | | | BHP Billiton Ltd. | | $ | 1,102,055 | | |
| | 110,000 | | | | | BlueScope Steel Ltd. | | | 745,933 | | |
| | 35,700 | | | | | National Australia Bank Ltd. | | | 1,136,571 | | |
| | 62,653 | | | | | Santos Ltd. | | | 487,590 | | |
| | | | 3,472,149 | | |
| | | | | Belgium: 2.9% | |
| | 7,000 | | | | | KBC Groep NV | | | 856,931 | | |
| | 9,126 | | | | | Omega Pharma SA | | | 686,742 | | |
| | 4,400 | | | | | Umicore | | | 747,637 | | |
| | | | 2,291,310 | | |
| | | | | Brazil: 1.8% | |
| | 6,300 | | | | | Petroleo Brasileiro SA | | | 648,837 | | |
| | 8,300 | | | L | | Uniao de Bancos Brasileiros
SA GDR | | | 771,568 | | |
| | | | 1,420,405 | | |
| | | | | China: 0.7% | |
| | 158,000 | | | | | China Life Insurance Co., Ltd. | | | 539,308 | | |
| | | | 539,308 | | |
| | | | | Egypt: 1.0% | |
| | 12,700 | | | | | Orascom Telecom GDR | | | 839,107 | | |
| | | | 839,107 | | |
| | | | | France: 12.1% | |
| | 95,209 | | | | | Alcatel SA | | | 1,358,337 | | |
| | 10,113 | | | @,I | | Atos Origin | | | 598,010 | | |
| | 14,100 | | | | | Bouygues | | | 902,771 | | |
| | 6,114 | | | | | Groupe Danone | | | 924,578 | | |
| | 6,795 | | | | | Societe Generale | | | 1,149,511 | | |
| | 21,000 | | | | | Total SA | | | 1,511,105 | | |
| | 15,138 | | | | | Veolia Environnement | | | 1,154,482 | | |
| | 8,200 | | | L | | Vinci SA | | | 1,045,103 | | |
| | 24,297 | | | | | Vivendi | | | 947,687 | | |
| | | | 9,591,584 | | |
| | | | | Germany: 7.3% | |
| | 9,216 | | | | | Deutsche Bank AG | | | 1,227,277 | | |
| | 6,900 | | | | | Fresenius Medical Care AG &
Co. KGaA | | | 918,559 | | |
| | 6,800 | | | | | Henkel KGaA | | | 999,467 | | |
| | 12,287 | | | | | Hochtief AG | | | 890,918 | | |
| | 4,669 | | | | | Muenchener
Rueckversicherungs AG | | | 804,476 | | |
| | 8,700 | | | | | RWE AG | | | 953,668 | | |
| | | | 5,794,365 | | |
| | | | | Greece: 1.2% | |
| | 25,487 | | | | | Coca-Cola Hellenic
Bottling Co. SA | | | 994,403 | | |
| | | | 994,403 | | |
| | | | | Hong Kong: 0.8% | |
| | 55,000 | | | | | Cheung Kong Holdings Ltd. | | | 675,637 | | |
| | | | 675,637 | | |
| Shares | | | | | | Value | |
| | | | | Indonesia: 1.0% | |
| | 17,600 | | | | | Telekomunikasi Indonesia
Tbk PT ADR | | $ | 802,560 | | |
| | | | 802,560 | | |
| | | | | Ireland: 2.0% | |
| | 39,100 | | | | | Bank of Ireland | | | 900,173 | | |
| | 37,308 | | | | | Depfa Bank PLC | | | 666,652 | | |
| | | | 1,566,825 | | |
| | | | | Italy: 5.9% | |
| | 136,735 | | | | | Banca Intesa S.p.A. | | | 1,053,045 | | |
| | 86,564 | | | | | Capitalia S.p.A. | | | 816,782 | | |
| | 26,600 | | | | | ERG S.p.A. | | | 607,259 | | |
| | 35,108 | | | | | Italcementi S.p.A. | | | 988,109 | | |
| | 482,106 | | | | | Telecom Italia S.p.A. | | | 1,220,887 | | |
| | | | 4,686,082 | | |
| | | | | Japan: 22.0% | |
| | 28,200 | | | | | Don Quijote Co., Ltd. | | | 538,322 | | |
| | 141 | | | | | East Japan Railway Co. | | | 939,885 | | |
| | 238,500 | | | @ | | Haseko Corp. | | | 851,093 | | |
| | 35,500 | | | @ | | Hitachi Construction
Machinery Co., Ltd. | | | 953,327 | | |
| | 16,400 | | | @ | | Hoya Corp. | | | 639,220 | | |
| | 93 | | | L | | Kenedix, Inc. | | | 419,546 | | |
| | 43,000 | | | | | Matsushita Electric
Industrial Co., Ltd. | | | 862,214 | | |
| | 122 | | | | | Mitsubishi UFJ Financial
Group, Inc. | | | 1,513,507 | | |
| | 96,000 | | | | | Mitsui OSK Lines Ltd. | | | 948,161 | | |
| | 198 | | | | | Nippon Telegraph &
Telephone Corp. | | | 976,435 | | |
| | 20,700 | | | | | Seven & I Holdings Co., Ltd. | | | 643,667 | | |
| | 3,360 | | | | | SFCG Co., Ltd. | | | 521,907 | | |
| | 20,000 | | | | | Shinko Electric Industries | | | 521,195 | | |
| | 111,000 | | | | | Sumitomo Chemical Co., Ltd. | | | 858,969 | | |
| | 52,000 | | | | | Sumitomo Corp. | | | 778,426 | | |
| | 269,000 | | | | | Sumitomo Metal Industries Ltd. | | | 1,167,923 | | |
| | 41,000 | | | | | Sumitomo Rubber Industries, Inc. | | | 528,883 | | |
| | 60,000 | | | | | Sumitomo Trust & Banking Co., Ltd. | | | 628,225 | | |
| | 137,000 | | | L | | Taisei Corp. | | | 417,019 | | |
| | 24,900 | | | | | Tokyo Electric Power Co., Inc. | | | 804,427 | | |
| | 129,000 | | | | | Toshiba Corp. | | | 838,269 | | |
| | 35,200 | | | | | Yamaha Motor Co., Ltd. | | | 1,106,468 | | |
| | | | 17,457,088 | | |
| | | | | Mexico: 1.1% | |
| | 7,400 | | | | | Fomento Economico Mexicano
SA de CV ADR | | | 856,624 | | |
| | | | 856,624 | | |
| | | | | Netherlands: 4.4% | |
| | 49,000 | | | | | Royal Dutch Shell PLC - Class B | | | 1,713,177 | | |
| | 42,265 | | | @,L | | Tele Atlas NV | | | 888,869 | | |
| | 20,204 | | | @ | | Tomtom, Inc. | | | 869,916 | | |
| | | | 3,471,962 | | |
| | | | | Norway: 2.2% | |
| | 30,280 | | | | | Norsk Hydro ASA | | | 934,660 | | |
| | 33,850 | | | @ | | Petroleum Geo-Services | | | 792,317 | | |
| | | | 1,726,977 | | |
See Accompanying Notes to Financial Statements
109
PORTFOLIO OF INVESTMENTS
ING VP INTERNATIONAL EQUITY PORTFOLIO AS OF DECEMBER 31, 2006 (CONTINUED)
| Shares | | | | | | Value | |
| | | | | South Africa: 0.9% | |
| | 20,000 | | | | | Sasol, Ltd. ADR | | $ | 738,000 | | |
| | | | 738,000 | | |
| | | | | South Korea: 0.8% | |
| | 7,837 | | | | | Kookmin Bank ADR | | | 631,976 | | |
| | | | 631,976 | | |
| | | | | Sweden: 1.1% | |
| | 26,500 | | | | | Atlas Copco AB | | | 856,442 | | |
| | | | 856,442 | | |
| | | | | Switzerland: 5.1% | |
| | 9,470 | | | | | Roche Holding AG | | | 1,694,312 | | |
| | 25,560 | | | | | UBS AG | | | 1,546,833 | | |
| | 3,122 | | | | | Zurich Financial Services AG | | | 837,592 | | |
| | | | 4,078,737 | | |
| | | | | United Kingdom: 20.8% | |
| | 22,275 | | | | | AstraZeneca PLC | | | 1,193,750 | | |
| | 105,043 | | | | | Barclays PLC | | | 1,499,802 | | |
| | 98,426 | | | @ | | British Airways PLC | | | 1,014,829 | | |
| | 33,121 | | | | | British American Tobacco PLC | | | 927,430 | | |
| | 17,875 | | | | | Carnival PLC | | | 902,990 | | |
| | 179,195 | | | | | First Choice Holidays PLC | | | 995,578 | | |
| | 62,600 | | | | | GlaxoSmithKline PLC | | | 1,647,683 | | |
| | 128,503 | | | | | HSBC Holdings PLC | | | 2,338,734 | | |
| | 109,393 | | | | | International Power PLC | | | 814,786 | | |
| | 360,297 | | | | | Legal & General Group PLC | | | 1,107,295 | | |
| | 76,482 | | | | | Reed Elsevier PLC | | | 838,846 | | |
| | 27,880 | | | | | Scottish & Southern Energy | | | 846,674 | | |
| | 51,205 | | | | | Unilever PLC | | | 1,424,153 | | |
| | 364,087 | | | | | Vodafone Group PLC | | | 1,005,488 | | |
| | | | 16,558,038 | | |
Total Common Stock
(Cost $65,311,349) | | | 79,049,579 | | |
Principal
Amount | | | | | | Value | |
| SHORT-TERM INVESTMENTS: 4.1% | | | |
| | | | | Repurchase Agreement: 0.6% | |
| $ | 447,000 | | | | | | | Goldman Sachs Repurchase
| |
Agreement dated 12/29/06,
| |
5.220%, due 01/02/07,
| |
| $ | 447,259 | to be received | |
upon repurchase (Collateralized
| |
by $455,000 Federal
| |
Home Loan Bank, 4.625%,
| |
Market Value plus accrued
| |
| interest $460,398, due 02/08/08) | | $447,000 | |
| | | Total Repurchase Agreement | | (Cost $447,000) | | 447,000 | |
Principal
Amount | | Value | |
| | | Securities Lending Collateralcc: 3.5% | |
| $ | 2,781,095 | | | | | | | The Bank of New York
| |
Institutional Cash
| |
| Reserves Fund | | $2,781,095 | |
| | | Total Securities Lending Collateral | | (Cost $2,781,095) | | 2,781,095 | |
| | | Total Short-Term Investments | | (Cost $3,228,095) | | 3,228,095 | |
| Total Investments in | | Securities
(Cost $68,539,444)* | | 103.6% | | $82,277,674 | |
| | | Other Assets and
Liabilities - Net | | | (3.6 | ) | | | (2,828,537 | ) | |
| | | Net Assets | | | 100.0 | % | | $ | 79,449,137 | | |
Certain foreign securities may have been fair valued in accordance with procedures approved by the Board of Directors/Trustees (note 2A).
@ Non-income producing security
ADR American Depositary Receipt
GDR Global Depositary Receipt
cc Securities purchased with cash collateral for securities loaned.
I Illiquid security
L Loaned security, a portion or all of the security is on loan at December 31, 2006.
* Cost for federal income tax purposes is $68,625,206.
Net unrealized appreciation consists of:
| Gross Unrealized Appreciation | | $ | 14,795,549 | | |
| Gross Unrealized Depreciation | | | (1,143,081 | ) | |
| Net Unrealized Appreciation | | $ | 13,652,468 | | |
See Accompanying Notes to Financial Statements
110
PORTFOLIO OF INVESTMENTS
ING VP INTERNATIONAL EQUITY PORTFOLIO AS OF DECEMBER 31, 2006 (CONTINUED)
| Industry | | Percentage of
Net Assets | |
| Agriculture | | | 1.2 | % | |
| Airlines | | | 1.3 | | |
| Auto Parts & Equipment | | | 0.7 | | |
| Banks | | | 19.1 | | |
| Beverages | | | 2.3 | | |
| Building Materials | | | 1.2 | | |
| Chemicals | | | 2.0 | | |
| Computers | | | 0.7 | | |
| Distribution/Wholesale | | | 1.0 | | |
| Diversified Financial Services | | | 3.1 | | |
| Electric | | | 4.3 | | |
| Electrical Components & Equipment | | | 1.0 | | |
| Electronics | | | 0.8 | | |
| Engineering & Construction | | | 4.1 | | |
| Food | | | 3.0 | | |
| Healthcare-Services | | | 1.2 | | |
| Home Builders | | | 1.1 | | |
| Home Furnishings | | | 1.1 | | |
| Household Products/Wares | | | 1.3 | | |
| Insurance | | | 4.1 | | |
| Iron/Steel | | | 2.4 | | |
| Leisure Time | | | 3.8 | | |
| Machinery-Construction & Mining | | | 2.3 | | |
| Media | | | 2.2 | | |
| Mining | | | 1.4 | | |
| Oil & Gas | | | 8.4 | | |
| Oil & Gas Services | | | 1.0 | | |
| Pharmaceuticals | | | 6.6 | | |
| Real Estate | | | 0.8 | | |
| Retail | | | 1.5 | | |
| Semiconductors | | | 0.7 | | |
| Software | | | 2.2 | | |
| Telecommunications | | | 7.8 | | |
| Transportation | | | 2.4 | | |
| Water | | | 1.4 | | |
| Short-Term Investments | | | 4.1 | | |
| Other Assets and Liabilities - Net | | | (3.6 | ) | |
| Net Assets | | | 100.0 | % | |
See Accompanying Notes to Financial Statements
111
TAX INFORMATION (UNAUDITED)
Dividends paid during the year ended December 31, 2006 were as follows:
| Fund Name | | Type | | Per Share Amount | |
| ING VP Balanced Portfolio | |
| Class I | | NII | | $ | 0.3317 | | |
| Class S | | NII | | $ | 0.2990 | | |
| ING VP Growth and Income Portfolio | |
| Class ADV | | NII | | $ | 0.2681 | | |
| Class I | | NII | | $ | 0.2732 | | |
| Class S | | NII | | $ | 0.2293 | | |
| ING VP Growth Portfolio | |
| Class I | | NII | | $ | 0.0056 | | |
| Class S | | NII | | $ | — | | |
| ING VP Small Company Portfolio | |
| Class I | | NII | | $ | 0.0888 | | |
| Class S | | NII | | $ | 0.0428 | | |
| All Classes | | STCG | | $ | 0.2237 | | |
| All Classes | | LTCG | | $ | 3.1478 | | |
| Fund Name | | Type | | Per Share Amount | |
| ING VP Value Opportunity Portfolio | |
| Class I | | NII | | $ | 0.2056 | | |
| Class S | | NII | | $ | 0.1989 | | |
| ING VP Intermediate Bond Portfolio | |
| Class ADV | | NII | | $ | 0.5308 | | |
| Class I | | NII | | $ | 0.5377 | | |
| Class S | | NII | | $ | 0.5076 | | |
| ING VP Money Market Portfolio | |
| Class I | | NII | | $ | 0.3981 | | |
| ING VP International Equity Portfolio | |
| Class I | | NII | | $ | 0.1726 | | |
| Class S | | NII | | $ | 0.1565 | | |
NII — Net investment income
STCG — Short-term capital gain
LTCG — Long-term capital gain
Of the ordinary distributions made during the year ended December 31, 2006, the following percentages qualify for the dividends received deduction (DRD) available to corporate shareholders:
| ING VP Balanced Portfolio | | | 42.02 | % | |
| ING VP Growth and Income Portfolio | | | 100.00 | % | |
| ING VP Growth Portfolio | | | 100.00 | % | |
| ING VP Small Company Portfolio | | | 43.84 | % | |
| ING VP Value Opportunity Portfolio | | | 100.00 | % | |
| ING VP Intermediate Bond Portfolio | | | 0.99 | % | |
For the year ended December 31, 2006, the following is a percentage of net investment income dividends paid by the Portfolio that is designated as qualifying dividend income (QDI) subject to reduced income tax rates for individuals:
| ING VP Growth and Income Portfolio | | | 100.00 | % | |
Pursuant to Section 853 of the Internal Revenue Code, the Portfolio designates the following amount as foreign taxes paid for the year ended December 31, 2006:
| | | Foreign Taxes
Paid | | Per Share
Amount | |
| ING VP International Equity Portfolio | | $ | 125,583 | | | $ | 0.0194 | | |
Listed below are the gross income earned and foreign taxes paid by country for ING VP International Equity Portfolio. Foreign taxes paid for purposes of Section 853 may be less than actual foreign taxes paid for financial statement purposes.
| Country | | Income
Earned | | Foreign
Tax Withheld | |
| Australia | | $ | 146,741 | | | $ | — | | |
| Belgium | | | 41,845 | | | | 3,402 | | |
| Brazil | | | 32,937 | | | | — | | |
| Canada | | | 2,001 | | | | 300 | | |
| China | | | 2,926 | | | | — | | |
| Egypt | | | 8,025 | | | | — | | |
| Finland | | | 75,031 | | | | 11,255 | | |
| France | | | 191,678 | | | | 28,723 | | |
| Germany | | | 199,657 | | | | 23,746 | | |
| Greece | | | 29,642 | | | | — | | |
| Hong Kong | | | 25,969 | | | | — | | |
| Hungary | | | 11,901 | | | | — | | |
| Indonesia | | | 20,655 | | | | 2,535 | | |
| Ireland | | | 27,931 | | | | — | | |
| Italy | | | 93,749 | | | | 14,062 | | |
| Japan | | | 195,006 | | | | 13,665 | | |
| Netherlands | | | 16,139 | | | | 2,420 | | |
| Norway | | | 47,081 | | | | 7,064 | | |
| Singapore | | | 8,915 | | | | — | | |
| South Korea | | | 2,660 | | | | 439 | | |
| Spain | | | 6,717 | | | | 1,011 | | |
| Sweden | | | 52,046 | | | | 7,807 | | |
| Switzerland | | | 61,521 | | | | 9,154 | | |
| United Kingdom | | | 1,059,810 | | | | — | | |
| Subtotal | | | 2,360,583 | | | | 125,583 | | |
| United States | | | 119,043 | | | | — | | |
| Total | | $ | 2,479,626 | | | $ | 125,583 | | |
Foreign taxes paid or withheld should be included in taxable income with an offsetting deduction from gross income or as a credit for taxes paid to foreign governments. Shareholders are strongly advised to consult their own tax advisors regarding the appropriate treatment of foreign taxes paid.
Above figures may differ from those cited elsewhere in this report due to differences in the calculation of income and gains under U.S. generally accepted accounting principles (book) purposes and Internal Revenue Service (tax) purposes.
Shareholders are strongly advised to consult their own tax advisers with respect to the tax consequences of their investments in the Portfolios. In January, shareholders, excluding corporate shareholders, receive an IRS 1099-DIV regarding the federal tax status of the dividends and distributions they received in the calendar year.
112
DIRECTOR/TRUSTEE AND OFFICER INFORMATION (UNAUDITED)
The business and affairs of the Portfolios are managed under the direction of the Board. A director/trustee who is not an interested person of the Funds, as defined in the 1940 Act, is an independent director/trustee ("Non-Interested Director/Trustee"). The Directors/Trustees of the Funds are listed below. The Statement of Additional Information includes additional information about directors/trustees of the Funds and is available, without charge, upon request at 1-800-992-0180.
Name, Address
and Age | | Position(s)
held
with the
Company/
Trust | | Term of
Office and
Length of
Time
Served(1) | | Principal
Occupation(s)
during the
Past Five Years | | Number of
Portfolios
in Fund
Complex
Overseen by
Director/
Trustee | | Other
Directorships
held by
Director/
Trustee | |
| Non-Interested Directors/Trustees: | |
|
Albert E. DePrince, Jr.
7337 E. Doubletree Ranch Rd.
Scottsdale, Arizona 85258
Age: 65 | | Director/Trustee | | June 1998 - Present | | Professor of Economics and Finance, Middle Tennessee State University (August 1991 - Present). | | | 36 | | | President, Academy of Economics and Finance (February 2006 - Present). | |
|
Maria Teresa Fighetti
7337 E. Doubletree Ranch Rd.
Scottsdale, Arizona 85258
Age: 63 | | Director/Trustee | | April 1994 - Present | | Retired. Formerly, Associate Commissioner/Attorney, New York City Department of Mental Health (June 1973 -October 2002). | | | 36 | | | None | |
|
Sidney Koch
7337 E. Doubletree Ranch Rd.
Scottsdale, Arizona 85258
Age: 71 | | Director/Trustee | | April 1994 - Present | | Self-Employed Consultant (June 2000 - Present). | | | 36 | | | None | |
|
Dr. Corine T. Norgaard
7337 E. Doubletree Ranch Rd.
Scottsdale, Arizona 85258
Age: 69 | | Director/Trustee | | June 1991 - Present | | Retired. Formerly, President, Thompson Enterprises (September 2004 - September 2005); and Dean, Barney School of Business, University of Hartford (August 1996 - June 2004). | | | 36 | | | Member, Board of Directors, Mass Mutual Corporate and Participation Investors (April 1997 - Present); Mass Mutual Premier Series (December 2004 - Present); and Mass Mutual MML Series II (April 2005 - Present). | |
|
Edward T. O'Dell
7337 E. Doubletree Ranch Rd.
Scottsdale, Arizona 85258
Age: 71 | | Director/Trustee | | June 2002 - Present | | Retired. Formerly, Partner of Goodwin Procter LLP (June 1966 - September 2000). | | | 36 | | | None | |
|
Joseph E. Obermeyer
7337 E. Doubletree Ranch Rd.
Scottsdale, Arizona 85258
Age: 49 | | Director/Trustee | | January 2003 - Present | | President, Obermeyer & Associates, Inc. (November 1999 - Present). | | | 36 | | | None | |
|
(1) Directors/Trustees serve until their successors are duly elected and qualified, subject to the Board's retirement policy.
113
TRUSTEE AND OFFICER INFORMATION (UNAUDITED) (CONTINUED)
Name, Address
and Age | | Position(s) Held with
the Company/Trust | | Term of Office and
Length of Time Served(1) | | Principal Occupation(s) during the
Past Five Years | |
| Officers: | |
|
Shaun P. Mathews
7337 E. Doubletree Ranch Rd.
Scottsdale, Arizona 85258
Age: 51 | | President and Chief Executive Officer | | December 2006 - Present | | President and Chief Executive Officer, ING Investments, LLC and ING Funds Services, LLC (December 2006 - Present); and Head of ING USFS Mutual Funds and Investment Products (October 2004 - Present). Formerly, CMO, ING USFS (April 2002 - October 2004); and Head of Rollover/Payout (October 2001 - December 2003). | |
|
Michael J. Roland
7337 E. Doubletree Ranch Rd. Scottsdale, Arizona 85258
Age: 48 | | Executive Vice President | | April 2002 - Present | | Executive Vice President, ING Investments, LLC (December 2001 - Present). Formerly, Chief Compliance Officer, ING Investments, LLC and Directed Services, LLC (October 2004 - December 2005); Chief Financial Officer and Treasurer, ING Investments, LLC (December 2001 - March 2005); and Senior Vice President, ING Investments, LLC (June 1998 - December 2001). | |
|
Stanley D. Vyner
7337 E. Doubletree Ranch Rd. Scottsdale, Arizona 85258
Age: 56 | | Executive Vice President | | March 2002 - Present | | Executive Vice President, ING Investments, LLC (July 2000 - Present), and Chief Investment Risk Officer, ING Investments, LLC (January 2003 - Present). Formerly, Chief Investment Officer of the International Portfolios, ING Investments, LLC (August 2000 - January 2003). | |
|
Joseph M. O'Donnell
7337 E. Doubletree Ranch Rd.
Scottsdale, Arizona 85258
Age: 52 | | Chief Compliance Officer
Executive Vice President | | November 2004 - Present
March 2006 - Present | | Chief Compliance Officer of the ING Funds (November 2004 - Present); ING Investments, LLC and Directed Services, LLC (March 2006 - Present); and Executive Vice President of the ING Funds (March 2006 - Present). Formerly, Vice President, Chief Legal Counsel, Chief Compliance Officer and Secretary of Atlas Securities, Inc., Atlas Advisers, Inc. and Atlas Funds (October 2001 - October 2004); and Chief Operating Officer and General Counsel of Matthews International Capital Management LLC and Vice President and Secretary of Matthews International Funds (August 1999 - May 2001). | |
|
Robert S. Naka
7337 E. Doubletree Ranch Rd. Scottsdale, Arizona 85258
Age: 43 | | Executive Vice President and Chief Operating Officer
Assistant Secretary | | March 2006 - Present
March 2002 - Present | | Executive Vice President and Chief Operating Officer, ING Funds Services, LLC and ING Investments, LLC (March 2006 - Present); and Assistant Secretary, ING Funds Services, LLC (October 2001 - Present). Formerly, Senior Vice President, ING Investments, LLC (August 1999 - March 2006). | |
|
Todd Modic
7337 E. Doubletree Ranch Rd. Scottsdale, Arizona 85258
Age: 39 | | Senior Vice President, Chief/Principal Financial Officer and Assistant Secretary | | March 2005 - Present | | Senior Vice President, ING Funds Services, LLC (April 2005 - Present). Formerly, Vice President, ING Funds Services, LLC (September 2002 - March 2005); and Director of Financial Reporting, ING Investments, LLC (March 2001 - September 2002). | |
|
Kimberly A. Anderson
7337 E. Doubletree Ranch Rd. Scottsdale, Arizona 85258
Age: 42 | | Senior Vice President | | December 2003 - Present | | Senior Vice President, ING Investments, LLC (October 2003 - Present). Formerly, Vice President and Assistant Secretary, ING Investments, LLC (January 2001 - October 2003). | |
|
Ernest J. C'DeBaca
7337 E. Doubletree Ranch Rd. Scottsdale, Arizona 85258
Age: 37 | | Senior Vice President | | June 2006 - Present | | Senior Vice President, ING Funds Services, LLC (April 2006 - Present). Formerly, Counsel, ING Americas, U.S. Legal Services (January 2004 - March 2006); and Attorney-Adviser, U.S. Securities and Exchange Commission (May 2001 - December 2003). | |
|
114
TRUSTEE AND OFFICER INFORMATION (UNAUDITED) (CONTINUED)
Name, Address
and Age | | Position(s) Held with
the Company/Trust | | Term of Office and
Length of Time Served(1) | | Principal Occupation(s) during the
Past Five Years | |
Robert Terris
7337 E. Doubletree Ranch Rd. Scottsdale, Arizona 85258
Age: 36 | | Senior Vice President | | June 2006 - Present | | Senior Vice President of Operations, ING Funds Services, LLC (May 2006 - Present). Formerly, Vice President of Administration, ING Funds Services, LLC (September 2001 - May 2006). | |
|
Robyn L. Ichilov
7337 E. Doubletree Ranch Rd. Scottsdale, Arizona 85258
Age: 39 | | Vice President and Treasurer | | March 2002 - Present | | Vice President and Treasurer, ING Funds Services, LLC (October 2001 - Present) and ING Investments, LLC (August 1997 - Present). | |
|
Lauren D. Bensinger
7337 E. Doubletree Ranch Rd. Scottsdale, Arizona 85258
Age: 52 | | Vice President | | March 2003 - Present | | Vice President and Chief Compliance Officer, ING Funds Distributor, LLC (July 1995 - Present); and Vice President (February 1996 - Present); and Director of Compliance, ING Investments, LLC (October 2004 - Present). Formerly, Chief Compliance Officer, ING Investments, LLC (October 2001 - October 2004). | |
|
Maria M. Anderson
7337 E. Doubletree Ranch Rd. Scottsdale, Arizona 85258
Age: 48 | | Vice President | | September 2004 - Present | | Vice President, ING Funds Services, LLC (September 2004 - Present). Formerly, Assistant Vice President, ING Funds Services, LLC (October 2001 - September 2004); and Manager Fund Accounting and Fund Compliance, ING Investments, LLC (September 1999 - October 2001). | |
|
Kimberly K. Palmer
7337 E. Doubletree Rand Rd.
Scottsdale, Arizona 85258
Age: 49 | | Vice President | | March 2006 - Present | | Vice President, ING Funds Services, LLC (March 2006 - Present). Formerly, Assistant Vice President, ING Funds Services, LLC (August 2004 - March 2006); Manager, Registration Statements, ING Funds Services, LLC (May 2003 - August 2004); Associate Partner, AMVESCAP PLC (October 2000 - May 2003); and Director of Federal Filings and Blue Sky Filings, INVESCO Funds Group, Inc. (March 1994 - May 2003). | |
|
Susan P. Kinens
7337 E. Doubletree Ranch Rd. Scottsdale, Arizona 85258
Age: 30 | | Assistant Vice President | | March 2003 - Present | | Assistant Vice President, ING Funds Services, LLC (December 2002 - Present); and has held various other positions with ING Funds Services, LLC for more than the last five years. | |
|
Theresa K. Kelety
7337 E. Doubletree Ranch Rd.
Scottsdale, Arizona 85258
Age: 43 | | Secretary | | September 2003 - Present | | Counsel, ING Americas, U.S. Legal Services (April 2003 - Present). Formerly, Senior Associate with Shearman & Sterling (February 2000 - April 2003). | |
|
Huey P. Falgout, Jr.
7337 E. Doubletree Ranch Rd.
Scottsdale, Arizona 85258
Age: 43 | | Assistant Secretary | | September 2003 - Present | | Chief Counsel, ING Americas, U.S. Legal Services (September 2003 - Present). Formerly, Counsel, ING Americas, U.S. Legal Services (November 2002 - September 2003); and Associate General Counsel of AIG American General (January 1999 - November 2002). | |
|
(1) The officers hold office until the next annual meeting of the Directors/Trustees and until their successors have been elected and qualified.
115
ADVISORY CONTRACT APPROVAL DISCUSSION (UNAUDITED)
Board Consideration and Approval of Investment Advisory and Sub-Advisory Agreements
The 1940 Act , provides, in substance, that each investment advisory agreement and sub-advisory agreement for a mutual fund will terminate automatically after the initial term of the agreement (which term may not exceed two years), unless continuation of the agreement is approved annually by the Board of Trustees or Directors, as the case may be (the "Board") of the fund, including a majority of the Trustees/Directors who have no direct or indirect interest in the agreement and who are not "interested persons" of the fund (the "Independent Trustees"). Consistent with this requirement of the 1940 Act, the Board of ING VP Balanced Portfolio, Inc., ING Strategic Allocation Portfolios, Inc., ING GET Fund, ING VP Intermediate Bond Portfolio, ING VP Money Market Portfolio, ING Variable Funds, ING Variable Portfolios, Inc. and ING Series Fund, Inc., with respect to each portfolio series thereof (collectively, the "Funds") has established a process for considering on an annual basis approval of the continuation of the Investment Management Agreement for each Fund (the "Advisory Agreement") with ING Investments, LLC (the "Adviser") and the sub-advisory agreement for each Fund (collectively, the "Sub-Advisory Agreements") with each sub-adviser of the Funds (the "Sub-Advisers"). Set forth below is a description of the process followed by the Board in considering approval of the continuation of each Advisory and Sub-Advisory Agreement (collectively, the "Agreements"), together with an explanation of many of the factors considered and related conclusions reached by the Board in voting to approve the continuation of each Agreement for an additional one-year period commencing January 1, 2007, followed by specific considerations with respect to each Portfolio covered in this Annual Report (each, a "Portfolio").
Overview of the Review Process
At a meeting of the Board held on December 13, 2006, the Board, including all of the Independent Trustees, voted to approve continuation of each of the existing Advisory and Sub-Advisory Agreements for the Funds. Prior to voting such approvals, the Board received the affirmative recommendation of the Contracts Committee of the Board, which is a Committee of the Board comprised of all of the Independent Trustees and exclusively of the Independent Trustees. The Contracts Committee recommended approval of the Advisory and Sub-Advisory Agreements after completing an extensive review of information requested by the Committee from the Adviser and each Sub-Adviser, including the following: (1) comparative performance data for each Fund for various time periods; (2) comparative data regarding management fees, including data regarding the fees charged by the Adviser and Sub-Advisers for managing other mutual funds and institutional accounts using inv estment strategies and techniques similar to those used in managing the Funds; (3) comparative data regarding the total expenses of each Fund; (4) copies of each form of Advisory Agreement and Sub-Advisory Agreement; (5) copies of the codes of ethics of the Adviser and each Sub-Adviser, together with information relating to the manner in which each code is administered; (6) financial statements of the Adviser and each Sub-Adviser; (7) profitability analyses for the Adviser and each Sub-Adviser with respect to each Fund, and all Funds as a group; (8) descriptions of the qualifications of the investment personnel responsible for managing each Fund, their compensation and their responsibilities with respect to managing other accounts or mutual funds; (9) descriptions of the services provided to the Funds, including the investment strategies and techniques used by each Sub-Adviser in managing the Funds; (10) data relating to portfolio turnover and brokerage practices, including practices with respect to the acqu isition of research through "soft dollar" benefits received in connection with the Funds' brokerage; (11) data comparing the performance of certain Funds against "static portfolios" of the Funds over various time periods; (12) descriptions of the policies and procedures of the various service providers of the Funds for protecting the privacy of shareholder information; (13) information relating to projected sales and redemptions of Fund shares and business plans relating to the Adviser's mutual fund platform; (14) descriptions of the business continuity and disaster recovery plans of the Adviser and each Sub-Adviser; (15) descriptions of various compliance programs of the Adviser and Sub-Advisers, including the Adviser's programs for monitoring and enforcing compliance with the Funds' policies with respect to market-timing, late trading and selective portfolio disclosure; (16) independent reports analyzing the quality of the trade execution services performed by Sub-Advisers for the Funds; and (17) other inf ormation relevant to an evaluation of the nature, extent and quality of the services provided by the Adviser and each Sub-Adviser in response to a series of detailed questions posed by independent legal counsel on behalf of the Independent Trustees.
The Contracts Committee began the formal review process in July 2006 when it met separately with independent legal counsel to review the information to be requested from management and the methodology to be used in
116
ADVISORY CONTRACT APPROVAL DISCUSSION (UNAUDITED) (CONTINUED)
determining the selected peer groups for comparing performance and expenses. The Contracts Committee then held meetings on October 25 and 26, 2006 and December 12, 2006, during which the Independent Trustees, meeting separately with independent legal counsel, reviewed and evaluated the information described above. As part of the review process, the Contracts Committee also met with representatives from the Adviser and the Sub-Advisers to discuss the information provided to the Committee. The Contracts Committee also considered information that had been provided by the Adviser and Sub-Advisers throughout the year at other meetings of the Contracts Committee, the Audit Committee, the Compliance Committee and the full Board.
The Independent Trustees were assisted by Goodwin Procter LLP, their independent legal counsel, throughout the contract review process. The Independent Trustees relied upon the advice of such counsel and their own business judgment in determining the material factors to be considered in evaluating each Advisory and Sub-Advisory Agreement and the weight to be given to each such factor. The conclusions reached by the Independent Trustees were based on a comprehensive evaluation of all of the information provided and were not the result of any one factor. Moreover, each Independent Trustee may have afforded different weight to the various factors in reaching his or her conclusions with respect to each Advisory and Sub-Advisory Agreement.
Nature, Extent and Quality of Services
In considering whether to approve the Advisory and Sub-Advisory Agreements for the Funds for the year commencing January 1, 2007, the Board evaluated the nature, extent and quality of services provided to the Funds by the Adviser and Sub-Advisers. The Board considered the investment management and related services provided by the Adviser and Sub-Advisers, including the quantity and quality of the resources available to provide such services. Among other things, the Board considered the qualifications of the individuals responsible for performing various investment related services. With respect to Funds sub-advised by an affiliate of the Adviser, the Board also received information regarding the compensation paid by the Sub-Adviser to attract and retain individuals to perform these services on both an absolute basis and relative to amounts paid by others in the investment management industry.
The Board also considered the quality of the compliance programs of the Adviser and each Sub-Adviser, including the manner in which the Adviser and each Sub-Adviser monitor for compliance with the investment policies and restrictions of a Fund and with the Codes of Ethics of the Funds, the Adviser and the Sub-Advisers with respect to personal trading by employees with access to portfolio information. The Board also considered the actions taken by the Adviser and Sub-Advisers to establish and maintain effective disaster recovery and business continuity plans.
The Board considered the actions taken by the Adviser and its affiliated companies to administer the Funds' policies and procedures for voting proxies, valuing the Funds' assets, selective disclosure of portfolio holdings and preventing late-trading and frequent trading of Fund shares. With respect to these and related compliance matters, the Board also considered the responsiveness of the Adviser and its affiliated companies over the course of the past several years to the inquiries of various regulatory authorities.
The Board also took into account the efforts of the Adviser and its affiliated companies to reduce the expenses of the Funds. With respect to those Funds that are sub-advised by an affiliate of the Adviser, the Board specifically noted that, in recent years, the Adviser and its affiliated companies have significantly reduced the Funds' brokerage costs and portfolio turnover rates, as well as the quantity of research acquired through the use of soft dollars from the Funds' brokerage. The Board also noted the efforts of the Adviser to optimize the number of Funds in the ING complex of mutual funds and to standardize the asset management characteristics and policies across the ING mutual fund platform. Consideration was also given to the benefits that shareholders of the Funds realize because the Funds are part of a larger ING family of mutual funds, including, in most cases, the ability of shareholders to exchange or transfer investments withi n the same class of shares among a wide variety of mutual funds without incurring additional sales charges.
The Board concluded that the nature, extent and quality of advisory and related services provided by the Adviser and each of the Sub-Advisers, taken as a whole, are consistent with the terms of the respective Advisory and Sub-Advisory Agreements and justify the fees paid by the Funds for such services.
117
ADVISORY CONTRACT APPROVAL DISCUSSION (UNAUDITED) (CONTINUED)
Fund Performance
The Board reviewed each Fund's investment performance over various time periods on an absolute basis and relative to the performance of (i) one or more appropriate benchmark indexes (such as the S&P 500 Composite Stock Price Index), (ii) a group of similarly managed mutual funds identified by Lipper, Inc. and/or Morningstar, Inc., and (iii) similarly managed mutual funds within a specified peer group based upon a methodology approved by the Contracts Committee (each, a "Selected Peer Group"). The Board reviewed comparative performance data for the one-, three-, five-, and ten-year periods, where applicable, ending June 30, 2006 and September 30, 2006. Summaries of selected portions of the performance information reviewed by the Board, together with the Board's conclusions regarding the performance of each Fund, are set forth below under "Fund-by-Fund Analysis."
Management Fees, Sub-Advisory Fees and Expenses
Consideration was given to the contractual investment advisory fee rates, inclusive of administrative fee rates, payable by the Funds to the Adviser and its affiliated companies (referred to collectively as "management fees") and the contractual sub-advisory fee rates payable by the Adviser to each Sub-Adviser for sub-advisory services. As part of its review, the Board considered each Fund's management fee and total expense ratio, as compared to its Selected Peer Group, both before and after giving effect to any undertaking by the Adviser to waive fees and/or limit the total expenses of a Fund. In addition, the Trustees received information regarding the fees charged by each Sub-Adviser to similarly-managed institutional accounts and other mutual funds, if any, and the comparability (or lack thereof) of the services provided by the Sub-Adviser in managing such accounts and other mutual funds to the services provided in managing the Funds. Wi th respect to the Funds sub-advised by an affiliate of the Adviser, the Board evaluated the reasonableness of the total fees received by the Adviser and its affiliate in the aggregate under the Advisory and Sub-Advisory Agreements. With respect to those Funds sub-advised by a Sub-Adviser that is not affiliated with the Adviser, the Board considered the reasonableness of the fees payable to the Sub-Adviser by the Adviser in light of the ability of the Adviser to negotiate such fees on an arm's-length basis. Summaries of selected portions of the fee and expense information reviewed are set forth below under "Fund-by-Fund Analysis." After reviewing the foregoing information, and in light of the nature, extent and quality of the services provided by the Adviser and each Sub-Adviser, the Board concluded with respect to each Fund that the management fee charged to the Fund for advisory, sub-advisory and related services is fair and reasonable and that the total expense ratio of the Fund is reasonable.
Profitability
The Board considered information relating to revenues, expenses, and profits realized by the Adviser and each Sub-Adviser attributable to performing advisory, sub-advisory and administrative services for the Funds. With respect to Funds sub-advised by an unaffiliated Sub-Adviser, the Board did not consider the profitability of the Sub-Adviser to be a material factor because the Board believes that the Adviser negotiates sub-advisory fees with the unaffiliated Sub-Adviser on an arm's-length basis. The Board reviewed profitability data for the Adviser and its affiliated companies, including the distributor of the Funds, relating to (i) each Fund separately, (ii) all Funds as a group, (iii) all "retail" Funds as a group, and (iv) all variable insurance product Funds as a group, in each case for the one-year periods ended December 31, 2005 and December 31, 2004 and the nine-month period ended September 30, 2006. With respect to the Adviser and i ts affiliates, such information was prepared in accordance with a methodology approved by the Contracts Committee. The Board considered the profitability of the Adviser and its affiliated companies attributable to managing and operating each Fund both with and without the profitability of the distributor of the Funds and both before and after giving effect to any expenses incurred by the Adviser or any affiliated company in making revenue sharing or other payments to third parties, including affiliated insurance companies, for distribution and administrative services. With respect to Funds sub-advised by an affiliate of the Adviser, the Board considered the total profits derived by the Adviser and its affiliate in the aggregate attributable to managing and operating each Fund. The Board also considered other direct or indirect benefits that the Adviser and Sub-Advisers, and any affiliated companies thereof, derive from their relationships with the Funds, including the receipt by ING U.S. Financial Services, an affiliate of the Adviser, of fees relating to the offering of bundled financial products, such as annuity contracts, and the receipt by Sub-Advisers of "soft dollar" benefits from the Funds' brokerage. The Board concluded that, in light of the nature, extent and quality of the services provided, the profits realized by the Adviser and its affiliated companies, taken as a whole, with respect to providing advisory, sub-advisory and administrative services for each Fund are reasonable.
118
ADVISORY CONTRACT APPROVAL DISCUSSION (UNAUDITED) (CONTINUED)
Economies of Scale
In considering the reasonableness of the management fee of each Fund, the Board considered the extent to which economies of scale can be expected to be realized by a Fund's Adviser and its affiliated companies, on the one hand, and by the Fund, on the other hand, as the assets of the Fund increase. The Board noted that the advisory fee for certain Funds includes breakpoints such that, as the assets of the Fund increase, the Fund's management fee will decrease as a percentage of the Fund's total assets. The Board recognized the inherent difficulties in measuring precisely the impact of any economies of scale being realized by the Adviser and its affiliated companies with respect to their management of any one or more Funds. In an effort to determine the extent to which economies of scale, if any, will be realized by the Adviser and its affiliated companies as the assets of the Funds grow, the Board considered the profitability data described above relating to the Adviser and its affiliated companies in light of changes in the assets of the Funds over various time periods. The Board noted that the total assets under management of many Funds have decreased during the past several years and concluded that the economies of scale realized by the Adviser and its affiliated companies from managing the Funds have not increased with respect to such Funds. The Board also reviewed information regarding the expense ratio of each Fund in light of changes in the assets of the Funds over various time periods, noting that, as the assets of a Fund increase, the fixed expenses of the Fund, as a percentage of the total assets of the Fund, can be expected to decrease. The Board considered such expense information in light of projections provided by the Adviser with respect to the future growth of assets of the Funds. Based upon the foregoing, the Board concluded that the economies of scale being realized by the Adviser and its affiliated companies do not mandate th e implementation of breakpoints or additional breakpoints, as the case may be, with respect to any Fund at this time.
Fund-by-Fund Analysis
In deciding to approve the continuation of each Advisory and Sub-Advisory Agreement for an additional one-year period beginning January 1, 2007, the Board took into account the specific data and factors identified below relating to the performance, fees and expenses of each Fund and actions being taken by the Adviser or Sub-Adviser, as the case may be, with respect to these matters. Except as otherwise indicated, the performance data described below for each Fund is for periods ended September 30, 2006 and the management fees and expense data described below are as of June 30, 2006.
ING VP Balanced Portfolio
In evaluating the investment performance of ING VP Balanced Portfolio, the Board noted that the Portfolio outperformed its Morningstar category median for the ten-year period, but underperformed for the most recent calendar quarter, year-to-date, one-, three- and five-year periods. The Board received performance information relating to a benchmark index of fixed income securities (the "FISB") and equity securities (the "ESB") from which the Board could calculate a composite benchmark index (the "Composite Benchmark") comprised of 60% ESB and 40% FISB. The Board noted that the Portfolio outperformed the Composite Benchmark for the three- and five-year periods, but underperformed for the last quarter, year-to-date, one- and ten-year periods. The Board considered the fact that the Portfolio is ranked in its Morningstar category in the third quintile for the five- and ten-year periods, in the fourth quintile for the most recent quarter, year-to- date and three-year periods and in the fifth quintile for the one-year period. The Board also noted that the portfolio manager for the domestic equity component of the Portfolio was replaced in December 2005 and that the Sub-Adviser has invested additional resources to improve Portfolio performance. The Board concluded that appropriate actions are being taken to improve performance and that additional time is needed to evaluate the effectiveness of these actions.
In assessing the reasonableness of the management fee and expense ratio of ING VP Balanced Portfolio, the Board noted that the management fee for the Portfolio is less than the median and average management fees of the funds in its Selected Peer Group and that the expense ratio for the Portfolio is below the median and average expense ratios of the funds in its Selected Peer Group.
ING VP Global Science and Technology Portfolio
In evaluating the investment performance of ING VP Global Science and Technology Portfolio, the Board noted that: (1) the Portfolio outperformed its Morningstar category median for the year-to-date, one-, three- and five-year periods, but underperformed for the most recent calendar quarter; (2) the Portfolio outperformed its
119
ADVISORY CONTRACT APPROVAL DISCUSSION (UNAUDITED) (CONTINUED)
benchmark index for the year-to-date and one-year periods, but underperformed for the most recent calendar quarter, three- and five-year periods; and (3) the Portfolio is ranked in its Morningstar category in the second quintile for the year-to-date, one- and three-year periods, in the third quintile for the five-year period and in the fourth quintile for the most recent calendar quarter. The Board further noted that, in an effort to address concerns regarding the Portfolio's performance, in February 2004 the Adviser retained BlackRock Advisors, Inc. to replace the previous Sub-Adviser and, in connection with this change, modified the Portfolio's investment strategy to permit exposure to science and technology companies on a global basis. The Board noted that the Portfolio's performance has improved since changing the Portfolio's Sub-Adviser and concluded that the performance of the Portfolio is satisfactory.
In assessing the reasonableness of the management fee and expense ratio for ING VP Global Science and Technology Portfolio, the Board noted that the management fee for the Portfolio is above the median and average management fees of the funds in its Selected Peer Group and that the expense ratio for the Portfolio is above the median and the average expense ratios of the portfolios in its Selected Peer Group.
ING VP Growth Portfolio
In evaluating the investment performance of ING VP Growth Portfolio, the Board noted that: (1) the Portfolio underperformed its Morningstar category median for all periods presented; (2) the Portfolio outperformed its benchmark index for the three-year period, but underperformed its benchmark index for all other periods presented; and (3) the Portfolio is ranked in its Morningstar category in the third quintile for the most recent calendar quarter, one-, and three-year periods and in the fourth quintile for the year-to-date and five-year periods. The Board further noted that, in an effort to address concerns regarding the Portfolio's performance, the Sub-Adviser has invested additional resources to improve stock screenings and related analyses. The Board concluded that appropriate actions are being taken to improve performance and that additional time is needed to evaluate the effectiveness of these actions.
In assessing the reasonableness of the management fee and expense ratio for ING VP Growth Portfolio, the Board noted that the management fee for the Portfolio is below the median and average management fees of the funds in its Selected Peer Group and that the expense ratio for the Portfolio is below the median and average expense ratios of the funds in its Selected Peer Group.
ING VP Growth and Income Portfolio
In evaluating the investment performance of ING VP Growth and Income Portfolio, the Board noted that: (1) the Portfolio outperformed its Morningstar category median for the year-to-date, one- and three-year periods, but underperformed for the most recent calendar quarter, five- and ten-year periods; (2) the Portfolio outperformed its benchmark index for the three-year period, but underperformed for all other periods presented; and (3) the Portfolio is ranked in its Morningstar category in the second quintile for the one- and three-year period, in the third quintile for the most recent calendar quarter and year-to-date periods and in the fifth quintile for the five- and ten-year periods. The Board concluded that the performance of the Portfolio is satisfactory.
In assessing the reasonableness of the management fee and expense ratio for ING VP Growth and Income Portfolio, the Board noted that the management fee for the Portfolio is below the median and average management fees of the funds in its Selected Peer Group and that the expense ratio for the Portfolio is below the median and average expense ratios of the funds in its Selected Peer Group.
ING VP International Equity Portfolio
In evaluating the investment performance of ING VP International Equity Portfolio, the Board noted that: (1) the Portfolio outperformed its Morningstar category median for the three-year period, but underperformed for all other periods presented; and (2) the Portfolio underperformed its benchmark index for all periods presented; and (3) the Portfolio ranked in its Morningstar category in the third quintile for the three-year period, in the fourth quintile for the most recent calendar quarter, year-to-date, one- and ten-year periods and in the fifth quintile for the five-year period. The Board further noted that, in an effort to address concerns regarding the Portfolio's performance, the Sub-Adviser has invested additional resources to improve stock screenings and related analyses. The Board concluded that appropriate actions are being taken to improve performance and that additional time is needed to evaluate the effectiveness of these actio ns.
120
ADVISORY CONTRACT APPROVAL DISCUSSION (UNAUDITED) (CONTINUED)
In assessing the reasonableness of the management fee and expense ratio for ING VP International Equity Portfolio, the Board noted that the management fee for the Portfolio is below the median and average management fees of the funds in its Selected Peer Group, and that the expense ratio for the Portfolio is above the median and average expense ratios of the funds in its Selected Peer Group.
ING VP Small Company Portfolio
In evaluating the investment performance of ING VP Small Company Portfolio, the Board noted that: (1) the Portfolio outperformed its Morningstar category median for the year-to-date and one-year periods, but underperformed for the most recent calendar quarter, three- and five-year periods; (2) the Portfolio outperformed its benchmark index for the one-year period, but underperformed for all other periods presented; and (3) the Portfolio is ranked in its Morningstar category in the first quintile for the one-year period, in the second quintile for the year-to-date period, in the third quintile for the most recent calendar quarter, in the fourth quintile for the three-year period and in the fifth quintile for the five-year period. The Board noted that the lead portfolio manager for the Portfolio was replaced in July 2005 and an additional portfolio manager was added in April 2006 to enhance sector coverage and security selection. The Board not ed that the performance of the Portfolio has improved and concluded that recent performance of the Portfolio was satisfactory.
In assessing the reasonableness of the management fee and expense ratio for ING VP Small Company Portfolio, the Board noted that the management fee for the Portfolio is below the median and average management fees of the funds in its Selected Peer Group, and that the expense ratio for the Portfolio is below the median and average expense ratios of the funds in its Selected Peer Group.
ING VP Value Opportunity Portfolio
In evaluating the investment performance of ING VP Value Opportunity Portfolio, the Board noted that: (1) the Portfolio underperformed its Morningstar category median and benchmark index for all periods presented; and (2) the Portfolio is ranked in its Morningstar category in the fourth quintile for the one-year period and in the fifth quintile for all other periods presented. The Board noted that the lead portfolio manager for the Portfolio was replaced in May 2005 and an additional portfolio manager was added in April 2006. The Board concluded that appropriate actions are being taken to improve performance and that additional time is needed to evaluate the effectiveness of these actions.
In assessing the reasonableness of the management fee and expense ratio for ING VP Value Opportunity Portfolio, the Board noted that the management fee for the Portfolio is below the median and average management fees of the funds in its Selected Peer Group, and that the expense ratio for the Portfolio is below the median and average expense ratios of the funds in its Selected Peer Group.
ING VP Intermediate Bond Portfolio
In evaluating the investment performance of ING VP Intermediate Bond Portfolio, the Board noted that: (1) the Portfolio outperformed its Morningstar category median for one-, three-, five- and ten-year periods, but underperformed for the most recent calendar quarter and year-to-date period; (2) the Portfolio outperformed its benchmark index for the three- and five-year periods, but underperformed for the most recent quarter, year-to-date, one- and ten-year periods; and (3) the Portfolio is ranked in its Morningstar category in the first quintile for the three-year period, in the second quintile for the one-, five, and ten-year periods, in the third quintile for year-to-date and in the fifth quintile for the most recent calendar quarter. The Board concluded that the investment performance of the Fund is satisfactory.
In assessing the reasonableness of the management fee and expense ratio for ING VP Intermediate Bond Portfolio, the Board noted that the management fee for the Portfolio is equal to the median and is below the average management fees of the funds in its Selected Peer Group, and that the expense ratio for the Portfolio is below the median and average expense ratios of the funds in its Selected Peer Group.
ING VP Money Market Portfolio
In evaluating the investment performance of ING VP Money Market Portfolio, the Board noted that: (1) the Portfolio outperformed its Morningstar category median and its benchmark index for all periods presented; and
121
ADVISORY CONTRACT APPROVAL DISCUSSION (UNAUDITED) (CONTINUED)
(2) the Portfolio is ranked in its Morningstar category in the first quintile for all periods presented. The Board concluded that the investment performance of the Portfolio is satisfactory.
In assessing the reasonableness of the management fee and expense ratio for ING VP Money Market Portfolio, the Board noted that the management fee for the Portfolio is below the median and average management fees of the funds in its Selected Peer Group, and that the expense ratio for the Portfolio is below the median and average expense ratios of the funds in its Selected Peer Group.
122
SHAREHOLDER MEETING INFORMATION (UNAUDITED)
A meeting of shareholders of the ING Variable Products Trust was held March 16, 2006, at the offices of ING Funds, 7337 East Doubletree Ranch Road, Scottsdale, AZ 85258.
A brief description of each matter voted upon as well as the results are outlined below:
Matters:
1 To approve an Agreement and Plan of Reorganization by and among VP Convertible Portfolio and ING VP Balanced Portfolio ("VP Balanced"), providing for the reorganization of VP Convertible Portfolio with and into VP Balanced; and
2 To transact such other business, not currently contemplated, that may properly come before the Special Meeting, or any adjournment(s) or postponement(s) thereof, in the discretion of the proxies or their substitutes.
Results:
| | | Proposal | | Shares voted for | | Shares voted
against or
withheld | | Shares
abstained | | Broker
non-vote | | Total Shares
Voted | |
| ING VP Convertible Portfolio | | | 1 | | | | 673,947 | | | | 9,538 | | | | 32,267 | | | | — | | | | 715,752 | | |
A joint meeting of shareholders of the USLICO Series Fund was held April 6, 2006, at the offices of ING Funds, 7337 East Doubletree Ranch Road, Scottsdale, AZ 85258.
A brief description of each matter voted upon as well as the results are outlined below:
Matters:
1 The Asset Allocation Portfolio Only. To approve an Agreement and Plan of Reorganization ("Reorganization Agreement") by and among The Asset Allocation Portfolio and ING VP Balanced Portfolio, a series of ING VP Balanced Portfolio, Inc., providing for the reorganization of The Asset Allocation Portfolio with and into ING VP Balanced Portfolio;
2 The Bond Portfolio Only. To approve an Agreement and Plan of Reorganization ("Reorganization Agreement") by and among The Bond Portfolio and ING VP Intermediate Bond Portfolio, a series of ING VP Intermediate Bond Portfolio, providing for the reorganization of The Bond Portfolio with and into ING VP Intermediate Bond Portfolio;
3 The Money Market Portfolio Only. To approve an Agreement and Plan of Reorganization ("Reorganization Agreement") by and among The Money Market Portfolio and ING Liquid Assets Portfolio, a series of ING Investors Trust, providing for the reorganization of The Money Market Portfolio with and into ING Liquid Assets Portfolio;
4 The Stock Portfolio Only. To approve an Agreement and Plan of Reorganization ("Reorganization Agreement") by and among The Stock Portfolio and ING Fundamental Research Portfolio, a series of ING Partners, Inc., providing for the reorganization of The Stock Portfolio with and into ING Fundamental Research Portfolio;
Results:
| | | Proposal | | Shares voted for | | Shares voted
against or
withheld | | Shares
abstained | | Broker
non-vote | | Total Shares
Voted | |
| The Asset Allocation Portfolio Only | | | 1 | | | | 1,229,166 | | | | 71,790 | | | | 61,839 | | | | — | | | | 1,362,795 | | |
| The Bond Portfolio Only | | | 2 | | | | 239,071 | | | | 40,013 | | | | 17,969 | | | | — | | | | 297,053 | | |
| The Money Market Portfolio Only | | | 3 | | | | 5,195,232 | | | | 151,805 | | | | 348,778 | | | | — | | | | 5,695,815 | | |
| The Stock Portfolio Only | | | 4 | | | | 1,935,352 | | | | 158,693 | | | | 72,796 | | | | — | | | | 2,166,841 | | |
123
Investment Adviser
ING Investments, LLC
7337 East Doubletree Ranch Road
Scottsdale, Arizona 85258
Administrator
ING Funds Services, LLC
7337 East Doubletree Ranch Road
Scottsdale, Arizona 85258
Distributor
ING Funds Distributor, LLC
7337 East Doubletree Ranch Road
Scottsdale, Arizona 85258
Transfer Agent
DST Systems, Inc.
P.O. Box 419368
Kansas City, Missouri 64141
Independent Registered Public
Accounting Firm
KPMG LLP
99 High Street
Boston, Massachusetts 02110
Custodian
The Bank of New York
One Wall Street
New York, New York 10286
Legal Counsel
Goodwin Procter LLP
Exchange Place
53 State Street
Boston, Massachusetts 02109
Before investing, carefully consider the investment objectives, risks, charges and expenses of the variable annuity contract and the underlying variable investment options. This and other information is contained in the prospectus for the variable annuity contract and the underlying variable investment options. Obtain these prospectuses from your agent/registered representative and read them carefully before investing.

VPAR-ACAPAPADVIS (1206-022607)

Funds
Annual Report
December 31, 2006
Classes ADV, I and S
Domestic Equity Index Portfolios
n ING VP Index Plus LargeCap Portfolio
n ING VP Index Plus MidCap Portfolio
n ING VP Index Plus SmallCap Portfolio
Strategic Allocation Portfolios
n ING VP Strategic Allocation Conservative Portfolio (Formerly, ING VP Strategic Allocation Income Portfolio)
n ING VP Strategic Allocation Growth Portfolio
n ING VP Strategic Allocation Moderate Portfolio (Formerly, ING VP Strategic Allocation Balanced Portfolio)
This report is submitted for general information to shareholders of the ING Funds. It is not authorized for distribution to prospective shareholders unless accompanied or preceded by a prospectus which includes details regarding the funds' investment objectives, risks, charges, expenses and other information. This information should be read carefully.

TABLE OF CONTENTS
| President's Letter | | | 1 | | |
|
| Market Perspective | | | 2 | | |
|
| Portfolio Managers' Reports | | | 4 | | |
|
| Shareholder Expense Examples | | | 17 | | |
|
| Report of Independent Registered Public Accounting Firm | | | 19 | | |
|
| Statements of Assets and Liabilities | | | 20 | | |
|
| Statements of Operations | | | 22 | | |
|
| Statements of Changes in Net Assets | | | 24 | | |
|
| Financial Highlights | | | 27 | | |
|
| Notes to Financial Statements | | | 33 | | |
|
| Portfolios of Investments | | | 46 | | |
|
| Tax Information | | | 97 | | |
|
| Director and Officer Information | | | 98 | | |
|
| Advisory Contract Approval Discussion | | | 101 | | |
|
PROXY VOTING INFORMATION
A description of the policies and procedures that the Portfolios use to determine how to vote proxies related to portfolio securities is available (1) without charge, upon request, by calling Shareholder Services toll-free at 1-800-992-0180; (2) on the ING Funds' website at www.ingfunds.com and (3) on the SEC's website at www.sec.gov. Information regarding how the Portfolios voted proxies related to portfolio securities during the most recent 12-month period ended June 30 is available without charge on the ING Funds' website at www.ingfunds.com and on the SEC's website at www.sec.gov.
QUARTERLY PORTFOLIO HOLDINGS
The Portfolios file their complete schedule of portfolio holdings with the SEC for the first and third quarters of each fiscal year on Form N-Q. The Portfolios' Forms N-Q are available on the SEC's website at www.sec.gov. The Portfolios' Forms N-Q may be reviewed and copied at the SEC's Public Reference Room in Washington, DC, and information on the operation of the Public Reference Room may be obtained by calling 1-800-SEC-0330; and is available upon request from the Portfolios by calling Shareholder Services toll-free at 1-800-992-0180.
(THIS PAGE INTENTIONALLY LEFT BLANK)
PRESIDENT'S LETTER

Dear Shareholder,
In its recent meetings, the U.S. Federal Reserve Board (the "Fed") ceased what was a two-year trend. That trend — a string of 17 consecutive interest rate hikes that ended last fall — was seen by many analysts as a sign that the Fed was concerned about containing inflation.
Now, the Fed is neither raising nor lowering interest rates, which puts us in the midst of what economists refer to as a "plateau." Historically, there have been six similar plateaus since 1982 and during four of those periods the Standard & Poor's 500® Composite Stock Price Index(1) ("S&P 500® Index") rose significantly.
Of course, the Fed's actions impact economies and market performance around the world. For instance, the current interest rate climate has been cited as one reason for a decline in the value of the dollar. Last year, that drop in the dollar meant that international stocks — which are often determined in foreign currencies — generally experienced strong performance as foreign currencies climbed and world stock markets continued to produce strong results.
Meanwhile, here at home, 2006 was an interesting year for equity investors. In May of 2006, the S&P 500® Index hit a five-year high followed by a market correction and several months of non-directional returns. A strong rally occurred in the second half of the year driven in part by the aforementioned dollar decline and the interest rate plateau. The good news is many economists believe that these conditions may continue in the months to come.
At ING Funds, we are committed to providing you, the investor, with an array of investment choices that enables you to build a diversified portfolio across a variety of asset classes. We do so, with a view that the globalization of markets is an initial consideration in the products we offer.
We take the confidence you place in us with your investments very seriously — everyone in our firm is committed to renewing this trust each and every day.

Shaun Mathews
President
ING Funds
January 31, 2007
The views expressed in the President's Letter reflect those of the President as of the date of the letter. Any such views are subject to change at any time based upon market or other conditions and ING Funds disclaims any responsibility to update such views. These views may not be relied on as investment advice and because investment decisions for an ING Fund are based on numerous factors, may not be relied on as an indication of investment intent on behalf of any ING Fund. Reference to specific company securities should not be construed as recommendations or investment advice.
(1) The S&P 500® Index is an unmanaged index that measures the performance of the securities of approximately 500 of the largest companies in the U.S.
1
MARKET PERSPECTIVE: YEAR ENDED DECEMBER 31, 2006
In our semi-annual report, we described how the feast of the first quarter had turned to famine in the second quarter for global equity markets on concerns that rising interest rates would freeze out global growth. Indeed as late as June 27, 2006, the year-to-date return on the Morgan Stanley Capital International ("MSCI") World IndexSM(1) measured in local currencies, including net reinvested dividends had been precisely 0%. However, the second half of the year ended December 31, 2006, was much healthier and the same index powered ahead 12.3% and for the year ended December 31, 2006, returned 20.07%. The return to dollar based in vestors was a little better at 13.2%, as late in the year a slowing economy and hints that central banks would be diversifying out of dollars weighed on that currency. For the six months ended December 31, 2006, the dollar fell 3.1% against the euro and 5.6% against the pound, but gained 4.1% on the yen due to stumbling growth and miniscule interest rates in Japan. For the year ended December 31, 2006, the dollar fell 10.6% against the euro and 12.4% against the pound, but gained 1.3% against the yen.
As the first half of 2006 ended, the Federal Open Market Committee ("FOMC") had just raised the federal funds rate for the seventeenth time since June 2004, to 5.25%. The relatively mild accompanying language led many in the fixed income market to hope that the tightening cycle was now over. Not everyone believed it, especially when new Middle East conflict pushed the price of oil to another record on July 14, 2006. But data, especially on housing, had mostly pointed to cooling demand and a tame employment report on August 4, 2006 probably decided the matter. Four days later the FOMC met and left rates unchanged. The booming housing market had been a powerful driver of growth in recent years through new construction and demand created by mortgage loan refinancing. This boom was deteriorating a ppreciably with housing prices and the key new building permits measure falling sharply. Only in the last few days of 2006 did the slump show some signs of bottoming out with unexpectedly good new and existing home sales figures reported, along with rebounding consumer confidence. For the six months ended December 31, 2006, the Lehman Brothers® Aggregate Bond ("LBAB") Index(2) of investment grade bonds gained 5.09% and for the year ended December 31, 2006 it gained 4.33%. The most important dynamic was the broad yield curve inversion, suggestive of an expected fall in interest rates and a further economic slow down. The ten-year Treasury yield fell 43 basis points (0.43%) to 4.71%, while the yield on the three-month Bill rose by 3 basis points (0.03%) to 4.89%. Since mid-August, with the exception of two days, bond investors had been prepar ed to lend money to the government for ten years at a lower interest rate than for three months.
Faced with fading business activity, as the key housing engine seized up, and a yield curve inverted to the point of recession according to some commentators, investors in U.S. equities must have been in the mood to sell. Not so fast. Those investors saw things differently and indeed the apparent "disagreement" between the bond market and global stock markets was a well discussed feature of the second half of the year. For one thing, the oil price, having hit its record, fell back, as surly calm returned to the Middle East, as the summer driving and hurricane seasons came and went and as winter got off to a mild start in the key North East region. The price of oil averaged 22% less in the fourth quarter than at its peak, boosting consumers' spending power and confidence. And if longer-term int erest rates were falling then stocks looked more attractive as bonds provided less competition and the present value of future corporate profits rose. Speaking of which, Standard & Poor's 500® Composite Stock Price ("S&P 500®") Index(3) companies duly reported their 13th straight double-digit quarterly percentage earnings gain. Gross domestic product ("GDP") growth may have slowed, but the share of corporate profits, reported at 12.4%, was the highest since the 1950's. The next merger or acquisition to get investors in the mood never seemed far away. Five of them were even announced in one day on November 6, 2006, sending markets up about 1%. For the six months ended December 31, 2006, the S&P 500® Index, including dividends, rose 12.7% and for the year ended December 31, 2006, the S&P 500&r eg; Index, including dividends, rose 15.8%. All but 30 basis points (0.30%) of the gain came after August 8, 2006, making six-year highs as the year ended.
International markets, based on MSCI local currency indices, as in the U.S., finished near their best levels for the year. In Japan the market advanced 8.7%, in 2006, after a late surge. The long awaited increase in interest rates from 0.0% to 0.25% took place in July just as the economic recovery was losing impetus. Third quarter growth was estimated at only 0.8% and generated by exports and capital spending alone. Consumer spending was lagging despite low unemployment and almost flat prices, yet business confidence remained high and profit growth healthy. Elsewhere, Asian markets ex Japan rose 28.2% in 2006, but with wide
2
MARKET PERSPECTIVE: YEAR ENDED DECEMBER 31, 2006
disparities, ranging from –2.0% in Thailand to 83.4% in China. In Thailand the uncertainty caused by a military coup was compounded when the junta imposed exchange controls to hold back the strong baht, only to rescind them the next day. China's market soared in surely speculative excess, and in the absence of attractive alternatives, as investors sought a piece of the world's fourth largest economy. By the end of 2006 the Chinese market had become the third biggest emerging market after South Korea and Taiwan. European ex UK markets surged 16.1%, in 2006. The Eurozone's GDP growth had recorded its best first half of a year since 2000, 1.7%, and the lowest unemployment rate, 7.8%, since the start of the Eurozone itself. But as the second half of 2006, wore on there were signs that the bes t news was behind it and the third quarter's annualized growth fell to 2.0%. Business confidence, however, stayed buoyant and cheered by extensive merger and acquisition activity despite headwinds in the form of a strengthening euro, a hawkish European Central Bank that raised rates three times and the looming rise in German sales tax. UK equities added 8.6% in the six months ended December 31, 2006. The Bank of England raised rates twice as GDP growth accelerated to 2.9% year over year, inflation climbed above target and house prices, an important demand generator, continued their recovery with average prices up more than 10% in 2006. Again, however, it was widespread, large scale mergers and acquisitions energizing the market.
(1) The MSCI World IndexSM is an unmanaged index that measures the performance of over 1,400 securities listed on exchanges in the U.S., Europe, Canada, Australia, New Zealand and the Far East.
(2) The LBAB Index is a widely recognized, unmanaged index of publicly issued investment grade U.S. Government, mortgage-backed, asset-backed and corporate debt securities.
(3) The S&P 500® Index is an unmanaged index that measures the performance of securities of approximately 500 of the largest companies in the U.S.
All indices are unmanaged and investors cannot invest directly in an index.
Past performance does not guarantee future results. The performance quoted represents past performance. Investment return and principal value of an investment will fluctuate, and shares, when redeemed, may be worth more or less than their original cost. The Portfolios' performance is subject to change since the period's end and may be lower or higher than the performance data shown. Please call (800) 992-0180 or log on to www.ingfunds.com to obtain performance data current to the most recent month end.
Market Perspective reflects the views of the Chief Investment Risk Officer only through the end of the period, and is subject to change based on market and other conditions.
3
ING VP INDEX PLUS LARGECAP PORTFOLIO
PORTFOLIO MANAGERS' REPORT
The ING VP Index Plus LargeCap Portfolio (the "Portfolio") seeks to outperform the total return performance of the Standard & Poor's 500® Composite Stock Price Index ("S&P 500® Index"), while maintaining a market level of risk. The Portfolio is managed by Omar Aguilar, Ph.D. and Vincent Costa, CFA, Portfolio Managers, of ING Investment Management Co.* — the Sub-Adviser.
Performance: For the year ended December 31, 2006, the Portfolio's Class I shares provided a total return of 14.58% compared to the S&P 500® Index, which returned 15.79% for the same period.
Portfolio Specifics: December was a rebound month for portfolio results as most of our factors performed well when the low quality rally ended and stocks with attractive valuations were bid up. Prior to December, the Portfolio struggled to keep pace with the overall market, which was up sharply. Overall, the Portfolio underperformed the benchmark for the year.
Valuation factors were positive during the year, while earnings quality and growth factors were flat and market recognition detracted from performance. Specific valuation factors that worked well included price to book and price to earnings before interest, taxes, depreciation, and amortization. Within quality, capital expenditures/depreciation worked well. In contrast, market recognition factors such as price momentum and estimate revisions were negatives.
An underweight in financials, combined with favorable security selection benefited the Portfolio. Security selection worked well in diversified financials including such stocks as Goldman Sachs Group, Inc. and Morgan Stanley. Both were overweight positions ranked high in terms of market recognition and valuation factors. Both companies appreciated due to key acquisitions in 2006. An overweight position in AT&T, Inc. contributed to performance, as it gained significantly over the year. The gains came as the AT&T, Inc. and BellSouth Corp. merger was announced along with some other key acquisitions during the year. Security selection in information technology also helped. An underweight position in Yahoo!, Inc., which ranked poorly in terms of valuation and market recognition, added to performance as the stock price slipped due to poor earnings news. Overweight positions in high quality companies including Cisco Systems, Inc. and Hewlet t-Packard Co. helped the Portfolio as both rose on the back of strong earnings and acquisitions.
In contrast, security selection in health care, particularly in Express Scripts, Inc. acted as a drag. An underweight position in materials along with poor stock selection negatively impacted the Portfolio. Freeport-McMoRan Copper & Gold, Inc., a well ranked stock and a slight overweight, detracted from performance. The company warned of lower copper output in June 2006. Additionally, in media, an underweight in Time Warner Cable, Inc., one of the lowest quality stocks in our universe with poor fundamentals hurt the Portfolio. The stock rallied as it reduced debt, bought back shares, completed its acquisition of Adelphia Communications Corp., now Time Warner Cable, Inc. and cleaned up its relationship with Comcast Corp.
Current Strategy and Outlook: Our research builds structured portfolios of stocks with fundamental characteristics that we believe will translate into a performance advantage over the benchmark. Our analysis positions the Portfolio to capitalize on high-quality companies with superior business momentum, growing earnings and attractive valuations.
As of December 31, 2006, the Portfolio was overweight financials and energy and underweight consumer staples and industrials. However, our sector exposures are a function of individual stock selection and by design quite close to the S&P 500® Index.

Top Ten Holdings*
as of December 31, 2006
(as a percent of net assets) | |
| ExxonMobil Corp. | | | 4.5 | % | |
| General Electric Co. | | | 2.9 | % | |
| Citigroup, Inc. | | | 2.9 | % | |
| Bank of America Corp. | | | 2.6 | % | |
| JPMorgan Chase & Co. | | | 2.0 | % | |
| Microsoft Corp. | | | 2.0 | % | |
| Cisco Systems, Inc. | | | 1.9 | % | |
| Chevron Corp. | | | 1.8 | % | |
| International Business Machines Corp. | | | 1.7 | % | |
| Procter & Gamble Co. | | | 1.5 | % | |
* Excludes short-term investments related to ING Institutional Prime Money Market Fund, repurchase agreement and securities lending collateral.
Portfolio holdings are subject to change daily.
* Effective December 31, 2006, Douglas Cotè resigned from ING Investment Management Co.
Portfolio holdings and characteristics are subject to change and may not be representative of current holdings and characteristics. The outlook for this Portfolio may differ from that presented for other ING Funds. Performance for the different classes of shares will vary based on differences in fees associated with each class.
4
PORTFOLIO MANAGERS' REPORT
ING VP INDEX PLUS LARGECAP PORTFOLIO
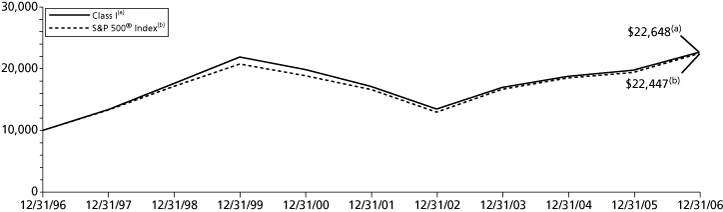
| Average Annual Total Returns for the Periods Ended December 31, 2006 | |
| | | 1 Year | | 5 Year | | 10 Year | | Since Inception
of Class S
July 16, 2001 | |
| Class I | | | 14.58 | % | | | 5.73 | % | | | 8.51 | % | | | — | | |
| Class S | | | 14.28 | % | | | 5.46 | % | | | — | | | | 4.08 | % | |
| S&P 500® Index(1) | | | 15.79 | % | | | 6.19 | % | | | 8.42 | % | | | 4.78 | %(2) | |
Based on a $10,000 initial investment, the graph and table above illustrate the total return of ING VP Index Plus LargeCap Portfolio against the index indicated. An index is unmanaged and has no cash in its portfolio, imposes no sales charges and incurs no operating expenses. An investor cannot invest directly in an index. The Portfolio's performance is shown without the imposition of any expenses or charges which are, or may be, imposed under your annuity contract or life insurance policy. Total returns would have been lower if such expenses or charges were included.
The performance graph and table do not reflect the deduction of taxes that a shareholder will pay on Portfolio distributions or the redemption of Portfolio shares.
The performance shown may include the effect of fee waivers and/or expense reimbursements by the Investment Adviser and/or other service providers, which have the effect of increasing total return. Had all fees and expenses been considered, the total returns would have been lower.
The performance update illustrates performance for a variable investment option available through a variable annuity contract and/or a variable universal life policy. The performance shown indicates past performance and is not a projection or prediction of future results. Actual investment returns and principal value will fluctuate so that shares and/or units, at redemption, may be worth more or less than their original cost. For variable annuity contracts, please call (800) 992-0181 to get performance through the most recent month end. For variable universal life policies, please log on to www.ing.com/us to get performance through the most recent month end.
This report contains statements that may be "forward-looking" statements. Actual results may differ materially from those projected in the "forward-looking" statements.
The views expressed in this report reflect those of the portfolio managers, only through the end of the period as stated on the cover. The portfolio managers' views are subject to change at any time based on market and other conditions.
Portfolio holdings are subject to change daily.
(1) The S&P 500® Index is an unmanaged index that measures the performance of securities of approximately 500 of the largest companies in the United States.
(2) Since inception performance for the index is shown from August 1, 2001.
Effective March 1, 2002, ING Investments, LLC began serving as investment adviser and ING Investment Management Co., the former investment adviser, began serving as sub-adviser to the Portfolio.
5
ING VP INDEX PLUS MIDCAP PORTFOLIO
PORTFOLIO MANAGERS' REPORT
The ING VP Index Plus MidCap Portfolio (the "Portfolio") seeks to outperform the total return performance of the Standard & Poor's MidCap 400 Index ("S&P MidCap 400 Index"), while maintaining a market level of risk. The Portfolio is managed by Omar Aguilar, Ph.D., and Vincent Costa, CFA, Portfolio Managers* of ING Investment Management Co. — the Sub-Adviser.
Performance: For the year ended December 31, 2006, the Portfolio's Class I shares provided a total return of 9.44% compared to the S&P MidCap 400 Index(1), which returned 10.32% for the same period.
Portfolio Specifics: Mid-cap generally stocks performed well in 2006, particularly in the second half of the year. With the U.S. Federal Reserve Board on hold, many investors were willing to take on more risky assets which helped the mid cap rally for the quarter. The Portfolio caught up with the rally this quarter but ended below the benchmark for the year.
An underweight in the energy sector combined with stock selection helped the Portfolio. An underweight position in Arch Coal, Inc., which declined during the year, was a positive. Arch Coal, Inc.'s earnings were lower than analyst estimates due to weak demand and low prices. An overweight position in Noble Energy, Inc., which ranked attractively in terms of quality and valuation, as well as market recognition helped. The stock gained during the year as it acquired United States Exploration, and saw its earnings rise due to tax benefits. An overweight position in retail stock American Eagle Outfitters also significantly benefited returns. The company ranked very highly in terms of quality and valuation, as well as market recognition, and its stock price rose sharply during the year as increased same store sales helped earnings growth.
In contrast, stock selection and an overweight in the financials sector hurt the Portfolio, due in part to and underweight and adverse stock selection in the real estate industry group. United Dominion Realty Trust, Inc. and Developers Diverse Realty Corp. detracted from performance. The Portfolio was underweight in both stocks as they ranked poorly in terms of valuation. Both rose markedly during the year, with United Dominion Realty Trust, Inc. appreciating on the back of positive earnings and Developers Diverse Realty Corp. rose due to key acquisitions. An underweight position in Commerce Bancorp., which registered most of its gains in the first half of the year as it opened 65 new branches, negatively impacted the strategy. The stock scored poorly on valuation and market recognition factors.
Stock selection in the information technology sector detracted from performance. Positions in Activision and Cognizant Technology Solutions Corp. acted as a drag. Both companies gained due to strong earnings. We were underweight in both due to poor valuation. Activision, Inc. and Cognizant Technology Solutions Corp. are no longer a part of the Portfolio.
Current Strategy and Outlook: Our research builds structured portfolios of stocks with fundamental characteristics that we believe will translate into a performance advantage over the benchmark. We believe our analysis positions the Portfolio to capitalize on high-quality companies with superior business momentum, growing earnings and attractive valuations.
As of December 31, 2006, the Portfolio was overweight in the information technology and financials sectors and underweight in the utilities and healthcare sectors. However, our sector exposures are a function of individual stock selection and, by design, quite close to the index.
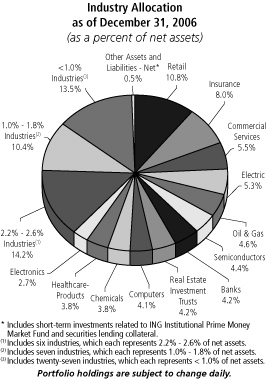
Top Ten Holdings*
as of December 31, 2006
(as a percent of net assets) | |
| Everest Re Group Ltd. | | | 1.3 | % | |
| WR Berkley Corp. | | | 1.3 | % | |
| Ross Stores, Inc. | | | 1.1 | % | |
| Manpower, Inc. | | | 1.1 | % | |
| Tidewater, Inc. | | | 1.0 | % | |
| American Eagle Outfitters | | | 1.0 | % | |
| AnnTaylor Stores Corp. | | | 1.0 | % | |
| Payless Shoesource, Inc. | | | 1.0 | % | |
| Sybase, Inc. | | | 1.0 | % | |
| Granite Construction, Inc. | | | 0.9 | % | |
* Excludes short-term investments related to securities lending collateral.
Portfolio holdings are subject to change daily.
* Effective December 31, 2006, Douglas Cotè resigned from ING Investment Management Co.
Portfolio holdings and characteristics are subject to change and may not be representative of current holdings and characteristics. The outlook for this Portfolio may differ from that presented for other ING Funds. Performance for the different classes of shares will vary based on differences in fees associated with each class.
6
PORTFOLIO MANAGERS' REPORT
ING VP INDEX PLUS MIDCAP PORTFOLIO
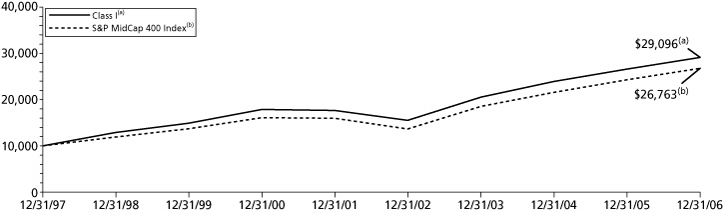
| Average Annual Total Returns for the Periods Ended December 31, 2006 | |
| | | 1 Year | | 5 Year | | Since Inception
of Class I
December 16, 1997 | | Since Inception
of Class S
July 16, 2001 | |
| Class I | | | 9.44 | % | | | 10.54 | % | | | 12.53 | % | | | — | | |
| Class S | | | 9.12 | % | | | 10.27 | % | | | — | | | | 9.56 | % | |
| S&P MidCap 400 Index(1) | | | 10.32 | % | | | 10.89 | % | | | 11.56 | %(2) | | | 10.00 | %(3) | |
Based on a $10,000 initial investment, the graph and table above illustrate the total return of ING VP Index Plus MidCap Portfolio against the index indicated. An index is unmanaged and has no cash in its portfolio, imposes no sales charges and incurs no operating expenses. An investor cannot invest directly in an index. The Portfolio's performance is shown without the imposition of any expenses or charges which are, or may be, imposed under your annuity contract or life insurance policy. Total returns would have been lower if such expenses or charges were included.
The performance graph and table do not reflect the deduction of taxes that a shareholder will pay on Portfolio distributions or the redemption of Portfolio shares.
The performance shown may include the effect of fee waivers and/or expense reimbursements by the Investment Adviser and/or other service providers, which have the effect of increasing total return. Had all fees and expenses been considered, the total returns would have been lower.
The performance update illustrates performance for a variable investment option available through a variable annuity contract and/or a variable universal life policy. The performance shown indicates past performance and is not a projection or prediction of future results. Actual investment returns and principal value will fluctuate so that shares and/or units, at redemption, may be worth more or less than their original cost. For variable annuity contracts, please call (800) 992-0181 to get performance through the most recent month end. For variable universal life policies, please log on to www.ing.com/us to get performance through the most recent month end.
This report contains statements that may be "forward-looking" statements. Actual results may differ materially from those projected in the "forward-looking" statements.
The views expressed in this report reflect those of the portfolio managers, only through the end of the period as stated on the cover. The portfolio managers' views are subject to change at any time based on market and other conditions.
Portfolio holdings are subject to change daily.
(1) The S&P MidCap 400 Index is an unmanaged index that measures the performance of the mid-size company segment of the U.S. market.
(2) Since inception performance for the index is shown from January 1, 1998.
(3) Since inception performance for the index is shown from August 1, 2001.
Effective March 1, 2002, ING Investments, LLC began serving as investment adviser and ING Investment Management Co., the former investment adviser, began serving as sub-adviser to the Portfolio.
7
ING VP INDEX PLUS SMALLCAP PORTFOLIO
PORTFOLIO MANAGERS' REPORT
The ING VP Index Plus SmallCap Portfolio (the "Portfolio") seeks to outperform the total return performance of the Standard & Poor's SmallCap 600 Index ("S&P SmallCap 600 Index"), while maintaining a market level of risk. The Portfolio is managed by Omar Aguilar, Ph.D., and Vincent Costa, CFA, Portfolio Managers* of ING Investment Management Co. — the Sub-Adviser.
Performance: For the year ended December 31, 2006, the Portfolio's Class I shares provided a total return of 13.82% compared to the S&P SmallCap 600 Index(1), which returned 15.12% for the same period.
Portfolio Specifics: Small-cap stocks generally performed well in 2006, particularly in the second half of the year. With the U.S. Federal Reserve Board on hold, investors were willing to buy into more risky assets which helped the small-cap rally. The Portfolio caught up with the rally in December, but underperformed the benchmark for the year.
An overweight in Frontier Oil Corp., which ranked well in terms of market recognition and valuation, added to performance. The stock rallied as it increased its quarterly cash dividend and bought back shares. Another big contribution came from an underweight in Massey Energy Co., which declined due to a third quarter earnings disappointment. Superior security selection in consumer discretionary added to performance. Overweight positions in Jack in the Box, Inc. and Gymboree Corp. helped, as both ranked highly in terms of market recognition. Jack in the Box Inc.'s profits increased and beat analysts' earnings expectations, while Gymboree Corp.'s strong same store sales helped raise its earnings guidance for the fourth quarter.
In contrast, an overweight in the financials sector, along with security selection hurt the Portfolio. Shurgard Storage Centers, Inc., a real estate investment trust, and Fremont General Corp., in banking, were notable detractors. Shurgard Storage Centers, Inc., an underweight position, rose during the period. Fremont General Corp., an overweight, saw its profits fall in the third quarter even though it ranked highly in terms of valuation. Security selection in information technology detracted from performance. An underweight position in software and services company, THQ, Inc., which ranked low in terms of quality, and technology and hardware equipment company, Daktronics, Inc., which had poor valuation scores, hurt the most. Both rose markedly during the year on the back of strong earnings.
Current Strategy and Outlook: Our research builds structured portfolios of stocks with fundamental characteristics that we believe will translate into a performance advantage over the benchmark. We believe our analysis positions the Portfolio to capitalize on high-quality companies with superior business momentum, growing earnings and attractive valuations.
As of December 31, 2006, the Portfolio was overweight in the consumer discretionary and financials sectors and underweight in the information technology and utilities sectors. However, our sector exposures are a function of individual stock selection and, by design, quite close to the index.
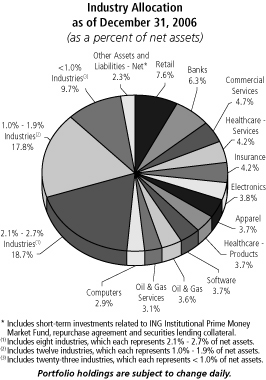
Top Ten Holdings*
as of December 31, 2006
(as a percent of net assets) | |
| Amerigroup Corp. | | | 1.1 | % | |
| Skywest, Inc. | | | 1.0 | % | |
| Frontier Oil Corp. | | | 1.0 | % | |
| Group 1 Automotive, Inc. | | | 0.8 | % | |
| Phillips-Van Heusen | | | 0.8 | % | |
| Piper Jaffray Cos. | | | 0.8 | % | |
| Gymboree Corp. | | | 0.8 | % | |
| NVR, Inc. | | | 0.8 | % | |
| HUB Group, Inc. | | | 0.7 | % | |
| Philadelphia Consolidated Holding Co. | | | 0.7 | % | |
* Excludes short-term investments related to ING Institutional Prime Money Market Fund, repurchase agreement and securities lending collateral.
Portfolio holdings are subject to change daily.
* Effective December 31, 2006, Douglas Cotè resigned from ING Investment Management Co.
Portfolio holdings and characteristics are subject to change and may not be representative of current holdings and characteristics. The outlook for this Portfolio may differ from that presented for other ING Funds. Performance for the different classes of shares will vary based on differences in fees associated with each class.
8
PORTFOLIO MANAGERS' REPORT
ING VP INDEX PLUS SMALLCAP PORTFOLIO
| Average Annual Total Returns for the Periods Ended December 31, 2006 | |
| | | 1 Year | | 5 Year | | Since Inception
of Class I
December 19, 1997 | | Since Inception
of Class S
July 16, 2001 | |
| Class I | | | 13.82 | % | | | 12.05 | % | | | 9.47 | % | | | — | | |
| Class S | | | 13.48 | % | | | 11.77 | % | | | — | | | | 11.21 | % | |
| S&P SmallCap 600 Index(1) | | | 15.12 | % | | | 12.49 | % | | | 10.12 | %(2) | | | 11.89 | %(3) | |
Based on a $10,000 initial investment, the graph and table above illustrate the total return of ING VP Index Plus SmallCap Portfolio against the index indicated. An index is unmanaged and has no cash in its portfolio, imposes no sales charges and incurs no operating expenses. An investor cannot invest directly in an index. The Portfolio's performance is shown without the imposition of any expenses or charges which are, or may be, imposed under your annuity contract or life insurance policy. Total returns would have been lower if such expenses or charges were included.
The performance graph and table do not reflect the deduction of taxes that a shareholder will pay on Portfolio distributions or the redemption of Portfolio shares.
The performance shown may include the effect of fee waivers and/or expense reimbursements by the Investment Adviser and/or other service providers, which have the effect of increasing total return. Had all fees and expenses been considered, the total returns would have been lower.
The performance update illustrates performance for a variable investment option available through a variable annuity contract and/or a variable universal life policy. The performance shown indicates past performance and is not a projection or prediction of future results. Actual investment returns and principal value will fluctuate so that shares and/or units, at redemption, may be worth more or less than their original cost. For variable annuity contracts, please call (800) 992-0181 to get performance through the most recent month end. For variable universal life policies, please log on to www.ing.com/us to get performance through the most recent month end.
This report contains statements that may be "forward-looking" statements. Actual results may differ materially from those projected in the "forward-looking" statements.
The views expressed in this report reflect those of the portfolio managers, only through the end of the period as stated on the cover. The portfolio managers' views are subject to change at any time based on market and other conditions.
Portfolio holdings are subject to change daily.
(1) The S&P SmallCap 600 Index is an unmanaged index used to measure stock market performance composed of companies with a weighted average market value of approximately $630 million.
(2) Since inception performance for the index is shown from January 1, 1998.
(3) Since inception performance for the index is shown from August 1, 2001.
Effective March 1, 2002, ING Investments, LLC began serving as investment adviser and ING Investment Management Co., the former investment adviser, began serving as sub-adviser to the Portfolio.
9
ING VP STRATEGIC ALLOCATION CONSERVATIVE PORTFOLIO
PORTFOLIO MANAGERS' REPORT
The ING VP Strategic Allocation Conservative Portfolio (the "Portfolio") seeks to provide total return consistent with preservation of capital. The Portfolio is managed by Mary Ann Fernandez, Portfolio Manager and Brian Gendreau, Ph.D., Portfolio Manager of ING Investment Management Co. — the Sub-Adviser.
Performance: For the year ended December 31, 2006, the Portfolio's Class I shares provided a total return of 8.37% compared to the Lehman Brothers® Aggregate Bond Index(1) ("LBAB Index") and the ING Strategic Allocation Conservative Composite Index(2) ("Composite Index"), which returned 4.33% and 8.29%, respectively, for the same period.
Portfolio Specifics: Over the period, domestic large-caps, international equity and fixed income securities generally did well. The Portfolio's asset allocations efforts were positive against the Composite Index, mainly due to an overweight in international and an underweight in fixed income. International stocks continued to rally on news of strong earnings growth in Japan and Europe, and as a result of the positive outlook for growth abroad. After 17 consecutive rate hikes by the Federal Open Market Committee it appears the U.S. Federal Reserve Board ("Fed") is on hold and the futures markets has even priced in a rate cut sometime in 2007. Our view is that the Fed is unlikely to raise rates further in the near term unless the economy shows signs of rapid growth or inflation rises. With the yield curve remaining inverted, we continue to underweight fixed i ncome.
The domestic equity portion of the Portfolio underperformed its sub-benchmark, the Russell 3000® Index, as a result of both sector allocation and security selection. Sector allocation suffered primarily from an underweight position in telecommunication services, which was the best-performing sector in the index. While security selection in consumer discretionary, energy, consumer staples and health care hurt the Portfolio, telecommunication services, information technology and industrials holdings helped. Security selection was strongest in large-cap stocks, while selection in mid-and small-cap securities acted as a drag. Valuation and quality factors positively impacted performance, while market recognition factors hurt.
The international portion of the Portfolio underperformed the sub-benchmark, the Morgan Stanley Capital International-Europe, Australasia, Far East® ("MSCI EAFE®") Index, due to unfavorable security selection, primarily in consumer discretionary, industrials and information technology. However, selection in consumer staples, health care and utilities benefited the Portfolio. Regionally, an overweight in emerging markets helped, while underweight positions in developed Asia and Europe acted as a drag.
The fixed income portion of the Portfolio underperformed the LBAB Index. Our short duration positioning hurt the Portfolio at the beginning of the period, but was beneficial in December. A relative underweight in corporate bonds acted as a drag as the sector outperformed Treasuries. Security selection in mortgage-backed securities was largely beneficial with our adjustable-rate mortgages adding to relative results. In December, our position in long corporate bonds and subordinated paper with maturities of 10 and 30 years was positive. In contrast, our exposure to a telecommunication company bond hindered results when spreads widened after the company missed earnings estimates following its merger with another wireless company.
Current Strategy and Outlook: A weak housing market coupled with the lagged effects of 17 rate hikes by the Fed has slowed the U.S. economy. We expect gross domestic product growth to be moderate, with output expanding at a slightly below-trend rate. While residential investment continues to decline, lower gasoline prices and credit conditions should help mitigate the spill over effects from the weakening housing market. Our view is that the economy is in a mid-cycle slowdown with a low likelihood of recession. Yields have fallen, and the inversion of U.S. Treasury yield curve has become much more pronounced in the one to three year range, suggesting growing confidence in eventual Fed easing. On an asset allocation basis, we have maintained our overweight in international equities.
Investment Type Allocation
as of December 31, 2006
(as a percent of net assets) | |
| Common Stock | | | 46.7 | % | |
| Collateralized Mortgage Obligations | | | 15.9 | % | |
| U.S. Government Agency Obligations | | | 15.3 | % | |
| Repurchase Agreement | | | 10.0 | % | |
| Corporate Bonds/Notes | | | 8.3 | % | |
| U.S. Treasury Obligations | | | 6.4 | % | |
| Commercial Paper | | | 3.4 | % | |
| Preferred Stock | | | 0.8 | % | |
| Asset-Backed Securities | | | 0.7 | % | |
| Municipal Bonds | | | 0.5 | % | |
| Equity-Linked Securities | | | 0.3 | % | |
| Other Assets and Liabilities - Net* | | | (8.3 | )% | |
| Net Assets | | | 100.0 | % | |
* Includes securities lending collateral.
Portfolio holdings are subject to change daily.
Top Ten Holdings*
as of December 31, 2006
(as a percent of net assets) | |
Federal National Mortgage Association,
5.000%, due 01/12/36 | | | 4.5 | % | |
| U.S. Treasury Bond, 4.500%, due 02/15/36 | | | 1.8 | % | |
MASTR Reperforming Loan Trust,
5.680%, due 07/25/35 | | | 1.7 | % | |
| U.S. Treasury Bond, 4.625%, due 11/15/16 | | | 1.6 | % | |
| ExxonMobil Corp. | | | 1.6 | % | |
Washington Mutual Alternative Mortgage
Pass-Through Certificates, 5.567%, due 01/25/47 | | | 1.0 | % | |
| Citigroup, Inc. | | | 1.0 | % | |
| General Electric Co. | | | 1.0 | % | |
| Bank of America Corp. | | | 0.9 | % | |
| Washington Mutual, Inc., 5.667%, due 11/25/46 | | | 0.8 | % | |
* Excludes short-term investments related to commercial paper, repurchase agreement and securities lending collateral.
Portfolio holdings are subject to change daily.
Portfolio holdings and characteristics are subject to change and may not be representative of current holdings and characteristics. The outlook for this Portfolio may differ from that presented for other ING Funds. Performance for the different classes of shares will vary based on differences in fees associated with each class.
10
PORTFOLIO MANAGERS' REPORT
ING VP STRATEGIC ALLOCATION CONSERVATIVE PORTFOLIO
| Average Annual Total Returns for the Periods Ended December 31, 2006* | |
| | | 1 Year | | 5 Year | | 10 Year | | Since Inception
of Class S
August 5, 2005 | |
| Class I | | | 8.37 | % | | | 5.72 | % | | | 5.89 | % | | | — | | |
| Class S | | | 8.13 | % | | | — | | | | — | | | | 6.81 | % | |
| LBAB Index(1) | | | 4.33 | % | | | 5.06 | % | | | 6.24 | % | | | 3.65 | %(3) | |
| Composite Index(2) | | | 8.29 | % | | | 6.01 | % | | | 6.71 | % | | | 6.75 | %(3) | |
Based on a $10,000 initial investment, the graph and table above illustrate the total return of ING VP Strategic Allocation Conservative Portfolio against the indices indicated. An index is unmanaged and has no cash in its portfolio, imposes no sales charges and incurs no operating expenses. An investor cannot invest directly in an index. The Portfolio's performance is shown without the imposition of any expenses or charges which are, or may be, imposed under your annuity contract. Total returns would have been lower if such expenses or charges were included.
The performance graph and table do not reflect the deduction of taxes that a shareholder will pay on Portfolio distributions or the redemption of Portfolio shares.
The performance shown may include the effect of fee waivers and/or expense reimbursements by the Investment Adviser and/or other service providers, which have the effect of increasing total return. Had all fees and expenses been considered, the total returns would have been lower.
The performance update illustrates performance for a variable investment option available through a variable annuity contract. The performance shown indicates past performance and is not a projection or prediction of future results. Actual investment returns and principal value will fluctuate so that shares and/or units, at redemption, may be worth more or less than their original cost. Please call (800) 992-0181 to get performance through the most recent month end.
This report contains statements that may be "forward-looking" statements. Actual results may differ materially from those projected in the "forward-looking" statements.
The views expressed in this report reflect those of the portfolio managers, only through the end of the period as stated on the cover. The portfolio managers' views are subject to change at any time based on market and other conditions.
Portfolio holdings are subject to change daily.
* ADV Class commenced operations on December 29, 2006, therefore, there is no performance information for the period ended December 31, 2006.
(1) The LBAB Index is a widely recognized, unmanaged index of publicly issued fixed rate U.S. government, investment grade, mortgaged-backed and corporate debt securities.
(2) The Composite is comprised of the asset class indices that correspond to the particular asset classes in which the Portfolio invests and their benchmark weightings. From time to time, adjustments have been made in the asset classes and/or weightings applicable to the Portfolio, and corresponding adjustments have been made to the composite. See page 16 for additional information.
(3) Since inception performance for the index is shown from
August 1, 2005.
Effective March 1, 2002, ING Investments, LLC began serving as investment adviser and ING Investment Management Co., the former investment adviser, began serving as sub-adviser to the Portfolio.
11
ING VP STRATEGIC ALLOCATION GROWTH PORTFOLIO
PORTFOLIO MANAGERS' REPORT
The ING VP Strategic Allocation Growth Portfolio (the "Portfolio") seeks to provide capital appreciation. The Portfolio is managed by Mary Ann Fernandez, Portfolio Manager and Brian Gendreau, Ph.D., Portfolio Manager of ING Investment Management Co. — the Sub-Adviser.
Performance: For the year ended December 31, 2006, the Portfolio's Class I shares provided a total return of 13.19% compared to the Russell 3000® Index(1) and the ING Strategic Allocation Growth Composite Index(2) ("Composite Index"), which returned 15.72% and 14.45%, respectively, for the same period.
Portfolio Specifics: Over the period, domestic large-caps, international equity and fixed income securities generally did well. The Portfolio's asset allocations efforts were positive against the Composite Index, mainly due to an overweight in international and an underweight in fixed income. International stocks continued to rally on news of strong earnings growth in Japan and Europe, and as a result of the positive outlook for growth abroad. After 17 consecutive rate hikes by the Federal Open Market Committee it appears the U.S. Federal Reserve Board ("Fed") is on hold and the futures markets has even priced in a rate cut sometime in 2007. Our view is that the Fed is unlikely to raise rates further in the near term unless the economy shows signs of rapid growth or inflation rises. With the yield curve remaining inverted, we continue to underweight fixed i ncome.
The domestic equity portion of the Portfolio underperformed its sub-benchmark, the Russell 3000® Index, as a result of both sector allocation and security selection. Sector allocation suffered primarily from an underweight position in telecommunication services, which was the best-performing sector in the index. While security selection in consumer discretionary, energy, consumer staples and health care hurt the Portfolio, telecommunication services, information technology and industrials holdings helped. Security selection was strongest in large-cap stocks, while selection in mid-and small-cap securities acted as a drag. Valuation and quality factors positively impacted performance, while market recognition factors hurt.
The international portion of the Portfolio underperformed the sub-benchmark, the Morgan Stanley Capital International-Europe, Australasia, Far East® ("MSCI EAFE®") Index, due to unfavorable security selection, primarily in consumer discretionary, industrials and information technology. However, selection in consumer staples, health care and utilities benefited the Portfolio. Regionally, an overweight in emerging markets helped, while underweight positions in developed Asia and Europe acted as a drag.
The fixed income portion of the Portfolio underperformed the Lehman Brothers® Aggregate Bond Index. Our short duration positioning hurt the Portfolio at the beginning of the period, but was beneficial in December. A relative underweight in corporate bonds acted as a drag as the sector outperformed Treasuries. Security selection in mortgage-backed securities was largely beneficial with our adjustable-rate mortgages adding to relative results. In December, our position in long corporate bonds and subordinated paper with maturities of 10 and 30 years was positive. In contrast, our exposure to a telecommunication company bond hindered results when spreads widened after the company missed earnings estimates following its merger with another wireless company.
Current Strategy and Outlook: A weak housing market coupled with the lagged effects of 17 rate hikes by the Fed has slowed the U.S. economy. We expect gross domestic product growth to be moderate, with output expanding at a slightly below-trend rate. While residential investment continues to decline, lower gasoline prices and credit conditions should help mitigate the spill over effects from the weakening housing market. Our view is that the economy is in a mid-cycle slowdown with a low likelihood of recession. Yields have fallen, and the inversion of U.S. Treasury yield curve has become much more pronounced in the one to three year range, suggesting growing confidence in eventual Fed easing. On an asset allocation basis, we have maintained our overweight in international equities.
Investment Type Allocation
as of December 31, 2006
(as a percent of net assets) | |
| Common Stock | | | 88.5 | % | |
| Collateralized Mortgage Obligations | | | 3.9 | % | |
| U.S. Government Agency Obligations | | | 3.3 | % | |
| Repurchase Agreement | | | 3.1 | % | |
| Corporate Bonds/Notes | | | 2.1 | % | |
| U.S. Treasury Obligations | | | 0.9 | % | |
| Asset-Backed Securities | | | 0.2 | % | |
| Preferred Stock | | | 0.2 | % | |
| Equity-Linked Securities | | | 0.1 | % | |
| Municipal Bonds | | | 0.1 | % | |
| Other Assets and Liabilities - Net* | | | (2.4 | )% | |
| Net Assets | | | 100.0 | % | |
* Includes securities lending collateral.
Portfolio holdings are subject to change daily.
Top Ten Holdings*
as of December 31, 2006
(as a percent of net assets) | |
| ExxonMobil Corp. | | | 2.6 | % | |
| Citigroup, Inc. | | | 1.7 | % | |
| General Electric Co. | | | 1.6 | % | |
| Bank of America Corp. | | | 1.5 | % | |
| JPMorgan Chase & Co. | | | 1.1 | % | |
| Microsoft Corp. | | | 1.1 | % | |
| Cisco Systems, Inc. | | | 1.1 | % | |
| Chevron Corp. | | | 1.0 | % | |
| International Business Machines Corp. | | | 1.0 | % | |
Federal National Mortgage Association,
5.500%, due 01/12/36 | | | 0.9 | % | |
* Excludes short-term investments related to repurchase agreement and securities lending collateral.
Portfolio holdings are subject to change daily.
Portfolio holdings and characteristics are subject to change and may not be representative of current holdings and characteristics. The outlook for this Portfolio may differ from that presented for other ING Funds. Performance for the different classes of shares will vary based on differences in fees associated with each class.
12
PORTFOLIO MANAGERS' REPORT
ING VP STRATEGIC ALLOCATION GROWTH PORTFOLIO
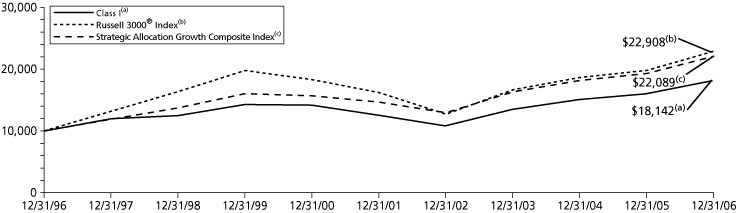
| Average Annual Total Returns for the Periods Ended December 31, 2006* | |
| | | 1 Year | | 5 Year | | 10 Year | | Since Inception
of Class S
August 5, 2005 | |
| Class I | | | 13.19 | % | | | 7.62 | % | | | 6.13 | % | | | — | | |
| Class S | | | 12.91 | % | | | — | | | | — | | | | 11.50 | % | |
| Russell 3000® Index(1) | | | 15.72 | % | | | 7.17 | % | | | 8.64 | % | | | 12.37 | %(3) | |
| Composite Index(2) | | | 14.45 | % | | | 8.54 | % | | | 8.25 | % | | | 12.05 | %(3) | |
Based on a $10,000 initial investment, the graph and table above illustrate the total return of ING VP Strategic Allocation Growth Portfolio against the indices indicated. An index is unmanaged and has no cash in its portfolio, imposes no sales charges and incurs no operating expenses. An investor cannot invest directly in an index. The Portfolio's performance is shown without the imposition of any expenses or charges which are, or may be, imposed under your annuity contract. Total returns would have been lower if such expenses or charges were included.
The performance graph and table do not reflect the deduction of taxes that a shareholder will pay on Portfolio distributions or the redemption of Portfolio shares.
The performance shown may include the effect of fee waivers and/or expense reimbursements by the Investment Adviser and/or other service providers, which have the effect of increasing total return. Had all fees and expenses been considered, the total returns would have been lower.
The performance update illustrates performance for a variable investment option available through a variable annuity contract. The performance shown indicates past performance and is not a projection or prediction of future results. Actual investment returns and principal value will fluctuate so that shares and/or units, at redemption, may be worth more or less than their original cost. Please call (800) 992-0181 to get performance through the most recent month end.
This report contains statements that may be "forward-looking" statements. Actual results may differ materially from those projected in the "forward-looking" statements.
The views expressed in this report reflect those of the portfolio managers, only through the end of the period as stated on the cover. The portfolio managers' views are subject to change at any time based on market and other conditions.
Portfolio holdings are subject to change daily.
* ADV Class commenced operations on December 29, 2006, therefore, there is no performance information for the period ended December 31, 2006.
(1) The Russell 3000® Index is an unmanaged index that measures the performance of 3000 U.S. companies based on total market capitalization.
(2) The Strategic Allocation Growth Composite Index is comprised of the asset class indices that correspond to the particular asset classes in which the Portfolio invests and their benchmark weightings. From time to time, adjustments have been made in the asset classes and/or weightings applicable to the Portfolio, and corresponding adjustments have been made to the composite. See page 16 for additional information.
(3) Since inception performance for the index is shown from
August 1, 2005.
Effective March 1, 2002, ING Investments, LLC began serving as investment adviser and ING Investment Management Co., the former investment adviser, began serving as sub-adviser to the Portfolio.
13
ING VP STRATEGIC ALLOCATION MODERATE PORTFOLIO
PORTFOLIO MANAGERS' REPORT
The ING VP Strategic Allocation Moderate Portfolio (the "Portfolio") seeks to provide total return (i.e., income and capital appreciation, both realized and unrealized). The Portfolio is managed by Mary Ann Fernandez, Portfolio Manager and Brian Gendreau, Ph.D., Portfolio Manager of ING Investment Management Co. — the Sub-Adviser.
Performance: For the year ended December 31, 2006, the Portfolio's Class I shares provided a total return of 11.17% compared to the Russell 3000® Index(1) and the ING Strategic Allocation Balanced Composite Index(2) ("Composite Index"), which returned 15.72% and 11.63%, respectively, for the same period.
Portfolio Specifics: Over the period, domestic large-caps, international equity and fixed income securities generally did well. The Portfolio's asset allocations efforts were positive against the Composite Index, mainly due to an overweight in international and an underweight in fixed income. International stocks continued to rally on news of strong earnings growth in Japan and Europe, and as a result of the positive outlook for growth abroad. After 17 consecutive rate hikes by the Federal Open Market Committee it appears the U.S. Federal Reserve Board ("Fed") is on hold and the futures markets has even priced in a rate cut sometime in 2007. Our view is that the Fed is unlikely to raise rates further in the near term unless the economy shows signs of rapid growth or inflation rises. With the yield curve remaining inverted, we continue to underweight fixed i ncome.
The domestic equity portion of the Portfolio underperformed its sub-benchmark, the Russell 3000® Index, as a result of both sector allocation and security selection. Sector allocation suffered primarily from an underweight position in telecommunication services, which was the best-performing sector in the index. While security selection in consumer discretionary, energy, consumer staples and health care hurt the Portfolio, telecommunication services, information technology and industrials holdings helped. Security selection was strongest in large-cap stocks, while selection in mid-and small-cap securities acted as a drag. Valuation and quality factors positively impacted performance, while market recognition factors hurt.
The international portion of the Portfolio underperformed the sub-benchmark, the Morgan Stanley Capital International-Europe, Australasia, Far East® ("MSCI EAFE®") Index, due to unfavorable security selection, primarily in consumer discretionary, industrials and information technology. However, selection in consumer staples, health care and utilities benefited the Portfolio. Regionally, an overweight in emerging markets helped, while underweight positions in developed Asia and Europe acted as a drag.
The fixed income portion of the Portfolio underperformed the Lehman Brothers® Aggregate Bond Index. Our short duration positioning hurt the Portfolio at the beginning of the period, but was beneficial in December. A relative underweight in corporate bonds acted as a drag as the sector outperformed Treasuries. Security selection in mortgage-backed securities was largely beneficial with our adjustable-rate mortgages adding to relative results. In December, our position in long corporate bonds and subordinated paper with maturities of 10 and 30 years was positive. In contrast, our exposure to a telecommunication company bond hindered results when spreads widened after the company missed earnings estimates following its merger with another wireless company.
Current Strategy and Outlook: A weak housing market coupled with the lagged effects of 17 rate hikes by the Fed has slowed the U.S. economy. We expect gross domestic product growth to be moderate, with output expanding at a slightly below-trend rate. While residential investment continues to decline, lower gasoline prices and credit conditions should help mitigate the spill over effects from the weakening housing market. Our view is that the economy is in a mid-cycle slowdown with a low likelihood of recession. Yields have fallen, and the inversion of U.S. Treasury yield curve has become much more pronounced in the one to three year range, suggesting growing confidence in eventual Fed easing. On an asset allocation basis, we have maintained our overweight in international equities.
Investment Type Allocation
as of December 31, 2006
(as a percent of net assets) | |
| Common Stock | | | 73.0 | % | |
| Repurchase Agreement | | | 7.1 | % | |
| Collateralized Mortgage Obligations | | | 6.8 | % | |
| U.S. Government Agency Obligations | | | 6.6 | % | |
| Corporate Bonds/Notes | | | 4.0 | % | |
| U.S. Treasury Obligations | | | 3.2 | % | |
| Commercial Paper | | | 1.8 | % | |
| Preferred Stock | | | 0.4 | % | |
| Asset-Backed Securities | | | 0.3 | % | |
| Equity-Linked Securities | | | 0.2 | % | |
| Municipal Bonds | | | 0.2 | % | |
| Other Assets and Liabilities - Net* | | | (3.6 | )% | |
| Net Assets | | | 100.0 | % | |
* Includes securities lending collateral.
Portfolio holdings are subject to change daily.
Top Ten Holdings*
as of December 31, 2006
(as a percent of net assets) | |
| ExxonMobil Corp. | | | 2.4 | % | |
| General Electric Co. | | | 1.6 | % | |
| Citigroup, Inc. | | | 1.5 | % | |
| Bank of America Corp. | | | 1.4 | % | |
Federal National Mortgage Association,
5.500%, due 01/12/36 | | | 1.3 | % | |
| JPMorgan Chase & Co. | | | 1.1 | % | |
| Microsoft Corp. | | | 1.1 | % | |
| Cisco Systems, Inc. | | | 1.0 | % | |
| U.S. Treasury Note, 4.625%, due 11/30/08 | | | 1.0 | % | |
Federal National Mortgage Association,
5.000%, due 01/12/36 | | | 1.0 | % | |
* Excludes short-term investments related to commercial paper, repurchase agreement and securities lending collateral.
Portfolio holdings are subject to change daily.
Portfolio holdings and characteristics are subject to change and may not be representative of current holdings and characteristics. The outlook for this Portfolio may differ from that presented for other ING Funds. Performance for the different classes of shares will vary based on differences in fees associated with each class.
14
PORTFOLIO MANAGERS' REPORT
ING VP STRATEGIC ALLOCATION MODERATE PORTFOLIO

| Average Annual Total Returns for the Periods Ended December 31, 2006* | |
| | | 1 Year | | 5 Year | | 10 Year | | Since Inception
of Class S
June 7, 2005 | |
| Class I | | | 11.17 | % | | | 6.75 | % | | | 5.92 | % | | | — | | |
| Class S | | | 10.80 | % | | | — | | | | — | | | | 9.34 | % | |
| Russell 3000® Index(1) | | | 15.72 | % | | | 7.17 | % | | | 8.64 | % | | | 14.36 | %(3) | |
| Composite Index(2) | | | 11.63 | % | | | 7.58 | % | | | 7.66 | % | | | 10.44 | %(3) | |
Based on a $10,000 initial investment, the graph and table above illustrate the total return of ING VP Strategic Allocation Moderate Portfolio against the indices indicated. An index is unmanaged and has no cash in its portfolio, imposes no sales charges and incurs no operating expenses. An investor cannot invest directly in an index. The Portfolio's performance is shown without the imposition of any expenses or charges which are, or may be, imposed under your annuity contract. Total returns would have been lower if such expenses or charges were included.
The performance graph and table do not reflect the deduction of taxes that a shareholder will pay on Portfolio distributions or the redemption of Portfolio shares.
The performance shown may include the effect of fee waivers and/or expense reimbursements by the Investment Adviser and/or other service providers, which have the effect of increasing total return. Had all fees and expenses been considered, the total returns would have been lower.
The performance update illustrates performance for a variable investment option available through a variable annuity contract. The performance shown indicates past performance and is not a projection or prediction of future results. Actual investment returns and principal value will fluctuate so that shares and/or units, at redemption, may be worth more or less than their original cost. Please call (800) 992-0181 to get performance through the most recent month end.
This report contains statements that may be "forward-looking" statements. Actual results may differ materially from those projected in the "forward-looking" statements.
The views expressed in this report reflect those of the portfolio managers, only through the end of the period as stated on the cover. The portfolio managers' views are subject to change at any time based on market and other conditions.
Portfolio holdings are subject to change daily.
* ADV Class commenced operations on December 29, 2006, therefore, there is no performance information for the period ended December 31, 2006.
(1) The Russell 3000® Index is an unmanaged index that measures the performance of 3000 U.S. companies based on total market capitalization.
(2) The Strategic Allocation Moderate Composite Index is comprised of the asset class indices that correspond to the particular asset classes in which the Portfolio invests and their benchmark weightings. From time to time, adjustments have been made in the asset classes and/or weightings applicable to the Portfolio, and corresponding adjustments have been made to the composite. See page 16 for additional information.
(3) Since inception performance for the index is shown from
June 1, 2005.
Effective March 1, 2002, ING Investments, LLC began serving as investment adviser and ING Investment Management Co., the former investment adviser, began serving as sub-adviser to the Portfolio.
15
PORTFOLIO MANAGERS' REPORT
ADDITIONAL INFORMATION
| Asset Class | |
| | | ING VP
Strategic
Allocation
Conservative Portfolio(1) | | ING VP
Strategic
Allocation
Growth Portfolio | | ING VP
Strategic
Allocation
Moderate Portfolio(2) | |
| Equities | |
| Domestic Stocks | |
| Range | | | 0-70 | % | | | 10-100 | % | | | 0-75 | % | |
| International Stocks | |
| Range | | | 0-20 | % | | | 0-30 | % | | | 0-20 | % | |
| Fixed Income | |
| Range | | | 0-100 | % | | | 0-40 | % | | | 0-70 | % | |
| Money Market Instruments | |
| Range | | | 0-30 | % | | | 0-30 | % | | | 0-30 | % | |
(1) ING Strategic Allocation Conservative Portfolio will invest no more than 35% of its assets in any combination of the following asset sub-classes:
small-/mid-capitalization stocks, high-yield bonds, international stocks and international fixed-income securities.
(2) ING Strategic Allocation Moderate Portfolio will invest no more than 60% of its assets in any combination of the following asset sub-classes:
small-/mid-capitalization stocks, high-yield bonds, international stocks and international fixed-income securities.
The Sub-Adviser uses the Strategic Allocation Conservative Composite, Strategic Allocation Growth Composite, and Strategic Allocation Moderate Composite indices as benchmarks to which it compares the performance of ING VP Strategic Allocation Conservative Portfolio, ING VP Strategic Allocation Growth Portfolio and ING VP Strategic Allocation Moderate Portfolio, respectively. Each of these Composite indices is a blended index that is derived from the asset class comparative indices set out in the chart below. The chart shows the weightings for each asset class comparative index represented in each benchmark Composite Index, as a percentage of the Composite Index.
| Composite Index | | Russell 3000®
Index(3) | | Morgan Stanley
Capital International
Europe, Australasia and
Far East® Index(4) | | Lehman Brothers
Aggregate Bond Index(5) | | 91-Day U.S.
Treasury
Bill Rate | |
| Strategic Allocation Conservative Composite(6) | | | 35 | % | | | 0 | % | | | 55 | % | | | 10 | % | |
| Strategic Allocation Growth Composite(7) | | | 70 | % | | | 10 | % | | | 20 | % | | | 0 | % | |
| Strategic Allocation Moderate Composite(8) | | | 55 | % | | | 5 | % | | | 35 | % | | | 5 | % | |
(3) The Russell 3000® Index measures performance of the 3,000 largest U.S. companies based on total market capitalization.
(4) The Morgan Stanley Capital International Europe, Australasia and Far East® (MSCI EAFE®) Index measures the performance of securities listed on exchanges in markets in Europe, Australasia and the Far East.
(5) The Lehman Brothers Aggregate Bond Index is composed of publicly issued, fixed-rate U.S. Government, investment grade, mortgaged-backed and corporate debt securities.
(6) The Strategic Allocation Conservative Composite Index is comprised of the asset class indices that correspond to the particular asset classes in which the Portfolio invests and their benchmark weightings. From time to time, adjustments have been made in the asset classes and/or weightings applicable to the Portfolio, and corresponding adjustments have been made to the composite. Prior to March 1, 2000, the benchmark weightings for the Portfolio and the composite were 15% in large capitalization stocks, 15% for small-/mid-cap stocks, 15% in international stocks, 15% in real estate stocks, 25% in U.S. dollar bonds, and 10% in international bonds and 5% in money market instruments. The composite for the period March 1, 2000 through December 31, 2001 reflects benchmark weightings of 25% in large cap stocks, 15% in small-/mid-cap stocks, 15% in international stocks, 5% in real estate stocks, 30% in U.S. dollar bonds, a nd 5% in international bonds and 5% in money market instruments. Effective October 1, 2002 a single category of domestic stocks replaced the group of categories of large cap stocks, small-/mid-cap stocks, and real estate stocks, and the category of international bonds was removed.
(7) The Strategic Allocation Growth Composite Index is comprised of the asset class indices that correspond to the particular asset classes in which the Portfolio invests and their benchmark weightings. From time to time, adjustments have been made in the asset classes and/or weightings applicable to the Portfolio, and corresponding adjustments have been made to the composite. Prior to March 1, 2000, the benchmark weightings for the Portfolio and the composite were 20% in large capitalization stocks, 20% for small-/mid-cap stocks, 20% in international stocks, 20% in real estate stocks, 10% in U.S. dollar bonds, and 10% in international bonds. The composite for the period March 1, 2000 through December 31, 2001 reflects benchmark weightings of 35% in large cap stocks, 20% in small-/mid-cap stocks, 20% in international stocks, 5% in real estate stocks, 15% in U.S. dollar bonds, and 5% in international bonds. Effective O ctober 1, 2002 a single category of domestic stocks replaced the group of categories of large cap stocks, small-/mid-cap stocks, and real estate stocks, and the category of international bonds was removed.
(8) The Strategic Allocation Moderate Composite Index is comprised of the asset class indices that correspond to the particular asset classes in which the Portfolio invests and their benchmark weightings. From time to time, adjustments have been made in the asset classes and/or weightings applicable to the Portfolio, and corresponding adjustments have been made to the composite. Prior to March 1, 2000, the benchmark weightings for the Portfolio and the composite were 10% in large capitalization stocks, 10% for small-/mid-cap stocks, 10% in international stocks, 10% in real estate stocks, 40% in U.S. dollar bonds, and 10% in international bonds and 10% in money market instruments. The composite for the period March 1, 2000 through December 31, 2001 reflects benchmark weightings of 15% in large cap stocks, 10% in small-/mid-cap stocks, 10% in international stocks, 5% in real estate stocks, 45% in U.S. dollar bonds, and 5% in international bonds and 10% in money market instruments. Effective October 1, 2002 a single category of domestic stocks replaced the group of categories of large cap stocks, small-/mid-cap stocks, and real estate stocks, and the category of international bonds was removed.
All indices are unmanaged.
An investor cannot invest directly in an index.
16
SHAREHOLDER EXPENSE EXAMPLES (UNAUDITED)
As a shareholder of a Portfolio, you incur two types of costs: (1) transaction costs, including redemption fees; and exchange fees; and (2) ongoing costs, including management fees; distribution and/or service (12b-1) fees; and other Portfolio expenses. These Examples are intended to help you understand your ongoing costs (in dollars) of investing in a Portfolio and to compare these costs with the ongoing costs of investing in other mutual funds.
The Examples are based on an investment of $1,000 invested at the beginning of the period and held for the entire period from July 1, 2006 to December 31, 2006. The Portfolios' expenses are shown without the imposition of any charges which are, or may be, imposed under your annuity contract. Expenses would have been higher if such charges were included.
Actual Expenses
The first section of the table shown, "Actual Portfolio Return," provides information about actual account values and actual expenses. You may use the information in this section, together with the amount you invested, to estimate the expenses that you paid over the period. Simply divide your account value by $1,000 (for example, an $8,600 account value divided by $1,000 = 8.6), then multiply the result by the number in the first section under the heading entitled "Expenses Paid During Period" to estimate the expenses you paid on your account during this period.
Hypothetical Example for Comparison Purposes
The second section of the table shown, "Hypothetical 5% Return," provides information about hypothetical account values and hypothetical expenses based on the Portfolio's actual expense ratio and an assumed rate of return of 5% per year before expenses, which is not the Portfolio's actual return. The hypothetical account values and expenses may not be used to estimate the actual ending account balance or expenses you paid for the period. You may use this information to compare the ongoing costs of investing in the Portfolio and other mutual funds. To do so, compare this 5% hypothetical example with the 5% hypothetical examples that appear in the shareholder reports of the other mutual funds.
Please note that the expenses shown in the table are meant to highlight your ongoing costs only and do not reflect any transactional costs, such as redemption fees or exchange fees. Therefore, the hypothetical lines of the table are useful in comparing ongoing costs only, and will not help you determine the relative total costs of owning different mutual funds. In addition, if these transactional costs were included, your costs would have been higher.
| ING VP Index Plus LargeCap Portfolio | | Beginning
Account
Value
July 1, 2006 | | Ending
Account
Value
December 31, 2006 | | Annualized
Expense
Ratio | | Expenses Paid
During the
Six Months Ended
December 31, 2006* | |
| Actual Portfolio Return | |
| Class I | | $ | 1,000.00 | | | $ | 1,122.70 | | | | 0.43 | % | | $ | 2.30 | | |
| Class S | | | 1,000.00 | | | | 1,121.80 | | | | 0.68 | | | | 3.64 | | |
| Hypothetical (5% return before expenses) | |
| Class I | | $ | 1,000.00 | | | $ | 1,023.04 | | | | 0.43 | % | | $ | 2.19 | | |
| Class S | | | 1,000.00 | | | | 1,021.78 | | | | 0.68 | | | | 3.47 | | |
| ING VP Index Plus MidCap Portfolio | |
| Actual Portfolio Return | |
| Class I | | $ | 1,000.00 | | | $ | 1,050.60 | | | | 0.49 | % | | $ | 2.53 | | |
| Class S | | | 1,000.00 | | | | 1,048.80 | | | | 0.74 | | | | 3.82 | | |
| Hypothetical (5% return before expenses) | |
| Class I | | $ | 1,000.00 | | | $ | 1,022.74 | | | | 0.49 | % | | $ | 2.50 | | |
| Class S | | | 1,000.00 | | | | 1,021.48 | | | | 0.74 | | | | 3.77 | | |
* Expenses are equal to each Portfolio's respective annualized expense ratios multiplied by the average account value over the period, multiplied by 184/365 to reflect the most recent fiscal half-year.
17
SHAREHOLDER EXPENSE EXAMPLES (UNAUDITED) (CONTINUED)
| ING VP Index Plus SmallCap Portfolio | | Beginning
Account
Value
July 1, 2006 | | Ending
Account
Value
December 31, 2006 | | Annualized
Expense
Ratio | | Expenses Paid
During the
Six Months Ended
December 31, 2006* | |
| Actual Portfolio Return | |
| Class I | | $ | 1,000.00 | | | $ | 1,056.40 | | | | 0.49 | % | | $ | 2.54 | | |
| Class S | | | 1,000.00 | | | | 1,054.50 | | | | 0.74 | | | | 3.83 | | |
| Hypothetical (5% return before expenses) | |
| Class I | | $ | 1,000.00 | | | $ | 1,022.74 | | | | 0.49 | % | | $ | 2.50 | | |
| Class S | | | 1,000.00 | | | | 1,021.48 | | | | 0.74 | | | | 3.77 | | |
| ING VP Strategic Allocation Conservative Portfolio | |
| Actual Portfolio Return | |
| Class ADV† | | $ | 1,000.00 | | | $ | 1,000.00 | | | | 1.15 | % | | $ | 0.09 | | |
| Class I | | | 1,000.00 | | | �� | 1,071.10 | | | | 0.65 | | | | 3.39 | | |
| Class S | | | 1,000.00 | | | | 1,069.70 | | | | 0.90 | | | | 4.70 | | |
| Hypothetical (5% return before expenses) | |
| Class ADV | | $ | 1,000.00 | | | $ | 1,000.32 | | | | 1.15 | % | | $ | 0.09 | | |
| Class I | | | 1,000.00 | | | | 1,021.93 | | | | 0.65 | | | | 3.31 | | |
| Class S | | | 1,000.00 | | | | 1,020.67 | | | | 0.90 | | | | 4.58 | | |
| ING VP Strategic Allocation Growth Portfolio | |
| Actual Portfolio Return | |
| Class ADV† | | $ | 1,000.00 | | | $ | 1,000.00 | | | | 1.21 | % | | $ | 0.10 | | |
| Class I | | | 1,000.00 | | | | 1,099.90 | | | | 0.71 | | | | 3.76 | | |
| Class S | | | 1,000.00 | | | | 1,098.20 | | | | 0.96 | | | | 5.08 | | |
| Hypothetical (5% return before expenses) | |
| Class ADV | | $ | 1,000.00 | | | $ | 1,000.31 | | | | 1.21 | % | | $ | 0.10 | | |
| Class I | | | 1,000.00 | | | | 1,021.63 | | | | 0.71 | | | | 3.62 | | |
| Class S | | | 1,000.00 | | | | 1,020.37 | | | | 0.96 | | | | 4.89 | | |
| ING VP Strategic Allocation Moderate Portfolio | |
| Actual Portfolio Return | |
| Class ADV† | | $ | 1,000.00 | | | $ | 1,000.00 | | | | 1.20 | % | | $ | 0.10 | | |
| Class I | | | 1,000.00 | | | | 1,089.60 | | | | 0.70 | | | | 3.69 | | |
| Class S | | | 1,000.00 | | | | 1,087.60 | | | | 0.95 | | | | 5.00 | | |
| Hypothetical (5% return before expenses) | |
| Class ADV | | $ | 1,000.00 | | | $ | 1,000.31 | | | | 1.20 | % | | $ | 0.10 | | |
| Class I | | | 1,000.00 | | | | 1,021.68 | | | | 0.70 | | | | 3.57 | | |
| Class S | | | 1,000.00 | | | | 1,020.42 | | | | 0.95 | | | | 4.84 | | |
† Commencement of operations for Class ADV was December 29, 2006. Expenses paid reflect the three day period ended December 31, 2006 with 0.00% return.
* Expenses are equal to each Portfolio's respective annualized expense ratios multiplied by the average account value over the period, multiplied by 184/365 to reflect the most recent fiscal half-year.
18
REPORT OF INDEPENDENT REGISTERED PUBLIC ACCOUNTING FIRM
The Shareholders and Board of Directors
ING Variable Portfolios, Inc. and ING Strategic Allocation Portfolios, Inc.
We have audited the accompanying statements of assets and liabilities, including the portfolios of investments, of ING VP Index Plus LargeCap Portfolio, ING VP Index Plus MidCap Portfolio, and ING VP Index Plus SmallCap Portfolio, each a series of ING Variable Portfolios, Inc. and ING VP Strategic Allocation Conservative Portfolio (formerly, ING VP Strategic Allocation Income Portfolio), ING VP Strategic Allocation Growth Portfolio, and ING VP Strategic Allocation Moderate Portfolio (formerly, ING VP Strategic Allocation Balanced Portfolio), each a series of ING Strategic Allocation Portfolios, Inc., as of December 31, 2006, the related statements of operations for the year then ended, statements of changes in net assets for each of the years in the two-year period then ended, and the financial highlights for each of the years or periods in the five-year period then ended. These financial statements and financial highlights are the responsib ility of management. Our responsibility is to express an opinion on these financial statements and financial highlights based on our audits.
We conducted our audits in accordance with the standards of the Public Company Accounting Oversight Board (United States). Those standards require that we plan and perform the audits to obtain reasonable assurance about whether the financial statements and financial highlights are free of material misstatement. An audit includes examining, on a test basis, evidence supporting the amounts and disclosures in the financial statements. Our procedures included confirmation of securities owned as of December 31, 2006, by correspondence with the custodian and brokers, or by other appropriate auditing procedures when replies from brokers were not received. An audit also includes assessing the accounting principles used and significant estimates made by management, as well as evaluating the overall financial statement presentation. We believe that our audits provide a reasonable basis for our opinion.
In our opinion, the financial statements and financial highlights referred to above present fairly, in all material respects, the financial position of the aforementioned portfolios as of December 31, 2006, the results of their operations, the changes in their net assets, and the financial highlights for the periods specified in the first paragraph above, in conformity with U.S. generally accepted accounting principles.

Boston, Massachusetts
February 26, 2007
19
STATEMENTS OF ASSETS AND LIABILITIES AS OF DECEMBER 31, 2006
| | | ING
VP Index Plus
LargeCap
Portfolio | | ING
VP Index Plus
MidCap
Portfolio | | ING
VP Index Plus
SmallCap
Portfolio | |
| ASSETS: | |
| Investments in securities at value+* | | $ | 2,499,585,293 | | | $ | 1,368,320,794 | | | $ | 927,184,191 | | |
| Short-term investment in affiliates at amortized cost | | | 49,000,000 | | | | 5,000,000 | | | | 8,000,000 | | |
| Short-term investments at amortized cost | | | 247,836,874 | | | | 310,743,528 | | | | 223,248,758 | | |
| Cash | | | — | | | | — | | | | 995,322 | | |
| Cash collateral for futures | | | 2,562,000 | | | | 256,500 | | | | 499,500 | | |
| Receivables: | |
| Investment securities sold | | | — | | | | 114,153,337 | | | | 75,293,627 | | |
| Fund shares sold | | | 2,052,301 | | | | 989,218 | | | | 602,251 | | |
| Dividends and interest | | | 3,744,328 | | | | 866,806 | | | | 816,435 | | |
| Prepaid expenses | | | 65,661 | | | | 37,213 | | | | 24,580 | | |
| Total assets | | | 2,804,846,457 | | | | 1,800,367,396 | | | | 1,236,664,664 | | |
| LIABILITIES: | |
| Payable for investment securities purchased | | | — | | | | 111,706,913 | | | | 69,924,713 | | |
| Payable for fund shares redeemed | | | 8,990,634 | | | | 885,757 | | | | 959,636 | | |
| Payable for futures variation margin | | | 228,150 | | | | 54,730 | | | | 120,091 | | |
| Payable upon receipt of securities loaned | | | 232,872,874 | | | | 310,743,528 | | | | 215,814,758 | | |
| Payable to affiliates | | | 920,356 | | | | 587,838 | | | | 411,755 | | |
| Payable to custodian due to bank overdraft | | | 24,686 | | | | — | | | | — | | |
| Payable for borrowings against line of credit | | | — | | | | 598,315 | | | | — | | |
| Payable for directors fees | | | 19,962 | | | | 6,908 | | | | 4,162 | | |
| Other accrued expenses and liabilities | | | 156,747 | | | | 92,787 | | | | 68,518 | | |
| Total liabilities | | | 243,213,409 | | | | 424,676,776 | | | | 287,303,633 | | |
| NET ASSETS | | $ | 2,561,633,048 | | | $ | 1,375,690,620 | | | $ | 949,361,031 | | |
| NET ASSETS WERE COMPRISED OF: | |
| Paid-in capital | | $ | 2,348,048,344 | | | $ | 1,172,108,102 | | | $ | 792,965,162 | | |
| Undistributed net investment income | | | 31,450,677 | | | | 10,574,611 | | | | 3,488,031 | | |
| Accumulated net realized gain (loss) on investments and futures | | | (73,444,754 | ) | | | 96,471,802 | | | | 82,189,591 | | |
| Net unrealized appreciation on investments and futures | | | 255,578,781 | | | | 96,536,105 | | | | 70,718,247 | | |
| NET ASSETS | | $ | 2,561,633,048 | | | $ | 1,375,690,620 | | | $ | 949,361,031 | | |
| +Including securities loaned at value | | $ | 226,076,158 | | | $ | 299,977,097 | | | $ | 207,661,258 | | |
| *Cost of investments in securities | | $ | 2,244,124,989 | | | $ | 1,271,638,800 | | | $ | 856,335,862 | | |
| Class I: | |
| Net assets | | $ | 2,352,192,871 | | | $ | 1,148,074,269 | | | $ | 745,114,613 | | |
| Shares authorized | | | 200,000,000 | | | | 100,000,000 | | | | 100,000,000 | | |
| Par value | | $ | 0.001 | | | $ | 0.001 | | | $ | 0.001 | | |
| Shares outstanding | | | 134,554,768 | | | | 60,783,966 | | | | 41,417,504 | | |
| Net asset value and redemption price per share | | $ | 17.48 | | | $ | 18.89 | | | $ | 17.99 | | |
| Class S: | |
| Net assets | | $ | 209,440,177 | | | $ | 227,616,351 | | | $ | 204,246,418 | | |
| Shares authorized | | | 100,000,000 | | | | 100,000,000 | | | | 100,000,000 | | |
| Par value | | $ | 0.001 | | | $ | 0.001 | | | $ | 0.001 | | |
| Shares outstanding | | | 12,090,682 | | | | 12,177,207 | | | | 11,480,925 | | |
| Net asset value and redemption price per share | | $ | 17.32 | | | $ | 18.69 | | | $ | 17.79 | | |
See Accompanying Notes to Financial Statements
20
STATEMENTS OF ASSETS AND LIABILITIES AS OF DECEMBER 31, 2006
| | | ING
VP Strategic
Allocation
Conservative
Portfolio | | ING
VP Strategic
Allocation
Growth
Portfolio | | ING
VP Strategic
Allocation
Moderate
Portfolio | |
| ASSETS: | |
| Investments in securities at value+* | | $ | 139,645,241 | | | $ | 296,698,636 | | | $ | 283,643,723 | | |
| Short-term investments at amortized cost | | | 40,393,799 | | | | 46,210,489 | | | | 65,447,729 | | |
| Cash | | | 27,014 | | | | 19,178 | | | | 21,058,543 | | |
| Cash collateral for futures | | | 86,961 | | | | 112,163 | | | | 120,208 | | |
| Foreign currencies at value** | | | 8 | | | | 187 | | | | — | | |
| Receivables: | |
| Investment securities sold | | | 1,925,324 | | | | 3,454,741 | | | | 2,631,260 | | |
| Fund shares sold | | | 1,148 | | | | 1,364 | | | | 1,511 | | |
| Dividends and interest | | | 573,286 | | | | 586,286 | | | | 736,956 | | |
| Variation margin receivable | | | 5,063 | | | | 719 | | | | 4,219 | | |
| Prepaid expenses | | | 4,234 | | | | 8,404 | | | | 8,800 | | |
| Reimbursement due from manager | | | 9,538 | | | | — | | | | 6,378 | | |
| Total assets | | | 182,671,616 | | | | 347,092,167 | | | | 373,659,327 | | |
| LIABILITIES: | |
| Payable for investment securities purchased | | | 13,969,217 | | | | 9,268,568 | | | | 33,237,665 | | |
| Payable for fund shares redeemed | | | 723,363 | | | | 1,819,563 | | | | 1,867,269 | | |
| Payable for futures variation margin | | | 15,985 | | | | 10,819 | | | | 15,219 | | |
| Payable upon receipt of securities loaned | | | 20,711,495 | | | | 37,007,489 | | | | 38,901,277 | | |
| Payable to affiliates | | | 82,418 | | | | 166,989 | | | | 168,082 | | |
| Payable to custodian due to foreign currency overdraft | | | — | | | | — | | | | 215 | | |
| Payable for directors fees | | | 4,371 | | | | 2,926 | | | | 7,171 | | |
| Other accrued expenses and liabilities | | | 50,172 | | | | 55,780 | | | | 53,270 | | |
| Total liabilities | | | 35,557,021 | | | | 48,332,134 | | | | 74,250,168 | | |
| NET ASSETS | | $ | 147,114,595 | | | $ | 298,760,033 | | | $ | 299,409,159 | | |
| NET ASSETS WERE COMPRISED OF: | |
| Paid-in capital | | $ | 127,773,425 | | | $ | 232,584,176 | | | $ | 246,114,259 | | |
| Undistributed net investment income | | | 4,696,995 | | | | 5,107,112 | | | | 6,584,365 | | |
Accumulated net realized gain on investments, foreign currency
related transactions, and futures | | | 2,757,067 | | | | 14,331,892 | | | | 8,472,620 | | |
Net unrealized appreciation on investments, foreign currency
related transactions, and futures | | | 11,887,108 | | | | 46,736,853 | | | | 38,237,915 | | |
| NET ASSETS | | $ | 147,114,595 | | | $ | 298,760,033 | | | $ | 299,409,159 | | |
| + Including securities loaned at value | | $ | 20,140,331 | | | $ | 35,851,298 | | | $ | 37,768,136 | | |
| * Cost of investments in securities | | $ | 127,752,263 | | | $ | 249,940,445 | | | $ | 245,390,422 | | |
| ** Cost of foreign currencies | | $ | 8 | | | $ | 187 | | | $ | — | | |
| Class ADV: | |
| Net assets | | $ | 1,000 | | | $ | 1,000 | | | $ | 1,000 | | |
| Shares authorized | | | 100,000,000 | | | | 100,000,000 | | | | 100,000,000 | | |
| Par value | | $ | 0.001 | | | $ | 0.001 | | | $ | 0.001 | | |
| Shares outstanding | | | 74 | | | | 59 | | | | 65 | | |
| Net asset value and redemption price per share | | $ | 13.53 | | | $ | 17.06 | | | $ | 15.32 | | |
| Class I: | |
| Net assets | | $ | 146,397,007 | | | $ | 298,450,691 | | | $ | 298,714,931 | | |
| Shares authorized | | | 100,000,000 | | | | 100,000,000 | | | | 100,000,000 | | |
| Par value | | $ | 0.001 | | | $ | 0.001 | | | $ | 0.001 | | |
| Shares outstanding | | | 10,803,425 | | | | 17,496,213 | | | | 19,501,988 | | |
| Net asset value and redemption price per share | | $ | 13.55 | | | $ | 17.06 | | | $ | 15.32 | | |
| Class S: | |
| Net assets | | $ | 716,588 | | | $ | 308,342 | | | $ | 693,228 | | |
| Shares authorized | | | 100,000,000 | | | | 100,000,000 | | | | 100,000,000 | | |
| Par value | | $ | 0.001 | | | $ | 0.001 | | | $ | 0.001 | | |
| Shares outstanding | | | 53,078 | | | | 18,137 | | | | 45,390 | | |
| Net asset value and redemption price per share | | $ | 13.50 | | | $ | 17.00 | | | $ | 15.27 | | |
See Accompanying Notes to Financial Statements
21
STATEMENTS OF OPERATIONS FOR THE YEAR ENDED DECEMBER 31, 2006
| | | ING
VP Index Plus
LargeCap
Portfolio | | ING
VP Index Plus
MidCap
Portfolio | | ING
VP Index Plus
SmallCap
Portfolio | |
| INVESTMENT INCOME: | |
| Dividends, net of foreign taxes withheld* | | $ | 40,790,404 | | | $ | 17,254,974 | | | $ | 7,829,661 | | |
| Interest(1) | | | 1,246,805 | | | | 557,364 | | | | 454,211 | | |
| Securities lending income | | | 54,139 | | | | 536,689 | | | | 406,036 | | |
| Total investment income | | | 42,091,348 | | | | 18,349,027 | | | | 8,689,908 | | |
| EXPENSES: | |
| Investment management fees | | | 7,813,259 | | | | 5,213,452 | | | | 3,432,609 | | |
| Distribution and service fees | | | 832,879 | | | | 621,056 | | | | 633,082 | | |
| Transfer agent fees | | | 1,252 | | | | 183 | | | | 803 | | |
| Administrative service fees | | | 1,227,763 | | | | 716,826 | | | | 471,968 | | |
| Shareholder reporting expense | | | 94,694 | | | | 69,729 | | | | 43,748 | | |
| Registration fees | | | 6,183 | | | | 3,409 | | | | 2,209 | | |
| Professional fees | | | 139,140 | | | | 85,594 | | | | 58,433 | | |
| Custody and accounting expense | | | 221,404 | | | | 152,705 | | | | 133,550 | | |
| Directors fees | | | 131,378 | | | | 81,040 | | | | 52,119 | | |
| Miscellaneous expense | | | 149,496 | | | | 83,369 | | | | 53,883 | | |
| Interest expense | | | 79 | | | | 1,959 | | | | 198 | | |
| Total expenses | | | 10,617,527 | | | | 7,029,322 | | | | 4,882,602 | | |
| Net waived and reimbursed fees | | | (3,233 | ) | | | (712 | ) | | | (123 | ) | |
| Net expenses | | | 10,614,294 | | | | 7,028,610 | | | | 4,882,479 | | |
| Net investment income | | | 31,477,054 | | | | 11,320,417 | | | | 3,807,429 | | |
REALIZED AND UNREALIZED GAIN (LOSS)
ON INVESTMENTS AND FUTURES: | |
| Net realized gain on: | |
| Investments | | | 163,690,235 | | | | 104,833,575 | | | | 85,610,442 | | |
| Futures | | | 1,555,372 | | | | 562,025 | | | | 85,285 | | |
| Net realized gain on investments and futures | | | 165,245,607 | | | | 105,395,600 | | | | 85,695,727 | | |
| Net change in unrealized appreciation or depreciation on: | |
| Investments | | | 114,859,843 | | | | (6,084,116 | ) | | | 17,613,862 | | |
| Futures | | | 211,473 | | | | (141,597 | ) | | | (130,082 | ) | |
Net change in unrealized appreciation or depreciation
on investments and futures | | | 115,071,316 | | | | (6,225,713 | ) | | | 17,483,780 | | |
| Net realized and unrealized gain on investments and futures | | | 280,316,923 | | | | 99,169,887 | | | | 103,179,507 | | |
| Increase in net assets resulting from operations | | $ | 311,793,977 | | | $ | 110,490,304 | | | $ | 106,986,936 | | |
| * Foreign taxes withheld | | $ | — | | | $ | — | | | $ | 3,825 | | |
| (1) Affiliated income | | $ | 231,859 | | | $ | 48,596 | | | $ | 11,464 | | |
See Accompanying Notes to Financial Statements
22
STATEMENTS OF OPERATIONS FOR THE YEAR ENDED DECEMBER 31, 2006
| | | ING
VP Strategic
Allocation
Conservative
Portfolio | | ING
VP Strategic
Allocation
Growth
Portfolio | | ING
VP Strategic
Allocation
Moderate
Portfolio | |
| INVESTMENT INCOME: | |
| Dividends, net of foreign taxes withheld* | | $ | 1,368,542 | | | $ | 4,876,122 | | | $ | 3,962,222 | | |
| Interest | | | 4,218,271 | | | | 2,318,039 | | | | 4,606,882 | | |
| Securities lending income | | | 58,628 | | | | 40,450 | | | | 84,457 | | |
| Total investment income | | | 5,645,441 | | | | 7,234,611 | | | | 8,653,561 | | |
| EXPENSES: | |
| Investment management fees | | | 889,028 | | | | 1,751,654 | | | | 1,762,375 | | |
| Distribution and service fees | | | 1,051 | | | | 457 | | | | 1,252 | | |
| Transfer agent fees | | | 183 | | | | 365 | | | | 401 | | |
| Administrative service fees | | | 81,491 | | | | 160,563 | | | | 161,545 | | |
| Shareholder reporting expense | | | 4,995 | | | | 16,425 | | | | 12,788 | | |
| Registration fees | | | 806 | | | | 1,546 | | | | 1,252 | | |
| Professional fees | | | 12,421 | | | | 27,767 | | | | 22,520 | | |
| Custody and accounting expense | | | 53,664 | | | | 78,085 | | | | 76,820 | | |
| Directors fees | | | 8,890 | | | | 16,600 | | | | 11,476 | | |
| Miscellaneous expense | | | 14,781 | | | | 21,233 | | | | 23,251 | | |
| Total expenses | | | 1,067,310 | | | | 2,074,695 | | | | 2,073,680 | | |
| Net waived and reimbursed fees | | | (101,707 | ) | | | — | | | | (15,186 | ) | |
| Net expenses | | | 965,603 | | | | 2,074,695 | | | | 2,058,494 | | |
| Net investment income | | | 4,679,838 | | | | 5,159,916 | | | | 6,595,067 | | |
REALIZED AND UNREALIZED GAIN (LOSS) ON INVESTMENTS,
FOREIGN CURRENCY RELATED TRANSACTIONS, AND FUTURES: | |
| Net realized gain (loss) on: | |
| Investments | | | 4,290,212 | | | | 17,961,247 | | | | 11,879,489 | | |
| Foreign currency related transactions | | | (19,314 | ) | | | (49,588 | ) | | | (39,562 | ) | |
| Futures | | | (122,794 | ) | | | 166,238 | | | | 17,259 | | |
Net realized gain on investments, foreign currency
related transactions, and futures | | | 4,148,104 | | | | 18,077,897 | | | | 11,857,186 | | |
| Net change in unrealized appreciation or depreciation on: | |
| Investments | | | 3,136,689 | | | | 12,974,274 | | | | 12,600,521 | | |
| Foreign currency related transactions | | | 642 | | | | 4,626 | | | | 2,008 | | |
| Futures | | | (26,584 | ) | | | (16,364 | ) | | | (30,888 | ) | |
Net change in unrealized appreciation or depreciation on investments,
foreign currency related transactions, and futures | | | 3,110,747 | | | | 12,962,536 | | | | 12,571,641 | | |
Net realized and unrealized gain on investments,
foreign currency related transactions, and futures | | | 7,258,851 | | | | 31,040,433 | | | | 24,428,827 | | |
| Increase in net assets resulting from operations | | $ | 11,938,689 | | | $ | 36,200,349 | | | $ | 31,023,894 | | |
| * Foreign taxes withheld | | $ | 22,283 | | | $ | 101,406 | | | $ | 59,396 | | |
See Accompanying Notes to Financial Statements
23
STATEMENTS OF CHANGES IN NET ASSETS
| | | ING VP Index Plus LargeCap Portfolio | | ING VP Index Plus MidCap Portfolio | |
| | | Year Ended
December 31,
2006 | | Year Ended
December 31,
2005 | | Year Ended
December 31,
2006 | | Year Ended
December 31,
2005 | |
| FROM OPERATIONS: | |
| Net investment income | | $ | 31,477,054 | | | $ | 22,254,884 | | | $ | 11,320,417 | | | $ | 7,674,447 | | |
| Net realized gain on investments and futures | | | 165,245,607 | | | | 133,084,265 | | | | 105,395,600 | | | | 88,493,475 | | |
Net change in unrealized appreciation or
depreciation on investments and futures | | | 115,071,316 | | | | (50,830,501 | ) | | | (6,225,713 | ) | | | 9,412,728 | | |
| Net increase in net assets resulting from operations | | | 311,793,977 | | | | 104,508,648 | | | | 110,490,304 | | | | 105,580,650 | | |
| FROM DISTRIBUTIONS TO SHAREHOLDERS: | |
| Net investment income: | |
| Class I | | | (15,985,488 | ) | | | (18,365,964 | ) | | | (5,598,196 | ) | | | (3,361,948 | ) | |
| Class S | | | (6,122,883 | ) | | | (4,990,903 | ) | | | (1,478,795 | ) | | | (773,217 | ) | |
| Net realized gains: | |
| Class I | | | — | | | | — | | | | (68,434,199 | ) | | | (51,641,723 | ) | |
| Class S | | | — | | | | — | | | | (24,305,765 | ) | | | (14,146,533 | ) | |
| Total distributions | | | (22,108,371 | ) | | | (23,356,867 | ) | | | (99,816,955 | ) | | | (69,923,421 | ) | |
| FROM CAPITAL SHARE TRANSACTIONS: | |
| Net proceeds from sale of shares | | | 1,045,734,833 | | | | 487,133,637 | | | | 469,884,334 | | | | 293,235,680 | | |
| Dividends reinvested | | | 22,108,371 | | | | 23,356,867 | | | | 99,816,955 | | | | 69,923,421 | | |
| | | | 1,067,843,204 | | | | 510,490,504 | | | | 569,701,289 | | | | 363,159,101 | | |
| Cost of shares redeemed | | | (742,168,372 | ) | | | (285,443,027 | ) | | | (327,940,417 | ) | | | (76,581,417 | ) | |
Net increase in net assets resulting from capital
share transactions | | | 325,674,832 | | | | 225,047,477 | | | | 241,760,872 | | | | 286,577,684 | | |
| Net increase in net assets | | | 615,360,438 | | | | 306,199,258 | | | | 252,434,221 | | | | 322,234,913 | | |
| NET ASSETS: | |
| Beginning of year | | | 1,946,272,610 | | | | 1,640,073,352 | | | | 1,123,256,399 | | | | 801,021,486 | | |
| End of year | | $ | 2,561,633,048 | | | $ | 1,946,272,610 | | | $ | 1,375,690,620 | | | $ | 1,123,256,399 | | |
Undistributed net investment income at end
of year | | $ | 31,450,677 | | | $ | 22,117,371 | | | $ | 10,574,611 | | | $ | 7,256,615 | | |
See Accompanying Notes to Financial Statements
24
STATEMENTS OF CHANGES IN NET ASSETS
| | | ING VP Index Plus
SmallCap Portfolio | | ING VP Strategic Allocation
Conservative Portfolio | |
| | | Year Ended
December 31,
2006 | | Year Ended
December 31,
2005 | | Year Ended
December 31,
2006 | | Year Ended
December 31,
2005 | |
| FROM OPERATIONS: | |
| Net investment income | | $ | 3,807,429 | | | $ | 3,130,609 | | | $ | 4,679,838 | | | $ | 3,875,244 | | |
Net realized gain on investments, foreign currency
related transactions, and futures | | | 85,695,727 | | | | 44,380,246 | | | | 4,148,104 | | | | 6,024,537 | | |
Net change in unrealized appreciation or depreciation
on investments, foreign currency related transactions,
and futures | | | 17,483,780 | | | | (2,412,384 | ) | | | 3,110,747 | | | | (4,139,708 | ) | |
| Net increase in net assets resulting from operations | | | 106,986,936 | | | | 45,098,471 | | | | 11,938,689 | | | | 5,760,073 | | |
| FROM DISTRIBUTIONS TO SHAREHOLDERS: | |
| Net investment income: | |
| Class I | | | (1,801,475 | ) | | | (1,005,229 | ) | | | (3,932,782 | ) | | | (3,088,074 | ) | |
| Class S | | | (1,012,877 | ) | | | (617,095 | ) | | | (6,475 | ) | | | — | | |
| Net realized gains: | |
| Class I | | | (23,600,099 | ) | | | (16,794,162 | ) | | | (4,796,861 | ) | | | — | | |
| Class S | | | (20,506,830 | ) | | | (12,347,644 | ) | | | (7,947 | ) | | | — | | |
| Total distributions | | | (46,921,281 | ) | | | (30,764,130 | ) | | | (8,744,065 | ) | | | (3,088,074 | ) | |
| FROM CAPITAL SHARE TRANSACTIONS: | |
| Net proceeds from sale of shares | | | 544,373,542 | | | | 307,363,456 | | | | 11,084,498 | | | | 22,558,625 | | |
| Dividends reinvested | | | 46,921,281 | | | | 30,764,130 | | | | 8,744,065 | | | | 3,088,074 | | |
| | | | 591,294,823 | | | | 338,127,586 | | | | 19,828,563 | | | | 25,646,699 | | |
| Cost of shares redeemed | | | (413,212,479 | ) | | | (54,582,141 | ) | | | (27,591,644 | ) | | | (28,124,159 | ) | |
Net increase (decrease) in net assets resulting
from capital share transactions | | | 178,082,344 | | | | 283,545,445 | | | | (7,763,081 | ) | | | (2,477,460 | ) | |
| Net increase (decrease) in net assets | | | 238,147,999 | | | | 297,879,786 | | | | (4,568,457 | ) | | | 194,539 | | |
| NET ASSETS: | |
| Beginning of year | | | 711,213,032 | | | | 413,333,246 | | | | 151,683,052 | | | | 151,488,513 | | |
| End of year | | $ | 949,361,031 | | | $ | 711,213,032 | | | $ | 147,114,595 | | | $ | 151,683,052 | | |
| Undistributed net investment income at end of year | | $ | 3,488,031 | | | $ | 2,868,688 | | | $ | 4,696,995 | | | $ | 3,938,007 | | |
See Accompanying Notes to Financial Statements
25
STATEMENTS OF CHANGES IN NET ASSETS
| | | ING VP Strategic Allocation
Growth Portfolio | | ING VP Strategic Allocation
Moderate Portfolio | |
| | | Year Ended
December 31,
2006 | | Year Ended
December 31,
2005 | | Year Ended
December 31,
2006 | | Year Ended
December 31,
2005 | |
| FROM OPERATIONS: | |
| Net investment income | | $ | 5,159,916 | | | $ | 3,916,086 | | | $ | 6,595,067 | | | $ | 5,365,085 | | |
Net realized gain on investments, foreign
currency related transactions, and futures | | | 18,077,897 | | | | 16,333,674 | | | | 11,857,186 | | | | 12,614,403 | | |
Net change in unrealized appreciation or depreciation
on investments, foreign currency related transactions,
and futures | | | 12,962,536 | | | | (3,407,926 | ) | | | 12,571,641 | | | | (4,526,758 | ) | |
| Net increase in net assets resulting from operations | | | 36,200,349 | | | | 16,841,834 | | | | 31,023,894 | | | | 13,452,730 | | |
| FROM DISTRIBUTIONS TO SHAREHOLDERS: | |
| Net investment income: | |
| Class I | | | (4,039,806 | ) | | | (3,375,749 | ) | | | (5,448,268 | ) | | | (4,230,268 | ) | |
| Class S | | | (804 | ) | | | — | | | | (5,320 | ) | | | (1,684 | ) | |
| Net realized gains: | |
| Class I | | | (3,897,573 | ) | | | — | | | | (6,437,221 | ) | | | — | | |
| Class S | | | (793 | ) | | | — | | | | (6,587 | ) | | | — | | |
| Total distributions | | | (7,938,976 | ) | | | (3,375,749 | ) | | | (11,897,396 | ) | | | (4,231,952 | ) | |
| FROM CAPITAL SHARE TRANSACTIONS: | |
| Net proceeds from sale of shares | | | 20,211,753 | | | | 38,357,026 | | | | 22,323,395 | | | | 39,779,060 | | |
| Dividends reinvested | | | 7,938,976 | | | | 3,375,749 | | | | 11,897,396 | | | | 4,231,952 | | |
| | | | 28,150,729 | | | | 41,732,775 | | | | 34,220,791 | | | | 44,011,012 | | |
| Cost of shares redeemed | | | (45,247,026 | ) | | | (31,098,364 | ) | | | (43,973,179 | ) | | | (31,488,536 | ) | |
Net increase (decrease) in net assets resulting
from capital share transactions | | | (17,096,297 | ) | | | 10,634,411 | | | | (9,752,388 | ) | | | 12,522,476 | | |
| Net increase in net assets | | | 11,165,076 | | | | 24,100,496 | | | | 9,374,110 | | | | 21,743,254 | | |
| NET ASSETS: | |
| Beginning of year | | | 287,594,957 | | | | 263,494,461 | | | | 290,035,049 | | | | 268,291,795 | | |
| End of year | | $ | 298,760,033 | | | $ | 287,594,957 | | | $ | 299,409,159 | | | $ | 290,035,049 | | |
| Undistributed net investment income at end of year | | $ | 5,107,112 | | | $ | 4,042,457 | | | $ | 6,584,365 | | | $ | 5,454,318 | | |
See Accompanying Notes to Financial Statements
26
ING VP INDEX PLUS LARGECAP PORTFOLIO
FINANCIAL HIGHLIGHTS
Selected data for a share of beneficial interest outstanding throughout each year.
| | | Class I
Year Ended December 31, | |
| | | 2006 | | 2005 | | 2004 | | 2003 | | 2002 | |
| Per Share Operating Performance: | |
| Net asset value, beginning of year | | $ | 15.42 | | | | 14.82 | | | | 13.54 | | | | 10.85 | | | | 13.86 | | |
| Income (loss) from investment operations: | |
| Net investment income | | $ | 0.23 | * | | | 0.19 | * | | | 0.22 | | | | 0.14 | | | | 0.14 | | |
Net realized and unrealized gain (loss)
on investments | | $ | 2.00 | | | | 0.60 | | | | 1.20 | | | | 2.68 | | | | (3.12 | ) | |
| Total from investment operations | | $ | 2.23 | | | | 0.79 | | | | 1.42 | | | | 2.82 | | | | (2.98 | ) | |
| Less distributions from: | |
| Net investment income | | $ | 0.17 | | | | 0.19 | | | | 0.14 | | | | 0.13 | | | | 0.03 | | |
| Total distributions | | $ | 0.17 | | | | 0.19 | | | | 0.14 | | | | 0.13 | | | | 0.03 | | |
| Net asset value, end of year | | $ | 17.48 | | | | 15.42 | | | | 14.82 | | | | 13.54 | | | | 10.85 | | |
| Total Return(1) | | % | 14.58 | | | | 5.38 | | | | 10.58 | | | | 26.14 | | | | (21.53 | ) | |
| Ratios and Supplemental Data: | |
| Net assets, end of year (000's) | | $ | 2,352,193 | | | | 1,389,139 | | | | 1,511,946 | | | | 1,389,298 | | | | 943,520 | | |
| Ratios to average net assets: | |
| Expenses | | % | 0.43 | (2) | | | 0.45 | | | | 0.44 | | | | 0.43 | | | | 0.45 | | |
| Net investment income | | % | 1.46 | (2) | | | 1.30 | | | | 1.55 | | | | 1.33 | | | | 1.18 | | |
| Portfolio turnover rate | | % | 128 | | | | 89 | | | | 70 | | | | 88 | | | | 139 | | |
| | | Class S
Year Ended December 31, | |
| | | 2006 | | 2005 | | 2004 | | 2003 | | 2002 | |
| Per Share Operating Performance: | |
| Net asset value, beginning of year | | $ | 15.30 | | | | 14.73 | | | | 13.49 | | | | 10.83 | | | | 13.86 | | |
| Income (loss) from investment operations: | |
| Net investment income | | $ | 0.18 | * | | | 0.16 | * | | | 0.19 | * | | | 0.15 | | | | 0.12 | | |
Net realized and unrealized gain (loss)
on investments | | $ | 1.99 | | | | 0.59 | | | | 1.18 | | | | 2.63 | | | | (3.13 | ) | |
| Total from investment operations | | $ | 2.17 | | | | 0.75 | | | | 1.37 | | | | 2.78 | | | | (3.01 | ) | |
| Less distributions from: | |
| Net investment income | | $ | 0.15 | | | | 0.18 | | | | 0.13 | | | | 0.12 | | | | 0.02 | | |
| Total distributions | | $ | 0.15 | | | | 0.18 | | | | 0.13 | | | | 0.12 | | | | 0.02 | | |
| Net asset value, end of year | | $ | 17.32 | | | | 15.30 | | | | 14.73 | | | | 13.49 | | | | 10.83 | | |
| Total Return(1) | | % | 14.28 | | | | 5.15 | | | | 10.26 | | | | 25.84 | | | | (21.74 | ) | |
| Ratios and Supplemental Data: | |
| Net assets, end of year (000's) | | $ | 209,440 | | | | 557,134 | | | | 128,127 | | | | 59,500 | | | | 4,597 | | |
| Ratios to average net assets: | |
| Expenses | | % | 0.68 | (2) | | | 0.70 | | | | 0.69 | | | | 0.68 | | | | 0.71 | | |
| Net investment income | | % | 1.13 | (2) | | | 1.10 | | | | 1.39 | | | | 1.11 | | | | 0.93 | | |
| Portfolio turnover rate | | % | 128 | | | | 89 | | | | 70 | | | | 88 | | | | 139 | | |
(1) Total return is calculated assuming reinvestment of all dividends and capital gain distributions at net asset value and does not reflect the effect of insurance contract charges.
(2) Impact of waiving the advisory fee for the ING Institutional Prime Money Market Fund holding has less than 0.01% impact on the expense ratio.
* Per share data calculated using average number of shares outstanding throughout the period.
See Accompanying Notes to Financial Statements.
27
ING VP INDEX PLUS MIDCAP PORTFOLIO
FINANCIAL HIGHLIGHTS
Selected data for a share of beneficial interest outstanding throughout each year.
| | | Class I
Year Ended December 31, | |
| | | 2006 | | 2005 | | 2004 | | 2003 | | 2002 | |
| Per Share Operating Performance: | |
| Net asset value, beginning of year | | $ | 18.69 | | | | 18.16 | | | | 15.64 | | | | 11.86 | | | | 13.54 | | |
| Income (loss) from investment operations: | |
| Net investment income | | $ | 0.17 | * | | | 0.16 | * | | | 0.09 | | | | 0.09 | | | | 0.04 | | |
Net realized and unrealized gain (loss)
on investments | | $ | 1.57 | | | | 1.77 | | | | 2.50 | | | | 3.75 | | | | (1.67 | ) | |
| Total from investment operations | | $ | 1.74 | | | | 1.93 | | | | 2.59 | | | | 3.84 | | | | (1.63 | ) | |
| Less distributions from: | |
| Net investment income | | $ | 0.12 | | | | 0.09 | | | | 0.07 | | | | 0.06 | | | | 0.05 | | |
| Net realized gain on investments | | $ | 1.42 | | | | 1.31 | | | | — | | | | — | | | | — | | |
| Total distributions | | $ | 1.54 | | | | 1.40 | | | | 0.07 | | | | 0.06 | | | | 0.05 | | |
| Net asset value, end of year | | $ | 18.89 | | | | 18.69 | | | | 18.16 | | | | 15.64 | | | | 11.86 | | |
| Total Return(1) | | % | 9.44 | | | | 11.14 | | | | 16.59 | | | | 32.45 | | | | (12.09 | ) | |
| Ratios and Supplemental Data: | |
| Net assets, end of year (000's) | | $ | 1,148,074 | | | | 844,703 | | | | 678,869 | | | | 451,213 | | | | 251,674 | | |
| Ratios to average net assets: | |
| Expenses | | % | 0.49 | (2) | | | 0.49 | | | | 0.49 | | | | 0.50 | | | | 0.53 | | |
| Net investment income | | % | 0.92 | (2) | | | 0.87 | | | | 0.73 | | | | 0.78 | | | | 0.61 | | |
| Portfolio turnover rate | | % | 84 | | | | 100 | | | | 108 | | | | 113 | | | | 139 | | |
| | | Class S
Year Ended December 31, | |
| | | 2006 | | 2005 | | 2004 | | 2003 | | 2002 | |
| Per Share Operating Performance: | |
| Net asset value, beginning of year | | $ | 18.53 | | | | 18.05 | | | | 15.57 | | | | 11.83 | | | | 13.52 | | |
| Income (loss) from investment operations: | |
| Net investment income | | $ | 0.12 | | | | 0.11 | * | | | 0.07 | * | | | 0.04 | | | | 0.01 | | |
Net realized and unrealized gain (loss)
on investments | | $ | 1.55 | | | | 1.75 | | | | 2.47 | | | | 3.74 | | | | (1.66 | ) | |
| Total from investment operations | | $ | 1.67 | | | | 1.86 | | | | 2.54 | | | | 3.78 | | | | (1.65 | ) | |
| Less distributions from: | |
| Net investment income | | $ | 0.09 | | | | 0.07 | | | | 0.06 | | | | 0.04 | | | | 0.04 | | |
| Net realized gain on investments | | $ | 1.42 | | | | 1.31 | | | | — | | | | — | | | | — | | |
| Total distributions | | $ | 1.51 | | | | 1.38 | | | | 0.06 | | | | 0.04 | | | | 0.04 | | |
| Net asset value, end of year | | $ | 18.69 | | | | 18.53 | | | | 18.05 | | | | 15.57 | | | | 11.83 | | |
| Total Return(1) | | % | 9.12 | | | | 10.84 | | | | 16.35 | | | | 32.06 | | | | (12.26 | ) | |
| Ratios and Supplemental Data: | |
| Net assets, end of year (000's) | | $ | 227,616 | | | | 278,554 | | | | 122,153 | | | | 19,960 | | | | 5,917 | | |
| Ratios to average net assets: | |
| Expenses | | % | 0.74 | (2) | | | 0.74 | | | | 0.74 | | | | 0.75 | | | | 0.78 | | |
| Net investment income | | % | 0.63 | (2) | | | 0.62 | | | | 0.45 | | | | 0.54 | | | | 0.37 | | |
| Portfolio turnover rate | | % | 84 | | | | 100 | | | | 108 | | | | 113 | | | | 139 | | |
(1) Total return is calculated assuming reinvestment of all dividends and capital gain distributions at net asset value and does not reflect the effect of insurance contract charges.
(2) Impact of waiving the advisory fee for the ING Institutional Prime Money Market Fund holding has less than 0.01% impact on the expense ratio.
* Per share data calculated using average number of shares outstanding throughout the period.
See Accompanying Notes to Financial Statements.
28
ING VP INDEX PLUS SMALLCAP PORTFOLIO
FINANCIAL HIGHLIGHTS
Selected data for a share of beneficial interest outstanding throughout each year.
| | | Class I
Year Ended December 31, | |
| | | 2006 | | 2005 | | 2004 | | 2003 | | 2002 | |
| Per Share Operating Performance: | |
| Net asset value, beginning of year | | $ | 16.68 | | | | 16.39 | | | | 13.52 | | | | 9.95 | | | | 11.60 | | |
| Income (loss) from investment operations: | |
| Net investment income | | $ | 0.09 | * | | | 0.11 | * | | | 0.07 | | | | 0.03 | | | | 0.01 | | |
Net realized and unrealized gain (loss)
on investments | | $ | 2.20 | | | | 1.09 | | | | 2.90 | | | | 3.56 | | | | (1.53 | ) | |
| Total from investment operations | | $ | 2.29 | | | | 1.20 | | | | 2.97 | | | | 3.59 | | | | (1.52 | ) | |
| Less distributions from: | |
| Net investment income | | $ | 0.07 | | | | 0.05 | | | | 0.02 | | | | 0.02 | | | | 0.01 | | |
| Net realized gain on investments | | $ | 0.91 | | | | 0.86 | | | | 0.08 | | | | — | | | | 0.12 | | |
| Total distributions | | $ | 0.98 | | | | 0.91 | | | | 0.10 | | | | 0.02 | | | | 0.13 | | |
| Net asset value, end of year | | $ | 17.99 | | | | 16.68 | | | | 16.39 | | | | 13.52 | | | | 9.95 | | |
| Total Return(1) | | % | 13.82 | | | | 7.62 | | | | 22.07 | | | | 36.15 | | | | (13.21 | ) | |
| Ratios and Supplemental Data: | |
| Net assets, end of year (000's) | | $ | 745,115 | | | | 378,121 | | | | 303,041 | | | | 168,035 | | | | 86,494 | | |
| Ratios to average net assets: | |
| Net expenses after expense reimbursement(3) | | % | 0.49 | (2) | | | 0.49 | | | | 0.49 | | | | 0.56 | | | | 0.58 | | |
| Gross expenses prior to expense reimbursement(3) | | % | 0.49 | | | | 0.49 | | | | 0.49 | | | | 0.56 | | | | 0.63 | | |
Net investment income after expense
reimbursement(3) | | % | 0.52 | (2) | | | 0.66 | | | | 0.64 | | | | 0.37 | | | | 0.30 | | |
| Portfolio turnover rate | | % | 93 | | | | 71 | | | | 94 | | | | 120 | | | | 134 | | |
| | | Class S
Year Ended December 31, | |
| | | 2006 | | 2005 | | 2004 | | 2003 | | 2002 | |
| Per Share Operating Performance: | |
| Net asset value, beginning of year | | $ | 16.53 | | | | 16.28 | | | | 13.46 | | | | 9.92 | | | | 11.58 | | |
| Income (loss) from investment operations: | |
| Net investment income | | $ | 0.04 | * | | | 0.07 | * | | | 0.06 | * | | | 0.01 | | | | 0.00 | ** | |
Net realized and unrealized gain (loss)
on investments | | $ | 2.18 | | | | 1.08 | | | | 2.86 | | | | 3.54 | | | | (1.53 | ) | |
| Total from investment operations | | $ | 2.22 | | | | 1.15 | | | | 2.92 | | | | 3.55 | | | | (1.53 | ) | |
| Less distributions from: | |
| Net investment income | | $ | 0.05 | | | | 0.04 | | | | 0.02 | | | | 0.01 | | | | 0.01 | | |
| Net realized gain on investments | | $ | 0.91 | | | | 0.86 | | | | 0.08 | | | | — | | | | 0.12 | | |
| Total distributions | | $ | 0.96 | | | | 0.90 | | | | 0.10 | | | | 0.01 | | | | 0.13 | | |
| Net asset value, end of year | | $ | 17.79 | | | | 16.53 | | | | 16.28 | | | | 13.46 | | | | 9.92 | | |
| Total Return(1) | | % | 13.48 | | | | 7.36 | | | | 21.74 | | | | 35.83 | | | | (13.39 | ) | |
| Ratios and Supplemental Data: | |
| Net assets, end of year (000's) | | $ | 204,246 | | | | 333,092 | | | | 110,292 | | | | 16,419 | | | | 4,014 | | |
| Ratios to average net assets: | |
| Net expenses after expense reimbursement(3) | | % | 0.74 | (2) | | | 0.74 | | | | 0.74 | | | | 0.80 | | | | 0.84 | | |
| Gross expenses prior to expense reimbursement(3) | | % | 0.74 | | | | 0.74 | | | | 0.74 | | | | 0.80 | | | | 0.88 | | |
Net investment income after expense
reimbursement(3) | | % | 0.25 | (2) | | | 0.43 | | | | 0.45 | | | | 0.13 | | | | 0.05 | | |
| Portfolio turnover rate | | % | 93 | | | | 71 | | | | 94 | | | | 120 | | | | 134 | | |
(1) Total return is calculated assuming reinvestment of all dividends and capital gain distributions at net asset value and does not reflect the effect of insurance contract charges.
(2) The Investment Adviser has agreed to limit expenses (excluding interest, taxes, brokerage and extraordinary expenses) subject to possible recoupment by ING Investments, LLC within three years of being incurred.
(3) Impact of waiving the advisory fee for the ING Institutional Prime Money Market Fund holding has less than 0.01% impact on the expense ratio.
* Per share data calculated using average number of shares outstanding throughout the period.
** Amount represents less than $0.005 per share.
See Accompanying Notes to Financial Statements.
29
ING VP STRATEGIC ALLOCATION CONSERVATIVE PORTFOLIO
FINANCIAL HIGHLIGHTS
Selected data for a share of beneficial interest outstanding throughout each period.
| | | Class ADV | | Class I | |
| | | December 29, 2006(1)
to | | Year Ended December 31, | |
| | | December 31, 2006 | | 2006 | | 2005 | | 2004 | | 2003 | | 2002 | |
| Per Share Operating Performance: | |
| Net asset value, beginning of period | | $ | 13.53 | | | | 13.27 | | | | 13.04 | | | | 12.31 | | | | 11.09 | | | | 11.99 | | |
| Income (loss) from investment operations: | |
| Net investment income | | $ | (0.00 | )** | | | 0.42 | * | | | 0.34 | | | | 0.25 | | | | 0.25 | | | | 0.27 | | |
Net realized and unrealized gain (loss)
on investments | | $ | — | | | | 0.64 | | | | 0.15 | | | | 0.72 | | | | 1.25 | | | | (0.78 | ) | |
| Total from investment operations | | $ | (0.00 | )** | | | 1.06 | | | | 0.49 | | | | 0.97 | | | | 1.50 | | | | (0.51 | ) | |
| Less distributions from: | |
| Net investment income | | $ | — | | | | 0.35 | | | | 0.26 | | | | 0.24 | | | | 0.28 | | | | 0.39 | | |
| Net realized gain on investments | | $ | — | | | | 0.43 | | | | — | | | | — | | | | — | | | | — | | |
| Total distributions | | $ | — | | | | 0.78 | | | | 0.26 | | | | 0.24 | | | | 0.28 | | | | 0.39 | | |
| Net asset value, end of period | | $ | 13.53 | | | | 13.55 | | | | 13.27 | | | | 13.04 | | | | 12.31 | | | | 11.09 | | |
| Total Return(2) | | % | — | | | | 8.37 | | | | 3.83 | | | | 7.99 | | | | 13.65 | | | | (4.34 | ) | |
| Ratios and Supplemental Data: | |
| Net assets, end of period (000's) | | $ | 1 | | | | 146,397 | | | | 151,565 | | | | 151,489 | | | | 135,628 | | | | 120,615 | | |
| Ratios to average net assets: | |
| Net expenses after expense reimbursement(3)(4) | | % | 1.15 | | | | 0.65 | | | | 0.65 | | | | 0.65 | | | | 0.65 | | | | 0.65 | | |
| Gross expenses prior to expense reimbursement(4) | | % | 1.22 | | | | 0.72 | | | | 0.75 | | | | 0.70 | | | | 0.74 | | | | 0.77 | | |
Net investment income after expense
reimbursement(3)(4) | | % | (1.15 | ) | | | 3.18 | | | | 2.53 | | | | 2.16 | | | | 2.18 | | | | 2.36 | | |
| Portfolio turnover rate | | % | 335 | | | | 335 | | | | 364 | | | | 317 | | | | 332 | | | | 248 | | |
| | | Class S | |
| | | Year Ended
December 31,
2006 | | August 5,
2005(1) to
December 31,
2005 | |
| Per Share Operating Performance: | |
| Net asset value, beginning of period | | $ | 13.25 | | | | 13.06 | | |
| Income from investment operations: | |
| Net investment income | | $ | 0.39 | * | | | 0.06 | | |
| Net realized and unrealized gain on investments | | $ | 0.64 | | | | 0.13 | | |
| Total from investment operations | | $ | 1.03 | | | | 0.19 | | |
| Less distributions from: | |
| Net investment income | | $ | 0.35 | | | | — | | |
| Net realized gains on investments | | $ | 0.43 | | | | — | | |
| Total distributions | | $ | 0.78 | | | | — | | |
| Net asset value, end of period | | $ | 13.50 | | | | 13.25 | | |
| Total Return(2) | | % | 8.13 | | | | 1.45 | | |
| Ratios and Supplemental Data: | |
| Net assets, end of period (000's) | | $ | 717 | | | | 118 | | |
| Ratios to average net assets: | |
| Net expenses after expense reimbursement(3)(4) | | % | 0.90 | | | | 0.90 | | |
| Gross expenses prior to expense reimbursement(4) | | % | 0.97 | | | | 1.00 | | |
| Net investment income after expense reimbursement(3)(4) | | % | 3.00 | | | | 2.68 | | |
| Portfolio turnover rate | | % | 335 | | | | 364 | | |
(1) Commencement of operations.
(2) Total return is calculated assuming reinvestment of all dividends and capital gain distributions at net asset value and does not reflect the effect of insurance contract charges. Total return for periods less than one year is not annualized.
(3) The Investment Adviser has agreed to limit expenses (excluding interest, taxes, brokerage and extraordinary expenses) subject to possible recoupment by ING Investments, LLC within three years.
(4) Annualized for periods less than one year.
* Per share data calculated using average number of shares outstanding throughout the period.
** Amount represents more than $(0.005) per share.
See Accompanying Notes to Financial Statements.
30
ING VP STRATEGIC ALLOCATION GROWTH PORTFOLIO
FINANCIAL HIGHLIGHTS
Selected data for a share of beneficial interest outstanding throughout each period.
| | | Class ADV | | Class I | |
| | | December 29, 2006(1)
to | | Year Ended December 31, | |
| | | December 31, 2006 | | 2006 | | 2005 | | 2004 | | 2003 | | 2002 | |
| Per Share Operating Performance: | |
| Net asset value, beginning of period | | $ | 17.06 | | | | 15.48 | | | | 14.76 | | | | 13.32 | | | | 10.81 | | | | 12.75 | | |
| Income (loss) from investment operations: | |
| Net investment income | | $ | (0.00 | )** | | | 0.28 | * | | | 0.22 | | | | 0.18 | | | | 0.15 | | | | 0.13 | | |
Net realized and unrealized gain (loss)
on investments | | $ | — | | | | 1.73 | | | | 0.68 | | | | 1.41 | | | | 2.47 | | | | (1.87 | ) | |
| Total from investment operations | | $ | (0.00 | )** | | | 2.01 | | | | 0.90 | | | | 1.59 | | | | 2.62 | | | | (1.74 | ) | |
| Less distributions from: | |
| Net investment income | | $ | — | | | | 0.22 | | | | 0.18 | | | | 0.15 | | | | 0.11 | | | | 0.20 | | |
| Net realized gains on investments | | $ | — | | | | 0.21 | | | | — | | | | — | | | | — | | | | — | | |
| Total distributions | | $ | — | | | | 0.43 | | | | 0.18 | | | | 0.15 | | | | 0.11 | | | | 0.20 | | |
| Net asset value, end of period | | $ | 17.06 | | | | 17.06 | | | | 15.48 | | | | 14.76 | | | | 13.32 | | | | 10.81 | | |
| Total Return(2) | | % | — | | | | 13.19 | | | | 6.20 | | | | 12.01 | | | | 24.34 | | | | (13.76 | ) | |
| Ratios and Supplemental Data: | |
| Net assets, end of period (000's) | | $ | 1 | | | | 298,451 | | | | 287,566 | | | | 263,494 | | | | 219,260 | | | | 165,733 | | |
| Ratios to average net assets: | |
Net expenses after expense reimbursement/
recoupment(3)(4) | | % | 1.21 | | | | 0.71 | | | | 0.73 | | | | 0.70 | | | | 0.75 | | | | 0.75 | | |
Gross expenses prior to expense reimbursement/
recoupment(4) | | % | 1.21 | | | | 0.71 | | | | 0.73 | | | | 0.70 | | | | 0.74 | | | | 0.77 | | |
Net investment income after expense
reimbursement(3)(4) | | % | (1.21 | ) | | | 1.77 | | | | 1.43 | | | | 1.46 | | | | 1.32 | | | | 1.14 | | |
| Portfolio turnover rate | | % | 233 | | | | 233 | | | | 232 | | | | 205 | | | | 232 | | | | 271 | | |
| | | Class S | |
| | | Year Ended
December 31,
2006 | | August 5,
2005(1) to
December 31,
2005 | |
| Per Share Operating Performance: | |
| Net asset value, beginning of period | | $ | 15.46 | | | | 14.98 | | |
| Income from investment operations: | |
| Net investment income | | $ | 0.23 | * | | | 0.06 | | |
| Net realized and unrealized gain on investments | | $ | 1.73 | | | | 0.42 | | |
| Total from investment operations | | $ | 1.96 | | | | 0.48 | | |
| Less distributions from: | |
| Net investment income | | $ | 0.21 | | | | — | | |
| Net realized gains on investments | | $ | 0.21 | | | | — | | |
| Total distributions | | $ | 0.42 | | | | — | | |
| Net asset value, end of period | | $ | 17.00 | | | | 15.46 | | |
| Total Return(2) | | % | 12.91 | | | | 3.20 | | |
| Ratios and Supplemental Data: | |
| Net assets, end of period (000's) | | $ | 308 | | | | 29 | | |
| Ratios to average net assets: | |
| Net expenses after expense reimbursement(3)(4) | | % | 0.96 | | | | 0.98 | | |
| Gross expenses prior to expense reimbursement(4) | | % | 0.96 | | | | 0.98 | | |
| Net investment income after expense reimbursement(3)(4) | | % | 1.47 | | | | 1.27 | | |
| Portfolio turnover rate | | % | 233 | | | | 232 | | |
(1) Commencement of operations.
(2) Total return is calculated assuming reinvestment of all dividends and capital gain distributions at net asset value and does not reflect the effect of insurance contract charges. Total return for periods less than one year is not annualized.
(3) The Investment Adviser has agreed to limit expenses (excluding interest, taxes, brokerage and extraordinary expenses) subject to possible recoupment by ING Investments, LLC within three years of being incurred.
(4) Annualized for periods less than one year.
* Per share data calculated using average number of shares outstanding throughout the period.
** Amount represents more than $(0.005) per share.
See Accompanying Notes to Financial Statements.
31
ING VP STRATEGIC ALLOCATION MODERATE PORTFOLIO
FINANCIAL HIGHLIGHTS
Selected data for a share of beneficial interest outstanding throughout each period.
| | | Class ADV | | Class I | |
| | | December 29, 2006(1)
to | | Year Ended December 31, | |
| | | December 31, 2006 | | 2006 | | 2005 | | 2004 | | 2003 | | 2002 | |
| Per Share Operating Performance: | |
| Net asset value, beginning of period | | $ | 15.32 | | | | 14.35 | | | | 13.91 | | | | 12.78 | | | | 10.86 | | | | 12.31 | | |
| Income (loss) from investment operations: | |
| Net investment income | | $ | (0.00 | )** | | | 0.33 | * | | | 0.26 | * | | | 0.20 | | | | 0.18 | | | | 0.20 | | |
Net realized and unrealized gain (loss)
on investments | | $ | — | | | | 1.23 | | | | 0.39 | | | | 1.09 | | | | 1.92 | | | | (1.36 | ) | |
| Total from investment operations | | $ | (0.00 | )** | | | 1.56 | | | | 0.65 | | | | 1.29 | | | | 2.10 | | | | (1.16 | ) | |
| Less distributions from: | |
| Net investment income | | $ | — | | | | 0.27 | | | | 0.21 | | | | 0.16 | | | | 0.18 | | | | 0.29 | | |
| Net realized gains on investments | | $ | — | | | | 0.32 | | | | — | | | | — | | | | — | | | | — | | |
| Total distributions | | $ | — | | | | 0.59 | | | | 0.21 | | | | 0.16 | | | | 0.18 | | | | 0.29 | | |
| Net asset value, end of period | | $ | 15.32 | | | | 15.32 | | | | 14.35 | | | | 13.91 | | | | 12.78 | | | | 10.86 | | |
| Total Return(2) | | % | — | | | | 11.17 | | | | 4.70 | | | | 10.23 | | | | 19.47 | | | | (9.54 | ) | |
| Ratios and Supplemental Data: | |
| Net assets, end of period (000's) | | $ | 1 | | | | 298,715 | | | | 289,673 | | | | 268,292 | | | | 208,837 | | | | 158,169 | | |
| Ratios to average net assets: | |
| Net expenses after expense reimbursement(3)(4) | | % | 1.20 | | | | 0.70 | | | | 0.70 | | | | 0.70 | | | | 0.70 | | | | 0.70 | | |
| Gross expenses prior to expense reimbursement(4) | | % | 1.21 | | | | 0.71 | | | | 0.74 | | | | 0.70 | | | | 0.74 | | | | 0.77 | | |
Net investment income after expense
reimbursement(3)(4) | | % | (1.20 | ) | | | 2.26 | | | | 1.89 | | | | 1.77 | | | | 1.75 | | | | 1.71 | | |
| Portfolio turnover rate | | % | 258 | | | | 258 | | | | 301 | | | | 262 | | | | 278 | | | | 267 | | |
| | | Class S | |
| | | Year Ended
December 31,
2006 | | June 7,
2005(1) to
December 31,
2005 | |
| Per Share Operating Performance: | |
| Net asset value, beginning of period | | $ | 14.34 | | | | 14.02 | | |
| Income from investment operations: | |
| Net investment income | | $ | 0.29 | * | | | 0.17 | * | |
| Net realized and unrealized gain on investments | | $ | 1.22 | | | | 0.36 | | |
| Total from investment operations | | $ | 1.51 | | | | 0.53 | | |
| Less distributions from: | |
| Net investment income | | $ | 0.26 | | | | 0.21 | | |
| Net realized gains on investments | | $ | 0.32 | | | | — | | |
| Total distributions | | $ | 0.58 | | | | 0.21 | | |
| Net asset value, end of period | | $ | 15.27 | | | | 14.34 | | |
| Total Return(2) | | % | 10.80 | | | | 3.81 | | |
| Ratios and Supplemental Data: | |
| Net assets, end of period (000's) | | $ | 693 | | | | 362 | | |
| Ratios to average net assets: | |
| Net expenses after expense reimbursement(3)(4) | | % | 0.95 | | | | 0.95 | | |
| Gross expenses prior to expense reimbursement(4) | | % | 0.96 | | | | 0.99 | | |
| Net investment income after expense reimbursement(3)(4) | | % | 2.00 | | | | 1.80 | | |
| Portfolio turnover rate | | % | 258 | | | | 301 | | |
(1) Commencement of operations.
(2) Total return is calculated assuming reinvestment of all dividends and capital gain distributions at net asset value and does not reflect the effect of insurance contract charges. Total return for periods less than one year is not annualized.
(3) The Investment Adviser has agreed to limit expenses (excluding interest, taxes, brokerage and extraordinary expenses) subject to possible recoupment by ING Investments, LLC within three years of being incurred.
(4) Annualized for periods less than one year.
* Per share data calculated using average number of shares outstanding throughout the period.
** Amount represents more than $(0.005) per share.
See Accompanying Notes to Financial Statements.
32
NOTES TO FINANCIAL STATEMENTS AS OF DECEMBER 31, 2006
NOTE 1 — ORGANIZATION
Organization. The ING Variable Portfolios, Inc. and the ING Strategic Allocation Portfolios, Inc. are each registered under the Investment Company Act of 1940, as amended ("1940 Act") as an open-end management investment company.
The ING Variable Portfolios, Inc. is a company incorporated under the laws of Maryland on June 4, 1996. There are eight separate investment portfolios that comprise the ING Variable Portfolios, Inc. The three portfolios (each a "Portfolio", collectively the "Portfolios") that are in this report are: ING VP Index Plus LargeCap Portfolio ("VP Index Plus LargeCap"), ING VP Index Plus MidCap Portfolio ("VP Index Plus MidCap") and ING VP Index Plus SmallCap Portfolio ("VP Index Plus SmallCap").
The ING Strategic Allocation Portfolios, Inc. is a company incorporated under the laws of Maryland on October 14, 1994 (each a "Company" and collectively, the "Companies"). There are three separate investment portfolios (each a "Portfolio", collectively the "Portfolios") that comprise the ING Strategic Allocation Portfolios, Inc.: ING VP Strategic Allocation Conservative Portfolio ("VP Strategic Allocation Conservative"), formerly, ING VP Strategic Allocation Income Portfolio, ING VP Strategic Allocation Growth Portfolio ("VP Strategic Allocation Growth") and ING VP Strategic Allocation Moderate Portfolio ("VP Strategic Allocation Moderate") formerly, ING VP Strategic Allocation Balanced Portfolio.
The VP Index Plus LargeCap seeks to outperform the total return performance of the S&P 500® Index, while maintaining a market level of risk.
The VP Index Plus MidCap seeks to outperform the total return performance of the S&P MidCap 400 Index, while maintaining a market level of risk.
The VP Index Plus SmallCap seeks to outperform the total return performance of the S&P SmallCap 600 Index, while maintaining a market level of risk.
The VP Strategic Allocation Conservative seeks to provide total return consistent with preservation of capital.
The VP Strategic Allocation Growth seeks to provide capital appreciation.
The VP Strategic Allocation Moderate seeks to provide total return (i.e., income and capital appreciation, both realized and unrealized).
Each Portfolio offers Class I and Class S shares. Additionally, VP Strategic Allocation Conservative, VP Strategic Allocation Growth and VP Strategic Allocation Moderate offer Adviser ("ADV") Class shares. The three classes differ principally in the applicable distribution and service fees. Shareholders of each class also bear certain expenses that pertain to that particular class. All shareholders bear the common expenses of the Portfolio and earn income and realized gains/losses from the portfolio pro rata based on the average daily net assets of each class, without distinction between share classes. Differences in per share dividend rates generally result from differences in separate class expenses, including shareholder servicing fees.
Shares of the Portfolios may be offered to segregated asset accounts of insurance companies as investment options under variable annuity contracts and variable life insurance policies ("Variable Contracts"). Shares may also be offered to qualified pension and retirement plans outside the Variable Contract and to certain investment advisers and their affiliates. Class I shares may be made available to other investment companies, including series of the Trust under fund-of-funds arrangements.
Participating insurance companies and other designated organizations are authorized to receive purchase orders on the Portfolio's behalf.
ING Investments, LLC ("ING Investments" or the "Investment Adviser"), an Arizona limited liability company, serves as the Investment Adviser to the Portfolios. ING Investments has engaged ING Investment Management Co. ("ING IM"), a Connecticut corporation, to serve as the Sub-Adviser to the Portfolios. ING Funds Distributor, LLC (the "Distributor") is the principal underwriter of the Portfolios. ING Investments, ING IM and the Distributor are indirect, wholly-owned subsidiaries of ING Groep N.V. ("ING Groep"). ING Groep is one of the largest financial services organizations in the world, and offers an array of banking, insurance and asset management services to both individuals and institutional investors.
NOTE 2 — SIGNIFICANT ACCOUNTING POLICIES
The following significant accounting policies are consistently followed by the Portfolios in the preparation of their financial statements. Such policies are in conformity with U.S. generally accepted accounting principles for investment companies.
A. Security Valuation. Investments in equity securities traded on a national securities exchange are valued at the last reported sale price. Securities reported by NASDAQ are valued at the NASDAQ official closing prices. Securities
33
NOTES TO FINANCIAL STATEMENTS AS OF DECEMBER 31, 2006 (CONTINUED)
NOTE 2 — SIGNIFICANT ACCOUNTING POLICIES (continued)
traded on an exchange or NASDAQ for which there has been no sale and securities traded in the over-the-counter-market are valued at the mean between the last reported bid and ask prices. All investments quoted in foreign currencies will be valued daily in U.S. dollars on the basis of the foreign currency exchange rates prevailing at that time. Debt securities are valued at prices obtained from independent services or from one or more dealers making markets in the securities and may be adjusted based on the Portfolios' valuation procedures. U.S. government obligations are valued by using market quotations or independent pricing services that use prices provided by market-makers or estimates of market values obtained from yield data relating to instruments or securities with similar characteristics.
Securities and assets for which market quotations are not readily available (which may include certain restricted securities which are subject to limitations as to their sale) are valued at their fair values as determined in good faith by or under the supervision of the Portfolio's Board of Directors ("Board"), in accordance with methods that are specifically authorized by the Board. Securities traded on exchanges, including foreign exchanges, which close earlier than the time that a Portfolio calculates its net asset value ("NAV") may also be valued at their fair values as determined in good faith by or under the supervision of a Portfolio's Board, in accordance with methods that are specifically authorized by the Board. The valuation techniques applied in any specific instance are likely to vary from case to case. With respect to a restricted security, for example, consideration is generally given to the cost of the investment, the market value of any unrestricted securities of the same class at the time of valuation, the potential expiration of restrictions on the security, the existence of any registration rights, the costs to the Portfolios related to registration of the security, as well as factors relevant to the issuer itself. Consideration may also be given to the price and extent of any public trading in similar securities of the issuer or comparable companies' securities. The value of a foreign security traded on an exchange outside the United States is generally based on its price on the principal foreign exchange where it trades as of the time a Portfolio determines its NAV or if the foreign exchange closes prior to the time the Portfolio determines its NAV, the most recent closing price of the foreign security on its principal exchange. Trading in certain non-U.S. securities may not take place on all days on which the New York Stock Exchange ("NYSE") is open. Further, trading takes place in various foreign markets on days on which the NYSE is not open. Consequently, the calculation of the Portfolio's NAV may not take place contemporaneously with the determination of the prices of securities held by a Portfolio in foreign securities markets. Further, the value of the Portfolio's assets may be significantly affected by foreign trading on days when a shareholder cannot purchase or redeem shares of the Portfolio. In calculating the Portfolio's NAV, foreign securities denominated in foreign currency are converted to U.S. dollar equivalents. If an event occurs after the time at which the market for foreign securities held by the Portfolio closes but before the time that the Portfolio's NAV is calculated, such event may cause the closing price on the foreign exchange to not represent a readily available reliable market value quotation for such securities at the time the Portfolio determines its NAV. In such a case, the Portfolio will use the fair value of such securitie s as determined under a Portfolio's valuation procedures. Events after the close of trading on a foreign market that could require the Portfolio to fair value some or all of its foreign securities include, among others, securities trading in the U.S. and other markets, corporate announcements, natural and other disasters, and political and other events. Among other elements of analysis in the determination of a security's fair value, the Board has authorized the use of one or more independent research services to assist with such determinations. An independent research service may use statistical analyses and quantitative models to help determine fair value as of the time a Portfolio calculates its NAV. There can be no assurance that such models accurately reflect the behavior of the applicable markets or the effect of the behavior of such markets on the fair value of securities, or that such markets will continue to behave in a fashion that is consistent with such models. Unlike the closing price of a secur ity on an exchange, fair value determinations employ elements of judgment. Consequently, the fair value assigned to a security may not represent the actual value that a Portfolio could obtain if it were to sell the security at the time of the close of the NYSE. Pursuant to procedures adopted by the Board, a Portfolio is not obligated to use the fair valuations suggested by any research service, and valuation recommendations provided by such
34
NOTES TO FINANCIAL STATEMENTS AS OF DECEMBER 31, 2006 (CONTINUED)
NOTE 2 — SIGNIFICANT ACCOUNTING POLICIES (continued)
research services may be overridden if other events have occurred or if other fair valuations are determined in good faith to be more accurate. Unless an event is such that it causes a Portfolio to determine that the closing prices for one or more securities do not represent readily available reliable market value quotations at the time the Portfolio determines its NAV, events that occur between the time of the close of the foreign market on which they are traded and the close of regular trading on the NYSE will not be reflected in the Portfolio's NAV. Investments in securities maturing in 60 days or less at the date of valuation are valued at amortized cost, which, when combined with accrued interest approximates market value.
B. Security Transactions and Revenue Recognition. Securities transactions are accounted for on the trade date. Realized gains and losses are reported on the basis of identified cost of securities sold. Interest income is recorded on an accrual basis. Dividend income is recorded on the ex-dividend date, or for certain foreign securities, when the information becomes available to the Portfolios. Premium amortization and discount accretion are determined by the effective yield method.
C. Foreign Currency Translation. The books and records of the Portfolios are maintained in U.S. dollars. Any foreign currency amounts are translated into U.S. dollars on the following basis:
(1) Market value of investment securities, other assets and liabilities — at the exchange rates prevailing at the end of the day.
(2) Purchases and sales of investment securities, income and expenses — at the rates of exchange prevailing on the respective dates of such transactions.
Although the net assets and the market values are presented at the foreign exchange rates at the end of the day, the Portfolios do not isolate the portion of the results of operations resulting from changes in foreign exchange rates on investments from the fluctuations arising from changes in market prices of securities held. Such fluctuations are included with the net realized and unrealized gains or losses from investments. For securities, which are subject to foreign withholding tax upon disposition, liabilities are recorded on the Statement of Assets and Liabilities for the estimated tax withholding based on the securities' current market value. Upon disposition, realized gains or losses on such securities are recorded net of foreign withholding tax.
Reported net realized foreign exchange gains or losses arise from sales of foreign currencies, currency gains or losses realized between the trade and settlement dates on securities transactions, the difference between the amounts of dividends, interest, and foreign withholding taxes recorded on the Portfolio's books, and the U.S. dollar equivalent of the amounts actually received or paid. Net unrealized foreign exchange gains and losses arise from changes in the value of assets and liabilities other than investments in securities at fiscal year end, resulting from changes in the exchange rate. Foreign security and currency transactions may involve certain considerations and risks not typically associated with investing in U.S. companies and U.S. Government securities. These risks include, but are not limited to, revaluation of currencies and future adverse political and economic developments which could cause securities and their markets to be less liquid and prices more volatile than those of comparable U.S. companies and U.S. Government securities.
D. Foreign Currency Transactions and Futures Contracts. Certain Portfolios may enter into foreign currency exchange transactions to convert to and from different foreign currencies and to and from the U.S. dollar in connection with the planned purchases or sales of securities. When entering into a currency forward contract, a Portfolio agrees to receive or deliver a fixed quantity of foreign currency for an agreed-upon price on an agreed upon date. The Portfolios either enter into these transactions on a spot basis at the spot rate prevailing in the foreign currency exchange market or use forward foreign currency contracts to purchase or sell foreign currencies. When the contract is fulfilled or closed, gains or losses are realized. Until then, the gain or loss is included in unreal ized appreciation or depreciation. Risks may arise upon entering into forward contracts from the potential inability of counterparties to meet the terms of their forward contracts and from unanticipated movements in the value of foreign currencies relative to the U.S. dollar.
Each Portfolio may enter into futures contracts involving foreign currency, interest rates, securities and security indices. A futures contract obligates the seller of the contract to deliver and the purchaser of the contract to take delivery of the type of foreign currency, financial instrument or
35
NOTES TO FINANCIAL STATEMENTS AS OF DECEMBER 31, 2006 (CONTINUED)
NOTE 2 — SIGNIFICANT ACCOUNTING POLICIES (continued)
security called for in the contract at a specified future time for a specified price. Upon entering into such a contract, a Portfolio is required to deposit and maintain as collateral such initial margin as required by the exchange on which the contract is traded. Pursuant to the contract, a Portfolio agrees to receive from or pay to the broker an amount equal to the daily fluctuations in the value of the contract. Such receipts or payments are known as variation margins and are recorded as unrealized gains or losses by the Portfolio. When the contract is closed, the Portfolio records a realized gain or loss equal to the difference between the value of the contract at the time it was opened and the value at the time it was closed.
E. Distributions to Shareholders. The Portfolios record distributions to their shareholders on the ex-dividend date. Dividends from net investment income and capital gains, if any, are declared and paid annually by the Portfolios. The Portfolios may make distributions on a more frequent basis to comply with the distribution requirements of the Internal Revenue Code. The characteristics of income and gains to be distributed are determined in accordance with income tax regulations, which may differ from U.S. generally accepted accounting principles for investment companies.
F. Federal Income Taxes. It is the policy of the Portfolios to comply with subchapter M of the Internal Revenue Code and related excise tax provisions applicable to regulated investment companies and to distribute substantially all of their net investment income and any net realized capital gains to their shareholders. Therefore, no federal income tax provision is required. No capital gain distributions shall be made until any capital loss carryforwards have been fully utilized or expired.
G. Use of Estimates. The preparation of financial statements in conformity with U.S. generally accepted accounting principles requires management to make estimates and assumptions that affect the reported amounts of assets and liabilities and disclosure of contingent assets and liabilities at the date of the financial statements and the reported amounts of increases and decreases in net assets from operations during the reporting period. Actual results could differ from those estimates.
H. Repurchase Agreements. Each Portfolio may invest in repurchase agreements only with government securities dealers recognized by the Board of Governors of the Federal Reserve System. Under such agreements, the seller of the security agrees to repurchase it at a mutually agreed upon time and price. The resale price is in excess of the purchase price and reflects an agreed upon interest rate for the period of time the agreement is outstanding. The period of the repurchase agreements is usually short, from overnight to one week, while the underlying securities generally have longer maturities. Each Portfolio will receive as collateral securities acceptable to it whose market value is equal to at least 100% of the carrying amount of the repurchase agreements, plus accrued interest, being invested by the Portfolio. The underlying collateral is valued daily on a mark to market basis to assure that the value, including accrued interest is at least equal to the repurchase price. There would be potential loss to the Portfolio in the event the Fund is delayed or prevented from exercising its right to dispose of the collateral, and it might incur disposition costs in liquidating the collateral.
I. Securities Lending. Each Portfolio has the option to temporarily loan up to 30% of its total assets to brokers, dealers or other financial institutions in exchange for a negotiated lender's fee. The borrower is required to fully collateralize the loans with cash or U.S. Government securities. Generally, in the event of counterparty default, the Portfolio has the right to use collateral to offset losses incurred. There would be potential loss to the Portfolio in the event the Portfolio is delayed or prevented from exercising its right to dispose of the collateral. The Portfolio bears the risk of loss with respect to the investment of collateral. Engaging in securities lending could have a leveraging effect, which may intensify the credit, market and other risks associated with inv esting in a Portfolio.
J. Illiquid and Restricted Securities. VP Index Plus LargeCap, VP Index Plus MidCap and VP Index Plus SmallCap each may not invest more than 10% of its net assets in illiquid securities. VP Strategic Allocation Conservative, VP Strategic Allocation Growth and VP Strategic Allocation Moderate each may not invest more than 15% of its net assets in illiquid securities. Illiquid securities are not readily marketable. Disposing of illiquid investments may involve time-consuming negotiation and legal expenses, and it may be difficult or impossible for the Portfolios to sell them promptly at an acceptable price. Each
36
NOTES TO FINANCIAL STATEMENTS AS OF DECEMBER 31, 2006 (CONTINUED)
NOTE 2 — SIGNIFICANT ACCOUNTING POLICIES (continued)
Portfolio may also invest in restricted securities, which include those sold under Rule 144A of the Securities Act of 1933 ("1933 Act") or securities offered pursuant to Section 4(2) of the 1933 Act, and/or are subject to legal or contractual restrictions on resale and may not be publicly sold without registration under the 1933 Act. Certain restricted securities may be considered liquid pursuant to procedures adopted by the Board or may be deemed to be illiquid because they may not be readily marketable. Illiquid and restricted securities are valued using market quotations when readily available. In the absence of market quotations, the securities are valued based upon their fair value determined under procedures approved by the Board.
K. Delayed Delivery Transactions. Each Portfolio may purchase or sell securities on a when-issued or forward commitment basis. The price of the underlying securities and date when the securities will be delivered and paid for are fixed at the time the transaction is negotiated. The market value of such is identified in each Portfolio's Portfolio of Investments. Losses may arise due to changes in the market value of the securities or from the inability of counterparties to meet the terms of the contract. In connection with such purchases, the Portfolios are required to segregate liquid assets sufficient to cover the purchase price.
L. Mortgage Dollar Roll Transactions. In connection with a Portfolio's ability to purchase or sell securities on a when-issued basis, VP Strategic Allocation Conservative, VP Strategic Allocation Growth and VP Strategic Allocation Moderate Portfolios may engage in dollar roll transactions with respect to mortgage-backed securities issued by Government National Mortgage Association, Federal National Mortgage Association and Federal Home Loan Mortgage Corp. In a dollar roll transaction, a Portfolio sells a mortgage-backed security to a financial institution, such as a bank or broker/dealer, and simultaneously agrees to repurchase a substantially similar (i.e., same type, coupon, and maturity) security from the institution on a delayed delivery basis at an agreed upon price. The mortga ge-backed securities that are repurchased will bear the same interest rate as those sold, but generally will be collateralized by different pools of mortgages with different prepayment histories. The Portfolios account for dollar roll transactions as purchases and sales.
M. Swap Contracts. Each Portfolio may enter into interest rate swaps, currency swaps and other types of swap agreements, including swaps on securities and indices. A swap is an agreement between two parties pursuant to which each party agrees to make one or more payments to the other on regularly scheduled dates over a stated term, based on different interest rates, currency exchange rates, security prices, the prices or rates of other types of financial instruments or assets or the levels of specified indices. During the term of the swap, changes in the value of the swap are recognized as unrealized appreciation or depreciation.
N. Indemnifications. In the normal course of business, the Companies may enter into contracts that provide certain indemnifications. The Companies maximum exposure under these arrangements is dependent on future claims that may be made against the Portfolios and, therefore, cannot be estimated; however, based on experience, the risk of loss from such claims is considered remote.
NOTE 3 — INVESTMENT TRANSACTIONS
For the year ended December 31, 2006, the cost of purchases and the proceeds from the sale of securities, excluding short-term securities, were as follows:
| | | Purchases | | Sales | |
| VP Index Plus LargeCap | | $ | 3,131,658,100 | | | $ | 2,833,314,607 | | |
| VP Index Plus MidCap | | | 1,245,448,660 | | | | 1,085,372,845 | | |
| VP Index Plus SmallCap | | | 910,805,107 | | | | 792,580,561 | | |
| VP Strategic Allocation Conservative | | | 170,579,237 | | | | 161,788,089 | | |
| VP Strategic Allocation Growth | | | 442,949,861 | | | | 438,083,077 | | |
| VP Strategic Allocation Moderate | | | 397,371,408 | | | | 388,411,264 | | |
U.S. government securities not included above were as follows:
| | | Purchases | | Sales | |
| VP Strategic Allocation Conservative | | $ | 271,794,951 | | | $ | 287,535,292 | | |
| VP Strategic Allocation Growth | | | 181,103,445 | | | | 199,260,721 | | |
| VP Strategic Allocation Moderate | | | 276,007,101 | | | | 302,928,672 | | |
NOTE 4 — INVESTMENT MANAGEMENT AND ADMINISTRATIVE FEES
The Portfolios entered into an investment management agreement ("Investment Management Agreement") with the Investment Adviser. The Investment Management Agreement compensates the Investment Adviser with a fee, computed daily and payable monthly, based on the average daily net assets of each Portfolio, at the following annual rates:
| VP Index Plus LargeCap | | | 0.35 | % | |
| VP Index Plus MidCap | | | 0.40 | % | |
| VP Index Plus SmallCap | | | 0.40 | % | |
| VP Strategic Allocation Conservative | | | 0.60 | % | |
| VP Strategic Allocation Growth | | | 0.60 | % | |
| VP Strategic Allocation Moderate | | | 0.60 | % | |
37
NOTES TO FINANCIAL STATEMENTS AS OF DECEMBER 31, 2006 (CONTINUED)
NOTE 4 — INVESTMENT MANAGEMENT AND ADMINISTRATIVE FEES (continued)
The Investment Adviser entered into a Sub-Advisory Agreement with ING IM. Subject to such policies as the Board or the Investment Adviser may determine, ING IM manages the Portfolios' assets in accordance with the Portfolios' investment objectives, policies, and limitations.
Effective November 1, 2006, all ING Portfolios sub-advised by ING IM are permitted to invest end-of-day cash balances into affiliated ING Money Market Funds, including ING Institutional Prime Money Market Fund. Investment management fees paid by the Portfolios will be reduced by an amount equal to the management fees paid indirectly to the ING Institutional Prime Money Market Fund with respect to assets invested by the Portfolios. As of December 31, 2006, VP Index Plus LargeCap, VP Index Plus MidCap and VP Index Plus SmallCap waived $3,233, $712 and $123, respectively. These fees are not subject to recoupment.
Pursuant to the Administration Agreement, ING Funds Services, LLC ("IFS"), an indirect, wholly-owned subsidiary of ING Groep, acts as administrator and provides certain administrative and shareholder services necessary for Portfolio operations and is responsible for the supervision of other service providers. IFS is entitled to receive from each Portfolio a fee at an annual rate of 0.055% on the first $5 billion of daily net assets and 0.03% thereafter.
NOTE 5 — DISTRIBUTION FEES
Each ADV Class shares of the respective Portfolios are subject to a Shareholder Service and Distribution Plan (the "Plan"). Under the Plan, the Distributor is paid an annual shareholder service fee at the rate of 0.25% and an annual distribution fee at the rate of 0.25% of the average daily net assets attributable to its ADV Class shares.
Each Class S share of the Portfolios has adopted a Distribution Plan pursuant to Rule 12b-1 under the 1940 Act (the "12b-1 Plan"), whereby the Distributor is compensated by each Portfolio for expenses incurred in the distribution of each Portfolio's Class S shares ("Distribution Fees"). Pursuant to the 12b-1 Plans, the Distributor is entitled to a payment each month to compensate for expenses incurred in the distribution and promotion of each Portfolio's S shares, including expenses incurred in printing prospectuses and reports used for sales purposes, expenses incurred in preparing and printing sales literature and other such distribution related expenses, including any distribution or shareholder servicing fees ("Service Fees") paid to securities dealers who have executed a distribution agreement with the Distributor. Under the 12b-1 Plans, Class S of the Portfolios pa ys the Distributor Distribution Fees at a rate of 0.25% based on average daily net assets.
NOTE 6 — OTHER TRANSACTIONS WITH AFFILIATED AND RELATED PARTIES
At December 31, 2006, the Portfolios had the following amounts recorded in payable to affiliates on the accompanying Statements of Assets and Liabilities (see Notes 4 and 5):
| | | Accrued
Investment
Management
Fees | | Accrued
Administrative
Fees | | Accrued
Shareholder
Service and
Distribution
Fees | | Total | |
| VP Index Plus LargeCap | | $ | 756,747 | | | $ | 119,298 | | | $ | 44,311 | | | $ | 920,356 | | |
| VP Index Plus MidCap | | | 474,085 | | | | 65,240 | | | | 48,513 | | | | 587,838 | | |
| VP Index Plus SmallCap | | | 324,104 | | | | 44,580 | | | | 43,071 | | | | 411,755 | | |
VP Strategic Allocation
Conservative | | | 75,355 | | | | 6,907 | | | | 156 | | | | 82,418 | | |
VP Strategic Allocation
Growth | | | 152,908 | | | | 14,016 | | | | 65 | | | | 166,989 | | |
VP Strategic Allocation
Moderate | | | 153,834 | | | | 14,101 | | | | 147 | | | | 168,082 | | |
At December 31, 2006, the following ING Portfolios or indirect, wholly-owned subsidiaries of ING Groep owned more than 5% of the following Portfolios:
ING Life Insurance and Annuity Company — VP Index Plus LargeCap (55.47%); VP Index Plus MidCap (59.65%); VP Index Plus SmallCap (41.47%); VP Strategic Allocation Conservative (97.99%); VP Strategic Allocation Growth (96.66%); VP Strategic Allocation Moderate (96.96%).
ING Lifestyle Aggressive Growth Portfolio — VP Index Plus LargeCap (5.46%).
ING Lifestyle Growth Portfolio — VP Index Plus LargeCap (10.92%); VP Index Plus MidCap (7.96%); VP Index Plus SmallCap (11.55%).
ING Lifestyle Moderate Growth Portfolio — VP Index Plus LargeCap (8.60%); VP Index Plus SmallCap (6.82%).
ING USA Annuity and Life Insurance Company — VP Index Plus LargeCap (8.02%); VP Index Plus MidCap (16.20%); VP Index Plus SmallCap (21.19%).
The Portfolios have adopted a Deferred Compensation Plan ("Policy"), which allows eligible non-affiliated directors as described in the Policy to defer the receipt of all or a portion of the directors' fees payable. Deferred fees are invested in various funds advised by ING Investments until distribution in accordance with the Policy.
NOTE 7 — EXPENSE LIMITATIONS
ING Investments entered into written expense limitation agreements ("Expense Limitation Agreements") with each of the Portfolios whereby the
38
NOTES TO FINANCIAL STATEMENTS AS OF DECEMBER 31, 2006 (CONTINUED)
NOTE 7 — EXPENSE LIMITATIONS (continued)
Investment Adviser has agreed to limit expenses, excluding interest, taxes, brokerage and extraordinary expenses to the levels listed below:
| | | Class ADV | | Class I | | Class S | |
| VP Index Plus LargeCap | | | N/A | | | | 0.55 | % | | | 0.80 | % | |
| VP Index Plus MidCap | | | N/A | | | | 0.60 | % | | | 0.85 | % | |
| VP Index Plus SmallCap | | | N/A | | | | 0.60 | % | | | 0.85 | % | |
VP Strategic Allocation
Conservative | �� | | 1.15 | % | | | 0.65 | % | | | 0.90 | % | |
VP Strategic Allocation
Growth | | | 1.25 | % | | | 0.75 | % | | | 1.00 | % | |
VP Strategic Allocation
Moderate | | | 1.20 | % | | | 0.70 | % | | | 0.95 | % | |
The Investment Adviser may at a later date recoup from a Portfolio for management fees waived and other expenses assumed by the Investment Adviser during the previous 36 months, but only if, after such recoupment, the Portfolio's expense ratio does not exceed the percentage described above. Waived and reimbursed fees and any recoupment by the Investment Adviser of such waived and reimbursed fees are reflected on the accompanying Statements of Operations for each Portfolio. Amounts payable by the Investment Adviser are reflected on the accompanying Statements of Assets and Liabilities for each Portfolio.
As of December 31, 2006, the amounts of waived and reimbursed fees that are subject to possible recoupment by the Investment Adviser, and the related expiration dates are as follows:
| | | December 31, | |
| | | 2007 | | 2008 | | 2009 | | Total | |
VP Strategic Allocation
Conservative | | $ | 69,974 | | | $ | 152,215 | | | $ | 101,707 | | | $ | 323,896 | | |
VP Strategic Allocation
Moderate | | | — | | | | 102,846 | | | | 15,186 | | | | 118,032 | | |
The Expense Limitation Agreement is contractual and shall renew automatically for one-year terms unless ING Investments provides written notice of the termination of an Expense Limitation Agreement within 90 days of the end of the then current term.
NOTE 8 — LINE OF CREDIT
All of the Portfolios included in this report, in addition to certain other Portfolios managed by the Investment Adviser, have entered into an unsecured committed revolving line of credit agreement (the "Credit Agreement") with Citibank, N.A. for an aggregate amount of $100,000,000. The proceeds may be used only to: (1) temporarily finance the purchase and sale of securities; (2) finance the redemption of shares of an investor in the Portfolios; and (3) enable the Portfolios to meet other emergency expenses as defined in the Credit Agreement. The Portfolios to which the line of credit is available pay a commitment fee equal to 0.09% per annum on the daily unused portion of the committed line amount. Each of the Portfolios will pay its pro rata share of both the agent and commitment fee. Generally, borrowings under the Credit Agreement accrue interest at the Federal Funds Rate plus a specified margin. Repayments generally must be made within 30 days after the date of a revolving credit advance. The following Portfolios utilized the line of credit during the year ended December 31, 2006.
| Portfolio | | Days
Utilized | | Approximate
Average Daily
Balance | | Approximate
Weighted
Average
Interest Rate | |
| VP Index Plus MidCap(1) | | | 5 | | | $ | 2,476,000 | | | | 5.77 | % | |
| VP Index Plus SmallCap | | | 2 | | | | 675,000 | | | | 5.35 | % | |
VP Strategic Allocation
Growth | | | 1 | | | | 550,000 | | | | 5.27 | % | |
(1) At December 31, 2006, VP Index Plus MidCap had an outstanding balance of $600,000.
NOTE 9 — CAPITAL SHARES
Transactions in capital shares and dollars were as follows:
| | | Class I | | Class S | |
| | | Year
Ended
December 31,
2006 | | Year
Ended
December 31,
2005 | | Year
Ended
December 31,
2006 | | Year
Ended
December 31,
2005 | |
| VP Index Plus LargeCap (Number of Shares) | |
| Shares sold | | | 56,686,371 | | | | 3,590,508 | | | | 8,488,048 | | | | 29,741,139 | | |
| Dividends reinvested | | | 1,001,597 | | | | 1,253,649 | | | | 386,302 | | | | 343,017 | | |
| Shares redeemed | | | (13,212,594 | ) | | | (16,787,302 | ) | | | (33,191,714 | ) | | | (2,371,711 | ) | |
| Net increase (decrease) in shares outstanding | | | 44,475,374 | | | | (11,943,145 | ) | | | (24,317,364 | ) | | | 27,712,445 | | |
| VP Index Plus LargeCap ($) | |
| Shares sold | | $ | 911,026,600 | | | $ | 53,622,071 | | | $ | 134,708,233 | | | $ | 433,511,566 | | |
| Dividends reinvested | | | 15,985,488 | | | | 18,365,964 | | | | 6,122,883 | | | | 4,990,903 | | |
| Shares redeemed | | | (214,302,014 | ) | | | (250,210,644 | ) | | | (527,866,358 | ) | | | (35,232,383 | ) | |
| Net increase (decrease) | | $ | 712,710,074 | | | $ | (178,222,609 | ) | | $ | (387,035,242 | ) | | $ | 403,270,086 | | |
39
NOTES TO FINANCIAL STATEMENTS AS OF DECEMBER 31, 2006 (CONTINUED)
NOTE 9 — CAPITAL SHARES (continued)
| | | Class I | | Class S | |
| | | Year
Ended
December 31,
2006 | | Year
Ended
December 31,
2005 | | Year
Ended
December 31,
2006 | | Year
Ended
December 31,
2005 | |
| VP Index Plus MidCap (Number of Shares) | |
| Shares sold | | | 20,080,967 | | | | 6,394,060 | | | | 5,083,472 | | | | 9,895,517 | | |
| Dividends reinvested | | | 3,999,589 | | | | 3,143,066 | | | | 1,405,153 | | | | 858,938 | | |
| Shares redeemed | | | (8,494,158 | ) | | | (1,712,781 | ) | | | (9,345,068 | ) | | | (2,488,298 | ) | |
| Net increase (decrease) in shares outstanding | | | 15,586,398 | | | | 7,824,345 | | | | (2,856,443 | ) | | | 8,266,157 | | |
| VP Index Plus MidCap ($) | |
| Shares sold | | $ | 374,484,789 | | | $ | 115,852,699 | | | $ | 95,399,545 | | | $ | 177,382,980 | | |
| Dividends reinvested | | | 74,032,395 | | | | 55,003,671 | | | | 25,784,560 | | | | 14,919,751 | | |
| Shares redeemed | | | (154,435,484 | ) | | | (30,993,911 | ) | | | (173,504,933 | ) | | | (45,587,506 | ) | |
| Net increase (decrease) | | $ | 294,081,700 | | | $ | 139,862,459 | | | $ | (52,320,828 | ) | | $ | 146,715,225 | | |
| | | Class I | | Class S | |
| | | Year
Ended
December 31,
2006 | | Year
Ended
December 31,
2005 | | Year
Ended
December 31,
2006 | | Year
Ended
December 31,
2005 | |
| VP Index Plus SmallCap (Number of Shares) | |
| Shares sold | | | 25,013,408 | | | | 4,648,726 | | | | 5,820,451 | | | | 14,354,375 | | |
| Dividends reinvested | | | 1,429,464 | | | | 1,121,575 | | | | 1,222,016 | | | | 823,681 | | |
| Shares redeemed | | | (7,693,244 | ) | | | (1,588,865 | ) | | | (15,716,149 | ) | | | (1,797,724 | ) | |
| Net increase (decrease) in shares outstanding | | | 18,749,628 | | | | 4,181,436 | | | | (8,673,682 | ) | | | 13,380,332 | | |
| VP Index Plus SmallCap ($) | |
| Shares sold | | $ | 442,612,423 | | | $ | 75,728,185 | | | $ | 101,761,119 | | | $ | 231,635,271 | | |
| Dividends reinvested | | | 25,401,574 | | | | 17,799,391 | | | | 21,519,707 | | | | 12,964,739 | | |
| Shares redeemed | | | (135,565,638 | ) | | | (25,657,658 | ) | | | (277,646,841 | ) | | | (28,924,483 | ) | |
| Net increase (decrease) | | $ | 332,448,359 | | | $ | 67,869,918 | | | $ | (154,366,015 | ) | | $ | 215,675,527 | | |
| | | Class ADV | | Class I | | Class S | |
| | | December 29,
2006(1) to
December 31,
2006 | | Year
Ended
December 31,
2006 | | Year
Ended
December 31,
2005 | | Year
Ended
December 31,
2006 | | August 5,
2005(1) to
December 31,
2005 | |
| VP Strategic Allocation Conservative (Number of Shares) | |
| Shares sold | | | 74 | | | | 795,428 | | | | 1,721,918 | | | | 51,431 | | | | 8,958 | | |
| Dividends reinvested | | | — | | | | 680,939 | | | | 238,646 | | | | 1,128 | | | | — | | |
| Shares redeemed | | | — | | | | (2,097,040 | ) | | | (2,152,919 | ) | | | (8,390 | ) | | | (49 | ) | |
| Net increase (decrease) in shares outstanding | | | 74 | | | | (620,673 | ) | | | (192,355 | ) | | | 44,169 | | | | 8,909 | | |
| VP Strategic Allocation Conservative ($) | |
| Shares sold | | $ | 1,000 | | | $ | 10,415,037 | | | $ | 22,441,531 | | | $ | 668,461 | | | $ | 117,094 | | |
| Dividends reinvested | | | — | | | | 8,729,643 | | | | 3,088,074 | | | | 14,422 | | | | — | | |
| Shares redeemed | | | — | | | | (27,479,240 | ) | | | (28,123,509 | ) | | | (112,404 | ) | | | (650 | ) | |
| Net increase (decrease) | | $ | 1,000 | | | $ | (8,334,560 | ) | | $ | (2,593,904 | ) | | $ | 570,479 | | | $ | 116,444 | | |
| | | Class ADV | | Class I | | Class S | |
| | | December 29,
2006(1) to
December 31,
2006 | | Year
Ended
December 31,
2006 | | Year
Ended
December 31,
2005 | | Year
Ended
December 31,
2006 | | August 5,
2005(1) to
December 31,
2005 | |
| VP Strategic Allocation Growth (Number of Shares) | |
| Shares sold | | | 59 | | | | 1,247,466 | | | | 2,575,090 | | | | 18,436 | | | | 1,863 | | |
| Dividends reinvested | | | — | | | | 500,465 | | | | 230,584 | | | | 101 | | | | — | | |
| Shares redeemed | | | — | | | | (2,828,645 | ) | | | (2,084,826 | ) | | | (2,258 | ) | | | (5 | ) | |
| Net increase (decrease) in shares outstanding | | | 59 | | | | (1,080,714 | ) | | | 720,848 | | | | 16,279 | | | | 1,858 | | |
| VP Strategic Allocation Growth ($) | |
| Shares sold | | $ | 1,000 | | | $ | 19,919,153 | | | $ | 38,329,234 | | | $ | 291,600 | | | $ | 27,792 | | |
| Dividends reinvested | | | — | | | | 7,937,380 | | | | 3,375,749 | | | | 1,596 | | | | — | | |
| Shares redeemed | | | — | | | | (45,210,797 | ) | | | (31,098,285 | ) | | | (36,229 | ) | | | (79 | ) | |
| Net increase (decrease) | | $ | 1,000 | | | $ | (17,354,264 | ) | | $ | 10,606,698 | | | $ | 256,967 | | | $ | 27,713 | | |
(1) Commencement of operations.
40
NOTES TO FINANCIAL STATEMENTS AS OF DECEMBER 31, 2006 (CONTINUED)
NOTE 9 — CAPITAL SHARES (continued)
| | | Class ADV | | Class I | | Class S | |
| | | December 29,
2006(1) to
December 31,
2006 | | Year
Ended
December 31,
2006 | | Year
Ended
December 31,
2005 | | Year
Ended
December 31,
2006 | | June 7,
2005(1) to
December 31,
2005 | |
| VP Strategic Allocation Moderate (Number of Shares) | |
| Shares sold | | | 65 | | | | 1,491,383 | | | | 2,832,525 | | | | 40,062 | | | | 25,739 | | |
| Dividends reinvested | | | — | | | | 828,835 | | | | 306,098 | | | | 831 | | | | 122 | | |
| Shares redeemed | | | — | | | | (2,999,552 | ) | | | (2,238,074 | ) | | | (20,723 | ) | | | (641 | ) | |
| Net increase (decrease) in shares outstanding | | | 65 | | | | (679,334 | ) | | | 900,549 | | | | 20,170 | | | | 25,220 | | |
| VP Strategic Allocation Moderate ($) | |
| Shares sold | | $ | 1,000 | | | $ | 21,742,480 | | | $ | 39,418,403 | | | $ | 579,915 | | | $ | 360,657 | | |
| Dividends reinvested | | | — | | | | 11,885,489 | | | | 4,230,268 | | | | 11,907 | | | | 1,684 | | |
| Shares redeemed | | | — | | | | (43,669,745 | ) | | | (31,479,642 | ) | | | (303,434 | ) | | | (8,894 | ) | |
| Net increase (decrease) | | $ | 1,000 | | | $ | (10,041,776 | ) | | $ | 12,169,029 | | | $ | 288,388 | | | $ | 353,447 | | |
(1) Commencement of operations.
NOTE 10 — SECURITIES LENDING
Under an agreement with The Bank of New York ("BNY"), the Portfolios can lend their securities to approved brokers, dealers and other financial institutions. Loans are collateralized by cash and U.S. Government securities. The collateral must be in an amount equal to at least 105% of the market value of non-U.S. securities loaned and 102% of the market value of U.S. securities loaned. The cash collateral received is invested in approved investments as defined in the Securities Lending Agreement with BNY (the "Agreement"). The securities purchased with cash collateral received are reflected in the Portfolio of Investments. Generally, in the event of counterparty default, the Portfolios have the right to use the collateral to offset losses incurred. The Agreement contains certain guarantees by BNY in the event of counterparty default and/or a borrower's failure to return a loaned security, however there would be a potential loss to the Portfol ios in the event the Portfolios are delayed or prevented from exercising their right to dispose of the collateral. The Portfolios bear the risk of loss with respect to the investment of collateral. Engaging in securities lending could have a leveraging effect, which may intensify the credit, market and other risks associated with investing in a Portfolio. At December 31, 2006, the Portfolios had securities on loan and received collateral with the following market values:
| | | Value of
Securities
Loaned | | Value of
Collateral | |
| VP Index Plus LargeCap | | $ | 226,076,158 | | | $ | 232,872,874 | | |
| VP Index Plus MidCap | | | 299,977,097 | | | | 310,743,528 | | |
| VP Index Plus SmallCap | | | 207,661,258 | | | | 215,814,758 | | |
| VP Strategic Allocation Conservative | | | 20,140,331 | | | | 20,711,495 | | |
| VP Strategic Allocation Growth | | | 35,851,298 | | | | 37,007,489 | | |
| VP Strategic Allocation Moderate | | | 37,768,136 | | | | 38,901,277 | | |
NOTE 11 — FEDERAL INCOME TAXES AND OTHER TAX MATTERS
The amount of distributions from net investment income and net realized capital gains are determined in accordance with federal income tax regulations, which may differ from U.S. generally accepted accounting principles for investment companies. These book/tax differences may be either temporary or permanent. Permanent differences are reclassified within the capital accounts based on their federal tax-basis treatment; temporary differences are not reclassified. Key differences include the treatment of short-term capital gains, foreign currency transactions, and wash sale deferrals. Distributions in excess of net investment income and/or net realized capital gains for tax purposes are reported as distributions of paid-in capital.
The following permanent tax differences have been reclassified as of December 31, 2006:
| | | Undistributed
Net Investment
Income On
Investments | | Accumulated
Net Realized
Gains/
(Losses) | |
| VP Index Plus LargeCap | | $ | (35,377 | ) | | $ | 35,377 | | |
| VP Index Plus MidCap | | | (925,430 | ) | | | 925,430 | | |
| VP Index Plus SmallCap | | | (373,734 | ) | | | 373,734 | | |
VP Strategic Allocation
Conservative | | | 18,407 | | | | (18,407 | ) | |
VP Strategic Allocation
Growth | | | (54,651 | ) | | | 54,651 | | |
VP Strategic Allocation
Moderate | | | (11,432 | ) | | | 11,432 | | |
Dividends paid by the Portfolios from net investment income and distributions of net realized short-term capital gains are, for federal income tax purposes, taxable as ordinary income to shareholders.
41
NOTES TO FINANCIAL STATEMENTS AS OF DECEMBER 31, 2006 (CONTINUED)
NOTE 11 — FEDERAL INCOME TAXES AND OTHER TAX MATTERS (continued)
The tax composition of dividends and distributions to shareholders was as follows:
| | | Year Ended
December 31, 2006 | | Year Ended
December 31, 2005 | |
| | | Ordinary
Income | | Long-Term
Capital Gains | | Ordinary
Income | | Long-Term
Capital Gains | |
| VP Index Plus LargeCap | | $ | 22,108,371 | | | $ | — | | | $ | 23,356,867 | | | $ | — | | |
| VP Index Plus MidCap | | | 55,247,050 | | | | 44,569,905 | | | | 35,539,804 | | | | 34,383,617 | | |
| VP Index Plus SmallCap | | | 20,353,752 | | | | 26,567,529 | | | | 20,247,474 | | | | 10,516,656 | | |
| VP Strategic Allocation Conservative | | | 4,642,345 | | | | 4,101,720 | | | | 3,088,074 | | | | — | | |
| VP Strategic Allocation Growth | | | 4,040,610 | | | | 3,898,366 | | | | 3,375,749 | | | | — | | |
| VP Strategic Allocation Moderate | | | 5,453,588 | | | | 6,443,808 | | | | 4,231,952 | | | | — | | |
The tax-basis components of distributable earnings and the expiration dates of the capital loss carryforwards which may be used to offset future realized capital gains for federal income tax purposes as of December 31, 2006 were:
| | | Undistributed
Ordinary Income | | Undistributed
Long Term
Capital Gains | | Unrealized
Appreciation/
Depreciation | | Capital
Loss
Carryforwards | | Expiration
Dates | |
| VP Index Plus LargeCap | | $ | 31,440,604 | | | $ | — | | | $ | 204,843,814 | | | $ | (22,699,714 | ) | | | 2011 | | |
| VP Index Plus MidCap | | | 36,012,879 | | | | 80,257,103 | | | | 87,312,536 | | | | — | | | | — | | |
| VP Index Plus SmallCap | | | 39,147,442 | | | | 53,870,309 | | | | 63,378,118 | | | | — | | | | — | | |
| VP Strategic Allocation Conservative | | | 5,501,145 | | | | 2,735,059 | | | | 11,104,966 | | | | — | | | | — | | |
| VP Strategic Allocation Growth | | | 9,493,962 | | | | 12,666,197 | | | | 44,015,698 | | | | — | | | | — | | |
| VP Strategic Allocation Moderate | | | 9,072,704 | | | | 8,514,536 | | | | 35,707,660 | | | | — | | | | — | | |
Under U.S. federal income tax law, as specified in the Internal Revenue Code (the "Code") and U.S. Treasury regulations, the Portfolios must meet various technical requirements relating to fund administration, portfolio investments, and "eligible investors" in the Portfolios. Complying with these requirements is a condition for beneficial tax treatment of certain insurance products that offer the Portfolios as investment options. The failure of the Portfolios to meet any of these complex requirements could result in an excise tax, administrative penalties imposed by the Internal Revenue Service, potential liability to insurers whose products include the Portfolios as investment options, and unanticipated costs associated with remedying a failure. We are aware that an affiliate of the Portfolios' investment adviser may have failed to limit the availability of VP Index Plus LargeCap, VP Index Plus MidCap and VP Index Plus SmallCap for investme nt to "eligible investors" under the Code. The legal and tax consequences, if any, of this are currently under active review, but we do not believe that it is probable that any liability has been incurred by the Portfolios. Although it is not probable that any liability has been incurred, ING has agreed to indemnify any affected Portfolio from and against economic consequences of any such failure incurred either (i) directly or (ii) by virtue of any indemnification by the Portfolios resulting from such failure.
NOTE 12 — ILLIQUID SECURITIES
Pursuant to guidelines adopted by the Portfolios' Board, the following securities have been deemed to be illiquid. The VP Index Plus LargeCap, VP Index Plus MidCap and VP Index Plus SmallCap may invest up to 10% of its net assets, in illiquid securities. The VP Strategic Allocation Conservative, VP Strategic Allocation Growth and VP Strategic Allocation Moderate limit investments in illiquid securities to 15%. Fair value for certain of securities was determined by ING Funds Valuation Committee appointed by the Portfolios' Board.
| Portfolio | | Security | | Shares/
Principal
Amount | | Initial
Acquisition
Date | | Cost | | Value | | Percent
of Net
Assets | |
VP Strategic Allocation
Conservative | | Atos Origin | | | 1,391 | | | 06/08/06 | | $ | 83,162 | | | $ | 82,254 | | | | 0.1 | % | |
VP Strategic Allocation
Conservative | | Cameron Highway Oil Pipeline | | | 357,000 | | | 12/05/05 | | | 357,000 | | | | 349,079 | | | | 0.2 | % | |
VP Strategic Allocation
Conservative | | Ras Laffan Liquefied Natural Gas Co., Ltd. II | | | 133,000 | | | 08/04/05 | | | 128,823 | | | | 124,849 | | | | 0.1 | % | |
VP Strategic Allocation
Growth | | Atos Origin | | | 7,420 | | | 06/08/06 | | | 457,268 | | | | 438,765 | | | | 0.1 | % | |
VP Strategic Allocation
Growth | | Cameron Highway Oil Pipeline | | | 202,000 | | | 12/05/05 | | | 202,000 | | | | 197,518 | | | | 0.1 | % | |
VP Strategic Allocation
Growth | | Ras Laffan Liquefied Natural Gas Co., Ltd. II | | | 81,000 | | | 10/18/05 | | | 78,781 | | | | 77,790 | | | | 0.0 | % | |
VP Strategic Allocation
Moderate | | Atos Origin | | | 5,023 | | | 06/08/06 | | | 310,217 | | | | 297,024 | | | | 0.1 | % | |
VP Strategic Allocation
Moderate | | Cameron Highway Oil Pipeline | | | 408,000 | | | 12/05/05 | | | 398,948 | | | | 408,000 | | | | 0.1 | % | |
42
NOTES TO FINANCIAL STATEMENTS AS OF DECEMBER 31, 2006 (CONTINUED)
NOTE 13 — OTHER ACCOUNTING PRONOUNCEMENTS
In June 2006, the Financial Accounting Standards Board ("FASB") issued FASB Interpretation No. 48 ("FIN 48"), "Accounting for Uncertainty in Income Taxes." This standard defines the threshold for recognizing the benefits of tax-return positions in the financial statements as "more-likely-than-not" to be sustained upon challenge by the taxing authority and requires measurement of a tax position meeting the more-likely-than-not criterion, based on the largest benefit that is more than 50 percent likely to be realized. FIN 48 is effective for fiscal years beginning after December 15, 2006, with early application permitted if no interim financial statements have been issued. However, acknowledging the unique issues that FIN 48 presents for investment companies that calculate NAVs, the Securites and Exchange Commission (the "SEC") has indicated that they would not object if a fund implements FIN 48 in its NAV calculation as late as its last NAV c alculation in the first required financial statement reporting period for its fiscal year beginning after December 15, 2006. For calendar-year open-end funds, this would be no later than their June 29, 2007 NAV and the effects of FIN 48 would be reflected in the funds' semi-annual financial statements contained in their Form N-CSR filing. At adoption, companies must adjust their financial statements to reflect only those tax positions that are more likely-than-not to be sustained as of the adoption date. Management is currently analyzing the tax positions of the Portfolios. To date, this analysis reflects an uncertain tax position in VP Index Plus LargeCap, VP Index Plus MidCap and VP Index Plus SmallCap that has the potential to result in a liability upon adoption of FIN 48. Management of the Portfolios is presently determining whether the tax benefits recorded by these Portfolios are more likely-than-not to be sustained if challenged by taxing authorities. To the extent that, in Management's judgment, the more likely-than-not threshold cannot be achieved, ING has agreed to indemnify the Portfolios and will bear any taxes and other costs related to this position that may occur. As a result, in Management's opinion, the adoption of FIN 48 is not expected to have a material impact on the financial statements of the Portfolios.
On September 15, 2006, the FASB issued Statement of Financial Accounting Standards No. 157 ("SFAS No. 157"), "Fair Value Measurements." The new accounting statement defines fair value, establishes a framework for measuring fair value in generally accepted accounting principles ("GAAP"), and expands disclosures about fair value measurements. SFAS No. 157 defines fair value as the price that would be received to sell an asset or paid to transfer a liability in an orderly transaction between market participants at the measurement date (an exit price). SFAS No. 157 also stipulates that, as a market-based measurement, fair value measurement should be determined based on the assumptions that market participants would use in pricing the asset or liability, and establishes a fair value hierarchy that distinguishes between (a) market participant assumptions developed based on mar ket data obtained from sources independent of the reporting entity (observable inputs) and (b) the reporting entity's own assumptions about market participant assumptions developed based on the best information available in the circumstances (unobservable inputs). SFAS No. 157 is effective for financial statements issued for fiscal years beginning after November 15, 2007. As of December 31, 2006, management of the Portfolios is currently assessing the impact, if any, that will result from adopting SFAS No. 157.
NOTE 14 — INFORMATION REGARDING TRADING OF ING'S U.S. MUTUAL FUNDS
In 2004, ING Investments reported to the Boards of Directors/Trustees (the "Boards") of the ING Funds that, like many U.S. financial services companies, ING Investments and certain of its U.S. affiliates have received informal and formal requests for information since September 2003 from various governmental and self-regulatory agencies in connection with investigations related to mutual funds and variable insurance products. ING Investments has advised the Boards that it and its affiliates have cooperated fully with each request.
In addition to responding to regulatory and governmental requests, ING Investments reported that management of U.S. affiliates of ING Groep, including ING Investments (collectively, "ING"), on their own initiative, have conducted, through independent special counsel and a national accounting firm, an extensive internal review of trading in ING insurance, retirement, and mutual fund products. The goal of this review was to identify any instances of inappropriate trading in those products by third parties or by ING investment professionals and other ING personnel. ING's internal review related to mutual fund trading is now substantially completed. ING has reported that, of the millions of customer relationships that ING maintains, the internal review identified several isolated arrangements allowing third parties to engage in
43
NOTES TO FINANCIAL STATEMENTS AS OF DECEMBER 31, 2006 (CONTINUED)
NOTE 14 — INFORMATION REGARDING TRADING OF ING'S U.S. MUTUAL FUNDS (continued)
frequent trading of mutual funds within ING's variable insurance and mutual fund products, and identified other circumstances where frequent trading occurred, despite measures taken by ING intended to combat market timing. ING further reported that each of these arrangements has been terminated and fully disclosed to regulators. The results of the internal review were also reported to the independent members of the Boards.
ING Investments has advised the Boards that most of the identified arrangements were initiated prior to ING's acquisition of the businesses in question in the U.S. ING Investments further reported that the companies in question did not receive special benefits in return for any of these arrangements, which have all been terminated.
Based on the internal review, ING Investments has advised the Boards that the identified arrangements do not represent a systemic problem in any of the companies that were involved.
In September 2005, ING Funds Distributor, LLC ("IFD"), the distributor of certain ING Funds, settled an administrative proceeding with the National Association of Securities Dealers ("NASD") regarding three arrangements, dating from 1995, 1996 and 1998, under which the administrator to the then-Pilgrim Funds, which subsequently became part of the ING Funds, entered into formal and informal arrangements that permitted frequent trading. Under the terms of the Letter of Acceptance, Waiver and Consent ("AWC") with the NASD, under which IFD neither admitted nor denied the allegations or findings, IFD consented to the following sanctions: (i) a censure; (ii) a fine of $1.5 million; (iii) restitution of approximately $1.44 million to certain ING Funds for losses attributable to excessive trading described in the AWC; and (iv) agreement to make certification to NASD regarding the review and establishment of certain procedures.
In addition to the arrangements discussed above, in 2004 ING Investments reported to the Boards that, at that time, these instances include the following, in addition to the arrangements subject to the AWC discussed above:
• Aeltus Investment Management, Inc. (a predecessor entity to ING Investment Management Co.) identified two investment professionals who engaged in extensive frequent trading in certain ING Funds. One was subsequently terminated for cause and incurred substantial financial penalties in connection with this conduct and the second has been disciplined.
• ReliaStar Life Insurance Company ("ReliaStar") entered into agreements seven years ago permitting the owner of policies issued by the insurer to engage in frequent trading and to submit orders until 4pm Central Time. In 2001 ReliaStar also entered into a selling agreement with a broker-dealer that engaged in frequent trading. Employees of ING affiliates were terminated and/or disciplined in connection with these matters.
• In 1998, Golden American Life Insurance Company entered into arrangements permitting a broker-dealer to frequently trade up to certain specific limits in a fund available in an ING variable annuity product. No employee responsible for this arrangement remains at the company.
For additional information regarding these matters, you may consult the Form 8-K and Form 8-K/A for each of four life insurance companies, ING USA Annuity and Life Insurance Company, ING Life Insurance and Annuity Company, ING Insurance Company of America, and ReliaStar Life Insurance Company of New York, each filed with the SEC on October 29, 2004 and September 8, 2004. These Forms 8-K and Forms 8-K/A can be accessed through the SEC's web site at http://www.sec.gov. Despite the extensive internal review conducted through independent special counsel and a national accounting firm, there can be no assurance that the instances of inappropriate trading reported to the Boards are the only instances of such trading respecting the ING Funds.
ING Investments reported to the Boards that ING is committed to conducting its business with the highest standards of ethical conduct with zero tolerance for noncompliance. Accordingly, ING Investments advised the Boards that ING management was disappointed that its voluntary internal review identified these situations. Viewed in the context of the breadth and magnitude of its U.S. business as a whole, ING management does not believe that ING's acquired companies had systemic ethical or compliance issues in these areas. Nonetheless, ING Investments reported that given ING's refusal to tolerate any lapses, it has taken the steps noted below, and will continue to seek opportunities to further strengthen the internal controls of its affiliates.
• ING has agreed with the ING Funds to indemnify and hold harmless the ING Funds from all damages resulting from wrongful conduct by ING or its employees or from ING's internal investigation, any investigations conducted by any governmental or self-regulatory agencies,
44
NOTES TO FINANCIAL STATEMENTS AS OF DECEMBER 31, 2006 (CONTINUED)
NOTE 14 — INFORMATION REGARDING TRADING OF ING'S U.S. MUTUAL FUNDS (continued)
litigation or other formal proceedings, including any proceedings by the SEC. ING Investments reported to the Board that ING management believes that the total amount of any indemnification obligations will not be material to ING or its U.S. business.
• ING updated its Code of Conduct for employees reinforcing its employees' obligation to conduct personal trading activity consistent with the law, disclosed limits, and other requirements.
• The ING Funds, upon a recommendation from ING, updated their respective Codes of Ethics applicable to investment professionals with ING entities and certain other fund personnel, requiring such personnel to pre-clear any purchases or sales of ING Funds that are not systematic in nature (i.e., dividend reinvestment), and imposing minimum holding periods for shares of ING Funds.
• ING instituted excessive trading policies for all customers in its variable insurance and retirement products and for shareholders of the ING Funds sold to the public through financial intermediaries. ING does not make exceptions to these policies.
• ING reorganized and expanded its U.S. Compliance Department, and created an Enterprise Compliance team to enhance controls and consistency in regulatory compliance.
Other Regulatory Matters
The New York Attorney General (the "NYAG") and other federal and state regulators are also conducting broad inquiries and investigations involving the insurance industry. These initiatives currently focus on, among other things, compensation and other sales incentives; potential conflicts of interest; potential anti-competitive activity; reinsurance; marketing practices (including suitability); specific product types (including group annuities and indexed annuities); fund selection for investment products and brokerage sales; and disclosure. It is likely that the scope of these industry investigations will further broaden before they conclude. ING has received formal and informal requests in connection with such investigations, and is cooperating fully with each request. In connection with one such investigation, affiliates of ING Investments were named in a petition for relief and cease and desist order filed by the New Hampshire Bureau of Securities Regulation (the "NH Bureau") concerning their administration of the New Hampshire state employees deferred compensation plan.
On October 10, 2006, an affiliate of ING Investments entered into an assurance of discontinuance with the NYAG (the "NYAG Agreement") regarding the endorsement of its products by the New York State United Teachers Union Member Benefits Trust ("NYSUT") and the sale of their products to NYSUT members. Under the terms of the NYAG Agreement, the affiliate of ING Investments, without admitting or denying the NYAG's findings, will distribute $30 million to NYSUT members, and/or former NYSUT members, who participated in the NYSUT-endorsed products at any point between January 1, 2001 and June 30, 2006. The affiliate also agreed with the NYAG's office to develop a one-page disclosure that will further improve transparency and disclosure regarding retirement product fees (the "One-Page Disclosure"). Pursuant to the terms of the NYAG Agreement, the affiliate has agreed for a five year period to provide its retirement product customers with the One-Pag e Disclosure.
In addition, on the same date, these affiliates of ING Investments entered into a consent agreement with the NH Bureau (the "NH Agreement") to resolve this petition for relief and cease and desist order. Under the terms of the NH Agreement, these affiliates of ING Investments, without admitting or denying the NH Bureau's claims, have agreed to pay $3 million to resolve the matter, and for a five year period to provide their retirement product customers with the One-Page Disclosure described above.
Other federal and state regulators could initiate similar actions in this or other areas of ING's businesses.
These regulatory initiatives may result in new legislation and regulation that could significantly affect the financial services industry, including businesses in which ING is engaged.
In light of these and other developments, ING continuously reviews whether modifications to its business practices are appropriate.
At this time, in light of the current regulatory factors, ING U.S. is actively engaged in reviewing whether any modifications in our practices are appropriate for the future.
There can be no assurance that these matters, or the adverse publicity associated with them, will not result in increased fund redemptions, reduced sale of fund shares, or other adverse consequences to ING Funds.
45
ING VP INDEX PLUS PORTFOLIO OF INVESTMENTS
LARGECAP PORTFOLIO AS OF DECEMBER 31, 2006
| Shares | | | | | | Value | |
| COMMON STOCK: 97.6% | | | |
| | | | | Advertising: 0.5% | |
| | 116,800 | | | L | | Omnicom Group | | $ | 12,210,272 | | |
| | | | 12,210,272 | | |
| | | | | Aerospace/Defense: 2.0% | |
| | 180,600 | | | | | Boeing Co. | | | 16,044,504 | | |
| | 384,950 | | | | | Raytheon Co. | | | 20,325,360 | | |
| | 229,700 | | | | | United Technologies Corp. | | | 14,360,844 | | |
| | | | 50,730,708 | | |
| | | | | Agriculture: 1.3% | |
| | 388,500 | | | | | Altria Group, Inc. | | | 33,341,070 | | |
| | | | 33,341,070 | | |
| | | | | Apparel: 0.6% | |
| | 279,100 | | | @,L | | Coach, Inc. | | | 11,990,136 | | |
| | 97,900 | | | L | | Jones Apparel Group, Inc. | | | 3,272,797 | | |
| | | | 15,262,933 | | |
| | | | | Auto Manufacturers: 0.5% | |
| | 1,554,771 | | | L | | Ford Motor Co. | | | 11,676,330 | | |
| | | | 11,676,330 | | |
| | | | | Banks: 6.2% | |
| | 1,238,947 | | | | | Bank of America Corp. | | | 66,147,380 | | |
| | 150,400 | | | | | Comerica, Inc. | | | 8,825,472 | | |
| | 424,037 | | | L | | National City Corp. | | | 15,502,793 | | |
| | 455,600 | | | | | Regions Financial Corp. | | | 17,039,440 | | |
| | 329,847 | | | | | US Bancorp. | | | 11,937,163 | | |
| | 328,886 | | | | | Wachovia Corp. | | | 18,730,058 | | |
| | 578,500 | | | L | | Wells Fargo & Co. | | | 20,571,460 | | |
| | | | 158,753,766 | | |
| | | | | Beverages: 1.6% | |
| | 378,150 | | | | | Coca-Cola Co. | | | 18,245,738 | | |
| | 126,050 | | | | | Pepsi Bottling Group, Inc. | | | 3,896,206 | | |
| | 305,900 | | | | | PepsiCo, Inc. | | | 19,134,045 | | |
| | | | 41,275,989 | | |
| | | | | Biotechnology: 0.6% | |
| | 217,240 | | | @,L | | Amgen, Inc. | | | 14,839,664 | | |
| | | | 14,839,664 | | |
| | | | | Chemicals: 1.0% | |
| | 179,000 | | | | | Dow Chemical Co. | | | 7,149,260 | | |
| | 177,000 | | | L | | EI DuPont de Nemours & Co. | | | 8,621,670 | | |
| | 93,200 | | | | | Monsanto Co. | | | 4,895,796 | | |
| | 89,000 | | | | | Sherwin-Williams Co. | | | 5,658,620 | | |
| | | | 26,325,346 | | |
| | | | | Commercial Services: 1.3% | |
| | 117,300 | | | @,L | | Apollo Group, Inc. | | | 4,571,181 | | |
| | 128,600 | | | @ | | Convergys Corp. | | | 3,058,108 | | |
| | 254,850 | | | | | McKesson Corp. | | | 12,920,895 | | |
| | 191,600 | | | | | Moody's Corp. | | | 13,231,896 | | |
| | | | 33,782,080 | | |
| | | | | Computers: 4.1% | |
| | 932,439 | | | @ | | Dell, Inc. | | | 23,394,895 | | |
| | 887,568 | | | | | Hewlett-Packard Co. | | | 36,558,926 | | |
| | 457,750 | | | | | International Business
Machines Corp. | | | 44,470,413 | | |
| | | | 104,424,234 | | |
| Shares | | | | | | Value | |
| | | | | Cosmetics/Personal Care: 1.7% | |
| | 119,900 | | | | | Estee Lauder Cos., Inc. | | $ | 4,894,318 | | |
| | 590,792 | | | | | Procter & Gamble Co. | | | 37,970,202 | | |
| | | | 42,864,520 | | |
| | | | | | | Diversified Financial
Services: 10.1% | | | | | |
| | 221,400 | | | | | American Express Co. | | | 13,432,338 | | |
| | 184,600 | | | L | | CIT Group, Inc. | | | 10,295,142 | | |
| | 1,322,600 | | | | | Citigroup, Inc. | | | 73,668,820 | | |
| | 179,600 | | | L | | Fannie Mae | | | 10,666,444 | | |
| | 159,950 | | | | | Goldman Sachs Group, Inc. | | | 31,886,033 | | |
| | 1,047,900 | | | | | JPMorgan Chase & Co. | | | 50,613,570 | | |
| | 268,200 | | | | | Lehman Brothers
Holdings, Inc. | | | 20,951,784 | | |
| | 152,319 | | | | | Merrill Lynch & Co., Inc. | | | 14,180,899 | | |
| | 402,100 | | | | | Morgan Stanley | | | 32,743,003 | | |
| | | | 258,438,033 | | |
| | | | | Electric: 2.1% | |
| | 963,200 | | | @,L | | AES Corp. | | | 21,228,928 | | |
| | 4,847 | | | @ | | Dynegy, Inc. | | | 35,092 | | |
| | 500,400 | | | | | PG&E Corp. | | | 23,683,932 | | |
| | 237,300 | | | | | Southern Co. | | | 8,746,878 | | |
| | | | 53,694,830 | | |
| | | | | Environmental Control: 0.7% | |
| | 499,300 | | | | | Waste Management, Inc. | | | 18,359,261 | | |
| | | | 18,359,261 | | |
| | | | | Food: 1.4% | |
| | 213,900 | | | | | Campbell Soup Co. | | | 8,318,571 | | |
| | 485,900 | | | | | ConAgra Foods, Inc. | | | 13,119,300 | | |
| | 261,250 | | | | | General Mills, Inc. | | | 15,048,000 | | |
| | | | 36,485,871 | | |
| | | | | Forest Products & Paper: 0.2% | |
| | 104,300 | | | L | | Temple-Inland, Inc. | | | 4,800,929 | | |
| | | | 4,800,929 | | |
| | | | | Hand/Machine Tools: 0.1% | |
| | 50,700 | | | | | Snap-On, Inc. | | | 2,415,348 | | |
| | | | 2,415,348 | | |
| | | | | Healthcare-Products: 1.8% | |
| | 526,550 | | | | | Johnson & Johnson | | | 34,762,831 | | |
| | 206,900 | | | | | Medtronic, Inc. | | | 11,071,219 | | |
| | | | 45,834,050 | | |
| | | | | Healthcare-Services: 3.8% | |
| | 398,300 | | | | | Aetna, Inc. | | | 17,198,594 | | |
| | 147,350 | | | @ | | Coventry Health Care, Inc. | | | 7,374,868 | | |
| | 153,050 | | | @ | | Humana, Inc. | | | 8,465,196 | | |
| | 116,100 | | | @,L | | Laboratory Corp. of
America Holdings | | | 8,529,867 | | |
| | 580,200 | | | | | UnitedHealth Group, Inc. | | | 31,174,146 | | |
| | 306,400 | | | @ | | WellPoint, Inc. | | | 24,110,616 | | |
| | | | 96,853,287 | | |
| | | | | Insurance: 8.3% | |
| | 234,000 | | | @@ | | ACE Ltd. | | | 14,173,380 | | |
| | 330,000 | | | | | Allstate Corp. | | | 21,486,300 | | |
| | 98,300 | | | | | AMBAC Financial Group, Inc. | | | 8,755,581 | | |
See Accompanying Notes to Financial Statements
46
ING VP INDEX PLUS PORTFOLIO OF INVESTMENTS
LARGECAP PORTFOLIO AS OF DECEMBER 31, 2006 (CONTINUED)
| Shares | | | | | | Value | |
| | | | | Insurance (continued) | |
| | 446,500 | | | | | American International
Group, Inc. | | $ | 31,996,190 | | |
| | 290,400 | | | | | Chubb Corp. | | | 15,365,064 | | |
| | 99,800 | | | | | Cigna Corp. | | | 13,130,686 | | |
| | 355,900 | | | | | Genworth Financial, Inc. | | | 12,175,339 | | |
| | 194,587 | | | | | Hartford Financial Services
Group, Inc. | | | 18,156,913 | | |
| | 331,100 | | | | | Loews Corp. | | | 13,730,717 | | |
| | 368,400 | | | L | | Metlife, Inc. | | | 21,739,284 | | |
| | 596,900 | | | | | Progressive Corp. | | | 14,456,918 | | |
| | 240,800 | | | L | | Prudential Financial, Inc. | | | 20,675,088 | | |
| | 91,270 | | | | | Safeco Corp. | | | 5,708,939 | | |
| | | | 211,550,399 | | |
| | | | | Internet: 0.8% | |
| | 35,000 | | | @ | | Google, Inc. | | | 16,116,800 | | |
| | 201,300 | | | @,L | | VeriSign, Inc. | | | 4,841,265 | | |
| | | | 20,958,065 | | |
| | | | | Iron/Steel: 0.8% | |
| | 239,400 | | | | | Nucor Corp. | | | 13,085,604 | | |
| | 118,100 | | | | | United States Steel Corp. | | | 8,637,834 | | |
| | | | 21,723,438 | | |
| | | | | Leisure Time: 0.1% | |
| | 122,100 | | | | | Sabre Holdings Corp. | | | 3,893,769 | | |
| | | | 3,893,769 | | |
| | | | | Lodging: 0.1% | |
| | 36,300 | | | | | Harrah's Entertainment, Inc. | | | 3,002,736 | | |
| | | | 3,002,736 | | |
| | | | | | | Machinery-Construction &
Mining: 0.3% | | | | | |
| | 121,700 | | | | | Caterpillar, Inc. | | | 7,463,861 | | |
| | | | 7,463,861 | | |
| | | | | Machinery-Diversified: 0.2% | |
| | 47,300 | | | L | | Cummins, Inc. | | | 5,589,914 | | |
| | | | 5,589,914 | | |
| | | | | Media: 3.4% | |
| | 129,200 | | | | | CBS Corp. - Class B | | | 4,028,456 | | |
| | 97,100 | | | | | Clear Channel
Communications, Inc. | | | 3,450,934 | | |
| | 319,300 | | | @,L | | Comcast Corp. | | | 13,515,969 | | |
| | 526,800 | | | @,L | | DIRECTV Group, Inc. | | | 13,138,392 | | |
| | 212,200 | | | | | McGraw-Hill Cos., Inc. | | | 14,433,844 | | |
| | 392,050 | | | | | News Corp., Inc. | | | 8,421,234 | | |
| | 29,200 | | | @,L | | Univision
Communications, Inc. | | | 1,034,264 | | |
| | 826,600 | | | | | Walt Disney Co. | | | 28,327,582 | | |
| | | | 86,350,675 | | |
| | | | | Mining: 0.2% | |
| | 39,940 | | | L | | Phelps Dodge Corp. | | | 4,781,617 | | |
| | | | 4,781,617 | | |
| | | | | | | Miscellaneous
Manufacturing: 6.5% | | | | | |
| | 171,100 | | | | | 3M Co. | | | 13,333,823 | | |
| | 104,000 | | | | | Cooper Industries Ltd. | | | 9,404,720 | | |
| | 219,000 | | | L | | Eastman Kodak Co. | | | 5,650,200 | | |
| | 170,300 | | | | | Eaton Corp. | | | 12,796,342 | | |
| Shares | | | | | | Value | |
| | 2,016,900 | | | | | General Electric Co. | | $ | 75,048,849 | | |
| | 585,500 | | | | | Honeywell International, Inc. | | | 26,488,020 | | |
| | 136,600 | | | | | Parker Hannifin Corp. | | | 10,501,808 | | |
| | 457,692 | | | @@ | | Tyco International Ltd. | | | 13,913,837 | | |
| | | | 167,137,599 | | |
| | | | | | | Office/Business
Equipment: 0.5% | | | | | |
| | 716,638 | | | @,L | | Xerox Corp. | | | 12,147,014 | | |
| | | | 12,147,014 | | |
| | | | | Oil & Gas: 9.5% | |
| | 285,000 | | | L | | Anadarko Petroleum Corp. | | | 12,403,200 | | |
| | 621,218 | | | | | Chevron Corp. | | | 45,678,160 | | |
| | 261,576 | | | | | ConocoPhillips | | | 18,820,393 | | |
| | 1,489,300 | | | | | ExxonMobil Corp. | | | 114,125,059 | | |
| | 183,700 | | | | | Marathon Oil Corp. | | | 16,992,250 | | |
| | 393,300 | | | L | | Occidental Petroleum Corp. | | | 19,204,839 | | |
| | 312,100 | | | | | Valero Energy Corp. | | | 15,967,036 | | |
| | | | 243,190,937 | | |
| | | | | Oil & Gas Services: 1.1% | |
| | 521,500 | | | L | | Halliburton Co. | | | 16,192,575 | | |
| | 188,000 | | | L | | Schlumberger Ltd. | | | 11,874,080 | | |
| | | | 28,066,655 | | |
| | | | | Packaging & Containers: 0.2% | |
| | 126,100 | | | @ | | Pactiv Corp. | | | 4,500,509 | | |
| | | | 4,500,509 | | |
| | | | | Pharmaceuticals: 5.7% | |
| | 283,500 | | | | | Abbott Laboratories | | | 13,809,285 | | |
| | 183,700 | | | | | AmerisourceBergen Corp. | | | 8,259,152 | | |
| | 268,500 | | | @ | | Forest Laboratories, Inc. | | | 13,586,100 | | |
| | 212,466 | | | @,L | | King Pharmaceuticals, Inc. | | | 3,382,459 | | |
| | 816,050 | | | | | Merck & Co., Inc. | | | 35,579,780 | | |
| | 189,200 | | | | | Mylan Laboratories | | | 3,776,432 | | |
| | 1,312,750 | | | | | Pfizer, Inc. | | | 34,000,225 | | |
| | 866,100 | | | | | Schering-Plough Corp. | | | 20,474,604 | | |
| | 249,750 | | | L | | Wyeth | | | 12,717,270 | | |
| | | | 145,585,307 | | |
| | | | | Pipelines: 0.5% | |
| | 21,000 | | | | | Kinder Morgan, Inc. | | | 2,220,750 | | |
| | 137,000 | | | | | Questar Corp. | | | 11,377,850 | | |
| | | | 13,598,600 | | |
| | | | | | | Real Estate Investment
Trusts: 0.1% | | | | | |
| | 74,600 | | | | | Equity Office Properties Trust | | | 3,593,482 | | |
| | | | 3,593,482 | | |
| | | | | Retail: 6.0% | |
| | 87,000 | | | @,L | | Big Lots, Inc. | | | 1,994,040 | | |
| | 135,100 | | | | | Family Dollar Stores, Inc. | | | 3,962,483 | | |
| | 355,300 | | | | | Federated Department
Stores, Inc. | | | 13,547,589 | | |
| | 461,200 | | | | | Gap, Inc. | | | 8,993,400 | | |
| | 403,250 | | | L | | Home Depot, Inc. | | | 16,194,520 | | |
| | 187,900 | | | @ | | Kohl's Corp. | | | 12,857,997 | | |
| | 270,300 | | | | | Lowe's Cos., Inc. | | | 8,419,845 | | |
| | 492,650 | | | L | | McDonald's Corp. | | | 21,839,175 | | |
| | 180,500 | | | L | | Nordstrom, Inc. | | | 8,905,870 | | |
| | 216,000 | | | @,L | | Office Depot, Inc. | | | 8,244,720 | | |
| | 54,400 | | | | | OfficeMax, Inc. | | | 2,700,960 | | |
See Accompanying Notes to Financial Statements
47
ING VP INDEX PLUS PORTFOLIO OF INVESTMENTS
LARGECAP PORTFOLIO AS OF DECEMBER 31, 2006 (CONTINUED)
| Shares | | | | | | Value | |
| | | | | Retail (continued) | |
| | 112,100 | | | L | | RadioShack Corp. | | $ | 1,881,038 | | |
| | 126,900 | | | @,L | | Starbucks Corp. | | | 4,494,798 | | |
| | 150,400 | | | | | Target Corp. | | | 8,580,320 | | |
| | 341,400 | | | | | TJX Cos., Inc. | | | 9,736,728 | | |
| | 456,487 | | | L | | Wal-Mart Stores, Inc. | | | 21,080,570 | | |
| | | | 153,434,053 | | |
| | | | | Semiconductors: 1.7% | |
| | 333,100 | | | @ | | Altera Corp. | | | 6,555,408 | | |
| | 946,300 | | | | | Intel Corp. | | | 19,162,575 | | |
| | 344,300 | | | @,L | | LSI Logic Corp. | | | 3,098,700 | | |
| | 599,000 | | | @,L | | Micron Technology, Inc. | | | 8,362,040 | | |
| | 102,300 | | | @ | | Novellus Systems, Inc. | | | 3,521,166 | | |
| | 161,600 | | | @,L | | Teradyne, Inc. | | | 2,417,536 | | |
| | | | 43,117,425 | | |
| | | | | Software: 3.3% | |
| | 187,000 | | | @ | | BMC Software, Inc. | | | 6,021,400 | | |
| | 335,750 | | | @,L | | Compuware Corp. | | | 2,796,798 | | |
| | 522,100 | | | | | First Data Corp. | | | 13,323,992 | | |
| | 1,687,550 | | | | | Microsoft Corp. | | | 50,390,243 | | |
| | 661,800 | | | @ | | Oracle Corp. | | | 11,343,252 | | |
| | | | 83,875,685 | | |
| | | | | Telecommunications: 6.3% | |
| | 758,896 | | | L | | AT&T, Inc. | | | 27,130,532 | | |
| | 423,900 | | | @,L | | Avaya, Inc. | | | 5,926,122 | | |
| | 354,800 | | | | | BellSouth Corp. | | | 16,714,628 | | |
| | 1,757,000 | | | @ | | Cisco Systems, Inc. | | | 48,018,804 | | |
| | 1,093,800 | | | | | Motorola, Inc. | | | 22,488,528 | | |
| | 271,000 | | | | | Qualcomm, Inc. | | | 10,241,090 | | |
| | 583,700 | | | L | | Sprint Nextel Corp. | | | 11,026,093 | | |
| | 566,300 | | | | | Verizon Communications, Inc. | | | 21,089,012 | | |
| | | | 162,634,809 | | |
| | | | | Toys/Games/Hobbies: 0.4% | |
| | 144,300 | | | | | Hasbro, Inc. | | | 3,932,175 | | |
| | 312,800 | | | | | Mattel, Inc. | | | 7,088,048 | | |
| | | | 11,020,223 | | |
Total Common Stock
(Cost $2,244,124,989) | | | 2,499,585,293 | | |
Principal
Amount | | | | Value | |
| SHORT-TERM INVESTMENTS: 11.6% | |
| | | Mutual Fund: 1.9% | |
| $ | 49,000,000 | ** | | ING Institutional Prime Money
Market Fund | | | 49,000,000 | | |
Total Mutual Fund
(Cost $49,000,000) | | | 49,000,000 | | |
Principal
Amount | | | | Value | |
| | | Repurchase Agreement: 0.6% | |
| $ | 14,964,000 | | | Goldman Sachs Repurchase
Agreement dated 12/29/06,
5.220%, due 01/02/07, $14,972,679
to be received upon repurchase
(Collateralized by $15,613,000
Federal National Mortgage
Association, 4.000%-6.125%,
Market Value plus accrued
interest $15,263,746, due
12/23/10-11/02/26) | | $ | 14,964,000 | | |
Total Repurchase Agreement
(Cost $14,964,000) | | | 14,964,000 | | |
| | | Securities Lending CollateralCC: 9.1% | |
| | 232,872,874 | | | The Bank of New York Institutional
Cash Reserves Fund | | | 232,872,874 | | |
Total Securities Lending Collateral
(Cost $232,872,874) | | | 232,872,874 | | |
Total Short-Term Investments
(Cost $296,836,874) | | | 296,836,874 | | |
Total Investments in
Securities
(Cost $2,540,961,863)* | | | 109.2 | % | | $ | 2,796,422,167 | | |
Other Assets and
Liabilities - Net | | | (9.2 | ) | | | (234,789,119 | ) | |
| Net Assets | | | 100.0 | % | | $ | 2,561,633,048 | | |
@ Non-income producing security
@@ Foreign Issuer
cc Securities purchased with cash collateral for securities loaned.
L Loaned security, a portion or all of the security is on loan at December 31, 2006.
** Investment in affiliate
* Cost for federal income tax purposes is $2,591,578,353.
| Net unrealized appreciation consists of: | |
| Gross Unrealized Appreciation | | $ | 231,001,925 | | |
| Gross Unrealized Depreciation | | | (26,158,111 | ) | |
| Net Unrealized Appreciation | | $ | 204,843,814 | | |
VP Index Plus Large Cap Open Futures Contracts on December 31, 2006:
Contract
Description | | Number
of
Contracts | | Notional
Market
Value ($) | | Expiration
Date | | Unrealized
Appreciation | |
| Long Contracts | |
| S&P 500 | | | 169 | | | | 60,349,900 | | | 3/15/07 | | $ | 118,477 | | |
| | | | | | | | | $ | 118,477 | | |
See Accompanying Notes to Financial Statements
48
ING VP INDEX PLUS PORTFOLIO OF INVESTMENTS
MIDCAP PORTFOLIO AS OF DECEMBER 31, 2006
| Shares | | | | | | Value | |
| COMMON STOCK: 99.5% | | | |
| | | | | Advertising: 0.1% | |
| | 67,621 | | | L | | Harte-Hanks, Inc. | | $ | 1,873,778 | | |
| | | | 1,873,778 | | |
| | | | | Aerospace/Defense: 0.5% | |
| | 45,857 | | | @,L | | Alliant Techsystems, Inc. | | | 3,585,559 | | |
| | 53,038 | | | L | | DRS Technologies, Inc. | | | 2,794,042 | | |
| | 8,900 | | | @ | | Sequa Corp. | | | 1,024,034 | | |
| | | | 7,403,635 | | |
| | | | | Agriculture: 0.1% | |
| | 32,500 | | | | | Universal Corp. | | | 1,592,825 | | |
| | | | 1,592,825 | | |
| | | | | Airlines: 0.5% | |
| | 105,700 | | | @,L | | Airtran Holdings, Inc. | | | 1,240,918 | | |
| | 52,700 | | | @,L | | Alaska Air Group, Inc. | | | 2,081,650 | | |
| | 231,800 | | | @,L | | JetBlue Airways Corp. | | | 3,291,560 | | |
| | | | 6,614,128 | | |
| | | | | Apparel: 1.1% | |
| | 162,300 | | | @,L | | Hanesbrands, Inc. | | | 3,833,526 | | |
| | 105,432 | | | | | Polo Ralph Lauren Corp. | | | 8,187,849 | | |
| | 85,862 | | | @,L | | Timberland Co. | | | 2,711,522 | | |
| | | | 14,732,897 | | |
| | | | | Auto Parts & Equipment: 0.8% | |
| | 151,882 | | | L | | ArvinMeritor, Inc. | | | 2,768,809 | | |
| | 14,100 | | | L | | Bandag, Inc. | | | 711,063 | | |
| | 72,650 | | | L | | BorgWarner, Inc. | | | 4,287,803 | | |
| | 84,800 | | | L | | Lear Corp. | | | 2,504,144 | | |
| | 53,008 | | | | | Modine Manufacturing Co. | | | 1,326,790 | | |
| | | | 11,598,609 | | |
| | | | | Banks: 4.2% | |
| | 166,500 | | | L | | Associated Banc Corp. | | | 5,807,520 | | |
| | 61,126 | | | L | | Bank of Hawaii Corp. | | | 3,297,748 | | |
| | 61,677 | | | L | | Cathay General Bancorp. | | | 2,128,473 | | |
| | 51,428 | | | | | City National Corp. | | | 3,661,674 | | |
| | 332,998 | | | L | | Colonial BancGroup, Inc. | | | 8,571,369 | | |
| | 70,315 | | | L | | Cullen/Frost Bankers, Inc. | | | 3,924,983 | | |
| | 136,107 | | | L | | FirstMerit Corp. | | | 3,285,623 | | |
| | 64,986 | | | | | Greater Bay Bancorp. | | | 1,711,081 | | |
| | 154,242 | | | | | Mercantile Bankshares Corp. | | | 7,216,983 | | |
| | 43,700 | | | @,L | | SVB Financial Group | | | 2,037,294 | | |
| | 187,233 | | | L | | TCF Financial Corp. | | | 5,133,929 | | |
| | 120,100 | | | L | | Webster Financial Corp. | | | 5,851,272 | | |
| | 38,381 | | | L | | Westamerica Bancorp. | | | 1,943,230 | | |
| | 84,343 | | | L | | Wilmington Trust Corp. | | | 3,556,744 | | |
| | | | 58,127,923 | | |
| | | | | Beverages: 0.2% | |
| | 104,498 | | | L | | PepsiAmericas, Inc. | | | 2,192,368 | | |
| | | | 2,192,368 | | |
| | | | | Biotechnology: 1.8% | |
| | 86,480 | | | @,L | | Charles River Laboratories
International, Inc. | | | 3,740,260 | | |
| | 68,829 | | | @,L | | Invitrogen Corp. | | | 3,895,033 | | |
| | 690,400 | | | @,L | | Millennium
Pharmaceuticals, Inc. | | | 7,525,360 | | |
| | 199,750 | | | @,L | | PDL BioPharma, Inc. | | | 4,022,965 | | |
| | 155,700 | | | @,L | | Vertex Pharmaceuticals, Inc. | | | 5,826,294 | | |
| | | | 25,009,912 | | |
| Shares | | | | | | Value | |
| | | | | Chemicals: 3.8% | |
| | 100,247 | | | | | Airgas, Inc. | | $ | 4,062,008 | | |
| | 50,329 | | | | | Albemarle Corp. | | | 3,613,622 | | |
| | 81,600 | | | L | | Cabot Corp. | | | 3,555,312 | | |
| | 310,000 | | | | | Chemtura Corp. | | | 2,985,300 | | |
| | 53,478 | | | L | | Cytec Industries, Inc. | | | 3,022,042 | | |
| | 48,849 | | | | | Ferro Corp. | | | 1,010,686 | | |
| | 50,388 | | | | | FMC Corp. | | | 3,857,201 | | |
| | 148,729 | | | | | Lubrizol Corp. | | | 7,455,785 | | |
| | 457,873 | | | L | | Lyondell Chemical Co. | | | 11,707,813 | | |
| | 24,000 | | | L | | Minerals Technologies, Inc. | | | 1,410,960 | | |
| | 120,060 | | | L | | Olin Corp. | | | 1,983,391 | | |
| | 152,028 | | | L | | RPM International, Inc. | | | 3,175,865 | | |
| | 56,000 | | | L | | Sensient Technologies Corp. | | | 1,377,600 | | |
| | 129,958 | | | | | Valspar Corp. | | | 3,592,039 | | |
| | | | 52,809,624 | | |
| | | | | Commercial Services: 5.5% | |
| | 106,267 | | | | | Adesa, Inc. | | | 2,948,909 | | |
| | 85,693 | | | @,L | | Alliance Data Systems Corp. | | | 5,353,242 | | |
| | 30,134 | | | | | Banta Corp. | | | 1,096,878 | | |
| | 119,900 | | | @,L | | Career Education Corp. | | | 2,971,122 | | |
| | 112,300 | | | @,L | | ChoicePoint, Inc. | | | 4,422,374 | | |
| | 109,024 | | | @,L | | Corinthian Colleges, Inc. | | | 1,485,997 | | |
| | 53,176 | | | L | | Corporate Executive
Board Co. | | | 4,663,535 | | |
| | 26,500 | | | L | | Deluxe Corp. | | | 667,800 | | |
| | 101,000 | | | L | | DeVry, Inc. | | | 2,828,000 | | |
| | 56,048 | | | @,L | | ITT Educational Services, Inc. | | | 3,719,906 | | |
| | 28,185 | | | | | Kelly Services, Inc. | | | 815,674 | | |
| | 503,642 | | | @,L | | Korn/Ferry International | | | 11,563,620 | | |
| | 194,616 | | | L | | Manpower, Inc. | | | 14,582,577 | | |
| | 225,122 | | | @ | | MPS Group, Inc. | | | 3,192,230 | | |
| | 131,536 | | | L | | Pharmaceutical Product
Development, Inc. | | | 4,238,090 | | |
| | 211,411 | | | @,L | | Quanta Services, Inc. | | | 4,158,454 | | |
| | 46,031 | | | | | Rollins, Inc. | | | 1,017,745 | | |
| | 70,054 | | | L | | Sotheby's | | | 2,173,075 | | |
| | 17,400 | | | L | | Strayer Education, Inc. | | | 1,845,270 | | |
| | 103,150 | | | @,L | | Valassis Communications, Inc. | | | 1,495,675 | | |
| | | | 75,240,173 | | |
| | | | | Computers: 4.1% | |
| | 151,200 | | | @,L | | BISYS Group, Inc. | | | 1,951,992 | | |
| | 361,325 | | | @,L | | Cadence Design Systems, Inc. | | | 6,471,331 | | |
| | 237,793 | | | @,L | | Ceridian Corp. | | | 6,653,448 | | |
| | 83,348 | | | L | | Diebold, Inc. | | | 3,884,017 | | |
| | 75,912 | | | @,L | | DST Systems, Inc. | | | 4,754,369 | | |
| | 59,973 | | | | | Imation Corp. | | | 2,784,546 | | |
| | 205,100 | | | @ | | McData Corp. | | | 1,138,305 | | |
| | 104,700 | | | @,L | | Mentor Graphics Corp. | | | 1,887,741 | | |
| | 178,600 | | | @,L | | Palm, Inc. | | | 2,516,474 | | |
| | 444,238 | | | @,L | | SRA International, Inc. | | | 11,878,924 | | |
| | 241,085 | | | @ | | Synopsys, Inc. | | | 6,444,202 | | |
| | 284,378 | | | @,L | | Western Digital Corp. | | | 5,818,374 | | |
| | | | 56,183,723 | | |
| | | | | Cosmetics/Personal Care: 0.2% | |
| | 106,500 | | | | | Alberto-Culver Co. | | | 2,284,425 | | |
| | | | 2,284,425 | | |
| | | | | Distribution/Wholesale: 1.7% | |
| | 75,987 | | | L | | CDW Corp. | | | 5,343,406 | | |
| | 240,831 | | | @,L | | Ingram Micro, Inc. | | | 4,915,361 | | |
See Accompanying Notes to Financial Statements
49
ING VP INDEX PLUS PORTFOLIO OF INVESTMENTS
MIDCAP PORTFOLIO AS OF DECEMBER 31, 2006 (CONTINUED)
| Shares | | | | | | Value | |
| | | | | | | Distribution/Wholesale
(continued) | | | | | |
| | 335,717 | | | @,L | | Tech Data Corp. | | $ | 12,713,603 | | |
| | | | 22,972,370 | | |
| | | | | | | Diversified Financial
Services: 2.5% | | | | | |
| | 130,353 | | | L | | AG Edwards, Inc. | | | 8,250,041 | | |
| | 267,840 | | | @,L | | AmeriCredit Corp. | | | 6,741,533 | | |
| | 159,975 | | | L | | Eaton Vance Corp. | | | 5,280,775 | | |
| | 84,433 | | | L | | IndyMac Bancorp., Inc. | | | 3,812,994 | | |
| | 50,148 | | | L | | Jefferies Group, Inc. | | | 1,344,969 | | |
| | 39,670 | | | | | Nuveen Investments, Inc. | | | 2,058,080 | | |
| | 154,031 | | | | | Raymond James Financial, Inc. | | | 4,668,680 | | |
| | 104,800 | | | | | Waddell & Reed Financial, Inc. | | | 2,867,328 | | |
| | | | 35,024,400 | | |
| | | | | Electric: 5.3% | |
| | 151,918 | | | L | | Alliant Energy Corp. | | | 5,737,943 | | |
| | 482,300 | | | @ | | Aquila, Inc. | | | 2,266,810 | | |
| | 107,700 | | | L | | Duquesne Light Holdings, Inc. | | | 2,137,845 | | |
| | 190,393 | | | L | | Energy East Corp. | | | 4,721,746 | | |
| | 102,586 | | | L | | Great Plains Energy, Inc. | | | 3,262,235 | | |
| | 54,722 | | | L | | Idacorp, Inc. | | | 2,115,005 | | |
| | 232,253 | | | L | | MDU Resources Group, Inc. | | | 5,954,967 | | |
| | 198,308 | | | | | Northeast Utilities | | | 5,584,353 | | |
| | 137,710 | | | | | NSTAR | | | 4,731,716 | | |
| | 116,389 | | | | | OGE Energy Corp. | | | 4,655,560 | | |
| | 243,678 | | | L | | Pepco Holdings, Inc. | | | 6,338,065 | | |
| | 121,000 | | | L | | PNM Resources, Inc. | | | 3,763,100 | | |
| | 149,942 | | | | | Puget Energy, Inc. | | | 3,802,529 | | |
| | 284,800 | | | @ | | Sierra Pacific Resources | | | 4,793,184 | | |
| | 112,489 | | | L | | Westar Energy, Inc. | | | 2,920,214 | | |
| | 149,550 | | | | | Wisconsin Energy Corp. | | | 7,097,643 | | |
| | 54,632 | | | | | WPS Resources Corp. | | | 2,951,767 | | |
| | | | 72,834,682 | | |
| | | | | | | Electrical Components &
Equipment: 0.6% | | | | | |
| | 183,392 | | | | | Ametek, Inc. | | | 5,839,201 | | |
| | 29,589 | | | @,L | | Energizer Holdings, Inc. | | | 2,100,523 | | |
| | | | 7,939,724 | | |
| | | | | Electronics: 2.7% | |
| | 114,337 | | | | | Amphenol Corp. | | | 7,098,041 | | |
| | 157,307 | | | @,L | | Arrow Electronics, Inc. | | | 4,963,036 | | |
| | 161,400 | | | @,L | | Avnet, Inc. | | | 4,120,542 | | |
| | 185,900 | | | | | Gentex Corp. | | | 2,892,604 | | |
| | 103,212 | | | @,L | | Kemet Corp. | | | 753,448 | | |
| | 68,925 | | | | | National Instruments Corp. | | | 1,877,517 | | |
| | 52,898 | | | @,L | | Newport Corp. | | | 1,108,213 | | |
| | 60,036 | | | @,L | | Plexus Corp. | | | 1,433,660 | | |
| | 92,757 | | | @ | | Thomas & Betts Corp. | | | 4,385,551 | | |
| | 67,668 | | | @ | | Varian, Inc. | | | 3,030,850 | | |
| | 400,753 | | | @,L | | Vishay Intertechnology, Inc. | | | 5,426,196 | | |
| | | | 37,089,658 | | |
| | | | | | | Engineering &
Construction: 1.6% | | | | | |
| | 255,100 | | | | | Granite Construction, Inc. | | | 12,836,632 | | |
| | 104,981 | | | @ | | Jacobs Engineering
Group, Inc. | | | 8,560,151 | | |
| | | | 21,396,783 | | |
| Shares | | | | | | Value | |
| | | | | Entertainment: 0.3% | |
| | 43,498 | | | | | International
Speedway Corp. | | $ | 2,220,138 | | |
| | 90,350 | | | @,L | | Macrovision Corp. | | | 2,553,291 | | |
| | | | 4,773,429 | | |
| | | | | Environmental Control: 0.5% | |
| | 60,600 | | | | | Republic Services, Inc. | | | 2,464,602 | | |
| | 58,171 | | | @,L | | Stericycle, Inc. | | | 4,391,911 | | |
| | | | 6,856,513 | | |
| | | | | Food: 0.9% | |
| | 97,354 | | | | | Hormel Foods Corp. | | | 3,635,198 | | |
| | 76,486 | | | | | JM Smucker Co. | | | 3,707,276 | | |
| | 47,873 | | | | | Ruddick Corp. | | | 1,328,476 | | |
| | 132,000 | | | @,L | | Smithfield Foods, Inc. | | | 3,387,120 | | |
| | | | 12,058,070 | | |
| | | | | Forest Products & Paper: 0.5% | |
| | 69,300 | | | L | | Bowater, Inc. | | | 1,559,250 | | |
| | 230,420 | | | | | Louisiana-Pacific Corp. | | | 4,960,943 | | |
| | | | 6,520,193 | | |
| | | | | Gas: 0.3% | |
| | 100,448 | | | L | | AGL Resources, Inc. | | | 3,908,432 | | |
| | | | 3,908,432 | | |
| | | | | Hand/Machine Tools: 0.2% | |
| | 49,500 | | | L | | Kennametal, Inc. | | | 2,913,075 | | |
| | | | 2,913,075 | | |
| | | | | Healthcare-Products: 3.8% | |
| | 75,100 | | | @,L | | Advanced Medical Optics, Inc. | | | 2,643,520 | | |
| | 78,193 | | | L | | Beckman Coulter, Inc. | | | 4,675,941 | | |
| | 246,450 | | | @,L | | Cytyc Corp. | | | 6,974,535 | | |
| | 336,844 | | | L | | Dentsply International, Inc. | | | 10,054,793 | | |
| | 101,599 | | | @,L | | Edwards Lifesciences Corp. | | | 4,779,217 | | |
| | 65,576 | | | @,L | | Gen-Probe, Inc. | | | 3,434,215 | | |
| | 113,667 | | | @,L | | Henry Schein, Inc. | | | 5,567,410 | | |
| | 82,066 | | | L | | Steris Corp. | | | 2,065,601 | | |
| | 84,748 | | | @,L | | Techne Corp. | | | 4,699,277 | | |
| | 167,300 | | | @ | | Varian Medical Systems, Inc. | | | 7,958,461 | | |
| | | | 52,852,970 | | |
| | | | | Healthcare-Services: 1.0% | |
| | 52,082 | | | @,L | | Apria Healthcare Group, Inc. | | | 1,387,985 | | |
| | 82,163 | | | @,L | | Covance, Inc. | | | 4,840,222 | | |
| | 71,100 | | | @ | | LifePoint Hospitals, Inc. | | | 2,396,070 | | |
| | 120,615 | | | @ | | Lincare Holdings, Inc. | | | 4,805,302 | | |
| | | | 13,429,579 | | |
| | | | | | | Holding Companies-
Diversified: 0.6% | | | | | |
| | 277,116 | | | L | | Leucadia National Corp. | | | 7,814,671 | | |
| | | | 7,814,671 | | |
| | | | | Home Builders: 0.1% | |
| | 18,100 | | | L | | Thor Industries, Inc. | | | 796,219 | | |
| | | | 796,219 | | |
| | | | | | | Household Products/
Wares: 0.6% | | | | | |
| | 98,689 | | | | | American Greetings Corp. | | | 2,355,706 | | |
| | 54,350 | | | L | | Blyth, Inc. | | | 1,127,763 | | |
See Accompanying Notes to Financial Statements
50
ING VP INDEX PLUS PORTFOLIO OF INVESTMENTS
MIDCAP PORTFOLIO AS OF DECEMBER 31, 2006 (CONTINUED)
| Shares | | | | | | Value | |
| | | | | | | Household Products/
Wares (continued) | | | | | |
| | 86,391 | | | L | | Church & Dwight Co., Inc. | | $ | 3,684,576 | | |
| | 77,457 | | | L | | Tupperware Corp. | | | 1,751,303 | | |
| | | | 8,919,348 | | |
| | | | | Insurance: 8.0% | |
| | 149,768 | | | L | | American Financial Group, Inc. | | | 5,378,169 | | |
| | 123,000 | | | | | Arthur J Gallagher & Co. | | | 3,634,650 | | |
| | 144,059 | | | L | | Brown & Brown, Inc. | | | 4,063,904 | | |
| | 184,084 | | | @@ | | Everest Re Group Ltd. | | | 18,060,481 | | |
| | 233,674 | | | | | Fidelity National Title
Group, Inc. | | | 5,580,135 | | |
| | 62,657 | | | L | | Hanover Insurance Group, Inc. | | | 3,057,662 | | |
| | 233,796 | | | | | HCC Insurance Holdings, Inc. | | | 7,502,514 | | |
| | 71,976 | | | | | Horace Mann Educators Corp. | | | 1,453,915 | | |
| | 44,925 | | | | | Mercury General Corp. | | | 2,368,895 | | |
| | 76,278 | | | | | Ohio Casualty Corp. | | | 2,273,847 | | |
| | 284,309 | | | | | Old Republic
International Corp. | | | 6,618,714 | | |
| | 185,259 | | | | | PMI Group, Inc. | | | 8,738,667 | | |
| | 118,917 | | | | | Protective Life Corp. | | | 5,648,558 | | |
| | 173,283 | | | L | | Radian Group, Inc. | | | 9,341,687 | | |
| | 90,214 | | | | | Stancorp Financial Group, Inc. | | | 4,064,141 | | |
| | 85,497 | | | | | Unitrin, Inc. | | | 4,284,255 | | |
| | 500,730 | | | L | | WR Berkley Corp. | | | 17,280,192 | | |
| | | | 109,350,386 | | |
| | | | | Internet: 1.4% | |
| | 65,889 | | | @,L | | Avocent Corp. | | | 2,230,343 | | |
| | 114,600 | | | @,L | | Checkfree Corp. | | | 4,602,336 | | |
| | 52,200 | | | @ | | F5 Networks, Inc. | | | 3,873,762 | | |
| | 203,800 | | | @ | | McAfee, Inc. | | | 5,783,844 | | |
| | 120,800 | | | @,L | | Valueclick, Inc. | | | 2,854,504 | | |
| | | | 19,344,789 | | |
| | | | | Iron/Steel: 0.5% | |
| | 82,600 | | | L | | Reliance Steel &
Aluminum Co. | | | 3,252,788 | | |
| | 117,328 | | | | | Steel Dynamics, Inc. | | | 3,807,294 | | |
| | | | 7,060,082 | | |
| | | | | | | Machinery-Construction &
Mining: 0.6% | | | | | |
| | 156,800 | | | | | Joy Global, Inc. | | | 7,579,712 | | |
| | | | 7,579,712 | | |
| | | | | Machinery-Diversified: 0.7% | |
| | 116,400 | | | @,L | | AGCO Corp. | | | 3,601,416 | | |
| | 74,750 | | | @,L | | Flowserve Corp. | | | 3,772,633 | | |
| | 58,014 | | | L | | Nordson Corp. | | | 2,890,838 | | |
| | | | 10,264,887 | | |
| | | | | Media: 0.9% | |
| | 108,211 | | | | | Belo Corp. | | | 1,987,836 | | |
| | 30,700 | | | | | Media General, Inc. | | | 1,141,119 | | |
| | 116,700 | | | L | | Reader's Digest
Association, Inc. | | | 1,948,890 | | |
| | 32,306 | | | @ | | Scholastic Corp. | | | 1,157,847 | | |
| | 7,155 | | | | | Washington Post | | | 5,334,768 | | |
| | 79,920 | | | L | | Westwood One, Inc. | | | 564,235 | | |
| | | | 12,134,695 | | |
| Shares | | | | | | Value | |
| | | | | Metal Fabricate/Hardware: 0.8% | |
| | 154,300 | | | | | Commercial Metals Co. | | $ | 3,980,940 | | |
| | 36,500 | | | | | Precision Castparts Corp. | | | 2,857,220 | | |
| | 124,223 | | | L | | Timken Co. | | | 3,624,827 | | |
| | | | 10,462,987 | | |
| | | | | Miscellaneous Manufacturing: 2.6% | |
| | 262,864 | | | | | Crane Co. | | | 9,631,337 | | |
| | 91,010 | | | L | | Donaldson Co., Inc. | | | 3,158,957 | | |
| | 58,244 | | | | | Federal Signal Corp. | | | 934,234 | | |
| | 55,473 | | | | | Harsco Corp. | | | 4,221,495 | | |
| | 133,588 | | | | | Pentair, Inc. | | | 4,194,663 | | |
| | 115,100 | | | | | Roper Industries, Inc. | | | 5,782,624 | | |
| | 126,512 | | | | | TeleFlex, Inc. | | | 8,174,071 | | |
| | | | 36,097,381 | | |
| | | | | Office Furnishings: 0.4% | |
| | 84,371 | | | L | | Herman Miller, Inc. | | | 3,067,730 | | |
| | 64,107 | | | | | HNI, Corp. | | | 2,846,992 | | |
| | | | 5,914,722 | | |
| | | | | Oil & Gas: 4.6% | |
| | 206,649 | | | | | ENSCO International, Inc. | | | 10,344,849 | | |
| | 73,700 | | | @ | | Forest Oil Corp. | | | 2,408,516 | | |
| | 209,176 | | | | | Helmerich & Payne, Inc. | | | 5,118,537 | | |
| | 192,500 | | | @ | | Newfield Exploration Co. | | | 8,845,375 | | |
| | 237,816 | | | L | | Noble Energy, Inc. | | | 11,669,631 | | |
| | 244,500 | | | L | | Patterson-UTI Energy, Inc. | | | 5,679,735 | | |
| | 183,700 | | | L | | Pioneer Natural Resources Co. | | | 7,291,053 | | |
| | 85,525 | | | L | | Pogo Producing Co. | | | 4,142,831 | | |
| | 240,150 | | | @,L | | Pride International, Inc. | | | 7,206,902 | | |
| | | | 62,707,429 | | |
| | | | | Oil & Gas Services: 2.2% | |
| | 164,359 | | | @,L | | Cameron International Corp. | | | 8,719,245 | | |
| | 192,200 | | | @,L | | Grant Prideco, Inc. | | | 7,643,794 | | |
| | 285,100 | | | L | | Tidewater, Inc. | | | 13,787,436 | | |
| | | | 30,150,475 | | |
| | | | | Packaging & Containers: 0.6% | |
| | 99,817 | | | L | | Packaging Corp. of America | | | 2,205,956 | | |
| | 171,034 | | | | | Sonoco Products Co. | | | 6,509,554 | | |
| | | | 8,715,510 | | |
| | | | | Pharmaceuticals: 2.2% | |
| | 78,311 | | | @,L | | Cephalon, Inc. | | | 5,513,878 | | |
| | 69,200 | | | | | Medicis Pharmaceutical Corp. | | | 2,430,996 | | |
| | 154,969 | | | L | | Omnicare, Inc. | | | 5,986,452 | | |
| | 96,805 | | | L | | Perrigo Co. | | | 1,674,727 | | |
| | 140,800 | | | @,L | | Sepracor, Inc. | | | 8,670,464 | | |
| | 118,900 | | | L | | Valeant Pharmaceuticals
International | | | 2,049,836 | | |
| | 107,195 | | | @,L | | VCA Antech, Inc. | | | 3,450,607 | | |
| | | | 29,776,960 | | |
| | | | | Pipelines: 0.6% | |
| | 191,150 | | | | | Oneok, Inc. | | | 8,242,388 | | |
| | | | 8,242,388 | | |
| | | | | | | Real Estate Investment
Trusts: 4.2% | | | | | |
| | 111,350 | | | L | | AMB Property Corp. | | | 6,526,224 | | |
| | 55,500 | | | L | | Developers Diversified
Realty Corp. | | | 3,493,725 | | |
See Accompanying Notes to Financial Statements
51
ING VP INDEX PLUS PORTFOLIO OF INVESTMENTS
MIDCAP PORTFOLIO AS OF DECEMBER 31, 2006 (CONTINUED)
| Shares | | | | | | Value | |
| | | | | | | Real Estate Investment
Trusts (continued) | | | | | |
| | 68,900 | | | L | | Highwoods Properties, Inc. | | $ | 2,808,364 | | |
| | 126,300 | | | | | Hospitality Properties Trust | | | 6,003,039 | | |
| | 113,421 | | | | | Liberty Property Trust | | | 5,573,508 | | |
| | 80,777 | | | L | | Longview Fibre Co. | | | 1,773,055 | | |
| | 36,400 | | | | | Macerich Co. | | | 3,151,148 | | |
| | 77,110 | | | | | Mack-Cali Realty Corp. | | | 3,932,610 | | |
| | 132,612 | | | | | New Plan Excel Realty Trust | | | 3,644,178 | | |
| | 94,588 | | | | | Rayonier, Inc. | | | 3,882,837 | | |
| | 86,542 | | | L | | Regency Centers Corp. | | | 6,764,988 | | |
| | 165,596 | | | L | | United Dominion Realty
Trust, Inc. | | | 5,264,297 | | |
| | 96,690 | | | L | | Weingarten Realty Investors | | | 4,458,376 | | |
| | | | 57,276,349 | | |
| | | | | Retail: 10.8% | |
| | 58,883 | | | @,L | | 99 Cents Only Stores | | | 716,606 | | |
| | 112,646 | | | L | | Abercrombie & Fitch Co. | | | 7,843,541 | | |
| | 129,575 | | | | | Advance Auto Parts, Inc. | | | 4,607,687 | | |
| | 406,100 | | | @,L | | Aeropostale, Inc. | | | 12,536,307 | | |
| | 430,700 | | | L | | American Eagle Outfitters | | | 13,442,147 | | |
| | 401,644 | | | @ | | AnnTaylor Stores Corp. | | | 13,189,989 | | |
| | 63,400 | | | L | | Barnes & Noble, Inc. | | | 2,517,614 | | |
| | 43,329 | | | L | | Bob Evans Farms, Inc. | | | 1,482,718 | | |
| | 152,631 | | | | | Brinker International, Inc. | | | 4,603,351 | | |
| | 39,900 | | | L | | CBRL Group, Inc. | | | 1,785,924 | | |
| | 262,300 | | | @,L | | Charming Shoppes, Inc. | | | 3,548,919 | | |
| | 162,676 | | | L | | Claire's Stores, Inc. | | | 5,391,083 | | |
| | 76,100 | | | @,L | | Coldwater Creek, Inc. | | | 1,865,972 | | |
| | 36,300 | | | @,L | | Copart, Inc. | | | 1,089,000 | | |
| | 46,760 | | | @,L | | Dick's Sporting Goods, Inc. | | | 2,290,772 | | |
| | 219,832 | | | @,L | | Dollar Tree Stores, Inc. | | | 6,616,943 | | |
| | 192,103 | | | | | Foot Locker, Inc. | | | 4,212,819 | | |
| | 38,100 | | | @,L | | GameStop Corp. | | | 2,099,691 | | |
| | 72,300 | | | | | MSC Industrial Direct Co. | | | 2,830,545 | | |
| | 143,493 | | | @,L | | O'Reilly Automotive, Inc. | | | 4,600,386 | | |
| | 91,500 | | | | | OSI Restaurant Partners, Inc. | | | 3,586,800 | | |
| | 400,050 | | | @,L | | Payless Shoesource, Inc. | | | 13,129,641 | | |
| | 241,150 | | | | | Petsmart, Inc. | | | 6,959,589 | | |
| | 77,050 | | | L | | Regis Corp. | | | 3,046,557 | | |
| | 523,008 | | | L | | Ross Stores, Inc. | | | 15,324,134 | | |
| | 70,765 | | | L | | Ruby Tuesday, Inc. | | | 1,941,792 | | |
| | 172,400 | | | @,L | | Saks, Inc. | | | 3,072,168 | | |
| | 143,600 | | | L | | Williams-Sonoma, Inc. | | | 4,514,784 | | |
| | | | 148,847,479 | | |
| | | | | Savings & Loans: 0.8% | |
| | 109,375 | | | L | | Astoria Financial Corp. | | | 3,298,750 | | |
| | 183,474 | | | L | | First Niagara Financial
Group, Inc. | | | 2,726,424 | | |
| | 130,800 | | | L | | New York Community
Bancorp., Inc. | | | 2,105,880 | | |
| | 148,450 | | | | | Washington Federal, Inc. | | | 3,493,029 | | |
| | | | 11,624,083 | | |
| | | | | Semiconductors: 4.4% | |
| | 1,083,074 | | | @,L | | Atmel Corp. | | | 6,552,598 | | |
| | 95,962 | | | @,L | | Cree, Inc. | | | 1,662,062 | | |
| | 263,600 | | | @,L | | Fairchild Semiconductor
International, Inc. | | | 4,431,116 | | |
| | 347,160 | | | @,L | | Integrated Device
Technology, Inc. | | | 5,374,037 | | |
| | 92,200 | | | @, L | | International Rectifier Corp. | | | 3,552,466 | | |
| Shares | | | | | | Value | |
| | 179,450 | | | L | | Intersil Corp. | | $ | 4,292,444 | | |
| | 181,372 | | | @,L | | Lam Research Corp. | | | 9,181,051 | | |
| | 136,600 | | | @,L | | Lattice Semiconductor Corp. | | | 885,168 | | |
| | 289,565 | | | @,L | | MEMC Electronic
Materials, Inc. | | | 11,333,574 | | |
| | 76,700 | | | @,L | | Micrel, Inc. | | | 826,826 | | |
| | 276,850 | | | L | | Microchip Technology, Inc. | | | 9,052,995 | | |
| | 126,650 | | | @ | | Semtech Corp. | | | 1,655,316 | | |
| | 28,850 | | | @,L | | Silicon Laboratories, Inc. | | | 999,653 | | |
| | 188,480 | | | @ | | Triquint Semiconductor, Inc. | | | 848,160 | | |
| | | | 60,647,466 | | |
| | | | | Software: 2.4% | |
| | 91,450 | | | | | Acxiom Corp. | | | 2,345,693 | | |
| | 33,219 | | | @,L | | Advent Software, Inc. | | | 1,172,299 | | |
| | 82,825 | | | @,L | | CSG Systems International | | | 2,213,912 | | |
| | 82,009 | | | @ | | Dun & Bradstreet Corp. | | | 6,789,525 | | |
| | 81,012 | | | L | | Fair Isaac Corp. | | | 3,293,138 | | |
| | 108,089 | | | L | | MoneyGram International, Inc. | | | 3,389,671 | | |
| | 529,442 | | | @,L | | Sybase, Inc. | | | 13,077,206 | | |
| | 91,153 | | | @,L | | Wind River Systems, Inc. | | | 934,318 | | |
| | | | 33,215,762 | | |
| | | | | Telecommunications: 2.3% | |
| | 484,089 | | | @,L | | 3Com Corp. | | | 1,989,606 | | |
| | 80,350 | | | L | | Adtran, Inc. | | | 1,823,945 | | |
| | 205,600 | | | @,L | | Andrew Corp. | | | 2,103,288 | | |
| | 338,486 | | | @,L | | Cincinnati Bell, Inc. | | | 1,546,881 | | |
| | 71,794 | | | @,L | | CommScope, Inc. | | | 2,188,281 | | |
| | 169,373 | | | L | | Harris Corp. | | | 7,767,446 | | |
| | 113,650 | | | @,L | | Polycom, Inc. | | | 3,512,922 | | |
| | 153,560 | | | L | | Telephone & Data
Systems, Inc. | | | 8,342,915 | | |
| | 221,200 | | | @,L | | Utstarcom, Inc. | | | 1,935,500 | | |
| | | | 31,210,784 | | |
| | | | | Textiles: 0.6% | |
| | 116,332 | | | @,L | | Mohawk Industries, Inc. | | | 8,708,614 | | |
| | | | 8,708,614 | | |
| | | | | Transportation: 1.8% | |
| | 229,058 | | | L | | CH Robinson Worldwide, Inc. | | | 9,366,182 | | |
| | 82,753 | | | L | | Con-way, Inc. | | | 3,644,442 | | |
| | 112,800 | | | L | | Expeditors International
Washington, Inc. | | | 4,568,400 | | |
| | 53,900 | | | L | | Overseas Shipholding Group | | | 3,034,570 | | |
| | 66,300 | | | @,L | | Swift Transportation Co., Inc. | | | 1,741,701 | | |
| | 76,025 | | | @,L | | YRC Worldwide, Inc. | | | 2,868,423 | | |
| | | | 25,223,718 | | |
Total Common Stock
(Cost $1,271,638,800) | | | 1,368,320,794 | | |
Principal
Amount | | | | Value | |
| SHORT-TERM INVESTMENTS: 22.9% | |
| | | Mutual Fund: 0.3% | |
| $ | 5,000,000 | ** | | ING Institutional Prime Money
Market Fund | | | 5,000,000 | | |
Total Mutual Fund
(Cost $5,000,000) | | | 5,000,000 | | |
See Accompanying Notes to Financial Statements
52
ING VP INDEX PLUS PORTFOLIO OF INVESTMENTS
MIDCAP PORTFOLIO AS OF DECEMBER 31, 2006 (CONTINUED)
Principal
Amount | | | | Value | |
| | | Securities Lending CollateralCC: 22.6% | |
| $ | 310,743,528 | | | The Bank of New York Institutional
Cash Reserves Fund | | $ | 310,743,528 | | |
Total Securities Lending Collateral
(Cost $310,743,528) | | | 310,743,528 | | |
Total Short-Term Investments
(Cost $315,743,528) | | | 315,743,528 | | |
Total Investments in
Securities
(Cost $1,587,382,328)* | | | 122.4 | % | | $ | 1,684,064,322 | | |
Other Assets and
Liabilities - Net | | | (22.4 | ) | | | (308,373,702 | ) | |
| Net Assets | | | 100.0 | % | | $ | 1,375,690,620 | | |
@ Non-income producing security
@@ Foreign Issuer
cc Securities purchased with cash collateral for securities loaned.
L Loaned security, a portion or all of the security is on loan at December 31, 2006.
** Investment in affiliate
* Cost for federal income tax purposes is $1,596,751,787.
| Net unrealized appreciation consists of: | |
| Gross Unrealized Appreciation | | $ | 117,272,909 | | |
| Gross Unrealized Depreciation | | | (29,960,374 | ) | |
| Net Unrealized Appreciation | | $ | 87,312,535 | | |
VP Index Plus Mid Cap Open Futures Contracts on December 31, 2006:
Contract
Description | | Number
of
Contracts | | Notional
Market
Value ($) | | Expiration
Date | | Unrealized
(Depreciation) | |
| Long Contracts | |
| MidCap400 | | | 20 | | | | 8,113,000 | | | 3/15/07 | | $ | (145,890 | ) | |
| | | | | | | | | $ | (145,890 | ) | |
See Accompanying Notes to Financial Statements
53
ING VP INDEX PLUS PORTFOLIO OF INVESTMENTS
SMALLCAP PORTFOLIO AS OF DECEMBER 31, 2006
| Shares | | | | | | Value | |
| COMMON STOCK: 97.7% | | | |
| | | | | Advertising: 0.4% | |
| | 52,800 | | | | | Advo, Inc. | | $ | 1,721,280 | | |
| | 47,708 | | | @,L | | inVentiv Health, Inc. | | | 1,686,478 | | |
| | | | 3,407,758 | | |
| | | | | Aerospace/Defense: 1.1% | |
| | 49,171 | | | @,L | | Armor Holdings, Inc. | | | 2,697,029 | | |
| | 72,650 | | | | | Curtiss-Wright Corp. | | | 2,693,862 | | |
| | 23,200 | | | L | | EDO Corp. | | | 550,768 | | |
| | 40,167 | | | @,L | | Esterline Technologies Corp. | | | 1,615,918 | | |
| | 15,928 | | | L | | Kaman Corp. | | | 356,628 | | |
| | 56,799 | | | @ | | Teledyne Technologies, Inc. | | | 2,279,344 | | |
| | | | 10,193,549 | | |
| | | | | Agriculture: 0.7% | |
| | 568,100 | | | @ | | Alliance One
International, Inc. | | | 4,010,786 | | |
| | 59,328 | | | | | Delta & Pine Land Co. | | | 2,399,818 | | |
| | | | 6,410,604 | | |
| | | | | Airlines: 1.1% | |
| | 60,900 | | | @,L | | Frontier Airlines Holdings | | | 450,660 | | |
| | 382,755 | | | | | Skywest, Inc. | | | 9,764,065 | | |
| | | | 10,214,725 | | |
| | | | | Apparel: 3.7% | |
| | 7,553 | | | @ | | Ashworth, Inc. | | | 54,835 | | |
| | 53,630 | | | @,L | | CROCS, Inc. | | | 2,316,816 | | |
| | 30,200 | | | @,L | | Deckers Outdoor Corp. | | | 1,810,490 | | |
| | 204,029 | | | @ | | Gymboree Corp. | | | 7,785,747 | | |
| | 162,425 | | | L | | Kellwood Co. | | | 5,282,061 | | |
| | 59,036 | | | | | K-Swiss, Inc. | | | 1,814,767 | | |
| | 24,675 | | | L | | Oxford Industries, Inc. | | | 1,225,114 | | |
| | 158,300 | | | | | Phillips-Van Heusen | | | 7,941,911 | | |
| | 40,400 | | | @,L | | Skechers USA, Inc. | | | 1,345,724 | | |
| | 53,712 | | | | | Stride Rite Corp. | | | 809,977 | | |
| | 158,038 | | | | | Wolverine World Wide, Inc. | | | 4,507,244 | | |
| | | | 34,894,686 | | |
| | | | | Auto Parts & Equipment: 0.1% | |
| | 26,000 | | | @ | | Keystone Automotive
Industries, Inc. | | | 883,740 | | |
| | 19,200 | | | | | Standard Motor Products, Inc. | | | 287,616 | | |
| | | | 1,171,356 | | |
| | | | | Banks: 6.3% | |
| | 98,100 | | | | | Bank Mutual Corp. | | | 1,187,991 | | |
| | 46,000 | | | L | | Cascade Bancorp. | | | 1,427,380 | | |
| | 49,905 | | | | | Central Pacific Financial Corp. | | | 1,934,318 | | |
| | 102,088 | | | | | Chittenden Corp. | | | 3,133,081 | | |
| | 56,510 | | | | | Community Bank System, Inc. | | | 1,299,730 | | |
| | 136,276 | | | | | East-West Bancorp., Inc. | | | 4,826,896 | | |
| | 179,770 | | | @@,L | | First Bancorp. | | | 1,713,208 | | |
| | 103,800 | | | | | First Commonwealth
Financial Corp. | | | 1,394,034 | | |
| | 53,400 | | | | | First Financial Bancorp. | | | 886,974 | | |
| | 20,735 | | | | | First Indiana Corp. | | | 525,840 | | |
| | 81,787 | | | | | First Midwest Bancorp., Inc. | | | 3,163,521 | | |
| | 20,078 | | | L | | First Republic Bank | | | 784,648 | | |
| | 112,442 | | | | | Fremont General Corp. | | | 1,822,685 | | |
| | 91,768 | | | | | Hanmi Financial Corp. | | | 2,067,533 | | |
| | 57,420 | | | | | Independent Bank Corp. | | | 1,452,152 | | |
| Shares | | | | | | Value | |
| | 37,864 | | | | | Irwin Financial Corp. | | $ | 856,862 | | |
| | 34,571 | | | | | Nara Bancorp., Inc. | | | 723,225 | | |
| | 29,000 | | | L | | PrivateBancorp, Inc. | | | 1,207,270 | | |
| | 39,278 | | | L | | Prosperity Bancshares, Inc. | | | 1,355,484 | | |
| | 52,683 | | | | | Provident Bankshares Corp. | | | 1,875,515 | | |
| | 123,911 | | | | | South Financial Group, Inc. | | | 3,294,793 | | |
| | 108,642 | | | L | | Sterling Bancshares, Inc. | | | 1,414,519 | | |
| | 60,961 | | | | | Sterling Financial Corp. | | | 2,061,091 | | |
| | 85,123 | | | | | Susquehanna Bancshares, Inc. | | | 2,288,106 | | |
| | 122,133 | | | L | | Trustco Bank Corp. | | | 1,358,119 | | |
| | 155,439 | | | | | UCBH Holdings, Inc. | | | 2,729,509 | | |
| | 93,545 | | | | | Umpqua Holdings Corp. | | | 2,753,029 | | |
| | 60,681 | | | | | United Bankshares, Inc. | | | 2,345,321 | | |
| | 187,265 | | | L | | Whitney Holding Corp. | | | 6,108,584 | | |
| | 20,700 | | | | | Wilshire Bancorp., Inc. | | | 392,679 | | |
| | 39,140 | | | L | | Wintrust Financial Corp. | | | 1,879,503 | | |
| | | | 60,263,600 | | |
| | | | | Biotechnology: 0.6% | |
| | 64,725 | | | @,L | | Arqule, Inc. | | | 383,172 | | |
| | 17,500 | | | L | | Cambrex Corp. | | | 397,600 | | |
| | 37,300 | | | @,L | | CryoLife, Inc. | | | 285,345 | | |
| | 38,400 | | | @ | | Digene Corp. | | | 1,840,128 | | |
| | 93,650 | | | @,L | | Regeneron
Pharmaceuticals, Inc. | | | 1,879,556 | | |
| | 114,586 | | | @,L | | Savient Pharmaceuticals, Inc. | | | 1,284,509 | | |
| | | | 6,070,310 | | |
| | | | | Building Materials: 0.9% | |
| | 33,500 | | | L | | ElkCorp | | | 1,376,515 | | |
| | 93,492 | | | | | Lennox International, Inc. | | | 2,861,790 | | |
| | 33,634 | | | @,L | | NCI Building Systems, Inc. | | | 1,740,560 | | |
| | 15,600 | | | L | | Texas Industries, Inc. | | | 1,001,988 | | |
| | 31,292 | | | | | Universal Forest Products, Inc. | | | 1,458,833 | | |
| | | | 8,439,686 | | |
| | | | | Chemicals: 1.9% | |
| | 39,880 | | | | | Arch Chemicals, Inc. | | | 1,328,403 | | |
| | 76,400 | | | | | Georgia Gulf Corp. | | | 1,475,284 | | |
| | 132,896 | | | | | HB Fuller Co. | | | 3,431,375 | | |
| | 41,280 | | | L | | MacDermid, Inc. | | | 1,407,648 | | |
| | 47,100 | | | @ | | OM Group, Inc. | | | 2,132,688 | | |
| | 66,420 | | | @ | | Omnova Solutions, Inc. | | | 304,204 | | |
| | 23,648 | | | | | Penford Corp. | | | 409,110 | | |
| | 598,813 | | | @ | | PolyOne Corp. | | | 4,491,098 | | |
| | 15,400 | | | | | Quaker Chemical Corp. | | | 339,878 | | |
| | 46,586 | | | L | | Schulman A, Inc. | | | 1,036,539 | | |
| | 92,300 | | | L | | Tronox, Inc. | | | 1,457,417 | | |
| | 53,600 | | | L | | Wellman, Inc. | | | 170,984 | | |
| | | | 17,984,628 | | |
| | | | | Commercial Services: 4.7% | |
| | 75,270 | | | L | | Aaron Rents, Inc. | | | 2,166,271 | | |
| | 70,875 | | | | | ABM Industries, Inc. | | | 1,609,571 | | |
| | 39,820 | | | L | | Administaff, Inc. | | | 1,703,101 | | |
| | 51,900 | | | @,L | | AMN Healthcare Services, Inc. | | | 1,429,326 | | |
| | 47,850 | | | L | | Arbitron, Inc. | | | 2,078,604 | | |
| | 17,300 | | | @,L | | Bankrate, Inc. | | | 656,535 | | |
| | 43,800 | | | | | Bowne & Co., Inc. | | | 698,172 | | |
| | 42,300 | | | @,L | | Bright Horizons Family
Solutions, Inc. | | | 1,635,318 | | |
| | 36,775 | | | | | Central Parking Corp. | | | 661,950 | | |
| | 41,194 | | | L | | Chemed Corp. | | | 1,523,354 | | |
See Accompanying Notes to Financial Statements
54
ING VP INDEX PLUS PORTFOLIO OF INVESTMENTS
SMALLCAP PORTFOLIO AS OF DECEMBER 31, 2006 (CONTINUED)
| Shares | | | | | | Value | |
| | | | | Commercial Services (continued) | |
| | 44,774 | | | @,L | | Coinstar, Inc. | | $ | 1,368,741 | | |
| | 26,116 | | | @,L | | Consolidated Graphics, Inc. | | | 1,542,672 | | |
| | 15,570 | | | L | | CPI Corp. | | | 723,849 | | |
| | 33,400 | | | @,L | | Cross Country Healthcare, Inc. | | | 728,788 | | |
| | 41,300 | | | | | Gevity HR, Inc. | | | 978,397 | | |
| | 45,822 | | | @ | | Heidrick & Struggles
International, Inc. | | | 1,941,020 | | |
| | 79,021 | | | @ | | Kendle International, Inc. | | | 2,485,210 | | |
| | 148,470 | | | @,L | | Labor Ready, Inc. | | | 2,721,455 | | |
| | 102,352 | | | @,L | | Live Nation, Inc. | | | 2,292,685 | | |
| | 17,200 | | | @ | | Midas, Inc. | | | 395,600 | | |
| | 43,495 | | | @,L | | On Assignment, Inc. | | | 511,066 | | |
| | 43,366 | | | @ | | Parexel International Corp. | | | 1,256,313 | | |
| | 30,211 | | | @,L | | Pharmanet
Development Group | | | 666,757 | | |
| | 14,096 | | | @,L | | Pre-Paid Legal Services, Inc. | | | 551,576 | | |
| | 32,650 | | | @,L | | Rewards Network, Inc. | | | 226,918 | | |
| | 132,324 | | | @ | | Spherion Corp. | | | 983,167 | | |
| | 12,950 | | | | | Startek, Inc. | | | 175,343 | | |
| | 38,368 | | | @,L | | Universal Technical
Institute, Inc. | | | 852,153 | | |
| | 23,648 | | | @,L | | Vertrue, Inc. | | | 908,320 | | |
| | 61,825 | | | W,L | | Viad Corp. | | | 2,510,095 | | |
| | 55,500 | | | @,L | | Volt Information Sciences, Inc. | | | 2,786,655 | | |
| | 94,676 | | | | | Watson Wyatt Worldwide, Inc. | | | 4,274,621 | | |
| | | | 45,043,603 | | |
| | | | | Computers: 2.9% | |
| | 57,628 | | | | | Agilysys, Inc. | | | 964,693 | | |
| | 50,324 | | | @ | | CACI International, Inc. | | | 2,843,306 | | |
| | 34,646 | | | @ | | Carreker Corp. | | | 264,695 | | |
| | 10,650 | | | @ | | Catapult
Communications Corp. | | | 95,637 | | |
| | 86,534 | | | @ | | Ciber, Inc. | | | 586,701 | | |
| | 107,440 | | | | | Factset Research Systems, Inc. | | | 6,068,211 | | |
| | 51,000 | | | @,L | | Komag, Inc. | | | 1,931,880 | | |
| | 51,687 | | | @,L | | Kronos, Inc. | | | 1,898,980 | | |
| | 60,251 | | | @,L | | Manhattan Associates, Inc. | | | 1,812,350 | | |
| | 59,100 | | | @ | | Mercury Computer
Systems, Inc. | | | 789,576 | | |
| | 86,294 | | | @,L | | Micros Systems, Inc. | | | 4,547,694 | | |
| | 29,154 | | | | | MTS Systems Corp. | | | 1,125,927 | | |
| | 61,010 | | | @,L | | Radisys Corp. | | | 1,017,037 | | |
| | 190,900 | | | @ | | SYKES Enterprises, Inc. | | | 3,367,476 | | |
| | | | 27,314,163 | | |
| | | | | Distribution/Wholesale: 1.1% | |
| | 187,745 | | | | | Building Materials
Holding Corp. | | | 4,635,424 | | |
| | 86,685 | | | L | | Pool Corp. | | | 3,395,451 | | |
| | 50,615 | | | @ | | United Stationers, Inc. | | | 2,363,214 | | |
| | | | 10,394,089 | | |
| | | | | | | Diversified Financial
Services: 2.1% | | | | | |
| | 42,275 | | | | | Financial Federal Corp. | | | 1,243,308 | | |
| | 96,821 | | | @ | | Investment Technology
Group, Inc. | | | 4,151,684 | | |
| | 86,485 | | | @,L | | LaBranche & Co., Inc. | | | 850,148 | | |
| | 119,939 | | | @ | | Piper Jaffray Cos. | | | 7,814,026 | | |
| | 24,810 | | | @,L | | Portfolio Recovery
Associates, Inc. | | | 1,158,379 | | |
| | 27,597 | | | L | | SWS Group, Inc. | | | 985,213 | | |
| Shares | | | | | | Value | |
| | 164,700 | | | @,L | | TradeStation Group, Inc. | | $ | 2,264,625 | | |
| | 29,303 | | | @,L | | World Acceptance, Corp. | | | 1,375,776 | | |
| | | | 19,843,159 | | |
| | | | | Electric: 1.4% | |
| | 55,639 | | | | | Allete, Inc. | | | 2,589,439 | | |
| | 89,950 | | | | | Avista Corp. | | | 2,276,635 | | |
| | 16,010 | | | | | Central Vermont Public
Service Corp. | | | 377,036 | | |
| | 24,228 | | | | | CH Energy Group, Inc. | | | 1,279,238 | | |
| | 103,649 | | | | | Cleco Corp. | | | 2,615,064 | | |
| | 86,832 | | | @ | | El Paso Electric Co. | | | 2,116,096 | | |
| | 4,900 | | | L | | Green Mountain Power Corp. | | | 166,061 | | |
| | 44,123 | | | L | | UIL Holdings Corp. | | | 1,861,549 | | |
| | | | 13,281,118 | | |
| | | | | | | Electrical Components &
Equipment: 0.9% | | | | | |
| | 57,800 | | | @ | | Advanced Energy
Industries, Inc. | | | 1,090,686 | | |
| | 97,057 | | | | | Belden CDT, Inc. | | | 3,793,958 | | |
| | 30,078 | | | @,L | | Greatbatch, Inc. | | | 809,700 | | |
| | 62,706 | | | @,L | | Littelfuse, Inc. | | | 1,999,067 | | |
| | 48,100 | | | @ | | Magnetek, Inc. | | | 271,765 | | |
| | 24,984 | | | | | Vicor Corp. | | | 277,572 | | |
| | | | 8,242,748 | | |
| | | | | Electronics: 3.8% | |
| | 24,116 | | | | | Bel Fuse, Inc. | | | 838,996 | | |
| | 106,800 | | | @,L | | Benchmark Electronics, Inc. | | | 2,601,648 | | |
| | 35,143 | | | | | Brady Corp. | | | 1,310,131 | | |
| | 59,840 | | | @,L | | Checkpoint Systems, Inc. | | | 1,208,768 | | |
| | 89,275 | | | @,L | | Coherent, Inc. | | | 2,818,412 | | |
| | 48,075 | | | | | CTS Corp. | | | 754,778 | | |
| | 43,773 | | | | | Cubic Corp. | | | 949,874 | | |
| | 26,057 | | | @,L | | Cymer, Inc. | | | 1,145,205 | | |
| | 20,926 | | | L | | Daktronics, Inc. | | | 771,123 | | |
| | 31,511 | | | @,L | | Dionex Corp. | | | 1,786,989 | | |
| | 48,414 | | | @ | | Electro Scientific
Industries, Inc. | | | 975,058 | | |
| | 39,059 | | | @,L | | FEI Co. | | | 1,029,986 | | |
| | 40,408 | | | @,L | | Itron, Inc. | | | 2,094,751 | | |
| | 22,350 | | | | | Keithley Instruments, Inc. | | | 293,903 | | |
| | 242,043 | | | | | Methode Electronics, Inc. | | | 2,621,326 | | |
| | 42,822 | | | | | Park Electrochemical Corp. | | | 1,098,384 | | |
| | 66,975 | | | @ | | Paxar Corp. | | | 1,544,444 | | |
| | 53,195 | | | @ | | Planar Systems, Inc. | | | 514,396 | | |
| | 27,450 | | | @ | | Rogers Corp. | | | 1,623,668 | | |
| | 63,905 | | | | | Technitrol, Inc. | | | 1,526,690 | | |
| | 89,608 | | | @,L | | Trimble Navigation Ltd. | | | 4,545,814 | | |
| | 41,550 | | | L | | Watts Water Technologies, Inc. | | | 1,708,121 | | |
| | 47,931 | | | | | Woodward Governor Co. | | | 1,903,340 | | |
| | | | 35,665,805 | | |
| | | | | Energy-Alternate Sources: 0.2% | |
| | 66,713 | | | @,L | | Headwaters, Inc. | | | 1,598,443 | | |
| | | | 1,598,443 | | |
| | | | | Engineering & Construction: 0.9% | |
| | 90,121 | | | @ | | EMCOR Group, Inc. | | | 5,123,379 | | |
| | 85,358 | | | @,L | | URS Corp. | | | 3,657,590 | | |
| | | | 8,780,969 | | |
See Accompanying Notes to Financial Statements
55
ING VP INDEX PLUS PORTFOLIO OF INVESTMENTS
SMALLCAP PORTFOLIO AS OF DECEMBER 31, 2006 (CONTINUED)
| Shares | | | | | | Value | |
| | | | | Entertainment: 0.4% | |
| | 77,149 | | | @ | | Pinnacle Entertainment, Inc. | | $ | 2,556,718 | | |
| | 56,775 | | | @,L | | Shuffle Master, Inc. | | | 1,487,505 | | |
| | | | 4,044,223 | | |
| | | | | Environmental Control: 0.5% | |
| | 90,176 | | | @,L | | Tetra Tech, Inc. | | | 1,631,284 | | |
| | 73,650 | | | @,L | | Waste Connections, Inc. | | | 3,060,158 | | |
| | | | 4,691,442 | | |
| | | | | Food: 1.8% | |
| | 163,217 | | | | | Corn Products
International, Inc. | | | 5,637,515 | | |
| | 87,406 | | | L | | Flowers Foods, Inc. | | | 2,359,088 | | |
| | 60,488 | | | @,L | | Hain Celestial Group, Inc. | | | 1,887,830 | | |
| | 21,402 | | | | | J&J Snack Foods Corp. | | | 886,043 | | |
| | 56,631 | | | @,L | | Performance Food Group Co. | | | 1,565,281 | | |
| | 59,117 | | | @,L | | Ralcorp Holdings, Inc. | | | 3,008,464 | | |
| | 48,324 | | | @,L | | TreeHouse Foods, Inc. | | | 1,507,709 | | |
| | | | 16,851,930 | | |
| | | | | Forest Products & Paper: 0.7% | |
| | 62,847 | | | @,L | | Buckeye Technologies, Inc. | | | 752,907 | | |
| | 29,388 | | | @ | | Caraustar Industries, Inc. | | | 237,749 | | |
| | 16,471 | | | L | | Deltic Timber Corp. | | | 918,752 | | |
| | 24,100 | | | L | | Neenah Paper, Inc. | | | 851,212 | | |
| | 71,475 | | | | | Rock-Tenn Co. | | | 1,937,687 | | |
| | 20,923 | | | | | Schweitzer-Mauduit
International, Inc. | | | 545,044 | | |
| | 69,173 | | | | | Wausau Paper Corp. | | | 1,036,903 | | |
| | | | 6,280,254 | | |
| | | | | Gas: 2.3% | |
| | 147,491 | | | | | Atmos Energy Corp. | | | 4,706,438 | | |
| | 18,384 | | | L | | Cascade Natural Gas Corp. | | | 476,513 | | |
| | 131,083 | | | L | | Energen Corp. | | | 6,153,036 | | |
| | 15,600 | | | | | Laclede Group, Inc. | | | 546,468 | | |
| | 49,641 | | | | | Northwest Natural Gas Co. | | | 2,106,764 | | |
| | 73,860 | | | | | Southwest Gas Corp. | | | 2,834,008 | | |
| | 190,679 | | | | | UGI Corp. | | | 5,201,723 | | |
| | | | 22,024,950 | | |
| | | | | Hand/Machine Tools: 0.4% | |
| | 47,242 | | | | | Baldor Electric Co. | | | 1,578,828 | | |
| | 50,053 | | | | | Regal-Beloit Corp. | | | 2,628,283 | | |
| | | | 4,207,111 | | |
| | | | | Healthcare-Products: 3.7% | |
| | 111,443 | | | @,L | | American Medical Systems
Holdings, Inc. | | | 2,063,924 | | |
| | 38,200 | | | @,L | | Biolase Technology, Inc. | | | 334,250 | | |
| | 28,698 | | | @,L | | Biosite, Inc. | | | 1,401,897 | | |
| | 20,526 | | | | | Datascope Corp. | | | 747,967 | | |
| | 59,450 | | | @ | | Haemonetics Corp. | | | 2,676,439 | | |
| | 87,182 | | | @,L | | Hologic, Inc. | | | 4,121,965 | | |
| | 22,625 | | | @,L | | ICU Medical, Inc. | | | 920,385 | | |
| | 52,134 | | | @ | | Idexx Laboratories, Inc. | | | 4,134,226 | | |
| | 110,835 | | | @,L | | Immucor, Inc. | | | 3,239,707 | | |
| | 32,715 | | | L | | LCA-Vision, Inc. | | | 1,124,087 | | |
| | 91,800 | | | | | Mentor Corp. | | | 4,486,266 | | |
| | 35,100 | | | L | | Meridian Bioscience, Inc. | | | 861,003 | | |
| | 58,832 | | | @ | | Osteotech, Inc. | | | 332,401 | | |
| | 29,100 | | | @,L | | Palomar Medical
Technologies, Inc. | | | 1,474,497 | | |
| Shares | | | | | | Value | |
| | 24,950 | | | @ | | Possis Medical, Inc. | | $ | 336,326 | | |
| | 119,917 | | | @ | | Respironics, Inc. | | | 4,526,867 | | |
| | 24,450 | | | @,L | | SurModics, Inc. | | | 760,884 | | |
| | 50,400 | | | @ | | Viasys Healthcare, Inc. | | | 1,402,128 | | |
| | 11,703 | | | | | Vital Signs, Inc. | | | 584,214 | | |
| | | | 35,529,433 | | |
| | | | | Healthcare-Services: 4.2% | |
| | 1 | | | @,L | | Amedisys, Inc. | | | 33 | | |
| | 280,725 | | | @,L | | Amerigroup Corp. | | | 10,075,220 | | |
| | 65,575 | | | @ | | Amsurg Corp. | | | 1,508,225 | | |
| | 278,606 | | | @,L | | Centene Corp. | | | 6,845,349 | | |
| | 60,744 | | | @,L | | Gentiva Health Services, Inc. | | | 1,157,781 | | |
| | 78,800 | | | @,L | | Healthways, Inc. | | | 3,759,548 | | |
| | 105,903 | | | @ | | Odyssey HealthCare, Inc. | | | 1,404,274 | | |
| | 108,243 | | | @,L | | Pediatrix Medical Group, Inc. | | | 5,293,083 | | |
| | 160,593 | | | @,L | | Sierra Health Services, Inc. | | | 5,787,772 | | |
| | 68,379 | | | @,L | | Sunrise Senior Living, Inc. | | | 2,100,603 | | |
| | 69,527 | | | @,L | | United Surgical Partners
International, Inc. | | | 1,971,090 | | |
| | | | 39,902,978 | | |
| | | | | Home Builders: 1.9% | |
| | 104,360 | | | @,L | | Champion Enterprises, Inc. | | | 976,810 | | |
| | 11,450 | | | | | Coachmen Industries, Inc. | | | 125,950 | | |
| | 35,200 | | | @,L | | Meritage Homes Corp. | | | 1,679,744 | | |
| | 44,362 | | | L | | Monaco Coach Corp. | | | 628,166 | | |
| | 11,225 | | | @,L | | NVR, Inc. | | | 7,240,125 | | |
| | 9,825 | | | L | | Skyline Corp. | | | 395,162 | | |
| | 202,550 | | | L | | Winnebago Industries | | | 6,665,921 | | |
| | | | 17,711,878 | | |
| | | | | Home Furnishings: 0.5% | |
| | 17,604 | | | @,L | | Audiovox Corp. | | | 248,040 | | |
| | 94,419 | | | | | Ethan Allen Interiors, Inc. | | | 3,409,470 | | |
| | 85,630 | | | L | | La-Z-Boy, Inc. | | | 1,016,428 | | |
| | | | 4,673,938 | | |
| | | | | Household Products/Wares: 0.4% | |
| | 38,900 | | | @ | | Central Garden & Pet Co. | | | 1,883,538 | | |
| | 92,528 | | | @ | | Playtex Products, Inc. | | | 1,331,478 | | |
| | 28,125 | | | | | WD-40 Co. | | | 980,719 | | |
| | | | 4,195,735 | | |
| | | | | Housewares: 0.5% | |
| | 6,019 | | | | | National Presto Industries, Inc. | | | 360,358 | | |
| | 91,510 | | | L | | Toro Co. | | | 4,267,111 | | |
| | | | 4,627,469 | | |
| | | | | Insurance: 4.2% | |
| | 70,935 | | | | | Delphi Financial Group | | | 2,870,030 | | |
| | 59,425 | | | L | | Hilb Rogal & Hobbs Co. | | | 2,502,981 | | |
| | 33,190 | | | | | Infinity Property &
Casualty Corp. | | | 1,606,064 | | |
| | 49,825 | | | L | | Landamerica Financial
Group, Inc. | | | 3,144,456 | | |
| | 157,785 | | | @ | | Philadelphia Consolidated
Holding Co. | | | 7,030,900 | | |
| | 60,421 | | | | | Presidential Life Corp. | | | 1,326,241 | | |
| | 94,802 | | | @,L | | ProAssurance Corp. | | | 4,732,516 | | |
| | 33,951 | | | | | RLI Corp. | | | 1,915,515 | | |
| | 41,670 | | | | | Safety Insurance Group, Inc. | | | 2,113,086 | | |
| | 15,968 | | | @,L | | SCPIE Holdings, Inc. | | | 417,404 | | |
| | 82,972 | | | L | | Selective Insurance Group | | | 4,753,466 | | |
See Accompanying Notes to Financial Statements
56
ING VP INDEX PLUS PORTFOLIO OF INVESTMENTS
SMALLCAP PORTFOLIO AS OF DECEMBER 31, 2006 (CONTINUED)
| Shares | | | | | | Value | |
| | | | | Insurance (continued) | |
| | 29,588 | | | L | | Stewart Information
Services Corp. | | $ | 1,282,936 | | |
| | 34,200 | | | | | United Fire & Casualty Co. | | | 1,205,550 | | |
| | 100,485 | | | L | | Zenith National
Insurance Corp. | | | 4,713,751 | | |
| | | | 39,614,896 | | |
| | | | | Internet: 2.1% | |
| | 16,650 | | | @,L | | Blue Coat Systems, Inc. | | | 398,768 | | |
| | 89,900 | | | @,L | | Blue Nile, Inc. | | | 3,316,411 | | |
| | 54,800 | | | @,L | | Digital Insight Corp. | | | 2,109,252 | | |
| | 145,200 | | | @ | | Digitas, Inc. | | | 1,947,132 | | |
| | 79,199 | | | @,L | | Infospace, Inc. | | | 1,624,371 | | |
| | 81,150 | | | @,L | | j2 Global Communications, Inc. | | | 2,211,338 | | |
| | 73,400 | | | @ | | Napster, Inc. | | | 266,442 | | |
| | 20,665 | | | @ | | PC-Tel, Inc. | | | 193,218 | | |
| | 144,121 | | | @,L | | Secure Computing Corp. | | | 945,434 | | |
| | 123,305 | | | @ | | Stamps.com, Inc. | | | 1,942,054 | | |
| | 154,922 | | | L | | United Online, Inc. | | | 2,057,364 | | |
| | 28,100 | | | @,L | | WebEx Communications, Inc. | | | 980,409 | | |
| | 76,320 | | | @,L | | Websense, Inc. | | | 1,742,386 | | |
| | | | 19,734,579 | | |
| | | | | Iron/Steel: 1.6% | |
| | 41,915 | | | | | Carpenter Technology Corp. | | | 4,297,126 | | |
| | 103,166 | | | | | Chaparral Steel Co. | | | 4,567,159 | | |
| | 68,920 | | | L | | Cleveland-Cliffs, Inc. | | | 3,338,485 | | |
| | 28,950 | | | @,L | | Material Sciences Corp. | | | 374,613 | | |
| | 74,018 | | | | | Ryerson, Inc. | | | 1,857,112 | | |
| | 25,586 | | | | | Steel Technologies, Inc. | | | 449,034 | | |
| | | | 14,883,529 | | |
| | | | | Leisure Time: 0.2% | |
| | 75,900 | | | @,L | | K2, Inc. | | | 1,001,121 | | |
| | 38,500 | | | @,L | | WMS Industries, Inc. | | | 1,342,110 | | |
| | | | 2,343,231 | | |
| | | | | Lodging: 0.4% | |
| | 59,500 | | | @ | | Aztar Corp. | | | 3,237,990 | | |
| | 34,431 | | | L | | Marcus Corp. | | | 880,745 | | |
| | | | 4,118,735 | | |
| | | | | Machinery-Diversified: 2.3% | |
| | 62,222 | | | | | Applied Industrial
Technologies, Inc. | | | 1,637,061 | | |
| | 67,287 | | | | | Cognex Corp. | | | 1,602,776 | | |
| | 147,451 | | | @,L | | Gardner Denver, Inc. | | | 5,501,397 | | |
| | 45,102 | | | @ | | Gerber Scientific, Inc. | | | 566,481 | | |
| | 87,077 | | | | | IDEX Corp. | | | 4,128,321 | | |
| | 34,000 | | | @ | | Intevac, Inc. | | | 882,300 | | |
| | 19,100 | | | L | | Lindsay Manufacturing Co. | | | 623,615 | | |
| | 101,816 | | | | | Manitowoc Co., Inc. | | | 6,050,925 | | |
| | 27,111 | | | L | | Robbins & Myers, Inc. | | | 1,244,937 | | |
| | | | 22,237,813 | | |
| | | | | Media: 0.1% | |
| | 21,400 | | | @ | | 4Kids Entertainment, Inc. | | | 389,908 | | |
| | 109,200 | | | @,L | | Radio One, Inc. | | | 736,008 | | |
| | | | 1,125,916 | | |
| | | | | Metal Fabricate/Hardware: 1.0% | |
| | 35,275 | | | | | AM Castle & Co. | | | 897,749 | | |
| | 44,410 | | | L | | Kaydon Corp. | | | 1,764,853 | | |
| Shares | | | | | | Value | |
| | 8,841 | | | | | Lawson Products | | $ | 405,713 | | |
| | 60,873 | | | | | Mueller Industries, Inc. | | | 1,929,674 | | |
| | 83,881 | | | L | | Quanex Corp. | | | 2,901,444 | | |
| | 27,075 | | | | | Valmont Industries, Inc. | | | 1,502,392 | | |
| | | | 9,401,825 | | |
| | | | | Miscellaneous Manufacturing: 2.4% | |
| | 128,605 | | | | | Acuity Brands, Inc. | | | 6,692,604 | | |
| | 37,559 | | | L | | AO Smith Corp. | | | 1,410,716 | | |
| | 60,001 | | | | | Aptargroup, Inc. | | | 3,542,459 | | |
| | 56,050 | | | | | Barnes Group, Inc. | | | 1,219,088 | | |
| | 43,425 | | | @,L | | Ceradyne, Inc. | | | 2,453,513 | | |
| | 136,844 | | | @,L | | EnPro Industries, Inc. | | | 4,544,589 | | |
| | 25,400 | | | @ | | Lydall, Inc. | | | 274,574 | | |
| | 43,991 | | | | | Myers Industries, Inc. | | | 688,899 | | |
| | 15,140 | | | | | Standex International Corp. | | | 456,168 | | |
| | 48,900 | | | @ | | Sturm Ruger & Co., Inc. | | | 469,440 | | |
| | 62,220 | | | | | Tredegar Corp. | | | 1,406,794 | | |
| | | | 23,158,844 | | |
| | | | | Office Furnishings: 0.1% | |
| | 72,244 | | | @ | | Interface, Inc. | | | 1,027,310 | | |
| | | | 1,027,310 | | |
| | | | | Office/Business Equipment: 0.2% | |
| | 85,728 | | | @ | | Global Imaging Systems, Inc. | | | 1,881,730 | | |
| | | | 1,881,730 | | |
| | | | | Oil & Gas: 3.6% | |
| | 79,949 | | | L | | Cabot Oil & Gas Corp. | | | 4,848,907 | | |
| | 135,946 | | | | | Cimarex Energy Co. | | | 4,962,029 | | |
| | 320,530 | | | | | Frontier Oil Corp. | | | 9,212,032 | | |
| | 41,783 | | | | | Penn Virginia Corp. | | | 2,926,481 | | |
| | 10,700 | | | @,L | | Petroleum Development Corp. | | | 460,635 | | |
| | 128,662 | | | L | | St. Mary Land &
Exploration Co. | | | 4,739,908 | | |
| | 45,143 | | | @ | | Stone Energy Corp. | | | 1,595,805 | | |
| | 48,473 | | | @,L | | Swift Energy Co. | | | 2,172,075 | | |
| | 76,005 | | | @ | | Unit Corp. | | | 3,682,442 | | |
| | | | 34,600,314 | | |
| | | | | Oil & Gas Services: 3.1% | |
| | 38,944 | | | @,L | | Dril-Quip, Inc. | | | 1,525,047 | | |
| | 149,413 | | | @ | | Helix Energy Solutions
Group, Inc. | | | 4,687,086 | | |
| | 31,550 | | | @,L | | Hydril | | | 2,372,245 | | |
| | 50,854 | | | @,L | | Lone Star Technologies | | | 2,461,842 | | |
| | 23,133 | | | L | | Lufkin Industries, Inc. | | | 1,343,565 | | |
| | 88,200 | | | @ | | Oceaneering
International, Inc. | | | 3,501,540 | | |
| | 62,814 | | | @,L | | SEACOR Holdings, Inc. | | | 6,227,380 | | |
| | 59,178 | | | @,L | | Veritas DGC, Inc. | | | 5,067,412 | | |
| | 48,375 | | | @ | | W-H Energy Services, Inc. | | | 2,355,379 | | |
| | | | 29,541,496 | | |
| | | | | Packaging & Containers: 0.1% | |
| | 35,050 | | | | | Chesapeake Corp. | | | 596,551 | | |
| | | | 596,551 | | |
| | | | | Pharmaceuticals: 1.7% | |
| | 28,275 | | | @,L | | Bradley Pharmaceuticals, Inc. | | | 581,900 | | |
| | 25,600 | | | L | | Mannatech, Inc. | | | 377,088 | | |
| | 51,367 | | | @,L | | MGI Pharma, Inc. | | | 945,666 | | |
| | 124,527 | | | @,L | | NBTY, Inc. | | | 5,176,587 | | |
See Accompanying Notes to Financial Statements
57
ING VP INDEX PLUS PORTFOLIO OF INVESTMENTS
SMALLCAP PORTFOLIO AS OF DECEMBER 31, 2006 (CONTINUED)
| Shares | | | | | | Value | |
| | | | | Pharmaceuticals (continued) | |
| | 157,157 | | | @,L | | Noven Pharmaceuticals, Inc. | | $ | 3,999,646 | | |
| | 37,100 | | | @,L | | PetMed Express, Inc. | | | 495,285 | | |
| | 49,160 | | | @,L | | Sciele Pharma, Inc. | | | 1,179,840 | | |
| | 52,600 | | | @ | | Theragenics Corp. | | | 163,060 | | |
| | 58,550 | | | @,L | | USANA Health Sciences, Inc. | | | 3,024,693 | | |
| | | | 15,943,765 | | |
| | | | | | | Real Estate Investment
Trusts: 2.7% | | | | | |
| | 20,356 | | | | | Acadia Realty Trust | | | 509,307 | | |
| | 75,544 | | | L | | Colonial Properties Trust | | | 3,541,503 | | |
| | 38,800 | | | | | EastGroup Properties, Inc. | | | 2,078,128 | | |
| | 43,764 | | | | | Entertainment Properties Trust | | | 2,557,568 | | |
| | 38,185 | | | | | Essex Property Trust, Inc. | | | 4,935,411 | | |
| | 109,250 | | | | | Inland Real Estate Corp. | | | 2,045,160 | | |
| | 34,100 | | | | | LTC Properties, Inc. | | | 931,271 | | |
| | 37,000 | | | | | Mid-America Apartment
Communities, Inc. | | | 2,117,880 | | |
| | 36,750 | | | L | | National Retail Properties, Inc. | | | 843,413 | | |
| | 75,200 | | | | | New Century Financial Corp. | | | 2,375,568 | | |
| | 25,400 | | | | | PS Business Parks, Inc. | | | 1,796,034 | | |
| | 29,946 | | | | | Sovran Self Storage, Inc. | | | 1,715,307 | | |
| | | | 25,446,550 | | |
| | | | | Retail: 7.6% | |
| | 78,148 | | | | | Brown Shoe Co., Inc. | | | 3,730,786 | | |
| | 31,100 | | | @,L | | California Pizza Kitchen, Inc. | | | 1,035,941 | | |
| | 79,838 | | | | | Casey's General Stores, Inc. | | | 1,880,185 | | |
| | 46,350 | | | L | | Cash America
International, Inc. | | | 2,173,815 | | |
| | 50,516 | | | | | Cato Corp. | | | 1,157,322 | | |
| | 55,110 | | | @ | | CEC Entertainment, Inc. | | | 2,218,178 | | |
| | 36,712 | | | @,L | | Childrens Place Retail
Stores, Inc. | | | 2,331,946 | | |
| | 103,243 | | | L | | Christopher & Banks Corp. | | | 1,926,514 | | |
| | 109,500 | | | | | CKE Restaurants, Inc. | | | 2,014,800 | | |
| | 129,590 | | | @,L | | Dress Barn, Inc. | | | 3,023,335 | | |
| | 15,139 | | | @,L | | Genesco, Inc. | | | 564,685 | | |
| | 155,525 | | | L | | Group 1 Automotive, Inc. | | | 8,043,753 | | |
| | 48,625 | | | L | | Haverty Furniture Cos., Inc. | | | 719,650 | | |
| | 49,625 | | | @ | | Hibbett Sporting Goods, Inc. | | | 1,515,051 | | |
| | 68,893 | | | @,L | | HOT Topic, Inc. | | | 919,033 | | |
| | 26,300 | | | | | IHOP Corp. | | | 1,386,010 | | |
| | 76,864 | | | @ | | Insight Enterprises, Inc. | | | 1,450,424 | | |
| | 100,346 | | | @,L | | Jack in the Box, Inc. | | | 6,125,120 | | |
| | 47,214 | | | L | | Longs Drug Stores Corp. | | | 2,000,929 | | |
| | 30,700 | | | @,L | | MarineMax, Inc. | | | 796,051 | | |
| | 151,527 | | | L | | Men's Wearhouse, Inc. | | | 5,797,423 | | |
| | 30,200 | | | @,L | | O'Charleys, Inc. | | | 642,656 | | |
| | 51,283 | | | @,L | | Panera Bread Co. | | | 2,867,233 | | |
| | 38,890 | | | @,L | | Papa John's International, Inc. | | | 1,128,199 | | |
| | 41,510 | | | @,L | | PF Chang's China Bistro, Inc. | | | 1,593,154 | | |
| | 27,000 | | | @,L | | Red Robin Gourmet
Burgers, Inc. | | | 967,950 | | |
| | 35,800 | | | @,L | | School Specialty, Inc. | | | 1,342,142 | | |
| | 340,289 | | | @,L | | Select Comfort Corp. | | | 5,917,626 | | |
| | 111,724 | | | @,L | | Sonic Corp. | | | 2,675,790 | | |
| | 102,400 | | | | | Triarc Cos. | | | 2,048,000 | | |
| | 54,315 | | | @,L | | Tween Brands, Inc. | | | 2,168,798 | | |
| | | | 72,162,499 | | |
| Shares | | | | | | Value | |
| | | | | Savings & Loans: 1.4% | |
| | 39,682 | | | L | | Anchor Bancorp.
Wisconsin, Inc. | | $ | 1,143,635 | | |
| | 96,910 | | | L | | Bankunited Financial Corp. | | | 2,709,604 | | |
| | 100,729 | | | L | | Brookline Bancorp., Inc. | | | 1,326,601 | | |
| | 36,400 | | | L | | Dime Community Bancshares | | | 509,964 | | |
| | 46,932 | | | L | | Downey Financial Corp. | | | 3,406,325 | | |
| | 35,400 | | | L | | Fidelity Bankshares, Inc. | | | 1,404,318 | | |
| | 47,992 | | | @,L | | FirstFed Financial Corp. | | | 3,214,024 | | |
| | | | 13,714,471 | | |
| | | | | Semiconductors: 2.2% | |
| | 74,117 | | | @,L | | Actel Corp. | | | 1,345,965 | | |
| | 66,700 | | | @ | | Axcelis Technologies, Inc. | | | 388,861 | | |
| | 168,087 | | | @,L | | Brooks Automation, Inc. | | | 2,420,453 | | |
| | 29,350 | | | | | Cohu, Inc. | | | 591,696 | | |
| | 64,602 | | | @,L | | DSP Group, Inc. | | | 1,401,863 | | |
| | 57,334 | | | @ | | Exar Corp. | | | 745,342 | | |
| | 125,737 | | | @,L | | Kopin Corp. | | | 448,881 | | |
| | 92,800 | | | @,L | | Kulicke & Soffa Industries, Inc. | | | 779,520 | | |
| | 59,400 | | | @ | | MKS Instruments, Inc. | | | 1,341,252 | | |
| | 89,151 | | | @,L | | Pericom Semiconductor Corp. | | | 1,022,562 | | |
| | 69,300 | | | @,L | | Photronics, Inc. | | | 1,132,362 | | |
| | 266,570 | | | @,L | | Skyworks Solutions, Inc. | | | 1,887,316 | | |
| | 34,950 | | | @,L | | Standard Microsystems Corp. | | | 977,901 | | |
| | 22,375 | | | @ | | Supertex, Inc. | | | 878,219 | | |
| | 93,707 | | | @,L | | Varian Semiconductor
Equipment Associates, Inc. | | | 4,265,543 | | |
| | 50,300 | | | @,L | | Veeco Instruments, Inc. | | | 942,119 | | |
| | | | 20,569,855 | | |
| | | | | Software: 3.7% | |
| | 75,000 | | | @,L | | Allscripts Healthcare
Solutions, Inc. | | | 2,024,250 | | |
| | 51,225 | | | @,L | | Altiris, Inc. | | | 1,300,091 | | |
| | 62,269 | | | @ | | Ansys, Inc. | | | 2,708,079 | | |
| | 79,357 | | | @ | | Captaris, Inc. | | | 616,604 | | |
| | 106,037 | | | @, L | | Cerner Corp. | | | 4,824,684 | | |
| | 98,097 | | | @ | | Dendrite International, Inc. | | | 1,050,619 | | |
| | 61,900 | | | @ | | Digi International, Inc. | | | 853,601 | | |
| | 80,210 | | | @ | | Epicor Software Corp. | | | 1,083,637 | | |
| | 112,191 | | | L | | Global Payments, Inc. | | | 5,194,443 | | |
| | 128,427 | | | @,L | | Hyperion Solutions Corp. | | | 4,615,666 | | |
| | 29,049 | | | | | Inter-Tel, Inc. | | | 643,726 | | |
| | 50,318 | | | @,L | | JDA Software Group, Inc. | | | 692,879 | | |
| | 69,933 | | | @,L | | Keane, Inc. | | | 832,902 | | |
| | 26,378 | | | @,L | | Mantech International Corp. | | | 971,502 | | |
| | 60,717 | | | @ | | Mapinfo Corp. | | | 792,357 | | |
| | 31,571 | | | @,L | | Open Solutions, Inc. | | | 1,188,332 | | |
| | 53,267 | | | @,L | | Per-Se Technologies, Inc. | | | 1,479,757 | | |
| | 34,167 | | | @ | | Phoenix Technologies Ltd. | | | 153,752 | | |
| | 65,269 | | | @,L | | Progress Software Corp. | | | 1,822,963 | | |
| | 25,800 | | | @,L | | Quality Systems, Inc. | | | 961,566 | | |
| | 32,271 | | | @ | | SPSS, Inc. | | | 970,389 | | |
| | | | 34,781,799 | | |
| | | | | Telecommunications: 1.8% | |
| | 232,311 | | | @,L | | Adaptec, Inc. | | | 1,082,569 | | |
| | 119,166 | | | @,L | | Aeroflex, Inc. | | | 1,396,626 | | |
| | 54,388 | | | @,L | | Anixter International, Inc. | | | 2,953,268 | | |
| | 29,391 | | | | | Black Box Corp. | | | 1,234,128 | | |
| | 75,925 | | | @,L | | C-COR, Inc. | | | 845,805 | | |
| | 33,925 | | | L | | Commonwealth Telephone
Enterprises, Inc. | | | 1,420,101 | | |
See Accompanying Notes to Financial Statements
58
ING VP INDEX PLUS PORTFOLIO OF INVESTMENTS
SMALLCAP PORTFOLIO AS OF DECEMBER 31, 2006 (CONTINUED)
| Shares | | | | | | Value | |
| | | | | Telecommunications (continued) | |
| | 37,700 | | | @,L | | Comtech
Telecommunications | | $ | 1,435,239 | | |
| | 32,400 | | | L | | CT Communications, Inc. | | | 742,608 | | |
| | 89,755 | | | @,L | | Ditech Networks, Inc. | | | 621,105 | | |
| | 72,392 | | | @ | | General Communication, Inc. | | | 1,138,726 | | |
| | 167,219 | | | @,L | | Harmonic, Inc. | | | 1,215,682 | | |
| | 70,975 | | | @ | | Network Equipment
Technologies, Inc. | | | 413,075 | | |
| | 49,300 | | | @,L | | Novatel Wireless, Inc. | | | 476,731 | | |
| | 76,261 | | | @,L | | Symmetricom, Inc. | | | 680,248 | | |
| | 41,143 | | | @ | | Tollgrade
Communications, Inc. | | | 434,882 | | |
| | 35,762 | | | @ | | Viasat, Inc. | | | 1,066,065 | | |
| | | | 17,156,858 | | |
| | | | | Textiles: 0.2% | |
| | 21,220 | | | | | Angelica Corp. | | | 547,476 | | |
| | 33,726 | | | L | | G&K Services, Inc. | | | 1,311,604 | | |
| | | | 1,859,080 | | |
| | | | | Toys/Games/Hobbies: 0.3% | |
| | 43,642 | | | @,L | | Jakks Pacific, Inc. | | | 953,141 | | |
| | 34,600 | | | @ | | RC2 Corp. | | | 1,522,400 | | |
| | | | 2,475,541 | | |
| | | | | Transportation: 2.6% | |
| | 56,187 | | | L | | Arkansas Best Corp. | | | 2,022,732 | | |
| | 38,092 | | | @,L | | Bristow Group, Inc. | | | 1,374,740 | | |
| | 52,383 | | | @ | | EGL, Inc. | | | 1,559,966 | | |
| | 97,646 | | | | | Heartland Express, Inc. | | | 1,466,643 | | |
| | 256,722 | | | @,L | | HUB Group, Inc. | | | 7,072,691 | | |
| | 123,500 | | | @,L | | Kansas City Southern | | | 3,579,030 | | |
| | 87,100 | | | @ | | Kirby Corp. | | | 2,972,723 | | |
| | 96,480 | | | L | | Landstar System, Inc. | | | 3,683,606 | | |
| | 46,470 | | | @ | | Old Dominion Freight Line | | | 1,118,533 | | |
| | | | 24,850,664 | | |
Total Common Stock
(Cost $856,335,862) | | | 927,184,191 | | |
| WARRANTS: 0.0% | | | |
| | | | | Airlines: 0.0% | |
| | 116 | | | | | Timco Aviation | | | — | | |
| | | | — | | |
Total Warrants
(Cost $—) | | | — | | |
Principal
Amount | | | | Value | |
| SHORT-TERM INVESTMENTS: 24.3% | |
| | | Mutual Fund: 0.8% | |
| $ | 8,000,000 | ** | | ING Institutional Prime Money
Market Fund | | | 8,000,000 | | |
Total Mutual Fund
(Cost $8,000,000) | | | 8,000,000 | | |
Principal
Amount | | | | Value | |
| | | Repurchase Agreement: 0.8% | |
| $ | 7,434,000 | | | Morgan Stanley Repurchase
Agreement dated 12/29/06,
5.250%, due 01/02/07, $7,438,337
to be received upon repurchase
(Collateralized by $23,685,000
Resolution Funding Corporation,
Discount Note, Market Value
$7,583,463, due 01/15/30) | | $ | 7,434,000 | | |
Total Repurchase Agreement
(Cost $7,434,000) | | | 7,434,000 | | |
| | | Securities Lending CollateralCC: 22.7% | |
| | 215,814,758 | | | The Bank of New York Institutional
Cash Reserves Fund | | | 215,814,758 | | |
Total Securities Lending Collateral
(Cost $215,814,758) | | | 215,814,758 | | |
Total Short-Term Investments
(Cost $231,248,758) | | | 231,248,758 | | |
Total Investments in
Securities
(Cost $1,087,584,620)* | | | 122.0 | % | | $ | 1,158,432,949 | | |
Other Assets and
Liabilities - Net | | | (22.0 | ) | | | (209,071,918 | ) | |
| Net Assets | | | 100.0 | % | | $ | 949,361,031 | | |
@ Non-income producing security
@@ Foreign Issuer
cc Securities purchased with cash collateral for securities loaned.
W When-issued or delayed delivery security
L Loaned security, a portion or all of the security is on loan at December 31, 2006.
** Investment in affiliate
* Cost for federal income tax purposes is $1,095,054,831.
| Net unrealized appreciation consists of: | |
| Gross Unrealized Appreciation | | $ | 90,298,469 | | |
| Gross Unrealized Depreciation | | | (26,920,351 | ) | |
| Net Unrealized Appreciation | | $ | 63,378,118 | | |
VP Index Plus Small Cap Open Futures Contracts on December 31, 2006:
Contract
Description | | Number
of
Contracts | | Notional
Market
Value ($) | | Expiration
Date | | Unrealized
(Depreciation) | |
| Long Contracts | |
| Russell 2000 | | | 46 | | | | 18,282,700 | | | 3/15/07 | | $ | (130,082 | ) | |
| | | | | | | | | $ | (130,082 | ) | |
See Accompanying Notes to Financial Statements
59
ING VP STRATEGIC ALLOCATION PORTFOLIO OF INVESTMENTS
CONSERVATIVE PORTFOLIO AS OF DECEMBER 31, 2006
| Shares | | | | | | Value | |
| COMMON STOCK: 46.7% | | | |
| | | | | Advertising: 0.2% | |
| | 160 | | | | | Advo, Inc. | | $ | 5,216 | | |
| | 2,500 | | | L | | Omnicom Group | | | 261,350 | | |
| | | | 266,566 | | |
| | | | | Aerospace/Defense: 0.6% | |
| | 3,100 | | | | | Boeing Co. | | | 275,404 | | |
| | 170 | | | | | Kaman Corp. | | | 3,806 | | |
| | 7,345 | | | | | Raytheon Co. | | | 387,816 | | |
| | 4,000 | | | | | United Technologies Corp. | | | 250,080 | | |
| | | | 917,106 | | |
| | | | | Agriculture: 0.6% | |
| | 2,240 | | | @ | | Alliance One International, Inc. | | | 15,814 | | |
| | 8,000 | | | | | Altria Group, Inc. | | | 686,560 | | |
| | 4,578 | | | @@ | | British American Tobacco PLC | | | 128,190 | | |
| | 190 | | | | | Delta & Pine Land Co. | | | 7,686 | | |
| | | | 838,250 | | |
| | | | | Airlines: 0.1% | |
| | 440 | | | @ | | Airtran Holdings, Inc. | | | 5,166 | | |
| | 80 | | | @ | | Alaska Air Group, Inc. | | | 3,160 | | |
| | 13,882 | | | @,@@ | | British Airways PLC | | | 143,131 | | |
| | 190 | | | @ | | JetBlue Airways Corp. | | | 2,698 | | |
| | 906 | | | | | Skywest, Inc. | | | 23,112 | | |
| | | | 177,267 | | |
| | | | | Apparel: 0.4% | |
| | 380 | | | @ | | Ashworth, Inc. | | | 2,759 | | |
| | 5,600 | | | @,L | | Coach, Inc. | | | 240,576 | | |
| | 200 | | | @,L | | Deckers Outdoor Corp. | | | 11,990 | | |
| | 470 | | | @,L | | Gymboree Corp. | | | 17,935 | | |
| | 1,610 | | | @ | | Hanesbrands, Inc. | | | 38,028 | | |
| | 2,000 | | | | | Jones Apparel Group, Inc. | | | 66,860 | | |
| | 610 | | | L | | Kellwood Co. | | | 19,837 | | |
| | 570 | | | | | K-Swiss, Inc. | | | 17,522 | | |
| | 730 | | | | | Phillips-Van Heusen | | | 36,624 | | |
| | 540 | | | | | Polo Ralph Lauren Corp. | | | 41,936 | | |
| | 880 | | | | | Wolverine World Wide, Inc. | | | 25,098 | | |
| | | | 519,165 | | |
| | | | | Auto Manufacturers: 0.2% | |
| | 28,900 | | | L | | Ford Motor Co. | | | 217,039 | | |
| | | | 217,039 | | |
| | | | | Auto Parts & Equipment: 0.1% | |
| | 1,670 | | | L | | ArvinMeritor, Inc. | | | 30,444 | | |
| | 50 | | | | | Bandag, Inc. | | | 2,522 | | |
| | 290 | | | L | | Standard Motor Products, Inc. | | | 4,344 | | |
| | 6,106 | | | @@ | | Sumitomo Rubber Industries, Inc. | | | 78,765 | | |
| | | | 116,075 | | |
| | | | | Banks: 3.9% | |
| | 19,338 | | | @@ | | Banca Intesa S.p.A. | | | 148,929 | | |
| | 24,950 | | | | | Bank of America Corp. | | | 1,332,081 | | |
| | 5,500 | | | @@ | | Bank of Ireland | | | 126,637 | | |
| | 15,307 | | | @@ | | Barclays PLC | | | 218,553 | | |
| | 12,253 | | | @@ | | Capitalia S.p.A. | | | 115,614 | | |
| | 790 | | | L | | Chittenden Corp. | | | 24,245 | | |
| | 1,880 | | | | | Colonial BancGroup, Inc. | | | 48,391 | | |
| | 3,000 | | | | | Comerica, Inc. | | | 176,040 | | |
| | 5,345 | | | @@ | | Depfa Bank PLC | | | 95,509 | | |
| | 1,219 | | | @@ | | Deutsche Bank AG | | | 162,332 | | |
| Shares | | | | | | Value | |
| | 870 | | | | | East-West Bancorp., Inc. | | $ | 30,815 | | |
| | 1,880 | | | @@,L | | First Bancorp. | | | 17,916 | | |
| | 200 | | | | | First Indiana Corp. | | | 5,072 | | |
| | 270 | | | | | First Midwest Bancorp., Inc. | | | 10,444 | | |
| | 1,320 | | | | | FirstMerit Corp. | | | 31,865 | | |
| | 910 | | | | | Hanmi Financial Corp. | | | 20,502 | | |
| | 18,036 | | | @@ | | HSBC Holdings PLC | | | 328,252 | | |
| | 520 | | | | | Independent Bank Corp. | | | 13,151 | | |
| | 1,000 | | | @@ | | KBC Groep NV | | | 122,419 | | |
| | 1,086 | | | @@ | | Kookmin Bank ADR | | | 87,575 | | |
| | 500 | | | | | Mercantile Bankshares Corp. | | | 23,395 | | |
| | 17 | | | @@ | | Mitsubishi UFJ Financial
Group, Inc. | | | 210,899 | | |
| | 5,100 | | | @@ | | National Australia Bank Ltd. | | | 162,367 | | |
| | 8,400 | | | L | | National City Corp. | | | 307,104 | | |
| | 8,700 | | | | | Regions Financial Corp. | | | 325,380 | | |
| | 911 | | | @@ | | Societe Generale | | | 154,114 | | |
| | 390 | | | | | South Financial Group, Inc. | | | 10,370 | | |
| | 8,000 | | | @@ | | Sumitomo Trust & Banking
Co., Ltd. | | | 83,763 | | |
| | 1,530 | | | L | | TCF Financial Corp. | | | 41,953 | | |
| | 300 | | | | | Umpqua Holdings Corp. | | | 8,829 | | |
| | 1,200 | | | @@,L | | Uniao de Bancos
Brasileiros SA GDR | | | 111,552 | | |
| | 6,500 | | | | | US Bancorp. | | | 235,235 | | |
| | 6,650 | | | | | Wachovia Corp. | | | 378,718 | | |
| | 810 | | | | | Webster Financial Corp. | | | 39,463 | | |
| | 11,600 | | | | | Wells Fargo & Co. | | | 412,496 | | |
| | 960 | | | | | Whitney Holding Corp. | | | 31,315 | | |
| | | | 5,653,295 | | |
| | | | | Beverages: 0.8% | |
| | 8,050 | | | | | Coca-Cola Co. | | | 388,413 | | |
| | 3,491 | | | @@ | | Coca-Cola Hellenic
Bottling Co. SA | | | 136,205 | | |
| | 1,012 | | | @@ | | Fomento Economico
Mexicano SA de CV ADR | | | 117,149 | | |
| | 30 | | | @ | | Hansen Natural Corp. | | | 1,010 | | |
| | 2,500 | | | | | Pepsi Bottling Group, Inc. | | | 77,275 | | |
| | 1,430 | | | | | PepsiAmericas, Inc. | | | 30,001 | | |
| | 6,450 | | | | | PepsiCo, Inc. | | | 403,448 | | |
| | | | 1,153,501 | | |
| | | | | Biotechnology: 0.3% | |
| | 4,500 | | | @ | | Amgen, Inc. | | | 307,395 | | |
| | 120 | | | @ | | Digene Corp. | | | 5,750 | | |
| | 30 | | | @ | | Invitrogen Corp. | | | 1,698 | | |
| | 3,000 | | | @,L | | Millennium Pharmaceuticals, Inc. | | | 32,700 | | |
| | 640 | | | @ | | PDL BioPharma, Inc. | | | 12,890 | | |
| | 1,190 | | | @,L | | Savient Pharmaceuticals, Inc. | | | 13,340 | | |
| | 620 | | | @,L | | Vertex Pharmaceuticals, Inc. | | | 23,200 | | |
| | | | 396,973 | | |
| | | | | Building Materials: 0.1% | |
| | 100 | | | | | ElkCorp | | | 4,109 | | |
| | 4,982 | | | @@ | | Italcementi S.p.A. | | | 140,218 | | |
| | | | 144,327 | | |
| | | | | Chemicals: 0.7% | |
| | 300 | | | | | Airgas, Inc. | | | 12,156 | | |
| | 570 | | | | | Chemtura Corp. | | | 5,489 | | |
| | 3,800 | | | | | Dow Chemical Co. | | | 151,772 | | |
| | 3,500 | | | | | EI DuPont de Nemours & Co. | | | 170,485 | | |
| | 70 | | | | | FMC Corp. | | | 5,359 | | |
See Accompanying Notes to Financial Statements
60
ING VP STRATEGIC ALLOCATION PORTFOLIO OF INVESTMENTS
CONSERVATIVE PORTFOLIO AS OF DECEMBER 31, 2006 (CONTINUED)
| Shares | | | | | | Value | |
| | | | | Chemicals (continued) | |
| | 730 | | | | | Georgia Gulf Corp. | | $ | 14,096 | | |
| | 870 | | | | | HB Fuller Co. | | | 22,463 | | |
| | 1,000 | | | | | Lubrizol Corp. | | | 50,130 | | |
| | 2,011 | | | L | | Lyondell Chemical Co. | | | 51,421 | | |
| | 130 | | | L | | MacDermid, Inc. | | | 4,433 | | |
| | 2,000 | | | | | Monsanto Co. | | | 105,060 | | |
| | 1,770 | | | L | | Olin Corp. | | | 29,240 | | |
| | 830 | | | @ | | Omnova Solutions, Inc. | | | 3,801 | | |
| | 1,950 | | | @,L | | PolyOne Corp. | | | 14,625 | | |
| | 2,000 | | | | | Sherwin-Williams Co. | | | 127,160 | | |
| | 15,000 | | | @@ | | Sumitomo Chemical Co., Ltd. | | | 116,077 | | |
| | 600 | | | @@ | | Umicore | | | 101,950 | | |
| | 1,560 | | | | | Valspar Corp. | | | 43,118 | | |
| | | | 1,028,835 | | |
| | | | | Commercial Services: 0.7% | |
| | 210 | | | @ | | Alliance Data Systems Corp. | | | 13,119 | | |
| | 2,500 | | | @,L | | Apollo Group, Inc. | | | 97,425 | | |
| | 100 | | | | | Banta Corp. | | | 3,640 | | |
| | 370 | | | @ | | Career Education Corp. | | | 9,169 | | |
| | 410 | | | | | Central Parking Corp. | | | 7,380 | | |
| | 232 | | | @,L | | Consolidated Graphics, Inc. | | | 13,704 | | |
| | 2,700 | | | @ | | Convergys Corp. | | | 64,206 | | |
| | 150 | | | L | | CPI Corp. | | | 6,974 | | |
| | 1,190 | | | | | DeVry, Inc. | | | 33,320 | | |
| | 350 | | | @ | | Heidrick & Struggles
International, Inc. | | | 14,826 | | |
| | 1,340 | | | @ | | Hooper Holmes, Inc. | | | 4,435 | | |
| | 320 | | | @ | | ITT Educational Services, Inc. | | | 21,238 | | |
| | 350 | | | @,L | | Kendle International, Inc. | | | 11,008 | | |
| | 1,190 | | | @,L | | Korn/Ferry International | | | 27,322 | | |
| | 1,160 | | | @,L | | Labor Ready, Inc. | | | 21,263 | | |
| | 830 | | | L | | Manpower, Inc. | | | 62,192 | | |
| | 5,100 | | | | | McKesson Corp. | | | 258,570 | | |
| | 3,900 | | | | | Moody's Corp. | | | 269,334 | | |
| | 1,640 | | | @ | | MPS Group, Inc. | | | 23,255 | | |
| | 670 | | | @ | | Quanta Services, Inc. | | | 13,179 | | |
| | 1,160 | | | @ | | Valassis Communications, Inc. | | | 16,820 | | |
| | 240 | | | @,L | | Vertrue, Inc. | | | 9,218 | | |
| | 510 | | | W,L | | Viad Corp. | | | 20,706 | | |
| | 170 | | | @,L | | Volt Information Sciences, Inc. | | | 8,536 | | |
| | 650 | | | | | Watson Wyatt Worldwide, Inc. | | | 29,348 | | |
| | | | 1,060,187 | | |
| | | | | Computers: 1.7% | |
| | 270 | | | | | Agilysys, Inc. | | | 4,520 | | |
| | 1,391 | | | @,@@, I | | Atos Origin | | | 82,254 | | |
| | 167 | | | @,L | | CACI International, Inc. | | | 9,436 | | |
| | 1,272 | | | @ | | Cadence Design Systems, Inc. | | | 22,782 | | |
| | 280 | | | @ | | Catapult Communications Corp. | | | 2,514 | | |
| | 520 | | | @,L | | Ceridian Corp. | | | 14,550 | | |
| | 19,100 | | | @ | | Dell, Inc. | | | 479,219 | | |
| | 570 | | | | | Factset Research Systems, Inc. | | | 32,194 | | |
| | 18,150 | | | | | Hewlett-Packard Co. | | | 747,599 | | |
| | 620 | | | | | Imation Corp. | | | 28,787 | | |
| | 9,350 | | | | | International Business
Machines Corp. | | | 908,353 | | |
| | 310 | | | @ | | Mercury Computer Systems, Inc. | | | 4,142 | | |
| | 515 | | | @ | | Micros Systems, Inc. | | | 27,141 | | |
| | 780 | | | @,L | | Palm, Inc. | | | 10,990 | | |
| | 580 | | | @ | | Radisys Corp. | | | 9,669 | | |
| | 690 | | | @ | | SRA International, Inc. | | | 18,451 | | |
| | 780 | | | @ | | SYKES Enterprises, Inc. | | | 13,759 | | |
| | 1,320 | | | @ | | Synopsys, Inc. | | | 35,284 | | |
| Shares | | | | | | Value | |
| | 940 | | | @ | | Western Digital Corp. | | $ | 19,232 | | |
| | | | 2,470,876 | | |
| | | | | Cosmetics/Personal Care: 0.6% | |
| | 2,500 | | | L | | Estee Lauder Cos., Inc. | | | 102,050 | | |
| | 11,850 | | | | | Procter & Gamble Co. | | | 761,600 | | |
| | | | 863,650 | | |
| | | | | Distribution/Wholesale: 0.1% | |
| | 700 | | | | | Building Materials Holding Corp. | | | 17,283 | | |
| | 280 | | | | | CDW Corp. | | | 19,690 | | |
| | 262 | | | L | | Pool Corp. | | | 10,263 | | |
| | 7,000 | | | @@ | | Sumitomo Corp. | | | 104,788 | | |
| | 830 | | | @ | | Tech Data Corp. | | | 31,432 | | |
| | | | 183,456 | | |
| | | | | Diversified Financial Services: 3.9% | |
| | 860 | | | | | AG Edwards, Inc. | | | 54,429 | | |
| | 4,200 | | | | | American Express Co. | | | 254,814 | | |
| | 1,360 | | | @,L | | AmeriCredit Corp. | | | 34,231 | | |
| | 3,600 | | | | | CIT Group, Inc. | | | 200,772 | | |
| | 26,600 | | | | | Citigroup, Inc. | | | 1,481,620 | | |
| | 3,600 | | | | | Fannie Mae | | | 213,804 | | |
| | 3,200 | | | | | Goldman Sachs Group, Inc. | | | 637,920 | | |
| | 740 | | | | | IndyMac Bancorp., Inc. | | | 33,418 | | |
| | 550 | | | @ | | Investment Technology
Group, Inc. | | | 23,584 | | |
| | 21,100 | | | | | JPMorgan Chase & Co. | | | 1,019,130 | | |
| | 14 | | | @@,L | | Kenedix, Inc. | | | 63,157 | | |
| | 5,400 | | | | | Lehman Brothers Holdings, Inc. | | | 421,848 | | |
| | 3,050 | | | | | Merrill Lynch & Co., Inc. | | | 283,955 | | |
| | 8,100 | | | | | Morgan Stanley | | | 659,583 | | |
| | 1,260 | | | | | Raymond James Financial, Inc. | | | 38,191 | | |
| | 500 | | | @@ | | SFCG Co., Ltd. | | | 77,665 | | |
| | 320 | | | L | | SWS Group, Inc. | | | 11,424 | | |
| | 650 | | | @,L | | TradeStation Group, Inc. | | | 8,938 | | |
| | 3,600 | | | @@ | | UBS AG | | | 217,864 | | |
| | | | 5,736,347 | | |
| | | | | Electric: 1.2% | |
| | 18,900 | | | @ | | AES Corp. | | | 416,556 | | |
| | 200 | | | | | Central Vermont Public
Service Corp. | | | 4,710 | | |
| | 350 | | | L | | Duquesne Light Holdings, Inc. | | | 6,948 | | |
| | 1,260 | | | | | Idacorp, Inc. | | | 48,699 | | |
| | 15,434 | | | @@ | | International Power PLC | | | 114,956 | | |
| | 270 | | | | | Northeast Utilities | | | 7,603 | | |
| | 1,720 | | | | | OGE Energy Corp. | | | 68,800 | | |
| | 1,310 | | | L | | Pepco Holdings, Inc. | | | 34,073 | | |
| | 10,300 | | | | | PG&E Corp. | | | 487,499 | | |
| | 1,850 | | | | | PNM Resources, Inc. | | | 57,535 | | |
| | 1,200 | | | @@ | | RWE AG | | | 131,540 | | |
| | 3,905 | | | @@ | | Scottish & Southern Energy | | | 118,589 | | |
| | 4,800 | | | | | Southern Co. | | | 176,928 | | |
| | 3,500 | | | @@ | | Tokyo Electric Power Co., Inc. | | | 113,072 | | |
| | 830 | | | | | Wisconsin Energy Corp. | | | 39,392 | | |
| | | | 1,826,900 | | |
| | | | | Electrical Components &
Equipment: 0.1% | | | | | | | |
| | 720 | | | L | | Belden CDT, Inc. | | | 28,145 | | |
| | 450 | | | @,L | | Littelfuse, Inc. | | | 14,346 | | |
| | 18,000 | | | @@ | | Toshiba Corp. | | | 116,968 | | |
| | | | 159,459 | | |
See Accompanying Notes to Financial Statements
61
ING VP STRATEGIC ALLOCATION PORTFOLIO OF INVESTMENTS
CONSERVATIVE PORTFOLIO AS OF DECEMBER 31, 2006 (CONTINUED)
| Shares | | | | | | Value | |
| | | | | Electronics: 0.2% | |
| | 380 | | | | | Amphenol Corp. | | $ | 23,590 | | |
| | 100 | | | @ | | Avnet, Inc. | | | 2,553 | | |
| | 340 | | | @,L | | Benchmark Electronics, Inc. | | | 8,282 | | |
| | 670 | | | @,L | | Coherent, Inc. | | | 21,152 | | |
| | 390 | | | L | | Cubic Corp. | | | 8,463 | | |
| | 140 | | | | | Gentex Corp. | | | 2,178 | | |
| | 2,400 | | | @,@@ | | Hoya Corp. | | | 93,544 | | |
| | 980 | | | | | Methode Electronics, Inc. | | | 10,613 | | |
| | 400 | | | @ | | Planar Systems, Inc. | | | 3,868 | | |
| | 660 | | | @,L | | Plexus Corp. | | | 15,761 | | |
| | 100 | | | @ | | Rogers Corp. | | | 5,915 | | |
| | 1,080 | | | @ | | Thomas & Betts Corp. | | | 51,062 | | |
| | 300 | | | @,L | | Trimble Navigation Ltd. | | | 15,219 | | |
| | 690 | | | @,L | | Varian, Inc. | | | 30,905 | | |
| | 2,480 | | | @ | | Vishay Intertechnology, Inc. | | | 33,579 | | |
| | | | 326,684 | | |
| | | | | Engineering & Construction: 0.4% | |
| | 2,000 | | | @@ | | Bouygues | | | 128,053 | | |
| | 510 | | | @ | | EMCOR Group, Inc. | | | 28,994 | | |
| | 830 | | | | | Granite Construction, Inc. | | | 41,766 | | |
| | 1,724 | | | @@ | | Hochtief AG | | | 125,005 | | |
| | 850 | | | @ | | Jacobs Engineering Group, Inc. | | | 69,309 | | |
| | 180 | | | @ | | Shaw Group, Inc. | | | 6,030 | | |
| | 20,000 | | | @@,L | | Taisei Corp. | | | 60,879 | | |
| | 270 | | | @ | | URS Corp. | | | 11,570 | | |
| | 1,200 | | | @@,L | | Vinci SA | | | 152,942 | | |
| | | | 624,548 | | |
| | | | | Entertainment: 0.0% | |
| | 230 | | | @,L | | Pinnacle Entertainment, Inc. | | | 7,622 | | |
| | | | 7,622 | | |
| | | | | Environmental Control: 0.2% | |
| | 8,600 | | | | | Waste Management, Inc. | | | 316,222 | | |
| | | | 316,222 | | |
| | | | | Exchange Traded Fund: 0.1% | |
| | 2,300 | | | @@,L | | iShares S&P SmallCap 600
Index Fund | | | 151,777 | | |
| | 340 | | | L | | Midcap SPDR Trust Series 1 | | | 49,844 | | |
| | | | 201,621 | | |
| | | | | Food: 0.8% | |
| | 4,500 | | | | | Campbell Soup Co. | | | 175,005 | | |
| | 9,800 | | | | | ConAgra Foods, Inc. | | | 264,600 | | |
| | 934 | | | | | Corn Products International, Inc. | | | 32,260 | | |
| | 5,626 | | | | | General Mills, Inc. | | | 324,058 | | |
| | 734 | | | @@ | | Groupe Danone | | | 110,998 | | |
| | 1,182 | | | | | Hormel Foods Corp. | | | 44,136 | | |
| | 460 | | | @,L | | Ralcorp Holdings, Inc. | | | 23,409 | | |
| | 280 | | | @ | | Smithfield Foods, Inc. | | | 7,185 | | |
| | 7,130 | | | @@ | | Unilever PLC | | | 198,305 | | |
| | 210 | | | @,L | | United Natural Foods, Inc. | | | 7,543 | | |
| | | | 1,187,499 | | |
| | | | | Forest Products & Paper: 0.1% | |
| | 590 | | | @ | | Caraustar Industries, Inc. | | | 4,773 | | |
| | 1,880 | | | | | Louisiana-Pacific Corp. | | | 40,476 | | |
| | 600 | | | | | Rock-Tenn Co. | | | 16,266 | | |
| | 310 | | | | | Schweitzer-Mauduit
International, Inc. | | | 8,076 | | |
| Shares | | | | | | Value | |
| | 2,000 | | | | | Temple-Inland, Inc. | | $ | 92,060 | | |
| | | | 161,651 | | |
| | | | | Gas: 0.1% | |
| | 60 | | | L | | Cascade Natural Gas Corp. | | | 1,555 | | |
| | 1,147 | | | L | | Energen Corp. | | | 53,840 | | |
| | 1,799 | | | | | UGI Corp. | | | 49,077 | | |
| | | | 104,472 | | |
| | | | | Hand/Machine Tools: 0.0% | |
| | 1,100 | | | | | Snap-On, Inc. | | | 52,404 | | |
| | | | 52,404 | | |
| | | | | Healthcare-Products: 0.9% | |
| | 270 | | | @ | | Advanced Medical Optics, Inc. | | | 9,504 | | |
| | 230 | | | L | | Cooper Cos., Inc. | | | 10,235 | | |
| | 1,470 | | | @ | | Cytyc Corp. | | | 41,601 | | |
| | 1,938 | | | | | Dentsply International, Inc. | | | 57,849 | | |
| | 960 | | | @,L | | Edwards Lifesciences Corp. | | | 45,158 | | |
| | 510 | | | @ | | Haemonetics Corp. | | | 22,960 | | |
| | 282 | | | @,L | | Hologic, Inc. | | | 13,333 | | |
| | 157 | | | @ | | Idexx Laboratories, Inc. | | | 12,450 | | |
| | 350 | | | @,L | | Immucor, Inc. | | | 10,231 | | |
| | 70 | | | @ | | Intuitive Surgical, Inc. | | | 6,713 | | |
| | 10,800 | | | | | Johnson & Johnson | | | 713,016 | | |
| | 4,500 | | | | | Medtronic, Inc. | | | 240,795 | | |
| | 470 | | | | | Mentor Corp. | | | 22,969 | | |
| | 500 | | | @ | | Osteotech, Inc. | | | 2,825 | | |
| | 450 | | | @ | | Possis Medical, Inc. | | | 6,066 | | |
| | 390 | | | @,L | | Respironics, Inc. | | | 14,723 | | |
| | 700 | | | @ | | Techne Corp. | | | 38,815 | | |
| | 650 | | | @ | | Varian Medical Systems, Inc. | | | 30,921 | | |
| | | | 1,300,164 | | |
| | | | | Healthcare-Services: 1.5% | |
| | 7,700 | | | | | Aetna, Inc. | | | 332,486 | | |
| | 460 | | | @ | | Amerigroup Corp. | | | 16,509 | | |
| | 510 | | | @,L | | Centene Corp. | | | 12,531 | | |
| | 2,950 | | | @ | | Coventry Health Care, Inc. | | | 147,648 | | |
| | 900 | | | @@ | | Fresenius Medical Care AG &
Co. KGaA | | | 119,812 | | |
| | 700 | | | @,L | | Gentiva Health Services, Inc. | | | 13,342 | | |
| | 560 | | | @ | | Health Net, Inc. | | | 27,250 | | |
| | 440 | | | @,L | | Healthways, Inc. | | | 20,992 | | |
| | 3,000 | | | @ | | Humana, Inc. | | | 165,930 | | |
| | 2,500 | | | @,L | | Laboratory Corp. of America
Holdings | | | 183,675 | | |
| | 140 | | | @ | | Lincare Holdings, Inc. | | | 5,578 | | |
| | 912 | | | @,L | | Odyssey HealthCare, Inc. | | | 12,093 | | |
| | 440 | | | @,L | | Pediatrix Medical Group, Inc. | | | 21,516 | | |
| | 412 | | | @,L | | Sierra Health Services, Inc. | | | 14,848 | | |
| | 12,100 | | | | | UnitedHealth Group, Inc. | | | 650,133 | | |
| | 6,500 | | | @ | | WellPoint, Inc. | | | 511,485 | | |
| | | | 2,255,828 | | |
| | | | | Holding Companies-Diversified: 0.0% | |
| | 1,540 | | | L | | Leucadia National Corp. | | | 43,428 | | |
| | | | 43,428 | | |
| | | | | Home Builders: 0.1% | |
| | 33,500 | | | @,@@ | | Haseko Corp. | | | 119,546 | | |
| | 25 | | | @ | | NVR, Inc. | | | 16,125 | | |
| | 610 | | | L | | Winnebago Industries | | | 20,075 | | |
| | | | 155,746 | | |
See Accompanying Notes to Financial Statements
62
ING VP STRATEGIC ALLOCATION PORTFOLIO OF INVESTMENTS
CONSERVATIVE PORTFOLIO�� AS OF DECEMBER 31, 2006 (CONTINUED)
| Shares | | | | | | Value | |
| | | | | Home Furnishings: 0.1% | |
| | 290 | | | @ | | Audiovox Corp. | | $ | 4,086 | | |
| | 640 | | | | | Ethan Allen Interiors, Inc. | | | 23,110 | | |
| | 5,000 | | | @@ | | Matsushita Electric
Industrial Co., Ltd. | | | 100,257 | | |
| | | | 127,453 | | |
| | | | | Household Products/Wares: 0.1% | |
| | 280 | | | | | American Greetings Corp. | | | 6,684 | | |
| | 560 | | | L | | Blyth, Inc. | | | 11,620 | | |
| | 900 | | | @@ | | Henkel KGaA | | | 132,282 | | |
| | | | 150,586 | | |
| | | | | Housewares: 0.0% | |
| | 657 | | | L | | Toro Co. | | | 30,636 | | |
| | | | 30,636 | | |
| | | | | Insurance: 3.6% | |
| | 4,700 | | | @@ | | ACE Ltd. | | | 284,679 | | |
| | 6,400 | | | | | Allstate Corp. | | | 416,704 | | |
| | 1,800 | | | | | AMBAC Financial Group, Inc. | | | 160,326 | | |
| | 1,051 | | | L | | American Financial Group, Inc. | | | 37,741 | | |
| | 9,000 | | | | | American International
Group, Inc. | | | 644,940 | | |
| | 170 | | | | | Brown & Brown, Inc. | | | 4,796 | | |
| | 22,000 | | | @@ | | China Life Insurance Co., Ltd. | | | 75,094 | | |
| | 5,600 | | | | | Chubb Corp. | | | 296,296 | | |
| | 2,000 | | | | | Cigna Corp. | | | 263,140 | | |
| | 680 | | | | | Delphi Financial Group | | | 27,513 | | |
| | 620 | | | @@ | | Everest Re Group Ltd. | | | 60,828 | | |
| | 802 | | | | | Fidelity National Title Group, Inc. | | | 19,152 | | |
| | 8,000 | | | | | Genworth Financial, Inc. | | | 273,680 | | |
| | 3,892 | | | | | Hartford Financial Services
Group, Inc. | | | 363,163 | | |
| | 1,370 | | | | | HCC Insurance Holdings, Inc. | | | 43,963 | | |
| | 950 | | | | | Horace Mann Educators Corp. | | | 19,190 | | |
| | 342 | | | L | | Landamerica Financial Group, Inc. | | | 21,584 | | |
| | 50,645 | | | @@ | | Legal & General Group PLC | | | 155,646 | | |
| | 7,100 | | | | | Loews Corp. | | | 294,437 | | |
| | 7,450 | | | | | Metlife, Inc. | | | 439,625 | | |
| | 642 | | | @@ | | Muenchener
Rueckversicherungs AG | | | 110,618 | | |
| | 1,060 | | | | | Old Republic International Corp. | | | 24,677 | | |
| | 756 | | | @ | | Philadelphia Consolidated
Holding Co. | | | 33,687 | | |
| | 330 | | | | | PMI Group, Inc. | | | 15,566 | | |
| | 580 | | | L | | Presidential Life Corp. | | | 12,731 | | |
| | 530 | | | @,L | | ProAssurance Corp. | | | 26,458 | | |
| | 12,200 | | | | | Progressive Corp. | | | 295,484 | | |
| | 870 | | | | | Protective Life Corp. | | | 41,325 | | |
| | 4,805 | | | | | Prudential Financial, Inc. | | | 412,557 | | |
| | 480 | | | | | Radian Group, Inc. | | | 25,877 | | |
| | 1,823 | | | | | Safeco Corp. | | | 114,029 | | |
| | 330 | | | L | | Safety Insurance Group, Inc. | | | 16,734 | | |
| | 482 | | | L | | Selective Insurance Group | | | 27,614 | | |
| | 790 | | | | | Stancorp Financial Group, Inc. | | | 35,590 | | |
| | 680 | | | | | Unitrin, Inc. | | | 34,075 | | |
| | 1,691 | | | | | WR Berkley Corp. | | | 58,356 | | |
| | 570 | | | | | Zenith National Insurance Corp. | | | 26,739 | | |
| | 440 | | | @@ | | Zurich Financial Services AG | | | 118,046 | | |
| | | | 5,332,660 | | |
| | | | | Internet: 0.3% | |
| | 160 | | | @ | | Digital Insight Corp. | | | 6,158 | | |
| Shares | | | | | | Value | |
| | 700 | | | @ | | Google, Inc. | | $ | 322,336 | | |
| | 260 | | | @,L | | j2 Global Communications, Inc. | | | 7,085 | | |
| | 707 | | | @ | | McAfee, Inc. | | | 20,065 | | |
| | 1,170 | | | @ | | Napster, Inc. | | | 4,247 | | |
| | 620 | | | @ | | PC-Tel, Inc. | | | 5,797 | | |
| | 490 | | | @ | | Stamps.com, Inc. | | | 7,718 | | |
| | 1,450 | | | L | | United Online, Inc. | | | 19,256 | | |
| | 4,100 | | | @ | | VeriSign, Inc. | | | 98,605 | | |
| | 120 | | | @ | | WebEx Communications, Inc. | | | 4,187 | | |
| | | | 495,454 | | |
| | | | | Iron/Steel: 0.5% | |
| | 15,700 | | | @@ | | BlueScope Steel Ltd. | | | 106,465 | | |
| | 120 | | | | | Carpenter Technology Corp. | | | 12,302 | | |
| | 390 | | | | | Chaparral Steel Co. | | | 17,265 | | |
| | 180 | | | L | | Cleveland-Cliffs, Inc. | | | 8,719 | | |
| | 4,800 | | | | | Nucor Corp. | | | 262,368 | | |
| | 600 | | | | | Ryerson, Inc. | | | 15,054 | | |
| | 250 | | | | | Steel Dynamics, Inc. | | | 8,113 | | |
| | 270 | | | | | Steel Technologies, Inc. | | | 4,739 | | |
| | 38,000 | | | @@ | | Sumitomo Metal Industries Ltd. | | | 164,985 | | |
| | 2,300 | | | | | United States Steel Corp. | | | 168,222 | | |
| | | | 768,232 | | |
| | | | | Leisure Time: 0.4% | |
| | 2,498 | | | @@ | | Carnival PLC | | | 126,191 | | |
| | 25,151 | | | @@ | | First Choice Holidays PLC | | | 139,735 | | |
| | 193 | | | L | | Polaris Industries, Inc. | | | 9,038 | | |
| | 2,600 | | | | | Sabre Holdings Corp. | | | 82,914 | | |
| | 4,900 | | | @@ | | Yamaha Motor Co., Ltd. | | | 154,025 | | |
| | | | 511,903 | | |
| | | | | Lodging: 0.0% | |
| | 200 | | | @ | | Aztar Corp. | | | 10,884 | | |
| | | | 10,884 | | |
| | | | | | | Machinery-Construction &
Mining: 0.3% | | | | | |
| | 3,602 | | | @@ | | Atlas Copco AB | | | 116,411 | | |
| | 2,500 | | | | | Caterpillar, Inc. | | | 153,325 | | |
| | 5,200 | | | @,@@ | | Hitachi Construction
Machinery Co., Ltd. | | | 139,642 | | |
| | 650 | | | | | Joy Global, Inc. | | | 31,421 | | |
| | | | 440,799 | | |
| | | | | Machinery-Diversified: 0.1% | |
| | 60 | | | @ | | AGCO Corp. | | | 1,856 | | |
| | 1,000 | | | | | Cummins, Inc. | | | 118,180 | | |
| | 830 | | | @ | | Gardner Denver, Inc. | | | 30,967 | | |
| | 283 | | | | | IDEX Corp. | | | 13,417 | | |
| | 340 | | | | | Manitowoc Co., Inc. | | | 20,206 | | |
| | | | 184,626 | | |
| | | | | Media: 1.4% | |
| | 2,600 | | | | | CBS Corp. | | | 81,068 | | |
| | 2,000 | | | | | Clear Channel
Communications, Inc. | | | 71,080 | | |
| | 7,000 | | | @,L | | Comcast Corp. | | | 296,310 | | |
| | 10,600 | | | @,L | | DIRECTV Group, Inc. | | | 264,364 | | |
| | 4,700 | | | | | McGraw-Hill Cos., Inc. | | | 319,694 | | |
| | 8,000 | | | | | News Corp., Inc. | | | 171,840 | | |
| | 380 | | | L | | Reader's Digest Association, Inc. | | | 6,346 | | |
| | 10,968 | | | @@ | | Reed Elsevier PLC | | | 120,296 | | |
| | 3,543 | | | @@ | | Vivendi | | | 138,192 | | |
See Accompanying Notes to Financial Statements
63
ING VP STRATEGIC ALLOCATION PORTFOLIO OF INVESTMENTS
CONSERVATIVE PORTFOLIO AS OF DECEMBER 31, 2006 (CONTINUED)
| Shares | | | | | | Value | |
| | | | | Media (continued) | |
| | 16,300 | | | | | Walt Disney Co. | | $ | 558,601 | | |
| | 30 | | | | | Washington Post | | | 22,368 | | |
| | | | 2,050,159 | | |
| | | | | Metal Fabricate/Hardware: 0.0% | |
| | 290 | | | | | AM Castle & Co. | | | 7,381 | | |
| | 820 | | | | | Commercial Metals Co. | | | 21,156 | | |
| | 553 | | | L | | Quanex Corp. | | | 19,128 | | |
| | | | 47,665 | | |
| | | | | Mining: 0.2% | |
| | 7,793 | | | @@ | | BHP Billiton Ltd. | | | 154,996 | | |
| | 840 | | | L | | Phelps Dodge Corp. | | | 100,565 | | |
| | | | 255,561 | | |
| | | | | Miscellaneous Manufacturing: 2.3% | |
| | 2,800 | | | | | 3M Co. | | | 218,204 | | |
| | 640 | | | L | | Acuity Brands, Inc. | | | 33,306 | | |
| | 540 | | | L | | AO Smith Corp. | | | 20,282 | | |
| | 161 | | | L | | Aptargroup, Inc. | | | 9,505 | | |
| | 80 | | | @ | | Ceradyne, Inc. | | | 4,520 | | |
| | 2,100 | | | | | Cooper Industries Ltd. | | | 189,903 | | |
| | 1,240 | | | | | Crane Co. | | | 45,434 | | |
| | 4,800 | | | L | | Eastman Kodak Co. | | | 123,840 | | |
| | 2,800 | | | | | Eaton Corp. | | | 210,392 | | |
| | 520 | | | @ | | EnPro Industries, Inc. | | | 17,269 | | |
| | 39,750 | | | | | General Electric Co. | | | 1,479,098 | | |
| | 50 | | | | | Harsco Corp. | | | 3,805 | | |
| | 11,800 | | | | | Honeywell International, Inc. | | | 533,832 | | |
| | 2,400 | | | | | Parker Hannifin Corp. | | | 184,512 | | |
| | 420 | | | | | Pentair, Inc. | | | 13,188 | | |
| | 140 | | | | | Roper Industries, Inc. | | | 7,034 | | |
| | 340 | | | | | Standex International Corp. | | | 10,244 | | |
| | 550 | | | @,L | | Sturm Ruger & Co., Inc. | | | 5,280 | | |
| | 843 | | | | | Teleflex, Inc. | | | 54,424 | | |
| | 240 | | | | | Tredegar Corp. | | | 5,426 | | |
| | 7,900 | | | @@ | | Tyco International Ltd. | | | 240,160 | | |
| | | | 3,409,658 | | |
| | | | | Office Furnishings: 0.0% | |
| | 1,291 | | | L | | Herman Miller, Inc. | | | 46,941 | | |
| | | | 46,941 | | |
| | | | | Office/Business Equipment: 0.2% | |
| | 14,700 | | | @ | | Xerox Corp. | | | 249,165 | | |
| | | | 249,165 | | |
| | | | | Oil & Gas: 4.2% | |
| | 5,800 | | | L | | Anadarko Petroleum Corp. | | | 252,416 | | |
| | 12,727 | | | | | Chevron Corp. | | | 935,816 | | |
| | 421 | | | | | Cimarex Energy Co. | | | 15,367 | | |
| | 5,400 | | | | | ConocoPhillips | | | 388,530 | | |
| | 1,020 | | | | | ENSCO International, Inc. | | | 51,061 | | |
| | 3,900 | | | @@ | | ERG S.p.A. | | | 89,034 | | |
| | 30,000 | | | | | ExxonMobil Corp. | | | 2,298,900 | | |
| | 320 | | | @ | | Forest Oil Corp. | | | 10,458 | | |
| | 1,316 | | | | | Frontier Oil Corp. | | | 37,822 | | |
| | 2,316 | | | | | Helmerich & Payne, Inc. | | | 56,673 | | |
| | 3,800 | | | | | Marathon Oil Corp. | | | 351,500 | | |
| | 960 | | | @ | | Newfield Exploration Co. | | | 44,112 | | |
| | 1,170 | | | L | | Noble Energy, Inc. | | | 57,412 | | |
| | 4,260 | | | @@ | | Norsk Hydro ASA | | | 131,494 | | |
| | 8,100 | | | | | Occidental Petroleum Corp. | | | 395,523 | | |
| Shares | | | | | | Value | |
| | 330 | | | L | | Penn Virginia Corp. | | $ | 23,113 | | |
| | 847 | | | @@ | | Petroleo Brasileiro SA | | | 87,233 | | |
| | 60 | | | | | Pioneer Natural Resources Co. | | | 2,381 | | |
| | 20 | | | @ | | Plains Exploration &
Production Co. | | | 951 | | |
| | 6,989 | | | @@ | | Royal Dutch Shell PLC - Class B | | | 244,355 | | |
| | 9,142 | | | @@ | | Santos Ltd. | | | 71,147 | | |
| | 2,800 | | | @@ | | Sasol, Ltd. ADR | | | 103,320 | | |
| | 440 | | | @ | | Southwestern Energy Co. | | | 15,422 | | |
| | 780 | | | L | | St. Mary Land & Exploration Co. | | | 28,735 | | |
| | 150 | | | @,L | | Stone Energy Corp. | | | 5,303 | | |
| | 2,800 | | | @@ | | Total SA | | | 201,481 | | |
| | 6,400 | | | | | Valero Energy Corp. | | | 327,424 | | |
| | | | 6,226,983 | | |
| | | | | Oil & Gas Services: 0.6% | |
| | 500 | | | @ | | Grant Prideco, Inc. | | | 19,885 | | |
| | 10,700 | | | L | | Halliburton Co. | | | 332,235 | | |
| | 470 | | | @,L | | Helix Energy Solutions Group, Inc. | | | 14,744 | | |
| | 120 | | | @ | | Lone Star Technologies | | | 5,809 | | |
| | 4,750 | | | @,@@ | | Petroleum Geo-Services | | | 111,182 | | |
| | 4,100 | | | L | | Schlumberger Ltd. | | | 258,956 | | |
| | 310 | | | @,L | | SEACOR Holdings, Inc. | | | 30,733 | | |
| | 1,210 | | | | | Tidewater, Inc. | | | 58,516 | | |
| | 190 | | | @,L | | Veritas DGC, Inc. | | | 16,270 | | |
| | | | 848,330 | | |
| | | | | Packaging & Containers: 0.1% | |
| | 2,600 | | | @ | | Pactiv Corp. | | | 92,794 | | |
| | 1,400 | | | | | Sonoco Products Co. | | | 53,284 | | |
| | | | 146,078 | | |
| | | | | Pharmaceuticals: 2.6% | |
| | 5,700 | | | | | Abbott Laboratories | | | 277,647 | | |
| | 3,900 | | | | | AmerisourceBergen Corp. | | | 175,344 | | |
| | 3,120 | | | @@ | | AstraZeneca PLC | | | 167,205 | | |
| | 160 | | | @ | | Cephalon, Inc. | | | 11,266 | | |
| | 5,500 | | | @ | | Forest Laboratories, Inc. | | | 278,300 | | |
| | 8,900 | | | @@ | | GlaxoSmithKline PLC | | | 234,255 | | |
| | 4,800 | | | @,L | | King Pharmaceuticals, Inc. | | | 76,416 | | |
| | 320 | | | | | Medicis Pharmaceutical Corp. | | | 11,242 | | |
| | 16,700 | | | | | Merck & Co., Inc. | | | 728,120 | | |
| | 3,900 | | | | | Mylan Laboratories | | | 77,844 | | |
| | 450 | | | @ | | NBTY, Inc. | | | 18,707 | | |
| | 620 | | | @,L | | Noven Pharmaceuticals, Inc. | | | 15,779 | | |
| | 1,264 | | | @@ | | Omega Pharma SA | | | 95,117 | | |
| | 150 | | | | | Omnicare, Inc. | | | 5,795 | | |
| | 26,900 | | | | | Pfizer, Inc. | | | 696,710 | | |
| | 1,350 | | | @@ | | Roche Holding AG | | | 241,533 | | |
| | 17,400 | | | | | Schering-Plough Corp. | | | 411,336 | | |
| | 500 | | | @,L | | Sepracor, Inc. | | | 30,790 | | |
| | 900 | | | @ | | Theragenics Corp. | | | 2,790 | | |
| | 240 | | | @,L | | USANA Health Sciences, Inc. | | | 12,398 | | |
| | 5,100 | | | | | Wyeth | | | 259,692 | | |
| | | | 3,828,286 | | |
| | | | | Pipelines: 0.2% | |
| | 2,800 | | | | | Questar Corp. | | | 232,540 | | |
| | | | 232,540 | | |
| | | | | Real Estate: 0.1% | |
| | 8,000 | | | @@ | | Cheung Kong Holdings Ltd. | | | 98,274 | | |
| | | | 98,274 | | |
See Accompanying Notes to Financial Statements
64
ING VP STRATEGIC ALLOCATION PORTFOLIO OF INVESTMENTS
CONSERVATIVE PORTFOLIO AS OF DECEMBER 31, 2006 (CONTINUED)
| Shares | | | | | | Value | |
| | | | | Real Estate Investment Trusts: 0.2% | |
| | 590 | | | | | AMB Property Corp. | | $ | 34,580 | | |
| | 250 | | | | | Colonial Properties Trust | | | 11,720 | | |
| | 1,500 | | | | | Equity Office Properties Trust | | | 72,255 | | |
| | 120 | | | | | Essex Property Trust, Inc. | | | 15,510 | | |
| | 220 | | | | | Highwoods Properties, Inc. | | | 8,967 | | |
| | 1,260 | | | L | | Hospitality Properties Trust | | | 59,888 | | |
| | 260 | | | | | Longview Fibre Co. | | | 5,707 | | |
| | 170 | | | | | LTC Properties, Inc. | | | 4,643 | | |
| | 310 | | | | | Macerich Co. | | | 26,837 | | |
| | 310 | | | | | Regency Centers Corp. | | | 24,233 | | |
| | | | 264,340 | | |
| | | | | Retail: 2.7% | |
| | 110 | | | @ | | 99 Cents Only Stores | | | 1,339 | | |
| | 328 | | | | | Abercrombie & Fitch Co. | | | 22,839 | | |
| | 480 | | | | | Advance Auto Parts, Inc. | | | 17,069 | | |
| | 850 | | | @,L | | Aeropostale, Inc. | | | 26,240 | | |
| | 1,509 | | | L | | American Eagle Outfitters | | | 47,096 | | |
| | 1,070 | | | @ | | AnnTaylor Stores Corp. | | | 35,139 | | |
| | 120 | | | | | Barnes & Noble, Inc. | | | 4,765 | | |
| | 2,000 | | | @,L | | Big Lots, Inc. | | | 45,840 | | |
| | 240 | | | | | Brinker International, Inc. | | | 7,238 | | |
| | 540 | | | L | | Brown Shoe Co., Inc. | | | 25,780 | | |
| | 80 | | | | | Cash America International, Inc. | | | 3,752 | | |
| | 1,720 | | | @,L | | Charming Shoppes, Inc. | | | 23,272 | | |
| | 680 | | | @,L | | Chico's FAS, Inc. | | | 14,069 | | |
| | 120 | | | @,L | | Childrens Place Retail Stores, Inc. | | | 7,622 | | |
| | 860 | | | L | | Christopher & Banks Corp. | | | 16,048 | | |
| | 826 | | | L | | Claire's Stores, Inc. | | | 27,374 | | |
| | 1,340 | | | @ | | Dollar Tree Stores, Inc. | | | 40,334 | | |
| | 4,100 | | | @@ | | Don Quijote Co., Ltd. | | | 78,267 | | |
| | 950 | | | @,L | | Dress Barn, Inc. | | | 22,164 | | |
| | 2,900 | | | | | Family Dollar Stores, Inc. | | | 85,057 | | |
| | 6,700 | | | | | Federated Department
Stores, Inc. | | | 255,471 | | |
| | 9,800 | | | | | Gap, Inc. | | | 191,100 | | |
| | 440 | | | L | | Group 1 Automotive, Inc. | | | 22,757 | | |
| | 6,950 | | | L | | Home Depot, Inc. | | | 279,112 | | |
| | 510 | | | @,L | | Jack in the Box, Inc. | | | 31,130 | | |
| | 4,100 | | | @ | | Kohl's Corp. | | | 280,563 | | |
| | 5,100 | | | | | Lowe's Cos., Inc. | | | 158,865 | | |
| | 10,900 | | | L | | McDonald's Corp. | | | 483,197 | | |
| | 782 | | | L | | Men's Wearhouse, Inc. | | | 29,919 | | |
| | 3,900 | | | L | | Nordstrom, Inc. | | | 192,426 | | |
| | 4,800 | | | @,L | | Office Depot, Inc. | | | 183,216 | | |
| | 1,300 | | | | | OfficeMax, Inc. | | | 64,545 | | |
| | 300 | | | | | OSI Restaurant Partners, Inc. | | | 11,760 | | |
| | 170 | | | @,L | | Panera Bread Co. | | | 9,505 | | |
| | 891 | | | @ | | Payless Shoesource, Inc. | | | 29,243 | | |
| | 1,230 | | | | | Petsmart, Inc. | | | 35,498 | | |
| | 1,760 | | | | | Ross Stores, Inc. | | | 51,568 | | |
| | 380 | | | @ | | Saks, Inc. | | | 6,772 | | |
| | 370 | | | @,L | | School Specialty, Inc. | | | 13,871 | | |
| | 1,049 | | | @,L | | Select Comfort Corp. | | | 18,242 | | |
| | 3,000 | | | @@ | | Seven & I Holdings Co., Ltd. | | | 93,285 | | |
| | 1,148 | | | @ | | Sonic Corp. | | | 27,495 | | |
| | 2,600 | | | @,L | | Starbucks Corp. | | | 92,092 | | |
| | 2,900 | | | | | Target Corp. | | | 165,445 | | |
| | 7,500 | | | | | TJX Cos., Inc. | | | 213,900 | | |
| | 412 | | | @,L | | Tween Brands, Inc. | | | 16,451 | | |
| | 9,450 | | | | | Wal-Mart Stores, Inc. | | | 436,401 | | |
| | | | 3,945,133 | | |
| Shares | | | | | | Value | |
| | | | | Savings & Loans: 0.0% | |
| | 470 | | | L | | Anchor Bancorp. Wisconsin, Inc. | | $ | 13,545 | | |
| | 730 | | | L | | Bankunited Financial Corp. | | | 20,411 | | |
| | 120 | | | L | | Fidelity Bankshares, Inc. | | | 4,760 | | |
| | 350 | | | @,L | | FirstFed Financial Corp. | | | 23,440 | | |
| | | | 62,156 | | |
| | | | | Semiconductors: 0.8% | |
| | 700 | | | @,L | | Actel Corp. | | | 12,712 | | |
| | 6,000 | | | @ | | Altera Corp. | | | 118,080 | | |
| | 3,930 | | | @,L | | Atmel Corp. | | | 23,777 | | |
| | 1,590 | | | @,L | | Brooks Automation, Inc. | | | 22,896 | | |
| | 210 | | | @ | | Cree, Inc. | | | 3,637 | | |
| | 580 | | | @ | | DSP Group, Inc. | | | 12,586 | | |
| | 1,900 | | | @ | | Fairchild Semiconductor
International, Inc. | | | 31,939 | | |
| | 2,330 | | | @ | | Integrated Device
Technology, Inc. | | | 36,068 | | |
| | 19,400 | | | | | Intel Corp. | | | 392,850 | | |
| | 616 | | | @ | | Lam Research Corp. | | | 31,182 | | |
| | 7,100 | | | @,L | | LSI Logic Corp. | | | 63,900 | | |
| | 830 | | | @,L | | MEMC Electronic Materials, Inc. | | | 32,486 | | |
| | 883 | | | | | Microchip Technology, Inc. | | | 28,874 | | |
| | 13,500 | | | @,L | | Micron Technology, Inc. | | | 188,460 | | |
| | 2,100 | | | @ | | Novellus Systems, Inc. | | | 72,282 | | |
| | 770 | | | @ | | Pericom Semiconductor Corp. | | | 8,832 | | |
| | 1,650 | | | @ | | Semtech Corp. | | | 21,566 | | |
| | 3,000 | | | @@ | | Shinko Electric Industries | | | 78,179 | | |
| | 200 | | | @,L | | Teradyne, Inc. | | | 2,992 | | |
| | 310 | | | @,L | | Varian Semiconductor
Equipment Associates, Inc. | | | 14,111 | | |
| | | | 1,197,409 | | |
| | | | | Software: 1.5% | |
| | 760 | | | | | Acxiom Corp. | | | 19,494 | | |
| | 490 | | | @,L | | Altiris, Inc. | | | 12,436 | | |
| | 210 | | | @,L | | Ansys, Inc. | | | 9,133 | | |
| | 3,900 | | | @ | | BMC Software, Inc. | | | 125,580 | | |
| | 800 | | | @ | | Captaris, Inc. | | | 6,216 | | |
| | 330 | | | @,L | | Cerner Corp. | | | 15,015 | | |
| | 8,100 | | | @ | | Compuware Corp. | | | 67,473 | | |
| | 730 | | | @,L | | CSG Systems International | | | 19,513 | | |
| | 1,140 | | | @ | | Dendrite International, Inc. | | | 12,209 | | |
| | 344 | | | @ | | Dun & Bradstreet Corp. | | | 28,480 | | |
| | 610 | | | | | Fair Isaac Corp. | | | 24,797 | | |
| | 10,700 | | | | | First Data Corp. | | | 273,064 | | |
| | 360 | | | | | Global Payments, Inc. | | | 16,668 | | |
| | 320 | | | @ | | Hyperion Solutions Corp. | | | 11,501 | | |
| | 110 | | | | | Inter-Tel, Inc. | | | 2,438 | | |
| | 570 | | | @ | | Mapinfo Corp. | | | 7,439 | | |
| | 33,250 | | | | | Microsoft Corp. | | | 992,845 | | |
| | 100 | | | @,L | | Open Solutions, Inc. | | | 3,764 | | |
| | 13,600 | | | @ | | Oracle Corp. | | | 233,104 | | |
| | 170 | | | @ | | Per-Se Technologies, Inc. | | | 4,723 | | |
| | 150 | | | @ | | SPSS, Inc. | | | 4,511 | | |
| | 1,436 | | | @,L | | Sybase, Inc. | | | 35,469 | | |
| | 6,061 | | | @,@@,L | | Tele Atlas NV | | | 127,468 | | |
| | 2,835 | | | @,@@ | | Tomtom, Inc. | | | 122,066 | | |
| | | | 2,175,406 | | |
| | | | | Telecommunications: 2.9% | |
| | 690 | | | @ | | 3Com Corp. | | | 2,836 | | |
| | 830 | | | @ | | Adaptec, Inc. | | | 3,868 | | |
| | 13,357 | | | @@ | | Alcatel SA | | | 190,564 | | |
See Accompanying Notes to Financial Statements
65
ING VP STRATEGIC ALLOCATION PORTFOLIO OF INVESTMENTS
CONSERVATIVE PORTFOLIO AS OF DECEMBER 31, 2006 (CONTINUED)
| Shares | | | | | | Value | |
| | | | | Telecommunications (continued) | |
| | 170 | | | @ | | Andrew Corp. | | $ | 1,739 | | |
| | 190 | | | @ | | Anixter International, Inc. | | | 10,317 | | |
| | 15,500 | | | | | AT&T, Inc. | | | 554,125 | | |
| | 9,000 | | | @,L | | Avaya, Inc. | | | 125,820 | | |
| | 7,300 | | | | | BellSouth Corp. | | | 343,903 | | |
| | 670 | | | @ | | C-COR, Inc. | | | 7,464 | | |
| | 2,590 | | | @ | | Cincinnati Bell, Inc. | | | 11,836 | | |
| | 35,950 | | | @ | | Cisco Systems, Inc. | | | 982,500 | | |
| | 110 | | | | | Commonwealth Telephone
Enterprises, Inc. | | | 4,605 | | |
| | 890 | | | @,L | | Ditech Networks, Inc. | | | 6,159 | | |
| | 548 | | | | | Harris Corp. | | | 25,131 | | |
| | 21,500 | | | | | Motorola, Inc. | | | 442,040 | | |
| | 660 | | | @ | | Network Equipment
Technologies, Inc. | | | 3,841 | | |
| | 28 | | | @@ | | Nippon Telegraph &
Telephone Corp. | | | 138,082 | | |
| | 1,759 | | | @@ | | Orascom Telecom GDR | | | 116,220 | | |
| | 5,500 | | | | | Qualcomm, Inc. | | | 207,845 | | |
| | 12,000 | | | | | Sprint Nextel Corp. | | | 226,680 | | |
| | 69,466 | | | @@ | | Telecom Italia S.p.A. | | | 175,916 | | |
| | 2,570 | | | @@ | | Telekomunikasi Indonesia
Tbk PT ADR | | | 117,192 | | |
| | 425 | | | | | Telephone & Data Systems, Inc. | | | 23,090 | | |
| | 1,220 | | | @ | | Utstarcom, Inc. | | | 10,675 | | |
| | 11,600 | | | | | Verizon Communications, Inc. | | | 431,984 | | |
| | 50,250 | | | @@ | | Vodafone Group PLC | | | 138,774 | | |
| | | | 4,303,206 | | |
| | | | | Textiles: 0.0% | |
| | 260 | | | | | Angelica Corp. | | | 6,708 | | |
| | 700 | | | @,L | | Mohawk Industries, Inc. | | | 52,402 | | |
| | | | 59,110 | | |
| | | | | Toys/Games/Hobbies: 0.2% | |
| | 3,000 | | | | | Hasbro, Inc. | | | 81,750 | | |
| | 6,300 | | | | | Mattel, Inc. | | | 142,758 | | |
| | | | 224,508 | | |
| | | | | Transportation: 0.3% | |
| | 1,060 | | | L | | CH Robinson Worldwide, Inc. | | | 43,343 | | |
| | 19 | | | @@ | | East Japan Railway Co. | | | 126,651 | | |
| | 120 | | | | | Expeditors International
Washington, Inc. | | | 4,860 | | |
| | 660 | | | @ | | HUB Group, Inc. | | | 18,183 | | |
| | 410 | | | @ | | Kansas City Southern | | | 11,882 | | |
| | 290 | | | @,L | | Kirby Corp. | | | 9,898 | | |
| | 317 | | | L | | Landstar System, Inc. | | | 12,103 | | |
| | 13,000 | | | @@ | | Mitsui OSK Lines Ltd. | | | 128,397 | | |
| | 690 | | | @,L | | Old Dominion Freight Line | | | 16,608 | | |
| | 787 | | | | | Overseas Shipholding Group | | | 44,308 | | |
| | 210 | | | @ | | Swift Transportation Co., Inc. | | | 5,517 | | |
| | 50 | | | @ | | YRC Worldwide, Inc. | | | 1,887 | | |
| | | | 423,637 | | |
| | | | | Water: 0.1% | |
| | 1,978 | | | @@ | | Veolia Environnement | | | 150,850 | | |
| | | | 150,850 | | |
Total Common Stock
(Cost $56,523,361) | | | 68,765,791 | | |
| Shares | | | | | | Value | |
| EQUITY-LINKED SECURITIES: 0.3% | | | |
| | | | | Equity Linked Securities: 0.3% | |
| | 500,000 | | | | | KAUP Bank | | $ | 469,407 | | |
Total Equity-Linked Securities
(Cost $500,000) | | | 469,407 | | |
| PREFERRED STOCK: 0.8% | | | |
| | | | | Banks: 0.2% | |
| | 14,000 | | | P | | Bank of American Corp. | | | 349,300 | | |
| | | | 349,300 | | |
| | | | | Diversified Financial Services: 0.2% | |
| | 10,000 | | | P | | Merrill Lynch & Co., Inc. | | | 260,800 | | |
| | | | 260,800 | | |
| | | | | Insurance: 0.4% | |
| | 13,125 | | | @@,P | | Aegon NV | | | 340,916 | | |
| | 11,400 | | | P | | Metlife, Inc. | | | 299,934 | | |
| | | | 640,850 | | |
Total Preferred Stock
(Cost $1,204,428) | | | 1,250,950 | | |
Principal
Amount | | | | | | | |
| CORPORATE BONDS/NOTES: 8.3% | | | |
| | | | | Banks: 3.4% | |
| $ | 230,000 | | | @@,C | | Australia & New Zealand
Banking Group Ltd., 5.556%,
due 10/29/49 | | $ | 200,251 | | |
| | 138,000 | | | @@,#,C | | Banco Mercantil del Norte SA,
6.135%, due 10/13/16 | | | 138,736 | | |
| | 94,000 | | | @@ | | Banco Santander Chile SA,
7.375%, due 07/18/12 | | | 102,902 | | |
| | 110,000 | | | @@,C | | Bank of Ireland, 5.625%,
due 12/29/49 | | | 95,801 | | |
| | 90,000 | | | @@,C | | Bank of Nova Scotia, 5.625%,
due 08/21/85 | | | 76,401 | | |
| | 50,000 | | | | | Bank of Scotland, 5.563%,
due 11/30/49 | | | 43,029 | | |
| | 61,000 | | | C | | BankAmerica Capital II, 8.000%,
due 12/15/26 | | | 63,508 | | |
| | 60,000 | | | @@,C | | Barclays Bank PLC, 5.750%,
due 12/31/49 | | | 52,484 | | |
| | 150,000 | | | @@,C,L | | BNP Paribas, 5.445%,
due 09/29/49 | | | 128,644 | | |
| | 122,000 | | | @@,#,C | | Chuo Mitsui Trust & BankingCo.,
Ltd., 5.506%, due 04/15/49 | | | 116,717 | | |
| | 100,000 | | | @@,C | | Den Norske Bank ASA, 5.563%,
due 08/29/49 | | | 85,000 | | |
| | 20,000 | | | @@,C | | Den Norske Bank ASA, 5.625%,
due 11/29/49 | | | 17,289 | | |
| | 143,000 | | | #,C | | Dresdner Funding Trust I,
8.151%, due 06/30/31 | | | 172,741 | | |
| | 307,000 | | | @@,#,C | | HBOS PLC, 5.375%, due 11/29/49 | | | 302,748 | | |
| | 350,000 | | | @@,C | | HSBC Bank PLC, 5.475%,
due 06/29/49 | | | 297,500 | | |
| | 180,000 | | | @@,C | | HSBC Bank PLC, 5.688%,
due 06/29/49 | | | 156,150 | | |
| | 220,000 | | | @@,C | | Lloyds TSB Bank PLC, 5.560%,
due 08/29/49 | | | 189,923 | | |
See Accompanying Notes to Financial Statements
66
ING VP STRATEGIC ALLOCATION PORTFOLIO OF INVESTMENTS
CONSERVATIVE PORTFOLIO AS OF DECEMBER 31, 2006 (CONTINUED)
Principal
Amount | | | | | | Value | |
| | | | | Banks (continued) | |
| $ | 20,000 | | | @@,C,L | | Lloyds TSB Bank PLC, 5.563%,
due 11/29/49 | | $ | 17,406 | | |
| | 222,000 | | | C | | M&I Capital Trust A, 7.650%,
due 12/01/26 | | | 229,800 | | |
| | 123,000 | | | C | | Mellon Capital I, 7.720%,
due 12/01/26 | | | 128,070 | | |
| | 120,000 | | | @@,C | | Mizuho Financial Group
Cayman Ltd., 8.375%,
due 12/31/49 | | | 126,845 | | |
| | 130,000 | | | @@,C,L | | National Australia Bank Ltd.,
5.556%, due 10/29/49 | | | 112,844 | | |
| | 20,000 | | | @@,C | | National Westminster Bank PLC,
5.500%, due 11/29/49 | | | 17,152 | | |
| | 139,000 | | | #,C | | Rabobank Capital Funding II,
5.260%, due 12/29/49 | | | 136,130 | | |
| | 64,000 | | | #,C | | Rabobank Capital Funding Trust,
5.254%, due 12/31/49 | | | 61,822 | | |
| | 36,000 | | | C,L | | RBS Capital Trust I, 5.512%,
due 09/30/49 | | | 35,638 | | |
| | 162,000 | | | @@,#,C | | Resona Bank Ltd., 5.850%,
due 09/29/49 | | | 158,465 | | |
| | 370,000 | | | @@,C | | Royal Bank of Scotland Group
PLC, 5.563%, due 12/29/49 | | | 317,475 | | |
| | 110,000 | | | @@,C | | Societe Generale, 5.438%,
due 11/29/49 | | | 95,056 | | |
| | 270,000 | | | @@,C | | Standard Chartered PLC,
5.500%, due 07/29/49 | | | 223,425 | | |
| | 410,000 | | | @@,C,L | | Standard Chartered PLC,
5.625%, due 11/29/49 | | | 344,400 | | |
| | 40,000 | | | @@,C | | Standard Chartered PLC,
5.730%, due 01/29/49 | | | 33,100 | | |
| | 133,000 | | | @@,C | | Sumitomo Mitsui Banking Corp.,
8.150%, due 08/01/49 | | | 137,968 | | |
| | 113,000 | | | C | | Wachovia Capital Trust III,
5.800%, due 12/31/49 | | | 114,038 | | |
| | 100,000 | | | @@,C | | Westpac Banking Corp., 5.525%,
due 09/30/49 | | | 85,584 | | |
| | 181,000 | | | #,C | | Westpac Capital Trust IV, 5.256%,
due 12/29/49 | | | 172,336 | | |
| | 219,000 | | | @@,#,C | | Woori Bank, 6.125%,
due 05/03/16 | | | 223,850 | | |
| | | | 5,011,228 | | |
| | | | | Beverages: 0.1% | |
| | 167,000 | | | @@ | | Cia Brasileira de Bebidas,
8.750%, due 09/15/13 | | | 195,390 | | |
| | | | 195,390 | | |
| | | | | Chemicals: 0.1% | |
| | 50,000 | | | | | Stauffer Chemical, 5.620%,
due 04/15/10 | | | 41,777 | | |
| | 80,000 | | | | | Stauffer Chemical, 5.890%,
due 04/15/18 | | | 41,919 | | |
| | 90,000 | | | | | Stauffer Chemical, 7.670%,
due 04/15/17 | | | 49,990 | | |
| | | | 133,686 | | |
| | | | | Diversified Financial Services: 2.3% | |
| | 290,000 | | | @@,#,C | | Aiful Corp., 4.450%,
due 02/16/10 | | | 278,347 | | |
| | 209,570 | | | @@,# | | Brazilian Merchant Voucher
Receivables Ltd., 5.911%,
due 06/15/11 | | | 206,426 | | |
Principal
Amount | | | | | | Value | |
| $ | 137,000 | | | C | | Citigroup Capital II, 7.750%,
due 12/01/36 | | $ | 141,663 | | |
| | 232,000 | | | #,C | | Corestates Capital Trust I,
8.000%, due 12/15/26 | | | 241,605 | | |
| | 136,000 | | | # | | Farmers Exchange Capital,
7.200%, due 07/15/48 | | | 139,739 | | |
| | 85,000 | | | @@,C | | Financiere CSFB NV, 5.485%,
due 03/29/49 | | | 72,888 | | |
| | 166,000 | | | C | | Fund American Cos., Inc.,
5.875%, due 05/15/13 | | | 165,225 | | |
| | 163,000 | | | #,C | | HVB Funding Trust III, 9.000%,
due 10/22/31 | | | 212,585 | | |
| | 127,000 | | | C | | JPM Capital Trust I, 7.540%,
due 01/15/27 | | | 131,769 | | |
| | 147,000 | | | C | | JPM Capital Trust II, 7.950%,
due 02/01/27 | | | 152,975 | | |
| | 269,000 | | | #,C | | Mangrove Bay Pass-Through
Trust, 6.102%, due 07/15/33 | | | 263,242 | | |
| | 211,000 | | | @@,C | | MUFG Capital Finance 1 Ltd.,
6.346%, due 12/31/49 | | | 214,522 | | |
| | 100,000 | | | @@,C | | Paribas, 5.500%, due 12/31/49 | | | 86,272 | | |
| | 65,333 | | | @@,#,C | | Petroleum Export Ltd., 4.623%,
due 06/15/10 | | | 64,337 | | |
| | 98,717 | | | @@,#,C | | Petroleum Export Ltd., 5.265%,
due 06/15/11 | | | 96,123 | | |
| | 259,267 | | | @@,#,C | | PF Export Receivables Master
Trust, 6.436%, due 06/01/15 | | | 264,614 | | |
| | 299,000 | | | @@,#,C | | Preferred Term Securities Ltd.,
5.860%, due 03/23/35 | | | 300,121 | | |
| | 842,089 | | | # | | Toll Road Investors Partnership II
LP, 17.590%, due 02/15/45 | | | 107,916 | | |
| | 100,000 | | | #,C | | Twin Reefs Pass-Through Trust,
6.350%, due 12/10/49 | | | 100,190 | | |
| | 179,000 | | | @@,C,L | | UFJ Finance Aruba AEC, 8.750%,
due 12/31/49 | | | 189,009 | | |
| | | | 3,429,568 | | |
| | | | | Electric: 0.5% | |
| | 136,000 | | | C | | Commonwealth Edison Co.,
5.950%, due 08/15/16 | | | 137,747 | | |
| | 27,000 | | | @@ | | Empresa Nacional de Electricidad
SA, 7.325%, due 02/01/37 | | | 29,411 | | |
| | 137,000 | | | @@,L | | Empresa Nacional de Electricidad
SA, 8.625%, due 08/01/15 | | | 161,543 | | |
| | 59,000 | | | C,L | | FirstEnergy Corp., 6.450%,
due 11/15/11 | | | 61,590 | | |
| | 83,972 | | | # | | Power Contract Financing, LLC,
6.256%, due 02/01/10 | | | 84,456 | | |
| | 31,843 | | | | | PPL Montana, LLC, 8.903%,
due 07/02/20 | | | 35,143 | | |
| | 183,000 | | | C | | Southern Co. CAP Trust I, 8.190%,
due 02/01/37 | | | 190,857 | | |
| | | | 700,747 | | |
| | | | | Healthcare-Products: 0.1% | |
| | 99,000 | | | C | | Boston Scientific Corp., 7.000%,
due 11/15/35 | | | 98,927 | | |
| | | | 98,927 | | |
| | | | | Home Builders: 0.1% | |
| | 159,000 | | | L | | D.R. Horton, Inc., 5.625%,
due 09/15/14 | | | 153,811 | | |
| | | | 153,811 | | |
See Accompanying Notes to Financial Statements
67
ING VP STRATEGIC ALLOCATION PORTFOLIO OF INVESTMENTS
CONSERVATIVE PORTFOLIO AS OF DECEMBER 31, 2006 (CONTINUED)
Principal
Amount | | | | | | Value | |
| | | | | Multi-National: 0.1% | |
| $ | 92,000 | | | @@ | | Corp. Andina de Fomento CAF,
5.125%, due 05/05/15 | | $ | 88,711 | | |
| | | | 88,711 | | |
| | | | | Oil & Gas: 0.4% | |
| | 131,000 | | | @@,# | | EMP Nacional Del Petrole,
4.875%, due 03/15/14 | | | 124,624 | | |
| | 27,000 | | | @@,# | | Empresa Nacional de Petroleo
ENAP, 6.750%, due 11/15/12 | | | 28,484 | | |
| | 63,000 | | | C | | Pemex Project Funding Master
Trust, 6.625%, due 06/15/35 | | | 64,528 | | |
| | 221,000 | | | # | | Pemex Project Funding Master
Trust, 6.660%, due 06/15/10 | | | 227,409 | | |
| | 130,000 | | | @@,#,C | | Ras Laffan Liquefied Natural
Gas Co., Ltd. II, 5.298%,
due 09/30/20 | | | 124,849 | | |
| | | | 569,894 | | |
| | | | | Pipelines: 0.2% | |
| | 357,000 | | | #,C | | Cameron Highway Oil Pipelines,
5.860%, due 12/15/17 | | | 349,079 | | |
| | | | 349,079 | | |
| | | | | Real Estate Investment Trusts: 0.2% | |
| | 48,000 | | | C | | Liberty Property LP, 6.375%,
due 08/15/12 | | | 50,065 | | |
| | 152,000 | | | C | | Liberty Property LP, 7.750%,
due 04/15/09 | | | 159,060 | | |
| | 140,000 | | | C | | Simon Property Group LP,
5.000%, due 03/01/12 | | | 137,690 | | |
| | | | 346,815 | | |
| | | | | Savings & Loans: 0.1% | |
| | 118,000 | | | C | | Great Western Financial, 8.206%,
due 02/01/27 | | | 123,041 | | |
| | | | 123,041 | | |
| | | | | Sovereign: 0.5% | |
| | 607,000 | | | L | | Fannie Mae, 7.250%,
due 01/15/10 | | | 646,224 | | |
| | | | 646,224 | | |
| | | | | Telecommunications: 0.2% | |
| | 129,000 | | | C | | Sprint Capital Corp., 6.875%,
due 11/15/28 | | | 129,493 | | |
| | 174,000 | | | @@,C | | TELUS Corp., 8.000%,
due 06/01/11 | | | 190,453 | | |
| | | | 319,946 | | |
Total Corporate Bonds/Notes
(Cost $12,231,243) | | | 12,167,067 | | |
| U.S. GOVERNMENT AGENCY OBLIGATIONS: 15.3% | | | |
| | | | | Federal Home Loan Bank: 0.2% | |
| | 327,000 | | | L | | 5.625%, due 06/13/16 | | | 337,158 | | |
| | | | 337,158 | | |
| | | | | | | Federal Home Loan Mortgage
Corporation: 3.6% | | | | | |
| | 495,102 | | | C | | 4.500%, due 12/15/16 | | | 486,110 | | |
| | 396,708 | | | C | | 5.000%, due 08/15/16 | | | 391,100 | | |
| | 477,000 | | | C | | 5.000%, due 05/15/20 | | | 462,582 | | |
| | 302,000 | | | L | | 5.125%, due 04/18/08 | | | 302,017 | | |
Principal
Amount | | | | | | Value | |
| $ | 333,000 | | | | | 5.125%, due 04/18/11 | | $ | 335,627 | | |
| | 618,000 | | | W | | 5.500%, due 01/00/00 | | | 611,240 | | |
| | 1,090,000 | | | C | | 5.750%, due 05/11/11 | | | 1,091,168 | | |
| | 342,000 | | | | | 5.750%, due 06/27/16 | | | 356,598 | | |
| | 412,897 | | | C | | 6.000%, due 01/15/29 | | | 418,419 | | |
| | 627,000 | | | | | 6.625%, due 09/15/09 | | | 653,422 | | |
| | 171,726 | | | | | 7.000%, due 11/01/31 | | | 176,696 | | |
| | | | 5,284,979 | | |
| | | | | | | Federal National Mortgage
Association: 11.2% | | | | | |
| | 624,000 | | | | | 4.500%, due 11/15/36 | | | 584,805 | | |
| | 271,000 | | | W | | 4.500%, due 01/00/00 | | | 261,430 | | |
| | 260,373 | | | | | 4.806%, due 08/01/35 | | | 256,978 | | |
| | 326,000 | | | L | | 4.875%, due 12/15/16 | | | 322,981 | | |
| | 6,912,000 | | | W | | 5.000%, due 01/12/36 | | | 6,674,400 | | |
| | 1,062,000 | | | W | | 5.000%, due 01/15/20 | | | 1,044,079 | | |
| | 814,000 | | | L | | 5.250%, due 08/01/12 | | | 818,938 | | |
| | 362,000 | | | | | 5.250%, due 09/15/16 | | | 369,241 | | |
| | 1,074,000 | | | W | | 5.500%, due 01/12/36 | | | 1,061,582 | | |
| | 14,110 | | | | | 5.500%, due 01/01/18 | | | 14,148 | | |
| | 250,416 | | | | | 5.500%, due 02/01/18 | | | 250,476 | | |
| | 396,000 | | | W | | 5.500%, due 01/15/20 | | | 396,000 | | |
| | 933,000 | | | | | 5.500%, due 05/25/30 | | | 917,686 | | |
| | 279,204 | | | | | 5.500%, due 11/01/33 | | | 276,502 | | |
| | 242,152 | | | | | 5.500%, due 11/01/36 | | | 237,952 | | |
| | 418,867 | | | | | 5.500%, due 12/25/36 | | | 407,590 | | |
| | 491,000 | | | C | | 5.600%, due 03/29/11 | | | 491,165 | | |
| | 762,000 | | | | | 6.000%, due 01/15/34 | | | 767,239 | | |
| | 294,873 | | | | | 6.000%, due 08/01/16 | | | 299,353 | | |
| | 282,453 | | | | | 6.000%, due 04/25/31 | | | 287,838 | | |
| | 198,000 | | | W | | 6.500%, due 01/15/35 | | | 201,774 | | |
| | 351,230 | | | | | 6.500%, due 07/01/29 | | | 357,970 | | |
| | 62,532 | | | | | 7.000%, due 02/01/31 | | | 64,406 | | |
| | 31,622 | | | | | 7.500%, due 09/01/31 | | | 32,911 | | |
| | | | 16,397,444 | | |
| | | | | | | Government National
Mortgage Association: 0.3% | | | | | |
| | 35,068 | | | | | 6.500%, due 01/15/29 | | | 36,079 | | |
| | 31,458 | | | | | 6.500%, due 10/15/31 | | | 32,339 | | |
| | 70,758 | | | | | 6.500%, due 01/15/32 | | | 72,718 | | |
| | 23,295 | | | | | 7.000%, due 01/15/28 | | | 24,080 | | |
| | 129,092 | | | | | 7.000%, due 02/15/28 | | | 133,445 | | |
| | 165,794 | | | | | 7.500%, due 12/15/23 | | | 172,952 | | |
| | | | 471,613 | | |
Total U.S. Government
Agency Obligations
(Cost $22,645,267) | | | 22,491,194 | | |
| U.S. TREASURY OBLIGATIONS: 6.4% | | | |
| | | | | U.S. Treasury Bonds: 4.6% | |
| | 650,000 | | | L | | 4.500%, due 11/30/11 | | | 644,415 | | |
| | 2,719,000 | | | L | | 4.500%, due 02/15/36 | | | 2,586,451 | | |
| | 2,346,000 | | | L | | 4.625%, due 11/15/16 | | | 2,331,340 | | |
| | 552,000 | | | L | | 6.000%, due 02/15/26 | | | 626,219 | | |
| | 538,000 | | | L | | 6.250%, due 08/15/23 | | | 619,415 | | |
| | | | 6,807,840 | | |
| | | | | | | Treasury Inflation
Protected Securities: 0.7% | | | | | |
| | 346,000 | | | | | 2.000%, due 01/15/16 | | | 339,782 | | |
| | 631,000 | | | L | | 2.375%, due 04/15/11 | | | 639,176 | | |
| | | | 978,958 | | |
See Accompanying Notes to Financial Statements
68
ING VP STRATEGIC ALLOCATION PORTFOLIO OF INVESTMENTS
CONSERVATIVE PORTFOLIO AS OF DECEMBER 31, 2006 (CONTINUED)
Principal
Amount | | | | | | Value | |
| | | | | U.S. Treasury Notes: 0.9% | |
| $ | 655,000 | | | | L | | | 4.625%, due 11/30/08 | | $ | 652,825 | | |
| | 616,000 | | | | L | | | 4.625%, due 11/15/09 | | | 614,268 | | |
| | | | 1,267,093 | | |
| | | | | | | | | U.S. Treasury Principal Only
STRIP: 0.2% | | | | | |
| | 1,291,000 | | | | L | | | Discount Note, due 02/15/36 | | | 327,128 | | |
| | | | 327,128 | | |
Total U.S. Treasury Obligations
(Cost $9,378,259) | | | 9,381,019 | | |
| ASSET-BACKED SECURITIES: 0.7% | | | |
| | | | | | | | | Automobile Asset-Backed
Securities: 0.0% | | | | | |
| | 28,000 | | | | C | | | AmeriCredit Automobile
Receivables Trust, 4.220%,
due 07/06/09 | | | 27,796 | | |
| | 23,413 | | | | C | | | Honda Auto Receivables Owner
Trust, 2.790%, due 03/16/09 | | | 23,209 | | |
| | | | 51,005 | | |
| | | | | | | | | Credit Card Asset-Backed
Securities: 0.1% | | | | | |
| | 115,000 | | | | C | | | Bank One Issuance Trust,
4.540%, due 09/15/10 | | | 113,960 | | |
| | | | 113,960 | | |
| | | | | | | | | Home Equity Asset-Backed
Securities: 0.1% | | | | | |
| | 18,000 | | | | +, | C | | Renaissance Home Equity
Loan Trust, 4.456%, (step
rate 4.956%), due 05/25/35 | | | 17,834 | | |
| | 72,000 | | | | +, | C | | Renaissance Home Equity
Loan Trust, 5.608%, (step
rate 6.108%), due 05/25/36 | | | 71,997 | | |
| | 100,000 | | | | C | | | Wells Fargo Home Equity Trust,
3.970%, due 05/25/34 | | | 97,921 | | |
| | | | 187,752 | | |
| | | | | Other Asset-Backed Securities: 0.5% | |
| | 25,000 | | | | C | | | Caterpillar Financial Asset Trust,
5.590%, due 02/25/09 | | | 24,996 | | |
| | 205,000 | | | | C | | | Countrywide Asset-Backed
Certificates, 5.683%,
due 10/25/46 | | | 204,936 | | |
| | 28,000 | | | | C | | | Countrywide Asset-Backed
Certificates, 5.689%,
due 10/25/46 | | | 28,061 | | |
| | 148,999 | | | | +, | C | | Credit-Based Asset Servicing and Securitization, 5.501%, (step
rate 6.001%), due 12/25/36 | | | 148,669 | | |
| | 124,000 | | | | C | | | Equity One, Inc., 5.050%,
due 09/25/33 | | | 122,341 | | |
| | 98,000 | | | | +, | C | | Merrill Lynch Mortgage Investors,
Inc., 5.609%, (step rate
6.109%), due 03/25/37 | | | 97,877 | | |
| | 2,784 | | | | C | | | Popular Mortgage Pass-Through
Trust, 3.735%, due 12/25/34 | | | 2,776 | | |
| | 41,000 | | | | C | | | Popular Mortgage Pass-Through
Trust, 4.000%, due 12/25/34 | | | 40,586 | | |
| | | | 670,242 | | |
Total Asset-Backed Securities
(Cost $1,026,707) | | | 1,022,959 | | |
Principal
Amount | | | | | | Value | |
| COLLATERALIZED MORTGAGE OBLIGATIONS: 15.9% | | | |
| $ | 10,000 | | | C | | Banc of America Commercial
Mortgage, Inc., 4.429%,
due 11/10/39 | | $ | 9,666 | | |
| | 190,000 | | | C | | Banc of America Commercial
Mortgage, Inc., 4.772%,
due 07/11/43 | | | 187,868 | | |
| | 38,000 | | | C | | Banc of America Commercial
Mortgage, Inc., 4.877%,
due 11/10/42 | | | 37,622 | | |
| | 47,176 | | | C | | Banc of America Commercial
Mortgage, Inc., 5.685%,
due 07/10/44 | | | 47,572 | | |
| | 20,000 | | | C | | Banc of America Commercial
Mortgage, Inc., 6.186%,
due 06/11/35 | | | 20,812 | | |
| | 321,944 | | | C | | Banc of America Funding Corp.,
5.858%, due 05/20/36 | | | 321,401 | | |
| | 106,000 | | | C | | Banc of America Mortgage
Securities, 4.147%,
due 07/25/34 | | | 103,223 | | |
| | 123,386 | | | C | | Banc of America Mortgage
Securities, 5.250%,
due 11/25/19 | | | 122,131 | | |
| | 100,723 | | | C | | Banc of America Mortgage
Securities, 5.500%,
due 11/25/33 | | | 99,272 | | |
| | 345,376 | | | C | | Bank of America Alternative
Loan Trust, 6.290%,
due 11/25/21 | | | 348,781 | | |
| | 538,188 | | | C | | Bank of America Alternative
Loan Trust, 6.500%,
due 04/25/36 | | | 545,084 | | |
| | 266,095 | | | C | | Bank of America Alternative
Loan Trust, 6.500%,
due 05/25/46 | | | 269,261 | | |
| | 26,000 | | | C | | Bear Stearns Commercial
Mortgage Securities, 4.030%,
due 02/13/46 | | | 25,158 | | |
| | 37,000 | | | C | | Capco America Securitization
Corp., 6.460%, due 10/15/30 | | | 37,717 | | |
| | 10,000 | | | C | | Citigroup Commercial Mortgage
Trust, 4.639%, due 05/15/43 | | | 9,814 | | |
| | 47,525 | | | C | | Citigroup Commercial Mortgage
Trust, 5.720%, due 03/15/49 | | | 48,162 | | |
| | 386,490 | | | C | | Countrywide Alternative Loan
Trust, 5.416%, due 10/25/35 | | | 381,658 | | |
| | 493,652 | | | C | | Countrywide Alternative Loan
Trust, 5.500%, due 02/25/25 | | | 491,699 | | |
| | 975,000 | | | C | | Credit Suisse First Boston
Mortgage Securities Corp.,
3.861%, due 03/15/36 | | | 954,444 | | |
| | 82,000 | | | C | | Credit Suisse First Boston
Mortgage Securities Corp.,
7.544%, due 04/15/62 | | | 88,358 | | |
| | 47,805 | | | C | | Credit Suisse Mortgage Capital
Certificates, 4.991%,
due 06/15/38 | | | 47,475 | | |
| | 456,098 | | | C | | DLJ Commercial Mortgage Corp.,
6.240%, due 11/12/31 | | | 461,361 | | |
| | 1,090,000 | | | C | | DLJ Commercial Mortgage Corp.,
7.300%, due 06/10/32 | | | 1,132,601 | | |
| | 132,356 | | | C | | GE Capital Commercial Mortgage
Corp., 3.752%, due 07/10/39 | | | 129,676 | | |
See Accompanying Notes to Financial Statements
69
ING VP STRATEGIC ALLOCATION PORTFOLIO OF INVESTMENTS
CONSERVATIVE PORTFOLIO AS OF DECEMBER 31, 2006 (CONTINUED)
Principal
Amount | | | | | | Value | |
| $ | 40,000 | | | C | | GE Capital Commercial
Mortgage Corp., 4.865%,
due 07/10/39 | | $ | 39,396 | | |
| | 10,978 | | | C | | GE Capital Commercial
Mortgage Corp., 5.560%,
due 06/10/38 | | | 11,052 | | |
| | 209,980 | | | C | | GMAC Mortgage Corp. Loan
Trust, 4.604%, due 10/19/33 | | | 203,652 | | |
| | 142,064 | | | C | | GMAC Mortgage Corp. Loan
Trust, 5.500%, due 09/25/34 | | | 141,085 | | |
| | 110,000 | | | C | | Greenwich Capital Commercial
Funding Corp., 5.117%,
due 04/10/37 | | | 109,678 | | |
| | 25,000 | | | C | | Greenwich Capital Commercial
Funding Corp., 5.912%,
due 07/10/38 | | | 25,716 | | |
| | 77,259 | | | #,C | | GSMPS Mortgage Loan Trust,
5.700%, due 01/25/35 | | | 77,621 | | |
| | 30,000 | | | C | | JP Morgan Chase Commercial
Mortgage Securities Corp.,
4.449%, due 01/12/38 | | | 29,183 | | |
| | 10,000 | | | C | | JP Morgan Chase Commercial
Mortgage Securities Corp.,
5.289%, due 05/15/45 | | | 10,020 | | |
| | 18,721 | | | C | | JP Morgan Chase Commercial
Mortgage Securities Corp.,
5.833%, due 04/15/45 | | | 18,954 | | |
| | 142,000 | | | C | | JP Morgan Chase Commercial
Mortgage Securities Corp.,
5.861%, due 04/15/45 | | | 145,931 | | |
| | 791,251 | | | C | | JP Morgan Mortgage Trust,
5.408%, due 11/25/35 | | | 781,360 | | |
| | 21,000 | | | C | | LB-UBS Commercial Mortgage
Trust, 4.201%, due 12/15/29 | | | 20,446 | | |
| | 66,000 | | | C | | LB-UBS Commercial Mortgage
Trust, 4.547%, due 08/15/29 | | | 64,425 | | |
| | 23,000 | | | C | | LB-UBS Commercial Mortgage
Trust, 4.567%, due 06/15/29 | | | 22,669 | | |
| | 74,000 | | | C | | LB-UBS Commercial Mortgage
Trust, 4.583%, due 08/15/29 | | | 72,163 | | |
| | 153,000 | | | C | | LB-UBS Commercial Mortgage
Trust, 4.821%, due 04/15/30 | | | 151,135 | | |
| | 21,000 | | | C | | LB-UBS Commercial Mortgage
Trust, 4.836%, due 02/15/40 | | | 20,193 | | |
| | 10,000 | | | C | | LB-UBS Commercial Mortgage
Trust, 4.885%, due 09/15/30 | | | 9,910 | | |
| | 87,000 | | | C | | LB-UBS Commercial Mortgage
Trust, 5.103%, due 11/15/30 | | | 86,733 | | |
| | 44,000 | | | C | | LB-UBS Commercial Mortgage
Trust, 5.207%, due 02/15/31 | | | 43,859 | | |
| | 48,347 | | | C | | LB-UBS Commercial Mortgage
Trust, 5.741%, due 06/15/32 | | | 49,006 | | |
| | 153,000 | | | C | | LB-UBS Commercial Mortgage
Trust, 6.365%, due 12/15/28 | | | 159,799 | | |
| | 121,000 | | | C | | LB-UBS Commercial Mortgage
Trust, 7.370%, due 08/15/26 | | | 128,214 | | |
| | 300,000 | | | | | MASTR Alternative Loans Trust,
Discount Note, due 12/25/36 | | | 300,000 | | |
| | 316,255 | | | C | | MASTR Alternative Loans Trust,
5.500%, due 01/25/20 | | | 315,786 | | |
| | 895,845 | | | C | | MASTR Asset Securitization
Trust, 5.500%, due 06/25/33 | | | 879,608 | | |
| | 2,497,006 | | | C | | MASTR Reperforming Loan
Trust, 5.680%, due 07/25/35 | | | 2,502,322 | | |
Principal
Amount | | | | | | Value | |
| $ | 54,000 | | | C | | Merrill Lynch Mortgage Trust,
5.660%, due 05/12/39 | | $ | 55,176 | | |
| | 50,000 | | | C | | Merrill Lynch/Countrywide
Commercial Mortgage Trust,
5.439%, due 02/12/39 | | | 50,367 | | |
| | 120,000 | | | C | | Morgan Stanley Capital I,
4.827%, due 06/12/47 | | | 117,857 | | |
| | 300,000 | | | C | | Morgan Stanley Capital I,
5.007%, due 01/14/42 | | | 296,809 | | |
| | 96,787 | | | C | | Morgan Stanley Capital I,
5.490%, due 07/12/44 | | | 97,513 | | |
| | 100,000 | | | C | | Morgan Stanley Capital I,
5.741%, due 08/12/41 | | | 102,317 | | |
| | 118,596 | | | C | | Morgan Stanley Dean Witter
Capital I, 4.180%, due 03/12/35 | | | 114,642 | | |
| | 206,756 | | | C | | RAAC Series, 5.250%,
due 09/25/34 | | | 204,330 | | |
| | 152,216 | | | C | | RAST 2006-A10 A5, 6.500%,
due 09/25/36 | | | 153,155 | | |
| | 315,959 | | | C | | Residential Accredit Loans, Inc.,
5.720%, due 04/25/35 | | | 317,188 | | |
| | 150,506 | | | | +, | C | | Thornburg Mortgage Securities
Trust, 5.720%, (step rate
6.060%), due 09/25/34 | | | 151,313 | | |
| | 10,000 | | | C | | Wachovia Bank Commercial
Mortgage Trust, 5.223%,
due 07/15/42 | | | 9,996 | | |
| | 47,014 | | | C | | Wachovia Bank Commercial
Mortgage Trust, 5.726%,
due 06/15/45 | | | 47,465 | | |
| | 50,000 | | | C | | Wachovia Bank Commercial
Mortgage Trust, 5.935%,
due 06/15/45 | | | 51,339 | | |
| | 274,234 | | | C | | Washington Mutual Alternative
Mortgage Pass-Through
Certificates, 5.000%,
due 12/25/18 | | | 268,661 | | |
| | 1,500,000 | | | C | | Washington Mutual Alternative
Mortgage Pass-Through
Certificates, 5.567%,
due 01/25/47 | | | 1,500,000 | | |
| | 964,437 | | | C | | Washington Mutual Alternative
Mortgage Pass-Through
Certificates, 5.568%,
due 12/25/46 | | | 964,889 | | |
| | 1,000,000 | | | C | | Washington Mutual Alternative
Mortgage Pass-Through
Certificates, 5.596%,
due 01/25/47 | | | 1,001,250 | | |
| | 446,632 | | | C | | Washington Mutual Alternative
Mortgage Pass-Through
Certificates, 5.728%,
due 05/25/46 | | | 447,766 | | |
| | 164,069 | | | C | | Washington Mutual Alternative
Mortgage Pass-Through
Certificates, 5.748%,
due 07/25/46 | | | 164,364 | | |
| | 509,045 | | | C | | Washington Mutual Alternative
Mortgage Pass-Through
Certificates, 5.750%,
due 02/25/36 | | | 510,920 | | |
| | 955,056 | | | C | | Washington Mutual, Inc.,
5.598%, due 11/25/46 | | | 954,870 | | |
See Accompanying Notes to Financial Statements
70
ING VP STRATEGIC ALLOCATION PORTFOLIO OF INVESTMENTS
CONSERVATIVE PORTFOLIO AS OF DECEMBER 31, 2006 (CONTINUED)
Principal
Amount | | | | | | Value | |
| $ | 1,203,371 | | | C | | Washington Mutual, Inc.,
5.667%, due 11/25/46 | | $ | 1,203,136 | | |
| | 984,007 | | | C | | Washington Mutual, Inc.,
5.882%, due 11/25/46 | | | 986,198 | | |
| | 131,000 | | | C | | Wells Fargo Mortgage-Backed
Securities Trust, 3.499%,
due 06/25/35 | | | 127,634 | | |
| | 565,393 | | | C | | Wells Fargo Mortgage-Backed
Securities Trust, 5.387%,
due 08/25/35 | | | 557,928 | | |
| | 556,124 | | | C | | Wells Fargo Mortgage-Backed
Securities Trust, 5.690%,
due 12/25/36 | | | 553,603 | | |
| | | | 23,351,418 | | |
Total Collateralized
Mortgage Obligations
(Cost $23,512,765) | | | 23,351,418 | | |
| MUNICIPAL BONDS: 0.5% | | | |
| | | | | California: 0.1% | |
| | 130,000 | | | C | | City of San Diego, 7.125%,
due 06/01/32 | | | 134,042 | | |
| | | | 134,042 | | |
| | | | | Louisiana: 0.2% | |
| | 300,000 | | | #,C | | Tulane University of Louisiana,
6.174%, due 11/15/12 | | | 300,000 | | |
| | | | 300,000 | | |
| | | | | Michigan: 0.2% | |
| | 300,000 | | | | | Michigan Tobacco Settlement
Finance Authority, 7.309%,
due 06/01/34 | | | 311,394 | | |
| | | | 311,394 | | |
Total Municipal Bonds
(Cost $730,233) | | | 745,436 | | |
Total Long-Term Investments
(Cost $127,752,263) | | | 139,645,241 | | |
| SHORT-TERM INVESTMENTS: 27.5% | | | |
| | | Commercial Paper: 3.4% | |
| | 3,000,000 | | | Concord Minutemen Capital Co., LLC,
5.250%, due 02/06/07 | | | 2,983,895 | | |
| | 2,000,000 | | | Tulip Funding Co., 5.320%, due 01/02/07 | | | 1,999,409 | | |
Total Commercial Paper
(Cost $4,983,304) | | | 4,983,304 | | |
| | | Repurchase Agreement: 10.0% | |
| | 14,699,000 | | | Deutsche Bank Repurchase Agreement
dated 12/29/06, 5.250%, due 01/02/07,
$14,707,574 to be received upon
repurchase (Collateralized by
$15,613,000 Federal National
Mortgage Association, 5.630%,
Market Value plus accrued interest
$14,993,589, due 04/19/35) | | | 14,699,000 | | |
Total Repurchase Agreement
(Cost $14,699,000) | | | 14,699,000 | | |
Principal
Amount | | | | Value | |
| | | Securities Lending CollateralCC: 14.1% | |
| $ | 20,711,495 | | | The Bank of New York Institutional
Cash Reserves Fund | | $ | 20,711,495 | | |
Total Securities Lending
Collateral (Cost $20,711,495) | | | 20,711,495 | | |
Total Short-Term Investments
(Cost $40,393,799) | | | 40,393,799 | | |
Total Investments in Securities
(Cost $168,146,062)* | | | 122.4 | % | | $ | 180,039,040 | | |
Other Assets and
Liabilities - Net | | | (22.4 | ) | | | (32,924,445 | ) | |
| Net Assets | | | 100.0 | % | | $ | 147,114,595 | | |
@ Non-income producing security
@@ Foreign Issuer
ADR American Depositary Receipt
GDR Global Depositary Receipt
STRIP Separate Trading of Registered Interest and Principal of Securities
MASTR Mortgage Asset Securitization Transaction, Inc.
+ Step-up basis bonds. Interest rates shown reflect current and future coupon rates.
# Securities with purchases pursuant to Rule 144A, under the Securities Act of 1933 and may not be resold subject to that rule except to qualified institutional buyers. These securities have been determined to be liquid under the guidelines established by the Funds' Board of Directors/Trustees.
C Bond may be called prior to maturity date.
P Preferred Stock may be called prior to convertible date.
cc Securities purchased with cash collateral for securities loaned.
W When-issued or delayed delivery security
I Illiquid security
L Loaned security, a portion or all of the security is on loan at December 31, 2006.
* Cost for federal income tax purposes is $168,926,982. Net unrealized appreciation consists of:
| Gross Unrealized Appreciation | | $ | 12,336,616 | | |
| Gross Unrealized Depreciation | | | (1,224,558 | ) | |
| Net Unrealized Appreciation | | $ | 11,112,058 | | |
VP Strategic Allocation Conservative Portfolio Open Futures Contracts on December 31, 2006:
Contract
Description | | Number
of
Contracts | | Notional
Market
Value ($) | | Expiration
Date | | Unrealized
Appreciation/
(Depreciation) | |
| Long Contracts | |
| S&P 500 E-Mini | | | 11 | | | | 785,620 | | | 3/16/07 | | $ | 1,230 | | |
U.S. Treasury
10-Year Note | | | 56 | | | | 6,018,250 | | | 3/21/07 | | | (81,599 | ) | |
U.S. Treasury
2-Year Note | | | 69 | | | | 14,078,157 | | | 3/30/07 | | | (50,187 | ) | |
U.S. Treasury
5-Year Note | | | 10 | | | | 1,050,625 | | | 3/30/07 | | | (9,259 | ) | |
| | | | | | | | | | | | | $ | (139,815 | ) | |
| Short Contracts | |
90-Day
Eurodollar | | | 66 | | | | (15,622,200 | ) | | 3/19/07 | | $ | 3,847 | | |
U.S. Treasury
Long Bond | | | 54 | | | | (6,017,625 | ) | | 3/21/07 | | | 129,722 | | |
| | | | | | | | | | | | | $ | 133,569 | | |
See Accompanying Notes to Financial Statements
71
ING VP STRATEGIC ALLOCATION PORTFOLIO OF INVESTMENTS
GROWTH PORTFOLIO AS OF DECEMBER 31, 2006
| Shares | | | | | | Value | |
| COMMON STOCK: 88.5% | | | |
| | | | | Advertising: 0.3% | |
| | 800 | | | | | Advo, Inc. | | $ | 26,080 | | |
| | 8,300 | | | | | Omnicom Group | | | 867,682 | | |
| | | | 893,762 | | |
| | | | | Aerospace/Defense: 1.1% | |
| | 10,400 | | | | | Boeing Co. | | | 923,936 | | |
| | 800 | | | | | Kaman Corp. | | | 17,912 | | |
| | 26,043 | | | | | Raytheon Co. | | | 1,375,070 | | |
| | 15,500 | | | | | United Technologies Corp. | | | 969,060 | | |
| | | | 3,285,978 | | |
| | | | | Agriculture: 1.0% | |
| | 10,900 | | | @ | | Alliance One International, Inc. | | | 76,954 | | |
| | 26,850 | | | | | Altria Group, Inc. | | | 2,304,267 | | |
| | 23,443 | | | @@ | | British American Tobacco PLC | | | 656,434 | | |
| | 900 | | | | | Delta & Pine Land Co. | | | 36,405 | | |
| | | | 3,074,060 | | |
| | | | | Airlines: 0.3% | |
| | 2,300 | | | @ | | Airtran Holdings, Inc. | | | 27,002 | | |
| | 400 | | | @ | | Alaska Air Group, Inc. | | | 15,800 | | |
| | 71,336 | | | @,@@ | | British Airways PLC | | | 735,515 | | |
| | 1,000 | | | @ | | JetBlue Airways Corp. | | | 14,200 | | |
| | 4,505 | | | | | Skywest, Inc. | | | 114,923 | | |
| | | | 907,440 | | |
| | | | | Apparel: 0.7% | |
| | 1,900 | | | @ | | Ashworth, Inc. | | | 13,794 | | |
| | 20,400 | | | @ | | Coach, Inc. | | | 876,384 | | |
| | 1,000 | | | @,L | | Deckers Outdoor Corp. | | | 59,950 | | |
| | 2,350 | | | @,L | | Gymboree Corp. | | | 89,676 | | |
| | 8,600 | | | @ | | Hanesbrands, Inc. | | | 203,132 | | |
| | 6,900 | | | L | | Jones Apparel Group, Inc. | | | 230,667 | | |
| | 3,000 | | | L | | Kellwood Co. | | | 97,560 | | |
| | 2,900 | | | | | K-Swiss, Inc. | | | 89,146 | | |
| | 3,590 | | | L | | Phillips-Van Heusen | | | 180,110 | | |
| | 2,900 | | | | | Polo Ralph Lauren Corp. | | | 225,214 | | |
| | 4,600 | | | | | Wolverine World Wide, Inc. | | | 131,192 | | |
| | | | 2,196,825 | | |
| | | | | Auto Manufacturers: 0.2% | |
| | 95,900 | | | L | | Ford Motor Co. | | | 720,209 | | |
| | | | 720,209 | | |
| | | | | Auto Parts & Equipment: 0.2% | |
| | 8,900 | | | L | | ArvinMeritor, Inc. | | | 162,247 | | |
| | 200 | | | | | Bandag, Inc. | | | 10,086 | | |
| | 1,400 | | | | | Standard Motor Products, Inc. | | | 20,972 | | |
| | 29,900 | | | @@ | | Sumitomo Rubber Industries, Inc. | | | 385,698 | | |
| | | | 579,003 | | |
| | | | | Banks: 7.9% | |
| | 99,218 | | | @@ | | Banca Intesa S.p.A. | | | 764,114 | | |
| | 83,800 | | | | | Bank of America Corp. | | | 4,474,082 | | |
| | 28,100 | | | @@ | | Bank of Ireland | | | 646,935 | | |
| | 77,695 | | | @@ | | Barclays PLC | | | 1,109,327 | | |
| | 62,272 | | | @@ | | Capitalia S.p.A. | | | 587,572 | | |
| | 4,000 | | | L | | Chittenden Corp. | | | 122,760 | | |
| | 10,000 | | | | | Colonial BancGroup, Inc. | | | 257,400 | | |
| | 9,900 | | | | | Comerica, Inc. | | | 580,932 | | |
| | 26,948 | | | @@ | | Depfa Bank PLC | | | 481,531 | | |
| | 6,622 | | | @@ | | Deutsche Bank AG | | | 881,839 | | |
| Shares | | | | | | Value | |
| | 4,331 | | | | | East-West Bancorp., Inc. | | $ | 153,404 | | |
| | 9,400 | | | @@,L | | First Bancorp. | | | 89,582 | | |
| | 1,000 | | | | | First Indiana Corp. | | | 25,360 | | |
| | 1,300 | | | | | First Midwest Bancorp., Inc. | | | 50,284 | | |
| | 7,000 | | | L | | FirstMerit Corp. | | | 168,980 | | |
| | 4,500 | | | | | Hanmi Financial Corp. | | | 101,385 | | |
| | 91,674 | | | @@ | | HSBC Holdings PLC | | | 1,668,452 | | |
| | 2,600 | | | | | Independent Bank Corp. | | | 65,754 | | |
| | 5,100 | | | @@ | | KBC Groep NV | | | 624,335 | | |
| | 5,580 | | | @@ | | Kookmin Bank ADR | | | 449,971 | | |
| | 2,600 | | | | | Mercantile Bankshares Corp. | | | 121,654 | | |
| | 87 | | | @@ | | Mitsubishi UFJ Financial
Group, Inc. | | | 1,079,304 | | |
| | 25,700 | | | @@ | | National Australia Bank Ltd. | | | 818,204 | | |
| | 28,000 | | | L | | National City Corp. | | | 1,023,680 | | |
| | 31,000 | | | | | Regions Financial Corp. | | | 1,159,400 | | |
| | 4,811 | | | @@ | | Societe Generale | | | 813,877 | | |
| | 2,000 | | | | | South Financial Group, Inc. | | | 53,180 | | |
| | 44,000 | | | @@ | | Sumitomo Trust & Banking
Co., Ltd. | | | 460,698 | | |
| | 8,100 | | | L | | TCF Financial Corp. | | | 222,102 | | |
| | 1,500 | | | | | Umpqua Holdings Corp. | | | 44,145 | | |
| | 5,900 | | | @@,L | | Uniao de Bancos Brasileiros
SA GDR | | | 548,464 | | |
| | 21,650 | | | | | US Bancorp. | | | 783,514 | | |
| | 23,300 | | | | | Wachovia Corp. | | | 1,326,935 | | |
| | 4,300 | | | | | Webster Financial Corp. | | | 209,496 | | |
| | 40,900 | | | | | Wells Fargo & Co. | | | 1,454,404 | | |
| | 4,800 | | | | | Whitney Holding Corp. | | | 156,576 | | |
| | | | 23,579,632 | | |
| | | | | Beverages: 1.4% | |
| | 26,100 | | | | | Coca-Cola Co. | | | 1,259,325 | | |
| | 18,251 | | | @@ | | Coca-Cola Hellenic Bottling
Co. SA | | | 712,083 | | |
| | 5,244 | | | @@ | | Fomento Economico Mexicano
SA de CV ADR | | | 607,045 | | |
| | 200 | | | @ | | Hansen Natural Corp. | | | 6,736 | | |
| | 8,400 | | | | | Pepsi Bottling Group, Inc. | | | 259,644 | | |
| | 7,600 | | | | | PepsiAmericas, Inc. | | | 159,448 | | |
| | 21,100 | | | | | PepsiCo, Inc. | | | 1,319,805 | | |
| | | | 4,324,086 | | |
| | | | | Biotechnology: 0.5% | |
| | 14,950 | | | @ | | Amgen, Inc. | | | 1,021,235 | | |
| | 600 | | | @ | | Digene Corp. | | | 28,752 | | |
| | 100 | | | @ | | Invitrogen Corp. | | | 5,659 | | |
| | 15,900 | | | @,L | | Millennium Pharmaceuticals, Inc. | | | 173,310 | | |
| | 3,400 | | | @ | | PDL BioPharma, Inc. | | | 68,476 | | |
| | 5,900 | | | @,L | | Savient Pharmaceuticals, Inc. | | | 66,139 | | |
| | 3,300 | | | @,L | | Vertex Pharmaceuticals, Inc. | | | 123,486 | | |
| | | | 1,487,057 | | |
| | | | | Building Materials: 0.2% | |
| | 500 | | | | | ElkCorp | | | 20,545 | | |
| | 24,927 | | | @@ | | Italcementi S.p.A. | | | 701,566 | | |
| | | | 722,111 | | |
| | | | | Chemicals: 1.5% | |
| | 1,600 | | | | | Airgas, Inc. | | | 64,832 | | |
| | 3,000 | | | | | Chemtura Corp. | | | 28,890 | | |
| | 12,500 | | | | | Dow Chemical Co. | | | 499,250 | | |
| | 11,400 | | | | | EI DuPont de Nemours & Co. | | | 555,294 | | |
| | 300 | | | | | FMC Corp. | | | 22,965 | | |
See Accompanying Notes to Financial Statements
72
ING VP STRATEGIC ALLOCATION PORTFOLIO OF INVESTMENTS
GROWTH PORTFOLIO AS OF DECEMBER 31, 2006 (CONTINUED)
| Shares | | | | | | Value | |
| | | | | Chemicals (continued) | |
| | 3,600 | | | | | Georgia Gulf Corp. | | $ | 69,516 | | |
| | 4,300 | | | L | | HB Fuller Co. | | | 111,026 | | |
| | 5,300 | | | | | Lubrizol Corp. | | | 265,689 | | |
| | 10,710 | | | L | | Lyondell Chemical Co. | | | 273,855 | | |
| | 600 | | | L | | MacDermid, Inc. | | | 20,460 | | |
| | 6,700 | | | | | Monsanto Co. | | | 351,951 | | |
| | 9,400 | | | L | | Olin Corp. | | | 155,288 | | |
| | 400 | | | @ | | OM Group, Inc. | | | 18,112 | | |
| | 4,100 | | | @ | | Omnova Solutions, Inc. | | | 18,778 | | |
| | 9,700 | | | @,L | | PolyOne Corp. | | | 72,750 | | |
| | 6,800 | | | | | Sherwin-Williams Co. | | | 432,344 | | |
| | 79,000 | | | @@ | | Sumitomo Chemical Co., Ltd. | | | 611,338 | | |
| | 3,200 | | | @@ | | Umicore | | | 543,736 | | |
| | 8,300 | | | | | Valspar Corp. | | | 229,412 | | |
| | | | 4,345,486 | | |
| | | | | Commercial Services: 1.4% | |
| | 1,100 | | | @ | | Alliance Data Systems Corp. | | | 68,717 | | |
| | 8,200 | | | @,L | | Apollo Group, Inc. | | | 319,554 | | |
| | 500 | | | | | Banta Corp. | | | 18,200 | | |
| | 2,000 | | | @ | | Career Education Corp. | | | 49,560 | | |
| | 2,200 | | | | | Central Parking Corp. | | | 39,600 | | |
| | 1,160 | | | @,L | | Consolidated Graphics, Inc. | | | 68,521 | | |
| | 9,000 | | | @ | | Convergys Corp. | | | 214,020 | | |
| | 660 | | | L | | CPI Corp. | | | 30,683 | | |
| | 6,300 | | | | | DeVry, Inc. | | | 176,400 | | |
| | 2,200 | | | @ | | Heidrick & Struggles
International, Inc. | | | 93,192 | | |
| | 6,700 | | | @ | | Hooper Holmes, Inc. | | | 22,177 | | |
| | 1,700 | | | @ | | ITT Educational Services, Inc. | | | 112,829 | | |
| | 1,600 | | | @ | | Kendle International, Inc. | | | 50,320 | | |
| | 6,300 | | | @,L | | Korn/Ferry International | | | 144,648 | | |
| | 5,600 | | | @,L | | Labor Ready, Inc. | | | 102,648 | | |
| | 4,400 | | | | | Manpower, Inc. | | | 329,692 | | |
| | 17,950 | | | | | McKesson Corp. | | | 910,065 | | |
| | 13,000 | | | | | Moody's Corp. | | | 897,780 | | |
| | 8,700 | | | @ | | MPS Group, Inc. | | | 123,366 | | |
| | 3,600 | | | @ | | Quanta Services, Inc. | | | 70,812 | | |
| | 6,100 | | | @ | | Valassis Communications, Inc. | | | 88,450 | | |
| | 1,260 | | | @,L | | Vertrue, Inc. | | | 48,397 | | |
| | 2,500 | | | W,L | | Viad Corp. | | | 101,500 | | |
| | 1,200 | | | @,L | | Volt Information Sciences, Inc. | | | 60,252 | | |
| | 3,300 | | | | | Watson Wyatt Worldwide, Inc. | | | 148,995 | | |
| | | | 4,290,378 | | |
| | | | | Computers: 3.0% | |
| | 1,300 | | | | | Agilysys, Inc. | | | 21,762 | | |
| | 7,420 | | | @,@@,I | | Atos Origin | | | 438,765 | | |
| | 835 | | | @ | | CACI International, Inc. | | | 47,178 | | |
| | 6,799 | | | @ | | Cadence Design Systems, Inc. | | | 121,770 | | |
| | 1,400 | | | @ | | Catapult Communications Corp. | | | 12,572 | | |
| | 2,800 | | | @,L | | Ceridian Corp. | | | 78,344 | | |
| | 63,400 | | | @ | | Dell, Inc. | | | 1,590,706 | | |
| | 2,570 | | | | | Factset Research Systems, Inc. | | | 145,154 | | |
| | 60,350 | | | | | Hewlett-Packard Co. | | | 2,485,817 | | |
| | 3,300 | | | | | Imation Corp. | | | 153,219 | | |
| | 31,100 | | | | | International Business Machines
Corp. | | | 3,021,365 | | |
| | 1,600 | | | @ | | Mercury Computer Systems, Inc. | | | 21,376 | | |
| | 2,559 | | | @,L | | Micros Systems, Inc. | | | 134,859 | | |
| | 4,200 | | | @,L | | Palm, Inc. | | | 59,178 | | |
| | 3,000 | | | @,L | | Radisys Corp. | | | 50,010 | | |
| | 3,700 | | | @ | | SRA International, Inc. | | | 98,938 | | |
| Shares | | | | | | Value | |
| | 3,000 | | | @ | | SYKES Enterprises, Inc. | | $ | 52,920 | | |
| | 7,000 | | | @ | | Synopsys, Inc. | | | 187,110 | | |
| | 5,000 | | | @ | | Western Digital Corp. | | | 102,300 | | |
| | | | 8,823,343 | | |
| | | | | Cosmetics/Personal Care: 1.0% | |
| | 8,400 | | | L | | Estee Lauder Cos., Inc. | | | 342,888 | | |
| | 39,450 | | | | | Procter & Gamble Co. | | | 2,535,452 | | |
| | | | 2,878,340 | | |
| | | | | Distribution/Wholesale: 0.3% | |
| | 3,500 | | | | | Building Materials Holding Corp. | | | 86,415 | | |
| | 1,500 | | | | | CDW Corp. | | | 105,480 | | |
| | 1,385 | | | L | | Pool Corp. | | | 54,250 | | |
| | 39,000 | | | @@ | | Sumitomo Corp. | | | 583,820 | | |
| | 4,400 | | | @ | | Tech Data Corp. | | | 166,628 | | |
| | | | 996,593 | | |
| | | | | Diversified Financial Services: 6.8% | |
| | 4,600 | | | | | AG Edwards, Inc. | | | 291,134 | | |
| | 15,100 | | | | | American Express Co. | | | 916,117 | | |
| | 7,200 | | | @,L | | AmeriCredit Corp. | | | 181,224 | | |
| | 12,100 | | | | | CIT Group, Inc. | | | 674,817 | | |
| | 89,500 | | | | | Citigroup, Inc. | | | 4,985,150 | | |
| | 12,100 | | | | | Fannie Mae | | | 718,619 | | |
| | 10,800 | | | | | Goldman Sachs Group, Inc. | | | 2,152,980 | | |
| | 3,900 | | | | | IndyMac Bancorp., Inc. | | | 176,124 | | |
| | 2,800 | | | @ | | Investment Technology Group, Inc. | | | 120,064 | | |
| | 70,900 | | | | | JPMorgan Chase & Co. | | | 3,424,470 | | |
| | 66 | | | @@ | | Kenedix, Inc. | | | 297,742 | | |
| | 18,100 | | | | | Lehman Brothers Holdings, Inc. | | | 1,413,972 | | |
| | 10,350 | | | | | Merrill Lynch & Co., Inc. | | | 963,585 | | |
| | 27,250 | | | | | Morgan Stanley | | | 2,218,968 | | |
| | | | | | 6,700 | | | Raymond James Financial, Inc. | | | 203,077 | | |
| | 2,450 | | | @@ | | SFCG Co., Ltd. | | | 380,557 | | |
| | 1,600 | | | L | | SWS Group, Inc. | | | 57,120 | | |
| | 3,200 | | | @,L | | TradeStation Group, Inc. | | | 44,000 | | |
| | 18,140 | | | @@ | | UBS AG | | | 1,097,791 | | |
| | | | 20,317,511 | | |
| | | | | Electric: 2.5% | |
| | 61,800 | | | @ | | AES Corp. | | | 1,362,072 | | |
| | 1,000 | | | | | Central Vermont Public Service Corp. | | | 23,550 | | |
| | 1,800 | | | L | | Duquesne Light Holdings, Inc. | | | 35,730 | | |
| | 6,700 | | | | | Idacorp, Inc. | | | 258,955 | | |
| | 80,451 | | | @@ | | International Power PLC | | | 599,219 | | |
| | 1,400 | | | | | Northeast Utilities | | | 39,424 | | |
| | 9,100 | | | | | OGE Energy Corp. | | | 364,000 | | |
| | 7,000 | | | L | | Pepco Holdings, Inc. | | | 182,070 | | |
| | 34,000 | | | | | PG&E Corp. | | | 1,609,220 | | |
| | 9,800 | | | | | PNM Resources, Inc. | | | 304,780 | | |
| | 6,600 | | | @@ | | RWE AG | | | 723,472 | | |
| | 19,837 | | | @@ | | Scottish & Southern Energy | | | 602,420 | | |
| | 16,100 | | | | | Southern Co. | | | 593,446 | | |
| | 17,800 | | | @@ | | Tokyo Electric Power Co., Inc. | | | 575,053 | | |
| | 4,400 | | | | | Wisconsin Energy Corp. | | | 208,824 | | |
| | | | 7,482,235 | | |
| | | | | | | Electrical Components &
Equipment: 0.3% | | | | | |
| | 3,600 | | | L | | Belden CDT, Inc. | | | 140,724 | | |
| | 2,200 | | | @,L | | Littelfuse, Inc. | | | 70,136 | | |
| | 92,000 | | | @@ | | Toshiba Corp. | | | 597,835 | | |
| | | | 808,695 | | |
See Accompanying Notes to Financial Statements
73
ING VP STRATEGIC ALLOCATION PORTFOLIO OF INVESTMENTS
GROWTH PORTFOLIO AS OF DECEMBER 31, 2006 (CONTINUED)
| Shares | | | | | | Value | |
| | | | | Electronics: 0.6% | |
| | 2,000 | | | | | Amphenol Corp. | | $ | 124,160 | | |
| | 500 | | | @ | | Avnet, Inc. | | | 12,765 | | |
| | 1,700 | | | @,L | | Benchmark Electronics, Inc. | | | 41,412 | | |
| | 3,340 | | | @,L | | Coherent, Inc. | | | 105,444 | | |
| | 2,100 | | | L | | Cubic Corp. | | | 45,570 | | |
| | 700 | | | | | Gentex Corp. | | | 10,892 | | |
| | 12,500 | | | @,@@ | | Hoya Corp. | | | 487,211 | | |
| | 5,200 | | | | | Methode Electronics, Inc. | | | 56,316 | | |
| | 2,100 | | | @ | | Planar Systems, Inc. | | | 20,307 | | |
| | 3,500 | | | @,L | | Plexus Corp. | | | 83,580 | | |
| | 500 | | | @ | | Rogers Corp. | | | 29,575 | | |
| | 5,800 | | | @ | | Thomas & Betts Corp. | | | 274,224 | | |
| | 1,570 | | | @,L | | Trimble Navigation Ltd. | | | 79,646 | | |
| | 3,700 | | | @ | | Varian, Inc. | | | 165,723 | | |
| | 13,200 | | | @,L | | Vishay Intertechnology, Inc. | | | 178,728 | | |
| | | | 1,715,553 | | |
| | | | | Engineering & Construction: 1.1% | |
| | 10,500 | | | @@ | | Bouygues | | | 672,276 | | |
| | 2,500 | | | @ | | EMCOR Group, Inc. | | | 142,125 | | |
| | 4,400 | | | | | Granite Construction, Inc. | | | 221,408 | | |
| | 8,765 | | | @@ | | Hochtief AG | | | 635,541 | | |
| | 4,500 | | | @ | | Jacobs Engineering Group, Inc. | | | 366,930 | | |
| | 900 | | | @ | | Shaw Group, Inc. | | | 30,150 | | |
| | 100,000 | | | @@ | | Taisei Corp. | | | 304,393 | | |
| | 1,370 | | | @ | | URS Corp. | | | 58,705 | | |
| | 5,900 | | | @@ | | Vinci SA | | | 751,965 | | |
| | | | 3,183,493 | | |
| | | | | Entertainment: 0.0% | |
| | 1,300 | | | @,L | | Pinnacle Entertainment, Inc. | | | 43,082 | | |
| | | | 43,082 | | |
| | | | | Environmental Control: 0.4% | |
| | 33,800 | | | | | Waste Management, Inc. | | | 1,242,826 | | |
| | | | 1,242,826 | | |
| | | | | Exchange Traded Fund: 0.2% | |
| | 11,200 | | | @@,L | | iShares S&P SmallCap 600
Index Fund | | | 739,088 | | |
| | | | 739,088 | | |
| | | | | Food: 1.6% | |
| | 15,000 | | | | | Campbell Soup Co. | | | 583,350 | | |
| | 32,900 | | | | | ConAgra Foods, Inc. | | | 888,300 | | |
| | 4,675 | | | | | Corn Products International, Inc. | | | 161,475 | | |
| | 18,529 | | | | | General Mills, Inc. | | | 1,067,270 | | |
| | 4,333 | | | @@ | | Groupe Danone | | | 655,249 | | |
| | 6,249 | | | | | Hormel Foods Corp. | | | 233,338 | | |
| | 2,300 | | | @,L | | Ralcorp Holdings, Inc. | | | 117,047 | | |
| | 1,500 | | | @ | | Smithfield Foods, Inc. | | | 38,490 | | |
| | 36,615 | | | @@ | | Unilever PLC | | | 1,018,365 | | |
| | 1,100 | | | @,L | | United Natural Foods, Inc. | | | 39,512 | | |
| | | | 4,802,396 | | |
| | | | | Forest Products & Paper: 0.2% | |
| | 2,900 | | | @ | | Caraustar Industries, Inc. | | | 23,461 | | |
| | 10,000 | | | | | Louisiana-Pacific Corp. | | | 215,300 | | |
| | 3,200 | | | | | Rock-Tenn Co. | | | 86,752 | | |
| | 1,600 | | | | | Schweitzer-Mauduit
International, Inc. | | | 41,680 | | |
| | 6,900 | | | L | | Temple-Inland, Inc. | | | 317,607 | | |
| | | | 684,800 | | |
| Shares | | | | | | Value | |
| | | | | Gas: 0.2% | |
| | 300 | | | | | Cascade Natural Gas Corp. | | $ | 7,776 | | |
| | 5,710 | | | L | | Energen Corp. | | | 268,027 | | |
| | 8,940 | | | | | UGI Corp. | | | 243,883 | | |
| | | | 519,686 | | |
| | | | | Hand/Machine Tools: 0.1% | |
| | 3,600 | | | | | Snap-On, Inc. | | | 171,504 | | |
| | | | 171,504 | | |
| | | | | Healthcare-Products: 1.7% | |
| | 1,400 | | | @ | | Advanced Medical Optics, Inc. | | | 49,280 | | |
| | 1,200 | | | L | | Cooper Cos., Inc. | | | 53,400 | | |
| | 7,800 | | | @,L | | Cytyc Corp. | | | 220,740 | | |
| | 10,316 | | | | | Dentsply International, Inc. | | | 307,933 | | |
| | 5,100 | | | @,L | | Edwards Lifesciences Corp. | | | 239,904 | | |
| | 2,500 | | | @ | | Haemonetics Corp. | | | 112,550 | | |
| | 1,440 | | | @,L | | Hologic, Inc. | | | 68,083 | | |
| | 857 | | | @ | | Idexx Laboratories, Inc. | | | 67,960 | | |
| | 1,700 | | | @,L | | Immucor, Inc. | | | 49,691 | | |
| | 400 | | | @ | | Intuitive Surgical, Inc. | | | 38,360 | | |
| | 35,850 | | | | | Johnson & Johnson | | | 2,366,817 | | |
| | 15,000 | | | | | Medtronic, Inc. | | | 802,650 | | |
| | 2,400 | | | | | Mentor Corp. | | | 117,288 | | |
| | 2,300 | | | @ | | Osteotech, Inc. | | | 12,995 | | |
| | 2,200 | | | @,L | | Possis Medical, Inc. | | | 29,656 | | |
| | 1,886 | | | @ | | Respironics, Inc. | | | 71,197 | | |
| | 3,700 | | | @ | | Techne Corp. | | | 205,165 | | |
| | 3,400 | | | @ | | Varian Medical Systems, Inc. | | | 161,738 | | |
| | | | 4,975,407 | | |
| | | | | Healthcare-Services: 2.7% | |
| | 26,600 | | | | | Aetna, Inc. | | | 1,148,588 | | |
| | 2,300 | | | @,L | | Amerigroup Corp. | | | 82,547 | | |
| | 2,500 | | | @,L | | Centene Corp. | | | 61,425 | | |
| | 9,850 | | | @ | | Coventry Health Care, Inc. | | | 492,993 | | |
| | 5,000 | | | @@ | | Fresenius Medical Care AG &
Co. KGaA | | | 665,622 | | |
| | 3,500 | | | @,L | | Gentiva Health Services, Inc. | | | 66,710 | | |
| | 3,000 | | | @ | | Health Net, Inc. | | | 145,980 | | |
| | 2,200 | | | @,L | | Healthways, Inc. | | | 104,962 | | |
| | 9,900 | | | @ | | Humana, Inc. | | | 547,569 | | |
| | 8,200 | | | @,L | | Laboratory Corp. of America
Holdings | | | 602,454 | | |
| | 800 | | | @ | | Lincare Holdings, Inc. | | | 31,872 | | |
| | 4,455 | | | @,L | | Odyssey HealthCare, Inc. | | | 59,073 | | |
| | 2,240 | | | @,L | | Pediatrix Medical Group, Inc. | | | 109,536 | | |
| | 2,000 | | | @,L | | Sierra Health Services, Inc. | | | 72,080 | | |
| | 40,100 | | | | | UnitedHealth Group, Inc. | | | 2,154,573 | | |
| | 21,100 | | | @ | | WellPoint, Inc. | | | 1,660,359 | | |
| | | | 8,006,343 | | |
| | | | | Holding Companies-Diversified: 0.1% | |
| | 8,200 | | | L | | Leucadia National Corp. | | | 231,240 | | |
| | | | 231,240 | | |
| | | | | Home Builders: 0.3% | |
| | 170,000 | | | @,@@ | | Haseko Corp. | | | 606,649 | | |
| | 140 | | | @,L | | NVR, Inc. | | | 90,300 | | |
| | 3,100 | | | L | | Winnebago Industries | | | 102,021 | | |
| | | | 798,970 | | |
See Accompanying Notes to Financial Statements
74
ING VP STRATEGIC ALLOCATION PORTFOLIO OF INVESTMENTS
GROWTH PORTFOLIO AS OF DECEMBER 31, 2006 (CONTINUED)
| Shares | | | | | | Value | |
| | | | | Home Furnishings: 0.3% | |
| | 1,500 | | | @ | | Audiovox Corp. | | $ | 21,135 | | |
| | 3,200 | | | | | Ethan Allen Interiors, Inc. | | | 115,552 | | |
| | 31,000 | | | @@ | | Matsushita Electric Industrial
Co., Ltd. | | | 621,596 | | |
| | | | 758,283 | | |
| | | | | Household Products/Wares: 0.3% | |
| | 1,500 | | | | | American Greetings Corp. | | | 35,805 | | |
| | 3,000 | | | L | | Blyth, Inc. | | | 62,250 | | |
| | 4,900 | | | @@ | | Henkel KGaA | | | 720,204 | | |
| | | | 818,259 | | |
| | | | | Housewares: 0.0% | |
| | 2,870 | | | L | | Toro Co. | | | 133,828 | | |
| | | | 133,828 | | |
| | | | | Insurance: 6.7% | |
| | 15,800 | | | @@ | | ACE Ltd. | | | 957,006 | | |
| | 22,400 | | | | | Allstate Corp. | | | 1,458,464 | | |
| | 6,900 | | | | | AMBAC Financial Group, Inc. | | | 614,583 | | |
| | 5,632 | | | L | | American Financial Group, Inc. | | | 202,245 | | |
| | 30,200 | | | | | American International
Group, Inc. | | | 2,164,132 | | |
| | 900 | | | | | Brown & Brown, Inc. | | | 25,389 | | |
| | 116,000 | | | @@ | | China Life Insurance Co., Ltd. | | | 395,948 | | |
| | 19,400 | | | | | Chubb Corp. | | | 1,026,454 | | |
| | 6,800 | | | | | Cigna Corp. | | | 894,676 | | |
| | 3,400 | | | | | Delphi Financial Group | | | 137,564 | | |
| | 3,300 | | | @@ | | Everest Re Group Ltd. | | | 323,763 | | |
| | 4,262 | | | | | Fidelity National Title Group, Inc. | | | 101,777 | | |
| | 26,600 | | | | | Genworth Financial, Inc. | | | 909,986 | | |
| | 12,531 | | | | | Hartford Financial Services
Group, Inc. | | | 1,169,268 | | |
| | 7,300 | | | | | HCC Insurance Holdings, Inc. | | | 234,257 | | |
| | 5,000 | | | | | Horace Mann Educators Corp. | | | 101,000 | | |
| | 1,705 | | | L | | Landamerica Financial Group, Inc. | | | 107,603 | | |
| | 264,361 | | | @@ | | Legal & General Group PLC | | | 812,456 | | |
| | 22,400 | | | | | Loews Corp. | | | 928,928 | | |
| | 25,800 | | | | | Metlife, Inc. | | | 1,522,458 | | |
| | 3,279 | | | @@ | | Muenchener
Rueckversicherungs AG | | | 564,977 | | |
| | 5,630 | | | | | Old Republic International Corp. | | | 131,066 | | |
| | 3,775 | | | @ | | Philadelphia Consolidated
Holding Co. | | | 168,214 | | |
| | 1,800 | | | | | PMI Group, Inc. | | | 84,906 | | |
| | 2,800 | | | | | Presidential Life Corp. | | | 61,460 | | |
| | 2,700 | | | @,L | | ProAssurance Corp. | | | 134,784 | | |
| | 40,600 | | | | | Progressive Corp. | | | 983,332 | | |
| | 4,600 | | | | | Protective Life Corp. | | | 218,500 | | |
| | 16,328 | | | L | | Prudential Financial, Inc. | | | 1,401,922 | | |
| | 2,500 | | | | | Radian Group, Inc. | | | 134,775 | | |
| | 6,208 | | | | | Safeco Corp. | | | 388,310 | | |
| | 1,700 | | | L | | Safety Insurance Group, Inc. | | | 86,207 | | |
| | 2,365 | | | L | | Selective Insurance Group | | | 135,491 | | |
| | 4,200 | | | | | Stancorp Financial Group, Inc. | | | 189,210 | | |
| | 3,600 | | | | | Unitrin, Inc. | | | 180,396 | | |
| | 8,985 | | | | | WR Berkley Corp. | | | 310,072 | | |
| | 3,000 | | | | | Zenith National Insurance Corp. | | | 140,730 | | |
| | 2,220 | | | @@ | | Zurich Financial Services AG | | | 595,597 | | |
| | | | 19,997,906 | | |
| Shares | | | | | | Value | |
| | | | | Internet: 0.6% | |
| | 800 | | | @ | | Digital Insight Corp. | | $ | 30,792 | | |
| | 2,400 | | | @ | | Google, Inc. | | | 1,105,152 | | |
| | 1,300 | | | @,L | | j2 Global Communications, Inc. | | | 35,425 | | |
| | 3,780 | | | @ | | McAfee, Inc. | | | 107,276 | | |
| | 5,800 | | | @ | | Napster, Inc. | | | 21,054 | | |
| | 3,100 | | | @ | | PC-Tel, Inc. | | | 28,985 | | |
| | 2,400 | | | @ | | Stamps.com, Inc. | | | 37,800 | | |
| | 7,400 | | | | | United Online, Inc. | | | 98,272 | | |
| | 13,700 | | | @ | | VeriSign, Inc. | | | 329,485 | | |
| | 600 | | | @ | | WebEx Communications, Inc. | | | 20,934 | | |
| | | | 1,815,175 | | |
| | | | | Iron/Steel: 1.1% | |
| | 83,800 | | | @@ | | BlueScope Steel Ltd. | | | 568,265 | | |
| | 600 | | | | | Carpenter Technology Corp. | | | 61,512 | | |
| | 1,900 | | | | | Chaparral Steel Co. | | | 84,113 | | |
| | 940 | | | | | Cleveland-Cliffs, Inc. | | | 45,534 | | |
| | 16,800 | | | | | Nucor Corp. | | | 918,288 | | |
| | 3,000 | | | | | Ryerson, Inc. | | | 75,270 | | |
| | 1,300 | | | | | Steel Dynamics, Inc. | | | 42,185 | | |
| | 1,300 | | | | | Steel Technologies, Inc. | | | 22,815 | | |
| | 192,000 | | | @@ | | Sumitomo Metal Industries Ltd. | | | 833,610 | | |
| | 7,700 | | | | | United States Steel Corp. | | | 563,178 | | |
| | | | 3,214,770 | | |
| | | | | Leisure Time: 0.8% | |
| | 12,941 | | | @@ | | Carnival PLC | | | 653,739 | | |
| | 127,837 | | | @@ | | First Choice Holidays PLC | | | 710,241 | | |
| | 1,025 | | | L | | Polaris Industries, Inc. | | | 48,001 | | |
| | 8,600 | | | | | Sabre Holdings Corp. | | | 274,254 | | |
| | 25,100 | | | @@ | | Yamaha Motor Co., Ltd. | | | 788,987 | | |
| | | | 2,475,222 | | |
| | | | | Lodging: 0.0% | |
| | 900 | | | @ | | Aztar Corp. | | | 48,978 | | |
| | 700 | | | | | Harrah's Entertainment, Inc. | | | 57,904 | | |
| | | | 106,882 | | |
| | | | | | | Machinery-Construction &
Mining: 0.7% | | | | | |
| | 19,158 | | | @@ | | Atlas Copco AB | | | 619,159 | | |
| | 8,200 | | | | | Caterpillar, Inc. | | | 502,906 | | |
| | 25,600 | | | @,@@ | | Hitachi Construction
Machinery Co., Ltd. | | | 687,470 | | |
| | 3,450 | | | | | Joy Global, Inc. | | | 166,773 | | |
| | | | 1,976,308 | | |
| | | | | Machinery-Diversified: 0.2% | |
| | 300 | | | @ | | AGCO Corp. | | | 9,282 | | |
| | 3,200 | | | | | Cummins, Inc. | | | 378,176 | | |
| | 4,100 | | | @,L | | Gardner Denver, Inc. | | | 152,971 | | |
| | 1,495 | | | | | IDEX Corp. | | | 70,878 | | |
| | 1,680 | | | | | Manitowoc Co., Inc. | | | 99,842 | | |
| | | | 711,149 | | |
| | | | | Media: 2.4% | |
| | 8,700 | | | | | CBS Corp. - Class B | | | 271,266 | | |
| | 6,600 | | | | | Clear Channel
Communications, Inc. | | | 234,564 | | |
| | 23,400 | | | @,L | | Comcast Corp. | | | 990,522 | | |
| | 35,600 | | | @ | | DIRECTV Group, Inc. | | | 887,864 | | |
| | 15,200 | | | | | McGraw-Hill Cos., Inc. | | | 1,033,904 | | |
| | 26,700 | | | | | News Corp., Inc. | | | 573,516 | | |
See Accompanying Notes to Financial Statements
75
ING VP STRATEGIC ALLOCATION PORTFOLIO OF INVESTMENTS
GROWTH PORTFOLIO AS OF DECEMBER 31, 2006 (CONTINUED)
| Shares | | | | | | Value | |
| | | | | Media (continued) | |
| | 2,000 | | | L | | Reader's Digest Association, Inc. | | $ | 33,400 | | |
| | 53,919 | | | @@ | | Reed Elsevier PLC | | | 591,378 | | |
| | 17,467 | | | @@ | | Vivendi | | | 681,288 | | |
| | 54,000 | | | | | Walt Disney Co. | | | 1,850,580 | | |
| | 150 | | | | | Washington Post | | | 111,840 | | |
| | | | 7,260,122 | | |
| | | | | Metal Fabricate/Hardware: 0.1% | |
| | 1,480 | | | L | | AM Castle & Co. | | | 37,666 | | |
| | 4,400 | | | | | Commercial Metals Co. | | | 113,520 | | |
| | 2,842 | | | L | | Quanex Corp. | | | 98,305 | | |
| | | | 249,491 | | |
| | | | | Mining: 0.4% | |
| | 38,471 | | | @@ | | BHP Billiton Ltd. | | | 765,154 | | |
| | 2,670 | | | | | Phelps Dodge Corp. | | | 319,652 | | |
| | | | 1,084,806 | | |
| | | | | Miscellaneous Manufacturing: 4.1% | |
| | 11,600 | | | | | 3M Co. | | | 903,988 | | |
| | 3,170 | | | L | | Acuity Brands, Inc. | | | 164,967 | | |
| | 2,720 | | | L | | AO Smith Corp. | | | 102,163 | | |
| | 797 | | | L | | Aptargroup, Inc. | | | 47,055 | | |
| | 400 | | | @ | | Ceradyne, Inc. | | | 22,600 | | |
| | 7,000 | | | | | Cooper Industries Ltd. | | | 633,010 | | |
| | 6,600 | | | | | Crane Co. | | | 241,824 | | |
| | 16,000 | | | L | | Eastman Kodak Co. | | | 412,800 | | |
| | 11,500 | | | | | Eaton Corp. | | | 864,110 | | |
| | 2,590 | | | @ | | EnPro Industries, Inc. | | | 86,014 | | |
| | 132,250 | | | | | General Electric Co. | | | 4,921,023 | | |
| | 300 | | | | | Harsco Corp. | | | 22,830 | | |
| | 39,600 | | | | | Honeywell International, Inc. | | | 1,791,504 | | |
| | 7,800 | | | | | Parker Hannifin Corp. | | | 599,664 | | |
| | 2,200 | | | | | Pentair, Inc. | | | 69,080 | | |
| | 800 | | | | | Roper Industries, Inc. | | | 40,192 | | |
| | 1,700 | | | | | Standex International Corp. | | | 51,221 | | |
| | 2,700 | | | @,L | | Sturm Ruger & Co., Inc. | | | 25,920 | | |
| | 4,503 | | | | | Teleflex, Inc. | | | 290,714 | | |
| | 1,200 | | | | | Tredegar Corp. | | | 27,132 | | |
| | 26,300 | | | @@ | | Tyco International Ltd. | | | 799,520 | | |
| | | | 12,117,331 | | |
| | | | | Office Furnishings: 0.1% | |
| | 6,878 | | | L | | Herman Miller, Inc. | | | 250,084 | | |
| | | | 250,084 | | |
| | | | | Office/Business Equipment: 0.3% | |
| | 48,700 | | | @ | | Xerox Corp. | | | 825,465 | | |
| | | | 825,465 | | |
| | | | | Oil & Gas: 7.7% | |
| | 19,400 | | | L | | Anadarko Petroleum Corp. | | | 844,288 | | |
| | 300 | | | | | Cabot Oil & Gas Corp. | | | 18,195 | | |
| | 42,202 | | | | | Chevron Corp. | | | 3,103,113 | | |
| | 2,090 | | | | | Cimarex Energy Co. | | | 76,285 | | |
| | 17,800 | | | | | ConocoPhillips | | | 1,280,710 | | |
| | 5,400 | | | | | ENSCO International, Inc. | | | 270,324 | | |
| | 19,300 | | | @@ | | ERG S.p.A. | | | 440,605 | | |
| | 101,300 | | | | | ExxonMobil Corp. | | | 7,762,619 | | |
| | 1,700 | | | @ | | Forest Oil Corp. | | | 55,556 | | |
| | 6,560 | | | | | Frontier Oil Corp. | | | 188,534 | | |
| | 12,280 | | | | | Helmerich & Payne, Inc. | | | 300,492 | | |
| | 12,500 | | | | | Marathon Oil Corp. | | | 1,156,250 | | |
| Shares | | | | | | Value | |
| | 5,100 | | | @ | | Newfield Exploration Co. | | $ | 234,345 | | |
| | 6,200 | | | L | | Noble Energy, Inc. | | | 304,234 | | |
| | 21,520 | | | @@ | | Norsk Hydro ASA | | | 664,263 | | |
| | 26,700 | | | | | Occidental Petroleum Corp. | | | 1,303,761 | | |
| | 1,600 | | | L | | Penn Virginia Corp. | | | 112,064 | | |
| | 4,758 | | | @@ | | Petroleo Brasileiro SA | | | 490,026 | | |
| | 300 | | | | | Pioneer Natural Resources Co. | | | 11,907 | | |
| | 100 | | | @ | | Plains Exploration &
Production Co. | | | 4,753 | | |
| | 35,243 | | | @@ | | Royal Dutch Shell PLC - Class B | | | 1,232,193 | | |
| | 45,944 | | | @@ | | Santos Ltd. | | | 357,554 | | |
| | 14,200 | | | @@ | | Sasol, Ltd. ADR | | | 523,980 | | |
| | 2,300 | | | @ | | Southwestern Energy Co. | | | 80,615 | | |
| | 3,900 | | | L | | St. Mary Land & Exploration Co. | | | 143,676 | | |
| | 700 | | | @,L | | Stone Energy Corp. | | | 24,745 | | |
| | 15,100 | | | @@ | | Total SA | �� | | 1,086,557 | | |
| | 21,200 | | | | | Valero Energy Corp. | | | 1,084,592 | | |
| | | | 23,156,236 | | |
| | | | | Oil & Gas Services: 1.1% | |
| | 2,600 | | | @ | | Grant Prideco, Inc. | | | 103,402 | | |
| | 35,500 | | | | | Halliburton Co. | | | 1,102,275 | | |
| | 2,300 | | | @,L | | Helix Energy Solutions
Group, Inc. | | | 72,151 | | |
| | 600 | | | @ | | Lone Star Technologies | | | 29,046 | | |
| | 24,100 | | | @,@@ | | Petroleum Geo-Services | | | 564,102 | | |
| | 12,800 | | | L | | Schlumberger Ltd. | | | 808,448 | | |
| | 1,600 | | | @,L | | SEACOR Holdings, Inc. | | | 158,624 | | |
| | 6,400 | | | | | Tidewater, Inc. | | | 309,504 | | |
| | 900 | | | @,L | | Veritas DGC, Inc. | | | 77,067 | | |
| | | | 3,224,619 | | |
| | | | | Packaging & Containers: 0.2% | |
| | 8,600 | | | @ | | Pactiv Corp. | | | 306,934 | | |
| | 7,400 | | | | | Sonoco Products Co. | | | 281,644 | | |
| | | | 588,578 | | |
| | | | | Pharmaceuticals: 4.7% | |
| | 18,600 | | | | | Abbott Laboratories | | | 906,006 | | |
| | 12,800 | | | | | AmerisourceBergen Corp. | | | 575,488 | | |
| | 15,893 | | | @@ | | AstraZeneca PLC | | | 851,729 | | |
| | 900 | | | @ | | Cephalon, Inc. | | | 63,369 | | |
| | 18,300 | | | @ | | Forest Laboratories, Inc. | | | 925,980 | | |
| | 44,900 | | | @@ | | GlaxoSmithKline PLC | | | 1,181,804 | | |
| | 16,600 | | | @,L | | King Pharmaceuticals, Inc. | | | 264,272 | | |
| | 1,700 | | | | | Medicis Pharmaceutical Corp. | | | 59,721 | | |
| | 55,500 | | | | | Merck & Co., Inc. | | | 2,419,800 | | |
| | 12,800 | | | | | Mylan Laboratories | | | 255,488 | | |
| | 2,300 | | | @ | | NBTY, Inc. | | | 95,611 | | |
| | 3,100 | | | @,L | | Noven Pharmaceuticals, Inc. | | | 78,895 | | |
| | 6,498 | | | @@ | | Omega Pharma SA | | | 488,982 | | |
| | 800 | | | | | Omnicare, Inc. | | | 30,904 | | |
| | 89,250 | | | | | Pfizer, Inc. | | | 2,311,575 | | |
| | 6,810 | | | @@ | | Roche Holding AG | | | 1,218,401 | | |
| | 58,600 | | | | | Schering-Plough Corp. | | | 1,385,304 | | |
| | 2,700 | | | @,L | | Sepracor, Inc. | | | 166,266 | | |
| | 4,280 | | | @ | | Theragenics Corp. | | | 13,268 | | |
| | 1,100 | | | @ | | USANA Health Sciences, Inc. | | | 56,826 | | |
| | 16,500 | | | | | Wyeth | | | 840,180 | | |
| | | | 14,189,869 | | |
| | | | | Pipelines: 0.3% | |
| | 9,300 | | | | | Questar Corp. | | | 772,365 | | |
| | | | 772,365 | | |
See Accompanying Notes to Financial Statements
76
ING VP STRATEGIC ALLOCATION PORTFOLIO OF INVESTMENTS
GROWTH PORTFOLIO AS OF DECEMBER 31, 2006 (CONTINUED)
| Shares | | | | | | Value | |
| | | | | Real Estate: 0.2% | |
| | 41,000 | | | @@ | | Cheung Kong Holdings Ltd. | | $ | 503,656 | | |
| | | | 503,656 | | |
| | | | | Real Estate Investment Trusts: 0.4% | |
| | 3,100 | | | | | AMB Property Corp. | | | 181,691 | | |
| | 1,200 | | | L | | Colonial Properties Trust | | | 56,256 | | |
| | 5,010 | | | | | Equity Office Properties Trust | | | 241,332 | | |
| | 580 | | | | | Essex Property Trust, Inc. | | | 74,965 | | |
| | 1,200 | | | | | Highwoods Properties, Inc. | | | 48,912 | | |
| | 6,700 | | | L | | Hospitality Properties Trust | | | 318,451 | | |
| | 1,400 | | | | | Longview Fibre Co. | | | 30,730 | | |
| | 900 | | | | | LTC Properties, Inc. | | | 24,579 | | |
| | 1,600 | | | | | Macerich Co. | | | 138,512 | | |
| | 1,600 | | | | | Regency Centers Corp. | | | 125,072 | | |
| | | | 1,240,500 | | |
| | | | | Retail: 4.9% | |
| | 600 | | | @ | | 99 Cents Only Stores | | | 7,302 | | |
| | 1,795 | | | | | Abercrombie & Fitch Co. | | | 124,986 | | |
| | 2,500 | | | | | Advance Auto Parts, Inc. | | | 88,900 | | |
| | 4,500 | | | @,L | | Aeropostale, Inc. | | | 138,915 | | |
| | 8,010 | | | L | | American Eagle Outfitters | | | 249,992 | | |
| | 5,700 | | | @ | | AnnTaylor Stores Corp. | | | 187,188 | | |
| | 600 | | | | | Barnes & Noble, Inc. | | | 23,826 | | |
| | 6,300 | | | @,L | | Big Lots, Inc. | | | 144,396 | | |
| | 1,300 | | | | | Brinker International, Inc. | | | 39,208 | | |
| | 2,650 | | | L | | Brown Shoe Co., Inc. | | | 126,511 | | |
| | 400 | | | | | Cash America International, Inc. | | | 18,760 | | |
| | 9,200 | | | @,L | | Charming Shoppes, Inc. | | | 124,476 | | |
| | 3,600 | | | @,L | | Chico's FAS, Inc. | | | 74,484 | | |
| | 600 | | | @,L | | Childrens Place Retail Stores, Inc. | | | 38,112 | | |
| | 4,300 | | | L | | Christopher & Banks Corp. | | | 80,238 | | |
| | 4,365 | | | L | | Claire's Stores, Inc. | | | 144,656 | | |
| | 7,100 | | | @ | | Dollar Tree Stores, Inc. | | | 213,710 | | |
| | 20,900 | | | @@ | | Don Quijote Co., Ltd. | | | 398,969 | | |
| | 4,780 | | | @,L | | Dress Barn, Inc. | | | 111,517 | | |
| | 9,500 | | | | | Family Dollar Stores, Inc. | | | 278,635 | | |
| | 22,300 | | | | | Federated Department
Stores, Inc. | | �� | 850,299 | | |
| | 32,200 | | | | | Gap, Inc. | | | 627,900 | | |
| | 2,200 | | | L | | Group 1 Automotive, Inc. | | | 113,784 | | |
| | 23,100 | | | L | | Home Depot, Inc. | | | 927,696 | | |
| | 2,500 | | | @,L | | Jack in the Box, Inc. | | | 152,600 | | |
| | 13,700 | | | @ | | Kohl's Corp. | | | 937,491 | | |
| | 19,000 | | | | | Lowe's Cos., Inc. | | | 591,850 | | |
| | 35,400 | | | L | | McDonald's Corp. | | | 1,569,282 | | |
| | 3,947 | | | L | | Men's Wearhouse, Inc. | | | 151,012 | | |
| | 12,700 | | | L | | Nordstrom, Inc. | | | 626,618 | | |
| | 15,800 | | | @ | | Office Depot, Inc. | | | 603,086 | | |
| | 4,100 | | | | | OfficeMax, Inc. | | | 203,565 | | |
| | 1,600 | | | | | OSI Restaurant Partners, Inc. | | | 62,720 | | |
| | 780 | | | @,L | | Panera Bread Co. | | | 43,610 | | |
| | 4,740 | | | @,L | | Payless Shoesource, Inc. | | | 155,567 | | |
| | 6,500 | | | | | Petsmart, Inc. | | | 187,590 | | |
| | 9,400 | | | | | Ross Stores, Inc. | | | 275,420 | | |
| | 2,000 | | | @ | | Saks, Inc. | | | 35,640 | | |
| | 1,900 | | | @,L | | School Specialty, Inc. | | | 71,231 | | |
| | 5,230 | | | @,L | | Select Comfort Corp. | | | 90,950 | | |
| | 15,000 | | | @@ | | Seven & I Holdings Co., Ltd. | | | 466,425 | | |
| | 5,717 | | | @,L | | Sonic Corp. | | | 136,922 | | |
| | 8,600 | | | @,L | | Starbucks Corp. | | | 304,612 | | |
| | 10,350 | | | | | Target Corp. | | | 590,468 | | |
| | 25,000 | | | | | TJX Cos., Inc. | | | 713,000 | | |
| Shares | | | | | | Value | |
| | 2,075 | | | @,L | | Tween Brands, Inc. | | $ | 82,855 | | |
| | 31,500 | | | L | | Wal-Mart Stores, Inc. | | | 1,454,670 | | |
| | | | 14,641,644 | | |
| | | | | Savings & Loans: 0.1% | |
| | 2,300 | | | | | Anchor Bancorp. Wisconsin, Inc. | | | 66,286 | | |
| | 3,632 | | | L | | Bankunited Financial Corp. | | | 101,551 | | |
| | 600 | | | L | | Fidelity Bankshares, Inc. | | | 23,802 | | |
| | 1,600 | | | @,L | | FirstFed Financial Corp. | | | 107,152 | | |
| | | | 298,791 | | |
| | | | | Semiconductors: 1.6% | |
| | 2,600 | | | @,L | | Actel Corp. | | | 47,216 | | |
| | 23,400 | | | @ | | Altera Corp. | | | 460,512 | | |
| | 20,900 | | | @,L | | Atmel Corp. | | | 126,445 | | |
| | 7,900 | | | @,L | | Brooks Automation, Inc. | | | 113,760 | | |
| | 1,100 | | | @ | | Cree, Inc. | | | 19,052 | | |
| | 2,900 | | | @ | | DSP Group, Inc. | | | 62,930 | | |
| | 10,100 | | | @ | | Fairchild Semiconductor
International, Inc. | | | 169,781 | | |
| | 12,400 | | | @ | | Integrated Device
Technology, Inc. | | | 191,952 | | |
| | 64,400 | | | | | Intel Corp. | | | 1,304,100 | | |
| | 3,290 | | | @,L | | Lam Research Corp. | | | 166,540 | | |
| | 23,600 | | | @,L | | LSI Logic Corp. | | | 212,400 | | |
| | 4,400 | | | @ | | MEMC Electronic Materials, Inc. | | | 172,216 | | |
| | 4,690 | | | L | | Microchip Technology, Inc. | | | 153,363 | | |
| | 44,400 | | | @,L | | Micron Technology, Inc. | | | 619,824 | | |
| | 6,900 | | | @ | | Novellus Systems, Inc. | | | 237,498 | | |
| | 3,540 | | | @ | | Pericom Semiconductor Corp. | | | 40,604 | | |
| | 8,700 | | | @,L | | Semtech Corp. | | | 113,709 | | |
| | 14,200 | | | @@ | | Shinko Electric Industries | | | 370,048 | | |
| | 11,100 | | | @,L | | Teradyne, Inc. | | | 166,056 | | |
| | 1,485 | | | @,L | | Varian Semiconductor
Equipment Associates, Inc. | | | 67,597 | | |
| | | | 4,815,603 | | |
| | | | | Software: 2.7% | |
| | 4,000 | | | | | Acxiom Corp. | | | 102,600 | | |
| | 2,400 | | | @,L | | Altiris, Inc. | | | 60,912 | | |
| | 1,055 | | | @,L | | Ansys, Inc. | | | 45,882 | | |
| | 12,500 | | | @ | | BMC Software, Inc. | | | 402,500 | | |
| | 3,800 | | | @ | | Captaris, Inc. | | | 29,526 | | |
| | 1,680 | | | @,L | | Cerner Corp. | | | 76,440 | | |
| | 24,400 | | | @ | | Compuware Corp. | | | 203,252 | | |
| | 3,900 | | | @,L | | CSG Systems International | | | 104,247 | | |
| | 5,700 | | | @,L | | Dendrite International, Inc. | | | 61,047 | | |
| | 1,892 | | | @ | | Dun & Bradstreet Corp. | | | 156,639 | | |
| | 3,300 | | | L | | Fair Isaac Corp. | | | 134,145 | | |
| | 35,500 | | | | | First Data Corp. | | | 905,960 | | |
| | 1,870 | | | | | Global Payments, Inc. | | | 86,581 | | |
| | 1,582 | | | @ | | Hyperion Solutions Corp. | | | 56,857 | | |
| | 500 | | | | | Inter-Tel, Inc. | | | 11,080 | | |
| | 2,800 | | | @ | | Mapinfo Corp. | | | 36,540 | | |
| | 110,650 | | | L | | Microsoft Corp. | | | 3,304,009 | | |
| | 500 | | | @,L | | Open Solutions, Inc. | | | 18,820 | | |
| | 45,000 | | | @ | | Oracle Corp. | | | 771,300 | | |
| | 800 | | | @ | | Per-Se Technologies, Inc. | | | 22,224 | | |
| | 700 | | | @ | | SPSS, Inc. | | | 21,049 | | |
| | 7,600 | | | @,L | | Sybase, Inc. | | | 187,720 | | |
| | 29,626 | | | @,@@ | | Tele Atlas NV | | | 623,060 | | |
| | 14,415 | | | @,@@ | | Tomtom, Inc. | | | 620,661 | | |
| | | | 8,043,051 | | |
See Accompanying Notes to Financial Statements
77
ING VP STRATEGIC ALLOCATION PORTFOLIO OF INVESTMENTS
GROWTH PORTFOLIO AS OF DECEMBER 31, 2006 (CONTINUED)
| Shares | | | | | | Value | |
| | | | | Telecommunications: 5.4% | |
| | 3,600 | | | @ | | 3Com Corp. | | $ | 14,796 | | |
| | 4,100 | | | @ | | Adaptec, Inc. | | | 19,106 | | |
| | 67,944 | | | @@ | | Alcatel SA | | | 969,356 | | |
| | 900 | | | @ | | Andrew Corp. | | | 9,207 | | |
| | 900 | | | @,L | | Anixter International, Inc. | | | 48,870 | | |
| | 51,600 | | | | | AT&T, Inc. | | | 1,844,700 | | |
| | 29,800 | | | @,L | | Avaya, Inc. | | | 416,604 | | |
| | 24,100 | | | | | BellSouth Corp. | | | 1,135,351 | | |
| | 3,300 | | | @ | | C-COR, Inc. | | | 36,762 | | |
| | 13,700 | | | @ | | Cincinnati Bell, Inc. | | | 62,609 | | |
| | 119,500 | | | @ | | Cisco Systems, Inc. | | | 3,265,929 | | |
| | 515 | | | | | Commonwealth Telephone
Enterprises, Inc. | | | 21,558 | | |
| | 4,300 | | | @,L | | Ditech Networks, Inc. | | | 29,756 | | |
| | 2,907 | | | | | Harris Corp. | | | 133,315 | | |
| | 71,500 | | | | | Motorola, Inc. | | | 1,470,040 | | |
| | 3,200 | | | @ | | Network Equipment
Technologies, Inc. | | | 18,624 | | |
| | 141 | | | @@ | | Nippon Telegraph &
Telephone Corp. | | | 695,340 | | |
| | 9,160 | | | @@ | | Orascom Telecom GDR | | | 605,214 | | |
| | 20,250 | | | | | Qualcomm, Inc. | | | 765,248 | | |
| | 39,700 | | | | | Sprint Nextel Corp. | | | 749,933 | | |
| | 347,082 | | | @@ | | Telecom Italia S.p.A. | | | 878,952 | | |
| | 13,086 | | | @@ | | Telekomunikasi Indonesia
Tbk PT ADR | | | 596,722 | | |
| | 2,250 | | | | | Telephone & Data Systems, Inc. | | | 122,243 | | |
| | 6,500 | | | @ | | Utstarcom, Inc. | | | 56,875 | | |
| | 38,500 | | | | | Verizon Communications, Inc. | | | 1,433,740 | | |
| | 256,012 | | | @@ | | Vodafone Group PLC | | | 707,020 | | |
| | | | 16,107,870 | | |
| | | | | Textiles: 0.1% | |
| | 1,300 | | | | | Angelica Corp. | | | 33,540 | | |
| | 3,700 | | | @,L | | Mohawk Industries, Inc. | | | 276,982 | | |
| | | | 310,522 | | |
| | | | | Toys/Games/Hobbies: 0.2% | |
| | 10,100 | | | L | | Hasbro, Inc. | | | 275,225 | | |
| | 21,200 | | | | | Mattel, Inc. | | �� | 480,392 | | |
| | | | 755,617 | | |
| | | | | Transportation: 0.7% | |
| | 5,620 | | | L | | CH Robinson Worldwide, Inc. | | | 229,802 | | |
| | 102 | | | @@ | | East Japan Railway Co. | | | 679,917 | | |
| | 600 | | | | | Expeditors International
Washington, Inc. | | | 24,300 | | |
| | 3,300 | | | @ | | HUB Group, Inc. | | | 90,915 | | |
| | 2,100 | | | @,L | | Kansas City Southern | | | 60,858 | | |
| | 1,400 | | | @,L | | Kirby Corp. | | | 47,782 | | |
| | 1,563 | | | | | Landstar System, Inc. | | | 59,675 | | |
| | 68,000 | | | @@ | | Mitsui OSK Lines Ltd. | | | 671,614 | | |
| | 3,400 | | | @,L | | Old Dominion Freight Line | | | 81,838 | | |
| | 4,185 | | | L | | Overseas Shipholding Group | | | 235,616 | | |
| | 1,100 | | | @ | | Swift Transportation Co., Inc. | | | 28,897 | | |
| | 300 | | | @ | | YRC Worldwide, Inc. | | | 11,319 | | |
| | | | 2,222,533 | | |
| | | | | Water: 0.3% | |
| | 11,259 | | | @@ | | Veolia Environnement | | | 858,655 | | |
| | | | 858,655 | | |
Total Common Stock
(Cost $217,490,441) | | | 264,352,322 | | |
| Shares | | | | | | Value | |
| EQUITY-LINKED SECURITIES: 0.1% | | | |
| | | | | Equity Linked Securities: 0.1% | |
| | 300,000 | | | | | KAUP Bank | | $ | 281,644 | | |
| | | | 281,644 | | |
Total Equity-Linked Securities
(Cost $300,000) | | | 281,644 | | |
| PREFERRED STOCK: 0.2% | | | |
| | | | | Banks: 0.1% | |
| | 6,000 | | | P | | Bank of American Corp. | | | 149,700 | | |
| | | | 149,700 | | |
| | | | | Diversified Financial Services: 0.0% | |
| | 5,000 | | | P | | Merrill Lynch & Co., Inc. | | | 130,400 | | |
| | | | 130,400 | | |
| | | | | Insurance: 0.1% | |
| | 7,050 | | | @@,P | | Aegon NV | | | 183,129 | | |
| | 5,425 | | | P | | Metlife, Inc. | | | 142,732 | | |
| | | | 325,861 | | |
Total Preferred Stock
(Cost $582,999) | | | 605,961 | | |
Principal
Amount | | | | | | | |
| CORPORATE BONDS/NOTES: 2.1% | | | |
| | | | | Banks: 0.9% | |
| $ | 110,000 | | | @@,C | | Australia & New Zealand
Banking Group Ltd., 5.556%,
due 10/29/49 | | | 95,772 | | |
| | 60,000 | | | @@,#,C | | Banco Mercantil del Norte SA,
6.135%, due 10/13/16 | | | 60,320 | | |
| | 44,000 | | | @@ | | Banco Santander Chile SA,
7.375%, due 07/18/12 | | | 48,167 | | |
| | 50,000 | | | @@,C | | Bank of Ireland, 5.625%,
due 12/29/49 | | | 43,546 | | |
| | 40,000 | | | @@,C | | Bank of Nova Scotia, 5.625%,
due 08/21/85 | | | 33,956 | | |
| | 20,000 | | | | | Bank of Scotland, 5.563%,
due 11/30/49 | | | 17,212 | | |
| | 38,000 | | | C | | BankAmerica Capital II, 8.000%,
due 12/15/26 | | | 39,563 | | |
| | 30,000 | | | @@,C | | Barclays Bank PLC, 5.750%,
due 12/31/49 | | | 26,242 | | |
| | 90,000 | | | @@,C | | BNP Paribas, 5.445%,
due 09/29/49 | | | 77,187 | | |
| | 57,000 | | | @@,#,C | | Chuo Mitsui Trust & Banking Co.,
Ltd., 5.506%, due 04/15/49 | | | 54,532 | | |
| | 50,000 | | | @@,C | | Den Norske Bank ASA, 5.563%,
due 08/29/49 | | | 42,500 | | |
| | 10,000 | | | @@,C | | Den Norske Bank ASA, 5.625%,
due 11/29/49 | | | 8,645 | | |
| | 69,000 | | | #,C | | Dresdner Funding Trust I,
8.151%, due 06/30/31 | | | 83,350 | | |
| | 192,000 | | | @@,#,C | | HBOS PLC, 5.375%, due 11/29/49 | | | 189,341 | | |
| | 220,000 | | | @@,C | | HSBC Bank PLC, 5.475%,
due 06/29/49 | | | 187,000 | | |
| | 110,000 | | | @@,C | | HSBC Bank PLC, 5.688%,
due 06/29/49 | | | 95,425 | | |
| | 140,000 | | | @@,C | | Lloyds TSB Bank PLC, 5.560%,
due 08/29/49 | | | 120,860 | | |
See Accompanying Notes to Financial Statements
78
ING VP STRATEGIC ALLOCATION PORTFOLIO OF INVESTMENTS
GROWTH PORTFOLIO AS OF DECEMBER 31, 2006 (CONTINUED)
Principal
Amount | | | | | | Value | |
| $ | 10,000 | | | @@,C | | Lloyds TSB Bank PLC, 5.563%,
due 11/29/49 | | $ | 8,703 | | |
| | 107,000 | | | C | | M&I Capital Trust A, 7.650%,
due 12/01/26 | | | 110,760 | | |
| | 58,000 | | | C | | Mellon Capital I, 7.720%,
due 12/01/26 | | | 60,391 | | |
| | 55,000 | | | @@,C | | Mizuho Financial Group Cayman
Ltd., 8.375%, due 12/31/49 | | | 58,137 | | |
| | 80,000 | | | @@,C | | National Australia Bank Ltd.,
5.556%, due 10/29/49 | | | 69,443 | | |
| | 10,000 | | | @@,C | | National Westminster Bank PLC,
5.500%, due 11/29/49 | | | 8,576 | | |
| | 87,000 | | | #,C | | Rabobank Capital Funding II,
5.260%, due 12/29/49 | | | 85,204 | | |
| | 30,000 | | | #,C | | Rabobank Capital Funding Trust,
5.254%, due 12/31/49 | | | 28,979 | | |
| | 23,000 | | | C,L | | RBS Capital Trust I, 5.512%,
due 09/30/49 | | | 22,769 | | |
| | 102,000 | | | @@,#,C | | Resona Bank Ltd., 5.850%,
due 09/29/49 | | | 99,774 | | |
| | 230,000 | | | @@,C | | Royal Bank of Scotland Group
PLC, 5.563%, due 12/29/49 | | | 197,349 | | |
| | 70,000 | | | @@,C | | Societe Generale, 5.438%,
due 11/29/49 | | | 60,490 | | |
| | 170,000 | | | @@,C | | Standard Chartered PLC,
5.500%, due 07/29/49 | | | 140,675 | | |
| | 260,000 | | | @@,C | | Standard Chartered PLC,
5.625%, due 11/29/49 | | | 218,400 | | |
| | 30,000 | | | @@,C | | Standard Chartered PLC,
5.730%, due 01/29/49 | | | 24,825 | | |
| | 58,000 | | | @@,C | | Sumitomo Mitsui Banking Corp.,
8.150%, due 08/01/49 | | | 60,167 | | |
| | 71,000 | | | C | | Wachovia Capital Trust III,
5.800%, due 12/31/49 | | | 71,652 | | |
| | 50,000 | | | @@,C | | Westpac Banking Corp., 5.525%,
due 09/30/49 | | | 42,792 | | |
| | 113,000 | | | #,C | | Westpac Capital Trust IV, 5.256%,
due 12/29/49 | | | 107,591 | | |
| | 103,000 | | | @@,#,C | | Woori Bank, 6.125%,
due 05/03/16 | | | 105,281 | | |
| | | | 2,805,576 | | |
| | | | | Beverages: 0.1% | |
| | 106,000 | | | @@ | | Cia Brasileira de Bebidas,
8.750%, due 09/15/13 | | | 124,020 | | |
| | | | 124,020 | | |
| | | | | Chemicals: 0.0% | |
| | 10,000 | | | | | Stauffer Chemical, 5.620%,
due 04/15/10 | | | 8,355 | | |
| | 40,000 | | | | | Stauffer Chemical, 5.890%,
due 04/15/18 | | | 20,960 | | |
| | 40,000 | | | | | Stauffer Chemical, 7.670%,
due 04/15/17 | | | 22,218 | | |
| | | | 51,533 | | |
| | | | | Diversified Financial Services: 0.5% | |
| | 181,000 | | | @@,#,C | | Aiful Corp., 4.450%,
due 02/16/10 | | | 173,727 | | |
| | 70,378 | | | @@,# | | Brazilian Merchant Voucher
Receivables Ltd., 5.911%,
due 06/15/11 | | | 69,322 | | |
| | 58,000 | | | C | | Citigroup Capital II, 7.750%,
due 12/01/36 | | | 59,974 | | |
Principal
Amount | | | | | | Value | |
| $ | 88,000 | | | #,C | | Corestates Capital Trust I,
8.000%, due 12/15/26 | | $ | 91,643 | | |
| | 100,000 | | | # | | Farmers Exchange Capital,
7.200%, due 07/15/48 | | | 102,749 | | |
| | 40,000 | | | @@,C | | Financiere CSFB NV, 5.485%,
due 03/29/49 | | | 34,300 | | |
| | 89,000 | | | C | | Fund American Cos., Inc.,
5.875%, due 05/15/13 | | | 88,584 | | |
| | 102,000 | | | #,C | | HVB Funding Trust III, 9.000%,
due 10/22/31 | | | 133,029 | | |
| | 52,000 | | | C | | JPM Capital Trust I, 7.540%,
due 01/15/27 | | | 53,953 | | |
| | 58,000 | | | C | | JPM Capital Trust II, 7.950%,
due 02/01/27 | | | 60,358 | | |
| | 168,000 | | | #,C | | Mangrove Bay Pass-Through
Trust, 6.102%, due 07/15/33 | | | 164,404 | | |
| | 100,000 | | | @@,C | | MUFG Capital Finance 1 Ltd.,
6.346%, due 12/31/49 | | | 101,669 | | |
| | 47,000 | | | @@,C | | Paribas, 5.500%, due 12/31/49 | | | 40,548 | | |
| | 28,000 | | | @@,#,C | | Petroleum Export Ltd., 4.623%,
due 06/15/10 | | | 27,573 | | |
| | 56,029 | | | @@,#,C | | Petroleum Export Ltd., 5.265%,
due 06/15/11 | | | 54,556 | | |
| | 111,114 | | | @@,#,C | | PF Export Receivables Master
Trust, 6.436%, due 06/01/15 | | | 113,406 | | |
| | 100,000 | | | @@,#,C | | Preferred Term Securities Ltd.,
5.860%, due 03/23/35 | | | 100,375 | | |
| | 374,262 | | | # | | Toll Road Investors Partnership
II LP, 17.590%, due 02/15/45 | | | 47,963 | | |
| | 86,000 | | | @@,C | | UFJ Finance Aruba AEC, 8.750%,
due 12/31/49 | | | 90,809 | | |
| | | | 1,608,942 | | |
| | | | | Electric: 0.1% | |
| | 60,000 | | | C | | Commonwealth Edison Co.,
5.950%, due 08/15/16 | | | 60,771 | | |
| | 12,000 | | | @@ | | Empresa Nacional de
Electricidad SA, 7.325%,
due 02/01/37 | | | 13,072 | | |
| | 60,000 | | | @@,L | | Empresa Nacional de
Electricidad SA, 8.625%,
due 08/01/15 | | | 70,749 | | |
| | 37,000 | | | C,L | | FirstEnergy Corp., 6.450%,
due 11/15/11 | | | 38,624 | | |
| | 33,256 | | | # | | Power Contract Financing, LLC,
6.256%, due 02/01/10 | | | 33,448 | | |
| | 13,330 | | | | | PPL Montana, LLC, 8.903%,
due 07/02/20 | | | 14,711 | | |
| | 79,000 | | | C | | Southern Co. CAP Trust I,
8.190%, due 02/01/37 | | | 82,392 | | |
| | | | 313,767 | | |
| | | | | Healthcare-Products: 0.0% | |
| | 44,000 | | | C | | Boston Scientific Corp., 7.000%,
due 11/15/35 | | | 43,968 | | |
| | | | 43,968 | | |
| | | | | Home Builders: 0.0% | |
| | 76,000 | | | L | | D.R. Horton, Inc., 5.625%,
due 09/15/14 | | | 73,520 | | |
| | | | 73,520 | | |
See Accompanying Notes to Financial Statements
79
ING VP STRATEGIC ALLOCATION PORTFOLIO OF INVESTMENTS
GROWTH PORTFOLIO AS OF DECEMBER 31, 2006 (CONTINUED)
Principal
Amount | | | | | | Value | |
| | | | | | | Multi-National: | | | 0.0 | % | |
| $ | 56,000 | | | @@ | | Corp. Andina de Fomento CAF,
5.125%, due 05/05/15 | | $ | 53,998 | | |
| | | | 53,998 | | |
| | | | | Oil & Gas: 0.1% | |
| | 62,000 | | | @@,# | | EMP Nacional Del Petrole,
4.875%, due 03/15/14 | | | 58,982 | | |
| | 12,000 | | | @@,# | | Empresa Nacional de Petroleo
ENAP, 6.750%, due 11/15/12 | | | 12,660 | | |
| | 27,000 | | | C | | Pemex Project Funding Master
Trust, 6.625%, due 06/15/35 | | | 27,655 | | |
| | 94,000 | | | # | | Pemex Project Funding Master
Trust, 6.660%, due 06/15/10 | | | 96,726 | | |
| | 81,000 | | | @@,#,C | | Ras Laffan Liquefied Natural
Gas Co., Ltd. II, 5.298%,
due 09/30/20 | | | 77,790 | | |
| | | | 273,813 | | |
| | | | | Pipelines: 0.1% | |
| | 202,000 | | | #,C,I | | Cameron Highway Oil Pipelines,
5.860%, due 12/15/17 | | | 197,518 | | |
| | | | 197,518 | | |
| | | | | Real Estate Investment Trusts: 0.1% | |
| | 23,000 | | | C | | Liberty Property LP, 6.375%,
due 08/15/12 | | | 23,989 | | |
| | 95,000 | | | C | | Liberty Property LP, 7.750%,
due 04/15/09 | | | 99,413 | | |
| | 62,000 | | | C | | Simon Property Group LP,
5.000%, due 03/01/12 | | | 60,977 | | |
| | | | 184,379 | | |
| | | | | Savings & Loans: 0.0% | |
| | 47,000 | | | C | | Great Western Financial,
8.206%, due 02/01/27 | | | 49,008 | | |
| | | | 49,008 | | |
| | | | | Sovereign: 0.1% | |
| | 267,000 | | | L | | Fannie Mae, 7.250%,
due 01/15/10 | | | 284,253 | | |
| | | | 284,253 | | |
| | | | | Telecommunications: 0.1% | |
| | 57,000 | | | C,L | | Sprint Capital Corp., 6.875%,
due 11/15/28 | | | 57,218 | | |
| | 77,000 | | | @@,C | | TELUS Corp., 8.000%,
due 06/01/11 | | | 84,281 | | |
| | | | 141,499 | | |
Total Corporate Bonds/Notes
(Cost $6,228,580) | | | 6,205,794 | | |
| U.S. GOVERNMENT AGENCY OBLIGATIONS: 3.3% | | | |
| | | | | Federal Home Loan Bank: 0.1% | |
| | 155,000 | | | L | | 5.625%, due 06/13/16 | | | 159,815 | | |
| | | | 159,815 | | |
| | | | | | | Federal Home Loan
Mortgage Corporation: 0.6% | | | | | |
| | 157,549 | | | C | | 4.500%, due 12/15/16 | | | 154,687 | | |
| | 215,563 | | | C | | 5.000%, due 08/15/16 | | | 212,515 | | |
| | 185,000 | | | C | | 5.000%, due 05/15/20 | | | 179,408 | | |
| | 119,000 | | | L | | 5.125%, due 04/18/08 | | | 119,007 | | |
Principal
Amount | | | | | | Value | |
| $ | 147,000 | | | | | 5.125%, due 04/18/11 | | $ | 148,160 | | |
| | 477,000 | | | C | | 5.750%, due 05/11/11 | | | 477,511 | | |
| | 140,000 | | | | | 5.750%, due 06/27/16 | | | 145,976 | | |
| | 167,552 | | | C | | 6.000%, due 01/15/29 | | | 169,793 | | |
| | 35,000 | | | | | 6.000%, due 01/15/36 | | | 35,263 | | |
| | 277,000 | | | L | | 6.625%, due 09/15/09 | | | 288,673 | | |
| | | | 1,930,993 | | |
| | | | | | | Federal National
Mortgage Association: 2.6% | | | | | |
| | 406,000 | | | | | 4.500%, due 11/15/36 | | | 380,498 | | |
| | 136,000 | | | W | | 4.500%, due 01/00/00 | | | 131,198 | | |
| | 88,581 | | | | | 4.806%, due 08/01/35 | | | 87,426 | | |
| | 144,000 | | | L | | 4.875%, due 12/15/16 | | | 142,666 | | |
| | 1,387,000 | | | W | | 5.000%, due 01/12/36 | | | 1,339,322 | | |
| | 595,000 | | | W | | 5.000%, due 01/15/20 | | | 584,959 | | |
| | 360,000 | | | L | | 5.250%, due 08/01/12 | | | 362,184 | | |
| | 171,000 | | | | | 5.250%, due 09/15/16 | | | 174,421 | | |
| | 2,826,000 | | | W | | 5.500%, due 01/12/36 | | | 2,793,326 | | |
| | 97,959 | | | | | 5.500%, due 02/01/18 | | | 97,983 | | |
| | 362,000 | | | | | 5.500%, due 05/25/30 | | | 356,058 | | |
| | 135,889 | | | | | 5.500%, due 11/01/33 | | | 134,574 | | |
| | 107,182 | | | | | 5.500%, due 11/01/36 | | | 105,323 | | |
| | 216,000 | | | C | | 5.600%, due 03/29/11 | | | 216,073 | | |
| | 51,971 | | | | | 6.000%, due 10/01/08 | | | 52,108 | | |
| | 110,577 | | | | | 6.000%, due 08/01/16 | | | 112,258 | | |
| | 93,000 | | | | | 6.000%, due 01/15/19 | | | 94,308 | | |
| | 116,999 | | | | | 6.000%, due 04/25/31 | | | 119,230 | | |
| | 133,000 | | | W | | 6.500%, due 01/15/35 | | | 135,535 | | |
| | 49,910 | | | | | 6.500%, due 04/01/27 | | | 51,258 | | |
| | 10,373 | | | | | 7.000%, due 12/01/27 | | | 10,716 | | |
| | 126,019 | | | | | 7.000%, due 02/01/31 | | | 129,794 | | |
| | 1,947 | | | | | 7.000%, due 08/01/35 | | | 1,999 | | |
| | 27,406 | | | | | 7.500%, due 09/01/31 | | | 28,523 | | |
| | | | 7,641,740 | | |
| | | | | | | Government National
Mortgage Association: 0.0% | | | | | |
| | 22,191 | | | | | 6.500%, due 01/15/29 | | | 22,830 | | |
| | 20,355 | | | | | 6.500%, due 01/15/32 | | | 20,919 | | |
| | 13,037 | | | | | 7.000%, due 04/15/26 | | | 13,488 | | |
| | 1,132 | | | | | 7.000%, due 01/15/28 | | | 1,170 | | |
| | 19,525 | | | | | 7.000%, due 02/15/28 | | | 20,183 | | |
| | | | 78,590 | | |
Total U.S. Government
Agency Obligations
(Cost $9,869,228) | | | 9,811,138 | | |
| U.S. TREASURY OBLIGATIONS: 0.9% | | | |
| | | | | U.S. Treasury Bonds: 0.4% | |
| | 586,000 | | | L | | 4.500%, due 02/15/36 | | | 557,433 | | |
| | 264,000 | | | L | | 4.625%, due 11/15/16 | | | 262,350 | | |
| | 242,000 | | | L | | 6.000%, due 02/15/26 | | | 274,538 | | |
| | 235,000 | | | L | | 6.250%, due 08/15/23 | | | 270,562 | | |
| | | | 1,364,883 | | |
| | | | | | | Treasury Inflation
Protected Securities: 0.2% | | | | | |
| | 220,000 | | | | | 2.000%, due 01/15/16 | | | 216,046 | | |
| | 276,000 | | | L | | 2.375%, due 04/15/11 | | | 279,576 | | |
| | | | 495,622 | | |
See Accompanying Notes to Financial Statements
80
ING VP STRATEGIC ALLOCATION PORTFOLIO OF INVESTMENTS
GROWTH PORTFOLIO AS OF DECEMBER 31, 2006 (CONTINUED)
Principal
Amount | | | | | | Value | |
| | | | | U.S. Treasury Notes: 0.3% | |
| $ | 278,000 | | | | L | | | 4.500%, due 11/30/11 | | $ | 275,611 | | |
| | 294,000 | | | | L | | | 4.625%, due 11/30/08 | | | 293,024 | | |
| | 268,000 | | | | L | | | 4.625%, due 11/15/09 | | | 267,246 | | |
| | | | 835,881 | | |
| | | | | | | | | U.S. Treasury Principal
Only STRIP: 0.0% | | | | | |
| | 541,000 | | | | L | | | Discount Note, due 02/15/36 | | | 137,085 | | |
| | | | 137,085 | | |
Total U.S. Treasury Obligations
(Cost $2,817,449) | | | 2,833,471 | | |
| ASSET-BACKED SECURITIES: 0.2% | | | |
| | | | | | | | | Automobile Asset-Backed
Securities: 0.0% | | | | | |
| | 36,000 | | | | C | | | AmeriCredit Automobile
Receivables Trust, 4.220%,
due 07/06/09 | | | 35,738 | | |
| | | | 35,738 | | |
| | | | | | | | | Credit Card Asset-Backed
Securities: 0.0% | | | | | |
| | 45,000 | | | | C | | | Bank One Issuance Trust,
4.540%, due 09/15/10 | | | 44,593 | | |
| | | | 44,593 | | |
| | | | | | | | | Home Equity Asset-Backed
Securities: 0.0% | | | | | |
| | 16,000 | | | | +, | C | | Renaissance Home Equity Loan
Trust, 4.456%, (step rate
4.956%), due 05/25/35 | | | 15,852 | | |
| | 25,000 | | | | +, | C | | Renaissance Home Equity Loan
Trust, 4.723%, (step rate
5.223%), due 11/25/35 | | | 24,855 | | |
| | 45,000 | | | | C | | | Wells Fargo Home Equity Trust,
3.970%, due 05/25/34 | | | 44,064 | | |
| | | | 84,771 | | |
| | | | | Other Asset-Backed Securities: 0.2% | |
| | 56,109 | | | | C | | | Chase Funding Mortgage Loan,
4.045%, due 05/25/33 | | | 55,366 | | |
| | 25,000 | | | | C | | | Countrywide Asset-Backed
Certificates, 4.493%,
due 02/25/36 | | | 24,781 | | |
| | 192,000 | | | | C | | | Countrywide Asset-Backed
Certificates, 5.683%,
due 10/25/46 | | | 191,940 | | |
| | 26,000 | | | | C | | | Countrywide Asset-Backed
Certificates, 5.689%,
due 10/25/46 | | | 26,057 | | |
| | 40,000 | | | | C | | | Equity One, Inc., 5.050%,
due 09/25/33 | | | 39,465 | | |
| | 46,000 | | | | +, | C | | Merrill Lynch Mortgage
Investors, Inc., 5.609%, (step
rate 6.109%), due 03/25/37 | | | 45,942 | | |
| | 407 | | | | C | | | Popular Mortgage Pass-Through
Trust, 3.735%, due 12/25/34 | | | 406 | | |
| | 6,000 | | | | C | | | Popular Mortgage Pass-Through
Trust, 4.000%, due 12/25/34 | | | 5,939 | | |
| | 19,000 | | | | C | | | Popular Mortgage Pass-Through
Trust, 4.596%, due 11/25/35 | | | 18,825 | | |
| | | | 408,721 | | |
Total Asset-Backed Securities
(Cost $576,478) | | | 573,823 | | |
Principal
Amount | | | | | | Value | |
| COLLATERALIZED MORTGAGE OBLIGATIONS: 3.9% | | | |
| $ | 36,000 | | | C | | Banc of America Commercial
Mortgage, Inc., 4.502%,
due 07/10/42 | | $ | 34,949 | | |
| | 11,000 | | | C | | Banc of America Commercial
Mortgage, Inc., 4.611%,
due 07/10/43 | | | 10,812 | | |
| | 25,000 | | | C | | Banc of America Commercial
Mortgage, Inc., 4.764%,
due 07/10/45 | | | 24,675 | | |
| | 83,000 | | | C | | Banc of America Commercial
Mortgage, Inc., 4.772%,
due 07/11/43 | | | 82,069 | | |
| | 53,000 | | | C | | Banc of America Commercial
Mortgage, Inc., 4.877%,
due 11/10/42 | | | 52,472 | | |
| | 19,460 | | | C | | Banc of America Commercial
Mortgage, Inc., 5.363%,
due 07/10/46 | | | 19,548 | | |
| | 103,786 | | | C | | Banc of America Commercial
Mortgage, Inc., 5.685%,
due 07/10/44 | | | 104,658 | | |
| | 10,000 | | | C | | Banc of America Commercial
Mortgage, Inc., 6.186%,
due 06/11/35 | | | 10,406 | | |
| | 137,300 | | | C | | Banc of America Funding Corp.,
5.858%, due 05/20/36 | | | 137,068 | | |
| | 46,000 | | | C | | Banc of America Mortgage
Securities, 4.147%,
due 07/25/34 | | | 44,795 | | |
| | 41,129 | | | C | | Banc of America Mortgage
Securities, 5.250%,
due 11/25/19 | | | 40,710 | | |
| | 36,911 | | | C | | Banc of America Mortgage
Securities, 5.500%,
due 11/25/33 | | | 36,379 | | |
| | 152,315 | | | C | | Bank of America Alternative
Loan Trust, 6.290%,
due 11/25/21 | | | 153,816 | | |
| | 271,794 | | | C | | Bank of America Alternative
Loan Trust, 6.500%,
due 04/25/36 | | | 275,277 | | |
| | 94,242 | | | C | | Bank of America Alternative
Loan Trust, 6.500%,
due 05/25/46 | | | 95,363 | | |
| | 69,000 | | | C | | Bear Stearns Commercial
Mortgage Securities, 3.880%,
due 08/13/39 | | | 67,043 | | |
| | 24,367 | | | C | | Bear Stearns Commercial
Mortgage Securities, 5.294%,
due 09/11/41 | | | 24,393 | | |
| | 10,000 | | | C | | Citigroup Commercial Mortgage
Trust, 4.639%, due 05/15/43 | | | 9,814 | | |
| | 19,010 | | | C | | Citigroup Commercial Mortgage
Trust, 5.720%, due 03/15/49 | | | 19,265 | | |
| | 100,902 | | | C | | Countrywide Alternative Loan
Trust, 5.416%, due 10/25/35 | | | 99,640 | | |
| | 122,727 | | | C | | Countrywide Alternative Loan
Trust, 5.500%, due 02/25/25 | | | 122,242 | | |
| | 41,472 | | | C | | Countrywide Alternative Loan
Trust, 6.000%, due 05/25/36 | | | 41,759 | | |
| | 34,565 | | | C | | Credit Suisse First Boston
Mortgage Securities Corp.,
3.819%, due 05/15/36 | | | 33,103 | | |
See Accompanying Notes to Financial Statements
81
ING VP STRATEGIC ALLOCATION PORTFOLIO OF INVESTMENTS
GROWTH PORTFOLIO AS OF DECEMBER 31, 2006 (CONTINUED)
Principal
Amount | | | | | | Value | |
| $ | 350,000 | | | C | | Credit Suisse First Boston
Mortgage Securities Corp.,
3.861%, due 03/15/36 | | $ | 342,621 | | |
| | 30,000 | | | C | | Credit Suisse First Boston
Mortgage Securities Corp.,
7.544%, due 04/15/62 | | | 32,326 | | |
| | 19,122 | | | C | | Credit Suisse Mortgage Capital
Certificates, 4.991%,
due 06/15/38 | | | 18,990 | | |
| | 164,592 | | | C | | DLJ Commercial Mortgage Corp.,
6.240%, due 11/12/31 | | | 166,491 | | |
| | 400,000 | | | C | | DLJ Commercial Mortgage Corp.,
7.300%, due 06/10/32 | | | 415,633 | | |
| | 44,813 | | | C | | GE Capital Commercial
Mortgage Corp., 3.752%,
due 07/10/39 | | | 43,906 | | |
| | 10,000 | | | C | | GE Capital Commercial
Mortgage Corp., 4.371%,
due 01/10/38 | | | 9,748 | | |
| | 70,894 | | | C | | GMAC Mortgage Corp. Loan
Trust, 4.604%, due 10/19/33 | | | 68,757 | | |
| | 62,675 | | | C | | GMAC Mortgage Corp. Loan
Trust, 5.500%, due 09/25/34 | | | 62,243 | | |
| | 93,000 | | | C | | Greenwich Capital Commercial
Funding Corp., 5.117%,
due 04/10/37 | | | 92,727 | | |
| | 25,341 | | | #,C | | GSMPS Mortgage Loan Trust,
5.700%, due 01/25/35 | | | 25,460 | | |
| | 54,000 | | | C | | JP Morgan Chase Commercial
Mortgage Securities Corp.,
4.223%, due 01/15/42 | | | 52,545 | | |
| | 28,000 | | | C | | JP Morgan Chase Commercial
Mortgage Securities Corp.,
4.449%, due 01/12/38 | | | 27,237 | | |
| | 19,389 | | | C | | JP Morgan Chase Commercial
Mortgage Securities Corp.,
5.338%, due 05/12/45 | | | 19,429 | | |
| | 9,361 | | | C | | JP Morgan Chase Commercial
Mortgage Securities Corp.,
5.833%, due 04/15/45 | | | 9,477 | | |
| | 11,000 | | | C | | JP Morgan Chase Commercial
Mortgage Securities Corp.,
5.857%, due 10/12/35 | | | 11,267 | | |
| | 121,000 | | | C | | JP Morgan Chase Commercial
Mortgage Securities Corp.,
5.861%, due 04/15/45 | | | 124,350 | | |
| | 336,980 | | | C | | JP Morgan Mortgage Trust,
5.408%, due 11/25/35 | | | 332,767 | | |
| | 28,000 | | | C | | LB-UBS Commercial Mortgage
Trust, 3.992%, due 10/15/29 | | | 27,123 | | |
| | 19,000 | | | C | | LB-UBS Commercial Mortgage
Trust, 4.201%, due 12/15/29 | | | 18,499 | | |
| | 32,000 | | | C | | LB-UBS Commercial Mortgage
Trust, 4.547%, due 08/15/29 | | | 31,236 | | |
| | 36,000 | | | C | | LB-UBS Commercial Mortgage
Trust, 4.583%, due 08/15/29 | | | 35,106 | | |
| | 152,000 | | | C | | LB-UBS Commercial Mortgage
Trust, 4.821%, due 04/15/30 | | | 150,148 | | |
| | 10,000 | | | C | | LB-UBS Commercial Mortgage
Trust, 4.836%, due 02/15/40 | | | 9,616 | | |
| | 42,000 | | | C | | LB-UBS Commercial Mortgage
Trust, 5.103%, due 11/15/30 | | | 41,871 | | |
| | 21,000 | | | C | | LB-UBS Commercial Mortgage
Trust, 5.207%, due 02/15/31 | | | 20,933 | | |
Principal
Amount | | | | | | Value | |
| $ | 19,339 | | | C | | LB-UBS Commercial Mortgage
Trust, 5.741%, due 06/15/32 | | $ | 19,602 | | |
| | 152,000 | | | C | | LB-UBS Commercial Mortgage
Trust, 6.365%, due 12/15/28 | | | 158,755 | | |
| | 104,665 | | | C | | MASTR Alternative Loans Trust,
5.500%, due 01/25/20 | | | 104,510 | | |
| | 281,296 | | | C | | MASTR Asset Securitization Trust,
5.500%, due 06/25/33 | | | 276,198 | | |
| | 26,000 | | | C | | Merrill Lynch Mortgage Trust,
5.660%, due 05/12/39 | | | 26,566 | | |
| | 25,000 | | | C | | Merrill Lynch/Countrywide
Commercial Mortgage Trust,
5.439%, due 02/12/39 | | | 25,183 | | |
| | 370,000 | | | C | | Morgan Stanley Capital I,
5.007%, due 01/14/42 | | | 366,065 | | |
| | 222,610 | | | C | | Morgan Stanley Capital I,
5.490%, due 07/12/44 | | | 224,280 | | |
| | 220,000 | | | C | | Morgan Stanley Capital I,
5.741%, due 08/12/41 | | | 225,098 | | |
| | 288,476 | | | C | | Morgan Stanley Dean Witter
Capital I, 4.180%, due 03/12/35 | | | 278,860 | | |
| | 91,803 | | | C | | RAAC Series, 5.250%,
due 09/25/34 | | | 90,725 | | |
| | 35,127 | | | C | | RAST 2006-A10 A5, 6.500%,
due 09/25/36 | | | 35,343 | | |
| | 789,896 | | | C | | Residential Accredit Loans, Inc.,
5.720%, due 04/25/35 | | | 792,970 | | |
| | 49,833 | | | | +, | C | | Thornburg Mortgage Securities
Trust, 5.720%, (step rate
6.060%), due 09/25/34 | | | 50,100 | | |
| | 10,000 | | | C | | Wachovia Bank Commercial
Mortgage Trust, 5.223%,
due 07/15/42 | | | 9,996 | | |
| | 18,806 | | | C | | Wachovia Bank Commercial
Mortgage Trust, 5.726%,
due 06/15/45 | | | 18,986 | | |
| | 20,000 | | | C | | Wachovia Bank Commercial
Mortgage Trust, 5.935%,
due 06/15/45 | | | 20,536 | | |
| | 218,714 | | | C | | Washington Mutual Alternative
Mortgage Pass-Through
Certificates, 5.000%,
due 12/25/18 | | | 214,270 | | |
| | 1,500,000 | | | C | | Washington Mutual Alternative
Mortgage Pass-Through
Certificates, 5.567%,
due 01/25/47 | | | 1,500,000 | | |
| | 500,000 | | | C | | Washington Mutual Alternative
Mortgage Pass-Through
Certificates, 5.596%,
due 01/25/47 | | | 500,625 | | |
| | 820,345 | | | C | | Washington Mutual Alternative
Mortgage Pass-Through
Certificates, 5.748%,
due 07/25/46 | | | 821,819 | | |
| | 278,384 | | | C | | Washington Mutual Alternative
Mortgage Pass-Through
Certificates, 5.750%,
due 02/25/36 | | | 279,410 | | |
| | 821,348 | | | C | | Washington Mutual, Inc.,
5.598%, due 11/25/46 | | | 821,188 | | |
| | 210,112 | | | C | | Washington Mutual, Inc.,
5.667%, due 11/25/46 | | | 210,071 | | |
See Accompanying Notes to Financial Statements
82
ING VP STRATEGIC ALLOCATION PORTFOLIO OF INVESTMENTS
GROWTH PORTFOLIO AS OF DECEMBER 31, 2006 (CONTINUED)
Principal
Amount | | | | | | Value | |
| $ | 354,242 | | | C | | Washington Mutual, Inc.,
5.882%, due 11/25/46 | | $ | 355,031 | | |
| | 53,000 | | | C | | Wells Fargo Mortgage-Backed
Securities Trust, 3.499%,
due 06/25/35 | | | 51,638 | | |
| | 32,468 | | | C | | Wells Fargo Mortgage-Backed
Securities Trust, 5.259%,
due 10/25/35 | | | 31,900 | | |
| | 236,960 | | | C | | Wells Fargo Mortgage-Backed
Securities Trust, 5.387%,
due 08/25/35 | | | 233,831 | | |
| | 245,320 | | | C | | Wells Fargo Mortgage-Backed
Securities Trust, 5.690%,
due 12/25/36 | | | 244,207 | | |
Total Collateralized
Mortgage Obligations
(Cost $11,765,799) | | | 11,718,525 | | |
| MUNICIPAL BONDS: 0.1% | | | |
| | | | | California: 0.0% | |
| | 65,000 | | | C | | City of San Diego, 7.125%,
due 06/01/32 | | | 67,021 | | |
| | | | 67,021 | | |
| | | | | Louisiana: 0.0% | |
| | 114,000 | | | #,C | | Tulane University of Louisiana,
6.174%, due 11/15/12 | | | 114,000 | | |
| | | | 114,000 | | |
| | | | | Michigan: 0.1% | |
| | 130,000 | | | | | Michigan Tobacco Settlement
Finance Authority, 7.309%,
due 06/01/34 | | | 134,937 | | |
| | | | 134,937 | | |
Total Municipal Bonds
(Cost $309,471) | | | 315,958 | | |
Total Long-Term Investments
(Cost $249,940,445) | | | 296,698,636 | | |
| SHORT-TERM INVESTMENTS: 15.5% | | | |
| | | Repurchase Agreement: 3.1% | |
| | 9,203,000 | | | Morgan Stanley Repurchase Agreement
dated 12/29/06, 5.250%, due 01/02/07,
$9,208,368 to be received upon
repurchase (Collateralized by
$29,615,000 Resolution Funding
Corporation, Discount Note, Market
Value $9,387,659, due 04/15/30) | | | 9,203,000 | | |
Total Repurchase Agreement
(Cost $9,203,000) | | | 9,203,000 | | |
Principal
Amount | | | | Value | |
| | | Securities Lending CollateralCC: 12.4% | |
| $ | 37,007,489 | | | The Bank of New York Institutional
Cash Reserves Fund | | $ | 37,007,489 | | |
Total Securities Lending
Collateral (Cost $37,007,489) | | | 37,007,489 | | |
Total Short-Term Investments
(Cost $46,210,489) | | | 46,210,489 | | |
Total Investments in Securities
(Cost $296,150,934)* | | | 114.8 | % | | $ | 342,909,125 | | |
Other Assets and
Liabilities - Net | | | (14.8 | ) | | | (44,149,092 | ) | |
| Net Assets | | | 100.0 | % | | $ | 298,760,033 | | |
@ Non-income producing security
@@ Foreign Issuer
ADR American Depositary Receipt
GDR Global Depositary Receipt
STRIP Separate Trading of Registered Interest and Principal of Securities
MASTR Mortgage Asset Securitization Transaction, Inc.
+ Step-up basis bonds. Interest rates shown reflect current and future coupon rates.
# Securities with purchases pursuant to Rule 144A, under the Securities Act of 1933 and may not be resold subject to that rule except to qualified institutional buyers. These securities have been determined to be liquid under the guidelines established by the Funds' Board of Directors/Trustees.
C Bond may be called prior to maturity date.
P Preferred Stock may be called prior to convertible date.
cc Securities purchased with cash collateral for securities loaned.
W When-issued or delayed delivery security
I Illiquid security
L Loaned security, a portion or all of the security is on loan at December 31, 2006.
* Cost for federal income tax purposes is $298,886,078. Net unrealized appreciation consists of:
| Gross Unrealized Appreciation | | $ | 46,644,960 | | |
| Gross Unrealized Depreciation | | | (2,621,913 | ) | |
| Net Unrealized Appreciation | | $ | 44,023,047 | | |
VP Strategic Allocation Growth Open Futures Contracts on December 31, 2006:
Contract
Description | | Number
of
Contracts | | Notional
Market
Value ($) | | Expiration
Date | | Unrealized
Appreciation/
(Depreciation) | |
| Long Contracts | |
| S&P 400 E-Mini | | | 4 | | | | 324,520 | | | 3/16/07 | | $ | (5,865 | ) | |
| S&P 500 | | | 4 | | | | 1,428,400 | | | 3/15/07 | | | 2,857 | | |
U.S. Treasury
2-Year Note | | | 22 | | | | 4,488,688 | | | 3/30/07 | | | (15,021 | ) | |
U.S. Treasury
5-Year Note | | | 24 | | | | 2,521,500 | | | 3/30/07 | | | (23,315 | ) | |
| | | | | | | | | | | | | $ | (41,344 | ) | |
| Short Contracts | |
90-Day
Eurodollar | | | 29 | | | | (6,864,300 | ) | | 3/19/07 | | $ | 2,598 | | |
U.S. Treasury
10-Year Note | | | 2 | | | | (214,938 | ) | | 3/21/07 | | | 2,365 | | |
U.S. Treasury
Long Bond | | | 5 | | | | (557,188 | ) | | 3/21/07 | | | 12,129 | | |
| | | | | | | | | | | | | $ | 17,092 | | |
See Accompanying Notes to Financial Statements
83
ING VP STRATEGIC ALLOCATION PORTFOLIO OF INVESTMENTS
MODERATE PORTFOLIO AS OF DECEMBER 31, 2006
| Shares | | | | | | Value | |
| COMMON STOCK: 73.0% | | | |
| | | | | Advertising: 0.3% | |
| | 500 | | | | | Advo, Inc. | | $ | 16,300 | | |
| | 7,900 | | | L | | Omnicom Group | | | 825,866 | | |
| | | | 842,166 | | |
| | | | | Aerospace/Defense: 1.0% | |
| | 9,600 | | | | | Boeing Co. | | | 852,864 | | |
| | 500 | | | | | Kaman Corp. | | | 11,195 | | |
| | 24,082 | | | | | Raytheon Co. | | | 1,271,530 | | |
| | 14,400 | | | | | United Technologies Corp. | | | 900,288 | | |
| | | | 3,035,877 | | |
| | | | | Agriculture: 0.9% | |
| | 6,700 | | | @ | | Alliance One International, Inc. | | | 47,302 | | |
| | 24,150 | | | | | Altria Group, Inc. | | | 2,072,553 | | |
| | 15,837 | | | @@ | | British American Tobacco PLC | | | 443,456 | | |
| | 600 | | | | | Delta & Pine Land Co. | | | 24,270 | | |
| | | | 2,587,581 | | |
| | | | | Airlines: 0.2% | |
| | 1,500 | | | @ | | Airtran Holdings, Inc. | | | 17,610 | | |
| | 300 | | | @ | | Alaska Air Group, Inc. | | | 11,850 | | |
| | 50,105 | | | @,@@ | | British Airways PLC | | | 516,611 | | |
| | 600 | | | @ | | JetBlue Airways Corp. | | | 8,520 | | |
| | 2,723 | | | | | Skywest, Inc. | | | 69,464 | | |
| | | | 624,055 | | |
| | | | | Apparel: 0.6% | |
| | 1,200 | | | @ | | Ashworth, Inc. | | | 8,712 | | |
| | 18,800 | | | @,L | | Coach, Inc. | | | 807,648 | | |
| | 600 | | | @,L | | Deckers Outdoor Corp. | | | 35,970 | | |
| | 1,390 | | | @,L | | Gymboree Corp. | | | 53,042 | | |
| | 5,400 | | | @ | | Hanesbrands, Inc. | | | 127,548 | | |
| | 6,300 | | | | | Jones Apparel Group, Inc. | | | 210,609 | | |
| | 1,500 | | | | | Kellwood Co. | | | 48,780 | | |
| | 1,800 | | | | | K-Swiss, Inc. | | | 55,332 | | |
| | 2,190 | | | | | Phillips-Van Heusen | | | 109,872 | | |
| | 1,820 | | | | | Polo Ralph Lauren Corp. | | | 141,341 | | |
| | 2,800 | | | | | Wolverine World Wide, Inc. | | | 79,856 | | |
| | | | 1,678,710 | | |
| | | | | Auto Manufacturers: 0.2% | |
| | 88,400 | | | L | | Ford Motor Co. | | | 663,884 | | |
| | | | 663,884 | | |
| | | | | Auto Parts & Equipment: 0.1% | |
| | 5,600 | | | L | | ArvinMeritor, Inc. | | | 102,088 | | |
| | 200 | | | | | Bandag, Inc. | | | 10,086 | | |
| | 900 | | | | | Standard Motor Products, Inc. | | | 13,482 | | |
| | 21,000 | | | @@ | | Sumitomo Rubber Industries, Inc. | | | 270,891 | | |
| | | | 396,547 | | |
| | | | | Banks: 6.1% | |
| | 67,149 | | | @@ | | Banca Intesa S.p.A. | | | 517,139 | | |
| | 77,350 | | | | | Bank of America Corp. | | | 4,129,717 | | |
| | 19,500 | | | @@ | | Bank of Ireland | | | 448,943 | | |
| | 51,863 | | | @@ | | Barclays PLC | | | 740,499 | | |
| | 41,545 | | | @@ | | Capitalia S.p.A. | | | 392,001 | | |
| | 2,400 | | | L | | Chittenden Corp. | | | 73,656 | | |
| | 6,300 | | | | | Colonial BancGroup, Inc. | | | 162,162 | | |
| | 9,100 | | | | | Comerica, Inc. | | | 533,988 | | |
| | 17,939 | | | @@ | | Depfa Bank PLC | | | 320,550 | | |
| | 4,608 | | | @@ | | Deutsche Bank AG | | | 613,639 | | |
| Shares | | | | | | Value | |
| | 2,686 | | | | | East-West Bancorp., Inc. | | $ | 95,138 | | |
| | 5,700 | | | @@ | | First Bancorp. | | | 54,321 | | |
| | 600 | | | | | First Indiana Corp. | | | 15,216 | | |
| | 800 | | | | | First Midwest Bancorp., Inc. | | | 30,944 | | |
| | 4,400 | | | L | | FirstMerit Corp. | | | 106,216 | | |
| | 2,800 | | | | | Hanmi Financial Corp. | | | 63,084 | | |
| | 62,303 | | | @@ | | HSBC Holdings PLC | | | 1,133,905 | | |
| | 1,600 | | | | | Independent Bank Corp. | | | 40,464 | | |
| | 3,500 | | | @@ | | KBC Groep NV | | | 428,465 | | |
| | 3,774 | | | @@ | | Kookmin Bank ADR | | | 304,335 | | |
| | 1,700 | | | | | Mercantile Bankshares Corp. | | | 79,543 | | |
| | 59 | | | @@ | | Mitsubishi UFJ Financial
Group, Inc. | | | 731,942 | | |
| | 17,800 | | | @@ | | National Australia Bank Ltd. | | | 566,694 | | |
| | 25,400 | | | L | | National City Corp. | | | 928,624 | | |
| | 23,800 | | | | | Regions Financial Corp. | | | 890,120 | | |
| | 3,275 | | | @@ | | Societe Generale | | | 554,032 | | |
| | 1,200 | | | | | South Financial Group, Inc. | | | 31,908 | | |
| | 29,000 | | | @@ | | Sumitomo Trust &
Banking Co., Ltd. | | | 303,642 | | |
| | 5,100 | | | L | | TCF Financial Corp. | | | 139,842 | | |
| | 900 | | | | | Umpqua Holdings Corp. | | | 26,487 | | |
| | 4,000 | | | @@ | | Uniao de Bancos
Brasileiros SA GDR | | | 371,840 | | |
| | 19,900 | | | | | US Bancorp. | | | 720,181 | | |
| | 21,450 | | | | | Wachovia Corp. | | | 1,221,578 | | |
| | 2,700 | | | L | | Webster Financial Corp. | | | 131,544 | | |
| | 37,800 | | | | | Wells Fargo & Co. | | | 1,344,168 | | |
| | 2,900 | | | | | Whitney Holding Corp. | | | 94,598 | | |
| | | | 18,341,125 | | |
| | | | | Beverages: 1.2% | |
| | 24,500 | | | | | Coca-Cola Co. | | | 1,182,125 | | |
| | 12,607 | | | @@ | | Coca-Cola Hellenic
Bottling Co. SA | | | 491,876 | | |
| | 3,608 | | | @@ | | Fomento Economico
Mexicano SA de CV ADR | | | 417,662 | | |
| | 100 | | | @ | | Hansen Natural Corp. | | | 3,368 | | |
| | 7,600 | | | | | Pepsi Bottling Group, Inc. | | | 234,916 | | |
| | 4,800 | | | | | PepsiAmericas, Inc. | | | 100,704 | | |
| | 19,850 | | | | | PepsiCo, Inc. | | | 1,241,618 | | |
| | | | 3,672,269 | | |
| | | | | Biotechnology: 0.4% | |
| | 14,050 | | | @ | | Amgen, Inc. | | | 959,756 | | |
| | 1,400 | | | @ | | CryoLife, Inc. | | | 10,710 | | |
| | 300 | | | @ | | Digene Corp. | | | 14,376 | | |
| | 100 | | | @ | | Invitrogen Corp. | | | 5,659 | | |
| | 10,100 | | | @,L | | Millennium Pharmaceuticals, Inc. | | | 110,090 | | |
| | 2,200 | | | @ | | PDL BioPharma, Inc. | | | 44,308 | | |
| | 3,600 | | | @,L | | Savient Pharmaceuticals, Inc. | | | 40,356 | | |
| | 2,100 | | | @,L | | Vertex Pharmaceuticals, Inc. | | | 78,582 | | |
| | | | 1,263,837 | | |
| | | | | Building Materials: 0.2% | |
| | 300 | | | | | ElkCorp | | | 12,327 | | |
| | 17,788 | | | @@ | | Italcementi S.p.A. | | | 500,640 | | |
| | | | 512,967 | | |
| | | | | Chemicals: 1.1% | |
| | 1,000 | | | | | Airgas, Inc. | | | 40,520 | | |
| | 1,900 | | | | | Chemtura Corp. | | | 18,297 | | |
| | 11,500 | | | | | Dow Chemical Co. | | | 459,310 | | |
| | 10,500 | | | | | EI DuPont de Nemours & Co. | | | 511,455 | | |
See Accompanying Notes to Financial Statements
84
ING VP STRATEGIC ALLOCATION PORTFOLIO OF INVESTMENTS
MODERATE PORTFOLIO AS OF DECEMBER 31, 2006 (CONTINUED)
| Shares | | | | | | Value | |
| | | | | Chemicals (continued) | |
| | 200 | | | | | FMC Corp. | | $ | 15,310 | | |
| | 2,200 | | | | | Georgia Gulf Corp. | | | 42,482 | | |
| | 2,700 | | | L | | HB Fuller Co. | | | 69,714 | | |
| | 3,400 | | | | | Lubrizol Corp. | | | 170,442 | | |
| | 6,749 | | | L | | Lyondell Chemical Co. | | | 172,572 | | |
| | 400 | | | L | | MacDermid, Inc. | | | 13,640 | | |
| | 4,600 | | | | | Monsanto Co. | | | 241,638 | | |
| | 6,000 | | | L | | Olin Corp. | | | 99,120 | | |
| | 2,500 | | | @ | | Omnova Solutions, Inc. | | | 11,450 | | |
| | 6,000 | | | @,L | | PolyOne Corp. | | | 45,000 | | |
| | 500 | | | | | Quaker Chemical Corp. | | | 11,035 | | |
| | 6,000 | | | L | | Sherwin-Williams Co. | | | 381,480 | | |
| | 54,000 | | | @@ | | Sumitomo Chemical Co., Ltd. | | | 417,877 | | |
| | 2,100 | | | @@ | | Umicore | | | 356,827 | | |
| | 5,200 | | | | | Valspar Corp. | | | 143,728 | | |
| | | | 3,221,897 | | |
| | | | | Commercial Services: 1.1% | |
| | 700 | | | @ | | Alliance Data Systems Corp. | | | 43,729 | | |
| | 7,500 | | | @,L | | Apollo Group, Inc. | | | 292,275 | | |
| | 300 | | | | | Banta Corp. | | | 10,920 | | |
| | 1,200 | | | @ | | Career Education Corp. | | | 29,736 | | |
| | 1,200 | | | | | Central Parking Corp. | | | 21,600 | | |
| | 700 | | | @,L | | Consolidated Graphics, Inc. | | | 41,349 | | |
| | 8,300 | | | @ | | Convergys Corp. | | | 197,374 | | |
| | 470 | | | L | | CPI Corp. | | | 21,850 | | |
| | 4,000 | | | | | DeVry, Inc. | | | 112,000 | | |
| | 1,300 | | | @ | | Heidrick & Struggles
International, Inc. | | | 55,068 | | |
| | 4,100 | | | @ | | Hooper Holmes, Inc. | | | 13,571 | | |
| | 1,100 | | | @ | | ITT Educational Services, Inc. | | | 73,007 | | |
| | 1,000 | | | @ | | Kendle International, Inc. | | | 31,450 | | |
| | 4,000 | | | @,L | | Korn/Ferry International | | | 91,840 | | |
| | 3,400 | | | @,L | | Labor Ready, Inc. | | | 62,322 | | |
| | 2,800 | | | | | Manpower, Inc. | | | 209,804 | | |
| | 16,550 | | | | | McKesson Corp. | | | 839,085 | | |
| | 12,000 | | | | | Moody's Corp. | | | 828,720 | | |
| | 5,500 | | | @ | | MPS Group, Inc. | | | 77,990 | | |
| | 2,300 | | | @ | | Quanta Services, Inc. | | | 45,241 | | |
| | 3,900 | | | @ | | Valassis Communications, Inc. | | | 56,550 | | |
| | 765 | | | @,L | | Vertrue, Inc. | | | 29,384 | | |
| | 1,300 | | | W,L | | Viad Corp. | | | 52,780 | | |
| | 700 | | | @ | | Volt Information Sciences, Inc. | | | 35,147 | | |
| | 2,000 | | | | | Watson Wyatt Worldwide, Inc. | | | 90,300 | | |
| | | | 3,363,092 | | |
| | | | | Computers: 2.6% | |
| | 800 | | | | | Agilysys, Inc. | | | 13,392 | | |
| | 5,023 | | | @,@@,I | | Atos Origin | | | 297,024 | | |
| | 555 | | | @ | | CACI International, Inc. | | | 31,358 | | |
| | 4,275 | | | @,L | | Cadence Design Systems, Inc. | | | 76,565 | | |
| | 800 | | | @ | | Catapult Communications Corp. | | | 7,184 | | |
| | 1,800 | | | @,L | | Ceridian Corp. | | | 50,364 | | |
| | 58,600 | | | @ | | Dell, Inc. | | | 1,470,274 | | |
| | 1,580 | | | | | Factset Research Systems, Inc. | | | 89,238 | | |
| | 55,800 | | | | | Hewlett-Packard Co. | | | 2,298,402 | | |
| | 2,100 | | | | | Imation Corp. | | | 97,503 | | |
| | 28,750 | | | | | International Business
Machines Corp. | | | 2,793,063 | | |
| | 900 | | | @ | | Mercury Computer Systems, Inc. | | | 12,024 | | |
| | 1,576 | | | @,L | | Micros Systems, Inc. | | | 83,055 | | |
| | 2,600 | | | @,L | | Palm, Inc. | | | 36,634 | | |
| | 1,700 | | | @,L | | Radisys Corp. | | | 28,339 | | |
| Shares | | | | | | Value | |
| | 2,300 | | | @ | | SRA International, Inc. | | $ | 61,502 | | |
| | 1,800 | | | @ | | SYKES Enterprises, Inc. | | | 31,752 | | |
| | 4,400 | | | @ | | Synopsys, Inc. | | | 117,612 | | |
| | 3,100 | | | @ | | Western Digital Corp. | | | 63,426 | | |
| | | | 7,658,711 | | |
| | | | | Cosmetics/Personal Care: 0.9% | |
| | 7,800 | | | L | | Estee Lauder Cos., Inc. | | | 318,396 | | |
| | 36,600 | | | | | Procter & Gamble Co. | | | 2,352,282 | | |
| | | | 2,670,678 | | |
| | | | | Distribution/Wholesale: 0.2% | |
| | 2,100 | | | | | Building Materials Holding Corp. | | | 51,849 | | |
| | 900 | | | L | | CDW Corp. | | | 63,288 | �� | |
| | 855 | | | L | | Pool Corp. | | | 33,490 | | |
| | 25,000 | | | @@ | | Sumitomo Corp. | | | 374,243 | | |
| | 2,800 | | | @ | | Tech Data Corp. | | | 106,036 | | |
| | | | 628,906 | | |
| | | | | Diversified Financial Services: 6.0% | |
| | 2,900 | | | | | AG Edwards, Inc. | | | 183,541 | | |
| | 13,850 | | | | | American Express Co. | | | 840,280 | | |
| | 4,600 | | | @, L | | AmeriCredit Corp. | | | 115,782 | | |
| | 11,100 | | | | | CIT Group, Inc. | | | 619,047 | | |
| | 82,600 | | | | | Citigroup, Inc. | | | 4,600,820 | | |
| | 10,800 | | | | | Fannie Mae | | | 641,412 | | |
| | 10,000 | | | | | Goldman Sachs Group, Inc. | | | 1,993,500 | | |
| | 2,500 | | | | | IndyMac Bancorp., Inc. | | | 112,900 | | |
| | 1,700 | | | @ | | Investment Technology
Group, Inc. | | | 72,896 | | |
| | 65,500 | | | | | JPMorgan Chase & Co. | | | 3,163,650 | | |
| | 45 | | | @@,L | | Kenedix, Inc. | | | 203,006 | | |
| | 16,800 | | | | | Lehman Brothers Holdings, Inc. | | | 1,312,416 | | |
| | 9,500 | | | | | Merrill Lynch & Co., Inc. | | | 884,450 | | |
| | 25,150 | | | | | Morgan Stanley | | | 2,047,965 | | |
| | 4,200 | | | | | Raymond James Financial, Inc. | | | 127,302 | | |
| | 1,720 | | | @@ | | SFCG Co., Ltd. | | | 267,166 | | |
| | 1,000 | | | | | SWS Group, Inc. | | | 35,700 | | |
| | 1,900 | | | @,L | | TradeStation Group, Inc. | | | 26,125 | | |
| | 12,370 | | | @@ | | UBS AG | | | 748,604 | | |
| | | | 17,996,562 | | |
| | | | | Electric: 2.0% | |
| | 58,000 | | | @ | | AES Corp. | | | 1,278,320 | | |
| | 600 | | | | | Central Vermont Public
Service Corp. | | | 14,130 | | |
| | 1,200 | | | L | | Duquesne Light Holdings, Inc. | | | 23,820 | | |
| | 4,200 | | | L | | Idacorp, Inc. | | | 162,330 | | |
| | 53,123 | | | @@ | | International Power PLC | | | 395,673 | | |
| | 900 | | | | | Northeast Utilities | | | 25,344 | | |
| | 5,800 | | | | | OGE Energy Corp. | | | 232,000 | | |
| | 4,400 | | | L | | Pepco Holdings, Inc. | | | 114,444 | | |
| | 31,400 | | | | | PG&E Corp. | | | 1,486,162 | | |
| | 6,200 | | | | | PNM Resources, Inc. | | | 192,820 | | |
| | 4,400 | | | @@ | | RWE AG | | | 482,315 | | |
| | 13,487 | | | @@ | | Scottish & Southern Energy | | | 409,580 | | |
| | 14,800 | | | | | Southern Co. | | | 545,528 | | |
| | 12,000 | | | @@ | | Tokyo Electric Power Co., Inc. | | | 387,676 | | |
| | 2,780 | | | | | Wisconsin Energy Corp. | | | 131,939 | | |
| | | | 5,882,081 | | |
| | | | | | | Electrical Components &
Equipment: 0.2% | | | | | |
| | 2,200 | | | L | | Belden CDT, Inc. | | | 85,998 | | |
See Accompanying Notes to Financial Statements
85
ING VP STRATEGIC ALLOCATION PORTFOLIO OF INVESTMENTS
MODERATE PORTFOLIO AS OF DECEMBER 31, 2006 (CONTINUED)
| Shares | | | | | | Value | |
| | | | | | | Electrical Components &
Equipment (continued) | | | | | |
| | 1,400 | | | @,L | | Littelfuse, Inc. | | $ | 44,632 | | |
| | 62,000 | | | @@ | | Toshiba Corp. | | | 402,889 | | |
| | | | 533,519 | | |
| | | | | Electronics: 0.4% | |
| | 1,300 | | | | | Amphenol Corp. | | | 80,704 | | |
| | 300 | | | @ | | Avnet, Inc. | | | 7,659 | | |
| | 1,000 | | | @,L | | Benchmark Electronics, Inc. | | | 24,360 | | |
| | 2,015 | | | @ | | Coherent, Inc. | | | 63,614 | | |
| | 1,300 | | | L | | Cubic Corp. | | | 28,210 | | |
| | 500 | | | | | Gentex Corp. | | | 7,780 | | |
| | 8,500 | | | @,@@ | | Hoya Corp. | | | 331,303 | | |
| | 2,900 | | | | | Methode Electronics, Inc. | | | 31,407 | | |
| | 1,200 | | | @ | | Planar Systems, Inc. | | | 11,604 | | |
| | 2,200 | | | @,L | | Plexus Corp. | | | 52,536 | | |
| | 300 | | | @ | | Rogers Corp. | | | 17,745 | | |
| | 3,600 | | | @ | | Thomas & Betts Corp. | | | 170,208 | | |
| | 900 | | | @,L | | Trimble Navigation Ltd. | | | 45,657 | | |
| | 2,300 | | | @ | | Varian, Inc. | | | 103,017 | | |
| | 8,300 | | | @,L | | Vishay Intertechnology, Inc. | | | 112,382 | | |
| | | | 1,088,186 | | |
| | | | | Engineering & Construction: 0.7% | |
| | 7,100 | | | @@ | | Bouygues | | | 454,587 | | |
| | 1,500 | | | @ | | EMCOR Group, Inc. | | | 85,275 | | |
| | 2,800 | | | | | Granite Construction, Inc. | | | 140,896 | | |
| | 5,957 | | | @@ | | Hochtief AG | | | 431,936 | | |
| | 2,900 | | | @ | | Jacobs Engineering Group, Inc. | | | 236,466 | | |
| | 500 | | | @ | | Shaw Group, Inc. | | | 16,750 | | |
| | 64,000 | | | @@,L | | Taisei Corp. | | | 194,812 | | |
| | 840 | | | @ | | URS Corp. | | | 35,994 | | |
| | 4,100 | | | @@ | | Vinci SA | | | 522,552 | | |
| | | | 2,119,268 | | |
| | | | | Entertainment: 0.0% | |
| | 700 | | | @,L | | Pinnacle Entertainment, Inc. | | | 23,198 | | |
| | | | 23,198 | | |
| | | | | Environmental Control: 0.4% | |
| | 31,200 | | | | | Waste Management, Inc. | | | 1,147,224 | | |
| | | | 1,147,224 | | |
| | | | | Exchange Traded Fund: 0.1% | |
| | 6,100 | | | @@,L | | iShares S&P SmallCap 600
Index Fund | | | 402,539 | | |
| | | | 402,539 | | |
| | | | | Food: 1.3% | |
| | 13,900 | | | | | Campbell Soup Co. | | | 540,571 | | |
| | 30,400 | | | | | ConAgra Foods, Inc. | | | 820,800 | | |
| | 2,880 | | | | | Corn Products International, Inc. | | | 99,475 | | |
| | 17,077 | | | | | General Mills, Inc. | | | 983,635 | | |
| | 2,892 | | | @@ | | Groupe Danone | | | 437,337 | | |
| | 3,969 | | | | | Hormel Foods Corp. | | | 148,202 | | |
| | 1,400 | | | @,L | | Ralcorp Holdings, Inc. | | | 71,246 | | |
| | 900 | | | @ | | Smithfield Foods, Inc. | | | 23,094 | | |
| | 25,400 | | | @@ | | Unilever PLC | | | 706,444 | | |
| | 700 | | | @,L | | United Natural Foods, Inc. | | | 25,144 | | |
| | | | 3,855,948 | | |
| | | | | Forest Products & Paper: 0.2% | |
| | 1,800 | | | @ | | Caraustar Industries, Inc. | | | 14,562 | | |
| | 6,300 | | | | | Louisiana-Pacific Corp. | | | 135,639 | | |
| Shares | | | | | | Value | |
| | 1,900 | | | | | Rock-Tenn Co. | | $ | 51,509 | | |
| | 900 | | | | | Schweitzer-Mauduit
International, Inc. | | | 23,445 | | |
| | 6,300 | | | L | | Temple-Inland, Inc. | | | 289,989 | | |
| | | | 515,144 | | |
| | | | | Gas: 0.1% | |
| | 200 | | | | | Cascade Natural Gas Corp. | | | 5,184 | | |
| | 3,514 | | | | | Energen Corp. | | | 164,947 | | |
| | 5,530 | | | | | UGI Corp. | | | 150,858 | | |
| | | | 320,989 | | |
| | | | | Hand/Machine Tools: 0.0% | |
| | 3,300 | | | | | Snap-On, Inc. | | | 157,212 | | |
| | | | 157,212 | | |
| | | | | Healthcare-Products: 1.4% | |
| | 900 | | | @ | | Advanced Medical Optics, Inc. | | | 31,680 | | |
| | 700 | | | L | | Cooper Cos., Inc. | | | 31,150 | | |
| | 4,900 | | | @,L | | Cytyc Corp. | | | 138,670 | | |
| | 6,524 | | | | | Dentsply International, Inc. | | | 194,741 | | |
| | 3,200 | | | @,L | | Edwards Lifesciences Corp. | | | 150,528 | | |
| | 1,600 | | | @ | | Haemonetics Corp. | | | 72,032 | | |
| | 884 | | | @,L | | Hologic, Inc. | | | 41,796 | | |
| | 467 | | | @ | | Idexx Laboratories, Inc. | | | 37,033 | | |
| | 1,100 | | | @,L | | Immucor, Inc. | | | 32,153 | | |
| | 200 | | | @ | | Intuitive Surgical, Inc. | | | 19,180 | | |
| | 33,750 | | | | | Johnson & Johnson | | | 2,228,175 | | |
| | 13,800 | | | | | Medtronic, Inc. | | | 738,438 | | |
| | 1,400 | | | | | Mentor Corp. | | | 68,418 | | |
| | 1,400 | | | @ | | Osteotech, Inc. | | | 7,910 | | |
| | 1,300 | | | @ | | Possis Medical, Inc. | | | 17,524 | | |
| | 1,115 | | | @ | | Respironics, Inc. | | | 42,091 | | |
| | 2,400 | | | @ | | Techne Corp. | | | 133,080 | | |
| | 2,200 | | | @ | | Varian Medical Systems, Inc. | | | 104,654 | | |
| | | | 4,089,253 | | |
| | | | | Healthcare-Services: 2.4% | |
| | 25,000 | | | | | Aetna, Inc. | | | 1,079,500 | | |
| | 1,400 | | | @ | | Amerigroup Corp. | | | 50,246 | | |
| | 1,500 | | | @,L | | Centene Corp. | | | 36,855 | | |
| | 9,050 | | | @ | | Coventry Health Care, Inc. | | | 452,953 | | |
| | 3,400 | | | @@ | | Fresenius Medical Care AG &
Co. KGaA | | | 452,623 | | |
| | 2,100 | | | @,L | | Gentiva Health Services, Inc. | | | 40,026 | | |
| | 1,920 | | | @ | | Health Net, Inc. | | | 93,427 | | |
| | 1,300 | | | @,L | | Healthways, Inc. | | | 62,023 | | |
| | 9,250 | | | @ | | Humana, Inc. | | | 511,618 | | |
| | 7,500 | | | @,L | | Laboratory Corp. of
America Holdings | | | 551,025 | | |
| | 500 | | | @ | | Lincare Holdings, Inc. | | | 19,920 | | |
| | 2,638 | | | @ | | Odyssey HealthCare, Inc. | | | 34,980 | | |
| | 1,360 | | | @,L | | Pediatrix Medical Group, Inc. | | | 66,504 | | |
| | 1,210 | | | @,L | | Sierra Health Services, Inc. | | | 43,608 | | |
| | 37,600 | | | | | UnitedHealth Group, Inc. | | | 2,020,248 | | |
| | 19,900 | | | @ | | WellPoint, Inc. | | | 1,565,931 | | |
| | | | 7,081,487 | | |
| | | | | Holding Companies-Diversified: 0.0% | |
| | 5,200 | | | | | Leucadia National Corp. | | | 146,640 | | |
| | | | 146,640 | | |
| | | | | Home Builders: 0.2% | |
| | 115,500 | | | @,@@ | | Haseko Corp. | | | 412,165 | | |
See Accompanying Notes to Financial Statements
86
ING VP STRATEGIC ALLOCATION PORTFOLIO OF INVESTMENTS
MODERATE PORTFOLIO AS OF DECEMBER 31, 2006 (CONTINUED)
| Shares | | | | | | Value | |
| | | | | Home Builders (continued) | |
| | 25 | | | @,L | | NVR, Inc. | | $ | 16,125 | | |
| | 1,800 | | | L | | Winnebago Industries | | | 59,238 | | |
| | | | 487,528 | | |
| | | | | Home Furnishings: 0.2% | |
| | 900 | | | @ | | Audiovox Corp. | | | 12,681 | | |
| | 2,000 | | | | | Ethan Allen Interiors, Inc. | | | 72,220 | | |
| | 21,000 | | | @@ | | Matsushita Electric
Industrial Co., Ltd. | | | 421,081 | | |
| | | | 505,982 | | |
| | | | | Household Products/Wares: 0.2% | |
| | 900 | | | | | American Greetings Corp. | | | 21,483 | | |
| | 1,900 | | | L | | Blyth, Inc. | | | 39,425 | | |
| | 3,300 | | | @@ | | Henkel KGaA | | | 485,035 | | |
| | | | 545,943 | | |
| | | | | Housewares: 0.0% | |
| | 2,015 | | | L | | Toro Co. | | | 93,959 | | |
| | | | 93,959 | | |
| | | | | Insurance: 5.7% | |
| | 14,600 | | | @@ | | ACE Ltd. | | | 884,322 | | |
| | 20,700 | | | | | Allstate Corp. | | | 1,347,777 | | |
| | 6,400 | | | | | AMBAC Financial Group, Inc. | | | 570,048 | | |
| | 3,575 | | | L | | American Financial Group, Inc. | | | 128,378 | | |
| | 27,900 | | | | | American International
Group, Inc. | | | 1,999,314 | | |
| | 600 | | | | | Brown & Brown, Inc. | | | 16,926 | | |
| | 80,000 | | | @@ | | China Life Insurance Co., Ltd. | | | 273,067 | | |
| | 18,100 | | | | | Chubb Corp. | | | 957,671 | | |
| | 6,300 | | | L | | Cigna Corp. | | | 828,891 | | |
| | 2,100 | | | | | Delphi Financial Group | | | 84,966 | | |
| | 2,100 | | | @@ | | Everest Re Group Ltd. | | | 206,031 | | |
| | 2,720 | | | | | Fidelity National Title Group, Inc. | | | 64,954 | | |
| | 24,500 | | | | | Genworth Financial, Inc. | | | 838,145 | | |
| | 11,540 | | | | | Hartford Financial Services
Group, Inc. | | | 1,076,797 | | |
| | 4,600 | | | | | HCC Insurance Holdings, Inc. | | | 147,614 | | |
| | 3,200 | | | | | Horace Mann Educators Corp. | | | 64,640 | | |
| | 1,020 | | | L | | Landamerica Financial
Group, Inc. | | | 64,372 | | |
| | 177,913 | | | @@ | | Legal & General Group PLC | | | 546,777 | | |
| | 21,900 | | | | | Loews Corp. | | | 908,193 | | |
| | 23,850 | | | | | Metlife, Inc. | | | 1,407,389 | | |
| | 2,129 | | | @@ | | Muenchener
Rueckversicherungs AG | | | 366,830 | | |
| | 3,530 | | | | | Old Republic
International Corp. | | | 82,178 | | |
| | 2,340 | | | @ | | Philadelphia Consolidated
Holding Co. | | | 104,270 | | |
| | 1,100 | | | | | PMI Group, Inc. | | | 51,887 | | |
| | 1,700 | | | | | Presidential Life Corp. | | | 37,315 | | |
| | 1,600 | | | @,L | | ProAssurance Corp. | | | 79,872 | | |
| | 37,500 | | | | | Progressive Corp. | | | 908,250 | | |
| | 2,900 | | | | | Protective Life Corp. | | | 137,750 | | |
| | 15,081 | | | L | | Prudential Financial, Inc. | | | 1,294,855 | | |
| | 1,610 | | | | | Radian Group, Inc. | | | 86,795 | | |
| | 5,669 | | | | | Safeco Corp. | | | 354,596 | | |
| | 1,000 | | | L | | Safety Insurance Group, Inc. | | | 50,710 | | |
| | 400 | | | @ | | SCPIE Holdings, Inc. | | | 10,456 | | |
| | 1,445 | | | L | | Selective Insurance Group | | | 82,784 | | |
| | 2,600 | | | | | Stancorp Financial Group, Inc. | | | 117,130 | | |
| Shares | | | | | | Value | |
| | 2,300 | | | | | Unitrin, Inc. | | $ | 115,253 | | |
| | 5,717 | | | | | WR Berkley Corp. | | | 197,294 | | |
| | 1,800 | | | L | | Zenith National
Insurance Corp. | | | 84,438 | | |
| | 1,560 | | | @@ | | Zurich Financial Services AG | | | 418,528 | | |
| | | | 16,997,463 | | |
| | | | | Internet: 0.5% | |
| | 500 | | | @ | | Digital Insight Corp. | | | 19,245 | | |
| | 2,200 | | | @,L | | Google, Inc. | | | 1,013,056 | | |
| | 800 | | | @,L | | j2 Global Communications, Inc. | | | 21,800 | | |
| | 2,390 | | | @ | | McAfee, Inc. | | | 67,828 | | |
| | 3,500 | | | @ | | Napster, Inc. | | | 12,705 | | |
| | 1,900 | | | @ | | PC-Tel, Inc. | | | 17,765 | | |
| | 1,500 | | | @ | | Stamps.com, Inc. | | | 23,625 | | |
| | 3,700 | | | | | United Online, Inc. | | | 49,136 | | |
| | 12,600 | | | @ | | VeriSign, Inc. | | | 303,030 | | |
| | 400 | | | @ | | WebEx Communications, Inc. | | | 13,956 | | |
| | | | 1,542,146 | | |
| | | | | Iron/Steel: 0.8% | |
| | 56,700 | | | @@ | | BlueScope Steel Ltd. | | | 384,494 | | |
| | 400 | | | | | Carpenter Technology Corp. | | | 41,008 | | |
| | 1,200 | | | | | Chaparral Steel Co. | | | 53,124 | | |
| | 620 | | | | | Cleveland-Cliffs, Inc. | | | 30,033 | | |
| | 15,500 | | | | | Nucor Corp. | | | 847,230 | | |
| | 1,700 | | | | | Ryerson, Inc. | | | 42,653 | | |
| | 800 | | | | | Steel Dynamics, Inc. | | | 25,960 | | |
| | 600 | | | | | Steel Technologies, Inc. | | | 10,530 | | |
| | 130,000 | | | @@ | | Sumitomo Metal Industries Ltd. | | | 564,424 | | |
| | 7,100 | | | | | United States Steel Corp. | | | 519,294 | | |
| | | | 2,518,750 | | |
| | | | | Leisure Time: 0.6% | |
| | 8,660 | | | @@ | | Carnival PLC | | | 437,476 | | |
| | 86,880 | | | @@ | | First Choice Holidays PLC | | | 482,691 | | |
| | 610 | | | L | | Polaris Industries, Inc. | | | 28,566 | | |
| | 7,900 | | | | | Sabre Holdings Corp. | | | 251,931 | | |
| | 17,000 | | | @@ | | Yamaha Motor Co., Ltd. | | | 534,374 | | |
| | | | 1,735,038 | | |
| | | | | Lodging: 0.1% | |
| | 600 | | | @ | | Aztar Corp. | | | 32,652 | | |
| | 2,300 | | | L | | Harrah's Entertainment, Inc. | | | 190,256 | | |
| | | | 222,908 | | |
| | | | | | | Machinery-Construction &
Mining: 0.5% | | | | | |
| | 12,695 | | | @@ | | Atlas Copco AB | | | 410,284 | | |
| | 7,500 | | | | | Caterpillar, Inc. | | | 459,975 | | |
| | 17,100 | | | @,@@ | | Hitachi Construction
Machinery Co., Ltd. | | | 459,208 | | |
| | 2,200 | | | | | Joy Global, Inc. | | | 106,348 | | |
| | | | 1,435,815 | | |
| | | | | Machinery-Diversified: 0.2% | |
| | 200 | | | @ | | AGCO Corp. | | | 6,188 | | |
| | 3,000 | | | | | Cummins, Inc. | | | 354,540 | | |
| | 2,500 | | | @,L | | Gardner Denver, Inc. | | | 93,275 | | |
| | 867 | | | | | IDEX Corp. | | | 41,104 | | |
| | 1,000 | | | | | Manitowoc Co., Inc. | | | 59,430 | | |
| | | | 554,537 | | |
See Accompanying Notes to Financial Statements
87
ING VP STRATEGIC ALLOCATION PORTFOLIO OF INVESTMENTS
MODERATE PORTFOLIO AS OF DECEMBER 31, 2006 (CONTINUED)
| Shares | | | | | | Value | |
| | | | | Media: 2.1% | |
| | 8,100 | | | | | CBS Corp.-Class B | | $ | 252,558 | | |
| | 6,100 | | | | | Clear Channel
Communications, Inc. | | | 216,794 | | |
| | 21,500 | | | @,L | | Comcast Corp. | | | 910,095 | | |
| | 32,900 | | | @ | | DIRECTV Group, Inc. | | | 820,526 | | |
| | 14,300 | | | | | McGraw-Hill Cos., Inc. | | | 972,686 | | |
| | 24,600 | | | | | News Corp., Inc. | | | 528,408 | | |
| | 1,300 | | | L | | Reader's Digest Association, Inc. | | | 21,710 | | |
| | 34,030 | | | @@ | | Reed Elsevier PLC | | | 373,237 | | |
| | 11,783 | | | @@ | | Vivendi | | | 459,588 | | |
| | 50,700 | | | | | Walt Disney Co. | | | 1,737,489 | | |
| | 110 | | | | | Washington Post | | | 82,016 | | |
| | | | 6,375,107 | | |
| | | | | Metal Fabricate/Hardware: 0.0% | |
| | 750 | | | L | | AM Castle & Co. | | | 19,088 | | |
| | 2,800 | | | | | Commercial Metals Co. | | | 72,240 | | |
| | 1,762 | | | L | | Quanex Corp. | | | 60,948 | | |
| | | | 152,276 | | |
| | | | | Mining: 0.3% | |
| | 27,472 | | | @@ | | BHP Billiton Ltd. | | | 546,393 | | |
| | 2,530 | | | L | | Phelps Dodge Corp. | | | 302,892 | | |
| | | | 849,285 | | |
| | | | | Miscellaneous Manufacturing: 3.6% | |
| | 8,450 | | | | | 3M Co. | | | 658,509 | | |
| | 1,900 | | | L | | Acuity Brands, Inc. | | | 98,876 | | |
| | 1,570 | | | L | | AO Smith Corp. | | | 58,969 | | |
| | 499 | | | L | | Aptargroup, Inc. | | | 29,461 | | |
| | 200 | | | @ | | Ceradyne, Inc. | | | 11,300 | | |
| | 6,500 | | | | | Cooper Industries Ltd. | | | 587,795 | | |
| | 4,200 | | | | | Crane Co. | | | 153,888 | | |
| | 14,800 | | | L | | Eastman Kodak Co. | | | 381,840 | | |
| | 9,800 | | | | | Eaton Corp. | | | 736,372 | | |
| | 1,520 | | | @ | | EnPro Industries, Inc. | | | 50,479 | | |
| | 126,692 | | | | | General Electric Co. | | | 4,714,209 | | |
| | 200 | | | | | Harsco Corp. | | | 15,220 | | |
| | 36,600 | | | | | Honeywell International, Inc. | | | 1,655,784 | | |
| | 7,200 | | | | | Parker Hannifin Corp. | | | 553,536 | | |
| | 1,400 | | | | | Pentair, Inc. | | | 43,960 | | |
| | 500 | | | | | Roper Industries, Inc. | | | 25,120 | | |
| | 1,000 | | | | | Standex International Corp. | | | 30,130 | | |
| | 1,600 | | | @,L | | Sturm Ruger & Co., Inc. | | | 15,360 | | |
| | 2,889 | | | | | Teleflex, Inc. | | | 186,514 | | |
| | 700 | | | | | Tredegar Corp. | | | 15,827 | | |
| | 24,200 | | | @@ | | Tyco International Ltd. | | | 735,680 | | |
| | | | 10,758,829 | | |
| | | | | Office Furnishings: 0.0% | |
| | 4,372 | | | L | | Herman Miller, Inc. | | | 158,966 | | |
| | | | 158,966 | | |
| | | | | Office/Business Equipment: 0.2% | |
| | 45,000 | | | @ | | Xerox Corp. | | | 762,750 | | |
| | | | 762,750 | | |
| | | | | Oil & Gas: 6.6% | |
| | 17,900 | | | L | | Anadarko Petroleum Corp. | | | 779,008 | | |
| | 200 | | | | | Cabot Oil & Gas Corp. | | | 12,130 | | |
| | 38,981 | | | | | Chevron Corp. | | | 2,866,273 | | |
| | 1,305 | | | | | Cimarex Energy Co. | | | 47,633 | | |
| | 16,400 | | | | | ConocoPhillips | | | 1,179,980 | | |
| Shares | | | | | | Value | |
| | 3,400 | | | | | ENSCO International, Inc. | | $ | 170,204 | | |
| | 13,300 | | | @@ | | ERG S.p.A. | | | 303,629 | | |
| | 93,550 | | | | | ExxonMobil Corp. | | | 7,168,737 | | |
| | 1,100 | | | @ | | Forest Oil Corp. | | | 35,948 | | |
| | 4,080 | | | | | Frontier Oil Corp. | | | 117,259 | | |
| | 7,810 | | | | | Helmerich & Payne, Inc. | | | 191,111 | | |
| | 11,500 | | | | | Marathon Oil Corp. | | | 1,063,750 | | |
| | 3,200 | | | @ | | Newfield Exploration Co. | | | 147,040 | | |
| | 3,880 | | | | | Noble Energy, Inc. | | | 190,392 | | |
| | 14,540 | | | @@ | | Norsk Hydro ASA | | | 448,810 | | |
| | 24,700 | | | | | Occidental Petroleum Corp. | | | 1,206,101 | | |
| | 1,000 | | | L | | Penn Virginia Corp. | | | 70,040 | | |
| | 3,180 | | | @@ | | Petroleo Brasileiro SA | | | 327,508 | | |
| | 200 | | | | | Pioneer Natural Resources Co. | | | 7,938 | | |
| | 100 | | | @ | | Plains Exploration &
Production Co. | | | 4,753 | | |
| | 24,188 | | | @@ | | Royal Dutch Shell PLC-Class B | | | 845,680 | | |
| | 30,707 | | | @@ | | Santos Ltd. | | | 238,974 | | |
| | 9,600 | | | @@ | | Sasol, Ltd. ADR | | | 354,240 | | |
| | 1,500 | | | @ | | Southwestern Energy Co. | | | 52,575 | | |
| | 2,400 | | | L | | St. Mary Land & Exploration Co. | | | 88,416 | | |
| | 400 | | | @,L | | Stone Energy Corp. | | | 14,140 | | |
| | 10,400 | | | @@ | | Total SA | | | 748,357 | | |
| | 19,600 | | | | | Valero Energy Corp. | | | 1,002,736 | | |
| | | | 19,683,362 | | |
| | | | | Oil & Gas Services: 0.9% | |
| | 1,700 | | | @ | | Grant Prideco, Inc. | | | 67,609 | | |
| | 32,800 | | | L | | Halliburton Co. | | | 1,018,440 | | |
| | 1,400 | | | @,L | | Helix Energy Solutions
Group, Inc. | | | 43,918 | | |
| | 300 | | | @ | | Lone Star Technologies | | | 14,523 | | |
| | 16,300 | | | @,@@ | | Petroleum Geo-Services | | | 381,530 | | |
| | 11,800 | | | L | | Schlumberger Ltd. | | | 745,288 | | |
| | 1,000 | | | @,L | | SEACOR Holdings, Inc. | | | 99,140 | | |
| | 4,030 | | | | | Tidewater, Inc. | | | 194,891 | | |
| | 600 | | | @,L | | Veritas DGC, Inc. | | | 51,378 | | |
| | | | 2,616,717 | | |
| | | | | Packaging & Containers: 0.1% | |
| | 7,900 | | | @,L | | Pactiv Corp. | | | 281,951 | | |
| | 4,700 | | | | | Sonoco Products Co. | | | 178,882 | | |
| | | | 460,833 | | |
| | | | | Pharmaceuticals: 4.1% | |
| | 18,400 | | | | | Abbott Laboratories | | | 896,264 | | |
| | 11,800 | | | | | AmerisourceBergen Corp. | | | 530,528 | | |
| | 10,849 | | | @@ | | AstraZeneca PLC | | | 581,414 | | |
| | 500 | | | @ | | Cephalon, Inc. | | | 35,205 | | |
| | 16,900 | | | @ | | Forest Laboratories, Inc. | | | 855,140 | | |
| | 30,500 | | | @@ | | GlaxoSmithKline PLC | | | 802,785 | | |
| | 13,800 | | | @,L | | King Pharmaceuticals, Inc. | | | 219,696 | | |
| | 1,100 | | | | | Medicis Pharmaceutical Corp. | | | 38,643 | | |
| | 52,300 | | | | | Merck & Co., Inc. | | | 2,280,280 | | |
| | 11,800 | | | | | Mylan Laboratories | | | 235,528 | | |
| | 1,400 | | | @ | | NBTY, Inc. | | | 58,198 | | |
| | 1,900 | | | @,L | | Noven Pharmaceuticals, Inc. | | | 48,355 | | |
| | 4,395 | | | @@ | | Omega Pharma SA | | | 330,729 | | |
| | 500 | | | | | Omnicare, Inc. | | | 19,315 | | |
| | 84,050 | | | | | Pfizer, Inc. | | | 2,176,895 | | |
| | 4,670 | | | @@ | | Roche Holding AG | | | 835,526 | | |
| | 54,100 | | | | | Schering-Plough Corp. | | | 1,278,924 | | |
| | 1,700 | | | @,L | | Sepracor, Inc. | | | 104,686 | | |
| | 2,640 | | | @ | | Theragenics Corp. | | | 8,184 | | |
See Accompanying Notes to Financial Statements
88
ING VP STRATEGIC ALLOCATION PORTFOLIO OF INVESTMENTS
MODERATE PORTFOLIO AS OF DECEMBER 31, 2006 (CONTINUED)
| Shares | | | | | | Value | |
| | | | | Pharmaceuticals (continued) | |
| | 800 | | | @,L | | USANA Health Sciences, Inc. | | $ | 41,328 | | |
| | 15,200 | | | | | Wyeth | | | 773,984 | | |
| | | | 12,151,607 | | |
| | | | | Pipelines: 0.2% | |
| | 8,600 | | | | | Questar Corp. | | | 714,230 | | |
| | | | 714,230 | | |
| | | | | Real Estate: 0.1% | |
| | 27,000 | | | @@ | | Cheung Kong Holdings Ltd. | | | 331,676 | | |
| | | | 331,676 | | |
| | | | | Real Estate Investment Trusts: 0.3% | |
| | 2,000 | | | | | AMB Property Corp. | | | 117,220 | | |
| | 700 | | | L | | Colonial Properties Trust | | | 32,816 | | |
| | 4,660 | | | | | Equity Office Properties Trust | | | 224,472 | | |
| | 415 | | | | | Essex Property Trust, Inc. | | | 53,639 | | |
| | 700 | | | L | | Highwoods Properties, Inc. | | | 28,532 | | |
| | 4,200 | | | L | | Hospitality Properties Trust | | | 199,626 | | |
| | 900 | | | | | Longview Fibre Co. | | | 19,755 | | |
| | 500 | | | | | LTC Properties, Inc. | | | 13,655 | | |
| | 1,000 | | | | | Macerich Co. | | | 86,570 | | |
| | 1,000 | | | | | Regency Centers Corp. | | | 78,170 | | |
| | | | 854,455 | | |
| | | | | Retail: 4.1% | |
| | 400 | | | @ | | 99 Cents Only Stores | | | 4,868 | | |
| | 1,135 | | | | | Abercrombie & Fitch Co. | | | 79,030 | | |
| | 1,600 | | | | | Advance Auto Parts, Inc. | | | 56,896 | | |
| | 2,900 | | | @,L | | Aeropostale, Inc. | | | 89,523 | | |
| | 5,048 | | | L | | American Eagle Outfitters | | | 157,532 | | |
| | 3,600 | | | @ | | AnnTaylor Stores Corp. | | | 118,224 | | |
| | 400 | | | | | Barnes & Noble, Inc. | | | 15,884 | | |
| | 5,800 | | | @,L | | Big Lots, Inc. | | | 132,936 | | |
| | 800 | | | | | Brinker International, Inc. | | | 24,128 | | |
| | 1,550 | | | | | Brown Shoe Co., Inc. | | | 73,997 | | |
| | 5,800 | | | @,L | | Charming Shoppes, Inc. | | | 78,474 | | |
| | 2,300 | | | @,L | | Chico's FAS, Inc. | | | 47,587 | | |
| | 400 | | | @,L | | Childrens Place Retail Stores, Inc. | | | 25,408 | | |
| | 2,600 | | | L | | Christopher & Banks Corp. | | | 48,516 | | |
| | 2,760 | | | L | | Claire's Stores, Inc. | | | 91,466 | | |
| | 4,500 | | | @,L | | Dollar Tree Stores, Inc. | | | 135,450 | | |
| | 14,000 | | | @@ | | Don Quijote Co., Ltd. | | | 267,252 | | |
| | 2,900 | | | @,L | | Dress Barn, Inc. | | | 67,657 | | |
| | 8,700 | | | | | Family Dollar Stores, Inc. | | | 255,171 | | |
| | 20,600 | | | | | Federated Department
Stores, Inc. | | | 785,478 | | |
| | 29,500 | | | | | Gap, Inc. | | | 575,250 | | |
| | 1,300 | | | L | | Group 1 Automotive, Inc. | | | 67,236 | | |
| | 21,250 | | | L | | Home Depot, Inc. | | | 853,400 | | |
| | 1,600 | | | @ | | Jack in the Box, Inc. | | | 97,664 | | |
| | 12,700 | | | @ | | Kohl's Corp. | | | 869,061 | | |
| | 17,500 | | | | | Lowe's Cos., Inc. | | | 545,125 | | |
| | 33,200 | | | L | | McDonald's Corp. | | | 1,471,756 | | |
| | 2,382 | | | L | | Men's Wearhouse, Inc. | | | 91,135 | | |
| | 11,600 | | | L | | Nordstrom, Inc. | | | 572,344 | | |
| | 14,600 | | | @ | | Office Depot, Inc. | | | 557,282 | | |
| | 4,000 | | | | | OfficeMax, Inc. | | | 198,600 | | |
| | 1,000 | | | | | OSI Restaurant Partners, Inc. | | | 39,200 | | |
| | 545 | | | @,L | | Panera Bread Co. | | | 30,471 | | |
| | 2,975 | | | @ | | Payless Shoesource, Inc. | | | 97,640 | | |
| | 4,100 | | | | | Petsmart, Inc. | | | 118,326 | | |
| | 5,900 | | | | | Ross Stores, Inc. | | | 172,870 | | |
| Shares | | | | | | Value | |
| | 1,300 | | | @ | | Saks, Inc. | | $ | 23,166 | | |
| | 1,100 | | | @,L | | School Specialty, Inc. | | | 41,239 | | |
| | 3,168 | | | @,L | | Select Comfort Corp. | | | 55,092 | | |
| | 9,000 | | | @@ | | Seven & I Holdings Co., Ltd. | | | 279,855 | | |
| | 3,477 | | | @ | | Sonic Corp. | | | 83,274 | | |
| | 8,000 | | | @,L | | Starbucks Corp. | | | 283,360 | | |
| | 9,700 | | | | | Target Corp. | | | 553,385 | | |
| | 23,000 | | | | | TJX Cos., Inc. | | | 655,960 | | |
| | 1,200 | | | @ | | Tween Brands, Inc. | | | 47,916 | | |
| | 28,200 | | | L | | Wal-Mart Stores, Inc. | | | 1,302,276 | | |
| | | | 12,238,360 | | |
| | | | | Savings & Loans: 0.1% | |
| | 1,100 | | | | | Anchor Bancorp. Wisconsin, Inc. | | | 31,702 | | |
| | 2,200 | | | L | | Bankunited Financial Corp. | | | 61,512 | | |
| | 300 | | | L | | Fidelity Bankshares, Inc. | | | 11,901 | | |
| | 1,000 | | | @,L | | FirstFed Financial Corp. | | | 66,970 | | |
| | | | 172,085 | | |
| | | | | Semiconductors: 1.2% | |
| | 2,000 | | | @,L | | Actel Corp. | | | 36,320 | | |
| | 18,500 | | | @ | | Altera Corp. | | | 364,080 | | |
| | 13,200 | | | @,L | | Atmel Corp. | | | 79,860 | | |
| | 4,900 | | | @,L | | Brooks Automation, Inc. | | | 70,560 | | |
| | 700 | | | @ | | Cree, Inc. | | | 12,124 | | |
| | 1,800 | | | @,L | | DSP Group, Inc. | | | 39,060 | | |
| | 6,400 | | | @ | | Fairchild Semiconductor
International, Inc. | | | 107,584 | | |
| | 7,800 | | | @ | | Integrated Device
Technology, Inc. | | | 120,744 | | |
| | 59,500 | | | | | Intel Corp. | | | 1,204,875 | | |
| | 2,065 | | | @ | | Lam Research Corp. | | | 104,530 | | |
| | 21,100 | | | @,L | | LSI Logic Corp. | | | 189,900 | | |
| | 2,800 | | | @ | | MEMC Electronic Materials, Inc. | | | 109,592 | | |
| | 2,960 | | | L | | Microchip Technology, Inc. | | | 96,792 | | |
| | 40,800 | | | @,L | | Micron Technology, Inc. | | | 569,568 | | |
| | 6,400 | | | @ | | Novellus Systems, Inc. | | | 220,288 | | |
| | 2,080 | | | @ | | Pericom Semiconductor Corp. | | | 23,858 | | |
| | 5,500 | | | @ | | Semtech Corp. | | | 71,885 | | |
| | 9,300 | | | @@ | | Shinko Electric Industries | | | 242,356 | | |
| | 200 | | | @,L | | Teradyne, Inc. | | | 2,992 | | |
| | 922 | | | @,L | | Varian Semiconductor
Equipment Associates, Inc. | | | 41,969 | | |
| | | | 3,708,937 | | |
| | | | | Software: 2.3% | |
| | 2,500 | | | | | Acxiom Corp. | | | 64,125 | | |
| | 1,900 | | | @,L | | Altiris, Inc. | | | 48,222 | | |
| | 660 | | | @,L | | Ansys, Inc. | | | 28,703 | | |
| | 12,200 | | | @ | | BMC Software, Inc. | | | 392,840 | | |
| | 2,300 | | | @ | | Captaris, Inc. | | | 17,871 | | |
| | 1,040 | | | @,L | | Cerner Corp. | | | 47,320 | | |
| | 22,150 | | | @ | | Compuware Corp. | | | 184,510 | | |
| | 2,500 | | | @ | | CSG Systems International | | | 66,825 | | |
| | 3,400 | | | @ | | Dendrite International, Inc. | | | 36,414 | | |
| | 800 | | | @ | | Digi International, Inc. | | | 11,032 | | |
| | 1,218 | | | @ | | Dun & Bradstreet Corp. | | | 100,838 | | |
| | 2,100 | | | L | | Fair Isaac Corp. | | | 85,365 | | |
| | 32,800 | | | | | First Data Corp. | | | 837,056 | | |
| | 1,170 | | | | | Global Payments, Inc. | | | 54,171 | | |
| | 947 | | | @ | | Hyperion Solutions Corp. | | | 34,035 | | |
| | 300 | | | | | Inter-Tel, Inc. | | | 6,648 | | |
| | 1,600 | | | @ | | Mapinfo Corp. | | | 20,880 | | |
| | 105,550 | | | | | Microsoft Corp. | | | 3,151,723 | | |
See Accompanying Notes to Financial Statements
89
ING VP STRATEGIC ALLOCATION PORTFOLIO OF INVESTMENTS
MODERATE PORTFOLIO AS OF DECEMBER 31, 2006 (CONTINUED)
| Shares | | | | | | Value | |
| | | | | Software (continued) | |
| | 300 | | | @,L | | Open Solutions, Inc. | | $ | 11,292 | | |
| | 41,600 | | | @ | | Oracle Corp. | | | 713,024 | | |
| | 500 | | | @ | | Per-Se Technologies, Inc. | | | 13,890 | | |
| | 400 | | | @ | | SPSS, Inc. | | | 12,028 | | |
| | 4,805 | | | @,L | | Sybase, Inc. | | | 118,684 | | |
| | 20,639 | | | @,@@,L | | Tele Atlas NV | | | 434,056 | | |
| | 9,796 | | | @,@@ | | Tomtom, Inc. | | | 421,783 | | |
| | | | 6,913,335 | | |
| | | | | Telecommunications: 4.5% | |
| | 2,300 | | | @ | | 3Com Corp. | | | 9,453 | | |
| | 2,500 | | | @ | | Adaptec, Inc. | | | 11,650 | | |
| | 46,136 | | | @@ | | Alcatel SA | | | 658,222 | | |
| | 600 | | | @ | | Andrew Corp. | | | 6,138 | | |
| | 600 | | | @,L | | Anixter International, Inc. | | | 32,580 | | |
| | 47,700 | | | | | AT&T, Inc. | | | 1,705,275 | | |
| | 27,500 | | | @,L | | Avaya, Inc. | | | 384,450 | | |
| | 22,300 | | | | | BellSouth Corp. | | | 1,050,553 | | |
| | 2,000 | | | @ | | C-COR, Inc. | | | 22,280 | | |
| | 8,700 | | | @ | | Cincinnati Bell, Inc. | | | 39,759 | | |
| | 110,400 | | | @ | | Cisco Systems, Inc. | | | 3,017,221 | | |
| | 300 | | | | | Commonwealth Telephone
Enterprises, Inc. | | | 12,558 | | |
| | 2,600 | | | @,L | | Ditech Networks, Inc. | | | 17,992 | | |
| | 1,806 | | | L | | Harris Corp. | | | 82,823 | | |
| | 66,100 | | | | | Motorola, Inc. | | | 1,359,016 | | |
| | 1,900 | | | @ | | Network Equipment
Technologies, Inc. | | | 11,058 | | |
| | 96 | | | @@ | | Nippon Telegraph &
Telephone Corp. | | | 473,423 | | |
| | 6,243 | | | @@ | | Orascom Telecom GDR | | | 412,484 | | |
| | 17,050 | | | | | Qualcomm, Inc. | | | 644,320 | | |
| | 36,700 | | | | | Sprint Nextel Corp. | | | 693,263 | | |
| | 237,038 | | | @@ | | Telecom Italia S.p.A. | | | 600,276 | | |
| | 8,953 | | | @@ | | Telekomunikasi Indonesia
Tbk PT ADR | | | 408,257 | | |
| | 1,435 | | | | | Telephone & Data Systems, Inc. | | | 77,964 | | |
| | 4,100 | | | @,L | | Utstarcom, Inc. | | | 35,875 | | |
| | 35,600 | | | | | Verizon Communications, Inc. | | | 1,325,744 | | |
| | 177,200 | | | @@ | | Vodafone Group PLC | | | 489,368 | | |
| | | | 13,582,002 | | |
| | | | | Textiles: 0.1% | |
| | 800 | | | | | Angelica Corp. | | | 20,640 | | |
| | 2,400 | | | @,L | | Mohawk Industries, Inc. | | | 179,664 | | |
| | | | 200,304 | | |
| | | | | Toys/Games/Hobbies: 0.2% | |
| | 9,200 | | | | | Hasbro, Inc. | | | 250,700 | | |
| | 19,500 | | | | | Mattel, Inc. | | | 441,870 | | |
| | | | 692,570 | | |
| | | | | Transportation: 0.5% | |
| | 3,610 | | | L | | CH Robinson Worldwide, Inc. | | | 147,613 | | |
| | 70 | | | @@ | | East Japan Railway Co. | | | 466,610 | | |
| | 400 | | | | | Expeditors International
Washington, Inc. | | | 16,200 | | |
| | 2,000 | | | @,L | | HUB Group, Inc. | | | 55,100 | | |
| | 1,200 | | | @,L | | Kansas City Southern | | | 34,776 | | |
| | 900 | | | @,L | | Kirby Corp. | | | 30,717 | | |
| | 972 | | | | | Landstar System, Inc. | | | 37,111 | | |
| | 46,000 | | | @@ | | Mitsui OSK Lines Ltd. | | | 454,327 | | |
| | 2,100 | | | @,L | | Old Dominion Freight Line | | | 50,547 | | |
| Shares | | | | | | Value | |
| | 2,680 | | | L | | Overseas Shipholding Group | | $ | 150,884 | | |
| | 700 | | | @ | | Swift Transportation Co., Inc. | | | 18,389 | | |
| | 200 | | | @ | | YRC Worldwide, Inc. | | | 7,546 | | |
| | | | 1,469,820 | | |
| | | | | Water: 0.2% | |
| | 7,620 | | | @@ | | Veolia Environnement | | | 581,131 | | |
| | | | 581,131 | | |
Total Common Stock
(Cost $180,069,147) | | | 218,590,258 | | |
| EQUITY-LINKED SECURITIES: 0.2% | | | |
| | | | | Equity Linked Securities: 0.2% | |
| | 600,000 | | | | | KAUP Bank | | | 563,288 | | |
| | | | 563,288 | | |
Total Equity-Linked Securities
(Cost $600,000) | | | 563,288 | | |
| PREFERRED STOCK: 0.4% | | | |
| | | | | Banks: 0.1% | |
| | 13,000 | | | P | | Bank of American Corp. | | | 324,350 | | |
| | | | 324,350 | | |
| | | | | Diversified Financial Services: 0.1% | |
| | 9,000 | | | P | | Merrill Lynch & Co., Inc. | | | 234,720 | | |
| | | | 234,720 | | |
| | | | | Insurance: 0.2% | |
| | 12,100 | | | @@,P | | Aegon NV | | | 314,297 | | |
| | 10,100 | | | P | | Metlife, Inc. | | | 265,731 | | |
| | | | 580,028 | | |
Total Preferred Stock
(Cost $1,096,693) | | | 1,139,098 | | |
Principal
Amount | | | | | | Value | |
| CORPORATE BONDS/NOTES: 4.0% | | | |
| | | | | Banks: 1.6% | |
| $ | 220,000 | | | @@,C | | Australia & New Zealand
Banking Group Ltd.,
5.556%, due 10/29/49 | | $ | 191,545 | | |
| | 123,000 | | | @@,#,C | | Banco Mercantil del Norte SA,
6.135%, due 10/13/16 | | | 123,656 | | |
| | 89,000 | | | @@ | | Banco Santander Chile SA,
7.375%, due 07/18/12 | | | 97,428 | | |
| | 110,000 | | | @@,C | | Bank of Ireland, 5.625%,
due 12/29/49 | | | 95,801 | | |
| | 90,000 | | | @@,C | | Bank of Nova Scotia, 5.625%,
due 08/21/85 | | | 76,401 | | |
| | 40,000 | | | | | Bank of Scotland, 5.563%,
due 11/30/49 | | | 34,423 | | |
| | 61,000 | | | C | | BankAmerica Capital II,
8.000%, due 12/15/26 | | | 63,508 | | |
| | 60,000 | | | @@,C | | Barclays Bank PLC, 5.750%,
due 12/31/49 | | | 52,484 | | |
| | 150,000 | | | @@,C,L | | BNP Paribas, 5.445%,
due 09/29/49 | | | 128,644 | | |
| | 116,000 | | | @@,#,C | | Chuo Mitsui Trust &
Banking Co., Ltd., 5.506%,
due 04/15/49 | | | 110,977 | | |
See Accompanying Notes to Financial Statements
90
ING VP STRATEGIC ALLOCATION PORTFOLIO OF INVESTMENTS
MODERATE PORTFOLIO AS OF DECEMBER 31, 2006 (CONTINUED)
| Shares | | | | | | Value | |
| | | | | Banks (continued) | |
| $ | 90,000 | | | @@,C | | Den Norske Bank ASA,
5.563%, due 08/29/49 | | $ | 76,500 | | |
| | 20,000 | | | @@,C | | Den Norske Bank ASA,
5.625%, due 11/29/49 | | | 17,289 | | |
| | 127,000 | | | #,C | | Dresdner Funding Trust I,
8.151%, due 06/30/31 | | | 153,413 | | |
| | 309,000 | | | @@,#,C | | HBOS PLC, 5.375%,
due 11/29/49 | | | 304,721 | | |
| | 350,000 | | | @@,C | | HSBC Bank PLC, 5.475%,
due 06/29/49 | | | 297,500 | | |
| | 180,000 | | | @@,C | | HSBC Bank PLC, 5.688%,
due 06/29/49 | | | 156,150 | | |
| | 220,000 | | | @@,C | | Lloyds TSB Bank PLC, 5.560%,
due 08/29/49 | | | 189,923 | | |
| | 20,000 | | | @@,C,L | | Lloyds TSB Bank PLC, 5.563%,
due 11/29/49 | | | 17,406 | | |
| | 195,000 | | | C | | M&I Capital Trust A, 7.650%,
due 12/01/26 | | | 201,852 | | |
| | 131,000 | | | C | | Mellon Capital I, 7.720%,
due 12/01/26 | | | 136,400 | | |
| | 110,000 | | | @@,C | | Mizuho Financial Group
Cayman Ltd., 8.375%,
due 12/31/49 | | | 116,275 | | |
| | 130,000 | | | @@,C,L | | National Australia Bank Ltd.,
5.556%, due 10/29/49 | | | 112,844 | | |
| | 20,000 | | | @@,C | | National Westminster
Bank PLC, 5.500%,
due 11/29/49 | | | 17,152 | | |
| | 140,000 | | | #,C | | Rabobank Capital Funding II,
5.260%, due 12/29/49 | | | 137,110 | | |
| | 60,000 | | | #,C | | Rabobank Capital Funding
Trust, 5.254%, due 12/31/49 | | | 57,958 | | |
| | 36,000 | | | C,L | | RBS Capital Trust I, 5.512%,
due 09/30/49 | | | 35,638 | | |
| | 163,000 | | | @@,#,C | | Resona Bank Ltd., 5.850%,
due 09/29/49 | | | 159,443 | | |
| | 370,000 | | | @@,C | | Royal Bank of Scotland Group
PLC, 5.563%, due 12/29/49 | | | 317,475 | | |
| | 110,000 | | | @@,C | | Societe Generale, 5.438%,
due 11/29/49 | | | 95,056 | | |
| | 270,000 | | | @@,C | | Standard Chartered PLC,
5.500%, due 07/29/49 | | | 223,425 | | |
| | 410,000 | | | @@,C | | Standard Chartered PLC,
5.625%, due 11/29/49 | | | 344,400 | | |
| | 40,000 | | | @@,C | | Standard Chartered PLC,
5.730%, due 01/29/49 | | | 33,100 | | |
| | 118,000 | | | @@,C | | Sumitomo Mitsui Banking Corp.,
8.150%, due 08/01/49 | | | 122,408 | | |
| | 114,000 | | | C | | Wachovia Capital Trust III,
5.800%, due 12/31/49 | | | 115,047 | | |
| | 90,000 | | | @@,C | | Westpac Banking Corp.,
5.525%, due 09/30/49 | | | 77,025 | | |
| | 181,000 | | | #,C | | Westpac Capital Trust IV,
5.256%, due 12/29/49 | | | 172,336 | | |
| | 210,000 | | | @@,#,C | | Woori Bank, 6.125%,
due 05/03/16 | | | 214,650 | | |
| | | | 4,877,363 | | |
| | | | | Beverages: 0.1% | |
| | 168,000 | | | @@ | | Cia Brasileira de Bebidas,
8.750%, due 09/15/13 | | | 196,560 | | |
| | | | 196,560 | | |
| Shares | | | | | | Value | |
| | | | | Chemicals: 0.0% | |
| $ | 40,000 | | | | | Stauffer Chemical, 5.620%,
due 04/15/10 | | $ | 33,421 | | |
| | 80,000 | | | | | Stauffer Chemical, 5.890%,
due 04/15/18 | | | 41,919 | | |
| | 80,000 | | | | | Stauffer Chemical, 7.670%,
due 04/15/17 | | | 44,435 | | |
| | | | 119,775 | | |
| | | | | Diversified Financial Services: 1.2% | |
| | 290,000 | | | @@,#,C | | Aiful Corp., 4.450%,
due 02/16/10 | | | 278,347 | | |
| | 193,930 | | | @@,# | | Brazilian Merchant Voucher
Receivables Ltd., 5.911%,
due 06/15/11 | | | 191,021 | | |
| | 151,000 | | | C | | Citigroup Capital II, 7.750%,
due 12/01/36 | | | 156,140 | | |
| | 256,000 | | | #,C | | Corestates Capital Trust I,
8.000%, due 12/15/26 | | | 266,598 | | |
| | 119,000 | | | #,L | | Farmers Exchange Capital,
7.200%, due 07/15/48 | | | 122,271 | | |
| | 75,000 | | | @@,C | | Financiere CSFB NV, 5.485%,
due 03/29/49 | | | 64,313 | | |
| | 148,000 | | | C | | Fund American Cos., Inc.,
5.875%, due 05/15/13 | | | 147,309 | | |
| | 164,000 | | | #,C | | HVB Funding Trust III,
9.000%, due 10/22/31 | | | 213,890 | | |
| | 134,000 | | | C | | JPM Capital Trust I, 7.540%,
due 01/15/27 | | | 139,032 | | |
| | 150,000 | | | C | | JPM Capital Trust II, 7.950%,
due 02/01/27 | | | 156,097 | | |
| | 269,000 | | | #,C | | Mangrove Bay Pass-Through
Trust, 6.102%, due 07/15/33 | | | 263,242 | | |
| | 188,000 | | | @@,C | | MUFG Capital Finance 1 Ltd.,
6.346%, due 12/31/49 | | | 191,138 | | |
| | 95,000 | | | @@,C | | Paribas, 5.500%, due 12/31/49 | | | 81,959 | | |
| | 72,333 | | | @@,#,C | | Petroleum Export Ltd., 4.623%,
due 06/15/10 | | | 71,230 | | |
| | 112,947 | | | @@,#,C | | Petroleum Export Ltd., 5.265%,
due 06/15/11 | | | 109,978 | | |
| | 280,529 | | | @@,#,C | | PF Export Receivables Master
Trust, 6.436%, due 06/01/15 | | | 286,315 | | |
| | 279,000 | | | @@,#,C | | Preferred Term Securities Ltd.,
5.860%, due 03/23/35 | | | 280,046 | | |
| | 935,655 | | | # | | Toll Road Investors
Partnership II LP, 17.590%,
due 02/15/45 | | | 119,907 | | |
| | 100,000 | | | #,C | | Twin Reefs Pass-Through Trust,
6.350%, due 12/10/49 | | | 100,190 | | |
| | 157,000 | | | @@,C,L | | UFJ Finance Aruba AEC,
8.750%, due 12/31/49 | | | 165,779 | | |
| | 108,000 | | | #,C | | Wachovia Capital Trust V,
7.965%, due 06/01/27 | | | 113,045 | | |
| | | | 3,517,847 | | |
| | | | | Electric: 0.2% | |
| | 120,000 | | | C | | Commonwealth Edison Co.,
5.950%, due 08/15/16 | | | 121,541 | | |
| | 24,000 | | | @@ | | Empresa Nacional de
Electricidad SA, 7.325%,
due 02/01/37 | | | 26,144 | | |
| | 122,000 | | | @@,L | | Empresa Nacional de
Electricidad SA, 8.625%,
due 08/01/15 | | | 143,856 | | |
See Accompanying Notes to Financial Statements
91
ING VP STRATEGIC ALLOCATION PORTFOLIO OF INVESTMENTS
MODERATE PORTFOLIO AS OF DECEMBER 31, 2006 (CONTINUED)
| Shares | | | | | | Value | |
| | | | | Electric (continued) | |
| $ | 59,000 | | | C,L | | FirstEnergy Corp., 6.450%,
due 11/15/11 | | $ | 61,590 | | |
| | 79,815 | | | # | | Power Contract Financing,
LLC, 6.256%, due 02/01/10 | | | 80,275 | | |
| | 32,584 | | | | | PPL Montana, LLC, 8.903%,
due 07/02/20 | | | 35,961 | | |
| | 198,000 | | | C | | Southern Co. CAP Trust I,
8.190%, due 02/01/37 | | | 206,501 | | |
| | | | 675,868 | | |
| | | | | Healthcare-Products: 0.0% | |
| | 88,000 | | | C | | Boston Scientific Corp.,
7.000%, due 11/15/35 | | | 87,935 | | |
| | | | 87,935 | | |
| | | | | Home Builders: 0.1% | |
| | 140,000 | | | L | | D.R. Horton, Inc., 5.625%,
due 09/15/14 | | | 135,431 | | |
| | | | 135,431 | | |
| | | | | Multi-National: 0.0% | |
| | 90,000 | | | @@ | | Corp. Andina de Fomento
CAF, 5.125%, due 05/05/15 | | | 86,783 | | |
| | | | 86,783 | | |
| | | | | Oil & Gas: 0.2% | |
| | 115,000 | | | @@,# | | EMP Nacional Del Petrole,
4.875%, due 03/15/14 | | | 109,403 | | |
| | 29,000 | | | @@,# | | Empresa Nacional de Petroleo
ENAP, 6.750%, due 11/15/12 | | | 30,594 | | |
| | 68,000 | | | C | | Pemex Project Funding
Master Trust, 6.625%,
due 06/15/35 | | | 69,649 | | |
| | 243,000 | | | # | | Pemex Project Funding
Master Trust, 6.660%,
due 06/15/10 | | | 250,047 | | |
| | 130,000 | | | @@,#,C | | Ras Laffan Liquefied Natural
Gas Co., Ltd. II, 5.298%,
due 09/30/20 | | | 124,849 | | |
| | | | 584,542 | | |
| | | | | Pipelines: 0.1% | |
| | 408,000 | | | #,C | | Cameron Highway Oil Pipelines,
5.860%, due 12/15/17 | | | 398,948 | | |
| | | | 398,948 | | |
| | | | | Real Estate Investment Trusts: 0.1% | |
| | 42,000 | | | C | | Liberty Property LP, 6.375%,
due 08/15/12 | | | 43,807 | | |
| | 153,000 | | | C | | Liberty Property LP, 7.750%,
due 04/15/09 | | | 160,107 | | |
| | 125,000 | | | C | | Simon Property Group LP,
5.000%, due 03/01/12 | | | 122,937 | | |
| | | | 326,851 | | |
| | | | | Savings & Loans: 0.1% | |
| | 125,000 | | | C | | Great Western Financial,
8.206%, due 02/01/27 | | | 130,340 | | |
| | | | 130,340 | | |
| | | | | Sovereign: 0.2% | |
| | 536,000 | | | | | Fannie Mae, 7.250%,
due 01/15/10 | | | 570,636 | | |
| | | | 570,636 | | |
| Shares | | | | | | Value | |
| | | | | Telecommunications: 0.1% | |
| $ | 115,000 | | | C | | Sprint Capital Corp., 6.875%,
due 11/15/28 | | $ | 115,440 | | |
| | 155,000 | | | @@,C | | TELUS Corp., 8.000%,
due 06/01/11 | | | 169,656 | | |
| | | | 285,096 | | |
Total Corporate Bonds/Notes
(Cost $12,067,022) | | | 11,993,975 | | |
| U.S. GOVERNMENT AGENCY OBLIGATIONS: 6.6% | | | |
| | | | | Federal Home Loan Bank: 0.1% | |
| | 288,000 | | | L | | 5.625%, due 06/13/16 | | | 296,946 | | |
| | | | 296,946 | | |
| | | | | | | Federal Home Loan Mortgage
Corporation: 1.7% | | | | | |
| | 459,312 | | | C | | 4.500%, due 12/15/16 | | | 450,969 | | |
| | 445,618 | | | C | | 5.000%, due 08/15/16 | | | 439,318 | | |
| | 429,000 | | | C | | 5.000%, due 05/15/20 | | | 416,033 | | |
| | 288,000 | | | L | | 5.125%, due 04/18/08 | | | 288,016 | | |
| | 300,000 | | | | | 5.125%, due 04/18/11 | | | 302,366 | | |
| | 91,000 | | | W | | 5.500%, due 01/15/19 | | | 90,943 | | |
| | 625,000 | | | W | | 5.500%, due 01/00/00 | | | 618,164 | | |
| | 962,000 | | | C | | 5.750%, due 05/11/11 | | | 963,031 | | |
| | 298,000 | | | | | 5.750%, due 06/27/16 | | | 310,720 | | |
| | 382,976 | | | C | | 6.000%, due 01/15/29 | | | 388,099 | | |
| | 122,165 | | | | | 6.000%, due 02/01/29 | | | 123,683 | | |
| | 559,000 | | | L | | 6.625%, due 09/15/09 | | | 582,557 | | |
| | 119,424 | | | | | 7.000%, due 11/01/31 | | | 122,880 | | |
| | | | 5,096,779 | | |
| | | | | | | Federal National Mortgage
Association: 4.7% | | | | | |
| | 75,000 | | | | | 4.500%, due 11/15/36 | | | 70,289 | | |
| | 652,000 | | | W | | 4.500%, due 01/00/00 | | | 628,977 | | |
| | 251,426 | | | | | 4.806%, due 08/01/35 | | | 248,148 | | |
| | 291,000 | | | L | | 4.875%, due 12/15/16 | | | 288,305 | | |
| | 2,998,000 | | | W | | 5.000%, due 01/12/36 | | | 2,894,944 | | |
| | 989,000 | | | W | | 5.000%, due 01/15/20 | | | 972,311 | | |
| | 719,000 | | | L | | 5.250%, due 08/01/12 | | | 723,361 | | |
| | 346,000 | | | | | 5.250%, due 09/15/16 | | | 352,921 | | |
| | 4,088,000 | | | W | | 5.500%, due 01/12/36 | | | 4,040,735 | | |
| | 231,540 | | | | | 5.500%, due 02/01/18 | | | 231,596 | | |
| | 838,000 | | | | | 5.500%, due 05/25/30 | | | 824,245 | | |
| | 457,419 | | | | | 5.500%, due 11/01/33 | | | 452,993 | | |
| | 214,364 | | | | | 5.500%, due 11/01/36 | | | 210,646 | | |
| | 373,637 | | | | | 5.500%, due 12/25/36 | | | 363,578 | | |
| | 434,000 | | | C | | 5.600%, due 03/29/11 | | | 434,146 | | |
| | 3,343 | | | | | 6.000%, due 03/01/17 | | | 3,393 | | |
| | 86,537 | | | | | 6.000%, due 10/01/18 | | | 87,796 | | |
| | 315,875 | | | | | 6.000%, due 12/01/18 | | | 320,675 | | |
| | 71,000 | | | | | 6.000%, due 01/15/19 | | | 71,998 | | |
| | 262,363 | | | | | 6.000%, due 04/25/31 | | | 267,364 | | |
| | 80,355 | | | | | 6.500%, due 02/01/28 | | | 82,503 | | |
| | 200,558 | | | | | 6.500%, due 09/01/32 | | | 205,218 | | |
| | 83,858 | | | | | 7.000%, due 02/01/31 | | | 86,369 | | |
| | 69,307 | | | | | 7.000%, due 06/01/31 | | | 71,383 | | |
| | 7,139 | | | | | 7.000%, due 08/01/35 | | | 7,331 | | |
| | 59,028 | | | | | 7.500%, due 09/01/31 | | | 61,434 | | |
| | | | 14,002,659 | | |
| | | | | | | Government National Mortgage
Association: 0.1% | | | | | |
| | 27,953 | | | | | 6.500%, due 01/15/29 | | | 28,758 | | |
See Accompanying Notes to Financial Statements
92
ING VP STRATEGIC ALLOCATION PORTFOLIO OF INVESTMENTS
MODERATE PORTFOLIO AS OF DECEMBER 31, 2006 (CONTINUED)
| Shares | | | | | | Value | |
| | | | | | | Government National Mortgage
Association (continued) | | | | | |
| $ | 77,543 | | | | | 6.500%, due 01/15/32 | | $ | 79,691 | | |
| | 3,193 | | | | | 7.000%, due 12/15/27 | | | 3,304 | | |
| | 12,229 | | | | | 7.000%, due 01/15/28 | | | 12,642 | | |
| | 100,874 | | | | | 7.000%, due 02/15/28 | | | 104,274 | | |
| | 72,788 | | | | | 7.500%, due 12/15/23 | | | 75,930 | | |
| | | | 304,599 | | |
Total U.S. Government
Agency Obligations
(Cost $19,820,534) | | | 19,700,983 | | |
| U.S. TREASURY OBLIGATIONS: 3.2% | | | |
| | | | | U.S. Treasury Bonds: 1.4% | |
| | 2,637,000 | | | L | | 4.500%, due 02/15/36 | | | 2,508,449 | | |
| | 583,000 | | | L | | 4.625%, due 11/15/16 | | | 579,357 | | |
| | 492,000 | | | L | | 6.000%, due 02/15/26 | | | 558,151 | | |
| | 479,000 | | | L | | 6.250%, due 08/15/23 | | | 551,487 | | |
| | | | 4,197,444 | | |
| | | | | | | Treasury Inflation Protected
Securities: 0.3% | | | | | |
| | 350,000 | | | | | 2.000%, due 01/15/16 | | | 343,710 | | |
| | 561,000 | | | L | | 2.375%, due 04/15/11 | | | 568,269 | | |
| | | | 911,979 | | |
| | | | | U.S. Treasury Notes: 1.4% | |
| | 581,000 | | | L | | 4.500%, due 11/30/11 | | | 576,007 | | |
| | 2,944,000 | | | L | | 4.625%, due 11/30/08 | | | 2,934,226 | | |
| | 579,000 | | | L | | 4.625%, due 11/15/09 | | | 577,372 | | |
| | | | 4,087,605 | | |
| | | | | U.S. Treasury Principal Only STRIP: 0.1% | |
| | 1,093,000 | | | L | | Discount Note, due 02/15/36 | | | 276,956 | | |
| | | | 276,956 | | |
Total U.S. Treasury Obligations
(Cost $9,411,526) | | | 9,473,984 | | |
| ASSET-BACKED SECURITIES: 0.3% | | | |
| | | | | Automobile Asset-Backed Securities: 0.0% | |
| | 38,000 | | | C | | AmeriCredit Automobile
Receivables Trust, 4.220%,
due 07/06/09 | | | 37,724 | | |
| | 26,414 | | | C | | Honda Auto Receivables
Owner Trust, 2.790%,
due 03/16/09 | | | 26,184 | | |
| | 61,463 | | | C | | Nissan Auto Receivables
Owner Trust, 2.050%,
due 03/16/09 | | | 60,837 | | |
| | | | 124,745 | | |
| | | | | Credit Card Asset-Backed Securities: 0.0% | |
| | 95,000 | | | C | | Bank One Issuance Trust,
4.540%, due 09/15/10 | | | 94,141 | | |
| | | | 94,141 | | |
| | | | | Home Equity Asset-Backed Securities: 0.1% | |
| | 29,000 | | | | +, | C | | Renaissance Home Equity
Loan Trust, 4.456%,
(step rate 4.956%),
due 05/25/35 | | | 28,732 | | |
| Shares | | | | | | Value | |
| $ | 28,000 | | | | +, | C | | Renaissance Home Equity
Loan Trust, 4.723%,
(step rate 5.223%),
due 11/25/35 | | $ | 27,837 | | |
| | 110,000 | | | | C | | | Wells Fargo Home Equity Trust,
3.970%, due 05/25/34 | | | 107,713 | | |
| | | | 164,282 | | |
| | | | | Other Asset-Backed Securities: 0.2% | |
| | 8,000 | | | | C | | | Caterpillar Financial Asset Trust,
5.590%, due 02/25/09 | | | 7,999 | | |
| | 19,237 | | | | C | | | Chase Funding Mortgage Loan,
4.045%, due 05/25/33 | | | 18,983 | | |
| | 33,000 | | | | C | | | Countrywide Asset-Backed
Certificates, 4.493%,
due 02/25/36 | | | 32,711 | | |
| | 228,000 | | | | C | | | Countrywide Asset-Backed
Certificates, 5.683%,
due 10/25/46 | | | 227,929 | | |
| | 31,000 | | | | C | | | Countrywide Asset-Backed
Certificates, 5.689%,
due 10/25/46 | | | 31,068 | | |
| | 25,000 | | | | +, | C | | Credit-Based Asset Servicing and Securitization, 5.501%,
(step rate 6.001%),
due 12/25/36 | | | 24,945 | | |
| | 65,000 | | | | C | | | Equity One, Inc., 5.050%,
due 09/25/33 | | | 64,130 | | |
| | 85,000 | | | | +, | C | | Merrill Lynch Mortgage
Investors, Inc., 5.609%,
(step rate 6.109%),
due 03/25/37 | | | 84,894 | | |
| | 4,958 | | | | C | | | Popular Mortgage
Pass-Through Trust, 3.735%,
due 12/25/34 | | | 4,943 | | |
| | 73,000 | | | | C | | | Popular Mortgage
Pass-Through Trust, 4.000%,
due 12/25/34 | | | 72,263 | | |
| | 24,000 | | | | C | | | Popular Mortgage
Pass-Through Trust, 4.596%,
due 11/25/35 | | | 23,779 | | |
| | 26,000 | | | | +, | C | | Renaissance Home Equity
Loan Trust, 5.608%,
(step rate 6.108%),
due 05/25/36 | | | 25,999 | | |
| | | | 619,643 | | |
Total Asset-Backed Securities
(Cost $1,007,485) | | | 1,002,811 | | |
| COLLATERALIZED MORTGAGE OBLIGATIONS: 6.8% | | | |
| | 33,000 | | | | C | | | Banc of America Commercial
Mortgage, Inc., 4.502%,
due 07/10/42 | | | 32,036 | | |
| | 23,000 | | | | C | | | Banc of America Commercial
Mortgage, Inc., 4.764%,
due 07/10/45 | | | 22,701 | | |
| | 73,000 | | | | C | | | Banc of America Commercial
Mortgage, Inc., 4.772%,
due 07/11/43 | | | 72,181 | | |
| | 143,000 | | | | C | | | Banc of America Commercial
Mortgage, Inc., 4.877%,
due 11/10/42 | | | 141,576 | | |
See Accompanying Notes to Financial Statements
93
ING VP STRATEGIC ALLOCATION PORTFOLIO OF INVESTMENTS
MODERATE PORTFOLIO AS OF DECEMBER 31, 2006 (CONTINUED)
| Shares | | | | | | Value | |
| COLLATERALIZED MORTGAGE OBLIGATIONS (continued) | | | |
| $ | 9,730 | | | C | | Banc of America Commercial
Mortgage, Inc., 5.363%,
due 07/10/46 | | $ | 9,774 | | |
| | 113,221 | | | C | | Banc of America Commercial
Mortgage, Inc., 5.685%,
due 07/10/44 | | | 114,172 | | |
| | 341,829 | | | C | | Banc of America Funding Corp.,
5.858%, due 05/20/36 | | | 341,252 | | |
| | 100,000 | | | C | | Banc of America Mortgage
Securities, 4.147%,
due 07/25/34 | | | 97,380 | | |
| | 118,666 | | | C | | Banc of America Mortgage
Securities, 5.250%,
due 11/25/19 | | | 117,459 | | |
| | 91,965 | | | C | | Banc of America Mortgage
Securities, 5.500%,
due 11/25/33 | | | 90,640 | | |
| | 305,599 | | | C | | Bank of America Alternative
Loan Trust, 6.290%,
due 11/25/21 | | | 308,612 | | |
| | 240,224 | | | C | | Bank of America Alternative
Loan Trust, 6.500%,
due 05/25/46 | | | 243,083 | | |
| | 7,000 | | | C | | Bear Stearns Commercial
Mortgage Securities, 4.030%,
due 02/13/46 | | | 6,773 | | |
| | 9,000 | | | C | | Capco America Securitization
Corp., 6.460%, due 10/15/30 | | | 9,174 | | |
| | 19,010 | | | C | | Citigroup Commercial Mortgage
Trust, 5.720%, due 03/15/49 | | | 19,265 | | |
| | 380,183 | | | C | | Countrywide Alternative Loan
Trust, 5.416%, due 10/25/35 | | | 375,431 | | |
| | 371,610 | | | C | | Countrywide Alternative Loan
Trust, 5.500%, due 02/25/25 | | | 370,140 | | |
| | 8,641 | | | C | | Credit Suisse First Boston
Mortgage Securities Corp.,
3.819%, due 05/15/36 | | | 8,276 | | |
| | 795,000 | | | C | | Credit Suisse First Boston
Mortgage Securities Corp.,
3.861%, due 03/15/36 | | | 778,239 | | |
| | 68,000 | | | C | | Credit Suisse First Boston
Mortgage Securities Corp.,
7.544%, due 04/15/62 | | | 73,272 | | |
| | 19,122 | | | C | | Credit Suisse Mortgage
Capital Certificates, 4.991%,
due 06/15/38 | | | 18,990 | | |
| | 376,776 | | | C | | DLJ Commercial Mortgage Corp.,
6.240%, due 11/12/31 | | | 381,124 | | |
| | 905,000 | | | C | | DLJ Commercial Mortgage Corp.,
7.300%, due 06/10/32 | | | 940,371 | | |
| | 127,145 | | | C | | GE Capital Commercial
Mortgage Corp., 3.752%,
due 07/10/39 | | | 124,570 | | |
| | 10,000 | | | C | | GE Capital Commercial
Mortgage Corp., 4.865%,
due 07/10/39 | | | 9,849 | | |
| | 16,264 | | | C | | GE Capital Commercial
Mortgage Corp., 5.560%,
due 06/10/38 | | | 16,374 | | |
| | 201,878 | | | C | | GMAC Mortgage Corp. Loan
Trust, 4.604%, due 10/19/33 | | | 195,794 | | |
| | 125,948 | | | C | | GMAC Mortgage Corp. Loan
Trust, 5.500%, due 09/25/34 | | | 125,080 | | |
| Shares | | | | | | Value | |
| $ | 62,000 | | | C | | Greenwich Capital Commercial
Funding Corp., 5.117%,
due 04/10/37 | | $ | 61,818 | | |
| | 74,787 | | | #,C | | GSMPS Mortgage Loan Trust,
5.700%, due 01/25/35 | | | 75,137 | | |
| | 87,000 | | | C | | JP Morgan Chase Commercial
Mortgage Securities Corp.,
4.449%, due 01/12/38 | | | 84,630 | | |
| | 10,000 | | | C | | JP Morgan Chase Commercial
Mortgage Securities Corp.,
5.289%, due 05/15/45 | | | 10,020 | | |
| | 9,361 | | | C | | JP Morgan Chase Commercial
Mortgage Securities Corp.,
5.833%, due 04/15/45 | | | 9,477 | | |
| | 153,000 | | | C | | JP Morgan Chase Commercial
Mortgage Securities Corp.,
5.861%, due 04/15/45 | | | 157,236 | | |
| | 840,588 | | | C | | JP Morgan Mortgage Trust,
5.408%, due 11/25/35 | | | 830,080 | | |
| | 51,000 | | | C | | LB-UBS Commercial Mortgage
Trust, 3.992%, due 10/15/29 | | | 49,403 | | |
| | 57,000 | | | C | | LB-UBS Commercial Mortgage
Trust, 4.201%, due 12/15/29 | | | 55,497 | | |
| | 10,000 | | | C | | LB-UBS Commercial Mortgage
Trust, 4.310%, due 02/15/30 | | | 9,744 | | |
| | 10,000 | | | C | | LB-UBS Commercial Mortgage
Trust, 4.510%, due 12/15/29 | | | 9,699 | | |
| | 38,000 | | | C | | LB-UBS Commercial Mortgage
Trust, 4.547%, due 08/15/29 | | | 37,093 | | |
| | 6,000 | | | C | | LB-UBS Commercial Mortgage
Trust, 4.567%, due 06/15/29 | | | 5,914 | | |
| | 42,000 | | | C | | LB-UBS Commercial Mortgage
Trust, 4.583%, due 08/15/29 | | | 40,957 | | |
| | 199,000 | | | C | | LB-UBS Commercial Mortgage
Trust, 4.821%, due 04/15/30 | | | 196,575 | | |
| | 15,000 | | | C | | LB-UBS Commercial Mortgage
Trust, 4.836%, due 02/15/40 | | | 14,424 | | |
| | 49,000 | | | C | | LB-UBS Commercial Mortgage
Trust, 5.103%, due 11/15/30 | | | 48,849 | �� | |
| | 25,000 | | | C | | LB-UBS Commercial Mortgage
Trust, 5.207%, due 02/15/31 | | | 24,920 | | |
| | 19,339 | | | C | | LB-UBS Commercial Mortgage
Trust, 5.741%, due 06/15/32 | | | 19,603 | | |
| | 244,000 | | | C | | LB-UBS Commercial Mortgage
Trust, 6.226%, due 03/15/26 | | | 248,514 | | |
| | 199,000 | | | C | | LB-UBS Commercial Mortgage
Trust, 6.365%, due 12/15/28 | | | 207,843 | | |
| | 232,000 | | | C | | LB-UBS Commercial Mortgage
Trust, 7.370%, due 08/15/26 | | | 245,833 | | |
| | 106,000 | | | | | MASTR Alternative Loans Trust,
Discount Note, due 12/25/36 | | | 106,000 | | |
| | 307,219 | | | C | | MASTR Alternative Loans Trust,
5.500%, due 01/25/20 | | | 306,764 | | |
| | 822,377 | | | C | | MASTR Asset Securitization Trust,
5.500%, due 06/25/33 | | | 807,472 | | |
| | 2,497,006 | | | C | | MASTR Reperforming Loan Trust,
5.680%, due 07/25/35 | | | 2,502,322 | | |
| | 31,000 | | | C | | Merrill Lynch Mortgage Trust,
5.660%, due 05/12/39 | | | 31,675 | | |
| | 25,000 | | | C | | Merrill Lynch/Countrywide
Commercial Mortgage Trust,
5.439%, due 02/12/39 | | | 25,183 | | |
| | 180,000 | | | C | | Morgan Stanley Capital I, 4.827%,
due 06/12/47 | | | 176,786 | | |
See Accompanying Notes to Financial Statements
94
ING VP STRATEGIC ALLOCATION PORTFOLIO OF INVESTMENTS
MODERATE PORTFOLIO AS OF DECEMBER 31, 2006 (CONTINUED)
| Shares | | | | | | Value | |
| COLLATERALIZED MORTGAGE OBLIGATIONS (continued) | | | |
| $ | 232,288 | | | C | | Morgan Stanley Capital I,
5.490%, due 07/12/44 | | $ | 234,031 | | |
| | 230,000 | | | C | | Morgan Stanley Capital I,
5.741%, due 08/12/41 | | | 235,330 | | |
| | 275,655 | | | C | | Morgan Stanley Dean Witter
Capital I, 4.180%,
due 03/12/35 | | | 266,466 | | |
| | 184,404 | | | C | | RAAC Series, 5.250%,
due 09/25/34 | | | 182,240 | | |
| | 134,203 | | | C | | RAST 2006-A10 A5, 6.500%,
due 09/25/36 | | | 135,030 | | |
| | 145,976 | | | +,C | | Thornburg Mortgage
Securities Trust, 5.720%,
(step rate 6.060%),
due 09/25/34 | | | 146,758 | | |
| | 18,806 | | | C | | Wachovia Bank Commercial
Mortgage Trust, 5.726%,
due 06/15/45 | | | 18,986 | | |
| | 20,000 | | | C | | Wachovia Bank Commercial
Mortgage Trust, 5.935%,
due 06/15/45 | | | 20,536 | | |
| | 246,194 | | | C | | Washington Mutual Alternative
Mortgage Pass-Through
Certificates, 5.000%,
due 12/25/18 | | | 241,191 | | |
| | 1,500,000 | | | C | | Washington Mutual Alternative
Mortgage Pass-Through
Certificates, 5.567%,
due 01/25/47 | | | 1,500,000 | | |
| | 1,000,000 | | | C | | Washington Mutual Alternative
Mortgage Pass-Through
Certificates, 5.596%,
due 01/25/47 | | | 1,001,250 | | |
| | 446,632 | | | C | | Washington Mutual Alternative
Mortgage Pass-Through
Certificates, 5.728%,
due 05/25/46 | | | 447,766 | | |
| | 626,586 | | | C | | Washington Mutual Alternative
Mortgage Pass-Through
Certificates, 5.750%,
due 02/25/36 | | | 628,894 | | |
| | 687,640 | | | C | | Washington Mutual, Inc.,
5.598%, due 11/25/46 | | | 687,506 | | |
| | 1,375,281 | | | C | | Washington Mutual, Inc.,
5.667%, due 11/25/46 | | | 1,375,013 | | |
| | 708,485 | | | C | | Washington Mutual, Inc.,
5.882%, due 11/25/46 | | | 710,063 | | |
| | 128,000 | | | C | | Wells Fargo Mortgage-Backed
Securities Trust, 3.499%,
due 06/25/35 | | | 124,711 | | |
| | 600,240 | | | C | | Wells Fargo Mortgage-Backed
Securities Trust, 5.387%,
due 08/25/35 | | | 592,315 | | |
| | 491,617 | | | C | | Wells Fargo Mortgage-Backed
Securities Trust, 5.690%,
due 12/25/36 | | | 489,388 | | |
Total Collateralized
Mortgage Obligations
(Cost $20,633,031) | | | 20,480,530 | | |
| Shares | | | | | | Value | |
| MUNICIPAL BONDS: 0.2% | | | |
| | | | | California: 0.0% | |
| $ | 120,000 | | | C | | City of San Diego, 7.125%,
due 06/01/32 | | $ | 123,731 | | |
| | | | 123,731 | | |
| | | | | Louisiana: 0.1% | |
| | 300,000 | | | #,C | | Tulane University of Louisiana,
6.174%, due 11/15/12 | | | 300,000 | | |
| | | | 300,000 | | |
| | | | | Michigan: 0.1% | |
| | 265,000 | | | | | Michigan Tobacco Settlement
Finance Authority, 7.309%,
due 06/01/34 | | | 275,065 | | |
Total Municipal Bonds
(Cost $684,984) | | | 698,796 | | |
Total Long-Term Investments
(Cost $245,390,422) | | | 283,643,723 | | |
| SHORT-TERM INVESTMENTS: 21.9% | | | |
| | | Commercial Paper: 1.8% | |
| | 1,347,000 | | | Concord Minutemen Capital Co., LLC,
5.250%, due 02/06/07 | | | 1,339,768 | | |
| | 1,000,000 | | | Crown Point, 5.270%, due 04/17/04 | | | 984,570 | | |
| | 3,000,000 | | | Tulip Funding Co., 5.320%,
due 01/02/07 | | | 2,999,114 | | |
Total Commercial Paper
(Cost $5,323,452) | | | 5,323,452 | | |
| | | Repurchase Agreement: 7.1% | |
| $ | 21,223,000 | | | Deutsche Bank Repurchase
Agreement dated 12/29/06, 5.250%,
due 01/02/07, $21,235,380 to be
received upon repurchase
(Collateralized by $21,686,000
various U.S. Government Agency
Obligations, 3.800%-4.375%,
Market Value plus accrued
interest $21,647,795,
due 01/18/08-09/17/1 0) | | | 21,223,000 | | |
Total Repurchase Agreement
(Cost $21,223,000) | | | 21,223,000 | | |
| | | Securities Lending CollateralCC: 13.0% | |
| | 38,901,277 | | | The Bank of New York Institutional
Cash Reserves Fund | | | 38,901,277 | | |
Total Securities Lending Collateral
(Cost $38,901,277) | | | 38,901,277 | | |
Total Short-Term Investments
(Cost $65,447,729) | | | 65,447,729 | | |
Total Investments in
Securities
(Cost $310,838,151)* | | | 116.6 | % | | $ | 349,091,452 | | |
Other Assets and
Liabilities - Net | | | (16.6 | ) | | | (49,682,293 | ) | |
| Net Assets | | | 100.0 | % | | $ | 299,409,159 | | |
@ Non-income producing security
@@ Foreign Issuer
See Accompanying Notes to Financial Statements
95
ING VP STRATEGIC ALLOCATION PORTFOLIO OF INVESTMENTS
MODERATE PORTFOLIO AS OF DECEMBER 31, 2006 (CONTINUED)
ADR American Depositary Receipt
GDR Global Depositary Receipt
STRIP Separate Trading of Registered Interest and Principal of Securities
MASTR Mortgage Asset Securitization Transaction, Inc.
+ Step-up basis bonds. Interest rates shown reflect current and future coupon rates.
# Securities with purchases pursuant to Rule 144A, under the Securities Act of 1933 and may not be resold subject to that rule except to qualified institutional buyers. These securities have been determined to be liquid under the guidelines established by the Funds' Board of Directors/Trustees.
C Bond may be called prior to maturity date.
P Preferred Stock may be called prior to convertible date.
cc Securities purchased with cash collateral for securities loaned.
W When-issued or delayed delivery security
I Illiquid security
L Loaned security, a portion or all of the security is on loan at December 31, 2006.
* Cost for federal income tax purposes is $313,375,851.
Net unrealized appreciation consists of:
| Gross Unrealized Appreciation | | $ | 38,120,863 | | |
| Gross Unrealized Depreciation | | | (2,405,262 | ) | |
| Net Unrealized Appreciation | | $ | 35,715,601 | | |
VP Strategic Allocation Moderate Open Futures Contracts on December 31, 2006:
Contract
Description | | Number
of
Contracts | | Notional
Market
Value ($) | | Expiration
Date | | Unrealized
Appreciation/
(Depreciation) | |
| Long Contracts | |
| S&P 400 E-Mini | | | 1 | | | | 81,130 | | | 3/16/07 | | $ | (1,322 | ) | |
| S&P 500 | | | 2 | | | | 714,200 | | | 3/15/07 | | | 6,991 | | |
U.S. Treasury
2-Year Note | | | 46 | | | | 9,385,438 | | | 3/30/07 | | | (33,421 | ) | |
U.S. Treasury
5-Year Note | | | 2 | | | | 210,125 | | | 3/30/07 | | | (2,289 | ) | |
U.S. Treasury
10-Year Note | | | 66 | | | | 7,092,938 | | | 3/21/07 | | | (99,249 | ) | |
| | | | | | | | | | | | | $ | (129,290 | ) | |
| Short Contracts | |
90-Day
Eurodollar | | | 59 | | | | (13,965,300 | ) | | 3/19/07 | | $ | 3,849 | | |
U.S. Treasury
Long Bond | | | 45 | | | | (5,014,688 | ) | | 3/21/07 | | | 108,995 | | |
| | | | | | | | | | | | | $ | 112,844 | | |
See Accompanying Notes to Financial Statements
96
TAX INFORMATION (UNAUDITED)
Dividends paid during the year ended December 31, 2006 were as follows:
| Fund Name | | Type | | Per Share Amount | |
| ING VP Index Plus LargeCap Portfolio | |
| Class I | | NII | | $ | 0.1713 | | |
| Class S | | NII | | $ | 0.1506 | | |
| ING VP Index Plus MidCap Portfolio | |
| Class I | | NII | | $ | 0.1159 | | |
| Class S | | NII | | $ | 0.0862 | | |
| All Classes | | STCG | | $ | 0.7359 | | |
| All Classes | | LTCG | | $ | 0.6809 | | |
| ING VP Index Plus SmallCap Portfolio | |
| Class I | | NII | | $ | 0.0697 | | |
| Class S | | NII | | $ | 0.0451 | | |
| All Classes | | STCG | | $ | 0.3631 | | |
| All Classes | | LTCG | | $ | 0.5500 | | |
| Fund Name | | Type | | Per Share Amount | |
| ING VP Strategic Allocation Conservative Portfolio | |
| Class I | | NII | | $ | 0.3541 | | |
| Class S | | NII | | $ | 0.3519 | | |
| All Classes(1) | | STCG | | $ | 0.0632 | | |
| All Classes(1) | | LTCG | | $ | 0.3687 | | |
| ING VP Strategic Allocation Growth Portfolio | |
| Class I | | NII | | $ | 0.2187 | | |
| Class S | | NII | | $ | 0.2139 | | |
| All Classes(1) | | LTCG | | $ | 0.2110 | | |
| ING VP Strategic Allocation Moderate Portfolio | |
| Class I | | NII | | $ | 0.2716 | | |
| Class S | | NII | | $ | 0.2592 | | |
| All Classes(1) | | LTCG | | $ | 0.3209 | | |
NII — Net investment income
STCG — Short-term capital gain
LTCG — Long-term capital gain
(1) Except Class ADV which commenced operations after the distribution occurred.
Of the ordinary distributions made during the year ended December 31, 2006, the following percentages qualify for the dividends received deduction (DRD) available to corporate shareholders:
| ING VP Index Plus LargeCap Portfolio | | | 100.00 | % | |
| ING VP Index Plus MidCap Portfolio | | | 18.16 | % | |
| ING VP Index Plus SmallCap Portfolio | | | 21.52 | % | |
| ING VP Strategic Allocation Conservative Portfolio | | | 19.18 | % | |
| ING VP Strategic Allocation Growth Portfolio | | | 73.06 | % | |
| ING VP Strategic Allocation Moderate Portfolio | | | 45.87 | % | |
Above figures may differ from those cited elsewhere in this report due to differences in the calculation of income and gains under U.S. generally accepted accounting principles (book) purposes and Internal Revenue Service (tax) purposes.
Shareholders are strongly advised to consult their own tax advisers with respect to the tax consequences of their investments in the Portfolios. In January, shareholders, excluding corporate shareholders, receive an IRS 1099-DIV regarding the federal tax status of the dividends and distributions they received in the calendar year.
97
DIRECTOR AND OFFICER INFORMATION (UNAUDITED)
The business and affairs of the Companies are managed under the direction of the Board. A director who is not an interested person of the Companies, as defined in the 1940 Act, is an independent director ("Non-Interested Director"). The Directors of the Companies are listed below. The Statement of Additional Information includes additional information about directors of the Portfolios and is available, without charge, upon request at 1-800-992-0180.
Name, Address
and Age | | Position(s)
held
with the
Companies | | Term of
Office and
Length of
Time
Served(1) | | Principal
Occupation(s)
during the
Past Five Years | | Number of
Portfolios
in Fund
Complex
Overseen by
Director | | Other
Directorships
held by
Director | |
| Non-Interested Directors: | |
|
Albert E. DePrince, Jr.
7337 E. Doubletree Ranch Rd.
Scottsdale, Arizona 85258
Age: 65 | | Director | | June 1998 - Present | | Professor of Economics and Finance, Middle Tennessee State University (August 1991 - Present). | | | 36 | | | President, Academy of Economics and Finance (February 2006 - Present). | |
|
Maria Teresa Fighetti
7337 E. Doubletree Ranch Rd.
Scottsdale, Arizona 85258
Age: 63 | | Director | | April 1994 - Present | | Retired. Formerly, Associate Commissioner/Attorney, New York City Department of Mental Health (June 1973 -October 2002). | | | 36 | | | None | |
|
Sidney Koch
7337 E. Doubletree Ranch Rd.
Scottsdale, Arizona 85258
Age: 71 | | Director | | April 1994 - Present | | Self-Employed Consultant (June 2000 - Present). | | | 36 | | | None | |
|
Dr. Corine T. Norgaard
7337 E. Doubletree Ranch Rd.
Scottsdale, Arizona 85258
Age: 69 | | Director | | June 1991 - Present | | Retired. Formerly, President, Thompson Enterprises (September 2004 - September 2005); and formerly, Dean, Barney School of Business, University of Hartford (August 1996 - June 2004). | | | 36 | | | Member, Board of Directors, Mass Mutual Corporate and Participation Investors (April 1997 - Present); Mass Mutual Premier Series (December 2004 - Present); and Mass Mutual MML Series II (April 2005 - Present). | |
|
Edward T. O'Dell
7337 E. Doubletree Ranch Rd.
Scottsdale, Arizona 85258
Age: 71 | | Director | | June 2002 - Present | | Retired. Formerly, Partner of Goodwin Procter LLP (June 1966 - September 2000). | | | 36 | | | None | |
|
Joseph E. Obermeyer
7337 E. Doubletree Ranch Rd.
Scottsdale, Arizona 85258
Age: 49 | | Director | | January 2003 - Present | | President, Obermeyer & Associates, Inc. (November 1999 - Present). | | | 36 | | | None | |
|
(1) Directors serve until their successors are duly elected and qualified, subject to the Board's retirement policy.
98
DIRECTOR AND OFFICER INFORMATION (UNAUDITED) (CONTINUED)
Name, Address
and Age | | Position(s)
Held with the Companies | | Term of Office and
Length of Time Served(1) | | Principal Occupation(s) during the
Past Five Years | |
| Officers: | |
|
Shaun P. Mathews
7337 E. Doubletree Ranch Rd.
Scottsdale, Arizona 85258
Age: 51 | | President and Chief Executive Officer | | December 2006 - Present | | President and Chief Executive Officer, ING Investments, LLC and ING Funds Services, LLC (December 2006 - Present); and Head of ING USFS Mutual Funds and Investment Products (October 2004 - Present). Formerly, CMO, ING USFS (April 2002 - October 2004); and Head of Rollover/Payout (October 2001 - December 2003). | |
|
Michael J. Roland
7337 E. Doubletree Ranch Rd. Scottsdale, Arizona 85258
Age: 48 | | Executive Vice President | | April 2002 - Present | | Executive Vice President, ING Investments, LLC (December 2001 - Present). Formerly, Chief Compliance Officer, ING Investments, LLC and Directed Services, LLC (October 2004 - December 2005); Chief Financial Officer and Treasurer, ING Investments, LLC (December 2001 - March 2005); and Senior Vice President, ING Investments, LLC (June 1998 - December 2001). | |
|
Stanley D. Vyner
7337 E. Doubletree Ranch Rd. Scottsdale, Arizona 85258
Age: 56 | | Executive Vice President | | March 2002 - Present | | Executive Vice President, ING Investments, LLC (July 2000 - Present), and Chief Investment Risk Officer, ING Investments, LLC (January 2003 - Present). Formerly, Chief Investment Officer of the International Portfolios, ING Investments, LLC (August 2000 - January 2003). | |
|
Joseph M. O'Donnell
7337 E. Doubletree Ranch Rd.
Scottsdale, Arizona 85258
Age: 52 | | Chief Compliance Officer
Executive Vice President | | November 2004 - Present
March 2006 - Present | | Chief Compliance Officer of the ING Funds (November 2004 - Present); ING Investments, LLC and Directed Services, LLC (March 2006 - Present); and Executive Vice President of the ING Funds (March 2006 - Present). Formerly, Vice President, Chief Legal Counsel, Chief Compliance Officer and Secretary of Atlas Securities, Inc., Atlas Advisers, Inc. and Atlas Funds (October 2001 - October 2004); and Chief Operating Officer and General Counsel of Matthews International Capital Management LLC and Vice President and Secretary of Matthews International Funds (August 1999 - May 2001). | |
|
Robert S. Naka
7337 E. Doubletree Ranch Rd. Scottsdale, Arizona 85258
Age: 43 | | Executive Vice President and Chief Operating Officer
Assistant Secretary | | March 2006 - Present
March 2002 - Present | | Executive Vice President and Chief Operating Officer, ING Funds Services, LLC and ING Investments, LLC (March 2006 - Present); and Assistant Secretary, ING Funds Services, LLC (October 2001 - Present). Formerly, Senior Vice President, ING Investments, LLC (August 1999 - March 2006). | |
|
Todd Modic
7337 E. Doubletree Ranch Rd. Scottsdale, Arizona 85258
Age: 39 | | Senior Vice President, Chief/Principal Financial Officer and Assistant Secretary | | March 2005 - Present | | Senior Vice President, ING Funds Services, LLC (April 2005 - Present). Formerly, Vice President, ING Funds Services, LLC (September 2002 - March 2005); and Director of Financial Reporting, ING Investments, LLC (March 2001 - September 2002). | |
|
Kimberly A. Anderson
7337 E. Doubletree Ranch Rd. Scottsdale, Arizona 85258
Age: 42 | | Senior Vice President | | December 2003 - Present | | Senior Vice President, ING Investments, LLC (October 2003 - Present). Formerly, Vice President and Assistant Secretary, ING Investments, LLC (January 2001 - October 2003). | |
|
Ernest J. C'DeBaca
7337 E. Doubletree Ranch Rd. Scottsdale, Arizona 85258
Age: 37 | | Senior Vice President | | June 2006 - Present | | Senior Vice President, ING Funds Services, LLC (April 2006 - Present). Formerly, Counsel, ING Americas, U.S. Legal Services (January 2004 - March 2006); and Attorney-Adviser, U.S. Securities and Exchange Commission (May 2001 - December 2003). | |
|
99
DIRECTOR AND OFFICER INFORMATION (UNAUDITED) (CONTINUED)
Name, Address
and Age | | Position(s)
Held with the Companies | | Term of Office and
Length of Time Served(1) | | Principal Occupation(s) during the
Past Five Years | |
Robert Terris
7337 E. Doubletree Ranch Rd. Scottsdale, Arizona 85258
Age: 36 | | Senior Vice President | | June 2006 - Present | | Senior Vice President of Operations, ING Funds Services, LLC (May 2006 - Present). Formerly, Vice President of Administration, ING Funds Services, LLC (September 2001 - May 2006). | |
|
Robyn L. Ichilov
7337 E. Doubletree Ranch Rd. Scottsdale, Arizona 85258
Age: 39 | | Vice President and Treasurer | | March 2002 - Present | | Vice President and Treasurer, ING Funds Services, LLC (October 2001 - Present) and ING Investments, LLC (August 1997 - Present). | |
|
Lauren D. Bensinger
7337 E. Doubletree Ranch Rd. Scottsdale, Arizona 85258
Age: 52 | | Vice President | | March 2003 - Present | | Vice President and Chief Compliance Officer, ING Funds Distributor, LLC (July 1995 - Present); and Vice President (February 1996 - Present); and Director of Compliance, ING Investments, LLC (October 2004 - Present). Formerly, Chief Compliance Officer, ING Investments, LLC (October 2001 - October 2004). | |
|
Maria M. Anderson
7337 E. Doubletree Ranch Rd. Scottsdale, Arizona 85258
Age: 48 | | Vice President | | September 2004 - Present | | Vice President, ING Funds Services, LLC (September 2004 - Present). Formerly, Assistant Vice President, ING Funds Services, LLC (October 2001 - September 2004); and Manager Fund Accounting and Fund Compliance, ING Investments, LLC (September 1999 - October 2001). | |
|
Kimberly K. Palmer
7337 E. Doubletree Rand Rd.
Scottsdale, Arizona 85258
Age: 49 | | Vice President | | March 2006 - Present | | Vice President, ING Funds Services, LLC (March 2006 - Present). Formerly, Assistant Vice President, ING Funds Services, LLC (August 2004 - March 2006); Manager, Registration Statements, ING Funds Services, LLC (May 2003 - August 2004); Associate Partner, AMVESCAP PLC (October 2000 - May 2003); and Director of Federal Filings and Blue Sky Filings, INVESCO Funds Group, Inc. (March 1994 - May 2003). | |
|
Susan P. Kinens
7337 E. Doubletree Ranch Rd. Scottsdale, Arizona 85258
Age: 30 | | Assistant Vice President | | March 2003 - Present | | Assistant Vice President, ING Funds Services, LLC (December 2002 - Present); and has held various other positions with ING Funds Services, LLC for more than the last five years. | |
|
Theresa K. Kelety
7337 E. Doubletree Ranch Rd.
Scottsdale, Arizona 85258
Age: 43 | | Secretary | | September 2003 - Present | | Counsel, ING Americas, U.S. Legal Services (April 2003 - Present). Formerly, Senior Associate with Shearman & Sterling (February 2000 - April 2003). | |
|
Huey P. Falgout, Jr.
7337 E. Doubletree Ranch Rd.
Scottsdale, Arizona 85258
Age: 43 | | Assistant Secretary | | September 2003 - Present | | Chief Counsel, ING Americas, U.S. Legal Services (September 2003 - Present). Formerly, Counsel, ING Americas, U.S. Legal Services (November 2002 - September 2003); and Associate General Counsel of AIG American General (January 1999 - November 2002). | |
|
(1) The officers hold office until the next annual meeting of the Directors and until their successors have been elected and qualified.
100
ADVISORY CONTRACT APPROVAL DISCUSSION (UNAUDITED)
Board Consideration and Approval of Investment Advisory and Sub-Advisory Agreements
The Investment Company Act of 1940, as amended (the "1940 Act"), provides, in substance, that each investment advisory agreement and sub-advisory agreement for a mutual fund will terminate automatically after the initial term of the agreement (which term may not exceed two years), unless continuation of the agreement is approved annually by the Board of Trustees or Directors, as the case may be (the "Board") of the fund, including a majority of the Trustees/Directors who have no direct or indirect interest in the agreement and who are not "interested persons" of the fund (the "Independent Trustees"). Consistent with this requirement of the 1940 Act, the Board of ING VP Balanced Portfolio, Inc., ING Strategic Allocation Portfolios, Inc., ING GET Fund, ING VP Intermediate Bond Portfolio, ING VP Money Market Portfolio, ING Variable Funds, ING Variable Portfolios, Inc. and ING Series Fund, Inc., with respect to each portfolio series thereof (col lectively, the "Funds") has established a process for considering on an annual basis approval of the continuation of the Investment Management Agreement for each Fund (the "Advisory Agreement") with ING Investments, LLC (the "Adviser") and the sub-advisory agreement for each Fund (collectively, the "Sub-Advisory Agreements") with each sub-adviser of the Funds (the "Sub-Advisers"). Set forth below is a description of the process followed by the Board in considering approval of the continuation of each Advisory and Sub-Advisory Agreement (collectively, the "Agreements"), together with an explanation of many of the factors considered and related conclusions reached by the Board in voting to approve the continuation of each Agreement for an additional one-year period commencing January 1, 2007, followed by specific considerations with respect to each Portfolio covered in this Annual Report (each, a "Portfolio").
Overview of the Review Process
At a meeting of the Board held on December 13, 2006, the Board, including all of the Independent Trustees, voted to approve continuation of each of the existing Advisory and Sub-Advisory Agreements for the Funds. Prior to voting such approvals, the Board received the affirmative recommendation of the Contracts Committee of the Board, which is a Committee of the Board comprised of all of the Independent Trustees and exclusively of the Independent Trustees. The Contracts Committee recommended approval of the Advisory and Sub-Advisory Agreements after completing an extensive review of information requested by the Committee from the Adviser and each Sub-Adviser, including the following: (1) comparative performance data for each Fund for various time periods; (2) comparative data regarding management fees, including data regarding the fees charged by the Adviser and Sub-Advisers for managing other mutual funds and institutional accounts using inv estment strategies and techniques similar to those used in managing the Funds; (3) comparative data regarding the total expenses of each Fund; (4) copies of each form of Advisory Agreement and Sub-Advisory Agreement; (5) copies of the codes of ethics of the Adviser and each Sub-Adviser, together with information relating to the manner in which each code is administered; (6) financial statements of the Adviser and each Sub-Adviser; (7) profitability analyses for the Adviser and each Sub-Adviser with respect to each Fund, and all Funds as a group; (8) descriptions of the qualifications of the investment personnel responsible for managing each Fund, their compensation and their responsibilities with respect to managing other accounts or mutual funds; (9) descriptions of the services provided to the Funds, including the investment strategies and techniques used by each Sub-Adviser in managing the Funds; (10) data relating to portfolio turnover and brokerage practices, including practices with respect to the acqu isition of research through "soft dollar" benefits received in connection with the Funds' brokerage; (11) data comparing the performance of certain Funds against "static portfolios" of the Funds over various time periods; (12) descriptions of the policies and procedures of the various service providers of the Funds for protecting the privacy of shareholder information; (13) information relating to projected sales and redemptions of Fund shares and business plans relating to the Adviser's mutual fund platform; (14) descriptions of the business continuity and disaster recovery plans of the Adviser and each Sub-Adviser; (15) descriptions of various compliance programs of the Adviser and Sub-Advisers, including the Adviser's programs for monitoring and enforcing compliance with the Funds' policies with respect to market-timing, late trading and selective portfolio disclosure; (16) independent reports analyzing the quality of the trade execution services performed by Sub-Advisers for the Funds; and (17) other inf ormation relevant to an evaluation of the nature, extent and quality of the services provided by the Adviser and each Sub-Adviser in response to a series of detailed questions posed by independent legal counsel on behalf of the Independent Trustees.
The Contracts Committee began the formal review process in July 2006 when it met separately with independent legal counsel to review the information to be requested from management and the methodology to be used in
101
ADVISORY CONTRACT APPROVAL DISCUSSION (UNAUDITED) (CONTINUED)
determining the selected peer groups for comparing performance and expenses. The Contracts Committee then held meetings on October 25 and 26, 2006 and December 12, 2006, during which the Independent Trustees, meeting separately with independent legal counsel, reviewed and evaluated the information described above. As part of the review process, the Contracts Committee also met with representatives from the Adviser and the Sub-Advisers to discuss the information provided to the Committee. The Contracts Committee also considered information that had been provided by the Adviser and Sub-Advisers throughout the year at other meetings of the Contracts Committee, the Audit Committee, the Compliance Committee and the full Board.
The Independent Trustees were assisted by Goodwin Procter LLP, their independent legal counsel, throughout the contract review process. The Independent Trustees relied upon the advice of such counsel and their own business judgment in determining the material factors to be considered in evaluating each Advisory and Sub-Advisory Agreement and the weight to be given to each such factor. The conclusions reached by the Independent Trustees were based on a comprehensive evaluation of all of the information provided and were not the result of any one factor. Moreover, each Independent Trustee may have afforded different weight to the various factors in reaching his or her conclusions with respect to each Advisory and Sub-Advisory Agreement.
Nature, Extent and Quality of Services
In considering whether to approve the Advisory and Sub-Advisory Agreements for the Funds for the year commencing January 1, 2007, the Board evaluated the nature, extent and quality of services provided to the Funds by the Adviser and Sub-Advisers. The Board considered the investment management and related services provided by the Adviser and Sub-Advisers, including the quantity and quality of the resources available to provide such services. Among other things, the Board considered the qualifications of the individuals responsible for performing various investment related services. With respect to Funds sub-advised by an affiliate of the Adviser, the Board also received information regarding the compensation paid by the Sub-Adviser to attract and retain individuals to perform these services on both an absolute basis and relative to amounts paid by others in the investment management industry.
The Board also considered the quality of the compliance programs of the Adviser and each Sub-Adviser, including the manner in which the Adviser and each Sub-Adviser monitor for compliance with the investment policies and restrictions of a Fund and with the Codes of Ethics of the Funds, the Adviser and the Sub-Advisers with respect to personal trading by employees with access to portfolio information. The Board also considered the actions taken by the Adviser and Sub-Advisers to establish and maintain effective disaster recovery and business continuity plans.
The Board considered the actions taken by the Adviser and its affiliated companies to administer the Funds' policies and procedures for voting proxies, valuing the Funds' assets, selective disclosure of portfolio holdings and preventing late-trading and frequent trading of Fund shares. With respect to these and related compliance matters, the Board also considered the responsiveness of the Adviser and its affiliated companies over the course of the past several years to the inquiries of various regulatory authorities.
The Board also took into account the efforts of the Adviser and its affiliated companies to reduce the expenses of the Funds. With respect to those Funds that are sub-advised by an affiliate of the Adviser, the Board specifically noted that, in recent years, the Adviser and its affiliated companies have significantly reduced the Funds' brokerage costs and portfolio turnover rates, as well as the quantity of research acquired through the use of soft dollars from the Funds' brokerage. The Board also noted the efforts of the Adviser to optimize the number of Funds in the ING complex of mutual funds and to standardize the asset management characteristics and policies across the ING mutual fund platform. Consideration was also given to the benefits that shareholders of the Funds realize because the Funds are part of a larger ING family of mutual funds, including, in most cases, the ability of shareholders to exchange or transfer investments withi n the same class of shares among a wide variety of mutual funds without incurring additional sales charges.
The Board concluded that the nature, extent and quality of advisory and related services provided by the Adviser and each of the Sub-Advisers, taken as a whole, are consistent with the terms of the respective Advisory and Sub-Advisory Agreements and justify the fees paid by the Funds for such services.
102
ADVISORY CONTRACT APPROVAL DISCUSSION (UNAUDITED) (CONTINUED)
Fund Performance
The Board reviewed each Fund's investment performance over various time periods on an absolute basis and relative to the performance of (i) one or more appropriate benchmark indexes (such as the S&P 500 Composite Stock Price Index), (ii) a group of similarly managed mutual funds identified by Lipper, Inc. and/or Morningstar, Inc., and (iii) similarly managed mutual funds within a specified peer group based upon a methodology approved by the Contracts Committee (each, a "Selected Peer Group"). The Board reviewed comparative performance data for the one-, three-, five-, and ten-year periods, where applicable, ending June 30, 2006 and September 30, 2006. Summaries of selected portions of the performance information reviewed by the Board, together with the Board's conclusions regarding the performance of each Fund, are set forth below under "Fund-by-Fund Analysis."
Management Fees, Sub-Advisory Fees and Expenses
Consideration was given to the contractual investment advisory fee rates, inclusive of administrative fee rates, payable by the Funds to the Adviser and its affiliated companies (referred to collectively as "management fees") and the contractual sub-advisory fee rates payable by the Adviser to each Sub-Adviser for sub-advisory services. As part of its review, the Board considered each Fund's management fee and total expense ratio, as compared to its Selected Peer Group, both before and after giving effect to any undertaking by the Adviser to waive fees and/or limit the total expenses of a Fund. In addition, the Trustees received information regarding the fees charged by each Sub-Adviser to similarly-managed institutional accounts and other mutual funds, if any, and the comparability (or lack thereof) of the services provided by the Sub-Adviser in managing such accounts and other mutual funds to the services provided in managing the Funds. Wi th respect to the Funds sub-advised by an affiliate of the Adviser, the Board evaluated the reasonableness of the total fees received by the Adviser and its affiliate in the aggregate under the Advisory and Sub-Advisory Agreements. With respect to those Funds sub-advised by a Sub-Adviser that is not affiliated with the Adviser, the Board considered the reasonableness of the fees payable to the Sub-Adviser by the Adviser in light of the ability of the Adviser to negotiate such fees on an arm's-length basis. Summaries of selected portions of the fee and expense information reviewed are set forth below under "Fund-by-Fund Analysis." After reviewing the foregoing information, and in light of the nature, extent and quality of the services provided by the Adviser and each Sub-Adviser, the Board concluded with respect to each Fund that the management fee charged to the Fund for advisory, sub-advisory and related services is fair and reasonable and that the total expense ratio of the Fund is reasonable.
Profitability
The Board considered information relating to revenues, expenses, and profits realized by the Adviser and each Sub-Adviser attributable to performing advisory, sub-advisory and administrative services for the Funds. With respect to Funds sub-advised by an unaffiliated Sub-Adviser, the Board did not consider the profitability of the Sub-Adviser to be a material factor because the Board believes that the Adviser negotiates sub-advisory fees with the unaffiliated Sub-Adviser on an arm's-length basis. The Board reviewed profitability data for the Adviser and its affiliated companies, including the distributor of the Funds, relating to (i) each Fund separately, (ii) all Funds as a group, (iii) all "retail" Funds as a group, and (iv) all variable insurance product Funds as a group, in each case for the one-year periods ended December 31, 2005 and December 31, 2004 and the nine-month period ended September 30, 2006. With respect to the Adviser and i ts affiliates, such information was prepared in accordance with a methodology approved by the Contracts Committee. The Board considered the profitability of the Adviser and its affiliated companies attributable to managing and operating each Fund both with and without the profitability of the distributor of the Funds and both before and after giving effect to any expenses incurred by the Adviser or any affiliated company in making revenue sharing or other payments to third parties, including affiliated insurance companies, for distribution and administrative services. With respect to Funds sub-advised by an affiliate of the Adviser, the Board considered the total profits derived by the Adviser and its affiliate in the aggregate attributable to managing and operating each Fund. The Board also considered other direct or indirect benefits that the Adviser and Sub-Advisers, and any affiliated companies thereof, derive from their relationships with the Funds, including the receipt by ING U.S. Financial Services, an affiliate of the Adviser, of fees relating to the offering of bundled financial products, such as annuity contracts, and the receipt by Sub-Advisers of "soft dollar" benefits from the Funds' brokerage. The Board concluded that, in light of the nature, extent and quality
103
ADVISORY CONTRACT APPROVAL DISCUSSION (UNAUDITED) (CONTINUED)
of the services provided, the profits realized by the Adviser and its affiliated companies, taken as a whole, with respect to providing advisory, sub-advisory and administrative services for each Fund are reasonable.
Economies of Scale
In considering the reasonableness of the management fee of each Fund, the Board considered the extent to which economies of scale can be expected to be realized by a Fund's Adviser and its affiliated companies, on the one hand, and by the Fund, on the other hand, as the assets of the Fund increase. The Board noted that the advisory fee for certain Funds includes breakpoints such that, as the assets of the Fund increase, the Fund's management fee will decrease as a percentage of the Fund's total assets. The Board recognized the inherent difficulties in measuring precisely the impact of any economies of scale being realized by the Adviser and its affiliated companies with respect to their management of any one or more Funds. In an effort to determine the extent to which economies of scale, if any, will be realized by the Adviser and its affiliated companies as the assets of the Funds grow, the Board considered the profitability data described above relating to the Adviser and its affiliated companies in light of changes in the assets of the Funds over various time periods. The Board noted that the total assets under management of many Funds have decreased during the past several years and concluded that the economies of scale realized by the Adviser and its affiliated companies from managing the Funds have not increased with respect to such Funds. The Board also reviewed information regarding the expense ratio of each Fund in light of changes in the assets of the Funds over various time periods, noting that, as the assets of a Fund increase, the fixed expenses of the Fund, as a percentage of the total assets of the Fund, can be expected to decrease. The Board considered such expense information in light of projections provided by the Adviser with respect to the future growth of assets of the Funds. Based upon the foregoing, the Board concluded that the economies of scale being realized by the Adviser and its affiliated companies do not mandate th e implementation of breakpoints or additional breakpoints, as the case may be, with respect to any Fund at this time.
Fund-by-Fund Analysis
In deciding to approve the continuation of each Advisory and Sub-Advisory Agreement for an additional one-year period beginning January 1, 2007, the Board took into account the specific data and factors identified below relating to the performance, fees and expenses of each Fund and actions being taken by the Adviser or Sub-Adviser, as the case may be, with respect to these matters. Except as otherwise indicated, the performance data described below for each Fund is for periods ended September 30, 2006 and the management fees and expense data described below are as of June 30, 2006.
ING VP Index Plus LargeCap Portfolio
In evaluating the investment performance of ING VP Index Plus LargeCap Portfolio, the Board noted that: (1) the Portfolio outperformed its Morningstar category median for the most recent calendar quarter, year-to-date, three- and ten-year periods, but underperformed for the one- and five-year periods; (2) the Portfolio outperformed its benchmark index for the ten-year period, but underperformed for all other periods presented; and (3) the Portfolio is ranked in its Morningstar category in the second quintile for the most recent calendar quarter and ten-year periods, in the third quintile for the year-to-date, one- and three-year periods and in the fourth quintile for the five-year period. The Board further noted that, in an effort to address concerns regarding the Portfolio's performance, the Sub-Adviser has been refining the models used for identifying and selecting appropriate weightings of securities held by the Portfolio and, in April 20 06, added another portfolio manager with day-to-day responsibility for the Portfolio. The Board also noted that, at the request of the Sub-Adviser, the Board had recently approved a proposal to increase the Portfolio's targeted tracking error to enhance returns and better position the Portfolio relative to its peers. The Board concluded that appropriate actions are being taken to improve performance and that additional time is needed to evaluate the effectiveness of these actions.
In assessing the reasonableness of the management fee and expense ratio for ING VP Index Plus LargeCap Portfolio, the Board noted that the management fee for the Portfolio is below the median and average management fees of the funds in its Selected Peer Group and that the expense ratio for the Portfolio is below the median and average expense ratios of the funds in its Selected Peer Group.
104
ADVISORY CONTRACT APPROVAL DISCUSSION (UNAUDITED) (CONTINUED)
ING VP Index Plus MidCap Portfolio
In evaluating the investment performance of ING VP Index Plus MidCap Portfolio, the Board noted that: (1) the Portfolio outperformed its Morningstar category median for the three-year period, but underperformed for all other periods presented; (2) the Portfolio underperformed its benchmark index for all periods presented; and (3) the Portfolio is ranked in its Morningstar category in the third quintile for the three- and five-year periods and in the fourth quintile for the most recent calendar quarter, year-to-date and one-year periods. The Board further noted that, in an effort to address concerns regarding the Portfolio's performance, the Sub-Adviser has been refining the models used for identifying and selecting appropriate weightings of securities held by the Portfolio and, in April 2006, added another portfolio manager with day-to-day responsibility for the Portfolio. The Board also noted that, at the request of the Sub-Adviser, the Boa rd had recently approved a proposal to increase the Portfolio's targeted tracking error to enhance returns and better position the Portfolio relative to its peers. The Board concluded that appropriate actions are being taken to improve performance and that additional time is needed to evaluate the effectiveness of these actions.
In assessing the reasonableness of the management fee and expense ratio for ING VP Index Plus MidCap Portfolio, the Board noted that the management fee for the Portfolio is equal to the median and is below the average management fees of the funds in its Selected Peer Group and that the expense ratio for the Portfolio is below the median and average expense ratios of the funds in its Selected Peer Group.
ING VP Index Plus SmallCap Portfolio
In evaluating the investment performance of ING VP Index Plus SmallCap Portfolio, the Board noted that: (1) the Portfolio outperformed its Morningstar category median for the three- and five-year periods, but underperformed for the most recent calendar quarter, year-to-date and one-year periods; (2) the Portfolio underperformed its benchmark index for all periods presented; and (3) the Portfolio is ranked in its Morningstar category in the second quintile for the three-year period, in the third quintile for the year-to-date, one-, and five-year periods and in the fourth quintile for the most recent calendar quarter. The Board further noted that, in an effort to address concerns regarding the Portfolio's performance, the Sub-Adviser has been refining the models used for identifying and selecting appropriate weightings of securities held by the Portfolio and, in April 2006, added another portfolio manager with day-to-day responsibility for the Portfolio. The Board also noted that, at the request of the Sub-Adviser, the Board had recently approved a proposal to increase the Portfolio's targeted tracking error to enhance returns and better position the Portfolio relative to its peers. The Board concluded that appropriate actions are being taken to improve performance and that additional time is needed to evaluate the effectiveness of these actions.
In assessing the reasonableness of the management fee and expense ratio for ING VP Index Plus SmallCap Portfolio, the Board noted that the management fee for the Portfolio equals the median and is below the average management fees of the funds in its Selected Peer Group, and that the expense ratio for the Portfolio is below the median and average expense ratios of the funds in its Selected Peer Group.
ING VP Strategic Allocation Conservative Portfolio
In evaluating the investment performance of ING VP Strategic Allocation Conservative Portfolio the Board noted that: (1) the Portfolio outperformed its Morningstar category median for the three-year period, but underperformed for all other periods presented; and (2) the Portfolio underperformed its benchmark index for all periods presented; and (3) the Portfolio is ranked in its Morningstar category in the third quintile for the three-year period and in the fourth quintile for all other periods presented. The Board noted that the co-portfolio manager for the Portfolio was replaced in April 2006 and that the Sub-Adviser has invested additional resources to improve stock screenings and related analyses. The Board concluded that appropriate actions are being taken to improve performance and that additional time is needed to evaluate the effectiveness of these actions.
In assessing the reasonableness of the management fee and expense ratio for ING VP Strategic Allocation Conservative Portfolio, the Board noted that the management fee for the Portfolio is equal to the median and above the average management fees of the funds in its Selected Peer Group, and that the expense ratio for the Portfolio is below the median and average expense ratios of the funds in its Selected Peer Group.
105
ADVISORY CONTRACT APPROVAL DISCUSSION (UNAUDITED) (CONTINUED)
ING VP Strategic Allocation Moderate Portfolio
In evaluating the investment performance of ING VP Strategic Allocation Moderate Portfolio, the Board noted that: (1) the Portfolio outperformed its Morningstar category median for the three- and five-year periods, but underperformed for all other periods presented; (2) the Portfolio underperformed its benchmark index for all periods presented; and (3) the Portfolio is ranked in its Morningstar category in the third quintile for the three- and five-year periods, in the fourth quintile for the most recent calendar quarter and year-to-date period, and in the fifth quintile for the one- and ten-year periods. The Board noted that the co-portfolio manager for the Portfolio was replaced in April 2006 and that the Sub-Adviser has invested additional resources to improve stock screenings and related analyses. The Board concluded that appropriate actions are being taken to improve performance and that additional time is needed to evaluate the effecti veness of these actions.
In assessing the reasonableness of the management fee and expense ratio for ING VP Strategic Allocation Moderate Portfolio, the Board noted that the management fee for the Portfolio is above the median and below the average management fees of the funds in its Selected Peer Group, and that the expense ratio for the Portfolio is below the median and average expense ratios of the funds in its Selected Peer Group.
ING VP Strategic Allocation Growth Portfolio
In evaluating the investment performance of ING VP Strategic Allocation Growth Portfolio, the Board noted that: (1) the Portfolio outperformed its Morningstar category median for the five-year period, but underperformed for all other periods presented; and (2) the Portfolio underperformed its benchmark index for all periods presented; and (3) the Portfolio is ranked in its Morningstar category in the second quintile for the five-year period, in the third quintile for the three-year period, in the fourth quintile for the year-to-date and ten-year periods, and in the fifth quintile for the most recent calendar quarter and one-year period. The Board noted that the co-portfolio manager for the Portfolio was replaced in April 2006 and that the Sub-Adviser has invested additional resources to improve stock screenings and related analyses. The Board concluded that appropriate actions are being taken to improve performance and that additional time i s needed to evaluate the effectiveness of these actions.
In assessing the reasonableness of the management fee and expense ratio for ING VP Strategic Allocation Growth Portfolio, the Board noted that the management fee for the Portfolio is above the median and below the average management fees of the funds in its Selected Peer Group, and that the expense ratio for the Portfolio is equal to the median and below the average expense ratios of the funds in its Selected Peer Group.
106
(THIS PAGE INTENTIONALLY LEFT BLANK)
Investment Adviser
ING Investments, LLC
7337 East Doubletree Ranch Road
Scottsdale, Arizona 85258
Administrator
ING Funds Services, LLC
7337 East Doubletree Ranch Road
Scottsdale, Arizona 85258
Distributor
INF Funds Distributor, LLC
7337 East Doubletree Ranch Road
Scottsdale, Arizona 85258
Transfer Agent
DST Systems, Inc.
P.O. Box 419368
Kansas City, Missouri 64141
Custodian
The Bank of New York
One Wall Street
New York, New York 10286
Independent Registered Public
Accounting Firm
KPMG LLP
99 High Street
Boston, Massachusetts 02110
Legal Counsel
Goodwin Procter LLP
Exchange Place
53 State Street
Boston, Massachusetts 02109
Before investing, carefully consider the investment objectives, risks, charges and expenses of the variable universal life insurance policy or variable annuity contract and the underlying variable investment options. This and other information is contained in the prospectus for the variable universal life policy or variable annuity contract and the underlying variable investment options. Obtain these prospectuses from your agent/registered representative and read them carefully before investing.

VAR-AIP/SAIS
(1206-022607)
Item 2. Code of Ethics.
As of the end of the period covered by this report, Registrant had adopted a code of ethics, as defined in Item 2 of Form N-CSR, that applies to the Registrant’s principal executive officer and principal financial officer. There were no amendments to the Code during the period covered by the report. The Registrant did not grant any waivers, including implicit waivers, from any provisions of the Code during the period covered by this report. The code of ethics is filed herewith pursuant to Item 10(a)(1), Exhibit 99.CODE ETH.
Item 3. Audit Committee Financial Expert.
The Board of Trustees has determined that Corine Norgaard and Joseph Obermeyer are each audit committee financial experts, as defined in Item 3 of Form N-CSR. Ms. Norgaard and Mr. Obermeyer are both “independent” for purposes of Item 3 of Form N-CSR.
Item 4. Principal Accountant Fees and Services.
(a) Audit Fees: The aggregate fees billed for each of the last two fiscal years for professional services rendered by KPMG LLP (“KPMG”), the principal accountant for the audit of the registrant’s annual financial statements, for services that are normally provided by the accountant in connection with statutory and regulatory filings or engagements for those fiscal years were $127,552 for year ended December 31, 2006 and $90,321 for year ended December 31, 2005.
(b) Audit-Related Fees: The aggregate fees billed in each of the last two fiscal years for assurance and related services by KPMG that are reasonably related to the performance of the audit of the registrant’s financial statements and are not reported under paragraph (a) of this Item were $14,540 for year ended December 31, 2006 and $15,200 for year ended December 31, 2005.
(c) Tax Fees: The aggregate fees billed in each of the last two fiscal years for professional services rendered by KPMG for tax compliance, tax advice, and tax planning were $31,320 in the year ended December 31, 2006 and $24,960 in the year ended December 31, 2005. Such services included review of excise distribution calculations (if applicable), preparation of the Funds’ federal, state and excise tax returns, tax services related to mergers and routine consulting.
(d) All Other Fees: The aggregate fees billed in each of the last two fiscal years for products and services provided by KPMG, other than the services reported in paragraphs (a) through (c) of this Item.
None
(e) (1) Audit Committee Pre-Approval Policies and Procedures
2
AUDIT AND NON-AUDIT SERVICES
PRE-APPROVAL POLICY
I. Statement of Principles
Under the Sarbanes-Oxley Act of 2002 (the “Act”), the Audit Committee of the Board of Directors or Trustees (the “Committee”) of the ING Funds (each a “Fund,” collectively, the “Funds”) set out under Paragraph I on Exhibit A to this Audit and Non-Audit Services Pre-Approval Policy (“Policy”) is responsible for the oversight of the work of the Funds’ independent auditors. As part of its responsibilities, the Committee must pre-approve the audit and non-audit services performed by the auditors in order to assure that the provision of these services does not impair the auditors’ independence from the Funds. The Committee has adopted, and the Board has ratified, this Policy, which sets out the procedures and conditions under which the services of the independent auditors may be pre-approved.
Under Securities and Exchange Commission (“SEC”) rules promulgated in accordance with the Act, the Funds’ may establish two different approaches to pre-approving audit and non-audit services. The Committee may approve services without consideration of specific case-by-case services (“general pre-approval”) or it may pre-approve specific services (“specific pre-approval”). The Committee believes that the combination of these approaches contemplated in this Policy results in an effective and efficient method for pre-approving audit and non-audit services to be performed by the Funds’ independent auditors. Under this Policy, services that are not of a type that may receive general pre-approval require specific pre-approval by the Committee. Any proposed services that exceed pre-approved cost levels or budgeted amounts will also require the Committee’s specific pre-approval.
For both types of approval, the Committee considers whether the subject services are consistent with the SEC’s rules on auditor independence and that such services are compatible with maintaining the auditors’ independence. The Committee also considers whether a particular audit firm is in the best position to provide effective and efficient services to the Funds. Reasons that the auditors are in the best position include the auditors’ familiarity with the Funds’ business, personnel, culture, accounting systems, risk profile, and other factors, and whether the services will enhance the Funds’ ability to manage and control risk or improve audit quality. Such factors will be considered as a whole, with no one factor being determinative.
The appendices attached to this Policy describe the audit, audit-related, tax-related, and other services that have the Committee’s general pre-approval. For any service that has been approved through general pre-approval, the general pre-approval will remain in place for a period 12 months from the date of pre-approval, unless the Committee determines that a different period is appropriate. The Committee will annually review and pre-approve the services that may be provided by the independent auditors without specific pre-approval. The Committee will revise the list of services subject to general pre-approval as appropriate. This Policy does not serve as a delegation to Fund management of the Committee’s duty to pre-approve services performed by the Funds’ independent auditors.
3
II. Audit Services
The annual audit services engagement terms and fees are subject to the Committee’s specific pre-approval. Audit services are those services that are normally provided by auditors in connection with statutory and regulatory filings or engagements or those that generally only independent auditors can reasonably provide. They include the Funds’ annual financial statement audit and procedures that the independent auditors must perform in order to form an opinion on the Funds’ financial statements (e.g., information systems and procedural reviews and testing). The Committee will monitor the audit services engagement and approve any changes in terms, conditions or fees deemed by the Committee to be necessary or appropriate.
The Committee may grant general pre-approval to other audit services, such as statutory audits and services associated with SEC registration statements, periodic reports and other documents filed with the SEC or issued in connection with securities offerings.
The Committee has pre-approved the audit services listed on Appendix A. The Committee must specifically approve all audit services not listed on Appendix A.
III. Audit-related Services
Audit-related services are assurance and related services that are reasonably related to the performance of the audit or the review of the Funds’ financial statements or are traditionally performed by the independent auditors. The Committee believes that the provision of audit-related services will not impair the independent auditors’ independence, and therefore may grant pre-approval to audit-related services. Audit-related services include accounting consultations related to accounting, financial reporting or disclosure matters not classified as “audit services;” assistance with understanding and implementing new accounting and financial reporting guidance from rulemaking authorities; agreed-upon or expanded audit procedures relating to accounting and/or billing records required to respond to or comply with financial, accounting or regulatory reporting matters; and assistance with internal control reporting requirements under Form N-SAR or Form N-CSR.
The Committee has pre-approved the audit-related services listed on Appendix B. The Committee must specifically approve all audit-related services not listed on Appendix B.
IV. Tax Services
The Committee believes the independent auditors can provide tax services to the Funds, including tax compliance, tax planning, and tax advice, without compromising the auditors’ independence. Therefore, the Committee may grant general pre-approval with respect to tax services historically provided by the Funds’ independent auditors that do not, in the Committee’s view, impair auditor independence and that are consistent with the SEC’s rules on auditor independence.
The Committee will not grant pre-approval if the independent auditors initially recommends a transaction the sole business purpose of which is tax avoidance and the tax treatment of which may
4
not be supported in the Internal Revenue Code and related regulations. The Committee may consult outside counsel to determine that tax planning and reporting positions are consistent with this Policy.
The Committee has pre-approved the tax-related services listed on Appendix C. The Committee must specifically approve all tax-related services not listed on Appendix C.
V. Other Services
The Committee believes it may grant approval of non-audit services that are permissible services for independent auditors to a Fund. The Committee has determined to grant general pre-approval to other services that it believes are routine and recurring, do not impair auditor independence, and are consistent with SEC rules on auditor independence.
The Committee has pre-approved the non-audit services listed on Appendix D. The Committee must specifically approve all non-audit services not listed on Appendix D.
A list of the SEC’s prohibited non-audit services is attached to this Policy as Appendix E. The SEC’s rules and relevant guidance should be consulted to determine the precise definitions of these impermissible services and the applicability of exceptions to certain of the SEC’s prohibitions.
VI. Pre-approval of Fee levels and Budgeted Amounts
The Committee will annually establish pre-approval fee levels or budgeted amounts for audit, audit-related, tax and non-audit services to be provided to the Funds by the independent auditors. Any proposed services exceeding these levels or amounts require the Committee’s specific pre-approval. The Committee considers fees for audit and non-audit services when deciding whether to pre-approve services. The Committee may determine, for a pre-approval period of 12 months, the appropriate ratio between the total amount of fees for the Fund’s audit, audit-related, and tax services (including fees for services provided to Fund affiliates that are subject to pre-approval), and the total amount of fees for certain permissible non-audit services for the Fund classified as other services (including any such services provided to Fund affiliates that are subject to pre-approval).
VII. Procedures
Requests or applications for services to be provided by the independent auditors will be submitted to management. If management determines that the services do not fall within those services generally pre-approved by the Committee and set out in the appendices to these procedures, management will submit the services to the Committee or its delagee. Any such submission will include a detailed description of the services to be rendered.
Notwithstanding this paragraph, the Committee will, on quarterly basis, receive from the independent auditors a list of services provided to date by the auditors during Pre-Approval Period.
5
VIII. Delegation
The Committee may delegate pre-approval authority to one or more of the Committee’s members. Any member or members to whom such pre-approval authority is delegated must report any pre-approval decisions, including any pre-approved services, to the Committee at its next scheduled meeting. The Committee will identify any member to whom pre-approval authority is delegated in writing. The member will retain such authority for a period of 12 months from the date of pre-approval unless the Committee determines that a different period is appropriate. The period of delegated authority may be terminated by the Committee or at the option of the member.
IX. Additional Requirements
The Committee will take any measures the Committee deems necessary or appropriate to oversee the work of the independent auditors and to assure the auditors’ independence from the Funds. This may include reviewing a formal written statement from the independent auditors delineating all relationships between the auditors and the Funds, consistent with Independence Standards Board No. 1, and discussing with the auditors their methods and procedures for ensuring independence.
Date last approved: December 13, 2005
6
Appendix A
Pre-Approved Audit Services for the Pre-Approval Period January 1, 2006 through December 31, 2006
Service
| | The Fund(s) | | Fee Range |
Statutory audits or financial audits (including tax services associated with audit services) | | ý | | As presented to Audit Committee(1) |
| | | | |
Services associated with SEC registration statements, periodic reports and other documents filed with the SEC or other documents issued in connection with securities offerings (e.g., consents), and assistance in responding to SEC comment letters. | | ý | | Not to exceed $9,300per filing |
| | | | |
Consultations by Fund management with respect to accounting or disclosure treatment of transactions or events and/or the actual or potential effect of final or proposed rules, standards or interpretations by the SEC, Financial Accounting Standards Board, or other regulatory or standard setting bodies. | | ý | | Not to exceed $8,000 during the Pre-Approval Period |
(1) For new Funds launched during the Pre-Approval Period, the fee ranges pre-approved will be the same as those for existing Funds, pro-rated in accordance with inception dates as provided in KPMG’s Proposal or any Engagement Letter covering the period at issue. Fees in the Engagement Letter will be controlling.
7
Appendix B
Pre-Approved Audit-Related Services for the Pre-Approval Period January 1, 2006 through December 31, 2006
Service
| | The
Fund(s) | | Fund Affiliates | | Fee Range |
Services related to Fund mergers (Excluding tax services – See Appendix C for tax services associated with fund mergers)
| | ý | | ý | | Not to exceed $10,000 per merger |
| | | | | | |
Consultations by Fund management with respect to accounting or disclosure treatment of transactions or events and/or the actual or potential effect of final or proposed rules, standards or interpretations by the SEC, Financial Accounting Standards Board, or other regulatory or standard setting bodies. [Note: Under SEC rules some consultations may be “audit” services and others may be “audit-related” services.] | | ý | | | | Not to exceed $5,000 per occurrence during the Pre-Approval Period |
| | | | | | |
Review of the Funds’ semi-annual financial statements | | ý | | | | Not to exceed $2,100 per set of financial statements per fund |
| | | | | | |
Reports to regulatory or government agencies related to the annual engagement | | ý | | | | Up to $5,000 per occurrence during the Pre-Approval Period |
| | | | | | |
Regulatory compliance assistance | | ý | | ý | | Not to exceed $5,000 per quarter |
| | | | | | |
Training courses | | ý | | ý | | Not to exceed $2,000 per course |
8
Appendix C
Pre-Approved Tax Services for the Pre-Approval Period January 1, 2006 through December 31, 2006
Service
| | The Fund(s) | | Fund
Affiliates | | Fee Range |
Preparation of federal and state income tax returns and federal excise tax returns for the Funds including assistance and review with excise tax distributions. | | ý | | | | As presented to Audit Committee(2) |
| | | | | | |
Review of IRC Sections 851(b) and 817(h) diversification testing on a real-time basis | | ý | | | | As presented to Audit Committee(2) |
| | | | | | |
Assistance and advice regarding year-end reporting for 1099’s | | ý | | | | As presented to Audit Committee(2) |
| | | | | | |
Tax assistance and advice regarding statutory, regulatory or administrative developments | | ý | | ý | | Not to exceed $5,000 in aggregate for the Funds or for the Funds’ investment adviser during the Pre-Approval Period |
| | | | | | |
Tax training courses | | ý | | ý | | Not to exceed $2,000 per course during the Pre-Approval Period |
| | | | | | |
Loan Staff Services | | | | ý | | Not to exceed $15,000 during the Pre-Approval Period |
(2) For new Funds launched during the Pre-Approval Period, the fee ranges pre-approved will be the same as those for existing Funds, as provided in KPMG’s Proposal or any Engagement Letter covering the period at issue. Fees in the Engagement Letter will be controlling.
9
Service
| | The Fund(s) | | Fund
Affiliates | | Fee Range |
Tax services associated with Fund mergers | | ý | | ý | | Not to exceed $4,000 per fund per merger during the Pre-Approval Period |
| | | | | | |
Other tax-related assistance and consultation, including, without limitation, assistance in evaluating derivative financial instruments and international tax issues, qualification and distribution issues, and similar routine tax consultations | | ý | | | | Not to exceed $50,000 during the Pre-Approval Period |
10
Appendix D
Pre-Approved Other Services for the Pre-Approval Period January 1, 2006 through December 31, 2006
Service
| | The Fund(s) | | Fund Affiliates | | Fee Range |
Agreed-upon procedures for Class B share 12b-1 programs | | | | ý | | Not to exceed $50,000 during the Pre-Approval Period |
| | | | | | |
Security counts performed pursuant to Rule 17f-2 of the 1940 Act (i.e., counts for Funds holding securities with affiliated sub-custodians) | | ý | | | | Not to exceed $5,000 per Fund during the Pre-Approval Period |
11
Appendix E
Prohibited Non-Audit Services
Dated: 2006
• Bookkeeping or other services related to the accounting records or financial statements of the Funds
• Financial information systems design and implementation
• Appraisal or valuation services, fairness opinions, or contribution-in-kind reports
• Actuarial services
• Internal audit outsourcing services
• Management functions
• Human resources
• Broker-dealer, investment adviser, or investment banking services
• Legal services
• Expert services unrelated to the audit
• Any other service that the Public Company Accounting Oversight Board determines, by regulation, is impermissible
12
(e) (2) Percentage of services referred to in 4(b) — (4)(d) that were approved by the audit committee
100% of the services were approved by the audit committee.
(f) Percentage of hours expended attributable to work performed by other than full time employees of KPMG if greater than 50%.
Not applicable.
(g) Non-Audit Fees: The non-audit fees billed by the registrant’s accountant for services rendered to the registrant, and rendered to the registrant’s investment adviser, and any entity controlling, controlled by, or under common control with the adviser that provides ongoing services to the registrant for each of the last two fiscal years of the registrant were $833,370 for year ended December 31, 2006 and $301,599 for year ended December 31, 2005.
(h) Principal Accountants Independence: The Registrant’s Audit committee has considered whether the provision of non-audit services that were rendered to the registrant’s investment adviser and any entity controlling, controlled by, or under common control with the investment adviser that provides ongoing services to the registrant that were not pre-approved pursuant to Rule 2-01(c)(7)(ii) of Regulation S-X is compatible with maintaining KPMG’s independence.
Item 5. Audit Committee of Listed Registrants.
Not applicable.
Item 6. Schedule of Investments
Schedule is included as part of the report to shareholders filed under Item 1 of this Form.
Item 7. Disclosure of Proxy Voting Policies and Procedures for Closed-End Management Investment Companies.
Not applicable.
Item 8. Portfolio Managers of Closed-End Management Investment Companies.
Not applicable.
Item 9. Purchases of Equity Securities by Closed-End Management Investment Company and Affiliated Purchasers
Not applicable.
Item 10. Submission of Matters to a Vote of Security Holders.
The Nominating Committee operates pursuant to a Charter approved by the Board. The primary purpose of the Nominating Committee is to consider, evaluate and make recommendations to the Board with respect to the nomination and selection of Independent Trustees. In evaluating candidates, the Nominating Committee may consider a variety of factors, but specific qualifications of candidates for Board membership will be based on the needs of the Board at the time of nomination.
The Nominating Committee is willing to consider nominations received from shareholders and shall assess shareholder nominees in the same manner as it reviews nominees it identifies. A shareholder nominee for director should be submitted in writing to the Fund’s Secretary. Any such shareholder nomination should include sufficient background information concerning the candidate and should be received in a timely manner. At a minimum, the following information as to each individual proposed for nomination as director should be included: the individual’s written consent to be named in the proxy statement as a nominee (if nominated) and to serve as a director (if elected), and all information relating to such individual that is required to be disclosed in a solicitation of proxies for election of directors, or is otherwise required, in each case under applicable federal securities laws, rules and regulations.
The Secretary shall submit all nominations received in a timely manner to the Nominating Committee. To be timely, any such submission must be delivered to the Fund’s Secretary not earlier than the 90th day prior to such meeting and not later than the close of business on the later of the 60th day prior to such meeting or the 10th day following the day on which public announcement of the date of the meeting is first made, by either disclosure in a press release or in a document publicly filed by the Fund with the SEC.
In evaluating a candidate for the position of Independent Trustee, including any candidate recommended by shareholders of the Fund, the Nominating Committee shall consider the following: (i) the candidate’s knowledge in matters relating to the mutual fund industry; (ii) any experience possessed by the candidate as a director or senior officer of other public companies; (iii) the candidate’s educational background, reputation for high ethical standards and professional integrity; (iv) any specific financial, technical or other expertise possessed by the candidate, and the extent to which such expertise would complement the Board’s existing mix of skills, core competencies and qualifications; (v) the candidate’s perceived ability to contribute to the ongoing functions of the Board, including the candidate’s ability and commitment to attend meetings regularly and work collaboratively with other members of the Board; (vi) the candidate’s ability to qualify as an Independent Trustee for purposes of the 1940 Act; and (vii) such other factors as the Committee determines to be relevant in light of the existing composition of the Board and any anticipated vacancies. Prior to making a final recommendation to the Board, the Committee shall conduct personal interviews with those candidates it concludes are the most qualified candidates.
13
Item 11. Controls and Procedures.
(a) Based on our evaluation conducted within 90 days of the filing date, hereof, the design and operation of the registrant’s disclosure controls and procedures are effective to ensure that material information relating to the registrant is made known to the certifying officers by others within the appropriate entities, particularly during the period in which Forms N-CSR are being prepared, and the registrant’s disclosure controls and procedures allow timely preparation and review of the information for the registrant’s Form N-CSR and the officer certifications of such Form N-CSR.
(b) There were no significant changes in the registrant’s internal controls that occurred during the second fiscal quarter of the period covered by this report that has materially affected, or is reasonably likely to materially affect, the registrant’s internal control over financial reporting.
Item 12. Exhibits.
(a)(1) | | Code of Ethics pursuant to Item 2 of Form N-CSR is filed and attached hereto as EX-99.CODE ETH. |
| | |
| | |
(a)(2) | | A separate certification for each principal executive officer and principal financial officer of the registrant as required by Rule 30a-2 under the Act (17 CFR 270.30a-2) is attached hereto as EX-99.CERT. |
| | |
(b) | | The officer certifications required by Section 906 of the Sarbanes-Oxley Act of 2002 are attached hereto as EX-99.906CERT |
| | |
(3) | | Not applicable. |
| | |
14
SIGNATURES
Pursuant to the requirements of the Securities Exchange Act of 1934 and the Investment Company Act of 1940, the registrant has duly caused this report to be signed on its behalf by the undersigned, thereunto duly authorized.
(Registrant): ING VP Variable Portfolios, Inc.
By | /s/ Shaun P. Mathews |
| Shaun P. Mathews |
| President and Chief Executive Officer |
Date: March 8, 2007
Pursuant to the requirements of the Securities Exchange Act of 1934 and the Investment Company Act of 1940, this report has been signed below by the following persons on behalf of the registrant and in the capacities and on the dates indicated.
By | /s/ Shaun P. Mathews |
| Shaun P. Mathews |
| President and Chief Executive Officer |
Date: March 8, 2007
By | /s/ Todd Modic |
| Todd Modic |
| Senior Vice President and Chief Financial Officer |
Date: March 8, 2007
15