UNITED STATES
SECURITIES AND EXCHANGE COMMISSION
Washington, D.C. 20549
FORM N-CSR
CERTIFIED SHAREHOLDER REPORT OF REGISTERED
MANAGEMENT INVESTMENT COMPANIES
Investment Company Act file number 811-07739
Harding, Loevner Funds, Inc.
(Exact name of registrant as specified in charter)
400 Crossing Boulevard
Fourth Floor
Bridgewater, NJ 08807
(Address of principal executive offices) (Zip code)
Owen T. Meacham
The Northern Trust Company
50 South LaSalle Street
Chicago, IL 60603
With a copy to:
Stephen H. Bier, Esq.
Dechert LLP
1095 Avenue of the Americas
New York, NY 10036
(Name and address of agent for service)
Registrant’s telephone number, including area code: (877) 435-8105
Date of fiscal year end: 10/31
Date of reporting period: 04/30/2014
Item 1. Reports to Stockholders.
About the Adviser
Harding Loevner Funds
Global equity investing for institutions is Harding Loevner’s exclusive focus. Through Harding Loevner Funds it offers five distinct global strategies based on its quality-and-growth investment philosophy. It seeks to purchase shares of growing, financially strong, well-managed companies at favorable prices. Harding Loevner manages each of the Funds’ Portfolios according to a disciplined, research-based investment process. It identifies companies with sustainable competitive advantages and assesses the durability of their earnings growth by conducting in-depth fundamental research into global industries. In constructing portfolios, Harding Loevner diversifies carefully to limit risk.
Receive Investor Materials Electronically
Shareholders may sign up for electronic delivery of investor materials. By doing so, you will receive the information faster and help us reduce the impact on the environment of providing these materials. To enroll in electronic delivery,
| | 1. | Go to http://www.icsdelivery.com |
| | 2. | Select the first letter of your brokerage firm’s name. |
| | 3. | From the list that follows, select your brokerage firm. If your brokerage firm is not listed, electronic delivery may not be available. Please contact your brokerage firm. |
| | 4. | Complete the information requested, including the e-mail address where you would like to receive notifications for electronic documents. |
Your information will be kept confidential and will not be used for any purpose other than electronic delivery. If you change your mind, you can cancel electronic delivery at any time and revert to physical delivery of your materials. Just go to http://www.icsdeliv-ery.com, perform the first three steps above, and follow the instructions for cancelling electronic delivery. If you have any questions, please contact your brokerage firm.
Table of Contents
| | |
Harding, Loevner Funds, Inc. c/o Northern Trust Attn: Funds Center C5S 801 South Canal Street Chicago, IL 60607 Phone: (877) 435-8105 Fax: (312) 267-3657 www.HardingLoevnerFunds.com | | Must be preceded or accompanied by a current Prospectus. Quasar Distributors, LLC, Distributor |
Global Equity Portfolio
Portfolio Managers
| | |

| | from left: Peter Baughan, CFA Co-Lead Portfolio Manager Ferrill Roll, CFA Co-Lead Portfolio Manager Alexander Walsh, CFA Portfolio Manager |
Performance Summary
The Global Equity Portfolio – Institutional Class rose 4.68% and the Advisor Class gained 4.54% (net of fees and expenses) in the six-month period ended April 30, 2014. The Portfolio’s benchmark, the MSCI All Country World Index, rose 5.28% (net of source taxes).
Market Review
Thanks to solid gains in the US and in Europe, equity markets delivered positive returns in the six months ended April 30, 2014, despite the declines experienced by Japanese and Emerging Market (EM) stocks. In doing so, markets had to overcome a sharp correction in January sparked by anxieties in a number of EMs and a tempering of optimism about the economic recovery in the US, Europe, and Japan. A second, less severe correction occurred in March, with Russia’s move to annex Crimea causing investors to rethink their risk appetites in an interconnected world at the same time as US economic statistics were reflecting the effects (however temporary) of a harsh and long-lasting winter.
Europe led global markets, with Energy, Financials, and Utilities performing well. The peripheral European Monetary Union (EMU) markets of Italy, Ireland, Spain, and Portugal posted double-digit returns in US dollars, with Greece (now classified as an EM) managing to issue its first new bonds to the private market in over three years. Banks on the continent continue to slowly rebuild their capital through retained earnings and some equity issuance, and a number of banks took large write-downs to clear the decks of accumulated losses, with markets reacting well to the recognition of the reality that this implied. Cutting across sectors, companies with significant revenue exposure to troubled developing economies often lagged, with a number of multinational companies warning of currency translation effects hampering their earnings.
In the US, market and media pundits not crowing over the teething problems of ObamaCare’s launch were focused on incoming US Federal Reserve Chair Janet Yellen’s first public appearances, in the hope of reading the tea leaves on any change of course in US monetary policy. As usual, they were disappointed. Apart from wobbles on delivery, there was no change signaled: US interest rates will remain lower for longer than in most recoveries, but—at some indeterminate pace—the Fed intends to continue withdrawing its extraordinary monetary stimulus. But that day was not hastened by any economic data in the first calendar quarter, with the severe and long-lasting winter weather dampening economic activity for the moment, giving the more deflation-minded bond investors something to cheer about. Long-term bond yields fell in the period, causing bonds to outperform stocks. The slower pace of recovery and falling inflation pressures, while hampering the revenue growth of most businesses, offered space for those companies with very high growth to be all the more hotly sought after by optimistic,
momentum-following investors—at least until a correction when spring arrived, as biotechnology and internet-related companies, among other high-growers, saw their shares decline in favor of the discounted shares of EM and cyclical businesses. Overall, the US market return was just slightly behind that of Europe ex-EMU and the euro zone, and well ahead of the Index.
Japanese stocks declined in the half year, with investors wary of the negative effects of the impending consumption tax hike, and skeptical about the further impetus of Prime Minister Shinzo Abe’s “Three Arrows” program. Financials, specifically real estate, stocks performed poorly, even as inflation “surprises” accelerated with no likelihood of a policy reversal. The yen, perversely, strengthened versus the dollar, against the desires of Mr. Abe and in spite of the prior “success” in generating a bit of inflation. Strong performance in Australia kept Pacific ex-Japan markets in positive territory, though Hong Kong and Singapore suffered from their linkages to the mainland Chinese economy and its shrinking trade and capital flows.
The largest EMs continued to struggle, with three out of the five “BRICS” (Brazil, Russia, India, China) suffering declines in the period. Chinese stocks reacted to slowing growth, while Brazil declined on related commodity export worries and in reaction to government meddling in the economy. Russian stocks fell hard, down 23% in US dollar terms, on fears that its intervention in Ukraine threatens both its economic growth and its attractiveness to overseas investment. Turkey also suffered from continuing turmoil in its markets and currency ahead of its August elections, which are seen as a referendum on the policies and personal conduct of Prime Minister Recep Tayyip Erdogan. In contrast, India began rebounding with the appointment of Raghuram Rajan as governor of the Reserve Bank of India. Rajan, who hails from the faculty of the University of Chica-go, has wasted little time in tackling both the weakness of the rupee and stubborn inflation with creative measures and strong rhetoric.
The best-performing sectors in the period were Health Care, Utilities, Information Technology (IT), and Energy—the latter reflecting the threats to supply from both Western sanctions against Russia and further government expropriation elsewhere (as seen in Egypt). Both Health Care and IT benefited from having a large share of the fastest-growing companies globally, as well as a large revenue exposure to the US, which seemed the least undesirable home for business in a world filled with rising threats. In contrast, Consumer Discretionary and Telecom Services were the worst performers.
Style effects were a factor, with “value” indices outperforming “growth” indices in many markets in Europe and especially in the US, where the effect was significant. Quality effects, however, were very slight. Currency played little role in developed market returns, and although the movement in EM currencies was large in some cases, there were offsetting changes in both directions.
Performance Attribution
While our sector emphasis had neutral effects, the Portfolio suffered from poor stock selection in the Consumer sectors, including Coach, which continues to struggle with competition, and Unicharm, hampered by over-optimistic growth expectations in China, as well as in IT, where eBay, Informatica, and Keyence each lagged the broader sector index. These were partially offset by good stocks that included Botox producer Allergan, which rose on a takeover bid from Valeant; Shire, which benefited from
1
Institutional Class HLMVX
Advisor Class HLMGX
| | | | | | | | | | | | | | | | | | | | | | | | | | | | | | | | | | | | | | | | | | | | |
| Performance | |
| Average Annualized Total Returns (%) | | | | |
| at March 31, 2014 | | | | | | at April 30, 2014 | | | | |
| | | | | | | | | | | | |
| | | Inception
Date | | | 1 year | | | 3 years | | | 5 years | | | 10 years | | | Since
Inception* | | | 1 year | | | 3 years | | | 5 years | | | 10 years | | | Since
Inception* | |
Global Equity Portfolio – Inst. Class | | | 11/3/09 | | | | 15.15 | | | | 8.52 | | | | – | | | | – | | | | 10.85 | | | | 13.59 | | | | 6.91 | | | | – | | | | – | | | | 10.66 | |
| | | | | | | | | | | | |
Global Equity Portfolio – Advisor Class | | | 12/1/96 | | | | 14.80 | | | | 8.24 | | | | 17.09 | | | | 7.97 | | | | 6.67 | | | | 13.29 | | | | 6.61 | | | | 14.75 | | | | 8.34 | | | | 6.64 | |
| | | | | | | | | | | | |
MSCI All Country World Index† | | | | | | | 16.58 | | | | 8.56 | | | | 17.81 | | | | 6.97 | | | | 11.20 | | | | 14.42 | | | | 7.45 | | | | 15.43 | | | | 7.33 | | | | 11.22 | |
*The since inception return of the MSCI All Country World Index is since 11/3/09; †The inception date of the Index is 1/1/01.
Performance data quoted represent past performance; past performance does not guarantee future results. The investment return and principal value of an investment will fluctuate so that an investor’s shares, when redeemed, may be worth more or less than their original cost. Current performance of the Portfolio may be lower or higher than the performance quoted. Performance data current to the most recent month end may be obtained by calling (877) 435-8105 or visiting www.hardingloevnerfunds.com. The Portfolio imposes a 2% redemption fee on shares held 90 days or less. Performance data does not reflect the redemption fee. If reflected, total returns would be reduced.
heightened mergers and acquisitions (M&A) interest in specialty pharmaceuticals; and Wells Fargo and Lazard within Financials, the latter buoyed by the surge in merger activity, where it has enjoyed a premier advisory role.
Viewed geographically, the Portfolio gained modestly from its strong emphasis on US companies and its lighter holdings of EM companies. That benefit was lost, however, by poor stocks in Europe, both within the euro zone and ex-EMU, where IT holdings Dassault Systemes and ARM Holdings were laggards, and Standard Chartered also trailed, echoing the travails of the EMs where it operates. Good performance from US holdings partially offset that European drag, led by, but not limited to, the gain from Allergan mentioned above.
Perspectives
EM shares were particularly volatile in recent months because ugly and unpredictable events occurred in multiple, unrelated locales. Most of these events reinforce the widely held bias that EM stocks ought to trade at discounted valuations relative to developed market stocks because the former have weaker institutions and greater variability of quality of governance. By adding to natural fears of investors, this bias also creates opportunities for those with a long-
| | | | |
| Fund Facts at April 30, 2014 |
Total Net Assets | | | | $740.9 M |
Sales Charge | | | | None |
Number of Holdings | | | | 68 |
Turnover (5 Yr. Average) | | | | 29% |
Redemption Fee | | | | 2% first 90 days |
Dividend Policy | | | | Annual |
| | | Institutional Class | | Advisor Class |
Ticker | | HLMVX | | HLMGX |
CUSIP | | 412295602 | | 412295206 |
Inception Date | | 11/3/2009 | | 12/1/1996 |
Minimum Investment* | | $100,000 | | $5,000 |
Net Expense Ratio | | 0.95%† | | 1.22% |
Gross Expense Ratio | | 0.96% | | 1.22% |
*Lower minimums available through certain brokerage firms. †Shown net of Harding Loevner’s contractual agreement, through February 28, 2015, to waive its management fee to the extent necessary to cap the Portfolio’s total operating expenses. The Net Expense Ratio and the Gross Expense Ratio are as of the Prospectus, dated February 28, 2014.
term perspective by affording the potential for higher expected returns through the mechanism of lower stock prices, assuming all other considerations are unchanged.
The Russian aggression in Crimea and toward Ukraine has been characterized as an EM problem, but we view it more as a developed-world issue. For all the correlated share price movements, Brazil and India, for example, aren’t directly affected by the crisis in Ukraine, except in the minds of investors. But a resurgence of Russian aggression and international intimidation has a lot of implications for Germany and indeed all of Western Europe, which depends on Russia for a significant portion of its energy needs (a key pillar of our investment thesis on Gazprom). The fragility of the global economic recovery has just ratcheted up a couple of notches, it seems to us. The recovery remains dependent on ever-widening free trade and decreasingly fettered movement of capital, but we may be witnessing the potential beginnings of a reversal of those long-term trends. It bears careful attention, especially as many of our Portfolio holdings are long-term enablers and beneficiaries of those trends.
In our opinion, nowhere are the potential returns for long-term investors—that is, the discount rates implied by current prices—higher than for EM Financials. Within developed markets and especially in the euro zone, we’ve avoided Financials with a higher risk of—and priced for—bankruptcy or the stagnation of capital-constrained slow healing. However, it is precisely those banks’ share prices that have bounced dramatically over the past couple of years as bankruptcy or distressed recapitalization has been taken off the table by central bank actions. Yet these banks are not growing their businesses, and we see little prospect of them doing so. We’ve chosen to stick with banks that are substantially higher in quality (in terms of measureable profitability and riskiness) and have grown substantially faster than the average Financials firm, based on our proprietary quality-growth rankings. Our Financials, like our holdings in other sectors, have earned their higher returns on capital—in this case cash flow return on equity (CFROE)—with significantly lower volatility or cyclicality through time than the average company in its sector.
| | | | |
| Variability of CFROE | | | | |
HL Global Equity Financials Holdings | | | 4.2 | % |
All Financials | | | 6.5 | % |
Source: HOLT database, as of May 5, 2014.
Based upon the historical CFROE of Financials holdings within the Global Equity Portfolio versus the global equity universe of Financials in the HOLT database excluding Insurance, Real Estate, and pure asset managers due to non-comparability issues in the metrics chosen.
2
Global Equity Portfolio continued
Nevertheless, hewing to the narrow field of companies more likely to deliver growing profits now and in the future—the more predictable, more profitable, better managed—means that we will endure periods when those seemingly chasing the next short-term turnaround achieve better returns than we do. It’s an uncomfortable position, but one that we have experienced before and, despite having experienced it, have no impulse to change our process to attempt (most likely, in vain) to accommodate it. Our history attests to the possibility of long-term outperformance through identifying businesses with persistently strong business franchises and capable management cultures.
The obvious objection, of course, is about the relative valuation of two investment opportunities. Clearly, the negative sentiment surrounding poor performers, and the positive sentiment surrounding steady performers create opportunities for share price performance that seems at odds with operating performance in the short run. A similar dynamic has carried the value-style outperformance in recent months that we noted earlier.
Several market observers have commented on the apparent narrowing of valuation dispersions within the market; that is, how the market is pricing different kinds of companies. When markets react in fear to negative developments in the economy or the financial system or the political environment, prices of the least stable, most leveraged, or most cyclical companies may be punished the most because investors fear what they don’t yet know. Meanwhile, the prices of the historically most stable, least leveraged companies have tended to be punished less, as investors have greater confidence that the unknowns are fewer, or at the very least, less severe than for the average company. When the economy is seen to be improving and markets have normalized, the prices of all companies have tended to converge to similar valuations, with the rising tide not only lifting all boats, but also erasing the notoriously short memories of investors and speculators of just how bad things can get, while encouraging them to imagine that things can get a whole lot better.
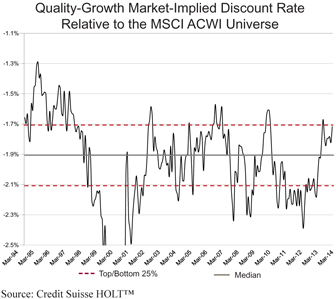
Markets seem to be at that latter point now, with the valuation of high-quality companies at smaller-than-usual premiums to the valuation of lower-quality companies. The chart to the right shows the degree to which high-quality and growth companies (as classified by Credit Suisse HOLT™ research) have traded at a lower discount rate than that for the market over time (a relative lower discount rate implying a higher valuation). On their analysis, high-quality
| | | | | | | | |
| Geographical Weightings (%) at April 30, 2014 | |
| Institutional and Advisor Classes | |
| Country/Region | | | Portfolio | | | | Benchmark | 1 |
Canada | | | 0.0 | | | | 3.8 | |
| | | |
Emerging Markets | | | 9.8 | | | | 10.5 | |
| | | |
Europe EMU | | | 7.8 | | | | 11.7 | |
| | | |
Europe ex-EMU | | | 15.7 | | | | 13.4 | |
| | | |
Japan | | | 7.6 | | | | 7.0 | |
| | | |
Middle East | | | 0.0 | | | | 0.2 | |
| | | |
Pacific ex-Japan | | | 2.7 | | | | 4.5 | |
| | | |
United States | | | 53.5 | | | | 48.9 | |
| | | |
Frontier Markets2 | | | 0.0 | | | | – | |
| | | |
Cash | | | 2.9 | | | | – | |
1MSCI All Country World Index. 2Includes countries with less-developed markets outside the Index.
| | | | | | | | |
| Sector Weightings (%) at April 30, 2014 | |
| Institutional and Advisor Classes | | | | | |
| Sector | | | Portfolio | | | | Benchmark | 1 |
Consumer Discretionary | | | 11.4 | | | | 11.4 | |
| | | |
Consumer Staples | | | 10.8 | | | | 9.8 | |
| | | |
Energy | | | 5.7 | | | | 10.1 | |
| | | |
Financials | | | 18.5 | | | | 21.4 | |
| | | |
Health Care | | | 15.8 | | | | 10.6 | |
| | | |
Industrials | | | 7.7 | | | | 10.8 | |
| | | |
Information Technology | | | 19.5 | | | | 12.6 | |
| | | |
Materials | | | 6.5 | | | | 6.1 | |
| | | |
Telecom Services | | | 1.2 | | | | 3.9 | |
| | | |
Utilities | | | 0.0 | | | | 3.3 | |
| | | |
Cash | | | 2.9 | | | | – | |
1MSCI All Country World Index
growth stocks are as cheap—relative to the market—as they have been at nearly any time over the past twenty years.
Our response to this observation: if the market is valuing all companies nearly the same, regardless of the quality of the business or the likelihood of their achieving sustainable growth, then we’ll have more of both quality and growth, please. We are tempted to think that a bigger prize might be had by emphasizing growth, but that’s likely because our emphasis on quality is already so pronounced. But, on the other hand, the valuation of the very fastest-growing companies in the US—and we’d highlight companies in the biotech industry and those with internet-based business models—have already discounted very rapid growth; there, caution would seem to be warranted.
Portfolio Structure
As always, the Portfolio remains unwavering in its emphasis of high-quality, growing companies.
The IT sector is seeing rapid innovations and disruptions in data storage, transmission, and analysis, spawning a number of new entrants to the industry—many not yet publicly traded—and raising
3
Institutional Class HLMVX
Advisor Class HLMGX
doubts about the anticipated durability of growth and profitability of even yesterday’s challengers, let alone the incumbents in the field. These structural changes led us to sell EMC and Teradata in December, both involved in data storage and analysis, after previously reducing both positions. We sold Amazon.com, which has begun to exhibit signs of increasing capital intensity in its headlong rush to shorten delivery times, along with the likelihood of continued high capital expenditures on new ventures such as the rollout of the AmazonFresh food line. There is a non-trivial risk that the announcement of raising prices for Prime (free delivery) membership is a sign of weak cash generation rather than strong bargaining power over its customers. We also reduced our holding in Google, selling off most of the new, non-voting shares that the company has foisted onto existing shareholders through a stock dividend, which will enable the company to use shares for compensation and for (potentially dilutive) acquisitions without the founder/managers giving up an iota of their voting control—a move in the direction of worse, rather than better, corporate governance in our view.
Still, the Portfolio continues to emphasize companies in the IT sector, where we have invested roughly a fifth of the Portfolio and hold significantly more than the Index weight. We continue to hold ARM Holdings, whose addressable market is expanding beyond the market for mobile devices in which it dominates, demonstrated by a recent design win from Google’s server-farm backbone. In the longer term, its low-power semiconductor chips should find many applications in a much broader array of “smart” appliances. Cognizant Technology, a US IT services firm with strong Indian roots, continues to see robust demand from the financial services and health care companies, as they embrace advances in cloud and mobile technologies to lower costs, improve customer service, and speed data analysis. In addition, we have become more involved in the electronic payments segment, with payments specialist PayPal via eBay, MasterCard (a new holding in 2013), and American Express, giving the Portfolio broad exposure to the ongoing substitution of cash by plastic outside the US and strong high-end spending in the US.
Our emphasis on EM companies increased, with our holdings roughly equal to the 10% Index weight for the first time in more than five years. Within EMs, both share price changes and business development news affected our judgments about companies we owned or follow. We added to Turkey’s Garanti Bank, impressed by comments from its strategic shareholder BBVA that the more it sees, the more it believes that Garanti is “a magnificent franchise1”—confirming our own earlier judgment (not bias!) about the business.
The building crisis in Ukraine, leading eventually to Russia’s incursion into Crimea, crystallized our changing view of Russian gas producer Gazprom, whose bargaining power over its customers in Western Europe has remained very strong. That attraction became moot as tensions rose in and about Ukraine, through whose pipelines flow a majority of Gazprom’s profitable exports; military aggression against—or civil war along—your key distribution route is scarcely a recipe for smooth product flow. Separately, as its share price fell along with the Russian market, we were attracted to Russian food retailer Magnit, whose large investments in logistics have given it a substantial edge over other competitors. We believe this edge should persist for years, capping costs and underpinning growth in a consolidating industry. We also bought a new holding in Yandex, Russia’s dominant internet search engine provider, a company that has turned back repeated competitive runs at its market by Google and others. We believe the 30% decline in this US-listed share affords a cushion of safety for the
| | | | | | | | |
| Ten Largest Holdings at April 30, 2014 | |
| Institutional and Advisor Classes | |
| Company | | Sector | | Country | | | % | |
Wells Fargo | | Financials | | United States | | | 3.4 | |
| | | | |
Schlumberger | | Energy | | United States | | | 3.0 | |
| | | | |
Nestlé | | Cons Staples | | Switzerland | | | 2.8 | |
| | | | |
eBay | | Info Technology | | United States | | | 2.5 | |
| | | | |
Sigma-Aldrich | | Materials | | United States | | | 2.2 | |
| | | | |
Google | | Info Technology | | United States | | | 2.2 | |
| | | | |
Fanuc | | Industrials | | Japan | | | 2.2 | |
| | | | |
Allergan | | Health Care | | United States | | | 2.1 | |
| | | | |
Nike | | Cons Discretionary | | United States | | | 2.1 | |
| | | | |
Microsoft | | Info Technology | | United States | | | 2.0 | |
very real challenges posed by slowing economic growth in Russia as well as heightened political risks.
We increased our emphasis on the Health Care sector, attracted, as always, by the steady growth, high returns, and ample free cash flow generation of many companies in the sector. We bought four new holdings in the period. Elekta, based in Sweden, produces radiation therapy equipment used to treat various forms of cancer. The market for radiation therapy systems has consolidated in recent years into an effective duopoly. Elekta leads in Asia and in most EMs, where radiation therapy is not yet widely used but is gaining adoption rapidly. We also bought Swiss pharma giant Roche Holding, the market leader in cancer care. The company has extended its breast cancer and hematology drug franchises through next-generation medicines that extend patient survival rates meaningfully, which could drive growth well into the next decade. The stock, in our opinion, barely discounts future earnings growth from the existing businesses, and does not reflect the contribution of future products in its research and development (R&D) pipeline.
DaVita HealthCare Partners, another addition, focuses on kidney care and population health management. DaVita provides kidney dialysis services in the US with about one-third market share. DaVita also owns HealthCare Partners (HCP), an independent medical practice association—that is, its doctors are not associated with a hospital group or insurance company—that specializes in spreading “best practice” across its patient populations, in order to achieve superior outcomes. In contrast to the traditional fee-for-service model in US health care, HCP pursues an incentive model where it is paid a fixed amount per patient per year and in return accepts responsibility for patient-related costs. We also bought Essilor International, the world’s largest producer of lenses for eyeglasses, with more than twice the market share of its nearest competitor. We have long admired this company, and so has the market, judging from its longstanding rich valuation. After a period of share price underperformance—where the focus of the market had shifted to the pyrotechnics of new-fangled biotech wunderkinder—we were able to buy the shares at what we believe is a reasonable price.
1 Harding Loevner Analyst meeting with Ángel Cano Fernández, COO of BBVA, First Quarter 2014.
Please read the separate disclosure page for important information, including the risks of investing in the Portfolio.
4
International Equity Portfolio
Portfolio Managers
| | |
 | | from left: Ferrill Roll, CFA Co-Lead Portfolio Manager Alexander Walsh, CFA Co-Lead Portfolio Manager Peter Baughan, CFA Portfolio Manager |
Performance Summary
The International Equity Portfolio – Institutional Class rose 1.64% and the Investor Class gained 1.52% (net of fees and expenses) in the six-month period ended April 30, 2014. The Portfolio’s benchmark, the MSCI All Country World ex-US Index, rose 2.91% (net of source taxes).
Market Review
Thanks to solid gains in Europe, non-US equity markets delivered positive returns in the six months ended April 30, 2014, despite the declines experienced by Japanese and Emerging Market (EM) stocks. In doing so, markets had to overcome a sharp correction in January sparked by anxieties in a number of EMs and a tempering of optimism about the economic recovery in the US, Europe, and Japan. A second, less severe correction occurred in March, with Russia’s move to annex Crimea causing investors to rethink their risk appetites in an interconnected world at the same time as US economic statistics were reflecting the effects (however temporary) of a harsh and long-lasting winter.
Europe ex-EMU led global markets, led by the Health Care and Energy sectors. Euro zone stocks performed almost as well. The peripheral markets of Italy, Ireland, Spain, and Portugal posted double-digit returns in US dollars, with Greece (now classified as an EM) managing to issue its first new sovereign bonds to the private market in over three years. Banks on the continent continue to slowly rebuild their capital through retained earnings and some equity issuance, and a number of banks took large write-downs to clear the decks of accumulated losses, with markets reacting well to the recognition of the reality that this implied. Cutting across sectors, companies with significant revenue exposure to troubled developing economies often lagged, with a number of multinational companies warning of currency translation effects hampering their earnings.
Japanese stocks declined in the half year, with investors wary of the negative effects of the impending consumption tax hike, and skeptical about the further impetus of Prime Minister Shinzo Abe’s “Three Arrows” program. Financials, specifically real estate, stocks performed poorly, even as inflation “surprises” accelerated with no likelihood of a policy reversal. The yen, perversely, strengthened versus the dollar, against the desires of Mr. Abe and in spite of the prior “success” in generating a bit of inflation. Strong performance in Australia kept Pacific ex-Japan markets in positive territory, though Hong Kong and Singapore suffered from their linkages to the mainland Chinese economy and its shrinking trade and capital flows.
The largest EMs continued to struggle, with three out of the five “BRICS” suffering declines in the period. Chinese stocks reacted
to slowing growth, while Brazil declined on related commodity export worries and in reaction to government meddling in the economy. Russian stocks fell hard, down 23% in US dollar terms, on fears that its intervention in Ukraine threatens both its economic growth and its attractiveness to overseas investment. Turkey also suffered from continuing turmoil in its markets and currency ahead of its August elections, which are seen as a referendum on the policies and personal conduct of Prime Minister Recep Tayyip Erdogan. In contrast, India began rebounding with the appointment of Raghuram Rajan as governor of the Reserve Bank of India. Rajan, who hails from the faculty of the University of Chicago, has wasted little time in tackling both the weakness of the rupee and stubborn inflation with creative measures and strong rhetoric.
The best-performing sectors in the period were Health Care, Utilities, and Energy—the latter reflecting the threats to supply from both Western sanctions against Russia and further government expropriation elsewhere (as seen in Egypt). Health Care benefited from having a large revenue exposure to the US, which seemed the least undesirable home for business in a world filled with rising threats abroad. In contrast, Consumer Discretionary, Financials, and Materials were the worst performers.
The Russian aggression in Crimea and toward Ukraine has been characterized as an EM problem, but we view it more as a developed-world issue.
Style effects were a factor, with “value” indices outperforming “growth” indices in many markets in Europe. Quality effects, however, were very slight. Currency played little role in developed market returns, and although the movement in EM currencies was large in some cases, there were offsetting changes in both directions.
Performance Attribution
Portfolio underperformance was mostly from price action in January that did not fully reverse; the effects were expressed as poor stock selection, rather than sector or regional allocation. The Portfolio did not keep up with strong returns in Europe, both in the euro zone and outside it, though our good stocks in EMs partially offset the drag from our European holdings.
We underperformed in Health Care, where the market focus was on M&A and on biotechnology, bypassing most of our holdings. CSL Limited, the Australian blood plasma specialist, and Sysmex, the Japanese blood testing equipment maker, were the biggest laggards, although neither company disappointed on operating results or forecasts. Our large weight in the strong sector went a long way to offset these laggards, and Novo Nordisk also helped. Our Information Technology (IT) holdings under-performed, including UK chip design specialist ARM Holdings, Chinese search engine Baidu, 3-D software provider Dassault Systemes, and Japanese sensor specialist Keyence, although only Dassault experienced a disappointment in earnings.
5
Institutional Class HLMIX
Investor Class HLMNX
| | | | | | | | | | | | | | | | | | | | | | | | | | | | | | | | | | | | | | | | | | | | |
| Performance | |
| Average Annualized Total Returns (%) | | | | |
| at March 31, 2014 | | | | | | | | | | | | | | | | | | | | at April 30, 2014 | | | | |
| | | | | | | | | | | | |
| | | Inception
Date | | | 1 year | | | 3 years | | | 5 years | | | 10 years | | | Since
Inception* | | | 1 year | | | 3 years | | | 5 years | | | 10 years | | | Since
Inception* | |
Intl Equity Portfolio – Institutional Class | | | 5/11/94 | | | | 10.78 | | | | 5.76 | | | | 17.24 | | | | 8.35 | | | | 6.35 | | | | 8.92 | | | | 4.38 | | | | 15.66 | | | | 8.81 | | | | 6.39 | |
| | | | | | | | | | | | |
Intl Equity Portfolio – Investor Class | | | 9/30/05 | | | | 10.41 | | | | 5.38 | | | | 16.85 | | | | – | | | | 6.74 | | | | 8.62 | | | | 4.01 | | | | 15.28 | | | | – | | | | 6.84 | |
| | | | | | | | | | | | |
MSCI ACW ex-US Index† | | | | | | | 12.32 | | | | 4.16 | | | | 15.53 | | | | 7.13 | | | | 5.28 | | | | 9.76 | | | | 2.96 | | | | 12.91 | | | | 7.62 | | | | 5.38 | |
*The since inception return of the MSCI ACW ex-US Index is since 9/30/05. †The inception date of the Index is 1/1/01.
Performance data quoted represent past performance; past performance does not guarantee future results. The investment return and principal value of an investment will fluctuate so that an investor’s shares, when redeemed, may be worth more or less than their original cost. Current performance of the Portfolio may be lower or higher than the performance quoted. Performance data current to the most recent month end may be obtained by calling (877) 435-8105 or visiting www.hardingloevnerfunds.com. The Portfolio imposes a 2% redemption fee on shares held 90 days or less. Performance data does not reflect the redemption fee. If reflected, total returns would be reduced.
Several European holdings with significant revenues derived from developing economies lagged the market after profit warnings over poor EM growth; the worst hit were WPP, Nokian Renkaat, and BG Group, whose production sharing arrangement in Egypt was abrogated, as well as Japan’s Unicharm. Japanese holdings underperformed a weak market, most notably Mitsubishi Estate, the Tokyo office property company whose fortunes are tied to the success of Abenomics and future rent increases. Offsetting these were very strong results from EM-domiciled Financials, including Brazil’s Itau Unibanco, India’s ICICI Bank, and Poland’s Bank Pekao. EM holdings did suffer a small drag from energy producers Gazprom and Petrobras, both sold in the period.
Perspectives
EM shares were particularly volatile in recent months because ugly and unpredictable events occurred in multiple, unrelated locales. Most of these events reinforce the widely held bias that EM stocks ought to trade at discounted valuations relative to developed market stocks because the former have weaker institutions and greater variability of quality of governance. By adding to natural fears of investors, this bias also creates opportunities for those with a long-term perspective by affording the potential for higher expected returns
| | | | |
| Fund Facts at April 30, 2014 |
Total Net Assets | | | | $4,123.2 M |
Sales Charge | | | | None |
Number of Holdings | | | | 53 |
Turnover (5 Yr. Average) | | 20% |
Redemption Fee | | | | 2% first 90 days |
Dividend Policy | | | | Annual |
| | | Institutional Class | | Investor Class |
Ticker | | HLMIX | | HLMNX |
CUSIP | | 412295107 | | 412295503 |
Inception Date | | 5/11/1994 | | 9/30/2005 |
Minimum Investment* | | $100,000 | | $5,000 |
Net Expense Ratio† | | 0.86% | | 1.18% |
Gross Expense Ratio | | 0.87% | | 1.20% |
*Lower minimums available through certain brokerage firms. †The Net Expense Ratio is as of April 30, 2014 as the Portfolio is operating below the contractual agreement, which is in effect until February 28, 2015. The Gross Expense Ratio is as of the Prospectus, dated February 28, 2014.
through the mechanism of lower stock prices, assuming all other considerations are unchanged.
The Russian aggression in Crimea and toward Ukraine has been characterized as an EM problem, but we view it more as a developed-world issue. For all the correlated share price movements, Brazil and India, for example, aren’t directly affected by the crisis in Ukraine, except in the minds of investors. But a resurgence of Russian aggression and international intimidation has a lot of implications for Germany and indeed all of Western Europe, which depends on Russia for a significant portion of its energy needs (a key pillar of our investment thesis on Gazprom). The fragility of the global economic recovery has just ratcheted up a couple of notches, it seems to us. The recovery remains dependent on ever-widening free trade and decreasingly fettered movement of capital, but we may be witnessing the potential beginnings of a reversal of those long-term trends. It bears careful attention, especially as many of our Portfolio holdings are long-term enablers and beneficiaries of those trends.
In our opinion, nowhere are the potential returns for long-term investors—that is, the discount rates implied by current prices—higher than for EM Financials. Within developed markets and especially in the euro zone, we’ve avoided Financials with a higher risk of—and priced for—bankruptcy or the stagnation of capital-constrained slow healing. However, it is precisely those banks’ share prices that have bounced dramatically over the past couple of years as bankruptcy or distressed recapitalization has been taken off the table by central bank actions. Nevertheless, these banks are not growing their businesses, and we see little prospect of them doing so.
Consider one recent example of the glaring contrast between banks that can grow, and those that cannot. We invest in a bank in Poland, Bank Pekao, whose largest shareholder is Unicredit, an Italian bank in which we do not invest. Pekao reported its fourth quarter and full year 2013 earnings in mid-March. It managed to grow its loan book, take its market share of mortgages to a new record high, grow its deposit base even faster, control costs and loan losses, and thus surprise the market, beating consensus estimates by 10%. Its stock, having underperformed European Financials in the past year, barely rose that day in a flat market. Unicredit, on the other hand, posted revenue growth driven solely by trading gains, expense growth that exceeded revenue growth, and a whopping EUR 15 billion loss due to write-offs of bad loans and goodwill (from
6
International Equity Portfolio continued
prior high-priced acquisitions, including that of Pekao, as well as EUR 600 million against Unicredit’s Ukrainian subsidiary). It also announced a hiving off of 17% of its loan book into a “bad bank” and the intention to reduce staff by 8,500 employees. The business clearly is shrinking, and its capital ratios are just above the minimums required by regulators (for now), allowing the bank to say that it did not foresee needing to issue more equity in the near future. Yet Unicredit’s share price, in contrast to the tepid greeting given to Pekao’s sparkling results, enjoyed an eye-popping gain on the day, after having already risen dramatically over the prior twelve months.
The obvious objection to our reading of this tale of two stock price reactions, of course, is that it ignores the initial relative valuation of the two investment opportunities. Clearly, the negative sentiment surrounding the chronic poor performer (Unicredit), and the positive sentiment surrounding the steady performer (Pekao), created the opportunity for the divergent reaction. A similar dynamic has carried the value-style outperformance this quarter that we noted earlier.
We point out this example not to complain about markets or accuse investors of irrationality, but rather to illustrate the challenges we face in implementing our chosen investment process. Hewing to the narrow field of companies more likely to deliver growing profits now and in the future—the more predictable, more profitable, better managed—means that we will endure periods when those seemingly chasing the next short-term turnaround achieve better returns than we do. It’s an uncomfortable position, but one that we have experienced before and, despite having experienced it, have no impulse to change our process to attempt (most likely, in vain) to accommodate it. Our history attests to the possibility of long-term outperformance through identifying businesses with persistently strong business franchises and capable management cultures.
Several market observers have commented on the apparent narrowing of valuation dispersions within the market; that is, how the market is pricing different kinds of companies. When markets react in fear to negative developments in the economy or the financial system or the political environment, prices of the least stable, most leveraged, or most cyclical companies may be punished
| | | | | | | | |
| Geographical Weightings (%) at April 30, 2014 | |
| Institutional and Investor Classes | |
| Country/Region | | | Portfolio | | | | Benchmark | 1 |
Canada | | | 4.3 | | | | 7.3 | |
| | | |
Emerging Markets | | | 16.1 | | | | 20.5 | |
| | | |
Europe EMU | | | 28.6 | | | | 22.9 | |
| | | |
Europe ex-EMU | | | 21.6 | | | | 26.3 | |
| | | |
Japan | | | 13.2 | | | | 13.7 | |
| | | |
Middle East | | | 0.0 | | | | 0.4 | |
| | | |
Pacific ex-Japan | | | 8.9 | | | | 8.9 | |
| | | |
Frontier Markets2 | | | 0.0 | | | | – | |
| | | |
Other3 | | | 4.5 | | | | – | |
| | | |
Cash | | | 2.8 | | | | – | |
1MSCI All Country World ex-US Index. 2Includes countries with less-developed markets outside the Index. 3Includes countries with developed markets outside the Index where some holdings are incorporated.
| | | | | | | | |
| Sector Weightings (%) at April 30, 2014 | |
| Institutional and Investor Classes | |
| Sector | | | Portfolio | | | | Benchmark | 1 |
Consumer Discretionary | | | 9.8 | | | | 10.6 | |
| | | |
Consumer Staples | | | 14.4 | | | | 10.0 | |
| | | |
Energy | | | 7.4 | | | | 9.5 | |
| | | |
Financials | | | 19.0 | | | | 26.6 | |
| | | |
Health Care | | | 13.2 | | | | 8.2 | |
| | | |
Industrials | | | 12.2 | | | | 11.1 | |
| | | |
Information Technology | | | 15.0 | | | | 6.6 | |
| | | |
Materials | | | 3.9 | | | | 8.7 | |
| | | |
Telecom Services | | | 1.3 | | | | 5.2 | |
| | | |
Utilities | | | 1.0 | | | | 3.5 | |
| | | |
Cash | | | 2.8 | | | | – | |
1MSCI All Country World ex-US Index
the most because investors fear what they don’t yet know. Meanwhile, the prices of the historically most stable, least leveraged companies have tended to be punished less, as investors have greater confidence that the unknowns are fewer, or at the very least, less severe than for the average company. When the economy is seen to be improving and markets have normalized, the prices of all companies have tended to converge to similar valuations, with the rising tide not only lifting all boats, but also erasing the notoriously short memories of investors and speculators of just how bad things can get, while encouraging them to imagine that things can get a whole lot better.
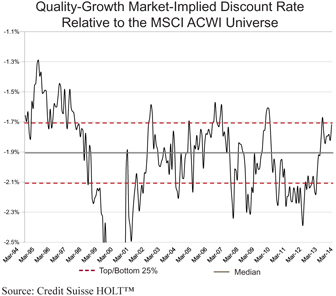
Markets seem to be at that latter point now, with the valuation of high-quality companies at smaller-than-usual premiums to the valuation of lower-quality companies. The chart below shows the degree to which high-quality and growth companies (as classified by Credit Suisse HOLT™ research) have traded at a lower discount rate than that for the market as a whole over time (a relative lower discount rate implying a higher valuation). On their analysis, high-quality growth stocks are as cheap—relative to the market—as they have been at nearly any time over the past twenty years.
7
Institutional Class HLMIX
Investor Class HLMNX
Our response to this observation: if the market is valuing all companies the nearly same, regardless of the quality of the business or the likelihood of their achieving sustainable growth, then we’ll have more of both quality and growth, please. We are tempted to think that a bigger prize might be had by emphasizing growth, but that’s likely because our emphasis on quality is already so pronounced. But, on the other hand, the valuation of the very fastest-growing companies—and we’d highlight companies in the biotech industry and those with internet-based business models—have already discounted very rapid growth; there, caution would seem to be warranted.
Portfolio Structure
As always, the Portfolio remains unwavering in its emphasis on high-quality, growing companies. Our weight in EM companies changed little; having added to several of our EM Financials in prior quarters, we bought nothing new in that segment, keeping intact the heavy emphasis we already had (four EM banks plus three more Financials from Hong Kong and Singapore). Within our other EM holdings, we reacted both to price changes and to company news headlines on business developments, both of which affected our judgments about companies we owned or follow.
Our history attests to the possibility of long-term outperformance through identifying businesses with persistently strong business franchises and capable management cultures.
We sold Gazprom, a company whose poor governance has been slowly improving in recent years, and whose bargaining power over its customers in Western Europe has remained very strong. That latter attraction became moot as tensions rose in and about Ukraine, through whose pipelines flow a majority of Gazprom’s profitable exports; military aggression against, or civil war along, your key distribution route is scarcely a recipe for smooth product flow. Combined with the sharply higher antipathy—including the risk of sanctions—against Russia, the long-term disaffection of Gazprom’s customers has increased, with the likely outcome a worsened bargaining position over time. We also sold our holding in Petrobras, acknowledging the abysmal track record of its management in capitalizing efficiently on its natural gift of dramatically abundant oil reserves, and recognizing the continuing risk of populist government policies hampering the march to correspondingly abundant returns on capital invested.
With part of the sale proceeds, we added to our holding in Imperial Oil, the Canadian subsidiary of ExxonMobil, which has improved its recovery techniques for its huge reserves of oil sands. These improvements will enable it to reduce dramatically the water and energy currently required to extract the oil, an advantage that we believe is not recognized by the stock market. We also bought ENN Energy, a rare investment for us in the Utilities sector. ENN is a Chinese pipeline operator and local gas distributor, delivering natural gas to a broad range of commercial, residential, and transportation (car and bus fleet) customers. We expect rapidly growing use of gas by commercial and industrial users in China as government incentives and penalties aimed at reducing coal-related air pollution become more meaningful.
| | | | | | | | |
| Ten Largest Holdings at April 30, 2014 | |
| Institutional and Investor Classes | |
| Company | | Sector | | Country | | | % | |
SAP | | Info Technology | | Germany | | | 3.6 | |
| | | | |
Nestlé | | Cons Staples | | Switzerland | | | 3.6 | |
| | | | |
Dassault Systemes | | Info Technology | | France | | | 3.3 | |
| | | | |
WPP | | Cons Discretionary | | United Kingdom | | | 3.2 | |
| | | | |
Roche Holding | | Health Care | | Switzerland | | | 3.1 | |
| | | | |
Itau Unibanco | | Financials | | Brazil | | | 3.0 | |
| | | | |
Allianz | | Financials | | Germany | | | 3.0 | |
| | | | |
Air Liquide | | Materials | | France | | | 3.0 | |
| | | | |
Schneider Electric | | Industrials | | France | | | 2.6 | |
| | | | |
AIA Group | | Financials | | Hong Kong | | | 2.6 | |
We reduced our holding in Chinese internet search engine provider Baidu, whose share price nearly doubled over little more than the half a year since we had bought shares. Valuing such rapid growers (the company grew revenues more than 40% in 2013, one of its slowest years ever) is challenging, but taking money off the table seemed the sensible thing to do. We bought a new holding in Sands China, the Macau-based casino business incorporated and listed in Hong Kong and 70% controlled by Las Vegas Sands. Macao is the only legal gaming venue within China’s vast territory, and the growth in visitors to Macao has been astounding. Sands China, Macao’s largest operator, has a decidedly mass-market franchise, which may lead to less-volatile results. Sands should be growing rapidly over the coming years, with planned construction adding 30% to its hotel capacity by 2016.
Our regional allocations have changed little in developed markets as well. Within EMU Europe, we sold Finnish tire maker Nokian Renkaat, whose management warned of falling profits and higher taxes, and whose Russian factory, heretofore a big advantage, will be facing greater competition as others’ plants come on line this year. We bought a new holding in non-voting shares of Fuchs Petrolub, a German maker of specialty lubricants used in all manner of transportation and industrial applications. Fuchs’ track record of innovation and value creation in this highly fragmented market attracts us, and we expect it to continue to invest to build on its 2% share of global lubricant volume, especially through its efforts to expand in Asia and other developing countries where automotive and industrial lubricant use is growing rapidly.
Please read the separate disclosure page for important information, including the risks of investing in the Portfolio.
8
International Small Companies Portfolio
Portfolio Managers
| | |

| | from left: Josephine Lewis Co-Portfolio Manager Jafar Rizvi, CFA Co-Portfolio Manager |
| |
| |
| |
| |
Performance Summary
The International Small Companies Portfolio – Institutional Class gained 7.45% and the Investor Class gained 7.29% (both net of fees and expenses) in the six months ended April 30, 2014. The Portfolio’s benchmark, the MSCI All Country World ex-US Small Cap Index, rose 4.82% (net of source taxes) in this period.
Market Review
All seven regions in the Index had positive returns with the exception of Japan, down 4% and Pacific ex-Japan, which was flat for the period. Small caps in Europe performed particularly well, with numerous countries (including Denmark, France, Italy, Spain, Sweden, and Switzerland) posting returns above 13%; Portugal was at the top with a remarkable gain of 49%. Emerging Markets (EMs) rose 2%. In Russia, small caps fell 26% in reaction to the Ukraine crisis, but the overall impact on the benchmark was minimal as Russia is only about 0.2% of the Index.
Every sector was positive, with Telecom Services providing by far the best returns in the Index. After rising nearly 39% in the fiscal year ended October 31, 2013, Telecom Services was up 18% overall and 34% in the European Monetary Union (EMU) in the past six months. In the large-cap MSCI All Country World ex-US Index, by contrast, the sector rose just 2% in this period. Returns from small companies in the Utilities and Information Technology (IT) sectors were also strong. Consumer Staples, the worst-performing sector in the small-cap Index, still gained 2%.
We believe the surge in performance by Telecom Services is attributable in part to a shifting regulatory environment that has created favorable operating dynamics for smaller companies. Historically, the sector has been dominated by large national companies that were founded with significant backing by their governments to support the massive capital investments necessary to develop their countries’ telecom networks. These companies faced little competition and soon developed into dominant monopolies, with the ability to overcharge for services. However, many governments globally have begun to recognize the need to allow greater competition in telecom markets to lower prices for consumers. As a result, regulators have encouraged competition by mandating that dominant telecom operators open their networks to new telecom companies at favorable prices and by issuing new licenses for additional wireless operators.
The EMU, as an example, passed a set of telecom industry reforms in 2009 with the primary objective of enhancing consumer
rights and increasing competition. These new laws enabled smaller companies to adopt new broadband technologies and wireless services and become true competitors in the telecom market. Some of these businesses have since grown in scale and profitability, to the benefit of their share prices. Similar reforms have also been introduced in Australia, Indonesia, and Mexico among others. The smaller telecom companies that stand to benefit from such regulatory shifts are often more profitable than larger national companies due to their income streams from new technologies and their lower expenses. These newer enterprises do not have legacy costs from older and more expensive technologies used for deploying networks nor do they have huge pension obligations and post-retirement health-care cost burdens on their balance sheets.
Performance Attribution
The Portfolio outperformed the Index in the period, primarily through strong stock selection in the IT sector. Germany’s Bechtle performed well after reporting strong revenue growth and market share gains in its main System House business, which provides consulting and system integration services to corporations. The company also teamed up with IBM to win a $115 million contract to deliver computer servers and services to the European Commission. Consumer Staples was the largest detractor partly due to poor performance by Polish food wholesaler Eurocash. Investors have been disappointed that the company’s 2011 acquisition of the distributor Tradis has not yet provided the cost savings that were originally expected.
We believe the surge in performance by Telecom Services is attributable in part to a shifting regulatory environment that has created favorable operating dynamics for smaller companies.
Viewed geographically, the Portfolio benefited most from our stock picks in European markets outside the euro zone. UK-based engineering firm Kentz outperformed as the company continued to grow new orders and earnings. A portion of this growth was from the acquisition of Valerus, which expanded the company’s operational footprint into US shale. Our exposure to EMs detracted most from performance, due to both weak stock selection and our modest overweight to the region. We had strong returns in Malaysia, but they were offset by losses in Turkey and Poland (Eurocash). In Malaysia, shipyard operator Coastal Contracts performed well as the company won additional contracts from both prior and new customers. In Turkey, insurance firm Anadolu Hayat was negatively impacted by a slowing Turkish economy as well as regulatory pressure to reduce its management fees for its pension fund products—a development we view as a short-term headwind (discussed in more detail later in this letter).
9
Institutional Class HLMRX
Investor Class HLMSX
| | | | | | | | | | | | | | | | | | | | | | | | | | | | | | | | | | | | |
| Performance | | | | | |
| Average Annualized Total Returns (%) | | | | |
| at March 31, 2014 | | | | | | at April 30, 2014 | | | | |
| | | | | | | | | | |
| | | Inception
Date | | | 1 year | | | 3 years | | | 5 years | | | Since
Inception* | | | 1 year | | | 3 years | | | 5 years | | | Since
Inception* | |
Intl Small Companies Portfolio – Institutional Class | | | 6/30/11 | | | | 19.78 | | | | – | | | | – | | | | 9.78 | | | | 17.16 | | | | – | | | | – | | | | 9.48 | |
| | | | | | | | | | |
Intl Small Companies Portfolio – Investor Class | | | 3/26/07 | | | | 19.53 | | | | 9.76 | | | | 25.92 | | | | 7.17 | | | | 16.92 | | | | 7.72 | | | | 22.29 | | | | 7.09 | |
| | | | | | | | | | |
MSCI ACW ex-US Small Cap Index† | | | | | | | 16.25 | | | | 5.50 | | | | 21.17 | | | | 6.14 | | | | 13.00 | | | | 3.79 | | | | 17.40 | | | | 5.90 | |
*The since inception return of the MSCI ACW ex-US Small Cap Index is since 6/30/11. †The inception date of the Index is 6/1/07.
Performance data quoted represent past performance; past performance does not predict future results. The investment return and principal value of an investment will fluctuate so that an investor’s shares, when redeemed, may be worth more or less than their original cost. Current performance of the Portfolio may be lower or higher than the performance quoted. Performance data current to the most recent month end may be obtained by calling (877) 435-8105 or visiting www.hardingloevnerfunds.com. The Portfolio imposes a 2% redemption fee on shares held 90 days or less. Performance data does not reflect the redemption fee. If reflected, total returns would be reduced.
Portfolio Highlights
In a global economy that continues to be characterized by tepid growth in many of the larger markets, corporations are especially keen to enhance profitability by increasing productivity and implementing cost controls. There is a large market therefore for companies that help businesses achieve these goals. We have found a number of attractive opportunities among small companies offering productivity improvements across different industries, including financial services and health care.
Banks, for instance, spend roughly US$32 billion annually worldwide on IT to help manage the complexities of industry regulation, risk management, and competitive analysis. Yet only about 20% of banks use third-party software, often relying instead on complex and inefficient legacy IT systems.1 Switzerland-based Temenos is amongst the industry leaders globally in providing core systems for banks, having invested heavily over the past decade in research and development to differentiate itself as a provider of specialty software tailored to meet the needs of large financial institutions. Its full software suite is capable of supporting the entire banking operation—from
| | | | |
| Fund Facts at April 30, 2014 |
Total Net Assets | | | | $89.7 M |
Sales Charge | | | | None |
Number of Holdings | | | | 97 |
Turnover (5 Yr. Average) | | | | 29% |
Redemption Fee | | | | 2% first 90 days |
Dividend Policy | | | | Annual |
| | | Institutional Class | | Investor Class |
Ticker | | HLMRX | | HLMSX |
CUSIP | | 412295875 | | 412295883 |
Inception Date | | 6/30/2011 | | 3/26/2007 |
Minimum Investment* | | $100,000 | | $5,000 |
Net Expense Ratio† | | 1.30% | | 1.55% |
Gross Expense Ratio | | 1.68% | | 1.99% |
*Lower minimums available through certain brokerage firms. †Shown net of Harding Loevner’s contractual agreement, through February 28, 2015, to waive its management fee to the extent necessary to cap the Portfolio’s total operating expenses. The Net Expense Ratio and the Gross Expense Ratio are as of the Prospectus, dated February 28, 2014.
customer-relationship management at the front end to credit-risk management at the back end. Once implemented, Temenos’ software can generate savings of up to 60%, mostly as a result of lower maintenance and service expenses compared to a bank’s old poorly designed systems.
Despite the benefits offered by its software, Temenos has faced a headwind from banks’ reluctance to abandon their legacy IT systems—no matter how outmoded they may be—because adopting a new system is costly and risky in the short term while the potential reward is some years down the road. To address this issue, Temenos wisely adjusted its strategy in recent years to help reduce banks’ switching costs. For instance, the company reengineered its software in 2012 to allow banks to implement the new system in stages rather than as one complete package, lowering the costs and risks of implementation. It also restructured its distribution strategy by partnering with major IT service companies Cognizant and Accenture, which oversee the implementation process. Temenos’ strong implementation record—on average 50 new financial institutions go live with its software annually—has also helped reduce banks’ fears of switching to a new system. Current customers include UBS, Bank of Shanghai, and SG Hambros. Additionally, Temenos is taking advantage of growth opportunities in EMs, including Africa and China, where legacy systems are not a concern. Finally, the company is moving into new software businesses, such as business intelligence and payments, which should help sustain the company’s growth over the long term.
In Health Care, Italian medical equipment manufacturer DiaSorin increases the productivity of diagnostic laboratories by enabling clinical tests to be performed more cheaply and rapidly. It is a leader in Vitamin D testing kits and is also strong in tests related to infectious diseases and hypertension. By improving the profitability of labs and hospitals, DiaSorin is indirectly helping strengthen the entire health care system.
About 70% of medical decisions are made based on the results of laboratory testing and public and private laboratories can expect increasing demand for their services.2 Yet labs also face dwindling
1 Temenos Analyst Presentation, (February 19, 2014).
2 AdvaMedDx, “A Policy Primer on Diagnostics,” (June 2011).
10
International Small Companies Portfolio continued
resources due to the efforts of governments and private health care facilities to control rising health care costs. In the US, for instance, the recently passed Protecting Access to Medicare Act of 2014 will substantially reduce lab fees for Medicare patients, bringing them in-line with commercial rates. Because labs are being asked to do more with less, they must increase volume and reduce costs to remain profitable.
DiaSorin’s LIAISON-brand products use proprietary technology to automate the testing process while improving accuracy and speed. Late last year, DiaSorin announced a partnership with the large Swiss health care company Roche Holding to combine Roche’s pre-analytical automation equipment with DiaSorin’s LIAISON products to allow high-volume laboratories to automate the entire diagnostic process for an increasing number of tests. We think DiaSorin’s continued investments in research and development should allow it to protect its strong competitive position and maintain its return-on-equity of over 20%.
Portfolio Update
Over the past year we have begun to invest in frontier markets, which we believe offer attractive opportunities in quality small companies that have the potential to achieve long-term growth in revenues and earnings. These markets also offer valuable portfolio diversification benefits. While correlations between equity markets have risen broadly over the years, individual frontier markets continue to move more in response to local news than to global developments.3 In the trailing five years, for example, the correlation of monthly returns between our Portfolio’s benchmark Index and the MSCI Emerging Markets Index was 0.93, while the correlation between the Index and the MSCI Frontier Markets Index was 0.76.4
We made our first foray into frontier markets in February 2013 by investing in the Bank of Georgia, a UK-listed company that is a leading bank in the Republic of Georgia. In March 2014, we purchased Equity Bank, a retail-focused bank serving individual
| | | | | | | | |
| Geographical Weightings (%) at April 30, 2014 | |
| Institutional and Investor Classes | |
| Country/Region | | | Portfolio | | | | Benchmark | 1 |
Canada | | | 0.9 | | | | 8.9 | |
| | | |
Emerging Markets | | | 21.4 | | | | 20.6 | |
| | | |
Europe EMU | | | 24.8 | | | | 16.9 | |
| | | |
Europe ex-EMU | | | 22.1 | | | | 25.7 | |
| | | |
Japan | | | 14.3 | | | | 17.7 | |
| | | |
Middle East | | | 0.0 | | | | 0.7 | |
| | | |
Pacific ex-Japan | | | 10.6 | | | | 9.5 | |
| | | |
Frontier Markets2 | | | 1.5 | | | | – | |
| | | |
Other3 | | | 0.4 | | | | – | |
| | | |
Cash | | | 4.0 | | | | – | |
1MSCI All Country World ex-US Small Cap Index. 2Includes countries with less-developed markets outside the Index. 3Includes countries with developed markets outside the Index where some holdings are incorporated.
| | | | | | | | |
| Sector Weightings (%) at April 30, 2014 | |
| Institutional and Investor Classes | |
| Sector | | | Portfolio | | | | Benchmark | 1 |
Consumer Discretionary | | | 12.7 | | | | 17.8 | |
| | | |
Consumer Staples | | | 10.3 | | | | 5.8 | |
| | | |
Energy | | | 1.8 | | | | 5.9 | |
| | | |
Financials | | | 10.9 | | | | 19.8 | |
| | | |
Health Care | | | 11.7 | | | | 5.6 | |
| | | |
Industrials | | | 27.1 | | | | 20.2 | |
| | | |
Information Technology | | | 12.2 | | | | 10.2 | |
| | | |
Materials | | | 5.0 | | | | 11.2 | |
| | | |
Telecom Services | | | 3.2 | | | | 1.3 | |
| | | |
Utilities | | | 1.1 | | | | 2.2 | |
| | | |
Cash | | | 4.0 | | | | – | |
1MSCI All Country World ex-US Small Cap Index
customers and small-to-medium sized enterprises (SMEs) across Kenya. Equity Bank has the largest distribution network in Kenya—including 200 branches, 5,000 agents, and 600 ATMs—which acts as a considerable barrier to entry for competitors. Through this network the bank has accumulated a vast number of small customers, whose deposits it lends to higher-yielding SMEs. While Equity Bank has 13% market share when measured by total assets, it holds about half of all bank accounts in Kenya. The company’s 30% return on equity is the highest among Kenyan banks, yet its price-to-book ratio is only about 1.5.
We have found a number of attractive opportunities among small companies offering productivity improvements across different industries.
Despite Equity Bank’s success in reducing Kenya’s under-banked population, the country’s credit market remains under-penetrated. Kenya’s loan-to-GDP ratio is only 36%, compared to 68% in Brazil and 183% in the US.5 Equity Bank is addressing this opportunity in part through its “group lending” microfinance scheme. As its microfinance customers grow and become SMEs with established credit histories, Equity Bank is well positioned to provide them higher-margin commercial loans. The company expects to see 300,000 microcredit borrowers become SME borrowers in the next few years. The company is also expanding geographically by replicating its successful Kenyan model in the neighboring markets of Uganda, Tanzania,
3 For an analysis of the rise of cross-asset correlations, see JPMorgan, “Rise of Cross-Asset Correlations: Asset Class Roadmap for Equity Investors,” Global Equity Derivatives & Delta One Strategy, (May 16, 2011).
4 Source: Bloomberg.
5 World Bank Data. http://data.worldbank.org/indicator/FS.AST.PRVT.GD.ZS
11
Institutional Class HLMRX
Investor Class HLMSX
and Rwanda. Currently, Equity Bank’s international business accounts for about 15% of earnings and we expect that proportion will grow.
We funded the purchase of Equity Bank through the sale of Sweden’s Mekonomen, an automobile parts distributer that has experienced a deteriorating industry structure. Prior to 2005 in Sweden, only approved “branded” parts could be used to repair automobiles still under warranty. But in 2005, the government passed reforms allowing cars to be serviced at independent dealers using less-expensive, non-branded parts without threatening the status of an automobile’s warranty. As a low-cost, independent company with a strong distribution network, Mekonomen initially profited significantly from this development. However, dealers of branded parts have responded aggressively to this new competition by selling service contracts to go along with new cars, hurting independent dealers. Mekonomen has also been impacted by a weak European auto market, particularly in Denmark. We had expected the company’s additional service offerings such as insurance to contribute to earnings, but these new services have failed to take off.
While Equity Bank has 13% market share when measured by total assets, it holds about half of all bank accounts in Kenya.
In Turkey, we recently purchased life insurer and pension company Anadolu Hayat, the country’s largest private pension fund manager and the second-largest life insurer behind state-owned Ziraat. We believe that Anadolu stands to benefit over the long-term from Turkey’s economic development and the inculcation of a savings culture amongst the country’s citizens. New regulations are encouraging greater participation in pension funds, including capping management fees, offering tax incentives, and providing matching government contributions. While the management fee caps may lower Anadolu’s margins, the other regulations should support long-term growth in its pension business. Currently, pension assets are only about 4% of Turkey’s GDP compared to the Organisation for Economic Co-operation and Development country average of 36%.6
We believe Anadolu’s life insurance business also has significant growth potential. Life insurance premiums, on average, account for roughly 5% of GDP in developed markets and 0.9% in EMs and frontier markets. But in Turkey life insurance premiums currently are only about 0.2% of GDP, an indication the market is significantly underpenetrated.7 Anadolu receives sales support from its part-owner, IsBank—one of Turkey’s oldest and largest national banks—which sells Anadolu policies alongside the
6 Organisation for Economic Co-operations and Development, StatExtracts (accessed February 14, 2014); http://stats.oecd.org/Index. aspx?DatasetCode=PNNI_NEW.
7 Swiss Re, “World Insurance in 2012: Progressing on the Long and Winding Road to Recovery,” Sigma 3 (2013).
8 Finansinvest Report, Anadolu Hayat Emeklilik, (July 9, 2013).
| | | | | | | | |
| Ten Largest Holdings at April 30, 2014 | |
| Institutional and Investor Classes | |
| Company | | Sector | | Country | | | % | |
Kentz | | Industrials | | UK | | | 2.2 | |
| | | | |
Coastal Contracts | | Industrials | | Malaysia | | | 2.1 | |
| | | | |
YOOX | | Cons Discretionary | | Italy | | | 1.8 | |
| | | | |
Bank of Georgia | | Financials | | UK | | | 1.8 | |
| | | | |
Ezion | | Energy | | Singapore | | | 1.8 | |
| | | | |
Grafton Group | | Industrials | | UK | | | 1.8 | |
| | | | |
RPC Group | | Materials | | UK | | | 1.7 | |
| | | | |
Industrial & Financial Systems | | Info Technology | | Sweden | | | 1.7 | |
| | | | |
Hiday Hidaka | | Cons Discretionary | | Japan | | | 1.7 | |
| | | | |
Rathbone Brothers | | Financials | | UK | | | 1.7 | |
bank’s mortgages and consumer loans. Only about 60% of Is-Bank’s customers have purchased Anadolu policies, while management expects this ratio to improve to 80%, suggesting continued favorable prospects for cross-selling.8
Finally, during this period we adjusted our exposure to Telecom Services, a sector that currently represents about 3% of the Portfolio—nearly three-times its weight in the Index. We added to our position in iiNet, an Australian telecom company focused on broadband services that has been taking advantage of the Australian Competition and Consumer Commission’s (ACCC) efforts to increase industry competition. In the early 2000s, the ACCC required Australia’s dominant telecom operator, Telstra, to provide other companies access to its copper network to allow them to compete in providing telephone services. The prices for accessing Telstra’s network were set by the regulator at a level that allowed viable alternative business models to develop. More recently the ACCC launched Australia’s National Broadband Network (NBN), a fiber-based network that is available at wholesale prices to companies seeking to offer broadband services to retail and business customers. Eventually the NBN is expected to replace Telstra’s copper network, which would completely level the playing field for all of Australia’s telecom companies. iiNet launched broadband services on the NBN in 2012 and we expect the company to profit from the continuing build-out of the network, which allows iiNet to offer internet connectivity at very high speeds across all parts of the country without investing heavily in the underlying infrastructure.
Please read the separate disclosure page for important information, including the risks of investing in the Portfolio.
12
Emerging Markets
Portfolio Managers
| | |
 | | from left: G. Rusty Johnson, CFA Co-Lead Portfolio Manager Craig Shaw, CFA Co-Lead Portfolio Manager Richard Schmidt, CFA Portfolio Manager |
The Institutional Emerging Markets Portfolio – Classes I and II and the Emerging Markets Portfolio – Advisor Class (collectively, the “Portfolios”) are both managed in strict accordance with the Emerging Markets Strategy Model Portfolio. The Portfolios, therefore, have highly similar holdings and characteristics. We have provided a single commentary to cover both Portfolios. The specific performance and characteristics of each are presented separately in the tables below.
Performance Summary
The Institutional Emerging Markets Portfolio – Class I rose 1.06% and the Emerging Markets Portfolio – Advisor Class gained 0.91% (net of fees and expenses) in the six months ended April 30, 2014. The Portfolios’ benchmark, the MSCI Emerging Markets Index, declined 2.99% (net of source taxes) over the same period.
Market Review
Emerging Markets (EMs) extended their three-year streak of underperformance relative to Developed Markets (DMs) over this reporting period, losing nearly 3%, while the MSCI EAFE Index, which represents DMs, gained 4.4%. This EM underperformance is partly due to reversing capital flows. EMs saw strong flows in 2009-10 when DMs were deemed dead in the wake of the Great Financial Crisis; EMs seemed to offer investors both quality and growth. China’s concurrent fiscal stimulus helped, too. But more recently, the gleam of even some economic growth in Europe and the US, off of a low base in terms of valuation and expectations, has resulted in capital flows out of EMs. Meanwhile, China’s demand for commodities has slowed as its government aims to shift its economy toward consumption and services, and away from fixed-asset investment. These factors, combined with a series of economic issues and bungled policies, has cast a pall over many countries and stifled EM stock market returns.
All sectors and regions within the EM universe have not been uniformly impaired, however, and we saw significant dispersion of returns. Information Technology (+6%), Utilities (+5%), and Health Care (+2%) each posted positive returns in the period. The Energy sector, on the other hand, was down nearly 11%, and Materials lost 6%. Geographically, this effect was highly visible in Latin America (nearly one-fifth of the Index), which declined almost 4%. Asia, however, which comprises many markets that do not rely on industrial commodity exports, lost 1%. Underlying the weakness in Materials and in resource-heavy markets is the ongoing impact of China’s decision, following its investment binge of 2009-10, to redirect its economy by slowing the rate of fixed-asset investment and altering the mix of its GDP, with the corresponding implication of lower demand for industrial commodities.
Russia was the worst-performing EM, down by nearly 23%. Russian aggression in Ukraine is a serious issue, with implications for investors in the EMs of the Baltics, Eastern Europe, and elsewhere in the former Soviet Union. But, while Russia’s ultimate intentions in Ukraine remain unknown, we caution against regarding this as purely an issue for EM investors. We view it as a global issue, with potential ramifications in Western Europe, which is dependent on Russian energy, and in places where financial and real estate markets, such as London, are deeply penetrated by Russian wealth. At this juncture, we think Russia is content with the annexation of the highly Russified Crimea region, but are watching for evidence that the posturing will take a darker turn, particularly if it includes Russian military action in Eastern Ukraine, as this would likely lead to severe sanctions that could have a significant impact on our portfolio companies.
China, the largest market in the EM Index, also underperformed, declining almost 7%. Although the fourth calendar quarter of 2013 was strong, investors retreated in 2014 due to weak manufacturing data and resurgent worry about a worsening credit market. More specifically, China’s first high-profile bond default in recent history rattled already nervous investors. Given the size of China’s economy and recent increases in the level of debt as a proportion of GDP, one should expect at least some incidence of strain among its many borrowers. For China to have no defaults at all would be incredible. We see it as good news that policymakers were not afraid to make this default public and, in fact, have suggested the market will take a stronger hand, even if it means more companies go bust. Admitting there is a problem is the first step to fixing it.
We note that the underperformance of EMs did not pertain to Frontier Markets: although generally perceived as riskier, the MSCI Frontier Markets Index rose 18% in the six months ended April 30, 2014.
Performance Attribution
The Portfolios outperformed the Index by approximately 400 basis points this reporting period, with good stock selection on both a sector and geographic basis. By sector, we added the most value in Financials, followed by Information Technology (IT) and Health Care. Within Financials, our banks contributed the most, particularly Bank of Georgia, which experienced accelerated loan growth after the landslide victory of the Georgian Dream party in the October 2013 elections. Indonesia’s Bank Rakyat was a top contributor as well, rebounding sharply from weak performance last year as Indonesia’s economy improved and its currency strengthened.
IT names that made a difference include the internet and online gaming company Tencent in China as well as Delta Electronics in Taiwan, which delivers cost savings for its clients through automation and control equipment. In addition, MediaTek did well as smartphones gained more traction in EMs on the back of lower prices and more advanced features. Cielo, a credit card processor in Brazil, benefitted from 20% growth in debit and credit transactions as people continue to move to plastic from checks and cash.
Hikma Pharmaceuticals, a UK-listed Jordanian generic pharma company with a focus on the Middle East and North Africa (and exposure in the US as well), was one of the top contributors to relative performance with very strong share price returns, far outpacing the Health Care sector. Hikma reported strong results in the first
13
Institutional Emerging Markets Portfolio - Class I HLMEX and Class II HLEEX
Emerging Markets Portfolio – Advisor Class HLEMX
| | | | | | | | | | | | | | | | | | | | | | | | | | | | | | | | | | | | | | | | | | | | |
| Performance | | | | | |
| Average Annualized Total Returns (%) | | | | | | | | | | | | | | | | | | | | | | | | | | | | | | | | | |
| at March 31, 2014 | | | | | | | | | | | | | | | | | | | | at April 30, 2014 | | | | |
| | | | | | | | | | | | |
| | | Inception
Date | | | 1 year | | | 3 years | | | 5 years | | | 10 years | | | Since
Inception* | | | 1 year | | | 3 years | | | 5 years | | | 10 years | | | Since
Inception* | |
Inst. Emerging Markets Portfolio – Class I | | | 10/17/05 | | | | 5.72 | | | | 2.80 | | | | 17.11 | | | | – | | | | 8.73 | | | | 4.18 | | | | 1.76 | | | | 14.02 | | | | – | | | | 8.73 | |
| | | | | | | | | | | | |
Emerging Markets Portfolio – Advisor Class | | | 11/9/98 | | | | 5.60 | | | | 2.62 | | | | 16.92 | | | | 11.13 | | | | 13.46 | | | | 3.90 | | | | 1.59 | | | | 13.84 | | | | 12.16 | | | | 13.44 | |
| | | | | | | | | | | | |
MSCI Emerging Markets Index† | | | | | | | -1.45 | | | | -2.87 | | | | 14.46 | | | | 10.10 | | | | 8.17 | | | | -1.86 | | | | -3.75 | | | | 11.06 | | | | 11.08 | | | | 8.13 | |
*The since inception return of the MSCI Emerging Markets Index is since 10/17/05. †The inception date of the Index is 1/1/01.
Performance data quoted represent past performance; past performance does not guarantee future results. The investment return and principal value of an investment will fluctuate so that an investor’s shares, when redeemed, may be worth more or less than their original cost. Current performance of each Portfolio may be lower or higher than the performance quoted. Performance data current to the most recent month end may be obtained by calling (877) 435-8105 or visiting www.hardingloevnerfunds.com. Each Portfolio imposes a 2% redemption fee on shares held 90 days or less. Performance data does not reflect the redemption fee. If reflected, total returns would be reduced.
quarter of 2014 and guided for more of the same. The company has been growing sales and margins by focusing on its more complex injectable generic drugs business, which is more profitable than its oral solids business. Hikma has also been raising prices and taking share in the US, as more competitors have been forced to address regulatory actions arising from increased scrutiny by the US Food and Drug Administration on generic producers, many of which have slipped on quality and best practices.
Regionally, China was our largest source of outperformance, helped by our market underweight and strong stock selection, particularly with respect to Tencent and Anhui Conch Cement. It may seem odd that a cement stock would do well in China when there are concerns over property and credit, but Conch has been a leader in greener production methods and is benefitting as the government shuts down competitors in its efforts to reduce pollution. Our allocation and stock picks in Frontier Markets also helped—as a group, our Frontier Markets holdings returned 14% in the period. Engro of Pakistan, a conglomerate that produces fertilizer (and,
| | | | | | |
| Portfolio Facts at April 30, 2014 |
Sales Charge | | | | | | None |
Number of Holdings | | | | | | 79 |
Redemption Fee | | | | | | 2% first 90 days |
Dividend Policy | | | | | | Annual |
| | | Institutional | | Advisor |
Portfolio Assets | | $1,276.5 M | | $2,245.9 M |
Turnover (5 Yr. Average) | | 35% | | 32% |
Class | | Class I | | Class II | | Advisor |
Ticker | | HLMEX | | HLEEX | | HLEMX |
CUSIP | | 412295701 | | 412295842 | | 412295305 |
Inception Date | | 10/17/2005 | | 3/5/2014 | | 11/9/1998 |
Minimum Investment* | | $500,000 | | $25,000,000 | | $5,000 |
Net Expense Ratio | | 1.30%† | | 1.15%† | | 1.44%‡ |
Gross Expense Ratio | | 1.32% | | 1.32% | | 1.46% |
*Lower minimums available through certain brokerage firms. †Shown net of Harding Loevner’s contractual agreement, through February 28, 2015, to waive its management fee to the extent necessary to cap the Portfolio’s total operating expenses. The Net and Gross Expense Ratio for the Institutional Portfolio are as of the Prospectus, dated February 28, 2014. ‡The Net Expense Ratio for the Advisor Class is as of April 30, 2014 as the Portfolio is operating below the contractual agreement, which is in effect until February 28, 2015. The Gross Expense Ratio is as of the Prospectus, dated February 28, 2014.
somewhat oddly, dairy products) was a leader in the Portfolios. Digital electronics retailer Jarir Marketing of Saudi Arabia also outperformed as the company is set to open a significant number of new stores in the next few years, on top of its still fairly modest base of thirty stores across Saudi Arabia, Qatar, Abu Dhabi, and Kuwait.
Despite our outperformance over the period, we had our troubles too. We underperformed in Utilities, due to our underweight, and in Energy due to poor stock selection. In Energy, Russian holding Lukoil, Brazil’s Petrobras, and Chinese oil and gas company CNOOC detracted from returns. Russia was also a source of underperformance, primarily due to our overweight. We discuss our Russian holdings in further detail in the next section.
Investment Perspectives
Don’t Just Do Something, Stand There!
Russia and Ukraine in the Spotlight
Within our investment process, we are far more likely to react to shifts in competitive dynamics within industries and companies than to geopolitical affairs. Over the years, the investment landscape for EMs has been colored by social unrest, political upheaval, and periods of related market volatility. While varying hues of political inertia and tumult shade each unique situation, we remind ourselves that, though we may feel the short-term sting of a sharp share-price adjustment based on market sentiment towards a country, our investment theses are primarily predicated on businesses, and it is rarely, if ever, in our best interests to join the knee-jerk selling in the face of these issues, especially after the news is well-disseminated among the press. As such, our net portfolio activity in Russia in this period has been very small.
For the last decade the Portfolios have, on average, been moderately overweight in the Russian market relative to the Index, with an average allocation of 7.4% versus the Index’s 6.5%. Our stock selection within Russia has been strong as our holdings have outperformed the broad Russian market over this time: we have added an average of over sixty basis points of value per year, primarily due to our stock picks.
We acknowledge the risks related to investing in Russia: the inconsistent enforcement of the rule of law, questionable corporate
14
Emerging Markets continued
governance standards, and a commodity-heavy universe of listed companies. That said, we remind ourselves and our clients that such risks are not unique to Russia; we face similar risks in other EMs as well. In addition, there are also factors that make Russia an attractive market for long-term investment. As in other emerging and frontier countries, many products and services that are fully present in developed countries remain underpenetrated in Russia, especially banking services. Most importantly, our fundamental company research has turned up many high-quality companies with clear competitive advantages. For example, Sberbank, our largest single holding in Russia, has one of the most dominant market positions we have observed in any major country, including DMs, with 46% of all retail deposits, 43% of all debit and credit cards, 30% of all bank capital, and 34% of all retail and commercial bank loans in the country. Sberbank’s priority is to run a sound bank worthy of public trust, and, to achieve that aim, management recognizes the need to keep loan quality strong and returns sufficiently high in order to grow the business and cover its risks. Sberbank earns high lending margins due to its mix of low-cost deposits and loans appropriately priced for the estimated risk of non-performance. This mix has supported high returns on assets and strong capital generation. Despite being majority owned by Russia’s Central Bank, there has been no transfer of wealth to borrowers when measured by credit allocation or pricing. We added to our position on weakness, as the stock price moved well below its book value.
We sold our small residual holding in the energy company Gaz-prom in early February, before the Russian invasion of Crimea. We were patient in retaining ownership in the company as shares continued to look notably undervalued, but, with deteriorating returns and moderating growth prospects both domestically and in Europe, we abandoned our view that the company’s growth and returns would undergo notable improvement in the coming years.
We added to our position in Alrosa, the world’s largest supplier of gem-quality rough diamonds. The company benefits from a weaker
| | | | | | | | | | | | |
| Geographical Weightings (%) at April 30, 2014 | |
| Country/Region | |
| Institutional
HLMEX /
HLEEX |
| |
| Advisor
HLEMX |
| | | Benchmark | 1 |
Brazil | | | 9.5 | | | | 9.5 | | | | 11.3 | |
| | | | |
China + Hong Kong2 | | | 14.4 | | | | 14.4 | | | | 18.5 | |
| | | | |
India | | | 8.1 | | | | 8.1 | | | | 6.6 | |
| | | | |
Mexico | | | 4.1 | | | | 4.1 | | | | 5.1 | |
| | | | |
Russia | | | 6.2 | | | | 6.2 | | | | 4.9 | |
| | | | |
South Africa | | | 5.3 | | | | 5.3 | | | | 7.8 | |
| | | | |
South Korea | | | 7.9 | | | | 7.9 | | | | 16.0 | |
| | | | |
Taiwan | | | 9.1 | | | | 9.2 | | | | 12.0 | |
| | | | |
Small Emerging Markets3 | | | 14.5 | | | | 14.5 | | | | 17.8 | |
| | | | |
Frontier Markets4 | | | 10.2 | | | | 10.2 | | | | – | |
| | | | |
Developed Market Listed5 | | | 8.2 | | | | 8.2 | | | | – | |
| | | | |
Cash | | | 2.5 | | | | 2.4 | | | | – | |
1MSCI Emerging Markets Index. 2The Harding Loevner Funds Emerging Markets Portfolios’ end weight in China is 8.8% and Hong Kong is 5.6%. The Benchmark does not include Hong Kong. 3Includes the remaining emerging markets which, individually, comprise less than 5% of the Index. 4Includes countries with less-developed markets outside the Index. 5Includes emerging markets or frontier markets companies listed in developed markets.
| | | | | | | | | | | | |
| Sector Weightings (%) at April 30, 2014 | |
| Sector | |
| Institutional
HLMEX /
HLEEX |
| |
| Advisor
HLEMX |
| | | Benchmark | 1 |
Consumer Discretionary | | | 10.4 | | | | 10.4 | | | | 9.0 | |
| | | | |
Consumer Staples | | | 10.3 | | | | 10.3 | | | | 8.5 | |
| | | | |
Energy | | | 8.0 | | | | 8.0 | | | | 10.8 | |
| | | | |
Financials | | | 25.3 | | | | 25.4 | | | | 26.8 | |
| | | | |
Health Care | | | 6.0 | | | | 6.0 | | | | 1.7 | |
| | | | |
Industrials | | | 8.4 | | | | 8.4 | | | | 6.5 | |
| | | | |
Information Technology | | | 17.0 | | | | 17.0 | | | | 16.8 | |
| | | | |
Materials | | | 7.1 | | | | 7.1 | | | | 9.3 | |
| | | | |
Telecom Services | | | 4.0 | | | | 4.0 | | | | 7.0 | |
| | | | |
Utilities | | | 1.0 | | | | 1.0 | | | | 3.6 | |
| | | | |
Cash | | | 2.5 | | | | 2.4 | | | | – | |
1MSCI Emerging Markets Index
ruble as 95% of sales are exports. As global diamond prices are increasing, the valuation for Alrosa remains attractive on our fundamental estimates.
We have one small holding in Ukraine, MHP, an integrated poultry producer. This company will, if anything, benefit if the Ukrainian consumer trades down as chicken is by far the least expensive protein in Ukraine. MHP has a unique business model given its full integration into feed grains, which enhances its cost structure relative to competitors that also grow chickens commercially. The company already has a roughly 50% share in the organized Ukrainian fresh chicken market, and the industry structure may even become more benign for it if non-integrated competitors are forced to fold or cede market share. Finally, MHP exports nearly 40% of its chicken output as well as surplus grains for US dollars, which provides a buffer for currency weakness at home.
When DO We Act?
Changes in Competitive Intensity
Our investment process is rooted in the hunt for companies with competitive advantages in industries with favorable structural dynamics. So while we remain loath to predict geo-political events, our experience and process enable us to discern changes in the competitive structures of industries, which are generally more relevant to our portfolio decisions.
In January, we sold our holding in Bajaj Auto, a manufacturer of motorcycles and three-wheelers in India, due to the deterioration in the structure of its industry. Bajaj has been facing rising competition in its main division, the two-wheeler market, as Honda Japan has introduced its own products to the market, which now compete against not only Bajaj but also Honda’s one-time joint venture partner Hero Motocorp. We expect that this new entrant in the motorcycle market will depress growth and profitability for Bajaj.
In contrast, in the cellular telephony market of India, we have seen structural improvement after many years of heightened competition from new entrants and adverse regulatory rulings. As the industry has matured, the weaker competitors failed, and the market consolidated so that the top three players now have over 70% revenue
15
Institutional Emerging Markets Portfolio - Class I HLMEX and Class II HLEEX
Emerging Markets Portfolio – Advisor Class HLEMX
market share and are again acting prudently to improve profitability, which had deteriorated materially over time. The result is greater price stability in a more rational competitive environment. Margins have risen, and the heavy capital expenditures that supported the network build-out is abating. This dynamic sets the stage for a future normalization of the industry’s currently still-low margins and returns, and we recently bought a new holding in Bharti Airtel, India’s leading cellular service provider.
Portfolio Structure
The key change we made over this six-month period was to reduce our positions in four IT companies that outperformed in 2013: MediaTek, Tencent, Baidu, and Naver. This brought down our IT allocation closer to an Index-neutral weight but, more importantly, pared our exposure to the “China internet” stocks, Baidu and Tencent, which have performed well. Combined, they represented, at one point, over 5% of the portfolio and now comprise just under 2%, in total. The stocks have moved faster than earnings, and we felt it was time to reduce exposure, especially as their popularity has seemingly reached new highs and most of the news is good.
Within China broadly, as our long-term readers know, we don’t own “the market,” nor much of China’s economy. We own no banks, no property companies, and few state-owned enterprises. Our holdings are largely estranged from the overall credit cycle and are instead related to unique themes such as travel, entertainment, green energy, and automation.
Health Care is now our largest relative overweight, at 6% of the Portfolios compared to less than 2% of the Index. In February, we purchased Sun Pharmaceutical, which is, in our view, India’s premier generic drug manufacturer. It specializes in manufacturing and marketing branded generics and other formulations targeted at various chronic therapy areas. Because these diseases are chronic, Sun benefits from a long tail of repeat purchases.
We’ve been steadily reducing our holdings in the Consumer Staples sector since the middle of 2010, almost entirely due to valuations, but we have also added selectively when we have seen opportunities. We initiated a position in Pão de Açúcar, a retailer in Brazil that reaches a broad range of consumers through a variety of formats including supermarkets, cash and carry stores, hypermarkets, and convenience stores. A new management team is in place at Pão and we expect the company to benefit from its focus on instituting internal improvements designed to make it more competitive and get closer to the customer. We found it refreshing to hear management speak about getting better, not just bigger. We also made a new investment in Tiger Brands of South Africa. Tiger has some of the best-known food and household product brands in South Africa along with a growing grocery segment. As a result of these purchases, the Portfolios once again have a modest overweight to the sector.
Outlook
Our broad view suggests that there may be more sun than rain ahead for EM investors. We have already been through a slew of
| | | | | | | | | | | | |
| Top Ten Holdings at April 30, 2014 | |
| Company | | Sector | | Country | |
| Institutional
HLMEX /
HLEEX |
| |
| Advisor
HLEMX |
|
| Samsung Electronics | | Info
Technology | | South
Korea | | | 4.3 | | | | 4.3 | |
| | | | | |
| Taiwan Semiconductor | | Info
Technology | | Taiwan | | | 3.1 | | | | 3.1 | |
| | | | | |
| Hikma Pharmaceuticals | | Health Care | | UK | | | 2.5 | | | | 2.5 | |
| | | | | |
| AIA Group | | Financials | | Hong
Kong | | | 2.1 | | | | 2.1 | |
| | | | | |
| SABMiller | | Cons
Staples | | UK | | | 1.9 | | | | 1.9 | |
| | | | | |
| Etihad Etisalat | | Telecom
Services | | Saudi
Arabia | | | 1.9 | | | | 1.9 | |
| | | | | |
| Hankook Tire | | Cons
Discretionary | | South
Korea | | | 1.9 | | | | 1.9 | |
| | | | | |
| Pão de Açúcar | | Cons
Staples | | Brazil | | | 1.8 | | | | 1.8 | |
| | | | | |
| Banco Bradesco | | Financials | | Brazil | | | 1.8 | | | | 1.8 | |
| | | | | |
| Jarir Marketing | | Industrials | | Saudi
Arabia | | | 1.7 | | | | 1.7 | |
currency devaluations, deteriorating economic indicators, social unrest, and plenty of other bad news. As is often the case after a period of such difficulties, the prospects for more positive changes appear to have improved. The current Indian elections are expected to result in the victory of a more pro-business party. In Brazil, the decline in popularity of President Dilma Roussef indicates that its electorate is also dissatisfied, and a change may be brewing. In Indonesia, inflation is falling and the current account is improving, progress that stimulated a rebound in its currency and stock market after notable declines in both last year. Other EMs are, at the margin, making harder and more sensible decisions that suggest some of the errant policy missteps we bemoaned last year may be correcting.
Perhaps more instructive to us, though, is the view from the bottom-up: our EM banks are doing well as businesses throughout all this. We would expect as much, as most have weathered some form of economic or political gale in past decades without major balance sheet stress. Given that banks can be especially sensitive to the macroeconomic environment vis-à-vis interest rate changes and foreign exchange fluctuations, we are encouraged by what we see. Banks we own in Indonesia, India, Thailand, Russia, South Africa, Brazil, Mexico, and Nigeria have all increased provisions over the past year, which has admittedly muted profit growth, but non-performing loans have been flat and, in some cases, actually fell for the full year of 2013. We do not see evidence of any sweeping crisis in EMs—surely not in our banks. In sum, although the past three years have been stormy, now seems a poor time to run for cover. We remain, as ever, focused on shifts in valuation and industry structure and will take portfolio action in accordance with changes that relate to fundamentals, rather than external drivers.
Please read the separate disclosure page for important information, including the risks of investing in each Portfolio.
16
Frontier Emerging Markets Portfolio
Portfolio Managers
| | |
 | | from left: Pradipta Chakrabortty Co-Lead Portfolio Manager G. Rusty Johnson, CFA Co-Lead Portfolio Manager Richard Schmidt, CFA Portfolio Manager |
Performance Summary
The Frontier Emerging Markets Portfolio – Institutional Class rose 13.31% and the Investor Class gained 12.99% (net of fees and expenses) in the six-month period ended April 30, 2014. The Portfolio’s benchmark, the MSCI Frontier Emerging Markets Index, rose 10.71% (net of source taxes) over the same period.
Market Review
There was a wide dispersion of returns for the Index’s constituents over the past six months, from the 63% return of the United Arab Emirates (UAE) to the 14% decline of Estonia. By a wide margin, the Gulf was the best-performing region in the Index, with especially strong gains not only in the UAE but also in Qatar. Together, these markets account for about 60% of the Gulf portion of the Index, although they will both soon be upgraded from the Frontier Market classification to Emerging Market (EM) by index providers MSCI (effective June 2014) and S&P Dow Jones (effective September 2014). We have noted clear evidence of improving economic performance in these two countries. In Qatar, massive infrastructure spending in preparation for the 2022 FIFA World Cup is having a positive spillover effect on other areas of the economy, including construction, power generation, real estate, manufacturing, and financial services. The UAE’s status as a relatively safe haven from the turmoil elsewhere in the Middle East has attracted increased tourism and business activity. We provide further discussion of the UAE later in this commentary.
Latin America was flat—and the worst-performing region this period—due to declines in the Colombian market, which comprises over 60% of the region’s weight in the Index. Colombia suffered from falling share prices in its resource sector amidst global growth concerns, commodity price weakness, and regulatory factors. Energy companies have struggled to grow reserves and production volumes due to bureaucratic delays in issuing environmental licenses to oil companies for drilling and water injection, as well as attacks on oil pipelines by FARC militant groups. Investors have also been cautious toward Colombia due to political uncertainty ahead of the presidential elections in May.
Returns in Latin America were boosted, however, by Argentina, which significantly outperformed the Index. This market’s strong returns reflect investor optimism that the electoral defeats suffered by President Cristina Kirchner’s Front for Victory party (FPV) in the mid-term congressional elections in October 2013 indicate that a regime change may be in the cards, which could be a prelude to improvements in Argentina’s political and economic environment. Since losing clout in the elections, Kirchner has “doubled-down” in defense of her rule. She seems determined to continue currency rationing and extended price controls into
another year. Consequently, we are still cautious of Argentina and have no investments there given the weakness of the peso and our concerns over the government’s policy making, nationalization of private entities, and failure to address the structural problems in the economy.
Outlook
As we have noted in past reports, the long-term investment opportunity within frontier and small emerging (FEM) countries reminds us of the progression that many of today’s larger EMs experienced over the last 25 years. Specifically, we expect three trends will help create an expanding number of attractive long-term investment opportunities in many of these countries: promotion of business-friendly policies by governments (including a large-scale focus on tackling infrastructure problems); favorable demographics with rising income levels; and innovations in banking and credit that support broadening economic inclusion. These conditions, combined with the low penetration of products and services in new developing economies, should support the growth of companies that are able to take advantage of these trends.
We note that over the next 18 months, a number of important FEM countries are facing political transitions. Colombia, Tunisia, Romania, Ukraine, and Egypt are scheduled for presidential elections from May through end of 2014, while elections in Nigeria and Argentina are to follow in 2015. These countries—which collectively account for approximately one-third of the Index—are each at different stages of maturity in their political systems and their progress toward democracy; nevertheless, in the months preceding an election, newly developing countries tend to exhibit heightened political risks. In some cases, there could be protests and violence that pose security threats or disrupt business activities, or both, as we witnessed in Bangladesh in early 2014. We have also observed instances where, in advance of elections, governments engage in profligate fiscal spending that sometimes threatens macroeconomic stability, primarily by causing higher inflation and a weaker currency. Such was the case in Ghana in 2012 and appears to be occurring currently in Argentina. Sometimes, the mere perception of risk by corporates and foreign investors leads to currency depreciation and growth slowdown.
While cognizant of the potential impact of political uncertainty for many FEM countries in the coming months, we will remain focused on investing over a longer-term horizon. Our goal is to invest in a disciplined way in companies that are favorably positioned in structurally attractive industries, have strong financials, and demonstrate capable management with the ability to successfully execute well-defined growth strategies. Given our long-term view, we may increase our exposure to high-quality companies that we follow if the crystallization of political risks that we deem to be temporary results in more attractive valuations.
Performance Attribution
The Portfolio outperformed the Index in this period. By sector, stock selection in Materials contributed the most to excess returns, although this was modestly tempered by our overweight to this underperforming sector. Shares of Pakistani fertilizer company Engro rose as the company reduced uncertainty over its supply of natural gas (a key input to its manufacturing process) by
17
Institutional Class HLFMX
Investor Class HLMOX
| | | | | | | | | | | | | | | | | | | | | | | | | | | | | | | | | | | | |
| Performance | |
| Average Annualized Total Returns (%) | | | | |
| at March 31, 2014 | | | | | | at April 30, 2014 | |
| | | | | | | | | | |
| | | Inception
Date | | | 1 year | | | 3 years | | | 5 years | | | Since
Inception* | | | 1 year | | | 3 years | | | 5 years | | | Since
Inception* | |
Frontier Emerging Markets Portfolio – Institutional Class | | | 5/27/08 | | | | 13.97 | | | | 7.18 | | | | 18.86 | | | | -1.01 | | | | 18.94 | | | | 7.80 | | | | 17.34 | | | | -0.11 | |
| | | | | | | | | | |
Frontier Emerging Markets Portfolio – Investor Class | | | 12/31/10 | | | | 13.48 | | | | 6.74 | | | | – | | | | 4.82 | | | | 18.34 | | | | 7.38 | | | | – | | | | 6.34 | |
| | | | | | | | | | |
MSCI Frontier Emerging Markets Index† | | | | | | | 7.17 | | | | 6.06 | | | | 15.53 | | | | 3.41 | | | | 12.28 | | | | 6.86 | | | | 14.28 | | | | 4.89 | |
*The since inception return of the MSCI Frontier Emerging Markets Index is since 12/31/10. †The inception date of the Index is 12/2/08.
Performance data quoted represent past performance; past performance does not guarantee future results. The investment return and principal value of an investment will fluctuate so that an investor’s shares, when redeemed, may be worth more or less than their original cost. Current performance of the Portfolio may be lower or higher than the performance quoted. Performance data current to the most recent month end may be obtained by calling (877) 435-8105 or visiting www.hardingloevnerfunds.com. The Portfolio imposes a 2% redemption fee on shares held 90 days or less. Performance data does not reflect the redemption fee. If reflected, total returns would be reduced.
signing a long-term gas supply agreement with Pakistan’s government and gas companies. Other contributors within the sector included cement companies Dangote Cement of Nigeria and Lafarge Surma Cement of Bangladesh. These companies dominate their local cement markets with relatively stable product prices and therefore were less impacted by the fall in commodity prices compared to other Materials companies that rely upon global commodities markets where prices were more volatile. Our stock selection in Financials detracted most from performance, primarily from Ghana Commercial Bank whose shares declined due to currency weakness.
Viewed geographically, the Portfolio’s outperformance can be attributed primarily to good stock selection in Asia. We benefitted from strong performance in Pakistan (Engro) as well from two companies in Bangladesh, Olympic Industries and Square Pharmaceuticals. Olympic’s shares performed well as the company shifted its product mix toward higher margin biscuits. Square reported an increase in profits from a combination of higher sales growth, lower costs of sales, and higher operating efficiency. Our underweight to the top performing Gulf region was the biggest detractor of performance in the period on a regional basis.
| | | | |
| Fund Facts at April 30, 2014 |
Total Net Assets | | | | $425.9 M |
Sales Charge | | | | None |
Number of Holdings | | | | 78 |
Turnover (5 Yr. Average) | | 32% |
Redemption Fee | | | | 2% first 90 days |
Dividend Policy | | | | Annual |
| | | Institutional Class | | Investor Class |
Ticker | | HLFMX | | HLMOX |
CUSIP | | 412295867 | | 412295859 |
Inception Date | | 5/27/2008 | | 12/31/2010 |
Minimum Investment* | | $100,000 | | $5,000 |
Net Expense Ratio† | | 1.73% | | 2.20% |
Gross Expense Ratio | | 1.80% | | 2.64% |
*Lower minimums available through certain brokerage firms. †The Net Expense Ratio is as of April 30, 2014 as the Portfolio is operating below the contractual agreement, which is in effect until February 28, 2015. The Gross Expense Ratio is as of the Prospectus, dated February 28, 2014.
United Arab Emirates
Strong economic fundamentals but market getting frothy
Economic activity in the UAE has continued to accelerate, as shown by the HSBC Purchasing Managers Index (PMI), which recorded an increase in output, new orders, and employment in February 2014.1 The improving economy has been reflected in the very strong performance of the UAE market; the MSCI UAE Index rose 63% in the last six months. Retail investors—who account for over 75% of total trading value on the stock exchange—have continued to buy stocks at high valuations ahead of MSCI’s reclassification of the UAE from a Frontier Market to a member of the MSCI Emerging Markets Index effective June 2014.2 Many hope that significant investment inflows from EM index funds and active EM managers will continue to push stock prices even higher. While recognizing the country’s strong economic momentum, we have been concerned that stock prices in the UAE may be moving beyond fundamentals and possibly even into “bubble” territory. We therefore have adopted a cautious stance toward the UAE market and maintained the Portfolio’s underweight relative to the Index.
One factor boosting the UAE market has been euphoria surrounding the resurgence in the country’s real estate industry, which accounts for about 40% of the MSCI UAE Index. The government has announced a number of large-scale real estate and infrastructure projects in preparation for the UAE’s hosting of the 2020 World Expo. Real estate companies have begun taking advantage of the lofty valuations resulting from this activity: DAMAC Real Estate launched an IPO in December 2013 and Emirates REITs did the same in March 2014. Alongside our concerns about stock valuations in the UAE, we are also wary of the rapid rise in property prices, which in some areas of Dubai are back to their peak levels seen before the 2008 financial crisis. Our view on the real estate market was supported by a recent report from Jones Lang LaSalle (JLL), an independent real estate research firm, which asserted that the return of speculation is driving rents and property values in the residential sector to unsustainable heights that, if not curtailed, could be harmful to the sector in the long term.3
1The PMI is an economic indicator derived from monthly surveys of private sector companies based on new orders, inventory levels, production, supplier deliveries, and employment.
2Dubai Financial Market (PJSC) Annual Report 2013, 16.
3Jones Lange LaSalle, “Dubai Real Estate Market Overview,” Q4 2013.
18
Frontier Emerging Markets Portfolio continued
Our only property-company holding in Dubai is Emaar Properties, a high-quality real estate developer that recently spun off its retail arm to cash in on the high stock prices and create value for shareholders. Emaar’s main competitive advantage is its access to a significant land bank in Downtown Dubai, which we believe will continue to be the prime location for real estate activities in the coming years. Emaar is highly profitable, in part because its land holdings were granted by the government to the company for free; the company should thus be more resilient than its peers in the event of a real estate pricing shock. More importantly, Emaar enjoys recurring income streams from hotels and malls, which comprise over half of the company’s revenues and the majority of its profits. By contrast, its competitors are solely dependent on property sales.
Nigeria
Political risk is rising but long-term opportunities remain
In early April 2014, Nigeria announced the results of its GDP re-basing, a process that countries undergo periodically to capture more accurately the weight of each sector by adjusting the reference date of the calculation. Nigeria changed its base year from 1990 to 2010 as the older data did not accurately capture the fast-growing service industries that sprang up in the intervening 20 years, such as mobile telecoms and Nollywood, currently the world’s third-largest film industry. The rebasing process—conducted in collaboration with the World Bank, IMF, and other international agencies—resulted in an 89% increase in reported GDP to US$510 billion, making Nigeria’s economy officially the largest in Africa.4 Although we applaud this effort to improve the accuracy of reported numbers, it does not change the fact that there is still much work to be done in Nigeria in terms of poverty reduction, job creation, and infrastructure development.
Nigeria displayed indications of increased political risk this period. In February, President Goodluck Jonathan suspended Central Bank Governor Lamido Sanusi, accusing him of financial recklessness and misconduct. The timing of the president’s actions suggest the suspension may have been politically motivated—the bank governor has been openly critical of the lack of transparency in the national oil company’s financial operations—and may be an ominous sign that the central bank is losing its independence. The country has also suffered a higher frequency of sectarian violence, kidnappings, and terrorism so far in 2014, mostly perpetrated
| | | | | | | | |
| Geographical Weightings (%) at April 30, 2014 | |
| Institutional and Investor Classes | |
| Region | | | Portfolio | | | | Benchmark | 1 |
| | | |
Africa | | | 23.0 | | | | 15.6 | |
| | | |
Asia | | | 28.0 | | | | 19.3 | |
| | | |
Europe | | | 7.8 | | | | 4.5 | |
| | | |
Gulf States | | | 24.4 | | | | 33.6 | |
| | | |
Latin America | | | 11.3 | | | | 25.7 | |
| | | |
Middle East | | | 1.1 | | | | 1.3 | |
| | | |
Developed Market Listed2 | | | 2.9 | | | | – | |
| | | |
Cash | | | 1.5 | | | | – | |
1MSCI Frontier Emerging Markers Index. 2Includes frontier markets or emerging markets companies listed in developed markets.
| | | | | | | | |
| Sector Weightings (%) at April 30, 2014 | |
| Institutional and Investor Classes | |
| Sector | | | Portfolio | | | | Benchmark | 1 |
| | | |
Consumer Discretionary | | | 3.5 | | | | 0.6 | |
| | | |
Consumer Staples | | | 15.0 | | | | 6.4 | |
| | | |
Energy | | | 4.2 | | | | 8.1 | |
| | | |
Financials | | | 35.9 | | | | 52.4 | |
| | | |
Health Care | | | 5.5 | | | | 1.2 | |
| | | |
Industrials | | | 11.8 | | | | 10.0 | |
| | | |
Information Technology | | | 0.6 | | | | 0.0 | |
| | | |
Materials | | | 15.7 | | | | 8.0 | |
| | | |
Telecom Services | | | 4.8 | | | | 10.4 | |
| | | |
Utilities | | | 1.5 | | | | 2.9 | |
| | | |
Cash | | | 1.5 | | | | – | |
1MSCI Frontier Emerging Markets Index
by the terrorist group called Boko Haram. While the violence is mostly confined to the less-developed northeastern part of Nigeria, there is a risk that the attacks could spread to other parts of the country. Nigeria saw significant capital outflows in the quarter and the central bank continued to deploy the country’s reserves to defend the currency.
Although recent events in Nigeria are reminders that FEM equities carry high risks, we remain focused on identifying industries with good growth prospects and favorable competitive structures. We think Nigeria’s cement industry is one such area that is attractive for investment. The country’s annual per capita cement consumption is very low by regional and global standards, presenting a significant opportunity for growth. Increasing demand for cement in Nigeria should be spurred by the country’s large and growing population, its expanding workforce and middle class, and rapid urbanization. The country’s cement manufacturers all expect demand to continue growing in double digits in the medium term, in line with the industry’s 16% growth in 2013.
The structure of Nigeria’s cement industry is also very favorable. The country has only four cement manufacturers with a combined total production capacity of over 28.5 million tons per year.5 These companies have benefitted from a ban on cement imports into Nigeria that was implemented in 2012 to attract domestic investment. We believe the limited competition, high barriers to entry, and strong bargaining power over buyers are reasons why the industry has long been able to sustain a cash-before-delivery sales model and high cement prices of about US$170 per ton. By contrast, in Pakistan, where the industry structure is more fragmented, cement is roughly half this price. Cement producers in Nigeria also enjoy access to low-cost natural gas because of its abundance in the country, reducing production costs and boosting operating margins.
Dangote Cement is Nigeria’s largest cement producer with an approximate 70% share of industry capacity. The company’s competitive advantages include its low cost of production, vast distribution
4Economist.com, “Give Yourself an 89% Raise: Nigeria’s Economy is Bigger than Everyone Thought,” April 7, 2014.
5Cement Manufacturers Association of Nigeria (CMAN), “Cement Availability in Nigerian Market,” 2012.
19
Institutional Class HLFMX
Investor Class HLMOX
network, and superior product quality. Dangote also has a geographical advantage because its plants are located near the expected sites of a majority of future housing construction and infrastructure projects—near Lagos in the southwest and in the central region close to the capital city of Abuja. The company has built an additional barrier to entry by acquiring exclusive limestone mining rights near important markets and fuel sources. It is also looking beyond its home market by launching an aggressive production capacity expansion program in 13 other African countries. Dangote is targeting a tripling of its production capacity to 60 million tons by 2015, which should place it among the top 15 global cement producers. The company’s balance sheet is strong and we are confident that its management team has the expertise to deliver on projects to achieve future growth.
Vietnam
Getting back on track
Over the last two years, Vietnam’s macroeconomic indicators have flashed major warning signals. The country’s large fiscal stimulus in response to the global financial crisis and uncontrolled credit growth led to a sharp upswing in inflation, which peaked at an annualized rate of 23% in August 2011. Similarly, rapid depletion of international reserves forced a devaluation of the dong in 2011. The country’s central bank—the State Bank of Vietnam (SBV)—responded with an aggressive tightening of monetary policy and the imposition of credit limits for banks. The massive real estate bubble bust that followed as an unintended consequence of these measures led to a spike in banks’ non-performing loans due to their credit exposure to these real estate projects and a general economic slowdown.6 Currently, the real estate market remains hampered by huge supply overhang, and price cuts on new residential projects are ongoing. Additionally, economic activity remains overwhelmingly dominated by inefficiently run, state owned enterprises (SOEs) that have struggled to service their debt, posing further risk to the weak banking sector.
However, economic conditions began to show signs of improvement in 2013. International reserves tripled from about US$14 billion at the end of 2011 to around US$39 billion at end of 2013, the exchange rate stabilized, and inflation came down to single-digit levels, giving the SBV room for accommodative monetary policy to spur economic growth.7 We are also encouraged to see that the government is showing serious signs of tackling the deep-rooted economic challenges that have plagued the country over the last few years. The first step is to reform the SOEs. Part of the reform agenda is to restructure them with the ultimate goal of privatization, either through strategic partnerships or stock exchange listings. Concurrently, the SBV is also working to set up a framework to address the high number of non-performing loans in the banking sector. SBV aims to use a “bad bank” model, transferring distressed assets to state-owned Vietnam Asset Management Company. Our Japan analyst, Yoko Sakai, visited Vietnam during March 2014 to meet the local managements of subsidiaries of several Japanese companies, as well as carry out channel checks of retail stores operated by businesses we cover. She returned with a
6International Monetary Fund, “Vietnam: 2012 Article IV Consultation,” IMF Country Report No.12/165, July 2012, p. 7.
7International Monetary Fund, “IMF Executive Board Concludes 2013 Article IV Consultation with Vietnam,” Press Release No. 13/304, August 9, 2013.
| | | | | | | | |
| Ten Largest Holdings at April 30, 2014 | |
| Institutional and Investor Classes | |
| Company | | Sector | | Country | | | % | |
| | | | |
Jarir Marketing | | Industrials | | Saudi Arabia | | | 4.1 | |
| | | | |
KIPCO | | Financials | | Kuwait | | | 3.7 | |
| | | | |
Engro | | Materials | | Pakistan | | | 3.5 | |
| | | | |
Universal Robina | | Cons Staples | | Philippines | | | 3.4 | |
| | | | |
Cementos Argos | | Materials | | Colombia | | | 3.2 | |
| | | | |
Square Pharmaceuticals | | Health Care | | Bangladesh | | | 3.1 | |
| | | | |
Olympic Industries | | Cons Staples | | Bangladesh | | | 3.1 | |
| | | | |
Qatar National Bank | | Financials | | Qatar | | | 2.9 | |
| | | | |
Halyk Savings Bank | | Financials | | Kazakhstan | | | 2.8 | |
| | | | |
Equity Bank | | Financials | | Kenya | | | 2.6 | |
generally positive outlook on the country and the progress of the recently launched economic reforms.
While the reform implementation will take a few years, we are enthused by the country’s high growth potential, supported by long-term structural drivers typical in frontier markets. Vietnam is richly endowed with natural resources such as coffee, rice, and hydrocarbons, with proven oil reserves of over four billion barrels.8 Vietnam is also the thirteenth most populous country in the world, with a population of about 90 million. Moreover, its population is relatively youthful and, more importantly, has a high literacy level of 93%, which is on par with some of the more affluent Asian nations and higher than many other frontier Asian countries.9 This demographic attractiveness, combined with the country’s relatively low wage rate (about one-third of China’s), makes Vietnam an attractive destination for global manufacturing. The IMF expects GDP growth to remain above 5% a year for the next five years, and we believe that Vietnam’s long-term economic growth outlook appears strong.10
Portfolio holding Hoa Phat Group, a leading construction steel manufacturer in Vietnam, released strong results for the three months ended March 2014 that indicated revenue and profits were up 66% and 89% respectively year over year. As the lowest-cost steel producer in the country with an extensive distribution network, the company continued to gain market share from smaller, less-efficient, and more-leveraged competitors. Hoa Phat’s margins also expanded as a result of increased production from its newly commissioned integrated steel factory, which uses more efficient blast furnace technology that provided additional cost advantages over its older plant.
8US Energy Information Administration, “Vietnam: Country Overview,” last updated August 2013.
9CIA World Factbook, “Vietnam: People and Society,” last updated January 8, 2014.
10International Monetary Fund, “World Economic Outlook Database: Vietnam,” last updated October 8, 2013. www.imf.org/external/pubs/ft/weo/2013/02/weo-data/index.aspx.
Please read the separate disclosure page for important information, including the risks of investing in the Portfolio.
20
Commentary Disclosures
The Portfolios invest in foreign securities, which will involve greater volatility and political, economic, and currency risks and differences in accounting methods. They also invest in emerging markets, which involve unique risks, such as exposure to economies less diverse and mature than the US or other more established foreign markets. Economic and political instability may cause larger price changes in emerging markets securities than other foreign securities.
Investments in small- and mid-cap companies involve additional risks such as limited liquidity and greater volatility.
Diversification does not guarantee a profit or prevent a loss in a declining market.
Long-term earnings growth and earnings per share growth are not a forecast of the Portfolios’ future performance.
Growth stocks typically are more volatile than value stocks; however, value stocks have a lower expected growth rate in earnings and sales.
Bold type indicates companies held in the Portfolios during the fiscal half year. Only the first reference to a particular holding appears in bold. The Portfolios are actively managed; therefore holdings shown may not be current. Portfolio holdings and sector and geographical allocations should not be considered recommendations to buy or sell any security. Please refer to the Portfolios of Investments in this report for complete Portfolio holdings. Current and future portfolio holdings are subject to risk.
While the Portfolios have no sales charge, management fees and other expenses still apply. Please see the Prospectus for further details.
Sector & Geographical Weightings data is sourced from: Wilshire Atlas, Harding Loevner Portfolios, and MSCI Barra. Differences may exist between this source data and similar information reported in the financial statements due to timing differences and/or adjustments required pursuant to Generally Accepted Accounting Principles (GAAP).
Five year average turnover data is calculated using a simple average of annual turnover figures for the past five fiscal years. These annual turnover figures utilize purchase, sales and market value data which is not reflective of adjustments required pursuant to Generally Accepted Accounting Principles (GAAP). Accordingly, differences may exist between this data and similar information reported in the financial statements.
The MSCI All Country World Index is a free float-adjusted market capitalization index that is designed to measure equity market performance in the global developed and emerging markets. The Index consists of 44 developed and emerging market countries. Net dividends reinvested.
The MSCI All Country World ex-US Index is a free float-adjusted market capitalization index that is designed to measure equity market performance in the global developed and emerging markets, excluding the US. The Index consists of 43 developed and emerging market countries. Net dividends reinvested.
The MSCI All Country World ex-US Small Cap Index is a free-float market capitalization index that is designed to measure small cap developed and emerging market equity performance. The Index consists of 43 developed and emerging markets countries and targets companies within a market capitalization range of USD 170–4,200 million in terms of the companies’ full market capitalization. Net dividends reinvested.
The MSCI All Country World ex-US Large Cap Index is a free float-adjusted market capitalization index that is designed to measure equity market performance in the global developed and emerging markets, excluding the US. The Index consists of 43 developed and emerging market countries. The Large Cap Indices target a coverage range of about 70% of the free float-adjusted market capitalization in each market. Net dividends reinvested.
The MSCI EAFE Index (Europe, Australasia, Far East) is a free float-adjusted market capitalization index that is designed to measure developed market equity performance, excluding the US & Canada. The Index consists of 21 developed market countries. Net dividends reinvested.
The MSCI Emerging Markets Index is a free float-adjusted market capitalization index that is designed to measure equity market performance in the global emerging markets. The Index consists of 21 emerging market countries. Net dividends reinvested.
The MSCI Frontier Emerging Markets Index is a free float-adjusted market capitalization index designed to measure equity market performance in all countries from the MSCI Frontier Markets Index and the lower size spectrum of the MSCI Emerging Markets Index. The Index consists of 26 frontier markets and 4 emerging markets countries. Net dividends reinvested.
The MSCI Frontier Markets Index is a free float-adjusted market capitalization index that is designed to measure equity market performance of frontier markets. The Index consists of 26 frontier markets countries.
The MSCI United Arab Emirates (UAE) Index is designed to measure the performance of the large and mid cap segments of the UAE market. The Index covers approximately 85% of the UAE equity universe.
You cannot invest directly in these Indices.
A basis point is a unit that is equal to 1/100th of a percentage point.
Book value is the cost of an asset minus the accumulated depreciation.
Cash Flow Return on Equity (CFROE) is an internal rate of return usually applied to the banking, diversified financials, insurance, and mortgage REITs industries. CFROE is approximately equal to Cash Earnings as a percent of Tangible Equity.
Correlation is the extent to which the values of different types of investments move in tandem with one another in response to changing economic and market conditions.
Free Cash Flow is the measure of the financial performance calculated as operating cash flow minus capital expenditures.
Gross Domestic Product (GDP) is the monetary value of all finished goods and services produced within a country’s borders in a specific time period (usually calculated on an annual basis).
Growth Rank and Quality Rank are proprietary measures determined using objective data to rank companies on a number of factors that, in the case of Quality, attempt to measure the stability, trend, and level of profitability, as well as balance sheet strength. In the case of Growth, objective data is utilized to rank companies based on an assessment of historic growth of earnings, sales, and assets, as well as expected moves in earnings and profitability.
Price to Book is the ratio of a firm’s closing stock price and its fiscal year end book value/share.
Return on Capital (ROC) is estimated by dividing the after-tax operating income by the book vale of invested capital.
Return on Equity (ROE) is the net income divided by total common equity outstanding, expressed as a percent.
Turnover is calculated by dividing the lesser of Purchases or Sales by Average Capital.
21

Semi-Annual Report
April 30, 2014
Global Equity Portfolio
International Equity Portfolio
International Small Companies Portfolio
Institutional Emerging Markets Portfolio
Emerging Markets Portfolio
Frontier Emerging Markets Portfolio
Harding, Loevner Funds, Inc.
c/o Northern Trust
Attn: Funds Center C5S
801 South Canal Street
Chicago, IL 60607
(877) 435-8105
www.hardingloevnerfunds.com
Harding, Loevner Funds, Inc.
Table of Contents
For use only when preceded or accompanied by a prospectus. Read the prospectus carefully before you invest or send money.
Harding, Loevner Funds, Inc.
Expense Example
April 30, 2014 (unaudited)
As a shareholder of a Harding Loevner Portfolio, you incur ongoing costs, including management fees; and to the extent applicable, distribution (12b-1) fees, and/or shareholder services fees and other fund expenses. The following example is intended to help you understand your ongoing costs (in dollars and cents) of investing in a Portfolio and to compare these costs with the ongoing costs of investing in other mutual funds.
The examples are based on an investment of $1,000 invested at the beginning of a six month period and held through the period ended April 30, 2014.
Actual Expenses
The first line under each Portfolio in the table below provides information about actual account values and actual expenses. You may use the information in this line, together with the amount you invested, to estimate the expenses that you paid over the period. Simply divide your account value by $1,000 (for example, an $8,600 account value divided by $1,000 = 8.6), then multiply the result by the number in the first line for your Portfolio under the heading entitled “Expenses Paid During Period” to estimate the expenses you paid on your account during this period.
Hypothetical Example for Comparison Purposes
The second line under each Portfolio in the table below provides information about hypothetical account values and hypothetical expenses based on the Portfolio’s actual expense ratio and an assumed rate of return of 5% per year before expenses, which is not the Portfolio’s actual return. The hypothetical account values and expenses may not be used to estimate the actual ending account balance or expenses you paid for the period. You may use this information to compare the ongoing costs of investing in your Portfolio and other funds. To do so, compare this 5% hypothetical example with the 5% hypothetical examples that appear in the shareholder reports of the other funds. Please note that the expenses shown in the table are meant to highlight your ongoing costs only. Therefore, the second line under each Portfolio in the table is useful in comparing ongoing costs only, and will not help you determine the relative total costs of owning different funds.
| | | | | | | | | | | | | | | | |
| | | | | | | | | | | | | |
| Portfolio | | Beginning
Account Value
November 1, 2013 | | | Ending Account
Value
April 30, 2014 | | | Annualized
Expense Ratio | | | Expenses Paid
During Period*
(November 1, 2013 to
April 30, 2014) | |
Global Equity Portfolio—Institutional Class | | | | | | | | | | | | | | | | |
Actual | | $ | 1,000.00 | | | $ | 1,046.80 | | | | 0.95 | % | | $ | 4.82 | |
Hypothetical (5% annual return before expenses) | | | 1,000.00 | | | | 1,020.08 | | | | 0.95 | % | | | 4.76 | |
Global Equity Portfolio—Advisor Class | | | | | | | | | | | | | | | | |
Actual | | | 1,000.00 | | | | 1,045.40 | | | | 1.22 | % | | | 6.19 | |
Hypothetical (5% annual return before expenses) | | | 1,000.00 | | | | 1,018.74 | | | | 1.22 | % | | | 6.11 | |
International Equity Portfolio—Institutional Class | | | | | | | | | | | | | | | | |
Actual | | | 1,000.00 | | | | 1,016.40 | | | | 0.86 | % | | | 4.30 | |
Hypothetical (5% annual return before expenses) | | | 1,000.00 | | | | 1,020.53 | | | | 0.86 | % | | | 4.31 | |
International Equity Portfolio—Investor Class | | | | | | | | | | | | | | | | |
Actual | | | 1,000.00 | | | | 1,015.20 | | | | 1.18 | % | | | 5.90 | |
Hypothetical (5% annual return before expenses) | | | 1,000.00 | | | | 1,018.94 | | | | 1.18 | % | | | 5.91 | |
International Small Companies Portfolio—Institutional Class | | | | | | | | | | | | | | | | |
Actual | | | 1,000.00 | | | | 1,074.50 | | | | 1.30 | % | | | 6.69 | |
Hypothetical (5% annual return before expenses) | | | 1,000.00 | | | | 1,018.35 | | | | 1.30 | % | | | 6.51 | |
International Small Companies Portfolio—Investor Class | | | | | | | | | | | | | | | | |
Actual | | | 1,000.00 | | | | 1,072.90 | | | | 1.55 | % | | | 7.97 | |
Hypothetical (5% annual return before expenses) | | | 1,000.00 | | | | 1,017.11 | | | | 1.55 | % | | | 7.75 | |
Institutional Emerging Markets Portfolio—Class I | | | | | | | | | | | | | | | | |
Actual | | | 1,000.00 | | | | 1,010.60 | | | | 1.30 | % | | | 6.48 | |
Hypothetical (5% annual return before expenses) | | | 1,000.00 | | | | 1,018.35 | | | | 1.30 | % | | | 6.51 | |
Institutional Emerging Markets Portfolio—Class II** | | | | | | | | | | | | | | | | |
Actual | | | 1,000.00 | | | | 1,040.00 | | | | 1.15 | % | | | 1.80 | |
Hypothetical (5% annual return before expenses) | | | 1,000.00 | | | | 1.019.09 | | | | 1.15 | % | | | 5.76 | |
Emerging Markets Portfolio—Advisor Class | | | | | | | | | | | | | | | | |
Actual | | | 1,000.00 | | | | 1,009.10 | | | | 1.44 | % | | | 7.17 | |
Hypothetical (5% annual return before expenses) | | | 1,000.00 | | | | 1,017.65 | | | | 1.44 | % | | | 7.20 | |
Frontier Emerging Markets Portfolio—Institutional Class | | | | | | | | | | | | | | | | |
Actual | | | 1,000.00 | | | | 1,133.10 | | | | 1.73 | % | | | 9.15 | |
Hypothetical (5% annual return before expenses) | | | 1,000.00 | | | | 1,016.22 | | | | 1.73 | % | | | 8.65 | |
Frontier Emerging Markets Portfolio—Investor Class | | | | | | | | | | | | | | | | |
Actual | | | 1,000.00 | | | | 1,129.90 | | | | 2.20 | % | | | 11.62 | |
Hypothetical (5% annual return before expenses) | | | 1,000.00 | | | | 1,013.88 | | | | 2.20 | % | | | 10.99 | |
* Expenses are calculated using each Portfolio’s annualized expense ratio (as disclosed in the table), multiplied by the average account value for the period, multiplied by the number of days in the period (181 days), and divided by the number of days in the year (365 days).
** Institutional Emerging Markets Portfolio – Class II commenced operations on March 5, 2014 (56 days) and the Actual example reflects the period from March 5, 2014 to April 30, 2014. However, for purposes of comparability, the Hypothetical example assumes that the Portfolio’s Class II was operational for the full six month period.
2
Harding, Loevner Funds, Inc.
Global Equity Portfolio
Portfolio of Investments
April 30, 2014 (unaudited)
| | | | | | | | |
| | |
| | | Shares | | | Value | |
| COMMON STOCKS - 97.1% | | | | | | |
| | |
Australia - 0.8% | | | | | | | | |
| | |
Cochlear Ltd. (Health Care Equipment & Services)† | | | 101,616 | | | | $5,554,427 | |
| | |
France - 5.5% | | | | | | | | |
| | |
Air Liquide SA (Materials)† | | | 75,430 | | | | 10,800,389 | |
| | |
Dassault Systemes SA (Software & Services)† | | | 116,028 | | | | 14,271,779 | |
| | |
Essilor International SA (Health Care Equipment & Services)† | | | 71,100 | | | | 7,608,301 | |
| | |
L’Oreal SA (Household & Personal Products)† | | | 48,600 | | | | 8,365,985 | |
| | |
| | | | | | | 41,046,454 | |
| | |
Germany - 1.2% | | | | | | | | |
| | |
QIAGEN NV (Pharmaceuticals, Biotechnology & Life Sciences)* | | | 391,650 | | | | 8,577,135 | |
| | |
Hong Kong - 2.0% | | | | | | | | |
| | |
AIA Group Ltd. (Insurance)† | | | 3,033,600 | | | | 14,713,709 | |
| | |
India - 2.1% | | | | | | | | |
| | |
HDFC Bank Ltd. - ADR (Banks) | | | 191,900 | | | | 7,685,595 | |
| | |
ICICI Bank Ltd. - Sponsored ADR (Banks) | | | 186,800 | | | | 7,970,756 | |
| | |
| | | | | | | 15,656,351 | |
| | |
Indonesia - 0.9% | | | | | | | | |
| | |
Bank Central Asia Tbk PT (Banks)† | | | 7,051,124 | | | | 6,710,750 | |
| | |
Japan - 7.6% | | | | | | | | |
| | |
ABC-Mart Inc. (Retailing)† | | | 215,500 | | | | 9,664,370 | |
| | |
FANUC Corp. (Capital Goods)† | | | 90,400 | | | | 16,267,591 | |
| | |
Keyence Corp. (Technology Hardware & Equipment)† | | | 27,196 | | | | 10,476,492 | |
| | |
M3 Inc. (Health Care Equipment & Services)† | | | 601,000 | | | | 8,279,711 | |
| | |
MonotaRO Co., Ltd. (Capital Goods)† | | | 142,600 | | | | 2,887,407 | |
| | |
Unicharm Corp. (Household & Personal Products)† | | | 157,900 | | | | 8,555,705 | |
| | |
| | | | | | | 56,131,276 | |
| | |
Mexico - 1.9% | | | | | | | | |
| | |
America Movil SAB de CV, Series L - ADR (Telecommunication Services) | | | 457,900 | | | | 9,194,632 | |
| | | | | | | | |
| | |
| | | Shares | | | Value | |
| COMMON STOCKS - 97.1% (continued) | | | | | | |
| | |
Mexico - 1.9% (continued) | | | | | | | | |
| | |
Coca-Cola Femsa SAB de CV - Sponsored ADR (Food, Beverage & Tobacco) | | | 46,400 | | | | $5,194,944 | |
| | |
| | | | | | | 14,389,576 | |
| | |
Russia - 1.8% | | | | | | | | |
| | |
Magnit OJSC - Sponsored GDR, Reg S (Food & Staples Retailing)† | | | 140,000 | | | | 6,619,928 | |
| | |
Yandex NV, Class A (Software & Services)* | | | 245,200 | | | | 6,497,800 | |
| | |
| | | | | | | 13,117,728 | |
| | |
South Africa - 1.4% | | | | | | | | |
| | |
Sasol Ltd. (Energy)† | | | 183,400 | | | | 10,302,595 | |
| | |
Spain - 1.1% | | | | | | | | |
| | |
Inditex SA (Retailing)† | | | 55,850 | | | | 8,400,363 | |
| | |
Sweden - 1.1% | | | | | | | | |
| | |
Elekta AB, Class B (Health Care Equipment & Services)† | | | 604,900 | | | | 8,475,910 | |
| | |
Switzerland - 8.1% | | | | | | | | |
| | |
Lonza Group AG, Reg S (Pharmaceuticals, Biotechnology & Life Sciences)*† | | | 80,300 | | | | 8,396,422 | |
| | |
Nestle SA - Sponsored ADR (Food, Beverage & Tobacco) | | | 270,000 | | | | 20,838,600 | |
| | |
Roche Holding AG, Genusschein (Pharmaceuticals, Biotechnology & Life Sciences)† | | | 38,400 | | | | 11,289,154 | |
| | |
Sonova Holding AG, Reg S (Health Care Equipment & Services)*† | | | 63,700 | | | | 9,213,652 | |
| | |
Swatch Group AG, Bearer (Consumer Durables & Apparel)† | | | 15,750 | | | | 10,140,265 | |
| | |
| | | | | | | 59,878,093 | |
| | |
Turkey - 1.7% | | | | | | | | |
| | |
BIM Birlesik Magazalar AS (Food & Staples Retailing)† | | | 41,080 | | | | 948,724 | |
| | |
Turkiye Garanti Bankasi AS - ADR (Banks) | | | 3,193,219 | | | | 11,782,978 | |
| | |
| | | | | | | 12,731,702 | |
| | |
United Kingdom - 6.5% | | | | | | | | |
| | |
Aggreko plc (Commercial & Professional Services)† | | | 141,100 | | | | 3,763,813 | |
See Notes to Financial Statements
3
Harding, Loevner Funds, Inc.
Global Equity Portfolio
Portfolio of Investments
April 30, 2014 (unaudited) (continued)
| | | | | | | | |
| | |
| | | Shares | | | Value | |
| COMMON STOCKS - 97.1% (continued) | | | | | | |
| | |
United Kingdom - 6.5% (continued) | | | | | | | | |
| | |
ARM Holdings plc - Sponsored ADR (Semiconductors & Semiconductor Equipment) | | | 236,880 | | | | $10,782,778 | |
| | |
Shire plc (Pharmaceuticals, Biotechnology & Life Sciences)† | | | 214,570 | | | | 12,268,119 | |
| | |
Standard Chartered plc (Banks)† | | | 431,300 | | | | 9,344,150 | |
| | |
WPP plc (Media)† | | | 541,500 | | | | 11,691,531 | |
| | |
| | | | | | | 47,850,391 | |
| | |
United States - 53.4% | | | | | | | | |
| | |
3M Co. (Capital Goods) | | | 70,500 | | | | 9,805,845 | |
| | |
Abbott Laboratories (Health Care Equipment & Services) | | | 193,400 | | | | 7,492,316 | |
| | |
Allergan Inc. (Pharmaceuticals, Biotechnology & Life Sciences) | | | 94,600 | | | | 15,688,464 | |
| | |
American Express Co. (Diversified Financials) | | | 103,500 | | | | 9,049,005 | |
| | |
BorgWarner Inc. (Automobiles & Components) | | | 173,100 | | | | 10,756,434 | |
| | |
Bunge Ltd. (Food, Beverage & Tobacco) | | | 105,400 | | | | 8,395,110 | |
| | |
Citrix Systems Inc. (Software & Services)* | | | 157,200 | | | | 9,323,532 | |
| | |
Coach Inc. (Consumer Durables & Apparel) | | | 281,800 | | | | 12,582,370 | |
| | |
Cognizant Technology Solutions Corp., Class A (Software & Services)* | | | 174,300 | | | | 8,349,842 | |
| | |
Colgate-Palmolive Co. (Household & Personal Products) | | | 201,100 | | | | 13,534,030 | |
| | |
DaVita HealthCare Partners Inc. (Health Care Equipment & Services)* | | | 207,300 | | | | 14,365,890 | |
| | |
eBay Inc. (Software & Services)* | | | 350,250 | | | | 18,153,458 | |
| | |
Emerson Electric Co. (Capital Goods) | | | 167,124 | | | | 11,394,514 | |
| | |
Exxon Mobil Corp. (Energy) | | | 95,500 | | | | 9,780,155 | |
| | |
F5 Networks Inc. (Technology Hardware & Equipment)* | | | 91,150 | | | | 9,586,245 | |
| | |
First Republic Bank (Banks) | | | 187,300 | | | | 9,507,348 | |
| | |
Google Inc., Class A (Software & Services)* | | | 23,360 | | | | 12,494,797 | |
| | |
Google, Inc., Class C (Software & Services)* | | | 7,660 | | | | 4,034,216 | |
| | |
Informatica Corp. (Software & Services)* | | | 210,100 | | | | 7,448,045 | |
| | | | | | | | |
| | |
| | | Shares | | | Value | |
| COMMON STOCKS - 97.1% (continued) | | | | | | |
|
United States - 53.4% (continued) | |
| | |
JPMorgan Chase & Co. (Banks) | | | 264,300 | | | | $14,795,514 | |
| | |
Lazard Ltd., Class A (Diversified Financials) | | | 214,100 | | | | 10,073,405 | |
| | |
MasterCard Inc., Class A (Software & Services) | | | 104,700 | | | | 7,700,685 | |
| | |
Microsoft Corp. (Software & Services) | | | 375,800 | | | | 15,182,320 | |
| | |
Monsanto Co. (Materials) | | | 104,600 | | | | 11,579,220 | |
| | |
NIKE Inc., Class B (Consumer Durables & Apparel) | | | 213,300 | | | | 15,560,235 | |
| | |
Praxair Inc. (Materials) | | | 70,000 | | | | 9,138,500 | |
| | |
Procter & Gamble Co. (Household & Personal Products) | | | 87,200 | | | | 7,198,360 | |
| | |
Ralph Lauren Corp. (Consumer Durables & Apparel) | | | 38,300 | | | | 5,797,471 | |
| | |
Roper Industries Inc. (Capital Goods) | | | 95,150 | | | | 13,221,092 | |
| | |
Schlumberger Ltd. (Energy) | | | 216,450 | | | | 21,980,498 | |
| | |
Sigma-Aldrich Corp. (Materials) | | | 172,050 | | | | 16,552,930 | |
| | |
SVB Financial Group (Banks)* | | | 95,400 | | | | 10,178,226 | |
| | |
Trimble Navigation Ltd. (Technology Hardware & Equipment)* | | | 265,610 | | | | 10,207,392 | |
| | |
Wells Fargo & Co. (Banks) | | | 504,050 | | | | 25,021,042 | |
| | |
| | | | | | | | 395,928,506 | |
| |
Total Common Stocks (Cost $566,785,554) | | | | $719,464,966 | |
| | |
| | | | | | | | |
| CASH EQUIVALENT - 2.9% | | | | | | |
| | |
Northern Institutional Funds - Prime Obligations Portfolio, 0.02% (Money Market Fund) | | | 21,712,909 | | | | 21,712,909 | |
| |
Total Cash Equivalent (Cost $21,712,909) | | | | $21,712,909 | |
| | |
| | | | | | | | | |
| | |
Total Investments — 100.0% | | | | | | | | |
| | |
(Cost $588,498,463) | | | | | | | $741,177,875 | |
| |
Liabilities Less Other Assets - 0.0% | | | | (291,588 | ) |
| | |
Net Assets — 100.0% | | | | | | | $740,886,287 | |
See Notes to Financial Statements
4
Harding, Loevner Funds, Inc.
Global Equity Portfolio
Portfolio of Investments
April 30, 2014 (unaudited) (continued)
Summary of Abbreviations
| ADR | American Depository Receipt. |
| GDR | Global Depository Receipt. |
| Reg S | Security sold outside United States without registration under the Securities Act of 1933. |
| * | Non-income producing security. |
| † | Investment categorized as level 2 security as disclosed in Note 2 of the Notes to Financial Statements. |
| | | | | |
| Industry | | Percentage of
Net Assets |
| |
Automobiles & Components | | | | 1.5 | % |
| |
Banks | | | | 13.9 | |
| |
Capital Goods | | | | 7.2 | |
| |
Commercial & Professional Services | | | | 0.5 | |
| |
Consumer Durables & Apparel | | | | 5.9 | |
| |
Diversified Financials | | | | 2.6 | |
| |
Energy | | | | 5.7 | |
| |
Food & Staples Retailing | | | | 1.0 | |
| |
Food, Beverage & Tobacco | | | | 4.6 | |
| |
Health Care Equipment & Services | | | | 8.2 | |
| |
Household & Personal Products | | | | 5.1 | |
| |
Insurance | | | | 2.0 | |
| |
Materials | | | | 6.5 | |
| |
Media | | | | 1.6 | |
| |
Money Market Fund | | | | 2.9 | |
| |
Pharmaceuticals, Biotechnology & Life Sciences | | | | 7.6 | |
| |
Retailing | | | | 2.4 | |
| |
Semiconductors & Semiconductor Equipment | | | | 1.5 | |
| |
Software & Services | | | | 14.0 | |
| |
Technology Hardware & Equipment | | | | 4.1 | |
| |
Telecommunication Services | | | | 1.2 | |
| |
| | | | | | |
Total Investments | | | | 100.0 | |
Liabilities Less Other Assets | | | | 0.0 | |
Net Assets | | | | 100.0 | % |
See Notes to Financial Statements
5
Harding, Loevner Funds, Inc.
International Equity Portfolio
Portfolio of Investments
April 30, 2014 (unaudited)
| | | | | | | | |
| | |
| | | Shares | | | Value | |
| COMMON STOCKS - 92.3% | | | | | | |
| | |
Australia - 2.5% | | | | | | | | |
| | |
Cochlear Ltd. (Health Care Equipment & Services)† | | | 612,300 | | | | $33,468,902 | |
| | |
CSL Ltd. (Pharmaceuticals, Biotechnology & Life Sciences)† | | | 1,101,500 | | | | 70,236,007 | |
| | |
| | | | | | | 103,704,909 | |
| | |
Belgium - 2.2% | | | | | | | | |
| | |
Anheuser-Busch InBev NV - Sponsored ADR (Food, Beverage & Tobacco) | | | 858,000 | | | | 90,793,560 | |
| | |
Canada - 4.2% | | | | | | | | |
| | |
Canadian National Railway Co. (Transportation) | | | 1,398,300 | | | | 81,898,431 | |
| | |
Imperial Oil Ltd. (Energy) | | | 1,909,300 | | | | 93,173,840 | |
| | |
| | | | | | | 175,072,271 | |
| | |
China - 1.8% | | | | | | | | |
| | |
Baidu Inc. - Sponsored ADR (Software & Services)* | | | 219,300 | | | | 33,739,305 | |
| | |
ENN Energy Holdings Ltd. (Utilities)† | | | 6,017,000 | | | | 42,070,773 | |
| | |
| | | | | | | 75,810,078 | |
| | |
Denmark - 2.0% | | | | | | | | |
| | |
Novo Nordisk A/S, Class B (Pharmaceuticals, Biotechnology & Life Sciences)† | | | 1,814,900 | | | | 82,344,657 | |
| | |
France - 12.6% | | | | | | | | |
| | |
Air Liquide SA (Materials)† | | | 867,800 | | | | 124,255,299 | |
| | |
Dassault Systemes SA (Software & Services)† | | | 1,121,974 | | | | 138,006,037 | |
| | |
L’Oreal SA (Household & Personal Products)† | | | 586,800 | | | | 101,011,523 | |
| | |
LVMH Moet Hennessy Louis Vuitton SA (Consumer Durables & Apparel)† | | | 250,200 | | | | 49,249,897 | |
| | |
Schneider Electric SA (Capital Goods)† | | | 1,149,600 | | | | 108,044,208 | |
| | |
| | | | | | | 520,566,964 | |
| | |
Germany - 11.3% | | | | | | | | |
| | |
Allianz SE, Reg S (Insurance)† | | | 717,200 | | | | 124,286,431 | |
| | |
Bayerische Motoren Werke AG (Automobiles & Components)† | | | 839,500 | | | | 105,116,157 | |
| | |
Fresenius Medical Care AG & Co. KGaA (Health Care Equipment & Services)† | | | 1,093,300 | | | | 75,155,656 | |
| | |
Fuchs Petrolub SE (Materials)† | | | 143,387 | | | | 13,202,903 | |
| | | | | | | | |
| | |
| | | Shares | | | Value | |
| COMMON STOCKS - 92.3% (continued) | |
| | |
Germany - 11.3% (continued) | | | | | | | | |
| | |
SAP AG - Sponsored ADR (Software & Services) | | | 1,845,800 | | | | $149,491,342 | |
| | |
| | | | | | | 467,252,489 | |
| | |
Hong Kong - 5.2% | | | | | | | | |
| | |
AIA Group Ltd. (Insurance)† | | | 22,231,200 | | | | 107,826,810 | |
| | |
Hong Kong Exchanges and Clearing Ltd. (Diversified Financials)† | | | 2,718,900 | | | | 49,003,622 | |
| | |
Sands China Ltd. (Consumer Services)† | | | 5,328,400 | | | | 39,198,879 | |
| | |
Xinyi Glass Holdings Ltd. (Automobiles & Components)† | | | 23,220,000 | | | | 18,339,899 | |
| | |
| | | | | | | 214,369,210 | |
| | |
India - 2.4% | | | | | | | | |
| | |
ICICI Bank Ltd. - Sponsored ADR (Banks) | | | 2,280,400 | | | | 97,304,668 | |
| | |
Japan - 13.2% | | | | | | | | |
| | |
FANUC Corp. (Capital Goods)† | | | 589,700 | | | | 106,117,238 | |
| | |
JGC Corp. (Capital Goods)† | | | 2,664,000 | | | | 86,241,295 | |
| | |
Keyence Corp. (Technology Hardware & Equipment)† | | | 165,681 | | | | 63,823,930 | |
| | |
M3 Inc. (Health Care Equipment & Services)† | | | 3,365,500 | | | | 46,365,006 | |
| | |
MISUMI Group Inc. (Capital Goods)† | | | 1,565,200 | | | | 38,058,856 | |
| | |
Mitsubishi Estate Co., Ltd. (Real Estate)† | | | 2,022,000 | | | | 45,764,375 | |
| | |
MonotaRO Co., Ltd. (Capital Goods)† | | | 789,000 | | | | 15,975,904 | |
| | |
Sysmex Corp. (Health Care Equipment & Services)† | | | 1,849,400 | | | | 58,514,956 | |
| | |
Unicharm Corp. (Household & Personal Products)† | | | 1,547,400 | | | | 83,844,827 | |
| | |
| | | | | | | 544,706,387 | |
| | |
Poland - 1.3% | | | | | | | | |
| | |
Bank Pekao SA - GDR, Reg S (Banks)#† | | | 822,300 | | | | 52,649,073 | |
| | |
Singapore - 1.2% | | | | | | | | |
| | |
DBS Group Holdings Ltd. (Banks)† | | | 3,764,083 | | | | 50,982,065 | |
| | |
South Africa - 2.4% | | | | | | | | |
| | |
MTN Group Ltd. (Telecommunication Services)† | | | 2,715,200 | | | | 54,464,090 | |
| | |
Sasol Ltd. (Energy)† | | | 823,200 | | | | 46,243,707 | |
| | |
| | | | | | | 100,707,797 | |
See Notes to Financial Statements
6
Harding, Loevner Funds, Inc.
International Equity Portfolio
Portfolio of Investments
April 30, 2014 (unaudited) (continued)
| | | | | | | | |
| | |
| | | Shares | | | Value | |
| COMMON STOCKS - 92.3% (continued) | |
| | |
South Korea - 1.1% | | | | | | | | |
| | |
Samsung Electronics Co., Ltd. - GDR, Reg S (Semiconductors & Semiconductor Equipment)† | | | 71,900 | | | | $46,422,544 | |
| | |
Spain - 1.8% | | | | | | | | |
| | |
Banco Bilbao Vizcaya Argentaria SA (Banks)† | | | 6,106,600 | | | | 75,201,836 | |
| | |
Sweden - 1.6% | | | | | | | | |
| | |
Atlas Copco AB, Class A (Capital Goods)† | | | 2,264,900 | | | | 65,920,653 | |
| | |
Switzerland - 9.4% | | | | | | | | |
| | |
Nestle SA - Sponsored ADR (Food, Beverage & Tobacco) | | | 1,908,300 | | | | 147,282,594 | |
| | |
Roche Holding AG, Genusschein (Pharmaceuticals, Biotechnology & Life Sciences)† | | | 440,600 | | | | 129,531,279 | |
| | |
Sonova Holding AG, Reg S (Health Care Equipment & Services)*† | | | 348,500 | | | | 50,407,502 | |
| | |
Swatch Group AG, Bearer (Consumer Durables & Apparel)† | | | 90,300 | | | | 58,137,517 | |
| | |
| | | | | | | 385,358,892 | |
| | |
Taiwan - 1.4% | | | | | | | | |
| | |
Taiwan Semiconductor Manufacturing Co., Ltd. (Semiconductors & Semiconductor Equipment)† | | | 11,038,125 | | | | 43,512,492 | |
| | |
Taiwan Semiconductor Manufacturing Co., Ltd. - Sponsored ADR (Semiconductors & Semiconductor Equipment) | | | 659,700 | | | | 13,259,970 | |
| | |
| | | | | | | 56,772,462 | |
| | |
Turkey - 1.4% | | | | | | | | |
| | |
Turkiye Garanti Bankasi AS - ADR (Banks) | | | 15,676,700 | | | | 57,847,023 | |
| | |
United Kingdom - 8.8% | | | | | | | | |
| | |
ARM Holdings plc (Semiconductors & Semiconductor Equipment)† | | | 5,008,200 | | | | 75,652,373 | |
| | |
BG Group plc (Energy)† | | | 3,212,400 | | | | 65,101,946 | |
| | |
Tesco plc (Food & Staples Retailing)† | | | 7,748,600 | | | | 38,426,404 | |
| | |
Unilever plc (Food, Beverage & Tobacco)† | | | 1,084,000 | | | | 48,538,128 | |
| | | | | | | | |
| | |
| | | Shares | | | Value | |
| COMMON STOCKS - 92.3% (continued) | |
| | |
United Kingdom - 8.8% (continued) | | | | | | | | |
| | |
WPP plc (Media)† | | | 6,183,700 | | | | $133,512,314 | |
| | |
| | | | | | | 361,231,165 | |
| | |
United States - 4.5% | | | | | | | | |
| | |
Bunge Ltd. (Food, Beverage & Tobacco) | | | 1,051,000 | | | | 83,712,150 | |
| | |
Schlumberger Ltd. (Energy) | | | 983,100 | | | | 99,833,805 | |
| | |
| | | | | | | | 183,545,955 | |
| |
Total Common Stocks (Cost $3,032,874,991) | | | | $3,808,564,658 | |
| | |
| | | | | | | | |
| PREFERRED STOCKS - 4.9% | | | | | | |
| | |
Brazil - 3.0% | | | | | | | | |
| | |
Itau Unibanco Holding SA - ADR (Banks) | | | 7,598,798 | | | | 124,316,335 | |
| | |
Germany - 0.6% | | | | | | | | |
| | |
Fuchs Petrolub SE (Materials)† | | | 239,000 | | | | 24,009,424 | |
| | |
South Korea - 1.3% | | | | | | | | |
| | |
Samsung Electronics Co., Ltd. - GDR, Reg S (Semiconductors & Semiconductor Equipment)† | | | 105,500 | | | | 52,558,483 | |
| |
Total Preferred Stocks (Cost $169,262,414) | | | | $200,884,242 | |
| | |
| | | | | | | | |
| CASH EQUIVALENT - 2.5% | | | | | | |
| | |
Northern Institutional Funds - Prime Obligations Portfolio, 0.02% (Money Market Fund) | | | 103,302,893 | | | | 103,302,893 | |
| |
Total Cash Equivalent (Cost $103,302,893) | | | | $103,302,893 | |
| | |
| | | | | | | | | |
| | |
Total Investments — 99.7% | | | | | | | | |
| | |
(Cost $3,305,440,298) | | | | | | | $4,112,751,793 | |
| | |
Other Assets Less Liabilities - 0.3% | | | | | | | 10,411,836 | |
| | |
Net Assets — 100.0% | | | | | | | $4,123,163,629 | |
See Notes to Financial Statements
7
Harding, Loevner Funds, Inc.
International Equity Portfolio
Portfolio of Investments
April 30, 2014 (unaudited) (continued)
Summary of Abbreviations
| ADR | American Depository Receipt. |
| GDR | Global Depository Receipt. |
| Reg S | Security sold outside United States without registration under the Securities Act of 1933. |
| # | Security valued at fair value as determined in good faith under policies and procedures established by and under the supervision of the Portfolio’s Board of Directors as disclosed in Note 2 of the Notes to Financial Statements. |
| * | Non-income producing security. |
| † | Investment categorized as level 2 security as disclosed in Note 2 of the Notes to Financial Statements. |
| | | | | |
| Industry | | Percentage of
Net Assets |
| |
Automobiles & Components | | | | 3.0 | % |
| |
Banks | | | | 11.1 | |
| |
Capital Goods | | | | 10.2 | |
| |
Consumer Durables & Apparel | | | | 2.6 | |
| |
Consumer Services | | | | 1.0 | |
| |
Diversified Financials | | | | 1.2 | |
| |
Energy | | | | 7.4 | |
| |
Food & Staples Retailing | | | | 0.9 | |
| |
Food, Beverage & Tobacco | | | | 9.0 | |
| |
Health Care Equipment & Services | | | | 6.4 | |
| |
Household & Personal Products | | | | 4.5 | |
| |
Insurance | | | | 5.6 | |
| |
Materials | | | | 3.9 | |
| |
Media | | | | 3.2 | |
| |
Money Market Fund | | | | 2.5 | |
| |
Pharmaceuticals, Biotechnology & Life Sciences | | | | 6.8 | |
| |
Real Estate | | | | 1.1 | |
| |
Semiconductors & Semiconductor Equipment | | | | 5.6 | |
| |
Software & Services | | | | 7.8 | |
| |
Technology Hardware & Equipment | | | | 1.6 | |
| |
Telecommunication Services | | | | 1.3 | |
| |
Transportation | | | | 2.0 | |
| |
Utilities | | | | 1.0 | |
| |
| | | | | | |
Total Investments | | | | 99.7 | |
Other Assets Less Liabilities | | | | 0.3 | |
Net Assets | | | | 100.0 | % |
See Notes to Financial Statements
8
Harding, Loevner Funds, Inc.
International Small Companies Portfolio
Portfolio of Investments
April 30, 2014 (unaudited)
| | | | | | | | |
| | |
| | | Shares | | | Value | |
| COMMON STOCKS - 95.6% | | | | | | |
| | |
Australia - 4.5% | | | | | | | | |
| | |
Cardno Ltd. (Capital Goods)† | | | 99,816 | | | | $649,077 | |
| | |
iiNET Ltd. (Telecommunication Services)† | | | 162,000 | | | | 1,081,199 | |
| | |
Imdex Ltd. (Materials)† | | | 803,200 | | | | 548,404 | |
| | |
SAI Global Ltd. (Commercial & Professional Services)† | | | 227,275 | | | | 902,743 | |
| | |
TPG Telecom Ltd. (Telecommunication
Services)† | | | 156,391 | | | | 862,963 | |
| | |
| | | | | | | 4,044,386 | |
| | |
Austria - 1.2% | | | | | | | | |
| | |
Semperit AG Holding (Capital Goods)† | | | 18,900 | | | | 1,055,963 | |
| | |
Brazil - 4.2% | | | | | | | | |
| | |
CETIP SA - Mercados Organizados (Diversified Financials)† | | | 94,400 | | | | 1,202,783 | |
| | |
Mills Estruturas e Servicos de Engenharia SA (Capital Goods)† | | | 75,200 | | | | 948,368 | |
| | |
SLC Agricola SA (Food, Beverage & Tobacco)† | | | 81,800 | | | | 623,657 | |
| | |
Valid Solucoes e Servicos de Seguranca em Meios de Pagamento e Identificacao SA (Commercial & Professional Services)† | | | 66,300 | | | | 1,027,319 | |
| | |
| | | | | | | 3,802,127 | |
| | |
Canada - 0.9% | | | | | | | | |
| | |
Laurentian Bank of Canada (Banks)† | | | 18,785 | | | | 806,896 | |
| | |
China - 1.0% | | | | | | | | |
| | |
Haitian International Holdings Ltd. (Capital Goods)† | | | 152,000 | | | | 306,273 | |
| | |
Yip’s Chemical Holdings Ltd. (Materials)† | | | 882,000 | | | | 625,211 | |
| | |
| | | | | | | 931,484 | |
| | |
Denmark - 0.5% | | | | | | | | |
| | |
Chr Hansen Holding A/S (Materials)† | | | 10,150 | | | | 457,669 | |
| | |
Finland - 2.1% | | | | | | | | |
| | |
PKC Group oyj (Capital Goods)† | | | 23,200 | | | | 769,750 | |
| | |
Vacon oyj (Capital Goods)† | | | 14,494 | | | | 601,549 | |
| | |
Vaisala oyj, Class A (Technology Hardware & Equipment)† | | | 15,980 | | | | 519,562 | |
| | |
| | | | | | | 1,890,861 | |
| | | | | | | | |
| | |
| | | Shares | | | Value | |
| COMMON STOCKS - 95.6% (continued) | |
| | |
France - 4.4% | | | | | | | | |
| | |
Alten SA (Software & Services)† | | | 17,550 | | | | $896,177 | |
| | |
Ingenico (Technology Hardware & Equipment)† | | | 7,110 | | | | 620,728 | |
| | |
IPSOS (Media)† | | | 24,400 | | | | 946,578 | |
| | |
Rubis SCA (Utilities)† | | | 14,246 | | | | 1,014,014 | |
| | |
Virbac SA (Pharmaceuticals, Biotechnology & Life Sciences)† | | | 2,000 | | | | 479,923 | |
| | |
| | | | | | | 3,957,420 | |
| | |
Germany - 9.8% | | | | | | | | |
| | |
Bechtle AG (Software & Services)† | | | 16,200 | | | | 1,439,051 | |
| | |
Bertrandt AG (Commercial & Professional Services)† | | | 4,120 | | | | 624,082 | |
| | |
Carl Zeiss Meditec AG, Bearer (Health Care Equipment & Services)† | | | 30,200 | | | | 918,653 | |
| | |
Gerresheimer AG (Pharmaceuticals, Biotechnology & Life Sciences)† | | | 17,600 | | | | 1,194,857 | |
| | |
Gerry Weber International AG (Consumer Durables & Apparel)† | | | 25,200 | | | | 1,330,199 | |
| | |
KWS Saat AG (Food, Beverage & Tobacco)† | | | 2,830 | | | | 1,012,255 | |
| | |
Leoni AG (Automobiles & Components)† | | | 8,200 | | | | 609,282 | |
| | |
Pfeiffer Vacuum Technology AG (Capital Goods)† | | | 6,700 | | | | 797,189 | |
| | |
Wirecard AG (Software & Services)† | | | 20,500 | | | | 860,639 | |
| | |
| | | | | | | 8,786,207 | |
| | |
Hong Kong - 1.8% | | | | | | | | |
| | |
Pico Far East Holdings Ltd. (Media)† | | | 2,485,000 | | | | 663,529 | |
| | |
Vitasoy International Holdings Ltd. (Food, Beverage & Tobacco)† | | | 681,000 | | | | 933,098 | |
| | |
| | | | | | | 1,596,627 | |
| | |
Indonesia - 2.7% | | | | | | | | |
| | |
AKR Corporindo Tbk PT (Capital Goods)† | | | 2,420,000 | | | | 1,004,351 | |
| | |
Tower Bersama Infrastructure Tbk PT (Telecommunication Services)† | | | 1,573,500 | | | | 888,478 | |
See Notes to Financial Statements
9
Harding, Loevner Funds, Inc.
International Small Companies Portfolio
Portfolio of Investments
April 30, 2014 (unaudited) (continued)
| | | | | | | | |
| | |
| | | Shares | | | Value | |
| COMMON STOCKS - 95.6% (continued) | |
| | |
Indonesia - 2.7% (continued) | | | | | | | | |
| | |
Wijaya Karya Persero Tbk PT (Capital Goods)† | | | 2,750,000 | | | | $539,115 | |
| | |
| | | | | | | 2,431,944 | |
| | |
Italy - 3.2% | | | | | | | | |
| | |
Danieli & C Officine Meccaniche SpA (Capital Goods)† | | | 25,400 | | | | 610,654 | |
| | |
DiaSorin SpA (Health Care Equipment & Services)† | | | 15,400 | | | | 635,984 | |
| | |
Yoox SpA (Retailing)*† | | | 44,900 | | | | 1,617,482 | |
| | |
| | | | | | | 2,864,120 | |
| | |
Japan - 14.3% | | | | | | | | |
| | |
ABC-Mart Inc. (Retailing)† | | | 6,900 | | | | 309,439 | |
| | |
Arcs Co., Ltd. (Food & Staples Retailing)† | | | 14,000 | | | | 280,445 | |
| | |
Asahi Diamond Industrial Co., Ltd. (Capital Goods)† | | | 27,200 | | | | 367,670 | |
| | |
Asics Corp. (Consumer Durables & Apparel)† | | | 48,100 | | | | 935,756 | |
| | |
BML Inc. (Health Care Equipment & Services)† | | | 35,400 | | | | 1,352,110 | |
| | |
Cosmos Pharmaceutical Corp. (Food & Staples Retailing)† | | | 6,200 | | | | 662,834 | |
| | |
Hiday Hidaka Corp. (Consumer Services)† | | | 65,500 | | | | 1,508,761 | |
| | |
Lintec Corp. (Materials)† | | | 24,100 | | | | 447,641 | |
| | |
M3 Inc. (Health Care Equipment & Services)† | | | 75,200 | | | | 1,035,997 | |
| | |
Message Co., Ltd. (Health Care Equipment & Services)† | | | 32,800 | | | | 1,050,692 | |
| | |
MISUMI Group Inc. (Capital Goods)† | | | 30,300 | | | | 736,764 | |
| | |
MonotaRO Co., Ltd. (Capital Goods)† | | | 41,400 | | | | 838,279 | |
| | |
Nakanishi Inc. (Health Care Equipment & Services)† | | | 30,000 | | | | 1,024,089 | |
| | |
Pigeon Corp. (Household & Personal Products)† | | | 18,600 | | | | 832,330 | |
| | |
Rohto Pharmaceutical Co., Ltd. (Pharmaceuticals, Biotechnology & Life Sciences)† | | | 23,000 | | | | 405,615 | |
| | |
Stanley Electric Co., Ltd. (Automobiles & Components)† | | | 47,300 | | | | 1,045,566 | |
| | |
| | | | | | | 12,833,988 | |
| | |
Kenya - 1.5% | | | | | | | | |
| | |
Equity Bank Ltd. (Banks)† | | | 2,986,000 | | | | 1,312,586 | |
| | | | | | | | |
| | |
| | | Shares | | | Value | |
| COMMON STOCKS - 95.6% (continued) | | | | | | |
| | |
Malaysia - 3.5% | | | | | | | | |
| | |
Coastal Contracts Bhd. (Capital Goods)† | | | 1,234,766 | | | | $1,894,806 | |
| | |
Dialog Group Bhd. (Capital Goods)† | | | 595,000 | | | | 654,198 | |
| | |
KPJ Healthcare Bhd. (Health Care Equipment & Services)† | | | 562,500 | | | | 559,012 | |
| | |
| | | | | | | 3,108,016 | |
| | |
Mexico - 0.5% | | | | | | | | |
| | |
Grupo Herdez SAB de CV (Food, Beverage & Tobacco)† | | | 139,000 | | | | 413,087 | |
| | |
Netherlands - 2.6% | | | | | | | | |
| | |
Arcadis NV (Capital Goods)† | | | 20,000 | | | | 710,210 | |
| | |
ASM International NV (Semiconductors & Semiconductor Equipment)† | | | 11,920 | | | | 521,256 | |
| | |
Brunel International NV (Commercial & Professional Services)† | | | 16,100 | | | | 1,093,601 | |
| | |
| | | | | | | 2,325,067 | |
| | |
Poland - 1.0% | | | | | | | | |
| | |
Eurocash SA (Food & Staples Retailing)† | | | 67,000 | | | | 886,985 | |
| | |
Singapore - 4.3% | | | | | | | | |
| | |
Ezion Holdings Ltd. (Energy)† | | | 873,400 | | | | 1,585,896 | |
| | |
Goodpack Ltd. (Materials)† | | | 458,000 | | | | 878,444 | |
| | |
Super Group Ltd. (Food, Beverage & Tobacco)† | | | 408,000 | | | | 1,140,921 | |
| | |
Tat Hong Holdings Ltd. (Capital Goods)† | | | 377,000 | | | | 244,470 | |
| | |
| | | | | | | 3,849,731 | |
| | |
South Africa - 1.8% | | | | | | | | |
| | |
Clicks Group Ltd. (Food & Staples Retailing)† | | | 128,800 | | | | 786,170 | |
| | |
Discovery Ltd. (Insurance)† | | | 95,900 | | | | 832,319 | |
| | |
| | | | | | | 1,618,489 | |
| | |
South Korea - 3.4% | | | | | | | | |
| | |
Binggrae Co., Ltd. (Food, Beverage & Tobacco)† | | | 6,400 | | | | 582,194 | |
| | |
Cheil Worldwide Inc. (Media)*† | | | 47,890 | | | | 1,162,936 | |
| | |
Halla Visteon Climate Control Corp. (Automobiles & Components)† | | | 30,050 | | | | 1,255,374 | |
| | |
| | | | | | | 3,000,504 | |
See Notes to Financial Statements
10
Harding, Loevner Funds, Inc.
International Small Companies Portfolio
Portfolio of Investments
April 30, 2014 (unaudited) (continued)
| | | | | | | | |
| | |
| | | Shares | | | Value | |
| COMMON STOCKS - 95.6% (continued) | | | | | | |
| | |
Spain - 1.2% | | | | | | | | |
| | |
Construcciones y Auxiliar de Ferrocarriles SA (Capital Goods)† | | | 2,242 | | | | $1,073,384 | |
| | |
Sweden - 2.6% | | | | | | | | |
| | |
Avanza Bank Holding AB (Diversified Financials)† | | | 21,500 | | | | 806,690 | |
| | |
Industrial & Financial Systems, Class B (Software & Services)† | | | 53,700 | | | | 1,536,424 | |
| | |
| | | | | | | 2,343,114 | |
| | |
Switzerland - 1.4% | | | | | | | | |
| | |
LEM Holding SA, Reg S (Technology Hardware & Equipment)† | | | 760 | | | | 627,840 | |
| | |
Temenos Group AG, Reg S (Software & Services)† | | | 18,340 | | | | 657,349 | |
| | |
| | | | | | | 1,285,189 | |
| | |
Taiwan - 2.5% | | | | | | | | |
| | |
Advantech Co., Ltd. (Technology Hardware & Equipment)† | | | 183,000 | | | | 1,184,146 | |
| | |
Chipbond Technology Corp. (Semiconductors & Semiconductor Equipment)† | | | 308,700 | | | | 527,095 | |
| | |
Youngtek Electronics Corp. (Semiconductors & Semiconductor Equipment)† | | | 252,042 | | | | 535,006 | |
| | |
| | | | | | | 2,246,247 | |
| | |
Turkey - 0.8% | | | | | | | | |
| | |
Anadolu Hayat Emeklilik AS (Insurance)† | | | 361,000 | | | | 755,815 | |
| | |
United Kingdom - 17.5% | | | | | | | | |
| | |
Abcam plc (Pharmaceuticals, Biotechnology & Life Sciences)† | | | 44,157 | | | | 294,389 | |
| | |
Bank of Georgia Holdings plc (Banks)† | | | 36,200 | | | | 1,594,001 | |
| | |
Britvic plc (Food, Beverage & Tobacco)† | | | 88,081 | | | | 1,079,653 | |
| | |
Domino Printing Sciences plc (Technology Hardware & Equipment)† | | | 78,300 | | | | 1,026,677 | |
| | |
Grafton Group plc (Capital Goods)† | | | 160,600 | | | | 1,579,060 | |
| | |
Jardine Lloyd Thompson Groupplc (Insurance)† | | | 34,100 | | | | 607,529 | |
| | |
Kentz Corp., Ltd. (Capital Goods)† | | | 158,000 | | | | 1,931,907 | |
| | | | | | | | |
| | |
| | | Shares | | | Value | |
| COMMON STOCKS - 95.6% (continued) | | | | | | |
|
United Kingdom - 17.5% (continued) | |
| | |
Morgan Advanced Materials plc (Capital Goods)† | | | 160,900 | | | | $912,014 | |
| | |
PayPoint plc (Commercial & Professional Services)† | | | 61,600 | | | | 1,184,289 | |
| | |
Rathbone Brothers plc (Diversified
Financials)† | | | 45,980 | | | | 1,503,159 | |
| | |
RPC Group plc (Materials)† | | | 153,000 | | | | 1,550,841 | |
| | |
RPS Group plc (Commercial & Professional Services)† | | | 253,300 | | | | 1,262,483 | |
| | |
Synergy Health plc (Health Care Equipment & Services)† | | | 56,800 | | | | 1,190,811 | |
| | |
| | | | | | | 15,716,813 | |
| | |
United States - 0.4% | | | | | | | | |
| | |
First Cash Financial Services Inc. (Diversified Financials)* | | | 7,800 | | | | 380,406 | |
| |
Total Common Stocks (Cost $65,779,109) | | | | $85,775,125 | |
| | |
| | | | | | | | |
| PREFERRED STOCKS - 0.4% | | | | | | |
| | |
Germany - 0.4% | | | | | | | | |
| | |
Draegerwerk AG & Co. KGaA (Health Care Equipment & Services)† | | | 2,857 | | | | 337,761 | |
| |
Total Preferred Stocks (Cost $198,272) | | | | $337,761 | |
| | |
| | | | | | | | |
| CASH EQUIVALENT - 2.3% | | | | | | |
| | |
Northern Institutional Funds - Prime Obligations Portfolio, 0.02% (Money Market Fund) | | | 2,037,899 | | | | 2,037,899 | |
| |
Total Cash Equivalent (Cost $2,037,899) | | | | $2,037,899 | |
| | |
| | | | | | | | | |
| | |
Total Investments — 98.3% | | | | | | | | |
| | |
(Cost $68,015,280) | | | | | | | $88,150,785 | |
| |
Other Assets Less Liabilities - 1.7% | | | | 1,517,371 | |
| | |
Net Assets — 100.0% | | | | | | | $89,668,156 | |
Summary of Abbreviations
| Reg S | Security sold outside United States without registration under the Securities Act of 1933. |
| * | Non-income producing security. |
See Notes to Financial Statements
11
Harding, Loevner Funds, Inc.
International Small Companies Portfolio
Portfolio of Investments
April 30, 2014 (unaudited) (continued)
| † | Investment categorized as level 2 security as disclosed in Note 2 of the Notes to Financial Statements. |
| | | | | |
| Industry | | Percentage of
Net Assets |
| |
Automobiles & Components | | | | 3.2 | % |
| |
Banks | | | | 4.1 | |
| |
Capital Goods | | | | 20.3 | |
| |
Commercial & Professional Services | | | | 6.8 | |
| |
Consumer Durables & Apparel | | | | 2.5 | |
| |
Consumer Services | | | | 1.7 | |
| |
Diversified Financials | | | | 4.3 | |
| |
Energy | | | | 1.8 | |
| |
Food & Staples Retailing | | | | 2.9 | |
| |
Food, Beverage & Tobacco | | | | 6.5 | |
| |
Health Care Equipment & Services | | | | 9.0 | |
| |
Household & Personal Products | | | | 0.9 | |
| |
Insurance | | | | 2.5 | |
| |
Materials | | | | 5.0 | |
| |
Media | | | | 3.1 | |
| |
Money Market Fund | | | | 2.3 | |
| |
Pharmaceuticals, Biotechnology & Life Sciences | | | | 2.7 | |
| |
Retailing | | | | 2.2 | |
| |
Semiconductors & Semiconductor Equipment | | | | 1.8 | |
| |
Software & Services | | | | 6.0 | |
| |
Technology Hardware & Equipment | | | | 4.4 | |
| |
Telecommunication Services | | | | 3.2 | |
| |
Utilities | | | | 1.1 | |
| |
| | | | | | |
Total Investments | | | | 98.3 | |
Other Assets Less Liabilities | | | | 1.7 | |
Net Assets | | | | 100.0 | % |
See Notes to Financial Statements
12
Harding, Loevner Funds, Inc.
Institutional Emerging Markets Portfolio
Portfolio of Investments
April 30, 2014 (unaudited)
| | | | | | | | |
| | |
| | | Shares | | | Value | |
| COMMON STOCKS - 84.7% | |
| | |
Brazil - 7.4% | | | | | | | | |
| | |
AMBEV SA - ADR (Food, Beverage & Tobacco) | | | 2,658,900 | | | | $19,277,025 | |
| | |
Banco Bradesco SA - ADR (Banks) | | | 1,561,300 | | | | 23,216,531 | |
| | |
BM&FBovespa SA (Diversified Financials)† | | | 3,172,000 | | | | 16,217,423 | |
| | |
Cielo SA (Software & Services)† | | | 847,000 | | | | 15,004,597 | |
| | |
Petroleo Brasileiro SA - ADR (Energy)* | | | 717,900 | | | | 9,964,452 | |
| | |
Vale SA - Sponsored ADR (Materials) | | | 810,200 | | | | 10,710,844 | |
| | |
| | | | | | | 94,390,872 | |
| | |
Chile - 0.8% | | | | | | | | |
| | |
Banco Santander Chile - ADR (Banks) | | | 399,100 | | | | 9,686,157 | |
| | |
China - 8.8% | | | | | | | | |
| | |
51job Inc. - ADR (Commercial & Professional Services)* | | | 218,700 | | | | 14,749,128 | |
| | |
Anhui Conch Cement Co., Ltd., Class H (Materials)† | | | 3,390,900 | | | | 12,598,885 | |
| | |
Baidu Inc. - Sponsored ADR (Software & Services)* | | | 87,800 | | | | 13,508,030 | |
| | |
China Merchants Holdings International Co., Ltd. (Transportation)† | | | 6,050,305 | | | | 18,928,389 | |
| | |
CNOOC Ltd. - ADR (Energy) | | | 102,200 | | | | 16,882,418 | |
| | |
Ctrip.com International Ltd. - ADR
(Retailing)* | | | 119,200 | | | | 5,571,408 | |
| | |
ENN Energy Holdings Ltd. (Utilities)† | | | 1,824,200 | | | | 12,754,779 | |
| | |
Jiangsu Expressway Co., Ltd., Class H (Transportation)† | | | 5,879,000 | | | | 6,620,981 | |
| | |
Tencent Holdings Ltd. (Software & Services)† | | | 173,300 | | | | 10,900,535 | |
| | |
| | | | | | | 112,514,553 | |
| | |
Colombia - 0.7% | | | | | | | | |
| | |
Ecopetrol SA - Sponsored ADR (Energy) | | | 228,300 | | | | 8,558,967 | |
| | |
Czech Republic - 1.1% | | | | | | | | |
| | |
Komercni Banka A/S (Banks)† | | | 61,700 | | | | 14,236,607 | |
| | |
Hong Kong - 5.6% | | | | | | | | |
| | |
AIA Group Ltd. (Insurance)† | | | 5,498,000 | | | | 26,666,658 | |
| | |
ASM Pacific Technology Ltd. (Semiconductors & Semiconductor Equipment)† | | | 795,200 | | | | 8,842,575 | |
| | | | | | | | |
| | |
| | | Shares | | | Value | |
| COMMON STOCKS - 84.7% (continued) | |
|
Hong Kong - 5.6% (continued) | |
| | |
Sands China Ltd. (Consumer Services)† | | | 2,914,400 | | | | $21,440,059 | |
| | |
Xinyi Glass Holdings Ltd. (Automobiles & Components)† | | | 18,263,000 | | | | 14,424,702 | |
| | |
| | | | | | | 71,373,994 | |
| | |
Hungary - 0.8% | | | | | | | | |
| | |
Richter Gedeon Nyrt (Pharmaceuticals, Biotechnology & Life Sciences)† | | | 634,600 | | | | 10,877,596 | |
| | |
India - 8.1% | | | | | | | | |
| | |
Ambuja Cements Ltd. (Materials)† | | | 6,026,700 | | | | 19,831,957 | |
| | |
Axis Bank Ltd. (Banks)† | | | 775,700 | | | | 19,518,339 | |
| | |
Bharti Airtel Ltd. (Telecommunication Services)† | | | 2,865,200 | | | | 15,583,402 | |
| | |
Dabur India Ltd. (Household & Personal Products)† | | | 4,424,400 | | | | 13,186,772 | |
| | |
Maruti Suzuki India Ltd. (Automobiles & Components)† | | | 660,900 | | | | 21,069,746 | |
| | |
Sun Pharmaceutical Industries Ltd. (Pharmaceuticals, Biotechnology & Life Sciences)† | | | 1,337,800 | | | | 14,035,405 | |
| | |
| | | | | | | 103,225,621 | |
| | |
Indonesia - 3.5% | | | | | | | | |
| | |
Astra International Tbk PT (Automobiles & Components)† | | | 20,268,800 | | | | 13,023,282 | |
| | |
Bank Rakyat Indonesia Persero Tbk PT (Banks)† | | | 21,375,000 | | | | 18,311,514 | |
| | |
Semen Indonesia Persero Tbk PT (Materials)† | | | 10,649,600 | | | | 13,836,973 | |
| | |
| | | | | | | 45,171,769 | |
| | |
Italy - 1.2% | | | | | | | | |
| | |
Tenaris SA - ADR (Energy) | | | 343,200 | | | | 15,117,960 | |
| | |
Malaysia - 0.8% | | | | | | | | |
| | |
Axiata Group Bhd. (Telecommunication Services)† | | | 5,131,800 | | | | 10,577,887 | |
| | |
Mexico - 4.1% | | | | | | | | |
| | |
Coca-Cola Femsa SAB de CV - Sponsored ADR (Food, Beverage & Tobacco) | | | 71,100 | | | | 7,960,356 | |
| | |
Fomento Economico Mexicano SAB de CV - Sponsored ADR (Food, Beverage & Tobacco) | | | 196,600 | | | | 17,845,382 | |
See Notes to Financial Statements
13
Harding, Loevner Funds, Inc.
Institutional Emerging Markets Portfolio
Portfolio of Investments
April 30, 2014 (unaudited) (continued)
| | | | | | | | |
| | |
| | | Shares | | | Value | |
| COMMON STOCKS - 84.7% (continued) | |
| | |
Mexico - 4.1% (continued) | | | | | | | | |
| | |
Grupo Aeroportuario del Sureste SAB de CV - ADR (Transportation) | | | 112,400 | | | | $13,740,900 | |
| | |
Grupo Financiero Banorte SAB de CV, Series O (Banks)† | | | 1,849,800 | | | | 12,262,953 | |
| | |
| | | | | | | 51,809,591 | |
| | |
Netherlands - 0.5% | | | | | | | | |
| | |
Nostrum Oil & Gas LP (Energy)† | | | 598,450 | | | | 5,979,539 | |
| | |
Nigeria - 1.4% | | | | | | | | |
| | |
Zenith Bank plc (Banks) | | | 127,806,100 | | | | 18,059,125 | |
| | |
Pakistan - 1.0% | | | | | | | | |
| | |
Engro Corp., Ltd. (Materials)*† | | | 6,247,900 | | | | 12,556,018 | |
| | |
Panama - 0.7% | | | | | | | | |
| | |
Copa Holdings SA, Class A (Transportation) | | | 64,100 | | | | 8,671,448 | |
| | |
Peru - 1.4% | | | | | | | | |
| | |
Credicorp Ltd. (Banks) | | | 118,500 | | | | 17,686,125 | |
| | |
Poland - 1.0% | | | | | | | | |
| | |
Bank Pekao SA (Banks)† | | | 192,600 | | | | 12,411,373 | |
| | |
Russia - 5.0% | | | | | | | | |
| | |
Alrosa AO (Materials)#† | | | 10,666,300 | | | | 11,021,488 | |
| | |
Lukoil OAO - Sponsored ADR (Energy) | | | 346,300 | | | | 18,326,196 | |
| | |
Moscow Exchange MICEX-RTS OAO (Diversified Financials)#† | | | 6,392,570 | | | | 9,472,510 | |
| | |
Novolipetsk Steel OJSC - GDR, Reg S (Materials)† | | | 521,600 | | | | 6,089,937 | |
| | |
Sberbank of Russia (Banks)#† | | | 624,100 | | | | 1,270,106 | |
| | |
Sberbank of Russia - Sponsored ADR (Banks)† | | | 2,044,400 | | | | 17,234,196 | |
| | |
| | | | | | | 63,414,433 | |
| | |
South Africa - 5.3% | | | | | | | | |
| | |
Aspen Pharmacare Holdings Ltd. (Pharmaceuticals, Biotechnology & Life Sciences)† | | | 734,600 | | | | 19,571,372 | |
| | |
Discovery Ltd. (Insurance)† | | | 1,669,000 | | | | 14,485,311 | |
| | |
Naspers Ltd., Class N (Media)† | | | 145,100 | | | | 13,736,962 | |
| | |
Standard Bank Group Ltd. (Banks)† | | | 952,700 | | | | 12,517,538 | |
| | |
Tiger Brands Ltd. (Food, Beverage & Tobacco)† | | | 293,000 | | | | 7,835,746 | |
| | |
| | | | | | | 68,146,929 | |
| | | | | | | | |
| | |
| | | Shares | | | Value | |
| COMMON STOCKS - 84.7% (continued) | |
| | |
South Korea - 4.2% | | | | | | | | |
| | |
Hankook Tire Co., Ltd. (Automobiles & Components)† | | | 413,832 | | | | $23,996,875 | |
| | |
NAVER Corp. (Software & Services)† | | | 10,300 | | | | 7,416,894 | |
| | |
Samsung Electronics Co., Ltd. - GDR, Reg S (Semiconductors & Semiconductor Equipment)† | | | 12,400 | | | | 8,006,113 | |
| | |
Samsung Fire & Marine Insurance Co., Ltd. (Insurance)† | | | 61,800 | | | | 14,652,438 | |
| | |
| | | | | | | 54,072,320 | |
| | |
Taiwan - 9.1% | | | | | | | | |
| | |
Advantech Co., Ltd. (Technology Hardware & Equipment)† | | | 2,419,000 | | | | 15,652,724 | |
| | |
Delta Electronics Inc. (Technology Hardware & Equipment)† | | | 2,591,189 | | | | 15,928,265 | |
| | |
Hiwin Technologies Corp. (Capital Goods)† | | | 999,391 | | | | 9,528,680 | |
| | |
Hon Hai Precision Industry Co., Ltd. (Technology Hardware & Equipment)† | | | 6,087,917 | | | | 17,491,662 | |
| | |
MediaTek Inc. (Semiconductors & Semiconductor Equipment)† | | | 1,215,000 | | | | 19,024,351 | |
| | |
Taiwan Semiconductor Manufacturing Co., Ltd. (Semiconductors & Semiconductor Equipment)† | | | 9,948,277 | | | | 39,216,291 | |
| | |
| | | | | | | 116,841,973 | |
| | |
Thailand - 1.6% | | | | | | | | |
| | |
Siam Commercial Bank pcl (Banks)† | | | 4,026,370 | | | | 20,281,159 | |
| | |
Turkey - 2.8% | | | | | | | | |
| | |
Arcelik A/S (Consumer Durables & Apparel)† | | | 3,240,100 | | | | 19,985,091 | |
| | |
Turkiye Garanti Bankasi AS (Banks)† | | | 4,488,800 | | | | 16,440,024 | |
| | |
| | | | | | | 36,425,115 | |
| | |
Ukraine - 0.3% | | | | | | | | |
| | |
MHP SA - GDR, Reg S (Food, Beverage & Tobacco)† | | | 349,700 | | | | 4,120,701 | |
| | |
United Arab Emirates - 0.9% | | | | | | | | |
| | |
Dragon Oil plc (Energy)† | | | 1,113,200 | | | | 11,867,436 | |
| | |
United Kingdom - 6.6% | | | | | | | | |
| | |
Bank of Georgia Holdings plc (Banks)† | | | 307,000 | | | | 13,518,183 | |
See Notes to Financial Statements
14
Harding, Loevner Funds, Inc.
Institutional Emerging Markets Portfolio
Portfolio of Investments
April 30, 2014 (unaudited) (continued)
| | | | | | | | |
| | |
| | | Shares | | | Value | |
| COMMON STOCKS - 84.7% (continued) | |
| | |
United Kingdom - 6.6% (continued) | | | | | | | | |
| | |
Coca-Cola HBC AG - CDI (Food, Beverage & Tobacco)† | | | 543,300 | | | | $13,783,661 | |
| | |
Hikma Pharmaceuticals plc (Pharmaceuticals, Biotechnology & Life Sciences)† | | | 1,217,300 | | | | 32,038,379 | |
| | |
SABMiller plc (Food, Beverage & Tobacco)† | | | 448,700 | | | | 24,457,642 | |
| | |
| | | | | | | | 83,797,865 | |
| |
Total Common Stocks (Cost $946,677,276) | | | | $1,081,873,133 | |
| | |
| | | | | | | | |
| PREFERRED STOCKS - 7.0% | | | | | | |
| | |
Brazil - 2.1% | | | | | | | | |
| | |
Cia Brasileira de Distribuicao Grupo Pao de Acucar - Sponsored ADR (Food & Staples Retailing) | | | 493,200 | | | | 23,456,592 | |
| | |
Vale SA - Sponsored ADR (Materials) | | | 308,600 | | | | 3,663,082 | |
| | |
| | | | | | | 27,119,674 | |
| | |
Russia - 1.2% | | | | | | | | |
| | |
AK Transneft OAO (Energy)#† | | | 6,960 | | | | 15,410,660 | |
| | |
South Korea - 3.7% | | | | | | | | |
| | |
Samsung Electronics Co., Ltd. - GDR, Reg S (Semiconductors & Semiconductor Equipment)† | | | 93,500 | | | | 46,580,267 | |
| | |
| | | | | | | | | |
| |
Total Preferred Stocks (Cost $73,894,410) | | | | $89,110,601 | |
| | |
| | | | | | | | |
| PARTICIPATION NOTES - 5.9% | | | | | | |
| | |
Qatar - 2.3% | | | | | | | | |
| | |
Industries Qatar QSC, Issued by HSBC Bank plc, Maturity Date 2/23/15 (Capital Goods)^† | | | 280,230 | | | | 13,700,356 | |
| | |
Qatar National Bank, Issued by HSBC Bank plc, Maturity Date 9/12/16
(Banks)^† | | | 297,900 | | | | 15,546,095 | |
| | |
| | | | | | | 29,246,451 | |
| | |
Saudi Arabia - 3.6% | | | | | | | | |
| | |
Etihad Etisalat Co., Issued by HSBC Bank plc, Maturity Date 12/5/14 (Telecommunication Services)^† | | | 953,600 | | | | 24,287,185 | |
| | | | | | | | |
| | |
| | | Shares | | | Value | |
| PARTICIPATION NOTES - 5.9% (continued) | | | | |
| | |
Saudi Arabia - 3.6% (continued) | | | | | | | | |
| | |
Jarir Marketing Co., Issued by HSBC Bank plc, Maturity Date 5/4/15 (Commercial & Professional
Services)^† | | | 402,700 | | | | $21,647,628 | |
| | |
| | | | | | | | 45,934,813 | |
| |
Total Participation Notes (Cost $58,778,468) | | | | $75,181,264 | |
| | |
| | | | | | | | |
| CASH EQUIVALENT - 2.1% | | | | | | |
| | |
Northern Institutional Funds - Prime Obligations Portfolio, 0.02% (Money Market Fund) | | | 26,549,773 | | | | 26,549,773 | |
| |
Total Cash Equivalent (Cost $26,549,773) | | | | $26,549,773 | |
| | |
| | | | | | | | | |
| | |
Total Investments — 99.7% | | | | | | | | |
| | |
(Cost $1,105,899,927) | | | | | | | $1,272,714,771 | |
| | |
Other Assets Less Liabilities - 0.3% | | | | | | | 3,764,470 | |
| | |
Net Assets — 100.0% | | | | | | | $1,276,479,241 | |
Summary of Abbreviations
| ADR | American Depository Receipt. |
| CDI | Chess Depository Interest. |
| GDR | Global Depository Receipt. |
| Reg S | Security sold outside United States without registration under the Securities Act of 1933. |
| # | Security valued at fair value as determined in good faith under policies and procedures established by and under the supervision of the Portfolio’s Board of Directors as disclosed in Note 2 of the Notes to Financial Statements. |
| * | Non-income producing security. |
| ^ | Security exempt from registration pursuant to Rule 144A of the Securities Act of 1933. These securities, which represent 5.9% of net assets as of April 30, 2014, are considered liquid and may be resold in transactions exempt from registration, normally to qualified buyers. |
| † | Investment categorized as level 2 security as disclosed in Note 2 of the Notes to Financial Statements. |
See Notes to Financial Statements
15
Harding, Loevner Funds, Inc.
Institutional Emerging Markets Portfolio
Portfolio of Investments
April 30, 2014 (unaudited) (continued)
| | | | | |
| Industry | | Percentage of
Net Assets |
| |
Automobiles & Components | | | | 5.7 | % |
| |
Banks | | | | 19.0 | |
| |
Capital Goods | | | | 1.8 | |
| |
Commercial & Professional Services | | | | 2.8 | |
| |
Consumer Durables & Apparel | | | | 1.6 | |
| |
Consumer Services | | | | 1.7 | |
| |
Diversified Financials | | | | 2.0 | |
| |
Energy | | | | 8.0 | |
| |
Food & Staples Retailing | | | | 1.8 | |
| |
Food, Beverage & Tobacco | | | | 7.5 | |
| |
Household & Personal Products | | | | 1.0 | |
| |
Insurance | | | | 4.4 | |
| |
Materials | | | | 7.1 | |
| |
Media | | | | 1.1 | |
| |
Money Market Fund | | | | 2.1 | |
| |
Pharmaceuticals, Biotechnology & Life Sciences | | | | 6.0 | |
| |
Retailing | | | | 0.4 | |
| |
Semiconductors & Semiconductor Equipment | | | | 9.5 | |
| |
Software & Services | | | | 3.7 | |
| |
Technology Hardware & Equipment | | | | 3.8 | |
| |
Telecommunication Services | | | | 3.9 | |
| |
Transportation | | | | 3.8 | |
| |
Utilities | | | | 1.0 | |
| |
| | | | | | |
Total Investments | | | | 99.7 | |
Other Assets Less Liabilities | | | | 0.3 | |
Net Assets | | | | 100.0 | % |
See Notes to Financial Statements
16
Harding, Loevner Funds, Inc.
Emerging Markets Portfolio
Portfolio of Investments
April 30, 2014 (unaudited)
| | | | | | | | |
| | |
| | | Shares | | | Value | |
| COMMON STOCKS - 84.9% | | | | | | |
| | |
Brazil - 7.5% | | | | | | | | |
| | |
AMBEV SA - ADR (Food, Beverage & Tobacco) | | | 4,678,400 | | | | $33,918,400 | |
| | |
Banco Bradesco SA - ADR (Banks) | | | 2,738,700 | | | | 40,724,469 | |
| | |
BM&FBovespa SA (Diversified
Financials)† | | | 5,630,000 | | | | 28,784,393 | |
| | |
Cielo SA (Software & Services)† | | | 1,504,200 | | | | 26,646,889 | |
| | |
Petroleo Brasileiro SA - ADR (Energy)* | | | 1,259,300 | | | | 17,479,084 | |
| | |
Vale SA - Sponsored ADR (Materials) | | | 1,624,300 | | | | 21,473,246 | |
| | |
| | | | | | | 169,026,481 | |
| | |
Chile - 0.7% | | | | | | | | |
| | |
Banco Santander Chile - ADR (Banks) | | | 693,900 | | | | 16,840,953 | |
| | |
China - 8.8% | | | | | | | | |
| | |
51job Inc. - ADR (Commercial & Professional Services)* | | | 388,171 | | | | 26,178,252 | |
| | |
Anhui Conch Cement Co., Ltd., Class H (Materials)† | | | 6,000,500 | | | | 22,294,851 | |
| | |
Baidu Inc. - Sponsored ADR (Software & Services)* | | | 156,000 | | | | 24,000,600 | |
| | |
China Merchants Holdings International Co., Ltd. (Transportation)† | | | 10,775,289 | | | | 33,710,510 | |
| | |
CNOOC Ltd. - ADR (Energy) | | | 179,100 | | | | 29,585,529 | |
| | |
Ctrip.com International Ltd. - ADR (Retailing)* | | | 210,100 | | | | 9,820,074 | |
| | |
ENN Energy Holdings Ltd. (Utilities)† | | | 3,216,000 | | | | 22,486,223 | |
| | |
Jiangsu Expressway Co., Ltd., Class H (Transportation)† | | | 10,089,000 | | | | 11,362,320 | |
| | |
Tencent Holdings Ltd. (Software & Services)† | | | 301,700 | | | | 18,976,868 | |
| | |
| | | | | | | 198,415,227 | |
| | |
Colombia - 0.7% | | | | | | | | |
| | |
Ecopetrol SA - Sponsored ADR (Energy) | | | 392,000 | | | | 14,696,080 | |
| | |
Czech Republic - 1.1% | | | | | | | | |
| | |
Komercni Banka A/S (Banks)† | | | 108,700 | | | | 25,081,348 | |
| | |
Hong Kong - 5.6% | | | | | | | | |
| | |
AIA Group Ltd. (Insurance)† | | | 9,644,200 | | | | 46,776,752 | |
| | |
ASM Pacific Technology Ltd. (Semiconductors & Semiconductor Equipment)† | | | 1,408,800 | | | | 15,665,769 | |
| | | | | | | | |
| | |
| | | Shares | | | Value | |
| COMMON STOCKS - 84.9% (continued) | |
| | |
Hong Kong - 5.6% (continued) | | | | | | | | |
| | |
Sands China Ltd. (Consumer Services)† | | | 5,160,400 | | | | $37,962,971 | |
| | |
Xinyi Glass Holdings Ltd. (Automobiles & Components)† | | | 32,076,000 | | | | 25,334,651 | |
| | |
| | | | | | | 125,740,143 | |
| | |
Hungary - 0.8% | | | | | | | | |
| | |
Richter Gedeon Nyrt (Pharmaceuticals, Biotechnology & Life Sciences)† | | | 1,113,200 | | | | 19,081,216 | |
| | |
India - 8.1% | | | | | | | | |
| | |
Ambuja Cements Ltd. (Materials)† | | | 10,686,400 | | | | 35,165,551 | |
| | |
Axis Bank Ltd. (Banks)† | | | 1,381,600 | | | | 34,764,133 | |
| | |
Bharti Airtel Ltd. (Telecommunication Services)† | | | 5,093,900 | | | | 27,704,974 | |
| | |
Dabur India Ltd. (Household & Personal Products)† | | | 7,863,404 | | | | 23,436,604 | |
| | |
Maruti Suzuki India Ltd. (Automobiles & Components)† | | | 1,164,200 | | | | 37,115,144 | |
| | |
Sun Pharmaceutical Industries Ltd. (Pharmaceuticals, Biotechnology & Life Sciences)† | | | 2,344,900 | | | | 24,601,301 | |
| | |
| | | | | | | 182,787,707 | |
| | |
Indonesia - 3.5% | | | | | | | | |
| | |
Astra International Tbk PT (Automobiles & Components)† | | | 36,009,500 | | | | 23,137,131 | |
| | |
Bank Rakyat Indonesia Persero Tbk PT (Banks)† | | | 37,715,500 | | | | 32,310,078 | |
| | |
Semen Indonesia Persero Tbk PT (Materials)† | | | 18,681,100 | | | | 24,272,261 | |
| | |
| | | | | | | 79,719,470 | |
| | |
Italy - 1.2% | | | | | | | | |
| | |
Tenaris SA - ADR (Energy) | | | 591,100 | | | | 26,037,955 | |
| | |
Malaysia - 0.8% | | | | | | | | |
| | |
Axiata Group Bhd. (Telecommunication Services)† | | | 8,966,100 | | | | 18,481,311 | |
| | |
Mexico - 4.1% | | | | | | | | |
| | |
Coca-Cola Femsa SAB de CV - Sponsored ADR (Food, Beverage & Tobacco) | | | 125,200 | | | | 14,017,392 | |
| | |
Fomento Economico Mexicano SAB de CV - Sponsored ADR (Food, Beverage & Tobacco) | | | 343,800 | | | | 31,206,726 | |
See Notes to Financial Statements
17
Harding, Loevner Funds, Inc.
Emerging Markets Portfolio
Portfolio of Investments
April 30, 2014 (unaudited) (continued)
| | | | | | | | |
| | |
| | | Shares | | | Value | |
| COMMON STOCKS - 84.9% (continued) | |
| | |
Mexico - 4.1% (continued) | | | | | | | | |
| | |
Grupo Aeroportuario del Sureste SAB de CV - ADR (Transportation) | | | 199,298 | | | | $24,364,181 | |
| | |
Grupo Financiero Banorte SAB de CV, Series O (Banks)† | | | 3,262,740 | | | | 21,629,813 | |
| | |
| | | | | | | 91,218,112 | |
| | |
Netherlands - 0.5% | | | | | | | | |
| | |
Nostrum Oil & Gas LP (Energy)† | | | 1,049,700 | | | | 10,488,298 | |
| | |
Nigeria - 1.4% | | | | | | | | |
| | |
Zenith Bank PLC (Banks) | | | 225,998,120 | | | | 31,933,752 | |
| | |
Pakistan - 1.0% | | | | | | | | |
| | |
Engro Corp., Ltd. (Materials)*† | | | 10,954,400 | | | | 22,014,379 | |
| | |
Panama - 0.7% | | | | | | | | |
| | |
Copa Holdings SA, Class A (Transportation) | | | 111,300 | | | | 15,056,664 | |
| | |
Peru - 1.4% | | | | | | | | |
| | |
Credicorp Ltd. (Banks) | | | 209,400 | | | | 31,252,950 | |
| | |
Poland - 1.0% | | | | | | | | |
| | |
Bank Pekao SA (Banks)† | | | 337,861 | | | | 21,772,165 | |
| | |
Russia - 5.0% | | | | | | | | |
| | |
Alrosa AO (Materials)#† | | | 18,711,200 | | | | 19,334,283 | |
| | |
Lukoil OAO - Sponsored ADR (Energy) | | | 608,594 | | | | 32,206,795 | |
| | |
Moscow Exchange MICEX-RTS OAO (Diversified Financials)#† | | | 11,168,830 | | | | 16,549,972 | |
| | |
Novolipetsk Steel OJSC - GDR, Reg S (Materials)† | | | 901,000 | | | | 10,519,618 | |
| | |
Sberbank of Russia - Sponsored ADR (Banks)† | | | 3,892,400 | | | | 32,812,749 | |
| | |
| | | | | | | 111,423,417 | |
| | |
South Africa - 5.3% | | | | | | | | |
| | |
Aspen Pharmacare Holdings Ltd. (Pharmaceuticals, Biotechnology & Life Sciences)† | | | 1,287,200 | | | | 34,293,862 | |
| | |
Discovery Ltd. (Insurance)† | | | 2,942,800 | | | | 25,540,667 | |
| | |
Naspers Ltd., Class N (Media)† | | | 254,000 | | | | 24,046,784 | |
| | |
Standard Bank Group Ltd. (Banks)† | | | 1,661,000 | | | | 21,823,901 | |
| | |
Tiger Brands Ltd. (Food, Beverage & Tobacco)† | | | 512,000 | | | | 13,692,498 | |
| | |
| | | | | | | 119,397,712 | |
| | | | | | | | |
| | |
| | | Shares | | | Value | |
| COMMON STOCKS - 84.9% (continued) | |
| | |
South Korea - 4.2% | | | | | | | | |
| | |
Hankook Tire Co., Ltd. (Automobiles & Components)† | | | 725,938 | | | | $42,094,965 | |
| | |
NAVER Corp. (Software & Services)† | | | 17,800 | | | | 12,817,544 | |
| | |
Samsung Electronics Co., Ltd. - GDR, Reg S (Semiconductors & Semiconductor Equipment)† | | | 21,780 | | | | 14,062,350 | |
| | |
Samsung Fire & Marine Insurance Co., Ltd. (Insurance)† | | | 108,800 | | | | 25,795,878 | |
| | |
| | | | | | | 94,770,737 | |
| | |
Taiwan - 9.2% | | | | | | | | |
| | |
Advantech Co., Ltd. (Technology Hardware & Equipment)† | | | 4,265,000 | | | | 27,597,713 | |
| | |
Delta Electronics Inc. (Technology Hardware & Equipment)† | | | 4,604,751 | | | | 28,305,806 | |
| | |
Hiwin Technologies Corp. (Capital Goods)† | | | 1,771,097 | | | | 16,886,500 | |
| | |
Hon Hai Precision Industry Co., Ltd. (Technology Hardware & Equipment)† | | | 10,722,931 | | | | 30,808,877 | |
| | |
MediaTek Inc. (Semiconductors & Semiconductor Equipment)† | | | 2,133,000 | | | | 33,398,305 | |
| | |
Taiwan Semiconductor Manufacturing Co., Ltd. (Semiconductors & Semiconductor Equipment)† | | | 17,519,637 | | | | 69,062,731 | |
| | |
| | | | | | | 206,059,932 | |
| | |
Thailand - 1.6% | | | | | | | | |
| | |
Siam Commercial Bank pcl (Banks)† | | | 7,153,200 | | | | 36,031,261 | |
| | |
Turkey - 2.9% | | | | | | | | |
| | |
Arcelik A/S (Consumer Durables & Apparel)† | | | 5,685,312 | | | | 35,067,275 | |
| | |
Turkiye Garanti Bankasi AS (Banks)† | | | 7,923,700 | | | | 29,020,188 | |
| | |
| | | | | | | 64,087,463 | |
| | |
Ukraine - 0.3% | | | | | | | | |
| | |
MHP SA - GDR, Reg S (Food, Beverage & Tobacco)† | | | 635,500 | | | | 7,488,435 | |
| | |
United Arab Emirates - 0.9% | | | | | | | | |
| | |
Dragon Oil plc (Energy)† | | | 1,952,800 | | | | 20,818,118 | |
| | |
United Kingdom - 6.6% | | | | | | | | |
| | |
Bank of Georgia Holdings PLC (Banks)† | | | 535,454 | | | | 23,577,737 | |
See Notes to Financial Statements
18
Harding, Loevner Funds, Inc.
Emerging Markets Portfolio
Portfolio of Investments
April 30, 2014 (unaudited) (continued)
| | | | | | | | |
| | |
| | | Shares | | | Value | |
| COMMON STOCKS - 84.9% (continued) | |
| | |
United Kingdom - 6.6% (continued) | | | | | | | | |
| | |
Coca-Cola HBC AG - CDI (Food, Beverage & Tobacco)† | | | 951,200 | | | | $24,132,189 | |
| | |
Hikma Pharmaceuticals plc (Pharmaceuticals, Biotechnology & Life Sciences)† | | | 2,165,653 | | | | 56,998,283 | |
| | |
SABMiller plc (Food, Beverage & Tobacco)† | | | 788,800 | | | | 42,995,739 | |
| | |
| | | | | | | | 147,703,948 | |
| |
Total Common Stocks (Cost $1,432,601,912) | | | | $1,907,425,234 | |
| | |
| | | | | | | | |
| PREFERRED STOCKS - 6.9% | | | | | | |
| | |
Brazil - 2.0% | | | | | | | | |
| | |
Cia Brasileira de Distribuicao Grupo Pao de Acucar - Sponsored ADR (Food & Staples Retailing) | | | 866,900 | | | | 41,229,764 | |
| | |
Vale SA - Sponsored ADR (Materials) | | | 333,000 | | | | 3,952,710 | |
| | |
| | | | | | | 45,182,474 | |
| | |
Russia - 1.2% | | | | | | | | |
| | |
AK Transneft OAO (Energy)#† | | | 12,400 | | | | 27,455,775 | |
| | |
South Korea - 3.7% | | | | | | | | |
| | |
Samsung Electronics Co., Ltd. - GDR, Reg S (Semiconductors & Semiconductor Equipment)† | | | 164,700 | | | | 82,051,016 | |
| |
Total Preferred Stocks (Cost $101,784,434) | | | | $154,689,265 | |
| | |
| | | | | | | | |
| PARTICIPATION NOTES - 5.9% | | | | | | |
| | |
Qatar - 2.3% | | | | | | | | |
| | |
Industries Qatar QSC, Issued by HSBC Bank plc, Maturity Date 2/23/15 (Capital Goods)^† | | | 489,510 | | | | 23,931,988 | |
| | |
Qatar National Bank, Issued by HSBC Bank plc, Maturity Date 9/12/16
(Banks)^† | | | 520,000 | | | | 27,136,520 | |
| | |
| | | | | | | 51,068,508 | |
| | |
Saudi Arabia - 3.6% | | | | | | | | |
| | |
Etihad Etisalat Co., Issued by HSBC Bank plc, Maturity Date 12/5/14 (Telecommunication Services)^† | | | 1,679,400 | �� | | | 42,772,545 | |
| | | | | | | | |
| | |
| | | Shares | | | Value | |
| PARTICIPATION NOTES - 5.9% (continued) | |
| | |
Saudi Arabia - 3.6% (continued) | | | | | | | | |
| | |
Jarir Marketing Co., Issued by HSBC Bank plc, Maturity Date 5/4/15 (Commercial & Professional
Services)^† | | | 708,450 | | | | $38,083,591 | |
| | |
| | | | | | | | 80,856,136 | |
| |
Total Participation Notes (Cost $97,746,272) | | | | $131,924,644 | |
| | |
| | | | | | | | |
| CASH EQUIVALENT - 1.8% | | | | | | |
| | |
Northern Institutional Funds - Prime Obligations Portfolio, 0.02% (Money Market Fund) | | | 41,136,666 | | | | 41,136,666 | |
| |
Total Cash Equivalent (Cost $41,136,666) | | | | $41,136,666 | |
| | |
| | | | | | | | | |
| | |
Total Investments — 99.5% | | | | | | | | |
| | |
(Cost $1,673,269,284) | | | | | | | $2,235,175,809 | |
| | |
Other Assets Less Liabilities - 0.5% | | | | | | | 10,763,141 | |
| | |
Net Assets — 100.0% | | | | | | | $2,245,938,950 | |
Summary of Abbreviations
| ADR | American Depository Receipt. |
| CDI | Chess Depository Receipt. |
| GDR | Global Depository Receipt. |
| # | Security valued at fair value as determined in good faith under policies and procedures established by and under the supervision of the Portfolio’s Board of Directors as disclosed in Note 2 of the Notes to Financial Statements. |
| * | Non-income producing security. |
| ^ | Security exempt from registration pursuant to Rule 144A of the Securities Act of 1933. These securities, which represent 5.9% of net assets as of April 30, 2014, are considered liquid and may be resold in transactions exempt from registration, normally to qualified buyers. |
| † | Investment categorized as level 2 security as disclosed in Note 2 of the Notes to Financial Statements. |
See Notes to Financial Statements
19
Harding, Loevner Funds, Inc.
Emerging Markets Portfolio
Portfolio of Investments
April 30, 2014 (unaudited) (continued)
| | | | | |
| Industry | | Percentage of
Net Assets |
| |
Automobiles & Components | | | | 5.7 | % |
| |
Banks | | | | 19.0 | |
| |
Capital Goods | | | | 1.8 | |
| |
Commercial & Professional Services | | | | 2.9 | |
| |
Consumer Durables & Apparel | | | | 1.6 | |
| |
Consumer Services | | | | 1.7 | |
| |
Diversified Financials | | | | 2.0 | |
| |
Energy | | | | 7.9 | |
| |
Food & Staples Retailing | | | | 1.8 | |
| |
Food, Beverage & Tobacco | | | | 7.4 | |
| |
Household & Personal Products | | | | 1.0 | |
| |
Insurance | | | | 4.4 | |
| |
Materials | | | | 7.1 | |
| |
Media | | | | 1.1 | |
| |
Money Market Fund | | | | 1.8 | |
| |
Pharmaceuticals, Biotechnology & Life Sciences | | | | 6.0 | |
| |
Retailing | | | | 0.4 | |
| |
Semiconductors & Semiconductor Equipment | | | | 9.5 | |
| |
Software & Services | | | | 3.7 | |
| |
Technology Hardware & Equipment | | | | 3.9 | |
| |
Telecommunication Services | | | | 4.0 | |
| |
Transportation | | | | 3.8 | |
| |
Utilities | | | | 1.0 | |
| |
| | | | | | |
Total Investments | | | | 99.5 | |
Other Assets Less Liabilities | | | | 0.5 | |
Net Assets | | | | 100.0 | % |
See Notes to Financial Statements
20
Harding, Loevner Funds, Inc.
Frontier Emerging Markets Portfolio
Portfolio of Investments
April 30, 2014 (unaudited)
| | | | | | | | |
| | |
| | | Shares | | | Value | |
| COMMON STOCKS - 86.8% | | | | | | |
| | |
Bangladesh - 7.0% | | | | | | | | |
| | |
GrameenPhone Ltd. (Telecommunication Services)† | | | 670,000 | | | | $2,321,565 | |
| | |
Lafarge Surma Cement Ltd. (Materials)*† | | | 1,300,000 | | | | 1,133,798 | |
| | |
Olympic Industries Ltd. (Food, Beverage & Tobacco)† | | | 4,199,750 | | | | 12,997,871 | |
| | |
Square Pharmaceuticals Ltd. (Pharmaceuticals, Biotechnology & Life Sciences)† | | | 3,650,008 | | | | 13,247,139 | |
| | |
| | | | | | | 29,700,373 | |
| | |
Canada - 0.2% | | | | | | | | |
| | |
Katanga Mining Ltd. (Materials)*† | | | 2,356,375 | | | | 999,694 | |
| | |
Colombia - 6.2% | | | | | | | | |
| | |
Bancolombia SA - Sponsored ADR (Banks) | | | 39,000 | | | | 2,220,270 | |
| | |
Cementos Argos SA - Sponsored ADR (Materials)#† | | | 490,000 | | | | 13,663,307 | |
| | |
Ecopetrol SA - Sponsored ADR (Energy) | | | 105,000 | | | | 3,936,450 | |
| | |
Grupo de Inversiones Suramericana SA - Sponsored ADR (Diversified Financials)#† | | | 41,800 | | | | 1,630,923 | |
| | |
Grupo Odinsa SA (Capital Goods)† | | | 664,449 | | | | 2,727,686 | |
| | |
Interconexion Electrica SA ESP - ADR (Utilities)#† | | | 19,000 | | | | 2,227,129 | |
| | |
| | | | | | | 26,405,765 | |
| | |
Croatia - 0.6% | | | | | | | | |
| | |
Ericsson Nikola Tesla (Technology Hardware & Equipment)† | | | 8,800 | | | | 2,593,808 | |
| | |
Egypt - 3.6% | | | | | | | | |
| | |
Commercial International Bank Egypt SAE (Banks)† | | | 775,000 | | | | 4,144,834 | |
| | |
Global Telecom Holding, - GDR (Telecommunication Services)*† | | | 625,000 | | | | 2,329,346 | |
| | |
Oriental Weavers (Consumer Durables & Apparel)† | | | 1,275,000 | | | | 8,869,897 | |
| | |
| | | | | | | 15,344,077 | |
| | |
Estonia - 1.0% | | | | | | | | |
| | |
Olympic Entertainment Group AS (Consumer Services) | | | 875,000 | | | | 2,294,330 | |
| | | | | | | | |
| | |
| | | Shares | | | Value | |
| COMMON STOCKS - 86.8% (continued) | |
| | |
Estonia - 1.0% (continued) | | | | | | | | |
| | |
Tallink Group AS (Transportation) | | | 1,875,000 | | | | $2,028,999 | |
| | |
| | | | | | | 4,323,329 | |
| | |
Ghana - 1.0% | | | | | | | | |
| | |
Ghana Commercial Bank Ltd. (Banks) | | | 2,849,949 | | | | 4,335,346 | |
| | |
Jordan - 0.8% | | | | | | | | |
| | |
Arab Bank plc (Banks)† | | | 263,888 | | | | 3,213,273 | |
| | |
Kazakhstan - 2.8% | | | | | | | | |
| | |
Halyk Savings Bank of Kazakhstan JSC - GDR, Reg S (Banks)† | | | 1,320,000 | | | | 11,900,291 | |
| | |
Kenya - 5.9% | | | | | | | | |
| | |
East African Breweries Ltd. (Food, Beverage & Tobacco)† | | | 1,250,000 | | | | 4,209,433 | |
| | |
Equity Bank Ltd. (Banks)† | | | 25,200,000 | | | | 11,077,417 | |
| | |
Nation Media Group Ltd. (Media)† | | | 240,040 | | | | 846,891 | |
| | |
Safaricom Ltd. (Telecommunication Services)† | | | 60,750,000 | | | | 9,142,457 | |
| | |
| | | | | | | 25,276,198 | |
| | |
Lebanon - 0.4% | | | | | | | | |
| | |
Bank Audi SAL - GDR, Reg S (Banks)† | | | 265,000 | | | | 1,696,000 | |
| | |
Mauritius - 0.4% | | | | | | | | |
| | |
MCB Group Ltd. (Banks)* | | | 252,780 | | | | 1,844,155 | |
| | |
Morocco - 0.9% | | | | | | | | |
| | |
Douja Promotion Groupe Addoha SA (Real Estate)† | | | 500,000 | | | | 3,700,709 | |
| | |
Netherlands - 0.6% | | | | | | | | |
| | |
Nostrum Oil & Gas LP (Energy)† | | | 235,000 | | | | 2,348,052 | |
| | |
Nigeria - 10.2% | | | | | | | | |
| | |
Dangote Cement plc (Materials) | | | 7,300,000 | | | | 10,269,984 | |
| | |
FBN Holdings plc (Banks) | | | 37,000,000 | | | | 3,261,251 | |
| | |
Guaranty Trust Bank plc (Banks) | | | 45,500,000 | | | | 7,428,976 | |
| | |
Lafarge Cement WAPCO Nigeria plc (Materials) | | | 5,900,000 | | | | 3,984,750 | |
| | |
Nigerian Breweries plc (Food, Beverage & Tobacco) | | | 3,150,000 | | | | 2,941,177 | |
| | |
UAC of Nigeria plc (Capital Goods) | | | 21,750,000 | | | | 7,657,516 | |
| | |
Zenith Bank plc (Banks) | | | 55,000,000 | | | | 7,771,553 | |
| | |
| | | | | | | 43,315,207 | |
See Notes to Financial Statements
21
Harding, Loevner Funds, Inc.
Frontier Emerging Markets Portfolio
Portfolio of Investments
April 30, 2014 (unaudited) (continued)
| | | | | | | | |
| | |
| | | Shares | | | Value | |
| COMMON STOCKS - 86.8% (continued) | |
| | |
Pakistan - 6.6% | | | | | | | | |
| | |
Engro Corp., Ltd. (Materials)*† | | | 7,449,992 | | | | $14,971,787 | |
| | |
Engro Fertilizers Ltd. (Materials)*† | | | 6,819,999 | | | | 4,592,407 | |
| | |
MCB Bank Ltd. (Banks)† | | | 1,575,000 | | | | 4,502,755 | |
| | |
Pakistan Petroleum Ltd. (Energy)† | | | 1,724,997 | | | | 4,067,402 | |
| | |
| | | | | | | 28,134,351 | |
| | |
Peru - 3.9% | | | | | | | | |
| | |
Alicorp SAA, Class C (Food, Beverage & Tobacco)† | | | 1,288,500 | | | | 3,901,068 | |
| | |
Credicorp Ltd. (Banks) | | | 35,000 | | | | 5,223,750 | |
| | |
Ferreycorp SAA (Capital Goods)† | | | 1,900,000 | | | | 1,136,955 | |
| | |
Union Andina de Cementos SAA (Materials)† | | | 5,050,000 | | | | 6,475,512 | |
| | |
| | | | | | | 16,737,285 | |
| | |
Philippines - 7.4% | | | | | | | | |
| | |
Bank of the Philippine Islands (Banks)† | | | 5,349,992 | | | | 10,898,923 | |
| | |
International Container Terminal Services Inc. (Transportation)† | | | 1,825,000 | | | | 4,428,182 | |
| | |
Philippine Long Distance Telephone Co. - Sponsored ADR (Telecommunication Services) | | | 25,500 | | | | 1,644,750 | |
| | |
Universal Robina Corp. (Food, Beverage & Tobacco)† | | | 4,400,000 | | | | 14,440,311 | |
| | |
| | | | | | | 31,412,166 | |
| | |
Poland - 0.1% | | | | | | | | |
| | |
Kernel Holding SA (Food, Beverage & Tobacco)*† | | | 60,000 | | | | 556,882 | |
| | |
Qatar - 6.3% | | | | | | | | |
| | |
Commercial Bank of Qatar QSC (Banks)† | | | 235,000 | | | | 4,413,584 | |
| | |
Industries Qatar QSC (Capital Goods)† | | | 122,500 | | | | 5,997,347 | |
| | |
Qatar Electricity & Water Co. (Utilities)† | | | 86,500 | | | | 4,330,845 | |
| | |
Qatar National Bank SAQ (Banks)† | | | 231,500 | | | | 12,099,986 | |
| | |
| | | | | | | 26,841,762 | |
| | |
Senegal - 1.0% | | | | | | | | |
| | |
Sonatel (Telecommunication Services) | | | 87,000 | | | | 4,140,115 | |
| | | | | | | | |
| | |
| | | Shares | | | Value | |
| COMMON STOCKS - 86.8% (continued) | |
| | |
Slovenia - 2.0% | | | | | | | | |
| | |
Krka dd Novo mesto (Pharmaceuticals, Biotechnology & Life Sciences)† | | | 95,500 | | | | $8,421,521 | |
| | |
Sri Lanka - 2.3% | | | | | | | | |
| | |
Commercial Bank of Ceylon plc (Banks)† | | | 8,300,000 | | | | 8,099,219 | |
| | |
John Keells Holdings plc (Capital Goods)† | | | 975,450 | | | | 1,777,038 | |
| | |
| | | | | | | 9,876,257 | |
| | |
Thailand - 1.4% | | | | | | | | |
| | |
Home Product Center pcl (Retailing)† | | | 9,713,996 | | | | 2,686,658 | |
| | |
Siam Commercial Bank pcl (Banks)† | | | 650,000 | | | | 3,274,104 | |
| | |
| | | | | | | 5,960,762 | |
| | |
Trinidad & Tobago - 1.2% | | | | | | | | |
| | |
Neal & Massy Holdings Ltd. (Capital Goods) | | | 255,000 | | | | 2,626,789 | |
| | |
Republic Bank Ltd. (Banks) | | | 130,948 | | | | 2,440,823 | |
| | |
| | | | | | | 5,067,612 | |
| | |
Ukraine - 1.2% | | | | | | | | |
| | |
MHP SA - GDR, Reg S (Food, Beverage & Tobacco)† | | | 445,000 | | | | 5,243,672 | |
| | |
United Arab Emirates - 6.3% | | | | | | | | |
| | |
Agthia Group PJSC (Food, Beverage & Tobacco)† | | | 5,850,000 | | | | 8,318,165 | |
| | |
DP World Ltd. (Transportation) | | | 70,000 | | | | 1,295,000 | |
| | |
DP World Ltd. (London Stock Exchange) (Transportation)#† | | | 165,000 | | | | 3,052,495 | |
| | |
Dragon Oil plc (Energy)† | | | 300,000 | | | | 3,198,195 | |
| | |
Dubai Financial Market (Diversified Financials)† | | | 6,600,000 | | | | 6,544,680 | |
| | |
Emaar Properties PJSC (Real Estate)† | | | 1,550,000 | | | | 4,606,349 | |
| | |
| | | | | | | 27,014,884 | |
| | |
United Kingdom - 0.7% | | | | | | | | |
| | |
Ferrexpo plc (Materials)† | | | 200,000 | | | | 493,925 | |
| | |
Hikma Pharmaceuticals plc (Pharmaceuticals, Biotechnology & Life Sciences)† | | | 67,000 | | | | 1,763,388 | |
| | |
Kazakhmys plc (Materials)*† | | | 120,000 | | | | 484,109 | |
| | |
| | | | | | | 2,741,422 | |
See Notes to Financial Statements
22
Harding, Loevner Funds, Inc.
Frontier Emerging Markets Portfolio
Portfolio of Investments
April 30, 2014 (unaudited) (continued)
| | | | | | | | |
| | |
| | | Shares | | | Value | |
| COMMON STOCKS - 86.8% (continued) | |
| | |
United States - 1.5% | | | | | | | | |
| | |
PriceSmart, Inc. (Food & Staples Retailing) | | | 67,500 | | | | $6,482,700 | |
| | |
Vietnam - 3.3% | | | | | | | | |
| | |
Hoa Phat Group JSC (Materials)† | | | 4,082,500 | | | | 9,650,093 | |
| | |
PetroVietnam Drilling and Well Services JSC (Energy)† | | | 1,100,000 | | | | 4,426,012 | |
| | |
| | | | | | | | 14,076,105 | |
| |
Total Common Stocks (Cost $312,003,751) | | | | $369,703,773 | |
| | |
| | | | | | | | |
| PARTICIPATION NOTES - 11.7% | | | | | | |
| | |
Kuwait - 5.5% | | | | | | | | |
| | |
Kuwait Projects Co. Holdings, Issued by HSBC Bank plc, Maturity Date 1/16/15 (Diversified Financials)^† | | | 5,905,137 | | | | 15,545,361 | |
| | |
National Bank of Kuwait, Issued by Deutsche Bank AG, Maturity Date 3/28/18
(Banks)^† | | | 2,296,812 | | | | 8,007,385 | |
| | |
| | | | | | | 23,552,746 | |
| | |
Saudi Arabia - 6.2% | | | | | | | | |
| | |
Al Rajhi Bank, Issued by JP Morgan Structured Products, Maturity Date 6/6/17 (Banks)^† | | | 200,410 | | | | 3,437,554 | |
| | |
Almarai Co., Ltd., Issued by HSBC Bank plc, Maturity Date 11/24/14 (Food, Beverage & Tobacco)^† | | | 255,000 | | | | 4,667,640 | |
| | |
Etihad Etisalat Co., Issued by HSBC Bank plc, Maturity Date 12/5/14 (Telecommunication Services)^† | | | 30,500 | | | | 776,803 | |
| | |
Jarir Marketing Co., Issued by HSBC Bank plc, Maturity Date 5/4/15 (Commercial & Professional Services)^† | | | 325,000 | | | | 17,470,770 | |
| | |
| | | | | | | | 26,352,767 | |
| |
Total Participation Notes (Cost $39,777,457) | | | | $49,905,513 | |
| | | | | | | | |
| | |
| | | Shares | | | Value | |
| CASH EQUIVALENT - 0.5% | | | | | | |
| | |
Northern Institutional Funds - Prime Obligations Portfolio, 0.02% (Money Market Fund) | | | 1,914,555 | | | | $1,914,555 | |
| |
Total Cash Equivalent (Cost $1,914,555) | | | | $1,914,555 | |
| | |
| | | | | | | | | |
| | |
Total Investments — 99.0% | | | | | | | | |
| | |
(Cost $353,695,763) | | | | | | | $421,523,841 | |
| | |
Other Assets Less Liabilities - 1.0% | | | | | | | 4,345,468 | |
| | |
Net Assets — 100.0% | | | | | | | $425,869,309 | |
Summary of Abbreviations
| ADR | American Depository Receipt. |
| GDR | Global Depository Receipt. |
| Reg S | Security sold outside United States without registration under the Securities Act of 1933. |
| # | Security valued at fair value as determined in good faith under policies and procedures established by and under the supervision of the Portfolio’s Board of Directors as disclosed in Note 2 of the Notes to Financial Statements. |
| * | Non-income producing security. |
| ^ | Security exempt from registration pursuant to Rule 144A of the Securities Act of 1933. These securities, which represent 11.7% of net assets as of April 30, 2014, are considered liquid and may be resold in transactions exempt from registration, normally to qualified buyers. |
| † | Investment categorized as level 2 security as disclosed in Note 2 of the Notes to Financial Statements. |
See Notes to Financial Statements
23
Harding, Loevner Funds, Inc.
Frontier Emerging Markets Portfolio
Portfolio of Investments
April 30, 2014 (unaudited) (continued)
| | | | | |
| Industry | | Percentage of
Net Assets |
| |
Banks | | | | 28.5 | % |
| |
Capital Goods | | | | 5.1 | |
| |
Commercial & Professional Services | | | | 4.1 | |
| |
Consumer Durables & Apparel | | | | 2.1 | |
| |
Consumer Services | | | | 0.5 | |
| |
Diversified Financials | | | | 5.6 | |
| |
Energy | | | | 4.2 | |
| |
Food & Staples Retailing | | | | 1.5 | |
| |
Food, Beverage & Tobacco | | | | 13.5 | |
| |
Materials | | | | 15.7 | |
| |
Media | | | | 0.2 | |
| |
Money Market Fund | | | | 0.5 | |
| |
Pharmaceuticals, Biotechnology & Life Sciences | | | | 5.5 | |
| |
Real Estate | | | | 2.0 | |
| |
Retailing | | | | 0.6 | |
| |
Technology Hardware & Equipment | | | | 0.6 | |
| |
Telecommunication Services | | | | 4.8 | |
| |
Transportation | | | | 2.5 | |
| |
Utilities | | | | 1.5 | |
| |
| | | | | | |
Total Investments | | | | 99.0 | |
Other Assets Less Liabilities | | | | 1.0 | |
Net Assets | | | | 100.0 | % |
See Notes to Financial Statements
24
Harding, Loevner Funds, Inc.
Statements of Assets and Liabilities
April 30, 2014 (unaudited)
| | | | | | | | | | | | |
| | | Global Equity Portfolio | | | International Equity Portfolio | | | International Small Companies Portfolio | |
ASSETS: | | | | | | | | | | | | |
Investments (cost $588,498,463, $3,305,440,298 and $68,015,280, respectively) | | | $741,177,875 | | | | $4,112,751,793 | | | | $88,150,785 | |
Dividends and interest receivable | | | 1,502,783 | | | | 13,151,933 | | | | 208,514 | |
Foreign currency (cost $2,660, $17,109 and $4,573, respectively) | | | 2,986 | | | | 17,057 | | | | 4,537 | |
Receivable for investments sold | | | — | | | | — | | | | 1,136,752 | |
Receivable for Fund shares sold | | | 100,677 | | | | 4,843,944 | | | | 524,677 | |
Tax reclaim receivable | | | 374,686 | | | | 5,353,377 | | | | 98,183 | |
Prepaid expenses | | | 36,072 | | | | 141,959 | | | | 31,330 | |
Total Assets | | | 743,195,079 | | | | 4,136,260,063 | | | | 90,154,778 | |
LIABILITIES: | | | | | | | | | | | | |
Payable to Investment Adviser | | | (511,471 | ) | | | (2,474,309 | ) | | | (95,111 | ) |
Payable for investments purchased | | | (1,545,937 | ) | | | — | | | | (197,562 | ) |
Payable for Fund shares redeemed | | | (94,299 | ) | | | (9,455,399 | ) | | | (115,136 | ) |
Payable for distribution fees | | | — | | | | (304,138 | ) | | | (11,769 | ) |
Other liabilities | | | (157,085 | ) | | | (862,588 | ) | | | (67,044 | ) |
Total Liabilities | | | (2,308,792 | ) | | | (13,096,434 | ) | | | (486,622 | ) |
Net Assets | | | $740,886,287 | | | | $4,123,163,629 | | | | $89,668,156 | |
ANALYSIS OF NET ASSETS: | | | | | | | | | | | | |
Paid in capital | | | $581,431,375 | | | | $3,336,104,750 | | | | $69,173,339 | |
Accumulated undistributed net investment income | | | 1,430,424 | | | | 16,210,935 | | | | 37,620 | |
Accumulated net realized gain (loss) from investment transactions | | | 5,333,628 | | | | (36,603,664 | ) | | | 317,500 | |
Net unrealized appreciation on investments and on assets and liabilities denominated in foreign currencies | | | 152,690,860 | | | | 807,451,608 | | | | 20,139,697 | |
Net Assets | | | $740,886,287 | | | | $4,123,163,629 | | | | $89,668,156 | |
Net Assets: | | | | | | | | | | | | |
Institutional Class | | | $663,064,133 | | | | $3,692,285,853 | | | | $30,563,673 | |
Investor Class | | | — | | | | 430,877,776 | | | | 59,104,483 | |
Advisor Class | | | 77,822,154 | | | | — | | | | — | |
Total Shares Outstanding: | | | | | | | | | | | | |
Institutional Class (400,000,000, 400,000,000 and 400,000,000, respectively, $.001 par value shares authorized) | | | 21,407,103 | | | | 203,773,857 | | | | 2,100,209 | |
Investor Class ( — , 400,000,000 and 400,000,000, respectively, $.001 par value shares authorized) | | | — | | | | 23,835,103 | | | | 4,069,947 | |
Advisor Class (400,000,000, — and — , respectively, $.001 par value shares authorized) | | | 2,514,490 | | | | — | | | | — | |
Net Asset Value, Offering Price and Redemption Price Per Share: | | | | | | | | | | | | |
Institutional Class | | | $30.97 | | | | $18.12 | | | | $14.55 | |
Investor Class | | | — | | | | 18.08 | | | | 14.52 | |
Advisor Class | | | 30.95 | | | | — | | | | — | |
See Notes to Financial Statements
25
Harding, Loevner Funds, Inc.
Statements of Assets and Liabilities (continued)
April 30, 2014 (unaudited)
| | | | | | | | | | | | |
| | | Institutional Emerging Markets Portfolio | | | Emerging Markets Portfolio | | | Frontier Emerging Markets Portfolio | |
ASSETS: | | | | | | | | | | | | |
Investments (cost $1,105,899,927, $1,673,269,284 and $353,695,763, respectively) | | | $1,272,714,771 | | | | $2,235,175,809 | | | | $421,523,841 | |
Dividends and interest receivable | | | 4,168,334 | | | | 7,347,179 | | | | 2,277,308 | |
Foreign currency (cost $42,504, $121,244 and $1,881,206, respectively) | | | 42,905 | | | | 122,016 | | | | 1,882,507 | |
Receivable for investments sold | | | — | | | | — | | | | 2,710,252 | |
Receivable for Fund shares sold | | | 3,453,064 | | | | 8,944,938 | | | | 2,441,610 | |
Tax reclaim receivable | | | 122,365 | | | | 271,384 | | | | 13,004 | |
Prepaid expenses | | | 77,919 | | | | 52,211 | | | | 38,978 | |
Total Assets | | | 1,280,579,358 | | | | 2,251,913,537 | | | | 430,887,500 | |
LIABILITIES: | | | | | | | | | | | | |
Payable to Investment Adviser | | | (1,189,239 | ) | | | (2,091,033 | ) | | | (508,377 | ) |
Payable for investments purchased | | | (974,545 | ) | | | (1,211,045 | ) | | | (1,310,638 | ) |
Payable for Fund shares redeemed | | | (702,629 | ) | | | (1,124,508 | ) | | | (2,399,128 | ) |
Payable for distribution fees | | | — | | | | — | | | | (14,336 | ) |
Payable for capital gains tax | | | (962,205 | ) | | | (437,818 | ) | | | (706,917 | ) |
Other liabilities | | | (271,499 | ) | | | (1,110,183 | ) | | | (78,795 | ) |
Total Liabilities | | | (4,100,117 | ) | | | (5,974,587 | ) | | | (5,018,191 | ) |
Net Assets | | | $1,276,479,241 | | | | $2,245,938,950 | | | | $425,869,309 | |
ANALYSIS OF NET ASSETS: | | | | | | | | | | | | |
Paid in capital | | | $1,162,725,739 | | | | $1,649,409,494 | | | | $367,028,396 | |
Accumulated undistributed net investment income | | | 5,667,304 | | | | 9,140,370 | | | | 2,933,074 | |
Accumulated net realized gain (loss) from investment transactions | | | (57,774,376 | ) | | | 25,908,762 | | | | (11,216,788 | ) |
Net unrealized appreciation on investments and on assets and liabilities denominated in foreign currencies | | | 165,860,574 | | | | 561,480,324 | | | | 67,124,627 | |
Net Assets | | | $1,276,479,241 | | | | $2,245,938,950 | | | | $425,869,309 | |
Net Assets: | | | | | | | | | | | | |
Institutional Class | | | $ — | | | | $ — | | | | $382,082,130 | |
Class I | | | 1,204,551,198 | | | | — | | | | — | |
Class II | | | 71,928,043 | | | | — | | | | — | |
Investor Class | | | — | | | | — | | | | 43,787,179 | |
Advisor Class | | | — | | | | 2,245,938,950 | | | | — | |
Total Shares Outstanding: | | | | | | | | | | | | |
Institutional Class ( — , — and 400,000,000, respectively, $.001 par value shares authorized) | | | — | | | | — | | | | 39,982,462 | |
Class I (500,000,000, — and — respectively, $.001 par value shares authorized) | | | 66,529,224 | | | | — | | | | — | |
Class II (400,000,000, — and — respectively, $.001 par value shares authorized) | | | 6,913,184 | | | | — | | | | — | |
Investor Class ( — , — and 400,000,000 , respectively, $.001 par value shares authorized) | | | — | | | | — | | | | 4,617,331 | |
Advisor Class ( — , 500,000,000 and — , respectively, $.001 par value shares authorized) | | | — | | | | 45,403,760 | | | | — | |
Net Asset Value, Offering Price and Redemption Price Per Share: | | | | | | | | | | | | |
Institutional Class | | | $— | | | | $— | | | | $9.56 | |
Class I | | | 18.11 | | | | — | | | | — | |
Class II | | | 10.40 | | | | — | | | | — | |
Investor Class | | | — | | | | — | | | | 9.48 | |
Advisor Class | | | — | | | | 49.47 | | | | — | |
See Notes to Financial Statements
26
Harding, Loevner Funds, Inc.
Statements of Operations
Six Months Ended April 30, 2014 (unaudited)
| | | | | | | | | | | | |
| | | Global Equity Portfolio | | | International Equity Portfolio | | | International Small Companies Portfolio | |
INVESTMENT INCOME | | | | | | | | | | | | |
Interest | | | $ — | | | | $34 | | | | $ — | |
Dividends (net of foreign withholding taxes of $300,757, $4,282,440 and $64,737, respectively) | | | 4,776,440 | | | | 33,659,865 | | | | 653,599 | |
Total investment income | | | 4,776,440 | | | | 33,659,899 | | | | 653,599 | |
| | | | |
EXPENSES | | | | | | | | | | | | |
Investment advisory fees (Note 3) | | | 2,897,044 | | | | 14,307,239 | | | | 526,547 | |
Administration fees (Note 3) | | | 115,423 | | | | 496,787 | | | | 16,850 | |
Distribution fees, Investor Class | | | — | | | | 511,774 | | | | 68,377 | |
Custody and accounting fees (Note 3) | | | 72,571 | | | | 399,071 | | | | 21,031 | |
Directors’ fees and expenses (Note 3) | | | 17,746 | | | | 107,279 | | | | 2,268 | |
Transfer agent fees and expenses (Note 3) | | | 25,107 | | | | 356,743 | | | | 22,584 | |
Printing and postage fees | | | 17,207 | | | | 148,865 | | | | 5,292 | |
State registration filing fees | | | 39,900 | | | | 128,473 | | | | 21,422 | |
Professional fees | | | 28,710 | | | | 96,408 | | | | 16,379 | |
Shareholder servicing fees (Note 3) | | | 125,046 | | | | 748,792 | | | | 36,947 | |
Compliance officers’ fees and expenses (Note 3) | | | 8,650 | | | | 33,621 | | | | 4,346 | |
Other fees and expenses | | | 13,971 | | | | 71,603 | | | | 4,226 | |
Total Expenses | | | 3,361,375 | | | | 17,406,655 | | | | 746,269 | |
Less Waiver of investment advisory fee and/or reimbursement of other operating expenses (Note 3) | | | (15,379 | ) | | | — | | | | (130,283 | ) |
Net expenses | | | 3,345,996 | | | | 17,406,655 | | | | 615,986 | |
Net investment income | | | 1,430,444 | | | | 16,253,244 | | | | 37,613 | |
REALIZED AND UNREALIZED GAIN (LOSS) | | | | | | | | | | | | |
Net realized gain (loss) | | | | | | | | | | | | |
Investment transactions | | | 8,370,222 | | | | (4,141,065 | ) | | | 1,051,985 | |
Foreign currency transactions | | | (9,633 | ) | | | (1,820 | ) | | | (25,594 | ) |
Net realized gain (loss) | | | 8,360,589 | | | | (4,142,885 | ) | | | 1,026,391 | |
Change in unrealized appreciation (depreciation) | | | | | | | | | | | | |
Investments | | | 22,270,668 | | | | 55,729,681 | | | | 4,994,175 | |
Translation of assets and liabilities denominated in foreign currencies | | | 1,874 | | | | 78,020 | | | | 2,085 | |
Net change in unrealized appreciation | | | 22,272,542 | | | | 55,807,701 | | | | 4,996,260 | |
Net realized and unrealized gain | | | 30,633,131 | | | | 51,664,816 | | | | 6,022,651 | |
| | | | |
NET INCREASE IN NET ASSETS RESULTING FROM OPERATIONS | | | $32,063,575 | | | | $67,918,060 | | | | $6,060,264 | |
See Notes to Financial Statements
27
Harding, Loevner Funds, Inc.
Statements of Operations (continued)
Six Months Ended April 30, 2014 (unaudited)
| | | | | | | | | | | | |
| | | Institutional Emerging Markets Portfolio | | | Emerging Markets Portfolio | | | Frontier Emerging Markets Portfolio | |
INVESTMENT INCOME | | | | | | | | | | | | |
Interest | | | $103 | | | | $145 | | | | $ — | |
Dividends (net of foreign withholding taxes of $1,378,488, $2,488,295 and $529,357, respectively) | | | 14,240,278 | | | | 26,217,632 | | | | 6,411,246 | |
Total investment income | | | 14,240,381 | | | | 26,217,777 | | | | 6,411,246 | |
| | | | |
EXPENSES | | | | | | | | | | | | |
Investment advisory fees (Note 3) | | | 6,384,914 | | | | 11,872,104 | | | | 2,550,834 | |
Administration fees (Note 3) | | | 174,665 | | | | 293,296 | | | | 64,568 | |
Distribution fees, Investor Class | | | — | | | | — | | | | 36,691 | |
Custody and accounting fees (Note 3) | | | 250,720 | | | | 447,022 | | | | 224,541 | |
Directors’ fees and expenses (Note 3) | | | 29,825 | | | | 57,875 | | | | 8,735 | |
Transfer agent fees and expenses (Note 3) | | | 29,057 | | | | 60,866 | | | | 22,088 | |
Printing and postage fees | | | 38,971 | | | | 135,313 | | | | 7,510 | |
State registration filing fees | | | 64,237 | | | | 47,109 | | | | 35,206 | |
Professional fees | | | 44,740 | | | | 68,233 | | | | 22,273 | |
Shareholder servicing fees (Note 3) | | | 232,808 | | | | 1,968,956 | | | | 29,537 | |
Compliance officers’ fees and expenses (Note 3) | | | 12,025 | | | | 19,892 | | | | 6,152 | |
Other fees and expenses | | | 21,482 | | | | 40,537 | | | | 7,937 | |
Total Expenses | | | 7,283,444 | | | | 15,011,203 | | | | 3,016,072 | |
Less Waiver of investment advisory fee and/or reimbursement of other operating expenses (Note 3) | | | (61,064 | ) | | | — | | | | — | |
Net expenses | | | 7,222,380 | | | | 15,011,203 | | | | 3,016,072 | |
Net investment income | | | 7,018,001 | | | | 11,206,574 | | | | 3,395,174 | |
REALIZED AND UNREALIZED GAIN (LOSS) | | | | | | | | | | | | |
Net realized gain (loss) | | | | | | | | | | | | |
Investment transactions | | | (4,500,485 | ) | | | 36,092,643 | | | | 3,241,980 | |
Foreign currency transactions | | | (292,525 | ) | | | (641,808 | ) | | | (247,824 | ) |
Net realized gain (loss) | | | (4,793,010 | ) | | | 35,450,835 | | | | 2,994,156 | |
Change in unrealized appreciation (depreciation)
Investments (net of increase in deferred foreign taxes of $612,503, $431,843 and $496,411, respectively) | | | 15,716,745 | | | | (24,910,077 | ) | | | 39,776,748 | |
Translation of assets and liabilities denominated in foreign currencies | | | (299 | ) | | | 3,700 | | | | (29,588 | ) |
Net change in unrealized appreciation (depreciation) | | | 15,716,446 | | | | (24,906,377 | ) | | | 39,747,160 | |
Net realized and unrealized gain | | | 10,923,436 | | | | 10,544,458 | | | | 42,741,316 | |
| | | | |
NET INCREASE IN NET ASSETS RESULTING FROM OPERATIONS | | | $17,941,437 | | | | $21,751,032 | | | | $46,136,490 | |
See Notes to Financial Statements
28
Harding, Loevner Funds, Inc.
Statements of Changes in Net Assets
For the Six Months Ended April 30, 2014 (unaudited) and the Fiscal Year Ended October 31, 2013
| | | | | | | | | | | | | | | | |
| | | Global Equity Portfolio | | | International Equity Portfolio | |
| | | April 30, 2014 | | | October 31, 2013 | | | April 30, 2014 | | | October 31, 2013 | |
INCREASE (DECREASE) IN NET ASSETS FROM OPERATIONS | | | | | | | | | | | | |
Net investment income | | | $1,430,444 | | | | $2,892,011 | | | | $16,253,244 | | | | $30,398,220 | |
Net realized gain (loss) on investments and foreign currency transactions | | | 8,360,589 | | | | 2,553,207 | | | | (4,142,885 | ) | | | (8,531,270 | ) |
Net change in unrealized appreciation on investments and translation of assets and liabilities denominated in foreign currencies | | | 22,272,542 | | | | 85,030,470 | | | | 55,807,701 | | | | 528,975,283 | |
Net increase in net assets resulting from operations | | | 32,063,575 | | | | 90,475,688 | | | | 67,918,060 | | | | 550,842,233 | |
DISTRIBUTIONS TO SHAREHOLDERS FROM: | | | | | | | | | | | | |
Net investment income | | | | | | | | | | | | |
Institutional Class | | | (2,478,096 | ) | | | (1,591,084 | ) | | | (27,911,956 | ) | | | (16,845,737 | ) |
Investor Class | | | — | | | | — | | | | (1,837,138 | ) | | | (1,676,084 | ) |
Advisor Class | | | (210,054 | ) | | | (131,246 | ) | | | — | | | | — | |
Net realized gain from investments and foreign-currency related transactions | | | | | | | | | | | | |
Institutional Class | | | (2,347,678 | ) | | | — | | | | — | | | | — | |
Advisor Class | | | (367,945 | ) | | | — | | | | — | | | | — | |
Total distributions to shareholders | | | (5,403,773 | ) | | | (1,722,330 | ) | | | (29,749,094 | ) | | | (18,521,821 | ) |
TRANSACTIONS IN SHARES OF COMMON STOCK(1) | | | | | | | | | | | | |
Proceeds from sale of shares | | | | | | | | | | | | |
Institutional Class | | | 135,644,562 | | | | 316,739,231 | | | | 537,995,872 | | | | 1,562,569,374 | |
Investor Class | | | — | | | | — | | | | 59,907,773 | | | | 179,403,001 | |
Advisor Class | | | 8,971,336 | | | | 30,063,834 | | | | — | | | | — | |
Net Asset Value of shares issued to shareholders upon reinvestment of dividends | | | | | | | | | | | | |
Institutional Class | | | 4,590,321 | | | | 1,242,112 | | | | 23,823,998 | | | | 14,398,899 | |
Investor Class | | | — | | | | — | | | | 1,631,420 | | | | 1,574,749 | |
Advisor Class | | | 565,236 | | | | 127,851 | | | | — | | | | — | |
Cost of shares redeemed | | | | | | | | | | | | |
Institutional Class | | | (43,907,161 | ) | | | (76,276,493 | ) | | | (370,681,129 | ) | | | (380,238,872 | ) |
Investor Class | | | — | | | | — | | | | (45,211,187 | ) | | | (106,907,598 | ) |
Advisor Class | | | (21,813,115 | ) | | | (25,712,784 | ) | | | — | | | | — | |
Net increase in net assets from portfolio share transactions | | | 84,051,179 | | | | 246,183,751 | | | | 207,466,747 | | | | 1,270,799,553 | |
NET INCREASE IN NET ASSETS | | | 110,710,981 | | | | 334,937,109 | | | | 245,635,713 | | | | 1,803,119,965 | |
NET ASSETS | | | | | | | | | | | | |
At beginning of period | | | 630,175,306 | | | | 295,238,197 | | | | 3,877,527,916 | | | | 2,074,407,951 | |
At end of period | | $ | 740,886,287 | | | $ | 630,175,306 | | | $ | 4,123,163,629 | | | $ | 3,877,527,916 | |
Accumulated Undistributed Net Investment Income Included in Net Assets | | | $1,430,424 | | | | $2,688,130 | | | | $16,210,935 | | | | $29,706,785 | |
| | | |
(1) CAPITAL SHARE TRANSACTIONS: | | | | | | | | | | | | |
INSTITUTIONAL CLASS: | | | | | | | | | | | | |
Shares sold | | | 4,491,130 | | | | 11,930,709 | | | | 30,593,829 | | | | 96,482,008 | |
Shares issued upon reinvestment of dividends | | | 151,246 | | | | 47,536 | | | | 1,349,802 | | | | 900,485 | |
Shares redeemed | | | (1,441,037 | ) | | | (2,813,589 | ) | | | (21,153,062 | ) | | | (23,141,347 | ) |
Net increase | | | 3,201,339 | | | | 9,164,656 | | | | 10,790,569 | | | | 74,241,146 | |
INVESTOR CLASS: | | | | | | | | | | | | |
Shares sold | | | — | | | | — | | | | 3,422,465 | | | | 11,060,209 | |
Shares issued upon reinvestment of dividends | | | — | | | | — | | | | 92,536 | | | | 98,609 | |
Shares redeemed | | | — | | | | — | | | | (2,580,614 | ) | | | (6,511,173 | ) |
Net increase | | | — | | | | — | | | | 934,387 | | | | 4,647,645 | |
ADVISOR CLASS: | | | | | | | | | | | | |
Shares sold | | | 296,065 | | | | 1,104,091 | | | | — | | | | — | |
Shares issued upon reinvestment of dividends | | | 18,618 | | | | 4,889 | | | | — | | | | — | |
Shares redeemed | | | (715,981 | ) | | | (941,434 | ) | | | — | | | | — | |
Net increase (decrease) | | | (401,298 | ) | | | 167,546 | | | | — | | | | — | |
See Notes to Financial Statements
29
Harding, Loevner Funds, Inc.
Statements of Changes in Net Assets (continued)
For the Six Months Ended April 30, 2014 (unaudited) and the Fiscal Year Ended October 31, 2013
| | | | | | | | | | | | | | | | |
| | | International Small Companies Portfolio | | | Institutional Emerging Markets Portfolio | |
| | | April 30, 2014 | | | October 31, 2013 | | | April 30, 2014 | | | October 31, 2013 | |
INCREASE (DECREASE) IN NET ASSETS FROM OPERATIONS | | | | | | | | | | | | |
Net investment income | | | $37,613 | | | | $391,145 | | | | $7,018,001 | | | | $7,839,258 | |
Net realized gain (loss) on investments and foreign currency transactions | | | 1,026,391 | | | | 4,927,371 | | | | (4,793,010 | ) | | | 4,325,397 | |
Net change in unrealized appreciation on investments and translation of assets and liabilities denominated in foreign currencies | | | 4,996,260 | | | | 11,917,687 | | | | 15,716,446 | | | | 63,512,406 | |
Net increase in net assets resulting from operations | | | 6,060,264 | | | | 17,236,203 | | | | 17,941,437 | | | | 75,677,061 | |
DISTRIBUTIONS TO SHAREHOLDERS FROM: | | | | | | | | | | | | |
Net investment income | | | | | | | | | | | | |
Institutional Class | | | (122,479 | ) | | | (431,876 | ) | | | — | | | | — | |
Class I | | | — | | | | — | | | | (8,999,751 | ) | | | (3,683,658 | ) |
Investor Class | | | (189,439 | ) | | | (308,126 | ) | | | — | | | | — | |
Net realized gain from investments and foreign-currency related transactions | | | | | | | | | | | | |
Institutional Class | | | (1,655,159 | ) | | | — | | | | — | | | | — | |
Investor Class | | | (3,131,178 | ) | | | — | | | | — | | | | — | |
Total distributions to shareholders | | | (5,098,255 | ) | | | (740,002 | ) | | | (8,999,751 | ) | | | (3,683,658 | ) |
TRANSACTIONS IN SHARES OF COMMON STOCK(1) | | | | | | | | | | | | |
Proceeds from sale of shares | | | | | | | | | | | | |
Institutional Class | | | 8,305,868 | | | | 19,148,813 | | | | — | | | | — | |
Class I | | | — | | | | — | | | | 273,642,558 | | | | 592,090,064 | |
Class II* | | | — | | | | — | | | | 71,167,540 | | | | — | |
Investor Class | | | 13,204,364 | | | | 28,307,070 | | | | — | | | | — | |
Net Asset Value of shares issued to shareholders upon reinvestment of dividends | | | | | | | | | | | | | | | | |
Institutional Class | | | 1,490,116 | | | | 365,536 | | | | — | | | | — | |
Class I | | | — | | | | — | | | | 7,692,156 | | | | 2,741,282 | |
Investor Class | | | 3,275,875 | | | | 289,745 | | | | — | | | | — | |
Cost of shares redeemed | | | | | | | | | | | | | | | | |
Institutional Class | | | (5,901,710 | ) | | | (33,508,188 | ) | | | — | | | | — | |
Class I | | | — | | | | — | | | | (128,006,022 | ) | | | (87,574,548 | ) |
Investor Class | | | (10,733,655 | ) | | | (16,798,202 | ) | | | — | | | | — | |
Net Increase (Decrease) in Net Assets from Portfolio Share Transactions | | | 9,640,858 | | | | (2,195,226 | ) | | | 224,496,232 | | | | 507,256,798 | |
NET INCREASE IN NET ASSETS | | | 10,602,867 | | | | 14,300,975 | | | | 233,437,918 | | | | 579,250,201 | |
NET ASSETS | | | | | | | | | | | | |
At beginning of period | | | 79,065,289 | | | | 64,764,314 | | | | 1,043,041,323 | | | | 463,791,122 | |
At end of period | | $ | 89,668,156 | | | $ | 79,065,289 | | | $ | 1,276,479,241 | | | $ | 1,043,041,323 | |
Accumulated Undistributed Net Investment Income Included in Net Assets | | | $37,620 | | | | $311,925 | | | | $5,667,304 | | | | $7,649,054 | |
| | | |
CAPITAL SHARE TRANSACTIONS: | | | | | | | | | | | | |
(1) INSTITUTIONAL CLASS: | | | | | | | | | | | | |
Shares sold | | | 588,299 | | | | 1,481,881 | | | | — | | | | — | |
Shares issued upon reinvestment of dividends | | | 109,487 | | | | 30,847 | | | | — | | | | — | |
Shares redeemed | | | (410,184 | ) | | | (2,627,617 | ) | | | — | | | | — | |
Net increase (decrease) | | | 287,602 | | | | (1,114,889 | ) | | | — | | | | — | |
CLASS I: | | | | | | | | | | | | |
Shares sold | | | — | | | | — | | | | 15,640,862 | | | | 34,724,731 | |
Shares issued upon reinvestment of dividends | | | — | | | | — | | | | 440,055 | | | | 160,028 | |
Shares redeemed | | | — | | | | — | | | | (7,274,871 | ) | | | (5,164,882 | ) |
Net increase | | | — | | | | — | | | | 8,806,046 | | | | 29,719,877 | |
CLASS II:* | | | | | | | | | | | | |
Shares sold | | | — | | | | — | | | | 6,913,184 | | | | — | |
Shares issued upon reinvestment of dividends | | | — | | | | — | | | | — | | | | — | |
Shares redeemed | | | — | | | | — | | | | — | | | | — | |
Net increase | | | — | | | | — | | | | 6,913,184 | | | | — | |
INVESTOR CLASS: | | | | | | | | | | | | |
Shares sold | | | 935,156 | | | | 2,186,667 | | | | — | | | | — | |
Shares issued upon reinvestment of dividends | | | 240,873 | | | | 24,430 | | | | — | | | | — | |
Shares redeemed | | | (762,726 | ) | | | (1,288,802 | ) | | | — | | | | — | |
Net increase | | | 413,303 | | | | 922,295 | | | | — | | | | — | |
| * | For the period from March 5, 2014 (commencement of class operations) through April 30, 2014. |
See Notes to Financial Statements
30
Harding, Loevner Funds, Inc.
Statements of Changes in Net Assets (continued)
For the Six Months Ended April 30, 2014 (unaudited) and the Fiscal Year Ended October 31, 2013
| | | | | | | | | | | | | | | | |
| | | Emerging Markets Portfolio | | | Frontier Emerging Markets Portfolio | |
| | | April 30, 2014 | | | October 31, 2013 | | | April 30, 2014 | | | October 31, 2013 | |
INCREASE (DECREASE) IN NET ASSETS FROM OPERATIONS | | | | | | | | | | | | |
Net investment income | | | $11,206,574 | | | | $15,455,410 | | | | $3,395,174 | | | | $1,296,072 | |
Net realized gain on investments and foreign currency transactions | | | 35,450,835 | | | | 53,925,044 | | | | 2,994,156 | | | | 485,757 | |
Net change in unrealized appreciation (depreciation) on investments and translation of assets and liabilities denominated in foreign currencies | | | (24,906,377 | ) | | | 111,079,769 | | | | 39,747,160 | | | | 21,872,266 | |
Net increase in net assets resulting from operations | | | 21,751,032 | | | | 180,460,223 | | | | 46,136,490 | | | | 23,654,095 | |
DISTRIBUTIONS TO SHAREHOLDERS FROM: | | | | | | | | | | | | |
Net investment income | | | | | | | | | | | | |
Institutional Class | | | — | | | | — | | | | (777,463 | ) | | | (962,492 | ) |
Investor Class | | | — | | | | — | | | | (28,323 | ) | | | (28,617 | ) |
Advisor Class | | | (16,977,080 | ) | | | (12,078,855 | ) | | | — | | | | — | |
Net realized gain from investments and foreign-currency related transactions | | | | | | | | | | | | |
Advisor Class | | | (54,210,866 | ) | | | (106,392,227 | ) | | | — | | | | — | |
Total distributions to shareholders | | | (71,187,946 | ) | | | (118,471,082 | ) | | | (805,786 | ) | | | (991,109 | ) |
TRANSACTIONS IN SHARES OF COMMON STOCK(1) | | | | | | | | | | | | |
Proceeds from sale of shares | | | | | | | | | | | | |
Institutional Class | | | — | | | | — | | | | 96,423,542 | | | | 181,207,514 | |
Investor Class | | | — | | | | — | | | | 24,459,314 | | | | 20,443,912 | |
Advisor Class | | | 395,284,904 | | | | 725,399,472 | | | | — | | | | — | |
Net Asset Value of shares issued to shareholders upon reinvestment of dividends | | | | | | | | | | | | |
Institutional Class | | | — | | | | — | | | | 442,478 | | | | 764,097 | |
Investor Class | | | — | | | | — | | | | 27,635 | | | | 27,866 | |
Advisor Class | | | 63,185,505 | | | | 108,806,723 | | | | — | | | | — | |
Cost of shares redeemed | | | | | | | | | | | | |
Institutional Class | | | — | | | | — | | | | (27,769,364 | ) | | | (13,347,232 | ) |
Investor Class | | | — | | | | — | | | | (6,536,673 | ) | | | (2,838,124 | ) |
Advisor Class | | | (275,640,894 | ) | | | (498,717,246 | ) | | | — | | | | — | |
Net increase in net assets from portfolio share transactions | | | 182,829,515 | | | | 335,488,949 | | | | 87,046,932 | | | | 186,258,033 | |
NET INCREASE IN NET ASSETS | | | 133,392,601 | | | | 397,478,090 | | | | 132,377,636 | | | | 208,921,019 | |
NET ASSETS | | | | | | | | | | | | |
At beginning of period | | | 2,112,546,349 | | | | 1,715,068,259 | | | | 293,491,673 | | | | 84,570,654 | |
At end of period | | $ | 2,245,938,950 | | | $ | 2,112,546,349 | | | $ | 425,869,309 | | | $ | 293,491,673 | |
Accumulated Undistributed Net Investment Income Included in Net Assets | | | $9,140,370 | | | | $14,910,876 | | | | $2,933,074 | | | | $343,686 | |
| | | |
(1) CAPITAL SHARE TRANSACTIONS: | | | | | | | | | | | | |
INSTITUTIONAL CLASS: | | | | | | | | | | | | |
Shares sold | | | — | | | | — | | | | 10,951,094 | | | | 22,269,797 | |
Shares issued upon reinvestment of dividends | | | — | | | | — | | | | 52,426 | | | | 104,958 | |
Shares redeemed | | | — | | | | — | | | | (3,153,524 | ) | | | (1,703,055 | ) |
Net increase | | | — | | | | — | | | | 7,849,996 | | | | 20,671,700 | |
INVESTOR CLASS: | | | | | | | | | | | | |
Shares sold | | | — | | | | — | | | | 2,765,004 | | | | 2,531,639 | |
Shares issued upon reinvestment of dividends | | | — | | | | — | | | | 3,294 | | | | 3,843 | |
Shares redeemed | | | — | | | | — | | | | (742,895 | ) | | | (367,459 | ) |
Net increase | | | — | | | | — | | | | 2,025,403 | | | | 2,168,023 | |
ADVISOR CLASS: | | | | | | | | | | | | |
Shares sold | | | 8,216,948 | | | | 15,073,331 | | | | — | | | | — | |
Shares issued upon reinvestment of dividends | | | 1,324,366 | | | | 2,261,619 | | | | — | | | | — | |
Shares redeemed | | | (5,759,504 | ) | | | (10,335,755 | ) | | | — | | | | — | |
Net increase | | | 3,781,810 | | | | 6,999,195 | | | | — | | | | — | |
See Notes to Financial Statements
31
Harding, Loevner Funds, Inc.
Financial Highlights
For the Six Months Ended April 30, 2014 (unaudited) or the Fiscal Year or Period Ended October 31
| | | | | | | | | | | | | | | | | | | | |
| | | | | |
| Global Equity Portfolio — Institutional Class | | | | | | | | | | | | | | | |
| Per Share Data | | April 30, 2014 | | | 2013 | | | 2012 | | | 2011 | | | 2010(1) | |
Net asset value, beginning of period | | | $29.84 | | | | $25.05 | | | | $23.38 | | | | $23.52 | | | | $20.43 | |
INCREASE IN NET ASSETS FROM OPERATIONS: | | | | | | | | | | | | | | | | | | | | |
Net investment income | | | 0.07 | (2) | | | 0.17 | (2) | | | 0.18 | (2) | | | 0.12 | (2) | | | 0.10 | |
Net realized and unrealized gain (loss) on investments and foreign currency-related transactions | | | 1.32 | | | | 4.74 | | | | 1.81 | | | | (0.04 | ) | | | 3.04 | |
Net increase from investment operations | | | 1.39 | | | | 4.91 | | | | 1.99 | | | | 0.08 | | | | 3.14 | |
DISTRIBUTIONS TO SHAREHOLDERS FROM: | | | | | | | | | | | | | | | | | | | | |
Net investment income | | | (0.13 | ) | | | (0.12 | ) | | | (0.10 | ) | | | (0.06 | ) | | | (0.05 | ) |
Net realized gain from investments | | | (0.13 | ) | | | — | | | | (0.22 | ) | | | (0.16 | ) | | | — | |
Total distributions | | | (0.26 | ) | | | (0.12 | ) | | | (0.32 | ) | | | (0.22 | ) | | | (0.05 | ) |
Net asset value, end of period | | | 30.97 | | | | $29.84 | | | | $25.05 | | | | $23.38 | | | | $23.52 | |
Total Return | | | 4.68 | %(A) | | | 19.66 | % | | | 8.73 | % | | | 0.27 | % | | | 15.39 | %(A) |
RATIOS/SUPPLEMENTAL DATA: | | | | | | | | | | | | | | | | | | | | |
Net assets, end of period (000’s) | | | $663,064 | | | | $543,293 | | | | $226,489 | | | | $147,108 | | | | $104,276 | |
Expenses to average net assets | | | 0.96 | %(B) | | | 0.99 | % | | | 1.12 | % | | | 1.16 | % | | | 1.27 | %(B) |
Expenses to average net assets (net of fees waived/reimbursed) | | | 0.95 | %(B) | | | 0.95 | % | | | 0.95 | % | | | 1.00 | % | | | 1.00 | %(B) |
Net investment income to average net assets | | | 0.46 | %(B) | | | 0.62 | % | | | 0.72 | % | | | 0.48 | % | | | 0.43 | %(B) |
Portfolio turnover rate | | | 14 | %(A) | | | 13 | % | | | 32 | % | | | 40 | % | | | 35 | %(A) |
| (1) | For the period from November 3, 2009 (commencement of class operations) through October 31, 2010. |
| (2) | Net investment income per share was calculated using the average shares outstanding method. |
| | | | | | | | | | | | | | | | | | | | | | | | |
| | | | | | |
| Global Equity Portfolio — Advisor Class | | | | | | | | | | | | | | | | | | |
| Per Share Data | | April 30, 2014 | | | 2013 | | | 2012 | | | 2011 | | | 2010 | | | 2009 | |
Net asset value, beginning of period | | | $29.80 | | | | $25.02 | | | | $23.36 | | | | $23.48 | | | | $20.27 | | | | $15.92 | |
INCREASE IN NET ASSETS FROM OPERATIONS: | | | | | | | | | | | | | | | | | | | | | | | | |
Net investment income | | | 0.02 | (1) | | | 0.09 | (1) | | | 0.11 | (1) | | | 0.07 | (1) | | | 0.10 | | | | 0.06 | |
Net realized and unrealized gain (loss) on investments and foreign currency-related transactions | | | 1.33 | | | | 4.74 | | | | 1.82 | | | | (0.02 | ) | | | 3.15 | | | | 4.38 | |
Net increase from investment operations | | | 1.35 | | | | 4.83 | | | | 1.93 | | | | 0.05 | | | | 3.25 | | | | 4.44 | |
DISTRIBUTIONS TO SHAREHOLDERS FROM: | | | | | | | | | | | | | | | | | | | | | | | | |
Net investment income | | | (0.07 | ) | | | (0.05 | ) | | | (0.05 | ) | | | (0.01 | ) | | | (0.04 | ) | | | (0.09 | ) |
Net realized gain from investments | | | (0.13 | ) | | | — | | | | (0.22 | ) | | | (0.16 | ) | | | — | | | | — | |
Total distributions | | | (0.20 | ) | | | (0.05 | ) | | | (0.27 | ) | | | (0.17 | ) | | | (0.04 | ) | | | (0.09 | ) |
Net asset value, end of period | | | $30.95 | | | | $29.80 | | | | $25.02 | | | | $23.36 | | | | $23.48 | | | | $20.27 | |
Total Return | | | 4.54 | %(A) | | | 19.33 | % | | | 8.43 | % | | | 0.18 | % | | | 16.07 | % | | | 28.05 | % |
RATIOS/SUPPLEMENTAL DATA: | | | | | | | | | | | | | | | | | | | | | | | | |
Net assets, end of period (000’s) | | | $77,822 | | | | $86,882 | | | | $68,749 | | | | $58,320 | | | | $46,450 | | | | $66,810 | |
Expenses to average net assets | | | 1.22 | %(B) | | | 1.25 | % | | | 1.35 | % | | | 1.30 | % | | | 1.41 | % | | | 1.63 | % |
Expenses to average net assets (net of fees waived/reimbursed) | | | 1.22 | %(B) | | | 1.24 | % | | | 1.23 | % | | | 1.18 | % | | | 1.17 | % | | | 1.25 | % |
Net investment income to average net assets | | | 0.13 | %(B) | | | 0.32 | % | | | 0.45 | % | | | 0.31 | % | | | 0.31 | % | | | 0.43 | % |
Portfolio turnover rate | | | 14 | %(A) | | | 13 | % | | | 32 | % | | | 40 | % | | | 35 | % | | | 31 | % |
| (1) | Net investment income per share was calculated using the average shares outstanding method. |
See Notes to Financial Statements
32
Harding, Loevner Funds, Inc.
Financial Highlights (continued)
For the Six Months Ended April 30, 2014 (unaudited) or the Fiscal Year Ended October 31
| | | | | | | | | | | | | | | | | | | | | | | | |
| | | | | | |
| International Equity Portfolio — Institutional Class | | | | | | | | | | | | | | | | | | |
| Per Share Data | | April 30, 2014 | | | 2013 | | | 2012 | | | 2011 | | | 2010 | | | 2009 | |
Net asset value, beginning of period | | | $17.97 | | | | $15.15 | | | | $14.06 | | | | $14.51 | | | | $12.04 | | | | $11.44 | |
INCREASE (DECREASE) IN NET ASSETS FROM OPERATIONS: | | | | | | | | | | | | | | | | | | | | | | | | |
Net investment income | | | 0.08 | (1) | | | 0.17 | (1) | | | 0.18 | (1) | | | 0.17 | (1) | | | 0.08 | | | | 0.13 | |
Net realized and unrealized gain (loss) on investments and foreign currency-related transactions | | | 0.21 | | | | 2.78 | | | | 1.06 | | | | (0.56 | ) | | | 2.49 | | | | 2.86 | |
Net increase (decrease) from investment operations | | | 0.29 | | | | 2.95 | | | | 1.24 | | | | (0.39 | ) | | | 2.57 | | | | 2.99 | |
DISTRIBUTIONS TO SHAREHOLDERS FROM: | | | | | | | | | | | | | | | | | | | | | | | | |
Net investment income | | | (0.14 | ) | | | (0.13 | ) | | | (0.11 | ) | | | (0.06 | ) | | | (0.10 | ) | | | (0.19 | ) |
Net realized gain from investments | | | — | | | | — | | | | (0.04 | ) | | | — | | | | — | | | | (2.20 | ) |
Total distributions | | | (0.14 | ) | | | (0.13 | ) | | | (0.15 | ) | | | (0.06 | ) | | | (0.10 | ) | | | (2.39 | ) |
Net asset value, end of period | | | $18.12 | | | | $17.97 | | | | $15.15 | | | | $14.06 | | | | $14.51 | | | | $12.04 | |
Total Return | | | 1.64 | %(A) | | | 19.58 | % | | | 9.00 | % | | | (2.72 | )% | | | 21.50 | % | | | 32.77 | % |
RATIOS/SUPPLEMENTAL DATA: | | | | | | | | | | | | | | | | | | | | | | | | |
Net assets, end of period (000’s) | | | $3,692,286 | | | | $3,467,793 | | | | $1,798,940 | | | | $969,139 | | | | $493,350 | | | | $259,450 | |
Expenses to average net assets | | | 0.86 | %(B) | | | 0.87 | % | | | 0.87 | % | | | 0.86 | % | | | 0.93 | % | | | 1.04 | % |
Expenses to average net assets (net of fees waived/reimbursed) | | | 0.86 | %(B) | | | 0.87 | % | | | 0.87 | % | | | 0.86 | % | | | 0.93 | % | | | 1.00 | % |
Net investment income to average net assets | | | 0.87 | %(B) | | | 1.06 | % | | | 1.26 | % | | | 1.13 | % | | | 0.91 | % | | | 1.31 | % |
Portfolio turnover rate | | | 4 | %(A) | | | 20 | % | | | 14 | % | | | 15 | % | | | 33 | % | | | 22 | % |
| (1) | Net investment income per share was calculated using the average shares outstanding method. |
| | | | | | | | | | | | | | | | | | | | | | | | |
| | | | | | |
| International Equity Portfolio — Investor Class | | | | | | | | | | | | | | | | | | |
| Per Share Data | | April 30, 2014 | | | 2013 | | | 2012 | | | 2011 | | | 2010 | | | 2009 | |
Net asset value, beginning of period | | | $17.89 | | | | $15.09 | | | | $14.01 | | | | $14.47 | | | | $12.02 | | | | $11.41 | |
INCREASE (DECREASE) IN NET ASSETS FROM OPERATIONS: | | | | | | | | | | | | | | | | | | | | | | | | |
Net investment income | | | 0.05 | (1) | | | 0.12 | (1) | | | 0.12 | (1) | | | 0.12 | (1) | | | 0.09 | | | | 0.13 | |
Net realized and unrealized gain (loss) on investments and foreign currency-related transactions | | | 0.22 | | | | 2.77 | | | | 1.06 | | | | (0.56 | ) | | | 2.44 | | | | 2.83 | |
Net increase (decrease) from investment operations | | | 0.27 | | | | 2.89 | | | | 1.18 | | | | (0.44 | ) | | | 2.53 | | | | 2.96 | |
DISTRIBUTIONS TO SHAREHOLDERS FROM: | | | | | | | | | | | | | | | | | | | | | | | | |
Net investment income | | | (0.08 | ) | | | (0.09 | ) | | | (0.06 | ) | | | (0.02 | ) | | | (0.08 | ) | | | (0.15 | ) |
Net realized gain from investments | | | — | | | | — | | | | (0.04 | ) | | | — | | | | — | | | | (2.20 | ) |
Total distributions | | | (0.08 | ) | | | (0.09 | ) | | | (0.10 | ) | | | (0.02 | ) | | | (0.08 | ) | | | (2.35 | ) |
Net asset value, end of period | | | $18.08 | | | | $17.89 | | | | $15.09 | | | | $14.01 | | | | $14.47 | | | | $12.02 | |
Total Return | | | 1.52 | %(A) | | | 19.19 | % | | | 8.51 | % | | | (3.02 | )% | | | 21.18 | % | | | 32.48 | % |
RATIOS/SUPPLEMENTAL DATA: | | | | | | | | | | | | | | | | | | | | | | | | |
Net assets, end of period (000’s) | | | $430,878 | | | | $409,735 | | | | $275,468 | | | | $237,494 | | | | $116,465 | | | | $38,134 | |
Expenses to average net assets | | | 1.18 | %(B) | | | 1.20 | % | | | 1.24 | % | | | 1.26 | % | | | 1.32 | % | | | 1.39 | % |
Expenses to average net assets (net of fees waived/reimbursed) | | | 1.18 | %(B) | | | 1.20 | % | | | 1.24 | % | | | 1.25 | % | | | 1.25 | % | | | 1.25 | % |
Net investment income to average net assets | | | 0.55 | %(B) | | | 0.76 | % | | | 0.87 | % | | | 0.79 | % | | | 0.69 | % | | | 1.03 | % |
Portfolio turnover rate | | | 4 | %(A) | | | 20 | % | | | 14 | % | | | 15 | % | | | 33 | % | | | 22 | % |
| (1) | Net investment income per share was calculated using the average shares outstanding method. |
See Notes to Financial Statements
33
Harding, Loevner Funds, Inc.
Financial Highlights (continued)
For the Six Months Ended April 30, 2014 (unaudited) or the Fiscal Year or Period Ended October 31
| | | | | | | | | | | | | | | | |
| | | | |
| International Small Companies Portfolio — Institutional Class | | | | | | | | | | | | |
| Per Share Data | | April 30, 2014 | | | 2013 | | | 2012 | | | 2011(1) | |
Net asset value, beginning of period | | | $14.47 | | | | $11.45 | | | | $10.53 | | | | $12.28 | |
INCREASE (DECREASE) IN NET ASSETS FROM OPERATIONS: | | | | | | | | | | | | | | | | |
Net investment income | | | 0.02 | (2) | | | 0.07 | (2) | | | 0.16 | (2) | | | 0.03 | (2) |
Net realized and unrealized gain (loss) on investments and foreign currency-related transactions | | | 0.99 | | | | 3.09 | | | | 0.85 | | | | (1.78 | ) |
Net increase (decrease) from investment operations | | | 1.01 | | | | 3.16 | | | | 1.01 | | | | (1.75 | ) |
DISTRIBUTIONS TO SHAREHOLDERS FROM: | | | | | | | | | | | | | | | | |
Net investment income | | | (0.06 | ) | | | (0.14 | ) | | | (0.09 | ) | | | — | |
Net realized gain from investments and foreign currency-related transactions | | | (0.87 | ) | | | — | | | | — | | | | — | |
Total distributions | | | (0.93 | ) | | | (0.14 | ) | | | (0.09 | ) | | | — | |
Net asset value, end of period | | | $14.55 | | | | $14.47 | | | | $11.45 | | | | $10.53 | |
Total Return | | | 7.45 | %(A) | | | 27.88 | % | | | 9.74 | % | | | (14.25 | )%(A) |
RATIOS/SUPPLEMENTAL DATA: | | | | | | | | | | | | | | | | |
Net assets, end of period (000’s) | | | $30,564 | | | | $26,236 | | | | $33,515 | | | | $14,000 | |
Expenses to average net assets | | | 1.57 | %(B) | | | 1.68 | % | | | 1.64 | % | | | 2.70 | %(B) |
Expenses to average net assets (net of fees waived/reimbursed) | | | 1.30 | %(B) | | | 1.39 | % | | | 1.50 | % | | | 1.50 | %(B) |
Net investment income to average net assets | | | 0.27 | %(B) | | | 0.57 | % | | | 1.49 | % | | | 0.89 | %(B) |
Portfolio turnover rate | | | 14 | %(A) | | | 97 | % | | | 10 | % | | | 12 | %(A) |
| (1) | For the period from June 30, 2011 (commencement of class operations) through October 31, 2011. |
| (2) | Net investment income per share was calculated using the average shares outstanding method. |
| | | | | | | | | | | | | | | | | | | | | | | | |
| | | | |
| International Small Companies Portfolio — Investor Class | | | | | | | | | | | | | |
| Per Share Data | | April 30, 2014 | | | 2013 | | | 2012 | | | 2011 | | | 2010 | | | 2009 | |
Net asset value, beginning of period | | | $14.45 | | | | $11.43 | | | | $10.51 | | | | $10.82 | | | | $8.92 | | | | $5.53 | |
INCREASE (DECREASE) IN NET ASSETS FROM OPERATIONS: | | | | | | | | | | | | | | | | | | | | | | | | |
Net investment income | | | — | (1)(2) | | | 0.08 | (1) | | | 0.11 | (1) | | | 0.15 | (1) | | | 0.05 | | | | 0.06 | |
Net realized and unrealized gain (loss) on investments and foreign currency-related transactions | | | 0.99 | | | | 3.05 | | | | 0.88 | | | | (0.43 | ) | | | 1.90 | | | | 3.40 | |
Net increase (decrease) from investment operations | | | 0.99 | | | | 3.13 | | | | 0.99 | | | | (0.28 | ) | | | 1.95 | | | | 3.46 | |
DISTRIBUTIONS TO SHAREHOLDERS FROM: | | | | | | | | | | | | | | | | | | | | | | | | |
Net investment income | | | (0.05 | ) | | | (0.11 | ) | | | (0.07 | ) | | | (0.03 | ) | | | (0.05 | ) | | | (0.07 | ) |
Net realized gain from investments | | | (0.87 | ) | | | — | | | | — | | | | — | | | | — | | | | — | |
Total distributions | | | (0.92 | ) | | | (0.11 | ) | | | (0.07 | ) | | | (0.03 | ) | | | (0.05 | ) | | | (0.07 | ) |
Net asset value, end of period | | | $14.52 | | | | $14.45 | | | | $11.43 | | | | $10.51 | | | | $10.82 | | | | $8.92 | |
Total Return | | | 7.29 | %(A) | | | 27.63 | % | | | 9.51 | % | | | (2.67 | )% | | | 21.93 | % | | | 63.47 | % |
RATIOS/SUPPLEMENTAL DATA: | | | | | | | | | | | | | | | | | | | | | | | | |
Net assets, end of period (000’s) | | | $59,104 | | | | $52,830 | | | | $31,249 | | | | $30,142 | | | | $13,972 | | | | $6,215 | |
Expenses to average net assets | | | 1.88 | %(B) | | | 1.99 | % | | | 2.02 | % | | | 2.15 | % | | | 3.14 | % | | | 5.21 | % |
Expenses to average net assets (net of fees waived/reimbursed) | | | 1.55 | %(B) | | | 1.60 | % | | | 1.75 | % | | | 1.75 | % | | | 1.75 | % | | | 1.75 | % |
Net investment income to average net assets | | | 0.00 | %(B) | | | 0.60 | % | | | 1.07 | % | | | 1.29 | % | | | 0.76 | % | | | 1.04 | % |
Portfolio turnover rate | | | 14 | %(A) | | | 97 | % | | | 10 | % | | | 12 | % | | | 11 | % | | | 24 | % |
| (1) | Net investment income per share was calculated using the average shares outstanding method. |
| (2) | Amount rounds to less than $0.01. |
See Notes to Financial Statements
34
Harding, Loevner Funds, Inc.
Financial Highlights (continued)
For the Six Months or Period Ended April 30, 2014 (unaudited) or the Fiscal Year Ended October 31
| | | | | | | | | | | | | | | | | | | | | | | | |
| | | | |
| Institutional Emerging Markets Portfolio — Class I | | | | | | | | | | | | | |
| Per Share Data | | April 30, 2014 | | | 2013 | | | 2012 | | | 2011 | | | 2010 | | | 2009 | |
Net asset value, beginning of period | | | $18.07 | | | | $16.56 | | | | $15.07 | | | | $16.70 | | | | $13.29 | | | | $9.29 | |
INCREASE (DECREASE) IN NET ASSETS FROM OPERATIONS: | | | | | | | | | | | | | | | | | | | | | | | | |
Net investment income | | | 0.11 | (1) | | | 0.18 | (1) | | | 0.16 | (1) | | | 0.15 | (1) | | | 0.09 | | | | 0.10 | |
Net realized and unrealized gain (loss) on investments and foreign currency-related transactions | | | 0.08 | | | | 1.45 | | | | 1.49 | | | | (1.74 | ) | | | 3.41 | | | | 4.27 | |
Net increase (decrease) from investment operations | | | 0.19 | | | | 1.63 | | | | 1.65 | | | | (1.59 | ) | | | 3.50 | | | | 4.37 | |
DISTRIBUTIONS TO SHAREHOLDERS FROM: | | | | | | | | | | | | | | | | | | | | | | | | |
Net investment income | | | (0.15 | ) | | | (0.12 | ) | | | (0.16 | ) | | | (0.04 | ) | | | (0.09 | ) | | | (0.37 | ) |
Total distributions | | | (0.15 | ) | | | (0.12 | ) | | | (0.16 | ) | | | (0.04 | ) | | | (0.09 | ) | | | (0.37 | ) |
Net asset value, end of period | | | $18.11 | | | | $18.07 | | | | $16.56 | | | | $15.07 | | | | $16.70 | | | | $13.29 | |
Total Return | | | 1.06 | %(A) | | | 9.85 | % | | | 11.17 | % | | | (9.58 | )% | | | 26.50 | % | | | 48.92 | % |
RATIOS/SUPPLEMENTAL DATA: | | | | | | | | | | | | | | | | | | | | | | | | |
Net assets, end of period (000’s) | | | $1,204,551 | | | | $1,043,041 | | | | $463,791 | | | | $328,713 | | | | $375,374 | | | | $203,548 | |
Expenses to average net assets | | | 1.31 | %(B) | | | 1.33 | % | | | 1.36 | % | | | 1.39 | % | | | 1.48 | % | | | 1.55 | % |
Expenses to average net assets (net of fees waived/reimbursed) | | | 1.30 | %(B) | | | 1.30 | % | | | 1.30 | % | | | 1.30 | % | | | 1.30 | % | | | 1.30 | % |
Net investment income to average net assets | | | 1.23 | %(B) | | | 1.06 | % | | | 1.00 | % | | | 0.93 | % | | | 0.74 | % | | | 0.93 | % |
Portfolio turnover rate | | | 14 | %(A) | | | 18 | % | | | 42 | % | | | 53 | % | | | 34 | % | | | 57 | % |
| (1) | Net investment income per share was calculated using the average shares outstanding method. |
| | | | |
| |
| Institutional Emerging Markets Portfolio — Class II | | | |
| Per Share Data | | April 30, 2014(1) | |
Net asset value, beginning of period | | | $10.00 | |
INCREASE (DECREASE) IN NET ASSETS FROM OPERATIONS: | | | | |
Net investment income | | | 0.06 | (2) |
Net realized and unrealized gain on investments and foreign currency-related transactions | | | 0.34 | |
Net increase from investment operations | | | 0.40 | |
Net asset value, end of period | | | $10.40 | |
Total Return | | | 4.00 | %(A) |
RATIOS/SUPPLEMENTAL DATA: | | | | |
Net assets, end of period (000’s) | | | $71,928 | |
Expenses to average net assets | | | 1.46 | %(B) |
Expenses to average net assets (net of fees waived/reimbursed) | | | 1.15 | %(B) |
Net investment income to average net assets | | | 3.97 | %(B) |
Portfolio turnover rate | | | 14 | %(A)�� |
| (1) | For the period from March 5, 2014 (commencement of class operations) through April 30, 2014. |
| (2) | Net investment income per share was calculated using the average shares outstanding method. |
See Notes to Financial Statements
35
Harding, Loevner Funds, Inc.
Financial Highlights (continued)
For the Six Months Ended April 30, 2014 (unaudited) or the Fiscal Year Ended October 31
| | | | | | | | | | | | | | | | | | | | | | | | |
| | | | | | |
| Emerging Markets Portfolio — Advisor Class | | | | | | | | | | | | | | | | | | |
| Per Share Data | | April 30, 2014 | | | 2013 | | | 2012 | | | 2011 | | | 2010 | | | 2009 | |
Net asset value, beginning of period | | | $50.76 | | | | $49.54 | | | | $45.18 | | | | $50.09 | | | | $39.64 | | | | $27.73 | |
INCREASE (DECREASE) IN NET ASSETS FROM OPERATIONS: | | | | | | | | | | | | | | | | | | | | | | | | |
Net investment income | | | 0.26 | (1) | | | 0.40 | (1) | | | 0.37 | (1) | | | 0.31 | (1) | | | 0.25 | | | | 0.26 | |
Net realized and unrealized gain (loss) on investments and foreign currency-related transactions | | | 0.14 | | | | 4.33 | | | | 4.34 | | | | (5.02 | ) | | | 10.33 | | | | 12.68 | |
Net increase (decrease) from investment operations | | | 0.40 | | | | 4.73 | | | | 4.71 | | | | (4.71 | ) | | | 10.58 | | | | 12.94 | |
DISTRIBUTIONS TO SHAREHOLDERS FROM: | | | | | | | | | | | | | | | | | | | | | | | | |
Net investment income | | | (0.40 | ) | | | (0.36 | ) | | | (0.35 | ) | | | (0.20 | ) | | | (0.13 | ) | | | (1.03 | ) |
Net realized gain from investments | | | (1.29 | ) | | | (3.15 | ) | | | — | | | | — | | | | — | | | | — | |
Total distributions | | | (1.69 | ) | | | (3.51 | ) | | | (0.35 | ) | | | (0.20 | ) | | | (0.13 | ) | | | (1.03 | ) |
Net asset value, end of period | | | $49.47 | | | | $50.76 | | | | $49.54 | | | | $45.18 | | | | $50.09 | | | | $39.64 | |
Total Return | | | 0.91 | %(A) | | | 9.93 | % | | | 10.60 | % | | | (9.48 | )% | | | 26.77 | % | | | 48.44 | % |
RATIOS/SUPPLEMENTAL DATA: | | | | | | | | | | | | | | | | | | | | | | | | |
Net assets, end of period (000’s) | | | $2,245,939 | | | | $2,112,546 | | | | $1,715,068 | | | | $1,693,650 | | | | $2,062,255 | | | | $1,540,822 | |
Expenses to average net assets | | | 1.44 | %(B) | | | 1.47 | % | | | 1.49 | % | | | 1.50 | % | | | 1.58 | % | | | 1.64 | % |
Net investment income to average net assets | | | 1.08 | %(B) | | | 0.83 | % | | | 0.80 | % | | | 0.63 | % | | | 0.60 | % | | | 0.56 | % |
Portfolio turnover rate | | | 15 | %(A) | | | 26 | % | | | 36 | % | | | 33 | % | | | 25 | % | | | 48 | % |
| (1) | Net investment income per share was calculated using the average shares outstanding method. |
See Notes to Financial Statements
36
Harding, Loevner Funds, Inc.
Financial Highlights (continued)
For the Six Months Ended April 30, 2014 (unaudited) or the Fiscal Year or Period Ended October 31
| | | | | | | | | | | | | | | | | | | | | | | | |
| | | | | | |
| Frontier Emerging Markets Portfolio — Institutional Class | | | | | | | | | | | | | | | | | | |
| Per Share Data | | April 30, 2014 | | | 2013 | | | 2012 | | | 2011 | | | 2010 | | | 2009 | |
Net asset value, beginning of period | | | $8.46 | | | | $7.12 | | | | $6.57 | | | | $7.88 | | | | $6.29 | | | | $4.98 | |
INCREASE (DECREASE) IN NET ASSETS FROM OPERATIONS: | | | | | | | | | | | | | | | | | | | | | | | | |
Net investment income | | | 0.09 | (1) | | | 0.07 | (1) | | | 0.07 | (1) | | | 0.07 | (1) | | | 0.03 | | | | 0.07 | |
Net realized and unrealized gain (loss) on investments and foreign currency-related transactions | | | 1.03 | | | | 1.35 | | | | 0.51 | | | | (1.37 | ) | | | 1.65 | | | | 1.26 | |
Net increase (decrease) from investment operations | | | 1.12 | | | | 1.42 | | | | 0.58 | | | | (1.30 | ) | | | 1.68 | | | | 1.33 | |
DISTRIBUTIONS TO SHAREHOLDERS FROM: | | | | | | | | | | | | | | | | | | | | | | | | |
Net investment income | | | (0.02 | ) | | | (0.08 | ) | | | (0.03 | ) | | | (0.01 | ) | | | (0.09 | ) | | | (0.02 | ) |
Total distributions | | | (0.02 | ) | | | (0.08 | ) | | | (0.03 | ) | | | (0.01 | ) | | | (0.09 | ) | | | (0.02 | ) |
Net asset value, end of period | | | $9.56 | | | | $8.46 | | | | $7.12 | | | | $6.57 | | | | $7.88 | | | | $6.29 | |
Total Return | | | 13.31 | %(A) | | | 20.20 | % | | | 8.93 | % | | | (16.49 | )% | | | 27.04 | % | | | 26.71 | % |
RATIOS/SUPPLEMENTAL DATA: | | | | | | | | | | | | | | | | | | | | | | | | |
Net assets, end of period (000’s) | | | $382,082 | | | | $271,728 | | | | $81,568 | | | | $101,666 | | | | $70,645 | | | | $9,071 | |
Expenses to average net assets | | | 1.73 | %(B) | | | 1.80 | % | | | 1.95 | % | | | 1.87 | % | | | 2.37 | % | | | 4.08 | % |
Expenses to average net assets (net of fees waived/reimbursed) | | | 1.73 | %(B) | | | 1.80 | % | | | 1.95 | % | | | 1.87 | % | | | 2.00 | % | | | 2.00 | % |
Net investment income (loss) to average net assets | | | 2.02 | %(B) | | | 0.94 | % | | | 1.03 | % | | | 0.89 | % | | | (0.08 | %) | | | 1.39 | % |
Portfolio turnover rate | | | 17 | %(A) | | | 24 | % | | | 72 | % | | | 23 | % | | | 17 | % | | | 55 | % |
| (1) | Net investment income per share was calculated using the average shares outstanding method. |
| | | | | | | | | | | | | | | | |
| | | | |
| Frontier Emerging Markets Portfolio — Investor Class | | | | | | | | | | | | |
| Per Share Data | | April 30, 2014 | | | 2013 | | | 2012 | | | 2011(1) | |
Net asset value, beginning of period | | | $8.40 | | | | $7.08 | | | | $6.55 | | | | $7.84 | |
INCREASE (DECREASE) IN NET ASSETS FROM OPERATIONS: | | | | | | | | | | | | | | | | |
Net investment income | | | 0.08 | (2) | | | 0.05 | (2) | | | 0.10 | (2) | | | 0.04 | (2) |
Net realized and unrealized gain (loss) on investments and foreign currency-related transactions | | | 1.01 | | | | 1.34 | | | | 0.45 | | | | (1.33 | ) |
Net increase (decrease) from investment operations | | | 1.09 | | | | 1.39 | | | | 0.55 | | | | (1.29 | ) |
DISTRIBUTIONS TO SHAREHOLDERS FROM: | | | | | | | | | | | | | | | | |
Net investment income | | | (0.01 | ) | | | (0.07 | ) | | | (0.02 | ) | | | — | |
Total Distributions | | | (0.01 | ) | | | (0.07 | ) | | | (0.02 | ) | | | — | |
Net asset value, end of period | | | $9.48 | | | | $8.40 | | | | $7.08 | | | | $6.55 | |
Total Return | | | 12.99 | %(A) | | | 19.83 | % | | | 8.49 | % | | | (16.45 | )%(A) |
RATIOS/SUPPLEMENTAL DATA: | | | | | | | | | | | | | | | | |
Net assets, end of period (000’s) | | | $43,787 | | | | $21,763 | | | | $3,003 | | | | $1,225 | |
Expenses to average net assets | | | 2.20 | %(B) | | | 2.64 | % | | | 4.71 | % | | | 9.06 | %(B) |
Expenses to average net assets (net of fees waived/reimbursed) | | | 2.20 | %(B) | | | 2.25 | % | | | 2.25 | % | | | 2.25 | %(B) |
Net investment income to average net assets | | | 1.83 | %(B) | | | 0.66 | % | | | 1.47 | % | | | 0.75 | %(B) |
Portfolio turnover rate | | | 17 | %(A) | | | 24 | % | | | 72 | % | | | 23 | %(A) |
| (1) | For the period from December 31, 2010 (commencement of class operations) through October 31, 2011. |
| (2) | Net investment income per share was calculated using the average shares outstanding method. |
See Notes to Financial Statements
37
Harding, Loevner Funds, Inc.
Notes to Financial Statements
April 30, 2014 (unaudited)
1. Organization
Harding, Loevner Funds, Inc. (the “Fund”) was organized as a Maryland corporation on July 31, 1996, and is registered under the Investment Company Act of 1940, as amended (the “1940 Act”), as an open-end diversified management investment company. The Fund currently has six Portfolios, all of which were active as of April 30, 2014 (individually, a “Portfolio”, collectively, the “Portfolios”). The Fund is managed by Harding Loevner LP (the “Investment Adviser”).
| | | | |
Portfolio | | Inception Date | | Investment Objective |
Global Equity Portfolio (“Global Equity”) | | Institutional Class: November 3, 2009 Advisor Class: December 1, 1996 | | to seek long-term capital appreciation through investments in equity securities of companies based both inside and outside the United States |
International Equity Portfolio (“International Equity”) | | Institutional Class: May 11, 1994* Investor Class: September 30, 2005 | | to seek long-term capital appreciation through investments in equity securities of companies based outside the United States |
International Small Companies Portfolio (“International Small Companies”) | | Institutional Class: June 30, 2011 Investor Class: March 26, 2007 | | to seek long-term capital appreciation through investments in equity securities of small companies based outside the United States |
Institutional Emerging Markets Portfolio** (“Institutional Emerging Markets”) | | Class I: October 17, 2005 Class II: March 5, 2014 | | to seek long-term capital appreciation through investments in equity securities of companies based in emerging markets |
Emerging Markets Portfolio (“Emerging Markets”) | | Advisor Class: November 9, 1998 | | to seek long-term capital appreciation through investments in equity securities of companies based in emerging markets |
Frontier Emerging Markets Portfolio (“Frontier Emerging Markets”) | | Institutional Class: May 27, 2008 Investor Class: December 31, 2010 | | to seek long-term capital appreciation through investments in equity securities of companies based in frontier and smaller emerging markets |
* International Equity is the successor to the HLM International Equity Portfolio of AMT Capital Fund, Inc., pursuant to a reorganization that took place on October 31, 1996. Information for periods prior to October 31, 1996 is historical information for the predecessor portfolio.
** Prior to the inception of Class II, shares of Institutional Emerging Markets Portfolio did not carry a specific class name. All shares of the Portfolio issued prior to March 5, 2014 have been re-designated as ‘Class I’ shares.
2. Summary of Significant Accounting Policies
The accounting policies of the Fund are in conformity with accounting principles generally accepted in the United States (“GAAP”) for investment companies. The following is a summary of the Fund’s significant accounting policies:
Indemnifications
Under the Fund’s organizational document, its officers and Board of Directors (“Board”) are indemnified against certain liability arising out of the performance of their duties to the Portfolios. In the normal course of business, the Fund may enter into contracts that contain a variety of representations or that provide indemnification for certain liabilities. The Fund’s maximum exposure under these arrangements is unknown, as this would involve future claims that may be made against the Fund that have not yet occurred. However, the Fund has not had prior claims or losses pursuant to these contracts and expects the risk of loss to be remote.
Estimates
The preparation of financial statements in accordance with GAAP requires management to make estimates and assumptions that affect the reported amounts and disclosures in the financial statements. Actual results could differ from those estimates.
38
Harding, Loevner Funds, Inc.
Notes to Financial Statements (continued)
April 30, 2014 (unaudited)
2. Summary of Significant Accounting Policies (continued)
Valuation
The Board has adopted procedures (“Procedures”) to govern the valuation of the securities held by each Portfolio of the Fund in accordance with the 1940 Act. The Procedures incorporate principles set forth in relevant pronouncements of the Securities and Exchange Commission (“SEC”) and its staff, including guidance on the obligations of the Portfolios and their Directors to determine, in good faith, the fair value of the Portfolios’ securities when market quotations are not readily available.
In determining a Portfolio’s net asset value (“NAV”), each equity security traded on a securities exchange, including the NASDAQ Stock Market, and over-the-counter securities, are first valued at the closing price on the exchange or market designated by the Fund’s accounting agent as the principal exchange (each, a “principal exchange”). The closing price provided by the Fund’s accounting agent for a principal exchange may differ from the price quoted elsewhere and may represent information such as last sales price, an official closing price, a closing auction price or other information, depending on exchange or market convention. Shares of open-end mutual funds including money market funds are valued at NAV. Such securities are typically categorized as “Level 1” pursuant to the hierarchy described below.
Participation notes are valued based upon the closing or last traded price of their underlying local shares. Such securities are typically categorized as “Level 2” pursuant to the hierarchy described below.
Since trading in many foreign securities is normally completed before the time at which a Portfolio calculates its NAV, the effect on the value of such securities held by a Portfolio of events that occur between the close of trading in the security and the time at which the Portfolio prices its securities would not be reflected in the Portfolio’s calculation of its NAV if foreign securities were generally valued at their closing prices.
To address this issue, the Board has approved the daily use of independently provided quantitative models that may adjust the closing prices of certain foreign equity securities based on information that becomes available after the foreign market closes, through the application of an adjustment factor to such securities’ closing price. Adjustment factors may be greater than, less than, or equal to 1. Thus, use of these quantitative models could cause a Portfolio to value a security higher, lower or equal to its closing market price, which in turn could cause the Portfolio’s NAV per share to differ significantly from that which would have been calculated using closing market prices. The use of these quantitative models is also intended to decrease the opportunities for persons to engage in ‘‘time zone arbitrage,’’ i.e., trading intended to take advantage of stale closing prices in foreign markets that could affect the NAV of the Portfolios. Securities subjected to an adjustment factor due to the use of these quantitative models are not specifically designated on the Portfolios’ Portfolio of Investments as being “fair valued”. However, absent the use of significant unobservable inputs into their valuation, such securities would be categorized as “Level 2” pursuant to the hierarchy described below.
Any securities for which market quotations are not readily available or for which available prices are deemed unreliable are priced by the Investment Adviser at “fair value as determined in good faith”, in accordance with the Procedures. Such securities are identified on the Portfolios’ Portfolio of Investments as securities valued at “fair value as determined in good faith” and absent the use of significant unobservable inputs into their valuation, such securities would be categorized as “Level 2” pursuant to the hierarchy described below.
GAAP includes a topic which establishes a hierarchy for NAV determination purposes in which various inputs are used in determining the value of each Portfolio’s assets or liabilities. This topic defines fair value as the price that the Portfolio would receive upon selling an investment in a timely transaction to an independent buyer in the principal or most advantageous market of the investment. This topic establishes a three-tier hierarchy to maximize the use of observable market data and minimize the use of unobservable inputs and to establish classification of fair value measurements for disclosure purposes. Inputs may be observable or unobservable and refer broadly to the assumptions that market participants would use in pricing the asset or liability including assumptions about risk. Such risks include the inherent risk in a particular valuation technique which is used to measure fair value. This may include the quantitative models and/or the inputs to the quantitative models used in the valuation technique described above. Observable inputs are inputs that reflect the assumptions market participants would use in pricing the asset or liability developed based on market data obtained from sources independent of the reporting entity. Unobservable inputs are inputs that reflect the reporting entity’s own assumptions about the assumptions market participants would use in pricing the asset or liability developed based on the best information available in the circumstances. The three-tier hierarchy of inputs is summarized in the three broad levels listed below.
| | |
| Level 1 | | unadjusted quoted prices in active markets for identical investments |
| Level 2 | | other significant observable inputs (including quoted prices for similar investments, interest rates, prepayment speeds, credit risk, etc.). |
| Level 3 | | significant unobservable inputs (including the Portfolio’s own assumptions in determining the fair value of investments) |
39
Harding, Loevner Funds, Inc.
Notes to Financial Statements (continued)
April 30, 2014 (unaudited)
2. Summary of Significant Accounting Policies (continued)
The Portfolios disclose all transfers between levels based on valuations at the end of each reporting period. At April 30, 2014, there were no transfers between Level 1, Level 2, or Level 3 classifications based on levels assigned to the securities on October 31, 2013.
GAAP provides additional guidance for estimating fair value when the volume and level of activity for the asset or liability have significantly decreased as well as guidance on identifying circumstances that indicate when a transaction is not orderly.
The following is a summary of the Portfolio’s investments classified by Level 1, Level 2 and Level 3 and security type as of April 30, 2014. Please refer to each Portfolio’s Portfolio of Investments to view individual securities classified by industry type and country.
| | | | | | | | | | | | | | | | | | | | | | | | | | | | |
| Portfolio | | Unadjusted Quoted Prices
in Active Markets for
Identical Assets (Level 1) | | | Other Significant
Observable Inputs (Level 2) | | | Total | |
| | | Common Stocks | | | Preferred
Stocks | | | Cash
Equivalents | | | Common Stocks | | | Preferred
Stocks | | | Participation
Notes | | | Investment
Securities | |
Global Equity | | | $484,453,724 | | | | $— | | | | $21,712,909 | | | | $235,011,242 | | | | $— | | | | $— | | | | $741,177,875 | |
International Equity | | | 948,336,688 | | | | 124,316,335 | | | | 103,302,893 | | | | 2,860,227,970 | | | | 76,567,907 | | | | — | | | | 4,112,751,793 | |
International Small Companies | | | 380,406 | | | | — | | | | 2,037,899 | | | | 85,394,719 | | | | 337,761 | | | | — | | | | 88,150,785 | |
Institutional Emerging Markets | | | 249,532,452 | | | | 27,119,674 | | | | 26,549,773 | | | | 832,340,681 | | | | 61,990,927 | | | | 75,181,264 | | | | 1,272,714,771 | |
Emerging Markets | | | 440,793,102 | | | | 45,182,474 | | | | 41,136,666 | | | | 1,466,632,132 | | | | 109,506,791 | | | | 131,924,644 | | | | 2,235,175,809 | |
Frontier Emerging Markets | | | 83,828,684 | | | | — | | | | 1,914,555 | | | | 285,875,089 | | | | — | | | | 49,905,513 | | | | 421,523,841 | |
As of April 30, 2014, there were no Level 3 investments held within the Portfolios.
Securities
For financial reporting purposes, all securities transactions are recorded on a trade date basis, as of the last business day in the reporting period. Throughout the reporting period, securities transactions are typically accounted for on a trade date - plus one business day basis. Interest income and expenses are recorded on an accrual basis. Dividend income is recorded on the ex-dividend date (except for certain foreign dividends that may be recorded as soon as the Portfolio is informed of such dividends). The Portfolios use the specific identification method for determining realized gains or losses from sales of securities.
Dividends to Shareholders
It is the policy of the Portfolios to declare dividends from net investment income annually. Net short-term and long-term capital gains distributions for the Portfolios, if any, normally are distributed on an annual basis.
Dividends from net investment income and distributions from net realized gains from investment transactions have been determined in accordance with income tax regulations and may differ from net investment income and realized gains recorded by the Portfolios for financial reporting purposes. Differences result primarily from foreign currency transactions and timing differences related to recognition of income, and gains and losses from investment transactions. In general, to the extent that any differences which are permanent in nature result in over distributions to shareholders, the amount of the over distribution is reclassified within the capital accounts based on its federal tax basis treatment and may be reported as return of capital. Temporary differences do not require reclassification.
Currency Translation
Assets and liabilities denominated in foreign currencies and commitments under forward foreign currency exchange contracts are translated into U.S. dollars at the mean of the quoted bid and asked prices of such currencies against the U.S. dollar. Purchases and sales of the Portfolios’ securities are translated at the rates of exchange prevailing when such securities were acquired or sold. Income and expenses are translated at exchange rates prevailing when accrued. The Portfolios do not isolate that portion of the results of operations resulting from changes in foreign exchange rates on investments from the fluctuations arising from changes in market prices of securities held. Such fluctuations are included with the Net realized gain (loss) from investments and Change in unrealized appreciation (depreciation) from investments on the Statements of Operations.
Net realized gains and losses from foreign currency-related transactions arise from sales of foreign currency, currency gains or losses realized between the trade and settlement dates on securities transactions, and the difference between the amounts of dividends, interest, and foreign withholding taxes recorded on the Portfolios’ books, and the U.S. dollar equivalent of the amounts actually received or paid. Net unrealized appreciation or depreciation on translation of assets and liabilities denominated in foreign currencies arise from changes in the value of assets and liabilities other than investments in securities at the period end, resulting from changes in the exchange rates.
40
Harding, Loevner Funds, Inc.
Notes to Financial Statements (continued)
April 30, 2014 (unaudited)
2. Summary of Significant Accounting Policies (continued)
Redemption Fees
Redemptions made within 90 days of purchase may be subject to a redemption fee equal to 2% of the amount redeemed. For the period or year ended April 30, 2014 and October 31, 2013, the Portfolios received the following redemption fees related to transactions in shares of common stock. These amounts are included as a component of “Cost of shares redeemed” in the Portfolio’s Statements of Changes in Net Assets.
| | | | | | | | | | | | | | | | | | | | |
| | | Institutional Class | | | Class I | | | Class II | |
| Portfolio | | Period Ended
April 30,
2014 (unaudited) | | | Year ended
October 31,
2013 | | | Period Ended
April 30,
2014 (unaudited) | | | Year ended
October 31,
2013 | | | Period Ended
April 30,
2014 (unaudited) | |
Global Equity | | $ | 270 | | | $ | 741 | | | $ | — | | | $ | — | | | $ | — | |
International Equity | | | 127,023 | | | | 234,492 | | | | — | | | | — | | | | — | |
International Small Companies | | | 805 | | | | 67,590 | | | | — | | | | — | | | | — | |
Institutional Emerging Markets | | | — | | | | — | | | | 26,127 | | | | 46,807 | | | | — | |
Frontier Emerging Markets | | | 31,910 | | | | 19,043 | | | | — | | | | — | | | | — | |
| | | | | | | | | | | | | | | | |
| | | Investor Class | | | Advisor Class | |
| Portfolio | | Period Ended
April 30,
2014 (unaudited) | | | Year ended
October 31,
2013 | | | Period Ended
April 30,
2014 (unaudited) | | | Year ended
October 31,
2013 | |
Global Equity | | $ | — | | | $ | — | | | $ | 1,872 | | | $ | 13,746 | |
International Equity | | | 28,684 | | | | 70,744 | | | | — | | | | — | |
International Small Companies | | | 12,604 | | | | 6,416 | | | | — | | | | — | |
Emerging Markets | | | — | | | | — | | | | 129,842 | | | | 231,312 | |
Frontier Emerging Markets | | | 5,461 | | | | 5,786 | | | | — | | | | — | |
3. Significant Agreements and Transactions with Affiliates
The Board has approved an investment advisory agreement (the “Agreement”) with the Investment Adviser. Advisory fees are computed daily and paid monthly based on the average daily net assets of each Portfolio. The Investment Adviser has contractually agreed to reduce its fee and/or reimburse the Portfolios for other operating expenses to the extent that aggregate expenses, excluding certain non-operating expenses, exceed certain annual rates of the average daily net assets of each class.
41
Harding, Loevner Funds, Inc.
Notes to Financial Statements (continued)
April 30, 2014 (unaudited)
3. Significant Agreements and Transactions with Affiliates (continued)
The following annualized advisory fees and contractual expense limits were in effect for the period ended April 30, 2014. The advisory fees are charged at the Portfolio level as a whole and expense limitations are at the class specific level.
| | | | | | |
| Portfolio | | Advisory Fees on assets up to $1 billion | | Advisory Fees on assets over $1 billion | | Contractual Expense Limit* |
Global Equity – Institutional Class | | 0.85% | | 0.83% | | 0.95% |
Global Equity – Advisor Class | | 0.85% | | 0.83% | | 1.25% |
International Equity – Institutional Class | | 0.75% | | 0.73% | | 1.00% |
International Equity – Investor Class | | 0.75% | | 0.73% | | 1.25% |
International Small Companies – Institutional Class | | 1.25% | | 1.23% | | 1.30% |
International Small Companies – Investor Class | | 1.25% | | 1.23% | | 1.55% |
Institutional Emerging Markets – Class I | | 1.15% | | 1.13% | | 1.30% |
Institutional Emerging Markets – Class II | | 1.15% | | 1.13% | | 1.15%** |
Emerging Markets – Advisor Class | | 1.15% | | 1.13% | | 1.75% |
Frontier Emerging Markets – Institutional Class | | 1.50% | | 1.48% | | 2.00% |
Frontier Emerging Markets – Investor Class | | 1.50% | | 1.48% | | 2.25% |
* Effective through February 28, 2015.
** The Investment Adviser has contractually agreed to waive a portion of its management fee and/or reimburse the Class II of the Portfolio for its other operating expenses to the extent Total Annual Portfolio Operating Expenses, as a percentage of average daily net assets, exceed the applicable contractual management fee, currently 1.15% for average daily net assets on the first $1 billion and 1.13% for average daily net assets over $1 billion, through February 28, 2015.
For the period ended April 30, 2014, the Investment Adviser waived and/or reimbursed the following amounts pursuant to the contractual expense limits described above:
| | |
| Portfolio | | Fees waived and/or reimbursed by the Investment Adviser |
Global Equity – Institutional Class | | $15,379 |
International Small Companies – Institutional Class | | 39,450 |
International Small Companies – Investor Class | | 90,833 |
Institutional Emerging Markets – Class I | | 43,775 |
Institutional Emerging Markets – Class II | | 17,289 |
The Fund has an administration agreement with The Northern Trust Company (“Northern Trust”), which provides certain accounting, clerical and bookkeeping services, Blue Sky, corporate secretarial services and assistance in the preparation and filing of tax returns and reports to shareholders and the SEC.
Northern Trust also serves as custodian of each Portfolio’s securities and cash, transfer agent, dividend disbursing agent and agent in connection with any accumulation, open-account or similar plans provided to the shareholders of the Portfolios.
Foreside Compliance Services, LLC (“FCS”) provides individuals to serve as chief compliance and anti-money laundering officers of the Fund. Fees paid to FCS are shown as “Compliance officers’ fees and expenses” on the Statements of Operations.
The Fund has adopted an Amended Plan of Distribution pursuant to Rule 12b-1 under the 1940 Act (“Distribution Plan”). Under the Distribution Plan, the Investor Class of each of the International Equity, International Small Companies and Frontier Emerging Markets Portfolios may pay underwriters, distributors, dealers or brokers a fee at an annual rate of up to 0.25% of the average daily net assets of the Portfolio’s Investor Class shares for services or expenses arising in connection with activities primarily intended to result in the sale of Investor Class shares of the Portfolios.
42
Harding, Loevner Funds, Inc.
Notes to Financial Statements (continued)
April 30, 2014 (unaudited)
3. Significant Agreements and Transactions with Affiliates (continued)
The Fund, on behalf of the Portfolios, has agreements with various financial intermediaries and “mutual fund supermarkets”, under which customers of these intermediaries may purchase and hold Portfolio shares. These intermediaries assess fees in consideration for providing certain distribution, account maintenance, record keeping and transactional services. In recognition of the savings of expenses to the Fund arising from the intermediaries’ assumption of functions that the Fund would otherwise perform, such as providing sub-accounting and related shareholder services, each Portfolio or class is authorized, pursuant to a Shareholder Servicing Plan, to pay to each intermediary an annual rate of up to 0.25% of its average daily net assets attributable to that intermediary (subject to the contractual expense limits described above). Because of the contractual expense limits on certain Portfolios’ fees and expenses, the Investment Adviser paid a portion of the Portfolios’ share of these fees during the period ended April 30, 2014.
4. Class Specific Expenses
Most expenses of the Fund can be directly attributed to a particular Portfolio. Expenses which cannot be directly attributed are apportioned among the Portfolios based upon relative net assets or other appropriate measures. If an expense is incurred at the Portfolio level, it is generally apportioned among the classes of that Portfolio based upon relative net assets of each respective class. Certain expenses are incurred at the class level and charged only to that particular class. These expenses may be class specific (i.e., Distribution fees charged only to a particular class) or they may be identifiable to a particular class (i.e., the costs related to printing and mailing shareholder reports to shareholders of a particular class). Class specific expenses for Portfolios with multiple active classes are shown in the table below.
| | | | | | | | | | | | | | | | | | | | |
| Portfolio | | Distribution
Fees | | | State Registration
Filing Fees | | | Printing and
Postage Fees | | | Transfer Agent
Fees and Expenses | | | Shareholder
Servicing Fees | |
Global Equity – Institutional Class | | $ | — | | | $ | 28,630 | | | $ | 11,856 | | | $ | 11,975 | | | $ | 36,102 | |
Global Equity – Advisor Class | | | — | | | | 11,270 | | | | 5,350 | | | | 13,132 | | | | 88,944 | |
International Equity – Institutional Class | | | — | | | | 107,970 | | | | 108,992 | | | | 297,456 | | | | 603,579 | |
International Equity – Investor Class | | | 511,774 | | | | 20,503 | | | | 39,873 | | | | 59,287 | | | | 145,213 | |
International Small Companies – Institutional Class | | | — | | | | 8,859 | | | | 920 | | | | 10,317 | | | | 3,932 | |
International Small Companies – Investor Class | | | 68,377 | | | | 12,563 | | | | 4,372 | | | | 12,267 | | | | 33,015 | |
Institutional Emerging Markets – Class I | | | — | | | | 60,722 | | | | 34,285 | | | | 25,542 | | | | 232,808 | |
Institutional Emerging Markets – Class II | | | — | | | | 3,515 | | | | 4,686 | | | | 3,515 | | | | — | |
Frontier Emerging Markets – Institutional Class | | | — | | | | 22,705 | | | | 6,127 | | | | 10,632 | | | | 18,271 | |
Frontier Emerging Markets – Investor Class | | | 36,691 | | | | 12,501 | | | | 1,383 | | | | 11,456 | | | | 11,266 | |
5. Investment Transactions
Cost of purchases and proceeds from sales of investment securities, other than short-term investments, for the period ended April 30, 2014, were as follows for each Portfolio:
| | | | | | | | | | | | |
| Portfolio | | Purchase Cost of
Investment Securities | | | | | Proceeds from Sales of
Investment Securities | | | |
Global Equity | | $ | 171,228,339 | | | | | $ | 96,038,388 | | | |
International Equity | | | 362,131,562 | | | | | | 149,234,495 | | | |
International Small Companies | | | 13,206,387 | | | | | | 11,202,736 | | | |
Institutional Emerging Markets | | | 362,123,059 | | | | | | 153,709,496 | | | |
Emerging Markets | | | 422,644,872 | | | | | | 321,039,222 | | | |
Frontier Emerging Markets | | | 149,570,462 | | | | | | 55,687,634 | | | |
43
Harding, Loevner Funds, Inc.
Notes to Financial Statements (continued)
April 30, 2014 (unaudited)
6. Income Tax
The cost of investments for federal income tax purposes and the components of net unrealized appreciation (depreciation) on investments at April 30, 2014, for each of the Portfolios were as follows:
| | | | | | | | | | | | | | | | |
| Portfolio | | Gross
Unrealized
Appreciation | | | Gross
Unrealized
Depreciation | | | Net
Unrealized
Appreciation /
(Depreciation) | | | Cost | |
Global Equity | | $ | 157,113,261 | | | $ | (8,400,254 | ) | | $ | 148,713,007 | | | $ | 592,464,868 | |
International Equity | | | 846,961,873 | | | | (44,235,228 | ) | | | 802,726,645 | | | | 3,310,025,148 | |
International Small Companies | | | 21,263,261 | | | | (2,107,118 | ) | | | 19,156,143 | | | | 68,994,642 | |
Institutional Emerging Markets | | | 197,621,072 | | | | (40,033,592 | ) | | | 157,587,480 | | | | 1,115,127,291 | |
Emerging Markets | | | 604,614,630 | | | | (49,118,350 | ) | | | 555,496,280 | | | | 1,679,679,529 | |
Frontier Emerging Markets | | | 75,410,850 | | | | (9,203,984 | ) | | | 66,206,866 | | | | 355,316,975 | |
It is the policy of each Portfolio of the Fund to qualify as a regulated investment company by complying with the applicable provisions of the Internal Revenue Code, and to make distributions of taxable income sufficient to relieve it from substantially all federal income and excise taxes; therefore, no federal income tax provision is required.
Management has performed an analysis of each Portfolio’s tax positions for the open tax years as of October 31, 2013 and has concluded that no provisions for income tax are required. The Portfolios’ federal tax returns for the prior three fiscal years (open tax years: October 31, 2011; October 31, 2012; October 31, 2013) remain subject to examination by the Portfolios’ major tax jurisdictions, which include the United States, the State of New Jersey and the State of Maryland. Management is not aware of any events that are reasonably possible to occur in the next twelve months that would result in the amounts of any unrecognized tax benefits significantly increasing or decreasing for the Portfolios. However, management’s conclusions regarding tax positions taken may be subject to review and adjustment at a later date based on factors including, but not limited to, new tax laws and accounting regulations and interpretations thereof.
The tax character of distributions paid during the fiscal years ended October 31, 2013 and 2012 were as follows:
| | | | | | | | | | | | | | | | |
| | | Distributions From | |
| Portfolio | | Ordinary
Income
2013 | | | Long-Term
Capital Gains 2013 | | | Ordinary Income 2012 | | | Long-Term Capital Gains 2012 | |
Global Equity | | $ | 1,722,330 | | | $ | — | | | $ | 797,569 | | | $ | 2,083,272 | |
International Equity | | | 18,521,821 | | | | — | | | | 9,328,089 | | | | 3,133,641 | |
International Small Companies | | | 740,002 | | | | — | | | | 334,833 | | | | — | |
Institutional Emerging Markets | | | 3,683,658 | | | | — | | | | 3,430,979 | | | | — | |
Emerging Markets | | | 12,078,855 | | | | 106,392,227 | | | | 12,198,687 | | | | — | |
Frontier Emerging Markets | | | 991,109 | | | | — | | | | 489,954 | | | | — | |
The Regulated Investment Company Modernization Act of 2010 (the “Act”) was enacted, which changed various technical rules governing the tax treatment of regulated investment companies. The changes are generally effective for taxable years beginning after its enactment on December 22, 2010 and became effective for the Portfolios for the fiscal year ended October 31, 2012. Under the Act, each Portfolio will be permitted to carry forward capital losses incurred in taxable years beginning after the date of enactment for an unlimited period. However, any losses incurred during those future taxable years will be required to be utilized prior to the losses incurred in pre-enactment taxable years, which carry an expiration date. As a result of this ordering rule, pre-enactment capital loss carryforwards may be more likely to expire unused. Additionally, post-enactment capital loss carryforwards will retain their character as either short-term or long-term capital losses rather than being considered all short-term as permitted under previous regulation.
Capital losses incurred that will be carried forward indefinitely under provisions of the Act are as follows:
| | | | | | | | | | | | |
| Portfolio | | Short-Term Capital Loss Carryforward | | | | | Long-Term Capital Loss Carryforward | | | |
International Equity | | $ | 26,491,344 | | | | | $ | 697,531 | | | |
Institutional Emerging Markets | | | 677,774 | | | | | | — | | | |
Frontier Emerging Markets | | | 4,639,023 | | | | | | 3,001,217 | | | |
44
Harding, Loevner Funds, Inc.
Notes to Financial Statements (continued)
April 30, 2014 (unaudited)
6. Income Tax (continued)
At October 31, 2013, the pre-enactment capital loss carryforwards and their respective years of expiration were as follows:
| | | | | | | | | | | | |
| Portfolio | | October 31, 2016 | | | October 31, 2017 | | | October 31, 2019 | |
Institutional Emerging Markets | | $ | 8,577,340 | | | $ | 29,793,794 | | | $ | 3,834,973 | |
Frontier Emerging Markets | | | — | | | | 1,252,470 | | | | 4,237,229 | |
7. Foreign Exchange Contracts
The Portfolios do not generally hedge foreign currency exposure, except on rare occasions when Harding Loevner has a strong view on the prospects for a particular currency or when hedging is desirable to improve portfolio diversification. Each Portfolio will conduct its currency transactions either on a spot (cash) basis at the rate prevailing in the currency exchange market, or by entering into forward contracts to purchase or sell currency. Foreign currency transactions entered into on the spot markets serve to pay for foreign investment purchases or to convert to dollars, the proceeds from foreign investment sales or dividend and interest receipts. The Portfolios will disclose open forward currency contracts, if any, on the Portfolios of Investments. The Portfolios do not separately disclose open spot market transactions on the Portfolios of Investments. However, on a semiannual basis, realized gain (loss) and unrealized appreciation (depreciation) on spot market transactions is included in “net realized gain (loss) on foreign currency transactions” and “change in unrealized appreciation (depreciation) on translation of assets and liabilities denominated in foreign currencies”, respectively, on the Portfolios’ Statements of Operations. The Portfolios held no open forward currency contracts on April 30, 2014.
8. Participation Notes
Each Portfolio may invest in participation notes. Participation notes are promissory notes that are designed to offer a return linked to the performance of a particular underlying equity security or market. Participation notes are issued by banks or broker-dealers and allow a Portfolio to gain exposure to common stocks in markets where direct investment may not be allowed. Participation notes are generally traded over-the-counter and are subject to the risk that the broker-dealer or bank that issues them will not fulfill its contractual obligation to complete the transaction with a Portfolio. Participation notes constitute general unsecured contractual obligations of the banks or broker-dealers that issue them, and a Portfolio investing in participation notes would be relying on the creditworthiness of such banks or broker-dealers and would have no rights under a participation note against the issuer of the underlying assets. Participation notes may be more volatile and less liquid than other investments held by the Portfolios.
9. Concentration of Ownership
At April 30, 2014, the percentage of total shares outstanding held by record shareholders each owning 10% or greater of the aggregate shares outstanding of each Portfolio were as follows:
| | | | | | | | | | | | |
| | | No. of
Shareholders | | | | | %
Ownership | | | |
Global Equity | | | 3 | | | | | | 49.16 | %* | | |
International Equity | | | 2 | | | | | | 38.50 | %* | | |
International Small Companies | | | 3 | | | | | | 68.69 | %* | | |
Institutional Emerging Markets | | | 2 | | | | | | 62.32 | %* | | |
Emerging Markets | | | 3 | | | | | | 75.54 | %* | | |
Frontier Emerging Markets | | | 3 | | | | | | 53.34 | %* | | |
* Includes omnibus positions of broker-dealers representing numerous shareholder accounts.
Investment activities of these shareholders may have a material effect on the Portfolios.
45
Harding, Loevner Funds, Inc.
Notes to Financial Statements (continued)
April 30, 2014 (unaudited)
10. Concentration of Risk
Investing in securities of foreign issuers and currency transactions may involve certain considerations and risks not typically associated with investments in U.S. issuers. These risks include revaluation of currencies, adverse fluctuations in foreign currency values and possible adverse political, social and economic developments, including those particular to a specific industry, country or region, which could cause the securities and their markets to be less liquid and prices more volatile than those of comparable U.S. companies and U.S. government securities. These risks are greater with respect to securities of issuers located in emerging market countries in which the Portfolios are authorized to invest.
Frontier Emerging Markets is permitted to invest up to 35% of its total assets in companies in the same industry, if, at the time of investment, that industry represents 20% or more of the Portfolio’s benchmark index. During periods when the Portfolio has invested more than 25% of its total assets in companies in the same industry, it will operate as a concentrated portfolio and be subject to additional risks and greater volatility. At April 30, 2014, the Portfolio’s investment in the Banking industry amounted to 28.2% of its total assets.
11. Line of Credit
The Fund has a $100 million line of credit agreement with Northern Trust. Borrowings would be made solely to facilitate the handling of redemptions or unusual or unanticipated short-term cash requirements. Because several Portfolios participate, and collateral requirements apply, there is no assurance that an individual Portfolio will have access to the entire $100 million at any particular time. Interest is charged to each Portfolio based on its borrowings at an amount above the Federal Funds rate, subject to a minimum rate. In addition, a facility fee is computed at an annual rate of 0.10% on the line of credit and is allocated among the Portfolios. For the period ended April 30, 2014, none of the portfolios had an outstanding balance.
12. Subsequent Events
Subsequent events occurring after the date of this report have been evaluated for potential impact, for purposes of recognition or disclosure in the financial statements, through the date the report was issued.
46
Harding, Loevner Funds, Inc.
Privacy Notice
(unaudited)
HARDING, LOEVNER FUNDS, INC.
PRIVACY NOTICE
The Fund collects nonpublic personal information about you from the following sources:
| | • | | Information, such as your name, address, social security number, assets and income, submitted by you on applications, forms, or in other written or verbal customer communications. This information may also be provided by a consultant or intermediary acting on your behalf. |
| | • | | Information that results from any transaction performed by us for you. |
The Fund will not disclose any nonpublic personal information about you or its former customers to anyone except as permitted or required by law.
If you decide to close your account(s) or become an inactive customer, the Fund will adhere to the privacy policies and practices as described in this notice.
The Fund restricts access to your personal and account information to only those employees who need to know that information to provide products or services to you. The Fund maintains physical, administrative and technical safeguards to protect your nonpublic personal information.
47
Harding, Loevner Funds, Inc.
Supplemental Information
(unaudited)
Quarterly Form N-Q Portfolio Schedule
Each Portfolio will file its complete portfolio of investments with the SEC on Form N-Q at the end of the first and third fiscal quarters within 60 days of the end of the quarter to which it relates. The Portfolios’ Form N-Q will be available on the SEC’s website at www.sec.gov and may also be reviewed and copied at the SEC’s Public Reference Room whose telephone number is (800) SEC-0330. Additionally, they are available upon request by calling (877) 435-8105.
Proxy Voting Record
The Fund’s proxy voting record relating to the Portfolios’ securities during the most recent 12-month period ended June 30 is available on the Fund’s website at www.hardingloevnerfunds.com and on the SEC’s website at www.sec.gov, on Form N-PX.
Proxy Voting Policies and Procedures
A description of the Fund proxy voting policies and procedures are located in the Statement of Additional Information and is available without charge, upon request, by calling (877) 435-8105 or on the SEC’s website at www.sec.gov.
Additional Information
The Adviser updates Fact Sheets for the Portfolios each calendar quarter, which are posted to the Fund’s website – www.hardingloevnerfunds.com. This information, along with the Adviser’s commentaries on its various strategies, is available without charge, upon request, by calling (877) 435-8105.
48
Harding, Loevner Funds, Inc.
Directors and Officers
(unaudited)
DIRECTORS AND OFFICERS OF THE FUNDS
David R. Loevner
Director and Chairman of the Board of Directors
Jane A. Freeman
Director
Jennifer M. Borggaard
Director
William E. Chapman II
Director
R. Kelly Doherty
Director
Charles Freeman
Director
Samuel R. Karetsky
Director
Eric Rakowski
Director
Richard Reiter
President
Charles S. Todd
Chief Financial Officer and Treasurer
Susan Mosher
Chief Compliance Officer
Owen T. Meacham
Secretary
Patrick Keniston
Anti-Money Laundering Compliance Officer
Aaron Bellish
Assistant Treasurer
Thomas A. Dula
Assistant Treasurer
Lori M. Renzulli
Assistant Secretary
Marcia Y. Lucas
Assistant Secretary
49


Item 2. Code of Ethics.
Not applicable to this filing.
Item 3. Audit Committee Financial Expert.
Not applicable to this filing.
Item 4. Principal Accountant Fees and Services.
Not applicable to this filing.
Item 5. Audit Committee of Listed Registrants.
Not applicable to this filing.
Item 6. Investments.
| (a) | Investments in securities of unaffiliated issuers as of the close of the reporting period as set forth in § 210.1212 of Regulation S-X [17 CFR 210.12-12], are included as part of the report to stockholders filed under Item 1 of this Form. |
Item 7. Disclosure of Proxy Voting Policies and Procedures for Closed-End Management Investment Companies.
Not applicable to this registrant.
Item 8. Portfolio Managers of Closed-End Management Investment Companies.
Not applicable to this registrant.
Item 9. Purchases of Equity Securities by Closed-End Management Investment Company and Affiliated Purchasers.
Not applicable to this registrant.
Item 10. Submission of Matters to a Vote of Security Holders.
Not applicable.
Item 11. Controls and Procedures.
| (a) | The Registrant’s Principal Executive Officer and Principal Financial Officer have concluded that the Registrant’s disclosure controls and procedures (as defined in Rule 30a-3(c) under the Investment Company Act of 1940, as amended (the “1940 Act”)) are effective, based on the evaluation of these controls and procedures required by Rule 30a-3(b) under the 1940 Act and Rules 13a-15(b) or 15d – 15(b) under the Securities and Exchange Act of 1934 as of the date within 90 days of the filing date of this report. |
| (b) | There were no changes in the Registrant’s internal control over financial reporting (as defined in Rule 30a-3(d) under the 1940 Act) that occurred during the second fiscal quarter of the period covered by this report that have materially affected, or are reasonably likely to materially affect, the Registrant’s internal control over financial reporting. |
Item 12. Exhibits.
(a)(1) Not applicable to this filing.
(a)(2) Exhibit 99.CERT: Section 302 Certifications.
(b) Exhibit 99.906 CERT: Section 906 Certifications.
SIGNATURES
Pursuant to the requirements of the Securities Exchange Act of 1934 and the Investment Company Act of 1940, the registrant has duly caused this report to be signed on its behalf by the undersigned, thereunto duly authorized.
| | | | |
| Harding, Loevner Funds, Inc. | | |
| | |
| By | | /s/ Richard T. Reiter | | |
| | Richard T. Reiter | | |
| | (Principal Executive Officer) | | |
| |
| Date: July 3, 2014 | | |
Pursuant to the requirements of the Securities Exchange Act of 1934 and the Investment Company Act of 1940, this report has been signed below by the following persons on behalf of the registrant and in the capacities and on the dates indicated.
| | | | |
| | |
| By | | /s/ Richard T. Reiter | | |
| | Richard T. Reiter | | |
| | (Principal Executive Officer) | | |
| |
| Date: July 3, 2014 | | |
| | |
| By | | /s/ Charles S. Todd | | |
| | Charles S. Todd | | |
| | (Principal Financial Officer) | | |
| |
| Date: July 3, 2014 | | |