UNITED STATES
SECURITIES AND EXCHANGE COMMISSION
Washington, D.C. 20549
FORM N-CSR
CERTIFIED SHAREHOLDER REPORT OF REGISTERED
MANAGEMENT INVESTMENT COMPANIES
Investment Company Act file number 811-07739
Harding, Loevner Funds, Inc.
(Exact name of registrant as specified in charter)
400 Crossing Boulevard
Fourth Floor
Bridgewater, NJ 08807
(Address of principal executive offices) (Zip code)
Owen T. Meacham
The Northern Trust Company
50 South LaSalle Street
Chicago, IL 60603
With a copy to:
Stephen H. Bier, Esq.
Dechert LLP
1095 Avenue of the Americas
New York, NY 10036
(Name and address of agent for service)
Registrant’s telephone number, including area code: (877) 435-8105
Date of fiscal year end: 10/31
Date of reporting period: 04/30/2015
Item 1. Reports to Stockholders.
About the Adviser
Harding Loevner Funds
Global equity investing for institutions is Harding Loevner’s exclusive focus. Through Harding Loevner Funds it offers five distinct global strategies based on its quality-and-growth investment philosophy. It seeks to purchase shares of growing, financially strong, well-managed companies at favorable prices. Harding Loevner manages each of the Funds’ Portfolios according to a disciplined, research-based investment process. It identifies companies with sustainable competitive advantages and assesses the durability of their earnings growth by conducting in-depth fundamental research into global industries. In constructing portfolios, Harding Loevner diversifies carefully to limit risk.
Receive Investor Materials Electronically
Shareholders may sign up for electronic delivery of investor materials. By doing so, you will receive the information faster and help us reduce the impact on the environment of providing these materials. To enroll in electronic delivery,
| | 1. | Go to http://www.icsdelivery.com |
| | 2. | Select the first letter of your brokerage firm’s name. |
| | 3. | From the list that follows, select your brokerage firm. If your brokerage firm is not listed, electronic delivery may not be available. Please contact your brokerage firm. |
| | 4. | Complete the information requested, including the e-mail address where you would like to receive notifications for electronic documents. |
Your information will be kept confidential and will not be used for any purpose other than electronic delivery. If you change your mind, you can cancel electronic delivery at any time and revert to physical delivery of your materials. Just go to
http://www.icsdelivery.com, perform the first three steps above, and follow the instructions for cancelling electronic delivery. If you have any questions, please contact your brokerage firm.
Table of Contents
|
| Harding, Loevner Funds, Inc. |
| c/o Northern Trust |
| Attn: Funds Center C5S |
| 801 South Canal Street |
| Chicago, IL 60607 |
| | |
| Phone: (877) 435-8105 | | Must be preceded or accompanied by a current Prospectus. Quasar Distributors, LLC, Distributor |
| Fax: (312) 267-3657 | |
| www.hardingloevnerfunds.com | |
Global Equity Portfolio
Portfolio Managers

| | |
Peter Baughan, CFA Co-Lead Portfolio Manager Ferrill Roll, CFA Co-Lead Portfolio Manager Christopher Mack, CFA Portfolio Manager | | Richard Schmidt, CFA Portfolio Manager Alexander Walsh, CFA Portfolio Manager |
Performance Summary
The Global Equity Portfolio – Institutional Class rose 3.96% and the Advisor Class gained 3.83% (net of fees and expenses) in the six-month period ended April 30, 2015. The Portfolio’s benchmark, the MSCI All Country World Index, rose 4.97% (net of source taxes).
Market Review
Equity markets made gains in the six months ended April 30, 2015, spurred by the prospect of monetary stimulus in Europe and continued government prodding in Japan to foster a better equity culture. The US market lagged other developed markets in the period, as earnings estimates were revised lower to account for the translation effects of weaker currencies on earnings abroad. Employment gains continued, with hiring intentions by US companies remaining firm, and notable wage rises at the low-skilled end of the labor market—including for Wal-Mart and McDonalds employees—injected a measure of debate about labor cost effects on the record US corporate profit margins. Meanwhile, market pundits watched every twitch of Federal Reserve Chair Janet Yellen’s public appearances for hints of how soon (or how tardily) the Fed would increase its benchmark interest rate, fomenting debate on how much any rate rise would impact stock market valuations.
Emerging Markets (EMs) provided lackluster returns overall, but masking, as is often true, widely divergent (and volatile) returns between individual markets. In India, the realities of regulatory reform and economic momentum haven’t narrowed the gap with the audacious hopes for Narendra Modi’s government. Brazilian stocks continued to flounder and the currency further weakened; President Dilma Rousseff’s administration was caught up still more deeply in scandal, while the export economy remains in the doldrums. Political factors also re-surfaced in Turkey with Erdo-gan’s government exerting undesirable influence on central bank policy. China, on the other hand, saw its stocks soar in response to some policy stimulus announcements—including several aimed at shoring up the banking system and local government borrowers —along with the opening of trading links between the Hong Kong and Shanghai stock markets.
That once-and-future king of hard currencies, the Swiss franc, was the source of some market fireworks in the period, when the Swiss National Bank (SNB), in a surprise announcement on January 15, abandoned its commitment to peg the franc to the euro at
the fixed exchange rate of 1.20. This caused the franc to soar as speculators had to unwind “carry” trades wherein they had borrowed low-interest Swiss francs in order to invest in the bonds of higher-yielding currencies. The resulting scramble sent the franc as much as 40% higher on “stop-loss” buying, before settling the day 21% higher against the euro, but not before bankrupting at least one hedge fund and seriously wounding many other levered speculators, not to mention rendering a number of Swiss exporters significantly less competitive against foreign rivals. That left the franc one of the few currencies to strengthen—about 3%—against the US dollar in the period.
Currencies played a key role in returns in
the period, especially in Europe and some
of the Emerging Markets.
Although eurozone shares rose 20% in euro terms, Japan led developed markets in US dollar terms, as the euro lost 11% against the dollar. Japanese stocks were sought by foreign investors, but also by the Government Pension Investment Fund (GPIF), which the Abe administration has prodded to move not only more into equities, but particularly into those of companies that have delivered higher-than-average returns on equity—whether Japanese or foreign. To do so, GPIF has mandated some of its asset managers to benchmark themselves against the new JPX-Nikkei 400 Index comprising high ROE companies with strong corporate governance records.
The best performing sectors were Consumer Discretionary and Information Technology, followed by Health Care, which was driven by a resurgence of biotech companies and further mergers & acquisitions (M&A) activity. Energy and Utilities performed the worst, with both sectors declining in the period.
Currencies, as mentioned, played a key role in returns in the period, especially in Europe and some of the Emerging Markets. Besides the euro’s 11% decline against the US dollar, the Swedish krona also fell 11%, and the British pound fell 4%. In EMs, the Brazilian real lost 18% and the Turkish lira lost 13%. Quality and growth style effects were modestly present, with stocks of higher quality or faster growing companies performing slightly better than the market.
Performance Attribution
The Portfolio trailed the Index in the period with negative stock selection partially mitigated by good sector selection. Consumer holdings, both in Discretionary and Staples, hurt performance most. Currency played a role, as a rising Swiss franc hurt the exporting watch maker Swatch Group and the depreciating Russian ruble hurt domestic grocery chain Magnit. We were in the right mind with our overweight to the Information Technology and Health Care sectors, but our stocks’ lagging performance more than offset the benefit of the sector’s strong returns: radiotherapy specialist Elekta and hearing aid maker Sonova Holding dragged down returns in Health Care, while IT returns suffered from the sluggish performance of internet search giants Google, Yandex, and Baidu. Stocks within Industrials—in particular, capital goods stocks MonotaRO and Fanuc—helped performance.
1
Institutional Class HLMVX
Advisor Class HLMGX
| | | | | | | | | | | | | | | | | | | | | | | | | | | | | | | | | | | | | | | | | | | | | | | | |
| Performance | |
| Total Returns (%) | | | | |
| at March 31, 2015 | | | | | | | | | | | | | | | | | | | | at April 30, 2015 | |
| | | | | | | | | | | |
| | | 1 year | | | 3 years | | | 5 years | | | 10 years | | | Since Inception* | | | 1 year | | | 3 years | | | 5 years | | | 10 years | | | Since Inception* | |
Global Equity Portfolio – Institutional Class | | | 8.73 | | | | 9.92 | | | | 9.37 | | | | – | | | | 10.45 | | | | – | | | | 10.78 | | | | 10.93 | | | | 9.81 | | | | – | | | | 10.69 | | | | – | |
| | | | | | | | | | | | | |
MSCI All Country World Index | | | 5.42 | | | | 10.76 | | | | 9.00 | | | | 6.44 | | | | 10.11 | | | | – | | | | 7.46 | | | | 12.25 | | | | 9.59 | | | | 6.98 | | | | 10.52 | | | | – | |
| | | | | | | | | | | | | |
Global Equity Portfolio – Advisor Class | | | 8.46 | | | | 9.64 | | | | 9.11 | | | | 8.32 | | | | – | | | | 6.76 | | | | 10.47 | | | | 10.62 | | | | 9.55 | | | | 8.85 | | | | – | | | | 6.85 | |
Returns are annualized for periods greater than 1 year. *Inception of the Institutional Class, 11/3/09. Inception of the Advisor Class, 12/1/96. Index performance prior to 1/1/01 cannot be shown since it relies on back-filled data.
Performance data quoted represent past performance; past performance does not guarantee future results. The investment return and principal value of an investment will fluctuate so that an investor’s shares, when redeemed, may be worth more or less than their original cost. Current performance of the Portfolio may be lower or higher than the performance quoted. Performance data current to the most recent month end may be obtained by calling (877) 435-8105 or visiting www.hardingloevnerfunds.com. The Portfolio imposes a 2% redemption fee on shares held 90 days or less. Performance data does not reflect the redemption fee. If reflected, total returns would be reduced.
Viewed by geography, EM holdings hurt performance most, especially internet search providers in Russia (Yandex) and China (Baidu). Russian grocery chain Magnit and South African energy producer Sasol also detracted from performance, the latter hurt by declining oil prices. Performance fared better in the US, buoyed by strong performance in online retailer Amazon.com, and across Financials (SVB Financial and First Republic Bank) and Information Technology (eBay, IPG Photonics, and Informatica). The Portfolio also had good stocks in the Eurozone, helped by Spanish fast fashion retailer Inditex, along with French cosmetics maker L’Oréal.
Perspectives
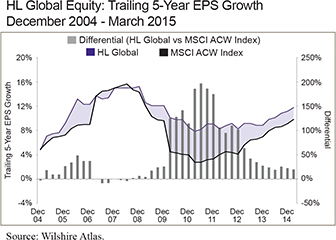
Having often talked about various aspects of company quality, we currently find our thoughts turning to the subject of growth, and in this letter will wrestle in public with the problem of assessing how much it is worth. First, a reminder that our portfolios have consistently been invested in companies that grow significantly faster than the market, as illustrated in the first chart at right. [Note we use trailing earnings results throughout, in order to keep our own and others’ biases about the future separated from the discussion.] The growth rate of our Portfolio companies has risen since the recession, and is higher than that of the Index. At economic cycle peaks, when growth opportunities are plentiful, the Index earnings growth has often rivaled that of our Portfolio, just as earnings
| | | | |
| Fund Facts at April 30, 2015 |
Total Net Assets | | | | $881.5 M |
Sales Charge | | | | None |
Number of Holdings | | | | 74 |
Turnover (5 Yr. Average) | | | | 29% |
Redemption Fee | | | | 2% first 90 days |
Dividend Policy | | | | Annual |
| | | Institutional Class | | Advisor Class |
Ticker | | HLMVX | | HLMGX |
CUSIP | | 412295602 | | 412295206 |
Inception Date | | 11/3/2009 | | 12/1/1996 |
Minimum Investment* | | $100,000 | | $5,000 |
Expense Ratio | | 0.92% | | 1.15% |
*Lower minimums available through certain brokerage firms.
growth begins to peak. For now, the Portfolio companies’ growth rates have remained healthily above that of the market, and for both Portfolio and Index, the trailing earnings growth rate is well below the heady levels of 2006-07.
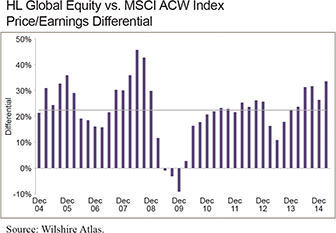
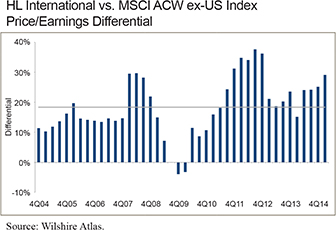
The next chart shows the premium to the Index average P/E ratio that the market has been willing to pay for our companies over time, in percentage terms. As you can see, the P/E premium for our companies versus the Index P/E has averaged about 20% over the past decade, and is above that level now.
2
Global Equity Portfolio continued
The upshot is that although our portfolio currently is more expensive than the average, it is not quite as relatively expensive as it has been at its peaks in the last decade. Thus, we don’t yet see wholesale warning signs for us embedded in the price levels of our stocks.
If there is no clear guide from overall valuations, the question comes back around to just how scarce is growth, and how defensible is the current level of profitability that companies are achieving? The issue is getting more of our attention, because companies, especially the best-quality businesses, and the fastest-growing ones, have seen their stocks rise faster (in local currency, at least) than their earnings, starting with the US, then in Japan, and now in Europe. The better stock price performance of the high-quality growth companies is thanks in part to their rarity in a generally poor economic environment and in part to the decline in bond yields, which inform the discount rate used by some investors to value their streams of earnings and dividends.
We’ve always been willing to pay higher-than-average multiples of sales, earnings, or cash flow for stocks of better-than-average companies that we believe can grow faster than average. But the seeming perpetuation of unconventional monetary stimulus leads us to question that willingness: just how much more are we willing to pay? More of our analysts are sensing the prices of their stocks to be “high” relative to their rather stable estimates of fair value, with some concluding that prices are too high. Portfolio managers so far, for the most part, have been reluctant to act on these worries by reducing allocations to pricey stocks in general, implicitly adopting a stance of tolerance towards rich valuations.
Nowhere, of course, has this problem of valuing the rare growth stock in a sluggish growth environment facing aggressive central bank stimulus been more pronounced than in Japan, where those conditions have lasted for two years, so far. Yoko Sakai, our analyst for Japanese companies, found that our valuation model, using a semi-fixed discount rate to value expected future corporate cash flows, produced fair values for her companies that were quickly outstripped by the prices set in the soaring market gripped in the reflation fever of “Abenomics.” To remain invested in Japan, HL portfolio managers had to be tolerant of stretched valuations on our internal discounted cash flow models, recognizing two important corollary effects of the government’s policies on stocks: first, that
| | | | | | | | |
| Geographical Weightings (%) at April 30, 2015 | |
| Institutional and Advisor Classes | |
| Country/Region | | | Portfolio | | | | Benchmark | 1 |
Canada | | | 0.0 | | | | 3.4 | |
| | | |
Emerging Markets | | | 11.8 | | | | 10.9 | |
| | | |
Europe EMU | | | 8.6 | | | | 10.7 | |
| | | |
Europe ex-EMU | | | 11.7 | | | | 12.2 | |
| | | |
Japan | | | 10.5 | | | | 7.8 | |
| | | |
Middle East | | | 0.0 | | | | 0.2 | |
| | | |
Pacific ex-Japan | | | 3.3 | | | | 4.2 | |
| | | |
United States | | | 51.9 | | | | 50.6 | |
| | | |
Frontier Markets2 | | | 0.0 | | | | – | |
| | | |
Cash | | | 2.2 | | | | – | |
1MSCI All Country World Index. 2Includes countries with less-developed markets outside the Index.
| | | | | | | | |
| Sector Weightings (%) at April 30, 2015 | |
| Institutional and Advisor Classes | |
| Sector | | | Portfolio | | | | Benchmark | 1 |
Consumer Discretionary | | | 10.3 | | | | 12.4 | |
| | | |
Consumer Staples | | | 8.5 | | | | 9.5 | |
| | | |
Energy | | | 4.7 | | | | 8.0 | |
| | | |
Financials | | | 18.6 | | | | 21.7 | |
| | | |
Health Care | | | 15.7 | | | | 11.8 | |
| | | |
Industrials | | | 9.5 | | | | 10.4 | |
| | | |
Information Technology | | | 23.8 | | | | 13.9 | |
| | | |
Materials | | | 4.9 | | | | 5.4 | |
| | | |
Telecom Services | | | 1.8 | | | | 3.7 | |
| | | |
Utilities | | | 0.0 | | | | 3.2 | |
| | | |
Cash | | | 2.2 | | | | – | |
1MSCI All Country World Index
most analysts would not be able to forecast accurately the full extent of the operating leverage the yen’s “maxi” devaluation would have on reported earnings, especially of exporters; and second, that alternative investments other than equities for domestic Japanese investors were being rendered unpalatable from the standpoint of preservation of value.
The operating leverage effect became clear as company earnings results came in a year later. Japan’s Topix Index rose 54% in calendar 2013, but the earnings of its constituent companies registered a 69% rise in trailing 12-month earnings for December 2013. So the startling rise in the market was well-supported—after the fact—by an even stronger rise in reported earnings: the higher price-to-earnings ratio, mirrored in the valuation models of most analysts, were evidence of justified investor confidence outstripping the ability of analysts to correctly forecast the earnings power of Japanese companies turbo-charged by devaluation and monetary stimulus. Growth simply turned out to be higher than forecast, as Japan’s stock market contained more winners from Abenomics than losers.
Portfolio Structure
In the first quarter of 2013, just after Abe was elected, we owned five companies in Japan, and held 9% of our portfolio in that market, slightly more than the Index weight. In the two years ended April 30, 2015, the Japanese market—measured in US dollars—has almost, but not quite, kept up with the MSCI All Country World Index. Our Japanese holdings, on the other hand, have delivered more than double the return of the Index in that period, and our holdings now are larger (nearly 11%) and more numerous (nine companies) than they were then. We are normally much more likely to respond to higher prices by selling than by holding or buying more. But a new factor gives us pause: the growing call within Japan to improve corporate profitability and, more generally, to recognize the interests of shareholders as the first priority of a company, instead of just as one among many stakeholders’ competing interests. Portfolio holding Fanuc is a poster child of that shift, increasing its dividend payout ratio substantially during the period.
We did make a significant number of portfolio changes outside Japan in the period, shifting the emphasis of the portfolio even more towards growth. Within Consumer Discretionary, we sold two
3
Institutional Class HLMVX
Advisor Class HLMGX
apparel makers with retailing operations, Ralph Lauren and Inditex. We have grown concerned that these and similar consumer businesses are confronting competitive pressures from e-commerce, and are responding by making heavy investments in that channel in order to achieve “omni-channel” distribution. We view these defensive expenditures as the price to remain in the game; we fear returns are deteriorating for the industry.
We’d much rather own companies that are investing for growth rather than for defense, and added several new ones this period. We have again bought Amazon.com, the internet retailer we sold just over a year ago on fears that raising prices to “Prime” customers was a break in the unspoken compact with loyal customers, and possibly a sign of troubled cash flow generation relative to ambitious capital investment plans. Those fears have so far proven unfounded, and we have come to regard the company’s determined investment outside the US as playing sound offense, in contrast to the defensive investments of traditional retailers, trying to stay relevant to their existing customers. Outside the Consumer Discretionary sector but clearly consumer facing, we bought new holdings in China’s dominant search engine provider Baidu, and in Facebook, the global social media giant with 1.4 billion active users. Both companies have explicitly undertaken margin-damaging expense ramp-ups to adapt their businesses to mobile platforms and to invest in emerging growth avenues, moves that hurt their share price performance in the short run, but which should drive strong growth in the long run.
We have come to regard Amazon’s
determined investment outside the US as
playing sound offense, in contrast to the
defensive investments of traditional retailers.
We continue to be attracted to companies that either can benefit from, or enable others to potentially benefit from, the falling costs of collecting, storing, and analyzing data. During the period we purchased Verisk Analytics, the data and risk analytics service business, with origins in the insurance industry. We also bought IMS Health, whose staggering collection of medical data, including 85% of the world’s drug prescriptions along with other medical records and patient data, is increasingly valuable as the ability to analyze the data improves via “big data” technology, and opportunities to monetize the same industry-wide data proliferate in different directions. Another new holding in salesforce.com, the provider of customer relationship management (CRM) software, intrigues us with their drive to provide mobile data analytics in real time for its users of their customer information: “big data” in the palm of your hand.
These purchases were, in part, funded by the sale of Informatica, whose price rebounded with the arrival in its shareholder register of an activist investor that has precipitated a sale to private equity investors. We also sold our holding in Allergan, now fully acquired by Actavis, a company we do not wish to own. Additionally, we reduced our holding in Dassault Systèmes and Microsoft.
We sold our holding in Swatch Group, which has much of its cost base in Switzerland, but was already facing pricing pressure in its main product categories in markets abroad – implying a slow
| | | | | | | | | | |
| Ten Largest Holdings at April 30, 2015 | |
| Institutional and Advisor Classes | |
| Company | | | Sector | | | Country | | | % | |
Nike | | | Cons Discretionary | | | United States | | | 3.0 | |
| | | | |
Nestlé | | | Consumer Staples | | | Switzerland | | | 2.5 | |
| | | | |
Schlumberger | | | Energy | | | United States | | | 2.5 | |
| | | | |
Roper | | | Industrials | | | United States | | | 2.5 | |
| | | | |
eBay | | | Info Technology | | | United States | | | 2.5 | |
| | | | |
AIA Group | | | Financials | | | Hong Kong | | | 2.4 | |
| | | | |
MasterCard | | | Info Technology | | | United States | | | 2.3 | |
| | | | |
SVB Financial | | | Financials | | | United States | | | 2.1 | |
| | | | |
Google | | | Info Technology | | | United States | | | 2.0 | |
| | | | |
DaVita HealthCare | | | Health Care | | | United States | | | 2.0 | |
recovery of profit margins from the hit they will have taken in the Swiss Franc revaluation. With the proceeds, we bought a new holding in Makita, the Japanese producer of electric power tools. Makita earns more than 80% of its revenues outside of Japan, and should benefit as housing remodeling and construction recovers from the doldrums everywhere, in Europe and especially in Emerging Markets, where it has assiduously invested over decades.
We sold our holding in Standard Chartered, throwing in the towel after more than a dozen years as a shareholder, dismayed that our milepost of revenue growth exceeding expense growth has been missed, and worried that credit risks are rising due to so much of the growth it has achieved coming from Chinese borrowers through various channels. Even the announcement of new management, made after our sale, will be hard pressed to right the ship quickly if our worries about credit costs are substantiated. We invested the proceeds in BBVA, the Spanish bank with large EM operations, including the largest and most profitable bank in Mexico, and now a controlling minority stake in Turkey’s Garanti Bank. BBVA’s shares had retreated on euro weakness and Greece contagion fears, to trade below stated book value, which afforded us a chance to buy a high quality franchise at an attractive price, just as the bank’s Spanish operations are poised to exit the seven year slog of loan write-offs and restructuring since the Spanish housing market collapsed in the financial crisis, revealing substantial earnings power.
Please read the separate disclosure page for important information, including the risks of investing in the Portfolio.
4
International Equity Portfolio
Portfolio Managers

| | |
Ferrill Roll, CFA Co-Lead Portfolio Manager Alexander Walsh, CFA Co-Lead Portfolio Manager Peter Baughan, CFA Portfolio Manager | | Bryan Lloyd, CFA Portfolio Manager Andrew West, CFA Portfolio Manager |
Performance Summary
The International Equity Portfolio – Institutional Class rose 6.15% and the Investor Class gained 5.96% (net of fees and expenses) in the six-month period ended April 30, 2015. The Portfolio’s benchmark, the MSCI All Country World ex-US Index, rose 5.54% (net of source taxes).
Market Review
Equity markets made gains in the six months ended April 30, 2015, spurred by the prospect of monetary stimulus in Europe and continued government prodding in Japan to foster a better equity culture.
The US market lagged other developed markets in the period, as earnings estimates were revised lower to account for the translation effects of weaker currencies on earnings abroad. Employment gains continued, with hiring intentions by US companies remaining firm, and notable wage rises at the low-skilled end of the labor market—including for Wal-Mart and McDonalds employees—injected a measure of debate about labor cost effects on the record US corporate profit margins. Meanwhile, market pundits watched every twitch of Federal Reserve Chair Janet Yellen’s public appearances for hints of how soon (or how tardily) the Fed would increase its benchmark interest rate, fomenting debate on how much any rate rise would impact stock market valuations.
Emerging Markets (EMs) provided lackluster returns overall, but masking, as is often true, widely divergent (and volatile) returns between individual markets. In India, the realities of regulatory reform and economic momentum haven’t narrowed the gap with the audacious hopes for Narendra Modi’s government. Brazilian stocks continued to flounder and the currency further weakened; President Dilma Rousseff’s administration was caught up still more deeply in scandal, while the export economy remains in the doldrums. Political factors also resurfaced in Turkey with Erdo-gan’s government exerting undesirable influence on central bank policy. China, on the other hand, saw its stocks soar in response to some policy stimulus announcements—including several aimed at shoring up the banking system and local government borrowers —along with the opening of trading links between the Hong Kong and Shanghai stock markets.
That once-and-future king of hard currencies, the Swiss franc, was the source of some market fireworks in the period, when the Swiss
National Bank (SNB), in a surprise announcement on January 15, abandoned its commitment to peg the franc to the euro at the fixed exchange rate of 1.20. This caused the franc to soar as speculators had to unwind “carry” trades wherein they had borrowed low-interest Swiss francs in order to invest in the bonds of higher-yielding currencies. The resulting scramble sent the franc as much as 40% higher on “stop-loss” buying, before settling the day 21% higher against the euro, but not before bankrupting at least one hedge fund and seriously wounding many other levered speculators, not to mention rendering a number of Swiss exporters significantly less competitive against foreign rivals. That left the franc one of the few currencies to strengthen—about 3%—against the US dollar in the period.
Although eurozone shares rose 20% in euro terms, Japan led developed markets in US dollar terms, as the euro lost 11% against the dollar. Japanese stocks were sought by foreign investors, but also by the Government Pension Investment Fund (GPIF), which the Abe administration has prodded to move not only more into equities, but particularly into those of companies that have delivered higher-than-average returns on equity—whether Japanese or foreign. To do so, GPIF has mandated some of its asset managers to benchmark themselves against the new JPX-Nikkei 400 Index comprising high return-on-equity companies with strong corporate governance records.
Japan led developed markets in US dollar terms, with Japanese stocks sought by both the Government Pension Investment Fund (GPIF) and foreign investors.
The best performing sectors were Consumer Discretionary, Information Technology, and Health Care, which was driven by a resurgence of biotech companies and further M&A activity. Energy and Utilities performed the worst, with both sectors declining in the period.
Currencies, as mentioned, played a key role in returns in the period, especially in Europe and some of the EMs. Besides the euro’s 11% decline against the US dollar, the Swedish krona also fell 11%, and the British pound fell 4%. In EMs, the Brazilian real lost 18% and the Turkish lira lost 13%. Quality and growth style effects were modestly present, with stocks of higher quality or faster growing companies performing slightly better than the market.
Performance Attribution
The Portfolio outperformed the Index in the half year mostly due to its hefty investments in the better-performing sectors—especially Information Technology and Health Care—and zero exposure in Utilities, one of the worst performing. Additionally, we enjoyed good stocks within capital goods (especially Japan’s Fanuc, Misumi Group, and MonotaRO), health care equipment & services (especially Japan’s Sysmex), and diversified financials (Hong Kong Exchanges), although poor stocks within consumer services (casino operator Sands China) and banks (Garanti Bank and Itau Unibanco) took away much of the benefits.
5
Institutional Class HLMIX
Investor Class HLMNX
| | | | | | | | | | | | | | | | | | | | | | | | | | | | | | | | | | | | | | | | | | | | | | | | |
| Performance | |
| Total Returns (%) | | | | | | | | | | | | | | | | | | | | | |
| at March 31, 2015 | | | | | | | | | | | | | | | | | | | | at April 30, 2015 | |
| | | | | | | | | | | |
| | | 1 year | | | 3 years | | | 5 years | | | 10 years | | | Since Inception* | | | 1 year | | | 3 years | | | 5 years | | | 10 years | | | Since Inception* | |
Intl Equity Portfolio – Institutional Class | | | 4.35 | | | | 8.29 | | | | 7.73 | | | | 7.75 | | | | – | | | | 6.25 | | | | 7.27 | | | | 10.22 | | | | 8.66 | | | | 8.36 | | | | – | | | | 6.43 | |
| | | | | | | | | | | | | |
MSCI ACW ex-US Index | | | -1.03 | | | | 6.40 | | | | 4.82 | | | | 5.47 | | | | 4.59 | | | | – | | | | 2.61 | | | | 8.74 | | | | 6.05 | | | | 6.26 | | | | 5.09 | | | | – | |
| | | | | | | | | | | | | |
Intl Equity Portfolio – Investor Class | | | 4.11 | | | | 7.97 | | | | 7.39 | | | | – | | | | 6.46 | | | | – | | | | 6.90 | | | | 9.86 | | | | 8.32 | | | | – | | | | 6.84 | | | | – | |
Returns are annualized for periods greater than 1 year. *Inception of the Institutional Class, 5/11/94. Index performance prior to 1/1/01 cannot be shown since it relies on back-filled data. Inception of the Investor Class, 9/30/05.
Performance data quoted represent past performance; past performance does not guarantee future results. The investment return and principal value of an investment will fluctuate so that an investor’s shares, when redeemed, may be worth more or less than their original cost. Current performance of the Portfolio may be lower or higher than the performance quoted. Performance data current to the most recent month end may be obtained by calling (877) 435-8105 or visiting www.hardingloevnerfunds.com. The Portfolio imposes a 2% redemption fee on shares held 90 days or less. Performance data does not reflect the redemption fee. If reflected, total returns would be reduced.
Viewed geographically, it was good stock selection that drove relative performance, rather than regional weightings. Our holdings within Japan performed especially well in the period, led by Sysmex and Fanuc, although held back by engineering firm JGC Corp, whose shares declined again, echoing the weakness in the Energy sector, wherein its largest customers (LNG plants) reside. Within the eurozone, strong stock performance from multinationals including Dassault Systèmes, L’Oreal, and LVMH Moët Hennessy enhanced results. Within Europe but outside the eu-rozone, Novo Nordisk, Shire, and WPP overshadowed laggard performance from Swiss holdings Sonova Holding and Swatch Group (since sold). Disparate factors hurt the performance within EMs, including the declining oil price on Sasol, weak Nigerian demand for telecommunications provider MTN Group, and declining profit margins for Chinese search engine Baidu.
Perspectives
Having often talked about various aspects of company quality, we currently find our thoughts turning to the subject of growth, and in this letter will wrestle in public with the problem of assessing how much it is worth. First, a reminder that our Portfolio has consistently been invested in companies that grow significantly faster than the market, as illustrated in the first chart. [Note we use trailing earnings results throughout, in order to keep our own and others’ biases about the future separated from the discussion.] The growth rate of our Portfolio companies has risen since the recession, and is higher than that of the Index. At economic cycle peaks, when growth
| | | | |
| Fund Facts at April 30, 2015 |
Total Net Assets | | | | $5,015.4 M |
Sales Charge | | | | None |
Number of Holdings | | | | 51 |
Turnover (5 Yr. Average) | | | | 16% |
Redemption Fee | | | | 2% first 90 days |
Dividend Policy | | | | Annual |
| | | Institutional Class | | Investor Class |
Ticker | | HLMIX | | HLMNX |
CUSIP | | 412295107 | | 412295503 |
Inception Date | | 5/11/1994 | | 9/30/2005 |
Minimum Investment* | | $100,000 | | $5,000 |
Expense Ratio | | 0.86% | | 1.16% |
*Lower minimums available through certain brokerage firms.
opportunities are plentiful, the Index earnings growth has often rivaled that of our Portfolio, just as earnings growth begins to peak. For now, the Portfolio companies’ growth rates have remained healthily above that of the market, and for both Portfolio and Index, the trailing earnings growth rate is well below the heady levels of 2006-07.
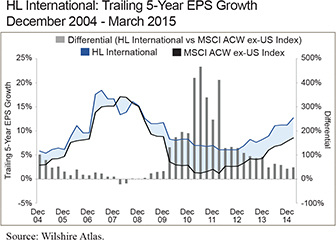
The next chart shows the premium to the Index average price-to-earnings ratio that the market has been willing to pay for our companies over time, in percentage terms. As you can see, the P/E premium for our companies versus the Index P/E has averaged about 20% over the past decade, and is above that level now.
6
International Equity Portfolio continued
The upshot is that although our Portfolio currently is more expensive than the average, it is not quite as relatively expensive as it has been at its peaks in the last decade. Thus, we don’t yet see wholesale warning signs for us embedded in the price levels of our stocks.
If there is no clear guide from overall valuations, the question comes back around to just how scarce is growth, and how defensible is the current level of profitability that companies are achieving? The issue is getting more of our attention, because companies, especially the best-quality businesses, and the fastest-growing ones, have seen their stocks rise faster (in local currency, at least) than their earnings, starting with the US, then in Japan, and now in Europe. The better stock price performance of the high-quality growth companies is thanks in part to their rarity in a generally poor economic environment and in part to the decline in bond yields, which inform the discount rate used by some investors to value their streams of earnings and dividends.
The issue of valuation is getting more of our attention because high-quality, fast-growing companies have seen their stocks rise faster
than their earnings.
We’ve always been willing to pay higher-than-average multiples of sales, earnings, or cash flow for stocks of better-than-average companies that we believe can grow faster than average. But the seeming perpetuation of unconventional monetary stimulus leads us to question that willingness: just how much more are we willing to pay? More of our analysts are sensing the prices of their stocks to be “high” relative to their rather stable estimates of fair value, with some concluding that prices are too high. Portfolio managers so far, for the most part, have been reluctant to act on these worries by reducing allocations to pricey stocks in general, implicitly adopting a stance of tolerance towards rich valuations.
Nowhere, of course, has this problem of valuing the rare growth stock in a sluggish growth environment facing aggressive
| | | | | | | | |
| Geographical Weightings (%) at April 30, 2015 | |
| Institutional and Investor Classes | |
| Country/Region | | | Portfolio | | | | Benchmark | 1 |
Canada | | | 3.9 | | | | 6.9 | |
| | | |
Emerging Markets | | | 13.6 | | | | 22.0 | |
| | | |
Europe EMU | | | 28.5 | | | | 21.6 | |
| | | |
Europe ex-EMU | | | 21.4 | | | | 24.7 | |
| | | |
Japan | | | 15.0 | | | | 15.8 | |
| | | |
Middle East | | | 0.0 | | | | 0.4 | |
| | | |
Pacific ex-Japan | | | 8.9 | | | | 8.6 | |
| | | |
Frontier Markets2 | | | 0.0 | | | | – | |
| | | |
Other3 | | | 3.9 | | | | – | |
| | | |
Cash | | | 4.8 | | | | – | |
1MSCI All Country World ex-US Index. 2Includes countries with less-developed markets outside the Index. 3Includes countries with developed markets outside the Index where some holdings are incorporated.
| | | | | | | | |
| Sector Weightings (%) at April 30, 2015 | |
| Institutional and Investor Classes | |
| Sector | | | Portfolio | | | | Benchmark | 1 |
Consumer Discretionary | | | 7.4 | | | | 11.6 | |
| | | |
Consumer Staples | | | 13.6 | | | | 9.7 | |
| | | |
Energy | | | 7.2 | | | | 7.5 | |
| | | |
Financials | | | 16.9 | | | | 27.6 | |
| | | |
Health Care | | | 13.9 | | | | 8.9 | |
| | | |
Industrials | | | 12.8 | | | | 11.0 | |
| | | |
Information Technology | | | 15.9 | | | | 7.5 | |
| | | |
Materials | | | 5.9 | | | | 7.6 | |
| | | |
Telecom Services | | | 1.6 | | | | 5.2 | |
| | | |
Utilities | | | 0.0 | | | | 3.4 | |
| | | |
Cash | | | 4.8 | | | | – | |
1MSCI All Country World ex-US Index
central bank stimulus been more pronounced than in Japan, where those conditions have lasted for two years, so far. Yoko Sakai, our analyst for Japanese companies, found that our valuation model, using a semi-fixed discount rate to value expected future corporate cash flows, produced fair values for her companies that were quickly outstripped by the prices set in the soaring market gripped in the reflation fever of “Abenomics.” To remain invested in Japan, HL portfolio managers had to be tolerant of stretched valuations on our internal discounted cash flow models, recognizing two important corollary effects of the government’s policies on stocks: first, that most analysts would not be able to forecast accurately the full extent of the operating leverage the yen’s “maxi” devaluation would have on reported earnings, especially of exporters; and second, that alternative investments other than equities for domestic Japanese investors were being rendered unpalatable from the standpoint of preservation of value.
The operating leverage effect became clear as company earnings results came in a year later. Japan’s Topix Index rose 54% in calendar 2013, but the earnings of its constituent companies registered a 69% rise in trailing 12-month earnings for December 2013. So the startling rise in the market was well-supported—after the fact—by an even stronger rise in reported earnings: the higher P/E ratio, mirrored in the valuation models of most analysts, were evidence of justified investor confidence outstripping the ability of analysts to correctly forecast the earnings power of Japanese companies turbo-charged by devaluation and monetary stimulus. Growth simply turned out to be higher than forecast, as Japan’s stock market contained more winners from Abenomics than losers.
Portfolio Structure
In the first quarter of 2013, just after Abe was elected, we owned seven companies in Japan, and held 12% of our Portfolio in that market, slightly less than the Index weight. In the two years ended April 30, 2015, the Japanese market—measured in US dollars—has kept up with the MSCI All Country World ex-US Index. Our Japanese holdings, on the other hand, have delivered more than double the return of the Index in that period, and our holdings now are larger (15%) and more numerous (nine companies) than they
7
Institutional Class HLMIX
Investor Class HLMNX
were then. We are normally much more likely to respond to higher prices by selling than by holding or buying more. But a new factor gives us pause: the growing call within Japan to improve corporate profitability and, more generally, to recognize the interests of shareholders as the first priority of a company, instead of just as one among many stakeholders’ competing interests. Portfolio holding Fanuc is a poster child of that shift, increasing its dividend payout ratio substantially during the period.
Portfolio holding Fanuc is a poster child of Japan’s recent move to prioritize corporate profitability and shareholders’ interests.
We made relatively few Portfolio changes in the six-month period. We bought a new holding in Kone, the Finnish elevator manufacturer, whose business in Europe and in China has the potential to recover from its slow growth of the past few years, and whose two key competitors, Schindler and Otis, are losing competiveness due to their manufacturing base in Switzerland and the US, whose currencies have strengthened dramatically, while Finland’s euro has weakened.
We sold our holding in Swatch Group, which has much of its cost base in Switzerland, but was already facing pricing pressure in its main product categories in markets abroad. This implies a slow recovery of profit margins to the hit they will have taken in the Swiss franc revaluation.
We added to Baidu, China’s largest search engine, on price weakness. Baidu posted results which revealed continued impressive revenue growth (48% YoY), but delivered only 16% earnings growth. The diminished profit margins reflect heavy investment in acquiring new small- and medium-sized enterprise customers through its online-to-offline (“O2O”) offering. Baidu has sacrificed short-term results in the past, such as during the company’s shift from desktop to mobile search, and we believe the downward adjustment to margins from the shift to mobile has run its course. We expect revenue growth to remain robust, as Baidu stays focused on product innovation and continues to gain market share.
We sold our holding in Chinese auto glass maker Xinyi Glass. Xinyi has a well-run business, the dominant replacement auto glass manufacturer in China, still run by its entrepreneurial founder. Management has done a good job boosting margins in the auto glass segment. But the evidence has mounted that management is more committed to empire building via capital intensive investments than it is in shareholder returns, including the latest adventure into windmill farms, which we can neither understand nor overlook. Corporate governance is not improving everywhere, it seems. Finally, we sold our holding in Bank Pekao out of our concerns over rising competitive pressures in Polish banking, and the associated risks to future profit growth.
| | | | | | | | |
| Ten Largest Holdings at April 30, 2015 | |
| Institutional and Investor Classes | |
| Company | | Sector | | Country | | | % | |
Dassault Systèmes | | Info Technology | | France | | | 4.5 | |
| | | | |
AIA Group | | Financials | | Hong Kong | | | 3.9 | |
| | | | |
Nestlé | | Cons Staples | | Switzerland | | | 3.8 | |
| | | | |
WPP | | Cons Discretionary | | United Kingdom | | | 3.2 | |
| | | | |
Fanuc | | Industrials | | Japan | | | 2.9 | |
| | | | |
Air Liquide | | Materials | | France | | | 2.9 | |
| | | | |
Roche Holding | | Health Care | | Switzerland | | | 2.8 | |
| | | | |
ICICI Bank | | Financials | | India | | | 2.8 | |
| | | | |
Allianz | | Financials | | Germany | | | 2.8 | |
| | | | |
Unicharm | | Cons Staples | | Japan | | | 2.6 | |
Please read the separate disclosure page for important information, including the risks of investing in the Portfolio.
8
International Small Companies Portfolio
Portfolio Managers
| | |
| | | |

| | Josephine Lewis Co-Portfolio Manager Jafar Rizvi, CFA Co-Portfolio Manager |
| | | |
Performance Summary
The International Small Companies Portfolio – Institutional Class gained 4.63% and the Investor Class gained 4.56% (both net of fees and expenses) in the six months ended April 30, 2015. The Portfolio’s benchmark, the MSCI All Country World ex-US Small Cap Index, rose 8.33% (net of source taxes) in this period.
Market Review
For dollar-based investors, returns for non-US small company stocks in the past six months were hurt by the strengthening of the dollar relative to nearly every currency in the Index. Eight major Index currencies have fallen 10% or more versus the dollar in this period, including the real, the euro, and the Australian dollar. In terms of local currencies, the Index is up over 15% over the past six months versus the 8% return in US dollar terms.
Despite the broad currency weakness, all seven regions in the Index had positive returns in US dollar terms with the exception of Canada, down 4% (hurt by the oil price decline). The European Monetary Union (EMU) was the best-performing region in the last 6 months, up 14% in US dollar terms and an astounding 27% in local currency. Markets surged in response to the announcement by the European Central Bank (ECB) that it was implementing a €1.1 trillion (US$1 trillion) quantitative-easing program to help combat deflation and lackluster growth. Japan, the second-best performing region returned 11% (again in dollars) amidst what appears to be a directed effort to increase returns for stockholders. Prime Minister Shinzo Abe encouraged the US$1.2 trillion Government Pension Investment Fund to reduce its allocation to Japanese government bonds in favor of foreign and domestic equities in an effort to enhance the returns of the fund.
Emerging Markets (EMs) rose 8% despite the 28% decline of Brazil. Investors have a number of reasons to be concerned about Brazil’s prospects. The extensive corruption scandal surrounding the state-owned oil company Petrobras has damaged both the reputation of President Dilma Rousseff and put into question Petro-bras-related projects, which account for 10% of investments in the country.1 Also the strengthening of the real, weakened global demand for the commodities Brazil produces, and years of excessive government spending have contributed to creating a budget deficit of 0.6% of GDP (down from a 2% surplus in 2012).2 Furthermore,
1Pearson, Samantha, “Brazil’s Economy Ekes out 0.3% Growth,” Financial Times (March 27, 2015).
2Pearson, Samantha, “Brazil Deficit Adds to Rousseff’s Woes,” Financial Times (January 30, 2015).
the economy is expected to contract in 2015 for the first time since 1990, the jobless rate has risen to a two-year high of 6%, and inflation is forecasted to reach nearly 8% next year.
Shares of small companies in frontier markets fell, down 7% in first half of the fiscal year after returning 23% in fiscal year 2014. While frontier markets are not part of our Index, our Portfolio has a 4% weight in these markets.
By sector there was a large dispersion in returns in this period; Energy was the worst performer (down 14%) and Utilities declined 3%. In contrast, Health Care (up 13%), Consumer Discretionary (11%), and Information Technology (12%) all outperformed.
Performance Attribution
The Portfolio underperformed in the first half of the fiscal year due mainly to poor stock selection in the Financials and Industrials sectors. In Financials, Bank of Georgia reported better than expected earnings in the fourth quarter of 2014 but its shares fell after management issued a negative outlook for the Georgian economy in 2015. In Industrials, Malaysian shipyard operator Coastal Contracts was the largest detractor. The stock faltered in the fourth quarter on suspicion that key new customers may defer some of their investments in the company’s products due to lower oil prices in the medium term. Stock selection in the Information Technology sector was most helpful to relative performance. Particularly notable was China’s Wasion, an electric meter company, whose shares performed well after the company won contract bids to supply Advanced Distribution Operations to the Jiangsu Electric Power company’s energy distribution business.
Viewed geographically, holdings in the eurozone detracted most from performance primarily due to our German stocks especially IT consultant Bechtle. The company has had solid growth in absolute terms—operating income grew 19% and revenues were up nearly 14% in 2014. But investors were not pleased with management guidance that 2015 will likely see weaker demand for IT services. Our underweight to the energy-heavy Canadian market and good stock picking in Japan were the largest contributors to returns relative to the Index. In Japan, MonotaRO, a distributor of maintenance and safety items reported higher gross margins first quarter 2015 despite foreign exchange headwinds. Sales improved due to upwards price revision in its new catalogs and lower costs associated with logistics.
Investment Perspectives
Japan in the Age of Three Arrows
From a top-down perspective, we believe Japan appears to be one of the least-promising major developed markets for equity investors. Economic growth in the world’s third-largest economy has been largely stagnant for the past two decades, averaging an annual real growth rate of just 0.9% (compared to 2.5% in the US). The country has suffered six recessions since 1997 and faces a huge debt burden, with a debt-to-GDP ratio that is the highest in the developed world. Japan’s unfavorable long-term demographics, with an aging and shrinking population, also poses a challenge to future growth.
9
Institutional Class HLMRX
Investor Class HLMSX
| | | | | | | | | | | | | | | | | | | | | | | | | | | | | | | | | | | | | | | | |
| Performance | | | | | |
| Total Returns (%) | | | | | | | |
| at March 31, 2015 | | | | | | | | | | | | | | | | | at April 30, 2015 | | | | |
| | | | | | | | | |
| | | 1 year | | | 3 years | | | 5 years | | | Since Inception* | | | 1 year | | | 3 years | | | 5 years | | | Since Inception* | |
Intl Small Companies Portfolio – Institutional Class | | | -3.71 | | | | 10.17 | | | | – | | | | 6.01 | | | | – | | | | -0.40 | | | | 10.96 | | | | – | | | | 6.81 | | | | – | |
| | | | | | | | | | | |
MSCI ACW ex-US Small Cap Index | | | -3.61 | | | | 7.37 | | | | 6.51 | | | | 3.45 | | | | – | | | | 2.33 | | | | 9.77 | | | | 7.31 | | | | 4.95 | | | | – | |
| | | | | | | | | | | |
Intl Small Companies Portfolio – Investor Class | | | -3.93 | | | | 9.89 | | | | 9.74 | | | | – | | | | 5.72 | | | | -0.62 | | | | 10.69 | | | | 10.01 | | | | – | | | | 6.10 | |
Returns are annualized for periods greater than 1 year. *Inception of the Institutional Class, 6/30/11. Inception of the Investor Class, 3/26/07. Index performance prior to 6/1/07 cannot be shown since it relies on back-filled data.
Performance data quoted represent past performance; past performance does not predict future results. The investment return and principal value of an investment will fluctuate so that an investor’s shares, when redeemed, may be worth more or less than their original cost. Current performance of the Portfolio may be lower or higher than the performance quoted. Performance data current to the most recent month end may be obtained by calling (877) 435-8105 or visiting www.hardingloevnerfunds.com. The Portfolio imposes a 2% redemption fee on shares held 90 days or less. Performance data does not reflect the redemption fee. If reflected, total returns would be reduced.
In 2013, Prime Minister Shinzo Abe launched his “Three Arrows” program of stimulus spending, monetary easing, and structural reforms to re-energize the economy. The program has not been very successful yet in terms of generating economic growth. In 2014, growth was flat and Japan even experienced a two-month recession in the middle of the year.
Amidst the weak GDP growth, however, Japan’s equity market has fared quite well in recent years supported by the stimulus policies linked to the first Two Arrows. Since the end of the 2012 fiscal year, the Tokyo Stock Price Index (Topix) has returned 50%, beating the 26% gain by the benchmark Index (in US dollar terms).
We have always had a strong investment interest in Japan, which we actually find to be a fertile ground for finding high-quality, growing companies. We do not ignore macro issues. However, such issues are not central to our bottom-up research process and they never dissuade us from searching for attractive investments in a particular country. We are underweight Japan relative to the Index (16% versus 20%), but we still currently hold 17 Japanese companies and the country represents the Portfolio’s largest absolute allocation to a single market. Recognizing that Japan offers the average company limited domestic growth opportunities, one type of business model we seek is the “disrupter” that is shaking
| | | | |
| Fund Facts at April 30, 2015 |
Total Net Assets | | | | $102.4 M |
Sales Charge | | | | None |
Number of Holdings | | | | 91 |
Turnover (5 Yr. Average) | | | | 33% |
Redemption Fee | | | | 2% first 90 days |
Dividend Policy | | | | Annual |
| | | Institutional Class | | Investor Class |
Ticker | | HLMRX | | HLMSX |
CUSIP | | 412295875 | | 412295883 |
Inception Date | | 6/30/2011 | | 3/26/2007 |
Minimum Investment* | | $100,000 | | $5,000 |
Net Expense Ratio† | | 1.30% | | 1.55% |
Gross Expense Ratio | | 1.59% | | 1.88% |
*Lower minimums available through certain brokerage firms. †Shown net of Harding Loevner’s contractual agreement, through February 29, 2016, to waive its management fee to the extent necessary to cap the fund’s total operating expenses.
up moribund domestic industries in an attempt to generate above-market growth and higher profits.
One such disrupter is Infomart, a Japanese eCommerce business dedicated to the food industry that we recently purchased for the Portfolio. Infomart offers an online marketplace that connects food producers to wholesalers and wholesalers to restaurants, replacing the old-fashioned and cumbersome process of phone and fax ordering. The company’s online system has the added benefit of providing sellers and buyers of food a convenient way to track sales, inventories, account receivables, and payables. Infomart’s target customers are small chains, not large businesses like McDonalds that already have integrated supply chains. The annual cost of Infomart’s automated system is less than ten percent of the cost required to pay an employee to manually manage purchasing and selling.3 The company generates revenue by charging fees to both the buyers and sellers using its online marketplace.
We estimate that ¥7 trillion (US$60 billion) of food is purchased by restaurants every year in Japan; 12% of this commerce is conducted through Infomart and the company is targeting 20% market share in three years. Infomart is by far the largest company in this space—having grown from below 10,000 customers in 2004 to 36,000 today—and faces limited competition. Over the past decade, the company has increased revenues and earnings at about 14% and 16% per year, respectively. It now earns a return-on-equity of over 30%. We believe Infomart will evolve into the de facto ordering system for the food industry in Japan, extending the historical 14% annual sales growth rate over the long term. If the company indeed becomes the market standard, we expect it will be able to charge its customers higher prices.
Aerospace—a Niche Opportunity in an Improving Industry
We recently purchased a new holding in Senior, a UK-based manufacturer of airplane components. According to the Global Industry Classification Standards (GICS) Senior is classified as belonging under the “Aerospace & Defense” industry, which is a very broad category encompassing a variety of companies operating in many different businesses. We wanted to provide an overview of how we narrowed down the industry to identify this new investment opportunity.
3Credit Suisse, Equity Research (Computer Services & IT Consulting (Internet (Japan)), January 15, 2014.
10
International Small Companies Portfolio continued
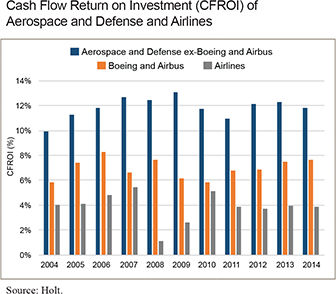
In our research of the aerospace industry, we have focused broadly on the supply chain associated with the manufacture of airplanes and began by looking at the end of the supply chain: the commercial airlines. The airlines have historically been plagued by large capital needs and intense competition. US airlines, for example, lost US$59 billion on domestic operations between 1979 and 2009.4 Globally, airlines have also earned low returns, as shown in the chart below indicating their annual Cash Flow Returns on Investment (CFROI), an approximation of the economic returns that a firm earns from investing in its business.
In recent years, however, the outlook for the airlines has improved. In 2014, the industry enjoyed its fifth year in a row of overall profitability and its CFROI has more than doubled from its 2008 low, putting airlines in a strong financial position for the future.5 One reason for this improved profitability is consolidation. There were 10 major airlines in the United States in 2001, for example. Thanks to a series of bankruptcies and mergers, the country now has only four.6 A recovering global economy, falling oil prices, and
| | | | | | | | |
| Geographical Weightings (%) at April 30, 2015 | |
| Institutional and Investor Classes | |
| Country/Region | | | Portfolio | | | | Benchmark | 1 |
Canada | | | 0.0 | | | | 7.8 | |
| | | |
Emerging Markets | | | 23.6 | | | | 22.9 | |
| | | |
Europe EMU | | | 24.2 | | | | 15.8 | |
| | | |
Europe ex-EMU | | | 20.6 | | | | 24.0 | |
| | | |
Japan | | | 15.7 | | | | 20.3 | |
| | | |
Middle East | | | 0.0 | | | | 0.7 | |
| | | |
Pacific ex-Japan | | | 7.8 | | | | 8.5 | |
| | | |
Frontier Markets2 | | | 3.2 | | | | – | |
| | | |
Other3 | | | 1.3 | | | | – | |
| | | |
Cash | | | 3.6 | | | | – | |
1MSCI All Country World ex-US Small Cap Index. 2Includes countries with less-developed markets outside the Index. 3Includes countries with developed markets outside the Index where some holdings are incorporated.
| | | | | | | | |
| Sector Weightings (%) at April 30, 2015 | |
| Institutional and Investor Classes | |
| Sector | | | Portfolio | | | | Benchmark | 1 |
| | | |
Consumer Discretionary | | | 13.8 | | | | 17.5 | |
| | | |
Consumer Staples | | | 12.3 | | | | 6.1 | |
| | | |
Energy | | | 1.0 | | | | 4.2 | |
| | | |
Financials | | | 11.1 | | | | 21.5 | |
| | | |
Health Care | | | 10.5 | | | | 6.5 | |
| | | |
Industrials | | | 24.1 | | | | 19.6 | |
| | | |
Information Technology | | | 16.0 | | | | 10.6 | |
| | | |
Materials | | | 3.3 | | | | 10.6 | |
| | | |
Telecom Services | | | 2.5 | | | | 1.2 | |
| | | |
Utilities | | | 1.8 | | | | 2.2 | |
| | | |
Cash | | | 3.6 | | | | – | |
1MSCI All Country World ex-US Small Cap Index
rapid passenger growth (especially in emerging markets) have also helped improve demand as well as profitability.
The improving health of the commercial airlines has been important for companies in the rest of the supply chain, namely airplane and component manufacturers. The demand for new airplanes has been growing as the airlines look to accommodate increasing passenger traffic and to invest in more fuel-efficient airplanes, accelerating the replacement cycle. Boeing and Airbus, the two dominant airplane manufactures, have benefited from this demand as evidenced by their improving CFROIs since 2010. At the close of 2014, Airbus’ order book included about 6,400 aircraft to-be-delivered, with a value of over US$900 billion dollars.7 Boeing has reported having a backlog over roughly 5,800 jets, worth over US$500 billion.8 At current production rates these figures represent roughly 7–8 years of orders. By comparison, in 2001 these two manufacturers had a backlog of just 3–4 years of orders.9
Excluding Boeing and Airbus, the rest of the Aerospace & Defense industry exhibits the strongest CFROIs as indicated in the chart. We think the most interesting businesses within this group are the diverse companies positioned at the beginning of the supply chain that produce various airplane components such as engines, fan blades, and fasteners. These companies produce highly engineered products that generate high operating margins. We believe the historically strong operating performance of airplane-parts manufacturers will continue to improve due to the positive trends favoring airlines and airplane manufacturers.
4Lester Picker, “The Persistent Financial Losses of U.S. Airlines,” The National Bureau of Economic Research (July 2011).
5International Air Transport Association, “Industry Economic Performance Tables,” IATA (December 2014).
6“US Airways-American Airlines to merge,” CNNMoney (February 14, 2013).
7Robert Wall, “Airbus Racks Up More 2014 Jet Orders Than Boeing,” Wall Street Journal (January 13, 2015).
8Boeing, “Boeing Reports Record 2014 Revenue, Core EPS and Backlog and Provides 2015 Guidance,” Press Release, January 28, 2015.
9Bernstein Research, “Commercial Aircraft Cycle: 2018? Could That Be the End?,” October 8, 2013.
11
Institutional Class HLMRX
Investor Class HLMSX
Senior specializes in producing parts of an airplane’s skeleton: wing ribs, the struts in front of the wings, landing-gear housing, fluid control systems, and air ducting systems. Its products are sold primarily to the airplane manufacturers (including Boeing and Air-bus) as well as to other suppliers and must meet rigorous safety and quality requirements. Senior is benefiting from the current business tailwinds enjoyed by the aerospace industry, but it has also been a high-quality, growing company for some time. Over the past seven years, the company has compounded its top and bottom lines each year at 10% and 25%, respectively. Senior also scores in the top decile of our investable universe based on our proprietary measures for quality and growth, which include factors such as returns on investment, degree of leverage, and margins. Senior’s long-standing relationships with key aerospace companies provide a crucial competitive advantage that we believe will support the company’s continued strong growth in the future.
Portfolio Highlights
A most unusual event transpired in our Portfolio in the first half of the year: Australia’s TPG Telecom, a Portfolio holding, announced on March 13th its intention to buy rival iiNet, another holding. Under the terms of the most recently proposed deal, TPG Telecom is offering shareholders a choice of all cash for AUD$9.55/share for total of AUD$1.56 billion (US$1.23 billion) or a mix of shares and cash; this offer is at a significant premium above the share price of iiNet in early March. The deal is far from finalized; the fourth-largest broadband company in Australia—M2—has also offered a mix of shares and cash. iiNet’s board has unanimously recommended TPG’s offer to shareholders provided no better offers are received.
We agree with iiNet’s board and think TPG’s offer makes the most sense in the medium- to long-term. It would improve the industry’s competitive dynamics by bringing together two previous competitors and provide the combined company a significant increase in scale. The two companies focus on different segments of the tele-com industry that complement one another well. For retail customers, TPG provides a value-based offering while iiNet has more of a premium offering. TPG also serves corporate and government clients while iiNet is more focused on small and medium enterprises. TPG has a high market share in Sydney/Melbourne while iiNet is strong in the states of Western Australia, South Australia and Queensland. The merged company would have 1.7 million broadband subscribers, giving it a market share of about 27%, and putting it in the number-two position behind Telstra, which has 46% share, and ahead of Optus, which has 13% share, and the M2 Group, which has 7% share. Finally, we think there is scope for significant cost cutting as the two companies integrate their networks and staff.
As with all mergers, joining TPG Telecom and iiNET would involve risks: customer churn may increase especially if there are delays in integration and two separate brands may have to be created, creating scope for confusion or need for additional spending on sales and marketing.
A year ago we wrote about the shifting regulatory dynamic across the globe in the Telecom Services sector and how it was creating opportunities for new and smaller telecom companies to grow at the expense of the incumbent telecom monopolies. We also highlighted the efforts of the Australian Competition and Consumer Commission to encourage this dynamic. The movement towards
| | | | | | | | |
| Ten Largest Holdings at April 30, 2015 | |
| Institutional and Investor Classes | |
| Company | | Sector | | Country | | | % | |
Wasion Group Holdings | | Info
Technology | | China | | | 2.6 | |
| | | | |
Grafton Group | | Industrials | | UK | | | 2.2 | |
| | | | |
Synergy Health | | Health Care | | UK | | | 2.2 | |
| | | | |
Industrial & Financial Systems | | Info
Technology | | Sweden | | | 2.1 | |
| | | | |
Hiday Hidaka | | Cons
Discretionary | | Japan | | | 2.0 | |
| | | | |
Bechtle | | Info
Technology | | Germany | | | 2.0 | |
| | | | |
Equity Bank | | Financials | | Kenya | | | 1.8 | |
| | | | |
Rubis | | Utilities | | France | | | 1.8 | |
| | | | |
Rathbone Brothers | | Financials | | UK | | | 1.7 | |
| | | | |
Max India | | Financials | | India | | | 1.6 | |
greater consolidation in Australia’s telecommunications industry comes just when the government is rolling out the National Broadband Network (NBN). The NBN makes extensive use of advanced fiber-based technology and represents a significant upgrade to Aus-tralia’s current internet and communications infrastructure. Companies such as TPG Telecom and iiNet can pay wholesale rates to access the NBN as they provision services for their retail and corporate customers. As a result, the NBN not only represents a technological upgrade but also encourages competition against the market-leader Telstra. It will be interesting to watch future developments in the Telecom Services sector in other parts of the world; we suspect that this trend towards consolidation may continue as smaller telecom companies try to build scale.
Please read the separate disclosure page for important information, including the risks of investing in the Portfolio.
12
Emerging Markets
| | |
Portfolio Managers | | |

|
G. Rusty Johnson, CFA Co-Lead Portfolio Manager Craig Shaw, CFA Co-Lead Portfolio Manager Pradipta Chakrabortty Portfolio Manager | | Scott Crawshaw Portfolio Manager Richard Schmidt, CFA Portfolio Manalger |
The Institutional Emerging Markets Portfolio (Class I and Class II) and the Emerging Markets Portfolio – Advisor Class (collectively, the “Portfolios”) are both managed in strict accordance with the Emerging Markets Equity Strategy model portfolio. The Portfolios, therefore, have highly similar holdings and characteristics. We have provided a single commentary to cover both Portfolios. The specific performance and characteristics of each are presented separately in the tables that follow.
Performance Summary
The Institutional Emerging Markets Portfolio – Class I rose 0.02%, the Institutional Emerging Markets Portfolio – Class II rose 0.20%, and the Emerging Markets Portfolio – Advisor Class gained 0.17% (net of fees and expenses) in the six months ended April 30, 2015. The Portfolios’ benchmark, the MSCI Emerging Markets Index (the “Index”), rose 3.92% (net of source taxes) in this period.
Market Review
Fortunes diverged across Emerging Markets (EMs) in the trailing six months through April 30, 2015. The ongoing shift in China’s development model from fixed-investment-led to consumer-led growth buoyed its stock market and those of its natural resource-poor Asian neighbors, but weighed on commodity-exporting countries broadly. Euro weakness, precipitated by the European Central Bank’s actual initiation of long-promised quantitative easing, was another discriminating factor, its impact on dollar-based market returns depending on the extent of each EM’s trade and currency linkage with Europe. EMs rose in dollars (+4.0%) over the six-month period but lagged developed markets (EAFE +7.2%).
Brazil and Turkey, whose currencies plummeted, were two of the weakest major markets. The Brazilian economic and political picture has deteriorated apace. Growth has slowed (to zero) as policy makers combat stubbornly high inflation and public account deficits. President Dilma Rousseff’s administration is under mounting attack by a public angry about the web of corruption revealed by the Petro-bras scandal, which is so wide that it directly threatens the country’s growth prospects. Yet, later in this report we will discuss signs of positive change, in policy and in market prospects, that we saw when we visited Brazil in March. The costly consequences to confidence and growth of political meddling also resurfaced in Turkey, where President Erdoğan has been heavy-handed in exerting influence on central bank policy at a time when the capital markets have low tolerance for such interference.
Signs of an economic slowdown in China intensified, creating broad concern across many EMs about the implications for global
growth—and, more specifically, Chinese demand for their commodities. Multiple reports during the first calendar quarter—of investment, retail sales, and industrial output, together with leading indicators— were suggestive of a rapid slowing of its GDP growth rate to well below the consensus 7% forecast. The Chinese government remains steady in its commitment to reduce capital intensity in its economy, but has also demonstrated its intent to reignite the economy through a concentrated burst of monetary easing, reducing interest rates, and lowering banks’ reserve requirements. This monetary action and further moves to open China’s capital markets have led to a strong rally in Chinese equities, most dramatically in the local “A-share” market, but also in Hong Kong with the MSCI China Index returning 29.6% over the reported period. Industrials (+53.2) and Financials (+43.9%) were the largest beneficiaries by sector within the MSCI China Index.
Regional performance largely reflected the disparity in relative currency moves during the six-month period. Commodity-heavy Latin America trailed, with severe weakness in the Brazilian real and Colombian peso hurting dollar returns; only Peru (+3.6%) and Chile (+0.4%) registered modest positive returns in dollars. By contrast, Asia continued to exhibit relative strength, led by China, with steady currency and robust equity market performance. The Chinese renminbi recovered from weakness in early 2015, spurred on by further moves by the government to open up the country’s capital account and the China Securities Regulatory Commission’s announcement at the end of March that it would allow mainland mutual funds to invest in Hong Kong (H) shares (as access to H shares was previously restricted to individuals), providing further momentum to the China market rally.
Sector performance was also highly divergent across EMs, with Information Technology (IT) and Industrials two of the top performers and Energy and Utilities the weakest performers. IT was led by heavyweight Tencent, a Chinese internet gaming and social media company, whose 2014 earnings report showed a 30% increase in revenues, ahead of market expectations, and, importantly, strong margins that drove the bottom line. Industrials was buoyed by Chinese transportation stocks, which we believe are set to benefit from China’s expansive “One Belt, One Road” initiative, which will include substantial investment into China’s rail infrastructure.
Performance and Attribution
The Portfolios underperformed in the period primarily through weak stock selection in Financials. The dominant influence was our zero-weight in Chinese Financials, which were particularly strong. Our financial holdings in Russia, Sberbank and Moscow Exchange, were also negative, as were other banks domiciled in oil-producing countries, like Zenith Bank of Nigeria and Bancolombia of Colombia. Positive contribution from Axis Bank in India, a net beneficiary of falling oil prices, helped to partially offset these poorly-performing stocks. Stock selection contributed most positively in Industrials, where China rail locomotive and rolling stock manufacturer CSR Corporation soared on news of a merger with lead domestic competitor CNR in late 2014 and subsequent announcements of targeted investment towards rail infrastructure.
Despite our holding in CSR Corporation, China was the primary geographic source of underperformance, due to our underweight exposure and selection effects dominated by our zero-weight in Financials. Our overweight in Turkey and poor stock selection in South Korea also hurt performance. Our Latin American holdings helped performance most, particularly Brazilian beer company
13
Institutional Emerging Markets Portfolio – Class I HLMEX and
Class II HLEEX
Emerging Markets Portfolio – Advisor Class HLEMX
| | | | | | | | | | | | | | | | | | | | | | | | | | | | | | | | | | | | | | | | | | | | | | | | | | | | | | | | |
| Performance | | | | |
| Total Returns (%) | | | | | | | | | | | | | | | | | | | | | | |
| at March 31, 2015 | | | | | | at April 30, 2015 | | | | | | | | | | |
| | | | | | | | | | | |
| | | 1 year | | | 3 years | | | 5 years | | | 10 years | | | Since Inception* | | | 1 year | | | 3 years | | | 5 years | | | 10 years | | | Since Inception* | |
Inst. Emerging Markets Portfolio – Class I | | | -1.23 | | | | 3.14 | | | | 4.22 | | | | – | | | | – | | | | 7.63 | | | | – | | | | 2.73 | | | | 5.27 | | | | 4.99 | | | | – | | | | – | | | | 8.08 | | | | – | |
| | | | | | | | | | | | | | | |
Inst. Emerging Markets Portfolio – Class II | | | -1.02 | | | | – | | | | – | | | | – | | | | 2.09 | | | | – | | | | – | | | | 3.09 | | | | – | | | | – | | | | – | | | | 6.22 | | | | – | | | | – | |
| | | | | | | | | | | | | | | |
MSCI Emerging Markets Index | | | 0.43 | | | | 0.30 | | | | 1.73 | | | | 8.47 | | | | 4.00 | | | | 7.33 | | | | – | | | | 7.80 | | | | 3.23 | | | | 3.01 | | | | 9.57 | | | | 10.59 | | | | 8.10 | | | | – | |
| | | | | | | | | | | | | | | |
Emerging Markets Portfolio – Advisor Class | | | -0.97 | | | | 3.24 | | | | 4.19 | | | | 9.17 | | | | – | | | | – | | | | 12.52 | | | | 3.02 | | | | 5.36 | | | | 4.96 | | | | 9.84 | | | | – | | | | – | | | | 12.78 | |
Returns are annualized for periods greater than 1 year. *Inception of Class I, 10/17/05. Inception of Class II, 3/5/14. Inception of the Advisor Class, 11/9/98. Index performance prior to 1/1/01 cannot be shown since it relies on back-filled data.
Performance data quoted represent past performance; past performance does not guarantee future results. The investment return and principal value of an investment will fluctuate so that an investor’s shares, when redeemed, may be worth more or less than their original cost. Current performance of each Portfolio may be lower or higher than the performance quoted. Performance data current to the most recent month end may be obtained by calling (877) 435-8105 or visiting www.hardingloevnerfunds.com. Each Portfolio imposes a 2% redemption fee on shares held 90 days or less. Performance data does not reflect the redemption fee. If reflected, total returns would be reduced.
Ambev, Brazilian payment processor Cielo, and Mexican airport operator ASUR.
Investment Perspectives
Commodity weakness promotes Asian dominance
The prolonged commodity weakness that stretches back to spring 2011 has affected EMs profoundly. Lower selling prices have eroded the profits of Materials and Energy companies and the export revenues of commodities-exporting countries, leading to currency adjustments, some severe, especially against the strong US dollar. Most recently, the collapse in energy prices has exacerbated the polarization between those countries that are net producers of commodities versus those that are net consumers.
From a regional perspective, Northern Asia has reaped a windfall from this dynamic. Not only is the region a net importer of most commodities—China the largest bar-none—but the equity markets of Asia are less loaded with the commodities-producing sectors than those of Latin America, Europe, the Middle East, and Africa. Since
| | | | | | |
| Portfolio Facts at April 30, 2015 |
Sales Charge | | | | | | None |
Number of Holdings | | | | | | 78 |
Redemption Fee | | | | 2% first 90 days |
Dividend Policy | | | | | | Annual |
| | | Institutional | | Advisor |
Portfolio Assets | | $2,130.2 M | | $2,698.7 M |
Turnover
(5 Yr. Average) | | 30% | | 30% |
Class | | Class I | | Class II | | Advisor |
Ticker | | HLMEX | | HLEEX | | HLEMX |
CUSIP | | 412295701 | | 412295842 | | 412295305 |
Inception Date | | 10/17/2005 | | 3/5/2014 | | 11/9/1998 |
Minimum Investment* | | $500,000 | | $25,000,000 | | $5,000 |
Net Expense Ratio | | 1.29%† | | 1.14%‡ | | 1.45% |
Gross Expense Ratio | | 1.31% | | 1.30% | | 1.45% |
*Lower minimums available through certain brokerage firms. †The Net Expense Ratio is as of March 31, 2015 as the Portfolio is operating below the contractual agreement, which is in effect until February 29, 2016. The Gross Expense Ratio is as of the Prospectus dated February 28, 2015. ‡Shown net of Harding Loevner’s contractual agreement, through February 29, 2016, to waive its management fee to the extent necessary to cap the fund’s total operating expenses.
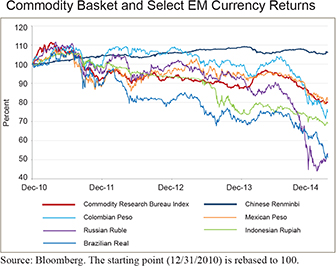
June 2008, the combined weight of Energy and Materials stocks in the EM Index has fallen from 37.6% to 15.9%, due to lagging dollar-based returns. In tandem the combined weight of Latin America and Europe in the Index has fallen from 41.1% to 22.6%.
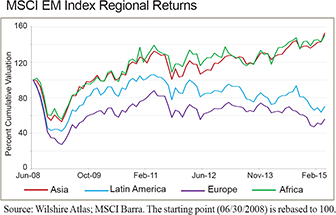
Significant policy reform, especially in the three most populous countries of China, India, and Indonesia, have complemented the boon Asian economies have received from the commodity bust. Rapid advance of high-value-added industries in Asia such as generic drugs, industrial automation, and IT (especially Chinese inter-
14
Emerging Markets continued
net companies) have created a broader set of opportunities for global investors seeking growth than in other EM regions that remain commodity-dependent, like Russia.
Asia’s weight in the Index has risen markedly since mid-2008 from below 50% to almost 70% as of today. China contributed approximately half of this growth, its weight increasing from 14% to 25%, but in fact the weight of every Asian country has increased (apart from Pakistan, which was relegated to Frontier Markets status), primarily at the expense of Brazil and Russia.
This trend of increasing Asian dominance of the EM Index may now be poised to accelerate, not due to continued market outperformance, but to changes in Index construction, specifically the potential inclusion of China A-Shares (which trade on mainland exchanges and were previously inaccessible to foreign investors) and some giant Chinese technology stocks, notably Baidu and Alibaba, which have thus far been excluded from the Index as their shares are listed on US exchanges. The further that China opens up its capital markets, allowing greater foreign access to its locally-listed shares, the stronger this possibility. Thus EMs, which as an asset class has been favored for its breadth and diversity, are increasingly concentrated geographically. At what stage do investors begin to question the risk consequences for their portfolios of such concentration?
Our Portfolios’ exposure to Asia has grown, most recently through two new investments in China, which we discuss below. However, its regional exposure relative to the Index continues to be negative, chiefly because we are underweight South Korea, where we find few companies that meet our investment criteria of high-quality, durable growth, and long-term value. The increasing regional concentration of its benchmark may result in higher tracking error for our Portfolios, but this prospect has only marginal influence on our investment decisions.
Brazil: Good news in the post from the Amazon!
In March, we traveled to Brazil, where the current reality is colored by economic recession, collapsing investment, rising taxes, revealed
| | | | | | | | | | | | |
| Geographical Weightings (%) at April 30, 2015 | |
| Country/Region | |
| Institutional
HLMEX / HLEEX |
| |
| Advisor
HLEMX |
| | | Benchmark | 1 |
Brazil | | | 7.5 | | | | 7.5 | | | | 7.9 | |
| | | | |
China + Hong Kong2 | | | 21.5 | | | | 21.5 | | | | 25.2 | |
| | | | |
India | | | 10.2 | | | | 10.1 | | | | 6.5 | |
| | | | |
Mexico | | | 4.0 | | | | 4.0 | | | | 4.4 | |
| | | | |
Russia | | | 4.5 | | | | 4.5 | | | | 4.0 | |
| | | | |
South Africa | | | 7.7 | | | | 7.7 | | | | 7.8 | |
| | | | |
South Korea | | | 6.1 | | | | 6.1 | | | | 14.6 | |
| | | | |
Taiwan | | | 10.8 | | | | 10.8 | | | | 12.5 | |
| | | | |
Small Emerging Markets3 | | | 16.1 | | | | 16.0 | | | | 17.1 | |
| | | | |
Frontier Markets4 | | | 3.0 | | | | 2.9 | | | | – | |
| | | | |
Developed Market Listed5 | | | 6.7 | | | | 6.7 | | | | – | |
| | | | |
Cash | | | 1.9 | | | | 2.2 | | | | – | |
1MSCI Emerging Markets Index. 2The Harding Loevner Funds Emerging Markets Portfolios’ end weight in China is 16.8% and Hong Kong is 4.7% . The Benchmark does not include Hong Kong. 3Includes the remaining emerging markets which, individually, comprise less than 5% of the Index. 4Includes countries with less-developed markets outside the Index. 5Includes emerging markets or frontier markets companies listed in developed markets.
| | | | | | | | | | | | |
| Sector Weightings (%) at April 30, 2015 | |
| Sector | |
| Institutional
HLMEX / HLEEX |
| |
| Advisor
HLEMX |
| | | Benchmark | 1 |
Consumer Discretionary | | | 12.1 | | | | 12.0 | | | | 9.1 | |
| | | | |
Consumer Staples | | | 10.2 | | | | 10.2 | | | | 7.5 | |
| | | | |
Energy | | | 6.7 | | | | 6.7 | | | | 8.7 | |
| | | | |
Financials | | | 27.9 | | | | 27.8 | | | | 29.3 | |
| | | | |
Health Care | | | 7.0 | | | | 6.9 | | | | 2.2 | |
| | | | |
Industrials | | | 6.5 | | | | 6.5 | | | | 7.0 | |
| | | | |
Information Technology | | | 20.0 | | | | 20.0 | | | | 18.3 | |
| | | | |
Materials | | | 2.7 | | | | 2.7 | | | | 7.2 | |
| | | | |
Telecom Services | | | 3.9 | | | | 3.9 | | | | 7.3 | |
| | | | |
Utilities | | | 1.1 | | | | 1.1 | | | | 3.4 | |
| | | | |
Cash | | | 1.9 | | | | 2.2 | | | | – | |
1MSCI Emerging Markets Index
corruption, and depreciating currency. We met with a wide range of listed companies and knowledgeable observers. Though it is certainly not a pretty picture, we concluded that the seeds of reform and economic rebalancing have already been sown. Brazil’s harsh economic headwinds are mostly the result of poor policies and decisions made years ago, during the good times when commodities and the real were both stronger. We have long been underweight in Brazil, as it was difficult to find companies which could overcome the poor policy tilts championed by the Rousseff administration. Little optimism is priced into the market today.
During our trip, we identified some potential pivot points on which change for the better could turn. Rousseff’s approval ratings are at record lows. She is fighting to keep her job. Her Workers’ Party (PT), in power for more than a decade, is fighting to stay there. The judiciary system, which appears to be relatively unencumbered by politics, has arrested and prosecuted numerous corrupt officials. The press is another positive influence, intrepid in its willingness to humiliate corrupt offenders publicly. This turmoil has been toxic for Brazilian stocks and the currency in the short run, but the political engagement it engenders is therapeutic in the long run, creating conditions for administrative and electoral change. The uber-liberal populist policies, which the country could never afford, even in the good times, helped the PT gain popularity but may well be finished. The new Finance Minister, Joaquim Levy, has already administered some bitter medicine in the form of across-the-board budget cuts and tax hikes, extending even to the politically-sensitive sectors of education and fuels.
We met with Banco do Brasil, which is 51%-owned by the government and often seen as another tool in the administration’s policy kit. Management is now articulating its focus on increasing returns and intention to take a less aggressive approach in the market, reversing policies that pressured private sector banks’ returns. The reality is that the private sector banks, including Banco Bradesco, which we own, disengaged from the riskier end of the lending spectrum two years ago. Now well-equipped with ample capital and strong balance sheets, we believe they are set to benefit from the new, less-aggressive lending and pricing policies from state-controlled banks. Returns on capital could rise for private sector banks even without a general economic revival.
A final positive takeaway from our trip to Brazil is that the six companies we own in the Portfolio are financially strong. They are still
15
Institutional Emerging Markets Portfolio – Class I HLMEX and
Class II HLEEX
Emerging Markets Portfolio – Advisor Class HLEMX
| | | | | | | | | | | | | | | | |
growing, albeit at reduced rates, and some, like Banco Bradesco, could be facing a better future as the competitive landscape normalizes. It seems to us that the clouds will eventually part. Today’s problems are likely to prove more transitory than they seem. Portfolio Activity We took action over the six-month period to take advantage of sizeable price moves related to the lower oil price, sharp depreciation followed by recovery in the ruble, and continued momentum in the Indian market. | | | | Top Ten Holdings at April 30, 2015 | |
| | | Company | | Sector | | Country | |
| Institutional
HLMEX / HLEEX |
| |
| Advisor
HLEMX |
|
| | | Samsung Electronics | | Info Technology | | South Korea | | | 4.3 | | | | 4.3 | |
| | | Taiwan Semiconductor | | Info Technology | | Taiwan | | | 3.7 | | | | 3.6 | |
| | | AIA Group | | Financials | | Hong Kong | | | 2.8 | | | | 2.8 | |
| | | Tencent | | Info Technology | | China | | | 2.3 | | | | 2.3 | |
| | | China Mobile | | Telecom Services | | China | | | 2.2 | | | | 2.2 | |
| | | Naspers | | Cons Discretionary | | South Africa | | | 2.0 | | | | 2.0 | |
| | | SABMiller | | Cons Staples | | UK | | | 1.9 | | | | 1.9 | |
| | | Aspen Pharmacare | | Health Care | | South Africa | | | 1.9 | | | | 1.9 | |
| | | Axis Bank | | Financials | | India | | | 1.9 | | | | 1.9 | |
| | | Jarir Marketing | | Cons Discretionary | | Saudi Arabia | | | 1.9 | | | | 1.8 | |
| | | | | | | | | | | | | | | |
In the Energy sector, we reduced our notable underweight position by adding to a selection of existing holdings. In Russia, following a strong rebound in the currency and stock prices, we reduced our exposure to neutral through the sale of Moscow Exchange, having increased our weight in late 2014 and early January through modest additions to select stocks (Magnit, Sberbank, and Lukoil). We continue to hold an overweight position in India, though we decreased our weight early in 2015 by reducing Axis Bank and auto manufacturer Maruti Suzuki.
Perhaps most importantly from a portfolio positioning perspective: we added exposure to China and Hong Kong, lifting our absolute weight to 21.5% from 15.6%, and reducing our underweight to 3.7%. We established new positions in the leading cellular giant China Mobile and Tingyi Holding, a food and beverage company.
We have owned China Mobile in the past. It remains the dominant cellular carrier in the country with over 800 million subscribers. Though that colossal figure may not grow much, the mix is improving as its 4G customer base grows from 90 million to 250 million by the end of 2015, corresponding to a notably higher per-customer billing figure. Data, currently 25% of the company’s revenues, is growing at very high rates as new smartphones offer improved data applications over older 3G phones. The company is cash-rich, and, as a state-owned enterprise, apt to increase its focus on capital allocation, with ample room to increase its payouts to investors.
Tingyi’s instant noodle business is impressive, with a market share of nearly 50% by volume and almost 60% by value. Its competitive environment is improving, and we see opportunity for margin expansion and increasing profit growth.
Another notable change in portfolio structure over the period was the reduction in Frontier Markets exposure, which fell from 9.9% to 6.9% (these figures include Developed Market listed companies, such as Bank of Georgia, with significant or exclusive Frontier exposure). In late 2014, we sold our positions in Copa Holdings and Etihad Etisalat, the former due to concerns about margin pressure with the loss of its most profitable market, Venezuela, and the latter due to financial pressures related to aggressive moves into cable assets in Saudi.
In early March we sold Vale, the Brazilian iron ore miner. The iron ore price has been under considerable pressure for a prolonged period and is now at 10-year lows with minimal chance for an imminent rebound: demand is not expected to pick up meaningfully, while new supply continues to come online, a lagged response from the high prices of 2010-11. With little opportunity for this company to grow, we have chosen to watch from the sidelines.
The Long View
We recognize growing evidence of what may be long-lasting changes afoot in China, India, Indonesia, and Mexico. Even Brazil may now be moving to correct some ill-advised policy choices. The dividends from such changes are deferred, but we see the majority of large and economically important EMs taking steps in the right direction again. Meanwhile, the capital markets are still punishing most EMs for past sins, such as fading current account surpluses, which in some cases were more cyclical rather than structural. Part of the headwind to dollar-based EM returns is from currency, which is clearly not just an EM problem, but a non-US one more generally. Dollar strength, too, will abate one day—we think probably sooner than the new dollar bulls predict. That would likely be a brisk tail-wind for EM returns.
We have heard the reports of a massive buildup within EM corporates of external (i.e., hard-currency) debt since the financial crisis that some think could prove to be an anchor around the necks of many EM countries. We have not seen, through our lens of company analysis, persuasive evidence. In the context of widespread trouble from financial imbalances, banks are the canaries in the coal mine. We own a few EM banks and meet with many others. They are still singing, and their song does not suggest distress among their borrowers from insupportable mountains of debt or mortal poisoning by local currency depreciation. Non-performing loan ratios are steady or even falling in many countries, including Brazil, India, Turkey, Indonesia, and Mexico. That the currency depreciation experienced by most EM countries has taken place over several years in an orderly way means there has been ample time by this point for material mismatches, where they exist, to have been made manifest.
China may be the outlier here: its currency has generally strengthened against the dollar, creating a unique opportunity for Chinese companies to engage in speculative interest-rate arbitrage. We have observed this carry trade being taken on, and acknowledge its potential for systemic harm, but at this point do not believe it warrants Portfolio response beyond the general caution toward China already reflected in our underweight position.
Please read the separate disclosure page for important information, including the risks of investing in each Portfolio.
16
Frontier Emerging Markets Portfolio
Portfolio Managers

| | |
Pradipta Chakrabortty Lead Portfolio Manager G. Rusty Johnson, CFA Portfolio Manager | | Babatunde Ojo, CFA Portfolio Manager Richard Schmidt, CFA Portfolio Manager |
Performance Summary
The Frontier Emerging Markets Portfolio – Institutional Class fell 4.42% and the Investor Class fell 4.73% (net of fees and expenses) in the six months ending April 30, 2015. The Portfolio’s benchmark, the MSCI Frontier Emerging Markets Index (“FEM Index”), fell 6.18% (net of source taxes).
Market Review
Persistently low oil prices, political events, and weakening currencies were among the factors that influenced many frontier and emerging markets (FEMs) in the first half of the fiscal year. In our broad investment universe, 26 out of 39 local currencies depreciated against the US dollar by more than 1%. The currency effect overshadowed the positive news of good earnings growth that various FEM companies reported during this period.
Markets in frontier Europe suffered some of the steepest declines in US-dollar terms—including Bulgaria (-25%), Kazakhstan (-27%), Serbia (-28%) and Ukraine (-34%). Ukraine was one of the stronger markets in local currency (up 9%), but this return was overcome by the 39% fall of the hryvnia relative to the US dollar, reflecting concern over the continued escalation of the conflict between Ukraine and separatist rebels supported by Russia. Kazakhstan has kept the value of the tenge fairly stable against the dollar since the 19% devaluation that occurred in February 2014; meanwhile the currencies of its main European trading partners have weakened overall in the past year. The tenge is thus widely regarded as overvalued and investors have continued to sell off the country’s equities in part due to expectations of another devaluation.1
Latin America performed poorly due to the 25% market decline in Colombia. About half of this negative performance in US dollar terms was due to weakening currencies—the Colombian peso depreciated by 14%. Though the sharp rise in the price of oil in April helped Colombia register gains for that month, the country suffered through much of the past six months due to the plummeting oil price as over half of its exports are connected to oil and oil derivatives. Argentina, by contrast, rose 10% in this period
1International Monetary Fund, The Republic of Kazakhstan, IMF Country Report No. 14/258 (Washington D.C.: IMF Publishing Services, July, 2014). http://www.imf.org/external/pubs/ft/scr/2014/cr14258.pdf; “Official (Market) Exchange Rates.” Official Internet Resource of the National Bank of Kazakh-stan (February 28, 2015).
as investors expressed approval that Mauricio Macri— the current Chief of Government of the Autonomous City of Buenos Aires and a market-friendly candidate—was surging in popularity ahead of the October 2015 presidential elections. Positive earnings reports from some Argentine companies during this period also fueled the market’s strong returns.
Africa as a region also returned less than the overall FEM Index, due mostly to Nigeria where investors were concerned about the falling oil price and political developments. The market fell in February after the government announced that Nigeria would postpone its presidential elections by six weeks (from February 14 to March 28) to give the army more time to counter the terrorist group Boko Haram and provide better security at the polls. The suspicion was that President Goodluck Jonathan was taking advantage of the security issue to remain in power. However, the presidential election did take place on March 28 and was relatively peaceful. The opposition party—the All Progressive Congress—won the election and President Jonathan has promised to ensure a smooth transition of power on May 29 to the new president-elect, Muhammadu Buhari. Elsewhere in Africa, Kenya posted an 11% return (in dollars) amid reports of strong corporate earnings growth in 2014. Kenya is a net oil importer and cheaper oil has resulted in reduced electricity prices, inflation, and interest rates—all of which are expected to boost consumption.
Asia was a bright spot in the Index even though most markets in the region declined during the last six months. The good overall performance was the tale of a single country: the Philippines, which rose 8%. The Philippines accounts for over three-quarters of the Asian portion of the FEM Index, so the performance of this market has an outsized impact on the region. The country’s macroeconomic conditions have been supportive of its capital markets, as we discuss in greater detail later in this commentary. By contrast, Sri Lanka’s equity market fell 13% (in dollars) in this period in the wake of the country’s recent transition of power. In the election held on January 8, the incumbent President Mahinda Rajapaksa (who had ruled since 2005) suffered a surprise defeat by the opposition party, the New Democratic Front (NDF) led by the now-current President Maithripala Sirisena. Investors, at first enthused by the NDF’s victory, were displeased with the new government’s debut decision-making: during a budget presentation to parliament on January 29, the administration announced policies unfriendly towards business, including a plan (already being implemented) to re-evaluate all infrastructure project contracts and gaming licenses awarded by the previous administration.2 The government has also imposed a variety of new taxes in a bid to redistribute wealth, such as a 25% additional one-off tax on company profits earned in the tax year ending March 31, 2014 that is being applied to companies with profits exceeding 2 billion rupees.
The wide dispersion of returns among the markets in the Index during the last six months demonstrates how, even in a period marked by broad trends (such as the lower oil price), local country events continue to influence individual market performance, especially among the frontier markets in the Index.
2Gordon Fairclough, “Sri Lanka Halts Chinese-Backed Construction Project,” Wall Street Journal, March 5, 2015.
17
Institutional Class HLFMX
Investor Class HLMOX
| | | | | | | | | | | | | | | | | | | | | | | | | | | | | | | | | | | | | | | | |
| Performance | |
| Total Returns (%) | |
| at March 31, 2015 | | | at April 30, 2015 | | | | | | | |
| | | | | | | | | |
| | | 1 year | | | 3 years | | | 5 years | | | Since Inception* | | | 1 year | | | 3 years | | | 5 years | | | Since Inception* | |
Frontier Emerging Markets Portfolio – Institutional Class | | | -5.16 | | | | 8.61 | | | | 4.47 | | | | – | | | | -1.63 | | | | -5.01 | | | | 10.43 | | | | 5.31 | | | | – | | | | -0.84 | |
| | | | | | | | | | | |
MSCI Frontier Emerging Markets Index | | | -2.50 | | | | 5.60 | | | | 5.00 | | | | 1.99 | | | | – | | | | -3.74 | | | | 6.42 | | | | 5.48 | | | | 2.83 | | | | – | |
| | | | | | | | | | | |
Frontier Emerging Markets Portfolio – Investor Class | | | -5.47 | | | | 8.26 | | | | – | | | | 2.30 | | | | – | | | | -5.44 | | | | 9.95 | | | | – | | | | 3.50 | | | | – | |
Returns are annualized for periods greater than 1 year. *Inception of the Institutional Class, 5/27/08. Index performance prior to 12/2/08 cannot be shown since it relies on back-filled data. Inception of the Investor Class, 12/31/10.
Performance data quoted represent past performance; past performance does not guarantee future results. The investment return and principal value of an investment will fluctuate so that an investor’s shares, when redeemed, may be worth more or less than their original cost. Current performance of the Portfolio may be lower or higher than the performance quoted. Performance data current to the most recent month end may be obtained by calling (877) 435-8105 or visiting www.hardingloevnerfunds.com. The Portfolio imposes a 2% redemption fee on shares held 90 days or less. Performance data does not reflect the redemption fee. If reflected, total returns would be reduced.
Performance Attribution
The Portfolio outperformed the Index in the half year primarily through strong stock selection in the Consumer Staples and Consumer Discretionary sectors. In Staples, Bangladesh-based packaged food company Olympic Industries benefited from rising margins for its biscuit and confectionery businesses due to lower commodity costs. In Discretionary, we benefited from strong performance from automobile and motorcycle maker Kolao Holdings, which released strong fourth-quarter 2014 results with strong volume growth as it increases its exposure to the pickup truck market through the launch of its “Extreme”-brand trucks. Going forward, we believe the company will leverage its wide distribution network to further expand into the pickup truck segment, which accounts for 54% of the Laos auto market. Weak stock selection in the Industrials sector hurt most, with Nigerian consumer company UAC of Nigeria the main culprit. The company’s shares fell sharply in US dollar terms because of the weakening naira and fears of slowing growth prospects for the Nigerian economy.
Viewed by geography, our outperformance shows up as a mix of positive stock selection as well as good region weighting decisions through our underweight to the weak-performing Latin Ameri-can markets and overweight to the best-performing Asia region, though our sizeable underweight to the strong Philippines market dragged on performance. Our strongest stock selection came from
| | | | |
| Fund Facts at April 30, 2015 | | | | |
Total Net Assets | | | | $626.9 M |
Sales Charge | | | | None |
Number of Holdings | | | | 79 |
Turnover (5 Yr. Average) | | | | 32% |
Redemption Fee | | | | 2% first 90 days |
Dividend Policy | | | | Annual |
| | | Institutional Class | | Investor Class |
Ticker | | HLFMX | | HLMOX |
CUSIP | | 412295867 | | 412295859 |
Inception Date | | 5/27/2008 | | 12/31/2010 |
Minimum Investment* | | $100,000 | | $5,000 |
Expense Ratio | | 1.77% | | 2.22% |
*Lower minimums available through certain brokerage firms.
investments in the Gulf States, where Saudi Arabian electronics retailer Jarir Marketing outperformed. In March 2015, Saudi Arabia’s newly crowned King Salman provided a stimulus package to consumers in the form of a two month salary bonus, which helped support growth in the company’s same-store sales. Stock selection was weakest in Latin America, primarily from poorly performing Peru-based packaged food company Alicorp where currency weakness and commodity hedging losses hurt the company’s profitability.
Investment Perspectives
Diversification is essential to our portfolio construction
When Qatar and the United Arab Emirates were removed from the FEM Index in May 2014, the concentration of many remaining countries in the Index increased.3 The Philippines is particularly notable—following its booming performance over the past year, the country now accounts for about 26% of the Index! Other large constituents include Colombia (14%) and Kuwait (11%). We will likely remain underweight in markets that we believe are too large in the Index in order to provide a well-diversified portfolio.
As noted earlier, returns in the FEMs have historically been heavily influenced by the idiosyncratic risks associated with each individual country. Diversification is therefore extremely helpful in mitigating the volatility of portfolio performance. A portfolio that is well diversified across the FEM universe should exhibit lower volatility than might be expected if one only considered the volatility of each market in isolation.
The Frontier Emerging Markets Portfolio is managed in strict accordance with the model portfolio constructed for Harding Loevner’s Frontier Emerging Markets Equity Strategy. The Strategy’s risk-control guidelines require that we invest in a minimum of 15 markets and have a maximum 20% exposure to each single market. The guidelines are defined on absolute terms, based on actual portfolios weights, rather than in terms relative to the Index. Our goal is to offer investors a diversified portfolio across regions and sectors, irrespective of the weights of the regions and sectors in the benchmark.
3Qatar and UAE had combined weights of about 20% before their elimination from the MSCI FEM Index.
18
Frontier Emerging Markets Portfolio continued
As we abide by the rules we have set for ourselves, we recognize the direct impact the Strategy’s risk-control constraints can have on relative performance due to the unusual nature of the Index. As we mentioned in the attribution discussion, our underweight to the top-performing Philippines was a drag on our returns compared to the benchmark in this period. We will continue to be underweight the Philippines unless its weight in the Index changes, and this positioning could again have a negative impact on relative returns if this market outperforms again in the future (and, similarly, could be a positive in the event of a significant correction in the market). Regardless, in our view the Strategy should benefit over the long term by maintaining a well-diversified portfolio that consistently adheres to the guidelines we have established.
Philippines
Lower oil prices stimulate an already robust economy
Previously regarded as the “sick man of Asia” for its slow economic growth over the two decades before the global financial crisis, the Philippines has recorded one of the highest growth rates in Asia in the past five years. We visited this nation of 100 million people in March 2015 to get a first-hand understanding of the underlying strength of its economy and capital markets, and we returned with a very positive outlook.
The Philippines’ US$290 billion economy grew 6% in 2014 and the International Monetary Fund (IMF) expects growth to accelerate to nearly 7% in 2015.4 Personal consumption, which accounts for over 70% of GDP, has been increasing an average of 5% per annum, supported by a young population eager to make purchases and rising income from the country’s emerging middle class.5 Inward remittances from overseas Filipinos have also been growing, further supporting domestic consumption. During our trip, we saw anecdotal evidence of increasing affluence with an influx of premium international brands, such as Louis Vuitton and Gucci, into the rapidly growing formal retail malls in the country. One of the main industries contributing to economic growth and rising incomes is Business Process Outsourcing (BPO), which is among the country’s largest employers with over 1 million people working in the industry. The BPO industry’s annual revenues have grown an average of 28% per year over the past decade to US$18 billion in 2014. Alongside the rising BPO industry and increasing remittances, another source of the Philippines improving economic health has
| | | | | | | | |
| Geographical Weightings (%) at April 30, 2015 | |
| Institutional and Investor Classes | |
| Region | | | Portfolio | | | | Benchmark | 1 |
| | | |
Africa | | | 24.7 | | | | 18.6 | |
| | | |
Asia | | | 32.4 | | | | 33.9 | |
| | | |
Europe | | | 6.9 | | | | 5.3 | |
| | | |
Gulf States | | | 17.7 | | | | 13.5 | |
| | | |
Latin America | | | 11.0 | | | | 27.3 | |
| | | |
Middle East | | | 0.5 | | | | 1.4 | |
| | | |
Developed Market Listed2 | | | 3.3 | | | | – | |
| | | |
Cash | | | 3.5 | | | | – | |
1MSCI Frontier Emerging Markets Index. 2Includes frontier markets or emerging markets companies listed in developed markets.
| | | | | | | | |
| Sector Weightings (%) at April 30, 2015 | |
| Institutional and Investor Classes | |
| Sector | | | Portfolio | | | | Benchmark | 1 |
| | | |
Consumer Discretionary | | | 11.8 | | | | 1.2 | |
| | | |
Consumer Staples | | | 16.6 | | | | 7.5 | |
| | | |
Energy | | | 5.6 | | | | 6.8 | |
| | | |
Financials | | | 35.9 | | | | 50.8 | |
| | | |
Health Care | | | 3.5 | | | | 1.4 | |
| | | |
Industrials | | | 3.7 | | | | 8.2 | |
| | | |
Information Technology | | | 0.4 | | | | 0.0 | |
| | | |
Materials | | | 12.3 | | | | 9.5 | |
| | | |
Telecom Services | | | 5.7 | | | | 11.5 | |
| | | |
Utilities | | | 1.0 | | | | 3.1 | |
| | | |
Cash | | | 3.5 | | | | – | |
1MSCI Frontier Emerging Markets Index
been falling oil prices. The government does not subsidize retail prices for petroleum products or electricity prices, so the population has enjoyed the direct impact of cheaper oil through subdued inflation and higher disposable income, bolstering people’s ability to consume. Several of the consumer companies we met with during our recent trip indicated they are struggling to meet surging demand. As oil imports accounted for about 5% of GDP in 2014, the IMF also expects the lower oil price to strengthen the current account surplus.6 We believe this could continue to boost foreign exchange reserves—which currently stand at about US$80 billion—and consequently strengthen the peso. The lower inflation caused by falling commodity prices has also given the Central Bank of the Philippines room to maintain accommodative monetary policies. The cost of credit has fallen sharply over the past 10 years (the country’s 10-year risk-free rate was around 12% in 2004 and currently stands at about 4%), which should also support business investment and consumer spending. Recognizing the positives in the Philippines’ domestic economy and external position, two of the major credit rating agencies—Standard & Poor’s and Moody’s—raised the country’s sovereign credit rating to BBB in 2014, one notch above the baseline investment grade level.
One Portfolio holding that is well placed to benefit from consumption growth in the Philippines is Universal Robina, a packaged-food manufacturing company with several strong brands in the Philippines and neighboring Association of Southeast Asian Nations (ASEAN) countries. We believe the company has three key competitive advantages: First, Universal Robina has strong local brands that are market leaders in their categories and enjoy significant consumer loyalty. Second, the company has a large distribution reach that allows it to supply thousands of mom-and-pop shops in the Philippines. This distribution network has made the company a natural partner for multinational companies interested in entering the Philippines market. For example, Universal Robina recently signed agreements with French Danone and Japanese Calbee Foods to manufacture and distribute their products in the
4International Monetary Fund, Statement at the End of an IMF Staff Mission to the Philippines, Press Release No. 15/150 (Washington D.C.: IMF Publication Services, March, 2015).
5Deutsche Bank, 2015 Philippines Strategy Presentation, (January 29, 2015).
6ibid
19
Institutional Class HLFMX
Investor Class HLMOX
country. Lastly, the company has an integrated business model that includes in-house flour mills and sugar refineries. The refined flour and sugar that Universal Robina produces is not only used in manufacturing its own products but is also sold in the external market. In this way, the company reduces the impact of raw material price volatility upon revenues as compared to its peers.
We particularly like how Universal Robina continues to seek growth opportunities in new locales while pursuing further market share gains in its existing markets. For instance, in July 2014 the company announced the acquisition of Griffin’s, a leader in New Zealand’s snack food industry. The acquisition should allow Universal Robina to both expand its distribution reach into Australia and New Zealand and diversify its product mix in long-standing markets through the addition of Griffin’s premium products.
Saudi Arabia
So far, so good despite oil price slump
We visited Saudi Arabia in November 2014 at a time when the crude oil price was experiencing a precipitous decline, and had expected to see consumers and business managers low in confidence and fearful of a grim future. To our surprise, it was business as usual in Saudi Arabia with confidence high and little concern over the oil “crisis”. This attitude can be attributed to the country’s strong fiscal position—it has very low government debt that is only 3% of GDP—which gives the country significant borrowing capacity to help sustain growth even in periods of low oil prices.7 The kingdom also has about US$500 billion in sovereign reserves from savings acquired when oil prices were high, which provides a buffer to comfortably finance expected deficits and avoid major cuts to current expenditures.8 The government has even announced an expansionary budget for 2015 that includes continued funding of major infrastructure projects and social programs. Saudi Arabia’s fiscal and external position could deteriorate if the oil price remains low for an extended period of time, given that over 90% of fiscal revenues and 80% of export revenues come from the sale of oil. However, Saudi Arabia is a key player in the global oil market with significant influence over oil market dynamics and pricing. We expect it will continue to pursue oil market strategies that ultimately benefit the country. In fact, the low price of the past several months appears to have been part of just such a strategy. OPEC (under Saudi Arabia’s leadership) decided last November not to try to boost prices by cutting oil production. By letting prices remain low, the cartel exerted pressure on the world’s higher-cost oil producers (especially US shale drillers) as a way to avoid surrendering market share.
Beyond its strong fiscal position, Saudi Arabia also possesses attractive demographics. At 30 million people, the country has the largest population among the six nations in the Gulf Cooperation Council—Bahrain, Kuwait, Oman, Qatar, Saudi Arabia, and the UAE. Its population is young, with a median age of around 25, and 2 million people enter the labor force every five years.9 Given the government’s ongoing efforts to increase employment, improve credit penetration, and increase wealth distribution, the spending
7International Monetary Fund, Saudi Arabia, IMF Country Report No. 14/292 (Washington D.C.: IMF Publication Services, September 2014), 11.
8Citi Research: Middle East Macro Monthly, (March 5, 2015), 49.
9Jarir Marketing, Investor Presentation, September 2014.
| | | | | | | | |
Ten Largest Holdings at April 30, 2015 Institutional and Investor Classes | |
| Company | | Sector | | Country | | | % | |
| | | | |
Universal Robina | | Cons Staples | | Philippines | | | 4.1 | |
| | | | |
Kolao Holdings | | Cons Discretionary | | South Korea | | | 3.7 | |
| | | | |
Jarir Marketing | | Cons Discretionary | | Saudi Arabia | | | 3.6 | |
| | | | |
Safaricom | | Telecom Services | | Kenya | | | 2.8 | |
| | | | |
Hoa Phat Group | | Materials | | Vietnam | | | 2.8 | |
| | | | |
Commercial Int’l Bank | | Financials | | Egypt | | | 2.7 | |
| | | | |
Cementos Argos | | Materials | | Colombia | | | 2.7 | |
| | | | |
PetroVietnam | | Energy | | Vietnam | | | 2.6 | |
| | | | |
Olympic Industries | | Cons Staples | | Bangladesh | | | 2.6 | |
| | | | |
Bank of the Philippines | | Financials | | Philippines | | | 2.5 | |
power of the country as a whole is expected to continue growing. Jarir Marketing, Saudi Arabia’s leading retailer of office supplies, books and electronic products, should benefit from the country’s consumption growth. The company has developed a unique brand in its home market—its stores bring to mind a successful fusion of its North American counterparts Staples, Barnes & Noble, and Best Buy. Jarir has significant competitive advantages that differentiate it from other retailers in the country, including holding the exclusive right in Saudi Arabia to translate English books into Arabic. It also has a robust retail network spread across the country and the company’s ability to provide warranty and after-sales service for its electronic products makes it difficult for competitors to compete solely on price. These advantages have allowed Jarir to develop a leading market share in its product categories, a very high return on equity of 60%, as well as high inflation-adjusted cash flow return on investment of about 30% (which is four to ten times higher than that of its aforementioned North American counterparts). The company currently has 36 stores—31 of which are in Saudi Arabia—with plans to spur medium-term growth by opening new sales outlets, with a target to reach a total of 60 stores by 2018.
Please read the separate disclosure page for important information, including the risks of investing in the Portfolio.
20
Commentary Disclosures
The Portfolios invest in foreign securities, which will involve greater volatility and political, economic, and currency risks and differences in accounting methods. They also invest in emerging markets, which involve unique risks, such as exposure to economies less diverse and mature than the US or other more established foreign markets. Economic and political instability may cause larger price changes in emerging markets securities than other foreign securities.
Investments in small- and mid-cap companies involve additional risks such as limited liquidity and greater volatility.
Diversification does not guarantee a profit or prevent a loss in a declining market.
Long-term earnings growth and earnings per share growth are not a forecast of the Portfolios’ future performance.
Bold type indicates companies held in the Portfolios during the fiscal year. Only the first reference to a particular holding appears in bold. The Portfolios are actively managed; therefore holdings shown may not be current. Portfolio holdings and sector and geographical allocations should not be considered recommendations to buy or sell any security. Please refer to the Portfolios of Investments in this report for complete Portfolio holdings. Current and future portfolio holdings are subject to risk.
While the Portfolios have no sales charge, management fees and other expenses still apply. Please see the Prospectus for further details.
Sector & Geographical Weightings data is sourced from: Wilshire Atlas, Harding Loevner Portfolios, and MSCI Barra. Differences may exist between this source data and similar information reported in the financial statements due to timing differences and/or adjustments required pursuant to Generally Accepted Accounting Principles (GAAP).
Five year average turnover data is calculated using a simple average of annual turnover figures for the past five fiscal years. These annual turnover figures utilize purchase, sales, and market value data which is not reflective of adjustments required pursuant to Generally Accepted Accounting Principles (GAAP). Accordingly, differences may exist between this data and similar information reported in the financial statements.
The Commodity Research Bureau Index measures the overall direction of commodity sectors.
The MSCI All Country World Index is a free float-adjusted market capitalization index that is designed to measure equity market performance in the global developed and emerging markets. The Index consists of 46 developed and emerging market countries. Net dividends reinvested.
The MSCI All Country World ex-US Index is a free float-adjusted market capitalization index that is designed to measure equity market performance in the global developed and emerging markets, excluding the US. The Index consists of 45 developed and emerging market countries. Net dividends reinvested.
The MSCI All Country World ex-US Small Cap Index is a free-float market capitalization index that is designed to measure small cap developed and emerging market equity performance. The Index consists of 43 developed and emerging markets countries and targets companies within a market capitalization range of USD 170–4,200 million in terms of the companies’ full market capitalization. Net dividends reinvested.
The MSCI China Index captures large and mid cap representation across China H shares, B shares, Red chips and P chips. With 140 constituents, the index covers about 85% of this China equity universe.
The MSCI EAFE Index (Europe, Australasia, Far East) is a free float-adjusted market capitalization index that is designed to measure developed market equity performance, excluding the US & Canada. The Index consists of 21 developed market countries.
The MSCI Emerging Markets Index is a free float-adjusted market capitalization index that is designed to measure equity market performance in the global emerging markets. The Index consists of 23
emerging market countries. Net dividends reinvested.
The MSCI Frontier Emerging Markets Index is a free float-adjusted market capitalization index designed to measure equity market performance in all countries from the MSCI Frontier Markets Index and the lower size spectrum of the MSCI Emerging Markets Index. The Index consists of 24 frontier markets and 4 emerging markets. Net dividends reinvested.
The JPX-Nikkei Index 400 is composed of 400 companies which meet requirements of the efficient use of capital and investor-focused management perspectives. The selection is based on quantitative criteria, including ROE for efficient use of capital, as well as other financial indicators.
The Tokyo Stock Price (Topix) Index is a capitalization-weighted index of all companies listed on the First Section of the Tokyo Stock Exchange.
You cannot invest directly in these Indices.
Cash Flow measures the cash generating capability of a company by adding non-cash charges (e.g. depreciation) and interest expense to pretax income.
Cash Flow Return on Investment (CFROI) is a valuation model that assumes the stock market sets prices based on cash flow, not on corporate performance and earnings.
Debt-to-GDP Ratio compares a country’s national debt to its gross domestic product. This ratio indicates the country’s ability to pay back its debt.
Earnings Per Share is the portion of a company’s profit allocated to each outstanding share of common stock.
Gross Domestic Product (GDP) is the monetary value of all finished goods and services produced within a country’s borders in a specific time period (usually calculated on an annual basis).
Price/Earnings (P/E) is the ratio of a firm’s closing stock price and its trailing 12 months’ earnings/share.
Return on Equity (ROE) is the net income divided by total common equity outstanding, expressed as a percent.
Revenue is the amount of money that a company actually receives during a specific period, including discounts and deductions for returned merchandise.
Tracking Error is a measure of the amount of active risk that is being taken by a manager in a specific portfolio.
Turnover is calculated by dividing the lesser of Purchases or Sales by Average Capital.
Quasar Distributors, LLC, Distributor.
21

Semi-Annual Report
April 30, 2015
Global Equity Portfolio
International Equity Portfolio
International Small Companies Portfolio
Institutional Emerging Markets Portfolio
Emerging Markets Portfolio
Frontier Emerging Markets Portfolio
Harding, Loevner Funds, Inc.
c/o Northern Trust
Attn: Funds Center C5S
801 South Canal Street
Chicago, IL 60607
(877) 435-8105
www.hardingloevnerfunds.com
Harding, Loevner Funds, Inc.
Table of Contents
For use only when preceded or accompanied by a prospectus. Read the prospectus carefully before you invest or send money.
Harding, Loevner Funds, Inc.
Expense Example
April 30, 2015 (unaudited)
As a shareholder of a Harding Loevner Portfolio, you incur ongoing costs, including management fees; and to the extent applicable, distribution (12b-1) fees, and/or shareholder services fees and other fund expenses. The following examples are intended to help you understand your ongoing costs (in dollars and cents) of investing in a Portfolio and to compare these costs with the ongoing costs of investing in other mutual funds.
The examples are based on an investment of $1,000 invested at the beginning of a six month period and held through the period ended April 30, 2015.
Actual Expenses
The first line under each Portfolio in the table below provides information about actual account values and actual expenses. You may use the information in this line, together with the amount you invested, to estimate the expenses that you paid over the period. Simply divide your account value by $1,000 (for example, an $8,600 account value divided by $1,000 = 8.6), then multiply the result by the number in the first line for your Portfolio under the heading entitled “Expenses Paid During Period” to estimate the expenses you paid on your account during this period.
Hypothetical Example for Comparison Purposes
The second line under each Portfolio in the table below provides information about hypothetical account values and hypothetical expenses based on the Portfolio’s actual expense ratio and an assumed rate of return of 5% per year before expenses, which is not the Portfolio’s actual return. The hypothetical account values and expenses may not be used to estimate the actual ending account balance or expenses you paid for the period. You may use this information to compare the ongoing costs of investing in your Portfolio and other funds. To do so, compare this 5% hypothetical example with the 5% hypothetical examples that appear in the shareholder reports of the other funds. Please note that the expenses shown in the table are meant to highlight your ongoing costs only. Therefore, the second line under each Portfolio in the table is useful in comparing ongoing costs only, and will not help you determine the relative total costs of owning different funds.
| | | | | | | | | | | | | | | | |
| | | | | | | | | | | | | |
| Portfolio | | Beginning
Account Value
November 1, 2014 | | | Ending Account
Value
April 30, 2015 | | | Annualized
Expense Ratio | | | Expenses Paid
During Period *
(November 1, 2014 to April 30, 2015) | |
Global Equity Portfolio—Institutional Class | | | | | | | | | | | | | | | | |
Actual | | $ | 1,000.00 | | | $ | 1,039.60 | | | | 0.91 | % | | $ | 4.60 | |
Hypothetical (5% annual return before expenses) | | | 1,000.00 | | | | 1,020.28 | | | | 0.91 | % | | | 4.56 | |
Global Equity Portfolio—Advisor Class | | | | | | | | | | | | | | | | |
Actual | | | 1,000.00 | | | | 1,038.30 | | | | 1.19 | % | | | 6.01 | |
Hypothetical (5% annual return before expenses) | | | 1,000.00 | | | | 1,018.89 | | | | 1.19 | % | | | 5.96 | |
International Equity Portfolio—Institutional Class | | | | | | | | | | | | | | | | |
Actual | | | 1,000.00 | | | | 1,061.50 | | | | 0.85 | % | | | 4.34 | |
Hypothetical (5% annual return before expenses) | | | 1,000.00 | | | | 1,020.58 | | | | 0.85 | % | | | 4.26 | |
International Equity Portfolio—Investor Class | | | | | | | | | | | | | | | | |
Actual | | | 1,000.00 | | | | 1,059.60 | | | | 1.16 | % | | | 5.92 | |
Hypothetical (5% annual return before expenses) | | | 1,000.00 | | | | 1,019.04 | | | | 1.16 | % | | | 5.81 | |
International Small Companies Portfolio—Institutional Class | | | | | | | | | | | | | | | | |
Actual | | | 1,000.00 | | | | 1,046.30 | | | | 1.30 | % | | | 6.60 | |
Hypothetical (5% annual return before expenses) | | | 1,000.00 | | | | 1,018.35 | | | | 1.30 | % | | | 6.51 | |
International Small Companies Portfolio—Investor Class | | | | | | | | | | | | | | | | |
Actual | | | 1,000.00 | | | | 1,045.60 | | | | 1.55 | % | | | 7.86 | |
Hypothetical (5% annual return before expenses) | | | 1,000.00 | | | | 1,017.11 | | | | 1.55 | % | | | 7.75 | |
Institutional Emerging Markets Portfolio—Class I | | | | | | | | | | | | | | | | |
Actual | | | 1,000.00 | | | | 1,000.20 | | | | 1.29 | % | | | 6.40 | |
Hypothetical (5% annual return before expenses) | | | 1,000.00 | | | | 1,018.40 | | | | 1.29 | % | | | 6.46 | |
Institutional Emerging Markets Portfolio—Class II | | | | | | | | | | | | | | | | |
Actual | | | 1,000.00 | | | | 1,002.00 | | | | 1.14 | % | | | 5.66 | |
Hypothetical (5% annual return before expenses) | | | 1,000.00 | | | | 1,019.14 | | | | 1.14 | % | | | 5.71 | |
Emerging Markets Portfolio—Advisor Class | | | | | | | | | | | | | | | | |
Actual | | | 1,000.00 | | | | 1,001.70 | | | | 1.45 | % | | | 7.20 | |
Hypothetical (5% annual return before expenses) | | | 1,000.00 | | | | 1,017.60 | | | | 1.45 | % | | | 7.25 | |
Frontier Emerging Markets Portfolio—Institutional Class | | | | | | | | | | | | | | | | |
Actual | | | 1,000.00 | | | | 955.80 | | | | 1.76 | % | | | 8.53 | |
Hypothetical (5% annual return before expenses) | | | 1,000.00 | | | | 1,016.07 | | | | 1.76 | % | | | 8.80 | |
Frontier Emerging Markets Portfolio—Investor Class | | | | | | | | | | | | | | | | |
Actual | | | 1,000.00 | | | | 952.70 | | | | 2.17 | % | | | 10.51 | |
Hypothetical (5% annual return before expenses) | | | 1,000.00 | | | | 1,014.03 | | | | 2.17 | % | | | 10.84 | |
* Expenses are calculated using each Portfolio’s annualized expense ratio (as disclosed in the table), multiplied by the average account value for the period, multiplied by the number of days in the period (181 days), and divided by the number of days in the year (365 days).
2
Harding, Loevner Funds, Inc.
Global Equity Portfolio
Portfolio of Investments
April 30, 2015 (unaudited)
| | | | | | | | |
| | |
| | | Shares | | | Value | |
| COMMON STOCKS - 97.4% | | | | | | |
| | |
Australia - 0.1% | | | | | | | | |
| | |
Cochlear Ltd. (Health Care Equipment & Services)† | | | 12,324 | | | | $813,386 | |
| | |
China - 1.9% | | | | | | | | |
| | |
Baidu Inc. - Sponsored ADR (Software & Services)* | | | 82,500 | | | | 16,523,100 | |
| | |
France - 4.5% | | | | | | | | |
| | |
Air Liquide SA (Materials)† | | | 87,700 | | | | 11,482,353 | |
| | |
Dassault Systemes SA (Software & Services)† | | | 123,900 | | | | 9,553,194 | |
| | |
Essilor International SA (Health Care Equipment & Services)† | | | 76,000 | | | | 9,232,998 | |
| | |
L’Oreal SA (Household & Personal Products)† | | | 50,200 | | | | 9,576,695 | |
| | |
| | | | | | | 39,845,240 | |
| | |
Germany - 2.0% | | | | | | | | |
| | |
Linde AG (Materials)† | | | 41,700 | | | | 8,171,947 | |
| | |
SAP SE - Sponsored ADR (Software & Services) | | | 125,100 | | | | 9,468,819 | |
| | |
| | | | | | | 17,640,766 | |
| | |
Hong Kong - 3.2% | | | | | | | | |
| | |
AIA Group Ltd. (Insurance)† | | | 3,219,300 | | | | 21,489,695 | |
| | |
Sands China Ltd. (Consumer Services)† | | | 1,762,519 | | | | 7,208,311 | |
| | |
| | | | | | | 28,698,006 | |
| | |
India - 2.5% | | | | | | | | |
| | |
HDFC Bank Ltd. - ADR (Banks) | | | 203,600 | | | | 11,572,624 | |
| | |
ICICI Bank Ltd. - Sponsored ADR (Banks) | | | 991,200 | | | | 10,833,816 | |
| | |
| | | | | | | 22,406,440 | |
| | |
Indonesia - 0.9% | | | | | | | | |
| | |
Bank Central Asia Tbk PT (Banks)† | | | 7,481,624 | | | | 7,758,527 | |
| | |
Japan - 10.5% | | | | | | | | |
| | |
ABC-Mart Inc. (Retailing)† | | | 230,600 | | | | 13,125,124 | |
| | |
FANUC Corp. (Capital Goods)† | | | 68,522 | | | | 14,987,220 | |
| | |
Kakaku.com Inc. (Software & Services)† | | | 331,888 | | | | 5,137,256 | |
| | |
Keyence Corp. (Technology Hardware & Equipment)† | | | 29,096 | | | | 15,549,808 | |
| | |
M3 Inc. (Health Care Equipment & Services)† | | | 441,500 | | | | 8,322,505 | |
| | |
Makita Corp. (Capital Goods)† | | | 179,200 | | | | 8,976,139 | |
| | |
MonotaRO Co., Ltd. (Capital Goods)† | | | 151,300 | | | | 5,221,767 | |
| | | | | | | | |
| | |
| | | Shares | | | Value | |
| COMMON STOCKS - 97.4% (continued) | | | | | | |
| | |
Japan - 10.5% (continued) | | | | | | | | |
| | |
Stanley Electric Co., Ltd. (Automobiles & Components)† | | | 400,763 | | | | $8,995,487 | |
| | |
Unicharm Corp. (Household & Personal Products)† | | | 479,924 | | | | 12,038,208 | |
| | |
| | | | | | | 92,353,514 | |
| | |
Mexico - 1.1% | | | | | | | | |
| | |
America Movil SAB de CV, Series L - Sponsored ADR (Telecommunication Services) | | | 450,360 | | | | 9,408,020 | |
| | |
Russia - 2.3% | | | | | | | | |
| | |
Magnit PJSC - Sponsored GDR, Reg S (Food & Staples Retailing)† | | | 144,700 | | | | 7,976,838 | |
| | |
Yandex NV, Class A (Software & Services)* | | | 630,500 | | | | 12,130,820 | |
| | |
| | | | | | | 20,107,658 | |
| | |
South Africa - 1.6% | | | | | | | | |
| | |
MTN Group Ltd. (Telecommunication
Services)† | | | 323,897 | | | | 6,490,075 | |
| | |
Sasol Ltd. (Energy)† | | | 194,600 | | | | 7,856,649 | |
| | |
| | | | | | | 14,346,724 | |
| | |
Spain - 1.6% | | | | | | | | |
| | |
Banco Bilbao Vizcaya Argentaria SA (Banks)† | | | 948,500 | | | | 9,549,571 | |
| | |
Grifols SA (Pharmaceuticals, Biotechnology & Life Sciences)† | | | 104,400 | | | | 4,448,014 | |
| | |
| | | | | | | 13,997,585 | |
| | |
Sweden - 1.4% | | | | | | | | |
| | |
Elekta AB, Class B (Health Care Equipment & Services)† | | | 1,320,500 | | | | 12,363,600 | |
| | |
Switzerland - 6.1% | | | | | | | | |
| | |
Lonza Group AG, Reg S (Pharmaceuticals, Biotechnology & Life Sciences)*† | | | 74,600 | | | | 10,594,960 | |
| | |
Nestle SA - Sponsored ADR (Food, Beverage & Tobacco) | | | 284,200 | | | | 22,059,604 | |
| | |
Roche Holding AG, Genusschein (Pharmaceuticals, Biotechnology & Life Sciences)† | | | 40,600 | | | | 11,694,406 | |
| | |
Sonova Holding AG, Reg S (Health Care Equipment & Services)† | | | 67,300 | | | | 9,332,435 | |
| | |
| | | | | | | 53,681,405 | |
See Notes to Financial Statements
3
Harding, Loevner Funds, Inc.
Global Equity Portfolio
Portfolio of Investments
April 30, 2015 (unaudited) (continued)
| | | | | | | | |
| | |
| | | Shares | | | Value | |
| COMMON STOCKS - 97.4% (continued) | |
| | |
Turkey - 1.5% | | | | | | | | |
| | |
Turkiye Garanti Bankasi AS - ADR (Banks) | | | 4,187,700 | | | | $13,442,517 | |
| | |
United Kingdom - 4.2% | | | | | | | | |
| | |
Abcam plc (Pharmaceuticals, Biotechnology & Life Sciences)† | | | 157,711 | | | | 1,266,255 | |
| | |
ARM Holdings plc - Sponsored ADR (Semiconductors & Semiconductor Equipment) | | | 251,300 | | | | 12,813,787 | |
| | |
Rotork plc (Capital Goods)† | | | 5,732 | | | | 207,056 | |
| | |
Shire plc (Pharmaceuticals, Biotechnology & Life Sciences)† | | | 112,000 | | | | 9,112,122 | |
| | |
WPP plc (Media)† | | | 572,400 | | | | 13,366,417 | |
| | |
| | | | | | | 36,765,637 | |
| | |
United States - 52.0% | | | | | | | | |
| | |
3M Co. (Capital Goods) | | | 74,900 | | | | 11,713,611 | |
| | |
Abbott Laboratories (Health Care Equipment & Services) | | | 204,400 | | | | 9,488,248 | |
| | |
AbbVie Inc. (Pharmaceuticals, Biotechnology & Life Sciences) | | | 176,200 | | | | 11,393,092 | |
| | |
Amazon.com Inc. (Retailing)* | | | 26,900 | | | | 11,345,882 | |
| | |
American Express Co. (Diversified Financials) | | | 181,800 | | | | 14,080,410 | |
| | |
BorgWarner Inc. (Automobiles & Components) | | | 185,200 | | | | 10,963,840 | |
| | |
Bunge Ltd. (Food, Beverage & Tobacco) | | | 108,900 | | | | 9,405,693 | |
| | |
Citrix Systems Inc. (Software & Services)* | | | 166,300 | | | | 11,168,708 | |
| | |
Colgate-Palmolive Co. (Household & Personal Products) | | | 211,700 | | | | 14,243,176 | |
| | |
DaVita HealthCare Partners Inc. (Health Care Equipment & Services)* | | | 219,900 | | | | 17,833,890 | |
| | |
eBay Inc. (Software & Services)* | | | 371,600 | | | | 21,649,416 | |
| | |
Emerson Electric Co. (Capital Goods) | | | 177,300 | | | | 10,430,559 | |
| | |
Exxon Mobil Corp. (Energy) | | | 135,300 | | | | 11,821,161 | |
| | |
F5 Networks Inc. (Technology Hardware & Equipment)* | | | 96,400 | | | | 11,762,728 | |
| | |
Facebook Inc., Class A (Software & Services)* | | | 110,300 | | | | 8,688,331 | |
| | |
First Republic Bank (Banks) | | | 286,600 | | | | 16,705,914 | |
| | |
Google Inc., Class A (Software & Services)* | | | 32,900 | | | | 18,054,533 | |
| | | | | | | | |
| | |
| | | Shares | | | Value | |
| COMMON STOCKS - 97.4% (continued) | | | | |
|
United States - 52.0% (continued) | |
| | |
IMS Health Holdings Inc. (Health Care Equipment & Services)* | | | 323,000 | | | | $8,911,570 | |
| | |
IPG Photonics Corp. (Technology Hardware & Equipment)* | | | 129,200 | | | | 11,444,536 | |
| | |
JPMorgan Chase & Co. (Banks) | | | 182,400 | | | | 11,538,624 | |
| | |
Lazard Ltd., Class A (Diversified Financials) | | | 227,100 | | | | 12,043,113 | |
| | |
MasterCard Inc., Class A (Software & Services) | | | 220,800 | | | | 19,918,368 | |
| | |
Microsoft Corp. (Software & Services) | | | 196,400 | | | | 9,552,896 | |
| | |
Monsanto Co. (Materials) | | | 146,500 | | | | 16,695,140 | |
| | |
NIKE Inc., Class B (Consumer Durables & Apparel) | | | 263,200 | | | | 26,014,688 | |
| | |
Praxair Inc. (Materials) | | | 55,200 | | | | 6,730,536 | |
| | |
Roper Technologies Inc. (Capital Goods) | | | 129,000 | | | | 21,693,930 | |
| | |
Salesforce.com Inc. (Software & Services)* | | | 128,400 | | | | 9,350,088 | |
| | |
Schlumberger Ltd. (Energy) | | | 229,600 | | | | 21,722,456 | |
| | |
SVB Financial Group (Banks)* | | | 140,000 | | | | 18,586,400 | |
| | |
Trimble Navigation Ltd. (Technology Hardware & Equipment)* | | | 280,700 | | | | 7,138,201 | |
| | |
Verisk Analytics Inc., Class A (Commercial & Professional Services)* | | | 130,800 | | | | 9,815,232 | |
| | |
Waters Corp. (Pharmaceuticals, Biotechnology & Life Sciences)* | | | 76,900 | | | | 9,627,111 | |
| | |
Wells Fargo & Co. (Banks) | | | 300,000 | | | | 16,530,000 | |
| | |
| | | | | | | | 458,062,081 | |
| |
Total Common Stocks (Cost $669,370,956) | | | | $858,214,206 | |
| | |
| | | | | | | | | |
| PREFERRED STOCKS - 0.4% | | | | | | |
| | |
Spain - 0.4% | | | | | | | | |
| | |
Grifols SA - ADR (Pharmaceuticals, Biotechnology & Life Sciences) | | | 125,300 | | | | 3,985,793 | |
| |
Total Preferred Stocks (Cost $4,288,302) | | | | $3,985,793 | |
See Notes to Financial Statements
4
Harding, Loevner Funds, Inc.
Global Equity Portfolio
Portfolio of Investments
April 30, 2015 (unaudited) (continued)
| | | | | | | | |
| | |
| | | Shares | | | Value | |
| SHORT TERM INVESTMENTS - 3.5% | | | | |
| | |
Northern Institutional Funds - Prime Obligations Portfolio, 0.04% (Money Market Fund) | | | 30,550,416 | | | | $30,550,416 | |
| |
Total Short Term Investments (Cost $30,550,416) | | | | $30,550,416 | |
| | |
| | | | | | | | | |
| | |
Total Investments — 101.3% | | | | | | | | |
| | |
(Cost $704,209,674) | | | | | | | $892,750,415 | |
| |
Liabilities Less Other Assets - (1.3)% | | | | (11,254,578 | ) |
| | |
Net Assets — 100.0% | | | | | | | $881,495,837 | |
Summary of Abbreviations
| ADR | American Depository Receipt. |
| GDR | Global Depository Receipt. |
| Reg S | Security sold outside United States without registration under the Securities Act of 1933. |
| * | Non-income producing security. |
| † | Investment categorized as level 2 security as disclosed in Note 2 of the Notes to Financial Statements. |
| | | | | |
| Industry | | Percentage of
Net Assets |
| |
Automobiles & Components | | | | 2.3 | % |
| |
Banks | | | | 13.2 | |
| |
Capital Goods | | | | 8.3 | |
| |
Commercial & Professional Services | | | | 1.1 | |
| |
Consumer Durables & Apparel | | | | 3.0 | |
| |
Consumer Services | | | | 0.8 | |
| |
Diversified Financials | | | | 3.0 | |
| |
Energy | | | | 4.7 | |
| |
Food & Staples Retailing | | | | 0.9 | |
| |
Food, Beverage & Tobacco | | | | 3.6 | |
| |
Health Care Equipment & Services | | | | 8.7 | |
| |
Household & Personal Products | | | | 4.1 | |
| |
Insurance | | | | 2.4 | |
| |
Materials | | | | 4.9 | |
| |
Media | | | | 1.5 | |
| |
Money Market Fund | | | | 3.5 | |
| |
Pharmaceuticals, Biotechnology & Life Sciences | | | | 7.0 | |
| |
Retailing | | | | 2.8 | |
| |
Semiconductors & Semiconductor Equipment | | | | 1.4 | |
| |
Software & Services | | | | 17.1 | |
| |
Technology Hardware & Equipment | | | | 5.2 | |
| |
Telecommunication Services | | | | 1.8 | |
| |
| | | | | | |
Total Investments | | | | 101.3 | |
Liabilities Less Other Assets | | | | (1.3 | ) |
Net Assets | | | | 100.0 | % |
See Notes to Financial Statements
5
Harding, Loevner Funds, Inc.
International Equity Portfolio
Portfolio of Investments
April 30, 2015 (unaudited)
| | | | | | | | |
| | |
| | | Shares | | | Value | |
| COMMON STOCKS - 92.2% | | | | | | |
| | |
Australia - 1.8% | | | | | | | | |
| | |
CSL Ltd. (Pharmaceuticals, Biotechnology & Life Sciences)† | | | 1,234,300 | | | | $88,601,550 | |
| | |
Belgium - 1.8% | | | | | | | | |
| | |
Anheuser-Busch InBev NV - Sponsored ADR (Food, Beverage & Tobacco) | | | 772,500 | | | | 92,730,900 | |
| | |
Canada - 3.9% | | | | | | | | |
| | |
Canadian National Railway Co. (Transportation) | | | 1,582,500 | | | | 102,102,900 | |
| | |
Imperial Oil Ltd. (Energy) | | | 2,150,200 | | | | 94,888,326 | |
| | |
| | | | | | | 196,991,226 | |
| | |
China - 1.9% | | | | | | | | |
| | |
Baidu Inc. - Sponsored ADR (Software & Services)* | | | 478,800 | | | | 95,894,064 | |
| | |
Denmark - 2.3% | | | | | | | | |
| | |
Novo Nordisk A/S, Class B (Pharmaceuticals, Biotechnology & Life Sciences)† | | | 2,049,800 | | | | 114,820,084 | |
| | |
Finland - 1.3% | | | | | | | | |
| | |
Kone oyj, Class B (Capital Goods)† | | | 1,488,420 | | | | 64,157,547 | |
| | |
France - 12.7% | | | | | | | | |
| | |
Air Liquide SA (Materials)† | | | 1,092,380 | | | | 143,022,725 | |
| | |
Dassault Systemes SA (Software & Services)† | | | 2,899,018 | | | | 223,526,071 | |
| | |
L’Oreal SA (Household & Personal Products)† | | | 663,200 | | | | 126,519,213 | |
| | |
LVMH Moet Hennessy Louis Vuitton SE (Consumer Durables & Apparel)† | | | 283,000 | | | | 49,484,369 | |
| | |
Schneider Electric SE (Capital Goods)† | | | 1,294,600 | | | | 96,539,767 | |
| | |
| | | | | | | 639,092,145 | |
| | |
Germany - 10.8% | | | | | | | | |
| | |
Allianz SE, Reg S (Insurance)† | | | 807,700 | | | | 138,113,877 | |
| | |
Bayerische Motoren Werke AG (Automobiles & Components)† | | | 948,700 | | | | 112,831,556 | |
| | |
Fresenius Medical Care AG & Co. KGaA (Health Care Equipment & Services)† | | | 896,000 | | | | 75,572,933 | |
| | |
Fuchs Petrolub SE (Materials)† | | | 358,274 | | | | 13,458,231 | |
| | |
Linde AG (Materials)† | | | 261,010 | | | | 51,150,118 | |
| | | | | | | | |
| | |
| | | Shares | | | Value | |
| COMMON STOCKS - 92.2% (continued) | | | | | | |
|
Germany - 10.8% (continued) | |
| | |
SAP SE - Sponsored ADR (Software & Services) | | | 1,250,780 | | | | $94,671,538 | |
| | |
Symrise AG (Materials)† | | | 923,100 | | | | 56,404,705 | |
| | |
| | | | | | | 542,202,958 | |
| | |
Hong Kong - 5.9% | | | | | | | | |
| | |
AIA Group Ltd. (Insurance)† | | | 29,166,700 | | | | 194,695,587 | |
| | |
Hong Kong Exchanges and Clearing Ltd. (Diversified Financials)† | | | 1,383,300 | | | | 52,765,012 | |
| | |
Sands China Ltd. (Consumer Services)† | | | 11,725,000 | | | | 47,952,641 | |
| | |
| | | | | | | 295,413,240 | |
| | |
India - 2.8% | | | | | | | | |
| | |
ICICI Bank Ltd. - Sponsored ADR (Banks) | | | 12,888,400 | | | | 140,870,212 | |
| | |
Japan - 15.0% | | | | | | | | |
| | |
FANUC Corp. (Capital Goods)† | | | 658,300 | | | | 143,984,222 | |
| | |
JGC Corp. (Capital Goods)† | | | 2,984,000 | | | | 62,201,016 | |
| | |
Keyence Corp. (Technology Hardware & Equipment)† | | | 185,881 | | | | 99,340,594 | |
| | |
M3 Inc. (Health Care Equipment & Services)† | | | 2,745,400 | | | | 51,752,218 | |
| | |
MISUMI Group Inc. (Capital Goods)† | | | 1,750,700 | | | | 65,660,627 | |
| | |
Mitsubishi Estate Co., Ltd. (Real Estate)† | | | 2,274,000 | | | | 53,457,516 | |
| | |
MonotaRO Co., Ltd. (Capital Goods)† | | | 890,800 | | | | 30,743,888 | |
| | |
Sysmex Corp. (Health Care Equipment & Services)† | | | 2,064,700 | | | | 114,081,162 | |
| | |
Unicharm Corp. (Household & Personal Products)† | | | 5,201,600 | | | | 130,474,707 | |
| | |
| | | | | | | 751,695,950 | |
| | |
Singapore - 1.3% | | | | | | | | |
| | |
DBS Group Holdings Ltd. (Banks)† | | | 4,225,083 | | | | 67,157,464 | |
| | |
South Africa - 2.4% | | | | | | | | |
| | |
MTN Group Ltd. (Telecommunication Services)† | | | 4,112,900 | | | | 82,412,097 | |
| | |
Sasol Ltd. (Energy)† | | | 916,400 | | | | 36,998,114 | |
| | |
| | | | | | | 119,410,211 | |
See Notes to Financial Statements
6
Harding, Loevner Funds, Inc.
International Equity Portfolio
Portfolio of Investments
April 30, 2015 (unaudited) (continued)
| | | | | | | | |
| | |
| | | Shares | | | Value | |
| COMMON STOCKS - 92.2% (continued) | | | | |
| | |
South Korea - 1.1% | | | | | | | | |
| | |
Samsung Electronics Co., Ltd. - GDR (Technology Hardware & Equipment)† | | | 80,600 | | | | $52,994,214 | |
| | |
Spain - 1.4% | | | | | | | | |
| | |
Banco Bilbao Vizcaya Argentaria SA (Banks)† | | | 6,905,700 | | | | 69,527,120 | |
| | |
Sweden - 1.6% | | | | | | | | |
| | |
Atlas Copco AB, Class A (Capital Goods)† | | | 2,537,500 | | | | 79,199,380 | |
| | |
Switzerland - 7.7% | | | | | | | | |
| | |
Nestle SA - Sponsored ADR (Food, Beverage & Tobacco) | | | 2,446,100 | | | | 189,866,282 | |
| | |
Roche Holding AG, Genusschein (Pharmaceuticals, Biotechnology & Life Sciences)† | | | 496,200 | | | | 142,925,226 | |
| | |
Sonova Holding AG, Reg S (Health Care Equipment & Services)† | | | 392,900 | | | | 54,483,116 | |
| | |
| | | | | | | 387,274,624 | |
| | |
Taiwan - 1.6% | | | | | | | | |
| | |
Taiwan Semiconductor Manufacturing Co., Ltd. (Semiconductors & Semiconductor Equipment)† | | | 11,038,125 | | | | 53,289,780 | |
| | |
Taiwan Semiconductor Manufacturing Co., Ltd. - Sponsored ADR (Semiconductors & Semiconductor Equipment) | | | 1,024,200 | | | | 25,031,448 | |
| | |
| | | | | | | 78,321,228 | |
| | |
Turkey - 1.1% | | | | | | | | |
| | |
Turkiye Garanti Bankasi AS - ADR (Banks) | | | 17,654,300 | | | | 56,670,303 | |
| | |
United Kingdom - 9.9% | | | | | | | | |
| | |
ARM Holdings plc (Semiconductors & Semiconductor Equipment)† | | | 5,640,000 | | | | 95,873,839 | |
| | |
BG Group plc (Energy)† | | | 7,011,000 | | | | 127,251,778 | |
| | |
Shire plc (Pharmaceuticals, Biotechnology & Life Sciences)† | | | 705,300 | | | | 57,381,960 | |
| | |
Unilever plc (Food, Beverage & Tobacco)† | | | 1,220,800 | | | | 53,601,565 | |
| | |
WPP plc (Media)† | | | 6,963,700 | | | | 162,613,069 | |
| | |
| | | | | | | 496,722,211 | |
| | | | | | | | |
| | |
| | | Shares | | | Value | |
| COMMON STOCKS - 92.2% (continued) | | | | |
| | |
United States - 3.9% | | | | | | | | |
| | |
Bunge Ltd. (Food, Beverage & Tobacco) | | | 1,056,660 | | | | $91,263,724 | |
| | |
Schlumberger Ltd. (Energy) | | | 1,110,300 | | | | 105,045,483 | |
| | |
| | | | | | | | 196,309,207 | |
| |
Total Common Stocks (Cost $3,537,178,829) | | | | $4,626,055,838 | |
| | |
| | | | | | | | |
| PREFERRED STOCKS - 3.5% | | | | | | |
| | |
Brazil - 1.6% | | | | | | | | |
| | |
Itau Unibanco Holding SA - Sponsored ADR (Banks) | | | 6,350,477 | | | | 81,413,115 | |
| | |
Germany - 0.7% | | | | | | | | |
| | |
Fuchs Petrolub SE (Materials)† | | | 777,700 | | | | 32,905,085 | |
| | |
South Korea - 1.2% | | | | | | | | |
| | |
Samsung Electronics Co., Ltd. - GDR,
Reg S (Technology Hardware &
Equipment)† | | | 119,300 | | | | 59,919,748 | |
| |
Total Preferred Stocks (Cost $161,707,580) | | | | $174,237,948 | |
| | |
| | | | | | | | |
| SHORT TERM INVESTMENTS - 5.1% | | | | | | |
| | |
Northern Institutional Funds - Prime Obligations Portfolio, 0.04% (Money Market Fund) | | | 257,194,223 | | | | 257,194,223 | |
| |
Total Short Term Investments (Cost $257,194,223) | | | | | |
| | |
| | | | | | | | | |
| | |
Total Investments — 100.8% | | | | | | | | |
| | |
(Cost $3,956,080,632) | | | | | | | $5,057,488,009 | |
| |
Liabilities Less Other Assets - (0.8)% | | | | (42,064,367 | ) |
| | |
Net Assets — 100.0% | | | | | | | $5,015,423,642 | |
See Notes to Financial Statements
7
Harding, Loevner Funds, Inc.
International Equity Portfolio
Portfolio of Investments
April 30, 2015 (unaudited) (continued)
Summary of Abbreviations
| ADR | American Depository Receipt. |
| GDR | Global Depository Receipt. |
| Reg S | Security sold outside United States without registration under the Securities Act of 1933. |
| * | Non-income producing security. |
| † | Investment categorized as level 2 security as disclosed in Note 2 of the Notes to Financial Statements. |
| | | | | |
| Industry | | Percentage of
Net Assets |
| |
Automobiles & Components | | | | 2.3 | % |
| |
Banks | | | | 8.3 | |
| |
Capital Goods | | | | 10.8 | |
| |
Consumer Durables & Apparel | | | | 1.0 | |
| |
Consumer Services | | | | 1.0 | |
| |
Diversified Financials | | | | 1.1 | |
| |
Energy | | | | 7.3 | |
| |
Food, Beverage & Tobacco | | | | 8.5 | |
| |
Health Care Equipment & Services | | | | 5.9 | |
| |
Household & Personal Products | | | | 5.1 | |
| |
Insurance | | | | 6.6 | |
| |
Materials | | | | 5.9 | |
| |
Media | | | | 3.2 | |
| |
Money Market Fund | | | | 5.1 | |
| |
Pharmaceuticals, Biotechnology & Life Sciences | | | | 8.0 | |
| |
Real Estate | | | | 1.1 | |
| |
Semiconductors & Semiconductor Equipment | | | | 3.5 | |
| |
Software & Services | | | | 8.3 | |
| |
Technology Hardware & Equipment | | | | 4.2 | |
| |
Telecommunication Services | | | | 1.6 | |
| |
Transportation | | | | 2.0 | |
| |
| | | | | | |
Total Investments | | | | 100.8 | |
Liabilities Less Other Assets | | | | (0.8 | ) |
Net Assets | | | | 100.0 | % |
See Notes to Financial Statements
8
Harding, Loevner Funds, Inc.
International Small Companies Portfolio
Portfolio of Investments
April 30, 2015 (unaudited)
| | | | | | | | |
| | |
| | | Shares | | | Value | |
| COMMON STOCKS - 93.6% | | | | | | |
| | |
Australia - 2.9% | | | | | | | | |
| | |
iiNET Ltd. (Telecommunication Services)† | | | 182,330 | | | | $1,431,240 | |
| | |
SAI Global Ltd. (Commercial & Professional Services)† | | | 341,765 | | | | 1,065,693 | |
| | |
TPG Telecom Ltd. (Telecommunication Services)† | | | 66,441 | | | | 466,712 | |
| | |
| | | | | | | 2,963,645 | |
| | |
Austria - 1.3% | | | | | | | | |
| | |
Semperit AG Holding (Capital Goods)† | | | 28,740 | | | | 1,319,456 | |
| | |
Brazil - 2.6% | | | | | | | | |
| | |
CETIP SA - Mercados Organizados (Diversified Financials) | | | 53,097 | | | | 608,872 | |
| | |
SLC Agricola SA (Food, Beverage & Tobacco) | | | 99,600 | | | | 576,850 | |
| | |
Valid Solucoes e Servicos de Seguranca em Meios de Pagamento e Identificacao SA (Commercial & Professional Services) | | | 94,000 | | | | 1,461,657 | |
| | |
| | | | | | | 2,647,379 | |
| | |
China - 4.0% | | | | | | | | |
| | |
Haitian International Holdings Ltd. (Capital Goods)† | | | 187,000 | | | | 466,015 | |
| | |
Shenzhou International Group Holdings Ltd. (Consumer Durables & Apparel)† | | | 94,000 | | | | 443,169 | |
| | |
Wasion Group Holdings Ltd. (Technology Hardware & Equipment)† | | | 1,658,000 | | | | 2,617,205 | |
| | |
Yip’s Chemical Holdings Ltd. (Materials)† | | | 978,000 | | | | 595,078 | |
| | |
| | | | | | | 4,121,467 | |
| | |
Denmark - 0.5% | | | | | | | | |
| | |
Chr Hansen Holding A/S (Materials)† | | | 11,450 | | | | 554,441 | |
| | |
Finland - 1.1% | | | | | | | | |
| | |
Vaisala OYJ, Class A (Technology Hardware & Equipment)† | | | 42,580 | | | | 1,140,997 | |
| | |
France - 5.2% | | | | | | | | |
| | |
Alten SA (Software & Services)† | | | 29,120 | | | | 1,423,384 | |
| | |
IPSOS (Media)† | | | 49,600 | | | | 1,464,144 | |
| | |
Rubis SCA (Utilities)† | | | 26,716 | | | | 1,815,965 | |
| | | | | | | | |
| | |
| | | Shares | | | Value | |
| COMMON STOCKS - 93.6% (continued) | | | | |
| | |
France - 5.2% (continued) | | | | | | | | |
| | |
Virbac SA (Pharmaceuticals, Biotechnology & Life Sciences)† | | | 2,300 | | | | $599,616 | |
| | |
| | | | | | | 5,303,109 | |
| | |
Germany - 9.4% | | | | | | | | |
| | |
Bechtle AG (Software & Services)† | | | 27,100 | | | | 2,000,081 | |
| | |
Bertrandt AG (Commercial & Professional Services)† | | | 7,880 | | | | 1,047,018 | |
| | |
Carl Zeiss Meditec AG, Bearer (Health Care Equipment & Services)† | | | 35,630 | | | | 903,999 | |
| | |
Gerresheimer AG (Pharmaceuticals, Biotechnology & Life Sciences)† | | | 20,750 | | | | 1,179,662 | |
| | |
Gerry Weber International AG (Consumer Durables & Apparel)† | | | 28,840 | | | | 947,440 | |
| | |
KWS Saat SE (Food, Beverage & Tobacco)† | | | 3,270 | | | | 985,806 | |
| | |
Leoni AG (Automobiles & Components)† | | | 16,000 | | | | 1,032,298 | |
| | |
Pfeiffer Vacuum Technology AG (Capital
Goods)† | | | 10,400 | | | | 969,935 | |
| | |
Wirecard AG (Software & Services)† | | | 12,010 | | | | 528,950 | |
| | |
| | | | | | | 9,595,189 | |
| | |
Hong Kong - 2.6% | | | | | | | | |
| | |
Pico Far East Holdings Ltd. (Media)† | | | 3,931,000 | | | | 1,139,439 | |
| | |
Vitasoy International Holdings Ltd. (Food, Beverage & Tobacco)† | | | 820,900 | | | | 1,505,949 | |
| | |
| | | | | | | 2,645,388 | |
| | |
Indonesia - 2.4% | | | | | | | | |
| | |
AKR Corporindo Tbk PT (Capital Goods)† | | | 2,626,500 | | | | 1,048,381 | |
| | |
Tower Bersama Infrastructure Tbk PT (Telecommunication Services)† | | | 1,009,500 | | | | 658,633 | |
| | |
Wijaya Karya Persero Tbk PT (Capital Goods)† | | | 3,408,000 | | | | 783,612 | |
| | |
| | | | | | | 2,490,626 | |
| | |
Italy - 2.9% | | | | | | | | |
| | |
Danieli & C Officine Meccaniche SpA (Capital Goods)† | | | 30,000 | | | | 556,928 | |
See Notes to Financial Statements
9
Harding, Loevner Funds, Inc.
International Small Companies Portfolio
Portfolio of Investments
April 30, 2015 (unaudited) (continued)
| | | | | | | | |
| | |
| | | Shares | | | Value | |
| COMMON STOCKS - 93.6% (continued) | | | | | | |
| | |
Italy - 2.9% (continued) | | | | | | | | |
| | |
DiaSorin SpA (Health Care Equipment & Services)† | | | 17,100 | | | $ | 780,812 | |
| | |
Yoox SpA (Retailing)*† | | | 52,500 | | | | 1,653,810 | |
| | |
| | | | | | | 2,991,550 | |
| | |
Japan - 15.6% | | | | | | | | |
| | |
ABC-Mart Inc. (Retailing)† | | | 11,900 | | | | 677,316 | |
| | |
Arcs Co., Ltd. (Food & Staples Retailing)† | | | 14,000 | | | | 294,347 | |
| | |
Asahi Diamond Industrial Co., Ltd. (Capital Goods)† | | | 27,200 | | | | 334,366 | |
| | |
Asics Corp. (Consumer Durables &
Apparel)† | | | 30,400 | | | | 775,231 | |
| | |
BML Inc. (Health Care Equipment & Services)† | | | 40,900 | | | | 1,242,681 | |
| | |
Cosmos Pharmaceutical Corp. (Food & Staples Retailing)† | | | 5,400 | | | | 725,972 | |
| | |
Hiday Hidaka Corp. (Consumer Services)† | | | 84,840 | | | | 2,067,289 | |
| | |
Infomart Corp. (Software & Services)† | | | 113,000 | | | | 1,121,521 | |
| | |
Lintec Corp. (Materials)† | | | 24,100 | | | | 590,790 | |
| | |
Message Co., Ltd. (Health Care Equipment & Services)† | | | 36,300 | | | | 1,121,497 | |
| | |
MISUMI Group Inc. (Capital Goods)† | | | 26,700 | | | | 1,001,393 | |
| | |
MonotaRO Co., Ltd. (Capital Goods)† | | | 46,600 | | | | 1,608,290 | |
| | |
Nakanishi Inc. (Health Care Equipment & Services)† | | | 32,600 | | | | 1,210,378 | |
| | |
Pigeon Corp. (Household & Personal Products)† | | | 59,700 | | | | 1,573,853 | |
| | |
Rohto Pharmaceutical Co., Ltd. (Pharmaceuticals, Biotechnology & Life Sciences)† | | | 23,000 | | | | 330,362 | |
| | |
Stanley Electric Co., Ltd. (Automobiles & Components)† | | | 31,300 | | | | 702,557 | |
| | |
Sugi Holdings Co., Ltd. (Food & Staples Retailing)† | | | 12,700 | | | | 618,365 | |
| | |
| | | | | | | 15,996,208 | |
| | |
Kenya - 3.2% | | | | | | | | |
| | |
East African Breweries Ltd. (Food, Beverage & Tobacco)† | | | 411,900 | | | | 1,394,499 | |
| | |
Equity Group Holdings Ltd. (Banks)† | | | 3,551,600 | | | | 1,847,839 | |
| | |
| | | | | | | 3,242,338 | |
| | | | | | | | |
| | |
| | | Shares | | | Value | |
| COMMON STOCKS - 93.6% (continued) | | | | |
| | |
Malaysia - 1.7% | | | | | | | | |
| | |
Coastal Contracts Bhd. (Capital Goods)† | | | 1,376,966 | | | $ | 1,160,903 | |
| | |
Dialog Group Bhd. (Capital Goods)† | | | 1,315,240 | | | | 595,449 | |
| | |
| | | | | | | 1,756,352 | |
| | |
Mexico - 0.5% | | | | | | | | |
| | |
Grupo Herdez SAB de CV (Food, Beverage & Tobacco)* | | | 169,500 | | | | 461,258 | |
| | |
Netherlands - 3.5% | | | | | | | | |
| | |
Arcadis NV (Capital Goods)† | | | 42,534 | | | | 1,347,414 | |
| | |
ASM International NV (Semiconductors & Semiconductor Equipment)† | | | 21,890 | | | | 1,060,156 | |
| | |
Brunel International NV (Commercial & Professional Services)† | | | 54,600 | | | | 1,117,846 | |
| | |
| | | | | | | 3,525,416 | |
| | |
Singapore - 2.3% | | | | | | | | |
| | |
Ezion Holdings Ltd. (Energy)† | | | 1,157,080 | | | | 1,047,022 | |
| | |
Super Group Ltd. (Food, Beverage &
Tobacco)† | | | 1,188,000 | | | | 1,337,145 | |
| | |
| | | | | | | 2,384,167 | |
| | |
South Africa - 1.7% | | | | | | | | |
| | |
Clicks Group Ltd. (Food & Staples Retailing)† | | | 144,310 | | | | 1,105,591 | |
| | |
Discovery Ltd. (Insurance)† | | | 61,160 | | | | 676,792 | |
| | |
| | | | | | | 1,782,383 | |
| | |
South Korea - 3.1% | | | | | | | | |
| | |
Cheil Worldwide Inc. (Media)*† | | | 67,670 | | | | 1,442,901 | |
| | |
Halla Visteon Climate Control Corp. (Automobiles & Components)† | | | 20,270 | | | | 761,103 | |
| | |
Kolao Holdings (Retailing)† | | | 52,850 | | | | 987,817 | |
| | |
| | | | | | | 3,191,821 | |
| | |
Spain - 0.9% | | | | | | | | |
| | |
Construcciones y Auxiliar de Ferrocarriles SA (Capital Goods)† | | | 2,500 | | | | 870,397 | |
| | |
Sweden - 2.1% | | | | | | | | |
| | |
Industrial & Financial Systems, Class B (Software & Services)† | | | 61,340 | | | | 2,121,341 | |
See Notes to Financial Statements
10
Harding, Loevner Funds, Inc.
International Small Companies Portfolio
Portfolio of Investments
April 30, 2015 (unaudited) (continued)
| | | | | | | | |
| | |
| | | Shares | | | Value | |
| COMMON STOCKS - 93.6% (continued) | |
| | |
Switzerland - 2.1% | | | | | | | | |
| | |
LEM Holding SA, Reg S (Technology Hardware & Equipment)† | | | 1,840 | | | | $1,632,228 | |
| | |
Temenos Group AG, Reg S (Software &
Services)*† | | | 12,720 | | | | 462,551 | |
| | |
| | | | | | | 2,094,779 | |
| | |
Taiwan - 3.3% | | | | | | | | |
| | |
Advantech Co., Ltd. (Technology Hardware & Equipment)† | | | 116,383 | | | | 959,966 | |
| | |
Airtac International Group (Capital Goods)† | | | 134,000 | | | | 1,095,443 | |
| | |
Chipbond Technology Corp. (Semiconductors & Semiconductor Equipment)† | | | 358,700 | | | | 777,845 | |
| | |
Youngtek Electronics Corp. (Semiconductors & Semiconductor Equipment)† | | | 254,540 | | | | 558,945 | |
| | |
| | | | | | | 3,392,199 | |
| | |
Turkey - 1.5% | | | | | | | | |
| | |
Anadolu Hayat Emeklilik AS (Insurance)† | | | 756,391 | | | | 1,570,172 | |
| | |
United Kingdom - 15.9% | | | | | | | | |
| | |
Abcam plc (Pharmaceuticals, Biotechnology & Life Sciences)† | | | 145,427 | | | | 1,167,627 | |
| | |
Bank of Georgia Holdings plc (Banks)† | | | 40,220 | | | | 1,109,058 | |
| | |
Britvic plc (Food, Beverage & Tobacco)† | | | 92,931 | | | | 1,033,068 | |
| | |
Grafton Group plc (Capital Goods)† | | | 181,640 | | | | 2,297,837 | |
| | |
Jardine Lloyd Thompson Group plc (Insurance)† | | | 38,958 | | | | 634,768 | |
| | |
Morgan Advanced Materials plc (Capital Goods)† | | | 177,500 | | | | 912,887 | |
| | |
PayPoint plc (Commercial & Professional Services)† | | | 70,510 | | | | 925,088 | |
| | |
Rathbone Brothers plc (Diversified Financials)† | | | 52,270 | | | | 1,716,904 | |
| | |
RPC Group plc (Materials)† | | | 177,430 | | | | 1,635,312 | |
| | |
RPS Group plc (Commercial & Professional Services)† | | | 437,560 | | | | 1,431,655 | |
| | |
Senior plc (Capital Goods)† | | | 249,840 | | | | 1,203,241 | |
| | |
Synergy Health plc (Health Care Equipment & Services)*† | | | 65,420 | | | | 2,221,227 | |
| | |
| | | | | | | 16,288,672 | |
| | | | | | | | |
| | |
| | | Shares | | | Value | |
| COMMON STOCKS - 93.6% (continued) | |
| | |
United States - 1.3% | | | | | | | | |
| | |
First Cash Financial Services Inc. (Diversified Financials)* | | | 8,800 | | | | $425,392 | |
| | |
PriceSmart Inc. (Food & Staples Retailing) | | | 11,720 | | | | 942,991 | |
| | |
| | | | | | | | 1,368,383 | |
| |
Total Common Stocks (Cost $78,299,153) | | | | $95,819,133 | |
| | |
| | | | | | | | |
| PARTICIPATION NOTES - 2.7% | |
| | |
India - 2.7% | | | | | | | | |
| | |
GRUH Finance Ltd., Issued by HSBC Bank plc, Maturity date 9/28/17 (Banks)^† | | | 276,800 | | | | 1,075,997 | |
| | |
Max India Ltd., Issued by HSBC Bank plc, Maturity date 8/18/17 (Insurance)^† | | | 245,500 | | | | 1,655,477 | |
| | |
| | | | | | | | 2,731,474 | |
| |
Total Participation Notes (Cost $2,564,244) | | | | $2,731,474 | |
| | |
| | | | | | | | |
| SHORT TERM INVESTMENTS - 3.5% | |
| | |
Northern Institutional Funds - Prime Obligations Portfolio, 0.04% (Money Market Fund) | | | 3,637,049 | | | | 3,637,049 | |
| |
Total Short Term Investments (Cost $3,637,049) | | | | $3,637,049 | |
| | |
| | | | | | | | | |
| |
Total Investments — 99.8% | | | | | |
| |
(Cost $84,500,446) | | | | $102,187,656 | |
| | |
Other Assets Less Liabilities - 0.2% | | | | | | | 228,996 | |
| |
Net Assets — 100.0% | | | | $102,416,652 | |
Summary of Abbreviations
| Reg S | Security sold outside United States without registration under the Securities Act of 1933. |
| * | Non-income producing security. |
| ^ | Security exempt from registration pursuant to Rule 144A of the Securities Act of 1933. These securities, which represent 2.7% of net assets as of April 30, 2015, are considered liquid and may be resold in transactions exempt from registration, normally to qualified buyers. |
| † | Investment categorized as level 2 security as disclosed in Note 2 of the Notes to Financial Statements. |
See Notes to Financial Statements
11
Harding, Loevner Funds, Inc.
International Small Companies Portfolio
Portfolio of Investments
April 30, 2015 (unaudited) (continued)
| | | | | |
| Industry | | Percentage of
Net Assets |
| |
Automobiles & Components | | | | 2.4 | % |
| |
Banks | | | | 3.9 | |
| |
Capital Goods | | | | 17.2 | |
| |
Commercial & Professional Services | | | | 6.9 | |
| |
Consumer Durables & Apparel | | | | 2.1 | |
| |
Consumer Services | | | | 2.0 | |
| |
Diversified Financials | | | | 2.7 | |
| |
Energy | | | | 1.0 | |
| |
Food & Staples Retailing | | | | 3.6 | |
| |
Food, Beverage & Tobacco | | | | 7.1 | |
| |
Health Care Equipment & Services | | | | 7.3 | |
| |
Household & Personal Products | | | | 1.5 | |
| |
Insurance | | | | 4.4 | |
| |
Materials | | | | 3.3 | |
| |
Media | | | | 4.0 | |
| |
Money Market Fund | | | | 3.5 | |
| |
Pharmaceuticals, Biotechnology & Life Sciences | | | | 3.2 | |
| |
Retailing | | | | 3.3 | |
| |
Semiconductors & Semiconductor Equipment | | | | 2.4 | |
| |
Software & Services | | | | 7.5 | |
| |
Technology Hardware & Equipment | | | | 6.2 | |
| |
Telecommunication Services | | | | 2.5 | |
| |
Utilities | | | | 1.8 | |
| | | | | |
Total Investments | | | | 99.8 | |
Other Assets Less Liabilities | | | | 0.2 | |
Net Assets | | | | 100.0 | % |
See Notes to Financial Statements
12
Harding, Loevner Funds, Inc.
Institutional Emerging Markets Portfolio
Portfolio of Investments
April 30, 2015 (unaudited)
| | | | | | | | |
| | |
| | | Shares | | | Value | |
| COMMON STOCKS - 89.3% | | | | |
| | |
Brazil - 3.3% | | | | | | | | |
| | |
Ambev SA - ADR (Food, Beverage & Tobacco) | | | 4,299,200 | | | | $27,213,936 | |
| | |
BM&FBovespa SA - Bolsa de Valores Mercadorias e Futuros (Diversified Financials) | | | 5,120,700 | | | | 21,091,584 | |
| | |
Cielo SA (Software & Services) | | | 1,638,700 | | | | 22,810,560 | |
| | |
| | | | | | | 71,116,080 | |
| | |
Chile - 0.9% | | | | | | | | |
| | |
Banco Santander Chile - ADR (Banks) | | | 937,800 | | | | 20,453,418 | |
| | |
China - 16.7% | | | | | | | | |
| | |
51job Inc. - ADR (Commercial & Professional Services)* | | | 795,900 | | | | 28,652,400 | |
| | |
Anhui Conch Cement Co., Ltd., Class H (Materials)† | | | 5,457,100 | | | | 22,168,562 | |
| | |
Baidu Inc. - Sponsored ADR (Software & Services)* | | | 163,000 | | | | 32,645,640 | |
| | |
China Merchants Holdings International Co., Ltd. (Transportation)† | | | 5,900,459 | | | | 26,785,645 | |
| | |
China Mobile Ltd. - Sponsored ADR (Telecommunication Services) | | | 656,200 | | | | 46,872,366 | |
| | |
CNOOC Ltd. - Sponsored ADR (Energy) | | | 164,600 | | | | 28,187,750 | |
| | |
CSR Corp., Ltd., Class H (Capital Goods)† | | | 10,160,982 | | | | 19,594,325 | |
| | |
Ctrip.com International Ltd. - ADR (Retailing)* | | | 419,700 | | | | 26,726,496 | |
| | |
ENN Energy Holdings Ltd. (Utilities)† | | | 3,245,200 | | | | 23,375,985 | |
| | |
Jiangsu Expressway Co., Ltd., Class H (Transportation)† | | | 9,357,000 | | | | 12,879,258 | |
| | |
Sino Biopharmaceutical Ltd. (Pharmaceuticals, Biotechnology & Life Sciences)† | | | 14,977,670 | | | | 17,135,463 | |
| | |
Tencent Holdings Ltd. (Software & Services)† | | | 2,350,000 | | | | 48,533,251 | |
| | |
Tingyi Cayman Islands Holding Corp. (Food, Beverage & Tobacco)† | | | 4,334,100 | | | | 9,146,188 | |
| | |
Want Want China Holdings Ltd. (Food, Beverage & Tobacco)† | | | 12,967,849 | | | | 14,230,808 | |
| | |
| | | | | | | 356,934,137 | |
| | |
Czech Republic - 1.2% | | | | | | | | |
| | |
Komercni Banka A/S (Banks)† | | | 116,000 | | | | 25,849,155 | |
| | | | | | | | |
| | |
| | | Shares | | | Value | |
| COMMON STOCKS - 89.3% (continued) | | | | |
| | |
Egypt - 0.5% | | | | | | | | |
| | |
Commercial International Bank Egypt SAE - GDR, Reg S (Banks)† | | | 1,465,800 | | | | $10,113,039 | |
| | |
Hong Kong - 4.7% | | | | | | | | |
| | |
AIA Group Ltd. (Insurance)† | | | 8,862,915 | | | | 59,162,347 | |
| | |
ASM Pacific Technology Ltd. (Semiconductors & Semiconductor Equipment)† | | | 1,299,991 | | | | 14,550,014 | |
| | |
Sands China Ltd. (Consumer Services)† | | | 6,473,096 | | | | 26,473,523 | |
| | |
| | | | | | | 100,185,884 | |
| | |
Hungary - 0.8% | | | | | | | | |
| | |
Richter Gedeon Nyrt (Pharmaceuticals, Biotechnology & Life Sciences)† | | | 1,023,000 | | | | 17,228,205 | |
| | |
India - 10.1% | | | | | | | | |
| | |
Ambuja Cements Ltd. (Materials)† | | | 7,323,000 | | | | 26,762,383 | |
| | |
Axis Bank Ltd. (Banks)† | | | 4,482,000 | | | | 39,988,967 | |
| | |
Bharti Airtel Ltd. (Telecommunication Services)† | | | 5,443,700 | | | | 32,598,058 | |
| | |
Dabur India Ltd. (Household & Personal Products)† | | | 7,132,000 | | | | 28,237,032 | |
| | |
Housing Development Finance Corp., Ltd. (Banks)† | | | 1,566,100 | | | | 28,809,507 | |
| | |
Maruti Suzuki India Ltd. (Automobiles & Components)† | | | 370,900 | | | | 21,710,850 | |
| | |
Sun Pharmaceutical Industries Ltd. (Pharmaceuticals, Biotechnology & Life Sciences)† | | | 2,549,600 | | | | 37,572,541 | |
| | |
| | | | | | | 215,679,338 | |
| | |
Indonesia - 2.8% | | | | | | | | |
| | |
Astra International Tbk PT (Automobiles & Components)† | | | 32,673,700 | | | | 17,235,133 | |
| | |
Bank Rakyat Indonesia Persero Tbk PT (Banks)† | | | 37,581,600 | | | | 33,647,055 | |
| | |
Semen Indonesia Persero Tbk PT (Materials)† | | | 9,526,200 | | | | 9,161,173 | |
| | |
| | | | | | | 60,043,361 | |
| | |
Italy - 1.1% | | | | | | | | |
| | |
Tenaris SA - ADR (Energy) | | | 747,600 | | | | 22,988,700 | |
See Notes to Financial Statements
13
Harding, Loevner Funds, Inc.
Institutional Emerging Markets Portfolio
Portfolio of Investments
April 30, 2015 (unaudited) (continued)
| | | | | | | | |
| | |
| | | Shares | | | Value | |
| COMMON STOCKS - 89.3% (continued) | | | | | | |
| | |
Malaysia - 0.2% | | | | | | | | |
| | |
Axiata Group Bhd. (Telecommunication Services)† | | | 1,814,275 | | | | $3,431,357 | |
| | |
Mexico - 4.0% | | | | | | | | |
| | |
Fomento Economico Mexicano SAB de CV - Sponsored ADR (Food, Beverage & Tobacco) | | | 140,700 | | | | 12,731,943 | |
| | |
Grupo Aeroportuario del Sureste SAB de CV - ADR (Transportation)* | | | 181,600 | | | | 26,253,912 | |
| | |
Grupo Financiero Banorte SAB de CV,
Series O (Banks) | | | 3,441,500 | | | | 19,623,414 | |
| | |
Grupo Televisa SAB - Sponsored ADR (Media)* | | | 732,900 | | | | 26,684,889 | |
| | |
| | | | | | | 85,294,158 | |
| | |
Netherlands - 0.6% | | | | | | | | |
| | |
Nostrum Oil & Gas plc (Energy)*† | | | 1,277,886 | | | | 12,053,828 | |
| | |
Nigeria - 0.8% | | | | | | | | |
| | |
Zenith Bank plc (Banks) | | | 154,374,000 | | | | 16,407,086 | |
| | |
Peru - 1.5% | | | | | | | | |
| | |
Credicorp Ltd. (Banks) | | | 204,800 | | | | 31,242,240 | |
| | |
Poland - 1.4% | | | | | | | | |
| | |
Bank Pekao SA (Banks)† | | | 559,800 | | | | 29,155,745 | |
| | |
Russia - 4.5% | | | | | | | | |
| | |
Lukoil OAO - Sponsored ADR (Energy) | | | 617,500 | | | | 31,646,875 | |
| | |
Magnit PJSC - Sponsored GDR, Reg S (Food & Staples Retailing)† | | | 601,900 | | | | 33,180,777 | |
| | |
Sberbank of Russia - Sponsored ADR
(Banks)† | | | 5,270,400 | | | | 31,298,112 | |
| | |
| | | | | | | 96,125,764 | |
| | |
South Africa - 7.7% | | | | | | | | |
| | |
Aspen Pharmacare Holdings Ltd. (Pharmaceuticals, Biotechnology & Life Sciences)*† | | | 1,338,000 | | | | 40,612,821 | |
| | |
Discovery Ltd. (Insurance)† | | | 3,164,600 | | | | 35,019,209 | |
| | |
Naspers Ltd., Class N (Media)† | | | 265,300 | | | | 41,629,892 | |
| | |
Sasol Ltd. (Energy)† | | | 597,600 | | | | 24,127,098 | |
| | |
Standard Bank Group Ltd. (Banks)† | | | 1,534,200 | | | | 22,491,936 | |
| | |
| | | | | | | 163,880,956 | |
| | | | | | | | |
| | |
| | | Shares | | | Value | |
| COMMON STOCKS - 89.3% (continued) | | | | | | |
| | |
South Korea - 5.4% | | | | | | | | |
| | |
Hankook Tire Co., Ltd. (Automobiles & Components)† | | | 667,132 | | | | $27,978,262 | |
| | |
NAVER Corp. (Software & Services)† | | | 16,600 | | | | 10,029,204 | |
| | |
Samsung Electronics Co., Ltd. - GDR (Technology Hardware & Equipment)† | | | 116,900 | | | | 76,861,335 | |
| | |
| | | | | | | 114,868,801 | |
| | |
Taiwan - 10.7% | | | | | | | | |
| | |
Advantech Co., Ltd. (Technology Hardware & Equipment)† | | | 2,665,289 | | | | 21,984,197 | |
| | |
Airtac International Group (Capital Goods)† | | | 1,122,000 | | | | 9,172,292 | |
| | |
Delta Electronics Inc. (Technology Hardware & Equipment)† | | | 2,867,189 | | | | 17,238,333 | |
| | |
Hiwin Technologies Corp. (Capital Goods)† | | | 2,062,010 | | | | 15,722,357 | |
| | |
Hon Hai Precision Industry Co., Ltd. (Technology Hardware & Equipment)† | | | 10,992,787 | | | | 32,954,885 | |
| | |
Largan Precision Co., Ltd. (Technology Hardware & Equipment)† | | | 293,000 | | | | 29,313,712 | |
| | |
MediaTek Inc. (Semiconductors & Semiconductor Equipment)† | | | 1,961,000 | | | | 25,223,809 | |
| | |
Taiwan Semiconductor Manufacturing Co., Ltd. (Semiconductors & Semiconductor Equipment)† | | | 16,037,277 | | | | 77,424,650 | |
| | |
| | | | | | | 229,034,235 | |
| | |
Thailand - 1.5% | | | | | | | | |
| | |
Siam Commercial Bank pcl, Reg S (Banks)† | | | 6,508,270 | | | | 31,391,322 | |
| | |
Turkey - 2.4% | | | | | | | | |
| | |
Arcelik A/S (Consumer Durables &
Apparel)† | | | 5,224,400 | | | | 28,122,725 | |
| | |
Turkiye Garanti Bankasi A/S (Banks)† | | | 7,253,000 | | | | 23,062,765 | |
| | |
| | | | | | | 51,185,490 | |
| | |
Ukraine - 0.3% | | | | | | | | |
| | |
MHP SA - GDR, Reg S (Food, Beverage & Tobacco)† | | | 563,800 | | | | 6,474,921 | |
| | |
United Arab Emirates - 1.1% | | | | | | | | |
| | |
Dragon Oil plc (Energy)† | | | 2,504,900 | | | | 23,796,088 | |
See Notes to Financial Statements
14
Harding, Loevner Funds, Inc.
Institutional Emerging Markets Portfolio
Portfolio of Investments
April 30, 2015 (unaudited) (continued)
| | | | | | | | |
| | |
| | | Shares | | | Value | |
| COMMON STOCKS - 89.3% (continued) | | | | |
| | |
United Kingdom - 5.1% | | | | | | | | |
| | |
Bank of Georgia Holdings plc (Banks)† | | | 494,100 | | | | $13,624,710 | |
| | |
Coca-Cola HBC AG - CDI (Food, Beverage & Tobacco)*† | | | 870,700 | | | | 18,374,257 | |
| | |
Hikma Pharmaceuticals plc (Pharmaceuticals, Biotechnology & Life Sciences)† | | | 1,123,100 | | | | 35,203,853 | |
| | |
SABMiller plc (Food, Beverage & Tobacco)† | | | 763,100 | | | | 40,715,757 | |
| | |
| | | | | | | | 107,918,577 | |
| |
Total Common Stocks (Cost $1,709,872,522) | | | | $1,902,851,885 | |
| | |
| | | | | | | | | |
| PREFERRED STOCKS - 5.7% | | | | | | |
| | |
Brazil - 4.2% | | | | | | | | |
| | |
Banco Bradesco SA - ADR (Banks) | | | 3,223,000 | | | | 34,453,870 | |
| | |
Cia Brasileira de Distribuicao - Sponsored ADR (Food & Staples Retailing) | | | 793,500 | | | | 26,613,990 | |
| | |
Itau Unibanco Holding SA - Sponsored ADR (Banks) | | | 2,199,700 | | | | 28,200,154 | |
| | |
| | | | | | | 89,268,014 | |
| | |
Colombia - 0.8% | | | | | | | | |
| | |
Bancolombia SA - Sponsored ADR (Banks) | | | 376,500 | | | | 17,044,155 | |
| | |
South Korea - 0.7% | | | | | | | | |
| | |
Samsung Electronics Co., Ltd. - GDR, Reg S (Technology Hardware & Equipment)† | | | 30,500 | | | | 15,318,963 | |
| |
Total Preferred Stocks (Cost $128,147,734) | | | | $121,631,132 | |
| | | | | | | | |
| | |
| | | Shares | | | Value | |
| PARTICIPATION NOTES - 2.9% | |
| | |
Qatar - 1.0% | | | | | | | | |
| | |
Qatar National Bank, Issued by HSBC Bank plc, Maturity Date 9/12/16 (Banks)^† | | | 382,700 | | | | $20,817,484 | |
| | |
Saudi Arabia - 1.9% | | | | | | | | |
| | |
Jarir Marketing Co., Issued by HSBC Bank plc, Maturity Date 1/22/18 (Retailing)^† | | | 651,000 | | | | 39,880,205 | |
| |
Total Participation Notes (Cost $58,758,620) | | | | $60,697,689 | |
| | |
| | | | | | | | | |
| SHORT TERM INVESTMENTS - 1.7% | | | | | | |
| | |
Northern Institutional Funds - Prime Obligations Portfolio, 0.04% (Money Market Fund) | | | 36,309,549 | | | | 36,309,549 | |
| |
Total Short Term Investments (Cost $36,309,549) | | | | $36,309,549 | |
| | |
| | | | | | | | | |
| |
Total Investments — 99.6% | | | | | |
| |
(Cost $1,933,088,425) | | | | $2,121,490,255 | |
| | |
Other Assets Less Liabilities - 0.4% | | | | | | | 8,780,083 | |
| |
Net Assets — 100.0% | | | | $2,130,270,338 | |
Summary of Abbreviations
| ADR | American Depository Receipt. |
| CDI | Chess Depository Interest. |
| GDR | Global Depository Receipt. |
| Reg S | Security sold outside United States without registration under the Securities Act of 1933. |
| * | Non-income producing security. |
| ^ | Security exempt from registration pursuant to Rule 144A of the Securities Act of 1933. These securities, which represent 2.9% of net assets as of April 30, 2015, are considered liquid and may be resold in transactions exempt from registration, normally to qualified buyers. |
| † | Investment categorized as level 2 security as disclosed in Note 2 of the Notes to Financial Statements. |
See Notes to Financial Statements
15
Harding, Loevner Funds, Inc.
Institutional Emerging Markets Portfolio
Portfolio of Investments
April 30, 2015 (unaudited) (continued)
| | | | | |
| Industry | | Percentage of
Net Assets |
| |
Automobiles & Components | | | | 3.1 | % |
| |
Banks | | | | 22.4 | |
| |
Capital Goods | | | | 2.1 | |
| |
Commercial & Professional Services | | | | 1.4 | |
| |
Consumer Durables & Apparel | | | | 1.3 | |
| |
Consumer Services | | | | 1.3 | |
| |
Diversified Financials | | | | 1.0 | |
| |
Energy | | | | 6.7 | |
| |
Food & Staples Retailing | | | | 2.8 | |
| |
Food, Beverage & Tobacco | | | | 6.1 | |
| |
Household & Personal Products | | | | 1.3 | |
| |
Insurance | | | | 4.4 | |
| |
Materials | | | | 2.7 | |
| |
Media | | | | 3.2 | |
| |
Money Market Fund | | | | 1.7 | |
| |
Pharmaceuticals, Biotechnology & Life Sciences | | | | 6.9 | |
| |
Retailing | | | | 3.1 | |
| |
Semiconductors & Semiconductor Equipment | | | | 5.5 | |
| |
Software & Services | | | | 5.4 | |
| |
Technology Hardware & Equipment | | | | 9.1 | |
| |
Telecommunication Services | | | | 3.9 | |
| |
Transportation | | | | 3.1 | |
| |
Utilities | | | | 1.1 | |
| | | | | | |
Total Investments | | | | 99.6 | |
Other Assets Less Liabilities | | | | 0.4 | |
Net Assets | | | | 100.0 | % |
See Notes to Financial Statements
16
Harding, Loevner Funds, Inc.
Emerging Markets Portfolio
Portfolio of Investments
April 30, 2015 (unaudited)
| | | | | | | | |
| | |
| | | Shares | | | Value | |
| COMMON STOCKS - 89.4% | | | | | | |
| | |
Brazil - 3.3% | | | | | | | | |
| | |
Ambev SA - ADR (Food, Beverage & Tobacco) | | | 5,449,500 | | | | $34,495,335 | |
| | |
BM&FBovespa SA - Bolsa de Valores Mercadorias e Futuros (Diversified Financials) | | | 6,490,900 | | | | 26,735,282 | |
| | |
Cielo SA (Software & Services) | | | 2,077,200 | | | | 28,914,442 | |
| | |
| | | | | | | 90,145,059 | |
| | |
Chile - 0.9% | | | | | | | | |
| | |
Banco Santander Chile - ADR (Banks) | | | 1,188,700 | | | | 25,925,547 | |
| | |
China - 16.8% | | | | | | | | |
| | |
51job Inc. - ADR (Commercial & Professional Services)* | | | 1,008,500 | | | | 36,306,000 | |
| | |
Anhui Conch Cement Co., Ltd., Class H (Materials)† | | | 6,917,000 | | | | 28,099,163 | |
| | |
Baidu Inc. - Sponsored ADR (Software & Services)* | | | 206,500 | | | | 41,357,820 | |
| | |
China Merchants Holdings International Co., Ltd. (Transportation)† | | | 7,479,313 | | | | 33,952,990 | |
| | |
China Mobile Ltd. - Sponsored ADR (Telecommunication Services) | | | 831,800 | | | | 59,415,474 | |
| | |
CNOOC Ltd. - Sponsored ADR (Energy) | | | 208,700 | | | | 35,739,875 | |
| | |
CSR Corp., Ltd., Class H (Capital Goods)† | | | 12,879,283 | | | | 24,836,267 | |
| | |
Ctrip.com International Ltd. - ADR (Retailing)* | | | 532,000 | | | | 33,877,760 | |
| | |
ENN Energy Holdings Ltd. (Utilities)† | | | 4,114,700 | | | | 29,639,210 | |
| | |
Jiangsu Expressway Co., Ltd., Class H (Transportation)† | | | 11,859,000 | | | | 16,323,087 | |
| | |
Sino Biopharmaceutical Ltd. (Pharmaceuticals, Biotechnology & Life Sciences)† | | | 18,990,128 | | | | 21,725,985 | |
| | |
Tencent Holdings Ltd. (Software &
Services)† | | | 2,983,000 | | | | 61,606,250 | |
| | |
Tingyi Cayman Islands Holding Corp. (Food, Beverage & Tobacco)† | | | 5,494,600 | | | | 11,595,174 | |
| | |
Want Want China Holdings Ltd. (Food, Beverage & Tobacco)† | | | 16,437,000 | | | | 18,037,825 | |
| | |
| | | | | | | 452,512,880 | |
| | |
Czech Republic - 1.2% | | | | | | | | |
| | |
Komercni Banka A/S (Banks)† | | | 147,100 | | | | 32,779,403 | |
| | | | | | | | |
| | |
| | | Shares | | | Value | |
| COMMON STOCKS - 89.4% (continued) | | | | | | |
| | |
Egypt - 0.5% | | | | | | | | |
| | |
Commercial International Bank Egypt SAE - GDR, Reg S (Banks)† | | | 1,858,100 | | | | $12,819,647 | |
| | |
Hong Kong - 4.7% | | | | | | | | |
| | |
AIA Group Ltd. (Insurance)† | | | 11,234,000 | | | | 74,989,979 | |
| | |
ASM Pacific Technology Ltd. (Semiconductors & Semiconductor Equipment)† | | | 1,647,597 | | | | 18,440,558 | |
| | |
Sands China Ltd. (Consumer Services)† | | | 8,202,100 | | | | 33,544,764 | |
| | |
| | | | | | | 126,975,301 | |
| | |
Hungary - 0.8% | | | | | | | | |
| | |
Richter Gedeon Nyrt (Pharmaceuticals, Biotechnology & Life Sciences)† | | | 1,296,700 | | | | 21,837,549 | |
| | |
India - 10.1% | | | | | | | | |
| | |
Ambuja Cements Ltd. (Materials)† | | | 9,282,500 | | | | 33,923,504 | |
| | |
Axis Bank Ltd. (Banks)† | | | 5,681,200 | | | | 50,688,381 | |
| | |
Bharti Airtel Ltd. (Telecommunication Services)† | | | 6,900,300 | | | | 41,320,495 | |
| | |
Dabur India Ltd. (Household & Personal Products)† | | | 9,040,400 | | | | 35,792,774 | |
| | |
Housing Development Finance Corp., Ltd. (Banks)† | | | 1,985,100 | | | | 36,517,306 | |
| | |
Maruti Suzuki India Ltd. (Automobiles & Components)† | | | 470,200 | | | | 27,523,433 | |
| | |
Sun Pharmaceutical Industries Ltd. (Pharmaceuticals, Biotechnology & Life Sciences)† | | | 3,231,800 | | | | 47,625,878 | |
| | |
| | | | | | | 273,391,771 | |
| | |
Indonesia - 2.8% | | | | | | | | |
| | |
Astra International Tbk PT (Automobiles & Components)† | | | 41,416,500 | | | | 21,846,895 | |
| | |
Bank Rakyat Indonesia Persero Tbk PT (Banks)† | | | 47,639,438 | | | | 42,651,903 | |
| | |
Semen Indonesia Persero Tbk PT (Materials)† | | | 12,075,100 | | | | 11,612,404 | |
| | |
| | | | | | | 76,111,202 | |
| | |
Italy - 1.1% | | | | | | | | |
| | |
Tenaris SA - ADR (Energy) | | | 950,000 | | | | 29,212,500 | |
See Notes to Financial Statements
17
Harding, Loevner Funds, Inc.
Emerging Markets Portfolio
Portfolio of Investments
April 30, 2015 (unaudited) (continued)
| | | | | | | | |
| | |
| | | Shares | | | Value | |
| COMMON STOCKS - 89.4% (continued) | | | | |
| | |
Malaysia - 0.2% | | | | | | | | |
| | |
Axiata Group Bhd. (Telecommunication Services)† | | | 2,333,802 | | | | $4,413,944 | |
| | |
Mexico - 4.0% | | | | | | | | |
| | |
Fomento Economico Mexicano SAB de CV - Sponsored ADR (Food, Beverage & Tobacco) | | | 178,300 | | | | 16,134,367 | |
| | |
Grupo Aeroportuario del Sureste SAB de CV - ADR (Transportation)* | | | 230,200 | | | | 33,280,014 | |
| | |
Grupo Financiero Banorte SAB de CV, Series O (Banks) | | | 4,362,440 | | | | 24,874,609 | |
| | |
Grupo Televisa SAB - Sponsored ADR (Media)* | | | 929,000 | | | | 33,824,890 | |
| | |
| | | | | | | 108,113,880 | |
| | |
Netherlands - 0.6% | | | | | | | | |
| | |
Nostrum Oil & Gas PLC (Energy)*† | | | 1,619,900 | | | | 15,279,920 | |
| | |
Nigeria - 0.8% | | | | | | | | |
| | |
Zenith Bank plc (Banks) | | | 195,681,200 | | | | 20,797,273 | |
| | |
Peru - 1.5% | | | | | | | | |
| | |
Credicorp Ltd. (Banks) | | | 259,600 | | | | 39,601,980 | |
| | |
Poland - 1.4% | | | | | | | | |
| | |
Bank Pekao SA (Banks)† | | | 709,600 | | | | 36,957,693 | |
| | |
Russia - 4.5% | | | | | | | | |
| | |
Lukoil OAO - Sponsored ADR (Energy) | | | 782,800 | | | | 40,118,500 | |
| | |
Magnit PJSC - Sponsored GDR, Reg S (Food & Staples Retailing)† | | | 762,900 | | | | 42,056,180 | |
| | |
Sberbank of Russia - Sponsored ADR
(Banks)† | | | 6,680,600 | | | | 39,672,543 | |
| | |
| | | | | | | 121,847,223 | |
| | |
South Africa - 7.7% | | | | | | | | |
| | |
Aspen Pharmacare Holdings Ltd. (Pharmaceuticals, Biotechnology & Life Sciences)*† | | | 1,696,000 | | | | 51,479,330 | |
| | |
Discovery Ltd. (Insurance)† | | | 4,011,400 | | | | 44,389,830 | |
| | |
Naspers Ltd., Class N (Media)† | | | 336,300 | | | | 52,770,948 | |
| | |
Sasol Ltd. (Energy)† | | | 757,548 | | | | 30,584,731 | |
| | |
Standard Bank Group Ltd. (Banks)† | | | 1,944,700 | | | | 28,510,017 | |
| | |
| | | | | | | 207,734,856 | |
| | | | | | | | |
| | |
| | | Shares | | | Value | |
| COMMON STOCKS - 89.4% (continued) | | | | |
| | |
South Korea - 5.4% | | | | | | | | |
| | |
Hankook Tire Co., Ltd. (Automobiles & Components)† | | | 845,638 | | | | $35,464,468 | |
| | |
NAVER Corp. (Software & Services)† | | | 20,900 | | | | 12,627,131 | |
| | |
Samsung Electronics Co., Ltd. - GDR (Technology Hardware & Equipment)† | | | 148,150 | | | | 97,408,098 | |
| | |
| | | | | | | 145,499,697 | |
| | |
Taiwan - 10.7% | | | | | | | | |
| | |
Advantech Co., Ltd. (Technology Hardware & Equipment)† | | | 3,379,439 | | | | 27,874,745 | |
| | |
Airtac International Group (Capital Goods)† | | | 1,421,000 | | | | 11,616,602 | |
| | |
Delta Electronics Inc. (Technology Hardware & Equipment)† | | | 3,633,751 | | | | 21,847,116 | |
| | |
Hiwin Technologies Corp. (Capital Goods)† | | | 2,613,566 | | | | 19,927,845 | |
| | |
Hon Hai Precision Industry Co., Ltd. (Technology Hardware & Equipment)† | | | 13,933,802 | | | | 41,771,649 | |
| | |
Largan Precision Co., Ltd. (Technology Hardware & Equipment)† | | | 372,000 | | | | 37,217,410 | |
| | |
MediaTek Inc. (Semiconductors & Semiconductor Equipment)† | | | 2,485,000 | | | | 31,963,878 | |
| | |
Taiwan Semiconductor Manufacturing Co., Ltd. (Semiconductors & Semiconductor Equipment)† | | | 20,327,637 | | | | 98,137,619 | |
| | |
| | | | | | | 290,356,864 | |
| | |
Thailand - 1.5% | | | | | | | | |
| | |
Siam Commercial Bank pcl, Reg S (Banks)† | | | 8,249,700 | | | | 39,790,757 | |
| | |
Turkey - 2.4% | | | | | | | | |
| | |
Arcelik A/S (Consumer Durables &
Apparel)† | | | 6,622,300 | | | | 35,647,562 | |
| | |
Turkiye Garanti Bankasi A/S (Banks)† | | | 9,193,800 | | | | 29,234,034 | |
| | |
| | | | | | | 64,881,596 | |
| | |
Ukraine - 0.3% | | | | | | | | |
| | |
MHP SA - GDR, Reg S (Food, Beverage & Tobacco)† | | | 700,227 | | | | 8,041,707 | |
| | |
United Arab Emirates - 1.1% | | | | | | | | |
| | |
Dragon Oil plc (Energy)† | | | 3,175,200 | | | | 30,163,815 | |
See Notes to Financial Statements
18
Harding, Loevner Funds, Inc.
Emerging Markets Portfolio
Portfolio of Investments
April 30, 2015 (unaudited) (continued)
| | | | | | | | |
| | |
| | | Shares | | | Value | |
| COMMON STOCKS - 89.4% (continued) | | | | |
| | |
United Kingdom - 5.1% | | | | | | | | |
| | |
Bank of Georgia Holdings plc (Banks)† | | | 626,254 | | | | $17,268,831 | |
| | |
Coca-Cola HBC AG - CDI (Food, Beverage & Tobacco)*† | | | 1,103,700 | | | | 23,291,222 | |
| | |
Hikma Pharmaceuticals plc (Pharmaceuticals, Biotechnology & Life Sciences)† | | | 1,423,600 | | | | 44,623,101 | |
| | |
SABMiller plc (Food, Beverage & Tobacco)† | | | 967,200 | | | | 51,605,661 | |
| | |
| | | | | | | | 136,788,815 | |
| |
Total Common Stocks (Cost $1,907,101,345) | | | | $2,411,980,879 | |
| | |
| | | | | | | | |
| PREFERRED STOCKS - 5.7% | | | | | | |
| | |
Brazil - 4.2% | | | | | | | | |
| | |
Banco Bradesco SA - ADR (Banks) | | | 4,085,400 | | | | 43,672,926 | |
| | |
Cia Brasileira de Distribuicao - Sponsored ADR (Food & Staples Retailing) | | | 1,005,800 | | | | 33,734,532 | |
| | |
Itau Unibanco Holding SA - Sponsored ADR (Banks) | | | 2,788,300 | | | | 35,746,006 | |
| | |
| | | | | | | 113,153,464 | |
| | |
Colombia - 0.8% | | | | | | | | |
| | |
Bancolombia SA - Sponsored ADR (Banks) | | | 477,200 | | | | 21,602,844 | |
| | |
South Korea - 0.7% | | | | | | | | |
| | |
Samsung Electronics Co., Ltd. - GDR, Reg S (Technology Hardware & Equipment)† | | | 38,700 | | | | 19,437,504 | |
| |
Total Preferred Stocks (Cost $144,973,405) | | | | $154,193,812 | |
| | |
| | | | | | | | |
| PARTICIPATION NOTES - 2.8% | | | | | | |
| | |
Qatar - 1.0% | | | | | | | | |
| | |
Qatar National Bank, Issued by HSBC Bank plc, Maturity Date 9/12/16 (Banks)^† | | | 481,643 | | | | 26,199,622 | |
| | |
Saudi Arabia - 1.8% | | | | | | | | |
| | |
Jarir Marketing Co., Issued by HSBC Bank plc, Maturity Date 1/22/18 (Retailing)^† | | | 814,000 | | | | 49,865,572 | |
| |
Total Participation Notes (Cost $72,674,243) | | | | $76,065,194 | |
| | | | | | | | |
| | |
| | | Shares | | | Value | |
| SHORT TERM INVESTMENTS - 2.0% | |
| | |
Northern Institutional Funds - Prime Obligations Portfolio, 0.04% (Money Market Fund) | | | 53,335,940 | | | | $53,335,940 | |
| |
Total Short Term Investments (Cost $53,335,940) | | | | $53,335,940 | |
| | |
| | | | | | | | | |
| | |
Total Investments — 99.9% | | | | | | | | |
| | |
(Cost $2,178,084,933) | | | | | | | $2,695,575,825 | |
| | |
Other Assets Less Liabilities - 0.1% | | | | | | | 3,161,168 | |
| | |
Net Assets — 100.0% | | | | | | | $2,698,736,993 | |
Summary of Abbreviations
| ADR | American Depository Receipt. |
| CDI | Chess Depository Interest. |
| GDR | Global Depository Receipt. |
| Reg S | Security sold outside United States without registration under the Securities Act of 1933. |
| * | Non-income producing security. |
| ^ | Security exempt from registration pursuant to Rule 144A of the Securities Act of 1933. These securities, which represent 2.8% of net assets as of April 30, 2015, are considered liquid and may be resold in transactions exempt from registration, normally to qualified buyers. |
| † | Investment categorized as level 2 security as disclosed in Note 2 of the Notes to Financial Statements. |
See Notes to Financial Statements
19
Harding, Loevner Funds, Inc.
Emerging Markets Portfolio
Portfolio of Investments
April 30, 2015 (unaudited) (continued)
| | | | | |
| Industry | | Percentage of
Net Assets |
| |
Automobiles & Components | | | | 3.2 | % |
| |
Banks | | | | 22.4 | |
| |
Capital Goods | | | | 2.1 | |
| |
Commercial & Professional Services | | | | 1.4 | |
| |
Consumer Durables & Apparel | | | | 1.3 | |
| |
Consumer Services | | | | 1.2 | |
| |
Diversified Financials | | | | 1.0 | |
| |
Energy | | | | 6.7 | |
| |
Food & Staples Retailing | | | | 2.8 | |
| |
Food, Beverage & Tobacco | | | | 6.1 | |
| |
Household & Personal Products | | | | 1.3 | |
| |
Insurance | | | | 4.4 | |
| |
Materials | | | | 2.7 | |
| |
Media | | | | 3.2 | |
| |
Money Market Fund | | | | 2.0 | |
| |
Pharmaceuticals, Biotechnology & Life Sciences | | | | 6.9 | |
| |
Retailing | | | | 3.1 | |
| |
Semiconductors & Semiconductor Equipment | | | | 5.5 | |
| |
Software & Services | | | | 5.4 | |
| |
Technology Hardware & Equipment | | | | 9.1 | |
| |
Telecommunication Services | | | | 3.9 | |
| |
Transportation | | | | 3.1 | |
| |
Utilities | | | | 1.1 | |
| |
| | | | | | |
Total Investments | | | | 99.9 | |
Other Assets Less Liabilities | | | | 0.1 | |
Net Assets | | | | 100.0 | % |
See Notes to Financial Statements
20
Harding, Loevner Funds, Inc.
Frontier Emerging Markets Portfolio
Portfolio of Investments
April 30, 2015 (unaudited)
| | | | | | | | |
| | |
| | | Shares | | | Value | |
| COMMON STOCKS - 83.1% | | | | | | |
| | |
Bangladesh - 6.6% | | | | | | | | |
| | |
BRAC Bank Ltd. (Banks)† | | | 20,500,000 | | | | $8,676,406 | |
| | |
GrameenPhone Ltd. (Telecommunication Services)† | | | 375,000 | | | | 1,560,303 | |
| | |
Lafarge Surma Cement Ltd. (Materials)† | | | 303,942 | | | | 416,320 | |
| | |
Olympic Industries Ltd. (Food, Beverage & Tobacco)† | | | 6,000,162 | | | | 16,256,366 | |
| | |
Square Pharmaceuticals Ltd. (Pharmaceuticals, Biotechnology & Life Sciences)† | | | 4,500,009 | | | | 14,223,777 | |
| | |
| | | | | | | 41,133,172 | |
| | |
Canada - 0.0% | | | | | | | | |
| | |
Katanga Mining Ltd. (Materials)* | | | 772,800 | | | | 169,741 | |
| | |
Colombia - 5.2% | | | | | | | | |
| | |
Cementos Argos SA - Sponsored ADR (Materials)#† | | | 785,000 | | | | 16,675,519 | |
| | |
Cemex Latam Holdings SA (Materials)* | | | 1,625,000 | | | | 9,073,258 | |
| | |
Ecopetrol SA - Sponsored ADR (Energy) | | | 152,500 | | | | 2,610,800 | |
| | |
Grupo de Inversiones Suramericana SA - Sponsored ADR (Diversified Financials)#† | | | 62,500 | | | | 2,053,944 | |
| | |
Interconexion Electrica SA ESP - ADR (Utilities)#† | | | 27,500 | | | | 2,308,985 | |
| | |
| | | | | | | 32,722,506 | |
| | |
Croatia - 0.4% | | | | | | | | |
| | |
Ericsson Nikola Tesla (Technology Hardware & Equipment)† | | | 14,250 | | | | 2,843,063 | |
| | |
Egypt - 4.1% | | | | | | | | |
| | |
Commercial International Bank Egypt SAE (Banks)† | | | 2,325,000 | | | | 16,858,301 | |
| | |
Global Telecom Holding SAE - GDR (Telecommunication Services)*† | | | 1,000,000 | | | | 2,189,494 | |
| | |
Oriental Weavers (Consumer Durables & Apparel)† | | | 4,750,000 | | | | 6,586,543 | |
| | |
| | | | | | | 25,634,338 | |
| | |
Estonia - 0.5% | | | | | | | | |
| | |
Olympic Entertainment Group AS (Consumer Services) | | | 1,100,000 | | | | 2,371,459 | |
| | | | | | | | |
| | |
| | | Shares | | | Value | |
| COMMON STOCKS - 83.1% (continued) | | | | | | |
| | |
Estonia - 0.5% (continued) | | | | | | | | |
| | |
Tallink Grupp AS (Transportation) | | | 587,234 | | | | $508,379 | |
| | |
| | | | | | | 2,879,838 | |
| | |
Ghana - 0.7% | | | | | | | | |
| | |
Ghana Commercial Bank Ltd. (Banks) | | | 3,276,549 | | | | 4,587,169 | |
| | |
Kazakhstan - 2.5% | | | | | | | | |
| | |
Halyk Savings Bank of Kazakhstan JSC - GDR, Reg S (Banks)† | | | 2,023,361 | | | | 15,641,218 | |
| | |
Kenya - 8.7% | | | | | | | | |
| | |
East African Breweries Ltd. (Food, Beverage & Tobacco)† | | | 3,000,000 | | | | 10,156,586 | |
| | |
Equity Group Holdings Ltd. (Banks)† | | | 23,048,000 | | | | 11,991,495 | |
| | |
Kenya Commercial Bank Ltd. (Banks)† | | | 21,000,000 | | | | 13,874,166 | |
| | |
Nation Media Group Ltd. (Media)† | | | 240,040 | | | | 592,772 | |
| | |
Safaricom Ltd. (Telecommunication
Services)† | | | 96,000,000 | | | | 17,650,583 | |
| | |
| | | | | | | 54,265,602 | |
| | |
Kuwait - 0.9% | | | | | | | | |
| | |
Kuwait Projects Co. Holding KSCP (Diversified Financials)† | | | 2,650,000 | | | | 5,784,309 | |
| | |
Lebanon - 0.5% | | | | | | | | |
| | |
Bank Audi SAL - GDR, Reg S (Banks) | | | 470,000 | | | | 3,102,000 | |
| | |
Mauritius - 0.3% | | | | | | | | |
| | |
MCB Group Ltd. (Banks) | | | 330,000 | | | | 1,925,000 | |
| | |
Morocco - 2.0% | | | | | | | | |
| | |
Attijariwafa Bank (Banks)† | | | 165,000 | | | | 6,136,493 | |
| | |
Maroc Telecom (Telecommunication Services)† | | | 475,000 | | | | 6,317,057 | |
| | |
| | | | | | | 12,453,550 | |
| | |
Netherlands - 1.3% | | | | | | | | |
| | |
Nostrum Oil & Gas plc (Energy)*† | | | 900,000 | | | | 8,489,369 | |
| | |
Nigeria - 6.9% | | | | | | | | |
| | |
Dangote Cement plc (Materials) | | | 11,200,000 | | | | 10,383,920 | |
| | |
FBN Holdings plc (Banks) | | | 25,049,330 | | | | 1,233,585 | |
| | |
Guaranty Trust Bank plc (Banks) | | | 72,500,000 | | | | 10,474,246 | |
| | |
Lafarge Africa plc (Materials) | | | 9,050,000 | | | | 4,274,874 | |
See Notes to Financial Statements
21
Harding, Loevner Funds, Inc.
Frontier Emerging Markets Portfolio
Portfolio of Investments
April 30, 2015 (unaudited) (continued)
| | | | | | | | |
| | |
| | | Shares | | | Value | |
| COMMON STOCKS - 83.1% (continued) | | | | | | |
| | |
Nigeria - 6.9% (continued) | | | | | | | | |
| | |
Nigerian Breweries plc (Food, Beverage & Tobacco) | | | 4,750,000 | | | | $3,747,726 | |
| | |
UAC of Nigeria plc (Capital Goods) | | | 20,500,000 | | | | 4,326,633 | |
| | |
Zenith Bank plc (Banks) | | | 83,500,000 | | | | 8,874,498 | |
| | |
| | | | | | | 43,315,482 | |
| | |
Pakistan - 5.2% | | | | | | | | |
| | |
Engro Corp., Ltd. (Materials)† | | | 3,099,992 | | | | 9,652,648 | |
| | |
Engro Fertilizers Ltd. (Materials)† | | | 10,499,999 | | | | 8,943,099 | |
| | |
MCB Bank Ltd. (Banks)† | | | 2,350,000 | | | | 6,396,357 | |
| | |
Oil & Gas Development Co., Ltd. (Energy)† | | | 1,550,000 | | | | 2,778,476 | |
| | |
Pakistan Petroleum Ltd. (Energy)† | | | 2,699,997 | | | | 4,767,038 | |
| | |
| | | | | | | 32,537,618 | |
| | |
Panama - 1.4% | | | | | | | | |
| | |
Copa Holdings SA, Class A (Transportation) | | | 78,500 | | | | 8,704,865 | |
| | |
Peru - 3.3% | | | | | | | | |
| | |
Alicorp SAA (Food, Beverage & Tobacco) | | | 1,800,000 | | | | 3,478,122 | |
| | |
Credicorp Ltd. (Banks) | | | 98,500 | | | | 15,026,175 | |
| | |
Ferreycorp SAA (Capital Goods) | | | 2,038,896 | | | | 892,139 | |
| | |
Union Andina de Cementos SAA (Materials) | | | 1,600,000 | | | | 1,251,996 | |
| | |
| | | | | | | 20,648,432 | |
| | |
Philippines - 8.2% | | | | | | | | |
| | |
Bank of the Philippine Islands (Banks)† | | | 6,899,992 | | | | 15,670,189 | |
| | |
International Container Terminal Services Inc. (Transportation)† | | | 2,750,000 | | | | 6,796,937 | |
| | |
Philippine Long Distance Telephone Co. - Sponsored ADR (Telecommunication Services) | | | 47,500 | | | | 3,060,900 | |
| | |
Universal Robina Corp. (Food, Beverage & Tobacco)† | | | 5,250,000 | | | | 25,682,996 | |
| | |
| | | | | | | 51,211,022 | |
| | |
Poland - 0.1% | | | | | | | | |
| | |
Kernel Holding SA (Food, Beverage & Tobacco)† | | | 60,000 | | | | 580,090 | |
| | |
Qatar - 1.1% | | | | | | | | |
| | |
Qatar Electricity & Water Co. QSC (Utilities)† | | | 66,500 | | | | 3,866,405 | |
| | | | | | | | |
| | |
| | | Shares | | | Value | |
| COMMON STOCKS - 83.1% (continued) | | | | | | |
| | |
Qatar - 1.1% (continued) | | | | | | | | |
| | |
Qatar National Bank SAQ (Banks)† | | | 56,000 | | | | $3,035,312 | |
| | |
| | | | | | | 6,901,717 | |
| | |
Romania - 1.4% | | | | | | | | |
| | |
Banca Transilvania (Banks)*† | | | 14,118,582 | | | | 8,780,854 | |
| | |
Senegal - 0.8% | | | | | | | | |
| | |
Sonatel (Telecommunication Services) | | | 125,000 | | | | 5,135,321 | |
| | |
Slovenia - 0.8% | | | | | | | | |
| | |
Krka dd Novo mesto (Pharmaceuticals, Biotechnology & Life Sciences)† | | | 63,500 | | | | 4,898,909 | |
| | |
South Korea - 3.7% | | | | | | | | |
| | |
Kolao Holdings (Retailing)† | | | 1,250,000 | | | | 23,363,695 | |
| | |
Sri Lanka - 2.1% | | | | | | | | |
| | |
Commercial Bank of Ceylon plc (Banks)† | | | 8,650,000 | | | | 11,164,807 | |
| | |
John Keells Holdings plc (Capital Goods)† | | | 1,450,000 | | | | 2,241,214 | |
| | |
| | | | | | | 13,406,021 | |
| | |
Tanzania - 1.4% | | | | | | | | |
| | |
Tanzania Breweries Ltd. (Food, Beverage & Tobacco) | | | 1,225,000 | | | | 8,912,444 | |
| | |
Thailand - 1.5% | | | | | | | | |
| | |
Home Product Center pcl, Reg S (Retailing)† | | | 17,279,994 | | | | 3,774,183 | |
| | |
Siam Commercial Bank pcl, Reg S (Banks)† | | | 1,150,000 | | | | 5,546,792 | |
| | |
| | | | | | | 9,320,975 | |
| | |
Ukraine - 1.3% | | | | | | | | |
| | |
MHP SA - GDR, Reg S (Food, Beverage & Tobacco)† | | | 691,556 | | | | 7,942,126 | |
| | |
United Arab Emirates - 2.9% | | | | | | | | |
| | |
Agthia Group PJSC (Food, Beverage & Tobacco)† | | | 7,128,193 | | | | 14,886,439 | |
| | |
Emaar Properties PJSC (Real Estate)† | | | 1,500,000 | | | | 3,318,323 | |
| | |
| | | | | | | 18,204,762 | |
| | |
United Kingdom - 0.6% | | | | | | | | |
| | |
Hikma Pharmaceuticals plc (Pharmaceuticals, Biotechnology & Life Sciences)† | | | 100,000 | | | | 3,134,525 | |
See Notes to Financial Statements
22
Harding, Loevner Funds, Inc.
Frontier Emerging Markets Portfolio
Portfolio of Investments
April 30, 2015 (unaudited) (continued)
| | | | | | | | |
| | |
| | | Shares | | | Value | |
| COMMON STOCKS - 83.1% (continued) | | | | |
| | |
United Kingdom - 0.6% (continued) | | | | | | | | |
| | |
KAZ Minerals plc (Materials)*† | | | 120,000 | | | | $478,999 | |
| | |
| | | | | | | 3,613,524 | |
| | |
United States - 1.3% | | | | | | | | |
| | |
PriceSmart Inc. (Food & Staples Retailing) | | | 102,000 | | | | 8,206,920 | |
| | |
Vietnam - 5.4% | | | | | | | | |
| | |
Hoa Phat Group JSC (Materials)† | | | 8,500,000 | | | | 17,263,469 | |
| | |
PetroVietnam Drilling and Well Services JSC (Energy)† | | | 6,500,000 | | | | 16,521,013 | |
| | |
| | | | | | | | 33,784,482 | |
| |
Total Common Stocks (Cost $506,890,177) | | | | $521,100,134 | |
| | |
| | | | | | | | | |
| PREFERRED STOCKS - 1.4% | | | | | | |
| | |
Colombia - 1.4% | | | | | | | | |
| | |
Bancolombia SA - Sponsored ADR (Banks) | | | 185,000 | | | | 8,374,950 | |
| |
Total Preferred Stocks (Cost $10,483,542) | | | | $8,374,950 | |
| | |
| | | | | | | | | |
| PARTICIPATION NOTES - 12.7% | | | | | | |
| | |
Kuwait - 3.3% | | | | | | | | |
| | |
Kuwait Projects Co. Holdings, Issued by HSBC Bank plc, Maturity Date 1/15/18 (Diversified Financials)^† | | | 6,655,137 | | | | 14,561,213 | |
| | |
National Bank of Kuwait, Issued by Deutsche Bank AG, Maturity Date 3/28/18 (Banks)^† | | | 2,085,000 | | | | 5,944,306 | |
| | |
| | | | | | | 20,505,519 | |
| | |
Saudi Arabia - 9.4% | | | | | | | | |
| | |
Al Rajhi Bank, Issued by JP Morgan Structured Products, Maturity Date 12/5/19 (Banks)^† | | | 50,000 | | | | 835,144 | |
| | |
Al Rajhi Bank, Issued by JP Morgan Structured Products, Maturity Date 6/6/17 (Banks)^† | | | 300,000 | | | | 5,010,866 | |
| | |
Almarai Co., Ltd., Issued by HSBC Bank plc, Maturity Date 7/31/17 (Food, Beverage & Tobacco)^† | | | 205,000 | | | | 4,933,338 | |
| | | | | | | | |
| | |
| | | Shares | | | Value | |
| PARTICIPATION NOTES - 12.7% (continued) | | | | |
| | |
Saudi Arabia - 9.4% (continued) | | | | | | | | |
| | |
Herfy Food Services Co., Issued by JP Morgan Structured Products, Maturity Date 1/14/19 (Consumer Services)^† | | | 407,500 | | | | $13,202,120 | |
| | |
Jarir Marketing Co., Issued by HSBC Bank plc, Maturity Date 1/22/18 (Retailing)^† | | | 372,500 | | | | 22,819,319 | |
| | |
Saudi British Bank, Issued by JP Morgan Structured Products, Maturity Date 12/2/19 (Banks)^† | | | 1,230,000 | | | | 12,053,197 | |
| | |
Saudi British Bank, Issued by JP Morgan Structured Products, Maturity Date 12/2/19 (Banks)^† | | | 45,000 | | | | 440,970 | |
| | |
| | | | | | | | 59,294,954 | |
| |
Total Participation Notes (Cost $81,158,182) | | | | $79,800,473 | |
| | |
| | | | | | | | | |
| | |
| | | Shares | | | Value | |
| SHORT TERM INVESTMENTS - 3.1% | | | | | | |
| | |
Northern Institutional Funds - Prime Obligations Portfolio, 0.04% (Money Market Fund) | | | 19,590,504 | | | | $19,590,504 | |
| |
Total Short Term Investments (Cost $19,590,504) | | | | $19,590,504 | |
| | |
| | | | | | | | | |
| | |
Total Investments — 100.3% | | | | | | | | |
| | |
(Cost $618,122,405) | | | | | | | $628,866,061 | |
| | |
Liabilities Less Other Assets - (0.3)% | | | | | | | (1,974,736 | ) |
| | |
Net Assets — 100.0% | | | | | | | $626,891,325 | |
Summary of Abbreviations
| ADR | American Depository Receipt. |
| GDR | Global Depository Receipt. |
| Reg S | Security sold outside United States without registration under the Securities Act of 1933. |
| # | Security valued at fair value as determined in good faith under policies and procedures established by and under the supervision of the Portfolio’s Board of Directors as disclosed in Note 2 of the Notes to Financial Statements. |
| * | Non-income producing security. |
See Notes to Financial Statements
23
Harding, Loevner Funds, Inc.
Frontier Emerging Markets Portfolio
Portfolio of Investments
April 30, 2015 (unaudited) (continued)
| ^ | Security exempt from registration pursuant to Rule 144A of the Securities Act of 1933. These securities, which represent 12.7% of net assets as of April 30, 2015, are considered liquid and may be resold in transactions exempt from registration, normally to qualified buyers. |
| † | Investment categorized as level 2 security as disclosed in Note 2 of the Notes to Financial Statements. |
| | | | | |
| Industry | | Percentage of
Net Assets |
| |
Banks | | | | 32.2 | % |
| |
Capital Goods | | | | 1.2 | |
| |
Consumer Durables & Apparel | | | | 1.0 | |
| |
Consumer Services | | | | 2.5 | |
| |
Diversified Financials | | | | 3.6 | |
| |
Energy | | | | 5.6 | |
| |
Food & Staples Retailing | | | | 1.3 | |
| |
Food, Beverage & Tobacco | | | | 15.4 | |
| |
Materials | | | | 12.5 | |
| |
Media | | | | 0.1 | |
| |
Money Market Fund | | | | 3.1 | |
| |
Pharmaceuticals, Biotechnology & Life Sciences | | | | 3.5 | |
| |
Real Estate | | | | 0.5 | |
| |
Retailing | | | | 8.0 | |
| |
Technology Hardware & Equipment | | | | 0.5 | |
| |
Telecommunication Services | | | | 5.7 | |
| |
Transportation | | | | 2.6 | |
| |
Utilities | | | | 1.0 | |
| | | | | | |
Total Investments | | | | 100.3 | |
Liabilities Less Other Assets | | | | (0.3 | ) |
Net Assets | | | | 100.0 | % |
See Notes to Financial Statements
24
Harding, Loevner Funds, Inc.
Statements of Assets and Liabilities
April 30, 2015 (unaudited)
| | | | | | | | | | | | |
| | | Global Equity Portfolio | | | International Equity Portfolio | | | International Small Companies Portfolio | |
ASSETS: | | | | | | | | | | | | |
Investments (cost $704,209,674, $3,956,080,632 and $84,500,446, respectively) | | | $892,750,415 | | | | $5,057,488,009 | | | | $102,187,656 | |
Dividends and interest receivable | | | 1,765,717 | | | | 14,519,961 | | | | 236,903 | |
Foreign currency (cost $2,660, $17,093 and $59,043, respectively) | | | 2,945 | | | | 16,819 | | | | 60,842 | |
Receivable for investments sold | | | 2,464,973 | | | | 5,497 | | | | — | |
Receivable for Fund shares sold | | | 207,405 | | | | 7,239,453 | | | | 410,784 | |
Tax reclaim receivable | | | 558,499 | | | | 7,447,286 | | | | 95,772 | |
Prepaid expenses | | | 20,573 | | | | 41,079 | | | | 41,138 | |
Total Assets | | | 897,770,527 | | | | 5,086,758,104 | | | | 103,033,095 | |
LIABILITIES: | | | | | | | | | | | | |
Payable to Investment Adviser | | | (577,006 | ) | | | (2,851,511 | ) | | | (103,666 | ) |
Payable for investments purchased | | | (15,359,861 | ) | | | (29,193,811 | ) | | | (250,889 | ) |
Payable for Fund shares redeemed | | | (115,084 | ) | | | (37,841,981 | ) | | | (128,336 | ) |
Payable for distribution fees | | | — | | | | (218,187 | ) | | | (27,822 | ) |
Deferred capital gains tax | | | — | | | | — | | | | (36,249 | ) |
Other liabilities | | | (222,739 | ) | | | (1,228,972 | ) | | | (69,481 | ) |
Total Liabilities | | | (16,274,690 | ) | | | (71,334,462 | ) | | | (616,443 | ) |
Net Assets | | | $881,495,837 | | | | $5,015,423,642 | | | | $102,416,652 | |
ANALYSIS OF NET ASSETS: | | | | | | | | | | | | |
Paid in capital | | | $673,148,393 | | | | $3,947,796,971 | | | | $84,088,925 | |
Accumulated undistributed net investment income | | | 2,108,437 | | | | 21,105,537 | | | | 6,668 | |
Accumulated net realized gain (loss) from investment transactions | | | 17,718,013 | | | | (54,613,409 | ) | | | 679,601 | |
Net unrealized appreciation on investments and on assets and liabilities denominated in foreign currencies | | | 188,520,994 | | | | 1,101,134,543 | | | | 17,641,458 | |
Net Assets | | | $881,495,837 | | | | $5,015,423,642 | | | | $102,416,652 | |
Net Assets: | | | | | | | | | | | | |
Institutional Class | | | $811,772,285 | | | | $4,568,279,964 | | | | $34,667,288 | |
Investor Class | | | — | | | | 447,143,678 | | | | 67,749,364 | |
Advisor Class | | | 69,723,552 | | | | — | | | | — | |
Total Shares Outstanding: | | | | | | | | | | | | |
Institutional Class (400,000,000, 400,000,000 and 400,000,000, respectively, $.001 par value shares authorized) | | | 24,672,961 | | | | 237,431,209 | | | | 2,447,432 | |
Investor Class ( — , 400,000,000 and 400,000,000, respectively, $.001 par value shares authorized) | | | — | | | | 23,286,001 | | | | 4,798,149 | |
Advisor Class (400,000,000, — and — , respectively, $.001 par value shares authorized) | | | 2,120,873 | | | | — | | | | — | |
Net Asset Value, Offering Price and Redemption Price Per Share: | | | | | | | | | | | | |
Institutional Class | | | $32.90 | | | | $19.24 | | | | $14.16 | |
Investor Class | | | — | | | | 19.20 | | | | 14.12 | |
Advisor Class | | | 32.87 | | | | — | | | | — | |
See Notes to Financial Statements
25
Harding, Loevner Funds, Inc.
Statements of Assets and Liabilities (continued)
April 30, 2015 (unaudited)
| | | | | | | | | | | | |
| | | Institutional Emerging Markets Portfolio | | | Emerging Markets Portfolio | | | Frontier Emerging Markets Portfolio | |
ASSETS: | | | | | | | | | | | | |
Investments (cost $1,933,088,425, $2,178,084,933 and $618,122,405, respectively) | | | $2,121,490,255 | | | | $2,695,575,825 | | | | $628,866,061 | |
Dividends and interest receivable | | | 4,157,037 | | | | 5,233,255 | | | | 3,242,449 | |
Foreign currency (cost $2,056,824, $3,078,492 and $2,604,155, respectively) | | | 2,102,610 | | | | 3,155,669 | | | | 2,595,821 | |
Receivable for investments sold | | | 904,382 | | | | 1,111,558 | | | | 1,444,962 | |
Receivable for Fund shares sold | | | 12,404,375 | | | | 4,894,609 | | | | 2,353,863 | |
Tax reclaim receivable | | | 125,004 | | | | 52,978 | | | | 110,953 | |
Prepaid expenses | | | 78,762 | | | | 44,859 | | | | 40,766 | |
Total Assets | | | 2,141,262,425 | | | | 2,710,068,753 | | | | 638,654,875 | |
LIABILITIES: | | | | | | | | | | | | |
Payable to Investment Adviser | | | (1,964,428 | ) | | | (2,464,382 | ) | | | (729,815 | ) |
Payable for investments purchased | | | (6,058,380 | ) | | | (5,016,501 | ) | | | (5,830,437 | ) |
Payable for Fund shares redeemed | | | (503,860 | ) | | | (2,228,135 | ) | | | (3,209,629 | ) |
Payable for distribution fees | | | — | | | | — | | | | (19,680 | ) |
Deferred capital gains tax | | | (1,885,118 | ) | | | — | | | | (1,676,894 | ) |
Other liabilities | | | (580,301 | ) | | | (1,622,742 | ) | | | (297,095 | ) |
Total Liabilities | | | (10,992,087 | ) | | | (11,331,760 | ) | | | (11,763,550 | ) |
Net Assets | | | $2,130,270,338 | | | | $2,698,736,993 | | | | $626,891,325 | |
ANALYSIS OF NET ASSETS: | | | | | | | | | | | | |
Paid in capital | | | $1,987,216,996 | | | | $2,153,526,155 | | | | $607,673,971 | |
Accumulated undistributed net investment income | | | 2,799,478 | | | | 1,032,164 | | | | 3,647,424 | |
Accumulated net realized gain (loss) from investment transactions | | | (46,349,985 | ) | | | 26,521,365 | | | | 6,504,889 | |
Net unrealized appreciation on investments and on assets and liabilities denominated in foreign currencies | | | 186,603,849 | | | | 517,657,309 | | | | 9,065,041 | |
Net Assets | | | $2,130,270,338 | | | | $2,698,736,993 | | | | $626,891,325 | |
Net Assets: | | | | | | | | | | | | |
Institutional Class | | | $— | | | | $— | | | | $570,950,868 | |
Class I | | | 1,905,536,222 | | | | — | | | | — | |
Class II | | | 224,734,116 | | | | — | | | | — | |
Investor Class | | | — | | | | — | | | | 55,940,457 | |
Advisor Class | | | — | | | | 2,698,736,993 | | | | — | |
Total Shares Outstanding: | | | | | | | | | | | | |
Institutional Class ( — , — and 400,000,000, respectively, $.001 par value shares authorized) | | | — | | | | — | | | | 64,035,851 | |
Class I (500,000,000, — and — respectively, $.001 par value shares authorized) | | | 103,140,874 | | | | — | | | | — | |
Class II (400,000,000, — and — respectively, $.001 par value shares authorized) | | | 21,249,037 | | | | — | | | | — | |
Investor Class ( — , — and 400,000,000, respectively, $.001 par value shares authorized) | | | — | | | | — | | | | 6,325,048 | |
Advisor Class ( — , 500,000,000 and — , respectively, $.001 par value shares authorized) | | | — | | | | 55,669,976 | | | | — | |
Net Asset Value, Offering Price and Redemption Price Per Share: | | | | | | | | | | | | |
Institutional Class | | | $— | | | | $— | | | | $8.92 | |
Class I | | | 18.48 | | | | — | | | | — | |
Class II | | | 10.58 | | | | — | | | | — | |
Investor Class | | | — | | | | — | | | | 8.84 | |
Advisor Class | | | — | | | | 48.48 | | | | — | |
See Notes to Financial Statements
26
Harding, Loevner Funds, Inc.
Statements of Operations
Six Months Ended April 30, 2015 (unaudited)
| | | | | | | | | | | | |
| | | Global Equity Portfolio | | | International Equity Portfolio | | | International Small Companies Portfolio | |
INVESTMENT INCOME | | | | | | | | | | | | |
Interest | | | $27 | | | | $311 | | | | $— | |
Dividends (net of foreign withholding taxes of $351,121, $5,324,463 and $71,057, respectively) | | | 5,589,908 | | | | 41,650,370 | | | | 680,117 | |
Total investment income | | | 5,589,935 | | | | 41,650,681 | | | | 680,117 | |
| | | | |
EXPENSES | | | | | | | | | | | | |
Investment advisory fees (Note 3) | | | 3,255,120 | | | | 15,715,657 | | | | 574,892 | |
Administration fees (Note 3) | | | 133,589 | | | | 551,926 | | | | 18,397 | |
Distribution fees, Investor Class | | | — | | | | 477,460 | | | | 77,062 | |
Custody and accounting fees (Note 3) | | | 82,873 | | | | 461,080 | | | | 27,987 | |
Directors’ fees and expenses (Note 3) | | | 17,785 | | | | 97,024 | | | | 2,048 | |
Transfer agent fees and expenses (Note 3) | | | 24,422 | | | | 66,883 | | | | 22,054 | |
Printing and postage fees | | | 17,361 | | | | 173,053 | | | | 5,498 | |
State registration filing fees | | | 36,293 | | | | 86,387 | | | | 24,235 | |
Professional fees | | | 35,385 | | | | 121,991 | | | | 16,678 | |
Shareholder servicing fees (Note 3) | | | 187,579 | | | | 1,296,339 | | | | 58,071 | |
Compliance officers’ fees and expenses (Note 3) | | | 8,628 | | | | 30,313 | | | | 4,282 | |
Other fees and expenses | | | 15,837 | | | | 74,104 | | | | 4,186 | |
Total Expenses | | | 3,814,872 | | | | 19,152,217 | | | | 835,390 | |
Less Waiver of investment advisory fee and/or reimbursement of other operating expenses (Note 3) | | | — | | | | — | | | | (160,440 | ) |
Net expenses | | | 3,814,872 | | | | 19,152,217 | | | | 674,950 | |
Net investment income | | | 1,775,063 | | | | 22,498,464 | | | | 5,167 | |
REALIZED AND UNREALIZED GAIN (LOSS) | | | | | | | | | | | | |
Net realized gain (loss) | | | | | | | | | | | | |
Investment transactions | | | 21,224,675 | | | | (13,548,733 | ) | | | 1,647,076 | |
Foreign currency transactions | | | 2,938 | | | | (463,327 | ) | | | (11,896 | ) |
Net realized gain (loss) | | | 21,227,613 | | | | (14,012,060 | ) | | | 1,635,180 | |
Change in unrealized appreciation (depreciation) | | | | | | | | | | | | |
Investments (net of increase in deferred foreign taxes of $ -, $ - and $37,543, respectively) | | | 9,438,815 | | | | 271,167,361 | | | | 3,040,040 | |
Translation of assets and liabilities denominated in foreign currencies | | | (34,737 | ) | | | 62,737 | | | | (2,147 | ) |
Net change in unrealized appreciation | | | 9,404,078 | | | | 271,230,098 | | | | 3,037,893 | |
Net realized and unrealized gain | | | 30,631,691 | | | | 257,218,038 | | | | 4,673,073 | |
| | | | |
NET INCREASE IN NET ASSETS RESULTING FROM OPERATIONS | | | $32,406,754 | | | | $279,716,502 | | | | $4,678,240 | |
See Notes to Financial Statements
27
Harding, Loevner Funds, Inc.
Statements of Operations (continued)
Six Months Ended April 30, 2015 (unaudited)
| | | | | | | | | | | | |
| | | Institutional Emerging Markets Portfolio | | | Emerging Markets Portfolio | | | Frontier Emerging Markets Portfolio | |
INVESTMENT INCOME | | | | | | | | | | | | |
Interest | | | $— | | | | $— | | | | $19 | |
Dividends (net of foreign withholding taxes of $2,282,153, $3,010,492 and $700,626, respectively) | | | 14,434,826 | | | | 18,791,956 | | | | 9,292,132 | |
Total investment income | | | 14,434,826 | | | | 18,791,956 | | | | 9,292,151 | |
| | | | |
EXPENSES | | | | | | | | | | | | |
Investment advisory fees (Note 3) | | | 10,417,298 | | | | 13,929,993 | | | | 4,130,467 | |
Administration fees (Note 3) | | | 264,363 | | | | 335,210 | | | | 97,421 | |
Distribution fees, Investor Class | | | — | | | | — | | | | 77,506 | |
Custody and accounting fees (Note 3) | | | 403,436 | | | | 552,403 | | | | 376,353 | |
Directors’ fees and expenses (Note 3) | | | 40,242 | | | | 55,793 | | | | 12,396 | |
Transfer agent fees and expenses (Note 3) | | | 30,606 | | | | 55,732 | | | | 33,373 | |
Printing and postage fees | | | 46,256 | | | | 137,819 | | | | 19,576 | |
State registration filing fees | | | 79,533 | | | | 63,307 | | | | 47,376 | |
Professional fees | | | 71,127 | | | | 92,150 | | | | 31,916 | |
Shareholder servicing fees (Note 3) | | | 390,403 | | | | 2,544,110 | | | | 116,834 | |
Compliance officers’ fees and expenses (Note 3) | | | 14,647 | | | | 19,094 | | | | 7,148 | |
Other fees and expenses | | | 30,155 | | | | 42,759 | | | | 12,026 | |
Total Expenses | | | 11,788,066 | | | | 17,828,370 | | | | 4,962,392 | |
Less Waiver of investment advisory fee and/or reimbursement of other operating expenses (Note 3) | | | (121,752 | ) | | | — | | | | — | |
Net expenses | | | 11,666,314 | | | | 17,828,370 | | | | 4,962,392 | |
Net investment income | | | 2,768,512 | | | | 963,586 | | | | 4,329,759 | |
REALIZED AND UNREALIZED GAIN (LOSS) | | | | | | | | | | | | |
Net realized gain (loss) | | | | | | | | | | | | |
Investment transactions | | | (3,816,930 | ) | | | 31,439,141 | | | | 8,450,711 | |
Foreign currency transactions | | | (645,468 | ) | | | (679,741 | ) | | | (594,143 | ) |
Net realized gain (loss) | | | (4,462,398 | ) | | | 30,759,400 | | | | 7,856,568 | |
Change in unrealized appreciation (depreciation) | | | | | | | | | | | | |
Investments (net of increase/(decrease) in deferred foreign taxes of $(1,708,118), $(2,163,184) and $1,310,975, respectively) | | | 17,545,391 | | | | (28,773,802 | ) | | | (35,904,076 | ) |
Translation of assets and liabilities denominated in foreign currencies | | | 226,530 | | | | 129,409 | | | | 17,952 | |
Net change in unrealized appreciation (depreciation) | | | 17,771,921 | | | | (28,644,393 | ) | | | (35,886,124 | ) |
Net realized and unrealized gain (loss) | | | 13,309,523 | | | | 2,115,007 | | | | (28,029,556 | ) |
| | | | |
NET INCREASE (DECREASE) IN NET ASSETS RESULTING FROM OPERATIONS | | | $16,078,035 | | | | $3,078,593 | | | | $ | (23,699,797) |
See Notes to Financial Statements
28
Harding, Loevner Funds, Inc.
Statements of Changes in Net Assets
For the Six Months Ended April 30, 2015 (unaudited) and the Fiscal Year Ended October 31, 2014
| | | | | | | | | | | | | | | | |
| | | Global Equity Portfolio | | | International Equity Portfolio | |
| | | April 30, 2015 | | | October 31,
2014 | | | April 30, 2015 | | | October 31, 2014 | |
INCREASE (DECREASE) IN NET ASSETS FROM OPERATIONS | | | | | | | | | | | | | | | | |
Net investment income | | | $1,775,063 | | | | $2,956,657 | | | | $22,498,464 | | | | $40,100,077 | |
Net realized gain (loss) on investments and foreign currency transactions | | | 21,227,613 | | | | 29,540,576 | | | | (14,012,060 | ) | | | (8,361,902 | ) |
Net change in unrealized appreciation on investments and translation of assets and liabilities denominated in foreign currencies | | | 9,404,078 | | | | 48,698,598 | | | | 271,230,098 | | | | 78,260,538 | |
Net increase in net assets resulting from operations | | | 32,406,754 | | | | 81,195,831 | | | | 279,716,502 | | | | 109,998,713 | |
DISTRIBUTIONS TO SHAREHOLDERS FROM: | | | | | | | | | | | | | | | | |
Net investment income | | | | | | | | | | | | | | | | |
Institutional Class | | | (2,554,143 | ) | | | (2,478,096 | ) | | | (38,846,985 | ) | | | (27,911,956 | ) |
Investor Class | | | — | | | | — | | | | (2,382,379 | ) | | | (1,837,137 | ) |
Advisor Class | | | (81,209 | ) | | | (210,054 | ) | | | — | | | | — | |
Net realized gain from investments and foreign-currency related transactions | | | | | | | | | | | | | | | | |
Institutional Class | | | (26,960,277 | ) | | | (2,347,678 | ) | | | — | | | | — | |
Advisor Class | | | (3,050,849 | ) | | | (367,945 | ) | | | — | | | | — | |
Total distributions to shareholders | | | (32,646,478 | ) | | | (5,403,773 | ) | | | (41,229,364 | ) | | | (29,749,093 | ) |
TRANSACTIONS IN SHARES OF COMMON STOCK(1) | | | | | | | | | | | | | | | | |
Proceeds from sale of shares | | | | | | | | | | | | | | | | |
Institutional Class | | | 116,189,209 | | | | 194,571,247 | | | | 878,122,599 | | | | 1,013,583,093 | |
Investor Class | | | — | | | | — | | | | 103,003,084 | | | | 114,060,149 | |
Advisor Class | | | 5,696,822 | | | | 14,896,685 | | | | — | | | | — | |
Net Asset Value of shares issued to shareholders upon reinvestment of dividends | | | | | | | | | | | | | | | | |
Institutional Class | | | 29,197,676 | | | | 4,590,321 | | | | 34,920,910 | | | | 23,823,998 | |
Investor Class | | | — | | | | — | | | | 2,200,814 | | | | 1,631,420 | |
Advisor Class | | | 3,034,341 | | | | 565,236 | | | | — | | | | — | |
Cost of shares redeemed | | | | | | | | | | | | | | | | |
Institutional Class | | | (65,815,478 | ) | | | (78,234,287 | ) | | | (382,075,673 | ) | | | (756,833,391 | ) |
Investor Class | | | — | | | | — | | | | (121,754,872 | ) | | | (91,523,163 | ) |
Advisor Class | | | (19,970,679 | ) | | | (28,952,896 | ) | | | — | | | | — | |
Net increase in net assets from portfolio share transactions | | | 68,331,891 | | | | 107,436,306 | | | | 514,416,862 | | | | 304,742,106 | |
NET INCREASE IN NET ASSETS | | | 68,092,167 | | | | 183,228,364 | | | | 752,904,000 | | | | 384,991,726 | |
NET ASSETS | | | | | | | | | | | | | | | | |
At beginning of period | | | 813,403,670 | | | | 630,175,306 | | | | 4,262,519,642 | | | | 3,877,527,916 | |
At end of period | | $ | 881,495,837 | | | $ | 813,403,670 | | | $ | 5,015,423,642 | | | $ | 4,262,519,642 | |
Accumulated Undistributed Net Investment Income Included in Net Assets | | | $2,108,437 | | | | $2,968,726 | | | | $21,105,537 | | | | $39,836,437 | |
| | | | |
(1) CAPITAL SHARE TRANSACTIONS: | | | | | | | | | | | | | | | | |
INSTITUTIONAL CLASS: | | | | | | | | | | | | | | | | |
Shares sold | | | 3,601,221 | | | | 6,335,104 | | | | 47,610,885 | | | | 56,472,269 | |
Shares issued upon reinvestment of dividends | | | 927,499 | | | | 151,246 | | | | 1,969,594 | | | | 1,349,802 | |
Shares redeemed | | | (2,044,709 | ) | | | (2,503,164 | ) | | | (20,835,530 | ) | | | (42,119,099 | ) |
Net increase | | | 2,484,011 | | | | 3,983,186 | | | | 28,744,949 | | | | 15,702,972 | |
INVESTOR CLASS: | | | | | | | | | | | | | | | | |
Shares sold | | | — | | | | — | | | | 5,591,323 | | | | 6,400,291 | |
Shares issued upon reinvestment of dividends | | | — | | | | — | | | | 124,129 | | | | 92,536 | |
Shares redeemed | | | — | | | | — | | | | (6,725,300 | ) | | | (5,097,694 | ) |
Net increase (decrease) | | | — | | | | — | | | | (1,009,848 | ) | | | 1,395,133 | |
ADVISOR CLASS: | | | | | | | | | | | | | | | | |
Shares sold | | | 176,991 | | | | 480,502 | | | | — | | | | — | |
Shares issued upon reinvestment of dividends | | | 96,389 | | | | 18,618 | | | | — | | | | — | |
Shares redeemed | | | (628,554 | ) | | | (938,861 | ) | | | — | | | | — | |
Net decrease | | | (355,174 | ) | | | (439,741 | ) | | | — | | | | — | |
See Notes to Financial Statements
29
Harding, Loevner Funds, Inc.
Statements of Changes in Net Assets (continued)
For the Six Months Ended April 30, 2015 (unaudited) and the Fiscal Year Ended October 31, 2014
| | | | | | | | | | | | | | | | |
| | | International Small Companies
Portfolio | | | Institutional Emerging Markets
Portfolio | |
| | | April 30, 2015 | | | October 31, 2014 | | | April 30, 2015 | | | October 31, 2014 | |
INCREASE (DECREASE) IN NET ASSETS FROM OPERATIONS | | | | | | | | | | | | | | | | |
Net investment income | | | $5,167 | | | | $374,880 | | | | $2,768,512 | | | | $15,470,194 | |
Net realized gain (loss) on investments and foreign currency transactions | | | 1,635,180 | | | | 1,249,872 | | | | (4,462,398 | ) | | | 10,413,623 | |
Net change in unrealized appreciation (depreciation) on investments and translation of assets and liabilities denominated in foreign currencies | | | 3,037,893 | | | | (539,872 | ) | | | 17,771,921 | | | | 18,687,800 | |
Net increase in net assets resulting from operations | | | 4,678,240 | | | | 1,084,880 | | | | 16,078,035 | | | | 44,571,617 | |
DISTRIBUTIONS TO SHAREHOLDERS FROM: | | | | | | | | | | | | | | | | |
Net investment income | | | | | | | | | | | | | | | | |
Institutional Class | | | (106,497 | ) | | | (122,479 | ) | | | — | | | | — | |
Class I | | | — | | | | — | | | | (11,022,311 | ) | | | (8,999,751 | ) |
Class II | | | — | | | | — | | | | (2,386,064 | ) | | | — | |
Investor Class | | | (121,488 | ) | | | (189,439 | ) | | | — | | | | — | |
Net realized gain from investments and foreign-currency related transactions | | | | | | | | | | | | | | | | |
Institutional Class | | | (559,248 | ) | | | (1,655,159 | ) | | | — | | | | — | |
Investor Class | | | (1,082,713 | ) | | | (3,131,178 | ) | | | — | | | | — | |
Total distributions to shareholders | | | (1,869,946 | ) | | | (5,098,255 | ) | | | (13,408,375 | ) | | | (8,999,751 | ) |
TRANSACTIONS IN SHARES OF COMMON STOCK(1) | | | | | | | | | | | | | | | | |
Proceeds from sale of shares | | | | | | | | | | | | | | | | |
Institutional Class | | | 13,645,028 | | | | 14,836,762 | | | | — | | | | — | |
Class I | | | — | | | | — | | | | 509,773,027 | | | | 677,867,908 | |
Class II* | | | — | | | | — | | | | 38,856,231 | | | | 192,807,410 | |
Investor Class | | | 16,931,732 | | | | 29,466,501 | | | | — | | | | — | |
Net Asset Value of shares issued to shareholders upon reinvestment of dividends | | | | | | | | | | | | | | | | |
Institutional Class | | | 639,159 | | | | 1,490,116 | | | | — | | | | — | |
Class I | | | — | | | | — | | | | 9,761,484 | | | | 7,692,156 | |
Class II* | | | — | | | | — | | | | 1,994,611 | | | | — | |
Investor Class | | | 1,186,338 | | | | 3,275,875 | | | | — | | | | — | |
Cost of shares redeemed | | | | | | | | | | | | | | | | |
Institutional Class | | | (9,102,161 | ) | | | (12,511,817 | ) | | | — | | | | — | |
Class I | | | — | | | | — | | | | (138,455,379 | ) | | | (241,309,959 | ) |
Class II* | | | — | | | | — | | | | (10,000,000 | ) | | | | |
Investor Class | | | (15,231,456 | ) | | | (20,069,633 | ) | | | — | | | | — | |
Net increase in net assets from portfolio share transactions | | | 8,068,640 | | | | 16,487,804 | | | | 411,929,974 | | | | 637,057,515 | |
NET INCREASE IN NET ASSETS | | | 10,876,934 | | | | 12,474,429 | | | | 414,599,634 | | | | 672,629,381 | |
NET ASSETS | | | | | | | | | | | | | | | | |
At beginning of period | | | 91,539,718 | | | | 79,065,289 | | | | 1,715,670,704 | | | | 1,043,041,323 | |
At end of period | | $ | 102,416,652 | | | $ | 91,539,718 | | | $ | 2,130,270,338 | | | $ | 1,715,670,704 | |
Accumulated Undistributed Net Investment Income Included in Net Assets | | | $6,668 | | | | $229,486 | | | | $2,799,478 | | | | $13,439,341 | |
| | | | |
CAPITAL SHARE TRANSACTIONS: | | | | | | | | | | | | | | | | |
(1) INSTITUTIONAL CLASS: | | | | | | | | | | | | | | | | |
Shares sold | | | 1,006,284 | | | | 1,039,529 | | | | — | | | | — | |
Shares issued upon reinvestment of dividends | | | 49,242 | | | | 109,487 | | | | — | | | | — | |
Shares redeemed | | | (681,720 | ) | | | (887,997 | ) | | | — | | | | — | |
Net increase | | | 373,806 | | | | 261,019 | | | | — | | | | — | |
CLASS I: | | | | | | | | | | | | | | | | |
Shares sold | | | — | | | | — | | | | 28,610,452 | | | | 37,002,702 | |
Shares issued upon reinvestment of dividends | | | — | | | | — | | | | 565,883 | | | | 440,055 | |
Shares redeemed | | | — | | | | — | | | | (7,825,277 | ) | | | (13,376,119 | ) |
Net increase | | | — | | | | — | | | | 21,351,058 | | | | 24,066,638 | |
CLASS II:* | | | | | | | | | | | | | | | | |
Shares sold | | | — | | | | — | | | | 3,842,786 | | | | 18,181,475 | |
Shares issued upon reinvestment of dividends | | | — | | | | — | | | | 202,293 | | | | — | |
Shares redeemed | | | — | | | | — | | | | (977,517 | ) | | | — | |
Net increase | | | — | | | | — | | | | 3,067,562 | | | | 18,181,475 | |
INVESTOR CLASS: | | | | | | | | | | | | | | | | |
Shares sold | | | 1,293,436 | | | | 2,066,286 | | | | — | | | | — | |
Shares issued upon reinvestment of dividends | | | 91,609 | | | | 240,873 | | | | — | | | | — | |
Shares redeemed | | | (1,140,262 | ) | | | (1,410,437 | ) | | | — | | | | — | |
Net increase | | | 244,783 | | | | 896,722 | | | | — | | | | — | |
| * | For the period from March 5, 2014 (commencement of class operations) through October 31, 2014. |
See Notes to Financial Statements
30
Harding, Loevner Funds, Inc.
Statements of Changes in Net Assets (continued)
For the Six Months Ended April 30, 2015 (unaudited) and the Fiscal Year Ended October 31, 2014
| | | | | | | | | | | | | | | | |
| | | Emerging Markets Portfolio | | | Frontier Emerging Markets Portfolio | |
| | | April 30, 2015 | | | October 31, 2014 | | | April 30, 2015 | | | October 31, 2014 | |
INCREASE (DECREASE) IN NET ASSETS FROM OPERATIONS | | | | | | | | | | | | | | | | |
Net investment income | | | $963,586 | | | | $22,455,192 | | | | $4,329,759 | | | | $4,016,750 | |
Net realized gain on investments and foreign currency transactions | | | 30,759,400 | | | | 100,672,133 | | | | 7,856,568 | | | | 17,648,853 | |
Net change in unrealized appreciation (depreciation) on investments and translation of assets and liabilities denominated in foreign currencies | | | (28,644,393 | ) | | | (40,084,999 | ) | | | (35,886,124 | ) | | | 17,573,698 | |
Net increase (decrease) in net assets resulting from operations | | | 3,078,593 | | | | 83,042,326 | | | | (23,699,797 | ) | | | 39,239,301 | |
DISTRIBUTIONS TO SHAREHOLDERS FROM: | | | | | | | | | | | | | | | | |
Net investment income | | | | | | | | | | | | | | | | |
Institutional Class | | | — | | | | — | | | | (2,796,658 | ) | | | (777,464 | ) |
Investor Class | | | — | | | | — | | | | (138,589 | ) | | | (28,324 | ) |
Advisor Class | | | (19,237,520 | ) | | | (16,977,080 | ) | | | — | | | | — | |
Net realized gain from investments and foreign-currency related transactions | | | | | | | | | | | | | | | | |
Institutional Class | | | — | | | | — | | | | (5,342,306 | ) | | | — | |
Investor Class | | | — | | | | — | | | | (749,018 | ) | | | — | |
Advisor Class | | | (96,450,985 | ) | | | (54,210,866 | ) | | | — | | | | — | |
Total distributions to shareholders | | | (115,688,505 | ) | | | (71,187,946 | ) | | | (9,026,571 | ) | | | (805,788 | ) |
TRANSACTIONS IN SHARES OF COMMON STOCK(1) | | | | | | | | | | | | | | | | |
Proceeds from sale of shares | | | | | | | | | | | | | | | | |
Institutional Class | | | — | | | | — | | | | 202,965,129 | | | | 233,577,907 | |
Investor Class | | | — | | | | — | | | | 19,539,117 | | | | 76,061,236 | |
Advisor Class | | | 538,897,735 | | | | 838,375,319 | | | | — | | | | — | |
Net Asset Value of shares issued to shareholders upon reinvestment of dividends | | | | | | | | | | | | | | | | |
Institutional Class | | | — | | | | — | | | | 6,425,116 | | | | 442,478 | |
Investor Class | | | — | | | | — | | | | 723,315 | | | | 27,636 | |
Advisor Class | | | 107,333,549 | | | | 63,185,505 | | | | — | | | | — | |
Cost of shares redeemed | | | | | | | | | | | | | | | | |
Institutional Class | | | — | | | | — | | | | (85,162,672 | ) | | | (66,783,481 | ) |
Investor Class | | | — | | | | — | | | | (38,422,710 | ) | | | (21,700,564 | ) |
Advisor Class | | | (380,401,440 | ) | | | (480,444,492 | ) | | | — | | | | — | |
Net increase in net assets from portfolio share transactions | | | 265,829,844 | | | | 421,116,332 | | | | 106,067,295 | | | | 221,625,212 | |
NET INCREASE IN NET ASSETS | | | 153,219,932 | | | | 432,970,712 | | | | 73,340,927 | | | | 260,058,725 | |
NET ASSETS | | | | | | | | | | | | | | | | |
At beginning of period | | | 2,545,517,061 | | | | 2,112,546,349 | | | | 553,550,398 | | | | 293,491,673 | |
At end of period | | $ | 2,698,736,993 | | | $ | 2,545,517,061 | | | $ | 626,891,325 | | | $ | 553,550,398 | |
Accumulated Undistributed Net Investment Income Included in Net Assets | | | $1,032,164 | | | | $19,306,098 | | | | $3,647,424 | | | | $2,252,912 | |
| | | | |
(1) CAPITAL SHARE TRANSACTIONS: | | | | | | | | | | | | | | | | |
INSTITUTIONAL CLASS: | | | | | | | | | | | | | | | | |
Shares sold | | | — | | | | — | | | | 23,038,972 | | | | 24,968,772 | |
Shares issued upon reinvestment of dividends | | | — | | | | — | | | | 746,239 | | | | 52,426 | |
Shares redeemed | | | — | | | | — | | | | (9,734,760 | ) | | | (7,168,264 | ) |
Net increase | | | — | | | | — | | | | 14,050,451 | | | | 17,852,934 | |
INVESTOR CLASS: | | | | | | | | | | | | | | | | |
Shares sold | | | — | | | | — | | | | 2,219,417 | | | | 8,083,195 | |
Shares issued upon reinvestment of dividends | | | — | | | | — | | | | 84,499 | | | | 3,294 | |
Shares redeemed | | | — | | | | — | | | | (4,344,896 | ) | | | (2,312,389 | ) |
Net increase (decrease) | | | — | | | | — | | | | (2,040,980 | ) | | | 5,774,100 | |
ADVISOR CLASS: | | | | | | | | | | | | | | | | |
Shares sold | | | 11,401,415 | | | | 16,822,043 | | | | — | | | | — | |
Shares issued upon reinvestment of dividends | | | 2,374,110 | | | | 1,324,366 | | | | — | | | | — | |
Shares redeemed | | | (8,136,067 | ) | | | (9,737,841 | ) | | | — | | | | — | |
Net increase | | | 5,639,458 | | | | 8,408,568 | | | | — | | | | — | |
See Notes to Financial Statements
31
Harding, Loevner Funds, Inc.
Financial Highlights
For the Six Months Ended April 30, 2015 (unaudited) or the Fiscal Year or Period Ended October 31
| | | | | | | | | | | | | | | | | | | | | | | | |
| | | | | | |
| Global Equity Portfolio — Institutional Class | | | | | | | | | | | | | | | | | | |
| Per Share Data | | April 30,
2015 | | | 2014 | | | 2013 | | | 2012 | | | 2011 | | | 2010(1) | |
Net asset value, beginning of period | | | $32.98 | | | | $29.84 | | | | $25.05 | | | | $23.38 | | | | $23.52 | | | | $20.43 | |
INCREASE IN NET ASSETS FROM OPERATIONS: | | | | | | | | | | | | | | | | | | | | | | | | |
Net investment income | | | 0.07 | (2) | | | 0.13 | (2) | | | 0.17 | (2) | | | 0.18 | (2) | | | 0.12 | (2) | | | 0.10 | |
Net realized and unrealized gain (loss) on investments and foreign currency-related transactions | | | 1.20 | | | | 3.27 | | | | 4.74 | | | | 1.81 | | | | (0.04 | ) | | | 3.04 | |
Net increase from investment operations | | | 1.27 | | | | 3.40 | | | | 4.91 | | | | 1.99 | | | | 0.08 | | | | 3.14 | |
DISTRIBUTIONS TO SHAREHOLDERS FROM: | | | | | | | | | | | | | | | | | | | | | | | | |
Net investment income | | | (0.12 | ) | | | (0.13 | ) | | | (0.12 | ) | | | (0.10 | ) | | | (0.06 | ) | | | (0.05 | ) |
Net realized gain from investments | | | (1.23 | ) | | | (0.13 | ) | | | — | | | | (0.22 | ) | | | (0.16 | ) | | | — | |
Total distributions | | | (1.35 | ) | | | (0.26 | ) | | | (0.12 | ) | | | (0.32 | ) | | | (0.22 | ) | | | (0.05 | ) |
Net asset value, end of period | | | $32.90 | | | | $32.98 | | | | $29.84 | | | | $25.05 | | | | $23.38 | | | | $23.52 | |
Total Return | | | 3.96 | %(A) | | | 11.47 | % | | | 19.66 | % | | | 8.73 | % | | | 0.27 | % | | | 15.39 | %(A) |
RATIOS/SUPPLEMENTAL DATA: | | | | | | | | | | | | | | | | | | | | | | | | |
Net assets, end of period (000’s) | | | $811,772 | | | | $731,897 | | | | $543,293 | | | | $226,489 | | | | $147,108 | | | | $104,276 | |
Expenses to average net assets | | | 0.91 | %(B) | | | 0.97 | % | | | 0.99 | % | | | 1.12 | % | | | 1.16 | % | | | 1.27 | %(B) |
Expenses to average net assets (net of fees waived/reimbursed) | | | 0.91 | %(B) | | | 0.95 | % | | | 0.95 | % | | | 0.95 | % | | | 1.00 | % | | | 1.00 | %(B) |
Net investment income to average net assets | | | 0.47 | %(B) | | | 0.43 | % | | | 0.62 | % | | | 0.72 | % | | | 0.48 | % | | | 0.43 | %(B) |
Portfolio turnover rate | | | 18 | %(A) | | | 30 | % | | | 13 | % | | | 32 | % | | | 40 | % | | | 35 | %(A) |
| (1) | For the period from November 3, 2009 (commencement of class operations) through October 31, 2010. |
| (2) | Net investment income per share was calculated using the average shares outstanding method. |
| | | | | | | | | | | | | | | | | | | | | | | | |
| | | | | | |
| Global Equity Portfolio — Advisor Class | | | | | | | | | | | | | | | | | | |
| Per Share Data | | April 30,
2015 | | | 2014 | | | 2013 | | | 2012 | | | 2011 | | | 2010 | |
Net asset value, beginning of period | | | $32.92 | | | | $29.80 | | | | $25.02 | | | | $23.36 | | | | $23.48 | | | | $20.27 | |
INCREASE IN NET ASSETS FROM OPERATIONS: | | | | | | | | | | | | | | | | | | | | | | | | |
Net investment income | | | 0.02 | (1) | | | 0.05 | (1) | | | 0.09 | (1) | | | 0.11 | (1) | | | 0.07 | (1) | | | 0.10 | |
Net realized and unrealized gain (loss) on investments and foreign currency-related transactions | | | 1.19 | | | | 3.27 | | | | 4.74 | | | | 1.82 | | | | (0.02 | ) | | | 3.15 | |
Net increase from investment operations | | | 1.21 | | | | 3.32 | | | | 4.83 | | | | 1.93 | | | | 0.05 | | | | 3.25 | |
DISTRIBUTIONS TO SHAREHOLDERS FROM: | | | | | | | | | | | | | | | | | | | | | | | | |
Net investment income | | | (0.03 | ) | | | (0.07 | ) | | | (0.05 | ) | | | (0.05 | ) | | | (0.01 | ) | | | (0.04 | ) |
Net realized gain from investments | | | (1.23 | ) | | | (0.13 | ) | | | — | | | | (0.22 | ) | | | (0.16 | ) | | | — | |
Total distributions | | | (1.26 | ) | | | (0.20 | ) | | | (0.05 | ) | | | (0.27 | ) | | | (0.17 | ) | | | (0.04 | ) |
Net asset value, end of period | | | $32.87 | | | | $32.92 | | | | $29.80 | | | | $25.02 | | | | $23.36 | | | | $23.48 | |
Total Return | | | 3.83 | %(A) | | | 11.19 | % | | | 19.33 | % | | | 8.43 | % | | | 0.18 | % | | | 16.07 | % |
RATIOS/SUPPLEMENTAL DATA: | | | | | | | | | | | | | | | | | | | | | | | | |
Net assets, end of period (000’s) | | | $69,724 | | | | $81,507 | | | | $86,882 | | | | $68,749 | | | | $58,320 | | | | $46,450 | |
Expenses to average net assets | | | 1.19 | %(B) | | | 1.20 | % | | | 1.25 | % | | | 1.35 | % | | | 1.30 | % | | | 1.41 | % |
Expenses to average net assets (net of fees waived/reimbursed) | | | 1.19 | %(B) | | | 1.20 | % | | | 1.24 | % | | | 1.23 | % | | | 1.18 | % | | | 1.17 | % |
Net investment income to average net assets | | | 0.14 | %(B) | | | 0.16 | % | | | 0.32 | % | | | 0.45 | % | | | 0.31 | % | | | 0.31 | % |
Portfolio turnover rate | | | 18 | %(A) | | | 30 | % | | | 13 | % | | | 32 | % | | | 40 | % | | | 35 | % |
| (1) | Net investment income per share was calculated using the average shares outstanding method. |
See Notes to Financial Statements
32
Harding, Loevner Funds, Inc.
Financial Highlights (continued)
For the Six Months Ended April 30, 2015 (unaudited) or the Fiscal Year Ended October 31
| | | | | | | | | | | | | | | | | | | | | | | | |
| | | | | | |
| International Equity Portfolio — Institutional Class | | | | | | | | | | | | | | | | | | |
| Per Share Data | | April 30,
2015 | | | 2014 | | | 2013 | | | 2012 | | | 2011 | | | 2010 | |
Net asset value, beginning of period | | | $18.30 | | | | $17.97 | | | | $15.15 | | | | $14.06 | | | | $14.51 | | | | $12.04 | |
INCREASE (DECREASE) IN NET ASSETS FROM OPERATIONS: | | | | | | | | | | | | | | | | | | | | | | | | |
Net investment income | | | 0.10 | (1) | | | 0.18 | (1) | | | 0.17 | (1) | | | 0.18 | (1) | | | 0.17 | (1) | | | 0.08 | |
Net realized and unrealized gain (loss) on investments and foreign currency-related transactions | | | 1.02 | | | | 0.29 | | | | 2.78 | | | | 1.06 | | | | (0.56 | ) | | | 2.49 | |
Net increase (decrease) from investment operations | | | 1.12 | | | | 0.47 | | | | 2.95 | | | | 1.24 | | | | (0.39 | ) | | | 2.57 | |
DISTRIBUTIONS TO SHAREHOLDERS FROM: | | | | | | | | | | | | | | | | | | | | | | | | |
Net investment income | | | (0.18 | ) | | | (0.14 | ) | | | (0.13 | ) | | | (0.11 | ) | | | (0.06 | ) | | | (0.10 | ) |
Net realized gain from investments | | | — | | | | — | | | | — | | | | (0.04 | ) | | | — | | | | — | |
Total distributions | | | (0.18 | ) | | | (0.14 | ) | | | (0.13 | ) | | | (0.15 | ) | | | (0.06 | ) | | | (0.10 | ) |
Net asset value, end of period | | | $19.24 | | | | $18.30 | | | | $17.97 | | | | $15.15 | | | | $14.06 | | | | $14.51 | |
Total Return | | | 6.15 | %(A) | | | 2.65 | % | | | 19.58 | % | | | 9.00 | % | | | (2.72 | )% | | | 21.50 | % |
RATIOS/SUPPLEMENTAL DATA: | | | | | | | | | | | | | | | | | | | | | | | | |
Net assets, end of period (000’s) | | | $4,568,280 | | | | $3,819,491 | | | | $3,467,793 | | | | $1,798,940 | | | | $969,139 | | | | $493,350 | |
Expenses to average net assets | | | 0.85 | %(B) | | | 0.87 | % | | | 0.87 | % | | | 0.87 | % | | | 0.86 | % | | | 0.93 | % |
Expenses to average net assets (net of fees waived/reimbursed) | | | 0.85 | %(B) | | | 0.87 | % | | | 0.87 | % | | | 0.87 | % | | | 0.86 | % | | | 0.93 | % |
Net investment income to average net assets | | | 1.05 | %(B) | | | 1.01 | % | | | 1.06 | % | | | 1.26 | % | | | 1.13 | % | | | 0.91 | % |
Portfolio turnover rate | | | 7 | %(A) | | | 10 | % | | | 20 | % | | | 14 | % | | | 15 | % | | | 33 | % |
| (1) | Net investment income per share was calculated using the average shares outstanding method. |
| | | | | | | | | | | | | | | | | | | | | | | | |
| | | | | | |
| International Equity Portfolio — Investor Class | | | | | | | | | | | | | | | | | | |
| Per Share Data | | April 30,
2015 | | | 2014 | | | 2013 | | | 2012 | | | 2011 | | | 2010 | |
Net asset value, beginning of period | | | $18.23 | | | | $17.89 | | | | $15.09 | | | | $14.01 | | | | $14.47 | | | | $12.02 | |
INCREASE (DECREASE) IN NET ASSETS FROM OPERATIONS: | | | | | | | | | | | | | | | | | | | | | | | | |
Net investment income | | | 0.07 | (1) | | | 0.13 | (1) | | | 0.12 | (1) | | | 0.12 | (1) | | | 0.12 | (1) | | | 0.09 | |
Net realized and unrealized gain (loss) on investments and foreign currency-related transactions | | | 1.02 | | | | 0.29 | | | | 2.77 | | | | 1.06 | | | | (0.56 | ) | | | 2.44 | |
Net increase (decrease) from investment operations | | | 1.09 | | | | 0.42 | | | | 2.89 | | | | 1.18 | | | | (0.44 | ) | | | 2.53 | |
DISTRIBUTIONS TO SHAREHOLDERS FROM: | | | | | | | | | | | | | | | | | | | | | | | | |
Net investment income | | | (0.12 | ) | | | (0.08 | ) | | | (0.09 | ) | | | (0.06 | ) | | | (0.02 | ) | | | (0.08 | ) |
Net realized gain from investments | | | — | | | | — | | | | — | | | | (0.04 | ) | | | — | | | | — | |
Total distributions | | | (0.12 | ) | | | (0.08 | ) | | | (0.09 | ) | | | (0.10 | ) | | | (0.02 | ) | | | (0.08 | ) |
Net asset value, end of period | | | $19.20 | | | | $18.23 | | | | $17.89 | | | | $15.09 | | | | $14.01 | | | | $14.47 | |
Total Return | | | 5.96 | %(A) | | | 2.36 | % | | | 19.19 | % | | | 8.51 | % | | | (3.02 | )% | | | 21.18 | % |
RATIOS/SUPPLEMENTAL DATA: | | | | | | | | | | | | | | | | | | | | | | | | |
Net assets, end of period (000’s) | | | $447,144 | | | | $443,029 | | | | $409,735 | | | | $275,468 | | | | $237,494 | | | | $116,465 | |
Expenses to average net assets | | | 1.16 | %(B) | | | 1.17 | % | | | 1.20 | % | | | 1.24 | % | | | 1.26 | % | | | 1.32 | % |
Expenses to average net assets (net of fees waived/reimbursed) | | | 1.16 | %(B) | | | 1.17 | % | | | 1.20 | % | | | 1.24 | % | | | 1.25 | % | | | 1.25 | % |
Net investment income to average net assets | | | 0.75 | %(B) | | | 0.72 | % | | | 0.76 | % | | | 0.87 | % | | | 0.79 | % | | | 0.69 | % |
Portfolio turnover rate | | | 7 | %(A) | | | 10 | % | | | 20 | % | | | 14 | % | | | 15 | % | | | 33 | % |
| (1) | Net investment income per share was calculated using the average shares outstanding method. |
See Notes to Financial Statements
33
Harding, Loevner Funds, Inc.
Financial Highlights (continued)
For the Six Months Ended April 30, 2015 (unaudited) or the Fiscal Year or Period Ended October 31
| | | | | | | | | | | | | | | | | | | | |
| | | | | |
| International Small Companies Portfolio — Institutional Class | | | | | | | | | | | | | | | |
| Per Share Data | | April 30,
2015 | | | 2014 | | | 2013 | | | 2012 | | | 2011(1) | |
Net asset value, beginning of period | | $ | 13.85 | | | $ | 14.47 | | | $ | 11.45 | | | $ | 10.53 | | | $ | 12.28 | |
INCREASE (DECREASE) IN NET ASSETS FROM OPERATIONS: | | | | | | | | | | | | | | | | | | | | |
Net investment income | | | 0.01 | (2) | | | 0.08 | (2) | | | 0.07 | (2) | | | 0.16 | (2) | | | 0.03 | (2) |
Net realized and unrealized gain (loss) on investments and foreign currency-related transactions | | | 0.61 | | | | 0.23 | | | | 3.09 | | | | 0.85 | | | | (1.78 | ) |
Net increase (decrease) from investment operations | | | 0.62 | | | | 0.31 | | | | 3.16 | | | | 1.01 | | | | (1.75 | ) |
DISTRIBUTIONS TO SHAREHOLDERS FROM: | | | | | | | | | | | | | | | | | | | | |
Net investment income | | | (0.05 | ) | | | (0.06 | ) | | | (0.14 | ) | | | (0.09 | ) | | | — | |
Net realized gain from investments | | | (0.26 | ) | | | (0.87 | ) | | | — | | | | — | | | | — | |
Total distributions | | | (0.31 | ) | | | (0.93 | ) | | | (0.14 | ) | | | (0.09 | ) | | | — | |
Net asset value, end of period | | $ | 14.16 | | | $ | 13.85 | | | $ | 14.47 | | | $ | 11.45 | | | $ | 10.53 | |
Total Return | | | 4.63 | %(A) | | | 2.28 | % | | | 27.88 | % | | | 9.74 | % | | | (14.25 | )%(A) |
RATIOS/SUPPLEMENTAL DATA: | | | | | | | | | | | | | | | | | | | | |
Net assets, end of period (000’s) | | $ | 34,667 | | | $ | 28,711 | | | $ | 26,236 | | | $ | 33,515 | | | $ | 14,000 | |
Expenses to average net assets | | | 1.65 | %(B) | | | 1.59 | % | | | 1.68 | % | | | 1.64 | % | | | 2.70 | %(B) |
Expenses to average net assets (net of fees waived/reimbursed) | | | 1.30 | %(B) | | | 1.30 | % | | | 1.39 | % | | | 1.50 | % | | | 1.50 | %(B) |
Net investment income to average net assets | | | 0.20 | %(B) | | | 0.58 | % | | | 0.57 | % | | | 1.49 | % | | | 0.89 | %(B) |
Portfolio turnover rate | | | 15 | %(A) | | | 36 | % | | | 97 | % | | | 10 | % | | | 12 | %(A) |
| (1) | For the period from June 30, 2011 (commencement of class operations) through October 31, 2011. |
| (2) | Net investment income per share was calculated using the average shares outstanding method. |
| | | | | | | | | | | | | | | | | | | | | | | | |
| | | | | | |
| International Small Companies Portfolio — Investor Class | | | | | | | | | | | | | | | | | | |
| Per Share Data | | April 30,
2015 | | | 2014 | | | 2013 | | | 2012 | | | 2011 | | | 2010 | |
Net asset value, beginning of period | | $ | 13.80 | | | $ | 14.45 | | | $ | 11.43 | | | $ | 10.51 | | | $ | 10.82 | | | $ | 8.92 | |
INCREASE (DECREASE) IN NET ASSETS FROM OPERATIONS: | | | | | | | | | | | | | | | | | | | | | | | | |
Net investment income (loss) | | | (0.01 | )(1) | | | 0.05 | (1) | | | 0.08 | (1) | | | 0.11 | (1) | | | 0.15 | (1) | | | 0.05 | |
Net realized and unrealized gain (loss) on investments and foreign currency-related transactions | | | 0.62 | | | | 0.22 | | | | 3.05 | | | | 0.88 | | | | (0.43 | ) | | | 1.90 | |
Net increase (decrease) from investment operations | | | 0.61 | | | | 0.27 | | | | 3.13 | | | | 0.99 | | | | (0.28 | ) | | | 1.95 | |
DISTRIBUTIONS TO SHAREHOLDERS FROM: | | | | | | | | | | | | | | | | | | | | | | | | |
Net investment income | | | (0.03 | ) | | | (0.05 | ) | | | (0.11 | ) | | | (0.07 | ) | | | (0.03 | ) | | | (0.05 | ) |
Net realized gain from investments | | | (0.26 | ) | | | (0.87 | ) | | | — | | | | — | | | | — | | | | — | |
Total distributions | | | (0.29 | ) | | | (0.92 | ) | | | (0.11 | ) | | | (0.07 | ) | | | (0.03 | ) | | | (0.05 | ) |
Net asset value, end of period | | $ | 14.12 | | | $ | 13.80 | | | $ | 14.45 | | | $ | 11.43 | | | $ | 10.51 | | | $ | 10.82 | |
Total Return | | | 4.56 | %(A) | | | 1.97 | % | | | 27.63 | % | | | 9.51 | % | | | (2.67 | )% | | | 21.93 | % |
RATIOS/SUPPLEMENTAL DATA: | | | | | | | | | | | | | | | | | | | | | | | | |
Net assets, end of period (000’s) | | $ | 67,749 | | | $ | 62,828 | | | $ | 52,830 | | | $ | 31,249 | | | $ | 30,142 | | | $ | 13,972 | |
Expenses to average net assets | | | 1.90 | %(B) | | | 1.88 | % | | | 1.99 | % | | | 2.02 | % | | | 2.15 | % | | | 3.14 | % |
Expenses to average net assets (net of fees waived/reimbursed) | | | 1.55 | %(B) | | | 1.55 | % | | | 1.60 | % | | | 1.75 | % | | | 1.75 | % | | | 1.75 | % |
Net investment income (loss) to average net assets | | | (0.08 | )%(B) | | | 0.32 | % | | | 0.60 | % | | | 1.07 | % | | | 1.29 | % | | | 0.76 | % |
Portfolio turnover rate | | | 15 | %(A) | | | 36 | % | | | 97 | % | | | 10 | % | | | 12 | % | | | 11 | % |
| (1) | Net investment income per share was calculated using the average shares outstanding method. |
See Notes to Financial Statements
34
Harding, Loevner Funds, Inc.
Financial Highlights (continued)
For the Six Months Ended April 30, 2015 (unaudited) or the Fiscal Year or Period Ended October 31
| | | | | | | | | | | | | | | | | | | | | | | | |
| | | | | | |
| Institutional Emerging Markets Portfolio — Class I | | | | | | | | | | | | | | | | | | |
| Per Share Data | | April 30, 2015 | | | 2014 | | | 2013 | | | 2012 | | | 2011 | | | 2010 | |
Net asset value, beginning of period | | | $18.60 | | | | $18.07 | | | | $16.56 | | | | $15.07 | | | | $16.70 | | | | $13.29 | |
INCREASE (DECREASE) IN NET ASSETS FROM OPERATIONS: | | | | | | | | | | | | | | | | | | | | | | | | |
Net investment income | | | 0.03 | (1) | | | 0.20 | (1) | | | 0.18 | (1) | | | 0.16 | (1) | | | 0.15 | (1) | | | 0.09 | |
Net realized and unrealized gain (loss) on investments and foreign currency-related transactions | | | (0.02 | ) | | | 0.48 | | | | 1.45 | | | | 1.49 | | | | (1.74 | ) | | | 3.41 | |
Net increase (decrease) from investment operations | | | 0.01 | | | | 0.68 | | | | 1.63 | | | | 1.65 | | | | (1.59 | ) | | | 3.50 | |
DISTRIBUTIONS TO SHAREHOLDERS FROM: | | | | | | | | | | | | | | | | | | | | | | | | |
Net investment income | | | (0.13 | ) | | | (0.15 | ) | | | (0.12 | ) | | | (0.16 | ) | | | (0.04 | ) | | | (0.09 | ) |
Total distributions | | | (0.13 | ) | | | (0.15 | ) | | | (0.12 | ) | | | (0.16 | ) | | | (0.04 | ) | | | (0.09 | ) |
Net asset value, end of period | | | $18.48 | | | | $18.60 | | | | $18.07 | | | | $16.56 | | | | $15.07 | | | | $16.70 | |
Total Return | | | 0.02 | %(A) | | | 3.80 | % | | | 9.85 | % | | | 11.17 | % | | | (9.58 | )% | | | 26.50 | % |
RATIOS/SUPPLEMENTAL DATA: | | | | | | | | | | | | | | | | | | | | | | | | |
Net assets, end of period (000’s) | | | $1,905,536 | | | | $1,521,194 | | | | $1,043,041 | | | | $463,791 | | | | $328,713 | | | | $375,374 | |
Expenses to average net assets | | | 1.29 | %(B) | | | 1.31 | % | | | 1.33 | % | | | 1.36 | % | | | 1.39 | % | | | 1.48 | % |
Expenses to average net assets (net of fees waived/reimbursed) | | | 1.29 | %(B) | | | 1.30 | % | | | 1.30 | % | | | 1.30 | % | | | 1.30 | % | | | 1.30 | % |
Net investment income to average net assets | | | 0.29 | %(B) | | | 1.12 | % | | | 1.06 | % | | | 1.00 | % | | | 0.93 | % | | | 0.74 | % |
Portfolio turnover rate | | | 15 | %(A) | | | 26 | % | | | 18 | % | | | 42 | % | | | 53 | % | | | 34 | % |
| (1) | Net investment income per share was calculated using the average shares outstanding method. |
| | | | | | | | |
| | |
| Institutional Emerging Markets Portfolio — Class II | | | | | | |
| Per Share Data | | April 30, 2015 | | | 2014(1) | |
Net asset value, beginning of period | | | $10.70 | | | | $10.00 | |
INCREASE IN NET ASSETS FROM OPERATIONS: | | | | | | | | |
Net investment income | | | 0.02 | (2) | | | 0.10 | (2) |
Net realized and unrealized gain (loss) on investments and foreign currency-related transactions | | | (0.01 | ) | | | 0.60 | |
Net increase from investment operations | | | 0.01 | | | | 0.70 | |
DISTRIBUTIONS TO SHAREHOLDERS FROM: | | | | | | | | |
Net investment income | | | (0.13 | ) | | | — | |
Total distributions | | | (0.13 | ) | | | — | |
Net asset value, end of period | | | $10.58 | | | | $10.70 | |
Total Return | | | 0.20 | %(A) | | | 7.00 | %(A) |
RATIOS/SUPPLEMENTAL DATA: | | | | | | | | |
Net assets, end of period (000’s) | | | $224,734 | | | | $194,477 | |
Expenses to average net assets | | | 1.27 | %(B) | | | 1.30 | %(B) |
Expenses to average net assets (net of fees waived/reimbursed) | | | 1.14 | %(B) | | | 1.14 | %(B) |
Net investment income to average net assets | | | 0.43 | %(B) | | | 1.36 | %(B) |
Portfolio turnover rate | | | 15 | %(A) | | | 26 | %(A) |
| (1) | For the period from March 5, 2014 (commencement of class operations) through October 31, 2014. |
| (2) | Net investment income per share was calculated using the average shares outstanding method. |
See Notes to Financial Statements
35
Harding, Loevner Funds, Inc.
Financial Highlights (continued)
For the Six Months Ended April 30, 2015 (unaudited) or the Fiscal Year Ended October 31
| | | | | | | | | | | | | | | | | | | | | | | | |
| | | | | | |
| Emerging Markets Portfolio — Advisor Class | | | | | | | | | | | | | | | | | | |
| Per Share Data | | April. 30, 2015 | | | 2014 | | | 2013 | | | 2012 | | | 2011 | | | 2010 | |
Net asset value, beginning of period | | | $50.88 | | | | $50.76 | | | | $49.54 | | | | $45.18 | | | | $50.09 | | | | $39.64 | |
INCREASE (DECREASE) IN NET ASSETS FROM OPERATIONS: | | | | | | | | | | | | | | | | | | | | | | | | |
Net investment income | | | 0.02 | (1) | | | 0.49 | (1) | | | 0.40 | (1) | | | 0.37 | (1) | | | 0.31 | (1) | | | 0.25 | |
Net realized and unrealized gain (loss) on investments and foreign currency-related transactions | | | (0.10 | ) | | | 1.32 | | | | 4.33 | | | | 4.34 | | | | (5.02 | ) | | | 10.33 | |
Net increase (decrease) from investment operations | | | (0.08 | ) | | | 1.81 | | | | 4.73 | | | | 4.71 | | | | (4.71 | ) | | | 10.58 | |
DISTRIBUTIONS TO SHAREHOLDERS FROM: | | | | | | | | | | | | | | | | | | | | | | | | |
Net investment income | | | (0.39 | ) | | | (0.40 | ) | | | (0.36 | ) | | | (0.35 | ) | | | (0.20 | ) | | | (0.13 | ) |
Net realized gain from investments | | | (1.93 | ) | | | (1.29 | ) | | | (3.15 | ) | | | — | | | | — | | | | — | |
Total distributions | | | (2.32 | ) | | | (1.69 | ) | | | (3.51 | ) | | | (0.35 | ) | | | (0.20 | ) | | | (0.13 | ) |
Net asset value, end of period | | | $48.48 | | | | $50.88 | | | | $50.76 | | | | $49.54 | | | | $45.18 | | | | $50.09 | |
Total Return | | | 0.17 | %(A) | | | 3.79 | % | | | 9.93 | % | | | 10.60 | % | | | (9.48 | )% | | | 26.77 | % |
RATIOS/SUPPLEMENTAL DATA: | | | | | | | | | | | | | | | | | | | | | | | | |
Net assets, end of period (000’s) | | | $2,698,737 | | | | $2,545,517 | | | | $2,112,546 | | | | $1,715,068 | | | | $1,693,650 | | | | $2,062,255 | |
Expenses to average net assets | | | 1.45 | %(B) | | | 1.45 | % | | | 1.47 | % | | | 1.49 | % | | | 1.50 | % | | | 1.58 | % |
Net investment income to average net assets | | | 0.08 | %(B) | | | 0.98 | % | | | 0.83 | % | | | 0.80 | % | | | 0.63 | % | | | 0.60 | % |
Portfolio turnover rate | | | 17 | %(A) | | | 28 | % | | | 26 | % | | | 36 | % | | | 33 | % | | | 25 | % |
| (1) | Net investment income per share was calculated using the average shares outstanding method. |
See Notes to Financial Statements
36
Harding, Loevner Funds, Inc.
Financial Highlights (continued)
For the Six Months Ended April 30, 2015 (unaudited) or the Fiscal Year or Period Ended October 31
| | | | | | | | | | | | | | | | | | | | | | | | |
| | | | | | |
| Frontier Emerging Markets Portfolio — Institutional Class | | | | | | | | | | | | | | | | | | |
| Per Share Data | | April 30, 2015 | | | 2014 | | | 2013 | | | 2012 | | | 2011 | | | 2010 | |
Net asset value, beginning of period | | | $9.50 | | | | $8.46 | | | | $7.12 | | | | $6.57 | | | | $7.88 | | | | $6.29 | |
INCREASE (DECREASE) IN NET ASSETS FROM OPERATIONS: | | | | | | | | | | | | | | | | | | | | | | | | |
Net investment income | | | 0.07 | (1) | | | 0.09 | (1) | | | 0.07 | (1) | | | 0.07 | (1) | | | 0.07 | (1) | | | 0.03 | |
Net realized and unrealized gain (loss) on investments and foreign currency-related transactions | | | (0.50 | ) | | | 0.97 | | | | 1.35 | | | | 0.51 | | | | (1.37 | ) | | | 1.65 | |
Net increase (decrease) from investment operations | | | (0.43 | ) | | | 1.06 | | | | 1.42 | | | | 0.58 | | | | (1.30 | ) | | | 1.68 | |
DISTRIBUTIONS TO SHAREHOLDERS FROM: | | | | | | | | | | | | | | | | | | | | | | | | |
Net investment income | | | (0.05 | ) | | | (0.02 | ) | | | (0.08 | ) | | | (0.03 | ) | | | (0.01 | ) | | | (0.09 | ) |
Net realized gain from investments | | | (0.10 | ) | | | — | | | | — | | | | — | | | | — | | | | — | |
Total distributions | | | (0.15 | ) | | | (0.02 | ) | | | (0.08 | ) | | | (0.03 | ) | | | (0.01 | ) | | | (0.09 | ) |
Net asset value, end of period | | | $8.92 | | | | $9.50 | | | | $8.46 | | | | $7.12 | | | | $6.57 | | | | $7.88 | |
Total Return | | | (4.42 | )%(A) | | | 12.60 | % | | | 20.20 | % | | | 8.93 | % | | | (16.49 | )% | | | 27.04 | % |
RATIOS/SUPPLEMENTAL DATA: | | | | | | | | | | | | | | | | | | | | | | | | |
Net assets, end of period (000’s) | | | $570,951 | | | | $474,838 | | | | $271,728 | | | | $81,568 | | | | $101,666 | | | | $70,645 | |
Expenses to average net assets | | | 1.76 | %(B) | | | 1.77 | % | | | 1.80 | % | | | 1.95 | % | | | 1.87 | % | | | 2.37 | % |
Expenses to average net assets (net of fees waived/reimbursed) | | | 1.76 | %(B) | | | 1.77 | % | | | 1.80 | % | | | 1.95 | % | | | 1.87 | % | | | 2.00 | % |
Net investment income (loss) to average net assets | | | 1.65 | %(B) | | | 1.01 | % | | | 0.94 | % | | | 1.03 | % | | | 0.89 | % | | | (0.08 | )% |
Portfolio turnover rate | | | 22 | %(A) | | | 37 | % | | | 24 | % | | | 72 | % | | | 23 | % | | | 17 | % |
| (1) | Net investment income per share was calculated using the average shares outstanding method. |
| | | | | | | | | | | | | | | | | | | | |
| | | | | |
| Frontier Emerging Markets Portfolio — Investor Class | | | | | | | | | | | | | | | |
| Per Share Data | | April 30, 2015 | | | 2014 | | | 2013 | | | 2012 | | | 2011(1) | |
Net asset value, beginning of period | | | $9.41 | | | | $8.40 | | | | $7.08 | | | | $6.55 | | | | $7.84 | |
INCREASE (DECREASE) IN NET ASSETS FROM OPERATIONS: | | | | | | | | | | | | | | | | | | | | |
Net investment income | | | 0.04 | (2) | | | 0.04 | (2) | | | 0.05 | (2) | | | 0.10 | (2) | | | 0.04 | (2) |
Net realized and unrealized gain (loss) on investments and foreign currency-related transactions | | | (0.49 | ) | | | 0.98 | | | | 1.34 | | | | 0.45 | | | | (1.33 | ) |
Net increase (decrease) from investment operations | | | (0.45 | ) | | | 1.02 | | | | 1.39 | | | | 0.55 | | | | (1.29 | ) |
DISTRIBUTIONS TO SHAREHOLDERS FROM: | | | | | | | | | | | | | | | | | | | | |
Net investment income | | | (0.02 | ) | | | (0.01 | ) | | | (0.07 | ) | | | (0.02 | ) | | | — | |
Net realized gain from investments | | | (0.10 | ) | | | — | | | | — | | | | — | | | | — | |
Total Distributions | | | (0.12 | ) | | | (0.01 | ) | | | (0.07 | ) | | | (0.02 | ) | | | — | |
Net asset value, end of period | | | $8.84 | | | | $9.41 | | | | $8.40 | | | | $7.08 | | | | $6.55 | |
Total Return | | | (4.73 | )%(A) | | | 12.15 | % | | | 19.83 | % | | | 8.49 | % | | | (16.45 | )%(A) |
RATIOS/SUPPLEMENTAL DATA: | | | | | | | | | | | | | | | | | | | | |
Net assets, end of period (000’s) | | | $55,940 | | | | $78,712 | | | | $21,763 | | | | $3,003 | | | | $1,225 | |
Expenses to average net assets | | | 2.17 | %(B) | | | 2.22 | % | | | 2.64 | % | | | 4.71 | % | | | 9.06 | %(B) |
Expenses to average net assets (net of fees waived/reimbursed) | | | 2.17 | %(B) | | | 2.22 | % | | | 2.25 | % | | | 2.25 | % | | | 2.25 | %(B) |
Net investment income to average net assets | | | 0.97 | %(B) | | | 0.38 | % | | | 0.66 | % | | | 1.47 | % | | | 0.75 | %(B) |
Portfolio turnover rate | | | 22 | %(A) | | | 37 | % | | | 24 | % | | | 72 | % | | | 23 | %(A) |
| (1) | For the period from December 31, 2010 (commencement of class operations) through October 31, 2011. |
| (2) | Net investment income per share was calculated using the average shares outstanding method. |
See Notes to Financial Statements
37
Harding, Loevner Funds, Inc.
Notes to Financial Statements
April 30, 2015 (unaudited)
1. Organization
Harding, Loevner Funds, Inc. (the “Fund”) was organized as a Maryland corporation on July 31, 1996, and is registered under the Investment Company Act of 1940, as amended (the “1940 Act”), as an open-end management investment company. The Fund currently has six separate diversified Portfolios, all of which were active as of April 30, 2015 (individually, a “Portfolio”, collectively, the “Portfolios”). The Fund is managed by Harding Loevner LP (the “Investment Adviser”).
| | | | |
Portfolio | | Inception Date | | Investment Objective |
Global Equity Portfolio (“Global Equity”) | | Institutional Class: November 3, 2009 Advisor Class: December 1, 1996 | | to seek long-term capital appreciation through investments in equity securities of companies based both inside and outside the United States |
International Equity Portfolio (“International Equity”) | | Institutional Class: May 11, 1994* Investor Class: September 30, 2005 | | to seek long-term capital appreciation through investments in equity securities of companies based outside the United States |
International Small Companies Portfolio (“International Small Companies”) | | Institutional Class: June 30, 2011 Investor Class: March 26, 2007 | | to seek long-term capital appreciation through investments in equity securities of small companies based outside the United States |
Institutional Emerging Markets Portfolio (“Institutional Emerging Markets”) | | Class I: October 17, 2005 Class II: March 5, 2014 | | to seek long-term capital appreciation through investments in equity securities of companies based in emerging markets |
Emerging Markets Portfolio (“Emerging Markets”) | | Advisor Class: November 9, 1998 | | to seek long-term capital appreciation through investments in equity securities of companies based in emerging markets |
Frontier Emerging Markets Portfolio (“Frontier Emerging Markets”) | | Institutional Class: May 27, 2008 Investor Class: December 31, 2010 | | to seek long-term capital appreciation through investments in equity securities of companies based in frontier and smaller emerging markets |
* International Equity is the successor to the HLM International Equity Portfolio of AMT Capital Fund, Inc., pursuant to a reorganization that took place on October 31, 1996. Information for periods prior to October 31, 1996 is historical information for the predecessor portfolio.
2. Summary of Significant Accounting Policies
The accounting policies of the Fund are in conformity with accounting principles generally accepted in the United States (“GAAP”) for investment companies. Accordingly, the Fund follows accounting and reporting guidance under FASB Accounting Standards Codification Topic 946, “Financial Services—Investment Companies”. The following is a summary of the Fund’s significant accounting policies:
Indemnifications
Under the Fund’s organizational document, its officers and Board of Directors (“Board”) are indemnified against certain liability arising out of the performance of their duties to the Portfolios. In the normal course of business, the Fund may enter into contracts that contain a variety of representations or that provide indemnification for certain liabilities. The Fund’s maximum exposure under these arrangements is unknown, as this would involve future claims that may be made against the Fund that have not yet occurred. However, the Fund has not had prior claims or losses pursuant to these contracts and expects the risk of loss to be remote.
Estimates
The preparation of financial statements in accordance with GAAP requires management to make estimates and assumptions that affect the reported amounts and disclosures in the financial statements. Actual results could differ from those estimates.
38
Harding, Loevner Funds, Inc.
Notes to Financial Statements (continued)
April 30, 2015 (unaudited)
2. Summary of Significant Accounting Policies (continued)
Valuation
The Board has adopted procedures (“Procedures”) to govern the valuation of the securities held by each Portfolio of the Fund in accordance with the 1940 Act. The Procedures incorporate principles set forth in relevant pronouncements of the Securities and Exchange Commission (“SEC”) and its staff, including guidance on the obligations of the Portfolios and their Directors to determine, in good faith, the fair value of the Portfolios’ securities when market quotations are not readily available.
In determining a Portfolio’s net asset value (“NAV”), each equity security traded on a securities exchange, including the NASDAQ Stock Market, and over-the-counter securities, are first valued at the closing price on the exchange or market designated by the Fund’s accounting agent as the principal exchange (each, a “principal exchange”). The closing price provided by the Fund’s accounting agent for a principal exchange may differ from the price quoted elsewhere and may represent information such as last sales price, an official closing price, a closing auction price or other information, depending on exchange or market convention. Shares of open-end mutual funds including money market funds are valued at NAV. Such securities are typically categorized as “Level 1” pursuant to the hierarchy described below.
Participation notes are valued based upon the closing or last traded price of their underlying local shares. Such securities are typically categorized as “Level 2” pursuant to the hierarchy described below.
Since trading in many foreign securities is normally completed before the time at which a Portfolio calculates its NAV, the effect on the value of such securities held by a Portfolio of events that occur between the close of trading in the security and the time at which the Portfolio prices its securities would not be reflected in the Portfolio’s calculation of its NAV if foreign securities were generally valued at their closing prices.
To address this issue, the Board has approved the daily use of independently provided quantitative models that may adjust the closing prices of certain foreign equity securities based on information that becomes available after the foreign market closes, through the application of an adjustment factor to such securities’ closing price. Adjustment factors may be greater than, less than, or equal to 1. Thus, use of these quantitative models could cause a Portfolio to value a security higher, lower or equal to its closing market price, which in turn could cause the Portfolio’s NAV per share to differ significantly from that which would have been calculated using closing market prices. The use of these quantitative models is also intended to decrease the opportunities for persons to engage in ‘‘time zone arbitrage,’’ i.e., trading intended to take advantage of stale closing prices in foreign markets that could affect the NAV of the Portfolios. Securities subjected to an adjustment factor due to the use of these quantitative models are not specifically designated on the Portfolios’ Portfolio of Investments as being “fair valued”. Securities with an adjustment factor greater than or less than 1, which are absent the use of significant unobservable inputs into their valuation, are categorized as “Level 2” and securities with an adjustment factor equal to 1, which are absent the use of significant unobservable inputs into their valuation, are categorized as “Level 1” pursuant to the hierarchy described below.
Any securities for which market quotations are not readily available or for which available prices are deemed unreliable are priced by the Investment Adviser at “fair value as determined in good faith”, in accordance with the Procedures. Such securities are identified on the Portfolios’ Portfolio of Investments as securities valued at “fair value as determined in good faith” and absent the use of significant unobservable inputs into their valuation, such securities would be categorized as “Level 2” pursuant to the hierarchy described below.
GAAP includes a topic which establishes a hierarchy for NAV determination purposes in which various inputs are used in determining the value of each Portfolio’s assets or liabilities. This topic defines fair value as the price that the Portfolio would receive upon selling an investment in a timely transaction to an independent buyer in the principal or most advantageous market of the investment. This topic establishes a three-tier hierarchy to maximize the use of observable market data and minimize the use of unobservable inputs and to establish classification of fair value measurements for disclosure purposes. Inputs may be observable or unobservable and refer broadly to the assumptions that market participants would use in pricing the asset or liability including assumptions about risk. Such risks include the inherent risk in a particular valuation technique which is used to measure fair value. This may include the quantitative models and/or the inputs to the quantitative models used in the valuation technique described above. Observable inputs are inputs that reflect the assumptions market participants would use in pricing the asset or liability developed based on market data obtained from sources independent of the reporting entity. Unobservable inputs are inputs that reflect the reporting entity’s own assumptions about the assumptions market participants would use in pricing the asset or liability developed based on the best information available in the circumstances. The three-tier hierarchy of inputs is summarized in the three broad levels listed below.
| | |
| Level 1 | | unadjusted quoted prices in active markets for identical investments |
| Level 2 | | other significant observable inputs (including quoted prices for similar investments, interest rates, prepayment speeds, credit risk, etc.). |
| Level 3 | | significant unobservable inputs (including the Portfolio’s own assumptions in determining the fair value of investments) |
39
Harding, Loevner Funds, Inc.
Notes to Financial Statements (continued)
April 30, 2015 (unaudited)
2. Summary of Significant Accounting Policies (continued)
The Portfolios disclose all transfers between levels based on valuations at the end of each reporting period.
At April 30, 2015, the Portfolios below had transfers from Level 1 to Level 2, based on levels assigned to the securities on October 31, 2014, due to the use of closing prices from a local exchange as inputs to the valuations of shares from the same issuer, trading on a foreign exchange and due to the use of an adjustment factor greater or less than 1 as inputs to the valuations.
| | | | | | | | | | | | |
| | | Institutional
Emerging Markets | | | Emerging Markets | | | Frontier
Emerging Markets | |
Common Stock | | | | | | | | | | | | |
Banks | | | $31,391,322 | | | | $39,790,757 | | | | $22,405,093 | |
Retailing | | | — | | | | — | | | | 3,774,183 | |
| | | | | | | | | | | | |
Total | | | $31,391,322 | | | | $39,790,757 | | | | $26,179,276 | |
| | | | | | | | | | | | |
GAAP provides additional guidance for estimating fair value when the volume and level of activity for the asset or liability have significantly decreased as well as guidance on identifying circumstances that indicate when a transaction is not orderly.
The following is a summary of the Portfolio’s investments classified by Level 1, Level 2 and Level 3 and security type as of April 30, 2015. Please refer to each Portfolio’s Portfolio of Investments to view individual securities classified by industry type and country.
| | | | | | | | | | | | | | | | | | | | | | | | | | | | |
| Portfolio | | Unadjusted Quoted Prices in Active Markets for Identical Assets (Level 1) | | | Other Significant Observable Inputs (Level 2) | | | Total | |
| | | Common
Stocks | | | Preferred
Stocks | | | Short-Term
Investments | | | Common
Stocks | | | Preferred
Stocks | | | Participation
Notes | | | Investment
Securities | |
Global Equity | | | $576,315,188 | | | | $3,985,793 | | | | $30,550,416 | | | | $281,899,018 | | | | $— | | | | $— | | | | $892,750,415 | |
International Equity | | | 1,089,035,180 | | | | 81,413,115 | | | | 257,194,223 | | | | 3,537,020,658 | | | | 92,824,833 | | | | — | | | | 5,057,488,009 | |
International Small Companies | | | 4,477,020 | | | | — | | | | 3,637,049 | | | | 91,342,113 | | | | — | | | | 2,731,474 | | | | 102,187,656 | |
Institutional Emerging Markets | | | 442,233,209 | | | | 106,312,169 | | | | 36,309,549 | | | | 1,460,618,676 | | | | 15,318,963 | | | | 60,697,689 | | | | 2,121,490,255 | |
Emerging Markets | | | 560,611,668 | | | | 134,756,308 | | | | 53,335,940 | | | | 1,851,369,211 | | | | 19,437,504 | | | | 76,065,194 | | | | 2,695,575,825 | |
Frontier Emerging Markets | | | 122,332,170 | | | | 8,374,950 | | | | 19,590,504 | | | | 398,767,964 | | | | — | | | | 79,800,473 | | | | 628,866,061 | |
As of April 30, 2015, there were no Level 3 investments held within the Portfolios.
Securities
For financial reporting purposes, all securities transactions are recorded on a trade date basis, as of the last business day in the reporting period. Throughout the reporting period, securities transactions are typically accounted for on a trade date – plus one business day basis. Interest income and expenses are recorded on an accrual basis. Dividend income is recorded on the ex-dividend date (except for certain foreign dividends that may be recorded as soon as the Portfolio is informed of such dividends). The Portfolios use the specific identification method for determining realized gains or losses from sales of securities.
Dividends to Shareholders
It is the policy of the Portfolios to declare dividends from net investment income annually. Net short-term and long-term capital gains distributions for the Portfolios, if any, are also normally distributed on an annual basis.
Dividends from net investment income and distributions from net realized gains from investment transactions have been determined in accordance with income tax regulations and may differ from net investment income and realized gains recorded by the Portfolios for financial reporting purposes. Differences result primarily from foreign currency transactions and timing differences related to recognition of income, and gains and losses from investment transactions. In general, to the extent that any differences, which are permanent in nature, result in over distributions to shareholders, the amount of the over distribution is reclassified within the capital accounts based on its federal tax basis treatment and may be reported as return of capital. Temporary differences do not require reclassification.
40
Harding, Loevner Funds, Inc.
Notes to Financial Statements (continued)
April 30, 2015 (unaudited)
2. Summary of Significant Accounting Policies (continued)
Currency Translation
Assets and liabilities denominated in foreign currencies and commitments under forward foreign currency exchange contracts are translated into U.S. dollars at the mean of the quoted bid and asked prices of such currencies against the U.S. dollar. Purchases and sales of the Portfolios’ securities are translated at the rates of exchange prevailing when such securities were acquired or sold. Income and expenses are translated at exchange rates prevailing when accrued. The Portfolios do not isolate that portion of the results of operations resulting from changes in foreign exchange rates on investments from the fluctuations arising from changes in market prices of securities held. Such fluctuations are included with the Net realized gain (loss) from investments and Change in unrealized appreciation (depreciation) from investments on the Statements of Operations.
Net realized gains and losses from foreign currency-related transactions arise from sales of foreign currency, currency gains or losses realized between the trade and settlement dates on securities transactions, and the difference between the amounts of dividends, interest, and foreign withholding taxes recorded on the Portfolios’ books, and the U.S. dollar equivalent of the amounts actually received or paid. Net unrealized appreciation or depreciation on translation of assets and liabilities denominated in foreign currencies arise from changes in the value of assets and liabilities other than investments in securities at the period end, resulting from changes in the exchange rates.
Redemption Fees
Redemptions made within 90 days of purchase may be subject to a redemption fee equal to 2% of the amount redeemed. For the period or year ended April 30, 2015 and October 31, 2014, the Portfolios received the following redemption fees related to transactions in shares of common stock. These amounts are included as a component of “Cost of shares redeemed” in the Portfolios’ Statements of Changes in Net Assets.
| | | | | | | | | | | | | | | | | | | | | | | | |
| | | Institutional Class | | | Class I | | | Class II | |
| Portfolio | | Period Ended
April 30,
2015 (unaudited) | | | Year ended
October 31,
2014 | | | Period Ended
April 30,
2015 (unaudited) | | | Year ended
October 31,
2014 | | | Period Ended
April 30,
2015 (unaudited) | | | Year ended
October 31,
2014 | |
Global Equity | | $ | 2,614 | | | $ | 297 | | | $ | — | | | $ | — | | | $ | — | | | $ | — | |
International Equity | | | 110,727 | | | | 202,246 | | | | — | | | | — | | | | — | | | | — | |
International Small Companies | | | 893 | | | | 1,536 | | | | — | | | | — | | | | — | | | | — | |
Institutional Emerging Markets | | | — | | | | — | | | | 65,500 | | | | 73,653 | | | | — | | | | — | |
Emerging Markets | | | — | | | | — | | | | — | | | | — | | | | — | | | | — | |
Frontier Emerging Markets | | | 58,838 | | | | 60,989 | | | | — | | | | — | | | | — | | | | — | |
| | | | | | | | | | | | | | | | |
| | | Investor Class | | | Advisor Class | |
| Portfolio | | Period Ended
April 30,
2015 (unaudited) | | | Year ended
October 31,
2014 | | | Period Ended
April 30,
2015 (unaudited) | | | Year ended
October 31,
2014 | |
Global Equity | | $ | — | | | $ | — | | | $ | 1,055 | | | $ | 2,772 | |
International Equity | | | 17,555 | | | | 40,158 | | | | — | | | | — | |
International Small Companies | | | 1,302 | | | | 14,171 | | | | — | | | | — | |
Institutional Emerging Markets | | | — | | | | — | | | | — | | | | — | |
Emerging Markets | | | — | | | | — | | | | 189,576 | | | | 272,857 | |
Frontier Emerging Markets | | | 41,771 | | | | 24,222 | | | | — | | | | — | |
41
Harding, Loevner Funds, Inc.
Notes to Financial Statements (continued)
April 30, 2015 (unaudited)
3. Significant Agreements and Transactions with Affiliates
The Board has approved an investment advisory agreement (the “Agreement”) with the Investment Adviser. Advisory fees are computed daily and paid monthly based on the average daily net assets of each Portfolio. The Investment Adviser has contractually agreed to reduce its fee and/or reimburse the Portfolios for other operating expenses to the extent that aggregate expenses, excluding certain non-operating expenses, exceed certain annual rates of the average daily net assets of each class.
The following annualized advisory fees and contractual expense limits were in effect for the period ended April 30, 2015. The advisory fees are charged at the Portfolio level as a whole and expense limitations are at the class specific level.
| | | | | | | | | | |
| Portfolio | | First $1 billion of assets | | Next $1 billion of assets | | Next $1 billion of assets | | Over $3 billion of assets | | Contractual Expense
Limit* |
Global Equity – Institutional Class | | 0.80% | | 0.78% | | 0.76% | | 0.74% | | 0.95% |
Global Equity – Advisor Class | | 0.80% | | 0.78% | | 0.76% | | 0.74% | | 1.25% |
International Equity – Institutional Class | | 0.75% | | 0.73% | | 0.71% | | 0.69% | | 1.00% |
International Equity – Investor Class | | 0.75% | | 0.73% | | 0.71% | | 0.69% | | 1.25% |
International Small Companies – Institutional Class | | 1.25% | | 1.23% | | 1.23% | | 1.23% | | 1.30% |
International Small Companies – Investor Class | | 1.25% | | 1.23% | | 1.23% | | 1.23% | | 1.55% |
Institutional Emerging Markets – Class I | | 1.15% | | 1.13% | | 1.11% | | 1.09% | | 1.30% |
Institutional Emerging Markets – Class II | | 1.15% | | 1.13% | | 1.11% | | 1.09% | | 1.15%** |
Emerging Markets – Advisor Class | | 1.15% | | 1.13% | | 1.11% | | 1.09% | | 1.75% |
Frontier Emerging Markets – Institutional Class | | 1.50% | | 1.48% | | 1.48% | | 1.48% | | 2.00% |
Frontier Emerging Markets – Investor Class | | 1.50% | | 1.48% | | 1.48% | | 1.48% | | 2.25% |
* Effective through February 29, 2016.
** The Investment Adviser has contractually agreed to waive a portion of its management fee and/or reimburse the Class II of the Portfolio for its other operating expenses to the extent Total Annual Portfolio Operating Expenses, as a percentage of average daily net assets, exceed the applicable contractual management fee, inclusive of breakpoints on assets, through February 29, 2016.
For the period ended April 30, 2015, the Investment Adviser waived and/or reimbursed the following amounts pursuant to the contractual expense limits described above:
| | |
| Portfolio | | Fees waived and/or reimbursed by the Investment Adviser |
International Small Companies – Institutional Class | | $53,362 |
International Small Companies – Investor Class | | 107,078 |
Institutional Emerging Markets – Class II | | 121,752 |
The Fund has an administration agreement with The Northern Trust Company (“Northern Trust”), which provides certain accounting, clerical and bookkeeping services, Blue Sky, corporate secretarial services and assistance in the preparation and filing of tax returns and reports to shareholders and the SEC.
Northern Trust also serves as custodian of each Portfolio’s securities and cash, transfer agent, dividend disbursing agent and agent in connection with any accumulation, open-account or similar plans provided to the shareholders of the Portfolios.
Alaric Compliance Services, LLC (“ACS”) provides an individual to serve as chief compliance and anti-money laundering compliance officer of the Fund. Fees paid to ACS are shown as “Compliance officers’ fees and expenses” on the Statements of Operations.
The Fund has adopted an Amended Plan of Distribution pursuant to Rule 12b-1 under the 1940 Act (“Distribution Plan”). Under the Distribution Plan, the Investor Class of each of the International Equity, International Small Companies and Frontier Emerging Markets Portfolios may pay underwriters, distributors, dealers or brokers a fee at an annual rate of up to 0.25% of the average daily net assets of the Portfolio’s Investor Class shares for services or expenses arising in connection with activities primarily intended to result in the sale of Investor Class shares of the Portfolios.
42
Harding, Loevner Funds, Inc.
Notes to Financial Statements (continued)
April 30, 2015 (unaudited)
3. Significant Agreements and Transactions with Affiliates (continued)
The Fund, on behalf of the Portfolios, has agreements with various financial intermediaries and “mutual fund supermarkets”, under which customers of these intermediaries may purchase and hold Portfolio shares. These intermediaries assess fees in consideration for providing certain distribution, account maintenance, record keeping and transactional services. In recognition of the savings of expenses to the Fund arising from the intermediaries’ assumption of functions that the Fund would otherwise perform, such as providing sub-accounting and related shareholder services, each Portfolio or class is authorized, pursuant to a Shareholder Servicing Plan, to pay to each intermediary an annual rate of up to 0.25% of its average daily net assets attributable to that intermediary (subject to the contractual expense limits described above). Because of the contractual expense limits on certain Portfolios’ fees and expenses, the Investment Adviser paid a portion of the Portfolios’ share of these fees during the period ended April 30, 2015.
4. Class Specific Expenses
Most expenses of the Fund can be directly attributed to a particular Portfolio. Expenses which cannot be directly attributed are apportioned among the Portfolios based upon relative net assets or other appropriate measures. If an expense is incurred at the Portfolio level, it is generally apportioned among the classes of that Portfolio based upon relative net assets of each respective class. Certain expenses are incurred at the class level and charged only to that particular class. These expenses may be class specific (i.e., Distribution fees charged only to a particular class) or they may be identifiable to a particular class (i.e., the costs related to printing and mailing shareholder reports to shareholders of a particular class). Class level expenses for Portfolios with multiple active classes are shown in the table below.
| | | | | | | | | | | | | | | | | | | | |
| Portfolio | | Distribution
Fees | | | State Registration
Filing Fees | | | Printing and
Postage Fees | | | Transfer Agent
Fees and Expenses | | | Shareholder
Servicing Fees | |
Global Equity – Institutional Class | | $ | — | | | $ | 24,790 | | | $ | 13,877 | | | $ | 12,178 | | | $ | 100,225 | |
Global Equity – Advisor Class | | | — | | | | 11,503 | | | | 3,484 | | | | 12,244 | | | | 87,354 | |
International Equity – Institutional Class | | | — | | | | 68,697 | | | | 140,967 | | | | 26,529 | | | | 1,130,533 | |
International Equity – Investor Class | | | 477,460 | | | | 17,690 | | | | 32,086 | | | | 40,354 | | | | 165,806 | |
International Small Companies – Institutional Class | | | — | | | | 11,550 | | | | 1,417 | | | | 10,963 | | | | 12,648 | |
International Small Companies – Investor Class | | | 77,062 | | | | 12,685 | | | | 4,081 | | | | 11,091 | | | | 45,423 | |
Institutional Emerging Markets – Class I | | | — | | | | 60,923 | | | | 42,892 | | | | 17,042 | | | | 390,403 | |
Institutional Emerging Markets – Class II | | | — | | | | 18,610 | | | | 3,364 | | | | 13,564 | | | | — | |
Frontier Emerging Markets – Institutional Class | | | — | | | | 29,184 | | | | 14,545 | | | | 19,437 | | | | 83,272 | |
Frontier Emerging Markets – Investor Class | | | 77,506 | | | | 18,192 | | | | 5,031 | | | | 13,936 | | | | 33,562 | |
5. Investment Transactions
Cost of purchases and proceeds from sales of investment securities, other than short-term investments, for the period ended April 30, 2015, were as follows for each Portfolio:
| | | | | | | | | | | | |
| Portfolio | | Purchase Cost of
Investment Securities | | | | | Proceeds from Sales of
Investment Securities | | | |
Global Equity | | $ | 185,242,660 | | | | | $ | 146,095,129 | | | |
International Equity | | | 684,446,215 | | | | | | 300,088,591 | | | |
International Small Companies | | | 19,225,726 | | | | | | 13,816,432 | | | |
Institutional Emerging Markets | | | 689,945,520 | | | | | | 275,687,266 | | | |
Emerging Markets | | | 601,161,840 | | | | | | 427,392,571 | | | |
Frontier Emerging Markets | | | 211,408,675 | | | | | | 120,134,433 | | | |
43
Harding, Loevner Funds, Inc.
Notes to Financial Statements (continued)
April 30, 2015 (unaudited)
6. Income Tax
The cost of investments for federal income tax purposes and the components of net unrealized appreciation (depreciation) on investments at April 30, 2015, for each of the Portfolios were as follows:
| | | | | | | | | | | | | | | | |
| Portfolio | | Gross
Unrealized
Appreciation | | | Gross
Unrealized
Depreciation | | | Net
Unrealized
Appreciation /
(Depreciation) | | | Cost | |
Global Equity | | $ | 198,063,251 | | | $ | (12,753,582 | ) | | $ | 185,309,669 | | | $ | 707,440,746 | |
International Equity | | | 1,172,260,605 | | | | (75,828,710 | ) | | | 1,096,431,895 | | | | 3,961,056,114 | |
International Small Companies | | | 19,697,111 | | | | (2,892,297 | ) | | | 16,804,814 | | | | 85,382,842 | |
Institutional Emerging Markets | | | 264,277,995 | | | | (86,579,853 | ) | | | 177,698,142 | | | | 1,943,792,113 | |
Emerging Markets | | | 602,517,064 | | | | (95,228,362 | ) | | | 507,288,702 | | | | 2,188,287,123 | |
Frontier Emerging Markets | | | 63,620,146 | | | | (54,849,656 | ) | | | 8,770,490 | | | | 620,095,571 | |
It is the policy of each Portfolio of the Fund to qualify as a regulated investment company by complying with the applicable provisions of the Internal Revenue Code, and to make distributions of taxable income sufficient to relieve it from substantially all federal income and excise taxes; therefore, no federal income tax provision is required.
Management has performed an analysis of each Portfolio’s tax positions for the open tax years as of October 31, 2014 and has concluded that no provisions for income tax are required. The Portfolios’ federal tax returns for the prior three fiscal years (open tax years: October 31, 2012; October 31, 2013; October 31, 2014) remain subject to examination by the Portfolios’ major tax jurisdictions, which include the United States, the State of New Jersey and the State of Maryland. Management is not aware of any events that are reasonably possible to occur in the next twelve months that would result in the amounts of any unrecognized tax benefits significantly increasing or decreasing for the Portfolios. However, management’s conclusions regarding tax positions taken may be subject to review and adjustment at a later date based on factors including, but not limited to, new tax laws and accounting regulations and interpretations thereof.
The tax character of distributions paid during the fiscal years ended October 31, 2014 and 2013 were as follows:
| | | | | | | | | | | | | | | | |
| | | Distributions From | |
| Portfolio | | Ordinary
Income
2014 | | | Long-Term
Capital Gains
2014 | | | Ordinary
Income
2013 | | | Long-Term
Capital Gains
2013 | |
Global Equity | | $ | 2,737,949 | | | $ | 2,665,824 | | | $ | 1,722,330 | | | $ | — | |
International Equity | | | 29,749,093 | | | | — | | | | 18,521,821 | | | | — | |
International Small Companies | | | 1,780,824 | | | | 3,317,431 | | | | 740,002 | | | | — | |
Institutional Emerging Markets | | | 8,999,751 | | | | — | | | | 3,683,658 | | | | — | |
Emerging Markets | | | 16,977,080 | | | | 54,210,866 | | | | 12,078,855 | | | | 106,392,227 | |
Frontier Emerging Markets | | | 805,788 | | | | — | | | | 991,109 | | | | — | |
The Regulated Investment Company Modernization Act of 2010 (the “Act”) changed various technical rules governing the tax treatment of regulated investment companies and became effective for the Portfolios for the fiscal year ended October 31, 2012. Under the Act, each Portfolio is permitted to carry forward capital losses incurred in taxable years beginning after the date of enactment for an unlimited period. However, any losses incurred during post-enactment years are required to be utilized prior to the losses incurred in pre-enactment taxable years, which carry an expiration date. As a result of this ordering rule, pre-enactment capital loss carryforwards may be more likely to expire unused. Additionally, post-enactment capital loss carryforwards will retain their character as either short-term or long-term capital losses rather than being considered all short-term as permitted under previous regulation.
44
Harding, Loevner Funds, Inc.
Notes to Financial Statements (continued)
April 30, 2015 (unaudited)
6. Income Tax (continued)
Capital losses incurred that will be carried forward indefinitely under provisions of the Act are as follows:
| | | | | | | | | | | | |
| Portfolio | | Short-Term
Capital Loss
Carryforward | | | | | Long-Term
Capital Loss
Carryforward | | | |
International Equity | | $ | 16,579,888 | | | | | $ | 19,176,254 | | | |
At October 31, 2014, the pre-enactment capital loss carryforwards and their respective years of expiration were as follows:
| | | | | | | | | | | | |
| Portfolio | | October 31,
2017 | | | | | October 31,
2019 | | | |
Institutional Emerging Markets | | $ | 28,667,656 | | | | | $ | 3,834,973 | | | |
7. Foreign Exchange Contracts
The Portfolios do not generally hedge foreign currency exposure, however, the Portfolios may enter into forward foreign exchange contracts in order to hedge their exposure to changes in foreign currency exchange rates on their foreign portfolio holdings. Each Portfolio will conduct its currency transactions either on a spot (cash) basis at the rate prevailing in the currency exchange market, or by entering into forward contracts to purchase or sell currency. Foreign currency transactions entered into on the spot markets serve to pay for foreign investment purchases or to convert to dollars, the proceeds from foreign investment sales or dividend and interest receipts. The Portfolios will disclose open forward currency contracts, if any, on the Portfolios of Investments. The Portfolios do not separately disclose open spot market transactions on the Portfolios of Investments. Such realized gain (loss) and unrealized appreciation (depreciation) on spot market transactions is included in “net realized gain (loss) on foreign currency transactions” and “change in unrealized appreciation (depreciation) on translation of assets and liabilities denominated in foreign currencies”, respectively, on the Portfolios’ Statements of Operations. The Portfolios held no open forward currency contracts on April 30, 2015.
8. Participation Notes
Each Portfolio may invest in participation notes. Participation notes are promissory notes that are designed to offer a return linked to the performance of a particular underlying equity security or market. Participation notes are issued by banks or broker-dealers and allow a Portfolio to gain exposure to common stocks in markets where direct investment may not be allowed. Participation notes are generally traded over-the-counter and are subject to the risk that the broker-dealer or bank that issues them will not fulfill its contractual obligation to complete the transaction with a Portfolio. Participation notes constitute general unsecured contractual obligations of the banks or broker-dealers that issue them, and a Portfolio investing in participation notes would be relying on the creditworthiness of such banks or broker-dealers and would have no rights under a participation note against the issuer of the underlying assets. Participation notes may be more volatile and less liquid than other investments held by the Portfolios.
9. Concentration of Ownership
At April 30, 2015, the percentage of total shares outstanding held by record shareholders each owning 10% or greater of the aggregate shares outstanding of each Portfolio were as follows:
| | | | | | | | | | | | |
| | | No. of
Shareholders | | | | | %
Ownership | | | |
Global Equity | | | 3 | | | | | | 53.68 | %* | | |
International Equity | | | 2 | | | | | | 54.79 | %* | | |
International Small Companies | | | 3 | | | | | | 74.92 | %* | | |
Institutional Emerging Markets | | | 2 | | | | | | 55.32 | %* | | |
Emerging Markets | | | 3 | | | | | | 78.10 | %* | | |
Frontier Emerging Markets | | | 4 | | | | | | 68.42 | %* | | |
* Includes omnibus positions of broker-dealers representing numerous shareholder accounts.
Investment activities of these shareholders may have a material effect on the Portfolios.
45
Harding, Loevner Funds, Inc.
Notes to Financial Statements (continued)
April 30, 2015 (unaudited)
10. Concentration of Risk
Investing in securities of foreign issuers and currency transactions may involve certain considerations and risks not typically associated with investments in U.S. issuers. These risks include revaluation of currencies, adverse fluctuations in foreign currency values and possible adverse political, social and economic developments, including those particular to a specific industry, country or region, which could cause the securities and their markets to be less liquid and prices more volatile than those of comparable U.S. companies and U.S. government securities. These risks are greater with respect to securities of issuers located in emerging market countries in which the Portfolios are authorized to invest.
Frontier Emerging Markets is permitted to invest up to 35% of its total assets in companies in the same industry, if, at the time of investment, that industry represents 20% or more of the Portfolio’s benchmark index. During periods when the Portfolio has invested more than 25% of its total assets in companies in the same industry, it will operate as a concentrated portfolio and be subject to additional risks and greater volatility. At April 30, 2015, the Portfolio’s investment in the Banking industry amounted to 31.57% of its total assets.
11. Line of Credit
The Fund has a $100 million line of credit agreement with Northern Trust. Borrowings are made solely to facilitate the handling of redemptions or unusual or unanticipated short-term cash requirements. Because several Portfolios participate, and collateral requirements apply, there is no assurance that an individual Portfolio will have access to the entire $100 million at any particular time. Interest is charged to each Portfolio based on borrowings at an amount above the Federal Funds rate, subject to a minimum rate. In addition, a facility fee is computed at an annual rate of 0.10% on the line of credit and is allocated among the Portfolios. For the period ended April 30, 2015, Institutional Emerging Markets had an outstanding balance on one day with a maximum balance of $600,000 at an average weighted interest rate of 1.37%, Emerging Markets had an outstanding balance on one day with a maximum balance of $8,600,000 at an average weighted interest rate of 1.37% and Frontier Emerging Markets had an outstanding balance on six days with a maximum balance of $3,400,000 at an average weighted interest rate of 1.75%.
12. India Tax Matter
In March 2015, Indian tax authorities issued a draft assessment order (the “Draft Order”) with respect to the Emerging Markets and Institutional Emerging Markets Portfolios (the “Affected Portfolios”). The Draft Order asserts that the Affected Portfolios are subject to an assessment of minimum alternate tax (“MAT”) for tax year 2011-2012 on capital gains realized. Similar assessment orders were reportedly issued to dozens of other investment funds that, like the Fund, are considered “foreign institutional investors” (“FIIs”) in India. In addition, a separate order (the “Penalty Order”) asserts that the Affected Portfolios may be subject to certain penalties for failing to pay MAT. The Indian tax authorities have also indicated that they will scrutinize the Affected Portfolios’ Returns of Income for the tax year 2009-2010. The Fund has taken steps to challenge the validity of both the Penalty Order and the Draft Order and Management believes that both orders are without merit. Furthermore, per a recent announcement by the Indian Central Board of Direct Taxation, all new assessments have been put on hold until an ad hoc Committee provides guidance on the matter. Based on information known by Management at this time, Management does not believe that the matters above will have a material effect on financial results of the Affected Portfolios, and has determined to make no provision for MAT in the accompanying financial statements. However, it is not possible to predict the ultimate outcome of these proceedings and, it is possible that an adverse outcome could negatively impact the Affected Portfolios’ financial results. The Fund will monitor future developments and may determine to make a provision for MAT in the future.
13. Subsequent Events
Subsequent events occurring after the date of this report have been evaluated for potential impact, for purposes of recognition or disclosure in the financial statements, through the date the report was issued.
46
Harding, Loevner Funds, Inc.
Privacy Notice
(unaudited)
HARDING, LOEVNER FUNDS, INC.
PRIVACY NOTICE
The Fund collects nonpublic personal information about you from the following sources:
| | • | | Information, such as your name, address, social security number, assets and income, submitted by you on applications, forms, or in other written or verbal customer communications. This information may also be provided by a consultant or intermediary acting on your behalf. |
| | • | | Information that results from any transaction performed by us for you. |
The Fund will not disclose any nonpublic personal information about you or its former customers to anyone except as permitted or required by law.
If you decide to close your account(s) or become an inactive customer, the Fund will adhere to the privacy policies and practices as described in this notice.
The Fund restricts access to your personal and account information to only those employees who need to know that information to provide products or services to you. The Fund maintains physical, administrative and technical safeguards to protect your nonpublic personal information.
47
Harding, Loevner Funds, Inc.
Supplemental Information
(unaudited)
Quarterly Form N-Q Portfolio Schedule
Each Portfolio will file its complete portfolio of investments with the SEC on Form N-Q at the end of the first and third fiscal quarters within 60 days of the end of the quarter to which it relates. The Portfolios’ Form N-Q will be available on the SEC’s website at www.sec.gov and may also be reviewed and copied at the SEC’s Public Reference Room whose telephone number is (800) SEC-0330. Additionally, they are available upon request by calling (877) 435-8105.
Proxy Voting Record
The Fund’s proxy voting record relating to the Portfolios’ securities during the most recent 12-month period ended June 30 is available on the Fund’s website at www.hardingloevnerfunds.com and on the SEC’s website at www.sec.gov, on Form N-PX.
Proxy Voting Policies and Procedures
A description of the Fund’s proxy voting policies and procedures are located in the Statement of Additional Information and is available without charge, upon request, by calling (877) 435-8105 or on the SEC’s website at www.sec.gov.
Additional Information
The Adviser updates Fact Sheets for the Portfolios each calendar quarter, which are posted to the Fund’s website – www.hardingloevnerfunds.com. This information, along with the Adviser’s commentaries on its various strategies, is available without charge, upon request, by calling (877) 435-8105.
48
Harding, Loevner Funds, Inc.
Directors and Officers
(unaudited)
DIRECTORS AND OFFICERS OF THE FUNDS
David R. Loevner
Director and Chairman of the Board of Directors
Carolyn Ainslie
Director
Jennifer M. Borggaard
Director
William E. Chapman, II
Director
R. Kelly Doherty
Director
Charles Freeman, III
Director
Samuel R. Karetsky
Director
Eric Rakowski
Director
Richard Reiter
President
Charles S. Todd
Chief Financial Officer and Treasurer
Susan Mosher
Chief Compliance Officer and Anti-Money Laundering Compliance Officer
Owen T. Meacham
Secretary
Aaron Bellish
Assistant Treasurer
Derek Jewusiak
Assistant Treasurer
Lori M. Renzulli
Assistant Secretary
Marcia Y. Lucas
Assistant Secretary
Brian Simon
Assistant Secretary
49


Item 2. Code of Ethics.
Not applicable to this filing.
Item 3. Audit Committee Financial Expert.
Not applicable to this filing.
Item 4. Principal Accountant Fees and Services.
Not applicable to this filing.
Item 5. Audit Committee of Listed Registrants.
Not applicable to this filing.
Item 6. Investments.
| (a) | Investments in securities of unaffiliated issuers as of the close of the reporting period as set forth in § 210.1212 of Regulation
S-X [17 CFR 210.12-12], are included as part of the report to stockholders filed under Item 1 of this Form. |
Item 7. Disclosure of Proxy Voting Policies and Procedures for Closed-End Management Investment Companies.
Not applicable to this registrant.
Item 8. Portfolio Managers of Closed-End Management Investment Companies.
Not applicable to this registrant.
Item 9. Purchases of Equity Securities by Closed-End Management Investment Company and Affiliated Purchasers.
Not applicable to this registrant.
Item 10. Submission of Matters to a Vote of Security Holders.
Not applicable.
Item 11. Controls and Procedures.
| (a) | The Registrant’s Principal Executive Officer and Principal Financial Officer have concluded that the Registrant’s disclosure controls and procedures (as defined in Rule 30a-3(c) under the Investment Company Act of 1940, as amended (the “1940 Act”)) are effective, based on the evaluation of these controls and procedures required by Rule 30a-3(b) under the 1940 Act and Rules 13a-15(b) or 15d – 15(b) under the Securities and Exchange Act of 1934 as of the date within 90 days of the filing date of this report. |
| (b) | There were no changes in the Registrant’s internal control over financial reporting (as defined in Rule 30a-3(d) under the 1940 Act) that occurred during the second fiscal quarter of the period covered by this report that have materially affected, or are reasonably likely to materially affect, the Registrant’s internal control over financial reporting. |
Item 12. Exhibits.
(a)(1) Not applicable to this filing.
(a)(2) Exhibit 99.CERT: Section 302 Certifications.
(b) Exhibit 99.906 CERT: Section 906 Certifications.
SIGNATURES
Pursuant to the requirements of the Securities Exchange Act of 1934 and the Investment Company Act of 1940, the registrant has duly caused this report to be signed on its behalf by the undersigned, thereunto duly authorized.
| | | | |
| Harding, Loevner Funds, Inc. | | |
| | |
| By | | /s/ Richard T. Reiter | | |
| | Richard T. Reiter | | |
| | (Principal Executive Officer) | | |
| |
| Date: July 6, 2015 | | |
|
| Pursuant to the requirements of the Securities Exchange Act of 1934 and the Investment Company Act of 1940, this report has been signed below by the following persons on behalf of the registrant and in the capacities and on the dates indicated. |
| | |
| By | | /s/ Richard T. Reiter | | |
| | Richard T. Reiter | | |
| | (Principal Executive Officer) | | |
| |
| Date: July 6, 2015 | | |
| | |
| By | | /s/ Charles S. Todd | | |
| | Charles S. Todd | | |
| | (Principal Financial Officer) | | |
| |
| Date: July 6, 2015 | | |