Table of Contents
UNITED STATES
SECURITIES AND EXCHANGE COMMISSION
Washington, D.C. 20549
FORM N-CSR
CERTIFIED SHAREHOLDER REPORT OF REGISTERED
MANAGEMENT INVESTMENT COMPANIES
Investment Company Act file number 811-07739
Harding, Loevner Funds, Inc.
(Exact name of registrant as specified in charter)
400 Crossing Boulevard
Fourth Floor
Bridgewater, NJ 08807
(Address of principal executive offices) (Zip code)
Owen T. Meacham
The Northern Trust Company
50 South LaSalle Street
Chicago, IL 60603
With a copy to:
Stephen H. Bier, Esq.
Dechert LLP
1095 Avenue of the Americas
New York, NY 10036
(Name and address of agent for service)
Registrant’s telephone number, including area code: (877) 435-8105
Date of fiscal year end: 10/31
Date of reporting period: 04/30/2018
Table of Contents
Item 1. Reports to Stockholders.
Table of Contents
Table of Contents
⬛ HARDING LOEVNER FUNDS
Global equity investing for institutions is Harding Loevner’s exclusive focus. Through Harding Loevner Funds it offers distinct global strategies based on its quality-and-growth investment philosophy. It seeks to purchase shares of growing, financially strong, well-managed companies at favorable prices. Harding Loevner manages each of the Funds’ Portfolios according to a disciplined, research-based investment process. It identifies companies with sustainable competitive advantages and assesses the durability of their earnings growth by conducting in-depth fundamental research into global industries. In constructing portfolios, Harding Loevner diversifies carefully to limit risk.
⬛ RECEIVE INVESTOR MATERIALS ELECTRONICALLY
Shareholders may sign up for electronic delivery of investor materials. By doing so, you will receive the information faster and help us reduce the impact on the environment of providing these materials. To enroll in electronic delivery,
| 1. | Go to http://www.icsdelivery.com |
| 2. | Select the first letter of your brokerage firm’s name. |
| 3. | From the list that follows, select your brokerage firm. If your brokerage firm is not listed, electronic delivery may not be avail-able. Please contact your brokerage firm. |
| 4. | Complete the information requested, including the e-mail address where you would like to receive notifications for electronic documents. |
Your information will be kept confidential and will not be used for any purpose other than electronic delivery. If you change your mind, you can cancel electronic delivery at any time and revert to physical delivery of your materials. Just go to http://www.icsdelivery.com, perform the first three steps above, and follow the instructions for cancelling electronic delivery. If you have any questions, please contact your brokerage firm.

Table of Contents
Table of Contents
 |
| |||
|
| |||
| ||||
International Small Companies Portfolio
| ||||
| ||||
Frontier Emerging Markets Portfolio
| ||||
|
Global Equity Research Portfolio
| |||
International Equity Research Portfolio
| ||||
Emerging Markets Research Portfolio
| ||||


Contact
Harding, Loevner Funds, Inc.
c/o Northern Trust
Attn: Funds Center C5S
801 South Canal Street
Chicago, IL 60607
Phone: (877) 435-8105 | ||
Fax: (312) 267-3657 | Must be preceded or accompanied by a current Prospectus. | |
www.hardingloevnerfunds.com | Quasar Distributors, LLC, Distributor |

Table of Contents

 | DAVID LOEVNER, CFA, CIC CHAIRMAN OF THE FUNDS AND CEO OF THE ADVISER | |||||
SIMON HALLETT, CFA CO-CIO OF THE ADVISER
| ||||||
FERRILL ROLL, CFA CO-CIO OF THE ADVISER |
Investing successfully is difficult. How do you improve? The process is captured nicely in a Latin phrase: Succisa Virescit—“Having been cut down, it grows up strong again.” It speaks to the notion that you will make mistakes that set you back, but, by having the courage and humility to embrace them, you make yourself better. In investing, mistakes occur in the course of making decisions every day, whether markets are steady, booming, or collapsing. Continuous study of your own mistakes and the mistakes of others can help you continuously improve.
Ten years have passed since the peak of the global financial crisis (GFC), and last October marked the thirtieth anniversary of Black Monday. Both terrifying events interrupted long periods of market tranquility. Both unleashed emotions that affected decision-making. Both provided opportunities for investors to err and to learn. The current stretch of relatively tranquil markets means that those who started investing after 2009 may not have developed the scar tissue that comes with living through a market crash. Given the importance of these events to the investors who experienced them, we thought a reflection on mistakes and the lessons we learned—in times of crisis and quotidian times—would be a worthy subject of this letter.
An early lesson we learned was to be wary of financial “innovation.” While “proven” safe in backtesting, complex new financial strategies can reveal previously unimagined faults under the stress of reality. The sell-off in markets in 1987 was exacerbated by one such innovation, called “portfolio insurance.” Its promoters offered to indemnify institutional investors against losses from a large fall in the stock market. They avouched that institutional investors who purchased insurance could own more equities without unacceptable risk. The product became very popular. However, investors, insurers, and regulators alike failed to recognize how its popularity would undermine its effectiveness. To hedge their obligations, the insurers needed to sell stock index futures programmatically as the stock market fell. On Black Monday, with the stock market declining, they found few willing buyers for the futures contracts they attempted to sell. The futures buyers, in turn, hedged their exposure by selling equities into the falling market. The result: a vicious vortex that fed upon itself. The S&P 500 Index fell 21% that day—still the largest single-day percentage decline in its history. The Hong Kong market closed for nearly a week, then dropped more than 40% when it reopened. The insurers were unable to fulfill their promises, and investors suffered heavy losses that many could ill afford.
Twenty years later, the market repeated the lesson: when investors buy an esoteric financial product, they need to understand what they are buying, especially the fundamental sources of the underlying cash flows including those to counterparties, and to view skeptically the guarantees of others. In the lead up to the GFC, the underwriters of securitized sub-prime mortgages convinced the ratings agencies and investors in collateralized debt obligations (CDOs) that, if numerous mortgages were pooled together to diversify away such risk factors as credit worthiness and regional concentration, and their repayment cash flows assembled into a priority waterfall of “tranches,” the senior-most tranches—those engineered to have the first claim on repayments—would be insulated from defaults to be anticipated on the underlying mortgages and were therefore worthy of “AAA” credit ratings. This logic proved flawed. As the real estate bubble inflated throughout the country, large mortgages were increasingly given to borrowers lacking the wherewithal to repay them. By 2006–07, diversification turned into a mirage. Pools became dominated by low-quality mortgages whose default rates were far higher than anticipated and whose repayments in many cases were inadequate even to satisfy the senior tranches. Banks and institutional investors didn’t buy just the new products—they also bought into a false promise of security.
Extraordinary market events like Black Monday and the GFC also reminded investors never to be complacent—the unexpected can happen at any time and have a greater intensity than they could ever imagine. In such situations, companies with the strongest balance sheets are best able to withstand periods when debt and equity markets are closed for financing, and all but non-discretionary spending largely ceases. From 2002 until 2007, for example, the world had enjoyed economic growth and tranquil markets. But nothing lasts forever. Between the collapse of Bear Stearns in early 2008 and the start of the market rally in early 2009, the S&P 500 lost nearly 50% of its value. The US economy contracted at an 8% rate in the fourth quarter of 2008 and at over 5% in the first quarter of 2009.
Another lesson made clear in times of crisis is that the best values occur when others are forced to liquidate. Investors, too, must have their own strong balance sheets and be prepared (financially and psychologically) to remain calm when panic strikes to take advantage of bargains. It is emotionally difficult to buy when all about you are screaming “sell,” as we are hardwired as humans to run with the crowd. In such times investors should want to be providers of liquidity, not seekers of it.
Black Monday and the GFC afford lessons to all investors open to improvement. But crises aren’t the only powerful teachers. Mistakes that are uniquely our own can be effective tutors. In 2003–04, for example, our International Equity Portfolio dramatically underperformed its benchmark. During the dot-com bust in 2000–02, we sought shelter with a significant weight in exceptionally high-quality, stable-growth businesses—e.g. Nestlé, Heineken, Air

Table of Contents
Liquide. Coming out of the bust, such businesses were as cheap as they had ever been in our investing experience, and we added to them in 2003–04 even as the market rallied. Events would reveal that nearly all equities were cheap at that time, and anything with a cyclical or an emerging-market exposure was really cheap. And that is what we should have owned and could have owned, but did not, to our clients’ detriment.
We analyzed our relative performance to understand why it was so poor in 2003–04. Two facts emerged: we faced a style headwind—e.g., the companies with the strongest balance sheets (where we already had a large weight by 2002) significantly underperformed the most indebted businesses, and our transactions adding to secular, instead of economically sensitive, growth in the period detracted over 800 basis points in performance relative to our benchmark.
The two immediate lessons we took away from this humbling experience were to place greater importance on valuation and to keep firmly in mind that what we didn’t own could hurt us (opportunity costs matter!). The scarring experience of 2003–04 taught us useful ways to navigate the extreme volatility of 2008–09. For example, our International Equity Portfolio outperformed during the terrible decline of 2008 partly due to its large overweight in the defensive Health Care sector. The Portfolio then outperformed during the sharp recovery in 2009, helped by our decision early that year to cut our Health Care weight on valuation grounds (everything was cheap) and our concerns about the impact of proposed US policy changes on the industry. We redeployed that capital into economically sensitive Industrials, Consumer Discretionary, and Information Technology companies (which were really cheap).
The experience of 2003–04 also confirmed our long-standing belief that an effective investment process requires a work environment where people feel safe in taking well-considered risks without fear of recrimination if things do not turn out as hoped. Transparency is critical for an investment team to learn and improve. During 2004, we strengthened our processes for capturing and analyzing our investment team’s actions. We also enhanced our procedures for sharing our findings internally with the stated goal of learning, not punishing. As one example, each quarter we encourage our portfolio managers to analyze their purchase and sale decisions of a year earlier and their rationales to see what they got right and wrong. Also, each year our analysts publish reviews of their biggest contributors and detractors to their individual performance in hope that patterns of behavior, both good and bad, will be recognized for the benefit of themselves and their colleagues.
Beating the market is an immensely difficult endeavor. Mistakes are inevitable. But mistakes identified, acknowledged, and dissected—whether they are made by you or others—can provide valuable insights that will help you make better decisions. Learning from your own mistakes is neither easy nor painless, and it cannot be done alone. But it will help you grow stronger. And, as we have found, learning from the mistakes of past crises and our daily work can also reduce the frequency of mistakes in the future.
Thank you for your support and your trust.
Sincerely, | ||||
 |  |  | ||
| David R. Loevner, CFA, CIC | Simon Hallett, CFA | Ferrill D. Roll, CFA | ||
Opinions expressed are those of Harding Loevner and are not intended to be forecasts of future events, a guarantee of future results, nor investment advice. Please read the separate disclosure page for important information, including the risks of investing in the Portfolios. Past performance is not a guarantee of future results.

Table of Contents

PORTFOLIO MANAGEMENT TEAM
 | ||
PETER BAUGHAN, CFA | SCOTT CRAWSHAW | |
| CO-LEAD PORTFOLIO MANAGER | PORTFOLIO MANAGER | |
FERRILL ROLL, CFA | CHRISTOPHER MACK, CFA | |
| CO-LEAD PORTFOLIO MANAGER | PORTFOLIO MANAGER | |
RICHARD SCHMIDT, CFA | ||
| PORTFOLIO MANAGER | ||
⬛ PERFORMANCE SUMMARY
For the Global Equity Portfolio, the Institutional Class rose 5.57%, the Institutional Class Z rose 5.61%, and the Advisor Class rose 5.46% (net of fees and expenses) in the six-month period ended April 30, 2018. The Portfolio’s benchmark, the MSCI All Country World Index, gained 3.56% (net of source taxes).
FUND FACTS at April 30, 2018
| ||||||||||||
TOTAL NET ASSETS
|
| $832.4M | ||||||||||
SALES CHARGE
|
| NONE | ||||||||||
NUMBER OF HOLDINGS
|
| 74 | ||||||||||
TURNOVER (5 YR. AVG.)
|
| 33% | ||||||||||
REDEMPTION FEE
|
| 2% FIRST 90 DAYS | ||||||||||
DIVIDEND POLICY
|
| ANNUAL | ||||||||||
| INSTITUTIONAL INVESTORS | INDIVIDUAL INVESTORS | |||||||||||
| INSTL CLASS | INSTL CLASS Z | ADVISOR CLASS | ||||||||||
TICKER
| HLMVX | HLGZX | HLMGX | |||||||||
CUSIP
| 412295602 | 412295727 | 412295206 | |||||||||
INCEPTION DATE
| 11/3/2009 | 8/1/2017 | 12/1/1996 | |||||||||
MINIMUM INVESTMENT1
| $100,000 | $10,000,000 | $5,000 | |||||||||
NET EXPENSE RATIO
| 0.93% | 0.90%2 | 1.14% | |||||||||
GROSS EXPENSE RATIO | 0.93% | 1.21% | 1.14% | |||||||||
1Lower minimums available through certain brokerage firms; 2Shown net of Harding Loevner’s contractual agreement through February 28, 2018.
⬛ MARKET REVIEW
Markets closed 2017 on an optimistic note, with stock prices rising strongly in December. Economic growth across all major regions remained positive and synchronized, while inflation was subdued. In the US, investors ignored the Federal Reserve’s signals of further interest rate increases, including a hike in mid-December. They weighed approvingly the expected future benefits of lower corporate tax rates from tax legislation, which finally passed in late December. In Europe, the European Central Bank remained accommodative on monetary policy, although it signaled a slowing pace of bond buying. China’s economy gathered momentum, shrugging off concerns over government corruption crackdowns and shaky property loans, with positive pull-through effects on its trading partners. Japanese economic growth edged higher, while inflation remained positive—a critical policy goal.
The markets’ positive trend continued into the new year, but the streak of 15 monthly gains ended in February as sanguinity gave way to worry. Although the backdrop of improving and increasingly synchronized economic growth and good corporate earnings remained in place, investors had to come to terms with some ugly prospects: higher interest rates, a trade war between the US and China, and increased regulation of technology companies.
Stock price volatility spiked at the end of January, exacerbated by the collapse of derivatives-based “inverse volatility” ETFs, contributing to an over 8% decline in equities in just 10 days. After a brief bounce in mid-February, stocks wallowed in a range through the end of April, reflecting a new set of worries about increasingly ubiquitous technology platforms. A mounting furor over
Facebook data illicitly exploited by political consultant Cambridge Analytica in favor of US President Donald Trump and Brexit, and the mowing down of a pedestrian by an Uber self-driving car in Arizona drew calls for more regulation of technology companies. The European Union continued its efforts to rein in “big tech,” announcing a tax on turnover of large digital companies and moving ahead with its General Data Protection Regulation mandate, which imposes strict requirements and stiff penalties regarding treatment of private data. The tech tumult turned farcical with Trump tweeting potshots at Amazon.com over its use of the Postal Service.
All sectors except Utilities and Consumer Staples advanced in the period. Energy was the top-performing sector, as crude oil prices reached levels in April not seen since the end of 2014. Information Technology (IT) moderately outpaced the index; its outsized January gains were nearly depleted by sharp declines late in March.
All regions except Canada advanced as well. Emerging Markets (EMs), more typically the loser from rising global risk and volatility, was the strongest-performing region. Confoundingly, EMs’ rise was supported by Brazil and Russia, two of the biggest exporters of steel and other commodities whose trade is endangered. A Brazilian court upheld the conviction of former president Luiz Inácio Lula da Silva on corruption charges, likely precluding him from running again and restoring his redistributionist policies.
The most expensive and fastest-growing quintiles of stocks gained in the period, outperforming the rest by a wide margin. Quality was not a significant return factor.

Table of Contents
PERFORMANCE (% TOTAL RETURN)
for periods ended March 31, 2018 |
for periods ended April 30, 2018
| |||||||||||||||||||||||||||
1 | 3 | 5 | 10 | SINCE INCEPTION* | 1 | 3 | 5 | 10 | SINCE INCEPTION* | |||||||||||||||||||
| YEAR | YEARS | YEARS | YEARS | Nov-09 | Aug-17 | Dec-96 | YEAR | YEARS | YEARS | YEARS | Nov-09 | Aug-17 | Dec-96 | |||||||||||||||
GLOBAL EQUITY PORTFOLIO – INST CLASS
| 23.40 | 12.13 | 12.03 | – | 11.05 | 19.07 | 11.16 | 11.56 | – | 10.85 | ||||||||||||||||||
GLOBAL EQUITY PORTFOLIO – INST CLASS Z
| – | – | – | – | 10.35 | – | – | – | – | 9.62 | ||||||||||||||||||
GLOBAL EQUITY PORTFOLIO - ADVISOR CLASS
| 23.17 | 11.85 | 11.75 | 7.56 | 7.47 | 18.84 | 10.89 | 11.28 | 7.06 | 7.40 | ||||||||||||||||||
MSCI ALL COUNTRY WORLD INDEX
| 14.85 | 8.12 | 9.20 | 5.57 | 9.46 | 6.66 | – | 14.17 | 7.43 | 8.80 | 5.10 | 9.48 | 7.68 | – | ||||||||||||||
Returns are annualized for periods greater than 1 year. *Inception of the Institutional Class, November 3, 2009. Inception of the Institutional Class Z, August 1, 2017. Inception of the Advisor Class, December 1, 1996. Index performance prior to January 1, 2001 cannot be shown since it relies on back-filled data.
Performance data quoted represents past performance; past performance does not guarantee future results. The investment return and principal value of an investment will fluctuate so that an investor’s shares, when redeemed, may be worth more or less than their original cost. Current performance of the Portfolio may be lower or higher than the performance quoted. Performance data current to the most recent month end may be obtained by calling (877) 435-8105 or visiting www.hardingloevnerfunds.com. Performance data shown does not reflect the 2.00% redemption fee imposed on shares held 90 days or less; otherwise, total returns would be reduced.
⬛ PERFORMANCE ATTRIBUTION
Our Portfolio’s good relative returns derived overwhelmingly from strong stock selection. Our stocks within Health Care delivered the most pronounced outperformance, followed by holdings in Financials, IT, and Consumer Discretionary. Health Care stocks were led by Wuxi Biologics, a new investment in December, which became the first Chinese manufacturer to receive approval for Trogarzo, an antiretroviral drug, from the US Food and Drug Administration. Japan’s Sysmex and M3, China’s Sino Biopharmaceutical, and the UK’s Shire were also strong performers in the sector. Financials got a boost from AIA Group in Hong Kong and from SVB Financial Group in the US.
From a geographic perspective, outperformance came mainly from good stocks in EMs, the US, and Japan. The two Chinese Health Care stocks along with social media platform Weibo led our EM holdings. US key contributors included SVB Financial Group, Verisk, Nike, Booking Holdings (formerly Priceline), and Mastercard. Facebook and Regeneron—high-priced, fast-growing companies—were detractors from our relative performance in the US.
Together, the outperformance in the US, EMs, and Japan more than offset poor stocks in Europe outside of the eurozone. The most significant detractor was Swedish debt collection company Intrum Justitia, which reported poor quarterly earnings. Several low-volatility stocks of high-quality, non-cyclical companies in Europe lagged the index and hurt relative performance, including Reckitt Benckiser and Nestlé.
⬛ PERSPECTIVE AND OUTLOOK
“If you buy something because it’s undervalued, then you have to think about selling it when it approaches your calculation of its intrinsic value. That’s hard. But, if you can buy a few great companies, then you can sit on your ass. That’s a good thing.”
— Charlie Munger,
Berkshire Hathaway annual meeting, 2000
Arguably the greatest contribution that Charlie Munger has made to Berkshire Hathaway’s shareholders was in convincing Warren Buffett in the 1970s that a long-duration growth business trading at an apparently premium price could still represent a good value. His reasoning was that the return on the shares would ultimately converge with the return on capital for the business as the compounding of the latter would, over a long period of time (Munger cited 40 years), come to dwarf the initial premium paid for the shares. That inevitability meant that you could buy, then sit and wait—but, presumably (and critically), only if you were assured that the company would manage to maintain its growth rate and sustain its high profitability in the process. You could tolerate occasional periods of overvaluation of that business’s shares because, given enough time, its profits would grow back into its share price.
As investors in businesses that can grow for many years with high and durable profitability, we at Harding Loevner adhere to an investment philosophy that resembles Munger’s. Through our research process, we look for companies that meet our criteria of what makes a great business. The process is focused entirely on business fundamentals: we evaluate the competitive structure of an industry, examine each participant’s competitive position, and then question whether a favorable industry structure or the particular advantages enjoyed by some participants are sustainable into the future. Upon identifying such apparently great businesses, we include them in our qualified investable universe. We estimate what their shares are worth by making financial forecasts and discounting their projected long-term cash flows to the present. While we’re not afraid to pay over the market average for shares of an excellent business, even a paragon will fail to make its way into our Portfolios if its superior long-term prospects are more than fully discounted in its current share price.
Munger’s challenge, and ours too, is in finding companies that will remain “great” for 10 years, let alone 40. Enduring jewels are more easily discovered in hindsight than in advance. The identification of such companies requires that all evidence in support of a purchase be weighed against an obvious fact—that the vast majority of businesses fail to maintain their profitability over the long term. Once an investment is made, we do much more than sit and watch the returns pour in. We set up structures

Table of Contents
to seek out evidence that the company will not stay great forever. To be able to “sit” comfortably on a holding presupposes, among other things, that the customers of that business continue to prefer its products or services. We guard against the risk of mishap through intensive monitoring of the business results of our portfolio companies, parsing financial disclosures, and checking third-party sources to gauge their progress against the mileposts that we set out in advance as supporting detail to our investment thesis. There is nothing sedentary about our ownership.
To “be right and sit tight,” to borrow a phrase from legendary Wall Street trader Jesse Livermore, is easier said than done in other ways. In addition to guarding against the deterioration of companies’ underlying businesses (the “be right” part), investors need also to guard against the human tendency to become risk averse when they are in a position of gain on their shares (the “sit tight” part); investors tend to harvest their gains too early. They process the constant bombardment of ever-shifting news as calls to action, feeding the instinct to lock in profits and avoid reversals. That flow of news can be company-specific but is often related to the general environment in which companies operate. We resist changing our views in reaction to current events. We didn’t alter the Portfolio materially in response to the Brexit referendum in 2016, nor to anticipate the “Trump bump,” or, more recently, to benefit from the US tax cuts; we also haven’t moved to a stance that bets significantly on rising interest rates. Instead, we focus on the growth prospects for each company and the specific threats that could endanger its stock’s market valuation relative to the rest of the market.
These habits of tolerating elevated valuations and resisting wholesale top-down portfolio shifts have continued to benefit the Portfolio. Despite the rising interest rate headwind and consequential impact on discount rates, growth stocks (particularly the most expensive growth stocks) outperformed this period, extending the trend from last year. Although we recognize the share prices of most rapidly growing companies are high relative to earnings and their history, we continue to take action in favor of cheaper ones only incrementally, and only against the priciest stocks in our Portfolio.
GEOGRAPHIC EXPOSURE (%) at April 30, 2018
COUNTRY/REGION
|
PORTFOLIO
|
BENCHMARK1
| ||||||
CANADA
|
| 0.0
|
|
| 3.0
|
| ||
EMERGING MARKETS
|
| 13.3
|
|
| 12.0
|
| ||
EUROPE EMU
|
| 13.3
|
|
| 11.0
|
| ||
EUROPE EX-EMU
|
| 14.8
|
|
| 10.0
|
| ||
FRONTIER MARKETS2
|
| 0.0
|
|
| —
|
| ||
JAPAN
|
| 10.8
|
|
| 8.0
|
| ||
MIDDLE EAST
|
| 0.8
|
|
| 0.1
|
| ||
PACIFIC EX-JAPAN
|
| 2.7
|
|
| 3.9
|
| ||
UNITED STATES
|
| 41.3
|
|
| 52.0
|
| ||
CASH
|
| 3.0
|
|
| —
|
| ||
1MSCI All Country World Index; 2Includes countries with less-developed markets outside the Index.
SECTOR EXPOSURE (%) at April 30, 2018
SECTOR
|
PORTFOLIO
|
BENCHMARK1
| ||||||
CONSUMER DISCRETIONARY
|
| 12.7
|
|
| 12.4
|
| ||
CONSUMER STAPLES
|
| 5.0
|
|
| 8.0
|
| ||
ENERGY
|
| 3.8
|
|
| 6.7
|
| ||
FINANCIALS
|
| 15.5
|
|
| 18.6
|
| ||
HEALTH CARE
|
| 17.6
|
|
| 10.8
|
| ||
INDUSTRIALS
|
| 14.3
|
|
| 10.7
|
| ||
INFORMATION TECHNOLOGY
|
| 19.6
|
|
| 18.6
|
| ||
MATERIALS
|
| 8.5
|
|
| 5.4
|
| ||
REAL ESTATE
|
| 0.0
|
|
| 3.0
|
| ||
TELECOM SERVICES
|
| 0.0
|
|
| 2.9
|
| ||
UTILITIES
|
| 0.0
|
|
| 2.9
|
| ||
CASH
|
| 3.0
|
|
| —
|
| ||
1MSCI All Country World Index.
Our reluctance to position the Portfolio in anticipation of political or economic developments does not mean we ignore the gathering clouds. Central banks are withdrawing monetary stimulus in reaction to signs that inflation expectations are increasing, and in the larger cause of normalizing interest rates ahead of the next recession. Rising populism, particularly in Europe, has called into question the longstanding consensus on advantages of a common currency, tax-free trade, and free movement of labor. And now the US threatens to precipitate a trade war that would have a devastating impact on globalization and potentially erase the enormous benefits that free trade has brought to nearly all parts of the world that have participated in it.
The recent announcements by the Trump administration to enact tariffs on various imports—including washing machines, solar panels, aluminum, steel, and, most recently, US$50 billion of other Chinese goods—could have devastating consequences for the US and its trading partners. While the brandishing of tariffs as a bilateral negotiating tactic—or as a domestic political sop—are not unique to the Trump presidency (recall tariffs from Barack Obama on Chinese tires or George W. Bush on steel), Trump’s enthusiastic use of them seems to us unusually provocative. The absolute amount of goods subject to tariffs is small relative to GDP, but the legal justification for many of them relies on an obscure clause of trade law allowing redress on the grounds of national security. This rationale sets a dangerous precedent, as it is intended to evade any adverse ruling by objective outside bodies, such as the World Trade Organization (WTO), and undermines the entire rules-based trading system that has served the global economy so well since the Second World War.
While Trump insists that “trade wars are good,” all evidence is to the contrary. Trade wars generally create losers on all sides. As countries, one after another, retaliate with their own tariffs or restrictions, the positive effects of globalization are undone. By preventing countries from focusing their productive efforts where each has a comparative advantage, trade barriers protect inefficient industries, resulting in misallocations of capital, higher costs and inflation, and lower wealth overall. Reversing

Table of Contents
globalization also has the potential to increase interest rates, which had been until recently on a more or less steady decline since the early 1980s. When economies are interdependent, local shocks are dampened by the global economy’s equilibrating mechanism, reducing economic volatility and the real component of long-term interest rates.1
We are uneasy, but admit a range of possible outcomes, from spiraling tit-for-tat tariff actions to possibly more-measured responses, and perhaps even some positive long-term consequences, such as potential reform of the WTO. But we know from experience that we have little ability to forecast the political outcome. We have resisted the temptation to alter course, unsure even what overall course we would take if our worst fears were realized with respect to the health of the world’s trading regime. Instead we continue to focus on the business fundamentals and valuations of the most resilient companies.
⬛ PORTFOLIO HIGHLIGHTS
Sticking to our last, Portfolio transactions in the last six months reflected our bottom-up assessments of profit outlook and valuation—with a particular emphasis on the latter. Many of the Portfolio changes during the period involved selling or reducing a more expensive-looking security in exchange for a less expensive alternative. Often, this meant going against prevailing momentum to sell an outperforming stock to buy an underperforming one. As one example, we sold our position in China’s Sino Biopharmaceutical in March. The stock had doubled in prior months and become significantly overvalued in our model. We then added to our holding in the UK’s Shire, which at the time was one of our worst-performing holdings and among the least expensive-looking securities in our analyst-qualified and -rated universe of companies. This transaction promptly yielded fruit when Japan’s Takeda Pharmaceutical indicated interest in acquiring Shire in late March, giving a welcome boost to Shire’s beleaguered share price.
We sold our profitable holding in Chinese gaming and social media giant Tencent, reinvesting the proceeds into South Africa’s Naspers, whose largest asset is a 31% stake in Tencent. The value of that stake alone approximates 145% of Naspers’ market capitalization. The longstanding discount to net asset value at Naspers—around a record high today—is increasingly controversial, and pressure is building on Naspers’ management to take steps to close it.
Finally, we reduced our sizable position in Nike in March, seeing less valuation appeal after the stock’s fourth-quarter 2017 share price surge, to add to Switzerland’s Lonza Group, a global leader in outsourced manufacturing for pharmaceuticals. Though a very successful investment long term, Lonza’s share price had declined sharply during the market correction, leaving its valuation looking more attractive than at any time in recent years.
1Tao Wu, “Globalization’s Effect on Interest Rates and the Yield Curve,” Economic Letter: Insights from the Federal Reserve Bank of Dallas 1, no. 9 (September 2006).
TEN LARGEST HOLDINGS at April 30, 2018
COMPANY
| SECTOR | COUNTRY | % | |||||
PAYPAL
| INFO TECHNOLOGY
| UNITED STATES
|
| 3.2
|
| |||
SYSMEX
| HEALTH CARE
| JAPAN
|
| 2.9
|
| |||
ROPER
| INDUSTRIALS
| UNITED STATES
|
| 2.8
|
| |||
BOOKING HOLDINGS
| CONS DISCRETIONARY
| UNITED STATES
|
| 2.8
|
| |||
AIA GROUP
| FINANCIALS
| HONG KONG
|
| 2.6
|
| |||
FIRST REPUBLIC BANK
| FINANCIALS
| UNITED STATES
|
| 2.5
|
| |||
LONZA GROUP
| HEALTH CARE
| SWITZERLAND
|
| 2.5
|
| |||
VERISK
| INDUSTRIALS
| UNITED STATES
|
| 2.2
|
| |||
SYMRISE
| MATERIALS
| GERMANY
|
| 2.2
|
| |||
STANDARD CHARTERED
| FINANCIALS
| UNITED KINGDOM
|
| 2.0
|
| |||
Our Portfolio structure has evolved considerably in the last year, the most significant changes being an increase in our Health Care weight and a decrease in IT. Health Care now comprises nearly 18% of the Global Equity Portfolio. The Portfolio has the smallest overweight in IT relative the index since 2003, as the sector’s strong outperformance as of late left valuations less attractive, leading us to sell a number of IT stocks. Geographically, we significantly decreased our US holdings. At the end of April 2018, just 41% of the Portfolio was invested in US stocks, versus 46% one year ago. The capital raised from sales of US stocks was redeployed mainly in companies domiciled in Europe and EMs.

Portfolio Management Team Update
Scott Crawshaw has joined our Global Equity strategy portfolio management team as of January 2, 2018. He is responsible specifically for the World Equity strategy, which is based on our Global Equity strategy but benchmarked to the developed market MSCI World Index. In this role, Scott, in consultation with its co-lead PMs, will adapt the Global Equity strategy to the requirements of the World Equity strategy. Co-Lead PM Peter Baughan, CFA previously performed this function.
Please read the separate disclosures page for important information, including the risks of investing in the Portfolio.

Table of Contents

PORTFOLIO MANAGEMENT TEAM
 | FERRILL ROLL, CFA CO-LEAD PORTFOLIO MANAGER
ALEXANDER WALSH, CFA CO-LEAD PORTFOLIO MANAGER
SCOTT CRAWSHAW PORTFOLIO MANAGER
BRYAN LLOYD, CFA PORTFOLIO MANAGER
PATRICK TODD, CFA PORTFOLIO MANAGER
ANDREW WEST, CFA PORTFOLIO MANAGER | |
⬛ PERFORMANCE SUMMARY
For the International Equity Portfolio, the Institutional Class gained 3.97%, the Institutional Class Z gained 4.00%, and the Investor Class rose 3.81% (net of fees and expenses) in the six-month period ended April 30, 2018. The Portfolio’s benchmark, the MSCI All Country World ex-US Index, gained 3.47% (net of source taxes).
⬛ MARKET REVIEW
Markets closed 2017 on an optimistic note, with stock prices rising strongly in December. Economic growth across all major regions remained positive and synchronized, while inflation was subdued. In Europe, the European Central Bank remained accommodative on monetary policy, although it signaled a slowing pace of bond buying. China’s economy gathered momentum, shrugging off concerns over government corruption crackdowns and shaky property loans, with positive pull-through effects on its trading partners. Japanese economic growth edged higher, while inflation remained positive—a critical policy goal.
The markets’ positive trend continued into the new year, but the streak of 14 monthly gains ended in February as sanguinity gave way to worry. Although the backdrop of improving and increasingly synchronized economic growth and good corporate earnings remained in place, investors had to come to terms with some ugly prospects: higher interest rates, a trade war between the US and China, and increased regulation of technology companies.
Stock price volatility spiked at the end of January, exacerbated by the collapse of derivatives-based “inverse volatility” ETFs, contributing to a near 9% decline in equities in just 10 days. After a brief bounce in mid-February, stocks wallowed in a range through the end of April, reflecting a new set of worries about
FUND FACTS at April 30, 2018
| ||||||||||||||
TOTAL NET ASSETS
|
| $ 14,157.5M | ||||||||||||
SALES CHARGE
|
| NONE | ||||||||||||
NUMBER OF HOLDINGS
|
| 56 | ||||||||||||
TURNOVER (5 YR. AVG.)
|
| 14% | ||||||||||||
REDEMPTION FEE
|
| 2% FIRST 90 DAYS | ||||||||||||
DIVIDEND POLICY
|
| ANNUAL | ||||||||||||
INSTITUTIONAL INVESTORS
|
INDIVIDUAL INVESTORS
| |||||||||||||
|
| INSTL CLASS
|
|
| INSTL CLASS Z
|
|
| INVESTOR CLASS
|
| ||||||
TICKER
| HLMIX | HLIZX | HLMNX | |||||||||||
CUSIP
| 412295107 | 412295719 | 412295503 | |||||||||||
INCEPTION DATE
| 5/11/1994 | 7/17/2017 | 9/30/2005 | |||||||||||
MINIMUM INVESTMENT1
| $100,000 | $10,000,000 | $5,000 | |||||||||||
NET EXPENSE RATIO
| 0.82% | 0.73% | 2 | 1.14% | ||||||||||
GROSS EXPENSE RATIO
| 0.82% | 0.99% | 3 | 1.14% | ||||||||||
1Lower minimums available through certain brokerage firms; 2The Net Expense Ratio is as of April 30, 2018 as the Portfolio is operating below the contractual agreement, which is in effect until February 28, 2019; 3The Gross Expense Ratio is as of the Prospectus dated February 28, 2018.
increasingly ubiquitous technology platforms. A mounting furor over Facebook data illicitly exploited by political consultant Cambridge Analytica in favor of US President Donald Trump and Brexit, and the mowing down of a pedestrian by an Uber self-driving car in Arizona drew calls for more regulation of technology companies. The European Union continued its efforts to rein in “big tech,” announcing a tax on turnover of large digital companies and moving ahead with its General Data Protection Regulation mandate, which imposes strict requirements and stiff penalties regarding treatment of private data. The tech tumult turned farcical with Trump tweeting potshots at Amazon.com over its use of the Postal Service.
All sectors advanced in the period, led by Energy, as crude oil prices reached levels in April not seen since the end of 2014. Information Technology (IT) lagged the index, as its outsized January gains were nearly depleted by sharp declines late in March.
All regions except Canada advanced as well. Emerging Markets (EMs), more typically the loser from rising global risk and volatility, was among the strongest-performing regions. Confoundingly, EMs’ rise was supported by Brazil and Russia, two of the biggest exporters of steel and other commodities whose trade is endangered. A Brazilian court upheld the conviction of former president Luiz In-ácio Lula da Silva on corruption charges, likely precluding him from running again and restoring his redistributionist policies.
The most expensive quintile of stocks gained in the period, outperforming the rest by a wide margin. The fastest-growing quintile of stocks also rose more than the other 80% of stocks, on average. Quality was not a significant return factor.

Table of Contents
PERFORMANCE (% TOTAL RETURN)
for periods ended March 31, 2018
| for periods ending April 30, 2018 | |||||||||||||||||||||||||||
| 1 | 3 | 5 | 10 | SINCE INCEPTION* | 1 | 3 | 5 | 10 | SINCE INCEPTION* | |||||||||||||||||||
YEAR
| YEARS
| YEARS
| YEARS
|
May-94
| Jul-17
| Sep-05
| YEAR
| YEARS
| YEARS
| YEARS
| May-94
| Jul-17
| Sep-05
| |||||||||||||||
INTL EQUITY PORTFOLIO – INST CLASS | 19.20 | 8.89 | 8.34 | 5.71 | 6.58 | 16.46 | 7.67 | 7.84 | 5.22 | 6.59 | ||||||||||||||||||
INTL EQUITY PORTFOLIO – INST CLASS Z
| – | – | – | – | 9.48 | – | – | – | – | 10.24 | ||||||||||||||||||
INTL EQUITY PORTFOLIO – INVESTOR CLASS
| 18.80 | 8.51 | 7.99 | 5.38 | 6.95 | 16.07 | 7.33 | 7.50 | 4.89 | 6.96 | ||||||||||||||||||
MSCI ALL COUNTRY WORLD EX-US INDEX
| 16.53 | 6.18 | 5.88 | 2.70 | – | 7.35 | 4.97 | 15.91 | 5.01 | 5.46 | 2.26 | – | 9.06 | 5.07 | ||||||||||||||
Returns are annualized for periods greater than 1 year. *Inception of the Institutional Class, May 11, 1994. Inception of the Institutional Class Z, July 17, 2017. Inception of the Investor Class, September 30, 2005. Index performance prior to January 1, 2001 cannot be shown since it relies on back-filled data.
Performance data quoted represents past performance; past performance does not guarantee future results. The investment return and principal value of an investment will fluctuate so that an investor’s shares, when redeemed, may be worth more or less than their original cost. Current performance of the Portfolio may be lower or higher than the performance quoted. Performance data current to the most recent month end may be obtained by calling (877) 435-8105 or visiting www.hardingloevnerfunds.com. Performance data shown does not reflect the 2.00% redemption fee imposed on shares held 90 days or less; otherwise, total returns would be reduced.
⬛ PERFORMANCE ATTRIBUTION
The Portfolio’s positive relative performance derived primarily from good stock selection, especially in Financials and Health Care. In Financials, Hong Kong-based life insurer AIA Group added to relative returns. Brazilian lender Itaú Unibanco rallied on the Lula court ruling, while DBS Group of Singapore signaled larger distributions of capital to shareholders with a surprising regular dividend increase plus a special dividend. Health Care was led by medical information provider M3, which rose on news that the company acquired an American clinical trials firm, signaling entry into the large and profitable US market. On the other side of the ledger, crop chemicals and pharmaceuticals giant Bayer suffered on news that regulators may require the company to divest some key businesses in order to win approval for its purchase of Monsanto, reducing its ability to exploit merger synergies.
Our holdings in Pacific ex-Japan added the most to relative performance from a regional perspective, aided by DBS Group and AIA Group. Stocks in Japan also contributed, especially M3 and Sysmex, the clinical-testing equipment manufacturer. Sysmex’s management stoked optimism over the potential impact of its R&D in liquid biopsy technology. Relative performance in EMs suffered as South African media conglomerate Naspers declined. Despite the large cash proceeds from the sale of a sliver of its successful investment in Chinese internet platform Tencent, many of Naspers’ newer investments are still absorbing resources rather than generating cash flow. Samsung Electronics also underperformed due to concerns that it will earn lackluster returns from its large investment to supply the latest Apple iPhone, which has been met with slow demand.
⬛ PERSPECTIVE AND OUTLOOK
“If you buy something because it’s undervalued, then you have to think about selling it when it approaches your calculation of its intrinsic value. That’s hard. But, if you can buy a few great companies, then you can sit on your ass. That’s a good thing.”
— Charlie Munger,
Berkshire Hathaway annual meeting, 2000
Arguably the greatest contribution that Charlie Munger has made to Berkshire Hathaway’s shareholders was in convincing Warren Buffett in the 1970s that a long-duration growth business trading at an apparently premium price could still represent a good value. His reasoning was that the return on the shares would ultimately converge with the return on capital for the business as the compounding of the latter would, over a long period of time (Munger cited 40 years), come to dwarf the initial premium paid for the shares. That inevitability meant that you could buy, then sit and wait—but, presumably (and critically), only if you were assured that the company would manage to maintain its growth rate and sustain its high profitability in the process. You could tolerate occasional periods of overvaluation of that business’s shares because, given enough time, its profits would grow back into its share price.
As investors in businesses that can grow for many years with high and durable profitability, we at Harding Loevner adhere to an investment philosophy that resembles Munger’s. Through our research process we look for companies that meet our criteria of what makes a great business. The process is focused entirely on business fundamentals: we evaluate the competitive structure of an industry, examine each participant’s competitive position, and then question whether a favorable industry structure or the particular advantages enjoyed by some participants are sustainable into the future. Upon identifying such apparently great businesses, we include them in our qualified investable universe. We estimate what their shares are worth by making financial forecasts and discounting their projected long-term cash flows to the present. While we’re not afraid to pay over the market average for shares of an excellent business, even a paragon will fail to make its way into our portfolios if its superior long-term prospects are more than fully discounted in its current share price.
Munger’s challenge, and ours too, is in finding companies that will remain “great” for 10 years, let alone 40. Enduring jewels are more easily discovered in hindsight than in advance. The identification of such companies requires that all evidence in support of a purchase be weighed against an obvious fact—that the vast majority of businesses fail to maintain their profitability over the long term. Once an investment is made, we do much more than sit and watch the returns pour in. We set up structures to seek out evidence that the company will not stay great forever. To be able to

Table of Contents
“sit” comfortably on a holding presupposes, among other things, that the customers of that business continue to prefer its products or services. We guard against the risk of mishap through intensive monitoring of the business results of our portfolio companies, parsing financial disclosures, and checking third-party sources to gauge their progress against the mileposts that we set out in advance as supporting detail to our investment thesis. There is nothing sedentary about our ownership.
To “be right and sit tight,” to borrow a phrase from legendary Wall Street trader Jesse Livermore, is easier said than done in other ways. In addition to guarding against the deterioration of companies’ underlying businesses (the “be right” part), investors need also to guard against the human tendency to become risk averse when they are in a position of gain on their shares (the “sit tight” part); investors tend to harvest their gains too early. They process the constant bombardment of ever-shifting news as calls to action, feeding the instinct to lock in profits and avoid reversals. That flow of news can be company-specific but is often related to the general environment in which companies operate. We resist changing our views in reaction to current events. We didn’t alter the portfolio materially in response to the Brexit referendum in 2016, nor to anticipate the “Trump bump,” nor, more recently, to benefit from the US tax cuts; we also haven’t moved to a stance that bets significantly on rising interest rates. Instead, we focus on the growth prospects for each company and the specific threats that could endanger its stock’s market valuation relative to the rest of the market.
These habits of tolerating elevated valuations and resisting wholesale top-down portfolio shifts have continued to benefit the Portfolio. Despite the rising interest rate headwind and consequential impact on discount rates, growth stocks (particularly the most expensive growth stocks) outperformed this period, extending the trend from last year. Although we recognize the share prices of most rapidly growing companies are high relative to earnings and their history, we continue to take action in favor of cheaper ones only incrementally, and only against the priciest stocks in our Portfolio.
Our reluctance to position the Portfolio in anticipation of political or economic developments does not mean we ignore the gathering
GEOGRAPHIC EXPOSURE (%) at April 30, 2018
COUNTRY/REGION
|
PORTFOLIO
|
BENCHMARK1
| ||||||
CANADA
| 1.9 | 6.2 | ||||||
EMERGING MARKETS
| 19.4 | 25.1 | ||||||
EUROPE EMU
| 29.9 | 22.9 | ||||||
EUROPE EX-EMU
| 19.6 | 20.7 | ||||||
FRONTIER MARKETS2
| 0.0 | — | ||||||
JAPAN
| 14.0 | 16.7 | ||||||
MIDDLE EAST
| 2.2 | 0.3 | ||||||
PACIFIC EX-JAPAN
| 8.2 | 8.1 | ||||||
OTHER3
| 1.5 | — | ||||||
CASH
| 3.3 | — | ||||||
1MSCI All Country World ex-US Index; 2Includes countries with less-developed markets outside the Index; 3Includes companies classified in countries outside the Index.
SECTOR EXPOSURE (%) at April 30, 2018
SECTOR
| PORTFOLIO
| BENCHMARK1
| ||||||
CONSUMER DISCRETIONARY
| 6.3 | 11.4 | ||||||
CONSUMER STAPLES
| 7.1 | 9.3 | ||||||
ENERGY
| 5.7 | 7.1 | ||||||
FINANCIALS
| 19.4 | 23.0 | ||||||
HEALTH CARE
| 17.1 | 7.6 | ||||||
INDUSTRIALS
| 12.1 | 11.8 | ||||||
INFORMATION TECHNOLOGY
| 20.5 | 11.5 | ||||||
MATERIALS
| 7.7 | 8.1 | ||||||
REAL ESTATE
| 0.8 | 3.2 | ||||||
TELECOM SERVICES
| 0.0 | 4.0 | ||||||
UTILITIES
| 0.0 | 3.0 | ||||||
CASH
| 3.3 | — | ||||||
1MSCI All Country World ex-US Index.
clouds. Central banks are withdrawing monetary stimulus in reaction to signs that inflation expectations are increasing, and in the larger cause of normalizing interest rates ahead of the next recession. Rising populism, particularly in Europe, has called into question the longstanding consensus on advantages of a common currency, tax-free trade, and free movement of labor. And now the US threatens to precipitate a trade war that would have a devastating impact on globalization and potentially erase the enormous benefits that free trade has brought to nearly all parts of the world that have participated in it.
The recent announcements by the Trump administration to enact tariffs on various imports—including washing machines, solar panels, aluminum, steel, and, more recently, US$50 billion of other Chinese goods—could have devastating consequences for the US and its trading partners. While the brandishing of tariffs as a bilateral negotiating tactic—or as a domestic political sop—are not unique to the Trump presidency (recall tariffs from Barack Obama on Chinese tires or George W. Bush on steel), Trump’s enthusiastic use of them seems to us unusually provocative. The absolute amount of goods subject to tariffs is small relative to GDP, but the legal justification for many of them relies on an obscure clause of trade law allowing redress on the grounds of national security. This rationale sets a dangerous precedent, as it is intended to evade any adverse ruling by objective outside bodies, such as the World Trade Organization (WTO), and undermines the entire rules-based trading system that has served the global economy so well since the Second World War.
While Trump insists that “trade wars are good,” all evidence is to the contrary. Trade wars generally create losers on all sides. As countries, one after another, retaliate with their own tariffs or restrictions, the positive effects of globalization are undone. By preventing countries from focusing their productive efforts where each has a comparative advantage, trade barriers protect inefficient industries, resulting in misallocations of capital, higher costs and inflation, and lower wealth overall. Reversing globalization also has the potential to increase interest rates, which had been until recently on a more or less steady decline since the early 1980s. When economies are

Table of Contents
interdependent, local shocks are dampened by the global economy’s equilibrating mechanism, reducing economic volatility and the real component of long-term interest rates.
We are uneasy, but admit a range of possible outcomes, from spiraling tit-for-tat tariff actions to possibly more-measured responses, and perhaps even some positive long-term consequences, such as potential reform of the WTO. But we know from experience that we have little ability to forecast the political outcome. We have resisted the temptation to alter course, unsure even what overall course we would take if our worst fears were realized with respect to the health of the world’s trading regime. Instead we continue to focus on the business fundamentals and valuations of the most resilient companies.
⬛ PORTFOLIO HIGHLIGHTS
Two of the largest contributors to positive relative returns in the Portfolio over the trailing six months—Dassault Systèmes and M3—are prime examples of companies that Charlie Munger might like. In both cases, we’ve been right about the durable profitability and rapid growth of the businesses. And Jesse Livermore would approve our having sat tight, as we have owned their shares continuously for a long time. We believed that both companies were capable of growing rapidly for many years. But to remain invested in them, we have had to live through periods of overvaluation.
Japan’s M3 is a health care IT company, first qualified and rated by one of our analysts in January 2006. M3’s flagship service is MR-kun, an online platform for physicians that provides information specific to their individual therapeutic specialties, including all relevant research studies and clinical trial data.
M3 now has recurring interaction with more than 80% of physicians in Japan, who represent a high-value audience for pharmaceutical companies seeking to develop or market new drugs. M3 will continue to grow as it adds more online and offline services in Japan. Meanwhile the company is replicating its information ecosystem outside of its home market, with four million doctors using its platform, and where it now garners 25% of its revenues. M3 is among Japan’s fastest-growing companies, and, accordingly, its shares trade at apparent high prices. Today, M3’s market capitalization is US$13 billion, compared with just over US$1 billion when we bought it in 2008.
Dassault Systèmes is a 3D-design software company that we have owned since 2003. After starting with an aerospace-design focus, Dassault’s software is now used by over 200,000 enterprises across a dozen industries in 140 countries. Its segment of the software industry, often referred to as product lifecycle management, features above-average and durable growth, fueled by the increasing global emphasis on efficient production.
To Munger’s point about the convergence of the return on capital of a business and the return to its shareholders, we have experienced something comparable. Over our 10-year holding period, M3 has had an average annual return on capital of 26%,
TEN LARGEST HOLDINGS at April 30, 2018
COMPANY
| SECTOR
| COUNTRY
| %
| |||||
AIA GROUP
| FINANCIALS | HONG KONG | 4.4 | |||||
ALLIANZ
| FINANCIALS | GERMANY | 3.6 | |||||
SAMSUNG ELECTRONICS
| INFO TECHNOLOGY | SOUTH KOREA | 3.6 | |||||
BAYER
| HEALTH CARE | GERMANY | 3.5 | |||||
ROYAL DUTCH SHELL
| ENERGY | UNITED KINGDOM | 3.3 | |||||
DASSAULT SYSTÈMES
| INFO TECHNOLOGY | FRANCE | 3.1 | |||||
NESTLÉ
| CONS STAPLES | SWITZERLAND | 3.0 | |||||
FANUC
| INDUSTRIALS | JAPAN | 2.8 | |||||
BAIDU
| INFO TECHNOLOGY | CHINA | 2.8 | |||||
DBS GROUP
| FINANCIALS | SINGAPORE | 2.6 | |||||
within shouting distance of the 32% compound annual return of the shares in that time. Similarly, Dassault’s return on capital has averaged 14% over our 15-year holding period, close to the 16% compound annual return of its shares.
The Portfolio’s structure has changed little in the last six months, with IT and Health Care remaining our largest overweights relative the index. We added one Health Care holding to the Portfolio. Novozymes is the leading manufacturer of industrial enzymes, used in a variety of applications, including fuel, detergent, and food. Its global market share approaches 50%, and the market is expanding as manufacturers replace inorganic chemicals in household products with naturally occurring enzymes. Novozymes controls more than twice as many patents than its next-largest competitor and spends more on R&D than its three biggest rivals combined.
We sold two companies in the period. We sold Mexican media company Televisa due to rising competitive intensity. We also sold Garanti Bank, which has suffered from the stock price volatility and currency depreciation that have marked all Turkish investments. With US dollar interest rates on the rise, and Turkey’s need for capital inflows undiminished, there is little prospect for the stabilization that seemed possible just a few years ago.

Portfolio Management Team Update
Scott Crawshaw has joined our International Equity strategy portfolio management team as of January 2, 2018. He is responsible specifically for the EAFE Equity strategy, which is based on our International Equity strategy but benchmarked to the developed market MSCI EAFE Index. In this role, Scott, in consultation with its co-lead PMs, will adapt the International Equity strategy to the requirements of the EAFE Equity strategy. Co-lead PM Alexander Walsh, CFA previously performed this function.
Please read the separate disclosures page for important information, including the risks of investing in the Portfolio.

Table of Contents

PORTFOLIO MANAGEMENT TEAM
 | JAFAR RIZVI, CFA CO-LEAD PORTFOLIO MANAGER
ANIX VYAS, CFA CO-LEAD PORTFOLIO MANAGER | |
⬛ PERFORMANCE SUMMARY
For the International Small Companies Portfolio, the Institutional Class gained 4.15% and the Investor Class gained 4.08% (net of fees and expenses) in the six-month period ended April 30, 2018. The Portfolio’s benchmark, the MSCI All Country World ex-US Small Cap Index, rose 5.44% (net of source taxes).
⬛ MARKET REVIEW
Stocks of international small caps rose steadily from early December through the first 25 days of 2018 on the prospects of continued economic growth and strong corporate earnings. In late January, however, employment reports stoked fears that economies were overheating and that central bankers would quicken monetary tightening. Largely absent since the Brexit vote in June 2016, market volatility returned. Between January 26 and February 9, non-US small cap stocks fell about 9% before stabilizing. Then, in March, US President Donald Trump threatened to precipitate a trade war by declaring tariffs on steel, aluminum, and other products. China and other trading partners vowed to retaliate.
Amid the tumult, non-US small caps continued to report strong revenue and earnings growth and outperformed non-US large companies by 200 basis points in the trailing six months. Smaller companies, which tend to focus more on their home markets, are relatively insulated from the effects of trade wars. One example is the Moscow Exchange, which is discussed later in this commentary.
Japan was the strongest performing “region,” rising over 7%. Europe also performed well, both within and outside of the eurozone. Emerging Market small caps were also strong, with above-index returns from Egypt, South Korea, South Africa, and Brazil. Canada and the Middle East were the only regions to decline.
All sectors rose in the six months. Health Care rose the most (14%), driven by innovations and improving prospects for growth at many small biotech and biopharmaceutical firms in both emerging and developed markets. Consumer Staples, Real Estate, and Energy were the next strongest sectors. Stocks of Industrials and Telecom Services companies lagged the index the most.
Based on our categorizations, stocks of the fastest-growing companies performed best—continuing a trend from 2017. The most expensive quintile of stocks also outperformed the rest by a wide margin. Quality was not a significant return factor in the period.
| FUND FACTS at April 30, 2018 | ||||||||
TOTAL NET ASSETS
|
| $250.1M | ||||||
SALES CHARGE
|
| NONE | ||||||
NUMBER OF HOLDINGS
|
| 96 | ||||||
TURNOVER (5 YR. AVG.)
|
| 36% | ||||||
REDEMPTION FEE
|
|
| 2% FIRST 90 DAYS
|
| ||||
DIVIDEND POLICY
|
| ANNUAL | ||||||
INSTITUTIONAL INVESTORS
| INDIVIDUAL INVESTORS
| |||||||
|
| INSTITUTIONAL CLASS
|
| INVESTOR CLASS | |||||
TICKER
| HLMRX | HLMSX | ||||||
CUSIP
| 412295875 | 412295883 | ||||||
INCEPTION DATE
| 6/30/2011 | 3/26/2007 | ||||||
MINIMUM INVESTMENT1
| $100,000 | $5,000 | ||||||
NET EXPENSE RATIO2
| 1.15% | 1.40% | ||||||
GROSS EXPENSE RATIO
| 1.41% | 1.80% | ||||||
1Lower minimums available through certain brokerage firms; 2Shown net of Harding Loevner’s contractual agreement through February 28, 2019.
⬛ PERFORMANCE ATTRIBUTION
Viewed by sector, stocks in Financials detracted from the Portfolio’s relative returns. Suruga Bank, which has over 100 branches across Japan, detracted from performance due to credit problems with the real estate company Smart Days. Smart Days leases residential property from investor-owners, then re-leases them to subtenants. Many of the owners financed their property purchases with Suruga Bank. In February, Japanese news outlets reported that due to low occupancy rates, Smart Days had been unable to continue making lease payments to many of the property owners and, as a result, the owners have stopped making payments to Suruga Bank on their loans. We are investigating whether Suraga’s arrangement with Smart Days was a one-off mistake, or if it is indicative of systematic credit-underwriting problems at the bank.
The decline was partially offset by strong stocks in Information Technology (IT) and the Portfolio’s overweight to Health Care. The bulk of our IT exposure is to software and services, which was the sector’s best-performing industry group. Infomart, a Japanese e-commerce company that services the restaurant industry, was one of the largest contributors to relative returns. In 2017, Infomart’s heavy investments in software that enables online invoicing weighed on profits. But in February, management forecast 42% growth in operating profit in 2018, suggesting that these investments are now bearing fruit as customers shift away from inefficient paper-invoicing systems in favor of Infomart’s product.
Regionally, poor stock selection in Emerging Markets detracted from relative returns. In India, Axis Bank accounts for over half of Max Financial’s life insurance distribution. This arrangement is likely in jeopardy, as Axis Bank is reportedly pursuing its own

Table of Contents
PERFORMANCE (% TOTAL RETURN)
for periods ended March 31, 2018
| for periods ended April 30, 2018
| |||||||||||||||||||||||
| 1 | 3 | 5 | 10 | SINCE INCEPTION* | 1 | 3 | 5 | 10 | SINCE INCEPTION* | |||||||||||||||
| YEAR | YEARS | YEARS | YEARS | Jun-11 | Mar-07 | YEAR | YEARS | YEARS | YEARS | Jun-11 | Mar-07 | |||||||||||||
INTL SMALL COMPANIES PORTFOLIO – INST CLASS
| 25.00 | 10.92 | 9.50 | – | 8.16 | 18.19 | 9.23 | 8.75 | – | 7.87 | ||||||||||||||
INTL SMALL COMPANIES PORTFOLIO – INVESTOR CLASS
| 24.66 | 10.63 | 9.23 | 8.09 | 7.04 | 17.98 | 8.97 | 8.50 | 7.81 | 6.87 | ||||||||||||||
MSCI ALL COUNTRY WORLD EX-US SMALL CAP INDEX | 20.60 | 10.40 | 8.57 | 5.51 | 6.49 | – | 18.44 | 8.70 | 8.24 | 5.33 | 6.59 | – | ||||||||||||
Returns are annualized for periods greater than 1 year. *Inception of the Institutional Class, June 30, 2011. Inception of the Investor Class, March 26, 2007. Index performance prior to June 1, 2007 cannot be shown since it relies on back-filled data.
Performance data quoted represents past performance; past performance does not guarantee future results. The investment return and principal value of an investment will fluctuate so that an investor’s shares, when redeemed, may be worth more or less than their original cost. Current performance of the Portfolio may be lower or higher than the performance quoted. Performance data current to the most recent month end may be obtained by calling (877) 435-8105 or visiting www.hardingloevnerfunds.com. Performance data shown does not reflect the 2.00% redemption fee imposed on shares held 90 days or less; otherwise, total returns would be reduced.
life insurance business. The news weighed on Max Financial’s stock price, but we continue to believe in the company’s ability to grow its other distribution channels and in the long-term growth of the Indian life insurance market overall.
The Portfolio gained from strong stock selection in Japan, our underweight to Canada, and our (off-benchmark) Frontier Market holdings, notably in Kenya. We have written about how a banking law newly enacted in Kenya that established a floor on deposit rates and capped lending rates was hurting the profitability of the entire sector. Since then, Equity Bank has sustained its profitability by increasing fee income, and by reclassifying savings accounts as current accounts to reduce the cost of funding. Equity Bank’s profits rose 14% in 2017. Further, the governor of the Central Bank of Kenya, Patrick Ngugi Njoroge, is pushing for a repeal of the 2016 interest rate regulation.
⬛ INVESTMENT PERSPECTIVES
We rely on an investment process that offers our clients a portfolio of businesses that we believe are more resilient to volatility and shocks from any number of directions. We look for competitive businesses with steady returns on capital, significant free cash flow, healthy balance sheets, and management focused on their companies’ core strengths. In particular, we look for pricing power, which we see as key to companies maintaining their margins in growth-challenged environments.
In Japan, a shrinking labor market and rising labor costs are sources of mounting concern for companies large and small. We are hard pressed to think of a company more advantageously positioned than SMS, a niche health care IT firm that provides software and services for staff recruitment for hospitals and elderly care facilities. While other Japanese companies have been struggling with the country’s shrinking labor pool and rising wages, SMS has thrived. Japan’s rising number of elderly increases demand for nurses and other health care workers. The company—which earns a 20% commission on the first-year salary of recruited personnel—not only benefits from that market growth, but also from rising wages. SMS has not grown complacent; it is channeling more resources into its Kaipoke software, which provides nursing care placement services, and the platform’s expanding capabilities
are transforming neatly into pricing power and market share. Subscriber growth has been steady despite a nearly seven-fold increase in subscription fees since the software was released in 2006.
Unlike SMS, which operates in the idiosyncratic Japanese labor market, Ottawa-based Kinaxis competes in the much faster-growing global market for supply chain management software. The company is outpacing its competitors, racking up an impressive win rate over the likes of SAP, Infor, and JDA Software, primarily due to the high quality and functionality of its product. Its revenue retention exceeds 100%, with clients not only renewing subscriptions but spending more each year. Because its recurring revenues are so reliable, Kinaxis can afford to be highly selective in its sales strategy. At its recent Investor Day in Toronto, CEO John Sicard stated that management is comfortable losing low-margin deals with customers with tight budgets and limited needs to focus on comprehensive solutions for potentially larger customers. In fact, Sicard said he wants Kinaxis’s sales staff to walk away from deals rather than compromise on pricing. This strategy aims to ensure that the company’s growth does not reduce margins, and that it generates free cash for reinvestment. The company is committed to spending 18% of revenues on R&D. Spending is concentrated on its core supply chain software, introducing more advanced machine-learn-ing-based analytics tools and a cloud-based mobile app that allows managers to monitor their entire supply chain in real time.
While Kinaxis shows that a company can achieve pricing power by building a clientele selectively, the Moscow Exchange demonstrates the merits of another approach: domination of a single domestic market. The company provides clearing and custody services as well as a trading platform for financial products (equities, bonds, derivatives, foreign exchange) in Russia. The strength of the company’s competitive position is evident in its ability to coordinate price increases with system upgrades in such a way as to meet widespread approval from its client base. In the volatile Russian market, the Moscow Exchange is highly successful in providing a core financial service, demand for which would only increase if developments in the political arena lead to more sanctions or other actions that further isolate Russian firms from rival financial institutions in the West.

Table of Contents
The Moscow Exchange illustrates our belief that, even in challenging environments, companies with steady fundamentals and financial strength can be resilient to a variety of shocks. Kinaxis shows how a company with a high-quality product and laser-focused management can gain market share without compromising profit margins in a highly competitive industry. SMS reminds us that, even in slowly growing economies, companies with innovative technological or service solutions for a precisely targeted market can flourish. We hold in our International Small Companies Portfolio a mix of these fundamentally strong small companies across a range of industries in developed, emerging, and frontier markets. The result of this broad diversification is a record of volatility below that of the benchmark and, in recent years, below that of international large caps as well (see chart below).
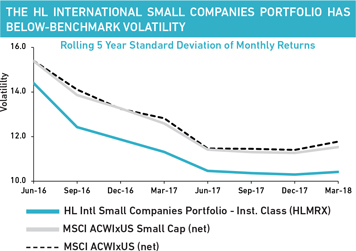
Source: eVestment alliance (eA); Harding Loevner International Small Companies Portfolio; MSCI Inc.; Data as of March 31, 2018.
GEOGRAPHIC EXPOSURE (%) at April 30, 2018
COUNTRY/REGION
|
PORTFOLIO
|
BENCHMARK1
| ||||||
CANADA
| 1.1 | 6.6 | ||||||
EMERGING MARKETS
| 16.4 | 22.2 | ||||||
EUROPE EMU
| 24.8 | 17.8 | ||||||
EUROPE EX-EMU
| 26.7 | 22.3 | ||||||
FRONTIER MARKETS2
| 7.0 | — | ||||||
JAPAN
| 13.3 | 22.2 | ||||||
MIDDLE EAST
| 1.3 | 1.0 | ||||||
PACIFIC EX-JAPAN
| 4.0 | 7.9 | ||||||
OTHER3
| 0.9 | — | ||||||
CASH
| 4.5 | — | ||||||
1MSCI All Country World ex-US Small Cap Index; 2Includes countries with less-developed markets outside the Index; 3Includes countries classified in countries outside the Index.
SECTOR EXPOSURE (%) at April 30, 2018
SECTOR
| PORTFOLIO
| BENCHMARK1
| ||||||
CONSUMER DISCRETIONARY
| 5.7 | 15.7 | ||||||
CONSUMER STAPLES
| 10.1 | 6.8 | ||||||
ENERGY
| 4.0 | 3.6 | ||||||
FINANCIALS
| 8.5 | 10.7 | ||||||
HEALTH CARE
| 14.3 | 7.6 | ||||||
INDUSTRIALS
| 21.4 | 19.0 | ||||||
INFORMATION TECHNOLOGY
| 23.4 | 11.8 | ||||||
MATERIALS
| 5.8 | 10.9 | ||||||
REAL ESTATE
| 0.0 | 10.0 | ||||||
TELECOM SERVICES
| 0.4 | 1.1 | ||||||
UTILITIES
| 1.9 | 2.8 | ||||||
CASH
| 4.5 | — | ||||||
1MSCI All Country World ex-US Small Cap Index.
⬛ PORTFOLIO HIGHLIGHTS
In the trailing six months, our complete sales included two companies for which our investment thesis had broken down. Dignity is a funeral services provider in the UK. Bereaved families are growing less accepting of high prices, in part due to the rising ease of comparing prices online. Dignity—which historically has differentiated itself by offering superior service—has responded to competitive pressures by slashing its prices. As a result, its profitability has suffered. Dignity will struggle to remain competitive, especially given its lack of a digital channel.
PAX Global makes electronic point-of-sale payment terminals in China. The market for terminals is shrinking in the country as merchants opt for online platforms such as WePay and Alipay. Our analyst’s original investment thesis anticipated that PAX would be able to move from a hardware maker to a software and services company. Despite the company’s investments in R&D, we no longer see PAX making this leap to keep up with the online payments platforms.
Other complete sales in the period included Clicks Group, GRUH Finance, Hiday Hidaka, and TPG Telecom. We also trimmed positions in several other strongly performing stocks that had become overvalued. We used the cash from these sales to establish positions in high-quality growth companies whose stocks appeared more attractively priced:
Security Bank, a commercial bank in the Philippines. We expect the bank to grow as demand for financial services accelerates in its home market. The company’s proven ability to assess credit risks places it at a strong competitive advantage in a national market that lacks a fully functioning credit bureau.
Diploma, an international group of businesses that sell technical products and services, including diagnostic equipment and supplies for hospital labs, filters and gaskets for industrial equipment, and specialty wiring used by aerospace, transportation,

Table of Contents
and defense companies. Each of Diploma’s businesses operates in lucrative niches. The company uses part of its strong cash flow to acquire more niche businesses with successful track records, expanding and diversifying Diploma’s client base.
We also purchased two South Korean companies—Hankook Tire and Coway. Other new purchases included UAE food and beverages manufacturer Agthia, Vietnamese steel producer Hoa Phat Group, and German software developer RIB Software. And we added to several existing positions because their valuations appeared attractive.

Portfolio Management Team Update
Anix Vyas, CFA was appointed co-lead portfolio manager of Harding Loevner’s International Small Companies Equity strategy, effective April 2, 2018. He joins Jafar Rizvi, CFA, who has served as a portfolio manager on the strategy since 2011. Anix joined Harding Loevner in 2013 as a research analyst and covers capital goods and materials companies—a role that he will continue as a portfolio manager.
TEN LARGEST HOLDINGS at April 30, 2018
COMPANY
| SECTOR | COUNTRY | % | |||||
REPLY | INFO TECHNOLOGY | ITALY | 2.7 | |||||
NAKANISHI | HEALTH CARE | JAPAN | 2.5 | |||||
ARIAKE | CONS STAPLES | JAPAN | 2.5 | |||||
CARL ZEISS MEDITEC | HEALTH CARE | GERMANY | 2.4 | |||||
ALTEN | INFO TECHNOLOGY | FRANCE | 2.4 | |||||
ABCAM | HEALTH CARE | UNITED KINGDOM | 2.4 | |||||
SENIOR | INDUSTRIALS | UNITED KINGDOM | 2.3 | |||||
ROTORK | INDUSTRIALS | UNITED KINGDOM | 2.1 | |||||
BECHTLE | INFO TECHNOLOGY | GERMANY | 2.0 | |||||
INFOMART | INFO TECHNOLOGY | JAPAN | 1.9 | |||||
Please read the separate disclosures page for important information, including the risks of investing in the Portfolio.

Table of Contents

PORTFOLIO MANAGEMENT TEAM

| G. RUSTY JOHNSON, CFA | PRADIPTA CHAKRABORTTY | |
| CO-LEAD PORTFOLIO MANAGER | PORTFOLIO MANAGER | |
| CRAIG SHAW, CFA | SCOTT CRAWSHAW | |
| CO-LEAD PORTFOLIO MANAGER | PORTFOLIO MANAGER | |
| RICHARD SCHMIDT, CFA | ||
| PORTFOLIO MANAGER | ||
The Institutional Emerging Markets Portfolio and the Emerging Markets Portfolio are generally closed to new investors.
The Institutional Emerging Markets Portfolio – Class I and Class II – and the Emerging Markets Portfolio – Advisor Class (collectively, the “Portfolios”) are both managed in strict accordance with Harding Loevner’s Emerging Markets Equity strategy model portfolio. Therefore, the Portfolios have highly similar holdings and characteristics. We have provided a single commentary to cover both Portfolios. The specific performance and characteristics of each are presented separately in the tables that follow.
⬛ PERFORMANCE SUMMARY
For the Institutional Emerging Markets Portfolio, Class I rose 4.10% and Class II rose 4.14% (net of fees and expenses). For the Emerging Markets Portfolio, the Advisor Class rose 3.99% (net of fees and expenses) in the six-month period ended April 30, 2018. The Portfolios’ benchmark, the MSCI Emerging Markets Index, rose 4.80% (net of source taxes).
⬛ MARKET REVIEW
The MSCI Emerging Markets (EMs) Index started strong in the new fiscal year through late January, benefiting from robust global economic growth and strong EM companies’ earnings growth—especially, but not exclusively, in the Information Technology (IT) sector. The ongoing absence of inflationary pressures also allowed developed countries to continue the easy monetary policies that have supported lofty real asset and financial valuations. But volatility returned to global equity markets in late January and February, and EMs declined sharply before staging a modest recovery. Investors appeared torn between the strength of EM companies’ fundamentals, as reflected in robust earnings growth, and emerging threats to the world’s cyclical economic expansion. Strong employment reports in the US and Japan presaged higher wage inflation and fed the fear that global interest rates would rise faster and further than previously expected. Another threat, of a global trade war, followed in March when US President Donald Trump announced import tariffs on aluminum, steel, and a broad cross-section of other products from China, and the US’s trading
FUND FACTS at April 30, 2018
| ||||||||||||
SALES CHARGE
|
| NONE | ||||||||||
NUMBER OF HOLDINGS
|
| 79 | ||||||||||
REDEMPTION FEE
|
| 2% FIRST 90 DAYS | ||||||||||
DIVIDEND POLICY
|
| ANNUAL | ||||||||||
INSTITUTIONAL INVESTORS
|
INDIVIDUAL INVESTORS
| |||||||||||
PORTFOLIO ASSETS
| $5,220.0M | $4,279.4M | ||||||||||
TURNOVER (5 YR. AVG.)
| 21% | 25% | ||||||||||
CLASS
| CLASS I | CLASS II | ADVISOR | |||||||||
TICKER
| HLMEX | HLEEX | HLEMX | |||||||||
CUSIP
| 412295701 | 412295693 | 412295305 | |||||||||
INCEPTION DATE
| 10/17/2005 | 3/5/2014 | 11/9/1998 | |||||||||
MINIMUM INVESTMENT1
| $500,000 | $25,000,000 | $5,000 | |||||||||
NET EXPENSE RATIO
| 1.28% | 1.11%2 | 1.42% | |||||||||
GROSS EXPENSE RATIO
| 1.28% | 1.23%3 | 1.42% | |||||||||
1Lower minimums available through certain brokerage firms; 2The Net Expense Ratio is as of April 30, 2018 as the Portfolio is operating below the contractual agreement, which is in effect until February 28, 2019; 3The Gross Expense Ratio is as of the Prospectus dated February 28, 2018.
partners, including the European Union and China, promptly responded with retaliatory measures.
The Health Care sector provided the strongest returns, with good performance from the leading South Korean and Chinese drug companies. The next-strongest sector was Energy, as Brent oil sustained higher prices in the US$65–70 range since the start of 2018. Meanwhile IT, home to many of the fastest-growing companies and most highly valued stocks at the start of the period, ended up lagging the index. While China’s online gaming giant Tencent continued to report standout results, concerns mounted over weaker-than-expected demand for Apple’s iPhone X negatively impacted companies in its supply chain, including component manufacturers Largan Precision (camera lenses) and assembler Hon Hai Precision. Financials and Consumer Discretionary—sectors that are often seen as a gauge of overall economic health—provided conflicting signals. Financials outperformed, with strong contributions from South Africa, China, and Brazil. Consumer Discretionary, in contrast, was the weakest sector dragged down by double-digit negative returns in Mexico and Brazil.
By region, Africa saw the best returns in the six-month period. In South Africa, investors were given a reason for hope in the ascension of Cyril Ramaphosa, who became the new leader of the African National Congress (ANC) party and succeeded Jacob Zuma as the country’s next president. Ramaphosa, an avowed reformer, has promised to stamp out corruption and attract foreign investment back to the country. Latin America was also strong on good returns in Brazil, Colombia, and Peru, all helped by rising commodity prices. The Brazilian market spiked after a court upheld the conviction of former president Luiz Inácio Lula da Silva on corruption charges, likely precluding him from running again and restoring his populist policies.

Table of Contents
PERFORMANCE (% TOTAL RETURN)
for periods ended March 31, 2018
|
for periods ended April 30, 2018
| |||||||||||||||||||||||||||
| 1 | 3 | 5 | 10 | SINCE INCEPTION* | 1 | 3 | 5 | 10 | SINCE INCEPTION* | |||||||||||||||||||
YEAR
| YEARS | YEARS | YEARS | Oct-05 | Mar-14 | Nov-98 | YEAR | YEARS | YEARS | YEARS | Oct-05 | Mar-14 | Nov-98 | |||||||||||||||
INST. EMERGING MARKETS PORTFOLIO – CLASS I
| 25.55 | 10.70 | 7.21 | 4.10 | 8.36 | 17.91 | 7.79 | 6.03 | 2.97 | 8.01 | ||||||||||||||||||
INST. EMERGING MARKETS PORTFOLIO – CLASS II
| 25.82 | 10.92 | – | – | 8.52 | 18.15 | 7.97 | – | – | 7.48 | ||||||||||||||||||
EMERGING MARKETS PORTFOLIO – ADVISOR CLASS
| 25.35 | 10.55 | 7.16 | 4.05 | 12.22 | 17.74 | 7.64 | 5.94 | 2.92 | 11.97 | ||||||||||||||||||
MSCI EMERGING MARKETS INDEX
| 24.93 | 8.81 | 4.99 | 3.02 | 7.69 | 7.52 | – | 21.71 | 6.00 | 4.74 | 2.17 | 7.60 | 7.25 | – | ||||||||||||||
Returns are annualized for periods greater than 1 year. *Inception of Class I, October 17, 2005. Inception of Class II, March 5, 2014. Inception of the Advisor Class, November 9, 1998. Index performance prior to January 1, 2001 cannot be shown since it relies on back-filled data.
Performance data quoted represents past performance; past performance does not guarantee future results. The investment return and principal value of an investment will fluctuate so that an investor’s shares, when redeemed, may be worth more or less than their original cost. Current performance of the Portfolio may be lower or higher than the performance quoted. Performance data current to the most recent month end may be obtained by calling (877) 435-8105 or visiting www.hardingloevnerfunds.com. Performance data shown does not reflect the 2.00% redemption fee imposed on shares held 90 days or less; otherwise, total returns would be reduced.
Performance varied widely across Asian markets, with Thailand, Malaysia, and Pakistan posting strong returns, China outperforming only modestly, and India, Taiwan, Indonesia, and the Philippines lagging. India faced a new challenge with its banking system: revelations of fraud inside one of the leading state banks, Punjab National. Also, India enacted a new capital gains tax on equity investments held for over a year. The tax—unusual in EM countries—cuts the potential net return for long-term investors and is antithetical to Prime Minister Narendra Modi’s avowed goal to attract more long-term investment capital.
⬛ PERFORMANCE ATTRIBUTION
The Portfolios underperformed this period primarily due to poor stocks in IT, particularly our holdings of key component suppliers to Apple’s iPhone: Taiwan’s Largan Precision and Hon Hai Precision as well as China’s AAC Technologies, a manufacturer of speakers and other acoustic components for smartphones.
In Real Estate, the United Arab Emirates’ Emaar Properties fell when its sale of shares in Emaar Development, its property development subsidiary, fetched a lower-than expected price. Also, while Emaar Properties reported solid fiscal year 2017 fundamental results, it disappointed investors with a lower-than-expected dividend and hints at weaker margins in 2018. The Portfolios also lagged in Telecom Services with shares of India’s Bharti Infratel performing poorly due to the consolidation of the country’s wireless service companies. This consolidation will result in fewer bidders for usage of Infratel’s towers and increased bargaining power for the remaining wireless companies. We sold the holding in this period.
Stocks in Energy and Financials were key positive contributors. In the former, oil producer Lukoil and pipe manufacturer Tenaris rose with oil prices. In Financials, the key contributor was South Africa’s Standard Bank, whose shares were boosted by strong fourth-quarter earnings. The company’s migration to a new digital banking platform, nearly complete after a half decade, promises greater efficiency and the ability to offer new, customized products and has helped to raise the market’s expectations for long-term profits. Despite difficult economic conditions on the continent, Standard Bank’s “Africa” business, which excludes its home country, has continued to grow and now accounts for almost one-third of its banking profits.
From a regional perspective, we lagged in the Middle East primarily due to Emaar Properties. We also underperformed in Asia overall due to weak stocks in Taiwan (Largan and Hon Hai) and South Korea (furniture retailer Hanssem). However, we had strong relative returns in China, where shares of Sino Biopharmaceutical surged as successful drug trials and regulatory approvals led to an acceleration in revenue projections. Standard Bank contributed to the Portfolios’ outperformance in Africa. The Portfolios’ allocation to EM companies listed in developed markets—including Hong Kong-listed insurance giant AIA Group—also contributed to relative returns.
⬛ INVESTMENT PERSPECTIVES
China’s Newest New Era Powered by Fundamentals
The impressive share-price appreciation of China’s dominant internet stocks in 2017 mesmerized investors. Equally remarkable was the elevation in profits and returns for China’s IT sector that supported this upsurge. IT businesses’ success has been underpinned by the rapid rise of China’s middle class and its epochal transformation into a consumption-led economy. From 2000 to 2016, per-capita GDP rose from about US$960 to US$8,120, while the portion of the population defined as middle class jumped from 5 million to 225 million people.1 With the help of supportive government policies, China’s IT companies created highly engaging products and services for shopping, communications, and entertainment. Share prices reflect the companies’ success at capturing the attention—and the money—of this vast and growing population.
Among developing countries, China is unique in possessing a combination of pro-development government policies, strong infrastructure, rising incomes for a vast population, and well-managed companies skillfully exploiting these advantages. This powerful combination aided the fundamental advance of IT companies. We believe it also presents attractive investment opportunities in other sectors.
1“Chinese Society: The New Class War,” The Economist (July 19, 2016); World Bank data.

Table of Contents
Growth in China’s IT and related businesses has been orchestrated by two highly skilled managements: the government and corporate leaders. Government provided the physical infrastructure (including advanced, and vast, transportation networks and a reliable energy grid) and schools and universities of an increasingly high quality lacking in most developing countries. State policies have also supported domestic champions in key industries, including internet-related enterprises, by providing incentives (such as tax breaks and subsidies for R&D) and protecting them from foreign competitors like Google and Facebook. Meanwhile, visionary leaders at businesses such as Alibaba and Tencent identified and seized the nascent growth opportunities that the internet provided by creating differentiated services and unique experiences for consumers. They also took advantage of the relative under-development and lack of strong incumbents within the retailing, services, and entertainment industries.
But the combined efforts of government and companies are spurring the growth not only of IT and internet-related businesses. A key element of President Xi Jinping’s “New Era” program—enshrined as the nation’s lodestar during the 19th National Congress of the Communist Party of China held in October—is achieving a continued rise in living standards through more-advanced production methods and the development of higher-quality products and services. Xi’s administration is therefore promoting innovation across multiple industries, including technology, energy, and health care. For example, the government has been encouraging more use of cleaner energy, notably natural gas. Further, China’s Food and Drug Administration recently upgraded the drug approval and regulation process to meet standards akin to those of the US and Europe. These reforms, by weeding out producers of ineffective or poor-quality drugs, should reduce the competition faced by China’s leading pharmaceutical companies.
Within their global universe, our analysts now follow more businesses in China than in any other country outside of the US and
GEOGRAPHIC EXPOSURE (%) at April 30, 2018
| COUNTRY/REGION |
INSTITUTIONAL HLMEX /HLEEX
|
ADVISOR HLEMX
| BENCHMARK1 | |||||||||
BRAZIL
| 6.7 | 6.7 | 7.2 | |||||||||
CHINA + HONG KONG2
| 34.4 | 34.4 | 30.1 | |||||||||
INDIA
| 3.5 | 3.5 | 8.5 | |||||||||
MEXICO
| 3.3 | 3.3 | 3.0 | |||||||||
RUSSIA
| 6.1 | 6.1 | 3.3 | |||||||||
SOUTH AFRICA
| 6.2 | 6.2 | 6.7 | |||||||||
SOUTH KOREA
| 9.6 | 9.6 | 15.6 | |||||||||
TAIWAN
| 8.2 | 8.2 | 11.2 | |||||||||
SMALL EMERGING MARKETS3
| 12.7 | 12.7 | 14.4 | |||||||||
FRONTIER MARKETS4
| 2.8 | 2.8 | – | |||||||||
DEVELOPED MARKET LISTED5
| 3.6 | 3.6 | – | |||||||||
CASH
| 2.9 | 2.9 | – | |||||||||
1MSCI Emerging Markets Index; 2The Harding Loevner Funds Emerging Markets Portfolios’ end weight in China is 27.9% and Hong Kong is 6.5%. The Benchmark does not include Hong Kong; 3Includes the remaining emerging markets which, individually, comprise less than 5% of the Index; 4Includes countries with less- developed markets outside the Index; 5Includes emerging markets or frontier markets companies listed in developed markets.
SECTOR EXPOSURE (%) at April 30, 2018
| SECTOR |
INSTITUTIONAL HLMEX /HLEEX
|
ADVISOR HLEMX
| BENCHMARK1 | |||||||||
CONSUMER DISCRETIONARY
| 12.6 | 12.6 | 9.5 | |||||||||
CONSUMER STAPLES
| 6.5 | 6.5 | 6.6 | |||||||||
ENERGY
| 7.1 | 7.1 | 7.3 | |||||||||
FINANCIALS
| 28.0 | 28.0 | 23.8 | |||||||||
HEALTH CARE
| 5.0 | 5.0 | 2.7 | |||||||||
INDUSTRIALS
| 7.8 | 7.8 | 5.3 | |||||||||
INFORMATION TECHNOLOGY
| 23.6 | 23.6 | 27.3 | |||||||||
MATERIALS
| 1.0 | 1.0 | 7.6 | |||||||||
REAL ESTATE
| 0.8 | 0.8 | 2.9 | |||||||||
TELECOM SERVICES
| 2.4 | 2.4 | 4.6 | |||||||||
UTILITIES
| 2.3 | 2.3 | 2.4 | |||||||||
CASH
| 2.9 | 2.9 | – | |||||||||
1MSCI Emerging Markets Index.
Japan. And in 2017 we markedly increased the breadth of investment opportunities available for the Portfolios by completing the administrative work necessary to gain access to the Chinese domestic A-share market. While there is much to admire within China’s brood of technology juggernauts, our Portfolios increasingly reflect the proliferation of innovative, high-quality, and growing businesses across a range of industries. Current holdings include Hangzhou Hikvision (security monitoring/analytics), Weibo (social media), Midea Group (home appliances), and Alibaba and JD.com (e-commerce). Another holding, ENN Energy, is a regulated monopoly that supplies natural gas to homes and businesses in 165 Chinese cities. We also hold pharmaceutical companies such as Jiangsu Hengrui Medicine and Sino Biopharmaceutical, whose treatments for serious ailments (including hepatitis and cancer) meet international quality standards but are available at prices notably lower than those of imported versions from foreign multinationals.
The Communist Party Congress in October 2017 allowed President Xi to consolidate his power further. The strength of his authority means the state administration can pursue reforms more forcefully. But it also poses risks. Such centralized authority, without even modest checks and balances, can make serious policy missteps. A source of risk from an investment perspective is how authorities reconcile the rapid growth of social-media companies and their desire to maintain the absolute state authority that includes restricting free expression in mass communications. While monitoring such risks, we think government efforts to raise living standards and promote the provision of higher-quality goods and services should continue to support the growth of China’s highest-quality companies.
Trade Fears
In the final two months of the reporting period, the Trump administration announced plans to enact tariffs on various imports— including washing machines, solar panels, aluminum, steel, and agricultural commodities. Most recently, the administration indicated it was considering higher tariffs on about US$150 billion of goods from its main target: China.

Table of Contents
In our Portfolios, a significant amount of companies’ revenues is from China. However, many of our Chinese companies are domestically focused and operate in industries that have little direct exposure to US trade policy. Examples include 51Job Inc. (online job search), ENN Energy (natural gas distribution), China Mobile (mobile telephony), and Jiangsu Hengrui Medicine (health care). To be sure, we also hold export-oriented Chinese businesses that would be directly affected by a severe breakdown in trade relations, such as clothing manufacturer Shenzhou International, Industrials company Han’s Laser, and global appliance manufacturer Midea. However, even their US-sourced revenues are low. Shenzhou’s is the highest of the three, at around 12%. Midea manufactures for major US brands including GE and Electrolux, but its US revenues represent only approximately 5% of the total. | TEN LARGEST HOLDINGS at April 30, 2018
| |||||||||||||
| COMPANY | SECTOR | COUNTRY | INSTITUTIONAL HLMEX / HLEEX |
ADVISOR HLEMX
| ||||||||||
SAMSUNG ELECTRONICS |
INFO TECHNOLOGY
| SOUTH KOREA | 4.9 | 4.9 | ||||||||||
TSMC
|
INFO TECHNOLOGY
| TAIWAN | 4.2 | 4.2 | ||||||||||
TENCENT |
INFO TECHNOLOGY
| CHINA | 4.2 | 4.2 | ||||||||||
AIA GROUP |
FINANCIALS
| HONG KONG | 2.8 | 2.8 | ||||||||||
SBERBANK |
FINANCIALS
| RUSSIA | 2.5 | 2.5 | ||||||||||
ENN ENERGY
|
UTILITIES
| CHINA | 2.3 | 2.3 | ||||||||||
CNOOC |
ENERGY
| CHINA | 2.1 | 2.1 | ||||||||||
LUKOIL |
ENERGY
| RUSSIA | 2.0 | 2.0 | ||||||||||
51 JOB INC. |
INDUSTRIALS
| CHINA | 2.0 | 2.0 | ||||||||||
ITAU UNIBANCO |
FINANCIALS
| BRAZIL | 2.0 | 2.0 | ||||||||||
⬛ PORTFOLIO HIGHLIGHTS
With some new purchases and significant appreciation, the combined weight of China and Hong Kong in each of the Portfolios grew to over 34%—nearly six percentage points higher than six months ago and just below the 35% limit of our self-imposed portfolio guidelines. As they sift through the gamut of potential equity investments in China, including the large number of domestically listed A-share companies, our analysts are finding high-quality, growing businesses operating in a variety of industries. Our China purchases in the past six months included:
Han’s Laser, China’s largest maker of laser-based equipment, with approximately 40% share of its domestic market. Most of the company’s sales are for low-powered lasers used to perform engraving, surface treatment, marking, and other processes used in the manufacture of products such as consumer electronics (including Apple smartphones). Han’s also offers more-advanced, high-powered lasers used for heavy-duty cutting and welding by industrial customers such as automobile and airplane manufacturers. The rise of automated manufacturing has introduced another evolving application with high growth potential for the company: using lasers to encode on production components miniature barcodes that are recognized by robots’ vision systems. Han’s competitive advantages include its ability to provide laser tools that are customized to the needs of its clients and its leading-edge technology supported by heavy spending on research and development.
CSPC Pharmaceutical Group (CSPC), a leader in China’s pharmaceutical industry with a broad product portfolio. The bulk of the company’s revenues are derived from finished drugs—specialties include treatments for cancer and stroke—but it also offers raw materials for drug production, such as vitamin C and caffeine. The company is ahead of many of its peers in proprietary drug development and has a strong position in generics. We think CSPC is poised to benefit from the consolidation in the pharmaceutical industry being propelled by recent regulatory changes that raise the bar on pharmaceutical product quality and penalize low-quality producers.
Not all of China’s policy actions have benefited our companies. We completed the sale of container-terminal operator China Merchants this period. When we purchased this holding in 2010, we based our decision on China’s growth in container volumes and China Merchant’s ability to offer new, higher-value services to handle a growing variety of imports, such as chilled containers for food. We also believed the company’s strong competitive position would allow it to increase container fees, subject to reasonable government regulation. The latter expectation was burst in November, when the Chinese antitrust regulator demanded price cuts of 10–20% at some of China’s largest container terminal ports. Our conclusion, and our principal reason to sell, was the company no longer appeared free to manage its business in the interest of shareholders.
Outside of China, we purchased Novatek, a Russian producer of natural gas, LNG, and natural gas liquids like condensate and propane. The company is the world’s eighth-largest gas producer and the third-largest owner of proven natural gas reserves. Its reserves’ low cost of development and production have enabled Novatek to earn returns above its cost of capital despite the depressed hydrocarbon prices of recent years. With the company’s launch of a large LNG plant on Yamal peninsula in December and more LNG projects in progress, we believe Novatek can grow production rapidly to continue gaining market share.
Lastly, our concerns about rising competitive intensity in Mexi-co’s media industry led us to sell Televisa, the country’s leading broadcast television, cable, and satellite TV operator and producer of some of Mexico’s most-popular entertainment programs. The advertising revenue that Televisa generates from its Spanish-language content is from free-to-air (FTA) broadcasting. That revenue is eroding as advertisers migrate from the broad reach of TV toward highly targeted and more-effective advertising on Google, Facebook, and other digital platforms. We were also concerned that Televisa’s other two key assets—cable TV and pay satellite TV—after years of impressive growth have been showing signs of slowing down. Subscriber penetration is high in urban areas, requiring the company increasingly to seek growth in rural areas, where new subscribers are more price sensitive.
Please read the separate disclosures page for important information, including the risks of investing in the Portfolios.

Table of Contents

PORTFOLIO MANAGEMENT TEAM
 |
PRADIPTA CHAKRABORTTY | |
| CO-LEAD PORTFOLIO MANAGER | ||
| BABATUNDE OJO, CFA | ||
| CO-LEAD PORTFOLIO MANAGER |
⬛ PERFORMANCE SUMMARY
For the Frontier Emerging Markets Portfolio, the Institutional Class I rose 9.41%, the Institutional Class II rose 9.59%, and the Investor Class rose 9.33% (net of fees and expenses) in the six-month period ended April 30, 2018. The Portfolio’s benchmark, the MSCI Frontier Emerging Markets Index, gained 5.77% (net of source taxes).
⬛ MARKET REVIEW
The escalating global trade dispute between the US and China appears unlikely to have major implications for frontier emerging market (FEM) economies. For many of the countries, exports do not constitute a high proportion of GDP. In addition, FEMs often export natural resources, such as oil, and low-end manufactured goods, where they enjoy a competitive advantage due to low labor costs. As such, these exports are not typically targeted by protectionists who seek to shield their domestic industries.
All regions except the Gulf States gained in the trailing six-month period. Asia rose modestly, but underperformed the index, dragged down by weakness in the Philippines, an index heavyweight. Share prices were weak across banks, industrial conglomerates, and real estate, reflecting mixed earnings results and concerns about rising inflation. In Vietnam, a growing economy and generally solid corporate earnings powered market performance. Consumer products company Masan Group rallied, bolstered by anticipated growth from brand refreshes and product launches. Aiming to expand its reach, Masan introduced several sauce, noodle, and coffee products targeted to the premium segment of the market.
Europe was the best-performing region, led by Kazakhstan. Halyk Savings Bank reported accelerating loan demand, mainly from its corporate customers, and profit growth fueled by its takeover of competitor Kazkommertsbank in 2017. Romania was also strong. Prime Minister Mihai Tudose’s resignation in January did not derail Romania’s expanding economy, which was stimulated in 2017 by generous salary increases for public sector workers. Banca Transilvania posted solid earnings growth on increased lending—especially to households and small businesses—and higher fee income. In late 2017, the bank agreed to acquire competitor Bancpost, which will give it the largest share of loans and deposits in Romania.
FUND FACTS at April 30, 2018
| ||||||||
TOTAL NET ASSETS
| $510.1M | |||||||
SALES CHARGE
| NONE | |||||||
NUMBER OF HOLDINGS
| 78 | |||||||
TURNOVER (5 YR. AVG.)
| 32% | |||||||
REDEMPTION FEE
| 2% FIRST 90 DAYS | |||||||
DIVIDEND POLICY
| ANNUAL | |||||||
| INSTITUTIONAL INVESTORS | INDIVIDUAL INVESTORS | |||||||
| INSTL CLASS I | INSTL CLASS II | INVESTOR CLASS | ||||||
TICKER
| HLFMX | HLFFX | HLMOX | |||||
CUSIP
| 412295867 | 412295735 | 412295859 | |||||
INCEPTION DATE
| 5/27/2008 | 3/1/2017 | 12/31/2010 | |||||
MINIMUM INVESTMENT1
| $100,000 | $10,000,000 | $5,000 | |||||
NET EXPENSE RATIO
| 1.66% | 1.35%2 | 2.00% | 2 | ||||
GROSS EXPENSE RATIO
| 1.66% | 1.58% | 2.08% | |||||
1Lower minimums available through certain brokerage firms; 2Shown net of Harding Loevner’s contractual agreement through February 28, 2019.
Africa’s markets also rose in the period, largely on the strong performance of Kenya, Nigeria, and Egypt. In Kenya, the charged political climate after August 2017’s disputed election normalized with the reconciliation of President Uhuru Kenyatta and opposition leader Raila Odinga. Nigeria advanced as the economy returned to growth after contracting in 2016 and most of 2017. Higher oil revenue, increased investments, and sales of dollar-denominated government bonds helped lift Nigeria’s foreign exchange reserves to a four-year high of almost US$42 billion in February.1 The greater supply of hard currency helped stabilize the Nigerian naira’s exchange rate and allowed local companies access to dollars needed to import machinery and raw materials. In Egypt, the presidential election ended predictably as incumbent president Abdel Fattah el-Sisi, who was virtually unchallenged, secured another term in office, signaling policy continuity. Egypt’s ongoing economic recovery is discussed later in this report.
Latin American markets rose as advances in Peru and Colombia outweighed a decline in Argentina. In Peru, President Pedro Pablo Kuczynski’s resignation was welcomed by investors who believe his replacement, First Vice President Martín Vizcarra, will have a more constructive relationship with Congress. Politics aside, Peru’s economy remains strong, with low public debt, a stable currency, low inflation, and accelerating growth.
Performance by sector was mixed in the period. Energy was the top-performing sector, as crude oil prices in April advanced to levels not seen since the end of 2014, and global oil producers, led by Saudi Arabia and Russia, extended last year’s deal to cut oil production to the end of 2018. The Materials sector also advanced,
1David Malingha Doya, “Charts Show Why Nigeria’s 2018 May Even Exceed the 2017 Rebound,” Bloomberg, February 27, 2018.

Table of Contents
PERFORMANCE (% TOTAL RETURN)
for periods ended March 31, 2018
|
for periods ended April 30, 2018
| |||||||||||||||||||||||||||||||||||||||||||||||
| 1 | 3 | 5 | SINCE INCEPTION* | 1 | 3 | 5 | SINCE INCEPTION* | |||||||||||||||||||||||||||||||||||||||||
YEAR
| YEARS | YEARS | May-08 | Mar-17 | Dec-10 | YEAR | YEARS | YEARS | May-08 | Mar-17 | Dec-10 | |||||||||||||||||||||||||||||||||||||
FRONTIER EMERGING MARKETS PORTFOLIO – INST CLASS I
| 25.18 | 4.78 | 4.46 | 0.28 | 21.57 | 2.13 | 3.77 | 0.05 | ||||||||||||||||||||||||||||||||||||||||
FRONTIER EMERGING MARKETS PORTFOLIO – INST CLASS II
| 25.49 | – | – | 25.74 | 21.96 | – | – | 21.44 | ||||||||||||||||||||||||||||||||||||||||
FRONTIER EMERGING MARKETS PORTFOLIO – INVESTOR CLASS
| 24.76 | 4.32 | 4.02 | 3.13 | 21.27 | 1.78 | 3.36 | 2.79 | ||||||||||||||||||||||||||||||||||||||||
MSCI FRONTIER EMERGING MARKETS INDEX
| 19.93 | 4.23 | 3.42 | – | 20.31 | 2.91 | 17.04 | 2.68 | 3.19 | – | 17.98 | 2.77 | ||||||||||||||||||||||||||||||||||||
Returns are annualized for periods greater than 1 year. *Inception of the Institutional Class I, May 27, 2008. Inception of the Institutional Class II, March 1, 2017. Inception of the Investor Class, December 31, 2010. Index performance prior to December 2, 2008 cannot be shown since it relies on back-filled data.
Performance data quoted represents past performance; past performance does not guarantee future results. The investment return and principal value of an investment will fluctuate so that an investor’s shares, when redeemed, may be worth more or less than their original cost. Current performance of the Portfolio may be lower or higher than the performance quoted. Performance data current to the most recent month end may be obtained by calling (877) 435-8105 or visiting www.hardingloevnerfunds.com. Performance data shown does not reflect the 2.00% redemption fee imposed on shares held 90 days or less; otherwise, total returns would be reduced.
helped by the strong performance of Vietnamese steel producer Hoa Phat Group and Nigerian cement company Dangote Cement. Hoa Phat, which continues to post strong profit gains from double-digit volume growth, is expanding its capacity to take advantage of solid domestic demand for steel. We further discuss Hoa Phat later in this commentary. Dangote Cement reported strong earnings growth after last year’s price increases; additionally, volume growth should pick up due to expected demand from Nigeria’s infrastructure programs in 2018. The Real Estate sector underperformed the index, dragged down by Philippine and Moroccan real estate developers.
⬛ PERFORMANCE ATTRIBUTION
The Portfolio’s positive relative performance in the trailing six months derived primarily from good stock selection, especially in Consumer Discretionary, Telecom Services, Materials, and Energy. In Consumer Discretionary, Saudi Arabian electronic retailer Jarir Marketing contributed to relative returns as it opened new stores and reduced costs by renegotiating supplier contracts. Telecom Services was led by Kenya’s Safaricom, as continued net-subscriber growth in its mobile data and voice segments resulted in strongly rising free cash flow. In Materials, we benefited most from Hoa Phat. Energy returns were led by Colombian oil exploration and production company Ecopetrol. Increased oil production and rising oil prices boosted Ecopetrol’s revenue while a cost savings program and lower debt improved its profitability. Our stocks in the Real Estate sector detracted, with United Arab Emirates (UAE)-based Emaar Properties falling as its sale of shares in Emaar Development, its property development subsidiary, fetched a lower-than-expected price. Also, while Emaar Properties reported solid fiscal year 2017 financial results, it disappointed investors with a lower-than-expected dividend and hints at weaker margins in 2018. Our poor selection in Consumer Staples also detracted. UAE-based food and beverages manufacturer Agthia continued to suffer from the government’s removal of subsidies on its flour and animal feeds business in 2016.
By geography, our holdings in Asia were the main source of our outperformance, with Hoa Phat and several companies in the Philippines providing strong relative returns. Stocks in Latin America also contributed, especially Peru’s Alicorp, which acquired a
leading oils and fats producer in Bolivia. This acquisition is expected to cement Alicorp’s position in Bolivia’s rapidly growing consumer market while improving its profitability through procurement, logistics, and supply chain optimization.
⬛ PERSPECTIVE AND OUTLOOK
In a number of frontier markets, governments have adopted business-friendly policies that strengthen the foundation for economic growth. One example is Egypt. In less than two years, it has significantly changed its policies to create an environment friendly to foreign investment. While Egypt’s journey is by no means over, we believe the country has taken the right steps to promote a sustainable recovery and long-term growth that creates attractive investment opportunities.
For five years after the onset of the Arab Spring in 2011, the Egyptian economy languished. The threat—and occasional reality—of terrorist activity spilling over from conflicts in Syria and Iraq caused the number of foreign tourists—an important source of hard currency—to drop from 14 million in 2010 to 5 million in 2016. Foreign investors were deterred by a burdensome regulatory environment, restrictive capital controls, and an uncertain growth outlook. Foreign direct investment, which from 2000–10 amounted to an average of 4% of GDP annually, declined to only 2% in 2014–17.2 An overvalued exchange rate for the Egyptian pound made the country’s exports uncompetitive, further reducing already-low foreign exchange reserves.
In late 2016, Egyptian authorities, working with the IMF, took decisive steps to encourage private investment and stimulate growth. Key reforms included the abolishment of capital controls and the introduction of a free-floating exchange rate regime for the Egyptian pound. These measures eliminated distortions in the foreign currency market and helped boost exports, resulting in a steady and sustainable supply of foreign currency. By February 2018, foreign currency reserves had reached over US$42 billion—the highest in five years.
2“Arab Republic of Egypt: Selected Issues,” International Monetary Fund, December 11, 2017.

Table of Contents
At Harding Loevner, we invest only in high-quality and growing companies. These businesses are not immune to external risks, of course, but their strong competitive advantages, robust balance sheets, and skilled managers make them more resilient to shocks from any number of directions. Our holdings in Egypt include a bank and a medical testing company, and we believe each is poised to benefit as Egypt’s recovery accelerates.
Commercial International Bank (CIB), Egypt’s largest private sector bank, stands to benefit from rising demand for loans and banking services. The free-floating pound and the elimination of capital controls cleared the backlog of foreign currency requests, allowing local producers to import machinery and equipment from abroad by borrowed US dollars from CIB and other banks instead of the black market. In addition, authorities cut interest rates after inflation dropped from 31% in October 2017 to 14% in February 2018. As the only privately owned bank in Egypt without a foreign parent, CIB can grow faster than many of its competitors, whose parent companies impose growth restrictions on their Egyptian subsidiaries.3 CIB’s other advantage is its low funding cost: cheap, sticky current and savings deposits, sourced through payroll accounts, comprise over 40% of its deposit base. With a loan-to-deposit ratio of only 35%, CIB has ample room to expand lending without having to mobilize additional deposits.
As Egypt’s economy picks up speed, more companies are operating close to their full capacity, necessitating further investments in plants and equipment. Lending is accelerating and shifting from short-term working capital and trade financing to longer-term loans. CIB, which has one of the strongest corporate lending franchises in the country, is capitalizing on this trend.
While corporate lending has traditionally been a pillar of CIB’s growth, the bank has recently turned its attention to lending to consumers. Retail offers significant growth potential in Egypt: the country is under-banked, with household loans comprising only 7% of GDP. As interest rates decline and Egypt’s economic recovery accelerates, more consumers will be able to access credit, and many will do so through CIB.
Consumption, which remains the primary driver of economy in Egypt, declined last year when inflation spiked. Many Egyptians
GEOGRAPHIC EXPOSURE (%) at April 30, 2018
REGION
| PORTFOLIO
| BENCHMARK1
| ||||||
AFRICA
| 19.0 | 16.3 | ||||||
ASIA
| 32.4 | 33.9 | ||||||
EUROPE
| 7.5 | 4.7 | ||||||
GULF STATES
| 10.4 | 11.5 | ||||||
LATIN AMERICA
| 27.8 | 31.6 | ||||||
MIDDLE EAST
| 0.0 | 2.0 | ||||||
DEVELOPED MARKET LISTED2
| 2.0 | — | ||||||
CASH
| 0.9 | — | ||||||
1MSCI Frontier Emerging Markets Index; 2Includes frontier or small emerging markets companies listed in developed markets.
SECTOR EXPOSURE (%) at April 30, 2018
SECTOR
| PORTFOLIO
| BENCHMARK1
| ||||||
CONSUMER DISCRETIONARY
| 9.3 | 1.2 | ||||||
CONSUMER STAPLES
| 14.3 | 7.3 | ||||||
ENERGY
| 7.6 | 6.0 | ||||||
FINANCIALS
| 34.4 | 47.0 | ||||||
HEALTH CARE
| 4.6 | 1.5 | ||||||
INDUSTRIALS
| 4.3 | 7.6 | ||||||
INFORMATION TECHNOLOGY
| 2.5 | 0.5 | ||||||
MATERIALS
| 7.9 | 7.2 | ||||||
REAL ESTATE
| 4.7 | 9.5 | ||||||
TELECOM SERVICES
| 9.5 | 8.6 | ||||||
UTILITIES
| 0.0 | 3.6 | ||||||
CASH
| 0.9 | — | ||||||
1MSCI Frontier Emerging Markets Index.
curbed spending even on essentials, such as food and health care. As inflation decelerates and consumers gradually adjust to higher prices, consumption is gradually recovering. Improved consumer purchasing power is supporting growth in the health care services sector. Integrated Diagnostics Holdings (IDH), the largest private lab diagnostic company in Egypt, has built a trusted brand over its 40 years in operation among patients and doctors. Egypt has a high prevalence of lifestyle diseases such as obesity, diabetes and hypertension, yet it has one of the lowest levels of tests per capita, suggesting solid long-term growth potential for IDH. Few competitors can match the company’s expertise in performing highly complex tests. IDH’s lab footprint of over 300 branches makes it the only company able to serve corporate and government employees nationwide. This proved critical in 2017 as more patients migrated from private-pay to institutionally sponsored health plans with unions and large corporations.
Recognizing that high inflation hits patients who pay for health care out of pocket the hardest, IDH developed innovative marketing programs that resulted in cost savings for customers. For example, the company now offers bundles of tests at a discount for patients with specific conditions. In the past, the patients had to purchase each test separately. IDH also partnered with a bank to offer more-affordable payment plans. These initiatives ensured continued growth in patient volumes and revenues in 2017, even in the face of restrained spending by consumers. IDH has weathered challenging conditions well—a testament to the skill of its management team.
⬛ PORTFOLIO HIGHLIGHTS
In March, we established a position in Telecom Argentina (TA), the country’s leading provider of fixed-line, broadband, and mobile telecom services. We believe Argentina’s improving regulatory landscape and TA’s strengthening competitive position will help it gain market share and profits.
3Egypt’s non-investment grade sovereign credit rating means these subsidiaries weaken their companies’ regulatory capital ratios.

Table of Contents
TA has a broad subscriber base in wireless (20 million users), fixed-line telephones (4 million), and internet access (2 million). The company’s average revenue per user in the mobile segment exceeds its competitors’, América Movil and Telefónica, mainly due to TA’s wireless brand, Personal, which caters to premium wireless customers who consume more voice minutes and data than average.
TA’s growth was hindered for years by government regulations. During the administrations of former presidents Néstor Kirchner and Cristina Fernández de Kirchner, the government froze telephone rates for 15 years even though inflation exceeded 20% per year. As a result, TA underinvested in network upgrades that would have improved the data transmission speeds for the phone company’s broadband subscribers.
The regulatory disadvantage ended in 2015, when newly elected president Mauricio Macri began to lift price caps on fixed-line phone rates. The administration also mapped out a plan to remove restrictions that prevented phone companies from offering pay television (“pay TV”) services, starting in 2018. To deliver pay TV, phone companies need faster networks that match the speed and quality of cable TV providers. Aiming to gain a first-mover advantage, TA merged with Cablevisión, Argentina’s dominant pay TV and broadband provider with 32% market share. Cablevisión’s network footprint covers 56% of homes in Argentina and can carry high-definition TV at high speeds, but, unlike TA, it lacks a sizable wireless subscriber base. The combined company is Argentina’s only truly integrated, multi-platform operator that can offer the quadruple-play bundles—mobile, fixed-line voice, broadband, and pay TV—that are increasingly popular. The company’s prodigious cash flow affords it the financial wherewithal to upgrade its network without incurring significant additional debt.
As Telecom Argentina illustrates, changes in a company’s competitive position that improve its growth outlook will prompt us to reconsider it. Changes might be triggered by a government policy shift, an acquisition, or an industry consolidation.
Recent headlines have been dominated by US president Donald Trump’s tariffs on steel, aluminum, and other products. Other countries—including China—have vowed to retaliate. While it remains to be seen how the trade dispute will play out, we do not believe it will have a significant impact on our holdings, including our only steel producer, Hoa Phat Group.
Hoa Phat is the leading construction steel manufacturer in Vietnam, with 25% market share. The company operates predominantly in the domestic market. While some other Vietnamese steel companies import raw materials from China, Hoa Phat is not dependent on Chinese imports; it sources a large part of its raw materials within Vietnam. Its total exports hover around 20%, the largest share of which is directed to neighboring Southeast Asian countries, where demand is growing fast. The company exports minimally—less than 2% of total volumes—to the US. For this
TEN LARGEST HOLDINGS at April 30, 2018
COMPANY
| SECTOR | COUNTRY | % | |||||
SAFARICOM
| TELECOM SERVICES | KENYA | 4.4 | |||||
ECOPETROL
| ENERGY | COLOMBIA | 4.1 | |||||
JOLLIBEE FOODS
| CONS DISCRETIONARY | PHILIPPINES | 4.0 | |||||
HOA PHAT GROUP
| MATERIALS | VIETNAM | 4.0 | |||||
CREDICORP
| FINANCIALS | PERU | 3.7 | |||||
ALICORP
| CONS STAPLES | PERU | 3.4 | |||||
BANCO MACRO
| FINANCIALS | ARGENTINA | 3.2 | |||||
GRUPO FINANCIERO GALICIA
| FINANCIALS | ARGENTINA | 2.9 | |||||
SQUARE PHARMACEUTICALS
| HEALTH CARE | BANGLADESH | 2.7 | |||||
VIETNAM DAIRY PRODUCTS
| CONS STAPLES | VIETNAM | 2.7 | |||||
reason, we expect the impact of the US-China trade dispute on Hoa Phat will be very limited.
Vietnam’s rapid urbanization is generating demand for residential housing and infrastructure, while rising investment flows are fueling growth in the country’s manufacturing sector. The activity translates into robust demand for steel. Hoa Phat continues to post solid profitability gains and is expanding capacity to take advantage of the solid domestic demand outlook for steel.

Portfolio Management Team Update
Richard Schmidt, CFA has stepped down as Portfolio Manager for the Frontier Emerging Markets Equity strategy as of January 2, 2018. Rick joined the team in 2012, assuming responsibility for top-down assessment of country risks. As external sources of country risk information have improved, this aspect of the strategy’s risk management has been assumed by the co-lead portfolio managers Pradipta Chakrabortty and Babatunde Ojo, CFA. Rick remains a portfolio manager on the Global Equity and Emerging Markets Equity strategies and a consumer industries analyst.
Please read the separate disclosures page for important information, including the risks of investing in the Portfolio.

Table of Contents

PORTFOLIO MANAGEMENT TEAM
|
ANDREW WEST, CFA PORTFOLIO MANAGER
MOON SURANA, CFA PORTFOLIO MANAGER | |

⬛ PERFORMANCE SUMMARY
For the Global Equity Research Portfolio, the Institutional Class gained 5.89% and the Investor Class rose 5.73% (net of fees and expenses) in the six-month period ended April 30, 2018. The Portfolio’s benchmark, the MSCI All Country World Index, gained 3.56% (net of source taxes).
⬛ MARKET REVIEW
Markets closed 2017 on an optimistic note, with stock prices rising strongly in December. Economic growth across all major regions remained positive and synchronized, while inflation was subdued. In the US, investors ignored the Federal Reserve’s signals of further interest rate increases, including a hike in mid-December. They weighed approvingly the expected future benefits of lower corporate tax rates from tax legislation, which finally passed in late December. In Europe, the European Central Bank remained accommodative on monetary policy, although it signaled a slowing pace of bond buying. China’s economy gathered momentum, shrugging off concerns over government corruption crackdowns and shaky property loans, with positive pull-through effects on its trading partners. Japanese economic growth edged higher, while inflation remained positive—a critical policy goal.
The markets’ positive trend continued into the new year, but the streak of 15 monthly gains ended in February as sanguinity gave way to worry. Although the backdrop of improving and increasingly synchronized economic growth and good corporate earnings remained in place, investors had to come to terms with some ugly prospects: higher interest rates, a trade war between the US and China, and increased regulation of technology companies.
Stock price volatility spiked at the end of January, exacerbated by the collapse of derivatives-based “inverse volatility” ETFs, contributing to an over 8% decline in equities in just 10 days. After a brief bounce in mid-February, stocks wallowed in a range through the end of April, reflecting a new set of worries about increasingly ubiquitous technology platforms. A mounting furor over Facebook data illicitly exploited by political consultant Cambridge Analytica in favor of US President Donald Trump and Brexit, and the mowing down of a pedestrian by an Uber self-driving car in Arizona drew calls for more regulation of technology companies. The European Union continued its efforts to rein in “big tech,” announcing a tax on turnover of large digital companies and moving ahead with its General Data Protection Regulation mandate, which imposes strict requirements and
FUND FACTS at April 30, 2018
| ||||||||
TOTAL NET ASSETS
|
|
| $6.2M
|
| ||||
SALES CHARGE
|
|
| NONE
|
| ||||
NUMBER OF HOLDINGS
|
|
| 272
|
| ||||
TURNOVER (5 YR. AVG.)
|
|
| –
|
| ||||
REDEMPTION FEE
|
|
| 2% FIRST 90 DAYS
|
| ||||
DIVIDEND POLICY
|
|
| ANNUAL
|
| ||||
INSTITUTIONAL INVESTORS
| INDIVIDUAL INVESTORS
| |||||||
|
| INSTITUTIONAL CLASS
|
|
| INVESTOR CLASS
|
| |||
TICKER
|
| HLRGX
|
|
| HLGNX
|
| ||
CUSIP
|
| 412295792
|
|
| 412295818
|
| ||
INCEPTION DATE
|
| 12/19/2016
|
|
| 12/19/2016
|
| ||
MINIMUM INVESTMENT1
|
| $100,000
|
|
| $5,000
|
| ||
NET EXPENSE RATIO2
|
| 0.90%
|
|
| 1.15%
|
| ||
GROSS EXPENSE RATIO
|
| 3.49%
|
|
| 13.36%
|
| ||
1Lower minimums available through certain brokerage firms; 2Shown net of Harding Loevner’s contractual agreement through February 28, 2019.
stiff penalties regarding treatment of private data. The tech tumult turned farcical with Trump tweeting potshots at Amazon.com over its use of the Postal Service.
All sectors except Utilities and Consumer Staples advanced in the period. Energy was the top-performing sector, as crude oil prices reached levels in April not seen since the end of 2014. Information Technology (IT) moderately outpaced the index; its outsized Janu-ary gains were nearly depleted by sharp declines late in March.
All regions except Canada advanced as well. Emerging Markets (EMs), more typically the loser from rising global risk and volatility, was the strongest-performing region. Confoundingly, EMs’ rise was supported by Brazil and Russia, two of the biggest exporters of steel and other commodities whose trade is endangered. A Brazilian court upheld the conviction of former president Luiz Inácio Lula da Silva on corruption charges, likely precluding him from running again and restoring his redistributionist policies.
The most expensive and fastest-growing quintiles of stocks gained in the period, outperforming the rest by a wide margin. Quality was not a significant return factor.
⬛ PERFORMANCE ATTRIBUTION
Stock selection, dictated as always by our analysts’ recommendations, was the main source of outperformance in the trailing six months. We had particularly strong relative returns in the Consumer Staples, Consumer Discretionary, Financials, and IT sectors. Strong stocks in Industrials and Energy also helped. Our performance lagged the index in the Real Estate and Telecom Services sectors, however.

Table of Contents
PERFORMANCE (% TOTAL RETURN)
for periods ended March 31, 2018
| for periods ended April 30, 2018
| |||||||||||
| CALENDAR YTD | 1 YEAR | SINCE INCEPTION* | CALENDAR YTD | 1 YEAR | SINCE INCEPTION* | |||||||
GLOBAL EQUITY RESEARCH PORTFOLIO – INSTITUTIONAL CLASS
| 1.96
| 21.03
| 22.93
| 1.39
| 18.27
| 20.91
| ||||||
GLOBAL EQUITY RESEARCH PORTFOLIO – INVESTOR CLASS
| 1.88
| 20.77
| 22.63
| 1.31
| 18.00
| 20.63
| ||||||
MSCI ALL COUNTRY WORLD INDEX
| -0.96
| 14.85
| 17.23
| -0.02
| 14.17
| 16.93
| ||||||
Returns are annualized for periods greater than 1 year. *Inception of the Institutional and Investor Class, December 19, 2016.
Performance data quoted represents past performance; past performance does not guarantee future results. The investment return and principal value of an investment will fluctuate so that an investor’s shares, when redeemed, may be worth more or less than their original cost. Current performance of the Portfolio may be lower or higher than the performance quoted. Performance data current to the most recent month end may be obtained by calling (877) 435-8105 or visiting www.hardinglo-evnerfunds.com. Performance data shown does not reflect the 2.00% redemption fee imposed on shares held 90 days or less; otherwise, total returns would be reduced.
In Consumer Staples, Shiseido and Alicorp contributed to relative returns. In Financials, Singapore bank DBS Group announced larger distributions of capital to shareholders with a surprising regular dividend increase plus a special dividend. Japanese companies M3 and Sysmex boosted returns in Health Care. We also had large positive contributions from IT holdings Cisco Systems and Infosys.
Poor returns in Real Estate stemmed largely from Emaar Properties, a major developer of residential property mega-developments in Dubai and owner of the Dubai Mall. Though the company reported strong 2017 earnings growth and our analyst forecasts rising profits in years ahead, investors seemed to punish the stock over disappointment regarding dividend payout and concerns that residential property demand could weaken.
By region, the Portfolio benefited from our strong stock selection in most regions, especially the US, the Pacific ex-Japan, and Japan. Returns for our US stocks exceeded the US market by 340 basis points. Key contributors included T. Rowe Price, Estee Lauder, Lululemon, TJX Companies, Costco, and Cisco Systems. Facebook and Regeneron—high-priced, fast-growing companies—were detractors from relative performance in the US.
In the Pacific ex-Japan, DBS Group, CSL Limited, and Hong Kong Exchanges contributed to relative returns. Hong Kong Exchanges reported that, after a weak start to 2017, trade volumes surged in the second half of the year, especially for its “Stock Connect” facility that provides foreign investors access to A-shares listed on the Shanghai and Shenzhen stock markets. Our analyst expects Stock Connect to be a long-term source of revenue growth. Positive stock selection in EMs was primarily due to Chinese holdings including Wuxi Biologics, Sino Biopharmaceutical, Jiangsu Hengrui Medicine, and 51Job Inc. The latter, China’s leading online job search portal, in recent years has instituted new employee incentive programs that have helped increase perclient revenues and profit margins.
In Japan, the Portfolio benefited from returns of Shiseido, Nidec, and Rinnai. However, we had a few detractors in Japan as well, including Suruga Bank, whose shares were down sharply as one of its large borrowers, a real-estate company, faced credit problems.
⬛ PERSPECTIVE AND OUTLOOK
“If you buy something because it’s undervalued, then you have to think about selling it when it approaches your calculation of its intrinsic value. That’s hard. But, if you can buy a few great companies, then you can sit on your ass. That’s a good thing.”
— Charlie Munger,
Berkshire Hathaway annual meeting, 2000
Arguably the greatest contribution that Charlie Munger has made to Berkshire Hathaway’s shareholders was in convincing Warren Buffett in the 1970s that a long-duration growth business trading at an apparently premium price could still represent a good value. His reasoning was that the return on the shares would ultimately converge with the return on capital for the business as the compounding of the latter would, over a long period of time (Munger cited 40 years), come to dwarf the initial premium paid for the shares. That inevitability meant that you could buy, then sit and wait—but, presumably (and critically), only if you were assured that the company would manage to maintain its growth rate and sustain its high profitability in the process. You could tolerate occasional periods of overvaluation of that business’s shares because, given enough time, its profits would grow back into its share price.
As investors in businesses that can grow for many years with high and durable profitability, we at Harding Loevner adhere to an investment philosophy that resembles Munger’s. Through our research process, we look for companies that meet our criteria of what makes a great business. The process is focused entirely on business fundamentals: we evaluate the competitive structure of an industry, examine each participant’s competitive position, and then question whether a favorable industry structure or the particular advantages enjoyed by some participants are sustainable into the future. Upon identifying such apparently great businesses, we include them in our qualified investable universe. We estimate what their shares are worth by making financial forecasts and discounting their projected long-term cash flows to the present. While we’re not afraid to pay over the market average for shares of an excellent business, even a paragon will fail to make its way into our portfolios if its superior long-term prospects are more than fully discounted in its current share price.

Table of Contents
Munger’s challenge, and ours too, is in finding companies that will remain “great” for 10 years, let alone 40. Enduring jewels are more easily discovered in hindsight than in advance. The identification of such companies requires that all evidence in support of a purchase be weighed against an obvious fact—that the vast majority of businesses fail to maintain their profitability over the long term. Once an investment is made, we do much more than sit and watch the returns pour in. We set up structures to seek out evidence that the company will not stay great forever. To be able to “sit” comfortably on a holding presupposes, among other things, that the customers of that business continue to prefer its products or services. We guard against the risk of mishap through intensive monitoring of the business results of our portfolio companies, parsing financial disclosures, and checking third-party sources to gauge their progress against the mileposts that we set out in advance as supporting detail to our investment thesis. There is nothing sedentary about our ownership.
To “be right and sit tight,” to borrow a phrase from legendary Wall Street trader Jesse Livermore, is easier said than done in other ways. In addition to guarding against the deterioration of companies’ underlying businesses (the “be right” part), investors need also to guard against the human tendency to become risk averse when they are in a position of gain on their shares (the “sit tight” part); investors tend to harvest their gains too early. They process the constant bombardment of ever-shifting news as calls to action, feeding the instinct to lock in profits and avoid reversals. That flow of news can be company-specific but is often related to the general environment in which companies operate. Our analysts try to avoid overreacting to possibly peripheral current events. Instead, we focus on the growth prospects for each company and the specific threats that could endanger its stock’s market valuation relative to the rest of the market.
Our limited reaction to political or economic developments does not mean we are unaware of such issues. Central banks are withdrawing monetary stimulus in reaction to signs that inflation expectations are increasing, and in the larger cause of normalizing interest rates ahead of the next recession. Rising populism, particularly in Europe, has called into question the longstanding consensus on advantages of a common currency, tax-free trade, and
GEOGRAPHIC EXPOSURE (%) at April 30, 2018
COUNTRY/REGION
| PORTFOLIO
| BENCHMARK1
| ||||||
CANADA
|
| 1.8
|
|
| 3.0
|
| ||
EMERGING MARKETS
|
| 21.2
|
|
| 12.0
|
| ||
EUROPE EMU
|
| 7.2
|
|
| 11.0
|
| ||
EUROPE EX-EMU
|
| 8.9
|
|
| 10.0
|
| ||
FRONTIER MARKETS2
|
| 1.1
|
|
| —
|
| ||
JAPAN
|
| 10.4
|
|
| 8.0
|
| ||
MIDDLE EAST
|
| 0.7
|
|
| 0.1
|
| ||
PACIFIC EX-JAPAN
|
| 3.6
|
|
| 3.9
|
| ||
UNITED STATES
|
| 43.8
|
|
| 52.0
|
| ||
CASH |
| 1.3
|
|
| —
|
| ||
1MSCI All Country World Index; 2Includes countries with less-developed markets outside the Index.
SECTOR EXPOSURE (%) at April 30, 2018
SECTOR
| PORTFOLIO
| BENCHMARK1
| ||||||
CONSUMER DISCRETIONARY
|
| 12.8
|
|
| 12.4
|
| ||
CONSUMER STAPLES
|
| 13.4
|
|
| 8.0
|
| ||
ENERGY
|
| 2.3
|
|
| 6.7
|
| ||
FINANCIALS
|
| 15.4
|
|
| 18.6
|
| ||
HEALTH CARE
|
| 10.0
|
|
| 10.8
|
| ||
INDUSTRIALS
|
| 15.7
|
|
| 10.7
|
| ||
INFORMATION TECHNOLOGY
|
| 23.0
|
|
| 18.6
|
| ||
MATERIALS
|
| 4.5
|
|
| 5.4
|
| ||
REAL ESTATE
|
| 0.4
|
|
| 3.0
|
| ||
TELECOM SERVICES
|
| 0.7
|
|
| 2.9
|
| ||
UTILITIES
|
| 0.5
|
|
| 2.9
|
| ||
CASH
|
| 1.3
|
|
| —
|
| ||
1MSCI All Country WorldIndex.
free movement of labor. And now the US threatens to precipitate a trade war that would have a devastating impact on globalization and potentially erase the enormous benefits that free trade has brought to nearly all parts of the world that have participated in it.
The recent announcements by the Trump administration to enact tariffs on various imports—including washing machines, solar panels, aluminum, steel, and, most recently, US$50 billion of other Chinese goods—could have devastating consequences for the US and its trading partners. While the brandishing of tariffs as a bilateral negotiating tactic—or as a domestic political sop—are not unique to the Trump presidency (recall tariffs from Barack Obama on Chinese tires or George W. Bush on steel), Trump’s enthusiastic use of them seems to us unusually provocative. The absolute amount of goods subject to tariffs is small relative to GDP, but the legal justification for many of them relies on an obscure clause of trade law allowing redress on the grounds of national security. This rationale sets a dangerous precedent, as it is intended to evade any adverse ruling by objective outside bodies, such as the World Trade Organization (WTO), and undermines the entire rules-based trading system that has served the global economy so well since the Second World War.
While Trump insists that “trade wars are good,” all evidence is to the contrary. Trade wars generally create losers on all sides. As countries, one after another, retaliate with their own tariffs or restrictions, the positive effects of globalization are undone. By preventing countries from focusing their productive efforts where each has a comparative advantage, trade barriers protect inefficient industries, resulting in misallocations of capital, higher costs and inflation, and lower wealth overall. Reversing globalization also has the potential to increase interest rates, which had been until recently on a more or less steady decline since the early 1980s. When economies are interdependent, local shocks are dampened by the global economy’s equilibrating mechanism, reducing economic volatility and the real component of long-term interest rates.1
1Tao Wu, “Globalization’s Effect on Interest Rates and the Yield Curve,” Economic Letter: Insights from the Federal Reserve Bank of Dallas 1, no. 9 (September 2006).

Table of Contents
We are uneasy, but admit a range of possible outcomes, from spiraling tit-for-tat tariff actions to possibly more-measured responses, and perhaps even some positive long-term consequences, such as potential reform of the WTO. But we know from experience that we have little ability to forecast the political outcome. Our analysts are watching these developments carefully for signs of potentially outsized and lasting impacts on the companies they cover. Thus far they are not expecting imminent deterioration of the business fundamentals or investment attractiveness of our companies.
⬛ PORTFOLIO HIGHLIGHTS
The Global Equity Research Portfolio’s holdings are directly determined by analysts’ recommendations among Harding Loevner’s collection of researched companies. During the trailing six months, which were marked by periods of significant market decline, our analysts recommended buying 58 companies and selling 38 holdings, resulting in the Portfolio’s holdings increasing by 20.
As we executed these changes in response to changes in the analysts’ ratings, we continued to adjust individual position weights to maintain our desired risk profile (moderately lower volatility compared with the benchmark and restrained tracking error). We were pleased that the Portfolio behaved as designed amid the period’s volatility, by generally falling less than the market during its sharpest downturns. We outperformed modestly in December and January, both moderately positive months, and fell significantly less than the benchmark in the sharper downturns of February and March. However, the Portfolio declined slightly in April while the index rose.
Our analysts upgraded a large number of Consumer Staples companies during the six months, leading us to increase our holdings in the sector from 31 to 37. A number of these upgrades were in recognition of increasingly appealing valuations following share price declines. For example, the stocks of two South Korean cosmetics companies, Amorepacific and LG Household & Health Care, have been hurt since early 2017 when China punished South Korea for deploying a US-made missile defense system by discouraging Chinese citizens from visiting Seoul, a popular shopping destination. In March, China signaled that it will end the punitive measures. Our analyst believed the shares of both companies were attractively priced and would recover once Chi-nese tourist visits returned to pre-dispute levels. In South Africa, shares of pharmacy chain Clicks Group and consumer-products company Tiger Brands fell in late January and early February, a period of political uncertainty when (now former) President Jacob Zuma maneuvered to delay the succession of Cyril Rama-phosa, the leader of the African National Congress party, to the presidency. Mr. Ramaphosa, who took over on February 15, has pledged to stamp out corruption and attract more foreign investment. Other new Consumer holdings this period included Sugi Holdings (a drugstore chain) and Kao (personal care products), both of Japan, and Anheuser-Busch InBev, the global brewer, which is based in Belgium.
TEN LARGEST HOLDINGS at April 30, 2018
COMPANY
| SECTOR
| COUNTRY
| %
| |||||
COSTCO WHOLESALE
| CONS STAPLES
| UNITED STATES
|
| 1.1
|
| |||
TJX
| CONS DISCRETIONARY
| UNITED STATES
|
| 1.1
|
| |||
MCDONALD’S
| CONS DISCRETIONARY
| UNITED STATES
|
| 1.1
|
| |||
T. ROWE PRICE
| FINANCIALS
| UNITED STATES
|
| 1.1
|
| |||
FISERV
| INFO TECHNOLOGY
| UNITED STATES
|
| 1.0
|
| |||
AUTOMATIC DATA PROCESSING
| INFO TECHNOLOGY
| UNITED STATES
|
| 1.0
|
| |||
TRACTOR SUPPLY CO
| CONS DISCRETIONARY
| UNITED STATES
|
| 1.0
|
| |||
MICROSOFT
| INFO TECHNOLOGY
| UNITED STATES
|
| 1.0
|
| |||
FIRST REPUBLIC BANK
| FINANCIALS
| UNITED STATES
|
| 1.0
|
| |||
ROPER
| INDUSTRIALS
| UNITED STATES
|
| 1.0
|
| |||
Our Materials sector weight remains lower than that of the index, but we narrowed the gap during the period by purchasing Chr. Hansen, a Danish producer of cultures, enzymes, and natural food ingredients, whose stock fell after quarterly results indicated a year-over-year decline in margins. The analyst, believing the company’s long-term growth potential remains undiminished, upgraded the shares to Buy. We also purchased French industrial gasses producer Air Liquide, whose improving growth prospects make its valuation more favorable.
We decreased our already small weight in Real Estate by selling what were our two largest holdings in the sector, Japan’s Mit-subishi Estate and Daito Trust.
From a regional perspective, we decreased our underweight in the European Monetary Union (EMU) by purchasing Anheuser-Busch InBev and Air Liquide. We funded our increased exposure to Europe partly by decreasing our overweight in Japan. Our new purchases in Japan (including Hoshizaki, Park24, and Shiseido) partially offset our trims and complete sales (including Daito Trust, Fast Retailing, Mitsubishi Estate, Misumi Group, and Suruga Bank). We also increased our weight to the US thanks to several new purchases.
Please read the separate disclosures page for important information, including the risks of investing in the Portfolio.

Table of Contents

PORTFOLIO MANAGEMENT TEAM
| ANDREW WEST, CFA PORTFOLIO MANAGER
MOON SURANA, CFA PORTFOLIO MANAGER |

⬛ PERFORMANCE SUMMARY
The International Equity Research Portfolio – Institutional Class gained 4.63% and the Investor Class rose 4.57% (net of fees and expenses) in the six-month period ended April 30, 2018. The Portfolio’s benchmark, the MSCI All Country World ex-US Index, gained 3.47% (net of source taxes).
⬛ MARKET REVIEW
Markets closed 2017 on an optimistic note, with stock prices rising strongly in December. Economic growth across all major regions remained positive and synchronized, while inflation was subdued. In Europe, the European Central Bank remained accommodative on monetary policy, although it signaled a slowing pace of bond buying. China’s economy gathered momentum, shrugging off concerns over government corruption crackdowns and shaky property loans, with positive pull-through effects on its trading partners. Japanese economic growth edged higher, while inflation remained positive—a critical policy goal.
The markets’ positive trend continued into the new year, but the streak of 14 monthly gains ended in February as sanguinity gave way to worry. Although the backdrop of improving and increasingly synchronized economic growth and good corporate earnings remained in place, investors had to come to terms with some ugly prospects: higher interest rates, a trade war between the US and China, and increased regulation of technology companies.
Stock price volatility spiked at the end of January, exacerbated by the collapse of derivatives-based “inverse volatility” ETFs, contributing to a near 9% decline in equities in just 10 days. After a brief bounce in mid-February, stocks wallowed in a range through the end of April, reflecting a new set of worries about increasingly ubiquitous technology platforms. A mounting furor over Facebook data illicitly exploited by political consultant Cambridge Analytica in favor of US President Donald Trump and Brexit, and the mowing down of a pedestrian by an Uber self-driving car in Arizona drew calls for more regulation of technology companies. The European Union continued its efforts to rein in “big tech,” announcing a tax on turnover of large digital companies and moving ahead with its General Data Protection Regulation mandate, which imposes strict requirements and stiff penalties regarding treatment of private data. The tech tumult turned farcical with Trump tweeting potshots at Amazon.com over its use of the Postal Service.
FUND FACTS at April 30, 2018
| ||||||||||||
TOTAL NET ASSETS |
| $11.5M | ||||||||||
SALES CHARGE |
| NONE | ||||||||||
NUMBER OF HOLDINGS |
| 201 | ||||||||||
TURNOVER (5 YR. AVG.) |
| - | ||||||||||
REDEMPTION FEE |
| 2% FIRST 90 DAYS | ||||||||||
DIVIDEND POLICY
|
|
| ANNUAL
|
| ||||||||
INSTITUTIONAL INVESTORS
|
INDIVIDUAL INVESTORS
| |||||||||||
| INSTL CLASS | INSTL CLASS Z | INVESTOR CLASS | ||||||||||
TICKER | HLIRX | HLMZX | HLINX | |||||||||
CUSIP | 412295826 | 412295743 | 412295834 | |||||||||
INCEPTION DATE | 12/17/2015 | – | 12/17/2015 | |||||||||
MINIMUM INVESTMENT1 | $ 100,000 | $10,000,000 | $5,000 | |||||||||
NET EXPENSE RATIO2 | 0.90% | 0.90% | 1.15% | |||||||||
GROSS EXPENSE RATIO | 2.26% | 1.88% | 6.49% | |||||||||
1Lower minimums available through certain brokerage firms; 2Shown net of Harding Loevner’s contractual agreement through February 28, 2019.
All sectors advanced in the period, led by Energy, as crude oil prices reached levels in April not seen since the end of 2014. Information Technology (IT) lagged the index, as its outsized January gains were nearly depleted by sharp declines late in March.
All regions except Canada advanced as well. Emerging Markets (EMs), more typically the loser from rising global risk and volatility, was among the strongest-performing regions. Confoundingly, EMs’ rise was supported by Brazil and Russia, two of the biggest exporters of steel and other commodities whose trade is endangered. A Brazilian court upheld the conviction of former president Luiz Inácio Lula da Silva on corruption charges, likely precluding him from running again and restoring his redistributionist policies.
The most expensive quintile of stocks gained in the period, outperforming the rest by a wide margin. The fastest-growing quintile of stocks also rose more than the other 80% of stocks, on average. Quality was not a significant return factor.
⬛ PERFORMANCE ATTRIBUTION
Stock selection, dictated as always by our analysts’ recommendations, was the main source of outperformance in the trailing six months. We had particularly strong relative returns in the Financials, IT, Consumer Staples, and Health Care sectors. Strong stocks in Energy, Consumer Discretionary, and Industrials also helped. Our performance lagged the index in the Real Estate and Telecom Services sectors, however.
In Financials, Singapore bank DBS Group announced larger distributions of capital to shareholders with a surprising regular

Table of Contents
PERFORMANCE (% TOTAL RETURN)
for periods ended March 31, 2018
| for periods ended April 30, 2018
| |||||||||||
| CALENDAR YTD | 1 YEAR | SINCE INCEPTION* | CALENDAR YTD | 1 YEAR | SINCE INCEPTION* | |||||||
INTL EQUITY RESEARCH PORTFOLIO – INSTITUTITONAL CLASS
| 1.40 | 20.16 | 16.76 | 1.01 | 16.44 | 15.95 | ||||||
INTL EQUITY RESEARCH PORTFOLIO – INVESTOR CLASS
| 1.33 | 19.85 | 16.50 | 0.94 | 16.24 | 15.70 | ||||||
MSCI ALL COUNTRY WORLD EX-US INDEX
| -1.18 | 16.53 | 12.99 | 0.40 | 15.91 | 13.27 | ||||||
Returns are annualized for periods greater than 1 year. *Inception of the Institutional and Investor Class, December 17, 2015.
Performance data quoted represents past performance; past performance does not guarantee future results. The investment return and principal value of an investment will fluctuate so that an investor’s shares, when redeemed, may be worth more or less than their original cost. Current performance of the Portfolio may be lower or higher than the performance quoted. Performance data current to the most recent month end may be obtained by calling (877) 435-8105 or visiting www.hardingloevnerfunds.com. Performance data shown does not reflect the 2.00% redemption fee imposed on shares held 90 days or less; otherwise, total returns would be reduced.
dividend increase plus a special dividend. Japanese companies M3 and Sysmex boosted returns in Health Care. We also had a large positive contribution from IT holding Dassault Systèmes, a 3D-design software developer that reported strong fourth-quarter earnings thanks to robust demand for its software platform and improvement in its operating margin.
Poor returns in Real Estate stemmed largely from Emaar Properties, a major developer of residential property mega-developments in Dubai and owner of the Dubai Mall. Though the company reported strong 2017 earnings growth and our analyst forecasts rising profits in years ahead, investors seemed to punish the stock over disappointment regarding dividend payout and concerns that residential property demand could weaken.
By region, the Portfolio benefited from our strong stock selection in Japan and the Pacific ex-Japan. In Japan, the Portfolio benefited from returns of Shiseido, JGC Corp, Nomura Research Institute, ABC-Mart (which reported its fifth straight quarter of positive same-store sales), and Nidec. However, we had a few notable detractors in Japan as well, including Daito Trust (a property company), Kubota (a manufacturer of engines as well as farming and construction machinery), and Suruga Bank. Kubota reported solid results for fiscal year 2017, but its guidance for 2018 was disappointing in part due to expectation of higher costs for personnel, raw materials, and marketing incentives. Shares of Suruga Bank were down sharply as one of its large borrowers, a real-estate company, faced credit problems.
In the Pacific ex-Japan, DBS Group, CSL Limited, and Hong Kong Exchanges contributed to relative returns. Hong Kong Exchanges reported that, after a weak start to 2017, trade volumes surged in the second half of the year, especially for its “Stock Connect” facility that provides foreign investors access to A-shares listed on the Shanghai and Shenzhen stock markets. Our analyst expects Stock Connect to be a long-term source of revenue growth. Positive stock selection in EMs was primarily due to Chinese holdings including Wuxi Biologics, Sino Biopharmaceutical, Jiangsu Hengrui Medicine, and 51Job Inc. The latter, China’s leading online job search portal, in recent years has instituted new employee incentive programs that have helped increase per-client revenues and profit margins.
⬛ PERSPECTIVE AND OUTLOOK
“If you buy something because it’s undervalued, then you have to think about selling it when it approaches your calculation of its intrinsic value. That’s hard. But, if you can buy a few great companies, then you can sit on your ass. That’s a good thing.”
— Charlie Munger,
Berkshire Hathaway annual meeting, 2000
Arguably the greatest contribution that Charlie Munger has made to Berkshire Hathaway’s shareholders was in convincing Warren Buffett in the 1970s that a long-duration growth business trading at an apparently premium price could still represent a good value. His reasoning was that the return on the shares would ultimately converge with the return on capital for the business as the compounding of the latter would, over a long period of time (Munger cited 40 years), come to dwarf the initial premium paid for the shares. That inevitability meant that you could buy, then sit and wait—but, presumably (and critically), only if you were assured that the company would manage to maintain its growth rate and sustain its high profitability in the process. You could tolerate occasional periods of overvaluation of that business’s shares because, given enough time, its profits would grow back into its share price.
As investors in businesses that can grow for many years with high and durable profitability, we at Harding Loevner adhere to an investment philosophy that resembles Munger’s. Through our research process we look for companies that meet our criteria of what makes a great business. The process is focused entirely on business fundamentals: we evaluate the competitive structure of an industry, examine each participant’s competitive position, and then question whether a favorable industry structure or the particular advantages enjoyed by some participants are sustainable into the future. Upon identifying such apparently great businesses, we include them in our qualified investable universe. We estimate what their shares are worth by making financial forecasts and discounting their projected long-term cash flows to the present. While we’re not afraid to pay over the market average for shares of an excellent business, even a paragon will fail to make its way into our portfolios if its superior long-term prospects are more than fully discounted in its current share price.

Table of Contents
Munger’s challenge, and ours too, is in finding companies that will remain “great” for 10 years, let alone 40. Enduring jewels are more easily discovered in hindsight than in advance. The identification of such companies requires that all evidence in support of a purchase be weighed against an obvious fact—that the vast majority of businesses fail to maintain their profitability over the long term. Once an investment is made, we do much more than sit and watch the returns pour in. We set up structures to seek out evidence that the company will not stay great forever. To be able to “sit” comfortably on a holding presupposes, among other things, that the customers of that business continue to prefer its products or services. We guard against the risk of mishap through intensive monitoring of the business results of our portfolio companies, parsing financial disclosures, and checking third-party sources to gauge their progress against the mileposts that we set out in advance as supporting detail to our investment thesis. There is nothing sedentary about our ownership.
To “be right and sit tight,” to borrow a phrase from legendary Wall Street trader Jesse Livermore, is easier said than done in other ways. In addition to guarding against the deterioration of companies’ underlying businesses (the “be right” part), investors need also to guard against the human tendency to become risk averse when they are in a position of gain on their shares (the “sit tight” part); investors tend to harvest their gains too early. They process the constant bombardment of ever-shifting news as calls to action, feeding the instinct to lock in profits and avoid reversals. That flow of news can be company-specific but is often related to the general environment in which companies operate. Our analysts try to avoid overreacting to possibly peripheral current events. Instead, we focus on the growth prospects for each company and the specific threats that could endanger its stock’s market valuation relative to the rest of the market.
Our limited reaction to political or economic developments does not mean we are unaware of such issues. Central banks are withdrawing monetary stimulus in reaction to signs that inflation expectations are increasing, and in the larger cause of normalizing interest rates ahead of the next recession. Rising populism, particularly in Europe, has called into question the longstanding consensus on advantages of a common currency, tax-free trade, and
GEOGRAPHIC EXPOSURE (%) at April 30, 2018
COUNTRY/REGION
|
PORTFOLIO
|
BENCHMARK1
| ||||||
CANADA | 2.7 | 6.2 | ||||||
EMERGING MARKETS | 30.3 | 25.1 | ||||||
EUROPE EMU | 16.2 | 22.9 | ||||||
EUROPE EX-EMU | 20.0 | 20.7 | ||||||
FRONTIER MARKETS2 | 1.8 | — | ||||||
JAPAN | 17.7 | 16.7 | ||||||
MIDDLE EAST | 0.7 | 0.3 | ||||||
PACIFIC EX-JAPAN | 7.1 | 8.1 | ||||||
CASH | 3.5 | — | ||||||
1MSCI All Country World ex-US Index; 2Includes countries with less-developed markets outside the Index
SECTOR EXPOSURE (%) at April 30, 2018
SECTOR
|
PORTFOLIO
|
BENCHMARK1
| ||||||
CONSUMER DISCRETIONARY | 12.3 | 11.4 | ||||||
CONSUMER STAPLES | 14.7 | 9.3 | ||||||
ENERGY | 3.5 | 7.1 | ||||||
FINANCIALS | 17.7 | 23.0 | ||||||
HEALTH CARE | 8.6 | 7.6 | ||||||
INDUSTRIALS | 17.0 | 11.8 | ||||||
INFORMATION TECHNOLOGY | 13.7 | 11.5 | ||||||
MATERIALS | 6.0 | 8.1 | ||||||
REAL ESTATE | 0.9 | 3.2 | ||||||
TELECOM SERVICES | 1.4 | 4.0 | ||||||
UTILITIES | 0.7 | 3.0 | ||||||
CASH | 3.5 | — | ||||||
1MSCI All Country World ex-US Index.
free movement of labor. And now the US threatens to precipitate a trade war that would have a devastating impact on globalization and potentially erase the enormous benefits that free trade has brought to nearly all parts of the world that have participated in it.
The recent announcements by the Trump administration to enact tariffs on various imports—including washing machines, solar panels, aluminum, steel, and, more recently, US$50 billion of other Chinese goods—could have devastating consequences for the US and its trading partners. While the brandishing of tariffs as a bilateral negotiating tactic—or as a domestic political sop—are not unique to the Trump presidency (recall tariffs from Barack Obama on Chinese tires or George W. Bush on steel), Trump’s enthusiastic use of them seems to us unusually provocative. The absolute amount of goods subject to tariffs is small relative to GDP, but the legal justification for many of them relies on an obscure clause of trade law allowing redress on the grounds of national security. This rationale sets a dangerous precedent, as it is intended to evade any adverse ruling by objective outside bodies, such as the World Trade Organization (WTO), and undermines the entire rules-based trading system that has served the global economy so well since the Second World War.
While Trump insists that “trade wars are good,” all evidence is to the contrary. Trade wars generally create losers on all sides. As countries, one after another, retaliate with their own tariffs or restrictions, the positive effects of globalization are undone. By preventing countries from focusing their productive efforts where each has a comparative advantage, trade barriers protect inefficient industries, resulting in misallocations of capital, higher costs and inflation, and lower wealth overall. Reversing globalization also has the potential to increase interest rates, which had been until recently on a more or less steady decline since the early 1980s. When economies are interdependent, local shocks are dampened by the global economy’s equilibrating mechanism, reducing economic volatility and the real component of long-term interest rates.
We are uneasy, but admit a range of possible outcomes, from spiraling tit-for-tat tariff actions to possibly more-measured responses,

Table of Contents
and perhaps even some positive long-term consequences, such as potential reform of the WTO. But we know from experience that we have little ability to forecast the political outcome. Our analysts are watching these developments carefully for signs of potentially outsized and lasting impacts on the companies they cover. Thus far they are not expecting imminent deterioration of the business fundamentals or investment attractiveness of our companies.
⬛ PORTFOLIO HIGHLIGHTS
The International Equity Research Portfolio’s holdings are directly determined by analysts’ recommendations among Harding Loevner’s collection of researched companies. During the trailing six months, which were marked by periods of significant market decline, our analysts recommended buying 42 companies and selling 31 holdings, resulting in the Portfolio’s holdings increasing by 11.
As we executed these changes in response to changes in the analysts’ ratings, we continued to adjust individual position weights to maintain our desired risk profile (moderately lower volatility compared with the benchmark and restrained tracking error). We were pleased that the Portfolio behaved as designed amid the period’s volatility, by generally falling less than the market during its sharpest downturns. We outperformed modestly in January, a positive month, and fell significantly less than the benchmark in February and March. However, the Portfolio declined slightly in April while the index rose.
Our analysts upgraded a large number of Consumer Staples companies during the six months, leading us to increase our holdings in the sector from 25 to 33. A number of these upgrades were in recognition of increasingly appealing valuations following share price declines. For example, the stocks of two South Korean cosmetics companies, Amorepacific and LG Household & Health Care, have been hurt since early 2017 when China punished South Korea for deploying a US-made missile defense system by discouraging Chinese citizens from visiting Seoul, a popular shopping destination. In March, China signaled that it will end the punitive measures. Our analyst believed the shares of both companies were attractively priced and would recover once Chinese tourist visits returned to pre-dispute levels. In South Africa, shares of pharmacy chain Clicks Group and consumer-products company Tiger Brands fell in late January and early February, a period of political uncertainty when (now former) President Jacob Zuma maneuvered to delay the succession of Cyril Ramaphosa, the leader of the African National Congress party, to the presidency. Mr. Ramaphosa, who took over on February 15, has pledged to stamp out corruption and attract more foreign investment. Other new Consumer holdings this period included Sugi Holdings (a drugstore chain) and Kao (personal care products), both of Japan, and Anheuser-Busch InBev, the global brewer, which is based in Belgium.
Our Materials sector weight remains lower than that of the index, but we narrowed the gap during the period by purchasing Chr. Hansen, a Danish producer of cultures, enzymes, and natural
TEN LARGEST HOLDINGS at April 30, 2018
COMPANY
|
SECTOR
|
COUNTRY
| %
| |||||
NOMURA RESEARCH INSTITUTE
| INFO TECHNOLOGY
| JAPAN
|
| 1.3
|
| |||
OCBC
| FINANCIALS
| SINGAPORE
|
| 1.2
|
| |||
CSL LIMITED
| HEALTH CARE
| AUSTRALIA
|
| 1.1
|
| |||
LINDE
| MATERIALS
| GERMANY
|
| 1.1
|
| |||
RICHEMONT
| CONS DISCRETIONARY
| SWITZERLAND
|
| 1.1
|
| |||
DIAGEO
| CONS STAPLES
| UNITED KINGDOM
|
| 1.1
|
| |||
DBS GROUP
| FINANCIALS
| SINGAPORE
|
| 1.1
|
| |||
BMW
| CONS DISCRETIONARY
| GERMANY
|
| 1.1
|
| |||
UNICHARM
| CONS STAPLES
| JAPAN
|
| 1.1
|
| |||
ABC-MART
| CONS DISCRETIONARY
| JAPAN
|
| 1.1
|
| |||
food ingredients, whose stock fell after quarterly results indicated a year-over-year decline in margins. The analyst, believing the company’s long-term growth potential remains undiminished, upgraded the shares to Buy. We also purchased French industrial gasses producer Air Liquide, whose improving growth prospects make its valuation more favorable.
We decreased our already small weight in Real Estate by selling what were our two largest holdings in the sector, Japan’s Mitsubishi Estate and Daito Trust.
From a regional perspective, we increased our overweight in EMs (largely through the Consumer Staples additions noted previously) and decreased our underweight in the European Monetary Union (EMU) by purchasing Anheuser-Busch InBev and Air Liquide. We also added to our holding in German flavor and fragrance supplier Symrise. In Europe outside of the EMU, we increased our weight in Sweden to nearly 5% by buying two companies, industrial manufacturer Alfa Laval and radiation-therapy equipment maker Elekta, as well as adding to our position in Assa Abloy, a manufacturer of locks and other security equipment.
We funded our increased exposure to Europe partly by decreasing our overweight in Japan. Our new purchases in Japan (including Shiseido, Unicharm, and Sugi Holdings) partially offset our trims and complete sales (including Mitsubishi Estate, Daito Trust, and Nidec).
Please read the separate disclosures page for important information, including the risks of investing in the Portfolio.

Table of Contents

PORTFOLIO MANAGEMENT TEAM
 | ANDREW WEST, CFA PORTFOLIO MANAGER
MOON SURANA, CFA PORTFOLIO MANAGER |
⬛ PERFORMANCE SUMMARY
For the Emerging Markets Research Portfolio, the Institutional Class rose 5.69% and the Investor Class rose 5.53% (net of fees and expenses) in the six-month period ended April 30, 2018. The Portfolio’s benchmark, the MSCI Emerging + Frontier Markets Index, gained 4.83% (net of source taxes).
⬛ MARKET REVIEW
Emerging Markets (EMs) started strong in the new fiscal year through late January, benefiting from robust global economic growth and strong EM companies’ earnings growth—especially, but not exclusively, in the Information Technology (IT) sector. The ongoing absence of inflationary pressures also allowed developed countries to continue the easy monetary policies that have supported lofty real asset and financial valuations. But volatility returned to global equity markets in late January and February, and EMs declined sharply before staging a modest recovery. Investors appeared torn between the strength of EM companies’ fundamentals, as reflected in robust earnings growth, and emerging threats to the world’s cyclical economic expansion. Strong employment reports in the US and Japan presaged higher wage inflation and fed the fear that global interest rates would rise faster and further than previously expected. Another threat, of a global trade war, followed in March when US President Donald Trump announced import tariffs on aluminum, steel, and a broad cross-section of other products from China, and the US’s trading partners, including the European Union and China, promptly responded with retaliatory measures.
The Health Care sector provided the strongest returns, with good performance from the leading South Korean and Chinese drug companies. The next-strongest sector was Energy, as Brent oil sustained higher prices in the US$65–70 range since the start of 2018. Meanwhile IT, home to many of the fastest-growing companies and most highly valued stocks at the start of the period, ended up lagging the index. While China’s online gaming giant Tencent continued to report standout results, concerns mounted over weaker-than-expected demand for Apple’s iPhone X negatively impacted companies in its supply chain, including component manufacturers Largan Precision (camera lenses). Financials and Consumer Discretionary—sectors that are often seen as a gauge of overall economic health—provided conflicting signals. Financials outperformed, with strong contributions from South Africa, China, and Brazil. Consumer Discretionary, in contrast,
FUND FACTS at April 30, 2018
| ||||||||
TOTAL NET ASSETS
|
| $7.4M | ||||||
SALES CHARGE
|
| NONE | ||||||
NUMBER OF HOLDINGS
|
| 133 | ||||||
TURNOVER (5 YR. AVG.)
|
| – | ||||||
REDEMPTION FEE
|
| 2% FIRST 90 DAYS | ||||||
DIVIDEND POLICY
|
| ANNUAL | ||||||
INSTITUTIONAL INVESTORS
| INDIVIDUAL INVESTORS
| |||||||
|
| INSTITUTIONAL CLASS
|
|
| INVESTOR CLASS
|
| |||
TICKER
| HLREX | HLENX | ||||||
CUSIP
| 412295776 | 412295784 | ||||||
INCEPTION DATE
| 12/19/2016 | 12/19/2016 | ||||||
MINIMUM INVESTMENT1
| $100,000 | $5,000 | ||||||
NET EXPENSE RATIO2
| 1.30% | 1.55% | ||||||
GROSS EXPENSE RATIO
| 3.72% | 12.64% | ||||||
1Lower minimums available through certain brokerage firms; 2Shown net of Harding Loevner’s contractual agreement through February 28, 2019.
was the weakest sector dragged down by double-digit negative returns in Mexico and Brazil.
By region, Africa saw the best returns in the six-month period. In South Africa, investors were given a reason for hope in the ascension of Cyril Ramaphosa, who became the new leader of the African National Congress (ANC) party and succeeded Jacob Zuma as the country’s next president. Ramaphosa, an avowed reformer, has promised to stamp out corruption and attract foreign investment back to the country. Latin America was also strong on good returns in Brazil, Colombia, and Peru, all helped by rising commodity prices. The Brazilian market spiked after a court upheld the conviction of former president Luiz Inácio Lula da Silva on corruption charges, likely precluding him from running again and restoring his populist policies.
Performance varied widely across Asian markets, with Thailand, Malaysia, and Pakistan posting strong returns, China outperforming only modestly, and India, Taiwan, Indonesia, and the Philippines lagging. India faced a new challenge with its banking system: revelations of fraud inside one of the leading state banks, Punjab National. Also, India enacted a new capital gains tax on equity investments held for over a year. The tax—unusual in EM countries—cuts the potential net return for long-term investors and is antithetical to Prime Minister Narendra Modi’s avowed goal to attract more long-term investment capital.

Table of Contents
PERFORMANCE (% TOTAL RETURN)
for periods ended March 31, 2018
|
for periods ended April 30, 2018
| |||||||||||
CALENDAR YTD
| 1 YEAR
| SINCE INCEPTION*
| CALENDAR YTD
| 1 YEAR
| SINCE INCEPTION*
| |||||||
EMERGING MARKETS RESEARCH PORTFOLIO – INSTL CLASS
| 3.89 | 25.82 | 30.93 | 1.19 | 19.88 | 26.35 | ||||||
EMERGING MARKETS RESEARCH PORTFOLIO – INVESTOR CLASS
| 3.82 | 25.56 | 30.63 | 1.11 | 19.62 | 26.07 | ||||||
MSCI EMERGING + FRONTIER MARKETS INDEX
| 1.50 | 24.99 | 31.08 | 0.99 | 21.72 | 28.48 | ||||||
Returns are annualized for periods greater than 1 year. *Inception of the Institutional and Investor Class, December 19, 2016.
Performance data quoted represents past performance; past performance does not guarantee future results. The investment return and principal value of an investment will fluctuate so that an investor’s shares, when redeemed, may be worth more or less than their original cost. Current performance of the Portfolio may be lower or higher than the performance quoted. Performance data current to the most recent month end may be obtained by calling (877) 435-8105 or visiting www.hardinglo-evnerfunds.com. Performance data shown does not reflect the 2.00% redemption fee imposed on shares held 90 days or less; otherwise, total returns would be reduced.
⬛ PERFORMANCE ATTRIBUTION
The Portfolio outperformed this period primarily due to strong stock selection in the Health Care and Consumer Discretionary sectors. In Health Care, shares of China’s Sino Biopharmaceutical surged as successful drug trials and regulatory approvals led to an acceleration in revenue projections. Another Chinese company, clothing manufacturer Shenzhou International, boosted relative returns in Consumer Discretionary. In recent earnings reports, Shenzhou has indicated continued steady growth in sales and earnings. Good stocks in Consumer Staples—including Wal-Mart de Mexico—and the Portfolio’s overweight to this outperforming sector were also helpful.
The Portfolio lagged in Information Technology, hurt by our holdings in key component suppliers to Apple’s iPhone: Taiwan’s Largan Precision and China’s AAC Technologies, a manufacturer of speakers and other acoustic components for smartphones. Poor stock selection in Real Estate was largely due to the United Arab Emirates’ Emaar Properties, whose sale of shares in Emaar Development, its property development subsidiary, fetched a lower-than expected price. Also, while Emaar Properties reported solid fiscal year 2017 fundamental results, it disappointed investors with a lower-than-expected dividend and hints at weaker margins in 2018.
From a regional perspective, the Portfolio had good stocks in China, including Health Care companies Sino Biopharmaceutical and Wuxi Biologics, a global leader in providing services necessary for the discovery, development, and manufacture of biologic drug therapies. We also outperformed in Africa thanks to South Africa’s Standard Bank, whose shares were boosted by strong fourth-quarter earnings. The company’s migration to a new digital banking platform, nearly complete after a half decade, promises greater efficiency and the ability to offer new, customized products and has helped to raise the market’s expectations for long-term profits. Despite difficult economic conditions on the continent, Standard Bank’s “Africa” business, which excludes its home country, has continued to grow and now accounts for almost one-third of its banking profits. Weak relative returns in the Middle East were primarily due to Emaar Properties.
⬛ INVESTMENT PERSPECTIVES
China’s Newest New Era Powered by Fundamentals
The impressive share-price appreciation of China’s dominant internet stocks in 2017 mesmerized investors. Equally remarkable was the elevation in profits and returns for China’s IT sector that supported this upsurge. IT businesses’ success has been underpinned by the rapid rise of China’s middle class and its epochal transformation into a consumption-led economy. From 2000 to 2016, per-capita GDP rose from about US$960 to US$8,120, while the portion of the population defined as middle class jumped from 5 million to 225 million people.1 With the help of supportive government policies, China’s IT companies created highly engaging products and services for shopping, communications, and entertainment. Share prices reflect the companies’ success at capturing the attention—and the money—of this vast and growing population.
Among developing countries, China is unique in possessing a combination of pro-development government policies, strong infrastructure, rising incomes for a vast population, and well-managed companies skillfully exploiting these advantages. This powerful combination aided the fundamental advance of IT companies. We believe it also presents attractive investment opportunities in other sectors.
Growth in China’s IT and related businesses has been orchestrated by two highly skilled managements: the government and corporate leaders. Government provided the physical infrastructure (including advanced, and vast, transportation networks and a reliable energy grid) and schools and universities of an increasingly high quality lacking in most developing countries. State policies have also supported domestic champions in key industries, including internet-related enterprises, by providing incentives (such as tax breaks and subsidies for R&D) and protecting them from foreign competitors like Google and Facebook. Meanwhile, visionary leaders at businesses such as Alibaba and Tencent identified and seized the nascent growth opportunities that the internet provided by creating differentiated services and unique experiences for consumers.
1“Chinese Society: The New Class War,” The Economist (July 19, 2016); World Bank data.

Table of Contents
They also took advantage of the relative underdevelopment and lack of strong incumbents within the retailing, services, and entertainment industries.
But the combined efforts of government and companies are spurring the growth not only of IT and internet-related businesses. A key element of President Xi Jinping’s “New Era” program—enshrined as the nation’s lodestar during the 19th National Congress of the Communist Party of China held in October—is achieving a continued rise in living standards through more-advanced production methods and the development of higher-quality products and services. Xi’s administration is therefore promoting innovation across multiple industries, including technology, energy, and health care. For example, the government has been encouraging more use of cleaner energy, notably natural gas. Further, China’s Food and Drug Administration recently upgraded the drug approval and regulation process to meet standards akin to those of the US and Europe. These reforms, by weeding out producers of ineffective or poor-quality drugs, should reduce the competition faced by China’s leading pharmaceutical companies.
Within their global universe, our analysts now follow more businesses in China than in any other country outside of the US and Japan. And in 2017 we markedly increased the breadth of investment opportunities available for the Portfolio by completing the administrative work necessary to gain access to the Chinese domestic A-share market. While there is much to admire within China’s brood of technology juggernauts, our Portfolio increasingly reflects the proliferation of innovative, quality-growth businesses across a range of industries. Current holdings include Hangzhou Hikvision (security monitoring/analytics), Weibo (so-cial media), Midea Group (home appliances), and Alibaba and JD.com (e-commerce). Another holding, ENN Energy, is a regulated monopoly that supplies natural gas to homes and businesses in 165 Chinese cities. We also hold pharmaceutical companies such as Jiangsu Hengrui Medicine and Sino Biopharmaceutical, whose treatments for serious ailments (including hepatitis and
GEOGRAPHIC EXPOSURE (%) at April 30, 2018
COUNTRY/REGION
| PORTFOLIO
| BENCHMARK1
| ||||||
BRAZIL
| 6.4 | 7.0 | ||||||
CHINA
| 28.2 | 29.4 | ||||||
INDIA
| 9.9 | 8.3 | ||||||
MEXICO
| 5.6 | 2.9 | ||||||
RUSSIA
| 4.9 | 3.3 | ||||||
SOUTH AFRICA
| 5.4 | 6.5 | ||||||
SOUTH KOREA
| 6.8 | 15.3 | ||||||
TAIWAN
| 5.0 | 11.0 | ||||||
SMALL EMERGING MARKETS2
| 15.7 | 14.0 | ||||||
FRONTIER MARKETS
| 8.3 | 2.3 | ||||||
DEVELOPED MARKET LISTED3
| 0.8 | — | ||||||
CASH
| 3.0 | — | ||||||
1MSCI Emerging + Frontier Markets Index; 2Includes the remaining emerging markets which, individually, comprise less than 5% of the Index; 3Includes emerging markets or frontier markets companies listed in developed markets.
SECTOR EXPOSURE (%) at April 30, 2018
SECTOR
| PORTFOLIO
| BENCHMARK1
| ||||||
CONSUMER DISCRETIONARY
| 13.2 | 9.3 | ||||||
CONSUMER STAPLES
| 18.3 | 6.7 | ||||||
ENERGY
| 7.1 | 7.3 | ||||||
FINANCIALS
| 25.2 | 24.3 | ||||||
HEALTH CARE
| 4.9 | 2.7 | ||||||
INDUSTRIALS
| 4.7 | 5.2 | ||||||
INFORMATION TECHNOLOGY
| 14.0 | 26.7 | ||||||
MATERIALS
| 2.8 | 7.5 | ||||||
REAL ESTATE
| 2.0 | 3.0 | ||||||
TELECOM SERVICES
| 3.5 | 4.8 | ||||||
UTILITIES
| 1.3 | 2.5 | ||||||
CASH
| 3.0 | — | ||||||
1MSCI Emerging + Frontier Markets Index.
cancer) meet international quality standards but are available at prices notably lower than those of imported versions from foreign multinationals.
The Communist Party Congress in October 2017 allowed Presi-dent Xi to consolidate his power further. The strength of his au-thority means the state administration can pursue reforms more forcefully. But it also poses risks. Such centralized authority, without even modest checks and balances, can make serious policy missteps. A source of risk from an investment perspective is how authorities reconcile the rapid growth of social-media companies and their desire to maintain the absolute state authority that includes restricting free expression in mass communications. While monitoring such risks, we think government efforts to raise living standards and promote the provision of higher-quality goods and services should continue to support the growth of China’s high-est-quality companies.
Trade Fears
In the final two months of the reporting period, the Trump administration announced plans to enact tariffs on various imports—including washing machines, solar panels, aluminum, steel, and agricultural commodities. Most recently, the administration indicated it was considering higher tariffs on about US$150 billion of goods from its main target: China.
A significant amount of our Portfolio companies’ revenues is from China. However, many of our Chinese companies are domestically focused and operate in industries that have little direct exposure to US trade policy. Examples include 51Job Inc. (online job search), ENN Energy (natural gas distribution), China Mobile (mobile telephony), and Jiangsu Hengrui Medicine (health care). To be sure, we also hold export-oriented Chinese businesses that would be directly affected by a severe breakdown in trade relations, such as clothing manufacturer Shenzhou International and global appliance manufacturer Midea. However, even their US-sourced revenues are low. Shenzhou has the highest of the two, at around 12%. Midea manufactures for major US brands including GE and Electrolux, but its US revenues represent only approxi-mately 5% of the total.

Table of Contents
⬛ PORTFOLIO HIGHLIGHTS
The Emerging Markets Research Portfolio’s holdings are directly determined by analysts’ recommendations among Harding Loevner’s collection of researched companies. As we executed these changes in response to changes in the analysts’ ratings, we continued to adjust individual position weights to maintain our desired risk profile (moderately lower volatility compared with the benchmark and restrained tracking error). We were pleased that the Portfolio generally behaved as designed amid the period’s volatility, by falling less than the market during this period’s sharpest downturns that occurred in February and March. However, in April the Portfolio fell more than the benchmark’s modest decline.
Our analysts upgraded a large number of Consumer Staples companies during the six months, leading us to increase our number of holdings in the sector. A number of these upgrades were in recognition of increasingly appealing valuations following share price declines. For example, the stocks of two South Korean cosmetics companies, Amorepacific and LG Household & Health Care, have been hurt since early 2017 when China punished South Korea for deploying a US-made missile defense system by discouraging Chinese citizens from visiting Seoul, a popular shopping destination. In March 2018, China signaled that it will end the punitive measures. Our analyst believed the shares of both companies were attractively priced and would recover once Chinese tourist visits returned to pre-dispute levels. In South Africa, shares of pharmacy chain Clicks Group and consumer-products company Tiger Brands fell in late January and early February, a period of political uncertainty when (now former) President Jacob Zuma maneuvered to delay the succession of Cyril Ramaphosa to the presidency.
We added to our Energy holdings with the purchase of Romgaz, a leading natural gas producer that focuses on serving households and industrial customers in Romania. One of the fastest-growing economies in the European Union (EU), Romania should see increasing gas demand from industrial customers. Also, our analyst expects the government’s recent deregulation of gas prices will support higher margins over time. Longer-term, Romgaz should benefit from the completion of a pipeline that links Romania with the EU’s gas-delivery network. The company is among the lowest-cost producers in the region and should see higher sales volume once it can export to neighboring EU countries.
Geographically, our China weight remained largely the same as the end of the last fiscal year, despite making a number of adjustments to our holdings. These included trimming our exposure to companies whose shares appeared relatively expensive after re-cent strong performance (such as the gaming company Tencent and health care holding Jiangsu Hengrui Medicine). Following our analyst’s recommendations, we also purchased Suofeiya, which offers custom-made furniture through over 2,400 stores across China. Nearly all revenues are domestic. The company is
TEN LARGEST HOLDINGS at April 30, 2018
COMPANY
| SECTOR
| COUNTRY
| %
| |||||
SINO BIOPHARMACEUTICAL
| HEALTH CARE | CHINA | 2.4 | |||||
SHENZHOU
| CONS DISCRETIONARY | CHINA | 2.1 | |||||
HDFC CORP
| FINANCIALS | INDIA | 2.0 | |||||
SAMSUNG ELECTRONICS
| INFO TECHNOLOGY | SOUTH KOREA | 1.9 | |||||
BANK CENTRAL ASIA
| FINANCIALS | INDONESIA | 1.9 | |||||
CHINA MOBILE
| TELECOM SERVICES | CHINA | 1.9 | |||||
AMBEV
| CONS STAPLES | BRAZIL | 1.9 | |||||
TSMC
| INFO TECHNOLOGY | TAIWAN | 1.9 | |||||
FUYAO GLASS INDUSTRY
| CONS DISCRETIONARY | CHINA | 1.6 | |||||
STANDARD BANK
| FINANCIALS | SOUTH AFRICA | 1.6 | |||||
helping lead (and benefiting from) the transformation of China’s furniture business from a fragmented industry dominated by small, regional stores to a more-consolidated, national structure. Suofeiya has also reduced its costs by automating the production of certain furniture parts. Our analyst believes Suofeiya’s revenues will grow as consumers increasingly prefer customized furniture from recognized brands over unbranded, mass-produced pieces.
Additionally, we sold container-terminal operator China Merchants. One of China Merchant’s competitive advantages has been its ability to offer quality service at its well-positioned terminals, which the analyst expected would allow the company to increase its container handling fees over time. However, the latter expectation was burst in November 2017, when in a surprise move the Chinese antitrust regulator demanded price cuts of 10–20% at some of China’s largest container terminal ports. The analyst took this as a signal that the company would face weaker pricing power over customers and was no longer as free to manage its business in the interest of shareholders as previously thought.
Lastly, in Mexico, concerns about rising competitive intensity in the broadcast advertising industry led us to sell Televisa, the country’s leading television, cable, and satellite TV operator and producer of some of Mexico’s most-popular entertainment programs. The advertising revenue that Televisa generates from its Spanish-language content is from free-to-air (FTA) broadcasting. That revenue is eroding as advertisers migrate from the broad reach of TV toward highly targeted and more-effective advertising on Google, Facebook, and other digital platforms. The analyst was also concerned that Televisa’s other two key assets—cable TV and pay satellite TV—after years of impressive growth have been showing signs of slowing down. Subscriber penetration is high in urban areas, requiring the company increasingly to seek growth in rural areas, where new subscribers are more price sensitive.
Please read the separate disclosures page for important information, including the risks of investing in the Portfolio.

Table of Contents
⬛ DISCLOSURES
The Portfolios invest in foreign securities, which will involve greater volatility and political, economic, and currency risks and differences in accounting methods. They also invest in emerging markets, which involve unique risks, such as exposure to economies less diverse and mature than the US or other more established foreign markets. Economic and political instability may cause larger price changes in emerging markets securities than other foreign securities.
Investments in small- and mid-cap companies involve additional risks such as limited liquidity and greater volatility.
Diversification does not guarantee a profit or prevent a loss in a declining market.
Long-term earnings growth and earnings per share growth are not a forecast of the Portfolios’ future performance.
Companies held in the Portfolios during the first half of the fiscal year appear in bold type; only the first reference to a particular holding appears in bold. The Portfolios are actively managed; therefore holdings shown may not be current. Portfolio holdings and sector and geographic allocations should not be considered recommendations to buy or sell any security. Please refer to the Portfolios of Investments in this report for complete Portfolio holdings. Current and future Portfolio holdings are subject to risk.
While the Portfolios have no sales charge, management fees and other expenses still apply. Please see the Prospectus for further details.
Sector & Geographic Exposure data is sourced from: FactSet, Harding Loevner Funds Portfolios, and MSCI Barra. Differences may exist between this source data and similar information reported in the financial statements due to timing differences and/or adjustments required pursuant to Generally Accepted Accounting Principles (GAAP).
Expense Ratios: Differences may exist between the commentary data and similar information reported in the financial statements due to timing differences. Unless otherwise stated, the expense ratios presented are shown as of the most recent Prospectus date, February 28, 2018.
Five year average turnover data is calculated using a simple average of annual turnover figures for the past five fiscal years. These annual turnover figures utilize purchase, sales, and market value data which is not reflective of adjustments required pursuant to Generally Accepted Accounting Principles (GAAP). Accordingly, differences may exist between this data and similar information reported in the financial statements.
Quasar Distributors, LLC, Distributor.
INDEX DEFINITIONS
The MSCI All Country World Index is a free float-adjusted market capitalization index that is designed to measure equity market performance in the global developed and emerging markets. The Index consists of 47 developed and emerging market countries. Net dividends reinvested.
The MSCI All Country World ex-US Index is a free float-adjusted market capitalization index that is designed to measure equity market performance in the global developed and emerging markets, excluding the US. The Index consists of 46 developed and emerging market countries. Net dividends reinvested.
The MSCI All Country World ex-US Small Cap Index is a free-float market capitalization index that is designed to measure small cap developed and emerging market equity performance. The Index consists of 46 developed and emerging markets countries and targets companies within a market capitalization range of USD 41–9,919 million (as of March 31, 2018) in terms of the companies’ full market capitalization. Net dividends reinvested.
The MSCI EAFE Index (Europe, Australasia, Far East) is a free float-adjusted market capitalization index that is designed to measure developed market equity performance, excluding the US & Canada. The Index consists of 21 developed market countries.
The MSCI Emerging Markets Index is a free float-adjusted market capitalization index that is designed to measure equity market performance in the global emerging markets. The Index consists of 24 emerging market countries. Net dividends reinvested.
The MSCI Emerging + Frontier Markets Index is a free float-adjusted market capitalization index that is designed to measure equity market performance in the global emerging markets and frontier markets. The Index consists of 24 emerging markets countries and 29 frontier markets countries. Net dividends reinvested.
The MSCI Frontier Emerging Markets Index is a free float-adjusted market capitalization index designed to measure equity market performance in all countries from the MSCI Frontier Markets Index and the lower size spectrum of the MSCI Emerging Markets Index. The Index consists of 29 frontier markets and 5 emerging markets. Net dividends reinvested.
You cannot invest directly in these Indexes.
TERM DEFINITIONS
Basis Points are a common measurement used chiefly for interest rates and other percentages in finance. A basis point is one hundredth of one percent.
Cash Flow measures the cash generating capability of a company by adding non-cash charges (e.g. depreciation) and interest expense to pretax income.
Duration is a measure of the sensitivity of the price–the value of principal–of a fixed-income investment to a change in interest rates.
Free cash flow is a measure of a company’s financial performance, calculated as operating cash flow minus capital expenditures.
Gross Domestic Product (GDP) is the monetary value of all finished goods and services produced within a country’s borders in a specific time period (usually calculated on an annual basis).
Market Capitalization is the total dollar market value of all of a company’s outstanding shares.
Return on Capital (ROC) is a calculation used to assess a company’s efficiency at allocating the capital under its control to profitable investments.
Standard Deviation is the statistical measure of the degree to which an individual value in a probability distribution tends to vary from the mean of the distribution.
Tracking Error is a measure of how closely a portfolio follows the index to which it is benchmarked.
Tranches are portions of debt offered at the same time with varying levels of risks, rewards, and maturities.
Turnover is calculated by dividing the lesser of Purchases or Sales by Average Capital.

Table of Contents
Table of Contents
Table of Contents
| 2 | ||||
| 4 | ||||
| 4 | ||||
| 7 | ||||
| 10 | ||||
| 13 | ||||
| 16 | ||||
| 19 | ||||
| 22 | ||||
| 29 | ||||
| 35 | ||||
| 40 | ||||
| 43 | ||||
| 45 | ||||
| 48 | ||||
| 52 | ||||
| 66 | ||||
| 67 | ||||
For use only when preceded or accompanied by a prospectus. Read the prospectus carefully before you invest or send money.
Table of Contents
Harding, Loevner Funds, Inc.
April 30, 2018 (unaudited)
As a shareholder of a Harding Loevner Portfolio, you incur ongoing costs, including management fees; and to the extent applicable, distribution (12b-1) fees, and/or shareholder services fees and other fund expenses. The following examples are intended to help you understand your ongoing costs (in dollars and cents) of investing in a Portfolio and to compare these costs with the ongoing costs of investing in other mutual funds.
The examples are based on an investment of $1,000 invested at the beginning of a six month period and held through the period ended April 30, 2018.
Actual Expenses
The first line under each Portfolio in the table below provides information about actual account values and actual expenses. You may use the information in this line, together with the amount you invested, to estimate the expenses that you paid over the period. Simply divide your account value by $1,000 (for example, an $8,600 account value divided by $1,000 = 8.6), then multiply the result by the number in the first line for your Portfolio under the heading entitled “Expenses Paid During Period” to estimate the expenses you paid on your account during this period.
Hypothetical Example for Comparison Purposes
The second line under each Portfolio in the table below provides information about hypothetical account values and hypothetical expenses based on the Portfolio’s actual expense ratio and an assumed rate of return of 5% per year before expenses, which is not the Portfolio’s actual return. The hypothetical account values and expenses may not be used to estimate the actual ending account balance or expenses you paid for the period. You may use this information to compare the ongoing costs of investing in your Portfolio and other funds. To do so, compare this 5% hypothetical example with the 5% hypothetical examples that appear in the shareholder reports of the other funds. Please note that the expenses shown in the table are meant to highlight your ongoing costs only. Therefore, the second line under each Portfolio in the table is useful in comparing ongoing costs only, and will not help you determine the relative total costs of owning different funds.
| Expenses Paid | ||||||||||||||
| Beginning | During Period* | |||||||||||||
| Account Value | Ending | (November 1, | ||||||||||||
| November 1, | Account Value | Annualized | 2017 to April 30, | |||||||||||
| Portfolio | 2017 | April 30, 2018 | Expense Ratio | 2018) | ||||||||||
Global Equity Portfolio — Institutional Class | ||||||||||||||
Actual | $ | 1,000.00 | $ | 1,055.70 | 0.94 | % | $ 4.79 | |||||||
Hypothetical (5% annual return before expenses) | 1,000.00 | 1,020.13 | 0.94 | 4.71 | ||||||||||
Global Equity Portfolio — Institutional Class Z | ||||||||||||||
Actual | 1,000.00 | 1,056.10 | 0.90 | 4.59 | ||||||||||
Hypothetical (5% annual return before expenses) | 1,000.00 | 1,020.33 | 0.90 | 4.51 | ||||||||||
Global Equity Portfolio — Advisor Class | ||||||||||||||
Actual | 1,000.00 | 1,054.60 | 1.11 | 5.65 | ||||||||||
Hypothetical (5% annual return before expenses) | 1,000.00 | 1,019.29 | 1.11 | 5.56 | ||||||||||
International Equity Portfolio — Institutional Class | ||||||||||||||
Actual | 1,000.00 | 1,039.70 | 0.80 | 4.05 | ||||||||||
Hypothetical (5% annual return before expenses) | 1,000.00 | 1,020.83 | 0.80 | 4.01 | ||||||||||
International Equity Portfolio — Institutional Class Z | ||||||||||||||
Actual | 1,000.00 | 1,040.00 | 0.73 | 3.69 | ||||||||||
Hypothetical (5% annual return before expenses) | 1,000.00 | 1,021.17 | 0.73 | 3.66 | ||||||||||
International Equity Portfolio — Investor Class | ||||||||||||||
Actual | 1,000.00 | 1,038.10 | 1.13 | 5.71 | ||||||||||
Hypothetical (5% annual return before expenses) | 1,000.00 | 1,019.19 | 1.13 | 5.66 | ||||||||||
International Small Companies Portfolio — Institutional Class | ||||||||||||||
Actual | 1,000.00 | 1,041.50 | 1.15 | 5.82 | ||||||||||
Hypothetical (5% annual return before expenses) | 1,000.00 | 1,019.09 | 1.15 | 5.76 | ||||||||||
* Expenses are calculated using each Portfolio’s annualized expense ratio (as disclosed in the table), multiplied by the average account value for the period, multiplied by the number of days in the period (181 days), and divided by the number of days in the year (365 days).
2
Table of Contents
Harding, Loevner Funds, Inc.
Expense Example (continued)
April 30, 2018 (unaudited)
| Expenses Paid | ||||||||||||||
| Beginning | During Period* | |||||||||||||
| Account Value | Ending | (November 1, | ||||||||||||
| November 1, | Account Value | Annualized | 2017 to April 30, | |||||||||||
| Portfolio | 2017 | April 30, 2018 | Expense Ratio | 2018) | ||||||||||
International Small Companies Portfolio — Investor Class | ||||||||||||||
Actual | $ | 1,000.00 | $ | 1,040.80 | 1.40 | % | $ 7.08 | |||||||
Hypothetical (5% annual return before expenses) | 1,000.00 | 1,017.85 | 1.40 | 7.00 | ||||||||||
Institutional Emerging Markets Portfolio — Class I | ||||||||||||||
Actual | 1,000.00 | 1,041.00 | 1.26 | 6.38 | ||||||||||
Hypothetical (5% annual return before expenses) | 1,000.00 | 1,018.55 | 1.26 | 6.31 | ||||||||||
Institutional Emerging Markets Portfolio — Class II | ||||||||||||||
Actual | 1,000.00 | 1,041.40 | 1.11 | 5.62 | ||||||||||
Hypothetical (5% annual return before expenses) | 1,000.00 | 1,019.29 | 1.11 | 5.56 | ||||||||||
Emerging Markets Portfolio — Advisor Class | ||||||||||||||
Actual | 1,000.00 | 1,039.90 | 1.37 | 6.93 | ||||||||||
Hypothetical (5% annual return before expenses) | 1,000.00 | 1,018.00 | 1.37 | 6.85 | ||||||||||
Frontier Emerging Markets Portfolio — Institutional Class I | ||||||||||||||
Actual | 1,000.00 | 1,094.10 | 1.61 | 8.36 | ||||||||||
Hypothetical (5% annual return before expenses) | 1,000.00 | 1,016.81 | 1.61 | 8.05 | ||||||||||
Frontier Emerging Markets Portfolio — Institutional Class II | ||||||||||||||
Actual | 1,000.00 | 1,095.90 | 1.35 | 7.02 | ||||||||||
Hypothetical (5% annual return before expenses) | 1,000.00 | 1,018.10 | 1.35 | 6.76 | ||||||||||
Frontier Emerging Markets Portfolio — Investor Class | ||||||||||||||
Actual | 1,000.00 | 1,093.30 | 2.00 | 10.38 | ||||||||||
Hypothetical (5% annual return before expenses) | 1,000.00 | 1,014.88 | 2.00 | 9.99 | ||||||||||
Global Equity Research Portfolio — Institutional Class | ||||||||||||||
Actual | 1,000.00 | 1,058.90 | 0.90 | 4.59 | ||||||||||
Hypothetical (5% annual return before expenses) | 1,000.00 | 1,020.33 | 0.90 | 4.51 | ||||||||||
Global Equity Research Portfolio — Investor Class | ||||||||||||||
Actual | 1,000.00 | 1,057.30 | 1.15 | 5.87 | ||||||||||
Hypothetical (5% annual return before expenses) | 1,000.00 | 1,019.09 | 1.15 | 5.76 | ||||||||||
International Equity Research Portfolio — Institutional Class | ||||||||||||||
Actual | 1,000.00 | 1,046.30 | 0.90 | 4.57 | ||||||||||
Hypothetical (5% annual return before expenses) | 1,000.00 | 1,020.33 | 0.90 | 4.51 | ||||||||||
International Equity Research Portfolio — Investor Class | ||||||||||||||
Actual | 1,000.00 | 1,045.70 | 1.15 | 5.83 | ||||||||||
Hypothetical (5% annual return before expenses) | 1,000.00 | 1,019.09 | 1.15 | 5.76 | ||||||||||
Emerging Markets Research Portfolio — Institutional Class | ||||||||||||||
Actual | 1,000.00 | 1,056.90 | 1.30 | 6.63 | ||||||||||
Hypothetical (5% annual return before expenses) | 1,000.00 | 1,018.35 | 1.30 | 6.51 | ||||||||||
Emerging Markets Research Portfolio — Investor Class | ||||||||||||||
Actual | 1,000.00 | 1,055.30 | 1.55 | 7.90 | ||||||||||
Hypothetical (5% annual return before expenses) | 1,000.00 | 1,017.11 | 1.55 | 7.75 | ||||||||||
* Expenses are calculated using each Portfolio’s annualized expense ratio (as disclosed in the table), multiplied by the average account value for the period, multiplied by the number of days in the period (181 days), and divided by the number of days in the year (365 days).
3
Table of Contents
Portfolio of Investments
April 30, 2018 (unaudited)
| Shares | Value | |||||||
COMMON STOCKS - 94.7% | ||||||||
China - 4.3% | ||||||||
Alibaba Group Holding Ltd. - Sponsored ADR (Software & Services)* | 44,226 | $7,896,110 | ||||||
Baidu Inc. - Sponsored ADR (Software & Services)* | 40,925 | 10,268,082 | ||||||
Weibo Corp. - Sponsored ADR (Software & Services)* | 42,673 | 4,886,912 | ||||||
Wuxi Biologics Cayman Inc. (Pharmaceuticals, Biotechnology & Life Sciences)*† | 1,404,500 | 12,700,401 | ||||||
| 35,751,505 | ||||||||
Denmark - 2.3% | ||||||||
Chr Hansen Holding A/S (Materials)† | 119,445 | 10,828,378 | ||||||
Novozymes A/S, Class B (Materials)† | 174,853 | 8,243,407 | ||||||
| 19,071,785 | ||||||||
Finland - 0.9% | ||||||||
Kone OYJ, Class B (Capital Goods)† | 142,390 | 7,070,855 | ||||||
France - 3.3% | ||||||||
Air Liquide SA (Materials)† | 65,452 | 8,503,771 | ||||||
Essilor International Cie Generale d’Optique SA (Health Care Equipment & Services)† | 78,243 | 10,648,302 | ||||||
L’Oreal SA (Household & Personal Products)† | 34,099 | 8,166,529 | ||||||
| 27,318,602 | ||||||||
Germany - 4.6% | ||||||||
Bayerische Motoren Werke AG (Automobiles & Components)† | 79,436 | 8,865,812 | ||||||
Linde AG (Materials)† | 48,860 | 10,857,306 | ||||||
Symrise AG (Materials)† | 227,819 | 18,400,577 | ||||||
| 38,123,695 | ||||||||
Hong Kong - 2.6% | ||||||||
AIA Group Ltd. (Insurance)† | 2,453,605 | 21,906,206 | ||||||
India - 2.1% | ||||||||
HDFC Bank Ltd. - ADR (Banks) | 77,577 | 7,432,652 | ||||||
ICICI Bank Ltd. - Sponsored ADR (Banks) | 1,226,106 | 10,434,162 | ||||||
| 17,866,814 | ||||||||
Indonesia - 1.3% | ||||||||
Bank Central Asia Tbk PT (Banks)† | 6,568,454 | 10,386,355 | ||||||
Israel - 0.8% | ||||||||
Check Point Software Technologies Ltd. (Software & Services)* | 71,833 | 6,932,603 | ||||||
| Shares | Value | |||||
COMMON STOCKS - 94.7% (continued) | ||||||
Italy - 2.1% | ||||||
Luxottica Group SpA (Consumer Durables & Apparel)† | 159,759 | $9,967,743 | ||||
Tenaris SA - ADR (Energy) | 210,256 | 7,859,369 | ||||
| 17,827,112 | ||||||
Japan - 10.8% | ||||||
FANUC Corp. (Capital Goods)† | 33,645 | 7,240,341 | ||||
Keyence Corp. (Technology Hardware & Equipment)† | 23,502 | 14,346,754 | ||||
Kubota Corp. (Capital Goods)† | 597,835 | 10,100,681 | ||||
M3 Inc. (Health Care Equipment & Services)† | 300,645 | 11,319,558 | ||||
Makita Corp. (Capital Goods)† | 178,135 | 7,986,660 | ||||
MonotaRO Co., Ltd. (Capital Goods)† | 232,980 | 8,133,320 | ||||
Park24 Co., Ltd. (Commercial & Professional Services)† | 230,700 | 6,538,879 | ||||
Sysmex Corp. (Health Care Equipment & Services)† | 275,065 | 24,284,825 | ||||
| 89,951,018 | ||||||
Mexico - 1.2% | ||||||
Grupo Televisa SAB - Sponsored ADR (Media) | 542,621 | 9,723,768 | ||||
Russia - 1.3% | ||||||
Yandex NV, Class A (Software & Services)* | 326,677 | 10,897,945 | ||||
South Africa - 2.0% | ||||||
Naspers Ltd., Class N (Media)† | 38,095 | 9,295,366 | ||||
Sasol Ltd. (Materials)† | 199,768 | 7,150,655 | ||||
| 16,446,021 | ||||||
Spain - 1.2% | ||||||
Banco Bilbao Vizcaya Argentaria SA (Banks)† | 1,253,602 | 10,153,967 | ||||
Sweden - 2.0% | ||||||
Atlas Copco AB, Class A (Capital Goods)† | 224,739 | 8,745,549 | ||||
Intrum Justitia AB (Commercial & Professional Services)† | 292,272 | 7,772,296 | ||||
| 16,517,845 | ||||||
Switzerland - 4.5% | ||||||
Lonza Group AG, Reg S (Pharmaceuticals, Biotechnology & Life Sciences)*† | 84,330 | 20,612,525 | ||||
Nestle SA - Sponsored ADR (Food Beverage & Tobacco) | 117,974 | 9,126,468 | ||||
Sonova Holding AG, Reg S (Health Care Equipment & Services)† | 45,669 | 7,547,725 | ||||
| 37,286,718 | ||||||
See Notes to Financial Statements
4
Table of Contents
Harding, Loevner Funds, Inc.
Global Equity Portfolio
Portfolio of Investments
April 30, 2018 (unaudited) (continued)
| Shares | Value | |||||
COMMON STOCKS - 94.7% (continued) | ||||||
United Kingdom - 6.0% | ||||||
Abcam plc (Pharmaceuticals, Biotechnology & Life Sciences)† | 479,305 | $8,027,981 | ||||
Reckitt Benckiser Group plc (Household & Personal Products)† | 114,395 | 8,968,521 | ||||
Shire plc (Pharmaceuticals, Biotechnology & Life Sciences)† | 46,900 | 2,492,403 | ||||
Standard Chartered plc (Banks)† | 1,618,956 | 17,053,331 | ||||
WPP plc (Media)† | 790,805 | 13,543,508 | ||||
| 50,085,744 | ||||||
United States - 41.4% | ||||||
3M Co. (Capital Goods) | 35,154 | 6,833,586 | ||||
Abbott Laboratories (Health Care Equipment & Services) | 138,728 | 8,064,259 | ||||
Amazon.com Inc. (Retailing)* | 7,575 | 11,863,435 | ||||
AmerisourceBergen Corp. (Health Care Equipment & Services) | 96,471 | 8,738,343 | ||||
Apple Inc. (Technology Hardware & Equipment) | 72,222 | 11,935,408 | ||||
Booking Holdings Inc. (Retailing)* | 10,599 | 23,084,622 | ||||
Cognex Corp. (Technology Hardware & Equipment) | 167,472 | 7,745,580 | ||||
Cognizant Technology Solutions Corp., Class A (Software & Services) | 115,116 | 9,418,791 | ||||
Colgate-Palmolive Co. (Household & Personal Products) | 143,667 | 9,371,398 | ||||
eBay Inc. (Software & Services)* | 212,670 | 8,055,940 | ||||
Exxon Mobil Corp. (Energy) | 91,838 | 7,140,404 | ||||
Facebook Inc., Class A (Software & Services)* | 74,830 | 12,870,760 | ||||
First Republic Bank (Banks) | 223,324 | 20,740,100 | ||||
IPG Photonics Corp. (Technology Hardware & Equipment)* | 52,606 | 11,206,656 | ||||
Mastercard Inc., Class A (Software & Services) | 73,803 | 13,156,861 | ||||
Microsoft Corp. (Software & Services) | 82,127 | 7,680,517 | ||||
Monsanto Co. (Materials) | 56,657 | 7,103,088 | ||||
NIKE Inc., Class B (Consumer Durables & Apparel) | 178,404 | 12,201,050 | ||||
PayPal Holdings Inc. (Software & Services)* | 352,452 | 26,296,444 | ||||
Regeneron Pharmaceuticals Inc. (Pharmaceuticals, Biotechnology & Life Sciences)* | 37,568 | 11,408,650 | ||||
Roper Technologies Inc. (Capital Goods) | 87,537 | 23,126,400 | ||||
| Shares | Value | |||||
COMMON STOCKS - 94.7% (continued) | ||||||
United States - 41.4% (continued) | ||||||
Schlumberger Ltd. (Energy) | 240,416 | $16,482,921 | ||||
Signature Bank (Banks)* | 42,423 | 5,394,084 | ||||
SVB Financial Group (Banks)* | 52,273 | 15,661,514 | ||||
Verisk Analytics Inc. (Commercial & Professional Services)* | 173,410 | 18,459,494 | ||||
WABCO Holdings Inc. (Capital Goods)* | 56,518 | 7,290,257 | ||||
Walgreens Boots Alliance Inc. (Food & Staples Retailing) | 88,675 | 5,892,454 | ||||
Walt Disney Co. (Media) | 78,076 | 7,833,365 | ||||
Waters Corp. (Pharmaceuticals, Biotechnology & Life Sciences)* | 52,217 | 9,838,205 | ||||
| 344,894,586 | ||||||
Total Common Stocks (Cost $524,502,547) |
| $788,213,144 | ||||
| ||||||
PREFERRED STOCKS - 2.5% | ||||||
Brazil - 1.2% | ||||||
Itau Unibanco Holding SA - Sponsored ADR, 0.39% (Banks)+ | 689,367 | 10,016,502 | ||||
Spain - 1.3% | ||||||
Grifols SA - ADR, 2.10% (Pharmaceuticals, Biotechnology & Life Sciences)+ | 522,061 | 10,608,280 | ||||
| ||||||
Total Preferred Stocks (Cost $13,715,824) |
| $20,624,782 | ||||
| ||||||
SHORT TERM INVESTMENTS - 2.9% | ||||||
Northern Institutional Funds - Prime Obligations Portfolio, 1.86% (Money Market Funds) | 15,600,156 | 15,600,156 | ||||
Northern Institutional Funds - Treasury Portfolio, 1.50% (Money Market Funds) | 8,506,430 | 8,506,430 | ||||
| ||||||
Total Short Term Investments (Cost $24,106,430) |
| $24,106,586 | ||||
| ||||||
Total Investments — 100.1% | ||||||
(Cost $562,324,801) | $832,944,512 | |||||
Liabilities Less Other Assets - (0.1)% | (571,111) | |||||
Net Assets — 100.0% | $832,373,401 | |||||
See Notes to Financial Statements
5
Table of Contents
Harding, Loevner Funds, Inc.
Global Equity Portfolio
Portfolio of Investments
April 30, 2018 (unaudited) (continued)
Summary of Abbreviations
| ADR | American Depositary Receipt. |
| Reg S | Security sold outside United States without registration under the Securities Act of 1933. |
| * | Non-income producing security. |
| † | Investment categorized as level 2 security as disclosed in Note 2 of the Notes to Financial Statements. |
| + | Current yield is disclosed. Dividends are calculated based on a percentage of the issuer’s net income. |
| Industry | Percentage of Net Assets | |||
Automobiles & Components | 1.1 | % | ||
Banks | 12.9 | |||
Capital Goods | 10.4 | |||
Commercial & Professional Services | 3.9 | |||
Consumer Durables & Apparel | 2.7 | |||
Energy | 3.8 | |||
Food & Staples Retailing | 0.7 | |||
Food Beverage & Tobacco | 1.1 | |||
Health Care Equipment & Services | 8.5 | |||
Household & Personal Products | 3.2 | |||
Insurance | 2.6 | |||
Materials | 8.5 | |||
Media | 4.9 | |||
Pharmaceuticals, Biotechnology & Life Sciences | 9.1 | |||
Retailing | 4.2 | |||
Software & Services | 14.2 | |||
Technology Hardware & Equipment | 5.4 | |||
Money Market Funds | 2.9 | |||
Total Investments | 100.1 | |||
Liabilities Less Other Assets | (0.1 | ) | ||
Net Assets | 100.0 | % | ||
See Notes to Financial Statements
6
Table of Contents
Harding, Loevner Funds, Inc.
International Equity Portfolio
Portfolio of Investments
April 30, 2018 (unaudited)
| Shares | Value | |||||||
COMMON STOCKS - 91.9% | ||||||||
Australia - 1.1% | ||||||||
CSL Ltd. (Pharmaceuticals, Biotechnology & Life Sciences)† | 1,204,282 | $153,774,676 | ||||||
Canada - 1.9% | ||||||||
Canadian National Railway Co. (Transportation) | 3,548,169 | 274,202,500 | ||||||
China - 4.2% | ||||||||
Baidu Inc. - Sponsored ADR (Software & Services)* | 1,574,880 | 395,137,392 | ||||||
Weibo Corp. - Sponsored ADR (Software & Services)* | 1,708,114 | 195,613,215 | ||||||
| 590,750,607 | ||||||||
Denmark - 0.9% | ||||||||
Novozymes A/S, Class B (Materials)† | 2,592,893 | 122,241,389 | ||||||
France - 9.5% | ||||||||
Air Liquide SA (Materials)† | 2,554,087 | 331,836,625 | ||||||
Dassault Systemes SE (Software & Services)† | 3,404,024 | 439,602,834 | ||||||
L’Oreal SA (Household & Personal Products)† | 1,486,920 | 356,109,449 | ||||||
LVMH Moet Hennessy Louis Vuitton SE (Consumer Durables & Apparel)† | 634,479 | 220,848,156 | ||||||
| 1,348,397,064 | ||||||||
Germany - 15.5% | ||||||||
Allianz SE, Reg S (Insurance)† | 2,138,215 | 505,830,242 | ||||||
Bayer AG, Reg S (Pharmaceuticals, Biotechnology & Life Sciences)† | 4,158,071 | 497,761,111 | ||||||
Bayerische Motoren Werke AG (Automobiles & Components)† | 1,627,268 | 181,618,562 | ||||||
Fresenius Medical Care AG & Co. KGaA (Health Care Equipment & Services)† | 2,008,861 | 204,568,387 | ||||||
FUCHS PETROLUB SE (Materials)† | 803,263 | 41,294,828 | ||||||
Infineon Technologies AG (Semiconductors & Semiconductor Equipment)† | 5,853,250 | 149,910,443 | ||||||
Linde AG (Materials)*† | 911,296 | 202,501,426 | ||||||
SAP SE - Sponsored ADR (Software & Services) | 2,142,742 | 237,480,096 | ||||||
Symrise AG (Materials)† | 2,069,657 | 167,162,889 | ||||||
| 2,188,127,984 | ||||||||
Hong Kong - 4.4% | ||||||||
AIA Group Ltd. (Insurance)† | 70,510,711 | 629,531,718 | ||||||
India - 2.0% | ||||||||
HDFC Bank Ltd. - ADR (Banks) | 1,400,253 | 134,158,240 | ||||||
| Shares | Value | |||||
COMMON STOCKS - 91.9% (continued) | ||||||
India - 2.0% (continued) | ||||||
ICICI Bank Ltd. - Sponsored ADR (Banks) | 16,720,892 | $142,294,791 | ||||
| 276,453,031 | ||||||
Israel - 2.2% | ||||||
Check Point Software Technologies Ltd. (Software & Services)* | 3,186,626 | 307,541,275 | ||||
Italy - 0.9% | ||||||
Tenaris SA - ADR (Energy) | 3,231,899 | 120,808,385 | ||||
Japan - 14.0% | ||||||
Daito Trust Construction Co., Ltd. (Real Estate)† | 692,000 | 116,452,168 | ||||
FANUC Corp. (Capital Goods)† | 1,864,400 | 401,215,419 | ||||
JGC Corp. (Capital Goods)† | 7,174,600 | 175,531,431 | ||||
Keyence Corp. (Technology Hardware & Equipment)† | 390,627 | 238,457,554 | ||||
Kubota Corp. (Capital Goods)† | 8,546,900 | 144,403,575 | ||||
M3 Inc. (Health Care Equipment & Services)† | 9,715,700 | 365,804,942 | ||||
MonotaRO Co., Ltd. (Capital Goods)† | 3,151,400 | 110,015,210 | ||||
Park24 Co., Ltd. (Commercial & Professional Services)† | 4,573,600 | 129,632,504 | ||||
Sysmex Corp. (Health Care Equipment & Services)† | 3,473,807 | 306,694,034 | ||||
| 1,988,206,837 | ||||||
Mexico - 1.2% | ||||||
Grupo Financiero Banorte SAB de CV, Series O (Banks) | 27,087,890 | 169,490,772 | ||||
Singapore - 2.6% | ||||||
DBS Group Holdings Ltd. (Banks)† | 16,179,583 | 373,767,134 | ||||
South Africa - 4.3% | ||||||
Aspen Pharmacare Holdings Ltd. (Pharmaceuticals, Biotechnology & Life Sciences)† | 6,389,421 | 137,609,036 | ||||
Naspers Ltd., Class N (Media)† | 1,398,312 | 341,194,955 | ||||
Sasol Ltd. (Materials)† | 3,617,373 | 129,483,135 | ||||
| 608,287,126 | ||||||
South Korea - 1.7% | ||||||
Samsung Electronics Co., Ltd. - GDR (Technology Hardware & Equipment)† | 192,656 | 237,922,858 | ||||
Spain - 2.9% | ||||||
Banco Bilbao Vizcaya Argentaria SA (Banks)† | 43,676,887 | 353,775,481 | ||||
Grifols SA (Pharmaceuticals, Biotechnology & Life Sciences)† | 2,206,820 | 61,757,783 | ||||
| 415,533,264 | ||||||
See Notes to Financial Statements
7
Table of Contents
Harding, Loevner Funds, Inc.
International Equity Portfolio
Portfolio of Investments
April 30, 2018 (unaudited) (continued)
| Shares | Value | |||||
COMMON STOCKS - 91.9% (continued) | ||||||
Sweden - 2.8% | ||||||
Alfa Laval AB (Capital Goods)† | 6,968,925 | $172,913,001 | ||||
Atlas Copco AB, Class A (Capital Goods)† | 5,738,772 | 223,319,994 | ||||
| 396,232,995 | ||||||
Switzerland - 7.9% | ||||||
Lonza Group AG, Reg S (Pharmaceuticals, Biotechnology & Life Sciences)*† | 707,765 | 172,996,841 | ||||
Nestle SA - Sponsored ADR (Food Beverage & Tobacco) | 5,484,592 | 424,288,037 | ||||
Roche Holding AG, Genusschein (Pharmaceuticals, Biotechnology & Life Sciences)† | 1,256,670 | 278,807,024 | ||||
Sonova Holding AG, Reg S (Health Care Equipment & Services)† | 880,898 | 145,586,188 | ||||
Temenos Group AG, Reg S (Software & Services)*† | 791,866 | 99,428,763 | ||||
| 1,121,106,853 | ||||||
Taiwan - 2.4% | ||||||
Taiwan Semiconductor Manufacturing Co., Ltd. (Semiconductors & Semiconductor Equipment)† | 10,837,125 | 82,150,522 | ||||
Taiwan Semiconductor Manufacturing Co., Ltd. - Sponsored ADR (Semiconductors & Semiconductor Equipment) | 6,822,630 | 262,330,123 | ||||
| 344,480,645 | ||||||
United Kingdom - 8.0% | ||||||
BBA Aviation plc (Transportation)† | 17,972,388 | 78,703,948 | ||||
HSBC Holdings plc (Banks)† | 18,266,667 | 182,057,642 | ||||
Royal Dutch Shell plc, Class B (Energy)† | 13,031,728 | 465,517,801 | ||||
Shire plc (Pharmaceuticals, Biotechnology & Life Sciences)† | 678,373 | 36,050,717 | ||||
Unilever plc (Household & Personal Products)† | 3,972,449 | 222,609,668 | ||||
WPP plc (Media)† | 8,320,023 | 142,490,622 | ||||
| 1,127,430,398 | ||||||
United States - 1.5% | ||||||
Schlumberger Ltd. (Energy) | 3,180,158 | 218,031,632 | ||||
Total Common Stocks (Cost $10,003,964,894) |
| $13,012,319,143 | ||||
| Shares | Value | |||||
PREFERRED STOCKS - 4.7% |
| |||||
Brazil - 1.7% |
| |||||
Itau Unibanco Holding SA - Sponsored ADR, 0.39% (Banks)+ | 16,975,718 | $246,657,183 | ||||
Germany - 0.7% |
| |||||
FUCHS PETROLUB SE, 2.05% (Materials)+† | 1,743,708 | 93,688,926 | ||||
South Korea - 1.9% |
| |||||
Samsung Electronics Co., Ltd. - GDR, Reg S, 4.15% (Technology Hardware & Equipment)+† | 269,802 | 265,402,753 | ||||
Spain - 0.4% |
| |||||
Grifols SA - ADR, 2.10% (Pharmaceuticals, Biotechnology & Life Sciences)+
|
| 2,936,262
|
| 59,664,844
| ||
Total Preferred Stocks (Cost $452,510,172) |
| $665,413,706 | ||||
SHORT TERM INVESTMENTS - 3.3% | ||||||
Northern Institutional Funds - Prime Obligations Portfolio, 1.86% (Money Market Funds) | 388,069,811 | 388,069,811 | ||||
Northern Institutional Funds - Treasury Portfolio, 1.50% (Money Market Funds)
|
| 83,157,598
|
| 83,157,598
| ||
Total Short Term Investments (Cost $471,214,446) |
| $471,227,409 | ||||
Total Investments — 99.9% |
| |||||
(Cost $10,927,689,512) |
| $14,148,960,258 | ||||
Other Assets Less Liabilities - 0.1% |
| 8,584,203 | ||||
Net Assets — 100.0% |
| $14,157,544,461 | ||||
Summary of Abbreviations
| ADR | American Depositary Receipt. |
| GDR | Global Depository Receipt. |
| Reg S | Security sold outside United States without registration under the Securities Act of 1933. |
| † | Investment categorized as level 2 security as disclosed in Note 2 of the Notes to Financial Statements. |
| * | Non-income producing security. |
| + | Current yield is disclosed. Dividends are calculated based on a percentage of the issuer’s net income. |
See Notes to Financial Statements
8
Table of Contents
Harding, Loevner Funds, Inc.
International Equity Portfolio
Portfolio of Investments
April 30, 2018 (unaudited) (continued)
| Industry | Percentage of Net Assets | |||
Automobiles & Components | 1.3 | % | ||
Banks | 11.3 | |||
Capital Goods | 8.7 | |||
Commercial & Professional Services | 0.9 | |||
Consumer Durables & Apparel | 1.6 | |||
Energy | 5.7 | |||
Food Beverage & Tobacco | 3.0 | |||
Health Care Equipment & Services | 7.2 | |||
Household & Personal Products | 4.1 | |||
Insurance | 8.0 | |||
Materials | 7.7 | |||
Media | 3.4 | |||
Pharmaceuticals, Biotechnology & Life Sciences | 9.9 | |||
Real Estate | 0.8 | |||
Semiconductors & Semiconductor Equipment | 3.5 | |||
Software & Services | 11.8 | |||
Technology Hardware & Equipment | 5.2 | |||
Transportation | 2.5 | |||
Money Market Funds | 3.3 | |||
Total Investments | 99.9 | |||
Other Assets Less Liabilities | 0.1 | |||
Net Assets | 100.0 | % | ||
See Notes to Financial Statements
9
Table of Contents
Harding, Loevner Funds, Inc.
International Small Companies Portfolio
Portfolio of Investments
April 30, 2018 (unaudited)
| Shares | Value | |||||||
COMMON STOCKS - 95.5% | ||||||||
Argentina - 1.2% | ||||||||
Globant SA (Software & Services)* | 66,264 | $2,982,543 | ||||||
Australia - 1.2% | ||||||||
DuluxGroup Ltd. (Materials)† | 519,014 | 3,020,587 | ||||||
Bangladesh - 0.9% | ||||||||
BRAC Bank Ltd. (Banks)*† | 1,067,113 | 1,127,238 | ||||||
Square Pharmaceuticals Ltd. (Pharmaceuticals, Biotechnology & Life Sciences)† | 312,828 | 1,156,682 | ||||||
| 2,283,920 | ||||||||
Canada - 1.1% | ||||||||
Kinaxis Inc. (Software & Services)* | 43,200 | 2,792,296 | ||||||
China - 2.3% | ||||||||
51job Inc. - ADR (Commercial & Professional Services)* | 20,009 | 1,651,543 | ||||||
Haitian International Holdings Ltd. (Capital Goods)† | 1,132,000 | 3,009,625 | ||||||
Shenzhou International Group Holdings Ltd. (Consumer Durables & Apparel)† | 96,000 | 1,045,725 | ||||||
| 5,706,893 | ||||||||
Colombia - 0.1% | ||||||||
CEMEX Latam Holdings SA (Materials)* | 103,464 | 318,979 | ||||||
Denmark - 0.6% | ||||||||
Chr Hansen Holding A/S (Materials)† | 17,010 | 1,542,055 | ||||||
Egypt - 1.3% | ||||||||
Integrated Diagnostics Holdings plc (Health Care Equipment & Services)† | 682,574 | 3,249,327 | ||||||
Finland - 1.7% | ||||||||
Vaisala OYJ, Class A (Technology Hardware & Equipment)† | 168,119 | 4,136,719 | ||||||
France - 6.8% | ||||||||
Alten SA (Software & Services)† | 60,020 | 5,952,107 | ||||||
IPSOS (Media)† | 85,377 | 3,241,312 | ||||||
LISI (Capital Goods)† | 79,769 | 2,936,306 | ||||||
Rubis SCA (Utilities)† | 62,036 | 4,810,789 | ||||||
| 16,940,514 | ||||||||
Germany - 9.9% | ||||||||
Bechtle AG (Software & Services)† | 59,628 | 5,036,866 | ||||||
Bertrandt AG (Commercial & Professional Services)† | 18,092 | 2,021,534 | ||||||
Carl Zeiss Meditec AG (Bearer) (Health Care Equipment & Services)† | 88,130 | 5,976,991 | ||||||
| Shares | Value | |||||
COMMON STOCKS - 95.5% (continued) | ||||||
Germany - 9.9% (continued) | ||||||
FUCHS PETROLUB SE (Materials)† | 22,918 | $1,178,188 | ||||
KWS Saat SE (Food Beverage & Tobacco)† | 7,315 | 2,637,336 | ||||
Pfeiffer Vacuum Technology AG (Capital Goods)† | 13,891 | 2,053,570 | ||||
Rational AG (Capital Goods)† | 880 | 550,151 | ||||
RIB Software SE (Software & Services)† | 95,221 | 2,514,199 | ||||
STRATEC Biomedical AG (Health Care Equipment & Services)† | 31,063 | 2,823,941 | ||||
| 24,792,776 | ||||||
Hong Kong - 2.8% | ||||||
ASM Pacific Technology Ltd. (Semiconductors & Semiconductor Equipment)† | 154,900 | 2,116,258 | ||||
Pico Far East Holdings Ltd. (Media)† | 6,999,000 | 2,847,611 | ||||
Vitasoy International Holdings Ltd. (Food Beverage & Tobacco)† | 742,900 | 1,966,421 | ||||
| 6,930,290 | ||||||
India - 2.5% | ||||||
Emami Ltd. (Household & Personal Products)† | 48,444 | 807,288 | ||||
Max Financial Services Ltd. (Insurance)*† | 467,690 | 3,599,367 | ||||
SH Kelkar & Co., Ltd. (Materials)† | 485,363 | 1,758,058 | ||||
| 6,164,713 | ||||||
Indonesia - 0.4% | ||||||
Tower Bersama Infrastructure Tbk PT (Telecommunication Services)† | 2,666,500 | 1,061,705 | ||||
Israel - 1.3% | ||||||
CyberArk Software Ltd. (Software & Services)* | 59,069 | 3,246,432 | ||||
Italy - 3.6% | ||||||
Danieli & C Officine Meccaniche SpA (RSP) (Capital Goods)† | 54,833 | 1,048,718 | ||||
DiaSorin SpA (Health Care Equipment & Services)† | 13,100 | 1,235,885 | ||||
Reply SpA (Software & Services)† | 107,200 | 6,764,093 | ||||
| 9,048,696 | ||||||
Japan - 13.3% | ||||||
ABC-Mart Inc. (Retailing)† | 6,700 | 441,287 | ||||
Ariake Japan Co., Ltd. (Food Beverage & Tobacco)† | 72,600 | 6,235,992 | ||||
BML Inc. (Health Care Equipment & Services)† | 73,700 | 1,860,091 | ||||
See Notes to Financial Statements
10
Table of Contents
Harding, Loevner Funds, Inc.
International Small Companies Portfolio
Portfolio of Investments
April 30, 2018 (unaudited) (continued)
| Shares | Value | |||||
COMMON STOCKS - 95.5% (continued) | ||||||
Japan - 13.3% (continued) | ||||||
Cosmos Pharmaceutical Corp. (Food & Staples Retailing)† | 3,900 | $876,175 | ||||
FINDEX Inc. (Health Care Equipment & Services)† | 169,400 | 1,226,282 | ||||
GMO Payment Gateway Inc. (Software & Services)† | 23,700 | 2,349,252 | ||||
Hiday Hidaka Corp. (Consumer Services)† | 1 | 21 | ||||
Infomart Corp. (Software & Services)† | 534,900 | 4,855,322 | ||||
MISUMI Group Inc. (Capital Goods)† | 44,800 | 1,239,835 | ||||
MonotaRO Co., Ltd. (Capital Goods)† | 14,500 | 506,194 | ||||
Nakanishi Inc. (Health Care Equipment & Services)† | 301,600 | 6,262,384 | ||||
SMS Co., Ltd. (Software & Services)† | 93,300 | 3,537,925 | ||||
Stanley Electric Co., Ltd. (Automobiles & Components)† | 59,800 | 2,165,655 | ||||
Suruga Bank Ltd. (Banks)† | 118,600 | 1,611,765 | ||||
| 33,168,180 | ||||||
Kenya - 0.7% | ||||||
East African Breweries Ltd. (Food Beverage & Tobacco)† | 388,500 | 969,667 | ||||
Equity Group Holdings Ltd. (Banks)† | 1,515,700 | 745,723 | ||||
| 1,715,390 | ||||||
Malaysia - 1.0% | ||||||
Dialog Group Bhd. (Energy)† | 3,350,840 | 2,572,095 | ||||
Mexico - 1.1% | ||||||
Grupo Herdez SAB de CV (Food Beverage & Tobacco) | 1,179,438 | 2,823,404 | ||||
Netherlands - 2.8% | ||||||
Arcadis NV (Capital Goods)† | 214,369 | 4,206,336 | ||||
ASM International NV (Semiconductors & Semiconductor Equipment)† | 25,249 | 1,509,314 | ||||
Brunel International NV (Commercial & Professional Services)† | 79,193 | 1,417,761 | ||||
| 7,133,411 | ||||||
Norway - 1.6% | ||||||
Tomra Systems ASA (Commercial & Professional Services)† | 221,068 | 4,092,770 | ||||
Peru - 0.3% | ||||||
Alicorp SAA (Food Beverage & Tobacco) | 233,035 | 856,062 | ||||
Philippines - 0.4% | ||||||
Security Bank Corp. (Banks)† | 220,440 | 887,070 | ||||
| Shares | Value | |||||
COMMON STOCKS - 95.5% (continued) | ||||||
Romania - 1.2% | ||||||
Societatea Nationala de Gaze Naturale ROMGAZ SA (Energy)† | 300,100 | $2,887,441 | ||||
Russia - 1.2% | ||||||
Moscow Exchange MICEX-RTS PJSC (Diversified Financials)† | 1,543,977 | 2,960,433 | ||||
South Korea - 1.4% | ||||||
Cheil Worldwide Inc. (Media)† | 23,032 | 410,437 | ||||
Coway Co., Ltd. (Consumer Durables & Apparel)† | 9,239 | 755,537 | ||||
Hankook Tire Co., Ltd. (Automobiles & Components)† | 49,000 | 2,263,853 | ||||
| 3,429,827 | ||||||
Sweden - 2.2% | ||||||
Alfa Laval AB (Capital Goods)† | 99,380 | 2,465,817 | ||||
Intrum Justitia AB (Commercial & Professional Services)† | 110,100 | 2,927,854 | ||||
| 5,393,671 | ||||||
Switzerland - 2.7% | ||||||
Bossard Holding AG, Class A, Reg S (Capital Goods)† | 10,750 | 2,197,820 | ||||
LEM Holding SA, Reg S (Technology Hardware & Equipment)† | 2,195 | 3,458,344 | ||||
Temenos Group AG, Reg S (Software & Services)*† | 8,261 | 1,037,273 | ||||
| 6,693,437 | ||||||
Taiwan - 2.3% | ||||||
Advantech Co., Ltd. (Technology Hardware & Equipment)† | 156,517 | 1,075,248 | ||||
Chipbond Technology Corp. (Semiconductors & Semiconductor Equipment)† | 1,187,700 | 2,350,361 | ||||
Eclat Textile Co., Ltd. (Consumer Durables & Apparel)† | 96,000 | 1,157,789 | ||||
Silergy Corp. (Semiconductors & Semiconductor Equipment)† | 57,000 | 1,191,977 | ||||
| 5,775,375 | ||||||
Tanzania - 0.7% | ||||||
Tanzania Breweries Ltd. (Food Beverage & Tobacco) | 255,893 | 1,793,381 | ||||
Turkey - 1.2% | ||||||
Anadolu Hayat Emeklilik AS (Insurance)† | 1,570,106 | 2,997,606 | ||||
Ukraine - 0.8% | ||||||
Kernel Holding SA (Food Beverage & Tobacco)† | 152,096 | 2,058,128 | ||||
United Arab Emirates - 0.9% | ||||||
Agthia Group PJSC (Food Beverage & Tobacco)† | 1,851,532 | 2,190,820 | ||||
See Notes to Financial Statements
11
Table of Contents
Harding, Loevner Funds, Inc.
International Small Companies Portfolio
Portfolio of Investments
April 30, 2018 (unaudited) (continued)
| Shares | Value | |||||||
COMMON STOCKS - 95.5% (continued) |
| |||||||
United Kingdom - 19.6% | ||||||||
Abcam plc (Pharmaceuticals, Biotechnology & Life Sciences)† | 352,487 | $5,903,880 | ||||||
BBA Aviation plc (Transportation)† | 706,505 | 3,093,898 | ||||||
BGEO Group plc (Banks)† | 56,389 | 2,689,414 | ||||||
Britvic plc (Food Beverage & Tobacco)† | 207,030 | 2,041,127 | ||||||
Clarkson plc (Transportation)† | 52,715 | 1,746,385 | ||||||
Dechra Pharmaceuticals plc (Pharmaceuticals, Biotechnology & Life Sciences)† | 101,464 | 3,820,118 | ||||||
Diploma plc (Capital Goods)† | 171,203 | 2,838,854 | ||||||
EMIS Group plc (Health Care Equipment & Services)† | 197,604 | 2,312,425 | ||||||
Halma plc (Technology Hardware & Equipment)† | 94,986 | 1,595,714 | ||||||
Jardine Lloyd Thompson Group plc (Insurance)† | 87,997 | 1,479,424 | ||||||
Nostrum Oil & Gas plc (Energy)*† | 709,670 | 2,904,609 | ||||||
Rathbone Brothers plc (Diversified Financials)† | 98,279 | 3,176,994 | ||||||
Rotork plc (Capital Goods)† | 1,133,220 | 5,127,271 | ||||||
RPC Group plc (Materials)† | 263,154 | 2,856,488 | ||||||
RPS Group plc (Commercial & Professional Services)† | 539,497 | 1,917,521 | ||||||
Senior plc (Capital Goods)† | 1,392,798 | 5,653,147 | ||||||
| 49,157,269 | ||||||||
United States - 0.9% | ||||||||
Core Laboratories NV (Energy) | 12,205 | 1,494,502 | ||||||
Sensata Technologies Holding plc (Capital Goods)* | 15,597 | 791,080 | ||||||
| 2,285,582 | ||||||||
Vietnam - 1.5% | ||||||||
Hoa Phat Group JSC (Materials)*† | 1,613,000 | 3,788,192 | ||||||
Total Common Stocks (Cost $195,648,949) |
| $238,877,989 | ||||||
SHORT TERM INVESTMENTS - 4.3% |
| |||||||
Northern Institutional Funds - Treasury Portfolio, 1.50% (Money Market Funds) | 10,842,502 | 10,842,502 | ||||||
| Shares | Value | |||
SHORT TERM INVESTMENTS - 4.3% (continued) | ||||
Total Short Term Investments (Cost $10,842,502) | $10,842,502 | |||
Total Investments — 99.8% | ||||
(Cost $206,491,451) | $249,720,491 | |||
Other Assets Less Liabilities - 0.2% | 470,432 | |||
Net Assets — 100.0% | $250,190,923 | |||
Summary of Abbreviations
| ADR | American Depositary Receipt. |
| Reg S | Security sold outside United States without registration under the Securities Act of 1933. |
| * | Non-income producing security. |
| † | Investment categorized as level 2 security as disclosed in Note 2 of the Notes to Financial Statements. |
| Industry | Percentage of Net Assets | |||
Automobiles & Components | 1.8 | % | ||
Banks | 2.8 | |||
Capital Goods | 13.8 | |||
Commercial & Professional Services | 5.6 | |||
Consumer Durables & Apparel | 1.2 | |||
Consumer Services | 0.0* | |||
Diversified Financials | 2.5 | |||
Energy | 3.9 | |||
Food & Staples Retailing | 0.4 | |||
Food Beverage & Tobacco | 9.4 | |||
Health Care Equipment & Services | 10.0 | |||
Household & Personal Products | 0.3 | |||
Insurance | 3.2 | |||
Materials | 5.8 | |||
Media | 2.6 | |||
Pharmaceuticals, Biotechnology & Life Sciences | 4.4 | |||
Retailing | 0.2 | |||
Semiconductors & Semiconductor Equipment | 2.9 | |||
Software & Services | 16.4 | |||
Technology Hardware & Equipment | 4.1 | |||
Telecommunication Services | 0.4 | |||
Transportation | 1.9 | |||
Utilities | 1.9 | |||
Money Market Fund | 4.3 | |||
Total Investments | 99.8 | |||
Other Assets Less Liabilities | 0.2 | |||
Net Assets | 100.0 | % | ||
| * | Rounds to less than 0.05%. |
See Notes to Financial Statements
12
Table of Contents
Harding, Loevner Funds, Inc.
Institutional Emerging Markets Portfolio
Portfolio of Investments
April 30, 2018 (unaudited)
| Shares | Value | |||||||
COMMON STOCKS - 91.1% | ||||||||
Argentina - 0.7% | ||||||||
Banco Macro SA - ADR (Banks) | 389,948 | $37,793,760 | ||||||
Brazil - 2.6% | ||||||||
Ambev SA - ADR (Food Beverage & Tobacco) | 8,244,652 | 54,579,596 | ||||||
B3 SA - Brasil Bolsa Balcao (Diversified Financials)* | 6,078,400 | 43,898,013 | ||||||
WEG SA (Capital Goods) | 7,404,670 | 37,581,364 | ||||||
| 136,058,973 | ||||||||
Chile - 1.1% | ||||||||
Banco Santander Chile - ADR (Banks) | 1,798,375 | 59,400,326 | ||||||
China - 27.9% | ||||||||
51job Inc. - ADR (Commercial & Professional Services)* | 1,291,057 | 106,563,845 | ||||||
AAC Technologies Holdings Inc. (Technology Hardware & Equipment)† | 3,588,000 | 51,495,536 | ||||||
Alibaba Group Holding Ltd. - Sponsored ADR (Software & Services)* | 479,927 | 85,686,167 | ||||||
Baidu Inc. - Sponsored ADR (Software & Services)* | 102,593 | 25,740,584 | ||||||
China Mobile Ltd. - Sponsored ADR (Telecommunication Services) | 911,080 | 43,239,857 | ||||||
CNOOC Ltd. - Sponsored ADR (Energy) | 645,228 | 109,049,984 | ||||||
CSPC Pharmaceutical Group Ltd. (Pharmaceuticals, Biotechnology & Life Sciences)† | 15,448,000 | 39,209,316 | ||||||
Ctrip.com International Ltd. - ADR (Retailing)* | 680,427 | 27,829,464 | ||||||
ENN Energy Holdings Ltd. (Utilities)† | 12,649,200 | 118,694,867 | ||||||
Hangzhou Hikvision Digital Technology Co., Ltd., Class A (Technology Hardware & Equipment)† | 11,981,243 | 73,336,469 | ||||||
Han’s Laser Technology Industry Group Co., Ltd., Class A (Capital Goods)† | 5,367,977 | 39,819,682 | ||||||
JD.com Inc. - ADR (Retailing)* | 1,812,070 | 66,158,676 | ||||||
Jiangsu Expressway Co., Ltd., Class H (Transportation)† | 17,943,000 | 24,557,397 | ||||||
Jiangsu Hengrui Medicine Co., Ltd., Class A (Pharmaceuticals, Biotechnology & Life Sciences)† | 4,206,445 | 55,296,047 | ||||||
Midea Group Co., Ltd., Class A (Consumer Durables & Apparel)† | 9,386,154 | 77,073,188 | ||||||
NetEase Inc. - ADR (Software & Services) | 70,517 | 18,127,805 | ||||||
| Shares | Value | |||||||
COMMON STOCKS - 91.1% (continued) |
| |||||||
China - 27.9% (continued) | ||||||||
Shenzhou International Group Holdings Ltd. (Consumer Durables & Apparel)† | 9,095,000 | $99,071,601 | ||||||
Sino Biopharmaceutical Ltd. (Pharmaceuticals, Biotechnology & Life Sciences)† | 35,867,505 | 75,559,564 | ||||||
Sunny Optical Technology Group Co. Ltd. (Technology Hardware & Equipment)† | 2,374,800 | 38,782,674 | ||||||
Tencent Holdings Ltd. (Software & Services)† | 4,471,100 | 219,515,254 | ||||||
Weibo Corp. - Sponsored ADR (Software & Services)* | 544,678 | 62,376,525 | ||||||
| 1,457,184,502 | ||||||||
Czech Republic - 1.0% | ||||||||
Komercni banka AS (Banks)† | 1,224,384 | 52,795,880 | ||||||
Egypt - 0.6% | ||||||||
Commercial International Bank Egypt SAE - GDR, Reg S (Banks)† | 6,179,705 | 31,679,312 | ||||||
Hong Kong - 6.5% | ||||||||
AIA Group Ltd. (Insurance)† | 16,096,215 | 143,709,768 | ||||||
ASM Pacific Technology Ltd. (Semiconductors & Semiconductor Equipment)† | 3,047,069 | 41,629,341 | ||||||
Hong Kong Exchanges & Clearing Ltd. (Diversified Financials)† | 2,404,049 | 77,924,812 | ||||||
Sands China Ltd. (Consumer Services)† | 12,824,938 | 74,005,465 | ||||||
| 337,269,386 | ||||||||
Hungary - 0.5% | ||||||||
Richter Gedeon Nyrt. (Pharmaceuticals, Biotechnology & Life Sciences)† | 1,409,201 | 28,496,412 | ||||||
India - 3.5% | ||||||||
Bharti Airtel Ltd. (Telecommunication Services)† | 5,040,734 | 30,849,936 | ||||||
Housing Development Finance Corp., Ltd. (Banks)† | 3,003,297 | 84,381,333 | ||||||
Maruti Suzuki India Ltd. (Automobiles & Components)† | 511,642 | 67,235,948 | ||||||
| 182,467,217 | ||||||||
Indonesia - 2.5% | ||||||||
Astra International Tbk PT (Automobiles & Components)† | 88,436,700 | 45,227,880 | ||||||
Bank Rakyat Indonesia Persero Tbk PT (Banks)† | 360,365,100 | 83,063,294 | ||||||
| 128,291,174 | ||||||||
See Notes to Financial Statements
13
Table of Contents
Harding, Loevner Funds, Inc.
Institutional Emerging Markets Portfolio
Portfolio of Investments
April 30, 2018 (unaudited) (continued)
| Shares | Value | |||||||
COMMON STOCKS - 91.1% (continued) |
| |||||||
Italy - 1.3% | ||||||||
Tenaris SA - ADR (Energy) | 1,777,712 | $66,450,875 | ||||||
Kenya - 1.3% | ||||||||
East African Breweries Ltd. (Food Beverage & Tobacco)† | 5,887,465 | 14,694,670 | ||||||
Safaricom plc (Telecommunication Services)† | 183,883,527 | 51,751,789 | ||||||
| 66,446,459 | ||||||||
Mexico - 3.3% | ||||||||
Fomento Economico Mexicano SAB de CV - Sponsored ADR (Food Beverage & Tobacco) | 269,816 | 26,080,414 | ||||||
Grupo Aeroportuario del Sureste SAB de CV - ADR (Transportation) | 348,262 | 62,617,508 | ||||||
Grupo Financiero Banorte SAB de CV, Series O (Banks) | 13,202,700 | 82,610,193 | ||||||
| 171,308,115 | ||||||||
Panama - 0.8% | ||||||||
Copa Holdings SA, Class A (Transportation) | 361,237 | 42,326,139 | ||||||
Peru - 1.2% | ||||||||
Credicorp Ltd. (Banks) | 275,703 | 64,098,190 | ||||||
Poland - 0.6% | ||||||||
Bank Polska Kasa Opieki SA (Banks)† | 983,765 | 32,596,502 | ||||||
Russia - 6.1% | ||||||||
LUKOIL PJSC - Sponsored ADR (Energy) | 1,617,696 | 106,589,989 | ||||||
Novatek PJSC - Sponsored GDR, Reg S (Energy)† | 646,430 | 81,853,358 | ||||||
Sberbank of Russia PJSC - Sponsored ADR (Banks)† | 8,694,786 | 128,536,621 | ||||||
| 316,979,968 | ||||||||
South Africa - 6.2% | ||||||||
Aspen Pharmacare Holdings Ltd. (Pharmaceuticals, Biotechnology & Life Sciences)† | 2,999,814 | 64,607,030 | ||||||
Discovery Ltd. (Insurance)† | 4,995,925 | 69,284,350 | ||||||
Naspers Ltd., Class N (Media)† | 191,610 | 46,753,776 | ||||||
Sasol Ltd. (Materials)† | 1,459,603 | 52,246,194 | ||||||
Standard Bank Group Ltd. (Banks)† | 5,255,891 | 89,912,979 | ||||||
| 322,804,329 | ||||||||
South Korea - 8.8% | ||||||||
Amorepacific Corp. (Household & Personal Products)† | 138,993 | 45,169,163 | ||||||
Hankook Tire Co., Ltd. (Automobiles & Components)† | 1,279,405 | 59,109,897 | ||||||
| Shares | Value | |||||||
COMMON STOCKS - 91.1% (continued) |
| |||||||
South Korea - 8.8% (continued) | ||||||||
Hanssem Co., Ltd. (Consumer Durables & Apparel)† | 229,755 | $24,962,387 | ||||||
LG Household & Health Care Ltd. (Household & Personal Products)† | 72,920 | 93,432,713 | ||||||
NAVER Corp. (Software & Services)† | 37,481 | 25,003,139 | ||||||
Samsung Electronics Co., Ltd. - GDR (Technology Hardware & Equipment)† | 169,469 | 209,287,792 | ||||||
| 456,965,091 | ||||||||
Taiwan - 8.1% | ||||||||
Advantech Co., Ltd. (Technology Hardware & Equipment)† | 1,445,109 | 9,927,681 | ||||||
Airtac International Group (Capital Goods)† | 2,499,515 | 43,212,904 | ||||||
Eclat Textile Co., Ltd. (Consumer Durables & Apparel)† | 4,050,752 | 48,853,287 | ||||||
Hon Hai Precision Industry Co., Ltd. (Technology Hardware & Equipment)† | 19,141,539 | 53,285,300 | ||||||
Largan Precision Co., Ltd. (Technology Hardware & Equipment)† | 410,000 | 47,568,986 | ||||||
Taiwan Semiconductor Manufacturing Co., Ltd. (Semiconductors & Semiconductor Equipment)† | 29,138,277 | 220,881,890 | ||||||
| 423,730,048 | ||||||||
Thailand - 1.2% | ||||||||
Siam Commercial Bank pcl, Reg S (Banks)† | 14,848,270 | 61,632,553 | ||||||
Turkey - 1.1% | ||||||||
Arcelik AS (Consumer Durables & Apparel)† | 4,831,945 | 21,480,889 | ||||||
Turkiye Garanti Bankasi AS (Banks)† | 17,122,159 | 38,630,501 | ||||||
| 60,111,390 | ||||||||
United Arab Emirates - 1.8% | ||||||||
DP World Ltd. (Transportation)† | 2,250,311 | 49,961,119 | ||||||
Emaar Properties PJSC (Real Estate)† | 28,102,695 | 44,144,846 | ||||||
| 94,105,965 | ||||||||
United Kingdom - 2.4% | ||||||||
BGEO Group plc (Banks)† | 1,013,313 | 48,328,905 | ||||||
Coca-Cola HBC AG - CDI (Food Beverage & Tobacco)*† | 2,050,291 | 68,868,843 | ||||||
Nostrum Oil & Gas plc (Energy)*† | 1,467,629 | 6,006,860 | ||||||
| 123,204,608 | ||||||||
Total Common Stocks (Cost $3,479,157,437) |
| $4,754,197,174 | ||||||
See Notes to Financial Statements
14
Table of Contents
Harding, Loevner Funds, Inc.
Institutional Emerging Markets Portfolio
Portfolio of Investments
April 30, 2018 (unaudited) (continued)
| Shares | Value | |||||
PREFERRED STOCKS - 6.0% | ||||||
Brazil - 4.1% | ||||||
Banco Bradesco SA - ADR (Banks)* | 7,493,948 | $73,440,690 | ||||
Cia Brasileira de Distribuicao - Sponsored ADR (Food & Staples Retailing)* | 1,749,481 | 39,083,406 | ||||
Itau Unibanco Holding SA - Sponsored ADR, 0.39% (Banks)+ | 7,146,046 | 103,832,048 | ||||
| 216,356,144 | ||||||
Colombia - 1.0% | ||||||
Bancolombia SA - Sponsored ADR, 3.06% (Banks)+ | 1,100,288 | 52,439,726 | ||||
South Korea - 0.9% | ||||||
Samsung Electronics Co., Ltd. - GDR, Reg S, 4.15% (Technology Hardware & Equipment)+† | 46,537 | 45,778,193 | ||||
Total Preferred Stocks (Cost $201,073,847) |
|
$314,574,063 | ||||
| ||||||
SHORT TERM INVESTMENTS - 2.7% | ||||||
Northern Institutional Funds - Prime Obligations Portfolio, 1.86% (Money Market Funds) | 114,195,923 | 114,195,923 | ||||
Northern Institutional Funds - Treasury Portfolio, 1.50% (Money Market Funds) | 26,495,829 | 26,495,829 | ||||
Total Short Term Investments |
$140,691,752 | |||||
Total Investments — 99.8% | ||||||
(Cost $3,820,914,293) |
$5,209,462,989 | |||||
Other Assets Less Liabilities - 0.2% |
10,476,118 | |||||
Net Assets — 100.0% |
$5,219,939,107 | |||||
Summary of Abbreviations
| ADR | American Depositary Receipt. |
| CDI | Chess Depository Interest. |
| GDR | Global Depository Receipt. |
| Reg S | Security sold outside United States without registration under the Securities Act of 1933. |
| * | Non-income producing security. |
| † | Investment categorized as level 2 security as disclosed in Note 2 of the Notes to Financial Statements. |
| + | Current yield is disclosed. Dividends are calculated based on a percentage of the issuer’s net income. |
| Industry | Percentage of Net Assets | |||
Automobiles & Components | 3.3 | % | ||
Banks | 21.6 | |||
Capital Goods | 2.3 | |||
Commercial & Professional Services | 2.0 | |||
Consumer Durables & Apparel | 5.2 | |||
Consumer Services | 1.4 | |||
Diversified Financials | 2.3 | |||
Energy | 7.1 | |||
Food & Staples Retailing | 0.8 | |||
Food Beverage & Tobacco | 3.2 | |||
Household & Personal Products | 2.7 | |||
Insurance | 4.1 | |||
Materials | 1.0 | |||
Media | 0.9 | |||
Pharmaceuticals, Biotechnology & Life Sciences | 5.0 | |||
Real Estate | 0.8 | |||
Retailing | 1.8 | |||
Semiconductors & Semiconductor Equipment | 5.0 | |||
Software & Services | 8.4 | |||
Technology Hardware & Equipment | 10.1 | |||
Telecommunication Services | 2.4 | |||
Transportation | 3.4 | |||
Utilities | 2.3 | |||
Money Market Funds | 2.7 | |||
Total Investments | 99.8 | |||
Other Assets Less Liabilities | 0.2 | |||
Net Assets | 100.0 | % | ||
See Notes to Financial Statements
15
Table of Contents
Harding, Loevner Funds, Inc.
Portfolio of Investments
April 30, 2018 (unaudited)
| Shares | Value | |||||||
COMMON STOCKS - 91.1%
| ||||||||
Argentina - 0.7% | ||||||||
Banco Macro SA - ADR (Banks) | 319,700 | $30,985,324 | ||||||
Brazil - 2.6% | ||||||||
Ambev SA - ADR (Food Beverage & Tobacco) | 6,758,400 | 44,740,608 | ||||||
B3 SA - Brasil Bolsa Balcao (Diversified Financials)* | 4,982,700 | 35,984,902 | ||||||
WEG SA (Capital Goods) | 6,069,830 | 30,806,571 | ||||||
| 111,532,081 | ||||||||
Chile - 1.1% | ||||||||
Banco Santander Chile - ADR (Banks) | 1,474,200 | 48,692,826 | ||||||
China - 27.9% | ||||||||
51job Inc. - ADR (Commercial & Professional Services)* | 1,058,370 | 87,357,860 | ||||||
AAC Technologies Holdings Inc. (Technology Hardware & Equipment)† | 2,941,000 | 42,209,691 | ||||||
Alibaba Group Holding Ltd. - Sponsored ADR (Software & Services)* | 393,310 | 70,221,567 | ||||||
Baidu Inc. - Sponsored ADR (Software & Services)* | 84,409 | 21,178,218 | ||||||
China Mobile Ltd. - Sponsored ADR (Telecommunication Services) | 746,800 | 35,443,128 | ||||||
CNOOC Ltd. - Sponsored ADR (Energy) | 528,960 | 89,399,530 | ||||||
CSPC Pharmaceutical Group Ltd. (Pharmaceuticals, Biotechnology & Life Sciences)† | 12,676,000 | 32,173,568 | ||||||
Ctrip.com International Ltd. - ADR (Retailing)* | 557,800 | 22,814,020 | ||||||
ENN Energy Holdings Ltd. (Utilities)† | 10,368,700 | 97,295,597 | ||||||
Hangzhou Hikvision Digital Technology Co., Ltd., Class A (Technology Hardware & Equipment)† | 9,821,400 | 60,116,200 | ||||||
Han’s Laser Technology Industry Group Co., Ltd., Class A (Capital Goods)† | 4,401,380 | 32,649,461 | ||||||
JD.com Inc. - ADR (Retailing)* | 1,485,400 | 54,231,954 | ||||||
Jiangsu Expressway Co., Ltd., Class H (Transportation)† | 14,709,000 | 20,131,235 | ||||||
Jiangsu Hengrui Medicine Co., Ltd., Class A (Pharmaceuticals, Biotechnology & Life Sciences)† | 3,448,100 | 45,327,182 | ||||||
Midea Group Co., Ltd., Class A (Consumer Durables & Apparel)† | 7,694,100 | 63,179,106 | ||||||
NetEase Inc. - ADR (Software & Services) | 57,531 | 14,789,494 | ||||||
| Shares | Value | |||||||
COMMON STOCKS - 91.1% (continued)
|
| |||||||
China - 27.9% (continued) | ||||||||
Shenzhou International Group Holdings Ltd. (Consumer Durables & Apparel)† | 7,456,000 | $81,218,017 | ||||||
Sino Biopharmaceutical Ltd. (Pharmaceuticals, Biotechnology & Life Sciences)† | 29,433,192 | 62,004,847 | ||||||
Sunny Optical Technology Group Co. Ltd. (Technology Hardware & Equipment)† | 1,947,000 | 31,796,305 | ||||||
Tencent Holdings Ltd. (Software & Services)† | 3,665,100 | 179,943,495 | ||||||
Weibo Corp. - Sponsored ADR (Software & Services)* | 446,500 | 51,133,180 | ||||||
| 1,194,613,655 | ||||||||
Czech Republic - 1.0% | ||||||||
Komercni banka AS (Banks)† | 1,001,700 | 43,193,665 | ||||||
Egypt - 0.6% | ||||||||
Commercial International Bank Egypt SAE - GDR, Reg S (Banks)† | 5,065,731 | 25,968,695 | ||||||
Hong Kong - 6.5% | ||||||||
AIA Group Ltd. (Insurance)† | 13,194,589 | 117,803,553 | ||||||
ASM Pacific Technology Ltd. (Semiconductors & Semiconductor Equipment)† | 2,497,723 | 34,124,125 | ||||||
Hong Kong Exchanges & Clearing Ltd. (Diversified Financials)† | 1,970,651 | 63,876,655 | ||||||
Sands China Ltd. (Consumer Services)† | 10,512,944 | 60,664,255 | ||||||
| 276,468,588 | ||||||||
Hungary - 0.5% | ||||||||
Richter Gedeon Nyrt. (Pharmaceuticals, Biotechnology & Life Sciences)† | 1,164,344 | 23,544,992 | ||||||
India - 3.5% | ||||||||
Bharti Airtel Ltd. (Telecommunication Services)† | 4,132,000 | 25,288,368 | ||||||
Housing Development Finance Corp., Ltd. (Banks)† | 2,461,900 | 69,170,117 | ||||||
Maruti Suzuki India Ltd. (Automobiles & Components)† | 419,500 | 55,127,374 | ||||||
| 149,585,859 | ||||||||
Indonesia - 2.5% | ||||||||
Astra International Tbk PT (Automobiles & Components)† | 72,494,500 | 37,074,795 | ||||||
Bank Rakyat Indonesia Persero Tbk PT (Banks)† | 295,402,690 | 68,089,614 | ||||||
| 105,164,409 | ||||||||
See Notes to Financial Statements
16
Table of Contents
Harding, Loevner Funds, Inc.
Emerging Markets Portfolio
Portfolio of Investments
April 30, 2018 (unaudited) (continued)
| Shares | Value | |||||||
COMMON STOCKS - 91.1% (continued)
|
| |||||||
Italy - 1.3% | ||||||||
Tenaris SA - ADR (Energy) | 1,457,200 | $54,470,136 | ||||||
Kenya - 1.3% | ||||||||
East African Breweries Ltd. (Food Beverage & Tobacco)† | 4,829,350 | 12,053,694 | ||||||
Safaricom plc (Telecommunication Services)† | 150,735,101 | 42,422,567 | ||||||
| 54,476,261 | ||||||||
Mexico - 3.3% | ||||||||
Fomento Economico Mexicano SAB de CV - Sponsored ADR (Food Beverage & Tobacco) | 221,200 | 21,381,192 | ||||||
Grupo Aeroportuario del Sureste SAB de CV - ADR (Transportation) | 285,500 | 51,332,900 | ||||||
Grupo Financiero Banorte SAB de CV, Series O (Banks) | 10,822,740 | 67,718,621 | ||||||
| 140,432,713 | ||||||||
Panama - 0.8% | ||||||||
Copa Holdings SA, Class A (Transportation) | 296,100 | 34,694,037 | ||||||
Peru - 1.2% | ||||||||
Credicorp Ltd. (Banks) | 226,000 | 52,542,740 | ||||||
Poland - 0.6% | ||||||||
Bank Polska Kasa Opieki SA (Banks)† | 812,416 | 26,918,949 | ||||||
Russia - 6.1% | ||||||||
LUKOIL PJSC - Sponsored ADR (Energy) | 1,326,093 | 87,376,268 | ||||||
Novatek PJSC - Sponsored GDR, Reg S (Energy)† | 529,946 | 67,103,723 | ||||||
Sberbank of Russia PJSC - Sponsored ADR (Banks)† | 7,127,400 | 105,365,665 | ||||||
| 259,845,656 | ||||||||
South Africa - 6.2% | ||||||||
Aspen Pharmacare Holdings Ltd. (Pharmaceuticals, Biotechnology & Life Sciences)† | 2,459,000 | 52,959,512 | ||||||
Discovery Ltd. (Insurance)† | 4,095,300 | 56,794,327 | ||||||
Naspers Ltd., Class N (Media)† | 157,100 | 38,333,167 | ||||||
Sasol Ltd. (Materials)† | 1,196,461 | 42,827,079 | ||||||
Standard Bank Group Ltd. (Banks)† | 4,308,400 | 73,704,170 | ||||||
| 264,618,255 | ||||||||
South Korea - 8.8% | ||||||||
Amorepacific Corp. (Household & Personal Products)† | 113,977 | 37,039,604 | ||||||
Hankook Tire Co., Ltd. (Automobiles & Components)† | 1,048,738 | 48,452,832 | ||||||
| Shares | Value | |||||||
COMMON STOCKS - 91.1% (continued)
|
| |||||||
South Korea - 8.8% (continued) | ||||||||
Hanssem Co., Ltd. (Consumer Durables & Apparel)† | 188,307 | $20,459,151 | ||||||
LG Household & Health Care Ltd. (Household & Personal Products)† | 59,800 | 76,622,000 | ||||||
NAVER Corp. (Software & Services)† | 30,769 | 20,525,642 | ||||||
Samsung Electronics Co., Ltd. - GDR (Technology Hardware & Equipment)† | 139,162 | 171,859,795 | ||||||
| 374,959,024 | ||||||||
Taiwan - 8.1% | ||||||||
Advantech Co., Ltd. (Technology Hardware & Equipment)† | 1,198,405 | 8,232,862 | ||||||
Airtac International Group (Capital Goods)† | 2,048,397 | 35,413,744 | ||||||
Eclat Textile Co., Ltd. (Consumer Durables & Apparel)† | 3,321,216 | 40,054,863 | ||||||
Hon Hai Precision Industry Co., Ltd. (Technology Hardware & Equipment)† | 15,691,171 | 43,680,331 | ||||||
Largan Precision Co., Ltd. (Technology Hardware & Equipment)† | 336,001 | 38,983,480 | ||||||
Taiwan Semiconductor Manufacturing Co., Ltd. (Semiconductors & Semiconductor Equipment)† | 23,885,637 | 181,064,400 | ||||||
| 347,429,680 | ||||||||
Thailand - 1.2% | ||||||||
Siam Commercial Bank pcl, Reg S (Banks)† | 12,171,600 | 50,522,167 | ||||||
Turkey - 1.1% | ||||||||
Arcelik AS (Consumer Durables & Apparel)† | 3,960,900 | 17,608,572 | ||||||
Turkiye Garanti Bankasi AS (Banks)† | 14,035,600 | 31,666,699 | ||||||
| 49,275,271 | ||||||||
United Arab Emirates - 1.8% | ||||||||
DP World Ltd. (Transportation)† | 1,844,700 | 40,955,795 | ||||||
Emaar Properties PJSC (Real Estate)† | 23,036,666 | 36,186,923 | ||||||
| 77,142,718 | ||||||||
United Kingdom - 2.4% | ||||||||
BGEO Group plc (Banks)† | 830,654 | 39,617,175 | ||||||
Coca-Cola HBC AG - CDI (Food Beverage & Tobacco)*† | 1,680,700 | 56,454,360 | ||||||
Nostrum Oil & Gas plc (Energy)*† | 1,220,694 | 4,996,179 | ||||||
| 101,067,714 | ||||||||
Total Common Stocks (Cost $2,639,762,764) |
| $3,898,145,415 | ||||||
See Notes to Financial Statements
17
Table of Contents
Harding, Loevner Funds, Inc.
Emerging Markets Portfolio
Portfolio of Investments
April 30, 2018 (unaudited) (continued)
| Shares | Value | |||||
PREFERRED STOCKS - 6.0% | ||||||
Brazil - 4.1% | ||||||
Banco Bradesco SA - ADR (Banks)* | 6,143,060 | $60,201,988 | ||||
Cia Brasileira de Distribuicao - Sponsored ADR (Food & Staples Retailing)* | 1,434,100 | 32,037,794 | ||||
Itau Unibanco Holding SA - Sponsored ADR, 0.39% (Banks)+ | 5,857,800 | 85,113,834 | ||||
| 177,353,616 | ||||||
Colombia - 1.0% | ||||||
Bancolombia SA - Sponsored ADR, 3.06% (Banks)+ | 901,900 | 42,984,554 | ||||
South Korea - 0.9% | ||||||
Samsung Electronics Co., Ltd. - GDR, Reg S, 4.15% (Technology Hardware & Equipment)+† | 37,882 | 37,264,316 | ||||
Total Preferred Stocks (Cost $144,453,481) |
| $257,602,486 | ||||
SHORT TERM INVESTMENTS - 2.6% | ||||||
Northern Institutional Funds - Prime Obligations Portfolio, 1.86% (Money Market Funds) | 84,392,894 | 84,392,894 | ||||
Northern Institutional Funds - Treasury Portfolio, 1.50% (Money Market Funds) | 26,952,515 | 26,952,515 | ||||
Total Short Term Investments (Cost $111,341,565) | $111,345,409 | |||||
Total Investments — 99.7% | ||||||
(Cost $2,895,557,810) | $4,267,093,310 | |||||
Other Assets Less Liabilities - 0.3% | 12,349,603 | |||||
Net Assets — 100.0% | $4,279,442,913 | |||||
Summary of Abbreviations
| ADR | American Depositary Receipt. |
| CDI | Chess Depository Interest. |
| GDR | Global Depository Receipt. |
| Reg S | Security sold outside United States without registration under the Securities Act of 1933. |
| * | Non-income producing security. |
| † | Investment categorized as level 2 security as disclosed in Note 2 of the Notes to Financial Statements. |
| + | Current yield is disclosed. Dividends are calculated based on a percentage of the issuer’s net income. |
| Industry | Percentage of Net Assets | |
Automobiles & Components | 3.3% | |
Banks | 21.6 | |
Capital Goods | 2.3 | |
Commercial & Professional Services | 2.0 | |
Consumer Durables & Apparel | 5.2 | |
Consumer Services | 1.4 | |
Diversified Financials | 2.3 | |
Energy | 7.1 | |
Food & Staples Retailing | 0.8 | |
Food Beverage & Tobacco | 3.1 | |
Household & Personal Products | 2.7 | |
Insurance | 4.1 | |
Materials | 1.0 | |
Media | 0.9 | |
Pharmaceuticals, Biotechnology & Life Sciences | 5.1 | |
Real Estate | 0.8 | |
Retailing | 1.8 | |
Semiconductors & Semiconductor Equipment | 5.0 | |
Software & Services | 8.4 | |
Technology Hardware & Equipment | 10.1 | |
Telecommunication Services | 2.4 | |
Transportation | 3.4 | |
Utilities | 2.3 | |
Money Market Funds | 2.6 | |
Total Investments | 99.7 | |
Other Assets Less Liabilities | 0.3 | |
Net Assets | 100.0% | |
See Notes to Financial Statements
18
Table of Contents
Frontier Emerging Markets Portfolio
Portfolio of Investments
April 30, 2018 (unaudited)
| Shares | Value | |||||||
COMMON STOCKS - 92.3% | ||||||||
Argentina - 11.2% | ||||||||
Banco Macro SA - ADR (Banks) | 169,797 | $ | 16,456,725 | |||||
Cablevision Holding SA - Sponsored GDR (Media)#*† | 269,626 | 5,379,389 | ||||||
Globant SA (Software & Services)* | 228,413 | 10,280,869 | ||||||
Grupo Clarin SA, Class B - GDR Reg S (Media)#† | 79,685 | 427,263 | ||||||
Grupo Financiero Galicia SA - ADR (Banks) | 234,129 | 14,965,526 | ||||||
Telecom Argentina SA - Sponsored ADR (Telecommunication Services) | 326,000 | 9,793,040 | ||||||
| 57,302,812 | ||||||||
Bangladesh - 5.1% | ||||||||
BRAC Bank Ltd. (Banks)*† | 905,250 | 956,256 | ||||||
GrameenPhone Ltd. (Telecommunication Services)† | 1,331,600 | 7,529,907 | ||||||
Olympic Industries Ltd. (Food Beverage & Tobacco)† | 1,065,417 | 3,396,161 | ||||||
Square Pharmaceuticals Ltd. (Pharmaceuticals, Biotechnology & Life Sciences)† | 3,779,521 | 13,974,782 | ||||||
| 25,857,106 | ||||||||
Colombia - 7.0% | ||||||||
Cementos Argos SA - Sponsored ADR (Materials)#† | 514,200 | 9,088,793 | ||||||
CEMEX Latam Holdings SA (Materials)* | 980,500 | 3,022,879 | ||||||
Ecopetrol SA - Sponsored ADR (Energy) | 938,621 | 20,724,752 | ||||||
Grupo Nutresa SA (Food Beverage & Tobacco) | 312,300 | 3,024,100 | ||||||
| 35,860,524 | ||||||||
Croatia - 0.5% | ||||||||
Ericsson Nikola Tesla (Technology Hardware & Equipment)† | 14,550 | 2,490,040 | ||||||
Egypt - 4.2% | ||||||||
Commercial International Bank Egypt SAE - GDR, Reg S (Banks)† | 2,555,400 | 13,099,867 | ||||||
Integrated Diagnostics Holdings plc (Health Care Equipment & Services)† | 1,385,100 | 6,593,634 | ||||||
Oriental Weavers (Consumer Durables & Apparel)† | 2,068,725 | 1,771,697 | ||||||
| 21,465,198 | ||||||||
Estonia - 0.7% | ||||||||
Tallink Grupp AS (Transportation)† | 2,640,800 | 3,361,691 | ||||||
| Shares | Value | |||||||
COMMON STOCKS - 92.3% (continued) |
| |||||||
Kazakhstan - 1.0% | ||||||||
Halyk Savings Bank of Kazakhstan JSC - GDR, Reg S (Banks)† | 418,287 | $ | 5,221,001 | |||||
Kenya - 4.9% | ||||||||
East African Breweries Ltd. (Food Beverage & Tobacco)† | 935,700 | 2,335,437 | ||||||
Safaricom plc (Telecommunication Services)† | 80,634,850 | 22,693,701 | ||||||
| 25,029,138 | ||||||||
Kuwait - 1.7% | ||||||||
Kuwait Projects Co. Holding KSCP (Diversified Financials)† | 712,110 | 583,923 | ||||||
Mabanee Co. SAK (Real Estate)† | 747,495 | 1,580,537 | ||||||
National Bank of Kuwait SAKP (Banks)† | 2,538,453 | 6,289,730 | ||||||
| 8,454,190 | ||||||||
Morocco - 3.0% | ||||||||
Attijariwafa Bank (Banks)† | 115,800 | 6,358,112 | ||||||
Maroc Telecom (Telecommunication Services)† | 250,300 | 4,256,360 | ||||||
Societe d’Exploitation des Ports (Transportation)† | 221,700 | 4,576,343 | ||||||
| 15,190,815 | ||||||||
Nigeria - 5.9% | ||||||||
Access Bank plc (Banks)† | 121,738,600 | 3,788,908 | ||||||
Dangote Cement plc (Materials)† | 7,077,500 | 4,838,086 | ||||||
Guaranty Trust Bank plc (Banks)† | 78,843,224 | 9,856,270 | ||||||
Lafarge Africa plc (Materials)† | 1,100,000 | 128,243 | ||||||
Nestle Nigeria plc (Food Beverage & Tobacco)† | 551,600 | 2,447,390 | ||||||
Nigerian Breweries plc (Food Beverage & Tobacco)† | 3,894,100 | 1,404,500 | ||||||
Zenith Bank plc (Banks)† | 100,704,392 | 7,699,112 | ||||||
| 30,162,509 | ||||||||
Pakistan - 2.5% | ||||||||
Engro Corp., Ltd. (Materials)† | 532,092 | 1,437,765 | ||||||
Lucky Cement Ltd. (Materials)† | 114,500 | 654,223 | ||||||
Maple Leaf Cement Factory Ltd. (Materials)† | 1,624,000 | 971,467 | ||||||
MCB Bank Ltd. (Banks)† | 1,393,700 | 2,516,768 | ||||||
Oil & Gas Development Co., Ltd. (Energy)† | 1,173,400 | 1,692,991 | ||||||
Pakistan Petroleum Ltd. (Energy)† | 2,236,597 | 4,148,137 | ||||||
United Bank Ltd. (Banks)† | 849,000 | 1,475,772 | ||||||
| 12,897,123 | ||||||||
See Notes to Financial Statements
19
Table of Contents
Harding, Loevner Funds, Inc.
Frontier Emerging Markets Portfolio
Portfolio of Investments
April 30, 2018 (unaudited) (continued)
| Shares | Value | |||||||
COMMON STOCKS - 92.3% (continued) |
| |||||||
Peru - 7.6% | ||||||||
Alicorp SAA (Food Beverage & Tobacco) | 4,664,646 | $ | 17,135,727 | |||||
Credicorp Ltd. (Banks) | 80,201 | 18,645,930 | ||||||
Ferreycorp SAA (Capital Goods) | 3,366,100 | 2,721,440 | ||||||
| 38,503,097 | ||||||||
Philippines - 15.7% | ||||||||
Bank of the Philippine Islands (Banks)† | 5,597,754 | 11,351,534 | ||||||
BDO Unibank Inc. (Banks)† | 3,040,518 | 7,706,557 | ||||||
International Container Terminal Services Inc. (Transportation)† | 2,847,620 | 4,638,181 | ||||||
Jollibee Foods Corp. (Consumer Services)† | 3,761,200 | 20,670,866 | ||||||
Robinsons Retail Holdings Inc. (Food & Staples Retailing)† | 5,324,100 | 9,355,011 | ||||||
Security Bank Corp. (Banks)† | 2,498,400 | 10,053,778 | ||||||
SM Prime Holdings Inc. (Real Estate)† | 20,436,600 | 13,479,125 | ||||||
Universal Robina Corp. (Food Beverage & Tobacco)† | 1,117,100 | 3,031,606 | ||||||
| 80,286,658 | ||||||||
Romania - 3.1% | ||||||||
Banca Transilvania SA (Banks)† | 15,322,163 | 10,162,003 | ||||||
Societatea Nationala de Gaze Naturale ROMGAZ SA (Energy)† | 585,700 | 5,635,368 | ||||||
| 15,797,371 | ||||||||
Senegal - 0.8% | ||||||||
Sonatel SA (Telecommunication Services) | 98,400 | 4,260,692 | ||||||
Slovenia - 0.6% | ||||||||
Krka dd Novo mesto (Pharmaceuticals, Biotechnology & Life Sciences)† | 46,124 | 3,218,785 | ||||||
Sri Lanka - 0.5% | ||||||||
Commercial Bank of Ceylon plc (Banks)† | 1,271,674 | 1,090,235 | ||||||
John Keells Holdings plc (Capital Goods)† | 1,257,142 | 1,311,435 | ||||||
| 2,401,670 | ||||||||
Tanzania - 0.3% | ||||||||
Tanzania Breweries Ltd. (Food Beverage & Tobacco) | 208,066 | 1,458,194 | ||||||
Thailand - 1.4% | ||||||||
Home Product Center pcl, Reg S (Retailing)† | 11,339,094 | 5,389,303 | ||||||
Siam Commercial Bank pcl, Reg S (Banks)† | 393,600 | 1,633,764 | ||||||
| 7,023,067 | ||||||||
| Shares | Value | |||||||
COMMON STOCKS - 92.3% (continued) |
| |||||||
Turkey - 0.3% | ||||||||
Turkiye Garanti Bankasi AS (Banks)† | 674,500 | $ | 1,521,787 | |||||
Ukraine - 1.3% | ||||||||
Kernel Holding SA (Food Beverage & Tobacco)† | 286,400 | 3,875,500 | ||||||
MHP SE - GDR (Food Beverage & Tobacco)† | 222,939 | 2,943,807 | ||||||
| 6,819,307 | ||||||||
United Arab Emirates - 3.5% | ||||||||
Agthia Group PJSC (Food Beverage & Tobacco)† | 2,931,716 | 3,468,945 | ||||||
DP World Ltd. (Transportation)† | 243,700 | 5,410,596 | ||||||
Emaar Properties PJSC (Real Estate)† | 5,788,200 | 9,092,338 | ||||||
| 17,971,879 | ||||||||
United Kingdom - 1.7% | ||||||||
BGEO Group plc (Banks)† | 37,900 | 1,807,601 | ||||||
Nostrum Oil & Gas plc (Energy)*† | 1,708,869 | 6,994,231 | ||||||
| 8,801,832 | ||||||||
United States - 0.3% | ||||||||
PriceSmart Inc. (Food & Staples Retailing) | 18,377 | 1,609,825 | ||||||
Vietnam - 7.5% | ||||||||
Hoa Phat Group JSC (Materials)*† | 8,649,302 | 20,313,217 | ||||||
Masan Group Corp. (Food Beverage & Tobacco)*† | 992,050 | 4,000,487 | ||||||
Vietnam Dairy Products JSC (Food Beverage & Tobacco)† | 1,692,200 | 13,752,009 | ||||||
| 38,065,713 | ||||||||
Total Common Stocks (Cost $371,564,950) |
| $ | 471,032,024 | |||||
|
| |||||||
PREFERRED STOCKS - 2.2% | ||||||||
Colombia - 2.2% | ||||||||
Bancolombia SA - Sponsored ADR, 3.06% (Banks)+ | 229,351 | 10,930,869 | ||||||
| ||||||||
Total Preferred Stocks (Cost $8,198,124) |
| $ | 10,930,869 | |||||
|
| |||||||
PARTICIPATION NOTES - 5.2% | ||||||||
Saudi Arabia - 5.2% | ||||||||
Al Rajhi Bank, Issued by JP Morgan Structured Products, Maturity Date 12/5/19 (Banks)^† | 566,100 | 12,653,899 | ||||||
Herfy Food Services Co., Issued by JP Morgan Structured Products, Maturity Date 1/14/19 (Consumer Services)^† | 104,620 | 1,323,157 | ||||||
See Notes to Financial Statements
20
Table of Contents
Harding, Loevner Funds, Inc.
Frontier Emerging Markets Portfolio
Portfolio of Investments
April 30, 2018 (unaudited) (continued)
| Shares | Value | |||||
PARTICIPATION NOTES - 5.2% (continued) | ||||||
Saudi Arabia - 5.2% (continued) | ||||||
Jarir Marketing Co., Issued by HSBC BANK PLC, Maturity Date 1/19/21 (Retailing)^† | 276,500 | $12,649,447 | ||||
| 26,626,503 | ||||||
Total Participation Notes (Cost $23,050,221) | $26,626,503 | |||||
| ||||||
SHORT TERM INVESTMENTS - 0.8% | ||||||
Northern Institutional Funds - Treasury Portfolio, 1.50% (Money Market Funds) | 4,214,737 | 4,214,737 | ||||
| ||||||
Total Short Term Investments (Cost $4,214,737) |
| $4,214,737 | ||||
|
| |||||
Total Investments — 100.5% | ||||||
(Cost $407,028,032) | $512,804,133 | |||||
Liabilities Less Other Assets - (0.5)% | (2,660,355) | |||||
Net Assets — 100.0% | $510,143,778 | |||||
Summary of Abbreviations
| ADR | American Depositary Receipt. |
| GDR | Global Depository Receipt. |
| Reg S | Security sold outside United States without registration under the Securities Act of 1933. |
| # | Security valued at fair value as determined in good faith under policies and procedures established by and under the supervision of the Portfolio’s Board of Directors as disclosed in Note 2 of the Notes to Financial Statements. |
| * | Non-income producing security. |
| † | Investment categorized as level 2 security as disclosed in Note 2 of the Notes to Financial Statements. |
| + | Current yield is disclosed. Dividends are calculated based on a percentage of the issuer’s net income. |
| ^ | Security exempt from registration pursuant to Rule 144A of the Securities Act of 1933. These securities, which represent 5.2% of net assets as of April 30, 2018, are considered liquid and may be resold in transactions exempt from registration, normally to qualified buyers. |
| Industry | Percentage of Net Assets | |||
Banks | 34.6 | % | ||
Capital Goods | 0.8 | |||
Consumer Durables & Apparel | 0.4 | |||
Consumer Services | 4.3 | |||
Diversified Financials | 0.1 | |||
Energy | 7.7 | |||
Food & Staples Retailing | 2.2 | |||
Food Beverage & Tobacco | 12.2 | |||
Health Care Equipment & Services | 1.3 | |||
Materials | 7.9 | |||
Media | 1.1 | |||
Pharmaceuticals, Biotechnology & Life Sciences | 3.4 | |||
Real Estate | 4.7 | |||
Retailing | 3.5 | |||
Software & Services | 2.0 | |||
Technology Hardware & Equipment | 0.5 | |||
Telecommunication Services | 9.5 | |||
Transportation | 3.5 | |||
Money Market Fund | 0.8 | |||
Total Investments | 100.5 | |||
Liabilities Less Other Assets | (0.5 | ) | ||
Net Assets | 100.0 | % | ||
See Notes to Financial Statements
21
Table of Contents
Harding, Loevner Funds, Inc.
Global Equity Research Portfolio
Portfolio of Investments
April 30, 2018 (unaudited)
| Shares | Value | |||||||
COMMON STOCKS - 98.4%
| ||||||||
Argentina - 0.9% | ||||||||
Banco Macro SA - ADR (Banks) | 250 | $24,230 | ||||||
Globant SA (Software & Services)* | 290 | 13,053 | ||||||
Telecom Argentina SA - Sponsored ADR (Telecommunication Services) | 598 | 17,964 | ||||||
| 55,247 | ||||||||
Australia - 1.1% | ||||||||
CSL Ltd. (Pharmaceuticals, Biotechnology & Life Sciences)† | 180 | 22,984 | ||||||
DuluxGroup Ltd. (Materials)† | 4,340 | 25,258 | ||||||
SEEK Ltd. (Commercial & Professional Services)† | 1,370 | 19,947 | ||||||
| 68,189 | ||||||||
Belgium - 0.7% | ||||||||
Anheuser-Busch InBev SA (Food Beverage & | 463 | 45,841 | ||||||
Brazil - 0.7% | ||||||||
Ambev SA - ADR (Food Beverage & Tobacco) | 1,430 | 9,467 | ||||||
B3 SA - Brasil Bolsa Balcao (Diversified Financials)* | 1,200 | 8,666 | ||||||
CCR SA (Transportation) | 2,500 | 8,535 | ||||||
Raia Drogasil SA (Food & Staples Retailing)* | 400 | 7,853 | ||||||
Ultrapar Participacoes SA - Sponsored ADR (Energy) | 340 | 5,889 | ||||||
| 40,410 | ||||||||
Canada - 1.8% | ||||||||
Alimentation Couche-Tard Inc. (Food & Staples Retailing) | 800 | 35,079 | ||||||
Canadian National Railway Co. (Transportation) | 600 | 46,368 | ||||||
Cenovus Energy Inc. (Energy) | 1,500 | 15,024 | ||||||
Encana Corp. (Energy) | 1,110 | 13,853 | ||||||
| 110,324 | ||||||||
China - 5.8% | ||||||||
51job Inc. - ADR (Commercial & Professional | 320 | 26,413 | ||||||
AAC Technologies Holdings Inc. (Technology Hardware & Equipment)† | 670 | 9,616 | ||||||
Alibaba Group Holding Ltd. - Sponsored ADR (Software & Services)* | 55 | 9,820 | ||||||
ANTA Sports Products Ltd. (Consumer Durables & Apparel)† | 3,000 | 17,130 | ||||||
Baidu Inc. - Sponsored ADR (Software & Services)* | 40 | 10,036 | ||||||
| Shares | Value | |||||||
COMMON STOCKS - 98.4% (continued)
| ||||||||
China - 5.8% (continued) | ||||||||
China Mobile Ltd. - Sponsored ADR (Telecommunication Services) | 130 | $6,170 | ||||||
CNOOC Ltd. - Sponsored ADR (Energy) | 119 | 20,112 | ||||||
CSPC Pharmaceutical Group Ltd. (Pharmaceuticals, Biotechnology & Life Sciences)† | 4,000 | 10,152 | ||||||
ENN Energy Holdings Ltd. (Utilities)† | 2,000 | 18,767 | ||||||
Fuyao Glass Industry Group Co., Ltd., Class H (Automobiles & Components)† | 5,200 | 17,855 | ||||||
Gree Electric Appliances Inc. of Zhuhai, Class A (Consumer Durables & Apparel)† | 1,700 | 11,909 | ||||||
Haitian International Holdings Ltd. (Capital Goods)† | 4,000 | 10,635 | ||||||
Hangzhou Hikvision Digital Technology Co., Ltd., Class A (Technology Hardware & Equipment)† | 2,250 | 13,772 | ||||||
Inner Mongolia Yili Industrial Group Co., Ltd., Class A (Food Beverage & Tobacco)† | 2,900 | 12,090 | ||||||
JD.com Inc. - ADR (Retailing)* | 270 | 9,858 | ||||||
Jiangsu Expressway Co., Ltd., Class H (Transportation)† | 6,000 | 8,212 | ||||||
Jiangsu Hengrui Medicine Co., Ltd., Class A (Pharmaceuticals, Biotechnology & Life Sciences)† | 900 | 11,781 | ||||||
Midea Group Co., Ltd., Class A (Consumer Durables & Apparel)† | 1,500 | 12,317 | ||||||
NetEase Inc. - ADR (Software & Services) | 27 | 6,941 | ||||||
New Oriental Education & Technology Group Inc. - Sponsored ADR (Consumer Services) | 100 | 8,984 | ||||||
Shenzhou International Group Holdings Ltd. (Consumer Durables & Apparel)† | 1,000 | 10,893 | ||||||
Sino Biopharmaceutical Ltd. (Pharmaceuticals, Biotechnology & Life Sciences)† | 12,000 | 25,279 | ||||||
Sun Art Retail Group Ltd. (Food & Staples Retailing)† | 8,000 | 8,988 | ||||||
Sunny Optical Technology Group Co. Ltd. (Technology Hardware & Equipment)† | 500 | 8,165 | ||||||
Suofeiya Home Collection Co., Ltd., Class A (Consumer Durables & Apparel)† | 1,800 | 9,192 | ||||||
See Notes to Financial Statements
22
Table of Contents
Harding, Loevner Funds, Inc.
Global Equity Research Portfolio
Portfolio of Investments
April 30, 2018 (unaudited) (continued)
| Shares | Value | |||||||
COMMON STOCKS - 98.4% (continued)
| ||||||||
China - 5.8% (continued) | ||||||||
Tencent Holdings Ltd. (Software & Services)† | 300 | $14,729 | ||||||
Tingyi Cayman Islands Holding Corp. (Food Beverage & Tobacco)† | 6,000 | 11,363 | ||||||
Wuxi Biologics Cayman Inc. (Pharmaceuticals, Biotechnology & Life Sciences)*† | 2,000 | 18,085 | ||||||
| 359,264 | ||||||||
Colombia - 0.7% | ||||||||
Cementos Argos SA - Sponsored ADR (Materials)#† | 370 | 6,540 | ||||||
CEMEX Latam Holdings SA (Materials)* | 2,090 | 6,444 | ||||||
Ecopetrol SA - Sponsored ADR (Energy) | 800 | 17,664 | ||||||
Grupo Nutresa SA (Food Beverage & Tobacco) | 1,370 | 13,266 | ||||||
| 43,914 | ||||||||
Czech Republic - 0.2% | ||||||||
Komercni banka AS (Banks)† | 350 | 15,092 | ||||||
Denmark - 0.4% | ||||||||
Chr Hansen Holding A/S (Materials)† | 150 | 13,598 | ||||||
Novozymes A/S, Class B (Materials)† | 290 | 13,672 | ||||||
| 27,270 | ||||||||
Egypt - 0.5% | ||||||||
Commercial International Bank Egypt SAE - GDR, Reg S (Banks)† | 6,189 | 31,727 | ||||||
France - 1.2% | ||||||||
Air Liquide SA (Materials)† | 105 | 13,642 | ||||||
Dassault Systemes SE (Software & Services)† | 130 | 16,788 | ||||||
Essilor International Cie Generale d’Optique SA (Health Care Equipment & Services)† | 320 | 43,550 | ||||||
| 73,980 | ||||||||
Germany - 2.9% | ||||||||
adidas AG (Consumer Durables & Apparel)† | 60 | 14,753 | ||||||
Allianz SE, Reg S (Insurance)† | 60 | 14,194 | ||||||
Bayer AG, Reg S (Pharmaceuticals, Biotechnology & Life Sciences)† | 100 | 11,971 | ||||||
Bayerische Motoren Werke AG (Automobiles & Components)† | 350 | 39,063 | ||||||
FUCHS PETROLUB SE (Materials)† | 220 | 11,310 | ||||||
| Shares | Value | |||||||
COMMON STOCKS - 98.4% (continued)
| ||||||||
Germany - 2.9% (continued) | ||||||||
Henkel AG & Co. KGaA (Household & Personal Products)† | 90 | $10,736 | ||||||
Infineon Technologies AG (Semiconductors & Semiconductor Equipment)† | 1,190 | 30,478 | ||||||
Linde AG (Materials)*† | 110 | 24,444 | ||||||
SAP SE - Sponsored ADR (Software & Services) | 110 | 12,191 | ||||||
Symrise AG (Materials)† | 160 | 12,923 | ||||||
| 182,063 | ||||||||
Hong Kong - 1.3% | ||||||||
AIA Group Ltd. (Insurance)† | 1,600 | 14,285 | ||||||
ASM Pacific Technology Ltd. (Semiconductors & Semiconductor Equipment)† | 1,000 | 13,662 | ||||||
Hong Kong Exchanges & Clearing Ltd. (Diversified Financials)† | 400 | 12,965 | ||||||
Sands China Ltd. (Consumer Services)† | 6,400 | 36,931 | ||||||
| 77,843 | ||||||||
India - 3.3% | ||||||||
Asian Paints Ltd. (Materials)† | 460 | 8,248 | ||||||
Bharti Infratel Ltd. (Telecommunication Services)† | 4,020 | 18,786 | ||||||
Dabur India Ltd. (Household & Personal Products)† | 1,710 | 9,434 | ||||||
Emami Ltd. (Household & Personal Products)† | 450 | 7,499 | ||||||
Godrej Consumer Products Ltd. (Household & Personal Products)† | 600 | 10,018 | ||||||
HDFC Bank Ltd. - ADR (Banks) | 250 | 23,953 | ||||||
Housing Development Finance Corp., Ltd. (Banks)† | 390 | 10,958 | ||||||
ICICI Bank Ltd. - Sponsored ADR (Banks) | 1,034 | 8,799 | ||||||
Infosys Ltd. - Sponsored ADR (Software & Services) | 3,310 | 58,488 | ||||||
ITC Ltd. (Food Beverage & Tobacco)† | 2,090 | 8,786 | ||||||
Kotak Mahindra Bank Ltd. (Banks)† | 590 | 10,670 | ||||||
Max Financial Services Ltd. (Insurance)*† | 1,630 | 12,545 | ||||||
Pidilite Industries Ltd. (Materials)† | 1,120 | 18,221 | ||||||
| 206,405 | ||||||||
Indonesia - 0.7% | ||||||||
Bank Central Asia Tbk PT (Banks)† | 28,000 | 44,275 | ||||||
See Notes to Financial Statements
23
Table of Contents
Harding, Loevner Funds, Inc.
Global Equity Research Portfolio
Portfolio of Investments
April 30, 2018 (unaudited) (continued)
| Shares | Value | |||||||
COMMON STOCKS - 98.4% (continued)
| ||||||||
Israel - 0.7% | ||||||||
Check Point Software Technologies Ltd. (Software & Services)* | 450 | $43,429 | ||||||
Italy - 0.4% | ||||||||
Tenaris SA - ADR (Energy) | 720 | 26,914 | ||||||
Japan - 10.5% | ||||||||
ABC-Mart Inc. (Retailing)† | 700 | 46,105 | ||||||
Asics Corp. (Consumer Durables & Apparel)† | 1,000 | 18,842 | ||||||
Dentsu Inc. (Media)† | 500 | 23,624 | ||||||
FANUC Corp. (Capital Goods)† | 200 | 43,040 | ||||||
Hakuhodo DY Holdings Inc. (Media)† | 3,100 | 43,386 | ||||||
Hoshizaki Corp. (Capital Goods)† | 200 | 18,565 | ||||||
Kakaku.com Inc. (Software & Services)† | 600 | 11,441 | ||||||
Kao Corp. (Household & Personal Products)† | 740 | 53,123 | ||||||
Komatsu Ltd. (Capital Goods)† | 900 | 30,746 | ||||||
Kubota Corp. (Capital Goods)† | 1,600 | 27,033 | ||||||
M3 Inc. (Health Care Equipment & Services)† | 400 | 15,060 | ||||||
Makita Corp. (Capital Goods)† | 1,200 | 53,802 | ||||||
MISUMI Group Inc. (Capital Goods)† | 400 | 11,070 | ||||||
NGK Insulators Ltd. (Capital Goods)† | 700 | 12,837 | ||||||
Nomura Research Institute Ltd. (Software & Services)† | 330 | 17,036 | ||||||
Park24 Co., Ltd. (Commercial & Professional | 1,000 | 28,344 | ||||||
Rinnai Corp. (Consumer Durables & Apparel)† | 540 | 53,678 | ||||||
Shiseido Co., Ltd. (Household & Personal | 500 | 32,438 | ||||||
SMC Corp. (Capital Goods)† | 40 | 15,241 | ||||||
Stanley Electric Co., Ltd. (Automobiles & | 500 | 18,107 | ||||||
Sugi Holdings Co., Ltd. (Food & Staples Retailing)† | 500 | 29,062 | ||||||
Sysmex Corp. (Health Care Equipment & Services)† | 200 | 17,657 | ||||||
Unicharm Corp. (Household & Personal Products)† | 1,000 | 28,107 | ||||||
| 648,344 | ||||||||
Mexico - 1.2% | ||||||||
Banco Santander Mexico SA Institucion de Banca Multiple Grupo Financiero Santand - ADR (Banks) | 1,000 | 7,330 | ||||||
Coca-Cola Femsa SAB de CV - Sponsored ADR (Food Beverage & Tobacco) | 110 | 7,220 | ||||||
| Shares | Value | |||||||
COMMON STOCKS - 98.4% (continued)
| ||||||||
Mexico - 1.2% (continued) | ||||||||
El Puerto de Liverpool SAB de CV, Series C1 (Retailing) | 1,100 | $7,339 | ||||||
Fomento Economico Mexicano SAB de CV - Sponsored ADR (Food Beverage & Tobacco) | 90 | 8,699 | ||||||
Grupo Bimbo SAB de CV, Series A (Food Beverage & Tobacco) | 4,200 | 9,776 | ||||||
Grupo Financiero Banorte SAB de CV, Series O (Banks) | 1,400 | 8,760 | ||||||
Grupo Televisa SAB - Sponsored ADR (Media) | 710 | 12,723 | ||||||
Wal-Mart de Mexico SAB de CV (Food & Staples Retailing) | 3,700 | 10,282 | ||||||
| 72,129 | ||||||||
Netherlands - 0.3% | ||||||||
ASML Holding NV, Reg S (Semiconductors & Semiconductor Equipment) | 90 | 16,960 | ||||||
Pakistan - 0.3% | ||||||||
Lucky Cement Ltd. (Materials)† | 2,750 | 15,713 | ||||||
Panama - 0.2% | ||||||||
Copa Holdings SA, Class A (Transportation) | 110 | 12,889 | ||||||
Peru - 0.7% | ||||||||
Alicorp SAA (Food Beverage & Tobacco) | 9,290 | 34,127 | ||||||
Credicorp Ltd. (Banks) | 50 | 11,625 | ||||||
| 45,752 | ||||||||
Philippines - 1.1% | ||||||||
Bank of the Philippine Islands (Banks)† | 4,772 | 9,677 | ||||||
BDO Unibank Inc. (Banks)† | 3,320 | 8,415 | ||||||
Jollibee Foods Corp. (Consumer Services)† | 1,710 | 9,398 | ||||||
Robinsons Retail Holdings Inc. (Food & Staples Retailing)† | 10,510 | 18,467 | ||||||
Security Bank Corp. (Banks)† | 3,360 | 13,521 | ||||||
SM Prime Holdings Inc. (Real Estate)† | 12,800 | 8,442 | ||||||
| 67,920 | ||||||||
Qatar - 0.4% | ||||||||
Qatar Electricity & Water Co. QSC (Utilities)† | 260 | 14,115 | ||||||
Qatar National Bank QPSC (Banks)† | 290 | 12,008 | ||||||
| 26,123 | ||||||||
Russia - 0.7% | ||||||||
LUKOIL PJSC - Sponsored ADR (Energy) | 130 | 8,566 | ||||||
See Notes to Financial Statements
24
Table of Contents
Harding, Loevner Funds, Inc.
Global Equity Research Portfolio
Portfolio of Investments
April 30, 2018 (unaudited) (continued)
| Shares | Value | |||||||
COMMON STOCKS - 98.4% (continued)
| ||||||||
Russia - 0.7% (continued) | ||||||||
Moscow Exchange MICEX-RTS PJSC (Diversified Financials)† | 3,590 | $6,883 | ||||||
Novatek PJSC - Sponsored GDR, Reg S (Energy)† | 50 | 6,331 | ||||||
Sberbank of Russia PJSC - Sponsored ADR (Banks)† | 620 | 9,166 | ||||||
Yandex NV, Class A (Software & Services)* | 274 | 9,141 | ||||||
| 40,087 | ||||||||
Singapore - 1.2% | ||||||||
DBS Group Holdings Ltd. (Banks)† | 2,000 | 46,202 | ||||||
Oversea-Chinese Banking Corp. Ltd. (Banks)† | 2,635 | 27,194 | ||||||
| 73,396 | ||||||||
South Africa - 1.1% | ||||||||
Aspen Pharmacare Holdings Ltd. (Pharmaceuticals, Biotechnology & Life Sciences)† | 360 | 7,753 | ||||||
Clicks Group Ltd. (Food & Staples Retailing)† | 1,520 | 25,788 | ||||||
Discovery Ltd. (Insurance)† | 850 | 11,788 | ||||||
Standard Bank Group Ltd. (Banks)† | 640 | 10,949 | ||||||
Tiger Brands Ltd. (Food Beverage & Tobacco)† | 290 | 9,047 | ||||||
| 65,325 | ||||||||
South Korea - 0.8% | ||||||||
Amorepacific Corp. (Household & Personal Products)† | 40 | 12,999 | ||||||
Coway Co., Ltd. (Consumer Durables & Apparel)† | 90 | 7,360 | ||||||
Hankook Tire Co., Ltd. (Automobiles & Components)† | 150 | 6,930 | ||||||
Hanssem Co., Ltd. (Consumer Durables & Apparel)† | 50 | 5,432 | ||||||
LG Household & Health Care Ltd. (Household & Personal Products)† | 9 | 11,532 | ||||||
NAVER Corp. (Software & Services)† | 10 | 6,671 | ||||||
| 50,924 | ||||||||
Spain - 1.4% | ||||||||
Amadeus IT Group SA (Software & Services)† | 210 | 15,304 | ||||||
Banco Bilbao Vizcaya Argentaria SA (Banks)† | 1,436 | 11,631 | ||||||
Banco Santander SA (Banks)† | 1,840 | 11,864 | ||||||
Bankinter SA (Banks)† | 4,810 | 50,254 | ||||||
| 89,053 | ||||||||
| Shares | Value | |||||||
COMMON STOCKS - 98.4% (continued)
| ||||||||
Sweden - 1.5% | ||||||||
Alfa Laval AB (Capital Goods)† | 520 | $12,902 | ||||||
Assa Abloy AB, Class B (Capital Goods)† | 1,220 | 25,487 | ||||||
Atlas Copco AB, Class A (Capital Goods)† | 290 | 11,285 | ||||||
Elekta AB, Class B (Health Care Equipment & Services)† | 1,200 | 13,623 | ||||||
Hexagon AB, Class B (Technology Hardware & Equipment)† | 270 | 15,547 | ||||||
Intrum Justitia AB (Commercial & Professional Services)† | 290 | 7,712 | ||||||
Skandinaviska Enskilda Banken AB, Class A (Banks)† | 900 | 8,466 | ||||||
| 95,022 | ||||||||
Switzerland - 2.3% | ||||||||
Cie Financiere Richemont SA, Reg S (Consumer Durables & Apparel)† | 140 | 13,295 | ||||||
Lonza Group AG, Reg S (Pharmaceuticals, Biotechnology & Life Sciences)*† | 60 | 14,666 | ||||||
Nestle SA - Sponsored ADR (Food Beverage & Tobacco) | 540 | 41,774 | ||||||
Novartis AG - Sponsored ADR (Pharmaceuticals, Biotechnology & Life Sciences) | 540 | 41,413 | ||||||
SGS SA, Reg S (Commercial & Professional Services)† | 8 | 19,405 | ||||||
Temenos Group AG, Reg S (Software & Services)*† | 98 | 12,305 | ||||||
| 142,858 | ||||||||
Taiwan - 1.7% | ||||||||
Advantech Co., Ltd. (Technology Hardware & Equipment)† | 4,000 | 27,479 | ||||||
Airtac International Group (Capital Goods)† | 1,044 | 18,049 | ||||||
Eclat Textile Co., Ltd. (Consumer Durables & Apparel)† | 714 | 8,611 | ||||||
Largan Precision Co., Ltd. (Technology Hardware & Equipment)† | 70 | 8,122 | ||||||
Silergy Corp. (Semiconductors & Semiconductor Equipment)† | 500 | 10,456 | ||||||
Taiwan Semiconductor Manufacturing Co., Ltd. (Semiconductors & Semiconductor Equipment)† | 4,000 | 30,322 | ||||||
| 103,039 | ||||||||
Thailand - 0.1% | ||||||||
Siam Commercial Bank pcl, Reg S (Banks)† | 1,800 | 7,471 | ||||||
See Notes to Financial Statements
25
Table of Contents
Harding, Loevner Funds, Inc.
Global Equity Research Portfolio
Portfolio of Investments
April 30, 2018 (unaudited) (continued)
| Shares | Value | |||||||
COMMON STOCKS - 98.4% (continued)
| ||||||||
Turkey - 0.3% | ||||||||
BIM Birlesik Magazalar AS (Food & Staples Retailing)† | 480 | $8,132 | ||||||
Turkiye Garanti Bankasi AS - ADR (Banks) | 3,380 | 7,470 | ||||||
| 15,602 | ||||||||
United Arab Emirates - 0.5% | ||||||||
DP World Ltd. (Transportation)† | 720 | 15,986 | ||||||
Emaar Properties PJSC (Real Estate)† | 9,900 | 15,551 | ||||||
| 31,537 | ||||||||
United Kingdom - 4.7% | ||||||||
Abcam plc (Pharmaceuticals, Biotechnology & Life Sciences)† | 970 | 16,247 | ||||||
BBA Aviation plc (Transportation)† | 2,830 | 12,393 | ||||||
BGEO Group plc (Banks)† | 320 | 15,262 | ||||||
Diageo plc (Food Beverage & Tobacco)† | 1,040 | 36,993 | ||||||
Diploma plc (Capital Goods)† | 1,500 | 24,873 | ||||||
Halma plc (Technology Hardware & Equipment)† | 820 | 13,775 | ||||||
HSBC Holdings plc - Sponsored ADR (Banks) | 920 | 46,239 | ||||||
Rathbone Brothers plc (Diversified Financials)† | 363 | 11,734 | ||||||
Reckitt Benckiser Group plc (Household & Personal Products)† | 110 | 8,624 | ||||||
Rightmove plc (Software & Services)† | 200 | 12,550 | ||||||
Rotork plc (Capital Goods)† | 3,050 | 13,800 | ||||||
Shire plc (Pharmaceuticals, Biotechnology & Life Sciences)† | 790 | 41,983 | ||||||
St. James’s Place plc (Diversified Financials)† | 750 | 11,707 | ||||||
Standard Chartered plc (Banks)† | 1,190 | 12,535 | ||||||
Unilever plc (Household & Personal Products)† | 220 | 12,328 | ||||||
| 291,043 | ||||||||
United States - 44.1% | ||||||||
Abbott Laboratories (Health Care Equipment & Services) | 220 | 12,789 | ||||||
Accenture plc, Class A (Software & Services) | 380 | 57,456 | ||||||
Adobe Systems Inc. (Software & Services)* | 90 | 19,944 | ||||||
Air Products & Chemicals Inc. (Materials) | 320 | 51,933 | ||||||
Allegion plc (Capital Goods) | 450 | 34,731 | ||||||
Alphabet Inc., Class A (Software & Services)* | 45 | 45,836 | ||||||
Amazon.com Inc. (Retailing)* | 20 | 31,323 | ||||||
| Shares | Value | |||||||
COMMON STOCKS - 98.4% (continued)
| ||||||||
United States - 44.1% (continued) | ||||||||
AmerisourceBergen Corp. (Health Care Equipment & Services) | 130 | $11,775 | ||||||
AMETEK Inc. (Capital Goods) | 820 | 57,236 | ||||||
Amphenol Corp., Class A (Technology Hardware & Equipment) | 700 | 58,597 | ||||||
Apple Inc. (Technology Hardware & Equipment) | 350 | 57,841 | ||||||
Automatic Data Processing Inc. (Software & Services) | 540 | 63,763 | ||||||
Booking Holdings Inc. (Retailing)* | 7 | 15,246 | ||||||
BorgWarner Inc. (Automobiles & Components) | 235 | 11,501 | ||||||
Church & Dwight Co., Inc. (Household & Personal Products) | 1,080 | 49,896 | ||||||
Cisco Systems Inc. (Technology Hardware & Equipment) | 1,270 | 56,248 | ||||||
Cognizant Technology Solutions Corp., Class A (Software & Services) | 170 | 13,909 | ||||||
Colgate-Palmolive Co. (Household & Personal Products) | 710 | 46,313 | ||||||
Costco Wholesale Corp. (Food & Staples Retailing) | 355 | 69,992 | ||||||
Danaher Corp. (Health Care Equipment & Services) | 135 | 13,543 | ||||||
Deere & Co. (Capital Goods) | 200 | 27,066 | ||||||
eBay Inc. (Software & Services)* | 1,070 | 40,532 | ||||||
Ecolab Inc. (Materials) | 400 | 57,908 | ||||||
Emerson Electric Co. (Capital Goods) | 185 | 12,286 | ||||||
EnerSys (Capital Goods) | 200 | 13,712 | ||||||
EPAM Systems Inc. (Software & Services)* | 150 | 17,153 | ||||||
Equifax Inc. (Commercial & Professional Services) | 520 | 58,266 | ||||||
Facebook Inc., Class A (Software & Services)* | 270 | 46,440 | ||||||
First Republic Bank (Banks) | 660 | 61,294 | ||||||
Fiserv Inc. (Software & Services)* | 900 | 63,774 | ||||||
Flowserve Corp. (Capital Goods) | 530 | 23,537 | ||||||
Gartner Inc. (Software & Services)* | 450 | 54,580 | ||||||
Guidewire Software Inc. (Software & Services)* | 152 | 12,862 | ||||||
Healthcare Services Group Inc. (Commercial & Professional Services) | 220 | 8,499 | ||||||
HEICO Corp. (Capital Goods) | 170 | 14,935 | ||||||
Helmerich & Payne Inc. (Energy) | 180 | 12,519 | ||||||
See Notes to Financial Statements
26
Table of Contents
Harding, Loevner Funds, Inc.
Global Equity Research Portfolio
Portfolio of Investments
April 30, 2018 (unaudited) (continued)
| Shares | Value | |||||||
COMMON STOCKS - 98.4% (continued)
| ||||||||
United States - 44.1% (continued) | ||||||||
IDEXX Laboratories Inc. (Health Care Equipment & Services)* | 70 | $13,614 | ||||||
Illumina Inc. (Pharmaceuticals, Biotechnology & Life Sciences)* | 60 | 14,456 | ||||||
International Business Machines Corp. (Software & Services) | 380 | 55,085 | ||||||
IPG Photonics Corp. (Technology Hardware & Equipment)* | 100 | 21,303 | ||||||
IQVIA Holdings Inc. (Pharmaceuticals, Biotechnology & Life Sciences)* | 580 | 55,541 | ||||||
JPMorgan Chase & Co. (Banks) | 295 | 32,090 | ||||||
Lazard Ltd., Class A (Diversified Financials) | 240 | 13,061 | ||||||
Lululemon Athletica Inc. (Consumer Durables & Apparel)* | 290 | 28,942 | ||||||
Mastercard Inc., Class A (Software & Services) | 290 | 51,698 | ||||||
McDonald’s Corp. (Consumer Services) | 390 | 65,302 | ||||||
Mettler-Toledo International Inc. (Pharmaceuticals, Biotechnology & Life Sciences)* | 30 | 16,798 | ||||||
Microsoft Corp. (Software & Services) | 670 | 62,658 | ||||||
NVIDIA Corp. (Semiconductors & Semiconductor Equipment) | 60 | 13,494 | ||||||
PayPal Holdings Inc. (Software & Services)* | 240 | 17,906 | ||||||
Procter & Gamble Co. (Household & Personal Products) | 560 | 40,510 | ||||||
Prudential Financial Inc. (Insurance) | 460 | 48,907 | ||||||
Red Hat Inc. (Software & Services)* | 120 | 19,567 | ||||||
Regeneron Pharmaceuticals Inc. (Pharmaceuticals, Biotechnology & Life Sciences)* | 82 | 24,902 | ||||||
Reinsurance Group of America Inc. (Insurance) | 380 | 56,772 | ||||||
Rockwell Automation Inc. (Capital Goods) | 170 | 27,970 | ||||||
Rollins Inc. (Commercial & Professional Services) | 400 | 19,408 | ||||||
Roper Technologies Inc. (Capital Goods) | 230 | 60,764 | ||||||
salesforce.com Inc. (Software & Services)* | 130 | 15,729 | ||||||
Schlumberger Ltd. (Energy) | 280 | 19,197 | ||||||
| Shares | Value | |||||||
COMMON STOCKS - 98.4% (continued)
| ||||||||
United States - 44.1% (continued) | ||||||||
Sensata Technologies Holding plc (Capital Goods)* | 240 | $12,173 | ||||||
Signature Bank (Banks)* | 320 | 40,688 | ||||||
T Rowe Price Group Inc. (Diversified Financials) | 570 | 64,877 | ||||||
Texas Instruments Inc. (Semiconductors & Semiconductor Equipment) | 390 | 39,558 | ||||||
Thermo Fisher Scientific Inc. (Pharmaceuticals, Biotechnology & Life Sciences) | 60 | 12,621 | ||||||
TJX Cos Inc. (Retailing) | 820 | 69,577 | ||||||
Tractor Supply Co. (Retailing) | 930 | 63,240 | ||||||
UnitedHealth Group Inc. (Health Care Equipment & Services) | 230 | 54,372 | ||||||
Verisk Analytics Inc. (Commercial & Professional Services)* | 350 | 37,257 | ||||||
Visa Inc., Class A (Software & Services) | 260 | 32,989 | ||||||
WABCO Holdings Inc. (Capital Goods)* | 140 | 18,059 | ||||||
Wabtec Corp. (Capital Goods) | 180 | 15,986 | ||||||
Walgreens Boots Alliance Inc. (Food & Staples Retailing) | 550 | 36,547 | ||||||
Walt Disney Co. (Media) | 460 | 46,152 | ||||||
Waters Corp. (Pharmaceuticals, Biotechnology & Life Sciences)* | 200 | 37,682 | ||||||
Workday Inc., Class A (Software & Services)* | 140 | 17,478 | ||||||
Zoetis Inc. (Pharmaceuticals, Biotechnology & Life Sciences) | 380 | 31,722 | ||||||
| 2,731,887 | ||||||||
Total Common Stocks (Cost $5,155,969) | $6,095,261 | |||||||
PREFERRED STOCKS - 0.8%
| ||||||||
Brazil - 0.3% | ||||||||
Banco Bradesco SA - ADR (Banks)* | 1,052 | 10,310 | ||||||
Itau Unibanco Holding SA - Sponsored ADR, 0.39% (Banks)+ | 730 | 10,607 | ||||||
| 20,917 | ||||||||
Colombia - 0.2% | ||||||||
Bancolombia SA - Sponsored ADR, 3.06% (Banks)+ | 187 | 8,912 | ||||||
South Korea - 0.1% | ||||||||
Samsung Electronics Co., Ltd. - GDR, Reg S, 4.15% (Technology Hardware & Equipment)+† | 9 | 8,853 | ||||||
See Notes to Financial Statements
27
Table of Contents
Harding, Loevner Funds, Inc.
Global Equity Research Portfolio
Portfolio of Investments
April 30, 2018 (unaudited) (continued)
| Shares | Value | |||||||
PREFERRED STOCKS - 0.8% (continued)
|
| |||||||
Spain - 0.2% | ||||||||
Grifols SA - ADR, 2.10% (Pharmaceuticals, Biotechnology & Life Sciences)+ | 660 | $13,411 | ||||||
Total Preferred Stocks (Cost $41,708) | $52,093 | |||||||
SHORT TERM INVESTMENTS - 1.1%
|
| |||||||
Northern Institutional Funds - Treasury Portfolio, 1.50% (Money Market Funds) | 67,712 | 67,712 | ||||||
Total Short Term Investments (Cost $67,712) |
| $67,712 | ||||||
Total Investments — 100.3% | ||||||||
(Cost $5,265,389) | $6,215,066 | |||||||
Liabilities Less Other Assets - (0.3)% | (17,530 | ) | ||||||
Net Assets — 100.0% | $6,197,536 | |||||||
Summary of Abbreviations
| ADR | American Depositary Receipt. |
| GDR | Global Depository Receipt. |
| Reg S | Security sold outside United States without registration under the Securities Act of 1933. |
| * | Non-income producing security. |
| † | Investment categorized as level 2 security as disclosed in Note 2 of the Notes to Financial Statements. |
| # | Security valued at fair value as determined in good faith under policies and procedures established by and under the supervision of the Portfolio’s Board of Directors as disclosed in Note 2 of the Notes to Financial Statements. |
| + | Current yield is disclosed. Dividends are calculated based on a percentage of the issuer’s net income. |
| Industry | Percentage of Net Assets | |
Automobiles & Components | 1.5% | |
Banks | 10.8 | |
Capital Goods | 10.5 | |
Commercial & Professional Services | 3.6 | |
Consumer Durables & Apparel | 3.4 | |
Consumer Services | 2.0 | |
Diversified Financials | 2.1 | |
Energy | 2.4 | |
Food & Staples Retailing | 4.0 | |
Food Beverage & Tobacco | 4.0 | |
Health Care Equipment & Services | 3.2 | |
Household & Personal Products | 5.4 | |
Insurance | 2.6 | |
Materials | 4.5 | |
Media | 2.0 | |
Pharmaceuticals, Biotechnology & Life Sciences | 6.9 | |
Real Estate | 0.4 | |
Retailing | 3.9 | |
Semiconductors & Semiconductor Equipment | 2.5 | |
Software & Services | 15.8 | |
Technology Hardware & Equipment | 4.8 | |
Telecommunication Services | 0.7 | |
Transportation | 1.7 | |
Utilities | 0.5 | |
Money Market Fund | 1.1 | |
Total Investments | 100.3 | |
Liabilities Less Other Assets | (0.3) | |
Net Assets | 100.0% | |
See Notes to Financial Statements
28
Table of Contents
Harding, Loevner Funds, Inc.
International Equity Research Portfolio
Portfolio of Investments
April 30, 2018 (unaudited)
| Shares | Value | |||||||
COMMON STOCKS - 94.8% | ||||||||
Argentina - 1.4% | ||||||||
Banco Macro SA - ADR (Banks) | 350 | $33,922 | ||||||
Globant SA (Software & Services)* | 1,246 | 56,082 | ||||||
Telecom Argentina SA - Sponsored ADR (Telecommunication Services) | 2,290 | 68,792 | ||||||
| 158,796 | ||||||||
Australia - 2.2% | ||||||||
CSL Ltd. (Pharmaceuticals, Biotechnology & Life Sciences)† | 1,030 | 131,521 | ||||||
DuluxGroup Ltd. (Materials)† | 9,240 | 53,775 | ||||||
SEEK Ltd. (Commercial & Professional Services)† | 4,580 | 66,682 | ||||||
| 251,978 | ||||||||
Belgium - 0.7% | ||||||||
Anheuser-Busch InBev SA (Food Beverage & Tobacco)† | 829 | 82,079 | ||||||
Brazil - 1.1% | ||||||||
Ambev SA - ADR (Food Beverage & Tobacco) | 4,310 | 28,532 | ||||||
B3 SA - Brasil Bolsa Balcao (Diversified Financials)* | 3,900 | 28,166 | ||||||
CCR SA (Transportation) | 7,700 | 26,288 | ||||||
Raia Drogasil SA (Food & Staples Retailing)* | 1,200 | 23,560 | ||||||
Ultrapar Participacoes SA - Sponsored ADR (Energy) | 990 | 17,147 | ||||||
| 123,693 | ||||||||
Canada - 2.7% | ||||||||
Alimentation Couche-Tard Inc. (Food & Staples Retailing) | 2,100 | 92,083 | ||||||
Canadian National Railway Co. (Transportation) | 1,230 | 95,054 | ||||||
Cenovus Energy Inc. (Energy) | 6,900 | 69,110 | ||||||
Encana Corp. (Energy) | 4,560 | 56,909 | ||||||
| 313,156 | ||||||||
China - 8.8% | ||||||||
51job Inc. - ADR (Commercial & Professional | 670 | 55,302 | ||||||
AAC Technologies Holdings Inc. (Technology Hardware & Equipment)† | 2,000 | 28,704 | ||||||
Alibaba Group Holding Ltd. - Sponsored ADR (Software & Services)* | 160 | 28,566 | ||||||
ANTA Sports Products Ltd. (Consumer Durables & Apparel)† | 7,600 | 43,396 | ||||||
Baidu Inc. - Sponsored ADR (Software & Services)* | 115 | 28,853 | ||||||
| Shares | Value | |||||||
COMMON STOCKS - 94.8% (continued) | ||||||||
China - 8.8% (continued) | ||||||||
China Mobile Ltd. - Sponsored ADR (Telecommunication Services) | 670 | $31,798 | ||||||
CNOOC Ltd. - Sponsored ADR (Energy) | 220 | 37,182 | ||||||
CSPC Pharmaceutical Group Ltd. (Pharmaceuticals, Biotechnology & Life Sciences)† | 14,000 | 35,534 | ||||||
ENN Energy Holdings Ltd. (Utilities)† | 4,000 | 37,534 | ||||||
Fuyao Glass Industry Group Co., Ltd., Class H (Automobiles & Components)† | 7,200 | 24,722 | ||||||
Gree Electric Appliances Inc. of Zhuhai, Class A (Consumer Durables & Apparel)† | 4,900 | 34,325 | ||||||
Haitian International Holdings Ltd. (Capital Goods)† | 12,400 | 32,968 | ||||||
Hangzhou Hikvision Digital Technology Co., Ltd., Class A (Technology Hardware & Equipment)† | 6,900 | 42,234 | ||||||
Inner Mongolia Yili Industrial Group Co., Ltd., Class A (Food Beverage & Tobacco)† | 5,500 | 22,930 | ||||||
JD.com Inc. - ADR (Retailing)* | 830 | 30,303 | ||||||
Jiangsu Expressway Co., Ltd., Class H (Transportation)† | 72,000 | 98,542 | ||||||
Jiangsu Hengrui Medicine Co., Ltd., Class A (Pharmaceuticals, Biotechnology & Life Sciences)† | 2,080 | 27,343 | ||||||
Midea Group Co., Ltd., Class A (Consumer Durables & Apparel)† | 4,700 | 38,593 | ||||||
NetEase Inc. - ADR (Software & Services) | 80 | 20,566 | ||||||
New Oriental Education & Technology Group Inc. - Sponsored ADR (Consumer Services) | 310 | 27,850 | ||||||
Shenzhou International Group Holdings Ltd. (Consumer Durables & Apparel)† | 3,770 | 41,067 | ||||||
Sino Biopharmaceutical Ltd. (Pharmaceuticals, Biotechnology & Life Sciences)† | 14,000 | 29,493 | ||||||
Sun Art Retail Group Ltd. (Food & Staples Retailing)† | 52,000 | 58,425 | ||||||
Sunny Optical Technology Group Co. Ltd. (Technology Hardware & Equipment)† | 2,000 | 32,662 | ||||||
Suofeiya Home Collection Co., Ltd., Class A (Consumer Durables & Apparel)† | 5,300 | 27,064 | ||||||
See Notes to Financial Statements
29
Table of Contents
Harding, Loevner Funds, Inc.
International Equity Research Portfolio
Portfolio of Investments
April 30, 2018 (unaudited) (continued)
| Shares | Value | |||||||
COMMON STOCKS - 94.8% (continued) | ||||||||
China - 8.8% (continued) | ||||||||
Tencent Holdings Ltd. (Software & Services)† | 500 | $24,548 | ||||||
Tingyi Cayman Islands Holding Corp. (Food Beverage & Tobacco)† | 21,150 | 40,054 | ||||||
Wuxi Biologics Cayman Inc. (Pharmaceuticals, Biotechnology & Life Sciences)*† | 3,250 | 29,389 | ||||||
| 1,009,947 | ||||||||
Colombia - 1.1% | ||||||||
Cementos Argos SA - Sponsored ADR (Materials)#† | 1,390 | 24,569 | ||||||
CEMEX Latam Holdings SA (Materials)* | 6,320 | 19,485 | ||||||
Ecopetrol SA - Sponsored ADR (Energy) | 2,280 | 50,342 | ||||||
Grupo Nutresa SA (Food Beverage & Tobacco) | 2,920 | 28,275 | ||||||
| 122,671 | ||||||||
Czech Republic - 0.2% | ||||||||
Komercni banka AS (Banks)† | 660 | 28,459 | ||||||
Denmark - 1.2% | ||||||||
Chr Hansen Holding A/S (Materials)† | 820 | 74,338 | ||||||
Novozymes A/S, Class B (Materials)† | 1,250 | 58,931 | ||||||
| 133,269 | ||||||||
Egypt - 0.3% | ||||||||
Commercial International Bank Egypt SAE - GDR, Reg S (Banks)† | 5,810 | 29,784 | ||||||
France - 2.3% | ||||||||
Air Liquide SA (Materials)† | 725 | 94,195 | ||||||
Dassault Systemes SE (Software & Services)† | 530 | 68,445 | ||||||
Essilor International Cie Generale d’Optique SA (Health Care Equipment & Services)† | 780 | 106,152 | ||||||
| 268,792 | ||||||||
Germany - 7.9% | ||||||||
adidas AG (Consumer Durables & Apparel)† | 320 | 78,683 | ||||||
Allianz SE, Reg S (Insurance)† | 505 | 119,466 | ||||||
Bayer AG, Reg S (Pharmaceuticals, Biotechnology & Life Sciences)† | 840 | 100,556 | ||||||
Bayerische Motoren Werke AG (Automobiles & Components)† | 1,114 | 124,333 | ||||||
FUCHS PETROLUB SE (Materials)† | 510 | 26,219 | ||||||
| Shares | Value | |||||||
COMMON STOCKS - 94.8% (continued) | ||||||||
Germany - 7.9% (continued) | ||||||||
Henkel AG & Co. KGaA (Household & Personal Products)† | 810 | $96,627 | ||||||
Infineon Technologies AG (Semiconductors & Semiconductor Equipment)† | 1,150 | 29,453 | ||||||
Linde AG (Materials)*† | 589 | 130,883 | ||||||
SAP SE - Sponsored ADR (Software & Services) | 1,000 | 110,830 | ||||||
Symrise AG (Materials)† | 1,113 | 89,895 | ||||||
| 906,945 | ||||||||
Hong Kong - 2.6% | ||||||||
AIA Group Ltd. (Insurance)† | 13,200 | 117,852 | ||||||
ASM Pacific Technology Ltd. (Semiconductors & Semiconductor Equipment)† | 6,400 | 87,437 | ||||||
Hong Kong Exchanges & Clearing Ltd. (Diversified Financials)† | 2,000 | 64,828 | ||||||
Sands China Ltd. (Consumer Services)† | 5,200 | 30,006 | ||||||
| 300,123 | ||||||||
India - 3.7% | ||||||||
Asian Paints Ltd. (Materials)† | 1,380 | 24,745 | ||||||
Bharti Infratel Ltd. (Telecommunication Services)† | 13,880 | 64,864 | ||||||
Dabur India Ltd. (Household & Personal Products)† | 5,390 | 29,735 | ||||||
Emami Ltd. (Household & Personal Products)† | 1,420 | 23,663 | ||||||
Godrej Consumer Products Ltd. (Household & Personal Products)† | 1,800 | 30,053 | ||||||
HDFC Bank Ltd. - ADR (Banks) | 282 | 27,019 | ||||||
Housing Development Finance Corp., Ltd. (Banks)† | 1,080 | 30,344 | ||||||
ICICI Bank Ltd. - Sponsored ADR (Banks) | 2,849 | 24,245 | ||||||
Infosys Ltd. - Sponsored ADR (Software & Services) | 3,240 | 57,251 | ||||||
ITC Ltd. (Food Beverage & Tobacco)† | 6,040 | 25,392 | ||||||
Kotak Mahindra Bank Ltd. (Banks)† | 1,770 | 32,011 | ||||||
Max Financial Services Ltd. (Insurance)*† | 2,340 | 18,009 | ||||||
Pidilite Industries Ltd. (Materials)† | 2,100 | 34,165 | ||||||
| 421,496 | ||||||||
Indonesia - 0.3% | ||||||||
Bank Central Asia Tbk PT (Banks)† | 21,000 | 33,206 | ||||||
See Notes to Financial Statements
30
Table of Contents
Harding, Loevner Funds, Inc.
International Equity Research Portfolio
Portfolio of Investments
April 30, 2018 (unaudited) (continued)
| Shares | Value | |||||||
COMMON STOCKS - 94.8% (continued) | ||||||||
Israel - 0.8% | ||||||||
Check Point Software Technologies Ltd. (Software & Services)* | 900 | $86,859 | ||||||
Italy - 0.5% | ||||||||
Tenaris SA - ADR (Energy) | 1,620 | 60,556 | ||||||
Japan - 17.7% | ||||||||
ABC-Mart Inc. (Retailing)† | 1,840 | 121,189 | ||||||
Asics Corp. (Consumer Durables & Apparel)† | 3,100 | 58,411 | ||||||
Dentsu Inc. (Media)† | 1,820 | 85,991 | ||||||
FANUC Corp. (Capital Goods)† | 300 | 64,559 | ||||||
Hakuhodo DY Holdings Inc. (Media)† | 7,890 | 110,423 | ||||||
Hoshizaki Corp. (Capital Goods)† | 1,300 | 120,671 | ||||||
Kakaku.com Inc. (Software & Services)† | 3,500 | 66,737 | ||||||
Kao Corp. (Household & Personal Products)† | 1,325 | 95,119 | ||||||
Komatsu Ltd. (Capital Goods)† | 3,040 | 103,853 | ||||||
Kubota Corp. (Capital Goods)† | 6,300 | 106,441 | ||||||
M3 Inc. (Health Care Equipment & Services)† | 900 | 33,886 | ||||||
Makita Corp. (Capital Goods)† | 2,600 | 116,571 | ||||||
MISUMI Group Inc. (Capital Goods)† | 2,000 | 55,350 | ||||||
MonotaRO Co., Ltd. (Capital Goods)† | 700 | 24,437 | ||||||
NGK Insulators Ltd. (Capital Goods)† | 4,150 | 76,108 | ||||||
Nomura Research Institute Ltd. (Software & Services)† | 2,902 | 149,814 | ||||||
Park24 Co., Ltd. (Commercial & Professional Services)† | 2,300 | 65,190 | ||||||
Rinnai Corp. (Consumer Durables & Apparel)† | 1,100 | 109,345 | ||||||
Shiseido Co., Ltd. (Household & Personal Products)† | 1,500 | 97,315 | ||||||
SMC Corp. (Capital Goods)† | 160 | 60,964 | ||||||
Stanley Electric Co., Ltd. (Automobiles & Components)† | 2,715 | 98,324 | ||||||
Sugi Holdings Co., Ltd. (Food & Staples Retailing)† | 855 | 49,695 | ||||||
Sysmex Corp. (Health Care Equipment & Services)† | 500 | 44,144 | ||||||
Unicharm Corp. (Household & Personal Products)† | 4,400 | 123,672 | ||||||
| 2,038,209 | ||||||||
Mexico - 2.1% | ||||||||
Banco Santander Mexico SA Institucion de Banca Multiple Grupo Financiero Santand - ADR (Banks) | 2,830 | 20,744 | ||||||
| Shares | Value | |||||||
COMMON STOCKS - 94.8% (continued) | ||||||||
Mexico - 2.1% (continued) | ||||||||
Coca-Cola Femsa SAB de CV - Sponsored ADR (Food Beverage & Tobacco) | 502 | $32,951 | ||||||
El Puerto de Liverpool SAB de CV, Series C1 (Retailing) | 3,000 | 20,016 | ||||||
Fomento Economico Mexicano SAB de CV - Sponsored ADR (Food Beverage & Tobacco) | 280 | 27,065 | ||||||
Grupo Bimbo SAB de CV, Series A (Food Beverage & Tobacco) | 13,500 | 31,422 | ||||||
Grupo Financiero Banorte SAB de CV, Series O (Banks) | 5,800 | 36,291 | ||||||
Grupo Televisa SAB - Sponsored ADR (Media) | 1,670 | 29,927 | ||||||
Wal-Mart de Mexico SAB de CV (Food & Staples Retailing) | 14,400 | 40,015 | ||||||
| 238,431 | ||||||||
Netherlands - 0.7% | ||||||||
ASML Holding NV, Reg S (Semiconductors & Semiconductor Equipment) | 450 | 84,803 | ||||||
Pakistan - 1.3% | ||||||||
Engro Corp., Ltd. (Materials)† | 8,100 | 21,887 | ||||||
Lucky Cement Ltd. (Materials)† | 5,900 | 33,711 | ||||||
MCB Bank Ltd. (Banks)† | 12,600 | 22,753 | ||||||
Oil & Gas Development Co., Ltd. (Energy)† | 17,700 | 25,538 | ||||||
Pakistan Petroleum Ltd. (Energy)† | 15,500 | 28,747 | ||||||
United Bank Ltd. (Banks)† | 12,200 | 21,207 | ||||||
| 153,843 | ||||||||
Panama - 0.4% | ||||||||
Copa Holdings SA, Class A (Transportation) | 394 | 46,165 | ||||||
Peru - 0.7% | ||||||||
Alicorp SAA (Food Beverage & Tobacco) | 10,540 | 38,719 | ||||||
Credicorp Ltd. (Banks) | 180 | 41,848 | ||||||
| 80,567 | ||||||||
Philippines - 1.4% | ||||||||
Bank of the Philippine Islands (Banks)† | 13,425 | 27,224 | ||||||
BDO Unibank Inc. (Banks)† | 10,450 | 26,487 | ||||||
Jollibee Foods Corp. (Consumer Services)† | 5,870 | 32,260 | ||||||
Robinsons Retail Holdings Inc. (Food & Staples Retailing)† | 14,760 | 25,935 | ||||||
Security Bank Corp. (Banks)† | 4,950 | 19,919 | ||||||
SM Prime Holdings Inc. (Real Estate)† | 38,900 | 25,657 | ||||||
| 157,482 | ||||||||
See Notes to Financial Statements
31
Table of Contents
Harding, Loevner Funds, Inc.
International Equity Research Portfolio
Portfolio of Investments
April 30, 2018 (unaudited) (continued)
| Shares | Value | |||||||
COMMON STOCKS - 94.8% (continued) | ||||||||
Qatar - 0.7% | ||||||||
Qatar Electricity & Water Co. QSC (Utilities)† | 820 | $44,518 | ||||||
Qatar National Bank QPSC (Banks)† | 920 | 38,093 | ||||||
| 82,611 | ||||||||
Russia - 1.3% | ||||||||
LUKOIL PJSC - Sponsored ADR (Energy) | 530 | 34,922 | ||||||
Moscow Exchange MICEX-RTS PJSC (Diversified Financials)† | 14,560 | 27,917 | ||||||
Novatek PJSC - Sponsored GDR, Reg S (Energy)† | 220 | 27,857 | ||||||
Sberbank of Russia PJSC - Sponsored ADR (Banks)† | 2,020 | 29,862 | ||||||
Yandex NV, Class A (Software & Services)* | 882 | 29,424 | ||||||
| 149,982 | ||||||||
Singapore - 2.3% | ||||||||
DBS Group Holdings Ltd. (Banks)† | 5,470 | 126,364 | ||||||
Oversea-Chinese Banking Corp. Ltd. (Banks)† | 13,100 | 135,193 | ||||||
| 261,557 | ||||||||
South Africa - 1.3% | ||||||||
Aspen Pharmacare Holdings Ltd. (Pharmaceuticals, Biotechnology & Life Sciences)† | 1,040 | 22,398 | ||||||
Clicks Group Ltd. (Food & Staples Retailing)† | 2,025 | 34,356 | ||||||
Discovery Ltd. (Insurance)† | 2,580 | 35,780 | ||||||
Standard Bank Group Ltd. (Banks)† | 1,550 | 26,516 | ||||||
Tiger Brands Ltd. (Food Beverage & Tobacco)† | 923 | 28,794 | ||||||
| 147,844 | ||||||||
South Korea - 1.7% | ||||||||
Amorepacific Corp. (Household & Personal Products)† | 140 | 45,496 | ||||||
Coway Co., Ltd. (Consumer Durables & Apparel)† | 670 | 54,791 | ||||||
Hankook Tire Co., Ltd. (Automobiles & Components)† | 490 | 22,639 | ||||||
Hanssem Co., Ltd. (Consumer Durables & Apparel)† | 150 | 16,297 | ||||||
LG Household & Health Care Ltd. (Household & Personal Products)† | 28 | 35,877 | ||||||
NAVER Corp. (Software & Services)† | 38 | 25,349 | ||||||
| 200,449 | ||||||||
| Shares | Value | |||||||
COMMON STOCKS - 94.8% (continued) | ||||||||
Spain - 3.2% | ||||||||
Amadeus IT Group SA (Software & Services)† | 1,485 | $108,220 | ||||||
Banco Bilbao Vizcaya Argentaria SA (Banks)† | 6,144 | 49,765 | ||||||
Banco Santander SA (Banks)† | 13,640 | 87,947 | ||||||
Bankinter SA (Banks)† | 11,130 | 116,284 | ||||||
| 362,216 | ||||||||
Sweden - 4.5% | ||||||||
Alfa Laval AB (Capital Goods)† | 1,110 | 27,541 | ||||||
Assa Abloy AB, Class B (Capital Goods)† | 5,505 | 115,004 | ||||||
Atlas Copco AB, Class A (Capital Goods)† | 2,690 | 104,680 | ||||||
Elekta AB, Class B (Health Care Equipment & Services)† | 4,400 | 49,950 | ||||||
Hexagon AB, Class B (Technology Hardware & Equipment)† | 1,450 | 83,496 | ||||||
Intrum Justitia AB (Commercial & Professional | 2,520 | 67,014 | ||||||
Skandinaviska Enskilda Banken AB, Class A (Banks)† | 7,530 | 70,832 | ||||||
| 518,517 | ||||||||
Switzerland - 3.8% | ||||||||
Cie Financiere Richemont SA, Reg S (Consumer Durables & Apparel)† | 1,358 | 128,965 | ||||||
Lonza Group AG, Reg S (Pharmaceuticals, Biotechnology & Life Sciences)*† | 110 | 26,887 | ||||||
Nestle SA - Sponsored ADR (Food Beverage & Tobacco) | 1,010 | 78,134 | ||||||
Novartis AG - Sponsored ADR (Pharmaceuticals, Biotechnology & Life Sciences) | 1,210 | 92,795 | ||||||
SGS SA, Reg S (Commercial & Professional Services)† | 45 | 109,151 | ||||||
| 435,932 | ||||||||
Taiwan - 1.8% | ||||||||
Advantech Co., Ltd. (Technology Hardware & Equipment)† | 6,000 | 41,219 | ||||||
Airtac International Group (Capital Goods)† | 3,000 | 51,865 | ||||||
Eclat Textile Co., Ltd. (Consumer Durables & Apparel)† | 2,040 | 24,603 | ||||||
Largan Precision Co., Ltd. (Technology Hardware & Equipment)† | 220 | 25,525 | ||||||
Silergy Corp. (Semiconductors & Semiconductor Equipment)† | 1,500 | 31,368 | ||||||
See Notes to Financial Statements
32
Table of Contents
Harding, Loevner Funds, Inc.
International Equity Research Portfolio
Portfolio of Investments
April 30, 2018 (unaudited) (continued)
| Shares | Value | |||||||
COMMON STOCKS - 94.8% (continued) | ||||||||
Taiwan - 1.8% (continued) | ||||||||
Taiwan Semiconductor Manufacturing Co., Ltd. (Semiconductors & Semiconductor Equipment)† | 4,000 | $30,322 | ||||||
| 204,902 | ||||||||
Thailand - 0.2% | ||||||||
Siam Commercial Bank pcl, Reg S (Banks)† | 5,700 | 23,660 | ||||||
Turkey - 0.4% | ||||||||
BIM Birlesik Magazalar AS (Food & Staples Retailing)† | 1,530 | 25,921 | ||||||
Turkiye Garanti Bankasi AS - ADR (Banks) | 8,480 | 18,741 | ||||||
| 44,662 | ||||||||
United Arab Emirates - 0.9% | ||||||||
Agthia Group PJSC (Food Beverage & Tobacco)† | 10,250 | 12,128 | ||||||
DP World Ltd. (Transportation)† | 1,070 | 23,756 | ||||||
Emaar Properties PJSC (Real Estate)† | 45,410 | 71,332 | ||||||
| 107,216 | ||||||||
United Kingdom - 10.6% | ||||||||
Abcam plc (Pharmaceuticals, Biotechnology & Life Sciences)† | 4,030 | 67,499 | ||||||
BBA Aviation plc (Transportation)† | 25,050 | 109,698 | ||||||
BGEO Group plc (Banks)† | 1,330 | 63,433 | ||||||
Diageo plc (Food Beverage & Tobacco)† | 3,623 | 128,869 | ||||||
Diploma plc (Capital Goods)† | 3,570 | 59,197 | ||||||
Halma plc (Technology Hardware & Equipment)† | 6,140 | 103,149 | ||||||
HSBC Holdings plc - Sponsored ADR (Banks) | 2,120 | 106,551 | ||||||
Rathbone Brothers plc (Diversified Financials)† | 1,747 | 56,474 | ||||||
Reckitt Benckiser Group plc (Household & Personal Products)† | 1,020 | 79,968 | ||||||
Rightmove plc (Software & Services)† | 1,090 | 68,396 | ||||||
Rotork plc (Capital Goods)† | 15,621 | 70,677 | ||||||
Shire plc (Pharmaceuticals, Biotechnology & Life Sciences)† | 1,791 | 95,179 | ||||||
St. James’s Place plc (Diversified Financials)† | 3,490 | 54,478 | ||||||
Standard Chartered plc (Banks)† | 6,710 | 70,680 | ||||||
| Shares | Value | |||||||
COMMON STOCKS - 94.8% (continued) | ||||||||
United Kingdom - 10.6% (continued) | ||||||||
Unilever plc (Household & Personal Products)† | 1,460 | $81,816 | ||||||
| 1,216,064 | ||||||||
Total Common Stocks (Cost $9,150,160) | $10,886,921 | |||||||
| ||||||||
PREFERRED STOCKS - 2.0% | ||||||||
Brazil - 0.5% | ||||||||
Banco Bradesco SA - ADR (Banks)* | 2,695 | 26,411 | ||||||
Itau Unibanco Holding SA - Sponsored ADR, 0.39% (Banks)+ | 1,940 | 28,188 | ||||||
| 54,599 | ||||||||
Colombia - 0.4% | ||||||||
Bancolombia SA - Sponsored ADR, 3.06% (Banks)+ | 910 | 43,371 | ||||||
South Korea - 0.3% | ||||||||
Samsung Electronics Co., Ltd. - GDR, Reg S, 4.15% (Technology Hardware & Equipment)+† | 30 | 29,511 | ||||||
Spain - 0.8% | ||||||||
Grifols SA - ADR, 2.10% (Pharmaceuticals, Biotechnology & Life Sciences)+
|
| 4,830
|
|
| 98,145
|
| ||
Total Preferred Stocks (Cost $175,210) | $225,626 | |||||||
| ||||||||
SHORT TERM INVESTMENTS - 2.6% | ||||||||
Northern Institutional Funds - Treasury Portfolio, 1.50% (Money Market Funds)
|
| 304,505
|
|
| 304,505
|
| ||
Total Short Term Investments (Cost $304,505) |
| $304,505 | ||||||
|
| |||||||
Total Investments — 99.4% | ||||||||
(Cost $9,629,875) | $11,417,052 | |||||||
Other Assets Less Liabilities - 0.6% | 67,748 | |||||||
Net Assets — 100.0% | $11,484,800 | |||||||
Summary of Abbreviations
| ADR | American Depositary Receipt. |
| GDR | Global Depository Receipt. |
| Reg S | Security sold outside United States without registration under the Securities Act of 1933. |
See Notes to Financial Statements
33
Table of Contents
Harding, Loevner Funds, Inc.
International Equity Research Portfolio
Portfolio of Investments
April 30, 2018 (unaudited) (continued)
| * | Non-income producing security. |
| † | Investment categorized as level 2 security as disclosed in Note 2 of the Notes to Financial Statements. |
| # | Security valued at fair value as determined in good faith under policies and procedures established by and under the supervision of the Portfolio’s Board of Directors as disclosed in Note 2 of the Notes to Financial Statements. |
| + | Current yield is disclosed. Dividends are calculated based on a percentage of the issuer’s net income. |
| Industry | Percentage of Net Assets | |||
Automobiles & Components | 2.4 | % | ||
Banks | 13.2 | |||
Capital Goods | 10.4 | |||
Commercial & Professional Services | 3.2 | |||
Consumer Durables & Apparel | 5.7 | |||
Consumer Services | 0.8 | |||
Diversified Financials | 2.0 | |||
Energy | 3.6 | |||
Food & Staples Retailing | 3.0 | |||
Food Beverage & Tobacco | 5.3 | |||
Health Care Equipment & Services | 2.0 | |||
Household & Personal Products | 6.4 | |||
Insurance | 2.5 | |||
Materials | 6.0 | |||
Media | 2.0 | |||
Pharmaceuticals, Biotechnology & Life Sciences | 6.6 | |||
Real Estate | 0.8 | |||
Retailing | 1.5 | |||
Semiconductors & Semiconductor Equipment | 2.3 | |||
Software & Services | 8.1 | |||
Technology Hardware & Equipment | 3.4 | |||
Telecommunication Services | 1.4 | |||
Transportation | 3.5 | |||
Utilities | 0.7 | |||
Money Market Fund | 2.6 | |||
Total Investments | 99.4 | |||
Other Assets Less Liabilities | 0.6 | |||
Net Assets | 100.0 | % | ||
See Notes to Financial Statements
34
Table of Contents
Emerging Markets Research Portfolio
Portfolio of Investments
April 30, 2018 (unaudited)
| Shares | Value | |||||||
COMMON STOCKS - 91.3% | ||||||||
Argentina - 1.4% | ||||||||
Banco Macro SA - ADR (Banks) | 566 | $54,857 | ||||||
Cablevision Holding SA - Sponsored GDR (Media)#*† | 653 | 13,028 | ||||||
Telecom Argentina SA - Sponsored ADR (Telecommunication Services) | 1,090 | 32,743 | ||||||
| 100,628 | ||||||||
Bangladesh - 0.5% | ||||||||
GrameenPhone Ltd. (Telecommunication Services)† | 3,400 | 19,226 | ||||||
Square Pharmaceuticals Ltd. (Pharmaceuticals, Biotechnology & Life Sciences)† | 4,246 | 15,700 | ||||||
| 34,926 | ||||||||
Brazil - 4.4% | ||||||||
Ambev SA - ADR (Food Beverage & Tobacco) | 20,920 | 138,491 | ||||||
B3 SA - Brasil Bolsa Balcao (Diversified Financials)* | 3,700 | 26,721 | ||||||
CCR SA (Transportation) | 10,000 | 34,140 | ||||||
Raia Drogasil SA (Food & Staples Retailing)* | 1,400 | 27,487 | ||||||
Ultrapar Participacoes SA - Sponsored ADR (Energy) | 5,710 | 98,897 | ||||||
| 325,736 | ||||||||
China - 28.3% | ||||||||
51job Inc. - ADR (Commercial & Professional | 910 | 75,111 | ||||||
AAC Technologies Holdings Inc. (Technology Hardware & Equipment)† | 4,500 | 64,585 | ||||||
Alibaba Group Holding Ltd. - Sponsored ADR (Software & Services)* | 420 | 74,987 | ||||||
ANTA Sports Products Ltd. (Consumer Durables & Apparel)† | 18,000 | 102,779 | ||||||
Baidu Inc. - Sponsored ADR (Software & Services)* | 150 | 37,635 | ||||||
China Mobile Ltd. - Sponsored ADR (Telecommunication Services) | 2,930 | 139,058 | ||||||
CNOOC Ltd. - Sponsored ADR (Energy) | 491 | 82,984 | ||||||
ENN Energy Holdings Ltd. (Utilities)† | 8,000 | 75,069 | ||||||
Fuyao Glass Industry Group Co., Ltd., Class H (Automobiles & Components)† | 35,200 | 120,864 | ||||||
Gree Electric Appliances Inc. of Zhuhai, Class A (Consumer Durables & Apparel)† | 6,100 | 42,731 | ||||||
| Shares | Value | |||||||
COMMON STOCKS - 91.3% (continued) | ||||||||
China - 28.3% (continued) | ||||||||
Haitian International Holdings Ltd. (Capital Goods)† | 15,000 | $39,880 | ||||||
Hangzhou Hikvision Digital Technology Co., Ltd., Class A (Technology Hardware & Equipment)† | 8,650 | 52,946 | ||||||
Inner Mongolia Yili Industrial Group Co., Ltd., Class A (Food Beverage & Tobacco)† | 19,863 | 82,810 | ||||||
JD.com Inc. - ADR (Retailing)* | 1,585 | 57,868 | ||||||
Jiangsu Expressway Co., Ltd., Class H | 34,000 | 46,533 | ||||||
Jiangsu Hengrui Medicine Co., Ltd., Class A (Pharmaceuticals, Biotechnology & Life Sciences)† | 2,480 | 32,463 | ||||||
Midea Group Co., Ltd., Class A (Consumer Durables & Apparel)† | 10,800 | 88,683 | ||||||
NetEase Inc. - ADR (Software & Services) | 419 | 107,712 | ||||||
New Oriental Education & Technology Group Inc. - Sponsored ADR (Consumer Services) | 435 | 39,080 | ||||||
Shenzhou International Group Holdings Ltd. (Consumer Durables & Apparel)† | 14,000 | 152,502 | ||||||
Sino Biopharmaceutical Ltd. (Pharmaceuticals, Biotechnology & Life Sciences)† | 84,000 | 176,957 | ||||||
Sun Art Retail Group Ltd. (Food & Staples Retailing)† | 49,500 | 55,616 | ||||||
Sunny Optical Technology Group Co. Ltd. (Technology Hardware & Equipment)† | 5,000 | 81,655 | ||||||
Suofeiya Home Collection Co., Ltd., Class A (Consumer Durables & Apparel)† | 6,200 | 31,660 | ||||||
Tencent Holdings Ltd. (Software & Services)† | 1,200 | 58,916 | ||||||
Tingyi Cayman Islands Holding Corp. (Food Beverage & Tobacco)† | 40,000 | 75,752 | ||||||
Weibo Corp. - Sponsored ADR (Software & Services)* | 150 | 17,178 | ||||||
Wuxi Biologics Cayman Inc. (Pharmaceuticals, Biotechnology & Life Sciences)*† | 7,500 | 67,820 | ||||||
| 2,081,834 | ||||||||
Colombia - 1.7% | ||||||||
Cementos Argos SA - Sponsored ADR (Materials)#† | 1,080 | 19,090 | ||||||
CEMEX Latam Holdings SA (Materials)* | 3,780 | 11,654 | ||||||
See Notes to Financial Statements
35
Table of Contents
Harding, Loevner Funds, Inc.
Emerging Markets Research Portfolio
Portfolio of Investments
April 30, 2018 (unaudited) (continued)
| Shares | Value | |||||||
COMMON STOCKS - 91.3% (continued) | ||||||||
Colombia - 1.7% (continued) | ||||||||
Ecopetrol SA - Sponsored ADR (Energy) | 3,729 | $82,336 | ||||||
Grupo Nutresa SA (Food Beverage & Tobacco) | 1,530 | 14,815 | ||||||
| 127,895 | ||||||||
Czech Republic - 0.3% | ||||||||
Komercni banka AS (Banks)† | 430 | 18,542 | ||||||
Egypt - 0.8% | ||||||||
Commercial International Bank Egypt SAE - GDR, Reg S (Banks)† | 10,800 | 55,365 | ||||||
India - 9.9% | ||||||||
Asian Paints Ltd. (Materials)† | 2,810 | 50,387 | ||||||
Bharti Infratel Ltd. (Telecommunication Services)† | 4,820 | 22,525 | ||||||
Dabur India Ltd. (Household & Personal Products)† | 10,830 | 59,746 | ||||||
Emami Ltd. (Household & Personal Products)† | 830 | 13,831 | ||||||
Godrej Consumer Products Ltd. (Household & Personal Products)† | 4,230 | 70,625 | ||||||
HDFC Bank Ltd. - ADR (Banks) | 400 | 38,324 | ||||||
Housing Development Finance Corp., Ltd. (Banks)† | 5,100 | 143,291 | ||||||
ICICI Bank Ltd. - Sponsored ADR (Banks) | 4,606 | 39,197 | ||||||
Infosys Ltd. - Sponsored ADR (Software & Services) | 3,449 | 60,944 | ||||||
ITC Ltd. (Food Beverage & Tobacco)† | 14,150 | 59,486 | ||||||
Kotak Mahindra Bank Ltd. (Banks)† | 4,150 | 75,053 | ||||||
Max Financial Services Ltd. (Insurance)*† | 3,880 | 29,861 | ||||||
Pidilite Industries Ltd. (Materials)† | 4,150 | 67,517 | ||||||
| 730,787 | ||||||||
Indonesia - 1.9% | ||||||||
Bank Central Asia Tbk PT (Banks)† | 88,000 | 139,150 | ||||||
Kazakhstan - 0.3% | ||||||||
Halyk Savings Bank of Kazakhstan JSC - GDR, Reg S (Banks)† | 1,610 | 20,096 | ||||||
Kenya - 0.2% | ||||||||
Safaricom plc (Telecommunication Services)† | 62,300 | 17,534 | ||||||
Kuwait - 1.1% | ||||||||
Kuwait Projects Co. Holding KSCP (Diversified Financials)† | 19,194 | 15,739 | ||||||
| Shares | Value | |||||||
COMMON STOCKS - 91.3% (continued) | ||||||||
Kuwait - 1.1% (continued) | ||||||||
Mabanee Co. SAK (Real Estate)† | 8,345 | $17,645 | ||||||
National Bank of Kuwait SAKP (Banks)† | 19,546 | 48,431 | ||||||
| 81,815 | ||||||||
Mexico - 5.6% | ||||||||
Banco Santander Mexico SA Institucion de Banca Multiple Grupo Financiero Santand - ADR (Banks) | 4,150 | 30,420 | ||||||
Coca-Cola Femsa SAB de CV - Sponsored ADR (Food Beverage & Tobacco) | 908 | 59,601 | ||||||
El Puerto de Liverpool SAB de CV, Series C1 (Retailing) | 2,600 | 17,347 | ||||||
Fomento Economico Mexicano SAB de CV - Sponsored ADR (Food Beverage & Tobacco) | 1,105 | 106,809 | ||||||
Grupo Bimbo SAB de CV, Series A (Food Beverage & Tobacco) | 24,900 | 57,956 | ||||||
Grupo Financiero Banorte SAB de CV, Series O (Banks) | 5,000 | 31,286 | ||||||
Wal-Mart de Mexico SAB de CV (Food & Staples Retailing) | 40,300 | 111,987 | ||||||
| 415,406 | ||||||||
Morocco - 0.4% | ||||||||
Attijariwafa Bank (Banks)† | 320 | 17,570 | ||||||
Maroc Telecom (Telecommunication Services)† | 900 | 15,304 | ||||||
| 32,874 | ||||||||
Nigeria - 1.1% | ||||||||
Dangote Cement plc (Materials)† | 28,327 | 19,364 | ||||||
Nestle Nigeria plc (Food Beverage & Tobacco)† | 6,250 | 27,730 | ||||||
Nigerian Breweries plc (Food Beverage & Tobacco)† | 44,900 | 16,194 | ||||||
Zenith Bank plc (Banks)† | 260,470 | 19,914 | ||||||
| 83,202 | ||||||||
Pakistan - 1.5% | ||||||||
Engro Corp., Ltd. (Materials)† | 4,900 | 13,240 | ||||||
Lucky Cement Ltd. (Materials)† | 4,400 | 25,140 | ||||||
MCB Bank Ltd. (Banks)† | 8,900 | 16,072 | ||||||
Oil & Gas Development Co., Ltd. (Energy)† | 11,200 | 16,160 | ||||||
Pakistan Petroleum Ltd. (Energy)† | 11,000 | 20,401 | ||||||
United Bank Ltd. (Banks)† | 9,900 | 17,209 | ||||||
| 108,222 | ||||||||
Panama - 0.7% | ||||||||
Copa Holdings SA, Class A (Transportation) | 439 | 51,438 | ||||||
See Notes to Financial Statements
36
Table of Contents
Harding, Loevner Funds, Inc.
Emerging Markets Research Portfolio
Portfolio of Investments
April 30, 2018 (unaudited) (continued)
| Shares | Value | |||||||
COMMON STOCKS - 91.3% (continued) | ||||||||
Peru - 1.4% | ||||||||
Alicorp SAA (Food Beverage & Tobacco) | 6,050 | $22,225 | ||||||
Credicorp Ltd. (Banks) | 350 | 81,371 | ||||||
| 103,596 | ||||||||
Philippines - 2.8% | ||||||||
Bank of the Philippine Islands (Banks)† | 23,883 | 48,432 | ||||||
BDO Unibank Inc. (Banks)† | 12,990 | 32,925 | ||||||
Jollibee Foods Corp. (Consumer Services)† | 9,090 | 49,957 | ||||||
Robinsons Retail Holdings Inc. (Food & Staples Retailing)† | 8,430 | 14,812 | ||||||
Security Bank Corp. (Banks)† | 3,720 | 14,969 | ||||||
SM Prime Holdings Inc. (Real Estate)† | 72,700 | 47,950 | ||||||
| 209,045 | ||||||||
Qatar - 1.0% | ||||||||
Qatar Electricity & Water Co. QSC (Utilities)† | 420 | 22,802 | ||||||
Qatar National Bank QPSC (Banks)† | 1,150 | 47,616 | ||||||
| 70,418 | ||||||||
Romania - 0.5% | ||||||||
Banca Transilvania SA (Banks)† | 26,660 | 17,682 | ||||||
Societatea Nationala de Gaze Naturale ROMGAZ SA (Energy)† | 2,060 | 19,820 | ||||||
| 37,502 | ||||||||
Russia - 5.0% | ||||||||
LUKOIL PJSC - Sponsored ADR (Energy) | 1,650 | 108,718 | ||||||
Moscow Exchange MICEX-RTS PJSC (Diversified Financials)† | 28,840 | 55,298 | ||||||
Novatek PJSC - Sponsored GDR, Reg S (Energy)† | 745 | 94,335 | ||||||
Sberbank of Russia PJSC - Sponsored ADR (Banks)† | 4,750 | 70,220 | ||||||
Yandex NV, Class A (Software & Services)* | 1,136 | 37,897 | ||||||
| 366,468 | ||||||||
Senegal - 0.2% | ||||||||
Sonatel SA (Telecommunication Services) | 360 | 15,588 | ||||||
South Africa - 5.5% | ||||||||
Aspen Pharmacare Holdings Ltd. (Pharmaceuticals, Biotechnology & Life Sciences)† | 3,150 | 67,842 | ||||||
Clicks Group Ltd. (Food & Staples Retailing)† | 4,405 | 74,734 | ||||||
Discovery Ltd. (Insurance)† | 7,600 | 105,398 | ||||||
| Shares | Value | |||||||
COMMON STOCKS - 91.3% (continued) | ||||||||
South Africa - 5.5% (continued) | ||||||||
Standard Bank Group Ltd. (Banks)† | 6,870 | $117,526 | ||||||
Tiger Brands Ltd. (Food Beverage & Tobacco)† | 1,147 | 35,782 | ||||||
| 401,282 | ||||||||
South Korea - 4.9% | ||||||||
Amorepacific Corp. (Household & Personal Products)† | 230 | 74,744 | ||||||
Coway Co., Ltd. (Consumer Durables & Apparel)† | 650 | 53,155 | ||||||
Hankook Tire Co., Ltd. (Automobiles & Components)† | 1,430 | 66,068 | ||||||
Hanssem Co., Ltd. (Consumer Durables & Apparel)† | 236 | 25,641 | ||||||
LG Household & Health Care Ltd. (Household & Personal Products)† | 70 | 89,691 | ||||||
NAVER Corp. (Software & Services)† | 80 | 53,367 | ||||||
| 362,666 | ||||||||
Taiwan - 5.0% | ||||||||
Advantech Co., Ltd. (Technology Hardware & Equipment)† | 8,000 | 54,959 | ||||||
Airtac International Group (Capital Goods)† | 4,178 | 72,231 | ||||||
Eclat Textile Co., Ltd. (Consumer Durables & | 4,080 | 49,206 | ||||||
Largan Precision Co., Ltd. (Technology Hardware & Equipment)† | 290 | 33,646 | ||||||
Silergy Corp. (Semiconductors & Semiconductor Equipment)† | 1,000 | 20,912 | ||||||
Taiwan Semiconductor Manufacturing Co., Ltd. (Semiconductors & Semiconductor Equipment)† | 18,000 | 136,449 | ||||||
| 367,403 | ||||||||
Thailand - 0.9% | ||||||||
Siam Commercial Bank pcl, Reg S (Banks)† | 16,100 | 66,828 | ||||||
Turkey - 1.3% | ||||||||
BIM Birlesik Magazalar AS (Food & Staples | 2,260 | 38,289 | ||||||
Turkiye Garanti Bankasi AS - ADR (Banks) | 25,851 | 57,131 | ||||||
| 95,420 | ||||||||
United Arab Emirates - 1.7% | ||||||||
Agthia Group PJSC (Food Beverage & Tobacco)† | 6,740 | 7,975 | ||||||
DP World Ltd. (Transportation)† | 1,360 | 30,194 | ||||||
See Notes to Financial Statements
37
Table of Contents
Harding, Loevner Funds, Inc.
Emerging Markets Research Portfolio
Portfolio of Investments
April 30, 2018 (unaudited) (continued)
| Shares | Value | |||||||
COMMON STOCKS - 91.3% (continued) | ||||||||
United Arab Emirates - 1.7% (continued) | ||||||||
Emaar Properties PJSC (Real Estate)† | 53,680 | $84,323 | ||||||
| 122,492 | ||||||||
United Kingdom - 0.8% | ||||||||
BGEO Group plc (Banks)† | 1,170 | 55,802 | ||||||
Vietnam - 0.2% | ||||||||
Vietnam Dairy Products JSC (Food Beverage & Tobacco)† | 2,060 | 16,741 | ||||||
Total Common Stocks (Cost $5,650,497) |
|
$6,716,701 |
| |||||
PREFERRED STOCKS - 4.5% | ||||||||
Brazil - 2.0% | ||||||||
Banco Bradesco SA - ADR (Banks)* | 7,403 | 72,550 | ||||||
Itau Unibanco Holding SA - Sponsored ADR, 0.39% (Banks)+ | 5,125 | 74,466 | ||||||
| 147,016 | ||||||||
Colombia - 0.6% | ||||||||
Bancolombia SA - Sponsored ADR, 3.06% (Banks)+ | 940 | 44,800 | ||||||
South Korea - 1.9% | ||||||||
Samsung Electronics Co., Ltd. - GDR, Reg S, 4.15% (Technology Hardware & Equipment)+† | 142 | 139,684 | ||||||
Total Preferred Stocks (Cost $285,647) |
|
$331,500 |
| |||||
PARTICIPATION NOTES - 1.7% | ||||||||
Saudi Arabia - 1.7% | ||||||||
Al Rajhi Bank, Issued by JP Morgan Structured Products, Maturity Date 12/5/19 (Banks)^† | 2,149 | 48,036 | ||||||
Jarir Marketing Co., Issued by HSBC BANK PLC, Maturity Date 1/19/21 (Retailing)^† | 1,338 | 61,212 | ||||||
Saudi British Bank, Issued by JP Morgan Structured Products, Maturity Date 12/9/19 (Banks)^† | 1,870 | 16,230 | ||||||
| 125,478 | ||||||||
Total Participation Notes |
|
$125,478 |
| |||||
SHORT TERM INVESTMENTS - 1.8% | ||||||||
Northern Institutional Funds - Treasury Portfolio, 1.50% (Money Market Funds) | 131,286 | 131,286 | ||||||
| Shares | Value | |||
SHORT TERM INVESTMENTS - 1.8% (continued) | ||||
Total Short Term Investments | $131,286 | |||
Total Investments — 99.3% | ||||
(Cost $6,173,806) | $7,304,965 | |||
Other Assets Less Liabilities - 0.7% | 54,699 | |||
Net Assets — 100.0% | $7,359,664 | |||
Summary of Abbreviations
| ADR | American Depositary Receipt. |
| GDR | Global Depository Receipt. |
| Reg S | Security sold outside United States without registration under the Securities Act of 1933. |
| # | Security valued at fair value as determined in good faith under policies and procedures established by and under the supervision of the Portfolio’s Board of Directors as disclosed in Note 2 of the Notes to Financial Statements. |
| * | Non-income producing security. |
| † | Investment categorized as level 2 security as disclosed in Note 2 of the Notes to Financial Statements. |
| + | Current yield is disclosed. Dividends are calculated based on a percentage of the issuer’s net income. |
| ^ | Security exempt from registration pursuant to Rule 144A of the Securities Act of 1933. These securities, which represent 1.7% of net assets as of April 30, 2018, are considered liquid and may be resold in transactions exempt from registration, normally to qualified buyers. |
See Notes to Financial Statements
38
Table of Contents
Harding, Loevner Funds, Inc.
Emerging Markets Research Portfolio
Portfolio of Investments
April 30, 2018 (unaudited) (continued)
| Industry | Percentage of Net Assets | |||
Automobiles & Components | 2.6 | % | ||
Banks | 22.2 | |||
Capital Goods | 1.5 | |||
Commercial & Professional Services | 1.0 | |||
Consumer Durables & Apparel | 7.4 | |||
Consumer Services | 1.2 | |||
Diversified Financials | 1.3 | |||
Energy | 7.1 | |||
Food & Staples Retailing | 4.4 | |||
Food Beverage & Tobacco | 9.8 | |||
Household & Personal Products | 4.2 | |||
Insurance | 1.8 | |||
Materials | 2.8 | |||
Media | 0.2 | |||
Pharmaceuticals, Biotechnology & Life Sciences | 4.9 | |||
Real Estate | 2.0 | |||
Retailing | 1.9 | |||
Semiconductors & Semiconductor Equipment | 2.2 | |||
Software & Services | 6.1 | |||
Technology Hardware & Equipment | 5.8 | |||
Telecommunication Services | 3.6 | |||
Transportation | 2.2 | |||
Utilities | 1.3 | |||
Money Market Fund | 1.8 | |||
Total Investments | 99.3 | |||
Other Assets Less Liabilities | 0.7 | |||
Net Assets | 100.0 | % | ||
See Notes to Financial Statements
39
Table of Contents
Harding, Loevner Funds, Inc.
Statements of Assets and Liabilities
April 30, 2018 (unaudited)
| Global Equity Portfolio | International Portfolio | International Small Companies Portfolio | ||||||||||
ASSETS: | ||||||||||||
Investments (cost $562,324,801, $10,927,689,512 and $206,491,451, respectively) | $832,944,512 | $14,148,960,258 | $249,720,491 | |||||||||
Dividends and interest receivable | 1,195,186 | 25,925,937 | 655,250 | |||||||||
Foreign currency (cost $69,492, $0 and $48,747, respectively) | 69,492 | — | 48,507 | |||||||||
Receivable for investments sold | 1,209,743 | 31,304,579 | — | |||||||||
Receivable for Fund shares sold | 2,110,625 | 15,581,832 | 212,906 | |||||||||
Tax reclaim receivable | 496,900 | 17,363,823 | 181,004 | |||||||||
Prepaid expenses | 43,981 | 471,889 | 56,538 | |||||||||
Total Assets: | 838,070,439 | 14,239,608,318 | 250,874,696 | |||||||||
LIABILITIES: | ||||||||||||
Payable to Investment Adviser | (546,847 | ) | (7,744,272 | ) | (239,096 | ) | ||||||
Payable for investments purchased | (778,908 | ) | (53,599,859 | ) | — | |||||||
Payable for Fund shares redeemed | (4,082,759 | ) | (17,355,430 | ) | (142,048 | ) | ||||||
Payable for distribution fees | — | (332,534 | ) | (27,902 | ) | |||||||
Deferred capital gains tax | — | — | (171,912 | ) | ||||||||
Other liabilities | (288,524 | ) | (3,031,762 | ) | (102,815 | ) | ||||||
Total Liabilities | (5,697,038 | ) | (82,063,857 | ) | (683,773 | ) | ||||||
Net Assets | $832,373,401 | $14,157,544,461 | $250,190,923 | |||||||||
ANALYSIS OF NET ASSETS: | ||||||||||||
Paid in capital | $479,376,610 | $10,985,768,915 | $200,397,507 | |||||||||
Accumulated undistributed net investment income | 1,002,829 | 51,864,147 | 460,829 | |||||||||
Accumulated net realized gain (loss) from investment transactions | 81,381,460 | (101,407,500 | ) | 6,281,317 | ||||||||
Net unrealized appreciation on investments and on assets and liabilities denominated in foreign currencies | 270,612,502 | 3,221,318,899 | 43,051,270 | |||||||||
Net Assets | $832,373,401 | $14,157,544,461 | $250,190,923 | |||||||||
Net Assets: | ||||||||||||
Institutional Class | $582,732,870 | $12,384,358,383 | $177,017,007 | |||||||||
Institutional Class Z | 149,341,316 | 1,282,342,142 | — | |||||||||
Investor Class | — | 490,843,936 | 73,173,916 | |||||||||
Advisor Class | 100,299,215 | — | — | |||||||||
Total Shares Outstanding: | ||||||||||||
Institutional Class (400,000,000, 500,000,000 and 400,000,000, respectively, $.001 par value shares authorized) | 15,417,540 | 534,980,983 | 10,319,325 | |||||||||
Institutional Class Z (200,000,000, 200,000,000 and —, respectively, $.001 par value shares authorized) | 3,953,536 | 55,406,373 | — | |||||||||
Investor Class (—, 400,000,000 and 400,000,000, respectively, $.001 par value shares authorized) | — | 21,261,480 | 4,297,956 | |||||||||
Advisor Class (400,000,000, — and —, respectively, $.001 par value shares authorized) | 2,656,281 | — | — | |||||||||
Net Asset Value, Offering Price and Redemption Price Per Share: | ||||||||||||
Institutional Class | $37.80 | $23.15 | $17.15 | |||||||||
Institutional Class Z | 37.77 | 23.14 | — | |||||||||
Investor Class | — | 23.09 | 17.03 | |||||||||
Advisor Class | 37.76 | — | — | |||||||||
See Notes to Financial Statements
40
Table of Contents
Harding, Loevner Funds, Inc.
Statements of Assets and Liabilities (continued)
April 30, 2018 (unaudited)
Institutional Portfolio | Emerging Portfolio | Frontier Emerging Markets Portfolio | ||||||||||
ASSETS: | ||||||||||||
Investments (cost $3,820,914,293, $2,895,557,810 and $407,028,032, respectively) | $5,209,462,989 | $4,267,093,310 | $512,804,133 | |||||||||
Dividends and interest receivable | 9,481,628 | 9,309,340 | 2,271,017 | |||||||||
Foreign currency (cost $253,693, $0 and $94,743, respectively) | 254,228 | — | 94,946 | |||||||||
Receivable for investments sold | 3,330,664 | 2,759,275 | — | |||||||||
Receivable for Fund shares sold | 10,625,999 | 7,650,515 | 385,875 | |||||||||
Tax reclaim receivable | 710,285 | 146,533 | — | |||||||||
Prepaid expenses | 92,767 | 55,310 | 49,010 | |||||||||
Total Assets: | 5,233,958,560 | 4,287,014,283 | 515,604,981 | |||||||||
LIABILITIES: | ||||||||||||
Payable to Investment Adviser | (4,837,689 | ) | (3,992,373 | ) | (573,831 | ) | ||||||
Payable for investments purchased | (92 | ) | — | (1,335,252 | ) | |||||||
Payable for Fund shares redeemed | (7,702,088 | ) | (1,577,222 | ) | (389,497 | ) | ||||||
Payable for distribution fees | — | — | (19,717 | ) | ||||||||
Deferred capital gains tax | — | — | (2,856,241 | ) | ||||||||
Other liabilities | (1,479,584 | ) | (2,001,775 | ) | (286,665 | ) | ||||||
Total Liabilities | (14,019,453 | ) | (7,571,370 | ) | (5,461,203 | ) | ||||||
Net Assets | $5,219,939,107 | $4,279,442,913 | $510,143,778 | |||||||||
ANALYSIS OF NET ASSETS: | ||||||||||||
Paid in capital | $3,971,870,822 | $2,943,680,784 | $507,514,426 | |||||||||
Accumulated undistributed net investment income (loss) | 7,419,571 | 3,947,580 | (1,925,111 | ) | ||||||||
Accumulated net realized loss from investment transactions | (147,843,044 | ) | (39,629,539 | ) | (98,325,084 | ) | ||||||
Net unrealized appreciation on investments and on assets and liabilities denominated in foreign currencies | 1,388,491,758 | 1,371,444,088 | 102,879,547 | |||||||||
Net Assets | $5,219,939,107 | $4,279,442,913 | $510,143,778 | |||||||||
Net Assets: | ||||||||||||
Institutional Class I | $— | $— | $283,539,056 | |||||||||
Institutional Class II | — | — | 192,482,093 | |||||||||
Class I | 4,775,765,037 | — | — | |||||||||
Class II | 444,174,070 | — | — | |||||||||
Investor Class | — | — | 34,122,629 | |||||||||
Advisor Class | — | 4,279,442,913 | — | |||||||||
Total Shares Outstanding: | ||||||||||||
Institutional Class I (—, — and 400,000,000, respectively, $.001 par value shares authorized) | — | — | 31,074,204 | |||||||||
Institutional Class II (—, — and 200,000,000, respectively, $.001 par value shares authorized) | — | — | 21,104,501 | |||||||||
Class I (500,000,000, — and —, respectively, $.001 par value shares authorized) | 210,798,960 | — | — | |||||||||
Class II (400,000,000, — and —, respectively, $.001 par value shares authorized) | 19,604,352 | — | — | |||||||||
Investor Class (—, — and 400,000,000, respectively, $.001 par value shares authorized) | — | — | 3,761,839 | |||||||||
Advisor Class (—, 500,000,000 and —, respectively, $.001 par value shares authorized) | — | 72,157,355 | — | |||||||||
Net Asset Value, Offering Price and Redemption Price Per Share: | ||||||||||||
Institutional Class I | $— | $— | $9.12 | |||||||||
Institutional Class II | — | — | 9.12 | |||||||||
Class I | 22.66 | — | — | |||||||||
Class II | 22.66 | — | — | |||||||||
Investor Class | — | — | 9.07 | |||||||||
Advisor Class | — | 59.31 | — | |||||||||
See Notes to Financial Statements
41
Table of Contents
Harding, Loevner Funds, Inc.
Statements of Assets and Liabilities (continued)
April 30, 2018 (unaudited)
| Global Equity Research Portfolio | International Equity Research Portfolio | Emerging Markets Research Portfolio | ||||||||||
ASSETS: | ||||||||||||
Investments (cost $5,265,389, $9,629,875 and $6,173,806, respectively) | $6,215,066 | $11,417,052 | $7,304,965 | |||||||||
Dividends and interest receivable | 11,330 | 34,316 | 13,237 | |||||||||
Cash | — | 552 | — | |||||||||
Foreign currency (cost $9,263, $63,779 and $54,414, respectively) | 9,266 | 63,784 | 54,422 | |||||||||
Receivable for investments sold | 69 | — | 46,002 | |||||||||
Tax reclaim receivable | 1,988 | 10,867 | 141 | |||||||||
Prepaid expenses | 18,473 | 18,202 | 18,452 | |||||||||
Total Assets: | 6,256,192 | 11,544,773 | 7,437,219 | |||||||||
LIABILITIES: | ||||||||||||
Payable to Investment Adviser | (4,095 | ) | (7,080 | ) | (7,017 | ) | ||||||
Payable for investments purchased | (12,417 | ) | — | (23,378 | ) | |||||||
Payable for distribution fees | (1,793 | ) | (4,282 | ) | (1,997 | ) | ||||||
Deferred capital gains tax | (161 | ) | (698 | ) | (4,425 | ) | ||||||
Other liabilities | (40,190 | ) | (47,913 | ) | (40,738 | ) | ||||||
Total Liabilities | (58,656 | ) | (59,973 | ) | (77,555 | ) | ||||||
Net Assets | $6,197,536 | $11,484,800 | $7,359,664 | |||||||||
ANALYSIS OF NET ASSETS: | ||||||||||||
Paid in capital | $4,985,925 | $9,258,133 | $5,924,832 | |||||||||
Accumulated undistributed net investment income | 18,324 | 40,201 | 12,760 | |||||||||
Accumulated net realized gain from investment transactions | 243,833 | 400,204 | 295,226 | |||||||||
Net unrealized appreciation on investments and on assets and liabilities denominated in foreign currencies | 949,454 | 1,786,262 | 1,126,846 | |||||||||
Net Assets | $6,197,536 | $11,484,800 | $7,359,664 | |||||||||
Net Assets: | ||||||||||||
Institutional Class | $5,617,855 | $10,383,223 | $6,712,213 | |||||||||
Investor Class | 579,681 | 1,101,577 | 647,451 | |||||||||
Total Shares Outstanding: | ||||||||||||
Institutional Class (300,000,000, 300,000,000 and 300,000,000, respectively, $.001 par value shares authorized) | 452,099 | 800,985 | 526,909 | |||||||||
Investor Class (200,000,000, 300,000,000 and 200,000,000, respectively, $.001 par value shares authorized) | 46,797 | 85,473 | 50,987 | |||||||||
Net Asset Value, Offering Price and Redemption Price Per Share: | ||||||||||||
Institutional Class | $12.43 | $12.96 | $12.74 | |||||||||
Investor Class | 12.39 | 12.89 | 12.70 | |||||||||
See Notes to Financial Statements
42
Table of Contents
Harding, Loevner Funds, Inc.
For the Six Months Ended April 30, 2018 (unaudited)
Global Equity | International Equity Portfolio | International Small Companies Portfolio | Institutional Emerging Markets Portfolio | Emerging Markets Portfolio | ||||||||||||||||
INVESTMENT INCOME | ||||||||||||||||||||
Interest | $— | $290 | $— | $348 | $377 | |||||||||||||||
Dividends (net of foreign withholding taxes of $452,244, $11,874,446, $208,755, $4,851,354 and $3,564,442, respectively) | 4,931,037 | 104,520,583 | 1,915,720 | 39,473,066 | 33,181,918 | |||||||||||||||
Total investment income | 4,931,037 | 104,520,873 | 1,915,720 | 39,473,414 | 33,182,295 | |||||||||||||||
EXPENSES | ||||||||||||||||||||
Investment advisory fees (Note 3) | 3,297,930 | 43,738,160 | 1,341,704 | 28,658,144 | 23,819,930 | |||||||||||||||
Administration fees (Note 3) | 135,061 | 1,521,321 | 46,606 | 638,142 | 538,276 | |||||||||||||||
Distribution fees, Investor Class | — | 713,576 | 76,822 | — | — | |||||||||||||||
Custody and accounting fees (Note 3) | 102,851 | 1,294,220 | 73,270 | 1,056,885 | 887,892 | |||||||||||||||
Directors’ fees and expenses | 11,640 | 172,952 | 3,093 | 69,380 | 57,537 | |||||||||||||||
Transfer agent fees and expenses (Note 3) | 38,350 | 198,386 | 24,944 | 48,918 | 242,766 | |||||||||||||||
Printing and postage fees | 16,147 | 330,551 | 7,232 | 116,937 | 174,329 | |||||||||||||||
State registration filing fees | 42,585 | 324,745 | 26,905 | 67,276 | 45,302 | |||||||||||||||
Professional fees | 26,245 | 127,229 | 24,188 | 74,823 | 61,631 | |||||||||||||||
Shareholder servicing fees (Note 3) | 249,283 | 4,085,121 | 74,507 | 1,476,540 | 3,372,381 | |||||||||||||||
Compliance officers’ fees and expenses (Note 3) | 1,408 | 20,481 | 361 | 8,254 | 6,841 | |||||||||||||||
Other fees and expenses | 15,603 | 140,017 | 5,774 | 59,501 | 48,907 | |||||||||||||||
Total Expenses | 3,937,103 | 52,666,759 | 1,705,406 | 32,274,800 | 29,255,792 | |||||||||||||||
Less Waiver of investment advisory fee and/or reimbursement of other operating expenses (Note 3) | (3,943 | ) | — | (286,879 | ) | (207,928 | ) | — | ||||||||||||
Less waiver of transfer agent fee and expenses (Note 3) | (7,945 | ) | (9,965 | ) | — | — | — | |||||||||||||
Net expenses | 3,925,215 | 52,656,794 | 1,418,527 | 32,066,872 | 29,255,792 | |||||||||||||||
Net investment income | 1,005,822 | 51,864,079 | 497,193 | 7,406,542 | 3,926,503 | |||||||||||||||
REALIZED AND UNREALIZED GAIN (LOSS) | ||||||||||||||||||||
Net realized gain (loss) | ||||||||||||||||||||
Investment transactions | 83,433,431 | (85,946,978 | ) | 6,993,411 | (24,193,496 | ) | (7,296,003 | ) | ||||||||||||
Foreign currency transactions | (29,988 | ) | 35,736 | (90,619 | ) | (319,395 | ) | (350,098 | ) | |||||||||||
Net realized gain (loss) | 83,403,443 | (85,911,242 | ) | 6,902,792 | (24,512,891 | ) | (7,646,101 | ) | ||||||||||||
Change in unrealized appreciation (depreciation) | ||||||||||||||||||||
Investments (net of increase (decrease) in deferred foreign taxes of $—, $—, $(218,588), $— and $—, respectively) | (38,447,212 | ) | 508,539,325 | 371,665 | 211,963,434 | 162,684,496 | ||||||||||||||
Translation of assets and liabilities denominated in foreign currencies | (10,818 | ) | (179,022 | ) | 3,919 | (91,943 | ) | (92,972 | ) | |||||||||||
Net change in unrealized appreciation (depreciation) | (38,458,030 | ) | 508,360,303 | 375,584 | 211,871,491 | 162,591,524 | ||||||||||||||
Net realized and unrealized gain | 44,945,413 | 422,449,061 | 7,278,376 | 187,358,600 | 154,945,423 | |||||||||||||||
NET INCREASE IN NET ASSETS RESULTING FROM OPERATIONS | $45,951,235 | $474,313,140 | $7,775,569 | $194,765,142 | $158,871,926 | |||||||||||||||
See Notes to Financial Statements
43
Table of Contents
Harding, Loevner Funds, Inc.
Statements of Operations (continued)
For the Six Months Ended April 30, 2018 (unaudited)
| Frontier Emerging Markets Portfolio | Global Equity Research Portfolio | International Equity Research Portfolio | Emerging Markets Research Portfolio | |||||||||||||
INVESTMENT INCOME | ||||||||||||||||
Dividends (net of foreign withholding taxes of $721,348, $2,963, $10,435 and $5,646, respectively) | $7,450,485 | $48,641 | $97,683 | $65,235 | ||||||||||||
Total investment income | 7,450,485 | 48,641 | 97,683 | 65,235 | ||||||||||||
EXPENSES | ||||||||||||||||
Investment advisory fees (Note 3) | 3,352,571 | 24,524 | 41,564 | 40,124 | ||||||||||||
Administration fees (Note 3) | 89,716 | 1,226 | 2,217 | 1,396 | ||||||||||||
Distribution fees, Investor Class | 41,372 | 717 | 1,410 | 805 | ||||||||||||
Custody and accounting fees (Note 3) | 270,003 | 7,191 | 9,213 | 9,517 | ||||||||||||
Directors’ fees and expenses | 6,733 | 87 | 153 | 93 | ||||||||||||
Transfer agent fees and expenses (Note 3) | 41,288 | 23,525 | 23,574 | 23,486 | ||||||||||||
Printing and postage fees | 13,818 | 206 | 274 | 216 | ||||||||||||
State registration filing fees | 51,720 | 27,116 | 23,754 | 27,122 | ||||||||||||
Professional fees | 21,304 | 17,041 | 18,444 | 17,965 | ||||||||||||
Shareholder servicing fees (Note 3) | 111,902 | — | 258 | — | ||||||||||||
Compliance officers’ fees and expenses (Note 3) | 798 | 11 | 19 | 11 | ||||||||||||
Offering fees | — | 2,775 | — | 2,775 | ||||||||||||
Other fees and expenses | 10,559 | 3,581 | 3,633 | 3,583 | ||||||||||||
Total Expenses | 4,011,784 | 108,000 | 124,513 | 127,093 | ||||||||||||
Less Waiver of investment advisory fee and/or reimbursement of other operating expenses (Note 3) | (188,744 | ) | (79,694 | ) | (73,294 | ) | (80,931 | ) | ||||||||
Less waiver of transfer agent fee and expenses (Note 3) | — | — | — | — | ||||||||||||
Net expenses | 3,823,040 | 28,306 | 51,219 | 46,162 | ||||||||||||
Net investment income | 3,627,445 | 20,335 | 46,464 | 19,073 | ||||||||||||
REALIZED AND UNREALIZED GAIN (LOSS) | ||||||||||||||||
Net realized gain (loss) | ||||||||||||||||
Investment transactions | 11,181,560 | 244,461 | 406,853 | 295,689 | ||||||||||||
Foreign currency transactions | (78,599 | ) | (493 | ) | (1,606 | ) | 6 | |||||||||
Net realized gain | 11,102,961 | 243,968 | 405,247 | 295,695 | ||||||||||||
Change in unrealized appreciation (depreciation) | ||||||||||||||||
Investments (net of increase (decrease) in deferred foreign taxes of $(134,017), $(2,554), $(3,012) and $(7,672), respectively) | 28,363,850 | 76,859 | 44,796 | 50,391 | ||||||||||||
Translation of assets and liabilities denominated in foreign currencies | (14,476 | ) | (32 | ) | (158 | ) | 397 | |||||||||
Net change in unrealized appreciation | 28,349,374 | 76,827 | 44,638 | 50,788 | ||||||||||||
Net realized and unrealized gain | 39,452,335 | 320,795 | 449,885 | 346,483 | ||||||||||||
NET INCREASE IN NET ASSETS RESULTING FROM OPERATIONS | $43,079,780 | $341,130 | $496,349 | $365,556 | ||||||||||||
See Notes to Financial Statements
44
Table of Contents
Harding, Loevner Funds, Inc.
Statements of Changes in Net Assets
For the Six Months Ended April 30, 2018 (unaudited) and the Fiscal Year Ended October 31, 2017
Global Equity Portfolio | International Equity Portfolio | International Small Companies Portfolio | ||||||||||||||||||||||
| April 30, 2018 | October 31, 2017 | April 30, 2018 | October 31, 2017 | April 30, 2018 | October 31, 2017 | |||||||||||||||||||
INCREASE (DECREASE) IN NET ASSETS FROM OPERATIONS | ||||||||||||||||||||||||
Net investment income | $1,005,822 | $2,072,840 | $51,864,079 | $108,279,538 | $497,193 | $872,266 | ||||||||||||||||||
Net realized gain (loss) on investments and foreign currency transactions | 83,403,443 | 99,351,243 | (85,911,242 | ) | 109,122,767 | 6,902,792 | 2,061,321 | |||||||||||||||||
Net change in unrealized appreciation (depreciation) on investments and translation of assets and liabilities denominated in foreign currencies | (38,458,030 | ) | 121,677,405 | 508,360,303 | 1,804,465,888 | 375,584 | 31,502,151 | |||||||||||||||||
Net increase in net assets resulting from operations | 45,951,235 | 223,101,488 | 474,313,140 | 2,021,868,193 | 7,775,569 | 34,435,738 | ||||||||||||||||||
DISTRIBUTIONS TO SHAREHOLDERS FROM: | ||||||||||||||||||||||||
Net investment income | ||||||||||||||||||||||||
Institutional Class | (2,026,571 | ) | (3,192,599 | ) | (99,643,720 | ) | (61,948,722 | ) | (608,162 | ) | (758,218 | ) | ||||||||||||
Institutional Class Z | (533,411 | ) | — | (1,882,622 | ) | — | — | — | ||||||||||||||||
Investor Class | — | — | (3,358,029 | ) | (2,877,064 | ) | (133,775 | ) | (455,833 | ) | ||||||||||||||
Advisor Class | (142,433 | ) | (71,969 | ) | — | — | — | — | ||||||||||||||||
Net realized gain from investments and foreign-currency related transactions | ||||||||||||||||||||||||
Institutional Class | (73,919,104 | ) | (9,438,405 | ) | (88,323,385 | ) | — | (1,437,824 | ) | (1,995,191 | ) | |||||||||||||
Institutional Class Z | (15,820,099 | ) | — | (1,576,355 | ) | — | — | — | ||||||||||||||||
Investor Class | — | — | (4,402,399 | ) | — | (423,467 | ) | (1,303,383 | ) | |||||||||||||||
Advisor Class | (9,280,160 | ) | (670,713 | ) | — | — | — | — | ||||||||||||||||
Total distributions to shareholders | (101,721,778 | ) | (13,373,686 | ) | (199,186,510 | ) | (64,825,786 | ) | (2,603,228 | ) | (4,512,625 | ) | ||||||||||||
TRANSACTIONS IN SHARES OF COMMON STOCK | ||||||||||||||||||||||||
Institutional Class | (168,682,201 | ) | (182,801,422 | ) | 976,546,769 | 2,919,220,272 | 28,398,505 | 59,600,587 | ||||||||||||||||
Institutional Class Z | 113,931,447 | 45,129,498 | 1,156,194,609 | 163,450,051 | — | — | ||||||||||||||||||
Investor Class | — | — | (169,225,233 | ) | 90,614,374 | 22,157,568 | (2,209,932 | ) | ||||||||||||||||
Advisor Class | 31,060,763 | 4,059,653 | — | — | — | — | ||||||||||||||||||
Net Increase (Decrease) in net assets from portfolio share transactions | (23,689,991 | ) | (133,612,271 | ) | 1,963,516,145 | 3,173,284,697 | 50,556,073 | 57,390,655 | ||||||||||||||||
NET INCREASE (DECREASE) IN | ||||||||||||||||||||||||
NET ASSETS | (79,460,534 | ) | 76,115,531 | 2,238,642,775 | 5,130,327,104 | 55,728,414 | 87,313,768 | |||||||||||||||||
NET ASSETS | ||||||||||||||||||||||||
At beginning of period | 911,833,935 | 835,718,404 | 11,918,901,686 | 6,788,574,582 | 194,462,509 | 107,148,741 | ||||||||||||||||||
At end of period | $832,373,401 | $911,833,935 | $14,157,544,461 | $11,918,901,686 | $250,190,923 | $194,462,509 | ||||||||||||||||||
Accumulated Undistributed Net Investment Income Included In Net Assets | $1,002,829 | $2,699,422 | $51,864,147 | $104,884,439 | $460,829 | $705,573 | ||||||||||||||||||
See Notes to Financial Statements
45
Table of Contents
Harding, Loevner Funds, Inc.
Statements of Changes in Net Assets (continued)
For the Six Months Ended April 30, 2018 (unaudited) and the Fiscal Year Ended October 31, 2017
Institutional Emerging Markets Portfolio | Emerging Markets Portfolio | Frontier Emerging Markets Portfolio | ||||||||||||||||||||||
| April 30, 2018 | October 31, 2017 | April 30, 2018 | October 31, 2017 | April 30, 2018 | October 31, 2017 | |||||||||||||||||||
INCREASE (DECREASE) IN NET ASSETS FROM OPERATIONS | ||||||||||||||||||||||||
Net investment income | $7,406,542 | $39,784,285 | $3,926,503 | $29,181,162 | $3,627,445 | $3,547,034 | ||||||||||||||||||
Net realized gain (loss) on investments and foreign currency transactions | (24,512,891 | ) | 17,200,140 | (7,646,101 | ) | 59,611,118 | 11,102,961 | (5,120,521 | ) | |||||||||||||||
Net change in unrealized appreciation on investments and translation of assets and liabilities denominated in foreign currencies | 211,871,491 | 868,787,971 | 162,591,524 | 698,935,059 | 28,349,374 | 67,483,381 | ||||||||||||||||||
Net increase in net assets resulting from operations | 194,765,142 | 925,772,396 | 158,871,926 | 787,727,339 | 43,079,780 | 65,909,894 | ||||||||||||||||||
DISTRIBUTIONS TO SHAREHOLDERS FROM: | ||||||||||||||||||||||||
Net investment income | ||||||||||||||||||||||||
Institutional Class I | — | — | — | — | (5,147,342 | ) | (3,512,132 | ) | ||||||||||||||||
Institutional Class II | — | — | — | — | (3,499,694 | ) | — | |||||||||||||||||
Class I | (34,875,251 | ) | (18,225,386 | ) | — | — | — | — | ||||||||||||||||
Class II | (3,886,186 | ) | (4,287,811 | ) | — | — | — | — | ||||||||||||||||
Investor Class | — | — | — | — | (491,328 | ) | (165,442 | ) | ||||||||||||||||
Advisor Class | — | — | (28,497,360 | ) | (17,343,528 | ) | — | — | ||||||||||||||||
Net realized gain from investments and foreign-currency related transactions | ||||||||||||||||||||||||
Advisor Class | — | — | (1,842,865 | ) | — | — | — | |||||||||||||||||
Total distributions to shareholders | (38,761,437 | ) | (22,513,197 | ) | (30,340,225 | ) | (17,343,528 | ) | (9,138,364 | ) | (3,677,574 | ) | ||||||||||||
TRANSACTIONS IN SHARES OF COMMON STOCK | ||||||||||||||||||||||||
Institutional Class I | — | — | — | — | (2,700,292 | ) | (113,854,561 | ) | ||||||||||||||||
Institutional Class II | — | — | — | — | 13,499,694 | 147,539,455 | ||||||||||||||||||
Class I | 249,021,445 | 521,998,725 | — | — | — | — | ||||||||||||||||||
Class II | (29,884,736 | ) | (12,909,702 | ) | — | — | — | — | ||||||||||||||||
Investor Class | — | — | — | — | 879,451 | (6,278,013 | ) | |||||||||||||||||
Advisor Class | — | — | 135,934,680 | 246,108,743 | — | — | ||||||||||||||||||
Net Increase in net assets from portfolio share transactions | 219,136,709 | 509,089,023 | 135,934,680 | 246,108,743 | 11,678,853 | 27,406,881 | ||||||||||||||||||
NET INCREASE IN NET ASSETS | 375,140,414 | 1,412,348,222 | 264,466,381 | 1,016,492,554 | 45,620,269 | 89,639,201 | ||||||||||||||||||
NET ASSETS | ||||||||||||||||||||||||
At beginning of period | 4,844,798,693 | 3,432,450,471 | 4,014,976,532 | 2,998,483,978 | 464,523,509 | 374,884,308 | ||||||||||||||||||
At end of period | $5,219,939,107 | $4,844,798,693 | $4,279,442,913 | $4,014,976,532 | $510,143,778 | $464,523,509 | ||||||||||||||||||
Accumulated Undistributed Net Investment Income (Loss) Included In Net Assets | $7,419,571 | $38,774,466 | $3,947,580 | $28,518,437 | $(1,925,111 | ) | $3,585,808 | |||||||||||||||||
See Notes to Financial Statements
46
Table of Contents
Harding, Loevner Funds, Inc.
Statements of Changes in Net Assets (continued)
For the Six Months Ended April 30, 2018 (unaudited) and the Fiscal Year Ended October 31, 2017
Global Equity Research Portfolio | International Equity Research Portfolio | Emerging Markets Research Portfolio | ||||||||||||||||||||||
| April 30, 2018 | October 31, 2017(1) | April 30, 2018 | October 31, 2017 | April 30, 2018 | October 31, 2017(1) | |||||||||||||||||||
INCREASE (DECREASE) IN NET ASSETS FROM OPERATIONS | ||||||||||||||||||||||||
Net investment income | $20,335 | $35,575 | $46,464 | $87,413 | $19,073 | $51,064 | ||||||||||||||||||
Net realized gain on investments and foreign currency transactions | 243,968 | 156,804 | 405,247 | 510,004 | 295,695 | 375,486 | ||||||||||||||||||
Net change in unrealized appreciation on investments and translation of assets and liabilities denominated in foreign currencies | 76,827 | 872,627 | 44,638 | 1,271,834 | 50,788 | 1,076,058 | ||||||||||||||||||
Net increase in net assets resulting from operations | 341,130 | 1,065,006 | 496,349 | 1,869,251 | 365,556 | 1,502,608 | ||||||||||||||||||
DISTRIBUTIONS TO SHAREHOLDERS FROM: | ||||||||||||||||||||||||
Net investment income Institutional Class | (80,143 | ) | — | (101,511 | ) | (106,029 | ) | (102,902 | ) | — | ||||||||||||||
Investor Class | (8,295 | ) | — | (12,062 | ) | (12,691 | ) | (10,758 | ) | — | ||||||||||||||
Net realized gain from investments and foreign-currency related transactions | ||||||||||||||||||||||||
Institutional Class | (139,191 | ) | — | (429,710 | ) | (121,633 | ) | (332,545 | ) | — | ||||||||||||||
Investor Class | (14,406 | ) | — | (51,060 | ) | (14,558 | ) | (34,765 | ) | — | ||||||||||||||
Total distributions to shareholders | (242,035 | ) | — | (594,343 | ) | (254,911 | ) | (480,970 | ) | — | ||||||||||||||
TRANSACTIONS IN SHARES OF COMMON STOCK | ||||||||||||||||||||||||
Institutional Class | 219,334 | 4,341,525 | 992,852 | 1,790,387 | 935,447 | 4,518,305 | ||||||||||||||||||
Investor Class | 22,701 | 449,875 | (13,084 | ) | 127,794 | 45,523 | 473,195 | |||||||||||||||||
Net Increase in net assets from portfolio share transactions | 242,035 | 4,791,400 | 979,768 | 1,918,181 | 980,970 | 4,991,500 | ||||||||||||||||||
NET INCREASE IN NET ASSETS | 341,130 | 5,856,406 | 881,774 | 3,532,521 | 865,556 | 6,494,108 | ||||||||||||||||||
NET ASSETS | ||||||||||||||||||||||||
At beginning of period | 5,856,406 | — | 10,603,026 | 7,070,505 | 6,494,108 | — | ||||||||||||||||||
At end of period | $6,197,536 | $5,856,406 | $11,484,800 | $10,603,026 | $7,359,664 | $6,494,108 | ||||||||||||||||||
Accumulated Undistributed Net Investment Income Included In Net Assets | $18,324 | $86,427 | $40,201 | $107,310 | $12,760 | $107,347 | ||||||||||||||||||
| (1) | For the period from December 19, 2016 (commencement of class operations) through October 31, 2017. |
See Notes to Financial Statements
47
Table of Contents
Harding, Loevner Funds, Inc.
For the Six Months Ended April 30, 2018 (unaudited) or the Fiscal Year Ended October 31
INCREASE (DECREASE) IN NET ASSETS FROM OPERATIONS:
| DISTRIBUTIONS TO SHAREHOLDERS FROM:
| RATIOS/SUPPLEMENTAL DATA:
| ||||||||||||||||||||||||||||||||||||||||||||||||||||||
Net asset value, beginning of period | Net investment income (loss)(1) | Net realized and unrealized gain (loss) on investments and foreign currency- related transactions | Net increase (decrease) from investment operations | Net investment income | Net realized gain from investments | Total distributions | Net asset value, end of period | Total Return | Net assets, end of period (000’s) | Expenses to average net assets | Expenses to average net assets (net of fees waived/ reimbursed) | Net investment income to average net assets | Portfolio turnover rate | |||||||||||||||||||||||||||||||||||||||||||
Global Equity Portfolio–Institutional Class |
| |||||||||||||||||||||||||||||||||||||||||||||||||||||||
04/30/18 | $40.84 | $0.05 | $2.07 | $2.12 | $(0.14 | ) | $(5.02 | ) | $(5.16 | ) | $37.80 | 5.57 | (A)% | $582,733 | 0.94 | (B)% | 0.94 | (B)% | 0.23 | (B)% | 17 | (A)% | ||||||||||||||||||||||||||||||||||
10/31/17 | 32.53 | 0.09 | 8.74 | 8.83 | (0.13 | ) | (0.39 | ) | (0.52 | ) | 40.84 | 27.58 | 790,097 | 0.93 | 0.93 | 0.25 | 33 | |||||||||||||||||||||||||||||||||||||||
10/31/16 | 32.44 | 0.13 | 0.92 | 1.05 | (0.12 | ) | (0.84 | ) | (0.96 | ) | 32.53 | 3.43 | 779,020 | 0.92 | 0.92 | 0.42 | 24 | |||||||||||||||||||||||||||||||||||||||
10/31/15 | 32.98 | 0.13 | 0.68 | 0.81 | (0.12 | ) | (1.23 | ) | (1.35 | ) | 32.44 | 2.51 | 805,291 | 0.92 | 0.92 | 0.41 | 45 | |||||||||||||||||||||||||||||||||||||||
10/31/14 | 29.84 | 0.13 | 3.27 | 3.40 | (0.13 | ) | (0.13 | ) | (0.26 | ) | 32.98 | 11.47 | 731,897 | 0.97 | 0.95 | 0.43 | 30 | |||||||||||||||||||||||||||||||||||||||
10/31/13 | 25.05 | 0.17 | 4.74 | 4.91 | (0.12 | ) | — | (0.12 | ) | 29.84 | 19.66 | 543,293 | 0.99 | 0.95 | 0.62 | 13 | ||||||||||||||||||||||||||||||||||||||||
Global Equity Portfolio–Institutional Class Z |
| |||||||||||||||||||||||||||||||||||||||||||||||||||||||
04/30/18 | 40.84 | 0.07 | 2.05 | 2.12 | (0.17 | ) | (5.02 | ) | (5.19 | ) | 37.77 | 5.61 | (A) | 149,341 | 0.91 | (B) | 0.90 | (B) | 0.36 | (B) | 17 | (A) | ||||||||||||||||||||||||||||||||||
10/31/17(2)(3) | 39.33 | (0.01 | ) | 1.52 | 1.51 | — | — | — | 40.84 | 3.80 | (A) | 46,493 | 1.21 | (B) | 0.90 | (B) | (0.05 | )(B) | 33 | (A) | ||||||||||||||||||||||||||||||||||||
Global Equity Portfolio–Advisor Class |
| |||||||||||||||||||||||||||||||||||||||||||||||||||||||
04/30/18 | 40.78 | 0.03 | 2.05 | 2.08 | (0.08 | ) | (5.02 | ) | (5.10 | ) | 37.76 | 5.46 | (A) | 100,299 | 1.11 | (B) | 1.11 | (B) | 0.15 | (B) | 17 | (A) | ||||||||||||||||||||||||||||||||||
10/31/17 | 32.47 | 0.01 | 8.73 | 8.74 | (0.04 | ) | (0.39 | ) | (0.43 | ) | 40.78 | 27.28 | 75,244 | 1.14 | 1.14 | 0.02 | 33 | |||||||||||||||||||||||||||||||||||||||
10/31/16 | 32.38 | 0.05 | 0.91 | 0.96 | (0.03 | ) | (0.84 | ) | (0.87 | ) | 32.47 | 3.12 | 56,698 | 1.19 | 1.19 | 0.15 | 24 | |||||||||||||||||||||||||||||||||||||||
10/31/15 | 32.92 | 0.04 | 0.68 | 0.72 | (0.03 | ) | (1.23 | ) | (1.26 | ) | 32.38 | 2.28 | 64,726 | 1.18 | 1.18 | 0.13 | 45 | |||||||||||||||||||||||||||||||||||||||
10/31/14 | 29.80 | 0.05 | 3.27 | 3.32 | (0.07 | ) | (0.13 | ) | (0.20 | ) | 32.92 | 11.19 | 81,507 | 1.20 | 1.20 | 0.16 | 30 | |||||||||||||||||||||||||||||||||||||||
10/31/13 | 25.02 | 0.09 | 4.74 | 4.83 | (0.05 | ) | — | (0.05 | ) | 29.80 | 19.33 | 86,882 | 1.25 | 1.24 | 0.32 | 13 | ||||||||||||||||||||||||||||||||||||||||
International Equity Portfolio–Institutional Class |
| |||||||||||||||||||||||||||||||||||||||||||||||||||||||
04/30/18 | 22.64 | 0.09 | 0.80 | 0.89 | (0.20 | ) | (0.18 | ) | (0.38 | ) | 23.15 | 3.97 | (A) | 12,384,358 | 0.80 | (B) | 0.80 | (B) | 0.78 | (B) | 5 | (A) | ||||||||||||||||||||||||||||||||||
10/31/17 | 18.37 | 0.23 | 4.22 | 4.45 | (0.18 | ) | — | (0.18 | ) | 22.64 | 24.47 | 11,107,736 | 0.82 | 0.82 | 1.22 | 12 | ||||||||||||||||||||||||||||||||||||||||
10/31/16 | 17.69 | 0.21 | 0.64 | 0.85 | (0.17 | ) | — | (0.17 | ) | 18.37 | 4.91 | 6,354,810 | 0.84 | 0.84 | 1.20 | 22 | ||||||||||||||||||||||||||||||||||||||||
10/31/15 | 18.30 | 0.20 | (0.63 | ) | (0.43 | ) | (0.18 | ) | — | (0.18 | ) | 17.69 | (2.40 | ) | 4,591,802 | 0.85 | 0.85 | 1.11 | 12 | |||||||||||||||||||||||||||||||||||||
10/31/14 | 17.97 | 0.18 | 0.29 | 0.47 | (0.14 | ) | — | (0.14 | ) | 18.30 | 2.65 | 3,819,491 | 0.87 | 0.87 | 1.01 | 10 | ||||||||||||||||||||||||||||||||||||||||
10/31/13 | 15.15 | 0.17 | 2.78 | 2.95 | (0.13 | ) | — | (0.13 | ) | 17.97 | 19.58 | 3,467,793 | 0.87 | 0.87 | 1.06 | 20 | ||||||||||||||||||||||||||||||||||||||||
International Equity Portfolio–Institutional Class Z |
| |||||||||||||||||||||||||||||||||||||||||||||||||||||||
04/30/18 | 22.64 | 0.17 | 0.72 | 0.89 | (0.21 | ) | (0.18 | ) | (0.39 | ) | 23.14 | 4.00 | (A) | 1,282,342 | 0.73 | (B) | 0.73 | (B) | 1.49 | (B) | 5 | (A) | ||||||||||||||||||||||||||||||||||
10/31/17(2)(4) | 21.35 | 0.02 | 1.27 | 1.29 | — | — | — | 22.64 | 6.00 | (A) | 166,923 | 0.99 | (B) | 0.80 | (B) | 0.33 | (B) | 12 | (A) | |||||||||||||||||||||||||||||||||||||
International Equity Portfolio–Investor Class |
| |||||||||||||||||||||||||||||||||||||||||||||||||||||||
04/30/18 | 22.55 | 0.04 | 0.81 | 0.85 | (0.13 | ) | (0.18 | ) | (0.31 | ) | 23.09 | 3.81 | (A) | 490,844 | 1.13 | (B) | 1.13 | (B) | 0.33 | (B) | 5 | (A) | ||||||||||||||||||||||||||||||||||
10/31/17 | 18.30 | 0.19 | 4.18 | 4.37 | (0.12 | ) | — | (0.12 | ) | 22.55 | 24.04 | 644,243 | 1.14 | 1.14 | 0.95 | 12 | ||||||||||||||||||||||||||||||||||||||||
10/31/16 | 17.62 | 0.14 | 0.66 | 0.80 | (0.12 | ) | — | (0.12 | ) | 18.30 | 4.63 | 433,765 | 1.15 | 1.15 | 0.83 | 22 | ||||||||||||||||||||||||||||||||||||||||
10/31/15 | 18.23 | 0.15 | (0.64 | ) | (0.49 | ) | (0.12 | ) | — | (0.12 | ) | 17.62 | (2.76 | ) | 405,101 | 1.17 | 1.17 | 0.83 | 12 | |||||||||||||||||||||||||||||||||||||
10/31/14 | 17.89 | 0.13 | 0.29 | 0.42 | (0.08 | ) | — | (0.08 | ) | 18.23 | 2.36 | 443,029 | 1.17 | 1.17 | 0.72 | 10 | ||||||||||||||||||||||||||||||||||||||||
10/31/13 | 15.09 | 0.12 | 2.77 | 2.89 | (0.09 | ) | — | (0.09 | ) | 17.89 | 19.19 | 409,735 | 1.20 | 1.20 | 0.76 | 20 | ||||||||||||||||||||||||||||||||||||||||
| (A) | Not Annualized. |
| (B) | Annualized. |
| (1) | Net investment income per share was calculated using the average shares outstanding method. |
| (2) | All per share amounts and net asset values have been adjusted as a result of the reverse share split effected on December 1, 2017. (See Note 1). |
| (3) | For the period from August 1, 2017 (commencement of class operations) through October 31, 2017. |
| (4) | For the period from July 17, 2017 (commencement of class operations) through October 31, 2017. |
See Notes to Financial Statements
48
Table of Contents
Harding, Loevner Funds, Inc.
Financial Highlights (continued)
For the Six Months Ended April 30, 2018 (unaudited) or the Fiscal Year Ended October 31
| INCREASE (DECREASE) IN NET ASSETS FROM OPERATIONS: | DISTRIBUTIONS TO SHAREHOLDERS FROM: | RATIOS/SUPPLEMENTAL DATA: | ||||||||||||||||||||||||||||||||||||||||||||||||||||||
| Net asset value, beginning of period | Net investment income (loss)(1) |
Net realized and foreign | Net increase (decrease) from investment operations | Net investment income | Net realized from | Total distributions | Net of | Total Return | Net assets, end of period | Expenses to average | Expenses to average net assets (net of fees reimbursed) | Net investment income to average net assets | Portfolio turnover rate | |||||||||||||||||||||||||||||||||||||||||||
International Small Companies Portfolio–Institutional Class |
| |||||||||||||||||||||||||||||||||||||||||||||||||||||||
04/30/18 | $16.67 | $ 0.04 | $ 0.65 | $ 0.69 | $(0.06 | ) | $(0.15 | ) | $(0.21 | ) | $17.15 | 4.15 | (A)% | $ 177,017 | 1.37 | (B)% | 1.15 | (B)% | 0.45 | (B)% | 32 | (A)% | ||||||||||||||||||||||||||||||||||
10/31/17 | 13.72 | 0.11 | 3.41 | 3.52 | (0.16 | ) | (0.41 | ) | (0.57 | ) | 16.67 | 26.98 | 144,170 | 1.41 | 1.15 | 0.72 | 19 | |||||||||||||||||||||||||||||||||||||||
10/31/16 | 13.40 | 0.20 | 0.34 | 0.54 | (0.09 | ) | (0.13 | ) | (0.22 | ) | 13.72 | 4.15 | 62,785 | 1.60 | 1.25 | 1.51 | 49 | |||||||||||||||||||||||||||||||||||||||
10/31/15 | 13.85 | 0.11 | (0.25 | ) | (0.14 | ) | (0.05 | ) | (0.26 | ) | (0.31 | ) | 13.40 | (0.98 | ) | 47,276 | 1.64 | 1.30 | 0.79 | 38 | ||||||||||||||||||||||||||||||||||||
10/31/14 | 14.47 | 0.08 | 0.23 | 0.31 | (0.06 | ) | (0.87 | ) | (0.93 | ) | 13.85 | 2.28 | 28,711 | 1.59 | 1.30 | 0.58 | 36 | |||||||||||||||||||||||||||||||||||||||
10/31/13 | 11.45 | 0.07 | 3.09 | 3.16 | (0.14 | ) | — | (0.14 | ) | 14.47 | 27.88 | 26,236 | 1.68 | 1.39 | 0.57 | 97 | ||||||||||||||||||||||||||||||||||||||||
International Small Companies Portfolio–Investor Class |
| |||||||||||||||||||||||||||||||||||||||||||||||||||||||
04/30/18 | 16.55 | 0.03 | 0.65 | 0.68 | (0.05 | ) | (0.15 | ) | (0.20 | ) | 17.03 | 4.08 | (A) | 73,174 | 1.73 | (B) | 1.40 | (B) | 0.35 | (B) | 32 | (A) | ||||||||||||||||||||||||||||||||||
10/31/17 | 13.64 | 0.05 | 3.42 | 3.47 | (0.15 | ) | (0.41 | ) | (0.56 | ) | 16.55 | 26.71 | 50,292 | 1.80 | 1.40 | 0.37 | 19 | |||||||||||||||||||||||||||||||||||||||
10/31/16 | 13.33 | 0.16 | 0.35 | 0.51 | (0.07 | ) | (0.13 | ) | (0.20 | ) | 13.64 | 3.92 | 44,363 | 1.90 | 1.50 | 1.18 | 49 | |||||||||||||||||||||||||||||||||||||||
10/31/15 | 13.80 | 0.08 | (0.26 | ) | (0.18 | ) | (0.03 | ) | (0.26 | ) | (0.29 | ) | 13.33 | (1.29 | ) | 50,164 | 1.93 | 1.55 | 0.58 | 38 | ||||||||||||||||||||||||||||||||||||
10/31/14 | 14.45 | 0.05 | 0.22 | 0.27 | (0.05 | ) | (0.87 | ) | (0.92 | ) | 13.80 | 1.97 | 62,828 | 1.88 | 1.55 | 0.32 | 36 | |||||||||||||||||||||||||||||||||||||||
10/31/13 | 11.43 | 0.08 | 3.05 | 3.13 | (0.11 | ) | — | (0.11 | ) | 14.45 | 27.63 | 52,830 | 1.99 | 1.60 | 0.60 | 97 | ||||||||||||||||||||||||||||||||||||||||
Institutional Emerging Markets Portfolio–Class I |
| |||||||||||||||||||||||||||||||||||||||||||||||||||||||
04/30/18 | 21.94 | 0.03 | 0.86 | 0.89 | (0.17 | ) | — | (0.17 | ) | 22.66 | 4.10 | (A) | 4,775,765 | 1.26 | (B) | 1.26 | (B) | 0.28 | (B) | 8 | (A) | |||||||||||||||||||||||||||||||||||
10/31/17 | 17.65 | 0.19 | 4.20 | 4.39 | (0.10 | ) | — | (0.10 | ) | 21.94 | 25.08 | 4,386,511 | 1.28 | 1.28 | 0.97 | 17 | ||||||||||||||||||||||||||||||||||||||||
10/31/16 | 16.04 | 0.14 | 1.56 | 1.70 | (0.09 | ) | — | (0.09 | ) | 17.65 | 10.74 | 3,051,419 | 1.29 | 1.29 | 0.88 | 20 | ||||||||||||||||||||||||||||||||||||||||
10/31/15 | 18.60 | 0.13 | (2.56 | ) | (2.43 | ) | (0.13 | ) | — | (0.13 | ) | 16.04 | (13.14 | ) | 1,876,495 | 1.31 | 1.30 | 0.77 | 23 | |||||||||||||||||||||||||||||||||||||
10/31/14 | 18.07 | 0.20 | 0.48 | 0.68 | (0.15 | ) | — | (0.15 | ) | 18.60 | 3.80 | 1,521,194 | 1.31 | 1.30 | 1.12 | 26 | ||||||||||||||||||||||||||||||||||||||||
10/31/13 | 16.56 | 0.18 | 1.45 | 1.63 | (0.12 | ) | — | (0.12 | ) | 18.07 | 9.85 | 1,043,041 | 1.33 | 1.30 | 1.06 | 18 | ||||||||||||||||||||||||||||||||||||||||
Institutional Emerging Markets Portfolio–Class II |
| |||||||||||||||||||||||||||||||||||||||||||||||||||||||
04/30/18 | 21.94 | 0.04 | 0.87 | 0.91 | (0.19 | ) | — | (0.19 | ) | 22.66 | 4.14 | (A) | 444,174 | 1.20 | (B) | 1.11 | (B) | 0.40 | (B) | 8 | (A) | |||||||||||||||||||||||||||||||||||
10/31/17(2) | 17.71 | 0.22 | 4.21 | 4.43 | (0.20 | ) | — | (0.20 | ) | 21.94 | 25.43 | 458,288 | 1.23 | 1.12 | 1.12 | 17 | ||||||||||||||||||||||||||||||||||||||||
10/31/16(2) | 16.14 | 0.16 | 1.59 | 1.75 | (0.18 | ) | — | (0.18 | ) | 17.71 | 11.06 | 381,031 | 1.24 | 1.13 | 0.96 | 20 | ||||||||||||||||||||||||||||||||||||||||
10/31/15(2) | 18.81 | 0.16 | (2.60 | ) | (2.44 | ) | (0.23 | ) | — | (0.23 | ) | 16.14 | (13.06 | ) | 241,425 | 1.27 | 1.14 | 0.96 | 23 | |||||||||||||||||||||||||||||||||||||
10/31/14(2)(3) | 17.58 | 0.17 | 1.06 | 1.23 | — | — | — | 18.81 | 7.00 | (A) | 194,477 | 1.30 | (B) | 1.14 | (B) | 1.36 | (B) | 26 | (A) | |||||||||||||||||||||||||||||||||||||
Emerging Markets Portfolio–Advisor Class |
| |||||||||||||||||||||||||||||||||||||||||||||||||||||||
04/30/18 | 57.46 | 0.06 | 2.22 | 2.28 | (0.40 | ) | (0.03 | ) | (0.43 | ) | 59.31 | 3.99 | (A) | 4,279,443 | 1.37 | (B) | 1.37 | (B) | 0.18 | (B) | 8 | (A) | ||||||||||||||||||||||||||||||||||
10/31/17 | 46.27 | 0.43 | 11.02 | 11.45 | (0.26 | ) | — | (0.26 | ) | 57.46 | 24.93 | 4,014,977 | 1.42 | 1.42 | 0.84 | 17 | ||||||||||||||||||||||||||||||||||||||||
10/31/16 | 42.02 | 0.30 | 4.17 | 4.47 | (0.22 | ) | — | (4) | (0.22 | ) | 46.27 | 10.73 | 2,998,484 | 1.42 | 1.42 | 0.72 | 26 | |||||||||||||||||||||||||||||||||||||||
10/31/15 | 50.88 | 0.26 | (6.80 | ) | (6.54 | ) | (0.39 | ) | (1.93 | ) | (2.32 | ) | 42.02 | (13.17 | ) | 2,381,671 | 1.45 | 1.45 | 0.57 | 30 | ||||||||||||||||||||||||||||||||||||
10/31/14 | 50.76 | 0.49 | 1.32 | 1.81 | (0.40 | ) | (1.29 | ) | (1.69 | ) | 50.88 | 3.79 | 2,545,517 | 1.45 | 1.45 | 0.98 | 28 | |||||||||||||||||||||||||||||||||||||||
10/31/13 | 49.54 | 0.40 | 4.33 | 4.73 | (0.36 | ) | (3.15 | ) | (3.51 | ) | 50.76 | 9.93 | 2,112,546 | 1.47 | 1.47 | 0.83 | 26 | |||||||||||||||||||||||||||||||||||||||
| (A) | Not Annualized. |
| (B) | Annualized. |
| (1) | Net investment income per share was calculated using the average shares outstanding method. |
| (2) | All per share amounts and net asset values have been adjusted as a result of the reverse share split effected on December 1, 2017. (See Note 1). |
| (3) | For the period from March 15, 2014 (commencement of class operations) through October 31, 2014. |
| (4) | Amount was less than $0.005 per share. |
See Notes to Financial Statements
49
Table of Contents
Harding, Loevner Funds, Inc.
Financial Highlights (continued)
For the Six Months Ended April 30, 2018 (unaudited) or the Fiscal Year Ended October 31
| INCREASE (DECREASE) IN NET | DISTRIBUTIONS TO | |||||||||||||||||||||||||||||||||||||||||||||||||||||||
| ASSETS FROM OPERATIONS: | SHAREHOLDERS FROM: | RATIOS/SUPPLEMENTAL DATA: | ||||||||||||||||||||||||||||||||||||||||||||||||||||||
| Net | ||||||||||||||||||||||||||||||||||||||||||||||||||||||||
| realized | ||||||||||||||||||||||||||||||||||||||||||||||||||||||||
| and | ||||||||||||||||||||||||||||||||||||||||||||||||||||||||
| unrealized | ||||||||||||||||||||||||||||||||||||||||||||||||||||||||
| gain (loss) | ||||||||||||||||||||||||||||||||||||||||||||||||||||||||
| on | ||||||||||||||||||||||||||||||||||||||||||||||||||||||||
| investments | Net | Net | Expenses | |||||||||||||||||||||||||||||||||||||||||||||||||||||
| and | increase | Net | asset | Net | to average | Net | ||||||||||||||||||||||||||||||||||||||||||||||||||
| Net asset | Net | foreign | (decrease) | realized | value, | assets, | net assets | investment | ||||||||||||||||||||||||||||||||||||||||||||||||
| value, | investment | currency- | from | Net | gain | end | end of | Expenses | (net of fees | income to | Portfolio | |||||||||||||||||||||||||||||||||||||||||||||
| beginning | income | related | investment | investment | from | Total | of | Total | period | to average | waived/ | average | turnover | |||||||||||||||||||||||||||||||||||||||||||
| of period | (loss)(1) | transactions | operations | income | investments | distributions | period | Return | (000’s) | net assets | reimbursed) | net assets | rate | |||||||||||||||||||||||||||||||||||||||||||
Frontier Emerging Markets Portfolio–Institutional Class I |
| |||||||||||||||||||||||||||||||||||||||||||||||||||||||
04/30/18 | $ 8.50 | $ 0.06 | $ 0.73 | $ 0.79 | $(0.17 | ) | $ — | $(0.17 | ) | $ 9.12 | 9.41 | (A)% | $ 283,539 | 1.61 | (B)% | 1.61 | (B)% | 1.37 | (B)% | 14 | (A)% | |||||||||||||||||||||||||||||||||||
10/31/17 | 7.35 | 0.05 | 1.17 | 1.22 | (0.07 | ) | — | (0.07 | ) | 8.50 | 16.82 | 266,844 | 1.71 | 1.71 | 0.69 | 28 | ||||||||||||||||||||||||||||||||||||||||
10/31/16 | 7.62 | 0.10 | (0.29 | ) | (0.19 | ) | (0.08 | ) | — | (0.08 | ) | 7.35 | (2.43 | ) | 342,114 | 1.79 | 1.79 | 1.41 | 47 | |||||||||||||||||||||||||||||||||||||
10/31/15 | 9.50 | 0.11 | (1.84 | ) | (1.73 | ) | (0.05 | ) | (0.10 | ) | (0.15 | ) | 7.62 | (18.35 | ) | 451,646 | 1.79 | 1.79 | 1.29 | 38 | ||||||||||||||||||||||||||||||||||||
10/31/14 | 8.46 | 0.09 | 0.97 | 1.06 | (0.02 | ) | — | (0.02 | ) | 9.50 | 12.60 | 474,838 | 1.77 | 1.77 | 1.01 | 37 | ||||||||||||||||||||||||||||||||||||||||
10/31/13 | 7.12 | 0.07 | 1.35 | 1.42 | (0.08 | ) | — | (0.08 | ) | 8.46 | 20.20 | 271,728 | 1.80 | 1.80 | 0.94 | 24 | ||||||||||||||||||||||||||||||||||||||||
Frontier Emerging Markets Portfolio–Institutional Class II |
| |||||||||||||||||||||||||||||||||||||||||||||||||||||||
04/30/18 | 8.50 | 0.08 | 0.72 | 0.80 | (0.18 | ) | — | (0.18 | ) | 9.12 | 9.59 | (A) | 192,482 | 1.55 | (B) | 1.35 | (B) | 1.67 | (B) | 14 | (A) | |||||||||||||||||||||||||||||||||||
10/31/17(2)(3) | 7.43 | 0.08 | 0.99 | 1.07 | — | — | — | 8.50 | 14.40 | (A) | 166,698 | 1.58 | (B) | 1.35 | (B) | 1.47 | (B) | 28 | (A) | |||||||||||||||||||||||||||||||||||||
Frontier Emerging Markets Portfolio–Investor Class |
| |||||||||||||||||||||||||||||||||||||||||||||||||||||||
04/30/18 | 8.43 | 0.04 | 0.74 | 0.78 | (0.14 | ) | — | (0.14 | ) | 9.07 | 9.33 | (A) | 34,123 | 2.04 | (B) | 2.00 | (B) | 1.00 | (B) | 14 | (A) | |||||||||||||||||||||||||||||||||||
10/31/17 | 7.28 | 0.04 | 1.15 | 1.19 | (0.04 | ) | — | (0.04 | ) | 8.43 | 16.40 | 30,981 | 2.13 | 2.00 | 0.48 | 28 | ||||||||||||||||||||||||||||||||||||||||
10/31/16 | 7.55 | 0.07 | (0.30 | ) | (0.23 | ) | (0.04 | ) | — | (0.04 | ) | 7.28 | (3.01 | ) | 32,771 | 2.23 | 2.23 | 1.02 | 47 | |||||||||||||||||||||||||||||||||||||
10/31/15 | 9.41 | 0.06 | (1.80 | ) | (1.74 | ) | (0.02 | ) | (0.10 | ) | (0.12 | ) | 7.55 | (18.64 | ) | 45,622 | 2.20 | 2.20 | 0.75 | 38 | ||||||||||||||||||||||||||||||||||||
10/31/14 | 8.40 | 0.04 | 0.98 | 1.02 | (0.01 | ) | — | (0.01 | ) | 9.41 | 12.15 | 78,712 | 2.22 | 2.22 | 0.38 | 37 | ||||||||||||||||||||||||||||||||||||||||
10/31/13 | 7.08 | 0.05 | 1.34 | 1.39 | (0.07 | ) | — | (0.07 | ) | 8.40 | 19.83 | 21,763 | 2.64 | 2.25 | 0.66 | 24 | ||||||||||||||||||||||||||||||||||||||||
Global Equity Research Portfolio–Institutional Class |
| |||||||||||||||||||||||||||||||||||||||||||||||||||||||
04/30/18 | 12.23 | 0.04 | 0.66 | 0.70 | (0.18 | ) | (0.32 | ) | (0.50 | ) | 12.43 | 5.89 | (A) | 5,618 | 2.76 | (B) | 0.90 | (B) | 0.69 | (B) | 22 | (A) | ||||||||||||||||||||||||||||||||||
10/31/17(4) | 10.00 | 0.08 | 2.15 | 2.23 | — | — | — | 12.23 | 22.30 | (A) | 5,308 | 3.49 | (B) | 0.90 | (B) | 0.80 | (B) | 36 | (A) | |||||||||||||||||||||||||||||||||||||
Global Equity Research Portfolio–Investor Class |
| |||||||||||||||||||||||||||||||||||||||||||||||||||||||
04/30/18 | 12.21 | 0.03 | 0.65 | 0.68 | (0.18 | ) | (0.32 | ) | (0.50 | ) | 12.39 | 5.73 | (A) | 580 | 10.92 | (B) | 1.15 | (B) | 0.44 | (B) | 22 | (A) | ||||||||||||||||||||||||||||||||||
10/31/17(4) | 10.00 | 0.05 | 2.16 | 2.21 | — | — | — | 12.21 | 22.10 | (A) | 548 | 13.36 | (B) | 1.15 | (B) | 0.55 | (B) | 36 | (A) | |||||||||||||||||||||||||||||||||||||
International Equity Research Portfolio–Institutional Class |
| |||||||||||||||||||||||||||||||||||||||||||||||||||||||
04/30/18 | 13.11 | 0.06 | 0.52 | 0.58 | (0.14 | ) | (0.59 | ) | (0.73 | ) | 12.96 | 4.63 | (A) | 10,383 | 1.83 | (B) | 0.90 | (B) | 0.87 | (B) | 21 | (A) | ||||||||||||||||||||||||||||||||||
10/31/17 | 11.10 | 0.12 | 2.26 | 2.38 | (0.17 | ) | (0.20 | ) | (0.37 | ) | 13.11 | 22.26 | 9,479 | 2.26 | 0.90 | 0.99 | 55 | |||||||||||||||||||||||||||||||||||||||
10/31/16(5) | 10.00 | 0.14 | 0.96 | 1.10 | — | — | — | 11.10 | 11.00 | (A) | 6,244 | 3.54 | (B) | 0.90 | (B) | 1.51 | (B) | 33 | (A) | |||||||||||||||||||||||||||||||||||||
International Equity Research Portfolio–Investor Class |
| |||||||||||||||||||||||||||||||||||||||||||||||||||||||
04/30/18 | 13.05 | 0.04 | 0.53 | 0.57 | (0.14 | ) | (0.59 | ) | (0.73 | ) | 12.89 | 4.57 | (A) | 1,102 | 5.91 | (B) | 1.15 | (B) | 0.57 | (B) | 21 | (A) | ||||||||||||||||||||||||||||||||||
10/31/17 | 11.07 | 0.08 | 2.27 | 2.35 | (0.17 | ) | (0.20 | ) | (0.37 | ) | 13.05 | 22.05 | 1,124 | 6.49 | 1.15 | 0.71 | 55 | |||||||||||||||||||||||||||||||||||||||
10/31/16(5) | 10.00 | 0.11 | 0.96 | 1.07 | — | — | — | 11.07 | 10.70 | (A) | 826 | 10.91 | (B) | 1.15 | (B) | 1.20 | (B) | 33 | (A) | |||||||||||||||||||||||||||||||||||||
Emerging Markets Research Portfolio–Institutional Class |
| |||||||||||||||||||||||||||||||||||||||||||||||||||||||
04/30/18 | 13.01 | 0.04 | 0.66 | 0.70 | (0.23 | ) | (0.74 | ) | (0.97 | ) | 12.74 | 5.69 | (A) | 6,712 | 2.97 | (B) | 1.30 | (B) | 0.57 | (B) | 25 | (A) | ||||||||||||||||||||||||||||||||||
10/31/17(4) | 10.00 | 0.10 | 2.91 | 3.01 | — | — | — | 13.01 | 30.10 | (A) | 5,880 | 3.72 | (B) | 1.30 | (B) | 1.04 | (B) | 46 | (A) | |||||||||||||||||||||||||||||||||||||
| (A) | Not Annualized. |
| (B) | Annualized. |
| (1) | Net investment income per share was calculated using the average shares outstanding method. |
| (2) | All per share amounts and net asset values have been adjusted as a result of the reverse share split effected on December 1, 2017. (See Note 1). |
| (3) | For the period from March 1, 2017 (commencement of class operations) through October 31, 2017. |
| (4) | For the period from December 19, 2016 (commencement of class operations) through October 31, 2017. |
| (5) | For the period from December 17, 2015 (commencement of class operations) through October 31, 2016. |
See Notes to Financial Statements
50
Table of Contents
Harding, Loevner Funds, Inc.
Financial Highlights (continued)
For the Six Months Ended April 30, 2018 (unaudited) or the Fiscal Year Ended October 31
| INCREASE (DECREASE) IN NET | DISTRIBUTIONS TO | |||||||||||||||||||||||||||||||||||||||||||||||||||||||
| ASSETS FROM OPERATIONS: | SHAREHOLDERS FROM: | RATIOS/SUPPLEMENTAL DATA: | ||||||||||||||||||||||||||||||||||||||||||||||||||||||
| Net | ||||||||||||||||||||||||||||||||||||||||||||||||||||||||
| realized | ||||||||||||||||||||||||||||||||||||||||||||||||||||||||
| and | ||||||||||||||||||||||||||||||||||||||||||||||||||||||||
| unrealized | ||||||||||||||||||||||||||||||||||||||||||||||||||||||||
| gain (loss) | ||||||||||||||||||||||||||||||||||||||||||||||||||||||||
| on | ||||||||||||||||||||||||||||||||||||||||||||||||||||||||
| investments | Net | Net | Expenses | |||||||||||||||||||||||||||||||||||||||||||||||||||||
| and | increase | Net | asset | Net | to average | Net | ||||||||||||||||||||||||||||||||||||||||||||||||||
| Net asset | Net | foreign | (decrease) | realized | value, | assets, | net assets | investment | ||||||||||||||||||||||||||||||||||||||||||||||||
| value, | investment | currency- | from | Net | gain | end | end of | Expenses | (net of fees | income to | Portfolio | |||||||||||||||||||||||||||||||||||||||||||||
| beginning | income | related | investment | investment | from | Total | of | Total | period | to average | waived/ | average | turnover | |||||||||||||||||||||||||||||||||||||||||||
| of period | (loss)(1) | transactions | operations | income | investments | distributions | period | Return | (000’s) | net assets | reimbursed) | net assets | rate | |||||||||||||||||||||||||||||||||||||||||||
Emerging Markets Research Portfolio–Investor Class |
| |||||||||||||||||||||||||||||||||||||||||||||||||||||||
04/30/18 | $12.99 | $ 0.02 | $0.66 | $ 0.68 | $(0.23 | ) | $(0.74 | ) | $(0.97 | ) | $12.70 | 5.53 | (A)% | $ 647 | 10.28 | (B)% | 1.55 | (B)% | 0.30 | (B)% | 25 | (A)% | ||||||||||||||||||||||||||||||||||
10/31/17(2) | 10.00 | 0.08 | 2.91 | 2.99 | — | — | — | 12.99 | 29.90 | (A) | 614 | 12.64 | (B) | 1.55 | (B) | 0.78 | (B) | 46 | (A) | |||||||||||||||||||||||||||||||||||||
| (A) | Not Annualized. |
| (B) | Annualized. |
| (1) | Net investment income per share was calculated using the average shares outstanding method. |
| (2) | For the period from December 19, 2016 (commencement of class operations) through October 31, 2017. |
See Notes to Financial Statements
51
Table of Contents
Harding, Loevner Funds, Inc.
April 30, 2018 (unaudited)
1. Organization
Harding, Loevner Funds, Inc. (the “Fund”) was organized as a Maryland corporation on July 31, 1996, and is registered under the Investment Company Act of 1940, as amended (the “1940 Act”), as an open-end management investment company. The Fund currently has nine separate diversified Portfolios, all of which were active as of April 30, 2018 (individually, a “Portfolio”, collectively, the “Portfolios”). The Fund is managed by Harding Loevner LP (the “Investment Adviser”).
| Portfolio | Inception Date | Investment Objective | ||
Global Equity Portfolio (“Global Equity”) | Institutional Class: November 3, 2009 Institutional Class Z: August 1, 2017 Advisor Class: December 1, 1996
| to seek long-term capital appreciation through investments in equity securities of companies based both inside and outside the United States | ||
International Equity Portfolio (“International Equity”) | Institutional Class: May 11, 1994* Institutional Class Z: July 17, 2017 Investor Class: September 30, 2005 | to seek long-term capital appreciation through investments in equity securities of companies based outside the United States | ||
International Small Companies Portfolio (“International Small Companies”) | Institutional Class: June 30, 2011 Investor Class: March 26, 2007
| to seek long-term capital appreciation through investments in equity securities of small companies based outside the United States | ||
Institutional Emerging Markets Portfolio** (“Institutional Emerging Markets”) | Class I: October 17, 2005 Class II: March 5, 2014
| to seek long-term capital appreciation through investments in equity securities of companies based in emerging markets | ||
Emerging Markets Portfolio** (“Emerging Markets”) | Advisor Class: November 9, 1998 | to seek long-term capital appreciation through investments in equity securities of companies based in emerging markets | ||
Frontier Emerging Markets Portfolio (“Frontier Emerging Markets”) | Institutional Class I (formerly, the Institutional Class): May 27, 2008 Institutional Class II: March 1, 2017 Investor Class: December 31, 2010 | to seek long-term capital appreciation through investments in equity securities of companies based in frontier and smaller emerging markets | ||
Global Equity Research Portfolio (“Global Equity Research”) | Institutional Class: December 19, 2016 Investor Class: December 19, 2016 | to seek long-term capital appreciation through investments in equity securities of companies based both inside and outside the United States | ||
International Equity Research Portfolio (“International Equity Research”) | Institutional Class: December 17, 2015 Investor Class: December 17, 2015 | to seek long-term capital appreciation through investments in equity securities of companies based outside the United States | ||
Emerging Markets Research Portfolio (“Emerging Markets Research”) | Institutional Class: December 19, 2016 Investor Class: December 19, 2016 | to seek long-term capital appreciation through investments in equity securities of companies based in emerging markets |
* The International Equity Portfolio is the successor to the HLM International Equity Portfolio of AMT Capital Fund, Inc., pursuant to a reorganization that took place on October 31, 1996. Information for periods prior to October 31, 1996, is historical information for the predecessor portfolio.
** The Institutional Emerging Markets and Emerging Markets Portfolios are generally closed to new investors.
On November 24, 2017, the Board of Directors (the “Board”) of the Fund approved reverse share splits (the “Reverse Splits”) of the outstanding Institutional Class Z shares of the Global Equity Portfolio, Institutional Class Z shares of the International Equity Portfolio, and Class II shares of the Institutional Emerging Markets Portfolio (each, a “Split Impacted Portfolio”) at the ratios indicated below.
| Reverse Share | ||||
| Portfolio | Split Ratio | |||
Global Equity Portfolio – Institutional Class Z | 1 for 3.933146 | |||
International Equity Portfolio – Institutional Class Z | 1 for 2.135356 | |||
Institutional Emerging Markets Portfolio – Class II | 1 for 1.758429 | |||
The Reverse Splits were effected after the close of business on December 1, 2017. Institutional Class Z shares and Class II shares of the Split Impacted Portfolios began trading on a split-adjusted basis on December 4, 2017.
52
Table of Contents
Harding, Loevner Funds, Inc.
Notes to Financial Statements (continued)
April 30, 2018 (unaudited)
1. Organization (continued)
The total dollar value of each shareholder’s investment in a Split Impacted Portfolio remained unchanged by the Reverse Splits. While the Reverse Splits reduced the number of outstanding Institutional Class Z or Class II shares of the Split Impacted Portfolios, they proportionately increased the net asset value (“NAV”) per share of Institutional Class Z shares and Class II shares of the Split Impacted Portfolio such that the aggregate market value of each Split Impacted Portfolio’s Institutional Class Z shares or Class II shares, as applicable, remained the same. The Reverse Splits did not affect the voting rights of a shareholder’s investment in a Split Impacted Portfolio, and was not a taxable event for the Split Impacted Portfolio’s shareholders.
On November 24, 2017, the Board also declared a share dividend (the “Share Dividend”) with respect to the Institutional Class II shares of the Frontier Emerging Markets Portfolio equal to 0.346467 shares on each outstanding Institutional Class II share. The Share Dividend was paid to the Portfolio’s Institutional Class II shareholders of record as of the close of business on December 1, 2017. The total dollar value of each shareholder’s investment in the Portfolio remained unchanged by the Share Dividend. While the Share Dividend increased the number of outstanding Institutional Class II shares of the Portfolio, it proportionately decreased the NAV per share of Institutional Class II shares of the Portfolio such that the aggregate market value of the Portfolio’s Institutional Class II shares remained the same. The Share Dividend did not affect the voting rights of a shareholder’s investment in the Portfolio, and was not a taxable event for the Portfolio’s shareholders.
The Board approved the Reverse Splits in order to bring the NAV per share of the Institutional Class Z shares of the Global Equity Portfolio and International Equity Portfolio and Class II shares of the Institutional Emerging Markets Portfolio into line with the NAV per share of the other share classes of the Split Impacted Portfolios. The Board also declared the Share Dividend in order to bring the NAV per share of the Institutional Class II shares of the Frontier Emerging Markets Portfolio into line with the NAV per share of the other share classes of the Portfolio. The Reverse Splits and the Share Dividend are intended to create a general level of parity of required distributions across the Fund’s share classes by increasing the NAV per share and reducing the number of outstanding shares of the share classes subject to the Reverse Splits and decreasing the NAV per share and increasing the number of outstanding shares of the Institutional Class II shares of the Frontier Emerging Markets Portfolio through the Share Dividend.
Per share data, including the proportionate impact to NAV, in the Financial Highlights and Capital Share activity presented in the Capital Share Transactions disclosure (see Note 6) have been restated to reflect the Reverse Splits and the Share Dividend, respectively.
2. Summary of Significant Accounting Policies
The accounting policies of the Fund are in conformity with accounting principles generally accepted in the United States (“GAAP”) for investment companies. Accordingly, the Fund follows accounting and reporting guidance under FASB Accounting Standards Codification Topic 946, “Financial Services - Investment Companies”. The following is a summary of the Fund’s significant accounting policies:
Estimates
The preparation of financial statements in accordance with GAAP requires management to make estimates and assumptions that affect the reported amounts and disclosures in the financial statements. Actual results could differ from those estimates.
Valuation
The Board has adopted procedures (“Procedures”) to govern the valuation of the securities held by each Portfolio of the Fund in accordance with the 1940 Act. The Procedures incorporate principles set forth in relevant pronouncements of the Securities and Exchange Commission (“SEC”) and its staff, including guidance on the obligations of the Portfolios and their Directors to determine, in good faith, the fair value of the Portfolios’ securities when market quotations are not readily available.
In determining a Portfolio’s NAV, each equity security traded on a securities exchange, including the NASDAQ Stock Market, and over-the-counter securities, are first valued at the closing price on the exchange or market designated by the Fund’s accounting agent as the principal exchange (each, a “principal exchange”). The closing price provided by the Fund’s accounting agent for a principal exchange may differ from the price quoted elsewhere and may represent information such as last sales price, an official closing price, a closing auction price or other information, depending on exchange or market convention. Shares of open-end mutual funds including money market funds are valued at NAV. Such securities are typically categorized as “Level 1” pursuant to the hierarchy described below.
Participation notes are valued based upon the closing or last traded price of their underlying local shares. Such securities are typically categorized as “Level 2” pursuant to the hierarchy described below.
53
Table of Contents
Harding, Loevner Funds, Inc.
Notes to Financial Statements (continued)
April 30, 2018 (unaudited)
2. Summary of Significant Accounting Policies (continued)
Since trading in many foreign securities is normally completed before the time at which a Portfolio calculates its NAV, the effect on the value of such securities held by a Portfolio of events that occur between the close of trading in the security and the time at which the Portfolio prices its securities would not be reflected in the Portfolio’s calculation of its NAV if foreign securities were generally valued at their closing prices.
To address this issue, the Board has approved the daily use of independently provided quantitative models that may adjust the closing prices of certain foreign equity securities based on information that becomes available after the foreign market closes, through the application of an adjustment factor to such securities’ closing price. Adjustment factors may be greater than, less than, or equal to 1. Thus, use of these quantitative models could cause a Portfolio to value a security higher, lower or equal to its closing market price, which in turn could cause the Portfolio’s NAV per share to differ significantly from that which would have been calculated using closing market prices. The use of these quantitative models is also intended to decrease the opportunities for persons to engage in ‘‘time zone arbitrage,’’ i.e., trading intended to take advantage of stale closing prices in foreign markets that could affect the NAV of the Portfolios. Securities subjected to an adjustment factor due to the use of these quantitative models are not specifically designated on the Portfolios’ Portfolio of Investments as being “fair valued”. Securities with an adjustment factor greater than or less than 1, which are absent the use of significant unobservable inputs into their valuation, are categorized as “Level 2” and securities with an adjustment factor equal to 1, which are absent the use of significant unobservable inputs into their valuation, are categorized as “Level 1” pursuant to the hierarchy described below.
Any securities for which market quotations are not readily available or for which available prices are deemed unreliable are priced by the Investment Adviser at “fair value as determined in good faith”, in accordance with the Procedures. Such securities are identified on the Portfolios’ Portfolio of Investments as securities valued at “fair value as determined in good faith” and absent the use of significant unobservable inputs into their valuation, such securities would be categorized as “Level 2” pursuant to the hierarchy described below.
GAAP includes a topic which establishes a hierarchy for NAV determination purposes in which various inputs are used in determining the value of each Portfolio’s assets or liabilities. This topic defines fair value as the price that the Portfolio would receive upon selling an investment in a timely transaction to an independent buyer in the principal or most advantageous market of the investment. This topic establishes a three-tier hierarchy to maximize the use of observable market data and minimize the use of unobservable inputs and to establish classification of fair value measurements for disclosure purposes. Inputs may be observable or unobservable and refer broadly to the assumptions that market participants would use in pricing the asset or liability including assumptions about risk. Such risks include the inherent risk in a particular valuation technique which is used to measure fair value. This may include the quantitative models and/or the inputs to the quantitative models used in the valuation technique described above. Observable inputs are inputs that reflect the assumptions market participants would use in pricing the asset or liability developed based on market data obtained from sources independent of the reporting entity. Unobservable inputs are inputs that reflect the reporting entity’s own assumptions about the assumptions market participants would use in pricing the asset or liability developed based on the best information available in the circumstances. The three-tier hierarchy of inputs is summarized in the three broad levels listed below.
Level 1 | unadjusted quoted prices in active markets for identical investments | |
Level 2 | other significant observable inputs (including quoted prices for similar investments, interest rates, prepayment speeds, credit risk, etc.) | |
Level 3 | significant unobservable inputs (including the Portfolio’s own assumptions in determining the fair value of investments) |
The Portfolios disclose all transfers between levels based on valuations at the end of each reporting period.
At April 30, 2018, the Portfolios below had transfers from Level 1 to Level 2, based on levels assigned to the securities on October 31, 2017, due to the use of an adjustment factor other than 1 as an input to the valuation.
International Small Companies | Institutional Emerging Markets | Emerging Markets | Frontier Emerging Markets | Global Equity Research | International Equity Research | Emerging Markets Research | ||||||||||||||||||||||
Common Stock | ||||||||||||||||||||||||||||
Automobiles & Components | $ | — | $ | 67,235,948 | $ | 55,127,374 | $ | — | $ | — | $ | — | $ | — | ||||||||||||||
Banks | — | — | — | 6,289,730 | 10,670 | 32,011 | 123,484 | |||||||||||||||||||||
Insurance | 3,599,367 | — | — | — | 12,545 | 18,009 | 29,861 | |||||||||||||||||||||
Materials | — | — | — | — | 18,221 | 34,165 | 67,516 | |||||||||||||||||||||
Telecommunication Services | $ | — | $ | 30,849,936 | $ | 25,288,368 | $ | — | $ | — | $ | — | $ | — | ||||||||||||||
Total | $ | 3,599,367 | $ | 98,085,884 | $ | 80,415,742 | $ | 6,289,730 | $ | 41,436 | $ | 84,185 | $ | 220,861 | ||||||||||||||
54
Table of Contents
Harding, Loevner Funds, Inc.
Notes to Financial Statements (continued)
April 30, 2018 (unaudited)
2. Summary of Significant Accounting Policies (continued)
GAAP provides additional guidance for estimating fair value when the volume and level of activity for the asset or liability have significantly decreased as well as guidance on identifying circumstances that indicate when a transaction is not orderly.
The following is a summary of the Portfolios’ investments classified by Level 1, Level 2 and Level 3 and security type as of April 30, 2018. Please refer to each Portfolio’s Portfolio of Investments to view individual securities classified by industry type and country.
| Portfolio | Unadjusted Quoted Prices in Active Markets for Identical Assets (Level 1) | Other Significant Observable Inputs (Level 2) | Significant Unobservable Inputs (Level 3) | Total | ||||||||||||
Global Equity | ||||||||||||||||
Common Stocks | $ | 430,352,657 | $ | 357,860,487 | $ | — | $ | 788,213,144 | ||||||||
Preferred Stocks | 20,624,782 | — | — | 20,624,782 | ||||||||||||
Short Term Investments | 24,106,586 | — | — | 24,106,586 | ||||||||||||
Total Investments | $ | 475,084,025 | $ | 357,860,487 | $ | — | $ | 832,944,512 | ||||||||
International Equity | ||||||||||||||||
Common Stocks | $ | 2,881,376,458 | $ | 10,130,942,685 | $ | — | $ | 13,012,319,143 | ||||||||
Preferred Stocks | 306,322,027 | 359,091,679 | — | 665,413,706 | ||||||||||||
Short Term Investments | 471,227,409 | — | — | 471,227,409 | ||||||||||||
Total Investments | $ | 3,658,925,894 | $ | 10,490,034,364 | $ | — | $ | 14,148,960,258 | ||||||||
International Small Companies | ||||||||||||||||
Common Stocks | $ | 18,750,222 | $ | 220,127,767 | $ | — | $ | 238,877,989 | ||||||||
Short Term Investments | 10,842,502 | — | — | 10,842,502 | ||||||||||||
Total Investments | $ | 29,592,724 | $ | 220,127,767 | $ | — | $ | 249,720,491 | ||||||||
Institutional Emerging Markets | ||||||||||||||||
Common Stocks | $ | 1,228,799,274 | $ | 3,525,397,900 | $ | — | $ | 4,754,197,174 | ||||||||
Preferred Stocks | 268,795,870 | 45,778,193 | — | 314,574,063 | ||||||||||||
Short Term Investments | 140,691,752 | — | — | 140,691,752 | ||||||||||||
Total Investments | $ | 1,638,286,896 | $ | 3,571,176,093 | $ | — | $ | 5,209,462,989 | ||||||||
Emerging Markets | ||||||||||||||||
Common Stocks | $ | 1,007,295,076 | $ | 2,890,850,339 | $ | — | $ | 3,898,145,415 | ||||||||
Preferred Stocks | 220,338,170 | 37,264,316 | — | 257,602,486 | ||||||||||||
Short Term Investments | 111,345,409 | — | — | 111,345,409 | ||||||||||||
Total Investments | $ | 1,338,978,655 | $ | 2,928,114,655 | $ | — | $ | 4,267,093,310 | ||||||||
Frontier Emerging Markets | ||||||||||||||||
Common Stocks | $ | 124,099,699 | $ | 346,932,325 | $ | — | $ | 471,032,024 | ||||||||
Preferred Stocks | 10,930,869 | — | — | 10,930,869 | ||||||||||||
Participation Notes | — | 26,626,503 | — | 26,626,503 | ||||||||||||
Short Term Investments | 4,214,737 | — | — | 4,214,737 | ||||||||||||
Total Investments | $ | 139,245,305 | $ | 373,558,828 | $ | — | $ | 512,804,133 | ||||||||
55
Table of Contents
Harding, Loevner Funds, Inc.
Notes to Financial Statements (continued)
April 30, 2018 (unaudited)
2. Summary of Significant Accounting Policies (continued)
| Portfolio | Unadjusted Quoted Prices in Active Markets for Identical Assets (Level 1) | Other Significant Observable Inputs (Level 2) | Significant Unobservable Inputs (Level 3) | Total | ||||||||||||
Global Equity Research | ||||||||||||||||
Common Stocks | $ | 3,549,683 | $ | 2,545,578 | $ | — | $ | 6,095,261 | ||||||||
Preferred Stocks | 43,240 | 8,853 | — | 52,093 | ||||||||||||
Short Term Investments | 67,712 | — | — | 67,712 | ||||||||||||
Total Investments | $ | 3,660,635 | $ | 2,554,431 | $ | — | $ | 6,215,066 | ||||||||
International Equity Research | ||||||||||||||||
Common Stocks | $ | 2,131,460 | $ | 8,755,461 | $ | — | $ | 10,886,921 | ||||||||
Preferred Stocks | 196,115 | 29,511 | — | 225,626 | ||||||||||||
Short Term Investments | 304,505 | — | — | 304,505 | ||||||||||||
Total Investments | $ | 2,632,080 | $ | 8,784,972 | $ | — | $ | 11,417,052 | ||||||||
Emerging Markets Research | ||||||||||||||||
Common Stocks | $ | 2,081,993 | $ | 4,634,708 | $ | — | $ | 6,716,701 | ||||||||
Preferred Stocks | 191,816 | 139,684 | — | 331,500 | ||||||||||||
Participation Notes | — | 125,478 | — | 125,478 | ||||||||||||
Short Term Investments | 131,286 | — | — | 131,286 | ||||||||||||
Total Investments | $ | 2,405,095 | $ | 4,899,870 | $ | — | $ | 7,304,965 | ||||||||
As of April 30, 2018, there were no Level 3 investments held within the Portfolios.
Securities
For financial reporting purposes, all securities transactions are recorded on a trade date basis, as of the last business day in the reporting period. Throughout the reporting period, securities transactions are typically accounted for on a trade date – plus one business day basis. Interest income and expenses are recorded on an accrual basis. Dividend income is recorded on the ex-dividend date (except for certain foreign dividends that may be recorded as soon as the Portfolio is informed of such dividends). The Portfolios use the specific identification method for determining realized gains or losses from sales of securities.
Dividends to Shareholders
It is the policy of the Portfolios to declare dividends from net investment income annually. Net short-term and long-term capital gains distributions for the Portfolios, if any, are also normally distributed on an annual basis.
Dividends from net investment income and distributions from net realized gains from investment transactions have been determined in accordance with income tax regulations and may differ from net investment income and realized gains recorded by the Portfolios for financial reporting purposes. Differences result primarily from foreign currency transactions and timing differences related to recognition of income, and gains and losses from investment transactions. In general, to the extent that any differences, which are permanent in nature, result in over distributions to shareholders, the amount of the over distribution is reclassified within the capital accounts based on its federal tax basis treatment and may be reported as return of capital. Temporary differences do not require reclassification.
Currency Translation
Assets and liabilities denominated in foreign currencies and commitments under forward foreign currency exchange contracts are translated into U.S. dollars at the mean of the quoted bid and asked prices of such currencies against the U.S. dollar. Purchases and sales of the Portfolios’ securities are translated at the rates of exchange prevailing when such securities were acquired or sold. Income and expenses are translated at
56
Table of Contents
Harding, Loevner Funds, Inc.
Notes to Financial Statements (continued)
April 30, 2018 (unaudited)
2. Summary of Significant Accounting Policies (continued)
exchange rates prevailing when accrued. The Portfolios do not isolate that portion of the results of operations resulting from changes in foreign exchange rates on investments from the fluctuations arising from changes in market prices of securities held. Such fluctuations are included with the Net realized gain (loss) from investments and Change in unrealized appreciation (depreciation) from investments on the Statements of Operations.
Net realized gains and losses from foreign currency-related transactions arise from sales of foreign currency, currency gains or losses realized between the trade and settlement dates on securities transactions, and the difference between the amounts of dividends, interest, and foreign withholding taxes recorded on the Portfolios’ books, and the U.S. dollar equivalent of the amounts actually received or paid. Net unrealized appreciation or depreciation on translation of assets and liabilities denominated in foreign currencies arise from changes in the value of assets and liabilities other than investments in securities at the period end, resulting from changes in the exchange rates.
Organization and Offering Fees
Costs incurred by the Global Equity Research Portfolio and the Emerging Markets Research Portfolio in connection with their organization were expensed as they were incurred. Costs related to the offering of shares were deferred and amortized on a straight line basis over the twelve-month period from the date of commencement of operations of the Portfolios.
Redemption Fees
The Fund uses fees on short-term redemptions to discourage frequent trading in Portfolio shares. Redemptions of Portfolio shares made within 90 days of purchase may be subject to a redemption fee equal to 2% of the amount redeemed. For the period or year ended April 30, 2018, and October 31, 2017, the Portfolios received the following redemption fees. These amounts are included as a component of “Payments for Shares Redeemed” in Note 6 - Capital Share Transactions.
| Institutional Class | Institutional Class I | Institutional Class II | Class I | |||||||||||||||||||||||||||||
| Portfolio |
Period Ended April 30, 2018 | Year Ended October 31, 2017 | Period Ended April 30, 2018 | Year Ended October 31, 2017 | Period Ended April 30, 2018 | Year Ended October 31, 2017 | Period Ended April 30, 2018 | Year Ended October 31, 2017 | ||||||||||||||||||||||||
Global Equity | $ | 7,756 | $ | 1,918 | $ | — | $ | — | $ | — | $ | — | $ | — | $ | — | ||||||||||||||||
International Equity | 262,223 | 658,145 | — | — | — | — | — | — | ||||||||||||||||||||||||
International Small Companies | 2,101 | 20,596 | — | — | — | — | — | — | ||||||||||||||||||||||||
Institutional Emerging Markets | — | — | — | — | — | — | 61,537 | 102,466 | ||||||||||||||||||||||||
Emerging Markets | — | — | — | — | — | — | — | — | ||||||||||||||||||||||||
Frontier Emerging Markets | — | — | 8,229 | 11,410 | — | — | — | — | ||||||||||||||||||||||||
Global Equity Research | — | — | — | — | — | — | — | — | ||||||||||||||||||||||||
International Equity Research | — | — | — | — | — | — | — | — | ||||||||||||||||||||||||
Emerging Markets Research | — | — | — | — | — | — | — | — | ||||||||||||||||||||||||
| Class II | Investor Class | Advisor Class | Institutional Class Z | |||||||||||||||||||||||||||||
| Portfolio |
Period | Year Ended October 31, 2017 | Period Ended April 30, 2018 | Year Ended October 31, 2017 | Period Ended April 30, 2018 | Year Ended October 31, 2017 | Period Ended April 30, 2018 | Year Ended October 31, 2017 | ||||||||||||||||||||||||
Global Equity | $ | — | $ | — | $ | — | $ | — | $ | 12,441 | $ | 4,375 | $ | — | $ | — | ||||||||||||||||
International Equity | — | — | 30,301 | 42,489 | — | — | 118 | — | ||||||||||||||||||||||||
International Small Companies | — | — | 2,763 | 4,790 | — | — | — | — | ||||||||||||||||||||||||
Institutional Emerging Markets | — | — | — | — | — | — | — | — | ||||||||||||||||||||||||
Emerging Markets | — | — | — | — | 63,204 | 166,320 | — | — | ||||||||||||||||||||||||
Frontier Emerging Markets | — | — | 711 | 4,709 | — | — | — | — | ||||||||||||||||||||||||
Global Equity Research | — | — | — | — | — | — | — | — | ||||||||||||||||||||||||
International Equity Research | — | — | — | 8 | — | — | — | — | ||||||||||||||||||||||||
Emerging Markets Research | — | — | — | — | — | — | — | — | ||||||||||||||||||||||||
57
Table of Contents
Harding, Loevner Funds, Inc.
Notes to Financial Statements (continued)
April 30, 2018 (unaudited)
2. Summary of Significant Accounting Policies (continued)
Indemnifications
Under the Fund’s organizational document, its officers and Board are indemnified against certain liability arising out of the performance of their duties to the Portfolios. In the normal course of business, the Fund may enter into contracts that contain a variety of representations or that provide indemnification for certain liabilities. The Fund’s maximum exposure under these arrangements is unknown, as this would involve future claims that may be made against the Fund that have not yet occurred. However, the Fund has not had prior claims or losses pursuant to these contracts and expects the risk of loss to be remote.
3. Transactions with Affiliates and Significant Agreements
The Board has approved investment advisory agreements with the Investment Adviser. Advisory fees are computed daily and paid monthly based on the average daily net assets of each Portfolio. The Investment Adviser has contractually agreed to reduce its fee and/or reimburse the Portfolios for other operating expenses to the extent that aggregate expenses, excluding certain non-operating expenses, exceed certain annual rates of the average daily net assets of each class.
The following annualized advisory fees and contractual expense limits were in effect for the period ended April 30, 2018. The advisory fees are charged at the Portfolio level as a whole and expense limitations are at the class specific level.
| Portfolio | First $1 billion of assets | Next $1 billion of assets | Next $1 billion of assets | Over $3 billion of assets | Over $4 billion of assets | Over $5 billion of assets | Contractual Expense Limit* | |||||||
Global Equity–Institutional Class | 0.80% | 0.78% | 0.76% | 0.74% | 0.74% | 0.74% | 0.95% | |||||||
Global Equity–Institutional Class Z | 0.80% | 0.78% | 0.76% | 0.74% | 0.74% | 0.74% | 0.90% | |||||||
Global Equity–Advisor Class | 0.80% | 0.78% | 0.76% | 0.74% | 0.74% | 0.74% | 1.25% | |||||||
International Equity–Institutional Class | 0.75% | 0.73% | 0.71% | 0.69% | 0.67% | 0.65% | 1.00% | |||||||
International Equity–Institutional Class Z | 0.75% | 0.73% | 0.71% | 0.69% | 0.67% | 0.65% | 0.80% | |||||||
International Equity–Investor Class | 0.75% | 0.73% | 0.71% | 0.69% | 0.67% | 0.65% | 1.25% | |||||||
International Small Companies–Institutional Class | 1.15% | 1.15% | 1.15% | 1.15% | 1.15% | 1.15% | 1.15% | |||||||
International Small Companies–Investor Class | 1.15% | 1.15% | 1.15% | 1.15% | 1.15% | 1.15% | 1.40% | |||||||
Institutional Emerging Markets–Class I | 1.15% | 1.13% | 1.11% | 1.09% | 1.09% | 1.09% | 1.30% | |||||||
Institutional Emerging Markets–Class II | 1.15% | 1.13% | 1.11% | 1.09% | 1.09% | 1.09% | 1.15%** | |||||||
Emerging Markets–Advisor Class | 1.15% | 1.13% | 1.11% | 1.09% | 1.09% | 1.09% | 1.75% | |||||||
Frontier Emerging Markets–Institutional Class I | 1.35% | 1.35% | 1.35% | 1.35% | 1.35% | 1.35% | 1.75% | |||||||
Frontier Emerging Markets–Institutional Class II | 1.35% | 1.35% | 1.35% | 1.35% | 1.35% | 1.35% | 1.35% | |||||||
Frontier Emerging Markets–Investor Class | 1.35% | 1.35% | 1.35% | 1.35% | 1.35% | 1.35% | 2.00% | |||||||
Global Equity Research–Institutional Class | 0.80% | 0.80% | 0.80% | 0.80% | 0.80% | 0.80% | 0.90% | |||||||
Global Equity Research–Investor Class | 0.80% | 0.80% | 0.80% | 0.80% | 0.80% | 0.80% | 1.15% | |||||||
International Equity Research–Institutional Class | 0.75% | 0.75% | 0.75% | 0.75% | 0.75% | 0.75% | 0.90% | |||||||
International Equity Research–Investor Class | 0.75% | 0.75% | 0.75% | 0.75% | 0.75% | 0.75% | 1.15% | |||||||
Emerging Markets Research–Institutional Class | 1.15% | 1.15% | 1.15% | 1.15% | 1.15% | 1.15% | 1.30% | |||||||
Emerging Markets Research–Investor Class | 1.15% | 1.15% | 1.15% | 1.15% | 1.15% | 1.15% | 1.55% |
| * | Effective through February 28, 2019. |
| ** | The Investment Adviser has contractually agreed to waive a portion of its management fee and/or reimburse the Portfolio’s Class II shares for their other operating expenses to the extent that the aggregate operating expenses of Class II exceed the applicable contractual management fee, currently 1.15% on the first $1 billion of average daily net assets, 1.13% on the next $1 billion, 1.11% on the next $1 billion and 1.09% for average daily net assets over $3 billion. |
58
Table of Contents
Harding, Loevner Funds, Inc.
Notes to Financial Statements (continued)
April 30, 2018 (unaudited)
3. Transactions with Affiliates and Significant Agreements (continued)
For the period ended April 30, 2018, the Investment Adviser waived and/or reimbursed the following amounts pursuant to the contractual expense limits described above:
| Portfolio | Fees waived and/or reimbursed by the Investment Adviser | |||
Global Equity–Institutional Class Z | $ 3,943 | |||
International Small Companies–Institutional Class | 186,948 | |||
International Small Companies–Investor Class | 99,931 | |||
Institutional Emerging Markets–Class II | 207,928 | |||
Frontier Emerging Markets–Institutional Class II | 182,069 | |||
Frontier Emerging Markets–Investor Class | 6,675 | |||
Global Equity Research–Institutional Class | 51,674 | |||
Global Equity Research–Investor Class | 28,020 | |||
International Equity Research–Institutional Class | 46,435 | |||
International Equity Research–Investor Class | 26,859 | |||
Emerging Markets Research–Institutional Class | 52,818 | |||
Emerging Markets Research–Investor Class | 28,113 | |||
The Fund has an administration agreement with The Northern Trust Company (“Northern Trust”), which provides certain accounting, clerical and bookkeeping services, Blue Sky, corporate secretarial services and assistance in the preparation and filing of tax returns and reports to shareholders and the SEC.
Northern Trust also serves as custodian of each Portfolio’s securities and cash, transfer agent, dividend disbursing agent and agent in connection with any accumulation, open-account or similar plans provided to the shareholders of the Portfolios. Northern Trust has agreed to waive certain transfer agent fees and expenses for Institutional Class Z of the Global Equity and International Equity Portfolios for a period of six months from the commencement of each class (through January 31, 2018 and January 16, 2018, respectively). The amounts waived are captioned as “Less Waiver of transfer agent fees and expenses” on the Statements of Operations.
Effective January 1, 2018, Foreside Fund Officer Services, LLC provides compliance support to the Fund’s Chief Compliance Officer. Prior to January 1, 2018, these services were provided by Alaric Compliance Services, LLC. Fees paid pursuant to these services are shown as “Compliance officers’ fees and expenses” on the Statements of Operations.
The Fund has adopted an Amended Plan of Distribution pursuant to Rule 12b-1 under the 1940 Act (“Distribution Plan”). Under the Distribution Plan, the Investor Class of each of the International Equity, International Small Companies, Frontier Emerging Markets, Global Equity Research, International Equity Research and Emerging Markets Research Portfolios may pay underwriters, distributors, dealers or brokers a fee at an annual rate of up to 0.25% of the average daily net assets of the Portfolio’s Investor Class shares for services or expenses arising in connection with activities primarily intended to result in the sale of Investor Class shares of the Portfolios or for Shareholder Services (defined below) consistent with those described under the Shareholder Servicing Plan.
The Fund, on behalf of the Portfolios, has agreements with various financial intermediaries and “mutual fund supermarkets”, under which customers of these intermediaries may purchase and hold Portfolio shares. These intermediaries assess fees in consideration for providing certain account maintenance, record keeping and transactional and other shareholder services (collectively, “Shareholder Services”). With the exception of Institutional Class Z, each Portfolio or class is authorized, pursuant to a Shareholder Servicing Plan, to pay to each intermediary an annual rate of up to 0.25% of its average daily net assets attributable to that intermediary (subject to the contractual expense limits described above) for such Shareholder Services. Because of the contractual expense limits on certain Portfolios’ fees and expenses, the Investment Adviser paid a portion of the Portfolios’ share of these fees during the period ended April 30, 2018. Such payments, if any, are included in the table above under the caption “Fees waived and/or reimbursed by the Investment Adviser”.
59
Table of Contents
Harding, Loevner Funds, Inc.
Notes to Financial Statements (continued)
April 30, 2018 (unaudited)
3. Transactions with Affiliates and Significant Agreements (continued)
A Portfolio may purchase securities from, or sell securities to, an affiliated fund provided the affiliation is due solely to having a common investment adviser, common officers, or common Trustees. For the period ended April 30, 2018, no Portfolios engaged in purchases and/or sales of securities from an affiliated portfolio in compliance with Rule 17a-7 of the 1940 Act.
4. Class Specific Expenses
Most expenses of the Fund can be directly attributed to a particular Portfolio. Expenses which cannot be directly attributed are apportioned among the Portfolios based upon relative net assets or other appropriate measures. If an expense is incurred at the Portfolio level, it is generally apportioned among the classes of that Portfolio based upon relative net assets of each respective class. Certain expenses are incurred at the class level and charged only to that particular class. These expenses may be class specific (i.e., Distribution fees charged only to a particular class) or they may be identifiable to a particular class (i.e., the costs related to mailing shareholder reports to shareholders of a particular class). Class level expenses for Portfolios with multiple active classes are shown in the table below.
The class level expenses for the period ended April 30, 2018, were as follows for each Portfolio:
| Portfolio | Distribution Fees | State Registration Filing Fees | Printing and Postage Fees | Transfer Agent Fees and Expenses | Shareholder Servicing Fees | |||||||||||||||
Global Equity–Institutional Class | $ | — | $ | 13,905 | $ | 6,328 | $ | 13,538 | $ | 183,564 | ||||||||||
Global Equity–Institutional Class Z | — | 15,847 | 498 | 11,539 | — | |||||||||||||||
Global Equity–Advisor Class | — | 12,833 | 9,321 | 13,273 | 65,719 | |||||||||||||||
International Equity–Institutional Class | — | 276,421 | 296,608 | 133,306 | 3,729,233 | |||||||||||||||
International Equity–Institutional Class Z | — | 22,459 | 1,752 | 13,631 | — | |||||||||||||||
International Equity–Investor Class | 713,576 | 25,865 | 32,191 | 51,449 | 355,888 | |||||||||||||||
International Small Companies–Institutional Class | — | 15,287 | 3,637 | 12,315 | 43,363 | |||||||||||||||
International Small Companies–Investor Class | 76,822 | 11,618 | 3,595 | 12,629 | 31,144 | |||||||||||||||
Institutional Emerging Markets–Class I | — | 54,350 | 110,004 | 32,167 | 1,476,540 | |||||||||||||||
Institutional Emerging Markets–Class II | — | 12,926 | 6,933 | 16,751 | — | |||||||||||||||
Frontier Emerging Markets–Institutional Class I | — | 20,728 | 9,349 | 15,585 | 93,292 | |||||||||||||||
Frontier Emerging Markets–Institutional Class II | — | 19,226 | 2,228 | 12,052 | — | |||||||||||||||
Frontier Emerging Markets–Investor Class | 41,372 | 11,766 | 2,241 | 13,651 | 18,610 | |||||||||||||||
Global Equity Research–Institutional Class | — | 13,632 | 136 | 11,758 | — | |||||||||||||||
Global Equity Research–Investor Class | 717 | 13,484 | 70 | 11,767 | — | |||||||||||||||
International Equity Research–Institutional Class | — | 11,612 | 172 | 11,823 | — | |||||||||||||||
International Equity Research–Investor Class | 1,410 | 12,142 | 102 | 11,751 | 258 | |||||||||||||||
Emerging Markets Research–Institutional Class | — | 13,637 | 145 | 11,718 | — | |||||||||||||||
Emerging Markets Research–Investor Class | 805 | 13,485 | 71 | 11,768 | — | |||||||||||||||
5. Investment Transactions
Cost of purchases and proceeds from sales of investment securities, other than short-term investments, for the period ended April 30, 2018, were as follows for each Portfolio:
| Portfolio | Purchase Cost of Investment Securities | Proceeds from Sales of Investment Securities | ||||||
Global Equity | $ 137,535,065 | $263,090,874 | ||||||
International Equity | 2,506,766,682 | 643,570,680 | ||||||
International Small Companies | 116,038,441 | 71,056,470 | ||||||
Institutional Emerging Markets | 545,125,089 | 405,575,735 | ||||||
Emerging Markets | 402,071,513 | 335,336,061 | ||||||
Frontier Emerging Markets | 70,531,256 | 65,243,872 | ||||||
Global Equity Research | 1,388,787 | 1,320,925 | ||||||
International Equity Research | 2,572,877 | 2,236,404 | ||||||
Emerging Markets Research | 2,144,512 | 1,722,140 | ||||||
60
Table of Contents
Harding, Loevner Funds, Inc.
Notes to Financial Statements (continued)
April 30, 2018 (unaudited)
6. Capital Share Transactions
Transactions in capital shares for the period ended April 30, 2018, were as follows for each Portfolio:
Shares Sold | Proceeds From Shares Sold | Shares From Reinvested Dividends | Reinvestment of Dividends | Shares Redeemed | Payments for Shares Redeemed | Net Increase (Decrease) in Shares | Net Increase (Decrease) in Net Assets | |||||||||||||||||||||||||
Global Equity | ||||||||||||||||||||||||||||||||
Institutional Class | 1,372,657 | $ | 52,670,018 | 1,985,000 | $ | 72,809,813 | (7,286,122 | ) | $ | (294,162,032 | ) | (3,928,465 | ) | $ | (168,682,201 | ) | ||||||||||||||||
Institutional Class Z* | 2,643,993 | 108,325,733 | 446,208 | 16,353,512 | (275,094 | ) | (10,747,798 | ) | 2,815,107 | 113,931,447 | ||||||||||||||||||||||
Advisor Class | 801,058 | 31,004,914 | 246,019 | 9,021,500 | (236,033 | ) | (8,965,651 | ) | 811,044 | 31,060,763 | ||||||||||||||||||||||
International Equity | ||||||||||||||||||||||||||||||||
Institutional Class | 122,845,732 | 2,843,671,483 | 7,307,212 | 163,096,976 | (85,836,575 | ) | (2,030,221,690 | ) | 44,316,369 | 976,546,769 | ||||||||||||||||||||||
Institutional Class Z* | 49,899,205 | 1,199,582,812 | 155,041 | 3,458,969 | (2,021,341 | ) | (46,847,172 | ) | 48,032,905 | 1,156,194,609 | ||||||||||||||||||||||
Investor Class | 4,330,066 | 99,635,288 | 300,709 | 6,702,815 | (11,940,396 | ) | (275,563,336 | ) | (7,309,621 | ) | (169,225,233 | ) | ||||||||||||||||||||
International Small Companies |
| |||||||||||||||||||||||||||||||
Institutional Class | 2,384,195 | 40,777,260 | 101,227 | 1,699,607 | (816,871 | ) | (14,078,362 | ) | 1,668,551 | 28,398,505 | ||||||||||||||||||||||
Investor Class | 1,730,472 | 30,136,380 | 32,401 | 540,442 | (503,892 | ) | (8,519,254 | ) | 1,258,981 | 22,157,568 | ||||||||||||||||||||||
Institutional Emerging Markets |
| |||||||||||||||||||||||||||||||
Class I | 24,348,059 | 562,516,208 | 1,419,752 | 31,021,590 | (14,915,728 | ) | (344,516,353 | ) | 10,852,083 | 249,021,445 | ||||||||||||||||||||||
Class II* | 341,997 | 8,000,000 | 148,911 | 3,252,204 | (1,777,112 | ) | (41,136,940 | ) | (1,286,204 | ) | (29,884,736 | ) | ||||||||||||||||||||
Emerging Markets | ||||||||||||||||||||||||||||||||
Advisor Class | 7,651,016 | 462,234,989 | 491,091 | 28,100,230 | (5,859,683 | ) | (354,400,539 | ) | 2,282,424 | 135,934,680 | ||||||||||||||||||||||
Frontier Emerging Markets |
| |||||||||||||||||||||||||||||||
Institutional Class I | 3,063,831 | 28,162,042 | 494,375 | 4,202,186 | (3,885,071 | ) | (35,064,520 | ) | (326,865 | ) | (2,700,292 | ) | ||||||||||||||||||||
Institutional Class II** | 1,074,114 | 10,000,000 | 411,728 | 3,499,694 | — | — | 1,485,842 | 13,499,694 | ||||||||||||||||||||||||
Investor Class | 507,917 | 4,686,290 | 52,964 | 448,604 | (471,978 | ) | (4,255,443 | ) | 88,903 | 879,451 | ||||||||||||||||||||||
Global Equity Research |
| |||||||||||||||||||||||||||||||
Institutional Class | — | — | 18,157 | 219,334 | — | — | 18,157 | 219,334 | ||||||||||||||||||||||||
Investor Class | — | — | 1,884 | 22,701 | — | — | 1,884 | 22,701 | ||||||||||||||||||||||||
International Equity Research |
| |||||||||||||||||||||||||||||||
Institutional Class | 48,049 | 627,154 | 42,396 | 531,220 | (12,668 | ) | (165,522 | ) | 77,777 | 992,852 | ||||||||||||||||||||||
Investor Class | 800 | 10,459 | 5,062 | 63,122 | (6,538 | ) | (86,665 | ) | (676 | ) | (13,084 | ) | ||||||||||||||||||||
Emerging Markets Research |
| |||||||||||||||||||||||||||||||
Institutional Class | 39,249 | 500,000 | 35,810 | 435,447 | — | — | 75,059 | 935,447 | ||||||||||||||||||||||||
Investor Class | — | — | 3,750 | 45,523 | — | — | 3,750 | 45,523 | ||||||||||||||||||||||||
| * | All share amounts have been adjusted as a result of the reverse share split effected after the close of business on December 1, 2017. (See Note 1). |
| ** | All share amounts have been adjusted as a result of the share dividend effected after the close of business on December 1, 2017. (See Note 1). |
Transactions in capital shares for the year ended October 31, 2017, were as follows for each Portfolio:
Shares Sold | Proceeds From Shares Sold | Shares From Reinvested Dividends | Reinvestment of Dividends | Shares Redeemed | Payments for Shares Redeemed | Net Increase (Decrease) in Shares | Net Increase (Decrease) in Net Assets | |||||||||||||||||||||||||
Global Equity | ||||||||||||||||||||||||||||||||
Institutional Class | 3,557,207 | $ | 126,591,078 | 380,579 | $ | 12,167,114 | (8,538,488 | ) | $ | (321,559,614 | ) | (4,600,702 | ) | $ | (182,801,422 | ) | ||||||||||||||||
Institutional Class Z* | 1,138,429 | 45,129,498 | — | — | — | — | 1,138,429 | 45,129,498 | ||||||||||||||||||||||||
Advisor Class | 591,509 | 21,937,118 | 22,083 | 706,436 | (514,528 | ) | (18,583,901 | ) | 99,064 | 4,059,653 | ||||||||||||||||||||||
International Equity | ||||||||||||||||||||||||||||||||
Institutional Class | 212,768,400 | 4,289,975,391 | 3,099,381 | 54,673,082 | (71,189,657 | ) | (1,425,428,201 | ) | 144,678,124 | 2,919,220,272 | ||||||||||||||||||||||
Institutional Class Z* | 7,386,891 | 163,751,319 | — | — | (13,423 | ) | (301,268 | ) | 7,373,468 | 163,450,051 | ||||||||||||||||||||||
Investor Class | 16,523,590 | 330,104,697 | 142,696 | 2,514,304 | (11,801,255 | ) | (242,004,627 | ) | 4,865,031 | 90,614,374 | ||||||||||||||||||||||
61
Table of Contents
Harding, Loevner Funds, Inc.
Notes to Financial Statements (continued)
April 30, 2018 (unaudited)
6. Capital Share Transactions (continued)
Shares Sold | Proceeds From Shares Sold | Shares From Reinvested Dividends | Reinvestment of Dividends | Shares Redeemed | Payments for Shares Redeemed | Net Increase (Decrease) in Shares | Net Increase (Decrease) in Net Assets | |||||||||||||||||||||||||
International Small Companies |
| |||||||||||||||||||||||||||||||
Institutional Class | 4,711,720 | $ | 69,203,857 | 198,337 | $ | 2,518,889 | (836,485 | ) | $ | (12,122,159 | ) | 4,073,572 | $ | 59,600,587 | ||||||||||||||||||
Investor Class | 738,353 | 11,215,961 | 136,919 | 1,729,291 | (1,088,280 | ) | (15,155,184 | ) | (213,008 | ) | (2,209,932 | ) | ||||||||||||||||||||
Institutional Emerging Markets |
| |||||||||||||||||||||||||||||||
Class I | 54,560,688 | 1,038,641,937 | 980,891 | 16,341,647 | (28,454,918 | ) | (532,984,859 | ) | 27,086,661 | 521,998,725 | ||||||||||||||||||||||
Class II* | 1,043,057 | 20,705,438 | 214,790 | 3,569,199 | (1,888,130 | ) | (37,184,339 | ) | (630,283 | ) | (12,909,702 | ) | ||||||||||||||||||||
Emerging Markets | ||||||||||||||||||||||||||||||||
Advisor Class | 19,627,835 | 977,092,988 | 367,978 | 16,069,613 | (14,929,149 | ) | (747,053,858 | ) | 5,066,664 | 246,108,743 | ||||||||||||||||||||||
Frontier Emerging Markets |
| |||||||||||||||||||||||||||||||
Institutional Class I | 10,785,448 | 81,054,731 | 416,181 | 2,975,698 | (26,327,254 | ) | (197,884,990 | ) | (15,125,625 | ) | (113,854,561 | ) | ||||||||||||||||||||
Institutional Class II** | 19,618,659 | 147,539,455 | — | — | — | — | 19,618,659 | 147,539,455 | ||||||||||||||||||||||||
Investor Class | 1,172,765 | 8,931,159 | 21,332 | 151,672 | (2,020,534 | ) | (15,360,844 | ) | (826,437 | ) | (6,278,013 | ) | ||||||||||||||||||||
Global Equity Research | ||||||||||||||||||||||||||||||||
Institutional Class | 433,942 | 4,341,525 | — | — | — | — | 433,942 | 4,341,525 | ||||||||||||||||||||||||
Investor Class | 44,913 | 449,875 | — | — | — | — | 44,913 | 449,875 | ||||||||||||||||||||||||
International Equity Research |
| |||||||||||||||||||||||||||||||
Institutional Class | 206,473 | 2,385,238 | 21,912 | 227,662 | (67,783 | ) | (822,513 | ) | 160,602 | 1,790,387 | ||||||||||||||||||||||
Investor Class | 27,569 | 319,632 | 2,630 | 27,249 | (18,674 | ) | (219,087 | ) | 11,525 | 127,794 | ||||||||||||||||||||||
Emerging Markets Research |
| |||||||||||||||||||||||||||||||
Institutional Class | 451,850 | 4,518,305 | — | — | — | — | 451,850 | 4,518,305 | ||||||||||||||||||||||||
Investor Class | 47,237 | 473,195 | — | — | — | — | 47,237 | 473,195 | ||||||||||||||||||||||||
| * | All share amounts have been adjusted as a result of the reverse share split effected after the close of business on December 1, 2017. (See Note 1). |
| ** | All share amounts have been adjusted as a result of the share dividend effected after the close of business on December 1, 2017. (See Note 1). |
7. Income Tax
The cost of investments for federal income tax purposes and the components of net unrealized appreciation (depreciation) on investments at April 30, 2018, for each of the Portfolios were as follows:
| Portfolio | Gross Unrealized Appreciation | Gross Unrealized Depreciation | Net Unrealized Appreciation / (Depreciation) | Cost | ||||||||||||
Global Equity | $ | 280,615,949 | $ | (9,996,238 | ) | $ | 270,619,711 | $ | 562,324,801 | |||||||
International Equity | 3,281,602,972 | (60,332,226 | ) | 3,221,270,746 | 10,927,689,512 | |||||||||||
International Small Companies | 48,731,473 | (5,538,795 | ) | 43,192,678 | 206,527,813 | |||||||||||
Institutional Emerging Markets | 1,476,086,046 | (87,524,243 | ) | 1,388,561,803 | 3,820,901,186 | |||||||||||
Emerging Markets | 1,433,101,246 | (61,544,662 | ) | 1,371,556,584 | 2,895,536,726 | |||||||||||
Frontier Emerging Markets | 129,161,500 | (28,898,970 | ) | 100,262,530 | 412,541,603 | |||||||||||
Global Equity Research | 1,079,362 | (129,170 | ) | 950,192 | 5,264,874 | |||||||||||
International Equity Research | 2,054,434 | (266,426 | ) | 1,788,008 | 9,629,044 | |||||||||||
Emerging Markets Research | 1,352,557 | (224,426 | ) | 1,128,131 | 6,176,834 | |||||||||||
It is the policy of each Portfolio of the Fund to qualify as a regulated investment company by complying with the applicable provisions of the Internal Revenue Code, and to make distributions of taxable income sufficient to relieve it from substantially all federal income and excise taxes; therefore, no federal income tax provision is required.
The Portfolios may be subject to taxes imposed by countries in which they invest. Such taxes are generally based on income and/or capital gains earned. Taxes are accrued based on net investment income, net realized gains and net unrealized appreciation as such income and/or gains are recorded. Taxes accrued on unrealized gains are reflected as a liability on the Statements of Assets and Liabilities under the caption “Deferred
62
Table of Contents
Harding, Loevner Funds, Inc.
Notes to Financial Statements (continued)
April 30, 2018 (unaudited)
7. Income Tax (continued)
capital gains tax” and as a reduction in “Net unrealized appreciation on investments and on assets and liabilities denominated in foreign currencies”. When assets subject to capital gains tax are sold, accrued taxes are relieved, and the actual amount of the taxes paid is reflected on the Statements of Operations as a reduction in “Net realized gain (loss) on Investment Transactions”. The Portfolios seek to recover a portion of foreign withholding taxes applied to income earned in jurisdictions where favorable treaty rates for US investors are available. The portion of such taxes believed to be recoverable is reflected as an asset on the Statements of Assets and Liabilities under the caption “Tax reclaim receivable”.
Management has performed an analysis of each Portfolio’s tax positions for the open tax years as of April 30, 2018, and has concluded that no provisions for income tax are required. The Portfolios’ federal tax returns for the prior three fiscal years (open tax years: October 31, 2015; October 31, 2016; October 31, 2017) remain subject to examination by the Portfolios’ major tax jurisdictions, which include the United States, the State of New Jersey and the State of Maryland. Management is not aware of any events that are reasonably possible to occur in the next twelve months that would result in the amounts of any unrecognized tax benefits significantly increasing or decreasing for the Portfolios. However, management’s conclusions regarding tax positions taken may be subject to review and adjustment at a later date based on factors including, but not limited to, new tax laws and accounting regulations and interpretations thereof.
The tax character of distributions paid during the fiscal years ended October 31, 2017 and 2016 were as follows:
| Distributions From | ||||||||||||||||
| Portfolio | Ordinary Income 2017 | Long-Term Capital Gains 2017 | Ordinary Income 2016 | Long-Term Capital Gains 2016 | ||||||||||||
Global Equity | $ | 3,264,568 | $ | 10,109,118 | $ | 2,915,631 | $ | 21,649,757 | ||||||||
International Equity | 64,825,786 | — | 48,284,777 | — | ||||||||||||
International Small Companies | 1,214,051 | 3,298,574 | 576,035 | 948,182 | ||||||||||||
Institutional Emerging Markets | 22,513,197 | — | 14,148,383 | — | ||||||||||||
Emerging Markets | 17,343,528 | — | 12,240,604 | 56,015 | ||||||||||||
Frontier Emerging Markets | 3,677,574 | — | 4,626,863 | — | ||||||||||||
Global Equity Research | — | — | — | — | ||||||||||||
International Equity Research | 254,911 | — | — | — | ||||||||||||
Emerging Markets Research | — | — | — | — | ||||||||||||
The Regulated Investment Company Modernization Act of 2010 (the “Act”) changed various technical rules governing the tax treatment of regulated investment companies and became effective for the Portfolios for the fiscal year ended October 31, 2012. Under the Act, each Portfolio is permitted to carry forward capital losses incurred in taxable years beginning after the date of enactment for an unlimited period. However, any losses incurred during post-enactment years are required to be utilized prior to the losses incurred in pre-enactment taxable years, which carry an expiration date. As a result of this ordering rule, pre-enactment capital loss carryforwards may be more likely to expire unused. Additionally, post-enactment capital loss carryforwards will retain their character as either short-term or long-term capital losses rather than being considered all short-term as permitted under previous regulation.
At October 31, 2017, capital losses incurred that will be carried forward indefinitely under provisions of the Act are as follows:
| Portfolio | Short-Term Capital Loss Carryforward | Long-Term Capital Loss Carryforward | ||||||
Institutional Emerging Markets | $ | (11,160,327 | ) | $ | (76,946,608 | ) | ||
Frontier Emerging Markets | (17,019,306 | ) | (84,046,818 | ) | ||||
At October 31, 2017, the pre-enactment capital loss carryforwards and their respective years of expiration were as follows:
| Portfolio | October 31, 2019 | |||
Institutional Emerging Markets | $ | (3,834,973 | ) | |
63
Table of Contents
Harding, Loevner Funds, Inc.
Notes to Financial Statements (continued)
April 30, 2018 (unaudited)
8. Foreign Exchange Contracts
The Portfolios do not generally hedge foreign currency exposure, however, the Portfolios may enter into forward foreign exchange contracts in order to hedge their exposure to changes in foreign currency exchange rates on their foreign portfolio holdings. Each Portfolio will conduct its currency transactions either on a spot (cash) basis at the rate prevailing in the currency exchange market, or by entering into forward contracts to purchase or sell currency. Foreign currency transactions entered into on the spot markets serve to pay for foreign investment purchases or to convert to dollars, the proceeds from foreign investment sales or dividend and interest receipts. The Portfolios will disclose open forward currency contracts, if any, on the Portfolios of Investments. The Portfolios do not separately disclose open spot market transactions on the Portfolios of Investments. Such realized gain (loss) and unrealized appreciation (depreciation) on spot market transactions is included in “net realized gain (loss) on foreign currency transactions” and “change in unrealized appreciation (depreciation) on translation of assets and liabilities denominated in foreign currencies”, respectively, on the Portfolios’ Statements of Operations. The Portfolios held no open forward currency contracts as of or during the period ended April 30, 2018.
9. Participation Notes
Each Portfolio may invest in participation notes. Participation notes are promissory notes that are designed to replicate the return of a particular underlying equity or debt security, currency or market. Participation notes are issued by banks or broker-dealers or their affiliates and allow a Portfolio to gain exposure to common stocks in markets where direct investment may not be allowed. Participation notes are generally traded over-the-counter. In addition to carrying the same risks associated with a direct investment in the underlying security, participation notes are subject to the risk that the broker-dealer or bank that issues them will not fulfill its contractual obligation to complete the transaction with a Portfolio. Participation notes constitute general unsecured contractual obligations of the banks or broker-dealers that issue them, and a Portfolio would be relying on the creditworthiness of such banks or broker-dealers and would have no rights under a participation note against the issuer(s) of the underlying security(ies). Participation notes may be more volatile and less liquid than other investments held by the Portfolios.
10. Concentration of Ownership
At April 30, 2018, the percentage of total shares outstanding held by record shareholders each owning 10% or greater of the aggregate shares outstanding of each Portfolio were as follows:
No. of Shareholders | % Ownership | |||||||
Global Equity | 3 | 44.09%* | ||||||
International Equity | 2 | 43.74%* | ||||||
International Small Companies | 5 | 82.40%* | ||||||
Institutional Emerging Markets | 2 | 51.74%* | ||||||
Emerging Markets | 3 | 64.12%* | ||||||
Frontier Emerging Markets | 2 | 48.41%* | ||||||
Global Equity Research | 2 | 83.53% | ||||||
International Equity Research | 2 | 61.80% | ||||||
Emerging Markets Research | 2 | 74.70% | ||||||
| * | Includes omnibus positions of broker-dealers representing numerous shareholder accounts. |
Investment activities of these shareholders may have a material effect on the Portfolios.
11. Concentration of Risk
Investing in securities of foreign issuers and currency transactions may involve certain considerations and risks not typically associated with investments in U.S. issuers. These risks include revaluation of currencies, adverse fluctuations in foreign currency values and possible adverse political, social and economic developments, including those particular to a specific industry, country or region, which could cause the securities and their markets to be less liquid and prices more volatile than those of comparable U.S. companies and U.S. government securities. These risks are greater with respect to securities of issuers located in emerging market countries in which the Portfolios are authorized to invest.
Frontier Emerging Markets is permitted to invest up to 35% of its total assets in companies in the same industry, if, at the time of investment, that industry represents 20% or more of the Portfolio’s benchmark index. During periods when the Portfolio has invested more than 25% of its total assets in companies in the same industry, it will operate as a concentrated portfolio and be subject to additional risks and greater volatility. At April 30, 2018, the Portfolio’s investment in the Banking industry amounted to 34.18% of its total assets.
64
Table of Contents
Harding, Loevner Funds, Inc.
Notes to Financial Statements (continued)
April 30, 2018 (unaudited)
12. Line of Credit
The Fund has a $150 million line of credit agreement with Northern Trust. Borrowings are made solely to facilitate the handling of redemptions or unusual or unanticipated short-term cash requirements. Because several Portfolios participate and collateral requirements apply, there is no assurance that an individual Portfolio will have access to the entire $150 million at any particular time. Interest is charged to each Portfolio based on its borrowings at an amount above the Federal Funds rate, subject to a minimum rate. In addition, a facility fee is computed at an annual rate of 0.15% on the line of credit and is allocated among the Portfolios.
For the period ended April 30, 2018, none of the portfolios had an outstanding balance.
13. Subsequent Events
Subsequent events occurring after the date of this report have been evaluated for potential impact, for purposes of recognition or disclosure in the financial statements, through the date the report was issued and it has been determined that no other adjustments or disclosures are required beyond what is already included in the financial statements and accompanying footnotes.
65
Table of Contents
Harding, Loevner Funds, Inc.
(unaudited)
Quarterly Form N-Q Portfolio Schedule
Each Portfolio will file its complete portfolio of investments with the SEC on Form N-Q at the end of the first and third fiscal quarters within 60 days of the end of the quarter to which it relates. The Portfolios’ Form N-Q will be available on the SEC’s website at www.sec.gov and may also be reviewed and copied at the SEC’s Public Reference Room whose telephone number is (800) SEC-0330. Additionally, they are available upon request by calling (877) 435-8105.
Proxy Voting Record
The Fund’s proxy voting record relating to the Portfolios’ securities during the most recent 12-month period ended June 30 is available on the Fund’s website at www.hardingloevnerfunds.com and on the SEC’s website at www.sec.gov, on Form N-PX.
Proxy Voting Policies and Procedures
The Fund’s proxy voting policies and procedures are included in Appendix B to Statement of Additional Information and is available without charge, upon request, by calling (877) 435-8105 or on the SEC’s website at www.sec.gov.
Additional Information
The Adviser updates Fact Sheets for the Portfolios each calendar quarter, which are posted to the Fund’s website at www.hardingloevnerfunds.com. This information, along with the Adviser’s commentaries on its various strategies, is available without charge, upon request, by calling (877) 435-8105.
66
Table of Contents
Harding, Loevner Funds, Inc.
Directors and Principal Officers
(unaudited)
DIRECTORS AND PRINCIPAL OFFICERS OF THE FUNDS
David R. Loevner
Director and Chairman of the Board of Directors
Carolyn Ainslie
Director
Christine C. Carsman
Director
Jill R. Cuniff
Director
R. Kelly Doherty
Director
Charles Freeman, III
Director
Samuel R. Karetsky
Director
Eric Rakowski
Director
Richard Reiter
President
Charles S. Todd
Chief Financial Officer and Treasurer
Brian Simon
Chief Compliance Officer, Anti-Money Laundering Compliance Officer, and Assistant Secretary
Owen T. Meacham
Secretary
Aaron Bellish
Assistant Treasurer
Derek Jewusiak
Assistant Treasurer
Lori M. Renzulli
Assistant Secretary
Marcia Y. Lucas
Assistant Secretary
67
Table of Contents
This report is intended for shareholders of Harding, Loevner Funds, Inc. It may not be used as sales literature unless preceded or accompanied by the current Prospectus, which gives details about charges, expenses, investment objectives, risks and policies of the Portfolios.
Table of Contents


Table of Contents
Item 2. Code of Ethics.
Not applicable.
Item 3. Audit Committee Financial Expert.
Not applicable.
Item 4. Principal Accountant Fees and Services.
Not applicable.
Item 5. Audit Committee of Listed Registrants.
Not applicable.
Item 6. Investments.
| (a) | Schedule I is included as part of the report to shareholders filed under Item 1 of this report on Form N-CSR. |
| (b) | Not applicable. |
Item 7. Disclosure of Proxy Voting Policies and Procedures for Closed-End Management Investment Companies.
Not applicable.
Item 8. Portfolio Managers of Closed-End Management Investment Companies.
Not applicable.
Item 9. Purchases of Equity Securities by Closed-End Management Investment Company and Affiliated Purchasers.
Not applicable.
Item 10. Submission of Matters to a Vote of Security Holders.
Not applicable.
Item 11. Controls and Procedures.
| (a) | The Registrant’s Principal Executive Officer and Principal Financial Officer, or persons performing similar functions, have concluded that the Registrant’s disclosure controls and procedures (as defined in Rule 30a-3(c) under the Investment Company Act of 1940, as amended (the “1940 Act”)) were effective as of a date within 90 days prior to the filing date of this report, based on their evaluation of the effectiveness of the Registrant’s disclosure controls and procedures as of the evaluation date. |
| (b) | There were no significant changes in the Registrant’s internal control over financial reporting (as defined in Rule 30a-3(d) under the 1940 Act) that occurred during the second fiscal quarter of the period covered by this report that have materially affected, or are reasonably likely to materially affect, the Registrant’s internal control over financial reporting. |
Table of Contents
Item 12. Disclosure of Securities Lending Activities for Closed-End Management Investment Companies.
Not applicable.
Item 13. Exhibits.
| (a)(1) | Not applicable. | |
| (a)(2) | Exhibit 99.CERT: Certifications pursuant to Rule 30a-2(a) of the Act are attached. | |
| (b) | Exhibit 99.906: Certifications pursuant to Rule 30a-2(b) of the Act are attached hereto. | |
Table of Contents
SIGNATURES
Pursuant to the requirements of the Securities Exchange Act of 1934 and the Investment Company Act of 1940, the Registrant has duly caused this report to be signed on its behalf by the undersigned, thereunto duly authorized.
| Harding, Loevner Funds, Inc. | ||||
| By | /s/ Richard T. Reiter | |||
| Richard T. Reiter | ||||
| (Principal Executive Officer) | ||||
| Date: June 29, 2018 | ||||
| Pursuant to the requirements of the Securities Exchange Act of 1934 and the Investment Company Act of 1940, this report has been signed below by the following persons on behalf of the Registrant and in the capacities and on the dates indicated. | ||||
| By | /s/ Richard T. Reiter | |||
| Richard T. Reiter | ||||
| (Principal Executive Officer) | ||||
| Date: June 29, 2018 | ||||
| By | /s/ Charles S. Todd | |||
| Charles S. Todd | ||||
| (Principal Financial Officer) | ||||
| Date: June 29, 2018 | ||||