As filed with the SEC on March 9, 2012.
SECURITIES AND EXCHANGE COMMISSION
WASHINGTON, D.C. 20549
FORM N-CSR
CERTIFIED SHAREHOLDER REPORT OF REGISTERED
MANAGEMENT INVESTMENT COMPANIES
Investment Company Act file number: 811-07717
|
| TRANSAMERICA ASSET ALLOCATION VARIABLE FUNDS |
570 Carillon Parkway, St. Petersburg, Florida 33716
(Address of Principal Executive Offices) (Zip Code)
Dennis P. Gallagher, Esq. P.O. Box 9012, Clearwater, Florida 33758-9771
(Name and Address of Agent for Service)
Registrant’s Telephone Number, including Area Code: (727) 299-1800
Date of fiscal year end: December 31
Date of reporting period: January 1, 2011 – December 31, 2011
Item 1: Report(s) to Shareholders. The Annual Report is attached.
TRANSAMERICA PARTNERS VARIABLE FUNDS
TRANSAMERICA ASSET
ALLOCATION VARIABLE FUNDS
Annual Report
December 31, 2011
This report is not to be construed as an offering for sale of any contracts participating in the Subaccounts (Series) of the Transamerica Partners Variable Funds or the Transamerica Asset Allocation Variable Funds, or as a solicitation of an offer to buy contracts unless preceded by or accompanied by a current prospectus which contains complete information about charges and expenses.
This report consists of the annual report of the Transamerica Asset Allocation Variable Funds and the annual reports of the Transamerica Partners Portfolios and the Calvert VP SRI Balanced Portfolio, the underlying portfolios in which the Transamerica Partners Variable Funds invest.
Proxy Voting Policies and Procedures
A description of the proxy voting policies and procedures of the Transamerica Asset Allocation Variable Funds and Transamerica Partners Portfolios is included in the Statement of Additional Information (“SAI”), which is available without charge, upon request: (i) by calling 1-888-233-4339; (ii) on the Subaccounts’ website at www.transamericapartners.com or (iii) on the SEC’s website at www.sec.gov. In addition, the Transamerica Asset Allocation Variable Funds and the Transamerica Partners Portfolios are required to file Form N-PX, with the complete proxy voting record for the twelve months ended June 30, no later than August 31 of each year. Form N-PX for the twelve months ended June 30, 2011, is available without charge, upon request by calling 1-800-851-9777 and on the SEC’s website at http://www.sec.gov.
Quarterly Portfolios
Transamerica Asset Allocation Variable Funds will file their portfolios of investments on Form N-Q with the SEC for the first and third quarters of each fiscal year. The Subaccounts’ Form N-Q is available on the SEC’s website at www.sec.gov. The Subaccounts’ Form N-Q may be reviewed and copied at the SEC’s Public Reference Room in Washington, DC. For information on the operation of the SEC’s Public Reference Room, call 1-800-SEC-0330. You may also obtain a copy of Form N-Q without charge, upon request, by calling 1-888-233-4339. Form N-Q for the corresponding Transamerica Partners Portfolios is also available without charge on the SEC website, at the SEC’s Public Reference Room, or by calling 1-888-233-4339.
TRANSAMERICA FINANCIAL LIFE INSURANCE COMPANY
440 Mamaroneck Avenue
Harrison, New York 10528
December 31, 2011
To Contract Holders with Interests in
the Transamerica Partners Variable Funds:
We are pleased to present the most recent annual reports for the Transamerica Partners Portfolios and for the Calvert VP SRI Balanced Portfolio. As required under applicable law, we are sending these annual reports to contract holders of Group Variable Annuity Contracts issued by Transamerica Financial Life Insurance Company with unit interests in one or more of the Transamerica Partners Variable Funds. Each subaccount available within the Transamerica Partners Variable Funds, other than the Calvert Subaccount, invests its assets in a corresponding mutual fund that is a series of Transamerica Partners Portfolios. The Calvert Subaccount invests in the Calvert VP SRI Balanced Portfolio, a series of Calvert Variable Series, Inc.
Please call your retirement plan administrator, Diversified Retirement Corporation, at (800) 755-5801 if you have any questions regarding these reports.
(This page intentionally left blank)
Dear Fellow Shareholder,
On behalf of Transamerica Asset Allocation Variable Funds, we would like to thank you for your continued support and confidence in our products as we look forward to continuing to serve you and your financial adviser in the future. We value the trust you have placed in us.
This annual report is provided to you with the intent of presenting a comprehensive review of the investments of each of your funds. The Securities and Exchange Commission requires that annual and semi-annual reports be sent to all shareholders, and we believe this report to be an important part of the investment process. In addition to providing a comprehensive review, this report also provides a discussion of accounting policies as well as matters presented to shareholders that may have required their vote.
We believe it is important to understand market conditions over the last year in order to provide a context for reading this report. As 2011 began, the Federal Reserve was in the middle of a second round of monetary stimulus known as quantitative easing (“QE2”). This effort began pumping what would eventually total $600 billion into the U.S. economy. In response, the U.S. economy and corporate earnings picked up steam throughout the 1st quarter. Equity and bond markets followed suit. During this same time, commodities prices and inflation also surged. In order to fight the inflation the Federal Reserve stimulus was creating, most central banks across the globe tightened monetary policy. In the spring, this global tightening collided with a global supply chain disruption caused by the Japanese tsunami. As a result, the global economy began slowing. As summer arrived, slower growth combined with concerns about high U.S. and European debt levels. Developments came to a head in late summer as the credit rating of the U.S. was lowered and Europe faced the possibility of a default by Greece. As a result, the global equity and corporate bond markets fell sharply while U.S. Treasuries rallied as investors sought safety. Fortunately, commodity prices including oil also fell sharply, putting more disposable income in consumer pockets.
As summer transitioned to fall, the U.S. economy re-strengthened. As a result, the U.S. corporate equity and bond markets responded in the fourth quarter by recovering much of the summer’s losses. For the twelve months ending December 31, 2011, the Dow Jones Industrial Average returned 8.38%, the Standard & Poor’s 500® Index returned 2.11%, and the Barclays Capital U.S. Aggregate Bond Index returned 7.84%. While the U.S. economy re-strengthened, the rest of the global economy continued to experience either slowing growth or contraction as European austerity programs continued to be implemented and European banks began selling Asian assets. As a result, European and Asian markets failed to recover the summer’s losses and the Morgan Stanley Capital International World ex-US Index returned (11.78)% for the year ending December 31, 2011. This serves as a good reminder that it is always important to maintain a diversified portfolio as investment returns have historically been difficult to predict.
In addition to your active involvement in the investment process, we firmly believe that a financial adviser is a key resource to help you build a complete picture of your current and future financial needs. Financial advisers are familiar with the market’s history, including long-term returns and volatility of various asset classes. With your financial adviser, you can develop an investment program that incorporates factors such as your goals, your investment timeline, and your risk tolerance.
Please contact your financial adviser if you have any questions about the contents of this report, and thanks again for the confidence you have placed in us.
Sincerely,
| | | | |
John K. Carter Chairman of the Board, President & Chief Executive Officer Transamerica Asset Allocation Variable Funds | | Christopher A. Staples Vice President & Chief Investment Officer Transamerica Asset Allocation Variable Funds | | |
The views expressed in this report reflect those of the portfolio managers only and may not necessarily represent the views of the Transamerica Asset Allocation Variable Funds. These views are subject to change based upon market conditions. These views should not be relied upon as investment advice and are not indicative of trading intent on behalf of the Transamerica Asset Allocation Variable Funds.
Transamerica Asset Allocation Variable Funds | Annual Report 2011 |
Page 1
Understanding Your Funds’ Expenses
(unaudited)
UNIT HOLDER EXPENSES
Transamerica Asset Allocation Variable Funds (individually, a “Subaccount” and collectively, the “Subaccounts”) is a separate investment account established by Transamerica Financial Life Insurance Company, Inc. (“TFLIC”), and is used as an investment vehicle under certain tax-deferred annuity contracts issued by TFLIC. Each Subaccount invests in underlying subaccounts of Transamerica Partners Variable Funds (“TPVF”), a unit investment trust. As a contractholder of a Subaccount, you will bear the ongoing costs of managing the corresponding subaccount in which your Subaccount invests. You will also bear the cost of operating the Subaccount. The following examples are intended to help you understand your ongoing costs (in dollars and cents) of investing in the Subaccounts and to compare these costs with the ongoing costs of investing in other funds.
The examples are based on an investment of $1,000 invested at July 1, 2011 and held for the entire period until December 31, 2011.
ACTUAL EXPENSES
The information in the table under the heading “Actual Expenses” provides information about actual account values and actual expenses. You may use the information in these columns, together with the amount you invested, to estimate the expenses that you paid over the period. Simply divide your account value by $1,000 (for example, an $8,600 account value divided by $1,000 = $8.60), then multiply the result by the number shown under the heading “Expenses paid during Period” to estimate the expenses you paid on your account during this period.
HYPOTHETICAL EXAMPLE FOR COMPARISON PURPOSES
The information in the table under the heading “Hypothetical Expenses” provides information about hypothetical account values and hypothetical expenses based on the Subaccount’s actual expense ratio and an assumed rate of return of 5% per year before expenses, which is not the Subaccount’s actual return. The hypothetical account values and expenses may not be used to estimate the actual ending account balance or expenses you paid for the period. You may use this information to compare the ongoing costs of investing in your Subaccount versus other funds. To do so, compare this 5% hypothetical example with the 5% hypothetical examples that appear in the shareholder reports of the other funds.
| | | | | | | | | | | | | | | | | | | | | | | | |
| | | | | | Actual Expenses | | | Hypothetical Expenses (B) | | | | |
Fund Name | | Beginning
Account Value | | | Ending Account
Value | | | Expenses Paid
During Period (A) | | | Ending Account
Value | | | Expenses Paid
During Period (A) | | | Annualized
Expense Ratio (C) | |
Transamerica Asset Allocation Variable Funds - Short Horizon Subaccount | | $ | 1,000.00 | | | $ | 1,012.20 | | | $ | 1.01 | | | $ | 1,024.20 | | | $ | 1.02 | | | | 0.20 | % |
Transamerica Asset Allocation Variable Funds - Intermediate Horizon Subaccount | | | 1,000.00 | | | | 958.10 | | | | 0.99 | | | | 1,024.20 | | | | 1.02 | | | | 0.20 | % |
Transamerica Asset Allocation Variable Funds - Intermediate/Long Horizon Subaccount | | | 1,000.00 | | | | 934.00 | | | | 0.97 | | | | 1,024.20 | | | | 1.02 | | | | 0.20 | % |
| (A) | Expenses are equal to each Subaccount’s annualized expense ratio (as disclosed in the table), multiplied by the average account value for the period, multiplied by the number of days in the period (184 days), and divided by the number of days in the year (365 days). |
| (B) | 5% return per year before actual expenses. |
| (C) | Expense ratios do not include expenses of the investment companies in which the portfolios invest. |
Transamerica Asset Allocation Variable Funds Annual Report 2011 |
Page 2
Schedules of Investments Composition
At December 31, 2011
(the following charts summarize the Schedule of Investments of each Subaccount by asset type)
(unaudited)
| | | | |
Transamerica Asset Allocation Variable Funds - Short Horizon Subaccount | | % of Net
Assets | |
Fixed Income | | | 89.9 | % |
Domestic Equity | | | 8.0 | |
International Equity | | | 1.9 | |
Money Market | | | 0.2 | |
Other Assets and Liabilities - Net | | | 0.0 | * |
| | | | |
Total | | | 100.0 | % |
| | | | |
| |
Transamerica Asset Allocation Variable Funds - Intermediate Horizon Subaccount | | % of Net
Assets | |
Fixed Income | | | 50.3 | % |
Domestic Equity | | | 38.8 | |
International Equity | | | 10.7 | |
Money Market | | | 0.2 | |
Other Assets and Liabilities - Net | | | 0.0 | * |
| | | | |
Total | | | 100.0 | % |
| | | | |
| |
Transamerica Asset Allocation Variable Funds - Intermediate/Long Horizon Subaccount | | % of Net
Assets | |
Domestic Equity | | | 54.2 | % |
Fixed Income | | | 29.4 | |
International Equity | | | 16.2 | |
Money Market | | | 0.2 | |
Other Assets and Liabilities - Net | | | 0.0 | * |
| | | | |
Total | | | 100.0 | % |
| | | | |
| * | Amount rounds to less than 0.1%. |
Transamerica Asset Allocation Variable Funds | Annual Report 2011 |
Page 3
Transamerica Asset Allocation Variable —
Short Horizon Subaccount
SCHEDULE OF INVESTMENTS
At December 31, 2011
| | | | | | | | |
| | | Shares | | | Value
(000’s) | |
INVESTMENT COMPANIES - 100.0%* | | | | | | | | |
Domestic Equity - 8.0% | | | | | | | | |
Transamerica Partners Variable Large Growth ‡ | | | 5,181 | | | $ | 262 | |
Transamerica Partners Variable Large Value ‡ | | | 5,657 | | | | 260 | |
Transamerica Partners Variable Small Core ‡ | | | 5,172 | | | | 190 | |
Fixed Income - 89.9% | | | | | | | | |
Transamerica Partners Variable Core Bond ‡ | | | 102,897 | | | | 4,195 | |
Transamerica Partners Variable High Quality Bond ‡ | | | 78,674 | | | | 1,379 | |
Transamerica Partners Variable High Yield Bond ‡ | | | 37,878 | | | | 931 | |
Transamerica Partners Variable Inflation-Protected Securities ‡ | | | 53,681 | | | | 1,479 | |
International Equity - 1.9% | | | | | | | | |
Transamerica Partners Variable International Equity ‡ | | | 9,693 | | | | 172 | |
Money Market - 0.2% | | | | | | | | |
Transamerica Partners Variable Money Market ‡ | | | 842 | | | | 18 | |
| | | | | | | | |
Total Investment Companies (cost $7,352)** | | | | | | | 8,886 | |
Other Assets and Liabilities - Net | | | | | | | (2 | ) |
| | | | | | | | |
Net Assets | | | | | | $ | 8,884 | |
| | | | | | | | |
NOTES TO SCHEDULE OF INVESTMENTS (all amounts in thousands):
| * | Each Subaccount invests its assets in an affiliated fund of Transamerica Partners Variable Funds. |
| ‡ | Non-income producing security. |
| ** | Aggregate cost for federal income tax purposes is $7,352. Aggregate gross/net unrealized appreciation for all securities in which there is an excess of value over tax cost was $1,534. |
VALUATION SUMMARY (all amounts in thousands):*
| | | | | | | | | | | | | | | | |
| | | Level 1 -
Quoted
Prices | | | Level 2 -
Other
Significant
Observable
Inputs | | | Level 3 -
Significant
Unobservable
Inputs | | | Value at
12/31/2011 | |
Investment Companies | | $ | 8,886 | | | $ | — | | | $ | — | | | $ | 8,886 | |
| * | See the notes to the financial statements for more information regarding pricing inputs and valuation techniques. |
The notes to the financial statements are an integral part of this report.
Transamerica Asset Allocation Variable Funds | Annual Report 2011 |
Page 4
Transamerica Asset Allocation Variable —
Intermediate Horizon Subaccount
SCHEDULE OF INVESTMENTS
At December 31, 2011
| | | | | | | | |
| | | Shares | | | Value
(000’s) | |
INVESTMENT COMPANIES - 100.0%* | | | | | | | | |
Domestic Equity - 38.8% | | | | | | | | |
Transamerica Partners Variable Large Growth ‡ | | | 64,015 | | | $ | 3,235 | |
Transamerica Partners Variable Large Value ‡ | | | 66,360 | | | | 3,055 | |
Transamerica Partners Variable Small Core ‡ | | | 57,169 | | | | 2,100 | |
Fixed Income - 50.3% | | | | | | | | |
Transamerica Partners Variable Core Bond ‡ | | | 127,646 | | | | 5,203 | |
Transamerica Partners Variable High Quality Bond ‡ | | | 99,406 | | | | 1,743 | |
Transamerica Partners Variable High Yield Bond ‡ | | | 54,562 | | | | 1,342 | |
Transamerica Partners Variable Inflation-Protected Securities ‡ | | | 93,285 | | | | 2,570 | |
International Equity - 10.7% | | | | | | | | |
Transamerica Partners Variable International Equity ‡ | | | 130,224 | | | | 2,312 | |
Money Market - 0.2% | | | | | | | | |
Transamerica Partners Variable Money Market ‡ | | | 2,048 | | | | 43 | |
| | | | | | | | |
Total Investment Companies (cost $19,392)** | | | | | | | 21,603 | |
Other Assets and Liabilities - Net | | | | | | | (4 | ) |
| | | | | | | | |
Net Assets | | | | | | $ | 21,599 | |
| | | | | | | | |
NOTES TO SCHEDULE OF INVESTMENTS (all amounts in thousands):
| * | Each Subaccount invests its assets in an affiliated fund of Transamerica Partners Variable Funds. |
| ‡ | Non-income producing security. |
| ** | Aggregate cost for federal income tax purposes is $19,397. Aggregate gross unrealized appreciation/depreciation for all securities in which there is an excess of value over tax cost were $2,722 and $516, respectively. Net unrealized appreciation for tax purposes is $2,206. |
VALUATION SUMMARY (all amounts in thousands):*
| | | | | | | | | | | | | | | | |
| | | Level 1 -
Quoted
Prices | | | Level 2 -
Other
Significant
Observable
Inputs | | | Level 3 -
Significant
Unobservable
Inputs | | | Value at
12/31/2011 | |
Investment Companies | | $ | 21,603 | | | $ | — | | | $ | — | | | $ | 21,603 | |
| * | See the notes to the financial statements for more information regarding pricing inputs and valuation techniques. |
The notes to the financial statements are an integral part of this report.
Transamerica Asset Allocation Variable Funds | Annual Report 2011 |
Page 5
Transamerica Asset Allocation Variable —
Intermediate/Long Horizon Subaccount
SCHEDULE OF INVESTMENTS
At December 31, 2011
| | | | | | | | |
| | | Shares | | | Value
(000’s) | |
INVESTMENT COMPANIES - 100.0%* | | | | | | | | |
Domestic Equity - 54.2% | | | | | | | | |
Transamerica Partners Variable Large Growth ‡ | | | 115,270 | | | $ | 5,826 | |
Transamerica Partners Variable Large Value ‡ | | | 115,306 | | | | 5,308 | |
Transamerica Partners Variable Small Core ‡ | | | 110,342 | | | | 4,052 | |
Fixed Income - 29.4% | | | | | | | | |
Transamerica Partners Variable Core Bond ‡ | | | 100,656 | | | | 4,102 | |
Transamerica Partners Variable High Quality Bond ‡ | | | 31,074 | | | | 545 | |
Transamerica Partners Variable High Yield Bond ‡ | | | 46,916 | | | | 1,154 | |
Transamerica Partners Variable Inflation-Protected Securities ‡ | | | 87,837 | | | | 2,420 | |
International Equity - 16.2% | | | | | | | | |
Transamerica Partners Variable International Equity ‡ | | | 255,889 | | | | 4,544 | |
Money Market - 0.2% | | | | | | | | |
Transamerica Partners Variable Money Market ‡ | | | 2,656 | | | | 56 | |
| | | | | | | | |
Total Investment Companies (cost $26,477)** | | | | | | | 28,007 | |
Other Assets and Liabilities - Net | | | | | | | (4 | ) |
| | | | | | | | |
Net Assets | | | | | | $ | 28,003 | |
| | | | | | | | |
NOTES TO SCHEDULE OF INVESTMENTS (all amounts in thousands):
| * | Each Subaccount invests its assets in an affiliated fund of Transamerica Partners Variable Funds. |
| ‡ | Non-income producing security. |
| ** | Aggregate cost for federal income tax purposes is $26,501. Aggregate gross unrealized appreciation/depreciation for all securities in which there is an excess of value over tax cost were $2,604 and $1,098, respectively. Net unrealized appreciation for tax purposes is $1,506. |
VALUATION SUMMARY (all amounts in thousands):*
| | | | | | | | | | | | | | | | |
Investment Securities | | Level 1 -
Quoted
Prices | | | Level 2 -
Other
Significant
Observable
Inputs | | | Level 3 -
Significant
Unobservable
Inputs | | | Value at
12/31/2011 | |
Investment Companies | | $ | 28,007 | | | $ | — | | | $ | — | | | $ | 28,007 | |
| * | See the notes to the financial statements for more information regarding pricing inputs and valuation techniques. |
The notes to the financial statements are an integral part of this report.
Transamerica Asset Allocation Variable Funds | Annual Report 2011 |
Page 6
STATEMENTS OF ASSETS AND LIABILITIES
At December 31, 2011
(all amounts except unit value in thousands)
| | | | | | | | | | | | |
| | | Short
Horizon | | | Intermediate
Horizon | | | Intermediate/Long
Horizon | |
Assets: | | | | | | | | | | | | |
Investments in affiliated investment companies, at value | | $ | 8,886 | | | $ | 21,603 | | | $ | 28,007 | |
Receivables: | | | | | | | | | | | | |
Units sold | | | 8 | | | | 16 | | | | 22 | |
Affiliated investment companies sold | | | 15 | | | | 58 | | | | 43 | |
| | | | | | | | | | | | |
| | | 8,909 | | | | 21,677 | | | | 28,072 | |
| | | | | | | | | | | | |
Liabilities: | | | | | | | | | | | | |
Accounts payable and accrued liabilities: | | | | | | | | | | | | |
Units redeemed | | | 2 | | | | 47 | | | | 4 | |
Affiliated investment companies purchased | | | 21 | | | | 27 | | | | 60 | |
Investment advisory fees | | | 2 | | | | 4 | | | | 5 | |
| | | | | | | | | | | | |
| | | 25 | | | | 78 | | | | 69 | |
| | | | | | | | | | | | |
Net Assets | | $ | 8,884 | | | $ | 21,599 | | | $ | 28,003 | |
| | | | | | | | | | | | |
| | | |
Net Assets Consist of: | | | | | | | | | | | | |
Cost of accumulation units | | | 4,749 | | | | 13,346 | | | | 21,084 | |
(Accumulated) net investment (loss) | | | (222 | ) | | | (627 | ) | | | (870 | ) |
Undistributed net realized gains | | | 2,823 | | | | 6,669 | | | | 6,259 | |
Net unrealized appreciation on investments in affiliated investment companies | | | 1,534 | | | | 2,211 | | | | 1,530 | |
| | | | | | | | | | | | |
Net Assets | | $ | 8,884 | | | $ | 21,599 | | | $ | 28,003 | |
| | | | | | | | | | | | |
| | | |
Accumulation units | | | 468 | | | | 1,189 | | | | 1,583 | |
| | | | | | | | | | | | |
| | | |
Unit value | | $ | 18.99 | | | $ | 18.17 | | | $ | 17.70 | |
| | | | | | | | | | | | |
| | | |
Investments in affiliated investment companies, at cost | | $ | 7,352 | | | $ | 19,392 | | | $ | 26,477 | |
| | | | | | | | | | | | |
STATEMENTS OF OPERATIONS
For the year ended December 31, 2011
(all amounts in thousands)
| | | | | | | | | | | | |
| | | Short
Horizon | | | Intermediate
Horizon | | | Intermediate/Long
Horizon | |
Investment advisory fees | | $ | 19 | | | $ | 47 | | | $ | 60 | |
| | | | | | | | | | | | |
| | | |
Net investment loss | | | (19 | ) | | | (47 | ) | | | (60 | ) |
| | | | | | | | | | | | |
| | | |
Net realized and unrealized gain (loss) on investments in affiliates: | | | | | | | | | | | | |
Realized gain from investments in affiliated investment companies | | | 315 | | | | 994 | | | | 541 | |
Change in net unrealized appreciation (depreciation) on investments in affiliated investment companies | | | 80 | | | | (836 | ) | | | (909 | ) |
| | | | | | | | | | | | |
Net realized and unrealized gain (loss) on investments in affiliated investment companies | | | 395 | | | | 158 | | | | (368 | ) |
| | | | | | | | | | | | |
Net increase (decrease) In net assets resulting from operations | | $ | 376 | | | $ | 111 | | | $ | (428 | ) |
| | | | | | | | | | | | |
The notes to the financial statements are an integral part of this report.
Transamerica Asset Allocation Variable Funds | Annual Report 2011 |
Page 7
STATEMENTS OF CHANGES IN NET ASSETS
For the years ended:
(all amounts in thousands)
| | | | | | | | | | | | | | | | | | | | | | | | |
| | | Short Horizon | | | Intermediate Horizon | | | Intermediate/Long Horizon | |
| | | Year Ended
December 31,
2011 | | | Year Ended
December 31,
2010 | | | Year Ended
December 31,
2011 | | | Year Ended
December 31,
2010 | | | Year Ended
December 31,
2011 | | | Year Ended
December 31,
2010 | |
From operations: | | | | | | | | | | | | | | | | | | | | | | | | |
Net investment loss | | $ | (19 | ) | | $ | (19 | ) | | $ | (47 | ) | | $ | (47 | ) | | $ | (60 | ) | | $ | (58 | ) |
Net realized gain on investments in affiliated investment companies | | | 315 | | | | 217 | | | | 994 | | | | 411 | | | | 541 | | | | 236 | |
Change in net unrealized appreciation (depreciation) on investments in affiliated investment companies | | | 80 | | | | 508 | | | | (836 | ) | | | 2,219 | | | | (909 | ) | | | 3,697 | |
| | | | | | | | | | | | | | | | | | | | | | | | |
Net increase (decrease) in net assets resulting from operations | | | 376 | | | | 706 | | | | 111 | | | | 2,583 | | | | (428 | ) | | | 3,875 | |
| | | | | | | | | | | | | | | | | | | | | | | | |
| | | | | | |
From unit transactions: | | | | | | | | | | | | | | | | | | | | | | | | |
Units sold | | | 1,591 | | | | 2,071 | | | | 3,096 | | | | 3,088 | | | | 3,376 | | | | 3,680 | |
Units redeemed | | | (2,691 | ) | | | (3,281 | ) | | | (5,788 | ) | | | (5,786 | ) | | | (5,936 | ) | | | (7,042 | ) |
| | | | | | | | | | | | | | | | | | | | | | | | |
Net decrease in net assets resulting from unit transactions | | | (1,100 | ) | | | (1,210 | ) | | | (2,692 | ) | | | (2,698 | ) | | | (2,560 | ) | | | (3,362 | ) |
| | | | | | | | | | | | | | | | | | | | | | | | |
Total increase (decrease) in net assets | | | (724 | ) | | | (504 | ) | | | (2,581 | ) | | | (115 | ) | | | (2,988 | ) | | | 513 | |
| | | | | | | | | | | | | | | | | | | | | | | | |
Net assets: | | | | | | | | | | | | | | | | | | | | | | | | |
Beginning of year | | | 9,608 | | | | 10,112 | | | | 24,180 | | | | 24,295 | | | | 30,991 | | | | 30,478 | |
| | | | | | | | | | | | | | | | | | | | | | | | |
End of year | | $ | 8,884 | | | $ | 9,608 | | | $ | 21,599 | | | $ | 24,180 | | | $ | 28,003 | | | $ | 30,991 | |
| | | | | | | | | | | | | | | | | | | | | | | | |
Undistributed net investment income | | $ | (222 | ) | | $ | (203 | ) | | $ | (627 | ) | | $ | (580 | ) | | $ | (870 | ) | | $ | (810 | ) |
| | | | | | | | | | | | | | | | | | | | | | | | |
| | | | | | |
Units outstanding beginning of year | | | 527 | | | | 597 | | | | 1,334 | | | | 1,498 | | | | 1,722 | | | | 1,932 | |
Units sold | | | 85 | | | | 117 | | | | 169 | | | | 184 | | | | 187 | | | | 226 | |
Units redeemed | | | (144 | ) | | | (187 | ) | | | (314 | ) | | | (348 | ) | | | (326 | ) | | | (436 | ) |
| | | | | | | | | | | | | | | | | | | | | | | | |
Units outstanding end of year | | | 468 | | | | 527 | | | | 1,189 | | | | 1,334 | | | | 1,583 | | | | 1,722 | |
| | | | | | | | | | | | | | | | | | | | | | | | |
The notes to the financial statements are an integral part of this report.
Transamerica Asset Allocation Variable Funds | Annual Report 2011 |
Page 8
FINANCIAL HIGHLIGHTS
For the years ended:
| | | | | | | | | | | | | | | | | | | | |
| | | Short Horizon | |
For a unit outstanding throughout each period | | December 31,
2011 | | | December 31,
2010 | | | December 31,
2009 | | | December 31,
2008 | | | December 31,
2007 | |
Unit value | | | | | | | | | | | | | | | | | | | | |
Beginning of year | | $ | 18.24 | | | $ | 16.95 | | | $ | 14.66 | | | $ | 16.28 | | | $ | 15.59 | |
| | | | | | | | | | | | | | | | | | | | |
| | | | | |
Investment operations | | | | | | | | | | | | | | | | | | | | |
From net investment (loss)(A) | | | (0.04 | ) | | | (0.04 | ) | | | (0.03 | ) | | | (0.03 | ) | | | (0.03 | ) |
From net realized and unrealized gains (loss) on investments in affiliated investment companies | | | 0.79 | | | | 1.33 | | | | 2.32 | | | | (1.59 | ) | | | 0.72 | |
| | | | | | | | | | | | | | | | | | | | |
Total from investment operations | | | 0.75 | | | | 1.29 | | | | 2.29 | | | | (1.62 | ) | | | 0.69 | |
| | | | | | | | | | | | | | | | | | | | |
| | | | | |
Unit value | | | | | | | | | | | | | | | | | | | | |
End of year | | $ | 18.99 | | | $ | 18.24 | | | $ | 16.95 | | | $ | 14.66 | | | $ | 16.28 | |
| | | | | | | | | | | | | | | | | | | | |
| | | | | |
Total return | | | 4.07 | % | | | 7.65 | % | | | 15.62 | % | | | (9.95 | %) | | | 4.43 | % |
| | | | | | | | | | | | | | | | | | | | |
| | | | | |
Net assets End of Year (000’s) | | $ | 8,884 | | | $ | 9,608 | | | $ | 10,112 | | | $ | 9,450 | | | $ | 11,097 | |
| | | | | | | | | | | | | | | | | | | | |
Ratio and supplemental data | | | | | | | | | | | | | | | | | | | | |
Expenses to average net assets(B) | | | 0.20 | % | | | 0.20 | % | | | 0.20 | % | | | 0.20 | % | | | 0.20 | % |
Net investment (loss), to average net assets | | | (0.20 | %) | | | (0.20 | %) | | | (0.20 | %) | | | (0.20 | %) | | | (0.20 | %) |
Portfolio turnover rate(C) | | | 46 | % | | | 36 | % | | | 28 | % | | | 125 | % | | | 55 | % |
| |
| | | Intermediate Horizon | |
For a unit outstanding throughout each period | | December 31,
2011 | | | December 31,
2010 | | | December 31,
2009 | | | December 31,
2008 | | | December 31,
2007 | |
Unit value | | | | | | | | | | | | | | | | | | | | |
Beginning of year | | $ | 18.13 | | | $ | 16.22 | | | $ | 13.46 | | | $ | 18.16 | | | $ | 17.44 | |
| | | | | | | | | | | | | | | | | | | | |
| | | | | |
Investment operations | | | | | | | | | | | | | | | | | | | | |
From net investment (loss)(A) | | | (0.04 | ) | | | (0.03 | ) | | | (0.03 | ) | | | (0.03 | ) | | | (0.04 | ) |
From net realized and unrealized gains (loss) on investments in affiliated investment companies | | | 0.08 | | | | 1.94 | | | | 2.79 | | | | (4.67 | ) | | | 0.76 | |
| | | | | | | | | | | | | | | | | | | | |
Total from investment operations | | | 0.04 | | | | 1.91 | | | | 2.76 | | | | (4.70 | ) | | | 0.72 | |
| | | | | | | | | | | | | | | | | | | | |
| | | | | |
Unit value | | | | | | | | | | | | | | | | | | | | |
End of year | | $ | 18.17 | | | $ | 18.13 | | | $ | 16.22 | | | $ | 13.46 | | | $ | 18.16 | |
| | | | | | | | | | | | | | | | | | | | |
| | | | | |
Total return | | | 0.19 | % | | | 11.81 | % | | | 20.51 | % | | | (25.88 | %) | | | 4.13 | % |
| | | | | | | | | | | | | | | | | | | | |
| | | | | |
Net assets End of Year (000’s) | | $ | 21,599 | | | $ | 24,180 | | | $ | 24,295 | | | $ | 21,990 | | | $ | 32,583 | |
| | | | | | | | | | | | | | | | | | | | |
Ratio and supplemental data | | | | | | | | | | | | | | | | | | | | |
Expenses to average net assets(B) | | | 0.20 | % | | | 0.20 | % | | | 0.20 | % | | | 0.20 | % | | | 0.20 | % |
Net investment (loss), to average net assets | | | (0.20 | %) | | | (0.20 | %) | | | (0.20 | %) | | | (0.20 | %) | | | (0.20 | %) |
Portfolio turnover rate(C) | | | 42 | % | | | 25 | % | | | 34 | % | | | 111 | % | | | 18 | % |
The notes to the financial statements are an integral part of this report.
Transamerica Asset Allocation Variable Funds | Annual Report 2011 |
Page 9
FINANCIAL HIGHLIGHTS (continued)
For the years ended:
| | | | | | | | | | | | | | | | | | | | |
| | | Intermediate/Long Horizon | |
For a unit outstanding throughout each period | | December 31,
2011 | | | December 31,
2010 | | | December 31,
2009 | | | December 31,
2008 | | | December 31,
2007 | |
Unit value | | | | | | | | | | | | | | | | | | | | |
Beginning of year | | $ | 17.99 | | | $ | 15.78 | | | $ | 12.89 | | | $ | 19.30 | | | $ | 18.56 | |
| | | | | | | | | | | | | | | | | | | | |
| | | | | |
Investment operations | | | | | | | | | | | | | | | | | | | | |
From net investment (loss)(A) | | | (0.04 | ) | | | (0.03 | ) | | | (0.03 | ) | | | (0.03 | ) | | | (0.04 | ) |
From net realized and unrealized gains (loss) on investments in affiliated investment companies | | | (0.25 | ) | | | 2.24 | | | | 2.92 | | | | (6.38 | ) | | | 0.78 | |
| | | | | | | | | | | | | | | | | | | | |
Total from investment operations | | | (0.29 | ) | | | 2.21 | | | | 2.89 | | | | (6.41 | ) | | | 0.74 | |
| | | | | | | | | | | | | | | | | | | | |
| | | | | |
Unit value | | | | | | | | | | | | | | | | | | | | |
End of year | | $ | 17.70 | | | $ | 17.99 | | | $ | 15.78 | | | $ | 12.89 | | | $ | 19.30 | |
| | | | | | | | | | | | | | | | | | | | |
| | | | | |
Total return | | | (1.66 | %) | | | 14.05 | % | | | 22.42 | % | | | (33.21 | %) | | | 3.99 | % |
| | | | | | | | | | | | | | | | | | | | |
| | | | | |
Net assets End of Year (000’s) | | $ | 28,003 | | | $ | 30,991 | | | $ | 30,478 | | | $ | 33,453 | | | $ | 52,704 | |
| | | | | | | | | | | | | | | | | | | | |
Ratio and supplemental data | | | | | | | | | | | | | | | | | | | | |
Expenses to average net assets(B) | | | 0.20 | % | | | 0.20 | % | | | 0.20 | % | | | 0.20 | % | | | 0.20 | % |
Net investment (loss), to average net assets | | | (0.20 | %) | | | (0.20 | %) | | | (0.20 | %) | | | (0.20 | %) | | | (0.20 | %) |
Portfolio turnover rate(C) | | | 34 | % | | | 23 | % | | | 54 | % | | | 105 | % | | | 21 | % |
| (A) | Calculation is based on average number of units outstanding. |
| (B) | Ratios exclude expenses incurred by the underlying affiliated investment companies in which the Subaccounts invest. |
| (C) | Does not include the Portfolio activity of the underlying affiliated investment companies. |
| Note: | Prior to January 1, 2010, the financial highlights were audited by another independent registered public accounting firm. |
The notes to the financial statements are an integral part of this report.
Transamerica Asset Allocation Variable Funds | Annual Report 2011 |
Page 10
NOTES TO FINANCIAL STATEMENTS
At December 31, 2011
(all amounts in thousands)
NOTE 1. ORGANIZATION AND SIGNIFICANT ACCOUNTING POLICIES
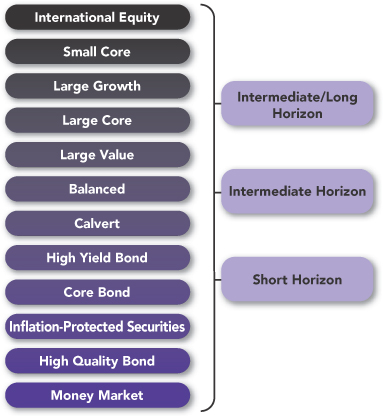
Transamerica Asset Allocation Variable Funds (the “Separate Account”), is a non-diversified separate account of Transamerica Financial Life Insurance Company (“TFLIC”), and is registered under the Investment Company Act of 1940, as amended (the “1940 Act”), as a management investment company. The Separate Account is composed of three different subaccounts that are separate investment funds: Transamerica Asset Allocation – Short Horizon Subaccount (“Short Horizon”), Transamerica Asset Allocation – Intermediate Horizon Subaccount (“Intermediate Horizon”), and Transamerica Asset Allocation – Intermediate/Long Horizon Subaccount (“Intermediate/Long Horizon”) (individually, a “Subaccount” and collectively, the “Subaccounts”). Each Subaccount invests all of its investable assets among certain Transamerica Partners Variable Funds (“TPVF”). Certain TPVF subaccounts invest all their investable assets in the Transamerica Partners Portfolios.
This report should be read in conjunction with the Subaccounts’ current prospectus, which contains more complete information about the Subaccounts, including investment objectives and strategies.
In the normal course of business, the Separate Account enters into contracts that contain a variety of representations that provide general indemnifications. The Separate Account’s maximum exposure under these arrangements is unknown, as this would involve future claims that may be made against the Separate Account and/or its affiliates that have not yet occurred. However, based on experience, the Separate Account expects the risk of loss to be remote.
In preparing the Separate Account’s financial statements in accordance with accounting principles generally accepted in the United States of America (“GAAP”), estimates or assumptions may be used that affect reported amounts and disclosures. Actual results could differ from those estimates. The following is a summary of significant accounting policies followed by the Separate Account.
Operating expenses: The Separate Account accounts separately for the assets, liabilities, and operations of each Subaccount. Each Subaccount will indirectly bear its share of fees and expenses incurred by TPVF in which it invests. These expenses are not reflected in the expenses in the Statements of Operations and are not included in the ratios to average net assets shown in the Financial Highlights.
Security transactions: Security transactions are recorded on the trade date (the date the order to buy or sell is executed). Net realized gain (loss) from investments in affiliates for the Subaccounts are from investments in units of affiliated investment companies.
NOTE 2. SECURITY VALUATIONS
All investments in securities are recorded at their estimated fair value. The value of each Subaccount’s investment in a corresponding subaccount of TPVF is valued at the unit value per share of each Subaccount determined as of the close of business of the New York Stock Exchange (“NYSE”), normally, 4:00 P.M. Eastern time, each day the NYSE is open for business. The Subaccount utilizes various methods to measure the fair value of its investments on a recurring basis. GAAP establishes a hierarchy that prioritizes inputs to valuation methods. The inputs or methodology used for valuing securities are not necessarily an indication of the risk associated with investing in those securities. The three Levels of inputs of the fair value hierarchy are defined as follows:
Level 1—Unadjusted quoted prices in active markets for identical securities.
Level 2—Inputs, other than quoted prices included in Level 1, that are observable, either directly or indirectly. These inputs may include quoted prices for the identical instrument on an inactive market, prices for similar instruments, interest rates, prepayment speeds, credit risk, yield curves, default rates, and similar data.
Level 3—Unobservable inputs, which may include Transamerica Asset Management, Inc.’s (“TAM”) Valuation Committee’s own assumptions in determining the fair value of investments. Factors considered in making this determination may include, but are not limited to, information obtained by contacting the sub-advisor, issuer, analysts, or the appropriate stock exchange (for exchange-traded securities), analysis of the issuer’s financial statements or other available documents and, if necessary, available information concerning other securities in similar circumstances.
The availability of observable inputs can vary from security to security and is affected by a wide variety of factors, including, but not limited to, the type of security, whether the security is new and not yet established in the marketplace, the liquidity of markets, and other characteristics particular to the security. To the extent that valuation is based on models or inputs that are less observable or unobservable in the market, the determination of fair value requires more judgment. Accordingly, the degree of judgment exercised in determining fair value is generally greatest for instruments categorized in Level 3.
The inputs used to measure fair value may fall into different Levels of the fair value hierarchy. In such cases, for disclosure purposes, the Level in the fair value hierarchy that is assigned to the fair value measurement of a security is determined based on the lowest Level input that is significant to the fair value measurement in its entirety.
Transamerica Asset Allocation Variable Funds | Annual Report 2011 |
Page 11
NOTES TO FINANCIAL STATEMENTS (continued)
At December 31, 2011
(all amounts in thousands)
NOTE 2. (continued)
Fair value measurements: Investment company securities are valued at the net asset value of the underlying subaccounts. These securities are actively traded and no valuation adjustments are applied. They are categorized in Level 1 of the fair value hierarchy.
The hierarchy classification of inputs used to value the Subaccounts’ investments at December 31, 2011 are disclosed in the Valuation Summary of each of the Subaccounts’ Schedule of Investments. Transfers between Levels are considered to have occurred at the end of the reporting period.
There were no transfers into or out of any Levels as described above during the year ended December 31, 2011.
NOTE 3. RELATED PARTY TRANSACTIONS
The Separate Account has entered into an Investment Advisory Agreement with TAM. TAM is directly owned by Western Reserve Life Assurance Co. of Ohio and AUSA Holding Company (“AUSA”), both of which are indirect, wholly-owned subsidiaries of AEGON NV. AUSA is wholly-owned by AEGON USA, LLC (“AEGON USA”), a financial services holding company whose primary emphasis is on life and health insurance, and annuity and investment products. AEGON USA is owned by AEGON US Holding Corporation, which is owned by Transamerica Corporation (DE). Transamerica Corporation (DE) is owned by The AEGON Trust, which is owned by AEGON International B.V., which is owned by AEGON NV, a Netherlands corporation, and a publicly traded international insurance group.
Pursuant to the Investment Advisory Agreement TAM provides general investment advice to each Subaccount. For providing these services and facilities and for bearing the related expenses, TAM receives a monthly fee from each Subaccount which is accrued daily and payable monthly at an annual rate equal to 0.20% of the average daily net assets of each Subaccount.
TFLIC is the legal holder of the assets in the Subaccounts and will at all times maintain assets in the Subaccounts with a total market value of at least equal to the contract liabilities for the Subaccounts.
Certain Managing Board Members and officers of TFLIC are also trustees, officers or employees of TAM or its affiliates. None of the non-independent Managing Board Members so affiliated receive compensation for services as Managing Board Members of the Separate Account. Similarly, none of the Separate Account’s officers receive compensation from the Subaccounts. The independent board members are also trustees of the Transamerica Partners Portfolios for which they receive fees.
Deferred compensation plan: Under a non-qualified deferred compensation plan, effective January 1, 1996, as amended and restated (the “Deferred Compensation Plan”), available to the Trustees, compensation may be deferred that would otherwise be payable by the Trust to an Independent Trustee on a current basis for services rendered as Trustee. Deferred compensation amounts will accumulate based on investment options under Transamerica Partners Institutional Funds and Transamerica Institutional Asset Allocation Funds, or the value of Class A (or comparable) shares of a series of Transamerica Funds (without imposition of sales charge), as elected by the Trustee.
NOTE 4. SECURITIES TRANSACTIONS
The cost of affiliated investments purchased and proceeds from affiliated investments sold for the year ended December 31, 2011 were as follows:
| | | | | | | | | | | | | | | | |
| | | Purchases of affiliated investments: | | | Proceeds from maturities and sales
affiliated investments: | |
Fund | | Long-term | | | U.S. Government | | | Long-term | | | U.S. Government | |
Short Horizon | | $ | 4,282 | | | $ | — | | | $ | 5,400 | | | $ | — | |
Intermediate Horizon | | | 9,819 | | | | — | | | | 12,558 | | | | — | |
Intermediate/Long Horizon | | | 10,249 | | | | — | | | | 12,869 | | | | — | |
NOTE 5. FEDERAL INCOME TAXES
The operations of the Separate Account form a part of, and are taxed with, the operations of TFLIC, a wholly-owned subsidiary of AEGON USA. TFLIC does not expect, based upon current tax law, to incur any income tax upon the earnings or realized capital gains attributable to the Separate Account. Based upon this expectation, no charges are currently being deducted from the Separate Account for federal income tax purposes. Management has evaluated the Separate Account’s tax positions taken for all open tax years (2008-2010), or expected to be taken in the Separate Account’s 2011 tax returns. Each subaccount is not aware of any tax positions for which it is reasonably possible that the total amounts of unrecognized tax benefits will change materially in the next twelve months
Transamerica Asset Allocation Variable Funds | Annual Report 2011 |
Page 12
NOTES TO FINANCIAL STATEMENTS (continued)
At December 31, 2011
(all amounts in thousands)
NOTE 6. ACCOUNTING PRONOUNCEMENTS
In May 2011, the Financial Accounting Standards Board (“FASB”) issued the authoritative guidance “Amendments to Achieve Common Fair Value Measurement and Disclosure Requirements in U.S. GAAP and IFRSs” which seeks to establish common requirements for measuring fair value and for disclosing information about fair value measurements in accordance with GAAP. The adoption of this disclosure requirement is effective for financial statements interim and annual periods beginning after December 15, 2011. Management is currently evaluating the application of the adoption of the additional disclosure requirements and its impact on the Subaccounts’ financial statements.
In April 2011, FASB issued an amendment to authoritative guidance “Reconsideration of Effective Control for Repurchase Agreements” which amends specifically the criteria required to determine whether a repurchase agreement and similar agreements should be accounted for as sales of financial assets or secured borrowings with commitments. The adoption of this guidance is effective for the first interim or annual period beginning on or after December 15, 2011 prospectively to transactions or modifications of existing transactions that occur on or after the effective date. Management is currently evaluating the application of the adoption of the additional disclosure requirements and its impact on the Subaccounts’ financial statements.
NOTE 7. SUBSEQUENT EVENT
Management has evaluated subsequent events through the date of issuance of the financial statements, and determined that no other material events or transactions would require recognition or disclosure in the Subaccounts’ financial statements.
Transamerica Asset Allocation Variable Funds | Annual Report 2011 |
Page 13
Report of Independent Registered Public Accounting Firm
To the Board of Directors of Transamerica Financial Life Insurance Company and the Contractholders of Transamerica Asset Allocation Variable Funds:
We have audited the accompanying statements of assets and liabilities, including the schedules of investments, of Transamerica Asset Allocation Variable Funds (comprising, respectively, Transamerica Asset Allocation—Short Horizon Subaccount, Transamerica Asset Allocation—Intermediate Horizon Subaccount and Transamerica Asset Allocation—Intermediate/Long Horizon Subaccount) (collectively, the “Subaccounts”) as of December 31, 2011, and the related statements of operations for the year then ended and the statements of changes in net assets and the financial highlights for each of the two years in the period then ended. These financial statements and financial highlights are the responsibility of the Subaccounts�� management. Our responsibility is to express an opinion on these financial statements and financial highlights based on our audits. The financial highlights for periods ended prior to January 1, 2010 were audited by another independent registered public accounting firm whose report, dated March 1, 2010, expressed an unqualified opinion on those financial highlights.
We conducted our audits in accordance with the standards of the Public Company Accounting Oversight Board (United States). Those standards require that we plan and perform the audits to obtain reasonable assurance about whether the financial statements and financial highlights are free of material misstatement. We were not engaged to perform an audit of the Subaccounts’ internal control over financial reporting. Our audits included consideration of internal control over financial reporting as a basis for designing audit procedures that are appropriate in the circumstances, but not for the purpose of expressing an opinion on the effectiveness of the Subaccounts’ internal control over financial reporting. Accordingly, we express no such opinion. An audit also includes examining, on a test basis, evidence supporting the amounts and disclosures in the financial statements and financial highlights, assessing the accounting principles used and significant estimates made by management, and evaluating the overall financial statement presentation. Our procedures included confirmation of securities owned as of December 31, 2011, by correspondence with the transfer agent and others or by other appropriate auditing procedures where replies from others were not received. We believe that our audits provide a reasonable basis for our opinion.
In our opinion, the financial statements and financial highlights referred to above present fairly, in all material respects, the financial position of each of the respective Subaccounts constituting Transamerica Asset Allocation Variable Funds at December 31, 2011, and the results of their operations for the year then ended and the changes in their net assets and the financial highlights for each of the two years in the period then ended, in conformity with U.S. generally accepted accounting principles.

Boston, Massachusetts
February 27, 2012
Transamerica Asset Allocation Variable Funds | Annual Report 2011 |
Page 14
BOARD MEMBERS AND OFFICERS
(unaudited)
The Board Members and executive officers of the Trust are listed below. The Board governs each fund and is responsible for protecting the interests of the shareholders. The Board Members are experienced executives who meet periodically throughout the year to oversee the business affairs of each fund and the operation of the Trust by its officers. The Board also reviews the management of each fund’s assets by the investment adviser and its respective sub-adviser. The funds are among the funds advised and sponsored by TAM (collectively, “Transamerica Asset Management Group”). Transamerica Asset Management Group (“TAMG”) consists of Transamerica Funds, Transamerica Series Trust (“TST”), Transamerica Income Shares, Inc. (“TIS”), Transamerica Partners Funds Group (“TPFG”), Transamerica Partners Funds Group II (“TPFG II”), Transamerica Partners Portfolios (“TPP”), and Transamerica Asset Allocation Variable Funds (“TAAVF”) and consists of 159 funds as of the date of this report.
The mailing address of each Board Member is c/o Secretary, 570 Carillon Parkway, St. Petersburg, Florida 33716. The Board Members, their year of birth, their positions with the Trust, and their principal occupations for the past five years (their titles may have varied during that period), the number of funds in TAMG the Board oversees, and other board memberships they hold are set forth in the table below.
| | | | | | | | | | |
Name and Year
of Birth | | Position(s) Held
with Trust | | Term of
Office and
Length of
Time Served* | | Principal Occupation(s) During Past 5 Years | | Number of
Funds in
Complex
Overseen
by Board
Member | | Other
Directorships |
INTERESTED BOARD MEMBER** | | | | | | |
| | | | | |
John K. Carter (1961) | | Chairman, Board Member, President, and Chief Executive Officer | | Since 2007 | | Chairman, Board Member, President and Chief Executive Officer, TPP, TPFG, TPFG II and TAAVF (2007 – present); | | 159 | | N/A |
| | | | | Chairman (2007 – present), Board Member (2006 – present), President and Chief Executive Officer (2006 – present), Senior Vice President (1999 – 2006), Chief Compliance Officer, General Counsel and Secretary (1999 – 2006), Transamerica Funds and TST; | | | | |
| | | | | |
| | | | | | Chairman (2007 – present), Board Member (2006 – present), President and Chief Executive Officer (2006 – present), Senior Vice President (2002 – 2006), General Counsel, Secretary and Chief Compliance Officer (2002 – 2006), TIS; | | | | |
| | | | | |
| | | | | | Chairman, President and Chief Executive Officer (2006 – present), Director (2002 – present), Senior Vice President (1999 – 2006), General Counsel and Secretary (2000 – 2006), Chief Compliance Officer (2004 – 2006), TAM; | | | | |
| | | | | |
| | | | | | Chairman, President and Chief Executive Officer (2006 – present), Senior Vice President (1999 – 2006), Director (2002 – present), General Counsel and Secretary (2001 – 2006), Transamerica Fund Services, Inc. (“TFS”); | | | | |
| | | | | |
| | | | | | Vice President, AFSG Securities Corporation (2001 – 2010); | | | | |
Transamerica Asset Allocation Variable Funds | Annual Report 2011 |
Page 15
| | | | | | | | | | |
Name and Year
of Birth | | Position(s) Held
with Trust | | Term of
Office and
Length of
Time Served* | | Principal Occupation(s) During Past 5 Years | | Number of
Funds in
Complex
Overseen
by Board
Member | | Other Directorships |
| | | | | | Chairman and Board Member (2008 – 2010), President (2007 – 2010), Chief Executive Officer (2006 – 2010), Vice President, Secretary and Chief Compliance Officer (2003 – 2006), Transamerica Investors, Inc. (“TII”); | | | | |
| | | | | |
| | | | | | Senior Vice President, General Counsel and Secretary, Transamerica Index Funds, Inc. (“TIF”) (2002 – 2004); and | | | | |
| | | | | |
| | | | | | Director, (2008 – present), Vice President, Transamerica Investment Services, Inc. (“TISI”) (2003 – 2005) and Transamerica Investment Management, LLC (“TIM”) (2001 – 2005). | | | | |
| | | | | |
Alan F. Warrick (1948) | | Interested Board Member | | Since 2012 | | Board Member, Transamerica Funds, TST, TIS, TPP, TPFG, TPFG II and TAAVF (January 2012 – present); | | 159 | | N/A |
| | | | | |
| | | | | | Consultant, AEGON USA (2010 – present); | | | | |
| | | | | |
| | | | | | Senior Advisor, Lovell Minnick Equity Partners
(2010 – present); | | | | |
| | | | | |
| | | | | | Retired (2010 – present); and | | | | |
| | | | | |
| | | | | | Managing Director for Strategic Business Development, AEGON USA (1994 – 2010). | | | | |
| | | |
INDEPENDENT BOARD MEMBERS*** | | | | | | |
| | | | | |
Sandra N. Bane (1952) | | Board Member | | Since 2008 | | Retired (1999 – present); Board Member, Transamerica Funds, TST, TIS, TPP, TPFG, TPFG II and TAAVF (2008 – present); Board Member, TII (2003 – 2010); and Partner, KPMG (1975 – 1999). | | 159 | | Big 5 Sporting Goods (2002 – present); AGL Resources, Inc. (energy services holding company) (2008 – present) |
| | | | | |
Leo J. Hill (1956) | | Lead Independent Board Member | | Since 2007 | | Principal, Advisor Network Solutions, LLC (business consulting) (2006 – present); Board Member, TST (2001 – present); Board Member, Transamerica Funds and TIS
(2002 – present); Board Member, TPP, TPFG, TPFG II and TAAVF (2007 – present); | | 159 | | N/A |
Transamerica Asset Allocation Variable Funds | Annual Report 2011 |
Page 16
| | | | | | | | | | |
Name and Year of
Birth | | Position(s) Held
with Trust | | Term of
Office and
Length of
Time Served* | | Principal Occupation(s) During
Past 5 Years | | Number of
Funds in
Complex
Overseen
by Board
Member | | Other
Directorships |
| | | | | |
| | | | | | Board Member, TII (2008 – 2010); | | | | |
| | | | | |
| | | | | | President, L. J. Hill & Company (a holding company for privately-held assets) (1999 – present); | | | | |
| | | | | |
| | | | | | Market President, Nations Bank of Sun Coast Florida (1998 – 1999); | | | | |
| | | | | |
| | | | | | Chairman, President and Chief Executive Officer, Barnett Banks of Treasure Coast Florida (1994 – 1998); | | | | |
| | | | | |
| | | | | | Executive Vice President and Senior Credit Officer, Barnett Banks of Jacksonville, Florida (1991 – 1994); and | | | | |
| | | | | |
| | | | | | Senior Vice President and Senior Loan Administration Officer, Wachovia Bank of Georgia (1976 – 1991). | | | | |
| | | | | |
David W. Jennings (1946) | | Board Member | | Since 2009 | | Board Member, Transamerica Funds, TST, TIS, TPP, TPFG, TPFG II and TAAVF (2009 – present); | | 159 | | N/A |
| | | | | |
| | | | | | Board Member, TII (2009 – 2010); | | | | |
| | | | | |
| | | | | | Managing Director, Hilton Capital (2010 – present); | | | | |
| | | | | |
| | | | | | Principal, Maxam Capital Management, LLC (2006 – 2008); and | | | | |
| | | | | |
| | | | | | Principal, Cobble Creek Management LP (2004 –2006). | | | | |
| | | | | |
Russell A. Kimball, Jr. (1944) | | Board Member | | Since 2007 | | General Manager, Sheraton Sand Key Resort (1975 – present); | | 159 | | N/A |
| | | | | |
| | | | | | Board Member, TST (1986 – present); | | | | |
| | | | | |
| | | | | | Board Member, Transamerica Funds, (1986 –1990), (2002 – present); | | | | |
| | | | | |
| | | | | | Board Member, TIS (2002 – present); | | | | |
| | | | | |
| | | | | | Board Member, TPP, TPFG, TPFG II and TAAVF (2007 – present); and | | | | |
| | | | | |
| | | | | | Board Member, TII (2008 – 2010). | | | | |
| | | | | |
Eugene M. Mannella (1954) | | Board Member | | Since 1993 | | Chief Executive Officer, HedgeServ Corporation (hedge fund administration) (2008 – present); | | 159 | | N/A |
| | | | | |
| | | | | | Self-employed consultant (2006 – present); | | | | |
Transamerica Asset Allocation Variable Funds | Annual Report 2011 |
Page 17
| | | | | | | | | | |
Name and Year of
Birth | | Position(s) Held
with Trust | | Term of
Office and
Length of
Time Served* | | Principal Occupation(s) During
Past 5 Years | | Number of
Funds in
Complex
Overseen
by Board
Member | | Other
Directorships |
| | | | | |
| | | | | | Managing Member and Chief Compliance Officer, HedgeServ Investment Services, LLC (limited purpose broker-dealer) (April 2011 – present); | | | | |
| | | | | |
| | | | | | President, ARAPAHO Partners LLC (limited purpose broker-dealer) (1998 – 2008); | | | | |
| | | | | |
| | | | | | Board Member, TPP, TPFG, TPFG II and TAAVF (1993 – present); | | | | |
| | | | | |
| | | | | | Board Member, Transamerica Funds, TST and TIS (2007 – present); | | | | |
| | | | | |
| | | | | | Board Member, TII (2008 – 2010); and | | | | |
| | | | | |
| | | | | | President, International Fund Services (alternative asset administration) (1993 – 2005). | | | | |
| | | | | |
Norman R. Nielsen, Ph.D. (1939) | | Board Member | | Since 2007 | | Retired (2005 – present); Board Member, Transamerica Funds, TST and TIS (2006 – present); Board Member, TPP, TPFG, TPFG II and TAAVF (2007 – present); Board Member, TII (2008 – 2010); | | 159 | | Buena Vista University Board of Trustees (2004 – present) |
| | | | | |
| | | | | | Director, Aspire Resources, Inc. (formerly, Iowa Student Loan Service Corporation) (2006 –present); | | | | |
| | | | | |
| | | | | | Director, League for Innovation in the Community Colleges (1985 – 2005); | | | | |
| | | | | |
| | | | | | Director, Iowa Health Systems (1994 – 2003); | | | | |
| | | | | |
| | | | | | Director, U.S. Bank (1985 – 2006); and | | | | |
| | | | | |
| | | | | | President, Kirkwood Community College (1985 – 2005). | | | | |
| | | | | |
Joyce G. Norden (1939) | | Board Member | | Since 1993 | | Retired (2004 – present); Board Member, TPFG, TPFG II and TAAVF (1993 – present); Board Member, TPP (2002 – present); Board Member, Transamerica Funds, TST and TIS (2007 – present); | | 159 | | Board of Governors, Reconstruction -ist Rabbinical College (2007 – present) |
| | | | | |
| | | | | | Board Member, TII (2008 – 2010); and | | | | |
Transamerica Asset Allocation Variable Funds | Annual Report 2011 |
Page 18
| | | | | | | | | | |
Name and Year of
Birth | | Position(s) Held
with Trust | | Term of
Office and
Length of
Time Served* | | Principal Occupation(s) During
Past 5 Years | | Number of
Funds in
Complex
Overseen
by Board
Member | | Other
Directorships |
| | | | | |
| | | | | | Vice President, Institutional Advancement, Reconstructionist Rabbinical College (1996 – 2004). | | | | |
| | | | | |
Patricia L. Sawyer (1950) | | Board Member | | Since 1993 | | Retired (2007 – present); President/Founder, Smith & Sawyer LLC (management consulting) (1989 – 2007); Board Member, Transamerica Funds, TST and TIS (2007 – present); Board Member, TII (2008 – 2010); Board Member, TPP, TPFG, TPFG II and TAAVF (1993 – present); | | 159 | | Honorary Trustee, Bryant University (1996 – present) |
| | | | | |
| | | | | | Trustee, Chair of Finance Committee and Chair of Nominating Committee (1987 – 1996), Bryant University; | | | | |
| | | | | |
| | | | | | Vice President, American Express (1987 – 1989); | | | | |
| | | | | |
| | | | | | Vice President, The Equitable (1986 – 1987); and | | | | |
| | | | | |
| | | | | | Strategy Consultant, Booz, Allen & Hamilton (1982 – 1986). | | | | |
| | | | | |
John W. Waechter (1952) | | Board Member | | Since 2007 | | Attorney, Englander and Fischer, LLP (2008 – present); Retired (2004 – 2008); Board Member, TST and TIS (2004 – present); Board Member, Transamerica Funds (2005 – present); Board Member, TPP, TPFG, TPFG II and TAAVF (2007 – present); Board Member, TII (2008 – 2010); Employee, RBC Dain Rauscher (securities dealer) (2004); Executive Vice President, Chief Financial Officer and Chief Compliance Officer, William R. Hough & Co. (securities dealer) (1979 – 2004); and Treasurer, The Hough Group of Funds (1993 – 2004). | | 159 | | Operation PAR, Inc. (2008 – present); West Central Florida Council – Boy Scouts of America (2008 – present) |
| * | Each Board Member shall hold office until: 1) his or her successor is elected and qualified or 2) he or she resigns, retires or his or her term as a Board Member is terminated in accordance with the Trust’s Declaration of Trust. |
| ** | May be deemed an “interested person” (as that term is defined in the 1940 Act) of the Trust because of his current or former service with TAM or an affiliate of TAM. |
| *** | Independent Board Member means a Board Member who is not an “interested person” (as defined under the 1940 Act) of the Trust. |
Transamerica Asset Allocation Variable Funds | Annual Report 2011 |
Page 19
OFFICERS
The mailing address of each officer is c/o Secretary, 570 Carillon Parkway, St. Petersburg, Florida 33716. The following table shows information about the officers, including their year of birth, their positions held with the Trust and their principal occupations during the past five years (their titles may have varied during that period). Each officer will hold office until his or her successor has been duly elected or appointed or until his or her earlier death, resignation or removal.
| | | | | | |
Name and Year of Birth | | Position | | Term of Office
and Length of
Time Served* | | Principal Occupation(s) or
Employment During Past 5 Years |
| | | |
John K. Carter (1961) | | Chairman, Board Member, President, and Chief Executive Officer | | Since 2007 | | See the table above. |
| | | |
Dennis P. Gallagher (1970) | | Vice President, General Counsel and Secretary | | Since 2007 | | Vice President, General Counsel and Secretary, Transamerica Funds, TST and TIS (2006 – present); |
| | | | | Vice President, General Counsel and Secretary, TPP, TPFG, TPFG II and TAAVF (2007 – present); |
| | | |
| | | | | | Vice President, General Counsel and Secretary, TII, (2006 – 2010); |
| | | |
| | | | | | Director, Senior Vice President, General Counsel, Operations and Secretary, TAM (2006 – present); |
| | | |
| | | | | | Director, Senior Vice President, General Counsel, Chief Administrative Officer and Secretary, TFS (2006 – present); |
| | | |
| | | | | | Assistant Vice President, TCI (2007 – present); |
| | | |
| | | | | | Director, Deutsche Asset Management (1998 – 2006); and |
| | | |
| | | | | | Corporate Associate, Ropes & Gray LLP (1995 – 1998). |
| | | |
Christopher A. Staples (1970) | | Vice President and Chief Investment Officer | | Since 2007 | | Vice President and Chief Investment Officer (2007 – present), Senior Vice President – Investment Management (2006 – 2007), Vice President – Investment Management (2005 – 2006), Transamerica Funds, TST and TIS; |
| | | |
| | | | | | Vice President and Chief Investment Officer, TPP, TPFG, TPFG II and TAAVF (2007 – present); |
| | | |
| | | | | | Vice President and Chief Investment Officer (2007 – 2010); Vice President – Investment Administration (2005 – 2007), TII; |
| | | |
| | | | | | Director (2005 – present), Senior Vice President – Investment Management (2006 – present) and Chief Investment Officer (2007 – present), TAM; |
| | | |
| | | | | | Director, TFS (2005 – present); and |
| | | |
| | | | | | Assistant Vice President, Raymond James & Associates (1999 – 2004). |
Transamerica Asset Allocation Variable Funds | Annual Report 2011 |
Page 20
| | | | | | |
Name and Year of Birth | | Position | | Term of Office
and Length of
Time Served* | | Principal Occupation(s) or
Employment During Past 5 Years |
Elizabeth Strouse (1974) | | Vice President, Treasurer and Principal Financial Officer | | Since 2010 | | Vice President, Treasurer and Principal Financial Officer (December 2011 –present), Assistant Treasurer (2010 – December 2011), Transamerica Funds, TST, TIS, TPP, TPFG, TPFG II and TAAVF; |
| | | | | Director, Fund Financial Services (2009 – present), TFS; |
| | | | | Director, Fund Administration, TIAA-CREF (2007 – 2009); and |
| | | |
| | | | | | Manager (2006 – 2007) and Senior (2003 – 2006) Accounting and Assurance, PricewaterhouseCoopers, LLC. |
| | | |
Robert S. Lamont, Jr. (1973) | | Vice President, Chief Compliance Officer and Conflicts of Interest Officer | | Since 2010 | | Vice President, Chief Compliance Officer and Conflicts of Interest Officer, Transamerica Funds, TST, TIS, TPP, TPFG, TPFG II and TAAVF (2010 – present); |
| | | | | Vice President and Senior Counsel, TAM and TFS (2007 – present); |
| | | | | Senior Counsel, United States Securities and Exchange Commission (2004 – 2007); and |
| | | |
| | | | | | Associate, Dechert, LLP (1999 – 2004). |
| | | |
Bradley O. Ackerman (1966) | | Deputy Chief Compliance Officer and Anti-Money Laundering Officer | | Since 2009 | | Deputy Chief Compliance Officer, Transamerica Funds, TST, TIS, TPP, TPFG, TPFG II and TAAVF (January 2012 – present); |
| | | | | Anti-Money Laundering Officer, TPP, TPFG, TPFG II and TAAVF (2009 – present); |
| | | | | Anti-Money Laundering Officer, Transamerica Funds, TST and TIS (2007 – present); |
| | | |
| | | | | | Senior Compliance Officer, TAM (2007 – present); and |
| | | |
| | | | | | Director, Institutional Services, Rydex Investments (2002 – 2007). |
| | | |
Sarah L. Bertrand (1967) | | Assistant Secretary | | Since 2009 | | Assistant Secretary, Transamerica Funds, TST, TIS, TPP, TPFG, TPFG II and TAAVF (2009 – present); |
| | | |
| | | | | | Assistant Secretary, TII (2009 – 2010); |
| | | |
| | | | | | Assistant Vice President and Director, Legal Administration, TAM and TFS (2007 – present); |
| | | |
| | | | | | Assistant Secretary and Chief Compliance Officer, 40|86 Series Trust and 40|86 Strategic Income Fund (2000 – 2007); and |
| | | |
| | | | | | Second Vice President and Assistant Secretary, Legal and Compliance, 40|86 Capital Management, Inc. (1994 – 2007). |
| | | |
Timothy J. Bresnahan (1968) | | Assistant Secretary | | Since 2009 | | Assistant Secretary, Transamerica Funds, TST, TIS, TPP, TPFG, TPFG II and TAAVF (2009 – present); |
| | | | | | Assistant Secretary, TII (2009 – 2010); |
| | | |
| | | | | | Counsel, TAM (2008 – present); |
Transamerica Asset Allocation Variable Funds | Annual Report 2011 |
Page 21
| | | | | | |
Name and Year of Birth | | Position | | Term of Office
and Length of
Time Served* | | Principal Occupation(s) or Employment During Past 5 Years |
| | | | | | Counsel (contract), Massachusetts Financial Services, Inc. (2007); |
| | | |
| | | | | | Assistant Counsel, BISYS Fund Services Ohio, Inc. (2005 – 2007); and |
| | | |
| | | | | | Associate, Greenberg Traurig, P.A. (2004 – 2005). |
| | | |
Margaret A. Cullem-Fiore (1957) | | Assistant Secretary | | Since 2010 | | Assistant Secretary, Transamerica Funds, TST, TIS, TPP, TPFG, TPFG II and TAAVF (2010 – present); Assistant Vice President, TCI (2009 – present); Vice President and Senior Counsel, TAM and TFS (2006 – present); Vice President and Senior Counsel, Transamerica Financial Advisors, Inc. (2004 – 2007); and Vice President and Senior Counsel, Western Reserve Life Assurance Co. of Ohio (2006). |
| * | Elected and serves at the pleasure of the Board of the Trust. |
If an officer has held offices for different funds for different periods of time, the earliest applicable date is shown. No officer of the Trust, except for the Chief Compliance Officer, receives any compensation from the Trust.
Additional information about the Funds’ Board Members can be found in the Statement of Additional Information, available, without charge, upon request, by calling toll free 1-888-233-4339 or on the Trust’s website at www.transamericainvestments.com
Transamerica Asset Allocation Variable Funds | Annual Report 2011 |
Page 22
Transamerica Partners Portfolios
I
(This page intentionally left blank)
MARKET ENVIRONMENT
While not without volatility, 2011 proved to be a very good environment for bond investors. Over the course of the year market participants were faced with an unprecedented downgrade of the U.S. credit rating, a political debate in Washington over raising the debt ceiling, and a European sovereign debt crisis. The result was longer term Treasuries generating a return of 29.9% according to Barclays Capital index data. The economic recovery continued to gain traction in the first few months of the year only to fade in response to a variety of negative headlines surrounding uncertainty in Washington, slower U.S. growth, and Europe’s debt woes. Increased volatility was also brought on as investors weighed the effects of unrest in the Middle East and the tsunami in Japan. In the U.S., economic data painted a slightly brighter picture with fourth quarter 2010 gross domestic product numbers being revised upward from 2.8% to 3.1%. This combined with continued employment momentum lead to positive excess returns. In the spring, this trend reversed with a series of negative data points related to job growth, housing prices and economic output. This coupled with uncertainty surrounding the Greek debt crisis and the political debate in Washington D.C. caused market participants to shed risk and seek the relative safety of U.S. Treasuries. Spreads on higher beta fixed income sectors moved broadly wider over the second quarter with the exception of asset-backed securities (“ABS”) and mortgage-backed securities (“MBS”). During the third quarter, Standard & Poor’s unprecedented downgrade of the U.S. sovereign credit rating and continued concern over Europe drove fixed income markets. Against this backdrop, interest rates fell and spreads widened. Despite this, most spread sectors exhibited positive total returns but lagged the performance of Treasuries. The last few months of the year were characterized by more positive domestic economic data led by jobless claims. This seemed to overshadow the lingering issues still entrenched in Europe. Spreads ground modestly tighter albeit on lower volumes as dealers closed up their books in anticipation of year end. Many strategists have begun to quietly speak of a “decoupling” from Europe but we don’t feel that the U.S. has completely overcome this concern.
PERFORMANCE
For the year ended December 31, 2011, Transamerica Partners High Quality Bond Portfolio (“Portfolio”) returned 2.16%. By comparison, its benchmark, the Bank of America Merrill Lynch U.S. Corporate & Government, 1-3 Years Index (“Index”), returned 1.56%.
STRATEGY REVIEW
The year 2011 has not been the story of economic recovery that many investors were predicting at the end of last year. Our overweight to certain spread sectors was rewarded as demand for high quality fixed income was strong as investors looked to shed risk and seek out alternatives to low-yielding money markets. The net result was that sector allocation was the largest contributor to performance for 2011 as Merganser’s overweight’s to ABS and commercial mortgage-backed securities (“CMBS”) drove the outperformance versus the index.
In the asset-backed sector, spreads tightened throughout the year due to strong investor appetite for high quality AAA rated paper. Heavy equipment holding CNH Equipment Trust posted a high single digit return as portions of the heavy equipment segment continue to see upgrades in subordinated tranches. Auto lease holding Avis Budge Rental Car Funding AESOP LLC also enjoyed strong performance as an off the run sector that saw spread tightening.
In the corporate sector, total returns for 2011 were positive as U.S. Treasury yields fell dramatically; however, excess returns versus the benchmark were negative due to dramatic spread widening. Throughout the year, financials were far and away the largest detractor from performance in the Portfolio from a sector allocation standpoint. Positions in Bank of America Corp. and American Express Credit Corp. both exhibited negative total returns for the year. This was slightly offset by our industrial corporate holdings in companies such as CVS Caremark Corp. and Airgas, Inc. Merganser’s selection of high quality investment grade securities consistently added to returns while minimizing credit risk.
CMBS was one of the few spread sectors to post positive excess return versus U.S. Treasuries in 2011. Consistent with all sectors in which we invest, Merganser’s focus in CMBS is in the highest quality tranches at the top of the capital structure. Our diligent stress testing and focus on the top tier tranches of the capital structure has allowed us to capture this spread tightening while avoiding potential troublesome pockets of the market. In particular, Wachovia Bank Commercial Mortgage Series 2007-C30 Class APB and Greenwich Capital Commercial Funding Corp. Series 2006-GG7 Class A2 were top performers in the sector for the Portfolio.
The Portfolio also benefited from its duration positioning throughout 2011. The Portfolio maintained an overweight in the 3-5 year band which benefited from Treasury curve flattening. Additionally, the Portfolio was able to pick up additional yield which contributed to total return.
Douglas A. Kelly, CFA
Peter S. Kaplan, CFA
Co-Portfolio Managers
Merganser Capital Management, Inc.
MARKET ENVIRONMENT
When the year opened, there was a widespread sense that the economic recovery that began in 2009 would persevere. While Europe’s debt problems were a significant issue, they appeared to be relatively well contained. It was only a few short months, however, before the world encountered a renewed recession scare sparked largely by deteriorating debt conditions in the Eurozone as well as some weaker-than-expected U.S. economic data. This Europe-induced fog of fear combined with political unrest in the Middle East and the rating downgrade of U.S. Treasury debt, resulted in a dramatic rally in U.S. Treasury Inflation-Protected Securities (TIPS) led by the front end of the yield curve. By the time the year drew to a close, positive forces reemerged as the U.S. economic growth picture had brightened and signs of progress regarding Europe’s debt crisis began to take hold.
PERFORMANCE
For the year ended December 31, 2011, Transamerica Partners Inflation-Protected Securities Portfolio (“Portfolio”) returned 12.33%. By comparison, its benchmark, the Barclays Capital U.S. TIPS Index, returned 13.56%.
STRATEGY REVIEW
For the year, the Portfolio maintained a real yield curve-flattening bias between the 10-year and 30-year points on the curve based on the view that improving economic data would pressure the intermediate portion of the curve to move higher. This positioning detracted from performance for a majority of the year as the real yield curve steepened due to a confluence of factors including: weakening U.S. economic data, political tensions in the Arab states, the U.S. Treasury debt rating downgrade, and escalating fears about the sovereign debt crisis in Europe. In addition, the Portfolio’s short duration compared to the benchmark index detracted from performance. Toward the end of the year, the Portfolio’s positioning was beneficial as U.S. economic data began to show signs of resilience and fears of a Eurozone collapse abated. Over the course of the year, the Portfolio actively traded exposure across the yield curve to take advantage of auctions and buybacks, including those under the Federal Reserve’s Operation “Twist” program. Our fundamental view continues to be that inflation expectations priced into the market make valuations more attractive on the long end of the real yield curve. The Portfolio ended the year with a shorter duration compared to the benchmark index as economic data in the U.S. has proven to be resilient in the near term.
The Portfolio uses interest rate derivative instruments, which may include futures contracts or options, mainly for the purpose of managing risks relating to portfolio duration and yield curve positioning. The Portfolio may also trade foreign currency exchange contracts or use foreign currency derivatives to manage currency risk in the Portfolio. During the period, derivatives had minimal impact on performance.
Martin Hegarty
Stuart Spodek
Brian Weinstein
Co-Portfolio Managers
BlackRock Financial Management, Inc.
MARKET ENVIRONMENT
When the year opened, there was a widespread sense that the economic recovery that began in 2009 would persevere. While Europe’s debt problems were a significant issue, they appeared to be relatively well contained. It was only a few short months, however, before the world encountered a renewed recession scare sparked largely by deteriorating debt conditions in the Eurozone as well as some weaker-than-expected U.S. economic data. This Europe-induced fog of fear was fueled further by political unrest in the Middle East and the rating downgrade of U.S. Treasury debt. By the time the year drew to a close, positive forces re-emerged as the U.S. economic growth picture had brightened and signs of progress regarding Europe’s debt crisis began to take hold.
PERFORMANCE
For the year ended December 31, 2011, Transamerica Partners Core Bond Portfolio (“Portfolio”) returned 6.20%. By comparison, its benchmark, the Barclays Capital U.S. Aggregate Bond Index, returned 7.84%.
STRATEGY REVIEW
For the 12-month period ending December 31, 2011, the Portfolio underperformed its benchmark, the Barclays Capital U.S. Aggregate Bond Index.
The Portfolio maintained a shorter duration bias (lower sensitivity to interest rates) relative to its benchmark index throughout most of the period. Although our duration and curve stance was beneficial during certain parts of the year, the overall impact on performance for the 12-month period was negative as interest rates declined to historically low levels in the latter half due to fears of a global slowdown and persistent sovereign debt problems in Europe. Throughout the 12-month period, the Portfolio was overweight relative to its benchmark index in non-government spread sectors (securities driven by movements in credit risk), and underweight in government-owned/government-related sectors. Spread sectors performed well in the first half of the year, and also toward year-end amid improving economic fundamentals and accommodative monetary policy. However, volatility dominated the markets for most of the year and caused periods in which investor sentiment switched to “risk off” mode, resulting in spread sectors dramatically underperforming U.S. Treasury securities. On balance, the Portfolio’s sector allocation had a negative impact on performance for the period as a whole. During the period, we increased the Portfolio’s quality profile and level of liquidity in an effort to limit volatility from exogenous factors, mostly emanating from Europe. We tactically managed investment grade credits, cautiously seeking to take advantage of relative value opportunities in industrials and financials. We slightly reduced the Portfolio’s exposure to non-agency residential mortgage-backed securities (“MBS”) and commercial mortgage-backed securities. To increase portfolio liquidity, we added to the Portfolio’s agency MBS and U.S. Treasury holdings during the latter half of the period. The Portfolio maintained an up-in-quality bias, which was a positive relative contributor to performance within risk sectors since lower quality securities struggled during periods of risk aversion. Also contributing positively to performance was security selection within securitized products, such as agency MBS and asset-backed securities. In addition, an out-of-index allocation to non-agency MBS helped performance early in the period. Finally, exposure to high-quality foreign agency debt was a positive factor for the Portfolio. Toward period end, the Portfolio adopted a somewhat more constructive stance on credit by reducing duration and adding to corporate credit in particular.
The Portfolio uses interest rate derivative instruments, which may include futures contracts or options, mainly for the purpose of managing risks relating to portfolio duration and yield curve positioning. The Portfolio may also trade foreign currency exchange contracts or use foreign currency derivatives to manage currency risk in the Portfolio. During the period, derivatives had minimal impact on performance.
Matthew Marra
Rick Rieder
Eric Pellicciaro
Bob Miller
Co-Portfolio Managers
BlackRock Financial Management, Inc.
MARKET ENVIRONMENT
The High Yield bond market started the 2011 year on a strong note with solid corporate fundamentals, low default risk, a record setting new issue calendar, and a healthy supply of mutual fund inflows. These were all contributing factors to above average returns in the first half of the year. The second half of the year; however, was a much different story. Macroeconomic issues such as the European debt crisis, slowed growth in the U.S. economy, the global impact from the natural disaster in Japan, and high oil prices all helped contribute to a volatile second half of 2011. Amidst the volatility, the market did end the year with a very strong October and a strong December leading to a yearly return of 4.38% according to the Bank of America Merrill Lynch High Yield Master II Index (“BofA Merrill Lynch High Yield Master II”). Throughout the course of the year spreads widened from 560 basis points to 743 basis points over U.S. Treasuries while the yield declined from 7.50% to 8.36% and the yield to maturity went from 7.85% to 8.65%.
Higher quality credits became increasingly attractive with market volatility plaguing investors for the majority of the year. The BB rated segment of the market saw the best performance among the rating classes, returning 6.11% for the year, followed by B rated bonds, which saw a 4.64% return. The CCC and below rated securities experienced a more difficult year with a loss of 1.40%. The standout sectors for the year were food and drug retail and cable/satellite television returning 14.53% and 10.09%, respectively, while the worst performing sector was printing and publishing, posting a loss of 6.02%. Though macro events were a primary driver of performance, companies on a micro level remained relatively solid throughout the year, leading to a 1.76% par-weighted default rate which is well below the 25 year historical average of 4.21% as measured by J.P. Morgan. The default rate is expected to remain well below its historical average for the next few years as liquidity in the market remains high.
PERFORMANCE
For the year ended December 31, 2011, Transamerica Partners High Yield Bond Portfolio (“Portfolio”) returned 4.93%. By comparison, its benchmark, the BofA Merrill Lynch High Yield Master II, returned 4.38%.
STRATEGY REVIEW
Performance was driven by credit selection along with issue selection within the company. Metals & Mining was the top contributor to the Portfolio as Quadra FNX Mining, Ltd. was acquired by KGHM Polska, resulting in a total return of 22.38% for the investment in Quadra FNX Mining, Ltd. The services sector was the second largest contributor to returns as RSC Equipment Rental, Inc./RSC Holdings III LLC was acquired by United Rentals North America, Inc., and the overall sector contributed 49 basis points to total return for the Portfolio. In addition, the Portfolio did not hold positions in Travelport or Sabre Holdings, which contributed to positive relative returns. Our negative view on homebuilders also contributed to positive relative returns. In addition, we continued to underweight financials and utilities which had a positive effect on relative returns of 45 basis points. Containers, healthcare, retail and leisure were factors in the Portfolio’s return for the year with Sealed Air Corp., HCA Holdings, Inc., Ltd. Brands, Inc. and the Reynolds Group Issuer, Inc. among the top performing names in the Portfolio. Our exposure to gaming and paper restrained relative performance by approximately 74 basis points. Holdings in Caesar’s Entertainment Operating Co., Inc. and Verso Paper Holdings LLC also detracted from the results. As the outlook for rising interest rates waned, we lengthened the duration of the Portfolio during the year by increasing exposure to BB rated securities. We continued to reduce our exposure to CCC rated bonds from 19.43% to 12.15% as the shorter maturities were refinanced and as the CCC segment of the market rallied early in the year.
We expect the Federal Reserve will remain committed to keeping interest rates low as the economy continues to grow at subpar levels. Healthy corporate fundamentals should result in a continued low default environment. Absent confidence about macroeconomic trends, particularly Europe’s ability to contain its debt crisis and the U.S.’s ability to break out of its slow growth pattern, we are likely to continue our conservative approach to the market as higher-rated credits are better positioned to weather economic stresses. Macro-driven events often create greater inefficiencies in the market, which plays to our value-based strategy of selecting credits through credit research. We think relative-value trading opportunities are likely to present themselves should systemic risk continue to serve as the major driver of market performance. As they do, we will look to take advantage of these opportunities across sectors, ratings tiers and credit.
Linda Carter, CFA
Michael W. Weilheimer, CFA
Co-Portfolio Managers
Eaton Vance Management
MARKET ENVIRONMENT
BlackRock Financial Management, Inc.
When the year opened, there was a widespread sense that the economic recovery that began in 2009 would persevere. While Europe’s debt problems were a significant issue, they appeared to be relatively well contained. It was only a few short months, however, before the world encountered a renewed recession scare sparked largely by deteriorating debt conditions in the Eurozone as well as some weaker-than-expected U.S. economic data. This Europe-induced fog of fear was fueled further by political unrest in the Middle East and the rating downgrade of U.S. Treasury debt. By the time the year drew to a close, positive forces reemerged as the US economic growth picture had brightened and signs of progress regarding Europe’s debt crisis began to take hold.
J.P. Morgan Investment Management Inc.
The year 2011 will be marked as one most equity investors are glad to see pass. Cultural revolutions, earthquakes and tsunamis, ratings downgrades of major economies, and extraordinary political events dominated the investment landscape. Volatility in the U.S. equity markets was at the highest levels since the 2008–2009 financial crisis. The Standard & Poor’s 500® Index (“S&P 500”) moved over 2% intraday nearly every other day during the second half of 2011. Such volatility only was surpassed three times since the year 2000.
The year started off strong with yet another quarter of solid results from U.S. companies, including a 10% year-over-year increase in revenue and the eighth-consecutive quarter of better-than-expected earnings. By the middle of the first quarter; however, investors were once again faced with rising uncertainty as various conflicts in the Middle East pushed oil prices higher followed by a devastating earthquake and subsequent tsunami in Japan. After these events, the S&P 500 sold off sharply and, by mid-March, was down almost 7% from its February peak.
Attention quickly shifted to Europe as the sovereign debt crisis intensified. At the end of June, a Greek default was narrowly averted when the parliament approved new austerity measures allowing bailout funds to be released. As contagion spread to core Europe, the European Central Bank (“ECB”) reluctantly initiated its Securities Markets Program in August by purchasing Italian and Spanish bonds in the secondary market. Meanwhile, the United States came extremely close to a default as politicians agreed at the last minute to raise the debt ceiling. Even so, Standard & Poor’s downgraded the U.S. sovereign rating from AAA to AA+. The Federal Reserve (“Fed”) announced that it would keep interest rates exceptionally low through mid-2013. Additionally, in September, the Fed introduced a new monetary easing policy termed “Operation Twist,” essentially a maturity extension program intended to put downward pressure on longer-term interest rates.
As concerns grew that the crisis might spread to larger European countries, many U.S. money market funds decreased lending activities with major French banks. In response to the increased stress in the interbank lending market, the ECB, in coordination with other leading central banks, agreed to provide increased U.S. dollar liquidity. Skepticism surrounding U.S. policy actions and the ongoing European crisis kept markets depressed. The third quarter was the toughest for U.S. equity markets as the S&P 500 declined 13.9% and was down 8.7% for the first nine months of the year.
However, a turn in sentiment led U.S. equity markets to rally sharply in the fourth quarter, allowing the S&P 500 to finish the year in positive territory. Investor confidence improved as economic data supported the fact that the U.S. is not headed towards a recession, and European policymakers took bolder actions in their efforts to stave off a sovereign debt crisis. Positive economic surprises in December included an upward move in the Institute for Supply Management Manufacturing Survey, a solid increase in the number of housing starts, and declines in initial jobless claims. There were also significant policy developments in Europe. The ECB took aggressive actions to support the banking system as it cut interest rates for the second time in as many months by 0.25% to 1.00%, reduced reserve requirements for European banks from 2.0% to 1.0%, and announced it would conduct two long-term refinancing operations (LTROs) with a maturity of 36 months and an option for banks to repay after one year.
PERFORMANCE
For the year ended December 31, 2011, Transamerica Partners Balanced Portfolio (“Portfolio”) returned 3.60%. By comparison, its primary and secondary benchmarks, the Barclays Capital U.S. Aggregate Bond Index and the S&P 500, returned 7.84% and 2.11%, respectively.
STRATEGY REVIEW
BlackRock Financial Management, Inc.
The Portfolio maintained a shorter duration bias (lower sensitivity to interest rates) relative to its benchmark index throughout most of the period. Although our duration and curve stance was beneficial during certain parts of the year, the overall impact on performance for the 12-month period was negative as interest rates declined to historically low levels in the latter half due to fears of a global slowdown and persistent sovereign debt problems in Europe. Throughout the 12-month period, the Portfolio was overweight relative to its benchmark index in non-government spread sectors (securities driven by movements in credit risk), and underweight in government-owned/government-related sectors. Spread sectors performed well in the first half of the year and toward year-end amid improving economic fundamentals and accommodative monetary policy. However, volatility dominated the markets for most of the year and caused periods in which investor sentiment switched to “risk off” mode, resulting in spread sectors dramatically underperforming U.S. Treasury securities. On balance, the Portfolio’s sector allocation had a negative impact on performance for the period as a whole. During the period, we increased the Portfolio’s quality profile and level of liquidity in an effort to limit volatility from exogenous factors, mostly emanating from Europe. We tactically managed investment grade credits, cautiously seeking to take advantage of relative value opportunities in industrials and financials. We slightly reduced the Portfolio’s exposure to non-agency residential mortgage-backed securities (“MBS”) and commercial mortgage-backed securities. To increase portfolio liquidity, we added to the Portfolio’s agency MBS and U.S. Treasury holdings during the latter half of the period. The Portfolio maintained an up-in-quality bias, which was a positive relative contributor to performance within risk sectors since lower quality securities struggled during periods of risk aversion. Also contributing positively to performance was security selection within securitized products such as agency MBS and asset-backed securities. In addition, an out-of-index allocation to non-agency MBS helped performance early in the period. Finally, exposure to high-quality foreign agency debt was a positive factor for the Portfolio. Toward period end, the Portfolio adopted a somewhat more constructive stance on credit by reducing duration and adding to corporate credit in particular.
STRATEGY REVIEW (continued)
J.P. Morgan Investment Management Inc.
The strategy underperformed its benchmark in 2011 as stock selection in consumer cyclical, utilities and basic materials sectors detracted from performance.
Within the telecommunications sector, Sprint Nextel Corp (“Sprint Nextel”). detracted from performance over the fourth quarter and year. Shares dropped earlier in the year after the company reported disappointing margins, driven by increased second-quarter expenses, including higher promotion costs. Additionally, Sprint Nextel announced a network rebuild plan that is expected to hurt margins moving forward. We have reduced our position in the company due to the uncertainty surrounding the release of the Apple iPhone and the expected negative impact of the new rebuild plan. Within the pharmaceutical and medical technology sector, a position in pharmaceutical company Dendreon detracted from performance for the year, having never recovered from the tumble in August. The company owns global rights to Provenge, a personalized vaccine for prostate cancer, which should be competitively positioned to increase penetration and benefit from long-term patent protection. However, shares fell after Dendreon missed second-quarter earnings and removed guidance, challenged by a slower-than-expected product adoption and lessened visibility into future revenue growth. With the lack of nearer-term catalyst given lackluster growth so far, we sold the position even though we believe in the differentiated offering and end demand. Within the basic materials sector, an overweight position in Alcoa, Inc. (“Alcoa”) detracted from returns over the quarter and year. Shares of the aluminum producer fell after the company reported weaker-than-expected earnings earlier in the year. Margins saw some pressure, as currency, electricity, oil, and material costs adversely impacted results, while growth in industrial, aerospace, and auto demand was limited. Despite disappointing results, we continue to believe that demand should increase in Alcoa’s core markets and abroad.
On the positive side, stock selection in the systems and network hardware, health services and systems, and energy sectors contributed to returns.
Within the media sector, CBS Corp. contributed to performance over the fourth quarter as well as the year. Throughout the year, the media giant saw strength in its advertising sales and pricing power. Additionally, CBS Corp. reported strong revenues across business segments, including international syndication and better costs. Moving forward, we have maintained an overweight position in CBS Corp. as the company is still attractively valued and has appealing long-term growth prospects. Within the pharmaceutical and medical technology sector, an overweight in Biogen Idec, Inc. was a top contributor to performance for the year. The company had solid earnings growth driven by revenue generation from its leading products, as well as encouraging clinical results of its new oral compound for multiple sclerosis. Given its strong biotechnology franchise with a promising product pipeline, we believe Biogen Idec, Inc. is one of the top names in the sector and, with focus on research and development, it is well positioned to differentiate itself from peers for market-share gain and long-term growth. Within the systems hardware sector, an overweight in Apple, Inc. performed well. Apple, Inc. demonstrated strong earnings driven by profitability in iPhones and iPads. Apple, Inc. has developed an ecosystem that that drives consumer taste and behavior and creates an effective barrier to entry. As the company looks attractively valued based on normalized earnings, we believe that it is strongly positioned, should continue to execute well and gain share in the rapidly growing mobility and tablet markets.
From a style perspective, we saw a reversal in a trend that has occurred over the past few years as larger stocks outperformed smaller stocks. The S&P 500 rose a modest 2.11%, outperforming the 4.18% loss for the Russell 2000® Index. Market leadership in 2011 was narrow as traditional valuation measures, with the exception of dividend yield, did not work. Of the major style categories, large-cap growth was the top performer as investors sought companies best positioned to maintain earnings growth in what is expected to be a below-trend growth environment. When looking at sectors within the S&P 500 Index, the utilities sector was clearly the standout, returning 19.9% and benefiting from investor appetite for dividends and greater earnings stability. The laggard in 2011 was the financials sector, losing, 17.1% as the group continued to wrestle with regulatory uncertainty, record-low interest rates and muted revenue growth.
The Portfolio uses interest rate derivative instruments, which may include futures contracts or options, mainly for the purpose of managing risks relating to portfolio duration and yield curve positioning. The Portfolio may also trade foreign currency exchange contracts or use foreign currency derivatives to manage currency risk in the Portfolio. During the period, derivatives had minimal impact on performance.
| | | | |
| Matthew Marra | | | | Raffaele Zingone, CFA |
| Rick Rieder | | | | Scott Blasdell, CFA |
| Eric Pellicciaro | | | | Terance Chen |
| | |
| Co-Portfolio Managers | | | | Co-Portfolio Managers |
| BlackRock Financial Management, Inc. | | | | J.P. Morgan Investment Management, Inc. |
Note: Russell Investment Group is the source and owner of the trademarks, service marks, and copyrights related to the Russell indexes. Russell® is a trademark of Russell Investment Group.
MARKET ENVIRONMENT
Despite unusual volatility, the market ended 2011 pretty much where it started, thanks to a rally at the end of the year. Global macro developments drove performance across markets all year long, especially in the second half of the year. Risk sensitivity played the central role in both intraday and day-to-day movement of broad market indices. Volatility climbed during the spring and stayed elevated through the year’s end. Correlation among, and within, asset classes rose to record levels, turning equity markets episodically into one-way bets. Markets rewarded low-risk, high-quality stocks with strong momentum, particularly during the middle two quarters.
PERFORMANCE
For the year ended December 31, 2011, Transamerica Partners Large Value Portfolio (“Portfolio”) returned 2.32%. By comparison, its primary and secondary benchmarks, the Russell 1000® Value Index and the Standard & Poor’s 500® Index, returned 0.39% and 2.11%, respectively.
STRATEGY REVIEW
The Portfolio invests in a broadly diversified selection of large-cap stocks using our disciplined investment approach. We are fully invested in U.S. equities, we avoid broad sector bets, and we take only modest industry-level and stock-specific bets. Our goal is to outperform the benchmark with incremental gains across many holdings. Using bottom-up stock selection, we evaluate companies relative to their industry peers using three broad categories of measures: value, management, and momentum. Value refers to the somewhat traditional ratios of price to fundamental value; management means we look for evidence that a company’s management team has and will continue to emphasize earning power; and momentum indicates when stocks might begin to rise toward full valuation. As we search for opportunities, we keep a sharp eye on minimizing transaction costs, helping us maximize profits in our stock-selection effort.
Over the course of the erratic year, our focus on holding companies with effective (and efficient) management, and avoiding the contrary, was critical to our success, notably in the technology sector. For example, not holding Hewlett-Packard, a company with poor long-term growth prospects relative to its peers, added to the bottom line. Avoiding companies with weak earnings momentum, such as Bank of America, Morgan Stanley, and Goldman Sachs, also contributed positively to relative return. Even the value component of our work, despite strong headwinds to value investing in general, benefitted the Portfolio, supporting our picks in the healthcare and energy sectors.
Although our stock selection worked well overall, it was less successful in the materials sector due to weakness in copper prices as holding Freeport-McMoRan Copper & Gold, Inc. detracted from the Portfolio. That said, given our diversification at the individual stock level and the benchmark’s relatively small allocation to this sector, the impact was minimal.
Theodore R. Aronson
Stefani Cranston
Gina Marie N. Moore
Martha E. Ortiz
R. Brian Wenzinger
Christopher J.W. Whitehead
Co-Portfolio Managers
Aronson Johnson Ortiz, LP
Note: Russell Investment Group is the source and owner of the trademarks, service marks, and copyrights related to the Russell indexes. Russell® is a trademark of Russell Investment Group.
MARKET ENVIRONMENT
Despite unusual volatility, the market ended 2011 pretty much where it started, thanks to a rally at the end of the year. Global macro developments drove performance across markets all year long, especially in the second half of the year. Risk sensitivity played the central role in both intraday and day-to-day movement of broad market indices. Volatility climbed during the spring and stayed elevated through the year’s end. Correlation among, and within, asset classes rose to record levels, turning equity markets episodically into one-way bets. Markets rewarded low-risk, high-quality stocks with strong momentum, particularly during the middle two quarters.
PERFORMANCE
For the year ended December 31, 2011, Transamerica Partners Large Core Portfolio (“Portfolio”) returned 3.51%. By comparison, its primary and secondary benchmarks, the Russell 1000® Index and the Standard & Poor’s 500® Index, returned 1.50% and 2.11%, respectively.
STRATEGY REVIEW
The Portfolio invests in a broadly diversified selection of large-cap stocks using our disciplined investment approach. We are fully invested in U.S. equities, we avoid broad sector bets, and we take only modest industry-level and stock-specific bets. Our goal is to outperform the benchmark with incremental gains across many holdings. Using bottom-up stock selection, we evaluate companies relative to their industry peers using three broad categories of measures: value, management, and momentum. Value refers to the somewhat traditional ratios of price to fundamental value; management means we look for evidence that a company’s management team has and will continue to emphasize earning power; momentum indicates when stocks might begin to rise toward full valuation. As we search for opportunities, we keep a sharp eye on minimizing transaction costs, helping us maximize profits in our stock-selection effort.
Over the course of the erratic year, avoiding companies with weak earnings momentum, such as Bank of America and Citigroup, Inc., was critical to our success. Our focus on companies with effective (and efficient) management also added value in 2011, notably in the technology sector. For example, underweighting Hewlett-Packard, a company with poor long-term growth prospects relative to its peers, contributed positively to performance. Even the value component of our work, despite strong headwinds to value investing in general, added to the bottom line, with our measure of price-to-sales supporting our healthcare picks Aetna, Inc., Humana, Inc., and UnitedHealth Group, Inc.
Although our stock selection worked well overall, it was less successful in the materials sector due to weakness in copper prices. Holdings in Teck Resources, Freeport-McMoRan Copper & Gold, Inc., and Southern Copper all detracted from the Portfolio. That said, given our diversification at the individual stock level and the benchmark’s relatively small allocation to this sector, the impact was minimal.
Theodore R. Aronson
Stefani Cranston
Gina Marie N. Moore
Martha E. Ortiz
R. Brian Wenzinger
Christopher J.W. Whitehead
Co-Portfolio Managers
Aronson Johnson Ortiz, LP
Note: Russell Investment Group is the source and owner of the trademarks, service marks, and copyrights related to the Russell indexes. Russell® is a trademark of Russell Investment Group.
MARKET ENVIRONMENT
Jennison Associates LLC
The U.S. stock market rallied strongly in the first several months of the reporting period on indications of continued global expansion, but relinquished much of its advance through the end of the year as investors’ worries about government debt and slowing economic growth drove heightened volatility.
Solid corporate earnings gains and continued spending, both corporate and personal, provided tailwinds that allowed the U.S. economy to continue expanding, although at a generally lackluster rate. Business production and housing measures were mixed and overall job growth remained anemic.
Strong commodity prices earlier in the period reflected continued demand in developing economies, which remained the primary drivers of global growth. However, raw materials, commodities, food, and energy prices grew more volatile as markets faced new challenges posed by a sovereign debt crisis in Europe, political turmoil in the Middle East, and a devastating earthquake and tsunami in Japan. In China, the government applied the brakes on growth and attempted to ease resource constraints, which spurred commodity cost inflation, rising real estate prices, and tightening labor rates.
The U.S. economy finished the year on firmer footing as fears of an autumn slowdown failed to materialize. Into year-end, most economic indicators, including employment, manufacturing, and housing, signaled accelerating improvement. While the pace of economic growth remained subpar, the end of year strength put to rest fears of another recession. The resilience of the U.S. economy was noteworthy in light of the magnitude of global macroeconomic and political shocks, and the inability of the U.S. House and Senate to overcome differences and to find a compromise.
Wellington Management Company, LLP
The one-year period ending December 31, 2011 was yet another extremely volatile period for equity markets. Global equities started the year on a strong note and continued to march higher in the first quarter of 2011, driven by investors’ enthusiasm for additional government debt purchases by the U.S. Federal Reserve, the extension of tax cuts in the U.S., strong earnings growth, and generally improving economic data. This enthusiasm reversed later in the period as concerns surfaced that the global economy could slip back into recession, resulting in a rapid decline in equity markets. Fears about sovereign debt and solvency in the Eurozone, slowing economic expansion in China and the U.S., and uncertainty about the sustainability of corporate earnings growth combined to produce an extremely volatile stock market, and return correlations among stocks spiked as investors shed risk and fled to safety. Markets ended the year on a positive note in the final month of the period with encouraging employment and manufacturing data in the U.S.
In this environment, seven of the ten sectors in the Russell 1000 Growth Index (+2.6%) posted positive returns during the period. The Utilities (+19.9%) and Consumer Staples (+15.3%) sectors increased the most, while the Materials sector (-9.8%) and Industrials (-2.5%) sectors posted the largest declines for the year.
PERFORMANCE
For the year ended December 31, 2011, Transamerica Partners Large Growth Portfolio (“Portfolio”) returned (1.78)%. By comparison, its primary and secondary benchmarks, the Russell 1000® Growth Index and the Standard & Poor’s 500® Index, returned 2.64% and 2.11%, respectively.
STRATEGY REVIEW
Jennison Associates, LLC
The Portfolio is built from the bottom up, based on the fundamentals of individual companies. Consumer staples holdings generated the Portfolio’s largest returns, although an underweight position in the sector hurt performance relative to the benchmark. Natural foods retailer Whole Foods Market, Inc. climbed on strong sales trends and market share gains. Estee Lauder Cos., Inc.’s strong revenue and earnings were fueled by successful new product launches and increased market penetration, particularly in emerging markets.
An overweight position in consumer discretionary worked well, but stock selection in the sector detracted from relative return, as Marriott International’s (“Marriot”) decline moderated Starbucks Corp.’s strong advance. Marriott, one of the world’s leading hoteliers, was hit by concerns that it would be hurt by anemic economic growth. Starbucks Corp. benefited from strong domestic and international growth, and enthusiasm about its expanded presence in the premium single-cup coffee market.
Stock selection was detrimental in energy, financials, and health care. In energy, oil services company Schlumberger, Ltd. was adversely affected by falling energy prices. It continues to develop new products and technologies providing dominant market share in what we consider important secular growth markets. In the financials sector, Goldman Sachs Group, Inc.’s decline reflected concerns about potential litigation against the company related to allegations it misled clients by not disclosing its proprietary interest in certain collateralized debt transactions. In health care, Illumina, Inc. (“Illumina”) was hurt by purchasing delays caused by research funding concerns. It develops genotyping, next-generation sequencing, and gene-expression tools to isolate and analyze genetic information. The commercialization of gene-based medicine is still in its early stages, and the opportunity for growth in Illumina’s core business remains strong in our view, despite near-term headwinds.
Stock selection benefitted relative return in Industrials, where Precision Castparts Corp. rose on an improved outlook for its industrial gas turbine operations and solid growth in its investment cast products and forged products aerospace business.
Several information technology holdings posted substantial gains. MasterCard, Inc.’s revenues and earnings exceeded consensus forecasts; the company received an additional boost when the Federal Reserve limited debit-transaction fees charged by banks less onerously than had been feared. Apple, Inc.’s financial results beat consensus forecasts, as sales of iPhones and iPads continued to impress. Detractors of note in the Information Technology sector included internet protocol routing company Juniper Networks, Inc., which was hurt by a deteriorating macroeconomic backdrop. NetApp, Inc.’s earnings were in line with consensus projections, but revenues were shy of estimates, and sales guidance came in below consensus forecasts.
STRATEGY REVIEW (continued)
Wellington Management Company, LLP
The Portfolio’s investment process leverages the extensive research resources of Wellington Management and emphasizes a balance of growth, quality, and valuation criteria in selecting stocks. We utilize risk analysis tools to help maintain the Portfolio’s emphasis on stock selection and minimize other sources of relative risk. With this bottom-up approach incorporating diversified sources of alpha and effective risk analysis, our goal is to generate consistent outperformance over time.
The Portfolio underperformed its benchmark primarily due to security selection. During the period, positive relative results from security selection in the health care and consumer discretionary sectors was not enough to offset weaker stock selection within information technology and materials. Sector allocation, a result of bottom-up stock selection, also detracted from relative performance, due largely to an underweight position in consumer staples.
The Portfolio’s largest relative detractors during the period included natural resources company Teck Resources, Ltd., an underweight position in tobacco company Philip Morris International, Inc., and provider of storage and data management solutions company NetApp, Inc. The Portfolio’s positions in Oracle Corp. and Walter Energy, Inc. also hurt absolute performance results during the period.
The Portfolio’s largest contributors to relative performance during the period included diversified health and “well-being” company UnitedHealth Group, Inc., global integrated hardware, software, and IT services company International Business Machines Corp., and Internet and software services company IAC/InterActiveCorp. The Portfolio’s position in Apple, Inc. also contributed positively to returns during the year.
As of the end of the period, the Portfolio was most overweight the information technology sector, and most underweight the consumer staples sector.
The Portfolio did not utilize derivatives during the period.
| | | | |
| Blair A. Boyer | | | | Paul E. Marrkand, CFA |
| Michael A. Del Balso | | | | |
| Spiros “Sig” Segalas | | | | |
| | |
| Co-Portfolio Managers | | | | Portfolio Manager |
| Jennison Associates LLC | | | | Wellington Management Company, LLP |
Note: Russell Investment Group is the source and owner of the trademarks, service marks, and copyrights related to the Russell indexes. Russell® is a trademark of Russell Investment Group.
MARKET ENVIRONMENT
Cramer, Rosenthal, McGlynn, LLC
As in the third quarter, business and investor confidence has been shaken and it will take time for business leaders to be comfortable making long-term commitments. The same seems to apply to investors. We understand the trepidation when on any given day, a news headline can appear out of nowhere to dramatically upset the capital markets. We are disappointed in our investment results for the second half of 2011, but remain very encouraged by the opportunities afforded us for the coming year. The characteristics we seek are abundant: the low growth/short business cycle is compelling management to more aggressively manage their assets, leading to numerous change dynamics; low free cash flow valuations are prevalent; corporations have historically strong balance sheets; and, finally, there is a significant amount of investor anxiety, which leads to behavioral overreaction/relative neglect. By staying true to our investment approach, we are confident that our stock selections will be validated in the coming quarters.
J.P. Morgan Investment Management Inc.
The year 2011 will be marked as one most equity investors are glad to see pass. Cultural revolutions, earthquakes and tsunamis, ratings downgrades of major economies, and extraordinary political events dominated the investment landscape. Volatility in the U.S. equity markets was at the highest levels since the 2008–2009 financial crisis. The year started off strong with yet another quarter of solid results from U.S. companies, including a 10% year-over-year increase in revenue, and the eighth-consecutive quarter of better-than-expected earnings. By the middle of the first quarter, however, investors were once again faced with rising uncertainty as various conflicts in the Middle East pushed oil prices higher, followed by a devastating earthquake and subsequent tsunami in Japan.
Attention quickly shifted to Europe as the sovereign debt crisis intensified. At the end of June, a Greek default was narrowly averted when the parliament approved new austerity measures allowing bailout funds to be released. As contagion spread to core Europe, the European Central Bank (“ECB”) reluctantly initiated its Securities Markets Program in August by purchasing Italian and Spanish bonds in the secondary market. Meanwhile, the United States came extremely close to a default as politicians agreed at the last minute to raise the debt ceiling. Even so, Standard & Poor’s downgraded the U.S. sovereign rating from AAA to AA+. The Federal Reserve (“Fed”) announced that it would keep interest rates exceptionally low through mid-2013. Additionally, in September, the Fed introduced a new monetary easing policy termed “Operation Twist,” essentially a maturity extension program intended to put downward pressure on longer-term interest rates.
However, a turn in sentiment led U.S. equity markets to rally sharply in the fourth quarter. Investor confidence improved as economic data supported the fact that the U.S. is not headed towards a recession, and European policymakers took bolder actions in their efforts to stave off a sovereign debt crisis. Positive economic surprises in December included an upward move in the Institute for Supply Management Manufacturing Survey, an increase in the number of housing starts, and declines in initial jobless claims.
PERFORMANCE
For the year ended December 31, 2011, Transamerica Partners Mid Value Portfolio (“Portfolio”) returned (2.19)%. By comparison, its benchmark, the Russell Midcap® Value Index (“Russell Midcap® Value”), returned (1.38)%.
STRATEGY REVIEW
Cramer, Rosenthal, McGlynn, LLC
2011 was a tale of two halves for the Portfolio as the first half of the year was marked by continued differentiation which provided for a more favorable environment for our bottom up style of investing. During the first half of 2011, our research was rewarded as investors differentiated among those companies with better fundamentals, and we experienced a period of better relative performance. The strategy outperformed the Russell MidCap® Value by approximately 200 basis points year-to-date through 6/30/2011 and was ahead by approximately 500 basis points on a one year basis as of 6/30/11. During the second half of 2011, the declining trend across stock correlations dramatically reversed as the markets finished a tumultuous third quarter, and then rapidly rebounded in early October on stronger U.S. economic data and a potential plan to stabilize the Eurozone, sustaining these gains into year end. This type of an environment was very challenging for the Portfolio as many of the stocks which outperformed during the first half retreated in the second half.
Amidst this backdrop, third quarter corporate earnings were once again robust with 70% exceeding forecasts, but reflected a slowing trend. The stock prices of the 30% who disappointed were treated very harshly as investors shed companies exhibiting any kind of difficulty regardless of valuation or long term investment appeal. Unfortunately, we had our fair share of such stocks across the mid cap value strategy during the fourth quarter, including positions such as Rovi Corp. and BMC Software, Inc.
After a strong start to the year, our healthcare stocks also significantly lagged the market in the second half. The primary factors continue to be: low utilization trends resulting from sustained high unemployment, more consumer driven healthcare plans, the residual impact of Food and Drug Administration/U.S. Department of Justice enforcement action, and peer medical journals/media criticism of the efficacy of some therapies. The FDA has stepped up its quality control compliance and Hospira, Inc. (“Hospira”) is in the process of remediating these functions at its largest domestic plant. Hospira will spend $300 million over 2+ years, most of it non-recurring. While near term earnings are depressed, the earnings power is not meaningfully compromised, and yet the stock has declined by 40% since our purchase last spring. Two other medical product companies, Stryker Corp. and St. Jude Medical, Inc., have suffered 30%+ declines since last spring and trade at multiples similar to Hospira. Despite these challenges, our stock selection was rewarded across other areas of the Portfolio and some of our top holdings were among the leading contributors for the year which included El Paso Corp., Tyco International, Ltd., Viacom, NYSE Euronext and Baker Hughes.
J.P. Morgan Investment Management Inc.
The Portfolio outperformed the Russell Midcap® Value during 2011, primarily due to a combination of stock selection and an overweight in the consumer discretionary sector, along with stock selection in the materials sector. Stock selection was positive in 9 out of 10 GICS
STRATEGY REVIEW (continued)
(Global Industry Classification Standard) sectors for 2011. An overweight in the telecommunication services sector and an underweight in the utilities sector detracted from results.
The Williams Cos., Inc. (“Williams Cos.”), an integrated natural gas company, was one of the top contributors to performance. Shares rallied on the announcement that Williams Cos. will be separated into two publicly traded companies. The restructuring plan calls for the separation of the company’s exploration and production business via an initial public offering (IPO) of up to 20% of its interest. The remaining interest is expected to be distributed to Williams Cos.’s shareholders via a tax-free spin-off in 2012. After the separation of the exploration and production segments is complete, Williams Cos. will be an operator of midstream infrastructure and natural gas pipeline assets. Also helping to propel the stock’s advance was the company’s announcement that it would increase its quarterly dividend.
Detracting from performance was Newfield Exploration Co. (“Newfield”), an independent oil and gas company. The stock underperformed during the period as the company announced that second-quarter production would be hurt by mechanical issues with equipment off the shores of Malaysia. The company also announced an increase in capital spending, which disappointed investors as there was no corresponding increase in production announced in association with the additional spending. We view the decline in production as temporary. Newfield has multiple fields under development, which have the potential to drive earnings growth going forward. Some of the more promising projects include development of the Southern Alberta Basin in Montana, where all wells to date have successfully uncovered oil deposits, and recently purchased acreage in the Uinta Basin in Utah.
| | |
| Jay B. Abramson | | Gloria Fu, CFA |
| Robert L. Rewey, III | | Lawrence Playford, CFA |
| | Jonathan K.L. Simon |
| |
| Co-Portfolio Managers | | Co-Portfolio Managers |
| Cramer, Rosenthal, McGlynn, LLC | | J.P. Morgan Investment Management Inc. |
Note: Russell Investment Group is the source and owner of the trademarks, service marks, and copyrights related to the Russell indexes. Russell® is a trademark of Russell Investment Group.
MARKET ENVIRONMENT
Despite strong relative performance through the end of November that had Transamerica Partners Mid Growth Portfolio within 100 basis points of the benchmark for the year, a perverse market during December rewarded market laggards and punished winners, resulting in a very poor month and a weak quarter. We describe the market as “perverse” due to its apparent reward of weak fundamentals and punishment of strong fundamentals. From a macroeconomic perspective, this is likely a symptom of financial anxiety causing investors to sell winners and hedge funds to cover their offsetting shorts. Regardless of the cause, the outcome was both disappointing and frustrating.
PERFORMANCE
For the year ended December 31, 2011, Transamerica Partners Mid Growth Portfolio (“Portfolio”) returned (6.90)%. By comparison, its benchmark, the Russell Midcap® Growth Index, returned (1.65)%.
STRATEGY REVIEW
Contributors to performance over the last year were Alexion Pharmaceuticals, Inc., Cabot Oil & Gas Corp., and SINA Corporation. Alexion Pharmaceuticals, Inc., a biotechnology company that sells a drug named Soliris for a genetic blood disorder called PNH, rose due to financial results that continue to exceed forecasts as the drug reaches new markets, and its patient base grows through longer survival. Cabot Oil & Gas Corp., an energy company focused on the development of natural gas reserves in the Pennsylvania Marcellus shale, increased. The company possesses what may be some of the most productive natural gas acreage in North America. SINA Corporation, the leading Chinese Internet portal, climbed as it benefited from the rapid adoption of the Internet in the world’s most populous country. Beyond financial results, which exceeded forecasts, Weibo, Sina’s Twitter-like service, continued to experience rapid subscriber growth.
The largest detractors from performance were Patterson-UTI Energy, Inc., DeVry Inc., and McDermott International Inc. Patterson-UTI Energy Inc., a provider of services to exploration and production companies, declined due to fears that land drilling activity would collapse as a result of economic weakness and lower oil prices. McDermott International, Inc., an engineering and construction company, fell despite a significant increase in bidding activity due to weaker profit margins that caused financial results to disappoint investors. Although DeVry Inc., a post-secondary education company, had successfully resisted the regulatory and economic pressures that bedeviled many of its competitors, it finally succumbed just as the environment seemed to be improving.
Environmental uncertainties are likely to continue dominating the investment landscape during 2012, obscuring company-specific results and making the stock market reluctant to pay for strong fundamentals. Although a global monetary easing cycle is now in place, resolutions to the European and U.S. debt crises are not yet in sight. In this uncertain environment, the market’s investment horizon may remain short, offsetting strong earnings growth with valuation compression. Though we understand that the market may not pay for strong results until macroeconomic uncertainty begins to subside, we will continue to do our best to keep our portfolios stocked with positively surprising fundamentals in the anticipation of eventual reward.
Entering the year we are most overweight technology, where a variety of secular trends support growth. We are also overweight consumer discretionary shares, where strong product and company-specific stories prevail, supported by recently improved domestic economic activity. Conversely, we are most underweight financials, where deleveraging continues to weigh on loan growth and reregulation threatens profitability. We are also underweight materials shares, preferring domestic shale energy exposure over global commodities at risk from weak economic activity.
Clifford Fox, CFA
Michael Iacono, CFA
Katerina Wasserman
Columbus Circle Investors
Note: Russell Investment Group is the source and owner of the trademarks, service marks, and copyrights related to the Russell indexes. Russell® is a trademark of Russell Investment Group.
MARKET ENVIRONMENT
The one-year period ending December 31, 2011 was yet another extremely volatile period for equity markets. Global equities started the year on a strong note and continued to march higher in the first quarter of 2011, driven by investors’ enthusiasm for additional government debt purchases by the U.S. Federal Reserve, the extension of tax cuts in the U.S., strong earnings growth, and generally improving economic data. This enthusiasm reversed later in the period; however, as concerns surfaced that the global economy could slip back into recession, resulting in a rapid decline in equity markets. Fears about sovereign debt and solvency in the Eurozone, slowing economic expansion in China and the U.S., and uncertainty about the sustainability of corporate earnings growth combined to produce an extremely volatile stock market, and return correlations among stocks spiked as investors shed risk and fled to safety. Despite these lingering concerns, markets ended the year on a positive note in the final month of the period in response to encouraging employment and manufacturing data in the U.S.
In this environment, seven of the ten sectors in the Russell 2000® Value Index (“Russell 2000® Value”) (-5.5%) posted negative returns for the period. The energy and telecommunication services sectors declined the most, while the utilities sector performed best.
PERFORMANCE
For the year ended December 31, 2011, Transamerica Partners Small Value Portfolio (“Portfolio”) returned 1.35%. By comparison, its benchmark, the Russell 2000® Value, returned (5.50)%.
STRATEGY REVIEW
The Team employs a bottom-up stock selection process that utilizes Wellington Management’s proprietary, fundamental research to identify undervalued companies that have the potential for significant outperformance over time. We take a long-term approach, focusing on high-quality companies with a record of above-average rates of profitability that sell at a discount relative to their intrinsic value and the overall small cap market. Companies with a history of above-average profitability are likely to have a strong and sustainable competitive position within a market niche. These companies typically generate strong cash flows that can be used to build the value of the business or fund measures that otherwise benefit shareholders, such as dividend distributions and share repurchases. The quality of a company’s management, its strategic direction, and expectations with regard to the use of current and future cash flows are integral components of our valuation process.
During the period, strong selection in the industrials, financials, and information technology sectors contributed most to outperformance. This was somewhat offset by weaker stock selection within energy and health care. Allocation among sectors, a residual of the bottom-up stock selection process, was modestly negative due to an overweight in Industrials and underweight in utilities.
The Portfolio’s largest contributors to relative performance during the period included Delphi Financial Group, Inc., an insurance holding company specializing in life and disability insurance, inland barge operator Kirby Corp., and Carlisle Cos., Inc., a diversified industrial manufacturer with significant operations in commercial roofing and specialty tires and wheels.
The Portfolio’s largest relative detractors during the period included independent oil and gas exploration and production company Penn Virginia Corp., cleaning products and solutions manufacturer Zep, Inc., and Scorpio Tankers, Inc., a transportation firm focused on seaborne shipments of refined petroleum products. Our position in contract research organization ICON PLC also detracted from relative and absolute results during the period.
The Portfolio’s investment approach emphasizes individual stock selection; sector weights are a residual of the process. We do, however, carefully consider diversification across economic sectors to limit risk. As of the end of the period, the Portfolio was most overweight the industrials and consumer discretionary sectors, and most underweight financials. Based on our two- to three-year time horizon, we continue to find opportunities created by the inefficiencies frequently found among small cap companies.
The Portfolio did not utilize derivatives during the period.
Timothy J. McCormack, CFA
Shaun F. Pedersen
Co-Portfolio Managers
Wellington Management Company, LLP
Note: Russell Investment Group is the source and owner of the trademarks, service marks, and copyrights related to the Russell indexes. Russell® is a trademark of Russell Investment Group.
MARKET ENVIRONMENT
Fort Washington Investment Advisors, Inc.
Over the last several quarters, the European debt crisis has been at the forefront of investors’ minds with a few diversions from the U.S. debt ceiling negotiations, including the Japanese earthquake, and fears of economic slowdown in China, among others. The markets remain extremely volatile, not only quarter to quarter as evidenced by the last two quarters’ decline and rebound in the Russell 2000® Growth Index, but also on a daily and even intraday basis. Europe will likely remain front and center as a significant amount of debt needs to be refinanced in the first quarter of 2012 alone.
On the positive side of the ledger, however, is a U.S. economy that is quite resilient as various economic reports over the last couple of months have shown modest improvements in employment as well as in the manufacturing sector. In addition, recent coordinated monetary action by the world’s central banks and rate cuts in China may help improve liquidity, sentiment, and economic fundamentals, at least in the near term.
Invesco Advisors, Inc.
U.S. equity markets enjoyed a strong rally in the fourth quarter, as mid-summer concerns over a full-blown financial contagion emanating from Europe did not materialize. Once Eurozone leaders announced their plans to more aggressively manage their sovereign debt problems, investors refocused their attention on investment opportunities in the U.S., where economic news was positive on balance and supportive of the stock market rally. Unemployment continued to inch lower, inflation remained tame as commodity prices slipped, and consumer confidence and spending both increased despite a continued decline in home prices. The Federal Reserve continued to support the recovery by keeping interest rates at zero and indicating no increase until at least mid-2013. On the geopolitical front, the war in Iraq officially ended in December. However, sovereign debt troubles in Europe continue to act as an overhang for the markets and remain the primary risk. In addition, a slowdown in global demand from China as its economy cools is also of concern. Lastly, the U.S. debt burden still lingers given the failure of the Congressional super committee to agree to long-term spending cuts. Despite these issues, the U.S. markets were resilient.
For 2011, the Russell 2000® Index (“Russell 2000®”) returned (4.18)% trailing both its mid-cap and large-cap peers, reversing small-cap’s leadership since 2008. For the third consecutive year, growth stocks outpaced value stocks in both large and small capitization segments, indicating that investors are still focused on growth prospects at this stage in the economic cycle.
Wellington Management Company, LLP
The one-year period ending December 31, 2011 was yet another extremely volatile period for equity markets. Global equities started the year on a strong note and continued to march higher in the first quarter of 2011, driven by investors’ enthusiasm for additional government debt purchases by the U.S. Federal Reserve, the extension of tax cuts in the U.S., strong earnings growth, and generally improving economic data. This enthusiasm reversed later in the period, however, as concerns surfaced that the global economy could slip back into recession, resulting in a rapid decline in equity markets. Fears about sovereign debt and solvency in the Eurozone, slowing economic expansion in China and the U.S., and uncertainty about the sustainability of corporate earnings growth combined to produce an extremely volatile stock market, and return correlations among stocks spiked as investors shed risk and fled to safety. Despite these lingering concerns, markets ended the year on a positive note in the final month of the period in response to encouraging employment and manufacturing data in the U.S.
In this environment, seven of the ten sectors in the Russell 2000 Value® Index (-5.50%) posted negative returns for the period. The energy and telecommunication services sectors declined the most, while the utilities sector performed best.
PERFORMANCE
For the year ended December 31, 2011, Transamerica Partners Small Core Portfolio (“Portfolio”) returned (2.19)%. By comparison, its primary and secondary benchmarks, the Russell 2000® and the Standard & Poor’s 500® Index, returned (4.18)% and 2.11%, respectively.
STRATEGY REVIEW
Fort Washington Investment Advisors, Inc.
The sectors with the most positive relative performance for the year include energy, healthcare, materials, consumer discretionary, and industrials. Information technology was the largest detractor from relative performance while consumer staples were a slight negative.
Stocks with the greatest outperformance for 2011 included:
| | • | | Energy – Brigham Exploration, International Coal, and Newpark Resources, Inc. |
| | • | | Healthcare – Alexion Pharmaceuticals, SonoSite, and BioMarin Pharmaceuticals, Inc. |
| | • | | Materials – LSB Industries, Inc. and Balchem Corp. |
| | • | | Consumer discretionary – Tractor Supply Co., 99 Cents Only Stores, and LKQ Corp. |
| | • | | Industrials – Wabtec Corp., Clarcor, Inc., and Landstar System, Inc. |
| | • | | Technology – Taleo Corp., Mellanox Technologies, Ltd., and MAXIMUS, Inc. |
Stocks with the greatest negative impact on the Portfolio included:
| | • | | Technology – Skyworks Solutions, Inc., Oclaro, Riverbed Technology, Inc., and Vistaprint NV |
| | • | | Healthcare – Inspire Pharmaceuticals, NxStage Medical, Inc., and United Therapeutics Corp. |
| | • | | Consumer discretionary – WMS Industries, Capella Education Co., and PetMed Express |
| | • | | Energy – PetroQuest Energy, Inc. |
The Portfolio continues to be positioned in companies that we believe can increase sales and profits in spite of the difficult economic and market environment. We continue to look for companies with good business models that 1) generate high levels of cash flow using modest or no financial leverage, 2) have unique products or services that have a competitive, sustainable advantage, and 3) are experiencing improving secular (preferable), or cyclical, fundamentals.
STRATEGY REVIEW (continued)
As of the end of fourth quarter 2011, the Portfolio is positioned as follows:
Overweight Sectors
| | • | | Consumer discretionary – companies focusing on value-conscious consumers, and/or experiencing strong organic top line growth driven by domestic geographic expansion and/or recurring revenue. |
| | • | | Healthcare – orphan-drug producers and device manufacturers with new product introductions. |
| | • | | Industrials – focus on transportation, niche capital goods, commercial aerospace/defense, electrical equipment companies and companies with recurring revenue. |
Underweight Sectors
| | • | | Consumer staples – companies with growth opportunities in Central and South American retailing, food rendering and renewable energy production plus a traditional food producer with new products. |
| | • | | Technology – companies that should benefit from the growth of internet traffic and the demand for increased mobility. |
| | • | | Materials – makers of specialty chemicals for agricultural, consumer and energy end markets. |
| | • | | Energy – Oil service and exploration and production companies that should benefit from domestic onshore shale plays and international offshore oil & gas drilling. |
| | • | | Financials – pawn brokers and debt collection companies that should benefit from the continued contraction in consumer credit, higher gold prices and increasing supply of charged off credit card debt. |
Invesco Advisors, Inc.
The Portfolio is an active small capitalization strategy designed to capture excess returns through Invesco Global Quantitative Equity’s proprietary multi-factor stock selection model. We believe that relative returns are predictable based on certain fundamental and behavioral concepts. To capture excess return, our process 1) systematically evaluates stocks within their respective industries using four key investment concepts: Earnings momentum, price trend, management action, and relative value, and 2) constructs the Portfolio and manages risk to limit the impact of unintended beta, size, and industry biases through an optimization technique that seeks to maximize expected return at a specified level of risk. The research team is dedicated to an on-going effort to identify factors that are strong predictors of return and that also complement our existing stock selection model. Stock selection is expected to be the primary driver of excess returns because we control for risk associated with sector/industry bets, style exposures, and beta. We are also very risk-management driven as the Portfolio has a low tracking error target of 4%.
Our stock selection model’s positive exposures to momentum and earnings yield factors were strong contributors to excess return. Overweighting the consumer services, health care, and energy sectors added value. In addition, having a slightly lower beta than the benchmark helped in the second and third quarters when the market declined.
Stock selection hurt results for the year particularly within basic materials (chemicals, gold), technology (semiconductors, hardware), telecommunications (wireless, telephone), and commercial services (industrial services). Overweighting OM Group, Inc. (chemicals), Imation Corp. (computers & peripherals), IDT Corp. (diversified telecommunication services), and Career Education (industrial services) had the greatest negative impact. Partially offsetting those negative results was selection within financials (REITs), transport (truck/sea/air freight, airlines), and energy (reserves). Specifically, overweighting Extra Space Storage, Inc. (real estate investment trusts), Alaska Air Group (airlines), and W&T Offshore, Inc. (oil, gas & consumable fuels) aided performance.
The Portfolio holds Russell Index futures solely for the purpose of equitizing cash.
Wellington Management Company, LLP
The Team employs a bottom-up stock selection process that utilizes Wellington Management’s proprietary, fundamental research to identify undervalued companies that have the potential for significant outperformance over time. We take a long-term approach, focusing on high-quality companies with a record of above-average rates of profitability that sell at a discount relative to their intrinsic value and the overall small cap market. Companies with a history of above-average profitability are likely to have a strong and sustainable competitive position within a market niche. These companies typically generate strong cash flows that can be used to build the value of the business or fund measures that otherwise benefit shareholders, such as dividend distributions and share repurchases. The quality of a company’s management, its strategic direction, and expectations with regard to the use of current and future cash flows are integral components of our valuation process.
During the period, strong selection in the industrials, financials, and information technology sectors contributed most to outperformance. This was somewhat offset by weaker stock selection within energy and health care. Allocation among sectors, a residual of the bottom-up stock selection process, was modestly negative due to an overweight in industrials and underweight in utilities.
The Portfolio’s largest contributors to relative performance during the period included Delphi Financial Group, Inc., an insurance holding company specializing in life and disability insurance, inland barge operator Kirby Corp., and CarlisleCos., Inc., a diversified industrial manufacturer with significant operations in commercial roofing and specialty tires and wheels.
The Portfolio’s largest relative detractors during the period included independent oil and gas exploration and production company Penn Virginia Corp., cleaning products and solutions manufacturer Zep, Inc., and Scorpio Tankers, Inc., a transportation firm focused on seaborne shipments of refined petroleum products. Our position in contract research organization ICON PLC also detracted from relative and absolute results during the period.
STRATEGY REVIEW (continued)
The Portfolio’s investment approach emphasizes individual stock selection; sector weights are a residual of the process. We do, however, carefully consider diversification across economic sectors to limit risk. As of the end of the period, the Portfolio was most overweight the industrials and consumer discretionary sectors, and most underweight financials. Based on our two- to three-year time horizon, we continue to find opportunities created by the inefficiencies frequently found among small cap companies.
| | | | |
| Richard R. Jandrain III | | Ralph Coutant, CFA | | Timothy J. McCormack, CFA |
| Daniel J. Kapusta | | Anthony Munchak, CFA | | Shaun F. Pedersen |
| Bihag N. Patel, CFA | | Glen Murphy, CFA | | |
| David K. Robinson, CFA | | Francis Orlando, CFA | | |
| | Anthony Shufflebotham, CFA | | |
| | |
| Co-Portfolio Managers | | Co-Portfolio Managers | | Co-Portfolio Managers |
| Fort Washington Investment Advisors, Inc. | | Invesco Advisers, Inc. | | Wellington Management Company, LLP |
Note: Russell Investment Group is the source and owner of the trademarks, service marks, and copyrights related to the Russell indexes. Russell® is a trademark of Russell Investment Group.
MARKET ENVIRONMENT
The year 2011 was marked by high volatility, record stock correlations, and multiple sentiment reversals. The first half of the year saw moderating, although steady, stock gains driven by improving industrial data and government stimulus. Higher beta sectors like energy, technology and materials led the market in the first quarter, although investors became increasingly risk-averse into late spring as commodity prices began to stall, suggesting a pause in economic growth.
Stock performance flattened and sentiment reversed in the second quarter on uncertainty surrounding the impact of the Japanese earthquake and tsunami. As a result, defensive sectors like consumer staples, healthcare and even telecom began to outperform riskier, higher-beta stocks.
It seemed investor fears were justified, given sharp stock declines in August as business activity slowed to a crawl, raising questions of the sustainability of the global recovery and flaming fears of a double-dip recession. Uncertainty surrounding the Eurozone financial crisis and the U.S. debt ceiling issues led to record stock volatility and historically high correlations. Industrial stocks were particularly hard hit in the third quarter, given close ties to the economic cycle, while the least economically-sensitive stocks like staples, healthcare and real estate investment trusts outperformed.
The year ended with yet another reversal, this time favoring higher beta stocks as economic data showed signs of improvement, including Gross Domestic Product expansion and a healing U.S. jobs market. Energy, industrials, materials and technology sectors carried the Russell 2000® Growth Index (“Russell 2000® Growth”) to the close of 2011, suggesting perhaps an improved outlook for 2012.
PERFORMANCE
For the year ended December 31, 2011, Transamerica Partners Small Growth Portfolio (“Portfolio”) returned (6.45)%. By comparison, its benchmark, the Russell 2000® Growth, returned (2.91)%.
STRATEGY REVIEW
Consumer discretionary continued to be a top contributor to the Portfolio’s performance again this year due primarily to strong stock selection, while an underweight position relative to the benchmark produced a modest headwind to returns. Given a robust spending environment in 2010 and falling consumer confidence levels into 2011, we preferred a modest underweight versus the benchmark. Instead, we remained focused on quality companies with strong positioning and momentum. Two top performers were Domino’s Pizza, Inc. and Genesco, Inc., both of which also benefited from secular themes in their respective industries.
Strong stock selection in the materials sector also contributed to the Porfolio’s performance. Although our slight overweight position created a modest drag, owning key top-performing stocks like Buckeye Technologies, Inc. and Rock-Tenn in the sector produced meaningful outperformance.
Technology was a significant detractor to performance for the year. High-valuation, high-beta stocks saw continued momentum into the first quarter as investors sought more risk. Given our focus on high quality growth companies with reasonable valuations, we did not participate in this high valuation trade, and saw performance suffer as a result. Towards the end of the year, some of our technology stocks experienced macro-related missteps and posted weak earnings results. In general, weak stock selection coupled with an unfavorable environment that rewarded high-flying stocks led the Portfolio to underperform within this sector.
For several years now the market has been trading less on company-specific fundamentals and more so on macro headlines, which we don’t view as sustainable. The middle of 2011 saw the re-emergence of the long-term trend where higher quality companies outperform their lower quality counterparts. We believe this heralded an environment with new market leadership, where quality company fundamentals will once again begin reasserting themselves in driving stock price performance. It is this type of environment where the Portfolio’s investment process has delivered some of the strongest relative performance in our 13 year history, leading to our high conviction and confidence level that our focus on quality companies with solid cash generation and strong balance sheets will be rewarded in 2012.
Mark D. Garfinkel, CFA
James N. Behre
Co-Portfolio Managers
Perimeter Capital Partners LLC
Note: Russell Investment Group is the source and owner of the trademarks, service marks, and copyrights related to the Russell indexes. Russell® is a trademark of Russell Investment Group.
MARKET ENVIRONMENT
Market conditions for the annual reporting period January 1, 2011 through December 31, 2011 were challenging. Myriad events caused turbulence in global equity markets throughout the year, such as the unrest in the Middle East and North Africa, the Japanese earthquake and Thailand flooding, and the European sovereign debt crisis. These events led investors to seek safety in the form of more defensively-oriented stocks and dividend oriented companies.
The market environment continues to be dominated by uncertainty and concerns surrounding the future of Europe’s economy and the Euro. Western Europe represents approximately 18% of global Gross Domestic Product, significant enough to create disruptions in other economies and in the global financial markets. The subdued performance of major financial institutions in Europe mirrors the low expectations investors have for these systemically important entities going forward. Our portfolio has fewer holdings tied primarily to the European economy than in past periods, reflecting the uncertainty of the outlook for the region. Successful resolution of the European financial crisis would presumably go a long way toward bolstering investor confidence in global securities markets, but the core issue of a lack of united fiscal and monetary policy in the region persists. While we have been mindful of maintaining healthy exposure to more defensively positioned companies, certain factors that could hamper global progress have not come to pass, including a potential hard landing for China and a recession in the U.S. In the months ahead, we are hopeful that the environment will improve in Europe. Meanwhile, many of the hurdles facing the region are seemingly priced into current valuations, which appear compelling.
PERFORMANCE
For the year ended December 31, 2011, Transamerica Partners International Equity Portfolio (“Portfolio”) returned (13.51)%. By comparison, its benchmark, the Morgan Stanley Capital International All Country World ex-U.S. Index (“MSCI ACWI ex-US”), returned (13.33)%.
STRATEGY REVIEW
The Portfolio is built from the bottom up, with stocks selected one at a time, based on the fundamentals of individual companies. For the calendar year 2011, the Portfolio underperformed relative to the MSCI ACWI ex-US, largely due to stock selection in the financials, energy and health care sectors.
Relative performance was strongest in the consumer discretionary and industrials sectors, primarily due to stock selection. On a country basis, top contributors to relative return were Germany, Canada and South Korea. British American Tobacco PLC, Canadian National Railway Co. and ARM Holdings PLC (“ARM”) were the Portfolio’s top contributors to return for the annual period. British American Tobacco PLC is a defensively positioned company with a leadership position in its markets, pricing power, and a healthy balance sheet. Canadian National Railway Co. was helped by expansion of its port activity, allowing increased trading of U.S. and Canadian goods to and from Asia. Due to solid management execution and a focus on high quality and relatively inexpensive products, ARM has cemented its status as the top designer of chips for mobile phones, powering more than 90% of all handsets while taking market share from Intel in the personal computer sector.
Relative performance was weakest in the financials, energy and health care sectors due to stock selection. China, Taiwan and the Netherlands had the weakest relative performance from a geographic perspective. The largest detractors from performance were HTC Corp. (“HTC”), Credit Suisse Group AG and ArcelorMittal. Patent litigation issues and a loss of market share, partially attributed to product cycle and poor shipment development in the U.S., weighed on HTC. Along with sovereign debt concerns, profitability at Credit Suisse Group AG is being impacted by regulatory requirements in its investment banking unit and a risk-averse low interest rate environment in its wealth management business. ArcelorMittal suffered from a global decline in demand for steel, and the inability to take advantage of emerging market growth as shifting currency valuations reduced cost effectiveness in large markets including Brazil.
The Portfolio’s derivative positions, which were limited to currency forward contracts, were beneficial to annual performance.
William V. Fries, CFA
Wendy Trevisani
Lei Wang, CFA
Co-Portfolio Managers
Thornburg Investment Management, Inc.
| | | | |
Transamerica Partners Money Market Portfolio | | % of Net
Assets | |
Commercial Paper | | | 21.9 | % |
Repurchase Agreement | | | 17.4 | |
Certificate of Deposit | | | 16.7 | |
Short-Term U.S. Government Obligation | | | 16.2 | |
U.S. Government Obligation | | | 10.7 | |
U.S. Government Agency Obligation | | | 8.1 | |
Corporate Debt Security | | | 4.8 | |
Short-Term Foreign Government Obligation | | | 2.7 | |
Other Assets and Liabilities - Net | | | 1.5 | |
| | | | |
Total | | | 100.0 | % |
| | | | |
| |
Transamerica Partners High Quality Bond Portfolio | | % of Net
Assets | |
Corporate Debt Security | | | 37.8 | % |
Asset-Backed Security | | | 28.4 | |
Mortgage-Backed Security | | | 18.3 | |
Securities Lending Collateral | | | 7.8 | |
U.S. Government Obligation | | | 4.9 | |
U.S. Government Agency Obligation | | | 4.8 | |
Repurchase Agreement | | | 3.4 | |
Foreign Government Obligation | | | 1.9 | |
Other Assets and Liabilities - Net | | | (7.3 | ) |
| | | | |
Total | | | 100.0 | % |
| | | | |
| |
Transamerica Partners Inflation-Protected Securities Portfolio | | % of Net
Assets | |
U.S. Government Obligation | | | 94.4 | % |
Repurchase Agreement | | | 4.3 | |
Securities Lending Collateral | | | 0.8 | |
Structured Note Debt | | | 0.5 | |
Foreign Government Obligation | | | 0.3 | |
Purchased Swaption | | | 0.3 | |
Mortgage-Backed Security | | | 0.1 | |
Purchased Option | | | 0.0 | * |
Other Assets and Liabilities - Net(A) | | | (0.7 | ) |
| | | | |
Total | | | 100.0 | % |
| | | | |
| |
Transamerica Partners Core Bond Portfolio | | % of Net
Assets | |
U.S. Government Agency Obligation | | | 49.9 | % |
Corporate Debt Security | | | 31.4 | |
Mortgage-Backed Security | | | 11.4 | |
U.S. Government Obligation | | | 7.6 | |
Repurchase Agreement | | | 7.3 | |
Asset-Backed Security | | | 4.8 | |
Securities Lending Collateral | | | 3.8 | |
Foreign Government Obligation | | | 3.6 | |
Preferred Corporate Debt Security | | | 0.3 | |
Municipal Government Obligation | | | 0.3 | |
Convertible Bond | | | 0.1 | |
Purchased Swaption | | | 0.1 | |
Preferred Stock | | | 0.1 | |
Common Stock | | | 0.0 | * |
Purchased Option | | | 0.0 | * |
Warrant | | | 0.0 | * |
Other Assets and Liabilities - Net(A) | | | (20.7 | ) |
| | | | |
Total | | | 100.0 | % |
| | | | |
| | | | |
Transamerica Partners High Yield Bond Portfolio | | % of Net
Assets | |
Corporate Debt Security | | | 90.7 | % |
Loan Assignment | | | 5.6 | |
Repurchase Agreement | | | 0.7 | |
Common Stock | | | 0.7 | |
Convertible Preferred Stock | | | 0.3 | |
Preferred Stock | | | 0.2 | |
Preferred Corporate Debt Security | | | 0.0 | * |
Convertible Bond | | | 0.0 | * |
Warrant | | | 0.0 | * |
Investment Company | | | 0.0 | * |
Right | | | 0.0 | * |
Other Assets and Liabilities - Net | | | 1.8 | |
| | | | |
Total | | | 100.0 | % |
| | | | |
| |
Transamerica Partners Balanced Portfolio | | % of Net
Assets | |
Common Stock | | | 58.7 | % |
U.S. Government Agency Obligation | | | 21.9 | |
Securities Lending Collateral | | | 18.9 | |
Corporate Debt Security | | | 12.9 | |
Mortgage-Backed Security | | | 5.5 | |
Repurchase Agreement | | | 3.7 | |
Foreign Government Obligation | | | 2.1 | |
Asset-Backed Security | | | 2.0 | |
U.S. Government Obligation | | | 1.4 | |
Preferred Corporate Debt Security | | | 0.2 | |
Preferred Stock | | | 0.1 | |
Municipal Government Obligation | | | 0.1 | |
Warrant | | | 0.0 | * |
Purchased Option | | | 0.0 | * |
Other Assets and Liabilities - Net(A) | | | (27.5 | ) |
| | | | |
Total | | | 100.0 | % |
| | | | |
| |
Transamerica Partners Large Value Portfolio | | % of Net
Assets | |
Common Stock | | | 98.6 | % |
Securities Lending Collateral | | | 3.8 | |
Repurchase Agreement | | | 1.3 | |
Other Assets and Liabilities - Net | | | (3.7 | ) |
| | | | |
Total | | | 100.0 | % |
| | | | |
| |
Transamerica Partners Large Core Portfolio | | % of Net
Assets | |
Common Stock | | | 97.9 | % |
Securities Lending Collateral | | | 3.3 | |
Repurchase Agreement | | | 1.9 | |
Other Assets and Liabilities - Net | | | (1.3 | ) |
| | | | |
Total | | | 100.0 | % |
| | | | |
| |
Transamerica Partners Large Growth Portfolio | | % of Net
Assets | |
Common Stock | | | 99.5 | % |
Securities Lending Collateral | | | 3.5 | |
Repurchase Agreement | | | 0.4 | |
Other Assets and Liabilities - Net | | | (3.4 | ) |
| | | | |
Total | | | 100.0 | % |
| | | | |
| |
Transamerica Partners Mid Value Portfolio | | % of Net
Assets | |
Common Stock | | | 97.1 | % |
Securities Lending Collateral | | | 5.0 | |
Repurchase Agreement | | | 2.2 | |
Other Assets and Liabilities - Net | | | (4.3 | ) |
| | | | |
Total | | | 100.0 | % |
| | | | |
| | | | |
Transamerica Partners Mid Growth Portfolio | | % of Net
Assets | |
Common Stock | | | 99.8 | % |
Securities Lending Collateral | | | 25.7 | |
Repurchase Agreement | | | 0.3 | |
Other Assets and Liabilities - Net | | | (25.8 | ) |
| | | | |
Total | | | 100.0 | % |
| | | | |
| |
Transamerica Partners Small Value Portfolio | | % of Net
Assets | |
Common Stock | | | 97.4 | % |
Securities Lending Collateral | | | 25.7 | |
Repurchase Agreement | | | 2.6 | |
Other Assets and Liabilities - Net | | | (25.7 | ) |
| | | | |
Total | | | 100.0 | % |
| | | | |
| |
Transamerica Partners Small Core Portfolio | | % of Net
Assets | |
Common Stock | | | 98.2 | % |
Securities Lending Collateral | | | 25.7 | % |
Repurchase Agreement | | | 1.4 | |
Investment Company | | | 0.2 | |
Short-Term U.S. Government Obligation | | | 0.1 | |
Other Assets and Liabilities - Net(A) | | | (25.7 | ) |
| | | | |
Total | | | 100.0 | % |
| | | | |
| |
Transamerica Partners Small Growth Portfolio | | % of Net
Assets | |
Common Stock | | | 100.1 | % |
Securities Lending Collateral | | | 25.7 | |
Repurchase Agreement | | | 0.3 | |
Warrant | | | 0.0 | * |
Other Assets and Liabilities - Net | | | (26.1 | ) |
| | | | |
Total | | | 100.0 | % |
| | | | |
| |
Transamerica Partners International Equity Portfolio | | % of Net
Assets | |
Common Stock | | | 94.1 | % |
Securities Lending Collateral | | | 4.8 | |
Repurchase Agreement | | | 3.2 | |
Preferred Stock | | | 1.8 | |
Other Assets and Liabilities - Net(A) | | | (3.9 | ) |
| | | | |
Total | | | 100.0 | % |
| | | | |
| * | Amount rounds to less than 0.1%. |
| (A) | The Other Assets and Liabilities - Net category may include, but is not limited to, Forward Currency contracts, Futures contracts, Swap Agreements, Written Options and Swaptions, Securities Sold Short, and Cash Collateral. |
| | | | | | | | |
| | | Principal
(000’s) | | | Value
(000’s) | |
COMMERCIAL PAPER p - 21.9% | |
Capital Markets - 1.5% | | | | | | | | |
Credit Suisse | | | | | | | | |
0.87%, 02/14/2012 | | $ | 15,250 | | | $ | 15,242 | |
Commercial Banks - 8.8% | | | | | | | | |
Australia & New Zealand Banking Group, Ltd. | | | | | | | | |
0.62%, 02/28/2012 - 144A | | | 12,000 | | | | 11,994 | |
0.64%, 02/07/2012 - 144A | | | 13,550 | | | | 13,546 | |
HSBC USA, Inc. | | | | | | | | |
0.24%, 01/23/2012 | | | 28,000 | | | | 27,998 | |
National Australia Funding Delaware, Inc. | | | | | | | | |
0.40%, 01/06/2012 - 144A | | | 24,350 | | | | 24,349 | |
Nordea Bank Finland PLC | | | | | | | | |
0.36%, 01/11/2012 | | | 10,450 | | | | 10,450 | |
Diversified Financial Services - 5.1% | |
JPMorgan Chase & Co. | | | | | | | | |
0.02%, 01/04/2012 | | | 27,450 | | | | 27,450 | |
Rabobank USA Financial Corp. | | | | | | | | |
0.70%, 01/12/2012 | | | 23,700 | | | | 23,697 | |
Food Products - 1.9% | | | | | | | | |
Nestle Capital Corp. | | | | | | | | |
0.10%, 02/03/2012 - 144A | | | 18,900 | | | | 18,899 | |
Household Products - 1.0% | | | | | | | | |
Procter & Gamble Co. | | | | | | | | |
0.12%, 03/20/2012 - 144A | | | 9,500 | | | | 9,499 | |
Pharmaceuticals - 3.6% | | | | | | | | |
Johnson & Johnson | | | | | | | | |
0.14%, 04/02/2012 - 144A | | | 24,500 | | | | 24,496 | |
Novartis Finance Corp. | | | | | | | | |
0.12%, 01/04/2012 - 144A | | | 11,200 | | | | 11,200 | |
| | | | | | | | |
Total Commercial Paper
(cost $218,820) | | | | 218,820 | |
| | | | | | | | |
CERTIFICATES OF DEPOSIT p - 16.7% | |
Commercial Banks - 16.7% | | | | | | | | |
Bank of Montreal | | | | | | | | |
0.39%, 09/26/2012 | | | 11,100 | | | | 11,100 | |
Bank of Nova Scotia | | | | | | | | |
0.29%, 01/13/2012 | | | 20,450 | | | | 20,450 | |
Barclays Bank PLC | | | | | | | | |
0.51%, 02/06/2012 | | | 16,300 | | | | 16,300 | |
Commonwealth Bank of Australia | | | | | | | | |
0.27%, 05/21/2012 - 144A | | | 26,800 | | | | 26,800 | |
Royal Bank of Canada | | | | | | | | |
0.25%, 03/12/2012 | | | 12,450 | | | | 12,450 | |
Standard Chartered Bank | | | | | | | | |
0.43%, 02/10/2012 | | | 20,150 | | | | 20,150 | |
Svenska Handelsbanken AB | | | | | | | | |
0.42%, 02/13/2012 | | | 15,000 | | | | 15,000 | |
Toronto-Dominion Bank | | | | | | | | |
0.24%, 02/08/2012 | | | 20,300 | | | | 20,300 | |
Westpac Banking Corp. | | | | | | | | |
0.28%, 05/11/2012 | | | 23,400 | | | | 23,400 | |
| | | | | | | | |
Total Certificates of Deposit
(cost $165,950) | | | | 165,950 | |
| | | | | | | | |
CORPORATE DEBT SECURITIES - 4.8% | | | | | |
Commercial Banks - 3.9% | | | | | | | | |
Eksportfinans ASA | | | | | | | | |
0.67%, 03/15/2012 * § | | | 6,600 | | | | 6,601 | |
0.68%, 03/19/2012 * § | | | 13,200 | | | | 13,202 | |
Westpac Banking Corp. | | | | | | | | |
0.30%, 02/21/2012 * | | | 18,700 | | | | 18,717 | |
| | | | | | | | |
| | | Principal
(000’s) | | | Value
(000’s) | �� |
Diversified Financial Services - 0.9% | | | | | |
JPMorgan Chase & Co. | | | | | | | | |
0.78%, 06/15/2012 * | | $ | 8,850 | | | $ | 8,874 | |
| | | | | | | | |
Total Corporate Debt Securities
(cost $47,394) | | | | 47,394 | |
| | | | | | | | |
SHORT-TERM FOREIGN GOVERNMENT
OBLIGATION p - 2.7% | |
World Bank Discount Notes | | | | | | | | |
0.05%, 02/01/2012 | | | 26,950 | | | | 26,949 | |
Total Short-Term Foreign Government Obligation
(cost $26,949) | |
SHORT-TERM U.S. GOVERNMENT
OBLIGATIONS p - 16.2% | |
Fannie Mae | | | | | | | | |
0.02%, 01/17/2012 | | | 13,350 | | | | 13,350 | |
0.04%, 04/02/2012 | | | 26,950 | | | | 26,947 | |
0.10%, 03/14/2012 | | | 7,250 | | | | 7,249 | |
Freddie Mac | | | | | | | | |
0.01%, 02/17/2012 - 02/29/2012 | | | 22,000 | | | | 22,000 | |
0.02%, 03/09/2012 | | | 6,850 | | | | 6,850 | |
0.03%, 01/27/2012 - 02/01/2012 | | | 32,700 | | | | 32,700 | |
0.06%, 05/01/2012 | | | 8,650 | | | | 8,649 | |
0.09%, 01/17/2012 - 05/18/2012 | | | 43,550 | | | | 43,543 | |
| | | | | | | | |
Total Short-Term U.S. Government
Obligations
(cost $161,288) | | | | 161,288 | |
| | | | | | | | |
U.S. GOVERNMENT AGENCY
OBLIGATIONS - 8.1% | |
Fannie Mae | | | | | | | | |
0.28%, 07/26/2012 * | | | 27,200 | | | | 27,222 | |
0.31%, 10/18/2012 * | | | 7,550 | | | | 7,559 | |
Freddie Mac | | | | | | | | |
0.21%, 05/01/2012 * | | | 13,400 | | | | 13,405 | |
0.24%, 04/03/2012 * | | | 27,500 | | | | 27,507 | |
0.26%, 02/16/2012 * | | | 5,400 | | | | 5,400 | |
| | | | | | | | |
Total U.S. Government Agency Obligations
(cost $81,093) | | | | 81,093 | |
| | | | | | | | |
U.S. GOVERNMENT OBLIGATIONS - 10.7% | |
U.S. Treasury Note | | | | | | | | |
0.63%, 06/30/2012 | | | 21,150 | | | | 21,207 | |
0.88%, 01/31/2012 | | | 16,850 | | | | 16,860 | |
1.00%, 03/31/2012 - 04/30/2012 | | | 54,500 | | | | 54,648 | |
1.13%, 01/15/2012 | | | 13,650 | | | | 13,656 | |
| | | | | | | | |
Total U.S. Government Obligations
(cost $106,371) | | | | 106,371 | |
| | | | | | | | |
REPURCHASE AGREEMENTS - 17.4% | |
Barclays Bank PLC | | | | | | | | |
0.02% p, dated 12/30/2011, to be repurchased at $49,900 on 01/03/2012. Collateralized by U.S. Government Obligations, 5.375% - 6.25%, due 5/15/2030 - 2/15/2031, and with a total value of $50,231. | | | 49,900 | | | | 49,900 | |
Deutsche Bank AG | | | | | | | | |
0.05% p, dated 12/30/2011, to be repurchased at $27,100 on 01/03/2012. Collateralized by a U.S. Government Agency Obligation, 0.6%, due 11/14/2013, and with a value of $27,621. | | | 27,100 | | | | 27,100 | |
| | | | | | | | |
| | | Principal
(000’s) | | | Value
(000’s) | |
Goldman Sachs | | | | | | | | |
0.09% p, dated 12/30/2011, to be repurchased at $54,600 on 01/03/2012. Collateralized by U.S. Government Agency Obligations, 4.00%, due 11/4/2026 - 11/17/2031, and with a total value of $55,366. | | $ | 54,600 | | | $ | 54,600 | |
HSBC Bank USA | | | | | | | | |
0.02% p, dated 12/30/2011, to be repurchased at $29,730 on 01/03/2012. Collateralized by U.S. Government Agency Obligations, 0.00%, due 5/15/2018 - 1/15/2030, and with a total value of $30,325. | | | 29,730 | | | | 29,730 | |
HSBC USA, Inc. | | | | | | | | |
0.03% p, dated 12/30/2011, to be repurchased at $11,500 on 01/03/2012. Collateralized by a U.S. Government Obligation, 2.00%, due 04/30/2016, and with a value of $11,730. | | | 11,500 | | | | 11,500 | |
State Street Bank & Trust Co. | | | | | | | | |
0.03% p, dated 12/30/2011, to be repurchased at $2 on 01/03/2012. Collateralized by a U.S. Government Agency Obligation, 3.00%, due 11/25/2040, and with a value of $5. | | | 2 | | | | 2 | |
| | | | | | | | |
Total Repurchase Agreements (cost $172,832) | | | | | | | 172,832 | |
| | | | | | | | |
Total Investment Securities (cost $980,697) | | | | 980,697 | |
Other Assets and Liabilities - Net | | | | | | | 14,932 | |
| | | | | | | | |
Net Assets | | | | | | $ | 995,629 | |
| | | | | | | | |
NOTES TO SCHEDULE OF INVESTMENTS (all amounts in thousands):
| * | Floating or variable rate note. Rate is listed as of 12/30/2011. |
| p | Rate shown reflects the yield at 12/30/2011. |
| § | Illiquid. At 12/31/2011, the fair value of illiquid investment securities aggregated to $19,803, or 1.99% of the portfolio’s net assets. |
| Aggregate cost for federal income tax purposes is $980,697, which equals the book cost; therefore, net unrealized appreciation/depreciation is $0. |
DEFINITION (all amounts in thousands):
| | |
| 144A | | 144A Securities are registered pursuant to Rule 144A of the Securities Act of 1933. These securities are deemed to be liquid for purposes of compliance limitations on holdings of illiquid securities and may be resold as transactions exempt from registration, normally to qualified institutional buyers. At 12/31/2011, these securities aggregated $140,783, or 14.14%, of the portfolio’s net assets. |
VALUATION SUMMARY (all amounts in thousands):
| | | | | | | | | | | | | | | | |
Investment Securities | | Level 1 -
Quoted
Prices | | | Level 2 -
Other
Significant
Observable
Inputs | | | Level 3 -
Significant
Unobservable
Inputs | | | Value at
12/31/2011 | |
Certificates of Deposit | | $ | — | | | $ | 165,950 | | | $ | — | | | $ | 165,950 | |
Commercial Paper | | | — | | | | 218,820 | | | | — | | | | 218,820 | |
Corporate Debt Securities | | | — | | | | 47,394 | | | | — | | | | 47,394 | |
Repurchase Agreements | | | — | | | | 172,832 | | | | — | | | | 172,832 | |
Short-Term Foreign Government Obligations | | | — | | | | 26,949 | | | | — | | | | 26,949 | |
Short-Term U.S. Government Obligations | | | — | | | | 161,288 | | | | — | | | | 161,288 | |
U.S. Government Agency Obligations | | | — | | | | 81,093 | | | | — | | | | 81,093 | |
U.S. Government Obligations | | | — | | | | 106,371 | | | | — | | | | 106,371 | |
| | | | | | | | | | | | | | | | |
Total | | $ | — | | | $ | 980,697 | | | $ | — | | | $ | 980,697 | |
| | | | | | | | | | | | | | | | |
| See the notes to the financial statements for more information regarding pricing inputs and valuation techniques. |
| | | | | | | | |
| | | Principal
(000’s) | | | Value
(000’s) | |
U.S. GOVERNMENT OBLIGATIONS - 4.9% | | | | | |
U.S. Treasury Note | | | | | | | | |
0.25%, 10/31/2013 ^ | | $ | 18,600 | | | $ | 18,602 | |
0.38%, 07/31/2013 | | | 4,000 | | | | 4,010 | |
| | | | | | | | |
Total U.S. Government Obligations
(cost $22,603) | | | | 22,612 | |
| | | | | | | | |
U.S. GOVERNMENT AGENCY OBLIGATIONS - 4.8% | |
Fannie Mae | | | | | | | | |
2.50%, 05/15/2014 | | | 950 | | | | 991 | |
4.00%, 12/25/2029 - 07/25/2033 | | | 233 | | | | 234 | |
5.50%, 12/01/2022 | | | 660 | | | | 724 | |
6.00%, 07/01/2014 - 09/01/2014 | | | 144 | | | | 155 | |
Freddie Mac | | | | | | | | |
1.00%, 03/27/2013 | | | 5,000 | | | | 5,042 | |
2.87%, 12/15/2016 | | | 57 | | | | 57 | |
3.38%, 03/15/2018 | | | 1,718 | | | | 1,771 | |
4.00%, 09/15/2016 - 09/15/2017 | | | 508 | | | | 513 | |
5.50%, 04/01/2017 | | | 244 | | | | 264 | |
6.00%, 10/15/2021 | | | 720 | | | | 733 | |
6.50%, 02/01/2013 - 04/01/2013 | | | 29 | | | | 30 | |
Ginnie Mae | | | | | | | | |
4.66%, 12/16/2030 * | | | 818 | | | | 844 | |
5.59%, 11/20/2059 | | | 4,061 | | | | 4,451 | |
5.65%, 06/20/2059 | | | 4,959 | | | | 5,450 | |
5.75%, 12/15/2022 | | | 685 | | | | 771 | |
| | | | | | | | |
Total U.S. Government Agency Obligations
(cost $21,776) | | | | 22,030 | |
| | | | | | | | |
FOREIGN GOVERNMENT OBLIGATIONS - 1.9% | |
Province of Ontario Canada | | | | | | | | |
2.30%, 05/10/2016 ^ | | | 4,795 | | | | 4,938 | |
Province of Quebec Canada | | | | | | | | |
4.88%, 05/05/2014 ^ | | | 3,650 | | | | 3,981 | |
| | | | | | | | |
Total Foreign Government Obligations
(cost $8,901) | | | | 8,919 | |
| | | | | | | | |
MORTGAGE-BACKED SECURITIES - 18.3% | |
Bear Stearns Commercial Mortgage Securities | | | | | | | | |
Series 2007-PW15, Class A2 | | | | | | | | |
5.21%, 02/11/2044 | | | 106 | | | | 106 | |
CFCRE Commercial Mortgage Trust | | | | | | | | |
Series 2011-C1, Class A2 | | | | | | | | |
3.76%, 04/15/2044 - 144A | | | 3,000 | | | | 3,123 | |
Commercial Mortgage Pass-Through Certificates | | | | | | | | |
Series 2001-J2A, Class B | | | | | | | | |
6.30%, 07/16/2034 - 144A | | | 2,425 | | | | 2,432 | |
Series 2005-LP5, Class A2 | | | | | | | | |
4.63%, 05/10/2043 | | | 1,266 | | | | 1,268 | |
Series 2006-C8, Class A3 | | | | | | | | |
5.31%, 12/10/2046 | | | 5,690 | | | | 5,916 | |
Community Program Loan Trust | | | | | | | | |
Series 1987-A, Class A4 | | | | | | | | |
4.50%, 10/01/2018 | | | 164 | | | | 165 | |
Credit Suisse Mortgage Capital Certificates | | | | | | | | |
Series 2007-C5, Class A2 | | | | | | | | |
5.59%, 09/15/2040 | | | 2,841 | | | | 2,879 | |
CW Capital Cobalt, Ltd. | | | | | | | | |
Series 2006-C1, Class A2 | | | | | | | | |
5.17%, 08/15/2048 | | | 2,903 | | | | 2,941 | |
DBUBS Mortgage Trust | | | | | | | | |
Series 2011-LC1A, Class A1 | | | | | | | | |
3.74%, 11/10/2046 - 144A | | | 4,422 | | | | 4,631 | |
| | | | | | | | |
| | | Principal
(000’s) | | | Value
(000’s) | |
MORTGAGE-BACKED SECURITIES (continued) | |
DBUBS Mortgage Trust (continued) | | | | | |
Series 2011-LC3A, Class A2 | | | | | | | | |
3.64%, 08/10/2044 | | $ | 1,400 | | | $ | 1,475 | |
GE Capital Commercial Mortgage Corp. | | | | | | | | |
Series 2005-C1, Class A2 | | | | | | | | |
4.35%, 06/10/2048 | | | 1,005 | | | | 1,004 | |
Greenwich Capital Commercial Funding Corp. | | | | | | | | |
Series 2005-GG3, Class A2 | | | | | | | | |
4.31%, 08/10/2042 | | | 427 | | | | 427 | |
Series 2006-GG7, Class A2 | | | | | | | | |
5.88%, 07/10/2038 * | | | 18 | | | | 18 | |
GS Mortgage Securities Corp. II | | | | | | | | |
Series 2004-GG2, Class A4 | | | | | | | | |
4.96%, 08/10/2038 | | | 3,636 | | | | 3,668 | |
Series 2006-GG6, Class A2 | | | | | | | | |
5.51%, 04/10/2038 * | | | 544 | | | | 548 | |
Series 2006-GG6, Class AAB | | | | | | | | |
5.59%, 04/10/2038 * | | | 3,718 | | | | 3,948 | |
Series 2006-GG8, Class AAB | | | | | | | | |
5.54%, 11/10/2039 | | | 4,546 | | | | 4,762 | |
Series 2007-GG10, Class AAB | | | | | | | | |
5.79%, 08/10/2045 * | | | 5,010 | | | | 5,264 | |
Interstar Millennium Trust | | | | | | | | |
Series 2003-3G, Class A2 | | | | | | | | |
1.07%, 09/27/2035 * | | | 155 | | | | 143 | |
JP Morgan Chase Commercial Mortgage Securities Corp. | | | | | | | | |
Series 2006-LDP7, Class A2 | | | | | | | | |
5.86%, 04/15/2045 * | | | 251 | | | | 252 | |
Series 2007-C1, Class A3 | | | | | | | | |
5.79%, 02/15/2051 | | | 7,000 | | | | 7,321 | |
LB-UBS Commercial Mortgage Trust | | | | | | | | |
Series 2003-C7, Class A3 | | | | | | | | |
4.56%, 09/15/2027 * | | | 4,550 | | | | 4,574 | |
Series 2005-C7, Class A2 | | | | | | | | |
5.10%, 11/15/2030 | | | 619 | | | | 618 | |
Series 2006-C4, Class AAB | | | | | | | | |
5.84%, 06/15/2032 * | | | 3,592 | | | | 3,829 | |
Series 2006-C7, Class A2 | | | | | | | | |
5.30%, 11/15/2038 | | | 1,651 | | | | 1,654 | |
Series 2007-C2, Class A2 | | | | | | | | |
5.30%, 02/15/2040 | | | 1,962 | | | | 1,967 | |
Merrill Lynch Mortgage Trust | | | | | | | | |
Series 2005-MKB2, Class A2 | | | | | | | | |
4.81%, 09/12/2042 | | | 966 | | | | 965 | |
Series 2006-C1, Class A2 | | | | | | | | |
5.62%, 05/12/2039 * | | | 463 | | | | 475 | |
Merrill Lynch/Countrywide Commercial Mortgage Trust | | | | | | | | |
Series 2007-8, Class A2 | | | | | | | | |
5.93%, 08/12/2049 * | | | 1,817 | | | | 1,924 | |
Wachovia Bank Commercial Mortgage Trust | | | | | | | | |
Series 2003-C5, Class A1 | | | | | | | | |
2.99%, 06/15/2035 | | | 166 | | | | 166 | |
Series 2003-C9, Class A3 | | | | | | | | |
4.61%, 12/15/2035 | | | 896 | | | | 906 | |
Series 2007-C30, Class A3 | | | | | | | | |
5.25%, 12/15/2043 | | | 4,700 | | | | 4,750 | |
Series 2007-C30, Class APB | | | | | | | | |
5.29%, 12/15/2043 | | | 5,000 | | | | 5,206 | |
| | | | | | | | |
| | | Principal
(000’s) | | | Value
(000’s) | |
MORTGAGE-BACKED SECURITIES (continued) | |
Wachovia Bank Commercial Mortgage Trust (continued) | | | | | |
Series 2007-C33, Class A3 | | | | | | | | |
5.90%, 02/15/2051 * | | $ | 4,300 | | | $ | 4,558 | |
Wells Fargo Mortgage Backed Securities Trust | | | | | |
Series 2005-9, Class 1A1 | | | | | | | | |
4.75%, 10/25/2035 | | | 80 | | | | 80 | |
| | | | | | | | |
Total Mortgage-Backed Securities
(cost $83,248) | | | | 83,963 | |
| | | | | | | | |
ASSET-BACKED SECURITIES - 28.4% | |
AmeriCredit Automobile Receivables Trust | | | | | | | | |
Series 2009-1, Class B | | | | | | | | |
9.79%, 04/15/2014 | | | 1,000 | | | | 1,074 | |
Avis Budget Rental Car Funding AESOP LLC | | | | | | | | |
Series 2010-5A, Class A | | | | | | | | |
3.15%, 03/20/2017 - 144A | | | 2,000 | | | | 2,023 | |
BMW Vehicle Owner Trust | | | | | | | | |
Series 2010-A, Class A4 | | | | | | | | |
2.10%, 10/25/2016 | | | 4,000 | | | | 4,066 | |
Capital One Multi-Asset Execution Trust | | | | | | | | |
Series 2008-A3, Class A3 | | | | | | | | |
5.05%, 02/15/2016 | | | 4,750 | | | | 5,001 | |
CarMax Auto Owner Trust | | | | | | | | |
Series 2010-2, Class A3 | | | | | | | | |
1.41%, 02/16/2015 | | | 4,301 | | | | 4,322 | |
CenterPoint Energy Transition Bond Co., LLC | | | | | | | | |
Series 2009-1, Class A1 | | | | | | | | |
1.83%, 02/15/2016 | | | 3,694 | | | | 3,754 | |
Chase Funding Mortgage Loan Asset-Backed Certificates | | | | | | | | |
Series 2003-4, Class 1A6 | | | | | | | | |
4.43%, 10/25/2014 * | | | 1,103 | | | | 1,102 | |
Citibank Credit Card Issuance Trust | | | | | | | | |
Series 2009-A4, Class A4 | | | | | | | | |
4.90%, 06/23/2016 ^ | | | 2,100 | | | | 2,305 | |
Citibank Omni Master Trust | | | | | | | | |
Series 2009-A8, Class A8 | | | | | | | | |
2.38%, 05/16/2016 - 144A * | | | 2,850 | | | | 2,868 | |
CNH Equipment Trust | | | | | | | | |
Series 2009-B, Class A4 | | | | | | | | |
5.17%, 10/15/2014 | | | 1,710 | | | | 1,749 | |
Series 2009-C, Class A4 | | | | | | | | |
3.00%, 08/17/2015 | | | 3,000 | | | | 3,046 | |
Series 2009-C, Class B | | | | | | | | |
4.98%, 04/15/2016 | | | 500 | | | | 519 | |
Series 2010-A, Class B | | | | | | | | |
4.04%, 09/15/2016 | | | 2,175 | | | | 2,239 | |
Series 2010-B, Class A4 | | | | | | | | |
1.74%, 01/17/2017 | | | 4,400 | | | | 4,446 | |
Series 2011-B, Class A4 | | | | | | | | |
1.29%, 09/15/2017 | | | 3,495 | | | | 3,475 | |
Discover Card Master Trust | | | | | | | | |
Series 2008-A4, Class A4 | | | | | | | | |
5.65%, 12/15/2015 ^ | | | 4,500 | | | | 4,815 | |
Entergy Texas Restoration Funding LLC | | | | | | | | |
Series 2009-A, Class A1 | | | | | | | | |
1.00%, 02/01/2016 | | | 1,664 | | | | 1,694 | |
Ford Credit Auto Owner Trust | | | | | | | | |
Series 2010-A, Class A3 | | | | | | | | |
1.32%, 06/15/2014 | | | 1,928 | | | | 1,935 | |
Series 2010-B, Class A4 | | | | | | | | |
1.58%, 09/15/2015 | | | 2,725 | | | | 2,757 | |
Series 2010-B, Class B | | | | | | | | |
2.54%, 02/15/2016 | | | 5,500 | | | | 5,659 | |
| | | | | | | | |
| | | Principal
(000’s) | | | Value
(000’s) | |
ASSET-BACKED SECURITIES (continued) | |
Ford Credit Floorplan Master Owner Trust | | | | | | | | |
Series 2010-5, Class A1 | | | | | | | | |
1.50%, 09/15/2015 | | $ | 2,000 | | | $ | 2,003 | |
GE Capital Credit Card Master Note Trust | | | | | | | | |
Series 2009-2, Class A | | | | | | | | |
3.69%, 07/15/2015 | | | 4,377 | | | | 4,446 | |
Series 2010-3, Class A | | | | | | | | |
2.21%, 06/15/2016 | | | 3,000 | | | | 3,059 | |
GE Equipment Midticket LLC | | | | | | | | |
Series 2009-1, Class A4 | | | | | | | | |
3.13%, 11/16/2020 | | | 4,750 | | | | 4,812 | |
GE Equipment Transportation LLC | | | | | | | | |
Series 2011-1, Class A4 | | | | | | | | |
1.33%, 05/20/2019 | | | 1,000 | | | | 1,002 | |
Honda Auto Receivables Owner Trust | | | | | | | | |
Series 2009-2, Class A3 | | | | | | | | |
2.79%, 01/16/2012 | | | 124 | | | | 124 | |
Series 2009-2, Class A4 | | | | | | | | |
4.43%, 08/15/2012 | | | 2,650 | | | | 2,700 | |
Series 2010-1, Class A3 | | | | | | | | |
1.25%, 10/21/2013 | | | 1,309 | | | | 1,312 | |
Huntington Auto Trust | | | | | | | | |
Series 2011-1A, Class A4 | | | | | | | | |
1.31%, 11/15/2016 - 144A | | | 2,000 | | | | 1,987 | |
Series 2011-1A, Class B | | | | | | | | |
1.84%, 01/17/2017 - 144A | | | 1,500 | | | | 1,494 | |
Hyundai Auto Receivables Trust | | | | | | | | |
Series 2010-B, Class A4 | | | | | | | | |
1.63%, 03/15/2017 | | | 2,000 | | | | 2,026 | |
Series 2011-A, Class A4 | | | | | | | | |
1.78%, 12/15/2015 | | | 3,000 | | | | 3,051 | |
Macquarie Equipment Funding Trust | | | | | | | | |
Series 2011-A, Class A3 | | | | | | | | |
1.91%, 04/20/2017 - 144A | | | 1,800 | | | | 1,819 | |
Massachusetts RRB Special Purpose Trust | | | | | | | | |
Series 2005-1, Class A4 | | | | | | | | |
4.40%, 03/15/2015 | | | 1,397 | | | | 1,433 | |
MBNA Credit Card Master Note Trust | | | | | | | | |
Series 2004-B1, Class B1 | | | | | | | | |
4.45%, 08/15/2016 | | | 1,100 | | | | 1,169 | |
Mercedes-Benz Auto Receivables Trust | | | | | | | | |
Series 2010-1, Class A3 | | | | | | | | |
1.42%, 08/15/2014 | | | 1,367 | | | | 1,373 | |
MMAF Equipment Finance LLC | | | | | | | | |
Series 2009-AA, Class A4 | | | | | | | | |
3.51%, 01/15/2030 - 144A | | | 5,385 | | | | 5,582 | |
Series 2011-AA, Class A3 | | | | | | | | |
1.27%, 09/15/2015 - 144A | | | 1,350 | | | | 1,349 | |
North Carolina State Education Assistance Authority | | | | | | | | |
Series 2011-2, Class A1 | | | | | | | | |
0.87%, 10/26/2020 * | | | 1,370 | | | | 1,361 | |
Railcar Leasing LLC | | | | | | | | |
Series 1, Class A2 | | | | | | | | |
7.13%, 01/15/2013 - 144A | | | 3,386 | | | | 3,480 | |
Toyota Auto Receivables Owner Trust | | | | | | | | |
Series 2010-A, Class A3 | | | | | | | | |
1.27%, 12/16/2013 | | | 2,697 | | | | 2,704 | |
USAA Auto Owner Trust | | | | | | | | |
Series 2009-2, Class A4 | | | | | | | | |
2.53%, 06/17/2013 | | | 1,005 | | | | 1,023 | |
Series 2010-1, Class A3 | | | | | | | | |
1.30%, 06/16/2014 | | | 1,449 | | | | 1,453 | |
| | | | | | | | |
| | | Principal
(000’s) | | | Value
(000’s) | |
ASSET-BACKED SECURITIES (continued) | | | | | |
Volkswagen Auto Loan Enhanced Trust | | | | | | | | |
Series 2010-1, Class A4 | | | | | | | | |
2.14%, 08/22/2016 | | $ | 1,870 | | | $ | 1,900 | |
Series 2011-1, Class A3 | | | | | | | | |
1.22%, 06/22/2015 | | | 3,250 | | | | 3,266 | |
World Financial Network Credit Card Master Trust | | | | | | | | |
Series 2009-B, Class A | | | | | | | | |
3.79%, 05/15/2016 | | | 2,450 | | | | 2,485 | |
Series 2009-D, Class A | | | | | | | | |
4.66%, 05/15/2017 | | | 1,250 | | | | 1,310 | |
Series 2010-A, Class A | | | | | | | | |
3.96%, 04/15/2019 | | | 4,750 | | | | 5,069 | |
World Omni Auto Receivables Trust | | | | | | | | |
Series 2010-A, Class A4 | | | | | | | | |
2.21%, 09/15/2013 | | | 2,200 | | | | 2,231 | |
World Omni Automobile Lease Securitization Trust | | | | | | | | |
Series 2011-A, Class A3 | | | | | | | | |
1.49%, 10/15/2014 | | | 3,750 | | | | 3,772 | |
| | | | | | | | |
Total Asset-Backed Securities
(cost $129,285) | | | | | | | 129,644 | |
| | | | | | | | |
CORPORATE DEBT SECURITIES - 37.8% | | | | | |
Aerospace & Defense - 0.3% | | | | | | | | |
Lockheed Martin Corp. | | | | | | | | |
2.13%, 09/15/2016 | | | 1,320 | | | | 1,322 | |
Beverages - 2.1% | | | | | | | | |
Anheuser-Busch InBev Worldwide, Inc. | | | | | | | | |
2.50%, 03/26/2013 ^ | | | 4,700 | | | | 4,787 | |
Bottling Group LLC | | | | | | | | |
6.95%, 03/15/2014 ^ | | | 4,210 | | | | 4,732 | |
Capital Markets - 3.9% | | | | | | | | |
Credit Suisse | | | | | | | | |
5.50%, 05/01/2014 | | | 4,230 | | | | 4,397 | |
Goldman Sachs Group, Inc. | | | | | | | | |
0.62%, 02/06/2012 * | | | 4,330 | | | | 4,323 | |
3.63%, 08/01/2012 ^ | | | 3,005 | | | | 3,023 | |
Morgan Stanley | | | | | | | | |
6.00%, 05/13/2014 | | | 6,100 | | | | 6,159 | |
Chemicals - 0.6% | | | | | | | | |
Airgas, Inc. | | | | | | | | |
4.50%, 09/15/2014 | | | 2,591 | | | | 2,745 | |
Commercial Banks - 4.1% | | | | | | | | |
Bank of Nova Scotia | | | | | | | | |
2.25%, 01/22/2013 ^ | | | 6,640 | | | | 6,731 | |
PNC Funding Corp. | | | | | | | | |
2.70%, 09/19/2016 ^ | | | 4,175 | | | | 4,250 | |
Wells Fargo Bank NA - Series AI | | | | | |
4.75%, 02/09/2015 | | | 5,000 | | | | 5,216 | |
Westpac Banking Corp. | | | | | | | | |
2.25%, 11/19/2012 ^ | | | 2,705 | | | | 2,732 | |
Commercial Services & Supplies - 1.4% | | | | | |
Yale University | | | | | | | | |
2.90%, 10/15/2014 | | | 6,250 | | | | 6,617 | |
Consumer Finance - 2.9% | | | | | | | | |
American Express Credit Corp. | | | | | | | | |
1.42%, 06/24/2014 * ^ | | | 4,345 | | | | 4,261 | |
7.30%, 08/20/2013 | | | 3,350 | | | | 3,636 | |
Capital One Financial Corp. | | | | | | | | |
2.13%, 07/15/2014 ^ | | | 2,195 | | | | 2,167 | |
Caterpillar Financial Services Corp. | | | | | | | | |
1.38%, 05/20/2014 ^ | | | 1,410 | | | | 1,428 | |
Household Finance Corp. | | | | | | | | |
6.38%, 11/27/2012 | | | 1,750 | | | | 1,800 | |
| | | | | | | | |
| | | Principal
(000’s) | | | Value
(000’s) | |
Diversified Financial Services - 8.4% | | | | | |
Bank of America Corp. | | | | | | | | |
4.90%, 05/01/2013 | | $ | 3,025 | | | $ | 3,027 | |
Citigroup, Inc. | | | | | | | | |
5.50%, 10/15/2014 | | | 4,625 | | | | 4,755 | |
CME Group, Inc. | | | | | | | | |
5.40%, 08/01/2013 ^ | | | 2,275 | | | | 2,424 | |
Diageo Finance BV | | | | | | | | |
5.50%, 04/01/2013 | | | 3,320 | | | | 3,510 | |
FUEL Trust | | | | | | | | |
3.98%, 06/15/2016 - 144A | | | 1,750 | | | | 1,750 | |
4.21%, 04/15/2016 - 144A | | | 2,060 | | | | 2,077 | |
General Electric Capital Corp. | | | | | | | | |
1.88%, 09/16/2013 | | | 2,000 | | | | 2,025 | |
2.10%, 01/07/2014 ^ | | | 5,700 | | | | 5,786 | |
John Deere Capital Corp. | | | | | | | | |
5.25%, 10/01/2012 | | | 2,875 | | | | 2,975 | |
JPMorgan Chase & Co. | | | | | | | | |
3.45%, 03/01/2016 | | | 5,610 | | | | 5,699 | |
NYSE Euronext | | | | | | | | |
4.80%, 06/28/2013 | | | 3,670 | | | | 3,861 | |
Diversified Telecommunication Services - 1.4% | | | | | |
AT&T, Inc. | | | | | | | | |
4.95%, 01/15/2013 | | | 6,375 | | | | 6,644 | |
Electric Utilities - 1.5% | | | | | | | | |
Hydro Quebec | | | | | | | | |
2.00%, 06/30/2016 | | | 4,160 | | | | 4,247 | |
Public Service Electric & Gas Co. | | | | | | | | |
5.13%, 09/01/2012 | | | 2,365 | | | | 2,431 | |
Food & Staples Retailing - 0.3% | | | | | | | | |
CVS Caremark Corp. | | | | | | | | |
3.25%, 05/18/2015 | | | 1,100 | | | | 1,160 | |
Household Products - 0.8% | | | | | | | | |
Procter & Gamble Co. | | | | | | | | |
1.38%, 08/01/2012 ^ | | | 3,870 | | | | 3,889 | |
Insurance - 4.2% | | | | | | | | |
Berkshire Hathaway, Inc. | | | | | | | | |
1.40%, 02/10/2012 ^ | | | 4,920 | | | | 4,925 | |
3.20%, 02/11/2015 ^ | | | 2,465 | | | | 2,613 | |
Metropolitan Life Global Funding I | | | | | |
2.50%, 09/29/2015 - 144A | | | 7,285 | | | | 7,327 | |
5.13%, 06/10/2014 - 144A | | | 430 | | | | 463 | |
New York Life Global Funding | | | | | | | | |
5.38%, 09/15/2013 - 144A | | | 3,745 | | | | 3,995 | |
Machinery - 0.5% | | | | | | | | |
Caterpillar, Inc. | | | | | | | | |
1.38%, 05/27/2014 | | | 2,365 | | | | 2,393 | |
Media - 0.6% | | | | | | | | |
Comcast Corp. | | | | | | | | |
5.30%, 01/15/2014 ^ | | | 2,600 | | | | 2,802 | |
Office Electronics - 0.7% | | | | | | | | |
Xerox Corp. | | | | | | | | |
8.25%, 05/15/2014 | | | 3,005 | | | | 3,391 | |
Oil, Gas & Consumable Fuels - 1.7% | | | | | | | | |
Shell International Finance BV | | | | | | | | |
4.00%, 03/21/2014 ^ | | | 4,025 | | | | 4,326 | |
Total Capital Canada, Ltd. | | | | | | | | |
1.63%, 01/28/2014 | | | 3,460 | | | | 3,518 | |
Pharmaceuticals - 0.8% | | | | | | | | |
Novartis Capital Corp. | | | | | | | | |
4.13%, 02/10/2014 | | | 3,215 | | | | 3,440 | |
Real Estate Investment Trusts - 0.2% | | | | | | | | |
Boston Properties, LP | | | | | | | | |
6.25%, 01/15/2013 ^ | | | 776 | | | | 806 | |
| | | | | | | | |
| | | Principal
(000’s) | | | Value
(000’s) | |
Wireless Telecommunication Services - 1.4% | | | | | |
ALLTEL Corp. | | | | | | | | |
7.00%, 07/01/2012 | | $ | 6,150 | | | $ | 6,337 | |
| | | | | | | | |
Total Corporate Debt Securities
(cost $171,033) | | | | 172,922 | |
| | | | | | | | |
| | |
| | | Shares | | | Value
(000’s) | |
SECURITIES LENDING COLLATERAL - 7.8% | |
State Street Navigator Securities Lending Trust - Prime Portfolio, 0.28% p | | | 35,891,640 | | | | 35,892 | |
Total Securities Lending Collateral
(cost $35,892) | |
| | |
| | | Principal
(000’s) | | | Value
(000’s) | |
REPURCHASE AGREEMENT - 3.4% | | | | | |
State Street Bank & Trust Co. | | | | | |
0.03% p , dated 12/30/2011, to be repurchased at $15,687 on 01/03/2012. Collateralized by a U.S. Government Agency Obligation, 3.00%, due 11/25/2040, and with a value of $16,001. | | $ | 15,687 | | | | 15,687 | |
Total Repurchase Agreement
(cost $15,687) | | | | | |
| | | | | | | | |
Total Investment Securities
(cost $488,425) | | | | 491,669 | |
Other Assets and Liabilities - Net | | | | (33,441 | ) |
| | | | | | | | |
Net Assets | | | | | | $ | 458,228 | |
| | | | | | | | |
NOTES TO SCHEDULE OF INVESTMENTS (all amounts in thousands):
| ^ | All or a portion of this security is on loan. The value of all securities on loan is $35,154. |
| * | Floating or variable rate note. Rate is listed as of 12/30/2011. |
| Security fair valued as determined in good faith in accordance with procedures established by the Board of Trustees. This security had a fair value of $3,480, or 0.76% of the portfolio’s net assets. |
| p | Rate shown reflects the yield at 12/30/2011. |
| Aggregate cost for federal income tax purposes is $488,433. Aggregate gross unrealized appreciation/depreciation for all securities in which there is an excess of value over tax cost were $5,091 and $1,855, respectively. Net unrealized appreciation for tax purposes is $3,236. |
DEFINITION (all amounts in thousands):
| | |
144A | | 144A Securities are registered pursuant to Rule 144A of the Securities Act of 1933. These securities are deemed to be liquid for purposes of compliance limitations on holdings of illiquid securities and may be resold as transactions exempt from registration, normally to qualified institutional buyers. At 12/31/2011, these securities aggregated $46,400, or 10.13%, of the portfolio’s net assets. |
VALUATION SUMMARY (all amounts in thousands):
| | | | | | | | | | | | | | | | |
Investment Securities | | Level 1 -
Quoted
Prices | | | Level 2 -
Other
Significant
Observable
Inputs | | | Level 3 -
Significant
Unobservable
Inputs | | | Value at
12/31/2011 | |
Asset-Backed Securities | | $ | — | | | $ | 129,644 | | | $ | — | | | $ | 129,644 | |
Corporate Debt Securities | | | — | | | | 172,922 | | | | — | | | | 172,922 | |
Foreign Government Obligations | | | — | | | | 8,919 | | | | — | | | | 8,919 | |
Mortgage-Backed Securities | | | — | | | | 83,963 | | | | — | | | | 83,963 | |
Repurchase Agreement | | | — | | | | 15,687 | | | | — | | | | 15,687 | |
Securities Lending Collateral | | | 35,892 | | | | — | | | | — | | | | 35,892 | |
U.S. Government Agency Obligations | | | — | | | | 22,030 | | | | — | | | | 22,030 | |
U.S. Government Obligations | | | — | | | | 22,612 | | | | — | | | | 22,612 | |
| | | | | | | | | | | | | | | | |
Total | | $ | 35,892 | | | $ | 455,777 | | | $ | — | | | $ | 491,669 | |
| | | | | | | | | | | | | | | | |
| See the notes to the financial statements for more information regarding pricing inputs and valuation techniques. |
| | | | | | | | |
| | |
Principal
(000’s) | | | Value
(000’s) | |
U.S. GOVERNMENT OBLIGATIONS - 94.4% | |
U.S. Treasury Bond | | | | | | | | |
3.75%, 08/15/2041 ^g | | $ | 2,128 | | | $ | 2,502 | |
4.38%, 05/15/2040 | | | 830 | | | | 1,078 | |
U.S. Treasury Inflation Indexed Bond | |
0.13%, 04/15/2016 a | | | 25,359 | | | | 26,437 | |
0.63%, 07/15/2021 | | | 19,143 | | | | 20,478 | |
1.13%, 01/15/2021 | | | 2,955 | | | | 3,296 | |
1.75%, 01/15/2028 | | | 11,527 | | | | 13,863 | |
2.00%, 01/15/2026 | | | 3,645 | | | | 4,481 | |
2.13%, 02/15/2040 - 02/15/2041 | | | 30,405 | | | | 40,934 | |
2.38%, 01/15/2025 - 01/15/2027 | | | 24,051 | | | | 30,702 | |
2.50%, 01/15/2029 | | | 5,917 | | | | 7,894 | |
3.38%, 04/15/2032 | | | 729 | | | | 1,123 | |
3.63%, 04/15/2028 | | | 9,814 | | | | 14,592 | |
3.88%, 04/15/2029 | | | 12,844 | | | | 20,014 | |
U.S. Treasury Inflation Indexed Note | | | | | |
0.50%, 04/15/2015 | | | 21,785 | | | | 22,794 | |
0.63%, 04/15/2013 | | | 252 | | | | 256 | |
1.25%, 04/15/2014 a | | | 10,796 | | | | 11,313 | |
1.38%, 07/15/2018 ^ | | | 1,197 | | | | 1,355 | |
1.38%, 01/15/2020 g | | | 10,631 | | | | 12,104 | |
1.63%, 01/15/2015 - 01/15/2018 | | | 4,885 | | | | 5,508 | |
1.88%, 07/15/2013 - 07/15/2015 | | | 21,321 | | | | 22,714 | |
1.88%, 07/15/2019 g | | | 6,999 | | | | 8,247 | |
2.00%, 04/15/2012 - 01/15/2016 | | | 36,529 | | | | 37,761 | |
2.13%, 01/15/2019 | | | 5,110 | | | | 6,074 | |
2.38%, 01/15/2017 | | | 7,023 | | | | 8,153 | |
2.50%, 07/15/2016 | | | 9,966 | | | | 11,527 | |
2.63%, 07/15/2017 | | | 606 | | | | 722 | |
3.00%, 07/15/2012 | | | 1,366 | | | | 1,396 | |
U.S. Treasury Note | | | | | | | | |
1.00%, 10/31/2016 ^ | | | 1,375 | | | | 1,388 | |
| | | | | | | | |
Total U.S. Government Obligations
(cost $317,858) | | | | 338,706 | |
| | | | | | | | |
FOREIGN GOVERNMENT OBLIGATIONS - 0.3% | |
Hellenic Republic Government Bond | | | | | | | | |
2.30%, 07/25/2030 | | | EUR1,158 | | | | 271 | |
Italy Buoni Poliennali Del Tesoro | | | | | |
2.10%, 09/15/2021 | | | 844 | | | | 808 | |
| | | | | | | | |
Total Foreign Government Obligations
(cost $2,008) | | | | 1,079 | |
| | | | | | | | |
MORTGAGE-BACKED SECURITY - 0.1% | |
GMAC Commercial Mortgage Securities, Inc. | | | | | |
Series 2004-C3, Class A4 | | | | | |
4.55%, 12/10/2041 | | $ | 183 | | | | 184 | |
Total Mortgage-Backed Security (cost $175) | |
STRUCTURED NOTES DEBT - 0.5% | | | | | |
Commercial Banks - 0.1% | | | | | | | | |
International Bank for Reconstruction & Development CPI | | | | | | | | |
2.09%, 12/10/2013 * | | | 315 | | | | 322 | |
Consumer Finance - 0.2% | | | | | | | | |
SLM Corp. CPI | | | | | | | | |
4.23%, 01/31/2014 * | | | 900 | | | | 851 | |
Diversified Financial Services - 0.2% | |
Bear Stearns Cos., LLC CPI | | | | | |
5.37%, 03/10/2014 * | | | 649 | | | | 657 | |
| | | | | | | | |
Total Structured Notes Debt
(cost $1,788) | | | | 1,830 | |
| | | | | | | | |
| | | | | | | | |
| | | Notional
Amount
(000’s) | | | Value
(000’s) | |
PURCHASED OPTIONS - 0.0% ¥ | | | | | |
Call Options - 0.0% ¥ | | | | | | | | |
Euro | | EUR | 2,600 | | | $ | ¨ | |
Call Strike $1.42 | | | | | | | | |
Expires 01/13/2012 | | | | | | | | |
Euro | | | 2,600 | | | | 10 | |
Call Strike $1.38 | | | | | | | | |
Expires 02/23/2012 | | | | | | | | |
Euro | | | 2,670 | | | | 33 | |
Call Strike $1.42 | | | | | | | | |
Expires 06/11/2012 | | | | | | | | |
USD vs. JPY | | $ | 7,040 | | | | ¨ | |
Call Strike $81.00 | | | | | | | | |
Expires 01/13/2012 | | | | | | | | |
| | | | | | | | |
Total Purchased Options
(cost $117) | | | | 43 | |
| | | | | | | | |
PURCHASED SWAPTIONS - 0.3% p | | | | | |
Call Options - 0.3% | | | | | |
If exercised the Series receives 4.39%, and pays floating 3 month LIBOR, European Style | | | 5,000 | | | | 1,021 | |
Expires 05/08/2012 | | | | | | | | |
Put Options - 0.0% ¥ | | | | | |
If exercised the Series receives floating 3 month LIBOR, and pays 3.9%, European Style | | | 3,600 | | | | 62 | |
Expires 09/19/2013 | | | | | | | | |
If exercised the Series receives floating 3 month LIBOR, and pays 4.39%, European Style | | | 5,000 | | | | 1 | |
Expires 05/08/2012 | | | | | | | | |
| | | | | | | | |
Total Purchased Swaptions (cost $677) | | | | 1,084 | |
| | | | | | | | |
| | |
| | | Shares | | | Value
(000’s) | |
SECURITIES LENDING COLLATERAL - 0.8% | |
State Street Navigator Securities Lending Trust - Prime Portfolio, 0.28% p | | | 2,716,190 | | | | 2,716 | |
Total Securities Lending Collateral
(cost $2,716) | |
| | |
| | | Principal
(000’s) | | | Value
(000’s) | |
REPURCHASE AGREEMENT - 4.3% | |
State Street Bank & Trust Co. | | | | | |
0.03% p , dated 12/30/2011, to be repurchased at $15,358 on 01/03/2012. Collateralized by a U.S. Government Agency Obligation, 3.50%, due 11/15/2040, and with a value of $15,666. | | $ | 15,358 | | | | 15,358 | |
Total Repurchase Agreement (cost $15,358) | |
| | | | | | | | |
Total Investment Securities (cost $340,697) | | | | 361,000 | |
Other Assets and Liabilities - Net | | | | (2,456 | ) |
| | | | | | | | |
Net Assets | | | | | | $ | 358,544 | |
| | | | | | | | |
| | | | | | | | |
| | | Notional
Amount
(000’s) | | | Value
(000’s) | |
WRITTEN OPTIONS - 0.0% ¥ | |
Call Options - 0.0% ¥ | |
10-Year U.S. Treasury Note Future | | $ | (47 | ) | | $ | (19 | ) |
Call Strike $132.00 | | | | | | | | |
Expires 01/27/2012 | | | | | | | | |
Euro | | EUR | (2,600 | ) | | | (23 | ) |
Call Strike $1.35 | | | | | | | | |
Expires 02/23/2012 | | | | | | | | |
Euro | | | (2,670 | ) | | | (55 | ) |
Call Strike $1.38 | | | | | | | | |
Expires 06/11/2012 | | | | | | | | |
Euro | | | (2,670 | ) | | | (33 | ) |
Call Strike $1.42 | | | | | | | | |
Expires 06/11/2012 | | | | | | | | |
Euro | | | (2,600 | ) | | | (10 | ) |
Call Strike $1.38 | | | | | | | | |
Expires 02/23/2012 | | | | | | | | |
Euro | | | (2,600 | ) | | | ¨ | |
Call Strike $1.42 | | | | | | | | |
Expires 01/13/2012 | | | | | | | | |
| | | | | | | | |
Total Written Options (premiums: $(320)) | | | | (140 | ) |
| | | | | | | | |
WRITTEN SWAPTIONS: p
| | | | | | | | | | | | | | | | | | | | | | | | | | |
Description | | Counterparty | | Floating Rate
Index | | Pay/Receive
Floating Rate | | Exercise
Rate | | | Expiration
Date | | | Notional
Amount
(000’s) | | | Premiums
(Received)
(000’s) | | | Value
(000’s) | |
Call - Interest Rate Swap, European Style | | CITI | | 3-month USD LIBOR | | Receive | | | 2.15 | % | | | 09/09/2013 | | | $ | (3,600 | ) | | $ | (81 | ) | | $ | (111 | ) |
Call - Interest Rate Swap, European Style | | UBS | | 3-month USD LIBOR | | Receive | | | 3.90 | | | | 03/19/2012 | | | | (6,000 | ) | | | (229 | ) | | | (1,006 | ) |
Call - Interest Rate Swap, European Style | | DUB | | 3-month USD LIBOR | | Receive | | | 4.01 | | | | 02/02/2012 | | | | (5,200 | ) | | | (202 | ) | | | (944 | ) |
Call - Interest Rate Swap, European Style | | DUB | | 3-month USD LIBOR | | Receive | | | 4.78 | | | | 02/25/2014 | | | | (4,000 | ) | | | (233 | ) | | | (819 | ) |
Put - Interest Rate Swap, European Style | | CITI | | 3-month USD LIBOR | | Pay | | | 2.00 | | | | 12/13/2012 | | | | (11,300 | ) | | | (111 | ) | | | (92 | ) |
Put - Interest Rate Swap, European Style | | UBS | | 3-month USD LIBOR | | Pay | | | 3.90 | | | | 03/19/2012 | | | | (6,000 | ) | | | (229 | ) | | | (¨ | ) |
Put - Interest Rate Swap, European Style | | DUB | | 3-month USD LIBOR | | Pay | | | 4.01 | | | | 02/02/2012 | | | | (5,200 | ) | | | (202 | ) | | | ¨ | |
Put - Interest Rate Swap, European Style | | DUB | | 3-month USD LIBOR | | Pay | | | 4.78 | | | | 02/25/2014 | | | | (4,000 | ) | | | (233 | ) | | | (58 | ) |
| | | | | | | | | | | | | | | | | | | | | | | | | | |
| | | | | | | | | | | | | | | | | | | | $ | (1,520 | ) | | $ | (3,030 | ) |
| | | | | | | | | | | | | | | | | | | | | | | | | | |
SWAP AGREEMENTS: p
INTEREST RATE SWAP AGREEMENTS - FIXED RATE PAYABLE:
| | | | | | | | | | | | | | | | | | | | | | | | | | | | | | | | |
Floating Rate Index | | Fixed Rate | | | Maturity
Date | | | Counterparty | | | Currency
Code | | | Notional
Amount
(000’s) | | | Market
Value
(000’s) | | | Premiums
Paid
(000’s) | | | Net Unrealized
Appreciation
(Depreciation)
(000’s) | |
3-Month USD-LIBOR | | | 0.57 | % | | | 09/23/2016 | | | | DUB | | | | USD | | | $ | 400 | | | $ | ¨ | | | $ | ¨ | | | $ | ¨ | |
3-Month USD-LIBOR | | | 0.44 | | | | 08/08/2021 | | | | CITI | | | | USD | | | | 6,600 | | | | 430 | | | | ¨ | | | | 430 | |
3-Month USD-LIBOR | | | 0.54 | | | | 09/13/2021 | | | | DUB | | | | USD | | | | 4,000 | | | | 67 | | | | ¨ | | | | 67 | |
6-Month EURIBOR | | | 1.00 | | | | 12/13/2013 | | | | DUB | | | | EUR | | | | 22,100 | | | | (36 | ) | | | ¨ | | | | (36 | ) |
U.S. CPI Urban Consumers NAS | | | 1.00 | | | | 10/25/2020 | | | | MYC | | | | USD | | | | 2,495 | | | | 36 | | | | ¨ | | | | 36 | |
U.S. CPI Urban Consumers NAS | | | 1.00 | | | | 06/23/2021 | | | | DUB | | | | USD | | | | 4,345 | | | | 201 | | | | ¨ | | | | 201 | |
| | | | | | | | | | | | | | | | | | | | | | | | | | | | | | | | |
| | | | | | | | | | | | | | | | | | | | | | $ | 698 | | | $ | ¨ | | | $ | 698 | |
| | | | | | | | | | | | | | | | | | | | | | | | | | | | | | | | |
INTEREST RATE SWAP AGREEMENTS - FIXED RATE RECEIVABLE:
| | | | | | | | | | | | | | | | | | | | | | | | | | | | |
Floating Rate Index | | Fixed
Rate | | | Maturity
Date | | | Counterparty | | Currency
Code | | Notional
Amount
(000’s) | | | Market
Value
(000’s) | | | Premiums
Paid
(Received)
(000’s) | | | Net Unrealized
Appreciation
(Depreciation)
(000’s) | |
3-Month USD-LIBOR | | | 4.13 | % | | | 12/20/2021 | | | DUB | | USD | | $ | 3,600 | | | $ | (704 | ) | | $ | (148 | ) | | $ | (556 | ) |
U.S. CPI Urban Consumers NAS | | | 1.84 | | | | 10/25/2015 | | | MYC | | USD | | | 4,730 | | | | 55 | | | | ¨ | | | | 55 | |
| | | | | | | | | | | | | | | | | | | | | | | | | | | | |
| | | | | | | | | | | | | | | | | | $ | (649 | ) | | $ | (148 | ) | | $ | (501 | ) |
| | | | | | | | | | | | | | | | | | | | | | | | | | | | |
FUTURES CONTRACTS: g
| | | | | | | | | | | | | | |
Description | | Type | | | Contracts | | | Expiration Date | | Net Unrealized
Appreciation
(Depreciation)
(000’s) | |
10-Year U.S. Treasury Note | | | Long | | | | 202 | | | 03/21/2012 | | $ | 219 | |
2-Year U.S. Treasury Note | | | Short | | | | (87 | ) | | 03/30/2012 | | | (9 | ) |
30-Year U.S. Treasury Bond | | | Short | | | | (181 | ) | | 03/21/2012 | | | (345 | ) |
3-Month Canadian Bankers’ Acceptance | | | Short | | | | (152 | ) | | 03/19/2012 | | | 52 | |
5-Year U.S. Treasury Note | | | Long | | | | 314 | | | 03/30/2012 | | | 127 | |
German Euro Bund | | | Short | | | | (33 | ) | | 03/08/2012 | | | (165 | ) |
German Euro Schatz | | | Short | | | | (200 | ) | | 03/08/2012 | | | (68 | ) |
Ultra Long U.S. Treasury Bond | | | Short | | | | (86 | ) | | 03/21/2012 | | | (168 | ) |
| | | | | | | | | | | | | | |
| | | | | | | | | | | | $ | (357 | ) |
| | | | | | | | | | | | | | |
FORWARD FOREIGN CURRENCY CONTRACTS:
| | | | | | | | | | | | | | | | |
Currency | | Counterparty | | Contracts
Bought
(Sold)
(000’s) | | | Settlement Date | | Amount in U.S.
Dollars Bought
(Sold)
(000’s) | | | Net Unrealized
Appreciation
(Depreciation)
(000’s) | |
Euro | | DUB | | | (174 | ) | | 01/25/2012 | | $ | (234 | ) | | $ | 9 | |
Euro | | CITI | | | (57 | ) | | 01/25/2012 | | | (77 | ) | | | 3 | |
Euro | | CITI | | | (1,320 | ) | | 01/25/2012 | | | (1,815 | ) | | | 107 | |
Euro | | DUB | | | 500 | | | 01/25/2012 | | | 670 | | | | (23 | ) |
Japanese Yen | | RBS | | | (423,053 | ) | | 03/05/2012 | | | (5,471 | ) | | | (33 | ) |
| | | | | | | | | | | | | | | | |
| | | | | | | | | | | | | | $ | 63 | |
| | | | | | | | | | | | | | | | |
Collateral (Received) Pledged for OTC Financial Derivative Instruments
The following is a summary by counterparty of the market value of OTC financial derivative instruments and collateral (received)/pledged as of 12/31/2011:
| | | | | | | | | | | | |
Counterparty | | Total Market Value of OTC
Derivatives
(000’s) | | | Collateral
(Received)/Pledged
(000’s) | | | Net Exposures (1)
(000’s) | |
CITI | | $ | 337 | | | $ | (1,224 | ) | | $ | (787 | ) |
DUB | | | (2,159 | ) | | | 2,082 | | | | (77 | ) |
MYC | | | 91 | | | | — | | | | 91 | |
RBS | | | (33 | ) | | | — | | | | (33 | ) |
| | | | | | | | | | | | |
UBS | | | (1,006 | ) | | | 672 | | | | (334 | ) |
| | | | | | | | | | | | |
| (1) | Net exposure represents the net receivable/(payable) that would be due from/to the counterparty in the event of default. |
NOTES TO SCHEDULE OF INVESTMENTS (all amounts in thousands):
| ^ | All or a portion of this security is on loan. The value of all securities on loan is $2,662. |
| g | A portion of these securities in the amount of $1,342 has been segregated as collateral with the broker to cover margin requirements for open futures contracts. |
| a | A portion of these securities in the amount of $2,755 has been segregated as collateral with the broker for open swaps contracts and/or for swaptions. |
| * | Floating or variable rate note. Rate is listed as of 12/30/2011. |
| Securities fair valued as determined in good faith in accordance with procedures established by the Board of Trustees. These securities had a total fair value of $(78), or (0.02)% of the portfolio’s net assets. |
| ¥ | Percentage rounds to less than 0.1%. |
| p | Securities with an aggregate market value of $1,224 have been pledged by the broker as collateral for open swap contracts and/or swaptions. |
| p | Rate shown reflects the yield at 12/30/2011. |
| Aggregate cost for federal income tax purposes is $341,558. Aggregate gross unrealized appreciation/depreciation for all securities in which there is an excess of value over tax cost were $20,951 and $1,509, respectively. Net unrealized appreciation for tax purposes is $19,442. |
| | |
| DEFINITIONS: | | |
| |
| CITI | | Citigroup, Inc. |
| CPI | | Consumer Price Index |
| DUB | | Deutsche Bank AG |
| EURIBOR | | Euro InterBank Offered Rate |
| LIBOR | | London Interbank Offered Rate |
| MYC | | Morgan Stanley Capital Services |
| NAS | | National Academy of Sciences |
| OTC | | Over The Counter |
| RBS | | Royal Bank of Scotland Group PLC |
|
| CURRENCY ABBREVIATIONS: |
| |
| EUR | | Euro |
| JPY | | Japanese Yen |
| USD | | United States Dollar |
VALUATION SUMMARY (all amounts in thousands):
| | | | | | | | | | | | | | | | |
Investment Securities | | Level 1 -
Quoted
Prices | | | Level 2 -
Other
Significant
Observable
Inputs | | | Level 3 -
Significant
Unobservable
Inputs | | | Value at
12/31/2011 | |
Foreign Government Obligations | | $ | — | | | $ | 1,079 | | | $ | — | | | $ | 1,079 | |
Mortgage-Backed Securities | | | — | | | | 184 | | | | — | | | | 184 | |
Purchased Options | | | — | | | | 43 | | | | — | | | | 43 | |
Purchased Swaptions | | | — | | | | 1,084 | | | | — | | | | 1,084 | |
Repurchase Agreement | | | — | | | | 15,358 | | | | — | | | | 15,358 | |
Securities Lending Collateral | | | 2,716 | | | | — | | | | — | | | | 2,716 | |
Structured Notes Debt | | | — | | | | 1,830 | | | | — | | | | 1,830 | |
U.S. Government Obligations | | | — | | | | 338,706 | | | | — | | | | 338,706 | |
| | | | | | | | | | | | | | | | |
Total | | $ | 2,716 | | | $ | 358,284 | | | $ | — | | | $ | 361,000 | |
| | | | | | | | | | | | | | | | |
| | | | |
Other Financial Instruments | | Level 1 -
Quoted
Prices | | | Level 2 -
Other
Significant
Observable
Inputs | | | Level 3 -
Significant
Unobservable
Inputs | | | Value at
12/31/2011 | |
Written Options | | $ | — | | | $ | (140 | ) | | $ | — | | | $ | (140 | ) |
Written Swaptions | | | — | | | | (3,030 | ) | | | — | | | | (3,030 | ) |
| | | | | | | | | | | | | | | | |
Total | | $ | — | | | $ | (3,170 | ) | | $ | — | | | $ | (3,170 | ) |
| | | | | | | | | | | | | | | | |
| | | | |
Other Financial Instruments | | Level 1 -
Quoted
Prices | | | Level 2 -
Other
Significant
Observable
Inputs | | | Level 3 -
Significant
Unobservable
Inputs | | | Value at
12/31/2011 | |
Futures Contracts - Appreciation | | $ | 398 | | | $ | — | | | $ | — | | | $ | 398 | |
Futures Contracts - Depreciation | | | (755 | ) | | | — | | | | — | | | | (755 | ) |
Forward Foreign Currency Contracts - Appreciation | | | — | | | | 119 | | | | — | | | | 119 | |
Forward Foreign Currency Contracts - Depreciation | | | — | | | | (56 | ) | | | — | | | | (56 | ) |
Interest Rate Swaps - Appreciation | | | — | | | | 789 | | | | — | | | | 789 | |
Interest Rate Swaps - Depreciation | | | — | | | | (592 | ) | | | — | | | | (592 | ) |
| | | | | | | | | | | | | | | | |
Total | | $ | (357 | ) | | $ | 260 | | | $ | — | | | $ | (97 | ) |
| | | | | | | | | | | | | | | | |
 | See the notes to the financial statements for more information regarding pricing inputs and valuation techniques. |
| Other financial instruments are derivative instruments that are valued at unrealized appreciation (depreciation) on the instrument. |
| | | | | | | | |
| | | Principal
(000’s) | | | Value
(000’s) | |
U.S. GOVERNMENT OBLIGATIONS - 7.6% | |
U.S. Treasury Bond | | | | | | | | |
4.38%, 05/15/2041 | | $ | 300 | | | $ | 391 | |
U.S. Treasury Inflation Indexed Bond | | | | | | | | |
2.13%, 02/15/2041 | | | 11,488 | | | | 15,517 | |
U.S. Treasury Note | | | | | | | | |
0.25%, 12/15/2014 ^ | | | 7,140 | | | | 7,117 | |
0.88%, 11/30/2016 ^ g | | | 6,465 | | | | 6,485 | |
2.00%, 11/15/2021 ^ a | | | 25,084 | | | | 25,369 | |
3.13%, 11/15/2041 ^ a g | | | 62,605 | | | | 65,588 | |
| | | | | | | | |
Total U.S. Government Obligations
(cost $118,591) | | | | | | | 120,467 | |
| | | | | | | | |
U.S. GOVERNMENT AGENCY OBLIGATIONS - 49.9% | |
Fannie Mae | | | | | | | | |
1.95%, 08/01/2034 * | | | 27 | | | | 28 | |
2.05%, 01/01/2035 * | | | 57 | | | | 59 | |
2.49%, 08/01/2035 * | | | 153 | | | | 161 | |
3.09%, 03/01/2041 * | | | 1,539 | | | | 1,607 | |
3.15%, 03/01/2041 * | | | 2,068 | | | | 2,151 | |
3.32%, 12/01/2040 * | | | 3,526 | | | | 3,676 | |
3.50%, 10/01/2026 - 12/01/2041 | | | 103,464 | | | | 106,696 | |
3.52%, 10/09/2019 p | | | 5,460 | | | | 4,198 | |
4.00%, 09/01/2024 - 12/01/2041 | | | 144,742 | | | | 153,102 | |
4.50%, 01/01/2041 - 06/01/2041 | | | 60,720 | | | | 65,007 | |
4.63%, 05/01/2013 | | | 10,200 | | | | 10,745 | |
5.00%, 07/01/2034 - 07/01/2035 | | | 26,244 | | | | 28,382 | |
5.25%, 08/01/2012 | | | 5,040 | | | | 5,179 | |
5.50%, 07/01/2014 - 01/01/2039 | | | 63,464 | | | | 69,283 | |
5.79%, 08/01/2037 * | | | 15 | | | | 16 | |
6.00%, 02/01/2034 - 03/01/2038 | | | 23,023 | | | | 25,662 | |
6.50%, 09/01/2037 - 10/01/2039 | | | 17,078 | | | | 19,118 | |
7.00%, 01/01/2015 - 09/01/2016 | | | 110 | | | | 119 | |
Fannie Mae, TBA | | | | | | | | |
3.50% | | | 2,700 | | | | 2,823 | |
4.50% | | | 80,900 | | | | 86,120 | |
5.00% | | | 2,100 | | | | 2,269 | |
6.00% | | | 35,100 | | | | 38,566 | |
Farmer Mac Guaranteed Notes Trust 2007-1 | | | | | |
5.13%, 04/19/2017 - 144A | | | 900 | | | | 1,050 | |
Freddie Mac | | | | | | | | |
2.50%, 12/01/2034 | | | 37 | | | | 38 | |
3.05%, 02/01/2041 * | | | 2,526 | | | | 2,639 | |
3.97%, 01/25/2021 * | | | 3,740 | | | | 4,112 | |
4.76%, 09/01/2035 * | | | 4,203 | | | | 4,443 | |
5.43%, 04/01/2037 * | | | 337 | | | | 356 | |
5.50%, 06/15/2015 - 12/01/2016 | | | 2,895 | | | | 3,093 | |
5.54%, 05/01/2037 * | | | 181 | | | | 193 | |
5.56%, 01/01/2038 * | | | 976 | | | | 1,044 | |
5.63%, 06/13/2016 | | | 9,195 | | | | 10,422 | |
5.66%, 02/01/2037 * | | | 69 | | | | 72 | |
5.86%, 05/01/2037 * | | | 179 | | | | 191 | |
5.96%, 09/01/2037 * | | | 212 | | | | 229 | |
6.00%, 09/01/2013 - 05/01/2031 | | | 1,687 | | | | 1,874 | |
Freddie Mac, TBA | | | | | | | | |
4.50% | | | 1,400 | | | | 1,483 | |
5.00% | | | 20,400 | | | | 21,920 | |
5.50% | | | 100 | | | | 109 | |
Ginnie Mae | | | | | | | | |
6.50%, 12/20/2031 | | | 45 | | | | 51 | |
Ginnie Mae, TBA | | | | | | | | |
4.00% | | | 13,800 | | | | 14,803 | |
| | | | | | | | |
| | | Principal
(000’s) | | | Value
(000’s) | |
U.S. GOVERNMENT AGENCY OBLIGATIONS (continued) | |
Ginnie Mae, TBA (continued) | | | | | |
4.50% | | $ | 25,500 | | | $ | 27,783 | |
5.00% | | | 27,500 | | | | 30,461 | |
5.50% | | | 12,500 | | | | 14,029 | |
6.00% | | | 11,700 | | | | 13,243 | |
Resolution Funding Corp., Interest STRIPS | |
1.66%, 07/15/2018 p | | | 1,200 | | | | 1,079 | |
1.82%, 10/15/2018 p | | | 1,200 | | | | 1,070 | |
Tennessee Valley Authority | | | | | |
5.25%, 09/15/2039 | | | 7,500 | | | | 9,574 | |
5.98%, 04/01/2036 | | | 440 | | | | 607 | |
U.S. Small Business Administration | | | | | |
4.50%, 02/01/2014 | | | 355 | | | | 366 | |
| | | | | | | | |
Total U.S. Government Agency Obligations
(cost $776,837) | | | | 791,301 | |
| | | | | | | | |
FOREIGN GOVERNMENT OBLIGATIONS - 3.6% | |
Hellenic Republic Government Bond | | | | | |
4.60%, 09/20/2040 | | EUR | 780 | | | | 173 | |
Hydro Quebec | | | | | | | | |
8.05%, 07/07/2024 | | $ | 8,200 | | | | 12,193 | |
8.40%, 01/15/2022 | | | 3,065 | | | | 4,482 | |
9.40%, 02/01/2021 | | | 1,695 | | | | 2,582 | |
Indonesia Government International Bond | |
4.88%, 05/05/2021 - 144A | | | 405 | | | | 433 | |
4.88%, 05/05/2021 - Reg S | | | 1,022 | | | | 1,094 | |
Italy Buoni Poliennali Del Tesoro | | | | | |
4.75%, 09/15/2016 | | EUR | 12,590 | | | | 15,443 | |
Poland Government International Bond | |
5.13%, 04/21/2021 | | $ | 3,505 | | | | 3,566 | |
Republic of Brazil | | | | | | | | |
7.13%, 01/20/2037 | | | 670 | | | | 925 | |
Republic of Peru | | | | | | | | |
6.55%, 03/14/2037 | | | 380 | | | | 483 | |
Republic of Poland | | | | | | | | |
6.38%, 07/15/2019 | | | 490 | | | | 543 | |
Republic of South Africa | | | | | |
5.50%, 03/09/2020 | | | 1,185 | | | | 1,327 | |
Republic of Turkey | | | | | | | | |
5.63%, 03/30/2021 | | | 2,765 | | | | 2,796 | |
7.00%, 03/11/2019 | | | 1,010 | | | | 1,119 | |
Russian Federation | | | | | | | | |
7.50%, 03/31/2030 | | | 3,578 | | | | 4,155 | |
United Mexican States | | | | | | | | |
5.13%, 01/15/2020 ^ | | | 3,605 | | | | 4,119 | |
5.63%, 01/15/2017 | | | 1,693 | | | | 1,947 | |
| | | | | | | | |
Total Foreign Government Obligations
(cost $57,260) | | | | 57,380 | |
| | | | | | | | |
MORTGAGE-BACKED SECURITIES - 11.4% | |
Adjustable Rate Mortgage Trust | |
Series 2004-2, Class 7A2 | | | | | |
1.13%, 02/25/2035 * | | | 30 | | | | 26 | |
American Home Mortgage Assets LLC | | | | | |
Series 2006-2, Class 2A1 | | | | | |
0.48%, 09/25/2046 * | | | 1,180 | | | | 555 | |
Banc of America Funding Corp. | | | | | |
Series 2005-E, Class 4A1 | | | | | |
2.68%, 03/20/2035 * | | | 430 | | | | 379 | |
Banc of America Large Loan, Inc. | | | | | |
Series 2010-UB4, Class A4A | | | | | |
5.03%, 12/20/2041 - 144A * | | | 3,510 | | | | 3,679 | |
| | | | | | | | |
| | | Principal
(000’s) | | | Value
(000’s) | |
MORTGAGE-BACKED SECURITIES (continued) | |
Banc of America Merrill Lynch Commercial Mortgage, Inc. | | | | | |
Series 2002-2, Class A3 | | | | | | | | |
5.12%, 07/11/2043 | | $ | 6,454 | | | $ | 6,490 | |
Series 2006-5, Class AM | | | | | | | | |
5.45%, 09/10/2047 | | | 525 | | | | 494 | |
Series 2007-3, Class A2 | | | | | | | | |
5.62%, 06/10/2049 * | | | 2,308 | | | | 2,331 | |
Series 2007-3, Class A4 | | | | | | | | |
5.62%, 06/10/2049 * | | | 4,240 | | | | 4,547 | |
Bear Stearns Adjustable Rate Mortgage Trust | | | | | |
Series 2004-8, Class 14A1 | | | | | | | | |
5.39%, 11/25/2034 * | | | 2,212 | | | | 1,923 | |
Series 2005-1, Class 4A1 | | | | | | | | |
5.23%, 03/25/2035 * | | | 2,486 | | | | 2,181 | |
Bear Stearns Alt-A Trust | | | | | | | | |
Series 2004-11, Class 2A2 | | | | | | | | |
2.81%, 11/25/2034 * | | | 136 | | | | 93 | |
Bear Stearns Commercial Mortgage Securities | | | | | |
Series 2005-PW10, Class AM | | | | | | | | |
5.45%, 12/11/2040 * | | | 610 | | | | 578 | |
Series 2007-PW17, Class A4 | | | | | | | | |
5.69%, 06/11/2050 * | | | 750 | | | | 826 | |
Bear Stearns Mortgage Funding Trust | | | | | |
Series 2006-AR5, Class 1A2 | | | | | | | | |
0.50%, 12/25/2046 * | | | 1,199 | | | | 234 | |
Citigroup/Deutsche Bank Commercial Mortgage Trust | | | | | |
Series 2006-CD3, Class A5 | | | | | | | | |
5.62%, 10/15/2048 | | | 1,170 | | | | 1,282 | |
Countrywide Alternative Loan Trust | | | | | | | | |
Series 2005-36, Class 2A1A | | | | | | | | |
0.60%, 08/25/2035 * | | | 1,989 | | | | 795 | |
Series 2005-36, Class 3A1 | | | | | | | | |
2.73%, 08/25/2035 * | | | 214 | | | | 134 | |
Series 2005-38, Class A3 | | | | | | | | |
0.64%, 09/25/2035 * | | | 521 | | | | 247 | |
Series 2005-50CB, Class 1A1 | | | | | | | | |
5.50%, 11/25/2035 | | | 4,515 | | | | 3,352 | |
Series 2005-51, Class 3A3A | | | | | | | | |
0.60%, 11/20/2035 * | | | 1,729 | | | | 776 | |
Series 2005-59, Class 1A1 | | | | | | | | |
0.59%, 11/20/2035 * | | | 262 | | | | 132 | |
Series 2006-OA21, Class A1 | | | | | | | | |
0.47%, 03/20/2047 * | | | 4,778 | | | | 2,114 | |
Series 2007-5CB, Class 1A31 | | | | | | | | |
5.50%, 04/25/2037 | | | 3,307 | | | | 1,874 | |
Countrywide Home Loan Mortgage Pass-Through Trust | | | | | |
Series 2003-60, Class 1A1 | | | | | | | | |
3.11%, 02/25/2034 * | | | 241 | | | | 196 | |
Series 2004-23, Class A | | | | | | | | |
2.55%, 11/25/2034 * | | | 126 | | | | 63 | |
Series 2004-R2, Class 1AF1 | | | | | | | | |
0.71%, 11/25/2034 - 144A * | | | 67 | | | | 55 | |
Series 2005-3, Class 1A2 | | | | | | | | |
0.58%, 04/25/2035 * | | | 367 | | | | 201 | |
Series 2006-OA5, Class 2A1 | | | | | | | | |
0.49%, 04/25/2036 * | | | 2,002 | | | | 1,002 | |
| | | | | | | | |
| | | Principal
(000’s) | | | Value
(000’s) | |
MORTGAGE-BACKED SECURITIES (continued) | |
Credit Suisse First Boston Mortgage Securities Corp. | | | | | |
Series 2003-C3, Class A5 | | | | | |
3.94%, 05/15/2038 | | $ | 14,005 | | | $ | 14,314 | |
Series 2004-AR5, Class 7A2 | | | | | |
2.57%, 06/25/2034 * | | | 517 | | | | 469 | |
Credit Suisse Mortgage Capital Certificates | | | | | |
Series 2007-C2, Class A2 | | | | | |
5.45%, 01/15/2049 * | | | 2,045 | | | | 2,065 | |
Series 2011-4R, Class 5A1 | | | | | |
5.28%, 05/27/2036 - 144A * | | | 4,048 | | | | 3,788 | |
DBRR Trust | | | | | | | | |
Series 2011-C32, Class A3A | | | | | |
5.74%, 06/17/2049 - 144A * | | | 1,500 | | | | 1,615 | |
Deutsche ALT-A Securities, Inc., Alternate Loan Trust | | | | | |
Series 2006-OA1, Class A1 | | | | | |
0.49%, 02/25/2047 * | | | 3,007 | | | | 1,661 | |
Deutsche Mortgage Securities, Inc. | | | | | |
Series 2005-WF1, Class 1A3 | | | | | |
5.25%, 06/26/2035 - 144A * | | | 1,270 | | | | 1,178 | |
Extended Stay America Trust | | | | | | | | |
Series 2010-ESHA, Class A | | | | | |
2.95%, 11/05/2027 - 144A | | | 2,229 | | | | 2,234 | |
Series 2010-ESHA, Class B | | | | | |
4.22%, 11/05/2027 - 144A | | | 5,000 | | | | 5,019 | |
Series 2010-ESHA, Class C | | | | | |
4.86%, 11/05/2027 - 144A | | | 2,450 | | | | 2,480 | |
Series 2010-ESHA, Class D | | | | | |
5.50%, 11/05/2027 - 144A | | | 945 | | | | 948 | |
First Horizon Alternative Mortgage Securities | | | | | |
Series 2006-FA8, Class 1A8 | | | | | |
0.66%, 02/25/2037 * | | | 491 | | | | 252 | |
GMAC Commercial Mortgage Securities, Inc. | | | | | |
Series 2006-C1, Class AM | | | | | |
5.29%, 11/10/2045 * | | | 920 | | | | 917 | |
GMAC Mortgage Corp., Loan Trust | | | | | |
Series 2003-AR2, Class 1A1 | | | | | |
3.54%, 12/19/2033 * | | | 42 | | | | 38 | |
Series 2005-AR1, Class 3A | | | | | |
3.06%, 03/18/2035 * | | | 138 | | | | 111 | |
Greenpoint Mortgage Funding Trust | | | | | |
Series 2006-AR4, Class A1A | | | | | |
0.35%, 09/25/2046 * | | | ¿ | | | | ¿ | |
Greenwich Capital Commercial Funding Corp. | | | | | |
Series 2005-GG3, Class A3 | | | | | |
4.57%, 08/10/2042 | | | 11,200 | | | | 11,324 | |
Series 2006-GG7, Class AJ | | | | | |
5.88%, 07/10/2038 * | | | 1,270 | | | | 889 | |
Series 2007-GG9, Class A4 | | | | | |
5.44%, 03/10/2039 | | | 1,245 | | | | 1,348 | |
GS Mortgage Securities Corp. II | | | | | |
Series 2005-GG4, Class A4A | | | | | |
4.75%, 07/10/2039 | | | 3,175 | | | | 3,389 | |
Series 2007-GG10, Class A4 | | | | | |
5.79%, 08/10/2045 * | | | 3,430 | | | | 3,725 | |
GSR Mortgage Loan Trust | | | | | |
Series 2005-AR1, Class 2A1 | | | | | |
2.76%, 01/25/2035 * | | | 2,837 | | | | 2,523 | |
Harborview Mortgage Loan Trust | | | | | |
Series 2005-8, Class 1A2A | | | | | |
0.61%, 09/19/2035 * | | | 512 | | | | 282 | |
Series 2006-11, Class A1A | | | | | |
0.45%, 12/19/2036 * | | | 6,091 | | | | 2,915 | |
| | | | | | | | |
| | | Principal
(000’s) | | | Value
(000’s) | |
MORTGAGE-BACKED SECURITIES (continued) | |
Impac CMB Trust | | | | | | | | |
Series 2004-6, Class 1A1 | | | | | |
1.09%, 10/25/2034 * | | $ | 73 | | | $ | 52 | |
IndyMac INDA Mortgage Loan Trust | | | | | |
Series 2006-AR2, Class 4A1 | | | | | |
5.43%, 09/25/2036 * | | | 2,420 | | | | 1,666 | |
Series 2007-AR7, Class 1A1 | | | | | |
5.73%, 09/25/2037 * | | | 730 | | | | 523 | |
IndyMac Index Mortgage Loan Trust | | | | | |
Series 2005-AR14, Class 2A1A | | | | | |
0.59%, 07/25/2035 * | | | 1,700 | | | | 952 | |
Series 2007-AR15, Class 2A1 | | | | | |
5.00%, 08/25/2037 * | | | 1,318 | | | | 762 | |
JPMorgan Chase Commercial Mortgage Securities Corp. | | | | | |
Series 2004-CB8, Class A1A | | | | | |
4.16%, 01/12/2039 - 144A | | | 1,445 | | | | 1,488 | |
Series 2004-LN2, Class A2 | | | | | |
5.12%, 07/15/2041 | | | 3,470 | | | | 3,669 | |
Series 2006-CB14, Class AM | | | | | |
5.45%, 12/12/2044 * | | | 1,420 | | | | 1,404 | |
Series 2007-CB18, Class A3 | | | | | |
5.45%, 06/12/2047 | | | 3,936 | | | | 4,134 | |
Series 2007-LD11, Class ASB | | | | | |
6.00%, 06/15/2049 * | | | 2,000 | | | | 2,126 | |
JPMorgan Mortgage Trust | | | | | |
Series 2004-A1, Class 1A1 | | | | | |
4.76%, 02/25/2034 * | | | 352 | | | | 340 | |
Series 2004-A3, Class 1A1 | | | | | |
2.54%, 07/25/2034 * | | | 105 | | | | 102 | |
Series 2006-A2, Class 5A1 | | | | | |
2.65%, 11/25/2033 * | | | 224 | | | | 212 | |
Series 2006-S2, Class 2A2 | | | | | |
5.88%, 07/25/2036 | | | 631 | | | | 591 | |
Series 2006-S3, Class 1A12 | | | | | |
6.50%, 08/25/2036 | | | 1,626 | | | | 1,471 | |
Series 2007-S1, Class 1A2 | | | | | |
5.50%, 03/25/2022 | | | 483 | | | | 445 | |
Series 2007-S1, Class 2A22 | | | | | |
5.75%, 03/25/2037 | | | 1,782 | | | | 1,398 | |
LB-UBS Commercial Mortgage Trust | | | | | |
Series 2003-C7, Class A3 | | | | | |
4.56%, 09/15/2027 * | | | 7,395 | | | | 7,435 | |
Series 2006-C4, Class AM | | | | | |
5.89%, 06/15/2038 * | | | 660 | | | | 672 | |
Series 2006-C7, Class AM | | | | | |
5.38%, 11/15/2038 | | | 660 | | | | 638 | |
Series 2007-C2, Class A3 | | | | | |
5.43%, 02/15/2040 | | | 9,658 | | | | 10,302 | |
Series 2007-C6, Class A4 | | | | | |
5.86%, 07/15/2040 * | | | 2,355 | | | | 2,580 | |
Series 2007-C7, Class A3 | | | | | |
5.87%, 09/15/2045 * | | | 3,190 | | | | 3,499 | |
MASTR Adjustable Rate Mortgages Trust | | | | | |
Series 2007-R5, Class A1 | | | | | |
2.57%, 11/25/2035 - 144A * | | | 891 | | | | 459 | |
Merrill Lynch Mortgage Investors, Inc. | | | | | |
Series 2004-A1, Class 2A1 | | | | | |
2.42%, 02/25/2034 * | | | 450 | | | | 404 | |
Series 2004-A3, Class 4A3 | | | | | |
5.01%, 05/25/2034 * | | | 331 | | | | 324 | |
Series 2005-A3, Class A1 | | | | | |
0.56%, 04/25/2035 * | | | 94 | | | | 67 | |
| | | | | | | | |
| | | Principal
(000’s) | | | Value
(000’s) | |
MORTGAGE-BACKED SECURITIES (continued) | |
Merrill Lynch Mortgage Investors, Inc. (continued) | |
Series 2005-A4, Class 2A2 | | | | | |
2.63%, 07/25/2035 * | | $ | 429 | | | $ | 327 | |
Series 2005-A5, Class A3 | | | | | |
2.61%, 06/25/2035 * | | | 400 | | | | 285 | |
MLCC Mortgage Investors, Inc. | | | | | |
Series 2003-F, Class A1 | | | | | |
0.93%, 10/25/2028 * | | | 100 | | | | 82 | |
Morgan Stanley Capital I | | | | | |
Series 1998-WF2, Class G | | | | | |
6.34%, 01/15/2013 - 144A * | | | 2,410 | | | | 2,527 | |
Series 2007-IQ15, Class A2 | | | | | |
5.84%, 06/11/2049 * | | | 2,200 | | | | 2,227 | |
Morgan Stanley Mortgage Loan Trust | | | | | |
Series 2004-8AR, Class 4A2 | | | | | |
2.51%, 10/25/2034 * | | | 368 | | | | 326 | |
Series 2006-3AR, Class 2A3 | | | | | |
2.70%, 03/25/2036 * | | | 835 | | | | 415 | |
Morgan Stanley Re-REMIC Trust | | | | | |
Series 2011-IO, Class A | | | | | |
2.50%, 03/23/2051 - 144A | | | 1,960 | | | | 1,957 | |
Nomura Asset Acceptance Corp. | | | | | |
Series 2004-R2, Class A1 | | | | | |
6.50%, 10/25/2034 - 144A * | | | 157 | | | | 158 | |
Prime Mortgage Trust | | | | | |
Series 2006-DR1, Class 2A1 | | | | | |
5.50%, 05/25/2035 - 144A | | | 4,552 | | | | 3,920 | |
Series 2006-DR1, Class 2A2 | | | | | |
6.00%, 05/25/2035 - 144A | | | 817 | | | | 721 | |
RBSCF Trust | | | | | | | | |
Series 2010-RR3, Class WBTA | | | | | |
5.90%, 04/16/2017 - 144A * | | | 8,050 | | | | 8,876 | |
RBSGC Mortgage Pass-Through Certificates | | | | | |
Series 2007-B, Class 1A4 | | | | | |
0.74%, 01/25/2037 * | | | 852 | | | | 422 | |
Residential Accredit Loans, Inc. | | | | | |
Series 2007-QO1, Class A1 | | | | | |
0.44%, 02/25/2047 * | | | 847 | | | | 446 | |
Series 2007-QO4, Class A1A | | | | | |
0.48%, 05/25/2047 * | | | 1,640 | | | | 881 | |
Residential Asset Securitization Trust | | | | | |
Series 2005-A14, Class A4 | | | | | |
5.50%, 12/25/2035 | | | 348 | | | | 342 | |
Structured Adjustable Rate Mortgage Loan Trust | | | | | |
Series 2004-20, Class 3A1 | | | | | |
2.53%, 01/25/2035 * | | | 666 | | | | 488 | |
Series 2005-15, Class 1A1 | | | | | |
2.50%, 07/25/2035 * | | | 949 | | | | 593 | |
Series 2007-3, Class 3A1 | | | | | |
5.22%, 04/25/2047 * | | | 3,260 | | | | 1,957 | |
Structured Asset Mortgage Investments, Inc. | | | | | |
Series 2003-AR4, Class A1 | | | | | |
0.63%, 01/19/2034 * | | | 99 | | | | 74 | |
Voyager BRSTN Delaware Trust, IO | | | | | |
Series 2009-1, Class UAU7 | | | | | |
0.54%, 12/26/2036 - 144A * | | | 778 | | | | 318 | |
WaMu Alternative Mortgage Pass-Through Certificates | | | | | |
Series 2006-AR3, Class A1A | | | | | |
1.18%, 05/25/2046 * | | | 2,199 | | | | 1,022 | |
WaMu Mortgage Pass-Through Certificates | | | | | |
Series 2005-AR8, Class 2A1A | | | | | |
0.58%, 07/25/2045 * | | | 107 | | | | 78 | |
| | | | | | | | |
| | | Principal
(000’s) | | | Value
(000’s) | |
MORTGAGE-BACKED SECURITIES (continued) | | | | | |
WaMu Mortgage Pass-Through Certificates (continued) | | | | | |
Series 2006-AR14, Class 1A3 | | | | | |
2.30%, 11/25/2036 * | | $ | 1,900 | | | $ | 1,209 | |
Series 2007-OA4, Class 1A | | | | | |
0.98%, 05/25/2047 * | | | 2,228 | | | | 1,272 | |
Series 2007-OA6, Class 1A1B | | | | | |
1.02%, 07/25/2047 * | | | 2,206 | | | | 663 | |
Wells Fargo Mortgage Backed Securities Trust | | | | | |
Series 2006-3, Class A9 | | | | | |
5.50%, 03/25/2036 | | | 1,865 | | | | 1,825 | |
| | | | | | | | |
Total Mortgage-Backed Securities
(cost $196,144) | | | | 181,169 | |
| | | | | | | | |
ASSET-BACKED SECURITIES - 4.8% | | | | | |
321 Henderson Receivables I LLC | | | | | |
Series 2010-1A, Class A | | | | | |
5.56%, 07/15/2059 - 144A | | | 5,683 | | | | 6,145 | |
Series 2010-2A, Class A | | | | | |
4.07%, 01/15/2048 - 144A | | | 1,795 | | | | 1,855 | |
Series 2010-3A, Class A | | | | | |
3.82%, 12/15/2048 - 144A | | | 3,658 | | | | 3,603 | |
AmeriCredit Automobile Receivables Trust | | | | | |
Series 2011-5, Class C | | | | | |
3.44%, 10/08/2017 | | | 1,650 | | | | 1,653 | |
Amortizing Residential Collateral Trust | | | | | |
Series 2002-BC5, Class M1 | | | | | |
1.33%, 07/25/2032 * | | | 347 | | | | 265 | |
Chase Funding Mortgage Loan Asset-Backed Certificates | | | | | |
Series 2003-4, Class 1A5 | | | | | |
5.42%, 05/25/2033 * | | | 1,072 | | | | 1,030 | |
Citibank Omni Master Trust | | | | | |
Series 2009-A8, Class A8 | | | | | |
2.38%, 05/16/2016 - 144A * | | | 11,940 | | | | 12,014 | |
Series 2009-A17, Class A17 | | | | | |
4.90%, 11/15/2018 - 144A | | | 1,875 | | | | 2,039 | |
Conseco Finance Securitizations Corp. | | | | | |
Series 2002-1, Class A | | | | | |
6.68%, 12/01/2033 * | | | 1,039 | | | | 1,098 | |
Series 2002-2, Class A2 | | | | | |
6.03%, 03/01/2033 * | | | 1,361 | | | | 1,419 | |
Countrywide Home Equity Loan Trust | | | | | |
Series 2006-RES, Class 4Q1B | | | | | |
0.58%, 12/15/2033 - 144A * | | | 318 | | | | 188 | |
DT Auto Owner Trust | | | | | |
Series 2011-3A, Class C | | | | | |
4.03%, 02/15/2017 - 144A | | | 1,010 | | | | 1,010 | |
Globaldrive BV | | | | | |
Series 2008-2, Class A | | | | | |
4.00%, 10/20/2016 | | | 1,165 | | | | 1,517 | |
Merrill Lynch Mortgage Investors, Inc. | | | | | |
Series 2007-SD1, Class A1 | | | | | |
0.74%, 02/25/2047 * | | | 1,348 | | | | 587 | |
Mirant Mid Atlantic Pass-Through Trust | | | | | |
Series C | | | | | | | | |
10.06%, 12/30/2028 | | | 312 | | | | 323 | |
Nelnet Student Loan Trust | | | | | |
Series 2006-1, Class A5 | | | | | |
0.61%, 08/23/2027 * | | | 2,230 | | | | 2,062 | |
RAAC Series | | | | | |
Series 2007-RP4, Class A | | | | | |
0.64%, 06/25/2037 - 144A * | | | 1,372 | | | | 654 | |
| | | | | | | | |
| | | Principal
(000’s) | | | Value
(000’s) | |
ASSET-BACKED SECURITIES (continued) | |
Renaissance Home Equity Loan Trust | | | | | |
Series 2007-2, Class AF6 | | | | | |
5.88%, 06/25/2037 * | | $ | 1,492 | | | $ | 675 | |
Santander Consumer Acquired Receivables Trust | | | | | |
Series 2011-S1A, Class B | | | | | |
1.66%, 08/15/2016 - 144A | | | 2,488 | | | | 2,460 | |
Series 2011-S1A, Class C | | | | | |
2.01%, 08/15/2016 - 144A | | | 1,970 | | | | 1,947 | |
Series 2011-WO, Class C | | | | | |
3.19%, 10/15/2015 - 144A | | | 2,490 | | | | 2,477 | |
Santander Drive Auto Receivables Trust | | | | | |
Series 2010-2, Class B | | | | | |
2.24%, 12/15/2014 | | | 3,840 | | | | 3,830 | |
Series 2010-2, Class C | | | | | |
3.89%, 07/17/2017 | | | 4,520 | | | | 4,594 | |
Series 2010-B, Class B | | | | | |
2.10%, 09/15/2014 - 144A | | | 3,100 | | | | 3,094 | |
Series 2010-B, Class C | | | | | |
3.02%, 10/17/2016 - 144A | | | 3,285 | | | | 3,252 | |
Series 2011-S1A, Class B | | | | | |
1.48%, 07/15/2013 - 144A | | | 1,900 | | | | 1,880 | |
Series 2011-S1A, Class D | | | | | |
3.10%, 03/15/2013 - 144A | | | 1,758 | | | | 1,742 | |
Scholar Funding Trust | | | | | |
Series 2011-A, Class A | | | | | |
1.32%, 10/28/2043 - 144A * | | | 2,372 | | | | 2,305 | |
Securitized Asset Backed Receivables LLC | | | | | |
Series 2007-BR3, Class A2B | | | | | |
0.51%, 04/25/2037 * | | | 2,700 | | | | 901 | |
SLC Student Loan Trust | | | | | |
Series 2008-1, Class A4A | | | | | |
2.15%, 12/15/2032 * | | | 400 | | | | 410 | |
SLM Student Loan Trust | | | | | |
Series 2004-B, Class A2 | | | | | |
0.75%, 06/15/2021 * | | | 893 | | | | 855 | |
Series 2008-5, Class A3 | | | | | |
1.72%, 01/25/2018 * | | | 2,070 | | | | 2,102 | |
Series 2008-5, Class A4 | | | | | |
2.12%, 07/25/2023 * | | | 2,445 | | | | 2,509 | |
Structured Asset Securities Corp. | | | | | |
Series 2003-AL2, Class A | | | | | |
3.36%, 01/25/2031 - 144A | | | 2,783 | | | | 2,544 | |
Series 2007-TC1, Class A | | | | | |
0.59%, 04/25/2031 - 144A * | | | 1,670 | | | | 1,184 | |
U.S. Small Business Administration | | | | | |
Series 2002-P10B, Class 1 | | | | | |
5.20%, 08/10/2012 | | | 340 | | | | 348 | |
| | | | | | | | |
Total Asset-Backed Securities
(cost $80,778) | | | | 76,571 | |
| | | | | | | | |
MUNICIPAL GOVERNMENT OBLIGATIONS - 0.3% | |
New York City Municipal Water Finance Authority | | | | | |
5.38%, 06/15/2043 | | | 1,670 | | | | 1,852 | |
5.50%, 06/15/2043 | | | 2,000 | | | | 2,244 | |
| | | | | | | | |
Total Municipal Government
Obligations (cost $3,617) | | | | 4,096 | |
| | | | | | | | |
PREFERRED CORPORATE DEBT
SECURITIES - 0.3% | |
Capital Markets - 0.1% | | | | | |
Credit Suisse | | | | | | | | |
5.86%, 05/15/2017 * Ž | | | 3,045 | | | | 2,474 | |
Lehman Brothers Holdings Capital Trust VII | | | | | |
5.86%, 05/31/2012 Ž ‡ § ‡ § | | | 1,945 | | | | ¿ | |
| | | | | | | | |
| | | Principal
(000’s) | | | Value
(000’s) | |
Capital Markets (continued) | | | | | | | | |
State Street Capital Trust IV | | | | | | | | |
1.55%, 06/15/2037 * | | $ | 290 | | | $ | 191 | |
Commercial Banks - 0.1% | |
ABN Amro North American Holding Preferred Capital Repackage Trust I | | | | | |
6.52%, 11/08/2012 - 144A * Ž^ | | | 2,720 | | | | 1,853 | |
Diversified Financial Services - 0.1% | |
JPMorgan Chase Capital XXV - Series Y | | | | | |
6.80%, 10/01/2037 | | | 875 | | | | 878 | |
| | | | | | | | |
Total Preferred Corporate Debt Securities (cost $8,731) | | | | | | | 5,396 | |
| | | | | | | | |
CORPORATE DEBT SECURITIES - 31.4% | |
Auto Components - 0.1% | |
BorgWarner, Inc. | | | | | | | | |
4.63%, 09/15/2020 | | | 1,185 | | | | 1,259 | |
Capital Markets - 1.3% | | | | | | | | |
BP Capital Markets PLC | | | | | | | | |
3.13%, 10/01/2015 | | | 1,370 | | | | 1,435 | |
Credit Suisse | | | | | | | | |
5.40%, 01/14/2020 | | | 1,060 | | | | 1,000 | |
Goldman Sachs Group, Inc. | | | | | | | | |
5.25%, 07/27/2021 | | | 2,230 | | | | 2,175 | |
Morgan Stanley | | | | | | | | |
2.95%, 05/14/2013 * | | | 9,540 | | | | 9,162 | |
4.00%, 07/24/2015 | | | 1,840 | | | | 1,725 | |
4.20%, 11/20/2014 | | | 1,740 | | | | 1,678 | |
5.50%, 07/28/2021 | | | 4,200 | | | | 3,883 | |
Chemicals - 0.7% | | | | | | | | |
CF Industries Holdings, Inc. | | | | | | | | |
7.13%, 05/01/2020 | | | 4,340 | | | | 5,131 | |
Dow Chemical Co. | | | | | | | | |
4.13%, 11/15/2021 | | | 1,460 | | | | 1,498 | |
Lyondell Chemical Co. | | | | | | | | |
11.00%, 05/01/2018 | | | 2,442 | | | | 2,668 | |
Lyondellbasell Industries NV | | | | | | | | |
6.00%, 11/15/2021 - 144A^ | | | 2,035 | | | | 2,111 | |
Westlake Chemical Corp. | | | | | | | | |
6.63%, 01/15/2016 | | | 44 | | | | 45 | |
Commercial Banks - 3.4% | |
ABN Amro Bank NV | | | | | | | | |
6.38%, 04/27/2021 | | EUR | 380 | | | | 448 | |
Bank of Scotland PLC | | | | | | | | |
5.25%, 02/21/2017 - 144A | | $ | 100 | | | | 105 | |
Barclays Bank PLC | | | | | | | | |
5.93%, 12/31/2049 - 144A * Ž ^ | | | 630 | | | | 523 | |
Capital One Capital VI | | | | | | | | |
8.88%, 05/15/2040 ^ | | | 2,190 | | | | 2,273 | |
CIT Group, Inc. | | | | | | | | |
6.63%, 04/01/2018 - 144A ^ | | | 761 | | | | 788 | |
7.00%, 05/01/2017 ^ | | | 1,860 | | | | 1,860 | |
Commerzbank AG | | | | | | | | |
6.38%, 03/22/2019 | | EUR | 1,000 | | | | 918 | |
Credit Suisse Group Finance US, Inc. | | | | | | | | |
3.63%, 09/14/2020 * | | | 505 | | | | 558 | |
Discover Bank | | | | | | | | |
7.00%, 04/15/2020 ^ | | $ | 330 | | | | 345 | |
8.70%, 11/18/2019 | | | 400 | | | | 456 | |
DNB Boligkreditt AS | | | | | | | | |
2.10%, 10/14/2015 - 144A | | | 11,965 | | | | 11,868 | |
2.90%, 03/29/2016 - 144A | | | 10,975 | | | | 11,157 | |
Eksportfinans ASA | | | | | | | | |
5.50%, 05/25/2016 ^ | | | 2,375 | | | | 2,190 | |
| | | | | | | | |
| | | Principal
(000’s) | | | Value
(000’s) | |
Commercial Banks (continued) | | | | | | | | |
Fifth Third Capital Trust IV | | | | | | | | |
6.50%, 04/15/2037 * | | $ | 2,125 | | | $ | 2,083 | |
Glitnir Banki Hf | | | | | | | | |
6.33%, 07/28/2011 - 144A ‡ | | | 290 | | | | 75 | |
6.69%, 06/15/2016 - 144A ‡ | | | 800 | | | | ¿ | |
HSBC Bank Brasil SA - Banco Multiplo | | | | | | | | |
4.00%, 05/11/2016 - 144A | | | 5,850 | | | | 5,806 | |
HSBC Bank PLC | | | | | | | | |
3.10%, 05/24/2016 - 144A | | | 2,900 | | | | 2,900 | |
HSBC Holdings PLC | | | | | | | | |
6.10%, 01/14/2042 ^ | | | 1,275 | | | | 1,445 | |
KFW | | | | | | | | |
1.38%, 07/15/2013 | | | 3,000 | | | | 3,027 | |
Landsbanki Islands HF | | | | | | | | |
6.10%, 08/25/2011 - 144A ‡ | | | 320 | | | | 11 | |
Sparebank 1 Boligkreditt AS | | | | | | | | |
1.25%, 10/25/2013 - 144A | | | 6,990 | | | | 6,940 | |
Construction Materials - 0.0% ¥ | | | | | | | | |
Lafarge SA | | | | | | | | |
7.13%, 07/15/2036 ^ | | | 700 | | | | 618 | |
Consumer Finance - 0.9% | | | | | | | | |
Capital One Financial Corp. | | | | | | | | |
3.15%, 07/15/2016 ^ | | | 7,810 | | | | 7,843 | |
4.75%, 07/15/2021 | | | 3,160 | | | | 3,252 | |
SLM Corp. | | | | | | | | |
6.25%, 01/25/2016 | | | 2,845 | | | | 2,767 | |
Diversified Consumer Services - 0.0% ¥ | | | | | |
Service Corp., International | | | | | | | | |
7.50%, 04/01/2027 | | | 55 | | | | 53 | |
7.63%, 10/01/2018 | | | 50 | | | | 55 | |
Diversified Financial Services - 3.5% | |
AngloGold Ashanti Holdings PLC | | | | | |
5.38%, 04/15/2020 | | | 1,355 | | | | 1,346 | |
CDP Financial, Inc. | | | | | |
3.00%, 11/25/2014 - 144A | | | 4,505 | | | | 4,685 | |
Citigroup, Inc. | | | | | | | | |
4.59%, 12/15/2015 ^ | | | 9,890 | | | | 9,953 | |
5.00%, 09/15/2014 | | | 1,210 | | | | 1,198 | |
Ford Motor Credit Co., LLC | | | | | | | | |
6.63%, 08/15/2017 | | | 1,740 | | | | 1,894 | |
General Electric Capital Corp. | | | | | |
0.70%, 04/10/2012 * | | | 4,255 | | | | 4,256 | |
General Electric Capital Corp. - Series A | | | | | |
6.88%, 01/10/2039 | | | 2,130 | | | | 2,552 | |
JPMorgan Chase & Co. | | | | | | | | |
3.15%, 07/05/2016 | | | 4,256 | | | | 4,276 | |
4.63%, 05/10/2021 ^ | | | 5,110 | | | | 5,287 | |
JPMorgan Chase Bank NA | | | | | | | | |
6.00%, 07/05/2017 - 10/01/2017 | | | 8,320 | | | | 8,929 | |
Kaupthing Bank Hf | | | | | |
7.13%, 05/19/2016 - 144A ‡ | | | 200 | | | | ¿ | |
Northern Rock Asset Management PLC | | | | | |
5.63%, 06/22/2017 - 144A | | | 1,335 | | | | 1,404 | |
Reynolds Group Issuer, Inc. | | | | | |
6.88%, 02/15/2021 - 144A | | | 2,320 | | | | 2,308 | |
7.88%, 08/15/2019 - 144A ^ | | | 2,760 | | | | 2,884 | |
Russian Agricultural Bank OJSC Via RSHB Capital SA | | | | | |
6.30%, 05/15/2017 - 144A | | | 170 | | | | 170 | |
Swiss Re Capital I LP | | | | | |
6.85%, 05/25/2016 - 144A * Ž | | | 2,285 | | | | 1,942 | |
WEA Finance LLC | | | | | |
4.63%, 05/10/2021 - 144A | | | 1,280 | | | | 1,256 | |
| | | | | | | | |
| | | Principal
(000’s) | | | Value
(000’s) | |
Diversified Financial Services (continued) | |
Woodside Finance, Ltd. | | | | | | | | |
4.60%, 05/10/2021 - 144A^ | | $ | 855 | | | $ | 873 | |
Diversified Telecommunication Services - 1.4% | |
America Movil SAB de CV | | | | | | | | |
2.38%, 09/08/2016 | | | 3,420 | | | | 3,410 | |
Frontier Communications Corp. | | | | | | | | |
7.13%, 03/15/2019 | | | 75 | | | | 73 | |
GTE Corp. | | | | | | | | |
6.84%, 04/15/2018 | | | 763 | | | | 914 | |
Intelsat Jackson Holdings SA | | | | | | | | |
7.25%, 04/01/2019 - 144A | | | 1,412 | | | | 1,433 | |
Level 3 Financing, Inc. | | | | | | | | |
8.13%, 07/01/2019 - 144A^ | | | 2,053 | | | | 2,022 | |
8.75%, 02/15/2017 | | | 377 | | | | 384 | |
Sprint Capital Corp. | | | | | | | | |
6.88%, 11/15/2028 | | | 822 | | | | 587 | |
8.75%, 03/15/2032 | | | 80 | | | | 65 | |
Telefonica Emisiones SAU | | | | | | | | |
4.95%, 01/15/2015 | | | 4,850 | | | | 4,825 | |
6.42%, 06/20/2016 | | | 75 | | | | 78 | |
Verizon Communications, Inc. | | | | | | | | |
3.50%, 11/01/2021 | | | 2,080 | | | | 2,166 | |
6.10%, 04/15/2018 ^ | | | 2,223 | | | | 2,671 | |
6.40%, 02/15/2038 | | | 1,004 | | | | 1,274 | |
8.95%, 03/01/2039 | | | 210 | | | | 336 | |
Virgin Media Secured Finance PLC | | | | | |
6.50%, 01/15/2018 | | | 2,160 | | | | 2,295 | |
Electric Utilities - 1.4% | |
Alabama Power Co. | | | | | | | | |
3.95%, 06/01/2021 | | | 1,905 | | | | 2,090 | |
Cleveland Electric Illuminating Co. | | | | | |
5.95%, 12/15/2036 ^ | | | 468 | | | | 499 | |
8.88%, 11/15/2018 | | | 459 | | | | 616 | |
Duke Energy Carolinas LLC | | | | | |
4.25%, 12/15/2041 | | | 1,560 | | | | 1,632 | |
Energy Future Intermediate Holding Co., LLC | | | | | |
10.00%, 12/01/2020 | | | 6,135 | | | | 6,473 | |
Florida Power Corp. | | | | | | | | |
6.40%, 06/15/2038 | | | 1,000 | | | | 1,356 | |
Georgia Power Co. | | | | | | | | |
3.00%, 04/15/2016 ^ | | | 3,370 | | | | 3,573 | |
Jersey Central Power & Light Co. | | | | | |
7.35%, 02/01/2019 ^ | | | 1,025 | | | | 1,287 | |
Midamerican Energy Holdings Co. | | | | | |
5.95%, 05/15/2037 | | | 2,560 | | | | 3,025 | |
Trans-Allegheny Interstate Line Co. | | | | | |
4.00%, 01/15/2015 - 144A ^ | | | 1,050 | | | | 1,094 | |
Energy Equipment & Services - 0.8% | |
Cie Generale de Geophysique-Veritas | | | | | |
7.75%, 05/15/2017 ^ | | | 105 | | | | 106 | |
Complete Production Services, Inc. | | | | | |
8.00%, 12/15/2016 | | | 195 | | | | 203 | |
El Paso Pipeline Partners Operating Co., LLC | | | | | |
6.50%, 04/01/2020 | | | 2,440 | | | | 2,690 | |
Ensco PLC | | | | | | | | |
3.25%, 03/15/2016 | | | 700 | | | | 714 | |
4.70%, 03/15/2021 ^ | | | 1,459 | | | | 1,519 | |
Enterprise Products Operating LLC | | | | | |
6.13%, 10/15/2039 ^ | | | 2,030 | | | | 2,267 | |
Gulfmark Offshore, Inc. | | | | | |
7.75%, 07/15/2014 | | | 40 | | | | 40 | |
| | | | | | | | |
| | | Principal
(000’s) | | | Value
(000’s) | |
Energy Equipment & Services (continued) | |
Pride International, Inc. | | | | | | | | |
6.88%, 08/15/2020 | | $ | 995 | | | $ | 1,167 | |
Rockies Express Pipeline LLC | | | | | | | | |
3.90%, 04/15/2015 - 144A | | | 3,949 | | | | 3,903 | |
Food Products - 0.4% | | | | | | | | |
Kraft Foods, Inc. | | | | | | | | |
5.38%, 02/10/2020 | | | 3,300 | | | | 3,808 | |
6.50%, 08/11/2017 | | | 1,120 | | | | 1,332 | |
Sara Lee Corp. | | | | | | | | |
4.10%, 09/15/2020 ^ | | | 1,239 | | | | 1,250 | |
Health Care Equipment & Supplies - 0.4% | |
Boston Scientific Corp. | | | | | | | | |
6.25%, 11/15/2015 | | | 5,230 | | | | 5,798 | |
Health Care Providers & Services - 0.9% | | | | | |
Fresenius Medical Care U.S. Finance, Inc. | | | | | |
6.88%, 07/15/2017 | | | 280 | | | | 298 | |
HCA, Inc. | | | | | | | | |
6.50%, 02/15/2020 | | | 3,408 | | | | 3,536 | |
7.25%, 09/15/2020 | | | 4,395 | | | | 4,636 | |
Tenet Healthcare Corp. | | | | | | | | |
6.25%, 11/01/2018 - 144A | | | 2,010 | | | | 2,045 | |
8.88%, 07/01/2019 | | | 2,855 | | | | 3,205 | |
UnitedHealth Group, Inc. | | | | | |
3.38%, 11/15/2021 | | | 665 | | | | 688 | |
Hotels, Restaurants & Leisure - 0.4% | |
Caesars Entertainment Operating Co., Inc. | | | | | |
10.00%, 12/15/2018 ^ | | | 1,685 | | | | 1,154 | |
Inn of the Mountain Gods Resort & Casino | | | | | |
1.25%, 11/30/2020 - 144A | | | 40 | | | | 21 | |
MGM Resorts International | | | | | |
10.38%, 05/15/2014 | | | 1,710 | | | | 1,954 | |
11.13%, 11/15/2017 ^ | | | 2,240 | | | | 2,554 | |
Independent Power Producers & Energy Traders - 0.1% | |
AES Corp. | | | | | | | | |
7.75%, 03/01/2014 ^ | | | 67 | | | | 72 | |
Constellation Energy Group, Inc. | | | | | |
7.60%, 04/01/2032 | | | 675 | | | | 870 | |
Insurance - 2.8% | |
Allianz Finance II BV | | | | | |
5.75%, 07/08/2041 * | | EUR | 1,000 | | | | 1,101 | |
American International Group, Inc. | | | | | |
5.45%, 05/18/2017 | | $ | 1,555 | | | | 1,486 | |
8.18%, 05/15/2058 * | | | 480 | | | | 427 | |
AXA SA | | | | | | | | |
5.25%, 04/16/2040 * | | EUR | 1,000 | | | | 944 | |
Fairfax Financial Holdings, Ltd. | | | | | |
5.80%, 05/15/2021 - 144A | | $ | 3,430 | | | | 3,269 | |
Hartford Financial Services Group, Inc. | | | | | |
6.00%, 01/15/2019 | | | 1,470 | | | | 1,509 | |
ING Verzekeringen NV | | | | | | | | |
3.27%, 06/21/2021 * | | EUR | 380 | | | | 414 | |
Lincoln National Corp. | | | | | |
7.00%, 06/15/2040 | | $ | 1,450 | | | | 1,639 | |
Manulife Financial Corp. | | | | | |
3.40%, 09/17/2015 | | | 3,480 | | | | 3,499 | |
MetLife Capital Trust IV | | | | | |
7.88%, 12/15/2037 - 144A | | | 555 | | | | 576 | |
Metropolitan Life Global Funding I | | | | | |
2.50%, 01/11/2013 - 144A | | | 17,330 | | | | 17,541 | |
2.88%, 09/17/2012 - 144A ^ | | | 1,525 | | | | 1,545 | |
| | | | | | | | |
| | | Principal
(000’s) | | | Value
(000’s) | |
Insurance (continued) | | | | | | | | |
Muenchener Rueckversicherungs AG | |
6.00%, 05/26/2041 * | | EUR | 200 | | | $ | 240 | |
Prudential Financial, Inc. | | | | | | | | |
4.50%, 11/15/2020 ^ | | $ | 1,000 | | | | 1,006 | |
4.75%, 09/17/2015 | | | 3,595 | | | | 3,796 | |
5.38%, 06/21/2020 ^ | | | 1,500 | | | | 1,605 | |
7.38%, 06/15/2019 | | | 1,630 | | | | 1,927 | |
XL Group PLC | | | | | | | | |
6.50%, 04/15/2017 * Ž ^ | | | 1,620 | | | | 1,268 | |
Life Sciences Tools & Services - 0.0% ¥ | |
Life Technologies Corp. | | | | | | | | |
5.00%, 01/15/2021 | | | 461 | | | | 482 | |
Machinery - 0.1% | | | | | | | | |
Joy Global, Inc. | | | | | | | | |
5.13%, 10/15/2021 | | | 900 | | | | 961 | |
Media - 2.5% | | | | | | | | |
CBS Corp. | | | | | | | | |
4.63%, 05/15/2018 | | | 670 | | | | 697 | |
5.75%, 04/15/2020 ^ | | | 1,060 | | | | 1,192 | |
8.88%, 05/15/2019 | | | 1,460 | | | | 1,875 | |
CCH II LLC | | | | | | | | |
13.50%, 11/30/2016 | | | 5,880 | | | | 6,792 | |
Clear Channel Worldwide Holdings, Inc. -Series B | | | | | |
9.25%, 12/15/2017 ^ | | | 950 | | | | 1,026 | |
Comcast Corp. | | | | | | | | |
5.88%, 02/15/2018 | | | 2,709 | | | | 3,132 | |
6.95%, 08/15/2037 | | | 2,935 | | | | 3,734 | |
COX Communications, Inc. | | | | | |
8.38%, 03/01/2039 - 144A | | | 3,525 | | | | 4,720 | |
CSC Holdings LLC | | | | | | | | |
8.50%, 04/15/2014 | | | 1,166 | | | | 1,290 | |
DIRECTV Holdings LLC | | | | | | | | |
3.13%, 02/15/2016 | | | 1,046 | | | | 1,060 | |
DISH DBS Corp. | | | | | | | | |
7.00%, 10/01/2013 | | | 115 | | | | 123 | |
Lamar Media Corp. - Series B | | | | | |
6.63%, 08/15/2015 ^ | | | 20 | | | | 20 | |
NBCUniversal Media LLC | | | | | | | | |
4.38%, 04/01/2021 | | | 575 | | | | 607 | |
5.15%, 04/30/2020 | | | 5,746 | | | | 6,397 | |
News America, Inc. | | | | | | | | |
6.65%, 11/15/2037 | | | 40 | | | | 45 | |
7.63%, 11/30/2028 | | | 1,070 | | | | 1,292 | |
Time Warner Cable, Inc. | | | | | | | | |
5.50%, 09/01/2041 | | | 2,070 | | | | 2,181 | |
5.88%, 11/15/2040 | | | 2,045 | | | | 2,213 | |
Time Warner, Inc. | | | | | | | | |
4.70%, 01/15/2021 | | | 950 | | | | 1,023 | |
6.10%, 07/15/2040 | | | 630 | | | | 739 | |
Metals & Mining - 1.1% | | | | | | | | |
Barrick Gold Corp. | | | | | | | | |
2.90%, 05/30/2016 | | | 8,979 | | | | 9,217 | |
Barrick North America Finance LLC | | | | | |
4.40%, 05/30/2021 | | | 65 | | | | 70 | |
Cliffs Natural Resources, Inc. | | | | | |
4.88%, 04/01/2021 | | | 2,495 | | | | 2,486 | |
Newcrest Finance Pty, Ltd. | | | | | | | | |
4.45%, 11/15/2021 - 144A | | | 2,135 | | | | 2,106 | |
Novelis, Inc. | | | | | | | | |
8.75%, 12/15/2020 ^ | | | 2,735 | | | | 2,933 | |
Old AII, Inc. | | | | | | | | |
9.00%, 12/15/2014 ‡ | | | 560 | | | | ¿ | |
| | | | | | | | |
| | | Principal
(000’s) | | | Value
(000’s) | |
Metals & Mining (continued) | |
Steel Dynamics, Inc. | | | | | | | | |
6.75%, 04/01/2015 | | $ | 105 | | | $ | 107 | |
7.38%, 11/01/2012 ^ | | | 55 | | | | 57 | |
Multiline Retail - 0.8% | | | | | | | | |
Dollar General Corp. | | | | | | | | |
11.88%, 07/15/2017 | | | 3,630 | | | | 4,012 | |
Macy’s Retail Holdings, Inc. | | | | | | | | |
5.90%, 12/01/2016 | | | 3,455 | | | | 3,861 | |
7.45%, 07/15/2017 | | | 2,484 | | | | 2,900 | |
QVC, Inc. | | | | | | | | |
7.50%, 10/01/2019 - 144A | | | 1,730 | | | | 1,855 | |
Multi-Utilities - 0.2% | |
Dominion Resources, Inc. | | | | | | | | |
1.95%, 08/15/2016 | | | 2,650 | | | | 2,663 | |
Oil, Gas & Consumable Fuels - 5.2% | |
Anadarko Petroleum Corp. | | | | | | | | |
5.95%, 09/15/2016 | | | 5,445 | | | | 6,172 | |
6.38%, 09/15/2017 | | | 3,763 | | | | 4,362 | |
Arch Coal, Inc. | | | | | | | | |
7.25%, 10/01/2020 ^ | | | 4,130 | | | | 4,223 | |
Chesapeake Energy Corp. | | | | | | | | |
6.63%, 08/15/2020 | | | 2,346 | | | | 2,516 | |
Consol Energy, Inc. | | | | | | | | |
8.00%, 04/01/2017 | | | 2,610 | | | | 2,858 | |
8.25%, 04/01/2020 ^ | | | 365 | | | | 403 | |
El Paso Corp. | | | | | | | | |
6.50%, 09/15/2020 | | | 1,605 | | | | 1,735 | |
7.80%, 08/01/2031 | | | 19 | | | | 22 | |
Enterprise Products Operating LLC | | | | | |
6.30%, 09/15/2017 | | | 4,150 | | | | 4,860 | |
KeySpan Gas East Corp. | | | | | | | | |
5.82%, 04/01/2041 - 144A | | | 2,100 | | | | 2,562 | |
Kinder Morgan Energy Partners, LP | | | | | |
5.95%, 02/15/2018 | | | 2,150 | | | | 2,456 | |
6.38%, 03/01/2041 | | | 660 | | | | 744 | |
6.55%, 09/15/2040 | | | 470 | | | | 526 | |
Kinder Morgan Finance Co., ULC | | | | | |
5.70%, 01/05/2016 | | | 2,125 | | | | 2,173 | |
Marathon Petroleum Corp. | | | | | | | | |
6.50%, 03/01/2041 | | | 3,154 | | | | 3,574 | |
MEG Energy Corp. | | | | | | | | |
6.50%, 03/15/2021 - 144A | | | 4,030 | | | | 4,121 | |
Nexen, Inc. | | | | | | | | |
6.40%, 05/15/2037 | | | 1,670 | | | | 1,769 | |
7.50%, 07/30/2039 | | | 2,660 | | | | 3,189 | |
OGX Petroleo e Gas Participacoes SA | | | | | |
8.50%, 06/01/2018 - 144A | | | 635 | | | | 622 | |
Peabody Energy Corp. | | | | | | | | |
6.25%, 11/15/2021 - 144A | | | 4,790 | | | | 4,958 | |
Pemex Project Funding Master Trust | | | | | |
6.63%, 06/15/2035 | | | 1,060 | | | | 1,202 | |
Petrobras International Finance Co. | | | | | |
3.88%, 01/27/2016 | | | 5,825 | | | | 6,001 | |
5.75%, 01/20/2020 | | | 7,340 | | | | 7,856 | |
5.88%, 03/01/2018 ^ | | | 1,010 | | | | 1,105 | |
6.13%, 10/06/2016 | | | 371 | | | | 411 | |
Plains Exploration & Production Co. | | | | | |
10.00%, 03/01/2016 | | | 455 | | | | 504 | |
Range Resources Corp. | | | | | |
5.75%, 06/01/2021 | | | 450 | | | | 487 | |
7.25%, 05/01/2018 | | | 3,480 | | | | 3,724 | |
Rockies Express Pipeline LLC | | | | | |
6.85%, 07/15/2018 - 144A | | | 856 | | | | 884 | |
| | | | | | | | |
| | | Principal
(000’s) | | | Value
(000’s) | |
Oil, Gas & Consumable Fuels (continued) | |
SemGroup, LP (Escrow Shares) | | | | | | | | |
8.75%, 11/15/2049 - 144A | | $ | 125 | | | | $ ¿ | |
Transocean, Inc. | | | | | | | | |
6.38%, 12/15/2021 | | | 1,000 | | | | 1,063 | |
6.50%, 11/15/2020 | | | 1,500 | | | | 1,549 | |
Western Gas Partners, LP | | | | | | | | |
5.38%, 06/01/2021 | | | 3,010 | | | | 3,191 | |
Williams Partners, LP | | | | | | | | |
4.13%, 11/15/2020 | | | 1,750 | | | | 1,796 | |
Paper & Forest Products - 0.3% | |
International Paper Co. | | | | | | | | |
4.75%, 02/15/2022 ^ | | | 1,750 | | | | 1,859 | |
6.00%, 11/15/2041 ^ | | | 1,280 | | | | 1,390 | |
Inversiones CMPC SA | | | | | | | | |
4.75%, 01/19/2018 - 144A | | | 985 | | | | 1,028 | |
Pharmaceuticals - 0.3% | |
Teva Pharmaceutical Finance Co., BV | | | | | |
3.65%, 11/10/2021 | | | 850 | | | | 865 | |
Teva Pharmaceutical Finance II BV | | | | | |
3.00%, 06/15/2015 | | | 2,330 | | | | 2,426 | |
Teva Pharmaceutical Finance IV BV | | | | | |
3.65%, 11/10/2021 | | | 2,050 | | | | 2,085 | |
Real Estate Investment Trusts - 0.6% | |
ERP Operating, LP | | | | | | | | |
4.63%, 12/15/2021 | | | 2,100 | | | | 2,141 | |
Hospitality Properties Trust | | | | | | | | |
5.63%, 03/15/2017 ^ | | | 1,507 | | | | 1,526 | |
Mack-Cali Realty, LP | | | | | | | | |
7.75%, 08/15/2019 | | | 1,300 | | | | 1,549 | |
Ventas Realty, LP | | | | | | | | |
4.75%, 06/01/2021 | | | 1,155 | | | | 1,115 | |
Vornado Realty, LP | | | | | | | | |
5.00%, 01/15/2022 | | | 3,495 | | | | 3,525 | |
Real Estate Management & Development - 0.1% | |
Forest City Enterprises, Inc. | | | | | | | | |
6.50%, 02/01/2017 | | | 30 | | | | 28 | |
7.63%, 06/01/2015 | | | 35 | | | | 34 | |
Realogy Corp. | | | | | | | | |
7.88%, 02/15/2019 - 144A ^ | | | 2,020 | | | | 1,758 | |
Road & Rail - 0.4% | |
Burlington Northern Santa Fe LLC | | | | | |
5.75%, 05/01/2040 | | | 4,680 | | | | 5,599 | |
Software - 0.3% | | | | | | | | |
First Data Corp. | | | | | | | | |
7.38%, 06/15/2019 - 144A ^ | | | 2,565 | | | | 2,411 | |
8.25%, 01/15/2021 - 144A ^ | | | 175 | | | | 157 | |
Oracle Corp. | | | | | | | | |
5.38%, 07/15/2040 | | | 1,690 | | | | 2,059 | |
Wireless Telecommunication Services - 1.0% | |
Cricket Communications, Inc. | | | | | | | | |
7.75%, 05/15/2016 | | | 2,093 | | | | 2,161 | |
Crown Castle Towers LLC | | | | | | | | |
6.11%, 01/15/2020 - 144A | | | 7,340 | | | | 8,098 | |
MetroPCS Wireless, Inc. | | | | | | | | |
7.88%, 09/01/2018 ^ | | | 117 | | | | 119 | |
SBA Tower Trust | | | | | | | | |
5.10%, 04/15/2017 - 144A | | | 1,570 | | | | 1,635 | |
Sprint Nextel Corp. | | | | | | | | |
9.00%, 11/15/2018 - 144A | | | 3,740 | | | | 3,927 | |
| | | | | | | | |
Total Corporate Debt Securities
(cost $488,649) | | | | 498,128 | |
| | | | | | | | |
| | | | | | | | |
| | | Principal
(000’s) | | | Value
(000’s) | |
CONVERTIBLE BOND - 0.1% | |
Machinery - 0.1% | |
Navistar International Corp. | | | | | | | | |
3.00%, 10/15/2014 | | $ | 1,020 | | | $ | 1,099 | |
Total Convertible Bond
(cost $1,207) | |
| | |
| | | Shares | | | Value
(000’s) | |
PREFERRED STOCKS - 0.1% | |
Consumer Finance - 0.0% ¥ | |
Ally Financial, Inc., 7.00% - 144A | | | 341 | | | | 244 | |
Diversified Financial Services - 0.1% | |
Citigroup Capital XIII, 7.88% * | | | 63,052 | | | | 1,643 | |
U.S. Government Agency Obligation - 0.0% ¥ | |
Fannie Mae, 0.00% * | | | 1,300 | | | | 3 | |
Fannie Mae, 0.00% * | | | 81,175 | | | | 112 | |
Freddie Mac, 8.38% * | | | 93,300 | | | | 124 | |
| | | | | | | | |
Total Preferred Stocks
(cost $3,819) | | | | | | | 2,126 | |
| | | | | | | | |
COMMON STOCK - 0.0% ¥ | |
Oil, Gas & Consumable Fuels - 0.0% ¥ | |
SemGroup Corp. - Class A ‡ ^ | | | 323 | | | | 8 | |
Total Common Stock
(cost $8) | |
WARRANT - 0.0% ¥ | |
Oil, Gas & Consumable Fuels - 0.0% ¥ | |
SemGroup Corp. ‡ | | | | | | | | |
Expiration: 11/30/2014 | | | | | | | | |
Exercise Price: $25.00 | | | 340 | | | | 2 | |
Total Warrant (cost $¿) | |
| | |
| | | Notional
Amount
(000’s) | | | Value
(000’s) | |
PURCHASED OPTIONS - 0.0% ¥ | |
Call Options - 0.0% ¥ | |
10-Year U.S. Treasury Note Future | | $ | 357 | | | | 61 | |
Call Strike $133.00 | | | | | | | | |
Expires 01/27/2012 | | | | | | | | |
10-Year U.S. Treasury Note Future | | | 142 | | | | 58 | |
Call Strike $132.00 | | | | | | | | |
Expires 01/27/2012 | | | | | | | | |
Euro | | EUR | 32,875 | | | | 8 | |
Call Strike $1.45 | | | | | | | | |
Expires 02/17/2012 | | | | | | | | |
Put Options - 0.0% ¥ | | | | | | | | |
10-Year U.S. Treasury Note Future | | $ | 191 | | | | 18 | |
Put Strike $128.00 | | | | | | | | |
Expires 01/27/2012 | | | | | | | | |
10-Year U.S. Treasury Note Future | | | 366 | | | | 17 | |
Put Strike $127.00 | | | | | | | | |
Expires 01/27/2012 | | | | | | | | |
Eurodollar Future | | | 1,070 | | | | 3 | |
Put Strike $99.00 | | | | | | | | |
Expires 01/13/2012 | | | | | | | | |
| | | | | | | | |
| | | Notional
Amount
(000’s) | | | Value
(000’s) | |
Put Options (continued) | | | | | |
Eurodollar, Mid-Curve 1-Year Future | | $ | 2,358 | | | $ | 94 | |
Put Strike $99.00 | | | | | | | | |
Expires 03/16/2012 | | | | | | | | |
| | | | | | | | |
Total Purchased Options
(cost $1,134) | | | | 259 | |
| | | | | | | | |
PURCHASED SWAPTIONS - 0.1% | | | | | |
Call Options - 0.1% | | | | | |
If exercised the Series receives 1.76%, and pays floating 3 month LIBOR, European Style | | | 40,800 | | | | 827 | |
Expires 01/26/2012 | | | | | |
If exercised the Series receives 5%, and pays 5-Year CDX, European Style | | | 17,505 | | | | 326 | |
Expires 01/18/2012 | | | | | |
Put Options - 0.0% ¥ | | | | | |
If exercised the Series receives floating 3 month LIBOR, and pays 1.76%, European Style | | | 40,800 | | | | t | |
Expires 01/26/2012 | | | | | |
If exercised the Series receives floating 3 month LIBOR, and pays 2.95%, European Style | | | 5,400 | | | | 226 | |
Expires 06/14/2012 | | | | | |
If exercised the Series receives floating 3 month LIBOR, and pays 2.5%, European Style | | | 18,400 | | | | t | |
Expires 01/26/2012 | | | | | |
If exercised the Series receives floating 3 month LIBOR, and pays 2.7%, European Style | | | 37,300 | | | | 4 | |
Expires 01/27/2012 | | | | | |
If exercised the Series receives floating 3 month LIBOR, and pays 2.85%, European Style | | | 20,300 | | | | t | |
Expires 01/13/2012 | | | | | |
If exercised the Series receives floating 3 month LIBOR, and pays 3.5%, European Style | | EUR | 16,400 | | | | 662 | |
Expires 11/08/2012 | | | | | |
| | | | | | | | |
Total Purchased Swaptions
(cost $2,446) | | | | 2,045 | |
| | | | | | | | |
| | | | | | | | |
| | | Shares | | |
Value
(000’s) | |
SECURITIES LENDING COLLATERAL - 3.8% | |
State Street Navigator Securities Lending Trust - Prime Portfolio, 0.28% p | | | 60,688,179 | | | $ | 60,688 | |
Total Securities Lending Collateral (cost $60,688) | |
| | |
| | | Principal
(000’s) | | | Value
(000’s) | |
REPURCHASE AGREEMENT - 7.3% | | | | | |
State Street Bank & Trust Co. 0.03% p, dated 12/30/2011, to be repurchased at $116,416 on 01/03/2012. Collateralized by U.S. Government Agency Obligations, 3.0% - 3.5%, due 11/15/2040 -11/25/2040, and with a total value of $118,744. | | $ | 116,415 | | | | 116,415 | |
Total Repurchase Agreement
(cost $116,415) | | | | | |
| | | | | | | | |
Total Investment Securities
(cost $1,916,324) | | | | 1,917,150 | |
Other Assets and Liabilities - Net | | | | (328,559 | ) |
| | | | | | | | |
Net Assets | | | | | | $ | 1,588,591 | |
| | | | | | | | |
| | | | | | | | |
| | | Principal
(000’s) | | | Value
(000’s) | |
SECURITIES SOLD SHORT - (15.5%) | |
U.S. Government Agency Obligations - (15.5%) | |
Fannie Mae, TBA | | | | | | | | |
3.50% | | $ | (80,600 | ) | | $ | (82,892 | ) |
4.00% | | | (104,400 | ) | | | (109,392 | ) |
5.50% | | | (49,300 | ) | | | (53,583 | ) |
| | | | | | | | |
Total Securities Sold Short
(proceeds $(244,044)) | | | $ | (245,867 | ) |
| | | | | | | | |
WRITTEN SWAPTIONS:
| | | | | | | | | | | | | | | | | | | | | | | | |
Description | | Counterparty | | Floating Rate
Index | | Pay/Receive
Floating Rate | | Exercise
Rate | | | Expiration
Date | | Notional
Amount
(000’s) | | | Premiums
(Received)
(000’s) | | | Value
(000’s) | |
Call - Interest Rate Swap, European Style | | GSC | | 3-month USD
LIBOR | | Receive | | | 2.08 | % | | 02/07/2012 | | $ | (39,100 | ) | | $ | (339 | ) | | $ | (1,038 | ) |
Call - Interest Rate Swap, European Style | | DUB | | 3-month USD
LIBOR | | Receive | | | 2.56 | | | 12/19/2013 | | | (8,600 | ) | | | (443 | ) | | | (439 | ) |
Call - Interest Rate Swap, European Style | | CITI | | 3-month USD
LIBOR | | Receive | | | 2.58 | | | 12/16/2013 | | | (8,000 | ) | | | (412 | ) | | | (420 | ) |
Call - Interest Rate Swap, European Style | | DUB | | 3-month USD
LIBOR | | Receive | | | 2.59 | | | 12/16/2013 | | | (2,000 | ) | | | (103 | ) | | | (106 | ) |
Call - Interest Rate Swap, European Style | | UBS | | 3-month USD
LIBOR | | Receive | | | 4.02 | | | 02/02/2012 | | | (15,100 | ) | | | (586 | ) | | | (2,756 | ) |
Put - Interest Rate Swap, European Style | | GSC | | 3-month USD
LIBOR | | Pay | | | 2.08 | | | 02/07/2012 | | | (39,100 | ) | | | (339 | ) | | | t | |
Put - Interest Rate Swap, European Style | | DUB | | 3-month USD
LIBOR | | Pay | | | 2.56 | | | 12/19/2013 | | | (8,600 | ) | | | (443 | ) | | | (443 | ) |
Put - Interest Rate Swap, European Style | | CITI | | 3-month USD
LIBOR | | Pay | | | 2.58 | | | 12/16/2013 | | | (8,000 | ) | | | (412 | ) | | | (403 | ) |
Put - Interest Rate Swap, European Style | | DUB | | 3-month USD
LIBOR | | Pay | | | 2.59 | | | 12/16/2013 | | | (2,000 | ) | | | (103 | ) | | | (100 | ) |
Put - Interest Rate Swap, European Style | | UBS | | 3-month USD
LIBOR | | Pay | | | 4.02 | | | 02/02/2012 | | | (15,100 | ) | | | (586 | ) | | | t | |
| | | | | | | | | | | | | | | | | | | | | | | | |
| | | | | | | | | | | | | | | | | | $ | (3,766 | ) | | $ | (5,705 | ) |
| | | | | | | | | | | | | | | | | | | | | | | | |
CREDIT DEFAULT WRITTEN SWAPTION ON CREDIT INDICES: p
| | | | | | | | | | | | | | | | | | | | | | | | |
Description | | Counterparty | | Buy/Sell
Protection | | Exercise
Rate | | | Expiration
Date | | | Notional
Amount
(000’s) | | | Premiums
(Received)
(000’s) | | | Value
(000’s) | |
Put - OTC CDX.NA.HY.17.V1, European Style | | MSC | | Sell | | | 5.00 | % | | | 01/18/2012 | | | $ | (13,129 | ) | | $ | (164 | ) | | $ | (2 | ) |
OTC SWAP AGREEMENTS: p
CREDIT DEFAULT SWAPS ON CORPORATE AND SOVEREIGN ISSUES - BUY PROTECTION:(1)
| | | | | | | | | | | | | | | | | | | | | | | | | | | | |
Reference Obligation | | Fixed Deal
Receive
Rate | | | Maturity
Date | | Counterparty | | Implied Credit
Spread (BP) at
12/31/2011(2) | | | Notional
Amount
(000’s)(3) | | | Market
Value
(000’s) | | | Premiums
Paid
(000’s) | | | Unrealized
Appreciation
(Depreciation)
(000’s) | |
Spain, 1.00% | | | 1.00 | | | 03/20/2016 | | MSC | | | 3.73 | | | $ | 8,000 | | | $ | 808 | | | $ | 475 | | | $ | 333 | |
Spain, 1.00% | | | 1.00 | | | 03/20/2016 | | DUB | | | 3.73 | | | | 8,000 | | | | 808 | | | | 473 | | | | 335 | |
| | | | | | | | | | | | | | | | | | | | | | | | | | | | |
| | | | | | | | | | | | | | | | | | $ | 1,616 | | | $ | 948 | | | $ | 668 | |
| | | | | | | | | | | | | | | | | | | | | | | | | | | | |
CREDIT DEFAULT SWAPS ON CORPORATE AND SOVEREIGN ISSUES - SELL PROTECTION:(4)
| | | | | | | | | | | | | | | | | | | | | | | | | | | | | | |
Reference Obligation | | Fixed Deal
Receive
Rate | | | Maturity
Date | | | Counterparty | | Implied Credit
Spread (BP) at
12/31/2011(2) | | | Notional
Amount
(000’s)(3) | | | Market
Value
(000’s) | | | Premiums
(Received)
(000’s) | | | Unrealized
Appreciation
(Depreciation)
(000’s) | |
Assured Guaranty Corp. | | | 5.00 | % | | | 12/20/2014 | | | CITI | | | 11.15 | | | $ | 15 | | | $ | (2 | ) | | $ | (2 | ) | | $ | t | |
Assured Guaranty Corp. | | | 5.00 | | | | 12/20/2014 | | | CITI | | | 11.15 | | | | 640 | | | | (94 | ) | | | (100 | ) | | | 6 | |
Assured Guaranty Corp. | | | 5.00 | | | | 03/20/2015 | | | CITI | | | 11.27 | | | | 65 | | | | (10 | ) | | | (12 | ) | | | 2 | |
Assured Guaranty Corp. | | | 5.00 | | | | 12/20/2016 | | | CITI | | | 11.57 | | | | 941 | | | | (196 | ) | | | (226 | ) | | | 30 | |
Aviva USA Corp. | | | 1.00 | | | | 05/25/2012 | | | DUB | | | 1.08 | | | | 4,800 | | | | (17 | ) | | | (12 | ) | | | (5 | ) |
MetLife, Inc., 5.00%, 06/15/2015 | | | 1.00 | | | | 12/20/2016 | | | CITI | | | 3.22 | | | | 7,625 | | | | (741 | ) | | | (554 | ) | | | (187 | ) |
MetLife, Inc., 5.00%, 06/15/2015 | | | 1.00 | | | | 12/20/2016 | | | CITI | | | 3.22 | | | | 1,175 | | | | (114 | ) | | | (92 | ) | | | (22 | ) |
MetLife, Inc., 5.00%, 06/15/2015 | | | 1.00 | | | | 09/20/2016 | | | DUB | | | 3.19 | | | | 1,560 | | | | (143 | ) | | | (124 | ) | | | (19 | ) |
MetLife, Inc., 5.00%, 06/15/2015 | | | 1.00 | | | | 09/20/2016 | | | MSC | | | 3.19 | | | | 1,960 | | | | (179 | ) | | | (152 | ) | | | (27 | ) |
MetLife, Inc., 5.00%, 06/15/2015 | | | 1.00 | | | | 09/20/2016 | | | BOA | | | 3.19 | | | | 470 | | | | (43 | ) | | | (37 | ) | | | (6 | ) |
MetLife, Inc., 5.00%, 06/15/2015 | | | 1.00 | | | | 09/20/2016 | | | GSC | | | 3.19 | | | | 1,200 | | | | (110 | ) | | | (93 | ) | | | (17 | ) |
MetLife, Inc., 5.00%, 06/15/2015 | | | 1.00 | | | | 09/20/2016 | | | MSC | | | 3.19 | | | | 1,180 | | | | (108 | ) | | | (82 | ) | | | (26 | ) |
| | | | | | | | | | | | | | | | | | | | | | | | | | | | | | |
| | | | | | | | | | | | | | | | | | | | $ | (1,757 | ) | | $ | (1,486 | ) | | $ | (271 | ) |
| | | | | | | | | | | | | | | | | | | | | | | | | | | | | | |
OTC SWAP AGREEMENTS: (continued) p
CREDIT DEFAULT SWAPS ON CREDIT INDICES - BUY PROTECTION:(1)
| | | | | | | | | | | | | | | | | | | | | | | | | | | | |
Reference Obligation | | Fixed Deal
Pay Rate | | | Maturity
Date | | Counterparty | | Implied Credit
Spread (BP) at
12/31/2011(2) | | | Notional
Amount
(000’s)(3) | | | Market
Value
(000’s)(5) | | | Premiums
Paid
(Received)
(000’s) | | | Unrealized
Appreciation
(Depreciation)
(000’s) | |
Dow Jones North America Investment Grade Index - Series 5, 1.00% | | | 1.00 | % | | 12/20/2016 | | MSC | | | 1.20 | | | $ | 16,340 | | | $ | 151 | | | $ | 185 | | | $ | (34 | ) |
Dow Jones North America Investment Grade Index - Series 5, 1.00% | | | 1.00 | | | 12/20/2016 | | CITI | | | 1.20 | | | | 21,170 | | | | 195 | | | | 305 | | | | (110 | ) |
Emerging Markets Index - Series 14, 5.00% | | | 5.00 | | | 12/20/2015 | | MSC | | | 2.86 | | | | 4,380 | | | | (318 | ) | | | (438 | ) | | | 120 | |
North America Investment Grade Index - Series 16, 1.00% | | | 1.00 | | | 06/20/2016 | | MSC | | | 1.18 | | | | 6,752 | | | | 52 | | | | 106 | | | | (54 | ) |
North America Investment Grade Index - Series 17, 1.00% | | | 1.00 | | | 12/20/2016 | | MSC | | | 1.20 | | | | 10,675 | | | | 99 | | | | 192 | | | | (93 | ) |
| | | | | | | | | | | | | | | | | | | | | | | | | | | | |
| | | | | | | | | | | | | | | | | | $ | 179 | | | $ | 350 | | | $ | (171 | ) |
| | | | | | | | | | | | | | | | | | | | | | | | | | | | |
|
| CREDIT DEFAULT SWAPS ON CREDIT INDICES - SELL PROTECTION:(4) | |
| | | | | | | | |
Reference Obligation | | Fixed Deal
Receive
Rate | | | Maturity
Date | | Counterparty | | Currency
Code | | | Notional
Amount
(000’s)(3) | | | Market
Value
(000’s)(5) | | | Premiums
(Received)
(000’s) | | | Unrealized
Appreciation
(000’s) | |
CMBX.NA.3.AAA | | | 0.08 | % | | 12/13/2049 | | MSC | | | USD | | | $ | 2,215 | | | $ | (208 | ) | | $ | (256 | ) | | $ | 48 | |
CMBX.NA.4.AAA | | | 0.35 | | | 02/17/2051 | | MSC | | | USD | | | | 2,215 | | | | (223 | ) | | | (265 | ) | | | 42 | |
North America High Yield Index - Series 17, 1.00% | | | 5.00 | | | 12/20/2016 | | CITI | | | USD | | | | 14,700 | | | | (1,013 | ) | | | (1,399 | ) | | | 386 | |
North America High Yield Index - Series 17, 2.00% | | | 5.00 | | | 12/20/2016 | | DUB | | | USD | | | | 3,185 | | | | (219 | ) | | | (240 | ) | | | 21 | |
| | | | | | | | | | | | | | | | | | | | | | | | | | | | |
| | | | | | | | | | | | | | | | | | $ | (1,663 | ) | | $ | (2,160 | ) | | $ | 497 | |
| | | | | | | | | | | | | | | | | | | | | | | | | | | | |
|
| INTEREST RATE SWAP AGREEMENTS - FIXED RATE PAYABLE: | |
| | | | | | | | |
Floating Rate Index | | Fixed Rate | | | Maturity
Date | | Counterparty | | Currency
Code | | | Notional
Amount
(000’s) | | | Market
Value
(000’s) | | | Premiums
Paid
(000’s) | | | Net Unrealized
Appreciation
(Depreciation)
(000’s) | |
3-Month USD-LIBOR | | | 0.73 | % | | 12/22/2013 | | BOA | | | USD | | | | 41,300 | | | $ | 14 | | | $ | t | | | $ | 14 | |
3-Month USD-LIBOR | | | 0.73 | | | 12/22/2013 | | CITI | | | USD | | | | 9,400 | | | | 4 | | | | t | | | | 4 | |
3-Month USD-LIBOR | | | 0.74 | | | 12/22/2013 | | DUB | | | USD | | | | 19,600 | | | | 7 | | | | t | | | | 7 | |
3-Month USD-LIBOR | | | 0.74 | | | 12/22/2013 | | DUB | | | USD | | | | 38,300 | | | | 19 | | | | t | | | | 19 | |
3-Month USD-LIBOR | | | 4.01 | | | 05/18/2021 | | GSC | | | USD | | | | 10,800 | | | | 1,927 | | | | 392 | | | | 1,535 | |
3-Month USD-LIBOR | | | 2.57 | | | 08/08/2021 | | DUB | | | USD | | | | 1,200 | | | | 64 | | | | t | | | | 64 | |
3-Month USD-LIBOR | | | 2.35 | | | 08/12/2021 | | DUB | | | USD | | | | 8,800 | | | | 295 | | | | t | | | | 295 | |
3-Month USD-LIBOR | | | 2.15 | | | 09/08/2021 | | DUB | | | USD | | | | 2,300 | | | | 40 | | | | t | | | | 40 | |
3-Month USD-LIBOR | | | 2.18 | | | 10/06/2021 | | BOA | | | USD | | | | 7,810 | | | | (35 | ) | | | t | | | | (35 | ) |
3-Month USD-LIBOR | | | 2.03 | | | 12/21/2021 | | DUB | | | USD | | | | 7,100 | | | | 17 | | | | t | | | | 17 | |
3-Month USD-LIBOR | | | 2.09 | | | 01/03/2022 | | DUB | | | USD | | | | 400 | | | | 3 | | | | t | | | | 3 | |
3-Month USD-LIBOR | | | 2.08 | | | 01/03/2022 | | DUB | | | USD | | | | 400 | | | | 3 | | | | t | | | | 3 | |
6-Month EURIBOR | | | 1.24 | | | 12/13/2013 | | CITI | | | EUR | | | | 169,030 | | | | (304 | ) | | | t | | | | (304 | ) |
| | | | | | | | | | | | | | | | | | | | | | | | | | | | |
| | | | | | | | | | | | | | | | | | $ | 2,054 | | | $ | 392 | | | $ | 1,662 | |
| | | | | | | | | | | | | | | | | | | | | | | | | | | | |
|
| INTEREST RATE SWAP AGREEMENTS - FIXED RATE RECEIVABLE: | |
| | | | | | | | |
Floating Rate Index | | Fixed Rate | | | Maturity
Date | | Counterparty | | Currency
Code | | | Notional
Amount
(000’s) | | | Market
Value
(000’s) | | | Premiums
(Received)
(000’s) | | | Net Unrealized
(Depreciation)
(000’s) | |
3-Month USD-LIBOR | | | 3.27 | % | | 05/16/2021 | | DUB | | | USD | | | | 3,650 | | | $ | (416 | ) | | $ | t | | | $ | (416 | ) |
3-Month USD-LIBOR | | | 2.26 | | | 12/05/2021 | | CITI | | | USD | | | | 15,000 | | | | (346 | ) | | | t | | | | (346 | ) |
3-Month USD-LIBOR | | | 2.18 | | | 12/29/2021 | | DUB | | | USD | | | | 8,200 | | | | (134 | ) | | | t | | | | (134 | ) |
3-Month USD-LIBOR | | | 3.00 | | | 01/03/2022 | | UBS | | | USD | | | | 10,300 | | | | (938 | ) | | | (102 | ) | | | (836 | ) |
6-Month EURIBOR | | | 2.58 | | | 11/11/2041 | | DUB | | | EUR | | | | 1,450 | | | | (2 | ) | | | t | | | | (2 | ) |
6-Month EURIBOR | | | 2.68 | | | 11/18/2041 | | DUB | | | EUR | | | | 3,125 | | | | (88 | ) | | | t | | | | (88 | ) |
| | | | | | | | | | | | | | | | | | | | | | | | | | | | |
| | | | | | | | | | | | | | | | | | $ | (1,924 | ) | | $ | (102 | ) | | $ | (1,822 | ) |
| | | | | | | | | | | | | | | | | | | | | | | | | | | | |
FUTURES CONTRACTS:
| | | | | | | | | | | | |
Description | | Type | | Contracts | | | Expiration Date | | Net Unrealized
Appreciation
(Depreciation)
(000’s) | |
10-Year U.S. Treasury Note | | Short | | | (260 | ) | | 03/21/2012 | | $ | (47 | ) |
2-Year U.S. Treasury Note | | Short | | | (348 | ) | | 03/30/2012 | | | 11 | |
30-Year U.S. Treasury Bond | | Long | | | 247 | | | 03/21/2012 | | | 584 | |
3-Month EURIBOR | | Long | | | 459 | | | 03/19/2012 | | | 143 | |
3-Month EURIBOR | | Long | | | 62 | | | 03/17/2014 | | | 64 | |
3-Month EURIBOR | | Long | | | 62 | | | 06/16/2014 | | | 70 | |
3-Month EURIBOR | | Long | | | 62 | | | 09/15/2014 | | | 75 | |
3-Month EURIBOR | | Long | | | 62 | | | 12/15/2014 | | | 77 | |
5-Year U.S. Treasury Note | | Long | | | 665 | | | 03/30/2012 | | | 63 | |
90-Day Eurodollar | | Long | | | 672 | | | 12/15/2014 | | | 388 | |
90-Day Eurodollar | | Long | | | 672 | | | 03/16/2015 | | | 472 | |
German Euro BOBL | | Short | | | (4 | ) | | 03/08/2012 | | | (11 | ) |
German Euro Bund | | Long | | | 154 | | | 01/27/2012 | | | (141 | ) |
German Euro Bund | | Short | | | (4 | ) | | 03/08/2012 | | | (22 | ) |
German Euro Schatz | | Short | | | (1,317 | ) | | 03/08/2012 | | | (488 | ) |
U.K. Long Gilt Bond | | Short | | | (1 | ) | | 03/28/2012 | | | (5 | ) |
Ultra Long U.S. Treasury Bond | | Short | | | (188 | ) | | 03/21/2012 | | | (451 | ) |
| | | | | | | | | | | | |
| | | | | | | | | | $ | 782 | |
| | | | | | | | | | | | |
FORWARD FOREIGN CURRENCY CONTRACTS:
| | | | | | | | | | | | | | | | |
Currency | | Counterparty | | Contracts
Bought
(Sold)
(000’s) | | | Settlement Date | | Amount in U.S.
Dollars Bought
(Sold)
(000’s) | | | Net Unrealized
Appreciation
(Depreciation)
(000’s) | |
Euro | | CITI | | | 730 | | | 01/25/2012 | | $ | 953 | | | $ | (8 | ) |
Euro | | RBS | | | 6,000 | | | 01/25/2012 | | | 8,000 | | | | (234 | ) |
Euro | | RBS | | | (12,741 | ) | | 01/25/2012 | | | (17,345 | ) | | | 853 | |
Euro | | CITI | | | (10,547 | ) | | 01/25/2012 | | | (14,383 | ) | | | 731 | |
Euro | | CITI | | | (3,192 | ) | | 01/25/2012 | | | (4,389 | ) | | | 257 | |
Euro | | DUB | | | 4,715 | | | 01/25/2012 | | | 6,350 | | | | (247 | ) |
| | | | | | | | | | | | | | | | |
| | | | | | | | | | | | | | $ | 1,352 | |
| | | | | | | | | | | | | | | | |
Collateral (Received) Pledged for OTC Financial Derivative Instruments
The following is a summary by counterparty of the market value of OTC financial derivative instruments and collateral (received)/pledged as of 12/31/2011:
| | | | | | | | | | | | |
Counterparty | | Total Market Value of OTC
Derivatives
(000’s) | | | Collateral
(Received)/Pledged
(000’s) | | | Net Exposures (1)
(000’s) | |
BOA | | $ | (64 | ) | | $ | 131 | | | $ | 67 | |
CITI | | | (2,464 | ) | | | 2,878 | | | | 414 | |
CSFB | | | — | | | | (156 | ) | | | (156 | ) |
DUB | | | (1,098 | ) | | | (320 | ) | | | (1,418 | ) |
GSC | | | 779 | | | | (900 | ) | | | (121 | ) |
MSC | | | 72 | | | | — | | | | 72 | |
RBS | | | 619 | | | | — | | | | 619 | |
UBS | | | (3,694 | ) | | | 7,110 | | | | 3,416 | |
| (1) | Net exposure represents the net receivable/(payable) that would be due from/to the counterparty in the event of default. |
NOTES TO SCHEDULE OF INVESTMENTS (all amounts in thousands):
| ^ | All or a portion of this security is on loan. The value of all securities on loan is $59,439. |
| * | Floating or variable rate note. Rate is listed as of 12/30/2011. |
| p | Rate shown reflects the yield at 12/30/2011. |
| ¿ | Amount rounds to less than 1. |
| ž | The security has a perpetual maturity. The date shown is the next call date. |
| In default. |
| Securities fair valued as determined in good faith in accordance with procedures established by the Board of Trustees. These securities aggregated to $8, or less than 0.01% of the portfolio’s net assets. |
NOTES TO SCHEDULE OF INVESTMENTS (all amounts in thousands) (continued):
| ¥ | Percentage rounds to less than 0.1%. |
| Payment in-kind. Securities pay interest or dividends in the form of additional bonds or preferred stock. |
| ‡ | Non-income producing security. |
| § | Illiquid. At 12/31/2011, the fair value of the illiquid investment security aggregated to less than $1, or less than 0.01% of the portfolio’s net assets. |
| g | A portion of these securities in the amount of $3,356 has been segregated as collateral with the broker to cover margin requirements for open futures contracts. |
| a | A portion of these securities in the amount of $6,763 has been segregated as collateral with the broker for open swaps contracts and/or for swaptions. |
| p | Securities with an aggregate market value of $156 and cash in the amount of $1,220 have been pledged by the broker as collateral with the custodian for open swaps contracts and/or for swaptions. |
| Aggregate cost for federal income tax purposes is $1,916,431. Aggregate gross unrealized appreciation/depreciation for all securities in which there is an excess of value over tax cost were $41,926 and $41,207, respectively. Net unrealized appreciation for tax purposes is $719. |
| (1) | If the Fund is a buyer of protection and a credit event occurs, as defined under the terms of that particular swap agreement, the Fund will either (a) receive from the seller of protection an amount equal to the notional amount of the swap and deliver the referenced obligation or underlying securities comprising the referenced index or (b) receive a net settlement amount in the form of cash or securities equal to the notional amount of the swap less the recovery value of the referenced obligation or underlying securities comprising the referenced index. |
| (2) | Implied credit spreads, represented in absolute terms, utilized in determining the market value of credit default swap agreements on corporate issues or sovereign issues of an emerging country as of period end serve as an indicator of the current status of the payment/performance risk and represent the likelihood of risk of default for the credit derivative. The implied credit spread of a particular referenced entity reflects the cost of buying/selling protection and may include the referenced entity’s credit soundness and a greater likelihood or risk of default or other credit event occurring as defined under the terms of the agreement. A credit spread identified as “Defaulted” indicates a credit event has occurred for the referenced entity or obligation. |
| (3) | The maximum potential amount the Fund could be required to make as a seller of credit protection or receive as a buyer of credit protection if a credit event occurs as defined under the terms of that particular swap agreement. |
| (4) | If the Fund is a seller of protection and a credit event occurs, as defined under the terms of that particular swap agreement, the fund will either (a) pay to the buyer of protection an amount equal to the notional amount of the swap and take delivery of the referenced obligation or underlying securities comprising the referenced index or (b) pay a net settlement amount in the form of cash or securities equal to the notional amount of the swap less the recovery value of the referenced obligation or underlying securities comprising the referenced index. |
| (5) | The quoted market prices and resulting values for credit default swap agreements on asset-backed securities and credit indices serve as an indicator of the current status of the payment/performance risk and represent the likelihood of an expected liability (or profit) for the credit derivative had the notional amount of the swap agreement been closed/sold as of the period ended. Increasing market values, in absolute terms when compared to the notional amount of the swap, represent a deterioration of the references entity’s credit soundness and a greater likelihood or risk of default or other credit event occurring as defined under the terms of the agreement. |
| | |
| DEFINITIONS (all amounts in thousands): |
| |
| 144A | | 144A Securities are registered pursuant to Rule 144A of the Securities Act of 1933. These securities are deemed to be liquid for purposes of compliance limitations on holdings of illiquid securities and may be resold as transactions exempt from registration, normally to qualified institutional buyers. At 12/31/2011, these securities aggregated $227,490, or 14.32%, of the fund’s net assets. |
| BOA | | Bank of America |
| BP | | Basis Point |
| CITI | | Citigroup, Inc. |
| CSFB | | Credit Suisse First Boston |
| CDX | | A series of indices that track North American and emerging market credit derivative indices. |
| DUB | | Deutsche Bank AG |
| EURIBOR | | Euro InterBank Offered Rate |
| GSC | | Goldman Sachs & Co. |
| IO | | Interest Only |
| LIBOR | | London Interbank Offered Rate |
| MSC | | Morgan Stanley |
| OJSC | | Open Joint Stock Company |
| OTC | | Over The Counter |
| REMIC | | Real Estate Mortgage Investment Conduits (consist of a fixed pool of mortgages broken apart and marketed to investors as individual securities) |
| RBS | | Royal Bank of Scotland Group PLC |
| STRIPS | | Separate Trading of Registered Interest and Principal of Securities |
| TBA | | To Be Announced |
| UBS | | UBS Warburg LLC |
|
| CURRENCY ABBREVIATIONS: |
| |
| EUR | | Euro |
| USD | | United States Dollar |
VALUATION SUMMARY (all amounts in thousands):
| | | | | | | | | | | | | | | | |
Investment Securities | | Level 1 -
Quoted
Prices | | | Level 2 -
Other
Significant
Observable
Inputs | | | Level 3 -
Significant
Unobservable
Inputs | | | Value at
12/31/2011 | |
Asset-Backed Securities | | $ | — | | | $ | 76,571 | | | $ | — | | | $ | 76,571 | |
Common Stock | | | 8 | | | | — | | | | — | | | | 8 | |
Convertible Bonds | | | — | | | | 1,099 | | | | — | | | | 1,099 | |
Corporate Debt Securities | | | — | | | | 498,128 | | | | ¿ | | | | 498,128 | |
Foreign Government Obligations | | | — | | | | 57,380 | | | | — | | | | 57,380 | |
Mortgage-Backed Securities | | | — | | | | 181,169 | | | | — | | | | 181,169 | |
Municipal Government Obligations | | | — | | | | 4,096 | | | | — | | | | 4,096 | |
Preferred Corporate Debt Securities | | | — | | | | 5,396 | | | | — | | | | 5,396 | |
Preferred Stocks | | | 2,126 | | | | — | | | | — | | | | 2,126 | |
Purchased Options | | | 251 | | | | 8 | | | | — | | | | 259 | |
Purchased Swaptions | | | — | | | | 2,045 | | | | — | | | | 2,045 | |
Repurchase Agreement | | | — | | | | 116,415 | | | | — | | | | 116,415 | |
Securities Lending Collateral | | | 60,688 | | | | — | | | | — | | | | 60,688 | |
U.S. Government Agency Obligations | | | — | | | | 791,301 | | | | — | | | | 791,301 | |
U.S. Government Obligations | | | — | | | | 120,467 | | | | — | | | | 120,467 | |
Warrant | | | 2 | | | | — | | | | — | | | | 2 | |
| | | | | | | | | | | | | | | | |
Total | | $ | 63,075 | | | $ | 1,854,075 | | | $ | ¿ | | | $ | 1,917,150 | |
| | | | | | | | | | | | | | | | |
| | | | |
Securities Sold Short | | Level 1 -
Quoted
Prices | | | Level 2 -
Other
Significant
Observable
Inputs | | | Level 3 -
Significant
Unobservable
Inputs | | | Value at
12/31/2011 | |
U.S. Government Agency Obligations | | $ | — | | | $ | (245,867 | ) | | $ | — | | | $ | (245,867 | ) |
| | | | | | | | | | | | | | | | |
| | | | |
Other Financial Instruments | | Level 1 -
Quoted
Prices | | | Level 2 -
Other
Significant
Observable
Inputs | | | Level 3 -
Significant
Unobservable
Inputs | | | Value at
12/31/2011 | |
Credit Default Swaptions | | $ | — | | | $ | (2 | ) | | $ | — | | | $ | (2 | ) |
Written Swaptions | | $ | — | | | $ | (5,705 | ) | | $ | — | | | $ | (5,705 | ) |
| | | | | | | | | | | | | | | | |
Total | | $ | — | | | $ | (5,707 | ) | | $ | — | | | $ | 5,707 | |
| | | | | | | | | | | | | | | | |
| | | | |
Other Financial Instruments | | Level 1 -
Quoted
Prices | | | Level 2 -
Other
Significant
Observable
Inputs | | | Level 3 -
Significant
Unobservable
Inputs | | | Value at
12/31/2011 | |
Futures Contracts - Appreciation | | $ | 1,947 | | | $ | — | | | $ | — | | | $ | 1,947 | |
Futures Contracts - Depreciation | | | (1,165 | ) | | | — | | | | — | | | | (1,165 | ) |
Credit Default Swap - Appreciation | | | — | | | | 1,323 | | | | — | | | | 1,323 | |
Credit Default Swap - Depreciation | | | — | | | | (600 | ) | | | — | | | | (600 | ) |
Forward Contracts - Appreciation | | | — | | | | 1,841 | | | | — | | | | 1,841 | |
Forward Contracts - Depreciation | | | — | | | | (489 | ) | | | — | | | | (489 | ) |
Interest Rate Swaps - Appreciation | | | — | | | | 2,001 | | | | — | | | | 2,001 | |
Interest Rate Swaps - Depreciation | | | — | | | | (2,161 | ) | | | — | | | | (2,161 | ) |
| | | | | | | | | | | | | | | | |
Total | | $ | 782 | | | $ | 1,915 | | | $ | — | | | $ | 2,697 | |
| | | | | | | | | | | | | | | | |
VALUATION SUMMARY (all amounts in thousands)(continued):
Level 3 Rollforward - Investment Securities
| | | | | | | | | | | | | | | | | | | | | | | | | | | | | | | | | | | | | | | | |
Securities | | Beginning
Balance at
12/31/2010 | | | Purchases | | | Sales | | | Accrued
Discounts/
(Premiums) | | | Total Realized
Gain/(Loss) | | | Net Change in
Unrealized
Appreciation/
(Depreciation) ƒ | | | Transfers into
Level 3 | | | Transfers
out of
Level 3 | | | Ending
Balance at
12/31/2011 | | | Net Change in
Unrealized
Appreciation/
(Depreciation)
on
Investments
Held at
12/31/2011 ƒ | |
Corporate Debt Securities | | $ | ¿ | | | $ | — | | | $ | — | | | $ | — | | | $ | — | | | $ | — | | | $ | — | | | $ | ( | ¿) | | $ | | ¿ | | $ | (2 | ) |
Preferred Corporate Debt Securities | | | ¿ | | | | — | | | | — | | | | — | | | | — | | | | — | | | | — | | | | ( | ¿) | | | — | | | | — | |
| | | | | | | | | | | | | | | | | | | | | | | | | | | | | | | | | | | | | | | | |
Total | | $ | ¿ | | | $ | — | | | $ | — | | | $ | — | | | $ | — | | | $ | — | | | $ | — | | | $ | ( | ¿) | | $ | | ¿ | | $ | (2 | ) |
| | | | | | | | | | | | | | | | | | | | | | | | | | | | | | | | | | | | | | | | |
| See the notes to the financial statements for more information regarding pricing inputs and valuation techniques. |
| Other financial instruments are derivative instruments that are valued at unrealized appreciation (depreciation) on the instrument. |
| ƒ | Any difference between Net Change in Unrealized Appreciation/(Depreciation) and Net Change in Unrealized Appreciation/(Depreciation) on Investments Held at 12/31/2011 may be due to an investment no longer held or categorized as Level 3 at period end. |
| Transferred out of Level 3 because of availability of observable inputs. |
| ¿ | Amount rounds to less than 1. |
| | | | | | | | |
| | | Principal
(000’s) | | | Value
(000’s) | |
PREFERRED CORPORATE DEBT
SECURITY - 0.0% ¥ | | | | | |
Hotels, Restaurants & Leisure - 0.0% ¥ | | | | | |
Fontainebleau Resorts | | | | | | | | |
12.50%, 06/30/2012 - 144A ‡ | | $ | 3,827 | | | $ | ¿ | |
Total Preferred Corporate Debt Security
(cost $3,759) | | | | | |
|
CORPORATE DEBT SECURITIES - 90.7% | |
Aerospace & Defense - 0.8% | | | | | |
Alliant Techsystems, Inc. | | | | | | | | |
6.88%, 09/15/2020 | | | 565 | | | | 576 | |
TransDigm, Inc. | | | | | | | | |
7.75%, 12/15/2018 | | | 4,880 | | | | 5,246 | |
Air Freight & Logistics - 0.3% | | | | | |
AMGH Merger Sub, Inc. | | | | | | | | |
9.25%, 11/01/2018 - 144A | | | 2,025 | | | | 2,086 | |
Auto Components - 1.5% | | | | | |
Affinia Group, Inc. | | | | | |
10.75%, 08/15/2016 - 144A | | | 1,062 | | | | 1,152 | |
Allison Transmission, Inc. | | | | | |
7.13%, 05/15/2019 - 144A | | | 850 | | | | 833 | |
American Axle & Manufacturing Holdings, Inc. | | | | | |
9.25%, 01/15/2017 - 144A | | | 1,917 | | | | 2,080 | |
Goodyear Tire & Rubber Co. | | | | | | | | |
10.50%, 05/15/2016 | | | 520 | | | | 573 | |
Meritor, Inc. | | | | | | | | |
8.13%, 09/15/2015 | | | 1,075 | | | | 962 | |
Tomkins LLC / Tomkins, Inc. | | | | | | | | |
9.00%, 10/01/2018 | | | 1,630 | | | | 1,807 | |
Tower Automotive Holdings USA LLC | | | | | |
10.63%, 09/01/2017 - 144A | | | 2,212 | | | | 2,223 | |
UCI International, Inc. | | | | | | | | |
8.63%, 02/15/2019 | | | 905 | | | | 878 | |
Visteon Corp. | | | | | | | | |
6.75%, 04/15/2019 - 144A | | | 545 | | | | 544 | |
Automobiles - 1.0% | | | | | | | | |
Chrysler Group LLC | | �� | | | |
8.25%, 06/15/2021 - 144A | | | 2,815 | | | | 2,562 | |
Ford Motor Co. | | | | | | | | |
7.45%, 07/16/2031 | | | 3,995 | | | | 4,794 | |
Biotechnology - 0.2% | | | | | | | | |
STHI Holding Corp. | | | | | | | | |
8.00%, 03/15/2018 - 144A | | | 1,115 | | | | 1,146 | |
Capital Markets - 0.5% | | | | | | | | |
E*Trade Financial Corp. | | | | | |
12.50%, 11/30/2017 | | | 3,070 | | | | 3,469 | |
Chemicals - 2.5% | | | | | | | | |
Celanese US Holdings LLC | | | | | |
5.88%, 06/15/2021 | | | 765 | | | | 790 | |
6.63%, 10/15/2018 | | | 655 | | | | 696 | |
CF Industries Holdings, Inc. | | | | | |
6.88%, 05/01/2018 | | | 2,180 | | | | 2,496 | |
7.13%, 05/01/2020 | | | 1,625 | | | | 1,922 | |
Chemtura Corp. | | | | | | | | |
7.88%, 09/01/2018 | | | 1,520 | | | | 1,566 | |
Hexion U.S. Finance Corp. | | | | | | | | |
9.00%, 11/15/2020 | | | 775 | | | | 639 | |
Ineos Group Holdings, Ltd. | | | | | |
8.50%, 02/15/2016 - 144A | | | 1,700 | | | | 1,352 | |
Kraton Polymers LLC | | | | | |
6.75%, 03/01/2019 | | | 550 | | | | 517 | |
Lyondell Chemical Co. | | | | | | | | |
11.00%, 05/01/2018 | | | 819 | | | | 894 | |
| | | | | | | | |
| | | Principal
(000’s) | | | Value
(000’s) | |
Chemicals (continued) | | | | | | | | |
Lyondellbasell Industries NV | | | | | |
6.00%, 11/15/2021 - 144A | | $ | 835 | | | $ | 866 | |
Nova Chemicals Corp. | | | | | |
8.38%, 11/01/2016 | | | 1,390 | | | | 1,515 | |
PolyOne Corp. | | | | | |
7.38%, 09/15/2020 | | | 440 | | | | 454 | |
Rain CII Carbon LLC | | | | | | | | |
8.00%, 12/01/2018 - 144A | | | 2,040 | | | | 2,045 | |
Scotts Miracle-Gro Co. | | | | | | | | |
7.25%, 01/15/2018 | | | 460 | | | | 483 | |
Solutia, Inc. | | | | | | | | |
8.75%, 11/01/2017 | | | 1,225 | | | | 1,338 | |
Vertellus Specialties, Inc. | | | | | | | | |
9.38%, 10/01/2015 - 144A | | | 890 | | | | 681 | |
Commercial Banks - 1.1% | | | | | | | | |
CIT Group, Inc. | | | | | | | | |
5.25%, 04/01/2014 - 144A | | | 2,080 | | | | 2,072 | |
7.00%, 05/01/2015 - 05/01/2017 | | | 5,885 | | | | 5,889 | |
Commercial Services & Supplies - 2.7% | | | | | |
ACCO Brands Corp. | | | | | | | | |
10.63%, 03/15/2015 | | | 1,490 | | | | 1,658 | |
Aramark Holdings Corp. | | | | | | | | |
8.63%, 05/01/2016 - 144A | | | 815 | | | | 839 | |
Casella Waste Systems, Inc. | | | | | | | | |
7.75%, 02/15/2019 | | | 810 | | | | 792 | |
Emergency Medical Services Corp. | | | | | |
8.13%, 06/01/2019 | | | 2,910 | | | | 2,903 | |
Interface, Inc. | | | | | | | | |
7.63%, 12/01/2018 | | | 730 | | | | 772 | |
International Lease Finance Corp. | | | | | |
8.75%, 03/15/2017 | | | 2,455 | | | | 2,529 | |
Jaguar Holding Co II / Jaguar Merger Sub, Inc. | | | | | |
9.50%, 12/01/2019 - 144A | | | 4,070 | | | | 4,273 | |
Koppers, Inc. | | | | | | | | |
7.88%, 12/01/2019 | | | 550 | | | | 583 | |
RBS Global, Inc. | | | | | | | | |
11.75%, 08/01/2016 | | | 870 | | | | 914 | |
RSC Equipment Rental, Inc./RSC Holdings III LLC | | | | | |
8.25%, 02/01/2021 | | | 290 | | | | 294 | |
Rural/Metro Corp. | | | | | | | | |
10.13%, 07/15/2019 - 144A | | | 925 | | | | 872 | |
TransUnion LLC | | | | | | | | |
11.38%, 06/15/2018 | | | 3,035 | | | | 3,466 | |
Communications Equipment - 0.3% | | | | | |
Brocade Communications Systems, Inc. | | | | | |
6.63%, 01/15/2018 | | | 565 | | | | 588 | |
6.88%, 01/15/2020 | | | 565 | | | | 601 | |
CommScope, Inc. | | | | | | | | |
8.25%, 01/15/2019 - 144A | | | 1,065 | | | | 1,065 | |
Computers & Peripherals - 0.4% | | | | | |
Seagate HDD Cayman | | | | | | | | |
7.00%, 11/01/2021 - 144A | | | 2,720 | | | | 2,788 | |
Construction & Engineering - 0.4% | | | | | |
Huntington Ingalls Industries, Inc. | | | | | |
6.88%, 03/15/2018 - 144A | | | 650 | | | | 637 | |
7.13%, 03/15/2021 - 144A | | | 2,155 | | | | 2,112 | |
Construction Materials - 0.3% | | | | | |
Building Materials Corp., of America | | | | | |
6.75%, 05/01/2021 - 144A | | | 2,185 | | | | 2,294 | |
RathGibson, Inc. | | | | | |
11.25%, 02/15/2014 ‡ | | | 2,145 | | | | ¿ | |
| | | | | | | | |
| | | Principal
(000’s) | | | Value
(000’s) | |
Consumer Finance - 0.9% | | | | | | | | |
Ally Financial, Inc. | | | | | | | | |
6.25%, 12/01/2017 | | $ | 3,830 | | | $ | 3,694 | |
8.00%, 11/01/2031 | | | 3,055 | | | | 2,948 | |
Containers & Packaging - 0.6% | | | | | | | | |
BWAY Holding Co. | | | | | | | | |
10.00%, 06/15/2018 | | | 455 | | | | 485 | |
Sealed Air Corp. | | | | | | | | |
8.38%, 09/15/2021 - 144A | | | 3,360 | | | | 3,712 | |
Diversified Consumer Services - 3.6% | | | | | | | | |
Education Management LLC | | | | | | | | |
8.75%, 06/01/2014 | | | 3,530 | | | | 3,539 | |
Express LLC | | | | | | | | |
8.75%, 03/01/2018 | | | 5,145 | | | | 5,569 | |
Laureate Education, Inc. | | | | | | | | |
10.00%, 08/15/2015 - 144A | | | 5,805 | | | | 5,921 | |
11.25%, 08/15/2015 - 144A | | | 8,015 | | | | 8,216 | |
12.75%, 08/15/2017 - 144A | | | 2,690 | | | | 2,771 | |
Stewart Enterprises, Inc. | | | | | | | | |
6.50%, 04/15/2019 | | | 440 | | | | 442 | |
Diversified Financial Services - 8.4% | | | | | | | | |
Abengoa Finance SAU | | | | | | | | |
8.88%, 11/01/2017 - 144A | | | 1,255 | | | | 1,255 | |
Bank of America NA | | | | | | | | |
5.30%, 03/15/2017 | | | 1,450 | | | | 1,308 | |
Buffalo Thunder Development Authority | | | | | | | | |
9.38%, 12/15/2014 - 144A ‡ | | | 3,095 | | | | 990 | |
CCM Merger, Inc. | | | | | | | | |
8.00%, 08/01/2013 - 144A | | | 730 | | | | 704 | |
Ceva Group PLC | | | | | | | | |
8.38%, 12/01/2017 - 144A | | | 3,450 | | | | 3,234 | |
11.50%, 04/01/2018 - 144A | | | 1,115 | | | | 1,006 | |
11.63%, 10/01/2016 - 144A | | | 1,715 | | | | 1,702 | |
CNH Capital LLC | | | | | | | | |
6.25%, 11/01/2016 - 144A | | | 1,640 | | | | 1,689 | |
DPL, Inc. | | | | | | | | |
6.50%, 10/15/2016 - 144A | | | 1,620 | | | | 1,725 | |
7.25%, 10/15/2021 - 144A | | | 3,290 | | | | 3,553 | |
Ford Motor Credit Co., LLC | | | | | | | | |
5.75%, 02/01/2021 | | | 1,945 | | | | 2,027 | |
5.88%, 08/02/2021 | | | 1,585 | | | | 1,652 | |
8.00%, 12/15/2016 | | | 3,595 | | | | 4,079 | |
8.13%, 01/15/2020 | | | 2,175 | | | | 2,560 | |
12.00%, 05/15/2015 | | | 1,150 | | | | 1,409 | |
General Motors Financial Co., Inc. | | | | | | | | |
6.75%, 06/01/2018 - 144A | | | 1,075 | | | | 1,097 | |
Ineos Finance PLC | | | | | | | | |
9.00%, 05/15/2015 - 144A | | | 2,000 | | | | 2,030 | |
International Lease Finance Corp. | | | | | | | | |
5.65%, 06/01/2014 | | | 1,775 | | | | 1,695 | |
5.88%, 05/01/2013 | | | 550 | | | | 542 | |
6.25%, 05/15/2019 | | | 1,630 | | | | 1,506 | |
8.25%, 12/15/2020 | | | 2,775 | | | | 2,803 | |
8.63%, 01/15/2022 | | | 3,740 | | | | 3,783 | |
MCE Finance, Ltd. | | | | | | | | |
10.25%, 05/15/2018 | | | 1,725 | | | | 1,859 | |
Nielsen Finance LLC | | | | | | | | |
11.50%, 05/01/2016 | | | 1,138 | | | | 1,303 | |
11.63%, 02/01/2014 | | | 1,189 | | | | 1,366 | |
Petroplus Finance, Ltd. | | | | | | | | |
7.00%, 05/01/2017 - 144A | | | 1,000 | | | | 495 | |
9.38%, 09/15/2019 - 144A | | | 1,080 | | | | 545 | |
| | | | | | | | |
| | | Principal
(000’s) | | | Value
(000’s) | |
Diversified Financial Services (continued) | |
Pinnacle Foods Finance LLC | | | | | | | | |
9.25%, 04/01/2015 | | $ | 745 | | | $ | 765 | |
Reynolds Group Issuer, Inc. | | | | | | | | |
6.88%, 02/15/2021 - 144A | | | 3,150 | | | | 3,134 | |
7.13%, 04/15/2019 - 144A | | | 1,885 | | | | 1,918 | |
8.75%, 10/15/2016 - 144A | | | 1,615 | | | | 1,700 | |
9.00%, 04/15/2019 - 144A | | | 670 | | | | 637 | |
9.88%, 08/15/2019 - 144A | | | 1,380 | | | | 1,339 | |
WMG Acquisition Corp. | | | | | | | | |
9.50%, 06/15/2016 - 144A | | | 490 | | | | 532 | |
11.50%, 10/01/2018 - 144A | | | 3,050 | | | | 3,027 | |
Diversified Telecommunication Services - 6.8% | |
Avaya, Inc. | | | | | | | | |
7.00%, 04/01/2019 - 144A | | | 890 | | | | 863 | |
9.75%, 11/01/2015 | | | 2,685 | | | | 2,417 | |
10.13%, 11/01/2015 | | | 4,687 | | | | 4,219 | |
CenturyLink, Inc. | | | | | | | | |
6.45%, 06/15/2021 | | | 4,320 | | | | 4,328 | |
EH Holding Corp. | | | | | | | | |
6.50%, 06/15/2019 - 144A | | | 2,725 | | | | 2,841 | |
GCI, Inc. | | | | | | | | |
6.75%, 06/01/2021 | | | 550 | | | | 536 | |
Intelsat Jackson Holdings SA | | | | | | | | |
9.50%, 06/15/2016 | | | 2,631 | | | | 2,749 | |
11.25%, 06/15/2016 | | | 2,580 | | | | 2,711 | |
Intelsat Luxembourg SA | | | | | | | | |
11.50%, 02/04/2017 | | | 2,695 | | | | 2,601 | |
11.50%, 02/04/2017 - 144A | | | 3,335 | | | | 3,218 | |
Telesat Canada | | | | | | | | |
11.00%, 11/01/2015 | | | 4,500 | | | | 4,832 | |
12.50%, 11/01/2017 | | | 3,065 | | | | 3,425 | |
UPCB Finance V, Ltd. | | | | | | | | |
7.25%, 11/15/2021 - 144A | | | 4,500 | | | | 4,556 | |
Virgin Media Finance PLC | | | | | | | | |
8.38%, 10/15/2019 | | | 250 | | | | 274 | |
Wind Acquisition Holdings Finance SA | | | | | |
12.25%, 07/15/2017 - 144A | | | 4,504 | | | | 3,045 | |
Windstream Corp. | | | | | | | | |
7.50%, 06/01/2022 - 144A | | | 1,495 | | | | 1,491 | |
7.75%, 10/01/2021 | | | 4,675 | | | | 4,792 | |
8.13%, 09/01/2018 | | | 615 | | | | 659 | |
Electric Utilities - 0.6% | | | | | | | | |
Calpine Construction Finance Co., LP | |
8.00%, 06/01/2016 - 144A | | | 1,520 | | | | 1,642 | |
Texas Competitive Electric Holdings Co. LLC | | | | | | | | |
11.50%, 10/01/2020 - 144A | | | 2,900 | | | | 2,461 | |
Electrical Equipment - 0.1% | | | | | | | | |
Polypore International, Inc. | | | | | | | | |
7.50%, 11/15/2017 | | | 555 | | | | 574 | |
Energy Equipment & Services - 0.8% | |
Basic Energy Services, Inc. | | | | | | | | |
7.75%, 02/15/2019 | | | 545 | | | | 549 | |
Oil States International, Inc. | | | | | | | | |
6.50%, 06/01/2019 | | | 2,685 | | | | 2,745 | |
Precision Drilling Corp. | | | | | | | | |
6.50%, 12/15/2021 - 144A | | | 1,835 | | | | 1,872 | |
6.63%, 11/15/2020 | | | 835 | | | | 854 | |
Food & Staples Retailing - 0.1% | | | | | | | | |
Pantry, Inc. | | | | | | | | |
7.75%, 02/15/2014 | | | 855 | | | | 849 | |
Food Products - 1.0% | | | | | | | | |
American Seafoods Group LLC | | | | | | | | |
10.75%, 05/15/2016 - 144A § D | | | 4,515 | | | | 4,018 | |
| | | | | | | | |
| | | Principal
(000’s) | | | Value
(000’s) | |
Food Products (continued) | | | | | |
ASG Consolidated LLC | | | | | | | | |
15.00%, 05/15/2017 - 144A § | | $ | 1,576 | | | $ | 1,176 | |
Michael Foods, Inc. | | | | | | | | |
9.75%, 07/15/2018 | | | 2,210 | | | | 2,326 | |
Gas Utilities - 0.2% | | | | | | | | |
AmeriGas Partners, LP | | | | | | | | |
6.25%, 08/20/2019 | | | 1,220 | | | | 1,214 | |
Health Care Equipment & Supplies - 2.4% | |
Accellent, Inc. | | | | | | | | |
8.38%, 02/01/2017 | | | 2,950 | | | | 2,891 | |
Alere, Inc. | | | | | | | | |
7.88%, 02/01/2016 | | | 1,815 | | | | 1,820 | |
American Renal Holdings Co., Inc. | | | | | | | | |
8.38%, 05/15/2018 | | | 435 | | | | 457 | |
Biomet, Inc. | | | | | | | | |
10.00%, 10/15/2017 | | | 200 | | | | 216 | |
10.38%, 10/15/2017 | | | 2,050 | | | | 2,219 | |
11.63%, 10/15/2017 | | | 7,445 | | | | 8,078 | |
Kinetic Concepts, Inc. | | | | | | | | |
10.50%, 11/01/2018 - 144A | | | 1,645 | | | | 1,612 | |
Teleflex, Inc. | | | | | | | | |
6.88%, 06/01/2019 | | | 435 | | | | 453 | |
Health Care Providers & Services - 2.0% | |
GCB U.S. Oncology, Inc. (Escrow Shares) 08/15/2017 | | | 1,110 | | | | 14 | |
HCA Holdings, Inc. | | | | | | | | |
7.75%, 05/15/2021 | | | 630 | | | | 641 | |
HCA, Inc. | | | | | | | | |
6.50%, 02/15/2020 | | | 2,380 | | | | 2,469 | |
7.50%, 02/15/2022 | | | 4,085 | | | | 4,178 | |
9.88%, 02/15/2017 | | | 372 | | | | 406 | |
inVentiv Health, Inc. | | | | | | | | |
10.00%, 08/15/2018 - 144A | | | 765 | | | | 700 | |
Multiplan, Inc. | | | | | | | | |
9.88%, 09/01/2018 - 144A | | | 2,885 | | | | 3,000 | |
Res-Care, Inc. | | | | | | | | |
10.75%, 01/15/2019 | | | 1,975 | | | | 2,039 | |
Rotech Healthcare, Inc. | | | | | | | | |
10.50%, 03/15/2018 | | | 1,530 | | | | 1,178 | |
Hotels, Restaurants & Leisure - 6.7% | |
Caesars Entertainment Operating Co., Inc. | | | | | | | | |
5.38%, 12/15/2013 | | | 900 | | | | 729 | |
5.63%, 06/01/2015 | | | 6,260 | | | | 3,396 | |
10.00%, 12/15/2015 - 12/15/2018 | | | 1,910 | | | | 1,423 | |
11.25%, 06/01/2017 | | | 3,240 | | | | 3,438 | |
12.75%, 04/15/2018 | | | 3,545 | | | | 2,818 | |
Cinemark USA, Inc. | | | | | | | | |
7.38%, 06/15/2021 | | | 540 | | | | 552 | |
Fontainebleau Las Vegas Holdings LLC | | | | | | | | |
10.25%, 06/15/2015 - 144A ‡ | | | 5,645 | | | | 4 | |
Greektown Holdings LLC (Escrow Shares) | | | | | | | | |
10.75%, 12/01/2013 - 144A | | | 1,495 | | | | ¿ | |
Inn of the Mountain Gods Resort & Casino | | | | | | | | |
1.25%, 11/30/2020 - 144A § | | | 1,302 | | | | 689 | |
8.75%, 11/30/2020 - 144A § | | | 566 | | | | 546 | |
Mandalay Resort Group | | | | | | | | |
7.63%, 07/15/2013 | | | 690 | | | | 690 | |
MGM Resorts International | | | | | | | | |
6.75%, 09/01/2012 - 04/01/2013 | | | 2,500 | | | | 2,516 | |
9.00%, 03/15/2020 | | | 555 | | | | 615 | |
10.38%, 05/15/2014 | | | 1,175 | | | | 1,342 | |
11.13%, 11/15/2017 | | | 1,215 | | | | 1,385 | |
| | | | | | | | |
| | | Principal
(000’s) | | | Value
(000’s) | |
Hotels, Restaurants & Leisure (continued) | |
Mohegan Tribal Gaming Authority | | | | | | | | |
6.88%, 02/15/2015 | | $ | 2,340 | | | $ | 1,041 | |
7.13%, 08/15/2014 | | | 2,225 | | | | 1,051 | |
8.00%, 04/01/2012 | | | 2,050 | | | | 1,374 | |
11.50%, 11/01/2017 - 144A | | | 1,385 | | | | 1,278 | |
NCL Corp., Ltd. | | | | | | | | |
9.50%, 11/15/2018 | | | 660 | | | | 688 | |
11.75%, 11/15/2016 | | | 2,135 | | | | 2,455 | |
NPC International, Inc. / NPC Operating Co. A, Inc. / NPC Operating Co. B, Inc. | | | | | | | | |
10.50%, 01/15/2020 - 144A | | | 2,725 | | | | 2,739 | |
Peninsula Gaming LLC | | | | | | | | |
8.38%, 08/15/2015 | | | 990 | | | | 1,049 | |
10.75%, 08/15/2017 | | | 2,400 | | | | 2,514 | |
Royal Caribbean Cruises, Ltd. | | | | | | | | |
6.88%, 12/01/2013 | | | 365 | | | | 385 | |
7.25%, 06/15/2016 - 03/15/2018 | | | 970 | | | | 1,029 | |
Seven Seas Cruises S. DE R.L., LLC | | | | | | | | |
9.13%, 05/15/2019 - 144A | | | 1,820 | | | | 1,861 | |
Sugarhouse HSP Gaming Prop Mezz, LP | | | | | | | | |
8.63%, 04/15/2016 - 144A | | | 595 | | | | 610 | |
Tunica-Biloxi Gaming Authority | | | | | | | | |
9.00%, 11/15/2015 - 144A § | | | 2,435 | | | | 2,344 | |
Vail Resorts, Inc. | | | | | | | | |
6.50%, 05/01/2019 | | | 555 | | | | 566 | |
Waterford Gaming LLC | | | | | | | | |
8.63%, 09/15/2014 - 144A § | | | 2,351 | | | | 1,355 | |
WMG Acquisition Corp. | | | | | | | | |
9.50%, 06/15/2016 | | | 2,865 | | | | 3,109 | |
Wynn Las Vegas LLC | | | | | | | | |
7.75%, 08/15/2020 | | | 3,265 | | | | 3,625 | |
Household Durables - 0.6% | | | | | |
Libbey Glass, Inc. | | | | | | | | |
10.00%, 02/15/2015 | | | 1,566 | | | | 1,676 | |
Sealy Mattress Co. | | | | | | | | |
10.88%, 04/15/2016 - 144A | | | 2,398 | | | | 2,619 | |
Household Products - 1.2% | | | | | |
Amscan Holdings, Inc. | | | | | | | | |
8.75%, 05/01/2014 | | | 5,060 | | | | 5,060 | |
Spectrum Brands Holdings, Inc. | | | | | | | | |
9.50%, 06/15/2018 - 144A | | | 870 | | | | 952 | |
12.00%, 08/28/2019 | | | 2,510 | | | | 2,730 | |
Independent Power Producers & Energy Traders - 2.7% | |
AES Corp. | | | | | | | | |
7.38%, 07/01/2021 - 144A | | | 1,075 | | | | 1,158 | |
Calpine Corp. | | | | | | | | |
7.50%, 02/15/2021 - 144A | | | 5,090 | | | | 5,446 | |
Edison Mission Energy | | | | | | | | |
7.50%, 06/15/2013 | | | 2,750 | | | | 2,668 | |
GenOn Energy, Inc. | | | | | | | | |
7.88%, 06/15/2017 | | | 3,235 | | | | 3,122 | |
9.88%, 10/15/2020 | | | 2,920 | | | | 2,964 | |
NRG Energy, Inc. | | | | | | | | |
7.88%, 05/15/2021 - 144A | | | 1,665 | | | | 1,623 | |
8.25%, 09/01/2020 | | | 2,960 | | | | 2,975 | |
Industrial Conglomerates - 0.5% | | | | | | | | |
Amsted Industries, Inc. | | | | | | | | |
8.13%, 03/15/2018 - 144A | | | 2,360 | | | | 2,502 | |
NBTY, Inc. | | | | | | | | |
9.00%, 10/01/2018 | | | 1,120 | | | | 1,232 | |
Insurance - 0.5% | | | | | |
Alliant Holdings I, Inc. | | | | | | | | |
11.00%, 05/01/2015 - 144A | | | 1,325 | | | | 1,365 | |
| | | | | | | | |
| | | Principal
(000’s) | | | Value
(000’s) | |
Insurance (continued) | | | | | |
Hub International Holdings, Inc. | | | | | | | | |
9.00%, 12/15/2014 - 144A | | $ | 1,340 | | | $ | 1,343 | |
USI Holdings Corp. | | | | | | | | |
4.33%, 11/15/2014 - 144A * | | | 640 | | | | 584 | |
Internet & Catalog Retail - 0.2% | | | | | | | | |
Checkout Holding Corp. | | | | | | | | |
Zero Coupon, 11/15/2015 - 144A | | | 2,305 | | | | 1,222 | |
Internet Software & Services - 0.2% | |
Equinix, Inc. | | | | | | | | |
7.00%, 07/15/2021 | | | 1,100 | | | | 1,161 | |
IT Services - 1.0% | | | | | |
Fidelity National Information Services, Inc. | | | | | | | | |
7.63%, 07/15/2017 - 144A | | | 1,095 | | | | 1,180 | |
SunGard Data Systems, Inc. | | | | | | | | |
10.63%, 05/15/2015 | | | 5,750 | | | | 6,124 | |
Life Sciences Tools & Services - 0.4% | |
Bio-Rad Laboratories, Inc. | | | | | | | | |
8.00%, 09/15/2016 | | | 2,125 | | | | 2,326 | |
Patheon, Inc. | | | | | | | | |
8.63%, 04/15/2017 - 144A | | | 880 | | | | 700 | |
Machinery - 1.3% | |
American Railcar Industries, Inc. | | | | | | | | |
7.50%, 03/01/2014 | | | 1,000 | | | | 1,000 | |
Commercial Vehicle Group, Inc. | | | | | | | | |
7.88%, 04/15/2019 - 144A | | | 870 | | | | 837 | |
Manitowoc Co., Inc. | | | | | | | | |
8.50%, 11/01/2020 | | | 970 | | | | 1,022 | |
9.50%, 02/15/2018 | | | 615 | | | | 655 | |
Meritor, Inc. | | | | | | | | |
10.63%, 03/15/2018 | | | 990 | | | | 931 | |
Navistar International Corp. | | | | | | | | |
8.25%, 11/01/2021 | | | 1,980 | | | | 2,106 | |
Terex Corp. | | | | | | | | |
10.88%, 06/01/2016 | | | 2,820 | | | | 3,116 | |
Marine - 0.2% | |
CMA CGM SA | | | | | | | | |
8.50%, 04/15/2017 - 144A | | | 2,475 | | | | 1,095 | |
Media - 5.9% | |
Adelphia Communications Corp. (Escrow Certificates) | | | | | | | | |
9.25%, 10/01/2049 | | | 1,305 | | | | 4 | |
10.25%, 06/15/2049 - 11/01/2049 | | | 1,460 | | | | 5 | |
AMC Entertainment, Inc. | | | | | | | | |
8.75%, 06/01/2019 | | | 535 | | | | 554 | |
AMC Networks, Inc. | | | | | | | | |
7.75%, 07/15/2021 - 144A | | | 890 | | | | 968 | |
Bresnan Broadband Holdings LLC | | | | | | | | |
8.00%, 12/15/2018 - 144A | | | 345 | | | | 359 | |
Cablevision Systems Corp. | | | | | | | | |
7.75%, 04/15/2018 | | | 805 | | | | 853 | |
8.63%, 09/15/2017 | | | 1,650 | | | | 1,827 | |
Catalina Marketing Corp. | | | | | | | | |
10.50%, 10/01/2015 - 144A | | | 2,384 | | | | 2,378 | |
11.63%, 10/01/2017 - 144A § | | | 2,828 | | | | 2,771 | |
CCO Holdings LLC / CCO Holdings Capital Corp. | | | | | | | | |
7.00%, 01/15/2019 | | | 1,140 | | | | 1,188 | |
7.25%, 10/30/2017 | | | 1,010 | | | | 1,064 | |
7.38%, 06/01/2020 | | | 1,755 | | | | 1,852 | |
7.88%, 04/30/2018 | | | 1,125 | | | | 1,200 | |
8.13%, 04/30/2020 | | | 100 | | | | 110 | |
Clear Channel Worldwide Holdings, Inc. -Series B | | | | | | | | |
9.25%, 12/15/2017 | | | 1,270 | | | | 1,372 | |
| | | | | | | | |
| | | Principal
(000’s) | | | Value
(000’s) | |
Media (continued) | |
Crown Media Holdings, Inc. | | | | | | | | |
10.50%, 07/15/2019 | | $ | 770 | | | $ | 810 | |
CSC Holdings LLC | | | | | | | | |
6.75%, 11/15/2021 - 144A | | | 2,210 | | | | 2,326 | |
Cumulus Media, Inc. | | | | | | | | |
7.75%, 05/01/2019 - 144A | | | 1,090 | | | | 967 | |
DISH DBS Corp. | | | | | | | | |
6.75%, 06/01/2021 | | | 2,630 | | | | 2,834 | |
LBI Media Holdings, Inc. | | | | | | | | |
11.00%, 10/15/2013 | | | 360 | | | | 320 | |
LBI Media, Inc. | | | | | | | | |
9.25%, 04/15/2019 - 144A | | | 1,490 | | | | 1,328 | |
MDC Partners, Inc. | | | | | | | | |
11.00%, 11/01/2016 | | | 2,240 | | | | 2,397 | |
MediaCom Broadband LLC | | | | | | | | |
8.50%, 10/15/2015 | | | 2,615 | | | | 2,693 | |
MediaCom LLC | | | | | | | | |
9.13%, 08/15/2019 | | | 935 | | | | 992 | |
NAI Entertainment Holdings LLC | | | | | | | | |
8.25%, 12/15/2017 - 144A | | | 690 | | | | 730 | |
National CineMedia LLC | | | | | | | | |
7.88%, 07/15/2021 | | | 3,010 | | | | 2,984 | |
Regal Cinemas Corp. | | | | | | | | |
8.63%, 07/15/2019 | | | 1,330 | | | | 1,436 | |
Regal Entertainment Group | | | | | | | | |
9.13%, 08/15/2018 | | | 1,340 | | | | 1,437 | |
Sirius XM Radio, Inc. | | | | | | | | |
8.75%, 04/01/2015 - 144A | | | 1,390 | | | | 1,522 | |
Sitel LLC | | | | | | | | |
11.50%, 04/01/2018 | | | 680 | | | | 502 | |
XM Satellite Radio, Inc. | | | | | | | | |
13.00%, 08/01/2013 - 144A | | | 2,715 | | | | 3,081 | |
Metals & Mining - 2.6% | |
FMG Resources August 2006 Pty, Ltd. | | | | | | | | |
7.00%, 11/01/2015 - 144A | | | 4,955 | | | | 5,004 | |
8.25%, 11/01/2019 - 144A | | | 4,390 | | | | 4,467 | |
JMC Steel Group | | | | | | | | |
8.25%, 03/15/2018 - 144A | | | 1,110 | | | | 1,082 | |
Novelis, Inc. | | | | | | | | |
8.38%, 12/15/2017 | | | 1,145 | | | | 1,217 | |
8.75%, 12/15/2020 | | | 2,205 | | | | 2,365 | |
Quadra FNX Mining, Ltd. | | | | | | | | |
7.75%, 06/15/2019 - 144A | | | 2,985 | | | | 3,377 | |
SunCoke Energy, Inc. | | | | | | | | |
7.63%, 08/01/2019 - 144A | | | 1,085 | | | | 1,085 | |
Multiline Retail - 0.1% | |
Burlington Coat Factory Warehouse Corp. | | | | | | | | |
10.00%, 02/15/2019 | | | 795 | | | | 777 | |
Oil, Gas & Consumable Fuels - 10.9% | |
Alpha Natural Resources, Inc. | | | | | | | | |
6.00%, 06/01/2019 | | | 1,800 | | | | 1,746 | |
6.25%, 06/01/2021 | | | 1,205 | | | | 1,169 | |
Anadarko Petroleum Corp. | | | | | | | | |
6.38%, 09/15/2017 | | | 1,855 | | | | 2,150 | |
Arch Coal, Inc. | | | | | | | | |
7.00%, 06/15/2019 - 144A | | | 2,160 | | | | 2,203 | |
7.25%, 10/01/2020 | | | 755 | | | | 772 | |
7.25%, 06/15/2021 - 144A | | | 2,160 | | | | 2,219 | |
8.75%, 08/01/2016 | | | 655 | | | | 716 | |
Berry Petroleum Co. | | | | | | | | |
10.25%, 06/01/2014 | | | 1,695 | | | | 1,917 | |
Bill Barrett Corp. | | | | | | | | |
7.63%, 10/01/2019 | | | 1,405 | | | | 1,468 | |
| | | | | | | | |
| | | Principal
(000’s) | | | Value
(000’s) | |
Oil, Gas & Consumable Fuels (continued) | |
Bill Barrett Corp. (continued) | | | | | | | | |
9.88%, 07/15/2016 | | $ | 340 | | | $ | 374 | |
Calfrac Holdings, LP | | | | | | | | |
7.50%, 12/01/2020 - 144A | | | 690 | | | | 673 | |
Carrizo Oil & Gas, Inc. | | | | | | | | |
8.63%, 10/15/2018 | | | 3,220 | | | | 3,252 | |
Chesapeake Oilfield Operating LLC | | | | | | | | |
6.63%, 11/15/2019 - 144A | | | 875 | | | | 910 | |
Cloud Peak Energy Resources LLC | | | | | | | | |
8.50%, 12/15/2019 | | | 2,735 | | | | 2,954 | |
Coffeyville Resources LLC | | | | | | | | |
9.00%, 04/01/2015 - 144A | | | 4,082 | | | | 4,327 | |
Concho Resources, Inc. | | | | | | | | |
6.50%, 01/15/2022 | | | 1,070 | | | | 1,118 | |
7.00%, 01/15/2021 | | | 1,325 | | | | 1,423 | |
Consol Energy, Inc. | | | | | | | | |
8.00%, 04/01/2017 | | | 1,335 | | | | 1,462 | |
8.25%, 04/01/2020 | | | 1,120 | | | | 1,238 | |
Continental Resources, Inc. | | | | | | | | |
7.13%, 04/01/2021 | | | 545 | | | | 591 | |
7.38%, 10/01/2020 | | | 230 | | | | 251 | |
Denbury Resources, Inc. | | | | | | | | |
8.25%, 02/15/2020 | | | 1,360 | | | | 1,520 | |
9.75%, 03/01/2016 | | | 3,875 | | | | 4,272 | |
Frac Tech Services LLC | | | | | | | | |
7.63%, 11/15/2018 - 144A | | | 3,300 | | | | 3,457 | |
Frontier Oil Corp. | | | | | | | | |
6.88%, 11/15/2018 | | | 445 | | | | 456 | |
GMX Resources, Inc. | | | | | | | | |
11.00%, 12/01/2017 - 144A | | | 675 | | | | 547 | |
Harvest Operations Corp. | | | | | | | | |
6.88%, 10/01/2017 - 144A | | | 645 | | | | 668 | |
Hollyfrontier Corp. | | | | | | | | |
9.88%, 06/15/2017 | | | 1,510 | | | | 1,669 | |
Kodiak Oil & Gas Corp. | | | | | | | | |
8.13%, 12/01/2019 - 144A | | | 2,175 | | | | 2,254 | |
Oasis Petroleum, Inc. | | | | | | | | |
6.50%, 11/01/2021 | | | 755 | | | | 749 | |
OGX Petroleo e Gas Participacoes SA | | | | | | | | |
8.50%, 06/01/2018 - 144A | | | 4,325 | | | | 4,239 | |
Peabody Energy Corp. | | | | | | | | |
6.00%, 11/15/2018 - 144A | | | 3,815 | | | | 3,891 | |
6.25%, 11/15/2021 - 144A | | | 3,270 | | | | 3,384 | |
Petroleum Development Corp. | | | | | | | | |
12.00%, 02/15/2018 | | | 1,170 | | | | 1,269 | |
Quicksilver Resources, Inc. | | | | | | | | |
11.75%, 01/01/2016 | | | 3,590 | | | | 4,075 | |
Range Resources Corp. | | | | | | | | |
6.75%, 08/01/2020 | | | 1,320 | | | | 1,465 | |
Rosetta Resources, Inc. | | | | | | | | |
9.50%, 04/15/2018 | | | 825 | | | | 891 | |
SemGroup, LP (Escrow Shares) | | | | | | | | |
8.75%, 11/15/2049 | | | 2,985 | | | | ¿ | |
SESI LLC | | | | | | | | |
6.38%, 05/01/2019 | | | 2,745 | | | | 2,793 | |
6.88%, 06/01/2014 | | | 290 | | | | 291 | |
Venoco, Inc. | | | | | | | | |
8.88%, 02/15/2019 | | | 2,995 | | | | 2,696 | |
11.50%, 10/01/2017 | | | 430 | | | | 434 | |
W&T Offshore, Inc. | | | | | | | | |
8.50%, 06/15/2019 - 144A | | | 2,165 | | | | 2,241 | |
WPX Energy, Inc. | | | | | | | | |
5.25%, 01/15/2017 - 144A | | | 1,305 | | | | 1,312 | |
| | | | | | | | |
| | | Principal
(000’s) | | | Value
(000’s) | |
Oil, Gas & Consumable Fuels (continued) | |
WPX Energy, Inc. (continued) | | | | | | | | |
6.00%, 01/15/2022 - 144A | | $ | 2,725 | | | $ | 2,790 | |
Paper & Forest Products - 1.6% | |
Boise Paper Holdings LLC | | | | | | | | |
8.00%, 04/01/2020 | | | 445 | | | | 471 | |
9.00%, 11/01/2017 | | | 1,835 | | | | 1,973 | |
Domtar Corp. | | | | | | | | |
10.75%, 06/01/2017 | | | 1,540 | | | | 1,940 | |
Longview Fibre Paper & Packaging, Inc. | | | | | | | | |
8.00%, 06/01/2016 - 144A | | | 1,095 | | | | 1,095 | |
Sappi Papier Holding GmbH | | | | | | | | |
6.63%, 04/15/2021 - 144A | | | 2,995 | | | | 2,567 | |
Verso Paper Holdings LLC | | | | | | | | |
8.75%, 02/01/2019 | | | 1,655 | | | | 1,010 | |
Verso Paper Holdings LLC -Series B | |
4.18%, 08/01/2014 * | | | 425 | | | | 268 | |
11.38%, 08/01/2016 | | | 5,165 | | | | 2,118 | |
Personal Products - 0.3% | |
Revlon Consumer Products Corp. | | | | | | | | |
9.75%, 11/15/2015 | | | 2,150 | | | | 2,287 | |
Pharmaceuticals - 1.4% | |
ConvaTec Healthcare E SA | | | | | | | | |
10.50%, 12/15/2018 - 144A | | | 4,905 | | | | 4,377 | |
Endo Pharmaceuticals Holdings, Inc. | | | | | | | | |
7.00%, 07/15/2019 - 12/15/2020 | | | 2,030 | | | | 2,160 | |
7.25%, 01/15/2022 | | | 450 | | | | 479 | |
Warner Chilcott Co. LLC | | | | | | | | |
7.75%, 09/15/2018 | | | 2,988 | | | | 3,051 | |
Real Estate Management & Development - 2.3% | |
CBRE Services, Inc. | | | | | | | | |
6.63%, 10/15/2020 | | | 2,150 | | | | 2,204 | |
11.63%, 06/15/2017 | | | 4,465 | | | | 5,146 | |
Toys “R” Us Property Co., I LLC | | | | | | | | |
10.75%, 07/15/2017 | | | 8,415 | | | | 9,204 | |
Road & Rail - 1.5% | |
Avis Budget Car Rental LLC / Avis Budget Finance, Inc. | | | | | | | | |
9.63%, 03/15/2018 | | | 2,480 | | | | 2,566 | |
9.75%, 03/15/2020 | | | 2,165 | | | | 2,225 | |
Hertz Corp. | | | | | | | | |
7.50%, 10/15/2018 | | | 735 | | | | 768 | |
Kansas City Southern de Mexico SA de CV | | | | | | | | |
6.13%, 06/15/2021 | | | 600 | | | | 617 | |
RSC Equipment Rental, Inc./RSC Holdings III LLC | | | | | | | | |
10.00%, 07/15/2017 - 144A | | | 2,835 | | | | 3,302 | |
10.25%, 11/15/2019 | | | 1,075 | | | | 1,172 | |
Semiconductors & Semiconductor Equipment - 0.3% | |
Advanced Micro Devices, Inc. | | | | | | | | |
7.75%, 08/01/2020 | | | 1,115 | | | | 1,145 | |
8.13%, 12/15/2017 | | | 840 | | | | 872 | |
Software - 0.6% | | | | | | | | |
SSI Investments II | | | | | | | | |
11.13%, 06/01/2018 | | | 4,165 | | | | 4,404 | |
Specialty Retail - 3.3% | |
Academy, Ltd. | | | | | | | | |
9.25%, 08/01/2019 - 144A | | | 2,375 | | | | 2,345 | |
Ltd. Brands, Inc. | | | | | | | | |
6.63%, 04/01/2021 | | | 4,135 | | | | 4,383 | |
8.50%, 06/15/2019 | | | 2,650 | | | | 3,087 | |
Michaels Stores, Inc. | | | | | | | | |
7.75%, 11/01/2018 | | | 495 | | | | 500 | |
11.38%, 11/01/2016 | | | 1,010 | | | | 1,070 | |
| | | | | | | | |
| | | Principal
(000’s) | | | Value
(000’s) | |
Specialty Retail (continued) | |
Petco Animal Supplies, Inc. | | | | | | | | |
9.25%, 12/01/2018 - 144A | | $ | 3,325 | | | $ | 3,566 | |
Sally Holdings LLC / Sally Capital, Inc. | | | | | | | | |
6.88%, 11/15/2019 - 144A | | | 4,790 | | | | 5,006 | |
Toys “R” Us - Delaware, Inc. | | | | | | | | |
7.38%, 09/01/2016 - 144A | | | 1,440 | | | | 1,444 | |
Toys “R” Us, Inc. | | | | | | | | |
7.88%, 04/15/2013 | | | 2,645 | | | | 2,688 | |
Textiles, Apparel & Luxury Goods - 0.9% | |
Oxford Industries, Inc. | | | | | | | | |
11.38%, 07/15/2015 | | | 840 | | | | 920 | |
Perry Ellis International, Inc. | | | | | | | | |
7.88%, 04/01/2019 | | | 1,490 | | | | 1,453 | |
Polymer Group, Inc. | | | | | | | | |
7.75%, 02/01/2019 - 144A | | | 1,265 | | | | 1,309 | |
PVH Corp. | | | | | | | | |
7.75%, 11/15/2023 | | | 2,795 | | | | 3,144 | |
Trading Companies & Distributors - 0.2% | |
United Rentals North America, Inc. | | | | | | | | |
10.88%, 06/15/2016 | | | 1,570 | | | | 1,743 | |
Transportation Infrastructure - 0.4% | |
CHC Helicopter SA | | | | | | | | |
9.25%, 10/15/2020 - 144A | | | 3,365 | | | | 3,029 | |
Wireless Telecommunication Services - 3.4% | |
Digicel, Ltd. | | | | | | | | |
8.25%, 09/01/2017 - 144A | | | 2,705 | | | | 2,719 | |
12.00%, 04/01/2014 - 144A | | | 1,445 | | | | 1,618 | |
Nextel Communications, Inc. -Series E | | | | | | | | |
6.88%, 10/31/2013 | | | 7,080 | | | | 7,045 | |
NII Capital Corp. | | | | | | | | |
8.88%, 12/15/2019 | | | 2,685 | | | | 2,826 | |
SBA Telecommunications, Inc. | | | | | | | | |
8.00%, 08/15/2016 | | | 985 | | | | 1,061 | |
8.25%, 08/15/2019 | | | 660 | | | | 718 | |
Sprint Nextel Corp. | | | | | | | | |
6.00%, 12/01/2016 | | | 1,530 | | | | 1,270 | |
8.38%, 08/15/2017 | | | 1,500 | | | | 1,344 | |
9.00%, 11/15/2018 - 144A | | | 6,225 | | | | 6,536 | |
| | | | | | | | |
Total Corporate Debt Securities (cost $664,947) | | | | | | | 661,089 | |
| | | | | | | | |
CONVERTIBLE BOND - 0.0% ¥ | |
Independent Power Producers & Energy
Traders - 0.0%¥ | |
Mirant Corp. (Escrow Certificates) | | | | | | | | |
2.50%, 06/15/2021 | | | 1,220 | | | | ¿ | |
Total Convertible Bond (cost $¿) | |
LOAN ASSIGNMENTS - 5.6% | |
Automobiles - 0.2% | | | | | | | | |
DaimlerChrysler Group LLC | | | | | | | | |
6.00%, 05/24/2017 * | | | 1,393 | | | | 1,315 | |
Building Products - 0.4% | | | | | | | | |
Panolam Industries International, Inc., 1st Lien | | | | | | | | |
8.25%, 12/31/2013 * | | | 2,242 | | | | 2,107 | |
Panolam Industries International, Inc., 2nd Lien | |
10.00%, 06/30/2014 * | | | 886 | | | | 811 | |
Diversified Financial Services - 0.5% | |
CCM Merger, Inc. Tranche B | | | | | | | | |
7.00%, 03/01/2017 * | | | 960 | | | | 949 | |
Ceva Group PLC Extended Letter of Credit | | | | | | | | |
5.58%, 08/31/2016 * | | | 535 | | | | 489 | |
| | | | | | | | |
| | | Principal
(000’s) | | | Value
(000’s) | |
Diversified Financial Services (continued) | |
Ceva Group PLC Extended Tranche B | |
5.43%, 08/31/2016 * | | $ | 1,493 | | | $ | 1,370 | |
First Data, Tranche B2 | | | | | | | | |
3.04%, 09/24/2014 * | | | 1,314 | | | | 1,181 | |
Electric Utilities - 0.5% | |
Texas Competitive Electric Holding Co., LLC Non-Extended | | | | | | | | |
3.78%, 10/10/2014 * | | | 4,791 | | | | 3,334 | |
Food Products - 0.4% | | | | | |
Del Monte Corp. | | | | | | | | |
4.50%, 03/08/2018 * | | | 2,786 | | | | 2,640 | |
Hotels, Restaurants & Leisure - 0.9% | |
Cannery Casino Resorts LLC, 2nd Lien | | | | | | | | |
4.55%, 05/16/2014 * | | | 860 | | | | 765 | |
Hit Entertainment, Inc., 2nd Lien | | | | | | | | |
5.78%, 02/26/2013 * | | | 4,360 | | | | 4,292 | |
NPC International, Inc., Tranche B | | | | | | | | |
6.75%, 12/28/2018 * | | | 1,500 | | | | 1,493 | |
Household Products - 0.4% | | | | | |
Amscan Holdings, Inc., Tranche B | | | | | | | | |
6.75%, 12/04/2017 * | | | 3,259 | | | | 3,235 | |
Insurance - 0.2% | | | | | | | | |
Asurion Corp., 2nd Lien | | | | | | | | |
9.00%, 05/24/2019 * | | | 1,800 | | | | 1,773 | |
Multiline Retail - 0.2% | | | | | |
Burlington Coat Factory Warehouse Corp., Tranche B | | | | | | | | |
6.25%, 02/23/2017 * | | | 1,170 | | | | 1,146 | |
Oil, Gas & Consumable Fuels - 0.9% | |
Samson Investment Co. | | | | | | | | |
8.00%, 12/21/2012 * | | | 6,600 | | | | 6,600 | |
Personal Products - 0.5% | | | | | |
Revlon Consumer Products, Tranche B | |
4.75%, 11/17/2017 * | | | 3,830 | | | | 3,779 | |
Pharmaceuticals - 0.3% | | | | | |
Aptalis Pharma, Inc., Tranche B | | | | | | | | |
5.50%, 02/10/2017 * | | | 2,376 | | | | 2,317 | |
Specialty Retail - 0.2% | | | | | | | | |
Academy Sports & Outdoors, Inc. | | | | | | | | |
6.00%, 08/03/2018 * | | | 1,500 | | | | 1,483 | |
| | | | | | | | |
Total Loan Assignments
(cost $42,066) | | | | | | | 41,079 | |
| | | | | | | | |
| | | | | | | | |
| | | Shares | | | Value
(000’s) | |
CONVERTIBLE PREFERRED STOCKS - 0.3% | |
Oil, Gas & Consumable Fuels - 0.3% | | | | | | | | |
Chesapeake Energy Corp., 4.50% | | | 18,815 | | | | 1,743 | |
Chesapeake Energy Corp., 5.00% | | | 2,304 | | | | 192 | |
| | | | | | | | |
Total Convertible Preferred Stocks (cost $2,091) | | | | 1,935 | |
| | | | | | | | |
PREFERRED STOCK - 0.2% | | | | | | | | |
Diversified Financial Services - 0.2% | |
GMAC Capital Trust I, 8.13% * | | | 87,120 | | | | 1,685 | |
Total Preferred Stock (cost $2,200) | | | | | |
COMMON STOCKS - 0.7% | | | | | |
Airlines - 0.0% ¥ | | | | | |
Delta Air Lines, Inc. ‡ | | | 13,451 | | | | 109 | |
Building Products - 0.2% | | | | | |
Panolam Holdings Co. ‡ § D | | | 1,803 | | | | 1,540 | |
Construction Materials - 0.5% | |
RathGibson, Inc. (Escrow Certificates) ‡ §D | | | 95,700 | | | | 2,957 | |
| | | | | | | | |
| | | Shares | | | Value
(000’s) | |
Hotels, Restaurants & Leisure - 0.0%¥ | |
Greektown Superholdings, Inc. ‡ | | | 1,131 | | | $ | 76 | |
Independent Power Producers & Energy Traders - 0.0%¥ | |
Mirant Corp. (Escrow Certificates) ‡ | | | 550,000 | | | | ¿ | |
Oil, Gas & Consumable Fuels - 0.0%¥ | |
SemGroup Corp. - Class A ‡ | | | 7,723 | | | | 201 | |
| | | | | | | | |
Total Common Stocks
(cost $4,305) | | | | | | | 4,883 | |
| | | | | | | | |
INVESTMENT COMPANY - 0.0% ¥ | |
Diversified Financial Services - 0.0%¥ | |
Adelphia Recovery Trust | | | 2,697,805 | | | | 3 | |
Total Investment Company (cost $2,641) | |
RIGHT - 0.0% ¥ | | | | | | | | |
Hotels, Restaurants & Leisure - 0.0% ¥ | |
BLB Contingent Value Rights ‡ § D | | | 2,010 | | | | 8 | |
Total Right (cost $2,010) | | | | | | | | |
WARRANTS - 0.0% ¥ | | | | | | | | |
Food Products - 0.0% ¥ | | | | | | | | |
American Seafoods Group LLC ‡ | | | | | | | | |
Expiration: 05/15/2018 | | | | | | | | |
Exercise Price: $0.01 | | | 1,265 | | | | 63 | |
Media - 0.0% ¥ | | | | | | | | |
Reader’s Digest Association, Inc. ‡ §D | |
Expiration: 02/19/2014 | | | | | | | | |
Exercise Price: $47.35 | | | 13,112 | | | | ¿ | |
Oil, Gas & Consumable Fuels - 0.0%¥ | |
SemGroup Corp. ‡ | | | | | | | | |
Expiration: 11/30/2014 | | | | | | | | |
Exercise Price: $25.00 | | | 8,130 | | | | 45 | |
| | | | | | | | |
Total Warrants (cost $¿) | | | | | | | 108 | |
| | | | | | | | |
| | |
| | | Principal
(000’s) | | | Value
(000’s) | |
REPURCHASE AGREEMENT - 0.7% | |
State Street Bank & Trust Co. 0.03% p, dated 12/30/2011, to be repurchased at $5,261 on 01/03/2012. Collateralized by a U.S. Government Agency Obligation, 4.00%, due 04/01/2025, and with a value of $5,366. | | $ | 5,260 | | | | 5,260 | |
| | | | | | | | |
Total Repurchase Agreement (cost $5,260) | |
Total Investment Securities (cost$729,279) | | | | 716,050 | |
Other Assets and Liabilities - Net | | | | 13,226 | |
| | | | | | | | |
Net Assets | | | | | | $ | 729,276 | |
| | | | | | | | |
NOTES TO SCHEDULE OF INVESTMENTS (all amounts in thousands):
| | |
| | In default. |
| | Security fair valued as determined in good faith in accordance with procedures established by the Board of Trustees. This security had a fair value of $13,266, or 1.82% of the portfolio’s net assets. |
| | Payment in-kind. Securities pay interest or dividends in the form of additional bonds or preferred stock. |
| * | | Floating or variable rate note. Rate is listed as of 12/30/2011. |
| ž | | The security has a perpetual maturity. The date shown is the next call date. |
| ¥ | | Percentage rounds to less than 0.1%. |
| ‡ | | Non-income producing security. |
| p | | Rate shown reflects the yield at 12/30/2011. |
| § | | Illiquid. These securities had an aggregate fair value of $17,404, or 2.39%, of the portfolio’s net assets. |
| | Aggregate cost for federal income tax purposes is $729,372. Aggregate gross unrealized appreciation/depreciation for all securities in which there is an excess of value over tax cost were $30,763 and $44,085, respectively. Net unrealized depreciation for tax purposes is $13,322. |
| D | | Restricted security. At 12/31/2011, the portfolio owned the following securities (representing 1.17% of net assets) which were restricted as to public resale. |
| | | | | | | | | | | | | | | | | | | | |
Description | | Date of Acquisition | | | Principal | | | Cost | | | Value | | | Price* | |
| American Seafoods Group LLC | | | 05/07/2010 | | | $ | 4,515 | | | $ | 4,414 | | | $ | 4,018 | | | $ | 89.00 | |
| | | | | |
Description | | Date of Acquisition | | | Shares* | | | Cost | | | Value | | | Price* | |
| Panolam Holdings Co. | | | 12/29/2009 | | | | 1,803 | | | $ | 3,080 | | | $ | 1,540 | | | $ | 854.04 | |
| RathGibson, Inc. (Escrow Certificates) | | | 06/14/2010 | | | | 95,700 | | | | 508 | | | | 2,957 | | | | 30.90 | |
| BLB Contingent Value Rights | | | 11/22/2010 | | | | 2,010 | | | | 2,010 | | | | 8 | | | | 4.00 | |
| Reader’s Digest Association, Inc. | | | 05/18/2010 | | | | 13,112 | | | | t | | | | t | | | | ¥ | |
| * | Amount not rounded to thousands. |
| ¥ | Price rounds to less than $0.01. |
DEFINITION (all amounts in thousands):
| | |
| 144A | | 144A Securities are registered pursuant to Rule 144A of the Securities Act of 1933. These securities are deemed to be liquid for purposes of compliance limitations on holdings of illiquid securities and may be resold as transactions exempt from registration, normally to qualified institutional buyers. At 12/31/2011, these securities aggregated $259,474, or 35.58%, of the portfolio’s net assets. |
VALUATION SUMMARY (all amounts in thousands):
| | | | | | | | | | | | | | | | |
Investment Securities | | Level 1 -
Quoted
Prices | | | Level 2 -
Other
Significant
Observable
Inputs | | | Level 3 -
Significant
Unobservable
Inputs | | | Value at
12/31/2011 | |
Common Stocks | | $ | 386 | | | $ | — | | | $ | 4,497 | | | $ | 4,883 | |
Convertible Bonds | | | — | | | | — | | | | t | | | | t | |
Convertible Preferred Stocks | | | 1,935 | | | | — | | | | — | | | | 1,935 | |
Corporate Debt Securities | | | — | | | | 659,734 | | | | 1,355 | | | | 661,089 | |
Investment Companies | | | — | | | | 3 | | | | — | | | | 3 | |
Loan Assignments | | | — | | | | 33,668 | | | | 7,411 | | | | 41,079 | |
Preferred Corporate Debt Securities | | | — | | | | — | | | | t | | | | t | |
Preferred Stocks | | | 1,685 | | | | — | | | | — | | | | 1,685 | |
Repurchase Agreement | | | — | | | | 5,260 | | | | — | | | | 5,260 | |
Rights | | | — | | | | 8 | | | | — | | | | 8 | |
Warrants | | | 108 | | | | — | | | | t | | | | 108 | |
| | | | | | | | | | | | | | | | |
Total | | $ | 4,114 | | | $ | 698,673 | | | $ | 13,263 | | | $ | 716,050 | |
| | | | | | | | | | | | | | | | |
VALUATION SUMMARY (all amounts in thousands) (continued):
Level 3 Rollforward - Investment Securities
| | | | | | | | | | | | | | | | | | | | | | | | | | | | | | | | | | | | | | | | |
Securities | | Beginning
Balance at
12/31/2010 | | | Purchases | | | Sales | | | Accrued
Discounts/
(Premiums) | | | Total
Realized
Gain/(Loss) | | | Net Change in
Unrealized
Appreciation
/(Depreciation) ƒ | | | Transfers
into
Level 3 y | | | Transfers
out of
Level 3 | | | Ending
Balance at
12/31/2011 | | | Net Change in
Unrealized
Appreciation/
(Depreciation)
on
Investments
Held at
12/31/2011ƒ | |
Common Stocks | | $ | 3,693 | | | $ | — | | | $ | (¿ | ) | | $ | — | | | $ | (1 | ) | | $ | 805 | | | $ | — | | | $ | — | | | $ | 4,497 | | | $ | 805 | |
Convertible Bonds | | | ¿ | | | | — | | | | — | | | | — | | | | — | | | | — | | | | — | | | | — | | | | ¿ | | | | — | |
Corporate Debt Securities | | | 1,866 | | | | — | | | | (503 | ) | | | — | | | | 7 | | | | (15 | ) | | | ¿ | | | | — | | | | 1,355 | | | | (13 | ) |
Loan Assignments | | | 810 | | | | 6,600 | | | | — | | | | 32 | | | | — | | | | (31 | ) | | | — | | | | — | | | | 7,411 | | | | (31 | ) |
Preferred Corporate Debt Securities | | | 32 | | | | — | | | | (193 | ) | | | — | | | | (20 | ) | | | 181 | | | | — | | | | — | | | | ¿ | | | | 181 | |
Warrants | | | ¿ | | | | — | | | | — | | | | — | | | | — | | | | — | | | | — | | | | — | | | | ¿ | | | | — | |
| | | | | | | | | | | | | | | | | | | | | | | | | | | | | | | | | | | | | | | | |
Total | | $ | 6,401 | | | $ | 6,600 | | | $ | (696 | ) | | $ | 32 | | | $ | (14 | ) | | $ | 940 | | | $ | — | | | $ | — | | | $ | 13,263 | | | $ | 942 | |
| | | | | | | | | | | | | | | | | | | | | | | | | | | | | | | | | | | | | | | | |
| | See the notes to the financial statements for more information regarding pricing inputs and valuation techniques. |
| ƒ | Any difference between Net Change in Unrealized Appreciation/(Depreciation) and Net Change in Unrealized Appreciation/(Depreciation) on Investments Held at 12/31/2011 may be due to an investment no longer held or categorized as Level 3 at period end. |
| y | Transferred into Level 3 because of unavailability of observable inputs. |
| ¿ | Amount rounds to less than 1. |
| | | | | | | | |
| | | Principal
(000’s) | | | Value
(000’s) | |
U.S. GOVERNMENT OBLIGATIONS - 1.4% | | | | | |
U.S. Treasury Bond | | | | | | | | |
4.75%, 02/15/2041 | | $ | 165 | | | $ | 227 | |
U.S. Treasury Inflation Indexed Bond | | | | | |
2.13%, 02/15/2041 | | | 227 | | | | 308 | |
U.S. Treasury Note | | | | | | | | |
0.25%, 12/15/2014 | | | 70 | | | | 70 | |
0.50%, 08/15/2014 | | | 95 | | | | 95 | |
0.63%, 06/30/2012 g | | | 70 | | | | 70 | |
0.88%, 11/30/2016 | | | 255 | | | | 256 | |
2.00%, 11/15/2021 | | | 220 | | | | 223 | |
3.13%, 11/15/2041 | | | 235 | | | | 246 | |
| | | | | | | | |
Total U.S. Government Obligations
(cost $1,437) | | | | 1,495 | |
| | | | | | | | |
U.S. GOVERNMENT AGENCY OBLIGATIONS - 21.9% | |
Fannie Mae | | | | | | | | |
3.09%, 03/01/2041 * | | | 81 | | | | 85 | |
3.15%, 03/01/2041 * | | | 80 | | | | 83 | |
3.32%, 12/01/2040 * | | | 94 | | | | 98 | |
3.50%, 10/01/2026 - 12/01/2041 | | | 2,693 | | | | 2,777 | |
3.52%, 10/09/2019 p | | | 280 | | | | 215 | |
4.00%, 09/01/2024 - 12/01/2041 | | | 4,311 | | | | 4,559 | |
4.50%, 01/01/2041 - 06/01/2041 | | | 741 | | | | 792 | |
5.00%, 07/01/2034 - 07/01/2035 | | | 675 | | | | 729 | |
5.50%, 06/01/2033 - 01/01/2039 | | | 1,730 | | | | 1,889 | |
6.50%, 07/01/2037 - 10/01/2039 | | | 533 | | | | 596 | |
Fannie Mae, TBA | | | | | | | | |
3.50% | | | 100 | | | | 105 | |
4.50% | | | 3,400 | | | | 3,620 | |
6.00% | | | 1,600 | | | | 1,758 | |
Farmer Mac Guaranteed Notes Trust 2007-1 | | | | | | | | |
5.13%, 04/19/2017 - 144A | | | 350 | | | | 408 | |
Freddie Mac | | | | | | | | |
3.05%, 02/01/2041 * | | | 87 | | | | 91 | |
3.97%, 01/25/2021 * | | | 120 | | | | 132 | |
Freddie Mac, TBA | | | | | | | | |
4.50% | | | 100 | | | | 106 | |
5.00% | | | 700 | | | | 752 | |
Ginnie Mae | | | | | | | | |
1.43%, 11/20/2059 * | | | 466 | | | | 473 | |
Ginnie Mae, TBA | | | | | | | | |
4.00% | | | 400 | | | | 429 | |
4.50% | | | 800 | | | | 872 | |
5.00% | | | 800 | | | | 886 | |
5.50% | | | 400 | | | | 449 | |
6.00% | | | 300 | | | | 340 | |
Resolution Funding Corp., Interest STRIPS | | | | | |
1.66%, 07/15/2018 p | | | 250 | | | | 225 | |
1.82%, 10/15/2018 p | | | 250 | | | | 223 | |
Tennessee Valley Authority | | | | | | | | |
5.25%, 09/15/2039 | | | 60 | | | | 77 | |
| | | | | | | | |
Total U.S. Government Agency Obligations
(cost $22,357) | | | | 22,769 | |
| | | | | | | | |
FOREIGN GOVERNMENT OBLIGATIONS - 2.1% | |
Hydro Quebec | | | | | | | | |
8.05%, 07/07/2024 | | | 240 | | | | 357 | |
8.40%, 01/15/2022 | | | 95 | | | | 139 | |
9.40%, 02/01/2021 | | | 50 | | | | 76 | |
Italy Buoni Poliennali Del Tesoro | | | | | | | | |
4.75%, 09/15/2016 | | EUR | 340 | | | | 416 | |
| | | | | | | | |
| | | Principal
(000’s) | | | Value
(000’s) | |
FOREIGN GOVERNMENT OBLIGATIONS (continued) | | | | | |
Japan Finance Corp. | | | | | | | | |
2.88%, 02/02/2015 ^ | | $ | 250 | | | $ | 264 | |
Poland Government International Bond | | | | | | | | |
5.13%, 04/21/2021 | | | 90 | | | | 92 | |
Republic of Brazil | | | | | | | | |
7.13%, 01/20/2037 | | | 100 | | | | 138 | |
Republic of South Africa | | | | | | | | |
5.50%, 03/09/2020 | | | 300 | | | | 336 | |
Russian Federation | | | | | | | | |
7.50%, 03/31/2030 Reg S | | | 230 | | | | 267 | |
United Mexican States | | | | | | | | |
5.13%, 01/15/2020 ^ | | | 120 | | | | 137 | |
| | | | | | | | |
Total Foreign Government Obligations
(cost $2,183) | | | | 2,222 | |
| | | | | | | | |
MORTGAGE-BACKED SECURITIES - 5.5% | | | | | |
Adjustable Rate Mortgage Trust | | | | | | | | |
Series 2004-2, Class 7A2 | | | | | | | | |
1.13%, 02/25/2035 * | | | 75 | | | | 65 | |
Banc of America Large Loan, Inc. | | | | | | | | |
Series 2010-UB4, Class A4A | | | | | | | | |
5.01%, 12/20/2041 - 144A * | | | 100 | | | | 105 | |
Banc of America Merrill Lynch Commercial Mortgage, Inc. | | | | | | | | |
Series 2005-5, Class A4 | | | | | | | | |
5.12%, 10/10/2045 * | | | 250 | | | | 276 | |
Series 2007-3, Class A4 | | | | | | | | |
5.62%, 06/10/2049 * | | | 60 | | | | 64 | |
Bear Stearns Commercial Mortgage Securities | | | | | | | | |
Series 2007-PW17, Class A3 | | | | | | | | |
5.74%, 06/11/2050 | | | 115 | | | | 121 | |
Bear Stearns Mortgage Funding Trust | | | | | | | | |
Series 2006-AR5, Class 1A2 | | | | | | | | |
0.50%, 12/25/2046 * | | | 1,066 | | | | 208 | |
Credit Suisse Mortgage Capital Certificates | | | | | |
Series 2006-C3, Class AM | | | | | | | | |
5.81%, 06/15/2038 * | | | 40 | | | | 40 | |
Series 2010-RR1, Class 2A | | | | | | | | |
5.70%, 09/15/2040 - 144A * | | | 90 | | | | 101 | |
Series 2010-RR2, Class 2A | | | | | | | | |
5.79%, 09/15/2039 - 144A * | | | 120 | | | | 134 | |
CW Capital Cobalt, Ltd. | | | | | | | | |
Series 2006-C1, Class A4 | | | | | | | | |
5.22%, 08/15/2048 | | | 200 | | | | 213 | |
Extended Stay America Trust | | | | | | | | |
Series 2010-ESHA, Class B | | | | | | | | |
4.22%, 11/05/2027 - 144A | | | 140 | | | | 141 | |
Series 2010-ESHA, Class C | | | | | | | | |
4.86%, 11/05/2027 - 144A | | | 200 | | | | 202 | |
GE Capital Commercial Mortgage Corp. | | | | | |
Series 2007-C1, Class AAB | | | | | | | | |
5.48%, 12/10/2049 | | | 100 | | | | 103 | |
GMAC Mortgage Corp., Loan Trust | | | | | | | | |
Series 2005-AR1, Class 3A | | | | | | | | |
3.06%, 03/18/2035 * | | | 415 | | | | 333 | |
Greenwich Capital Commercial Funding Corp. | | | | | |
Series 2006-GG7, Class AJ | | | | | | | | |
5.88%, 07/10/2038 * | | | 40 | | | | 28 | |
GS Mortgage Securities Corp. II | | | | | | | | |
Series 2007-GG10, Class A4 | | | | | | | | |
5.79%, 08/10/2045 * | | | 95 | | | | 103 | |
| | | | | | | | |
| | | Principal
(000’s) | | | Value
(000’s) | |
MORTGAGE-BACKED SECURITIES (continued) | |
Impac CMB Trust | | | | | | | | |
Series 2004-6, Class 1A1 | | | | | | | | |
1.09%, 10/25/2034 * | | $ | 170 | | | $ | 122 | |
IndyMac INDA Mortgage Loan Trust | | | | | | | | |
Series 2007-AR7, Class 1A1 | | | | | | | | |
5.73%, 09/25/2037 * | | | 318 | | | | 228 | |
IndyMac Index Mortgage Loan Trust | | | | | | | | |
Series 2007-AR15, Class 2A1 | | | | | | | | |
5.00%, 08/25/2037 * | | | 390 | | | | 225 | |
JPMorgan Chase Commercial Mortgage Securities Corp. | | | | | | | | |
Series 2004-CB8, Class A1A | | | | | | | | |
4.16%, 01/12/2039 - 144A | | | 196 | | | | 202 | |
Series 2004-LN2, Class A2 | | | | | | | | |
5.12%, 07/15/2041 | | | 90 | | | | 95 | |
Series 2006-CB14, Class AM | | | | | | | | |
5.45%, 12/12/2044 * | | | 50 | | | | 49 | |
Series 2007-CB18, Class A3 | | | | | | | | |
5.45%, 06/12/2047 | | | 103 | | | | 108 | |
JPMorgan Mortgage Trust | | | | | | | | |
Series 2004-A3, Class 1A1 | | | | | | | | |
2.54%, 07/25/2034 * | | | 263 | | | | 254 | |
Merrill Lynch Mortgage Investors, Inc. | | | | | | | | |
Series 2004-A3, Class 4A3 | | | | | | | | |
5.01%, 05/25/2034 * | | | 132 | | | | 130 | |
Series 2005-A5, Class A3 | | | | | | | | |
2.61%, 06/25/2035 * | | | 1,300 | | | | 925 | |
Merrill Lynch Mortgage Trust | | | | | | | | |
Series 2004-KEY2, Class A4 | | | | | | | | |
4.86%, 08/12/2039 * | | | 60 | | | | 64 | |
Merrill Lynch/Countrywide Commercial Mortgage Trust | | | | | | | | |
Series 2007-9, Class A4 | | | | | | | | |
5.70%, 09/12/2049 | | | 200 | | | | 213 | |
MLCC Mortgage Investors, Inc. | | | | | | | | |
Series 2003-F, Class A1 | | | | | | | | |
0.93%, 10/25/2028 * | | | 137 | | | | 112 | |
Morgan Stanley Capital I | | | | | | | | |
Series 2005-HQ6, Class A4A | | | | | | | | |
4.99%, 08/13/2042 | | | 190 | | | | 207 | |
Series 2007-HQ12, Class A2FL | | | | | | | | |
0.53%, 04/12/2049 * | | | 27 | | | | 26 | |
Series 2007-HQ12, Class A2FX | | | | | | | | |
5.60%, 04/12/2049 * | | | 54 | | | | 56 | |
Morgan Stanley Re-REMIC Trust | | | | | | | | |
Series 2011-IO, Class A | | | | | | | | |
2.50%, 03/23/2051 - 144A | | | 40 | | | | 40 | |
Structured Asset Mortgage Investments, Inc. | | | | | |
Series 2003-AR4, Class A1 | | | | | | | | |
0.63%, 01/19/2034 * | | | 235 | | | | 175 | |
Wachovia Bank Commercial Mortgage Trust | | | | | |
Series 2007-C33, Class A4 | | | | | | | | |
5.90%, 02/15/2051 * | | | 240 | | | | 260 | |
| | | | | | | | |
Total Mortgage-Backed Securities
(cost $7,246) | | | | 5,728 | |
| | | | | | | | |
ASSET-BACKED SECURITIES - 2.0% | |
AmeriCredit Automobile Receivables Trust | | | | | |
Series 2011-2, Class C | | | | | | | | |
3.19%, 10/12/2016 | | | 115 | | | | 115 | |
Series 2011-5, Class C | | | | | | | | |
3.44%, 10/08/2017 | | | 40 | | | | 40 | |
Avis Budget Rental Car Funding AESOP LLC | | | | | |
Series 2010-3A, Class A | | | | | | | | |
4.64%, 05/20/2016 - 144A | | | 100 | | | | 106 | |
| | | | | | | | |
| | | Principal
(000’s) | | | Value
(000’s) | |
ASSET-BACKED SECURITIES (continued) | | | | | |
Citibank Omni Master Trust | | | | | | | | |
Series 2009-A17, Class A17 | | | | | | | | |
4.90%, 11/15/2018 - 144A | | $ | 250 | | | $ | 272 | |
Education Funding Capital Trust I | | | | | | | | |
Series 2003-3, Class A7 | | | | | | | | |
2.43%, 12/15/2042 * | | | 150 | | | | 123 | |
Hertz Corp. | | | | | | | | |
Series 2009-2A, Class A2 | | | | | | | | |
5.29%, 03/25/2016 - 144A | | | 120 | | | | 130 | |
Santander Consumer Acquired Receivables Trust | | | | | |
Series 2011-S1A, Class B | | | | | | | | |
1.66%, 08/15/2016 - 144A | | | 224 | | | | 221 | |
Series 2011-S1A, Class C | | | | | | | | |
2.01%, 08/15/2016 - 144A | | | 239 | | | | 236 | |
Series 2011-WO, Class C | | | | | | | | |
3.19%, 10/15/2015 - 144A | | | 70 | | | | 70 | |
Santander Drive Auto Receivables Trust | | | | | |
Series 2010-2, Class B | | | | | | | | |
2.24%, 12/15/2014 | | | 110 | | | | 110 | |
Series 2010-2, Class C | | | | | | | | |
3.89%, 07/17/2017 | | | 130 | | | | 132 | |
Series 2011-S1A, Class B | | | | | | | | |
1.48%, 07/15/2013 - 144A | | | 167 | | | | 165 | |
Series 2011-S1A, Class D | | | | | | | | |
3.10%, 03/15/2013 - 144A | | | 69 | | | | 68 | |
Scholar Funding Trust | | | | | | | | |
Series 2011-A, Class A | | | | | | | | |
1.32%, 10/28/2043 - 144A * | | | 142 | | | | 138 | |
SLM Student Loan Trust | | | | | | | | |
Series 2004-B, Class A2 | | | | | | | | |
0.75%, 06/15/2021 * | | | 197 | | | | 188 | |
| | | | | | | | |
Total Asset-Backed Securities
(cost $2,120) | | | | 2,114 | |
| | | | | | | | |
MUNICIPAL GOVERNMENT
OBLIGATIONS - 0.1% | | | | | |
New York City Municipal Water Finance Authority | | | | | | | | |
5.38%, 06/15/2043 | | | 45 | | | | 50 | |
5.50%, 06/15/2043 | | | 55 | | | | 62 | |
| | | | | | | | |
Total Municipal Government Obligations
(cost $99) | | | | 112 | |
| | | | | | | | |
PREFERRED CORPORATE DEBT
SECURITIES - 0.2% | | | | | |
Capital Markets - 0.1% | | | | | | | | |
Credit Suisse | | | | | | | | |
5.86%, 05/15/2017 *ž | | | 90 | | | | 72 | |
Lehman Brothers Holdings Capital Trust VII | | | | | |
5.86%, 05/31/2012 ž ‡§ ‡§ | | | 200 | | | | ¿ | |
Lehman Brothers Holdings E-Capital
Trust I | | | | | | | | |
3.59%, 08/19/2065 ‡ | | | 120 | | | | ¿ | |
State Street Capital Trust IV | | | | | | | | |
1.55%, 06/15/2037 * | | | 10 | | | | 7 | |
Commercial Banks - 0.1% | | | | | | | | |
ABN Amro North American Holding Preferred Capital Repackage Trust I | | | | | | | | |
6.52%, 11/08/2012 - 144A *ž | | | 80 | | | | 55 | |
Diversified Financial Services - 0.0% ¥ | | | | | |
JPMorgan Chase Capital XXV - Series Y | | | | | |
6.80%, 10/01/2037 | | | 25 | | | | 25 | |
| | | | | | | | |
Total Preferred Corporate Debt Securities
(cost $470) | | | | 159 | |
| | | | | | | | |
CORPORATE DEBT SECURITIES - 12.9% | |
Auto Components - 0.0% ¥ | | | | | | | | |
BorgWarner, Inc. | | | | | | | | |
4.63%, 09/15/2020 | | | 30 | | | | 32 | |
| | | | | | | | |
| | | Principal
(000’s) | | | Value
(000’s) | |
Automobiles - 0.0% ¥ | |
General Motors Corp. (Escrow Shares) | | | | | | | | |
8.25%, 07/15/2023 | | $ | 453 | | | $ | ¿ | |
Capital Markets - 0.6% | | | | | | | | |
BP Capital Markets PLC | | | | | | | | |
3.13%, 10/01/2015 ^ | | | 40 | | | | 42 | |
3.88%, 03/10/2015 | | | 100 | | | | 107 | |
Credit Suisse | | | | | | | | |
5.40%, 01/14/2020 ^ | | | 30 | | | | 28 | |
Goldman Sachs Group, Inc. | | | | | | | | |
5.25%, 07/27/2021 | | | 60 | | | | 59 | |
Lehman Brothers Holdings, Inc. | | | | | | | | |
5.25%, 02/06/2012 ‡ | | | 100 | | | | 26 | |
Lehman Brothers Holdings, Inc. - Series I | | | | | | | | |
6.75%, 12/28/2017 ‡ | | | 480 | | | | ¿ | |
Morgan Stanley | | | | | | | | |
2.95%, 05/14/2013 * | | | 200 | | | | 191 | |
4.20%, 11/20/2014 ^ | | | 140 | | | | 135 | |
5.50%, 07/28/2021 ^ | | | 40 | | | | 37 | |
Chemicals - 0.2% | | | | | | | | |
Dow Chemical Co. | | | | | | | | |
4.13%, 11/15/2021 | | | 40 | | | | 41 | |
Lyondell Chemical Co. | | | | | | | | |
11.00%, 05/01/2018 | | | 50 | | | | 55 | |
Lyondellbasell Industries NV | | | | | | | | |
6.00%, 11/15/2021 - 144A ^ | | | 55 | | | | 57 | |
Westlake Chemical Corp. | | | | | | | | |
6.63%, 01/15/2016 | | | 17 | | | | 17 | |
Commercial Banks - 1.5% | | | | | | | | |
Capital One Capital VI | | | | | | | | |
8.88%, 05/15/2040 | | | 55 | | | | 57 | |
CIT Group, Inc. | | | | | | | | |
7.00%, 05/01/2017 | | | 71 | | | | 71 | |
DNB Boligkreditt AS | | | | | | | | |
2.10%, 10/14/2015 - 144A | | | 610 | | | | 604 | |
2.90%, 03/29/2016 - 144A | | | 325 | | | | 330 | |
Fifth Third Capital Trust IV | | | | | | | | |
6.50%, 04/15/2037 * | | | 65 | | | | 64 | |
Glitnir Banki HF | | | | | | | | |
6.33%, 07/28/2011 - 144A ‡ | | | 160 | | | | 42 | |
6.69%, 06/15/2016 - 144A ‡ | | | 380 | | | | ¿ | |
HSBC Bank Brasil SA - Banco Multiplo | | | | | | | | |
4.00%, 05/11/2016 - 144A | | | 200 | | | | 199 | |
HSBC Bank PLC | | | | | | | | |
3.10%, 05/24/2016 - 144A ^ | | | 150 | | | | 150 | |
HSBC Holdings PLC | | | | | | | | |
6.10%, 01/14/2042 ^ | | | 35 | | | | 40 | |
Landsbanki Islands HF | | | | | | | | |
6.10%, 08/25/2011 - 144A ‡ | | | 140 | | | | 5 | |
Construction Materials - 0.0% ¥ | | | | | | | | |
Lafarge SA | | | | | | | | |
7.13%, 07/15/2036 ^ | | | 20 | | | | 18 | |
Consumer Finance - 0.5% | | | | | | | | |
Ally Financial, Inc. | | | | | | | | |
1.75%, 10/30/2012 | | | 150 | | | | 152 | |
Capital One Financial Corp. | | | | | | | | |
3.15%, 07/15/2016 ^ | | | 230 | | | | 230 | |
4.75%, 07/15/2021 ^ | | | 90 | | | | 93 | |
SLM Corp. | | | | | | | | |
6.25%, 01/25/2016 | | | 78 | | | | 76 | |
Containers & Packaging - 0.1% | | | | | | | | |
Ball Corp. | | | | | | | | |
6.75%, 09/15/2020 | | | 50 | | | | 54 | |
| | | | | | | | |
| | | Principal
(000’s) | | | Value
(000’s) | |
Diversified Consumer Services - 0.0% ¥ | |
Service Corp., International | | | | | | | | |
7.50%, 04/01/2027 ^ | | $ | 35 | | | $ | 34 | |
Diversified Financial Services - 1.4% | |
AngloGold Ashanti Holdings PLC | | | | | | | | |
5.38%, 04/15/2020 | | | 40 | | | | 40 | |
Citigroup, Inc. | | | | | | | | |
4.59%, 12/15/2015 | | | 345 | | | | 346 | |
5.00%, 09/15/2014 | | | 40 | | | | 40 | |
General Electric Capital Corp. | | | | | | | | |
5.50%, 01/08/2020 ^ | | | 75 | | | | 83 | |
JPMorgan Chase & Co. | | | | | | | | |
3.15%, 07/05/2016 | | | 51 | | | | 51 | |
4.63%, 05/10/2021 ^ | | | 150 | | | | 155 | |
JPMorgan Chase Bank NA | | | | | | | | |
6.00%, 10/01/2017 | | | 250 | | | | 269 | |
Kaupthing Bank Hf | | | | | | | | |
7.13%, 05/19/2016 - 144A ‡ | | | 130 | | | | ¿ | |
Kaupthing Bank Hf -Series 1 | | | | | | | | |
7.63%, 02/28/2015 - 144A ‡ | | | 710 | | | | 176 | |
Reynolds Group Issuer, Inc. | | | | | | | | |
6.88%, 02/15/2021 - 144A^ | | | 210 | | | | 209 | |
Swiss Re Capital I LP | | | | | | | | |
6.85%, 12/31/2049 - 144A *ž | | | 70 | | | | 59 | |
WEA Finance LLC | | | | | | | | |
4.63%, 05/10/2021 - 144A | | | 35 | | | | 34 | |
Woodside Finance, Ltd. | | | | | | | | |
4.60%, 05/10/2021 - 144A ^ | | | 25 | | | | 26 | |
Diversified Telecommunication Services - 0.4% | |
GTE Corp. | | | | | | | | |
6.84%, 04/15/2018 | | | 22 | | | | 26 | |
Intelsat Jackson Holdings SA | | | | | | | | |
7.25%, 04/01/2019 - 144A | | | 44 | | | | 45 | |
8.50%, 11/01/2019 ^ | | | 50 | | | | 53 | |
Level 3 Financing, Inc. | | | | | | | | |
8.13%, 07/01/2019 - 144A ^ | | | 64 | | | | 63 | |
8.75%, 02/15/2017 | | | 11 | | | | 11 | |
Sprint Capital Corp. | | | | | | | | |
6.88%, 11/15/2028 | | | 24 | | | | 17 | |
8.75%, 03/15/2032 | | | 60 | | | | 49 | |
Verizon Communications, Inc. | | | | | | | | |
3.50%, 11/01/2021 ^ | | | 50 | | | | 52 | |
6.10%, 04/15/2018 ^ | | | 63 | | | | 76 | |
6.40%, 02/15/2038 | | | 37 | | | | 47 | |
8.95%, 03/01/2039 | | | 10 | | | | 16 | |
Electric Utilities - 0.7% | | | | | | | | |
Alabama Power Co. | | | | | | | | |
3.95%, 06/01/2021 | | | 55 | | | | 60 | |
Cleveland Electric Illuminating Co. | | | | | | | | |
5.95%, 12/15/2036 ^ | | | 37 | | | | 39 | |
8.88%, 11/15/2018 | | | 7 | | | | 9 | |
Duke Energy Carolinas LLC | | | | | | | | |
4.25%, 12/15/2041 | | | 50 | | | | 52 | |
Energy Future Intermediate Holding Co., LLC | | | | | | | | |
10.00%, 12/01/2020 ^ | | | 336 | | | | 355 | |
Georgia Power Co. | | | | | | | | |
3.00%, 04/15/2016 ^ | | | 100 | | | | 107 | |
Jersey Central Power & Light Co. | | | | | | | | |
7.35%, 02/01/2019 ^ | | | 30 | | | | 38 | |
Trans-Allegheny Interstate Line Co. | | | | | | | | |
4.00%, 01/15/2015 - 144A ^ | | | 30 | | | | 31 | |
Energy Equipment & Services - 0.3% | | | | | |
Cie Generale de Geophysique-Veritas | | | | | | | | |
7.75%, 05/15/2017 ^ | | | 40 | | | | 41 | |
| | | | | | | | |
| | | Principal
(000’s) | | | Value
(000’s) | |
Energy Equipment & Services (continued) | |
Complete Production Services, Inc. | | | | | | | | |
8.00%, 12/15/2016 | | $ | 105 | | | $ | 108 | |
El Paso Pipeline Partners Operating Co., LLC | | | | | | | | |
6.50%, 04/01/2020 | | | 75 | | | | 83 | |
Ensco PLC | | | | | | | | |
3.25%, 03/15/2016 | | | 20 | | | | 20 | |
4.70%, 03/15/2021 ^ | | | 45 | | | | 47 | |
Pride International, Inc. | | | | | | | | |
6.88%, 08/15/2020 | | | 30 | | | | 35 | |
Rockies Express Pipeline LLC | | | | | | | | |
3.90%, 04/15/2015 - 144A ^ | | | 15 | | | | 15 | |
Food Products - 0.2% | | | | | | | | |
Kraft Foods, Inc. | | | | | | | | |
5.38%, 02/10/2020 | | | 75 | | | | 86 | |
6.50%, 08/11/2017 | | | 35 | | | | 42 | |
Sara Lee Corp. | | | | | | | | |
4.10%, 09/15/2020 ^ | | | 34 | | | | 34 | |
Health Care Equipment & Supplies - 0.1% | |
Boston Scientific Corp. | | | | | | | | |
6.25%, 11/15/2015 | | | 138 | | | | 153 | |
Health Care Providers & Services - 0.3% | |
Fresenius Medical Care U.S. Finance, Inc. | | | | | | | | |
6.88%, 07/15/2017 | | | 120 | | | | 128 | |
HCA, Inc. | | | | | | | | |
6.30%, 10/01/2012 | | | 6 | | | | 6 | |
6.50%, 02/15/2020 | | | 50 | | | | 52 | |
Tenet Healthcare Corp. | | | | | | | | |
6.25%, 11/01/2018 - 144A ^ | | | 55 | | | | 56 | |
10.00%, 05/01/2018 ^ | | | 45 | | | | 51 | |
UnitedHealth Group, Inc. | | | | | | | | |
3.38%, 11/15/2021 ^ | | | 15 | | | | 16 | |
Hotels, Restaurants & Leisure - 0.3% | |
Boyd Gaming Corp. | | | | | | | | |
6.75%, 04/15/2014 | | | 25 | | | | 24 | |
7.13%, 02/01/2016 ^ | | | 80 | | | | 69 | |
Caesars Entertainment Operating Co., Inc. | | | | | | | | |
10.00%, 12/15/2018 ^ | | | 50 | | | | 34 | |
Inn of the Mountain Gods Resort & Casino | | | | | | | | |
1.25%, 11/30/2020 - 144A | | | 20 | | | | 11 | |
MGM Resorts International | | | | | | | | |
10.38%, 05/15/2014 | | | 50 | | | | 57 | |
11.13%, 11/15/2017 ^ | | | 120 | | | | 137 | |
Mohegan Tribal Gaming Authority | | | | | | | | |
6.13%, 02/15/2013 ^ | | | 15 | | | | 10 | |
Station Casinos, Inc. | | | | | | | | |
6.88%, 03/01/2016 ‡ | | | 10 | | | | ¿ | |
Independent Power Producers & Energy Traders - 0.0% ¥ | | | | | |
Constellation Energy Group, Inc. | | | | | | | | |
7.60%, 04/01/2032 | | | 25 | | | | 32 | |
Insurance - 0.8% | | | | | | | | |
American International Group, Inc. | | | | | | | | |
5.45%, 05/18/2017 ^ | | | 45 | | | | 43 | |
8.18%, 05/15/2058 * | | | 15 | | | | 13 | |
Fairfax Financial Holdings, Ltd. | | | | | | | | |
5.80%, 05/15/2021 - 144A | | | 75 | | | | 71 | |
Hartford Financial Services Group, Inc. | | | | | | | | |
6.00%, 01/15/2019 | | | 40 | | | | 41 | |
Lincoln National Corp. | | | | | | | | |
7.00%, 06/15/2040 | | | 50 | | | | 57 | |
Manulife Financial Corp. | | | | | | | | |
3.40%, 09/17/2015 | | | 110 | | | | 111 | |
| | | | | | | | |
| | | Principal
(000’s) | | | Value
(000’s) | |
Insurance (continued) | | | | | | | | |
Metropolitan Life Global Funding I | | | | | | | | |
2.50%, 01/11/2013 - 144A | | $ | 200 | | | $ | 202 | |
5.13%, 06/10/2014 - 144A | | | 100 | | | | 108 | |
Prudential Financial, Inc. | | | | | | | | |
4.75%, 09/17/2015 ^ | | | 140 | | | | 148 | |
XL Group PLC | | | | | | | | |
6.50%, 12/31/2049 * ž ^ | | | 50 | | | | 39 | |
Life Sciences Tools & Services - 0.0% ¥ | |
Life Technologies Corp. | | | | | | | | |
5.00%, 01/15/2021 ^ | | | 11 | | | | 12 | |
Machinery - 0.0% ¥ | | | | | | | | |
Joy Global, Inc. | | | | | | | | |
5.13%, 10/15/2021 | | | 25 | | | | 27 | |
Media - 0.9% | | | | | | | | |
CBS Corp. | | | | | | | | |
4.63%, 05/15/2018 ^ | | | 20 | | | | 21 | |
5.75%, 04/15/2020 ^ | | | 30 | | | | 34 | |
8.88%, 05/15/2019 | | | 30 | | | | 39 | |
Clear Channel Worldwide Holdings, Inc. - Series B | | | | | | | | |
9.25%, 12/15/2017 | | | 30 | | | | 32 | |
Comcast Corp. | | | | | | | | |
5.88%, 02/15/2018 | | | 99 | | | | 115 | |
6.45%, 03/15/2037 ^ | | | 50 | | | | 61 | |
COX Communications, Inc. | | | | | | | | |
8.38%, 03/01/2039 - 144A | | | 95 | | | | 128 | |
CSC Holdings LLC | | | | | | | | |
8.50%, 04/15/2014 | | | 31 | | | | 34 | |
8.63%, 02/15/2019 | | | 5 | | | | 6 | |
DIRECTV Holdings LLC | | | | | | | | |
3.13%, 02/15/2016 | | | 97 | | | | 98 | |
DISH DBS Corp. | | | | | | | | |
7.00%, 10/01/2013 | | | 30 | | | | 32 | |
NBCUniversal Media LLC | | | | | | | | |
4.38%, 04/01/2021 | | | 97 | | | | 102 | |
News America, Inc. | | | | | | | | |
6.40%, 12/15/2035 | | | 5 | | | | 5 | |
6.65%, 11/15/2037 | | | 10 | | | | 11 | |
Time Warner, Inc. | | | | | | | | |
4.70%, 01/15/2021 | | | 30 | | | | 32 | |
6.10%, 07/15/2040 | | | 20 | | | | 23 | |
Time Warner Cable, Inc. | | | | | | | | |
5.50%, 09/01/2041 | | | 60 | | | | 63 | |
5.88%, 11/15/2040 | | | 55 | | | | 60 | |
Metals & Mining - 0.5% | | | | | | | | |
Barrick Gold Corp. | | | | | | | | |
2.90%, 05/30/2016 | | | 262 | | | | 269 | |
Newcrest Finance Pty, Ltd. | | | | | | | | |
4.45%, 11/15/2021 - 144A | | | 55 | | | | 54 | |
Novelis, Inc. | | | | | | | | |
8.75%, 12/15/2020 | | | 80 | | | | 86 | |
Steel Dynamics, Inc. | | | | | | | | |
6.75%, 04/01/2015 | | | 65 | | | | 66 | |
Multiline Retail - 0.3% | | | | | | | | |
JC Penney Corp., Inc. | | | | | | | | |
7.40%, 04/01/2037 | | | 20 | | | | 19 | |
Macy’s Retail Holdings, Inc. | | | | | | | | |
5.90%, 12/01/2016 ^ | | | 95 | | | | 106 | |
7.45%, 07/15/2017 ^ | | | 75 | | | | 88 | |
QVC, Inc. | | | | | | | | |
7.50%, 10/01/2019 - 144A | | | 45 | | | | 48 | |
| | | | | | | | |
| | | Principal
(000’s) | | | Value
(000’s) | |
Multi-Utilities - 0.1% | | | | | | | | |
Dominion Resources, Inc. | | | | | | | | |
1.95%, 08/15/2016 ^ | | $ | 70 | | | $ | 70 | |
Oil, Gas & Consumable Fuels - 2.5% | | | | | |
Anadarko Petroleum Corp. | | | | | | | | |
5.95%, 09/15/2016 | | | 163 | | | | 184 | |
6.38%, 09/15/2017 | | | 85 | | | | 99 | |
Consol Energy, Inc. | | | | | | | | |
8.25%, 04/01/2020 ^ | | | 10 | | | | 11 | |
El Paso Corp. | | | | | | | | |
6.50%, 09/15/2020 | | | 45 | | | | 49 | |
7.80%, 08/01/2031 | | | 1 | | | | 1 | |
Enterprise Products Operating LLC | | | | | | | | |
6.30%, 09/15/2017 | | | 150 | | | | 176 | |
KeySpan Gas East Corp. | | | | | | | | |
5.82%, 04/01/2041 - 144A | | | 50 | | | | 61 | |
Kinder Morgan Energy Partners, LP | | | | | | | | |
5.95%, 02/15/2018 | | | 100 | | | | 114 | |
6.38%, 03/01/2041 ^ | | | 20 | | | | 23 | |
6.55%, 09/15/2040 ^ | | | 15 | | | | 17 | |
Kinder Morgan Finance Co., ULC | | | | | | | | |
5.70%, 01/05/2016 ^ | | | 185 | | | | 188 | |
Marathon Petroleum Corp. | | | | | | | | |
6.50%, 03/01/2041 | | | 132 | | | | 150 | |
MEG Energy Corp. | | | | | | | | |
6.50%, 03/15/2021 - 144A | | | 110 | | | | 112 | |
Nexen, Inc. | | | | | | | | |
7.50%, 07/30/2039 | | | 135 | | | | 162 | |
Peabody Energy Corp. | | | | | | | | |
6.25%, 11/15/2021 - 144A | | | 130 | | | | 135 | |
Pemex Project Funding Master Trust | | | | | | | | |
6.63%, 06/15/2035 ^ | | | 147 | | | | 167 | |
Petrobras International Finance Co. | | | | | | | | |
3.88%, 01/27/2016 | | | 160 | | | | 165 | |
5.75%, 01/20/2020 ^ | | | 250 | | | | 267 | |
6.13%, 10/06/2016 ^ | | | 50 | | | | 55 | |
Plains Exploration & Production Co. | | | | | | | | |
10.00%, 03/01/2016 ^ | | | 10 | | | | 11 | |
Range Resources Corp. | | | | | | | | |
5.75%, 06/01/2021 | | | 10 | | | | 11 | |
7.25%, 05/01/2018 | | | 90 | | | | 96 | |
Rockies Express Pipeline LLC | | | | | | | | |
6.85%, 07/15/2018 - 144A | | | 25 | | | | 26 | |
SandRidge Energy, Inc. | | | | | | | | |
8.75%, 01/15/2020 | | | 60 | | | | 62 | |
SemGroup, LP (Escrow Shares) | | | | | | | | |
8.75%, 11/15/2049 | | | 25 | | | | | |
Transocean, Inc. | | | | | | | | |
6.38%, 12/15/2021 ^ | | | 25 | | | | 27 | |
6.50%, 11/15/2020 ^ | | | 50 | | | | 52 | |
Western Gas Partners, LP | | | | | | | | |
5.38%, 06/01/2021 | | | 95 | | | | 101 | |
Williams Partners, LP | | | | | | | | |
4.13%, 11/15/2020 ^ | | | 45 | | | | 46 | |
Paper & Forest Products - 0.1% | | | | | |
International Paper Co. | | | | | | | | |
4.75%, 02/15/2022 ^ | | | 50 | | | | 53 | |
6.00%, 11/15/2041 ^ | | | 35 | | | | 38 | |
Pharmaceuticals - 0.1% | | | | | | | | |
Teva Pharmaceutical Finance Co., BV | | | | | | | | |
3.65%, 11/10/2021 ^ | | | 25 | | | | 25 | |
Teva Pharmaceutical Finance IV BV | | | | | | | | |
3.65%, 11/10/2021 ^ | | | 50 | | | | 51 | |
| | | | | | | | |
| | | Principal
(000’s) | | | Value
(000’s) | |
Real Estate Investment Trusts - 0.2% | | | | | |
ERP Operating, LP | | | | | | | | |
4.63%, 12/15/2021 | | $ | 55 | | | $ | 56 | |
Ventas Realty, LP | | | | | | | | |
4.75%, 06/01/2021 | | | 35 | | | | 34 | |
Vornado Realty, LP | | | | | | | | |
5.00%, 01/15/2022 | | | 90 | | | | 91 | |
Real Estate Management & Development - 0.1% | |
Realogy Corp. | | | | | | | | |
7.88%, 02/15/2019 - 144A ^ | | | 55 | | | | 48 | |
11.50%, 04/15/2017 ^ | | | 120 | | | | 93 | |
Road & Rail - 0.2% | | | | | | | | |
Burlington Northern Santa Fe LLC | | | | | | | | |
5.75%, 05/01/2040 ^ | | | 135 | | | | 162 | |
Software - 0.1% | | | | | | | | |
First Data Corp. | | | | | | | | |
7.38%, 06/15/2019 - 144A ^ | | | 80 | | | | 75 | |
8.25%, 01/15/2021 - 144A ^ | | | 5 | | | | 4 | |
Oracle Corp. | | | | | | | | |
5.38%, 07/15/2040 | | | 35 | | | | 43 | |
Wireless Telecommunication Services - 0.4% | |
Crown Castle Towers LLC | | | | | | | | |
6.11%, 01/15/2020 - 144A | | | 200 | | | | 220 | |
MetroPCS Wireless, Inc. | | | | | | | | |
7.88%, 09/01/2018 ^ | | | 4 | | | | 4 | |
SBA Tower Trust | | | | | | | | |
5.10%, 04/15/2017 - 144A | | | 40 | | | | 42 | |
Sprint Nextel Corp. | | | | | | | | |
9.00%, 11/15/2018 - 144A ^ | | | 100 | | | | 1 05 | |
| | | | | | | | |
Total Corporate Debt Securities
(cost $15,039) | | | | 13,313 | |
| | | | | | | | |
| | | | | | | | |
| | | Shares | | | Value
(000’s) | |
PREFERRED STOCKS - 0.1% | | | | | | | | |
Diversified Financial Services - 0.1% | | | | | | | | |
Citigroup Capital XIII, 7.88% * ^ | | | 1,692 | | | | 44 | |
U.S. Government Agency Obligation - 0.0% ¥ | |
Fannie Mae, 0.00% * | | | 11,400 | | | | 16 | |
Freddie Mac, 8.38% * | | | 14,925 | | | | 20 | |
| | | | | | | | |
Total Preferred Stocks (cost $720) | | | | | | | 80 | |
| | | | | | | | |
COMMON STOCKS - 58.7% | | | | | |
Aerospace & Defense - 1.3% | | | | | |
General Dynamics Corp. | | | 1,839 | | | | 122 | |
Goodrich Corp. | | | 553 | | | | 68 | |
Honeywell International, Inc. | | | 6,470 | | | | 352 | |
Northrop Grumman Corp. ^ | | | 1,283 | | | | 75 | |
United Technologies Corp. | | | 10,092 | | | | 738 | |
Airlines - 0.1% | | | | | | | | |
Southwest Airlines Co. | | | 11,531 | | | | 99 | |
Auto Components - 0.3% | | | | | | | | |
Johnson Controls, Inc. | | | 9,825 | | | | 307 | |
Automobiles - 0.4% | | | | | | | | |
General Motors Co. ‡^ | | | 18,153 | | | | 368 | |
Beverages - 1.6% | | | | | | | | |
Beam, Inc. | | | 736 | | | | 38 | |
Coca-Cola Co. | | | 12,014 | | | | 840 | |
Dr. Pepper Snapple Group, Inc. ^ | | | 3,847 | | | | 152 | |
PepsiCo, Inc. | | | 9,178 | | | | 609 | |
| | | | | | | | |
| | | Shares | | | Value
(000’s) | |
Biotechnology - 1.1% | | | | | | | | |
Alexion Pharmaceuticals, Inc. ‡ | | | 1,292 | | | $ | 92 | |
Biogen Idec, Inc. ‡ | | | 3,961 | | | | 436 | |
Celgene Corp. ‡^ | | | 8,290 | | | | 561 | |
Vertex Pharmaceuticals, Inc. ‡^ | | | 2,111 | | | | 70 | |
Building Products - 0.1% | | | | | | | | |
Masco Corp. | | | 5,145 | | | | 54 | |
Capital Markets - 1.1% | | | | | | | | |
BlackRock, Inc. - Class A | | | 938 | | | | 167 | |
Goldman Sachs Group, Inc. | | | 3,262 | | | | 295 | |
Invesco, Ltd. | | | 14,097 | | | | 283 | |
Legg Mason, Inc. ^ | | | 626 | | | | 15 | |
Morgan Stanley | | | 11,950 | | | | 181 | |
State Street Corp. ^ | | | 6,004 | | | | 242 | |
Chemicals - 1.3% | | | | | | | | |
Air Products & Chemicals, Inc. ^ | | | 4,339 | | | | 370 | |
Dow Chemical Co. ^ | | | 2,212 | | | | 64 | |
E.I. du Pont de Nemours & Co. ^ | | | 16,196 | | | | 741 | |
Georgia Gulf Corp. ‡^ | | | 2,050 | | | | 40 | |
Mosaic Co. | | | 2,585 | | | | 130 | |
Commercial Banks - 1.2% | | | | | | | | |
SunTrust Banks, Inc. | | | 5,206 | | | | 92 | |
Wells Fargo & Co. | | | 42,711 | | | | 1,177 | |
Zions Bancorporation | | | 959 | | | | 16 | |
Communications Equipment - 1.2% | |
Cisco Systems, Inc. | | | 37,624 | | | | 680 | |
Juniper Networks, Inc. ‡ | | | 2,777 | | | | 57 | |
QUALCOMM, Inc. | | | 9,687 | | | | 530 | |
Computers & Peripherals - 3.1% | |
Apple, Inc. ‡ | | | 6,451 | | | | 2,612 | |
EMC Corp. ‡^ | | | 13,318 | | | | 286 | |
Hewlett-Packard Co. | | | 6,874 | | | | 177 | |
NetApp, Inc. ‡ | | | 733 | | | | 27 | |
SanDisk Corp. ‡^ | | | 1,255 | | | | 62 | |
Western Digital Corp. ‡ | | | 1,223 | | | | 38 | |
Construction & Engineering - 0.3% | |
Fluor Corp. | | | 6,746 | | | | 339 | |
Consumer Finance - 1.0% | | | | | | | | |
American Express Co. ^ | | | 9,715 | | | | 458 | |
Capital One Financial Corp. ^ | | | 12,533 | | | | 530 | |
Discover Financial Services | | | 2,814 | | | | 68 | |
Containers & Packaging - 0.2% | |
Ball Corp. | | | 2,616 | | | | 93 | |
Crown Holdings, Inc. ‡^ | | | 1,781 | | | | 60 | |
Sealed Air Corp. | | | 5,610 | | | | 97 | |
Diversified Consumer Services - 0.1% | |
DeVry, Inc. ^ | | | 2,831 | | | | 109 | |
Diversified Financial Services - 1.4% | |
Bank of America Corp. | | | 88,219 | | | | 490 | |
Citigroup, Inc. | | | 21,083 | | | | 555 | |
CME Group, Inc. - Class A | | | 829 | | | | 202 | |
IntercontinentalExchange, Inc. ‡^ | | | 1,717 | | | | 207 | |
Diversified Telecommunication Services - 1.6% | |
AT&T, Inc. ^ | | | 20,858 | | | | 631 | |
Frontier Communications Corp. ^ | | | 5,313 | | | | 27 | |
Verizon Communications, Inc. ^ | | | 23,967 | | | | 962 | |
Electric Utilities - 1.4% | | | | | | | | |
American Electric Power Co., Inc. | | | 8,808 | | | | 364 | |
Exelon Corp. | | | 3,450 | | | | 150 | |
Nextera Energy, Inc. | | | 5,801 | | | | 353 | |
Northeast Utilities ^ | | | 6,551 | | | | 236 | |
NV Energy, Inc. | | | 3,969 | | | | 65 | |
PPL Corp. | | | 8,194 | | | | 241 | |
Electrical Equipment - 0.5% | | | | | | | | |
Emerson Electric Co. | | | 11,275 | | | | 525 | |
Electronic Equipment & Instruments - 0.1% | |
TE Connectivity, Ltd. | | | 3,925 | | | | 121 | |
Energy Equipment & Services - 1.5% | |
Baker Hughes, Inc. | | | 4,836 | | | | 235 | |
| | | | | | | | |
| | | Shares | | | Value
(000’s) | |
Energy Equipment & Services (continued) | |
Halliburton Co. | | | 4,722 | | | $ | 163 | |
National Oilwell Varco, Inc. ^ | | | 5,910 | | | | 402 | |
Rowan Cos., Inc. ‡^ | | | 2,478 | | | | 75 | |
Schlumberger, Ltd. | | | 8,927 | | | | 610 | |
Weatherford International, Ltd. ‡ | | | 4,204 | | | | 62 | |
Food & Staples Retailing - 1.3% | | | | | | | | |
CVS Caremark Corp. | | | 10,765 | | | | 439 | |
Kroger Co. | | | 7,906 | | | | 191 | |
Sysco Corp. ^ | | | 4,873 | | | | 143 | |
Wal-Mart Stores, Inc. ^ | | | 9,274 | | | | 555 | |
Food Products - 1.3% | | | | | | | | |
General Mills, Inc. ^ | | | 4,520 | | | | 183 | |
Kellogg Co. ^ | | | 2,265 | | | | 115 | |
Kraft Foods, Inc. - Class A | | | 19,467 | | | | 726 | |
Ralcorp Holdings, Inc. ‡^ | | | 2,247 | | | | 192 | |
Tyson Foods, Inc. - Class A | | | 4,538 | | | | 94 | |
Gas Utilities - 0.2% | | | | | | | | |
AGL Resources, Inc. | | | 5,293 | | | | 224 | |
Health Care Equipment & Supplies -0.8% | |
Becton, Dickinson and Co. ^ | | | 2,462 | | | | 184 | |
Covidien PLC | | | 14,352 | | | | 646 | |
Health Care Providers & Services - 1.3% | |
Aetna, Inc. ^ | | | 2,673 | | | | 113 | |
Humana, Inc. ^ | | | 3,880 | | | | 340 | |
McKesson Corp. | | | 4,233 | | | | 330 | |
UnitedHealth Group, Inc. | | | 10,873 | | | | 551 | |
Hotels, Restaurants & Leisure - 0.6% | |
Carnival Corp. ^ | | | 2,309 | | | | 75 | |
Darden Restaurants, Inc. ^ | | | 548 | | | | 25 | |
Marriott International, Inc. - Class A ^ | | | 4,223 | | | | 123 | |
McDonald’s Corp. | | | 2,298 | | | | 231 | |
Yum! Brands, Inc. | | | 2,420 | | | | 143 | |
Household Durables - 0.3% | | | | | | | | |
D.R. Horton, Inc. ^ | | | 7,843 | | | | 99 | |
Lennar Corp. - Class A ^ | | | 2,972 | | | | 58 | |
PulteGroup, Inc. ‡^ | | | 9,762 | | | | 62 | |
Ryland Group, Inc. ^ | | | 4,385 | | | | 69 | |
Household Products - 1.6% | | | | | | | | |
Kimberly-Clark Corp. ^ | | | 4,111 | | | | 302 | |
Procter & Gamble Co. | | | 19,951 | | | | 1,331 | |
Industrial Conglomerates - 1.7% | |
3M Co. | | | 4,599 | | | | 376 | |
General Electric Co. | | | 56,533 | | | | 1,012 | |
Tyco International, Ltd. ^ | | | 8,576 | | | | 401 | |
Insurance - 1.9% | | | | | | | | |
ACE, Ltd. | | | 5,578 | | | | 391 | |
Allstate Corp. | | | 7,370 | | | | 202 | |
Axis Capital Holdings, Ltd. | | | 2,822 | | | | 90 | |
Berkshire Hathaway, Inc. - Class B ‡^ | | | 7,587 | | | | 579 | |
Everest RE Group, Ltd. | | | 2,583 | | | | 217 | |
MetLife, Inc. | | | 8,750 | | | | 273 | |
PartnerRe, Ltd. | | | 450 | | | | 29 | |
Prudential Financial, Inc. | | | 4,951 | | | | 248 | |
Internet & Catalog Retail - 0.5% | | | | | | | | |
Amazon.com, Inc. ‡ | | | 2,781 | | | | 481 | |
Expedia, Inc. ^ | | | 488 | | | | 14 | |
TripAdvisor, Inc. ‡^ | | | 467 | | | | 12 | |
Internet Software & Services - 1.0% | |
eBay, Inc. ‡ | | | 1,879 | | | | 57 | |
Google, Inc. - Class A ‡^ | | | 1,324 | | | | 855 | |
Yahoo! Inc. ‡ | | | 6,571 | | | | 106 | |
IT Services - 2.3% | | | | | | | | |
Accenture PLC - Class A | | | 6,438 | | | | 343 | |
Booz Allen Hamilton Holding Corp. - Class A ‡^ | | | 2,382 | | | | 41 | |
Cognizant Technology Solutions Corp. - Class A‡ | | | 3,180 | | | | 205 | |
Genpact, Ltd. ‡ | | | 3,758 | | | | 56 | |
| | | | | | | | |
| | | Shares | | | Value
(000’s) | |
IT Services (continued) | | | | | | | | |
International Business Machines Corp. | | | 7,829 | | | $ | 1,439 | |
Mastercard, Inc. - Class A | | | 836 | | | | 312 | |
Leisure Equipment & Products - 0.0% ¥ | | | | | | | | |
Hasbro, Inc. ^ | | | 1,567 | | | | 50 | |
Life Sciences Tools & Services - 0.1% | | | | | | | | |
Life Technologies Corp. ‡ | | | 921 | | | | 36 | |
PerkinElmer, Inc. ^ | | | 2,168 | | | | 43 | |
Machinery - 0.5% | | | | | | | | |
Cummins, Inc. | | | 333 | | | | 29 | |
Ingersoll-Rand PLC ^ | | | 5,501 | | | | 168 | |
PACCAR, Inc. ^ | | | 9,427 | | | | 353 | |
Media - 2.0% | | | | | | | | |
CBS Corp. - Class B | | | 20,497 | | | | 556 | |
Comcast Corp. - Class A ^ | | | 25,062 | | | | 594 | |
DIRECTV - Class A ‡ | | | 2,370 | | | | 101 | |
Time Warner, Inc. ^ | | | 22,690 | | | | 821 | |
Metals & Mining - 0.6% | | | | | | | | |
Alcoa, Inc. ^ | | | 17,961 | | | | 155 | |
Freeport-McMoRan Copper & Gold, Inc. | | | 7,091 | | | | 261 | |
Newmont Mining Corp. ^ | | | 2,628 | | | | 158 | |
Multiline Retail - 0.8% | | | | | | | | |
Kohl’s Corp. | | | 3,378 | | | | 167 | |
Macy’s, Inc. ^ | | | 6,603 | | | | 212 | |
Nordstrom, Inc. ^ | | | 1,877 | | | | 93 | |
Target Corp. | | | 6,635 | | | | 340 | |
Multi-Utilities - 0.9% | | | | | | | | |
CenterPoint Energy, Inc. ^ | | | 19,145 | | | | 384 | |
Dominion Resources, Inc. ^ | | | 2,046 | | | | 109 | |
DTE Energy Co. | | | 2,369 | | | | 129 | |
Oge Energy Corp. ^ | | | 1,089 | | | | 62 | |
PG&E Corp. ^ | | | 6,086 | | | | 251 | |
Oil, Gas & Consumable Fuels - 5.4% | | | | | |
Anadarko Petroleum Corp. ^ | | | 1,384 | | | | 106 | |
Chesapeake Energy Corp. ^ | | | 3,563 | | | | 79 | |
Chevron Corp. ^ | | | 13,657 | | | | 1,453 | |
ConocoPhillips | | | 8,996 | | | | 656 | |
Devon Energy Corp. | | | 5,831 | | | | 362 | |
Exxon Mobil Corp. | | | 21,034 | | | | 1,782 | |
Hess Corp. | | | 1,561 | | | | 89 | |
Marathon Oil Corp. | | | 4,895 | | | | 143 | |
Murphy Oil Corp. ^ | | | 919 | | | | 51 | |
Occidental Petroleum Corp. | | | 6,024 | | | | 564 | |
SemGroup Corp. - Class A ‡^ | | | 64 | | | | 2 | |
Southwestern Energy Co. ‡ | | | 8,779 | | | | 280 | |
Valero Energy Corp. | | | 2,951 | | | | 62 | |
Williams Cos., Inc. | | | 3,081 | | | | 102 | |
Pharmaceuticals - 3.5% | | | | | | | | |
Abbott Laboratories | | | 10,369 | | | | 583 | |
Allergan, Inc. ^ | | | 2,044 | | | | 179 | |
Johnson & Johnson | | | 5,227 | | | | 343 | |
Merck & Co., Inc. | | | 32,371 | | | | 1,220 | |
Mylan, Inc. ‡ | | | 11,102 | | | | 238 | |
Pfizer, Inc. | | | 50,052 | | | | 1,083 | |
Teva Pharmaceutical Industries, Ltd. ADR | | | 2,171 | | | | 88 | |
Real Estate Investment Trusts - 1.1% | | | | | |
Alexandria Real Estate Equities, Inc. ^ | | | 2,226 | | | | 154 | |
Colonial Properties Trust | | | 3,067 | | | | 64 | |
Duke Realty Corp. ^ | | | 3,841 | | | | 46 | |
Equity Lifestyle Properties, Inc. ^ | | | 882 | | | | 59 | |
Highwoods Properties, Inc. ^ | | | 1,908 | | | | 57 | |
Mack-Cali Realty Corp. ^ | | | 3,141 | | | | 84 | |
Mid-America Apartment Communities, Inc. ^ | | | 1,070 | | | | 67 | |
Pebblebrook Hotel Trust ^ | | | 1,571 | | | | 30 | |
Plum Creek Timber Co., Inc. ^ | | | 740 | | | | 27 | |
Post Properties, Inc. ^ | | | 1,503 | | | | 66 | |
Regency Centers Corp. | | | 1,529 | | | | 58 | |
Senior Housing Properties Trust | | | 5,180 | | | | 116 | |
Ventas, Inc. ^ | | | 4,027 | | | | 221 | |
| | | | | | | | |
| | | Shares | | | Value
(000’s) | |
Real Estate Investment Trusts (continued) | |
Weyerhaeuser Co. ^ | | | 2,747 | | | $ | 51 | |
Road & Rail - 1.8% | | | | | | | | |
CSX Corp. | | | 27,084 | | | | 570 | |
Norfolk Southern Corp. ^ | | | 6,241 | | | | 455 | |
Union Pacific Corp. | | | 7,730 | | | | 819 | |
Semiconductors & Semiconductor Equipment - 1.3% | |
Altera Corp. ^ | | | 6,579 | | | | 245 | |
Broadcom Corp. - Class A ‡ | | | 2,614 | | | | 77 | |
Freescale Semiconductor Holdings I, Ltd. ‡^ | | | 2,923 | | | | 37 | |
Intel Corp. ^ | | | 3,601 | | | | 87 | |
LAM Research Corp. ‡^ | | | 6,305 | | | | 233 | |
LSI Corp. ‡ | | | 16,167 | | | | 96 | |
MagnaChip Semiconductor Corp. ‡ | | | 149 | | | | 1 | |
Marvell Technology Group, Ltd. ‡^ | | | 4,365 | | | | 60 | |
Micron Technology, Inc. ‡^ | | | 5,349 | | | | 34 | |
ON Semiconductor Corp. ‡ | | | 8,189 | | | | 63 | |
Texas Instruments, Inc. ^ | | | 3,027 | | | | 88 | |
Xilinx, Inc. ^ | | | 10,207 | | | | 328 | |
Software - 2.0% | | | | | | | | |
Adobe Systems, Inc. ‡^ | | | 5,773 | | | | 163 | |
Microsoft Corp. | | | 50,100 | | | | 1,301 | |
Oracle Corp. | | | 23,031 | | | | 591 | |
Zynga, Inc. - Class A ‡^ | | | 3,129 | | | | 29 | |
Specialty Retail - 1.3% | | | | | | | | |
AutoZone, Inc. ‡ | | | 1,117 | | | | 363 | |
Bed Bath & Beyond, Inc. ‡^ | | | 455 | | | | 26 | |
GameStop Corp. - Class A ‡^ | | | 704 | | | | 17 | |
Home Depot, Inc. ^ | | | 5,777 | | | | 243 | |
Lowe’s Cos., Inc. | | | 13,262 | | | | 337 | |
Staples, Inc. ^ | | | 2,554 | | | | 35 | |
TJX Cos., Inc. ^ | | | 5,838 | | | | 377 | |
Textiles, Apparel & Luxury Goods - 0.6% | |
Nike, Inc. - Class B | | | 3,850 | | | | 371 | |
V.F. Corp. | | | 2,322 | | | | 295 | |
Tobacco - 0.9% | | | | | | | | |
Altria Group, Inc. ^ | | | 12,797 | | | | 379 | |
Philip Morris International, Inc. | | | 6,709 | | | | 527 | |
Wireless Telecommunication Services - 0.2% | |
Crown Castle International Corp. ‡ | | | 2,814 | | | | 126 | |
Sprint Nextel Corp. ‡^ | | | 35,779 | | | | 84 | |
| | | | | | | | |
Total Common Stocks (cost $59,552) | | | | 61,070 | |
| | | | | | | | |
WARRANTS - 0.0% ¥ | | | | | | | | |
Automobiles - 0.0% ¥ | | | | | | | | |
General Motors Co. ‡ | | | | | | | | |
Expiration: 07/10/2019 | | | | | | | | |
Exercise Price: $18.33 | | | 1,742 | | | | 14 | |
General Motors Co. ‡^ | | | | | | | | |
Expiration: 07/10/2016 | | | | | | | | |
Exercise Price: $10.00 | | | 1,742 | | | | 20 | |
Oil, Gas & Consumable Fuels - 0.0% ¥ | |
SemGroup Corp. ‡^ | | | | | | | | |
Expiration: 11/30/2014 | | | | | | | | |
Exercise Price: $25.00 | | | 68 | | | | ¨ | |
| | | | | | | | |
Total Warrants (cost $174) | | | | | | | 34 | |
| | | | | | | | |
| | | Notional
Amount
(000’s) | | | Value
(000’s) | |
PURCHASED OPTIONS - 0.0% ¥ | |
Call Options - 0.0% ¥ | | | | | | | | |
10-Year U.S. Treasury Note Future | | $ | 4 | | | | 2 | |
Call Strike $132.00 | | | | | | | | |
Expires 01/27/2012 | | | | | | | | |
Euro | | EUR | 875 | | | ¨ | | |
Call Strike $1.45 | | | | | | | | |
Expires 02/17/2012 | | | | | | | | |
| | | | | | | | |
| | | Notional
Amount
(000’s) | | | Value
(000’s) | |
Put Options - 0.0% ¥ | | | | | | | | |
10-Year U.S. Treasury Note Future | | $ | 5 | | | $ | ¿ | |
Put Strike $128.00 | | | | | | | | |
Expires 01/27/2012 | | | | | | | | |
10-Year U.S. Treasury Note Future | | | 10 | | | | ¿ | |
Put Strike $127.00 | | | | | | | | |
Expires 01/27/2012 | | | | | | | | |
Eurodollar Future | | | 28 | | | | ¿ | |
Put Strike $99.00 | | | | | | | | |
Expires 01/13/2012 | | | | | | | | |
Eurodollar, Mid-Curve 1-Year Future | | | 63 | | | | 3 | |
Put Strike $99.00 | | | | | | | | |
Expires 03/16/2012 | | | | | | | | |
| | | | | | | | |
Total Purchased Options (cost $25) | | | | | | | 5 | |
| | | | | | | | |
| | | | | | | | |
| | | Shares | | | Value
(000’s) | |
SECURITIES LENDING COLLATERAL - 18.9% | |
State Street Navigator Securities Lending Trust - Prime Portfolio, 0.28% p | | | 19,659,132 | | | | 19,659 | |
Total Securities Lending Collateral
(cost $19,659) | | | | | |
| | | | | | | | |
| | | Principal
(000’s) | | | Value
(000’s) | |
REPURCHASE AGREEMENT - 3.7% | |
State Street Bank & Trust Co. 0.03% p , dated 12/30/2011, to be repurchased at $3,895 on 01/03/2012. Collateralized by U.S. Government Agency Obligations, 3.00%, due 11/25/2040, and with a total value of $3,979. | | $ | 3,895 | | | | 3,895 | |
Total Repurchase Agreement
(cost $3,895) | | | | | |
| | | | | | | | |
Total Investment Securities
(cost $134,976) | | | | | | | 132,655 | |
Other Assets and Liabilities - Net | | | | | | | (28,544 | ) |
| | | | | | | | |
Net Assets | | | | | | $ | 104,111 | |
| | | | | | | | |
| | | | | | | | |
| | | Shares | | | Value
(000’s) | |
SECURITIES SOLD SHORT - (6.6%) | | | | | |
COMMON STOCK - (0.0%) ¥ | | | | | |
Oil, Gas & Consumable Fuels - (0.0%) ¥ | |
WPX Energy, Inc. ‡ | | | (896 | ) | | $ | (16 | ) |
Total Common Stock (cost $(16)) | | | | | | | | |
| | | | | | | | |
| | | Principal
(000’s) | | | Value
(000’s) | |
U.S. GOVERNMENT AGENCY OBLIGATIONS - (6.6%) | |
Fannie Mae, TBA | | | | | | | | |
3.50% | | $ | (1,900 | ) | | | (1,954 | ) |
4.00% | | | (3,100 | ) | | | (3,248 | ) |
5.00% | | | (100 | ) | | | (108 | ) |
5.50% | | | (1,400 | ) | | | (1,522 | ) |
Total U.S. Government Agency Obligations
(cost $(6,783)) | | | | (6,832 | ) |
| | | | | | | | |
Total Securities Sold Short
(proceeds $(6,799)) | | | | | | | (6,848 | ) |
| | | | | | | | |
| | | | | | | | | | | | | | | | |
| FUTURES CONTRACTS: € | | | | | | | | | | | | | | | | |
| | | | |
Description | | Type | | | Contracts | | | Expiration Date | | | Net Unrealized
Appreciation
(Depreciation)
(000’s) | |
10-Year U.S. Treasury Note | | | Short | | | | (14 | ) | | | 03/21/2012 | | | $ | (6 | ) |
2-Year U.S. Treasury Note | | | Long | | | | 5 | | | | 03/30/2012 | | | | (¿ | ) |
30-Year U.S. Treasury Bond | | | Long | | | | 1 | | | | 03/21/2012 | | | | 2 | |
3-Month EURIBOR | | | Long | | | | 13 | | | | 03/19/2012 | | | | 4 | |
3-Month EURIBOR | | | Long | | | | 2 | | | | 03/17/2014 | | | | 2 | |
3-Month EURIBOR | | | Long | | | | 2 | | | | 06/16/2014 | | | | 2 | |
3-Month EURIBOR | | | Long | | | | 2 | | | | 09/15/2014 | | | | 2 | |
3-Month EURIBOR | | | Long | | | | 2 | | | | 12/15/2014 | | | | 2 | |
5-Year U.S. Treasury Note | | | Short | | | | (1 | ) | | | 03/30/2012 | | | | (¿ | ) |
90-Day Euro | | | Long | | | | 16 | | | | 12/15/2014 | | | | 9 | |
90-Day Euro | | | Long | | | | 16 | | | | 03/16/2015 | | | | 12 | |
German Euro Bund | | | Long | | | | 5 | | | | 01/27/2012 | | | | (5 | ) |
S&P 500 E-Mini Index | | | Long | | | | 15 | | | | 03/16/2012 | | | | 3 | |
Ultra Long U.S. Treasury Bond | | | Long | | | | 8 | | | | 03/21/2012 | | | | 35 | |
| | | | | | | | | | | | | | | | |
| | | | | | | | | | | | | | $ | 62 | |
| | | | | | | | | | | | | | | | |
FORWARD FOREIGN CURRENCY CONTRACTS:
| | | | | | | | | | | | | | | | |
Currency | | Counterparty | | Contracts
Bought
(Sold)
(000’s) | | | Settlement
Date | | Amount in U.S.
Dollars Bought
(Sold)
(000’s) | | | Net Unrealized
Appreciation
(Depreciation)
(000’s) | |
Euro | | RBS | | | 125 | | | 01/25/2012 | | $ | 168 | | | $ | (7 | ) |
Euro | | DUB | | | (284 | ) | | 01/25/2012 | | | (387 | ) | | | 20 | |
Euro | | CITI | | | 150 | | | 01/25/2012 | | | 200 | | | | (6 | ) |
Euro | | RBS | | | (320 | ) | | 01/25/2012 | | | (436 | ) | | | 22 | |
| | | | | | | | | | | | | | | | |
| | | | | | | | | | | | | | $ | 29 | |
| | | | | | | | | | | | | | | | |
Collateral (Received) Pledged for OTC Financial Derivative Instruments
The following is a summary by counterparty of the market value of OTC financial derivative instruments and collateral (received)/pledged as of 12/31/2011:
| | | | | | | | | | |
Counterparty | | Total Market Value of OTC
Derivatives
(000’s) | | | Collateral
(Received)/Pledged
(000’s) | | Net Exposures (1)
(000’s) | |
CITI | | $ | (6 | ) | | $— | | $ | (6 | ) |
DUB | | | 20 | | | — | | | 20 | |
RBS | | | 15 | | | — | | | 15 | |
| (1) | Net exposure represents the net receivable/(payable) that would be due from/to the counterparty in the event of default. |
NOTES TO SCHEDULE OF INVESTMENTS (all amounts in thousands):
| g | This security, in the amount of $70, has been segregated as collateral with the broker to cover margin requirements for open futures contracts. |
| € | Cash in the amount of $87 has been segregated as collateral with the broker to cover margin requirements for open futures contracts. |
| * | Floating or variable rate note. Rate is listed as of 12/30/2011. |
| p | Rate shown reflects the yield at 12/30/2011. |
| ^ | All or a portion of this security is on loan. The value of all securities on loan is $19,226. |
| § | Illiquid. At 12/31/2011, the fair value of illiquid investment securities aggregated to less than $1, or less than 0.01%, of the portfolio’s net assets. |
| ž | The security has a perpetual maturity. The date shown is the next call date. |
| | In default. |
| ¥ | Percentage rounds to less than 0.1%. |
| | Security fair valued as determined in good faith in accordance with procedures established by the Board of Trustees. These securities had a fair value of less than $1, or less than 0.01%, of the portfolio’s net assets. |
| | Payment in-kind. Securities pay interest or dividends in the form of additional bonds or preferred stock. |
| ‡ | Non-income producing security. |
| | Aggregate cost for federal income tax purposes is $137,473. Aggregate gross unrealized appreciation/depreciation for all securities in which there is an excess of value over tax cost were $2,259 and $7,077, respectively. Net unrealized depreciation for tax purposes is $4,818. |
DEFINITIONS (all amounts in thousands):
| 144A | 144A Securities are registered pursuant to Rule 144A of the Securities Act of 1933. These securities are deemed to be liquid for purposes of compliance limitations on holdings of illiquid securities and may be resold as transactions exempt from registration, normally to qualified institutional buyers. At 12/31/2011, these securities aggregated $6,345, or 6.09%, of the portfolio’s net assets. |
| ADR | American Depositary Receipt |
| EURIBOR | Euro InterBank Offered Rate |
| REMIC | Real Estate Mortgage Investment Conduits (consist of a fixed pool of mortgages broken apart and marketed to investors as individual securities) |
| RBS | Royal Bank of Scotland Group PLC |
| STRIPS | Separate Trading of Registered Interest and Principal of Securities |
CURRENCY ABBREVIATION:
VALUATION SUMMARY (all amounts in thousands):
| | | | | | | | | | | | | | | | |
Investment Securities | | Level 1 -
Quoted Prices | | | Level 2 - Other
Significant
Observable
Inputs | | | Level 3 -
Significant
Unobservable
Inputs | | | Value at
12/31/2011 | |
Asset-Backed Securities | | $ | — | | | $ | 2,114 | | | $ | — | | | $ | 2,114 | |
Common Stocks | | | 58,850 | | | | 2,220 | | | | — | | | | 61,070 | |
Corporate Debt Securities | | | — | | | | 13,313 | | | | ¨ | | | | 13,313 | |
Foreign Government Obligations | | | — | | | | 2,222 | | | | — | | | | 2,222 | |
Mortgage-Backed Securities | | | — | | | | 5,728 | | | | — | | | | 5,728 | |
Municipal Government Obligations | | | — | | | | 112 | | | | — | | | | 112 | |
Preferred Corporate Debt Securities | | | — | | | | 159 | | | | — | | | | 159 | |
Preferred Stocks | | | 80 | | | | — | | | | — | | | | 80 | |
Purchased Options | | | 5 | | | | ¨ | | | | — | | | | 5 | |
Repurchase Agreement | | | — | | | | 3,895 | | | | — | | | | 3,895 | |
Securities Lending Collateral | | | 19,659 | | | | — | | | | — | | | | 19,659 | |
U.S. Government Agency Obligations | | | — | | | | 22,769 | | | | — | | | | 22,769 | |
U.S. Government Obligations | | | — | | | | 1,495 | | | | — | | | | 1,495 | |
Warrants | | | 34 | | | | — | | | | — | | | | 34 | |
| | | | | | | | | | | | | | | | |
Total | | $ | 78,628 | | | $ | 54,027 | | | $ | | ¨ | | $ | 132,655 | |
| | | | | | | | | | | | | | | | |
| | | | | | | | | | | | | | | | |
Securities Sold Short | | Level 1 -
Quoted
Prices | | | Level 2 - Other
Significant
Observable Inputs | | | Level 3 -
Significant
Unobservable
Inputs | | | Value at
12/31/2011 | |
Common Stock | | $ | (16 | ) | | $ | — | | | $ | — | | | $ | (16 | ) |
U.S. Government Agency Obligations | | | — | | | | (6,832 | ) | | | — | | | | (6,832 | ) |
| | | | | | | | | | | | | | | | |
Total | | $ | (16 | ) | | $ | (6,832 | ) | | $ | — | | | $ | (6,848 | ) |
| | | | | | | | | | | | | | | | |
| | | | | | | | | | | | | | | | |
Other Financial Instruments | | Level 1 -
Quoted
Prices | | | Level 2 - Other
Significant
Observable Inputs | | | Level 3 -
Significant
Unobservable
Inputs | | | Value at
12/31/2011 | |
Futures Contracts - Appreciation | | $ | 73 | | | $ | — | | | $ | — | | | $ | 73 | |
Futures Contracts - Depreciation | | | (11 | ) | | | — | | | | — | | | | (11 | ) |
Forward Foreign Currency Contracts - Appreciation | | | — | | | | 42 | | | | — | | | | 42 | |
Forward Foreign Currency Contracts - Depreciation | | | — | | | | (13 | ) | | | — | | | | (13 | ) |
| | | | | | | | | | | | | | | | |
Total | | $ | 62 | | | $ | 29 | | | $ | — | | | $ | 91 | |
| | | | | | | | | | | | | | | | |
Level 3 Rollforward - Investment Securities
| | | | | | | | | | | | | | | | | | | | | | | | | | | | | | | | | | | | | | | | |
Securities | | Beginning
Balance at
12/31/2010 | | | Purchases | | | Sales | | | Accrued Discounts/
(Premiums) | | | Total
Realized
Gain/(Loss) | | | Net Change in
Unrealized
Appreciation/
(Depreciation) | | | Transfers
into
Level 3 y | | | Transfers
out of
Level 3 | | | Ending
Balance at
12/31/2011 | | | Net Change in
Unrealized
Appreciation/
(Depreciation) on
Investments Held at
12/31/2011 ƒ | |
Corporate Debt Securities | | $ | ¨ | | | $ | — | | | $ | (¨) | | | $ | — | | | $ | ¨ | | | $ | ¨ | | | $ | ¨ | | | $ | (¨) | | | $ | ¨ | | | $ | — | |
| | | | | | | | | | | | | | | | | | | | | | | | | | | | | | | | | | | | | | | | |
| See the notes to the financial statements for more information regarding pricing inputs and valuation techniques. |
| Other financial instruments are derivative instruments that are valued at unrealized appreciation (depreciation) on the instrument. |
| ƒ | Any difference between Net Change in Unrealized Appreciation/(Depreciation) and Net Change in Unrealized Appreciation/(Depreciation) on Investments Held at 12/31/2011 may be due to an investment no longer held or categorized as Level 3 at period end. |
| y | Transferred into Level 3 because of unavailability of observable inputs. |
| Transferred out of Level 3 because of availability of observable inputs. |
| ¨ | Amount rounds to less than 1. |
| | | | | | | | |
| | | Shares | | | Value
(000’s) | |
COMMON STOCKS - 98.6% | | | | | | | | |
Aerospace & Defense - 2.5% | | | | | | | | |
Lockheed Martin Corp. Ù | | | 80,500 | | | $ | 6,512 | |
Northrop Grumman Corp. Ù | | | 154,200 | | | | 9,018 | |
Raytheon Co. | | | 138,100 | | | | 6,681 | |
Airlines - 0.4% | | | | | | | | |
Delta Air Lines, Inc. ‡ | | | 407,200 | | | | 3,294 | |
Auto Components - 1.0% | | | | | | | | |
Goodyear Tire & Rubber Co. ‡ | | | 607,600 | | | | 8,610 | |
Biotechnology - 1.0% | | | | | | | | |
Gilead Sciences, Inc. ‡ | | | 204,200 | | | | 8,358 | |
Capital Markets - 0.5% | | | | | | | | |
Ameriprise Financial, Inc. | | | 83,000 | | | | 4,120 | |
Chemicals - 1.2% | | | | | | | | |
Agrium, Inc. Ù | | | 49,200 | | | | 3,302 | |
Eastman Chemical Co. | | | 129,600 | | | | 5,062 | |
Huntsman Corp. | | | 243,100 | | | | 2,431 | |
Commercial Banks - 9.4% | | | | | | | | |
Fifth Third Bancorp | | | 773,000 | | | | 9,833 | |
Huntington Bancshares, Inc. | | | 1,311,200 | | | | 7,198 | |
KeyCorp | | | 1,056,300 | | | | 8,123 | |
PNC Financial Services Group, Inc. | | | 235,600 | | | | 13,587 | |
Regions Financial Corp. | | | 1,288,800 | | | | 5,542 | |
U.S. Bancorp | | | 404,700 | | | | 10,947 | |
Wells Fargo & Co. | | | 988,800 | | | | 27,250 | |
Communications Equipment - 1.5% | | | | | | | | |
Cisco Systems, Inc. | | | 744,400 | | | | 13,459 | |
Construction & Engineering - 0.8% | | | | | |
KBR, Inc. | | | 255,600 | | | | 7,124 | |
Consumer Finance - 2.4% | | | | | | | | |
American Express Co. | | | 128,000 | | | | 6,038 | |
Capital One Financial Corp. Ù | | | 152,000 | | | | 6,428 | |
Discover Financial Services | | | 357,400 | | | | 8,577 | |
Diversified Consumer Services - 1.0% | | | | | |
Apollo Group, Inc. - Class A ‡ | | | 161,600 | | | | 8,705 | |
Diversified Financial Services - 5.4% | | | | | | | | |
Bank of America Corp. | | | 596,800 | | | | 3,318 | |
Citigroup, Inc. | | | 512,700 | | | | 13,489 | |
JPMorgan Chase & Co. | | | 823,700 | | | | 27,389 | |
NASDAQ OMX Group ‡ | | | 142,000 | | | | 3,480 | |
Diversified Telecommunication Services - 4.5% | | | | | |
AT&T, Inc. | | | 597,400 | | | | 18,065 | |
Verizon Communications, Inc. | | | 534,700 | | | | 21,453 | |
Electric Utilities - 3.9% | | | | | | | | |
Edison International | | | 255,400 | | | | 10,574 | |
Entergy Corp. | | | 143,000 | | | | 10,446 | |
Exelon Corp. | | | 198,900 | | | | 8,626 | |
NV Energy, Inc. | | | 271,000 | | | | 4,431 | |
Food & Staples Retailing - 3.9% | | | | | | | | |
CVS Caremark Corp. | | | 230,200 | | | | 9,388 | |
Kroger Co. | | | 369,500 | | | | 8,949 | |
Safeway, Inc. Ù | | | 396,100 | | | | 8,334 | |
Walgreen Co. | | | 235,000 | | | | 7,769 | |
Health Care Providers & Services - 8.3% | | | | | |
Aetna, Inc. | | | 248,900 | | | | 10,501 | |
AmerisourceBergen Corp. - Class A | | | 203,200 | | | | 7,557 | |
Cardinal Health, Inc. | | | 220,100 | | | | 8,938 | |
CIGNA Corp. | | | 113,500 | | | | 4,767 | |
Health Net, Inc. ‡ | | | 246,000 | | | | 7,483 | |
Humana, Inc. | | | 83,800 | | | | 7,342 | |
McKesson Corp. | | | 45,800 | | | | 3,568 | |
UnitedHealth Group, Inc. | | | 223,000 | | | | 11,302 | |
WellPoint, Inc. | | | 167,500 | | | | 11,097 | |
Hotels, Restaurants & Leisure - 0.3% | | | | | |
Wyndham Worldwide Corp. | | | 69,700 | | | | 2,637 | |
Household Durables - 0.4% | | | | | | | | |
Whirlpool Corp. Ù | | | 75,900 | | | | 3,601 | |
Household Products - 0.6% | | | | | | | | |
Procter & Gamble Co. | | | 84,500 | | | | 5,637 | |
| | | | | | | | |
| | | Shares | | | Value
(000’s) | |
Independent Power Producers & Energy Traders - 0.7% | |
Constellation Energy Group, Inc. | | | 159,100 | | | $ | 6,311 | |
Industrial Conglomerates - 1.8% | | | | | |
General Electric Co. | | | 869,100 | | | | 15,566 | |
Insurance - 6.2% | | | | | | | | |
ACE, Ltd. | | | 155,500 | | | | 10,904 | |
Aflac, Inc. | | | 73,800 | | | | 3,193 | |
Assurant, Inc. | | | 189,500 | | | | 7,781 | |
Chubb Corp. | | | 177,400 | | | | 12,279 | |
Lincoln National Corp. | | | 206,000 | | | | 4,001 | |
Reinsurance Group of America, Inc. - Class A | | | 62,500 | | | | 3,266 | |
Torchmark Corp. | | | 105,150 | | | | 4,562 | |
Travelers Cos., Inc. | | | 144,300 | | | | 8,538 | |
IT Services - 0.7% | | | | | | | | |
Visa, Inc. - Class A | | | 63,600 | | | | 6,457 | |
Machinery - 1.1% | | | | | | | | |
Gardner Denver, Inc. | | | 79,900 | | | | 6,158 | |
Timken Co. | | | 98,900 | | | | 3,828 | |
Media - 4.9% | | | | | | | | |
CBS Corp. - Class B | | | 376,200 | | | | 10,210 | |
Comcast Corp. - Class A | | | 355,800 | | | | 8,436 | |
DIRECTV - Class A ‡ | | | 227,200 | | | | 9,715 | |
Time Warner Cable, Inc. | | | 100,900 | | | | 6,414 | |
Viacom, Inc. - Class B | | | 176,500 | | | | 8,015 | |
Metals & Mining - 1.0% | | | | | | | | |
Freeport-McMoRan Copper & Gold, Inc. | | | 234,100 | | | | 8,613 | |
Multiline Retail - 0.7% | | | | | | | | |
Family Dollar Stores, Inc. | | | 43,100 | | | | 2,485 | |
Kohl’s Corp. | | | 65,400 | | | | 3,228 | |
Multi-Utilities - 2.6% | | | | | | | | |
Ameren Corp. | | | 80,400 | | | | 2,664 | |
Public Service Enterprise Group, Inc. | | | 309,900 | | | | 10,229 | |
Sempra Energy | | | 175,100 | | | | 9,631 | |
Oil, Gas & Consumable Fuels - 13.2% | | | | | |
Chevron Corp. | | | 331,700 | | | | 35,292 | |
ConocoPhillips | | | 286,600 | | | | 20,885 | |
Exxon Mobil Corp. | | | 213,100 | | | | 18,062 | |
Hess Corp. | | | 59,300 | | | | 3,368 | |
Marathon Oil Corp. | | | 131,100 | | | | 3,837 | |
Marathon Petroleum Corp. | | | 135,000 | | | | 4,494 | |
Murphy Oil Corp. | | | 196,500 | | | | 10,953 | |
Tesoro Corp. ‡Ù | | | 397,800 | | | | 9,293 | |
Valero Energy Corp. | | | 427,300 | | | | 8,995 | |
Paper & Forest Products - 0.4% | | | | | | | | |
Domtar Corp. | | | 47,400 | | | | 3,790 | |
Personal Products - 0.4% | | | | | | | | |
Herbalife, Ltd. | | | 75,600 | | | | 3,906 | |
Pharmaceuticals - 3.9% | | | | | | | | |
Merck & Co., Inc. | | | 266,500 | | | | 10,047 | |
Pfizer, Inc. | | | 1,098,000 | | | | 23,761 | |
Road & Rail - 1.2% | | | | | | | | |
Norfolk Southern Corp. | | | 47,900 | | | | 3,490 | |
Ryder System, Inc. | | | 137,100 | | | | 7,285 | |
Semiconductors & Semiconductor Equipment - 2.6% | |
Intel Corp. | | | 928,600 | | | | 22,519 | |
Software - 3.8% | | | | | | | | |
Activision Blizzard, Inc. | | | 812,400 | | | | 10,009 | |
Amdocs, Ltd. ‡ | | | 118,600 | | | | 3,384 | |
CA, Inc. | | | 185,100 | | | | 3,742 | |
Microsoft Corp. | | | 349,000 | | | | 9,060 | |
Symantec Corp. ‡ | | | 459,200 | | | | 7,186 | |
Specialty Retail - 1.4% | | | | | | | | |
AutoZone, Inc. ‡ | | | 10,800 | | | | 3,510 | |
Bed Bath & Beyond, Inc. ‡ | | | 66,100 | | | | 3,832 | |
Best Buy Co., Inc. Ù | | | 142,200 | | | | 3,323 | |
Gap, Inc. | | | 82,900 | | | | 1,538 | |
Textiles, Apparel & Luxury Goods - 0.9% | | | | | |
Coach, Inc. | | | 131,300 | | | | 8,015 | |
| | | | | | | | |
| | | Shares | | | Value
(000’s) | |
Tobacco - 2.1% | | | | | | | | |
Lorillard, Inc. | | | 55,800 | | | $ | 6,361 | |
Philip Morris International, Inc. | | | 157,600 | | | | 12,369 | |
| | | | | | | | |
Total Common Stocks (cost $796,123) | | | | 865,130 | |
| | | | | | | | |
SECURITIES LENDING COLLATERAL - 3.8% | |
State Street Navigator Securities Lending Trust - Prime Portfolio, 0.28% p | | | 33,249,401 | | | | 33,249 | |
Total Securities Lending Collateral
(cost $33,249) | | | | | |
| | |
| | | Principal
(000’s) | | | Value
(000’s) | |
REPURCHASE AGREEMENT - 1.3% | | | | | |
State Street Bank & Trust Co. 0.03% p , dated 12/30/2011, to be repurchased at $11,609 on 01/03/2012. Collateralized by a U.S. Government Agency Obligation, 3.00%, due 11/25/2040, and with a value of $11,846. | | $ | 11,609 | | | | 11,609 | |
Total Repurchase Agreement
(cost $11,609) | | | | | |
Total Investment Securities (cost $840,981) | | | | | |
| | | | | | | | |
| | | | | | | 909,988 | |
Other Assets and Liabilities - Net | | | | (32,222 | ) |
| | | | | | | | |
Net Assets | | | | | | $ | 877,766 | |
| | | | | | | | |
NOTES TO SCHEDULE OF INVESTMENTS (all amounts in thousands):
| Ù | All or a portion of this security is on loan. The value of all securities on loan is $32,518. |
| ‡ | Non-income producing security. |
| p | Rate shown reflects the yield at 12/30/2011. |
| | Aggregate cost for federal income tax purposes is $845,902. Aggregate gross unrealized appreciation/depreciation for all securities in which there is an excess of value over tax cost were $102,709 and $38,623, respectively. Net unrealized appreciation for tax purposes is $64,086. |
VALUATION SUMMARY (all amounts in thousands):
| | | | | | | | | | | | | | | | |
Investment Securities | | Level 1 -
Quoted
Prices | | | Level 2 -
Other
Significant
Observable
Inputs | | | Level 3 -
Significant
Unobservable
Inputs | | | Value at
12/31/2011 | |
Common Stocks | | $ | 850,842 | | | $ | 14,288 | | | $ | — | | | $ | 865,130 | |
Repurchase Agreement | | | — | | | | 11,609 | | | | — | | | | 11,609 | |
Securities Lending Collateral | | | 33,249 | | | | — | | | | — | | | | 33,249 | |
| | | | | | | | | | | | | | | | |
Total | | $ | 884,091 | | | $ | 25,897 | | | $ | — | | | $ | 909,988 | |
| | | | | | | | | | | | | | | | |
| See the notes to the financial statements for more information regarding pricing inputs and valuation techniques. |
| | | | | | | | |
| | | Shares | | | Value
(000’s) | |
COMMON STOCKS - 97.9% | | | | | | | | |
Aerospace & Defense - 4.0% | | | | | | | | |
General Dynamics Corp. | | | 14,200 | | | $ | 943 | |
Lockheed Martin Corp. Ù | | | 38,300 | | | | 3,099 | |
Northrop Grumman Corp. Ù | | | 41,900 | | | | 2,450 | |
Raytheon Co. | | | 57,900 | | | | 2,801 | |
Airlines - 0.4% | | | | | | | | |
Delta Air Lines, Inc. ‡ | | | 112,900 | | | | 913 | |
Auto Components - 0.9% | | | | | | | | |
Goodyear Tire & Rubber Co. ‡ | | | 152,600 | | | | 2,162 | |
Beverages - 0.5% | | | | | | | | |
Hansen Natural Corp. ‡ | | | 12,700 | | | | 1,170 | |
Biotechnology - 1.6% | | | | | | | | |
Celgene Corp. ‡ | | | 15,400 | | | | 1,041 | |
Gilead Sciences, Inc. ‡ | | | 64,200 | | | | 2,628 | |
Chemicals - 1.7% | | | | | | | | |
Agrium, Inc. Ù | | | 24,400 | | | | 1,637 | |
Eastman Chemical Co. | | | 63,200 | | | | 2,469 | |
Commercial Banks - 5.3% | | | | | | | | |
Fifth Third Bancorp | | | 175,500 | | | | 2,232 | |
Huntington Bancshares, Inc. | | | 152,800 | | | | 839 | |
KeyCorp | | | 271,500 | | | | 2,088 | |
PNC Financial Services Group, Inc. | | | 37,700 | | | | 2,174 | |
U.S. Bancorp | | | 51,100 | | | | 1,382 | |
Wells Fargo & Co. | | | 136,900 | | | | 3,773 | |
Communications Equipment - 1.6% | | | | | | | | |
Cisco Systems, Inc. | | | 208,000 | | | | 3,761 | |
Computers & Peripherals - 4.1% | | | | | | | | |
Apple, Inc. ‡ | | | 24,000 | | | | 9,720 | |
Construction & Engineering - 0.4% | | | | | | | | |
Fluor Corp. | | | 16,900 | | | | 849 | |
Consumer Finance - 2.3% | | | | | | | | |
American Express Co. | | | 24,700 | | | | 1,165 | |
Capital One Financial Corp. Ù | | | 41,000 | | | | 1,734 | |
Discover Financial Services | | | 101,700 | | | | 2,441 | |
Diversified Consumer Services - 1.1% | | | | | | | | |
Apollo Group, Inc. - Class A ‡ | | | 49,600 | | | | 2,672 | |
Diversified Financial Services - 2.8% | | | | | | | | |
Citigroup, Inc. | | | 63,000 | | | | 1,658 | |
JPMorgan Chase & Co. | | | 148,700 | | | | 4,944 | |
Diversified Telecommunication Services - 2.8% | | | | | |
AT&T, Inc. | | | 57,800 | | | | 1,748 | |
Verizon Communications, Inc. | | | 120,200 | | | | 4,822 | |
Electric Utilities - 2.1% | | | | | | | | |
Edison International | | | 59,200 | | | | 2,451 | |
Entergy Corp. | | | 33,900 | | | | 2,476 | |
Food & Staples Retailing - 5.5% | | | | | | | | |
CVS Caremark Corp. | | | 64,400 | | | | 2,626 | |
Kroger Co. | | | 123,700 | | | | 2,996 | |
Safeway, Inc. Ù | | | 47,300 | | | | 995 | |
SUPERVALU, Inc. Ù | | | 119,300 | | | | 969 | |
Walgreen Co. | | | 70,400 | | | | 2,327 | |
Wal-Mart Stores, Inc. | | | 52,300 | | | | 3,126 | |
Food Products - 0.9% | | | | | | | | |
Dean Foods Co. ‡ | | | 180,800 | | | | 2,025 | |
Health Care Providers & Services - 8.2% | | | | | |
Aetna, Inc. | | | 68,600 | | | | 2,894 | |
AmerisourceBergen Corp. - Class A | | | 65,100 | | | | 2,421 | |
Cardinal Health, Inc. | | | 54,700 | | | | 2,221 | |
CIGNA Corp. | | | 28,700 | | | | 1,205 | |
Humana, Inc. | | | 30,500 | | | | 2,672 | |
McKesson Corp. | | | 24,400 | | | | 1,901 | |
UnitedHealth Group, Inc. | | | 62,900 | | | | 3,189 | |
WellPoint, Inc. | | | 40,700 | | | | 2,696 | |
Hotels, Restaurants & Leisure - 0.8% | | | | | | | | |
Wyndham Worldwide Corp. | | | 51,400 | | | | 1,944 | |
Household Products - 1.2% | | | | | | | | |
Procter & Gamble Co. | | | 42,400 | | | | 2,829 | |
Independent Power Producers & Energy Traders - 0.6% | |
Constellation Energy Group, Inc. | | | 33,600 | | | | 1,333 | |
| | | | | | | | |
| | | Shares | | | Value
(000’s) | |
Industrial Conglomerates - 1.6% | | | | | |
General Electric Co. | | | 212,400 | | | $ | 3,804 | |
Insurance - 2.4% | | | | | | | | |
ACE, Ltd. | | | 37,000 | | | | 2,594 | |
Aflac, Inc. | | | 22,100 | | | | 956 | |
Chubb Corp. | | | 30,800 | | | | 2,132 | |
IT Services - 3.2% | | | | | | | | |
International Business Machines Corp. | | | 25,600 | | | | 4,708 | |
Mastercard, Inc. - Class A | | | 3,000 | | | | 1,118 | |
Visa, Inc. - Class A | | | 15,900 | | | | 1,614 | |
Machinery - 1.4% | | | | | | | | |
Caterpillar, Inc. | | | 12,600 | | | | 1,142 | |
Cummins, Inc. | | | 13,800 | | | | 1,214 | |
Parker Hannifin Corp. | | | 11,800 | | | | 900 | |
Media - 6.2% | | | | | | | | |
CBS Corp. - Class B | | | 95,600 | | | | 2,595 | |
Comcast Corp. - Class A | | | 61,500 | | | | 1,458 | |
DIRECTV - Class A ‡ | | | 66,400 | | | | 2,839 | |
Discovery Communications, Inc. - Series A ‡ | | | 23,100 | | | | 946 | |
Time Warner Cable, Inc. | | | 39,100 | | | | 2,486 | |
Time Warner, Inc. | | | 49,400 | | | | 1,785 | |
Viacom, Inc. - Class B | | | 52,700 | | | | 2,393 | |
Metals & Mining - 1.3% | | | | | | | | |
Freeport-McMoRan Copper & Gold, Inc. | | | 83,600 | | | | 3,076 | |
Multiline Retail - 0.3% | | | | | | | | |
Family Dollar Stores, Inc. | | | 10,500 | | | | 605 | |
Multi-Utilities - 0.6% | | | | | | | | |
Public Service Enterprise Group, Inc. | | | 40,500 | | | | 1,337 | |
Oil, Gas & Consumable Fuels - 12.9% | | | | | |
Chevron Corp. | | | 65,500 | | | | 6,969 | |
ConocoPhillips | | | 64,000 | | | | 4,664 | |
Exxon Mobil Corp. | | | 122,800 | | | | 10,410 | |
Hess Corp. | | | 18,800 | | | | 1,068 | |
Marathon Petroleum Corp. | | | 34,250 | | | | 1,140 | |
Murphy Oil Corp. | | | 36,400 | | | | 2,029 | |
Tesoro Corp. ‡ | | | 83,100 | | | | 1,941 | |
Valero Energy Corp. | | | 116,200 | | | | 2,446 | |
Personal Products - 0.6% | | | | | | | | |
Herbalife, Ltd. | | | 25,300 | | | | 1,307 | |
Pharmaceuticals - 2.0% | | | | | | | | |
Merck & Co., Inc. | | | 31,300 | | | | 1,180 | |
Pfizer, Inc. | | | 160,800 | | | | 3,480 | |
Road & Rail - 1.5% | | | | | | | | |
Norfolk Southern Corp. | | | 12,700 | | | | 925 | |
Ryder System, Inc. | | | 17,100 | | | | 909 | |
Union Pacific Corp. | | | 16,900 | | | | 1,790 | |
Semiconductors & Semiconductor Equipment - 2.3% | |
Intel Corp. | | | 186,900 | | | | 4,533 | |
LSI Corp. ‡ | | | 149,800 | | | | 891 | |
Software - 6.2% | | | | | | | | |
Activision Blizzard, Inc. | | | 188,100 | | | | 2,317 | |
Amdocs, Ltd. ‡ | | | 31,600 | | | | 902 | |
CA, Inc. | | | 103,800 | | | | 2,098 | |
Microsoft Corp. | | | 249,100 | | | | 6,467 | |
Symantec Corp. ‡ | | | 179,600 | | | | 2,811 | |
Specialty Retail - 1.9% | | | | | | | | |
AutoZone, Inc. ‡ | | | 6,600 | | | | 2,145 | |
Bed Bath & Beyond, Inc. ‡ | | | 28,700 | | | | 1,664 | |
Best Buy Co., Inc. Ù | | | 33,000 | | | | 771 | |
Textiles, Apparel & Luxury Goods - 1.5% | | | | | |
Coach, Inc. | | | 42,800 | | | | 2,613 | |
Nike, Inc. - Class B | | | 9,900 | | | | 954 | |
Tobacco - 3.0% | | | | | | | | |
Lorillard, Inc. | | | 15,300 | | | | 1,744 | |
Philip Morris International, Inc. | | | 68,600 | | | | 5,384 | |
Wireless Telecommunication Services - 0.2% | |
MetroPCS Communications, Inc. ‡ | | | 59,700 | | | | 518 | |
| | | | | | | | |
Total Common Stocks
(cost $209,305) | | | | | | | 230,383 | |
| | | | | | | | |
| | | | | | | | |
| | | Shares | | | Value
(000’s) | |
SECURITIES LENDING COLLATERAL - 3.3% | |
State Street Navigator Securities Lending Trust - Prime Portfolio, 0.28% p | | | 7,698,478 | | | $ | 7,698 | |
Total Securities Lending Collateral
(cost $7,698) | | | | | |
| | |
| | | Principal
(000’s) | | | Value
(000’s) | |
REPURCHASE AGREEMENT - 1.9% | | | | | |
State Street Bank & Trust Co. 0.03% p , dated 12/30/2011, to be repurchased at $4,490 on 01/03/2012. Collateralized by a U.S. Government Agency Obligation, 3.00%, due 11/25/2040, and with a value of $4,580. | | $ | 4,490 | | | | 4,490 | |
Total Repurchase Agreement
(cost $4,490) | | | | | |
Total Investment Securities
(cost $221,493) | | | | 242,571 | |
| | | | | | | | |
Other Assets and Liabilities - Net | | | | (7,367 | ) |
| | | | | | | | |
Net Assets | | | | | | $ | 235,204 | |
| | | | | | | | |
NOTES TO SCHEDULE OF INVESTMENTS (all amounts in thousands):
| Ù | All or a portion of this security is on loan. The value of all securities on loan is $7,513. |
| ‡ | Non-income producing security. |
| p | Rate shown reflects the yield at 12/30/2011. |
| | Aggregate cost for federal income tax purposes is $225,199. Aggregate gross unrealized appreciation/depreciation for all securities in which there is an excess of value over tax cost were $25,793 and $8,421, respectively. Net unrealized appreciation for tax purposes is $17,372. |
VALUATION SUMMARY (all amounts in thousands):
| | | | | | | | | | | | | | | | |
Investment Securities | | Level 1 -
Quoted
Prices | | | Level 2 -
Other
Significant
Observable
Inputs | | | Level 3 -
Significant
Unobservable
Inputs | | | Value at
12/31/2011 | |
Common Stocks | | $ | 226,887 | | | $ | 3,496 | | | $ | — | | | $ | 230,383 | |
Repurchase Agreement | | | — | | | | 4,490 | | | | — | | | | 4,490 | |
Securities Lending Collateral | | | 7,698 | | | | — | | | | — | | | | 7,698 | |
| | | | | | | | | | | | | | | | |
Total | | $ | 234,585 | | | $ | 7,986 | | | $ | — | | | $ | 242,571 | |
| | | | | | | | | | | | | | | | |
| See the notes to the financial statements for more information regarding pricing inputs and valuation techniques. |
| | | | | | | | |
| | | Shares | | | Value
(000’s) | |
COMMON STOCKS - 99.5% | | | | | | | | |
Aerospace & Defense - 3.9% | | | | | | | | |
Boeing Co. | | | 211,867 | | | $ | 15,539 | |
Honeywell International, Inc. | | | 114,067 | | | | 6,200 | |
Precision Castparts Corp. | | | 77,729 | | | | 12,809 | |
United Technologies Corp. | | | 69,839 | | | | 5,105 | |
Auto Components - 0.5% | | | | | | | | |
BorgWarner, Inc. ‡^ | | | 81,360 | | | | 5,186 | |
Automobiles - 0.8% | | | | | | | | |
Bayerische Motoren Werke AG ADR | | | 142,306 | | | | 3,163 | |
Harley-Davidson, Inc. | | | 138,035 | | | | 5,366 | |
Beverages - 0.5% | | | | | | | | |
Coca-Cola Co. | | | 79,006 | | | | 5,528 | |
Biotechnology - 2.9% | | | | | | | | |
Alexion Pharmaceuticals, Inc. ‡ | | | 61,890 | | | | 4,425 | |
Amgen, Inc. | | | 148,180 | | | | 9,515 | |
Celgene Corp. ‡ | | | 149,385 | | | | 10,098 | |
Gilead Sciences, Inc. ‡ | | | 35,638 | | | | 1,459 | |
Vertex Pharmaceuticals, Inc. ‡ | | | 108,092 | | | | 3,590 | |
Capital Markets - 0.5% | | | | | | | | |
Goldman Sachs Group, Inc. | | | 51,678 | | | | 4,673 | |
Chemicals - 1.9% | | | | | | | | |
CF Industries Holdings, Inc. | | | 13,950 | | | | 2,022 | |
E.I. du Pont de Nemours & Co. | | | 70,953 | | | | 3,248 | |
Monsanto Co. | | | 162,382 | | | | 11,379 | |
Sherwin-Williams Co. | | | 33,867 | | | | 3,023 | |
Communications Equipment - 4.9% | | | | | | | | |
Cisco Systems, Inc. | | | 1,370,595 | | | | 24,780 | |
Emulex Corp. ‡ | | | 301,727 | | | | 2,070 | |
F5 Networks, Inc. ‡ | | | 20,850 | | | | 2,213 | |
Juniper Networks, Inc. ‡ | | | 90,936 | | | | 1,856 | |
QUALCOMM, Inc. | | | 308,696 | | | | 16,886 | |
Riverbed Technology, Inc. ‡ | | | 102,912 | | | | 2,418 | |
Computers & Peripherals - 11.3% | | | | | | | | |
Apple, Inc. ‡ | | | 153,659 | | | | 62,231 | |
Dell, Inc. ‡ | | | 281,781 | | | | 4,122 | |
EMC Corp. ‡ | | | 1,131,082 | | | | 24,364 | |
NetApp, Inc. ‡ | | | 301,182 | | | | 10,924 | |
QLogic Corp. ‡ | | | 573,555 | | | | 8,603 | |
SanDisk Corp. ‡ | | | 72,510 | | | | 3,568 | |
Consumer Finance - 1.4% | | | | | | | | |
American Express Co. | | | 302,824 | | | | 14,284 | |
Diversified Consumer Services - 1.1% | | | | | |
Apollo Group, Inc. - Class A ‡ | | | 118,960 | | | | 6,408 | |
ITT Educational Services, Inc. ‡^ | | | 84,876 | | | | 4,829 | |
Electrical Equipment - 0.1% | | | | | | | | |
Roper Industries, Inc. | | | 15,812 | | | | 1,374 | |
Energy Equipment & Services - 3.6% | | | | | | | | |
Baker Hughes, Inc. | | | 26,555 | | | | 1,292 | |
Cameron International Corp. ‡ | | | 68,875 | | | | 3,388 | |
Core Laboratories NV | | | 36,817 | | | | 4,195 | |
Diamond Offshore Drilling, Inc. ^ | | | 102,286 | | | | 5,652 | |
National Oilwell Varco, Inc. | | | 122,786 | | | | 8,348 | |
Oceaneering International, Inc. | | | 102,603 | | | | 4,733 | |
Schlumberger, Ltd. | | | 131,189 | | | | 8,962 | |
Food & Staples Retailing - 2.1% | | | | | | | | |
Costco Wholesale Corp. | | | 163,191 | | | | 13,597 | |
Whole Foods Market, Inc. | | | 113,139 | | | | 7,872 | |
Food Products - 0.6% | | | | | | | | |
Mead Johnson Nutrition Co. - Class A | | | 92,010 | | | | 6,324 | |
Health Care Equipment & Supplies - 1.1% | | | | | |
Edwards Lifesciences Corp. ‡ | | | 21,514 | | | | 1,521 | |
Hologic, Inc. ‡ | | | 225,187 | | | | 3,943 | |
Intuitive Surgical, Inc. ‡ | | | 12,057 | | | | 5,583 | |
Health Care Providers & Services - 1.9% | | | | | |
AmerisourceBergen Corp. - Class A | | | 72,672 | | | | 2,703 | |
Cardinal Health, Inc. | | | 70,195 | | | | 2,851 | |
Express Scripts, Inc. ‡ | | | 106,370 | | | | 4,754 | |
UnitedHealth Group, Inc. | | | 185,855 | | | | 9,418 | |
| | | | | | | | |
| | | Shares | | | Value
(000’s) | |
Hotels, Restaurants & Leisure - 3.7% | | | | | |
Chipotle Mexican Grill, Inc. - Class A ‡^ | | | 21,145 | | | $ | 7,142 | |
Dunkin’ Brands Group, Inc. ‡ | | | 103,754 | | | | 2,592 | |
McDonald’s Corp. | | | 93,925 | | | | 9,423 | |
Starbucks Corp. | | | 390,205 | | | | 17,953 | |
Industrial Conglomerates - 1.0% | | | | | | | | |
General Electric Co. | | | 372,365 | | | | 6,669 | |
Tyco International, Ltd. | | | 70,023 | | | | 3,271 | |
Internet & Catalog Retail - 3.1% | | | | | | | | |
Amazon.com, Inc. ‡ | | | 127,261 | | | | 22,029 | |
priceline.com, Inc. ‡ | | | 20,030 | | | | 9,368 | |
Internet Software & Services - 5.5% | | | | | | | | |
Baidu, Inc. ADR ‡ | | | 78,976 | | | | 9,198 | |
eBay, Inc. ‡ | | | 215,458 | | | | 6,535 | |
Google, Inc. - Class A ‡ | | | 40,461 | | | | 26,133 | |
IAC/InterActiveCorp ^ | | | 173,389 | | | | 7,386 | |
LinkedIn Corp. - Class A ‡^ | | | 44,654 | | | | 2,814 | |
Tencent Holdings, Ltd. | | | 151,389 | | | | 3,041 | |
Youku, Inc. ADR ‡^ | | | 26,715 | | | | 419 | |
IT Services - 6.1% | | | | | | | | |
Cognizant Technology Solutions Corp. - Class A ‡ | | | 91,625 | | | | 5,892 | |
International Business Machines Corp. | | | 194,494 | | | | 35,764 | |
Mastercard, Inc. - Class A | | | 40,995 | | | | 15,284 | |
Visa, Inc. - Class A | | | 50,883 | | | | 5,166 | |
Life Sciences Tools & Services - 1.9% | | | | | | | | |
Agilent Technologies, Inc. ‡ | | | 171,926 | | | | 6,005 | |
Bruker Corp. ‡ | | | 146,949 | | | | 1,825 | |
Illumina, Inc. ‡^ | | | 88,245 | | | | 2,690 | |
Life Technologies Corp. ‡ | | | 49,158 | | | | 1,913 | |
Waters Corp. ‡ | | | 98,428 | | | | 7,289 | |
Machinery - 2.5% | | | | | | | | |
Caterpillar, Inc. | | | 112,304 | | | | 10,174 | |
Cummins, Inc. | | | 29,285 | | | | 2,578 | |
Dover Corp. | | | 49,691 | | | | 2,885 | |
Joy Global, Inc. | | | 53,560 | | | | 4,015 | |
Parker Hannifin Corp. | | | 81,993 | | | | 6,252 | |
Media - 2.2% | | | | | | | | |
DIRECTV - Class A ‡ | | | 70,478 | | | | 3,014 | |
News Corp. - Class A | | | 262,017 | | | | 4,674 | |
Omnicom Group, Inc. | | | 163,707 | | | | 7,298 | |
Sirius XM Radio, Inc. ‡^ | | | 852,535 | | | | 1,552 | |
Walt Disney Co. | | | 143,573 | | | | 5,384 | |
Metals & Mining - 1.5% | | | | | | | | |
Cliffs Natural Resources, Inc. | | | 49,808 | | | | 3,106 | |
Freeport-McMoRan Copper & Gold, Inc. | | | 107,466 | | | | 3,953 | |
Rio Tinto PLC ADR | | | 57,076 | | | | 2,792 | |
Teck Resources, Ltd. - Class B ^ | | | 82,031 | | | | 2,887 | |
Walter Energy, Inc. | | | 35,073 | | | | 2,124 | |
Oil, Gas & Consumable Fuels - 5.6% | | | | | | | | |
Anadarko Petroleum Corp. | | | 118,350 | | | | 9,034 | |
Canadian Natural Resources, Ltd. ^ | | | 73,286 | | | | 2,739 | |
Concho Resources, Inc. ‡ | | | 56,342 | | | | 5,282 | |
EOG Resources, Inc. | | | 46,582 | | | | 4,589 | |
Exxon Mobil Corp. | | | 199,831 | | | | 16,937 | |
Occidental Petroleum Corp. | | | 140,001 | | | | 13,118 | |
Valero Energy Corp. | | | 250,598 | | | | 5,275 | |
Personal Products - 0.8% | | | | | | | | |
Estee Lauder Cos., Inc. - Class A | | | 75,094 | | | | 8,435 | |
Pharmaceuticals - 4.7% | | | | | | | | |
Abbott Laboratories | | | 91,860 | | | | 5,165 | |
Allergan, Inc. | | | 105,809 | | | | 9,284 | |
Bristol-Myers Squibb Co. | | | 181,742 | | | | 6,405 | |
Johnson & Johnson | | | 90,499 | | | | 5,935 | |
Novo Nordisk A/S ADR | | | 77,911 | | | | 8,980 | |
Shire PLC ADR | | | 117,902 | | | | 12,250 | |
Road & Rail - 0.7% | | | | | | | | |
Union Pacific Corp. | | | 64,164 | | | | 6,798 | |
Semiconductors & Semiconductor Equipment - 4.0% | |
Altera Corp. | | | 505,708 | | | | 18,763 | |
| | | | | | | | |
| | | Shares | | | Value
(000’s) | |
Semiconductors & Semiconductor Equipment (continued) | |
Analog Devices, Inc. | | | 136,506 | | | $ | 4,884 | |
ARM Holdings PLC ADR | | | 99,071 | | | | 2,741 | |
Avago Technologies, Ltd. | | | 124,477 | | | | 3,592 | |
Broadcom Corp. - Class A ‡ | | | 69,694 | | | | 2,046 | |
Intersil Corp. - Class A ^ | | | 299,262 | | | | 3,124 | |
Xilinx, Inc. | | | 184,113 | | | | 5,903 | |
Software - 7.9% | | | | | | | | |
Autodesk, Inc. ‡ | | | 99,643 | | | | 3,022 | |
BMC Software, Inc. ‡ | | | 50,945 | | | | 1,670 | |
Check Point Software Technologies, Ltd. ‡ | | | 84,899 | | | | 4,461 | |
Citrix Systems, Inc. ‡ | | | 50,827 | | | | 3,086 | |
Microsoft Corp. | | | 698,715 | | | | 18,139 | |
Oracle Corp. | | | 894,611 | | | | 22,946 | |
Red Hat, Inc. ‡ | | | 171,814 | | | | 7,094 | |
Salesforce.com, Inc. ‡^ | | | 90,884 | | | | 9,221 | |
Symantec Corp. ‡ | | | 75,612 | | | | 1,183 | |
VMware, Inc. - Class A ‡ | | | 97,883 | | | | 8,143 | |
Specialty Retail - 3.2% | | | | | | | | |
Bed Bath & Beyond, Inc. ‡ | | | 121,201 | | | | 7,026 | |
Buckle, Inc. ^ | | | 48,641 | | | | 1,988 | |
Inditex SA | | | 43,833 | | | | 3,590 | |
Lowe’s Cos., Inc. | | | 166,060 | | | | 4,215 | |
PetSmart, Inc. | | | 57,464 | | | | 2,947 | |
Ross Stores, Inc. | | | 105,140 | | | | 4,997 | |
Tiffany & Co. | | | 58,116 | | | | 3,851 | |
TJX Cos., Inc. | | | 65,750 | | | | 4,244 | |
Textiles, Apparel & Luxury Goods - 4.4% | |
Burberry Group PLC | | | 234,496 | | | | 4,315 | |
Coach, Inc. | | | 156,117 | | | | 9,529 | |
Deckers Outdoor Corp. ‡^ | | | 25,643 | | | | 1,938 | |
Lululemon Athletica, Inc. ‡^ | | | 119,418 | | | | 5,572 | |
LVMH Moet Hennessy Louis Vuitton SA | | | 10,172 | | | | 1,440 | |
Nike, Inc. - Class B | | | 110,906 | | | | 10,688 | |
Ralph Lauren Corp. - Class A | | | 78,123 | | | | 10,788 | |
| | | | | | | | |
| | | Shares | | | Value
(000’s) | |
Tobacco - 0.7% | | | | | | | | |
Philip Morris International, Inc. | | | 97,085 | | | $ | 7,619 | |
Wireless Telecommunication Services - 0.9% | |
American Tower Corp. - Class A | | | 159,134 | | | | 9,550 | |
| | | | | | | | |
Total Common Stocks (cost $922,732) | | | | 1,011,424 | |
| | | | | | | | |
SECURITIES LENDING COLLATERAL - 3.5% | |
State Street Navigator Securities Lending Trust - Prime Portfolio, 0.28% p | | | 35,781,619 | | | | 35,782 | |
Total Securities Lending Collateral (cost $35,782) | |
| | | | | | | | |
| | | Principal
(000’s) | | | Value
(000’s) | |
REPURCHASE AGREEMENT - 0.4% | |
State Street Bank & Trust Co. 0.03% p, dated 12/30/2011, to be repurchased at $4,105 on 01/03/2012. Collateralized by U.S. Government Agency Obligations, 3.00%, due 11/25/2040, and with a total value of $4,194. | | $ | 4,105 | | | | 4,105 | |
| | | | | | | | |
Total Repurchase Agreement (cost $4,105) | |
Total Investment Securities (cost $962,619) | | | | | | | 1,051,311 | |
Other Assets and Liabilities - Net | | | | (35,004 | ) |
| | | | | | | | |
Net Assets | | | | | | $ | 1,016,307 | |
| | | | | | | | |
NOTES TO SCHEDULE OF INVESTMENTS (all amounts in thousands):
| ^ | All or a portion of this security is on loan. The value of all securities on loan is $34,987. |
| ‡ | Non-income producing security. |
| p | Rate shown reflects the yield at 12/30/2011. |
| Aggregate cost for federal income tax purposes is $974,028. Aggregate gross unrealized appreciation/depreciation for all securities in which there is an excess of value over tax cost were $125,962 and $48,679, respectively. Net unrealized appreciation for tax purposes is $77,283. |
DEFINITION:
| ADR | American Depositary Receipt |
VALUATION SUMMARY (all amounts in thousands):
| | | | | | | | | | | | | | | | |
Investment Securities | | Level 1 -
Quoted
Prices | | | Level 2 -
Other
Significant
Observable
Inputs | | | Level 3 -
Significant
Unobservable
Inputs | | | Value at
12/31/2011 | |
Common Stocks | | $ | 956,634 | | | $ | 54,790 | | | $ | — | | | $ | 1,011,424 | |
Repurchase Agreements | | | — | | | | 4,105 | | | | — | | | | 4,105 | |
Securities Lending Collateral | | | 35,782 | | | | — | | | | — | | | | 35,782 | |
| | | | | | | | | | | | | | | | |
Total | | $ | 992,416 | | | $ | 58,895 | | | $ | — | | | $ | 1,051,311 | |
| | | | | | | | | | | | | | | | |
| See the notes to the financial statements for more information regarding pricing inputs and valuation techniques. |
| | | | | | | | |
| | | Shares | | | Value
(000’s) | |
COMMON STOCKS - 97.1% | |
Aerospace & Defense - 0.7% | |
Alliant Techsystems, Inc. | | | 48,000 | | | $ | 2,744 | |
L-3 Communications Holdings, Inc. | | | 32,800 | | | | 2,187 | |
Beverages - 1.3% | | | | | | | | |
Beam, Inc. | | | 105,900 | | | | 5,425 | |
Brown-Forman Corp. - Class B | | | 22,900 | | | | 1,844 | |
Dr. Pepper Snapple Group, Inc. | | | 57,600 | | | | 2,274 | |
Building Products - 0.3% | |
Fortune Brands Home & Security, Inc. ‡ | | | 129,300 | | | | 2,202 | |
Capital Markets - 3.6% | | | | | | | | |
Ameriprise Financial, Inc. | | | 124,500 | | | | 6,180 | |
Invesco, Ltd. | | | 188,850 | | | | 3,794 | |
Northern Trust Corp. | | | 189,400 | | | | 7,511 | |
State Street Corp. | | | 131,100 | | | | 5,285 | |
T. Rowe Price Group, Inc. | | | 73,200 | | | | 4,169 | |
Chemicals - 4.4% | | | | | | | | |
Air Products & Chemicals, Inc. | | | 63,750 | | | | 5,431 | |
Airgas, Inc. | | | 136,400 | | | | 10,650 | |
Albemarle Corp. | | | 76,620 | | | | 3,947 | |
Ashland, Inc. | | | 86,650 | | | | 4,953 | |
Sherwin-Williams Co. | | | 47,500 | | | | 4,240 | |
Sigma-Aldrich Corp. | | | 64,100 | | | | 4,004 | |
Commercial Banks - 4.5% | | | | | | | | |
BancorpSouth, Inc. ^ | | | 77,200 | | | | 851 | |
City National Corp. ^ | | | 74,600 | | | | 3,296 | |
Cullen/Frost Bankers, Inc. ^ | | | 60,400 | | | | 3,196 | |
Fifth Third Bancorp | | | 678,800 | | | | 8,634 | |
Huntington Bancshares, Inc. | | | 237,400 | | | | 1,303 | |
M&T Bank Corp. ^ | | | 61,700 | | | | 4,710 | |
SunTrust Banks, Inc. | | | 605,400 | | | | 10,715 | |
Zions Bancorporation | | | 108,100 | | | | 1,760 | |
Commercial Services & Supplies - 2.8% | |
Avery Dennison Corp. | | | 137,560 | | | | 3,945 | |
Republic Services, Inc. - Class A | | | 621,700 | | | | 17,128 | |
Communications Equipment - 1.6% | |
Motorola Solutions, Inc. | | | 264,950 | | | | 12,265 | |
Computers & Peripherals - 0.7% | | | | | | | | |
NetApp, Inc. ‡ | | | 151,100 | | | | 5,480 | |
Containers & Packaging - 1.8% | | | | | | | | |
Ball Corp. | | | 163,100 | | | | 5,824 | |
Rock-Tenn Co. - Class A | | | 57,300 | | | | 3,306 | |
Silgan Holdings, Inc. | | | 103,900 | | | | 4,015 | |
Distributors - 0.5% | | | | | | | | |
Genuine Parts Co. | | | 63,000 | | | | 3,856 | |
Diversified Financial Services - 1.0% | |
NYSE Euronext | | | 296,700 | | | | 7,744 | |
Diversified Telecommunication Services - 0.4% | |
CenturyLink, Inc. | | | 75,000 | | | | 2,790 | |
Electric Utilities - 4.3% | | | | | | | | |
Edison International | | | 154,900 | | | | 6,413 | |
Northeast Utilities | | | 59,700 | | | | 2,153 | |
NV Energy, Inc. | | | 237,700 | | | | 3,886 | |
PPL Corp. | | | 310,000 | | | | 9,121 | |
Westar Energy, Inc. | | | 180,700 | | | | 5,201 | |
Wisconsin Energy Corp. | | | 144,800 | | | | 5,062 | |
Electrical Equipment - 2.4% | | | | | | | | |
AMETEK, Inc. | | | 95,600 | | | | 4,025 | |
Cooper Industries PLC - Class A | | | 186,850 | | | | 10,118 | |
Regal Beloit Corp. ^ | | | 76,600 | | | | 3,904 | |
Electronic Equipment & Instruments - 2.4% | |
Amphenol Corp. - Class A | | | 102,320 | | | | 4,644 | |
Arrow Electronics, Inc. ‡ | | | 105,300 | | | | 3,939 | |
TE Connectivity, Ltd. | | | 303,800 | | | | 9,361 | |
Energy Equipment & Services - 0.7% | |
Cameron International Corp. ‡ | | | 108,300 | | | | 5,327 | |
Food Products - 4.0% | | | | | | | | |
General Mills, Inc. | | | 212,900 | | | | 8,603 | |
Hershey Co. | | | 44,500 | | | | 2,749 | |
JM Smucker Co. | | | 126,100 | | | | 9,857 | |
| | | | | | | | |
| | | Shares | | | Value
(000’s) | |
Food Products (continued) | | | | | | | | |
Mead Johnson Nutrition Co. - Class A | | | 51,300 | | | $ | 3,526 | |
Ralcorp Holdings, Inc. ‡ | | | 57,000 | | | | 4,874 | |
Gas Utilities - 1.1% | | | | | | | | |
EQT Corp. | | | 52,720 | | | | 2,889 | |
Oneok, Inc. | | | 63,900 | | | | 5,539 | |
Health Care Equipment & Supplies - 3.7% | |
Becton, Dickinson and Co. | | | 47,500 | | | | 3,549 | |
Hospira, Inc. ‡^ | | | 211,050 | | | | 6,410 | |
St. Jude Medical, Inc. | | | 287,500 | | | | 9,861 | |
Stryker Corp. | | | 156,600 | | | | 7,785 | |
Health Care Providers & Services - 4.1% | |
AmerisourceBergen Corp. - Class A | | | 126,700 | | | | 4,712 | |
CIGNA Corp. | | | 287,100 | | | | 12,058 | |
Coventry Health Care, Inc. ‡ | | | 91,900 | | | | 2,791 | |
HCA Holdings, Inc. ‡ | | | 77,200 | | | | 1,701 | |
Humana, Inc. | | | 49,180 | | | | 4,309 | |
Lincare Holdings, Inc. | | | 205,850 | | | | 5,292 | |
Hotels, Restaurants & Leisure - 2.7% | |
Darden Restaurants, Inc. ^ | | | 91,599 | | | | 4,175 | |
Intercontinental Hotels Group PLC ADR | | | 167,020 | | | | 3,005 | |
Marriott International, Inc. - Class A | | | 165,166 | | | | 4,818 | |
Royal Caribbean Cruises, Ltd. ^ | | | 51,540 | | | | 1,277 | |
Starwood Hotels & Resorts Worldwide, Inc. ^ | | | 73,200 | | | | 3,511 | |
Yum! Brands, Inc. | | | 64,400 | | | | 3,800 | |
Household Durables - 4.2% | | | | | | | | |
Jarden Corp. | | | 71,700 | | | | 2,142 | |
Mohawk Industries, Inc. ‡ | | | 48,300 | | | | 2,891 | |
Newell Rubbermaid, Inc. | | | 470,800 | | | | 7,603 | |
Snap-On, Inc. | | | 76,706 | | | | 3,883 | |
Stanley Black & Decker, Inc. | | | 220,000 | | | | 14,872 | |
Household Products - 0.5% | | | | | | | | |
Energizer Holdings, Inc. ‡ | | | 44,600 | | | | 3,456 | |
Industrial Conglomerates - 3.2% | | | | | | | | |
Carlisle Cos., Inc. | | | 91,500 | | | | 4,053 | |
Tyco International, Ltd. | | | 423,100 | | | | 19,763 | |
Insurance - 8.2% | | | | | | | | |
Arch Capital Group, Ltd. ‡ | | | 198,300 | | | | 7,383 | |
Chubb Corp. | | | 52,200 | | | | 3,613 | |
Loews Corp. | | | 182,900 | | | | 6,886 | |
Marsh & McLennan Cos., Inc. | | | 148,600 | | | | 4,699 | |
Old Republic International Corp. ^ | | | 294,900 | | | | 2,734 | |
OneBeacon Insurance Group, Ltd. - Class A^ | | | 131,255 | | | | 2,020 | |
Principal Financial Group, Inc. | | | 229,000 | | | | 5,633 | |
Torchmark Corp. | | | 42,700 | | | | 1,853 | |
Transatlantic Holdings, Inc. | | | 83,400 | | | | 4,564 | |
Willis Group Holdings PLC | | | 148,900 | | | | 5,777 | |
WR Berkley Corp. | | | 163,000 | | | | 5,606 | |
XL Group PLC - Class A | | | 563,600 | | | | 11,142 | |
Internet & Catalog Retail - 0.9% | | | | | | | | |
Expedia, Inc. ^ | | | 56,350 | | | | 1,635 | |
Liberty Interactive Corp. ‡ | | | 229,400 | | | | 3,720 | |
TripAdvisor, Inc. ‡^ | | | 56,350 | | | | 1,421 | |
IT Services - 1.6% | | | | | | | | |
Fidelity National Information Services, Inc. | | | 120,700 | | | | 3,209 | |
Western Union Co. | | | 462,800 | | | | 8,451 | |
Leisure Equipment & Products - 0.3% | |
Hasbro, Inc. | | | 60,000 | | | | 1,913 | |
Machinery - 1.4% | | | | | | | | |
Dover Corp. | | | 102,300 | | | | 5,938 | |
Eaton Corp. | | | 104,400 | | | | 4,545 | |
Media - 2.4% | | | | | | | | |
AMC Networks, Inc. ‡ | | | 27,590 | | | | 1,037 | |
Cablevision Systems Corp. - Class A | | | 76,060 | | | | 1,082 | |
CBS Corp. - Class B | | | 287,700 | | | | 7,809 | |
Clear Channel Outdoor Holdings, Inc. - Class A ‡ | | | 117,961 | | | | 1,480 | |
DISH Network Corp. - Class A | | | 115,500 | | | | 3,289 | |
Gannett Co., Inc. ^ | | | 172,100 | | | | 2,301 | |
| | | | | | | | |
| | | Shares | | | Value
(000’s) | |
Media (continued) | | | | | | | | |
Washington Post Co. - Class B | | | 2,400 | | | $ | 904 | |
Metals & Mining - 0.5% | | | | | | | | |
Allegheny Technologies, Inc. | | | 71,000 | | | | 3,394 | |
Multiline Retail - 2.1% | | | | | | | | |
Family Dollar Stores, Inc. | | | 53,500 | | | | 3,085 | |
Kohl’s Corp. | | | 83,460 | | | | 4,119 | |
Nordstrom, Inc. | | | 172,750 | | | | 8,587 | |
Multi-Utilities - 4.9% | | | | | | | | |
CenterPoint Energy, Inc. | | | 117,380 | | | | 2,358 | |
CMS Energy Corp. ^ | | | 613,200 | | | | 13,538 | |
NSTAR | | | 92,200 | | | | 4,330 | |
Sempra Energy | | | 87,200 | | | | 4,796 | |
Xcel Energy, Inc. | | | 438,200 | | | | 12,112 | |
Oil, Gas & Consumable Fuels - 4.3% | |
CVR Energy, Inc. ‡ | | | 55,300 | | | | 1,036 | |
Devon Energy Corp. | | | 78,800 | | | | 4,886 | |
El Paso Corp. | | | 335,900 | | | | 8,924 | |
Energen Corp. | | | 142,721 | | | | 7,136 | |
Newfield Exploration Co. ‡ | | | 63,100 | | | | 2,381 | |
Teekay Corp. ^ | | | 56,490 | | | | 1,510 | |
Williams Cos., Inc. | | | 190,500 | | | | 6,290 | |
Real Estate Investment Trusts - 1.2% | |
HCP, Inc. | | | 74,600 | | | | 3,091 | |
Regency Centers Corp. | | | 81,500 | | | | 3,066 | |
Vornado Realty Trust | | | 40,037 | | | | 3,077 | |
Real Estate Management & Development - 0.9% | |
Brookfield Office Properties, Inc. | | | 184,500 | | | | 2,886 | |
CBRE Group, Inc. - Class A ‡ | | | 229,700 | | | | 3,496 | |
Semiconductors & Semiconductor Equipment - 2.3% | |
Analog Devices, Inc. | | | 111,740 | | | | 3,998 | |
LSI Corp. ‡ | | | 1,284,600 | | | | 7,644 | |
Maxim Integrated Products, Inc. | | | 202,500 | | | | 5,273 | |
Software - 3.2% | | | | | | | | |
BMC Software, Inc. ‡ | | | 157,330 | | | | 5,157 | |
Jack Henry & Associates, Inc. ^ | | | 138,900 | | | | 4,668 | |
Parametric Technology Corp. ‡ | | | 260,550 | | | | 4,758 | |
Rovi Corp. ‡ | | | 220,800 | | | | 5,427 | |
Synopsys, Inc. ‡ | | | 149,800 | | | | 4,075 | |
| | | | | | | | |
| | | Shares | | | Value
(000’s) | |
Specialty Retail - 3.6% | | | | | | | | |
AutoZone, Inc. ‡ | | | 12,900 | | | $ | 4,192 | |
Bed Bath & Beyond, Inc. ‡ | | | 62,400 | | | | 3,617 | |
Gap, Inc. | | | 172,700 | | | | 3,204 | |
Limited Brands, Inc. | | | 92,700 | | | | 3,740 | |
PetSmart, Inc. | | | 48,600 | | | | 2,493 | |
Tiffany & Co. | | | 41,600 | | | | 2,756 | |
TJX Cos., Inc. | | | 82,700 | | | | 5,339 | |
Williams-Sonoma, Inc. | | | 35,300 | | | | 1,359 | |
Textiles, Apparel & Luxury Goods - 0.5% | |
PVH Corp. | | | 50,500 | | | | 3,560 | |
Thrifts & Mortgage Finance - 0.6% | |
Capitol Federal Financial, Inc. | | | 119,800 | | | | 1,382 | |
People’s United Financial, Inc. ^ | | | 259,200 | | | | 3,331 | |
Water Utilities - 0.9% | | | | | | | | |
American Water Works Co., Inc. | | | 219,100 | | | | 6,981 | |
Wireless Telecommunication Services - 0.4% | |
Telephone & Data Systems, Inc. | | | | | | | | |
(Special Shares) - Class L | | | 118,763 | | | | 2,828 | |
| | | | | | | | |
Total Common Stocks
(cost $674,374) | | | | 727,090 | |
| | | | | | | | |
SECURITIES LENDING COLLATERAL - 5.0% | |
State Street Navigator Securities Lending Trust - Prime Portfolio, 0.28% p | | | 37,586,548 | | | | 37,587 | |
Total Securities Lending Collateral
(cost $37,587) | | | | | |
| | |
| | | Principal
(000’s) | | | Value
(000’s) | |
REPURCHASE AGREEMENT - 2.2% | |
State Street Bank & Trust Co. 0.03% p , dated 12/30/2011, to be repurchased at $16,112 on 01/03/2012. Collateralized by U.S. Government Agency Obligations, 3.00%, due 11/25/2040, and with a total value of $16,440. | | $ | 16,111 | | | | 16,111 | |
Total Repurchase Agreement
(cost $16,111) | | | | | | | | |
| | | | | | | | |
Total Investment Securities (cost $728,072) | | | | | | | 780,788 | |
Other Assets and Liabilities - Net | | | | | | | (31,953 | ) |
| | | | | | | | |
Net Assets | | | | | | $ | 748,835 | |
| | | | | | | | |
NOTES TO SCHEDULE OF INVESTMENTS (all amount in thousands):
| ‡ | Non-income producing security. |
| ^ | All or a portion of this security is on loan. The value of all securities on loan is $36,716. |
| p | Rate shown reflects the yield at 12/30/2011. |
| Aggregate cost for federal income tax purposes is $734,729. Aggregate gross unrealized appreciation/depreciation for all securities in which there is an excess of value over tax cost were $77,695 and $31,636, respectively. Net unrealized appreciation for tax purposes is $46,059. |
DEFINITION:
| ADR | American Depositary Receipt |
VALUATION SUMMARY (all amounts in thousands):
| | | | | | | | | | | | | | | | |
Investment Securities | | Level 1 -
Quoted
Prices | | | Level 2 -
Other
Significant
Observable
Inputs | | | Level 3 -
Significant
Unobservable
Inputs | | | Value at
12/31/2011 | |
Common Stocks | | $ | 665,137 | | | $ | 61,953 | | | $ | — | | | $ | 727,090 | |
Repurchase Agreement | | | — | | | | 16,111 | | | | — | | | | 16,111 | |
Securities Lending Collateral | | | 37,587 | | | | — | | | | — | | | | 37,587 | |
| | | | | | | | | | | | | | | | |
Total | | $ | 702,724 | | | $ | 78,064 | | | $ | — | | | $ | 780,788 | |
| | | | | | | | | | | | | | | | |
| See the notes to the financial statements for more information regarding pricing inputs and valuation techniques. |
| | | | | | | | |
| | | Shares | | | Value
(000’s) | |
COMMON STOCKS - 99.8% | | | | | |
Aerospace & Defense - 2.2% | | | | | | | | |
BE Aerospace, Inc. ‡^ | | | 118,230 | | | $ | 4,577 | |
Biotechnology - 2.2% | | | | | | | | |
Alexion Pharmaceuticals, Inc. ‡^ | | | 62,760 | | | | 4,487 | |
Chemicals - 1.0% | | | | | | | | |
Albemarle Corp. | | | 41,480 | | | | 2,137 | |
Commercial Services & Supplies - 1.1% | | | | | |
Stericycle, Inc. ‡^ | | | 28,470 | | | | 2,218 | |
Computers & Peripherals - 3.8% | | | | | |
SanDisk Corp. ‡^ | | | 104,000 | | | | 5,117 | |
Teradata Corp. ‡ | | | 55,940 | | | | 2,714 | |
Construction & Engineering - 2.5% | | | | | | | | |
Chicago Bridge & Iron Co. NV - Class Y | | | 134,855 | | | | 5,098 | |
Consumer Finance - 1.1% | | | | | | | | |
Discover Financial Services | | | 92,000 | | | | 2,208 | |
Diversified Consumer Services - 2.5% | |
Apollo Group, Inc. - Class A ‡^ | | | 96,170 | | | | 5,181 | |
Electrical Equipment - 2.5% | | | | | | | | |
Roper Industries, Inc. ^ | | | 37,220 | | | | 3,233 | |
Sensata Technologies Holding NV ‡^ | | | 70,888 | | | | 1,863 | |
Energy Equipment & Services - 2.4% | |
FMC Technologies, Inc. ‡^ | | | 42,900 | | | | 2,241 | |
Patterson-UTI Energy, Inc. ^ | | | 140,990 | | | | 2,817 | |
Food & Staples Retailing - 2.9% | | | | | | | | |
Whole Foods Market, Inc. ^ | | | 85,523 | | | | 5,951 | |
Food Products - 1.6% | | | | | | | | |
Mead Johnson Nutrition Co. -
Class A ^ | | | 47,930 | | | | 3,294 | |
Health Care Equipment & Supplies - 3.2% | | | | | |
Cooper Cos., Inc. ^ | | | 55,300 | | | | 3,900 | |
Edwards Lifesciences Corp. ‡^ | | | 37,170 | | | | 2,628 | |
Health Care Providers & Services - 2.6% | | | | | |
Humana, Inc. ^ | | | 62,090 | | | | 5,440 | |
Hotels, Restaurants & Leisure - 4.8% | | | | | |
Arcos Dorados Holdings, Inc. - Class A ^ | | | 191,460 | | | | 3,931 | |
Panera Bread Co. - Class A ‡^ | | | 42,225 | | | | 5,972 | |
Household Durables - 1.7% | | | | | | | | |
Tempur-Pedic International, Inc. ‡^ | | | 66,800 | | | | 3,509 | |
Internet & Catalog Retail - 2.0% | | | | | |
Expedia, Inc. ^ | | | 78,000 | | | | 2,264 | |
TripAdvisor, Inc. ‡^ | | | 78,000 | | | | 1,966 | |
Internet Software & Services - 2.9% | | | | | | | | |
IAC/InterActiveCorp ^ | | | 142,244 | | | | 6,060 | |
IT Services - 5.0% | | | | | | | | |
Alliance Data Systems Corp. ‡^ | | | 38,400 | | | | 3,987 | |
Gartner, Inc. ‡^ | | | 123,545 | | | | 4,296 | |
VeriFone Holdings, Inc. ‡^ | | | 57,285 | | | | 2,035 | |
Leisure Equipment & Products - 2.0% | | | | | |
Polaris Industries, Inc. ^ | | | 75,030 | | | | 4,200 | |
Machinery - 3.0% | | | | | | | | |
Gardner Denver, Inc. | | | 26,900 | | | | 2,073 | |
Kennametal, Inc. ^ | | | 69,665 | | | | 2,544 | |
Pall Corp. | | | 28,800 | | | | 1,646 | |
Metals & Mining - 3.2% | | | | | | | | |
Carpenter Technology Corp. ^ | | | 71,590 | | | | 3,685 | |
Eldorado Gold Corp. | | | 208,300 | | | | 2,856 | |
Oil, Gas & Consumable Fuels - 10.2% | | | | | |
Cabot Oil & Gas Corp. ^ | | | 80,880 | | | | 6,138 | |
Concho Resources, Inc. ‡^ | | | 27,670 | | | | 2,594 | |
Pioneer Natural Resources Co. ^ | | | 43,000 | | | | 3,848 | |
Range Resources Corp. ^ | | | 69,300 | | | | 4,292 | |
SM Energy Co. ^ | | | 54,600 | | | | 3,991 | |
Personal Products - 2.5% | | | | | | | | |
Estee Lauder Cos., Inc. - Class A ^ | | | 45,758 | | | | 5,140 | |
Pharmaceuticals - 4.3% | | | | | | | | |
Perrigo Co. ^ | | | 43,035 | | | | 4,187 | |
Shire PLC ADR ^ | | | 45,545 | | | | 4,732 | |
Road & Rail - 2.4% | | | | | | | | |
Kansas City Southern ‡^ | | | 73,605 | | | | 5,006 | |
| | | | | | | | |
| | | Shares | | | Value
(000's) | |
Semiconductors & Semiconductor Equipment - 4.5% | |
ARM Holdings PLC ADR ^ | | | 103,400 | | | $ | 2,861 | |
Cavium, Inc. ‡^ | | | 67,855 | | | | 1,929 | |
FEI Co. ‡^ | | | 111,790 | | | | 4,559 | |
Software - 7.8% | | | | | | | | |
Citrix Systems, Inc. ‡ | | | 39,624 | | | | 2,406 | |
Commvault Systems, Inc. ‡^ | | | 26,283 | | | | 1,123 | |
Electronic Arts, Inc. ‡^ | | | 210,310 | | | | 4,331 | |
Nuance Communications, Inc. ‡^ | | | 41,400 | | | | 1,042 | |
Red Hat, Inc. ‡^ | | | 79,430 | | | | 3,280 | |
Salesforce.com, Inc. ‡^ | | | 37,445 | | | | 3,799 | |
Specialty Retail - 6.3% | | | | | | | | |
Foot Locker, Inc. ^ | | | 127,580 | | | | 3,042 | |
Genesco, Inc. ‡^ | | | 72,500 | | | | 4,475 | |
GNC Holdings, Inc. - Class A ‡^ | | | 100,814 | | | | 2,919 | |
Ulta Salon Cosmetics & Fragrance, Inc. ‡^ | | | 40,877 | | | | 2,654 | |
Textiles, Apparel & Luxury Goods - 4.6% | |
Deckers Outdoor Corp. ‡^ | | | 23,585 | | | | 1,782 | |
Fossil, Inc. ‡^ | | | 40,429 | | | | 3,208 | |
Under Armour, Inc. - Class A ‡^ | | | 61,822 | | | | 4,439 | |
Wireless Telecommunication Services - 1.0% | |
SBA Communications Corp. - Class A ‡^ | | | 50,300 | | | | 2,161 | |
| | | | | | | | |
Total Common Stocks
(cost $190,170) | | | | | | | 206,066 | |
| | | | | | | | |
SECURITIES LENDING COLLATERAL - 25.7% | |
State Street Navigator Securities Lending
Trust - Prime Portfolio, 0.28% p | | | 53,128,969 | | | | 53,129 | |
Total Securities Lending Collateral
(cost $53,129) | | | | | |
| | |
| | | Principal
(000’s) | | | Value
(000’s) | |
REPURCHASE AGREEMENT - 0.3% | |
State Street Bank & Trust Co. 0.03% p , dated 12/30/2011, to be repurchased at $637 on 01/03/2012. Collateralized by a U.S. Government Agency Obligation, 3.00%, due 11/25/2040, and with a value of $654. | | $ | 637 | | | | 637 | |
| | | | | | | | |
Total Repurchase Agreement
(cost $637) | | | | | |
Total Investment Securities
(cost $243,936) | | | | | | | 259,832 | |
Other Assets and Liabilities - Net | | | | | | | (53,230 | ) |
| | | | | | | | |
Net Assets | | | | | | $ | 206,602 | |
| | | | | | | | |
NOTES TO SCHEDULE OF INVESTMENTS (all amounts in thousands):
| ^ | All or a portion of this security is on loan. The value of all securities on loan is $51,980. |
| ‡ | Non-income producing security. |
| p | Rate shown reflects the yield at 12/30/2011. |
| Aggregate cost for federal income tax purposes is $244,803. Aggregate gross unrealized appreciation/depreciation for all securities in which there is an excess of value over tax cost were $25,221 and $10,192, respectively. Net unrealized appreciation for tax purposes is $15,029. |
DEFINITION:
| | |
| ADR | | American Depositary Receipt |
VALUATION SUMMARY (all amounts in thousands):
| | | | | | | | | | | | | | | | |
Investment Securities | | Level 1 -
Quoted
Prices | | | Level 2 -
Other
Significant
Observable
Inputs | | | Level 3 -
Significant
Unobservable
Inputs | | | Value at
12/31/2011 | |
Common Stocks | | $ | 191,512 | | | $ | 14,554 | | | $ | — | | | $ | 206,066 | |
Repurchase Agreements | | | — | | | | 637 | | | | — | | | | 637 | |
Securities Lending Collateral | | | 53,129 | | | | — | | | | — | | | | 53,129 | |
| | | | | | | | | | | | | | | | |
Total | | $ | 244,641 | | | $ | 15,191 | | | $ | — | | | $ | 259,832 | |
| | | | | | | | | | | | | | | | |
| See the notes to the financial statements for more information regarding pricing inputs and valuation techniques. |
| | | | | | | | |
| | | Shares | | | Value
(000’s) | |
COMMON STOCKS - 97.4% | | | | | |
Chemicals - 2.3% | | | | | | | | |
Koppers Holdings, Inc. ^ | | | 27,800 | | | $ | 955 | |
Zep, Inc. ^ | | | 101,700 | | | | 1,422 | |
Commercial Banks - 8.3% | | | | | | | | |
First Busey Corp. ^ | | | 191,130 | | | | 956 | |
First Midwest Bancorp, Inc. ^ | | | 129,700 | | | | 1,314 | |
Hancock Holding Co. ^ | | | 31,200 | | | | 997 | |
International Bancshares Corp. ^ | | | 99,600 | | | | 1,827 | |
MB Financial, Inc. ^ | | | 57,300 | | | | 980 | |
Webster Financial Corp. ^ | | | 88,100 | | | | 1,796 | |
Westamerica Bancorporation ^ | | | 16,000 | | | | 702 | |
Commercial Services & Supplies - 5.8% | | | | | |
ACCO Brands Corp. ‡^ | | | 146,600 | | | | 1,415 | |
G&K Services, Inc. - Class A ^ | | | 38,900 | | | | 1,132 | |
Standard Parking Corp. ‡^ | | | 48,800 | | | | 872 | |
United Stationers, Inc. ^ | | | 78,700 | | | | 2,563 | |
Computers & Peripherals - 1.4% | | | | | |
Diebold, Inc. ^ | | | 48,300 | | | | 1,452 | |
Construction & Engineering - 0.3% | | | | | |
Sterling Construction Co., Inc. ‡^ | | | 28,500 | | | | 307 | |
Containers & Packaging - 2.1% | | | | | |
Aptargroup, Inc. ^ | | | 30,900 | | | | 1,612 | |
Greif, Inc. - Class A ^ | | | 13,200 | | | | 601 | |
Diversified Consumer Services - 1.3% | | | | | |
Matthews International Corp. -
Class A ^ | | | 41,400 | | | | 1,301 | |
Diversified Financial Services - 1.7% | | | | | |
Ares Capital Corp. ^ | | | 117,500 | | | | 1,815 | |
Electric Utilities - 2.4% | | | | | |
Unisource Energy Corp. ^ | | | 36,400 | | | | 1,344 | |
Westar Energy, Inc. ^ | | | 40,800 | | | | 1,174 | |
Electrical Equipment - 3.5% | | | | | |
Acuity Brands, Inc. ^ | | | 17,100 | | | | 906 | |
Belden, Inc. ^ | | | 83,300 | | | | 2,773 | |
Electronic Equipment & Instruments - 2.2% | | | | | |
Coherent, Inc. ‡^ | | | 18,500 | | | | 967 | |
MTS Systems Corp. ^ | | | 32,932 | | | | 1,342 | |
Energy Equipment & Services - 2.4% | | | | | |
Bristow Group, Inc. ^ | | | 25,000 | | | | 1,185 | |
SEACOR Holdings, Inc. ‡^ | | | 14,300 | | | | 1,272 | |
Food & Staples Retailing - 1.5% | | | | | |
Casey’s General Stores, Inc. ^ | | | 31,100 | | | | 1,602 | |
Gas Utilities - 2.4% | | | | | |
Atmos Energy Corp. ^ | | | 33,300 | | | | 1,110 | |
New Jersey Resources Corp. ^ | | | 12,900 | | | | 635 | |
WGL Holdings, Inc. ^ | | | 17,000 | | | | 752 | |
Health Care Equipment & Supplies - 2.1% | | | | | |
Haemonetics Corp. ‡^ | | | 11,300 | | | | 692 | |
ICU Medical, Inc. ‡^ | | | 33,700 | | | | 1,516 | |
Health Care Providers & Services - 2.9% | | | | | |
Amsurg Corp. - Class A ‡^ | | | 68,500 | | | | 1,784 | |
Corvel Corp. ‡^ | | | 23,400 | | | | 1,210 | |
Hotels, Restaurants & Leisure - 3.0% | | | | | |
CEC Entertainment, Inc. ^ | | | 33,700 | | | | 1,161 | |
Choice Hotels International, Inc. ^ | | | 31,300 | | | | 1,191 | |
Sonic Corp. ‡^ | | | 110,900 | | | | 746 | |
Household Durables - 1.8% | | | | | |
Helen of Troy, Ltd. ‡^ | | | 60,435 | | | | 1,855 | |
Industrial Conglomerates - 3.3% | | | | | |
Carlisle Cos., Inc. ^ | | | 78,200 | | | | 3,464 | |
Insurance - 6.7% | | | | | |
Alleghany Corp. ^ | | | 4,446 | | | | 1,268 | |
Amerisafe, Inc. ‡^ | | | 47,600 | | | | 1,107 | |
Assured Guaranty, Ltd. ^ | | | 58,800 | | | | 773 | |
Delphi Financial Group, Inc. -
Class A | | | 23,600 | | | | 1,045 | |
Platinum Underwriters Holdings,
Ltd. ^ | | | 38,400 | | | | 1,310 | |
Primerica, Inc. | | | 64,500 | | | | 1,499 | |
IT Services - 2.3% | | | | | |
MAXIMUS, Inc. ^ | | | 57,000 | | | | 2,357 | |
| | | | | | | | |
| | | Shares | | | Value
(000’s) | |
Life Sciences Tools & Services - 3.8% | | | | | |
Charles River Laboratories International, Inc.‡^ | | | 71,000 | | | $ | 1,940 | |
ICON PLC ADR ‡^ | | | 120,100 | | | | 2,055 | |
Machinery - 5.3% | | | | | |
Albany International Corp. - Class A ^ | | | 80,900 | | | | 1,870 | |
ESCO Technologies, Inc. ^ | | | 52,200 | | | | 1,502 | |
Mueller Industries, Inc. ^ | | | 56,200 | | | | 2,160 | |
Marine - 1.9% | | | | | |
Kirby Corp. ‡^ | | | 29,600 | | | | 1,949 | |
Media - 2.1% | | | | | | | | |
Arbitron, Inc. ^ | | | 62,900 | | | | 2,164 | |
Multiline Retail - 1.5% | | | | | |
Fred’s, Inc. - Class A ^ | | | 107,700 | | | | 1,570 | |
Office Electronics - 1.2% | | | | | |
Zebra Technologies Corp. - Class A ‡^ | | | 34,300 | | | | 1,227 | |
Oil, Gas & Consumable Fuels - 1.8% | | | | | |
GeoResources, Inc. ‡^ | | | 34,200 | | | | 1,002 | |
Penn Virginia Corp. ^ | | | 66,942 | | | | 354 | |
Scorpio Tankers, Inc. ‡^ | | | 108,900 | | | | 533 | |
Paper & Forest Products - 1.4% | | | | | |
Deltic Timber Corp. ^ | | | 24,700 | | | | 1,492 | |
Real Estate Investment Trusts - 3.7% | | | | | |
Campus Crest Communities, Inc. ^ | | | 91,700 | | | | 923 | |
DiamondRock Hospitality Co. ^ | | | 112,000 | | | | 1,080 | |
Education Realty Trust, Inc. ^ | | | 91,300 | | | | 934 | |
Mack-Cali Realty Corp. ^ | | | 32,800 | | | | 875 | |
Road & Rail - 2.0% | | | | | |
Genesee & Wyoming, Inc. - Class A ‡^ | | | 33,800 | | | | 2,048 | |
Software - 1.1% | | | | | |
Websense, Inc. ‡^ | | | 62,500 | | | | 1,171 | |
Specialty Retail - 5.4% | | | | | |
Ascena Retail Group, Inc. ‡^ | | | 49,400 | | | | 1,468 | |
Cato Corp. - Class A ^ | | | 88,300 | | | | 2,137 | |
Stage Stores, Inc. ^ | | | 142,400 | | | | 1,978 | |
Textiles, Apparel & Luxury Goods - 1.2% | | | | | |
Skechers U.S.A., Inc. -
Class A ‡^ | | | 49,500 | | | | 600 | |
Unifirst Corp. ^ | | | 11,400 | | | | 647 | |
Thrifts & Mortgage Finance - 3.3% | | | | | |
First Niagara Financial Group, Inc. | | | 99,010 | | | | 854 | |
Flushing Financial Corp. ^ | | | 61,800 | | | | 781 | |
Northwest Bancshares, Inc. ^ | | | 145,000 | | | | 1,804 | |
Trading Companies & Distributors - 2.0% | | | | | |
GATX Corp. ^ | | | 46,700 | | | | 2,039 | |
| | | | | | | | |
Total Common Stocks (cost $89,008) | | | | 101,216 | |
| | | | | | | | |
SECURITIES LENDING COLLATERAL - 25.7% | |
State Street Navigator Securities Lending | | | | | | | | |
Trust - Prime Portfolio, .28% p | | | 26,705,472 | | | | 26,705 | |
Total Securities Lending Collateral
(cost $26,705) | | | | | |
| | | | | | | | |
| | | Principal
(000’s) | | | Value
(000’s) | |
REPURCHASE AGREEMENT - 2.6% | | | | | |
State Street Bank & Trust Co. 0.03% p, dated 12/30/2011, to be repurchased at $2,713 on 01/03/2012. Collateralized by a U.S. Government Agency Obligation, 3.00%, due 11/25/2040, and with a value of $2,772. | | $ | 2,713 | | | | 2,713 | |
Total Repurchase Agreement (cost $2,713) | | | | | |
| | | | | | | | |
Total Investment Securities
(cost $118,426) | | | | | | | 130,634 | |
Other Assets and Liabilities - Net | | | | | | | (26,676 | ) |
| | | | | | | | |
Net Assets | | | | | | $ | 103,958 | |
| | | | | | | | |
NOTES TO SCHEDULE OF INVESTMENTS (all amounts in thousands):
| ^ | All or a portion of this security is on loan. The value of all securities on loan is $26,051. |
| ‡ | Non-income producing security. |
| p | Rate shown reflects the yield at 12/30/2011. |
| | Aggregate cost for federal income tax purposes is $119,047. Aggregate gross unrealized appreciation/depreciation for all securities in which there is an excess of value over tax cost were $16,171 and $4,584, respectively. Net unrealized appreciation for tax purposes is $11,587. |
DEFINITION:
| ADR | American Depositary Receipt |
VALUATION SUMMARY (all amounts in thousands):
| | | | | | | | | | | | | | | | |
Investment Securities | | Level 1 -
Quoted
Prices | | | Level 2 -
Other
Significant
Observable
Inputs | | | Level 3 -
Significant
Unobservable
Inputs | | | Value at
12/31/2011 | |
Common Stocks | | $ | 98,628 | | | $ | 2,588 | | | $ | — | | | $ | 101,216 | |
Repurchase Agreements | | | — | | | | 2,713 | | | | — | | | | 2,713 | |
Securities Lending Collateral | | | 26,705 | | | | — | | | | — | | | | 26,705 | |
| | | | | | | | | | | | | | | | |
Total | | $ | 125,333 | | | $ | 5,301 | | | $ | — | | | $ | 130,634 | |
| | | | | | | | | | | | | | | | |
| | See the notes to the financial statements for more information regarding pricing inputs and valuation techniques. |
| | | | | | | | |
| | | Shares | | | Value
(000’s) | |
COMMON STOCKS - 98.2% | | | | | |
Aerospace & Defense - 1.7% | | | | | |
Aerovironment, Inc. ‡^ | | | 24,620 | | | $ | 775 | |
American Science & Engineering, Inc. ^ | | | 8,740 | | | | 595 | |
Ceradyne, Inc. ‡^ | | | 75,870 | | | | 2,031 | |
GenCorp, Inc. ‡^ | | | 99,200 | | | | 528 | |
Triumph Group, Inc. ^ | | | 21,245 | | | | 1,242 | |
Air Freight & Logistics - 0.2% | | | | | |
Hub Group, Inc. - Class A ‡^ | | | 19,646 | | | | 637 | |
Park-Ohio Holdings Corp. ‡^ | | | 1,800 | | | | 32 | |
Airlines - 0.6% | | | | | | | | |
Alaska Air Group, Inc. ‡^ | | | 21,900 | | | | 1,645 | |
US Airways Group, Inc. ‡ | | | 28,300 | | | | 143 | |
Biotechnology - 4.1% | | | | | | | | |
Acorda Therapeutics, Inc. ‡^ | | | 80,245 | | | | 1,913 | |
BioMarin Pharmaceutical, Inc. ‡^ | | | 72,190 | | | | 2,482 | |
Cubist Pharmaceuticals, Inc. ‡^ | | | 15,400 | | | | 610 | |
Genomic Health, Inc. ‡^ | | | 83,180 | | | | 2,112 | |
Maxygen, Inc. ‡^ | | | 77,000 | | | | 434 | |
Onyx Pharmaceuticals, Inc. ‡^ | | | 29,820 | | | | 1,311 | |
Progenics Pharmaceuticals, Inc. ‡^ | | | 64,800 | | | | 553 | |
Repligen Corp. ‡ | | | 7,800 | | | | 27 | |
RTI Biologics, Inc. ‡^ | | | 409,688 | | | | 1,819 | |
United Therapeutics Corp. ‡ | | | 13,980 | | | | 661 | |
Vanda Pharmaceuticals, Inc. ‡^ | | | 31,600 | | | | 150 | |
Capital Markets - 0.6% | | | | | | | | |
American Capital, Ltd. ‡ | | | 22,200 | | | | 149 | |
Arlington Asset Investment Corp. - Class A ^ | | | 18,900 | | | | 403 | |
Financial Engines, Inc. ‡^ | | | 24,820 | | | | 555 | |
Gladstone Investment Corp. ^ | | | 45,800 | | | | 333 | |
HFF, Inc. - Class A ‡ | | | 2,700 | | | | 28 | |
TICC Capital Corp. ^ | | | 22,000 | | | | 190 | |
Chemicals - 1.7% | | | | | | | | |
Balchem Corp. ^ | | | 30,088 | | | | 1,220 | |
Chemtura Corp. ‡ | | | 8,100 | | | | 92 | |
China Green Agriculture, Inc. ‡^ | | | 8,300 | | | | 25 | |
Georgia Gulf Corp. ‡ | | | 4,000 | | | | 78 | |
Koppers Holdings, Inc. ^ | | | 24,100 | | | | 828 | |
LSB Industries, Inc. ‡^ | | | 38,413 | | | | 1,077 | |
OM Group, Inc. ‡^ | | | 27,100 | | | | 607 | |
Zep, Inc. ^ | | | 88,100 | | | | 1,231 | |
Commercial Banks - 6.0% | | | | | | | | |
1st Source Corp. ^ | | | 6,600 | | | | 167 | |
Access National Corp. | | | 4,200 | | | | 37 | |
Bancfirst Corp. ^ | | | 2,800 | | | | 105 | |
Banco Latinoamericano de Comercio Exterior SA - Class E ^ | | | 63,300 | | | | 1,016 | |
Bancorp, Inc. ‡^ | | | 22,400 | | | | 162 | |
C&F Financial Corp. | | | 1,000 | | | | 27 | |
Cape Bancorp, Inc. ‡^ | | | 2,900 | | | | 23 | |
Cathay General Bancorp ^ | | | 3,800 | | | | 57 | |
Center Bancorp, Inc. | | | 28,400 | | | | 277 | |
Central Pacific Financial Corp. ‡^ | | | 29,900 | | | | 386 | |
Century Bancorp, Inc. - Class A ^ | | | 1,200 | | | | 34 | |
Citizens & Northern Corp. ^ | | | 21,000 | | | | 388 | |
Citizens Republic Bancorp, Inc. ‡ | | | 29,900 | | | | 341 | |
Community Bank System, Inc. ^ | | | 26,100 | | | | 726 | |
East-West Bancorp, Inc. ^ | | | 5,400 | | | | 107 | |
Enterprise Bancorp, Inc. ^ | | | 2,700 | | | | 39 | |
Enterprise Financial Services Corp. ^ | | | 42,900 | | | | 635 | |
First Busey Corp. ^ | | | 152,172 | | | | 761 | |
First California Financial Group,
Inc. ‡ | | | 10,300 | | | | 34 | |
First Defiance Financial Corp. ^ | | | 9,800 | | | | 143 | |
First Financial Bancorp ^ | | | 8,200 | | | | 136 | |
First Financial Bankshares, Inc. ^ | | | 18,300 | | | | 612 | |
First Financial Corp. ^ | | | 3,200 | | | | 106 | |
First Midwest Bancorp, Inc. | | | 111,000 | | | | 1,124 | |
Fulton Financial Corp. ^ | | | 17,500 | | | | 172 | |
Great Southern Bancorp, Inc. ^ | | | 3,700 | | | | 87 | |
| | | | | | | | |
| | | Shares | | | Value
(000’s) | |
Commercial Banks (continued) | | | | | |
Hancock Holding Co. ^ | | | 27,700 | | | $ | 886 | |
International Bancshares Corp. ^ | | | 88,300 | | | | 1,619 | |
Lakeland Bancorp, Inc. ^ | | | 8,819 | | | | 76 | |
Lakeland Financial Corp. ^ | | | 31,200 | | | | 807 | |
MainSource Financial Group, Inc. ^ | | | 12,400 | | | | 109 | |
MB Financial, Inc. ^ | | | 51,000 | | | | 872 | |
National Bankshares, Inc. | | | 1,100 | | | | 31 | |
National Penn Bancshares, Inc. ^ | | | 27,900 | | | | 235 | |
Northrim BanCorp, Inc. ^ | | | 2,100 | | | | 37 | |
OceanFirst Financial Corp. ^ | | | 16,600 | | | | 217 | |
Old National Bancorp ^ | | | 54,100 | | | | 630 | |
Southside Bancshares, Inc. ^ | | | 6,800 | | | | 147 | |
UMB Financial Corp. ^ | | | 29,900 | | | | 1,114 | |
Virginia Commerce Bancorp, Inc. ‡ | | | 5,400 | | | | 42 | |
Washington Trust Bancorp, Inc. ^ | | | 9,000 | | | | 215 | |
Webster Financial Corp. ^ | | | 77,200 | | | | 1,574 | |
WesBanco, Inc. ^ | | | 2,700 | | | | 53 | |
West Bancorporation, Inc. ^ | | | 44,700 | | | | 428 | |
Westamerica Bancorporation ^ | | | 13,300 | | | | 584 | |
Western Alliance Bancorp ‡ | | | 12,500 | | | | 78 | |
WSFS Financial Corp. ^ | | | 3,400 | | | | 122 | |
Commercial Services & Supplies - 3.1% | | | | | |
ACCO Brands Corp. ‡^ | | | 134,700 | | | | 1,300 | |
Clean Harbors, Inc. ‡^ | | | 30,111 | | | | 1,919 | |
G&K Services, Inc. - Class A ^ | | | 34,253 | | | | 997 | |
Herman Miller, Inc. ^ | | | 22,400 | | | | 413 | |
Rollins, Inc. ^ | | | 63,220 | | | | 1,405 | |
Standard Parking Corp. ‡^ | | | 45,088 | | | | 806 | |
TRC Cos., Inc. ‡^ | | | 39,900 | | | | 240 | |
United Stationers, Inc. ^ | | | 65,400 | | | | 2,129 | |
Communications Equipment - 1.6% | | | | | |
Acme Packet, Inc. ‡^ | | | 24,481 | | | | 757 | |
Aruba Networks, Inc. ‡^ | | | 29,554 | | | | 547 | |
Brocade Communications Systems, Inc. ‡ | | | 32,600 | | | | 169 | |
Comtech Telecommunications
Corp. ^ | | | 40,000 | | | | 1,145 | |
Finisar Corp. ‡^ | | | 63,291 | | | | 1,060 | |
Polycom, Inc. ‡ | | | 39,313 | | | | 641 | |
Riverbed Technology, Inc. ‡^ | | | 23,975 | | | | 563 | |
Computers & Peripherals - 1.0% | | | | | |
Diebold, Inc. ^ | | | 42,500 | | | | 1,278 | |
Electronics for Imaging, Inc. ‡ | | | 67,800 | | | | 966 | |
Imation Corp. ‡^ | | | 104,000 | | | | 596 | |
Synaptics, Inc. ‡^ | | | 6,975 | | | | 210 | |
Construction & Engineering - 0.7% | | | | | |
MasTec, Inc. ‡^ | | | 83,850 | | | | 1,457 | |
Primoris Services Corp. ^ | | | 16,600 | | | | 248 | |
Sterling Construction Co., Inc. ‡^ | | | 47,200 | | | | 508 | |
Consumer Finance - 0.8% | | | | | |
Advance America Cash Advance Centers, Inc. ^ | | | 30,100 | | | | 269 | |
Ezcorp, Inc. - Class A ‡^ | | | 80,025 | | | | 2,111 | |
Containers & Packaging - 0.6% | | | | | |
Aptargroup, Inc. ^ | | | 25,500 | | | | 1,330 | |
Greif, Inc. - Class A ^ | | | 11,500 | | | | 524 | |
Distributors - 0.4% | | | | | |
LKQ Corp. ‡ | | | 31,270 | | | | 941 | |
VOXX International Corp. -
Class A ‡^ | | | 14,600 | | | | 123 | |
Diversified Consumer Services - 2.6% | | | | | | | | |
American Public Education, Inc. ‡^ | | | 31,290 | | | | 1,355 | |
Bridgepoint Education, Inc. ‡^ | | | 22,300 | | | | 513 | |
Cambium Learning Group, Inc. ‡^ | | | 8,300 | | | | 25 | |
Capella Education Co. ‡ | | | 34,869 | | | | 1,257 | |
Coinstar, Inc. ‡^ | | | 42,865 | | | | 1,957 | |
ITT Educational Services, Inc. ‡^ | | | 8,900 | | | | 506 | |
Matthews International Corp. -
Class A ^ | | | 36,000 | | | | 1,131 | |
Steiner Leisure, Ltd. ‡^ | | | 19,285 | | | | 875 | |
Diversified Financial Services - 2.9% | | | | | |
Ares Capital Corp. ^ | | | 102,700 | | | | 1,587 | |
Asta Funding, Inc. | | | 5,100 | | | | 41 | |
| | | | | | | | |
| | | Shares | | | Value
(000’s) | |
Diversified Financial Services (continued) | | | | | |
Cash America International, Inc. ^ | | | 29,365 | | | $ | 1,369 | |
Encore Capital Group, Inc. ‡^ | | | 60,543 | | | | 1,287 | |
First Cash Financial Services, Inc. ‡^ | | | 60,980 | | | | 2,139 | |
Gain Capital Holdings, Inc. ^ | | | 14,600 | | | | 98 | |
Gladstone Capital Corp. ^ | | | 8,000 | | | | 61 | |
Marlin Business Services Corp. ^ | | | 3,600 | | | | 46 | |
MCG Capital Corp. ^ | | | 37,100 | | | | 148 | |
Medallion Financial Corp. ^ | | | 3,800 | | | | 43 | |
Portfolio Recovery Associates, Inc. ‡^ | | | 24,129 | | | | 1,629 | |
QC Holdings, Inc. | | | 9,100 | | | | 37 | |
Diversified Telecommunication Services - 0.3% | | | | | |
IDT Corp. - Class B ^ | | | 44,300 | | | | 416 | |
Neutral Tandem, Inc. ‡^ | | | 26,500 | | | | 283 | |
Surewest Communications | | | 11,300 | | | | 136 | |
Electric Utilities - 1.7% | | | | | | | | |
Cleco Corp. ^ | | | 5,100 | | | | 194 | |
El Paso Electric Co. | | | 41,500 | | | | 1,438 | |
NGP Capital Resources Co. ^ | | | 7,100 | | | | 51 | |
Portland General Electric Co. ^ | | | 5,400 | | | | 137 | |
Unisource Energy Corp. ^ | | | 60,100 | | | | 2,218 | |
Westar Energy, Inc. ^ | | | 36,300 | | | | 1,045 | |
Electrical Equipment - 2.1% | | | | | | | | |
Acuity Brands, Inc. ^ | | | 14,600 | | | | 774 | |
Belden, Inc. ^ | | | 102,400 | | | | 3,407 | |
Franklin Electric Co., Inc. ^ | | | 7,400 | | | | 322 | |
Generac Holdings, Inc. ‡^ | | | 1,200 | | | | 34 | |
Woodward, Inc. ^ | | | 39,253 | | | | 1,607 | |
Electronic Equipment & Instruments - 1.4% | | | | | |
Brightpoint, Inc. ‡^ | | | 2,900 | | | | 31 | |
Coherent, Inc. ‡^ | | | 16,100 | | | | 842 | |
Electro Scientific Industries, Inc. ‡^ | | | 19,000 | | | | 275 | |
Insight Enterprises, Inc. ‡^ | | | 2,000 | | | | 31 | |
LoJack Corp. ‡^ | | | 45,600 | | | | 140 | |
MTS Systems Corp. ^ | | | 28,500 | | | | 1,161 | |
Multi-Fineline Electronix, Inc. ‡^ | | | 34,077 | | | | 700 | |
Newport Corp. ‡^ | | | 35,400 | | | | 482 | |
RadiSys Corp. ‡^ | | | 19,700 | | | | 100 | |
Tech Data Corp. ‡^ | | | 9,700 | | | | 479 | |
Energy Equipment & Services - 2.6% | | | | | |
Bristow Group, Inc. ^ | | | 20,800 | | | | 986 | |
Dril-Quip, Inc. ‡^ | | | 21,645 | | | | 1,425 | |
Helix Energy Solutions Group, Inc. ‡^ | | | 77,100 | | | | 1,218 | |
Lufkin Industries, Inc. ^ | | | 20,405 | | | | 1,373 | |
Newpark Resources, Inc. ‡^ | | | 172,225 | | | | 1,636 | |
SEACOR Holdings, Inc. ‡^ | | | 12,500 | | | | 1,112 | |
T.G.C. Industries, Inc. ‡ | | | 11,800 | | | | 84 | |
Food & Staples Retailing - 0.7% | | | | | |
Casey’s General Stores, Inc. ^ | | | 27,200 | | | | 1,401 | |
SUPERVALU, Inc. ^ | | | 3,400 | | | | 28 | |
Susser Holdings Corp. ‡ | | | 13,400 | | | | 303 | |
Winn-Dixie Stores, Inc. ‡^ | | | 49,800 | | | | 467 | |
Food Products - 0.7% | | | | | | | | |
Darling International, Inc. ‡^ | | | 38,487 | | | | 511 | |
Dole Food Co., Inc. ‡^ | | | 78,400 | | | | 678 | |
Lancaster Colony Corp. ^ | | | 8,810 | | | | 611 | |
Omega Protein Corp. ‡ | | | 49,900 | | | | 356 | |
Gas Utilities - 1.4% | | | | | | | | |
Atmos Energy Corp. ^ | | | 30,200 | | | | 1,007 | |
Chesapeake Utilities Corp. ^ | | | 10,900 | | | | 473 | |
Laclede Group, Inc. ^ | | | 2,300 | | | | 93 | |
New Jersey Resources Corp. ^ | | | 11,472 | | | | 564 | |
Southwest Gas Corp. ^ | | | 34,500 | | | | 1,466 | |
WGL Holdings, Inc. ^ | | | 15,000 | | | | 663 | |
Health Care Equipment & Supplies - 3.3% | | | | | |
Dexcom, Inc. ‡^ | | | 85,015 | | | | 791 | |
DynaVox, Inc. - Class A ‡^ | | | 12,600 | | | | 46 | |
Haemonetics Corp. ‡^ | | | 9,900 | | | | 606 | |
ICU Medical, Inc. ‡^ | | | 29,700 | | | | 1,337 | |
Insulet Corp. ‡^ | | | 98,948 | | | | 1,863 | |
| | | | | | | | |
| | | Shares | | | Value
(000’s) | |
Health Care Equipment & Supplies (continued) | | | | | |
NxStage Medical, Inc. ‡^ | | | 116,021 | | | $ | 2,063 | |
Spectranetics Corp. ��^ | | | 174,654 | | | | 1,261 | |
Thoratec Corp. ‡^ | | | 51,935 | | | | 1,743 | |
Health Care Providers & Services - 2.2% | | | | | |
Amsurg Corp. - Class A ‡^ | | | 79,000 | | | | 2,057 | |
CardioNet, Inc. ‡^ | | | 61,200 | | | | 145 | |
Corvel Corp. ‡^ | | | 22,600 | | | | 1,169 | |
HMS Holdings Corp. ‡^ | | | 66,350 | | | | 2,122 | |
PDI, Inc. ‡ | | | 16,800 | | | | 108 | |
Select Medical Holdings Corp. ‡^ | | | 39,600 | | | | 336 | |
WellCare Health Plans, Inc. ‡ | | | 11,300 | | | | 593 | |
Hotels, Restaurants & Leisure - 3.3% | | | | | | | | |
Ameristar Casinos, Inc. ^ | | | 26,100 | | | | 451 | |
Biglari Holdings, Inc. ‡^ | | | 840 | | | | 309 | |
BJ’s Restaurants, Inc. ‡^ | | | 25,305 | | | | 1,147 | |
Boyd Gaming Corp. ‡^ | | | 33,900 | | | | 253 | |
Brinker International, Inc. ^ | | | 18,700 | | | | 500 | |
Buffalo Wild Wings, Inc. ‡^ | | | 18,125 | | | | 1,224 | |
CEC Entertainment, Inc. | | | 30,100 | | | | 1,037 | |
Choice Hotels International, Inc. ^ | | | 28,200 | | | | 1,073 | |
Penn National Gaming, Inc. ‡ | | | 10,600 | | | | 404 | |
Pinnacle Entertainment, Inc. ‡^ | | | 14,800 | | | | 150 | |
Red Lion Hotels Corp. ‡^ | | | 4,300 | | | | 30 | |
Red Robin Gourmet Burgers, Inc. ‡^ | | | 14,300 | | | | 396 | |
Sonic Corp. ‡^ | | | 109,200 | | | | 735 | |
Texas Roadhouse, Inc. - Class A ^ | | | 88,120 | | | | 1,313 | |
Town Sports International Holdings, Inc. ‡^ | | | 58,100 | | | | 427 | |
Wendy’s Co. ^ | | | 83,000 | | | | 445 | |
Household Durables - 1.3% | | | | | | | | |
Blyth, Inc. ^ | | | 9,200 | | | | 523 | |
Helen of Troy, Ltd. ‡ | | | 53,600 | | | | 1,646 | |
Tupperware Brands Corp. | | | 29,885 | | | | 1,672 | |
Independent Power Producers &Energy
Traders - 0.0%¥ | |
Genie Energy, Ltd. ^ | | | 6,100 | | | | 48 | |
Industrial Conglomerates - 1.3% | | | | | |
Carlisle Cos., Inc. ^ | | | 67,900 | | | | 3,008 | |
Raven Industries, Inc. ^ | | | 15,775 | | | | 976 | |
Insurance - 4.7% | | | | | | | | |
Alleghany Corp. ^ | | | 3,925 | | | | 1,120 | |
American Equity Investment Life Holding Co. ^ | | | 91,200 | | | | 948 | |
Amerisafe, Inc. ‡^ | | | 43,800 | | | | 1,018 | |
Amtrust Financial Services, Inc. ^ | | | 50,400 | | | | 1,197 | |
Assured Guaranty, Ltd. ^ | | | 50,800 | | | | 668 | |
Crawford & Co. - Class B ^ | | | 58,300 | | | | 359 | |
Delphi Financial Group, Inc. -
Class A | | | 63,828 | | | | 2,828 | |
First American Financial Corp. ^ | | | 45,000 | | | | 570 | |
Maiden Holdings, Ltd. ^ | | | 121,500 | | | | 1,064 | |
Meadowbrook Insurance Group,
Inc. ^ | | | 12,000 | | | | 128 | |
National Financial Partners Corp. ‡^ | | | 78,700 | | | | 1,064 | |
Platinum Underwriters Holdings,
Ltd. ^ | | | 33,500 | | | | 1,143 | |
Primerica, Inc. | | | 55,100 | | | | 1,281 | |
RLI Corp. ^ | | | 2,100 | | | | 153 | |
Internet Software & Services - 1.9% | | | | | |
comScore, Inc. ‡^ | | | 64,672 | | | | 1,371 | |
Constant Contact, Inc. ‡^ | | | 34,652 | | | | 804 | |
IAC/InterActiveCorp ^ | | | 16,700 | | | | 711 | |
Infospace, Inc. ‡^ | | | 64,600 | | | | 710 | |
j2 Global, Inc. ^ | | | 41,045 | | | | 1,155 | |
VistaPrint NV ‡^ | | | 30,316 | | | | 928 | |
IT Services - 2.5% | | | | | | | | |
Agilysys, Inc. ‡ | | | 51,400 | | | | 409 | |
CACI International, Inc. -
Class A ‡^ | | | 20,800 | | | | 1,163 | |
Global Cash Access Holdings,
Inc. ‡^ | | | 24,900 | | | | 111 | |
MAXIMUS, Inc. ^ | | | 85,858 | | | | 3,550 | |
VeriFone Holdings, Inc. ‡^ | | | 33,343 | | | | 1,184 | |
Virtusa Corp. ‡^ | | | 69,043 | | | | 1,000 | |
| | | | | | | | |
| | | Shares | | | Value
(000’s) | |
Leisure Equipment & Products - 0.1% | | | | | |
Brunswick Corp. ^ | | | 10,700 | | | $ | 193 | |
Multimedia Games Holding Co.,
Inc. ‡^ | | | 17,500 | | | | 139 | |
Life Sciences Tools & Services - 1.4% | | | | | | | | |
Charles River Laboratories International, Inc. ‡ | | | 63,400 | | | | 1,733 | |
Fluidigm Corp. ‡ | | | 48,534 | | | | 639 | |
ICON PLC ADR ^ ‡ | | | 105,900 | | | | 1,811 | |
Machinery - 4.2% | | | | | | | | |
Albany International Corp. -
Class A ^ | | | 78,200 | | | | 1,808 | |
Altra Holdings, Inc. ‡^ | | | 6,400 | | | | 121 | |
Clarcor, Inc. ^ | | | 31,660 | | | | 1,583 | |
ESCO Technologies, Inc. ^ | | | 78,318 | | | | 2,253 | |
Hurco Cos., Inc. ‡^ | | | 16,500 | | | | 347 | |
Kadant, Inc. ‡ | | | 21,000 | | | | 475 | |
LB Foster Co. - Class A ^ | | | 9,600 | | | | 272 | |
Middleby Corp. ‡^ | | | 5,545 | | | | 521 | |
Mueller Industries, Inc. ^ | | | 54,500 | | | | 2,094 | |
Toro Co. ^ | | | 21,430 | | | | 1,300 | |
Wabtec Corp. | | | 20,820 | | | | 1,456 | |
Marine - 0.6% | | | | | | | | |
Kirby Corp. ‡^ | | | 25,900 | | | | 1,705 | |
Media - 0.8% | | | | | | | | |
Arbitron, Inc. ^ | | | 54,900 | | | | 1,888 | |
Ascent Capital Group, Inc. ‡^ | | | 4,000 | | | | 203 | |
Global Sources, Ltd. ‡^ | | | 32,300 | | | | 157 | |
Nexstar Broadcasting Group, Inc. - Class A ‡ | | | 5,200 | | | | 41 | |
Saga Communications, Inc. -
Class A ‡^ | | | 800 | | | | 30 | |
Sinclair Broadcast Group, Inc. -
Class A | | | 5,000 | | | | 57 | |
Metals & Mining - 0.5% | | | | | | | | |
Coeur D’alene Mines Corp. ‡^ | | | 32,000 | | | | 772 | |
Hecla Mining Co. ^ | | | 65,460 | | | | 342 | |
RTI International Metals, Inc. ‡^ | | | 17,000 | | | | 395 | |
Multiline Retail - 1.3% | | | | | | | | |
Big Lots, Inc. ‡ | | | 36,115 | | | | 1,364 | |
Dillard’s, Inc. - Class A ^ | | | 11,200 | | | | 503 | |
Fred’s, Inc. - Class A ^ | | | 93,700 | | | | 1,366 | |
PriceSmart, Inc. ^ | | | 9,325 | | | | 649 | |
Saks, Inc. ‡^ | | | 3,300 | | | | 32 | |
Multi-Utilities - 0.0% ¥ | | | | | | | | |
PNM Resources, Inc. ^ | | | 4,900 | | | | 89 | |
Office Electronics - 0.4% | | | | | | | | |
Zebra Technologies Corp. - Class A ‡ | | | 29,600 | | | | 1,059 | |
Oil, Gas & Consumable Fuels - 3.4% | | | | | | | | |
Adams Resources & Energy, Inc. ^ | | | 1,100 | | | | 32 | |
Alon USA Energy, Inc. ^ | | | 2,400 | | | | 21 | |
CVR Energy, Inc. ‡ | | | 36,500 | | | | 684 | |
Delek US Holdings, Inc. ^ | | | 67,600 | | | | 771 | |
GeoResources, Inc. ‡^ | | | 29,500 | | | | 865 | |
Gulfport Energy Corp. ‡^ | | | 46,355 | | | | 1,365 | |
Oasis Petroleum, Inc. ‡^ | | | 48,295 | | | | 1,405 | |
Penn Virginia Corp. ^ | | | 59,600 | | | | 315 | |
PetroQuest Energy, Inc. ‡^ | | | 177,685 | | | | 1,173 | |
Scorpio Tankers, Inc. ‡^ | | | 94,100 | | | | 460 | |
Vaalco Energy, Inc. ‡^ | | | 45,300 | | | | 274 | |
W&T Offshore, Inc. ^ | | | 51,600 | | | | 1,094 | |
Western Refining, Inc. ‡^ | | | 16,600 | | | | 221 | |
World Fuel Services Corp. ^ | | | 34,642 | | | | 1,454 | |
Paper & Forest Products - 1.1% | | | | | |
Buckeye Technologies, Inc. | | | 17,000 | | | | 568 | |
Deltic Timber Corp. ^ | | | 22,000 | | | | 1,328 | |
Domtar Corp. | | | 11,500 | | | | 920 | |
P.H. Glatfelter Co. ^ | | | 26,600 | | | | 376 | |
Personal Products - 0.0% ¥ | | | | | |
Nature’s Sunshine Products, Inc. ‡ | | | 6,500 | | | | 101 | |
Pharmaceuticals - 2.1% | | | | | | | | |
Auxilium Pharmaceuticals, Inc. ‡^ | | | 87,050 | | | | 1,735 | |
Cumberland Pharmaceuticals, Inc. ‡^ | | | 39,800 | | | | 214 | |
Impax Laboratories, Inc. ‡^ | | | 65,770 | | | | 1,327 | |
| | | | | | | | |
| | | Shares | | | Value
(000’s) | |
Pharmaceuticals (continued) | | | | | |
Medicines Co. ‡ | | | 26,500 | | | $ | 494 | |
Medicis Pharmaceutical Corp. -
Class A ^ | | | 11,300 | | | | 376 | |
Questcor Pharmaceuticals, Inc. ‡ | | | 1,300 | | | | 54 | |
Salix Pharmaceuticals, Ltd. ‡^ | | | 39,130 | | | | 1,872 | |
ViroPharma, Inc. ‡^ | | | 6,500 | | | | 178 | |
Professional Services - 0.3% | | | | | | | | |
Barrett Business Services, Inc. ^ | | | 25,200 | | | | 503 | |
CRA International, Inc. ‡^ | | | 18,400 | | | | 365 | |
Real Estate Investment Trusts - 5.3% | | | | | |
Alexander’s, Inc. ^ | | | 2,060 | | | | 762 | |
Campus Crest Communities, Inc. ^ | | | 79,600 | | | | 801 | |
CBL & Associates Properties, Inc. ^ | | | 13,900 | | | | 218 | |
Colonial Properties Trust | | | 72,300 | | | | 1,509 | |
CreXus Investment Corp. | | | 42,800 | | | | 444 | |
CubeSmart | | | 125,700 | | | | 1,337 | |
DiamondRock Hospitality Co. ^ | | | 98,752 | | | | 952 | |
Education Realty Trust, Inc. ^ | | | 79,600 | | | | 814 | |
Extra Space Storage, Inc. ^ | | | 61,500 | | | | 1,491 | |
First Industrial Realty Trust, Inc. ‡^ | | | 114,900 | | | | 1,175 | |
Kite Realty Group Trust ^ | | | 57,000 | | | | 257 | |
Mack-Cali Realty Corp. ^ | | | 28,500 | | | | 761 | |
Mission West Properties, Inc. ^ | | | 56,700 | | | | 511 | |
Monmouth Real Estate Investment
Corp. - Class A ^ | | | 9,400 | | | | 86 | |
Post Properties, Inc. | | | 35,500 | | | | 1,553 | |
Retail Opportunity Investments
Corp. ^ | | | 58,900 | | | | 697 | |
Sovran Self Storage, Inc. | | | 5,700 | | | | 243 | |
Strategic Hotels & Resorts, Inc. ‡^ | | | 108,100 | | | | 580 | |
Sun Communities, Inc. ^ | | | 25,700 | | | | 939 | |
Winthrop Realty Trust ^ | | | 40,000 | | | | 407 | |
Road & Rail - 1.7% | | | | | | | | |
Amerco, Inc. ^ | | | 4,300 | | | | 380 | |
Arkansas Best Corp. ^ | | | 54,500 | | | | 1,050 | |
Con-way, Inc. ^ | | | 2,000 | | | | 58 | |
Genesee & Wyoming, Inc. -
Class A ‡^ | | | 30,700 | | | | 1,861 | |
Landstar System, Inc. | | | 26,615 | | | | 1,275 | |
Old Dominion Freight Line, Inc. ‡ | | | 5,600 | | | | 227 | |
RailAmerica, Inc. ‡^ | | | 7,200 | | | | 107 | |
Semiconductors & Semiconductor
Equipment - 2.0% | | | | | |
Cavium, Inc. ‡^ | | | 34,356 | | | | 977 | |
DSP Group, Inc. ‡ | | | 6,700 | | | | 35 | |
FEI Co. ‡^ | | | 700 | | | | 29 | |
FormFactor, Inc. ‡^ | | | 81,100 | | | | 410 | |
Mellanox Technologies, Ltd. ‡^ | | | 35,927 | | | | 1,168 | |
Microsemi Corp. ‡^ | | | 67,905 | | | | 1,137 | |
Photronics, Inc. ‡^ | | | 42,600 | | | | 259 | |
RF Micro Devices, Inc. ‡^ | | | 155,235 | | | | 838 | |
Skyworks Solutions, Inc. ‡^ | | | 44,842 | | | | 727 | |
Tessera Technologies, Inc. ‡ | | | 28,400 | | | | 476 | |
Software - 3.4% | | | | | | | | |
Ariba, Inc. ‡^ | | | 28,688 | | | | 806 | |
Aspen Technology, Inc. ‡^ | | | 72,860 | | | | 1,264 | |
Blackbaud, Inc. | | | 12,685 | | | | 351 | |
Cadence Design Systems, Inc. ‡^ | | | 167,471 | | | | 1,742 | |
Fair Isaac Corp. ^ | | | 30,000 | | | | 1,075 | |
Micros Systems, Inc. ‡ | | | 25,825 | | | | 1,203 | |
Parametric Technology Corp. ‡ | | | 67,183 | | | | 1,227 | |
Pervasive Software, Inc. ‡^ | | | 4,500 | | | | 26 | |
Taleo Corp. - Class A ‡ | | | 34,766 | | | | 1,345 | |
Websense, Inc. ‡^ | | | 56,800 | | | | 1,064 | |
Specialty Retail - 5.2% | | | | | | | | |
Ann, Inc. ‡^ | | | 3,700 | | | | 92 | |
Ascena Retail Group, Inc. ‡^ | | | 42,600 | | | | 1,266 | |
Bebe Stores, Inc. ^ | | | 28,100 | | | | 234 | |
Body Central Corp. ‡^ | | | 78,620 | | | | 1,963 | |
Build-A-Bear Workshop, Inc. ‡ | | | 8,200 | | | | 69 | |
Cato Corp. - Class A ^ | | | 135,749 | | | | 3,286 | |
Chico’s FAS, Inc. ^ | | | 82,146 | | | | 915 | |
Conn’s, Inc. ‡ | | | 79,700 | | | | 885 | |
| | | | | | | | |
| | | Shares | | | Value
(000’s) | |
Specialty Retail (continued) | | | | | |
DSW, Inc. - Class A ^ | | | 24,955 | | | $ | 1,103 | |
Finish Line, Inc. - Class A ^ | | | 1,400 | | | | 27 | |
Hot Topic, Inc. ^ | | | 115,800 | | | | 765 | |
Pier 1 Imports, Inc. ‡ ^ | | | 26,200 | | | | 365 | |
RadioShack Corp. ^ | | | 7,400 | | | | 72 | |
Rex American Resources Corp. ‡ ^ | | | 24,600 | | | | 544 | |
Select Comfort Corp. ‡ ^ | | | 4,700 | | | | 102 | |
Stage Stores, Inc. ^ | | | 125,400 | | | | 1,742 | |
Tractor Supply Co. | | | 12,329 | | | | 865 | |
Wet Seal, Inc. - Class A ‡ ^ | | | 73,400 | | | | 239 | |
Williams-Sonoma, Inc. ^ | | | 1,800 | | | | 69 | |
Zumiez, Inc. ‡ ^ | | | 16,300 | | | | 452 | |
Textiles, Apparel & Luxury Goods - 1.6% | | | | | |
Deckers Outdoor Corp. ‡ ^ | | | 13,387 | | | | 1,012 | |
Movado Group, Inc. ^ | | | 47,500 | | | | 863 | |
Oxford Industries, Inc. ^ | | | 1,200 | | | | 54 | |
Skechers U.S.A., Inc. - Class A ‡ ^ | | | 44,000 | | | | 533 | |
True Religion Apparel, Inc. ‡ ^ | | | 6,100 | | | | 211 | |
Unifirst Corp. ^ | | | 9,500 | | | | 539 | |
Vera Bradley, Inc. ‡ ^ | | | 45,167 | | | | 1,457 | |
Thrifts & Mortgage Finance - 1.3% | | | | | | | | |
Dime Community Bancshares,
Inc. ^ | | | 19,200 | | | | 242 | |
First Financial Northwest, Inc. ‡ ^ | | | 6,300 | | | | 37 | |
First Niagara Financial Group, Inc. | | | 86,639 | | | | 748 | |
Flushing Financial Corp. ^ | | | 52,800 | | | | 667 | |
Northwest Bancshares, Inc. ^ | | | 125,400 | | | | 1,559 | |
Parkvale Financial Corp. | | | 1,100 | | | | 27 | |
Provident Financial Services, Inc. ^ | | | 16,300 | | | | 218 | |
Rockville Financial, Inc. ^ | | | 13,200 | | | | 137 | |
Trustco Bank Corp. ^ | | | 19,700 | | | | 111 | |
Tobacco - 0.1% | | | | | | | | |
Vector Group, Ltd. ^ | | | 16,500 | | | | 293 | |
Trading Companies & Distributors - 1.3% | | | | | |
Applied Industrial Technologies, Inc. ^ | | | 56,060 | | | | 1,971 | |
GATX Corp. ^ | | | 41,400 | | | | 1,808 | |
Water Utilities - 0.0% ¥ | | | | | |
Consolidated Water Co., Ltd. ^ | | | 6,700 | | | | 57 | |
Wireless Telecommunication Services - 0.2% | | | | | |
NTELOS Holdings Corp. ^ | | | 19,919 | | | | 406 | |
Telephone & Data Systems, Inc. ^ | | | 3,100 | | | | 80 | |
| | | | | | | | |
Total Common Stocks (cost $253,737) | | | | 290,933 | |
| | | | | | | | |
| | | | | | | | |
| | | Shares | | | Value
(000’s) | |
INVESTMENT COMPANY - 0.2% | | | | | |
Diversified Financial Services - 0.2% | |
KKR Financial Holdings LLC | | | 57,700 | | | $ | 504 | |
Total Investment Company (cost $178) | |
| | |
| | | Principal
(000’s) | | | Value
(000’s) | |
SHORT-TERM U.S. GOVERNMENT OBLIGATION - 0.1% | | | | | |
U.S. Treasury Bill 0.02%, 03/15/2012 p g | | $ | 420 | | | | 420 | |
Total Short-Term U.S. Government Obligation (cost $420) | |
| | |
| | | Shares | | | Value
(000’s) | |
SECURITIES LENDING COLLATERAL - 25.7% | |
State Street Navigator Securities Lending Trust - Prime Portfolio, 0.28% p | | | 75,960,906 | | | | 75,961 | |
Total Securities Lending Collateral (cost $75,961) | |
| | |
| | | Principal
(000’s) | | | Value
(000’s) | |
REPURCHASE AGREEMENT - 1.4% | |
State Street Bank & Trust Co. 0.03% p, dated 12/30/2011, to be repurchased at $4,216 on 01/03/2012. Collateralized by U.S. Government Agency Obligations, 3.00%, due 11/25/2040, and with a total value of $4,308. | | $ | 4,216 | | | $ | 4,216 | |
Total Repurchase Agreement (cost $4,216) | |
| | | | | | | | |
Total Investment Securities
(cost $334,512) | | | | 372,034 | |
Other Assets and Liabilities - Net | | | | (75,974 | ) |
| | | | | | | | |
Net Assets | | | | | | $ | 296,060 | |
| | | | | | | | |
FUTURES CONTRACTS:
| | | | | | | | | | | | | | |
Description | | Type | | | Contracts | | | Expiration Date | | Net Unrealized
Appreciation
(000’s) | |
Russell 2000 Mini Index | | | Long | | | | 10 | | | 03/16/2012 | | $ | 22 | |
NOTES TO SCHEDULE OF INVESTMENTS (all amounts in thousands):
| ^ | All or a portion of this security is on loan. The value of all securities on loan is $74,054. |
| ‡ | Non-income producing security. |
| ¥ | Percentage rounds to less than 0.1%. |
| g | All or a portion of this security in the amount of $420 has been segregated as collateral with the broker to cover margin requirements for open futures contracts. |
| p | Rate shown reflects the yield at 12/30/2011. |
| Aggregate cost for federal income tax purposes is $338,712. Aggregate gross unrealized appreciation/depreciation for all securities in which there is an excess of value over tax cost were $48,322 and $15,000, respectively. Net unrealized appreciation for tax purposes is $33,322. |
DEFINITION:
| ADR | American Depositary Receipt |
VALUATION SUMMARY (all amounts in thousands):
| | | | | | | | | | | | | | | | |
Investment Securities | | Level 1 -
Quoted
Prices | | | Level 2 -
Other
Significant
Observable
Inputs | | | Level 3 -
Significant
Unobservable
Inputs | | | Value at
12/31/2011 | |
Common Stocks | | $ | 286,566 | | | $ | 4,367 | | | $ | — | | | $ | 290,933 | |
Investment Companies | | | 504 | | | | — | | | | — | | | | 504 | |
Repurchase Agreements | | | — | | | | 4,216 | | | | — | | | | 4,216 | |
Securities Lending Collateral | | | 75,961 | | | | — | | | | — | | | | 75,961 | |
Short-Term U.S. Government Obligations | | | — | | | | 420 | | | | — | | | | 420 | |
| | | | | | | | | | | | | | | | |
Total | | $ | 363,031 | | | $ | 9,003 | | | $ | — | | | $ | 372,034 | |
| | | | | | | | | | | | | | | | |
| | | | |
Other Financial Instruments | | Level 1 -
Quoted
Prices | | | Level 2 -
Other
Significant
Observable
Inputs | | | Level 3 -
Significant
Unobservable
Inputs | | | Value at
12/31/2011 | |
Futures Contracts - Appreciation | | $ | 22 | | | $ | — | | | $ | — | | | $ | 22 | |
| See the notes to the financial statements for more information regarding pricing inputs and valuation techniques. |
| | Other financial instruments are derivative instruments that are valued at unrealized appreciation (depreciation) on the instrument. |
| | | | | | | | |
| | | Shares | | | Value
(000’s) | |
COMMON STOCKS - 100.1% | | | | | | | | |
Aerospace & Defense - 2.0% | | | | | | | | |
DigitalGlobe, Inc. ‡ ^ | | | 30,800 | | | $ | 527 | |
Hexcel Corp. ‡ ^ | | | 32,792 | | | | 794 | |
Triumph Group, Inc. ^ | | | 14,100 | | | | 824 | |
Air Freight & Logistics - 1.0% | | | | | | | | |
Atlas Air Worldwide Holdings, Inc. ‡ ^ | | | 16,850 | | | | 648 | |
Hub Group, Inc. - Class A ‡ ^ | | | 11,966 | | | | 388 | |
Biotechnology - 3.1% | | | | | | | | |
Astex Pharmaceuticals ‡ ^ | | | 244,618 | | | | 462 | |
Myriad Genetics, Inc. ‡ | | | 40,500 | | | | 848 | |
Onyx Pharmaceuticals, Inc. ‡ ^ | | | 21,900 | | | | 963 | |
Seattle Genetics, Inc. ‡ ^ | | | 42,700 | | | | 714 | |
United Therapeutics Corp. ‡ | | | 7,300 | | | | 345 | |
Building Products - 0.8% | | | | | | | | |
AO Smith Corp. ^ | | | 22,174 | | | | 890 | |
Capital Markets - 1.1% | | | | | | | | |
Walter Investment Management Corp. | | | 39,407 | | | | 808 | |
WisdomTree Investments, Inc. ‡ ^ | | | 57,800 | | | | 350 | |
Chemicals - 2.7% | | | | | | | | |
Balchem Corp. ^ | | | 13,197 | | | | 535 | |
Kraton Performance Polymers, Inc. ‡ ^ | | | 36,048 | | | | 732 | |
Kronos Worldwide, Inc. ^ | | | 43,900 | | | | 792 | |
Newmarket Corp. ^ | | | 4,500 | | | | 891 | |
Commercial Banks - 2.3% | | | | | | | | |
Boston Private Financial Holdings, Inc. ^ | | | 74,612 | | | | 592 | |
First Citizens BancShares, Inc. - Class A | | | 1,930 | | | | 338 | |
SVB Financial Group ‡ ^ | | | 17,021 | | | | 812 | |
Texas Capital Bancshares, Inc. ‡ | | | 9,300 | | | | 285 | |
Umpqua Holdings Corp. ^ | | | 41,015 | | | | 508 | |
Commercial Services & Supplies - 0.8% | | | | | |
Consolidated Graphics, Inc. ‡ ^ | | | 5,931 | | | | 286 | |
Progressive Waste Solutions, Ltd. | | | 31,092 | | | | 609 | |
Communications Equipment - 1.7% | | | | | | | | |
Aruba Networks, Inc. ‡ ^ | | | 17,600 | | | | 326 | |
InterDigital, Inc. ^ | | | 16,000 | | | | 698 | |
Procera Networks, Inc. ‡ | | | 18,700 | | | | 291 | |
Sonus Networks, Inc. ‡ | | | 228,423 | | | | 548 | |
Construction & Engineering - 1.4% | | | | | | | | |
MasTec, Inc. ‡ ^ | | | 51,600 | | | | 896 | |
MYR Group, Inc. ‡ ^ | | | 33,132 | | | | 634 | |
Consumer Finance - 1.7% | | | | | | | | |
DFC Global Corp. ‡ ^ | | | 26,118 | | | | 472 | |
Ezcorp, Inc. - Class A ‡ ^ | | | 24,664 | | | | 650 | |
World Acceptance Corp. ‡ ^ | | | 9,600 | | | | 706 | |
Containers & Packaging - 0.5% | | | | | | | | |
Silgan Holdings, Inc. | | | 14,700 | | | | 568 | |
Diversified Consumer Services - 0.3% | | | | | |
Sotheby’s ^ | | | 10,060 | | | | 287 | |
Diversified Financial Services - 0.8% | | | | | | | | |
Euronet Worldwide, Inc. ‡ | | | 7,362 | | | | 136 | |
First Cash Financial Services, Inc. ‡ ^ | | | 19,858 | | | | 697 | |
Diversified Telecommunication Services - 2.0% | | | | | |
AboveNet, Inc. ‡ ^ | | | 12,500 | | | | 812 | |
Allot Communications, Ltd. ‡ ^ | | | 29,300 | | | | 445 | |
Cbeyond, Inc. ‡ ^ | | | 67,500 | | | | 541 | |
inContact, Inc. ‡ | | | 76,000 | | | | 337 | |
Electrical Equipment - 1.5% | | | | | | | | |
EnerSys ‡ ^ | | | 27,764 | | | | 721 | |
General Cable Corp. ‡ ^ | | | 12,632 | | | | 316 | |
II-VI, Inc. ‡ ^ | | | 30,345 | | | | 557 | |
Electronic Equipment & Instruments - 1.5% | | | | | | | | |
Maxwell Technologies, Inc. ‡ ^ | | | 25,824 | | | | 419 | |
Newport Corp. ‡ ^ | | | 27,463 | | | | 374 | |
OSI Systems, Inc. ‡ ^ | | | 15,933 | | | | 777 | |
Energy Equipment & Services - 3.4% | | | | | | | | |
Dawson Geophysical Co. ‡ ^ | | | 16,879 | | | | 667 | |
Helix Energy Solutions Group, Inc. ‡ ^ | | | 38,399 | | | | 607 | |
Key Energy Services, Inc. ‡ ^ | | | 38,866 | | | | 601 | |
Newpark Resources, Inc. ‡ ^ | | | 75,555 | | | | 718 | |
| | | | | | | | |
| | | Shares | | | Value
(000’s) | |
Energy Equipment & Services (continued) | | | | | |
OYO Geospace Corp. ‡ ^ | | | 9,774 | | | $ | 756 | |
Pioneer Drilling Co. ‡ ^ | | | 35,446 | | | | 343 | |
Food & Staples Retailing - 0.6% | | | | | | | | |
Ruddick Corp. ^ | | | 14,100 | | | | 601 | |
Food Products - 2.0% | | | | | | | | |
Hain Celestial Group, Inc. ‡ ^ | | | 16,551 | | | | 607 | |
Sanderson Farms, Inc. ^ | | | 15,300 | | | | 767 | |
Sensient Technologies Corp. ^ | | | 19,774 | | | | 749 | |
Health Care Equipment & Supplies - 4.0% | | | | | |
Arthrocare Corp. ‡ ^ | | | 23,088 | | | | 732 | |
Atrion Corp. ^ | | | 1,412 | | | | 339 | |
Haemonetics Corp. ‡ ^ | | | 10,870 | | | | 665 | |
ICU Medical, Inc. ‡ ^ | | | 15,018 | | | | 676 | |
Integra LifeSciences Holdings Corp. ‡ ^ | | | 16,543 | | | | 510 | |
Masimo Corp. ‡ ^ | | | 14,900 | | | | 278 | |
Merit Medical Systems, Inc. ‡ ^ | | | 51,700 | | | | 692 | |
Thoratec Corp. ‡ ^ | | | 14,100 | | | | 473 | |
Health Care Providers & Services - 3.1% | | | | | |
Centene Corp. ‡ | | | 17,200 | | | | 681 | |
Ensign Group, Inc. ^ | | | 22,095 | | | | 541 | |
IPC The Hospitalist Co., Inc. ‡ ^ | | | 15,900 | | | | 727 | |
Kindred Healthcare, Inc. ‡ ^ | | | 59,300 | | | | 698 | |
Metropolitan Health Networks, Inc. ‡ ^ | | | 41,100 | | | | 307 | |
Transcend Services, Inc. ‡ ^ | | | 16,100 | | | | 382 | |
Health Care Technology - 1.5% | | | | | | | | |
Computer Programs & Systems, Inc. ^ | | | 10,300 | | | | 526 | |
HealthStream, Inc. ‡ ^ | | | 22,195 | | | | 409 | |
Omnicell, Inc. ‡ | | | 38,600 | | | | 639 | |
Hotels, Restaurants & Leisure - 1.8% | | | | | |
Buffalo Wild Wings, Inc. ‡ ^ | | | 6,304 | | | | 426 | |
Caribou Coffee Co., Inc. ‡ ^ | | | 26,895 | | | | 375 | |
Domino’s Pizza, Inc. ‡ | | | 12,000 | | | | 407 | |
WMS Industries, Inc. ‡ ^ | | | 37,600 | | | | 772 | |
Household Durables - 0.5% | | | | | | | | |
Ethan Allen Interiors, Inc. ^ | | | 15,500 | | | | 367 | |
La-Z-Boy, Inc. ‡ | | | 14,526 | | | | 173 | |
Household Products - 0.7% | | | | | | | | |
Spectrum Brands Holdings, Inc. ‡ ^ | | | 26,071 | | | | 714 | |
Insurance - 1.5% | | | | | | | | |
Maiden Holdings, Ltd. ^ | | | 60,200 | | | | 527 | |
Platinum Underwriters Holdings, Ltd. ^ | | | 20,400 | | | | 696 | |
Proassurance Corp. ^ | | | 5,600 | | | | 447 | |
Internet & Catalog Retail - 0.9% | | | | | | | | |
Shutterfly, Inc. ‡ ^ | | | 32,970 | | | | 750 | |
U.S. Auto Parts Network, Inc. ‡ ^ | | | 52,300 | | | | 229 | |
Internet Software & Services - 5.7% | | | | | | | | |
Dealertrack Holdings, Inc. ‡ ^ | | | 24,500 | | | | 668 | |
j2 Global, Inc. ^ | | | 25,300 | | | | 712 | |
Liveperson, Inc. ‡ ^ | | | 71,069 | | | | 892 | |
NIC, Inc. ^ | | | 29,649 | | | | 395 | |
Open Text Corp. ‡ | | | 9,487 | | | | 485 | |
Radware, Ltd. ‡ ^ | | | 19,740 | | | | 577 | |
Valueclick, Inc. ‡ ^ | | | 58,153 | | | | 947 | |
VistaPrint NV ‡ ^ | | | 31,000 | | | | 949 | |
Zix Corp. ‡ ^ | | | 216,750 | | | | 611 | |
IT Services - 1.0% | | | | | | | | |
NeuStar, Inc. - Class A ‡ | | | 8,662 | | | | 296 | |
Teletech Holdings, Inc. ‡ ^ | | | 14,419 | | | | 234 | |
Wright Express Corp. ‡ ^ | | | 9,893 | | | | 537 | |
Life Sciences Tools & Services - 1.8% | | | | | |
Bruker Corp. ‡ | | | 51,613 | | | | 641 | |
ICON PLC ADR ‡ ^ | | | 47,406 | | | | 811 | |
Parexel International Corp. ‡ ^ | | | 22,643 | | | | 470 | |
Machinery - 3.5% | | | | | | | | |
Actuant Corp. - Class A ^ | | | 6,093 | | | | 138 | |
Chart Industries, Inc. ‡ ^ | | | 14,519 | | | | 785 | |
EnPro Industries, Inc. ‡ ^ | | | 22,813 | | | | 752 | |
Robbins & Myers, Inc. | | | 16,490 | | | | 802 | |
Trimas Corp. ‡ ^ | | | 35,667 | | | | 640 | |
| | | | | | | | |
| | | Shares | | | Value
(000’s) | |
Machinery (continued) | |
Wabash National Corp. ‡ ^ | | | 80,637 | | | $ | 632 | |
Media - 0.3% | | | | | | | | |
Dolan Co. ‡ ^ | | | 41,230 | | | | 351 | |
Multiline Retail - 0.6% | |
PriceSmart, Inc. ^ | | | 8,835 | | | | 615 | |
Oil, Gas & Consumable Fuels - 5.0% | |
Comstock Resources, Inc. ‡ ^ | | | 27,266 | | | | 417 | |
Energy XXI Bermuda, Ltd. ‡ ^ | | | 17,800 | | | | 567 | |
GeoResources, Inc. ‡ | | | 28,263 | | | | 828 | |
Kodiak Oil & Gas Corp. ‡ ^ | | | 73,000 | | | | 694 | |
North American Energy Partners, Inc. ‡ | | | 58,053 | | | | 374 | |
Patriot Coal Corp. ‡ ^ | | | 40,900 | | | | 346 | |
Rex Energy Corp. ‡ ^ | | | 58,201 | | | | 859 | |
Rosetta Resources, Inc. ‡ | | | 16,525 | | | | 719 | |
Swift Energy Co. ‡ ^ | | | 18,700 | | | | 556 | |
Paper & Forest Products - 1.1% | |
Buckeye Technologies, Inc. ^ | | | 21,044 | | | | 704 | |
KapStone Paper and Packaging Corp. ‡ ^ | | | 30,800 | | | | 485 | |
Personal Products - 0.5% | |
Inter Parfums, Inc. ^ | | | 35,038 | | | | 545 | |
Pharmaceuticals - 4.1% | |
Akorn, Inc. ‡ ^ | | | 50,891 | | | | 566 | |
Cardiome Pharma Corp. ‡ ^ | | | 74,951 | | | | 197 | |
Depomed, Inc. ‡ ^ | | | 72,764 | | | | 377 | |
Hi-Tech Pharmacal Co., Inc. ‡ ^ | | | 6,400 | | | | 249 | |
Impax Laboratories, Inc. ‡ ^ | | | 43,921 | | | | 886 | |
Jazz Pharmaceuticals, Inc. ‡ ^ | | | 19,600 | | | | 757 | |
Nektar Therapeutics ‡ ^ | | | 78,244 | | | | 438 | |
Salix Pharmaceuticals, Ltd. ‡ ^ | | | 19,700 | | | | 942 | |
Professional Services - 2.2% | |
FTI Consulting, Inc. ‡ ^ | | | 20,000 | | | | 848 | |
Huron Consulting Group, Inc. ‡ ^ | | | 20,985 | | | | 813 | |
Mistras Group, Inc. ‡ ^ | | | 26,600 | | | | 678 | |
Real Estate Management & Development - 0.3% | |
Altisource Portfolio Solutions SA ‡ ^ | | | 6,300 | | | | 316 | |
Road & Rail - 2.0% | |
Genesee & Wyoming,
Inc. -Class A ‡ ^ | | | 9,100 | | | | 551 | |
Landstar System, Inc. ^ | | | 10,900 | | | | 522 | |
Marten Transport, Ltd. ^ | | | 20,523 | | | | 369 | |
Old Dominion Freight Line, Inc. ‡ ^ | | | 17,987 | | | | 730 | |
Semiconductors & Semiconductor Equipment - 6.0% | |
Cavium, Inc. ‡ ^ | | | 18,700 | | | | 532 | |
Diodes, Inc. ‡ ^ | | | 35,743 | | | | 760 | |
Ezchip Semiconductor, Ltd. ‡ ^ | | | 22,800 | | | | 646 | |
Kulicke & Soffa Industries, Inc. ‡ ^ | | | 49,600 | | | | 459 | |
Lattice Semiconductor Corp. ‡ ^ | | | 91,251 | | | | 542 | |
Mellanox Technologies, Ltd. ‡ ^ | | | 21,624 | | | | 703 | |
Mips Technologies, Inc. - Class A ‡ ^ | | | 88,700 | | | | 396 | |
Nova Measuring Instruments, Ltd. ‡ ^ | | | 57,000 | | | | 420 | |
NVE Corp. ‡ ^ | | | 9,483 | | | | 527 | |
Silicon Image, Inc. ‡ ^ | | | 115,800 | | | | 544 | |
TriQuint Semiconductor, Inc. ‡ ^ | | | 144,700 | | | | 705 | |
Volterra Semiconductor Corp. ‡ ^ | | | 13,600 | | | | 348 | |
Software - 7.8% | |
ACI Worldwide, Inc. ‡ | | | 28,367 | | | | 812 | |
BroadSoft, Inc. ‡ ^ | | | 18,507 | | | | 559 | |
Clicksoftware Technologies, Ltd. | | | 69,242 | | | | 664 | |
Commvault Systems, Inc. ‡ ^ | | | 17,791 | | | | 760 | |
Interactive Intelligence Group, Inc. ‡ ^ | | | 36,986 | | | | 848 | |
JDA Software Group, Inc. ‡ | | | 15,212 | | | | 493 | |
Mentor Graphics Corp. ‡ ^ | | | 49,000 | | | | 664 | |
Monotype Imaging Holdings, Inc. ‡ ^ | | | 26,500 | | | | 413 | |
Netscout Systems, Inc. ‡ ^ | | | 36,300 | | | | 639 | |
NICE Systems, Ltd. ADR ‡ | | | 20,463 | | | | 705 | |
OPNET Technologies, Inc. ^ | | | 25,448 | | | | 933 | |
Parametric Technology Corp. ‡ | | | 37,400 | | | | 683 | |
Ultimate Software Group, Inc. ‡ ^ | | | 6,173 | | | | 402 | |
Specialty Retail - 8.9% | |
Ascena Retail Group, Inc. ‡ ^ | | | 9,800 | | | | 291 | |
| | | | | | | | |
| | | Shares | | | Value
(000’s) | |
Specialty Retail (continued) | |
Body Central Corp. ‡ ^ | | | 18,200 | | | $ | 454 | |
Buckle, Inc. ^ | | | 16,600 | | | | 678 | |
Casual Male Retail Group, Inc. ‡ ^ | | | 141,198 | | | | 483 | |
Chico’s FAS, Inc. ^ | | | 51,600 | | | | 575 | |
Express, Inc. ‡ | | | 38,126 | | | | 760 | |
Finish Line, Inc. - Class A ^ | | | 30,900 | | | | 596 | |
Genesco, Inc. ‡ ^ | | | 11,044 | | | | 682 | |
Hibbett Sports, Inc. ‡ ^ | | | 12,248 | | | | 553 | |
JOS A. Bank Clothiers, Inc. ‡ ^ | | | 2,171 | | | | 106 | |
Lithia Motors,
Inc. - Class A ^ | | | 29,913 | | | | 654 | |
Pier 1 Imports, Inc. ‡ ^ | | | 61,500 | | | | 858 | |
Rent-A-Center, Inc. ^ | | | 21,200 | | | | 784 | |
Rush Enterprises, Inc. -Class A ‡ ^ | | | 25,683 | | | | 537 | |
Select Comfort Corp. ‡ ^ | | | 40,900 | | | | 888 | |
Vitamin Shoppe, Inc. ‡ ^ | | | 20,682 | | | | 825 | |
Textiles, Apparel & Luxury Goods - 3.1% | |
CROCS, Inc. ‡ ^ | | | 29,300 | | | | 433 | |
Iconix Brand Group, Inc. ‡ | | | 44,400 | | | | 723 | |
Maidenform Brands, Inc. ‡ ^ | | | 14,900 | | | | 273 | |
Perry Ellis International, Inc. ‡ ^ | | | 28,806 | | | | 410 | |
Steven Madden, Ltd. ‡ ^ | | | 22,699 | | | | 783 | |
Wolverine World Wide, Inc. ^ | | | 21,000 | | | | 748 | |
Trading Companies & Distributors - 1.0% | |
Beacon Roofing Supply, Inc. ‡ ^ | | | 33,630 | | | | 680 | |
DXP Enterprises, Inc. ‡ ^ | | | 12,920 | | | | 416 | |
| | | | | | | | |
Total Common Stocks
(cost $104,057) | | | | | | | 108,343 | |
| | | | | | | | |
WARRANTS - 0.0% ¥ | | | | | | | | |
Hotels, Restaurants & Leisure - 0.0% ¥ | |
Krispy Kreme Doughnuts, Inc. ‡ | | | | | | | | |
Expiration: 03/02/2012 | | | | | | | | |
Exercise Price: $12.21 | | | 141 | | | | ¿ | |
Magnum Hunter Resources ‡ ^ | | | | | | | | |
Expiration: 10/14/2013 | | | | | | | | |
Exercise Price: $10.50 | | | 10,092 | | | | ¿ | |
| | | | | | | | |
Total Warrants
(cost $¿) | | | | | | | ¿ | |
| | | | | | | | |
SECURITIES LENDING COLLATERAL - 25.7% | |
State Street Navigator Securities Lending Trust - Prime Portfolio, 0.28% p | | | 27,748,519 | | | | 27,749 | |
Total Securities Lending Collateral
(cost $27,749) | | | | | | | | |
| | |
| | | Principal
(000’s) | | | Value
(000’s) | |
REPURCHASE AGREEMENT - 0.3% | |
State Street Bank & Trust Co. 0.03% p, dated 12/30/2011, to be repurchased at $277 on 01/03/2012. Collateralized by a U.S. Government Agency Obligation, 3.00%, due 11/25/2040, and with
a value of $286. | | $ | 277 | | | | 277 | |
Total Repurchase Agreement
(cost $277) | |
| | | | | | | | |
Total Investment Securities
(cost $132,083) P | | | | | | | 136,369 | |
Other Assets and Liabilities - Net | | | | | | | (28,245 | ) |
| | | | | | | | |
Net Assets | | | | | | $ | 108,124 | |
| | | | | | | | |
NOTES TO SCHEDULE OF INVESTMENTS (all amounts in thousands):
| ^ | All or a portion of this security is on loan. The value of all securities on loan is $27,054. |
| ‡ | Non-income producing security. |
| ¥ | Percentage rounds to less than 0.1%. |
| p | Rate shown reflects the yield at 12/30/2011. |
| P | Aggregate cost for federal income tax purposes is $133,239. Aggregate gross unrealized appreciation/depreciation for all securities in which there is an excess of value over tax cost were $11,154 and $8,024, respectively. Net unrealized appreciation for tax purposes is $3,130. |
DEFINITION:
| ADR | American Depositary Receipt |
VALUATION SUMMARY (all amounts in thousands):
| | | | | | | | | | | | | | | | |
Investment Securities | | Level 1 -
Quoted
Prices | | | Level 2 -
Other
Significant
Observable
Inputs | | | Level 3 -
Significant
Unobservable
Inputs | | | Value at
12/31/2011 | |
Common Stocks | | $ | 102,107 | | | $ | 6,236 | | | $ | — | | | $ | 108,343 | |
Repurchase Agreements | | | — | | | | 277 | | | | — | | | | 277 | |
Securities Lending Collateral | | | 27,749 | | | | — | | | | — | | | | 27,749 | |
Warrants | | | ¿ | | | | ¿ | | | | — | | | | ¿ | |
Total | | $ | 129,856 | | | $ | 6,513 | | | $ | — | | | $ | 136,369 | |
| See the notes to the financial statements for more information regarding pricing inputs and valuation techniques. |
| | | | | | | | |
| | | Shares | | | Value
(000’s) | |
PREFERRED STOCK - 1.8% | |
Germany - 1.8% | | | | | | | | |
Volkswagen AG , 1.95% p | | | 80,877 | | | $ | 12,116 | |
Total Preferred Stock (cost $7,303) | | | | | |
COMMON STOCKS - 94.1% | |
Australia - 1.5% | | | | | | | | |
BHP Billiton, Ltd. | | | 281,401 | | | | 9,907 | |
Brazil - 2.5% | | | | | | | | |
BM&FBOVESPA SA | | | 950,300 | | | | 4,993 | |
Embraer SA ADR ‡ ^ | | | 225,400 | | | | 5,685 | |
Natura Cosmeticos SA | | | 362,400 | | | | 7,045 | |
Canada - 6.1% | | | | | | | | |
Canadian National Railway Co. | | | 165,950 | | | | 13,056 | |
Canadian Natural Resources, Ltd. ^ | | | 267,700 | | | | 10,025 | |
Cenovus Energy, Inc. | | | 220,688 | | | | 7,328 | |
Potash Corp., of Saskatchewan, Inc. | | | 257,100 | | | | 10,613 | |
Cayman Islands - 1.0% | | | | | | | | |
Tencent Holdings, Ltd. | | | 322,118 | | | | 6,470 | |
China - 4.3% | | | | | | | | |
China Life Insurance Co., Ltd. - Class H | | | 2,293,157 | | | | 5,675 | |
China Merchants Bank Co., Ltd. - Class H | | | 4,696,845 | | | | 9,495 | |
Industrial & Commercial Bank of China - Class H | | | 13,207,300 | | | | 7,856 | |
Sinopharm Group Co., Ltd. - Class H | | | 2,458,090 | | | | 5,899 | |
Denmark - 2.4% | | | | | | | | |
Novo Nordisk A/S - Class B | | | 146,364 | | | | 16,819 | |
France - 6.6% | | | | | | | | |
Air Liquide SA | | | 112,149 | | | | 13,875 | |
LVMH Moet Hennessy Louis Vuitton SA | | | 118,733 | | | | 16,812 | |
Publicis Groupe SA ^ | | | 218,554 | | | | 10,054 | |
Vallourec SA | | | 65,300 | | | | 4,239 | |
Germany - 10.3% | | | | | | | | |
Adidas AG | | | 233,677 | | | | 15,200 | |
Allianz SE | | | 103,200 | | | | 9,872 | |
Fresenius Medical Care AG & Co., KGaA | | | 209,289 | | | | 14,221 | |
SAP AG | | | 328,960 | | | | 17,392 | |
Siemens AG | | | 140,600 | | | | 13,455 | |
Hong Kong - 3.7% | |
CNOOC, Ltd. | | | 7,502,847 | | | | 13,157 | |
Hong Kong Exchanges & Clearing, Ltd. | | | 749,000 | | | | 12,026 | |
Ireland - 1.4% | | | | | | | | |
Covidien PLC | | | 210,600 | | | | 9,479 | |
Israel - 3.2% | | | | | | | | |
Check Point Software Technologies, Ltd. ‡^ | | | 154,256 | | | | 8,105 | |
Teva Pharmaceutical Industries, Ltd. ADR | | | 330,494 | | | | 13,339 | |
Japan - 11.1% | | | | | | | | |
Canon, Inc. ^ | | | 250,424 | | | | 11,095 | |
Dai-ichi Life Insurance Co., Ltd. ^ | | | 4,777 | | | | 4,698 | |
Fanuc Corp. | | | 52,796 | | | | 8,080 | |
KDDI Corp. | | | 1,643 | | | | 10,566 | |
Komatsu, Ltd. | | | 599,004 | | | | 14,001 | |
Mitsubishi UFJ Financial Group, Inc. ^ | | | 3,050,100 | | | | 12,958 | |
Toyota Motor Corp. | | | 422,391 | | | | 14,076 | |
Korea, Republic of - 2.0% | | | | | | | | |
Hyundai Motor Co. ‡ | | | 74,030 | | | | 13,712 | |
Mexico - 1.5% | | | | | | | | |
Wal-Mart de Mexico SAB de CV- Series V ^ | | | 3,824,400 | | | | 10,496 | |
Netherlands - 0.5% | | | | | | | | |
Yandex NV - Class A ‡ ^ | | | 184,000 | | | | 3,625 | |
Netherland Antilles - 2.2% | | | | | | | | |
Schlumberger, Ltd. | | | 219,800 | | | | 15,015 | |
Sweden - 2.3% | | | | | | | | |
Hennes & Mauritz AB - Class B | | | 381,671 | | | | 12,273 | |
Svenska Handelsbanken AB - Class A | | | 133,100 | | | | 3,501 | |
Switzerland - 8.3% | | | | | | | | |
Credit Suisse Group AG ‡ | | | 450,800 | | | | 10,592 | |
Julius Baer Group, Ltd. ‡ | | | 173,596 | | | | 6,790 | |
| | | | | | | | |
| | | Shares | | | Value
(000’s) | |
Switzerland (continued) | |
Nestle SA | | | 312,854 | | | $ | 17,986 | |
Novartis AG | | | 291,371 | | | | 16,657 | |
Swatch Group AG | | | 12,040 | | | | 4,506 | |
Taiwan - 0.6% | | | | | | | | |
High Tech Computer Corp. | | | 247,960 | | | | 4,070 | |
Turkey - 0.9% | | | | | | | | |
Turkiye Garanti Bankasi AS | | | 1,913,300 | | | | 5,961 | |
United Kingdom - 21.7% | | | | | | | | |
ARM Holdings PLC | | | 796,819 | | | | 7,326 | |
BG Group PLC | | | 737,186 | | | | 15,760 | |
British American Tobacco PLC | | | 387,073 | | | | 18,367 | |
Carnival PLC | | | 364,198 | | | | 12,025 | |
Kingfisher PLC | | | 2,745,210 | | | | 10,688 | |
Pearson PLC | | | 426,637 | | | | 8,017 | |
Reckitt Benckiser Group PLC | | | 292,934 | | | | 14,467 | |
Rolls-Royce Holdings PLC ‡ | | | 463,240 | | | | 5,370 | |
SABMiller PLC | | | 251,757 | | | | 8,862 | |
Standard Chartered PLC | | | 735,968 | | | | 16,103 | |
Tesco PLC | | | 2,632,557 | | | | 16,495 | |
Vodafone Group PLC | | | 5,013,060 | | | | 13,928 | |
| | | | | | | | |
Total Common Stocks
(cost $562,602) | | | | | | | 640,158 | |
| | | | | | | | |
SECURITIES LENDING COLLATERAL - 4.8% | |
State Street Navigator Securities Lending Trust - Prime Portfolio, 0.28% p | | | 32,734,310 | | | | 32,734 | |
Total Securities Lending Collateral
(cost $32,734) | | | | | | | | |
| | |
| | | Principal
(000’s) | | | Value
(000’s) | |
REPURCHASE AGREEMENT - 3.2% | |
State Street Bank & Trust Co. | | | | | | | | |
0.03% p, dated 12/30/2011, to be repurchased at $21,450 on 01/03/2012. Collateralized by a U.S. Government Agency Obligation, 3.00%, due 11/25/2040, and with a value of $21,884. | | $ | 21,450 | | | | 21,450 | |
Total Repurchase Agreement
(cost $21,450) | |
| | | | | | | | |
Total Investment Securities
(cost $624,089) P | | | | | | | 706,458 | |
Other Assets and Liabilities - Net | | | | | | | (26,288 | ) |
| | | | | | | | |
Net Assets | | | | | | $ | 680,170 | |
| | | | | | | | |
| | | | | | | | |
INVESTMENTS BY INDUSTRY (unaudited): | | Percentage of
Total Investments | | | Value
(000’s) | |
Commercial Banks | | | 7.9 | % | | $ | 55,875 | |
Pharmaceuticals | | | 6.6 | | | | 46,816 | |
Oil, Gas & Consumable Fuels | | | 6.5 | | | | 46,270 | |
Automobiles | | | 5.6 | | | | 39,905 | |
Textiles, Apparel & Luxury Goods | | | 5.2 | | | | 36,517 | |
Food & Staples Retailing | | | 3.8 | | | | 26,991 | |
Machinery | | | 3.7 | | | | 26,320 | |
Software | | | 3.6 | | | | 25,497 | |
Wireless Telecommunication Services | | | 3.5 | | | | 24,494 | |
Chemicals | | | 3.5 | | | | 24,488 | |
Specialty Retail | | | 3.3 | | | | 22,961 | |
Insurance | | | 2.9 | | | | 20,245 | |
Health Care Providers & Services | | | 2.8 | | | | 20,120 | |
Tobacco | | | 2.6 | | | | 18,367 | |
Media | | | 2.6 | | | | 18,071 | |
Food Products | | | 2.5 | | | | 17,986 | |
Capital Markets | | | 2.5 | | | | 17,382 | |
Diversified Financial Services | | | 2.4 | | | | 17,019 | |
Energy Equipment & Services | | | 2.1 | | | | 15,015 | |
Household Products | | | 2.0 | | | | 14,467 | |
Industrial Conglomerates | | | 1.9 | | | | 13,455 | |
Road & Rail | | | 1.8 | | | | 13,056 | |
Hotels, Restaurants & Leisure | | | 1.7 | | | | 12,025 | |
Office Electronics | | | 1.6 | | | | 11,094 | |
Aerospace & Defense | | | 1.6 | | | | 11,055 | |
Internet Software & Services | | | 1.4 | | | | 10,095 | |
Metals & Mining | | | 1.4 | | | | 9,907 | |
Health Care Equipment & Supplies | | | 1.3 | | | | 9,479 | |
Beverages | | | 1.3 | | | | 8,861 | |
Semiconductors & Semiconductor Equipment | | | 1.0 | | | | 7,326 | |
Personal Products | | | 1.0 | | | | 7,045 | |
Communications Equipment | | | 0.6 | | | | 4,070 | |
| | | | | | | | |
Investment Securities, at Value | | | 92.2 | | | | 652,274 | |
Short-Term Investments | | | 7.8 | | | | 54,184 | |
| | | | | | | | |
Total Investments | | | 100.0 | % | | $ | 706,458 | |
| | | | | | | | |
| | | | | | | | | | | | | | | | |
| FORWARD FOREIGN CURRENCY CONTRACTS: | |
| | | | | |
Currency | | Counterparty | | Contracts
Bought/
(Sold)
(000’s) | | | Settlement Date | | Amount in U.S.
Dollars Bought/
(Sold) (000’s) | | | Net Unrealized
Appreciation/
(Depreciation)
(000’s) | |
Euro | | SSB | | | (20,023 | ) | | 01/23/2012 | | $ | (26,163 | ) | | $ | 245 | |
Euro | | SSB | | | (28,539 | ) | | 05/09/2012 | | | (39,183 | ) | | | 2,196 | |
| | | | | | | | | | | | | | | | |
| | | | | | | | | | | | | | $ | 2,441 | |
| | | | | | | | | | | | | | | | |
Collateral (Received) Pledged for OTC Financial Derivative Instruments
The following is a summary by counterparty of the market value of OTC financial derivative instruments and collateral (received)/pledged as of 12/31/2011:
| | | | | | | | | | | | |
Counterparty | | Total Market Value of OTC
Derivatives (000’s) | | | Collateral
(Received)/Pledged
(000’s) | | | Net Exposures (1)
(000’s) | |
SSB | | $ | 2,441 | | | $ | — | | | $ | 2,441 | |
| | | | | | | | | | | | |
| (1) | Net exposure represents the net receivable/(payable) that would be due from/to the counterparty in the event of default. |
NOTES TO SCHEDULE OF INVESTMENTS (all amounts in thousands):
| p | Rate shown reflects the yield at 12/30/2011. |
| ^ | All or a portion of this security is on loan. The value of all securities on loan is $31,228. |
| ‡ | Non-income producing security. |
| Aggregate cost for federal income tax purposes is $626,298. Aggregate gross unrealized appreciation/depreciation for all securities in which there is an excess of value over tax cost were $127,303 and $47,143, respectively. Net unrealized appreciation for tax purposes is $80,160. |
DEFINITION:
| ADR | American Depositary Receipt |
| SSB | State Street Bank & Trust Co. |
VALUATION SUMMARY (all amounts in thousands):
| | | | | | | | | | | | | | | | |
Investment Securities | | Level 1 -
Quoted
Prices | | | Level 2 -
Other
Significant
Observable
Inputs | | | Level 3 -
Significant
Unobservable
Inputs | | | Value at
12/31/2011 | |
Common Stocks | | $ | 90,726 | | | $ | 549,432 | | | $ | — | | | $ | 640,158 | |
Preferred Stocks | | | — | | | | 12,116 | | | | — | | | | 12,116 | |
Repurchase Agreements | | | — | | | | 21,450 | | | | — | | | | 21,450 | |
Securities Lending Collateral | | | 32,734 | | | | — | | | | — | | | | 32,734 | |
| | | | | | | | | | | | | | | | |
Total | | $ | 123,460 | | | $ | 582,998 | | | $ | — | | | $ | 706,458 | |
| | | | | | | | | | | | | | | | |
| | | | | | | | | | | | | | | | |
Other Financial Instruments | | Level 1 -
Quoted
Prices | | | Level 2 -
Other
Significant
Observable
Inputs | | | Level 3 -
Significant
Unobservable
Inputs | | | Value at
12/31/2011 | |
Forward Foreign Currency Contracts - Appreciation | | $ | — | | | $ | 2,441 | | | $ | — | | | $ | 2,441 | |
| | | | | | | | | | | | | | | | |
| See the notes to the financial statements for more information regarding pricing inputs and valuation techniques. |
| Other financial instruments are derivative instruments that are valued at unrealized appreciation / (depreciation) on the instrument. |
| | | | | | | | | | | | | | | | | | | | | | | | |
| | | Money Market | | | High Quality
Bond | | | Inflation-
Protected
Securities | | | Core Bond | | | High Yield Bond | | | Balanced | |
Assets: | | | | | | | | | | | | | | | | | | | | | | | | |
Investment securities, at value | | $ | 807,865 | | | $ | 475,982 | | | $ | 345,642 | | | $ | 1,800,735 | | | $ | 710,790 | | | $ | 128,760 | |
Repurchase agreements, at value | | | 172,832 | | | | 15,687 | | | | 15,358 | | | | 116,415 | | | | 5,260 | | | | 3,895 | |
Cash on deposit with broker | | | — | | | | — | | | | — | | | | — | | | | — | | | | 87 | |
Cash | | | — | | | | 42 | | | | — | | | | — | | | | 230 | | | | — | |
Foreign currency, at value | | | — | | | | — | | | | 326 | | | | 2,046 | | | | — | | | | 35 | |
Unrealized appreciation on forward foreign currency contracts | | | — | | | | — | | | | 119 | | | | 1,841 | | | | — | | | | 42 | |
Unrealized appreciation on swap agreements | | | — | | | | — | | | | 789 | | | | 3,324 | | | | — | | | | — | |
Premium paid on swap agreements | | | — | | | | — | | | | — | (A) | | | 2,128 | | | | — | | | | — | |
Receivables: | | | | | | | | | | | | | | | | | | | | | | | | |
Due from advisor | | | — | | | | — | | | �� | 1 | | | | — | | | | — | | | | 6 | |
Investment securities sold | | | 14,700 | | | | — | | | | 2,254 | | | | 607,275 | | | | 145 | | | | 19,332 | |
Interest | | | 532 | | | | 2,587 | | | | 2,029 | | | | 11,760 | | | | 13,279 | | | | 299 | |
Dividends | | | — | | | | — | | | | — | | | | — | | | | — | | | | 103 | |
Securities lending income (net) | | | — | | | | 8 | | | | 1 | | | | 16 | | | | — | | | | 4 | |
Variation margin | | | — | | | | — | | | | 1 | | | | 11 | | | | — | | | | — | |
Other | | | — | | | | — | | | | 21 | | | | 3 | | | | — | | | | — | |
Prepaid expenses | | | 1 | | | | — | (A) | | | — | (A) | | | 2 | | | | 1 | | | | — | (A) |
| | | | | | | | | | | | | | | | | | | | | | | | |
| | | 995,930 | | | | 494,306 | | | | 366,541 | | | | 2,545,556 | | | | 729,705 | | | | 152,563 | |
| | | | | | | | | | | | | | | | | | | | | | | | |
Liabilities: | | | | | | | | | | | | | | | | | | | | | | | | |
Cash on deposit with broker | | | — | | | | — | | | | — | | | | 1,220 | | | | — | | | | — | |
Accounts payable and accrued liabilities: | | | | | | | | | | | | | | | | | | | | | | | | |
Collateral for securities on loan | | | — | | | | 35,892 | | | | 2,716 | | | | 60,688 | | | | — | | | | 19,659 | |
Due to advisor | | | — | | | | — | | | | — | | | | — | | | | — | (A) | | | — | |
Investment securities purchased | | | — | | | | — | | | | 1,148 | | | | 635,066 | | | | — | | | | 21,821 | |
Variation margin | | | — | | | | — | | | | — | | | | — | | | | — | | | | 2 | |
Advisory fees | | | 209 | | | | 136 | | | | 107 | | | | 471 | | | | 341 | | | | 40 | |
Trustee fees | | | 4 | | | | 2 | | | | 2 | | | | 7 | | | | 3 | | | | — | (A) |
Custody fees | | | 38 | | | | 18 | | | | 25 | | | | 124 | | | | 46 | | | | 37 | |
Interest and Dividends from securities sold short | | | — | | | | — | | | | — | | | | 316 | | | | — | | | | 9 | |
Audit and tax fees | | | 18 | | | | 18 | | | | 20 | | | | 22 | | | | 20 | | | | 20 | |
Legal fees | | | 23 | | | | 11 | | | | 12 | | | | 41 | | | | 17 | | | | 2 | |
Other | | | 9 | | | | 1 | | | | 1 | | | | — | | | | 2 | | | | 1 | |
Unrealized depreciation on swap agreements | | | — | | | | — | | | | 592 | | | | 2,761 | | | | — | | | | — | |
Premium received on swap agreements | | | — | | | | — | | | | 148 | | | | 4,186 | | | | — | | | | — | |
Securities sold short, at value | | | — | | | | — | | | | — | | | | 245,867 | | | | — | | | | 6,848 | |
Written options and swaptions, at value | | | — | | | | — | | | | 3,170 | | | | 5,707 | | | | — | | | | — | |
Unrealized depreciation on forward foreign currency contracts | | | — | | | | — | | | | 56 | | | | 489 | | | | — | | | | 13 | |
| | | | | | | | | | | | | | | | | | | | | | | | |
| | | 301 | | | | 36,078 | | | | 7,997 | | | | 956,965 | | | | 429 | | | | 48,452 | |
| | | | | | | | | | | | | | | | | | | | | | | | |
Net Assets | | $ | 995,629 | | | $ | 458,228 | | | $ | 358,544 | | | $ | 1,588,591 | | | $ | 729,276 | | | $ | 104,111 | |
| | | | | | | | | | | | | | | | | | | | | | | | |
Investment securities, at cost | | $ | 807,865 | | | $ | 472,738 | | | $ | 325,339 | | | $ | 1,799,909 | | | $ | 724,019 | | | $ | 131,081 | |
Repurchase agreements, at cost | | $ | 172,832 | | | $ | 15,687 | | | $ | 15,358 | | | $ | 116,415 | | | $ | 5,260 | | | $ | 3,895 | |
Foreign currency, at cost | | $ | — | | | $ | — | | | $ | 324 | | | $ | 1,907 | | | $ | — | | | $ | 35 | |
Securities loaned, at value | | $ | — | | | $ | 35,154 | | | $ | 2,662 | | | $ | 59,439 | | | $ | — | | | $ | 19,226 | |
Proceeds from securities sold short | | $ | — | | | $ | — | | | $ | — | | | $ | 244,044 | | | $ | — | | | $ | 6,799 | |
Premium on written options and swaptions | | $ | — | | | $ | — | | | $ | 1,840 | | | $ | 3,930 | | | $ | — | | | $ | — | |
| | | | | | | | | | | | | | | | | | | | | | | | |
| | | | | | | | | | | | | | | | | | | | | | | | |
| | | Large Value | | | Large Core | | | Large Growth | | | Mid Value | | | Mid Growth | | | Small Value | |
Assets: | | | | | | | | | | | | | | | | | | | | | | | | |
Investment securities, at value | | $ | 898,379 | | | $ | 238,081 | | | $ | 1,047,206 | | | $ | 764,677 | | | $ | 259,195 | | | $ | 127,921 | |
Repurchase agreements, at value | | | 11,609 | | | | 4,490 | | | | 4,105 | | | | 16,111 | | | | 637 | | | | 2,713 | |
Cash | | | — | | | | — | | | | — | | | | 65 | | | | — | | | | — | |
Foreign currency, at value | | | — | | | | — | | | | 2 | | | | — | | | | — | | | | — | |
Receivables: | | | | | | | | | | | | | | | | | | | | | | | | |
Due from advisor | | | — | | | | — | | | | — | | | | 1 | | | | 3 | | | | — | (A) |
Investment securities sold | | | 110 | | | | 151 | | | | 4,697 | | | | 6,816 | | | | — | | | | 112 | |
Interest | | | — | (A) | | | — | (A) | | | — | (A) | | | — | (A) | | | — | (A) | | | — | (A) |
Dividends | | | 1,299 | | | | 333 | | | | 697 | | | | 1,259 | | | | 48 | | | | 144 | |
Dividend reclaims | | | — | | | | — | | | | 80 | | | | 19 | | | | — | | | | — | |
Securities lending income (net) | | | 11 | | | | 3 | | | | 35 | | | | 12 | | | | 13 | | | | 7 | |
Other | | | 4 | | | | — | | | | 5 | | | | — | | | | — | | | | — | |
Prepaid expenses | | | 1 | | | | — | (A) | | | 1 | | | | 1 | | | | — | (A) | | | — | (A) |
| | | | | | | | | | | | | | | | | | | | | | | | |
| | | 911,413 | | | | 243,058 | | | | 1,056,828 | | | | 788,961 | | | | 259,896 | | | | 130,897 | |
| | | | | | | | | | | | | | | | | | | | | | | | |
Liabilities: | | | | | | | | | | | | | | | | | | | | | | | | |
Accounts payable and accrued liabilities: | | | | | | | | | | | | | | | | | | | | | | | | |
Collateral for securities on loan | | | 33,249 | | | | 7,698 | | | | 35,782 | | | | 37,587 | | | | 53,129 | | | | 26,705 | |
Due to advisor | | | — | | | | — | | | | 11 | | | | — | | | | — | | | | — | |
Investment securities purchased | | | — | | | | — | | | | 4,095 | | | | 2,038 | | | | — | | | | 134 | |
Advisory fees | | | 332 | | | | 119 | | | | 541 | | | | 432 | | | | 130 | | | | 73 | |
Trustee fees | | | 4 | | | | 1 | | | | 5 | | | | 3 | | | | 1 | | | | — | (A) |
Custody fees | | | 23 | | | | 8 | | | | 43 | | | | 27 | | | | 10 | | | | 6 | |
Audit and tax fees | | | 19 | | | | 20 | | | | 20 | | | | 18 | | | | 18 | | | | 18 | |
Legal fees | | | 20 | | | | 5 | | | | 24 | | | | 18 | | | | 5 | | | | 2 | |
Other | | | — | | | | 3 | | | | — | (A) | | | 3 | | | | 1 | | | | 1 | |
| | | | | | | | | | | | | | | | | | | | | | | | |
| | | 33,647 | | | | 7,854 | | | | 40,521 | | | | 40,126 | | | | 53,294 | | | | 26,939 | |
| | | | | | | | | | | | | | | | | | | | | | | | |
Net Assets | | $ | 877,766 | | | $ | 235,204 | | | $ | 1,016,307 | | | $ | 748,835 | | | $ | 206,602 | | | $ | 103,958 | |
| | | | | | | | | | | | | | | | | | | | | | | | |
Investment securities, at cost | | $ | 829,372 | | | $ | 217,003 | | | $ | 958,514 | | | $ | 711,961 | | | $ | 243,299 | | | $ | 115,713 | |
Repurchase agreements, at cost | | $ | 11,609 | | | $ | 4,490 | | | $ | 4,105 | | | $ | 16,111 | | | $ | 637 | | | $ | 2,713 | |
Foreign currency, at cost | | $ | — | | | $ | — | | | $ | 2 | | | $ | — | | | $ | — | | | $ | — | |
Securities loaned, at value | | $ | 32,518 | | | $ | 7,513 | | | $ | 34,987 | | | $ | 36,716 | | | $ | 51,980 | | | $ | 26,051 | |
| | | | | | | | | | | | | | | | | | | | | | | | |
| | | | | | | | | | | | |
| | | Small Core | | | Small Growth | | | International
Equity | |
Assets: | | | | | | | | | | | | |
Investment securities, at value | | $ | 367,818 | | | $ | 136,092 | | | $ | 685,008 | |
Repurchase agreements, at value | | | 4,216 | | | | 277 | | | | 21,450 | |
Cash | | | — | | | | — | | | | 9 | |
Foreign currency, at value | | | — | | | | — | | | | 37 | |
Unrealized appreciation on forward foreign currency contracts | | | — | | | | — | | | | 2,441 | |
Receivables: | | | | | | | | | | | | |
Due from advisor | | | — | | | | 7 | | | | — | |
Investment securities sold | | | 94 | | | | 290 | | | | 77 | |
Interest | | | — | (A) | | | — | (A) | | | — | (A) |
Dividends | | | 317 | | | | 40 | | | | 877 | |
Dividend reclaims | | | — | | | | — | | | | 3,567 | |
Securities lending income (net) | | | 32 | | | | 8 | | | | 28 | |
Prepaid expenses | | | — | (A) | | | — | (A) | | | 1 | |
| | | | | | | | | | | | |
| | | 372,477 | | | | 136,714 | | | | 713,495 | |
| | | | | | | | | | | | |
Liabilities: | | | | | | | | | | | | |
Accounts payable and accrued liabilities: | | | | | | | | | | | | |
Collateral for securities on loan | | | 75,961 | | | | 27,749 | | | | 32,734 | |
Investment securities purchased | | | 206 | | | | 726 | | | | — | (A) |
Variation margin | | | 3 | | | | — | | | | — | |
Advisory fees | | | 201 | | | | 81 | | | | 439 | |
Trustee fees | | | 1 | | | | — | (A) | | | 3 | |
Custody fees | | | 18 | | | | 13 | | | | 102 | |
Audit and tax fees | | | 18 | | | | 18 | | | | 23 | |
Legal fees | | | 7 | | | | 2 | | | | 20 | |
Other | | | 2 | | | | 1 | | | | 4 | |
| | | | | | | | | | | | |
| | | 76,417 | | | | 28,590 | | | | 33,325 | |
| | | | | | | | | | | | |
Net Assets | | $ | 296,060 | | | $ | 108,124 | | | $ | 680,170 | |
| | | | | | | | | | | | |
Investment securities, at cost | | $ | 330,296 | | | $ | 131,806 | | | $ | 602,639 | |
Repurchase agreements, at cost | | $ | 4,216 | | | $ | 277 | | | $ | 21,450 | |
Foreign currency, at cost | | $ | — | | | $ | — | | | $ | 37 | |
Securities loaned, at value | | $ | 74,054 | | | $ | 27,054 | | | $ | 31,228 | |
| | | | | | | | | | | | |
| (A) | Rounds to less than $1. |
| | | | | | | | | | | | | | | | | | | | | | | | |
| | | Money Market | | | High Quality
Bond | | | Inflation-
Protected
Securities | | | Core Bond | | | High Yield Bond | | | Balanced | |
Investment income: | | | | | | | | | | | | | | | | | | | | | | | | |
Interest income | | $ | 2,365 | | | $ | 13,222 | | | $ | 12,809 | | | $ | 61,478 | | | $ | 62,425 | | | $ | 1,707 | |
Securities lending income (net) | | | — | | | | 49 | | | | 37 | | | | 188 | | | | — | | | | 36 | |
Dividend income | | | — | | | | — | | | | — | | | | 48 | | | | 342 | | | | 1,345 | |
Withholding taxes on foreign income | | | — | | | | — | | | | — | | | | — | | | | (18 | ) | | | — | (A) |
| | | | | | | | | | | | | | | | | | | | | | | | |
| | | 2,365 | | | | 13,271 | | | | 12,846 | | | | 61,714 | | | | 62,749 | | | | 3,088 | |
| | | | | | | | | | | | | | | | | | | | | | | | |
Expenses: | | | | | | | | | | | | | | | | | | | | | | | | |
Advisory | | | 2,516 | | | | 1,656 | | | | 1,215 | | | | 5,492 | | | | 4,003 | | | | 504 | |
Custody | | | 151 | | | | 70 | | | | 95 | | | | 509 | | | | 169 | | | | 157 | |
Audit and tax | | | 16 | | | | 16 | | | | 18 | | | | 20 | | | | 18 | | | | 18 | |
Legal | | | 63 | | | | 31 | | | | 31 | | | | 106 | | | | 46 | | | | 7 | |
Printing and shareholder reports | | | 4 | | | | 1 | | | | 1 | | | | 3 | | | | 2 | | | | — | (A) |
Trustee and CCO | | | 21 | | | | 10 | | | | 7 | | | | 33 | | | | 15 | | | | 2 | |
Other | | | 30 | | | | 8 | | | | 6 | | | | 27 | | | | 12 | | | | 2 | |
| | | | | | | | | | | | | | | | | | | | | | | | |
Total expenses | | | 2,801 | | | | 1,792 | | | | 1,373 | | | | 6,190 | | | | 4,265 | | | | 690 | |
| | | | | | | | | | | | | | | | | | | | | | | | |
Expenses reimbursed/waived | | | — | | | | — | | | | — | | | | — | | | | — | | | | (130 | ) |
| | | | | | | | | | | | | | | | | | | | | | | | |
Net expenses | | | 2,801 | | | | 1,792 | | | | 1,373 | | | | 6,190 | | | | 4,265 | | | | 560 | |
| | | | | | | | | | | | | | | | | | | | | | | | |
Net investment income (loss) | | | (436 | ) | | | 11,479 | | | | 11,473 | | | | 55,524 | | | | 58,484 | | | | 2,528 | |
| | | | | | | | | | | | | | | | | | | | | | | | |
Net realized gain (loss) on transactions from: | | | | | | | | | | | | | | | | | | | | | | | | |
Investment securities | | | 8 | | | | 483 | | | | 23,949 | | | | 50,263 | | | | 9,982 | | | | 6,223 | |
Swap agreements | | | — | | | | — | | | | (229 | ) | | | 1,689 | | | | — | | | | — | |
Futures contracts | | | — | | | | — | | | | (6,532 | ) | | | 1,471 | | | | — | | | | 89 | |
Written option and swaption contracts | | | — | | | | — | | | | 906 | | | | (11,446 | ) | | | — | | | | 58 | |
Foreign currency transactions | | | — | | | | — | | | | (241 | ) | | | (522 | ) | | | — | | | | (3 | ) |
Securities sold short | | | — | | | | — | | | | — | | | | (249 | ) | | | — | | | | (2 | ) |
| | | | | | | | | | | | | | | | | | | | | | | | |
| | | 8 | | | | 483 | | | | 17,853 | | | | 41,206 | | | | 9,982 | | | | 6,365 | |
| | | | | | | | | | | | | | | | | | | | | | | | |
Net increase (decrease) in unrealized appreciation (depreciation) on: | | | | | | | | | | | | | | | | | | | | | | | | |
Investment securities | | | — | | | | (1,728 | ) | | | 12,704 | | | | (313 | ) | | | (34,284 | ) | | | (5,173 | ) |
Swap agreements | | | — | | | | — | | | | 186 | | | | (1,656 | ) | | | — | | | | — | |
Futures contracts | | | — | | | | — | | | | (326 | ) | | | 2,390 | | | | — | | | | 131 | |
Written option and swaption contracts | | | — | | | | — | | | | (1,401 | ) | | | (2,268 | ) | | | — | | | | 3 | |
Securities sold short | | | — | | | | — | | | | — | | | | (2,243 | ) | | | — | | | | (67 | ) |
Translation of assets and liabilities denominated in foreign currencies | | | — | | | | — | | | | 42 | | | | 1,384 | | | | — | | | | 28 | |
| | | | | | | | | | | | | | | | | | | | | | | | |
| | | — | | | | (1,728 | ) | | | 11,205 | | | | (2,706 | ) | | | (34,284 | ) | | | (5,078 | ) |
| | | | | | | | | | | | | | | | | | | | | | | | |
Net realized and unrealized gain (loss) | | | 8 | | | | (1,245 | ) | | | 29,058 | | | | 38,500 | | | | (24,302 | ) | | | 1,287 | |
| | | | | | | | | | | | | | | | | | | | | | | | |
Net increase (decrease) in net assets resulting from operations | | $ | (428 | ) | | $ | 10,234 | | | $ | 40,531 | | | $ | 94,024 | | | $ | 34,182 | | | $ | 3,815 | |
| | | | | | | | | | | | | | | | | | | | | | | | |
| | | | | | | | | | | | | | | | | | | | | | | | |
| | | Large Value | | | Large Core | | | Large Growth | | | Mid Value | | | Mid Growth | | | Small Value | |
Investment income: | | | | | | | | | | | | | | | | | | | | | | | | |
Interest income | | $ | 3 | | | $ | 1 | | | $ | 3 | | | $ | 3 | | | $ | — | (A) | | $ | — | (A) |
Securities lending income (net) | | | 179 | | | | 56 | | | | 306 | | | | 144 | | | | 108 | | | | 53 | |
Dividend income | | | 20,153 | | | | 4,888 | | | | 10,756 | | | | 14,938 | | | | 892 | | | | 1,643 | |
Withholding taxes on foreign income | | | (5 | ) | | | (2 | ) | | | (68 | ) | | | (15 | ) | | | (2 | ) | | | — | |
| | | | | | | | | | | | | | | | | | | | | | | | |
| | | 20,330 | | | | 4,943 | | | | 10,997 | | | | 15,070 | | | | 998 | | | | 1,696 | |
| | | | | | | | | | | | | | | | | | | | | | | | |
Expenses: | | | | | | | | | | | | | | | | | | | | | | | | |
Advisory | | | 4,216 | | | | 1,485 | | | | 6,861 | | | | 5,671 | | | | 1,721 | | | | 938 | |
Custody | | | 98 | | | | 34 | | | | 202 | | | | 115 | | | | 42 | | | | 27 | |
Audit and tax | | | 17 | | | | 18 | | | | 20 | | | | 16 | | | | 16 | | | | 16 | |
Legal | | | 57 | | | | 15 | | | | 67 | | | | 56 | | | | 14 | | | | 7 | |
Printing and shareholder reports | | | 1 | | | | 1 | | | | — | (A) | | | 2 | | | | 1 | | | | — | (A) |
Trustee and CCO | | | 20 | | | | 5 | | | | 24 | | | | 18 | | | | 5 | | | | 2 | |
Other | | | 16 | | | | 4 | | | | 23 | | | | 14 | | | | 4 | | | | 2 | |
| | | | | | | | | | | | | | | | | | | | | | | | |
Total expenses | | | 4,425 | | | | 1,562 | | | | 7,197 | | | | 5,892 | | | | 1,803 | | | | 992 | |
| | | | | | | | | | | | | | | | | | | | | | | | |
Expenses reimbursed/waived | | | — | | | | — | | | | — | | | | — | | | | (10 | ) | | | (20 | ) |
| | | | | | | | | | | | | | | | | | | | | | | | |
Net expenses | | | 4,425 | | | | 1,562 | | | | 7,197 | | | | 5,892 | | | | 1,793 | | | | 972 | |
| | | | | | | | | | | | | | | | | | | | | | | | |
Net investment income (loss) | | | 15,905 | | | | 3,381 | | | | 3,800 | | | | 9,178 | | | | (795 | ) | | | 724 | |
| | | | | | | | | | | | | | | | | | | | | | | | |
Net realized gain (loss) on transactions from: | | | | | | | | | | | | | | | | | | | | | | | | |
Investment securities | | | 68,630 | | | | 19,124 | | | | 102,849 | | | | 76,188 | | | | 30,656 | | | | 10,311 | |
Foreign currency transactions | | | — | (A) | | | 1 | | | | (32 | ) | | | 1 | | | | — | | | | — | |
| | | | | | | | | | | | | | | | | | | | | | | | |
| | | 68,630 | | | | 19,125 | | | | 102,817 | | | | 76,189 | | | | 30,656 | | | | 10,311 | |
| | | | | | | | | | | | | | | | | | | | | | | | |
Net increase (decrease) in unrealized appreciation (depreciation) on: | | | | | | | | | | | | | | | | | | | | | | | | |
Investment securities | | | (57,168 | ) | | | (13,573 | ) | | | (120,670 | ) | | | (100,232 | ) | | | (44,996 | ) | | | (8,991 | ) |
Translation of assets and liabilities denominated in foreign currencies | | | — | (A) | | | 1 | | | | — | (A) | | | — | (A) | | | — | | | | — | |
| | | | | | | | | | | | | | | | | | | | | | | | |
| | | (57,168 | ) | | | (13,572 | ) | | | (120,670 | ) | | | (100,232 | ) | | | (44,996 | ) | | | (8,991 | ) |
| | | | | | | | | | | | | | | | | | | | | | | | |
Net realized and unrealized gain (loss) | | | 11,462 | | | | 5,553 | | | | (17,853 | ) | | | (24,043 | ) | | | (14,340 | ) | | | 1,320 | |
| | | | | | | | | | | | | | | | | | | | | | | | |
Net increase (decrease) in net assets resulting from operations | | $ | 27,367 | | | $ | 8,934 | | | $ | (14,053 | ) | | $ | (14,865 | ) | | $ | (15,135 | ) | | $ | 2,044 | |
| | | | | | | | | | | | | | | | | | | | | | | | |
| | | | | | | | | | | | |
| | | Small Core | | | Small Growth | | | International
Equity | |
Investment income: | | | | | | | | | | | | |
Interest income | | $ | 2 | | | $ | — | (A) | | $ | 2 | |
Securities lending income (net) | | | 237 | | | | 165 | | | | 632 | |
Dividend income | | | 3,500 | | | | 497 | | | | 21,513 | |
Withholding taxes on foreign income | | | — | (A) | | | (6 | ) | | | (1,857 | ) |
| | | | | | | | | | | | |
| | | 3,739 | | | | 656 | | | | 20,290 | |
| | | | | | | | | | | | |
Expenses: | | | | | | | | | | | | |
Advisory | | | 2,585 | | | | 1,084 | | | | 6,043 | |
Custody | | | 76 | | | | 60 | | | | 433 | |
Audit and tax | | | 16 | | | | 16 | | | | 21 | |
Legal | | | 20 | | | | 7 | | | | 56 | |
Printing and shareholder reports | | | 1 | | | | — | (A) | | | 1 | |
Trustee and CCO | | | 7 | | | | 3 | | | | 17 | |
Other | | | 5 | | | | 2 | | | | 14 | |
| | | | | | | | | | | | |
Total expenses | | | 2,710 | | | | 1,172 | | | | 6,585 | |
| | | | | | | | | | | | |
Expenses reimbursed/waived | | | — | | | | (51 | ) | | | — | |
| | | | | | | | | | | | |
Net expenses | | | 2,710 | | | | 1,121 | | | | 6,585 | |
| | | | | | | | | | | | |
Net investment income (loss) | | | 1,029 | | | | (465 | ) | | | 13,705 | |
| | | | | | | | | | | | |
Net realized gain (loss) on transactions from: | | | | | | | | | | | | |
Investment securities | | | 44,374 | | | | 17,926 | | | | 40,245 | |
Futures contracts | | | 248 | | | | — | | | | — | |
Foreign currency transactions | | | — | | | | — | (A) | | | (2,490 | ) |
| | | | | | | | | | | | |
| | | 44,622 | | | | 17,926 | | | | 37,755 | |
| | | | | | | | | | | | |
Net increase (decrease) in unrealized appreciation (depreciation) on: | | | | | | | | | | | | |
Investment securities | | | (51,720 | ) | | | (24,244 | ) | | | (160,515 | ) |
Futures contracts | | | (5 | ) | | | — | | | | — | |
Translation of assets and liabilities denominated in foreign currencies | | | — | | | | — | (A) | | | 4,811 | |
| | | | | | | | | | | | |
| | | (51,725 | ) | | | (24,244 | ) | | | (155,704 | ) |
| | | | | | | | | | | | |
Net realized and unrealized (loss) | | | (7,103 | ) | | | (6,318 | ) | | | (117,949 | ) |
| | | | | | | | | | | | |
Net (decrease) in net assets resulting from operations | | $ | (6,074 | ) | | $ | (6,783 | ) | | $ | (104,244 | ) |
| | | | | | | | | | | | |
| (A) | Rounds to less than $1. |
| | | | | | | | | | | | | | | | | | | | | | | | |
| | | Money Market | | | High Quality Bond | | | Inflation-Protected Securities | |
| | | December 31,
2011 | | | December 31,
2010 | | | December 31,
2011 | | | December 31,
2010 | | | December 31,
2011 | | | December 31,
2010 | |
From operations: | | | | | | | | | | | | | | | | | | | | | | | | |
Net investment income (loss) | | $ | (436 | ) | | $ | 251 | | | $ | 11,479 | | | $ | 14,025 | | | $ | 11,473 | | | $ | 7,069 | |
Net realized gain | | | 8 | | | | 7 | | | | 483 | | | | 3,943 | | | | 17,853 | | | | 14,798 | |
Change in net unrealized appreciation (depreciation) | | | — | | | | — | | | | (1,728 | ) | | | 1,444 | | | | 11,205 | | | | (795 | ) |
| | | | | | | | | | | | | | | | | | | | | | | | |
Net increase (decrease) in net assets resulting from operations | | | (428 | ) | | | 258 | | | | 10,234 | | | | 19,412 | | | | 40,531 | | | | 21,072 | |
| | | | | | | | | | | | | | | | | | | | | | | | |
From transactions in investors’ beneficial interests: | | | | | | | | | | | | | | | | | | | | | | | | |
Contributions | | | 494,457 | | | | 662,569 | | | | 242,064 | | | | 195,218 | | | | 76,278 | | | | 57,416 | |
Withdrawals | | | (563,796 | ) | | | (730,338 | ) | | | (257,771 | ) | | | (228,017 | ) | | | (86,275 | ) | | | (120,488 | ) |
| | | | | | | | | | | | | | | | | | | | | | | | |
Net decrease in net assets resulting from transactions in investors’ beneficial interests | | | (69,339 | ) | | | (67,769 | ) | | | (15,707 | ) | | | (32,799 | ) | | | (9,997 | ) | | | (63,072 | ) |
| | | | | | | | | | | | | | | | | | | | | | | | |
Net increase (decrease) in net assets | | | (69,767 | ) | | | (67,511 | ) | | | (5,473 | ) | | | (13,387 | ) | | | 30,534 | | | | (42,000 | ) |
| | | | | | | | | | | | | | | | | | | | | | | | |
Net Assets: | | | | | | | | | | | | | | | | | | | | | | | | |
Beginning of year | | | 1,065,396 | | | | 1,132,907 | | | | 463,701 | | | | 477,088 | | | | 328,010 | | | | 370,010 | |
| | | | | | | | | | | | | | | | | | | | | | | | |
End of year | | $ | 995,629 | | | $ | 1,065,396 | | | $ | 458,228 | | | $ | 463,701 | | | $ | 358,544 | | | $ | 328,010 | |
| | | | | | | | | | | | | | | | | | | | | | | | |
| | | |
| | | Core Bond | | | High Yield Bond | | | Balanced | |
| | | December 31,
2011 | | | December 31,
2010 | | | December 31,
2011 | | | December 31,
2010 | | | December 31,
2011 | | | December 31,
2010 | |
From operations: | | | | | | | | | | | | | | | | | | | | | | | | |
Net investment income | | $ | 55,524 | | | $ | 62,549 | | | $ | 58,484 | | | $ | 58,452 | | | $ | 2,528 | | | $ | 2,981 | |
Net realized gain | | | 41,206 | | | | 43,546 | | | | 9,982 | | | | 22,236 | | | | 6,365 | | | | 2,358 | |
Change in net unrealized appreciation (depreciation) | | | (2,706 | ) | | | 32,634 | | | | (34,284 | ) | | | 16,058 | | | | (5,078 | ) | | | 10,743 | |
| | | | | | | | | | | | | | | | | | | | | | | | |
Net increase in net assets resulting from operations | | | 94,024 | | | | 138,729 | | | | 34,182 | | | | 96,746 | | | | 3,815 | | | | 16,082 | |
| | | | | | | | | | | | | | | | | | | | | | | | |
From transactions in investors’ beneficial interests: | | | | | | | | | | | | | | | | | | | | | | | | |
Contributions | | | 274,865 | | | | 314,602 | | | | 120,713 | | | | 189,188 | | | | 7,124 | | | | 7,343 | |
Withdrawals | | | (402,304 | ) | | | (580,856 | ) | | | (134,702 | ) | | | (218,768 | ) | | | (23,165 | ) | | | (44,822 | ) |
| | | | | | | | | | | | | | | | | | | | | | | | |
Net decrease in net assets resulting from transactions in investors’ beneficial interests | | | (127,439 | ) | | | (266,254 | ) | | | (13,989 | ) | | | (29,580 | ) | | | (16,041 | ) | | | (37,479 | ) |
| | | | | | | | | | | | | | | | | | | | | | | | |
Net increase (decrease) in net assets | | | (33,415 | ) | | | (127,525 | ) | | | 20,193 | | | | 67,166 | | | | (12,226 | ) | | | (21,397 | ) |
| | | | | | | | | | | | | | | | | | | | | | | | |
Net Assets: | | | | | | | | | | | | | | | | | | | | | | | | |
Beginning of year | | | 1,622,006 | | | | 1,749,531 | | | | 709,083 | | | | 641,917 | | | | 116,337 | | | | 137,734 | |
| | | | | | | | | | | | | | | | | | | | | | | | |
End of year | | $ | 1,588,591 | | | $ | 1,622,006 | | | $ | 729,276 | | | $ | 709,083 | | | $ | 104,111 | | | $ | 116,337 | |
| | | | | | | | | | | | | | | | | | | | | | | | |
| | | |
| | | Large Value | | | Large Core | | | Large Growth | |
| | | December 31,
2011 | | | December 31,
2010 | | | December 31,
2011 | | | December 31,
2010 | | | December 31,
2011 | | | December 31,
2010 | |
From operations: | | | | | | | | | | | | | | | | | | | | | | | | |
Net investment income | | $ | 15,905 | | | $ | 17,446 | | | $ | 3,381 | | | $ | 3,762 | | | $ | 3,800 | | | $ | 6,494 | |
Net realized gain | | | 68,630 | | | | 109,679 | | | | 19,125 | | | | 8,624 | | | | 102,817 | | | | 130,845 | |
Change in net unrealized appreciation (depreciation) | | | (57,168 | ) | | | 10,261 | | | | (13,572 | ) | | | 15,463 | | | | (120,670 | ) | | | 37,120 | |
| | | | | | | | | | | | | | | | | | | | | | | | |
Net increase (decrease) in net assets resulting from operations | | | 27,367 | | | | 137,386 | | | | 8,934 | | | | 27,849 | | | | (14,053 | ) | | | 174,459 | |
| | | | | | | | | | | | | | | | | | | | | | | | |
From transactions in investors’ beneficial interests: | | | | | | | | | | | | | | | | | | | | | | | | |
Contributions | | | 67,603 | | | | 97,725 | | | | 16,232 | | | | 25,843 | | | | 66,114 | | | | 77,698 | |
Withdrawals | | | (231,319 | ) | | | (484,459 | ) | | | (45,957 | ) | | | (78,593 | ) | | | (212,337 | ) | | | (417,094 | ) |
| | | | | | | | | | | | | | | | | | | | | | | | |
Net decrease in net assets resulting from transactions in investors’ beneficial interests | | | (163,716 | ) | | | (386,734 | ) | | | (29,725 | ) | | | (52,750 | ) | | | (146,223 | ) | | | (339,396 | ) |
| | | | | | | | | | | | | | | | | | �� | | | | | | |
Net decrease in net assets | | | (136,349 | ) | | | (249,348 | ) | | | (20,791 | ) | | | (24,901 | ) | | | (160,276 | ) | | | (164,937 | ) |
| | | | | | | | | | | | | | | | | | | | | | | | |
Net Assets: | | | | | | | | | | | | | | | | | | | | | | | | |
Beginning of year | | | 1,014,115 | | | | 1,263,463 | | | | 255,995 | | | | 280,896 | | | | 1,176,583 | | | | 1,341,520 | |
| | | | | | | | | | | | | | | | | | | | | | | | |
End of year | | $ | 877,766 | | | $ | 1,014,115 | | | $ | 235,204 | | | $ | 255,995 | | | $ | 1,016,307 | | | $ | 1,176,583 | |
| | | | | | | | | | | | | | | | | | | | | | | | |
| | | | | | | | | | | | | | | | | | | | | | | | |
| | | Mid Value | | | Mid Growth | | | Small Value | |
| | | December 31,
2011 | | | December 31,
2010 | | | December 31,
2011 | | | December 31,
2010 | | | December 31,
2011 | | | December 31,
2010 | |
From operations: | | | | | | | | | | | | | | | | | | | | | | | | |
Net investment income (loss) | | $ | 9,178 | | | $ | 9,412 | | | $ | (795 | ) | | $ | (874 | ) | | $ | 724 | | | $ | 1,114 | |
Net realized gain | | | 76,189 | | | | 64,305 | | | | 30,656 | | | | 41,475 | | | | 10,311 | | | | 15,484 | |
Change in net unrealized appreciation (depreciation) | | | (100,232 | ) | | | 87,619 | | | | (44,996 | ) | | | 22,589 | | | | (8,991 | ) | | | 11,023 | |
| | | | | | | | | | | | | | | | | | | | | | | | |
Net increase (decrease) in net assets resulting from operations | | | (14,865 | ) | | | 161,336 | | | | (15,135 | ) | | | 63,190 | | | | 2,044 | | | | 27,621 | |
| | | | | | | | | | | | | | | | | | | | | | | | |
From transactions in investors’ beneficial interests: | | | | | | | | | | | | | | | | | | | | | | | | |
Contributions | | | 58,995 | | | | 269,938 | | | | 25,002 | | | | 39,943 | | | | 8,136 | | | | 12,187 | |
Withdrawals | | | (204,429 | ) | | | (330,801 | ) | | | (72,998 | ) | | | (85,149 | ) | | | (40,649 | ) | | | (51,108 | ) |
| | | | | | | | | | | | | | | | | | | | | | | | |
Net decrease in net assets resulting from transactions in investors’ beneficial interests | | | (145,434 | ) | | | (60,863 | ) | | | (47,996 | ) | | | (45,206 | ) | | | (32,513 | ) | | | (38,921 | ) |
| | | | | | | | | | | | | | | | | | | | | | | | |
Net increase (decrease) in net assets | | | (160,299 | ) | | | 100,473 | | | | (63,131 | ) | | | 17,984 | | | | (30,469 | ) | | | (11,300 | ) |
| | | | | | | | | | | | | | | | | | | | | | | | |
Net Assets: | | | | | | | | | | | | | | | | | | | | | | | | |
Beginning of year | | | 909,134 | | | | 808,661 | | | | 269,733 | | | | 251,749 | | | | 134,427 | | | | 145,727 | |
| | | | | | | | | | | | | | | | | | | | | | | | |
End of year | | $ | 748,835 | | | $ | 909,134 | | | $ | 206,602 | | | $ | 269,733 | | | $ | 103,958 | | | $ | 134,427 | |
| | | | | | | | | | | | | | | | | | | | | | | | |
| | | |
| | | Small Core | | | Small Growth | | | International Equity | |
| | | December 31,
2011 | | | December 31,
2010 | | | December 31,
2011 | | | December 31,
2010 | | | December 31,
2011 | | | December 31,
2010 | |
From operations: | | | | | | | | | | | | | | | | | | | | | | | | |
Net investment income (loss) | | $ | 1,029 | | | $ | 1,356 | | | $ | (465 | ) | | $ | (564 | ) | | $ | 13,705 | | | $ | 12,864 | |
Net realized gain | | | 44,622 | | | | 47,999 | | | | 17,926 | | | | 21,668 | | | | 37,755 | | | | 66,537 | |
Change in net unrealized appreciation (depreciation) | | | (51,725 | ) | | | 34,164 | | | | (24,244 | ) | | | 10,962 | | | | (155,704 | ) | | | 32,655 | |
| | | | | | | | | | | | | | | | | | | | | | | | |
Net increase (decrease) in net assets resulting from operations | | | (6,074 | ) | | | 83,519 | | | | (6,783 | ) | | | 32,066 | | | | (104,244 | ) | | | 112,056 | |
| | | | | | | | | | | | | | | | | | | | | | | | |
From transactions in investors’ beneficial interests: | | | | | | | | | | | | | | | | | | | | | | | | |
Contributions | | | 20,061 | | | | 24,934 | | | | 11,856 | | | | 15,020 | | | | 70,059 | | | | 84,159 | |
Withdrawals | | | (59,525 | ) | | | (106,899 | ) | | | (39,680 | ) | | | (57,079 | ) | | | (178,905 | ) | | | (347,004 | ) |
| | | | | | | | | | | | | | | | | | | | | | | | |
Net decrease in net assets resulting from transactions in investors’ beneficial interests | | | (39,464 | ) | | | (81,965 | ) | | | (27,824 | ) | | | (42,059 | ) | | | (108,846 | ) | | | (262,845 | ) |
| | | | | | | | | | | | | | | | | | | | | | | | |
Net increase (decrease) in net assets | | | (45,538 | ) | | | 1,554 | | | | (34,607 | ) | | | (9,993 | ) | | | (213,090 | ) | | | (150,789 | ) |
| | | | | | | | | | | | | | | | | | | | | | | | |
Net Assets: | | | | | | | | | | | | | | | | | | | | | | | | |
Beginning of year | | | 341,598 | | | | 340,044 | | | | 142,731 | | | | 152,724 | | | | 893,260 | | | | 1,044,049 | |
| | | | | | | | | | | | | | | | | | | | | | | | |
End of year | | $ | 296,060 | | | $ | 341,598 | | | $ | 108,124 | | | $ | 142,731 | | | $ | 680,170 | | | $ | 893,260 | |
| | | | | | | | | | | | | | | | | | | | | | | | |
| | | | | | | | | | | | | | | | | | | | |
| | | December 31,
2011 | | | December 31,
2010 | | | Money Market
December 31,
2009 | | | December 31,
2008 | | | December 31,
2007 | |
Net assets end of year (000’s) | | $ | 995,629 | | | $ | 1,065,396 | | | $ | 1,132,907 | | | $ | 1,325,802 | | | $ | 1,050,796 | |
| | | | | | | | | | | | | | | | | | | | |
Total return | | | (0.04 | %) | | | 0.02 | % | | | 0.36 | % | | | 2.44 | % | | | 5.17 | % |
| | | | | | | | | | | | | | | | | | | | |
Ratios and supplemental data | | | | | | | | | | | | | | | | | | | | |
Expenses to average net assets | | | | | | | | | | | | | | | | | | | | |
After reimbursement | | | 0.28 | % | | | 0.28 | % | | | 0.27 | % | | | 0.27 | % | | | 0.28 | % |
Before reimbursement | | | 0.28 | % | | | 0.28 | % | | | 0.27 | % | | | 0.27 | % | | | 0.28 | % |
Net investment income (loss), to average net assets | | | (0.04 | %) | | | 0.02 | % | | | 0.37 | % | | | 2.43 | % | | | 5.01 | % |
| | | | | | | | | | | | | | | | | | | | |
| | | | | |
| | | December 31,
2011 | | | December 31,
2010 | | | High Quality Bond
December 31,
2009 | | | December 31,
2008 | | | December 31,
2007 | |
Net assets end of year (000’s) | | $ | 458,228 | | | $ | 463,701 | | | $ | 477,088 | | | $ | 421,232 | | | $ | 833,291 | |
| | | | | | | | | | | | | | | | | | | | |
Total return | | | 2.16 | % | | | 4.20 | % | | | 9.83 | % | | | 0.55 | % | | | 5.34 | % |
| | | | | | | | | | | | | | | | | | | | |
Ratios and supplemental data | | | | | | | | | | | | | | | | | | | | |
Expenses to average net assets | | | | | | | | | | | | | | | | | | | | |
After reimbursement | | | 0.38 | % | | | 0.38 | % | | | 0.38 | % | | | 0.38 | % | | | 0.38 | % |
Before reimbursement | | | 0.38 | % | | | 0.38 | % | | | 0.38 | % | | | 0.38 | % | | | 0.38 | % |
Net investment income, to average net assets | | | 2.43 | % | | | 2.99 | % | | | 3.75 | % | | | 4.24 | % | | | 4.38 | % |
Portfolio turnover rate | | | 84 | % | | | 87 | % | | | 104 | % | | | 64 | % | | | 56 | % |
| | | | | | | | | | | | | | | | | | | | |
| | | |
| | | | | | Inflation-Protected Securities | | | | |
| | | December 31,
2011 | | | December 31,
2010 | | | December 31,
2009 | | | December 31,
2008 | | | December 31,
2007 | |
Net assets end of year (000’s) | | $ | 358,544 | | | $ | 328,010 | | | $ | 370,010 | | | $ | 389,198 | | | $ | 149,013 | |
| | | | | | | | | | | | | | | | | | | | |
Total return | | | 12.33 | % | | | 6.23 | % | | | 10.22 | % | | | (2.14 | %) | | | 10.16 | % |
| | | | | | | | | | | | | | | | | | | | |
Ratios and supplemental data | | | | | | | | | | | | | | | | | | | | |
Expenses to average net assets | | | | | | | | | | | | | | | | | | | | |
After reimbursement | | | 0.40 | % | | | 0.38 | % | | | 0.40 | % | | | 0.39 | % | | | 0.40 | % |
Before reimbursement | | | 0.40 | % | | | 0.38 | % | | | 0.40 | % | | | 0.39 | % | | | 0.42 | % |
Net investment income, to average net assets | | | 3.30 | % | | | 2.04 | % | | | 1.02 | % | | | 4.99 | % | | | 5.26 | % |
Portfolio turnover rate | | | 134 | % | | | 117 | % | | | 118 | % | | | 154 | % | | | 340 | % |
| | | | | | | | | | | | | | | | | | | | |
| | | | | |
| | | | | | | | | Core Bond | | | | | | | |
| | | December 31,
2011 | | | December 31,
2010 | | | December 31,
2009 | | | December 31,
2008 | | | December 31,
2007 | |
Net assets end of year (000’s) | | $ | 1,588,591 | | | $ | 1,622,006 | | | $ | 1,749,531 | | | $ | 1,667,313 | | | $ | 2,248,880 | |
| | | | | | | | | | | | | | | | | | | | |
Total return | | | 6.20 | % | | | 8.26 | % | | | 12.89 | % | | | (1.83 | %) | | | 6.67 | % |
| | | | | | | | | | | | | | | | | | | | |
Ratios and supplemental data | | | | | | | | | | | | | | | | | | | | |
Expenses to average net assets | | | | | | | | | | | | | | | | | | | | |
After reimbursement | | | 0.39 | % | | | 0.39 | % | | | 0.38 | % | | | 0.38 | % | | | 0.38 | % |
Before reimbursement | | | 0.39 | % | | | 0.39 | % | | | 0.38 | % | | | 0.38 | % | | | 0.38 | % |
Net investment income, to average net assets | | | 3.54 | % | | | 3.65 | % | | | 4.45 | % | | | 5.12 | % | | | 4.81 | % |
Portfolio turnover rate | | | 406 | % | | | 633 | % | | | 1,014 | % (A) | | | 530 | % | | | 503 | % |
| | | | | | | | | | | | | | | | | | | | |
| | | | | |
| | | | | | | | | High Yield Bond | | | | | | | |
| | | December 31,
2011 | | | December 31,
2010 | | | December 31,
2009 | | | December 31,
2008 | | | December 31,
2007 | |
Net assets end of year (000’s) | | $ | 729,276 | | | $ | 709,083 | | | $ | 641,917 | | | $ | 439,863 | | | $ | 538,727 | |
| | | | | | | | | | | | | | | | | | | | |
Total return | | | 4.93 | % | | | 15.81 | % | | | 57.21 | % | | | (28.90 | %) | | | 2.02 | % |
| | | | | | | | | | | | | | | | | | | | |
Ratios and supplemental data | | | | | | | | | | | | | | | | | | | | |
Expenses to average net assets | | | | | | | | | | | | | | | | | | | | |
After reimbursement | | | 0.59 | % | | | 0.59 | % | | | 0.59 | % | | | 0.58 | % | | | 0.58 | % |
Before reimbursement | | | 0.59 | % | | | 0.59 | % | | | 0.59 | % | | | 0.58 | % | | | 0.58 | % |
Net investment income, to average net assets | | | 8.04 | % | | | 8.84 | % | | | 10.10 | % | | | 9.57 | % | | | 7.97 | % |
Portfolio turnover rate | | | 81 | % | | | 98 | % | | | 98 | % | | | 54 | % | | | 96 | % |
| | | | | | | | | | | | | | | | | | | | |
| | | | | | | | | | | | | | | | | | | | |
| | | December 31,
2011 | | | December 31,
2010 | | | Balanced
December 31,
2009 | | | December 31,
2008 | | | December 31,
2007 | |
Net assets end of year (000’s) | | $ | 104,111 | | | $ | 116,337 | | | $ | 137,734 | | | $ | 168,930 | | | $ | 318,635 | |
| | | | | | | | | | | | | | | | | | | | |
Total return | | | 3.60 | % | | | 13.91 | % | | | 23.45 | % | | | (26.71 | %) | | | 1.79 | % |
| | | | | | | | | | | | | | | | | | | | |
Ratios and supplemental data | | | | | | | | | | | | | | | | | | | | |
Expenses to average net assets | | | | | | | | | | | | | | | | | | | | |
After reimbursement | | | 0.50 | % | | | 0.50 | % | | | 0.50 | % | | | 0.50 | % | | | 0.50 | % |
Before reimbursement | | | 0.62 | % | | | 0.59 | % | | | 0.55 | % | | | 0.53 | % | | | 0.52 | % |
Net investment income, to average net assets | | | 2.26 | % | | | 2.42 | % | | | 3.01 | % | | | 3.45 | % | | | 2.87 | % |
Portfolio turnover rate | | | 245 | % | | | 211 | % | | | 167 | % | | | 154 | % | | | 226 | % |
| | | | | |
| | | December 31,
2011 | | | December 31,
2010 | | | Large Value
December 31,
2009 | | | December 31,
2008 | | | December 31,
2007 | |
Net assets end of year (000’s) | | $ | 877,766 | | | $ | 1,014,115 | | | $ | 1,263,463 | | | $ | 1,450,970 | | | $ | 3,165,025 | |
| | | | | | | | | | | | | | | | | | | | |
Total return | | | 2.32 | % | | | 14.66 | % | | | 16.71 | % | | | (42.94 | %) | | | (1.75 | %) |
| | | | | | | | | | | | | | | | | | | | |
Ratios and supplemental data | | | | | | | | | | | | | | | | | | | | |
Expenses to average net assets | | | | | | | | | | | | | | | | | | | | |
After reimbursement | | | 0.47 | % | | | 0.47 | % | | | 0.48 | % | | | 0.48 | % | | | 0.48 | % |
Before reimbursement | | | 0.47 | % | | | 0.47 | % | | | 0.48 | % | | | 0.48 | % | | | 0.48 | % |
Net investment income, to average net assets | | | 1.70 | % | | | 1.65 | % | | | 2.22 | % | | | 2.53 | % | | | 1.68 | % |
Portfolio turnover rate | | | 55 | % | | | 62 | % | | | 124 | % (A) | | | 26 | % | | | 30 | % |
| | | | | |
| | | December 31,
2011 | | | December 31,
2010 | | | Large Core
December 31,
2009 | | | December 31,
2008 | | | December 31,
2007 | |
Net assets end of year (000’s) | | $ | 235,204 | | | $ | 255,995 | | | $ | 280,896 | | | $ | 281,774 | | | $ | 903,262 | |
| | | | | | | | | | | | | | | | | | | | |
Total return | | | 3.51 | % | | | 11.79 | % | | | 23.36 | % | | | (36.65 | %) | | | 2.11 | % |
| | | | | | | | | | | | | | | | | | | | |
Ratios and supplemental data | | | | | | | | | | | | | | | | | | | | |
Expenses to average net assets | | | | | | | | | | | | | | | | | | | | |
After reimbursement | | | 0.63 | % | | | 0.63 | % | | | 0.62 | % | | | 0.65 | % | | | 0.64 | % |
Before reimbursement | | | 0.63 | % | | | 0.63 | % | | | 0.62 | % | | | 0.65 | % | | | 0.64 | % |
Net investment income, to average net assets | | | 1.37 | % | | | 1.47 | % | | | 1.57 | % | | | 1.31 | % | | | 1.08 | % |
Portfolio turnover rate | | | 63 | % | | | 55 | % | | | 168 | % | | | 99 | % | | | 101 | % |
| | | | | |
| | | December 31,
2011 | | | December 31,
2010 | | | Large Growth
December 31,
2009 | | | December 31,
2008 | | | December 31,
2007 | |
Net assets end of year (000’s) | | $ | 1,016,307 | | | $ | 1,176,583 | | | $ | 1,341,520 | | | $ | 1,130,783 | | | $ | 2,444,761 | |
| | | | | | | | | | | | | | | | | | | | |
Total return | | | (1.78 | %) | | | 16.62 | % | | | 35.56 | % | | | (39.87 | %) | | | 12.25 | % |
| | | | | | | | | | | | | | | | | | | | |
Ratios and supplemental data | | | | | | | | | | | | | | | | | | | | |
Expenses to average net assets | | | | | | | | | | | | | | | | | | | | |
After reimbursement | | | 0.65 | % | | | 0.65 | % | | | 0.65 | % | | | 0.65 | % | | | 0.65 | % |
Before reimbursement | | | 0.65 | % | | | 0.66 | % | | | 0.65 | % | | | 0.65 | % | | | 0.65 | % |
Net investment income, to average net assets | | | 0.34 | % | | | 0.56 | % | | | 0.97 | % | | | 0.92 | % | | | 0.61 | % |
Portfolio turnover rate | | | 53 | % | | | 119 | % | | | 102 | % (A) | | | 102 | % | | | 129 | % |
| | | | | | | | | | | | | | | | | | | | |
| | | December 31,
2011 | | | December 31,
2010 | | | Mid Value
December 31,
2009 | | | December 31,
2008 | | | December 31,
2007 | |
Net assets end of year (000’s) | | $ | 748,835 | | | $ | 909,134 | | | $ | 808,661 | | | $ | 630,249 | | | $ | 998,177 | |
| | | | | | | | | | | | | | | | | | | | |
Total return | | | (2.19 | %) | | | 21.29 | % | | | 32.53 | % | | | (37.73 | %) | | | 2.62 | % |
| | | | | | | | | | | | | | | | | | | | |
Ratios and supplemental data | | | | | | | | | | | | | | | | | | | | |
Expenses to average net assets | | | | | | | | | | | | | | | | | | | | |
After reimbursement | | | 0.70 | % | | | 0.69 | % | | | 0.70 | % | | | 0.70 | % | | | 0.70 | % |
Before reimbursement | | | 0.70 | % | | | 0.69 | % | | | 0.70 | % | | | 0.70 | % | | | 0.70 | % |
Net investment income, to average net assets | | | 1.08 | % | | | 1.14 | % | | | 1.44 | % | | | 1.69 | % | | | 1.37 | % |
Portfolio turnover rate | | | 69 | % | | | 76 | % | | | 122 | % | | | 68 | % | | | 69 | % |
| | | | | |
| | | December 31,
2011 | | | December 31,
2010 | | | Mid Growth
December 31,
2009 | | | December 31,
2008 | | | December 31,
2007 | |
Net assets end of year (000’s) | | $ | 206,602 | | | $ | 269,733 | | | $ | 251,749 | | | $ | 228,966 | | | $ | 337,189 | |
| | | | | | | | | | | | | | | | | | | | |
Total return | | | (6.90 | %) | | | 29.27 | % | | | 25.24 | % | | | (41.55 | %) | | | 30.42 | % |
| | | | | | | | | | | | | | | | | | | | |
Ratios and supplemental data | | | | | | | | | | | | | | | | | | | | |
Expenses to average net assets | | | | | | | | | | | | | | | | | | | | |
After reimbursement | | | 0.75 | % | | | 0.75 | % | | | 0.75 | % | | | 0.75 | % | | | 0.75 | % |
Before reimbursement | | | 0.75 | % | | | 0.75 | % | | | 0.76 | % | | | 0.75 | % | | | 0.75 | % |
Net investment loss, to average net assets | | | (0.33 | %) | | | (0.36 | %) | | | (0.23 | %) | | | (0.02 | %) | | | (0.23 | %) |
Portfolio turnover rate | | | 135 | % | | | 199 | % | | | 214 | % | | | 158 | % | | | 152 | % |
| | | | | |
| | | December 31,
2011 | | | December 31,
2010 | | | Small Value
December 31,
2009 | | | December 31,
2008 | | | December 31,
2007 | |
Net assets end of year (000’s) | | $ | 103,958 | | | $ | 134,427 | | | $ | 145,727 | | | $ | 156,628 | | | $ | 185,137 | |
| | | | | | | | | | | | | | | | | | | | |
Total return | | | 1.35 | % | | | 23.12 | % | | | 19.64 | % | | | (26.63 | %) | | | (7.74 | %) |
| | | | | | | | | | | | | | | | | | | | |
Ratios and supplemental data | | | | | | | | | | | | | | | | | | | | |
Expenses to average net assets | | | | | | | | | | | | | | | | | | | | |
After reimbursement | | | 0.85 | % | | | 0.85 | % | | | 0.85 | % | | | 0.85 | % | | | 0.85 | % |
Before reimbursement | | | 0.87 | % | | | 0.87 | % | | | 0.88 | % | | | 0.87 | % | | | 0.87 | % |
Net investment income, to average net assets | | | 0.63 | % | | | 0.84 | % | | | 1.24 | % | | | 1.94 | % | | | 1.36 | % |
Portfolio turnover rate | | | 16 | % | | | 121 | % | | | 103 | % | | | 117 | % | | | 94 | % |
| | | | | |
| | | December 31,
2011 | | | December 31,
2010 | | | Small Core
December 31,
2009 | | | December 31,
2008 | | | December 31,
2007 | |
Net assets end of year (000’s) | | $ | 296,060 | | | $ | 341,598 | | | $ | 340,044 | | | $ | 389,662 | | | $ | 950,197 | |
| | | | | | | | | | | | | | | | | | | | |
Total return | | | (2.19 | %) | | | 29.89 | % | | | 27.64 | % | | | (36.06 | %) | | | (4.49 | %) |
| | | | | | | | | | | | | | | | | | | | |
Ratios and supplemental data | | | | | | | | | | | | | | | | | | | | |
Expenses to average net assets | | | | | | | | | | | | | | | | | | | | |
After reimbursement | | | 0.84 | % | | | 0.85 | % | | | 0.85 | % | | | 0.85 | % | | | 0.84 | % |
Before reimbursement | | | 0.84 | % | | | 0.85 | % | | | 0.85 | % | | | 0.85 | % | | | 0.84 | % |
Net investment income, to average net assets | | | 0.32 | % | | | 0.43 | % | | | 0.67 | % | | | 0.94 | % | | | 0.58 | % |
Portfolio turnover rate | | | 59 | % | | | 55 | % | | | 88 | % | | | 106 | % | | | 97 | % |
| | | | | |
| | | December 31,
2011 | | | December 31,
2010 | | | Small Growth
December 31,
2009 | | | December 31,
2008 | | | December 31,
2007 | |
Net assets end of year (000’s) | | $ | 108,124 | | | $ | 142,731 | | | $ | 152,724 | | | $ | 152,513 | | | $ | 166,817 | |
| | | | | | | | | | | | | | | | | | | | |
Total return | | | (6.45 | %) | | | 25.65 | % | | | 32.99 | % | | | (37.87 | %) | | | 8.64 | % |
| | | | | | | | | | | | | | | | | | | | |
Ratios and supplemental data | | | | | | | | | | | | | | | | | | | | |
Expenses to average net assets | | | | | | | | | | | | | | | | | | | | |
After reimbursement | | | 0.90 | % | | | 0.90 | % | | | 0.90 | % | | | 0.90 | % | | | 0.90 | % |
Before reimbursement | | | 0.94 | % | | | 0.93 | % | | | 0.93 | % | | | 0.93 | % | | | 0.92 | % |
Net investment loss, to average net assets | | | (0.37 | %) | | | (0.41 | %) | | | (0.38 | %) | | | (0.18 | %) | | | (0.42 | %) |
Portfolio turnover rate | | | 120 | % | | | 99 | % | | | 104 | % | | | 146 | % | | | 144 | % |
| | | | | | | | | | | | | | | | | | | | |
| | | December 31,
2011 | | | December 31,
2010 | | | International Equity
December 31,
2009 | | | December 31,
2008 | | | December 31,
2007 | |
Net assets end of year (000’s) | | $ | 680,170 | | | $ | 893,260 | | | $ | 1,044,049 | | | $ | 1,100,060 | | | $ | 2,264,062 | |
| | | | | | | | | | | | | | | | | | | | |
Total return | | | (13.51 | %) | | | 14.94 | % | | | 26.10 | % | | | (49.94 | %) | | | 11.69 | % |
| | | | | | | | | | | | | | | | | | | | |
Ratios and supplemental data | | | | | | | | | | | | | | | | | | | | |
Expenses to average net assets | | | | | | | | | | | | | | | | | | | | |
After reimbursement | | | 0.82 | % | | | 0.81 | % | | | 0.82 | % | | | 0.84 | % | | | 0.87 | % |
Before reimbursement | | | 0.82 | % | | | 0.81 | % | | | 0.82 | % | | | 0.84 | % | | | 0.87 | % |
Net investment income, to average net assets | | | 1.70 | % | | | 1.45 | % | | | 1.39 | % | | | 2.78 | % | | | 2.25 | % |
Portfolio turnover rate | | | 24 | % | | | 29 | % | | | 138 | % | | | 174 | % | | | 110 | % |
| (A) | Excludes investment securities received in kind. |
Note: Prior to Janurary 1, 2010, all of the Financial Highlights were audited by another independent registered public accounting firm.
NOTE 1. ORGANIZATION AND SIGNIFICANT ACCOUNTING POLICIES
Transamerica Partners Portfolios (the “Series Portfolio”) is an open-end management investment company, registered under the Investment Company Act of 1940, as amended (the “1940 Act”), and was organized as a series trust under the laws of the State of New York. The Series Portfolio is composed of fifteen different series that are, in effect, separate investment funds: Transamerica Partners Money Market Portfolio (“Money Market”), Transamerica Partners High Quality Bond Portfolio (“High Quality Bond”), Transamerica Partners Inflation-Protected Securities Portfolio (“Inflation-Protected Securities”), Transamerica Partners Core Bond Portfolio (“Core Bond”), Transamerica Partners High Yield Bond Portfolio (“High Yield Bond”), Transamerica Partners Balanced Portfolio (“Balanced”), Transamerica Partners Large Value Portfolio (“Large Value”), Transamerica Partners Large Core Portfolio (“Large Core”), Transamerica Partners Large Growth Portfolio (“Large Growth”), Transamerica Partners Mid Value Portfolio (“Mid Value”), Transamerica Partners Mid Growth Portfolio (“Mid Growth”), Transamerica Partners Small Value Portfolio (“Small Value”), Transamerica Partners Small Core Portfolio (“Small Core”), Transamerica Partners Small Growth Portfolio (“Small Growth”), and Transamerica Partners International Equity Portfolio (“International Equity”) (each a “Portfolio” and collectively, the “Portfolios”). Each Portfolio issues shares of beneficial interest only in private placement transactions that do not involve a public offering within the meaning of Section 4(2) of the Securities Act of 1933, as amended (“Securities Act”). Only “accredited investors”, as defined in Regulation D under the Securities Act, may invest in the Portfolios. Accredited investors include investment companies, insurance company separate accounts, common or commingled trust funds, or other similar organizations or entities.
This report should be read in conjunction with the Portfolios’ current prospectus, which contains more complete information about the Portfolios, including investment objectives and strategies.
In the normal course of business, the Portfolios enter into contracts that contain a variety of representations and warranties which provide general indemnifications. The Portfolios’ maximum exposure under these arrangements is unknown, as this would involve future claims that may be made against the Portfolios and/or their affiliates that have not yet occurred. However, based on experience, the Portfolios expect the risk of loss to be remote.
In preparing the Portfolios’ financial statements in accordance with U.S. generally accepted accounting principles (“GAAP”), estimates or assumptions (which could differ from actual results) may be used that affect reported amounts and disclosures. The following is a summary of significant accounting policies followed by the Portfolios.
Repurchase agreements: Securities purchased subject to repurchase agreements are held at the Portfolios’ custodian and, pursuant to the terms of the repurchase agreements, must be collateralized by securities with an aggregate market value greater than or equal to 100% of the resale price. The Portfolios will bear the risk of value fluctuations until the securities can be sold and may encounter delays and incur costs in liquidating the securities. In the event of bankruptcy or insolvency of the seller, delays and costs may be incurred.
Foreign currency denominated investments: The accounting records of the Portfolios are maintained in U.S. dollars. Securities and other assets and liabilities denominated in foreign currencies are translated into U.S. dollars at the closing exchange rate each day. The cost of foreign securities is translated at the exchange rates in effect when the investment was acquired. Each Portfolio combines fluctuations from currency exchange rates and fluctuations in value when computing net realized and unrealized gains or losses from investments.
Net foreign currency gains and losses resulting from changes in exchange rates include: 1) foreign currency fluctuations between trade date and settlement date of investment security transactions; 2) gains and losses on forward foreign currency contracts; and 3) the difference between the receivable amounts of interest and dividends recorded in the accounting records in U.S. dollars and the amounts actually received.
Foreign currency denominated assets may involve risks not typically associated with domestic transactions. These risks include revaluation of currencies, adverse fluctuations in foreign currency values, and possible adverse political, social, and economic developments, including those particular to a specific industry, country, or region.
Forward foreign currency contracts: The Portfolios are subject to foreign currency exchange rate risk exposure in the normal course of pursuing their investment objectives. The Portfolios, with the exception of Money Market, enter into forward foreign currency contracts to hedge against exchange rate risk arising from investments in securities denominated in foreign currencies. Forward foreign currency contracts are marked to market daily, with the change in value recorded as an unrealized gain or loss. When the contracts are settled, a realized gain or loss is incurred. Risks may arise from changes in market value of the underlying currencies and from the possible inability of counterparties to meet the terms of their contracts.
Open forward foreign currency contracts at December 31, 2011 are listed in the Schedules of Investments.
NOTE 1. (continued)
Option and swaption contracts: The Portfolios are subject to equity price risk, interest rate risk, and foreign currency exchange rate risk in the normal course of pursuing their investment objectives. The Portfolios, with the exception of Money Market, enter into option contracts to manage exposure to various market fluctuations. Options are valued at the average of the bid and ask (“Mean Quote”) established each day at the close of the board of trade or exchange on which they are traded. The primary risks associated with options are: an imperfect correlation between the change in value of the securities held and the prices of the option contracts, the possibility of an illiquid market, and an inability of the counterparty to meet the contract terms.
The Portfolios write call and put options/swaptions on futures, swaps, securities, or currencies they own or in which they may invest. When a Portfolio writes a covered call or a put option/swaption, an amount equal to the premium received by a Portfolio is included in the Portfolio’s Statement of Assets and Liabilities as an asset and as an equivalent liability. Premiums received from writing options/swaptions which expire are treated as realized gains. Premiums received from writing options/swaptions which are exercised or closed are added to the proceeds or offset against amounts paid on the underlying future, swap, security, or currency transaction to determine the realized gain or loss. Options are marked-to-market daily to reflect the current value of the option/swaption written.
The Portfolios purchase put and call options/swaptions on foreign or U.S. securities, indices, futures, swaps, and commodities. Purchasing call options tends to increase exposure to the underlying instrument. Purchasing put options tends to decrease exposure to the underlying instrument. The Portfolios pay premiums, which are included in the Statements of Assets and Liabilities as an investment and subsequently marked-to-market to reflect the current value of the option. Premiums paid for purchasing options which expire are treated as realized losses. The risk associated with purchasing put and call options is limited to the premium paid. Premiums paid for purchasing options/swaptions which are exercised or closed are added to the amounts paid or offset against the proceeds on the underlying futures, swaps, security, commodity, or currency transaction to determine the realized gain or loss. Realized gains or losses are reflected in the realized gains or losses of investment securities on the Statements of Operations.
The underlying face amounts of open option and swaption contracts at December 31, 2011, are listed in the Schedules of Investments.
Transactions in written options were as follows:
| | | | | | | | |
Inflation-Protected Securities | | Premium | | | Notional
Amount | |
Balance at December 31, 2010 | | $ | — | | | $ | — | |
Sales | | | 586 | | | | 1,724 | |
Closing Buys | | | (202 | ) | | | (587 | ) |
Expirations | | | (357 | ) | | | (1,090 | ) |
Exercised | | | — | | | | — | |
| | | | | | | | |
Balance at December 31, 2011 | | $ | 27 | | | $ | 47 | |
| | | | | | | | |
| | |
Inflation-Protected Securities | | Premium | | | Notional
Amount | |
Balance at December 31, 2010 | | $ | — | | | EUR | — | |
Sales | | | 411 | | | | 23,060 | |
Closing Buys | | | (118 | ) | | | (9,920 | ) |
Expirations | | | — | | | | — | |
Exercised | | | — | | | | — | |
Balance at December 31, 2011 | | $ | 293 | | | EUR | 13,140 | |
| | | | | | | | |
| | | | | | | | |
Core Bond | | Premium | | | Notional
Amount | |
Balance at December 31, 2010 | | $ | 851 | | | $ | 516 | |
Sales | | | 5,501 | | | | 16,608 | |
Closing Buys | | | (3,771 | ) | | | (8,562 | ) |
Expirations | | | (2,581 | ) | | | (8,562 | ) |
Exercised | | | — | | | | — | |
Balance at December 31, 2011 | | $ | — | | | $ | — | |
| | | | | | | | |
| | |
Balanced | | Premium | | | Notional
Amount | |
Balance at December 31, 2010 | | $ | 20 | | | $ | 12 | |
Sales | | | 131 | | | | 306 | |
Closing Buys | | | (93 | ) | | | (188 | ) |
Expirations | | | (58 | ) | | | (130 | ) |
Exercised | | | — | | | | — | |
Balance at December 31, 2011 | | $ | — | | | $ | — | |
| | | | | | | | |
NOTE 1. (continued)
Transactions in written swaptions were as follows:
| | | | | | | | |
Inflation-Protected Securities | | Premium | | | Notional
Amount | |
Balance at December 31, 2010 | | $ | 1,971 | | | $ | 42,800 | |
Sales | | | 1,983 | | | | 181,000 | |
Closing Buys | | | (1,614 | ) | | | (119,300 | ) |
Expirations | | | (820 | ) | | | (59,200 | ) |
Exercised | | | — | | | | — | |
| | | | | | | | |
Balance at December 31, 2011 | | $ | 1,520 | | | $ | 45,300 | |
| | | | | | | | |
Core Bond | | Premium | | | Notional
Amount | |
Balance at December 31, 2010 | | $ | 37,686 | | | $ | 784,700 | |
Sales | | | 34,627 | | | | 1,268,805 | |
Closing Buys | | | (65,926 | ) | | | (1,619,676 | ) |
Expirations | | | (2,457 | ) | | | (275,100 | ) |
Exercised | | | — | | | | — | |
| | | | | | | | |
Balance at December 31, 2011 | | $ | 3,930 | | | $ | 158,729 | |
Futures contracts: The Portfolios are subject to equity price risk, interest rate risk, and foreign currency exchange rate risk, and commodity risk in the normal course of pursuing their investment objectives. The Portfolios, with the exception of Money Market, use futures contracts to gain exposure to, or hedge against, changes in the value of equities, interest rates, or foreign currencies. A futures contract represents a commitment for the future purchase or sale of an asset at a specified price on a specified date. Upon entering into such contracts, the Portfolios are required to deposit with the broker, either in cash or securities, an initial margin in an amount equal to a certain percentage of the contract amount.
Subsequent payments (variation margin) are paid or received by the Portfolios each day, depending on the daily fluctuations in the value of the contracts, and are recorded for financial statement purposes as unrealized gains or losses by the Portfolios. Upon entering into such contracts, the Portfolios bear the risk of interest or exchange rates or security prices moving unexpectedly, in which case, the Portfolios may not achieve the anticipated benefits of the futures contracts and may realize losses. With futures, there is minimal counterparty credit risk to the Portfolios since futures are exchange traded and the exchange’s clearinghouse, as counterparty to all exchange traded futures, guarantees the futures against default.
The open futures contracts at December 31, 2011 are listed in the Schedules of Investments. The variation margin receivable or payable, as applicable, is included in the Statements of Assets and Liabilities.
Swap agreements: Swap agreements are privately negotiated agreements between the Portfolios and a counterparty to exchange or swap investments, cash flows, assets, foreign currencies, or market-linked returns at specified, future intervals. Certain Portfolios, with the exception of Money Market, enter into credit default, cross-currency, interest rate, total return, variance, and other forms of swap agreements to manage exposure to credit, currency, and interest rate risk. In connection with these agreements, securities may be identified as collateral in accordance with the terms of the respective swap agreements to provide assets of value and recourse in the event of default or bankruptcy/insolvency. Swaps are marked to market daily based upon values from third party vendors or quotations from market makers to the extent available and the change in value, if any, is recorded as an unrealized gain or loss on the Statements of Assets and Liabilities. Payments received or made at the beginning of the measurement period are reflected as such on the Statements of Assets and Liabilities and represent payments made or received upon entering into the swap agreement to compensate for differences between the stated terms of the swap agreement and prevailing market conditions (credit spreads, currency exchange rates, interest rates, and other relevant factors). These upfront payments are recorded as realized gains or losses on the Statements of Operations upon termination or maturity of the swap. A liquidation payment received or made at the termination of the swap is recorded as realized gain or loss on the Statements of Operations. Net periodic payments received or paid by a Portfolio are included as part of realized gains or losses on the Statements of Operations. Specific risks and accounting related to each type of swap agreement are identified and described in the following paragraphs:
Credit default swap agreements: The Portfolios are subject to credit risk in the normal course of pursuing their investment objectives. The Portfolios enter into credit default swaps to manage their exposure to the market or to certain sectors of the market, to reduce their risk exposure to defaults of corporate and sovereign issuers, or to create exposure to corporate or sovereign issuers to which they are not otherwise exposed. Credit default swaps involve the exchange of a fixed rate premium for protection against the loss in value of an underlying security in the event of a defined credit event, such as payment default or bankruptcy (buy protection).
NOTE 1. (continued)
Under a credit default swap, one party acts as a guarantor by receiving the fixed periodic payment in exchange for the commitment to purchase the underlying security at par if the defined credit event occurs (sell protection). The Portfolios’ maximum risk of loss from counterparty risk, either as the protection seller or as the protection buyer, is the notional amount of the contract. This risk is mitigated by having a master netting arrangement between the Portfolios and the counterparty, and by the posting of collateral by the counterparty to the Portfolios to cover the Portfolios’ exposure to the counterparty.
Certain Portfolios sell credit default swaps which expose them to risk of loss from credit risk related events specified in the contracts. Although contract-specific, credit events are generally defined as bankruptcy, failure to pay, restructuring, obligation acceleration, obligation default, or repudiation/moratorium. The aggregate fair value of the credit default swaps are disclosed in the Schedules of Investments. The aggregate fair value of assets posted as collateral, net of assets received as collateral, for these swaps is included in the footnotes to the Schedules of Investments. If a defined credit event had occurred during the period, the swaps’ credit-risk-related contingent features would have been triggered, and the Portfolios would have been required to pay the notional amounts for the credit default swaps with a sell protection less the value of the contracts’ related reference obligations.
Interest rate swap agreements: The Portfolios are subject to interest rate risk exposure in the normal course of pursuing their investment objectives. To help hedge against this risk, the Portfolios enter into interest rate swap contracts. Interest rate swaps are agreements between two parties to exchange cash flows based on a notional principal amount. The Portfolios with interest rate swap agreements can elect to pay a fixed rate and receive a floating rate, or, receive a fixed rate and pay a floating rate, on a notional principal amount. The risks of interest rate swaps include changes in market conditions which will affect the value of the contract or the cash flows and the possible inability of the counterparty to fulfill its obligations under the agreement. The Portfolios’ maximum risk of loss from counterparty credit risk is the discounted net value of the cash flows to be received from/paid to the counterparties over the contracts’ remaining lives, to the extent that that amount is positive. This risk is mitigated by having a master netting arrangement between the Portfolios and the counterparty, and by the posting of collateral by the counterparty to the Portfolios to cover the Portfolios’ exposure to the counterparty.
The open swap agreements at December 31, 2011 are disclosed in the Schedules of Investments.
Short sales: A short sale is a transaction in which a Portfolio, with the exception of Money Market, sells securities it does not own, but has borrowed, in anticipation of a decline in the market price of the securities. The Portfolios are obligated to replace the borrowed securities at the market price at the time of replacement. The Portfolios’ obligation to replace the securities borrowed in connection with a short sale is fully secured by collateral deposited with the custodian. In addition, the Portfolios consider the short sale to be a borrowing by the Portfolios that is subject to the asset coverage requirements of the 1940 Act. The Portfolios incur a profit or a loss, depending upon whether the market price of the securities decrease or increase between the date of the short sale and the date on which the Portfolios must replace the borrowed securities. Short sales represent an aggressive trading practice with a high risk/return potential, and short sales involve special considerations. Risks of short sales include that possible losses from short sales may be unlimited (e.g., if the price of stocks sold short rises), whereas losses from direct purchases of securities are limited to the total amount invested, and the Portfolios may be unable to replace borrowed securities sold short.
The Portfolios investing in short sales are liable for any interest or dividends payable on securities while those securities are in a short position and also bear other costs, such as charges for the prime brokerage accounts, in connection with its short positions. These costs, if any, are reported in the Statements of Operations.
Loan participations/assignments: Participations/assignments in commercial loans may be secured or unsecured. These investments may include standby financing commitments, including revolving credit facilities that obligate the Portfolios to supply additional cash to the borrowers on demand. Loan participations/assignments involve risks of insolvency of the lending banks or other financial intermediaries. As such, the Portfolios assume the credit risks associated with the corporate borrowers, and may assume the credit risks associated with the interposed banks or other financial intermediaries.
The Portfolios, with the exception of Money Market, may be contractually obligated to receive approval from the agent banks and/or borrowers prior to the sale of these investments. Loan participations typically represent direct participation in loans to corporate borrowers, and generally are offered by banks or other financial institutions or lending syndicates. The Portfolios that participate in such syndications, or can buy a portion of the loans, become part lenders. Loans are often administered by agent banks acting as agents for all holders.
The agent banks administer the terms of the loans, as specified in the loan agreements. In addition, the agent banks are normally responsible for the collection of principal and interest payments from the corporate borrowers, and the apportionment of these payments to the credit of all institutions that are parties to the loan agreements. Unless, under the terms of the loans or other indebtedness, the Portfolios have direct recourse against the corporate borrowers, the Portfolios may have to rely on the agent banks or other financial intermediaries to apply appropriate credit remedies against corporate borrowers.
The Portfolios held no unsecured loan participations at December 31, 2011.
NOTE 1. (continued)
To be announced purchase commitments (“TBA”): TBA purchase commitments are entered into to purchase securities for a fixed price at a future date, typically not to exceed 45 days. They are considered securities in themselves, and involve a risk of loss if the value of the security to be purchased declines prior to settlement date, in addition to the risk of decline in the value of the Portfolios’ other assets. Unsettled TBA purchase commitments are valued at the current value of the underlying securities, according to the procedures described under Security Valuations.
Treasury inflation-protected securities (“TIPS”): Certain Portfolios invest in TIPS, specially structured bonds in which the principal amount is adjusted daily to keep pace with inflation as measured by the U.S. Consumer Price Index. The adjustments to principal due to inflation/deflation are reflected as increases/decreases to interest income with a corresponding adjustment to cost.
Restricted and illiquid securities: Restricted and illiquid securities are subject to legal or contractual restrictions on resale or are illiquid. Restricted securities generally may be resold in transactions exempt from registration. A security may be considered illiquid if it lacks a readily available market, or if its valuation has not changed for a certain period of time. Disposal of these securities may involve time-consuming negotiations and expense, and prompt sale at the current valuation may be difficult.
The restricted and illiquid securities at December 31, 2011 are listed in the Schedules of Investments.
Payment in-kind securities (“PIKs”): PIKs give the issuer the option at each interest payment date of making interest payments in either cash or additional debt securities. Those additional debt securities usually have the same terms, including maturity dates and interest rates, and associated risks as the original bonds. The daily market quotations of the original bonds may include the accrued interest (referred to as a “dirty price”) and require a pro-rata adjustment from interest receivable to the unrealized appreciation or depreciation on investments on the Statements of Assets and Liabilities.
The PIKs at December 31, 2011 are listed in the Schedules of Investments.
Securities lending: Securities are lent to qualified financial institutions and brokers. The lending of the Portfolios’ securities exposes the Portfolios to risks such as the following: (i) the borrowers may fail to return the loaned securities; (ii) the borrowers may not be able to provide additional collateral; (iii) the Portfolios may experience delays in recovery of the loaned securities or delays in access to collateral; or (iv) the Portfolios may experience losses related to the investment collateral. To minimize certain risks, loan counterparties pledge cash collateral equal to at least the market value of the securities loaned. Cash collateral received is invested in the State Street Navigator Securities Lending Trust-Prime Portfolio, a money market mutual fund registered under the 1940 Act. By lending such securities, the Portfolios seek to increase their net investment income through the receipt of interest (after rebates and fees).
Such income is reflected separately on the Statements of Operations. The value of loaned securities and related collateral outstanding at December 31, 2011 are shown in the Schedules of Investments and Statements of Assets and Liabilities.
Income from loaned securities on the Statements of Operations is net of fees earned by the lending agent for its services.
Commission recapture: The sub-advisers of certain Portfolios, to the extent consistent with the best execution and usual commission rate policies and practices, have elected to place security transactions of the Portfolios with broker/dealers with which other funds or portfolios advised by Transamerica Asset Management, Inc. (“TAM”) have established a Commission Recapture Program. A Commission Recapture Program is any arrangement under which a broker/dealer applies a portion of the commissions received by such broker/dealer on the security transactions to the Portfolios. In no event will commissions paid by the Portfolios be used to pay expenses that would otherwise be borne by any other funds or portfolios advised by TAM or by any other party.
Commissions recaptured for the year ended December 31, 2011, are included in net realized gains/(losses) on the Statements of Operations and are summarized as follows:
| | | | |
Portfolio | | Commissions | |
Large Growth | | $ | 65 | |
Mid Value | | | 237 | |
Mid Growth | | | 52 | |
Small Core | | | 52 | |
Small Growth | | | 104 | |
Small Value | | | 1 | |
Portfolios not listed in the above table did not have any commissions recaptured during the year ended December 31, 2011.
Security transactions and investment income: Security transactions are recorded on the trade date. Security gains and losses are calculated on the specific identification basis. Dividend income, if any, is recorded on the ex-dividend date or, in the case of foreign securities, as soon as the Portfolios are informed of the ex-dividend dates net of foreign taxes. Interest income, including accretion of discounts and amortization of premiums, is recorded on the accrual basis commencing on the settlement date.
NOTE 1. (continued)
TBAs, when-issued or delayed delivery securities may be settled a month or more after the trade date. Interest income is not accrued until settlement date.
Core Bond and Balanced had TBAs outstanding as of December 31, 2011, which are included in Investment securities sold and Investment securities purchased on the Statements of Assets and Liabilities.
Dividend income related to a Real Estate Investment Trust (“REIT”) is recorded at management’s estimate of the income included in distributions from the REIT investments. Distributions received in excess of the estimated amount are recorded as a reduction of cost of investments or realized gain/loss. The actual amounts of income, return of capital, and capital gains are only determined by each REIT after the fiscal year-end and may differ from the estimated amounts.
All of the net investment income and realized and unrealized gains and losses from security transactions are determined on each valuation day and allocated pro rata among the investors in a Portfolio at the time of such determination.
Foreign taxes: The Portfolios may be subject to foreign taxes on income, gains on investments, or currency repatriation, a portion of which may be recoverable. The Portfolios will accrue such taxes and recoveries as applicable, based upon the current interpretation of tax rules and regulations that exist in the markets in which the Portfolios invest.
NOTE 2. SECURITY VALUATIONS
All investments in securities are recorded at their estimated fair value. The Portfolios value their investments at the close of the New York Stock Exchange (“NYSE”), normally 4 p.m. Eastern Time, each day the NYSE is open for business. The Portfolios utilize various methods to measure the fair value of their investments on a recurring basis. GAAP establishes a hierarchy that prioritizes inputs to valuation methods. The inputs or methodology used for valuing securities are not necessarily an indication of the risk associated with investing in those securities. The three Levels of inputs of the fair value hierarchy are defined as follows:
Level 1—Unadjusted quoted prices in active markets for identical securities.
Level 2—Inputs, other than quoted prices included in Level 1, that are observable, either directly or indirectly. These inputs may include quoted prices for the identical instrument on an inactive market, prices for similar instruments, interest rates, prepayment speeds, credit risk, yield curves, default rates, and similar data.
Level 3—Unobservable inputs, which may include Transamerica Asset Management Inc’s (“TAM”) Valuation Committee’s own assumptions in determining the fair value of investments. Factors considered in making this determination may include, but are not limited to, information obtained by contacting the sub-adviser, issuer, analysts, or the appropriate stock exchange (for exchange-traded securities), analysis of the issuer’s financial statements or other available documents and, if necessary, available information concerning other securities in similar circumstances.
The availability of observable inputs can vary from security to security and is affected by a wide variety of factors, including, but not limited to, the type of security, whether the security is new and not yet established in the marketplace, the liquidity of markets, and other characteristics particular to the security. To the extent that valuation is based on models or inputs that are less observable or unobservable in the market, the determination of fair value requires more judgment. Accordingly, the degree of judgment exercised in determining fair value is generally greatest for instruments categorized in Level 3. Due to the inherent uncertainty of valuation, TAM’s Valuation Committee’s determination of values may differ significantly from values that would have been realized had a ready market for investments existed and the differences could be material.
The inputs used to measure fair value may fall into different Levels of the fair value hierarchy. In such cases, for disclosure purposes, the Level in the fair value hierarchy that is assigned to the fair value measurement of a security is determined based on the lowest Level input that is significant to the fair value measurement in its entirety.
Fair value measurements: Descriptions of the valuation techniques applied to the Portfolios’ major categories of assets and liabilities measured at fair value on a recurring basis are as follows:
Equity securities (common and preferred stock): Securities are stated at the last reported sales price or closing price on the day of valuation taken from the primary exchange where the security is principally traded. To the extent these securities are actively traded and valuation adjustments are not applied, they are categorized in Level 1 of the fair value hierarchy.
Foreign securities, in which their primary trading market closes at the same time or after the NYSE, are valued based on quotations from the primary market in which they are traded and are categorized in Level 1. Because many foreign securities markets and exchanges close prior to the close of the NYSE, closing prices for foreign securities in those markets or on those exchanges do not reflect the events that occur after that close. Certain foreign securities may be fair valued using a pricing service that considers the correlation of the trading patterns of the foreign security to the intra-day trading in the U.S. markets for investments such as American Depositary Receipts, financial futures, Exchange Traded Funds, and the movement of certain indices of securities based on a statistical analysis of their historical relationship, such valuations are generally categorized in Level 2.
NOTE 2. (continued)
Preferred stock, repurchase agreements, and other equities traded on inactive markets or valued by reference to similar instruments are also generally categorized in Level 2.
Corporate bonds: The fair value of corporate bonds is estimated using various techniques, which consider recently executed transactions in securities of the issuer or comparable issuers, market price quotations (where observable), bond spreads, fundamental data relating to the issuer, and credit default swap spreads adjusted for any basis difference between cash and derivative instruments. While most corporate bonds are categorized in Level 2 of the fair value hierarchy, in instances where lower relative weight is placed on transaction prices, quotations, or similar observable inputs, they are categorized in Level 3.
Asset backed securities: The fair value of asset backed securities is estimated based on models that consider the estimated cash flows of each tranche of the entity, establish a benchmark yield, and develop an estimated tranche specific spread to the benchmark yield based on the unique attributes of the tranche. To the extent the inputs are observable and timely, the values would generally be categorized in Level 2 of the fair value hierarchy; otherwise they would be categorized as Level 3.
Short term notes: Short-term notes are valued using amortized cost, which approximates fair value. To the extent the inputs are observable and timely, the values would be generally categorized in Level 2 of the fair value hierarchy.
Government securities: Government securities are normally valued using a model that incorporates market observable data such as reported sales of similar securities, broker quotes, yields, bids, offers, and reference data. Certain securities are valued by principally using dealer quotations. Government securities generally are categorized in Level 2 of the fair value hierarchy.
U.S. government agency securities: U.S. government agency securities are comprised of two main categories consisting of agency issued debt and mortgage pass-throughs. Generally, agency issued debt securities are valued in a manner similar to U.S. government securities. Mortgage pass-throughs include TBA securities and mortgage pass-through certificates. Generally, TBA securities and mortgage pass-throughs are valued using dealer quotations. Depending on market activity levels and whether quotations or other observable data are used, these securities are typically categorized in Level 2 of the fair value hierarchy.
Restricted securities (equity and debt): Restricted securities for which quotations are not readily available are valued at fair value as determined in good faith by TAM’s Valuation Committee under the supervision of the Portfolios’ Board of Trustees. Restricted securities issued by publicly traded companies are generally valued at a discount to similar publicly traded securities. Restricted securities issued by nonpublic entities may be valued by reference to comparable public entities and/or fundamental data relating to the issuer. Depending on the relative significance of valuation inputs, these instruments may be classified in either Level 2 or Level 3 of the fair value hierarchy.
Investment company securities: Securities are valued at the net asset value of the underlying portfolio. These securities are actively traded and no valuation adjustments are applied. They are categorized in Level 1 of the fair value hierarchy.
Securities lending collateral: Securities lending collateral is invested in a money market fund which is valued at the net asset value of the underlying portfolios and no valuation adjustments are applied. It is categorized in Level 1 of the fair value hierarchy
Derivative instruments: Listed derivatives that are actively traded are valued based on quoted prices from the exchange and are categorized in Level 1 of the fair value hierarchy. Over the counter (“OTC”) derivative contracts include forward, swap, option, and swaption contracts related to interest rates, foreign currencies, credit standing of reference entities, equity prices, or commodity prices. Depending on the product and the terms of the transaction, the fair value of the OTC derivative products can be modeled taking into account the counterparties’ creditworthiness and using a series of techniques, including simulation models. Many pricing models do not entail material subjectivity because the methodologies employed do not necessitate significant judgments and the pricing inputs are observed from actively quoted markets, as is the case of interest rate swap and option contracts. A substantial majority of OTC derivative products valued by the Portfolios using pricing models fall into this category and are categorized within Level 2 of the fair value hierarchy.
Other: Securities for which quotations are not readily available or whose values have been determined to be unreliable are valued at fair market value as determined in good faith by TAM’s Valuation Committee under the supervision of the Portfolios’ Board of Trustees. For instances which daily market quotes are not readily available, securities may be valued, pursuant to procedures adopted by the Board of Trustees, with reference to other instruments or indices. Depending on the relative significance of valuation inputs, these instruments may be classified in either Level 2 or Level 3 of the fair value hierarchy. When a Portfolio uses fair valuation methods that rely on significant unobservable inputs to determine a security’s value, the Valuation Committee will choose the method that is believed to accurately reflect fair market value. These securities categorized as Level 3 of the fair value hierarchy.
The hierarchy classification of inputs used to value the Portfolios’ investments at December 31, 2011 are disclosed in the Valuation Summary of each Portfolio’s Schedule of Investments. Transfers between Levels are considered to have occurred at the end of the reporting period.
There were no significant transfers into or out of any Level described above during the year ended December 31, 2011.
NOTE 2. (continued)
For assets and liabilities for which significant unobservable inputs (Level 3) were used, there is a reconciliation of the beginning to the ending balances for reported market values that presents changes attributable to total realized and unrealized gains or losses, purchases and sales, and transfers in/out of the Level 3 category during the period. The Level 3 reconciliation, if any, is disclosed in the Valuation Summary of each respective Portfolio’s Schedule of Investments.
NOTE 3. RELATED PARTY TRANSACTIONS
TAM, the Portfolios’ investment adviser, is directly owned by Western Reserve Life Assurance Co. of Ohio and AUSA Holding Company (“AUSA”), both of which are indirect, wholly-owned subsidiaries of AEGON NV. AUSA is wholly-owned by AEGON USA, LLC (“AEGON USA”), a financial services holding company whose primary emphasis is on life and health insurance, and annuity and investment products. AEGON USA is owned by AEGON US Holding Corporation, which is owned by Transamerica Corporation (DE). Transamerica Corporation (DE) is owned by The AEGON Trust, which is owned by AEGON International B.V., which is owned by AEGON NV, a Netherlands corporation, and a publicly traded international insurance group.
Transamerica Financial Life Insurance Company (“TFLIC”) is a wholly-owned subsidiary of AEGON USA. The percentage of each Portfolio that is owned by TFLIC sub-accounts is as follows:
| | | | |
TFLIC Sub-accounts | | Investments
in Portfolio | |
Money Market | | | 3.95 | % |
High Quality Bond | | | 14.03 | |
Inflation-Protected Securities | | | 14.94 | |
Core Bond | | | 9.70 | |
High Yield Bond | | | 5.77 | |
Balanced | | | 52.23 | |
Large Value | | | 32.58 | |
Large Core | | | 50.62 | |
Large Growth | | | 29.38 | |
Mid Value | | | 5.15 | |
Mid Growth | | | 1.85 | |
Small Value | | | 3.41 | |
Small Core | | | 46.07 | |
Small Growth | | | 3.21 | |
International Equity | | | 19.39 | |
Diversified Investment Advisors Collective Investment Trust (“CIT”) is managed by Massachusetts Fidelity Trust Company, which is a wholly-owned subsidiary of AEGON USA. The percentage of each Portfolio that is owned by CIT sub-accounts is as follows:
| | | | |
CIT Sub-accounts | | Investments
in Portfolio | |
Money Market | | | 16.72 | % |
High Quality Bond | | | 40.00 | |
Inflation-Protected Securities | | | 16.60 | |
Core Bond | | | 29.45 | |
High Yield Bond | | | 26.08 | |
Balanced | | | 6.02 | |
Large Value | | | 23.44 | |
Large Core | | | 13.37 | |
Large Growth | | | 21.75 | |
Mid Value | | | 11.44 | |
Mid Growth | | | 33.80 | |
Small Value | | | 45.34 | |
Small Core | | | 12.01 | |
Small Growth | | | 41.18 | |
International Equity | | | 30.07 | |
NOTE 3. (continued)
Transamerica Asset Management, Inc. Collective Trust Funds (“CTF”) is managed by Massachusetts Fidelity Trust Company, which is a wholly-owned subsidiary of AEGON USA. The percentage of each Portfolio that is owned by CTF sub-accounts is as follows:
| | | | |
CTF Sub-accounts | | Investments
in Portfolio | |
Money Market | | | 0.03 | % |
High Quality Bond | | | 9.02 | |
Inflation-Protected Securities | | | 4.41 | |
Core Bond | | | 5.42 | |
High Yield Bond | | | 17.49 | |
Balanced | | | — | |
Large Value | | | 4.66 | |
Large Core | | | 2.90 | |
Large Growth | | | 2.36 | |
Mid Value | | | 23.38 | |
Mid Growth | | | 9.94 | |
Small Value | | | 5.69 | |
Small Core | | | 1.39 | |
Small Growth | | | 5.14 | |
International Equity | | | 4.70 | |
Transamerica Fund Services, Inc. (“TFS”) is the Portfolios’ administrator. TAM and TFS are affiliates of AEGON NV.
Certain officers and trustees of the Series Portfolio and of the entities that invest in the Series Portfolio are also officers of TAM or its affiliates. None of the non-independent trustees receive compensation for services as trustees of the Series Portfolio or the entities that invest in the Series Portfolio.
Investment advisory fees: TAM manages the assets of each Portfolio of the Series Portfolio pursuant to the Investment Advisory Agreement with the Series Portfolio. For its services, TAM receives fees from each Portfolio, accrued daily and payable monthly, at an annual rate equal to the percentages specified in the table below of the corresponding Portfolios’ average daily net assets (“ANA”).
For each Portfolio, TAM has entered into Investment Sub-Advisory Agreements with the Portfolios’ sub-advisers. It is the responsibility of each sub-adviser to make the day-to-day investment decisions of the Portfolios and to place the purchase and sales orders for securities transactions of the Portfolios, subject in all cases to the general supervision of TAM.
Payment of fees to the sub-advisers is the responsibility of TAM, and is not an additional expense of a Portfolio.
| | | | |
Portfolio | | Advisory
Fee | |
Money Market | | | 0.25 | % |
High Quality Bond | | | 0.35 | |
Inflation-Protected Securities | | | 0.35 | |
Core Bond | | | 0.35 | |
High Yield Bond | | | 0.55 | |
Balanced | | | 0.45 | |
Large Value | | | 0.45 | |
Large Core | | | 0.60 | |
Large Growth | | | 0.62 | |
Mid Value | | | 0.67 | |
Mid Growth | | | 0.72 | |
Small Value | | | 0.82 | |
Small Core | | | 0.80 | |
Small Growth | | | 0.87 | |
International Equity | | | 0.75 | |
TAM has voluntarily elected to waive fees to the extent the total operating expenses of a Portfolio exceed the following expense caps (as a proportion of ANA):
| | | | |
Portfolio | | Expense Cap | |
Money Market | | | 0.30 | % |
High Quality Bond | | | 0.40 | |
Inflation-Protected Securities | | | 0.40 | |
Core Bond | | | 0.40 | |
High Yield Bond | | | 0.60 | |
Balanced | | | 0.50 | |
Large Value | | | 0.50 | |
Large Core | | | 0.65 | |
Large Growth | | | 0.65 | |
Mid Value | | | 0.70 | |
Mid Growth | | | 0.75 | |
Small Value | | | 0.85 | |
Small Core | | | 0.85 | |
Small Growth | | | 0.90 | |
International Equity | | | 0.90 | |
NOTE 3. (continued)
Such fee waivers are not subject to recoupment by TAM in future years.
TAM also may waive additional fees from time to time to help them maintain competitive expense ratios. These arrangements are voluntary and may be terminated at any time.
Deferred compensation plan: Under a non-qualified deferred compensation plan effective January 1, 1996, as amended and restated (the “Deferred Compensation Plan”), available to the Trustees, compensation may be deferred that would otherwise be payable by the Trust to an Independent Trustee on a current basis for services rendered as Trustee. Deferred compensation amounts will accumulate based on the value of Class A (or comparable) shares of a series of Transamerica Funds (without imposition of sales charge), or investment options under Transamerica Partners Institutional Funds and Transamerica Institutional Asset Allocation Funds, as elected by the Trustee.
Brokerage commissions: There were no brokerage commissions incurred on security transactions placed with affiliates of TAM or sub-advisers for the year ended December 31, 2011.
NOTE 4. INVESTMENT TRANSACTIONS
The cost of securities purchased and proceeds from securities sold (excluding short-term securities) for the year ended December 31, 2011 were as follows:
| | | | | | | | | | | | | | | | |
| | | Purchases of securities: | | | Proceeds from maturities and sales of
securities: | |
Fund | | Long-term | | | U.S. Government | | | Long-term | | | U.S. Government | |
Money Market | | $ | — | | | $ | — | | | $ | — | | | $ | — | |
High Quality Bond | | | 193,417 | | | | 202,013 | | | | 159,259 | | | | 250,388 | |
Inflation-Protected Securities | | | 83,781 | | | | 359,284 | | | | 128,609 | | | | 350,454 | |
Core Bond | | | 3,371,753 | | | | 4,279,529 | | | | 3,529,361 | | | | 4,311,445 | |
High Yield Bond | | | 623,870 | | | | — | | | | 560,328 | | | | — | |
Balanced | | | 221,305 | | | | 68,801 | | | | 270,422 | | | | 69,997 | |
Large Value | | | 513,629 | | | | — | | | | 656,625 | | | | — | |
Large Core | | | 154,424 | | | | — | | | | 181,299 | | | | — | |
Large Growth | | | 582,901 | | | | — | | | | 727,270 | | | | — | |
Mid Value | | | 572,709 | | | | — | | | | 697,886 | | | | — | |
Mid Growth | | | 320,283 | | | | — | | | | 358,516 | | | | — | |
Small Value | | | 17,836 | | | | — | | | | 45,810 | | | | — | |
Small Core | | | 189,233 | | | | — | | | | 225,548 | | | | — | |
Small Growth | | | 149,422 | | | | — | | | | 173,879 | | | | — | |
International Equity | | | 195,297 | | | | — | | | | 306,255 | | | | — | |
NOTE 5. DERIVATIVE FINANCIAL INSTRUMENTS
Inflation-Protected Securities:
The Portfolio is subject to various risks in the normal course of pursuing its investment objectives. The volume of purchased option and swaption contracts increased during the year from four contracts at the beginning of the year to seven contracts at year end. The volume of swap contracts increased to 11 contracts during the third quarter of the year, and then subsequently decreased to eight contracts held at year end. The volume of futures contracts increased during the year from four contracts at the beginning of the year to eight contracts at year end. The volume of written option and swaption contracts increased during the year from eight contracts at the beginning of the year to 14 contracts at year end. The volume of forward contracts increased to 10 contracts during the first quarter of the year, and then subsequently decreased to five contracts held at year end. The tables below highlight the types of risks and the derivative instruments used to mitigate the risks:
Fair Values of Derivative Instruments on the Statement of Assets and Liabilities as of December 31, 2011
Derivatives not accounted for as hedging instruments
| | | | | | | | | | | | |
Location | | Interest rate
contracts | | | Foreign exchange
contracts | | | Total | |
Asset derivatives | | | | | | | | | | | | |
Purchased options and swaptions, at value | | $ | 1,084 | | | $ | 43 | | | $ | 1,127 | ** |
Unrealized appreciation on swap agreements | | | 789 | | | | — | | | | 789 | |
Unrealized appreciation on futures contracts | | | 398 | | | | — | | | | 398 | * |
Unrealized appreciation on forward foreign currency transactions | | | — | | | | 119 | | | | 119 | |
Liability derivatives | | | | | | | | | | | | |
Written options and swaptions, at value | | | (3,049 | ) | | | (121 | ) | | | (3,170 | ) |
Unrealized depreciation on swap agreements | | | (592 | ) | | | — | | | | (592 | ) |
Premium received on swap agreements | | | (148 | ) | | | — | | | | (148 | ) |
Unrealized depreciation on futures contracts | | | (755 | ) | | | — | | | | (755 | )* |
Unrealized depreciation on forward currency contracts | | | — | | | | (56 | ) | | | (56 | ) |
| | | | | | | | | | | | |
Total | | $ | (2,273 | ) | | $ | (15 | ) | | $ | (2,288 | ) |
| | | | | | | | | | | | |
| * | Includes cumulative appreciation/depreciation of futures contracts as reported in the Schedule of Investments. Only current day’s variation margin is reported within the Statement of Assets and Liabilities. |
| ** | Included within Investment securities at value. |
NOTE 5. (continued)
Effect of Derivative Instruments on the Statement of Operations for the period ended December 31, 2011
Derivatives not accounted for as hedging instruments
| | | | | | | | | | | | |
Location | | Interest rate
contracts | | | Foreign exchange
contracts | | | Total | |
Realized Gain/(Loss) on derivatives recognized in income | | | | | | | | | | | | |
Net realized gain on purchased option and swaption contracts | | $ | 426 | | | $ | (141 | ) | | $ | 285 | ^ |
Net realized (loss) on swap agreements | | | (229 | ) | | | — | | | | (229 | ) |
Net realized (loss) on futures contracts | | | (6,532 | ) | | | — | | | | (6,532 | ) |
Net realized gain on written option and swaption contracts | | | 726 | | | | 180 | | | | 906 | |
Net realized (loss) on forward foreign currency transactions | | | — | | | | (304 | ) | | | (304 | ) ~ |
Net Change in Unrealized Appreciation/(Depreciation) on derivatives recognized in income | | | | | | | | | | | | |
Net change in unrealized appreciation (depreciation) on purchased option and swaption contracts | | | 531 | | | | (73 | ) | | | 458 | Y |
Net change in unrealized appreciation (depreciation) on swap agreements | | | 186 | | | | — | | | | 186 | |
Net change in unrealized appreciation (depreciation) on futures contracts | | | (326 | ) | | | — | | | | (326 | ) |
Net change in unrealized appreciation (depreciation) on written option and swaption contracts | | | (1,573 | ) | | | 172 | | | | (1,401 | ) |
Net change in unrealized appreciation (depreciation) on translation of assets and liabilities denominated in foreign currencies | | | — | | | | 48 | | | | 48 | |
| | | | | | | | | | | | |
Total | | $ | (6,791 | ) | | $ | (118 | ) | | $ | (6,909 | ) |
| | | | | | | | | | | | |
| ^ | Included within net realized gain (loss) on transactions from Investment securities. |
| ~ | Included within net realized gain (loss) on transactions from foreign currency transactions. |
| Y | Included within net increase (decrease) in unrealized appreciation (depreciation) on transactions from Investment securities. |
For non-exchange traded derivatives (swaps and forward foreign currency contracts), under standard derivatives agreements, the Portfolio may be required to post collateral on derivatives if the Portfolio is in a net liability position with the counterparty exceeding certain amounts. Additionally, counterparties may immediately terminate derivatives contracts if the Portfolio fails to maintain sufficient asset coverage for its contracts or its net assets decline by stated percentages.
Core Bond:
The Portfolio is subject to various risks in the normal course of pursuing its investment objectives. The volume of purchased option and swaption contracts, and written swaption and option contracts held throughout the year decreased, starting at 28 and 46 contracts, respectively, and ending at 15 and 11 contracts, respectively. The volume of swap contracts, futures contracts, and forward foreign currency contracts increased during the year from 24, seven, and two contracts, respectively, at the beginning go of the year, to 42, 17, and six contracts at year end. The tables below highlight the types of risks and the derivative instruments used to mitigate the risks:
Fair Values of Derivative Instruments on the Statement of Assets and Liabilities as of December 31, 2011
Derivatives not accounted for as hedging instruments
| | | | | | | | | | | | | | | | |
Location | | Interest rate
contracts | | | Foreign exchange
contracts | | | Credit contracts | | | Total | |
Asset derivatives | | | | | | | | | | | | | | | | |
Purchased options and swaptions, at value | | $ | 2,296 | | | $ | 8 | | | $ | — | | | $ | 2,304 | ** |
Unrealized appreciation on forward foreign currency contracts | | | — | | | | 1,841 | | | | — | | | | 1,841 | |
Premium paid on swap agreements | | | 392 | | | | — | | | | 1,736 | | | | 2,128 | |
Unrealized appreciation on swap agreements | | | 2,001 | | | | — | | | | 1,323 | | | | 3,324 | |
Unrealized appreciation on futures contracts | | | 1,947 | | | | — | | | | — | | | | 1,947 | * |
Liability derivatives | | | | | | | | | | | | | | | | |
Unrealized depreciation on swap agreements | | | (2,161 | ) | | | — | | | | (600 | ) | | | (2,761 | ) |
Unrealized depreciation on forward foreign currency contracts | | | — | | | | (489 | ) | | | — | | | | (489 | ) |
Premium received on swap agreements | | | (102 | ) | | | — | | | | (4,084 | ) | | | (4,186 | ) |
Written options and swaptions, at value | | | (5,705 | ) | | | — | | | | (2 | ) | | | (5,707 | ) |
Unrealized depreciation on futures contracts | | | (1,165 | ) | | | — | | | | — | | | | (1,165 | )* |
| | | | | | | | | | | | | | | | |
Total | | $ | (2,497 | ) | | $ | 1,360 | | | $ | (1,627 | ) | | $ | (2,764 | ) |
| | | | | | | | | | | | | | | | |
| * | Includes cumulative appreciation/depreciation of futures contracts as reported in the Schedule of Investments. Only current day’s variation margin is reported within the Statement of Assets and Liabilities. |
| ** | Included within Investment securities at value. |
NOTE 5. (continued)
Effect of Derivative Instruments on the Statement of Operations for the period ended December 31, 2011
Derivatives not accounted for as hedging instruments
| | | | | | | | | | | | | | | | |
Location | | Interest rate
contracts | | | Foreign exchange
contracts | | | Credit
contracts | | | Total | |
Realized Gain/(Loss) on derivatives recognized in income | | | | | | | | | | | | | | | | |
Net realized (loss) on purchased option and swaption contracts | | $ | (1,115 | ) | | $ | — | | | $ | — | | | $ | (1,115 | )^ |
Net realized gain/(loss) on swap agreements | | | 3,899 | | | | — | | | | (2,210 | ) | | | 1,689 | |
Net realized gain on futures contracts | | | 1,476 | | | | (5 | ) | | | — | | | | 1,471 | |
Net realized (loss) on written option and swaption contracts | | | (11,624 | ) | | | — | | | | — | | | | (11,624 | ) |
Net realized (loss) on forward foreign currency transactions | | | — | | | | (305 | ) | | | — | | | | (305 | )~ |
Net Change in Unrealized Appreciation/(Depreciation) on derivatives recognized in income | | | | | | | | | | | | | | | | |
Net change in unrealized appreciation (depreciation) on purchased option and swaption contracts | | | (200 | ) | | | (273 | ) | | | — | | | | (473 | )Y |
Net change in unrealized appreciation (depreciation) on swap agreements | | | (2,641 | ) | | | — | | | | 985 | | | | (1,656 | ) |
Net change in unrealized appreciation (depreciation) on futures contracts | | | 2,390 | | | | — | | | | — | | | | 2,390 | |
Net change in unrealized appreciation (depreciation) on written option and swaption contracts | | | (2,268 | ) | | | — | | | | — | | | | (2,268 | ) |
Net change in unrealized appreciation (depreciation) on translation of assets and liabilities denominated in foreign currencies | | | — | | | | 1,276 | | | | — | | | | 1,276 | |
| | | | | | | | | | | | | | | | |
Total | | $ | (10,083 | ) | | $ | 693 | | | $ | (1,225 | ) | | $ | (10,615 | ) |
| | | | | | | | | | | | | | | | |
| ^ | Included within net realized gain (loss) on transactions from Investment securities. |
| ~ | Included within net realized gain (loss) on transactions from foreign currency transactions. |
| Y | Included within net increase (decrease) in unrealized appreciation (depreciation) on transactions from Investment securities. |
For non-exchange traded derivatives (swaps and forward foreign currency contracts), under standard derivatives agreements, the Portfolio may be required to post collateral on derivatives if the Portfolio is in a net liability position with the counterparty exceeding certain amounts. Additionally, counterparties may immediately terminate derivatives contracts if the Portfolio fails to maintain sufficient asset coverage for its contracts or its net assets decline by stated percentages.
Balanced:
The Portfolio is subject to various risks in the normal course of pursuing its investment objectives. The volume of forward foreign currency contracts and purchased option and swaption contracts increased from zero contracts at the beginning to the year to four and six contracts, respectively, at year end. The volume of written option and swaption contracts held throughout the year decreased from four contracts at the beginning of the year to zero contracts at year end. The volume of futures contracts held at the beginning of the year increased from six contracts to 14 contracts at year end. The tables below highlight the types of risks and the derivative instruments used to mitigate the risks:
Fair Values of Derivative Instruments on the Statement of Assets and Liabilities as of December 31, 2011
Derivatives not accounted for as hedging instruments
| | | | | | | | | | | | | | | | |
Location | | Interest
rate
contracts | | | Equity
contracts | | | Foreign
Exchange
Contracts | | | Total | |
Asset derivatives | | | | | | | | | | | | | | | | |
Purchased options and swaptions, at value | | $ | 2 | | | $ | — | | | $ | 3 | | | $ | 5 | |
Unrealized appreciation on futures contracts | | | 70 | | | | 3 | | | | — | | | | 73 | * |
Unrealized appreciation on forward foreign currency contracts | | | — | | | | — | | | | 42 | | | | 42 | |
Liability derivatives | | | | | | | | | | | | | | | | |
Unrealized depreciation on futures contracts | | | (11 | ) | | | — | | | | — | | | | (11 | )* |
Unrealized depreciation on forward foreign currency contracts | | | — | | | | — | | | | (13 | ) | | | (13 | ) |
| | | | | | | | | | | | | | | | |
Total | | $ | 61 | | | $ | 3 | | | $ | 32 | | | $ | 96 | |
| | | | | | | | | | | | | | | | |
| * | Includes cumulative appreciation/depreciation of futures contracts as reported in the Schedule of Investments. Only current day’s variation margin is reported within the Statement of Assets and Liabilities. |
Effect of Derivative Instruments on the Statement of Operations for the period ended December 31, 2011
Derivatives not accounted for as hedging instruments
| | | | | | | | | | | | | | | | |
Location | | Interest
rate
contracts | | | Equity
contracts | | | Foreign
Exchange
Contracts | | | Total | |
Realized Gain/(Loss) on derivatives recognized in income | | | | | | | | | | | | | | | | |
Net realized (loss) on purchased option and swaption contracts | | $ | (77 | ) | | $ | — | | | $ | 1 | | | $ | (76 | )^ |
Net realized (loss) on futures contracts | | | 102 | | | | (13 | ) | | | — | | | | 89 | |
Net realized gain on written option and swaption contracts | | | 52 | | | | — | | | | 6 | | | | 58 | |
Net Change in Unrealized Appreciation/(Depreciation) on derivatives recognized in income | | | | | | | | | | | | | | | | |
Net change in unrealized appreciation (depreciation) on purchased option and swaption contracts | | | (4 | ) | | | — | | | | (15 | ) | | | (19 | )Y |
Net change in unrealized appreciation (depreciation) on futures contracts | | | 131 | | | | — | | | | — | | | | 131 | |
Net change in unrealized appreciation (depreciation) on written option and swaption contracts | | | 3 | | | | — | | | | — | | | | 3 | |
Net change in unrealized appreciation (depreciation) on translation of assets and liabilities denominated in foreign currencies | | | — | | | | — | | | | 28 | | | | 28 | |
| | | | | | | | | | | | | | | | |
Total | | $ | 207 | | | $ | (13 | ) | | $ | 20 | | | $ | 214 | |
| | | | | | | | | | | | | | | | |
| ^ | Included within net realized gain (loss) on transactions from Investment securities. |
Y Included within net increase (decrease) in unrealized appreciation (depreciation) on transactions from Investment securities.
NOTE 5. (continued)
Small Core:
The Portfolio is subject to various risks in the normal course of pursuing its investment objectives. The volume of futures contracts held at year end is indicative of the volume held throughout the year. The tables below highlight the types of risks and the derivative instruments used to mitigate the risks:
Fair Values of Derivative Instruments on the Statement of Assets and Liabilities as of December 31, 2011
Derivatives not accounted for as hedging instruments
| | | | |
Location | | Equity contracts | |
Asset derivatives | | | | |
Unrealized appreciation on futures contracts | | $ | 22 | * |
| * | Includes cumulative appreciation/depreciation of futures contracts as reported in the Schedule of Investments. Only current day’s variation margin is reported within the Statement of Assets and Liabilities. |
Effect of Derivative Instruments on the Statement of Operations for the period ended December 31, 2011
Derivatives not accounted for as hedging instruments
| | | | |
Location | | Equity contracts | |
Realized Gain/(Loss) on derivatives recognized in income | | | | |
Net realized gain on futures contracts | | $ | 248 | |
Net Change in Unrealized Appreciation/(Depreciation) on derivatives recognized in income | | | | |
Net change in unrealized appreciation (depreciation) on futures contracts | | | (5 | ) |
| | | | |
Total | | $ | 243 | |
| | | | |
International Equity:
The Portfolio is subject to various risks in the normal course of pursuing its investment objectives. The volume of forward foreign currency contracts held at year end is indicative of the volume held throughout the year. The tables below highlight the types of risks and the derivative instruments used to mitigate the risks:
Fair Values of Derivative Instruments on the Statement of Assets and Liabilities as of December 31, 2011
Derivatives not accounted for as hedging instruments
| | | | |
Location | | Foreign exchange
contracts | |
Asset derivatives | | | | |
Unrealized appreciation on forward foreign currency contracts | | $ | 2,441 | |
Effect of Derivative Instruments on the Statement of Operations for the period ended December 31, 2011
Derivatives not accounted for as hedging instruments
| | | | |
Location | | Foreign exchange
contracts | |
Realized Gain/(Loss) on derivatives recognized in income | |
Net realized (loss) on forward foreign currency transactions | | $ | (1,866 | ) |
Net Change in Unrealized Appreciation/(Depreciation) on derivatives recognized in income | | | | |
Net change in unrealized appreciation (depreciation) on translation of assets and liabilities denominated in foreign currencies | | | 4,907 | |
| | | | |
Total | | $ | 3,041 | |
| | | | |
For non-exchange traded derivatives (swaps and forward foreign currency contracts), under standard derivatives agreements, the Portfolio may be required to post collateral on derivatives if the Portfolio is in a net liability position with the counterparty exceeding certain amounts. Additionally, counterparties may immediately terminate derivatives contracts if the Portfolio fails to maintain sufficient asset coverage for its contracts or its net assets decline by stated percentages.
NOTE 6. FEDERAL INCOME TAX MATTERS
The Series Portfolio has received rulings from the Internal Revenue Service that each Portfolio will be treated as a separate partnership for federal income tax purposes. Income taxes are not provided for by the Portfolios because taxable income/(loss) of each Portfolio is included in the income tax returns of the investors. It is intended that the Portfolios’ assets will be managed so an investor in the Portfolio can satisfy the requirements of Subchapter M of the Internal Revenue Code. The Portfolios recognize the tax benefits of uncertain tax positions only where the position is “more likely than not” to be sustained assuming examination by tax authorities. Management has evaluated the Portfolios’ tax provisions taken for all open tax years (2008 - 2010), or expected to be taken in the Portfolios’ 2011 tax returns, and has concluded that no provision for income tax is required in the Portfolios’ financial statements. For tax purposes, each component of the Portfolios’ net assets are reported at the investor level; therefore, the Statements of Assets and Liabilities do not present the components of net assets.
NOTE 6. (continued)
Each investor in the Portfolio will be subject to taxation on its share of the Portfolio’s ordinary income and capital gains; which may differ from GAAP. These differences are primarily due to different treatment for items including, but not limited to, wash sales, structured notes, foreign bonds, swaps, net operating losses, distribution reclasses for REITs, passive foreign investment companies, foreign currency transactions, capital loss carryforwards, and post-October loss deferrals.
NOTE 7. ACCOUNTING PRONOUNCEMENTS
In May 2011, the Financial Accounting Standards Board (“FASB”) issued the authoritative guidance “Amendments to Achieve Common Fair Value Measurement and Disclosure Requirements in U.S. GAAP and IFRS” which seeks to establish common requirements for measuring fair value and for disclosing information about fair value measurements in accordance with GAAP. The adoption of this disclosure requirement is effective for financial statements interim and annual periods beginning after December 15, 2011. Management is currently evaluating the application of the adoption of the additional disclosure requirements and its impact on the Portfolios’ financial statements.
In April 2011, FASB issued an amendment to authoritative guidance “Reconsideration of Effective Control for Repurchase Agreements” which amends specifically the criteria required to determine whether a repurchase agreement and similar agreements should be accounted for as sales of financial assets or secured borrowings with commitments. The adoption of this guidance is effective for the first interim or annual period beginning on or after December 15, 2011 prospectively to transactions or modifications of existing transactions that occur on or after the effective date. Management is currently evaluating the application of the adoption of the additional disclosure requirements and its impact on the Portfolios’ financial statements.
NOTE 8. SUBSEQUENT EVENT
Management has evaluated subsequent events through the date of issuance of the financial statements, and determined that no other material events or transactions would require recognition or disclosure in the Portfolios’ financial statements.
To the Board of Trustees and Owners of Beneficial Interests of the Transamerica Partners Portfolios:
We have audited the accompanying statements of assets and liabilities, including the schedules of investments, of Transamerica Partners Portfolios (comprising, respectively, the Money Market Portfolio, High Quality Bond Portfolio, Inflation-Protected Securities Portfolio, Core Bond Portfolio, High Yield Bond Portfolio, Balanced Portfolio, Large Value Portfolio, Large Core Portfolio, Large Growth Portfolio, Mid Value Portfolio, Mid Growth Portfolio, Small Value Portfolio, Small Core Portfolio, Small Growth Portfolio and International Equity Portfolio) (collectively, the “Portfolios”) as of December 31, 2011, and the related statements of operations for the year then ended and the statements of changes in net assets and the financial highlights for each of the two years in the period then ended. These financial statements and financial highlights are the responsibility of the Portfolios’ management. Our responsibility is to express an opinion on these financial statements and financial highlights based on our audits. The financial highlights for periods ended prior to January 1, 2010 were audited by another independent registered public accounting firm whose report, dated March 1, 2010, expressed an unqualified opinion on those financial highlights.
We conducted our audits in accordance with the standards of the Public Company Accounting Oversight Board (United States). Those standards require that we plan and perform the audits to obtain reasonable assurance about whether the financial statements and financial highlights are free of material misstatement. We were not engaged to perform an audit of the Portfolios’ internal control over financial reporting. Our audits included consideration of internal control over financial reporting as a basis for designing audit procedures that are appropriate in the circumstances, but not for the purpose of expressing an opinion on the effectiveness of the Portfolios’ internal control over financial reporting. Accordingly, we express no such opinion. An audit also includes examining, on a test basis, evidence supporting the amounts and disclosures in the financial statements and financial highlights, assessing the accounting principles used and significant estimates made by management, and evaluating the overall financial statement presentation. Our procedures included confirmation of securities owned as of December 31, 2011, by correspondence with the custodian and others or by other appropriate auditing procedures where replies from others were not received. We believe that our audits provide a reasonable basis for our opinion.
In our opinion, the financial statements and financial highlights referred to above present fairly, in all material respects, the financial position of each of the respective portfolios constituting Transamerica Partners Portfolios at December 31, 2011, and the results of their operations for the year then ended and the changes in their net assets and the financial highlights for each of the two years in the period then ended, in conformity with U.S. generally accepted accounting principles.

Boston, Massachusetts
February 27, 2012
TRANSAMERICA PARTNERS SMALL GROWTH PORTFOLIO
APPROVAL OF NEW SUB-ADVISORY AGREEMENT
(unaudited)
At a meeting of the Board of Trustees of Transamerica Partners Portfolios (the “Board,” or the “Board Members”) held on October 13, 2011, the Board reviewed and considered the approval of a new investment sub-advisory agreement (the “New Sub-Advisory Agreement”) between Transamerica Asset Management, Inc. (“TAM,” or “Management”) and Perimeter Capital Management (“Perimeter,” or the “Sub-Adviser”) with regard to Transamerica Partners Small Growth Portfolio (the “Portfolio”). The Board Members reviewed information relating to a change in equity ownership of Perimeter that occurred on September 30, 2011, and which might have been deemed to be a “change of control” of Perimeter resulting in the termination of the existing sub-advisory agreement between Perimeter and TAM, the Portfolio’s investment adviser.
The Board Members also received and considered information provided to them regarding a memorandum received from counsel to Perimeter, advising Perimeter that because neither Perimeter nor any person controlling Perimeter would, directly or indirectly, receive any money or benefit in connection with the change in control, Perimeter could rely on an exemptive rule, which permitted a replacement sub-advisory agreement to be approved by the Board under certain conditions. The Board Members also considered information received from Perimeter that confirmed that Perimeter’s staff, including portfolio management and all operational staff would continue in their current roles after the assignment as well as assurances from Perimeter that there would be no diminution in the services to be provided by Perimeter.
To assist the Board in its consideration of the new sub-advisory agreement with Perimeter (“New Sub-Advisory Agreement”), the Board received in advance of the Meeting certain materials and information. In addition, the Board Members who are not interested persons of the Funds, consulted with their independent legal counsel, discussing, among other things, the legal standards and certain other considerations relevant to the Board’s deliberations. Following the presentation by TAM and a discussion amongst the Board Members and Management, the Board Members approved the New Sub-Advisory Agreement for an initial two-year period on behalf of the Portfolio.
Among other things, the Board considered:
| | (a) | that the Board had previously performed a full annual review of the sub-advisory agreement with Perimeter and had determined that Perimeter had the capabilities, resources and personnel necessary to provide the sub-advisory services to the Portfolio; |
| | (b) | assurances received from Perimeter that the change of control is not expected to result in any diminution in the nature, quality and extent of services provided to the Portfolio and its shareholders, including compliance services; |
| | (c) | assurances received from Perimeter as to the consistency of the portfolio management team that would be primarily responsible for the day-to-day management of the Portfolio; and |
| | (d) | that the sub-advisory fee schedule under the New Sub-Advisory Agreement would not differ from the schedule under the prior sub-advisory agreement. |
Based upon its review and the representations made to it and after consideration of the above factors, and such other factors and information as it deemed relevant, the Board approved the New Sub-Advisory Agreement. No single factor reviewed by the Board was identified as the principal factor in determining whether to approve the New Sub-Advisory Agreement and each Board Member may have attributed different weights to the various factors considered.
BOARD MEMBERS AND OFFICERS
(unaudited)
The Board Members and executive officers of the Trust are listed below. The Board governs each fund and is responsible for protecting the interests of the shareholders. The Board Members are experienced executives who meet periodically throughout the year to oversee the business affairs of each fund and the operation of the Trust by its officers. The Board also reviews the management of each fund’s assets by the investment adviser and its respective sub-adviser. The funds are among the funds advised and sponsored by TAM (collectively, “Transamerica Asset Management Group”). Transamerica Asset Management Group (“TAMG”) consists of Transamerica Funds, Transamerica Series Trust (“TST”), Transamerica Income Shares, Inc. (“TIS”), Transamerica Partners Funds Group (“TPFG”), Transamerica Partners Funds Group II (“TPFG II”), Transamerica Partners Portfolios (“TPP”), and Transamerica Asset Allocation Variable Funds (“TAAVF”) and consists of 159 funds as of the date of this report.
The mailing address of each Board Member is c/o Secretary, 570 Carillon Parkway, St. Petersburg, Florida 33716. The Board Members, their year of birth, their positions with the Trust, and their principal occupations for the past five years (their titles may have varied during that period), the number of funds in TAMG the Board oversees, and other board memberships they hold are set forth in the table below.
| | | | | | | | | | |
Name and Year of Birth | | Position(s) Held with Trust | | Term of Office
and Length of
Time Served* | | Principal Occupation(s) During Past 5 Years | | Number of Funds in Complex Overseen by Board Member | | Other
Directorships |
INTERESTED BOARD MEMBER** |
| | | | | |
John K. Carter (1961) | | Chairman, Board Member, President, and Chief Executive Officer | | Since 2007 | | Chairman, Board Member, President and Chief Executive Officer, TPP, TPFG, TPFG II and TAAVF (2007 – present); Chairman (2007 – present), Board Member (2006 – present), President and Chief Executive Officer (2006 – present), Senior Vice President (1999 – 2006), Chief Compliance Officer, General Counsel and Secretary (1999 – 2006), Transamerica Funds and TST; Chairman (2007 – present), Board Member (2006 – present), President and Chief Executive Officer (2006 – present), Senior Vice President (2002 – 2006), General Counsel, Secretary and Chief Compliance Officer (2002 – 2006), TIS; Chairman, President and Chief Executive Officer (2006 – present), Director (2002 – present), Senior Vice President (1999 – 2006), General Counsel and Secretary (2000 – 2006), Chief Compliance Officer (2004 – 2006), TAM; Chairman, President and Chief Executive Officer (2006 – present), Senior Vice President (1999 – 2006), Director (2002 – present), General Counsel and Secretary (2001 – 2006), Transamerica Fund Services, Inc. (“TFS”); Vice President, AFSG Securities Corporation (2001 – 2010); Chairman and Board Member (2008 – 2010), President (2007 – 2010), Chief Executive Officer (2006 – 2010), Vice President, Secretary and Chief Compliance Officer (2003 – 2006), Transamerica Investors, Inc. (“TII”); Senior Vice President, General Counsel and Secretary, Transamerica Index Funds, Inc. (“TIF”)–2004);(2002and | | 159 | | N/A |
| | | | | | | | | | |
Name and Year of Birth | | Position(s) Held with Trust | | Term of Office
and Length of
Time Served* | | Principal Occupation(s) During Past 5 Years | | Number of Funds in Complex Overseen by Board Member | | Other Directorships |
| | | | | | Director, (2008 – present), Vice President, Transamerica Investment Services, Inc. (“TISI”) (2003 – 2005) and Transamerica Investment Management, LLC (“TIM”) (2001 – 2005). | | | | |
| | | | | |
Alan F. Warrick (1948) | | Interested Board Member | | Since 2012 | | Board Member, Transamerica Funds, TST, TIS, TPP, TPFG, TPFG II and TAAVF (January 2012 – present); Consultant, AEGON USA (2010 – present); Senior Advisor, Lovell Minnick Equity Partners (2010 – present); Retired (2010 – present); and Managing Director for Strategic Business Development, AEGON USA (1994 - 2010). | | 159 | | N/A |
INDEPENDENT BOARD MEMBERS*** | | | | |
| | | | | |
Sandra N. Bane (1952) | | Board Member | | Since 2008 | | Retired (1999 – present); Board Member, Transamerica Funds, TST, TIS, TPP, TPFG, TPFG II and TAAVF (2008 – present); Board Member, TII (2003 – 2010); and Partner, KPMG (1975 – 1999). | | 159 | | Big 5 Sporting Goods (2002 – present); AGL Resources, Inc. (energy services holding company) (2008 – present) |
| | | | | |
Leo J. Hill (1956) | | Lead Independent Board Member | | Since 2007 | | Principal, Advisor Network Solutions, LLC (business consulting) (2006 – present); Board Member, TST (2001 – present); Board Member, Transamerica Funds and TIS (2002 – present); Board Member, TPP, TPFG, TPFG II and TAAVF (2007 – present); Board Member, TII (2008 – 2010); President, L. J. Hill & Company (a holding company for privately-held assets) (1999 – present); Market President, Nations Bank of Sun Coast Florida (1998 – 1999); Chairman, President and Chief Executive Officer, Barnett Banks of Treasure Coast Florida (1994 – 1998); | | 159 | | N/A |
| | | | | | | | | | | | | | |
Name and Year of Birth | | Position(s) Held with
Trust | | Term of Office
and Length of
Time Served* | | Principal Occupation(s) During Past 5 Years | | Number of
Funds in
Complex
Overseen by
Board
Member | | | Other
Directorships | |
| | | | | |
| | | | | | Executive Vice President and Senior Credit Officer, Barnett Banks of Jacksonville, Florida (1991 – 1994); and Senior Vice President and Senior Loan Administration Officer, Wachovia Bank of Georgia (1976 – 1991). | | | | | | | | |
| | | | | |
David W. Jennings (1946) | | Board Member | | Since 2009 | | Board Member, Transamerica Funds, TST, TIS, TPP, TPFG, TPFG II and TAAVF (2009 – present); Board Member, TII (2009 – 2010); Managing Director, Hilton Capital (2010-Present); Principal, Maxam Capital Management, LLC (2006 – 2008); and Principal, Cobble Creek Management LP (2004 – 2006). | | | 159 | | | | N/A | |
| | | | | |
Russell A. Kimball, Jr. (1944) | | Board Member | | Since 2007 | | General Manager, Sheraton Sand Key Resort (1975 – present); Board Member, TST (1986 – present); Board Member, Transamerica Funds, (1986 – 1990), (2002 – present); Board Member, TIS (2002 – present); Board Member, TPP, TPFG, TPFG II and TAAVF (2007 – present); and Board Member, TII (2008 – 2010). | | | 159 | | | | N/A | |
| | | | | |
Eugene M. Mannella (1954) | | Board Member | | Since 1993 | | Chief Executive Officer, HedgeServ Corporation (hedge fund administration) (2008 – present); Self-employed consultant (2006 – present); Managing Member and Chief Compliance Officer, HedgeServ Investment Services, LLC (limited purpose broker-dealer) (April 2011 – present); President, ARAPAHO Partners LLC (limited purpose broker-dealer) (1998 – 2008); Board Member, TPP, TPFG, TPFG II and TAAVF (1993 – present); Board Member, Transamerica Funds, TST and TIS (2007 – present); | | | 159 | | | | N/A | |
| | | | | | | | | | |
Name and Year of Birth | | Position(s) Held with Trust | | Term of Office
and Length of
Time Served* | | Principal Occupation(s) During Past 5 Years | | Number of Funds in Complex Overseen by Board Member | | Other Directorships |
| | | | | | Board Member, TII (2008 – 2010); and President, International Fund Services (alternative asset administration) (1993 – 2005). | | | | |
| | | | | |
Norman R. Nielsen, Ph.D. (1939) | | Board Member | | Since 2007 | | Retired (2005 – present); Board Member, Transamerica Funds, TST and TIS (2006 – present); Board Member, TPP, TPFG, TPFG II and TAAVF (2007 – present); Board Member, TII (2008 – 2010); Director, Aspire Resources, Inc. (formerly, Iowa Student Loan Service Corporation) (2006 – present); Director, League for Innovation in the Community Colleges (1985 – 2005); Director, Iowa Health Systems (1994 – 2003); Director, U.S. Bank (1985 – 2006); and President, Kirkwood Community College (1985 – 2005). | | 159 | | Buena Vista University Board of Trustees (2004 - present) |
| | | | | |
Joyce G. Norden (1939) | | Board Member | | Since 2002 | | Retired (2004 – present); Board Member, TPFG, TPFG II and TAAVF (1993 – present); Board Member, TPP (2002 – present); Board Member, Transamerica Funds, TST and TIS (2007 – present); Board Member, TII (2008 – 2010); and Vice President, Institutional Advancement, Reconstructionist Rabbinical College (1996 – 2004). | | 159 | | Board of Governors, Reconstruction-ist Rabbinical College (2007 - present) |
| | | | | |
Patricia L. Sawyer (1950) | | Board Member | | Since 1993 | | Retired (2007 – present); President/Founder, Smith & Sawyer LLC (management consulting) (1989 – 2007); Board Member, Transamerica Funds, TST and TIS (2007 – present); Board Member, TII (2008 – 2010); Board Member, TPP, TPFG, TPFG II and TAAVF (1993 – present); | | 159 | | Honorary Trustee, Bryant University (1996 – present) |
| | | | | | | | | | |
Name and Year of Birth | | Position(s) Held with Trust | | Term of Office
and Length of
Time Served* | | Principal Occupation(s) During Past 5 Years | | Number of Funds in Complex Overseen by Board Member | | Other Directorships |
| | | | | | Trustee, Chair of Finance Committee and Chair of Nominating Committee (1987 – 1996), Bryant University; Vice President, American Express (1987 – 1989); Vice President, The Equitable (1986 – 1987); and Strategy Consultant, Booz, Allen & Hamilton (1982 – 1986). | | | | |
| | | | | |
John W. Waechter (1952) | | Board Member | | Since 2007 | | Attorney, Englander and Fischer, LLP (2008 – present); Retired (2004 – 2008); Board Member, TST and TIS (2004 – present); Board Member, Transamerica Funds (2005 – present); Board Member, TPP, TPFG, TPFG II and TAAVF (2007 – present); Board Member, TII (2008 – 2010); Employee, RBC Dain Rauscher (securities dealer) (2004); Executive Vice President, Chief Financial Officer and Chief Compliance Officer, William R. Hough & Co. (securities dealer) (1979 – 2004); and Treasurer, The Hough Group of Funds (1993 – 2004). | | 159 | | Operation PAR, Inc. (2008 – present); West Central Florida Council – Boy Scouts of America (2008 – present) |
| * | Each Board Member shall hold office until: 1) his or her successor is elected and qualified or 2) he or she resigns, retires or his or her term as a Board Member is terminated in accordance with the Trust’s Declaration of Trust. |
| ** | May be deemed an “interested person” (as that term is defined in the 1940 Act) of the Trust because of his current or former service with TAM or an affiliate of TAM. |
| *** | Independent Board Member means a Board Member who is not an “interested person” (as defined under the 1940 Act) of the Trust. |
OFFICERS
The mailing address of each officer is c/o Secretary, 570 Carillon Parkway, St. Petersburg, Florida 33716. The following table shows information about the officers, including their year of birth, their positions held with the Trust and their principal occupations during the past five years (their titles may have varied during that period). Each officer will hold office until his or her successor has been duly elected or appointed or until his or her earlier death, resignation or removal.
| | | | | | |
Name and Year of Birth | | Position | | Term of Office and Length of Time Served* | | Principal Occupation(s) or Employment During Past 5 Years |
John K. Carter (1961) | | Chairman, Board Member, President, and Chief Executive Officer | | Since 2007 | | See the table above. |
| | | | | | |
Name and Year of Birth | | Position | | Term of Office and Length of Time Served* | | Principal Occupation(s) or Employment During Past 5 Years |
Dennis P. Gallagher (1970) | | Vice President, General Counsel and Secretary | | Since 2007 | | Vice President, General Counsel and Secretary, Transamerica Funds, TST and TIS (2006 – present); Vice President, General Counsel and Secretary, TPP, TPFG, TPFG II and TAAVF (2007 – present); Vice President, General Counsel and Secretary, TII, (2006 – 2010); Director, Senior Vice President, General Counsel, Operations and Secretary, TAM (2006 – present); Director, Senior Vice President, General Counsel, Chief Administrative Officer and Secretary, TFS (2006 – present); Assistant Vice President, TCI (2007 – present); Director, Deutsche Asset Management (1998 – 2006); and Corporate Associate, Ropes & Gray LLP (1995 – 1998). |
| | | |
Christopher A. Staples (1970) | | Vice President and Chief Investment Officer | | Since 2007 | | Vice President and Chief Investment Officer (2007 – present), Senior Vice President - Investment Management (2006 – 2007), Vice President - Investment Management (2005 – 2006), Transamerica Funds, TST and TIS; Vice President and Chief Investment Officer, TPP, TPFG, TPFG II and TAAVF (2007 – present); Vice President and Chief Investment Officer (2007 – 2010); Vice President - Investment Administration (2005 – 2007), TII; Director (2005 – present), Senior Vice President – Investment Management (2006 – present) and Chief Investment Officer (2007 – present), TAM; Director, TFS (2005 – present); and Assistant Vice President, Raymond James & Associates (1999 – 2004). |
| | | |
Elizabeth Strouse (1974) | | Vice President, Treasurer and Principal Financial Officer | | Since 2010 | | Vice President, Treasurer and Principal Financial Officer (December 2011 – present), Assistant Treasurer (2010 – December 2011), Transamerica Funds, TST, TIS, TPP, TPFG, TPFG II and TAAVF; Director, Fund Financial Services (2009 - 2011), TFS; Director, Fund Administration, TIAA-CREF (2007 – 2009); and Manager (2006 – 2007) and Senior (2003 – 2006) Accounting and Assurance, PricewaterhouseCoopers, LLC. |
| | | | | | |
Name and Year of Birth | | Position | | Term of Office and Length of Time Served* | | Principal Occupation(s) or Employment During Past 5 Years |
Robert S. Lamont, Jr. (1973) | | Vice President, Chief Compliance Officer and Conflicts of Interest Officer | | Since 2010 | | Vice President, Chief Compliance Officer and Conflicts of Interest Officer, Transamerica Funds, TST, TIS, TPP, TPFG, TPFG II and TAAVF (2010 – present); Vice President and Senior Counsel, TAM and TFS (2007 – present); Senior Counsel, United States Securities and Exchange Commission (2004 – 2007); and Associate, Dechert, LLP (1999 – 2004). |
| | | |
Bradley O. Ackerman (1966) | | Deputy Chief Compliance Officer and Anti-Money Laundering Officer | | Since 2009 | | Deputy Chief Compliance Officer, Transamerica Funds, TST, TIS, TPP, TPFG, TPFG II and TAAVF (January 2012 – present); Anti-Money Laundering Officer, TPP, TPFG, TPFG II and TAAVF (2009 – present); Anti-Money Laundering Officer, Transamerica Funds, TST and TIS (2007 – present); Senior Compliance Officer, TAM (2007 – present); and Director, Institutional Services, Rydex Investments (2002 – 2007). |
| | | |
Sarah L. Bertrand (1967) | | Assistant Secretary | | Since 2009 | | Assistant Secretary, Transamerica Funds, TST, TIS, TPP, TPFG, TPFG II and TAAVF (2009 – present); Assistant Secretary, TII (2009 – 2010); Assistant Vice President and Director, Legal Administration, TAM and TFS (2007 – present); Assistant Secretary and Chief Compliance Officer, 40|86 Series Trust and 40|86 Strategic Income Fund (2000 - 2007); and Second Vice President and Assistant Secretary, Legal and Compliance, 40|86 Capital Management, Inc. (1994 – 2007). |
| | | |
Timothy J. Bresnahan (1968) | | Assistant Secretary | | Since 2009 | | Assistant Secretary, Transamerica Funds, TST, TIS, TPP, TPFG, TPFG II and TAAVF (2009 – present); Assistant Secretary, TII (2009 – 2010); Counsel, TAM (2008 – present); Counsel (contract), Massachusetts Financial Services, Inc. (2007); Assistant Counsel, BISYS Fund Services Ohio, Inc. (2005 – 2007); and Associate, Greenberg Traurig, P.A. (2004 – 2005). |
| | | | | | |
Name and Year of Birth | | Position | | Term of Office and Length of Time Served* | | Principal Occupation(s) or Employment During Past 5 Years |
Margaret A. Cullem-Fiore (1957) | | Assistant Secretary | | Since 2010 | | Assistant Secretary, Transamerica Funds, TST, TIS, TPP, TPFG, TPFG II and TAAVF (2010 – present); Assistant Vice President, TCI (2009 – present); Vice President and Senior Counsel, TAM and TFS (2006 – present); Vice President and Senior Counsel, Transamerica Financial Advisors, Inc. (2004 – 2007); and Vice President and Senior Counsel, Western Reserve Life Assurance Co. of Ohio (2006). |
| * | Elected and serves at the pleasure of the Board of the Trust. |
If an officer has held offices for different funds for different periods of time, the earliest applicable date is shown. No officer of the Trust, except for the Chief Compliance Officer, receives any compensation from the Trust.
Additional information about the Funds’ Board Members can be found in the Statement of Additional Information, available, without charge, upon request, by calling toll free 1-888-233-4339 or on the Trust’s website at www.transamericainvestments.com
TRANSAMERICA FINANCIAL LIFE INSURANCE COMPANY
440 Mamaroneck Avenue
Harrison, NY 10528
2873 (2/12)
Item 2: Code of Ethics.
| (a) | Registrant has adopted a code of ethics that applies to its principal executive officer, principal financial officer, and any other officers who serve a similar function. |
| (b) | Registrant’s code of ethics is reasonably designed as described in this Form N-CSR. |
| (c) | During the period covered by the report, the code of ethics was revised to reflect the appointment of a new Principal Financial Officer. |
| (d) | During the period covered by the report, Registrant did not grant any waivers, including implicit waivers, from the provisions of this code of ethics. |
| (f) | Registrant has filed this code of ethics as an exhibit pursuant to Item 12(a)(1) of Form N-CSR. |
Item 3: Audit Committee Financial Experts.
Registrant’s Board of Trustees has determined that Sandra N. Bane, John W. Waechter and Eugene M. Mannella are “audit committee financial experts,” as such term is defined in Item 3 of Form N-CSR. Ms. Bane, Mr. Waechter and Mr. Mannella are “independent” under the standards set forth in Item 3 of Form N-CSR. The designation of Ms. Bane, Mr. Waechter and Mr. Mannella as “audit committee financial experts” pursuant to Item 3 of Form N-CSR does not (i) impose upon them any duties, obligations, or liabilities that are greater than the duties, obligations and liabilities imposed upon them as a member of the Registrant’s audit committee or Board of Trustees in the absence of such designation; or (ii) affect the duties, obligations or liabilities of any other member of the Registrant’s audit committee or Board of Trustees.
Item 4: Principal Accountant Fees and Services.
| | | | | | | | | | |
| | | (in thousands) | | Fiscal Year Ended 12/31 | |
| | | | | 2011 | | | 2010* | |
(a) | | Audit Fees | | $ | 13 | | | $ | 13 | |
(b) | | Audit-related Fees (1) | | | — | | | $ | 1 | |
(c) | | Tax Fees (2) | | | — | | | $ | 0 | |
(d) | | All Other Fees | | | — | | | $ | 0 | |
(e) (1) | | Pre-approval policy (3) | | | | | | | | |
(e) (2) | | % of above that were pre-approved | | | 0 | % | | | 0 | % |
(f) | | If greater than 50%, disclose hours | | | N/A | | | | N/A | |
(g) | | Non-audit fees rendered to Adviser (or affiliate that provided services to Registrant) | | | N/A | | | | N/A | |
(h) | | Disclose whether the Audit Committee has considered whether the provisions of non-audit services rendered to the Adviser that were NOT pre-approved is compatible with maintaining the auditor’s independence. | | | Yes | | | | Yes | |
| (1) | Audit-Related Fees represent assurance and related services provided that are reasonably related to the performance of the audit of the financial statements of the Registrant, specifically data verification and agreed-upon procedures related to asset securitizations and agreed-upon procedures engagements. |
| (2) | Tax Fees represent tax compliance, tax planning and tax advice services provided in connection with the preparation and review of the Registrant’s tax returns. |
| (3) | The Audit Committee may delegate any portion of its authority, including the authority to grant pre-approvals of audit and permitted non-audit services, to one or more members or a subcommittee. Any decision of the subcommittee to grant pre-approvals shall be presented to the full Audit Committee at its next regularly scheduled meeting. |
| * | PricewaterhouseCoopers LLP (“PwC”) served as independent registered certified public accounting firm through April 7, 2010. On April 8, 2010, Ernst & Young LLP (“E&Y”) replaced PwC as the independent public accountant. Audit fees, audit-related fees, tax fees and all other fees include $13, $1, $0 and $0, respectively, billed to Transamerica Asset Allocation Variable Funds by E&Y for the fiscal year end December 31, 2010. |
Item 5: Audit Committee of Listed Registrants.
The following individuals comprise the standing Audit Committee: Sandra N. Bane, Leo J. Hill, David W. Jennings, Russell A. Kimball, Jr., Eugene M. Mannella, Norman R. Nielsen, Joyce G.Norden, Patricia L. Sawyer and John W. Waechter.
Item 6: Schedule of Investments.
The schedules of investments are included in the annual report to shareholders filed under Item 1 of this Form N-CSR.
Item 7: Disclosure of Proxy Voting Policies and Procedures for Closed-End Management Investment Companies.
Not applicable.
Item 8: Portfolio Managers of Closed-End Management Investment Companies. Not applicable.
Item 9. Purchases of Equity Securities by Closed-End Management Investment Company and Affiliated Purchasers.
Not applicable.
Item 10: Submission of Matters to a Vote of Security Holders
There have been no material changes to the procedures by which shareholders may recommend nominees to the Registrant’s Board of Trustees that have been implemented since the Registrant last provided disclosure in response to the requirements of this Item.
Item 11: Controls and Procedures.
| | (a) | The Registrant’s principal executive officer and principal financial officer evaluated the Registrant’s disclosure controls and procedures within 90 days of this filing and have concluded that the Registrant’s disclosure controls and procedures (as defined in Rule 30a-3(c) under the Investment Company Act of 1940) are appropriately designed to ensure that information required to be disclosed by Registrant in the reports that it files on Form N-CSR (a) is accumulated and communicated to Registrant’s management, including its principal executive officer and principal financial officer, to allow timely decisions regarding required disclosure, and (b) is recorded, processed, summarized and reported, within the time periods specified in the rules and forms adopted by the U.S. Securities and Exchange Commission. |
| | (b) | The Registrant’s principal executive officer and principal financial officer are aware of no change in the Registrant’s internal control over financial reporting that occurred during the Registrant’s most recent fiscal quarter that has materially affected, or is reasonably likely to materially affect, the Registrant’s internal control over financial reporting. |
Item 12: Exhibits.
| (a) | (1) Registrant’s code of ethics (that is the subject of the disclosure required by Item 2(a)) is attached. |
| | (2) | Separate certifications for Registrant’s principal executive officer and principal financial officer, as required by Rule 30a-2(a) under the 1940 Act, are attached. |
| (b) | A certification for Registrant’s principal executive officer and principal financial officer, as required by Rule 30a-2(b) under the 1940 Act, is attached. The certification furnished pursuant to this paragraph is not deemed to be “filed” for purposes of Section 18 of the Securities Exchange Act of 1934, or otherwise subject to liability of that section. Such certification is not deemed to be incorporated by reference into any filing under the Securities Act of 1933 or the Securities Exchange Act of 1934, except to the extent that the Registrant specifically incorporates it by reference. |
SIGNATURES
Pursuant to the requirements of the Securities Exchange Act of 1934 and the Investment Company Act of 1940, the Registrant has duly caused this report to be signed on its behalf by the undersigned, thereunto duly authorized.
| | |
Transamerica Asset Allocation Variable Funds (Registrant) |
| |
| By: | | /s/ John K. Carter |
| | John K. Carter Chief Executive Officer Date: February 29, 2012 |
Pursuant to the requirements of the Securities Exchange Act of 1934 and the Investment Company Act of 1940, this report has been signed below by the following persons on behalf of the Registrant and in the capacities and on the dates indicated.
| | |
| |
| By: | | /s/ John K. Carter |
| | John K. Carter Chief Executive Officer Date: February 29, 2012 |
| |
| By: | | /s/ Elizabeth Strouse |
| | Elizabeth Strouse Principal Financial Officer Date: February 29, 2012 |
EXHIBIT INDEX
| | |
Exhibit No. | | Description of Exhibit |
| |
| 12(a)(1) | | Code of Ethics for Principal Executive and Senior Financial Officers |
| |
| 12(a)(2)(i) | | Section 302 N-CSR Certification of Principal Executive Officer |
| |
| 12(a)(2)(ii) | | Section 302 N-CSR Certification of Principal Financial Officer |
| |
| 12(b) | | Section 906 N-CSR Certification of Principal Executive Officer and Principal Financial Officer |