As filed with the Securities and Exchange Commission on September 4, 2019
SECURITIES AND EXCHANGE COMMISSION
WASHINGTON, D.C. 20549
FORMN-CSR
CERTIFIED SHAREHOLDER REPORT OF REGISTERED
MANAGEMENT INVESTMENT COMPANIES
Investment Company Act file number:811-07717
TRANSAMERICA ASSET ALLOCATION VARIABLE FUNDS
(Exact Name of Registrant as Specified in Charter)
1801 California St., Suite 5200, Denver, Colorado 80202
(Address of Principal Executive Offices) (Zip Code)
Registrant’s Telephone Number, including Area Code:1-888-233-4339
Rhonda A. Mills, Esq., 1801 California St., Suite 5200, Denver, Colorado 80202
(Name and Address of Agent for Service)
Date of fiscal year end: December 31
Date of reporting period: June 30, 2019
| Item 1: | Report(s) to Shareholders. |
The Semi-Annual Report is attached.
TRANSAMERICA VARIABLE FUNDS
TRANSAMERICA ASSET
ALLOCATION VARIABLE FUNDS
Semi-Annual Report
June 30, 2019
| | |
We want to let you know that beginning January 1, 2021, we will no longer mail copies of shareholder reports for funds in your portfolio. This change is permitted by regulations adopted by the Securities and Exchange Commission. Instead, the reports will be made available on our website. We’ll let you know by mail each time a report is posted. The notification will have a URL for accessing the report. If you’ve already elected to receive documents from us electronically, you’re not affected by this change. You’re already receiving an email with a link to the reports so there’s nothing you need to do. You do have the option of continuing to receive paper copies of all future shareholder reports free of charge. If you’d like this option, give us a call at the number on your account statement, Monday through Thursday 8 - 6:30, or Friday 8 - 5:30 ET. | | 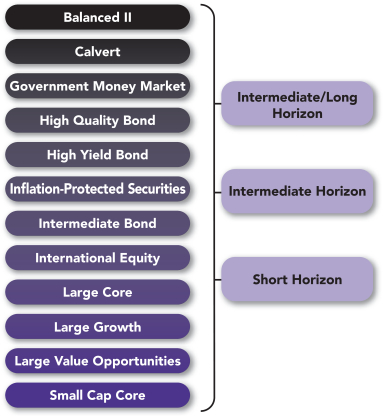 |
Table of Contents
Authorized for distribution only when accompanied or preceded by a prospectus. Investors should carefully consider a fund’s investment goals, risks, charges and expenses before investing. A prospectus contains this and other information; please read it carefully before investing.
| | |
| Transamerica Asset Allocation Variable Funds | | Semi-Annual Report 2019 |
This report is not to be construed as an offering for sale of any contracts participating in the Subaccounts (Series) of the Transamerica Variable Funds or the Transamerica Asset Allocation Variable Funds, or as a solicitation of an offer to buy contracts unless preceded by or accompanied by a current prospectus which contains complete information about charges and expenses.
This report consists of the semi-annual report of the Transamerica Asset Allocation Variable Funds and the semi-annual report of the Calvert VP SRI Balanced Portfolio.
Proxy Voting Policies and Procedures
A description of the proxy voting policies and procedures of the Transamerica Asset Allocation Variable Funds is included in the applicable Statements of Additional Information which are available without charge, upon request: (i) by calling 1-800-755-5801; or (ii) on the SEC’s website atwww.sec.gov. In addition, the Transamerica Asset Allocation Variable Funds are required to file FormN-PX, with the complete proxy voting record for the most recent twelve months ended June 30, no later than August 31 of each year.Form N-PX for the twelve months ended June 30, 2019, is available without charge, upon request by calling1-800-851-9777 and on the SEC’s website at http://www.sec.gov.
Quarterly Portfolios
Each fiscal quarter, Transamerica Asset Allocation Variable Funds will file with the SEC a complete schedule of their monthly portfolio holdings on Form N-PORT. The Subaccounts’ holdings as of the end of the third month of every fiscal quarter, as reported on Form N-PORT, will be publicly available on the SEC’s website at http://www.sec.gov within 60 days of the end of the fiscal quarter.
TRANSAMERICA FINANCIAL LIFE INSURANCE COMPANY
440 Mamaroneck Avenue
Harrison, New York 10528
To Contract Holders with Interests in the
Transamerica Variable Funds:
We are pleased to present the most recent semi-annual report for the Calvert VP SRI Balanced Portfolio. As required under applicable law, we are sending this semi-annual report to contract holders of Group Variable Annuity Contracts issued by Transamerica Financial Life Insurance Company with unit interests in the Calvert Series Subaccount of the Transamerica Variable Funds, which invests its assets in the Calvert VP SRI Balanced Portfolio, a series of Calvert Variable Series, Inc.
Please call your retirement plan administrator, Transamerica Retirement Solutions, LLC, at (800) 755-5801 if you have any questions regarding these reports.
Dear Contract Holder,
On behalf of Transamerica Asset Allocation Variable Funds, we would like to thank you for your continued support and confidence in our products as we look forward to continuing to serve you and your financial professional in the future. We value the trust you have placed in us.
This semi-annual report is provided to you to show the investments and performance of your Subaccount(s) during the fiscal period. The Securities and Exchange Commission requires that annual and semi-annual reports be sent to all contract holders, and we believe it to be an important part of the investment process. This report provides detailed information about your Subaccount(s) for the six-month period ended June 30, 2019.
We believe it is important to understand market conditions over the six-month period ended June 30, 2019, to provide a context for reading this report. The period began with markets seeking to recover from a brutal year-end selloff in which stock prices plummeted and credit spreads widened considerably. Topping the list of investor concerns was fear of the U.S Federal Reserve (“Fed”) raising interest rates into a slowing economy, the U.S./China trade dispute and the threat of additional tariffs between the two nations, weaker than expected economic data and forecasts for declining corporate earnings growth during the upcoming year. Markets quickly began to recover during January when the Fed indicated it would take a more patient approach to monetary policy and that further rate hikes were likely on hold. As a result, stocks moved higher and corporate bond yields fell into the spring months.
Declining treasury yields as well as the Fed’s new perspective on monetary policy, combined with some weakness in economic data and persistently low rates of inflation, began to spark speculation that rate cuts could be on the horizon. This created more conjecture during the period that the market could be headed toward a “Goldilocks” scenario in which the economy will not be too hot or too cold, the Fed would be more market friendly and modest earnings growth could be achieved. Optimism was further encouraged by first quarter gross domestic product (“GDP”) growth of 3.10% which was above most estimates. By the end of April, the S&P 500® had reached new record highs, fully recovering from the previous December’s selloff.
Volatility returned to the markets in early May when, to the surprise of many investors, the U.S. and China failed to come to terms on a trade agreement, and, therefore, additional tariffs were imposed on Chinese produced goods followed by retaliatory tariffs implemented by China. This led to an immediate decline in stocks, and as longer-term Treasury yields dropped on concerns of negative impacts stemming from the tariffs and the ongoing trade dispute, the yield curve inverted as the 10-year Treasury yield fell below the three-month yield. This provoked further concerns of economic slowing, as inverted yield curves have often preceded recessions. By early June, the 10-year Treasury yield had fallen to 2.07%, more than 70 basis points lower than where it began the year.
The Fed then began to signal its apparent willingness to ease monetary policy and in Chairman Powell’s words, “act as appropriate to sustain the expansion,” and in the days to follow, expectations of rate cuts in the second half of the year rose dramatically. During the final days of June, Presidents Trump and Xi Jinping of China met at the G20 summit in Japan where trade relations were discussed. Further tariffs were averted, but no formal resolution was reached. However, the combination of anticipated action by the Fed and ongoing dialogue with China allowed stocks to close out the period having reversed their May losses and achieved near record highs. Credit spreads narrowed once again as both high yield and investment grade bond indexes closed out the first half of the year with strong returns. International developed and emerging market equities also posted gains for the period, however, due to slowing rates of global growth, their returns lagged stocks in the U.S.
For the six-month period ended June 30, 2019, the S&P 500® returned 18.54%, while the MSCI EAFE Index, representing international developed market equities, returned 14.49%. During the same period, the Bloomberg Barclays US Aggregate Bond Index returned 6.11%. Please keep in mind that it is important to maintain a diversified portfolio as investment returns have historically been difficult to predict.
In addition to your active involvement in the investment process, we firmly believe that a financial professional is a key resource to help you build a complete picture of your current and future financial needs. Financial professionals are familiar with the market’s history, including long-term returns and volatility of various asset classes. With your financial professional, you can develop an investment program that incorporates factors such as your goals, your investment timeline and your risk tolerance.
Please contact your financial professional if you have any questions about the contents of this report, and thanks again for the confidence you have placed in us.
Sincerely,

Marijn Smit
President & Chief Executive Officer
Transamerica Asset Allocation Variable Funds

Tom Wald, CFA
Chief Investment Officer
Transamerica Asset Allocation Variable Funds
S&P 500®: A market-capitalization weighted index of 500 large U.S. companies with common stock listed on the New York Stock Exchange or NASDAQ Stock Market.
MSCI EAFE Index: A free float-adjusted market capitalization index that is designed to measure the equity market performance of developed markets, excluding the U.S. and Canada.
Bloomberg Barclays US Aggregate Bond Index: Measures investment grade, U.S. dollar denominated, fixed-rate taxable bonds, including Treasuries, government-related and corporate securities, as well as both mortgage- and asset-backed securities.
The views expressed in this report reflect those of the portfolio managers only and may not necessarily represent the views of the Transamerica Asset Allocation Variable Funds. These views are as of the date of this report and are subject to change based upon market conditions. These views should not be relied upon as investment advice and are not indicative of trading intent on behalf of the Transamerica Asset Allocation Variable Funds. Investing involves risk, including potential loss of principal. The performance data presented represents past performance and does not guarantee future results. Indexes are unmanaged and an investor cannot invest directly in an index.
Disclosure of Expenses
(unaudited)
UNIT HOLDER EXPENSES
Transamerica Asset Allocation Variable Funds (each individually, a “Subaccount” and collectively, the “Subaccounts”) is a separate investment account established by Transamerica Financial Life Insurance Company, Inc. (“TFLIC”), and is used as an investment vehicle under certaintax-deferred annuity contracts issued by TFLIC. Each Subaccount invests in underlying subaccounts of Transamerica Variable Funds (“TVF”), a unit investment trust. Subaccount contract holders bear the cost of operating the Subaccount (such as the advisory fee).
The following examples are intended to help you understand your ongoing costs (in dollars and cents) of investing in the Subaccounts and to compare these costs with the ongoing costs of investing in other funds.
The examples are based on an investment of $1,000 invested at January 1, 2019, and held for the entiresix-month period until June 30, 2019.
ACTUAL EXPENSES
The information in the table below provides information about actual account values and actual expenses. You may use the information in these columns, together with the amount you invested, to estimate the expenses that you paid over the period. Simply divide your account value by $1,000 (for example, an $8,600 account value divided by $1,000 = $8.60), then multiply the result by the number in the appropriate column for your share class titled “Expenses Paid During Period” to estimate the expenses you paid on your account during this period.
HYPOTHETICAL EXAMPLE FOR COMPARISON PURPOSES
The information in the table below provides information about hypothetical account values and hypothetical expenses based on the Subaccounts’ actual expense ratios and assumed rates of return of 5% per year before expenses, which are not the Subaccounts’ actual returns. The hypothetical account values and expenses may not be used to estimate the actual ending account balance or expenses you paid for the period. You may use this information to compare the ongoing costs of investing in your Subaccount versus other funds. To do so, compare this 5% hypothetical example with the 5% hypothetical examples that appear in the shareholder reports of the other funds.
| | | | | | | | | | | | | | | | | | | | | | | | |
| | | | | | Actual Expenses | | | Hypothetical Expenses (A) | | | | |
| Subaccount | | Beginning
Account Value | | | Ending
Account Value | | | Expenses Paid
During Period (B) | | | Ending
Account Value | | | Expenses Paid
During Period (B) | | | Annualized
Expense Ratio (C) | |
Transamerica Asset Allocation – Short Horizon Subaccount | | $ | 1,000.00 | | | $ | 1,062.00 | | | $ | 1.02 | | | $ | 1,023.80 | | | $ | 1.00 | | | | 0.20 | % |
Transamerica Asset Allocation – Intermediate Horizon Subaccount | | | 1,000.00 | | | | 1,095.10 | | | | 1.04 | | | | 1,023.80 | | | | 1.00 | | | | 0.20 | |
Transamerica Asset Allocation – Intermediate/Long Horizon Subaccount | | | 1,000.00 | | | | 1,113.20 | | | | 1.05 | | | | 1,023.80 | | | | 1.00 | | | | 0.20 | |
| | |
| |
| (A) | | 5% return per year before expenses. |
| |
| (B) | | Expenses are calculated using the Subaccounts’ annualized expense ratios (as disclosed in the table), multiplied by the average account value for the period, multiplied by the number of days in the period (181 days), and divided by the number of days in the year (365 days). |
| |
| (C) | | Expense ratios (as disclosed in the table) do not include the expenses of the underlying funds in which the Subaccounts invest. The annualized expense ratios, as stated in the fee table of the Subaccounts’ Prospectus, may differ from the expense ratios disclosed in this report. |
| | |
| Transamerica Asset Allocation Variable Funds | | Semi-Annual Report 2019 |
Page 4
Schedules of Investments Composition
At June 30, 2019
(unaudited)
| | | | |
| Transamerica Asset Allocation – Short Horizon Subaccount | |
| |
| Asset Allocation | | Percentage of Net
Assets | |
U.S. Fixed Income Funds | | | 89.9 | % |
U.S. Equity Funds | | | 8.2 | |
International Equity Fund | | | 1.8 | |
Money Market Fund | | | 0.2 | |
Net Other Assets (Liabilities) | | | (0.1 | ) |
Total | | | 100.0 | % |
| | | | |
|
Transamerica Asset Allocation – Intermediate Horizon
Subaccount | |
| |
| Asset Allocation | | Percentage of Net
Assets | |
U.S. Fixed Income Funds | | | 49.3 | % |
U.S. Equity Funds | | | 39.7 | |
International Equity Fund | | | 10.9 | |
Money Market Fund | | | 0.2 | |
Net Other Assets (Liabilities) | | | (0.1 | ) |
Total | | | 100.0 | % |
| | | | |
|
Transamerica Asset Allocation – Intermediate/Long Horizon
Subaccount | |
| |
| Asset Allocation | | Percentage of Net
Assets | |
U.S. Equity Funds | | | 53.8 | % |
U.S. Fixed Income Funds | | | 29.6 | |
International Equity Fund | | | 16.5 | |
Money Market Fund | | | 0.2 | |
Net Other Assets (Liabilities) | | | (0.1 | ) |
Total | | | 100.0 | % |
| | | | |
| | |
| Transamerica Asset Allocation Variable Funds | | Semi-Annual Report 2019 |
Page 5
Transamerica Asset Allocation – Short Horizon Subaccount
SCHEDULE OF INVESTMENTS
At June 30, 2019
(unaudited)
| | | | | | | | |
| | | Shares | | | Value | |
| INVESTMENT COMPANIES - 100.1% | |
| International Equity Fund - 1.8% | |
Transamerica Variable International Equity(A) (B) | | | 4,620 | | | | $ 106,273 | |
| | | | | | | | |
| Money Market Fund - 0.2% | |
Transamerica Variable Government Money Market(A) (B) | | | 545 | | | | 11,627 | |
| | | | | | | | |
| U.S. Equity Funds - 8.2% | |
Transamerica Variable Large Growth(A) (B) | | | 1,328 | | | | 190,953 | |
Transamerica Variable Large Value Opportunities (A) (B) | | | 1,817 | | | | 179,095 | |
Transamerica Variable Small Cap Core(A) (B) | | | 1,764 | | | | 105,542 | |
| | | | | | | | |
| | | | | | | 475,590 | |
| | | | | | | | |
| U.S. Fixed Income Funds - 89.9% | |
Transamerica Variable High Quality Bond(A) (B) | | | 51,457 | | | | 938,368 | |
| | | | | | | | |
| | | Shares | | | Value | |
| INVESTMENT COMPANIES (continued) | |
| U.S. Fixed Income Funds (continued) | |
Transamerica Variable High Yield Bond(A) (B) | | | 16,474 | | | | $ 603,687 | |
Transamerica Variable Inflation-Protected Securities(A) (B) | | | 33,076 | | | | 930,669 | |
Transamerica Variable Intermediate Bond(A) (B) | | | 56,008 | | | | 2,749,428 | |
| | | | | | | | |
| | | | | | | 5,222,152 | |
| | | | | | | | |
Total Investment Companies
(Cost $5,277,292) | | | | 5,815,642 | |
| | | | | |
Total Investments
(Cost $5,277,292) | | | | 5,815,642 | |
Net Other Assets (Liabilities) - (0.1)% | | | | | | | (7,419 | ) |
| | | | | | | | |
| | |
Net Assets - 100.0% | | | | | | | $ 5,808,223 | |
| | | | | | | | |
SECURITY VALUATION:
Valuation Inputs(C)
| | | | | | | | | | | | | | | | |
| | | Level 1 -
Unadjusted
Quoted Prices | | | Level 2 -
Other Significant
Observable Inputs | | | Level 3 -
Significant
Unobservable Inputs | | | Value | |
ASSETS | |
Investments | |
Investment Companies | | $ | 5,815,642 | | | $ | — | | | $ | — | | | $ | 5,815,642 | |
| | | | | | | | | | | | | | | | |
Total Investments | | $ | 5,815,642 | | | $ | — | | | $ | — | | | $ | 5,815,642 | |
| | | | | | | | | | | | | | | | |
FOOTNOTES TO SCHEDULE OF INVESTMENTS:
| | |
| (A) | | Affiliated investment in Transamerica Variable Funds. Affiliated interest income, dividends income, realized and unrealized gains (losses), if any, are broken out within the Statements of Operations. |
| (B) | | Non-income producing securities. |
| (C) | | There were no transfers in or out of Level 3 during thesix-month period ended June 30, 2019. Please reference the Security Valuation section of the Notes to Financial Statements for more information regarding security valuation and pricing inputs. |
The Notes to Financial Statements are an integral part of this report.
| | |
| Transamerica Asset Allocation Variable Funds | | Semi-Annual Report 2019 |
Page 6
Transamerica Asset Allocation – Intermediate Horizon Subaccount
SCHEDULE OF INVESTMENTS
At June 30, 2019
(unaudited)
| | | | | | | | |
| | | Shares | | | Value | |
| INVESTMENT COMPANIES - 100.1% | |
| International Equity Fund - 10.9% | |
Transamerica Variable International Equity (A) (B) | | | 76,460 | | | | $ 1,758,714 | |
| | | | | | | | |
| Money Market Fund - 0.2% | |
Transamerica Variable Government Money Market(A) (B) | | | 1,473 | | | | 31,404 | |
| | | | | | | | |
| U.S. Equity Funds - 39.7% | |
Transamerica Variable Large Growth(A) (B) | | | 17,693 | | | | 2,544,842 | |
Transamerica Variable Large Value Opportunities(A) (B) | | | 25,119 | | | | 2,476,507 | |
Transamerica Variable Small Cap Core(A) (B) | | | 22,897 | | | | 1,369,689 | |
| | | | | | | | |
| | | | | | | 6,391,038 | |
| | | | | | | | |
| U.S. Fixed Income Funds - 49.3% | |
Transamerica Variable High Quality Bond(A) (B) | | | 68,118 | | | | 1,242,191 | |
| | | | | | | | |
| | | Shares | | | Value | |
| INVESTMENT COMPANIES (continued) | |
| U.S. Fixed Income Funds (continued) | |
Transamerica Variable High Yield Bond(A) (B) | | | 25,974 | | | | $ 951,787 | |
Transamerica Variable Inflation-Protected Securities(A) (B) | | | 67,773 | | | | 1,906,942 | |
Transamerica Variable Intermediate Bond (A) (B) | | | 78,041 | | | | 3,831,050 | |
| | | | | | | | |
| | | | | | | 7,931,970 | |
| | | | | | | | |
Total Investment Companies
(Cost $12,791,290) | | | | 16,113,126 | |
| | | | | |
Total Investments
(Cost $12,791,290) | | | | 16,113,126 | |
Net Other Assets (Liabilities) - (0.1)% | | | | | | | (13,780 | ) |
| | | | | | | | |
| | |
Net Assets - 100.0% | | | | | | | $ 16,099,346 | |
| | | | | | | | |
SECURITY VALUATION:
Valuation Inputs(C)
| | | | | | | | | | | | | | | | |
| | | Level 1 -
Unadjusted
Quoted Prices | | | Level 2 -
Other Significant
Observable Inputs | | | Level 3 -
Significant
Unobservable Inputs | | | Value | |
ASSETS | |
Investments | |
Investment Companies | | $ | 16,113,126 | | | $ | — | | | $ | — | | | $ | 16,113,126 | |
| | | | | | | | | | | | | | | | |
Total Investments | | $ | 16,113,126 | | | $ | — | | | $ | — | | | $ | 16,113,126 | |
| | | | | | | | | | | | | | | | |
FOOTNOTES TO SCHEDULE OF INVESTMENTS:
| | |
| (A) | | Affiliated investment in Transamerica Variable Funds. Affiliated interest income, dividends income, realized and unrealized gains (losses), if any, are broken out within the Statements of Operations. |
| (B) | | Non-income producing securities. |
| (C) | | There were no transfers in or out of Level 3 during thesix-month period ended June 30, 2019. Please reference the Security Valuation section of the Notes to Financial Statements for more information regarding security valuation and pricing inputs. |
The Notes to Financial Statements are an integral part of this report.
| | |
| Transamerica Asset Allocation Variable Funds | | Semi-Annual Report 2019 |
Page 7
Transamerica Asset Allocation – Intermediate/Long Horizon Subaccount
SCHEDULE OF INVESTMENTS
At June 30, 2019
(unaudited)
| | | | | | | | |
| | | Shares | | | Value | |
| INVESTMENT COMPANIES - 100.1% | |
| International Equity Fund - 16.5% | |
Transamerica Variable International Equity (A) (B) | | | 214,973 | | | | $ 4,944,758 | |
| | | | | | | | |
| Money Market Fund - 0.2% | |
Transamerica Variable Government Money Market(A) (B) | | | 2,808 | | | | 59,862 | |
| | | | | | | | |
| U.S. Equity Funds - 53.8% | |
Transamerica Variable Large Growth(A) (B) | | | 44,371 | | | | 6,381,890 | |
Transamerica Variable Large Value Opportunities(A) (B) | | | 63,227 | | | | 6,233,512 | |
Transamerica Variable Small Cap Core(A) (B) | | | 57,820 | | | | 3,458,748 | |
| | | | | | | | |
| | | | | | | 16,074,150 | |
| | | | | | | | |
| U.S. Fixed Income Funds - 29.6% | |
Transamerica Variable High Quality Bond(A) (B) | | | 31,868 | | | | 581,146 | |
| | | | | | | | |
| | | Shares | | | Value | |
| INVESTMENT COMPANIES (continued) | |
| U.S. Fixed Income Funds (continued) | |
Transamerica Variable High Yield Bond(A) (B) | | | 31,883 | | | | $ 1,168,335 | |
Transamerica Variable Inflation-Protected Securities(A) (B) | | | 94,036 | | | | 2,645,897 | |
Transamerica Variable Intermediate Bond (A) (B) | | | 90,793 | | | | 4,457,042 | |
| | | | | | | | |
| | | | | | | 8,852,420 | |
| | | | | | | | |
Total Investment Companies
(Cost $19,862,664) | | | | 29,931,190 | |
| | | | | |
Total Investments
(Cost $19,862,664) | | | | 29,931,190 | |
Net Other Assets (Liabilities) - (0.1)% | | | | | | | (31,029 | ) |
| | | | | | | | |
| | |
Net Assets - 100.0% | | | | | | | $ 29,900,161 | |
| | | | | | | | |
SECURITY VALUATION:
Valuation Inputs(C)
| | | | | | | | | | | | | | | | |
| | | Level 1 -
Unadjusted
Quoted Prices | | | Level 2 -
Other Significant
Observable Inputs | | | Level 3 -
Significant
Unobservable Inputs | | | Value | |
ASSETS | |
Investments | |
Investment Companies | | $ | 29,931,190 | | | $ | — | | | $ | — | | | $ | 29,931,190 | |
| | | | | | | | | | | | | | | | |
Total Investments | | $ | 29,931,190 | | | $ | — | | | $ | — | | | $ | 29,931,190 | |
| | | | | | | | | | | | | | | | |
FOOTNOTES TO SCHEDULE OF INVESTMENTS:
| | |
| (A) | | Affiliated investment in Transamerica Variable Funds. Affiliated interest income, dividends income, realized and unrealized gains (losses), if any, are broken out within the Statements of Operations. |
| (B) | | Non-income producing securities. |
| (C) | | There were no transfers in or out of Level 3 during thesix-month period ended June 30, 2019. Please reference the Security Valuation section of the Notes to Financial Statements for more information regarding security valuation and pricing inputs. |
The Notes to Financial Statements are an integral part of this report.
| | |
| Transamerica Asset Allocation Variable Funds | | Semi-Annual Report 2019 |
Page 8
STATEMENTS OF ASSETS AND LIABILITIES
At June 30, 2019
(unaudited)
| | | | | | | | | | | | |
| | | Short Horizon | | | Intermediate Horizon | | | Intermediate/Long
Horizon | |
Assets: | | | | | | | | | | | | |
Affiliated investments, at value(A) | | $ | 5,815,642 | | | $ | 16,113,126 | | | $ | 29,931,190 | |
Receivables and other assets: | | | | | | | | | | | | |
Affiliated investments sold | | | 9,026 | | | | 24 | | | | 53,663 | |
Total assets | | | 5,824,668 | | | | 16,113,150 | | | | 29,984,853 | |
| | | | |
Liabilities: | | | | | | | | | | | | |
Payables and other liabilities: | | | | | | | | | | | | |
Affiliated investments purchased | | | 15,562 | | | | 11,360 | | | | 80,205 | |
Investment advisory fees | | | 883 | | | | 2,444 | | | | 4,487 | |
Total liabilities | | | 16,445 | | | | 13,804 | | | | 84,692 | |
Net assets | | $ | 5,808,223 | | | $ | 16,099,346 | | | $ | 29,900,161 | |
| | | | |
Net assets consist of: | | | | | | | | | | | | |
Costs of accumulation units | | $ | 226,983 | | | $ | (367,965 | ) | | $ | 7,584,802 | |
Total distributable earnings (accumulated losses) | | | 5,581,240 | | | | 16,467,311 | | | | 22,315,359 | |
Net assets | | $ | 5,808,223 | | | $ | 16,099,346 | | | $ | 29,900,161 | |
Accumulation units | | | 250,035 | | | | 580,686 | | | | 1,001,447 | |
Unit value | | $ | 23.23 | | | $ | 27.72 | | | $ | 29.86 | |
| | | | | | | | | | | | | |
(A) Affiliated investments, at cost | | $ | 5,277,292 | | | $ | 12,791,290 | | | $ | 19,862,664 | |
STATEMENTS OF OPERATIONS
For the period ended June 30, 2019
(unaudited)
| | | | | | | | | | | | |
| | | Short Horizon | | | Intermediate Horizon | | | Intermediate/Long
Horizon | |
Expenses: | | | | | | | | | | | | |
Investment advisory fees | | $ | 5,571 | | | $ | 15,601 | | | $ | 28,580 | |
| | | | |
Net investment income (loss) | | | (5,571 | ) | | | (15,601 | ) | | | (28,580 | ) |
| | | | |
Net realized gain (loss) on: | | | | | | | | | | | | |
Affiliated investments | | | 36,966 | | | | 274,248 | | | | 613,697 | |
| | | | |
Net change in unrealized appreciation (depreciation) on: | | | | | | | | | | | | |
Affiliated investments | | | 310,176 | | | | 1,160,777 | | | | 2,465,065 | |
Net realized and change in unrealized gain (loss) | | | 347,142 | | | | 1,435,025 | | | | 3,078,762 | |
Net increase (decrease) in net assets resulting from operations | | $ | 341,571 | | | $ | 1,419,424 | | | $ | 3,050,182 | |
The Notes to Financial Statements are an integral part of this report.
| | |
| Transamerica Asset Allocation Variable Funds | | Semi-Annual Report 2019 |
Page 9
STATEMENTS OF CHANGES IN NET ASSETS
For the period and year ended:
| | | | | | | | | | | | | | | | | | | | | | | | |
| | | Short Horizon | | | Intermediate Horizon | | | Intermediate/Long Horizon | |
| | | June 30, 2019
(unaudited) | | | December 31,
2018 | | | June 30, 2019
(unaudited) | | | December 31,
2018 | | | June 30, 2019
(unaudited) | | | December 31,
2018 | |
From operations: | | | | | | | | | | | | | | | | | | | | | | | | |
Net investment income (loss) | | $ | (5,571 | ) | | $ | (11,671 | ) | | $ | (15,601 | ) | | $ | (33,601 | ) | | $ | (28,580 | ) | | $ | (60,314 | ) |
Net realized gain (loss) | | | 36,966 | | | | 141,590 | | | | 274,248 | | | | 1,428,785 | | | | 613,697 | | | | 1,843,203 | |
Net change in unrealized appreciation (depreciation) | | | 310,176 | | | | (281,679 | ) | | | 1,160,777 | | | | (2,332,530 | ) | | | 2,465,065 | | | | (4,000,660 | ) |
Net increase (decrease) in net assets resulting from operations | | | 341,571 | | | | (151,760 | ) | | | 1,419,424 | | | | (937,346 | ) | | | 3,050,182 | | | | (2,217,771 | ) |
| | | | | | | |
Unit transactions: | | | | | | | | | | | | | | | | | | | | | | | | |
Units sold | | | 294,924 | | | | 967,369 | | | | 776,520 | | | | 1,753,212 | | | | 1,368,076 | | | | 2,492,185 | |
Units redeemed | | | (442,589 | ) | | | (1,018,648 | ) | | | (1,134,427 | ) | | | (3,396,117 | ) | | | (1,533,056 | ) | | | (4,690,721 | ) |
Net increase (decrease) in net assets resulting from unit transactions | | | (147,665 | ) | | | (51,279 | ) | | | (357,907 | ) | | | (1,642,905 | ) | | | (164,980 | ) | | | (2,198,536 | ) |
Net increase (decrease) in net assets | | | 193,906 | | | | (203,039 | ) | | | 1,061,517 | | | | (2,580,251 | ) | | | 2,885,202 | | | | (4,416,307 | ) |
| | | | | | | |
Net assets: | | | | | | | | | | | | | | | | | | | | | | | | |
Beginning of period/year | | | 5,614,317 | | | | 5,817,356 | | | | 15,037,829 | | | | 17,618,080 | | | | 27,014,959 | | | | 31,431,266 | |
End of period/year | | $ | 5,808,223 | | | $ | 5,614,317 | | | $ | 16,099,346 | | | $ | 15,037,829 | | | $ | 29,900,161 | | | $ | 27,014,959 | |
| | | | | | | |
Unit transactions - shares: | | | | | | | | | | | | | | | | | | | | | | | | |
Units sold | | | 13,103 | | | | 43,641 | | | | 28,701 | | | | 64,940 | | | | 46,916 | | | | 84,939 | |
Units redeemed | | | (19,751 | ) | | | (45,945 | ) | | | (41,986 | ) | | | (125,630 | ) | | | (52,675 | ) | | | (159,971 | ) |
Net increase (decrease) | | | (6,648 | ) | | | (2,304 | ) | | | (13,285 | ) | | | (60,690 | ) | | | (5,759 | ) | | | (75,032 | ) |
The Notes to Financial Statements are an integral part of this report.
| | |
| Transamerica Asset Allocation Variable Funds | | Semi-Annual Report 2019 |
Page 10
FINANCIAL HIGHLIGHTS
| | | | | | | | | | | | | | | | | | | | | | | | |
| For a unit outstanding during the period and years indicated: | | Short Horizon | |
| | | June 30, 2019
(unaudited) | | | December 31,
2018 | | | December 31,
2017 | | | December 31,
2016 | | | December 31,
2015 | | | December 31,
2014 | |
Unit value, beginning of period/year | | $ | 21.87 | | | $ | 22.46 | | | $ | 21.56 | | | $ | 20.81 | | | $ | 21.16 | | | $ | 20.52 | |
| | | | | | | |
Investment operations: | | | | | | | | | | | | | | | | | | | | | | | | |
Net investment income (loss) (A) | | | (0.02 | ) | | | (0.04 | ) | | | (0.04 | ) | | | (0.04 | ) | | | (0.04 | ) | | | (0.04 | ) |
Net realized and unrealized gain (loss) | | | 1.38 | | | | (0.55 | ) | | | 0.94 | | | | 0.79 | | | | (0.31 | ) | | | 0.68 | |
Total investment operations | | | 1.36 | | | | (0.59 | ) | | | 0.90 | | | | 0.75 | | | | (0.35 | ) | | | 0.64 | |
| | | | | | | |
Unit value, end of period/year | | $ | 23.23 | | | $ | 21.87 | | | $ | 22.46 | | | $ | 21.56 | | | $ | 20.81 | | | $ | 21.16 | |
Total return (B) | | | 6.20 | %(C) | | | (2.62 | )% | | | 4.19 | % | | | 3.58 | % | | | (1.66 | )% | | | 3.13 | % |
| | | | | | | |
Ratio and supplemental data: | | | | | | | | | | | | | | | | | | | | | | | | |
Net assets end of period/year (000’s) | | $ | 5,808 | | | $ | 5,614 | | | $ | 5,817 | | | $ | 5,754 | | | $ | 6,385 | | | $ | 7,068 | |
Expenses to average net assets (D) | | | 0.20 | %(E) | | | 0.20 | % | | | 0.20 | % | | | 0.20 | % | | | 0.20 | % | | | 0.20 | % |
Net investment income (loss) to average net assets | | | (0.20 | )%(E) | | | (0.20 | )% | | | (0.20 | )% | | | (0.20 | )% | | | (0.20 | )% | | | (0.20 | )% |
Portfolio turnover rate | | | 13 | %(C) | | | 44 | % | | | 34 | % | | | 33 | % | | | 51 | % | | | 36 | % |
| | |
| (A) | | Calculated based on average number of units outstanding. |
| (B) | | Total return reflects Subaccount expenses. |
| (C) | | Not annualized. |
| (D) | | Does not include expenses of the underlying funds in which the Subaccount invests. |
| (E) | | Annualized. |
| | | | | | | | | | | | | | | | | | | | | | | | |
| For a unit outstanding during the period and years indicated: | | Intermediate Horizon | |
| | | June 30, 2019
(unaudited) | | | December 31,
2018 | | | December 31,
2017 | | | December 31,
2016 | | | December 31,
2015 | | | December 31,
2014 | |
Unit value, beginning of period/year | | $ | 25.32 | | | $ | 26.91 | | | $ | 24.28 | | | $ | 23.12 | | | $ | 23.47 | | | $ | 22.73 | |
| | | | | | | |
Investment operations: | | | | | | | | | | | | | | | | | | | | | | | | |
Net investment income (loss) (A) | | | (0.03 | ) | | | (0.05 | ) | | | (0.05 | ) | | | (0.05 | ) | | | (0.05 | ) | | | (0.05 | ) |
Net realized and unrealized gain (loss) | | | 2.43 | | | | (1.54 | ) | | | 2.68 | | | | 1.21 | | | | (0.30 | ) | | | 0.79 | |
Total investment operations | | | 2.40 | | | | (1.59 | ) | | | 2.63 | | | | 1.16 | | | | (0.35 | ) | | | 0.74 | |
| | | | | | | |
Unit value, end of period/year | | $ | 27.72 | | | $ | 25.32 | | | $ | 26.91 | | | $ | 24.28 | | | $ | 23.12 | | | $ | 23.47 | |
Total return (B) | | | 9.51 | %(C) | | | (5.92 | )% | | | 10.84 | % | | | 5.01 | % | | | (1.48 | )% | | | 3.24 | % |
| | | | | | | |
Ratio and supplemental data: | | | | | | | | | | | | | | | | | | | | | | | | |
Net assets end of period/year (000’s) | | $ | 16,099 | | | $ | 15,038 | | | $ | 17,618 | | | $ | 17,250 | | | $ | 18,196 | | | $ | 19,435 | |
Expenses to average net assets (D) | | | 0.20 | %(E) | | | 0.20 | % | | | 0.20 | % | | | 0.20 | % | | | 0.20 | % | | | 0.20 | % |
Net investment income (loss) to average net assets | | | (0.20 | )%(E) | | | (0.20 | )% | | | (0.20 | )% | | | (0.20 | )% | | | (0.20 | )% | | | (0.20 | )% |
Portfolio turnover rate | | | 11 | %(C) | | | 37 | % | | | 40 | % | | | 26 | % | | | 23 | % | | | 29 | % |
| | |
| (A) | | Calculated based on average number of units outstanding. |
| (B) | | Total return reflects Subaccount expenses. |
| (C) | | Not annualized. |
| (D) | | Does not include expenses of the underlying funds in which the Subaccount invests. |
| (E) | | Annualized. |
| | | | | | | | | | | | | | | | | | | | | | | | |
| For a unit outstanding during the period and years indicated: | | Intermediate/Long Horizon | |
| | | June 30, 2019
(unaudited) | | | December 31,
2018 | | | December 31,
2017 | | | December 31,
2016 | | | December 31,
2015 | | | December 31,
2014 | |
Unit value, beginning of period/year | | $ | 26.82 | | | $ | 29.04 | | | $ | 25.48 | | | $ | 24.13 | | | $ | 24.47 | | | $ | 23.70 | |
| | | | | | | |
Investment operations: | | | | | | | | | | | | | | | | | | | | | | | | |
Net investment income (loss) (A) | | | (0.03 | ) | | | (0.06 | ) | | | (0.05 | ) | | | (0.05 | ) | | | (0.05 | ) | | | (0.05 | ) |
Net realized and unrealized gain (loss) | | | 3.07 | | | | (2.16 | ) | | | 3.61 | | | | 1.40 | | | | (0.29 | ) | | | 0.82 | |
Total investment operations | | | 3.04 | | | | (2.22 | ) | | | 3.56 | | | | 1.35 | | | | (0.34 | ) | | | 0.77 | |
| | | | | | | |
Unit value, end of period/year | | $ | 29.86 | | | $ | 26.82 | | | $ | 29.04 | | | $ | 25.48 | | | $ | 24.13 | | | $ | 24.47 | |
Total return (B) | | | 11.32 | %(C) | | | (7.65 | )% | | | 13.97 | % | | | 5.60 | % | | | (1.40 | )% | | | 3.28 | % |
| | | | | | | |
Ratio and supplemental data: | | | | | | | | | | | | | | | | | | | | | | | | |
Net assets end of period/year (000’s) | | $ | 29,900 | | | $ | 27,015 | | | $ | 31,431 | | | $ | 28,225 | | | $ | 28,993 | | | $ | 30,627 | |
Expenses to average net assets (D) | | | 0.20 | %(E) | | | 0.20 | % | | | 0.20 | % | | | 0.20 | % | | | 0.20 | % | | | 0.20 | % |
Net investment income (loss) to average net assets | | | (0.20 | )%(E) | | | (0.20 | )% | | | (0.20 | )% | | | (0.20 | )% | | | (0.20 | )% | | | (0.20 | )% |
Portfolio turnover rate | | | 13 | %(C) | | | 30 | % | | | 25 | % | | | 21 | % | | | 16 | % | | | 17 | % |
| | |
| (A) | | Calculated based on average number of units outstanding. |
| (B) | | Total return reflects Subaccount expenses. |
| (C) | | Not annualized. |
| (D) | | Does not include expenses of the underlying funds in which the Subaccount invests. |
| (E) | | Annualized. |
The Notes to Financial Statements are an integral part of this report.
| | |
| Transamerica Asset Allocation Variable Funds | | Semi-Annual Report 2019 |
Page 11
NOTES TO FINANCIAL STATEMENTS
At June 30, 2019
(unaudited)
1. ORGANIZATION
Transamerica Asset Allocation Variable Funds (the “Separate Account”), is anon-diversified separate account of Transamerica Financial Life Insurance Company (“TFLIC”), and is registered as a management investment company under the Investment Company Act of 1940, as amended. The Separate Account applies investment company accounting and reporting guidance. The Separate Account is composed of three different subaccounts (each, a “Subaccount” and collectively, the “Subaccounts”) that are separate investment funds and are as follows. Each Subaccount invests substantially all of its investable assets among certain Transamerica Variable Funds (“TVF”). Certain TVF subaccounts invest substantially all of their investable assets in underlying series of Transamerica Funds (each a “Fund” and collectively, the “Funds”).
|
| Subaccount |
Transamerica Asset Allocation – Short Horizon Subaccount (“Short Horizon”) |
Transamerica Asset Allocation – Intermediate Horizon Subaccount (“Intermediate Horizon”) |
Transamerica Asset Allocation – Intermediate/Long Horizon Subaccount (“Intermediate/Long Horizon”) |
The only shareholders of the Separate Account are contract holders of the affiliated insurance company variable life and annuity contracts.
Transamerica Asset Management, Inc. (“TAM”) serves as investment manager for the Subaccounts pursuant to an investment management agreement. TAM provides continuous and regular investment management services to the Subaccounts. TAM supervises each Subaccount’s investments, conducts its investment program and provides supervisory, compliance and administrative services to the Subaccounts.
TAM is responsible for all aspects of theday-to-day management of the Subaccounts.
TAM’s investment management services also include the provision of supervisory and administrative services to the Subaccounts. These services include performing certain administrative services for the Subaccounts and supervising and overseeing the administrative, clerical, recordkeeping and bookkeeping services provided to the Subaccounts by State Street Bank and Trust Company (“State Street”), to whom TAM has outsourced the provision of certain services as described below: to the extent agreed upon by TAM and the Subaccounts from time to time, monitoring and verifying the custodian’s daily calculation of the Net Asset Values (“NAV”); shareholder relations functions; compliance services; valuation services; assisting in due diligence and in the oversight and monitoring of certain activities ofsub-advisers and certain aspects of Subaccount investments; assisting with Subaccount combinations and liquidations: oversight of the preparation and filing, and review, of all returns and reports, in connection with federal, state and local taxes; oversight and review of regulatory reporting; supervising and coordinating the Subaccounts’ custodian and dividend disbursing agent and monitoring their services to the Subaccounts; assisting the Subaccounts in preparing reports to shareholders; acting as liaison with the Subaccounts’ independent public accountants and providing, upon request, analyses, fiscal year summaries and other audit related services; assisting in the preparation of agendas and supporting documents for and minutes of meetings of trustees and committees of trustees; assisting in the preparation of regular communications with the trustees; and providing personnel and office space, telephones and other office equipment as necessary in order for TAM to perform supervisory and administrative services to the Subaccounts.
For each of the Funds, TAM currently acts as a “manager of managers” and hiressub-advisers to furnishday-to-day investment advice and recommendations to the Funds.
2. SIGNIFICANT ACCOUNTING POLICIES
In preparing the Subaccounts’ financial statements in accordance with Generally Accepted Accounting Principles in the United States of America (“GAAP”), estimates or assumptions (which could differ from actual results) may be used that affect reported amounts and disclosures. The following is a summary of significant accounting policies followed by the Subaccounts.
Security transactions:Security transactions are accounted for on the trade date. Security gains and losses are calculated on the specific identification basis. Net realized gain (loss) is from investments in units of investment companies.
Operating expenses:The Separate Account accounts separately for the assets, liabilities, and operations of each Subaccount. Each Subaccount will indirectly bear the fees and expenses reflected in the corresponding TVF unit value. These expenses are not reflected in the expenses within the Statements of Operations of the Subaccount and are not included in the Expenses to average net assets, and Net investment income (loss) to average net assets within the Financial Highlights.
| | |
| Transamerica Asset Allocation Variable Funds | | Semi-Annual Report 2019 |
Page 12
NOTES TO FINANCIAL STATEMENTS (continued)
At June 30, 2019
(unaudited)
2. SIGNIFICANT ACCOUNTING POLICIES (continued)
Indemnification:In the normal course of business, the Subaccounts enter into contracts that contain a variety of representations that provide general indemnifications. The Subaccounts’ maximum exposure under these arrangements is unknown, as this would involve future claims that may be made against the Subaccounts and/or their affiliates that have not yet occurred. However, based on experience, the Subaccounts expect the risk of loss to be remote.
3. SECURITY VALUATION
All investments in securities are recorded at their estimated fair value. The value of each Subaccount’s investment in a corresponding TVF subaccount is valued at the TVF unit value per share at the official close of the New York Stock Exchange (“NYSE”) each day the NYSE is open for business.
The Subaccounts utilize various methods to measure the fair value of their investments on a recurring basis. GAAP establishes a hierarchy that prioritizes inputs to valuation methods. The inputs or methodology used for valuing securities are not necessarily an indication of the risk associated with investing in those securities. The three levels (“Levels”) of inputs of the fair value hierarchy are defined as follows:
Level 1—Unadjusted quoted prices in active markets for identical securities.
Level 2—Inputs, other than quoted prices included in Level 1, which are observable, either directly or indirectly. These inputs may include quoted prices for the identical instrument on an inactive market, prices for similar instruments, interest rates, prepayment speeds, credit risk, yield curves, default rates, and similar data.
Level 3—Unobservable inputs based on the best information available in the circumstances, to the extent observable inputs are not available, which may include the Subaccounts, own assumptions used in determining the fair value of investments.
The inputs used to measure fair value may fall into different Levels of the fair value hierarchy. In such cases, for disclosure purposes, the Level in the fair value hierarchy that is assigned to the fair value measurement of a security is determined based on the lowest Level input that is significant to the fair value measurement in its entirety. Certain investments that are measured at fair value using NAV per share, or its equivalent, using the “practical expedient” have not been classified in the fair value Levels. The hierarchy classification of inputs used to value the Subaccounts’ investments at June 30, 2019, is disclosed within the Security Valuation section of each Subaccount’s Schedule of Investments.
The availability of observable inputs can vary from security to security and is affected by a wide variety of factors, including, but not limited to, the type of security, whether the security is new and not yet established in the marketplace, the liquidity of markets, and other characteristics particular to the security. To the extent that valuation is based on models or inputs that are less observable or unobservable in the market, the determination of fair value requires more judgment. Accordingly, the degree of judgment exercised in determining fair value is generally greatest for instruments categorized in Level 3. Due to the inherent uncertainty of valuation, the determination of values may differ significantly from values that would have been realized had a ready market for investments existed, and the differences could be material.
Fair value measurements: Each Subaccount invests substantially all of its investable assets among certain TVF subaccounts and the TVF subaccounts invest all of their investable assets in the Funds. The summary of the inputs used for valuing each Fund’s assets carried at fair value is discussed in the Security Valuation section of the Funds’ Notes to Financial Statements. Descriptions of the valuation techniques applied to the Subaccounts’ significant categories of assets and liabilities measured at fair value on a recurring basis are as follows:
Investment companies:Certain investment companies are valued at the NAV of the underlying Subaccounts as the practical expedient. These investment companies are not included within the fair value hierarchy. Certain other investment companies are valued at the actively traded NAV of the underlying subaccounts and no valuation adjustments are applied. These investment companies are categorized in Level 1 of the fair value hierarchy.
4. FEES AND OTHER AFFILIATED TRANSACTIONS
TAM, the Subaccounts’ investment adviser, is directly owned by Transamerica Premier Life Insurance Company (“TPLIC”) and AUSA Holding Company (“AUSA”), both of which are indirect, wholly owned subsidiaries of Aegon NV. TPLIC is owned by Commonwealth General Corporation (“Commonwealth”) and Aegon USA, LLC (“Aegon USA”). Commonwealth and AUSA are wholly owned by Aegon USA. Aegon USA is wholly owned by Aegon US Holding Corporation, which is wholly owned by Transamerica Corporation (DE).
| | |
| Transamerica Asset Allocation Variable Funds | | Semi-Annual Report 2019 |
Page 13
NOTES TO FINANCIAL STATEMENTS (continued)
At June 30, 2019
(unaudited)
4. FEES AND OTHER AFFILIATED TRANSACTIONS (continued)
Transamerica Corporation (DE) is wholly owned by The Aegon Trust, which is wholly owned by Aegon International B.V., which is wholly owned by Aegon NV, a Netherlands corporation, and a publicly traded international insurance group.
The Subaccounts purchase interests in the TVF, which in turn, purchase interests in the Funds. The net assets of the Subaccounts will reflect the investment management fee and other expenses incurred by the Funds. TAM serves as the investment adviser to each Fund.
All Subaccount holdings in investment companies are considered affiliated. Realized and unrealized gains (losses) are broken out within the Statements of Operations.
Investment advisory fees:TAM provides general investment advice to each Subaccount pursuant to the investment advisory agreement. For its services, each Subaccount pays management fees accrued daily and payable monthly, at an annual rate equal to 0.20% of each Subaccount’s daily ANA.
TFLIC is the legal holder of the assets in the Subaccounts and will at all times maintain assets in the Subaccounts with a total market value of at least equal to the contract liabilities for the Subaccounts.
Certain managing board members and officers of TFLIC are also trustees, officers, or employees of TAM or its affiliates. No interested managing board member, who is deemed an interested person due to current or former service with TAM or an affiliate of TAM, receives compensation from the Separate Account. Similarly, none of the Separate Account’s officers or interested trustees receive compensation from the Subaccounts. The independent board members of TFLIC are also trustees of the Funds, for which they receive fees.
Deferred compensation plan:Under anon-qualified deferred compensation plan effective January 1, 2008, (as amended and restated January 1, 2010), available to the trustees, compensation may be deferred that would otherwise be payable by the Separate Account to an independent trustee on a current basis for services rendered as trustee. Deferred compensation amounts will accumulate based on the value of the investment option, as elected by the trustee.
Brokerage commissions:The Subaccounts incurred no brokerage commissions on security transactions placed with affiliates of the adviser for the period ended June 30, 2019.
5. PURCHASES AND SALES OF SECURITIES
For the period ended June 30, 2019, the cost of securities purchased and proceeds from securities sold (excluding short-term securities) are as follows:
| | | | | | | | |
| Subaccount | | Purchases of
Securities | | | Sales of
Securities | |
Short Horizon | | $ | 721,008 | | | $ | 867,778 | |
Intermediate Horizon | | | 1,815,409 | | | | 2,177,731 | |
Intermediate/Long Horizon | | | 3,800,413 | | | | 3,967,618 | |
6. FEDERAL INCOME TAXES
The operations of the Separate Account form a part of, and are taxed with, the operations of TFLIC, a wholly-owned subsidiary of Aegon USA. TFLIC does not expect, based upon current tax law, to incur any income tax upon the earnings or realized capital gains attributable to the Separate Account. Based upon this expectation, no charges are currently being deducted from the Separate Account for federal income tax purposes. The Subaccounts recognize the tax benefits of uncertain tax positions only where the position is “more likely than not” to be sustained assuming examination by tax authorities. The Subaccounts’ tax returns remain subject to examination by the Internal Revenue Service and state tax authorities three years from the date of filing for federal purposes and four years from the date of filing for state purposes. Management has evaluated the Subaccounts’ tax provisions taken for all open tax years, and has concluded that no provision for income tax is required in the Subaccounts’ financial statements. If applicable, the Subaccounts recognize interest accrued related to unrecognized tax benefits in relation to interest and penalties expense in Other within the Statements of Operations. The Subaccounts identify their major tax jurisdictions as U.S. Federal, the state of Colorado, and foreign jurisdictions where the Subaccounts make significant investments; however, the Subaccounts are not aware of any tax positions for which it is reasonably possible that the total amounts of unrecognized tax benefits will change materially in the next twelve months.
| | |
| Transamerica Asset Allocation Variable Funds | | Semi-Annual Report 2019 |
Page 14
NOTES TO FINANCIAL STATEMENTS (continued)
At June 30, 2019
(unaudited)
7. NEW ACCOUNTING PRONOUNCEMENT
In August 2018, the Financial Accounting Standards Board issued Accounting Standards UpdateNo. 2018-13 (“ASU2018-13”), “Fair Value Measurement (Topic 820: Disclosure Framework), Changes to the Disclosure Requirements for Fair Value Measurement”. ASU2018-13 eliminates the requirement to disclose the amount of and reasons for transfers between Level 1 and Level 2 of the fair value hierarchy, the timing of transfers between levels of the fair value hierarchy and the valuation processes for Level 3 fair value measurements. ASU2018-13 does not eliminate the requirement to disclose the range and weighted average used to develop significant unobservable inputs for Level 3 fair value measurements, or the reporting of changes in unrealized gains and losses for recurring Level 3 fair value measurements. ASU2018-13 requires that information is provided about the measurement uncertainty of Level 3 fair value measurements as of the reporting date. The amendment is effective for fiscal years, and interim periods within those fiscal years, beginning after December 15, 2019. Management has evaluated and has early adopted the disclosure requirements and the impact is reflected within the Subaccounts’ financial statements.
8. LEGAL PROCEEDINGS
On August 27, 2018, Transamerica Asset Management, Inc. (“TAM”), Aegon USA Investment Management, LLC (“AUIM”) and Transamerica Capital, Inc. (“TCI”) reached a settlement with the Securities and Exchange Commission (the “SEC”) that resolved an investigation into asset allocation models and volatility overlays utilized by AUIM when it served assub-adviser to certain Transamerica-sponsored mutual funds, and related disclosures. TAM and TCI serve as investment manager and principal underwriter, respectively, to Transamerica-sponsored mutual funds. TCI also serves as the principal underwriter to the variable life insurance and annuity products through which certain Transamerica-sponsored mutual funds are offered. AUIM, an affiliate of TAM and TCI, serves assub-adviser to a number of Transamerica-sponsored mutual funds.
The SEC’s order instituting administrative andcease-and-desist proceedings (the “Order”) pertains to events that occurred during the period between July 2011 and June 2015, and, among other things, the operation and/or implementation of an asset allocation model utilized by AUIM when it served assub-adviser to certain Transamerica tactical funds and asset allocation funds, the designation of the portfolio manager for certain of these funds as well as the operation and/or implementation of volatility overlays utilized by AUIM when it served assub-adviser to the asset allocation funds. The Order also states that the parties failed to make appropriate disclosures regarding these matters, including in marketing materials, and failed to have adequate compliance policies and procedures. AUIM ceased to serve assub-adviser to the Transamerica tactical funds on April 30, 2015 and to the Transamerica asset allocation funds on June 30, 2015.
Under the terms of the Order, AUIM, TAM and TCI were censured, and agreed, without admitting or denying the findings in the Order, to cease and desist from committing or causing any violations of certain statutory provisions and SEC rules. AUIM agreed to pay civil penalties of $21,000,000, $24,599,896 in disgorgement and $3,682,195 in prejudgment interest. TAM agreed to pay civil penalties of $10,500,000, $15,000,000 in disgorgement and $2,235,765 in prejudgment interest. TCI agreed to pay civil penalties of $4,000,000, $12,000,000 in disgorgement and $1,826,022 in prejudgment interest. The amounts paid in disgorgement, prejudgment interest and civil penalties have been deposited into a Fair Fund for distribution to affected investors. Affected investors are those who purchased or held the relevant mutual funds, variable life insurance and annuity investment portfolios and separately managed account strategies during the period between July 2011 and June 2015. The Order states that these investors are to receive from the Fair Fund the pro rata fees and commissions paid by them during that period, subject to any de minimis threshold.
The settlement does not impose any restrictions on the business or continued ability of AUIM, TAM or TCI to serve the funds.
The foregoing is only a brief summary of the Order. A copy of the Order is available on the SEC’s website at https://www.sec.gov.
The funds are affected by many factors and risks: for example, the risk that thesub-advisers’ judgments and investment decisions, and methods, tools, resources, information, models and analyses utilized in making investment decisions, are incorrect or flawed, do not produce the desired results, and cause the funds to lose value. See “Principal Risks” in the prospectus.
The Order and settlement has no impact on the Funds’ financial statements.
| | |
| Transamerica Asset Allocation Variable Funds | | Semi-Annual Report 2019 |
Page 15
TRANSAMERICA ASSET ALLOCATION VARIABLE FUNDS
INVESTMENT ADVISORY AGREEMENTS — CONTRACT RENEWAL
At a meeting of the Managing Board of Transamerica Asset Allocation Variable Funds (the “Trustees” or the “Board”) held on June19-20, 2019, the Board considered the renewal of the investment advisory agreements (each an “Investment Advisory Agreement” and collectively the “Investment Advisory Agreements”) between Transamerica Asset Management, Inc. (“TAM”) and Transamerica Asset Allocation Variable Funds, on behalf of Transamerica Asset Allocation — Intermediate Horizon Subaccount, Transamerica Asset Allocation — Intermediate/Long Horizon Subaccount, and Transamerica Asset Allocation — Short Horizon Subaccount (each a “Fund” and collectively the “Funds”).
Following its review and consideration, the Board determined that the terms of each Investment Advisory Agreement were reasonable and that the renewal of each of the Investment Advisory Agreements was in the best interests of the applicable Fund and the contract holders. The Board, including the independent members of the Board (the “Independent Board Members”), unanimously approved the renewal of each Investment Advisory Agreement through June 30, 2020.
Prior to reaching their decision, the Board Members requested and received from TAM certain information. They then reviewed such information as they deemed reasonably necessary to evaluate the Investment Advisory Agreements, including information they had previously received from TAM as part of their regular oversight of each Fund, and knowledge they gained over time through meeting with TAM. Among other materials, the Trustees considered comparative fee, expense, and performance information prepared by TAM based on information provided by Broadridge Financial Solutions, Inc. (“Broadridge”), an independent provider of mutual fund performance information, as well as fee, expense and profitability information prepared by TAM. In their review, the Board Members also sought to identify instances in which a Fund’s performance, fees, total expenses and/or profitability appeared to be outliers within their respective peer groups or other comparative metrics, and sought to understand the reasons for such comparative positions.
In their deliberations, the Independent Board Members met privately without representatives of TAM present and were represented throughout the process by their independent legal counsel. In considering the proposed continuation of each Investment Advisory Agreement, the Board Members evaluated and weighed a number of considerations that they believed to be relevant in light of the legal advice furnished to them by counsel, including independent legal counsel, and made a decision in the exercise of their own business judgment. They based their decisions on the considerations discussed below, among others, although they did not identify any particular consideration or item of information that was controlling of their decisions, and each Board Member may have attributed different weights to the various factors.
Nature, Extent and Quality of the Services Provided
The Board considered the nature, extent and quality of the services provided by TAM to the applicable Fund in the past and the services anticipated to be provided in the future. The Board also considered the investment approach for each Fund; the experience, capability and integrity of TAM’s senior management; the financial resources of TAM; TAM’s management process; TAM’s responsiveness to any questions by the Board Members; and the professional qualifications and compensation program of the portfolio management team.
The Board noted that the investment management and other services provided by TAM include the design, development and ongoing review and evaluation of each Fund and its investment strategy; risk management oversight and analysis; design, development, implementation and ongoing review and evaluation of a process for the valuation of Fund investments; design, development, implementation and ongoing review and evaluation of a compliance program for the Funds; design, development, implementation and ongoing review and evaluation of a process for the voting of proxies and exercise of rights to consent to corporate action for Fund investments; participation in Board meetings and oversight of preparation of materials for the Board, including materials for Board meetings and regular communications with the Board; oversight of preparation of the Funds’ prospectuses, statements of additional information, shareholder reports and other disclosure materials and regulatory filings for the Funds; and ongoing cash management services. The Board considered that TAM’s investment management services also include the provision of supervisory and administrative services to each Fund. The Board also noted that TAM, as part of the services it provides to all Transamerica mutual funds, including the Funds, oversees the services provided by the funds’ custodian, transfer agent, independent accountant and legal counsel and supervises the performance of the recordkeeping and shareholder functions of the funds.
Investment Performance
In addition, the Board considered the short- and longer-term performance, as applicable, of each Fund in light of its investment objective, policies and strategies, including relative performance against a peer universe of mutual funds, based on Broadridge information, for various trailing periods ended December 31, 2018. Based on these considerations, the Board determined that TAM can provide investment and related services that are appropriate in scope and extent in light of the applicable Fund’s investment objectives, policies and strategies and operations, the competitive landscape of the investment company business and investor needs. The Board’s conclusions as to each Fund’s performance are summarized below. In describing each Fund’s performance relative to its peer universe, the summary conclusions characterize performance for the relevant periods in relation to whether it was “above,” “below” or “in line with” the peer universe median and do so using quintile rankings prepared by Broadridge. For simplicity, performance is described as “above” the median if the Fund’s performance ranked anywhere in the first or second quintiles, as “below” the median if it ranked anywhere in the fourth or fifth quintiles, or “in line with” the median if it ranked anywhere in the third quintile (i.e., even if its precise return was somewhat above or somewhat below the precise median return).
| | |
| Transamerica Asset Allocation Variable Funds | | Semi-Annual Report 2019 |
Page 16
TRANSAMERICA ASSET ALLOCATION VARIABLE FUNDS
INVESTMENT ADVISORY AGREEMENTS — CONTRACT RENEWAL (continued)
When considering each Fund’s performance, the Board Members considered any representations made by TAM regarding the appropriateness of certain peer groups and benchmarks. They recognized that performance reflects a snapshot of a period as of a specific date, and that consideration of performance data for a different period could generate significantly different performance results. The Board Members also recognized that even longer-term performance can be negatively affected by performance over a short-term period when that short-term performance is significantly below the performance of the comparable benchmark or universe of peer funds.
Transamerica Asset Allocation — Intermediate Horizon Subaccount. The Board noted that the performance of the Fund was below the median for its peer universe and below its composite benchmark for the past1-,3-,5- and10-year periods.
Transamerica Asset Allocation — Intermediate/Long Horizon Subaccount. The Board noted that the performance of the Fund was below the median for its peer universe and below its composite benchmark for the past1-,3-,5- and10-year periods.
Transamerica Asset Allocation — Short Horizon Subaccount. The Board noted that the performance of the Fund was above the median for its peer universe for the past10-year period, in line with the median for the past3- and5-year periods and below the median for the past1-year period. The Board also noted that the performance of the Fund was below its composite benchmark for the past1-,3-,5- and10-year periods.
Investment Advisory Fees and Total Expense Ratios
The Board considered the investment advisory fee and total expense ratio of each Fund, including information comparing the investment advisory fee and total expense ratio of each Fund to the investment advisory fees and total expense ratios of comparable investment companies, based on Broadridge information. On the basis of these considerations, together with the other information it considered, the Board determined that the investment advisory fees to be received by TAM under the Investment Advisory Agreements are reasonable in light of the services provided.
Cost of Services Provided and Level of Profitability
The Board reviewed information provided by TAM about the cost of providing fund management, administration and other services to each Fund by TAM and its affiliates. The Board considered the profitability of TAM and its affiliates in providing these services for each Fund. The Trustees recognized the competitiveness of the investment advisory industry and the importance of an investment adviser’s long-term profitability, including for maintaining company and management stability and accountability.
The Board also considered the allocation methodology used for calculating the profitability of TAM and its affiliates. The Board noted that the revenue and expense allocation methodology used by TAM to estimate its profitability with respect to its relationship with the Funds had been reviewed previously by an independent consultant. The Board Members considered that TAM had not made material changes to this methodology, which had been applied consistently for each Fund.
Based on this information, the Board determined that the profitability of TAM and its affiliates from their relationships with the Funds was not excessive.
Economies of Scale
The Board considered economies of scale with respect to the management of each Fund, whether the Fund had appropriately benefited from any economies of scale and whether there was the potential for realization of any future economies of scale. The Board also considered the existence of economies of scale with respect to management of the Transamerica mutual funds overall and the extent to which the Funds benefited from any economies of scale. The Board recognized that, as a Fund’s assets increase, any economies of scale realized by TAM may not directly correlate with any economies of scale that might be realized by the Fund. The Board considered each Fund’s investment advisory fee schedule and the extent to which TAM shared economies of scale, if any, with the Funds through its undertakings to limit or reimburse Fund expenses and to invest in maintaining and developing its capabilities and services. The Board Members concluded that each Fund’s fee structure reflected an appropriate sharing of any efficiencies or economies of scale to date and noted that they will have the opportunity to periodically reexamine the appropriateness of the investment advisory fees payable to TAM in light of any economies of scale experienced in the future.
Benefits to TAM and/or its Affiliates from their Relationships with the Funds
The Board considered other benefits derived by TAM and/or its affiliates from their relationships with the Funds. The Board noted that TAM does not receive benefits from research obtained with commissions paid to broker-dealers for portfolio transactions (“soft dollars”) as a result of its relationship with the Funds.
Other Considerations
The Board noted that TAM has made a substantial commitment to the recruitment and retention of high quality personnel and maintains the financial, compliance and operational resources reasonably necessary to manage each Fund in a professional manner that is
| | |
| Transamerica Asset Allocation Variable Funds | | Semi-Annual Report 2019 |
Page 17
TRANSAMERICA ASSET ALLOCATION VARIABLE FUNDS
INVESTMENT ADVISORY AGREEMENTS — CONTRACT RENEWAL (continued)
consistent with the best interests of each Fund and the contract holders. In this regard, the Board favorably considered the procedures and policies TAM has in place to enforce compliance with applicable laws and regulations. The Board also noted that TAM has made a significant entrepreneurial commitment and undertaken certain business risks with respect to the management and success of the Funds.
Conclusion
After consideration of the factors described above, as well as other factors, the Board Members, including the Independent Board Members, concluded that the renewal of each Investment Advisory Agreement was in the best interests of the applicable Fund and the contract holders and voted to approve the renewal of each Investment Advisory Agreement.
| | |
| Transamerica Asset Allocation Variable Funds | | Semi-Annual Report 2019 |
Page 18
LIQUIDITY RISK MANAGEMENT PROGRAM (“LRMP”)
(unaudited)
Per initial requirements for SEC Rule 22e-4, TAM established a LRMP in 2018, which was approved by the Board in March of 2019. In advance of the final compliance date of June 1, 2019, TAM successfully completed the liquidity rule implementation. All Funds were on-boarded to the State Street Global Exchange (SSGX) truView system (a third-party liquidity bucketing tool) at the end of December 2018. TAM currently has policies and procedures established for the day to day monitoring of liquidity risk, and continues to test and improve these policies and procedures as may be required.
| | |
| Transamerica Asset Allocation Variable Funds | | Semi-Annual Report 2019 |
Page 19
TRANSAMERICA FINANCIAL LIFE INSURANCE COMPANY
c/o Transamerica Retirement Solutions
440 Mamaroneck Avenue
Harrison, NY 10528
124292 06/19
Not applicable for semi-annual reports.
| Item 3: | Audit Committee Financial Experts. |
Not applicable for semi-annual reports.
Not applicable for semi-annual reports.
| Item 5: | Audit Committee of Listed Registrants. |
Not applicable for semi-annual reports.
| Item 6: | Schedule of Investments. |
| | (a) | The schedules of investments are included in the Semi-Annual Report to shareholders filed under Item 1 of this FormN-CSR. |
| Item 7: | Disclosure of Proxy Voting Policies and Procedures forClosed-End Management Investment Companies. |
Not applicable.
| Item 8: | Portfolio Managers ofClosed-End Management Investment Companies. |
Not applicable.
| Item 9: | Purchases of Equity Securities byClosed-End Management Investment Company and Affiliated Purchasers. |
Not applicable.
| Item 10: | Submission of Matters to a Vote of Security Holders |
There have been no material changes to the procedures by which shareholders may recommend nominees to the Registrant’s Board of Trustees that have been implemented since the Registrant last provided disclosure in response to the requirements of this Item.
| Item 11: | Controls and Procedures. |
| | (a) | The Registrant’s principal executive officer and principal financial officer evaluated the Registrant’s disclosure controls and procedures within 90 days of this filing and have concluded that the Registrant’s disclosure controls and procedures (as defined in Rule30a-3(c) under the Investment Company Act of 1940, as amended (the “1940 Act”)) are appropriately designed to ensure that information required to be disclosed by the Registrant in |
| | the reports that it files on FormN-CSR (a) is accumulated and communicated to the Registrant’s management, including its principal executive officer and principal financial officer, to allow timely decisions regarding required disclosure, and (b) is recorded, processed, summarized and reported, within the time periods specified in the rules and forms adopted by the U.S. Securities and Exchange Commission. |
| | (b) | The Registrant’s principal executive officer and principal financial officer are aware of no change in the Registrant’s internal control over financial reporting that occurred during the Registrant’s most recent fiscal half-year that has materially affected, or is reasonably likely to materially affect, the Registrant’s internal control over financial reporting. |
| Item 12: | Disclosure of Securities Lending Activities forClosed-End Management Investment Companies. |
Not Applicable.
| | (a)(1) | Any code of ethics, or amendment thereto, that is the subject of the disclosure required by Item 2, to the extent that the registrant intends to satisfy the Item 2 requirements through filing of an exhibit.Not applicable. |
| | (a)(2) | Certifications pursuant to Section 302 of the Sarbanes-Oxley Act of 2002.Separate certifications for Registrant’s principal executive officer and principal financial officer, as required by Rule30a-2(a) under the 1940 Act, are attached. |
| | (a)(3) | Any written solicitation to purchase securities under Rule 23c 1 under the Act sent or given during the period covered by the report by or on behalf of the registrant to 10 or more persons. Not applicable. |
| | (a)(4) | Change in the registrant’s independent public accountant. Not applicable. |
| | (b) | Certification pursuant to Section 906 of the Sarbanes-Oxley Act of 2002. A certification for Registrant’s principal executive officer and principal financial officer, as required by Rule30a-2(b) under the 1940 Act, is attached. The certification furnished pursuant to this paragraph is not deemed to be “filed” for purposes of Section 18 of the Securities Exchange Act of 1934, or otherwise subject to liability of that section. Such certification is not deemed to be incorporated by reference into any filing under the Securities Act of 1933 or the Securities Exchange Act of 1934, except to the extent that the Registrant specifically incorporates it by reference. |
SIGNATURES
Pursuant to the requirements of the Securities Exchange Act of 1934 and the Investment Company Act of 1940, the Registrant has duly caused this report to be signed on its behalf by the undersigned, thereunto duly authorized.
| | |
Transamerica Asset Allocation Variable Funds |
| (Registrant) |
| |
| By: | | /s/ Marijn P. Smit |
| | Marijn P. Smit |
| | Chief Executive Officer |
| | (Principal Executive Officer) |
| Date: | | September 4, 2019 |
Pursuant to the requirements of the Securities Exchange Act of 1934 and the Investment Company Act of 1940, this report has been signed below by the following persons on behalf of the Registrant and in the capacities and on the dates indicated.
| | |
| By: | | /s/ Marijn P. Smit |
| | Marijn P. Smit |
| | Chief Executive Officer |
| | (Principal Executive Officer) |
| Date: | | September 4, 2019 |
| |
| By: | | /s/ Vincent J. Toner |
| | Vincent J. Toner |
| | Treasurer |
| | (Principal Financial Officer) |
| Date: | | September 4, 2019 |
EXHIBIT INDEX
| | |
Exhibit No. | | Description of Exhibit |
| |
| 13(a)(2)(i) | | Section 302N-CSR Certification of Principal Executive Officer |
| |
| 13(a)(2)(ii) | | Section 302N-CSR Certification of Principal Financial Officer |
| |
| 13(b) | | Section 906N-CSR Certification of Principal Executive Officer and Principal Financial Officer |