As filed with the Securities and Exchange Commission on September 2, 2022
UNITED STATES
SECURITIES AND EXCHANGE COMMISSION
WASHINGTON, D.C. 20549
FORM N-CSR
CERTIFIED SHAREHOLDER REPORT OF
REGISTERED MANAGEMENT INVESTMENT COMPANIES
Investment Company Act file number: 811-07717
TRANSAMERICA ASSET ALLOCATION VARIABLE FUNDS
(Exact Name of Registrant as Specified in Charter)
1801 California St., Suite 5200, Denver, Colorado 80202
(Address of Principal Executive Offices) (Zip Code)
Registrant’s Telephone Number, including Area Code: 1-888-233-4339
Dennis P. Gallagher, Esq., 1801 California St., Suite 5200, Denver, CO 80202
(Name and Address of Agent for Service)
Date of fiscal year end: December 31
Date of reporting period: June 30, 2022
| Item 1: | Report(s) to Shareholders. |
The Semi-Annual Report is attached.
TRANSAMERICA VARIABLE FUNDS
TRANSAMERICA ASSET
ALLOCATION VARIABLE FUNDS
Semi-Annual Report
June 30, 2022
Table of Contents
Authorized for distribution only when accompanied or preceded by a prospectus. Investors should carefully consider a Fund’s investment goals, risks, charges and expenses before investing. A prospectus contains this and other information; please read it carefully before investing.
| | |
| Transamerica Asset Allocation Variable Funds | | Semi-Annual Report 2022 |
This report is not to be construed as an offering for sale of any contracts participating in the Subaccounts (Series) of the Transamerica Variable Funds or the Transamerica Asset Allocation Variable Funds, or as a solicitation of an offer to buy contracts unless preceded by or accompanied by a current prospectus which contains complete information about charges and expenses.
This report consists of the semi-annual report of the Transamerica Asset Allocation Variable Funds and the semi-annual report of the Calvert VP SRI Balanced Portfolio.
Proxy Voting Policies and Procedures
A description of the proxy voting policies and procedures of the Transamerica Asset Allocation Variable Funds is included in the applicable Statements of Additional Information which are available without charge, upon request: (i) by calling 1-800-755-5801; or (ii) on the SEC’s website at www.sec.gov. In addition, the Transamerica Asset Allocation Variable Funds are required to file Form N-PX, with the complete proxy voting record for the most recent twelve months ended June 30, no later than August 31 of each year. Form N-PX for the twelve months ended June 30, 2022, is available without charge, on the Transamerica Funds website at https://www.transamerica.com/sites/default/files/files/e070d/TAAVF%20N-PX%202021.pdf and on the SEC’s website at http://www.sec.gov.
Quarterly Portfolio Holdings
Each fiscal quarter, Transamerica Asset Allocation Variable Funds will file with the SEC a complete schedule of their monthly portfolio holdings on Form N-PORT. The Subaccounts’ holdings as of the end of the third month of every fiscal quarter, as reported on Form N-PORT, will be publicly available on the SEC’s website at http://www.sec.gov within 60 days of the end of the fiscal quarter.
TRANSAMERICA FINANCIAL LIFE INSURANCE COMPANY
440 Mamaroneck Avenue
Harrison, New York 10528
To Contract Holders with Interests in
the Transamerica Variable Funds:
We are pleased to present the most recent semi-annual report for the Calvert VP SRI Balanced Portfolio. As required under applicable law, we are sending this annual report to contract holders of Group Variable Annuity Contracts issued by Transamerica Financial Life Insurance Company with unit interests in the Calvert Series Subaccount of the Transamerica Variable Funds, which invests its assets in the Calvert VP SRI Balanced Portfolio, a series of Calvert Variable Series, Inc.
Please call your retirement plan administrator, Transamerica Retirement Solutions, LLC, at (800) 755-5801 if you have any questions regarding these reports.
Dear Contract Holder,
On behalf of Transamerica Asset Allocation Variable Funds, we would like to thank you for your continued support and confidence in our products as we look forward to continuing to serve you and your financial professional in the future. We value the trust you have placed in us.
This semi-annual report provides certain information about your Subaccount(s) during the period covered by the report. The Securities and Exchange Commission currently requires that annual and semi-annual reports be sent to all contract holders, and we believe it to be an important part of the investment process. This report covers the six-month period ended June 30, 2022.
We believe it is important to understand market conditions over the six-month period covered by this report to provide context for reading this report. The period began on January 1, 2022, with the S&P 500® Index near a record high coming off a year of extremely strong economic and corporate earnings growth, ongoing accommodative monetary policy from the U.S. Federal Reserve (“Fed”) and continuing impacts of the Federal government’s historically unprecedented fiscal stimulus. However, in the early months of the year inflation continued to rise sharply, reaching multi-decade highs. With that came growing market expectations the Fed would soon need to begin a more aggressive tightening cycle than most had expected. As a result, equities declined sharply with some of the largest declines occurring among high growth stocks which have major components of their expected earnings increases further out in the future.
The month of February not only saw inflation continue toward levels not seen since the early 1980s, but also the Russian invasion of Ukraine. In addition to creating a humanitarian crisis, the war in Ukraine also drove energy and food prices higher. Against this backdrop bond yields rose across the yield curve and credit spreads widened. In March 2022, the Fed, by this time facing criticism it might be behind the curve on fighting inflation, hiked interest rates for the first time since 2018 taking the Fed Funds Rate to 0.50%.
Inflation continued to rise into the second quarter, and the Fed intensified its rate hikes by raising the target range on the Fed Funds Rate by 0.50% in May and 0.75% in June, finishing the reporting period at an upper bound of 1.75%. Longer-term rates also jumped, and by mid-June the 10-year U.S. Treasury yield reached 3.50%, its highest level in more than a decade. With the Fed’s tightening cycle now established, recession fears began to emerge as a predominant investor concern rivaling inflation. Stocks fell further, and by the first half of June most major indexes had declined more than 20% from previous highs and officially entered bear market territory. This environment also took a further toll on the credit markets as high yield and investment grade credit spreads reached levels not seen since the initial summer months of the COVID-19 pandemic. By the end of the six-month period ended June 30, 2022, economic growth concerns had reached a point where many considered a recession close to imminent. This sent longer-term bond yields quickly back into decline and to the point where they were essentially flat with those of 2-year Treasuries, signifying the risk of a soon to be inverted yield curve historically coinciding with an upcoming recession.
For the six-month period ended June 30, 2022, the S&P 500® Index returned -19.96%, while the MSCI EAFE Index, representing international developed market equities, returned -19.25%. During the same period, the Bloomberg US Aggregate Bond Index returned -10.29%. Please keep in mind that it is important to maintain a diversified portfolio as investment returns have historically been difficult to predict.
In addition to your active involvement in the investment process, we firmly believe that a financial professional is a key resource to help you build a complete picture of your current and future financial needs. Financial professionals are familiar with the market’s history, including long-term returns and volatility of various asset classes. With your financial professional, you can develop an investment program that incorporates factors such as your goals, your investment timeline, and your risk tolerance.
Please contact your financial professional if you have any questions about the contents of this report, and thanks again for the confidence you have placed in us.
Sincerely,

Marijn Smit
President & Chief Executive Officer
Transamerica Asset Allocation Variable Funds

Tom Wald, CFA
Chief Investment Officer
Transamerica Asset Allocation Variable Funds
Bloomberg US Aggregate Bond Index: Measures investment grade, U.S. dollar denominated, fixed-rate taxable bonds, including Treasuries, government-related and corporate securities, as well as both mortgage- and asset-backed securities.
MSCI EAFE Index: A free float-adjusted market capitalization index that is designed to measure the equity market performance of developed markets, excluding the U.S. and Canada.
S&P 500® Index: A market-capitalization weighted index of 500 large U.S. companies with common stock listed on the New York Stock Exchange or NASDAQ Stock Market.
The views expressed in this report reflect those of Transamerica Asset Management only and may not necessarily represent the views of Transamerica Asset Allocation Variable Funds. These views are as of the date of this report and subject to change based upon market conditions. These views should not be relied upon as investment advice and are not indicative of trading intent on behalf of Transamerica Asset Allocation Variable Funds. Investing involves risk, including potential loss of principal. The performance data presented represents past performance and does not guarantee future results. Indexes are unmanaged and it is not possible to invest directly in an index.
Disclosure of Expenses
(unaudited)
UNIT HOLDER EXPENSES
Transamerica Asset Allocation Variable Funds (each individually, a “Subaccount” and collectively, the “Subaccounts”) is a separate investment account established by Transamerica Financial Life Insurance Company, Inc. (“TFLIC”), and is used as an investment vehicle under certain tax-deferred annuity contracts issued by TFLIC. Each Subaccount invests in underlying subaccounts of Transamerica Variable Funds (“TVF”), a unit investment trust. Subaccount contract holders bear the costs of operating the Subaccount (such as the advisory fee).
The following examples are intended to help you understand your ongoing costs (in dollars and cents) of investing in the Subaccounts and to compare these costs with the ongoing costs of investing in other funds.
The examples are based on an investment of $1,000 invested at January 1, 2022, and held for the entire six-month period until June 30, 2022.
ACTUAL EXPENSES
The information in the table below provides information about actual account values and actual expenses. You may use the information in these columns, together with the amount you invested, to estimate the expenses that you paid over the period. Simply divide your account value by $1,000 (for example, an $8,600 account value divided by $1,000 = $8.60), then multiply the result by the number in the appropriate column for your share class titled “Expenses Paid During Period” to estimate the expenses you paid on your account during this period.
HYPOTHETICAL EXAMPLE FOR COMPARISON PURPOSES
The information in the table below provides information about hypothetical account values and hypothetical expenses based on the Subaccounts’ actual expense ratios and assumed rates of return of 5% per year before expenses, which are not the Subaccounts’ actual returns. The hypothetical account values and expenses may not be used to estimate the actual ending account balance or expenses you paid for the period. You may use this information to compare the ongoing costs of investing in your Subaccount versus other funds. To do so, compare this 5% hypothetical example with the 5% hypothetical examples that appear in the shareholder reports of the other funds.
| | | | | | | | | | | | | | | | | | | | | | | | |
| | | | | | Actual Expenses | | | Hypothetical Expenses (A) | | | | |
| Subaccount | | Beginning
Account Value
January 1, 2022 | | | Ending
Account Value
June 30, 2022 | | | Expenses Paid
During Period (B) | | | Ending
Account Value
June 30, 2022 | | | Expenses Paid
During Period (B) | | | Net Annualized
Expense Ratio (C) | |
Transamerica Asset Allocation – Short Horizon Subaccount | | $ | 1,000.00 | | | $ | 884.80 | | | $ | 0.93 | | | $ | 1,023.80 | | | $ | 1.00 | | | | 0.20 | % |
Transamerica Asset Allocation – Intermediate Horizon Subaccount | | | 1,000.00 | | | | 822.50 | | | | 0.90 | | | | 1,023.80 | | | | 1.00 | | | | 0.20 | |
Transamerica Asset Allocation – Intermediate/Long Horizon Subaccount | | | 1,000.00 | | | | 793.60 | | | | 0.89 | | | | 1,023.80 | | | | 1.00 | | | | 0.20 | |
| | | | | | | | | | | | |
| |
| (A) | | 5% return per year before expenses. |
| |
| (B) | | Expenses are calculated using each Subaccount’s net annualized expense ratios, as disclosed in the table, multiplied by the average account value for the period, multiplied by the number of days in the period (181 days), and divided by the number of days in the year (365 days). |
| |
| (C) | | Net annualized expense ratios, as disclosed in the table, do not include the expenses of the underlying investments in which the Subaccounts invest. The total annual expenses, as stated in the fee table of the Subaccounts’ Prospectus, may differ from the expense ratios disclosed in this report. |
| | |
| Transamerica Asset Allocation Variable Funds | | Semi-Annual Report 2022 |
Page 4
Schedules of Investments Composition
At June 30, 2022
(unaudited)
| | | | |
| Transamerica Asset Allocation – Short Horizon Subaccount | |
| |
| Asset Allocation | | Percentage of Net
Assets | |
U.S. Fixed Income Funds | | | 90.2 | % |
U.S. Equity Funds | | | 7.6 | |
International Equity Fund | | | 1.9 | |
Money Market Fund | | | 0.2 | |
Net Other Assets (Liabilities) | | | 0.1 | |
Total | | | 100.0 | % |
| | | | |
|
Transamerica Asset Allocation – Intermediate Horizon
Subaccount | |
| |
| Asset Allocation | | Percentage of Net
Assets | |
U.S. Fixed Income Funds | | | 50.5 | % |
U.S. Equity Funds | | | 37.0 | |
International Equity Fund | | | 12.2 | |
Money Market Fund | | | 0.3 | |
Net Other Assets (Liabilities) | | | (0.0 | )* |
Total | | | 100.0 | % |
| | | | |
|
Transamerica Asset Allocation – Intermediate/Long Horizon
Subaccount | |
| |
| Asset Allocation | | Percentage of Net
Assets | |
U.S. Equity Funds | | | 51.3 | % |
U.S. Fixed Income Funds | | | 30.7 | |
International Equity Fund | | | 17.8 | |
Money Market Fund | | | 0.2 | |
Net Other Assets (Liabilities) | | | 0.0 | * |
Total | | | 100.0 | % |
| | | | |
| * | Percentage rounds to less than 0.1% or (0.1)%. |
| | |
| Transamerica Asset Allocation Variable Funds | | Semi-Annual Report 2022 |
Page 5
Transamerica Asset Allocation – Short Horizon Subaccount
SCHEDULE OF INVESTMENTS
At June 30, 2022
(unaudited)
| | | | | | | | |
| | | Shares | | | Value | |
| INVESTMENT COMPANIES - 99.9% | |
| International Equity Fund - 1.9% | |
Transamerica Variable International Equity (A) (B) | | | 3,740 | | | | $89,762 | |
| | | | | | | | |
| Money Market Fund - 0.2% | |
Transamerica Variable Government Money Market, 0.00% (A) (B) (C) | | | 432 | | | | 9,235 | |
| | | | | | | | |
| U.S. Equity Funds - 7.6% | |
Transamerica Variable Large Growth (A) (B) | | | 766 | | | | 125,664 | |
Transamerica Variable Large Value Opportunities (A) (B) | | | 1,146 | | | | 135,413 | |
Transamerica Variable Small Cap Growth (A) (B) | | | 4,169 | | | | 41,614 | |
Transamerica Variable Small Cap Value (A) (B) | | | 3,164 | | | | 45,048 | |
| | | | | | | | |
| | | | | | | 347,739 | |
| | | | | | | | |
| U.S. Fixed Income Funds - 90.2% | |
Transamerica Variable High Quality Bond (A) (B) | | | 43,370 | | | | 775,064 | |
| | | | | | | | |
| | | Shares | | | Value | |
| INVESTMENT COMPANIES (continued) | |
| U.S. Fixed Income Funds (continued) | |
Transamerica Variable High Yield Bond (A) (B) | | | 13,438 | | | | $ 474,202 | |
Transamerica Variable Inflation-Protected Securities (A) (B) | | | 26,604 | | | | 777,781 | |
Transamerica Variable Intermediate Bond (A) (B) | | | 45,754 | | | | 2,125,883 | |
| | | | | | | | |
| | | | | | | 4,152,930 | |
| | | | | | | | |
Total Investment Companies
(Cost $4,586,263) | | | | 4,599,666 | |
| | | | | |
Total Investments
(Cost $4,586,263) | | | | 4,599,666 | |
Net Other Assets (Liabilities) - 0.1% | | | | | | | 5,252 | |
| | | | | | | | |
| | |
Net Assets - 100.0% | | | | | | | $4,604,918 | |
| | | | | | | | |
INVESTMENT VALUATION:
Valuation Inputs (D)
| | | | | | | | | | | | | | | | |
| | | Level 1 -
Unadjusted
Quoted Prices | | | Level 2 -
Other Significant
Observable Inputs | | | Level 3 -
Significant
Unobservable Inputs | | | Value | |
ASSETS | |
Investments | |
Investment Companies | | $ | 4,599,666 | | | $ | — | | | $ | — | | | $ | 4,599,666 | |
| | | | | | | | | | | | | | | | |
Total Investments | | $ | 4,599,666 | | | $ | — | | | $ | — | | | $ | 4,599,666 | |
| | | | | | | | | | | | | | | | |
FOOTNOTES TO SCHEDULE OF INVESTMENTS:
| | |
| (A) | | Affiliated investment in Transamerica Variable Funds. Affiliated interest, dividends, realized and unrealized gains (losses), if any, are broken out within the Statements of Operations. |
| (B) | | Non-income producing security. |
| (C) | | Rate disclosed reflects the yield at June 30, 2022. |
| (D) | | There were no transfers in or out of Level 3 during the six-month period ended June 30, 2022. Please reference the Investment Valuation section of the Notes to Financial Statements for more information regarding investment valuation and pricing inputs. |
The Notes to Financial Statements are an integral part of this report.
| | |
| Transamerica Asset Allocation Variable Funds | | Semi-Annual Report 2022 |
Page 6
Transamerica Asset Allocation – Intermediate Horizon Subaccount
SCHEDULE OF INVESTMENTS
At June 30, 2022
(unaudited)
| | | | | | | | |
| | | Shares | | | Value | |
| INVESTMENT COMPANIES - 100.0% | |
| International Equity Fund - 12.2% | |
Transamerica Variable International Equity (A) (B) | | | 71,235 | | | | $1,709,794 | |
| | | | | | | | |
| Money Market Fund - 0.3% | |
Transamerica Variable Government Money Market, 0.00% (A) (B) (C) | | | 1,868 | | | | 39,980 | |
| | | | | | | | |
| U.S. Equity Funds - 37.0% | |
Transamerica Variable Large Growth (A) (B) | | | 10,692 | | | | 1,753,018 | |
Transamerica Variable Large Value Opportunities (A) (B) | | | 17,903 | | | | 2,114,706 | |
Transamerica Variable Small Cap Growth (A) (B) | | | 59,399 | | | | 592,983 | |
Transamerica Variable Small Cap Value (A) (B) | | | 49,324 | | | | 702,333 | |
| | | | | | | | |
| | | | | | | 5,163,040 | |
| | | | | | | | |
| U.S. Fixed Income Funds - 50.5% | |
Transamerica Variable High Quality Bond (A) (B) | | | 64,865 | | | | 1,159,197 | |
| | | | | | | | |
| | | Shares | | | Value | |
| INVESTMENT COMPANIES (continued) | |
| U.S. Fixed Income Funds (continued) | |
Transamerica Variable High Yield Bond (A) (B) | | | 23,404 | | | | $ 825,885 | |
Transamerica Variable Inflation-Protected Securities (A) (B) | | | 58,804 | | | | 1,719,178 | |
Transamerica Variable Intermediate Bond (A) (B) | | | 71,836 | | | | 3,337,737 | |
| | | | | | | | |
| | | | | | | 7,041,997 | |
| | | | | | | | |
Total Investment Companies
(Cost $13,179,825) | | | | 13,954,811 | |
| | | | | | | | |
Total Investments
(Cost $13,179,825) | | | | 13,954,811 | |
Net Other Assets (Liabilities) - (0.0)% (D) | | | | | | | (3,390 | ) |
| | | | | | | | |
| | |
Net Assets - 100.0% | | | | | | | $13,951,421 | |
| | | | | | | | |
| |
INVESTMENT VALUATION:
Valuation Inputs (E)
| | | | | | | | | | | | | | | | |
| | | Level 1 -
Unadjusted
Quoted Prices | | | Level 2 -
Other Significant
Observable Inputs | | | Level 3 -
Significant
Unobservable Inputs | | | Value | |
ASSETS | | | | | | | | | | | | | | | | |
Investments | | | | | | | | | | | | | | | | |
Investment Companies | | $ | 13,954,811 | | | $ | — | | | $ | — | | | $ | 13,954,811 | |
| | | | | | | | | | | | | | | | |
Total Investments | | $ | 13,954,811 | | | $ | — | | | $ | — | | | $ | 13,954,811 | |
| | | | | | | | | | | | | | | | |
FOOTNOTES TO SCHEDULE OF INVESTMENTS:
| | | | | | | | |
| (A) | | Affiliated investment in Transamerica Variable Funds. Affiliated interest, dividends, realized and unrealized gains (losses), if any, are broken out within the Statements of Operations. |
| (B) | | Non-income producing security. |
| (C) | | Rate disclosed reflects the yield at June 30, 2022. |
| (D) | | Percentage rounds to less than 0.1% or (0.1)%. |
| (E) | | There were no transfers in or out of Level 3 during the six-month period ended June 30, 2022. Please reference the Investment Valuation section of the Notes to Financial Statements for more information regarding investment valuation and pricing inputs. |
The Notes to Financial Statements are an integral part of this report.
| | |
| Transamerica Asset Allocation Variable Funds | | Semi-Annual Report 2022 |
Page 7
Transamerica Asset Allocation – Intermediate/Long Horizon Subaccount
SCHEDULE OF INVESTMENTS
At June 30, 2022
(unaudited)
| | | | | | | | |
| | | Shares | | | Value | |
| INVESTMENT COMPANIES - 100.0% | |
| International Equity Fund - 17.8% | |
Transamerica Variable International Equity (A) (B) | | | 197,139 | | | | $4,731,755 | |
| | | | | | | | |
| Money Market Fund - 0.2% | |
Transamerica Variable Government Money Market, 0.00% (A) (B) (C) | | | 193 | | | | 41,164 | |
| | | | | | | | |
| U.S. Equity Funds - 51.3% | |
Transamerica Variable Large Growth (A) (B) | | | 27,565 | | | | 4,519,625 | |
Transamerica Variable Large Value Opportunities (A) (B) | | | 48,475 | | | | 5,725,767 | |
Transamerica Variable Small Cap Growth (A) (B) | | | 158,740 | | | | 1,584,705 | |
Transamerica Variable Small Cap Value (A) (B) | | | 127,380 | | | | 1,813,792 | |
| | | | | | | | |
| | | | | | | 13,643,889 | |
| | | | | | | | |
| U.S. Fixed Income Funds - 30.7% | |
Transamerica Variable High Quality Bond (A) (B) | | | 31,459 | | | | 562,201 | |
| | | | | | | | |
| | | Shares | | | Value | |
| INVESTMENT COMPANIES (continued) | |
| U.S. Fixed Income Funds (continued) | |
Transamerica Variable High Yield Bond (A) (B) | | | 30,393 | | | | $ 1,072,521 | |
Transamerica Variable Inflation-Protected Securities (A) (B) | | | 83,444 | | | | 2,439,521 | |
Transamerica Variable Intermediate Bond (A) (B) | | | 87,951 | | | | 4,086,472 | |
| | | | | | | | |
| | | | | | | 8,160,715 | |
| | | | | | | | |
Total Investment Companies
(Cost $22,671,032) | | | | 26,577,523 | |
| | | | | | | | |
Total Investments
(Cost $22,671,032) | | | | 26,577,523 | |
Net Other Assets (Liabilities) - 0.0% (D) | | | | | | | 2,682 | |
| | | | | | | | |
| | |
Net Assets - 100.0% | | | | | | | $26,580,205 | |
| | | | | | | | |
INVESTMENT VALUATION:
Valuation Inputs (E)
| | | | | | | | | | | | | | | | |
| | | Level 1 -
Unadjusted
Quoted Prices | | | Level 2 -
Other Significant
Observable Inputs | | | Level 3 -
Significant
Unobservable Inputs | | | Value | |
ASSETS | | | | | | | | | | | | | | | | |
Investments | | | | | | | | | | | | | | | | |
Investment Companies | | $ | 26,577,523 | | | $ | — | | | $ | — | | | $ | 26,577,523 | |
| | | | | | | | | | | | | | | | |
Total Investments | | $ | 26,577,523 | | | $ | — | | | $ | — | | | $ | 26,577,523 | |
| | | | | | | | | | | | | | | | |
FOOTNOTES TO SCHEDULE OF INVESTMENTS:
| | |
| (A) | | Affiliated investment in Transamerica Variable Funds. Affiliated interest, dividends, realized and unrealized gains (losses), if any, are broken out within the Statements of Operations. |
| (B) | | Non-income producing security. |
| (C) | | Rate disclosed reflects the yield at June 30, 2022. |
| (D) | | Percentage rounds to less than 0.1% or (0.1)%. |
| (E) | | There were no transfers in or out of Level 3 during the six-month period ended June 30, 2022. Please reference the Investment Valuation section of the Notes to Financial Statements for more information regarding investment valuation and pricing inputs. |
The Notes to Financial Statements are an integral part of this report.
| | |
| Transamerica Asset Allocation Variable Funds | | Semi-Annual Report 2022 |
Page 8
STATEMENTS OF ASSETS AND LIABILITIES
At June 30, 2022
(unaudited)
| | | | | | | | | | | | |
| | | Short Horizon | | | Intermediate
Horizon | | | Intermediate/Long
Horizon | |
Assets: | | | | | | | | | | | | |
Affiliated investments, at value (A) | | $ | 4,599,666 | | | $ | 13,954,811 | | | $ | 26,577,523 | |
Receivables and other assets: | | | | | | | | | | | | |
Affiliated investments sold | | | 11,236 | | | | 61 | | | | 11,267 | |
Total assets | | | 4,610,902 | | | | 13,954,872 | | | | 26,588,790 | |
| | | | |
Liabilities: | | | | | | | | | | | | |
Payables and other liabilities: | | | | | | | | | | | | |
Affiliated investments purchased | | | 5,220 | | | | 1,115 | | | | 4,092 | |
Investment advisory fees | | | 764 | | | | 2,336 | | | | 4,493 | |
Total liabilities | | | 5,984 | | | | 3,451 | | | | 8,585 | |
Net assets | | $ | 4,604,918 | | | $ | 13,951,421 | | | $ | 26,580,205 | |
| | | | |
Net assets consist of: | | | | | | | | | | | | |
Costs of accumulation units | | $ | (1,040,060 | ) | | $ | (3,951,155 | ) | | $ | 581,034 | |
Total distributable earnings (accumulated losses) | | | 5,644,978 | | | | 17,902,576 | | | | 25,999,171 | |
Net assets | | $ | 4,604,918 | | | $ | 13,951,421 | | | $ | 26,580,205 | |
Accumulation units | | | 200,453 | | | | 467,406 | | | | 807,139 | |
Unit value | | $ | 22.97 | | | $ | 29.85 | | | $ | 32.93 | |
| | | | | | | | | | | | | |
(A) Affiliated investments, at cost | | $ | 4,586,263 | | | $ | 13,179,825 | | | $ | 22,671,032 | |
STATEMENTS OF OPERATIONS
For the period ended June 30, 2022
(unaudited)
| | | | | | | | | | | | |
| | | Short Horizon | | | Intermediate
Horizon | | | Intermediate/Long
Horizon | |
Expenses: | | | | | | | | | | | | |
Investment advisory fees | | $ | 5,119 | | | $ | 15,642 | | | $ | 30,708 | |
| | | | |
Net investment income (loss) | | | (5,119 | ) | | | (15,642 | ) | | | (30,708 | ) |
| | | | |
Net realized gain (loss) on: | | | | | | | | | | | | |
Affiliated investments | | | 108,397 | | | | 516,988 | | | | 1,856,217 | |
| | | | |
Net change in unrealized appreciation (depreciation) on: | | | | | | | | | | | | |
Affiliated investments | | | (735,762 | ) | | | (3,578,423 | ) | | | (8,970,803 | ) |
Net realized and change in unrealized gain (loss) | | | (627,365 | ) | | | (3,061,435 | ) | | | (7,114,586 | ) |
Net increase (decrease) in net assets resulting from operations | | $ | (632,484 | ) | | $ | (3,077,077 | ) | | $ | (7,145,294 | ) |
The Notes to Financial Statements are an integral part of this report.
| | |
| Transamerica Asset Allocation Variable Funds | | Semi-Annual Report 2022 |
Page 9
STATEMENTS OF CHANGES IN NET ASSETS
For the period and year ended:
| | | | | | | | | | | | | | | | | | | | | | | | |
| | | Short Horizon | | | Intermediate Horizon | | | Intermediate/Long Horizon | |
| | | June 30,
2022
(unaudited) | | | December 31,
2021 | | | June 30,
2022
(unaudited) | | | December 31,
2021 | | | June 30,
2022
(unaudited) | | | December 31,
2021 | |
| From operations: | | | | | | | | | | | | | | | | | | | | | | | | |
Net investment income (loss) | | $ | (5,119 | ) | | $ | (12,154 | ) | | $ | (15,642 | ) | | $ | (35,496 | ) | | $ | (30,708 | ) | | $ | (71,656 | ) |
Net realized gain (loss) | | | 108,397 | | | | 225,135 | | | | 516,988 | | | | 1,252,933 | | | | 1,856,217 | | | | 2,179,549 | |
Net change in unrealized appreciation (depreciation) | | | (735,762 | ) | | | (113,796 | ) | | | (3,578,423 | ) | | | 330,815 | | | | (8,970,803 | ) | | | 1,973,023 | |
Net increase (decrease) in net assets resulting from operations | | | (632,484 | ) | | | 99,185 | | | | (3,077,077 | ) | | | 1,548,252 | | | | (7,145,294 | ) | | | 4,080,916 | |
| | | | | | | |
Unit transactions: | | | | | | | | | | | | | | | | | | | | | | | | |
Units sold | | | 125,097 | | | | 331,796 | | | | 506,769 | | | | 1,248,572 | | | | 894,467 | | | | 1,942,982 | |
Units redeemed | | | (761,387 | ) | | | (1,107,003 | ) | | | (1,394,786 | ) | | | (2,168,930 | ) | | | (3,159,583 | ) | | | (3,927,840 | ) |
Net increase (decrease) in net assets resulting from unit transactions | | | (636,290 | ) | | | (775,207 | ) | | | (888,017 | ) | | | (920,358 | ) | | | (2,265,116 | ) | | | (1,984,858 | ) |
Net increase (decrease) in net assets | | | (1,268,774 | ) | | | (676,022 | ) | | | (3,965,094 | ) | | | 627,894 | | | | (9,410,410 | ) | | | 2,096,058 | |
| | | | | | | |
Net assets: | | | | | | | | | | | | | | | | | | | | | | | | |
Beginning of period/year | | | 5,873,692 | | | | 6,549,714 | | | | 17,916,515 | | | | 17,288,621 | | | | 35,990,615 | | | | 33,894,557 | |
End of period/year | | $ | 4,604,918 | | | $ | 5,873,692 | | | $ | 13,951,421 | | | $ | 17,916,515 | | | $ | 26,580,205 | | | $ | 35,990,615 | |
| | | | | | | |
Unit transactions - shares: | | | | | | | | | | | | | | | | | | | | | | | | |
Units sold | | | 5,120 | | | | 12,926 | | | | 15,491 | | | | 35,516 | | | | 23,879 | | | | 48,632 | |
Units redeemed | | | (30,906 | ) | | | (43,066 | ) | | | (41,815 | ) | | | (61,605 | ) | | | (84,062 | ) | | | (97,456 | ) |
Net increase (decrease) | | | (25,786 | ) | | | (30,140 | ) | | | (26,324 | ) | | | (26,089 | ) | | | (60,183 | ) | | | (48,824 | ) |
The Notes to Financial Statements are an integral part of this report.
| | |
| Transamerica Asset Allocation Variable Funds | | Semi-Annual Report 2022 |
Page 10
FINANCIAL HIGHLIGHTS
| | | | | | | | | | | | | | | | | | | | | | | | |
For a unit outstanding during the period and years
indicated: | | Short Horizon | |
| | | June 30, 2022
(unaudited) | | | December 31,
2021 | | | December 31,
2020 | | | December 31,
2019 | | | December 31,
2018 | | | December 31,
2017 | |
Unit value, beginning of period/year | | $ | 25.96 | | | $ | 25.55 | | | $ | 23.80 | | | $ | 21.87 | | | $ | 22.46 | | | $ | 21.56 | |
| | | | | | | |
Investment operations: | | | | | | | | | | | | | | | | | | | | | | | | |
Net investment income (loss) (A) | | | (0.02 | ) | | | (0.05 | ) | | | (0.05 | ) | | | (0.05 | ) | | | (0.04 | ) | | | (0.04 | ) |
Net realized and unrealized gain (loss) | | | (2.97 | ) | | | 0.46 | | | | 1.80 | | | | 1.98 | | | | (0.55 | ) | | | 0.94 | |
Total investment operations | | | (2.99 | ) | | | 0.41 | | | | 1.75 | | | | 1.93 | | | | (0.59 | ) | | | 0.90 | |
| | | | | | | |
Unit value, end of period/year | | $ | 22.97 | | | $ | 25.96 | | | $ | 25.55 | | | $ | 23.80 | | | $ | 21.87 | | | $ | 22.46 | |
Total return | | | (11.52 | )%(B) | | | 1.63 | % | | | 7.35 | % | | | 8.80 | % | | | (2.62 | )% | | | 4.19 | % |
| | | | | | | |
Ratio and supplemental data: | | | | | | | | | | | | | | | | | | | | | | | | |
Net assets end of period/year (000’s) | | $ | 4,605 | | | $ | 5,874 | | | $ | 6,550 | | | $ | 5,976 | | | $ | 5,614 | | | $ | 5,817 | |
Expenses to average net assets (C) | | | 0.20 | %(D) | | | 0.20 | % | | | 0.20 | % | | | 0.20 | % | | | 0.20 | % | | | 0.20 | % |
Net investment income (loss) to average net assets | | | (0.20 | )%(D) | | | (0.20 | )% | | | (0.20 | )% | | | (0.20 | )% | | | (0.20 | )% | | | (0.20 | )% |
Portfolio turnover rate | | | 20 | %(B) | | | 27 | % | | | 58 | % | | | 36 | % | | | 44 | % | | | 34 | % |
| | |
| (A) | | Calculated based on average number of units outstanding. |
| (B) | | Not annualized. |
| (C) | | Does not include expenses of the underlying investments in which the Subaccount invests. |
| (D) | | Annualized. |
| | | | | | | | | | | | | | | | | | | | | | | | |
For a unit outstanding during the period and years
indicated: | | Intermediate Horizon | |
| | | June 30, 2022
(unaudited) | | | December 31,
2021 | | | December 31,
2020 | | | December 31,
2019 | | | December 31,
2018 | | | December 31,
2017 | |
Unit value, beginning of period/year | | $ | 36.29 | | | $ | 33.26 | | | $ | 29.13 | | | $ | 25.32 | | | $ | 26.91 | | | $ | 24.28 | |
| | | | | | | |
Investment operations: | | | | | | | | | | | | | | | | | | | | | | | | |
Net investment income (loss) (A) | | | (0.03 | ) | | | (0.07 | ) | | | (0.06 | ) | | | (0.06 | ) | | | (0.05 | ) | | | (0.05 | ) |
Net realized and unrealized gain (loss) | | | (6.41 | ) | | | 3.10 | | | | 4.19 | | | | 3.87 | | | | (1.54 | ) | | | 2.68 | |
Total investment operations | | | (6.44 | ) | | | 3.03 | | | | 4.13 | | | | 3.81 | | | | (1.59 | ) | | | 2.63 | |
| | | | | | | |
Unit value, end of period/year | | $ | 29.85 | | | $ | 36.29 | | | $ | 33.26 | | | $ | 29.13 | | | $ | 25.32 | | | $ | 26.91 | |
Total return | | | (17.75 | )%(B) | | | 9.11 | % | | | 14.19 | % | | | 15.04 | % | | | (5.92 | )% | | | 10.84 | % |
| | | | | | | |
Ratio and supplemental data: | | | | | | | | | | | | | | | | | | | | | | | | |
Net assets end of period/year (000’s) | | $ | 13,951 | | | $ | 17,917 | | | $ | 17,289 | | | $ | 16,687 | | | $ | 15,038 | | | $ | 17,618 | |
Expenses to average net assets (C) | | | 0.20 | %(D) | | | 0.20 | % | | | 0.20 | % | | | 0.20 | % | | | 0.20 | % | | | 0.20 | % |
Net investment income (loss) to average net assets | | | (0.20 | )%(D) | | | (0.20 | )% | | | (0.20 | )% | | | (0.20 | )% | | | (0.20 | )% | | | (0.20 | )% |
Portfolio turnover rate | | | 20 | %(B) | | | 38 | % | | | 73 | % | | | 23 | % | | | 37 | % | | | 40 | % |
| | |
| (A) | | Calculated based on average number of units outstanding. |
| (B) | | Not annualized. |
| (C) | | Does not include expenses of the underlying investments in which the Subaccount invests. |
| (D) | | Annualized. |
| | | | | | | | | | | | | | | | | | | | | | | | |
For a unit outstanding during the period and years
indicated: | | Intermediate/Long Horizon | |
| | | June 30, 2022
(unaudited) | | | December 31,
2021 | | | December 31,
2020 | | | December 31,
2019 | | | December 31,
2018 | | | December 31,
2017 | |
Unit value, beginning of period/year | | $ | 41.50 | | | $ | 37.00 | | | $ | 31.76 | | | $ | 26.82 | | | $ | 29.04 | | | $ | 25.48 | |
| | | | | | | |
Investment operations: | | | | | | | | | | | | | | | | | | | | | | | | |
Net investment income (loss) (A) | | | (0.04 | ) | | | (0.08 | ) | | | (0.06 | ) | | | (0.06 | ) | | | (0.06 | ) | | | (0.05 | ) |
Net realized and unrealized gain (loss) | | | (8.53 | ) | | | 4.58 | | | | 5.30 | | | | 5.00 | | | | (2.16 | ) | | | 3.61 | |
Total investment operations | | | (8.57 | ) | �� | | 4.50 | | | | 5.24 | | | | 4.94 | | | | (2.22 | ) | | | 3.56 | |
| | | | | | | |
Unit value, end of period/year | | $ | 32.93 | | | $ | 41.50 | | | $ | 37.00 | | | $ | 31.76 | | | $ | 26.82 | | | $ | 29.04 | |
Total return | | | (20.64 | )%(B) | | | 12.16 | % | | | 16.50 | % | | | 18.40 | % | | | (7.65 | )% | | | 13.97 | % |
| | | | | | | |
Ratio and supplemental data: | | | | | | | | | | | | | | | | | | | | | | | | |
Net assets end of period/year (000’s) | | $ | 26,580 | | | $ | 35,991 | | | $ | 33,895 | | | $ | 31,976 | | | $ | 27,015 | | | $ | 31,431 | |
Expenses to average net assets (C) | | | 0.20 | %(D) | | | 0.20 | % | | | 0.20 | % | | | 0.20 | % | | | 0.20 | % | | | 0.20 | % |
Net investment income (loss) to average net assets | | | (0.20 | )%(D) | | | (0.20 | )% | | | (0.20 | )% | | | (0.20 | )% | | | (0.20 | )% | | | (0.20 | )% |
Portfolio turnover rate | | | 20 | %(B) | | | 25 | % | | | 71 | % | | | 25 | % | | | 30 | % | | | 25 | % |
| | |
| (A) | | Calculated based on average number of units outstanding. |
| (B) | | Not annualized. |
| (C) | | Does not include expenses of the underlying investments in which the Subaccount invests. |
| (D) | | Annualized. |
The Notes to Financial Statements are an integral part of this report.
| | |
| Transamerica Asset Allocation Variable Funds | | Semi-Annual Report 2022 |
Page 11
NOTES TO FINANCIAL STATEMENTS
At June 30, 2022
(unaudited)
1. ORGANIZATION
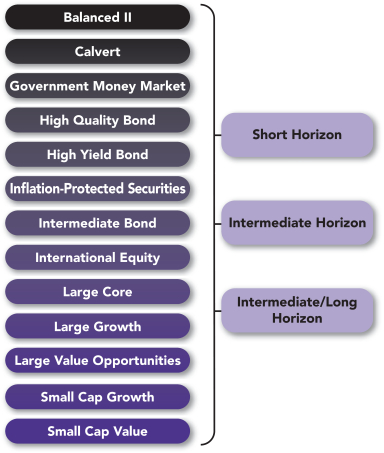
Transamerica Asset Allocation Variable Funds (the “Separate Account”), is a non-diversified separate account of Transamerica Financial Life Insurance Company (“TFLIC”), and is registered as a management investment company under the Investment Company Act of 1940, as amended. The Separate Account applies investment company accounting and reporting guidance. The Separate Account is composed of three different subaccounts (each, a “Subaccount” and collectively, the “Subaccounts”) that are separate investment funds and are as follows. Each Subaccount invests substantially all of its investable assets among certain Transamerica Variable Funds (“TVF”). Certain TVF subaccounts invest substantially all of their investable assets in underlying series of Transamerica Funds (each a “Fund” and collectively, the “Funds”).
|
| Subaccount |
Transamerica Asset Allocation – Short Horizon Subaccount (“Short Horizon”) |
Transamerica Asset Allocation – Intermediate Horizon Subaccount (“Intermediate Horizon”) |
Transamerica Asset Allocation – Intermediate/Long Horizon Subaccount (“Intermediate/Long Horizon”) |
The only shareholders of the Separate Account are contract holders of the affiliated insurance company variable life and annuity contracts.
Transamerica Asset Management, Inc. (“TAM”) serves as investment adviser for the Subaccounts pursuant to an investment advisory agreement. TAM provides continuous and regular investment advisory services to the Subaccounts. TAM supervises each Subaccount’s investments and conducts its investment program.
TAM is responsible for all aspects of the day-to-day management of the Subaccounts.
TAM’s investment management services also include the provision of supervisory and administrative services to the Subaccounts. These services include performing certain administrative services for the Subaccounts and supervising and overseeing the administrative, clerical, recordkeeping and bookkeeping services provided to the Subaccounts by State Street Bank and Trust Company (“State Street”), to whom TAM has outsourced the provision of certain sub-administration services. To the extent agreed upon by TAM and the Subaccounts from time to time, TAM’s supervisory and administrative services include, but are not limited to: monitoring and verifying the custodian’s daily calculation of the Net Asset Values (“NAV”); shareholder relations functions; compliance services; valuation services; assisting in due diligence and in the oversight and monitoring of certain activities of sub-advisers and certain aspects of Subaccount investments; assisting with Subaccount combinations and liquidations; oversight of the preparation and filing, and review, of all returns and reports, in connection with federal, state and local taxes; oversight and review of regulatory reporting; supervising and coordinating the Subaccounts’ custodian and dividend disbursing agent and monitoring their services to the Subaccounts; assisting the Subaccounts in preparing reports to shareholders; acting as liaison with the Subaccounts’ independent public accountants and providing, upon request, analyses, fiscal year summaries and other audit related services; assisting in the preparation of agendas and supporting documents for and minutes of meetings of trustees and committees of trustees; assisting in the preparation of regular communications with the trustees; and providing personnel and office space, telephones and other office equipment as necessary in order for TAM to perform supervisory and administrative services to the Subaccounts. The Subaccounts pay certain fees and expenses to State Street for sub-administration services which are not administrative services covered by the management agreement with TAM or paid for through the management fees payable thereunder. For the period ended June 30, 2022, (i) the expenses paid to State Street for sub-administration services by the Subaccounts are shown as a part of Other expenses within the Statements of Operations and (ii) the expenses payable to State Street for sub-administration services from the Subaccounts are shown as part of Other accrued expenses within the Statements of Assets and Liabilities.
For each of the Funds, TAM currently acts as a “manager of managers” and has hired sub-advisers to furnish day-to-day investment advice and recommendations to the Funds.
2. SIGNIFICANT ACCOUNTING POLICIES
In preparing the Subaccounts’ financial statements in accordance with Generally Accepted Accounting Principles in the United States of America (“GAAP”), estimates or assumptions (which could differ from actual results) may be used that affect reported amounts and disclosures. The following is a summary of significant accounting policies followed by the Subaccounts.
Security transactions: Security transactions are accounted for on the trade date. Security gains and losses are calculated on the specific identification basis. Net realized gain (loss) is from investments in units of investment companies.
Operating expenses: The Separate Account accounts separately for the assets, liabilities, and operations of each Subaccount. Each Subaccount will indirectly bear the fees and expenses reflected in the corresponding TVF unit value. These expenses are not reflected in the expenses within the Statements of Operations of the Subaccount and are not included in the Expenses to average net assets, and Net investment income (loss) to average net assets within the Financial Highlights.
Indemnification: In the normal course of business, the Subaccounts enter into contracts that contain a variety of representations that provide general indemnifications. The Subaccounts’ maximum exposure under these arrangements is unknown, as this would involve future claims that may be made against the Subaccounts and/or their affiliates that have not yet occurred. However, based on experience, the Subaccounts expect the risk of loss to be remote.
| | |
| Transamerica Asset Allocation Variable Funds | | Semi-Annual Report 2022 |
Page 12
NOTES TO FINANCIAL STATEMENTS (continued)
At June 30, 2022
(unaudited)
3. INVESTMENT VALUATION
All investments in securities are recorded at their estimated fair value. The value of each Subaccount’s investment in a corresponding TVF subaccount is valued at the TVF unit value per share at the official close of the New York Stock Exchange (“NYSE”) each day the NYSE is open for business.
The Subaccounts utilize various methods to measure the fair value of their investments on a recurring basis. GAAP establishes a hierarchy that prioritizes inputs to valuation methods. The inputs or methodology used for valuing securities are not necessarily an indication of the risk associated with investing in those securities. The three levels (“Levels”) of inputs of the fair value hierarchy are defined as follows:
Level 1—Unadjusted quoted prices in active markets for identical securities.
Level 2—Inputs, other than quoted prices included in Level 1, which are observable, either directly or indirectly. These inputs may include quoted prices for the identical instrument on an inactive market, prices for similar instruments, interest rates, prepayment speeds, credit risk, yield curves, default rates, and similar data.
Level 3—Unobservable inputs based on the best information available in the circumstances, to the extent observable inputs are not available, which may include the Subaccounts’ own assumptions used in determining the fair value of investments.
The inputs used to measure fair value may fall into different Levels of the fair value hierarchy. In such cases, for disclosure purposes, the Level in the fair value hierarchy that is assigned to the fair value measurement of a security is determined based on the lowest Level input that is significant to the fair value measurement in its entirety. Certain investments that are measured at fair value using NAV per share, or its equivalent, using the “practical expedient” have not been classified in the fair value Levels. The hierarchy classification of inputs used to value the Subaccounts’ investments at June 30, 2022, is disclosed within the Investment Valuation section of each Subaccount’s Schedule of Investments.
The availability of observable inputs can vary from security to security and is affected by a wide variety of factors, including, but not limited to, the type of security, whether the security is new and not yet established in the marketplace, the liquidity of markets, and other characteristics particular to the security. To the extent that valuation is based on models or inputs that are less observable or unobservable in the market, the determination of fair value requires more judgment. Accordingly, the degree of judgment exercised in determining fair value is generally greatest for instruments categorized in Level 3. Due to the inherent uncertainty of valuation, the determination of values may differ significantly from values that would have been realized had a ready market for investments existed, and the differences could be material.
Fair value measurements: Each Subaccount invests substantially all of its investable assets among certain TVF subaccounts and the TVF subaccounts invest all of their investable assets in the Funds. The summary of the inputs used for valuing each Fund’s assets carried at fair value is discussed in the Investment Valuation section of the Funds’ Notes to Financial Statements. Descriptions of the valuation techniques applied to the Subaccounts’ significant categories of assets and liabilities measured at fair value on a recurring basis are as follows:
Investment companies: Certain investment companies are valued at the NAV as the practical expedient. These investment companies are not included within the fair value hierarchy. Certain other investment companies are valued at the actively traded NAV and no valuation adjustments are applied. These investment companies are categorized in Level 1 of the fair value hierarchy.
4. RISK FACTOR
Investing in the Subaccounts involves certain key risks related to the Subaccounts’ trading activity. Please reference the Subaccounts’ prospectus for a more complete discussion of the following risk(s), as well as other risks of investing in the Subaccounts.
Market risk: The market prices of a Fund’s securities and other assets may go up or down, sometimes sharply and unpredictably, due to general market conditions, overall economic trends or events, inflation, changes in interest rates, government actions or interventions, actions taken by the U.S. Federal Reserve or foreign central banks, market disruptions caused by wars, tariffs, trade disputes or other factors, political developments, investor sentiment, the global and domestic effects of a pandemic or other health emergency, and other factors that may or may not be related to the issuer of the security or other asset. The market prices of securities and other assets also may go down due to events or conditions that affect particular sectors, industries, issuers, or geographies. Adverse market conditions may be prolonged and may not have the same impact on all types of securities or other assets. If the value of a Fund’s securities and assets fall, the value of your investment will go down. A Fund may experience a substantial or complete loss on any individual security or asset.
Economies and financial markets throughout the world are increasingly interconnected. Economic, financial or political events, trading and tariff arrangements, the imposition of economic sanctions, public health events (such as the spread of infectious disease), wars,
| | |
| Transamerica Asset Allocation Variable Funds | | Semi-Annual Report 2022 |
Page 13
NOTES TO FINANCIAL STATEMENTS (continued)
At June 30, 2022
(unaudited)
4. RISK FACTOR (continued)
terrorism, cybersecurity events, technology and data interruptions, natural disasters, and other circumstances in one or more countries or regions could be highly disruptive to, and have profound impacts on, global economies or markets. In the past decade, financial markets throughout the world have experienced increased volatility and decreased liquidity. These conditions may continue or worsen. As a result, whether or not a Fund invests in securities of issuers located in or with significant exposure to the countries directly affected, the value and liquidity of a Fund’s investments may go down. Securities markets may also be susceptible to market manipulation or other fraudulent trade practices, which could disrupt the orderly functioning of these markets or adversely affect the value of securities traded in these markets, including a Fund’s securities.
The pandemic of the novel coronavirus respiratory disease designated COVID-19 has resulted in economic downturns throughout the world, severe losses, particularly to some sectors of the economy and individual issuers, and reduced liquidity of many instruments. There also have been significant disruptions to business operations, including business closures; strained healthcare systems; disruptions to supply chains and employee availability; large fluctuations in consumer demand; and widespread uncertainty regarding the duration and long-term effects of the pandemic. Economic downturns may be prolonged, and political and social instability, continued volatility and decreased liquidity in the securities markets may result. Developing or emerging market countries may be more impacted by the pandemic.
The U.S. government and the Federal Reserve, as well as certain foreign governments and central banks, have taken extraordinary actions to support local and global economies and the financial markets in response to the COVID-19 pandemic. These and other government intervention into the economy and financial markets may not work as intended. In addition, government actions to mitigate the economic impact of the pandemic have resulted in large expansion of government deficits and debt, the long-term consequences of which are not known. Rates of inflation have recently risen, which could adversely affect economies and markets. The pandemic could continue to adversely affect the value and liquidity of a Fund’s investments.
Europe: A number of countries in Europe have experienced severe economic and financial difficulties; and financial markets in Europe and elsewhere have experienced extreme volatility and declines in asset values and liquidity. These difficulties may continue, worsen or spread within or outside Europe. Responses to the financial problems by European governments, central banks and others may not work, may result in conflicts and social unrest and may limit future growth and economic recovery or have other unintended consequences. In January, 2020, through “Brexit,” the United Kingdom withdrew from the European Union. The ramifications of Brexit are unknown, and the implications of possible political, regulatory, economic, and market outcomes could be significant. The United Kingdom has one of the largest economies in Europe and is a major trading partner with European Union countries and the United States. Brexit may create additional and substantial economic stresses for the United Kingdom, including a contraction of the United Kingdom’s economy, decreased trade, capital outflows, devaluation of the British pound, and a decrease in business and consumer spending and investment. The negative impact on not only the United Kingdom and European Union economies but also the broader global economy could be significant. A number of countries in Europe have suffered terror attacks, and additional attacks may occur in the future. Europe has also been struggling with mass migration from the Middle East, Eastern Europe and Africa. The ultimate effects of these events and other socio-political or geopolitical issues could profoundly affect global economies and markets. Whether or not a Fund invests in securities of issuers located in Europe or with significant exposure to European issuers or countries, these events could negatively affect the value and liquidity of a Fund’s investments.
Additional Market Disruption: Russia’s invasion of Ukraine in February, 2022, the resulting responses by the United States and other countries, and the potential for wider conflict, have increased and may continue to increase volatility and uncertainty in financial markets worldwide. The United States and other countries have imposed broad-ranging economic sanctions on Russia and Russian entities and individuals, and may impose additional sanctions, including on other countries that provide military or economic support to Russia. These sanctions, among other things, restrict companies from doing business with Russia and Russian issuers, and may adversely affect companies with economic or financial exposure to Russia and Russian issuers. The extent and duration of Russia’s military actions and the repercussions of such actions are not known. The invasion may widen beyond Ukraine and may escalate, including through retaliatory actions and cyberattacks by Russia and even other countries. These events may result in further and significant market disruptions and may adversely affect regional and global economies including those of Europe and the United States. Certain industries and markets, such as those involving oil, natural gas and other commodities, as well as global supply chains, may be particularly adversely affected. Whether or not a Fund invests in securities of issuers located in Russia, Ukraine and adjacent countries or with significant exposure to issuers in these countries, these events could negatively affect the value and liquidity of a Fund’s investments.
5. FEES AND OTHER AFFILIATED TRANSACTIONS
TAM, the Subaccounts’ investment adviser, is directly owned by Transamerica Life Insurance Company (“TLIC”) and AUSA Holding, LLC (“AUSA”), both of which are indirect, wholly owned subsidiaries of Aegon NV. TLIC is owned by Commonwealth General Corporation (“Commonwealth”). Commonwealth and AUSA are wholly owned by Transamerica Corporation (DE). Transamerica Corporation (DE) is wholly owned by Aegon International B.V., which is wholly owned by Aegon NV, a Netherlands corporation, and a publicly traded international insurance group.
| | |
| Transamerica Asset Allocation Variable Funds | | Semi-Annual Report 2022 |
Page 14
NOTES TO FINANCIAL STATEMENTS (continued)
At June 30, 2022
(unaudited)
5. FEES AND OTHER AFFILIATED TRANSACTIONS (continued)
The Subaccounts purchase interests in the TVF, which in turn, purchase interests in the Funds. The net assets of the Subaccounts will reflect the investment management fee and other expenses incurred by the Funds. TAM serves as the investment manager to each Fund.
All Subaccount holdings in investment companies are considered affiliated. Realized and unrealized gains (losses) are broken out within the Statements of Operations.
Investment advisory fees: TAM provides general investment advice to each Subaccount pursuant to the investment advisory agreement. For its services, each Subaccount pays advisory fees accrued daily and payable monthly, at an annual rate equal to 0.20% of each Subaccount’s daily average net assets.
TFLIC is the legal holder of the assets in the Subaccounts and will at all times maintain assets in the Subaccounts with a total market value of at least equal to the contract liabilities for the Subaccounts.
Certain managing board members and officers of TFLIC are also trustees, officers, or employees of TAM or its affiliates. No interested managing board member, who is deemed an interested person due to current or former service with TAM or an affiliate of TAM receives compensation from the Separate Account. Similarly, none of the Separate Account’s officers or interested trustees receive compensation from the Subaccounts. The independent board members of TFLIC are also trustees of the Funds, for which they receive fees.
Deferred compensation plan: Effective September 23, 2021, the Board has approved the termination of the deferred compensation plan. Payments will be made to applicable current and former Board members consistent with Section 409A of the Code. Under a non-qualified deferred compensation plan effective January 1, 1996, as amended and restated January 1, 2010, available to the trustees, compensation may be deferred that would otherwise be payable by the Separate Account to an independent trustee on a current basis for services rendered as trustee. Deferred compensation amounts will accumulate based on the value of the investment option, as elected by the trustee.
Brokerage commissions: The Subaccounts incurred no brokerage commissions on security transactions placed with affiliates of the investment manager or sub-adviser(s) for the period ended June 30, 2022.
6. PURCHASES AND SALES OF SECURITIES
For the period ended June 30, 2022, the cost of securities purchased and proceeds from securities sold (excluding short-term securities) are as follows:
| | | | | | | | |
| Subaccount | | Purchases of
Securities | | | Sales of
Securities | |
Short Horizon | | $ | 1,047,763 | | | $ | 1,695,442 | |
Intermediate Horizon | | | 3,157,350 | | | | 4,060,626 | |
Intermediate/Long Horizon | | | 6,370,784 | | | | 8,675,326 | |
7. FEDERAL INCOME TAXES
The operations of the Separate Account form a part of, and are taxed with, the operations of TFLIC, a wholly-owned subsidiary of Aegon USA. TFLIC does not expect, based upon current tax law, to incur any income tax upon the earnings or realized capital gains attributable to the Separate Account. Based upon this expectation, no charges are currently being deducted from the Separate Account for federal income tax purposes. The Subaccounts recognize the tax benefits of uncertain tax positions only where the position is “more likely than not” to be sustained assuming examination by tax authorities. The Subaccounts’ tax returns remain subject to examination by the Internal Revenue Service and state tax authorities three years from the date of filing for federal purposes and four years from the date of filing for state purposes. Management has evaluated the Subaccounts’ tax provisions taken for all open tax years, and has concluded that no provision for income tax is required in the Subaccounts’ financial statements. If applicable, the Subaccounts recognize interest accrued related to unrecognized tax benefits in relation to interest and penalties expense in Other within the Statements of Operations. The Subaccounts identify their major tax jurisdictions as U.S. Federal, the state of Colorado, and foreign jurisdictions where the Subaccounts make significant investments; however, the Subaccounts are not aware of any tax positions for which it is reasonably possible that the total amounts of unrecognized tax benefits will change materially in the next twelve months.
8. SUBSEQUENT EVENT
The Board has approved the liquidation of Short Horizon, Intermediate Horizon and Intermediate/Long Horizon Subaccounts effective on or about October 28, 2022.
| | |
| Transamerica Asset Allocation Variable Funds | | Semi-Annual Report 2022 |
Page 15
TRANSAMERICA ASSET ALLOCATION VARIABLE FUNDS
INVESTMENT ADVISORY AGREEMENTS — CONTRACT RENEWAL
At a meeting of the Managing Board of Transamerica Asset Allocation Variable Funds (the “Trustees” or the “Board”) held on June 15-16, 2022, the Board considered the renewal of the investment advisory agreements (each an “Investment Advisory Agreement” and collectively the “Investment Advisory Agreements”) between Transamerica Asset Management, Inc. (“TAM”) and Transamerica Asset Allocation Variable Funds, on behalf of Transamerica Asset Allocation – Intermediate Horizon Subaccount, Transamerica Asset Allocation – Intermediate/Long Horizon Subaccount, and Transamerica Asset Allocation – Short Horizon Subaccount (each a “Fund” and collectively the “Funds”).
Following its review and consideration, the Board determined that the terms of each Investment Advisory Agreement were reasonable and that the renewal of each of the Investment Advisory Agreements was in the best interests of the applicable Fund and the contract holders. The Board, including the independent members of the Board (the “Independent Board Members”), unanimously approved the renewal of each Investment Advisory Agreement through June 30, 2023.
Prior to reaching their decision, the Board Members requested and received from TAM certain information. They then reviewed such information as they deemed reasonably necessary to evaluate the Investment Advisory Agreements, including information they had previously received from TAM as part of their regular oversight of each Fund, and knowledge they gained over time through meeting with TAM. Among other materials, the Trustees considered comparative fee, expense and performance information prepared by TAM based on information provided by Broadridge Financial Solutions, Inc. (“Broadridge”), an independent provider of mutual fund performance information, as well as fee, expense and profitability information prepared by TAM. In their review, the Board Members also sought to identify instances in which a Fund’s performance, fees, total expenses and/or profitability appeared to be outliers within their respective peer groups or other comparative metrics, and sought to understand the reasons for such comparative positions.
In their deliberations, the Independent Board Members met privately without representatives of TAM present and were represented throughout the process by their independent legal counsel. In considering the proposed continuation of each Investment Advisory Agreement, the Board Members evaluated and weighed a number of considerations that they believed to be relevant in light of the legal advice furnished to them by counsel, including independent legal counsel, and made a decision in the exercise of their own business judgment. They based their decisions on the considerations discussed below, among others, although they did not identify any particular consideration or item of information that was controlling of their decisions, and each Board Member may have attributed different weights to the various factors.
Nature, Extent and Quality of the Services Provided
The Board considered the nature, extent and quality of the services provided by TAM to the applicable Fund in the past and the services anticipated to be provided in the future. The Board also considered the investment approach for each Fund; the experience, capability and integrity of TAM’s senior management; the financial resources of TAM; TAM’s management process; TAM’s responsiveness to any questions by the Board Members; and the professional qualifications and compensation program of the portfolio management team.
The Board noted that the investment management and other services provided by TAM include the design, development and ongoing review and evaluation of each Fund and its investment strategy; risk management oversight and analysis; design, development, implementation and ongoing review and evaluation of a process for the valuation of Fund investments; design, development, implementation and ongoing review and evaluation of a compliance program for the Funds; design, development, implementation and ongoing review and evaluation of a process for the voting of proxies and exercise of rights to consent to corporate action for Fund investments; participation in Board meetings and oversight of preparation of materials for the Board, including materials for Board meetings and regular communications with the Board; oversight of preparation of the Funds’ prospectuses, statements of additional information, shareholder reports and other disclosure materials and regulatory filings for the Funds; and ongoing cash management services for the Funds. The Board considered that TAM’s investment management services also include the provision of supervisory and administrative services to each Fund. The Board also noted that TAM, as part of the services it provides to all Transamerica mutual funds, including the Funds, oversees the services provided by the funds’ custodian, transfer agent, independent accountant and legal counsel and supervises the performance of the recordkeeping and shareholder functions of the funds. The Board noted that it had approved the liquidation of the Funds and that each Fund was expected to be liquidated on or about October 28, 2022, subject to any necessary regulatory approvals.
Investment Performance
In addition, the Board considered the short- and longer-term performance, as applicable, of each Fund in light of its investment objective, policies and strategies, including relative performance against a peer universe of mutual funds, based on Broadridge information, for various trailing periods ended December 31, 2021. Based on these considerations, the Board determined that TAM can provide investment and related services that are appropriate in scope and extent in light of the applicable Fund’s investment objectives, policies and strategies and operations, the competitive landscape of the investment company business and investor needs. The Board’s conclusions as to each Fund’s performance are summarized below. In describing each Fund’s performance relative to its peer universe,
| | |
| Transamerica Asset Allocation Variable Funds | | Semi-Annual Report 2022 |
Page 16
TRANSAMERICA ASSET ALLOCATION VARIABLE FUNDS
INVESTMENT ADVISORY AGREEMENTS — CONTRACT RENEWAL (continued)
the summary conclusions characterize performance for the relevant periods in relation to whether it was “above,” “below” or “in line with” the peer universe median and do so using quintile rankings prepared by Broadridge. For simplicity, performance is described as “above” the median if the Fund’s performance ranked anywhere in the first or second quintiles, as “below” the median if it ranked anywhere in the fourth or fifth quintiles, or “in line with” the median if it ranked anywhere in the third quintile (i.e., even if its precise return was somewhat above or somewhat below the precise median return).
When considering each Fund’s performance, the Board Members considered any representations made by TAM regarding the appropriateness of certain peer groups and benchmarks. They recognized that performance reflects a snapshot of a period as of a specific date, and that consideration of performance data for a different period could generate significantly different performance results. The Board Members also recognized that even longer-term performance can be negatively affected by performance over a short-term period when that short-term performance is significantly below the performance of the comparable benchmark or universe of peer funds.
Transamerica Asset Allocation – Intermediate Horizon Subaccount. The Board noted that the performance of the Fund was in line with the median for its peer universe for the past 3-year period and below the median for the past 1-, 5- and 10-year periods. The Board also noted that the performance of the Fund was below its composite benchmark for the past 1-, 3-, 5- and 10-year periods.
Transamerica Asset Allocation – Intermediate/Long Horizon Subaccount. The Board noted that the performance of the Fund was in line with the median for its peer universe for the past 3-year period and below the median for the past 1-, 5- and 10-year periods. The Board also noted that the performance of the Fund was below its composite benchmark for the past 1-, 3-, 5- and 10-year periods.
Transamerica Asset Allocation – Short Horizon Subaccount. The Board noted that the performance of the Fund was above the median for its peer universe for the past 1- and 3-year periods and in line with the median for the past 5- and 10-year periods. The Board also noted that the performance of the Fund was below its composite benchmark for the past 1-, 3-, 5- and 10- year periods.
Investment Advisory Fees and Total Expense Ratios
The Board considered the investment advisory fee and total expense ratio of each Fund, including information comparing the investment advisory fee and total expense ratio of each Fund to the investment advisory fees and total expense ratios of comparable investment companies, based on Broadridge information. On the basis of these considerations, together with the other information it considered, the Board determined that the investment advisory fees to be received by TAM under the Investment Advisory Agreements are reasonable in light of the services provided.
Cost of Services Provided and Level of Profitability
The Board reviewed information provided by TAM about the cost of providing fund management, administration and other services to each Fund by TAM and its affiliates. The Board considered the profitability of TAM and its affiliates in providing these services for each Fund. The Trustees recognized the competitiveness of the investment advisory industry and the importance of an investment adviser’s long-term profitability, including for maintaining company and management stability and accountability.
The Board also considered the allocation methodology used for calculating the profitability of TAM and its affiliates. The Board noted that the revenue and expense allocation methodology used by TAM to estimate its profitability with respect to its relationship with the Funds had been reviewed previously by an independent consultant. The Board Members considered that TAM had not made material changes to this methodology, which had been applied consistently for each Fund.
Based on this information, the Board determined that the profitability of TAM and its affiliates from their relationships with the Funds was not excessive.
Economies of Scale
The Board considered economies of scale with respect to the management of each Fund, whether the Fund had appropriately benefited from any economies of scale and whether there was the potential for realization of any future economies of scale. The Board also considered the existence of economies of scale with respect to management of the Transamerica mutual funds overall and the extent to which the Funds benefited from any economies of scale. The Board recognized that, as a Fund’s assets increase, any economies of scale realized by TAM may not directly correlate with any economies of scale that might be realized by the Fund. The Board considered each Fund’s investment advisory fee schedule and the extent to which TAM shared economies of scale, if any, with the Funds through its undertakings to limit or reimburse Fund expenses and to invest in maintaining and developing its capabilities and services. The Board Members concluded that each Fund’s fee structure reflected an appropriate sharing of any efficiencies or economies of scale to date and noted that they will have the opportunity to periodically reexamine the appropriateness of the investment advisory fees payable to TAM in light of any economies of scale experienced in the future.
| | |
| Transamerica Asset Allocation Variable Funds | | Semi-Annual Report 2022 |
Page 17
TRANSAMERICA ASSET ALLOCATION VARIABLE FUNDS
INVESTMENT ADVISORY AGREEMENTS — CONTRACT RENEWAL (continued)
Benefits to TAM and/or its Affiliates from their Relationships with the Funds
The Board considered other benefits derived by TAM and/or its affiliates from their relationships with the Funds. The Board noted that TAM does not receive benefits from research obtained with commissions paid to broker-dealers for portfolio transactions (“soft dollars”) as a result of its relationship with the Funds.
Other Considerations
The Board noted that TAM has made a substantial commitment to the recruitment and retention of high quality personnel and maintains the financial, compliance and operational resources reasonably necessary to manage each Fund in a professional manner that is consistent with the best interests of each Fund and the contract holders. In this regard, the Board favorably considered the procedures and policies TAM has in place to enforce compliance with applicable laws and regulations. The Board also noted that TAM has made an entrepreneurial commitment and undertaken certain business risks with respect to the management and success of the Funds.
Conclusion
After consideration of the factors described above, as well as other factors, the Board Members, including the Independent Board Members, concluded that the renewal of each Investment Advisory Agreement was in the best interests of the applicable Fund and the contract holders and voted to approve the renewal of each Investment Advisory Agreement.
| | |
| Transamerica Asset Allocation Variable Funds | | Semi-Annual Report 2022 |
Page 18
LIQUIDITY RISK MANAGEMENT PROGRAM
(unaudited)
The Securities and Exchange Commission adopted Rule 22e-4 under the Investment Company Act of 1940, as amended (the “Liquidity Rule”) to promote effective liquidity risk management throughout the open-end investment company industry, thereby reducing the risk that funds will be unable to meet their redemption obligations and mitigating dilution of the interests of fund shareholders. The series of Transamerica Asset Allocation Variable Funds (the “Trust”) (for purposes of this section only, the “Funds”), have adopted and implemented a liquidity risk management program pursuant to the Liquidity Rule (the “Program”). The Managing Board of Trustees of the Trust (the “Board”) has appointed Transamerica Asset Management, Inc. (“TAM”), the investment manager to the Funds, as the Program administrator for the Funds. TAM has established a Liquidity Risk Management Committee (the “Committee”) to manage the Program for the Funds, including oversight of the liquidity risk management process, reporting to the Board, and reviewing the Program’s effectiveness.
The Board met on March 9-10, 2022 (the “Meeting”) to review the Program with respect to the Funds, pursuant to the Liquidity Rule. At the Meeting, the Committee provided the Board with a written report that addressed the operation of the Program during the 2021 reporting period, and assessed the Program’s adequacy and effectiveness, including any material changes to the Program (the “Report”). The Report covered the period from January 1, 2021, through December 31, 2021 (the “Program Reporting Period”). The Report described the Program’s liquidity classification methodology. The Report noted that the Funds utilize analysis from a third-party liquidity metrics service, which takes into account a variety of factors including market, trading and other investment specific considerations. The Report also described the Committee’s methodology in determining whether a Highly Liquid Investment Minimum (a “HLIM”) is necessary and noted that, given the composition of the Funds’ holdings, a HLIM was not currently required for the Funds. The Report noted three material changes to the classification methodology during the Program Reporting Period. The Report reviewed the changes and why the Committee believes the changes are an enhancement to the prior method. The Report also noted that the Program includes provisions reasonably designed to comply with the 15% limit on illiquid investments.
The Report noted that the Program (a) complied with the key factors for consideration under the Liquidity Rule for monitoring the adequacy and effectiveness of the Program and (b) on a periodic basis assesses each Fund’s liquidity risk based on a variety of factors including: (1) the Fund’s investment strategy and portfolio liquidity during normal and reasonably foreseeable stressed conditions, (2) cash flow projections during normal and reasonably foreseeable stressed conditions and (3) holdings of cash and cash equivalents, borrowings and other funding sources. The Report concluded that the Program is operating effectively and is reasonably designed to assess and manage the Funds’ liquidity risk pursuant to the requirements of the Liquidity Rule.
| | |
| Transamerica Asset Allocation Variable Funds | | Semi-Annual Report 2022 |
Page 19
Appendix A
Calvert VP SRI Balanced Portfolio

Calvert
VP SRI Balanced Portfolio
Semiannual Report
June 30, 2022

Commodity Futures Trading Commission Registration. The Commodity Futures Trading Commission (“CFTC”) has adopted regulations that subject registered investment companies and advisers to regulation by the CFTC if a fund invests more than a prescribed level of its assets in certain CFTC-regulated instruments (including futures, certain options and swap agreements) or markets itself as providing investment exposure to such instruments. The adviser has claimed an exclusion from the definition of “commodity pool operator” under the Commodity Exchange Act with respect to its management of the Fund and the other funds it manages. Accordingly, neither the Fund nor the adviser is subject to CFTC regulation.
Fund shares are not insured by the FDIC and are not deposits or other obligations of, or guaranteed by, any depository institution. Shares are subject to investment risks, including possible loss of principal invested.
This report must be preceded or accompanied by a current summary prospectus or prospectus. Before investing, investors should consider carefully the investment objective, risks, and charges and expenses of a mutual fund. This and other important information is contained in the summary prospectus and prospectus, which can be obtained from a financial intermediary. Prospective investors should read the prospectus carefully before investing. For further information, please call 1-800-368-2745.
Semiannual Report June 30, 2022
Calvert
VP SRI Balanced Portfolio
Calvert
VP SRI Balanced Portfolio
June 30, 2022
Performance
Portfolio Manager(s) Vishal Khanduja, CFA, Brian S. Ellis, CFA and Charles B. Gaffney, each of Calvert Research and Management
| | | | | | | | | | | | | | | | | | | | | | | | |
| % Average Annual Total Returns1,2 | | Class
Inception Date | | | Performance
Inception Date | | | Six Months | | | One Year | | | Five Years | | | Ten Years | |
| | | | | | |
Class I at NAV | | | 09/02/1986 | | | | 09/02/1986 | | | | (15.47)% | | | | (10.50)% | | | | 7.65% | | | | 7.93% | |
Class F at NAV | | | 10/18/2013 | | | | 09/02/1986 | | | | (15.52) | | | | (10.54) | | | | 7.34 | | | | 7.63 | |
| | |
Russell 1000® Index | | | — | | | | — | | | | (20.94)% | | | | (13.04)% | | | | 11.00% | | | | 12.81% | |
Bloomberg U.S. Aggregate Bond Index | | | — | | | | — | | | | (10.35) | | | | (10.29) | | | | 0.88 | | | | 1.54 | |
Balanced Blended Benchmark | | | — | | | | — | | | | (16.73) | | | | (11.71) | | | | 7.20 | | | | 8.42 | |
| | | | | | |
| % Total Annual Operating Expense Ratios3 | | | | | | | | | | | | | | | | | | | Class I | | | | Class F | |
| | | | | | |
| | | | | | | | | | | | | | | | | | | 0.63% | | | | 0.88% | |
See Endnotes and Additional Disclosures in this report.
Past performance is no guarantee of future results. Returns are historical and are calculated by determining the percentage change in net asset value (NAV) or offering price (as applicable) with all distributions reinvested. Furthermore, returns do not reflect the deduction of taxes that shareholders may have to pay on Fund distributions or upon the redemption of Fund shares. Investment return and principal value will fluctuate so that shares, when redeemed, may be worth more or less than their original cost. Performance for periods less than or equal to one year is cumulative. Performance is for the stated time period only; due to market volatility, current Fund performance may be lower or higher than the quoted return.
2
Calvert
VP SRI Balanced Portfolio
June 30, 2022
| | | | |
| Fund Profile | | | | |
| | |
| Asset Allocation (% of total investments) | | | | Fixed-Income Allocation (% of total investments) |
| | | | |
| | |
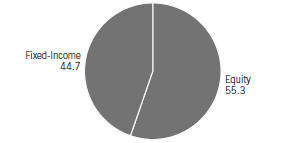
| | | | 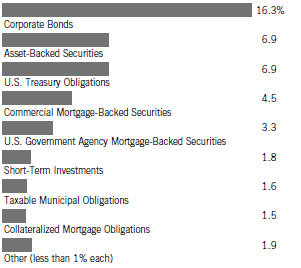 |
| Equity Investments Sector Allocation (% of total investments) | | |
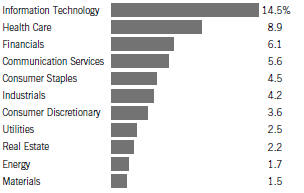 | | |
3
Calvert
VP SRI Balanced Portfolio
June 30, 2022
Endnotes and Additional Disclosures
| 1 | Russell 1000® Index is an unmanaged index of 1,000 U.S. large-cap stocks. Bloomberg U.S. Aggregate Bond Index is an unmanaged index of domestic investment-grade bonds, including corporate, government and mortgage-backed securities. The Balanced Blended Benchmark is an internally constructed benchmark which is comprised of a blend of 60% Russell 1000® Index and 40% Bloomberg U.S. Aggregate Bond Index, and is rebalanced monthly. Prior to 11/1/15, the fixed income component was the Bloomberg U.S. Credit Index. Unless otherwise stated, index returns do not reflect the effect of any applicable sales charges, commissions, expenses, taxes or leverage, as applicable. It is not possible to invest directly in an index. |
| 2 | There is no sales charge. Insurance-related charges are not included in the calculation of returns. If such charges were reflected, the returns would be lower. Please refer to the report for your insurance contract for performance data reflecting insurance-related charges. |
Performance prior to the inception date of a class may be linked to the performance of an older class of the Fund. This linked performance is adjusted for any applicable sales charge, but is not adjusted for class expense differences. If adjusted for such differences, the performance would be different. The performance of Class F is linked to Class I. Performance presented in the Financial Highlights included in the financial statements is not linked.
Calvert Research and Management became the investment adviser to the Fund on December 31, 2016. Performance reflected prior to such date is that of the Fund’s former investment adviser.
| 3 | Source: Fund prospectus. The expense ratios for the current reporting period can be found in the Financial Highlights section of this report. Performance reflects expenses waived and/or reimbursed, if applicable. Without such waivers and/or reimbursements, performance would have been lower. |
Fund profile subject to change due to active management.
4
Calvert
VP SRI Balanced Portfolio
June 30, 2022
Fund Expenses
Example
As a Fund shareholder, you incur ongoing costs, including management fees; distribution and/or service fees; and other Fund expenses. This Example is intended to help you understand your ongoing costs (in dollars) of Fund investing and to compare these costs with the ongoing costs of investing in other mutual funds. The Example is based on an investment of $1,000 invested at the beginning of the period and held for the entire period (January 1, 2022 to June 30, 2022).
Actual Expenses
The first section of the table below provides information about actual account values and actual expenses. You may use the information in this section, together with the amount you invested, to estimate the expenses that you paid over the period. Simply divide your account value by $1,000 (for example, an $8,600 account value divided by $1,000 = 8.6), then multiply the result by the number in the first section under the heading entitled “Expenses Paid During Period” to estimate the expenses you paid on your account during this period.
Hypothetical Example for Comparison Purposes
The second section of the table below provides information about hypothetical account values and hypothetical expenses based on the actual Fund expense ratio and an assumed rate of return of 5% per year (before expenses), which is not the actual Fund return. The hypothetical account values and expenses may not be used to estimate the actual ending account balance or expenses you paid for the period. You may use this information to compare the ongoing costs of investing in the Fund and other funds. To do so, compare this 5% hypothetical example with the 5% hypothetical examples that appear in the shareholder reports of the other funds.
Please note that the expenses shown in the table are meant to highlight your ongoing costs only and do not reflect expenses and charges which are, or may be imposed under the variable annuity contract or variable life insurance policy (variable contracts) (if applicable) or qualified pension or retirement plans (Qualified Plans) through which your investment in the Fund is made. Therefore, the second section of the table is useful in comparing ongoing costs associated with an investment in vehicles which fund benefits under variable contracts and Qualified Plans, and will not help you determine the relative total costs of investing in the Fund through variable contracts or Qualified Plans. In addition, if these expenses and charges imposed under the variable contracts or Qualified Plans were included, your costs would have been higher.
| | | | | | | | | | | | | | | | |
| | | Beginning
Account Value
(1/1/22) | | | Ending
Account Value
(6/30/22) | | Expenses Paid
During Period*
(1/1/22 – 6/30/22) | | | Annualized
Expense
Ratio | |
| | | | |
Actual | | | | | | | | | | | | | | | | |
Class I | | | $1,000.00 | | | | $ 845.30 | | | | $2.88 | | | | 0.63% | |
Class F | | | $1,000.00 | | | | $ 844.80 | | | | $4.03 | | | | 0.88% | |
| | | | |
Hypothetical | | | | | | | | | | | | | | | | |
(5% return per year before expenses) | | | | | | | | | | | | | | | | |
Class I | | | $1,000.00 | | | | $1,021.67 | | | | $3.16 | | | | 0.63% | |
Class F | | | $1,000.00 | | | | $1,020.43 | | | | $4.41 | | | | 0.88% | |
| * | Expenses are equal to the Fund’s annualized expense ratio for the indicated Class, multiplied by the average account value over the period, multiplied by 181/365 (to reflect the one-half year period). The Example assumes that the $1,000 was invested at the net asset value per share determined at the close of business on December 31, 2021. Expenses shown do not include insurance-related charges or direct expenses of Qualified Plans. |
5
Calvert
VP SRI Balanced Portfolio
June 30, 2022
Schedule of Investments (Unaudited)
Asset-Backed Securities — 7.1%
| | | | | | | | |
| Security | | Principal
Amount
(000’s omitted) | | | Value | |
| |
| | |
Adams Outdoor Advertising, L.P., Series 2018-1, Class A, 4.81%, 11/15/48(1) | | $ | 152 | | | $ | 149,790 | |
Affirm Asset Securitization Trust, Series 2021-A, Class A, 0.88%, 8/15/25(1) | | | 115 | | | | 113,583 | |
Business Jet Securities, LLC, Series 2020-1A, Class A, 2.981%, 11/15/35(1) | | | 59 | | | | 53,940 | |
Coinstar Funding, LLC, Series 2017-1A,
Class A2, 5.216%, 4/25/47(1) | | | 353 | | | | 342,961 | |
Cologix Data Centers US Issuer, LLC: | | | | | | | | |
Series 2021-1A, Class A2, 3.30%, 12/26/51(1) | | | 600 | | | | 553,034 | |
Series 2021-1A, Class B, 3.79%, 12/26/51(1) | | | 350 | | | | 318,007 | |
Conn’s Receivables Funding, LLC: | | | | | | | | |
Series 2021-A, Class A, 1.05%, 5/15/26(1) | | | 318 | | | | 316,044 | |
Series 2021-A, Class B, 2.87%, 5/15/26(1) | | | 520 | | | | 504,657 | |
Series 2021-A, Class C, 4.59%, 5/15/26(1) | | | 155 | | | | 147,486 | |
DataBank Issuer, Series 2021-2A, Class A2, 2.40%, 10/25/51(1) | | | 283 | | | | 252,662 | |
DB Master Finance, LLC, Series 2017-1A, Class A2II, 4.03%, 11/20/47(1) | | | 81 | | | | 78,197 | |
Diamond Infrastructure Funding, LLC: | | | | | | | | |
Series 2021-1A, Class A, 1.76%, 4/15/49(1) | | | 415 | | | | 357,251 | |
Series 2021-1A, Class C, 3.475%, 4/15/49(1) | | | 99 | | | | 84,541 | |
Diamond Issuer, Series 2021-1A, Class A, 2.305%, 11/20/51(1) | | | 782 | | | | 688,864 | |
Driven Brands Funding, LLC, Series 2018-1A, Class A2, 4.739%, 4/20/48(1) | | | 62 | | | | 60,781 | |
ExteNet, LLC: | | | | | | | | |
Series 2019-1A, Class A2, 3.204%, 7/26/49(1) | | | 345 | | | | 331,567 | |
Series 2019-1A, Class B, 4.14%, 7/26/49(1) | | | 55 | | | | 53,190 | |
FMC GMSR Issuer Trust: | | | | | | | | |
Series 2021-GT1, Class A, 3.62%, 7/25/26(1)(2) | | | 100 | | | | 90,735 | |
Series 2021-GT2, Class A, 3.85%, 10/25/26(1)(2) | | | 420 | | | | 375,999 | |
Series 2022-GT1, Class A, 6.19%, 4/25/27(1) | | | 100 | | | | 97,382 | |
FOCUS Brands Funding, LLC: | | | | | | | | |
Series 2017-1A, Class A2IB, 3.857%, 4/30/47(1) | | | 561 | | | | 540,634 | |
Series 2017-1A, Class A2II, 5.093%, 4/30/47(1) | | | 171 | | | | 165,232 | |
GoodLeap Sustainable Home Solutions Trust, Series 2021-5CS, Class A, 2.31%, 10/20/48(1) | | | 230 | | | | 200,380 | |
Hardee’s Funding, LLC, Series 2020-1A,
Class A2, 3.981%, 12/20/50(1) | | | 177 | | | | 161,586 | |
Jersey Mike’s Funding, Series 2019-1A,
Class A2, 4.433%, 2/15/50(1) | | | 280 | | | | 267,166 | |
JPMorgan Chase Bank, NA: | | | | | | | | |
Series 2021-2, Class B, 0.889%, 12/26/28(1) | | | 288 | | | | 279,187 | |
Series 2021-3, Class B, 0.76%, 2/26/29(1) | | | 267 | | | | 258,366 | |
Lendingpoint Asset Securitization Trust, Series 2022-A, Class A, 1.68%, 6/15/29(1) | | | 340 | | | | 334,372 | |
| | | | | | | | |
| Security | | Principal
Amount
(000’s omitted) | | | Value | |
| |
| | |
Loanpal Solar Loan, Ltd., Series 2020-1GS, Class C, 2.00%, 6/20/47(1) | | $ | 84 | | | $ | 70,536 | |
Mill City Solar Loan, Ltd., Series 2020-1A,
Class C, 2.00%, 6/20/47(1) | | | 174 | | | | 147,159 | |
Mosaic Solar Loan Trust: | | | | | | | | |
Series 2019-1A, Class A, 4.37%, 12/21/43(1) | | | 204 | | | | 196,034 | |
Series 2019-2A, Class B, 3.28%, 9/20/40(1) | | | 499 | | | | 463,224 | |
Series 2020-1A, Class A, 2.10%, 4/20/46(1) | | | 56 | | | | 51,093 | |
Series 2020-1A, Class B, 3.10%, 4/20/46(1) | | | 56 | | | | 51,842 | |
Series 2020-2A, Class A, 1.44%, 8/20/46(1) | | | 100 | | | | 87,095 | |
Series 2020-2A, Class B, 2.21%, 8/20/46(1) | | | 119 | | | | 105,261 | |
Series 2021-1A, Class A, 1.51%, 12/20/46(1) | | | 206 | | | | 177,441 | |
Series 2021-1A, Class C, 2.25%, 12/20/46(1) | | | 546 | | | | 502,395 | |
Series 2021-3A, Class C, 1.77%, 6/20/52(1) | | | 100 | | | | 88,188 | |
Neighborly Issuer, LLC, Series 2021-1A,
Class A2, 3.584%, 4/30/51(1) | | | 386 | | | | 336,856 | |
NRZ Excess Spread-Collateralized Notes, Series 2021-GNT1, Class A, 3.474%, 11/25/26(1) | | | 675 | | | | 630,877 | |
OneMain Financial Issuance Trust: | | | | | | | | |
Series 2016-3A, Class A, 3.83%, 6/18/31(1) | | | 3 | | | | 2,480 | |
Series 2020-1A, Class A, 3.84%, 5/14/32(1) | | | 319 | | | | 318,018 | |
Series 2022-S1, Class A, 4.13%, 5/14/35(1) | | | 495 | | | | 488,180 | |
Oportun Funding XIV, LLC, Series 2021-A, Class B, 1.76%, 3/8/28(1) | | | 100 | | | | 94,146 | |
Oportun Funding, LLC, Series 2022-1, Class A, 3.25%, 6/15/29(1) | | | 599 | | | | 591,180 | |
Oportun Issuance Trust: | | | | | | | | |
Series 2021-B, Class A, 1.47%, 5/8/31(1) | | | 361 | | | | 335,046 | |
Series 2021-B, Class C, 3.65%, 5/8/31(1) | | | 100 | | | | 93,788 | |
Series 2021-C, Class A, 2.18%, 10/8/31(1) | | | 1,850 | | | | 1,712,885 | |
Series 2021-C, Class B, 2.67%, 10/8/31(1) | | | 220 | | | | 201,625 | |
Pagaya AI Debt Selection Trust: | | | | | | | | |
Series 2020-3, Class B, 3.22%, 5/17/27(1) | | | 125 | | | | 124,143 | |
Series 2021-2, 3.00%, 1/25/29(1) | | | 406 | | | | 385,152 | |
Series 2021-3, Class A, 1.15%, 5/15/29(1) | | | 863 | | | | 839,594 | |
Series 2021-5, Class A, 1.53%, 8/15/29(1) | | | 648 | | | | 627,433 | |
Series 2021-HG1, Class A, 1.22%, 1/16/29(1) | | | 183 | | | | 174,184 | |
Planet Fitness Master Issuer, LLC, Series 2019-1A, Class A2, 3.858%, 12/5/49(1) | | | 273 | | | | 243,562 | |
Prosper Marketplace Issuance Trust, Series 2019-4A, Class C, 4.95%, 2/17/26(1) | | | 65 | | | | 64,400 | |
ServiceMaster Funding, LLC: | | | | | | | | |
Series 2020-1, Class A2I, 2.841%, 1/30/51(1) | | | 159 | | | | 137,539 | |
Series 2020-1, Class A2II, 3.337%, 1/30/51(1) | | | 180 | | | | 150,841 | |
SERVPRO Master Issuer, LLC, Series 2019-1A, Class A2, 3.882%, 10/25/49(1) | | | 926 | | | | 866,976 | |
SolarCity LMC Series I, LLC, Series 2013-1, Class A, 4.80%, 11/20/38(1) | | | 227 | | | | 220,334 | |
| | | | |
| | 6 | | See Notes to Financial Statements. |
Calvert
VP SRI Balanced Portfolio
June 30, 2022
Schedule of Investments (Unaudited) — continued
| | | | | | | | |
| Security | | Principal
Amount
(000’s omitted) | | | Value | |
| |
| | |
Sonic Capital, LLC, Series 2020-1A,
Class A2I, 3.845%, 1/20/50(1) | | $ | 513 | | | $ | 486,309 | |
SpringCastle America Funding, LLC, Series 2020-AA, Class A, 1.97%, 9/25/37(1) | | | 282 | | | | 261,559 | |
Stack Infrastructure Issuer, LLC: | | | | | | | | |
Series 2019-1A, Class A2, 4.54%, 2/25/44(1) | | | 2,135 | | | | 2,119,658 | |
Series 2019-2A, Class A2, 3.08%, 10/25/44(1) | | | 200 | | | | 192,458 | |
Series 2020-1A, Class A2, 1.893%, 8/25/45(1) | | | 342 | | | | 314,349 | |
Sunnova Helios II Issuer, LLC, Series 2021-A, Class A, 1.80%, 2/20/48(1) | | | 307 | | | | 268,715 | |
Sunnova Sol II Issuer, LLC, Series 2020-2A, Class A, 2.73%, 11/1/55(1) | | | 555 | | | | 477,480 | |
Sunnova Sol Issuer, LLC, Series 2020-1A, Class A, 3.35%, 2/1/55(1) | | | 98 | | | | 87,479 | |
Sunrun Atlas Issuer, LLC, Series 2019-2, Class A, 3.61%, 2/1/55(1) | | | 205 | | | | 186,528 | |
Sunrun Callisto Issuer, LLC, Series 2015-1A, Class B, 5.38%, 7/20/45(1) | | | 288 | | | | 271,807 | |
Sunrun Demeter Issuer, LLC, Series 2021-2A, Class A, 2.27%, 1/30/57(1) | | | 260 | | | | 218,468 | |
Sunrun Jupiter Issuer, LLC, Series 2022-1A, Class A, 4.75%, 7/30/57(1) | | | 735 | | | | 701,268 | |
Sunrun Xanadu Issuer, LLC, Series 2019-1A, Class A, 3.98%, 6/30/54(1) | | | 165 | | | | 155,701 | |
TES, LLC, Series 2017-1A, Class A, 4.33%, 10/20/47(1) | | | 361 | | | | 339,508 | |
Theorem Funding Trust: | | | | | | | | |
Series 2020-1A, Class B, 3.95%, 10/15/26(1) | | | 113 | | | | 112,776 | |
Series 2021-1A, Class A, 1.21%, 12/15/27(1) | | | 321 | | | | 313,926 | |
Series 2021-1A, Class B, 1.84%, 12/15/27(1) | | | 100 | | | | 91,753 | |
United States Small Business Administration, Series 2017-20E, Class 1, 2.88%, 5/1/37 | | | 453 | | | | 438,286 | |
Upstart Pass-Through Trust, Series 2020-ST1, Class A, 3.75%, 2/20/28(1) | | | 110 | | | | 108,293 | |
Vantage Data Centers Issuer, LLC: | | | | | | | | |
Series 2018-2A, Class A2, 4.196%, 11/16/43(1) | | | 77 | | | | 76,531 | |
Series 2019-1A, Class A2, 3.188%, 7/15/44(1) | | | 292 | | | | 283,537 | |
Series 2020-2A, Class A2, 1.992%, 9/15/45(1) | | | 735 | | | | 641,092 | |
Series 2021-1A, Class A2, 2.165%, 10/15/46(1) | | | 224 | | | | 200,716 | |
Vivint Solar Financing VII, LLC, Series 2020-1A, Class A, 2.21%, 7/31/51(1) | | | 384 | | | | 324,879 | |
Willis Engine Structured Trust V, Series 2020-A, Class B, 4.212%, 3/15/45(1) | | | 217 | | | | 173,811 | |
| |
| | |
Total Asset-Backed Securities
(identified cost $28,378,705) | | | | | | $ | 26,603,988 | |
| |
| | | | | | | | |
|
| Collateralized Mortgage Obligations — 1.5% | |
| Security | | Principal
Amount
(000’s omitted) | | | Value | |
| |
| | |
Bellemeade Re, Ltd.: | | | | | | | | |
Series 2021-1A, Class M1A, 2.676%, (30-day average SOFR + 1.75%), 3/25/31(1)(3) | | $ | 108 | | | $ | 108,354 | |
Series 2021-1A, Class M1B, 3.126%, (30-day average SOFR + 2.20%), 3/25/31(1)(3) | | | 155 | | | | 149,625 | |
Series 2021-1A, Class M1C, 3.876%, (30-day average SOFR + 2.95%), 3/25/31(1)(3) | | | 150 | | | | 147,437 | |
Series 2021-2A, Class M1A, 2.126%, (30-day average SOFR + 1.20%), 6/25/31(1)(3) | | | 472 | | | | 464,934 | |
Series 2021-3A, Class A2, 1.926%, (30-day average SOFR + 1.00%), 9/25/31(1)(3) | | | 215 | | | | 212,431 | |
Series 2021-3A, Class M1B, 2.326%, (30-day average SOFR + 1.40%), 9/25/31(1)(3) | | | 170 | | | | 154,851 | |
CHL GMSR Issuer Trust, Series 2018-GT1, Class A, 4.374%, (1 mo. USD LIBOR + 2.75%), 5/25/23(1)(3) | | | 100 | | | | 99,152 | |
Eagle Re, Ltd.: | | | | | | | | |
Series 2021-1, Class M1A, 2.626%, (30-day average SOFR + 1.70%), 10/25/33(1)(3) | | | 104 | | | | 104,366 | |
Series 2021-2, Class M1C, 4.376%, (30-day average SOFR + 3.45%), 4/25/34(1)(3) | | | 150 | | | | 147,152 | |
Federal Home Loan Mortgage Corp. Structured Agency Credit Risk Debt Notes: | | | | | | | | |
Series 2015-HQ2, Class M3, 4.874%, (1 mo. USD LIBOR + 3.25%), 5/25/25(3) | | | 125 | | | | 125,581 | |
Series 2018-DNA1, Class M2AT, 2.674%, (1 mo. USD LIBOR + 1.05%), 7/25/30(3) | | | 85 | | | | 85,259 | |
Series 2019-DNA3, Class B2, 9.774%, (1 mo. USD LIBOR + 8.15%), 7/25/49(1)(3) | | | 85 | | | | 85,499 | |
Series 2019-DNA3, Class M2, 3.674%, (1 mo. USD LIBOR + 2.05%), 7/25/49(1)(3) | | | 401 | | | | 399,218 | |
Series 2019-DNA4, Class M2, 3.574%, (1 mo. USD LIBOR + 1.95%),
10/25/49(1)(3) | | | 40 | | | | 39,630 | |
Series 2019-HQA2, Class B1, 5.724%, (1 mo. USD LIBOR + 4.10%), 4/25/49(1)(3) | | | 65 | | | | 64,090 | |
Series 2019-HQA4, Class B1, 4.574%, (1 mo. USD LIBOR + 2.95%),
11/25/49(1)(3) | | | 20 | | | | 19,125 | |
Series 2020-DNA6, Class B1, 3.926%, (30-day average SOFR + 3.00%), 12/25/50(1)(3) | | | 25 | | | | 21,502 | |
Series 2020-HQA2, Class B1, 5.724%, (1 mo. USD LIBOR + 4.10%), 3/25/50(1)(3) | | | 41 | | | | 38,269 | |
Series 2021-DNA3, Class M1, 1.676%, (30-day average SOFR + 0.75%), 10/25/33(1)(3) | | | 148 | | | | 146,455 | |
Series 2022-DNA2, Class M1A, 2.226%, (30-day average SOFR + 1.30%), 2/25/42(1)(3) | | | 357 | | | | 349,356 | |
Federal National Mortgage Association Connecticut Avenue Securities: | | | | | | | | |
Series 2013-C01, Class M2, 6.874%, (1 mo. USD LIBOR + 5.25%), 10/25/23(3) | | | 117 | | | | 121,268 | |
Series 2014-C02, Class 2M2, 4.224%, (1 mo. USD LIBOR + 2.60%), 5/25/24(3) | | | 48 | | | | 48,377 | |
Series 2014-C03, Class 2M2, 4.524%, (1 mo. USD LIBOR + 2.90%), 7/25/24(3) | | | 68 | | | | 67,753 | |
| | | | |
| | 7 | | See Notes to Financial Statements. |
Calvert
VP SRI Balanced Portfolio
June 30, 2022
Schedule of Investments (Unaudited) — continued
| | | | | | | | |
| Security | | Principal
Amount
(000’s omitted) | | | Value | |
| |
| | |
Federal National Mortgage Association Connecticut Avenue Securities: (continued) | | | | | | | | |
Series 2014-C04, Class 1M2, 6.524%, (1 mo. USD LIBOR + 4.90%), 11/25/24(3) | | $ | 201 | | | $ | 207,872 | |
Series 2018-R07, Class 1M2, 4.024%, (1 mo. USD LIBOR + 2.40%), 4/25/31(1)(3) | | | 39 | | | | 38,809 | |
Series 2019-R01, Class 2B1, 5.974%, (1 mo. USD LIBOR + 4.35%), 7/25/31(1)(3) | | | 55 | | | | 55,021 | |
Series 2019-R02, Class 1B1, 5.774%, (1 mo. USD LIBOR + 4.15%), 8/25/31(1)(3) | | | 55 | | | | 54,539 | |
Series 2019-R02, Class 1M2, 3.924%, (1 mo. USD LIBOR + 2.30%), 8/25/31(1)(3) | | | 4 | | | | 4,081 | |
Series 2019-R03, Class 1B1, 5.724%, (1 mo. USD LIBOR + 4.10%), 9/25/31(1)(3) | | | 55 | | | | 54,431 | |
Series 2019-R05, Class 1B1, 5.724%, (1 mo. USD LIBOR + 4.10%), 7/25/39(1)(3) | | | 84 | | | | 82,685 | |
Series 2019-R06, Class 2B1, 5.374%, (1 mo. USD LIBOR + 3.75%), 9/25/39(1)(3) | | | 330 | | | | 313,191 | |
Series 2019-R07, Class 1B1, 5.024%, (1 mo. USD LIBOR + 3.40%), 10/25/39(1)(3) | | | 109 | | | | 101,919 | |
Series 2020-R02, Class 2B1, 4.624%, (1 mo. USD LIBOR + 3.00%), 1/25/40(1)(3) | | | 405 | | | | 363,280 | |
Series 2021-R01, Class 1B2, 6.926%, (30-day average SOFR + 6.00%),
10/25/41(1)(3) | | | 143 | | | | 119,653 | |
Series 2021-R02, Class 2B1, 4.226%, (30-day average SOFR + 3.30%),
11/25/41(1)(3) | | | 12 | | | | 10,553 | |
Federal National Mortgage Association Grantor Trust, Series 2017-T1, Class A, 2.898%, 6/25/27 | | | 274 | | | | 266,258 | |
Home Re, Ltd.: | | | | | | | | |
Series 2018-1, Class M2, 4.624%, (1 mo. USD LIBOR + 3.00%), 10/25/28(1)(3) | | | 344 | | | | 337,005 | |
Series 2021-1, Class M1B, 3.174%, (1 mo. USD LIBOR + 1.55%), 7/25/33(1)(3) | | | 265 | | | | 262,025 | |
Series 2021-1, Class M2, 4.474%, (1 mo.
USD LIBOR + 2.85%), 7/25/33(1)(3) | | | 150 | | | | 137,022 | |
Oaktown Re V, Ltd., Series 2020-2A, Class M1B, 5.224%, (1 mo. USD LIBOR + 3.60%), 10/25/30(1)(3) | | | 77 | | | | 77,403 | |
| |
| | |
Total Collateralized Mortgage Obligations
(identified cost $5,883,115) | | | | | | $ | 5,685,431 | |
|
|
| Commercial Mortgage-Backed Securities — 4.6% | |
| Security | | Principal
Amount
(000’s omitted) | | | Value | |
| |
| | |
BAMLL Commercial Mortgage Securities Trust: | | | | | | | | |
Series 2019-BPR, Class DNM, 3.843%, 11/5/32(1)(2) | | $ | 695 | | | $ | 589,714 | |
Series 2019-BPR, Class ENM, 3.843%, 11/5/32(1)(2) | | | 325 | | | | 272,598 | |
Series 2019-BPR, Class FNM, 3.843%, 11/5/32(1)(2) | | | 485 | | | | 400,604 | |
BBCMS Mortgage Trust, Series 2017-DELC, Class F, 4.824%, (1 mo. USD LIBOR + 3.50%), 8/15/36(1)(3) | | | 156 | | | | 146,467 | |
| | | | | | | | |
| Security | | Principal
Amount
(000’s omitted) | | | Value | |
| |
| | |
BX Commercial Mortgage Trust: | | | | | | | | |
Series 2019-XL, Class A, 2.244%, (1 mo. USD LIBOR + 0.92%), 10/15/36(1)(3) | | $ | 525 | | | $ | 516,259 | |
Series 2019-XL, Class B, 2.404%, (1 mo. USD LIBOR + 1.08%), 10/15/36(1)(3) | | | 280 | | | | 273,772 | |
Series 2021-VOLT, Class B, 2.274%, (1 mo. USD LIBOR + 0.95%), 9/15/36(1)(3) | | | 666 | | | | 627,254 | |
Series 2021-VOLT, Class C, 2.424%, (1 mo. USD LIBOR + 1.10%), 9/15/36(1)(3) | | | 204 | | | | 190,165 | |
Series 2021-VOLT, Class D, 2.974%, (1 mo. USD LIBOR + 1.65%), 9/15/36(1)(3) | | | 702 | | | | 658,717 | |
Credit Suisse Mortgage Trust, Series 2022-CNTR, Class A, 5.223%, (1 mo. SOFR + 3.944%), 1/15/24(1)(3) | | | 100 | | | | 92,462 | |
Extended Stay America Trust: | | | | | | | | |
Series 2021-ESH, Class A, 2.405%, (1 mo. USD LIBOR + 1.08%), 7/15/38(1)(3) | | | 231 | | | | 225,154 | |
Series 2021-ESH, Class C, 3.025%, (1 mo. USD LIBOR + 1.70%), 7/15/38(1)(3) | | | 596 | | | | 578,199 | |
Series 2021-ESH, Class D, 3.575%, (1 mo. USD LIBOR + 2.25%), 7/15/38(1)(3) | | | 201 | | | | 194,251 | |
Federal Home Loan Mortgage Corp. Multifamily Structured Pass Through Certificates: | | | | | | | | |
Series KG02, Class A2, 2.412%, 8/25/29 | | | 1,440 | | | | 1,329,819 | |
Series KG03, Class A2, 1.297%, 6/25/30(2) | | | 305 | | | | 256,773 | |
Series KSG1, Class A2, 1.503%, 9/25/30 | | | 278 | | | | 237,250 | |
Series KW06, Class A2, 3.80%, 6/25/28(2) | | | 530 | | | | 538,432 | |
Series W5FX, Class AFX, 3.336%, 4/25/28(2) | | | 192 | | | | 189,594 | |
Federal National Mortgage Association: | | | | | | | | |
Series 2017-M13, Class A2, 3.024%, 9/25/27(2) | | | 586 | | | | 578,101 | |
Series 2018-M13, Class A2, 3.87%, 9/25/30(2) | | | 1,488 | | | | 1,509,171 | |
Series 2019-M1, Class A2, 3.671%, 9/25/28(2) | | | 456 | | | | 456,874 | |
Series 2019-M22, Class A2, 2.522%, 8/25/29 | | | 523 | | | | 490,569 | |
Series 2020-M1, Class A2, 2.444%, 10/25/29 | | | 963 | | | | 901,123 | |
Series 2020-M20, Class A2, 1.435%, 10/25/29 | | | 605 | | | | 527,915 | |
Federal National Mortgage Association Multifamily Connecticut Avenue Securities Trust: | | | | | | | | |
Series 2019-01, Class M7, 3.324%, (1 mo. USD LIBOR + 1.70%), 10/15/49(1)(3) | | | 35 | | | | 34,111 | |
Series 2019-01, Class M10, 4.874%, (1 mo. USD LIBOR + 3.25%), 10/15/49(1)(3) | | | 234 | | | | 218,129 | |
Series 2020-01, Class M10, 5.374%, (1 mo. USD LIBOR + 3.75%), 3/25/50(1)(3) | | | 525 | | | | 473,721 | |
Hawaii Hotel Trust, Series 2019-MAUI, Class A, 2.474%, (1 mo. USD LIBOR + 1.15%), 5/15/38(1)(3) | | | 989 | | | | 963,405 | |
JPMorgan Chase Commercial Mortgage Securities Trust: | | | | | | | | |
Series 2014-DSTY, Class B, 3.771%, 6/10/27(1) | | | 300 | | | | 85,050 | |
Series 2014-DSTY, Class C, 3.931%, 6/10/27(1)(2) | | | 100 | | | | 17,850 | |
Morgan Stanley Capital I Trust: | | | | | | | | |
Series 2017-CLS, Class A, 2.024%, (1 mo. USD LIBOR + 0.70%), 11/15/34(1)(3)(4) | | | 685 | | | | 678,577 | |
Series 2017-CLS, Class E, 3.274%, (1 mo. USD LIBOR + 1.95%), 11/15/34(1)(3)(4) | | | 79 | | | | 76,969 | |
| | | | |
| | 8 | | See Notes to Financial Statements. |
Calvert
VP SRI Balanced Portfolio
June 30, 2022
Schedule of Investments (Unaudited) — continued
| | | | | | | | |
| Security | | Principal
Amount
(000’s omitted) | | | Value | |
| |
| | |
Morgan Stanley Capital I Trust: (continued) | | | | | | | | |
Series 2017-CLS, Class F, 3.924%, (1 mo. USD LIBOR + 2.60%), 11/15/34(1)(3)(4) | | $ | 169 | | | $ | 164,105 | |
Series 2019-BPR, Class A, 2.974%, (1 mo. USD LIBOR + 1.65%), 5/15/36(1)(3)(4) | | | 473 | | | | 456,512 | |
Series 2019-BPR, Class B, 3.674%, (1 mo. USD LIBOR + 2.35%), 5/15/36(1)(3)(4) | | | 187 | | | | 178,934 | |
Series 2019-BPR, Class C, 4.624%, (1 mo. USD LIBOR + 3.30%), 5/15/36(1)(3)(4) | | | 100 | | | | 94,281 | |
SLG Office Trust, Series 2021-OVA, Class A, 2.585%, 7/15/41(1) | | | 618 | | | | 525,894 | |
VMC Finance, LLC: | | | | | | | | |
Series 2021-HT1, Class A, 3.262%, (1 mo. USD LIBOR + 1.65%), 1/18/37(1)(3) | | | 513 | | | | 493,307 | |
Series 2021-HT1, Class B, 6.112%, (1 mo. USD LIBOR + 4.50%), 1/18/37(1)(3) | | | 753 | | | | 705,282 | |
WFLD Mortgage Trust, Series 2014-MONT, Class C, 3.88%, 8/10/31(1)(2) | | | 450 | | | | 387,169 | |
| |
| | |
Total Commercial Mortgage-Backed Securities
(identified cost $18,709,216) | | | | | | $ | 17,334,533 | |
| |
|
Common Stocks — 56.2% | |
| | |
| Security | | Shares | | | Value | |
| |
| | |
Auto Components — 0.3% | | | | | | | | |
| |
| | |
Aptiv PLC(5) | | | 13,700 | | | $ | 1,220,259 | |
| |
| | |
| | | | | | $ | 1,220,259 | |
| |
| | |
Banks — 1.9% | | | | | | | | |
| |
| | |
PNC Financial Services Group, Inc. (The) | | | 21,600 | | | $ | 3,407,832 | |
Wells Fargo & Co. | | | 97,700 | | | | 3,826,909 | |
| |
| | |
| | | | | | $ | 7,234,741 | |
| |
| | |
Beverages — 2.3% | | | | | | | | |
| |
| | |
Coca-Cola Co. (The) | | | 95,800 | | | $ | 6,026,778 | |
Coca-Cola Europacific Partners PLC | | | 53,700 | | | | 2,771,457 | |
| |
| | |
| | | | | | $ | 8,798,235 | |
| |
| | |
Biotechnology — 1.6% | | | | | | | | |
| |
| | |
AbbVie, Inc. | | | 39,900 | | | $ | 6,111,084 | |
| |
| | |
| | | | | | $ | 6,111,084 | |
| |
| | |
Capital Markets — 2.4% | | | | | | | | |
| |
| | |
Intercontinental Exchange, Inc. | | | 41,200 | | | $ | 3,874,448 | |
S&P Global, Inc. | | | 8,800 | | | | 2,966,128 | |
Tradeweb Markets, Inc., Class A | | | 33,503 | | | | 2,286,580 | |
| |
| | |
| | | | | | $ | 9,127,156 | |
| |
| | | | | | | | |
| Security | | Shares | | | Value | |
| |
| | |
Chemicals — 1.6% | | | | | | | | |
| |
| | |
Ecolab, Inc. | | | 18,400 | | | $ | 2,829,184 | |
FMC Corp. | | | 27,700 | | | | 2,964,177 | |
| |
| | |
| | | | | | $ | 5,793,361 | |
| |
| | |
Commercial Services & Supplies — 1.0% | | | | | | | | |
| |
| | |
Waste Management, Inc. | | | 23,516 | | | $ | 3,597,478 | |
| |
| | |
| | | | | | $ | 3,597,478 | |
| |
| | |
Diversified Telecommunication Services — 1.2% | | | | | | | | |
| |
| | |
Verizon Communications, Inc. | | | 88,000 | | | $ | 4,466,000 | |
| |
| | |
| | | | | | $ | 4,466,000 | |
| |
| | |
Electric Utilities — 1.3% | | | | | | | | |
| |
| | |
NextEra Energy, Inc. | | | 64,000 | | | $ | 4,957,440 | |
| |
| | |
| | | | | | $ | 4,957,440 | |
| |
| | |
Electrical Equipment — 0.7% | | | | | | | | |
| |
| | |
AMETEK, Inc. | | | 23,900 | | | $ | 2,626,371 | |
| |
| | |
| | | | | | $ | 2,626,371 | |
| |
|
Electronic Equipment, Instruments & Components — 0.8% | |
| |
| | |
TE Connectivity, Ltd. | | | 24,700 | | | $ | 2,794,805 | |
| |
| | |
| | | | | | $ | 2,794,805 | |
| |
| | |
Energy Equipment & Services — 1.6% | | | | | | | | |
| |
| | |
Baker Hughes Co. | | | 211,100 | | | $ | 6,094,457 | |
| |
| | |
| | | | | | $ | 6,094,457 | |
| |
| | |
Entertainment — 0.5% | | | | | | | | |
| |
| | |
Electronic Arts, Inc. | | | 16,300 | | | $ | 1,982,895 | |
| |
| | |
| | | | | | $ | 1,982,895 | |
| |
| |
Equity Real Estate Investment Trusts (REITs) — 2.2% | | | | | |
| |
| | |
EastGroup Properties, Inc. | | | 26,900 | | | $ | 4,151,477 | |
Lamar Advertising Co., Class A | | | 46,400 | | | | 4,081,808 | |
| |
| | |
| | | | | | $ | 8,233,285 | |
| |
| | |
Food & Staples Retailing — 2.3% | | | | | | | | |
| |
| | |
Sysco Corp. | | | 55,000 | | | $ | 4,659,050 | |
Walmart, Inc. | | | 31,800 | | | | 3,866,244 | |
| |
| | |
| | | | | | $ | 8,525,294 | |
| |
| | |
Health Care Equipment & Supplies — 1.1% | | | | | | | | |
| |
| | |
Boston Scientific Corp.(5) | | | 82,300 | | | $ | 3,067,321 | |
Teleflex, Inc. | | | 4,200 | | | | 1,032,570 | |
| |
| | |
| | | | | | $ | 4,099,891 | |
| |
| | | | |
| | 9 | | See Notes to Financial Statements. |
Calvert
VP SRI Balanced Portfolio
June 30, 2022
Schedule of Investments (Unaudited) — continued
| | | | | | | | |
| Security | | Shares | | | Value | |
| |
| | |
Health Care Providers & Services — 1.3% | | | | | | | | |
| |
| | |
Elevance Health, Inc. | | | 10,300 | | | $ | 4,970,574 | |
| |
| | |
| | | | | | $ | 4,970,574 | |
| |
| | |
Hotels, Restaurants & Leisure — 0.5% | | | | | | | | |
| |
| | |
Marriott International, Inc., Class A | | | 14,800 | | | $ | 2,012,948 | |
| |
| | |
| | | | | | $ | 2,012,948 | |
| |
| | |
Insurance — 1.8% | | | | | | | | |
| |
| | |
Allstate Corp. (The) | | | 36,100 | | | $ | 4,574,953 | |
W.R. Berkley Corp. | | | 32,100 | | | | 2,191,146 | |
| |
| | |
| | | | | | $ | 6,766,099 | |
| |
| | |
Interactive Media & Services — 3.2% | | | | | | | | |
| |
| | |
Alphabet, Inc., Class C(5) | | | 5,490 | | | $ | 12,009,100 | |
| |
| | |
| | | | | | $ | 12,009,100 | |
| |
| | |
Internet & Direct Marketing Retail — 2.2% | | | | | | | | |
| |
| | |
Amazon.com, Inc.(5) | | | 78,680 | | | $ | 8,356,603 | |
| |
| | |
| | | | | | $ | 8,356,603 | |
| |
| | |
IT Services — 2.3% | | | | | | | | |
| |
| | |
Automatic Data Processing, Inc. | | | 18,300 | | | $ | 3,843,732 | |
Visa, Inc., Class A | | | 24,900 | | | | 4,902,561 | |
| |
| | |
| | | | | | $ | 8,746,293 | |
| |
| | |
Life Sciences Tools & Services — 2.3% | | | | | | | | |
| |
| | |
Danaher Corp. | | | 17,500 | | | $ | 4,436,600 | |
Thermo Fisher Scientific, Inc. | | | 8,018 | | | | 4,356,019 | |
| |
| | |
| | | | | | $ | 8,792,619 | |
| |
| | |
Machinery — 1.0% | | | | | | | | |
| |
| | |
Westinghouse Air Brake Technologies Corp. | | | 45,800 | | | $ | 3,759,264 | |
| |
| | |
| | | | | | $ | 3,759,264 | |
| |
| | |
Multi-Utilities — 1.3% | | | | | | | | |
| |
| | |
Sempra Energy | | | 31,400 | | | $ | 4,718,478 | |
| |
| | |
| | | | | | $ | 4,718,478 | |
| |
| | |
Pharmaceuticals — 2.6% | | | | | | | | |
| |
| | |
Bristol-Myers Squibb Co. | | | 60,500 | | | $ | 4,658,500 | |
Eli Lilly & Co. | | | 10,500 | | | | 3,404,415 | |
Pfizer, Inc. | | | 33,100 | | | | 1,735,433 | |
| |
| | |
| | | | | | $ | 9,798,348 | |
| |
| | | | | | | | |
| Security | | Shares | | | Value | |
| |
| | |
Professional Services — 0.9% | | | | | | | | |
| |
| | |
Booz Allen Hamilton Holding Corp. | | | 36,000 | | | $ | 3,252,960 | |
| |
| | |
| | | | | | $ | 3,252,960 | |
| |
| | |
Road & Rail — 0.8% | | | | | | | | |
| |
| | |
Union Pacific Corp. | | | 14,700 | | | $ | 3,135,216 | |
| |
| | |
| | | | | | $ | 3,135,216 | |
| |
|
Semiconductors & Semiconductor Equipment — 2.5% | |
| |
| | |
Analog Devices, Inc. | | | 25,600 | | | $ | 3,739,904 | |
Lam Research Corp. | | | 5,700 | | | | 2,429,055 | |
Texas Instruments, Inc. | | | 20,451 | | | | 3,142,296 | |
| |
| | |
| | | | | | $ | 9,311,255 | |
| |
| | |
Software — 5.9% | | | | | | | | |
| |
| | |
Black Knight, Inc.(5) | | | 33,500 | | | $ | 2,190,565 | |
Fair Isaac Corp.(5) | | | 5,500 | | | | 2,204,950 | |
Intuit, Inc. | | | 4,852 | | | | 1,870,155 | |
Microsoft Corp. | | | 54,393 | | | | 13,969,753 | |
VMware, Inc., Class A | | | 17,500 | | | | 1,994,650 | |
| |
| | |
| | | | | | $ | 22,230,073 | |
| |
| | |
Specialty Retail — 0.7% | | | | | | | | |
| |
| | |
TJX Cos., Inc. (The) | | | 43,700 | | | $ | 2,440,645 | |
| |
| | |
| | | | | | $ | 2,440,645 | |
| |
| |
Technology Hardware, Storage & Peripherals — 3.4% | | | | | |
| |
| | |
Apple, Inc. | | | 93,688 | | | $ | 12,809,023 | |
| |
| | |
| | | | | | $ | 12,809,023 | |
| |
| |
Wireless Telecommunication Services — 0.7% | | | | | |
| |
| | |
T-Mobile US, Inc.(5) | | | 20,330 | | | $ | 2,735,198 | |
| |
| | |
| | | | | | $ | 2,735,198 | |
| |
| |
Total Common Stocks
(identified cost $160,533,142) | | | $ | 211,507,448 | |
| |
| | |
Convertible Bonds — 0.1% | | | | | | | | |
| | |
| Security | | Principal
Amount
(000’s omitted) | | | Value | |
| |
| | |
Technology — 0.1% | | | | | | | | |
| |
| | |
1Life Healthcare, Inc., 3.00%, 6/15/25 | | $ | 62 | | | $ | 51,181 | |
ams-OSRAM AG, 0.875%, 9/28/22(6) | | | 200 | | | | 195,679 | |
| |
| |
Total Convertible Bonds
(identified cost $253,550) | | | $ | 246,860 | |
| |
| | | | |
| | 10 | | See Notes to Financial Statements. |
Calvert
VP SRI Balanced Portfolio
June 30, 2022
Schedule of Investments (Unaudited) — continued
| | | | | | | | |
Corporate Bonds — 16.7% | | | | | | | | |
| | |
| Security | | Principal
Amount
(000’s omitted) | | | Value | |
| |
| | |
Basic Materials — 0.1% | | | | | | | | |
| |
| | |
South32 Treasury, Ltd., 4.35%, 4/14/32(1) | | $ | 306 | | | $ | 286,205 | |
| |
| | |
| | | | | | $ | 286,205 | |
| |
| | |
Communications — 1.0% | | | | | | | | |
| |
| | |
AT&T, Inc.: | | | | | | | | |
3.50%, 9/15/53 | | $ | 44 | | | $ | 33,426 | |
3.65%, 6/1/51 | | | 517 | | | | 405,145 | |
3.65%, 9/15/59 | | | 53 | | | | 39,812 | |
3.80%, 12/1/57 | | | 266 | | | | 206,051 | |
CCO Holdings, LLC/CCO Holdings Capital Corp., 5.00%, 2/1/28(1) | | | 124 | | | | 114,843 | |
Charter Communications Operating, LLC/Charter Communications Operating Capital, 4.80%, 3/1/50 | | | 1,105 | | | | 877,773 | |
Comcast Corp.: | | | | | | | | |
2.887%, 11/1/51 | | | 446 | | | | 319,196 | |
2.937%, 11/1/56 | | | 456 | | | | 317,801 | |
Level 3 Financing, Inc., 3.75%, 7/15/29(1) | | | 35 | | | | 27,125 | |
Nokia Oyj: | | | | | | | | |
4.375%, 6/12/27 | | | 347 | | | | 328,284 | |
6.625%, 5/15/39 | | | 395 | | | | 391,315 | |
SES Global Americas Holdings GP, 5.30%, 3/25/44(1) | | | 185 | | | | 158,041 | |
SES S.A., 5.30%, 4/4/43(1) | | | 109 | | | | 93,033 | |
T-Mobile USA, Inc.: | | | | | | | | |
2.25%, 2/15/26 | | | 23 | | | | 20,740 | |
2.25%, 11/15/31(7) | | | 64 | | | | 52,005 | |
2.55%, 2/15/31 | | | 147 | | | | 123,847 | |
2.625%, 4/15/26 | | | 300 | | | | 272,811 | |
| |
| | |
| | | | | | $ | 3,781,248 | |
| |
| | |
Consumer, Cyclical — 1.3% | | | | | | | | |
| |
| | |
Air Canada, 3.875%, 8/15/26(1) | | $ | 545 | | | $ | 462,130 | |
American Airlines Pass-Through Trust, 4.40%, 9/22/23 | | | 97 | | | | 92,219 | |
American Airlines, Inc./AAdvantage Loyalty IP, Ltd.: | | | | | | | | |
5.50%, 4/20/26(1) | | | 768 | | | | 708,326 | |
5.75%, 4/20/29(1) | | | 21 | | | | 18,001 | |
Aptiv PLC/Aptiv Corp., 3.25%, 3/1/32(7) | | | 146 | | | | 124,208 | |
Bath & Body Works, Inc.: | | | | | | | | |
6.625%, 10/1/30(1) | | | 234 | | | | 202,724 | |
6.875%, 11/1/35 | | | 39 | | | | 31,803 | |
7.60%, 7/15/37 | | | 165 | | | | 133,765 | |
Brunswick Corp., 5.10%, 4/1/52 | | | 65 | | | | 48,621 | |
Dave & Buster’s, Inc., 7.625%, 11/1/25(1) | | | 104 | | | | 102,822 | |
Delta Air Lines, Inc./SkyMiles IP, Ltd.: | | | | | | | | |
4.50%, 10/20/25(1) | | | 300 | | | | 291,783 | |
| | | | | | | | |
| | |
| Security | | Principal
Amount
(000’s omitted) | | | Value | |
| |
| | |
Consumer, Cyclical (continued) | | | | | | | | |
| |
| | |
Delta Air Lines, Inc./SkyMiles IP, Ltd.: (continued) | | | | | | | | |
4.75%, 10/20/28(1) | | $ | 460 | | | $ | 434,881 | |
Dick’s Sporting Goods, Inc., 4.10%, 1/15/52 | | | 678 | | | | 451,659 | |
Ford Motor Co., 4.75%, 1/15/43 | | | 45 | | | | 32,199 | |
Ford Motor Credit Co., LLC, 3.375%, 11/13/25 | | | 200 | | | | 180,724 | |
General Motors Financial Co., Inc., 4.30%, 4/6/29 | | | 438 | | | | 402,379 | |
Hyatt Hotels Corp.: | | | | | | | | |
1.30%, 10/1/23 | | | 149 | | | | 144,357 | |
1.80%, 10/1/24 | | | 61 | | | | 57,707 | |
Lithia Motors, Inc.: | | | | | | | | |
3.875%, 6/1/29(1)(7) | | | 417 | | | | 355,103 | |
4.375%, 1/15/31(1)(7) | | | 70 | | | | 59,794 | |
Macy’s Retail Holdings, LLC, 4.30%, 2/15/43 | | | 30 | | | | 18,956 | |
Magallanes, Inc.: | | | | | | | | |
5.05%, 3/15/42(1) | | | 336 | | | | 286,384 | |
5.141%, 3/15/52(1) | | | 246 | | | | 206,802 | |
MDC Holdings, Inc., 2.50%, 1/15/31 | | | 61 | | | | 45,085 | |
Powdr Corp., 6.00%, 8/1/25(1) | | | 92 | | | | 91,777 | |
| |
| | |
| | | | | | $ | 4,984,209 | |
| |
| | |
Consumer, Non-cyclical — 1.4% | | | | | | | | |
| |
| | |
Ashtead Capital, Inc.: | | | | | | | | |
4.00%, 5/1/28(1) | | $ | 200 | | | $ | 180,710 | |
4.25%, 11/1/29(1) | | | 384 | | | | 338,200 | |
Avantor Funding, Inc., 4.625%, 7/15/28(1) | | | 329 | | | | 302,460 | |
Avon Products, Inc., 8.45%, 3/15/43 | | | 33 | | | | 31,978 | |
Block Financial, LLC, 3.875%, 8/15/30 | | | 575 | | | | 517,700 | |
Centene Corp.: | | | | | | | | |
2.50%, 3/1/31 | | | 372 | | | | 296,439 | |
3.375%, 2/15/30 | | | 199 | | | | 169,332 | |
4.25%, 12/15/27 | | | 257 | | | | 240,698 | |
4.625%, 12/15/29 | | | 36 | | | | 33,676 | |
Coca-Cola Europacific Partners PLC, 1.50%, 1/15/27(1) | | | 221 | | | | 196,268 | |
Coca-Cola Femsa SAB de CV, 1.85%, 9/1/32 | | | 255 | | | | 198,418 | |
Conservation Fund (The), Green Bonds, 3.474%, 12/15/29 | | | 285 | | | | 263,394 | |
CVS Pass-Through Trust, 6.036%, 12/10/28 | | | 305 | | | | 313,140 | |
Doris Duke Charitable Foundation (The), 2.345%, 7/1/50 | | | 678 | | | | 459,513 | |
Ford Foundation (The), 2.415%, 6/1/50 | | | 435 | | | | 311,142 | |
Natura & Co. Luxembourg Holdings S.a.r.l., | | | | | | | | |
6.00%, 4/19/29(1)(7) | | | 414 | | | | 365,268 | |
Natura Cosmeticos S.A., 4.125%, 5/3/28(1) | | | 288 | | | | 237,542 | |
Perrigo Finance Unlimited Co., 4.40%, 6/15/30 | | | 305 | | | | 272,603 | |
Royalty Pharma PLC, 3.55%, 9/2/50 | | | 431 | | | | 301,800 | |
Smithfield Foods, Inc.: | | | | | | | | |
2.625%, 9/13/31(1) | | | 323 | | | | 255,415 | |
| | | | |
| | 11 | | See Notes to Financial Statements. |
Calvert
VP SRI Balanced Portfolio
June 30, 2022
Schedule of Investments (Unaudited) — continued
| | | | | | | | |
| Security | | Principal
Amount
(000’s omitted) | | | Value | |
| |
| | |
Consumer, Non-cyclical (continued) | | | | | | | | |
| |
| | |
Smithfield Foods, Inc.: (continued) | | | | | | | | |
3.00%, 10/15/30(1) | | $ | 77 | | | $ | 63,923 | |
5.20%, 4/1/29(1) | | | 45 | | | | 44,256 | |
| |
| | |
| | | | | | $ | 5,393,875 | |
| |
| | |
Energy — 0.4% | | | | | | | | |
| |
| | |
NuStar Logistics, L.P.: | | | | | | | | |
6.00%, 6/1/26 | | $ | 439 | | | $ | 411,242 | |
6.375%, 10/1/30 | | | 137 | | | | 119,250 | |
TerraForm Power Operating, LLC: | | | | | | | | |
4.75%, 1/15/30(1) | | | 486 | | | | 417,107 | |
5.00%, 1/31/28(1) | | | 743 | | | | 674,362 | |
| |
| | |
| | | | | | $ | 1,621,961 | |
| |
| | |
Financial — 8.3% | | | | | | | | |
| |
| | |
AerCap Ireland Capital DAC/AerCap Global Aviation Trust: | | | | | | | | |
2.875%, 8/14/24 | | $ | 150 | | | $ | 143,014 | |
3.50%, 1/15/25 | | | 222 | | | | 212,233 | |
4.50%, 9/15/23 | | | 291 | | | | 289,792 | |
6.50%, 7/15/25 | | | 175 | | | | 179,311 | |
Affiliated Managers Group, Inc., 3.30%, 6/15/30 | | | 225 | | | | 203,546 | |
Agree, L.P., 2.00%, 6/15/28 | | | 122 | | | | 104,328 | |
Air Lease Corp.: | | | | | | | | |
2.875%, 1/15/26 | | | 355 | | | | 326,437 | |
2.875%, 1/15/32 | | | 119 | | | | 93,006 | |
Alliance Data Systems Corp., 4.75%, 12/15/24(1) | | | 420 | | | | 385,764 | |
Alliant Holdings Intermediate, LLC/Alliant Holdings Co-Issuer, 6.75%, 10/15/27(1) | | | 60 | | | | 53,401 | |
American Assets Trust, L.P., 3.375%, 2/1/31 | | | 84 | | | | 71,969 | |
American National Group, Inc., 6.144%, 6/13/32(1) | | | 70 | | | | 69,426 | |
Andrew W. Mellon Foundation (The), 0.947%, 8/1/27 | | | 335 | | | | 294,238 | |
Australia & New Zealand Banking Group, Ltd., 2.95% to 7/22/25, 7/22/30(1)(8) | | | 458 | | | | 432,306 | |
Banco de Chile, 2.99%, 12/9/31(1) | | | 289 | | | | 241,853 | |
Banco Santander S.A., 1.722% to 9/14/26, 9/14/27(8) | | | 400 | | | | 347,473 | |
Bank of America Corp.: | | | | | | | | |
1.734% to 7/22/26, 7/22/27(8) | | | 830 | | | | 739,210 | |
1.898% to 7/23/30, 7/23/31(8) | | | 227 | | | | 181,625 | |
1.922% to 10/24/30, 10/24/31(8) | | | 288 | | | | 230,313 | |
2.087% to 6/14/28, 6/14/29(8) | | | 379 | | | | 324,914 | |
2.299% to 7/21/31, 7/21/32(8) | | | 379 | | | | 306,649 | |
2.456% to 10/22/24, 10/22/25(8) | | | 949 | | | | 904,919 | |
2.551% to 2/4/27, 2/4/28(8) | | | 522 | | | | 475,140 | |
2.60%, (SOFR + 1.10%), 4/25/25(3) | | | 100 | | | | 99,453 | |
2.83%, (SOFR + 1.33%), 4/2/26(3) | | | 617 | | | | 609,192 | |
3.846% to 3/8/32, 3/8/37(8) | | | 1,478 | | | | 1,279,175 | |
| | | | | | | | |
| Security | | Principal
Amount
(000’s omitted) | | | Value | |
| |
| | |
Financial (continued) | | | | | | | | |
| |
| | |
BankUnited, Inc., 5.125%, 6/11/30 | | $ | 147 | | | $ | 142,530 | |
BBVA Bancomer S.A./Texas: | | | | | | | | |
1.875%, 9/18/25(1) | | | 262 | | | | 237,914 | |
5.125% to 1/18/28, 1/18/33(1)(8) | | | 500 | | | | 424,235 | |
Boston Properties, L.P., 2.45%, 10/1/33 | | | 750 | | | | 577,024 | |
BPCE S.A., 3.648% to 1/14/32, 1/14/37(1)(8) | | | 261 | | | | 219,086 | |
Broadstone Net Lease, LLC, 2.60%, 9/15/31 | | | 24 | | | | 19,599 | |
Brown & Brown, Inc.: | | | | | | | | |
2.375%, 3/15/31 | | | 40 | | | | 31,705 | |
4.20%, 3/17/32 | | | 50 | | | | 45,573 | |
Capital One Financial Corp.: | | | | | | | | |
3.273% to 3/1/29, 3/1/30(8) | | | 256 | | | | 226,777 | |
3.30%, 10/30/24 | | | 209 | | | | 204,141 | |
3.75%, 7/28/26 | | | 122 | | | | 116,809 | |
4.20%, 10/29/25 | | | 190 | | | | 187,773 | |
4.927% to 5/10/27, 5/10/28(8) | | | 352 | | | | 348,901 | |
CI Financial Corp.: | | | | | | | | |
3.20%, 12/17/30 | | | 477 | | | | 373,461 | |
4.10%, 6/15/51 | | | 269 | | | | 174,713 | |
Citigroup, Inc.: | | | | | | | | |
1.281% to 11/3/24, 11/3/25(8) | | | 228 | | | | 211,875 | |
2.17%, (SOFR + 0.67%), 5/1/25(3)(7) | | | 104 | | | | 102,042 | |
2.78%, (SOFR + 1.28%), 2/24/28(3) | | | 536 | | | | 514,551 | |
3.106% to 4/8/25, 4/8/26(8) | | | 285 | | | | 273,942 | |
3.785% to 3/17/32, 3/17/33(8) | | | 510 | | | | 459,956 | |
3.887% to 1/10/27, 1/10/28(8) | | | 205 | | | | 197,258 | |
4.00% to 12/10/25(8)(9) | | | 310 | | | | 268,925 | |
Corporate Office Properties, L.P., 2.90%, 12/1/33 | | | 226 | | | | 175,409 | |
Discover Bank, 4.682% to 8/9/23, 8/9/28(8) | | | 270 | | | | 262,592 | |
Enact Holdings, Inc., 6.50%, 8/15/25(1) | | | 461 | | | | 435,640 | |
EPR Properties: | | | | | | | | |
3.75%, 8/15/29 | | | 516 | | | | 429,937 | |
4.50%, 6/1/27 | | | 376 | | | | 340,666 | |
Extra Space Storage, L.P., 2.55%, 6/1/31 | | | 293 | | | | 241,376 | |
GA Global Funding Trust: | | | | | | | | |
2.25%, 1/6/27(1) | | | 677 | | | | 606,118 | |
2.90%, 1/6/32(1) | | | 537 | | | | 446,816 | |
Goldman Sachs Group, Inc. (The): | | | | | | | | |
1.948% to 10/21/26, 10/21/27(8) | | | 531 | | | | 470,307 | |
2.08%, (SOFR + 0.58%), 3/8/24(3) | | | 155 | | | | 152,510 | |
2.64% to 2/24/27, 2/24/28(8) | | | 150 | | | | 136,247 | |
2.65% to 10/21/31, 10/21/32(8) | | | 286 | | | | 235,990 | |
3.102% to 2/24/32, 2/24/33(8) | | | 91 | | | | 77,809 | |
HAT Holdings I, LLC/HAT Holdings II, LLC: | | | | | | | | |
3.375%, 6/15/26(1) | | | 871 | | | | 751,320 | |
| | | | |
| | 12 | | See Notes to Financial Statements. |
Calvert
VP SRI Balanced Portfolio
June 30, 2022
Schedule of Investments (Unaudited) — continued
| | | | | | | | |
| Security | | Principal
Amount
(000’s omitted) | | | Value | |
| |
| | |
Financial (continued) | | | | | | | | |
| |
| | |
HAT Holdings I, LLC/HAT Holdings II, LLC: (continued) | | | | | | | | |
3.75%, 9/15/30(1) | | $ | 158 | | | $ | 126,308 | |
6.00%, 4/15/25(1)(7) | | | 283 | | | | 271,489 | |
HSBC Holdings PLC, 2.251% to 11/22/26, 11/22/27(8) | | | 508 | | | | 452,999 | |
Iron Mountain, Inc.: | | | | | | | | |
4.50%, 2/15/31(1) | | | 449 | | | | 368,180 | |
5.00%, 7/15/28(1) | | | 161 | | | | 142,895 | |
JPMorgan Chase & Co.: | | | | | | | | |
1.47% to 9/22/26, 9/22/27(8) | | | 618 | | | | 542,459 | |
2.08%, (SOFR + 0.58%), 3/16/24(3) | | | 69 | | | | 68,194 | |
2.10%, (SOFR + 0.60%), 12/10/25(3) | | | 103 | | | | 99,657 | |
2.68%, (SOFR + 1.18%), 2/24/28(3) | | | 378 | | | | 363,641 | |
2.739% to 10/15/29, 10/15/30(8) | | | 185 | | | | 161,571 | |
2.82%, (SOFR + 1.32%), 4/26/26(3) | | | 315 | | | | 310,180 | |
4.586% to 4/26/32, 4/26/33(8) | | | 131 | | | | 128,810 | |
KKR Group Finance Co. VII, LLC, 3.625%, 2/25/50(1) | | | 301 | | | | 232,086 | |
KKR Group Finance Co. X, LLC, 3.25%, 12/15/51(1) | | | 109 | | | | 77,374 | |
Liberty Mutual Group, Inc., 4.125% to 9/15/26, 12/15/51(1)(8) | | | 289 | | | | 230,979 | |
Life Storage, L.P., 2.40%, 10/15/31 | | | 382 | | | | 304,438 | |
Macquarie Bank, Ltd.: | | | | | | | | |
3.052% to 3/3/31, 3/3/36(1)(8) | | | 630 | | | | 500,228 | |
3.624%, 6/3/30(1) | | | 255 | | | | 222,642 | |
National Bank of Canada, 0.55% to 11/15/23, 11/15/24(8) | | | 301 | | | | 287,116 | |
Newmark Group, Inc., 6.125%, 11/15/23 | | | 134 | | | | 133,731 | |
OneMain Finance Corp.: | | | | | | | | |
3.50%, 1/15/27 | | | 594 | | | | 476,040 | |
7.125%, 3/15/26 | | | 58 | | | | 53,741 | |
PennyMac Financial Services, Inc., 4.25%, 2/15/29(1) | | | 53 | | | | 39,053 | |
PNC Financial Services Group, Inc. (The), 2.20%, 11/1/24 | | | 875 | | | | 848,190 | |
Radian Group, Inc.: | | | | | | | | |
4.875%, 3/15/27 | | | 483 | | | | 433,602 | |
6.625%, 3/15/25 | | | 37 | | | | 36,189 | |
Rocket Mortgage, LLC/Rocket Mortgage Co-Issuer, Inc.: | | | | | | | | |
2.875%, 10/15/26(1) | | | 161 | | | | 133,506 | |
3.875%, 3/1/31(1) | | | 485 | | | | 364,790 | |
Sabra Health Care, L.P., 3.20%, 12/1/31 | | | 465 | | | | 369,547 | |
SITE Centers Corp., 3.625%, 2/1/25 | | | 259 | | | | 251,984 | |
Societe Generale S.A., 6.221% to 6/15/32, 6/15/33(1)(8) | | | 255 | | | | 243,665 | |
Standard Chartered PLC: | | | | | | | | |
1.214% to 3/23/24, 3/23/25(1)(8) | | | 200 | | | | 188,697 | |
1.456% to 1/14/26, 1/14/27(1)(8) | | | 226 | | | | 199,572 | |
1.822% to 11/23/24, 11/23/25(1)(8) | | | 236 | | | | 218,735 | |
Stifel Financial Corp., 4.00%, 5/15/30 | | | 266 | | | | 247,414 | |
Sun Communities Operating, L.P.: | | | | | | | | |
2.30%, 11/1/28 | | | 141 | | | | 120,738 | |
| | | | | | | | |
| Security | | Principal
Amount
(000’s omitted) | | | Value | |
| |
| | |
Financial (continued) | | | | | | | | |
| |
| | |
Sun Communities Operating, L.P.: (continued) | | | | | | | | |
2.70%, 7/15/31 | | $ | 112 | | | $ | 90,384 | |
4.20%, 4/15/32 | | | 328 | | | | 298,627 | |
Synovus Bank/Columbus, GA, 4.00% to 10/29/25, 10/29/30(8) | | | 250 | | | | 242,606 | |
Synovus Financial Corp.: | | | | | | | | |
3.125%, 11/1/22 | | | 156 | | | | 155,803 | |
5.90% to 2/7/24, 2/7/29(8) | | | 35 | | | | 33,840 | |
Texas Capital Bancshares, Inc., 4.00% to 5/6/26, 5/6/31(8) | | | 240 | | | | 221,194 | |
Toronto-Dominion Bank (The), 2.09%, (SOFR + 0.59%), 9/10/26(3) | | | 467 | | | | 454,288 | |
Truist Financial Corp., 5.10% to 3/1/30(7)(8)(9) | | | 409 | | | | 372,190 | |
UBS AG, 1.25%, 6/1/26(1) | | | 331 | | | | 294,484 | |
UBS Group AG: | | | | | | | | |
2.095% to 2/11/31, 2/11/32(1)(8) | | | 359 | | | | 285,403 | |
4.375% to 2/10/31(1)(8)(9) | | | 219 | | | | 160,768 | |
UniCredit SpA, 5.459% to 6/30/30, 6/30/35(1)(8) | | | 200 | | | | 161,800 | |
United Overseas Bank, Ltd., 3.863% to 10/7/27, 10/7/32(1)(8) | | | 249 | | | | 238,427 | |
Westpac Banking Corp., 3.02% to 11/18/31, 11/18/36(8) | | | 223 | | | | 179,819 | |
| |
| | |
| | | | | | $ | 31,160,287 | |
| |
| | |
Government - Multinational — 1.9% | | | | | | | | |
| |
| | |
Asian Development Bank, 3.125%, 9/26/28 | | $ | 540 | | | $ | 536,795 | |
European Bank for Reconstruction & Development, 1.50%, 2/13/25 | | | 475 | | | | 456,182 | |
European Investment Bank: | | | | | | | | |
1.625%, 5/13/31(7) | | | 925 | | | | 820,634 | |
2.375%, 5/24/27(7) | | | 1,026 | | | | 991,486 | |
2.875%, 6/13/25(1) | | | 1,892 | | | | 1,881,531 | |
Inter-American Development Bank, 0.875%, 4/3/25 | | | 377 | | | | 354,588 | |
International Bank for Reconstruction & Development: | | | | | | | | |
1.63%, (SOFR + 0.13%), 1/13/23(3) | | | 621 | | | | 621,071 | |
3.125%, 11/20/25 | | | 1,200 | | | | 1,200,508 | |
International Finance Corp., 1.59%, (SOFR + 0.09%), 4/3/24(3) | | | 246 | | | | 246,021 | |
| |
| | |
| | | | | | $ | 7,108,816 | |
| |
| | |
Government - Regional — 0.2% | | | | | | | | |
| |
| | |
Kommuninvest I Sverige AB, 0.375%, 6/19/24(1) | | $ | 720 | | | $ | 682,393 | |
| |
| | |
| | | | | | $ | 682,393 | |
| |
| | |
Industrial — 0.6% | | | | | | | | |
| |
| | |
Imola Merger Corp., 4.75%, 5/15/29(1) | | $ | 264 | | | $ | 221,757 | |
Jabil, Inc.: | | | | | | | | |
3.00%, 1/15/31 | | | 881 | | | | 740,790 | |
3.60%, 1/15/30 | | | 493 | | | | 439,546 | |
| | | | |
| | 13 | | See Notes to Financial Statements. |
Calvert
VP SRI Balanced Portfolio
June 30, 2022
Schedule of Investments (Unaudited) — continued
| | | | | | | | |
| Security | | Principal
Amount
(000’s omitted) | | | Value | |
| |
| | |
Industrial (continued) | | | | | | | | |
| |
| | |
Owens Corning, 3.95%, 8/15/29 | | $ | 631 | | | $ | 585,928 | |
Valmont Industries, Inc.: | | | | | | | | |
5.00%, 10/1/44 | | | 55 | | | | 50,334 | |
5.25%, 10/1/54 | | | 340 | | | | 325,072 | |
| |
| | |
| | | | | | $ | 2,363,427 | |
| |
| | |
Other Revenue — 0.2% | | | | | | | | |
| |
| | |
BlueHub Loan Fund, Inc., 3.099%, 1/1/30 | | $ | 675 | | | $ | 613,737 | |
| |
| | |
| | | | | | $ | 613,737 | |
| |
| | |
Technology — 0.4% | | | | | | | | |
| |
| | |
DXC Technology Co., 2.375%, 9/15/28 | | $ | 228 | | | $ | 196,419 | |
HP, Inc., 4.00%, 4/15/29 | | | 263 | | | | 246,636 | |
Kyndryl Holdings, Inc.: | | | | | | | | |
2.05%, 10/15/26(1) | | | 380 | | | | 320,159 | |
2.70%, 10/15/28(1)(7) | | | 151 | | | | 120,407 | |
Seagate HDD Cayman: | | | | | | | | |
3.375%, 7/15/31 | | | 435 | | | | 338,898 | |
4.091%, 6/1/29 | | | 320 | | | | 275,801 | |
5.75%, 12/1/34(7) | | | 180 | | | | 158,724 | |
| |
| | |
| | | | | | $ | 1,657,044 | |
| |
| | |
Utilities — 0.9% | | | | | | | | |
| |
| | |
AES Corp. (The), 2.45%, 1/15/31 | | $ | 675 | | | $ | 543,559 | |
American Water Capital Corp.: | | | | | | | | |
2.30%, 6/1/31 | | | 41 | | | | 34,771 | |
2.95%, 9/1/27 | | | 193 | | | | 181,267 | |
Avangrid, Inc., 3.15%, 12/1/24 | | | 141 | | | | 137,833 | |
Clearway Energy Operating, LLC, 3.75%, 1/15/32(1) | | | 176 | | | | 139,757 | |
Enel Finance International N.V., 1.375%, 7/12/26(1) | | | 567 | | | | 498,224 | |
MidAmerican Energy Co.: | | | | | | | | |
3.15%, 4/15/50 | | | 215 | | | | 168,997 | |
4.25%, 7/15/49 | | | 300 | | | | 279,033 | |
NextEra Energy Capital Holdings, Inc., 1.90%, 6/15/28 | | | 371 | | | | 322,955 | |
NextEra Energy Operating Partners, L.P.: | | | | | | | | |
4.25%, 9/15/24(1) | | | 34 | | | | 32,594 | |
4.50%, 9/15/27(1) | | | 60 | | | | 55,676 | |
Niagara Mohawk Power Corp., 1.96%, 6/27/30(1) | | | 233 | | | | 193,004 | |
Pattern Energy Operations, L.P./Pattern Energy Operations, Inc., 4.50%, 8/15/28(1) | | | 664 | | | | 578,918 | |
| |
| | |
| | | | | | $ | 3,166,588 | |
| |
| |
Total Corporate Bonds
(identified cost $71,277,725) | | | $ | 62,819,790 | |
| |
| | | | | | | | |
Preferred Stocks — 0.3% | | | | | | | | |
| | |
| Security | | Shares | | | Value | |
| |
| | |
Oil, Gas & Consumable Fuels — 0.1% | | | | | | | | |
| |
| | |
NuStar Energy, L.P., Series B, 7.673%, (3 mo. USD LIBOR + 5.643%)(3)(7) | | | 9,964 | | | $ | 205,159 | |
| |
| | |
| | | | | | $ | 205,159 | |
| |
|
Real Estate Management & Development — 0.1% | |
| |
| | |
Brookfield Property Partners, L.P.: | | | | | | | | |
Series A, 5.75% | | | 13,670 | | | $ | 233,483 | |
Series A2, 6.375% | | | 12,000 | | | | 236,520 | |
| |
| | |
| | | | | | $ | 470,003 | |
| |
|
Wireless Telecommunication Services — 0.1% | |
| |
| | |
United States Cellular Corp.: | | | | | | | | |
5.50% | | | 21,600 | | | $ | 401,112 | |
6.25% | | | 2,200 | | | | 45,100 | |
| |
| | |
| | | | | | $ | 446,212 | |
| |
| |
Total Preferred Stocks
(identified cost $1,468,576) | | | $ | 1,121,374 | |
| |
|
Senior Floating-Rate Loans — 0.7%(10) | |
| | |
| Borrower/Description | | Principal
Amount
(000’s omitted) | | | Value | |
| |
| | |
Automobiles — 0.0%(11) | | | | | | | | |
| |
| | |
Bombardier Recreational Products, Inc., Term Loan, 3.666%, (1 mo. USD LIBOR + 2.00%), 5/24/27 | | $ | 68 | | | $ | 62,528 | |
| |
| | |
| | | | | | $ | 62,528 | |
| |
|
Diversified Telecommunication Services — 0.2% | |
| |
| | |
CenturyLink, Inc., Term Loan, 3.916%, (1 mo. USD LIBOR + 2.25%), 3/15/27 | | $ | 320 | | | $ | 294,420 | |
Level 3 Financing, Inc., Term Loan, 3.416%, (1 mo. USD LIBOR + 1.75%), 3/1/27 | | | 74 | | | | 68,955 | |
Ziggo Financing Partnership, Term Loan, 3.824%, (1 mo. USD LIBOR + 2.50%), 4/30/28 | | | 325 | | | | 303,672 | |
| |
| | |
| | | | | | $ | 667,047 | |
| |
| | |
Health Care Technology — 0.1% | | | | | | | | |
| |
| | |
Change Healthcare Holdings, LLC, Term Loan, 4.166%, (1 mo. USD LIBOR + 2.50%), 3/1/24 | | $ | 175 | | | $ | 170,691 | |
| |
| | |
| | | | | | $ | 170,691 | |
| |
| | |
IT Services — 0.1% | | | | | | | | |
| |
| | |
Asurion, LLC: | | | | | | | | |
Term Loan, 4.791%, (1 mo. USD LIBOR + 3.125%), 11/3/23 | | $ | 97 | | | $ | 93,484 | |
| | | | |
| | 14 | | See Notes to Financial Statements. |
Calvert
VP SRI Balanced Portfolio
June 30, 2022
Schedule of Investments (Unaudited) — continued
| | | | | | | | |
| Borrower/Description | | Principal
Amount
(000’s omitted) | | | Value | |
| |
| | |
IT Services (continued) | | | | | | | | |
| |
| | |
Asurion, LLC: (continued) | | | | | | | | |
Term Loan, 4.916%, (1 mo. USD LIBOR + 3.25%), 12/23/26 | | $ | 59 | | | $ | 53,744 | |
Informatica, LLC, Term Loan, 4.438%, (1 mo. USD LIBOR + 2.75%), 10/27/28 | | | 299 | | | | 284,849 | |
| |
| | |
| | | | | | $ | 432,077 | |
| |
|
Real Estate Management & Development — 0.1% | |
| |
| | |
Cushman & Wakefield U.S. Borrower, LLC, Term Loan, 4.416%, (1 mo. USD LIBOR + 2.75%), 8/21/25 | | $ | 290 | | | $ | 273,024 | |
| |
| | |
| | | | | | $ | 273,024 | |
| |
| | |
Software — 0.1% | | | | | | | | |
| |
| | |
Hyland Software, Inc., Term Loan, 5.166%, (1 mo. USD LIBOR + 3.50%), 7/1/24 | | $ | 204 | | | $ | 197,786 | |
Seattle Spinco, Inc., Term Loan, 4.416%, (1 mo. USD LIBOR + 2.75%), 6/21/24 | | | 69 | | | | 66,172 | |
Ultimate Software Group, Inc. (The), Term Loan, 5.416%, (1 mo. USD LIBOR + 3.75%), 5/4/26 | | | 246 | | | | 232,162 | |
| |
| | |
| | | | | | $ | 496,120 | |
| |
| | |
Specialty Retail — 0.1% | | | | | | | | |
| |
| | |
Petsmart, Inc., Term Loan, 4.50%, (6 mo. USD LIBOR + 3.75%, Floor 0.75%), 2/11/28 | | $ | 399 | | | $ | 376,177 | |
| |
| | |
| | | | | | $ | 376,177 | |
| |
| |
Total Senior Floating-Rate Loans
(identified cost $2,622,066) | | | $ | 2,477,664 | |
| |
| |
Sovereign Government Bonds — 0.7% | | | | | |
| | |
| Security | | Principal
Amount
(000’s omitted) | | | Value | |
| |
| | |
Kreditanstalt fuer Wiederaufbau: | | | | | | | | |
0.75%, 9/30/30 | | $ | 235 | | | $ | 194,571 | |
1.00%, 10/1/26 | | | 1,526 | | | | 1,398,707 | |
2.00%, 9/29/22 | | | 1,048 | | | | 1,047,807 | |
| |
| |
Total Sovereign Government Bonds
(identified cost $2,793,626) | | | $ | 2,641,085 | |
| |
| | | | | | | | |
| |
Taxable Municipal Obligations — 1.6% | | | | | |
| | |
| Security | | Principal
Amount
(000’s omitted) | | | Value | |
| |
| | |
General Obligations — 0.4% | | | | | | | | |
| |
| | |
Los Angeles Unified School District, CA, 5.75%, 7/1/34(12) | | $ | 450 | | | $ | 500,715 | |
Massachusetts, Green Bonds, 3.277%, 6/1/46 | | | 435 | | | | 365,487 | |
New York City, NY, 5.206%, 10/1/31(12) | | | 470 | | | | 502,585 | |
San Francisco City and County, CA, (Social Bonds - Affordable Housing, 2016), 3.921%, 6/15/39 | | | 285 | | | | 268,083 | |
| |
| | |
| | | | | | $ | 1,636,870 | |
| |
| | |
Special Tax Revenue — 0.6% | | | | | | | | |
| |
| | |
California Health Facilities Financing Authority, (No Place Like Home Program): | | | | | | | | |
2.361%, 6/1/26 | | $ | 405 | | | $ | 385,536 | |
2.484%, 6/1/27 | | | 290 | | | | 273,139 | |
2.534%, 6/1/28 | | | 360 | | | | 333,086 | |
2.584%, 6/1/29 | | | 200 | | | | 182,396 | |
2.984%, 6/1/33 | | | 220 | | | | 193,640 | |
Connecticut, Special Tax Revenue, 5.459%, 11/1/30(12) | | | 300 | | | | 320,043 | |
New York City Transitional Finance Authority, NY, Future Tax Secured Revenue Bonds, 5.767%, 8/1/36(12) | | | 600 | | | | 656,796 | |
| |
| | |
| | | | | | $ | 2,344,636 | |
| |
| | |
Water and Sewer — 0.6% | | | | | | | | |
| |
| | |
District of Columbia Water & Sewer Authority, Green Bonds, 4.814%, 10/1/2114 | | $ | 130 | | | $ | 130,996 | |
Narragansett Bay Commission, RI, Wastewater System Revenue: | | | | | | | | |
Green Bonds, 2.094%, 9/1/30 | | | 170 | | | | 147,495 | |
Green Bonds, 2.184%, 9/1/31 | | | 140 | | | | 120,009 | |
Green Bonds, 2.264%, 9/1/32 | | | 125 | | | | 105,868 | |
Green Bonds, 2.344%, 9/1/33 | | | 135 | | | | 112,529 | |
San Diego County Water Authority, CA: | | | | | | | | |
Green Bonds, 1.531%, 5/1/30 | | | 145 | | | | 121,401 | |
Green Bonds, 1.701%, 5/1/31 | | | 130 | | | | 107,058 | |
Green Bonds, 1.951%, 5/1/34 | | | 75 | | | | 58,768 | |
San Francisco City and County Public Utilities Commission, CA, Water Revenue, Green Bonds, 3.303%, 11/1/39 | | | 1,440 | | | | 1,275,091 | |
| |
| | |
| | | | | | $ | 2,179,215 | |
| |
| |
Total Taxable Municipal Obligations
(identified cost $6,765,265) | | | $ | 6,160,721 | |
| |
| | | | |
| | 15 | | See Notes to Financial Statements. |
Calvert
VP SRI Balanced Portfolio
June 30, 2022
Schedule of Investments (Unaudited) — continued
| | | | | | | | |
U.S. Government Agencies and Instrumentalities — 0.5% | |
| | |
| Security | | Principal
Amount
(000’s omitted) | | | Value | |
| |
| | |
U.S. Department of Housing and Urban Development: | | | | | | | | |
2.547%, 8/1/22 | | $ | 137 | | | $ | 137,140 | |
2.618%, 8/1/23 | | | 69 | | | | 68,664 | |
2.668%, 8/1/24 | | | 240 | | | | 236,998 | |
2.738%, 8/1/25 | | | 240 | | | | 236,616 | |
3.435%, 8/1/34 | | | 220 | | | | 221,656 | |
3.485%, 8/1/35 | | | 125 | | | | 127,780 | |
3.585%, 8/1/37 | | | 225 | | | | 237,938 | |
U.S. International Development Finance Corp.: | | | | | | | | |
3.22%, 9/15/29 | | | 337 | | | | 335,287 | |
3.52%, 9/20/32 | | | 323 | | | | 323,733 | |
| |
| |
Total U.S. Government Agencies and Instrumentalities
(identified cost $1,966,709) | | | $ | 1,925,812 | |
| |
|
U.S. Government Agency Mortgage-Backed Securities — 3.3% | |
| | |
| Security | | Principal
Amount
(000’s omitted) | | | Value | |
| |
| | |
Federal Home Loan Mortgage Corp., Pool #ZT0383, 3.50%, 3/1/48 | | $ | 100 | | | $ | 97,277 | |
Federal National Mortgage Association: | | | | | | | | |
3.50%, 30-Year, TBA(13) | | | 3,354 | | | | 3,224,948 | |
4.00%, 30-Year, TBA(13) | | | 5,749 | | | | 5,668,152 | |
4.50%, 30-Year, TBA(13) | | | 1,450 | | | | 1,455,551 | |
Pool #AN1909, 2.68%, 7/1/26 | | | 344 | | | | 334,682 | |
Pool #BM3990, 4.00%, 3/1/48 | | | 264 | | | | 264,245 | |
Pool #FM1867, 3.00%, 11/1/49 | | | 277 | | | | 260,904 | |
Pool #FM6803, 2.00%, 4/1/51 | | | 238 | | | | 207,934 | |
Pool #MA3149, 4.00%, 10/1/47 | | | 320 | | | | 319,893 | |
Government National Mortgage Association II: | | | | | | | | |
Pool #CB2653, 2.50%, 3/20/51 | | | 320 | | | | 291,466 | |
Pool #CB8629, 2.50%, 4/20/51 | | | 474 | | | | 432,176 | |
| |
| |
Total U.S. Government Agency Mortgage-Backed Securities
(identified cost $12,856,360) | | | $ | 12,557,228 | |
| |
|
U.S. Treasury Obligations — 7.0% | |
| | |
| Security | | Principal
Amount
(000’s omitted) | | | Value | |
| |
| | |
U.S. Treasury Bonds: | | | | | | | | |
1.125%, 8/15/40 | | $ | 99 | | | $ | 68,438 | |
1.375%, 8/15/50 | | | 497 | | | | 327,370 | |
1.875%, 2/15/41 | | | 481 | | | | 377,444 | |
1.875%, 2/15/51 | | | 227 | | | | 170,383 | |
| | | | | | | | |
| Security | | Principal
Amount
(000’s omitted) | | | Value | |
| |
| | |
U.S. Treasury Bonds: (continued) | | | | | | | | |
1.875%, 11/15/51 | | $ | 368 | | | $ | 276,230 | |
2.00%, 11/15/41 | | | 795 | | | | 631,714 | |
2.00%, 8/15/51 | | | 338 | | | | 261,382 | |
2.25%, 5/15/41 | | | 3,172 | | | | 2,648,291 | |
2.25%, 2/15/52 | | | 523 | | | | 430,576 | |
U.S. Treasury Notes: | | | | | | | | |
0.125%, 12/31/22 | | | 1,098 | | | | 1,084,902 | |
0.125%, 12/15/23 | | | 131 | | | | 125,724 | |
0.125%, 1/15/24 | | | 131 | | | | 125,422 | |
0.125%, 2/15/24 | | | 132 | | | | 126,130 | |
0.25%, 3/15/24 | | | 1,022 | | | | 975,970 | |
0.25%, 6/30/25 | | | 89 | | | | 81,955 | |
0.375%, 10/31/23 | | | 109 | | | | 105,347 | |
0.375%, 4/15/24 | | | 345 | | | | 329,394 | |
0.375%, 9/30/27 | | | 166 | | | | 144,417 | |
0.75%, 11/15/24 | | | 105 | | | | 99,578 | |
0.875%, 11/15/30 | | | 54 | | | | 45,607 | |
1.00%, 7/31/28 | | | 155 | | | | 137,108 | |
1.125%, 1/15/25 | | | 301 | | | | 287,102 | |
1.125%, 2/29/28 | | | 1,356 | | | | 1,219,553 | |
1.25%, 12/31/26 | | | 1,384 | | | | 1,279,362 | |
1.25%, 3/31/28 | | | 581 | | | | 524,988 | |
1.25%, 4/30/28 | | | 1,022 | | | | 922,036 | |
1.25%, 6/30/28 | | | 303 | | | | 272,617 | |
1.375%, 10/31/28 | | | 33 | | | | 29,758 | |
1.375%, 11/15/31 | | | 612 | | | | 530,910 | |
1.50%, 1/31/27 | | | 152 | | | | 141,939 | |
1.625%, 5/15/31 | | | 107 | | | | 95,631 | |
1.743%, (3 mo. Treasury Bill Rate - 0.015%), 1/31/24(3) | | | 264 | | | | 264,308 | |
1.875%, 2/28/27 | | | 3,887 | | | | 3,689,613 | |
1.875%, 2/15/32 | | | 610 | | | | 552,717 | |
2.125%, 3/31/24 | | | 2,650 | | | | 2,611,596 | |
2.625%, 4/15/25 | | | 310 | | | | 306,670 | |
2.75%, 4/30/27 | | | 824 | | | | 812,960 | |
2.875%, 4/30/29 | | | 4,465 | | | | 4,413,373 | |
| |
| |
Total U.S. Treasury Obligations
(identified cost $28,536,630) | | | $ | 26,528,515 | |
| |
| | | | |
| | 16 | | See Notes to Financial Statements. |
Calvert
VP SRI Balanced Portfolio
June 30, 2022
Schedule of Investments (Unaudited) — continued
| | | | | | | | |
Short-Term Investments — 1.9% | |
| | |
Affiliated Fund — 1.7% | | | | | | | | |
| |
| | |
| Security | | Shares | | | Value | |
| |
| | |
Morgan Stanley Institutional Liquidity Funds - Government Portfolio, Institutional Class,
1.38%(14) | | | 6,228,467 | | | $ | 6,228,467 | |
| |
| | |
Total Affiliated Fund
(identified cost $6,228,467) | | | | | | $ | 6,228,467 | |
| |
| | |
Securities Lending Collateral — 0.2% | | | | | | | | |
| |
| | |
| Security | | Shares | | | Value | |
| |
| | |
State Street Navigator Securities Lending Government Money Market Portfolio,
1.56%(15) | | | 822,318 | | | $ | 822,318 | |
| |
| | |
Total Securities Lending Collateral
(identified cost $822,318) | | | | | | $ | 822,318 | |
| |
| | |
Total Short-Term Investments
(identified cost $7,050,785) | | | | | | $ | 7,050,785 | |
| |
| | |
Total Investments — 102.2%
(identified cost $349,095,470) | | | | | | $ | 384,661,234 | |
| |
| |
Other Assets, Less Liabilities — (2.2)% | | | $ | (8,125,419 | ) |
| |
| | |
Net Assets — 100.0% | | | | | | $ | 376,535,815 | |
| |
The percentage shown for each investment category in the Schedule of Investments is based on net assets.
| (1) | Security exempt from registration under Rule 144A of the Securities Act of 1933, as amended. These securities may be sold in certain transactions in reliance on an exemption from registration (normally to qualified institutional buyers). At June 30, 2022, the aggregate value of these securities is $61,952,342 or 16.5% of the Fund’s net assets. |
| (2) | Weighted average fixed-rate coupon that changes/updates monthly. Rate shown is the rate at June 30, 2022. |
| (3) | Variable rate security. The stated interest rate represents the rate in effect at June 30, 2022. |
| (4) | Represents an investment in an issuer that may be deemed to be an affiliate (see Note 9). |
| (5) | Non-income producing security. |
| (6) | Security exempt from registration under Regulation S of the Securities Act of 1933, as amended, which exempts from registration securities offered and sold outside the United States. Security may not be offered or sold in the United States except pursuant to an exemption from, or in a transaction not subject to, the registration requirements of the Securities Act of 1933, as amended. At June 30, 2022, the aggregate value of these securities is $195,679 or less than 0.05% of the Fund’s net assets. |
| (7) | All or a portion of this security was on loan at June 30, 2022. The aggregate market value of securities on loan at June 30, 2022 was $3,144,324. |
| (8) | Security converts to variable rate after the indicated fixed-rate coupon period. |
| (9) | Perpetual security with no stated maturity date but may be subject to calls by the issuer. |
| (10) | Senior floating-rate loans (Senior Loans) often require prepayments from excess cash flows or permit the borrowers to repay at their election. The degree to which borrowers repay, whether as a contractual requirement or at their election, cannot be predicted with accuracy. As a result, the actual remaining maturity may be substantially less than the stated maturities shown. However, Senior Loans will typically have an expected average life of approximately two to four years. Senior Loans typically have rates of interest which are redetermined periodically by reference to a base lending rate, plus a spread. These base lending rates are primarily the London Interbank Offered Rate (“LIBOR”) or the Secured Overnight Financing Rate (“SOFR”) and secondarily, the prime rate offered by one or more major United States banks (the “Prime Rate”). Base lending rates may be subject to a floor, or minimum rate. Rates for SOFR are generally 1 or 3-month tenors and may also be subject to a credit spread adjustment. Senior Loans are generally subject to contractual restrictions that must be satisfied before they can be bought or sold. |
| (11) | Amount is less than 0.05%. |
| (12) | Build America Bond. Represents taxable municipal obligation issued pursuant to the American Recovery and Reinvestment Act of 2009 or other legislation providing for the issuance of taxable municipal debt on which the issuer receives federal support. |
| (13) | TBA (To Be Announced) securities are purchased on a forward commitment basis with an approximate principal amount and maturity date. The actual principal amount and maturity date are determined upon settlement. |
| (14) | May be deemed to be an affiliated investment company. The rate shown is the annualized seven-day yield as of June 30, 2022. |
| (15) | Represents investment of cash collateral received in connection with securities lending. |
| | | | |
| | 17 | | See Notes to Financial Statements. |
Calvert
VP SRI Balanced Portfolio
June 30, 2022
Schedule of Investments (Unaudited) — continued
Futures Contracts
| | | | | | | | | | | | | | | | | | | | |
| Description | | Number of
Contracts | | | Position | | | Expiration
Date | | | Notional
Amount | | | Value/
Unrealized
Appreciation
(Depreciation) | |
| |
| | | | | |
Interest Rate Futures | | | | | | | | | | | | | | | | | | | | |
U.S. 2-Year Treasury Note | | | 35 | | | | Long | | | | 9/30/22 | | | $ | 7,350,547 | | | | $ (40,429 | ) |
U.S. 5-Year Treasury Note | | | 38 | | | | Long | | | | 9/30/22 | | | | 4,265,500 | | | | (35,096 | ) |
U.S. Long Treasury Bond | | | 47 | | | | Long | | | | 9/21/22 | | | | 6,515,375 | | | | (57,723 | ) |
U.S. Ultra-Long Treasury Bond | | | 30 | | | | Long | | | | 9/21/22 | | | | 4,630,313 | | | | (86,497 | ) |
U.S. Long Treasury Bond | | | (1 | ) | | | Short | | | | 9/21/22 | | | | (138,625 | ) | | | 2,319 | |
U.S. Ultra 10-Year Treasury Note | | | (106 | ) | | | Short | | | | 9/21/22 | | | | (13,501,750 | ) | | | 202,951 | |
U.S. Ultra-Long Treasury Bond | | | (6 | ) | | | Short | | | | 9/21/22 | | | | (926,063 | ) | | | 20,509 | |
| |
| | | | | |
| | | | | | | | | | | | | | | | | | | $ 6,034 | |
| |
Abbreviations:
| | | | | | |
| LIBOR | | – | | London Interbank Offered Rate | | |
| | | |
| SOFR | | – | | Secured Overnight Financing Rate | | |
| | | |
| TBA | | – | | To Be Announced | | |
| |
| Currency Abbreviations: | | |
| | | |
| USD | | – | | United States Dollar | | |
| | | | |
| | 18 | | See Notes to Financial Statements. |
Calvert
VP SRI Balanced Portfolio
June 30, 2022
Statement of Assets and Liabilities (Unaudited)
| | | | |
| Assets | | June 30, 2022 | |
| |
| |
Investments in securities of unaffiliated issuers, at value (identified cost $341,179,317) - including $3,144,324 of securities on loan | | $ | 376,783,389 | |
Investments in securities of affiliated issuers, at value (identified cost $7,916,153) | | | 7,877,845 | |
Receivable for variation margin on open futures contracts | | | 39,983 | |
Cash | | | 153,599 | |
Deposits at broker for futures contracts | | | 438,000 | |
Receivable for investments sold | | | 1,944,553 | |
Receivable for capital shares sold | | | 312,081 | |
Dividends and interest receivable | | | 1,172,824 | |
Dividends and interest receivable - affiliated | | | 6,429 | |
Securities lending income receivable | | | 722 | |
Tax reclaims receivable | | | 46,374 | |
Directors’ deferred compensation plan | | | 156,983 | |
| |
| |
Total assets | | $ | 388,932,782 | |
| |
| |
| Liabilities | | | |
| |
| |
Payable for investments purchased | | $ | 546,543 | |
Payable for when-issued/delayed delivery/forward commitment securities | | | 10,445,732 | |
Payable for capital shares redeemed | | | 155,057 | |
Deposits for securities loaned | | | 822,318 | |
Payable to affiliates: | | | | |
Investment advisory fee | | | 128,210 | |
Administrative fee | | | 37,675 | |
Distribution and service fees | | | 2,530 | |
Sub-transfer agency fee | | | 294 | |
Directors’ deferred compensation plan | | | 156,983 | |
Accrued expenses | | | 101,625 | |
| |
| |
Total liabilities | | $ | 12,396,967 | |
| |
| |
Net Assets | | $ | 376,535,815 | |
| |
| |
| Sources of Net Assets | | | |
| |
| |
Paid-in capital | | $ | 295,525,777 | |
Distributable earnings | | | 81,010,038 | |
| |
| |
Net Assets | | $ | 376,535,815 | |
| |
| |
| Class I Shares | | | |
| |
| |
Net Assets | | $ | 364,356,597 | |
| |
Shares Outstanding | | | 155,253,323 | |
| |
Net Asset Value, Offering Price and Redemption Price Per Share | | | | |
(net assets ÷ shares of beneficial interest outstanding) | | $ | 2.35 | |
| |
| |
| Class F Shares | | | |
| |
| |
Net Assets | | $ | 12,179,218 | |
| |
Shares Outstanding | | | 5,210,406 | |
| |
Net Asset Value, Offering Price and Redemption Price Per Share | | | | |
(net assets ÷ shares of beneficial interest outstanding) | | $ | 2.34 | |
| |
| | | | |
| | 19 | | See Notes to Financial Statements. |
Calvert
VP SRI Balanced Portfolio
June 30, 2022
Statement of Operations (Unaudited)
| | | | |
| Investment Income | | Six Months Ended
June 30, 2022 | |
| |
Dividend income (net of foreign taxes withheld of $2,714) | | | $ 1,801,979 | |
Dividend income - affiliated issuers | | | 8,469 | |
Interest and other income (net of foreign taxes withheld of $622) | | | 2,293,481 | |
Interest income - affiliated issuers | | | 16,700 | |
Securities lending income, net | | | 5,777 | |
| |
Total investment income | | | $ 4,126,406 | |
| |
| Expenses | | | |
| |
Investment advisory fee | | | $ 845,090 | |
Administrative fee | | | 247,343 | |
Distribution and service fees: | | | | |
Class F | | | 16,387 | |
Directors’ fees and expenses | | | 9,819 | |
Custodian fees | | | 10,333 | |
Transfer agency fees and expenses | | | 82,602 | |
Accounting fees | | | 69,698 | |
Professional fees | | | 22,621 | |
Reports to shareholders | | | 7,909 | |
Miscellaneous | | | 10,733 | |
| |
Total expenses | | | $ 1,322,535 | |
Waiver and/or reimbursement of expenses by affiliate | | | $ (914 | ) |
| |
Net expenses | | | $ 1,321,621 | |
| |
Net investment income | | | $ 2,804,785 | |
| |
| Realized and Unrealized Gain (Loss) | | | |
| |
Net realized gain (loss): | | | | |
Investment securities | | | $ 1,298,494 | |
Investment securities - affiliated issuers | | | 971 | |
Futures contracts | | | (365,560 | ) |
| |
Net realized gain | | | $ 933,905 | |
Change in unrealized appreciation (depreciation): | | | | |
Investment securities | | | $(74,020,083 | ) |
Investment securities - affiliated issuers | | | (19,248 | ) |
Futures contracts | | | 181,444 | |
Foreign currency | | | (1,833 | ) |
| |
Net change in unrealized appreciation (depreciation) | | | $(73,859,720 | ) |
| |
Net realized and unrealized loss | | | $(72,925,815 | ) |
| |
Net decrease in net assets from operations | | | $(70,121,030 | ) |
| | | | |
| | 20 | | See Notes to Financial Statements. |
Calvert
VP SRI Balanced Portfolio
June 30, 2022
Statements of Changes in Net Assets
| | | | | | | | | | |
| Increase (Decrease) in Net Assets | | Six Months Ended
June 30, 2022
(Unaudited) | | Year Ended
December 31,
2021 |
| | |
From operations: | | | | | | | | | | |
Net investment income | | | $ | 2,804,785 | | | | $ | 4,584,745 | |
Net realized gain | | | | 933,905 | | | | | 37,979,705 | |
Net change in unrealized appreciation (depreciation) | | | | (73,859,720 | ) | | | | 18,037,454 | |
| | |
Net increase (decrease) in net assets from operations | | | $ | (70,121,030 | ) | | | $ | 60,601,904 | |
Distributions to shareholders: | | | | | | | | | | |
Class I | | | $ | — | | | | $ | (18,133,416) | |
Class F | | | | — | | | | | (482,625) | |
| | |
Total distributions to shareholders | | | $ | — | | | | $ | (18,616,041) | |
Capital share transactions: | | | | | | | | | | |
Class I | | | $ | (13,700,391 | ) | | | $ | (3,410,574) | |
Class F | | | | 1,437,218 | | | | | 4,225,654 | |
| | |
Net increase (decrease) in net assets from capital share transactions | | | $ | (12,263,173 | ) | | | $ | 815,080 | |
| | |
Net increase (decrease) in net assets | | | $ | (82,384,203 | ) | | | $ | 42,800,943 | |
| | |
| Net Assets | | | | |
| | |
At beginning of period | | | $ | 458,920,018 | | | | $ | 416,119,075 | |
| | |
At end of period | | | $ | 376,535,815 | | | | $ | 458,920,018 | |
| | | | |
| | 21 | | See Notes to Financial Statements. |
Calvert
VP SRI Balanced Portfolio
June 30, 2022
Financial Highlights
| | | | | | | | | | | | | | | | | | | | | | | | | | | | | | |
| |
| | | Class I |
| | |
| | | Six Months Ended June 30, 2022 (Unaudited) | | Year Ended December 31, |
| | 2021 | | 2020 | | 2019 | | 2018 | | 2017 |
| | | | | | |
Net asset value — Beginning of period | | | $ | 2.78 | | | | $ | 2.52 | | | | $ | 2.29 | | | | $ | 1.94 | | | | $ | 2.23 | | | | $ | 2.05 | |
| | | | | | |
| Income (Loss) From Operations | | | | | | | | | | | | |
| | | | | | |
Net investment income(1) | | | $ | 0.02 | | | | $ | 0.03 | | | | $ | 0.03 | | | | $ | 0.04 | | | | $ | 0.04 | | | | $ | 0.04 | |
Net realized and unrealized gain (loss) | | | | (0.45 | ) | | | | 0.34 | | | | | 0.31 | | | | | 0.43 | | | | | (0.08 | ) | | | | 0.20 | |
| | | | | | |
Total income (loss) from operations | | | $ | (0.43 | ) | | | $ | 0.37 | | | | $ | 0.34 | | | | $ | 0.47 | | | | $ | (0.04 | ) | | | $ | 0.24 | |
| | | | | | |
| Less Distributions | | | | | | | | | | | | |
| | | | | | |
From net investment income | | | $ | — | | | | $ | (0.03 | ) | | | $ | (0.04 | ) | | | $ | (0.04 | ) | | | $ | (0.04 | ) | | | $ | (0.04 | ) |
From net realized gain | | | | — | | | | | (0.08 | ) | | | | (0.07 | ) | | | | (0.08 | ) | | | | (0.21 | ) | | | | (0.02 | ) |
| | | | | | |
Total distributions | | | $ | — | | | | $ | (0.11 | ) | | | $ | (0.11 | ) | | | $ | (0.12 | ) | | | $ | (0.25 | ) | | | $ | (0.06 | ) |
| | | | | | |
Net asset value — End of period | | | $ | 2.35 | | | | $ | 2.78 | | | | $ | 2.52 | | | | $ | 2.29 | | | | $ | 1.94 | | | | $ | 2.23 | |
| | | | | | |
Total Return(2) | | | | (15.47 | )%(3) | | | | 15.12 | % | | | | 15.26 | % | | | | 24.40 | % | | | | (2.67 | )% | | | | 12.16 | % |
| | | | | | |
| Ratios/Supplemental Data | | | | | | | | | | | | |
| | | | | | |
Net assets, end of period (000’s omitted) | | | $ | 364,357 | | | | $ | 445,917 | | | | $ | 408,223 | | | | $ | 362,392 | | | | $ | 296,345 | | | | $ | 329,060 | |
Ratios (as a percentage of average daily net assets):(4) | | | | | | | | | | | | | | | | | | | | | | | | | | | | | | |
Total expenses | | | | 0.63 | %(5) | | | | 0.63 | % | | | | 0.63 | % | | | | 0.62 | % | | | | 0.72 | % | | | | 0.69 | % |
Net expenses | | | | 0.63 | %(5)(6) | | | | 0.63 | % | | | | 0.63 | % | | | | 0.62 | % | | | | 0.70 | % | | | | 0.68 | % |
Net investment income | | | | 1.37 | %(5) | | | | 1.04 | % | | | | 1.39 | % | | | | 1.68 | % | | | | 1.66 | % | | | | 1.73 | % |
Portfolio Turnover | | | | 43 | %(3)(7) | | | | 93 | %(7) | | | | 104 | %(7) | | | | 70 | %(7) | | | | 77 | % | | | | 132 | % |
| (1) | Computed using average shares outstanding. |
| (2) | Returns are historical and are calculated by determining the percentage change in net asset value with all distributions reinvested and do not reflect fees and expenses imposed by variable annuity contracts or variable life insurance policies. If included, total return would be lower. |
| (4) | Total expenses do not reflect amounts reimbursed and/or waived by the adviser and certain of its affiliates, if applicable. Net expenses are net of all reductions and represent the net expenses paid by the Fund. |
| (6) | The investment adviser reduced a portion of its advisory fee (equal to less than 0.005% of average daily net assets for the six months ended June 30, 2022). |
| (7) | Includes the effect of To-Be-Announced (TBA) transactions. |
| | | | |
| | 22 | | See Notes to Financial Statements. |
Calvert
VP SRI Balanced Portfolio
June 30, 2022
Financial Highlights — continued
| | | | | | | | | | | | | | | | | | | | | | | | | | | | | | |
| |
| | | Class F |
| | |
| | | Six Months Ended June 30, 2022 (Unaudited) | | Year Ended December 31, |
| | 2021 | | 2020 | | 2019 | | 2018 | | 2017 |
| | | | | | |
Net asset value — Beginning of period | | | $ | 2.77 | | | | $ | 2.52 | | | | $ | 2.30 | | | | $ | 1.95 | | | | $ | 2.24 | | | | $ | 2.08 | |
| | | | | | |
| Income (Loss) From Operations | | | | | | | | | | | | |
| | | | | | |
Net investment income(1) | | | $ | 0.01 | | | | $ | 0.02 | | | | $ | 0.03 | | | | $ | 0.03 | | | | $ | 0.03 | | | | $ | 0.03 | |
Net realized and unrealized gain (loss) | | | | (0.44 | ) | | | | 0.34 | | | | | 0.30 | | | | | 0.44 | | | | | (0.07 | ) | | | | 0.19 | |
| | | | | | |
Total income (loss) from operations | | | $ | (0.43 | ) | | | $ | 0.36 | | | | $ | 0.33 | | | | $ | 0.47 | | | | $ | (0.04 | ) | | | $ | 0.22 | |
| | | | | | |
| Less Distributions | | | | | | | | | | | | |
| | | | | | |
From net investment income | | | $ | — | | | | $ | (0.03 | ) | | | $ | (0.04 | ) | | | $ | (0.04 | ) | | | $ | (0.04 | ) | | | $ | (0.04 | ) |
From net realized gain | | | | — | | | | | (0.08 | ) | | | | (0.07 | ) | | | | (0.08 | ) | | | | (0.21 | ) | | | | (0.02 | ) |
| | | | | | |
Total distributions | | | $ | — | | | | $ | (0.11 | ) | | | $ | (0.11 | ) | | | $ | (0.12 | ) | | | $ | (0.25 | ) | | | $ | (0.06 | ) |
| | | | | | |
Net asset value — End of period | | | $ | 2.34 | | | | $ | 2.77 | | | | $ | 2.52 | | | | $ | 2.30 | | | | $ | 1.95 | | | | $ | 2.24 | |
| | | | | | |
Total Return(2) | | | | (15.52 | )%(3) | | | | 14.72 | % | | | | 14.76 | % | | | | 24.28 | % | | | | (2.65 | )% | | | | 11.01 | % |
| | | | | | |
| Ratios/Supplemental Data | | | | | | | | | | | | |
| | | | | | |
Net assets, end of period (000’s omitted) | | | $ | 12,179 | | | | $ | 13,003 | | | | $ | 7,896 | | | | $ | 5,023 | | | | $ | 1,920 | | | | $ | 1,540 | |
Ratios (as a percentage of average daily net assets):(4) | | | | | | | | | | | | | | | | | | | | | | | | | | | | | | |
Total expenses | | | | 0.88 | %(5) | | | | 0.88 | % | | | | 0.88 | % | | | | 0.86 | % | | | | 0.96 | % | | | | 1.40 | % |
Net expenses | | | | 0.88 | %(5)(6) | | | | 0.88 | % | | | | 0.88 | % | | | | 0.86 | % | | | | 0.96 | % | | | | 1.08 | % |
Net investment income | | | | 1.13 | %(5) | | | | 0.79 | % | | | | 1.13 | % | | | | 1.44 | % | | | | 1.40 | % | | | | 1.30 | % |
Portfolio Turnover | | | | 43 | %(3)(7) | | | | 93 | %(7) | | | | 104 | %(7) | | | | 70 | %(7) | | | | 77 | % | | | | 132 | % |
| (1) | Computed using average shares outstanding. |
| (2) | Returns are historical and are calculated by determining the percentage change in net asset value with all distributions reinvested and do not reflect fees and expenses imposed by variable annuity contracts or variable life insurance policies. If included, total return would be lower. |
| (4) | Total expenses do not reflect amounts reimbursed and/or waived by the adviser and certain of its affiliates, if applicable. Net expenses are net of all reductions and represent the net expenses paid by the Fund. |
| (6) | The investment adviser reduced a portion of its advisory fee (equal to less than 0.005% of average daily net assets for the six months ended June 30, 2022). |
| (7) | Includes the effect of To-Be-Announced (TBA) transactions. |
| | | | |
| | 23 | | See Notes to Financial Statements. |
Calvert
VP SRI Balanced Portfolio
June 30, 2022
Notes to Financial Statements (Unaudited)
1 Significant Accounting Policies
Calvert VP SRI Balanced Portfolio (the Fund) is a diversified series of Calvert Variable Series, Inc. (the Corporation). The Corporation is a Maryland corporation registered under the Investment Company Act of 1940, as amended (the 1940 Act), as an open-end management investment company. The investment objective of the Fund is to seek to provide a competitive total return through an actively managed portfolio of stocks, bonds and money market instruments which offer income and capital growth opportunity.
Shares of the Fund are sold without sales charge to insurance companies for allocation to certain of their variable separate accounts and to qualified pension and retirement plans and other eligible investors. The Fund offers Class I and Class F shares. Among other things, each class has different: (a) dividend rates due to differences in Distribution Plan expenses and other class-specific expenses; (b) exchange privileges; and (c) class-specific voting rights.
The Fund applies the accounting and reporting guidance in the Financial Accounting Standards Board (FASB) Accounting Standards Codification Topic 946, Financial Services – Investment Companies (ASC 946). Subsequent events, if any, through the date that the financial statements were issued have been evaluated in the preparation of the financial statements.
A Investment Valuation — Net asset value per share is determined every business day as of the close of the regular session of the New York Stock Exchange (generally 4:00 p.m. Eastern time). The Fund uses independent pricing services approved by the Board of Directors (the Board) to value its investments wherever possible. Investments for which market quotations are not available or deemed not reliable are fair valued in good faith under the direction of the Board.
U.S. generally accepted accounting principles (U.S. GAAP) establishes a disclosure hierarchy that categorizes the inputs to valuation techniques used to value assets and liabilities at measurement date. These inputs are summarized in the three broad levels listed below:
Level 1 - quoted prices in active markets for identical securities
Level 2 - other significant observable inputs (including quoted prices for similar securities, interest rates, prepayment speeds, credit risk, etc.)
Level 3 - significant unobservable inputs (including the Fund’s own assumptions in determining the fair value of investments)
The inputs or methodologies used for valuing securities are not necessarily an indication of the risk associated with investing in those securities.
Valuation techniques used to value the Fund’s investments by major category are as follows:
Equity Securities. Equity securities (including warrants and rights) listed on a U.S. securities exchange generally are valued at the last sale or closing price as reported by an independent pricing service on the primary market or exchange on which they are traded and are categorized as Level 1 in the hierarchy. Equity securities listed on the NASDAQ National Market System are valued at the NASDAQ official closing price and are categorized as Level 1 in the hierarchy. Unlisted or listed securities for which closing sales prices or closing quotations are not available are valued at the mean between the latest available bid and ask prices and are categorized as Level 2 in the hierarchy.
Debt Securities. Debt securities are generally valued based on valuations provided by third party pricing services, as derived from such services’ pricing models. Inputs to the models may include, but are not limited to, reported trades, executable bid and ask prices, broker/dealer quotations, prices or yields of securities with similar characteristics, interest rates, anticipated prepayments, benchmark curves or information pertaining to the issuer, as well as industry and economic events. Accordingly, debt securities are generally categorized as Level 2 in the hierarchy. Short-term debt securities with a remaining maturity at time of purchase of more than sixty days are valued based on valuations provided by a third party pricing service. Such securities are generally categorized as Level 2 in the hierarchy. Short-term debt securities of sufficient credit quality purchased with remaining maturities of sixty days or less for which a valuation from a third party pricing service is not readily available may be valued at amortized cost, which approximates fair value, and are categorized as Level 2 in the hierarchy.
Senior Floating-Rate Loans. Interests in senior floating-rate loans for which reliable market quotations are readily available are valued generally at the average mean of bid and ask quotations obtained from a third party pricing service, and are categorized as Level 2 in the hierarchy.
Other Securities. Investments in management investment companies (including money market funds) that do not trade on an exchange are valued at the net asset value as of the close of each business day and are categorized as Level 1 in the hierarchy.
Derivatives. Futures contracts are valued at unrealized appreciation (depreciation) based on the settlement price established each day by the board of trade or exchange on which they are traded and are categorized as Level 1 in the hierarchy.
Fair Valuation. If a market value cannot be determined for a security using the methodologies described above, or if, in the good faith opinion of the Fund’s adviser, the market value does not constitute a readily available market quotation, or if a significant event has occurred that would materially affect the value of the security, the security will be fair valued as determined in good faith by or at the direction of the Board in a manner that most fairly reflects the security’s “fair value”, which is the amount that the Fund might reasonably expect to receive for the security upon its current sale in the ordinary course. Each such determination is based on a consideration of relevant factors, which are likely to vary from one pricing context to another. These factors may include, but are not limited to, the type of security, the existence of any contractual restrictions on the security’s disposition, the price and extent of public
24
Calvert
VP SRI Balanced Portfolio
June 30, 2022
Notes to Financial Statements (Unaudited) — continued
trading in similar securities of the issuer or of comparable companies or entities, quotations or relevant information obtained from broker/dealers or other market participants, information obtained from the issuer, analysts, and/or the appropriate stock exchange (for exchange-traded securities), an analysis of the company’s or entity’s financial statements, and an evaluation of the forces that influence the issuer and the market(s) in which the security is purchased and sold.
The values assigned to fair value investments are based on available information and do not necessarily represent amounts that might ultimately be realized. Further, due to the inherent uncertainty of valuations of such investments, the fair values may differ significantly from the values that would have been used had an active market existed, and the differences could be material.
The following table summarizes the market value of the Fund’s holdings as of June 30, 2022, based on the inputs used to value them:
| | | | | | | | | | | | | | | | |
| Asset Description | | Level 1 | | | Level 2 | | | Level 3 | | | Total | |
| | | | |
Asset-Backed Securities | | $ | — | | | $ | 26,603,988 | | | $ | — | | | $ | 26,603,988 | |
| | | | |
Collateralized Mortgage Obligations | | | — | | | | 5,685,431 | | | | — | | | | 5,685,431 | |
| | | | |
Commercial Mortgage-Backed Securities | | | — | | | | 17,334,533 | | | | — | | | | 17,334,533 | |
| | | | |
Common Stocks | | | 211,507,448 | (1) | | | — | | | | — | | | | 211,507,448 | |
| | | | |
Convertible Bonds | | | — | | | | 246,860 | | | | — | | | | 246,860 | |
| | | | |
Corporate Bonds | | | — | | | | 62,819,790 | | | | — | | | | 62,819,790 | |
| | | | |
Preferred Stocks | | | 1,121,374 | | | | — | | | | — | | | | 1,121,374 | |
| | | | |
Senior Floating-Rate Loans | | | — | | | | 2,477,664 | | | | — | | | | 2,477,664 | |
| | | | |
Sovereign Government Bonds | | | — | | | | 2,641,085 | | | | — | | | | 2,641,085 | |
| | | | |
Taxable Municipal Obligations | | | — | | | | 6,160,721 | | | | — | | | | 6,160,721 | |
| | | | |
U.S. Government Agencies and Instrumentalities | | | — | | | | 1,925,812 | | | | — | | | | 1,925,812 | |
| | | | |
U.S. Government Agency Mortgage-Backed Securities | | | — | | | | 12,557,228 | | | | — | | | | 12,557,228 | |
| | | | |
U.S. Treasury Obligations | | | — | | | | 26,528,515 | | | | — | | | | 26,528,515 | |
| | | | |
Short-Term Investments: | | | | | | | | | | | | | | | | |
| | | | |
Affiliated Fund | | | 6,228,467 | | | | — | | | | — | | | | 6,228,467 | |
| | | | |
Securities Lending Collateral | | | 822,318 | | | | — | | | | — | | | | 822,318 | |
| | | | |
Total Investments | | $ | 219,679,607 | | | $ | 164,981,627 | | | $ | — | | | $ | 384,661,234 | |
| | | | |
Futures Contracts | | $ | 225,779 | | | $ | — | | | $ | — | | | $ | 225,779 | |
| | | | |
Total | | $ | 219,905,386 | | | $ | 164,981,627 | | | $ | — | | | $ | 384,887,013 | |
| | | | |
Liability Description | | | | | | | | | | | | | | | | |
| | | | |
Futures Contracts | | $ | (219,745 | ) | | $ | — | | | $ | — | | | $ | (219,745 | ) |
| | | | |
Total | | $ | (219,745 | ) | | $ | — | | | $ | — | | | $ | (219,745 | ) |
| (1) | The level classification by major category of investments is the same as the category presentation in the Schedule of Investments. |
B Investment Transactions and Income — Investment transactions for financial statement purposes are accounted for on trade date. Realized gains and losses are recorded on an identified cost basis and may include proceeds from litigation. Dividend income is recorded on the ex-dividend date for dividends received in cash and/or securities or, in the case of dividends on certain foreign securities, as soon as the Fund is informed of the ex-dividend date. Non-cash dividends are recorded at the fair value of the securities received. Withholding taxes on foreign dividends and interest, if any, have been provided for in accordance with the Fund’s understanding of the applicable country’s tax rules and rates. Distributions received that represent a return of capital are recorded as a reduction of cost of investments. Distributions received that represent a capital gain are recorded as a realized gain. Interest income, which includes amortization of premium and accretion of discount on debt securities, is accrued as earned. The Fund may earn certain fees in connection with its investments in senior floating-rate loans. These fees are in addition to interest payments earned and may include amendment fees, consent fees and prepayment fees, which are recorded to income as earned.
C Share Class Accounting — Realized and unrealized gains and losses and net investment income and losses, other than class-specific expenses, are allocated daily to each class of shares based upon the relative net assets of each class to the total net assets of the Fund. Expenses arising in connection with a specific class are charged directly to that class.
25
Calvert
VP SRI Balanced Portfolio
June 30, 2022
Notes to Financial Statements (Unaudited) — continued
D Foreign Currency Transactions — The Fund’s accounting records are maintained in U.S. dollars. For valuation of assets and liabilities on each date of net asset value determination, foreign denominations are converted into U.S. dollars using the current exchange rate. Security transactions, income and expenses are translated at the prevailing rate of exchange on the date of the event. Recognized gains or losses on investment transactions attributable to changes in foreign currency exchange rates are recorded for financial statement purposes as net realized gains and losses on investments. That portion of unrealized gains and losses on investments that results from fluctuations in foreign currency exchange rates is not separately disclosed.
E Senior Floating-Rate Loans — The Fund may invest in direct debt instruments, which are interests in amounts owed to lenders or lending syndicates by corporate, governmental, or other borrowers. The Fund’s investment in loans may be in the form of participations in loans or assignments of all or a portion of loans from third parties. A loan is often administered by a bank or other financial institution (the lender) that acts as agent for all holders. The agent administers the terms of the loan, as specified in the loan agreement. The Fund may invest in multiple series or tranches of a loan, which may have varying terms and carry different associated risks. When the Fund purchases assignments from lenders, it acquires direct rights against the borrower of the loan. When investing in a loan participation, the Fund has the right to receive payments of principal, interest and any fees to which it is entitled only from the lender selling the loan agreement and only upon receipt of such payments by the lender from the borrower. The Fund generally has no right to enforce compliance by the borrower with the terms of the loan agreement. As a result, the Fund may be subject to the credit risk of both the borrower and the lender that is issuing the participation interest.
F Unfunded Loan Commitments — The Fund may enter into certain loan agreements all or a portion of which may be unfunded. The Fund is obligated to fund these commitments at the borrower’s discretion. The commitments, if any, are disclosed in the accompanying Schedule of Investments.
G Futures Contracts — The Fund may enter into futures contracts to buy or sell a financial instrument for a set price at a future date. Initial margin deposits of either cash or securities as required by the broker are made upon entering into the contract. While the contract is open, daily variation margin payments are made to or received from the broker reflecting the daily change in market value of the contract and are recorded for financial reporting purposes as unrealized gains or losses by the Fund. When a futures contract is closed, a realized gain or loss is recorded equal to the difference between the opening and closing value of the contract. The risks associated with entering into futures contracts may include the possible illiquidity of the secondary market which would limit the Fund’s ability to close out a futures contract prior to the settlement date, an imperfect correlation between the value of the contracts and the underlying financial instruments, or that the counterparty will fail to perform its obligations under the contracts’ terms. Futures contracts are designed by boards of trade, which are designated “contracts markets” by the Commodities Futures Trading Commission. Futures contracts trade on the contracts markets in a manner that is similar to the way a stock trades on a stock exchange, and the boards of trade, through their clearing corporations, guarantee the futures contracts against default. As a result, there is minimal counterparty credit risk to the Fund.
H Options Contracts — Upon the purchase of a call or put option, the premium paid by the Fund is included in the Statement of Assets and Liabilities as an investment. The amount of the investment is subsequently marked-to-market to reflect the current market value of the option purchased, in accordance with the Fund’s policies on investment valuations discussed above. Premiums paid for purchasing options that expire are treated as realized losses. Premiums paid for purchasing options that are exercised or closed are added to the amounts paid or offset against the proceeds on the underlying investment transaction to determine the realized gain or loss. As the purchaser of an index option, the Fund has the right to receive a cash payment equal to any depreciation in the value of the index below the exercise price of the option (in the case of a put) or equal to any appreciation in the value of the index over the exercise price of the option (in the case of a call) as of the valuation date of the option. The risk associated with purchasing options is limited to the premium originally paid. Purchased options traded over-the-counter involve risk that the issuer or counterparty will fail to perform its contractual obligations.
I Distributions to Shareholders — Distributions to shareholders are recorded by the Fund on ex-dividend date. The Fund distributes any net investment income and net realized capital gains at least annually. Both types of distributions are made in shares of the Fund unless an election is made on behalf of a separate account to receive some or all of the distributions in cash. Distributions are declared separately for each class of shares. Distributions are determined in accordance with income tax regulations, which may differ from U.S. GAAP; accordingly, periodic reclassifications are made within the Fund’s capital accounts to reflect income and gains available for distribution under income tax regulations.
J Estimates — The preparation of financial statements in conformity with U.S. GAAP requires management to make estimates and assumptions that affect the reported amounts of assets and liabilities and disclosure of contingent assets and liabilities at the date of the financial statements and the reported amounts of increases and decreases in net assets from operations during the reporting period. Actual results could differ from those estimates.
K Indemnifications — The Corporation’s By-Laws provide for indemnification for Directors or officers of the Corporation and certain other parties, to the fullest extent permitted by Maryland law and the 1940 Act, provided certain conditions are met. Additionally, in the normal course of business, the Fund enters into agreements with service providers that may contain indemnification clauses. The Fund’s maximum exposure under these arrangements is unknown as this would involve future claims that may be made against the Fund that have not yet occurred.
L Federal Income Taxes — No provision for federal income or excise tax is required since the Fund intends to continue to qualify as a regulated investment company under the Internal Revenue Code and to distribute substantially all of its taxable earnings.
26
Calvert
VP SRI Balanced Portfolio
June 30, 2022
Notes to Financial Statements (Unaudited) — continued
Management has analyzed the Fund’s tax positions taken for all open federal income tax years and has concluded that no provision for federal income tax is required in the Fund’s financial statements. A Fund’s federal tax return is subject to examination by the Internal Revenue Service for a period of three years from the date of filing.
M When-Issued Securities and Delayed Delivery Transactions — The Fund may purchase securities on a delayed delivery, when-issued or forward commitment basis, including TBA (To Be Announced) securities. Payment and delivery may take place after the customary settlement period for that security. At the time the transaction is negotiated, the price of the security that will be delivered is fixed. The Fund maintains cash and/or security positions for these commitments such that sufficient liquid assets will be available to make payments upon settlement. Securities purchased on a delayed delivery, when-issued or forward commitment basis are marked-to-market daily and begin earning interest on settlement date. Such security purchases are subject to the risk that when delivered they will be worth less than the agreed upon payment price. Losses may also arise if the counterparty does not perform under the contract. A forward purchase commitment may be closed by entering into an offsetting commitment. If an offsetting commitment is entered into, the Fund will realize a gain or loss on investments based on the price established when the Fund entered into the commitment.
N Interim Financial Statements — The interim financial statements relating to June 30, 2022 and for the six months then ended have not been audited by an independent registered public accounting firm, but in the opinion of the Fund’s management, reflect all adjustments, consisting only of normal recurring adjustments, necessary for the fair presentation of the financial statements.
| 2 Related Party Transactions | |
The investment advisory fee is earned by Calvert Research and Management (CRM), an indirect, wholly-owned subsidiary of Morgan Stanley, as compensation for investment advisory services rendered to the Fund. The investment advisory fee is computed at an annual rate as a percentage of the Fund’s average daily net assets as follows and is payable monthly:
| | |
| Average Daily Net Assets | | Annual Fee
Rate |
| |
Up to and including $500 million | | 0.410% |
Over $500 million up to and including $1 billion | | 0.360% |
Over $1 billion | | 0.325% |
For the six months ended June 30, 2022, the investment advisory fee amounted to $845,090 or 0.41% (annualized) of the Fund’s average daily net assets.
Effective April 26, 2022, the Fund may invest in a money market fund, the Institutional Class of the Morgan Stanley Institutional Liquidity Funds - Government Portfolio (the “Liquidity Fund”), an open-end management investment company managed by Morgan Stanley Investment Management Inc., a wholly-owned subsidiary of Morgan Stanley. The investment advisory fee paid by the Fund is reduced by an amount equal to its pro-rata share of the advisory and administration fees paid by the Fund due to its investment in the Liquidity Fund. For the six months ended June 30, 2022, the investment advisory fee paid was reduced by $914 relating to the Fund’s investment in the Liquidity Fund. Prior to April 26, 2022, the Fund may have invested its cash in Calvert Cash Reserves Fund, LLC (Cash Reserves Fund), an affiliated investment company managed by CRM. CRM did not receive a fee for advisory services provided to Cash Reserves Fund.
The administrative fee is earned by CRM as compensation for administrative services rendered to the Fund. The fee is computed at an annual rate of 0.12% of the Fund’s average daily net assets attributable to Class I and Class F and is payable monthly. For the six months ended June 30, 2022, CRM was paid administrative fees of $247,343.
The Fund has in effect a distribution plan for Class F shares (Class F Plan) pursuant to Rule 12b-1 under the 1940 Act. Pursuant to the Class F Plan, the Fund pays Eaton Vance Distributors, Inc. (EVD), an affiliate of CRM and the Fund’s principal underwriter, a distribution and service fee of 0.25% per annum of its average daily net assets attributable to Class F shares for distribution services and facilities provided to the Fund, as well as for personal and/or account maintenance services provided to the class shareholders. Distribution and service fees paid or accrued for the six months ended June 30, 2022 amounted to $16,387 for Class F shares.
Eaton Vance Management (EVM), an affiliate of CRM, provides sub-transfer agency and related services to the Fund pursuant to a Sub-Transfer Agency Support Services Agreement. For the six months ended June 30, 2022, sub-transfer agency fees and expenses incurred to EVM amounted to $345 and are included in transfer agency fees and expenses on the Statement of Operations.
Each Director of the Fund who is not an employee of CRM or its affiliates receives an annual fee of $214,000, plus an annual Committee fee ranging from $8,500 to $16,500 depending on the Committee. The Board chair receives an additional $30,000 annual fee, Committee chairs receive an additional $6,000 annual fee and the special equities liaison receives an additional $2,500 annual fee. Eligible Directors may participate in a Deferred Compensation Plan (the Plan). Amounts deferred under the Plan are treated as though equal dollar amounts had been invested in shares of the Fund or other Calvert
27
Calvert
VP SRI Balanced Portfolio
June 30, 2022
Notes to Financial Statements (Unaudited) — continued
funds selected by the Directors. The Fund purchases shares of the funds selected equal to the dollar amounts deferred under the Plan, resulting in an asset equal to the deferred compensation liability. Obligations of the Plan are paid solely from the Fund’s assets. Directors’ fees are allocated to each of the Calvert funds served. Salaries and fees of officers and Directors of the Fund who are employees of CRM or its affiliates are paid by CRM.
| 3 Shareholder Servicing Plan | |
The Corporation, on behalf of the Fund, has adopted a Shareholder Servicing Plan (Servicing Plan), which permits the Fund to enter into shareholder servicing agreements with intermediaries that maintain accounts in the Fund for the benefit of shareholders. These services may include, but are not limited to, processing purchase and redemption requests, processing dividend payments, and providing account information to shareholders. Under the Servicing Plan, the Fund may make payments at an annual rate of up to 0.11% of its average daily net assets. For the six months ended June 30, 2022, expenses incurred under the Servicing Plan amounted to $81,654, and are included in transfer agency fees and expenses on the Statement of Operations.
During the six months ended June 30, 2022, the cost of purchases and proceeds from sales of investments, other than U.S. government and agency securities and short-term securities and including maturities, paydowns and principal repayments on senior floating-rate loans, were $97,218,741 and $127,443,988, respectively. Purchases and sales of U.S. government and agency securities, including paydowns and TBA transactions, were $85,267,456 and $78,373,484, respectively.
| 5 Distributions to Shareholders and Income Tax Information | |
The cost and unrealized appreciation (depreciation) of investments, including open derivative contracts, of the Fund at June 30, 2022, as determined on a federal income tax basis, were as follows:
| | | | |
Aggregate cost | | $ | 349,626,692 | |
| |
Gross unrealized appreciation | | $ | 57,123,536 | |
Gross unrealized depreciation | | | (22,082,960 | ) |
| |
Net unrealized appreciation | | $ | 35,040,576 | |
A summary of futures contracts outstanding at June 30, 2022 is included in the Schedule of Investments. During the six months ended June 30, 2022, the Fund used futures contracts and options thereon to hedge against fluctuations in interest rates and to manage overall duration.
At June 30, 2022, the fair value of open derivative instruments (not considered to be hedging instruments for accounting disclosure purposes) and whose primary underlying risk exposure is interest rate risk was as follows:
| | | | | | | | | | |
| Derivative | | Statement of Assets and Liabilities Caption | | Assets | | | Liabilities | |
| | | |
Futures contracts | | Distributable earnings | | $ | 225,779 | (1) | | $ | (219,745 | )(1) |
| (1) | Only the current day’s variation margin is reported within the Statement of Assets and Liabilities as Receivable or Payable for variation margin on open futures contracts, as applicable. |
28
Calvert
VP SRI Balanced Portfolio
June 30, 2022
Notes to Financial Statements (Unaudited) — continued
The effect of derivative instruments (not considered to be hedging instruments for accounting disclosure purposes) on the Statement of Operations and whose primary underlying risk exposure is interest rate risk for the six months ended June 30, 2022 was as follows:
| | | | |
| Statement of Operations Caption | |
| |
Net realized gain (loss): | | | | |
Investment securities(1) | | $ | 1,076 | |
Futures contracts | | | (365,560 | ) |
| |
Total | | $ | (364,484 | ) |
| |
Change in unrealized appreciation (depreciation): | | | | |
Investment securities(1) | | $ | 1,210 | |
Futures contracts | | | 181,444 | |
| |
Total | | $ | 182,654 | |
| (1) | Relates to purchased options. |
The average notional cost of futures contracts (long) and futures contracts (short) outstanding during the six months ended June 30, 2022 was approximately $36,278,000 and $21,493,000, respectively. The average number of purchased options contracts outstanding during the six months ended June 30, 2022 was 7 contracts.
To generate additional income, the Fund may lend its securities pursuant to a securities lending agency agreement with State Street Bank and Trust Company (SSBT), the securities lending agent. Security loans are subject to termination by the Fund at any time and, therefore, are not considered illiquid investments. The Fund requires that the loan be continuously collateralized by either cash or securities in an amount at least equal to the market value of the securities on loan. The market value of securities loaned is determined daily and any additional required collateral is delivered to the Fund on the next business day. Cash collateral is generally invested in a money market fund registered under the 1940 Act that is managed by an affiliate of SSBT. Any gain or loss in the market price of the loaned securities that might occur and any interest earned or dividends declared during the term of the loan would accrue to the account of the Fund. Income earned on the investment of collateral, net of broker rebates and other expenses incurred by the securities lending agent, is split between the Fund and the securities lending agent based on agreed upon contractual terms. Non-cash collateral, if any, is held by the lending agent on behalf of the Fund and cannot be sold or re-pledged by the Fund; accordingly, such collateral is not reflected in the Statement of Assets and Liabilities.
The risks associated with lending portfolio securities include, but are not limited to, possible delays in receiving additional collateral or in the recovery of the loaned securities, possible loss of rights to the collateral should the borrower fail financially, as well as risk of loss in the value of the collateral or the value of the investments made with the collateral. The securities lending agent shall indemnify the Fund in the case of default of any securities borrower.
At June 30, 2022, the total value of securities on loan, including accrued interest, was $3,156,105 and the total value of collateral received was $3,229,117, comprised of cash of $822,318 and U.S. government and/or agencies securities of $2,406,799.
The following table provides a breakdown of securities lending transactions accounted for as secured borrowings, the obligations by class of collateral pledged, and the remaining contractual maturity of those transactions as of June 30, 2022.
| | | | | | | | | | | | | | |
| | | Remaining Contractual Maturity of the Transactions | |
| | | | |
| | | Overnight
and
Continuous | | | <30 days | | 30 to 90
days | | >90 days | | Total |
| |
| | | | | |
Corporate Bonds | | | $822,318 | | | $ — | | $ — | | $ — | | | $822,318 | |
| |
The carrying amount of the liability for deposits for securities loaned at June 30, 2022 approximated its fair value. If measured at fair value, such liability would have been considered as Level 2 in the fair value hierarchy (see Note 1A) at June 30, 2022.
29
Calvert
VP SRI Balanced Portfolio
June 30, 2022
Notes to Financial Statements (Unaudited) — continued
The Fund participates with other portfolios and funds managed by EVM and its affiliates, including CRM, in an $800 million unsecured line of credit with a group of banks, which is in effect through October 25, 2022. Borrowings are made by the Fund solely for temporary purposes related to redemptions and other short-term cash needs. Interest is charged to the Fund based on its borrowings at an amount above either the Secured Overnight Financing Rate (SOFR) or Federal Funds rate. In addition, a fee computed at an annual rate of 0.15% on the daily unused portion of the line of credit is allocated among the participating portfolios and funds at the end of each quarter. In connection with the renewal of the agreement in October 2021, an arrangement fee of $150,000 was incurred that was allocated to the participating portfolios and funds. Because the line of credit is not available exclusively to the Fund, it may be unable to borrow some or all of its requested amounts at any particular time.
The Fund had no borrowings pursuant to its line of credit during the six months ended June 30, 2022.
9 Affiliated Issuers and Funds
The Fund invested in issuers that may be deemed to be affiliated with Morgan Stanley. At June 30, 2022, the value of the Fund’s investment in affiliated issuers and funds was $7,877,845, which represents 2.1% of the Fund’s net assets. Transactions in affiliated issuers and funds by the Fund for the six months ended June 30, 2022 were as follows:
| | | | | | | | | | | | | | | | | | | | | | | | | | | | | | | | |
| Name | | Value,
beginning
of period | | | Purchases | | | Sales
proceeds | | | Net
realized
gain
(loss) | | | Change in
unrealized
appreciation
(depreciation) | | Value, end of period | | Interest/
Dividend
income | | | Principal amount/
Units/Shares,
end of period | |
| |
Commercial Mortgage-Backed Securities | | | | | | | | | | | | | | | | | | | | | | | | | | | | | | | | |
Morgan Stanley Capital I Trust: | | | | | | | | | | | | | | | | | | | | | | | | | | | | | | | | |
Series 2017-CLS, Class A, 2.024%, (1 mo. USD LIBOR + 0.70%), 11/15/34 | | $ | 685,150 | | | | $ — | | | | $ — | | | $ | — | | | | $ (6,516 | ) | | | $ 678,577 | | | | $ 4,017 | | | | $ 685,000 | |
Series 2017-CLS, Class E, 3.274%, (1 mo. USD LIBOR + 1.95%), 11/15/34 | | | 78,896 | | | | — | | | | — | | | | — | | | | (1,927 | ) | | | 76,969 | | | | 967 | | | | 79,000 | |
Series 2017-CLS, Class F, 3.924%, (1 mo. USD LIBOR + 2.60%), 11/15/34 | | | 168,469 | | | | — | | | | — | | | | — | | | | (4,212 | ) | | | 164,105 | | | | 2,468 | | | | 169,000 | |
Series 2019-BPR, Class A, 2.974%, (1 mo. USD LIBOR + 1.65%), 5/15/36 | | | 533,095 | | | | — | | | | (66,412 | ) | | | — | | | | (10,171 | ) | | | 456,512 | | | | 4,993 | | | | 472,588 | |
Series 2019-BPR, Class B, 3.674%, (1 mo. USD LIBOR + 2.35%), 5/15/36 | | | 178,500 | | | | — | | | | — | | | | — | | | | 373 | | | | 178,934 | | | | 2,482 | | | | 187,000 | |
Series 2019-BPR, Class C, 4.624%, (1 mo. USD LIBOR + 3.30%), 5/15/36 | | | 91,069 | | | | — | | | | — | | | | — | | | | 3,212 | | | | 94,281 | | | | 1,773 | | | | 100,000 | |
Short-Term Investments | | | | | | | | | | | | | | | | | | | | | | | | | | | | | | | | |
Cash Reserves Fund | | | 232,492 | | | | 44,420,856 | | | | (44,654,312 | ) | | | 971 | | | | (7 | ) | | | — | | | | 1,243 | | | | — | |
Liquidity Fund | | | — | | | | 23,025,530 | | | | (16,797,063 | ) | | | — | | | | — | | | | 6,228,467 | | | | 7,226 | | | | 6,228,467 | |
| |
| | | | | | | | |
Total | | | | | | | | | | | | | | $ | 971 | | | | $ (19,248 | ) | | | $7,877,845 | | | | $25,169 | | | | | |
| |
30
Calvert
VP SRI Balanced Portfolio
June 30, 2022
Notes to Financial Statements (Unaudited) — continued
10 Capital Shares
The Corporation may issue its shares in one or more series (such as the Fund). The authorized shares of the Fund consist of 500,000,000 common shares, $0.01 par value, for each Class.
Transactions in capital shares for the six months ended June 30, 2022 and the year ended December 31, 2021 were as follows:
| | | | | | | | | | | | | | | | | | | | | | | | | | | | |
| | | Six Months Ended | | | | | | | |
| | | June 30, 2022 | | | Year Ended | | | | |
| | | (Unaudited) | | | December 31, 2021 | | | | |
| | | | | | | | |
| | | Shares | | | | | Amount | | | | | | Shares | | | | | Amount | | | | |
| | | | | | | | |
Class I | | | | | | | | | | | | | | | | | | | | | | | | | | | | |
Shares sold | | | 3,933,175 | | | | | $ | 10,034,253 | | | | | | | | 9,350,542 | | | | | $ | 25,017,694 | | | | | |
Reinvestment of distributions | | | — | | | | | | — | | | | | | | | 6,842,798 | | | | | | 18,133,416 | | | | | |
Shares redeemed | | | (9,331,538 | ) | | | | | (23,734,644 | ) | | | | | | | (17,282,540 | ) | | | | | (46,561,684 | ) | | | | |
| | | | | | | | |
Net decrease | | | (5,398,363 | ) | | | | $ | (13,700,391 | ) | | | | | | | (1,089,200 | ) | | | | $ | (3,410,574 | ) | | | | |
| | | | | | | | |
Class F | | | | | | | | | | | | | | | | | | | | | | | | | | | | |
Shares sold | | | 1,621,822 | | | | | $ | 4,176,819 | | | | | | | | 1,857,812 | | | | | $ | 5,015,150 | | | | | |
Reinvestment of distributions | | | — | | | | | | — | | | | | | | | 182,813 | | | | | | 482,625 | | | | | |
Shares redeemed | | | (1,108,344 | ) | | | | | (2,739,601 | ) | | | | | | | (471,455 | ) | | | | | (1,272,121 | ) | | | | |
| | | | | | | | |
Net increase | | | 513,478 | | | | | $ | 1,437,218 | | | | | | | | 1,569,170 | | | | | $ | 4,225,654 | | | | | |
At June 30, 2022, separate accounts of three insurance companies each owned more than 10% of the value of the outstanding shares of the Fund, aggregating 71.0%.
11 Risks and Uncertainties
Pandemic Risk
An outbreak of respiratory disease caused by a novel coronavirus was first detected in China in late 2019 and subsequently spread internationally. This coronavirus has resulted in closing borders, enhanced health screenings, changes to healthcare service preparation and delivery, quarantines, cancellations, disruptions to supply chains and customer activity, as well as general concern and uncertainty. Health crises caused by outbreaks of disease, such as the coronavirus outbreak, may exacerbate other pre-existing political, social and economic risks and disrupt normal market conditions and operations. The impact of this outbreak has negatively affected the worldwide economy, as well as the economies of individual countries and industries, and could continue to affect the market in significant and unforeseen ways. Other epidemics and pandemics that may arise in the future may have similar effects. Any such impact could adversely affect the Fund’s performance, or the performance of the securities in which the Fund invests.
Calvert
VP SRI Balanced Portfolio
June 30, 2022
Board of Directors’ Contract Approval
Overview of the Contract Review Process
The Investment Company Act of 1940, as amended, provides, in substance, that each investment advisory agreement between a fund and its investment adviser will continue in effect from year to year only if its continuation is approved at least annually by the fund’s board of directors, including by a vote of a majority of the directors who are not “interested persons” of the fund (“Independent Directors”), cast in person at a meeting called for the purpose of considering such approval.
At a video conference meeting of the Boards of Trustees/Directors (each a “Board”) of the registered investment companies advised by Calvert Research and Management (“CRM” or the “Adviser”) (the “Calvert Funds”) held on June 14, 2022, the Board, including a majority of the Independent Directors, voted to approve continuation of existing investment advisory and investment sub-advisory agreements for the Calvert Funds for an additional one-year period. The meeting was held by video conference due to circumstances related to current or potential effects of COVID-19 pursuant to temporary exemptive relief issued by the Securities and Exchange Commission.
In evaluating the investment advisory and investment sub-advisory agreements for the Calvert Funds, the Board considered a variety of information relating to the Calvert Funds and various service providers, including the Adviser. The Independent Directors reviewed a report prepared by the Adviser regarding various services provided to the Calvert Funds by the Adviser and its affiliates. Such report included, among other data, information regarding the Adviser’s personnel and the Adviser’s revenue and cost of providing services to the Calvert Funds, and a separate report prepared by an independent data provider, which compared each fund’s investment performance, fees and expenses to those of comparable funds as identified by such independent data provider (“comparable funds”).
The Independent Directors were separately represented by independent legal counsel with respect to their consideration of the continuation of the investment advisory and investment sub-advisory agreements for the Calvert Funds. Prior to voting, the Independent Directors reviewed the proposed continuation of the Calvert Funds’ investment advisory and investment sub-advisory agreements with management and also met in private sessions with their counsel at which time no representatives of management were present.
The information that the Board considered included, among other things, the following (for funds that invest through one or more affiliated underlying fund(s), references to “each fund” in this section may include information that was considered at the underlying fund-level):
Information about Fees, Performance and Expenses
• A report from an independent data provider comparing the advisory and related fees paid by each fund with fees paid by comparable funds;
• A report from an independent data provider comparing each fund’s total expense ratio and its components to comparable funds;
• A report from an independent data provider comparing the investment performance of each fund to the investment performance of comparable funds over various time periods;
• Data regarding investment performance in comparison to benchmark indices;
• For each fund, comparative information concerning the fees charged and the services provided by the Adviser in managing other accounts (including mutual funds, other collective investment funds and institutional accounts) using investment strategies and techniques similar to those used in managing such fund;
• Profitability analyses for the Adviser with respect to each fund;
Information about Portfolio Management and Trading
• Descriptions of the investment management services provided to each fund, including investment strategies and processes it employs;
• Information about the Adviser’s policies and practices with respect to trading, including the Adviser’s processes for monitoring best execution of portfolio transactions;
• Information about the allocation of brokerage transactions and the benefits received by the Adviser as a result of brokerage allocation, including information concerning the acquisition of research through client commission arrangements and policies with respect to “soft dollars”;
Information about the Adviser
• Reports detailing the financial results and condition of CRM;
• Descriptions of the qualifications, education and experience of the individual investment professionals whose responsibilities include portfolio management and investment research for the funds, and information relating to their compensation and responsibilities with respect to managing other mutual funds and investment accounts;
• Policies and procedures relating to proxy voting and the handling of corporate actions and class actions;
• A description of CRM’s procedures for overseeing sub-advisers, including with respect to regulatory and compliance issues, investment management and other matters;
Calvert
VP SRI Balanced Portfolio
June 30, 2022
Board of Directors’ Contract Approval — continued
Other Relevant Information
• Information concerning the nature, cost and character of the administrative and other non-investment advisory services provided by CRM and its affiliates; and
• The terms of each investment advisory agreement.
Over the course of the year, the Board and its committees held regular quarterly meetings. During these meetings, the Directors participated in investment and performance reviews with the portfolio managers and other investment professionals of the Adviser relating to each fund, and considered various investment and trading strategies used in pursuing each fund’s investment objective(s), such as the use of derivative instruments, as well as risk management techniques. The Board and its committees also evaluated issues pertaining to industry and regulatory developments, compliance procedures, corporate governance and other issues with respect to the funds, and received and participated in reports and presentations provided by CRM and its affiliates with respect to such matters. In addition to the formal meetings of the Board and its committees, the Independent Directors held regular video conferences in between meetings to discuss, among other topics, matters relating to the continuation of the Calvert Funds’ investment advisory and investment sub-advisory agreements.
For funds that invest through one or more affiliated underlying funds, the Board considered similar information about the underlying fund(s) when considering the approval of investment advisory agreements. In addition, in cases where the Adviser has engaged a sub-adviser, the Board considered similar information about the sub-adviser when considering the approval of any investment sub-advisory agreement.
The Independent Directors were assisted throughout the contract review process by their independent legal counsel. The Independent Directors relied upon the advice of such counsel and their own business judgment in determining the material factors to be considered in evaluating each investment advisory and investment sub-advisory agreement and the weight to be given to each such factor. The Board, including the Independent Directors, did not identify any single factor as controlling, and each Director may have attributed different weight to various factors.
Results of the Contract Review Process
Based on its consideration of the foregoing, and such other information as it deemed relevant, including the factors and conclusions described below, the Board, including the Independent Directors, concluded that the continuation of the investment advisory agreement of Calvert VP SRI Balanced Portfolio (the “Fund”), including the fee payable under the agreement, is in the best interests of the Fund’s shareholders. Accordingly, the Board, including a majority of the Independent Directors, voted to approve the continuation of the investment advisory agreement of the Fund.
Nature, Extent and Quality of Services
In considering the nature, extent and quality of the services provided by the Adviser under the investment advisory agreement, the Board reviewed information provided by the Adviser relating to its operations and personnel, including, among other information, biographical information on the Adviser’s investment personnel and descriptions of its organizational and management structure. The Board also took into account similar information provided periodically throughout the previous year by the Adviser as well as the Board’s familiarity with management through Board meetings, discussions and other reports. The Board considered the Adviser’s management style and its performance in employing its investment strategies as well as its current level of staffing and overall resources. The Board also noted that it reviewed on a quarterly basis information regarding the Adviser’s compliance with applicable policies and procedures, including those related to personal investing. The Board took into account, among other items, periodic reports received from the Adviser over the past year concerning the Adviser’s ongoing review and enhancement of certain processes, policies and procedures of the Calvert Funds and the Adviser. The Board concluded that it was satisfied with the nature, extent and quality of services provided to the Fund by the Adviser under the investment advisory agreement.
Fund Performance
In considering the Fund’s performance, the Board noted that it reviewed on a quarterly basis detailed information about the Fund’s performance results, portfolio composition and investment strategies. The Board compared the Fund’s investment performance to that of the Fund’s peer universe and its blended benchmark. The Board’s review included comparative performance data for the one-, three- and five-year periods ended December 31, 2021. This performance data indicated that the Fund had outperformed the median of its peer universe for the one-, three- and five-year periods ended December 31, 2021. It also indicated that the Fund had outperformed its blended benchmark for the one- and three-year periods ended December 31, 2021, while it had underperformed its blended benchmark for the five-year period ended December 31, 2021. Based upon its review, the Board concluded that the Fund’s performance was satisfactory relative to the performance of its peer universe and its blended benchmark.
Management Fees and Expenses
In considering the Fund’s fees and expenses, the Board compared the Fund’s fees and total expense ratio with those of comparable funds in its expense group. Among other findings, the data indicated that the Fund’s advisory and administrative fees (referred to collectively as “management fees”) and the Fund’s total expenses were each below the respective median of the Fund’s expense group. Based upon its review, the Board concluded that the management fees were reasonable in view of the nature, extent and quality of services provided by the Adviser.
Calvert
VP SRI Balanced Portfolio
June 30, 2022
Board of Directors’ Contract Approval — continued
Profitability and Other “Fall-Out” Benefits
The Board reviewed the Adviser’s profitability in regard to the Fund and the Calvert Funds in the aggregate. In reviewing the overall profitability of the Fund to the Adviser, the Board also considered the fact that the Adviser and its affiliates provided sub-transfer agency support, administrative and distribution services to the Fund for which they received compensation. The information considered by the Board included the profitability of the Fund to the Adviser and its affiliates without regard to any marketing support or other payments by the Adviser and its affiliates to third parties in respect of distribution services. The Board also considered that the Adviser and its affiliates derived benefits to their reputation and other indirect benefits from their relationships with the Fund. Based upon its review, the Board concluded that the Adviser’s and its affiliates’ level of profitability from their relationships with the Fund was reasonable.
Economies of Scale
The Board considered the effect of the Fund’s current size and its potential growth on its performance and fees. The Board also took into account the breakpoints in the advisory fee schedule for the Fund that would reduce the advisory fee rate on assets above specific asset levels. The Board noted that if the Fund’s assets increased over time, the Fund might realize other economies of scale if assets increased proportionally more than certain other expenses.
Calvert
VP SRI Balanced Portfolio
June 30, 2022
Liquidity Risk Management Program
The Fund has implemented a written liquidity risk management program (Program) and related procedures to manage its liquidity in accordance with Rule 22e-4 under the Investment Company Act of 1940, as amended (Liquidity Rule). The Liquidity Rule defines “liquidity risk” as the risk that a fund could not meet requests to redeem shares issued by the fund without significant dilution of the remaining investors’ interests in the fund. The Fund’s Board of Trustees/Directors has designated the investment adviser to serve as the administrator of the Program and the related procedures. The administrator has established a Liquidity Risk Management Oversight Committee (Committee) to perform the functions necessary to administer the Program. As part of the Program, the administrator is responsible for identifying illiquid investments and categorizing the relative liquidity of the Fund’s investments in accordance with the Liquidity Rule. Under the Program, the administrator assesses, manages, and periodically reviews the Fund’s liquidity risk, and is responsible for making certain reports to the Fund’s Board of Trustees/Directors and the Securities and Exchange Commission (SEC) regarding the liquidity of the Fund’s investments, and to notify the Board of Trustees/Directors and the SEC of certain liquidity events specified in the Liquidity Rule. The liquidity of the Fund’s portfolio investments is determined based on a number of factors including, but not limited to, relevant market, trading and investment-specific considerations under the Program.
At a meeting of the Fund’s Board of Trustees/Directors on June 14, 2022, the Committee provided a written report to the Fund’s Board of Trustees/Directors pertaining to the operation, adequacy, and effectiveness of implementation of the Program, as well as the operation of the highly liquid investment minimum (if applicable) for the period January 1, 2021 through December 31, 2021 (Review Period). The Program operated effectively during the Review Period, supporting the administrator’s ability to assess, manage and monitor Fund liquidity risk, including during periods of market volatility and net redemptions. During the Review Period, the Fund met redemption requests on a timely basis.
There can be no assurance that the Program will achieve its objectives in the future. Please refer to the Fund’s prospectus for more information regarding the Fund’s exposure to liquidity risk and other principal risks to which an investment in the Fund may be subject.
Calvert
VP SRI Balanced Portfolio
June 30, 2022
Officers and Directors
Officers
Hope L. Brown
Chief Compliance Officer
Deidre E. Walsh
Secretary, Vice President and
Chief Legal Officer
James F. Kirchner
Treasurer
Directors
Alice Gresham Bullock
Chairperson
Richard L. Baird, Jr.
Cari M. Dominguez
John G. Guffey, Jr.
Miles D. Harper, III
Joy V. Jones
John H. Streur*
Anthony A. Williams
*Interested Director and President
36
Calvert Funds
| | |
| Privacy Notice | | April 2021 |
| | |
FACTS | | WHAT DOES EATON VANCE DO WITH YOUR PERSONAL INFORMATION? |
|
| Why? | | Financial companies choose how they share your personal information. Federal law gives consumers the right to limit some but not all sharing. Federal law also requires us to tell you how we collect, share, and protect your personal information. Please read this notice carefully to understand what we do. |
| | |
What? | | The types of personal information we collect and share depend on the product or service you have with us. This information can include: ∎ Social Security number and income ∎ investment experience and risk tolerance ∎ checking account number and wire transfer instructions |
| | |
| How? | | All financial companies need to share customers’ personal information to run their everyday business. In the section below, we list the reasons financial companies can share their customers’ personal information; the reasons Eaton Vance chooses to share; and whether you can limit this sharing. |
| | | | |
Reasons we can share your personal information | | Does Eaton Vance share? | | Can you limit this sharing? |
| | | |
| For our everyday business purposes — such as to process your transactions, maintain your account(s), respond to court orders and legal investigations, or report to credit bureaus | | Yes | | No |
| | | |
| For our marketing purposes — to offer our products and services to you | | Yes | | No |
| | | |
| For joint marketing with other financial companies | | No | | We don’t share |
| | | |
| For our investment management affiliates’ everyday business purposes — information about your transactions, experiences, and creditworthiness | | Yes | | Yes |
| | | |
| For our affiliates’ everyday business purposes — information about your transactions and experiences | | Yes | | No |
| | | |
| For our affiliates’ everyday business purposes — information about your creditworthiness | | No | | We don’t share |
| | | |
| For our investment management affiliates to market to you | | Yes | | Yes |
| | | |
| For our affiliates to market to you | | No | | We don’t share |
| | | |
| For nonaffiliates to market to you | | No | | We don’t share |
| | |
To limit our sharing | | Call toll-free 1-800-368-2745 or email: CRMPrivacy@calvert.com Please note: If you are a new customer, we can begin sharing your information 30 days from the date we sent this notice. When you are no longer our customer, we continue to share your information as described in this notice. However, you can contact us at any time to limit our sharing. |
Questions? | | Call toll-free 1-800-368-2745 or email: CRMPrivacy@calvert.com |
Calvert Funds
| | |
| Privacy Notice — continued | | April 2021 |
| | |
Who we are |
| | |
| Who is providing this notice? | | Eaton Vance Management, Eaton Vance Distributors, Inc., Eaton Vance Trust Company, Eaton Vance Management (International) Limited, Eaton Vance Advisers International Ltd., Eaton Vance Global Advisors Limited, Eaton Vance Management’s Real Estate Investment Group, Boston Management and Research, Calvert Research and Management, Eaton Vance and Calvert Fund Families and our investment advisory affiliates (“Eaton Vance”) (see Investment Management Affiliates definition below) |
What we do |
| | |
| How does Eaton Vance protect my personal information? | | To protect your personal information from unauthorized access and use, we use security measures that comply with federal law. These measures include computer safeguards and secured files and buildings. We have policies governing the proper handling of customer information by personnel and requiring third parties that provide support to adhere to appropriate security standards with respect to such information. |
| | |
| How does Eaton Vance collect my personal information? | | We collect your personal information, for example, when you ∎ open an account or make deposits or withdrawals from your account ∎ buy securities from us or make a wire transfer ∎ give us your contact information We also collect your personal information from others, such as credit bureaus, affiliates, or other companies. |
| | |
| Why can’t I limit all sharing? | | Federal law gives you the right to limit only ∎ sharing for affiliates’ everyday business purposes — information about your creditworthiness ∎ affiliates from using your information to market to you ∎ sharing for nonaffiliates to market to you State laws and individual companies may give you additional rights to limit sharing. See below for more on your rights under state law. |
Definitions |
| | |
| Investment Management Affiliates | | Eaton Vance Investment Management Affiliates include registered investment advisers, registered broker-dealers, and registered and unregistered funds. Investment Management Affiliates does not include entities associated with Morgan Stanley Wealth Management, such as Morgan Stanley Smith Barney LLC and Morgan Stanley & Co. |
| | |
| Affiliates | | Companies related by common ownership or control. They can be financial and nonfinancial companies. ∎ Our affiliates include companies with a Morgan Stanley name and financial companies such as Morgan Stanley Smith Barney LLC and Morgan Stanley & Co. |
| | |
| Nonaffiliates | | Companies not related by common ownership or control. They can be financial and nonfinancial companies. ∎ Eaton Vance does not share with nonaffiliates so they can market to you. |
| | |
| Joint marketing | | A formal agreement between nonaffiliated financial companies that together market financial products or services to you. ∎ Eaton Vance doesn’t jointly market. |
Other important information |
| |
Vermont: Except as permitted by law, we will not share personal information we collect about Vermont residents with Nonaffiliates unless you provide us with your written consent to share such information. California: Except as permitted by law, we will not share personal information we collect about California residents with Nonaffiliates and we will limit sharing such personal information with our Affiliates to comply with California privacy laws that apply to us. |
Calvert Funds
Delivery of Shareholder Documents. The Securities and Exchange Commission (SEC) permits funds to deliver only one copy of shareholder documents, including prospectuses, proxy statements and shareholder reports, to fund investors with multiple accounts at the same residential or post office box address. This practice is often called “householding” and it helps eliminate duplicate mailings to shareholders. Calvert funds, or your financial intermediary, may household the mailing of your documents indefinitely unless you instruct Calvert funds, or your financial intermediary, otherwise. If you would prefer that your Calvert fund documents not be householded, please contact Calvert funds at 1-800-368-2745, or contact your financial intermediary. Your instructions that householding not apply to delivery of your Calvert fund documents will typically be effective within 30 days of receipt by Calvert funds or your financial intermediary.
Portfolio Holdings. Each Calvert fund files a schedule of portfolio holdings on Part F to Form N-PORT with the SEC. Certain information filed on Form N-PORT may be viewed on the Calvert website at www.calvert.com, by calling Calvert at 1-800-368-2745 or in the EDGAR database on the SEC’s website at www.sec.gov.
Proxy Voting. The Proxy Voting Guidelines that each Calvert fund uses to determine how to vote proxies relating to portfolio securities is provided as an Appendix to the fund’s Statement of Additional Information. The Statement of Additional Information can be obtained free of charge by calling the Calvert funds at 1-800-368-2745, by visiting the Calvert funds’ website at www.calvert.com or visiting the SEC’s website at www.sec.gov. Information regarding how a Calvert fund voted proxies relating to portfolio securities during the most recent 12-month period ended June 30 is available by calling Calvert funds, by visiting the Calvert funds’ website at www.calvert.com or by visiting the SEC’s website at www.sec.gov.
This Page Intentionally Left Blank
| | |
| Investment Adviser and Administrator | | Transfer Agent |
| Calvert Research and Management | | DST Asset Manager Solutions, Inc. |
| 1825 Connecticut Avenue NW, Suite 400 | | 2000 Crown Colony Drive |
| Washington, DC 20009 | | Quincy, MA 02169 |
| |
| Principal Underwriter* | | Fund Offices |
| Eaton Vance Distributors, Inc. | | 1825 Connecticut Avenue NW, Suite 400 |
| Two International Place | | Washington, DC 20009 |
| Boston, MA 02110 | | |
| (617) 482-8260 | | |
| |
| Custodian | | |
| State Street Bank and Trust Company | | |
| State Street Financial Center, One Lincoln Street | | |
| Boston, MA 02111 | | |
| * | FINRA BrokerCheck. Investors may check the background of their Investment Professional by contacting the Financial Industry Regulatory Authority (FINRA). FINRA BrokerCheck is a free tool to help investors check the professional background of current and former FINRA-registered securities firms and brokers. FINRA BrokerCheck is available by calling 1-800-289-9999 and at www.FINRA.org. The FINRA BrokerCheck brochure describing this program is available to investors at www.FINRA.org. |
| | | | |
| Printed on recycled paper. | | 24218 | | 6.30.22 |
TRANSAMERICA FINANCIAL LIFE INSURANCE COMPANY
c/o Transamerica Retirement Solutions
440 Mamaroneck Avenue
Harrison, NY 10528
2259169 6/22
Not applicable for semi-annual reports.
| Item 3: | Audit Committee Financial Experts. |
Not applicable for semi-annual reports.
| Item 4: | Principal Accountant Fees and Services. |
Not applicable for semi-annual reports.
| Item 5: | Audit Committee of Listed Registrants. |
Not applicable for semi-annual reports.
| Item 6: | Schedule of Investments. |
| | (a) | The schedules of investments are included in the Semi-Annual Report to shareholders filed under Item 1 of this Form N-CSR. |
| Item 7: | Disclosure of Proxy Voting Policies and Procedures for Closed-End Management Investment Companies. |
Not applicable.
| Item 8: | Portfolio Managers of Closed-End Management Investment Companies. |
Not applicable.
| Item 9: | Purchases of Equity Securities by Closed-End Management Investment Company and Affiliated Purchasers. |
Not applicable.
| Item 10: | Submission of Matters to a Vote of Security Holders |
There have been no material changes to the procedures by which shareholders may recommend nominees to the Registrant’s Board of Trustees that have been implemented since the Registrant last provided disclosure in response to the requirements of this Item.
| Item 11: | Controls and Procedures. |
| | (a) | The Registrant’s principal executive officer and principal financial officer evaluated the effectiveness of the Registrant’s disclosure controls and procedures within 90 days of this filing and have concluded that the Registrant’s disclosure controls and procedures (as defined in Rule |
| | 30a-3(c) under the Investment Company Act of 1940, as amended (the “1940 Act”)) are appropriately designed to ensure that information required to be disclosed by the Registrant in the reports that it files on Form N-CSR (a) is accumulated and communicated to the Registrant’s management, including its principal executive officer and principal financial officer, to allow timely decisions regarding required disclosure, and (b) is recorded, processed, summarized and reported, within the time periods specified in the rules and forms adopted by the U.S. Securities and Exchange Commission. |
| | (b) | The Registrant’s principal executive officer and principal financial officer are aware of no change in the Registrant’s internal control over financial reporting that occurred during the Registrant’s most recent fiscal half-year that has materially affected, or is reasonably likely to materially affect, the Registrant’s internal control over financial reporting. |
| Item 12: | Disclosure of Securities Lending Activities for Closed-End Management Investment Companies. |
Not Applicable.
SIGNATURES
Pursuant to the requirements of the Securities Exchange Act of 1934 and the Investment Company Act of 1940, the Registrant has duly caused this report to be signed on its behalf by the undersigned, thereunto duly authorized.
| | | | | | |
| | | | Transamerica Asset Allocation Variable Funds |
| | | | (Registrant) |
| | | |
| | | | By: | | /s/ Marijn P. Smit |
| | | | | | Marijn P. Smit |
| | | | | | Chief Executive Officer |
| | | | | | (Principal Executive Officer) |
| | | |
| | | | Date: | | September 2, 2022 |
Pursuant to the requirements of the Securities Exchange Act of 1934 and the Investment Company Act of 1940, this report has been signed below by the following persons on behalf of the Registrant and in the capacities and on the dates indicated.
| | | | | | |
| | By: | | /s/ Marijn P. Smit | | |
| | | | Marijn P. Smit | | |
| | | | Chief Executive Officer | | |
| | | | (Principal Executive Officer) | | |
| | | |
| | Date: | | September 2, 2022 | | |
| | | |
| | By: | | /s/ Vincent J. Toner | | |
| | | | Vincent J. Toner | | |
| | | | Vice President and Treasurer (Principal Financial Officer and Principal Accounting Officer) | | |
| | | |
| | Date: | | September 2, 2022 | | |
EXHIBIT INDEX
| | | | |
Exhibit No. | | | | Description of Exhibit |
| | |
13(a)(2) | | | | Section 302 N-CSR Certification of Principal Executive Officer and Principal Financial Officer |
13(b) | | | | Section 906 N-CSR Certification of Principal Executive Officer and Principal Financial Officer |