UNITED STATES
SECURITIES AND EXCHANGE COMMISSION
Washington, D.C. 20549
FORM N-CSR
CERTIFIED SHAREHOLDER REPORT OF REGISTERED MANAGEMENT
INVESTMENT COMPANIES
Investment Company Act file number 811-07751
Nuveen Multistate Trust IV
(Exact name of registrant as specified in charter)
Nuveen Investments
333 West Wacker Drive, Chicago, IL 60606
(Address of principal executive offices) (Zip code)
Kevin J. McCarthy
Nuveen Investments
333 West Wacker Drive
Chicago, IL 60606
(Name and address of agent for service)
Registrant’s telephone number, including area code: (312) 917-7700
Date of fiscal year end: May 31
Date of reporting period: May 31, 2012
Form N-CSR is to be used by management investment companies to file reports with the Commission not later than 10 days after the transmission to stockholders of any report that is required to be transmitted to stockholders under Rule 30e-1 under the Investment Company Act of 1940 (17 CFR 270.30e-1). The Commission may use the information provided on Form N-CSR in its regulatory, disclosure review, inspection, and policy making roles.
A registrant is required to disclose the information specified by Form N-CSR, and the Commission will make this information public. A registrant is not required to respond to the collection of information contained in Form N-CSR unless the Form displays a currently valid Office of Management and Budget (“OMB”) control number. Please direct comments concerning the accuracy of the information collection burden estimate and any suggestions for reducing the burden to Secretary, Securities and Exchange Commission, 450 Fifth Street, NW, Washington, DC 20549-0609. The OMB has reviewed this collection of information under the clearance requirements of 44 U.S.C. ss.3507.
ITEM 1. REPORTS TO STOCKHOLDERS.

Mutual Funds
Nuveen Municipal Bond Funds
Dependable, tax-free income because it’s not what you earn, it’s what you keep.®
Annual Report
May 31, 2012
| Share Class / Ticker Symbol | ||||||||
| Fund Name | Class A | Class B | Class C | Class I | ||||
Nuveen Kansas Municipal Bond Fund | FKSTX | — | FCKSX | FRKSX | ||||
Nuveen Kentucky Municipal Bond Fund | FKYTX | FKYBX | FKYCX | FKYRX | ||||
Nuveen Michigan Municipal Bond Fund | FMITX | — | FLMCX | NMMIX | ||||
Nuveen Missouri Municipal Bond Fund | FMOTX | FMMBX | FMOCX | FMMRX | ||||
Nuveen Ohio Municipal Bond Fund | FOHTX | FOHBX | FOHCX | NXOHX | ||||
Nuveen Wisconsin Municipal Bond Fund | FWIAX | — | FWICX | FWIRX | ||||
LIFE IS COMPLEX.
Nuveen makes things e-simple.
It only takes a minute to sign up for e-Reports. Once enrolled, you’ll receive an e-mail as soon as your Nuveen Fund information is ready. No more waiting for delivery by regular mail. Just click on the link within the e-mail to see the report and save it on your computer if you wish.
Free e-Reports right to your e-mail!
www.investordelivery.com
If you receive your Nuveen Fund distributions and statements from your financial advisor or brokerage account.
OR
www.nuveen.com/accountaccess
If you receive your Nuveen Fund distributions and statements directly from Nuveen.
| Must be preceded by or accompanied by a prospectus. | NOT FDIC INSURED | MAY LOSE VALUE | NO BANK GUARANTEE |
| 4 | ||||
| 5 | ||||
| 17 | ||||
| 30 | ||||
| 32 | ||||
| 34 | ||||
| 36 | ||||
| 37 | ||||
| 38 | ||||
| 84 | ||||
| 85 | ||||
| 86 | ||||
| 90 | ||||
| 102 | ||||
| 114 | ||||
| 118 | ||||
| 126 | ||||
| 127 | ||||
Letter to Shareholders

Dear Shareholders,
Investors have many reasons to remain cautious. The challenges in the Euro area are casting a shadow over global economies and financial markets. The political support for addressing fiscal issues is eroding as the economic and social impacts become more visible. At the same time, member nations appear unwilling to provide adequate financial support or to surrender sufficient sovereignty to strengthen the banks or unify the Euro area financial system. The gains made in reducing deficits, and the hard-won progress on winning popular acceptance of the need for economic austerity, are at risk. To their credit, European political leaders press on to find compromise solutions, but there is increasing concern that time will begin to run out.
In the U.S., strong corporate earnings have enabled the equity markets to withstand much of the downward pressures coming from weakening job creation, slower economic growth and political uncertainty. The Fed remains committed to low interest rates but has refrained from predicting another program of quantitative easing unless economic growth were to weaken significantly or the threat of recession appears on the horizon. Pre-election maneuvering has added to the already highly partisan atmosphere in the Congress. The end of the Bush-era tax cuts and implementation of the spending restrictions of the Budget Control Act of 2011, both scheduled to take place at year-end, loom closer.
During the last year, U.S. based investors have experienced a sharp decline and a strong recovery in the equity markets. The experienced investment teams at Nuveen keep their eye on a longer time horizon and use their practiced investment disciplines to negotiate through market peaks and valleys to achieve long-term goals for investors. Experienced professionals pursue investments that will weather short-term volatility and at the same time, seek opportunities that are created by markets that overreact to negative developments. Monitoring this process is an important consideration for the Fund Board as it oversees your Nuveen Fund on your behalf.
As always, I encourage you to contact your financial consultant if you have any questions about your investment in a Nuveen Fund. On behalf of the other members of your Fund Board, we look forward to continuing to earn your trust in the months and years ahead.
Sincerely,

Robert P. Bremner
Chairman of the Board
July 20, 2012
| 4 | Nuveen Investments |
Certain statements in this report are forward-looking statements. Discussions of specific investments are for illustration only and are not intended as recommendations of individual investments. The forward-looking statements and other views expressed herein are those of the portfolio managers as of the date of this report. Actual future results or occurrences may differ significantly from those anticipated in any forward-looking statements and the views expressed herein are subject to change at any time, due to numerous market and other factors. The Funds disclaim any obligation to update publicly or revise any forward-looking statements or views expressed herein.
Ratings shown are the highest rating given by one of the following national rating agencies: Standard & Poor’s Group, Moody’s Investors Service, Inc. or Fitch, Inc. Credit ratings are subject to change. AAA, AA, A and BBB are investment grade ratings; BB, B, CCC, CC, C and D are below investment grade ratings. Certain bonds backed by U.S. Government or agency securities are regarded as having an implied rating equal to the rating of such securities. Holdings designated N/R are not rated by a national rating agency.
Portfolio managers Daniel Close, CFA, Steven Hlavin and Chris Drahn, CFA, review economic and municipal market conditions at the national and state levels, key investment strategies and the performance of the Nuveen Kansas Municipal Bond Fund, the Nuveen Kentucky Municipal Bond Fund, the Nuveen Michigan Municipal Bond Fund, the Nuveen Missouri Municipal Bond Fund, the Nuveen Ohio Municipal Bond Fund and the Nuveen Wisconsin Municipal Bond Fund. Dan, who has 14 years of investment experience, has managed the Kentucky, Michigan and Ohio Funds since 2007. Steve, with nine years of investment experience, has managed the Kansas and Wisconsin Funds since 2011. Chris, who has 32 years of investment experience, has managed the Missouri Fund since 2011.
Effective March 9, 2012, the Nuveen Missouri Tax Free Fund and the Nuveen Ohio Tax Free Fund were merged into the Nuveen Missouri Municipal Bond Fund and the Nuveen Ohio Municipal Bond Fund, respectively.
What factors affected the U.S. economy and the national municipal bond market during the twelve-month reporting period ending May 31, 2012?
During this period, the U.S. economy’s progress toward recovery from recession remained moderate. The Federal Reserve (Fed) maintained its efforts to improve the overall economic environment by continuing to hold the benchmark Fed Funds rate at the record low level of zero to 0.25% that it had established in December 2008. At its June 2012 meeting (following the end of this reporting period), the central bank affirmed its opinion that economic conditions would likely warrant keeping the Fed Funds rate at “exceptionally low levels” at least through late 2014. The Fed also announced that it would extend its program to lengthen the average maturity of its holdings of U.S. Treasury securities by purchasing another $267 billion of these securities (in addition to the $400 billion originally announced in September 2011) with remaining maturities of six to thirty years and selling an equal amount of U.S. Treasury securities with maturities of three years or less. The goals of this program, which the Fed has now extended through the end of December 2012, are to lower longer-term interest rates, make broader financial conditions more accommodating, support a stronger economic recovery and help ensure that inflation remains at levels consistent with the Fed’s mandates of maximum employment and price stability.
In the first quarter of 2012, the U.S. economy, as measured by the U.S. gross domestic product (GDP), grew at an annualized rate of 1.9%, marking eleven consecutive quarters of positive growth. The Consumer Price Index (CPI) rose 1.7% year-over-year as of May 2012, the lowest twelve-month rate of change since February 2011, while the core CPI (which excludes food and energy) increased 2.3% during the period, edging above the
| Nuveen Investments | 5 |
Fed’s unofficial objective of 2.0% or lower for this inflation measure. Labor market conditions continued to be slow to improve, with national unemployment registering 8.2% in May 2012, down from 9.0% in May 2011 but a slight uptick from the 8.1% reading in April 2012. The housing market remained the major weak spot in the economy, beleaguered by a high level of distressed properties and difficult credit conditions. For the twelve months ended April 2012 (most recent data available at the time this report was prepared), the average home price in the Standard & Poor’s (S&P)/Case-Shiller Index of 20 major metropolitan areas lost 1.9%, as housing prices remained at the lowest levels since early 2003, down approximately 34% from their 2006 peak. In addition, the U.S. economic picture continued to be clouded by concerns about the European debt crisis and global financial markets in general and efforts to reduce the U.S. federal deficit.
Municipal bond prices generally rallied during this period, amid strong demand and tight supply. Although the availability of tax-exempt supply improved in recent months, the pattern of new issuance remained light compared with long-term historical trends. This served as a key driver of performance, as tight supply and strong demand combined to create favorable market conditions for municipal bonds. Concurrent with rising prices, yields declined across most maturities, especially at the longer end of the municipal yield curve. The depressed level of municipal bond issuance during the first part of this period was due in part to the lingering effects of the taxable Build America Bonds (BAB) program. Even though the BAB program expired at the end of 2010, issuers had made extensive use of its favorable terms to issue almost $190 billion in taxable BAB bonds during 2009 and 2010, representing approximately 25% of all municipal issuance during that period. Some borrowers accelerated issuance into 2010 in order to take advantage of the program before its termination, fulfilling their capital program borrowing needs well into 2011 and 2012. The low level of municipal issuance during this period also reflected the current political distaste for additional borrowing by state and local governments and the prevalent atmosphere of municipal budget austerity. In recent months, we have seen an increasing number of borrowers come to market seeking to take advantage of the current rate environment by calling existing debt and refinancing at lower rates.
Over the twelve months ended May 31, 2012, municipal bond issuance nationwide totaled $357.4 billion, an increase of 2.7% compared with issuance during the twelve-month period ended May 31, 2011. During this period, demand for municipal bonds remained very strong, especially from individual investors.
What type of economic environment did the states profiled in this report experience?
Kansas has been slowly recovering from the recent economic recession. In 2011, the state’s economy expanded at a rate of 0.5%, compared with the national growth rate of 1.5%, ranking Kansas 35th in terms of GDP growth by state. Private industry in the state continued to add jobs, and indications were that these employment gains were permanent. While not the lowest in the region, Kansas’s jobless rate was well below the May 2012 average of 8.2% for the nation as a whole. For May 2012, the Kansas unemployment rate stood at 6.1%, its lowest level since December 2008, down from 6.7% in May 2011. Recent employment gains have been led by professional and business services, manufacturing, and education and health services, the state’s largest private
| 6 | Nuveen Investments |
sectors. According to Moody’s, manufacturing was expected to be key to Kansas’s long-term recovery, with hiring projected to accelerate in this high wage industry. Agricultural products were also expected to bolster the Kansas economy. Kansas ranks among the top ten states in the nation in agricultural production, with strong price support for two of its major crops, soy and corn. On the fiscal front, the Kansas state budget for fiscal 2013, which was introduced in January 2012 and enacted in June 2012, fully funded or increased funding for essential services, while holding state general fund expenditures below fiscal 2012 levels. While the 2013 budget closed a $500 million gap, it also included a package of income tax cuts projected to reduce state revenues by $3.7 billion over the next five years. The budget also called for adding $465 million in reserves to the state general fund, which had been largely depleted by the end of fiscal 2013. As of May 2012, Kansas general obligation bonds continued to carry ratings of Aa2 and AA from Moody’s and S&P, respectively. For the twelve months ending May 31, 2012, municipal issuance in Kansas totaled $2.8 billion, representing a 7% year-over-year increase.
Kentucky’s recovery from the recession has been slow but broad-based, with significant gains in employment in the professional and business services sector and more modest gains across almost all other sectors, chiefly education and health care, tourism, and manufacturing. In 2011, Kentucky ranked fourth among the states in the number of automobiles and trucks assembled. As of May 2012, Kentucky’s unemployment rate was 8.2%, the lowest since November 2008, down from 9.6% in May 2011 and in line with national average for May 2012. In 2011, the commonwealth’s economy posted growth of 0.5%, compared with the national growth rate of 1.5%, ranking Kentucky 34th in terms of GDP growth by state. According to Moody’s, Kentucky’s low cost of doing business and highly affordable housing should continue to provide support for economic expansion. Kentucky’s biennial budget for fiscal 2013 and 2014, which was proposed in January 2012, addressed a $742 million shortfall through funding cuts of 8.4% for state agencies, 6.4% for higher education, and 2.2% for public safety services, while maintaining funding for K-12 education and correctional facilities. As of May 2012, general obligation debt was rated Aa2 and AA- by Moody’s and S&P, respectively. For the twelve months ending May 31, 2012, Kentucky issued $3.5 billion in municipal bonds, representing a 25% decline from the twelve months ended May 31, 2011.
After struggling to emerge from recession over the past few years, Michigan has begun to see improvement. In 2011, the state’s economy expanded at a rate of 2.3%, compared with the national growth rate of 1.5%, ranking the state sixth in terms of GDP growth by state. Overall employment in the state grew 1.7% in 2011, the first increase in more than eleven years. As of May 2012, Michigan’s jobless rate was 8.5%, down from 10.6% in May 2011 and its record high of 14.2% in August 2009. Acceleration in the manufacturing sector and rising home sales that outpaced the national average also pointed to improving strength in the Michigan economy. Auto output for the first quarter of 2012 was projected to be 8% higher than a year ago, and U.S. and international automakers, suppliers, and research and development facilities have begun expansions. Michigan continued to rely heavily on manufacturing, which represented 13% of employment in the state, compared with 9% nationally. According to the S&P/Case-Shiller Index of 20 major metropolitan areas, housing prices in Detroit rose 1.2% during the twelve months ended April 2012, compared with a price decline of 1.9% nationally. Despite the increase, the
| Nuveen Investments | 7 |
average home price in Detroit remained below January 2000 levels. The state, which was sixth in the nation in terms of foreclosure rates in 2011, ranked eighth as of May 2012, with one in every 519 housing units in foreclosure, compared with the national average of one in 639. For fiscal 2012, Michigan balanced its state budget by implementing $1.6 billion in expenditure cuts broadly spread across state programs including health and human services, school funding, and local government revenue sharing. As of May 2012, Moody’s and S&P rated Michigan general obligation debt at Aa2 and AA-, respectively, with stable outlooks. During the twelve months ended May 31, 2012, municipal issuance in Michigan totaled $11.0 billion, an increase of 83% compared with the twelve months ended May 2012.
For 2011, Missouri’s economic growth remained essentially flat, while the national economy expanded at a rate of 1.5%. This ranked Missouri 43rd in terms of GDP growth by state. Job losses were spread across a number of sectors, including information services, construction, financial services and transportation. Missouri’s unemployment rate as of May 2012 was 7.3%, its lowest level since December 2008, down from 8.6% in May 2011 and below the national average of 8.2% for May 2012. Missouri has focused efforts on transitioning part of the state economy away from traditional manufacturing jobs into the development of biotechnology and alternative energy industries. Trade with China also has provided new opportunities. Although export growth fell in 2011, a recent agreement with emphasis on agricultural exports to China improved the outlook for food manufacturers, which accounted for 10% of the state’s $14 billion in exports. For fiscal 2013, the $24 billion Missouri state budget, which was introduced in January 2012, focused on job creation, K-12 education funding, disaster recovery funding, and continued efforts to streamline the state government, while making cuts to Medicaid and higher education. The budget, which contained no new taxes, also called for eliminating more than 800 additional state jobs, bringing total reductions to 4,100 over the past four years and resulting in the smallest state workforce since 1997. As of May 2012, Moody’s and S&P rated Missouri general obligation debt at Aaa and AAA, respectively, with stable outlooks. During the twelve months ended May 31, 2012, municipal issuance in Missouri totaled $4.7 billion, on par with the issuance of the previous twelve-month period.
After weathering difficult years during and following the recent recession, Ohio has shown signs of modest growth. In 2011, the state’s economy expanded at a rate of 1.1%, compared with the national growth rate of 1.5%, ranking Ohio 28th in terms of GDP growth by state. As of May 2012, the state’s unemployment rate was 7.3%, down from 8.8% in May 2011. Ohio’s education and health services industry, the largest source of employment in the state and the only sector to demonstrate growth even during the recession, continued to be a leader in adding jobs. Meanwhile, Toledo, Akron, and Cleveland were leading the rebound in manufacturing. Hiring in the healthcare and business services sectors was also expected to add to the state’s job growth. Ohio’s housing market, while stabilizing, has yet to make the transition to recovery. Growth in housing sales was helping to reduce the inventory of homes, but excess supply continued to be a problem, especially in Cleveland, Dayton, and Toledo. Ohio, which ranked eleventh in the nation in terms of foreclosure rates in 2011, moved up to seventh place as of May 2012, with one in every 495 housing units in foreclosure, compared with the national average of one in 639. According to the S&P/Case-Shiller Index of 20 major
| 8 | Nuveen Investments |
metropolitan areas, housing prices in Cleveland fell 1.3% during the twelve months ended April 2012, compared with a price decline of 1.9% nationally, as the average home price in Cleveland remained below January 2000 levels. In June 2011, Ohio enacted a two-year budget for fiscal 2012 and 2013 that cut school funding and reduced aid to cities, townships, and other local governments by $1 billion over the two years. The budget also provided for the elimination of the state estate tax in 2013, the sale of six prisons, and exploration of a long-term lease of the Ohio Turnpike to private operators. As of May 2012, Moody’s and S&P rated Ohio general obligation debt at Aa1 and AA+, respectively, with stable outlooks. For the twelve months ended May 31, 2012, municipal issuance in Ohio totaled $10.3 billion, a decrease of 20% compared with the twelve months ended May 2011.
Wisconsin’s economy received an early boost on its way to recovery from an above-average rate of hiring in manufacturing, the state’s largest employment sector, which represents more than 16% of jobs in Wisconsin. However, as manufacturing hiring slowed again, so too did the pace of growth in Wisconsin. In 2011, the state’s economy expanded at a rate of 1.1%, compared with the national growth rate of 1.5%, ranking Wisconsin 26th in terms of GDP growth by state. Layoffs in the government sector, the state’s third largest employment sector, occurred primarily at the state level and contributed to the slowdown. At the same time, job growth in education and health care, Wisconsin’s second largest sector with more than 15% of the state’s jobs, and leisure and hospitality helped Wisconsin’s unemployment rate continue to trend below national levels. As of May 2012, the Wisconsin jobless rate was 6.8%, compared with the U.S. average of 8.2%, down from 7.6% in May 2011. According to Moody’s, the state was expected to see further gains in manufacturing, benefiting from growth in Wisconsin’s largest trading partner, Canada, which provides the market for one-third of the state’s exports. In June 2011, Wisconsin enacted a two-year budget for fiscal 2012 and 2013, which closed a budget shortfall through reductions in spending for education, the University of Wisconsin system, Medicaid and state aid to local governments. That shortfall became part of the argument for legislation reducing most collective bargaining rights from the majority of the state’s public workers, which resulted in a gubernatorial recall election. Since the close of this reporting period, republican Scott Walker defeated Milwaukee Mayor Tom Barrett to retain the governorship in a Wisconsin election recall. As of May 2012, Wisconsin’s general obligation debt carried ratings of Aa2 from Moody’s and AA from S&P. For the twelve months ended May 31, 2012, Wisconsin issued $5.9 billion of municipal bonds, an increase of 12% from the twelve-month period ended May 31, 2011.
How did the Funds perform during the twelve-month period ending May 31, 2012?
The tables in the Fund Performance and Expense Ratios section of this report provide Class A Share total returns for the Funds for the one-year, five-year and ten-year periods ending May 31, 2012. Each Fund’s total returns are compared with the performance of each Fund’s benchmark index and their appropriate Lipper classification average.
| Nuveen Investments | 9 |
During the past twelve months, the Class A Shares at net asset value of the Kansas, Missouri and Wisconsin Funds outperformed the S&P National Municipal Bond Index, their corresponding state-specific S&P Index and their respective Lipper classification averages. The Kentucky Fund beat both the national S&P Index and its Lipper average but trailed its state specific average. The Ohio Fund performed in line with the national S&P Index while lagging its state S&P Index and outpacing its Lipper average. Of final note, the Michigan Fund underperformed both its national and state S&P benchmarks, but modestly surpassed its Lipper average.
What strategies were used to manage the Funds during the reporting period? How did these strategies influence performance?
All of the Funds continued to employ the same fundamental investment strategies and tactics as used in the past. Nuveen municipal bond portfolios are managed with a value-oriented approach and close input from Nuveen’s research team. Below we highlight the specific factors influencing each Fund’s investment strategy, as well as how we managed each portfolio in light of recent market conditions.
Nuveen Kansas and Wisconsin Municipal Bond Funds
Compared with the S&P National Municipal Bond Index, the Nuveen Kansas Municipal Bond Fund enjoyed very favorable results during the twelve-month period. The Fund benefited the most from its duration positioning, meaning its sensitivity to interest rate changes. Interest rates, and especially long-term interest rates, fell steadily throughout the past year. This situation was positive for our portfolio, given that the Fund’s duration was longer than that of the overall market, as measured by the national S&P index, and therefore the Fund was more responsive as rates fell. Similarly, the Fund was helped by its smaller allocation to very short dated bonds, which failed to gain in value to the same extent as longer dated bonds.
Another source of outperformance was the Fund’s credit quality positioning. Lower rated and non-rated bonds tended to outperform issues with high credit ratings, as investors sought better yields in the low interest rate environment and were willing to assume additional credit risk. Under these conditions, our increased exposure to higher yielding, non-rated bonds proved helpful. While our credit quality positioning was beneficial on balance, performance was moderated by the fact that some of these non-rated bonds had relatively short call dates, which kept them priced lower, close to their call prices.
In sector terms, the Fund’s performance was supported by our overweighting in categories that did relatively well, specifically, sales tax bonds and health care issues, including hospitals and senior living centers. Overall, sales tax bonds benefited from slow but steady economic growth, which in turn increased investors’ expectations for stronger sales tax revenues that sustain the bonds’ income stream. Hospital bonds, meanwhile, outperformed on the improving financial position of many issuers and the expected financial benefits surrounding federal health care reform legislation. The positive impact of our sector exposure was somewhat offset by untimely underweightings in corporate-backed industrial development revenue bonds and longer dated water/sewer bonds, both of which performed well given their elevated interest rate sensitivity.
| 10 | Nuveen Investments |
The Kansas Fund enjoyed a healthy amount of new shareholder investments into the portfolio throughout the period. To a much lesser extent, we also had assets to invest from selling certain higher rated bonds with short call dates, whose future performance potential was limited. Many of our new purchases were lower investment grade rated bonds. We favored these bonds specifically during this reporting period due to their historically wide credit spreads, meaning that lower rated bonds were paying an attractive premium relative to their higher grade counterparts. Through careful research, we hoped to identify lower rated debt securities that provided a favorable income stream relative to a manageable degree of risk. We added non-rated bonds for the Topeka YMCA, non-rated Santa Marta senior living center bonds, BBB-rated Burlington gas and electric bonds, as well as A-rated hospital issues. Purchases toward the end of the period included a variety of bonds from the new issue market, including securities issued by the University of Kansas, the athletic department of Kansas State University, the Kansas Turnpike Authority and Kansas Power Pool bonds for Dogwood Energy. We also added some diversified exposure to Puerto Rico bonds, which we purchased in the secondary municipal market. When the period began, the Fund had minimal exposure to bonds issued by U.S. territories, which, in light of our interest in emphasizing in-state debt, gave us flexibility to take advantage of the attractive investment values we were finding in this part of the market. Bonds issued by Puerto Rico and other U.S. territories are generally fully exempt from federal and state income taxes. The use of tender option bonds (TOBs) enhanced performance during the period as the use of TOBs increases the Fund’s duration and being long was beneficial as interest rates and credit spreads declined.
The Wisconsin Fund outperformed the national S&P index and was lifted by many of the same factors as the Kansas Fund. For example, the Fund was overweight to the market’s longest dated securities, which resulted in a longer portfolio duration than the national municipal bond market, and this heightened sensitivity to declining interest rates boosted the Fund’s performance. Similarly, the Fund was helped by its credit rating positioning. Given Wisconsin’s limited issuance of bonds with below investment grade credit ratings (below BBB), the Fund benefited from maintaining greater exposure to BBB-rated and A-rated securities. As in Kansas, lower rated securities in Wisconsin saw their yields decline more than higher rated bonds did, while the lower rated bonds’ prices rose accordingly (a bond’s yield and price move in opposite directions). The overweighting in A-rated bonds was predominantly composed of investments in Wisconsin issues, while the BBB weighting came primarily from our investments in Puerto Rico bonds, which we owned to keep the Fund fully invested at times when we were unable to find suitable Wisconsin issuance for the portfolio.
The Fund’s sector positioning was overweight among hospital bonds, as many issues in that category did relatively well. Tempering the favorable impact, however, was a negative contribution from our overweighting in single-family housing bonds. During periods of declining interest rates, housing bonds often underperform as many homeowners elect to prepay their mortgages before the bonds mature, thereby prematurely cutting off the securities’ income stream. Trading activity for the Wisconsin Fund was subdued, in large part because of relatively sparse issuance in the state. One significant area of activity included hospital bonds, which were strong performers during the past year. We were able to find several attractive new securities in this group and
| Nuveen Investments | 11 |
added to A-rated and BBB-rated issues. Another purchase included non-rated senior living center bonds. Much of the municipal bond issuance within Wisconsin is not “double exempt”, meaning not exempt from both federal and state income taxes. Because there is only a limited amount of fully tax-exempt bonds to purchase in Wisconsin, we often turn to securities issued by U.S. territories and bought several Puerto Rico bonds. As we mentioned earlier, U.S. territorial bonds are generally fully tax exempt for residents of all 50 states. In addition, we also swapped some of our existing Puerto Rico holdings, exchanging intermediate and shorter dated issues for longer dated bonds. To finance our purchases throughout the period, we typically relied on new shareholder investments into the portfolio, which enabled us to take advantage of timely buying opportunities and improve the Fund’s diversification.
Nuveen Kentucky, Michigan and Ohio Municipal Bond Funds
The Nuveen Kentucky Municipal Bond Fund’s relative outperformance of the S&P National Municipal Bond Index was attributable to its favorable duration, or interest rate positioning. The Fund had greater representation of more interest rate sensitive, longer duration bonds as well as less exposure to shorter duration issues. This was a positive factor for the Fund’s results as longer duration securities benefited more than shorter duration issues in the declining interest rate environment of the past twelve months. On an individual basis, some of the portfolio’s longest duration holdings fared the best in this environment, including an inverse floating rate security and long dated zero coupon bonds. Because “inverse floaters” and “zeroes” tend to have long durations, their elevated sensitivity to rate movements added to performance. For the performance period, the tender option bonds (TOBs) in the Kentucky Fund contributed positively to performance.
A more modest source of outperformance came from our credit rating positioning, namely, the Fund was underweight in high quality bonds with AAA credit ratings while overweight in less creditworthy bonds with ratings of BBB. Given investors’ search for income amid low interest rates, bonds with higher yields but more credit risk were in demand. As such, the portfolio’s BBB-rated securities performed well for the Fund.
The Fund was hampered in sector terms by a small overweighting to pre-refunded bonds. These very high quality, short duration securities lagged in an environment in which investors preferred the opposite, lower quality, longer duration issues. That underperformance, however, was counterbalanced by good results from the Fund’s health care positioning.
During the past year, and especially in the latter half of the reporting period, our management approach was shaped by substantial bond call activity. In the low interest rate environment, issuers had a significant financial incentive to refinance their debt. As a number of the holdings in the portfolio were called, new cash flowed into the portfolio, in addition to new shareholder investments. Consequently, we were often in search of attractive new opportunities to invest those proceeds and keep the portfolio fully invested. To put this money to work, we were active in both the Kentucky new-issue market and the secondary tax-exempt bond market. Purchases ranged across a number of sectors, including dedicated tax bonds, appropriation bonds and water/sewer issues. Our
| 12 | Nuveen Investments |
acquisitions tended to feature intermediate and longer maturities and mid- to higher grade credit quality, reflecting the type of issuance that is most common in the state.
In contrast to the Kentucky Fund, the Nuveen Michigan Municipal Bond Fund lagged the national S&P Index, in part because of the effects of its large overweighting in pre-refunded bonds. These types of securities, as we mentioned, are very high in credit quality and short in duration. Neither characteristic was a desirable attribute in a market environment that favored lower quality, longer duration securities. On the positive side, our overweighting in health care bonds moderated some of that negative impact.
As with the Kentucky Fund, however, good duration positioning helped lift the Michigan Fund’s results. More specifically, the Fund’s overweighting in longer duration securities and corresponding underweighting in shorter-dated issues added to performance, as interest rates on longer bonds fell more than they did on their shorter dated counterparts. On an individual basis, some of our top performing securities were very long-duration holdings, including the Fund’s long dated zero coupon bonds and an inverse floater. The Fund’s credit rating positioning also added to relative performance. The portfolio was overweighted in bonds with BBB credit ratings and underweighted in AAA-rated bonds. Both stances were assets, given investors’ willingness to take on added credit risk in exchange for higher amounts of income in the low interest rate environment.
In managing the Michigan Fund, we initiated new purchases during the period through both the primary (new issue) and secondary municipal bond markets, and our portfolio additions favored bonds with intermediate and long durations, where we believed the best values along the yield curve were available and which best enabled us to achieve our preferred portfolio positioning. We invested in a broad mix of sectors, with new lower and mid-quality purchases including Michigan tobacco bonds and health care issues, while we added some higher quality Michigan general obligation debt to the portfolio as well.
Our purchase activity was driven in large part by bond calls, which provided us with a steady stream of cash requiring investment in order to keep the portfolio fully invested. New shareholder inflows gave us additional funds with which to purchase securities. While sales were very limited, we did sell some of our pre-refunded bonds.
As we mentioned, the Nuveen Ohio Municipal Bond Fund performed roughly in line with the national S&P Index, and the portfolio’s credit-quality positioning added to positive returns. Compared with other states, Ohio features a wide variety of lower rated supply to choose from, which enabled us to maintain an overweighting in BBB-rated and lower rated bonds, an advantage given the favorable conditions for those types of securities during the past twelve months. Relatedly, the portfolio was also underweight in the market’s highest quality AAA-rated bonds.
A lesser but still positive contributing factor was the Fund’s duration positioning. As with our other portfolios, the Fund was overweighted in long-maturity securities, including helpful long dated zero coupon bonds and inverse floating rate securities, while having less exposure to shorter dated issues. Our sector allocations produced mixed results. An overweighting in pre-refunded bonds hurt performance because of those securities’ very short maturities and very high credit quality. The Fund also benefited from its exposure to water/sewer bonds.
| Nuveen Investments | 13 |
As with the other two portfolios, call activity and to a lesser extent new investments from shareholders were the key drivers of our purchases during the period, as we sought to reinvest those proceeds in a timely manner. We had little need to sell portfolio holdings in order to make purchases, given the healthy amount of cash coming into the portfolio, and we were comfortable with the portfolio’s existing structure and saw no reason to make significant changes. Purchases during the period came from both the primary and, more often, the secondary municipal bond market and focused on intermediate and long dated bonds, depending on what was available when we had funds needing investment. With a generally healthy level of bond supply within the state, we were able to add a variety of Ohio positions to maintain our desired diversification across sectors, maturity ranges and credit quality.
Nuveen Missouri Municipal Bond Fund
The Nuveen Missouri Municipal Bond Fund’s outperformance of the S&P National Municipal Bond Index was primarily the result of its favorable credit quality positioning. Most notably, the Fund’s overweighting in BBB-rated and non-rated issues proved positive amid the favorable backdrop for lower rated, higher yielding investments, as investors were increasingly willing throughout the year to consider such lower rated securities in exchange for increased income in the low interest rate environment. Relatedly, the Fund’s smaller allocation to the highest rated tax-exempt securities in the Missouri market also added to results, given those securities’ relative underperformance. A lesser but still positive factor shaping the Fund’s strong results was its helpful duration positioning. The Fund was slightly more exposed to longer dated securities, which benefited significantly in the declining interest rate environment of the past twelve months. Similarly, compared with the index, the Fund’s underweighting in shorter maturity issues was advantageous, given their more subdued returns. In contrast, we saw extremely modest underperformance due to the portfolio’s underweighting of utility bonds, which performed well overall. This, however, was a very minor detraction in what was otherwise a positive reporting period for the Fund.
During the past twelve months, our management approach focused on staying the course rather than making substantial changes to the portfolio, which was well positioned going into the reporting period. We added a number of new securities to the portfolio, including Kansas City water revenue bonds rated Aa2/AA+ (Moody’s/S&P), Kansas City general obligation (GO) bonds rated Aa2/AA (Moody’s/S&P), Missouri Joint Municipal Electric Utility Commission bonds for the Missouri Public Energy Pool project rated A2/A (Moody’s/Fitch) and Branson School District GO bonds rated A+ (S&P). While these securities represented the major new purchases of the period, we added BBB-rated holdings when we felt they were available at reasonable prices. Most of our purchases, however, were centered on bonds with higher credit quality, as we wished to keep the Fund’s allocation to lower investment grade bonds close to its existing level.
The reporting period witnessed relatively strong demand for Missouri bonds, which periodically limited the supply of in-state securities available for investment. As such, we bought and subsequently added to our position in Puerto Rico sales tax bonds, which are generally fully tax exempt for Missouri residents, to keep the Fund fully invested when
| 14 | Nuveen Investments |
suitable Missouri bonds were scarce. Funding for these and other purchases came primarily from new shareholder investments into the portfolio, as well as the proceeds of bond calls and maturities.
Risk Considerations
Mutual fund investing involves risk; principal loss is possible. Debt or fixed income securities such as those held by the Funds, are subject to market risk, credit risk, interest rate risk, call risk, state concentration risk, tax risk, and income risk. As interest rates rise, bond prices fall. Credit risk refers to an issuers ability to make interest and principal payments when due. Below investment grade or high yield debt securities are subject to liquidity risk and heightened credit risk. The Funds’ use of inverse floaters creates effective leverage. Leverage involves the risk that the Funds could lose more than its original investment and also increases the Funds’ exposure to volatility and interest rate risk.
Dividend Information
The Class C Shares of the Nuveen Kansas Municipal Bond Fund and the Class B and C Shares of the Nuveen Kentucky Municipal Bond Fund experienced two monthly dividend cuts. The Class I Shares of the Nuveen Michigan Municipal Bond Fund and Nuveen Missouri Municipal Bond Fund each saw one monthly dividend increase. The Class A and I Shares of the Nuveen Kansas Municipal Bond Fund, the Class A and I Shares of the Nuveen Kentucky Municipal Fund, the Class C Shares of the Nuveen Wisconsin Municipal Bond Fund, the Class B Shares of the Nuveen Missouri Municipal Bond Fund and the Class B Shares of Nuveen Ohio Municipal Bond Fund experienced one monthly dividend reduction. The Class I Shares of the Nuveen Missouri Municipal Bond Fund and all share classes of the Nuveen Wisconsin Municipal Bond Fund saw one monthly dividend increase. There were no other dividend changes during the twelve-month reporting period.
Each Fund seeks to pay dividends at a rate that reflects the past and projected performance of the Fund. To permit a Fund to maintain a more stable monthly dividend, the Fund may pay dividends at a rate that may be more or less than the amount of net investment income actually earned by the Fund during the period. If the Fund has cumulatively earned more than it has paid in dividends, it will hold the excess in reserve as undistributed net investment income (UNII) as part of the Fund’s net asset value. Conversely, if the Fund has cumulatively paid in dividends more than it has earned, the excess will constitute a negative UNII that will likewise be reflected in the Fund’s net asset value. Each Fund will, over time, pay all its net investment income as dividends to shareholders. As of May 31, 2012, all of the Funds had positive UNII balances for tax purposes. As of May 31, 2012, Kentucky had a negative UNII balance, while all the other Funds had positive UNII balances for financial statement purposes.
| Nuveen Investments | 15 |
[THIS PAGE INTENTIONALLY LEFT BLANK]
| 16 | Nuveen Investments |
Fund Performance and Expense Ratios
The Fund Performance and Expense Ratios for each Fund are shown on the following twelve pages.
Returns quoted represent past performance, which is no guarantee of future results. Current performance may be higher or lower than the performance shown. Investment returns and principal value will fluctuate so that when shares are redeemed, they may be worth more or less than their original cost. Returns without sales charges would be lower if the sales charge were included. Returns do not reflect the deduction of taxes that a shareholder would pay on Fund distributions or the redemption of Fund shares. Income is generally exempt from regular federal income taxes. Some income may be subject to state and local income taxes and to the federal alternative minimum tax. Capital gains, if any, are subject to tax.
Returns may reflect a contractual agreement between certain Funds and the investment adviser to waive certain fees and expenses; see Notes to Financial Statements, Footnote 7 — Management Fees and Other Transactions with Affiliates for more information. In addition, returns may reflect a voluntary expense limitation by the Funds’ investment adviser that may be modified or discontinued at any time without notice. For the most recent month-end performance visit www.nuveen.com or call (800) 257-8787.
Returns reflect differences in sales charges and expenses, which are primarily differences in distribution and service fees. Fund returns assume reinvestment of dividends and capital gains.
Comparative index and Lipper return information is provided for the Funds’ Class A Shares at net asset value (NAV) only.
The expense ratios shown reflect the Funds’ total operating expenses (before fee waivers or expense reimbursements, if any) as shown in the Funds’ most recent prospectus. The expense ratios include management fees and other fees and expenses.
| Nuveen Investments | 17 |
Fund Performance and Expense Ratios (continued)
Nuveen Kansas Municipal Bond Fund
Refer to the first page of this Fund Performance and Expense Ratios section for further explanation of the information included within this page.
Fund Performance
Average Annual Total Returns as of May 31, 2012
| Average Annual | ||||||||||||
| 1-Year | 5-Year | 10-Year | ||||||||||
Class A Shares at NAV | 12.43% | 5.83% | 5.22% | |||||||||
Class A Shares at maximum Offering Price | 7.75% | 4.92% | 4.77% | |||||||||
Standard & Poor’s (S&P) Kansas Municipal Bond Index* | 10.35% | 5.68% | 5.48% | |||||||||
Standard & Poor’s (S&P) Municipal Bond Index* | 10.77% | 5.54% | 5.44% | |||||||||
Lipper Other States Municipal Debt Funds Classification Average* | 10.01% | 4.61% | 4.52% | |||||||||
Class C Shares | 11.86% | 5.26% | 4.64% | |||||||||
Class I Shares | 12.62% | 6.04% | 5.43% | |||||||||
Average Annual Total Returns as of June 30, 2012 (Most Recent Calendar Quarter)
| Average Annual | ||||||||||||
| 1-Year | 5-Year | 10-Year | ||||||||||
Class A Shares at NAV | 11.98% | 5.93% | 5.11% | |||||||||
Class A Shares at maximum Offering Price | 7.23% | 5.03% | 4.66% | |||||||||
Class C Shares | 11.32% | 5.34% | 4.53% | |||||||||
Class I Shares | 12.18% | 6.12% | 5.31% | |||||||||
Class A Shares have a maximum 4.20% sales charge (Offering Price). Class A Share purchases of $1 million or more are sold at net asset value without an up-front sales charge but may be subject to a contingent deferred sales charge (CDSC), also known as a back-end sales charge, if redeemed within eighteen months of purchase. Class C Shares have a 1% CDSC for redemptions within less than twelve months, which is not reflected in the one-year total return. Class I Shares have no sales charge and may be purchased under limited circumstances or by specified classes of investors.
Expense Ratios as of Most Recent Prospectus
| Expense Ratios | ||||
Class A Shares | 0.83% | |||
Class C Shares | 1.38% | |||
Class I Shares | 0.63% | |||
| * | Refer to the Glossary of Terms Used in this Report for definitions. Indexes and Lipper averages are not available for direct investment. |
| 18 | Nuveen Investments |
Growth of an Assumed $10,000 Investment as of May 31, 2012 – Class A Shares
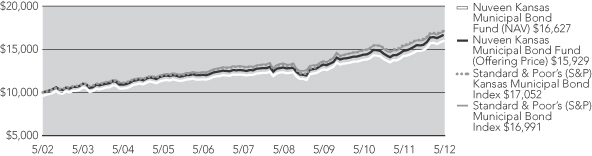
The graphs do not reflect the deduction of taxes, such as state and local income taxes or capital gains taxes, that a shareholder may pay on Fund distributions or the redemption of Fund shares.
| Nuveen Investments | 19 |
Fund Performance and Expense Ratios (continued)
Nuveen Kentucky Municipal Bond Fund
Refer to the first page of this Fund Performance and Expense Ratios section for further explanation of the information included within this page.
Fund Performance
Average Annual Total Returns as of May 31, 2012
| Average Annual | ||||||||||||
| 1-Year | 5-Year | 10-Year | ||||||||||
Class A Shares at NAV | 11.10% | 5.24% | 5.01% | |||||||||
Class A Shares at maximum Offering Price | 6.42% | 4.34% | 4.56% | |||||||||
Standard & Poor’s (S&P) Kentucky Municipal Bond Index* | 11.84% | 6.14% | 5.01% | |||||||||
Standard & Poor’s (S&P) Municipal Bond Index* | 10.77% | 5.54% | 5.44% | |||||||||
Lipper Other States Municipal Debt Funds Classification Average* | 10.01% | 4.61% | 4.52% | |||||||||
Class B Shares w/o CDSC | 10.20% | 4.44% | 4.38% | |||||||||
Class B Shares w/CDSC | 6.20% | 4.27% | 4.38% | |||||||||
Class C Shares | 10.44% | 4.66% | 4.44% | |||||||||
Class I Shares | 11.24% | 5.44% | 5.22% | |||||||||
Average Annual Total Returns as of June 30, 2012 (Most Recent Calendar Quarter)
| Average Annual | ||||||||||||
| 1-Year | 5-Year | 10-Year | ||||||||||
Class A Shares at NAV | 10.38% | 5.28% | 4.90% | |||||||||
Class A Shares at maximum Offering Price | 5.73% | 4.38% | 4.45% | |||||||||
Class B Shares w/o CDSC | 9.58% | 4.50% | 4.27% | |||||||||
Class B Shares w/CDSC | 5.58% | 4.33% | 4.27% | |||||||||
Class C Shares | 9.82% | 4.70% | 4.32% | |||||||||
Class I Shares | 10.61% | 5.50% | 5.10% | |||||||||
Class A Shares have a maximum 4.20% sales charge (Offering Price). Class A Share purchases of $1 million or more are sold at net asset value without an up-front sales charge but may be subject to a contingent deferred sales charge (CDSC), also known as a back-end sales charge, if redeemed within eighteen months of purchase. Class B Shares have a CDSC that begins at 5% for redemptions during the first year and declines periodically until after six years when the charge becomes 0%. Class B Shares automatically convert to Class A Shares eight years after purchase. Class C Shares have a 1% CDSC for redemptions within less than twelve months, which is not reflected in the one-year total return. Class I Shares have no sales charge and may be purchased under limited circumstances or by specified classes of investors.
Expense Ratios as of Most Recent Prospectus
| Expense Ratios | ||||
Class A Shares | 0.80% | |||
Class B Shares | 1.55% | |||
Class C Shares | 1.35% | |||
Class I Shares | 0.60% | |||
| * | Refer to the Glossary of Terms Used in this Report for definitions. Indexes and Lipper averages are not available for direct investment. |
| 20 | Nuveen Investments |
Growth of an Assumed $10,000 Investment as of May 31, 2012 – Class A Shares
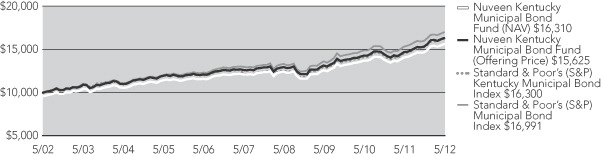
The graphs do not reflect the deduction of taxes, such as state and local income taxes or capital gains taxes, that a shareholder may pay on Fund distributions or the redemption of Fund shares.
| Nuveen Investments | 21 |
-
Fund Performance and Expense Ratios (continued)
Nuveen Michigan Municipal Bond Fund
Refer to the first page of this Fund Performance and Expense Ratios section for further explanation of the information included within this page.
Fund Performance
Average Annual Total Returns as of May 31, 2012
| Average Annual | ||||||||||||
| 1-Year | 5-Year | 10-Year | ||||||||||
Class A Shares at NAV | 10.48% | 4.97% | 4.93% | |||||||||
Class A Shares at maximum Offering Price | 5.80% | 4.07% | 4.47% | |||||||||
Standard & Poor’s (S&P) Michigan Municipal Bond Index* | 11.42% | 5.52% | 5.41% | |||||||||
Standard & Poor’s (S&P) Municipal Bond Index* | 10.77% | 5.54% | 5.44% | |||||||||
Lipper Michigan Municipal Debt Funds Classification Average* | 10.35% | 3.54% | 4.44% | |||||||||
Class C Shares | 9.81% | 4.40% | 4.35% | |||||||||
Class I Shares | 10.59% | 5.17% | 5.13% | |||||||||
Average Annual Total Returns as of June 30, 2012 (Most Recent Calendar Quarter)
| Average Annual | ||||||||||||
| 1-Year | 5-Year | 10-Year | ||||||||||
Class A Shares at NAV | 9.88% | 5.11% | 4.81% | |||||||||
Class A Shares at maximum Offering Price | 5.24% | 4.21% | 4.36% | |||||||||
Class C Shares | 9.32% | 4.54% | 4.24% | |||||||||
Class I Shares | 10.19% | 5.33% | 5.03% | |||||||||
Class A Shares have a maximum 4.20% sales charge (Offering Price). Class A Share purchases of $1 million or more are sold at net asset value without an up-front sales charge but may be subject to a contingent deferred sales charge (CDSC), also known as a back-end sales charge, if redeemed within eighteen months of purchase. Class C Shares have a 1% CDSC for redemptions within less than twelve months, which is not reflected in the one-year total return. Class I Shares have no sales charge and may be purchased under limited circumstances or by specified classes of investors.
Expense Ratios as of Most Recent Prospectus
| Expense Ratios | ||||
Class A Shares | 0.84% | |||
Class C Shares | 1.39% | |||
Class I Shares | 0.64% | |||
| * | Refer to the Glossary of Terms Used in this Report for definitions. Indexes and Lipper averages are not available for direct investment. |
| 22 | Nuveen Investments |
Growth of an Assumed $10,000 Investment as of May 31, 2012 – Class A Shares
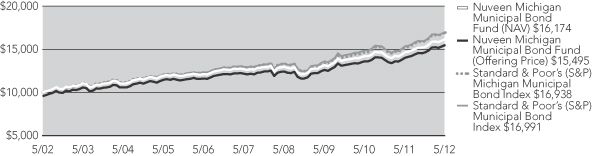
The graphs do not reflect the deduction of taxes, such as state and local income taxes or capital gains taxes, that a shareholder may pay on Fund distributions or the redemption of Fund shares.
| Nuveen Investments | 23 |
Fund Performance and Expense Ratios (continued)
Nuveen Missouri Municipal Bond Fund
Refer to the first page of this Fund Performance and Expense Ratios section for further explanation of the information included within this page.
Fund Performance
Average Annual Total Returns as of May 31, 2012
| Average Annual | ||||||||||||
| 1-Year | 5-Year | 10-Year | ||||||||||
Class A Shares at NAV | 12.08% | 5.46% | 5.18% | |||||||||
Class A Shares at maximum Offering Price | 7.36% | 4.56% | 4.73% | |||||||||
Standard & Poor’s (S&P) Missouri Municipal Bond Index* | 10.52% | 5.60% | 5.55% | |||||||||
Standard & Poor’s (S&P) Municipal Bond Index* | 10.77% | 5.54% | 5.44% | |||||||||
Lipper Other States Municipal Debt Funds Classification Average* | 10.01% | 4.61% | 4.52% | |||||||||
Class B Shares w/o CDSC | 11.24% | 4.68% | 4.56% | |||||||||
Class B Shares w/CDSC | 7.24% | 4.51% | 4.56% | |||||||||
Class C Shares | 11.50% | 4.88% | 4.60% | |||||||||
Class I Shares | 12.28% | 5.69% | 5.38% | |||||||||
Average Annual Total Returns as of June 30, 2012 (Most Recent Calendar Quarter)
| Average Annual | ||||||||||||
| 1-Year | 5-Year | 10-Year | ||||||||||
Class A Shares at NAV | 10.94% | 5.56% | 5.07% | |||||||||
Class A Shares at maximum Offering Price | 6.30% | 4.66% | 4.62% | |||||||||
Class B Shares w/o CDSC | 10.11% | 4.78% | 4.45% | |||||||||
Class B Shares w/CDSC | 6.11% | 4.61% | 4.45% | |||||||||
Class C Shares | 10.37% | 4.98% | 4.50% | |||||||||
Class I Shares | 11.15% | 5.77% | 5.28% | |||||||||
Class A Shares have a maximum 4.20% sales charge (Offering Price). Class A Share purchases of $1 million or more are sold at net asset value without an up-front sales charge but may be subject to a contingent deferred sales charge (CDSC), also known as a back-end sales charge, if redeemed within eighteen months of purchase. Class B Shares have a CDSC that begins at 5% for redemptions during the first year and declines periodically until after six years when the charge becomes 0%. Class B Shares automatically convert to Class A Shares eight years after purchase. Class C Shares have a 1% CDSC for redemptions within less than twelve months, which is not reflected in the one-year total return. Class I Shares have no sales charge and may be purchased under limited circumstances or by specified classes of investors.
Expense Ratios as of Most Recent Prospectus
| Expense Ratios | ||||
Class A Shares | 0.82% | |||
Class B Shares | 1.57% | |||
Class C Shares | 1.37% | |||
Class I Shares | 0.62% | |||
| * | Refer to the Glossary of Terms Used in this Report for definitions. Indexes and Lipper averages are not available for direct investment. |
| 24 | Nuveen Investments |
Growth of an Assumed $10,000 Investment as of May 31, 2012 – Class A Shares

The graphs do not reflect the deduction of taxes, such as state and local income taxes or capital gains taxes, that a shareholder may pay on Fund distributions or the redemption of Fund shares.
| Nuveen Investments | 25 |
Fund Performance and Expense Ratios (continued)
Nuveen Ohio Municipal Bond Fund
Refer to the first page of this Fund Performance and Expense Ratios section for further explanation of the information included within this page.
Fund Performance
Average Annual Total Returns as of May 31, 2012
| Average Annual | ||||||||||||
| 1-Year | 5-Year | 10-Year | ||||||||||
Class A Shares at NAV | 10.77% | 5.33% | 5.08% | |||||||||
Class A Shares at maximum Offering Price | 6.14% | 4.43% | 4.63% | |||||||||
Standard & Poor’s (S&P) Ohio Municipal Bond Index* | 11.34% | 4.97% | 5.05% | |||||||||
Standard & Poor’s (S&P) Municipal Bond Index* | 10.77% | 5.54% | 5.44% | |||||||||
Lipper Ohio Municipal Debt Funds Classification Average* | 10.26% | 4.21% | 4.38% | |||||||||
Class B Shares w/o CDSC | 10.00% | 4.52% | 4.46% | |||||||||
Class B Shares w/CDSC | 6.00% | 4.35% | 4.46% | |||||||||
Class C Shares | 10.13% | 4.74% | 4.50% | |||||||||
Class I Shares | 10.94% | 5.52% | 5.29% | |||||||||
Average Annual Total Returns as of June 30, 2012 (Most Recent Calendar Quarter)
| Average Annual | ||||||||||||
| 1-Year | 5-Year | 10-Year | ||||||||||
Class A Shares at NAV | 9.97% | 5.46% | 4.99% | |||||||||
Class A Shares at maximum Offering Price | 5.39% | 4.56% | 4.54% | |||||||||
Class B Shares w/o CDSC | 9.10% | 4.65% | 4.37% | |||||||||
Class B Shares w/CDSC | 5.10% | 4.49% | 4.37% | |||||||||
Class C Shares | 9.34% | 4.87% | 4.41% | |||||||||
Class I Shares | 10.13% | 5.65% | 5.19% | |||||||||
Class A Shares have a maximum 4.20% sales charge (Offering Price). Class A Share purchases of $1 million or more are sold at net asset value without an up-front sales charge but may be subject to a contingent deferred sales charge (CDSC), also known as a back-end sales charge, if redeemed within eighteen months of purchase. Class B Shares have a CDSC that begins at 5% for redemptions during the first year and declines periodically until after six years when the charge becomes 0%. Class B Shares automatically convert to Class A Shares eight years after purchase. Class C Shares have a 1% CDSC for redemptions within less than twelve months, which is not reflected in the one-year total return. Class I Shares have no sales charge and may be purchased under limited circumstances or by specified classes of investors.
Expense Ratios as of Most Recent Prospectus
| Expense Ratios | ||||
Class A Shares | 0.82% | |||
Class B Shares | 1.57% | |||
Class C Shares | 1.37% | |||
Class I Shares | 0.62% | |||
| * | Refer to the Glossary of Terms Used in this Report for definitions. Indexes and Lipper averages are not available for direct investment. |
| 26 | Nuveen Investments |
Growth of an Assumed $10,000 Investment as of May 31, 2012 – Class A Shares
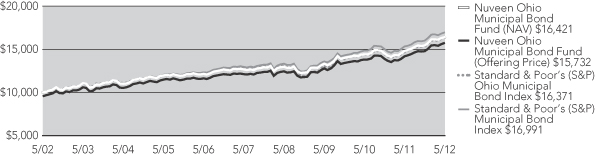
The graphs do not reflect the deduction of taxes, such as state and local income taxes or capital gains taxes, that a shareholder may pay on Fund distributions or the redemption of Fund shares.
| Nuveen Investments | 27 |
Fund Performance and Expense Ratios (continued)
Nuveen Wisconsin Municipal Bond Fund
Refer to the first page of this Fund Performance and Expense Ratios section for further explanation of the information included within this page.
Fund Performance
Average Annual Total Returns as of May 31, 2012
| Average Annual | ||||||||||||
| 1-Year | 5-Year | 10-Year | ||||||||||
Class A Shares at NAV | 11.96% | 5.57% | 5.01% | |||||||||
Class A Shares at maximum Offering Price | 7.26% | 4.67% | 4.56% | |||||||||
Standard & Poor’s (S&P) Wisconsin Municipal Bond Index* | 9.11% | 5.77% | 5.87% | |||||||||
Standard & Poor’s (S&P) Municipal Bond Index* | 10.77% | 5.54% | 5.44% | |||||||||
Lipper Other States Municipal Debt Funds Classification Average* | 10.01% | 4.61% | 4.52% | |||||||||
Class C Shares | 11.27% | 4.98% | 4.44% | |||||||||
Class I Shares | 12.16% | 5.80% | 5.22% | |||||||||
Average Annual Total Returns as of June 30, 2012 (Most Recent Calendar Quarter)
| Average Annual | ||||||||||||
| 1-Year | 5-Year | 10-Year | ||||||||||
Class A Shares at NAV | 10.90% | 5.70% | 4.88% | |||||||||
Class A Shares at maximum Offering Price | 6.27% | 4.80% | 4.43% | |||||||||
Class C Shares | 10.23% | 5.11% | 4.32% | |||||||||
Class I Shares | 11.11% | 5.95% | 5.09% | |||||||||
Class A Shares have a maximum 4.20% sales charge (Offering Price). Class A Share purchases of $1 million or more are sold at net asset value without an up-front sales charge but may be subject to a contingent deferred sales charge (CDSC), also known as a back-end sales charge, if redeemed within eighteen months of purchase. Class C Shares have a 1% CDSC for redemptions within less than twelve months, which is not reflected in the one-year total return. Class I Shares have no sales charge and may be purchased under limited circumstances or by specified classes of investors.
Expense Ratios as of Most Recent Prospectus
| Expense Ratios | ||||
Class A Shares | 0.87% | |||
Class C Shares | 1.42% | |||
Class I Shares | 0.67% | |||
| * | Refer to the Glossary of Terms Used in this Report for definitions. Indexes and Lipper averages are not available for direct investment. |
| 28 | Nuveen Investments |
Growth of an Assumed $10,000 Investment as of May 31, 2012 – Class A Shares
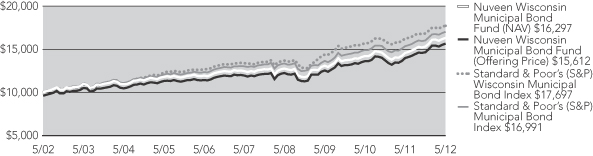
The graphs do not reflect the deduction of taxes, such as state and local income taxes or capital gains taxes, that a shareholder may pay on Fund distributions or the redemption of Fund shares.
| Nuveen Investments | 29 |
Dividend Yield is the most recent dividend per share (annualized) divided by the offering price per share.
The SEC 30-Day Yield is a standardized measure of a Fund’s yield that accounts for the future amortization of premiums or discounts of bonds held in the Fund’s portfolio. The SEC 30-Day Yield is computed under an SEC standardized formula and is based on the maximum offer price per share. Dividend Yield may differ from the SEC 30-Day Yield because the Fund may be paying out more or less than it is earning and it may not include the effect of amortization of bond premium.
The Taxable-Equivalent Yield represents the yield that must be earned on a fully taxable investment in order to equal the yield of the Fund on an after-tax basis at a specified tax rate. With respect to investments that generate qualified dividend income that is taxable at a maximum rate of 15%, the Taxable-Equivalent Yield is lower.
Nuveen Kansas Municipal Bond Fund
| Dividend Yield | SEC 30-Day Yield | Taxable- Equivalent Yield1 | ||||||||||
Class A Shares5 | 3.54% | 2.65% | 3.93% | |||||||||
Class C Shares | 3.16% | 2.22% | 3.29% | |||||||||
Class I Shares | 3.89% | 2.97% | 4.41% | |||||||||
Nuveen Kentucky Municipal Bond Fund
| Dividend Yield | SEC 30-Day Yield | Taxable- Equivalent Yield2 | ||||||||||
Class A Shares5 | 3.68% | 2.36% | 3.49% | |||||||||
Class B Shares | 3.11% | 1.71% | 2.53% | |||||||||
Class C Shares | 3.32% | 1.92% | 2.84% | |||||||||
Class I Shares | 4.05% | 2.67% | 3.94% | |||||||||
Nuveen Michigan Municipal Bond Fund
| Dividend Yield | SEC 30-Day Yield | Taxable- Equivalent Yield3 | ||||||||||
Class A Shares5 | 3.66% | 2.41% | 3.50% | |||||||||
Class C Shares | 3.32% | 1.97% | 2.86% | |||||||||
Class I Shares | 4.03% | 2.72% | 3.95% | |||||||||
Nuveen Missouri Municipal Bond Fund
| Dividend Yield | SEC 30-Day Yield | Taxable- Equivalent Yield4 | ||||||||||
Class A Shares5 | 3.90% | 2.71% | 4.00% | |||||||||
Class B Shares | 3.34% | 2.07% | 3.06% | |||||||||
Class C Shares | 3.55% | 2.28% | 3.37% | |||||||||
Class I Shares | 4.28% | 3.02% | 4.46% | |||||||||
| 1 | TheTaxable-Equivalent Yield is based on the Fund’s SEC 30-Day Yield on the indicated date and a combined federal and state income tax rate of 32.6%. |
| 2 | TheTaxable-Equivalent Yield is based on the Fund’s SEC 30-Day Yield on the indicated date and a combined federal and state income tax rate of 32.3%. |
| 3 | TheTaxable-Equivalent Yield is based on the Fund’s SEC 30-Day Yield on the indicated date and a combined federal and state income tax rate of 31.1%. |
| 4 | TheTaxable-Equivalent Yield is based on the Fund’s SEC 30-Day Yield on the indicated date and a combined federal and state income tax rate of 32.3%. |
| 5 | The SEC Yield for Class A shares quoted in the table reflects the maximum sales load. Investors paying a reduced load because of volume discounts, investors paying no load because they qualify for one of the several exclusions from the load, and existing shareholders who previously paid a load but would like to know the SEC Yield applicable to their shares on a going-forward basis, should understand that the SEC Yield effectively applicable to them would be higher than the figure quoted in the table. |
| 30 | Nuveen Investments |
Nuveen Ohio Municipal Bond Fund
| Dividend Yield | SEC 30-Day Yield | Taxable- Equivalent Yield1 | ||||||||||
Class A Shares3 | 3.83% | 2.24% | 3.29% | |||||||||
Class B Shares | 3.29% | 1.58% | 2.32% | |||||||||
Class C Shares | 3.50% | 1.80% | 2.64% | |||||||||
Class I Shares | 4.22% | 2.58% | 3.79% | |||||||||
Nuveen Wisconsin Municipal Bond Fund
| Dividend Yield | SEC 30-Day Yield | Taxable- Equivalent Yield2 | ||||||||||
Class A Shares3 | 3.47% | 2.70% | 4.02% | |||||||||
Class C Shares | 3.08% | 2.28% | 3.40% | |||||||||
Class I Shares | 3.83% | 3.02% | 4.50% | |||||||||
| 1 | The Taxable-Equivalent Yield is based on the Fund’s SEC 30-Day Yield on the indicated date and a combined federal and state income tax rate of 31.9%. |
| 2 | The Taxable-Equivalent Yield is based on the Fund’s SEC 30-Day Yield on the indicated date and a combined federal and state income tax rate of 32.9%. |
| 3 | The SEC Yield for Class A shares quoted in the table reflects the maximum sales load. Investors paying a reduced load because of volume discounts, investors paying no load because they qualify for one of the several exclusions from the load, and existing shareholders who previously paid a load but would like to know the SEC Yield applicable to their shares on a going-forward basis, should understand that the SEC Yield effectively applicable to them would be higher than the figure quoted in the table. |
| Nuveen Investments | 31 |
Holding Summaries as of May 31, 2012
This data relates to the securities held in each Fund’s portfolio of investments. It should not be construed as a measure of performance for the Fund itself.
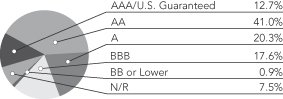
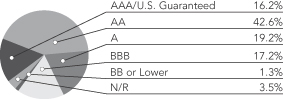
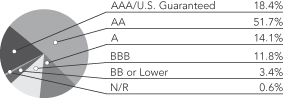
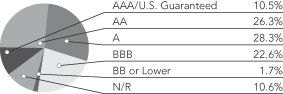
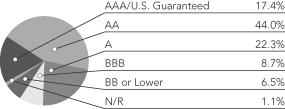
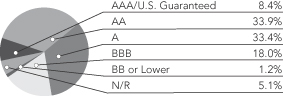
Ratings shown are the highest rating given by one of the following national rating agencies: Standard & Poor’s Group, Moody’s Investors Service, Inc. or Fitch, Inc. Credit ratings are subject to change. AAA, AA, A and BBB are investment grade ratings; BB, B, CCC, CC, C and D are below investment grade ratings. Certain bonds backed by U.S. Government or agency securities are regarded as having an implied rating equal to the rating of such securities. Holdings designated N/R are not rated by a national rating agency.
Nuveen Kansas Municipal Bond Fund
Bond Credit Quality1
Nuveen Kentucky Municipal Bond Fund
Bond Credit Quality1
Nuveen Michigan Municipal Bond Fund
Bond Credit Quality1
Nuveen Missouri Municipal Bond Fund
Bond Credit Quality1
| Portfolio Composition1 | ||||
Tax Obligation/Limited | 25.4% | |||
Health Care | 24.1% | |||
Tax Obligation/General | 14.1% | |||
Utilities | 13.2% | |||
Water and Sewer | 6.0% | |||
Long-Term Care | 5.0% | |||
Other | 12.2% | |||
| Portfolio Composition1 | ||||
Tax Obligation/Limited | 25.1% | |||
Health Care | 18.2% | |||
Utilities | 17.9% | |||
Water and Sewer | 12.0% | |||
U.S. Guaranteed | 10.3% | |||
Transportation | 4.6% | |||
| Other | 11.9% | |||
| Portfolio Composition1 | ||||
Tax Obligation/General | 38.8% | |||
Water and Sewer | 13.9% | |||
U.S. Guaranteed | 11.7% | |||
Tax Obligation/Limited | 11.5% | |||
Health Care | 11.4% | |||
Other | 12.7% | |||
| Portfolio Composition1 | ||||
Tax Obligation/Limited | 23.6% | |||
Health Care | 21.9% | |||
Tax Obligation/General | 10.1% | |||
U.S. Guaranteed | 7.5% | |||
Long-Term Care | 7.1% | |||
Education and Civic Organizations | 7.0% | |||
Utilities | 6.8% | |||
Water and Sewer | 6.3% | |||
Other | 9.7% | |||
| 1 | As a percentage of total investments as of May 31, 2012. Holdings are subject to change. |
| 32 | Nuveen Investments |
Nuveen Ohio Municipal Bond Fund
Bond Credit Quality1
Nuveen Wisconsin Municipal Bond Fund
Bond Credit Quality1
| Portfolio Composition1 | ||||
Tax Obligation/General | 17.5% | |||
Tax Obligation/Limited | 17.0% | |||
Health Care | 15.7% | |||
U.S. Guaranteed | 10.7% | |||
Education and Civic Organizations | 8.6% | |||
Water and Sewer | 7.7% | |||
Utilities | 7.3% | |||
Consumer Staples | 4.9% | |||
Other | 10.6% | |||
| Portfolio Composition1 | ||||
Tax Obligation/Limited | 50.6% | |||
Health Care | 19.2% | |||
Education and Civic Organizations | 7.7% | |||
Utilities | 5.5% | |||
Water and Sewer | 3.4% | |||
Other | 13.6% | |||
| 1 | As a percentage of total investments as of May 31, 2012. Holdings are subject to change. |
| Nuveen Investments | 33 |
As a shareholder of one or more of the Funds, you incur two types of costs: (1) transaction costs, including up-front and back-end sales charges (loads) or redemption fees, where applicable; and (2) ongoing costs, including management fees; distribution and service (12b-1) fees, where applicable; and other Fund expenses. The Examples below are intended to help you understand your ongoing costs (in dollars) of investing in the Funds and to compare these costs with the ongoing costs of investing in other mutual funds.
The Examples below are based on an investment of $1,000 invested at the beginning of the period and held for the period.
The information under “Actual Performance,” together with the amount you invested, allows you to estimate actual expenses incurred over the reporting period. Simply divide your account value by $1,000 (for example, an $8,600 account value divided by $1,000 = 8.60) and multiply the result by the cost shown for your share class, in the row entitled “Expenses Incurred During Period” to estimate the expenses incurred on your account during this period.
The information under “Hypothetical Performance,” provides information about hypothetical account values and hypothetical expenses based on the respective Fund’s actual expense ratio and an assumed rate of return of 5% per year before expenses, which is not the Fund’s actual return. The hypothetical account values and expenses may not be used to estimate the actual ending account balance or expense you incurred for the period. You may use this information to compare the ongoing costs of investing in the Fund and other funds. To do so, compare this 5% hypothetical example with the 5% hypothetical examples that appear in the shareholder reports of the other funds.
Please note that the expenses shown in the tables are meant to highlight your ongoing costs only and do not reflect any transaction costs. Therefore, the hypothetical information is useful in comparing ongoing costs only, and will not help you determine the relative total costs of owning different funds or share classes. In addition, if these transaction costs were included, your costs would have been higher.
Kansas
| Hypothetical Performance | ||||||||||||||||||||||||||
| Actual Performance | (5% annualized return before expenses) | |||||||||||||||||||||||||
| A Shares | C Shares | I Shares | A Shares | C Shares | I Shares | |||||||||||||||||||||
| Beginning Account Value (12/01/11) | $ | 1,000.00 | $ | 1,000.00 | $ | 1,000.00 | $ | 1,000.00 | $ | 1,000.00 | $ | 1,000.00 | ||||||||||||||
| Ending Account Value (5/31/12) | $ | 1,073.90 | $ | 1,071.20 | $ | 1,075.70 | $ | 1,020.85 | $ | 1,018.15 | $ | 1,021.85 | ||||||||||||||
| Expenses Incurred During Period | $ | 4.30 | $ | 7.09 | $ | 3.27 | $ | 4.19 | $ | 6.91 | $ | 3.18 | ||||||||||||||
For each class of the Fund, expenses are equal to the Fund’s annualized net expense ratio of .83%, 1.37% and .63% for Classes A, C and I, respectively, multiplied by the average account value over the period, multiplied by 183/366 (to reflect the one-half year period).
Kentucky
| Hypothetical Performance | ||||||||||||||||||||||||||||||||||
| Actual Performance | (5% annualized return before expenses) | |||||||||||||||||||||||||||||||||
| A Shares | B Shares | C Shares | I Shares | A Shares | B Shares | C Shares | I Shares | |||||||||||||||||||||||||||
| Beginning Account Value (12/01/11) | $ | 1,000.00 | $ | 1,000.00 | $ | 1,000.00 | $ | 1,000.00 | $ | 1,000.00 | $ | 1,000.00 | $ | 1,000.00 | $ | 1,000.00 | ||||||||||||||||||
| Ending Account Value (5/31/12) | $ | 1,065.10 | $ | 1,061.20 | $ | 1,062.30 | $ | 1,066.20 | $ | 1,021.00 | $ | 1,017.20 | $ | 1,018.25 | $ | 1,022.00 | ||||||||||||||||||
| Expenses Incurred During Period | $ | 4.13 | $ | 8.04 | $ | 6.96 | $ | 3.10 | $ | 4.04 | $ | 7.87 | $ | 6.81 | $ | 3.03 | ||||||||||||||||||
For each class of the Fund, expenses are equal to the Fund’s annualized net expense ratio of .80%, 1.56%, 1.35% and .60% for Classes A, B, C and I, respectively, multiplied by the average account value over the period, multiplied by 183/366 (to reflect the one-half year period).
Michigan
| Hypothetical Performance | ||||||||||||||||||||||||||
| Actual Performance | (5% annualized return before expenses) | |||||||||||||||||||||||||
| A Shares | C Shares | I Shares | A Shares | C Shares | I Shares | |||||||||||||||||||||
| Beginning Account Value (12/01/11) | $ | 1,000.00 | $ | 1,000.00 | $ | 1,000.00 | $ | 1,000.00 | $ | 1,000.00 | $ | 1,000.00 | ||||||||||||||
| Ending Account Value (5/31/12) | $ | 1,059.10 | $ | 1,056.40 | $ | 1,060.20 | $ | 1,020.80 | $ | 1,018.05 | $ | 1,021.80 | ||||||||||||||
| Expenses Incurred During Period | $ | 4.32 | $ | 7.15 | $ | 3.30 | $ | 4.24 | $ | 7.01 | $ | 3.23 | ||||||||||||||
For each class of the Fund, expenses are equal to the Fund’s annualized net expense ratio of .84%, 1.39% and .64% for Classes A, C and I, respectively, multiplied by the average account value over the period, multiplied by 183/366 (to reflect the one-half year period).
| 34 | Nuveen Investments |
Missouri
| Hypothetical Performance | ||||||||||||||||||||||||||||||||||
| Actual Performance | (5% annualized return before expenses) | |||||||||||||||||||||||||||||||||
| A Shares | B Shares | C Shares | I Shares | A Shares | B Shares | C Shares | I Shares | |||||||||||||||||||||||||||
| Beginning Account Value (12/01/11) | $ | 1,000.00 | $ | 1,000.00 | $ | 1,000.00 | $ | 1,000.00 | $ | 1,000.00 | $ | 1,000.00 | $ | 1,000.00 | $ | 1,000.00 | ||||||||||||||||||
| Ending Account Value (5/31/12) | $ | 1,068.10 | $ | 1,064.10 | $ | 1,065.40 | $ | 1,069.10 | $ | 1,020.80 | $ | 1,017.00 | $ | 1,018.05 | $ | 1,021.95 | ||||||||||||||||||
| Expenses Incurred During Period | $ | 4.34 | $ | 8.26 | $ | 7.18 | $ | 3.16 | $ | 4.24 | $ | 8.07 | $ | 7.01 | $ | 3.08 | ||||||||||||||||||
For each class of the Fund, expenses are equal to the Fund’s annualized net expense ratio of .84%, 1.60%, 1.39% and .61% for Classes A, B, C and I, respectively, multiplied by the average account value over the period, multiplied by 183/366 (to reflect the one-half year period).
Ohio
| Hypothetical Performance | ||||||||||||||||||||||||||||||||||
| Actual Performance | (5% annualized return before expenses) | |||||||||||||||||||||||||||||||||
| A Shares | B Shares | C Shares | I Shares | A Shares | B Shares | C Shares | I Shares | |||||||||||||||||||||||||||
| Beginning Account Value (12/01/11) | $ | 1,000.00 | $ | 1,000.00 | $ | 1,000.00 | $ | 1,000.00 | $ | 1,000.00 | $ | 1,000.00 | $ | 1,000.00 | $ | 1,000.00 | ||||||||||||||||||
| Ending Account Value (5/31/12) | $ | 1,062.60 | $ | 1,059.00 | $ | 1,059.20 | $ | 1,063.00 | $ | 1,020.90 | $ | 1,017.10 | $ | 1,018.15 | $ | 1,021.90 | ||||||||||||||||||
| Expenses Incurred During Period | $ | 4.23 | $ | 8.13 | $ | 7.05 | $ | 3.20 | $ | 4.14 | $ | 7.97 | $ | 6.91 | $ | 3.13 | ||||||||||||||||||
For each class of the Fund, expenses are equal to the Fund’s annualized net expense ratio of .82%, 1.58%, 1.37% and .62% for Classes A, B, C and I, respectively, multiplied by the average account value over the period, multiplied by 183/366 (to reflect the one-half year period).
Wisconsin
| Hypothetical Performance | ||||||||||||||||||||||||||
| Actual Performance | (5% annualized return before expenses) | |||||||||||||||||||||||||
| A Shares | C Shares | I Shares | A Shares | C Shares | I Shares | |||||||||||||||||||||
| Beginning Account Value (12/01/11) | $ | 1,000.00 | $ | 1,000.00 | $ | 1,000.00 | $ | 1,000.00 | $ | 1,000.00 | $ | 1,000.00 | ||||||||||||||
| Ending Account Value (5/31/12) | $ | 1,066.50 | $ | 1,062.80 | $ | 1,067.50 | $ | 1,020.65 | $ | 1,017.90 | $ | 1,021.65 | ||||||||||||||
| Expenses Incurred During Period | $ | 4.49 | $ | 7.32 | $ | 3.46 | $ | 4.39 | $ | 7.16 | $ | 3.39 | ||||||||||||||
For each class of the Fund, expenses are equal to the Fund’s annualized net expense ratio of .87%, 1.42% and .67% for Classes A, C and I, respectively, multiplied by the average account value over the period, multiplied by 183/366 (to reflect the one-half year period).
| Nuveen Investments | 35 |
A special meeting of shareholders was held in the offices of Nuveen Investments on February 16, 2012; at this meeting the shareholders were asked to vote on the approval of an Agreement and Plan of Reorganization.
| Missouri Tax Free Fund | Ohio Tax Free Fund | |||||||
To approve an Agreement and Plan of Reorganization | ||||||||
For | 11,414,020 | 4,452,985 | ||||||
Against | 82,149 | 2,030 | ||||||
Abstain | 33,555 | 16,722 | ||||||
Total | 11,529,724 | 4,471,737 | ||||||
| 36 | Nuveen Investments |
Independent Registered
Public Accounting Firm
To the Board of Trustees and Shareholders of
Nuveen Multistate Trust IV:
In our opinion, the accompanying statements of assets and liabilities, including the portfolios of investments, and the related statements of operations, of changes in net assets, and the financial highlights present fairly, in all material respects, the financial position of Nuveen Kansas Municipal Bond Fund, Nuveen Kentucky Municipal Bond Fund, Nuveen Michigan Municipal Bond Fund, Nuveen Missouri Municipal Bond Fund, Nuveen Ohio Municipal Bond Fund, and Nuveen Wisconsin Municipal Bond Fund (each a series of the Nuveen Multistate Trust IV, hereinafter referred to as the “Funds”) at May 31, 2012, the results of each of their operations for the year then ended, the changes in each of their net assets for each of the two years in the period then ended and the financial highlights for each of the five years in the period then ended, in conformity with accounting principles generally accepted in the United States of America. These financial statements and financial highlights (hereafter referred to as “financial statements”) are the responsibility of the Funds’ management; our responsibility is to express an opinion on these financial statements based on our audits. We conducted our audits of these financial statements in accordance with the standards of the Public Company Accounting Oversight Board (United States). Those standards require that we plan and perform the audit to obtain reasonable assurance about whether the financial statements are free of material misstatement. An audit includes examining, on a test basis, evidence supporting the amounts and disclosures in the financial statements, assessing the accounting principles used and significant estimates made by management, and evaluating the overall financial statement presentation. We believe that our audits, which included confirmation of securities at May 31, 2012 by correspondence with the custodian and brokers, provide a reasonable basis for our opinion.
PRICEWATERHOUSECOOPERS LLP
Chicago, IL
July 26, 2012
| Nuveen Investments | 37 |
Nuveen Kansas Municipal Bond Fund
May 31, 2012
| Principal Amount (000) | Description (1) | Optional Call Provisions (2) | Ratings (3) | Value | ||||||||||||||
Consumer Staples – 0.7% | ||||||||||||||||||
| $ | 1,535 | Puerto Rico, The Children’s Trust Fund, Tobacco Settlement Asset-Backed Refunding Bonds, Series 2002, 5.500%, 5/15/39 | 11/12 at 100.00 | BBB+ | $ | 1,530,671 | ||||||||||||
Education and Civic Organizations – 4.0% | ||||||||||||||||||
| 1,200 | Kansas Development Finance Authority, Board of Regents, Revenue Bonds, Kansas State University Housing System, Series 2005A, 5.000%, 4/01/22 – NPFG Insured | 4/15 at 100.00 | Aa3 | 1,328,232 | ||||||||||||||
| 2,950 | Kansas Development Finance Authority, Refunding Revenue Bonds, University of Kansas Center for Research Inc. Project, Series 2012-E1, 4.000%, 2/01/24 | 2/20 at 100.00 | Aa1 | 3,235,737 | ||||||||||||||
Kansas Development Finance Authority, Revenue Bonds, Kansas Board of Regents University of Kansas Medical Center Research Institute, Series 2010N: | ||||||||||||||||||
| 675 | 5.000%, 4/01/29 | 4/20 at 100.00 | Aa1 | 765,315 | ||||||||||||||
| 1,390 | 5.000%, 4/01/30 | 4/20 at 100.00 | Aa1 | 1,566,711 | ||||||||||||||
| 1,750 | Topeka, Kansas, Economic Development Revenue Bonds, YMCA Project, Refunding Series 2011A, 6.500%, 9/01/32 | 9/21 at 100.00 | N/R | 1,828,260 | ||||||||||||||
| 7,965 | Total Education and Civic Organizations | 8,724,255 | ||||||||||||||||
Health Care – 24.6% | ||||||||||||||||||
| 8,650 | Kansas Development Finance Authority Hospital Revenue Bonds, Adventist Health System/Sunbelt Obligated Group, Series 2009C, 5.750%, 11/15/38 (UB) | 11/19 at 100.00 | AA– | 9,963,243 | ||||||||||||||
| 2,400 | Kansas Development Finance Authority Hospital Revenue Bonds, Adventist Health System/Sunbelt Obligated Group, Series 2009D, 5.000%, 11/15/29 (UB) | 11/17 at 100.00 | AA– | 2,619,048 | ||||||||||||||
| 1,680 | Kansas Development Finance Authority, Health Facilities Revenue Bonds, Hays Medical Center Inc., Series 2005L, 5.000%, 11/15/20 | 11/15 at 100.00 | A2 | 1,807,747 | ||||||||||||||
| 3,950 | Kansas Development Finance Authority, Health Facilities Revenue Bonds, Hays Medical Center Inc., Series 2010Q, 5.000%, 5/15/35 | 5/19 at 100.00 | A2 | 4,258,535 | ||||||||||||||
| 5,000 | Kansas Development Finance Authority, Health Facilities Revenue Bonds, KU Health System, Series 2011H, 5.125%, 3/01/39 | 3/20 at 100.00 | A+ | 5,274,150 | ||||||||||||||
| 2,000 | Kansas Development Finance Authority, Health Facilities Revenue Bonds, Stormont-Vail Health Care Inc., Series 2008F, 5.375%, 11/15/28 | 11/17 at 100.00 | A2 | 2,173,860 | ||||||||||||||
| 3,715 | Kansas Development Finance Authority, Health Facilities Revenue Bonds, Stormont-Vail Health Care Inc., Series 2011F, 5.250%, 11/15/29 | 11/19 at 100.00 | A2 | 4,075,727 | ||||||||||||||
| 1,285 | Kansas Development Finance Authority, Hospital Revenue Bonds, Susan B. Allen Memorial Hospital, Series 2002Q, 5.375%, 12/15/16 – RAAI Insured | 12/12 at 100.00 | BBB– | 1,299,636 | ||||||||||||||
Kansas Development Finance Authority, Revenue Bonds, Sisters of Charity of Leavenworth Health Services Corporation, Series 2010A: | ||||||||||||||||||
| 1,010 | 5.000%, 1/01/20 | No Opt. Call | AA | 1,211,586 | ||||||||||||||
| 1,000 | 5.000%, 1/01/23 | 1/20 at 100.00 | AA | 1,159,350 | ||||||||||||||
| 1,515 | 5.000%, 1/01/40 (UB) (4) | 1/20 at 100.00 | AA | 1,629,110 | ||||||||||||||
| 1,750 | Kansas Development Finance Authority, Revenue Bonds, Sisters of Charity of Leavenworth Health Services Corporation, Tender Option Bond Trust 4153, 17.805%, 1/01/18 (IF) (4) | No Opt. Call | AA | 2,277,048 | ||||||||||||||
| 2,850 | Labette County Medical Center, Kansas, Revenue Bonds, Series 2007A, 5.750%, 9/01/37 | 9/17 at 100.00 | N/R | 2,952,714 | ||||||||||||||
Lawrence, Kansas, Hospital Revenue Bonds, Lawrence Memorial Hospital, Refunding Series 2006: | ||||||||||||||||||
| 2,500 | 5.125%, 7/01/26 | 7/16 at 100.00 | A1 | 2,627,500 | ||||||||||||||
| 500 | 5.125%, 7/01/36 | 7/16 at 100.00 | A1 | 518,025 | ||||||||||||||
| 3,000 | Neosho County, Kansas, Hospital Revenue Bonds, Neosho Memorial Regional Medical Center, Series 2006A, 5.150%, 9/01/31 | 9/14 at 100.00 | N/R | 3,002,910 | ||||||||||||||
| 1,000 | Olathe, Kansas, Health Facilities Revenue Bonds, Olathe Medical Center, Series 2010A, 5.000%, 9/01/30 | 9/19 at 100.00 | A+ | 1,073,070 | ||||||||||||||
| 500 | Olathe, Kansas, Health Facilities Revenue Bonds, Olathe Medical Center, Series 2012A, 4.000%, 9/01/30 | 9/21 at 100.00 | A+ | 506,740 | ||||||||||||||
| 750 | Salina, Kansas, Hospital Revenue Bonds, Salina Regional Medical Center, Series 2006, 4.625%, 10/01/31 | 4/16 at 100.00 | A1 | 775,770 | ||||||||||||||
| 38 | Nuveen Investments |
| Principal Amount (000) | Description (1) | Optional Call Provisions (2) | Ratings (3) | Value | ||||||||||||||
Health Care (continued) | ||||||||||||||||||
| $ | 4,000 | Wichita, Kansas, Hospital Facilities Revenue Refunding and Improvement Bonds, Via Christi Health System Inc., Series 2011A-IV, 5.000%, 11/15/29 | 11/21 at 100.00 | AA– | $ | 4,386,560 | ||||||||||||
| 49,055 | Total Health Care | 53,592,329 | ||||||||||||||||
Housing/Single Family – 2.7% | ||||||||||||||||||
| 1,945 | Sedgwick and Shawnee Counties, Kansas, FNMA/GNMA Mortgage-Backed Securities Program Single Family Revenue Bonds, Series 2002B-1, 5.950%, 12/01/33 (Alternative Minimum Tax) | 12/12 at 105.00 | Aaa | 1,991,213 | ||||||||||||||
| 1,665 | Sedgwick and Shawnee Counties, Kansas, FNMA/GNMA Mortgage-Backed Securities Program Single Family Revenue Bonds, Series 2005A, 5.550%, 6/01/37 (Alternative Minimum Tax) | 6/15 at 105.00 | Aaa | 1,712,436 | ||||||||||||||
| 65 | Sedgwick and Shawnee Counties, Kansas, GNMA Mortgage-Backed Securities Program Single Family Revenue Bonds, Series 1997A-1, 6.950%, 6/01/29 (Alternative Minimum Tax) | No Opt. Call | Aaa | 65,374 | ||||||||||||||
| 1,950 | Sedgwick and Shawnee Counties, Kansas, Mortgage Backed Securities Program Single Family Mortgage Revenue Bonds, Series 2006A6, 5.550%, 6/01/38 (Alternative Minimum Tax) | No Opt. Call | Aaa | 2,047,500 | ||||||||||||||
| 5,625 | Total Housing/Single Family | 5,816,523 | ||||||||||||||||
Industrials – 1.3% | ||||||||||||||||||
| 2,025 | Wichita Airport Authority, Kansas, Special Facilities Revenue Bonds, Cessna Citation Service Center, Series 2002A, 6.250%, 6/15/32 (Alternative Minimum Tax) | 6/12 at 101.00 | BBB– | 2,032,229 | ||||||||||||||
| 825 | Wichita, Kansas, Industrial Revenue Bonds, NMF America Inc. Series 2000-II, 5.800%, 8/01/15 (Alternative Minimum Tax) | 8/12 at 100.00 | AA– | 827,772 | ||||||||||||||
| 2,850 | Total Industrials | 2,860,001 | ||||||||||||||||
Long-Term Care – 5.1% | ||||||||||||||||||
| 3,125 | Kansas Development Finance Authority, Revenue Bonds, Lifespace Communities, Inc., Refunding Series 2010S, 5.000%, 5/15/30 | 5/20 at 100.00 | A | 3,289,281 | ||||||||||||||
Lenexa, Kansas, Health Care Facilities Revenue Bonds, Lakeview Village Inc, Refunding & Improvement Series 2007: | ||||||||||||||||||
| 1,270 | 5.125%, 5/15/16 | No Opt. Call | N/R | 1,289,253 | ||||||||||||||
| 1,100 | 5.500%, 5/15/39 | 5/17 at 100.00 | N/R | 1,084,754 | ||||||||||||||
| 1,980 | Manhattan Health Care Facility Revenue Bonds, Kansas, Meadowlarks Hills Retirement, Series 2007B, 5.125%, 5/15/42 | 5/14 at 103.00 | N/R | 1,901,810 | ||||||||||||||
| 2,000 | Olathe, Kansas, Senior Living Facility Revenue Bonds, Aberdeen Village Inc, Refunding Series 2005A, 5.600%, 5/15/28 | 11/12 at 100.00 | N/R | 1,961,120 | ||||||||||||||
| 1,500 | Olathe, Kansas, Senior Living Facility Revenue Bonds, Catholic Care Campus Santa Marta, Series 2006A, 6.000%, 11/15/38 | 11/16 at 100.00 | N/R | 1,538,745 | ||||||||||||||
| 10,975 | Total Long-Term Care | 11,064,963 | ||||||||||||||||
Tax Obligation/General – 12.8% | ||||||||||||||||||
| 4,000 | Allen County, Kansas Public Building Commission Revenue Bonds, Allen County Hospital Project, Series 2012, 5.150%, 12/01/36 | 12/22 at 100.00 | A | 4,243,520 | ||||||||||||||
| 2,500 | Butler and Sedgwick Counties Unified School District 385, Andover, Kansas, General Obligation Refunding and Improvement Bonds, Series 2000, 6.000%, 9/01/16 – AGM Insured | No Opt. Call | AA– | 3,017,750 | ||||||||||||||
| 2,000 | Butler County Unified School District 402, Kansas, General Obligation Bonds, Series 2008A, 5.125%, 9/01/32 – AGC Insured | 9/18 at 100.00 | Aa3 | 2,202,980 | ||||||||||||||
| 65 | Cowley County Unified School District 465, Winfield, Kansas, General Obligation Bonds, Series 2003, 5.250%, 10/01/23 – NPFG Insured | 10/13 at 100.00 | BBB | 67,979 | ||||||||||||||
| 3,000 | Johnson and Miami Counties Unified School District 230, Kansas, General Obligation Bonds, Series 2011A, 5.250%, 9/01/28 | 9/21 at 100.00 | Aa3 | 3,558,900 | ||||||||||||||
| 2,250 | Johnson County Unified School District 229, Blue Valley, Kansas, General Obligation Bonds, Series 2012A, 5.000%, 10/01/23 – NPFG Insured | 10/22 at 100.00 | Aaa | 2,861,595 | ||||||||||||||
| 2,000 | Johnson County Unified School District 231, Gardner, Edgerton and Antioch, Kansas, General Obligation Bonds, Refunding and Improvement Series 2012A, 5.000%, 10/01/23 | 10/22 at 100.00 | A+ | 2,403,300 | ||||||||||||||
| Nuveen Investments | 39 |
Portfolio of Investments
Nuveen Kansas Municipal Bond Fund (continued)
May 31, 2012
| Principal Amount (000) | Description (1) | Optional Call Provisions (2) | Ratings (3) | Value | ||||||||||||||
Tax Obligation/General (continued) | ||||||||||||||||||
| $ | 1,100 | Puerto Rico, General Obligation Bonds, Public Improvement, Refunding Series 2011C, 6.500%, 7/01/40 | 7/21 at 100.00 | Baa1 | $ | 1,277,199 | ||||||||||||
| 1,900 | Puerto Rico, General Obligation Bonds, Public Improvement, Refunding Series 2012A, 5.000%, 7/01/41 | 7/22 at 100.00 | Baa1 | 1,906,650 | ||||||||||||||
| 3,000 | Sedgwick County Unified School District 262, Kansas, General Obligation Bonds, Series 2008, 5.000%, 9/01/23 – AGC Insured | 9/18 at 100.00 | AA– | 3,435,480 | ||||||||||||||
| 500 | Unified School District 470, Cowley County, Kansas, General Obligation Bonds, Series 2008A, 5.500%, 9/01/21 – AGM Insured | 9/18 at 100.00 | AA– | 599,135 | ||||||||||||||
| 2,085 | Wyandotte County Unified School District 203, Piper, Kansas, General Obligation Bonds, Series 2008B, 5.500%, 9/01/28 | 9/18 at 100.00 | AA– | 2,472,998 | ||||||||||||||
| 24,400 | Total Tax Obligation/General | 28,047,486 | ||||||||||||||||
Tax Obligation/Limited – 25.9% | ||||||||||||||||||
| 1,000 | Dodge City, Kansas, Sales Tax Revenue Bonds, Series 2009, 5.000%, 6/01/34 – AGC Insured | 6/19 at 100.00 | AA– | 1,123,760 | ||||||||||||||
| 875 | Government of Guam, Business Privilege Tax Bonds, Series 2011A, 5.125%, 1/01/42 | 1/22 at 100.00 | A | 949,428 | ||||||||||||||
| 1,000 | Guam Government, Limited Obligation Section 30 Revenue Bonds, Series 2009A, 5.750%, 12/01/34 | 12/19 at 100.00 | BBB– | 1,074,550 | ||||||||||||||
Johnson County Public Building Commission, Kansas, Lease Purchase Revenue Bonds, Series 2011A: | ||||||||||||||||||
| 1,820 | 4.000%, 9/01/25 | 9/20 at 100.00 | AAA | 2,031,666 | ||||||||||||||
| 2,020 | 4.000%, 9/01/26 | 9/20 at 100.00 | AAA | 2,237,877 | ||||||||||||||
| 1,625 | 4.000%, 9/01/27 | 9/20 at 100.00 | AAA | 1,787,565 | ||||||||||||||
| 1,220 | 4.125%, 9/01/28 | 9/20 at 100.00 | AAA | 1,348,234 | ||||||||||||||
| 1,270 | 4.250%, 9/01/29 | 9/20 at 100.00 | AAA | 1,409,217 | ||||||||||||||
| 1,200 | Kansas Development Finance Authority, Athletic Facilities Revenue Bonds, K-State Athletics Inc Project, Series 2011-A1, 5.000%, 7/01/28 | 7/16 at 100.00 | A1 | 1,281,324 | ||||||||||||||
Kansas Development Finance Authority, Athletic Facilities Revenue Bonds, K-State Athletics, Inc., Project, Series 2012B-1: | ||||||||||||||||||
| 2,750 | 5.000%, 7/01/30 | 7/17 at 100.00 | A1 | 2,994,585 | ||||||||||||||
| 1,240 | 5.000%, 7/01/32 | 7/17 at 100.00 | A1 | 1,340,589 | ||||||||||||||
| 990 | Kansas Development Finance Authority, Board of Regents, Revenue Bonds, Scientific Research and Development Facilities Projects, Series 2003C, 5.000%, 10/01/23 – AMBAC Insured | 4/13 at 102.00 | AA | 1,044,509 | ||||||||||||||
| 1,665 | Kansas Development Finance Authority, K-State Olathe Innovation Campus Inc., Johnson County Sales Tax Revenue Bonds, Series 2009L, 5.000%, 9/01/39 | 9/19 at 100.00 | AA | 1,825,290 | ||||||||||||||
| 500 | Kansas Development Finance Authority, Lease Revenue Bonds, Department of Administration, State Capitol Restoration Parking Facility Project, Series 2002C, 5.000%, 10/01/21 – AGM Insured | 10/12 at 100.00 | AA | 507,130 | ||||||||||||||
| 1,140 | Kansas Development Finance Authority, Lease Revenue Bonds, Department of Administration, State Capitol Restoration Project, Series 2004G-1, 5.125%, 4/01/21 – NPFG Insured | 4/14 at 100.00 | AA | 1,214,647 | ||||||||||||||
| 3,910 | Kansas Development Finance Authority, Revenue Bonds, Department of Administration, Comprehensive Transportation Program, Series 2006A, 5.000%, 11/01/23 – FGIC Insured | 11/16 at 100.00 | AA | 4,507,526 | ||||||||||||||
Kansas Development Finance Authority, Revenue Bonds, Department of Commerce Impact Program, Series 2011K: | ||||||||||||||||||
| 4,900 | 5.000%, 12/01/20 | 12/19 at 100.00 | AA | 5,929,343 | ||||||||||||||
| 2,700 | 4.000%, 12/01/22 | 12/19 at 100.00 | AA | 2,991,573 | ||||||||||||||
| 460 | Kansas Development Finance Authority, Revenue Bonds, State Projects, Series 2001W, 5.000%, 10/01/17 – NPFG Insured | 10/12 at 100.00 | AA | 461,564 | ||||||||||||||
| 1,155 | Kansas Development Finance Authority, Revenue Bonds, State Projects, Series 2004A, 5.000%, 4/01/22 – FGIC Insured | 4/14 at 101.00 | AA | 1,252,482 | ||||||||||||||
| 5,000 | Overland Park Development Corporation, Kansas, First Tier Revenue Bonds, Overland Park Convention Center, Series 2007A, 5.250%, 1/01/32 – AMBAC Insured | 1/17 at 100.00 | Baa3 | 4,757,850 | ||||||||||||||
| 40 | Nuveen Investments |
| Principal Amount (000) | Description (1) | Optional Call Provisions (2) | Ratings (3) | Value | ||||||||||||||
Tax Obligation/Limited (continued) | ||||||||||||||||||
Overland Park Transportation Development District, Kansas, Sales Tax Revenue Bonds, Oak Park Mall Project, Series 2010: | ||||||||||||||||||
| $ | 935 | 5.200%, 4/01/20 | No Opt. Call | BBB | $ | 1,063,899 | ||||||||||||
| 1,350 | 5.900%, 4/01/32 | 4/20 at 100.00 | BBB | 1,490,859 | ||||||||||||||
| 3,000 | Puerto Rico Infrastructure Financing Authority, Special Tax Revenue Bonds, Series 2006, 5.000%, 7/01/46, | 7/16 at 100.00 | BBB+ | 3,014,610 | ||||||||||||||
| 1,535 | Puerto Rico Sales Tax Financing Corporation, Sales Tax Revenue Bonds, First Subordinate Series 2010C, 5.250%, 8/01/41 | 8/20 at 100.00 | A+ | 1,630,646 | ||||||||||||||
| 7,500 | Puerto Rico Sales Tax Financing Corporation, Sales Tax Revenue Bonds, Series 2007A, 0.000%, 8/01/56 | No Opt. Call | Aa2 | 575,550 | ||||||||||||||
| 1,830 | Virgin Islands Public Finance Authority, Gross Receipts Taxes Loan Note, Series 1999A, 6.375%, 10/01/19 | 10/12 at 100.00 | BBB+ | 1,836,131 | ||||||||||||||
| 1,150 | Virgin Islands Public Finance Authority, Matching Fund Loan Notes Revenue Bonds, Subordinate Lien Series 2010B, 5.250%, 10/01/29 | 10/20 at 100.00 | Baa2 | 1,224,520 | ||||||||||||||
| 845 | Wyandotte County-Kansas City Unified Government, Kansas, Sales Tax Special Obligation Bonds, Redevelopment Project Area B, Series 2005, 5.000%, 12/01/20 | 12/15 at 100.00 | AA– | 896,139 | ||||||||||||||
| 4,000 | Wyandotte County-Kansas City Unified Government, Kansas, Sales Tax Special Obligation Capital Appreciation Revenue Bonds Redevelopment Project Area B – Major Multi-Sport Athletic Complex Project, Subordinate Lien Series 2010, 0.000%, 6/01/21 | No Opt. Call | BBB | 2,762,360 | ||||||||||||||
| 60,585 | Total Tax Obligation/Limited | 56,565,423 | ||||||||||||||||
Transportation – 1.3% | ||||||||||||||||||
| 1,750 | Kansas Turnpike Authority, Revenue Bonds, Series 2012A, 4.000%, 9/01/26 (WI/DD, Settling 6/07/12) | 9/20 at 100.00 | AA– | 1,898,033 | ||||||||||||||
| 945 | Virginia Small Business Financing Authority, Senior Lien Revenue Bonds, Elizabeth River Crossing, Opco LLC Project, Series 2012, 5.250%, 1/01/32 (Alternative Minimum Tax) | 7/22 at 100.00 | BBB– | 985,550 | ||||||||||||||
| 2,695 | Total Transportation | 2,883,583 | ||||||||||||||||
U.S. Guaranteed – 2.4% (5) | ||||||||||||||||||
| 1,005 | Coffeyville Public Building Commission, Kansas, Healthcare Facilities Revenue Bonds, Coffeyville Regional Medical Center, Series 2002, 5.000%, 8/01/18 (Pre-refunded 8/01/12) – AMBAC Insured | 8/12 at 100.00 | N/R | (5) | 1,012,980 | |||||||||||||
| 2,010 | Kansas Development Finance Authority, Board of Regents, Revenue Bonds, Scientific Research and Development Facilities Projects, Series 2003C, 5.000%, 10/01/23 (Pre-refunded 4/01/13) – AMBAC Insured | 4/13 at 102.00 | Aa2 | (5) | 2,129,796 | |||||||||||||
| 1,000 | Kansas Development Finance Authority, Water Pollution Control Revolving Fund Leveraged Bonds, Series 2002-II, 5.000%, 11/01/23 (Pre-refunded 11/01/12) | 11/12 at 100.00 | AAA | 1,020,040 | ||||||||||||||
| 1,010 | Wichita, Kansas, Revenue Bonds, CSJ Health System of Wichita, Inc., Series 1985-XXV, 7.200%, 10/01/15 (ETM) | 11/12 at 100.00 | N/R | (5) | 1,127,110 | |||||||||||||
| 5,025 | Total U.S. Guaranteed | 5,289,926 | ||||||||||||||||
Utilities – 13.5% | ||||||||||||||||||
| 2,235 | Burlington, Kansas, Pollution Control Revenue Bonds, Kansas Gas and Electric Company, Refunding Series 2004A, 5.300%, 6/01/31 – NPFG Insured | 6/14 at 100.00 | A3 | 2,309,135 | ||||||||||||||
Kansas State Power Pool, Electric Utility Revenue Bonds, Dogwood Energy Facility, Series 2012A: | ||||||||||||||||||
| 1,395 | 5.000%, 12/01/22 | No Opt. Call | Baa1 | 1,557,141 | ||||||||||||||
| 1,265 | 5.000%, 12/01/23 | 12/22 at 100.00 | Baa1 | 1,398,888 | ||||||||||||||
| 2,575 | 5.000%, 12/01/31 | 12/20 at 100.00 | Baa1 | 2,720,050 | ||||||||||||||
| 3,000 | Puerto Rico Electric Power Authority, Power Revenue Bonds, Refunding Series 2012A, 5.050%, 7/01/42 | 7/22 at 100.00 | BBB+ | 3,048,480 | ||||||||||||||
Wyandotte County-Kansas City Unified Government, Kansas, Utility System Revenue Bonds, Series 2004B: | ||||||||||||||||||
| 1,000 | 5.000%, 9/01/24 – AGM Insured | 9/14 at 100.00 | AA– | 1,076,550 | ||||||||||||||
| 9,265 | 5.000%, 9/01/32 – AGM Insured | 9/14 at 100.00 | AA– | 9,938,566 | ||||||||||||||
| Nuveen Investments | 41 |
Portfolio of Investments
Nuveen Kansas Municipal Bond Fund (continued)
May 31, 2012
| Principal Amount (000) | Description (1) | Optional Call Provisions (2) | Ratings (3) | Value | ||||||||||||||
Utilities (continued) | ||||||||||||||||||
Wyandotte County-Kansas City Unified Government, Kansas, Utility System Revenue Bonds, Series 2009A: | ||||||||||||||||||
| $ | 1,075 | 5.000%, 9/01/29 – BHAC Insured | 3/19 at 100.00 | AA+ | $ | 1,236,970 | ||||||||||||
| 3,000 | 5.250%, 9/01/34 – BHAC Insured | 3/19 at 100.00 | AA+ | 3,396,810 | ||||||||||||||
| 1,535 | Wyandotte County-Kansas City Unified Government, Kansas, Utility System Revenue Bonds, Series 2011A, 5.000%, 9/01/28 | 9/21 at 100.00 | A+ | 1,759,279 | ||||||||||||||
| 1,000 | Wynadotte County-Kansas City Unified Government, Kansas, Industrial Revenue Bonds, Board of Public Utilities Office Building Complex, Series 2001, 5.000%, 5/01/21 – NPFG Insured | 11/12 at 100.00 | BBB | 1,003,250 | ||||||||||||||
| 27,345 | Total Utilities | 29,445,119 | ||||||||||||||||
Water and Sewer – 6.2% | ||||||||||||||||||
| 2,000 | Guam Government Waterworks Authority, Water and Wastewater System Revenue Bonds, Series 2005, 5.875%, 7/01/35 | 7/15 at 100.00 | Ba2 | 2,039,100 | ||||||||||||||
| 3,000 | Kansas Development Finance Authority, Water Pollution Control Revolving Fund,State Match Program, Series 2008-CW, 5.000%, 11/01/24 | 1/13 at 100.00 | AAA | 3,164,640 | ||||||||||||||
| 1,000 | Puerto Rico Aqueduct and Sewerage Authority, Revenue Bonds, Senior Lien Series 2008A, 6.000%, 7/01/38 | 7/18 at 100.00 | Baa2 | 1,068,320 | ||||||||||||||
| 2,000 | Puerto Rico Aqueduct and Sewerage Authority, Revenue Bonds, Senior Lien Series 2012A, 5.250%, 7/01/42 | 7/22 at 100.00 | Baa2 | 2,014,699 | ||||||||||||||
| 2,000 | Wichita, Kansas, Water and Sewer Utility Revenue Bonds, Refunding Series 2011A, 5.000%, 10/01/28 | 10/21 at 100.00 | AA– | 2,369,039 | ||||||||||||||
| 2,500 | Wichita, Kansas, Water and Sewer Utility Revenue Bonds, Series 2009A, 5.000%, 10/01/39 | 10/19 at 100.00 | AA– | 2,787,624 | ||||||||||||||
| 12,500 | Total Water and Sewer | 13,443,422 | ||||||||||||||||
| 210,555 | Total Long-Term Investments (cost $203,579,598) – 100.5% | 219,263,701 | ||||||||||||||||
SHORT-TERM INVESTMENTS – 1.6% | ||||||||||||||||||
Tax Obligation/General – 1.6% | ||||||||||||||||||
| 3,400 | Wichita, Kansas, General Obligation Bonds, Variable Rate Demand Obligations, Renewal and Improvement Temporary Notes, Series 2011-248, 0.300%, 8/15/13 (6) | 8/12 at 100.00 | SP-1+ | 3,400,340 | ||||||||||||||
| $ | 3,400 | Total Short-Term Investments (cost $3,399,100) | 3,400,340 | |||||||||||||||
Total Investments ($206,978,698) – 102.1% | 222,664,041 | |||||||||||||||||
Floating Rate Obligations – (4.3)% | (9,420,000) | |||||||||||||||||
Other Assets Less Liabilities – 2.2% | 4,908,692 | |||||||||||||||||
Net Assets – 100% | $ | 218,152,733 | ||||||||||||||||
| (1) | All percentages shown in the Portfolio of Investments are based on net assets. |
| (2) | Optional Call Provisions (not covered by the report of independent registered public accounting firm): Dates (month and year) and prices of the earliest optional call or redemption. There may be other call provisions at varying prices at later dates. Certain mortgage-backed securities may be subject to periodic principal paydowns. |
| (3) | Ratings (not covered by the report of independent registered public accounting firm): Using the highest of Standard & Poor’s Group (“Standard & Poor’s”), Moody’s Investors Service, Inc. (“Moody’s”) or Fitch, Inc. (“Fitch”) rating. Ratings below BBB by Standard & Poor’s, Baa by Moody’s or BBB by Fitch are considered to be below investment grade. Holdings designated N/R are not rated by any of these national rating agencies. |
| (4) | Investment, or portion of investment, has been pledged to collateralize the net payment obligations for investments in inverse floating rate transactions. |
| (5) | Backed by an escrow or trust containing sufficient U.S. Government or U.S. Government agency securities, which ensure the timely payment of principal and interest. Certain bonds backed by U.S. Government or agency securities are regarded as having an implied rating equal to the rating of such securities. |
| (6) | Investment has a maturity of more than one year, but has variable rate and demand features which qualify it as a short-term investment. The rate disclosed is that in effect at the end of the reporting period. This rate changes periodically based on market conditions or a specified market index. |
| N/R | Not rated. |
| WI/DD | Purchased on a when-issued or delayed delivery basis. |
| (ETM) | Escrowed to maturity. |
| (IF) | Inverse floating rate investment. |
| (UB) | Underlying bond of an inverse floating rate trust reflected as a financing transaction. See Notes to Financial Statements, Footnote 1 – General Information and Significant Accounting Policies, Inverse Floating Rate Securities for more information. |
See accompanying notes to financial statements.
| 42 | Nuveen Investments |
Portfolio of Investments
Nuveen Kentucky Municipal Bond Fund
May 31, 2012
| Principal Amount (000) | Description (1) | Optional Call Provisions (2) | Ratings (3) | Value | ||||||||||||||
Consumer Staples – 1.5% | ||||||||||||||||||
| $ | 25,000 | Puerto Rico, The Children’s Trust Fund, Tobacco Settlement Asset-Backed Bonds, Series 2005A, 0.000%, 5/15/50 | 5/15 at 11.19 | BBB– | $ | 1,789,250 | ||||||||||||
| 4,820 | Puerto Rico, The Children’s Trust Fund, Tobacco Settlement Asset-Backed Refunding Bonds, Series 2002, 5.375%, 5/15/33 | 11/12 at 100.00 | BBB+ | 4,810,842 | ||||||||||||||
| 29,820 | Total Consumer Staples | 6,600,092 | ||||||||||||||||
Education and Civic Organizations – 4.5% | ||||||||||||||||||
| 3,690 | Campbellsville, Kentucky, Industrial Building Revenue Bonds, Campbellsville University Project, Series 1999, 5.500%, 3/01/29 | 9/12 at 100.00 | N/R | 3,693,100 | ||||||||||||||
| 1,000 | Campbellsville, Kentucky, Revenue Bonds, Campbellsville University, Series 2005, 5.700%, 3/01/34 | 3/15 at 100.00 | N/R | 1,030,250 | ||||||||||||||
| 1,000 | Kentucky Asset/Liability Commission, General Receipts Revenue Bonds, University of Kentucky, Series 2005, 5.000%, 10/01/16 – FGIC Insured | 10/15 at 100.00 | Aa2 | 1,137,340 | ||||||||||||||
Kentucky Asset/Liability Commission, General Receipts Revenue Bonds, University of Kentucky, Series 2007A: | ||||||||||||||||||
| 1,645 | 5.000%, 10/01/20 – AMBAC Insured | 10/17 at 100.00 | Aa2 | 1,919,797 | ||||||||||||||
| 2,675 | 5.000%, 10/01/21 – AMBAC Insured | 10/17 at 100.00 | Aa2 | 3,111,480 | ||||||||||||||
| 4,435 | 5.000%, 10/01/22 – AMBAC Insured | 10/17 at 100.00 | Aa2 | 5,153,514 | ||||||||||||||
| 1,500 | Louisville and Jefferson County Metropolitan Government, Kentucky, General Revenue Bonds, Bellarmine University, Series 2008A, 6.000%, 5/01/38 | 5/18 at 100.00 | Baa3 | 1,621,740 | ||||||||||||||
| 2,000 | Louisville and Jefferson County Metropolitan Government, Kentucky, Industrial Building Revenue Bonds, Sisters of Mercy of the Americas, Series 2006, 5.000%, 10/01/35 | 10/16 at 100.00 | A+ | 2,072,700 | ||||||||||||||
| 17,945 | Total Education and Civic Organizations | 19,739,921 | ||||||||||||||||
Health Care – 17.9% | ||||||||||||||||||
| 3,360 | Christian County, Kentucky, Hospital Revenue Refunding Bonds, Jennie Stuart Medical Center, Series 2006A, 5.500%, 2/01/36 – AGC Insured | 2/18 at 100.00 | AA– | 3,612,202 | ||||||||||||||
Glasgow, Kentucky, Healthcare Revenue Bonds, T.J. Samson Community Hospital Project, Series 2011: | ||||||||||||||||||
| 2,000 | 6.375%, 2/01/35 | 8/21 at 100.00 | BBB | 2,172,480 | ||||||||||||||
| 3,310 | 6.450%, 2/01/41 | 8/21 at 100.00 | BBB | 3,603,332 | ||||||||||||||
| 540 | Kentucky Economic Development Finance Authority , Medical Center Revenue Bonds, Ashland Hospital Corporation d/b/a Kings Daughters Medical Center Project, Series 2010A, 5.000%, 2/01/40 | 2/20 at 100.00 | A+ | 567,853 | ||||||||||||||
Kentucky Economic Development Finance Authority, Hospital Facilities Revenue Bonds, Owensboro Medical Health System, Series 2010A: | ||||||||||||||||||
| 3,825 | 5.500%, 6/01/21 | 6/20 at 100.00 | BBB+ | 4,410,684 | ||||||||||||||
| 165 | 6.375%, 6/01/40 | 6/20 at 100.00 | BBB+ | 190,809 | ||||||||||||||
| 3,375 | 6.500%, 3/01/45 | 6/20 at 100.00 | BBB+ | 3,923,978 | ||||||||||||||
| 7,005 | Kentucky Economic Development Finance Authority, Hospital Revenue Bonds, Baptist Healthcare System Obligated Group, Series 2009A, 5.625%, 8/15/27 | 8/19 at 100.00 | AA– | 7,964,405 | ||||||||||||||
| 6,500 | Kentucky Economic Development Finance Authority, Hospital Revenue Bonds, Baptist Healthcare System Obligated Group, Series 2011, 5.000%, 8/15/42 | 8/21 at 100.00 | AA– | 6,941,870 | ||||||||||||||
| 5,000 | Kentucky Economic Development Finance Authority, Hospital Revenue Bonds, Saint Elizabeth Medical Center, Series 2009A, 5.500%, 5/01/39 | 5/19 at 100.00 | AA– | 5,549,450 | ||||||||||||||
Kentucky Economic Development Finance Authority, Hospital System Revenue Refunding and Improvement Bonds, Appalachian Regional Healthcare Inc., Series 1997: | ||||||||||||||||||
| 3,500 | 5.850%, 10/01/17 | 10/12 at 100.00 | BB | 3,502,590 | ||||||||||||||
| 1,495 | 5.875%, 10/01/22 | 10/12 at 100.00 | BB | 1,495,419 | ||||||||||||||
| 7,000 | Murray Hospital Facilities, Kentucky, Revenue Bonds, Murray-Calloway County Public Hospital, Series 2007, 5.125%, 8/01/37 | 8/17 at 100.00 | Baa2 | 6,825,560 | ||||||||||||||
| 7,000 | Pikeville, Kentucky, Hospital Revenue Bonds, Pikeville Medical Center, Inc. Project, Improvement and Refunding Series 2011, 6.500%, 3/01/41 | 3/21 at 100.00 | A3 | 8,187,760 | ||||||||||||||
| Nuveen Investments | 43 |
Portfolio of Investments
Nuveen Kentucky Municipal Bond Fund (continued)
May 31, 2012
| Principal Amount (000) | Description (1) | Optional Call Provisions (2) | Ratings (3) | Value | ||||||||||||||
Health Care (continued) | ||||||||||||||||||
| $ | 2,195 | Rockcastle County, Kentucky, First Mortgage Revenue Bonds, Rockcastle Hospital and Respiratory Care Center Inc. Project, Series 2005, 5.550%, 6/01/30 | 6/15 at 100.00 | BBB– | $ | 2,230,866 | ||||||||||||
| 16,535 | Russell, Kentucky, Revenue Bonds, Bon Secours Health System, Series 2002A, 5.625%, 11/15/30 | 11/12 at 100.00 | A– | 16,663,808 | ||||||||||||||
| 1,000 | Warren County, Kentucky, Hospital Facilities Revenue Bonds, Community Hospital, Series 2007A, 5.000%, 8/01/29 | 8/17 at 100.00 | A– | 1,028,100 | ||||||||||||||
| 73,805 | Total Health Care | 78,871,166 | ||||||||||||||||
Housing/Multifamily – 0.3% | ||||||||||||||||||
| 1,190 | Kentucky Housing Corporation, Conduit Multifamily Mortgage Revenue Bonds, Florence Homes III Apartments Project, Series 2005B, 5.000%, 6/01/35 (Mandatory put 6/01/23) (Alternative Minimum Tax) | 6/15 at 102.00 | N/R | 1,253,998 | ||||||||||||||
Housing/Single Family – 2.6% | ||||||||||||||||||
Kentucky Housing Corporation Housing Revenue Bonds Series 2011B: | ||||||||||||||||||
| 150 | 3.000%, 1/01/21 | No Opt. Call | AAA | 157,896 | ||||||||||||||
| 485 | 3.000%, 7/01/21 | No Opt. Call | AAA | 510,647 | ||||||||||||||
| 705 | 3.100%, 7/01/22 | 7/21 at 100.00 | AAA | 745,347 | ||||||||||||||
| 360 | 3.300%, 1/01/23 | 7/21 at 100.00 | AAA | 379,966 | ||||||||||||||
| 595 | 3.300%, 7/01/23 | 7/21 at 100.00 | AAA | 627,999 | ||||||||||||||
| 610 | 3.625%, 1/01/25 | 7/21 at 100.00 | AAA | 643,337 | ||||||||||||||
| 535 | Kentucky Housing Corporation, Housing Revenue Bonds, Series 2004F, 3.900%, 7/01/31 (Alternative Minimum Tax) | 1/14 at 100.00 | AAA | 535,669 | ||||||||||||||
| 675 | Kentucky Housing Corporation, Housing Revenue Bonds, Series 2007K, 5.000%, 7/01/34 | 1/17 at 100.00 | AAA | 706,158 | ||||||||||||||
| 45 | Kentucky Housing Corporation, Housing Revenue Bonds, Series 2008D, 5.650%, 7/01/38 (Alternative Minimum Tax) | 7/17 at 100.00 | AAA | 47,542 | ||||||||||||||
Kentucky Housing Corporation, Housing Revenue Bonds, Series 2008E: | ||||||||||||||||||
| 50 | 5.375%, 7/01/33 | 1/18 at 100.00 | AAA | 53,797 | ||||||||||||||
| 100 | 5.450%, 7/01/38 | 1/18 at 100.00 | AAA | 106,313 | ||||||||||||||
| 625 | Kentucky Housing Corporation, Housing Revenue Bonds, Series 2009A, 5.750%, 7/01/39 | 1/19 at 100.00 | AAA | 684,706 | ||||||||||||||
| 4,585 | Kentucky Housing Corporation, Housing Revenue Bonds, Series 2009B, 5.150%, 7/01/39 | 1/19 at 100.00 | AAA | 4,908,747 | ||||||||||||||
| 1,145 | Kentucky Housing Corporation, Housing Revenue Bonds, Series 2010C, 4.625%, 7/01/33 | 1/20 at 100.00 | AAA | 1,216,780 | ||||||||||||||
| 10,665 | Total Housing/Single Family | 11,324,904 | ||||||||||||||||
Long-Term Care – 0.5% | ||||||||||||||||||
| 2,090 | Kentucky Economic Development Finance Authority, Multifamily Housing Revenue Bonds, Christian Care Communities Projects, Series 2005, 5.250%, 11/20/25 | 11/15 at 103.00 | AA+ | 2,283,095 | ||||||||||||||
Materials – 0.6% | ||||||||||||||||||
| 2,820 | Wickliffe, Kentucky, Solid Waste Disposal Facility Revenue Bonds, Westvaco Corporation, Series 1996, 6.375%, 4/01/26 (Alternative Minimum Tax) | 10/12 at 100.00 | BBB | 2,821,325 | ||||||||||||||
Tax Obligation/General – 1.8% | ||||||||||||||||||
Crittenden County, Kentucky, General Obligation Bonds, Series 2007: | ||||||||||||||||||
| 1,085 | 6.000%, 12/01/27 | 12/17 at 100.00 | N/R | 1,192,589 | ||||||||||||||
| 1,605 | 6.250%, 12/01/32 | 12/17 at 100.00 | N/R | 1,770,476 | ||||||||||||||
| 2,190 | 6.500%, 12/01/37 | 12/17 at 100.00 | N/R | 2,425,469 | ||||||||||||||
Louisville and Jefferson County Metropolitan Government, Kentucky, General Obligation Bonds, Series 2004A-B: | ||||||||||||||||||
| 1,195 | 5.000%, 11/01/16 – AMBAC Insured | 11/14 at 100.00 | AAA | 1,317,153 | ||||||||||||||
| 1,000 | 5.000%, 11/01/17 – AMBAC Insured | 11/14 at 100.00 | AAA | 1,102,220 | ||||||||||||||
| 7,075 | Total Tax Obligation/General | 7,807,907 | ||||||||||||||||
| 44 | Nuveen Investments |
| Principal Amount (000) | Description (1) | Optional Call Provisions (2) | Ratings (3) | Value | ||||||||||||||
Tax Obligation/Limited – 24.7% | ||||||||||||||||||
| $ | 3,020 | Government of Guam, Business Privilege Tax Bonds, Series 2011A, 5.125%, 1/01/42 | 1/22 at 100.00 | A | $ | 3,276,881 | ||||||||||||
Kentucky Area Development Districts Financing Trust, Ewing, Lease Acquisition Program Revenue Bonds, Series 2000C: | ||||||||||||||||||
| 425 | 5.850%, 6/01/20 | 12/12 at 100.00 | AA | 426,165 | ||||||||||||||
| 895 | 6.000%, 6/01/30 | 12/12 at 100.00 | AA | 896,647 | ||||||||||||||
| 1,000 | Kentucky Asset/Liability Commission, General Fund Revenue Project Notes, Federal Highway Trust Fund First Series 2010A, 5.000%, 9/01/21 | 9/20 at 100.00 | AA | 1,217,070 | ||||||||||||||
| 2,000 | Kentucky Asset/Liability Commission, General Fund Revenue Project Notes, First Series 2005, 5.000%, 5/01/25 – NPFG Insured | 5/15 at 100.00 | Aa3 | 2,171,620 | ||||||||||||||
| 2,440 | Kentucky Asset/Liability Commission, General Fund Revenue, Project Notes – Federal Highway Trust Fund First Series 2005, 5.000%, 9/01/14 – NPFG Insured | No Opt. Call | AA | 2,683,073 | ||||||||||||||
Kentucky Economic Development Finance Authority, Louisville Arena Project Revenue Bonds, Louisville Arena Authority, Inc., Series 2008-A1: | ||||||||||||||||||
| 1,950 | 5.750%, 12/01/28 – AGC Insured | 6/18 at 100.00 | AA– | 2,163,896 | ||||||||||||||
| 3,450 | 6.000%, 12/01/33 – AGC Insured | 6/18 at 100.00 | AA– | 3,808,076 | ||||||||||||||
| 4,430 | 6.000%, 12/01/38 – AGC Insured | 6/18 at 100.00 | AA– | 4,835,567 | ||||||||||||||
| 8,965 | 6.000%, 12/01/42 – AGC Insured | 6/18 at 100.00 | AA– | 9,736,349 | ||||||||||||||
Kentucky Economic Development Finance Authority, Louisville Arena Project Revenue Bonds, Louisville Arena Authority, Inc., Series 2008-A2: | ||||||||||||||||||
| 35 | 0.000%, 12/01/15 – AGC Insured | No Opt. Call | AA– | 32,763 | ||||||||||||||
| 50 | 0.000%, 12/01/16 – AGC Insured | No Opt. Call | AA– | 45,372 | ||||||||||||||
| 3,505 | 0.000%, 12/01/22 – AGC Insured | No Opt. Call | AA– | 2,470,780 | ||||||||||||||
| 3,750 | 0.000%, 12/01/23 – AGC Insured | No Opt. Call | AA– | 2,518,725 | ||||||||||||||
| 5,000 | Kentucky Economic Development Finance Authority, Louisville Arena Project Revenue Bonds, Louisville Arena Authority, Inc., Tender Option Bonds Trust 11810-1, 16.020%, 6/01/16 – AGC Insured (IF) | No Opt. Call | AA– | 7,193,800 | ||||||||||||||
Kentucky Local Correctional Facilities Authority, Multi-County Lease Revenue Bonds, Series 2004: | ||||||||||||||||||
| 1,430 | 5.250%, 11/01/13 – NPFG Insured | No Opt. Call | BBB | 1,513,927 | ||||||||||||||
| 2,365 | 5.250%, 11/01/14 – NPFG Insured | No Opt. Call | BBB | 2,585,323 | ||||||||||||||
| 1,000 | Kentucky State Property and Buildings Commission, Revenue Bonds, Project 81, Series 2003, 5.000%, 11/01/19 – AMBAC Insured | 11/13 at 100.00 | AA– | 1,051,730 | ||||||||||||||
Kentucky State Property and Buildings Commission, Revenue Bonds, Project 84, Series 2005: | ||||||||||||||||||
| 2,025 | 5.000%, 8/01/18 – NPFG Insured | No Opt. Call | Aa3 | 2,434,982 | ||||||||||||||
| 125 | 5.000%, 8/01/19 – NPFG Insured | No Opt. Call | Aa3 | 151,864 | ||||||||||||||
| 2,000 | Kentucky State Property and Buildings Commission, Revenue Bonds, Project 85, Series 2005, 5.000%, 8/01/15 – AGM Insured | No Opt. Call | AA– | 2,260,300 | ||||||||||||||
Kentucky State Property and Buildings Commission, Revenue Bonds, Project 93, Refunding Series��2009: | ||||||||||||||||||
| 2,500 | 5.250%, 2/01/28 – AGC Insured | 2/19 at 100.00 | AA– | 2,870,850 | ||||||||||||||
| 2,500 | 5.250%, 2/01/29 – AGC Insured | 2/19 at 100.00 | AA– | 2,857,775 | ||||||||||||||
| 2,000 | Kentucky Turnpike Authority, Economic Development Road Revenue Bonds, Revitalization Project, Refunding Series 2010A, 5.000%, 7/01/20 | No Opt. Call | AA+ | 2,494,760 | ||||||||||||||
| 1,800 | Kentucky Turnpike Authority, Economic Development Road Revenue Bonds, Revitalization Project, Refunding Series 2011A, 5.000%, 7/01/24 | 7/21 at 100.00 | AA+ | 2,179,062 | ||||||||||||||
Kentucky Turnpike Authority, Economic Development Road Revenue Bonds, Revitalization Project, Refunding Series 2012A: | ||||||||||||||||||
| 4,000 | 5.000%, 7/01/30 | 7/22 at 100.00 | AA+ | 4,739,360 | ||||||||||||||
| 2,000 | 5.000%, 7/01/31 | 7/22 at 100.00 | AA+ | 2,356,260 | ||||||||||||||
Kentucky Turnpike Authority, Economic Development Road Revenue Bonds, Revitalization Project, Series 2006B: | ||||||||||||||||||
| 2,095 | 5.000%, 7/01/15 – AMBAC Insured | No Opt. Call | AA+ | 2,377,909 | ||||||||||||||
| 5,000 | 5.000%, 7/01/24 – AMBAC Insured | 7/16 at 100.00 | AA+ | 5,651,350 | ||||||||||||||
| Nuveen Investments | 45 |
Portfolio of Investments
Nuveen Kentucky Municipal Bond Fund (continued)
May 31, 2012
| Principal Amount (000) | Description (1) | Optional Call Provisions (2) | Ratings (3) | Value | ||||||||||||||
Tax Obligation/Limited (continued) | ||||||||||||||||||
| $ | 25 | Kentucky Turnpike Authority, Economic Development Road Revenue Bonds, Revitalization Project, Series 2008A, 5.000%, 7/01/28 | 7/18 at 100.00 | AA+ | $ | 28,153 | ||||||||||||
| 2,820 | Kentucky Turnpike Authority, Economic Development Road Revenue Bonds, Revitalization Project, Series 2009A, 5.000%, 7/01/29 | 7/19 at 100.00 | AA+ | 3,220,919 | ||||||||||||||
| 2,060 | Laurel County School District Finance Corporation, Kentucky, School Building Revenue Bonds, Series 2007, 5.000%, 6/01/27 – AGM Insured | 6/17 at 100.00 | Aa3 | 2,249,067 | ||||||||||||||
| 3,000 | Lexington-Fayette Urban County Government Public Facilities Corporation, Kentucky State Lease Revenue Bonds, Eastern State Hospital Project, Series 2011A, 5.250%, 6/01/29 | 6/21 at 100.00 | Aa3 | 3,418,470 | ||||||||||||||
| 1,695 | Louisville and Jefferson County Visitors and Convention Commission, Kentucky, Dedicated Tax Revenue Bonds, Series 2004A, 5.000%, 12/01/15 – AGM Insured | 6/14 at 101.00 | AA– | 1,837,889 | ||||||||||||||
Oldham County School District Finance Corporation, Kentucky, School Building Revenue Bonds, Series 2004: | ||||||||||||||||||
| 1,230 | 5.000%, 5/01/18 – NPFG Insured | 5/14 at 100.00 | Aa3 | 1,311,143 | ||||||||||||||
| 1,635 | 5.000%, 5/01/20 – NPFG Insured | 5/14 at 100.00 | Aa3 | 1,742,861 | ||||||||||||||
| 1,715 | 5.000%, 5/01/21 – NPFG Insured | 5/14 at 100.00 | Aa3 | 1,828,139 | ||||||||||||||
| 500 | Pendleton County, Kentucky, Leasing Trust Revenue Bonds, Kentucky Association of Counties, Series 1993A, 6.400%, 3/01/19 | No Opt. Call | B | 574,190 | ||||||||||||||
| 1,000 | Puerto Rico Highway and Transportation Authority, Highway Revenue Bonds, Series 2005K, 5.000%, 7/01/30 | 7/15 at 100.00 | Baa1 | 1,009,760 | ||||||||||||||
| 1,000 | Puerto Rico Highway and Transportation Authority, Highway Revenue Bonds, Series 2007N, 5.500%, 7/01/25 | No Opt. Call | Baa1 | 1,118,550 | ||||||||||||||
| 11,600 | Puerto Rico Sales Tax Financing Corporation, Sales Tax Revenue Bonds, First Subordinate Series 2009A, 0.000%, 8/01/34 | No Opt. Call | A+ | 3,466,428 | ||||||||||||||
| 26,250 | Puerto Rico Sales Tax Financing Corporation, Sales Tax Revenue Bonds, First Subordinate Series 2010A, 0.000%, 8/01/35 | No Opt. Call | A+ | 7,280,700 | ||||||||||||||
| 1,010 | Virgin Islands Public Finance Authority, Gross Receipts Taxes Loan Note, Series 2003, 5.250%, 10/01/21 – AGM Insured | 10/14 at 100.00 | AA– | 1,077,115 | ||||||||||||||
| 127,295 | Total Tax Obligation/Limited | 109,165,620 | ||||||||||||||||
Transportation – 4.5% | ||||||||||||||||||
Guam International Airport Authority, Revenue Bonds, Series 2003C: | ||||||||||||||||||
| 5,000 | 5.250%, 10/01/22 – NPFG Insured (Alternative Minimum Tax) | 10/12 at 100.00 | BBB | 5,007,600 | ||||||||||||||
| 2,195 | 5.000%, 10/01/23 – NPFG Insured (Alternative Minimum Tax) | 10/13 at 100.00 | BBB | 2,224,237 | ||||||||||||||
| 5,090 | Kenton County Airport Board, Kentucky, Airport Revenue Bonds, Cincinnati/Northern Kentucky International Airport, Series 2003B, 5.000%, 3/01/23 – NPFG Insured (Alternative Minimum Tax) | 3/13 at 100.00 | A– | 5,144,056 | ||||||||||||||
| 980 | Kenton County Airport Board, Kentucky, Airport Revenue Bonds, Cincinnati/Northern Kentucky International Airport, Series 2007B, 5.000%, 3/01/13 – SYNCORA GTY Insured (Alternative Minimum Tax) | No Opt. Call | A– | 1,004,696 | ||||||||||||||
| 1,000 | Louisville and Jefferson County Regional Airport Authority, Kentucky, Airport System Revenue Bonds, Series 2003C, 5.250%, 7/01/22 – AGM Insured (Alternative Minimum Tax) | 7/13 at 100.00 | AA– | 1,023,730 | ||||||||||||||
| 5,480 | Louisville and Jefferson County Regional Airport Authority, Kentucky, Special Facilities Revenue Bonds, Airis Louisville LLC Project, Series 1999A, 5.500%, 3/01/19 (Alternative Minimum Tax) | 9/12 at 100.00 | Baa3 | 5,481,041 | ||||||||||||||
| 19,745 | Total Transportation | 19,885,360 | ||||||||||||||||
U.S. Guaranteed – 10.1% (4) | ||||||||||||||||||
| 1,305 | Ballard County School District Finance Corporation, Kentucky, School Building Revenue Bonds, Series 2004, 5.000%, 6/01/21 (Pre-refunded 6/01/14) – AMBAC Insured | 6/14 at 100.00 | Aa3 | (4) | 1,425,347 | |||||||||||||
Boone County School District Finance Corporation, Kentucky, School Building Revenue Bonds, Series 2004B: | ||||||||||||||||||
| 1,460 | 5.000%, 5/01/20 (Pre-refunded 5/01/14) – AGM Insured | 5/14 at 100.00 | Aa3 | (4) | 1,589,210 | |||||||||||||
| 2,580 | 5.000%, 5/01/21 (Pre-refunded 5/01/14) – AGM Insured | 5/14 at 100.00 | Aa3 | (4) | 2,808,330 | |||||||||||||
| 46 | Nuveen Investments |
| Principal Amount (000) | Description (1) | Optional Call Provisions (2) | Ratings (3) | Value | ||||||||||||||
U.S. Guaranteed (4) (continued) | ||||||||||||||||||
| $ | 1,465 | Boone County, Kentucky, Public Properties Corporation, First Mortgage Bonds, AOC Judicial Facility, Series 2001, 5.125%, 9/01/22 (Pre-refunded 9/01/12) | 9/12 at 101.00 | Aa3 | (4) | $ | 1,497,845 | |||||||||||
Butler County School District Finance Corporation, Kentucky, Revenue Bonds, School Buildings, Series 2004C: | ||||||||||||||||||
| 1,220 | 5.000%, 6/01/20 (Pre-refunded 6/01/14) | 6/14 at 100.00 | Aa3 | (4) | 1,333,789 | |||||||||||||
| 1,255 | 5.000%, 6/01/22 (Pre-refunded 6/01/14) | 6/14 at 100.00 | Aa3 | (4) | 1,372,054 | |||||||||||||
Kenton County School District Finance Corporation, Kentucky, School Building Revenue Bonds, Series 2004: | ||||||||||||||||||
| 2,115 | 5.000%, 6/01/17 (Pre-refunded 6/01/14) – NPFG Insured | 6/14 at 100.00 | Aa3 | (4) | 2,310,045 | |||||||||||||
| 3,510 | 5.000%, 6/01/18 (Pre-refunded 6/01/14) – NPFG Insured | 6/14 at 100.00 | Aa3 | (4) | 3,833,692 | |||||||||||||
| 3,690 | 5.000%, 6/01/19 (Pre-refunded 6/01/14) – NPFG Insured | 6/14 at 100.00 | Aa3 | (4) | 4,030,292 | |||||||||||||
| 2,795 | Kentucky State Property and Buildings Commission, Revenue Bonds, Project 85, Series 2005, 5.000%, 8/01/22 (Pre-refunded 8/01/15) – AGM Insured | 8/15 at 100.00 | Aa2 | (4) | 3,195,048 | |||||||||||||
| 5,000 | Kentucky State Property and Buildings Commission, Revenue Refunding Bonds, Project 79, Series 2003, 5.000%, 10/01/22 (Pre-refunded 10/01/13) – NPFG Insured | 10/13 at 100.00 | A+ | (4) | 5,316,950 | |||||||||||||
Letcher County School District Finance Corporation, Kentucky, School Building Revenue Bonds, Series 2004: | ||||||||||||||||||
| 1,430 | 5.000%, 6/01/18 (Pre-refunded 6/01/14) – AGM Insured | 6/14 at 100.00 | Aa3 | (4) | 1,560,359 | |||||||||||||
| 1,585 | 5.000%, 6/01/20 (Pre-refunded 6/01/14) – AGM Insured | 6/14 at 100.00 | Aa3 | (4) | 1,729,489 | |||||||||||||
| 2,000 | Louisville, Kentucky, General Obligation Bonds, Series 2002A, 5.000%, 10/01/23 (Pre-refunded 10/01/12) – FGIC Insured | 10/12 at 100.00 | AA+ | (4) | 2,032,140 | |||||||||||||
| 1,730 | Louisville-Jefferson County Metropolitan Government, Kentucky, Health Facilities Revenue Bonds, Jewish Hospital & Saint Mary’s HealthCare Inc. Project, Series 2008, 6.125%, 2/01/37 (Pre-refunded 2/01/18) | 2/18 at 100.00 | Aaa | 2,201,477 | ||||||||||||||
| 410 | Puerto Rico Highway and Transportation Authority, Highway Revenue Bonds, Series 2002D, 5.000%, 7/01/32 (Pre-refunded 7/01/12) – AGM Insured | 7/12 at 100.00 | Aaa | 411,644 | ||||||||||||||
Puerto Rico Public Finance Corporation, Commonwealth Appropriation Bonds, Series 2002E: | ||||||||||||||||||
| 245 | 6.000%, 8/01/26 – AGC Insured (ETM) | No Opt. Call | AA– | (4) | 349,875 | |||||||||||||
| 2,755 | 6.000%, 8/01/26 – AGC Insured (ETM) | No Opt. Call | AA+ | (4) | 3,934,305 | |||||||||||||
| 1,360 | Shelby County School District Finance Corporation, Kentucky, Revenue Bonds, School Buildings, Series 2004, 5.000%, 5/01/23 (Pre-refunded 5/01/14) – NPFG Insured | 5/14 at 100.00 | Aa3 | (4) | 1,480,360 | |||||||||||||
| 2,185 | Spencer County School District Finance Corporation, Kentucky, Revenue Bonds, School Buildings, Series 2004, 5.000%, 7/01/21 (Pre-refunded 7/01/14) – AGM Insured | 7/14 at 100.00 | Aa3 | (4) | 2,389,713 | |||||||||||||
| 40,095 | Total U.S. Guaranteed | 44,801,964 | ||||||||||||||||
Utilities – 17.6% | ||||||||||||||||||
| 1,175 | Boone County, Kentucky, Collateralized Pollution Control Revenue Bonds, Dayton Power & Light Company, Series 2005A, 4.700%, 1/01/28 – FGIC Insured | 7/15 at 100.00 | A3 | 1,213,094 | ||||||||||||||
| 6,000 | Guam Power Authority, Revenue Bonds, Series 2010A, 5.000%, 10/01/37 – AGM Insured | 10/20 at 100.00 | AA– | 6,561,420 | ||||||||||||||
Kentucky Municipal Power Agency, Power Supply System Revenue Bonds, Prairie State Project Series 2007A: | ||||||||||||||||||
| 4,000 | 5.000%, 9/01/37 – NPFG Insured | 9/17 at 100.00 | A– | 4,238,960 | ||||||||||||||
| 4,600 | 5.250%, 9/01/42 – NPFG Insured | 9/17 at 100.00 | A– | 4,915,606 | ||||||||||||||
| 7,535 | 5.250%, 9/01/42 – NPFG Insured (UB) | 9/17 at 100.00 | AA+ | 8,590,051 | ||||||||||||||
| 2,500 | Kentucky Municipal Power Agency, Power Supply System Revenue Bonds, Prairie State Project, Tender Option Bond Trust 1025, 18.504%, 9/01/42 – NPFG Insured (IF) | 9/17 at 100.00 | AA+ | 3,899,800 | ||||||||||||||
| Nuveen Investments | 47 |
Portfolio of Investments
Nuveen Kentucky Municipal Bond Fund (continued)
May 31, 2012
| Principal Amount (000) | Description (1) | Optional Call Provisions (2) | Ratings (3) | Value | ||||||||||||||
Utilities (continued) | ||||||||||||||||||
| $ | 1,275 | Louisville-Jefferson County Metropolitan Government, Kentucky, Environmental Facilities Revenue, Louisville Gas & Electric Company Project, Series 2007B, 1.600%, 6/01/33 (Mandatory put 6/01/17) (WI/DD, Settling 6/01/12) | No Opt. Call | A– | $ | 1,277,015 | ||||||||||||
| 4,000 | Louisville-Jefferson County Metropolitan Government, Kentucky, Pollution Control Revenue Bonds, Louisville Gas and Electric Company Project, Series 2003A, 1.650%, 10/01/33 (Mandatory put 4/03/17) | No Opt. Call | N/R | 4,036,680 | ||||||||||||||
Owensboro, Kentucky, Electric Light and Power System Revenue Bonds, Series 1991B: | ||||||||||||||||||
| 3,745 | 0.000%, 1/01/15 – AMBAC Insured | No Opt. Call | A3 | 3,559,623 | ||||||||||||||
| 7,900 | 0.000%, 1/01/17 – AMBAC Insured | No Opt. Call | A3 | 7,089,776 | ||||||||||||||
| 13,300 | 0.000%, 1/01/18 – AMBAC Insured | No Opt. Call | A3 | 11,510,485 | ||||||||||||||
Paducah, Kentucky, Electric Board Revenue Bonds, Series 2009A: | ||||||||||||||||||
| 2,945 | 5.000%, 10/01/20 – AGC Insured | 4/19 at 100.00 | Aa3 | 3,523,634 | ||||||||||||||
| 45 | 5.000%, 10/01/28 – AGC Insured | 4/19 at 100.00 | Aa3 | 50,242 | ||||||||||||||
| 8,595 | 5.250%, 10/01/35 – AGC Insured | 4/19 at 100.00 | Aa3 | 9,444,186 | ||||||||||||||
| 2,975 | Puerto Rico Electric Power Authority, Power Revenue Bonds, Series 2003NN, 5.250%, 7/01/23 – NPFG Insured | No Opt. Call | BBB+ | 3,405,631 | ||||||||||||||
| 3,990 | Puerto Rico Electric Power Authority, Power Revenue Bonds, Series 2005RR, 5.000%, 7/01/24 – FGIC Insured | 7/15 at 100.00 | BBB+ | 4,220,223 | ||||||||||||||
| 74,580 | Total Utilities | 77,536,426 | ||||||||||||||||
Water and Sewer – 11.8% | ||||||||||||||||||
Campbell & Kenton Counties Sanitation District 1, Kentucky, Revenue Bonds, Series 2007: | ||||||||||||||||||
| 100 | 5.000%, 8/01/21 – NPFG Insured | 8/17 at 100.00 | AA | 117,325 | ||||||||||||||
| 3,795 | 5.000%, 8/01/24 – NPFG Insured | 8/17 at 100.00 | AA | 4,378,329 | ||||||||||||||
| 2,750 | Kentucky Infrastructure Authority, Wastewater and Drinking Water Revolving Fund Revenue Bonds, Series 2012A, 5.000%, 2/01/30 | 2/22 at 100.00 | AAA | 3,265,570 | ||||||||||||||
| 915 | Kentucky Rural Water Finance Corporation, Multimodal Public Projects Revenue Bonds, Flexible Term Program, Series 2001A, 5.375%, 2/01/20 | 8/12 at 101.00 | A+ | 926,693 | ||||||||||||||
Louisville and Jefferson County Metropolitan Government Board of Water Works, Kentucky, Water System Revenue Bonds, Series 2006: | ||||||||||||||||||
| 2,565 | 5.000%, 11/15/27 | 11/16 at 100.00 | AAA | 2,894,371 | ||||||||||||||
| 4,990 | 5.000%, 11/15/29 | 11/16 at 100.00 | AAA | 5,630,765 | ||||||||||||||
Louisville and Jefferson County Metropolitan Sewer District, Kentucky, Sewer and Drainage System Revenue Bonds, Refunding Series 2011A: | ||||||||||||||||||
| 7,500 | 5.000%, 5/15/28 | 11/21 at 100.00 | AA | 8,790,899 | ||||||||||||||
| 3,000 | 5.000%, 5/15/34 | 11/21 at 100.00 | AA | 3,417,839 | ||||||||||||||
Louisville and Jefferson County Metropolitan Sewer District, Kentucky, Sewer and Drainage System Revenue Bonds, Series 2004A: | ||||||||||||||||||
| 5,405 | 5.250%, 5/15/37 – FGIC Insured | 5/14 at 101.00 | AA | 5,832,535 | ||||||||||||||
| 750 | 5.000%, 5/15/38 – FGIC Insured | 5/14 at 101.00 | AA | 808,604 | ||||||||||||||
| 2,000 | Northern Kentucky Water District, Revenue Bonds, Series 2009, 6.500%, 2/01/33 – AGM Insured | 8/18 at 100.00 | Aa3 | 2,335,519 | ||||||||||||||
| 4,740 | Owen County, Kentucky, Waterworks System Revenue Bonds, Kentucky-American Water Company Project, Series 2009A, 6.250%, 6/01/39 | 6/19 at 100.00 | BBB+ | 5,276,994 | ||||||||||||||
| 5,000 | Owen County, Kentucky, Waterworks System Revenue Bonds, Kentucky-American Water Company Project, Series 2009B, 5.625%, 9/01/39 | 9/19 at 100.00 | BBB+ | 5,326,799 | ||||||||||||||
| 3,000 | Puerto Rico Aqueduct and Sewerage Authority, Revenue Bonds, Senior Lien Series 2012A, 5.250%, 7/01/42 | 7/22 at 100.00 | Baa2 | 3,022,049 | ||||||||||||||
| 46,510 | Total Water and Sewer | 52,024,291 | ||||||||||||||||
| $ | 453,635 | Total Investments (cost $398,829,785) – 98.4% | 434,116,069 | |||||||||||||||
Floating Rate Obligations – (1.3)% | (5,650,000) | |||||||||||||||||
Other Assets Less Liabilities – 2.9% | 12,487,579 | |||||||||||||||||
Net Assets – 100% | $ | 440,953,648 | ||||||||||||||||
| 48 | Nuveen Investments |
| (1) | All percentages shown in the Portfolio of Investments are based on net assets. |
| (2) | Optional Call Provisions (not covered by the report of independent registered public accounting firm): Dates (month and year) and prices of the earliest optional call or redemption. There may be other call provisions at varying prices at later dates. Certain mortgage-backed securities may be subject to periodic principal paydowns. |
| (3) | Ratings (not covered by the report of independent registered public accounting firm): Using the highest of Standard & Poor’s Group (“Standard & Poor’s”), Moody’s Investors Service, Inc. (“Moody’s”) or Fitch, Inc. (“Fitch”) rating. Ratings below BBB by Standard & Poor’s, Baa by Moody’s or BBB by Fitch are considered to be below investment grade. Holdings designated N/R are not rated by any of these national rating agencies. |
| (4) | Backed by an escrow or trust containing sufficient U.S. Government or U.S. Government agency securities, which ensure the timely payment of principal and interest. Certain bonds backed by U.S. Government or agency securities are regarded as having an implied rating equal to the rating of such securities. |
| N/R | Not rated. |
| WI/DD | Purchased on a when-issued or delayed delivery basis. |
| (ETM) | Escrowed to maturity. |
| (IF) | Inverse floating rate investment. |
| (UB) | Underlying bond of an inverse floating rate trust reflected as a financing transaction. See Notes to Financial Statements, Footnote 1 – General Information and Significant Accounting Policies, Inverse Floating Rate Securities for more information. |
See accompanying notes to financial statements.
| Nuveen Investments | 49 |
Portfolio of Investments
Nuveen Michigan Municipal Bond Fund
May 31, 2012
| Principal Amount (000) | Description (1) | Optional Call Provisions (2) | Ratings (3) | Value | ||||||||||||||
Consumer Staples – 3.7% | ||||||||||||||||||
| $ | 7,095 | Michigan Tobacco Settlement Finance Authority, Tobacco Settlement Asset-Backed Revenue Bonds, Series 2008A, 6.875%, 6/01/42 | 6/18 at 100.00 | BB+ | $ | 6,940,896 | ||||||||||||
| 730 | Puerto Rico, The Children’s Trust Fund, Tobacco Settlement Asset-Backed Refunding Bonds, Series 2002, 5.375%, 5/15/33 | 11/12 at 100.00 | BBB+ | 728,613 | ||||||||||||||
| 7,825 | Total Consumer Staples | 7,669,509 | ||||||||||||||||
Education and Civic Organizations – 1.7% | ||||||||||||||||||
| 830 | Michigan Finance Authority, Public School Academy Limited Obligation Revenue and Refunding Bonds, Detroit Service Learning Academy Project, Series 2011, 7.000%, 10/01/31 | 10/21 at 100.00 | BBB– | 901,546 | ||||||||||||||
| 1,000 | Michigan Finance Authority, Public School Academy Limited Obligation Revenue Bonds, Hanley International Academy, Inc. Project, Series 2010A, 6.125%, 9/01/40 | 9/20 at 100.00 | BBB– | 1,009,220 | ||||||||||||||
| 500 | Michigan Finance Authority, Public School Academy Limited Obligation Revenue Bonds, Holly Academy Project, Refunding Series 2011, 7.750%, 10/01/30 | 10/21 at 100.00 | BBB– | 566,945 | ||||||||||||||
| 1,000 | Michigan State University, General Revenue Bonds, Refunding Series 2010C, 5.000%, 2/15/40 | 2/20 at 100.00 | Aa1 | 1,100,850 | ||||||||||||||
| 3,330 | Total Education and Civic Organizations | 3,578,561 | ||||||||||||||||
Health Care – 11.2% | ||||||||||||||||||
| 2,000 | Grand Traverse County Hospital Financal Authority, Michigan, Revenue Bonds, Munson Healthcare, Refunding Series 2011A, 5.000%, 7/01/29 | 7/21 at 100.00 | AA– | 2,136,080 | ||||||||||||||
| 450 | Jackson County Hospital Finance Authority, Michigan, Hospital Revenue Bonds, Alligiance Health, Refunding Series 2010A, 5.000%, 6/01/37 – AGM Insured | 6/20 at 100.00 | AA– | 481,662 | ||||||||||||||
Kent Hospital Finance Authority, Michigan, Revenue Refunding Bonds, Spectrum Health System, Refunding Series 2011C: | ||||||||||||||||||
| 2,135 | 5.000%, 1/15/31 | 1/22 at 100.00 | AA | 2,373,437 | ||||||||||||||
| 365 | 5.000%, 1/15/42 | 1/22 at 100.00 | AA | 393,747 | ||||||||||||||
| 1,250 | Michigan Finance Authority, Revenue Bonds, Oakwood Obligated Group, Refunding Series 2012, 5.000%, 11/01/42 | 11/22 at 100.00 | A | 1,333,088 | ||||||||||||||
| 2,000 | Michigan Finance Authority, Revenue Bonds, Trinity Health Credit Group, Refunding Series 2011, 5.000%, 12/01/39 | 12/21 at 100.00 | AA | 2,175,740 | ||||||||||||||
| 3,300 | Michigan State Hospital Finance Authority, Hospital Revenue Bonds, Henry Ford Health System, Refunding Series 2009, 5.750%, 11/15/39 | 11/19 at 100.00 | A1 | 3,656,730 | ||||||||||||||
| 1,000 | Michigan State Hospital FInance Authority, Hospital Revenue Bonds,MidMichigan Obligated Group, Series 2009A, 5.875%, 6/01/39 –AGC Insured | 6/19 at 100.00 | AA– | 1,117,440 | ||||||||||||||
| 1,000 | Michigan State Hospital Finance Authority, Hospital Revenue Refunding Bonds, Crittenton Hospital, Series 2002A, 5.625%, 3/01/27 | 3/13 at 100.00 | A– | 1,010,880 | ||||||||||||||
Michigan State Hospital Finance Authority, Revenue Bonds, Marquette General Hospital, Series 2005A: | ||||||||||||||||||
| 1,400 | 5.000%, 5/15/26 | 5/15 at 100.00 | Baa3 | 1,411,438 | ||||||||||||||
| 50 | 5.000%, 5/15/34 | 5/15 at 100.00 | Baa3 | 49,020 | ||||||||||||||
| 2,000 | Michigan State Hospital Finance Authority, Revenue Bonds, Sparrow Obligated Group, Series 2005, 5.000%, 11/15/36 – NPFG Insured | 5/15 at 100.00 | A+ | 2,040,380 | ||||||||||||||
| 1,550 | Royal Oak Hospital Finance Authority, Michigan, Hospital Revenue and Refunding Bonds, William Beaumont Hospital Obligated Group, Series 2009W, 6.000%, 8/01/39 | 8/19 at 100.00 | A1 | 1,746,029 | ||||||||||||||
| 1,200 | Royal Oak Hospital Finance Authority, Michigan, Hospital Revenue Bonds, William Beaumont Hospital, Refunding Series 2009V, 8.250%, 9/01/39 | 9/18 at 100.00 | A1 | 1,536,408 | ||||||||||||||
| 1,755 | Royal Oak Hospital Finance Authority, Michigan, Hospital Revenue Bonds, William Beaumont Hospital, Series 2001M, 5.250%, 11/15/35 – NPFG Insured | 11/12 at 100.00 | A1 | 1,756,264 | ||||||||||||||
| 21,455 | Total Health Care | 23,218,343 | ||||||||||||||||
| 50 | Nuveen Investments |
| Principal Amount (000) | Description (1) | Optional Call Provisions (2) | Ratings (3) | Value | ||||||||||||||
Housing/Multifamily – 2.3% | ||||||||||||||||||
| $ | 1,200 | Michigan Housing Development Authority, Rental Housing Revenue Bonds, Series 2006D, 5.125%, 4/01/31 – AGM Insured (Alternative Minimum Tax) | 7/15 at 100.00 | AA | $ | 1,237,776 | ||||||||||||
| 2,175 | Michigan Housing Development Authority, Rental Housing Revenue Bonds, Series 2009A, 5.700%, 10/01/39 | 10/18 at 100.00 | AA | 2,349,631 | ||||||||||||||
| 1,335 | Michigan Housing Development Authority, Section 8 Assisted Mortgage Revenue Bonds, Series 1983I, 0.000%, 4/01/14 | No Opt. Call | AA | 1,193,730 | ||||||||||||||
| 4,710 | Total Housing/Multifamily | 4,781,137 | ||||||||||||||||
Tax Obligation/General – 38.0% | ||||||||||||||||||
| 690 | Ann Arbor Public School District, Washtenaw County, Michigan, General Obligation Bonds, Refunding Series 2012, 5.000%, 5/01/29 | 5/22 at 100.00 | Aa2 | 818,333 | ||||||||||||||
| 660 | Ann Arbor Public School District, Washtenaw County, Michigan, General Obligation Bonds, Series 2008, 5.000%, 5/01/23 | 5/18 at 100.00 | AA+ | 761,944 | ||||||||||||||
| 800 | Ann Arbor, Michigan, General Obligation Bonds, Court & Police Facilities Capital Improvement Series 2008, 5.000%, 5/01/38 | 5/18 at 100.00 | AA+ | 871,416 | ||||||||||||||
| 1,435 | Bay City, Michigan, General Obligation Bonds, Series 2008B, 5.500%, 4/01/28 – AGM Insured | 4/18 at 100.00 | AA– | 1,624,377 | ||||||||||||||
| 1,020 | Caledonia Community Schools, Kent, Allegan and Barry Counties, Michigan, General Obligation Bonds, Series 2003, 5.250%, 5/01/22 | 5/13 at 100.00 | Aa2 | 1,062,891 | ||||||||||||||
Caledonia Community Schools, Kent, Allegan and Barry Counties, Michigan, General Obligation Bonds, Series 2005: | ||||||||||||||||||
| 1,000 | 5.000%, 5/01/23 – NPFG Insured | 5/15 at 100.00 | Aa2 | 1,114,140 | ||||||||||||||
| 2,085 | 5.000%, 5/01/24 – NPFG Insured | 5/15 at 100.00 | Aa2 | 2,262,871 | ||||||||||||||
| 1,000 | 5.000%, 5/01/25 – NPFG Insured | 5/15 at 100.00 | Aa2 | 1,062,190 | ||||||||||||||
| 2,013 | Caledonia Community Schools, Kent, Allegan and Barry Counties, Michigan, General Obligation Bonds, Tender Option Bond Trust 2008-1096, 7.812%, 5/01/32 – NPFG Insured (IF) | 5/17 at 100.00 | Aa2 | 2,239,140 | ||||||||||||||
| 1,850 | Chippewa Valley Schools, Macomb County, Michigan, General Obligation Bonds, Series 2005, 5.000%, 5/01/24 – NPFG Insured | 5/15 at 100.00 | Aa2 | 2,007,824 | ||||||||||||||
| 1,450 | City of Jackson, County of Jackson, State of Michigan, Downtown Development Bonds, Series 2001, General Obligation Limited Tax, 0.000%, 6/01/21 – AGM Insured | No Opt. Call | AA– | 986,464 | ||||||||||||||
Detroit-Wayne County Stadium Authority, Michigan, Limited Tax General Obligation Building Authority Stadium Bonds, Series 1997: | ||||||||||||||||||
| 500 | 5.500%, 2/01/17 – FGIC Insured | 8/12 at 100.00 | BBB+ | 501,365 | ||||||||||||||
| 11,000 | 5.250%, 2/01/27 – FGIC Insured | 8/12 at 100.00 | BBB+ | 11,016,717 | ||||||||||||||
| 1,245 | Edwardsburg Public School, Cass County, Michigan, General Obligation Bonds, Series 2004, 5.000%, 5/01/24 – AGM Insured | 5/14 at 100.00 | AA– | 1,295,858 | ||||||||||||||
| 480 | Genesee County, Michigan, General Obligaton Water Supply Bonds, Series 2003, 5.125%, 11/01/33 – NPFG Insured | 11/13 at 100.00 | A1 | 489,638 | ||||||||||||||
| 2,615 | Hazel Park School District, Oakland County, Michigan, General Obligation Bonds, Refunding Series 2012, 4.750%, 5/01/30 – AGM Insured | 5/21 at 100.00 | AA– | 2,831,156 | ||||||||||||||
| 50 | Holly Area School District, Oakland County, Michigan, General Obligation Bonds, Series 2006, 5.125%, 5/01/32 – NPFG Insured | 5/16 at 100.00 | Aa2 | 53,188 | ||||||||||||||
| 1,060 | Homer Community School District, Calhourn, Jackson, Hillsdale and Branch Counties, Michigan, General Obligation Bonds, School Building & Site, Series 2011B, 5.500%, 5/01/41 | 5/21 at 100.00 | AA– | 1,199,030 | ||||||||||||||
| 1,675 | Hopkins Public Schools, Allegan County, Michigan, General Obligation Bonds, Series 2007, 5.000%, 5/01/25 – NPFG Insured | 5/17 at 100.00 | Aa2 | 1,833,053 | ||||||||||||||
| 1,215 | Kalamazoo Public Schools, Michigan, General Obligation Bonds, Series 2006, 5.000%, 5/01/25 – AGM Insured | 5/16 at 100.00 | Aa2 | 1,356,742 | ||||||||||||||
| 1,300 | Lansing Community College, Michigan, General Obligation Bonds, Series 2003, 5.000%, 5/01/20 – NPFG Insured | 5/13 at 100.00 | AA | 1,351,948 | ||||||||||||||
| 840 | Lowell Area Schools, Kent and Ionia Counties, Michigan, General Obligation Bonds, Series 2007, 5.000%, 5/01/37 – AGM Insured | 5/17 at 100.00 | Aa2 | 890,014 | ||||||||||||||
| Nuveen Investments | 51 |
Portfolio of Investments
Nuveen Michigan Municipal Bond Fund (continued)
May 31, 2012
| Principal Amount (000) | Description (1) | Optional Call Provisions (2) | Ratings (3) | Value | ||||||||||||||
Tax Obligation/General (continued) | ||||||||||||||||||
| $ | 410 | Michigan Finance Authority, Revenue Bonds, Detroit City School District, Series 2012, 5.000%, 6/01/20 | No Opt. Call | A+ | $ | 461,418 | ||||||||||||
| 1,230 | Michigan Municipal Bond Authority, AMBAC Insured Bonds, Series 2007B-A, 5.000%, 12/01/34 – AMBAC Insured | 6/17 at 100.00 | N/R | 1,152,670 | ||||||||||||||
| 1,000 | Michigan State, General Obligation Bonds, Environmental Program, Refunidng Series 2011A, 5.000%, 12/01/22 | 12/21 at 100.00 | Aa2 | 1,222,830 | ||||||||||||||
| 350 | Michigan State, General Obligation Bonds, Environmental Program, Series 2009A, 5.500%, 11/01/25 | 5/19 at 100.00 | Aa2 | 411,999 | ||||||||||||||
| 140 | Oakland County Building Authority, Michigan, General Obligation Bonds, Refunding Series 2006, 5.000%, 6/01/27 | 6/13 at 100.00 | AAA | 145,152 | ||||||||||||||
Oakland Intermediate School District, Oakland County, Michigan, General Obligation Bonds, Series 2007: | ||||||||||||||||||
| 500 | 5.000%, 5/01/27 – AGM Insured | 5/17 at 100.00 | Aaa | 550,235 | ||||||||||||||
| 1,200 | 5.000%, 5/01/36 – AGM Insured | 5/17 at 100.00 | Aaa | 1,280,340 | ||||||||||||||
| 1,370 | Oakridge Public Schools, Muskegon County, Michigan, General Obligation Bonds, Series 2005, 5.000%, 5/01/24 – NPFG Insured | 5/15 at 100.00 | AA– | 1,501,178 | ||||||||||||||
Okemos Public School District, Ingham County, Michigan, General Obligation Refunding Bonds, Series 1993: | ||||||||||||||||||
| 1,000 | 0.000%, 5/01/17 – NPFG Insured | No Opt. Call | Aa3 | 905,420 | ||||||||||||||
| 1,020 | 0.000%, 5/01/18 – NPFG Insured | No Opt. Call | Aa3 | 893,479 | ||||||||||||||
| 1,100 | Ottawa County, Michigan, General Obligation Bonds, Sewer Disposal System, Series 2010, 5.000%, 5/01/37 | 5/20 at 100.00 | Aaa | 1,256,057 | ||||||||||||||
| 4,000 | Ottawa County, Michigan, Water Supply System, General Obligation Bonds, Series 2007, 5.000%, 8/01/30 – NPFG Insured | 8/17 at 100.00 | Aaa | 4,345,160 | ||||||||||||||
| 1,075 | Parchment School District, Kalamazoo County, Michigan, General Obligation Bonds, Tender Option Bond Trust 2836, 10.888%, 5/01/15 – AGM Insured (IF) | No Opt. Call | Aa2 | 1,211,568 | ||||||||||||||
| 150 | South Haven, Van Buren County,Michigan, General Obligation Bonds, Capital Improvement Series 2009, 5.125%, 12/01/33 – AGC Insured | 12/19 at 100.00 | AA– | 171,320 | ||||||||||||||
| 500 | South Redford School District, Wayne County, Michigan, General Obligation Bonds, School Building and Site, Series 2005, 5.000%, 5/01/30 – NPFG Insured | 5/15 at 100.00 | Aa2 | 522,800 | ||||||||||||||
| 1,400 | South Redford School District, Wayne County, Michigan, General Obligation Bonds, Series 2004, 5.000%, 5/01/21 – FGIC Insured | 11/14 at 100.00 | Aa2 | 1,539,202 | ||||||||||||||
| 1,405 | Thornapple Kellogg School District, Barry County, Michigan, General Obligation Bonds, Series 2007, 5.000%, 5/01/32 – NPFG Insured | 5/17 at 100.00 | Aa2 | 1,501,032 | ||||||||||||||
| 1,530 | Trenton Public Schools District, Michigan, General Obligation Bonds, Series 2008, 5.000%, 5/01/34 – AGM Insured | 5/18 at 100.00 | Aa2 | 1,651,222 | ||||||||||||||
| 1,350 | Van Dyke Public Schools, Macomb County, Michigan, General Obligation Bonds, School Building and Site, Series 2008, 5.000%, 5/01/38 – AGM Insured | 5/18 at 100.00 | Aa2 | 1,443,569 | ||||||||||||||
| 1,500 | Wayland Union School District, Allegan County, Michigan, General Obligation Bonds, Series 2008, 5.000%, 5/01/28 – AGM Insured | 5/18 at 100.00 | Aa2 | 1,655,085 | ||||||||||||||
| 975 | Wayne Charter County, Michigan, General Obligation Bonds, Building Improvements, Series 2009A, 6.750%, 11/01/39 | 12/19 at 100.00 | BBB+ | 1,109,687 | ||||||||||||||
| 1,150 | Wayne Westland Community Schools, Michigan, General Obligation Bonds, Series 2004, 5.000%, 5/01/17 – AGM Insured | 11/14 at 100.00 | Aa2 | 1,266,967 | ||||||||||||||
| 1,915 | West Bloomfield School District, Oakland County, Michigan, General Obligation Bonds, Series 2005, 5.000%, 5/01/20 – AGM Insured | 5/15 at 100.00 | AA– | 2,137,102 | ||||||||||||||
| 3,270 | West Ottawa Public School District, Ottawa County, Michigan, General Obligation Refunding Bonds, Series 1992, 0.000%, 5/01/17 – FGIC Insured | No Opt. Call | Aa3 | 2,936,329 | ||||||||||||||
| 5,175 | Williamston Community School District, Michigan, Unlimited Tax General Obligation QSBLF Bonds, Series 1996, 5.500%, 5/01/25 – NPFG Insured | No Opt. Call | Aa3 | 6,414,877 | ||||||||||||||
| 52 | Nuveen Investments |
| Principal Amount (000) | Description (1) | Optional Call Provisions (2) | Ratings (3) | Value | ||||||||||||||
Tax Obligation/General (continued) | ||||||||||||||||||
| $ | 3,170 | Zeeland Public Schools, Ottawa and Allegan Counties, Michigan, General Obligation Bonds, Series 2005, 5.000%, 5/01/22 – FGIC Insured | 5/15 at 100.00 | Aa3 | $ | 3,526,974 | ||||||||||||
| 73,868 | Total Tax Obligation/General | 78,843,971 | ||||||||||||||||
Tax Obligation/Limited – 11.3% | ||||||||||||||||||
| 1,045 | Government of Guam, Business Privilege Tax Bonds, Series 2011A, 5.125%, 1/01/42 | 1/22 at 100.00 | A | 1,133,888 | ||||||||||||||
Grand Rapids Downtown Development Authority, Michigan, Tax Increment Revenue Bonds, Series 1994: | ||||||||||||||||||
| 3,985 | 0.000%, 6/01/17 – NPFG Insured | No Opt. Call | BBB | 3,205,972 | ||||||||||||||
| 3,295 | 0.000%, 6/01/18 – NPFG Insured | No Opt. Call | BBB | 2,508,714 | ||||||||||||||
| 1,455 | Kalkaska County Hospital Authority, Michigan, Hospital Revenue Bonds, Series 2007, 5.125%, 5/01/14 | No Opt. Call | A– | 1,508,777 | ||||||||||||||
| 4,400 | Michigan State Building Authority, Revenue Bonds, Facilities Program, Series 2005II, 5.000%, 10/15/30 – AMBAC Insured | 10/15 at 100.00 | Aa3 | 4,801,939 | ||||||||||||||
Michigan State Building Authority, Revenue Bonds, Refunding Series 2006IA: | ||||||||||||||||||
| 3,000 | 0.000%, 10/15/27 – AGM Insured | 10/16 at 58.27 | AA– | 1,462,380 | ||||||||||||||
| 1,500 | 0.000%, 10/15/28 – AGM Insured | 10/16 at 55.35 | AA– | 691,560 | ||||||||||||||
| 3,960 | 5.000%, 10/15/36 – FGIC Insured | 10/16 at 100.00 | Aa3 | 4,173,246 | ||||||||||||||
| 2,000 | Michigan State Building Authority, Revenue Refunding Bonds, Facilities Program, Series 2003II, 5.000%, 10/15/22 – NPFG Insured | 10/13 at 100.00 | Aa3 | 2,109,920 | ||||||||||||||
| 700 | Michigan State Trunk Line Fund Refunding Bonds, Series 2009, 5.000%, 11/15/36 | 11/21 at 100.00 | AA+ | 799,330 | ||||||||||||||
| 1,000 | Virgin Islands Public Finance Authority, Matching Fund Loan Notes Revenue Bonds, Series 2009B, 5.000%, 10/01/25 | 10/19 at 100.00 | BBB+ | 1,073,940 | ||||||||||||||
| 26,340 | Total Tax Obligation/Limited | 23,469,666 | ||||||||||||||||
Transportation – 0.6% | ||||||||||||||||||
| 50 | Kent County, Michigan, Airport Revenue Bonds, Gerald R. Ford International Airport, Series 2007, 5.000%, 1/01/32 | 1/17 at 100.00 | AAA | 53,620 | ||||||||||||||
| 1,000 | Wayne County Airport Authority, Michigan, Revenue Bonds, Detroit Metropolitan Airport, Refunding Series 2011A, 5.000%, 12/01/21 (Alternative Minimum Tax) | No Opt. Call | A | 1,126,030 | ||||||||||||||
| 1,050 | Total Transportation | 1,179,650 | ||||||||||||||||
U.S. Guaranteed – 11.4% (4) | ||||||||||||||||||
| 2,505 | Detroit, Michigan, Senior Lien Water Supply System Revenue Bonds, Series 2003A, 5.000%, 7/01/25 (Pre-refunded 7/01/13) – NPFG Insured | 7/13 at 100.00 | A+ | (4) | 2,633,231 | |||||||||||||
| 2,000 | Howell Public Schools, Livingston County, Michigan, General Obligation Bonds, Series 2003, 5.000%, 5/01/24 (Pre-refunded 11/01/13) | 11/13 at 100.00 | Aa2 | (4) | 2,133,820 | |||||||||||||
| 1,000 | Jackson Public Schools, Jackson County, Michigan, General Obligation School Building and Site Bonds, Series 2004, 5.000%, 5/01/22 (Pre-refunded 5/01/14) – AGM Insured | 5/14 at 100.00 | Aa2 | (4) | 1,089,510 | |||||||||||||
| 4,000 | Michigan House of Representatives, Certificates of Participation, Series 1998, 0.000%, 8/15/23 – AMBAC Insured (ETM) | No Opt. Call | N/R | (4) | 2,995,960 | |||||||||||||
| 3,350 | Michigan State Hospital Finance Authority, Hospital Revenue Bonds, Oakwood Obligated Group, Series 2002A, 5.750%, 4/01/32 (Pre-refunded 4/01/13) | 4/13 at 100.00 | AA+ | (4) | 3,502,258 | |||||||||||||
| 2,000 | Michigan State Hospital Finance Authority, Hospital Revenue Refunding Bonds, Henry Ford Health System, Series 2003A, 5.625%, 3/01/17 (Pre-refunded 3/01/13) | 3/13 at 100.00 | A1 | (4) | 2,081,240 | |||||||||||||
Michigan State Hospital Finance Authority, Hospital Revenue Refunding Bonds, Trinity Health Credit Group, Series 2002C: | ||||||||||||||||||
| 125 | 5.375%, 12/01/30 (Pre-refunded 12/01/12) | 12/12 at 100.00 | Aa2 | (4) | 128,245 | |||||||||||||
| 1,375 | 5.375%, 12/01/30 (Pre-refunded 12/01/12) | 12/12 at 100.00 | AA | (4) | 1,410,571 | |||||||||||||
| 1,000 | Michigan State Hospital Finance Authority, Revenue Bonds, Chelsea Community Hospital, Series 2005, 5.000%, 5/15/37 (Pre-refunded 5/15/15) | 5/15 at 100.00 | AA+ | (4) | 1,131,000 | |||||||||||||
| Nuveen Investments | 53 |
Portfolio of Investments
Nuveen Michigan Municipal Bond Fund (continued)
May 31, 2012
| Principal Amount (000) | Description (1) | Optional Call Provisions (2) | Ratings (3) | Value | ||||||||||||||
U.S. Guaranteed (4) (continued) | ||||||||||||||||||
Michigan Technological University, General Revenue Bonds, Series 2004A: | ||||||||||||||||||
| $ | 1,230 | 5.000%, 10/01/24 (Pre-refunded 10/01/13) – NPFG Insured | 10/13 at 100.00 | Aa3 | (4) | $ | 1,307,121 | |||||||||||
| 1,740 | 5.000%, 10/01/29 (Pre-refunded 10/01/13) – NPFG Insured | 10/13 at 100.00 | Aa3 | (4) | 1,849,098 | |||||||||||||
| 4,000 | Puerto Rico Electric Power Authority, Power Revenue Refunding Bonds, Series 1989N, 0.000%, 7/01/17 – NPFG Insured (ETM) | No Opt. Call | BBB+ | (4) | 3,450,720 | |||||||||||||
| 24,325 | Total U.S. Guaranteed | 23,712,774 | ||||||||||||||||
Utilities – 4.2% | ||||||||||||||||||
| 1,000 | Lansing Board of Water and Light, Michigan, Steam and Electric Utility System Revenue Bonds, Series 2003A, 5.000%, 7/01/21 – AGM Insured | 7/13 at 100.00 | AA– | 1,034,330 | ||||||||||||||
Lansing Board of Water and Light, Michigan, Steam and Electric Utility System Revenue Bonds, Series 2008A: | ||||||||||||||||||
| 175 | 5.000%, 7/01/28 | 7/18 at 100.00 | AA– | 192,334 | ||||||||||||||
| 2,130 | 5.000%, 7/01/32 | 7/18 at 100.00 | AA– | 2,306,684 | ||||||||||||||
Lansing Board of Water and Light, Michigan, Utility System Rvenue Bonds, Tender Option Bond Trust 4700: | ||||||||||||||||||
| 800 | 17.590%, 7/01/37 (IF) (5) | 7/21 at 100.00 | AA– | 1,198,464 | ||||||||||||||
| 250 | 17.744%, 7/01/37 (IF) (5) | 7/21 at 100.00 | AA– | 374,520 | ||||||||||||||
| 2,000 | Michigan Public Power Agency, Revenue Bonds, Combustion Turbine 1 Project, Series 2011, 5.000%, 1/01/27 – AGM Insured | 1/21 at 100.00 | AA– | 2,245,140 | ||||||||||||||
| 1,000 | Monroe County Economic Development Corporation, Michigan, Collateralized Limited Obligation Revenue Refunding Bonds, Detroit Edison Company, Series 1992AA, 6.950%, 9/01/22 – FGIC Insured | No Opt. Call | A2 | 1,342,380 | ||||||||||||||
| 7,355 | Total Utilities | 8,693,852 | ||||||||||||||||
Water and Sewer – 13.7% | ||||||||||||||||||
| 2,495 | Detroit, Michigan, Senior Lien Water Supply System Revenue Bonds, Series 2003A, 5.000%, 7/01/25 – NPFG Insured | 7/13 at 100.00 | A+ | 2,521,771 | ||||||||||||||
| 4,455 | Detroit, Michigan, Sewerage Disposal System Revenue Bonds, Series 1999A, 0.000%, 7/01/19 – FGIC Insured | No Opt. Call | A+ | 3,487,909 | ||||||||||||||
| 2,915 | Detroit, Michigan, Water Supply System Revenue Bonds, Senior Lien Series 2011A, 5.250%, 7/01/41 | 7/21 at 100.00 | A+ | 3,005,132 | ||||||||||||||
| 4,000 | Grand Rapids, Michigan, Sanitary Sewer System Revenue Bonds, Series 2005, 5.000%, 1/01/30 – NPFG Insured | 7/15 at 100.00 | AA+ | 4,252,640 | ||||||||||||||
Grand Rapids, Michigan, Sanitary Sewer System Revenue Bonds, Series 2008: | ||||||||||||||||||
| 145 | 5.000%, 1/01/28 | 1/18 at 100.00 | AA+ | 160,944 | ||||||||||||||
| 3,500 | 5.000%, 1/01/38 | 1/18 at 100.00 | AA+ | 3,768,660 | ||||||||||||||
| 2,000 | Grand Rapids, Michigan, Water Supply System Revenue Bonds, Series 2009, 5.100%, 1/01/39 – AGC Insured | 1/19 at 100.00 | AA | 2,200,840 | ||||||||||||||
| 1,625 | Lansing, Michigan, Sewerage Disposal System Revenue Bonds, Series 2003, 5.000%, 5/01/21 – FGIC Insured | 5/14 at 100.00 | Aa2 | 1,748,890 | ||||||||||||||
| 365 | Michigan Finance Authority, State Revolving Fund Revenue Bonds, Clean Water Series 2012, 5.000%, 10/01/32 | 10/22 at 100.00 | AAA | 430,324 | ||||||||||||||
| 4,055 | Michigan Municipal Bond Authority, Drinking Water Revolving Fund Revenue Bonds, Series 2004, 5.000%, 10/01/24 | 10/14 at 100.00 | AAA | 4,444,887 | ||||||||||||||
| 1,000 | Michigan Municipal Bond Authority, Water Revolving Fund Revenue Bonds, Series 2007, 5.000%, 10/01/23 | 10/17 at 100.00 | AAA | 1,169,840 | ||||||||||||||
| 500 | Saginaw, Michigan, Water Supply System Revenue Bonds, Series 2008, 5.250%, 7/01/22 – NPFG Insured | 7/18 at 100.00 | A | 553,765 | ||||||||||||||
| 500 | Saginaw, Michigan, Water Supply System Revenue Bonds, Series 2011A, 5.000%, 7/01/31 – AGM Insured | 8/21 at 100.00 | AA– | 546,255 | ||||||||||||||
| 27,555 | Total Water and Sewer | 28,291,857 | ||||||||||||||||
| $ | 197,813 | Total Investments (cost $186,089,395) – 98.1% | 203,439,320 | |||||||||||||||
Other Assets Less Liabilities – 1.9% | 4,044,232 | |||||||||||||||||
Net Assets – 100% | $ | 207,483,552 | ||||||||||||||||
| 54 | Nuveen Investments |
| (1) | All percentages shown in the Portfolio of Investments are based on net assets. |
| (2) | Optional Call Provisions (not covered by the report of independent registered public accounting firm): Dates (month and year) and prices of the earliest optional call or redemption. There may be other call provisions at varying prices at later dates. Certain mortgage-backed securities may be subject to periodic principal paydowns. |
| (3) | Ratings (not covered by the report of independent registered public accounting firm): Using the highest of Standard & Poor’s Group (“Standard & Poor’s”), Moody’s Investors Service, Inc. (“Moody’s”) or Fitch, Inc. (“Fitch”) rating. Ratings below BBB by Standard & Poor’s, Baa by Moody’s or BBB by Fitch are considered to be below investment grade. Holdings designated N/R are not rated by any of these national rating agencies. |
| (4) | Backed by an escrow or trust containing sufficient U.S. Government or U.S. Government agency securities, which ensure the timely payment of principal and interest. Certain bonds backed by U.S. Government or agency securities are regarded as having an implied rating equal to the rating of such securities. |
| (5) | Investment, or portion of investment, has been pledged to collateralize the net payment obligations for investments in inverse floating rate transactions. |
| N/R | Not rated. |
| (ETM) | Escrowed to maturity. |
| (IF) | Inverse floating rate investment. |
See accompanying notes to financial statements.
| Nuveen Investments | 55 |
Portfolio of Investments
Nuveen Missouri Municipal Bond Fund
May 31, 2012
| Principal Amount (000) | Description (1) | Optional Call Provisions (2) | Ratings (3) | Value | ||||||||||||||
Consumer Staples – 3.0% | ||||||||||||||||||
| $ | 3,000 | Cape Girardeau County Industrial Development Authority, Missouri, Solid Waste Disposal Revenue Bonds, Procter & Gamble Products Company Project, Series 1998, 5.300%, 5/15/28 (Alternative Minimum Tax) | 11/12 at 100.00 | AA– | $ | 3,004,770 | ||||||||||||
| 8,790 | Missouri Development Finance Board, Solid Waste Disposal Revenue Bonds, Procter and Gamble Inc., Series 1999, 5.200%, 3/15/29 (Alternative Minimum Tax) | No Opt. Call | AA– | 10,693,387 | ||||||||||||||
| 11,790 | Total Consumer Staples | 13,698,157 | ||||||||||||||||
Education and Civic Organizations – 6.9% | ||||||||||||||||||
| 1,000 | Curators of the University of Missouri, System Facilities Revenue Bonds, Series 2007A, 5.000%, 11/01/33 | 11/17 at 100.00 | AA+ | 1,134,950 | ||||||||||||||
| 1,025 | Kansas City Metropolitan Junior College District Certificates of Participation, Missouri, Series 2008, 4.500%, 7/01/21 | 7/17 at 100.00 | Aa2 | 1,147,201 | ||||||||||||||
| 1,000 | Lincoln University, Missouri, Auxillary System Revenue Bonds, Series 2007, 5.125%, 6/01/37 – AGC Insured | 6/17 at 100.00 | AA– | 1,053,580 | ||||||||||||||
| 1,185 | Missouri Development Finance Board, Research Facility Revenue Bonds, Midwest Research Institute Project, Series 2007, 5.000%, 11/01/17 | No Opt. Call | Baa2 | 1,347,701 | ||||||||||||||
| 1,625 | Missouri Health and Educational Facilities Authority, Educational Facilities Revenue Bonds, Ranken Technical College, Series 2011, 5.125%, 11/01/31 | 11/19 at 100.00 | A– | 1,738,588 | ||||||||||||||
| 3,870 | Missouri Health and Educational Facilities Authority, Revenue Bonds, A.T. Still University of Health Sciences, Series 2011, 5.250%, 10/01/41 | 10/21 at 100.00 | A– | 4,249,183 | ||||||||||||||
| 1,500 | Missouri Health and Educational Facilities Authority, Revenue Bonds, Rockhurst University, Series 1999, 6.000%, 10/01/25 | 10/18 at 103.00 | BBB | 1,682,370 | ||||||||||||||
Missouri Health and Educational Facilities Authority, Revenue Bonds, Rockhurst University, Series 2011A: | ||||||||||||||||||
| 2,500 | 6.500%, 10/01/30 | 10/18 at 103.00 | BBB | 2,817,400 | ||||||||||||||
| 1,300 | 6.500%, 10/01/35 | 10/18 at 103.00 | BBB | 1,448,239 | ||||||||||||||
| 900 | Missouri Health and Educational Facilities Authority, Revenue Bonds, Stephens College, Series 1999, 6.000%, 6/01/24 | 12/12 at 100.00 | Aa2 | 901,998 | ||||||||||||||
| 3,000 | Missouri Health and Educational Facilities Authority, Revenue Bonds, Washington University, Seres 2008A, 5.375%, 3/15/39 | 3/18 at 100.00 | AAA | 3,471,660 | ||||||||||||||
| 1,000 | Missouri Health and Educational Facilities Authority, Revenue Bonds, Washington University, Series 2001A, 5.500%, 6/15/16 | No Opt. Call | AAA | 1,195,540 | ||||||||||||||
| 2,600 | Missouri Health and Educational Facilities Authority, Revenue Bonds, Washington University, Series 2011B, 5.000%, 11/15/37 | 11/21 at 100.00 | AAA | 3,045,172 | ||||||||||||||
| 2,400 | Missouri Health and Educational Facilities Authority, Revenue Bonds, Webster University, Series 2011, 5.000%, 4/01/36 | 4/21 at 100.00 | A2 | 2,632,200 | ||||||||||||||
| 2,590 | Missouri State University, Auxiliary Enterprise System Revenue Bonds, Series 2007A, 5.000%, 4/01/24 – SYNCORA GTY Insured | 4/17 at 100.00 | A+ | 2,870,290 | ||||||||||||||
| 1,000 | Saint Louis Industrial Development Authority, Missouri, Confluence Academy Project, Series 2007A, 5.350%, 6/15/32 | 6/15 at 103.00 | N/R | 909,600 | ||||||||||||||
| 28,495 | Total Education and Civic Organizations | 31,645,672 | ||||||||||||||||
Health Care – 21.7% | ||||||||||||||||||
| 2,000 | Boone County, Missouri, Hospital Revenue Bonds, Boone Hospital Center, Series 2008, 5.625%, 8/01/38 | 8/18 at 100.00 | A | 2,149,360 | ||||||||||||||
| 1,025 | Boone County, Missouri, Hospital Revenue Bonds, Series 2002, 5.050%, 8/01/20 | 8/12 at 100.00 | A | 1,028,454 | ||||||||||||||
Cape Girardeau County Industrial Development Authority, Missouri, Health Facilities Revenue Bonds, Saint Francis Medical Center, Series 2009A: | ||||||||||||||||||
| 250 | 5.125%, 6/01/23 | 6/19 at 100.00 | AA– | 276,730 | ||||||||||||||
| 200 | 5.125%, 6/01/24 | 6/19 at 100.00 | AA– | 218,892 | ||||||||||||||
| 500 | 5.500%, 6/01/29 | 6/19 at 100.00 | AA– | 546,195 | ||||||||||||||
| 4,150 | 5.750%, 6/01/39 | 6/19 at 100.00 | AA– | 4,585,626 | ||||||||||||||
| 56 | Nuveen Investments |
| Principal Amount (000) | Description (1) | Optional Call Provisions (2) | Ratings (3) | Value | ||||||||||||||
Health Care (continued) | ||||||||||||||||||
| $ | 245 | Cape Girardeau County Industrial Development Authority, Missouri, Health Facilities Revenue Bonds, Southeast Missouri Hospital Association, Series 2002, 5.625%, 6/01/22 | 6/12 at 100.00 | BBB+ | $ | 245,345 | ||||||||||||
Cape Girardeau County Industrial Development Authority, Missouri, Health Facilities Revenue Bonds, Southeast Missouri Hospital Association, Series 2007: | ||||||||||||||||||
| 1,490 | 5.000%, 6/01/27 | 6/17 at 100.00 | BBB+ | 1,517,088 | ||||||||||||||
| 2,500 | 5.000%, 6/01/36 | 6/17 at 100.00 | BBB+ | 2,511,525 | ||||||||||||||
Cass County, Missouri, Hospital Revenue Bonds, Series 2007: | ||||||||||||||||||
| 2,500 | 5.500%, 5/01/27 | 11/16 at 100.00 | BBB– | 2,558,800 | ||||||||||||||
| 6,020 | 5.625%, 5/01/38 | 11/16 at 100.00 | BBB– | 6,084,053 | ||||||||||||||
Clinton County Industrial Development Authority, Missouri, Revenue Bonds, Cameron Regional Medical Center, Series 2007: | ||||||||||||||||||
| 1,250 | 5.000%, 12/01/32 | 12/17 at 100.00 | N/R | 1,165,000 | ||||||||||||||
| 4,995 | 5.000%, 12/01/37 | 12/17 at 100.00 | N/R | 4,565,430 | ||||||||||||||
Grundy County Industrial Development Authority, Missouri, Health Facility Revenue Bonds, Wright Memorial Hospital, Series 2009: | ||||||||||||||||||
| 1,120 | 5.650%, 9/01/22 | 9/19 at 100.00 | BBB– | 1,209,477 | ||||||||||||||
| 1,000 | 5.750%, 9/01/23 | 9/19 at 100.00 | BBB– | 1,081,790 | ||||||||||||||
| 850 | Hannibal Industrial Development Authority, Missouri, Health Facilities Refunding Revenue Bonds, Hannibal Regional Hospital, Refunding Series 2010, 5.375%, 9/01/19 | 9/13 at 102.00 | BBB+ | 889,219 | ||||||||||||||
| 1,835 | Hannibal Industrial Development Authority, Missouri, Health Facilities Revenue Bonds, Hannibal Regional Hospital, Series 2006, 5.000%, 3/01/22 | 3/16 at 100.00 | BBB+ | 1,902,546 | ||||||||||||||
Joplin Industrial Development Authority, Missouri, Health Facilities Revenue Bonds, Freeman Health System, Series 2004: | ||||||||||||||||||
| 2,000 | 5.500%, 2/15/24 | 2/15 at 102.00 | BBB+ | 2,106,240 | ||||||||||||||
| 1,250 | 5.500%, 2/15/29 | 2/15 at 102.00 | BBB+ | 1,301,050 | ||||||||||||||
| 800 | Joplin Industrial Development Authority, Missouri, Health Facilities Revenue Bonds, Freeman Health System, Series 2011, 5.500%, 2/15/31 | 2/21 at 100.00 | BBB+ | 861,520 | ||||||||||||||
| 2,800 | Missouri Health and Educational Facilities Authority, Health Facilities Revenue Bonds The Childrens Mercy Hospital, Series 2009, 5.625%, 5/15/39 | 5/19 at 100.00 | A+ | 3,049,900 | ||||||||||||||
Missouri Health and Educational Facilities Authority, Health Facilities Revenue Bonds, Capital Region Medical Center, Series 2011: | ||||||||||||||||||
| 365 | 3.000%, 11/01/17 | No Opt. Call | A3 | 369,154 | ||||||||||||||
| 575 | 3.250%, 11/01/18 | No Opt. Call | A3 | 586,023 | ||||||||||||||
| 2,160 | 5.000%, 11/01/27 | 11/20 at 100.00 | A3 | 2,339,820 | ||||||||||||||
| 2,000 | Missouri Health and Educational Facilities Authority, Health Facilities Revenue Bonds, St. Luke’s Episcopal and Presbyterian Hospitals, Series 2011, 5.000%, 12/01/25 | 12/21 at 100.00 | A+ | 2,238,800 | ||||||||||||||
| 2,000 | Missouri Health and Educational Facilities Authority, Health Facility Revenue Bonds, St. Lukes’s Health System, Series 2003B, 5.500%, 11/15/32 – AGM Insured | 11/18 at 100.00 | AA– | 2,227,480 | ||||||||||||||
Missouri Health and Educational Facilities Authority, Health Facility Revenue Bonds, St. Lukes’s Health System, Series 2010A: | ||||||||||||||||||
| 485 | 5.250%, 11/15/25 | 11/20 at 100.00 | A+ | 552,012 | ||||||||||||||
| 2,525 | 5.000%, 11/15/30 | 11/20 at 100.00 | A+ | 2,758,563 | ||||||||||||||
| 1,000 | 5.000%, 11/15/40 | 11/20 at 100.00 | A+ | 1,072,240 | ||||||||||||||
| 1,000 | Missouri Health and Educational Facilities Authority, Revenue Bonds, BJC Health System, Series 2003, 5.125%, 5/15/25 | 5/13 at 100.00 | AA | 1,035,860 | ||||||||||||||
| 1,000 | Missouri Health and Educational Facilities Authority, Revenue Bonds, BJC Health System, Series 2005A, 5.000%, 5/15/22 | 5/15 at 100.00 | AA | 1,111,830 | ||||||||||||||
Missouri Health and Educational Facilities Authority, Revenue Bonds, Freeman Health System, Series 1998: | ||||||||||||||||||
| 685 | 5.250%, 2/15/18 | 8/12 at 100.00 | BBB+ | 686,110 | ||||||||||||||
| 1,300 | 5.250%, 2/15/28 | 8/12 at 100.00 | BBB+ | 1,300,637 | ||||||||||||||
| Nuveen Investments | 57 |
Portfolio of Investments
Nuveen Missouri Municipal Bond Fund (continued)
May 31, 2012
| Principal Amount (000) | Description (1) | Optional Call Provisions (2) | Ratings (3) | Value | ||||||||||||||
Health Care (continued) | ||||||||||||||||||
| $ | 2,300 | Missouri Health and Educational Facilities Authority, Revenue Bonds, Jefferson Memorial Hospital Obligated Group, Refunding and Improvement Series 2004, 5.000%, 8/15/19 – RAAI Insured | 8/14 at 100.00 | Baa2 | $ | 2,373,186 | ||||||||||||
| 2,770 | Missouri Health and Educational Facilities Authority, Revenue Bonds, Lake Regional Health System, Series 2003, 5.700%, 2/15/34 | 2/14 at 100.00 | BBB+ | 2,847,671 | ||||||||||||||
Missouri Health and Educational Facilities Authority, Revenue Bonds, Lester E. Cox Medical Center, Series 1992H: | ||||||||||||||||||
| 1,650 | 0.000%, 9/01/17 – NPFG Insured | No Opt. Call | A2 | 1,431,210 | ||||||||||||||
| 3,005 | 0.000%, 9/01/21 – NPFG Insured | No Opt. Call | A2 | 2,173,667 | ||||||||||||||
| 4,025 | 0.000%, 9/01/22 – NPFG Insured | No Opt. Call | A2 | 2,762,760 | ||||||||||||||
| 2,010 | Missouri Health and Educational Facilities Authority, Revenue Bonds, SSM Health Care System, Series 2008A, 5.000%, 6/01/36 | 6/18 at 100.00 | AA– | 2,144,429 | ||||||||||||||
Missouri Health and Educational Facilities Authority, Revenue Bonds, SSM Health Care System, Series 2010B: | ||||||||||||||||||
| 1,500 | 5.000%, 6/01/30 | 6/20 at 100.00 | AA– | 1,668,540 | ||||||||||||||
| 3,000 | 5.000%, 6/01/34 | 6/20 at 100.00 | AA– | 3,297,360 | ||||||||||||||
| 7,140 | Missouri Health and Educational Facilities Authority, Revenue Refunding Bonds, CoxhHealth Systems Inc., Series 2008A, 5.500%, 11/15/39 | 11/18 at 100.00 | A2 | 7,729,121 | ||||||||||||||
| 1,000 | North Carolina Medical Care Commission, Healthcare Facilities Revenue Bonds, Duke University Health System, Series 2009A, 5.000%, 6/01/39 | 6/19 at 100.00 | AA | 1,083,700 | ||||||||||||||
| 1,000 | Saline County Industrial Development Authority, Missouri, Health Facilities Revenue Bonds, John Fitzgibbon Memorial Hospital Inc., Series 2005, 5.625%, 12/01/35 | 12/15 at 100.00 | BBB– | 1,000,160 | ||||||||||||||
| 4,780 | Saline County Industrial Development Authority, Missouri, Health Facilities Revenue Bonds, John Fitzgibbon Memorial Hospital Inc., Series 2010, 5.600%, 12/01/28 | 12/20 at 100.00 | BBB– | 4,993,809 | ||||||||||||||
St. Louis County Industrial Development Authority, Missouri, Healthcare Facilities Revenue Bonds, Ranken-Jordan Project, Refunding Series 2007: | ||||||||||||||||||
| 125 | 4.250%, 11/15/14 | No Opt. Call | N/R | 126,921 | ||||||||||||||
| 1,320 | 5.000%, 11/15/22 | 11/16 at 100.00 | N/R | 1,337,846 | ||||||||||||||
| 2,345 | 5.000%, 11/15/27 | 11/16 at 100.00 | N/R | 2,345,868 | ||||||||||||||
| 2,600 | 5.000%, 11/15/35 | 11/16 at 100.00 | N/R | 2,492,542 | ||||||||||||||
| 2,880 | Taney County Industrial Development Authority, Missouri, Hospital Revenue Bonds, Skaggs Community Hospital Association, Series 1998, 5.400%, 5/15/28 | 11/12 at 100.00 | BB | 2,712,499 | ||||||||||||||
| 97,325 | Total Health Care | 98,654,058 | ||||||||||||||||
Housing/Multifamily – 1.0% | ||||||||||||||||||
| 1,290 | Kansas City Industrial Development Authority, Missouri, GNMA Collateralized Multifamily Housing Revenue Bonds, Grand Boulevard Lofts Project, Series 2009A, 5.300%, 11/20/49 | 11/19 at 100.00 | Aaa | 1,394,838 | ||||||||||||||
Missouri Housing Development Commission, GNMA Collateralized Multifamily Housing Revenue Bonds, JB Hughes Apartments I and II, Series 2002G: | ||||||||||||||||||
| 163 | 6.200%, 5/20/19 | 5/17 at 100.00 | Aaa | 175,476 | ||||||||||||||
| 975 | 6.300%, 5/20/37 | 5/17 at 100.00 | Aaa | 1,024,637 | ||||||||||||||
| 1,840 | Missouri Housing Development Commission, Multifamily Housing Revenue Bonds, Mansion Apartments II, Series 1999, 6.125%, 4/01/22 (Alternative Minimum Tax) | 10/12 at 100.00 | N/R | 1,805,923 | ||||||||||||||
| 4,268 | Total Housing/Multifamily | 4,400,874 | ||||||||||||||||
Housing/Single Family – 0.8% | ||||||||||||||||||
| 565 | Missouri Housing Development Commission, Single Family Mortgage Revenue Bonds, Homeownership Loan Program, Series 2005A-1, 5.900%, 9/01/35 (Alternative Minimum Tax) | 9/14 at 100.00 | Aaa | 579,826 | ||||||||||||||
| 435 | Missouri Housing Development Commission, Single Family Mortgage Revenue Bonds, Homeownership Loan Program, Series 2006B, 4.800%, 9/01/31 (Alternative Minimum Tax) | 9/15 at 100.00 | AA+ | 445,122 | ||||||||||||||
| 58 | Nuveen Investments |
| Principal Amount (000) | Description (1) | Optional Call Provisions (2) | Ratings (3) | Value | ||||||||||||||
Housing/Single Family (continued) | ||||||||||||||||||
| $ | 230 | Missouri Housing Development Commission, Single Family Mortgage Revenue Bonds, Homeownership Loan Program, Series 2006C-1, 5.000%, 9/01/37 (Alternative Minimum Tax) | 9/15 at 100.00 | AA+ | $ | 235,837 | ||||||||||||
| 835 | Missouri Housing Development Commission, Single Family Mortgage Revenue Bonds, Homeownership Loan Program, Series 2007A-1, 4.700%, 9/01/27 (Alternative Minimum Tax) | 9/16 at 100.00 | AA+ | 864,359 | ||||||||||||||
| 1,275 | Missouri Housing Development Commission, Single Family Mortgage Revenue Bonds, Homeownership Loan Program, Series 2007E-1, 5.200%, 9/01/38 (Alternative Minimum Tax) | 3/17 at 100.00 | AA+ | 1,325,133 | ||||||||||||||
| 305 | Missouri Housing Development Commission, Single Family Mortgage Revenue Bonds, Homeownership Loan Program, Series 2008A-1, 5.300%, 3/01/39 (Alternative Minimum Tax) | 9/17 at 100.00 | AA+ | 318,813 | ||||||||||||||
| 3,645 | Total Housing/Single Family | 3,769,090 | ||||||||||||||||
Industrials – 0.4% | ||||||||||||||||||
Kennett Industrial Development Authority, Missouri, Revenue Bonds, Manac Trailers USA Inc Project, Series 2007: | ||||||||||||||||||
| 1,500 | 4.250%, 3/01/22 (Alternative Minimum Tax) | 3/15 at 100.00 | Ba2 | 1,235,040 | ||||||||||||||
| 500 | 4.250%, 3/01/24 (Alternative Minimum Tax) | 3/15 at 100.00 | Ba2 | 396,185 | ||||||||||||||
| 2,000 | Total Industrials | 1,631,225 | ||||||||||||||||
Long-Term Care – 7.0% | ||||||||||||||||||
Cole County Industrial Development Authority, Missouri, Revenue Bonds, Lutheran Senior Services – Heisinger Project, Series 2004: | ||||||||||||||||||
| 2,000 | 5.250%, 2/01/24 | 2/14 at 100.00 | BBB+ | 2,031,480 | ||||||||||||||
| 2,250 | 5.500%, 2/01/35 | 2/14 at 100.00 | BBB+ | 2,283,593 | ||||||||||||||
Joplin Industrial Development Authority, Missouri, Revenue Bonds, Christian Homes Inc., Series 2007F: | ||||||||||||||||||
| 1,000 | 5.500%, 5/15/17 | No Opt. Call | BBB– | 1,098,840 | ||||||||||||||
| 2,000 | 5.750%, 5/15/31 | 5/17 at 100.00 | BBB– | 2,088,240 | ||||||||||||||
| 4,250 | Kansas City Industrial Development Authority, Missouri, Retirement Center Revenue Refunding and Improvement Bonds, Kingswood Project, Series 1998A, 5.875%, 11/15/29 | 11/12 at 100.00 | N/R | 4,030,105 | ||||||||||||||
Lees Summit Industrial Development Authority, Missouri, Revenue Bonds, John Knox Village Obligated Group, Series 2007A: | ||||||||||||||||||
| 1,035 | 5.000%, 8/15/14 | No Opt. Call | BBB– | 1,081,296 | ||||||||||||||
| 1,500 | 5.125%, 8/15/26 | 8/17 at 100.00 | BBB– | 1,499,130 | ||||||||||||||
| 2,525 | 5.125%, 8/15/32 | 8/17 at 100.00 | BBB– | 2,485,787 | ||||||||||||||
| 1,625 | Missouri Health and Educational Facilities Authority, Revenue Bonds, Lutheran Senior Services Projects, Senior Lien Series 2010, 5.500%, 2/01/42 | 2/20 at 100.00 | BBB+ | 1,699,783 | ||||||||||||||
Missouri Health and Educational Facilities Authority, Revenue Bonds, Lutheran Senior Services Projects, Series 2011: | ||||||||||||||||||
| 1,000 | 5.750%, 2/01/31 | 2/21 at 100.00 | BBB+ | 1,100,500 | ||||||||||||||
| 2,750 | 6.000%, 2/01/41 | 2/21 at 100.00 | BBB+ | 3,031,738 | ||||||||||||||
| 2,100 | Missouri Health and Educational Facilities Authority, Revenue Bonds, Lutheran Senior Services, Series 2005, 5.375%, 2/01/35 | 2/15 at 100.00 | BBB+ | 2,129,484 | ||||||||||||||
Missouri Health and Educational Facilities Authority, Revenue Bonds, Lutheran Senior Services, Series 2007A: | ||||||||||||||||||
| 325 | 4.875%, 2/01/18 | 2/17 at 100.00 | BBB+ | 348,238 | ||||||||||||||
| 2,000 | 4.875%, 2/01/37 | 2/17 at 100.00 | BBB+ | 1,980,040 | ||||||||||||||
St. Louis County Industrial Development Authority, Missouri, Revenue Bonds, Friendship Village of West County, Series 2007A: | ||||||||||||||||||
| 700 | 5.375%, 9/01/21 | 9/17 at 100.00 | BBB | 731,136 | ||||||||||||||
| 4,000 | 5.500%, 9/01/28 | 9/17 at 100.00 | BBB | 4,093,800 | ||||||||||||||
| 31,060 | Total Long-Term Care | 31,713,190 | ||||||||||||||||
| Nuveen Investments | 59 |
Portfolio of Investments
Nuveen Missouri Municipal Bond Fund (continued)
May 31, 2012
| Principal Amount (000) | Description (1) | Optional Call Provisions (2) | Ratings (3) | Value | ||||||||||||||
Materials – 0.4% | ||||||||||||||||||
| $ | 2,000 | Sugar Creek, Missouri, Industrial Development Revenue Bonds, Lafarge North America Inc., Series 2003A, 5.650%, 6/01/37 (Alternative Minimum Tax) | 6/13 at 101.00 | BB+ | $ | 1,958,860 | ||||||||||||
Tax Obligation/General – 10.0% | ||||||||||||||||||
Belton, Missouri, General Obligation Bonds, Refunding & Improvement Series 2011: | ||||||||||||||||||
| 1,120 | 5.000%, 3/01/29 | 3/21 at 100.00 | A+ | 1,280,552 | ||||||||||||||
| 1,245 | 5.000%, 3/01/30 | 3/21 at 100.00 | A+ | 1,414,283 | ||||||||||||||
| 1,000 | 4.750%, 3/01/31 | 3/21 at 100.00 | A+ | 1,122,710 | ||||||||||||||
| 850 | Blue Springs, Missouri, General Obligation Bonds, South Area Neighborhood Improvement, Refunding Series 2009, 5.000%, 2/15/29 | 2/19 at 100.00 | AA– | 947,334 | ||||||||||||||
Branson Reorganized School District R-4, Taney County, Missouri, General Obligation Bonds, School Building Series 2012: | ||||||||||||||||||
| 270 | 4.000%, 3/01/27 – AGM Insured | 3/22 at 100.00 | A+ | 285,706 | ||||||||||||||
| 1,095 | 3.750%, 3/01/31 | 3/22 at 100.00 | A+ | 1,122,233 | ||||||||||||||
| 2,400 | 4.375%, 3/01/32 | 3/22 at 100.00 | A+ | 2,562,888 | ||||||||||||||
| 2,000 | Hazelwood School District, St Louis County, Missouri, General Obligation Bonds, Refunding & Improvement, Missouri Direct Deposit Program, Series 2012, 4.000%, 3/01/31 | 3/22 at 100.00 | AA+ | 2,158,260 | ||||||||||||||
| 1,315 | Independence School District, Jackson County, Missouri, General Obligation Bonds, Series 2010, 5.000%, 3/01/27 | 3/20 at 100.00 | AA+ | 1,539,510 | ||||||||||||||
| 2,000 | Jackson County Reorganized School District 4, Blue Springs, Missouri, General Obligation Bonds, Refunding & Improvement Series 2009A, 4.750%, 3/01/26 | 3/19 at 100.00 | AA | 2,253,080 | ||||||||||||||
| 1,000 | Jackson County Reorganized School District R-7, Lees Summit, Missouri, General Obligation Bonds, School Building Series 2008, 4.750%, 3/01/27 | 3/18 at 100.00 | Aa1 | 1,114,270 | ||||||||||||||
| 500 | Jefferson City School District, Missouri, General Obligation Bonds, Series 2007, 5.000%, 3/01/20 – NPFG Insured | 3/17 at 100.00 | AA+ | 576,185 | ||||||||||||||
Kansas City, Missouri, General Obligation Bonds, Improvement & Refunding Series 2012A: | ||||||||||||||||||
| 1,025 | 4.000%, 2/01/25 | 2/22 at 100.00 | AA | 1,143,408 | ||||||||||||||
| 200 | 4.500%, 2/01/28 | 2/22 at 100.00 | AA | 228,886 | ||||||||||||||
| 495 | Manchester, Missouri, General Obligation Bonds, Refunding Series 2012, 2.000%, 3/01/13 | No Opt. Call | AA– | 500,529 | ||||||||||||||
| 2,000 | Miller County School District R-2, Osage, Missouri, General Obligation Bonds, Series 2006, 5.000%, 3/01/24 – AGM Insured | 3/16 at 100.00 | AA– | 2,176,720 | ||||||||||||||
Missouri School Boards Association, Lease Participation Certificates, Clay County School District 53 Liberty, Series 2007: | ||||||||||||||||||
| 1,015 | 5.250%, 3/01/25 – AGM Insured | 3/17 at 100.00 | AA– | 1,132,496 | ||||||||||||||
| 1,070 | 5.250%, 3/01/26 – AGM Insured | 3/17 at 100.00 | AA– | 1,186,951 | ||||||||||||||
| 625 | 5.250%, 3/01/27 – AGM Insured | 3/17 at 100.00 | AA– | 691,256 | ||||||||||||||
| 1,250 | Nixa Reorganized School District R 02, Missouri, General Obligation Bonds, Series 2006, 5.250%, 3/01/24 – AGM Insured | 3/16 at 100.00 | AA+ | 1,413,688 | ||||||||||||||
| 1,240 | North Kansas City School District 74, Clay County, Missouri, General Obligation Bonds, Direct Deposit Program, Series 2007, 5.000%, 3/01/27 | 3/18 at 100.00 | AA+ | 1,437,569 | ||||||||||||||
| 605 | North Kansas City School District 74, Clay County, Missouri, General Obligation Bonds, Series 2005, 5.000%, 3/01/25 | 3/15 at 100.00 | AA+ | 661,912 | ||||||||||||||
| 685 | Platte County Reorganized School District R3, Missouri, General Obligation Bonds, Series 2004, 5.000%, 3/01/24 – NPFG Insured | 3/14 at 100.00 | AA | 731,477 | ||||||||||||||
| 200 | Platte County R-III School District Building Corporation, Missouri, Leasehold Refunding and Improvement Revenue Bonds, Series 2008, 5.000%, 3/01/28 | 3/18 at 100.00 | AA– | 219,698 | ||||||||||||||
| 2,000 | Puerto Rico, General Obligation Bonds, Public Improvement, Refunding Series 2012A, 5.500%, 7/01/39 | 7/22 at 100.00 | Baa1 | 2,085,600 | ||||||||||||||
| 1,000 | Puerto Rico, General Obligation Bonds, Public Improvement Refunding Series 2008A, 5.250%, 7/01/26 | 7/18 at 100.00 | Baa1 | 1,048,430 | ||||||||||||||
| 690 | Richmond Heights, Missouri, General Obligation Bonds, Manhasset Village Nieghboorhood, Series 2006, 4.500%, 4/01/26 | 4/14 at 100.00 | N/R | 731,483 | ||||||||||||||
| 60 | Nuveen Investments |
| Principal Amount (000) | Description (1) | Optional Call Provisions (2) | Ratings (3) | Value | ||||||||||||||
Tax Obligation/General (continued) | ||||||||||||||||||
| $ | 1,000 | Saint Charles County Francis Howell School District, Missouri, General Obligation Bonds, Series 2009, 5.000%, 3/01/27 | 3/19 at 100.00 | AA+ | $ | 1,146,530 | ||||||||||||
Saint Louis Special Administrative Board of the Transitional School District, Missouri, General Obligation Bonds, St Louis Public Schools, Missouri Direct Deposit Program, Series 2011B: | ||||||||||||||||||
| 2,500 | 4.000%, 4/01/25 | 4/21 at 100.00 | AA+ | 2,734,900 | ||||||||||||||
| 1,000 | 4.000%, 4/01/27 | 4/21 at 100.00 | AA+ | 1,072,480 | ||||||||||||||
Springfield School District R12, Missouri, General Obligation Bonds, Series 2003: | ||||||||||||||||||
| 1,225 | 5.125%, 3/01/20 – FGIC Insured | 3/13 at 100.00 | AA+ | 1,264,445 | ||||||||||||||
| 2,000 | 5.000%, 3/01/22 – FGIC Insured | 3/13 at 100.00 | AA+ | 2,063,460 | ||||||||||||||
| 1,250 | 5.000%, 3/01/23 – FGIC Insured | 3/13 at 100.00 | AA+ | 1,287,550 | ||||||||||||||
| 1,345 | St. Louis County Pattonville School District R3, Missouri, General Obligation Bonds, Series 2000, 6.500%, 3/01/14 – FGIC Insured | No Opt. Call | AA | 1,486,898 | ||||||||||||||
| 5,000 | Wentzville School District R-04, Saint Charles County, Missouri, General Obligation Improvement and Refunding Bonds, Series 2009A, 0.000%, 3/01/26 | 3/19 at 66.11 | AA+ | 2,590,300 | ||||||||||||||
| 44,215 | Total Tax Obligation/General | 45,413,677 | ||||||||||||||||
Tax Obligation/Limited – 23.3% | ||||||||||||||||||
Arnold, Missouri, Certificates of Participation, Series 2012: | ||||||||||||||||||
| 250 | 2.000%, 8/15/13 (WI/DD, Settling 6/14/12) | No Opt. Call | A+ | 253,803 | ||||||||||||||
| 505 | 2.000%, 8/15/14 (WI/DD, Settling 6/14/12) | No Opt. Call | A+ | 514,640 | ||||||||||||||
| 835 | 3.500%, 8/15/29 (WI/DD, Settling 6/14/12) | 8/19 at 100.00 | A+ | 821,273 | ||||||||||||||
Belton, Missouri, Certificates of Participation, Series 2007: | ||||||||||||||||||
| 600 | 4.375%, 3/01/19 – NPFG Insured | 3/17 at 100.00 | Baa2 | 645,582 | ||||||||||||||
| 250 | 4.500%, 3/01/22 – NPFG Insured | 3/17 at 100.00 | Baa2 | 263,778 | ||||||||||||||
| 355 | Belton, Missouri, Certificates of Participation, Series 2008, 5.250%, 3/01/29 | 3/18 at 100.00 | A | 383,915 | ||||||||||||||
Cape Girardeau County Building Corporation, Missouri, Leasehold Revenue Bonds, Reorganized School District R-02, Jackson R-II School District High School Project, Series 2005: | ||||||||||||||||||
| 1,290 | 5.250%, 3/01/21 – NPFG Insured | 3/16 at 100.00 | A | 1,435,460 | ||||||||||||||
| 1,000 | 5.250%, 3/01/26 – NPFG Insured | 3/16 at 100.00 | A | 1,084,000 | ||||||||||||||
| 1,975 | Cass County, Missouri, Certificates of Participation, Refunding Series 2010, 4.000%, 5/01/22 | 5/20 at 100.00 | A | 2,127,944 | ||||||||||||||
Columbia, Missouri, Special Obligation Bonds, Electric Utility Project – Annual Appropriation Obligation, Series 2012D: | ||||||||||||||||||
| 1,005 | 3.000%, 10/01/24 | 10/20 at 100.00 | AA | 1,018,698 | ||||||||||||||
| 950 | 3.000%, 10/01/25 | 10/20 at 100.00 | AA | 953,601 | ||||||||||||||
| 1,360 | 3.250%, 10/01/28 | 10/20 at 100.00 | AA | 1,365,399 | ||||||||||||||
Cottleville, Missouri, Certificates of Participation, Series 2006: | ||||||||||||||||||
| 200 | 5.125%, 8/01/26 | 8/14 at 100.00 | N/R | 204,928 | ||||||||||||||
| 2,120 | 5.250%, 8/01/31 | 8/14 at 100.00 | N/R | 2,156,061 | ||||||||||||||
| 1,035 | Dunklin County, Missouri, Certificates of Participation, Series 2004, 5.000%, 12/01/19 – FGIC Insured | 12/14 at 100.00 | BBB | 1,060,088 | ||||||||||||||
Fenton, Missouri, Tax Increment Revenue Bonds, Gravois Bluffs Redevelopment Project, Series 2006: | ||||||||||||||||||
| 1,000 | 5.000%, 4/01/14 | No Opt. Call | BBB+ | 1,057,620 | ||||||||||||||
| 550 | 4.500%, 4/01/21 | 4/14 at 100.00 | BBB+ | 564,619 | ||||||||||||||
| 1,685 | Fulton, Missouri, Tax Increment Revenue Bonds, Fulton Commons Redevelopment Project, Series 2006, 5.000%, 6/01/28 | 6/16 at 100.00 | N/R | 1,394,843 | ||||||||||||||
| 530 | Government of Guam, Business Privilege Tax Bonds, Series 2011A, 5.125%, 1/01/42 | 1/22 at 100.00 | A | 575,082 | ||||||||||||||
| 2,270 | Government of Guam, Business Privilege Tax Bonds, Series 2012B-1, 5.000%, 1/01/42 (WI/DD, Settling 6/06/12) | 1/22 at 100.00 | A | 2,440,727 | ||||||||||||||
| Nuveen Investments | 61 |
Portfolio of Investments
Nuveen Missouri Municipal Bond Fund (continued)
May 31, 2012
| Principal Amount (000) | Description (1) | �� | Optional Call Provisions (2) | Ratings (3) | Value | |||||||||||||
Tax Obligation/Limited (continued) | ||||||||||||||||||
Harrisonville, Missouri, Annual Appropriation-Supported Tax Increment and Sales Tax Revenue Bonds, Harrisonville Towne Center Project, Series 2007: | ||||||||||||||||||
| $ | 340 | 4.375%, 11/01/17 | 11/13 at 100.00 | A+ | $ | 349,452 | ||||||||||||
| 715 | 4.500%, 11/01/22 | 11/13 at 100.00 | A+ | 725,704 | ||||||||||||||
Hazelwood School District, St Louis County, Missouri, Certificates of Participation, Energy Improvements Project, Series 2006: | ||||||||||||||||||
| 515 | 4.500%, 3/01/17 | 3/16 at 100.00 | A+ | 566,176 | ||||||||||||||
| 445 | 4.500%, 3/01/18 | 3/16 at 100.00 | A+ | 487,030 | ||||||||||||||
| 1,745 | Howard Bend Levee District, Missouri, Levee District Improvement Bonds, Series 2005, 5.500%, 3/01/26 – SYNCORA GTY Insured | No Opt. Call | BBB+ | 2,066,289 | ||||||||||||||
| 3,000 | Jackson County, Missouri, Special Obligation Bonds, Harry S. Truman Sports Complex, Series 2006, 5.000%, 12/01/28 – AMBAC Insured | 12/16 at 100.00 | Aa3 | 3,275,640 | ||||||||||||||
| 925 | Kansas City Industrial Development Authority, Missouri, Downtown Redevelpment District Revenue Bonds, Series 2011A, 5.000%, 9/01/32 | 9/21 at 100.00 | AA– | 1,020,321 | ||||||||||||||
Kansas City Industrial Development Authority, Missouri, Infrastructure Revenue Bonds, NNSA National Security Campus Project, MoDot Funded Transportation Improvements, Series 2010: | ||||||||||||||||||
| 1,250 | 4.000%, 9/01/13 | No Opt. Call | N/R | 1,272,663 | ||||||||||||||
| 670 | 4.000%, 9/01/14 | No Opt. Call | N/R | 688,794 | ||||||||||||||
| 2,000 | Kansas City Municipal Assistance Corporation, Missouri, Leasehold Revenue Bonds, Series 2004B-1, 0.000%, 4/15/27 – AMBAC Insured | No Opt. Call | AA– | 1,067,700 | ||||||||||||||
| 2,525 | Kansas City Tax Increment Financing Commission, Missouri, Tax Increment Revenue Bonds, Briarcliff West Project, Series 2006A, 5.400%, 6/01/24 | 6/14 at 102.00 | N/R | 2,423,798 | ||||||||||||||
| 1,000 | Kansas City Tax Increment Financing Commission, Missouri, Tax Increment Revenue Bonds, Maincor Project, Series 2007A, 5.250%, 3/01/18 | No Opt. Call | N/R | 1,043,730 | ||||||||||||||
| 610 | Kansas City Tax Increment Financing Commission, Missouri, Tax Increment Revenue Bonds, Shoal Creek Parkway Project, Series 2011, 5.000%, 6/01/21 | 6/16 at 100.00 | N/R | 635,089 | ||||||||||||||
| 1,025 | Kansas City, Missouri, Special Obligation Bonds, Kansas City Missouri Projects, Series 2012A, 5.000%, 3/01/26 | 3/22 at 100.00 | AA– | 1,168,295 | ||||||||||||||
| 2,000 | Lakeside 370 Levee District, Saint Charles, Missouri, Levee District Improvement Bonds, Series 2008, 7.000%, 4/01/28 | 4/16 at 100.00 | N/R | 1,615,260 | ||||||||||||||
| 3,885 | Missouri Association of Rural Education, Pulaski County, Certificates of Participation, Waynesville School District R-6, Series 2004, 5.100%, 3/01/24 – NPFG Insured | 3/14 at 100.00 | BBB | 3,969,382 | ||||||||||||||
| 4,920 | Missouri Development Finance Board, Infrastructure Facilities Revenue Bonds, Branson Landing Project, Series 2005A, 5.000%, 6/01/35 | 6/15 at 100.00 | A | 5,057,071 | ||||||||||||||
| 1,000 | Missouri Development Finance Board, Infrastructure Facilities Revenue Bonds, City of Independence, Centerpoint Project, Series 2007E, 5.125%, 4/01/25 | 4/17 at 100.00 | A– | 1,072,320 | ||||||||||||||
| 2,335 | Missouri Development Finance Board, Infrastructure Facilities Revenue Bonds, City of Independence, Crackerneck Creek Project, Series 2006C, 5.000%, 3/01/28 | 3/16 at 100.00 | A– | 2,382,377 | ||||||||||||||
| 1,000 | Missouri Development Finance Board, Infrastructure Facilities Revenue Bonds, City of Independence, Crackerneck Creek Project, Series 2008B, 5.000%, 3/01/25 | 3/18 at 100.00 | A– | 1,065,390 | ||||||||||||||
| 1,010 | Missouri Development Finance Board, Infrastructure Facilities Revenue Bonds, City of Independence, Eastland Center Project, Refunding Series 2007A, 4.250%, 4/01/15 | No Opt. Call | A– | 1,078,609 | ||||||||||||||
| 1,000 | Missouri State Board of Public Building, Special Obligation Bonds, Series 2003A, 5.000%, 10/15/27 | 10/13 at 100.00 | AA+ | 1,051,060 | ||||||||||||||
| 450 | Monarch-Chesterfield Levee District, St. Louis County, Missouri, Levee District Improvement Bonds, Series 1999, 5.750%, 3/01/19 – NPFG Insured | 9/12 at 100.00 | A | 451,638 | ||||||||||||||
| 1,000 | Monarch-Chesterfield Levee District, St. Louis County, Missouri, Levee District Improvement Bonds, Series 2010, 3.000%, 3/01/18 | 3/17 at 100.00 | A– | 1,063,820 | ||||||||||||||
| 1,000 | Oak Grove, Missouri, Refunding and Improvement Certificates of Participation Series 2012, 5.000%, 1/01/33 | 1/22 at 100.00 | Baa1 | 1,023,280 | ||||||||||||||
| 62 | Nuveen Investments |
| Principal Amount (000) | Description (1) | Optional Call Provisions (2) | Ratings (3) | Value | ||||||||||||||
Tax Obligation/Limited (continued) | ||||||||||||||||||
| $ | 3,955 | Osage Beach, Missouri, Tax Increment Revenue Bonds, Prewitts Point Transportation Development District, Series 2006, 5.000%, 5/01/23 | 5/13 at 101.00 | N/R | $ | 3,398,690 | ||||||||||||
| 1,000 | Pevely, Missouri, General Obligation Bonds, Series 2004, 5.250%, 3/01/24 – RAAI Insured | 3/13 at 100.00 | N/R | 1,015,070 | ||||||||||||||
| 1,000 | Puerto Rico Highway and Transportation Authority, Highway Revenue Bonds, Series 2005K, 5.000%, 7/01/17 | 7/15 at 100.00 | Baa1 | 1,069,760 | ||||||||||||||
| 3,000 | Puerto Rico Public Buildings Authority, Guaranteed Government Facilities Revenue Bonds, Series 1993L, 5.500%, 7/01/21 | No Opt. Call | Baa1 | 3,367,740 | ||||||||||||||
| 3,540 | Puerto Rico Sales Tax Financing Corporation, Sales Tax Revenue Bonds, First Subordinate Series 2009A, 6.000%, 8/01/42 | 8/19 at 100.00 | A+ | 3,992,412 | ||||||||||||||
| 250 | Puerto Rico Sales Tax Financing Corporation, Sales Tax Revenue Bonds, First Subordinate Series 2010A, 5.500%, 8/01/42 | 2/20 at 100.00 | A+ | 268,640 | ||||||||||||||
Puerto Rico Sales Tax Financing Corporation, Sales Tax Revenue Bonds, First Subordinate Series 2010C: | ||||||||||||||||||
| 1,660 | 6.000%, 8/01/39 | 8/20 at 100.00 | A+ | 1,897,330 | ||||||||||||||
| 1,265 | 5.250%, 8/01/41 | 8/20 at 100.00 | A+ | 1,343,822 | ||||||||||||||
| 1,070 | Puerto Rico Sales Tax Financing Corporation, Sales Tax Revenue Bonds, First Subordinate Series 2011A-1, 5.250%, 8/01/43 | 8/21 at 100.00 | A+ | 1,135,859 | ||||||||||||||
Puerto Rico Sales Tax Financing Corporation, Sales Tax Revenue Bonds, Series 2007A: | ||||||||||||||||||
| 15,780 | 0.000%, 8/01/41 – NPFG Insured | No Opt. Call | Aa2 | 3,146,059 | ||||||||||||||
| 8,935 | 0.000%, 8/01/42 – NPFG Insured | No Opt. Call | Aa2 | 1,678,172 | ||||||||||||||
| 1,000 | Raytown, Missouri, Annual Appropriation Supported Tax Increment and Sales Tax Revenue Bonds, Raytown Live Redevelopment Project Area 1, Series 2007, 5.125%, 12/01/31 | 6/17 at 100.00 | A+ | 1,054,000 | ||||||||||||||
| 1,400 | Riverside Industrial Development Authority, Missouri, Industrial Development Revenue Bonds, Riverside Horizon, Series 2007A, 5.000%, 5/01/27 – ACA Insured | 5/17 at 100.00 | A | 1,440,782 | ||||||||||||||
| 2,170 | Riverside, Missouri, L-385 Levee Redevelopment Plan Tax Increment Revenue Bonds, Series 2004, 5.250%, 5/01/20 | 5/15 at 100.00 | A | 2,292,258 | ||||||||||||||
| 1,150 | Saint Charles, Missouri, Certificates of Participation, Series 2012, 2.000%, 5/01/13 | No Opt. Call | A1 | 1,164,214 | ||||||||||||||
Saint Joseph Industrial Development Authority, Missouri, Special Obligation Revenue Bonds, Sewerage System Improvements Project, Series 2007: | ||||||||||||||||||
| 500 | 4.750%, 4/01/20 | 4/17 at 100.00 | A | 547,990 | ||||||||||||||
| 390 | 4.750%, 4/01/21 | 4/17 at 100.00 | A | 425,396 | ||||||||||||||
Saint Louis Municipal Finance Corporation, Missouri, Leasehold Revenue Bonds, Convention Center, Series 2009A: | ||||||||||||||||||
| 1,000 | 0.000%, 7/15/26 – AGC Insured | No Opt. Call | AA– | 557,920 | ||||||||||||||
| 1,000 | 0.000%, 7/15/27 – AGC Insured | No Opt. Call | AA– | 522,810 | ||||||||||||||
| 1,000 | 0.000%, 7/15/28 – AGC Insured | No Opt. Call | AA– | 494,580 | ||||||||||||||
| 1,000 | 0.000%, 7/15/29 – AGC Insured | No Opt. Call | AA– | 461,700 | ||||||||||||||
| 1,945 | Springfield Center City Development Corporation, Missouri, Lease Revenue Bonds, Jordan Valley Park Exposition Center, Series 2002A, 5.000%, 6/01/27 – AMBAC Insured | 6/12 at 100.00 | Aa3 | 1,951,049 | ||||||||||||||
| 2,055 | Springfield Public Building Corporation, Missouri, Lease Revenue Bonds, Jordan Valley Park Projects, Series 2000A, 6.125%, 6/01/21 – AMBAC Insured | 6/12 at 100.00 | N/R | 2,055,000 | ||||||||||||||
| 4,500 | Springfield Public Building Corporation, Missouri, Lease Revenue Bonds, Series 2004, 5.000%, 3/01/24 – AMBAC Insured | 3/14 at 100.00 | Aa2 | 4,789,890 | ||||||||||||||
St. Joseph Industrial Development Authority, Missouri, Tax Increment Bonds, Shoppes at North Village Project, Series 2005A: | ||||||||||||||||||
| 660 | 5.375%, 11/01/24 | 11/14 at 100.00 | N/R | 660,040 | ||||||||||||||
| 1,600 | 5.500%, 11/01/27 | 11/14 at 100.00 | N/R | 1,588,432 | ||||||||||||||
| 1,800 | St. Joseph Industrial Development Authority, Missouri, Tax Increment Bonds, Shoppes at North Village Project, Series 2005B, 5.500%, 11/01/27 | 11/14 at 100.00 | N/R | 1,786,986 | ||||||||||||||
| Nuveen Investments | 63 |
Portfolio of Investments
Nuveen Missouri Municipal Bond Fund (continued)
May 31, 2012
| Principal Amount (000) | Description (1) | Optional Call Provisions (2) | Ratings (3) | Value | ||||||||||||||
Tax Obligation/Limited (continued) | ||||||||||||||||||
| $ | 3,225 | St. Louis Industrial Development Authority, Missouri, Senior Lien Revenue Bonds, St. Louis Convention Center Headquarters Hotel, Series 2000, 0.000%, 7/15/15 – AMBAC Insured | No Opt. Call | A | $ | 2,742,798 | ||||||||||||
| 1,595 | Texas County, Missouri, Certificates of Participation, Justice Center Project, Series 2006, 4.500%, 12/01/25 – AGC Insured | 12/16 at 100.00 | AA– | 1,697,016 | ||||||||||||||
| 520 | Union, Missouri, Certificates of Participation, Series 2006A, 5.200%, 7/01/23 | 7/14 at 100.00 | N/R | 534,435 | ||||||||||||||
| 126,095 | Total Tax Obligation/Limited | 106,023,799 | ||||||||||||||||
Transportation – 4.0% | ||||||||||||||||||
| 2,000 | Kansas City, Missouri, Passenger Facility Charge Revenue Bonds, Kansas City International Airport, Series 2001, 5.000%, 4/01/23 – AMBAC Insured (Alternative Minimum Tax) | 10/12 at 100.50 | A | 2,012,700 | ||||||||||||||
St. Louis Land Clearance Redevelopment Authority, Missouri, Revenue Refunding and Improvement Bonds, LCRA Parking Facilities, Series 1999C: | ||||||||||||||||||
| 1,000 | 7.000%, 9/01/19 | 9/12 at 100.00 | N/R | 1,000,570 | ||||||||||||||
| 2,400 | 7.050%, 9/01/24 | 9/12 at 100.00 | N/R | 2,399,952 | ||||||||||||||
| 2,000 | St. Louis, Missouri, Airport Revenue Bonds, Lambert-St Louis International Series 2009A-2, 6.125%, 7/01/24 | 7/19 at 100.00 | A– | 2,327,860 | ||||||||||||||
| 3,100 | St. Louis, Missouri, Airport Revenue Bonds, Lambert-St. Louis International Airport, Series 2005, 5.500%, 7/01/18 – NPFG Insured | No Opt. Call | A– | 3,581,988 | ||||||||||||||
St. Louis, Missouri, Airport Revenue Bonds, Lambert-St. Louis International Airport, Series 2007A: | ||||||||||||||||||
| 1,035 | 5.000%, 7/01/20 – AGM Insured | 7/17 at 100.00 | AA– | 1,142,681 | ||||||||||||||
| 2,000 | 5.000%, 7/01/21 – AGM Insured | 7/17 at 100.00 | AA– | 2,190,200 | ||||||||||||||
St. Louis, Missouri, Airport Revenue Refunding Bonds, Series 2003A: | ||||||||||||||||||
| 2,450 | 5.250%, 7/01/16 – AGM Insured | 7/13 at 100.00 | AA– | 2,556,183 | ||||||||||||||
| 1,000 | 5.250%, 7/01/18 – AGM Insured | 7/13 at 100.00 | AA– | 1,037,660 | ||||||||||||||
| 16,985 | Total Transportation | 18,249,794 | ||||||||||||||||
U.S. Guaranteed – 7.4% (4) | ||||||||||||||||||
| 4,500 | Cape Girardeau County, Missouri, Single Family Mortgage Revenue Bonds, Series 1983, 0.000%, 12/01/14 (ETM) | No Opt. Call | Aaa | 4,434,525 | ||||||||||||||
Columbia, Misouri, Special Obligation Electric Utility Improvement Bonds, Annual Appropriation Obligation, Series 2008A: | ||||||||||||||||||
| 400 | 5.000%, 10/01/21 (Pre-refunded 10/01/17) | 10/17 at 100.00 | AA | (4) | 486,256 | |||||||||||||
| 445 | 5.000%, 10/01/23 (Pre-refunded 10/01/17) | 10/17 at 100.00 | AA | (4) | 540,960 | |||||||||||||
| 500 | 5.125%, 10/01/30 (Pre-refunded 10/01/17) | 10/17 at 100.00 | AA | (4) | 611,070 | |||||||||||||
| 2,710 | Columbia, Missouri, Water and Electric Revenue Bonds, Series 2002A, 5.000%, 10/01/26 (Pre-refunded 10/01/12) – AMBAC Insured | 10/12 at 100.00 | AA– | (4) | 2,753,550 | |||||||||||||
| 1,025 | Excelsior Springs School District, Missouri, Leasehold Revenue Bonds, Series 1994, 0.000%, 3/01/14 – AGM Insured (ETM) | No Opt. Call | AA– | (4) | 1,015,990 | |||||||||||||
| 2,500 | Fenton, Missouri, Tax Increment Refunding and Improvement Revenue Bonds, Gravois Bluffs Redevelopment Project, Series 2002, 6.125%, 10/01/21 (Pre-refunded 10/01/12) | 10/12 at 100.00 | AAA | 2,549,700 | ||||||||||||||
| 3,000 | Harrisonville, Missouri, Lease Participation Certificates, Series 2003, 5.000%, 12/01/22 (Pre-refunded 12/01/13) – SYNCORA GTY Insured | 12/13 at 100.00 | A+ | (4) | 3,208,290 | |||||||||||||
| 4,000 | Kansas City, Missouri, Special Facility Revenue Bonds, MCI Overhaul Base Project, Series 2005G, 4.750%, 9/01/28 (Pre-refunded 9/01/15) (Alternative Minimum Tax) | 9/15 at 100.00 | AA– | (4) | 4,476,800 | |||||||||||||
| 1,500 | Lees Summit Industrial Development Authority, Missouri, Health Facilities Revenue Bonds, John Knox Village, Series 2002, 5.700%, 8/15/22 (Pre-refunded 8/15/12) | 8/12 at 101.00 | AAA | 1,531,365 | ||||||||||||||
Missouri Development Finance Board, Infrastructure Facilities Revenue Bonds, Branson City, Series 2003A: | ||||||||||||||||||
| 1,000 | 5.000%, 12/01/17 (Pre-refunded 12/01/12) | 12/12 at 100.00 | A | (4) | 1,023,810 | |||||||||||||
| 755 | 5.375%, 12/01/22 (Pre-refunded 12/01/12) | 12/12 at 100.00 | A | (4) | 774,396 | |||||||||||||
| 64 | Nuveen Investments |
| Principal Amount (000) | Description (1) | Optional Call Provisions (2) | Ratings (3) | Value | ||||||||||||||
U.S. Guaranteed (4) (continued) | ||||||||||||||||||
Missouri Health and Educational Facilities Authority, Revenue Bonds, Lester E. Cox Medical Center, Series 1992H: | ||||||||||||||||||
| $ | 1,000 | 0.000%, 9/01/17 – NPFG Insured (ETM) | No Opt. Call | A2 | (4) | $ | 924,160 | |||||||||||
| 1,800 | 0.000%, 9/01/21 – NPFG Insured (ETM) | No Opt. Call | BBB | (4) | 1,440,648 | |||||||||||||
| 2,385 | 0.000%, 9/01/22 – NPFG Insured (ETM) | No Opt. Call | A2 | (4) | 1,832,968 | |||||||||||||
| 1,195 | Nixa, Missouri, Electric System Revenue Bonds, Series 2005, 5.000%, 4/01/25 (Pre-refunded 4/01/13) – SYNCORA GTY Insured | 4/13 at 100.00 | N/R | (4) | 1,239,813 | |||||||||||||
| 3,905 | North Kansas City School District 74, Clay County, Missouri, General Obligation Bonds, Series 2005, 5.000%, 3/01/25 (Pre-refunded 3/01/15) | 3/15 at 100.00 | N/R | (4) | 4,391,758 | |||||||||||||
| 500 | St. Louis County Industrial Development Authority, Missouri, Health Facilities Revenue Bonds, Ranken-Jordan Project, Series 2003, 6.625%, 11/15/35 (Pre-refunded 11/15/13) | 11/13 at 100.00 | N/R | (4) | 544,740 | |||||||||||||
| 33,120 | Total U.S. Guaranteed | 33,780,799 | ||||||||||||||||
Utilities – 6.7% | ||||||||||||||||||
| 375 | Missouri Development Finance Board, Infrastructure Facilities Leasehold Revenue Bonds, City of Independence, Missouri, Annual Appropriation Electric System Revenue Bonds – Dogwood Project, Series 2012A, 5.000%, 6/01/26 | 6/22 at 100.00 | AA– | 419,700 | ||||||||||||||
| 3,000 | Missouri Environmental Improvement and Energy Resources Authority, Revenue Bonds, Kansas City Power & Light Company Project, Series 2008, 4.900%, 5/01/38 | No Opt. Call | BBB | 3,105,030 | ||||||||||||||
| 1,000 | Missouri Joint Municipal Electric Utility Commission, Iatan 2 Power Project Revenue Bonds, Series 2006A, 5.000%, 1/01/28 – AMBAC Insured | 1/16 at 100.00 | A2 | 1,073,250 | ||||||||||||||
Missouri Joint Municipal Electric Utility Commission, Plum Point Project, Revenue Bonds, Series 2006: | ||||||||||||||||||
| 1,500 | 5.000%, 1/01/16 – NPFG Insured | No Opt. Call | A– | 1,652,370 | ||||||||||||||
| 395 | 5.000%, 1/01/17 – NPFG Insured | 1/16 at 100.00 | A– | 431,261 | ||||||||||||||
| 285 | 5.000%, 1/01/19 – NPFG Insured | 1/16 at 100.00 | A– | 306,583 | ||||||||||||||
| 4,720 | 5.000%, 1/01/34 – NPFG Insured | 1/16 at 100.00 | A– | 4,892,705 | ||||||||||||||
| 2,005 | Missouri Joint Municipal Electric Utility Commission, Power Project Revenue Bonds, Iatan 2 Project, Series 2009A, 6.000%, 1/01/39 | 1/16 at 100.00 | A2 | 2,287,906 | ||||||||||||||
Missouri Joint Municipal Electric Utility Commission, Power Supply System Revenue Bonds, MoPEP Facilities, Series 2012: | ||||||||||||||||||
| 285 | 4.000%, 1/01/17 | No Opt. Call | A2 | 315,709 | ||||||||||||||
| 2,200 | 5.000%, 1/01/32 | 1/21 at 100.00 | A2 | 2,390,916 | ||||||||||||||
| 2,000 | 5.000%, 1/01/37 | 1/21 at 100.00 | A2 | 2,132,800 | ||||||||||||||
Missouri Joint Municipal Electric Utility Commission, Prairie State Power Project Revenue Bonds, Series 2007A: | ||||||||||||||||||
| 500 | 5.000%, 1/01/16 – AMBAC Insured | No Opt. Call | A3 | 565,595 | ||||||||||||||
| 1,010 | 5.000%, 1/01/42 – AMBAC Insured | 1/17 at 100.00 | A3 | 1,065,944 | ||||||||||||||
| 2,000 | Puerto Rico Electric Power Authority, Power Revenue Bonds, Series 2003NN, 5.250%, 7/01/23 – NPFG Insured | No Opt. Call | BBB+ | 2,289,500 | ||||||||||||||
| 3,035 | Puerto Rico Electric Power Authority, Power Revenue Bonds, Series 2010XX, 5.250%, 7/01/40 | 7/20 at 100.00 | BBB+ | 3,122,408 | ||||||||||||||
| 1,000 | Puerto Rico Electric Power Authority, Power Revenue Bonds, Series WW, 5.250%, 7/01/25 | 7/18 at 100.00 | BBB+ | 1,091,390 | ||||||||||||||
| 3,030 | Sikeston, Missouri, Electric System Revenue Refunding Bonds, Series 1996, 6.000%, 6/01/14 – NPFG Insured | No Opt. Call | BBB | 3,261,553 | ||||||||||||||
| 28,340 | Total Utilities | 30,404,620 | ||||||||||||||||
Water and Sewer – 6.2% | ||||||||||||||||||
Cape Girardeau, Missouri, Waterworks System Refunding Revenue Bonds, Series 2012A: | ||||||||||||||||||
| 250 | 3.250%, 1/01/25 | 1/20 at 100.00 | A+ | 250,748 | ||||||||||||||
| 725 | 3.375%, 1/01/26 | 1/20 at 100.00 | A+ | 731,518 | ||||||||||||||
| Nuveen Investments | 65 |
Portfolio of Investments
Nuveen Missouri Municipal Bond Fund (continued)
May 31, 2012
| Principal Amount (000) | Description (1) | Optional Call Provisions (2) | Ratings (3) | Value | ||||||||||||||
Water and Sewer (continued) | ||||||||||||||||||
| $ | 1,500 | Carroll County Public Water Supply District 1, Missouri, Water System Revenue Bonds, Refunding Series 2009, 6.000%, 3/01/39 | 3/18 at 100.00 | A | $ | 1,678,365 | ||||||||||||
| 1,370 | Guam Government Waterworks Authority, Water and Wastewater System Revenue Bonds, Series 2010, 5.625%, 7/01/40 | 7/20 at 100.00 | Ba2 | 1,390,975 | ||||||||||||||
Jefferson County Consolidated Public Water Supply District C1, Missouri, Waterworks Revenue Bonds, Refunding Series 2010: | ||||||||||||||||||
| 745 | 4.125%, 12/01/24 | 12/17 at 100.00 | A+ | 797,783 | ||||||||||||||
| 500 | 4.250%, 12/01/25 | 12/17 at 100.00 | A+ | 537,645 | ||||||||||||||
| 2,000 | Kansas City, Missouri, Sanitary Sewer System Revenue Bonds, Series 2009A, 5.250%, 1/01/34 | 1/19 at 100.00 | AA | 2,279,140 | ||||||||||||||
| 500 | Kansas City, Missouri, Water Revenue Bonds, Refunding & Improvement Series 2009A, 5.250%, 12/01/32 | 12/18 at 100.00 | AA+ | 575,385 | ||||||||||||||
| 4,600 | Kansas City, Missouri, Water Revenue Bonds, Series 2012A, 4.500%, 12/01/36 | 12/21 at 100.00 | AA+ | 5,049,006 | ||||||||||||||
| 1,500 | Lincoln County Public Water Supply District 1, Missouri, Certificates of Participation, Refunding Series 2009, 6.750%, 6/15/35 | 6/16 at 100.00 | A– | 1,614,735 | ||||||||||||||
| 500 | Metropolitan St. Louis Sewerage District, Missouri, Wastewater System Revenue Bonds, Series 2008A, 5.750%, 5/01/38 | 5/17 at 100.00 | AAA | 570,135 | ||||||||||||||
| 2,600 | Missouri Development Finance Board, Independence, Infrastructure Facilities Revenue Bonds, Water System Improvement Projects, Series 2004, 5.000%, 11/01/24 – AMBAC Insured | 11/14 at 100.00 | A– | 2,695,966 | ||||||||||||||
| 500 | Missouri Development Finance Board, Independence, Infrastructure Facilities Revenue Bonds, Water System Improvement Projects, Series 2009C, 5.750%, 11/01/29 | 11/14 at 100.00 | A– | 525,660 | ||||||||||||||
| 1,000 | Missouri Development Finance Board, Infrastructure Facilities Revenue Bonds, City of Saint Joseph Sewerage System Improvement Projects, Series 2011E, 5.375%, 5/01/36 | 5/20 at 100.00 | A | 1,053,270 | ||||||||||||||
| 2,965 | Missouri Environmental Improvement and Energy Resources Authority, Water Facility Revenue Bonds, Missouri-American Water Company, Series 2006, 4.600%, 12/01/36 – AMBAC Insured (Alternative Minimum Tax) (UB) | 12/16 at 100.00 | AA+ | 3,047,427 | ||||||||||||||
| 470 | Missouri Environmental Improvement and Energy Resources Authority, Water Pollution Control and Drinking Water Revenue Bonds, State Revolving Fund Program, Series 2001C, 5.000%, 7/01/23 | 7/12 at 100.00 | Aaa | 471,757 | ||||||||||||||
| 410 | Missouri Environmental Improvement and Energy Resources Authority, Water Pollution Control and Drinking Water Revenue Bonds, State Revolving Fund Program, Series 2005C, 4.750%, 7/01/23 | 1/16 at 100.00 | Aaa | 459,896 | ||||||||||||||
| 1,000 | Missouri Environmental Improvement and Energy Resources Authority, Water Pollution Control and Drinking Water Revenue Bonds, State Revolving Fund Program, Series 2008A, 5.750%, 1/01/29 | 1/19 at 100.00 | Aaa | 1,215,419 | ||||||||||||||
| 65 | Missouri Environmental Improvement and Energy Resources Authority, Water Pollution Control Revenue Bonds, State Revolving Fund Program - Multi-Participants, Series 1998B, 5.250%, 1/01/15 | 7/12 at 100.00 | Aaa | 65,263 | ||||||||||||||
| 2,070 | North Central Missouri Regional Water Commission, Waterworks System Revenue Bonds, Series 2006, 5.000%, 1/01/37 | 1/17 at 100.00 | N/R | 2,121,397 | ||||||||||||||
Sedalia, Missouri, Water Revenue Bonds, Series 2012: | ||||||||||||||||||
| 345 | 2.000%, 3/15/13 – AGM Insured | No Opt. Call | AA– | 348,918 | ||||||||||||||
| 375 | 2.000%, 3/15/14 – AGM Insured | No Opt. Call | AA– | 383,249 | ||||||||||||||
| 590 | Taney County Public Water Supply District 3, Missouri, Certificates of Participation, Refundind Series 2010, 4.500%, 7/01/25 | 7/15 at 101.00 | A+ | 616,177 | ||||||||||||||
| 26,580 | Total Water and Sewer | 28,479,834 | ||||||||||||||||
| $ | 455,918 | Total Investments (cost $417,222,609) – 98.8% | 449,823,649 | |||||||||||||||
Floating Rate Obligations – (0.5)% | (2,225,000) | |||||||||||||||||
Other Assets Less Liabilities – 1.7% | 7,462,850 | |||||||||||||||||
Net Assets – 100% | $ | 455,061,499 | ||||||||||||||||
| 66 | Nuveen Investments |
| (1) | All percentages shown in the Portfolio of Investments are based on net assets. |
| (2) | Optional Call Provisions (not covered by the report of independent registered public accounting firm): Dates (month and year) and prices of the earliest optional call or redemption. There may be other call provisions at varying prices at later dates. Certain mortgage-backed securities may be subject to periodic principal paydowns. |
| (3) | Ratings (not covered by the report of independent registered public accounting firm): Using the highest of Standard & Poor’s Group (“Standard & Poor’s”), Moody’s Investors Service, Inc. (“Moody’s”) or Fitch, Inc. (“Fitch”) rating. Ratings below BBB by Standard & Poor’s, Baa by Moody’s or BBB by Fitch are considered to be below investment grade. Holdings designated N/R are not rated by any of these national rating agencies. |
| (4) | Backed by an escrow or trust containing sufficient U.S. Government or U.S. Government agency securities, which ensure the timely payment of principal and interest. Certain bonds backed by U.S. Government or agency securities are regarded as having an implied rating equal to the rating of such securities. |
| N/R | Not rated. |
| WI/DD | Purchased on a when-issued or delayed delivery basis. |
| (ETM) | Escrowed to maturity. |
| (UB) | Underlying bond of an inverse floating rate trust reflected as a financing transaction. See Notes to Financial Statements, Footnote 1 – General Information and Significant Accounting Policies, Inverse Floating Rate Securities for more information. |
See accompanying notes to financial statements.
| Nuveen Investments | 67 |
Portfolio of Investments
Nuveen Ohio Municipal Bond Fund
May 31, 2012
| Principal Amount (000) | Description (1) | Optional Call Provisions (2) | Ratings (3) | Value | ||||||||||||||
Consumer Staples – 4.8% | ||||||||||||||||||
| $ | 250 | Buckeye Tobacco Settlement Financing Authority, Ohio, Tobacco Settlement Asset-Backed Revenue Bonds, Senior Lien, Series 2007A-1, 5.000%, 6/01/16 | No Opt. Call | A1 | $ | 274,530 | ||||||||||||
Buckeye Tobacco Settlement Financing Authority, Ohio, Tobacco Settlement Asset-Backed Revenue Bonds, Senior Lien, Series 2007A-2: | ||||||||||||||||||
| 6,850 | 5.125%, 6/01/24 | 6/17 at 100.00 | B | 5,502,879 | ||||||||||||||
| 20,840 | 5.875%, 6/01/47 | 6/17 at 100.00 | BB | 15,931,346 | ||||||||||||||
| 5,195 | Puerto Rico, The Children’s Trust Fund, Tobacco Settlement Asset-Backed Refunding Bonds, Series 2002, 5.375%, 5/15/33 | 11/12 at 100.00 | BBB+ | 5,185,130 | ||||||||||||||
| 33,135 | Total Consumer Staples | 26,893,885 | ||||||||||||||||
Education and Civic Organizations – 8.4% | ||||||||||||||||||
| 4,090 | Cleveland State University, Ohio, General Receipts Bonds, Series 2003A, 5.000%, 6/01/23 – FGIC Insured | 6/13 at 100.00 | A+ | 4,240,348 | ||||||||||||||
| 1,925 | Miami University of Ohio, General Receipts Bonds, Series 2011, 5.000%, 9/01/36 | 9/21 at 100.00 | AA | 2,186,415 | ||||||||||||||
Ohio Higher Education Facilities Commission, General Revenue Bonds, Case Western Reserve University, Series 2004A: | ||||||||||||||||||
| 2,310 | 5.000%, 12/01/16 – AMBAC Insured | 12/13 at 100.00 | AA– | 2,439,106 | ||||||||||||||
| 2,825 | 5.000%, 12/01/17 – AMBAC Insured | 12/13 at 100.00 | AA– | 2,964,725 | ||||||||||||||
| 2,975 | 5.000%, 12/01/18 – AMBAC Insured | 12/13 at 100.00 | AA– | 3,122,144 | ||||||||||||||
| 1,600 | Ohio Higher Education Facilities Commission, General Revenue Bonds, Kenyon College, Series 2006, 5.000%, 7/01/41 | 7/16 at 100.00 | A+ | 1,667,328 | ||||||||||||||
| 1,750 | Ohio Higher Education Facilities Commission, General Revenue Bonds, Oberlin College, Series 2003, 5.125%, 10/01/24 | 10/13 at 100.00 | AA | 1,835,418 | ||||||||||||||
| 910 | Ohio Higher Education Facilities Commission, Revenue Bonds, Case Western Reserve University, Series 1990B, 6.500%, 10/01/20 | No Opt. Call | AA– | 1,124,414 | ||||||||||||||
| 400 | Ohio Higher Education Facilities Commission, Revenue Bonds, College of Wooster Project, Series 2005, 5.000%, 9/01/20 | 9/15 at 100.00 | A1 | 434,156 | ||||||||||||||
| 1,000 | Ohio Higher Education Facilities Commission, Revenue Bonds, John Carroll University, Series 1997, 5.000%, 4/01/19 | 4/16 at 100.00 | A3 | 1,101,590 | ||||||||||||||
| 1,000 | Ohio Higher Education Facilities Commission, Revenue Bonds, Mount Union College, Series 2006, 5.000%, 10/01/31 | 10/16 at 100.00 | A3 | 1,057,920 | ||||||||||||||
Ohio Higher Education Facilities Commission, Revenue Bonds, Ohio Northern University, Series 2005: | ||||||||||||||||||
| 760 | 5.000%, 5/01/20 | 5/15 at 100.00 | Baa2 | 784,084 | ||||||||||||||
| 1,000 | 5.000%, 5/01/26 | 5/15 at 100.00 | Baa2 | 1,011,310 | ||||||||||||||
Ohio Higher Education Facilities Commission, Revenue Bonds, Wittenberg University, Series 2005: | ||||||||||||||||||
| 1,505 | 5.000%, 12/01/24 | 12/15 at 100.00 | Ba1 | 1,448,141 | ||||||||||||||
| 1,000 | 5.000%, 12/01/29 | 12/15 at 100.00 | Ba1 | 929,400 | ||||||||||||||
Ohio Higher Educational Facilities Commission, Revenue Bonds, Denison University Project, Series 2012: | ||||||||||||||||||
| 1,140 | 5.000%, 11/01/27 | 5/22 at 100.00 | AA | 1,336,103 | ||||||||||||||
| 1,000 | 5.000%, 11/01/30 | 5/22 at 100.00 | AA | 1,152,350 | ||||||||||||||
| 645 | Ohio Higher Educational Facilities Commission, Revenue Bonds, University of Dayton, Refunding Series 2009, 5.375%, 12/01/29 | 12/18 at 100.00 | A | 719,330 | ||||||||||||||
Ohio Higher Educational Facilities Commission, Revenue Bonds, University of Dayton, Series 2004: | ||||||||||||||||||
| 1,315 | 5.000%, 12/01/25 – AMBAC Insured | 12/14 at 100.00 | A | 1,374,622 | ||||||||||||||
| 1,060 | 5.000%, 12/01/27 – AMBAC Insured | 12/14 at 100.00 | A | 1,103,036 | ||||||||||||||
Ohio Higher Educational Facilities Commission, Revenue Bonds, Wittenberg University, Series 2001: | ||||||||||||||||||
| 1,200 | 5.500%, 12/01/21 | 12/12 at 100.00 | Ba1 | 1,200,216 | ||||||||||||||
| 2,075 | 5.000%, 12/01/26 | 12/12 at 100.00 | Ba1 | 1,970,275 | ||||||||||||||
| 500 | Ohio Higher Educational Facility Commission, Higher Educational Facility Revenue Bonds, Xavier University Project, Series 2010, 5.000%, 5/01/40 | 5/20 at 100.00 | A– | 543,345 | ||||||||||||||
| 1,885 | Ohio State Higher Education Facilities, Revenue Bonds, Case Western Reserve University, Series 2006, 5.000%, 12/01/44 – NPFG Insured | 12/16 at 100.00 | AA– | 1,999,759 | ||||||||||||||
| 750 | Ohio State, Higher Educational Facility Revenue Bonds, Baldwin-Wallace College Project, Series 2004, 5.000%, 12/01/13 | No Opt. Call | A– | 793,695 | ||||||||||||||
| 68 | Nuveen Investments |
| Principal Amount (000) | Description (1) | Optional Call Provisions (2) | Ratings (3) | Value | ||||||||||||||
Education and Civic Organizations (continued) | ||||||||||||||||||
| $ | 500 | Ohio State, Higher Educational Facility Revenue Bonds, Otterbein College Project, Series 2008A, 5.500%, 12/01/28 | 12/18 at 100.00 | A3 | $ | 562,790 | ||||||||||||
| 1,900 | Ohio University at Athens, Subordinate Lien General Receipts Bonds, Series 2004, 5.000%, 12/01/23 – NPFG Insured | 6/14 at 100.00 | Aa3 | 2,047,763 | ||||||||||||||
| 250 | Port of Greater Cincinnati Development Authority, Ohio, Economic Development Revenue Bonds, Sisters of Mercy of the Americas, Series 2006, 5.000%, 10/01/25 | �� | 10/16 at 100.00 | A+ | 259,913 | |||||||||||||
| 1,675 | University of Cincinnati, Ohio, General Receipts Bonds, Series 2004A, 5.000%, 6/01/21 – AMBAC Insured | 6/14 at 100.00 | AA– | 1,802,484 | ||||||||||||||
University of Cincinnati, Ohio, General Receipts Bonds, Series 2004D: | ||||||||||||||||||
| 1,325 | 5.000%, 6/01/24 – AMBAC Insured | 6/14 at 100.00 | AA– | 1,417,803 | ||||||||||||||
| 1,005 | 5.000%, 6/01/26 – AMBAC Insured | 6/14 at 100.00 | AA– | 1,075,390 | ||||||||||||||
| 1,025 | University of Cincinnati, Ohio, General Receipts Bonds, Series 2004E, 5.000%, 6/01/21 – AMBAC Insured | 12/14 at 100.00 | AA– | 1,121,442 | ||||||||||||||
| 44,300 | Total Education and Civic Organizations | 46,826,815 | ||||||||||||||||
Health Care – 15.4% | ||||||||||||||||||
| 7,130 | Akron, Bath and Copley Joint Township Hospital District, Ohio, Hospital Facilities Revenue Bonds, Summa Health System, Series 1998A, 5.375%, 11/15/24 | 11/12 at 100.00 | Baa1 | 7,135,205 | ||||||||||||||
Akron, Bath and Copley Joint Township Hospital District, Ohio, Hospital Facilities Revenue Bonds, Summa Health System, Series 2004A: | ||||||||||||||||||
| 1,220 | 5.250%, 11/15/31 – RAAI Insured | 11/14 at 100.00 | Baa1 | 1,254,014 | ||||||||||||||
| 150 | 5.500%, 11/15/34 – RAAI Insured | 11/14 at 100.00 | Baa1 | 152,489 | ||||||||||||||
| 1,065 | Akron, Bath and Copley Joint Township Hospital District, Ohio, Hospital Revenue Bonds, Children’s Hospital Medical Center, Series 2003, 5.250%, 11/15/25 – AGM Insured | 11/13 at 100.00 | Aa3 | 1,097,461 | ||||||||||||||
Allen County, Ohio, Hospital Facilities Revenue Bonds, Catholic Healthcare Partners, Series 2010A: | ||||||||||||||||||
| 3,050 | 5.250%, 6/01/38 | 6/20 at 100.00 | AA– | 3,329,533 | ||||||||||||||
| 250 | 5.000%, 6/01/38 | 6/20 at 100.00 | AA– | 266,885 | ||||||||||||||
| 500 | Allen County, Ohio, Hospital Facilities Revenue Bonds, Catholic Healthcare Partners, Series 2010B, 4.125%, 9/01/20 | No Opt. Call | AA– | 570,015 | ||||||||||||||
Butler County, Ohio, Hospital Facilities Revenue Bonds, UC Health, Series 2010: | ||||||||||||||||||
| 750 | 5.500%, 11/01/22 | 11/20 at 100.00 | BBB+ | 859,283 | ||||||||||||||
| 3,440 | 5.500%, 11/01/40 | 11/20 at 100.00 | BBB+ | 3,692,358 | ||||||||||||||
| 345 | Fairfield County, Ohio, Hsopital Facilities Revenue Bonds, Fairfield Medical Center Project, Series 2003, 5.000%, 6/15/22 – RAAI Insured | 6/12 at 100.00 | Baa2 | 345,166 | ||||||||||||||
Franklin County, Ohio, Hospital Revenue Bonds, Nationwide Children’s Hospital Project, Improvement Series 2009: | ||||||||||||||||||
| 3,000 | 5.000%, 11/01/34 | 11/19 at 100.00 | Aa2 | 3,253,890 | ||||||||||||||
| 3,000 | 5.250%, 11/01/40 | 11/19 at 100.00 | Aa2 | 3,279,780 | ||||||||||||||
Franklin County, Ohio, Hospital Revenue Bonds, Nationwide Children’s Hospital Project, Series 2005: | ||||||||||||||||||
| 365 | 4.750%, 11/01/23 | 11/18 at 100.00 | Aa2 | 403,931 | ||||||||||||||
| 3,180 | 5.000%, 11/01/40 | 11/18 at 100.00 | Aa2 | 3,362,914 | ||||||||||||||
| 640 | Franklin County, Ohio, Hospital Revenue Bonds, OhioHealth Corporation, Series 2011A, 5.000%, 11/15/41 | 11/21 at 100.00 | AA | 690,752 | ||||||||||||||
| 4,830 | Franklin County, Ohio, Hospital Revenue Bonds, OhioHealth Corporation, Tender Option Bond Trust 11-21B, 9.234%, 11/15/41 (IF) (4) | 11/21 at 100.00 | AA | 5,596,038 | ||||||||||||||
| 500 | Franklin County, Ohio, Revenue Bonds, Trinity Health Credit Group, Refunding Series 2010C, 4.500%, 12/01/37 | 12/20 at 100.00 | AA | 517,320 | ||||||||||||||
| 750 | Lake County, Ohio, Hospital Facilities Revenue Bonds, Lake Hospital System, Inc., Refunding Series 2008C, 5.625%, 8/15/29 | 8/18 at 100.00 | A– | 793,313 | ||||||||||||||
| Nuveen Investments | 69 |
Portfolio of Investments
Nuveen Ohio Municipal Bond Fund (continued)
May 31, 2012
| Principal Amount (000) | Description (1) | Optional Call Provisions (2) | Ratings (3) | Value | ||||||||||||||
Health Care (continued) | ||||||||||||||||||
Lucas County, Ohio, Hospital Revenue Bonds, ProMedica Healthcare Obligated Group, Series 2008D: | ||||||||||||||||||
| $ | 400 | 5.000%, 11/15/38 | 11/18 at 100.00 | AA– | $ | 422,436 | ||||||||||||
| 305 | 5.125%, 11/15/40 | 11/18 at 100.00 | AA– | 323,901 | ||||||||||||||
| 3,240 | Lucas County, Ohio, Hospital Revenue Bonds, ProMedica Healthcare Obligated Group, Series 2011A, 6.000%, 11/15/41 | 11/21 at 100.00 | AA– | 3,825,695 | ||||||||||||||
| 2,500 | Miami County, Ohio, Hospital Facilities Revenue Refunding Bonds, Upper Valley Medical Center Inc., Series 2006, 5.250%, 5/15/26 | 5/16 at 100.00 | A2 | 2,618,650 | ||||||||||||||
| 930 | Middleburg Heights, Ohio, Hospital Facilities Revenue Bonds, Southwest General Health Center Project, Refunding Series 2011, 5.250%, 8/01/41 | 8/21 at 100.00 | A2 | 998,113 | ||||||||||||||
| 7,000 | Montgomery County, Ohio, Hospital Facilities Revenue Refunding and Improvement Bonds, Kettering Medical Center, Series 1996, 6.250%, 4/01/20 – NPFG Insured | No Opt. Call | A | 8,431,430 | ||||||||||||||
| 750 | Montgomery County, Ohio, Revenue Bonds, Catholic Health Initiatives, Refunding Series 2009A, 5.000%, 5/01/39 | 5/19 at 100.00 | AA | 797,468 | ||||||||||||||
| 2,270 | Montgomery County, Ohio, Revenue Bonds, Catholic Health Initiatives, Series 2004A, 5.000%, 5/01/32 | 5/14 at 100.00 | AA | 2,332,743 | ||||||||||||||
| 100 | Montgomery County, Ohio, Revenue Bonds, Catholic Health Initiatives, Series 2008D, 6.250%, 10/01/33 | 10/18 at 100.00 | AA | 117,386 | ||||||||||||||
Montgomery County, Ohio, Revenue Bonds, Miami Valley Hospital, Series 2009A: | ||||||||||||||||||
| 2,000 | 6.250%, 11/15/33 | 11/14 at 100.00 | Aa3 | 2,137,780 | ||||||||||||||
| 1,125 | 6.250%, 11/15/39 | 11/14 at 100.00 | Aa3 | 1,195,391 | ||||||||||||||
| 2,480 | Ohio State Higher Educational Facilities Commission, Hospital Revenue Bonds, Summa Health System Project, Series 2010, 5.250%, 11/15/40 – AGM Insured | 5/20 at 100.00 | AA– | 2,683,782 | ||||||||||||||
| 1,650 | Ohio State Higher Educational Facilities Commission, Hospital Revenue Bonds, University Hospitals Health System, Series 2009, 6.750%, 1/15/39 | 1/15 at 100.00 | A | 1,763,289 | ||||||||||||||
| 2,990 | Ohio State, Hospital Facility Revenue Refunding Bonds, Cleveland Clinic Health System Obligated Group, Series 2009A, 5.500%, 1/01/39 | 1/19 at 100.00 | Aa2 | 3,321,172 | ||||||||||||||
Ohio State, Hospital Facility Revenue Refunding Bonds, Cleveland Clinic Health System Obligated Group, Tender Option Bond Trust 3551: | ||||||||||||||||||
| 700 | 19.746%, 1/01/17 (IF) | No Opt. Call | Aa2 | 961,632 | ||||||||||||||
| 5,625 | 20.072%, 1/01/33 (IF) | 1/19 at 100.00 | Aa2 | 8,117,100 | ||||||||||||||
| 2,280 | Ohio State, Hospital Facility Revenue Refunding Bonds, Cleveland Clinic Health System Obligated Group, Tender Option Bond Trust 3591, 20.231%, 1/01/17 (IF) | No Opt. Call | Aa2 | 3,290,131 | ||||||||||||||
Richland County, Ohio, Hospital Revenue Bonds, MidCentral Health System Group, Series 2006: | ||||||||||||||||||
| 75 | 5.000%, 11/15/13 | No Opt. Call | A– | 78,798 | ||||||||||||||
| 3,235 | 5.250%, 11/15/36 | 11/16 at 100.00 | A– | 3,378,990 | ||||||||||||||
Ross County, Ohio, Hospital Revenue Refunding Bonds, Adena Health System Series 2008: | ||||||||||||||||||
| 500 | 5.500%, 12/01/28 | 12/18 at 100.00 | A | 546,895 | ||||||||||||||
| 1,075 | 5.750%, 12/01/35 | 12/18 at 100.00 | A | 1,185,951 | ||||||||||||||
| 800 | Scioto County, Ohio, Hospital Facilities Refunding Revenue Bonds, Southern Ohio Medical Center, Series 2008, 5.750%, 2/15/38 | 2/18 at 100.00 | A2 | 855,784 | ||||||||||||||
| 76,195 | Total Health Care | 85,984,864 | ||||||||||||||||
Housing/Multifamily – 1.8% | ||||||||||||||||||
| 500 | Bowling Green, Ohio, Student Housing Revenue Bonds, CFP I LLC – Bowling Green State University Project, Series 2010, 5.750%, 6/01/31 | 6/20 at 100.00 | BBB– | 525,150 | ||||||||||||||
| 945 | Clark County, Ohio, Multifamily Housing Revenue Bonds, Church of God Retirement Home, Series 1998, 6.250%, 11/01/30 (Alternative Minimum Tax) | 11/12 at 100.00 | N/R | 739,283 | ||||||||||||||
| 70 | Nuveen Investments |
| Principal Amount (000) | Description (1) | Optional Call Provisions (2) | Ratings (3) | Value | ||||||||||||||
Housing/Multifamily (continued) | ||||||||||||||||||
| $ | 1,805 | Montgomery County, Ohio, GNMA Guaranteed Multifamily Housing Revenue Bonds, Canterbury Court Project, Series 2007, 5.500%, 10/20/42 (Alternative Minimum Tax) | 10/18 at 101.00 | Aa1 | $ | 1,946,115 | ||||||||||||
| 1,250 | Ohio Capital Corporation for Housing, FHA-Insured Section 8 Assisted Mortgage Loan Revenue Refunding Bonds, Series 1999D, 5.950%, 2/01/23 | 8/12 at 100.00 | Aa2 | 1,252,588 | ||||||||||||||
| 2,175 | Summit County Port Authority, Ohio, Multifamily Housing Revenue Bonds, Callis Tower Apartments Project, Series 2007, 5.250%, 9/20/47 (Alternative Minimum Tax) | 9/17 at 102.00 | Aaa | 2,296,757 | ||||||||||||||
| 3,000 | Trumbull County, Ohio, Multifamily Housing Revenue Bonds, Royal Mall Apartments, Series 2007, 5.000%, 5/20/49 (Alternative Minimum Tax) | 11/17 at 102.00 | Aaa | 3,136,230 | ||||||||||||||
| 9,675 | Total Housing/Multifamily | 9,896,123 | ||||||||||||||||
Housing/Single Family – 0.5% | ||||||||||||||||||
| 320 | Ohio Housing Finance Agency, GNMA Mortgage-Backed Securities Program Residential Mortgage Revenue Bonds, Series 2006E, 4.850%, 9/01/26 (Alternative Minimum Tax) | 3/16 at 100.00 | Aaa | 331,226 | ||||||||||||||
| 450 | Ohio Housing Finance Agency, Residential Mortgage Revenue Bonds, Mortgage-Backed Securities Program, Series 2008F, 5.450%, 9/01/33 | 3/18 at 100.00 | Aaa | 470,696 | ||||||||||||||
| 805 | Ohio Housing Finance Agency, Residential Mortgage Revenue Bonds, Mortgage-Backed Securities Program, Series 2009C, 5.200%, 9/01/29 | 9/18 at 100.00 | Aaa | 875,438 | ||||||||||||||
| 860 | Ohio Housing Finance Agency, Single Family Mortgage Revenue Bonds, Series 2006H, 5.000%, 9/01/31 (Alternative Minimum Tax) | 9/15 at 100.00 | Aaa | 883,409 | ||||||||||||||
| 2,435 | Total Housing/Single Family | 2,560,769 | ||||||||||||||||
Industrials – 1.5% | ||||||||||||||||||
| 500 | Cleveland-Cuyahoga County Port Authority, Ohio, Common Bond Fund Revenue Bonds, Cleveland Christian Home Project, Series 2002C, 5.950%, 5/15/22 | 5/14 at 100.00 | BBB– | 504,745 | ||||||||||||||
| 275 | Cleveland-Cuyahoga County Port Authority, Ohio, Development Revenue Bonds, Bond Fund Program – Columbia National Group Project, Series 2005D, 5.000%, 5/15/20 (Alternative Minimum Tax) | 11/15 at 100.00 | BBB– | 276,933 | ||||||||||||||
| 1,355 | Cleveland-Cuyahoga County Port Authority, Ohio, Development Revenue Bonds, Jergens Inc., Series 1998A, 5.375%, 5/15/18 (Alternative Minimum Tax) | 11/12 at 100.00 | BBB– | 1,359,472 | ||||||||||||||
| 75 | Cleveland-Cuyahoga County Port Authority, Ohio, Development Revenue Bonds, Port Cleveland Bond Fund, Series 1997A, 5.800%, 5/15/27 (Alternative Minimum Tax) | 11/12 at 100.00 | BBB– | 75,142 | ||||||||||||||
| 355 | Cleveland-Cuyahoga County Port Authority, Ohio, Development Revenue Bonds, Port Cleveland Bond Fund, Series 2002A, 5.600%, 11/15/15 | 11/12 at 102.00 | BBB– | 362,391 | ||||||||||||||
Ohio State, Economic Development Revenue Bonds, Ohio Enterprise Bond Fund, Shearer’s Foods Inc. Project, Series 2009-5.,: | ||||||||||||||||||
| 1,455 | 5.000%, 6/01/22 | 12/19 at 100.00 | AA+ | 1,718,602 | ||||||||||||||
| 1,645 | 5.000%, 12/01/24 | 12/19 at 100.00 | AA+ | 1,889,496 | ||||||||||||||
Ohio, Economic Development Revenue Bonds, Enterprise Bond Fund Loan Pool, Series 2002-4: | ||||||||||||||||||
| 220 | 5.000%, 6/01/15 (Alternative Minimum Tax) | 6/14 at 100.00 | AA+ | 227,306 | ||||||||||||||
| 675 | 5.450%, 6/01/22 (Alternative Minimum Tax) | 6/14 at 100.00 | AA+ | 695,561 | ||||||||||||||
| 1,020 | Ohio, Economic Development Revenue Bonds, Enterprise Bond Fund Loan Pool, Series 2002-7, 5.850%, 12/01/22 (Alternative Minimum Tax) | 12/12 at 102.00 | AA+ | 1,052,956 | ||||||||||||||
| 7,575 | Total Industrials | 8,162,604 | ||||||||||||||||
Long-Term Care – 1.4% | ||||||||||||||||||
| 800 | Franklin County, Ohio, Healthcare Facilities Revenue Bonds, Ohio Presbyterian Retirement Services, Improvement Series 2005A, 5.000%, 7/01/26 | 7/15 at 100.00 | BBB | 814,016 | ||||||||||||||
| 1,505 | Franklin County, Ohio, Healthcare Facilities Revenue Bonds, Ohio Presbyterian Retirement Services, Improvement Series 2010A, 5.625%, 7/01/26 | 7/21 at 100.00 | BBB | 1,645,793 | ||||||||||||||
| Nuveen Investments | 71 |
Portfolio of Investments
Nuveen Ohio Municipal Bond Fund (continued)
May 31, 2012
| Principal Amount (000) | Description (1) | Optional Call Provisions (2) | Ratings (3) | Value | ||||||||||||||
Long-Term Care (continued) | ||||||||||||||||||
| $ | 2,000 | Franklin County, Ohio, Healthcare Facilities Revenue Bonds, Ohio Presbyterian Retirement Services, Series 2002A, 5.125%, 7/01/22 – RAAI Insured | 7/12 at 100.00 | BBB | $ | 2,002,040 | ||||||||||||
| 400 | Hamilton County, Ohio, Health Care Revenue Refunding Bonds, Life Enriching Communities Project, Series 2006A, 5.000%, 1/01/27 | 1/17 at 100.00 | BBB | 406,364 | ||||||||||||||
| 3,080 | Montgomery County, Ohio, Health Care and Multifamily Housing Revenue Bonds, Saint Leonard, Refunding & improvement Series 2010, 6.625%, 4/01/40 | 4/20 at 100.00 | BBB– | 3,257,685 | ||||||||||||||
| 7,785 | Total Long-Term Care | 8,125,898 | ||||||||||||||||
Materials – 0.7% | ||||||||||||||||||
| 3,500 | Lorain County Port Authority, Ohio, Recovery Zone Facility Economic Development Revenue Bonds, United State Steel Corporation Project, Series 2010, 6.750%, 12/01/40 | 12/20 at 100.00 | BB+ | 3,953,040 | ||||||||||||||
Tax Obligation/General – 17.2% | ||||||||||||||||||
| 4,310 | Adams County Valley School District, Adams and Highland Counties, Ohio, Unlimited Tax School Improvement General Obligation Bonds, Series 1995, 7.000%, 12/01/15 – NPFG Insured | No Opt. Call | BBB | 4,745,396 | ||||||||||||||
| 600 | Anthony Wayne Local School District, Lucas, Wood and Fulton Counties, Ohio, School Facilities Construction and Improvement Bonds, Series 1995, 0.000%, 12/01/13 – FGIC Insured | No Opt. Call | Aa3 | 592,398 | ||||||||||||||
| 25 | Barberton City School District, Summit County, Ohio, General Obligation Bonds, School Improvement Series 2008, 5.250%, 12/01/31 | 6/18 at 100.00 | AA | 27,843 | ||||||||||||||
| 1,000 | Beavercreek City School District, Ohio, General Obligation Bonds, Series 2009, 5.000%, 12/01/36 | 6/19 at 100.00 | Aa1 | 1,102,530 | ||||||||||||||
| 1,185 | Buckeye Valley Local School District, Ohio, Unlimited Tax General Obligation Bonds, Series 1995A, 6.850%, 12/01/15 – NPFG Insured | No Opt. Call | BBB | 1,308,335 | ||||||||||||||
| 1,180 | Canal Winchester Local School District, Franklin and Fairfield Counties, Ohio, General Obligation Bonds, Series 2005B, 0.000%, 12/01/33 – NPFG Insured | No Opt. Call | A1 | 467,209 | ||||||||||||||
| 2,515 | Canton City School District, Stark County, Ohio, General Obligation Bonds, Series 2005, 5.000%, 12/01/19 – NPFG Insured | 6/15 at 100.00 | A | 2,755,811 | ||||||||||||||
| 2,295 | Central Ohio Solid Waste Authority, General Obligation Bonds, Series 2004A, 5.000%, 12/01/15 – AMBAC Insured | 6/14 at 100.00 | AAA | 2,492,370 | ||||||||||||||
| 300 | Cincinnati City School District, Hamilton County, Ohio, General Obligation Bonds, School Improvement, Refunding Series 2010, 5.250%, 6/01/21 | 6/20 at 100.00 | Aa2 | 369,978 | ||||||||||||||
Cincinnati City School District, Hamilton County, Ohio, General Obligation Bonds, Series 2006: | ||||||||||||||||||
| 535 | 5.250%, 12/01/19 – FGIC Insured | No Opt. Call | AA+ | 669,360 | ||||||||||||||
| 380 | 5.250%, 12/01/27 – FGIC Insured | No Opt. Call | AA+ | 492,294 | ||||||||||||||
| 150 | Cincinnati, Ohio, Various Purpose General Obligation Bonds, Series 2009A, 4.500%, 12/01/29 | 6/19 at 100.00 | AA+ | 166,662 | ||||||||||||||
| 1,000 | Clyde-Green Springs Exempt Village School District, Summit County, Ohio, General Obligation Bonds, Series 2008, 5.000%, 12/01/27 – AGM Insured | 6/18 at 100.00 | Aa2 | 1,107,690 | ||||||||||||||
| 1,000 | Columbus City School District, Franklin County, Ohio, General Obligation Bonds, Series 2006, 0.000%, 12/01/28 – AGM Insured | No Opt. Call | AA | 538,650 | ||||||||||||||
| 2,675 | Cuyahoga County, Ohio, General Obligation Bonds, Series 2004, 5.000%, 12/01/22 | 12/14 at 100.00 | AA+ | 2,949,723 | ||||||||||||||
| 1,345 | Cuyahoga County, Ohio, Limited Tax General Obligation Bonds, Series 1993, 5.650%, 5/15/18 | No Opt. Call | Aa1 | 1,567,382 | ||||||||||||||
| 435 | Cuyahoga County, Ohio, Limited Tax General Obligation Various Purpose Refunding Bonds, Series 1993B, 5.250%, 10/01/13 | No Opt. Call | AAA | 448,246 | ||||||||||||||
| 1,245 | Cuyahoga Falls, Ohio, General Obligation Bonds, Series 2004, 5.000%, 12/01/18 – NPFG Insured | 6/14 at 100.00 | Aa2 | 1,343,878 | ||||||||||||||
| 750 | Cuyahoga Falls, Ohio, General Obligation Bonds, Various Purpose Refunding Series 2009, 4.250%, 12/01/34 | 12/17 at 100.00 | Aa2 | 801,720 | ||||||||||||||
| 72 | Nuveen Investments |
| Principal Amount (000) | Description (1) | Optional Call Provisions (2) | Ratings (3) | Value | ||||||||||||||
Tax Obligation/General (continued) | ||||||||||||||||||
| $ | 1,170 | Dayton, Ohio, General Obligation Bonds, Series 2004, 5.250%, 12/01/15 – AMBAC Insured | 6/14 at 100.00 | Aa2 | $ | 1,275,791 | ||||||||||||
| 1,000 | Fairview Park, Ohio, General Obligation Bonds, Series 2005, 5.000%, 12/01/25 – NPFG Insured | 12/15 at 100.00 | Aa2 | 1,108,610 | ||||||||||||||
| 1,005 | Findlay, Ohio, General Obligation Bonds, Series 2004, 5.250%, 7/01/15 – NPFG Insured | 7/14 at 100.00 | AA | 1,099,510 | ||||||||||||||
Franklin County, Ohio, General Obligation Bonds, Series 2007: | ||||||||||||||||||
| 690 | 4.500%, 12/01/27 | 12/17 at 100.00 | AAA | 756,268 | ||||||||||||||
| 3,160 | 5.000%, 12/01/28 | 12/17 at 100.00 | AAA | 3,622,182 | ||||||||||||||
| 400 | Gahanna, Ohio, General Obligation Bonds, Various Purpose Series 2007, 5.000%, 12/01/27 – NPFG Insured | 12/17 at 100.00 | Aa1 | 442,764 | ||||||||||||||
| 1,000 | Greene County, Ohio, General Obligation Bonds, General Infrastructure Series 2007, 5.250%, 12/01/26 – AMBAC Insured | 12/17 at 100.00 | Aa2 | 1,124,950 | ||||||||||||||
Highland Local School District, Morrow and Delaware Counties, Ohio, General Obligation Bonds, School Facilities Construction and Improvement Series 2008: | ||||||||||||||||||
| 100 | 0.000%, 12/01/22 | No Opt. Call | Aa2 | 73,241 | ||||||||||||||
| 1,000 | 5.375%, 12/01/33 | 12/18 at 100.00 | Aa2 | 1,146,620 | ||||||||||||||
| 2,500 | Hubbard Exempt Village School District, Trumbull County, Ohio, General Obligation Bonds, Classroom Facilities Improvements, Series 2007, 5.000%, 12/01/34 – CIFG Insured | 6/17 at 100.00 | A+ | 2,680,725 | ||||||||||||||
Indian Creek Local School District, Jefferson County, Ohio, General Obligation Bonds, School Facilities Construction and Improvements, Series 2009: | ||||||||||||||||||
| 1,750 | 5.000%, 12/01/34 | 6/19 at 100.00 | Aa2 | 1,964,218 | ||||||||||||||
| 1,100 | 5.125%, 12/01/36 | 6/19 at 100.00 | Aa2 | 1,241,053 | ||||||||||||||
| 1,095 | Kenston Local School District, Geauga County, Ohio, General Obligation Bonds, School improvement Series 2012, 0.000%, 12/01/27 | No Opt. Call | Aa1 | 617,974 | ||||||||||||||
| 755 | Kenston Local School District, Geauga County, Ohio, General Obligation Bonds, Series 2011, 5.000%, 12/01/19 | No Opt. Call | Aa1 | 925,336 | ||||||||||||||
| 1,400 | Kent City School District, Portage County, Ohio, General Obligation Library Improvement Bonds, Series 2004, 5.000%, 12/01/20 – FGIC Insured | 12/14 at 100.00 | AA | 1,543,780 | ||||||||||||||
| 1,560 | Kettering City School District, Montgomery County, Ohio, General Obligation Bonds, Series 2007, 5.250%, 12/01/31 – AGM Insured | No Opt. Call | Aa2 | 1,922,419 | ||||||||||||||
| 185 | Kettering, Ohio, Limited Tax General Obligation Bonds, Series 1991, 6.650%, 12/01/12 | 6/12 at 100.00 | Aa2 | 185,993 | ||||||||||||||
Kings Local School District, Warren County, Ohio, General Obligation School Improvement Bonds, Series 2005: | ||||||||||||||||||
| 1,000 | 5.000%, 12/01/22 – NPFG Insured | 6/15 at 100.00 | Aaa | 1,118,810 | ||||||||||||||
| 1,480 | 5.000%, 12/01/24 – NPFG Insured | 6/15 at 100.00 | Aaa | 1,631,626 | ||||||||||||||
| 505 | Lake County, Ohio, Limited Tax Sewer District Improvement Bonds, Series 2000, 5.600%, 12/01/20 | No Opt. Call | Aa1 | 608,293 | ||||||||||||||
| 1,725 | �� | Lakewood City School District, Cuyahoga County, Ohio, General Obligation Bonds, Series 2007, 5.000%, 12/01/30 – FGIC Insured | 12/17 at 100.00 | Aa2 | 1,880,906 | |||||||||||||
| 1,000 | Lorain, Ohio, General Obligation Bonds, Pellet Terminal Improvement Series 2008, 6.750%, 12/01/28 – AMBAC Insured | 12/12 at 100.00 | A3 | 1,184,610 | ||||||||||||||
| 2,380 | Lucas County, Ohio, General Obligation Bonds, Various Purpose Series 2010, 5.000%, 10/01/40 | 10/18 at 100.00 | Aa2 | 2,559,404 | ||||||||||||||
| 1,855 | Marysville Exempted School District, Union County, Ohio, General Obligation Bonds, Series 2006, 5.000%, 12/01/24 – AGM Insured | 12/15 at 100.00 | AA– | 1,995,294 | ||||||||||||||
| 1,000 | Mason City School District, Counties of Warren and Butler, Ohio, General Obligation Bonds, Series 2007, 5.000%, 12/01/31 | 6/17 at 100.00 | Aaa | 1,128,300 | ||||||||||||||
| 1,000 | Maumee City School District, Lucas County, Ohio, General Obligation Bonds, Capital Apprication Refunding Series 2012, 0.000%, 12/01/23 | No Opt. Call | AA– | 704,510 | ||||||||||||||
| 1,000 | Milford Exempted Village School District, Ohio, General Obligation Bonds, Series 2008, 5.250%, 12/01/36 | 12/18 at 100.00 | Aa3 | 1,089,130 | ||||||||||||||
| Nuveen Investments | 73 |
Portfolio of Investments
Nuveen Ohio Municipal Bond Fund (continued)
May 31, 2012
| Principal Amount (000) | Description (1) | Optional Call Provisions (2) | Ratings (3) | Value | ||||||||||||||
Tax Obligation/General (continued) | ||||||||||||||||||
| $ | 1,265 | Monroe Local School District, Butler County, Ohio, General Obligation Bonds, Series 2002, 5.750%, 12/01/20 – AMBAC Insured | No Opt. Call | A2 | $ | 1,539,872 | ||||||||||||
| 530 | Newark, Ohio, General Obligation Bonds, Storm Sewer Improvement Series 2009, 5.500%, 12/01/34 | 12/19 at 100.00 | Aa3 | 619,369 | ||||||||||||||
Oak Hills Local School District, Hamilton County, Ohio, General Obligation Bonds, Refunding Series 2005: | ||||||||||||||||||
| 3,740 | 5.000%, 12/01/23 – AGM Insured | 12/15 at 100.00 | AA– | 4,016,648 | ||||||||||||||
| 500 | 5.000%, 12/01/24 – AGM Insured | 12/15 at 100.00 | AA– | 533,010 | ||||||||||||||
| 1,000 | 5.000%, 12/01/25 – AGM Insured | 12/15 at 100.00 | AA– | 1,062,530 | ||||||||||||||
| 925 | Oakwood City School District, Montgomery County, Ohio, General Obligation Bonds, Series 2012, 0.000%, 12/01/21 | No Opt. Call | Aa2 | 710,465 | ||||||||||||||
| 3,280 | Ohio State, General Obligation Bonds, Refunding Common Schools Series 2012A, 5.000%, 9/15/23 | No Opt. Call | AA+ | 4,136,966 | ||||||||||||||
| 730 | Ohio, General Obligation Bonds, Common Schools, Series 2004B, 5.000%, 3/15/21 | 3/14 at 100.00 | AA+ | 785,604 | ||||||||||||||
| 1,845 | Ohio, General Obligation Bonds, Infrastructure Improvement Series 2005A, 5.000%, 9/01/16 | 3/15 at 100.00 | AA+ | 2,059,555 | ||||||||||||||
| 1,000 | Ohio, General Obligation Bonds, Infrastructure Improvements, Refunding Series 2002A, 5.500%, 2/01/20 | No Opt. Call | AA+ | 1,274,680 | ||||||||||||||
| 1,000 | Olmsted Falls City School District, Cuyahoga County, Ohio, General Obligation Bonds, Series 2007, 5.000%, 12/01/35 – SYNCORA GTY Insured | 6/17 at 100.00 | A+ | 1,070,860 | ||||||||||||||
| 1,500 | Pettisville Local School District, Fulton County, Ohio, General Obligation Bonds, School Facilities Construction and Improvement Bonds, Series 2009, 5.000%, 12/01/36 | 6/19 at 100.00 | Aa2 | 1,680,615 | ||||||||||||||
| 600 | Saint Marys City School District, Auglaize County, Ohio, General Obligation Bonds, School Facilities Construction and Improvement, Series 2008, 5.000%, 12/01/28 – AGM Insured | 6/18 at 100.00 | Aa2 | 660,774 | ||||||||||||||
| 755 | Sidney City School District, Shelby County, Ohio, General Obligation Bonds, Refunding Series 2007, 4.375%, 12/01/27 – FGIC Insured | 12/17 at 100.00 | Aa3 | 804,120 | ||||||||||||||
| 1,000 | Solon, Ohio, General Obligation Refunding and Improvement Bonds, Series 2002, 5.000%, 12/01/21 | 12/12 at 100.00 | AAA | 1,021,770 | ||||||||||||||
| 3,315 | South Point Local School District, Lawrence County, Ohio, General Obligation Bonds, Series 2004, 5.000%, 12/01/24 – AGM Insured | 12/14 at 100.00 | AA | 3,611,460 | ||||||||||||||
| 30 | Strongsville, Ohio, Limited Tax General Obligation Various Purpose Improvement Bonds, Series 1996, 5.950%, 12/01/21 | 6/12 at 100.00 | Aaa | 30,134 | ||||||||||||||
| 3,435 | Summit County, Ohio, General Obligation Bonds, Series 2002R, 5.500%, 12/01/21 – FGIC Insured | No Opt. Call | Aa1 | 4,416,963 | ||||||||||||||
| 1,300 | Sylvania City School District, Lucas County, Ohio, General Obligation Bonds, School Improvement Series 1995, 5.250%, 12/01/36 – AGC Insured | 6/17 at 100.00 | Aa2 | 1,397,656 | ||||||||||||||
| 735 | Symmes Township, Hamilton County, Ohio, General Obligation Bonds, Parkland Acquistion & Improvment Series 2010, 5.250%, 12/01/37 | 12/20 at 100.00 | Aa1 | 857,966 | ||||||||||||||
| 1,000 | Vandalia Butler City School District, Montgomery County, Ohio, General Obligation Bonds, School Improvment Series 2009, 5.125%, 12/01/37 | 6/19 at 100.00 | AA | 1,097,250 | ||||||||||||||
| 500 | Wadsworth City School District, Medina County, Ohio, General Obligation Bonds, School Improvement Series 2009, 5.000%, 12/01/37 – AGC Insured | 12/17 at 100.00 | AA– | 546,775 | ||||||||||||||
| 2,000 | West Clermont Local School District, Clermont County, Ohio, General Obligation Bonds, Series 2008, 5.000%, 12/01/31 – AGM Insured | 12/18 at 100.00 | AA– | 2,230,260 | ||||||||||||||
| 87,725 | Total Tax Obligation/General | 95,745,094 | ||||||||||||||||
Tax Obligation/Limited – 16.7% | ||||||||||||||||||
| 5,690 | Akron, Ohio, Income Tax Revenue Bonds, Community Learning Centers, Series 2004A, 5.000%, 12/01/33 – FGIC Insured | 12/13 at 100.00 | AA+ | 5,961,754 | ||||||||||||||
| 74 | Nuveen Investments |
| Principal Amount (000) | Description (1) | Optional Call Provisions (2) | Ratings (3) | Value | ||||||||||||||
Tax Obligation/Limited (continued) | ||||||||||||||||||
Blue Ash, Ohio, Tax Increment Financing Revenue Bonds, Duke Realty Ohio, Series 2006: | ||||||||||||||||||
| $ | 950 | 5.000%, 12/01/25 | 12/16 at 102.00 | N/R | $ | 980,562 | ||||||||||||
| 1,165 | 5.000%, 12/01/30 | 12/16 at 102.00 | N/R | 1,176,266 | ||||||||||||||
| 650 | 5.000%, 12/01/35 | 12/16 at 102.00 | N/R | 644,235 | ||||||||||||||
| 1,150 | Cincinnati, Ohio, Economic Development Revenue Bonds, Keystone Parke Project, Series 2008A, 5.000%, 11/01/38 | 11/13 at 102.00 | AA | 1,183,281 | ||||||||||||||
| 2,600 | Cleveland-Cuyahoga County Port Authority, Ohio, Development Revenue Bonds, R.I.T.A. Project, Series 2004, 5.000%, 11/15/19 – RAAI Insured | 11/14 at 100.00 | A– | 2,715,908 | ||||||||||||||
Columbiana Exempted Village School District, Columbiana County, Ohio, Certificates of Participation, Series 2010: | ||||||||||||||||||
| 1,400 | 5.000%, 12/01/26 – AGM Insured | 12/20 at 100.00 | AA– | 1,605,884 | ||||||||||||||
| 1,645 | 5.000%, 12/01/28 – AGM Insured | 12/20 at 100.00 | AA– | 1,869,740 | ||||||||||||||
| 1,380 | Columbus, Ohio, Tax Increment Financing Bonds, Easton Project, Series 2004A, 5.000%, 12/01/25 – AMBAC Insured | 6/14 at 100.00 | BBB+ | 1,429,625 | ||||||||||||||
Cuyhoga County, Ohio, Recovery Zone Facility Economic Development Revenue Bonds, Medical Mart- Convention Center Project, Series 2010F: | ||||||||||||||||||
| 2,710 | 5.250%, 12/01/25 | 12/20 at 100.00 | AA | 3,168,695 | ||||||||||||||
| 3,250 | 5.000%, 12/01/27 | 12/20 at 100.00 | AA | 3,688,815 | ||||||||||||||
| 1,700 | Delaware County District Library, Delaware, Franklin, Marion, Morrow and Union Counties, Ohio, Library Fund Library Facilities Special Obligation Notes, Series 2009, 5.000%, 12/01/34 | 12/19 at 100.00 | Aa2 | 1,904,408 | ||||||||||||||
| 5,615 | Franklin County Convention Facilities Authority, Ohio, Excise Tax and Lease Revenue Anticipation Bonds, Series 2005, 5.000%, 12/01/25 – AMBAC Insured | 12/15 at 100.00 | Aaa | 6,204,743 | ||||||||||||||
Franklin County Convention Facilities Authority, Ohio, Excise Tax and Lease Revenue Refunding Anticipation Bonds, Series 2007: | ||||||||||||||||||
| 2,215 | 5.000%, 12/01/26 | 12/17 at 100.00 | Aaa | 2,578,902 | ||||||||||||||
| 2,000 | 5.000%, 12/01/27 | 12/17 at 100.00 | Aaa | 2,328,020 | ||||||||||||||
| 2,875 | Government of Guam, Business Privilege Tax Bonds, Series 2011A, 5.125%, 1/01/42 | 1/22 at 100.00 | A | 3,119,548 | ||||||||||||||
| 1,220 | Government of Guam, Business Privilege Tax Bonds, Series 2012B-1, 5.000%, 1/01/42 (WI/DD, Settling 6/06/12) | 1/22 at 100.00 | A | 1,311,756 | ||||||||||||||
| 3,810 | Greater Cleveland Regional Transit Authority, Ohio, General Obligation Bonds, Capital Improvement Refunding Series 2004, 5.000%, 12/01/17 – NPFG Insured | 12/14 at 100.00 | Aa2 | 4,150,728 | ||||||||||||||
Hamilton County Convention Facilities Authority, Ohio, First Lien Revenue Bonds, Series 2004: | ||||||||||||||||||
| 2,300 | 5.000%, 12/01/20 – FGIC Insured | 6/14 at 100.00 | A+ | 2,457,090 | ||||||||||||||
| 2,535 | 5.000%, 12/01/22 – FGIC Insured | 6/14 at 100.00 | A+ | 2,713,337 | ||||||||||||||
| 5,800 | Hamilton County, Ohio, Sales Tax Bonds, Subordinate Lien, Series 2006A, 5.000%, 12/01/32 – AMBAC Insured | 12/16 at 100.00 | A+ | 6,235,580 | ||||||||||||||
Hamilton County, Ohio, Sales Tax Bonds, Subordinate Series 2000B: | ||||||||||||||||||
| 3,300 | 0.000%, 12/01/28 – AMBAC Insured | No Opt. Call | A+ | 1,597,629 | ||||||||||||||
| 1,750 | 0.000%, 12/01/28 – AMBAC Insured | No Opt. Call | AA– | 869,418 | ||||||||||||||
Hamilton County, Ohio, Sales Tax Revenue Bonds, Refunding Series 2011A: | ||||||||||||||||||
| 1,235 | 5.000%, 12/01/25, DD1 | 12/21 at 100.00 | A2 | 1,387,770 | ||||||||||||||
| 5,375 | 5.000%, 12/01/31 | 12/21 at 100.00 | A+ | 5,860,685 | ||||||||||||||
| 475 | Mahoning Career and Technology Center, Ohio, Certificate of Participation, Series 2009B, 4.750%, 12/01/36 | 12/17 at 100.00 | AA– | 512,734 | ||||||||||||||
Mayfield City School District, Ohio, Certificates of Participation, Middle School Project, Series 2009B: | ||||||||||||||||||
| 435 | 0.000%, 9/01/27 | No Opt. Call | Aa2 | 239,389 | ||||||||||||||
| 855 | 0.000%, 9/01/28 | No Opt. Call | Aa2 | 446,720 | ||||||||||||||
| 2,635 | 5.000%, 9/01/31 | 9/19 at 100.00 | Aa2 | 2,883,375 | ||||||||||||||
| 2,015 | Milton Union Exempt Village School District, Ohio, Special Limited Obligation Bonds, Series 2009, 5.000%, 12/01/32 | 12/19 at 100.00 | A+ | 2,251,581 | ||||||||||||||
| Nuveen Investments | 75 |
Portfolio of Investments
Nuveen Ohio Municipal Bond Fund (continued)
May 31, 2012
| Principal Amount (000) | Description (1) | Optional Call Provisions (2) | Ratings (3) | Value | ||||||||||||||
Tax Obligation/Limited (continued) | ||||||||||||||||||
New Albany Community Authority, Ohio, Community Facilities Revenue Refunding Bonds, Series 2012C: | ||||||||||||||||||
| $ | 1,100 | 5.000%, 10/01/23 | 10/22 at 100.00 | A1 | $ | 1,297,186 | ||||||||||||
| 110 | 5.000%, 10/01/24 | 10/22 at 100.00 | A1 | 127,742 | ||||||||||||||
| 1,900 | Ohio State Building Authority, State Facilities Bonds, Administrative Building Fund Projects, Series 2005A, 5.000%, 4/01/25 – AGM Insured | 4/15 at 100.00 | AA | 2,081,260 | ||||||||||||||
| 3,135 | Ohio State Building Authority, State Facilities Bonds, Adult Correctional Building Fund Project, Series 2005A, 5.000%, 4/01/23 – AGM Insured | 4/15 at 100.00 | AA | 3,453,359 | ||||||||||||||
Ohio, State Appropriation Lease Bonds, Parks and Recreation Capital Facilities, Series 2005A-II: | ||||||||||||||||||
| 1,000 | 5.250%, 2/01/19 – AGM Insured | 2/15 at 100.00 | AA | 1,113,280 | ||||||||||||||
| 1,000 | 5.250%, 2/01/20 – AGM Insured | 2/15 at 100.00 | AA | 1,110,200 | ||||||||||||||
| 11,900 | Puerto Rico Sales Tax Financing Corporation, Sales Tax Revenue Bonds, First Subordinate Series 2009A, 0.000%, 8/01/34 | No Opt. Call | A+ | 3,556,077 | ||||||||||||||
Puerto Rico Sales Tax Financing Corporation, Sales Tax Revenue Bonds, First Subordinate Series 2010A: | ||||||||||||||||||
| 400 | 0.000%, 8/01/35 | No Opt. Call | A+ | 110,944 | ||||||||||||||
| 500 | 5.375%, 8/01/39 | 2/20 at 100.00 | A+ | 535,600 | ||||||||||||||
| 18,000 | Puerto Rico Sales Tax Financing Corporation, Sales Tax Revenue Bonds, Series 2007A, 0.000%, 8/01/44 – NPFG Insured | No Opt. Call | Aa2 | 2,977,200 | ||||||||||||||
| 400 | Riversouth Authority, Ohio, Lazarus Building Redevelopment Bonds, Series 2007A, 5.750%, 12/01/27 | 12/17 at 100.00 | N/R | 404,672 | ||||||||||||||
Riversouth Authority, Ohio, Riversouth Area Redevelopment Bonds, Refunding Series 2012A: | ||||||||||||||||||
| 1,400 | 5.000%, 12/01/23 | 12/22 at 100.00 | AA+ | 1,678,810 | ||||||||||||||
| 800 | 5.000%, 12/01/24 | 12/22 at 100.00 | AA+ | 948,832 | ||||||||||||||
| 112,380 | Total Tax Obligation/Limited | 92,873,340 | ||||||||||||||||
Transportation – 4.5% | ||||||||||||||||||
Cleveland, Ohio, Airport System Revenue Bonds, Series 2012A: | ||||||||||||||||||
| 5,000 | 5.000%, 1/01/30 | No Opt. Call | A– | 5,400,800 | ||||||||||||||
| 3,450 | 5.000%, 1/01/31 – AGM Insured | 1/22 at 100.00 | AA– | 3,726,552 | ||||||||||||||
| 1,000 | Columbus Regional Airport Authority, Ohio, Revenue Bonds, Refunding Series 2007, 5.000%, 1/01/28 – NPFG Insured | 1/17 at 100.00 | A+ | 1,068,000 | ||||||||||||||
Dayton, Ohio, Airport Revenue Bonds, James M. Cox International Airport, Series 2003C: | ||||||||||||||||||
| 1,025 | 5.250%, 12/01/27 – RAAI Insured (Alternative Minimum Tax) | 12/13 at 100.00 | A– | 1,043,922 | ||||||||||||||
| 1,000 | 5.350%, 12/01/32 – RAAI Insured (Alternative Minimum Tax) | 12/13 at 100.00 | A– | 1,010,750 | ||||||||||||||
| 10,000 | Ohio Turnpike Commission, Revenue Refunding Bonds, Series 1998A, 5.500%, 2/15/24 – FGIC Insured | No Opt. Call | AA | 12,739,400 | ||||||||||||||
| 21,475 | Total Transportation | 24,989,424 | ||||||||||||||||
U.S. Guaranteed – 10.5% (5) | ||||||||||||||||||
| 3,590 | Canal Winchester Local School District, Franklin and Fairfield Counties, Ohio, General Obligation Bonds, Series 2005B, 5.000%, 12/01/27 (Pre-refunded 6/01/15) – NPFG Insured | 6/15 at 100.00 | A1 | (5) | 4,071,599 | |||||||||||||
Cuyahoga County, Ohio, Revenue Refunding Bonds, Cleveland Clinic Health System, Series 2003A: | ||||||||||||||||||
| 1,990 | 6.000%, 1/01/32 (Pre-refunded 7/01/13) | 7/13 at 100.00 | Aa2 | (5) | 2,113,380 | |||||||||||||
| 1,910 | 6.000%, 1/01/32 (Pre-refunded 7/01/13) | 7/13 at 100.00 | Aa2 | (5) | 2,028,420 | |||||||||||||
| 1,235 | Dayton, Ohio, Airport Revenue Bonds, James M. Cox International Airport, Series 2005B, 5.000%, 12/01/14 – SYNCORA GTY Insured (ETM) | No Opt. Call | A– | (5) | 1,376,346 | |||||||||||||
| 1,210 | Groveport, Ohio, Special Obligation Income Tax Receipts Bonds, Series 2002, 5.000%, 12/01/22 (Pre-refunded 12/01/12) – NPFG Insured | 12/12 at 100.00 | A1 | (5) | 1,238,810 | |||||||||||||
| 1,270 | Kenston Local School District, Geauga County, Ohio, General Obligation Bonds, Series 2003, 5.000%, 12/01/23 (Pre-refunded 6/01/13) – NPFG Insured | 6/13 at 100.00 | Aa1 | (5) | 1,330,541 | |||||||||||||
| 76 | Nuveen Investments |
| Principal Amount (000) | Description (1) | Optional Call Provisions (2) | Ratings (3) | Value | ||||||||||||||
U.S. Guaranteed (5) (continued) | ||||||||||||||||||
| $ | 1,865 | Hebron, Ohio, Mortgage Revenue Bonds, Waterworks System Improvements, Series 2004, 5.875%, 12/01/25 (Pre-refunded 6/01/14) | 6/14 at 100.00 | N/R | (5) | $ | 1,894,803 | |||||||||||
Lorain County, Ohio, Hospital Revenue Refunding and Improvement Bonds, Catholic Healthcare Partners, Refunding Series 2002: | ||||||||||||||||||
| 350 | 5.500%, 10/01/17 (Pre-refunded 10/01/12) | 10/12 at 100.00 | AA– | (5) | 356,171 | |||||||||||||
| 2,000 | 5.375%, 10/01/30 (Pre-refunded 10/01/12) | 10/12 at 100.00 | AA– | (5) | 2,034,440 | |||||||||||||
| 185 | Lorain, Ohio, Hospital Revenue Refunding Bonds, Lakeland Community Hospital Inc., Series 1992, 6.500%, 11/15/12 (ETM) | No Opt. Call | A1 | (5) | 188,702 | |||||||||||||
| 5,610 | Montgomery County, Ohio, Revenue Bonds, Catholic Health Initiatives, Series 2001, 5.375%, 9/01/21 (ETM) | 9/12 at 100.00 | N/R | (5) | 5,633,282 | |||||||||||||
| 3,000 | Ohio Higher Education Facilities Commission, Revenue Bonds, Case Western Reserve University, Series 2002B, 5.500%, 10/01/22 (Pre-refunded 10/01/12) | 10/12 at 100.00 | N/R | (5) | 3,053,400 | |||||||||||||
| 1,855 | Ohio University at Athens, Subordinate Lien General Receipts Bonds, Series 2004, 5.000%, 12/01/21 (Pre-refunded 6/01/14) – NPFG Insured | 6/14 at 100.00 | Aa3 | (5) | 2,026,068 | |||||||||||||
| 3,010 | Ohio Water Development Authority, Loan Revenue Bonds, Pure Water Development, Series 1990I, 6.000%, 12/01/16 – AMBAC Insured (ETM) | No Opt. Call | Aaa | 3,331,619 | ||||||||||||||
| 530 | Ohio Water Development Authority, Revenue Bonds, Drinking Water Assistance Fund, State Match, Series 2008, 5.000%, 6/01/28 (Pre-refunded 6/01/18) – AGM Insured | 6/18 at 100.00 | AAA | 651,911 | ||||||||||||||
Ohio Water Development Authority, Water Pollution Control Loan Fund Revenue Bonds, Water Quality Project, Series 2005B: | ||||||||||||||||||
| 1,000 | 5.000%, 6/01/25 (Pre-refunded 6/01/15) | 6/15 at 100.00 | AAA | 1,136,070 | ||||||||||||||
| 645 | 5.000%, 6/01/25 (Pre-refunded 6/01/15) | 6/15 at 100.00 | AAA | 732,765 | ||||||||||||||
| 6,055 | Ohio, General Obligation Bonds, Infrastructure Improvements, Series 2003F, 5.000%, 2/01/22 (Pre-refunded 2/01/13) | 2/13 at��100.00 | AA+ | (5) | 6,249,002 | |||||||||||||
| 1,490 | Ohio, State Appropriation Lease Bonds, Mental Health Capital Facilities, Series 2003B-II, 5.000%, 6/01/16 (Pre-refunded 6/01/13) | 6/13 at 100.00 | AA | (5) | 1,560,566 | |||||||||||||
| 1,000 | Ohio, State Appropriation Lease Bonds, Parks and Recreation Capital Facilities, Series 2004A-II, 5.000%, 12/01/15 (Pre-refunded 12/01/13) | 12/13 at 100.00 | AA | (5) | 1,070,210 | |||||||||||||
Olentangy Local School District, Delaware and Franklin Counties, Ohio, General Obligation Bonds, Series 2004A: | ||||||||||||||||||
| 400 | 5.250%, 12/01/21 (Pre-refunded 6/01/14) – FGIC Insured | 6/14 at 100.00 | AA+ | (5) | 438,876 | |||||||||||||
| 3,055 | 5.250%, 12/01/22 (Pre-refunded 6/01/14) – FGIC Insured | 6/14 at 100.00 | AA+ | (5) | 3,351,915 | |||||||||||||
| 1,495 | Otsego Local School District, Wood, Henry and Lucas Counties, Ohio, General Obligation Bonds, Series 2004, 5.375%, 12/01/22 (Pre-refunded 12/01/14) – AGM Insured | 12/14 at 100.00 | Aa3 | (5) | 1,680,829 | |||||||||||||
| 1,545 | Puerto Rico Electric Power Authority, Power Revenue Refunding Bonds, Series 1989O, 0.000%, 7/01/17 (ETM) | No Opt. Call | AA+ | (5) | 1,352,431 | |||||||||||||
| 1,000 | Riversouth Authority, Ohio, Riversouth Area Redevelopment Bonds, Series 2004A, 5.250%, 12/01/17 (Pre-refunded 6/01/14) | 6/14 at 100.00 | AA+ | (5) | 1,097,190 | |||||||||||||
| 1,185 | Sugarcreek Local School District, Athens County, Ohio, General Obligation Bonds, Series 2003, 5.250%, 12/01/24 (Pre-refunded 12/01/13) – NPFG Insured | 12/13 at 100.00 | N/R | (5) | 1,273,555 | |||||||||||||
| 3,755 | Toledo City School District, Lucas County, Ohio, General Obligation Bonds, Series 2003B, 5.000%, 12/01/22 (Pre-refunded 12/01/13) – FGIC Insured | 12/13 at 100.00 | Aa2 | (5) | 4,015,710 | |||||||||||||
West Chester Township, Butler County, Ohio, General Obligation Bonds, Series 2003: | ||||||||||||||||||
| 1,365 | 5.250%, 12/01/19 (Pre-refunded 12/01/13) – NPFG Insured | 12/13 at 100.00 | Aaa | 1,467,225 | ||||||||||||||
| 1,515 | 5.250%, 12/01/21 (Pre-refunded 12/01/13) – NPFG Insured | 12/13 at 100.00 | Aaa | 1,628,458 | ||||||||||||||
| 55,115 | Total U.S. Guaranteed | 58,384,294 | ||||||||||||||||
Utilities – 7.2% | ||||||||||||||||||
American Municipal Power Ohio Inc., General Revenue Bonds, Prairie State Energy Campus Project Series 2008A: | ||||||||||||||||||
| 1,000 | 5.000%, 2/15/31 | 2/18 at 100.00 | A1 | 1,085,270 | ||||||||||||||
| 5,000 | 5.250%, 2/15/43 | 2/18 at 100.00 | A1 | 5,412,450 | ||||||||||||||
| Nuveen Investments | 77 |
Portfolio of Investments
Nuveen Ohio Municipal Bond Fund (continued)
May 31, 2012
| Principal Amount (000) | Description (1) | Optional Call Provisions (2) | Ratings (3) | Value | ||||||||||||||
Utilities (continued) | ||||||||||||||||||
| $ | 1,535 | Cleveland Public Power System, Ohio, First Mortgage Improvement Revenue Bonds, Series 1994A, 0.000%, 11/15/13 – NPFG Insured | No Opt. Call | A2 | $ | 1,509,381 | ||||||||||||
Cleveland, Ohio, Public Power System Revenue Bonds, Series 2008B-2: | ||||||||||||||||||
| 4,740 | 0.000%, 11/15/34 – NPFG Insured | No Opt. Call | A2 | 1,617,762 | ||||||||||||||
| 7,500 | 0.000%, 11/15/38 – NPFG Insured | No Opt. Call | A2 | 2,022,900 | ||||||||||||||
| 2,000 | 5.000%, 11/15/38 – NPFG Insured | 5/18 at 100.00 | A2 | 2,121,880 | ||||||||||||||
| 1,000 | Hamilton, Ohio, Electric System Revenue Bonds, Refunding Series 2002A, 4.300%, 10/15/16 – AGM Insured | 10/15 at 101.00 | Aa3 | 1,123,090 | ||||||||||||||
| 1,800 | Ohio Air Quality Development Authority, Air Quality Revenue Refunding Bonds, Columbus Southern Power Company Project, Series 2009B, 5.800%, 12/01/38 (Mandatory put 12/01/19) | 12/19 at 100.00 | Baa1 | 2,026,152 | ||||||||||||||
| 500 | Ohio Air Quality Development Authority, Ohio, Pollution Control Revenue Refunding Bonds, FirstEnergy Generation Corp. Project, Series 2010, 3.375%, 7/01/33 (Mandatory put 7/01/15) | No Opt. Call | BBB– | 518,855 | ||||||||||||||
| 500 | Ohio Air Quality Development Authority, Ohio, Revenue Bonds, FirstEnergy Generation Corp. Project, Series 2009A, 5.700%, 8/01/20 | No Opt. Call | BBB– | 578,290 | ||||||||||||||
| 4,400 | Ohio Air Quality Development Authority, Ohio, Revenue Bonds, Ohio Valley Electric Corporation Project, Series 2009E, 5.625%, 10/01/19 | No Opt. Call | BBB– | 5,082,968 | ||||||||||||||
Ohio Municipal Electric Generation Agency, Beneficial Interest Certificates, Belleville Hydroelectric Project – Joint Venture 5, Series 2004: | ||||||||||||||||||
| 1,000 | 5.000%, 2/15/20 – AMBAC Insured | 2/14 at 100.00 | A1 | 1,050,490 | ||||||||||||||
| 5,450 | 5.000%, 2/15/21 – AMBAC Insured | 2/14 at 100.00 | A1 | 5,705,660 | ||||||||||||||
| 1,640 | 5.000%, 2/15/22 – AMBAC Insured | 2/14 at 100.00 | A1 | 1,709,470 | ||||||||||||||
| 3,295 | 5.000%, 2/15/23 – AMBAC Insured | 2/14 at 100.00 | A1 | 3,428,678 | ||||||||||||||
| 400 | Puerto Rico Electric Power Authority, Power Revenue Bonds, Series WW, 5.375%, 7/01/23 | 7/18 at 100.00 | BBB+ | 449,736 | ||||||||||||||
| 4,460 | Puerto Rico Industrial, Tourist, Educational, Medical and Environmental Control Facilities Financing Authority, Co-Generation Facility Revenue Bonds, Series 2000A, 6.625%, 6/01/26 (Alternative Minimum Tax) | 12/12 at 100.00 | Ba1 | 4,477,082 | ||||||||||||||
| 46,220 | Total Utilities | 39,920,114 | ||||||||||||||||
Water and Sewer – 7.5% | ||||||||||||||||||
| 1,390 | Akron, Ohio, Waterworks System Mortgage Revenue Improvement and Refunding Bonds, Series 2009, 5.000%, 3/01/34 – AGC Insured | 3/19 at 100.00 | Aa3 | 1,495,696 | ||||||||||||||
| 1,730 | Butler County, Ohio, Sewerage System Revenue Bonds, Series 2005, 5.000%, 12/01/23 – AGM Insured | No Opt. Call | Aa3 | 2,125,340 | ||||||||||||||
| 4,355 | Cincinnati, Ohio, Water System Revenue Bonds, Series 2007B, 5.000%, 12/01/32 | 12/17 at 100.00 | AAA | 4,967,444 | ||||||||||||||
| 865 | City of Marysville, Ohio, Water System Mortgage Revenue Bonds, Series 2007, 5.000%, 12/01/32 – AMBAC Insured | 12/17 at 100.00 | A1 | 926,943 | ||||||||||||||
| 10,330 | Cleveland, Ohio, Waterworks First Mortgage Revenue Refunding and Improvement Bonds, Series 1993G, 5.500%, 1/01/21 – NPFG Insured | No Opt. Call | Aa1 | 13,015,077 | ||||||||||||||
| 930 | Hamilton County, Ohio, Sewer System Revenue and Improvement Bonds, Metropolitan Sewer District of Greater Cincinnati, Series 2006A, 5.000%, 12/01/26 – NPFG Insured | 12/16 at 100.00 | AA+ | 1,050,564 | ||||||||||||||
| 450 | Ironton, Ohio, Sewer System Improvement Revenue Bonds, Series 2011, 5.250%, 12/01/40 – AGM Insured | 12/20 at 100.00 | Aa3 | 500,993 | ||||||||||||||
| 1,260 | Lancaster, Ohio, Wastewater System Improvement Revenue Bonds, Series 2004, 5.000%, 12/01/25 – AMBAC Insured | 12/14 at 100.00 | N/R | 1,306,972 | ||||||||||||||
| 1,745 | Lebanon, Ohio, Waterworks System Revenue Bonds, Improvement and Refunding Series 2012, 5.000%, 12/01/31 | 12/21 at 100.00 | Aa3 | 1,996,715 | ||||||||||||||
| 4,590 | Marysville, Ohio, Wastewater Treatement System Revenue Bonds, Series 2007, 4.750%, 12/01/47 – SYNCORA GTY Insured | 12/17 at 100.00 | A– | 4,706,034 | ||||||||||||||
| 78 | Nuveen Investments |
| Principal Amount (000) | Description (1) | Optional Call Provisions (2) | Ratings (3) | Value | ||||||||||||||
Water and Sewer (continued) | ||||||||||||||||||
Marysville, Ohio, Wastewater Treatment System Revenue Bonds, Series 2006: | ||||||||||||||||||
| $ | 1,755 | 5.250%, 12/01/25 – SYNCORA GTY Insured | 12/16 at 100.00 | A– | $ | 1,905,367 | ||||||||||||
| 80 | 4.750%, 12/01/46 – SYNCORA GTY Insured | 12/16 at 100.00 | A– | 81,697 | ||||||||||||||
| 1,000 | Montgomery County, Ohio, Water System Revenue Bonds, Greater Moraine Beaver District, Series 2002 Refunding, 5.375%, 11/15/16 – AMBAC Insured | 11/12 at 100.00 | N/R | 1,015,219 | ||||||||||||||
| 700 | Northeast Ohio Regional Sewer District, Wastewater Improvement Revenue Bonds, Series 2007, 4.500%, 11/15/37 – NPFG Insured | 5/17 at 100.00 | AA+ | 723,372 | ||||||||||||||
| 105 | Ohio Water Development Authority, Revenue Bonds, Fresh Water Development, Series 2004, 5.250%, 12/01/15 | 6/14 at 100.00 | AAA | 114,901 | ||||||||||||||
Ohio Water Development Authority, Revenue Bonds, Water Development Community Assistance Program, Refunding Series 2009: | ||||||||||||||||||
| 1,405 | 5.000%, 12/01/25 | 12/19 at 100.00 | Aa1 | 1,639,367 | ||||||||||||||
| 1,475 | 5.000%, 12/01/26 | 12/19 at 100.00 | Aa1 | 1,711,102 | ||||||||||||||
| 200 | Ohio Water Development Authority, Water Pollution Control Loan Fund Revenue Bonds, Water Quality Project, Series 2010A, 5.000%, 6/01/30 | 12/19 at 100.00 | AAA | 230,969 | ||||||||||||||
| 2,060 | Springboro, Ohio, Sewer System Mortgage Revenue Bonds, Refunding Series 2012, 5.000%, 6/01/27 | 6/22 at 100.00 | Aa3 | 2,416,585 | ||||||||||||||
| 36,425 | Total Water and Sewer | 41,930,357 | ||||||||||||||||
| $ | 543,940 | Total Investments (cost $503,081,377) – 98.1% | 546,246,621 | |||||||||||||||
Other Assets Less Liabilities – 1.9% | 10,552,804 | |||||||||||||||||
Net Assets – 100% | $ | 556,799,425 | ||||||||||||||||
| (1) | All percentages shown in the Portfolio of Investments are based on net assets. |
| (2) | Optional Call Provisions (not covered by the report of independent registered public accounting firm): Dates (month and year) and prices of the earliest optional call or redemption. There may be other call provisions at varying prices at later dates. Certain mortgage-backed securities may be subject to periodic principal paydowns. |
| (3) | Ratings (not covered by the report of independent registered public accounting firm): Using the highest of Standard & Poor’s Group (“Standard & Poor’s”), Moody’s Investors Service, Inc. (“Moody’s”) or Fitch, Inc. (“Fitch”) rating. Ratings below BBB by Standard & Poor’s, Baa by Moody’s or BBB by Fitch are considered to be below investment grade. Holdings designated N/R are not rated by any of these national rating agencies. |
| (4) | Investment, or portion of investment, has been pledged to collateralize the net payment obligations for investments in inverse floating rate transactions. |
| (5) | Backed by an escrow or trust containing sufficient U.S. Government or U.S. Government agency securities, which ensure the timely payment of principal and interest. Certain bonds backed by U.S. Government or agency securities are regarded as having an implied rating equal to the rating of such securities. |
| N/R | Not rated. |
| DD1 | Investment, or portion of investment, purchased on a delayed delivery basis. |
| WI/DD | Purchased on a when-issued or delayed delivery basis. |
| (ETM) | Escrowed to maturity. |
| (IF) | Inverse floating rate investment. |
See accompanying notes to financial statements.
| Nuveen Investments | 79 |
Portfolio of Investments
Nuveen Wisconsin Municipal Bond Fund
May 31, 2012
| Principal Amount (000) | Description (1) | Optional Call Provisions (2) | Ratings (3) | Value | ||||||||||||||
Consumer Staples – 1.0% | ||||||||||||||||||
| $ | 1,000 | Puerto Rico, The Children’s Trust Fund, Tobacco Settlement Asset-Backed Refunding Bonds, Series 2002, 5.500%, 5/15/39 | 11/12 at 100.00 | BBB+ | $ | 997,180 | ||||||||||||
Education and Civic Organizations – 7.3% | ||||||||||||||||||
| 500 | Delafield Community Development Authority, Wisconsin, Redevelopment Revenue Bonds, Saint John’s Northwestern Milirary Academy, Series 2009, 4.700%, 6/01/34 | 6/19 at 100.00 | Aaa | 560,720 | ||||||||||||||
Madison Community Development Authority, Wisconsin, Revenue Bonds, The Wisconsin Alumni Research Foundation, Series 2009: | ||||||||||||||||||
| 1,000 | 5.000%, 10/01/23 | 10/19 at 100.00 | AAA | 1,205,550 | ||||||||||||||
| 500 | 5.000%, 10/01/27 | 10/19 at 100.00 | AAA | 589,055 | ||||||||||||||
| 300 | 5.000%, 10/01/28 | 10/19 at 100.00 | AAA | 352,044 | ||||||||||||||
| 2,250 | 5.000%, 10/01/34 | 10/19 at 100.00 | AAA | 2,567,205 | ||||||||||||||
| 1,300 | Milwaukee Redevelopment Authority, Wisconsin, Revenue Bonds, Milwaukee School of Engineering Project, Series 2012, 4.100%, 4/01/32 – AGM Insured | 4/22 at 100.00 | AA– | 1,314,118 | ||||||||||||||
| 200 | Puerto Rico Industrial, Tourist, Educational, Medical and Environmental Control Facilities Financing Authority, Higher Education Revenue Bonds, University of the Sacred Heart, Series 2001, 5.250%, 9/01/21 | 9/12 at 100.00 | BBB | 200,272 | ||||||||||||||
| 250 | Puerto Rico Industrial, Tourist, Educational, Medical and Environmental Control Facilities Financing Authority, Higher Education Revenue Refunding Bonds, Ana G. Mendez University System, Series 2002, 5.500%, 12/01/31 | 12/12 at 101.00 | BBB– | 251,070 | ||||||||||||||
| 6,300 | Total Education and Civic Organizations | 7,040,034 | ||||||||||||||||
Health Care – 18.2% | ||||||||||||||||||
Monroe Redevelopment Authority, Wisconsin, Development Revenue Bonds, The Monroe Clinic, Inc., Series 2009: | ||||||||||||||||||
| 1,150 | 5.500%, 2/15/29 | 2/19 at 100.00 | A3 | 1,256,513 | ||||||||||||||
| 2,485 | 5.875%, 2/15/39 | 2/19 at 100.00 | A3 | 2,768,091 | ||||||||||||||
| 5 | Puerto Rico Industrial, Tourist, Educational, Medical and Environmental Control Facilities Financing Authority, FHA-Insured Mortgage Hospital Revenue Bonds, Doctor Pila Hospital, Series 1995A, 5.875%, 8/01/12 | No Opt. Call | AA+ | 5,019 | ||||||||||||||
| 1,500 | Puerto Rico Industrial, Tourist, Educational, Medical and Environmental Control Facilities Financing Authority, Hospital Revenue Bonds, Auxilio Mutuo Hospital, Series 2011A, 6.000%, 7/01/33 | 7/21 at 100.00 | A– | 1,678,650 | ||||||||||||||
| 1,205 | Wisconsin Health and Educational Facilities Authority, Revenue Bonds, Aurora Health Care, Inc., Series 2012A, 5.000%, 7/15/28 | 7/21 at 100.00 | A3 | 1,317,969 | ||||||||||||||
| 1,230 | Wisconsin Health and Educational Facilities Authority, Revenue Bonds, Divine Savior Healthcare, Series 2006, 5.000%, 5/01/32 | 5/16 at 100.00 | BBB | 1,246,298 | ||||||||||||||
| 1,000 | Wisconsin Health and Educational Facilities Authority, Revenue Bonds, Froedtert Community Health, Inc. Obligated Group, Tender Option Bond Trust 3592, 17.770%, 4/01/17 (IF) (4) | No Opt. Call | AA– | 1,355,320 | ||||||||||||||
| 1,000 | Wisconsin Health and Educational Facilities Authority, Revenue Bonds, Gundersen Lutheran, Series 2011A, 5.250%, 10/15/39 | 10/21 at 100.00 | A+ | 1,078,600 | ||||||||||||||
| 1,000 | Wisconsin Health and Educational Facilities Authority, Revenue Bonds, Marshfield Clinic, Series 2006A, 5.375%, 2/15/34 | 2/16 at 100.00 | A– | 1,026,570 | ||||||||||||||
| 1,000 | Wisconsin Health and Educational Facilities Authority, Revenue Bonds, Meriter Hospital, Inc., Series 2011A, 5.750%, 5/01/35 | 5/21 at 100.00 | A+ | 1,117,010 | ||||||||||||||
| 1,350 | Wisconsin Health and Educational Facilities Authority, Revenue Bonds, Ministry Health Care, Inc., Refunding 2012C, 5.000%, 8/15/32 | 8/22 at 100.00 | A+ | 1,468,625 | ||||||||||||||
| 1,000 | Wisconsin Health and Educational Facilities Authority, Revenue Bonds, ThedaCare, Inc., Series 2009A, 5.500%, 12/15/38 | 12/19 at 100.00 | AA– | 1,084,930 | ||||||||||||||
| 2,000 | Wisconsin Health and Educational Facilities Authority, Revenue Bonds, Wheaton Franciscan Healthcare System, Series 2006, 5.250%, 8/15/19 | 8/16 at 100.00 | A– | 2,188,380 | ||||||||||||||
| 15,925 | Total Health Care | 17,591,975 | ||||||||||||||||
| 80 | Nuveen Investments |
| Principal Amount (000) | Description (1) | Optional Call Provisions (2) | Ratings (3) | Value | ||||||||||||||
Housing/Multifamily – 3.0% | ||||||||||||||||||
| $ | 1,780 | Puerto Rico Housing Finance Authority, Subordinate Lien Capital Fund Program Revenue Bonds, Modernization Series 2008, 5.125%, 12/01/27 | 12/18 at 100.00 | A+ | $ | 1,945,451 | ||||||||||||
| 965 | Wisconsin Housing and Economic Development Authority, Housing Revenue Bonds, Series 2006A, 4.550%, 5/01/27 (Alternative Minimum Tax) | 5/16 at 100.00 | AA | 987,726 | ||||||||||||||
| 2,745 | Total Housing/Multifamily | 2,933,177 | ||||||||||||||||
Housing/Single Family – 2.6% | ||||||||||||||||||
| 25 | Virgin Islands Housing Finance Corporation, GNMA Mortgage-Backed Securities Program Single Family Mortgage Revenue Refunding Bonds, Series 1995A, 6.450%, 3/01/16 (Alternative Minimum Tax) | 9/12 at 100.00 | N/R | 25,066 | ||||||||||||||
Wisconsin Housing and Economic Development Authority, Home Ownership Revenue Bonds, Series 2005E: | ||||||||||||||||||
| 1,000 | 4.900%, 11/01/35 | 5/15 at 100.00 | AA | 1,025,180 | ||||||||||||||
| 1,375 | 4.900%, 11/01/35 – AMBAC Insured | 5/15 at 100.00 | AA | 1,409,623 | ||||||||||||||
| 2,400 | Total Housing/Single Family | 2,459,869 | ||||||||||||||||
Long-Term Care – 1.1% | ||||||||||||||||||
| 1,000 | New Richmond Community Development Authority, Wisconsin, Health Care Facilities Revenue Bonds, PHM/New Richmond Senior Housing, Inc., Series 2011, 6.650%, 9/01/43 | 9/18 at 101.00 | N/R | 1,066,050 | ||||||||||||||
Materials – 1.2% | ||||||||||||||||||
| 1,040 | Green Bay Redevelopment Authority, Wisconsin, Industrial Development Revenue Bonds, Fort James Project, Series 1999, 5.600%, 5/01/19 (Alternative Minimum Tax) | No Opt. Call | N/R | 1,173,921 | ||||||||||||||
Tax Obligation/General – 1.2% | ||||||||||||||||||
| 95 | Guam, General Obligation Bonds, Series 1993A, 5.400%, 11/15/18 | 11/12 at 100.00 | B+ | 95,072 | ||||||||||||||
| 1,000 | Puerto Rico, General Obligation Bonds, Public Improvement, Refunding Series 2012A, 5.125%, 7/01/37 | 7/22 at 100.00 | Baa1 | 1,014,110 | ||||||||||||||
| 1,095 | Total Tax Obligation/General | 1,109,182 | ||||||||||||||||
Tax Obligation/Limited – 48.1% | ||||||||||||||||||
| 650 | Beloit Community Development Authority, Rock County, Wisconsin, Lease Revenue Bonds, Series 2009, 5.000%, 3/01/25 | 3/18 at 100.00 | N/R | 715,098 | ||||||||||||||
| 2,000 | Glendale Community Development Authority, Wisconsin, Community Development Lease Revenue Bonds, Bayshore Public Parking Project, Series 2004A, 5.000%, 10/01/24 | 10/14 at 100.00 | A1 | 2,104,200 | ||||||||||||||
Glendale Community Development Authority, Wisconsin, Community Development Lease Revenue Refunding Bonds, Tax Increment District 7, Series 2011B: | ||||||||||||||||||
| 1,000 | 3.850%, 9/01/20 | 9/18 at 100.00 | A1 | 1,090,030 | ||||||||||||||
| 500 | 3.700%, 9/01/21 | 9/18 at 100.00 | A1 | 534,445 | ||||||||||||||
Government of Guam, Business Privilege Tax Bonds, Series 2011A: | ||||||||||||||||||
| 1,000 | 5.000%, 1/01/31 | 1/22 at 100.00 | A | 1,100,240 | ||||||||||||||
| 440 | 5.125%, 1/01/42 | 1/22 at 100.00 | A | 477,426 | ||||||||||||||
| 960 | Madison Community Development Authority, Wisconsin, Lease Revenue Refunding Bonds, Monona Terrace, Series 2002, 4.375%, 3/01/20 | 3/20 at 100.00 | Aa2 | 962,064 | ||||||||||||||
| 675 | Milwaukee Redevelopment Authority, Wisconsin, HSI Industrial I LLC Project Revenue Bonds, Series 2008, 5.125%, 6/01/29 | 6/16 at 100.00 | A1 | 702,938 | ||||||||||||||
| 2,000 | Milwaukee Redevelopment Authority, Wisconsin, Lease Revenue Bonds, Neighborhood Public Schools Initiative, Series 2002A, 4.875%, 8/01/21 – AMBAC Insured | 8/12 at 100.00 | Aa3 | 2,013,720 | ||||||||||||||
| 1,300 | Milwaukee Redevelopment Authority, Wisconsin, Lease Revenue Bonds, Neighborhood Public Schools Initiative, Series 2007A, 4.000%, 8/01/23 – AMBAC Insured | 8/17 at 100.00 | Aa3 | 1,396,408 | ||||||||||||||
| 275 | Milwaukee Redevelopment Authority, Wisconsin, Lease Revenue Bonds, Public Schools, Series 2005A, 4.600%, 8/01/22 | 8/15 at 100.00 | Aa3 | 292,875 | ||||||||||||||
| Nuveen Investments | 81 |
Portfolio of Investments
Nuveen Wisconsin Municipal Bond Fund (continued)
May 31, 2012
| Principal Amount (000) | Description (1) | Optional Call Provisions (2) | Ratings (3) | Value | ||||||||||||||
Tax Obligation/Limited (continued) | ||||||||||||||||||
| $ | 1,500 | Neenah Community Development Authority, Wisconsin, Lease Revenue Bonds, Series 2004A, 5.000%, 12/01/26 | 12/14 at 100.00 | Aa3 | $ | 1,575,660 | ||||||||||||
Neenah Community Development Authority, Wisconsin, Lease Revenue Bonds, Series 2008A: | ||||||||||||||||||
| 500 | 4.625%, 12/01/28 | 12/18 at 100.00 | Aa3 | 549,985 | ||||||||||||||
| 1,000 | 4.750%, 12/01/32 | 12/18 at 100.00 | Aa3 | 1,090,010 | ||||||||||||||
| 1,000 | Onalaska Community Development Authority, Wisconsin, Community Development Lease Revenue Bonds, Series 2003, 4.875%, 10/01/27 | 10/13 at 100.00 | A1 | 1,016,080 | ||||||||||||||
| 2,500 | Oneida Tribe of Indians of Wisconsin, Retail Sales Revenue Bonds, Series 2010, 6.500%, 2/01/31 | 2/19 at 102.00 | AA– | 2,852,550 | ||||||||||||||
| 1,200 | Puerto Rico Highway and Transportation Authority, Highway Revenue Bonds, Series 2004-I, 5.000%, 7/01/23 – FGIC Insured | 7/14 at 100.00 | Baa1 | 1,261,380 | ||||||||||||||
| 1,400 | Puerto Rico Infrastructure Financing Authority, Special Tax Revenue Bonds, Series 2006, 5.000%, 7/01/46 | 7/16 at 100.00 | BBB+ | 1,406,818 | ||||||||||||||
| 1,280 | Puerto Rico Public Buildings Authority, Guaranteed Government Facilities Revenue Bonds, Series 2011S, 6.000%, 7/01/41 | 7/21 at 100.00 | Baa1 | 1,402,317 | ||||||||||||||
| 1,000 | Puerto Rico Sales Tax Financing Corporation, Sales Tax Revenue Bonds, First Subordinate Series 2009A, 6.000%, 8/01/42 | 8/19 at 100.00 | A+ | 1,127,800 | ||||||||||||||
| 1,325 | Puerto Rico Sales Tax Financing Corporation, Sales Tax Revenue Bonds, First Subordinate Series 2010C, 6.000%, 8/01/39 | 8/20 at 100.00 | A+ | 1,514,435 | ||||||||||||||
| 6,615 | Puerto Rico Sales Tax Financing Corporation, Sales Tax Revenue Bonds, Series 2007A, 0.000%, 8/01/45 – NPFG Insured | No Opt. Call | Aa2 | 1,024,928 | ||||||||||||||
Saint Francis Community Development Authority, Wisconsin, Lease Revenue Bonds, Series 2007: | ||||||||||||||||||
| 400 | 4.150%, 3/01/20 | 3/17 at 100.00 | A1 | 438,756 | ||||||||||||||
| 300 | 4.350%, 3/01/22 | 3/17 at 100.00 | A1 | 323,127 | ||||||||||||||
| 280 | 4.500%, 3/01/24 | 3/17 at 100.00 | A1 | 299,387 | ||||||||||||||
| 520 | 4.600%, 3/01/27 | 3/17 at 100.00 | A1 | 554,538 | ||||||||||||||
Southeast Wisconsin Professional Baseball Park District, Sales Tax Revenue Refunding Bonds, Series 1998A: | ||||||||||||||||||
| 900 | 5.500%, 12/15/18 – NPFG Insured | No Opt. Call | AA– | 1,131,651 | ||||||||||||||
| 400 | 5.500%, 12/15/19 – NPFG Insured | No Opt. Call | AA– | 511,352 | ||||||||||||||
| 2,220 | 5.500%, 12/15/20 – NPFG Insured | No Opt. Call | AA– | 2,861,336 | ||||||||||||||
| 1,760 | 5.500%, 12/15/26 – NPFG Insured | No Opt. Call | AA– | 2,175,694 | ||||||||||||||
| 1,220 | Sturgeon Bay Waterfront Redevelopment Authority, Wisconsin, Lease Revenue Bonds, Series 2006A, 4.500%, 10/01/21 | 10/16 at 100.00 | N/R | 1,290,894 | ||||||||||||||
| 1,305 | Sun Prairie Community Development Authority, Wisconsin, Lease Revenue Bonds, Tax Increment District 8, Series 2006, 4.250%, 8/01/25 | 8/16 at 100.00 | A1 | 1,357,278 | ||||||||||||||
| 1,145 | Virgin Islands Public Finance Authority, Matching Fund Loan Notes Revenue Bonds, Subordinate Lien Series 2010B, 5.250%, 10/01/29 | 10/20 at 100.00 | Baa2 | 1,219,196 | ||||||||||||||
| 1,000 | Weston Community Development Authority, Wisconsin, Lease Revenue Bonds, Series 2004A, 5.250%, 10/01/21 | 10/14 at 100.00 | A1 | 1,068,450 | ||||||||||||||
| 1,000 | Weston Community Development Authority, Wisconsin, Lease Revenue Bonds, Series 2005A, 5.000%, 10/01/21 | 10/15 at 100.00 | A1 | 1,069,680 | ||||||||||||||
| 380 | Winnebago County Housing Authority, Wisconsin, Housing Revenue Bonds, Group Home III Project, Series 1992A, 7.125%, 3/01/22 | 9/12 at 100.00 | N/R | 381,338 | ||||||||||||||
Wisconsin Center District, Junior Dedicated Tax Revenue Refunding Bonds, Series 1999: | ||||||||||||||||||
| 2,975 | 5.250%, 12/15/23 – AGM Insured | No Opt. Call | AA– | 3,577,378 | ||||||||||||||
| 710 | 5.250%, 12/15/27 – AGM Insured | No Opt. Call | AA– | 855,848 | ||||||||||||||
| 2,035 | Wisconsin Center District, Senior Dedicated Tax Revenue Refunding Bonds, Series 2003A, 0.000%, 12/15/28 – AGM Insured | No Opt. Call | AA– | 1,099,897 | ||||||||||||||
| 48,670 | Total Tax Obligation/Limited | 46,427,207 | ||||||||||||||||
| 82 | Nuveen Investments |
| Principal Amount (000) | Description (1) | Optional Call Provisions (2) | Ratings (3) | Value | ||||||||||||||
Transportation – 0.4% | ||||||||||||||||||
| $ | 355 | Virginia Small Business Financing Authority, Senior Lien Revenue Bonds, Elizabeth River Crossing, Opco LLC Project, Series 2012, 5.250%, 1/01/32 (Alternative Minimum Tax) | 7/22 at 100.00 | BBB– | $ | 370,233 | ||||||||||||
U.S. Guaranteed – 2.6% (5) | ||||||||||||||||||
| 1,300 | Milwaukee Redevelopment Authority, Wisconsin, Lease Revenue Bonds, Public Schools, Series 2003A, 5.125%, 8/01/21 (Pre-refunded 8/01/13) – AMBAC Insured | 8/13 at 100.00 | A1 | (5) | 1,372,644 | |||||||||||||
| 1,000 | Wisconsin Health and Educational Facilities Authority, Revenue Bonds, ProHealth Care, Inc. Obligated Group, Series 2009, 6.625%, 2/15/32 (Pre-refunded 2/18/14) | 2/14 at 100.00 | A+ | (5) | 1,106,100 | |||||||||||||
| 2,300 | Total U.S. Guaranteed | 2,478,744 | ||||||||||||||||
Utilities – 5.2% | ||||||||||||||||||
| 1,000 | Guam Power Authority, Revenue Bonds, Series 1999A, 5.125%, 10/01/29 – NPFG Insured | 10/12 at 100.00 | BBB | 1,000,140 | ||||||||||||||
| 1,310 | Puerto Rico Electric Power Authority, Power Revenue Bonds, Series 2003NN, 5.250%, 7/01/23 – NPFG Insured | No Opt. Call | BBB+ | 1,499,623 | ||||||||||||||
| 1,060 | Puerto Rico Electric Power Authority, Power Revenue Bonds, Series 2007VV, 5.250%, 7/01/24 – FGIC Insured | No Opt. Call | BBB+ | 1,205,029 | ||||||||||||||
| 1,265 | Puerto Rico Electric Power Authority, Power Revenue Bonds, Series 2010XX, 5.250%, 7/01/40 | 7/20 at 100.00 | BBB+ | 1,301,432 | ||||||||||||||
| 4,635 | Total Utilities | 5,006,224 | ||||||||||||||||
Water and Sewer – 3.3% | ||||||||||||||||||
| 1,000 | Guam Government Waterworks Authority, Water and Wastewater System Revenue Bonds, Series 2010, 5.625%, 7/01/40 | 7/20 at 100.00 | Ba2 | 1,015,310 | ||||||||||||||
| 1,000 | Puerto Rico Aqueduct and Sewerage Authority, Revenue Bonds, Senior Lien Series 2008A, 6.000%, 7/01/38 | 7/18 at 100.00 | Baa2 | 1,068,320 | ||||||||||||||
| 1,000 | Puerto Rico Aqueduct and Sewerage Authority, Revenue Bonds, Senior Lien Series 2012A, 5.750%, 7/01/37 | 7/22 at 100.00 | Baa2 | 1,048,690 | ||||||||||||||
| 3,000 | Total Water and Sewer | 3,132,320 | ||||||||||||||||
| $ | 90,465 | Total Investments (cost $84,324,762) – 95.2% | 91,786,116 | |||||||||||||||
Other Assets Less Liabilities – 4.8% | 4,660,962 | |||||||||||||||||
Net Assets – 100% | $ | 96,447,078 | ||||||||||||||||
| (1) | All percentages shown in the Portfolio of Investments are based on net assets. |
| (2) | Optional Call Provisions (not covered by the report of independent registered public accounting firm): Dates (month and year) and prices of the earliest optional call or redemption. There may be other call provisions at varying prices at later dates. Certain mortgage-backed securities may be subject to periodic principal paydowns. |
| (3) | Ratings (not covered by the report of independent registered public accounting firm): Using the highest of Standard & Poor’s Group (“Standard & Poor’s”), Moody’s Investors Service, Inc. (“Moody’s”) or Fitch, Inc. (“Fitch”) rating. Ratings below BBB by Standard & Poor’s, Baa by Moody’s or BBB by Fitch are considered to be below investment grade. Holdings designated N/R are not rated by any of these national rating agencies. |
| (4) | Investment, or portion of investment, has been pledged to collateralize the net payment obligations for investments in inverse floating rate transactions. |
| (5) | Backed by an escrow or trust containing sufficient U.S. Government or U.S. Government agency securities, which ensure the timely payment of principal and interest. Certain bonds backed by U.S. Government or agency securities are regarded as having an implied rating equal to the rating of such securities. |
| N/R | Not rated. |
| (IF) | Inverse floating rate investment. |
See accompanying notes to financial statements.
| Nuveen Investments | 83 |
Statement of Assets and Liabilities
May 31, 2012
| Kansas | Kentucky | Michigan | Missouri | Ohio | Wisconsin | |||||||||||||||||||
Assets | ||||||||||||||||||||||||
Investments, at value (cost $206,978,698, $398,829,785 $186,089,395 $417,222,609, $503,081,377 and $84,324,762, respectively) | $ | 222,664,041 | $ | 434,116,069 | $ | 203,439,320 | $ | 449,823,649 | $ | 546,246,621 | $ | 91,786,116 | ||||||||||||
Cash | 3,367,020 | 2,042,377 | 2,357,029 | 5,353,158 | 8,682,569 | 1,366,876 | ||||||||||||||||||
Receivables: | ||||||||||||||||||||||||
Interest | 2,531,495 | 5,565,538 | 2,120,900 | 5,521,392 | 9,834,378 | 1,345,847 | ||||||||||||||||||
Investments sold | 935,000 | 7,693,740 | — | 1,275,265 | 1,365,000 | 1,878,065 | ||||||||||||||||||
Shares sold | 1,556,110 | 328,887 | 319,827 | 1,024,218 | 1,266,121 | 328,266 | ||||||||||||||||||
Other assets | 215 | 58,788 | 31,927 | 21,357 | 71,909 | 81 | ||||||||||||||||||
Total assets | 231,053,881 | 449,805,399 | 208,269,003 | 463,019,039 | 567,466,598 | 96,705,251 | ||||||||||||||||||
Liabilities | ||||||||||||||||||||||||
Floating rate obligations | 9,420,000 | 5,650,000 | — | 2,225,000 | — | — | ||||||||||||||||||
Payables: | ||||||||||||||||||||||||
Dividends | 199,226 | 450,938 | 276,391 | 868,371 | 783,848 | 94,125 | ||||||||||||||||||
Investments purchased | 2,507,445 | 1,275,000 | — | 4,023,778 | 8,119,778 | — | ||||||||||||||||||
Shares redeemed | 551,233 | 1,008,094 | 263,247 | 331,072 | 1,066,615 | 57,279 | ||||||||||||||||||
Accrued expenses: | ||||||||||||||||||||||||
Management fees | 94,289 | 189,623 | 90,583 | 197,166 | 300,113 | 42,338 | ||||||||||||||||||
12b-1 distribution and service fees | 58,197 | 102,127 | 44,922 | 61,912 | 99,107 | 16,392 | ||||||||||||||||||
Other | 70,758 | 175,969 | 110,308 | 250,241 | 297,712 | 48,039 | ||||||||||||||||||
Total liabilities | 12,901,148 | 8,851,751 | 785,451 | 7,957,540 | 10,667,173 | 258,173 | ||||||||||||||||||
Net assets | $ | 218,152,733 | $ | 440,953,648 | $ | 207,483,552 | $ | 455,061,499 | $ | 556,799,425 | $ | 96,447,078 | ||||||||||||
Class A Shares | ||||||||||||||||||||||||
Net assets | $ | 151,334,402 | $ | 360,084,460 | $ | 153,466,870 | $ | 233,521,119 | $ | 317,441,793 | $ | 51,123,841 | ||||||||||||
Shares outstanding | 13,500,673 | 31,581,298 | 13,041,429 | 20,307,572 | 27,136,948 | 4,610,452 | ||||||||||||||||||
Net asset value per share | $ | 11.21 | $ | 11.40 | $ | 11.77 | $ | 11.50 | $ | 11.70 | $ | 11.09 | ||||||||||||
Offering price per share (net asset value per share plus maximum sales charge of 4.20% of offering price) | $ | 11.70 | $ | 11.90 | $ | 12.29 | $ | 12.00 | $ | 12.21 | $ | 11.58 | ||||||||||||
Class B Shares | ||||||||||||||||||||||||
Net assets | N/A | $ | 1,499,219 | N/A | $ | 546,217 | $ | 2,064,664 | N/A | |||||||||||||||
Shares outstanding | N/A | 131,438 | N/A | 47,474 | 176,974 | N/A | ||||||||||||||||||
Net asset value and offering price per share | N/A | $ | 11.41 | N/A | $ | 11.51 | $ | 11.67 | N/A | |||||||||||||||
Class C Shares | ||||||||||||||||||||||||
Net assets | $ | 52,450,572 | $ | 63,377,596 | $ | 30,129,430 | $ | 33,690,384 | $ | 68,343,616 | $ | 12,541,702 | ||||||||||||
Shares outstanding | 4,684,372 | 5,557,619 | 2,562,714 | 2,935,040 | 5,864,034 | 1,130,037 | ||||||||||||||||||
Net asset value and offering price per share | $ | 11.20 | $ | 11.40 | $ | 11.76 | $ | 11.48 | $ | 11.65 | $ | 11.10 | ||||||||||||
Class I Shares | ||||||||||||||||||||||||
Net assets | $ | 14,367,759 | $ | 15,992,373 | $ | 23,887,252 | $ | 187,303,779 | $ | 168,949,352 | $ | 32,781,535 | ||||||||||||
Shares outstanding | 1,276,339 | 1,402,306 | 2,030,964 | 16,290,675 | 14,484,762 | 2,947,996 | ||||||||||||||||||
Net asset value and offering price per share | $ | 11.26 | $ | 11.40 | $ | 11.76 | $ | 11.50 | $ | 11.66 | $ | 11.12 | ||||||||||||
Net assets consist of: | ||||||||||||||||||||||||
Capital paid-in | $ | 200,257,974 | $ | 409,396,306 | $ | 191,666,831 | $ | 422,479,462 | $ | 514,154,530 | $ | 89,188,398 | ||||||||||||
Undistributed (Over-distribution of) net investment income | 434,695 | (18,919 | ) | 432,876 | 1,010,474 | 2,175,264 | 209,726 | |||||||||||||||||
Accumulated net realized gain (loss) | 1,774,721 | (3,710,023 | ) | (1,966,080 | ) | (1,029,477 | ) | (2,695,613 | ) | (412,400 | ) | |||||||||||||
Net unrealized appreciation (depreciation) | 15,685,343 | 35,286,284 | 17,349,925 | 32,601,040 | 43,165,244 | 7,461,354 | ||||||||||||||||||
Net assets | $ | 218,152,733 | $ | 440,953,648 | $ | 207,483,552 | $ | 455,061,499 | $ | 556,799,425 | $ | 96,447,078 | ||||||||||||
Authorized shares | Unlimited | Unlimited | Unlimited | Unlimited | Unlimited | Unlimited | ||||||||||||||||||
Par value per share | $ | 0.01 | $ | 0.01 | $ | 0.01 | $ | 0.01 | $ | 0.01 | $ | 0.01 | ||||||||||||
| N/A – | Kansas, Michigan and Wisconsin do not offer Class B Shares. Class B Shares of Kansas, Michigan and Wisconsin converted to Class A Shares at the close of business on February 15, 2012 and are no longer available for dividend reinvestment or through an exchange from other Nuveen mutual funds. |
See accompanying notes to financial statements.
| 84 | Nuveen Investments |
Year Ended May 31, 2012
| Kansas | Kentucky | Michigan | Missouri | Ohio | Wisconsin | |||||||||||||||||||
Investment Income | $ | 9,202,958 | $ | 20,522,598 | $ | 9,986,459 | $ | 14,509,062 | $ | 25,070,388 | $ | 4,058,661 | ||||||||||||
Expenses | ||||||||||||||||||||||||
Management fees | 983,913 | 2,137,056 | 1,049,700 | 1,487,992 | 2,514,883 | 444,464 | ||||||||||||||||||
12b-1 service fees – Class A | 272,395 | 690,267 | 305,618 | 411,172 | 603,967 | 97,142 | ||||||||||||||||||
12b-1 distribution and service fees – Class B | N/A | 18,653 | N/A | 7,671 | 21,529 | N/A | ||||||||||||||||||
12b-1 distribution and service fees – Class C | 323,031 | 426,045 | 220,007 | 222,631 | 478,719 | 77,673 | ||||||||||||||||||
Shareholders’ servicing agent fees and expenses | 72,058 | 152,185 | 97,008 | 102,167 | 227,771 | 35,058 | ||||||||||||||||||
Interest expense on floating rate obligations | 54,982 | 19,628 | — | 7,334 | — | — | ||||||||||||||||||
Custodian’s fees and expenses | 34,156 | 65,291 | 37,449 | 46,495 | 77,631 | 19,609 | ||||||||||||||||||
Trustees’ fees and expenses | 5,531 | 12,183 | 5,972 | 8,539 | 14,429 | 2,568 | ||||||||||||||||||
Professional fees | 40,645 | 60,757 | 42,262 | 45,941 | 67,053 | 31,526 | ||||||||||||||||||
Shareholders’ reports – printing and mailing expenses | 27,589 | 59,318 | 33,756 | 35,375 | 76,347 | 16,488 | ||||||||||||||||||
Federal and state registration fees | 4,470 | 4,394 | 1,066 | 25,646 | 7,435 | 2,548 | ||||||||||||||||||
Reorganization expense | — | — | — | 24,000 | 29,000 | — | ||||||||||||||||||
Other expenses | 8,995 | 13,878 | 9,580 | 12,210 | 16,765 | 6,770 | ||||||||||||||||||
Total expenses before custodian fee credit | 1,827,765 | 3,659,655 | 1,802,418 | 2,437,173 | 4,135,529 | 733,846 | ||||||||||||||||||
Custodian fee credit | (3,295 | ) | (3,903 | ) | (869 | ) | (1,873 | ) | (1,883 | ) | (1,461 | ) | ||||||||||||
Net expenses | 1,824,470 | 3,655,752 | 1,801,549 | 2,435,300 | 4,133,646 | 732,385 | ||||||||||||||||||
Net investment income (loss) | 7,378,488 | 16,866,846 | 8,184,910 | 12,073,762 | 20,936,742 | 3,326,276 | ||||||||||||||||||
Realized and Unrealized Gain (Loss) | ||||||||||||||||||||||||
Net realized gain (loss) from investments | 3,170,557 | 628,279 | 1,038,140 | 241,154 | 2,692,800 | 77,544 | ||||||||||||||||||
Change in unrealized appreciation (depreciation) of investments | 11,261,319 | 26,013,734 | 10,616,833 | 19,118,899 | 26,443,568 | 5,971,539 | ||||||||||||||||||
Net realized and unrealized gain (loss) | 14,431,876 | 26,642,013 | 11,654,973 | 19,360,053 | 29,136,368 | 6,049,083 | ||||||||||||||||||
Net increase (decrease) in net assets from operations | $ | 21,810,364 | $ | 43,508,859 | $ | 19,839,883 | $ | 31,433,815 | $ | 50,073,110 | $ | 9,375,359 | ||||||||||||
| N/A – | Kansas, Michigan and Wisconsin do not offer Class B Shares. Class B Shares of Kansas, Michigan and Wisconsin converted to Class A Shares at the close of business on February 15, 2012 and are no longer available for dividend reinvestment or through an exchange from other Nuveen mutual funds. |
See accompanying notes to financial statements.
| Nuveen Investments | 85 |
Statement of Changes in Net Assets
| Kansas | Kentucky | |||||||||||||||
Year Ended | Year Ended 5/31/11 | Year Ended | Year Ended 5/31/11 | |||||||||||||
Operations | ||||||||||||||||
Net investment income (loss) | $ | 7,378,488 | $ | 7,015,099 | $ | 16,866,846 | $ | 17,951,668 | ||||||||
Net realized gain (loss) from investments | 3,170,557 | (390,853 | ) | 628,279 | 1,150,771 | |||||||||||
Change in net unrealized appreciation (depreciation) of investments | 11,261,319 | (2,096,205 | ) | 26,013,734 | (8,667,600 | ) | ||||||||||
Net increase (decrease) in net assets from operations | 21,810,364 | 4,528,041 | 43,508,859 | 10,434,839 | ||||||||||||
Distributions to Shareholders | ||||||||||||||||
From net investment income: | ||||||||||||||||
Class A | (5,265,199 | ) | (5,015,396 | ) | (14,181,181 | ) | (14,908,075 | ) | ||||||||
Class B | N/A | (50,274 | ) | (66,648 | ) | (126,624 | ) | |||||||||
Class C | (1,467,755 | ) | (1,314,958 | ) | (2,042,205 | ) | (1,983,317 | ) | ||||||||
Class I | (475,234 | ) | (623,380 | ) | (573,751 | ) | (408,545 | ) | ||||||||
Decrease in net assets from distributions to shareholders | (7,208,188 | ) | (7,004,008 | ) | (16,863,785 | ) | (17,426,561 | ) | ||||||||
Fund Share Transactions | ||||||||||||||||
Fund reorganization | — | — | — | — | ||||||||||||
Proceeds from sale of shares | 47,176,523 | 43,211,178 | 43,701,109 | 36,846,739 | ||||||||||||
Proceeds from shares issued to shareholders due to reinvestment of distributions | 4,899,727 | 4,589,760 | 11,128,791 | 11,126,031 | ||||||||||||
| 52,076,250 | 47,800,938 | 54,829,900 | 47,972,770 | |||||||||||||
Cost of shares redeemed | (19,562,372 | ) | (38,447,078 | ) | (40,582,088 | ) | (85,628,061 | ) | ||||||||
Net increase (decrease) in net assets from Fund share transactions | 32,513,878 | 9,353,860 | 14,247,812 | (37,655,291 | ) | |||||||||||
Net increase (decrease) in net assets | 47,116,054 | 6,877,893 | 40,892,886 | (44,647,013 | ) | |||||||||||
Net assets at the beginning of period | 171,036,679 | 164,158,786 | 400,060,762 | 444,707,775 | ||||||||||||
Net assets at the end of period | $ | 218,152,733 | $ | 171,036,679 | $ | 440,953,648 | $ | 400,060,762 | ||||||||
Undistributed (Over-distribution of) net investment income at the end of period | $ | 434,695 | $ | 293,786 | $ | (18,919 | ) | $ | (6,132 | ) | ||||||
| N/A – | Kansas does not offer Class B Shares. Class B Shares of Kansas converted to Class A Shares at the close of business on February 15, 2012 and are no longer available for dividend reinvestment or through an exchange from other Nuveen mutual funds. |
See accompanying notes to financial statements.
| 86 | Nuveen Investments |
| Michigan | Missouri | |||||||||||||||
| Year Ended 5/31/12 | Year Ended 5/31/11 | Year Ended 5/31/12 | Year Ended 5/31/11 | |||||||||||||
Operations | ||||||||||||||||
Net investment income (loss) | $ | 8,184,910 | $ | 8,404,132 | $ | 12,073,762 | $ | 10,342,154 | ||||||||
Net realized gain (loss) from investments | 1,038,140 | 611,209 | 241,154 | 447,590 | ||||||||||||
Change in net unrealized appreciation (depreciation) of investments | 10,616,833 | (2,948,195 | ) | 19,118,899 | (3,965,953 | ) | ||||||||||
Net increase (decrease) in net assets from operations | 19,839,883 | 6,067,146 | 31,433,815 | 6,823,791 | ||||||||||||
Distributions to Shareholders | ||||||||||||||||
From net investment income: | ||||||||||||||||
Class A | (5,939,900 | ) | (6,219,392 | ) | (8,634,006 | ) | (8,455,392 | ) | ||||||||
Class B | N/A | (42,077 | ) | (28,063 | ) | (56,348 | ) | |||||||||
Class C | (1,001,466 | ) | (1,077,189 | ) | (1,088,082 | ) | (1,056,040 | ) | ||||||||
Class I | (866,554 | ) | (855,791 | ) | (2,173,436 | ) | (513,123 | ) | ||||||||
Decrease in net assets from distributions to shareholders | (7,807,920 | ) | (8,194,449 | ) | (11,923,587 | ) | (10,080,903 | ) | ||||||||
Fund Share Transactions | ||||||||||||||||
Fund reorganization | — | — | 176,817,906 | — | ||||||||||||
Proceeds from sale of shares | 19,160,143 | 25,750,124 | 74,290,341 | 33,628,688 | ||||||||||||
Proceeds from shares issued to shareholders due to reinvestment of distributions | 4,341,983 | 4,335,820 | 6,810,577 | 6,536,909 | ||||||||||||
| 23,502,126 | 30,085,944 | 257,918,824 | 40,165,597 | |||||||||||||
Cost of shares redeemed | (26,112,242 | ) | (41,304,933 | ) | (49,400,901 | ) | (45,479,079 | ) | ||||||||
Net increase (decrease) in net assets from Fund share transactions | (2,610,116 | ) | (11,218,989 | ) | 208,517,923 | (5,313,482 | ) | |||||||||
Net increase (decrease) in net assets | 9,421,847 | (13,346,292 | ) | 228,028,151 | (8,570,594 | ) | ||||||||||
Net assets at the beginning of period | 198,061,705 | 211,407,997 | 227,033,348 | 235,603,942 | ||||||||||||
Net assets at the end of period | $ | 207,483,552 | $ | 198,061,705 | $ | 455,061,499 | $ | 227,033,348 | ||||||||
Undistributed (Over-distribution of) net investment income at the end of period | $ | 432,876 | $ | 95,887 | $ | 1,010,474 | $ | 855,161 | ||||||||
| N/A – | Michigan does not offer Class B Shares. Class B Shares of Michigan converted to Class A Shares at the close of business on February 15, 2012 and are no longer available for dividend reinvestment or through an exchange from other Nuveen mutual funds. |
See accompanying notes to financial statements.
| Nuveen Investments | 87 |
Statement of Changes in Net Assets (continued)
| Ohio | Wisconsin | |||||||||||||||
Year Ended 5/31/12 | Year Ended 5/31/11 | Year Ended 5/31/12 | Year Ended 5/31/11 | |||||||||||||
Operations | ||||||||||||||||
Net investment income (loss) | $ | 20,936,742 | $ | 21,411,825 | $ | 3,326,276 | $ | 2,369,774 | ||||||||
Net realized gain (loss) from investments | 2,692,800 | (3,481,898 | ) | 77,544 | (438,486 | ) | ||||||||||
Change in net unrealized appreciation (depreciation) of investments | 26,443,568 | (6,209,949 | ) | 5,971,539 | (53,257 | ) | ||||||||||
Net increase (decrease) in net assets from operations | 50,073,110 | 11,719,978 | 9,375,359 | 1,878,031 | ||||||||||||
Distributions to Shareholders | ||||||||||||||||
From net investment income: | ||||||||||||||||
Class A | (12,572,284 | ) | (13,193,242 | ) | (1,756,455 | ) | (1,769,900 | ) | ||||||||
Class B | (78,365 | ) | (137,109 | ) | N/A | (29,877 | ) | |||||||||
Class C | (2,326,719 | ) | (2,325,318 | ) | (331,505 | ) | (301,821 | ) | ||||||||
Class I | (5,430,554 | ) | (5,073,430 | ) | (1,052,887 | ) | (220,506 | ) | ||||||||
Decrease in net assets from distributions to shareholders | (20,407,922 | ) | (20,729,099 | ) | (3,140,847 | ) | (2,322,104 | ) | ||||||||
Fund Share Transactions | ||||||||||||||||
Fund reorganization | 54,288,873 | — | — | — | ||||||||||||
Proceeds from sale of shares | 52,236,670 | 49,983,840 | 32,770,206 | 24,383,081 | ||||||||||||
Proceeds from shares issued to shareholders due to reinvestment of distributions | 12,405,593 | 11,881,711 | 2,118,693 | 1,587,318 | ||||||||||||
| 118,931,136 | 61,865,551 | 34,888,899 | 25,970,399 | |||||||||||||
Cost of shares redeemed | (57,129,774 | ) | (101,310,911 | ) | (17,666,169 | ) | (16,123,179 | ) | ||||||||
Net increase (decrease) in net assets from Fund share transactions | 61,801,362 | (39,445,360 | ) | 17,222,730 | 9,847,220 | |||||||||||
Net increase (decrease) in net assets | 91,466,550 | (48,454,481 | ) | 23,457,242 | 9,403,147 | |||||||||||
Net assets at the beginning of period | 465,332,875 | 513,787,356 | 72,989,836 | 63,586,689 | ||||||||||||
Net assets at the end of period | $ | 556,799,425 | $ | 465,332,875 | $ | 96,447,078 | $ | 72,989,836 | ||||||||
Undistributed (Over-distribution of) net investment income at the end of period | $ | 2,175,264 | $ | 1,678,087 | $ | 209,726 | $ | 25,819 | ||||||||
| N/A – | Wisconsin does not offer Class B Shares. Class B Shares of Wisconsin converted to Class A Shares at the close of business on February 15, 2012 and are no longer available for dividend reinvestment or through an exchange from other Nuveen mutual funds. |
See accompanying notes to financial statements.
| 88 | Nuveen Investments |
[THIS PAGE INTENTIONALLY LEFT BLANK]
| Nuveen Investments | 89 |
| Selected data for a share outstanding throughout each period: | ||||||||||||||||||||||||||||||||||||
| Class (Commencement Date) | ||||||||||||||||||||||||||||||||||||
| Investment Operations | Less Distributions | |||||||||||||||||||||||||||||||||||
| KANSAS | ||||||||||||||||||||||||||||||||||||
| Year Ended May 31, | Beginning Net Asset Value | Net Invest- ment Income (Loss)(a) | Net Realized/ Unrealized Gain (Loss) | Total | Net Invest- ment Income | Capital Gains(b) | Total | Ending Net Asset Value | Total Return(c) | |||||||||||||||||||||||||||
Class A (1/92) |
| |||||||||||||||||||||||||||||||||||
2012 | $ | 10.37 | $ | .44 | $ | .83 | $ | 1.27 | $ | (.43 | ) | $ | — | $ | (.43 | ) | $ | 11.21 | 12.43 | % | ||||||||||||||||
2011 | 10.48 | .43 | (.11 | ) | .32 | (.43 | ) | — | (.43 | ) | 10.37 | 3.10 | ||||||||||||||||||||||||
2010 | 10.03 | .44 | .44 | .88 | (.43 | ) | — | (.43 | ) | 10.48 | 8.67 | |||||||||||||||||||||||||
2009 | 10.23 | .43 | (.20 | ) | .23 | (.43 | ) | — | (.43 | ) | 10.03 | 2.62 | ||||||||||||||||||||||||
2008 | 10.40 | .43 | (.16 | ) | .27 | (.42 | ) | (.02 | ) | (.44 | ) | 10.23 | 2.70 | |||||||||||||||||||||||
Class C (2/97) |
| |||||||||||||||||||||||||||||||||||
2012 | 10.36 | .37 | .84 | 1.21 | (.37 | ) | — | (.37 | ) | 11.20 | 11.86 | |||||||||||||||||||||||||
2011 | 10.48 | .37 | (.12 | ) | .25 | (.37 | ) | — | (.37 | ) | 10.36 | 2.47 | ||||||||||||||||||||||||
2010 | 10.03 | .38 | .44 | .82 | (.37 | ) | — | (.37 | ) | 10.48 | 8.10 | |||||||||||||||||||||||||
2009 | 10.23 | .38 | (.21 | ) | .17 | (.37 | ) | — | (.37 | ) | 10.03 | 2.05 | ||||||||||||||||||||||||
2008 | 10.40 | .37 | (.15 | ) | .22 | (.37 | ) | (.02 | ) | (.39 | ) | 10.23 | 2.17 | |||||||||||||||||||||||
Class I (2/97)(f) |
| |||||||||||||||||||||||||||||||||||
2012 | 10.42 | .46 | .83 | 1.29 | (.45 | ) | — | (.45 | ) | 11.26 | 12.62 | |||||||||||||||||||||||||
2011 | 10.53 | .45 | (.11 | ) | .34 | (.45 | ) | — | (.45 | ) | 10.42 | 3.32 | ||||||||||||||||||||||||
2010 | 10.07 | .46 | .45 | .91 | (.45 | ) | — | (.45 | ) | 10.53 | 8.96 | |||||||||||||||||||||||||
2009 | 10.27 | .45 | (.20 | ) | .25 | (.45 | ) | — | (.45 | ) | 10.07 | 2.82 | ||||||||||||||||||||||||
2008 | 10.45 | .45 | (.16 | ) | .29 | (.45 | ) | (.02 | ) | (.47 | ) | 10.27 | 2.83 | |||||||||||||||||||||||
| 90 | Nuveen Investments |
| Ratios/Supplemental Data | ||||||||||||||||||
| Ratios to Average Net Assets(d) | ||||||||||||||||||
| Ending Net Assets (000) | Expenses Including Interest(e) | Expenses Excluding Interest | Net Invest- ment Income (Loss) | Portfolio Turnover Rate | ||||||||||||||
| $ | 151,334 | .86 | % | .83 | % | 4.03 | % | 36 | % | |||||||||
| 122,629 | .83 | .82 | 4.12 | 16 | ||||||||||||||
| 120,162 | .84 | .84 | 4.27 | 18 | ||||||||||||||
| 110,130 | .85 | .85 | 4.38 | 13 | ||||||||||||||
| 94,259 | .87 | .87 | 4.12 | 16 | ||||||||||||||
| 52,451 | 1.40 | 1.37 | 3.47 | 36 | ||||||||||||||
| 36,864 | 1.38 | 1.37 | 3.58 | 16 | ||||||||||||||
| 33,948 | 1.39 | 1.39 | 3.71 | 18 | ||||||||||||||
| 25,570 | 1.40 | 1.40 | 3.83 | 13 | ||||||||||||||
| 21,090 | 1.42 | 1.42 | 3.57 | 16 | ||||||||||||||
| 14,368 | .65 | .62 | 4.22 | 36 | ||||||||||||||
| 10,648 | .63 | .62 | 4.29 | 16 | ||||||||||||||
| 7,960 | .64 | .64 | 4.47 | 18 | ||||||||||||||
| 5,069 | .65 | .65 | 4.58 | 13 | ||||||||||||||
| 4,293 | .67 | .67 | 4.31 | 16 | ||||||||||||||
| (a) | Per share Net Investment Income (Loss) is calculated using the average daily shares method. |
| (b) | Distributions from Capital Gains include short-term capital gains, if any. |
| (c) | Total return is the combination of changes in net asset value without any sales charge, reinvested dividend income at net asset value and reinvested capital gains distributions at net asset value, if any. Total returns are not annualized. |
| (d) | Ratios do not reflect the effect of custodian fee credits earned on the Fund’s net cash on deposit with the custodian bank, where applicable. |
| (e) | The expense ratios reflect, among other things, the interest expense deemed to have been paid by the Fund on the floating rate certificates issued by the special purpose trusts for the self-deposited inverse floaters held by the Fund, where applicable, as described in Footnote 1 – General Information and Significant Accounting Policies, Inverse Floating Rate Securities. |
| (f) | Effective May 1, 2008, Class R Shares were renamed Class I Shares. |
See accompanying notes to financial statements.
| Nuveen Investments | 91 |
Financial Highlights (continued)
| Selected data for a share outstanding throughout each period: | ||||||||||||||||||||||||||||||||||||
| Class (Commencement Date) | ||||||||||||||||||||||||||||||||||||
| Investment Operations | Less Distributions | |||||||||||||||||||||||||||||||||||
| KENTUCKY | ||||||||||||||||||||||||||||||||||||
| Year Ended May 31, | Beginning Net Asset Value | Net Invest- ment Income (Loss)(a) | Net Gain | Total | Net | Capital Gains(b) | Total | Ending Net Asset Value | Total Return(c) | |||||||||||||||||||||||||||
Class A (5/87) |
| |||||||||||||||||||||||||||||||||||
2012 | $ | 10.69 | $ | .46 | $ | .70 | $ | 1.16 | $ | (.45 | ) | $ | — | $ | (.45 | ) | $ | 11.40 | 11.10 | % | ||||||||||||||||
2011 | 10.85 | .46 | (.18 | ) | .28 | (.44 | ) | — | (.44 | ) | 10.69 | 2.68 | ||||||||||||||||||||||||
2010 | 10.39 | .44 | .46 | .90 | (.44 | ) | — | * | (.44 | ) | 10.85 | 8.81 | ||||||||||||||||||||||||
2009 | 10.78 | .44 | (.32 | ) | .12 | (.44 | ) | (.07 | ) | (.51 | ) | 10.39 | 1.33 | |||||||||||||||||||||||
2008 | 10.96 | .44 | (.16 | ) | .28 | (.44 | ) | (.02 | ) | (.46 | ) | 10.78 | 2.63 | |||||||||||||||||||||||
Class B (2/97) |
| |||||||||||||||||||||||||||||||||||
2012 | 10.70 | .37 | .71 | 1.08 | (.37 | ) | — | (.37 | ) | 11.41 | 10.20 | |||||||||||||||||||||||||
2011 | 10.85 | .38 | (.16 | ) | .22 | (.37 | ) | — | (.37 | ) | 10.70 | 2.03 | ||||||||||||||||||||||||
2010 | 10.40 | .36 | .45 | .81 | (.36 | ) | — | * | (.36 | ) | 10.85 | 7.91 | ||||||||||||||||||||||||
2009 | 10.79 | .36 | (.32 | ) | .04 | (.36 | ) | (.07 | ) | (.43 | ) | 10.40 | .56 | |||||||||||||||||||||||
2008 | 10.97 | .36 | (.17 | ) | .19 | (.35 | ) | (.02 | ) | (.37 | ) | 10.79 | 1.85 | |||||||||||||||||||||||
Class C (10/93) |
| |||||||||||||||||||||||||||||||||||
2012 | 10.70 | .39 | .71 | 1.10 | (.40 | ) | — | (.40 | ) | 11.40 | 10.44 | |||||||||||||||||||||||||
2011 | 10.85 | .40 | (.16 | ) | .24 | (.39 | ) | — | (.39 | ) | 10.70 | 2.22 | ||||||||||||||||||||||||
2010 | 10.39 | .38 | .46 | .84 | (.38 | ) | — | * | (.38 | ) | 10.85 | 8.20 | ||||||||||||||||||||||||
2009 | 10.79 | .38 | (.33 | ) | .05 | (.38 | ) | (.07 | ) | (.45 | ) | 10.39 | .64 | |||||||||||||||||||||||
2008 | 10.96 | .38 | (.15 | ) | .23 | (.38 | ) | (.02 | ) | (.40 | ) | 10.79 | 2.15 | |||||||||||||||||||||||
Class I (2/97)(f) |
| |||||||||||||||||||||||||||||||||||
2012 | 10.70 | .48 | .70 | 1.18 | (.48 | ) | — | (.48 | ) | 11.40 | 11.24 | |||||||||||||||||||||||||
2011 | 10.85 | .48 | (.16 | ) | .32 | (.47 | ) | — | (.47 | ) | 10.70 | 3.01 | ||||||||||||||||||||||||
2010 | 10.39 | .47 | .45 | .92 | (.46 | ) | — | * | (.46 | ) | 10.85 | 9.00 | ||||||||||||||||||||||||
2009 | 10.79 | .46 | (.33 | ) | .13 | (.46 | ) | (.07 | ) | (.53 | ) | 10.39 | 1.41 | |||||||||||||||||||||||
2008 | 10.96 | .46 | (.15 | ) | .31 | (.46 | ) | (.02 | ) | (.48 | ) | 10.79 | 2.90 | |||||||||||||||||||||||
| 92 | Nuveen Investments |
| Ratios/Supplemental Data | ||||||||||||||||||
| Ratios to Average Net Assets(d) | ||||||||||||||||||
| Ending Net Assets (000) | Expenses Including Interest(e) | Expenses Excluding Interest | Net Invest- ment Income (Loss) | Portfolio Turnover Rate | ||||||||||||||
| $ | 360,084 | .80 | % | .80 | % | 4.12 | % | 16 | % | |||||||||
| 334,809 | .80 | .80 | 4.26 | 7 | ||||||||||||||
| 376,621 | .81 | .81 | 4.15 | 9 | ||||||||||||||
| 346,849 | .85 | .82 | 4.28 | 19 | ||||||||||||||
| 362,734 | .89 | .83 | 4.04 | 8 | ||||||||||||||
| 1,499 | 1.55 | 1.55 | 3.38 | 16 | ||||||||||||||
| 2,465 | 1.55 | 1.55 | 3.49 | 7 | ||||||||||||||
| 5,119 | 1.56 | 1.56 | 3.40 | 9 | ||||||||||||||
| 7,289 | 1.60 | 1.57 | 3.52 | 19 | ||||||||||||||
| 9,685 | 1.64 | 1.58 | 3.29 | 8 | ||||||||||||||
| 63,378 | 1.35 | 1.35 | 3.56 | 16 | ||||||||||||||
| 51,820 | 1.35 | 1.35 | 3.71 | 7 | ||||||||||||||
| 55,515 | 1.36 | 1.36 | 3.59 | 9 | ||||||||||||||
| 47,428 | 1.40 | 1.37 | 3.73 | 19 | ||||||||||||||
| 46,588 | 1.44 | 1.38 | 3.49 | 8 | ||||||||||||||
| 15,992 | .60 | .60 | 4.30 | 16 | ||||||||||||||
| 10,967 | .60 | .60 | 4.46 | 7 | ||||||||||||||
| 7,453 | .61 | .61 | 4.35 | 9 | ||||||||||||||
| 3,394 | .65 | .62 | 4.48 | 19 | ||||||||||||||
| 2,891 | .69 | .63 | 4.24 | 8 | ||||||||||||||
| (a) | Per share Net Investment Income (Loss) is calculated using the average daily shares method. |
| (b) | Distributions from Capital Gains include short-term capital gains, if any. |
| (c) | Total return is the combination of changes in net asset value without any sales charge, reinvested dividend income at net asset value and reinvested capital gains distributions at net asset value, if any. Total returns are not annualized. |
| (d) | Ratios do not reflect the effect of custodian fee credits earned on the Fund’s net cash on deposit with the custodian bank, where applicable. |
| (e) | The expense ratios reflect, among other things, the interest expense deemed to have been paid by the Fund on the floating rate certificates issued by the special purpose trusts for the self-deposited inverse floaters held by the Fund, where applicable, as described in Footnote 1 – General Information and Significant Accounting Policies, Inverse Floating Rate Securities. |
| (f) | Effective May 1, 2008, Class R Shares were renamed Class I Shares. |
| * | Rounds to less than $.01 per share. |
See accompanying notes to financial statements.
| Nuveen Investments | 93 |
Financial Highlights (continued)
| Selected data for a share outstanding throughout each period: | ||||||||||||||||||||||||||||||||||||
| Class (Commencement Date) | ||||||||||||||||||||||||||||||||||||
| Investment Operations | Less Distributions | |||||||||||||||||||||||||||||||||||
| MICHIGAN | ||||||||||||||||||||||||||||||||||||
| Year Ended May 31, | Beginning Net Asset Value | Net Invest- ment Income (Loss)(a) | Net Realized/ Unrealized Gain (Loss) | Total | Net Invest- ment Income | Capital Gains(b) | Total | Ending Net Asset Value | Total Return(c) | |||||||||||||||||||||||||||
Class A (6/85) |
| |||||||||||||||||||||||||||||||||||
2012 | $ | 11.08 | $ | .47 | $ | .67 | $ | 1.14 | $ | (.45 | ) | $ | — | $ | (.45 | ) | $ | 11.77 | 10.48 | % | ||||||||||||||||
2011 | 11.19 | .47 | (.12 | ) | .35 | (.46 | ) | — | (.46 | ) | 11.08 | 3.16 | ||||||||||||||||||||||||
2010 | 10.83 | .46 | .36 | .82 | (.46 | ) | — | (.46 | ) | 11.19 | 7.73 | |||||||||||||||||||||||||
2009 | 11.15 | .47 | (.32 | ) | .15 | (.46 | ) | (.01 | ) | (.47 | ) | 10.83 | 1.59 | |||||||||||||||||||||||
2008 | 11.41 | .47 | (.23 | ) | .24 | (.47 | ) | (.03 | ) | (.50 | ) | 11.15 | 2.17 | |||||||||||||||||||||||
Class C (6/93) |
| |||||||||||||||||||||||||||||||||||
2012 | 11.08 | .41 | .66 | 1.07 | (.39 | ) | — | (.39 | ) | 11.76 | 9.81 | |||||||||||||||||||||||||
2011 | 11.18 | .41 | (.11 | ) | .30 | (.40 | ) | — | (.40 | ) | 11.08 | 2.70 | ||||||||||||||||||||||||
2010 | 10.83 | .40 | .35 | .75 | (.40 | ) | — | (.40 | ) | 11.18 | 7.05 | |||||||||||||||||||||||||
2009 | 11.15 | .42 | (.33 | ) | .09 | (.40 | ) | (.01 | ) | (.41 | ) | 10.83 | 1.04 | |||||||||||||||||||||||
2008 | 11.40 | .41 | (.23 | ) | .18 | (.40 | ) | (.03 | ) | (.43 | ) | 11.15 | 1.67 | |||||||||||||||||||||||
Class I (2/97)(f) |
| |||||||||||||||||||||||||||||||||||
2012 | 11.08 | .49 | .66 | 1.15 | (.47 | ) | — | (.47 | ) | 11.76 | 10.59 | |||||||||||||||||||||||||
2011 | 11.18 | .49 | (.11 | ) | .38 | (.48 | ) | — | (.48 | ) | 11.08 | 3.46 | ||||||||||||||||||||||||
2010 | 10.83 | .48 | .36 | .84 | (.49 | ) | — | (.49 | ) | 11.18 | 7.87 | |||||||||||||||||||||||||
2009 | 11.15 | .50 | (.32 | ) | .18 | (.49 | ) | (.01 | ) | (.50 | ) | 10.83 | 1.82 | |||||||||||||||||||||||
2008 | 11.41 | .49 | (.23 | ) | .26 | (.49 | ) | (.03 | ) | (.52 | ) | 11.15 | 2.39 | |||||||||||||||||||||||
| 94 | Nuveen Investments |
| Ratios/Supplemental Data | ||||||||||||||||||
| Ratios to Average Net Assets(d) | ||||||||||||||||||
| Ending Net Assets (000) | Expenses Including Interest(e) | Expenses Excluding Interest | Net Invest- ment Income (Loss) | Portfolio Turnover Rate | ||||||||||||||
| $ | 153,467 | .84 | % | .84 | % | 4.12 | % | 12 | % | |||||||||
| 148,020 | .84 | .84 | 4.22 | 6 | ||||||||||||||
| 159,191 | .85 | .85 | 4.18 | 11 | ||||||||||||||
| 151,852 | .86 | .86 | 4.45 | 9 | ||||||||||||||
| 159,696 | .86 | .85 | 4.14 | 14 | ||||||||||||||
| 30,129 | 1.38 | 1.38 | 3.58 | 12 | ||||||||||||||
| 29,681 | 1.39 | 1.39 | 3.67 | 6 | ||||||||||||||
| 30,655 | 1.40 | 1.40 | 3.63 | 11 | ||||||||||||||
| 32,068 | 1.41 | 1.41 | 3.90 | 9 | ||||||||||||||
| 35,814 | 1.41 | 1.40 | 3.59 | 14 | ||||||||||||||
| 23,887 | .63 | .63 | 4.32 | 12 | ||||||||||||||
| 19,397 | .64 | .64 | 4.42 | 6 | ||||||||||||||
| 19,888 | .65 | .65 | 4.38 | 11 | ||||||||||||||
| 18,297 | .66 | .66 | 4.65 | 9 | ||||||||||||||
| 19,100 | .66 | .65 | 4.34 | 14 | ||||||||||||||
| (a) | Per share Net Investment Income (Loss) is calculated using the average daily shares method. |
| (b) | Distributions from Capital Gains include short-term capital gains, if any. |
| (c) | Total return is the combination of changes in net asset value without any sales charge, reinvested dividend income at net asset value and reinvested capital gains distributions at net asset value, if any. Total returns are not annualized. |
| (d) | Ratios do not reflect the effect of custodian fee credits earned on the Fund’s net cash on deposit with the custodian bank, where applicable. |
| (e) | The expense ratios reflect, among other things, the interest expense deemed to have been paid by the Fund on the floating rate certificates issued by the special purpose trusts for the self-deposited inverse floaters held by the Fund, where applicable, as described in Footnote 1 – General Information and Significant Accounting Policies, Inverse Floating Rate Securities. |
| (f) | Effective May 1, 2008, Class R Shares were renamed Class I Shares. |
See accompanying notes to financial statements.
| Nuveen Investments | 95 |
Financial Highlights (continued)
| Selected data for a share outstanding throughout each period: | ||||||||||||||||||||||||||||||||||||
| Class (Commencement Date) | ||||||||||||||||||||||||||||||||||||
| Investment Operations | Less Distributions | |||||||||||||||||||||||||||||||||||
| MISSOURI | ||||||||||||||||||||||||||||||||||||
| Year Ended May 31, | Beginning Net Asset Value | Net Invest- ment Income (Loss)(a) | Net Realized/ Unrealized Gain (Loss) | Total | Net Invest- ment Income | Capital Gains(b) | Total | Ending Net Asset Value | Total Return(c) | |||||||||||||||||||||||||||
Class A (8/87) |
| |||||||||||||||||||||||||||||||||||
2012 | $ | 10.70 | $ | .48 | $ | .79 | $ | 1.27 | $ | (.47 | ) | $ | — | $ | (.47 | ) | $ | 11.50 | 12.08 | % | ||||||||||||||||
2011 | 10.82 | .48 | (.13 | ) | .35 | (.47 | ) | — | (.47 | ) | 10.70 | 3.30 | ||||||||||||||||||||||||
2010 | 10.14 | .48 | .66 | 1.14 | (.46 | ) | — | (.46 | ) | 10.82 | 11.49 | |||||||||||||||||||||||||
2009 | 10.73 | .47 | (.56 | ) | (.09 | ) | (.45 | ) | (.05 | ) | (.50 | ) | 10.14 | (.52 | ) | |||||||||||||||||||||
2008 | 11.03 | .45 | (.28 | ) | .17 | (.45 | ) | (.02 | ) | (.47 | ) | 10.73 | 1.59 | |||||||||||||||||||||||
Class B (2/97) |
| |||||||||||||||||||||||||||||||||||
2012 | 10.71 | .40 | .79 | 1.19 | (.39 | ) | — | (.39 | ) | 11.51 | 11.24 | |||||||||||||||||||||||||
2011 | 10.83 | .40 | (.13 | ) | .27 | (.39 | ) | — | (.39 | ) | 10.71 | 2.55 | ||||||||||||||||||||||||
2010 | 10.15 | .40 | .67 | 1.07 | (.39 | ) | — | (.39 | ) | 10.83 | 10.69 | |||||||||||||||||||||||||
2009 | 10.74 | .39 | (.55 | ) | (.16 | ) | (.38 | ) | (.05 | ) | (.43 | ) | 10.15 | (1.26 | ) | |||||||||||||||||||||
2008 | 11.04 | .37 | (.28 | ) | .09 | (.37 | ) | (.02 | ) | (.39 | ) | 10.74 | .81 | |||||||||||||||||||||||
Class C (2/94) |
| |||||||||||||||||||||||||||||||||||
2012 | 10.68 | .41 | .80 | 1.21 | (.41 | ) | — | (.41 | ) | 11.48 | 11.50 | |||||||||||||||||||||||||
2011 | 10.80 | .42 | (.13 | ) | .29 | (.41 | ) | — | (.41 | ) | 10.68 | 2.74 | ||||||||||||||||||||||||
2010 | 10.13 | .42 | .66 | 1.08 | (.41 | ) | — | (.41 | ) | 10.80 | 10.83 | |||||||||||||||||||||||||
2009 | 10.72 | .41 | (.55 | ) | (.14 | ) | (.40 | ) | (.05 | ) | (.45 | ) | 10.13 | (1.06 | ) | |||||||||||||||||||||
2008 | 11.02 | .39 | (.28 | ) | .11 | (.39 | ) | (.02 | ) | (.41 | ) | 10.72 | 1.03 | |||||||||||||||||||||||
Class I (2/97)(f) |
| |||||||||||||||||||||||||||||||||||
2012 | 10.70 | .48 | .81 | 1.29 | (.49 | ) | — | (.49 | ) | 11.50 | 12.28 | |||||||||||||||||||||||||
2011 | 10.82 | .50 | (.13 | ) | .37 | (.49 | ) | — | (.49 | ) | 10.70 | 3.52 | ||||||||||||||||||||||||
2010 | 10.14 | .50 | .67 | 1.17 | (.49 | ) | — | (.49 | ) | 10.82 | 11.74 | |||||||||||||||||||||||||
2009 | 10.73 | .49 | (.55 | ) | (.06 | ) | (.48 | ) | (.05 | ) | (.53 | ) | 10.14 | (.29 | ) | |||||||||||||||||||||
2008 | 11.03 | .47 | (.28 | ) | .19 | (.47 | ) | (.02 | ) | (.49 | ) | 10.73 | 1.81 | |||||||||||||||||||||||
| 96 | Nuveen Investments |
| Ratios/Supplemental Data | ||||||||||||||||||
| Ratios to Average Net Assets(d) | ||||||||||||||||||
| Ending Net Assets (000) | Expenses Including Interest(e) | Expenses Excluding Interest | Net Invest- ment Income (Loss) | Portfolio Turnover Rate | ||||||||||||||
| $ | 233,521 | .83 | % | .83 | % | 4.28 | % | 8 | % | |||||||||
| 187,844 | .82 | .82 | 4.48 | 6 | ||||||||||||||
| 196,974 | .83 | .83 | 4.52 | 6 | ||||||||||||||
| 183,868 | .86 | .84 | 4.68 | 12 | ||||||||||||||
| 195,691 | .87 | .84 | 4.16 | 14 | ||||||||||||||
| 546 | 1.57 | 1.57 | 3.58 | 8 | ||||||||||||||
| 1,117 | 1.57 | 1.57 | 3.71 | 6 | ||||||||||||||
| 2,439 | 1.58 | 1.58 | 3.79 | 6 | ||||||||||||||
| 3,533 | 1.61 | 1.59 | 3.90 | 12 | ||||||||||||||
| 5,785 | 1.62 | 1.59 | 3.41 | 14 | ||||||||||||||
| 33,690 | 1.38 | 1.38 | 3.73 | 8 | ||||||||||||||
| 26,958 | 1.37 | 1.37 | 3.93 | 6 | ||||||||||||||
| 26,957 | 1.38 | 1.38 | 3.97 | 6 | ||||||||||||||
| 22,120 | 1.41 | 1.39 | 4.13 | 12 | ||||||||||||||
| 21,541 | 1.42 | 1.39 | 3.61 | 14 | ||||||||||||||
| 187,304 | .63 | .63 | 4.34 | 8 | ||||||||||||||
| 11,115 | .62 | .62 | 4.67 | 6 | ||||||||||||||
| 9,235 | .63 | .63 | 4.72 | 6 | ||||||||||||||
| 6,224 | .67 | .65 | 4.90 | 12 | ||||||||||||||
| 2,657 | .68 | .65 | 4.36 | 14 | ||||||||||||||
| (a) | Per share Net Investment Income (Loss) is calculated using the average daily shares method. |
| (b) | Distributions from Capital Gains include short-term capital gains, if any. |
| (c) | Total return is the combination of changes in net asset value without any sales charge, reinvested dividend income at net asset value and reinvested capital gains distributions at net asset value, if any. Total returns are not annualized. |
| (d) | Ratios do not reflect the effect of custodian fee credits earned on the Fund’s net cash on deposit with the custodian bank, where applicable. |
| (e) | The expense ratios reflect, among other things, the interest expense deemed to have been paid by the Fund on the floating rate certificates issued by the special purpose trusts for the self-deposited inverse floaters held by the Fund, where applicable, as described in Footnote 1 – General Information and Significant Accounting Policies, Inverse Floating Rate Securities. |
| (f) | Effective May 1, 2008, Class R Shares were renamed Class I Shares. |
See accompanying notes to financial statements.
| Nuveen Investments | 97 |
Financial Highlights (continued)
| Selected data for a share outstanding throughout each period: | ||||||||||||||||||||||||||||||||||||
| Class (Commencement Date) | ||||||||||||||||||||||||||||||||||||
| Investment Operations | Less Distributions | |||||||||||||||||||||||||||||||||||
| OHIO | ||||||||||||||||||||||||||||||||||||
| Year Ended May 31, | Beginning Net Asset Value | Net Invest- ment Income (Loss)(a) | Net Realized/ Unrealized Gain (Loss) | Total | Net Invest- ment Income | Capital Gains(b) | Total | Ending Net Asset Value | Total Return(c) | |||||||||||||||||||||||||||
Class A (6/85) |
| |||||||||||||||||||||||||||||||||||
2012 | $ | 11.01 | $ | .49 | $ | .67 | $ | 1.16 | $ | (.47 | ) | $ | — | $ | (.47 | ) | $ | 11.70 | 10.77 | % | ||||||||||||||||
2011 | 11.18 | .48 | (.18 | ) | .30 | (.47 | ) | — | (.47 | ) | 11.01 | 2.75 | ||||||||||||||||||||||||
2010 | 10.77 | .48 | .39 | .87 | (.46 | ) | — | (.46 | ) | 11.18 | 8.18 | |||||||||||||||||||||||||
2009 | 10.99 | .47 | (.19 | ) | .28 | (.46 | ) | (.04 | ) | (.50 | ) | 10.77 | 2.75 | |||||||||||||||||||||||
2008 | 11.25 | .46 | (.19 | ) | .27 | (.46 | ) | (.07 | ) | (.53 | ) | 10.99 | 2.47 | |||||||||||||||||||||||
Class B (2/97) |
| |||||||||||||||||||||||||||||||||||
2012 | 10.98 | .40 | .68 | 1.08 | (.39 | ) | — | (.39 | ) | 11.67 | 10.00 | |||||||||||||||||||||||||
2011 | 11.16 | .40 | (.19 | ) | .21 | (.39 | ) | — | (.39 | ) | 10.98 | 1.90 | ||||||||||||||||||||||||
2010 | 10.75 | .39 | .40 | .79 | (.38 | ) | — | (.38 | ) | 11.16 | 7.41 | |||||||||||||||||||||||||
2009 | 10.97 | .39 | (.19 | ) | .20 | (.38 | ) | (.04 | ) | (.42 | ) | 10.75 | 1.97 | |||||||||||||||||||||||
2008 | 11.24 | .38 | (.21 | ) | .17 | (.37 | ) | (.07 | ) | (.44 | ) | 10.97 | 1.61 | |||||||||||||||||||||||
Class C (8/93) |
| |||||||||||||||||||||||||||||||||||
2012 | 10.97 | .42 | .67 | 1.09 | (.41 | ) | — | (.41 | ) | 11.65 | 10.13 | |||||||||||||||||||||||||
2011 | 11.15 | .42 | (.19 | ) | .23 | (.41 | ) | — | (.41 | ) | 10.97 | 2.11 | ||||||||||||||||||||||||
2010 | 10.74 | .42 | .39 | .81 | (.40 | ) | — | (.40 | ) | 11.15 | 7.62 | |||||||||||||||||||||||||
2009 | 10.96 | .41 | (.19 | ) | .22 | (.40 | ) | (.04 | ) | (.44 | ) | 10.74 | 2.19 | |||||||||||||||||||||||
2008 | 11.22 | .40 | (.19 | ) | .21 | (.40 | ) | (.07 | ) | (.47 | ) | 10.96 | 1.93 | |||||||||||||||||||||||
Class I (2/97)(f) |
| |||||||||||||||||||||||||||||||||||
2012 | 10.98 | .51 | .67 | 1.18 | (.50 | ) | — | (.50 | ) | 11.66 | 10.94 | |||||||||||||||||||||||||
2011 | 11.15 | .51 | (.19 | ) | .32 | (.49 | ) | — | (.49 | ) | 10.98 | 2.98 | ||||||||||||||||||||||||
2010 | 10.75 | .50 | .38 | .88 | (.48 | ) | — | (.48 | ) | 11.15 | 8.33 | |||||||||||||||||||||||||
2009 | 10.97 | .49 | (.19 | ) | .30 | (.48 | ) | (.04 | ) | (.52 | ) | 10.75 | 2.99 | |||||||||||||||||||||||
2008 | 11.24 | .49 | (.21 | ) | .28 | (.48 | ) | (.07 | ) | (.55 | ) | 10.97 | 2.60 | |||||||||||||||||||||||
| 98 | Nuveen Investments |
| Ratios/Supplemental Data | ||||||||||||||||||
| Ratios to Average Net Assets(d) | ||||||||||||||||||
| Ending Net Assets (000) | Expenses Including Interest(e) | Expenses Excluding Interest | Net Invest- ment Income (Loss) | Portfolio Turnover Rate | ||||||||||||||
| $ | 317,442 | .82 | % | .82 | % | 4.28 | % | 13 | % | |||||||||
| 292,694 | .82 | .82 | 4.40 | 10 | ||||||||||||||
| 330,410 | .82 | .82 | 4.33 | 10 | ||||||||||||||
| 321,253 | .84 | .84 | 4.40 | 9 | ||||||||||||||
| 338,770 | .93 | .84 | 4.16 | 20 | ||||||||||||||
| 2,065 | 1.57 | 1.57 | 3.55 | 13 | ||||||||||||||
| 2,821 | 1.57 | 1.57 | 3.64 | 10 | ||||||||||||||
| 5,034 | 1.58 | 1.58 | 3.58 | 10 | ||||||||||||||
| 7,790 | 1.58 | 1.58 | 3.64 | 9 | ||||||||||||||
| 11,577 | 1.67 | 1.58 | 3.42 | 20 | ||||||||||||||
| 68,344 | 1.37 | 1.37 | 3.73 | 13 | ||||||||||||||
| 60,016 | 1.37 | 1.37 | 3.85 | 10 | ||||||||||||||
| 63,181 | 1.37 | 1.37 | 3.78 | 10 | ||||||||||||||
| 52,693 | 1.39 | 1.39 | 3.85 | 9 | ||||||||||||||
| 50,642 | 1.48 | 1.39 | 3.61 | 20 | ||||||||||||||
| 168,949 | .62 | .62 | 4.48 | 13 | ||||||||||||||
| 109,802 | .62 | .62 | 4.60 | 10 | ||||||||||||||
| 115,162 | .62 | .62 | 4.54 | 10 | ||||||||||||||
| 109,553 | .64 | .64 | 4.60 | 9 | ||||||||||||||
| 116,718 | .73 | .64 | 4.36 | 20 | ||||||||||||||
| (a) | Per share Net Investment Income (Loss) is calculated using the average daily shares method. |
| (b) | Distributions from Capital Gains include short-term capital gains, if any. |
| (c) | Total return is the combination of changes in net asset value without any sales charge, reinvested dividend income at net asset value and reinvested capital gains distributions at net asset value, if any. Total returns are not annualized. |
| (d) | Ratios do not reflect the effect of custodian fee credits earned on the Fund’s net cash on deposit with the custodian bank, where applicable. The Fund did not receive an expense reimbursement from the Adviser during the periods presented herein. |
| (e) | The expense ratios reflect, among other things, the interest expense deemed to have been paid by the Fund on the floating rate certificates issued by the special purpose trusts for the self-deposited inverse floaters held by the Fund, where applicable, as described in Footnote 1 – General Information and Significant Accounting Policies, Inverse Floating Rate Securities. |
| (f) | Effective May 1, 2008, Class R Shares were renamed Class I Shares. |
See accompanying notes to financial statements.
| Nuveen Investments | 99 |
Financial Highlights (continued)
| Selected data for a share outstanding throughout each period: | ||||||||||||||||||||||||||||||||||||
| Class (Commencement Date) | ||||||||||||||||||||||||||||||||||||
| Investment Operations | Less Distributions | |||||||||||||||||||||||||||||||||||
| WISCONSIN | ||||||||||||||||||||||||||||||||||||
| Year Ended May 31, | Beginning Net Asset Value | Net Invest- ment Income (Loss)(a) | Net Realized/ Unrealized Gain (Loss) | Total | Net Invest- ment Income | Capital Gains(b) | Total | Ending Net Asset Value | Total Return(c) | |||||||||||||||||||||||||||
Class A (6/94) |
| |||||||||||||||||||||||||||||||||||
2012 | $ | 10.28 | $ | .43 | $ | .78 | $ | 1.21 | $ | (.40 | ) | $ | — | $ | (.40 | ) | $ | 11.09 | 11.96 | % | ||||||||||||||||
2011 | 10.39 | .39 | (.12 | ) | .27 | (.38 | ) | — | (.38 | ) | 10.28 | 2.71 | ||||||||||||||||||||||||
2010 | 9.95 | .38 | .44 | .82 | (.38 | ) | — | (.38 | ) | 10.39 | 8.42 | |||||||||||||||||||||||||
2009 | 10.09 | .39 | (.14 | ) | .25 | (.38 | ) | (.01 | ) | (.39 | ) | 9.95 | 2.61 | |||||||||||||||||||||||
2008 | 10.24 | .38 | (.13 | ) | .25 | (.38 | ) | (.02 | ) | (.40 | ) | 10.09 | 2.51 | |||||||||||||||||||||||
Class C (2/97) |
| |||||||||||||||||||||||||||||||||||
2012 | 10.30 | .36 | .78 | 1.14 | (.34 | ) | — | (.34 | ) | 11.10 | 11.27 | |||||||||||||||||||||||||
2011 | 10.41 | .33 | (.11 | ) | .22 | (.33 | ) | — | (.33 | ) | 10.30 | 2.17 | ||||||||||||||||||||||||
2010 | 9.96 | .33 | .45 | .78 | (.33 | ) | — | (.33 | ) | 10.41 | 7.94 | |||||||||||||||||||||||||
2009 | 10.11 | .34 | (.16 | ) | .18 | (.32 | ) | (.01 | ) | (.33 | ) | 9.96 | 1.93 | |||||||||||||||||||||||
2008 | 10.26 | .32 | (.12 | ) | .20 | (.33 | ) | (.02 | ) | (.35 | ) | 10.11 | 1.96 | |||||||||||||||||||||||
Class I (2/97)(f) |
| |||||||||||||||||||||||||||||||||||
2012 | 10.31 | .44 | .79 | 1.23 | (.42 | ) | — | (.42 | ) | 11.12 | 12.16 | |||||||||||||||||||||||||
2011 | 10.42 | .42 | (.12 | ) | .30 | (.41 | ) | — | (.41 | ) | 10.31 | 2.92 | ||||||||||||||||||||||||
2010 | 9.97 | .40 | .46 | .86 | (.41 | ) | — | (.41 | ) | 10.42 | 8.73 | |||||||||||||||||||||||||
2009 | 10.12 | .41 | (.15 | ) | .26 | (.40 | ) | (.01 | ) | (.41 | ) | 9.97 | 2.72 | |||||||||||||||||||||||
2008 | 10.28 | .40 | (.13 | ) | .27 | (.41 | ) | (.02 | ) | (.43 | ) | 10.12 | 2.64 | |||||||||||||||||||||||
| 100 | Nuveen Investments |
| Ratios/Supplemental Data | ||||||||||||||||||
| Ratios to Average Net Assets(d) | ||||||||||||||||||
| Ending Net Assets (000) | Expenses Including Interest(e) | Expenses Excluding Interest | Net Invest- ment Income (Loss) | Portfolio Turnover Rate | ||||||||||||||
| $ | 51,124 | .87 | % | .87 | % | 3.94 | % | 19 | % | |||||||||
| 45,101 | .87 | .87 | 3.81 | 14 | ||||||||||||||
| 50,270 | .90 | .90 | 3.75 | 6 | ||||||||||||||
| 46,933 | .89 | .89 | 4.02 | 12 | ||||||||||||||
| 50,640 | .88 | .88 | 3.72 | 3 | ||||||||||||||
| 12,542 | 1.41 | 1.41 | 3.38 | 19 | ||||||||||||||
| 9,105 | 1.42 | 1.42 | 3.26 | 14 | ||||||||||||||
| 9,329 | 1.45 | 1.45 | 3.19 | 6 | ||||||||||||||
| 6,907 | 1.44 | 1.44 | 3.46 | 12 | ||||||||||||||
| 6,512 | 1.43 | 1.43 | 3.17 | 3 | ||||||||||||||
| 32,782 | .66 | .66 | 4.13 | 19 | ||||||||||||||
| 18,236 | .67 | .67 | 4.14 | 14 | ||||||||||||||
| 2,605 | .70 | .70 | 3.94 | 6 | ||||||||||||||
| 1,573 | .69 | .69 | 4.20 | 12 | ||||||||||||||
| 1,506 | .68 | .68 | 3.92 | 3 | ||||||||||||||
| (a) | Per share Net Investment Income (Loss) is calculated using the average daily shares method. |
| (b) | Distributions from Capital Gains include short-term capital gains, if any. |
| (c) | Total return is the combination of changes in net asset value without any sales charge, reinvested dividend income at net asset value and reinvested capital gains distributions at net asset value, if any. Total returns are not annualized. |
| (d) | Ratios do not reflect the effect of custodian fee credits earned on the Fund’s net cash on deposit with the custodian bank, where applicable. |
| (e) | The expense ratios reflect, among other things, the interest expense deemed to have been paid by the Fund on the floating rate certificates issued by the special purpose trusts for the self-deposited inverse floaters held by the Fund, where applicable, as described in Footnote 1 – General Information and Significant Accounting Policies, Inverse Floating Rate Securities. |
| (f) | Effective May 1, 2008, Class R Shares were renamed Class I Shares. |
See accompanying notes to financial statements.
| Nuveen Investments | 101 |
1. General Information and Significant Accounting Policies
General Information
The Nuveen Multistate Trust IV (the “Trust”) is an open-end investment company registered under the Investment Company Act of 1940, as amended. The Trust is comprised of the Nuveen Kansas Municipal Bond Fund (“Kansas”), Nuveen Kentucky Municipal Bond Fund (“Kentucky”), Nuveen Michigan Municipal Bond Fund (“Michigan”), Nuveen Missouri Municipal Bond Fund (“Missouri”), Nuveen Ohio Municipal Bond Fund (“Ohio”) and Nuveen Wisconsin Municipal Bond Fund (“Wisconsin”) (each a “Fund” and collectively, the “Funds”). The Trust was organized as a Massachusetts business trust on July 1, 1996. The Funds were each organized as a series of predecessor trusts or corporations prior to that date.
Each Fund’s investment objective is to provide as high a level of current interest income exempt from regular federal, state and, in some cases, local income taxes as is consistent with preservation of capital. Under normal market conditions, each Fund invests at least 80% of its net assets in municipal bonds that pay interest that is exempt from regular federal and its respective state personal income tax. Each Fund invests at least 80% of its net assets in investment grade municipal bonds rated BBB/Baa or higher at the time of purchase by at least one independent rating agency, or, if unrated, judged by Nuveen Asset Management, LLC (the “Sub-Adviser”), a wholly-owned subsidiary of Nuveen Fund Advisors, Inc. (the “Adviser”), a wholly-owned subsidiary of Nuveen Investments, Inc. (“Nuveen”), to be of comparable quality. Each Fund may invest up to 20% of its net assets in below investment grade municipal bonds, commonly referred to as “high yield” or “junk” bonds. Each Fund may invest up to 15% of its net assets in municipal securities whose interest payments vary inversely with changes in short-term tax-exempt interest rates (i.e., inverse floating rate securities).
The Funds’ most recent prospectus provides further description of each Fund’s investment objective, principal investment strategies, and principal risks.
Effective at the close of business on February 15, 2012, Class B Shares of Kansas, Michigan and Wisconsin converted to Class A Shares and are no longer available for dividend reinvestment or through an exchange from other Nuveen mutual funds.
Significant Accounting Policies
The following is a summary of significant accounting policies followed by the Funds in the preparation of their financial statements in accordance with accounting principles generally accepted in the United States (“U.S. GAAP”).
Investment Valuation
Prices of municipal bonds are provided by a pricing service approved by the Funds’ Board of Trustees. These securities are generally classified as Level 2 for fair value measurement purposes. The pricing service establishes a security’s fair value using methods that may include consideration of the following: yields or prices of investments of comparable quality, type of issue, coupon, maturity and rating, market quotes or indications of value from security dealers, evaluations of anticipated cash flows or collateral, general market conditions and other information and analysis, including the obligor’s credit characteristics considered relevant. In pricing certain securities, particularly less liquid and lower quality securities, the pricing service may consider information about a security, its issuer, or market activity, provided by the Adviser. These securities are generally classified as Level 2 or Level 3 depending on the priority of the significant inputs.
Certain securities may not be able to be priced by the pre-established pricing methods as described above. Such securities may be valued by the Funds’ Board of Trustees or its designee at fair value. These securities generally include, but are not limited to, restricted securities (securities which may not be publicly sold without registration under the Securities Act of 1933, as amended) for which a pricing service is unable to provide a market price; securities whose trading has been formally suspended; debt securities that have gone into default and for which there is no current market quotation; a security whose market price is not available from a pre-established pricing source; a security with respect to which an event has occurred that is likely to materially affect the value of the security after the market has closed but before the calculation of a Fund’s net asset value (as may be the case in non-U.S. markets on which the security is primarily traded) or make it difficult or impossible to obtain a reliable market quotation; and a security whose price, as provided by the pricing service, is not deemed to reflect the security’s fair value. As a general principle, the fair value of a security would appear to be the amount that the owner might reasonably expect to receive for it in a current sale. A variety of factors may be considered in determining the fair value of such securities, which may include consideration of the following: yields or prices of investments of comparable quality, type of issue, coupon, maturity and rating, market quotes or indications of value from security dealers, evaluations of anticipated cash flows or collateral, general market conditions and other information and analysis, including the obligor’s credit characteristics considered relevant. These securities are generally classified as Level 2 or Level 3 depending on the priority of the significant inputs. Regardless of the method employed to value a particular security, all valuations are subject to review by the Funds’ Board of Trustees or its designee.
Refer to Footnote 2 – Fair Value Measurements for further details on the leveling of securities held by the Funds as of the end of the reporting period.
Investment Transactions
Investment transactions are recorded on a trade date basis. Realized gains and losses from transactions are determined on the specific identification method, which is the same basis used for federal income tax purposes. Investments purchased on a when-issued/delayed delivery basis may have extended settlement periods. Any investments so purchased are subject to market fluctuation during
| 102 | Nuveen Investments |
this period. The Funds have instructed the custodian to earmark securities in the Funds’ portfolios with a current value at least equal to the amount of the when-issued/delayed delivery purchase commitments. At May 31, 2012, Kansas, Kentucky, Missouri and Ohio had outstanding when-issued/delayed delivery purchase commitments of $1,891,348, $1,275,000, $4,001,080 and $2,549,481, respectively. There were no such outstanding purchase commitments in any of the other Funds.
Investment Income
Investment income, which reflects the amortization of premiums and includes accretion of discounts for financial reporting purposes, is recorded on an accrual basis. Investment income also reflects paydown gains and losses, if any.
Income Taxes
Each Fund is a separate taxpayer for federal income tax purposes. Each Fund intends to distribute substantially all of its net investment income and net capital gains to shareholders and to otherwise comply with the requirements of Subchapter M of the Internal Revenue Code applicable to regulated investment companies (“RICs”). Therefore, no federal income tax provision is required. Furthermore, each Fund intends to satisfy conditions that will enable interest from municipal securities, which is exempt from regular federal and designated state income taxes, to retain such tax-exempt status when distributed to shareholders of the Funds. Net realized capital gains and ordinary income distributions paid by the Funds are subject to federal taxation.
For all open tax years and all major taxing jurisdictions, management of the Funds has concluded that there are no significant uncertain tax positions that would require recognition in the financial statements. Open tax years are those that are open for examination by taxing authorities (i.e., generally the last four tax year ends and the interim tax period since then). Furthermore, management of the Funds is also not aware of any tax positions for which it is reasonably possible that the total amounts of unrecognized tax benefits will significantly change in the next twelve months.
Dividends and Distributions to Shareholders
The Funds declare dividends from their net investment income daily and pay shareholders monthly. Fund shares begin to accrue dividends on the business day after the day when the monies used to purchase Fund shares are collected by the Funds’ transfer agent.
Net realized capital gains and/or market discount from investment transactions, if any, are declared and distributed to shareholders at least annually. Furthermore, capital gains are distributed only to the extent they exceed available capital loss carryforwards.
Distributions to shareholders of net investment income, net realized capital gains and/or market discount, if any, are recorded on the ex-dividend date. The amount and timing of distributions are determined in accordance with federal income tax regulations, which may differ from U.S. GAAP.
Flexible Sales Charge Program
Class A Shares are generally sold with an up-front sales charge and incur a .20% annual 12b-1 service fee. Class A Share purchases of $1 million or more are sold at net asset value without an up-front sales charge but may be subject to a contingent deferred sales charge (“CDSC”) if redeemed within eighteen months of purchase. Class B Shares were sold without an up-front sales charge but incur a .75% annual 12b-1 distribution fee and a .20% annual 12b-1 service fee. Class B Shares are subject to a CDSC of up to 5% depending upon the length of time the shares are held by the investor (CDSC is reduced to 0% at the end of six years). Class B Shares automatically convert to Class A Shares eight years after purchase. Class C Shares are sold without an up-front sales charge but incur a .55% annual 12b-1 distribution fee and a .20% annual 12b-1 service fee. Class C Shares are subject to a CDSC of 1% if redeemed within twelve months of purchase. Class I Shares are not subject to any sales charge or 12b-1 distribution or service fees.
Inverse Floating Rate Securities
Each Fund is authorized to invest in inverse floating rate securities. An inverse floating rate security is created by depositing a municipal bond, typically with a fixed interest rate, into a special purpose trust created by a broker-dealer. In turn, this trust (a) issues floating rate certificates, in face amounts equal to some fraction of the deposited bond’s par amount or market value, that typically pay short-term tax-exempt interest rates to third parties, and (b) issues to a long-term investor (such as one of the Funds) an inverse floating rate certificate (sometimes referred to as an “inverse floater”) that represents all remaining or residual interest in the trust. The income received by the inverse floater holder varies inversely with the short-term rate paid to the floating rate certificates’ holders, and in most circumstances the inverse floater holder bears substantially all of the underlying bond’s downside investment risk and also benefits disproportionately from any potential appreciation of the underlying bond’s value. The price of an inverse floating rate security will be more volatile than that of the underlying bond because the interest rate is dependent on not only the fixed coupon rate of the underlying bond but also on the short-term interest paid on the floating rate certificates, and because the inverse floating rate security essentially bears the risk of loss of the greater face value of the underlying bond.
A Fund may purchase an inverse floating rate security in a secondary market transaction without first owning the underlying bond (referred to as an “externally-deposited inverse floater”), or instead by first selling a fixed-rate bond to a broker-dealer for deposit into the special purpose trust and receiving in turn the residual interest in the trust (referred to as a “self-deposited inverse floater”). The inverse floater held by a Fund gives the Fund the right (a) to cause the holders of the floating rate certificates to tender their notes at par, and (b) to have the broker transfer the fixed-rate bond held by the trust to the Fund, thereby collapsing the trust. An investment in an externally-deposited inverse floater is identified in the Portfolio of Investments as “(IF) – Inverse floating rate investment.” An
| Nuveen Investments | 103 |
Notes to Financial Statements (continued)
investment in a self-deposited inverse floater is accounted for as a financing transaction. In such instances, a fixed-rate bond deposited into a special purpose trust is identified in the Portfolio of Investments as “(UB) – Underlying bond of an inverse floating rate trust reflected as a financing transaction,” with the Fund accounting for the short-term floating rate certificates issued by the trust as “Floating rate obligations” on the Statement of Assets and Liabilities. In addition, the Fund reflects in “Investment Income” the entire earnings of the underlying bond and recognizes the related interest paid to the holders of the short-term floating rate certificates as “Interest expense on floating rate obligations” on the Statement of Operations.
During the fiscal year ended May 31, 2012, each Fund invested in externally-deposited inverse floaters and/or self-deposited inverse floaters.
Each Fund may also enter into shortfall and forbearance agreements (sometimes referred to as a “recourse trust” or “credit recovery swap”) (such agreements referred to herein as “Recourse Trusts”) with a broker-dealer by which a Fund agrees to reimburse the broker-dealer, in certain circumstances, for the difference between the liquidation value of the fixed-rate bond held by the trust and the liquidation value of the floating rate certificates issued by the trust plus any shortfalls in interest cash flows. Under these agreements, a Fund’s potential exposure to losses related to or on inverse floaters may increase beyond the value of a Fund’s inverse floater investments as a Fund may potentially be liable to fulfill all amounts owed to holders of the floating rate certificates. At period end, any such shortfall is recognized as “Unrealized depreciation on Recourse Trusts” on the Statement of Assets and Liabilities.
At May 31, 2012, each Fund’s maximum exposure to externally-deposited Recourse Trusts was as follows:
| Kansas | Kentucky | Michigan | Missouri | Ohio | Wisconsin | |||||||||||||||||||
Maximum exposure to Recourse Trusts | $ | 5,250,000 | $ | 15,000,000 | $ | 3,150,000 | $ | — | $ | 4,830,000 | $ | 3,000,000 | ||||||||||||
The average floating rate obligations outstanding and average annual interest rate and fees related to self-deposited inverse floaters for the following Funds during the fiscal year ended May 31, 2012, were as follows:
| Kansas | Kentucky | Missouri | ||||||||||
Average floating rate obligations outstanding | $ | 8,331,516 | $ | 3,041,120 | $ | 2,225,000 | ||||||
Average annual interest rate and fees | 0.66 | % | 0.65 | % | 0.33 | % | ||||||
Derivative Financial Instruments
Each Fund is authorized to invest in certain derivative instruments, including foreign currency forwards, futures, options and swap contracts. Although each Fund is authorized to invest in such derivative instruments, and may do so in the future, they did make any such investments during the fiscal year ended May 31, 2012.
Market and Counterparty Credit Risk
In the normal course of business each Fund may invest in financial instruments and enter into financial transactions where risk of potential loss exists due to changes in the market (market risk) or failure of the other party to the transaction to perform (counterparty credit risk). The potential loss could exceed the value of the financial assets recorded on the financial statements. Financial assets, which potentially expose each Fund to counterparty credit risk, consist principally of cash due from counterparties on forward, option and swap transactions, when applicable. The extent of each Fund’s exposure to counterparty credit risk in respect to these financial assets approximates their carrying value as recorded on the Statement of Assets and Liabilities. Futures contracts, when applicable, expose a Fund to minimal counterparty credit risk as they are exchange traded and the exchange’s clearinghouse, which is counterparty to all exchange traded futures, guarantees the futures contracts against default.
Each Fund helps manage counterparty credit risk by entering into agreements only with counterparties the Adviser believes have the financial resources to honor their obligations and by having the Adviser monitor the financial stability of the counterparties. Additionally, counterparties may be required to pledge collateral daily (based on the daily valuation of the financial asset) on behalf of each Fund with a value approximately equal to the amount of any unrealized gain above a pre-determined threshold. Reciprocally, when each Fund has an unrealized loss, the Funds have instructed the custodian to pledge assets of the Funds as collateral with a value approximately equal to the amount of the unrealized loss above a pre-determined threshold. Collateral pledges are monitored and subsequently adjusted if and when the valuations fluctuate, either up or down, by at least the pre-determined threshold amount.
Zero Coupon Securities
Each Fund is authorized to invest in zero coupon securities. A zero coupon security does not pay a regular interest coupon to its holders during the life of the security. Tax-exempt income to the holder of the security comes from accretion of the difference between the original purchase price of the security at issuance and the par value of the security at maturity and is effectively paid at maturity. The market prices of zero coupon securities generally are more volatile than the market prices of securities that pay interest periodically.
Multiclass Operations and Allocations
Income and expenses of the Funds that are not directly attributable to a specific class of shares are prorated among the classes based on the relative settled shares of each class. Expenses directly attributable to a class of shares, which presently only include 12b-1 distribution and service fees, are recorded to the specific class.
Realized and unrealized capital gains and losses of the Funds are prorated among the classes based on the relative net assets of each class.
| 104 | Nuveen Investments |
Custodian Fee Credit
Each Fund has an arrangement with the custodian bank whereby certain custodian fees and expenses are reduced by net credits earned on each Fund’s cash on deposit with the bank. Such deposit arrangements are an alternative to overnight investments. Credits for cash balances may be offset by charges for any days on which a Fund overdraws its account at the custodian bank.
Indemnifications
Under the Trust’s organizational documents, its officers and trustees are indemnified against certain liabilities arising out of the performance of their duties to the Trust. In addition, in the normal course of business, the Trust enters into contracts that provide general indemnifications to other parties. The Trust’s maximum exposure under these arrangements is unknown as this would involve future claims that may be made against the Trust that have not yet occurred. However, the Trust has not had prior claims or losses pursuant to these contracts and expects the risk of loss to be remote.
Use of Estimates
The preparation of financial statements in conformity with U.S. GAAP requires management to make estimates and assumptions that affect the reported amounts of assets and liabilities at the date of the financial statements and the reported amounts of increases and decreases in net assets from operations during the reporting period. Actual results may differ from those estimates.
2. Fair Value Measurements
Fair value is defined as the price that the Funds would receive upon selling an investment or transferring a liability in an orderly transaction to an independent buyer in the principal or most advantageous market for the investment. A three-tier hierarchy is used to maximize the use of observable market data and minimize the use of unobservable inputs and to establish classification of fair value measurements for disclosure purposes. Observable inputs reflect the assumptions market participants would use in pricing the asset or liability. Observable inputs are based on market data obtained from sources independent of the reporting entity. Unobservable inputs reflect the reporting entity’s own assumptions about the assumptions market participants would use in pricing the asset or liability. Unobservable inputs are based on the best information available in the circumstances. The three-tier hierarchy of inputs is summarized in the three broad levels listed below:
| Level 1 – | Quoted prices in active markets for identical securities. | |
| Level 2 – | Other significant observable inputs (including quoted prices for similar securities, interest rates, prepayment speeds, credit risk, etc.). | |
| Level 3 – | Significant unobservable inputs (including management’s assumptions in determining the fair value of investments). |
The inputs or methodologies used for valuing securities are not an indication of the risk associated with investing in those securities. The following is a summary of each Fund’s fair value measurements as of May 31, 2012:
| Kansas | Level 1 | Level 2 | Level 3 | Total | ||||||||||||
Long-Term Investments: | ||||||||||||||||
Municipal Bonds | $ | — | $ | 219,263,701 | $ | — | $ | 219,263,701 | ||||||||
Short-Term Investments: | ||||||||||||||||
Municipal Bonds | — | 3,400,340 | — | 3,400,340 | ||||||||||||
Total | $ | — | $ | 222,664,001 | $ | — | $ | 222,664,001 | ||||||||
| Kentucky | Level 1 | Level 2 | Level 3 | Total | ||||||||||||
Long-Term Investments: | ||||||||||||||||
Municipal Bonds | $ | — | $ | 434,116,069 | $ | — | $ | 434,116,069 | ||||||||
| Michigan | Level 1 | Level 2 | Level 3 | Total | ||||||||||||
Long-Term Investments: | ||||||||||||||||
Municipal Bonds | $ | — | $ | 203,439,320 | $ | — | $ | 203,439,320 | ||||||||
| Missouri | Level 1 | Level 2 | Level 3 | Total | ||||||||||||
Long-Term Investments: | ||||||||||||||||
Municipal Bonds | $ | — | $ | 449,823,649 | $ | — | $ | 449,823,649 | ||||||||
| Ohio | Level 1 | Level 2 | Level 3 | Total | ||||||||||||
Long-Term Investments: | ||||||||||||||||
Municipal Bonds | $ | — | $ | 546,246,621 | $ | — | $ | 546,246,621 | ||||||||
| Wisconsin | Level 1 | Level 2 | Level 3 | Total | ||||||||||||
Long-Term Investments: | ||||||||||||||||
Municipal Bonds | $ | — | $ | 91,786,116 | $ | — | $ | 91,786,116 | ||||||||
During the fiscal year ended May 31, 2012, the Funds recognized no significant transfers to or from Level 1, Level 2 or Level 3.
| Nuveen Investments | 105 |
Notes to Financial Statements (continued)
3. Derivative Instruments and Hedging Activities
The Funds record derivative instruments at fair value, with changes in fair value recognized on the Statement of Operations, when applicable. Even though the Funds’ investments in derivatives may represent economic hedges, they are not considered to be hedge transactions for financial reporting purposes. The Funds did not invest in derivative instruments during the fiscal year ended May 31, 2012.
4. Fund Shares
Transactions in Fund shares were as follows:
| Kansas | ||||||||||||||||
| Year Ended 5/31/12 | Year Ended 5/31/11 | |||||||||||||||
| Shares | Amount | Shares | Amount | |||||||||||||
Shares sold: | ||||||||||||||||
Class A | 2,382,416 | $ | 25,954,110 | 2,373,395 | $ | 24,618,995 | ||||||||||
Class A – automatic conversion of Class B Shares | 45,433 | 504,079 | 47,870 | 498,089 | ||||||||||||
Class B | 2,191 | 23,086 | 133 | 1,364 | ||||||||||||
Class C | 1,343,252 | 14,592,447 | 714,113 | 7,476,577 | ||||||||||||
Class I | 555,842 | 6,102,801 | 1,007,494 | 10,616,153 | ||||||||||||
Shares issued to shareholders due to reinvestment of distributions: | ||||||||||||||||
Class A | 342,330 | 3,704,264 | 331,261 | 3,431,331 | ||||||||||||
Class B | 1,536 | 16,214 | 3,455 | 35,546 | ||||||||||||
Class C | 87,999 | 952,085 | 77,596 | 802,631 | ||||||||||||
Class I | 20,855 | 227,164 | 30,784 | 320,252 | ||||||||||||
| 4,781,854 | 52,076,250 | 4,586,101 | 47,800,938 | |||||||||||||
Shares redeemed: | ||||||||||||||||
Class A | (1,091,581 | ) | (11,828,292 | ) | (2,395,122 | ) | (24,538,356 | ) | ||||||||
Class B | (44,956 | ) | (489,369 | ) | (69,338 | ) | (708,133 | ) | ||||||||
Class B – automatic conversion to Class A Shares | (45,846 | ) | (504,079 | ) | (48,295 | ) | (498,089 | ) | ||||||||
Class C | (303,465 | ) | (3,266,047 | ) | (475,612 | ) | (4,871,031 | ) | ||||||||
Class I | (322,533 | ) | (3,474,585 | ) | (772,173 | ) | (7,831,469 | ) | ||||||||
| (1,808,381 | ) | (19,562,372 | ) | (3,760,540 | ) | (38,447,078 | ) | |||||||||
Net increase (decrease) | 2,973,473 | $ | 32,513,878 | 825,561 | $ | 9,353,860 | ||||||||||
| Kentucky | ||||||||||||||||
| Year Ended 5/31/12 | Year Ended 5/31/11 | |||||||||||||||
| Shares | Amount | Shares | Amount | |||||||||||||
Shares sold: | ||||||||||||||||
Class A | 2,371,170 | $ | 26,346,859 | 1,886,089 | $ | 20,349,081 | ||||||||||
Class A – automatic conversion of Class B Shares | 67,832 | 750,886 | 99,590 | 1,058,354 | ||||||||||||
Class B | 389 | 4,292 | 776 | 8,361 | ||||||||||||
Class C | 945,220 | 10,490,733 | 830,339 | 8,971,206 | ||||||||||||
Class I | 549,539 | 6,108,339 | 606,810 | 6,459,737 | ||||||||||||
Shares issued to shareholders due to reinvestment of distributions: | ||||||||||||||||
Class A | 846,254 | 9,375,162 | 883,038 | 9,470,996 | ||||||||||||
Class B | 4,564 | 50,471 | 8,419 | 90,676 | ||||||||||||
Class C | 127,008 | 1,408,460 | 125,387 | 1,346,496 | ||||||||||||
Class I | 26,522 | 294,698 | 20,305 | 217,863 | ||||||||||||
| 4,938,498 | 54,829,900 | 4,460,753 | 47,972,770 | |||||||||||||
Shares redeemed: | ||||||||||||||||
Class A | (3,011,874 | ) | (33,272,048 | ) | (6,283,503 | ) | (66,823,731 | ) | ||||||||
Class B | (36,064 | ) | (396,032 | ) | (150,915 | ) | (1,618,871 | ) | ||||||||
Class B – automatic conversion to Class A Shares | (67,810 | ) | (750,886 | ) | (99,511 | ) | (1,058,354 | ) | ||||||||
Class C | (357,390 | ) | (3,959,122 | ) | (1,227,623 | ) | (12,998,799 | ) | ||||||||
Class I | (198,867 | ) | (2,204,000 | ) | (288,742 | ) | (3,128,306 | ) | ||||||||
| (3,672,005 | ) | (40,582,088 | ) | (8,050,294 | ) | (85,628,061 | ) | |||||||||
Net increase (decrease) | 1,266,493 | $ | 14,247,812 | (3,589,541 | ) | $ | (37,655,291 | ) | ||||||||
| 106 | Nuveen Investments |
| Michigan | ||||||||||||||||
| Year Ended 5/31/12 | Year Ended 5/31/11 | |||||||||||||||
| Shares | Amount | Shares | Amount | |||||||||||||
Shares sold: | ||||||||||||||||
Class A | 917,339 | $ | 10,495,117 | 1,877,751 | $ | 20,563,436 | ||||||||||
Class A – automatic conversion of Class B Shares | 64,230 | 739,735 | 5,894 | 64,906 | ||||||||||||
Class B | 180 | 2,045 | 505 | 5,611 | ||||||||||||
Class C | 254,078 | 2,912,982 | 229,357 | 2,540,096 | ||||||||||||
Class I | 435,709 | 5,010,264 | 233,116 | 2,576,075 | ||||||||||||
Shares issued to shareholders due to reinvestment of distributions: | ||||||||||||||||
Class A | 289,643 | 3,318,158 | 296,360 | 3,281,905 | ||||||||||||
Class B | 666 | 7,549 | 1,954 | 21,701 | ||||||||||||
Class C | 39,702 | 454,560 | 41,891 | 463,595 | ||||||||||||
Class I | 49,039 | 561,716 | 51,375 | 568,619 | ||||||||||||
| 2,050,586 | 23,502,126 | 2,738,203 | 30,085,944 | |||||||||||||
Shares redeemed: | ||||||||||||||||
Class A | (1,584,843 | ) | (18,120,037 | ) | (3,052,747 | ) | (33,471,462 | ) | ||||||||
Class B | (23,556 | ) | (268,908 | ) | (59,100 | ) | (655,304 | ) | ||||||||
Class B – automatic conversion to Class A Shares | (64,132 | ) | (739,735 | ) | (5,884 | ) | (64,906 | ) | ||||||||
Class C | (410,780 | ) | (4,655,846 | ) | (332,783 | ) | (3,673,986 | ) | ||||||||
Class I | (204,937 | ) | (2,327,716 | ) | (311,963 | ) | (3,439,275 | ) | ||||||||
| (2,288,248 | ) | (26,112,242 | ) | (3,762,477 | ) | (41,304,933 | ) | |||||||||
Net increase (decrease) | (237,662 | ) | $ | (2,610,116 | ) | (1,024,274 | ) | $ | (11,218,989 | ) | ||||||
| Missouri | ||||||||||||||||
| Year Ended 5/31/12 | Year Ended 5/31/11 | |||||||||||||||
| Shares | Amount | Shares | Amount | |||||||||||||
Shares issued from reorganization (1): | ||||||||||||||||
Class A | 2,347,227 | $ | 26,692,203 | — | $ | — | ||||||||||
Class B | — | — | — | — | ||||||||||||
Class C | — | — | — | — | ||||||||||||
Class I | 13,203,086 | 150,125,703 | — | — | ||||||||||||
Shares sold: | ||||||||||||||||
Class A | 3,235,606 | 36,069,843 | 1,710,347 | $ | 18,411,554 | |||||||||||
Class A – automatic conversion of Class B Shares | 33,272 | 367,252 | 86,749 | 934,751 | ||||||||||||
Class B | 98 | 1,090 | 223 | 2,392 | ||||||||||||
Class C | 612,475 | 6,852,081 | 477,585 | 5,106,206 | ||||||||||||
Class I | 2,729,020 | 31,000,075 | 848,162 | 9,173,785 | ||||||||||||
Shares issued to shareholders due to reinvestment of distributions: | ||||||||||||||||
Class A | 522,907 | 5,835,803 | 531,014 | 5,682,728 | ||||||||||||
Class B | 2,207 | 24,465 | 4,608 | 49,518 | ||||||||||||
Class C | 56,805 | 633,613 | 51,573 | 550,919 | ||||||||||||
Class I | 28,238 | 316,696 | 23,688 | 253,744 | ||||||||||||
| 22,770,941 | 257,918,824 | 3,733,949 | 40,165,597 | |||||||||||||
Shares redeemed: | ||||||||||||||||
Class A | (3,388,284 | ) | (37,862,489 | ) | (2,975,284 | ) | (31,580,126 | ) | ||||||||
Class B | (25,907 | ) | (286,251 | ) | (38,996 | ) | (422,667 | ) | ||||||||
Class B – automatic conversion to Class A Shares | (33,243 | ) | (367,252 | ) | (86,676 | ) | (934,751 | ) | ||||||||
Class C | (257,896 | ) | (2,872,792 | ) | (500,716 | ) | (5,313,836 | ) | ||||||||
Class I | (708,877 | ) | (8,012,117 | ) | (686,279 | ) | (7,227,699 | ) | ||||||||
| (4,414,207 | ) | (49,400,901 | ) | (4,287,951 | ) | (45,479,079 | ) | |||||||||
Net increase (decrease) | 18,356,734 | $ | 208,517,923 | (554,002 | ) | $ | (5,313,482 | ) | ||||||||
| (1) | Refer to Footnote 8 – Fund Reorganizations for further details. |
| Nuveen Investments | 107 |
Notes to Financial Statements (continued)
| Ohio | ||||||||||||||||
| Year Ended 5/31/12 | Year Ended 5/31/11 | |||||||||||||||
| Shares | Amount | Shares | Amount | |||||||||||||
Shares issued from reorganization (1): | ||||||||||||||||
Class A | 351,397 | $ | 4,072,374 | — | $ | — | ||||||||||
Class B | — | — | — | — | ||||||||||||
Class C | — | — | — | — | ||||||||||||
Class I | 4,345,610 | 50,216,498 | — | — | ||||||||||||
Shares sold: | ||||||||||||||||
Class A | 2,736,123 | 31,191,510 | 3,114,850 | 34,046,787 | ||||||||||||
Class A – automatic conversion of Class B Shares | 34,397 | 384,024 | 52,855 | 585,666 | ||||||||||||
Class B | 328 | 3,699 | 783 | 8,652 | ||||||||||||
Class C | 946,512 | 10,800,354 | 665,559 | 7,341,378 | ||||||||||||
Class I | 862,023 | 9,857,084 | 730,135 | 8,001,357 | ||||||||||||
Shares issued to shareholders due to reinvestment of distributions: | ||||||||||||||||
Class A | 650,714 | 7,417,263 | 640,290 | 7,054,109 | ||||||||||||
Class B | 5,530 | 62,832 | 7,454 | 81,952 | ||||||||||||
Class C | 115,357 | 1,310,377 | 108,161 | 1,186,730 | ||||||||||||
Class I | 318,148 | 3,615,121 | 324,007 | 3,558,920 | ||||||||||||
| 10,366,139 | 118,931,136 | 5,644,094 | 61,865,551 | |||||||||||||
Shares redeemed: | ||||||||||||||||
Class A | (3,230,124 | ) | (36,696,313 | ) | (6,765,267 | ) | (73,603,132 | ) | ||||||||
Class B | (51,283 | ) | (575,239 | ) | (149,553 | ) | (1,645,195 | ) | ||||||||
Class B – automatic conversion to Class A Shares | (34,470 | ) | (384,024 | ) | (52,955 | ) | (585,666 | ) | ||||||||
Class C | (669,197 | ) | (7,635,125 | ) | (971,277 | ) | (10,508,712 | ) | ||||||||
Class I | (1,044,769 | ) | (11,839,073 | ) | (1,374,841 | ) | (14,968,206 | ) | ||||||||
| (5,029,843 | ) | (57,129,774 | ) | (9,313,893 | ) | (101,310,911 | ) | |||||||||
Net increase (decrease) | 5,336,296 | $ | 61,801,362 | (3,669,799 | ) | $ | (39,445,360 | ) | ||||||||
(1) Refer to Footnote 8 – Fund Reorganizations for further details. |
| |||||||||||||||
| Wisconsin | ||||||||||||||||
| Year Ended 5/31/12 | Year Ended 5/31/11 | |||||||||||||||
| Shares | Amount | Shares | Amount | |||||||||||||
Shares sold: | ||||||||||||||||
Class A | 655,888 | $ | 7,082,522 | 529,620 | $ | 5,440,704 | ||||||||||
Class A – automatic conversion of Class B Shares | 31,997 | 349,636 | 12,220 | 126,145 | ||||||||||||
Class B | 17 | 185 | 27 | 275 | ||||||||||||
Class C | 308,011 | 3,328,514 | 219,215 | 2,277,264 | ||||||||||||
Class I | 2,051,353 | 22,009,349 | 1,646,182 | 16,538,693 | ||||||||||||
Shares issued to shareholders due to reinvestment of distributions: | ||||||||||||||||
Class A | 126,764 | 1,364,196 | 119,375 | 1,224,178 | ||||||||||||
Class B | 867 | 9,212 | 2,157 | 22,262 | ||||||||||||
Class C | 23,849 | 257,127 | 21,518 | 220,905 | ||||||||||||
Class I | 45,350 | 488,158 | 11,718 | 119,973 | ||||||||||||
| 3,244,096 | 34,888,899 | 2,562,032 | 25,970,399 | |||||||||||||
Shares redeemed: | ||||||||||||||||
Class A | (590,272 | ) | (6,289,132 | ) | (1,113,501 | ) | (11,321,640 | ) | ||||||||
Class B | (22,129 | ) | (242,597 | ) | (69,639 | ) | (702,764 | ) | ||||||||
Class B – automatic conversion to Class A Shares | (31,938 | ) | (349,636 | ) | (12,191 | ) | (126,145 | ) | ||||||||
Class C | (86,112 | ) | (910,574 | ) | (252,970 | ) | (2,568,078 | ) | ||||||||
Class I | (917,078 | ) | (9,874,230 | ) | (139,604 | ) | (1,404,552 | ) | ||||||||
| (1,647,529 | ) | (17,666,169 | ) | (1,587,905 | ) | (16,123,179 | ) | |||||||||
Net increase (decrease) | 1,596,567 | $ | 17,222,730 | 974,127 | $ | 9,847,220 | ||||||||||
| 108 | Nuveen Investments |
5. Investment Transactions
Purchases and sales (including maturities but excluding short-term investments, where applicable) during the fiscal year ended May 31, 2012, were as follows:
| Kansas | Kentucky | Michigan | Missouri | Ohio | Wisconsin | |||||||||||||||||||
Purchases | $ | 96,892,385 | $ | 75,664,565 | $ | 23,859,954 | $ | 215,202,001 | $ | 119,211,594 | $ | 29,573,046 | ||||||||||||
Sales and maturities | 68,757,580 | 66,211,034 | 30,323,966 | 23,883,317 | 61,117,179 | 15,713,724 | ||||||||||||||||||
6. Income Tax Information
The following information is presented on an income tax basis. Differences between amounts for financial statement and federal income tax purposes are primarily due to timing differences in recognizing taxable market discount, timing differences in recognizing certain gains and losses on investment transactions and the treatment of investments in inverse floating rate securities reflected as financing transactions, if any. To the extent that differences arise that are permanent in nature, such amounts are reclassified within the capital accounts as detailed below. Temporary differences do not require reclassification. Temporary and permanent differences do not impact the net asset values of the Funds.
At May 31, 2012, the cost and unrealized appreciation (depreciation) of investments as determined on a federal income tax basis, were as follows:
| Kansas | Kentucky | Michigan | Missouri | Ohio | Wisconsin | |||||||||||||||||||
Cost of investments | $ | 197,237,346 | $ | 393,150,533 | $ | 185,911,168 | $ | 414,513,425 | $ | 502,813,918 | $ | 84,269,193 | ||||||||||||
Gross unrealized: | ||||||||||||||||||||||||
Appreciation | $ | 16,319,168 | $ | 35,446,397 | $ | 17,627,736 | $ | 34,809,012 | $ | 43,831,412 | $ | 7,541,281 | ||||||||||||
Depreciation | (312,157 | ) | (130,463 | ) | (99,584 | ) | (1,723,957 | ) | (398,709 | ) | (24,358 | ) | ||||||||||||
Net unrealized appreciation (depreciation) of investments | $ | 16,007,011 | $ | 35,315,934 | $ | 17,528,152 | $ | 33,085,055 | $ | 43,432,703 | $ | 7,516,923 | ||||||||||||
Permanent differences, primarily due to federal taxes paid, taxable market discount, nondeductible reorganizational expenses and reorganizational adjustments, resulted in reclassifications among the Funds’ components of net assets at May 31, 2012, the Funds’ tax year end, as follows:
| Kansas | Kentucky | Michigan | Missouri | Ohio | Wisconsin | |||||||||||||||||||
Capital paid-in | $ | 6,250 | $ | — | $ | 9,032 | �� | $ | (13,420 | ) | $ | 941,972 | $ | 517 | ||||||||||
Undistributed (Over-distribution of) net investment income | (29,391 | ) | (15,848 | ) | (40,001 | ) | 5,138 | (31,643 | ) | (1,522 | ) | |||||||||||||
Accumulated net realized gain (loss) | 23,141 | 15,848 | 30,969 | 8,282 | (910,329 | ) | 1,005 | |||||||||||||||||
The tax components of undistributed net tax-exempt income, net ordinary income and net long-term capital gains at May 31, 2012, the Funds’ tax year end, were as follows:
| Kansas | Kentucky | Michigan | Missouri | Ohio | Wisconsin | |||||||||||||||||||
Undistributed net tax-exempt income* | $ | 789,594 | $ | 1,320,859 | $ | 903,914 | $ | 2,072,017 | $ | 3,711,557 | $ | 436,610 | ||||||||||||
Undistributed net ordinary income** | 41,387 | 10,914 | — | 10,886 | 58,062 | 6,012 | ||||||||||||||||||
Undistributed net long-term capital gains | 1,697,215 | — | — | 2,167 | — | — | ||||||||||||||||||
| * | Undistributed net tax-exempt income (on a tax basis) has not been reduced for the dividends declared during the period May 1, 2012 through May 31, 2012, and paid on June 1, 2012. |
| ** | Net ordinary income consists of taxable market discount income and net short-term capital gains, if any. |
The tax character of distributions paid during the Funds’ tax years ended May 31, 2012 and May 31, 2011, was designated for purposes of the dividends paid deduction as follows:
| 2012 | Kansas | Kentucky | Michigan | Missouri | Ohio | Wisconsin | ||||||||||||||||||
Distributions from net tax-exempt income*** | $ | 7,140,628 | $ | 16,883,775 | $ | 7,817,648 | $ | 11,193,335 | $ | 19,950,770 | $ | 3,075,226 | ||||||||||||
Distributions from net ordinary income** | — | — | — | — | 240,637 | — | ||||||||||||||||||
Distributions from net long-term capital gains | — | — | — | — | — | — | ||||||||||||||||||
| 2011 | Kansas | Kentucky | Michigan | Missouri | Ohio | Wisconsin | ||||||||||||||||||
Distributions from net tax-exempt income | $ | 6,971,310 | $ | 17,493,087 | $ | 8,250,957 | $ | 10,102,147 | $ | 20,457,840 | $ | 2,289,195 | ||||||||||||
Distributions from net ordinary income** | — | — | — | — | 373,843 | — | ||||||||||||||||||
Distributions from net long-term capital gains | — | — | — | — | — | — | ||||||||||||||||||
| ** | Net ordinary income consists of taxable market discount income and net short-term capital gains, if any. |
| *** | The Funds hereby designate these amounts paid during the fiscal year ended May 31, 2012, as Exempt Interest Dividends. |
| Nuveen Investments | 109 |
Notes to Financial Statements (continued)
At May 31, 2012, the Funds’ tax year end, the following Funds had unused capital loss carryforwards available for federal income tax purposes to be applied against future capital gains, if any. If not applied, the carryforwards will expire as follows:
| Kentucky | Michigan | Missouri* | Ohio* | Wisconsin | ||||||||||||||||
Expiration: | ||||||||||||||||||||
May 31, 2016 | $ | — | $ | — | $ | — | $ | 219,990 | �� | $ | — | |||||||||
May 31, 2017 | — | — | 368,288 | 204,682 | — | |||||||||||||||
May 31, 2018 | 3,710,023 | 1,966,080 | 663,355 | 30,607 | 40,757 | |||||||||||||||
May 31, 2019 | — | — | — | 2,149,014 | — | |||||||||||||||
Total | $ | 3,710,023 | $ | 1,966,080 | $ | 1,031,643 | $ | 2,604,293 | $ | 40,757 | ||||||||||
| * | A portion of Missouri’s and Ohio’s capital loss carryforward is subject to an annual limitation under Internal Revenue code and related regulations. |
During the Funds’ tax year ended May 31, 2012, the following Funds utilized their capital loss carryforwards as follows:
| Kansas | Kentucky | Michigan | Missouri | Ohio | ||||||||||||||||
Utilized capital loss carryforwards | $ | 1,017,846 | $ | 644,127 | $ | 1,069,109 | $ | 247,269 | $ | 1,805,166 | ||||||||||
On December 22, 2010, the Regulated Investment Company Modernization Act of 2010 (the “Act”) was enacted, which changed various technical rules governing the tax treatment of RICs. The changes are generally effective for taxable years beginning after the date of enactment. One of the more prominent changes addresses capital loss carryforwards. Under the Act, each Fund will be permitted to carry forward capital losses incurred in taxable years beginning after the date of enactment for an unlimited period. However, any losses incurred during those future taxable years will be required to be utilized prior to the losses incurred in pre-enactment taxable years, which carry an expiration date. As a result of this ordering rule, pre-enactment capital loss carryforwards may be more likely to expire unused. Additionally, post-enactment capital loss carryforwards will retain their character as either short-term or long-term capital losses rather than being considered all short-term as permitted under previous regulation.
The Act also contains several provisions aimed at preserving the character of distributions made by a fiscal year RIC during the portion of its taxable year ending after October 31 or December 31, reducing the circumstances under which a RIC might be required to file amended Forms 1099 to restate previously reported distributions.
Capital losses incurred that will be carried forward under the provisions of the Act are as follows:
| Wisconsin | ||||
Post-enactment losses: | ||||
Short-term | $ | — | ||
Long-term | 306,610 | |||
The Funds have elected to defer losses incurred from November 1, 2011 through May 31, 2012, the Funds’ tax year end, in accordance with federal income tax rules. These losses are treated as having arisen on the first day of the following fiscal year. The following Fund has elected to defer losses as follows:
| Wisconsin | ||||
Post-October capital losses | $ | 65,031 | ||
Late-year ordinary losses | — | |||
7. Management Fees and Other Transactions with Affiliates
Each Fund’s management fee consists of two components – a fund-level fee, based only on the amount of assets within each individual Fund, and a complex-level fee, based on the aggregate amount of all eligible fund assets managed by the Adviser. This pricing structure enables each Fund’s shareholders to benefit from growth in the assets within their respective Fund as well as from growth in the amount of complex-wide assets managed by the Adviser.
The annual fund-level fee for each Fund, payable monthly, is calculated according to the following schedule:
| Average Daily Net Assets | Fund-Level Fee Rate | |||
For the first $125 million | .3500 | % | ||
For the next $125 million | .3375 | |||
For the next $250 million | .3250 | |||
For the next $500 million | .3125 | |||
For the next $1 billion | .3000 | |||
For the next $3 billion | .2750 | |||
For net assets over $5 billion | .2500 | |||
| 110 | Nuveen Investments |
The annual complex-level fee for each Fund, payable monthly, is calculated according to the following schedule:
| Complex-Level Asset Breakpoint Level* | Effective Rate at Breakpoint Level | |||
$55 billion | .2000 | % | ||
$56 billion | .1996 | |||
$57 billion | .1989 | |||
$60 billion | .1961 | |||
$63 billion | .1931 | |||
$66 billion | .1900 | |||
$71 billion | .1851 | |||
$76 billion | .1806 | |||
$80 billion | .1773 | |||
$91 billion | .1691 | |||
$125 billion | .1599 | |||
$200 billion | .1505 | |||
$250 billion | .1469 | |||
$300 billion | .1445 | |||
| * | The complex-level fee is calculated based upon the aggregate daily “eligible assets” of all Nuveen Funds. Eligible assets do not include assets attributable to investments in other Nuveen Funds or assets in excess of $2 billion added to the Nuveen Fund complex in connection with the Adviser’s assumption of the management of the former First American Funds effective January 1, 2011. Eligible assets include closed-end fund assets managed by the Adviser that are attributable to financial leverage. For these purposes, financial leverage includes the closed-end funds’ use of preferred stock and borrowings and certain investments in the residual interest certificates (also called inverse floating rate securities) in tender option bond (TOB) trusts, including the portion of assets held by a TOB trust that has been effectively financed by the trust’s issuance of floating rate securities, subject to an agreement by the Adviser as to certain funds to limit the amount of such assets for determining eligible assets in certain circumstances. As of May 31, 2012, the complex-level fee rate for these Funds was as follows: |
| Fund | Complex-Level Fee Rate | |||
Kansas | 0.1735 | % | ||
Kentucy | 0.1735 | |||
Michigan | 0.1735 | |||
Missouri | 0.1815 | |||
Ohio | 0.1760 | |||
Wisconsin | 0.1735 | |||
The management fee compensates the Adviser for overall investment advisory and administrative services and general office facilities. The Adviser is responsible for each Fund’s overall investment strategy and asset allocation decisions. The Adviser has entered into sub-advisory agreements with the Sub-Adviser under which the Sub-Adviser manages the investment portfolios of the Funds. The Sub-Adviser is compensated for its services to the Funds from the management fees paid to the Adviser.
The Adviser has agreed to waive fees and/or reimburse expenses (“Expense Cap”) so that total annual Fund operating expenses (excluding 12b-1 distribution and service fees, interest expenses, taxes, fees incurred in acquiring and disposing of portfolio securities and extraordinary expenses) for Ohio do not exceed .750% of the average daily net assets of any class of Fund shares. The Adviser may also voluntarily reimburse additional expenses from time to time in any of the Funds. Voluntary reimbursements may be terminated at any time at the Adviser’s discretion.
The Trust pays no compensation directly to those of its trustees who are affiliated with the Adviser or to its officers, all of whom receive remuneration for their services to the Trust from the Adviser or its affiliates. The Board of Trustees has adopted a deferred compensation plan for independent trustees that enables trustees to elect to defer receipt of all or a portion of the annual compensation they are entitled to receive from certain Nuveen-advised funds. Under the plan, deferred amounts are treated as though equal dollar amounts had been invested in shares of select Nuveen-advised funds.
During the fiscal year ended May 31, 2012, Nuveen Securities, LLC (the “Distributor”), a wholly-owned subsidiary of Nuveen, collected sales charges on purchases of Class A Shares, the majority of which were paid out as concessions to financial intermediaries as follows:
| Kansas | Kentucky | Michigan | Missouri | Ohio | Wisconsin | |||||||||||||||||||
Sales charges collected (Unaudited) | $ | 588,901 | $ | 530,861 | $ | 161,982 | $ | 482,813 | $ | 448,600 | $ | 115,421 | ||||||||||||
Paid to financial intermediaries (Unaudited) | 513,134 | 463,321 | 141,057 | 417,660 | 384,098 | 99,948 | ||||||||||||||||||
The Distributor also received 12b-1 service fees on Class A Shares, substantially all of which were paid to compensate financial intermediaries for providing services to shareholders relating to their investments.
During the fiscal year ended May 31, 2012, the Distributor compensated financial intermediaries directly with commission advances at the time of purchase as follows:
| Kansas | Kentucky | Michigan | Missouri | Ohio | Wisconsin | |||||||||||||||||||
Commission advances (Unaudited) | $ | 196,034 | $ | 166,105 | $ | 36,175 | $ | 92,475 | $ | 144,395 | $ | 32,876 | ||||||||||||
| Nuveen Investments | 111 |
Notes to Financial Statements (continued)
To compensate for commissions advanced to financial intermediaries, all 12b-1 service fees collected on Class B Shares during the first year following a purchase, all 12b-1 distribution fees collected on Class B Shares, and all 12b-1 service and distribution fees collected on Class C Shares during the first year following a purchase are retained by the Distributor. During the fiscal year ended May 31, 2012, the Distributor retained such 12b-1 fees as follows:
| Kansas | Kentucky | Michigan | Missouri | Ohio | Wisconsin | |||||||||||||||||||
12b-1 fees retained (Unaudited) | $ | 58,483 | $ | 67,272 | $ | 23,313 | $ | 44,749 | $ | 63,621 | $ | 18,673 | ||||||||||||
The remaining 12b-1 fees charged to the Funds were paid to compensate financial intermediaries for providing services to shareholders relating to their investments.
The Distributor also collected and retained CDSC on share redemptions during the fiscal year ended May 31, 2012, as follows:
| Kansas | Kentucky | Michigan | Missouri | Ohio | Wisconsin | |||||||||||||||||||
CDSC retained (Unaudited) | $ | 10,000 | $ | — | $ | 1,969 | $ | 1,394 | $ | 17,410 | $ | 1,179 | ||||||||||||
8. Fund Reorganizations
During the current fiscal period, the following Nuveen open-end funds were reorganized into the following Funds included in this report as follows (each the “Reorganization” and collectively, the “Reorganizations”):
| • | Nuveen Missouri Tax Free Fund (“Missouri Tax Free”), into Missouri; and |
| • | Nuveen Ohio Tax Free Fund (“Ohio Tax Free”) into Ohio. |
Missouri Tax Free and Ohio Tax Free are collectively the “Acquired Funds.” Missouri and Ohio are collectively the “Acquiring Funds.”
The Adviser proposed the Reorganizations of the Acquired Funds into the Acquiring Funds, as well as a number of other fund reorganizations between funds with similar investment objectives and policies, as part of an initiative to eliminate certain redundancies among the products it offers and in an effort to achieve certain operating efficiencies. The Acquired Funds’ Board of Trustees has determined that the Reorganizations were in the best interest of the Acquired Funds and that the interests of existing shareholders will not be diluted as a result of the Reorganizations. The Board of Trustees unanimously approved the Reorganizations on September 20, 2011.
A special meeting of Missouri Tax Free’s and Ohio Tax Free’s shareholders was held on February 16, 2012, for the purpose of voting on the Reorganization, at which time, each of the Reorganizations were approved. The Reorganizations were consummated at the close of business on March 9, 2012.
Upon consummation of each Fund’s Reorganization, the Acquired Funds transferred all of their assets and liabilities to the Acquiring Funds in exchange for the Acquiring Funds’ shares of equal value. The Acquiring Funds’ shares were then distributed to the Acquired Funds’ shareholders and the Acquired Funds were terminated. As a result of the Reorganizations, the Acquired Funds’ shareholders became shareholders of the Acquiring Funds and the Acquired Funds’ shareholders received the Acquiring Funds’ shares with a total value equal to the total value of their Acquired Funds’ shares immediately prior to the closing of their Reorganization.
The Reorganizations were structured to qualify as tax-free reorganizations under the Internal Revenue Code for federal income tax purposes, and the Acquired Funds’ shareholders will recognize no gain or loss for federal income tax purposes as a result of the Reorganizations. Prior to the closing of each of the Reorganizations, the Acquired Funds distributed all of their net investment income and capital gains, if any. Such a distribution may be taxable to the Acquired Funds’ shareholders for federal income tax purposes.
The cost, fair value and net unrealized appreciation (depreciation) of the investments of the Acquired Funds as of the date of their respective Reorganization were as follows:
| Missouri Tax Free | Ohio Tax Free | |||||||
Cost of investments | $ | 161,788,408 | $ | 49,965,589 | ||||
Fair value of investments | 172,688,737 | 53,532,979 | ||||||
Unrealized appreciation (depreciation) of investments | 10,900,279 | 3,567,390 | ||||||
For financial reporting purposes, assets received and shares issued by the Acquiring Funds were recorded at fair value; however, the cost basis of the investments received from the Acquired Funds were carried forward to align ongoing reporting of the Acquiring Funds’ realized and unrealized gains and losses with amounts distributable to shareholders for tax purposes.
| 112 | Nuveen Investments |
For accounting and performance reporting purposes, the Acquiring Funds are the survivors. The shares outstanding, net assets and NAV per share immediately before and after the Reorganizations are as follows:
| Acquired Funds – Prior to Reorganizations | Shares Outstanding | Net Assets | NAV per Share | |||||||||
Missouri Tax Free | ||||||||||||
Class A Shares | 2,014,487 | $ | 24,932,701 | $ | 12.38 | |||||||
Class C1 Shares | 142,600 | 1,759,503 | 12.34 | |||||||||
Class I Shares | 12,130,585 | 150,125,702 | 12.38 | |||||||||
Ohio Tax Free | ||||||||||||
Class A Shares | 211,685 | 2,291,286 | 10.82 | |||||||||
Class C1 Shares | 166,843 | 1,781,088 | 10.68 | |||||||||
Class I Shares | 4,638,858 | 50,216,498 | 10.83 | |||||||||
| Acquiring Funds – Prior to Reorganizations | Shares Outstanding | Net Assets | NAV per Share | |||||||||
Missouri | ||||||||||||
Class A Shares | 17,359,459 | $ | 197,408,414 | $ | 11.37 | |||||||
Class B Shares | 48,162 | 548,011 | 11.38 | |||||||||
Class C Shares | 2,772,579 | 31,475,271 | 11.35 | |||||||||
Class I Shares | 2,508,565 | 28,523,583 | 11.37 | |||||||||
Ohio | ||||||||||||
Class A Shares | 26,582,704 | 308,070,336 | 11.59 | |||||||||
Class B Shares | 180,652 | 2,088,204 | 11.56 | |||||||||
Class C Shares | 5,787,394 | 66,830,674 | 11.55 | |||||||||
Class I Shares | 10,026,321 | 115,861,225 | 11.56 | |||||||||
| Acquiring Funds – Post Reorganizations | Shares Outstanding | Net Assets | NAV per Share | |||||||||
Missouri | ||||||||||||
Class A Shares | 19,706,686 | $ | 224,100,618 | $ | 11.37 | |||||||
Class B Shares | 48,162 | 548,011 | 11.38 | |||||||||
Class C Shares | 2,772,579 | 31,475,271 | 11.35 | |||||||||
Class I Shares | 15,711,651 | 178,649,285 | 11.37 | |||||||||
Ohio | ||||||||||||
Class A Shares | 26,934,101 | 312,142,710 | 11.59 | |||||||||
Class B Shares | 180,652 | 2,088,204 | 11.56 | |||||||||
Class C Shares | 5,787,394 | 66,830,674 | 11.55 | |||||||||
Class I Shares | 14,371,931 | 166,077,723 | 11.56 | |||||||||
The beginning of the Acquired Funds’ current fiscal period was June 1, 2011.
Assuming the Reorganizations had been completed on June 1, 2011, the beginning of the Acquiring Funds’ current fiscal period, the pro forma results of operations for the Acquired Funds for the period June 1, 2011 through March 9, 2012, each Fund’s Reorganization date, are as follows:
| Missouri Tax Free | Ohio Tax Free | |||||||
Net investment income (loss) | $ | (34,657 | ) | $ | (48,565 | ) | ||
Net realized and unrealized gains (losses) | 11,238,276 | 3,611,723 | ||||||
Change in net assets resulting from operations | 9,797,872 | 2,532,911 | ||||||
Because the combined investment portfolios for each Reorganization have been managed as a single integrated portfolio since each Reorganization was completed, it is not practicable to separate the amounts of revenue and earnings of the Acquired Funds that have been included in the Statement of Operations since the Reorganizations were consummated.
In connection with the reorganizations, each of the Acquiring Funds has accrued for certain associated costs and expenses. Such amounts are included as components of “Accrued other expense” on the Statement of Assets and Liabilities and “Reorganization expense” on the Statement of Operations.
9. New Accounting Pronouncements
Fair Value Measurements and Disclosures
On May 12, 2011, the Financial Accounting Standards Board (“FASB”) issued an Accounting Standards Update (“ASU”) No. 2011-04 (“ASU No. 2011-04”) modifying Topic 820, Fair Value Measurements and Disclosures. At the same time, the International Accounting Standards Board (“IASB”) issued International Financial Reporting Standard (“IFRS”) 13, Fair Value Measurement. The objective of the FASB and IASB is convergence of their guidance on fair value measurements and disclosures. Specifically, ASU No. 2011-04 requires reporting entities to disclose i) the amounts of any transfers between Level 1 and Level 2 and the reasons for the transfers and ii) for Level 3 fair value measurements, a) quantitative information about significant unobservable inputs used, b) a description of the valuation
| Nuveen Investments | 113 |
Trustees and Officers (Unaudited)
The management of the Funds, including general supervision of the duties performed for the Funds by the Adviser, is the responsibility of the Board of Trustees of the Funds. The number of trustees of the Funds is currently set at ten. None of the trustees who are not “interested” persons of the Funds (referred to herein as “independent trustees”) has ever been a director or employee of, or consultant to, Nuveen or its affiliates. The names and business addresses of the trustees and officers of the Funds, their principal occupations and other affiliations during the past five years, the number of portfolios each oversees and other directorships they hold are set forth below.
The Funds’ Statement of Additional Information (“SAI”) includes more information about the trustees. To request a free copy, call Nuveen Investments at (800) 257-8787 or visit the Funds’ website at www.nuveen.com.
Name, Birthdate and Address | Position(s) Held with the Funds | Year First Elected or Appointed (1) | Principal Occupation(s) Including other Directorships During Past 5 Years | Number of Portfolios in Fund Complex Overseen by Trustee | ||||
| Independent Trustees: | ||||||||
Robert P. Bremner 8/22/40 333 W. Wacker Drive Chicago, IL 60606 | Chairman of the Board and Trustee | 1996 | Private Investor and Management Consultant; Treasurer and Director, Humanities Council of Washington, D.C.; Board Member, Independent Directors Council affiliated with the Investment Company Institute. | 222 | ||||
Jack B. Evans 10/22/48 333 W. Wacker Drive Chicago, IL 60606 | Trustee | 1999 | President, The Hall-Perrine Foundation, a private philanthropic corporation (since 1996); Director and Chairman, United Fire Group, a publicly held company; member of the Board of Regents for the State of Iowa University System; Director, Source Media Group; Life Trustee of Coe College and the Iowa College Foundation; formerly, Director, Alliant Energy; formerly, Director, Federal Reserve Bank of Chicago; formerly, President and Chief Operating Officer, SCI Financial Group, Inc., a regional financial services firm. | 222 | ||||
William C. Hunter 3/6/48 333 W. Wacker Drive Chicago, IL 60606 | Trustee | 2004 | Dean Emeritus (since June 30, 2012), formerly, Dean, Tippie College of Business, University of Iowa (2006-2012); Director (since 2004) of Xerox Corporation; Director (since 2005), Beta Gamma Sigma International Honor Society; Director of Wellmark, Inc. (since 2009); formerly, Dean and Distinguished Professor of Finance, School of Business at the University of Connecticut (2003-2006); previously, Senior Vice President and Director of Research at the Federal Reserve Bank of Chicago (1995-2003); formerly, Director (1997-2007), Credit Research Center at George Washington University. | 222 | ||||
David J. Kundert 10/28/42 333 W. Wacker Drive Chicago, IL 60606 | Trustee | 2005 | Director, Northwestern Mutual Wealth Management Company; retired (since 2004) as Chairman, JPMorgan Fleming Asset Management, President and CEO, Banc One Investment Advisors Corporation, and President, One Group Mutual Funds; prior thereto, Executive Vice President, Banc One Corporation and Chairman and CEO, Banc One Investment Management Group; Member, Board of Regents, Luther College; member of the Wisconsin Bar Association; member of Board of Directors, Friends of Boerner Botanical Gardens; member of Board of Directors and Chair of Investment Committee, Greater Milwaukee Foundation. | 222 | ||||
William J. Schneider 9/24/44 333 W. Wacker Drive Chicago, IL 60606 | Trustee | 1996 | Chairman of Miller-Valentine Partners Ltd., a real estate investment company; formerly, Senior Partner and Chief Operating Officer (retired 2004) of Miller-Valentine Group; member, University of Dayton Business School Advisory Council; member, Mid-America Health System Board; formerly, member and chair, Dayton Philharmonic Orchestra Association; formerly, member, Business Advisory Council, Cleveland Federal Reserve Bank. | 222 | ||||
Judith M. Stockdale 12/29/47 333 W. Wacker Drive Chicago, IL 60606 | Trustee | 1997 | Executive Director, Gaylord and Dorothy Donnelley Foundation (since 1994); prior thereto, Executive Director, Great Lakes Protection Fund (1990-1994). | 222 | ||||
Carole E. Stone 6/28/47 333 W. Wacker Drive Chicago, IL 60606 | Trustee | 2007 | Director, Chicago Board Options Exchange (since 2006); Director, C2 Options Exchange, Incorporated (since 2009); formerly, Commissioner, New York State Commission on Public Authority Reform (2005-2010); formerly, Chair, New York Racing Association Oversight Board (2005-2007). | 222 | ||||
| 114 | Nuveen Investments |
Name, Birthdate and Address | Position(s) Held with the Funds | Year First Elected or Appointed (1) | Principal Occupation(s) During Past Five Years | Number of Portfolios in Fund Complex Overseen by Trustee | ||||
Virginia L. Stringer 8/16/44 333 West Wacker Drive Chicago, IL 60606 | Trustee | 2011 | Board Member, Mutual Fund Directors Forum; former governance consultant and non-profit board member; former Owner and President, Strategic Management Resources, Inc. a management consulting firm; former Member, Governing Board, Investment Company Institute’s Independent Directors Council; previously, held several executive positions in general management, marketing and human resources at IBM and The Pillsbury Company; Independent Director, First American Fund Complex (1987-2010) and Chair (1997-2010). | 222 | ||||
Terence J. Toth 9/29/59 333 W. Wacker Drive Chicago, IL 60606 | Trustee | 2008 | Director, Legal & General Investment Management America, Inc. (since 2008); Managing Partner, Promus Capital (since 2008); formerly, CEO and President, Northern Trust Global Investments (2004-2007); Executive Vice President, Quantitative Management & Securities Lending (2000-2004); prior thereto, various positions with Northern Trust Company (since 1994); member: Goodman Theatre Board (since 2004), Chicago Fellowship Board (since 2005), Catalyst Schools of Chicago Board (since 2008); Mather Foundation Board (since 2012) and a member of its investment committee; formerly, member: Northern Trust Mutual Funds Board (2005-2007), Northern Trust Global Investments Board (2004-2007), Northern Trust Japan Board (2004-2007), Northern Trust Securities Inc. Board (2003-2007) and Northern Trust Hong Kong Board (1997-2004). | 222 | ||||
| Interested Trustee: | ||||||||
John P. Amboian (2) 6/14/61 333 W. Wacker Drive Chicago, IL 60606 | Trustee | 2008 | Chief Executive Officer and Chairman (since 2007) and Director (since 1999) of Nuveen Investments, Inc., formerly, President (1999-2007); Chief Executive Officer (since 2007) of Nuveen Investments Advisers Inc.; Director (since 1998) formerly, Chief Executive Officer (2007-2010) of Nuveen Fund Advisors, Inc. | 222 | ||||
Name, Birthdate and Address | Position(s) Held with the Funds | Year First Elected or Appointed (3) | Principal Occupation(s) During Past 5 Years | Number of Portfolios in Fund Complex Overseen by Officer | ||||
| Officers of the Funds: | ||||||||
Gifford R. Zimmerman 9/9/56 333 W. Wacker Drive Chicago, IL 60606 | Chief Administrative Officer | 1988 | Managing Director (since 2002), Assistant Secretary of Nuveen Securities, LLC; Managing Director (since 2004) and Assistant Secretary (since 1994) of Nuveen Investments, Inc.; Managing Director (since 2002), Assistant Secretary (since 1997) and Co-General Counsel (since 2011) of Nuveen Fund Advisors, Inc.; Managing Director, Assistant Secretary and Associate General Counsel of Nuveen Asset Management, LLC (since 2011); Managing Director, Associate General Counsel and Assistant Secretary of Symphony Asset Management LLC (since 2003); Vice President and Assistant Secretary of NWQ Investment Management Company, LLC (since 2002), Nuveen Investments Advisers Inc. (since 2002), Santa Barbara Asset Management, LLC (since 2006) and of Winslow Capital Management Inc. (since 2010); Chief Administrative Officer and Chief Compliance Officer (since 2006) of Nuveen Commodities Asset Management, LLC; Chartered Financial Analyst. | 222 | ||||
Margo L. Cook 4/11/64 333 W. Wacker Drive Chicago, IL 60606 | Vice President | 2009 | Executive Vice President (since 2008) of Nuveen Investments, Inc. and of Nuveen Fund Advisors, Inc. (since 2011); Managing Director – Investment Services of Nuveen Commodities Asset Management, LLC (since August 2011) previously, Head of Institutional Asset Management (2007-2008) of Bear Stearns Asset Management; Head of Institutional Asset Management (1986-2007) of Bank of NY Mellon; Chartered Financial Analyst. | 222 | ||||
| Nuveen Investments | 115 |
Trustees and Officers (Unaudited) (continued)
Name, Birthdate and Address | Position(s) Held with the Funds | Year First Elected or Appointed (3) | Principal Occupation(s) During Past 5 Years | Number of Portfolios in Fund Complex Overseen by Officer | ||||
Lorna C. Ferguson 10/24/45 333 W. Wacker Drive Chicago, IL 60606 | Vice President | 1998 | Managing Director (since 2005) of Nuveen Fund Advisors, Inc. and Nuveen Securities, LLC (since 2004). | 222 | ||||
Stephen D. Foy 5/31/54 333 W. Wacker Drive Chicago, IL 60606 | Vice President and Controller | 1998 | Senior Vice President (since 2010), formerly, Vice President (2005-2010) and Funds Controller of Nuveen Securities, LLC; Vice President of Nuveen Fund Advisors, Inc.; Chief Financial Officer of Nuveen Commodities Asset Management, LLC (since 2010); Certified Public Accountant. | 222 | ||||
Scott S. Grace 8/20/70 333 W. Wacker Drive Chicago, IL 60606 | Vice President and Treasurer | 2009 | Managing Director, Corporate Finance & Development, Treasurer (since 2009) of Nuveen Securities, LLC; Managing Director and Treasurer (since 2009) of Nuveen Fund Advisors, Inc., Nuveen Investments Advisers, Inc., Nuveen Investments Holdings Inc. and (since 2011) Nuveen Asset Management, LLC; Vice President and Treasurer of NWQ Investment Management Company, LLC, Tradewinds Global Investors, LLC, Symphony Asset Management LLC and Winslow Capital Management, Inc.; Vice President of Santa Barbara Asset Management, LLC; formerly, Treasurer (2006-2009), Senior Vice President (2008-2009), previously, Vice President (2006-2008) of Janus Capital Group, Inc.; formerly, Senior Associate in Morgan Stanley’s Global Financial Services Group (2000-2003); Chartered Accountant Designation. | 222 | ||||
Walter M. Kelly 2/24/70 333 W. Wacker Drive Chicago, IL 60606 | Chief Compliance Officer and Vice President | 2003 | Senior Vice President (since 2008) and Assistant Secretary (since 2003) of Nuveen Fund Advisors, Inc; Senior Vice President (since 2008) of Nuveen Investments Holdings, Inc; formerly, Senior Vice President (2008-2011) of Nuveen Securities, LLC. | 222 | ||||
Tina M. Lazar 8/27/61 333 W. Wacker Drive Chicago, IL 60606 | Vice President | 2002 | Senior Vice President (since 2010), formerly, Vice President (2005-2010) of Nuveen Fund Advisors, Inc. | 222 | ||||
Name, Birthdate and Address | Position(s) Held with the Funds | Year First Elected or Appointed (3) | Principal Occupation(s) Including other Directorships During Past 5 Years | Number of Portfolios in Fund Complex Overseen by Officer | ||||
Kevin J. McCarthy 3/26/66 333 W. Wacker Drive Chicago, IL 60606 | Vice President and Secretary | 2007 | Managing Director and Assistant Secretary (since 2008), formerly, Vice President (2007-2008), Nuveen Securities, LLC; Managing Director (since 2008), Assistant Secretary (since 2007) and Co-General Counsel (since 2011) of Nuveen Fund Advisors, Inc.; Managing Director, Assistant Secretary and Associate General Counsel (since 2011) of Nuveen Asset Management, LLC; Managing Director (since 2008), and Assistant Secretary, Nuveen Investment Holdings, Inc.; Vice President (since 2007) and Assistant Secretary of Nuveen Investments Advisers Inc., NWQ Investment Management Company, LLC, Tradewinds Global Investors LLC, NWQ Holdings, LLC, Symphony Asset Management LLC, Santa Barbara Asset Management, LLC, and of Winslow Capital Management, Inc. (since 2010); Vice President and Secretary (since 2010) of Nuveen Commodities Asset Management, LLC; prior thereto, Partner, Bell, Boyd & Lloyd LLP (1997-2007). | 222 | ||||
Kathleen L. Prudhomme 3/30/53 901 Marquette Avenue Minneapolis, MN 55402 | Vice President and Assistant Secretary | 2011 | Managing Director, Assistant Secretary and Co-General Counsel (since 2011) of Nuveen Fund Advisors, Inc.; Managing Director, Assistant Secretary and Associate General Counsel (since 2011) of Nuveen Asset Management, LLC; Managing Director and Assistant Secretary (since 2011) of Nuveen Securities, LLC; formerly, Deputy General Counsel, FAF Advisors, Inc. (2004-2010). | 222 |
| 116 | Nuveen Investments |
Name, Birthdate and Address | Position(s) Held with the Funds | Year First Elected or Appointed (3) | Principal Occupation(s) Including other Directorships During Past 5 Years | Number of Portfolios in Fund Complex Overseen by Officer | ||||
Jeffery M. Wilson 3/13/56 333 West Wacker Drive Chicago, IL 60606 | Vice President | 2011 | Senior Vice President of Nuveen Securities, LLC (since 2011); formerly, Senior Vice President of FAF Advisors, Inc. (2000-2010). | 100 |
| (1) | Trustees serve an indefinite term until his/her successor is elected or appointed. The year first elected or appointed represents the year in which the trustee was first elected or appointed to any fund in the Nuveen Fund Complex. |
| (2) | Mr. Amboian is an interested trustee because of his position with Nuveen Investments, Inc. and certain of its subsidiaries, which are affiliates of the Nuveen Funds. |
| (3) | Officers serve one year terms through August of each year. The year first elected or appointed represents the year in which the officer was first elected or appointed to any fund in the Nuveen Fund Complex. |
| Nuveen Investments | 117 |
Annual Investment Management Agreement Approval Process
(Unaudited)
processes used by the reporting entity and c) a narrative description of the sensitivity of the fair value measurement to changes in unobservable inputs if a change in those inputs might result in a significantly higher or lower fair value measurement. The effective date of ASU No. 2011-04 is for interim and annual periods beginning after December 15, 2011. At this time, management is evaluating the implications of this guidance and the impact it will have to the financial statement amounts and footnote disclosures, if any.
The Board of Trustees (each, a “Board” and each Trustee, a “Board Member”) of the Funds, including the Board Members who are not parties to the Funds’ advisory or sub-advisory agreements or “interested persons” of any such parties (the “Independent Board Members”), is responsible for approving the advisory agreements (each, an “Investment Management Agreement”) between each Fund and Nuveen Fund Advisors, Inc. (the “Advisor”) and the sub-advisory agreements (each a “Sub-Advisory Agreement”) between the Advisor and Nuveen Asset Management, LLC (the “Sub-Advisor”) (the Investment Management Agreements and the Sub-Advisory Agreements are referred to collectively as the “Advisory Agreements”) and their periodic continuation. Pursuant to the Investment Company Act of 1940, as amended (the “1940 Act”), the Board is required to consider the continuation of the Advisory Agreements on an annual basis. Accordingly, at an in-person meeting held on May 21-23, 2012 (the “May Meeting”), the Board, including a majority of the Independent Board Members, considered and approved the continuation of the Advisory Agreements for the Funds for an additional one-year period.
In preparation for their considerations at the May Meeting, the Board requested and received extensive materials prepared in connection with the review of the Advisory Agreements. The materials provided a broad range of information regarding the Funds, the Advisor and the Sub-Advisor (the Advisor and the Sub-Advisor are collectively, the “Fund Advisers” and each, a “Fund Adviser”). As described in more detail below, the information provided included, among other things, a review of Fund performance, including Fund investment performance assessments against peer groups and appropriate benchmarks, a comparison of Fund fees and expenses relative to peers, a description and assessment of shareholder service levels for the Funds, a summary of the performance of certain service providers, a review of product initiatives and shareholder communications and an analysis of the Advisor’s profitability with comparisons to comparable peers in the managed fund business. As part of their annual review, the Board also held a separate meeting on April 18-19, 2012, to review the Funds’ investment performance and consider an analysis provided by the Advisor of the Sub-Advisor which generally evaluated the Sub-Advisor’s investment team, investment mandate, organizational structure and history, investment philosophy and process, performance of the applicable Fund, and significant changes to the foregoing. As a result of their review of the materials and discussions, the Board presented the Advisor with questions and the Advisor responded.
The materials and information prepared in connection with the annual review of the Advisory Agreements supplement the information and analysis provided to the Board during the year. In this regard, throughout the year, the Board, acting directly or through its committees, regularly reviews the performance and various services provided by the Advisor and the Sub-Advisor. The Board meets at least quarterly as well as at other times as the need arises. At its quarterly meetings, the Board reviews reports by the Advisor which include, among other things, Fund performance, a review of the investment teams and reports on compliance, regulatory matters and risk management. The Board also meets with key investment personnel managing the Fund portfolios during the year. In October 2011, the Board also created two new standing committees (the Open-end Fund Committee and the Closed-end Fund Committee) to assist the full Board in monitoring and gaining a deeper insight into the distinctive issues and business practices of open-end and closed-end funds.
In addition, the Board continues its program of seeking to have the Board Members or a subset thereof visit each sub-advisor to the Nuveen funds at least once over a multiple year rotation, meeting with key investment and business personnel. In this regard, the Board visited with the Sub-Advisor’s municipal team in Minneapolis in September 2011, and with the Sub-Advisor’s municipal team in Chicago in November 2011. Further, an ad hoc committee of the Board visited the then-current transfer agents of the Nuveen funds in 2011 and the audit committee of the Board visited the various pricing agents for the Nuveen funds in January 2012.
The Board considers factors and information that are relevant to its annual consideration of the renewal of the Advisory Agreements at the meetings held throughout the year. Accordingly, the Board considers the information provided and knowledge gained at these meetings when performing its annual review of the Advisory Agreements. The Independent Board Members are assisted throughout the process by independent legal counsel who provided materials describing applicable law and the duties of directors or trustees in reviewing advisory contracts and met with the Independent Board Members in executive sessions without management present. In addition, it is important to recognize that the management arrangements for the Nuveen funds are the result of many years of review and discussion between the Independent Board Members and fund management and that the Board Members’ conclusions may be based, in part, on their consideration of fee arrangements and other factors developed in previous years.
The Board considered all factors it believed relevant with respect to each Fund, including among other factors: (a) the nature, extent and quality of the services provided by the Fund Advisers, (b) the investment performance of the Fund and Fund Advisers, (c) the advisory fees and costs of the services to be provided to the Funds and the profitability of the Fund Advisers, (d) the extent of any economies of scale, (e) any benefits derived by the Fund Advisers from the relationship with the Fund and (f) other factors. Each Board Member may have accorded different weight to the various factors in reaching his or her conclusions with respect to a Fund’s Advisory Agreements. The Independent Board Members did not identify any single factor as all important or controlling. The Independent Board Members’ considerations were instead based on a comprehensive consideration of all the information presented. The principal factors considered by the Board and its conclusions are described below.
| 118 | Nuveen Investments |
A. Nature, Extent and Quality of Services
In considering renewal of the Advisory Agreements, the Independent Board Members considered the nature, extent and quality of the Fund Adviser’s services, including advisory services and the resulting Fund performance and administrative services. The Independent Board Members further considered the overall reputation and capabilities of the Advisor and its affiliates, the commitment of the Advisor to provide high quality service to the Funds, their overall confidence in the Advisor’s integrity and the Advisor’s responsiveness to questions and concerns raised by them. The Independent Board Members reviewed materials outlining, among other things, the Fund Adviser’s organization and business; the types of services that the Fund Adviser or its affiliates provide to the Funds; the performance record of the applicable Fund (as described in further detail below); and any initiatives Nuveen had taken for the applicable fund product line.
In considering advisory services, the Board recognized that the Advisor provides various oversight, administrative, compliance and other services for the Funds and the Sub-Advisor generally provides the portfolio investment management services to the Funds. In reviewing the portfolio management services provided to each Fund, the Board reviewed the materials provided by the Nuveen Investment Services Oversight Team analyzing, among other things, the Sub-Advisor’s investment team and changes thereto, organization and history, assets under management, Fund objectives and mandate, the investment team’s philosophy and strategies in managing the Fund, developments affecting the Sub-Advisor or Fund and Fund performance. The Independent Board Members also reviewed portfolio manager compensation arrangements to evaluate each Fund Adviser’s ability to attract and retain high quality investment personnel, preserve stability, and reward performance but not provide an inappropriate incentive to take undue risks. In addition, the Board considered the Advisor’s execution of its oversight responsibilities over the Sub-Advisor. Given the importance of compliance, the Independent Board Members also considered Nuveen’s compliance program, including the report of the chief compliance officer regarding the Funds’ compliance policies and procedures; the resources dedicated to compliance; and the record of compliance with the policies and procedures.
In addition to advisory services, the Board considered the quality and extent of administrative and other non-investment advisory services the Advisor and its affiliates provide to the Funds, including product management, investment services (such as oversight of investment policies and procedures, risk management, and pricing), fund administration, oversight of service providers, shareholder services and communications, administration of Board relations, regulatory and portfolio compliance and legal support. The Board further recognized Nuveen’s additional investments in personnel, including in compliance and risk management. In reviewing the services provided, the Board also reviewed materials describing various notable initiatives and projects the Advisor performed in connection with the open-end fund product line. These initiatives included efforts to eliminate product overlap through mergers or liquidations; commencement of various new funds; elimination of insurance mandates for various funds; updates in investment policies or guidelines for several funds; and reductions in management fees and expense caps for certain funds.
Based on their review, the Independent Board Members found that, overall, the nature, extent and quality of services provided to the respective Funds under each applicable Advisory Agreement were satisfactory.
B. The Investment Performance of the Funds and Fund Advisers
The Board, including the Independent Board Members, reviewed and considered the performance history of each Fund over various time periods. The Board reviewed, among other things, each Fund’s historic investment performance as well as information comparing the Fund’s performance information with that of other funds (the “Performance Peer Group”) based on data compiled by Nuveen that was provided by an independent provider of mutual fund data and with recognized and/or customized benchmarks (i.e., benchmarks derived from multiple recognized benchmarks).
The Board reviewed reports, including a comprehensive analysis of the Funds’ performance and the applicable investment team. In this regard, the Board reviewed each Fund’s total return information compared to its Performance Peer Group for the quarter, one-, three- and five-year periods ending December 31, 2011, as well as performance information reflecting the first quarter of 2012. In addition, the Board reviewed each Fund’s total return information compared to recognized and/or customized benchmarks for the quarter, one- and three-year periods ending December 31, 2011, as well as performance information reflecting the first quarter of 2012.
In reviewing performance comparison information, the Independent Board Members recognized that the usefulness of the comparisons of the performance of certain funds with the performance of their respective Performance Peer Group may be limited because the Performance Peer Group may not adequately represent the objectives and strategies of the applicable funds or may be limited in size or number. In this regard, the Independent Board Members noted that the Performance Peer Groups of the Nuveen Kansas Municipal Bond Fund (the “Kansas Fund”), the Nuveen Kentucky Municipal Bond Fund (the “Kentucky Fund”), the Nuveen Missouri Municipal Bond Fund (the “Missouri Fund”) and the Nuveen Wisconsin Municipal Bond Fund (the “Wisconsin Fund”) were classified as having significant differences from such Funds based on various considerations such as special fund objectives, potential investable universe and the composition of the peer set (e.g., the number and size of competing funds and number of competing managers). The Independent Board Members also noted that the investment experience of a particular shareholder in the Nuveen funds will vary depending on when such shareholder invests in the applicable fund, the class held (if multiple classes are offered in a fund) and the performance of the fund (or respective class) during that shareholder’s investment period. In addition, although the performance below reflects the performance results for the time periods ending as of the most recent calendar year end (unless
| Nuveen Investments | 119 |
Annual Investment Management Agreement Approval Process
(Unaudited) (continued)
otherwise indicated), the Board also recognized that selecting a different ending time period may derive different results. Furthermore, while the Board is cognizant of the relevant performance of a fund’s peer set and/or benchmark(s), the Board evaluated fund performance in light of the respective fund’s investment objectives, investment parameters and guidelines and recognized that the objectives, investment parameters and guidelines of peers and/or benchmarks may differ to some extent, thereby resulting in differences in performance results. Nevertheless, with respect to any Nuveen funds that the Board considers to have underperformed their peers and/or benchmarks from time to time, the Board monitors such funds closely and considers any steps necessary or appropriate to address such issues.
In considering the results of the comparisons, the Independent Board Members observed, among other things, that the Nuveen Ohio Municipal Bond Fund had demonstrated generally favorable performance in comparison to peers, performing in the first or second quartile over various periods and that the Nuveen Michigan Municipal Bond Fund had satisfactory performance compared to its peers, performing in the third quartile over various periods. With respect to the other Funds which, as noted above, had significant differences with their Performance Peer Groups, the Independent Board Members considered the performance of such Funds compared to their respective benchmarks. In this regard, the Independent Board Members noted that the Kansas Fund, the Missouri Fund and the Wisconsin Fund outperformed their respective benchmarks in the one- and three-year periods, while the performance of the Kentucky Fund was similar to that of its benchmark for the one- and three-year periods.
Based on their review, the Independent Board Members determined that each Fund’s investment performance had been satisfactory.
C. Fees, Expenses and Profitability
1. Fees and Expenses
The Board evaluated the management fees and expenses of each Fund reviewing, among other things, such Fund’s gross management fees, net management fees and net expense ratios in absolute terms as well as compared to the fee and expenses of a comparable universe of funds provided by an independent fund data provider (the “Peer Universe”) and to a more focused subset of funds in the Peer Universe (the “Peer Group”) and any expense limitations.
The Independent Board Members further reviewed the methodology regarding the construction of the applicable Peer Universe and Peer Group. In reviewing the comparisons of fee and expense information, the Independent Board Members took into account that in certain instances various factors such as: the limited size and particular composition of the Peer Universe or Peer Group (including the inclusion of other Nuveen funds in the peer set); expense anomalies; changes in the funds comprising the Peer Universe or Peer Group from year to year; levels of reimbursement or fee waivers; the timing of information used; and differences in the states reflected in the Peer Universe or Peer Group may impact the comparative data, thereby limiting somewhat the ability to make a meaningful comparison with peers.
In reviewing the fee schedule for a Fund, the Independent Board Members also considered the fund-level and complex-wide breakpoint schedules (described in further detail below) and any fee waivers and reimbursements provided by Nuveen. In reviewing fees and expenses, the Board considered the expenses and fees to be higher if they were over 10 basis points higher, slightly higher if they were approximately 6 to 10 basis points higher, in line if they were within approximately 5 basis points higher than the peer average and below if they were below the peer average of the Peer Group. In reviewing the reports, the Board noted that the overwhelming majority of the Nuveen funds were at, close to or below their Peer Group or Peer Universe (if no separate Peer Group) average based on the net total expense ratio. The Independent Board Members noted that each Fund had net management fees slightly higher or higher than the peer average but net expense ratios below or in line with the peer average.
Based on their review of the fee and expense information provided, the Independent Board Members determined that each Fund’s management fees were reasonable in light of the nature, extent and quality of services provided to the Fund.
2. Comparisons with the Fees of Other Clients
The Independent Board Members further reviewed information regarding the nature of services and range of fees offered by the Advisor to other clients, including municipal separately managed accounts and passively managed exchange traded funds (ETFs) sub-advised by the Advisor. In evaluating the comparisons of fees, the Independent Board Members noted that the fee rates charged to the Funds and other clients vary, among other things, because of the different services involved and the additional regulatory and compliance requirements associated with registered investment companies, such as the Funds. Accordingly, the Independent Board Members considered the differences in the product types, including, but not limited to, the services provided, the structure and operations, product distribution and costs thereof, portfolio investment policies, investor profiles, account sizes and regulatory requirements. The Independent Board Members noted, in particular, that the range of services provided to the Funds (as discussed above) is much more extensive than that provided to separately managed accounts. Given the inherent differences in the various products, particularly the extensive services provided to the Funds, the Independent Board Members believe such facts justify the different levels of fees.
In considering the fees of the Sub-Advisor, the Independent Board Members also considered the pricing schedule or fees that the Sub-Advisor charges for similar investment management services for other Nuveen funds, funds of other sponsors (if any), and other clients (such as retail and/or institutional managed accounts).
| 120 | Nuveen Investments |
3. Profitability of Fund Advisers
In conjunction with its review of fees, the Independent Board Members also considered the profitability of Nuveen for its advisory activities and its financial condition. The Independent Board Members reviewed the revenues and expenses of Nuveen’s advisory activities for the last two calendar years, the allocation methodology used in preparing the profitability data and an analysis of the key drivers behind the changes in revenues and expenses that impacted profitability in 2011. The Independent Board Members noted this information supplemented the profitability information requested and received during the year to help keep them apprised of developments affecting profitability (such as changes in fee waivers and expense reimbursement commitments). In this regard, the Independent Board Members noted that they have an Independent Board Member serve as a point person to review and keep them apprised of changes to the profitability analysis and/or methodologies during the year. The Independent Board Members also considered Nuveen’s revenues for advisory activities, expenses, and profit margin compared to that of various unaffiliated management firms with comparable assets under management (based on asset size and asset composition).
In reviewing profitability, the Independent Board Members recognized the Advisor’s continued investment in its business to enhance its services, including capital improvements to investment technology, updated compliance systems, and additional personnel in compliance, risk management, and product development as well as its ability to allocate resources to various areas of the Advisor as the need arises. In addition, in evaluating profitability, the Independent Board Members also recognized the subjective nature of determining profitability which may be affected by numerous factors including the allocation of expenses. Further, the Independent Board Members recognized the difficulties in making comparisons as the profitability of other advisers generally is not publicly available and the profitability information that is available for certain advisers or management firms may not be representative of the industry and may be affected by, among other things, the adviser’s particular business mix, capital costs, types of funds managed and expense allocations. Notwithstanding the foregoing, the Independent Board Members reviewed Nuveen’s methodology and assumptions for allocating expenses across product lines to determine profitability. In reviewing profitability, the Independent Board Members recognized Nuveen’s investment in its fund business. Based on their review, the Independent Board Members concluded that the Advisor’s level of profitability for its advisory activities was reasonable in light of the services provided.
With respect to sub-advisers affiliated with Nuveen, including the Sub-Advisor, the Independent Board Members reviewed the sub-adviser’s revenues, expenses and profitability margins (pre- and post-tax) for its advisory activities and the methodology used for allocating expenses among the internal sub-advisers. Based on their review, the Independent Board Members were satisfied that the Sub-Advisor’s level of profitability was reasonable in light of the services provided.
In evaluating the reasonableness of the compensation, the Independent Board Members also considered other amounts paid to a Fund Adviser by the Funds as well as any indirect benefits (such as soft dollar arrangements, if any) the Fund Adviser and its affiliates receive, or are expected to receive, that are directly attributable to the management of the Funds, if any. See Section E below for additional information on indirect benefits a Fund Adviser may receive as a result of its relationship with the Funds. Based on their review of the overall fee arrangements of each Fund, the Independent Board Members determined that the advisory fees and expenses of the respective Fund were reasonable.
D. Economies of Scale and Whether Fee Levels Reflect These Economies of Scale
With respect to economies of scale, the Independent Board Members have recognized the potential benefits resulting from the costs of a fund being spread over a larger asset base, although economies of scale are difficult to measure and predict with precision, particularly on a fund-by-fund basis. One method to help ensure the shareholders share in these benefits is to include breakpoints in the advisory fee schedule. Generally, management fees for funds in the Nuveen complex are comprised of a fund-level component and a complex-level component, subject to certain exceptions. Accordingly, the Independent Board Members reviewed and considered the applicable fund-level breakpoints in the advisory fee schedules that reduce advisory fees as asset levels increase.
In addition to fund-level advisory fee breakpoints, the Board also considered the Funds’ complex-wide fee arrangement. Pursuant to the complex-wide fee arrangement, the fees of the funds in the Nuveen complex are generally reduced as the assets in the fund complex reach certain levels. The complex-wide fee arrangement seeks to provide the benefits of economies of scale to fund shareholders when total fund complex assets increase, even if assets of a particular fund are unchanged or have decreased. The approach reflects the notion that some of Nuveen’s costs are attributable to services provided to all its funds in the complex and therefore all funds benefit if these costs are spread over a larger asset base. In addition, with the acquisition of the funds previously advised by FAF Advisors, Inc., the Board noted that a portion of such funds’ assets at the time of acquisition were deemed eligible to be included in the complex-wide fee calculation in order to deliver fee savings to shareholders in the combined complex and such funds were subject to differing complex-level fee rates.
Based on their review, the Independent Board Members concluded that the breakpoint schedules and complex-wide fee arrangement were acceptable and reflect economies of scale to be shared with shareholders when assets under management increase.
E. Indirect Benefits
In evaluating fees, the Independent Board Members received and considered information regarding potential “fall out” or ancillary benefits the respective Fund Adviser or its affiliates may receive as a result of its relationship with each Fund. In this regard, the
| Nuveen Investments | 121 |
Annual Investment Management Agreement Approval Process
(Unaudited) (continued)
Independent Board Members considered, among other things, any sales charges, distribution fees and shareholder services fees received and retained by the Funds’ principal underwriter, an affiliate of the Advisor, which includes fees received pursuant to any 12b-1 plan. The Independent Board Members, therefore, considered the 12b-1 fees retained by Nuveen during the last calendar year.
In addition to the above, the Independent Board Members considered whether the Fund Advisers received any benefits from soft dollar arrangements whereby a portion of the commissions paid by a Fund for brokerage may be used to acquire research that may be useful to the Fund Adviser in managing the assets of the Funds and other clients. The Independent Board Members recognized that each Fund Adviser has the authority to pay a higher commission in return for brokerage and research services if it determines in good faith that the commission paid is reasonable in relation to the value of the brokerage and research services provided and may benefit from such soft dollar arrangements. Similarly, the Board recognized that the research received pursuant to soft dollar arrangements by a Fund Adviser may also benefit a Fund and shareholders to the extent the research enhances the ability of the Fund Adviser to manage the Fund. The Independent Board Members noted that the Fund Advisers’ profitability may be somewhat lower if they did not receive the research services pursuant to the soft dollar arrangements and had to acquire such services directly.
Based on their review, the Independent Board Members concluded that any indirect benefits received by a Fund Adviser as a result of its relationship with the Funds were reasonable and within acceptable parameters.
F. Other Considerations
The Independent Board Members did not identify any single factor discussed previously as all-important or controlling. The Board Members, including the Independent Board Members, unanimously concluded that the terms of each Advisory Agreement are fair and reasonable, that the respective Fund Adviser’s fees are reasonable in light of the services provided to each Fund and that the Advisory Agreements be renewed.
| 122 | Nuveen Investments |
Notes
| Nuveen Investments | 123 |
Notes
| 124 | Nuveen Investments |
Notes
| Nuveen Investments | 125 |
Glossary of Terms Used in this Report
Average Annual Total Return: This is a commonly used method to express an investment’s performance over a particular, usually multi-year time period. It expresses the return that would have been necessary each year to equal the investment’s actual cumulative performance (including change in NAV or offer price and reinvested dividends and capital gains distributions, if any) over the time period being considered.
Average Effective Maturity: The market-value-weighted average of the effective maturity dates of the individual securities including cash. In the case of a bond that has been advance-refunded to a call date, the effective maturity is the date on which the bond is scheduled to be redeemed using the proceeds of an escrow account. In most other cases the effective maturity is the stated maturity date of the security.
Duration: Duration is a measure of the expected period over which a bond’s principal and interest will be paid, and consequently is a measure of the sensitivity of a bond’s (or bond fund’s) value to changes when market interest rates change. Generally, the longer a bond or Fund’s duration, the more the price of the bond or Fund will change as interest rates change.
Gross Domestic Product (GDP): The total market value of all final goods and services produced in a country/region in a given year, equal to total consumer, investment and government spending, plus the value of exports, minus the value of imports.
Inverse Floating Rate Securities: Inverse floating rate securities, also known as inverse floaters or tender option bonds (TOBs), are created by depositing a municipal bond, typically with a fixed interest rate, into a special purpose trust created by a broker-dealer. This trust, in turn, (a) issues floating rate certificates typically paying short-term tax-exempt interest rates to third parties in amounts equal to some fraction of the deposited bond’s par amount or market value, and (b) issues an inverse floating rate certificate (sometimes referred to as an “inverse floater”) to an investor (such as a Fund) interested in gaining investment exposure to a long-term municipal bond. The income received by the holder of the inverse floater varies inversely with the short-term rate paid to the floating rate certificates’ holders, and in most circumstances the holder of the inverse floater bears substantially all of the underlying bond’s downside investment risk. The holder of the inverse floater typically also benefits disproportionately from any potential appreciation of the underlying bond’s value. Hence, an inverse floater essentially represents an investment in the underlying bond on a leveraged basis.
Leverage: Leverage is created whenever a fund has investment exposure (both reward and/or risk) equivalent to more than 100% of the investment capital.
Lipper Michigan Municipal Debt Funds Classification Average: Represents the average annualized total return for all reporting funds in the Lipper Michigan Municipal Debt Funds Classification. Lipper returns account for the effects of management fees and assume reinvestment of distributions, but do not reflect any applicable sales charge.
Lipper Ohio Municipal Debt Funds Classification Average: Represents the average annualized total return for all reporting funds in the Lipper Ohio Municipal Debt Funds Classification. Lipper returns account for the effects of management fees and assume reinvestment of distributions, but do not reflect any applicable sales charge.
Lipper Other States Municipal Debt Funds Classification Average: Represents the average annualized total return for all reporting funds in the Lipper Other States Municipal Debt Funds Classification. The Shareholders should note that the performance of the Lipper Other States Average represents the overall average of returns for funds from ten different states with a wide variety of municipal market conditions, making direct comparisons less meaningful. Lipper returns account for the effects of management fees and assume reinvestment of distributions, but do not reflect any applicable sales charge.
Net Asset Value (NAV): The net market value of all securities held in a portfolio.
Net Asset Value (NAV) Per Share: The market value of one share of a mutual fund or closed-end fund. For a Fund, the NAV is calculated daily by taking the Fund’s total assets (securities, cash, and accrued earnings), subtracting the Funds’s liabilities, and dividing by the number of shares outstanding.
Pre-Refundings: Pre-Refundings, also known as advance refundings or refinancings, occur when an issuer sells new bonds and uses the proceeds to fund principal and interest payments of older existing bonds. This process often results in lower borrowing costs for bond issuers.
Standard & Poor’s (S&P) Kansas Municipal Bond Index: An unleveraged, market value-weighted index designed to measure the performance of the tax-exempt, investment-grade Kansas municipal bond market. Index returns assume reinvestment of distributions, but do not reflect any applicable sales charges or management fees.
Standard & Poor’s (S&P) Kentucky Municipal Bond Index: An unleveraged, market value-weighted index designed to measure the performance of the tax-exempt, investment-grade Kentucky municipal bond market. Index returns assume reinvestment of distributions, but do not reflect any applicable sales charges or management fees.
Standard & Poor’s (S&P) Michigan Municipal Bond Index: An unleveraged, market value-weighted index designed to measure the performance of the tax-exempt, investment-grade Michigan municipal bond market. Index returns assume reinvestment of distributions, but do not reflect any applicable sales charges or management fees.
Standard & Poor’s (S&P) Missouri Municipal Bond Index: An unleveraged, market value-weighted index designed to measure the performance of the tax-exempt, investment-grade Missouri municipal bond market. Index returns assume reinvestment of distributions, but do not reflect any applicable sales charges or management fees.
Standard & Poor’s (S&P) Municipal Bond Index: An unleveraged, market value-weighted index designed to measure the performance of the tax-exempt, investment-grade U.S. municipal bond market. Index returns assume reinvestment of distributions, but do not reflect any applicable sales charges or management fees.
Standard & Poor’s (S&P) Ohio Municipal Bond Index: An unleveraged, market value-weighted index designed to measure the performance of the tax-exempt, investment-grade Ohio municipal bond market. Index returns assume reinvestment of distributions, but do not reflect any applicable sales charges or management fees.
Standard & Poor’s (S&P) Wisconsin Municipal Bond Index: An unleveraged, market value-weighted index designed to measure the performance of the tax-exempt, investment-grade Wisconsin municipal bond market. Index returns assume reinvestment of distributions, but do not reflect any applicable sales charges or management fees.
Zero Coupon Bond: A zero coupon bond does not pay a regular interest coupon to its holders during the life of the bond. Tax-exempt income to the holder of the bond comes from accretion of the difference between the original purchase price of the bond at issuance and the par value of the bond at maturity and is effectively paid at maturity. The market prices of zero coupon bonds generally are more volatile than the market prices of bonds that pay interest periodically.
| 126 | Nuveen Investments |
Fund Manager
Nuveen Fund Advisors, Inc.
333 West Wacker Drive
Chicago, IL 60606
Sub-Adviser
Nuveen Asset Management, LLC
333 West Wacker Drive
Chicago, IL 60606
Legal Counsel
Chapman and Cutler LLP
Chicago, IL
Independent Registered Public Accounting Firm
PricewaterhouseCoopers LLP
Chicago, IL
Custodian
State Street Bank & Trust Company
Boston, MA
Transfer Agent and Shareholder Services
Boston Financial
Data Services, Inc.
Nuveen Investor Services
P.O. Box 8530
Boston, MA 02266-8530
(800) 257-8787
Quarterly Portfolio of Investments and Proxy Voting information: You may obtain (i) each Fund’s quarterly portfolio of investments, (ii) information regarding how each Fund voted proxies relating to portfolio securities held during the most recent twelve-month period ended June 30, and (iii) a description of the policies and procedures that each Fund used to determine how to vote proxies relating to portfolio securities without charge, upon request, by calling Nuveen Investments at (800) 257-8787 or on Nuveen’s website at www.nuveen.com.
You may also obtain this and other Fund information directly from the Securities and Exchange Commission (SEC). The SEC may charge a copying fee for this information. Visit the SEC on-line at http://www.sec.gov or in person at the SEC’s Public Reference Room in Washington, D.C. Call the SEC at (202) 942-8090 for room hours and operation. You may also request Fund information by sending an e-mail request to publicinfo@sec.gov or by writing to the SEC’s Public Reference Section at 100 F Street NE, Washington, D.C. 20549.
The Financial Industry Regulatory Authority (FINRA) provides a Public Disclosure Program which supplies certain information regarding the disciplinary history of FINRA members and their associated persons in response to either telephone inquiries at (800) 289-9999 or written inquiries at www.finra.org. FINRA also provides an investor brochure that includes information describing the Public Disclosure Program.
| Nuveen Investments | 127 |
Nuveen Investments:
Serving Investors for Generations
Since 1898, financial advisors and their clients have relied on Nuveen Investments to provide dependable investment solutions through continued adherence to proven, long-term investing principles. Today, we offer a range of high quality equity and fixed-income solutions designed to be integral components of a well-diversified core portfolio.
Focused on meeting investor needs.
Nuveen Investments provides high-quality investment services designed to help secure the longterm goals of institutional and individual investors as well as the consultants and financial advisors who serve them. Nuveen Investments markets a wide range of specialized investment solutions which provide investors access to capabilities of its high-quality boutique investment affiliates-Nuveen Asset Management, Symphony Asset Management, NWQ Investment Management Company, Santa Barbara Asset Management, Tradewinds Global Investors, Winslow Capital Management, and Gresham Investment Management. In total, Nuveen Investments managed $227 billion as of March 31, 2012.
Find out how we can help you.
To learn more about how the products and services of Nuveen Investments may be able to help you meet your financial goals, talk to your financial advisor, or call us at (800) 257-8787. Please read the information provided carefully before you invest. Investors should consider the investment objective and policies, risk considerations, charges and expenses of any investment carefully. Where applicable, be sure to obtain a prospectus, which contains this and other relevant information. To obtain a prospectus, please contact your securities representative or Nuveen Investments, 333 W. Wacker Dr., Chicago, IL 60606. Please read the prospectus carefully before you invest or send money.
Learn more about Nuveen Funds at: www.nuveen.com/mf
Distributed by Nuveen Securities, LLC 333 West Wacker Drive Chicago, IL 60606 www.nuveen.com |
MAN-MS6-0512D
ITEM 2. CODE OF ETHICS.
As of the end of the period covered by this report, the registrant has adopted a code of ethics that applies to the registrant’s principal executive officer, principal financial officer, principal accounting officer or controller, or persons performing similar functions. There were no amendments to or waivers from the code during the period covered by this report. The registrant has posted the code of ethics on its website at www.nuveen.com/mf. (To view the code, click on the Shareholder Resources drop down menu box, click on Fund Governance and then click on Code of Conduct.)
ITEM 3. AUDIT COMMITTEE FINANCIAL EXPERT.
The registrant’s Board of Trustees determined that the registrant has at least one “audit committee financial expert” (as defined in Item 3 of Form N-CSR) serving on its Audit Committee. The registrant’s audit committee financial expert is Carole E. Stone, who is “independent” for purposes of Item 3 of Form N-CSR.
Ms. Stone served for five years as Director of the New York State Division of the Budget. As part of her role as Director, Ms. Stone was actively involved in overseeing the development of the State’s operating, local assistance and capital budgets, its financial plan and related documents; overseeing the development of the State’s bond-related disclosure documents and certifying that they fairly presented the State’s financial position; reviewing audits of various State and local agencies and programs; and coordinating the State’s system of internal audit and control. Prior to serving as Director, Ms Stone worked as a budget analyst/examiner with increasing levels of responsibility over a 30 year period, including approximately five years as Deputy Budget Director. Ms. Stone has also served as Chair of the New York State Racing Association Oversight Board, as Chair of the Public Authorities Control Board, as a Commissioner on the New York State Commission on Public Authority Reform and as a member of the Boards of Directors of several New York State public authorities. These positions have involved overseeing operations and finances of certain entities and assessing the adequacy of project/entity financing and financial reporting. Currently, Ms. Stone is on the Board of Directors of CBOE Holdings, Inc., of the Chicago Board Options Exchange, and of C2 Options Exchange. Ms. Stone’s position on the boards of these entities and as a member of both CBOE Holdings’ Audit Committee and its Finance Committee has involved, among other things, the oversight of audits, audit plans and preparation of financial statements.
ITEM 4. PRINCIPAL ACCOUNTANT FEES AND SERVICES.
The following tables show the amount of fees that PricewaterhouseCoopers LLP, the Trust’s auditor, billed to the Trust during the Trust’s last two full fiscal years. The Audit Committee approved in advance all audit services and non-audit services that PricewaterhouseCoopers LLP provided to the Trust, except for those non-audit services that were subject to the pre-approval exception under Rule 2-01 of Regulation S-X (the “pre-approval exception”). The pre-approval exception for services provided directly to the Trust waives the pre-approval requirement for services other than audit, review or attest services if: (A) the aggregate amount of all such services provided constitutes no more than 5% of the total amount of revenues paid by the Trust during the fiscal year in which the services are provided; (B) the Trust did not recognize the services as non-audit services at the time of the engagement; and (C) the services are promptly brought to the Audit Committee’s attention, and the Committee (or its delegate) approves the services before the audit is completed.
The Audit Committee has delegated certain pre-approval responsibilities to its Chairman (or, in his absence, any other member of the Audit Committee).
SERVICES THAT THE TRUST’S AUDITOR BILLED TO THE TRUST
Fiscal Year Ended May 31, 2012 | Audit Fees Billed to Funds 1 | Audit-Related Fees Billed to Funds 2 | Tax Fees Billed to Funds 3 | All Other Fees Billed to Funds 4 | ||||||||||||
Name of Series | ||||||||||||||||
Kansas Municipal Bond Fund | 24,114 | 0 | 580 | 0 | ||||||||||||
Kentucky Municipal Bond Fund | 25,176 | 0 | 580 | 0 | ||||||||||||
Michigan Municipal Bond Fund | 24,134 | 0 | 580 | 0 | ||||||||||||
Missouri Municipal Bond Fund | 24,366 | 0 | 580 | 0 | ||||||||||||
Ohio Municipal Bond Fund | 25,443 | 0 | 580 | 0 | ||||||||||||
Wisconsin Municipal Bond Fund | 23,613 | 0 | 580 | 0 | ||||||||||||
|
|
|
|
|
|
|
| |||||||||
Total | $ | 146,846 | $ | 0 | $ | 3,480 | $ | 0 | ||||||||
| 1 | “Audit Fees” are the aggregate fees billed for professional services for the audit of the Fund’s annual financial statements and services provided in connection with statutory and regulatory filings or engagements. |
| 2 | “Audit Related Fees” are the aggregate fees billed for assurance and related services reasonably related to the performance of the audit or review of financial statements and are not reported under “Audit Fees”. |
| 3 | “Tax Fees” are the aggregate fees billed for professional services for tax advice, tax compliance, and tax planning. |
| 4 | “All Other Fees” are the aggregate fees billed for products and services other than “Audit Fees”, “Audit Related Fees”, and “Tax Fees”. |
| Percentage Approved Pursuant to Pre-approval Exception | ||||||||||||||||
| Audit Fees Billed to Funds | Audit-Related Fees Billed to Funds | Tax Fees | All Other Fees | |||||||||||||
Name of Series | ||||||||||||||||
Kansas Municipal Bond Fund | 0 | % | 0 | % | 0 | % | 0 | % | ||||||||
Kentucky Municipal Bond Fund | 0 | % | 0 | % | 0 | % | 0 | % | ||||||||
Michigan Municipal Bond Fund | 0 | % | 0 | % | 0 | % | 0 | % | ||||||||
Missouri Municipal Bond Fund | 0 | % | 0 | % | 0 | % | 0 | % | ||||||||
Ohio Municipal Bond Fund | 0 | % | 0 | % | 0 | % | 0 | % | ||||||||
Wisconsin Municipal Bond Fund | 0 | % | 0 | % | 0 | % | 0 | % | ||||||||
Fiscal Year Ended May 31, 2011 | Audit Fees Billed to Funds 1 | Audit-Related Fees Billed to Funds 2 | Tax Fees Billed to Funds 3 | All Other Fees Billed to Funds 4 | ||||||||||||
Name of Series | ||||||||||||||||
Kansas Municipal Bond Fund | 15,530 | 0 | 565 | 0 | ||||||||||||
Kentucky Municipal Bond Fund | 17,192 | 0 | 565 | 0 | ||||||||||||
Michigan Municipal Bond Fund | 15,728 | 0 | 565 | 0 | ||||||||||||
Missouri Municipal Bond Fund | 15,941 | 0 | 565 | 0 | ||||||||||||
Ohio Municipal Bond Fund | 17,599 | 0 | 565 | 0 | ||||||||||||
Wisconsin Municipal Bond Fund | 14,822 | 0 | 565 | 0 | ||||||||||||
|
|
|
|
|
|
|
| |||||||||
Total | $ | 96,812 | $ | 0 | $ | 3,390 | $ | 0 | ||||||||
| 1 | “Audit Fees” are the aggregate fees billed for professional services for the audit of the Fund’s annual financial statements and services provided in connection with statutory and regulatory filings or engagements. |
| 2 | “Audit Related Fees” are the aggregate fees billed for assurance and related services reasonably related to the performance of the audit or review of financial statements and are not reported under “Audit Fees”. |
| 3 | “Tax Fees” are the aggregate fees billed for professional services for tax advice, tax compliance, and tax planning. |
| 4 | “All Other Fees” are the aggregate fees billed for products and services other than “Audit Fees”, “Audit Related Fees”, and “Tax Fees”. |
| Percentage Approved Pursuant to Pre-approval Exception | ||||||||||||||||
| Audit Fees Billed to Funds | Audit-Related Fees Billed to Funds | Tax Fees Billed to Funds | All Other Fees Billed to Funds | |||||||||||||
Name of Series | ||||||||||||||||
Kansas Municipal Bond Fund | 0 | % | 0 | % | 0 | % | 0 | % | ||||||||
Kentucky Municipal Bond Fund | 0 | % | 0 | % | 0 | % | 0 | % | ||||||||
Michigan Municipal Bond Fund | 0 | % | 0 | % | 0 | % | 0 | % | ||||||||
Missouri Municipal Bond Fund | 0 | % | 0 | % | 0 | % | 0 | % | ||||||||
Ohio Municipal Bond Fund | 0 | % | 0 | % | 0 | % | 0 | % | ||||||||
Wisconsin Municipal Bond Fund | 0 | % | 0 | % | 0 | % | 0 | % | ||||||||
Fiscal Year Ended May 31, 2012 | Audit-Related Fees Billed to Adviser and Affiliated Fund Service Providers | Tax Fees Billed to Adviser and Affiliated Fund Service Providers | All Other Fees Billed to Adviser and Affiliated Fund Service Providers | |||||||||
Nuveen Multistate Trust IV | $ | 0 | $ | 0 | $ | 0 | ||||||
| Percentage Approved Pursuant to Pre-approval Exception | ||||||||||||
| Audit-Related Fees Billed to Adviser and Affiliated Fund Service Providers | Tax Fees Billed to Adviser and Affiliated Fund Service Providers | All Other Fees Billed to Adviser and Affiliated Fund Service Providers | ||||||||||
| 0 | % | 0 | % | 0 | % | |||||||
Fiscal Year Ended May 31, 2011 | Audit-Related Fees Billed to Adviser and Affiliated Fund Service Providers | Tax Fees Billed to Adviser and Affiliated Fund Service Providers | All Other Fees Billed to Adviser and Affiliated Fund Service Providers | |||||||||
Nuveen Multistate Trust IV | $ | 0 | $ | 0 | $ | 0 | ||||||
| Percentage Approved Pursuant to Pre-approval Exception | ||||||||||||
| Audit-Related Fees Billed to Adviser and Affiliated Fund Service Providers | Tax Fees Billed to Adviser and Affiliated Fund Service Providers | All Other Fees Billed to Adviser and Affiliated Fund Service Providers | ||||||||||
| 0 | % | 0 | % | 0 | % | |||||||
Fiscal Year Ended May 31, 2012 | Total Non-Audit Fees Billed to Trust | Total Non-Audit Fees billed to Adviser and Affiliated Fund Service Providers (engagements related directly to the operations and financial reporting of the Trust) | Total Non-Audit Fees billed to Adviser and Affiliated Fund Service Providers (all other engagements) | Total | ||||||||||||
Name of Series | ||||||||||||||||
Kansas Municipal Bond Fund | 580 | 0 | 0 | 580 | ||||||||||||
Kentucky Municipal Bond Fund | 580 | 0 | 0 | 580 | ||||||||||||
Michigan Municipal Bond Fund | 580 | 0 | 0 | 580 | ||||||||||||
Missouri Municipal Bond Fund | 580 | 0 | 0 | 580 | ||||||||||||
Ohio Municipal Bond Fund | 580 | 0 | 0 | 580 | ||||||||||||
Wisconsin Municipal Bond Fund | 580 | 0 | 0 | 580 | ||||||||||||
|
|
|
|
|
|
|
| |||||||||
Total | $ | 3,480 | $ | 0 | $ | 0 | $ | 3,480 | ||||||||
“Non-Audit Fees Billed to Trust” represent “Tax Fees” and “All Other Fees” billed to each Fund in their respective amounts from the previous table.
Fiscal Year Ended May 31, 2011 | Total Non-Audit Fees Billed to Trust | Total Non-Audit Fees billed to Adviser and Affiliated Fund Service Providers (engagements related directly to the operations and financial reporting of the Trust) | Total Non-Audit Fees billed to Adviser and Affiliated Fund Service Providers (all other engagements) | Total | ||||||||||||
Name of Series | ||||||||||||||||
Kansas Municipal Bond Fund | 565 | 0 | 0 | 565 | ||||||||||||
Kentucky Municipal Bond Fund | 565 | 0 | 0 | 565 | ||||||||||||
Michigan Municipal Bond Fund | 565 | 0 | 0 | 565 | ||||||||||||
Missouri Municipal Bond Fund | 565 | 0 | 0 | 565 | ||||||||||||
Ohio Municipal Bond Fund | 565 | 0 | 0 | 565 | ||||||||||||
Wisconsin Municipal Bond Fund | 565 | 0 | 0 | 565 | ||||||||||||
|
|
|
|
|
|
|
| |||||||||
Total | $ | 3,390 | $ | 0 | $ | 0 | $ | 3,390 | ||||||||
“Non-Audit Fees Billed to Trust” represent “Tax Fees” and “All Other Fees” billed to each Fund in their respective amounts from the previous table.
Audit Committee Pre-Approval Policies and Procedures. Generally, the Audit Committee must approve (i) all non-audit services to be performed for the Trust by the Trust’s independent accountants and (ii) all audit and non-audit services to be performed by the Trust’s independent accountants for the Affiliated Fund Service Providers with respect to the operations and financial reporting of the Trust. Regarding tax and research projects conducted by the independent accountants for the Trust and Affiliated Fund Service Providers (with respect to operations and financial reports of the Trust), such engagements will be (i) pre-approved by the Audit Committee if they are expected to be for amounts greater than $10,000; (ii) reported to the Audit Committee Chairman for his verbal approval prior to engagement if they are expected to be for amounts under $10,000 but greater than $5,000; and (iii) reported to the Audit Committee at the next Audit Committee meeting if they are expected to be for an amount under $5,000.
ITEM 5. AUDIT COMMITTEE OF LISTED REGISTRANTS.
Not applicable to this registrant.
ITEM 6. SCHEDULE OF INVESTMENTS.
| a) | See Portfolio of Investments in Item 1. |
| b) | Not applicable. |
ITEM 7. DISCLOSURE OF PROXY VOTING POLICIES AND PROCEDURES FOR CLOSED-END
MANAGEMENT INVESTMENT COMPANIES.
Not applicable to this registrant.
ITEM 8. PORTFOLIO MANAGERS OF CLOSED-END MANAGEMENT INVESTMENT COMPANIES.
Not applicable to this registrant.
ITEM 9. PURCHASES OF EQUITY SECURITIES BY CLOSED-END MANAGEMENT INVESTMENT COMPANY AND AFFILIATED PURCHASERS.
Not applicable to this registrant.
ITEM 10. SUBMISSION OF MATTERS TO A VOTE OF SECURITY HOLDERS.
There have been no material changes to the procedures by which shareholders may recommend nominees to the registrant’s Board of Trustees implemented after the registrant last provided disclosure in response to this Item.
ITEM 11. CONTROLS AND PROCEDURES.
| (a) | The registrant’s principal executive and principal financial officers, or persons performing similar functions, have concluded that the registrant’s disclosure controls and procedures (as defined in Rule 30a-3(c) under the Investment Company Act of 1940, as amended (the “1940 Act”) (17 CFR 270.30a-3(c))) are effective, as of a date within 90 days of the filing date of this report that includes the disclosure required by this paragraph, based on their evaluation of the controls and procedures required by Rule 30a-3(b) under the 1940 Act (17 CFR 270.30a-3(b)) and Rules 13a-15(b) or 15d-15(b) under the Securities Exchange Act of 1934, as amended (the “Exchange Act”) (17 CFR 240.13a-15(b) or 240.15d-15(b)). |
| (b) | There were no changes in the registrant’s internal control over financial reporting (as defined in Rule 30a-3(d) under the 1940 Act (17 CFR 270.30a-3(d)) that occurred during the second fiscal quarter of the period covered by this report that has materially affected, or is reasonably likely to materially affect, the registrant’s internal control over financial reporting. |
ITEM 12. EXHIBITS.
File the exhibits listed below as part of this Form.
| (a)(1) | Any code of ethics, or amendment thereto, that is the subject of the disclosure required by Item 2, to the extent that the registrant intends to satisfy the Item 2 requirements through filing of an exhibit: Not applicable because the code is posted on registrant’s website at www.nuveen.com/mf and there were no amendments during the period covered by this report. (To view the code, click on the Shareholder Resources drop down menu box, click on Fund Governance and then Code of Conduct.) | |
| (a)(2) | A separate certification for each principal executive officer and principal financial officer of the registrant as required by Rule 30a-2(a) under the 1940 Act (17 CFR 270.30a-2(a)) in the exact form set forth below: See EX-99.CERT attached hereto. | |
| (a)(3) | Any written solicitation to purchase securities under Rule 23c-1 under the 1940 Act (17 CFR 270.23c-1) sent or given during the period covered by the report by or on behalf of the registrant to 10 or more persons: Not applicable to this registrant. | |
| (b) | If the report is filed under Section 13(a) or 15(d) of the Exchange Act, provide the certifications required by Rule 30a-2(b) under the 1940 Act (17 CFR 270.30a-2(b)), Rule 13a-14(b) or Rule 15d-14(b) under the Exchange Act (17 CFR 240.13a-14(b) or 240.15d-14(b)), and Section 1350 of Chapter 63 of Title 18 of the United States Code (18 U.S.C. 1350) as an Exhibit. A certification furnished pursuant to this paragraph will not be deemed “filed” for purposes of Section 18 of the Exchange Act (15 U.S.C. 78r), or otherwise subject to the liability of that section. Such certification will not be deemed to be incorporated by reference into any filing under the Securities Act of 1933 or the Exchange Act, except to the extent that the registration specifically incorporates it by reference: See EX-99.906 CERT attached hereto. | |
SIGNATURES
Pursuant to the requirements of the Securities Exchange Act of 1934 and the Investment Company Act of 1940, the registrant has duly caused this report to be signed on its behalf by the undersigned, thereunto duly authorized.
(Registrant) Nuveen Multistate Trust IV
By (Signature and Title)
| /s/ Kevin J. McCarthy | |
| Kevin J. McCarthy | ||
| Vice President and Secretary | ||
Date: August 8, 2012
Pursuant to the requirements of the Securities Exchange Act of 1934 and the Investment Company Act of 1940, this report has been signed below by the following persons on behalf of the registrant and in the capacities and on the dates indicated.
By (Signature and Title)
| /s/ Gifford R. Zimmerman | |
| Gifford R. Zimmerman | ||
| Chief Administrative Officer | ||
| (principal executive officer) | ||
Date: August 8, 2012
| By (Signature and Title) | /s/ Stephen D. Foy | |
| Stephen D. Foy | ||
| Vice President and Controller | ||
| (principal financial officer) | ||
Date: August 8, 2012