UNITED STATES
SECURITIES AND EXCHANGE COMMISSION
Washington, D.C. 20549
FORM N-CSR
CERTIFIED SHAREHOLDER REPORT OF REGISTERED MANAGEMENT
INVESTMENT COMPANIES
Investment Company Act file number 811-07751
Nuveen Multistate Trust IV
(Exact name of registrant as specified in charter)
Nuveen Investments
333 West Wacker Drive, Chicago, IL 60606
(Address of principal executive offices) (Zip code)
Kevin J. McCarthy
Nuveen Investments
333 West Wacker Drive
Chicago, IL 60606
(Name and address of agent for service)
Registrant’s telephone number, including area code: (312) 917-7700
Date of fiscal year end: May 31
Date of reporting period: May 31, 2014
Form N-CSR is to be used by management investment companies to file reports with the Commission not later than 10 days after the transmission to stockholders of any report that is required to be transmitted to stockholders under Rule 30e-1 under the Investment Company Act of 1940 (17 CFR 270.30e-1). The Commission may use the information provided on Form N-CSR in its regulatory, disclosure review, inspection, and policy making roles.
A registrant is required to disclose the information specified by Form N-CSR, and the Commission will make this information public. A registrant is not required to respond to the collection of information contained in Form N-CSR unless the Form displays a currently valid Office of Management and Budget (“OMB”) control number. Please direct comments concerning the accuracy of the information collection burden estimate and any suggestions for reducing the burden to Secretary, Securities and Exchange Commission, 450 Fifth Street, NW, Washington, DC 20549-0609. The OMB has reviewed this collection of information under the clearance requirements of 44 U.S.C. ss.3507.
ITEM 1. REPORTS TO STOCKHOLDERS.
 | ||
| Mutual Funds |
Nuveen Municipal
Bond Funds |
| Dependable, tax-free income because it’s not what you earn, it’s what you keep.® |
| Annual Report May 31, 2014 |
| Share Class / Ticker Symbol | ||||||||||||||
| Fund Name | Class A | Class C | Class C2 | Class I | ||||||||||
| ||||||||||||||
Nuveen Kansas Municipal Bond Fund | FKSTX | FAFOX | FCKSX | FRKSX | ||||||||||
Nuveen Kentucky Municipal Bond Fund | FKYTX | FKCCX | FKYCX | FKYRX | ||||||||||
Nuveen Michigan Municipal Bond Fund | FMITX | FAFNX | FLMCX | NMMIX | ||||||||||
Nuveen Missouri Municipal Bond Fund | FMOTX | FAFPX | FMOCX | FMMRX | ||||||||||
Nuveen Ohio Municipal Bond Fund | FOHTX | FAFMX | FOHCX | NXOHX | ||||||||||
Nuveen Wisconsin Municipal Bond Fund | FWIAX | FWCCX | FWICX | FWIRX | ||||||||||
| ||||||||||||
| ||||||||||||
| NUVEEN INVESTMENTS TO BE ACQUIRED BY TIAA-CREFF | ||||||||||||
On April 14, 2014, TIAA-CREF announced that it had entered into an agreement to acquire Nuveen Investments, the parent company of your fund’s investment adviser, Nuveen Fund Advisors, LLC (“NFAL”) and the Nuveen affiliates that act as sub-advisers to the majority of the Nuveen Funds. TIAA-CREF is a national financial services organization with approximately $569 billion in assets under management (as of March 31, 2014) and is a leading provider of retirement services in the academic, research, medical and cultural fields. Nuveen anticipates that it will operate as a separate subsidiary within TIAA-CREF’s asset management business, and that its current leadership and key investment teams will stay in place.
Your fund investment will not change as a result of Nuveen’s change of ownership. You will still own the same fund shares and the underlying value of those shares will not change as a result of the transaction. NFAL and your fund’s sub-adviser(s) will continue to manage your fund according to the same objectives and policies as before, and we do not anticipate any significant changes to your fund’s operations. Under the securities laws, the consummation of the transaction will result in the automatic termination of the investment management agreements between the funds and NFAL and the investment sub-advisory agreements between NFAL and each fund’s sub-adviser(s). New agreements will be presented to the funds’ shareholders for approval, and, if approved, will take effect upon consummation of the transaction or such later time as shareholder approval is obtained.
The transaction, expected to be completed by year end, is subject to customary closing conditions. | ||||||||||||
Must be preceded by or accompanied by a prospectus.
NOT FDIC INSURED MAY LOSE VALUE | ||||||||||||
| ||||||||||||

of Contents
| 4 | ||||
| 5 | ||||
| 15 | ||||
Fund Performance, Expense Ratios and Effective Leverage Ratios | 17 | |||
| 30 | ||||
| 32 | ||||
| 38 | ||||
| 42 | ||||
| 43 | ||||
| 90 | ||||
| 91 | ||||
| 92 | ||||
| 96 | ||||
| 108 | ||||
| 121 | ||||
| 122 | ||||
| 124 | ||||
| 134 | ||||
| Nuveen Investments | 3 |
to Shareholders

Dear Shareholders,
After significant growth in 2013, domestic and international equity markets have been less compelling during the first part of 2014. Concerns about deflation, political uncertainty in many places and the potential for more fragile economies to impact other countries have produced uncertainty in the markets.
Europe is beginning to emerge slowly from the recession in mid-2013, with improved GDP and employment trends in some countries. However, Japan’s deflationary headwinds have resurfaced; and China shows signs of slowing from credit distress combined with declines in manufacturing and exports. Most recently, tensions between Russia and Ukraine may continue to hold back stocks and support government bonds in the near term.
Despite these headwinds, there are some encouraging signs of forward momentum in the markets. In the U.S., the news is more positive with financial risks slowly receding, positive GDP trends, downward trending unemployment and stronger household finances and corporate spending.
It is in such changeable markets that professional investment management is most important. Investment teams who have experienced challenging markets in the past understand how their asset class can behave in rapidly changing times. Remaining committed to their investment disciplines during these times is a critical component to achieving long-term success. In fact, many strong investment track records are established during challenging periods because experienced investment teams understand that volatile markets place a premium on companies and investment ideas that can weather the short-term volatility. By maintaining appropriate time horizons, diversification and relying on practiced investment teams, we believe that investors can achieve their long-term investment objectives.
As always, I encourage you to communicate with your financial consultant if you have any questions about your investment in a Nuveen Fund. On behalf of the other members of the Nuveen Fund Board, we look forward to continuing to earn your trust in the months and years ahead.
Sincerely,

William J. Schneider
Chairman of the Board
July 21, 2014
| 4 | Nuveen Investments |
Comments
Nuveen Kansas Municipal Bond Fund
Nuveen Kentucky Municipal Bond Fund
Nuveen Michigan Municipal Bond Fund
Nuveen Missouri Municipal Bond Fund
Nuveen Ohio Municipal Bond Fund
Nuveen Wisconsin Municipal Bond Fund
These Funds feature portfolio management by Nuveen Asset Management, LLC, an affiliate of Nuveen Investments, Inc. Portfolio managers Daniel Close, CFA, Steven M. Hlavin and Christopher L. Drahn, CFA, review economic and market conditions, key investment strategies and the performance of the Nuveen Kansas Municipal Bond Fund, Nuveen Kentucky Municipal Bond Fund, Nuveen Michigan Municipal Bond Fund, Nuveen Missouri Municipal Bond Fund, Nuveen Ohio Municipal Bond Fund and Nuveen Wisconsin Municipal Bond Fund. Dan has managed the Kentucky, Michigan and Ohio Funds since 2007, Steve has managed the Kansas and Wisconsin Funds since 2011 and Chris has managed the Missouri Fund since 2011.
What factors affected the U.S. economy and the national municipal market during the twelve-month reporting period ended May 31, 2014?
During this reporting period, the U.S. economy continued its bumpy advance toward recovery from recession. The Federal Reserve (Fed) maintained efforts to bolster growth and promote progress toward its mandates of maximum employment and price stability by holding the benchmark fed funds rate at the record low level of zero to 0.25% that it established in December 2008. Based on its view that the underlying strength in the broader economy was enough to support ongoing improvement in the labor market, the Fed began to reduce or taper its monthly asset purchases in $10 billion increments over the course of five consecutive meetings (December 2013 through June 2014). As of July 2014 (subsequent to the close of this reporting period), the Fed’s monthly purchases comprise $15 billion in mortgage-backed securities (versus the original $40 billion per month) and $20 billion in longer-term Treasury securities (versus $45 billion). Following its June 2014 meeting (subsequent to the close of this reporting period), the Fed reiterated that it would continue to look at a wide range of factors, including labor market conditions, indicators of inflationary pressures and readings on financial developments, in determining future actions, saying that it would likely maintain the current target range for the fed funds rate for a considerable time after the asset purchase program ends, especially if projected inflation continues to run below the Fed’s 2% longer-run goal.
In the first quarter of 2014, the U.S. economy, as measured by the U.S. gross domestic product (GDP), contracted at an annualized rate of 2.9%, the economy’s weakest quarter since the recession officially ended in June 2009. The decline during this period was attributed in part to the severe weather of the past winter, which deterred consumer spending and disrupted construction, production and shipping. The Consumer Price Index (CPI) rose 2.1% year-over-year as of May 2014, the largest twelve-month increase since October 2012, while the core CPI (which excludes food and energy) increased 2.0% during the same period, in line with the Fed’s unofficial longer-term objective of 2.0% for this inflation measure. As of May 2014, the national unemployment rate was 6.3%,
Certain statements in this report are forward-looking statements. Discussions of specific investments are for illustration only and are not intended as recommendations of individual investments. The forward-looking statements and other views expressed herein are those of the portfolio managers as of the date of this report. Actual future results or occurrences may differ significantly from those anticipated in any forward-looking statements and the views expressed herein are subject to change at any time, due to numerous market and other factors. The Funds disclaim any obligation to update publicly or revise any forward-looking statements or views expressed herein.
Ratings shown are the highest rating given by one of the following national rating agencies: Standard & Poor’s (S&P), Moody’s Investors Service, Inc. (Moody’s) or Fitch, Inc (Fitch). Credit ratings are subject to change. AAA, AA, A, and BBB are investment grade ratings; BB, B, CCC, CC, C and D are below-investment grade ratings. Certain bonds backed by U.S. Government or agency securities are regarded as having an implied rating equal to the rating of such securities. Holdings designated N/R are not rated by these national rating agencies.
Bond insurance guarantees only the payment of principal and interest on the bond when due, and not the value of the bonds themselves, which will fluctuate with the bond market and the financial success of the issuer and the insurer. Insurance relates specifically to the bonds in the portfolio and not to the share prices of a Fund. No representation is made as to the insurers’ ability to meet their commitments.
| Nuveen Investments | 5 |
Portfolio Managers’ Comments (continued)
the lowest reading since September 2008, down from the 7.5% reported in May 2013, but still higher than levels that would provide consistent support for optimal GDP growth. The 113,000 net new jobs added in May 2014 meant that the economy finally had regained all of the 8.7 million jobs lost during the recent recession. The housing market continued to post gains, as the average home price in the S&P/Case-Shiller Index of 20 major metropolitan areas rose 10.8% for the twelve months ended April 2014 (most recent data available at the time this report was prepared). This brought the average U.S. home price back to summer 2004 levels, although prices continued to be down 18% – 19% from their mid-2006 peak.
As this reporting period began, several events touched off increased volatility in the financial markets. First, in May 2013, then-Fed Chairman Ben Bernanke’s remarks about tapering the Fed’s asset purchase program triggered widespread uncertainty about the next step for the Fed’s quantitative easing program and its impact on the markets as well as the overall economy. This uncertainty was compounded by headline credit stories involving Detroit’s bankruptcy filing in July 2013, the largest municipal bankruptcy in history and the disappointing news that continued to come out of Puerto Rico, where a struggling economy and years of deficit spending and borrowing led to multiple downgrades on the commonwealth’s bonds. Meanwhile, political debate over federal spending continued, as Congress failed to reach agreement on the federal budget for fiscal 2014. On October 1, 2013, the start date for Fiscal 2014, the federal government shut down for 16 days until an interim appropriations bill was signed into law. (Consensus on a $1.1 trillion federal spending bill was ultimately reached in January 2014, and in February 2014, members of Congress agreed to suspend the $16.7 trillion debt ceiling until March 2015.) In the unsettled environment of the first half of this reporting period, the Treasury market traded off, the municipal market followed suit, and spreads widened as investor concern grew, which prompted increased selling by bondholders across the fixed income markets.
During the second half of this reporting period, municipal bonds generally rebounded, as the Fed remained accommodative, the Treasury market rallied and municipal credit fundamentals continued to improve. Higher yields and the prospect of higher taxes sparked increased demand and improved flows into municipal bond funds, while supply continued to drop. This supply/demand dynamic served as a key driver of municipal market performance. While yields retraced 2013 gains during the first five months of 2014, municipal bonds generally produced positive total returns for the reporting period as a whole. Fundamentals on municipal bonds remained strong, as state governments overall made good progress in dealing with budget issues. Due to strong growth in personal tax and sales tax collections, year-over-year totals for state tax revenues have increased for 16 consecutive quarters, while on the expense side, many states made headway in cutting and controlling costs, with more than 40 states implementing some type of pension reform. The current level of municipal issuance reflects the more conservative approach to state budgeting. For the twelve months ended May 31, 2014, municipal bond issuance nationwide totaled $296.0 billion, down 21% from the issuance for the twelve-month period ended May 31, 2013.
What were the economic and market conditions in Kansas, Kentucky, Michigan, Missouri, Ohio and Wisconsin during the twelve-month reporting period ended May 31, 2014?
Kansas
Kansas has been slowly recovering from the recent economic recession. In 2013, Kansas’ GDP grew by 1.9%, slightly above the national growth rate of 1.8%, ranking Kansas’ GDP growth 23rd among all states. Kansas’ May 2014 unemployment rate of 4.8% was the lowest since October 2008 and down from 5.6% in May 2013. Recent employment gains continue to be driven by the state’s largest private sectors; professional and business services, manufacturing, and education and health services. According to Moody’s, manufacturing and construction payrolls are expected to be key to surpassing pre-recession employment highs in 2015. The Kansas economy continues to be impacted by previously passed tax reforms which slowed payments to KanCare (the program through which the State of Kansas administers Medicaid).
On the fiscal front, Kansas continues to deal with a significant amount of issues following Governor Brownback’s income tax cuts in 2012 and 2013. The state budget passed in June 2013 for Fiscal 2014 and 2015, planned for general fund expenditures to fall $200 million in 2014 before increasing $150 million in 2015. Unfortunately for the state, slow economic growth, reduced tax rates and abnormally high Fiscal 2013 collections have caused tax collections through May 2014 (11 months of the fiscal year) to be
| 6 | Nuveen Investments |
$274.5 million below budget. If tax collections continue to miss estimates the Governor will need to cut previously approved Fiscal 2015 expenditures to solve the shortfall. On April 30, 2014, Moody’s downgraded the State of Kansas to Aa2 from Aa1 citing a sluggish economic recovery and tax reform related budget stresses. As of May 2014, Kansas general obligation bonds carry a AA+/stable rating from S&P. For the twelve months ending May 31, 2014, municipal issuance in Kansas totaled $2.5 billion, representing a 26.1% decrease from the twelve months ended May 31, 2013.
Kentucky
Kentucky’s economy has stabilized, but is expected to be a below average performer over the next year. In 2013, the Commonwealth’s economy posted growth of 1.6%, slightly below the national growth rate of 1.8%, ranking Kentucky 30th in terms of GDP growth by state. Total non-farm employment growth has been flat, essentially unchanged in April 2014 (the most recent data available at the time this report was prepared) from the prior year. And though auto manufacturing in the state is doing well, recent increased production has been achieved through automation, not through payroll additions. Overall, the state is becoming more dependent on education and health care as economic drivers, moving away from manufacturing and coal as increased environmental regulations and competition from natural gas mining. Kentucky’s unemployment levels typically trend higher than the nation, though recently they have moved closer to the national average. As of May 2014, the jobless rate had dropped to 7.7% from 8.3% in the prior year. The U.S. rate stood at 6.3%. Resident income indices have also historically compared poorly with median per capita income at only 81% of the nation, ranking Kentucky only 45th among the states. Kentucky’s $20 billion biennial budget for Fiscal 2015 and 2016 is the fourth consecutive budget in which expenditures are set to outpace revenues. Kentucky was particularly reliant on one-time, non-recurring revenues throughout the economic downturn, including use of federal funds, spending down reserves, debt restructuring and fund transfers. Annual revenue growth since 2011 has helped reduce reliance on non-recurring revenues and improved the state’s structural imbalance, which is now estimated at about 4% of projected revenues. Over the past six years the Commonwealth has made significant budget reductions. The current spending plan does provide increases for preschool, elementary and secondary education. Pension underfunding continues to be an issue for Kentucky, resulting from decades of underfunding annual pension contributions. The largest pension program for teachers (KTRS) had a funding ratio of just 51.9% at the close of Fiscal 2013. The second largest program in terms of accrued liability, the employee retirement system (KERS), was only 23.2% funded. Kentucky passed much needed pension reform measures in 2013, which will require the Commonwealth to fully fund the actuarially required contribution for general employees in 2015 and replace the defined benefit plan with a defined contribution plan for new hires, but reforms for the teachers’ plan have not yet been addressed. Though the state does not have any outstanding general obligation debt, as of June 2014 the state’s implied general obligation rating was Aa2 and AA- by Moody’s and S&P, respectively. The state typically issues annual appropriation debt, which is rated a notch lower at Aa3 and A+, by Moody’s and S&P. In June 2014 (most recent data available at the time this report was prepared), Moody’s revised its rating outlook to Stable from Negative. Debt levels are moderately high in relation to the Commonwealth’s economic base. Net tax supported debt per capita is above average at $2,037 and 5.7% of personal income, above the Moody’s medians of $1,054 and 2.6%, respectively. For the twelve months ending May 31, 2014, Kentucky issued $4.1 billion in municipal bonds, representing a 35% increase from the twelve months ended May 31, 2013.
Michigan
Michigan’s economic recovery has mirrored national progress. The state economy continued to slowly improve, driven in part by the recovering auto industry. Strong domestic auto sales have incrementally bolstered growth over the past five years, though growth in 2013 was more modest than that of 2012. To a large extent, the Michigan economy remained tied to events in the auto industry, as the “Big Three” (General Motors, Ford and Chrysler) continued to rank among the state’s five largest employers. Overall, Michigan remained heavily reliant on manufacturing, which represented 13% of employment in the state, compared with 9% nationally. As of May 2014, Michigan’s unemployment rate was 7.5%, down from 8.9% in May 2013, the lowest level since April 2008. Following the peak in housing prices in mid-2006, home prices in Michigan declined dramatically and the inventory of foreclosed homes remained elevated in many of the state’s hardest-hit metropolitan areas, including Detroit, Warren and Flint. Improvement in the state economy has brought some recuperation in the housing market. According to the S&P/Case-Shiller Index of 20 major metropolitan
| Nuveen Investments | 7 |
Portfolio Managers’ Comments (continued)
areas, housing prices in Detroit rose 15.0% over the twelve months ended April 2014 (most recent data available at the time this report was prepared), compared with the national average increase of 10.8%. On the fiscal front, Michigan’s budgetary performance over the last two years has been impressive. As revenues improved, the state demonstrated a commitment to rebuild reserves. For Fiscal 2013, Michigan’s $48.2 billion budget was structurally balanced and did not require major expenditure cuts or borrowings. The General Fund closed Fiscal 2013 with a $400 million surplus. In 2013, a $140 million deposit brought Michigan’s reserve fund balance to $505 million, representing the largest reserve fund balance in more than a decade and the Fiscal 2014 budget appropriated another $75 million to the rainy day fund. The state’s improved financial and cash position has eliminated the need for cash flow borrowing. Michigan’s $49 billion budget for Fiscal 2014 provides revenue sharing for local governments, increased funding for K-12 education and additional transportation funding, which is expected to benefit construction spending and payroll growth. As of June 2014, Moody’s and S&P rated Michigan general obligation (GO) debt at Aa2 and AA-, respectively. Both agencies revised their outlook for the state to positive in 2013. During the twelve months ended May 31, 2014, municipal issuance in Michigan totaled $5.9 billion, a decrease of almost 37% from the twelve months ended May 31, 2013.
Missouri
Missouri’s economic recovery continued to lag that at the national level. For 2013, national economic growth of 1.8% outpaced Missouri’s expansion rate of 0.8%, which ranked Missouri 45th among the states. Continued job losses in the government and information technology sectors were offset by employment growth in construction, leisure and hospitality, financial activities and education and health services. As of May 2014, Missouri’s unemployment rate of 6.6% remained higher than the national rate of 6.3%, but represented a slight improvement over the state’s reading of 6.7% in May 2013. Missouri’s overexposure to traditional defense-related manufacturing jobs caused a drag on its recovery, but efforts to transition part of the state economy away from these jobs to health care and financial services could position Missouri for future growth. The state’s plan to expand exports suffered a setback in 2013, with exports falling 8.5% from 2012, as increases in exports to Mexico failed to offset large decreases in exports to Canada and China. For Fiscal 2015, the proposed $26.4 billion Missouri state budget, which was introduced in January 2014, focused on increased funding for K-12 education, higher education and the renovation of Fulton State Mental Hospital. In August 2014, residents will vote on a $0.0075 ten-year sales tax increase that would provide an estimated $500 million in annual transportation revenues. Although previous budgets have reduced state payrolls, the Fiscal 2015 budget called for increased spending on employee resources. As of May 2014, Moody’s, S&P and Fitch rated Missouri general obligation debt at Aaa/AAA/AAA with stable outlooks. For the twelve months ended May 31, 2014, municipal issuance in Missouri totaled $6.5 billion, representing a 3.5% increase from the twelve months ended May 31, 2013.
Ohio
Ohio’s economy continued to expand modestly, but at a slower pace than immediately following the recession. As of May 2014, the state’s unemployment rate was 5.5%, its lowest level since June 2008, down from 7.4% in May 2013. Manufacturing remained the largest of Ohio’s major employment sectors and the state continued to be a leading producer of steel and autos. Like other manufacturing-heavy states, Ohio tends to have a somewhat more cyclical economy than the nation as a whole. The state has experienced a small boom in oil and gas production, due largely to hydraulic fracturing in the Utica shale field in the Appalachian Basin. According to a recent report from the Ohio Oil and Gas Association, production of natural gas and oil in the state more than doubled in 2013. Ohio also saw improvement in its housing market in 2013, with the state’s home sales rising almost 15%. According to the S&P/Case-Shiller Index of prices in 20 major metropolitan areas, housing prices in Cleveland rose 2.7% over the twelve months ended April 2014 (most recent data available at the time this report was prepared), compared with the national average increase of 10.8%. On the fiscal front, Ohio has seen revenue recovery in line with its economic recovery, with Fiscal 2013 tax revenues 10.6% higher than prior-year collections. Income and sales taxes now make up more than half the state’s general fund revenues. In Fiscal 2013, Ohio fully funded its budget stabilization fund to its statutory maximum for the first time since 2000. Ohio’s Fiscal 2014-2015 biennial budget included significant tax reform, including a 10% personal income tax reduction over the next three years and a 0.25% sales tax rate increase effective September 2013. The state’s Medicaid expansion, which became effective January 1, 2014, was expected to have minimal budget impact due to the fact that additional enrollment will be covered by an estimated $562 million in federal funds for
| 8 | Nuveen Investments |
Fiscal 2014. As of March 2014, Moody’s and S&P rated Ohio GO debt at Aa1 and AA+, respectively, with stable outlooks. For the twelve months ended May 31, 2014, municipal issuance in Ohio totaled $8.8 billion, a decrease of over 29% compared with the twelve months ended May 31, 2013.
Wisconsin
Wisconsin’s economic recovery continues at a steady pace after strengthening somewhat in 2013. Last year the state’s economy expanded at a rate of 1.7%, aligned with the national growth rate of 1.8%, ranking Wisconsin 27th in terms of GDP growth by state. Favorably, manufacturing has held up well and has buoyed Wisconsin’s economy. Factory payrolls in Wisconsin are projected to outpace the national average in 2014. Though the state’s economy has diversified, manufacturing still accounts for 16.3% of employment in the state, compared to the national average of 8.9%. Wisconsin’s unemployment rate typically trends below the nation and as of May 2014 was 5.7% (compared to 6.3% nationally). Wisconsin enacted a two-year budget for Fiscal 2014 and 2015, which was balanced assuming 5% revenue growth and use of the budget surplus generated in Fiscal 2012-2013. The state closed the prior budget period with a cash surplus and positively added $125 million to the previously depleted rainy day fund. Solid growth in income and sales tax collections has bolstered state revenues, which are projected to be up over 4% in Fiscal 2015 year-over-year. The state plans to use a portion of the surplus generated in the current biennium to build reserves, though additional tax relief has also been considered by lawmakers. Wisconsin’s debt levels remain above average. Wisconsin is ranked 13th among states with tax supported debt per capita at $1,874, above the national median of $1,074. Debt as a percentage of personal income is 4.7%, also above the national median of 2.8%. Wisconsin’s high debt ratios are partially attributed to its issuance of $1.8 billion in 2003 to fund the State’s pension liability. As a result, the state has no unfunded pension liability. As of June 2014, Wisconsin’s general obligation debt carried ratings of Aa2 from Moody’s and AA from S&P with stable outlooks. For the twelve months ended May 31, 2014, Wisconsin issued $5.2 billion of municipal bonds, a decrease of 18.9% from the twelve-month period ended May 31, 2013.
How did the Funds perform during the twelve-month reporting period ended May 31, 2014?
The tables in the Fund Performance, Expense Ratios and Effective Leverage Ratios section of this report provide each Fund’s total return performance for its Class A Shares at net asset value (NAV) for the one-year, five-year and ten-year periods ending May 31, 2014. Each Fund’s Class A Share returns are compared with the performance of a corresponding market index and Lipper classification average.
During the twelve-month reporting period, the Class A Shares at NAV of all six Funds trailed the S&P Municipal Bond Index to varying degrees. Meanwhile, Kansas, Kentucky, Michigan, Missouri and Ohio outpaced their respective Lipper classification average, while Wisconsin trailed.
What strategies were used to manage the Funds during the twelve-month reporting period ended May 31, 2014 and how did these strategies influence performance?
All of the Funds continued to employ the same fundamental investment strategies and tactics long relied upon by Nuveen Asset Management. Our municipal bond portfolios are managed with a value-oriented approach and close input from Nuveen Asset Management’s experienced research team. Below we highlight the specific factors influencing each Fund’s investment strategy, as well as how we managed each portfolio in light of recent market conditions.
Nuveen Kansas and Wisconsin Municipal Bond Funds
The Nuveen Kansas Municipal Bond Fund lagged the S&P Municipal Bond Index during the twelve-month reporting period, with credit quality positioning and sector selection the primary factors behind the Fund’s underperformance. This impact was skewed by the large negative performance of Puerto Rico bonds, which made up roughly 9% of the Fund’s exposure at the beginning of the reporting period and roughly 3% at the end of the reporting period.
Puerto Rico bonds suffered significant price declines during much of the reporting period, given the U.S. territory’s deteriorating economic and fiscal condition. Against that backdrop, the Fund was hurt by its overweighted exposure to BBB-rated and BB-rated
| Nuveen Investments | 9 |
Portfolio Managers’ Comments (continued)
securities, many of which were Puerto Rico bonds that moved into those rating tiers after the territory saw its credit quality downgraded. Similarly, the Fund’s larger exposure to dedicated-tax bonds hurt, as Puerto Rico issues in that sector accounted for much of the segment’s underperformance. We also note that Kansas dedicated-tax bonds themselves lagged the index, which further hampered results.
The Fund’s duration, which measures its interest rate sensitivity, aided performance versus the index, with a key mid-year shift in our approach benefiting relative results. In the first half of the reporting period, we were active in selling bonds to satisfy shareholder redemptions, as investors withdrew money from the municipal bond market. As previously mentioned, we sold a large portion of our Puerto Rico holdings. We also sold some lower coupon, longer duration bonds during a period of heightened demand for such securities among individual investors. At the same time, the Fund had a number of bonds called by their issuers, leaving proceeds to reinvest. We used these assets to extend the portfolio’s duration at the end of 2013 and this approach helped the Fund to more fully participate in the market rally that subsequently occurred as interest rates declined in the following months. Similarly, the Fund’s yield curve positioning was a plus for relative performance, with our underweighting in shorter term securities and overweighting in longer term bonds enhancing the Fund’s ability to participate in the municipal bond market’s 2014 rebound.
Although new purchases were limited during the reporting period, given limited inflows into the Fund, we took advantage of some buying opportunities among bonds of Guam and the U.S. Virgin Islands, which added diversification and triple exemption (i.e., exemption from most federal, state and local taxes). These securities, which performed well and added to the Fund’s relative performance, benefited from limited supply amid increased demand in light of Puerto Rico’s credit troubles.
We also added various Kansas securities whose yields we found attractive, as we sought to enhance the Fund’s income stream. Additions to the portfolio included longer term securities backed by Tabor College, Presbyterian Manors, Jameson Energy and Stormont-Vail HealthCare.
The Nuveen Wisconsin Municipal Bond Fund underperformed the S&P Municipal Bond Index during the twelve-month reporting period, with its Puerto Rico holdings largely responsible for these results. Given the routine scarcity of Wisconsin bonds, tax-free debt in the state traded at what we believed to be unattractive prices. At the same time, we sometimes found that bonds issued in the U.S. territories of Puerto Rico, Guam and the Virgin Islands were more attractively valued, provided an important source of diversification for the Fund and helped enhance its income.
During the past twelve months, however, owning Puerto Rico securities proved detrimental. These bonds faced significant pressure due to worries about the territory’s high debt load and sluggish economy. Against that backdrop, the Fund’s credit rating positioning worked against it, largely stemming from overweightings in BBB-rated and BB-rated Puerto Rico bonds. From a sector allocation perspective, this debt also dominated our holdings in the utility and tobacco sectors, which significantly lagged the index. We were also hurt by overweighted positions in pre-refunded and dedicated-tax bonds, which were a mix of Puerto Rico bonds and Wisconsin securities, the latter of which also lagged the benchmark.
Throughout the reporting period, we significantly reduced the Fund’s stake in Puerto Rico bonds from approximately 18% at the beginning of the reporting period to roughly 4% at the end of the reporting period. The Fund’s remaining exposure to Puerto Rico at period end was diversified across several distinct issuers, with an emphasis on bonds whose income payments are not dependent on the central government’s financial position. These included holdings in Puerto Rico tobacco, sales tax, higher education and U.S. government-backed bonds.
In contrast, the Fund benefited from its duration stance. Specifically, the portfolio’s longer duration meant it was more sensitive to interest rate changes and, therefore, was helped more as rates declined in 2014. Additionally, the Fund’s relative overweighting in longer term bonds further bolstered its relative results. As interest rates declined, the yield curve flattened, meaning that yields on longer term bonds fell more than those on shorter term bonds, in which the Fund was underweighted. This curve flattening resulted in significant outperformance of longer term bonds and underperformance of shorter term securities.
| 10 | Nuveen Investments |
The municipal bond market experienced outflows during the reporting period, especially in the first half of the reporting period and the Fund followed suit. To meet shareholder redemptions, we sold Puerto Rico securities, as mentioned earlier. We also sold some Wisconsin taxable municipal bonds, which had previously been added to the portfolio at times when we believed their yields and prices were attractive enough to offset their tax liabilities.
The Fund also experienced a number of bond calls and we used the proceeds to finance a limited number of purchases. These portfolio additions included certain issues of Guam and the U.S. Virgin Islands, both of whose economies and fiscal situation we believed were far more stable than that of Puerto Rico. The bonds were further bolstered by favorable technical factors, supply of Guam and Virgin Islands bonds is limited while demand rose, as investors looked for tax-exempt alternatives to Puerto Rico securities.
Other purchases included various fully tax-exempt Wisconsin bonds that we believed provided favorable yields relative to the securities’ prices. These new portfolio additions included Hudson Housing Authority Cedar Ridge Apartments bonds, Western Technical College student housing debt and Milwaukee Science Education Consortium bonds.
Nuveen Kentucky, Michigan and Ohio Municipal Bond Funds
The Nuveen Kentucky Municipal Bond Fund underperformed the S&P Municipal Bond Index. Duration positioning, which reflects the Fund’s interest rate sensitivity, was the biggest detractor from relative results. The Fund was overweighted in longer duration securities, which suffered more than shorter term bonds as interest rates rose during the first half of the reporting period.
The Fund was also hurt by its holdings in Puerto Rico bonds, which performed poorly in response to a series of credit rating downgrades, as the territory’s financial prospects worsened. By the end of the reporting period, we had eliminated the Fund’s exposure to Puerto Rico bonds, which stood at roughly 7% at the beginning of the reporting period. Our decision to sell much of our stake early on helped the Fund escape some, but not all, of the price declines Puerto Rico bonds continued to suffer as the reporting period progressed.
In contrast, credit rating positioning helped boost the Fund’s results compared with the index. A relative overweighting in AA-rated bonds was the biggest contributor, as these securities outperformed other credit quality tiers, thanks to growing investor interest in relatively creditworthy issues with better yields than those offered by AAA-rated bonds. Sector selection also aided the Fund’s relative performance, especially an overweighting in health care debt, which outpaced the overall market. However, a relative overweighting in pre-refunded bonds, which have short maturities and high credit quality, hampered results, as these securities lagged the index.
The Fund experienced significant investment outflows during much of the reporting period, especially in the first half, echoing the trend in the broader market. To generate the proceeds needed to accommodate shareholder redemption activity, we sold some U.S. Virgin Islands and pre-refunded bonds, as well as others for which we believed we were able to get good prices from individual investors.
Although sales made up the majority of our transaction activity, we did make a modest number of purchases, mostly in the intermediate- to long-term part of the market. One notable new addition to the portfolio consisted of Kentucky PFIA Toll Bridge bonds. We particularly liked these securities, both because of the essential service nature of the bridge, which makes it less dependent on a healthy economy for its revenues, as well as its BBB-rated credit, which helped enhance the Fund’s income stream and diversification, the latter of which can be a challenge with lower rated Kentucky issues. Other purchases, which took place in the new issue and secondary markets, included two health care issues, a student-loan bond issue, a dedicated-tax bond and an industrial development revenue/pollution control revenue bond.
The Nuveen Michigan Municipal Bond Fund modestly underperformed the S&P Municipal Bond Index during the twelve-month reporting period. From the standpoint of duration, or sensitivity to interest rate changes, the Fund benefited from its underweighting in shorter duration investments, which was generally helpful. The Fund also saw good results from its intermediate-duration securities.
| Nuveen Investments | 11 |
Portfolio Managers’ Comments (continued)
Meanwhile, credit quality positioning was beneficial, particularly an underweighting in BBB-rated bonds, which lagged their higher quality counterparts, as investors shied away from riskier assets during much of the reporting period. Sector selection also bolstered the Fund’s results compared with the index, with its overweighting in tax-increment-financing (TIF) district bonds providing much of the outperformance. The Fund’s tobacco bonds were another plus.
The Fund had very little direct exposure to the reporting period’s two major credit challenges, Detroit, which filed for bankruptcy in July 2013, and Puerto Rico, which suffered from worries about the U.S. territory’s high debt level and weak economy. The Fund had no exposure to Detroit general obligation (GO) bonds. We purposely avoided those securities, given our negative credit outlook for the city. Although the Fund entered the reporting period with roughly 2% Puerto Rico exposure, we sold this position, as well as our small holdings in Puerto Rico tobacco-securitization and electric utility debt. At the end of the reporting period, the Fund had no exposure to Puerto Rico bonds.
While we intentionally lacked any exposure to Detroit GO bonds, we continued to own and occasionally bought new bonds of issuers that investors perceived as having a connection to the city’s credit troubles, but that we determined were likely to sustain their income payments despite Detroit’s bankruptcy proceedings. We maintained the Fund’s stake in Detroit water/sewer bonds, which are backed by a dedicated revenue stream and are independent of the city’s general taxing authority. We also held AA+rated Detroit City School District bonds which, under the School Bond Qualification and Loan Fund, are backed by the state’s full faith and credit and held our Wayne County (Detroit) airport bonds. In all of these cases, we had confidence in the issuers’ credit quality and believed the bonds were trading at unusually attractive prices and therefore offered shareholders good long-term value.
We used the proceeds of called bonds to fund many of those and other purchases, including some dedicated-tax bonds and securities issued by the University of Michigan and Michigan State Trunk Line, the latter of which are transportation bonds backed by motor-fuel taxes. In addition, we actively sold bonds to meet the large amount of shareholder redemptions taking place across the municipal bond fund industry. We pared our stake in tobacco bonds to enhance the Fund’s diversification. Other sales included some pre-refunded bonds when we felt we could obtain attractive prices in return. Finally, we sold the Fund’s stake in two tender option bond trusts for duration and cash management purposes. We used available cash to place the bonds involved back on the Fund’s balance sheet.
The Nuveen Ohio Municipal Bond Fund underperformed the S&P Municipal Bond Index, in part because of sector allocation. Specifically, the Fund was hurt by its overweighting of dedicated tax-bonds, particularly modest exposure early in the reporting period to Puerto Rico sales-tax credits. During the reporting period, we had eliminated our small allocation to all Puerto Rico bonds, which had been roughly 3.9% at the beginning of the reporting period. Selling the Fund’s Puerto Rico holdings allowed us to sidestep the further price deterioration these securities eventually suffered. On the positive side, the Fund’s overweighting in corporate-backed industrial development revenue/pollution control revenue bonds helped, given that category’s outperformance.
Meanwhile, the Fund benefited on a relative basis from its credit quality and duration positioning. From a credit stand-point, the portfolio was overweighted in AA-rated bonds, which outpaced other credit quality tiers throughout much of the reporting period. In terms of duration, underweighting shorter duration bonds helped the Fund’s relative performance in the second half of the reporting period, given that these securities lagged as interest rates rose. Later, however, the Fund’s overweighting in longer-term bonds detracted; when rates were declining, these securities trailed intermediate-duration issues, to which the Fund was underweighted.
Throughout the reporting period, and especially in the first half, we were active in selling bonds to satisfy shareholder redemptions, as investors withdrew money from the municipal bond market. As previously mentioned, we sold the Fund’s Puerto Rico positions. We also sold some of the Fund’s lower coupon, longer duration bonds and pre-refunded securities during a period of heightened demand for such bonds on the part of individual investors. We further sold some tobacco securities to reduce our exposure to that part of the market. Finally, we unwound the Fund’s holdings in three trusts. These sales, coupled with the proceeds from called and maturing bonds, provided the funds to purchase a number of new securities, including bonds issued by Miami University and Cleveland Regional Transportation Authority, both of whose structural characteristics and valuations we found compelling. Other additions to the portfolio included one state and two local general obligation (GO) bond issues and a water and sewer security. A majority of our purchases were intermediate-duration issues, which occupied what we saw as a better valued portion of the yield curve.
| 12 | Nuveen Investments |
Nuveen Missouri Municipal Bond Fund
The Nuveen Missouri Municipal Bond Fund lagged the S&P Municipal Bond Index during the twelve-month reporting period. The Fund was hurt by its weighting in Puerto Rico bonds. Bonds issued by the territory, which made up approximately 6% of the Fund at the beginning of the reporting period, suffered as the U.S. territory’s fiscal and economic outlook dimmed and its credit rating was downgraded. We reduced our stake in Puerto Rico bonds to about 2% of the portfolio by the end of the reporting period.
In contrast, the Fund benefited from yield curve and sector positioning. From a yield curve perspective, the portfolio’s larger allocation to bonds in the longer intermediate part of the yield curve and related underweighting in shorter term securities proved beneficial, as longer intermediate-term bonds were among the best performers in the market during the reporting period.
Sector positioning generally bolstered the Fund’s relative results. Compared to the national municipal market, where the supply of new issue bonds was limited, Missouri somewhat bucked the trend with slightly higher new issuance, affording opportunities to add to our stake in hospital and senior living bonds at what we believed were attractive values. As national new issue supply waned, both sectors performed well on a relative basis, helped further by investors’ growing enthusiasm for higher yielding securities in a declining rate environment.
To fund these purchases, as well as the investment outflows the Fund experienced during the first half of the reporting period, we used the proceeds of called bonds as well as our Puerto Rico bond sales. Other transactions included trading lower yielding securities for higher coupon bonds when the market presented opportunities to do so; this helped bolster the Fund’s income stream.
On the purchase side, in addition to hospital and senior living bonds, we actively bought across a variety of sectors, with an emphasis on investment grade securities. The combination of these buys and sells had a modest impact on the Fund’s overall credit quality positioning. The most notable changes were an increase in AA-rated bonds, the result of an upgrade in the credit quality of a municipal bond insurer that backed some of the Fund’s securities and a decrease in BBB-rated bonds, reflecting our sales of Puerto Rico holdings.
An Update Regarding Detroit and Puerto Rico
Shareholders also should be aware of two events in the broader municipal bond market that continued to have an impact on the Funds’ holdings and performance: the City of Detroit’s ongoing bankruptcy proceedings and the downgrade of ratings on Puerto Rico general obligation (GO) bonds and related debt to below investment grade. Burdened by decades of population loss, changes in the auto manufacturing industry and significant tax base deterioration, the City of Detroit filed for Chapter 9 in federal bankruptcy court in July 2013. Given the complexity of its debt portfolio, number of creditors, numerous union contracts and significant legal questions that must be addressed, Detroit’s bankruptcy filing is expected to be a lengthy one. In April 2014, Detroit announced that it had reached agreements with bond insurance companies over the treatment of voter-approved GO bonds and with one of its retired worker groups over pension and health care benefits.
During this reporting period, developments in Puerto Rico also had an impact on the Funds’ holdings and performance. The commonwealth’s continued economic weakening, escalating debt service obligations and long-standing inability to deliver a balanced budget have led to multiple downgrades on its debt. In another round of rating reductions in February 2014, Moody’s, S&P, and Fitch cut their ratings on Puerto Rico general obligation (GO) debt to below investment grade, at Ba2/BB+/BB, respectively, with negative outlooks. In late June 2014, Puerto Rico approved new legislation creating a judicial framework and formal process that would allow several of the commonwealth’s public corporations to restructure their public debt. As of July 2014, the Nuveen complex holds $80.6 million in bonds backed by public corporations in Puerto Rico that could be restructured under this legislation, representing less than 0.1% of our municipal assets under management. In light of the evolving economic situation in Puerto Rico, Nuveen’s credit analysis of Puerto Rico had previously considered the possibility of a default and restructuring of public corporations and we adjusted our port-folios to prepare for such an outcome, although no such default or restructuring has occurred to date. The Nuveen complex’s entire exposure to obligations of the government of Puerto Rico and other Puerto Rico issuers amounts to 0.8% of
| Nuveen Investments | 13 |
Portfolio Managers’ Comments (continued)
our municipal assets under management. On July 1, 2014, in response to the new legislation, Moody’s further dropped its rating on Puerto Rico GO debt by an additional three notches, to B2 from Ba2. To date, S&P and Fitch have not announced any additional rating adjustments. For the reporting period ended May 31, 2014, Puerto Rico paper underperformed the municipal market as a whole.
| 14 | Nuveen Investments |
and Dividend Information
Risk Considerations
Mutual fund investing involves risk; principal loss is possible. Debt or fixed income securities such as those held by the Funds, are subject to market risk, credit risk, interest rate risk, call risk, state concentration risk, tax risk, and income risk. As interest rates rise, bond prices fall. Credit risk refers to an issuers ability to make interest and principal payments when due. Below investment grade or high yield debt securities are subject to liquidity risk and heightened credit risk. The Funds’ use of inverse floaters creates effective leverage. Leverage involves the risk that the Funds could lose more than its original investment and also increases the Funds’ exposure to volatility and interest rate risk.
Dividend Information
Each Fund seeks to pay dividends at a rate that reflects the past and projected performance of the Fund. To permit a Fund to maintain a more stable monthly dividend, the Fund may pay dividends at a rate that may be more or less than the amount of net investment income actually earned by the Fund during the period. If the Fund has cumulatively earned more than it has paid in dividends, it will hold the excess in reserve as undistributed net investment income (UNII) as part of the Fund’s NAV. Conversely, if the Fund has cumulatively paid in dividends more than it has earned, the excess will constitute a negative UNII that will likewise be reflected in the Fund’s NAV. Each Fund will, over time, pay all its net investment income as dividends to shareholders.
As of May 31, 2014, all six Funds had positive UNII balances for tax and financial reporting purposes.
| Nuveen Investments | 15 |
THIS PAGE INTENTIONALLY LEFT BLANK
| 16 | Nuveen Investments |
Fund Performance, Expense Ratios
and Effective Leverage Ratios
The Fund Performance, Expense Ratios and Effective Leverage Ratios for each Fund are shown within this section of the report.
Returns quoted represent past performance, which is no guarantee of future results. Current performance may be higher or lower than the performance shown. Investment returns and principal value will fluctuate so that when shares are redeemed, they may be worth more or less than their original cost. Returns without sales charges would be lower if the sales charge were included. Returns do not reflect the deduction of taxes that a shareholder would pay on Fund distributions or the redemption of Fund shares. Income is generally exempt from regular federal income taxes. Some income may be subject to state and local income taxes and to the federal alternative minimum tax. Capital gains, if any, are subject to tax.
Returns may reflect a contractual agreement by the investment adviser to waive certain fees and expenses; see Notes to Financial Statements, Note 7—Management Fees and Other Transactions with Affiliates for more information. In addition, returns may reflect a voluntary expense limitation by the investment adviser that may be modified or discontinued at any time without notice. For the most recent month-end performance visit www.nuveen.com or call (800) 257-8787.
Returns reflect differences in sales charges and expenses, which are primarily differences in distribution and service fees. Fund returns assume reinvestment of dividends and capital gains.
Comparative index and Lipper return information is provided for Class A Shares at net asset value (NAV) only.
The expense ratios shown reflect total operating expenses (before fee waivers and/or expense reimbursements, if any) as shown in the most recent prospectus. The expense ratios include management fees and other fees and expenses.
Leverage is created whenever a Fund has investment exposure (both reward and/or risk) equivalent to more than 100% of the investment capital. The effective leverage ratio shown is the amount of investment exposure created either through borrowings or indirectly through inverse floaters, divided by the assets invested, including those assets that were purchased with the proceeds of the leverage, or referenced by the levered instrument.
| Nuveen Investments | 17 |
Fund Performance, Expense Ratios and Effective Leverage Ratios (continued)
Nuveen Kansas Municipal Bond Fund
Refer to the first page of this Fund Performance, Expense Ratios and Effective Leverage Ratios section for further explanation of the information included within this section. Refer to the Glossary of Terms Used in this Report for definitions of terms used within this section.
Fund Performance
Average Annual Total Returns as of May 31, 2014
| Average Annual | ||||||||||||
| 1-Year | 5-Year | 10-Year | ||||||||||
Class A Shares at NAV | 1.72% | 5.73% | 4.82% | |||||||||
Class A Shares at maximum Offering Price | (2.58)% | 4.83% | 4.37% | |||||||||
S&P Municipal Bond Index | 2.98% | 5.91% | 5.06% | |||||||||
Lipper Other States Municipal Debt Funds Classification Average | 1.02% | 4.89% | 4.01% | |||||||||
Class C2 Shares | 1.24% | 5.15% | 4.25% | |||||||||
Class I Shares | 1.95% | 5.96% | 5.04% | |||||||||
| Cumulative | ||||
| Since Inception* | ||||
Class C Shares | 4.37% | |||
Indexes and Lipper averages are not available for direct investment.
Average Annual Total Returns as of June 30, 2014 (Most Recent Calendar Quarter)
| Average Annual | ||||||||||||
| 1-Year | 5-Year | 10-Year | ||||||||||
Class A Shares at NAV | 5.45% | 5.89% | 4.78% | |||||||||
Class A Shares at maximum Offering Price | 1.00% | 4.98% | 4.33% | |||||||||
Class C2 Shares | 4.76% | 5.30% | 4.20% | |||||||||
Class I Shares | 5.57% | 6.10% | 4.98% | |||||||||
| Cumulative | ||||
| Since Inception* | ||||
Class C Shares | 4.34% | |||
Class A Shares have a maximum 4.20% sales charge (Offering Price). Class A Share purchases of $1 million or more are sold at net asset value without an up-front sales charge but may be subject to a contingent deferred sales charge (CDSC), also known as a backend sales charge, if redeemed within eighteen months of purchase. Class C and Class C2 Shares have a 1% CDSC for redemptions within less than twelve months, which is not reflected in the one-year total return. Class I Shares have no sales charge and may be purchased under limited circumstances or by specified classes of investors.
Expense Ratios as of Most Recent Prospectus
| Share Class | ||||||||||||||||
| Class A | Class C | Class C2 | Class I | |||||||||||||
Expense Ratios | 0.84% | 1.64% | 1.39% | 0.64% | ||||||||||||
| 18 | Nuveen Investments |
Effective Leverage Ratio as of May 31, 2014
Effective Leverage Ratio | 6.90% |
Growth of an Assumed $10,000 Investment as of May 31, 2014 – Class A Shares
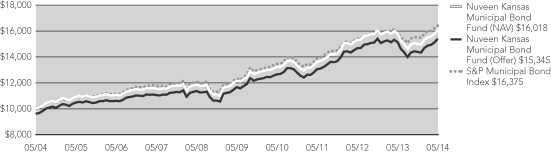
The graphs do not reflect the deduction of taxes, such as state and local income taxes or capital gains taxes that a shareholder may pay on Fund distributions or the redemptions of Fund shares.
| * | Since inception returns for Class C Shares are from 2/10/14. |
| Nuveen Investments | 19 |
Fund Performance, Expense Ratios and Effective Leverage Ratios (continued)
Nuveen Kentucky Municipal Bond Fund
Refer to the first page of this Fund Performance, Expense Ratios and Effective Leverage Ratios section for further explanation of the information included within this section. Refer to the Glossary of Terms Used in this Report for definitions of terms used within this section.
Fund Performance
Average Annual Total Returns as of May 31, 2014
| Average Annual | ||||||||||||
| 1-Year | 5-Year | 10-Year | ||||||||||
Class A Shares at NAV | 2.14% | 5.43% | 4.51% | |||||||||
Class A Shares at maximum Offering Price | (2.11)% | 4.52% | 4.06% | |||||||||
S&P Municipal Bond Index | 2.98% | 5.91% | 5.06% | |||||||||
Lipper Other States Municipal Debt Funds Classification Average | 1.02% | 4.89% | 4.01% | |||||||||
Class C2 Shares | 1.66% | 4.87% | 3.94% | |||||||||
Class I Shares | 2.36% | 5.65% | 4.72% | |||||||||
| Cumulative | ||||
| Since Inception* | ||||
Class C Shares | 3.49% | |||
Indexes and Lipper averages are not available for direct investment.
Average Annual Total Returns as of June 30, 2014 (Most Recent Calendar Quarter)
| Average Annual | ||||||||||||
| 1-Year | 5-Year | 10-Year | ||||||||||
Class A Shares at NAV | 5.59% | 5.63% | 4.49% | |||||||||
Class A Shares at maximum Offering Price | 1.14% | 4.73% | 4.04% | |||||||||
Class C2 Shares | 5.01% | 5.05% | 3.91% | |||||||||
Class I Shares | 5.83% | 5.83% | 4.69% | |||||||||
| Cumulative | ||||
| Since Inception* | ||||
Class C Shares | 3.46% | |||
Class A Shares have a maximum 4.20% sales charge (Offering Price). Class A Share purchases of $1 million or more are sold at net asset value without an up-front sales charge but may be subject to a contingent deferred sales charge (CDSC), also known as a backend sales charge, if redeemed within eighteen months of purchase. Class C and Class C2 Shares have a 1% CDSC for redemptions within less than twelve months, which is not reflected in the one-year total return. Class I Shares have no sales charge and may be purchased under limited circumstances or by specified classes of investors.
Expense Ratios as of Most Recent Prospectus
| Share Class | ||||||||||||||||
| Class A | Class C | Class C2 | Class I | |||||||||||||
Expense Ratios | 0.78% | 1.58% | 1.33% | 0.58% | ||||||||||||
| 20 | Nuveen Investments |
Effective Leverage Ratio as of May 31, 2014
Effective Leverage Ratio | 6.91% |
Growth of an Assumed $10,000 Investment as of May 31, 2014 – Class A Shares
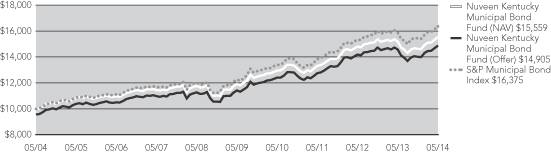
The graphs do not reflect the deduction of taxes, such as state and local income taxes or capital gains taxes that a shareholder may pay on Fund distributions or the redemptions of Fund shares.
| * | Since inception returns for Class C Shares are from 2/10/14. |
| Nuveen Investments | 21 |
Fund Performance, Expense Ratios and Effective Leverage Ratios (continued)
Nuveen Michigan Municipal Bond Fund
Refer to the first page of this Fund Performance, Expense Ratios and Effective Leverage Ratios section for further explanation of the information included within this section. Refer to the Glossary of Terms Used in this Report for definitions of terms used within this section.
Fund Performance
Average Annual Total Returns as of May 31, 2014
| Average Annual | ||||||||||||
| 1-Year | 5-Year | 10-Year | ||||||||||
Class A Shares at NAV | 2.70% | 5.54% | 4.59% | |||||||||
Class A Shares at maximum Offering Price | (1.64)% | 4.64% | 4.14% | |||||||||
S&P Municipal Bond Index | 2.98% | 5.91% | 5.06% | |||||||||
Lipper Other States Municipal Debt Funds Classification Average | 1.02% | 4.89% | 4.01% | |||||||||
Class C2 Shares | 2.05% | 4.94% | 4.02% | |||||||||
Class I Shares | 2.84% | 5.74% | 4.79% | |||||||||
| Cumulative | ||||
| Since Inception* | ||||
Class C Shares | 4.11% | |||
Indexes and Lipper averages are not available for direct investment.
Average Annual Total Returns as of June 30, 2014 (Most Recent Calendar Quarter)
| Average Annual | ||||||||||||
| 1-Year | 5-Year | 10-Year | ||||||||||
Class A Shares at NAV | 6.31% | 5.79% | 4.58% | |||||||||
Class A Shares at maximum Offering Price | 1.83% | 4.88% | 4.13% | |||||||||
Class C2 Shares | 5.74% | 5.21% | 4.00% | |||||||||
Class I Shares | 6.54% | 6.00% | 4.78% | |||||||||
| Cumulative | ||||
| Since Inception* | ||||
Class C Shares | 4.29% | |||
Class A Shares have a maximum 4.20% sales charge (Offering Price). Class A Share purchases of $1 million or more are sold at net asset value without an up-front sales charge but may be subject to a contingent deferred sales charge (CDSC), also known as a backend sales charge, if redeemed within eighteen months of purchase. Class C and Class C2 Shares have a 1% CDSC for redemptions within less than twelve months, which is not reflected in the one-year total return. Class I Shares have no sales charge and may be purchased under limited circumstances or by specified classes of investors.
Expense Ratios as of Most Recent Prospectus
| Share Class | ||||||||||||||||
| Class A | Class C | Class C2 | Class I | |||||||||||||
Expense Ratios | 0.81% | 1.61% | 1.36% | 0.61% | ||||||||||||
| 22 | Nuveen Investments |
Effective Leverage Ratio as of May 31, 2014
Effective Leverage Ratio | 1.92% |
Growth of an Assumed $10,000 Investment as of May 31, 2014 – Class A Shares
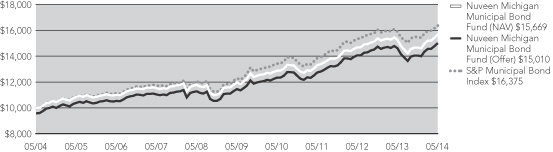
The graphs do not reflect the deduction of taxes, such as state and local income taxes or capital gains taxes that a shareholder may pay on Fund distributions or the redemptions of Fund shares.
| * | Since inception returns for Class C Shares are from 2/10/14. |
| Nuveen Investments | 23 |
Fund Performance, Expense Ratios and Effective Leverage Ratios (continued)
Nuveen Missouri Municipal Bond Fund
Refer to the first page of this Fund Performance, Expense Ratios and Effective Leverage Ratios section for further explanation of the information included within this section. Refer to the Glossary of Terms Used in this Report for definitions of terms used within this section.
Fund Performance
Average Annual Total Returns as of May 31, 2014
| Average Annual | ||||||||||||
| 1-Year | 5-Year | 10-Year | ||||||||||
Class A Shares at NAV | 2.53% | 6.60% | 4.91% | |||||||||
Class A Shares at maximum Offering Price | (1.74)% | 5.69% | 4.47% | |||||||||
S&P Municipal Bond Index | 2.98% | 5.91% | 5.06% | |||||||||
Lipper Other States Municipal Debt Funds Classification Average | 1.02% | 4.89% | 4.01% | |||||||||
Class C2 Shares | 1.97% | 6.00% | 4.34% | |||||||||
Class I Shares | 2.75% | 6.80% | 5.12% | |||||||||
| Cumulative | ||||
| Since Inception* | ||||
Class C Shares | 3.98% | |||
Indexes and Lipper averages are not available for direct investment.
Average Annual Total Returns as of June 30, 2014 (Most Recent Calendar Quarter)
| Average Annual | ||||||||||||
| 1-Year | 5-Year | 10-Year | ||||||||||
Class A Shares at NAV | 6.12% | 6.72% | 4.86% | |||||||||
Class A Shares at maximum Offering Price | 1.63% | 5.81% | 4.42% | |||||||||
Class C2 Shares | 5.47% | 6.13% | 4.29% | |||||||||
Class I Shares | 6.26% | 6.90% | 5.06% | |||||||||
| Cumulative | ||||
| Since Inception* | ||||
Class C Shares | 3.79% | |||
Class A Shares have a maximum 4.20% sales charge (Offering Price). Class A Share purchases of $1 million or more are sold at net asset value without an up-front sales charge but may be subject to a contingent deferred sales charge (CDSC), also known as a backend sales charge, if redeemed within eighteen months of purchase. Class C and Class C2 Shares have a 1% CDSC for redemptions within less than twelve months, which is not reflected in the one-year total return. Class I Shares have no sales charge and may be purchased under limited circumstances or by specified classes of investors.
Expense Ratios as of Most Recent Prospectus
| Share Class | ||||||||||||||||
| Class A | Class C | Class C2 | Class I | |||||||||||||
Expense Ratios | 0.79% | 1.59% | 1.34% | 0.59% | ||||||||||||
| 24 | Nuveen Investments |
Effective Leverage Ratio as of May 31, 2014
Effective Leverage Ratio | 0.53% |
Growth of an Assumed $10,000 Investment as of May 31, 2014 – Class A Shares
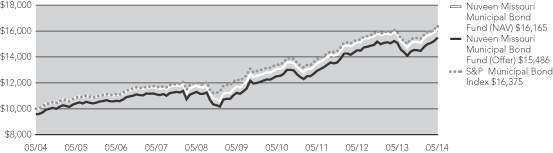
The graphs do not reflect the deduction of taxes, such as state and local income taxes or capital gains taxes that a shareholder may pay on Fund distributions or the redemptions of Fund shares.
| * | Since inception returns for Class C Shares are from 2/10/14. |
| Nuveen Investments | 25 |
Fund Performance, Expense Ratios and Effective Leverage Ratios (continued)
Nuveen Ohio Municipal Bond Fund
Refer to the first page of this Fund Performance, Expense Ratios and Effective Leverage Ratios section for further explanation of the information included within this section. Refer to the Glossary of Terms Used in this Report for definitions of terms used within this section.
Fund Performance
Average Annual Total Returns as of May 31, 2014
| Average Annual | ||||||||||||
| 1-Year | 5-Year | 10-Year | ||||||||||
Class A Shares at NAV | 2.31% | 5.58% | 4.75% | |||||||||
Class A Shares at maximum Offering Price | (1.96)% | 4.68% | 4.30% | |||||||||
S&P Municipal Bond Index | 2.98% | 5.91% | 5.06% | |||||||||
Lipper Ohio Municipal Debt Funds Classification Average | 1.75% | 4.94% | 4.13% | |||||||||
Class C2 Shares | 1.80% | 5.00% | 4.18% | |||||||||
Class I Shares | 2.58% | 5.79% | 4.96% | |||||||||
| Cumulative | ||||
| Since Inception* | ||||
Class C Shares | 3.79% | |||
Indexes and Lipper averages are not available for direct investment.
Average Annual Total Returns as of June 30, 2014 (Most Recent Calendar Quarter)
| Average Annual | ||||||||||||
| 1-Year | 5-Year | 10-Year | ||||||||||
Class A Shares at NAV | 6.11% | 5.83% | 4.69% | |||||||||
Class A Shares at maximum Offering Price | 1.69% | 4.94% | 4.25% | |||||||||
Class C2 Shares | 5.60% | 5.25% | 4.13% | |||||||||
Class I Shares | 6.41% | 6.05% | 4.91% | |||||||||
| Cumulative | ||||
| Since Inception* | ||||
Class C Shares | 3.71% | |||
Class A Shares have a maximum 4.20% sales charge (Offering Price). Class A Share purchases of $1 million or more are sold at net asset value without an up-front sales charge but may be subject to a contingent deferred sales charge (CDSC), also known as a backend sales charge, if redeemed within eighteen months of purchase. Class C and Class C2 Shares have a 1% CDSC for redemptions within less than twelve months, which is not reflected in the one-year total return. Class I Shares have no sales charge and may be purchased under limited circumstances or by specified classes of investors.
Expense Ratios as of Most Recent Prospectus
| Share Class | ||||||||||||||||
| Class A | Class C | Class C2 | Class I | |||||||||||||
Expense Ratios | 0.79% | 1.59% | 1.34% | 0.59% | ||||||||||||
| 26 | Nuveen Investments |
Effective Leverage Ratio as of May 31, 2014
Effective Leverage Ratio | 5.92% |
Growth of an Assumed $10,000 Investment as of May 31, 2014 – Class A Shares

The graphs do not reflect the deduction of taxes, such as state and local income taxes or capital gains taxes that a shareholder may pay on Fund distributions or the redemptions of Fund shares.
| * | Since inception returns for Class C Shares are from 2/10/14. |
| Nuveen Investments | 27 |
Fund Performance, Expense Ratios and Effective Leverage Ratios (continued)
Nuveen Wisconsin Municipal Bond Fund
Refer to the first page of this Fund Performance, Expense Ratios and Effective Leverage Ratios section for further explanation of the information included within this section. Refer to the Glossary of Terms Used in this Report for definitions of terms used within this section.
Fund Performance
Average Annual Total Returns as of May 31, 2014
| Average Annual | ||||||||||||
| 1-Year | 5-Year | 10-Year | ||||||||||
Class A Shares at NAV | 0.76% | 5.27% | 4.48% | |||||||||
Class A Shares at maximum Offering Price | (3.45)% | 4.36% | 4.03% | |||||||||
S&P Municipal Bond Index | 2.98% | 5.91% | 5.06% | |||||||||
Lipper Other States Municipal Debt Funds Classification Average | 1.02% | 4.89% | 4.01% | |||||||||
Class C2 Shares | 0.21% | 4.71% | 3.91% | |||||||||
Class I Shares | 0.99% | 5.51% | 4.69% | |||||||||
| Cumulative | ||||
| Since Inception* | ||||
Class C Shares | 5.07% | |||
Indexes and Lipper averages are not available for direct investment.
Average Annual Total Returns as of June 30, 2014 (Most Recent Calendar Quarter)
| Average Annual | ||||||||||||
| 1-Year | 5-Year | 10-Year | ||||||||||
Class A Shares at NAV | 5.36% | 5.55% | 4.44% | |||||||||
Class A Shares at maximum Offering Price | 0.94% | 4.65% | 3.99% | |||||||||
Class C2 Shares | 4.79% | 4.97% | 3.87% | |||||||||
Class I Shares | 5.59% | 5.77% | 4.64% | |||||||||
| Cumulative | ||||
| Since Inception* | ||||
Class C Shares | 5.04% | |||
Class A Shares have a maximum 4.20% sales charge (Offering Price). Class A Share purchases of $1 million or more are sold at net asset value without an up-front sales charge but may be subject to a contingent deferred sales charge (CDSC), also known as a backend sales charge, if redeemed within eighteen months of purchase. Class C and Class C2 Shares have a 1% CDSC for redemptions within less than twelve months, which is not reflected in the one-year total return. Class I Shares have no sales charge and may be purchased under limited circumstances or by specified classes of investors.
Expense Ratios as of Most Recent Prospectus
| Share Class | ||||||||||||||||
| Class A | Class C | Class C2 | Class I | |||||||||||||
Expense Ratios | 0.84% | 1.65% | 1.39% | 0.65% | ||||||||||||
| 28 | Nuveen Investments |
Effective Leverage Ratio as of May 31, 2014
Effective Leverage Ratio | 4.17% |
Growth of an Assumed $10,000 Investment as of May 31, 2014 – Class A Shares
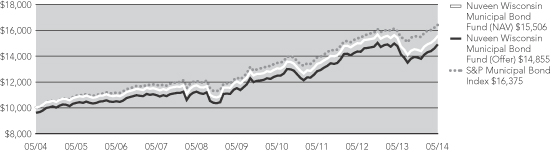
The graphs do not reflect the deduction of taxes, such as state and local income taxes or capital gains taxes that a shareholder may pay on Fund distributions or the redemptions of Fund shares.
| * | Since inception returns for Class C Shares are from 2/10/14. |
| Nuveen Investments | 29 |
Dividend Yield is the most recent dividend per share (annualized) divided by the offering price per share.
The SEC 30-Day Yield is a standardized measure of a fund’s yield that accounts for the future amortization of premiums or discounts of bonds held in the fund’s portfolio. The SEC 30-Day Yield is computed under an SEC standardized formula and is based on the maximum offer price per share. Dividend Yield may differ from the SEC 30-Day Yield because the fund may be paying out more or less than it is earning and it may not include the effect of amortization of bond premium.
The Taxable-Equivalent Yield represents the yield that must be earned on a fully taxable investment in order to equal the yield of the fund on an after-tax basis at a specified tax rate. With respect to investments that generate qualified dividend income that is taxable at a maximum rate of 15%, the Taxable-Equivalent Yield is lower.
Nuveen Kansas Municipal Bond Fund
| Share Class | ||||||||||||||||
| Class A1 | Class C | Class C2 | Class I | |||||||||||||
Dividend Yield | 3.54% | 2.93% | 3.15% | 3.90% | ||||||||||||
SEC 30-Day Yield | 2.87% | 2.17% | 2.45% | 3.19% | ||||||||||||
Taxable-Equivalent Yield (31.5%)2 | 4.19% | 3.17% | 3.58% | 4.66% | ||||||||||||
Nuveen Kentucky Municipal Bond Fund
| Share Class | ||||||||||||||||
| Class A1 | Class C | Class C2 | Class I | |||||||||||||
Dividend Yield | 3.47% | 2.86% | 3.08% | 3.83% | ||||||||||||
SEC 30-Day Yield | 2.08% | 1.37% | 1.63% | 2.37% | ||||||||||||
Taxable-Equivalent Yield (32.3%)2 | 3.07% | 2.02% | 2.41% | 3.50% | ||||||||||||
Nuveen Michigan Municipal Bond Fund
| Share Class | ||||||||||||||||
| Class A1 | Class C | Class C2 | Class I | |||||||||||||
Dividend Yield | 3.72% | 3.11% | 3.37% | 4.09% | ||||||||||||
SEC 30-Day Yield | 2.67% | 1.84% | 2.24% | 2.99% | ||||||||||||
Taxable-Equivalent Yield (31.1%)2 | 3.88% | 2.67% | 3.25% | 4.34% | ||||||||||||
Nuveen Missouri Municipal Bond Fund
| Share Class | ||||||||||||||||
| Class A1 | Class C | Class C2 | Class I | |||||||||||||
Dividend Yield | 3.70% | 3.08% | 3.34% | 4.08% | ||||||||||||
SEC 30-Day Yield | 2.58% | 1.87% | 2.15% | 2.89% | ||||||||||||
Taxable-Equivalent Yield (32.3%)2 | 3.81% | 2.76% | 3.18% | 4.27% | ||||||||||||
| 30 | Nuveen Investments |
Nuveen Ohio Municipal Bond Fund
| Share Class | ||||||||||||||||
| Class A1 | Class C | Class C2 | Class I | |||||||||||||
Dividend Yield | 3.80% | 3.19% | 3.40% | 4.18% | ||||||||||||
SEC 30-Day Yield | 2.53% | 1.79% | 2.09% | 2.84% | ||||||||||||
Taxable-Equivalent Yield (31.6%)2 | 3.70% | 2.62% | 3.06% | 4.15% | ||||||||||||
Nuveen Wisconsin Municipal Bond Fund
| Share Class | ||||||||||||||||
| Class A1 | Class C | Class C2 | Class I | |||||||||||||
Dividend Yield | 3.66% | 3.03% | 3.31% | 4.03% | ||||||||||||
SEC 30-Day Yield | 2.74% | 1.98% | 2.32% | 3.06% | ||||||||||||
Taxable-Equivalent Yield (32.5%)2 | 4.06% | 2.93% | 3.44% | 4.53% | ||||||||||||
| 1 | The SEC Yield for Class A shares quoted in the table reflects the maximum sales load. Investors paying a reduced load because of volume discounts, investors paying no load because they qualify for one of the several exclusions from the load and existing shareholders who previously paid a load but would like to know the SEC Yield applicable to their shares on a going-forward basis, should understand that the SEC Yield effectively applicable to them would be higher than the figure quoted in the table. |
| 2 | The Taxable-Equivalent Yield is based on the Fund’s SEC 30-Day Yield on the indicated date and a combined federal and state income tax rate as shown in the respective table above. |
| Nuveen Investments | 31 |
Summaries as of May 31, 2014
This data relates to the securities held in each Fund’s portfolio of investments as of the end of this reporting period. It should not be construed as a measure of performance for the Fund itself. Holdings are subject to change.
Ratings shown are the highest rating given by one of the following national rating agencies: Standard & Poor’s, Moody’s Investors Service, Inc. or Fitch, Inc. Credit ratings are subject to change. AAA, AA, A and BBB are investment grade ratings; BB, B, CCC, CC, C and D are below investment grade ratings. Certain bonds backed by U.S. Government or agency securities are regarded as having an implied rating equal to the rating of such securities. Holdings designated N/R are not rated by these national rating agencies.
Refer to the Glossary of Terms Used in this Report for definitions of terms used within this section.
Nuveen Kansas Municipal Bond Fund
Fund Allocation
(% of net assets)
Municipal Bonds | 102.3% | |||
Floating Rate Obligations | (4.8)% | |||
Other Assets Less Liabilities | 2.5% |
Portfolio Composition
(% of total investments)
Health Care | 26.1% | |||
Tax Obligation/Limited | 22.7% | |||
Tax Obligation/General | 12.3% | |||
Utilities | 11.5% | |||
U.S. Guaranteed | 7.5% | |||
Education and Civic Organizations | 7.2% | |||
Long-Term Care | 6.9% | |||
Other Industries | 5.8% |
Bond Credit Quality
(% of total investment exposure)
AAA/U.S. Guaranteed | 12.9% | |||
AA | 30.5% | |||
A | 28.9% | |||
BBB | 11.1% | |||
BB or Lower | 5.0% | |||
N/R (not rated) | 11.6% |
| 32 | Nuveen Investments |
Nuveen Kentucky Municipal Bond Fund
Fund Allocation
(% of net assets)
Municipal Bonds | 98.6% | |||
Short-Term Investments | 1.9% | |||
Floating Rate Obligations | (1.5)% | |||
Other Assets Less Liabilities | 1.0% |
Portfolio Composition
(% of total investments)
Health Care | 24.8% | |||
Tax Obligation/Limited | 22.1% | |||
Utilities | 19.3% | |||
Water and Sewer | 9.0% | |||
Education and Civic Organizations | 7.5% | |||
Transportation | 5.9% | |||
Other Industries | 11.4% |
Bond Credit Quality
(% of total investment exposure)
AAA/U.S. Guaranteed | 11.7% | |||
AA | 49.1% | |||
A | 28.2% | |||
BBB | 10.6% | |||
BB or Lower | 0.1% | |||
N/R (not rated) | 0.3% |
| Nuveen Investments | 33 |
Holding Summaries as of May 31, 2014 (continued)
Nuveen Michigan Municipal Bond Fund
Fund Allocation
(% of net assets)
Municipal Bonds | 96.9% | |||
Other Assets Less Liabilities | 3.1% |
Portfolio Composition
(% of total investments)
Tax Obligation/General | 32.4% | |||
Water and Sewer | 17.8% | |||
Health Care | 15.0% | |||
Tax Obligation/Limited | 10.2% | |||
Utilities | 7.2% | |||
U.S. Guaranteed | 5.3% | |||
Other Industries | 12.1% |
Bond Credit Quality
(% of total investment exposure)
AAA/U.S. Guaranteed | 13.6% | |||
AA | 67.2% | |||
A | 9.7% | |||
BBB | 3.5% | |||
BB or Lower | 5.3% | |||
N/R (not rated) | 0.7% | |||
| 34 | Nuveen Investments |
Nuveen Missouri Municipal Bond Fund
Fund Allocation
(% of net assets)
Municipal Bonds | 99.5% | |||
Floating Rate Obligations | (0.5)% | |||
Other Assets Less Liabilities | 1.0% |
Portfolio Composition
(% of total investments)
Health Care | 24.5% | |||
Tax Obligation/Limited | 21.1% | |||
Education and Civic Organizations | 12.6% | |||
Tax Obligation/General | 10.7% | |||
Long-Term Care | 8.2% | |||
U.S. Guaranteed | 6.0% | |||
Water and Sewer | 5.4% | |||
Other Industries | 11.5% |
Bond Credit Quality
(% of total investment exposure)
AAA/U.S. Guaranteed | 10.5% | |||
AA | 33.3% | |||
A | 28.2% | |||
BBB | 18.1% | |||
N/R (not rated) | 9.9% |
| Nuveen Investments | 35 |
Holding Summaries as of May 31, 2014 (continued)
Nuveen Ohio Municipal Bond Fund
Fund Allocation
(% of net assets)
Municipal Bonds | 99.4% | |||
Other Assets Less Liabilities | 0.6% |
Portfolio Composition
(% of total investments)
Health Care | 21.0% | |||
Tax Obligation/Limited | 19.3% | |||
Tax Obligation/General | 15.6% | |||
Water and Sewer | 11.2% | |||
U.S. Guaranteed | 8.7% | |||
Transportation | 6.1% | |||
Education and Civic Organizations | 5.4% | |||
Other Industries | 12.7% |
Bond Credit Quality
(% of total investment exposure)
AAA/U.S. Guaranteed | 15.3% | |||
AA | 55.3% | |||
A | 16.6% | |||
BBB | 6.7% | |||
BB or Lower | 5.0% | |||
N/R (not rated) | 1.1% |
| 36 | Nuveen Investments |
Nuveen Wisconsin Municipal Bond Fund
Fund Allocation
(% of net assets)
Municipal Bonds | 98.0% | |||
Other Assets Less Liabilities | 2.0% |
Portfolio Composition
(% of total investments)
Tax Obligation/Limited | 46.8% | |||
Health Care | 17.7% | |||
Housing/Multifamily | 9.6% | |||
Education and Civic Organizations | 6.5% | |||
Other Industries | 19.4% |
Bond Credit Quality
(% of total investment exposure)
AAA/U.S. Guaranteed | 6.0% | |||
AA | 31.6% | |||
A | 33.0% | |||
BBB | 19.8% | |||
BB or Lower | 3.5% | |||
N/R (not rated) | 6.1% |
| Nuveen Investments | 37 |
Examples
As a shareholder of one or more of the Funds, you incur two types of costs: (1) transaction costs, including up-front and back-end sales charges (loads) or redemption fees, where applicable; and (2) ongoing costs, including management fees; distribution and service (12b-1) fees, where applicable; and other Fund expenses. The Examples below are intended to help you understand your ongoing costs (in dollars) of investing in the Funds and to compare these costs with the ongoing costs of investing in other mutual funds. Since the expense examples for Class C Shares reflect only the first 110 days of the class’ operations, they may not provide a meaningful understanding of the class’ ongoing expense.
The Examples below are based on an investment of $1,000 invested at the beginning of the period and held through the period ended May 31, 2014.
The beginning of the period for Classes A, C2, and I is December 1, 2013. The beginning of the period for Class C is February 10, 2014.
The information under “Actual Performance,” together with the amount you invested, allows you to estimate actual expenses incurred over the reporting period. Simply divide your account value by $1,000 (for example, an $8,600 account value divided by $1,000 = 8.60) and multiply the result by the cost shown for your share class, in the row entitled “Expenses Incurred During Period” to estimate the expenses incurred on your account during this period.
The information under “Hypothetical Performance,” provides information about hypothetical account values and hypothetical expenses based on each Fund’s actual expense ratios and an assumed rate of return of 5% per year before expenses, which is not the Fund’s actual return. The hypothetical account values and expenses may not be used to estimate the actual ending account balance or expense you incurred for the period. You may use this information to compare the ongoing costs of investing in the Fund and other funds. To do so, compare this 5% hypothetical example with the 5% hypothetical examples that appear in the shareholder reports of the other funds.
Please note that the expenses shown in the following tables are meant to highlight your ongoing costs only and do not reflect any transaction costs. Therefore, the hypothetical information is useful in comparing ongoing costs only, and will not help you determine the relative total costs of owning different funds or share classes. In addition, if these transaction costs were included, your costs would have been higher.
| 38 | Nuveen Investments |
Nuveen Kansas Municipal Bond Fund
| Share Class | ||||||||||||||||
| Class A | Class C | Class C2 | Class I | |||||||||||||
Actual Performance | ||||||||||||||||
Beginning Account Value | $ | 1,000.00 | $ | 1,000.00 | $ | 1,000.00 | $ | 1,000.00 | ||||||||
Ending Account Value | $ | 1,070.30 | $ | 1,043.70 | $ | 1,068.40 | $ | 1,072.20 | ||||||||
Expenses Incurred During Period | $ | 4.28 | $ | 4.90 | $ | 7.12 | $ | 3.25 | ||||||||
Hypothetical Performance (5% annualized return before expenses) | ||||||||||||||||
Beginning Account Value | $ | 1,000.00 | $ | 1,000.00 | $ | 1,000.00 | $ | 1,000.00 | ||||||||
Ending Account Value | $ | 1,020.79 | $ | 1,017.00 | $ | 1,018.05 | $ | 1,021.79 | ||||||||
Expenses Incurred During Period | $ | 4.18 | $ | 4.83 | $ | 6.94 | $ | 3.18 | ||||||||
For each class of the Fund, expenses are equal to the Fund’s annualized net expense ratio of 0.83%, 1.38% and 0.63% for Classes A, C2 and I, respectively, multiplied by the average account value over the period, multiplied by 182/365 (to reflect the one-half year period). For Class C, expenses are equal to the Fund’s annualized net expense ratio of 1.63%, multiplied by the average account value over the period, multiplied by 110/365 (to reflect the 110 days since the commencement of operations).
Nuveen Kentucky Municipal Bond Fund
| Share Class | ||||||||||||||||
| Class A | Class C | Class C2 | Class I | |||||||||||||
Actual Performance | ||||||||||||||||
Beginning Account Value | $ | 1,000.00 | $ | 1,000.00 | $ | 1,000.00 | $ | 1,000.00 | ||||||||
Ending Account Value | $ | 1,062.60 | $ | 1,034.90 | $ | 1,059.70 | $ | 1,063.80 | ||||||||
Expenses Incurred During Period | $ | 4.06 | $ | 4.72 | $ | 6.88 | $ | 3.04 | ||||||||
Hypothetical Performance (5% annualized return before expenses) | ||||||||||||||||
Beginning Account Value | $ | 1,000.00 | $ | 1,000.00 | $ | 1,000.00 | $ | 1,000.00 | ||||||||
Ending Account Value | $ | 1,020.99 | $ | 1,017.25 | $ | 1,018.25 | $ | 1,021.99 | ||||||||
Expenses Incurred During Period | $ | 3.98 | $ | 4.68 | $ | 6.74 | $ | 2.97 | ||||||||
For each class of the Fund, expenses are equal to the Fund’s annualized net expense ratio of 0.79%, 1.34% and 0.59% for Classes A, C2 and I, respectively, multiplied by the average account value over the period, multiplied by 182/365 (to reflect the one-half year period). For Class C, expenses are equal to the Fund’s annualized net expense ratio of 1.59%, multiplied by the average account value over the period, multiplied by 110/365 (to reflect the 110 days since the commencement of operations).
| Nuveen Investments | 39 |
Expense Examples (continued)
Nuveen Michigan Municipal Bond Fund
| Share Class | ||||||||||||||||
| Class A | Class C | Class C2 | Class I | |||||||||||||
Actual Performance | ||||||||||||||||
Beginning Account Value | $ | 1,000.00 | $ | 1,000.00 | $ | 1,000.00 | $ | 1,000.00 | ||||||||
Ending Account Value | $ | 1,068.20 | $ | 1,041.10 | $ | 1,065.50 | $ | 1,069.40 | ||||||||
Expenses Incurred During Period | $ | 4.33 | $ | 4.86 | $ | 7.16 | $ | 3.30 | ||||||||
Hypothetical Performance (5% annualized return before expenses) | ||||||||||||||||
Beginning Account Value | $ | 1,000.00 | $ | 1,000.00 | $ | 1,000.00 | $ | 1,000.00 | ||||||||
Ending Account Value | $ | 1,020.74 | $ | 1,017.05 | $ | 1,018.00 | $ | 1,021.74 | ||||||||
Expenses Incurred During Period | $ | 4.23 | $ | 4.80 | $ | 6.99 | $ | 3.23 | ||||||||
For each class of the Fund, expenses are equal to the Fund’s annualized net expense ratio of 0.84%, 1.39% and 0.64% for Classes A, C2 and I, respectively, multiplied by the average account value over the period, multiplied by 182/365 (to reflect the one-half year period). For Class C, expenses are equal to the Fund’s annualized net expense ratio of 1.64%, multiplied by the average account value over the period, multiplied by 110/365 (to reflect the 110 days since the commencement of operations).
Nuveen Missouri Municipal Bond Fund
| Share Class | ||||||||||||||||
| Class A | Class C | Class C2 | Class I | |||||||||||||
Actual Performance | ||||||||||||||||
Beginning Account Value | $ | 1,000.00 | $ | 1,000.00 | $ | 1,000.00 | $ | 1,000.00 | ||||||||
Ending Account Value | $ | 1,066.00 | $ | 1,039.80 | $ | 1,063.30 | $ | 1,066.20 | ||||||||
Expenses Incurred During Period | $ | 4.12 | $ | 4.73 | 6.94 | $ | 3.09 | |||||||||
Hypothetical Performance (5% annualized return before expenses) | ||||||||||||||||
Beginning Account Value | $ | 1,000.00 | $ | 1,000.00 | $ | 1,000.00 | $ | 1,000.00 | ||||||||
Ending Account Value | $ | 1,020.94 | $ | 1,017.25 | $ | 1,018.20 | $ | 1,021.94 | ||||||||
Expenses Incurred During Period | $ | 4.03 | $ | 4.68 | $ | 6.79 | $ | 3.02 | ||||||||
For each class of the Fund, expenses are equal to the Fund’s annualized net expense ratio of 0.80%, 1.35% and 0.60% for Classes A, C2 and I, respectively, multiplied by the average account value over the period, multiplied by 182/365 (to reflect the one-half year period). For Class C, expenses are equal to the Fund’s annualized net expense ratio of 1.59%, multiplied by the average account value over the period, multiplied by 110/365 (to reflect the 110 days since the commencement of operations).
| 40 | Nuveen Investments |
Nuveen Ohio Municipal Bond Fund
| Share Class | ||||||||||||||||
| Class A | Class C | Class C2 | Class I | |||||||||||||
Actual Performance | ||||||||||||||||
Beginning Account Value | $ | 1,000.00 | $ | 1,000.00 | $ | 1,000.00 | $ | 1,000.00 | ||||||||
Ending Account Value | $ | 1,065.90 | $ | 1,037.90 | $ | 1,063.00 | $ | 1,066.90 | ||||||||
Expenses Incurred During Period | $ | 4.12 | $ | 4.70 | $ | 6.94 | $ | 3.09 | ||||||||
Hypothetical Performance (5% annualized return before expenses) | ||||||||||||||||
Beginning Account Value | $ | 1,000.00 | $ | 1,000.00 | $ | 1,000.00 | $ | 1,000.00 | ||||||||
Ending Account Value | $ | 1,020.94 | $ | 1,017.30 | $ | 1,018.20 | $ | 1,021.94 | ||||||||
Expenses Incurred During Period | $ | 4.03 | $ | 4.65 | $ | 6.79 | $ | 3.02 | ||||||||
For each class of the Fund, expenses are equal to the Fund’s annualized net expense ratio of 0.80%, 1.35% and 0.60% for Classes A, C2 and I, respectively, multiplied by the average account value over the period, multiplied by 182/365 (to reflect the one-half year period). For Class C, expenses are equal to the Fund’s annualized net expense ratio of 1.59%, multiplied by the average account value over the period, multiplied by 110/365 (to reflect the 110 days since the commencement of operations).
Nuveen Wisconsin Municipal Bond Fund
| Share Class | ||||||||||||||||
| Class A | Class C | Class C2 | Class I | |||||||||||||
Actual Performance | ||||||||||||||||
Beginning Account Value | $ | 1,000.00 | $ | 1,000.00 | $ | 1,000.00 | $ | 1,000.00 | ||||||||
Ending Account Value | $ | 1,073.10 | $ | 1,050.70 | $ | 1,070.30 | $ | 1,075.20 | ||||||||
Expenses Incurred During Period | $ | 4.60 | $ | 4.98 | $ | 7.43 | $ | 3.57 | ||||||||
Hypothetical Performance (5% annualized return before expenses) | ||||||||||||||||
Beginning Account Value | $ | 1,000.00 | $ | 1,000.00 | $ | 1,000.00 | $ | 1,000.00 | ||||||||
Ending Account Value | $ | 1,020.49 | $ | 1,016.90 | $ | 1,017.75 | $ | 1,021.49 | ||||||||
Expenses Incurred During Period | $ | 4.48 | $ | 4.89 | $ | 7.24 | $ | 3.48 | ||||||||
For each class of the Fund, expenses are equal to the Fund’s annualized net expense ratio of 0.89%, 1.44% and 0.69% for Classes A, C2 and I, respectively, multiplied by the average account value over the period, multiplied by 182/365 (to reflect the one-half year period). For Class C, expenses are equal to the Fund’s annualized net expense ratio of 1.68%, multiplied by the average account value over the period, multiplied by 110/365 (to reflect the 110 days since the commencement of operations).
| Nuveen Investments | 41 |
Independent Registered Public Accounting Firm
To the Board of Trustees and Shareholders of
Nuveen Multistate Trust IV:
In our opinion, the accompanying statements of assets and liabilities, including the portfolios of investments, and the related statements of operations and of changes in net assets and the financial highlights present fairly, in all material respects, the financial position of Nuveen Kansas Municipal Bond Fund, Nuveen Kentucky Municipal Bond Fund, Nuveen Michigan Municipal Bond Fund, Nuveen Missouri Municipal Bond Fund, Nuveen Ohio Municipal Bond Fund and Nuveen Wisconsin Municipal Bond Fund (each a series of Nuveen Multistate Trust IV, hereafter referred to as the “Funds”) at May 31, 2014, the results of each of their operations for the year then ended, the changes in each of their net assets for each of the two years in the period then ended and the financial highlights for each of the periods presented, in conformity with accounting principles generally accepted in the United States of America. These financial statements and financial highlights (hereafter referred to as “financial statements”) are the responsibility of the Funds’ management; our responsibility is to express an opinion on these financial statements based on our audits. We conducted our audits of these financial statements in accordance with the standards of the Public Company Accounting Oversight Board (United States). Those standards require that we plan and perform the audit to obtain reasonable assurance about whether the financial statements are free of material misstatement. An audit includes examining, on a test basis, evidence supporting the amounts and disclosures in the financial statements, assessing the accounting principles used and significant estimates made by management, and evaluating the overall financial statement presentation. We believe that our audits, which included confirmation of securities at May 31, 2014 by correspondence with the custodian and brokers, provide a reasonable basis for our opinion.
PRICEWATERHOUSECOOPERS LLP
Chicago, IL
July 28, 2014
| 42 | Nuveen Investments |
Nuveen Kansas Municipal Bond Fund
Portfolio of Investments May 31, 2014
| Principal Amount (000) | Description (1) | Optional Call Provisions (2) | Ratings (3) | Value | ||||||||||||||
LONG-TERM INVESTMENTS – 102.3% | ||||||||||||||||||
MUNICIPAL BONDS – 102.3% | ||||||||||||||||||
Consumer Staples – 0.7% | ||||||||||||||||||
| $ | 1,535 | Puerto Rico, The Children’s Trust Fund, Tobacco Settlement Asset-Backed Refunding Bonds, Series 2002, 5.500%, 5/15/39 | 8/14 at 100.00 | BBB | $ | 1,399,398 | ||||||||||||
Education and Civic Organizations – 7.4% | ||||||||||||||||||
| 1,200 | Kansas Development Finance Authority, Athletic Facilities Revenue Bonds, K-State Athletics Inc Project, Series 2011-A1, 5.000%, 7/01/28 | 7/16 at 100.00 | A1 | 1,290,312 | ||||||||||||||
Kansas Development Finance Authority, Athletic Facilities Revenue Bonds, K-State Athletics, Inc., Project, Series 2012B-1: | ||||||||||||||||||
| 1,750 | 5.000%, 7/01/30 | 7/17 at 100.00 | A1 | 1,911,017 | ||||||||||||||
| 1,855 | 5.000%, 7/01/32 | 7/17 at 100.00 | A1 | 2,025,679 | ||||||||||||||
| 1,200 | Kansas Development Finance Authority, Board of Regents, Revenue Bonds, Kansas State University Housing System, Series 2005A, 5.000%, 4/01/22 – NPFG Insured | 4/15 at 100.00 | AA– | 1,246,488 | ||||||||||||||
| 675 | Kansas Development Finance Authority, Revenue Bonds, Kansas Board of Regents University of Kansas Medical Center Research Institute, Series 2010N, 5.000%, 4/01/29 | 4/20 at 100.00 | AA | 742,014 | ||||||||||||||
| 5,430 | Kansas Independent College Finance Authority, Educational Facilities Revenue Bonds, Tabor College Project, Series 2013, 5.800%, 3/01/37 | 3/20 at 100.00 | N/R | 5,512,862 | ||||||||||||||
| 1,750 | Topeka, Kansas, Economic Development Revenue Bonds, YMCA Project, Refunding Series 2011A, 6.500%, 9/01/32 | 9/21 at 100.00 | N/R | 1,805,825 | ||||||||||||||
| 13,860 | Total Education and Civic Organizations | 14,534,197 | ||||||||||||||||
Health Care – 26.7% | ||||||||||||||||||
| 1,680 | Kansas Development Finance Authority, Health Facilities Revenue Bonds, Hays Medical Center Inc., Series 2005L, 5.000%, 11/15/20 | 11/15 at 100.00 | A2 | 1,787,302 | ||||||||||||||
| 3,950 | Kansas Development Finance Authority, Health Facilities Revenue Bonds, Hays Medical Center Inc., Series 2010Q, 5.000%, 5/15/35 | 5/19 at 100.00 | A2 | 4,162,312 | ||||||||||||||
| 5,000 | Kansas Development Finance Authority, Health Facilities Revenue Bonds, KU Health System, Series 2011H, 5.130%, 3/01/39 | 3/20 at 100.00 | A+ | 5,302,050 | ||||||||||||||
| 2,000 | Kansas Development Finance Authority, Health Facilities Revenue Bonds, Stormont-Vail Health Care Inc., Series 2008F, 5.380%, 11/15/28 | 11/17 at 100.00 | A2 | 2,142,660 | ||||||||||||||
| 3,715 | Kansas Development Finance Authority, Health Facilities Revenue Bonds, Stormont-Vail Health Care Inc., Series 2011F, 5.250%, 11/15/29 | 11/19 at 100.00 | A2 | 4,081,893 | ||||||||||||||
| 2,000 | Kansas Development Finance Authority, Health Facilities Revenue Bonds, Stormont-Vail Health Care Inc., Series 2013J, 5.000%, 11/15/38 | 11/22 at 100.00 | A2 | 2,127,520 | ||||||||||||||
| 8,650 | Kansas Development Finance Authority, Hospital Revenue Bonds, Adventist Health System/Sunbelt Obligated Group, Series 2009C, 5.750%, 11/15/38 (UB) | 11/19 at 100.00 | Aa2 | 9,771,905 | ||||||||||||||
| 2,400 | Kansas Development Finance Authority, Hospital Revenue Bonds, Adventist Health System/Sunbelt Obligated Group, Series 2009D, 5.000%, 11/15/29 (UB) | 11/17 at 100.00 | Aa2 | 2,655,312 | ||||||||||||||
Kansas Development Finance Authority, Revenue Bonds, Sisters of Charity of Leavenworth Health Services Corporation, Series 2010A: | ||||||||||||||||||
| 1,000 | 5.000%, 1/01/23 | 1/20 at 100.00 | AA– | 1,124,290 | ||||||||||||||
| 1,515 | 5.000%, 1/01/40 (UB) (4) | 1/20 at 100.00 | AA– | 1,599,037 | ||||||||||||||
| Nuveen Investments | 43 |
Nuveen Kansas Municipal Bond Fund (continued)
Portfolio of Investments May 31, 2014
| Principal Amount (000) | Description (1) | Optional Call Provisions (2) | Ratings (3) | Value | ||||||||||||||
Health Care (continued) | ||||||||||||||||||
| $ | 1,750 | Kansas Development Finance Authority, Revenue Bonds, Sisters of Charity of Leavenworth Health Services Corporation, Tender Option Bond Trust 4153, 18.262%, 1/01/18 (IF) (4) | No Opt. Call | AA– | $ | 2,138,045 | ||||||||||||
| 3,250 | Labette County Medical Center, Kansas, Revenue Bonds, Series 2007A, 5.750%, 9/01/37 | 9/17 at 100.00 | N/R | 3,287,538 | ||||||||||||||
Lawrence, Kansas, Hospital Revenue Bonds, Lawrence Memorial Hospital, Refunding Series 2006: | ||||||||||||||||||
| 2,500 | 5.130%, 7/01/26 | 7/16 at 100.00 | A1 | 2,583,275 | ||||||||||||||
| 500 | 5.130%, 7/01/36 | 7/16 at 100.00 | A1 | 511,840 | ||||||||||||||
| 3,000 | Manhattan, Kansas, Hospital Revenue Bonds, Mercy Regional Health Center, Inc., Refunding Series 2013, 5.000%, 11/15/29 | 11/22 at 100.00 | A+ | 3,301,590 | ||||||||||||||
| 3,000 | Neosho County, Kansas, Hospital Revenue Bonds, Neosho Memorial Regional Medical Center, Series 2006A, 5.150%, 9/01/31 | 9/14 at 100.00 | N/R | 3,007,290 | ||||||||||||||
| 1,000 | Olathe, Kansas, Health Facilities Revenue Bonds, Olathe Medical Center, Series 2010A, 5.000%, 9/01/30 | 9/19 at 100.00 | A+ | 1,064,440 | ||||||||||||||
| 1,500 | Puerto Rico Industrial, Tourist, Educational, Medical and Environmental Control Facilities Financing Authority, Hospital Revenue Bonds, Auxilio Mutuo Hospital, Series 2011A, 6.000%, 7/01/33 | 7/21 at 100.00 | A– | 1,533,300 | ||||||||||||||
| 750 | Salina, Kansas, Hospital Revenue Bonds, Salina Regional Medical Center, Series 2006, 4.630%, 10/01/31 | 4/16 at 100.00 | A1 | 761,505 | ||||||||||||||
| 49,160 | Total Health Care | 52,943,104 | ||||||||||||||||
Housing/Multifamily – 0.5% | ||||||||||||||||||
| 1,000 | Puerto Rico Housing Finance Authority, Subordinate Lien Capital Fund Program Revenue Bonds, Modernization Series 2008, 5.130%, 12/01/27 | 12/18 at 100.00 | A+ | 1,005,380 | ||||||||||||||
Housing/Single Family – 0.4% | ||||||||||||||||||
| 40 | Sedgwick and Shawnee Counties, Kansas, GNMA Mortgage-Backed Securities Program Single Family Revenue Bonds, Series 1997A-1, 6.950%, 6/01/29 (Alternative Minimum Tax) | No Opt. Call | Aaa | 42,339 | ||||||||||||||
| 645 | Sedgwick and Shawnee Counties, Kansas, Mortgage Backed Securities Program Single Family Mortgage Revenue Bonds, Series 2006A6, 5.550%, 6/01/38 (Alternative Minimum Tax) | 6/16 at 103.00 | Aaa | 655,114 | ||||||||||||||
| 685 | Total Housing/Single Family | 697,453 | ||||||||||||||||
Long-Term Care – 7.0% | ||||||||||||||||||
| 3,125 | Kansas Development Finance Authority, Revenue Bonds, Lifespace Communities, Inc., Refunding Series 2010S, 5.000%, 5/15/30 | 5/20 at 100.00 | A | 3,285,781 | ||||||||||||||
Lenexa, Kansas, Health Care Facilities Revenue Bonds, Lakeview Village Inc, Refunding & Improvement Series 2007: | ||||||||||||||||||
| 1,270 | 5.130%, 5/15/16 | No Opt. Call | N/R | 1,344,892 | ||||||||||||||
| 1,100 | 5.500%, 5/15/39 | 5/17 at 100.00 | N/R | 1,110,406 | ||||||||||||||
| 2,030 | Manhattan Health Care Facility Revenue Bonds, Kansas, Meadowlarks Hills Retirement, Series 2007B, 5.130%, 5/15/42 | 11/14 at 103.00 | N/R | 1,963,375 | ||||||||||||||
| 2,000 | Olathe, Kansas, Senior Living Facility Revenue Bonds, Aberdeen Village Inc, Refunding Series 2005A, 5.600%, 5/15/28 | 11/14 at 100.00 | N/R | 2,000,060 | ||||||||||||||
| 1,540 | Olathe, Kansas, Senior Living Facility Revenue Bonds, Catholic Care Campus Santa Marta, Series 2006A, 6.000%, 11/15/38 | 11/16 at 100.00 | N/R | 1,560,082 | ||||||||||||||
| 2,500 | Wichita, Kansas, Health Care Facilities Revenue Bonds, Presbyterian Manors, Series 2013IV-A, 6.380%, 5/15/43 | 5/23 at 100.00 | AA | 2,648,500 | ||||||||||||||
| 13,565 | Total Long-Term Care | 13,913,096 | ||||||||||||||||
| 44 | Nuveen Investments |
| Principal Amount (000) | Description (1) | Optional Call Provisions (2) | Ratings (3) | Value | ||||||||||||||
Tax Obligation/General – 12.5% | ||||||||||||||||||
| $ | 2,000 | Allen County, Kansas Public Building Commission Revenue Bonds, Allen County Hospital Project, Series 2012, 5.150%, 12/01/36 | 12/22 at 100.00 | A | $ | 2,163,500 | ||||||||||||
| 1,500 | Anderson County, Kansas, General Obligation Bonds, Refunding and Improvement Series 2013A, 5.000%, 8/01/33 – AGM Insured | 8/23 at 100.00 | AA | 1,679,490 | ||||||||||||||
| 2,500 | Butler and Sedgwick Counties Unified School District 385, Andover, Kansas, General Obligation Refunding and Improvement Bonds, Series 2000, 6.000%, 9/01/16 – AGM Insured | No Opt. Call | AA | 2,803,875 | ||||||||||||||
| 65 | Cowley County Unified School District 465, Winfield, Kansas, General Obligation Bonds, Series 2003, 5.250%, 10/01/23 – NPFG Insured | 10/14 at 100.00 | AA– | 65,212 | ||||||||||||||
| 2,500 | Guam, General Obligation Bonds, Series 2007A, 5.000%, 11/15/23 | 11/17 at 100.00 | BB– | 2,552,000 | ||||||||||||||
| 3,000 | Johnson and Miami Counties Unified School District 230, Kansas, General Obligation Bonds, Series 2011A, 5.250%, 9/01/28 | 9/21 at 100.00 | Aa3 | 3,484,620 | ||||||||||||||
| 2,250 | Johnson County Unified School District 229, Blue Valley, Kansas, General Obligation Bonds, Series 2012A, 5.000%, 10/01/23 – NPFG Insured | 10/22 at 100.00 | Aaa | 2,745,585 | ||||||||||||||
Johnson County Unified School District 231, Gardner, Edgerton and Antioch, Kansas, General Obligation Bonds, Refunding & Improvement Series 2012A: | ||||||||||||||||||
| 2,000 | 5.000%, 10/01/23 | 10/22 at 100.00 | A+ | 2,353,500 | ||||||||||||||
| 2,200 | 5.000%, 10/01/28 | 10/23 at 100.00 | A+ | 2,495,482 | ||||||||||||||
| 1,000 | Sedgwick County Unified School District 260, Kansas, General Obligation Bonds, Refunding & School Improvement Series 2012, 5.000%, 10/01/30 | 10/22 at 100.00 | AA– | 1,138,200 | ||||||||||||||
| 2,000 | Sedgwick County Unified School District 262, Kansas, General Obligation Bonds, Series 2008, 5.000%, 9/01/23 – AGC Insured | 9/18 at 100.00 | AA | 2,293,820 | ||||||||||||||
| 500 | Unified School District 470, Cowley County, Kansas, General Obligation Bonds, Series 2008A, 5.500%, 9/01/21 – AGM Insured | 9/18 at 100.00 | AA | 584,860 | ||||||||||||||
| 390 | Wyandotte County Unified School District 203, Piper, Kansas, General Obligation Bonds, Series 2008B, 5.500%, 9/01/28 | 9/18 at 100.00 | AA– | 450,742 | ||||||||||||||
| 21,905 | Total Tax Obligation/General | 24,810,886 | ||||||||||||||||
Tax Obligation/Limited – 23.2% | ||||||||||||||||||
| 1,000 | Dodge City, Kansas, Sales Tax Revenue Bonds, Series 2009, 5.000%, 6/01/34 – AGC Insured | 6/19 at 100.00 | AA | 1,114,540 | ||||||||||||||
| 875 | Government of Guam, Business Privilege Tax Bonds, Series 2011A, 5.130%, 1/01/42 | 1/22 at 100.00 | A | 914,646 | ||||||||||||||
| 1,760 | Government of Guam, Business Privilege Tax Bonds, Series 2012B-1, 5.000%, 1/01/42 | 1/22 at 100.00 | A | 1,825,701 | ||||||||||||||
| 1,115 | Guam Government, Limited Obligation Section 30 Revenue Bonds, Series 2009A, 5.750%, 12/01/34 | 12/19 at 100.00 | BBB+ | 1,221,181 | ||||||||||||||
Johnson County Public Building Commission, Kansas, Lease Purchase Revenue Bonds, Series 2011A: | ||||||||||||||||||
| 1,320 | 4.000%, 9/01/25 | 9/20 at 100.00 | AAA | 1,438,034 | ||||||||||||||
| 2,020 | 4.000%, 9/01/26 | 9/20 at 100.00 | AAA | 2,183,984 | ||||||||||||||
| 1,625 | 4.000%, 9/01/27 | 9/20 at 100.00 | AAA | 1,744,925 | ||||||||||||||
| 1,220 | 4.130%, 9/01/28 | 9/20 at 100.00 | AAA | 1,312,696 | ||||||||||||||
| 1,270 | 4.250%, 9/01/29 | 9/20 at 100.00 | AAA | 1,369,238 | ||||||||||||||
| 365 | Kansas Development Finance Authority, Board of Regents, Revenue Bonds, Scientific Research and Development Facilities Projects, Series 2003C, 5.000%, 10/01/23 – AMBAC Insured | 10/14 at 101.50 | AA | 371,902 | ||||||||||||||
| 1,665 | Kansas Development Finance Authority, K-State Olathe Innovation Campus Inc., Johnson County Sales Tax Revenue Bonds, Series 2009L, 5.000%, 9/01/39 | 9/19 at 100.00 | AA | 1,829,219 | ||||||||||||||
| Nuveen Investments | 45 |
Nuveen Kansas Municipal Bond Fund (continued)
Portfolio of Investments May 31, 2014
| Principal Amount (000) | Description (1) | Optional Call Provisions (2) | Ratings (3) | Value | ||||||||||||||
Tax Obligation/Limited (continued) | ||||||||||||||||||
| $ | 3,910 | Kansas Development Finance Authority, Revenue Bonds, Department of Administration, Comprehensive Transportation Program, Series 2006A, 5.000%, 11/01/23 – FGIC Insured | 11/16 at 100.00 | AA | $ | 4,316,445 | ||||||||||||
| 1,400 | Kansas Development Finance Authority, Revenue Bonds, Department of Commerce Impact Program, Series 2011K, 5.000%, 12/01/20 | 12/19 at 100.00 | AA | 1,592,430 | ||||||||||||||
| 40 | Kansas Development Finance Authority, Revenue Bonds, State Projects, Series 2001W, 5.000%, 10/01/17 – NPFG Insured | 10/14 at 100.00 | AA | 40,156 | ||||||||||||||
| 5,000 | Overland Park Development Corporation, Kansas, First Tier Revenue Bonds, Overland Park Convention Center, Series 2007A, 5.250%, 1/01/32 – AMBAC Insured | 1/17 at 100.00 | BB+ | 4,991,200 | ||||||||||||||
Overland Park Transportation Development District, Kansas, Sales Tax Revenue Bonds, Oak Park Mall Project, Series 2010: | ||||||||||||||||||
| 360 | 5.200%, 4/01/20 | No Opt. Call | BBB | 404,593 | ||||||||||||||
| 2,350 | 5.900%, 4/01/32 | 4/20 at 100.00 | BBB | 2,559,174 | ||||||||||||||
| 2,675 | Overland Park, Kansas, Sales Tax Special Obligation Revenue Bonds, Prairiefire at Lionsgate Project, Series 2012, 6.000%, 12/15/32 | No Opt. Call | N/R | 2,607,804 | ||||||||||||||
| 1,500 | Puerto Rico Infrastructure Financing Authority, Special Tax Revenue Bonds, Series 2005C, 5.500%, 7/01/27 – AMBAC Insured | No Opt. Call | BB+ | 1,475,220 | ||||||||||||||
| 1,000 | Puerto Rico Sales Tax Financing Corporation, Sales Tax Revenue Bonds, First Subordinate Series 2009A, 1.000%, 8/01/32 | 8/26 at 100.00 | A+ | 813,780 | ||||||||||||||
| 5,000 | Virgin Islands Public Finance Authority, Gross Receipts Taxes Loan Note, Refunding Series 2012A, 5.000%, 10/01/32 | No Opt. Call | BBB+ | 5,400,900 | ||||||||||||||
| 2,000 | Virgin Islands Public Finance Authority, Gross Receipts Taxes Loan Note, Refunding Series 2012A., 5.000%, 10/01/32 – AGM Insured | No Opt. Call | AA | 2,196,220 | ||||||||||||||
| 1,100 | Virgin Islands Public Finance Authority, Matching Fund Loan Notes Revenue Bonds, Series 2012A, 5.000%, 10/01/32 | 10/22 at 100.00 | BBB | 1,187,868 | ||||||||||||||
| 1,150 | Virgin Islands Public Finance Authority, Matching Fund Loan Notes Revenue Bonds, Subordinate Lien Series 2010B, 5.250%, 10/01/29 | 10/20 at 100.00 | Baa2 | 1,230,684 | ||||||||||||||
| 2,630 | Wyandotte County-Kansas City Unified Government, Kansas, Sales Tax Special Obligation Capital Appreciation Revenue Bonds Redevelopment Project Area B - Major Multi-Sport Athletic Complex Project, Subordinate Lien Series 2010B, 0.000%, 6/01/21 | No Opt. Call | A– | 1,825,693 | ||||||||||||||
| 44,350 | Total Tax Obligation/Limited | 45,968,233 | ||||||||||||||||
Transportation – 0.5% | ||||||||||||||||||
| 945 | Virginia Small Business Financing Authority, Senior Lien Revenue Bonds, Elizabeth River Crossing, Opco LLC Project, Series 2012, 5.250%, 1/01/32 (Alternative Minimum Tax) | 7/22 at 100.00 | BBB– | 1,012,133 | ||||||||||||||
U.S. Guaranteed – 7.7% (5) | ||||||||||||||||||
| 2,000 | Butler County Unified School District 402, Kansas, General Obligation Bonds, Series 2008A, 5.130%, 9/01/32 – AGC Insured (Pre-refunded 9/01/18) | 9/18 at 100.00 | A1 (5) | 2,295,720 | ||||||||||||||
| 4,000 | Wichita, Kansas, Hospital Facilities Revenue Refunding and Improvement Bonds, Via Christi Health System Inc., Series 2011A-IV, 5.000%, 11/15/29 (Pre-refunded 11/15/21) | 11/21 at 100.00 | N/R (5) | 4,892,000 | ||||||||||||||
| 1,010 | Wichita, Kansas, Revenue Bonds, CSJ Health System of Wichita, Inc., Series 1985-XXV, 7.200%, 10/01/15 (ETM) | 8/14 at 100.00 | N/R (5) | 1,011,960 | ||||||||||||||
| 1,695 | Wyandotte County Unified School District 203, Piper, Kansas, General Obligation Bonds, Series 2008B, 5.500%, 9/01/28 (Pre-refunded 9/01/18) | 9/18 at 100.00 | N/R (5) | 2,014,965 | ||||||||||||||
| 46 | Nuveen Investments |
| Principal Amount (000) | Description (1) | Optional Call Provisions (2) | Ratings (3) | Value | ||||||||||||||
U.S. Guaranteed (5) (continued) | ||||||||||||||||||
Wyandotte County-Kansas City Unified Government, Kansas, Utility System Revenue Bonds, Series 2004B: | ||||||||||||||||||
| $ | 1,000 | 5.000%, 9/01/24 – AGM Insured (Pre-refunded 9/01/14) | 9/14 at 100.00 | AA (5) | $ | 1,012,270 | ||||||||||||
| 4,000 | 5.000%, 9/01/32 – AGM Insured (Pre-refunded 9/01/14) | 9/14 at 100.00 | AA (5) | 4,049,080 | ||||||||||||||
| 13,705 | Total U.S. Guaranteed | 15,275,995 | ||||||||||||||||
Utilities – 11.8% | ||||||||||||||||||
| 3,000 | Burlington, Kansas, Environmental Improvement Revenue Bonds, Kansas City Power and Light Company, Series 2005, 4.650%, 9/01/35 – SYNCORA GTY Insured | 9/15 at 100.00 | BBB+ | 3,013,530 | ||||||||||||||
| 1,375 | Guam Power Authority, Revenue Bonds, Series 2012A., 5.000%, 10/01/30 – AGM Insured | 10/22 at 100.00 | AA | 1,527,666 | ||||||||||||||
| 1,500 | Kansas Municipal Energy Agency, Power Project Revenue Bonds, Jameson Energy Center Project, Series 2013, 5.750%, 7/01/38 | 7/23 at 100.00 | A– | 1,697,670 | ||||||||||||||
Kansas State Power Pool, Electric Utility Revenue Bonds, Dogwood Energy Facility, Series 2012A: | ||||||||||||||||||
| 1,395 | 5.000%, 12/01/22 | No Opt. Call | Baa1 | 1,579,698 | ||||||||||||||
| 1,265 | 5.000%, 12/01/23 | 12/22 at 100.00 | Baa1 | 1,416,749 | ||||||||||||||
| 2,575 | 5.000%, 12/01/31 | 12/20 at 100.00 | Baa1 | 2,711,372 | ||||||||||||||
| 1,465 | Virgin Islands Water and Power Authority, Electric System Revenue Bonds, Series 2007B, 5.000%, 7/01/31 | 7/17 at 100.00 | BB+ | 1,324,199 | ||||||||||||||
| 1,000 | Wyandotte County-Kansas City Unified Government, Kansas, Industrial Revenue Bonds, Board of Public Utilities Office Building Complex, Series 2001, 5.000%, 5/01/21 – NPFG Insured | 11/14 at 100.00 | AA– | 1,003,710 | ||||||||||||||
| 2,500 | Wyandotte County-Kansas City Unified Government, Kansas, Utility System Revenue Bonds, Refunding Series 2012A, 5.000%, 9/01/32 | 9/22 at 100.00 | A+ | 2,775,175 | ||||||||||||||
Wyandotte County-Kansas City Unified Government, Kansas, Utility System Revenue Bonds, Series 2009A: | ||||||||||||||||||
| 1,075 | 5.000%, 9/01/29 – BHAC Insured | 3/19 at 100.00 | AA+ | 1,220,544 | ||||||||||||||
| 3,000 | 5.250%, 9/01/34 – BHAC Insured | 3/19 at 100.00 | AA+ | 3,391,530 | ||||||||||||||
| 1,535 | Wyandotte County-Kansas City Unified Government, Kansas, Utility System Revenue Bonds, Series 2011A, 5.000%, 9/01/28 | 9/21 at 100.00 | A+ | 1,717,251 | ||||||||||||||
| 21,685 | Total Utilities | 23,379,094 | ||||||||||||||||
Water and Sewer – 3.9% | ||||||||||||||||||
| 2,000 | Guam Government Waterworks Authority, Water and Wastewater System Revenue Bonds, Series 2005, 5.880%, 7/01/35 | 7/15 at 100.00 | A– | 2,024,720 | ||||||||||||||
| 500 | Guam Waterworks Authority, Water and Wastewater System Revenue Bonds, Series 2013, 5.250%, 7/01/33 | 7/23 at 100.00 | A– | 533,460 | ||||||||||||||
| 2,000 | Wichita, Kansas, Water and Sewer Utility Revenue Bonds, Refunding Series 2011A, 5.000%, 10/01/28 | 10/21 at 100.00 | AA– | 2,314,880 | ||||||||||||||
| 2,500 | Wichita, Kansas, Water and Sewer Utility Revenue Bonds, Series 2009A, 5.000%, 10/01/39 | 10/19 at 100.00 | AA– | 2,755,126 | ||||||||||||||
| 7,000 | Total Water and Sewer | 7,628,186 | ||||||||||||||||
| $ | 189,395 | Total Long-Term Investments (cost $188,861,773) | 202,567,155 | |||||||||||||||
Floating Rate Obligations – (4.8)% | (9,420,000 | ) | ||||||||||||||||
Other Assets Less Liabilities – 2.5% | 4,844,404 | |||||||||||||||||
Net Assets – 100% | $ | 197,991,559 | ||||||||||||||||
| Nuveen Investments | 47 |
Nuveen Kansas Municipal Bond Fund (continued)
Portfolio of Investments May 31, 2014
| (1) | All percentages shown in the Portfolio of Investments are based on net assets. |
| (2) | Optional Call Provisions (not covered by the report of independent registered public accounting firm): Dates (month and year) and prices of the earliest optional call or redemption. There may be other call provisions at varying prices at later dates. Certain mortgage-backed securities may be subject to periodic principal paydowns. |
| (3) | Ratings (not covered by the report of independent registered public accounting firm): Using the highest of Standard & Poor’s Group (“Standard & Poor’s”), Moody’s Investors Service, Inc. (“Moody’s”) or Fitch, Inc. (“Fitch”) rating. Ratings below BBB by Standard & Poor’s, Baa by Moody’s or BBB by Fitch are considered to be below investment grade. Holdings designated N/R are not rated by any of these national rating agencies. |
| (4) | Investment, or portion of investment, has been pledged to collateralize the net payment obligations for investments in inverse floating rate transactions. |
| (5) | Backed by an escrow or trust containing sufficient U.S. Government or U.S. Government agency securities, which ensure the timely payment of principal and interest. Certain bonds backed by U.S. Government or agency securities are regarded as having an implied rating equal to the rating of such securities. |
| (IF) | Inverse floating rate investment. |
| (UB) | Underlying bond of an inverse floating rate trust reflected as a financing transaction. See Notes to Financial Statements, Note 3 – Portfolio Securities and Investments in Derivatives, Inverse Floating Rate Securities for more information. |
| (ETM) | Escrowed to maturity. |
See accompanying notes to financial statements.
| 48 | Nuveen Investments |
Nuveen Kentucky Municipal Bond Fund
Portfolio of Investments May 31, 2014
| Principal Amount (000) | Description (1) | Optional Call Provisions (2) | Ratings (3) | Value | ||||||||||||||
LONG-TERM INVESTMENTS – 98.6% | ||||||||||||||||||
MUNICIPAL BONDS – 98.6% | ||||||||||||||||||
Education and Civic Organizations – 7.5% | ||||||||||||||||||
| $ | 110 | Campbellsville, Kentucky, Revenue Bonds, Campbellsville University, Series 2005., 5.700%, 3/01/34 | 3/15 at 100.00 | N/R | $ | 110,961 | ||||||||||||
| 830 | Eastern Kentucky University, General Receipts Bonds, Refunding Series 2012A, 5.000%, 4/01/20 | No Opt. Call | Aa3 | 966,004 | ||||||||||||||
| 1,000 | Kentucky Asset/Liability Commission, General Receipts Revenue Bonds, University of Kentucky, Series 2005, 5.000%, 10/01/16 – FGIC Insured | 10/15 at 100.00 | Aa2 | 1,062,830 | ||||||||||||||
Kentucky Asset/Liability Commission, General Receipts Revenue Bonds, University of Kentucky, Series 2007A: | ||||||||||||||||||
| 1,645 | 5.000%, 10/01/20 – AMBAC Insured | 10/17 at 100.00 | Aa2 | 1,860,544 | ||||||||||||||
| 2,675 | 5.000%, 10/01/21 – AMBAC Insured | 10/17 at 100.00 | Aa2 | 3,022,670 | ||||||||||||||
| 4,435 | 5.000%, 10/01/22 – AMBAC Insured | 10/17 at 100.00 | Aa2 | 4,998,955 | ||||||||||||||
Kentucky Higher Education Student Loan Corporation, Student Loan Revenue Bonds, Senior Series 2014A.: | ||||||||||||||||||
| 900 | 5.000%, 6/01/22 (Alternative Minimum Tax) | No Opt. Call | A | 996,399 | ||||||||||||||
| 700 | 5.000%, 6/01/23 (Alternative Minimum Tax) | No Opt. Call | A | 770,560 | ||||||||||||||
| 400 | 5.000%, 6/01/24 (Alternative Minimum Tax) | No Opt. Call | A | 438,268 | ||||||||||||||
| 1,500 | Louisville and Jefferson County Metropolitan Government, Kentucky, General Revenue Bonds, Bellarmine University, Series 2008A, 6.000%, 5/01/38 | 5/18 at 100.00 | Baa3 | 1,592,400 | ||||||||||||||
| 2,000 | Louisville and Jefferson County Metropolitan Government, Kentucky, Industrial Building Revenue Bonds, Sisters of Mercy of the Americas, Series 2006, 5.000%, 10/01/35 | 10/16 at 100.00 | A+ | 2,053,520 | ||||||||||||||
University of Kentucky, General Receipts Bonds, Refunding Series 2012A: | ||||||||||||||||||
| 1,435 | 5.000%, 5/01/19 | No Opt. Call | Aa2 | 1,694,376 | ||||||||||||||
| 1,185 | 5.000%, 5/01/20 | No Opt. Call | Aa2 | 1,417,497 | ||||||||||||||
| 2,340 | 5.000%, 5/01/21 | No Opt. Call | Aa2 | 2,829,411 | ||||||||||||||
University of Louisville, Kentucky, Revenue Bonds, General Receipts Series 2011A: | ||||||||||||||||||
| 150 | 5.000%, 9/01/20 | No Opt. Call | Aa2 | 178,763 | ||||||||||||||
| 2,005 | 5.000%, 9/01/26 | 9/21 at 100.00 | Aa2 | 2,339,133 | ||||||||||||||
| 1,910 | University of Louisville, Kentucky, Revenue Bonds, General Receipts Series 2012A, 5.000%, 9/01/25 | 9/21 at 100.00 | Aa2 | 2,243,085 | ||||||||||||||
| 25,220 | Total Education and Civic Organizations | 28,575,376 | ||||||||||||||||
Health Care – 25.0% | ||||||||||||||||||
| 3,360 | Christian County, Kentucky, Hospital Revenue Refunding Bonds, Jennie Stuart Medical Center, Series 2006A, 5.500%, 2/01/36 – AGC Insured | 2/18 at 100.00 | AA | 3,554,914 | ||||||||||||||
Glasgow, Kentucky, Healthcare Revenue Bonds, T.J. Samson Community Hospital Project, Series 2011: | ||||||||||||||||||
| 100 | 5.350%, 2/01/24 | 8/21 at 100.00 | BBB | 108,693 | ||||||||||||||
| 2,000 | 6.380%, 2/01/35 | 8/21 at 100.00 | BBB | 2,217,140 | ||||||||||||||
| 3,310 | 6.450%, 2/01/41 | 8/21 at 100.00 | BBB | 3,648,282 | ||||||||||||||
Kentucky Economic Development Finance Authority, Hospital Facilities Revenue Bonds, Owensboro Medical Health System, Series 2010A: | ||||||||||||||||||
| 3,925 | 5.500%, 6/01/21 | 6/20 at 100.00 | BBB+ | 4,473,715 | ||||||||||||||
| Nuveen Investments | 49 |
Nuveen Kentucky Municipal Bond Fund (continued)
Portfolio of Investments May 31, 2014
| Principal Amount (000) | Description (1) | Optional Call Provisions (2) | Ratings (3) | Value | ||||||||||||||
Health Care (continued) | ||||||||||||||||||
| $ | 165 | 6.380%, 6/01/40 | 6/20 at 100.00 | BBB+ | $ | 184,610 | ||||||||||||
| 5,150 | 6.500%, 3/01/45 | 6/20 at 100.00 | BBB+ | 5,784,325 | ||||||||||||||
Kentucky Economic Development Finance Authority, Hospital Revenue Bonds, Baptist Healthcare System Obligated Group, Series 2009A: | ||||||||||||||||||
| 1,100 | 5.380%, 8/15/24 | 8/19 at 100.00 | A+ | 1,237,731 | ||||||||||||||
| 7,090 | 5.630%, 8/15/27 | 8/19 at 100.00 | A+ | 7,826,226 | ||||||||||||||
Kentucky Economic Development Finance Authority, Hospital Revenue Bonds, Baptist Healthcare System Obligated Group, Series 2011: | ||||||||||||||||||
| 1,500 | 5.000%, 8/15/42 | 8/21 at 100.00 | A+ | 1,608,570 | ||||||||||||||
| 3,000 | 5.250%, 8/15/46 | 8/21 at 100.00 | A+ | 3,262,020 | ||||||||||||||
| 10,000 | Kentucky Economic Development Finance Authority, Hospital Revenue Bonds, Catholic Health Initiatives, Series 2013A, 5.250%, 1/01/45 | 1/23 at 100.00 | A+ | 10,999,600 | ||||||||||||||
Kentucky Economic Development Finance Authority, Hospital Revenue Bonds, Saint Elizabeth Medical Center, Series 2009A: | ||||||||||||||||||
| 210 | 5.380%, 5/01/34 | 5/19 at 100.00 | AA | 237,044 | ||||||||||||||
| 5,010 | 5.500%, 5/01/39 | 5/19 at 100.00 | AA | 5,656,490 | ||||||||||||||
| 540 | Kentucky Economic Development Finance Authority, Medical Center Revenue Bonds, Ashland Hospital Corporation d/b/a Kings Daughters Medical Center Project, Series 2010A, 5.000%, 2/01/40 | 2/20 at 100.00 | A | 561,838 | ||||||||||||||
| 3,320 | Louisville/Jefferson County Metro Government, Kentucky, Revenue Bonds, Catholic Health Initiatives, Series 2012A, 5.000%, 12/01/26 | 6/22 at 100.00 | A+ | 3,744,993 | ||||||||||||||
| 7,000 | Murray Hospital Facilities, Kentucky, Revenue Bonds, Murray-Calloway County Public Hospital, Series 2007, 5.130%, 8/01/37 | 8/17 at 100.00 | Baa3 | 7,038,500 | ||||||||||||||
| 7,500 | Pikeville, Kentucky, Hospital Revenue Bonds, Pikeville Medical Center, Inc. Project, Improvement and Refunding Series 2011, 6.500%, 3/01/41 | 3/21 at 100.00 | A3 | 8,566,050 | ||||||||||||||
| 2,195 | Rockcastle County, Kentucky, First Mortgage Revenue Bonds, Rockcastle Hospital and Respiratory Care Center Inc. Project, Series 2005, 5.550%, 6/01/30 | 6/15 at 100.00 | BBB– | 2,212,297 | ||||||||||||||
| 8,000 | Russell, Kentucky, Revenue Bonds, Bon Secours Health System, Series 2013, 5.000%, 11/01/26 | No Opt. Call | A– | 9,016,400 | ||||||||||||||
| 3,300 | Russell, Kentucky, Revenue Bonds, Bon Secours Health System, Series 2013., 5.000%, 11/01/22 | No Opt. Call | A– | 3,864,465 | ||||||||||||||
| 1,000 | Warren County, Kentucky, Hospital Facilities Revenue Bonds, Community Hospital, Series 2007A, 5.000%, 8/01/29 | 8/17 at 100.00 | A | 1,039,710 | ||||||||||||||
| 3,250 | Warren County, Kentucky, Hospital Refunding Revenue Bonds, Bowling Green-Warren County Community Hospital Corporation, Series 2013, 5.000%, 4/01/35 | 4/23 at 100.00 | A | 3,512,340 | ||||||||||||||
Warren County, Kentucky, Hospital Revenue Bonds, Bowling Green-Warren County Community Hospital Corporation, Series 2012A: | ||||||||||||||||||
| 1,980 | 5.000%, 10/01/33 | 10/22 at 100.00 | A | 2,135,093 | ||||||||||||||
| 2,000 | 5.000%, 10/01/37 | 10/22 at 100.00 | A | 2,150,760 | ||||||||||||||
| 86,005 | Total Health Care | 94,641,806 | ||||||||||||||||
Housing/Multifamily – 0.3% | ||||||||||||||||||
| 1,190 | Kentucky Housing Corporation, Conduit Multifamily Mortgage Revenue Bonds, Florence Homes III Apartments Project, Series 2005B, 5.000%, 6/01/35 (Alternative Minimum Tax) (Mandatory Put 6/01/23) | 6/15 at 102.00 | N/R | 1,228,330 | ||||||||||||||
| 50 | Nuveen Investments |
| Principal Amount (000) | Description (1) | Optional Call Provisions (2) | Ratings (3) | Value | ||||||||||||||
Housing/Single Family – 2.7% | ||||||||||||||||||
Kentucky Housing Corporation Housing Revenue Bonds Series 2011B: | ||||||||||||||||||
| $ | 150 | 3.000%, 1/01/21 | No Opt. Call | AAA | $ | 158,405 | ||||||||||||
| 485 | 3.000%, 7/01/21 | No Opt. Call | AAA | 511,156 | ||||||||||||||
| 705 | 3.100%, 7/01/22 | 7/21 at 100.00 | AAA | 739,573 | ||||||||||||||
| 360 | 3.300%, 1/01/23 | 7/21 at 100.00 | AAA | 378,709 | ||||||||||||||
| 595 | 3.300%, 7/01/23 | 7/21 at 100.00 | AAA | 623,572 | ||||||||||||||
| 610 | 3.630%, 1/01/25 | 7/21 at 100.00 | AAA | 637,139 | ||||||||||||||
| 675 | Kentucky Housing Corporation, Housing Revenue Bonds, Series 2007K, 5.000%, 7/01/34 | 1/17 at 100.00 | AAA | 695,338 | ||||||||||||||
| 2,520 | Kentucky Housing Corporation, Housing Revenue Bonds, Series 2007N, 5.000%, 7/01/32 (Alternative Minimum Tax) | No Opt. Call | AAA | 2,593,130 | ||||||||||||||
| 3,800 | Kentucky Housing Corporation, Housing Revenue Bonds, Series 2009B, 5.150%, 7/01/39 | 1/19 at 100.00 | AAA | 4,011,470 | ||||||||||||||
| 9,900 | Total Housing/Single Family | 10,348,492 | ||||||||||||||||
Long-Term Care – 0.6% | ||||||||||||||||||
| 2,090 | Kentucky Economic Development Finance Authority, Multifamily Housing Revenue Bonds, Christian Care Communities Projects, Series 2005, 5.250%, 11/20/25 | 11/15 at 103.00 | AA+ | 2,209,506 | ||||||||||||||
Materials – 0.7% | ||||||||||||||||||
| 2,820 | Wickliffe, Kentucky, Solid Waste Disposal Facility Revenue Bonds, Westvaco Corporation, Series 1996, 6.380%, 4/01/26 (Alternative Minimum Tax) | 10/14 at 100.00 | BBB | 2,820,705 | ||||||||||||||
Tax Obligation/General – 0.3% | ||||||||||||||||||
| 1,085 | Crittenden County, Kentucky, General Obligation Bonds, Series 2007, 6.000%, 12/01/27 | 12/17 at 100.00 | N/R | 1,158,834 | ||||||||||||||
Tax Obligation/Limited – 22.2% | ||||||||||||||||||
| 1,000 | Kentucky Asset/Liability Commission, General Fund Revenue Project Notes, Federal Highway Trust Fund First Series 2010A, 5.000%, 9/01/21 | 9/20 at 100.00 | AA | 1,172,150 | ||||||||||||||
| 1,500 | Kentucky Asset/Liability Commission, General Fund Revenue Project Notes, Federal Highway Trust Fund First Series 2013A, 5.000%, 9/01/17 | No Opt. Call | AA | 1,701,405 | ||||||||||||||
| 2,000 | Kentucky Asset/Liability Commission, General Fund Revenue Project Notes, First Series 2005, 5.000%, 5/01/25 – NPFG Insured | 5/15 at 100.00 | AA– | 2,078,960 | ||||||||||||||
Kentucky Economic Development Finance Authority, Louisville Arena Project Revenue Bonds, Louisville Arena Authority, Inc., Series 2008-A1: | ||||||||||||||||||
| 1,950 | 5.750%, 12/01/28 – AGC Insured | 6/18 at 100.00 | AA | 2,092,584 | ||||||||||||||
| 3,450 | 6.000%, 12/01/33 – AGC Insured | 6/18 at 100.00 | AA | 3,664,210 | ||||||||||||||
| 4,630 | 6.000%, 12/01/38 – AGC Insured | 6/18 at 100.00 | AA | 4,900,068 | ||||||||||||||
| 9,350 | 6.000%, 12/01/42 – AGC Insured | 6/18 at 100.00 | AA | 9,874,535 | ||||||||||||||
Kentucky Economic Development Finance Authority, Louisville Arena Project Revenue Bonds, Louisville Arena Authority, Inc., Series 2008-A2: | ||||||||||||||||||
| 35 | 0.000%, 12/01/15 – AGC Insured | No Opt. Call | AA | 33,841 | ||||||||||||||
| 50 | 0.000%, 12/01/16 – AGC Insured | No Opt. Call | AA | 47,030 | ||||||||||||||
| 3,505 | 0.000%, 12/01/22 – AGC Insured | No Opt. Call | AA | 2,453,465 | ||||||||||||||
| 3,750 | 0.000%, 12/01/23 – AGC Insured | No Opt. Call | AA | 2,477,813 | ||||||||||||||
| 5,000 | Kentucky Economic Development Finance Authority, Louisville Arena Project Revenue Bonds, Louisville Arena Authority, Inc., Tender Option Bonds Trust 11810, 16.385%, 6/01/16 – AGC Insured (IF) | No Opt. Call | AA | 6,462,400 | ||||||||||||||
| 2,365 | Kentucky Local Correctional Facilities Authority, Multi-County Lease Revenue Bonds, Series 2004, 5.250%, 11/01/14 – NPFG Insured | No Opt. Call | AA– | 2,409,888 | ||||||||||||||
| Nuveen Investments | 51 |
Nuveen Kentucky Municipal Bond Fund (continued)
Portfolio of Investments May 31, 2014
| Principal Amount (000) | Description (1) | Optional Call Provisions (2) | Ratings (3) | Value | ||||||||||||||
Tax Obligation/Limited (continued) | ||||||||||||||||||
Kentucky State Property and Buildings Commission, Revenue Bonds, Project 84, Series 2005: | ||||||||||||||||||
| $ | 2,115 | 5.000%, 8/01/18 – NPFG Insured | No Opt. Call | AA– | $ | 2,447,224 | ||||||||||||
| 125 | 5.000%, 8/01/19 – NPFG Insured | No Opt. Call | AA– | 146,883 | ||||||||||||||
| 2,000 | Kentucky State Property and Buildings Commission, Revenue Bonds, Project 85, Series 2005, 5.000%, 8/01/15 – AGM Insured | No Opt. Call | AA | 2,111,420 | ||||||||||||||
Kentucky State Property and Buildings Commission, Revenue Bonds, Project 93, Refunding Series 2009: | ||||||||||||||||||
| 2,500 | 5.250%, 2/01/28 – AGC Insured | 2/19 at 100.00 | AA | 2,865,500 | ||||||||||||||
| 2,500 | 5.250%, 2/01/29 – AGC Insured | 2/19 at 100.00 | AA | 2,862,100 | ||||||||||||||
| 2,000 | Kentucky Turnpike Authority, Economic Development Road Revenue Bonds, Revitalization Project, Refunding Series 2010A, 5.000%, 7/01/20 | No Opt. Call | AA+ | 2,387,740 | ||||||||||||||
| 1,800 | Kentucky Turnpike Authority, Economic Development Road Revenue Bonds, Revitalization Project, Refunding Series 2011A, 5.000%, 7/01/24 | 7/21 at 100.00 | AA+ | 2,116,746 | ||||||||||||||
Kentucky Turnpike Authority, Economic Development Road Revenue Bonds, Revitalization Project, Refunding Series 2012A: | ||||||||||||||||||
| 500 | 5.000%, 7/01/24 | 7/22 at 100.00 | AA+ | 594,420 | ||||||||||||||
| 4,000 | 5.000%, 7/01/30 | 7/22 at 100.00 | AA+ | 4,587,520 | ||||||||||||||
| 6,740 | 5.000%, 7/01/31 | 7/22 at 100.00 | AA+ | 7,693,508 | ||||||||||||||
Kentucky Turnpike Authority, Economic Development Road Revenue Bonds, Revitalization Project, Series 2006B: | ||||||||||||||||||
| 2,095 | 5.000%, 7/01/15 – AMBAC Insured | No Opt. Call | AA+ | 2,205,344 | ||||||||||||||
| 5,000 | 5.000%, 7/01/24 – AMBAC Insured | 7/16 at 100.00 | AA+ | 5,441,550 | ||||||||||||||
| 25 | Kentucky Turnpike Authority, Economic Development Road Revenue Bonds, Revitalization Project, Series 2008A, 5.000%, 7/01/28 | 7/18 at 100.00 | AA+ | 28,175 | ||||||||||||||
| 2,820 | Kentucky Turnpike Authority, Economic Development Road Revenue Bonds, Revitalization Project, Series 2009A, 5.000%, 7/01/29 | 7/19 at 100.00 | AA+ | 3,226,841 | ||||||||||||||
| 2,060 | Laurel County School District Finance Corporation, Kentucky, School Building Revenue Bonds, Series 2007, 5.000%, 6/01/27 – AGM Insured | 6/17 at 100.00 | Aa3 | 2,262,642 | ||||||||||||||
| 3,000 | Lexington-Fayette Urban County Government Public Facilities Corporation, Kentucky State Lease Revenue Bonds, Eastern State Hospital Project, Series 2011A, 5.250%, 6/01/29 | 6/21 at 100.00 | Aa3 | 3,350,190 | ||||||||||||||
| 500 | Pendleton County, Kentucky, Leasing Trust Revenue Bonds, Kentucky Association of Counties, Series 1993A, 6.400%, 3/01/19 | No Opt. Call | B | 554,310 | ||||||||||||||
| 78,365 | Total Tax Obligation/Limited | 84,250,462 | ||||||||||||||||
Transportation – 5.9% | ||||||||||||||||||
| 5,090 | Kenton County Airport Board, Kentucky, Airport Revenue Bonds, Cincinnati/Northern Kentucky International Airport, Series 2003B, 5.000%, 3/01/23 – NPFG Insured (Alternative Minimum Tax) | 9/14 at 100.00 | AA– | 5,107,611 | ||||||||||||||
| 2,000 | Kentucky Public Transportation Infrastructure Authority, First Tier Toll Revenue Bonds, Downtown Crossing Project, Capital Appreciation Series 2013B., 0.000%, 7/01/23 | No Opt. Call | Baa3 | 1,359,420 | ||||||||||||||
| 10,000 | Kentucky Public Transportation Infrastructure Authority, First Tier Toll Revenue Bonds, Downtown Crossing Project, Series 2013A., 6.000%, 7/01/53 | 7/23 at 100.00 | Baa3 | 11,190,300 | ||||||||||||||
Lexington-Fayette Urban County Government, Kentucky, General Airport Revenue Refunding Bonds, Series 2012B: | ||||||||||||||||||
| 1,215 | 5.000%, 7/01/29 (Alternative Minimum Tax) | No Opt. Call | AA | 1,342,806 | ||||||||||||||
| 1,100 | 5.000%, 7/01/31 (Alternative Minimum Tax) | No Opt. Call | AA | 1,198,714 | ||||||||||||||
| 1,000 | Lexington-Fayette Urban County Government, Kentucky, General Airport Revenue Refunding Bonds, Series 2012B, 5.000%, 7/01/38 | No Opt. Call | AA | 1,090,830 | ||||||||||||||
| 52 | Nuveen Investments |
| Principal Amount (000) | Description (1) | Optional Call Provisions (2) | Ratings (3) | Value | ||||||||||||||
Transportation (continued) | ||||||||||||||||||
| $ | 1,000 | Louisville and Jefferson County Regional Airport Authority, Kentucky, Airport System Revenue Bonds, Series 2003C, 5.250%, 7/01/22 – AGM Insured (Alternative Minimum Tax) | 7/14 at 100.00 | AA | $ | 1,003,830 | ||||||||||||
| 21,405 | Total Transportation | 22,293,511 | ||||||||||||||||
U.S. Guaranteed – 4.9% (4) | ||||||||||||||||||
| 890 | Campbellsville, Kentucky, Revenue Bonds, Campbellsville University, Series 2005, 5.700%, 3/01/34 (Pre-refunded 3/01/15) | 3/15 at 100.00 | N/R (4) | 926,606 | ||||||||||||||
Crittenden County, Kentucky, General Obligation Bonds, Series 2007: | ||||||||||||||||||
| 1,605 | 6.250%, 12/01/32 (Pre-refunded 12/01/17) | 12/17 at 100.00 | N/R (4) | 1,904,284 | ||||||||||||||
| 2,190 | 6.500%, 12/01/37 (Pre-refunded 12/01/17) | 12/17 at 100.00 | N/R (4) | 2,617,225 | ||||||||||||||
| 2,795 | Kentucky State Property and Buildings Commission, Revenue Bonds, Project 85, Series 2005, 5.000%, 8/01/22 – AGM Insured (Pre-refunded 8/01/15) | 8/15 at 100.00 | AA (4) | 2,952,806 | ||||||||||||||
Louisville and Jefferson County Metropolitan Government, Kentucky, General Obligation Bonds, Series 2004A-B: | ||||||||||||||||||
| 1,195 | 5.000%, 11/01/16 – AMBAC Insured (Pre-refunded 11/01/14) | 11/14 at 100.00 | AAA | 1,219,438 | ||||||||||||||
| 1,000 | 5.000%, 11/01/17 – AMBAC Insured (Pre-refunded 11/01/14) | 11/14 at 100.00 | AAA | 1,020,450 | ||||||||||||||
| 1,730 | Louisville-Jefferson County Metropolitan Government, Kentucky, Health Facilities Revenue Bonds, Jewish Hospital & Saint Mary’s HealthCare Inc. Project, Series 2008, 6.130%, 2/01/37 (Pre-refunded 2/01/18) | 2/18 at 100.00 | Aaa | 2,064,841 | ||||||||||||||
| 3,745 | Owensboro, Kentucky, Electric Light and Power System Revenue Bonds, Series 1991B, 0.000%, 1/01/15 – AMBAC Insured (ETM) | No Opt. Call | A3 (4) | 3,737,885 | ||||||||||||||
| 2,185 | Spencer County School District Finance Corporation, Kentucky, Revenue Bonds, School Buildings, Series 2004, 5.000%, 7/01/21 – AGM Insured (Pre-refunded 7/01/14) | 7/14 at 100.00 | Aa3 (4) | 2,194,177 | ||||||||||||||
| 17,335 | Total U.S. Guaranteed | 18,637,712 | ||||||||||||||||
Utilities – 19.4% | ||||||||||||||||||
Kentucky Municipal Power Agency, Power Supply System Revenue Bonds, Prairie State Project Series 2007A: | ||||||||||||||||||
| 6,500 | 5.000%, 9/01/37 – NPFG Insured | 9/17 at 100.00 | AA– | 6,980,155 | ||||||||||||||
| 4,600 | 5.250%, 9/01/42 – NPFG Insured | 9/17 at 100.00 | AA– | 5,077,296 | ||||||||||||||
| 7,535 | 5.250%, 9/01/42 – NPFG Insured (UB) (5) | 9/17 at 100.00 | AA+ | 8,357,144 | ||||||||||||||
| 2,500 | Kentucky Municipal Power Agency, Power Supply System Revenue Bonds, Prairie State Project, Tender Option Bond Trust 1025, 18.924%, 9/01/42 – NPFG Insured (IF) (5) | 9/17 at 100.00 | AA+ | 3,590,775 | ||||||||||||||
| 1,275 | Louisville-Jefferson County Metropolitan Government, Kentucky, Environmental Facilities Revenue, Louisville Gas & Electric Company Project, Series 2007B, 1.600%, 6/01/33 (Mandatory Put 6/01/17) | No Opt. Call | A– | 1,283,032 | ||||||||||||||
| 4,740 | Owen County, Kentucky, Waterworks System Revenue Bonds, Kentucky-American Water Company Project, Series 2009A, 6.250%, 6/01/39 | 6/19 at 100.00 | A– | 5,304,629 | ||||||||||||||
| 5,000 | Owen County, Kentucky, Waterworks System Revenue Bonds, Kentucky-American Water Company Project, Series 2009B, 5.630%, 9/01/39 | 9/19 at 100.00 | A– | 5,397,150 | ||||||||||||||
Owensboro, Kentucky, Electric Light and Power System Revenue Bonds, Series 1991B: | ||||||||||||||||||
| 7,900 | 0.000%, 1/01/17 – AMBAC Insured | No Opt. Call | A3 | 7,563,539 | ||||||||||||||
| 13,300 | 0.000%, 1/01/18 – AMBAC Insured | No Opt. Call | A3 | 12,441,219 | ||||||||||||||
Paducah, Kentucky, Electric Board Revenue Bonds, Series 2009A: | ||||||||||||||||||
| 2,945 | 5.000%, 10/01/20 – AGC Insured | 4/19 at 100.00 | A3 | 3,330,206 | ||||||||||||||
| 3,995 | 5.000%, 10/01/25 – AGC Insured | 4/19 at 100.00 | A3 | 4,478,475 | ||||||||||||||
| 95 | 5.000%, 10/01/28 – AGC Insured | 4/19 at 100.00 | A3 | 106,503 | ||||||||||||||
| Nuveen Investments | 53 |
Nuveen Kentucky Municipal Bond Fund (continued)
Portfolio of Investments May 31, 2014
| Principal Amount (000) | Description (1) | Optional Call Provisions (2) | Ratings (3) | Value | ||||||||||||||
Utilities (continued) | ||||||||||||||||||
| $ | 8,595 | 5.250%, 10/01/35 – AGC Insured | 4/19 at 100.00 | A3 | $ | 9,596,575 | ||||||||||||
| 68,980 | Total Utilities | 73,506,698 | ||||||||||||||||
Water and Sewer – 9.1% | ||||||||||||||||||
Campbell & Kenton Counties Sanitation District 1, Kentucky, Revenue Bonds, Series 2007: | ||||||||||||||||||
| 225 | 5.000%, 8/01/21 – NPFG Insured | 8/17 at 100.00 | AA | 253,093 | ||||||||||||||
| 3,795 | 5.000%, 8/01/24 – NPFG Insured | 8/17 at 100.00 | AA | 4,242,317 | ||||||||||||||
| 2,750 | Kentucky Infrastructure Authority, Wastewater and Drinking Water Revolving Fund Revenue Bonds, Series 2012A, 5.000%, 2/01/30 | 2/22 at 100.00 | AAA | 3,172,042 | ||||||||||||||
| 315 | Kentucky Rural Water Finance Corporation, Multimodal Public Projects Revenue Bonds, Flexible Term Program, Series 2001A, 5.380%, 2/01/20 | 8/14 at 100.00 | A+ | 316,266 | ||||||||||||||
Louisville and Jefferson County Metropolitan Government Board of Water Works, Kentucky, Water System Revenue Bonds, Series 2006: | ||||||||||||||||||
| 2,565 | 5.000%, 11/15/27 | 11/16 at 100.00 | AAA | 2,805,135 | ||||||||||||||
| 4,990 | 5.000%, 11/15/29 | 11/16 at 100.00 | AAA | 5,430,368 | ||||||||||||||
| 7,500 | Louisville and Jefferson County Metropolitan Sewer District, Kentucky, Sewer and Drainage System Revenue Bonds, Refunding Series 2011A, 5.000%, 5/15/28 | 11/21 at 100.00 | AA | 8,566,350 | ||||||||||||||
| 2,000 | Northern Kentucky Water District, Revenue Bonds, Series 2009, 6.500%, 2/01/33 – AGM Insured | 8/18 at 100.00 | Aa3 | 2,335,620 | ||||||||||||||
Northern Kentucky Water District, Revenue Bonds, Series 2012: | ||||||||||||||||||
| 2,590 | 5.000%, 2/01/22 | No Opt. Call | Aa3 | 3,093,729 | ||||||||||||||
| 3,495 | 5.000%, 2/01/26 | 2/22 at 100.00 | Aa3 | 3,980,386 | ||||||||||||||
| 195 | Owensboro, Kentucky, Water Revenue Bonds, Refunding & Improvement Series 2009, 5.000%, 9/15/29 | 9/18 at 100.00 | A1 | 219,736 | ||||||||||||||
| 30,420 | Total Water and Sewer | 34,415,042 | ||||||||||||||||
| $ | 344,815 | Total Long-Term Investments (cost $348,686,663) | 374,086,474 | |||||||||||||||
| Principal Amount (000) | Description (1) | Optional Call Provisions (2) | Ratings (3) | Value | ||||||||||||||
SHORT-TERM INVESTMENTS – 1.9% | ||||||||||||||||||
MUNICIPAL BONDS – 1.9% | ||||||||||||||||||
Industrials – 1.9% | ||||||||||||||||||
| $ | 7,000 | Kentucky Economic Development Finance Authority, Solid Waste Disposal Revenue Bonds, Republic Services Inc., Variable Rate Demand Obligations, Refunding 2010B, 0.400%, 4/01/31 – AGM Insured Mandatory Put 6/03/14 (6) | No Opt. Call | A-2 | $ | 7,000,000 | ||||||||||||
| $ | 7,000 | Total Short-Term Investments (cost $7,000,000) | 7,000,000 | |||||||||||||||
Total Investments (cost $355,686,663) – 100.5% | 381,086,474 | |||||||||||||||||
Floating Rate Obligations – (1.5)% | (5,650,000 | ) | ||||||||||||||||
Other Assets Less Liabilities – 1.0% | 3,941,225 | |||||||||||||||||
Net Assets – 100% | $ | 379,377,699 | ||||||||||||||||
| 54 | Nuveen Investments |
| (1) | All percentages shown in the Portfolio of Investments are based on net assets. |
| (2) | Optional Call Provisions (not covered by the report of independent registered public accounting firm): Dates (month and year) and prices of the earliest optional call or redemption. There may be other call provisions at varying prices at later dates. Certain mortgage-backed securities may be subject to periodic principal paydowns. |
| (3) | Ratings (not covered by the report of independent registered public accounting firm): Using the highest of Standard & Poor’s Group (“Standard & Poor’s”), Moody’s Investors Service, Inc. (“Moody’s”) or Fitch, Inc. (“Fitch”) rating. Ratings below BBB by Standard & Poor’s, Baa by Moody’s or BBB by Fitch are considered to be below investment grade. Holdings designated N/R are not rated by any of these national rating agencies. |
| (4) | Backed by an escrow or trust containing sufficient U.S. Government or U.S. Government agency securities, which ensure the timely payment of principal and interest. Certain bonds backed by U.S. Government or agency securities are regarded as having an implied rating equal to the rating of such securities. |
| (5) | Investment, or portion of investment, has been pledged to collateralize the net payment obligations for investments in inverse floating rate transactions. |
| (6) | Investment has a maturity of more than one year, but has variable rate and demand features which qualify it as a short-term investment. The rate disclosed is that in effect at the end of the reporting period. This rate changes periodically based on market conditions or a specified market index. |
| (IF) | Inverse floating rate investment. |
| (ETM) | Escrowed to maturity. |
| (UB) | Underlying bond of an inverse floating rate trust reflected as a financing transaction. See Notes to Financial Statements, Note 3 – Portfolio Securities and Investments in Derivatives, Inverse Floating Rate Securities for more information. |
See accompanying notes to financial statements.
| Nuveen Investments | 55 |
Nuveen Michigan Municipal Bond Fund
Portfolio of Investments May 31, 2014
Principal Amount (000) | Description (1) | Optional Call Provisions (2) | Ratings (3) | Value | ||||||||||||||
LONG-TERM INVESTMENTS – 96.9% | ||||||||||||||||||
MUNICIPAL BONDS – 96.9% | ||||||||||||||||||
Consumer Staples – 2.9% | ||||||||||||||||||
| $ | 3,000 | Michigan Tobacco Settlement Finance Authority, Tobacco Settlement Asset-Backed Revenue Bonds, Senior Lien Series 2007A, 6.000%, 6/01/34 | 6/17 at 100.00 | B– | $ | 2,534,850 | ||||||||||||
| 2,215 | Michigan Tobacco Settlement Finance Authority, Tobacco Settlement Asset-Backed Revenue Bonds, Series 2008A, 6.880%, 6/01/42 | 6/18 at 100.00 | BB– | 2,136,545 | ||||||||||||||
| 5,215 | Total Consumer Staples | 4,671,395 | ||||||||||||||||
Education And Civic Organizations – 4.3% | ||||||||||||||||||
| 830 | Michigan Finance Authority, Public School Academy Limited Obligation Revenue and Refunding Bonds, Detroit Service Learning Academy Project, Series 2011, 7.000%, 10/01/31 | 10/21 at 100.00 | BB+ | 888,739 | ||||||||||||||
| 1,000 | Michigan Finance Authority, Public School Academy Limited Obligation Revenue Bonds, Hanley International Academy, Inc. Project, Series 2010A, 6.130%, 9/01/40 | 9/20 at 100.00 | BBB– | 1,003,230 | ||||||||||||||
| 500 | Michigan Finance Authority, Public School Academy Limited Obligation Revenue Bonds, Holly Academy Project, Refunding Series 2011, 7.750%, 10/01/30 | 10/21 at 100.00 | BBB– | 562,135 | ||||||||||||||
| 1,000 | Michigan State University, General Revenue Bonds, Refunding Series 2010C, 5.000%, 2/15/40 | 2/20 at 100.00 | Aa1 | 1,080,990 | ||||||||||||||
| 3,000 | University of Michigan, General Revenue Bonds, Series 2014A., 5.000%, 4/01/44 | 4/24 at 100.00 | AAA | 3,394,290 | ||||||||||||||
| 6,330 | Total Education and Civic Organizations | 6,929,384 | ||||||||||||||||
Health Care – 14.6% | ||||||||||||||||||
| 1,000 | Grand Traverse County Hospital Financial Authority, Michigan, Revenue Bonds, Munson Healthcare, Refunding Series 2011A, 5.000%, 7/01/29 | 7/21 at 100.00 | AA– | 1,082,940 | ||||||||||||||
| 450 | Jackson County Hospital Finance Authority, Michigan, Hospital Revenue Bonds, Alligiance Health, Refunding Series 2010A, 5.000%, 6/01/37 – AGM Insured | 6/20 at 100.00 | AA | 476,019 | ||||||||||||||
Kent Hospital Finance Authority, Michigan, Revenue Refunding Bonds, Spectrum Health System, Refunding Series 2011C: | ||||||||||||||||||
| 2,135 | 5.000%, 1/15/31 | 1/22 at 100.00 | AA | 2,340,878 | ||||||||||||||
| 365 | 5.000%, 1/15/42 | 1/22 at 100.00 | AA | 389,137 | ||||||||||||||
| 3,000 | Michigan Finance Authority, Hospital Revenue and Refunding Bonds, Crittenton Hospital Medical Center, Series 2012A, 5.000%, 6/01/39 | No Opt. Call | BBB+ | 3,017,700 | ||||||||||||||
Michigan Finance Authority, Revenue Bonds, Oakwood Obligated Group, Refunding Series 2012: | ||||||||||||||||||
| 1,670 | 5.000%, 11/01/25 | 11/22 at 100.00 | A | 1,856,840 | ||||||||||||||
| 1,250 | 5.000%, 11/01/42 | 11/22 at 100.00 | A | 1,315,725 | ||||||||||||||
| 2,305 | Michigan Finance Authority, Revenue Bonds, Trinity Health Credit Group, Refunding Series 2011, 5.000%, 12/01/39 | 12/21 at 100.00 | Aa2 | 2,478,636 | ||||||||||||||
| 3,300 | Michigan State Hospital Finance Authority, Hospital Revenue Bonds, Henry Ford Health System, Refunding Series 2009, 5.750%, 11/15/39 | 11/19 at 100.00 | A2 | 3,585,648 | ||||||||||||||
| 1,000 | Michigan State Hospital Finance Authority, Hospital Revenue Bonds, MidMichigan Obligated Group, Series 2009A, 5.880%, 6/01/39 – AGC Insured | 6/19 at 100.00 | AA | 1,095,160 | ||||||||||||||
| 2,000 | Michigan State Hospital Finance Authority, Revenue Bonds, Sparrow Obligated Group, Series 2005, 5.000%, 11/15/36 – NPFG Insured | 5/15 at 100.00 | AA– | 2,018,780 | ||||||||||||||
| 56 | Nuveen Investments |
Principal Amount (000) | Description (1) | Optional Call Provisions (2) | Ratings (3) | Value | ||||||||||||||
Health Care (continued) | ||||||||||||||||||
| $ | 2,000 | Michigan State Hospital Finance Authority, Revenue Bonds, Trinity Health Care Group, Series 2009C, 5.000%, 12/01/48 | 6/22 at 100.00 | Aa2 | $ | 2,119,640 | ||||||||||||
| 1,590 | Royal Oak Hospital Finance Authority, Michigan, Hospital Revenue and Refunding Bonds, William Beaumont Hospital Obligated Group, Series 2009W, 6.000%, 8/01/39 | 8/19 at 100.00 | A1 | 1,744,071 | ||||||||||||||
| 22,065 | Total Health Care | 23,521,174 | ||||||||||||||||
Housing/Multifamily – 1.9% | ||||||||||||||||||
| 1,200 | Michigan Housing Development Authority, Rental Housing Revenue Bonds, Series 2006D, 5.130%, 4/01/31 – AGM Insured (Alternative Minimum Tax) | 7/15 at 100.00 | AA | 1,212,444 | ||||||||||||||
| 1,690 | Michigan Housing Development Authority, Rental Housing Revenue Bonds, Series 2009A, 5.700%, 10/01/39 | 10/18 at 100.00 | AA | 1,791,434 | ||||||||||||||
| 2,890 | Total Housing/Multifamily | 3,003,878 | ||||||||||||||||
Tax Obligation/General – 31.4% | ||||||||||||||||||
| 690 | Ann Arbor Public School District, Washtenaw County, Michigan, General Obligation Bonds, Refunding Series 2012, 5.000%, 5/01/29 | 5/22 at 100.00 | Aa2 | 784,792 | ||||||||||||||
| 660 | Ann Arbor Public School District, Washtenaw County, Michigan, General Obligation Bonds, Series 2008, 5.000%, 5/01/23 | 5/18 at 100.00 | Aa2 | 744,236 | ||||||||||||||
| 800 | Ann Arbor, Michigan, General Obligation Bonds, Court & Police Facilities Capital Improvement Series 2008, 5.000%, 5/01/38 | 5/18 at 100.00 | AA+ | 878,856 | ||||||||||||||
| 1,435 | Bay City, Michigan, General Obligation Bonds, Series 2008B, 5.500%, 4/01/28 – AGM Insured | 4/18 at 100.00 | AA | 1,626,946 | ||||||||||||||
| 3,660 | Caledonia Community Schools, Kent, Allegan and Barry Counties, Michigan, General Obligation Bonds, Series 2007., 4.750%, 5/01/32 – NPFG Insured | 5/17 at 100.00 | Aa2 | 3,785,318 | ||||||||||||||
| 370 | Detroit City School District, Wayne County, Michigan, Unlimited Tax School Building and Site Improvement Bonds, Series 1998C, 5.250%, 5/01/25 – FGIC Insured | No Opt. Call | AA+ | 415,110 | ||||||||||||||
| 5,500 | Detroit-Wayne County Stadium Authority, Michigan, Wayne County Limited Tax General Obligation Bonds, Building Authority Stadium Refunding Series 2012, 5.000%, 10/01/26 – AGM Insured | 10/22 at 100.00 | AA | 5,900,455 | ||||||||||||||
| 480 | Genesee County, Michigan, General Obligation Water Supply Bonds, Series 2003, 5.130%, 11/01/33 – NPFG Insured | 11/14 at 100.00 | AA– | 480,442 | ||||||||||||||
| 50 | Holly Area School District, Oakland County, Michigan, General Obligation Bonds, Series 2006, 5.130%, 5/01/32 – NPFG Insured | 5/16 at 100.00 | Aa2 | 53,026 | ||||||||||||||
| 1,060 | Homer Community School District, Calhourn, Jackson, Hillsdale and Branch Counties, Michigan, General Obligation Bonds, School Building & Site, Series 2011B, 5.500%, 5/01/41 | 5/21 at 100.00 | AA– | 1,173,123 | ||||||||||||||
| 1,675 | Hopkins Public Schools, Allegan County, Michigan, General Obligation Bonds, Series 2007, 5.000%, 5/01/25 – NPFG Insured | 5/17 at 100.00 | Aa2 | 1,776,069 | ||||||||||||||
| 1,450 | Jackson, Jackson County, Michigan, Downtown Development Bonds, Series 2001, 0.000%, 6/01/21 – AGM Insured | No Opt. Call | AA | 1,189,769 | ||||||||||||||
| 840 | Lowell Area Schools, Kent and Ionia Counties, Michigan, General Obligation Bonds, Series 2007, 5.000%, 5/01/37 – AGM Insured | 5/17 at 100.00 | AA | 910,358 | ||||||||||||||
| 410 | Michigan Finance Authority, Revenue Bonds, Detroit City School District, Series 2012, 5.000%, 6/01/20 | No Opt. Call | A+ | 459,561 | ||||||||||||||
| 1,230 | Michigan Municipal Bond Authority, AMBAC Insured Bonds, Series 2007B-A, 5.000%, 12/01/34 – AMBAC Insured | 6/17 at 100.00 | N/R | 1,176,052 | ||||||||||||||
| 1,000 | Michigan State, General Obligation Bonds, Environmental Program, Refunding Series 2011A, 5.000%, 12/01/22 | 12/21 at 100.00 | Aa2 | 1,194,770 | ||||||||||||||
| Nuveen Investments | 57 |
Nuveen Michigan Municipal Bond Fund (continued)
Portfolio of Investments May 31, 2014
Principal Amount (000) | Description (1) | Optional Call Provisions (2) | Ratings (3) | Value | ||||||||||||||
Tax Obligation/General (continued) | ||||||||||||||||||
| $ | 350 | Michigan State, General Obligation Bonds, Environmental Program, Series 2009A, 5.500%, 11/01/25 Oakland Intermediate School District, Oakland County, Michigan, General Obligation Bonds, Series 2007: | 5/19 at 100.00 | Aa2 | $ | 403,347 | ||||||||||||
| 500 | 5.000%, 5/01/27 – AGM Insured | 5/17 at 100.00 | Aaa | 547,535 | ||||||||||||||
| 1,200 | 5.000%, 5/01/36 – AGM Insured | 5/17 at 100.00 | Aaa | 1,306,284 | ||||||||||||||
| 1,370 | Oakridge Public Schools, Muskegon County, Michigan, General Obligation Bonds, Series 2005, 5.000%, 5/01/24 – NPFG Insured | 5/15 at 100.00 | AA– | 1,425,554 | ||||||||||||||
Okemos Public School District, Ingham County, Michigan, General Obligation Refunding Bonds, Series 1993: | ||||||||||||||||||
| 1,000 | 0.000%, 5/01/17 – NPFG Insured | No Opt. Call | AA– | 959,080 | ||||||||||||||
| 1,020 | 0.000%, 5/01/18 – NPFG Insured | No Opt. Call | AA– | 957,627 | ||||||||||||||
| 1,100 | Ottawa County, Michigan, General Obligation Bonds, Sewer Disposal System, Series 2010, 5.000%, 5/01/37 | 5/20 at 100.00 | Aaa | 1,231,461 | ||||||||||||||
| 4,000 | Ottawa County, Michigan, Water Supply System, General Obligation Bonds, Series 2007, 5.000%, 8/01/30 – NPFG Insured | 8/17 at 100.00 | Aaa | 4,440,440 | ||||||||||||||
| 2,715 | Parchment School District, Kalamazoo County, Michigan, General Obligation Bonds, Series 2007., 4.750%, 5/01/36 – AGM Insured | 5/17 at 100.00 | AA | 2,795,011 | ||||||||||||||
| 150 | South Haven, Van Buren County, Michigan, General Obligation Bonds, Capital Improvement Series 2009, 5.130%, 12/01/33 – AGC Insured | 12/19 at 100.00 | AA | 164,504 | ||||||||||||||
| 500 | South Redford School District, Wayne County, Michigan, General Obligation Bonds, School Building and Site, Series 2005, 5.000%, 5/01/30 – NPFG Insured | 5/15 at 100.00 | Aa2 | 515,355 | ||||||||||||||
| 1,400 | South Redford School District, Wayne County, Michigan, General Obligation Bonds, Series 2004, 5.000%, 5/01/21 – FGIC Insured | 11/14 at 100.00 | Aa2 | 1,425,914 | ||||||||||||||
| 500 | Thornapple Kellogg School District, Barry County, Michigan, General Obligation Bonds, Series 2007, 5.000%, 5/01/32 – NPFG Insured | 5/17 at 100.00 | Aa2 | 542,060 | ||||||||||||||
| 970 | Wayne Charter County, Michigan, General Obligation Bonds, Building Improvements, Series 2009A, 6.750%, 11/01/39 | 12/19 at 100.00 | BBB– | 1,005,502 | ||||||||||||||
| 1,150 | Wayne Westland Community Schools, Michigan, General Obligation Bonds, Series 2004, 5.000%, 5/01/17 – AGM Insured | 11/14 at 100.00 | AA | 1,173,012 | ||||||||||||||
| 3,270 | West Ottawa Public School District, Ottawa County, Michigan, General Obligation Refunding Bonds, Series 1992, 0.000%, 5/01/17 – FGIC Insured | No Opt. Call | AA– | 3,124,387 | ||||||||||||||
| 5,175 | Williamston Community School District, Michigan, Unlimited Tax General Obligation QSBLF Bonds, Series 1996, 5.500%, 5/01/25 – NPFG Insured | No Opt. Call | AA– | 6,128,597 | ||||||||||||||
| 47,680 | Total Tax Obligation/General | 50,694,553 | ||||||||||||||||
Tax Obligation/Limited – 9.8% | ||||||||||||||||||
Grand Rapids Downtown Development Authority, Michigan, Tax Increment Revenue Bonds, Series 1994: | ||||||||||||||||||
| 3,985 | 0.000%, 6/01/17 – NPFG Insured | No Opt. Call | AA– | 3,502,456 | ||||||||||||||
| 3,295 | 0.000%, 6/01/18 – NPFG Insured | No Opt. Call | AA– | 2,763,319 | ||||||||||||||
Michigan State Building Authority, Revenue Bonds, Refunding Series 2006IA: | ||||||||||||||||||
| 3,000 | 0.000%, 10/15/27 – AGM Insured | 10/16 at 58.27 | AA | 1,686,270 | ||||||||||||||
| 1,500 | 0.000%, 10/15/28 – AGM Insured | 10/16 at 55.35 | AA | 769,350 | ||||||||||||||
| 3,960 | 5.000%, 10/15/36 – FGIC Insured | 10/16 at 100.00 | AA– | 4,234,349 | ||||||||||||||
| 1,015 | Michigan State Trunk Line Fund Bonds, Series 2011., 5.000%, 11/15/33 | 11/21 at 100.00 | AA+ | 1,144,250 | ||||||||||||||
| 700 | Michigan State Trunk Line Fund Refunding Bonds, Series 2009, 5.000%, 11/15/36 | 11/21 at 100.00 | AA+ | 778,883 | ||||||||||||||
| 58 | Nuveen Investments |
Principal Amount (000) | Description (1) | Optional Call Provisions (2) | Ratings (3) | Value | ||||||||||||||
Tax Obligation/Limited (continued) | ||||||||||||||||||
| $ | 1,000 | Taylor Brownfield Redevelopment Authority, Wayne County, Michigan, Tax Increment Bonds, Series 2005A, 5.000%, 5/01/34 – NPFG Insured | 5/15 at 100.00 | AA– | $ | 984,470 | ||||||||||||
| 18,455 | Total Tax Obligation/Limited | 15,863,347 | ||||||||||||||||
Transportation – 2.7% | ||||||||||||||||||
| 50 | Kent County, Michigan, Airport Revenue Bonds, Gerald R. Ford International Airport, Series 2007, 5.000%, 1/01/32 | 1/17 at 100.00 | AAA | 54,242 | ||||||||||||||
Wayne County Airport Authority, Michigan, Airport Revenue Bonds, Detroit Metro Wayne County Airport, Series 2012A: | ||||||||||||||||||
| 2,000 | 5.000%, 12/01/37 | No Opt. Call | A | 2,118,540 | ||||||||||||||
| 1,000 | 5.000%, 12/01/42 – AGM Insured | 12/22 at 100.00 | AA | 1,046,150 | ||||||||||||||
| 1,000 | Wayne County Airport Authority, Michigan, Revenue Bonds, Detroit Metropolitan Airport, Refunding Series 2011A, 5.000%, 12/01/21 (Alternative Minimum Tax) | No Opt. Call | A | 1,149,940 | ||||||||||||||
| 4,050 | Total Transportation | 4,368,872 | ||||||||||||||||
U.S. Guaranteed – 5.1% (4) | ||||||||||||||||||
| 4,000 | Michigan House of Representatives, Certificates of Participation, Series 1998, 0.000%, 8/15/23 – AMBAC Insured (ETM) | No Opt. Call | N/R (4) | 3,160,520 | ||||||||||||||
| 1,000 | Michigan Municipal Bond Authority, Drinking Water Revolving Fund Revenue Bonds, Series 2004, 5.000%, 10/01/24 (Pre-refunded 10/01/14) | 10/14 at 100.00 | N/R (4) | 1,016,290 | ||||||||||||||
| 1,000 | Michigan State Hospital Finance Authority, Revenue Bonds, Chelsea Community Hospital, Series 2005, 5.000%, 5/15/37 (Pre-refunded 5/15/15) | 5/15 at 100.00 | AA+ (4) | 1,045,710 | ||||||||||||||
Michigan State Hospital Finance Authority, Revenue Bonds, Marquette General Hospital, Series 2005A: | ||||||||||||||||||
| 1,400 | 5.000%, 5/15/26 (Pre-refunded 5/15/15) | 5/15 at 100.00 | N/R (4) | 1,463,574 | ||||||||||||||
| 50 | 5.000%, 5/15/34 (Pre-refunded 5/15/15) | 5/15 at 100.00 | N/R (4) | 52,271 | ||||||||||||||
| 1,200 | Royal Oak Hospital Finance Authority, Michigan, Hospital Revenue Bonds, William Beaumont Hospital, Refunding Series 2009V, 8.250%, 9/01/39 (Pre-refunded 9/01/18) | 9/18 at 100.00 | Aaa | 1,564,884 | ||||||||||||||
| 8,650 | Total U.S. Guaranteed | 8,303,249 | ||||||||||||||||
Utilities – 7.0% | ||||||||||||||||||
Lansing Board of Water and Light, Michigan, Steam and Electric Utility System Revenue Bonds, Series 2008A: | ||||||||||||||||||
| 175 | 5.000%, 7/01/28 | 7/18 at 100.00 | AA– | 196,049 | ||||||||||||||
| 2,130 | 5.000%, 7/01/32 | 7/18 at 100.00 | AA– | 2,323,809 | ||||||||||||||
| 525 | Lansing Board of Water and Light, Michigan, Utility System Revenue Bonds, Series 2011A, 5.000%, 7/01/34 | No Opt. Call | AA– | 583,243 | ||||||||||||||
Lansing Board of Water and Light, Michigan, Utility System Revenue Bonds, Tender Option Bond Trust 4700: | ||||||||||||||||||
| 800 | 18.446%, 7/01/37 (IF) (5) | 7/21 at 100.00 | AA– | 1,140,064 | ||||||||||||||
| 250 | 18.446%, 7/01/37 (IF) (5) | 7/21 at 100.00 | AA– | 356,270 | ||||||||||||||
| 3,000 | Michigan Public Power Agency, AFEC Project Revenue Bonds, Series 2012A, 5.000%, 1/01/43 | 1/22 at 100.00 | A2 | 3,165,390 | ||||||||||||||
| 2,000 | Michigan Public Power Agency, Revenue Bonds, Combustion Turbine 1 Project, Series 2011, 5.000%, 1/01/27 – AGM Insured | 1/21 at 100.00 | AA | 2,197,880 | ||||||||||||||
| 1,000 | Monroe County Economic Development Corporation, Michigan, Collateralized Limited Obligation Revenue Refunding Bonds, Detroit Edison Company, Series 1992AA, 6.950%, 9/01/22 – FGIC Insured | No Opt. Call | Aa3 | 1,288,640 | ||||||||||||||
| 9,880 | Total Utilities | 11,251,345 | ||||||||||||||||
| Nuveen Investments | 59 |
Nuveen Michigan Municipal Bond Fund (continued)
Portfolio of Investments May 31, 2014
Principal Amount (000) | Description (1) | Optional Call Provisions (2) | Ratings (3) | Value | ||||||||||||||
Water and Sewer – 17.2% | ||||||||||||||||||
| $ | 1,500 | Detroit Water and Sewerage Department, Michigan, Sewage Disposal System Revenue Bonds, Refunding Senior Lien Series 2012A, 5.000%, 7/01/39 – AGM Insured | 7/22 at 100.00 | AA | $ | 1,481,970 | ||||||||||||
| 2,140 | Detroit, Michigan, Second Lien Sewerage Disposal System Revenue Bonds, Series 2005A, 5.000%, 7/01/35 – NPFG Insured | 7/15 at 100.00 | AA– | 2,140,471 | ||||||||||||||
| 25 | Detroit, Michigan, Senior Lien Sewerage Disposal System Revenue Bonds, Series 2003A, 5.000%, 7/01/32 – AGM Insured | 7/14 at 100.00 | AA | 24,990 | ||||||||||||||
Detroit, Michigan, Sewer Disposal System Revenue Bonds, Second Lien, Series 2006B: | ||||||||||||||||||
| 125 | 5.000%, 7/01/33 – FGIC Insured | 7/16 at 100.00 | AA– | 125,154 | ||||||||||||||
| 75 | 5.000%, 7/01/36 – MBIA-NPFG Insured | 7/16 at 100.00 | AA– | 75,034 | ||||||||||||||
Detroit, Michigan, Sewerage Disposal System Revenue Bonds, Series 1999A: | ||||||||||||||||||
| 4,455 | 0.000%, 7/01/19 – FGIC Insured | No Opt. Call | AA– | 3,340,760 | ||||||||||||||
| 700 | 0.000%, 7/01/21 – FGIC Insured | No Opt. Call | AA– | 460,747 | ||||||||||||||
| 2,915 | Detroit, Michigan, Water Supply System Revenue Bonds, Senior Lien Series 2011A, 5.250%, 7/01/41 | 7/21 at 100.00 | B1 | 2,900,250 | ||||||||||||||
Detroit, Michigan, Water Supply System Senior Lien Revenue Bonds, Series 2003A: | ||||||||||||||||||
| 2,495 | 5.000%, 7/01/25 – NPFG Insured | No Opt. Call | AA– | 2,495,125 | ||||||||||||||
| 115 | 5.000%, 7/01/34 – NPFG Insured | No Opt. Call | AA– | 114,992 | ||||||||||||||
| 345 | Detroit, Michigan, Water Supply System Senior Lien Revenue Bonds, Series 2003D. RMKTD, 5.000%, 7/01/33 – NPFG Insured | No Opt. Call | AA– | 345,424 | ||||||||||||||
| 350 | Grand Rapids, Michigan, Kent County, Michigan, Sanitary Sewer System Improvement Revenue Bonds, Series 2012, 5.000%, 1/01/32 | 1/23 at 100.00 | AA+ | 399,360 | ||||||||||||||
| 4,000 | Grand Rapids, Michigan, Sanitary Sewer System Revenue Bonds, Series 2005, 5.000%, 1/01/30 – NPFG Insured | 7/15 at 100.00 | AA+ | 4,155,760 | ||||||||||||||
Grand Rapids, Michigan, Sanitary Sewer System Revenue Bonds, Series 2008: | ||||||||||||||||||
| 145 | 5.000%, 1/01/28 | 1/18 at 100.00 | AA+ | 161,228 | ||||||||||||||
| 3,500 | 5.000%, 1/01/38 | 1/18 at 100.00 | AA+ | 3,839,255 | ||||||||||||||
| 2,000 | Grand Rapids, Michigan, Water Supply System Revenue Bonds, Series 2009, 5.100%, 1/01/39 – AGC Insured | 1/19 at 100.00 | AA | 2,217,000 | ||||||||||||||
| 365 | Michigan Finance Authority, State Revolving Fund Revenue Bonds, Clean Water Series 2012, 5.000%, 10/01/32 | 10/22 at 100.00 | AAA | 416,020 | ||||||||||||||
| 500 | Michigan Municipal Bond Authority, Clean Water Revolving Fund Revenue Bonds, Series 2010, 5.000%, 10/01/30 | No Opt. Call | AAA | 582,620 | ||||||||||||||
| 245 | Michigan Municipal Bond Authority, Drinking Water Revolving Fund Revenue Bonds, Series 2004, 5.000%, 10/01/24 | 10/14 at 100.00 | AAA | 248,812 | ||||||||||||||
| 1,000 | Michigan Municipal Bond Authority, Water Revolving Fund Revenue Bonds, Series 2007, 5.000%, 10/01/23 | 10/17 at 100.00 | AAA | 1,137,030 | ||||||||||||||
| 500 | Saginaw, Michigan, Water Supply System Revenue Bonds, Series 2008, 5.250%, 7/01/22 – NPFG Insured | 7/18 at 100.00 | AA– | 540,850 | ||||||||||||||
| 500 | Saginaw, Michigan, Water Supply System Revenue Bonds, Series 2011A, 5.000%, 7/01/31 – AGM Insured | 8/21 at 100.00 | AA | 542,710 | ||||||||||||||
| 27,995 | Total Water and Sewer | 27,745,562 | ||||||||||||||||
| $ | 153,210 | Total Long-Term Investments (cost $146,977,539) | 156,352,759 | |||||||||||||||
Other Assets Less Liabilities – 3.1% | 4,928,895 | |||||||||||||||||
Net Assets – 100% | $ | 161,281,654 | ||||||||||||||||
| 60 | Nuveen Investments |
| (1) | All percentages shown in the Portfolio of Investments are based on net assets. |
| (2) | Optional Call Provisions (not covered by the report of independent registered public accounting firm): Dates (month and year) and prices of the earliest optional call or redemption. There may be other call provisions at varying prices at later dates. Certain mortgage-backed securities may be subject to periodic principal paydowns. |
| (3) | Ratings (not covered by the report of independent registered public accounting firm): Using the highest of Standard & Poor’s Group (“Standard & Poor’s”), Moody’s Investors Service, Inc. (“Moody’s”) or Fitch, Inc. (“Fitch”) rating. Ratings below BBB by Standard & Poor’s, Baa by Moody’s or BBB by Fitch are considered to be below investment grade. Holdings designated N/R are not rated by any of these national rating agencies. |
| (4) | Backed by an escrow or trust containing sufficient U.S. Government or U.S. Government agency securities, which ensure the timely payment of principal and interest. Certain bonds backed by U.S. Government or agency securities are regarded as having an implied rating equal to the rating of such securities. |
| (5) | Investment, or portion of investment, has been pledged to collateralize the net payment obligations for investments in inverse floating rate transactions. |
| (ETM) | Escrowed to maturity. |
| (IF) | Inverse floating rate investment. |
See accompanying notes to financial statements.
| Nuveen Investments | 61 |
Nuveen Missouri Municipal Bond Fund
Portfolio of Investments May 31, 2014
| Principal Amount (000) | Description (1) | Optional Call Provisions (2) | Ratings (3) | Value | ||||||||||||||
LONG-TERM INVESTMENTS – 99.5% | ||||||||||||||||||
MUNICIPAL BONDS – 99.5% | ||||||||||||||||||
Consumer Staples – 3.2% | ||||||||||||||||||
| $ | 3,000 | Cape Girardeau County Industrial Development Authority, Missouri, Solid Waste Disposal Revenue Bonds, Procter & Gamble Products Company Project, Series 1998, 5.300%, 5/15/28 (Alternative Minimum Tax) | 11/14 at 100.00 | AA– | $ | 3,004,860 | ||||||||||||
| 8,800 | Missouri Development Finance Board, Solid Waste Disposal Revenue Bonds, Procter and Gamble Inc., Series 1999, 5.200%, 3/15/29 (Alternative Minimum Tax) | No Opt. Call | AA– | 10,420,080 | ||||||||||||||
| 11,800 | Total Consumer Staples | 13,424,940 | ||||||||||||||||
Education and Civic Organizations – 12.5% | ||||||||||||||||||
| 3,000 | Callaway County Industrial Development Authority, Missouri, Revenue Bonds, Westminster College Project, Refunding Series 2012C, 5.250%, 8/01/37 | 8/22 at 100.00 | N/R | 3,010,650 | ||||||||||||||
| 1,200 | Curators of the University of Missouri, System Facilities Revenue Bonds, Refunding Series 2012A., 4.000%, 11/01/33 | 11/24 at 100.00 | AA+ | 1,270,812 | ||||||||||||||
| 1,025 | Kansas City, Missouri, Metropolitan Junior College District Certificates of Participation, Series 2008, 4.500%, 7/01/21 | 7/17 at 100.00 | Aa2 | 1,128,515 | ||||||||||||||
| 1,000 | Lincoln University, Missouri, Auxiliary System Revenue Bonds, Series 2007, 5.130%, 6/01/37 – AGC Insured | 6/17 at 100.00 | AA | 1,046,660 | ||||||||||||||
| 1,185 | Missouri Development Finance Board, Research Facility Revenue Bonds, Midwest Research Institute Project, Series 2007, 5.000%, 11/01/17 | No Opt. Call | Baa2 | 1,316,772 | ||||||||||||||
| 1,025 | Missouri Health and Educational Facilities Authority, Educational Facilities Revenue Bonds, Kansas City University of Medicine and Biosciences, Series 2013A., 5.000%, 6/01/33 | 6/23 at 100.00 | A1 | 1,107,082 | ||||||||||||||
| 1,625 | Missouri Health and Educational Facilities Authority, Educational Facilities Revenue Bonds, Ranken Technical College, Series 2011, 5.130%, 11/01/31 | 11/19 at 100.00 | A– | 1,749,702 | ||||||||||||||
| 3,000 | Missouri Health and Educational Facilities Authority, Educational Facilities Revenue Bonds, Saint Louis College of Pharmacy, Series 2013, 5.500%, 5/01/43 | 5/23 at 100.00 | BBB+ | 3,244,620 | ||||||||||||||
Missouri Health and Educational Facilities Authority, Educational Facilities Revenue Bonds, Southwest Baptist University Project, Series 2012: | ||||||||||||||||||
| 420 | 3.000%, 10/01/18 | No Opt. Call | BBB– | 430,916 | ||||||||||||||
| 575 | 3.500%, 10/01/22 | No Opt. Call | BBB– | 580,583 | ||||||||||||||
| 3,470 | 5.000%, 10/01/33 | 10/22 at 100.00 | BBB– | 3,597,835 | ||||||||||||||
| 2,180 | Missouri Health and Educational Facilities Authority, Educational Facilities Revenue Bonds, University of Central Missouri, Series 2013C2, 5.000%, 10/01/34 | 10/23 at 100.00 | A | 2,400,987 | ||||||||||||||
| 3,870 | Missouri Health and Educational Facilities Authority, Revenue Bonds, A.T. Still University of Health Sciences, Series 2011, 5.250%, 10/01/41 | 10/21 at 100.00 | A– | 4,219,654 | ||||||||||||||
| 3,275 | Missouri Health and Educational Facilities Authority, Revenue Bonds, A.T. Still University of Health Sciences, Series 2014., 5.000%, 10/01/39 | 10/23 at 100.00 | A– | 3,537,164 | ||||||||||||||
| 1,500 | Missouri Health and Educational Facilities Authority, Revenue Bonds, Rockhurst University, Series 1999, 6.000%, 10/01/25 | 10/18 at 103.00 | BBB– | 1,696,770 | ||||||||||||||
Missouri Health and Educational Facilities Authority, Revenue Bonds, Rockhurst University, Series 2011A: | ||||||||||||||||||
| 2,500 | 6.500%, 10/01/30 | 10/18 at 103.00 | BBB– | 2,832,125 | ||||||||||||||
| 1,300 | 6.500%, 10/01/35 | 10/18 at 103.00 | BBB– | 1,460,407 | ||||||||||||||
| 62 | Nuveen Investments |
| Principal Amount (000) | Description (1) | Optional Call Provisions (2) | Ratings (3) | Value | ||||||||||||||
Education and Civic Organizations (continued) | ||||||||||||||||||
| $ | 3,475 | Missouri Health and Educational Facilities Authority, Revenue Bonds, Washington University, Series 2008A, 5.380%, 3/15/39 | 3/15 at 100.00 | AAA | $ | 3,898,776 | ||||||||||||
| 6,600 | Missouri Health and Educational Facilities Authority, Revenue Bonds, Washington University, Series 2011B, 5.000%, 11/15/37 | 11/21 at 100.00 | AAA | 7,426,914 | ||||||||||||||
| 2,400 | Missouri Health and Educational Facilities Authority, Revenue Bonds, Webster University, Series 2011, 5.000%, 4/01/36 | 4/21 at 100.00 | A2 | 2,593,584 | ||||||||||||||
| 2,590 | Missouri State University, Auxiliary Enterprise System Revenue Bonds, Series 2007A, 5.000%, 4/01/24 – SYNCORA GTY Insured | 4/17 at 100.00 | A+ | 2,863,452 | ||||||||||||||
| 1,000 | Saint Louis Industrial Development Authority, Missouri, Confluence Academy Project, Series 2007A, 5.350%, 6/15/32 | 6/15 at 103.00 | N/R | 928,300 | ||||||||||||||
| 48,215 | Total Education and Civic Organizations | 52,342,280 | ||||||||||||||||
Health Care – 24.4% | ||||||||||||||||||
| 2,005 | Boone County, Missouri, Hospital Revenue Bonds, Boone Hospital Center, Series 2008, 5.630%, 8/01/38 | 8/18 at 100.00 | A | 2,163,996 | ||||||||||||||
Cape Girardeau County Industrial Development Authority, Missouri, Health Facilities Revenue Bonds, Saint Francis Medical Center, Series 2009A: | ||||||||||||||||||
| 250 | 5.130%, 6/01/23 | 6/19 at 100.00 | AA– | 274,197 | ||||||||||||||
| 200 | 5.130%, 6/01/24 | 6/19 at 100.00 | AA– | 218,006 | ||||||||||||||
| 500 | 5.500%, 6/01/29 | 6/19 at 100.00 | AA– | 542,185 | ||||||||||||||
| 4,170 | 5.750%, 6/01/39 | 6/19 at 100.00 | AA– | 4,529,412 | ||||||||||||||
Cape Girardeau County Industrial Development Authority, Missouri, Health Facilities Revenue Bonds, Saint Francis Medical Center, Series 2013A: | ||||||||||||||||||
| 900 | 3.380%, 6/01/28 | 6/22 at 100.00 | AA– | 868,734 | ||||||||||||||
| 4,000 | 5.000%, 6/01/33 | 6/22 at 100.00 | AA– | 4,340,040 | ||||||||||||||
Cape Girardeau County Industrial Development Authority, Missouri, Health Facilities Revenue Bonds, Southeast Missouri Hospital Association, Series 2007: | ||||||||||||||||||
| 1,490 | 5.000%, 6/01/27 | 6/17 at 100.00 | BBB+ | 1,532,614 | ||||||||||||||
| 3,000 | 5.000%, 6/01/36 | 6/17 at 100.00 | BBB+ | 3,063,660 | ||||||||||||||
Cass County, Missouri, Hospital Revenue Bonds, Series 2007: | ||||||||||||||||||
| 2,500 | 5.500%, 5/01/27 | 11/16 at 100.00 | BBB– | 2,556,225 | ||||||||||||||
| 6,020 | 5.630%, 5/01/38 | 11/16 at 100.00 | BBB– | 6,115,417 | ||||||||||||||
| 1,000 | Citizens Memorial Hospital District of Polk County, Missouri, Hospital Revenue Bonds, Refunding Series 2012, 5.000%, 8/01/28 | 8/19 at 100.00 | N/R | 1,022,770 | ||||||||||||||
Clinton County Industrial Development Authority, Missouri, Revenue Bonds, Cameron Regional Medical Center, Series 2007: | ||||||||||||||||||
| 1,250 | 5.000%, 12/01/32 | 12/17 at 100.00 | N/R | 1,252,975 | ||||||||||||||
| 4,995 | 5.000%, 12/01/37 | 12/17 at 100.00 | N/R | 4,943,901 | ||||||||||||||
Grundy County Industrial Development Authority, Missouri, Health Facility Revenue Bonds, Wright Memorial Hospital, Series 2009: | ||||||||||||||||||
| 1,120 | 5.650%, 9/01/22 | 9/19 at 100.00 | BBB– | 1,193,584 | ||||||||||||||
| 1,000 | 5.750%, 9/01/23 | 9/19 at 100.00 | BBB– | 1,067,770 | ||||||||||||||
| 1,935 | Hannibal Industrial Development Authority, Missouri, Health Facilities Revenue Bonds, Hannibal Regional Hospital, Series 2006, 5.000%, 3/01/22 | 3/16 at 100.00 | BBB+ | 1,976,661 | ||||||||||||||
Joplin Industrial Development Authority, Missouri, Health Facilities Revenue Bonds, Freeman Health System, Series 2004: | ||||||||||||||||||
| 2,000 | 5.500%, 2/15/24 | 2/15 at 102.00 | BBB+ | 2,063,540 | ||||||||||||||
| 1,250 | 5.500%, 2/15/29 | 2/15 at 102.00 | BBB+ | 1,286,575 | ||||||||||||||
| Nuveen Investments | 63 |
Nuveen Missouri Municipal Bond Fund (continued)
Portfolio of Investments May 31, 2014
| Principal Amount (000) | Description (1) | Optional Call Provisions (2) | Ratings (3) | Value | ||||||||||||||
Health Care (continued) | ||||||||||||||||||
| $ | 800 | Joplin Industrial Development Authority, Missouri, Health Facilities Revenue Bonds, Freeman Health System, Series 2011, 5.500%, 2/15/31 | 2/21 at 100.00 | BBB+ | $ | 863,592 | ||||||||||||
| 2,810 | Missouri Health and Educational Facilities Authority, Health Facilities Revenue Bonds The Childrens Mercy Hospital, Series 2009, 5.630%, 5/15/39 | 5/19 at 100.00 | A+ | 3,020,019 | ||||||||||||||
| 2,160 | Missouri Health and Educational Facilities Authority, Health Facilities Revenue Bonds, Capital Region Medical Center, Series 2011, 5.000%, 11/01/27 | 11/20 at 100.00 | A3 | 2,335,738 | ||||||||||||||
| 3,035 | Missouri Health and Educational Facilities Authority, Health Facilities Revenue Bonds, Heartland Regional Medical Center, Series 2012, 5.000%, 2/15/37 | 2/22 at 100.00 | A1 | 3,248,998 | ||||||||||||||
| 2,000 | Missouri Health and Educational Facilities Authority, Health Facilities Revenue Bonds, SSM Health Care, Series 2014A., 5.000%, 6/01/31 | 6/24 at 100.00 | AA– | 2,271,240 | ||||||||||||||
| 1,000 | Missouri Health and Educational Facilities Authority, Health Facilities Revenue Bonds, BJC Health System, Series 2014., 5.000%, 1/01/44 | 1/24 at 100.00 | AA | 1,103,660 | ||||||||||||||
Missouri Health and Educational Facilities Authority, Health Facilities Revenue Bonds, CoxHealth, Series 2013A: | ||||||||||||||||||
| 1,235 | 5.000%, 11/15/44 | 11/23 at 100.00 | A2 | 1,322,401 | ||||||||||||||
| 2,955 | 5.000%, 11/15/48 | 11/23 at 100.00 | A2 | 3,164,125 | ||||||||||||||
| 45 | Missouri Health and Educational Facilities Authority, Health Facilities Revenue Bonds, Mercy Health, Series 2012, 4.000%, 11/15/42 | No Opt. Call | AA– | 45,015 | ||||||||||||||
| 2,000 | Missouri Health and Educational Facilities Authority, Health Facilities Revenue Bonds, St. Luke’s Episcopal and Presbyterian Hospitals, Series 2011, 5.000%, 12/01/25 | 12/21 at 100.00 | A+ | 2,231,600 | ||||||||||||||
| 2,000 | Missouri Health and Educational Facilities Authority, Health Facility Revenue Bonds, St. Luke’s Health System, Series 2003B, 5.500%, 11/15/32 – AGM Insured | 11/18 at 100.00 | AA | 2,266,880 | ||||||||||||||
Missouri Health and Educational Facilities Authority, Health Facility Revenue Bonds, St. Luke’s Health System, Series 2010A: | ||||||||||||||||||
| 555 | 5.250%, 11/15/25 | 11/20 at 100.00 | A+ | 622,710 | ||||||||||||||
| 2,540 | 5.000%, 11/15/30 | 11/20 at 100.00 | A+ | 2,760,015 | ||||||||||||||
| 1,000 | 5.000%, 11/15/40 | 11/20 at 100.00 | A+ | 1,064,010 | ||||||||||||||
| 1,000 | Missouri Health and Educational Facilities Authority, Revenue Bonds, BJC Health System, Series 2005A, 5.000%, 5/15/22 | 5/15 at 100.00 | AA | 1,044,300 | ||||||||||||||
Missouri Health and Educational Facilities Authority, Revenue Bonds, Lester E. Cox Medical Center, Series 1992H: | ||||||||||||||||||
| 1,825 | 0.000%, 9/01/17 – NPFG Insured | No Opt. Call | AA– | 1,715,537 | ||||||||||||||
| 3,005 | 0.000%, 9/01/21 – NPFG Insured | No Opt. Call | AA– | 2,433,419 | ||||||||||||||
| 4,025 | 0.000%, 9/01/22 – NPFG Insured | No Opt. Call | AA– | 3,105,650 | ||||||||||||||
| 1,000 | Missouri Health and Educational Facilities Authority, Revenue Bonds, SSM Health Care System, Series 2008A, 5.000%, 6/01/36 | 6/18 at 100.00 | AA– | 1,046,250 | ||||||||||||||
Missouri Health and Educational Facilities Authority, Revenue Bonds, SSM Health Care System, Series 2010B: | ||||||||||||||||||
| 1,500 | 5.000%, 6/01/30 | 6/20 at 100.00 | AA– | 1,632,300 | ||||||||||||||
| 3,040 | 5.000%, 6/01/34 | 6/20 at 100.00 | AA– | 3,261,981 | ||||||||||||||
| 7,275 | Missouri Health and Educational Facilities Authority, Revenue Refunding Bonds, CoxHealth Systems Inc., , Series 2008A, 5.500%, 11/15/39 | 11/18 at 100.00 | A2 | 7,750,058 | ||||||||||||||
| 1,000 | Saline County Industrial Development Authority, Missouri, Health Facilities Revenue Bonds, John Fitzgibbon Memorial Hospital Inc., Series 2005, 5.630%, 12/01/35 | 12/15 at 100.00 | BBB– | 1,019,300 | ||||||||||||||
| 4,780 | Saline County Industrial Development Authority, Missouri, Health Facilities Revenue Bonds, John Fitzgibbon Memorial Hospital Inc., Series 2010, 5.600%, 12/01/28 | 12/20 at 100.00 | BBB– | 5,253,077 | ||||||||||||||
| 64 | Nuveen Investments |
| Principal Amount (000) | Description (1) | Optional Call Provisions (2) | Ratings (3) | Value | ||||||||||||||
Health Care (continued) | ||||||||||||||||||
St. Louis County Industrial Development Authority, Missouri, Healthcare Facilities Revenue Bonds, Ranken-Jordan Project, Refunding Series 2007: | ||||||||||||||||||
| $ | 125 | 4.250%, 11/15/14 | No Opt. Call | N/R | $ | 126,385 | ||||||||||||
| 1,320 | 5.000%, 11/15/22 | 11/16 at 100.00 | N/R | 1,338,691 | ||||||||||||||
| 2,345 | 5.000%, 11/15/27 | 11/16 at 100.00 | N/R | 2,329,077 | ||||||||||||||
| 2,600 | 5.000%, 11/15/35 | 11/16 at 100.00 | N/R | 2,440,464 | ||||||||||||||
| 98,560 | Total Health Care | 101,828,754 | ||||||||||||||||
Housing/Multifamily – 0.6% | ||||||||||||||||||
| 1,290 | Kansas City Industrial Development Authority, Missouri, GNMA Collateralized Multifamily Housing Revenue Bonds, Grand Boulevard Lofts Project, Series 2009A, 5.300%, 11/20/49 | 11/19 at 100.00 | Aa1 | 1,378,365 | ||||||||||||||
| 1,000 | Missouri Housing Development Commission, Multifamily Housing Revenue Bonds, Shepard Apartments Project, 2013 Series 3, 5.000%, 7/01/45 | 7/23 at 100.00 | AA+ | 1,050,230 | ||||||||||||||
| 2,290 | Total Housing/Multifamily | 2,428,595 | ||||||||||||||||
Housing/Single Family – 0.3% | ||||||||||||||||||
| 105 | Missouri Housing Development Commission, Single Family Mortgage Revenue Bonds, Homeownership Loan Program, Series 2005A-1, 5.900%, 9/01/35 (Alternative Minimum Tax) | 9/14 at 100.00 | Aaa | 105,858 | ||||||||||||||
| 220 | Missouri Housing Development Commission, Single Family Mortgage Revenue Bonds, Homeownership Loan Program, Series 2006B, 4.800%, 9/01/31 (Alternative Minimum Tax) | 9/15 at 100.00 | AA+ | 221,861 | ||||||||||||||
| 115 | Missouri Housing Development Commission, Single Family Mortgage Revenue Bonds, Homeownership Loan Program, Series 2006C-1, 5.000%, 9/01/37 (Alternative Minimum Tax) | 9/15 at 100.00 | AA+ | 115,957 | ||||||||||||||
| 400 | Missouri Housing Development Commission, Single Family Mortgage Revenue Bonds, Homeownership Loan Program, Series 2007A-1, 4.700%, 9/01/27 (Alternative Minimum Tax) | 9/16 at 100.00 | AA+ | 408,780 | ||||||||||||||
| 215 | Missouri Housing Development Commission, Single Family Mortgage Revenue Bonds, Homeownership Loan Program, Series 2007E-1, 5.200%, 9/01/38 (Alternative Minimum Tax) | 3/17 at 100.00 | AA+ | 219,231 | ||||||||||||||
| 90 | Missouri Housing Development Commission, Single Family Mortgage Revenue Bonds, Homeownership Loan Program, Series 2008A-1, 5.300%, 3/01/39 (Alternative Minimum Tax) | 9/17 at 100.00 | AA+ | 92,479 | ||||||||||||||
| 1,145 | Total Housing/Single Family | 1,164,166 | ||||||||||||||||
Industrials – 0.4% | ||||||||||||||||||
Kennett Industrial Development Authority, Missouri, Revenue Bonds, Manac Trailers USA Inc Project, Series 2007: | ||||||||||||||||||
| 1,500 | 4.250%, 3/01/22 (Alternative Minimum Tax) | 3/15 at 100.00 | Baa3 | 1,322,400 | ||||||||||||||
| 500 | 4.250%, 3/01/24 (Alternative Minimum Tax) | 3/15 at 100.00 | Baa3 | 427,945 | ||||||||||||||
| 2,000 | Total Industrials | 1,750,345 | ||||||||||||||||
Long-Term Care – 8.2% | ||||||||||||||||||
| 750 | Bridgeton Industrial Development Authority, Missouri, Senior Housing Revenue Bonds, The Sarah Community Project, Series 2013, 4.500%, 5/01/28 | 5/18 at 100.00 | N/R | 719,955 | ||||||||||||||
Joplin Industrial Development Authority, Missouri, Revenue Bonds, Christian Homes Inc., Series 2007F: | ||||||||||||||||||
| 630 | 5.500%, 5/15/17 | No Opt. Call | BBB– | 670,761 | ||||||||||||||
| 2,000 | 5.750%, 5/15/31 | 5/17 at 100.00 | BBB– | 2,058,440 | ||||||||||||||
| 2,950 | Kansas City Industrial Development Authority, Missouri, Retirement Center Revenue Refunding and Improvement Bonds, Kingswood Project, Series 1998A, 5.880%, 11/15/29 | 11/14 at 100.00 | N/R | 2,898,522 | ||||||||||||||
Lees Summit Industrial Development Authority, Missouri, Revenue Bonds, John Knox Village Obligated Group, Series 2007A: | ||||||||||||||||||
| 1,035 | 5.000%, 8/15/14 | No Opt. Call | BBB– | 1,043,518 | ||||||||||||||
| Nuveen Investments | 65 |
Nuveen Missouri Municipal Bond Fund (continued)
Portfolio of Investments May 31, 2014
| Principal Amount (000) | Description (1) | Optional Call Provisions (2) | Ratings (3) | Value | ||||||||||||||
Long-Term Care (continued) | ||||||||||||||||||
| $ | 1,500 | 5.130%, 8/15/26 | 8/17 at 100.00 | BBB– | $ | 1,548,645 | ||||||||||||
| 2,525 | 5.130%, 8/15/32 | 8/17 at 100.00 | BBB– | 2,565,072 | ||||||||||||||
| 1,625 | Missouri Health and Educational Facilities Authority, Revenue Bonds, Lutheran Senior Services Projects, Senior Lien Series 2010, 5.500%, 2/01/42 | 2/20 at 100.00 | BBB+ | 1,717,901 | ||||||||||||||
Missouri Health and Educational Facilities Authority, Revenue Bonds, Lutheran Senior Services Projects, Series 2011: | ||||||||||||||||||
| 1,025 | 5.750%, 2/01/31 | 2/21 at 100.00 | BBB+ | 1,131,559 | ||||||||||||||
| 2,750 | �� | 6.000%, 2/01/41 | 2/21 at 100.00 | BBB+ | 3,023,405 | |||||||||||||
| 1,500 | Missouri Health and Educational Facilities Authority, Revenue Bonds, Lutheran Senior Services Projects, Series 2014A, 5.000%, 2/01/44 (WI/DD, Settling 6/05/14) | 2/24 at 100.00 | BBB+ | 1,568,970 | ||||||||||||||
| 2,100 | Missouri Health and Educational Facilities Authority, Revenue Bonds, Lutheran Senior Services, Series 2005, 5.380%, 2/01/35 | 2/15 at 100.00 | BBB+ | 2,116,674 | ||||||||||||||
Missouri Health and Educational Facilities Authority, Revenue Bonds, Lutheran Senior Services, Series 2007A: | ||||||||||||||||||
| 325 | 4.880%, 2/01/18 | 2/17 at 100.00 | BBB+ | 352,251 | ||||||||||||||
| 2,000 | 4.880%, 2/01/37 | 2/17 at 100.00 | BBB+ | 2,028,100 | ||||||||||||||
| 590 | St. Louis County Industrial Development Authority, Missouri, Revenue Bonds, Friendship Village of Chesterfield, Series 2012, 5.000%, 9/01/42 | No Opt. Call | BBB– | 593,924 | ||||||||||||||
St. Louis County Industrial Development Authority, Missouri, Revenue Bonds, Friendship Village of Sunset Hills, Series 2012: | ||||||||||||||||||
| 500 | 5.000%, 9/01/32 | No Opt. Call | A– | 530,845 | ||||||||||||||
| 1,690 | 5.000%, 9/01/42 | 9/22 at 100.00 | A– | 1,757,059 | ||||||||||||||
| 2,570 | St. Louis County Industrial Development Authority, Missouri, Revenue Bonds, Friendship Village of Sunset Hills, Series 2013A., 5.875%, 9/01/43 | 9/23 at 100.00 | A– | 2,776,243 | ||||||||||||||
St. Louis County Industrial Development Authority, Missouri, Revenue Bonds, Friendship Village of West County, Series 2007A: | ||||||||||||||||||
| 700 | 5.380%, 9/01/21 | 9/17 at 100.00 | BBB– | 733,390 | ||||||||||||||
| 4,100 | 5.500%, 9/01/28 | 9/17 at 100.00 | BBB– | 4,222,467 | ||||||||||||||
| 32,865 | Total Long-Term Care | 34,057,701 | ||||||||||||||||
Tax Obligation/General – 10.7% | ||||||||||||||||||
| 1,000 | Belton School District 124, Cass County, Missouri, General Obligation Bonds, Refunding & Improvement Series 2012, 4.000%, 3/01/28 – NPFG Insured | 3/20 at 100.00 | AA+ | 1,049,920 | ||||||||||||||
Belton, Missouri, General Obligation Bonds, Refunding & Improvement Series 2011: | ||||||||||||||||||
| 1,120 | 5.000%, 3/01/29 | 3/21 at 100.00 | A+ | 1,243,301 | ||||||||||||||
| 1,245 | 5.000%, 3/01/30 | 3/21 at 100.00 | A+ | 1,371,729 | ||||||||||||||
| 1,010 | 4.750%, 3/01/31 | 3/21 at 100.00 | A+ | 1,100,193 | ||||||||||||||
| 850 | Blue Springs, Missouri, General Obligation Bonds, South Area Neighborhood Improvement, Refunding Series 2009, 5.000%, 2/15/29 | 2/19 at 100.00 | AA– | 918,076 | ||||||||||||||
Branson Reorganized School District R-4, Taney County, Missouri, General Obligation Bonds, School Building Series 2012: | ||||||||||||||||||
| 1,670 | 4.000%, 3/01/27 – AGM Insured | 3/22 at 100.00 | A+ | 1,776,195 | ||||||||||||||
| 2,000 | 4.380%, 3/01/32 | 3/22 at 100.00 | A+ | 2,111,580 | ||||||||||||||
| 1,000 | Camdenton Reorganized School District R3, Camden County, Missouri, General Obligation Bonds, Refunding & Improvement Series 2014., 5.000%, 3/01/33 | 3/22 at 100.00 | AA– | 1,118,670 | ||||||||||||||
| 2,000 | Hazelwood School District, St Louis County, Missouri, General Obligation Bonds, Missouri Direct Deposit Program, Series 2013A, 5.000%, 3/01/33 | 3/23 at 100.00 | AA+ | 2,281,840 | ||||||||||||||
| 66 | Nuveen Investments |
| Principal Amount (000) | Description (1) | Optional Call Provisions (2) | Ratings (3) | Value | ||||||||||||||
Tax Obligation/General (continued) | ||||||||||||||||||
| $ | 1,315 | Independence School District, Jackson County, Missouri, General Obligation Bonds, Series 2010, 5.000%, 3/01/27 | 3/20 at 100.00 | AA+ | $ | 1,475,614 | ||||||||||||
| 1,000 | Jackson County Consolidated School District 2, Raytown, Missouri, General Obligation Bonds, Series 2014., 5.000%, 3/01/32 | 3/24 at 100.00 | AA+ | 1,158,360 | ||||||||||||||
| 2,000 | Jackson County Reorganized School District 4, Blue Springs, Missouri, General Obligation Bonds, Refunding & Improvement Series 2009A, 4.750%, 3/01/26 | 3/19 at 100.00 | AA | 2,242,980 | ||||||||||||||
| 500 | Jackson County Reorganized School District 4, Blue Springs, Missouri, General Obligation Bonds, School Building Series 2013A, 5.000%, 3/01/31 | 3/21 at 100.00 | AA | 562,810 | ||||||||||||||
| 1,000 | Jackson County Reorganized School District R-7, Lees Summit, Missouri, General Obligation Bonds, School Building Series 2008, 4.750%, 3/01/27 | 3/18 at 100.00 | Aa1 | 1,105,500 | ||||||||||||||
Kansas City, Missouri, General Obligation Bonds, Improvement & Refunding Series 2012A: | ||||||||||||||||||
| 1,025 | 4.000%, 2/01/25 | 2/22 at 100.00 | AA | 1,127,029 | ||||||||||||||
| 5,000 | 4.500%, 2/01/26 | No Opt. Call | AA | 5,651,850 | ||||||||||||||
| 2,000 | Miller County School District R-2, Osage, Missouri, General Obligation Bonds, Series 2006, 5.000%, 3/01/24 – AGM Insured | 3/16 at 100.00 | AA | 2,147,120 | ||||||||||||||
Missouri School Boards Association, Lease Participation Certificates, Clay County School District 53 Liberty, Series 2007: | ||||||||||||||||||
| 1,015 | 5.250%, 3/01/25 – AGM Insured | 3/17 at 100.00 | AA | 1,129,705 | ||||||||||||||
| 1,070 | 5.250%, 3/01/26 – AGM Insured | 3/17 at 100.00 | AA | 1,181,697 | ||||||||||||||
| 625 | 5.250%, 3/01/27 – AGM Insured | 3/17 at 100.00 | AA | 686,675 | ||||||||||||||
| 1,250 | Nixa Reorganized School District R 02, Christian County, Missouri, General Obligation Bonds, Series 2006, 5.250%, 3/01/24 – AGM Insured | 3/16 at 100.00 | AA+ | 1,353,325 | ||||||||||||||
| 500 | North Kansas City School District 74, Clay County, Missouri, General Obligation Bonds, Direct Deposit Program, Refunding & Improvement Series 2014, 4.000%, 3/01/32 (WI/DD, Settling 6/10/14) | 3/24 at 100.00 | AA+ | 526,615 | ||||||||||||||
| 1,240 | North Kansas City School District 74, Clay County, Missouri, General Obligation Bonds, Direct Deposit Program, Series 2007, 5.000%, 3/01/27 | 3/18 at 100.00 | AA+ | 1,399,824 | ||||||||||||||
| 595 | North Kansas City School District 74, Clay County, Missouri, General Obligation Bonds, Series 2005, 5.000%, 3/01/25 | 3/15 at 100.00 | AA+ | 616,063 | ||||||||||||||
| 1,000 | Osage School Lake Ozark, Missouri, General Obligation Bonds, School Building Series 2014B., 5.000%, 3/01/34 | 3/24 at 100.00 | AA– | 1,134,040 | ||||||||||||||
| 200 | Platte County R-III School District Building Corporation, Missouri, Leasehold Refunding and Improvement Revenue Bonds, Series 2008, 5.000%, 3/01/28 | 3/18 at 100.00 | AA– | 222,906 | ||||||||||||||
| 2,500 | Saint Louis Special Administrative Board of the Transitional School District, Missouri, General Obligation Bonds, St Louis Public Schools, Missouri Direct Deposit Program, Series 2011B, 4.000%, 4/01/25 | 4/21 at 100.00 | AA+ | 2,695,125 | ||||||||||||||
Springfield School District R12, Missouri, General Obligation Bonds, Series 2013: | ||||||||||||||||||
| 1,000 | 5.000%, 3/01/32 | 3/23 at 100.00 | AA+ | 1,150,000 | ||||||||||||||
| 1,000 | 5.000%, 3/01/33 | 3/23 at 100.00 | AA+ | 1,145,040 | ||||||||||||||
| 5,000 | Wentzville School District R-04, Saint Charles County, Missouri, General Obligation Improvement and Refunding Bonds, Series 2009A, 0.000%, 3/01/26 | 3/19 at 66.11 | AA+ | 2,954,900 | ||||||||||||||
| 42,730 | Total Tax Obligation/General | 44,638,682 | ||||||||||||||||
Tax Obligation/Limited – 21.0% | ||||||||||||||||||
Belton, Missouri, Certificates of Participation, Series 2007: | ||||||||||||||||||
| 600 | 4.380%, 3/01/19 – NPFG Insured | 3/17 at 100.00 | A3 | 632,994 | ||||||||||||||
| 250 | 4.500%, 3/01/22 – NPFG Insured | 3/17 at 100.00 | A3 | 259,460 | ||||||||||||||
| Nuveen Investments | 67 |
Nuveen Missouri Municipal Bond Fund (continued)
Portfolio of Investments May 31, 2014
| Principal Amount (000) | Description (1) | Optional Call Provisions (2) | Ratings (3) | Value | ||||||||||||||
Tax Obligation/Limited (continued) | ||||||||||||||||||
| $ | 375 | Belton, Missouri, Certificates of Participation, Series 2008, 5.250%, 3/01/29 | 3/18 at 100.00 | A | $ | 396,720 | ||||||||||||
| 4,930 | Bi-State Development Agency of the Missouri-Illinois Metropolitan District, Mass Transit Sales Tax Appropriation Bonds, Refunding Combined Lien Series 2013A, 5.000%, 10/01/33 | 10/22 at 100.00 | AA+ | 5,557,293 | ||||||||||||||
Cape Girardeau County Building Corporation, Missouri, Leasehold Revenue Bonds, Reorganized School District R-02, Jackson R-II School District High School Project, Series 2005: | ||||||||||||||||||
| 1,290 | 5.250%, 3/01/21 – NPFG Insured | 3/16 at 100.00 | AA– | 1,394,142 | ||||||||||||||
| 1,000 | 5.250%, 3/01/26 – NPFG Insured | 3/16 at 100.00 | AA– | 1,078,530 | ||||||||||||||
| 1,975 | Cass County, Missouri, Certificates of Participation, Refunding Series 2010, 4.000%, 5/01/22 | 5/20 at 100.00 | A | 2,112,164 | ||||||||||||||
| 500 | Franklin County Industrial Development Authority, Missouri, Sales Tax Refunding Revenue Bonds, Phoenix Center II Community Improvement District Project, Series 2013A, 5.000%, 11/01/37 | 11/20 at 100.00 | N/R | 512,350 | ||||||||||||||
| 1,685 | Fulton, Missouri, Tax Increment Revenue Bonds, Fulton Commons Redevelopment Project, Series 2006, 5.000%, 6/01/28 | 6/16 at 100.00 | N/R | 1,468,848 | ||||||||||||||
| 530 | Government of Guam, Business Privilege Tax Bonds, Series 2011A, 5.130%, 1/01/42 | 1/22 at 100.00 | A | 554,014 | ||||||||||||||
| 1,850 | Government of Guam, Business Privilege Tax Bonds, Series 2012B-1, 5.000%, 1/01/42 | 1/22 at 100.00 | A | 1,919,060 | ||||||||||||||
Great Rivers Greenway Metropolitan Park & Recreation District, Missouri, Sales Tax Appropriation Bonds, Gateway Arch Project, Series 2014.: | ||||||||||||||||||
| 3,500 | 5.000%, 12/30/29 | 12/23 at 100.00 | A+ | 3,989,965 | ||||||||||||||
| 4,090 | 5.000%, 12/30/31 | 12/23 at 100.00 | A+ | 4,608,817 | ||||||||||||||
Harrisonville, Missouri, Annual Appropriation-Supported Tax Increment and Sales Tax Revenue Bonds, Harrisonville Towne Center Project, Series 2007: | ||||||||||||||||||
| 340 | 4.380%, 11/01/17 | 11/14 at 100.00 | A+ | 340,677 | ||||||||||||||
| 715 | 4.500%, 11/01/22 | 11/14 at 100.00 | A+ | 715,736 | ||||||||||||||
Hazelwood School District, St Louis County, Missouri, Certificates of Participation, Energy Improvements Project, Series 2006: | ||||||||||||||||||
| 515 | 4.500%, 3/01/17 | 3/16 at 100.00 | A+ | 543,727 | ||||||||||||||
| 445 | 4.500%, 3/01/18 | 3/16 at 100.00 | A+ | 467,361 | ||||||||||||||
| 1,745 | Howard Bend Levee District, Missouri, Levee District Improvement Bonds, Series 2005, 5.500%, 3/01/26 – SYNCORA GTY Insured | No Opt. Call | BBB+ | 2,049,729 | ||||||||||||||
Howard Bend Levee District, St. Louis County, Missouri, Levee District Improvement Bonds, Series 2013B: | ||||||||||||||||||
| 820 | 4.880%, 3/01/33 | 3/23 at 100.00 | BBB+ | 842,386 | ||||||||||||||
| 885 | 5.000%, 3/01/38 | 3/23 at 100.00 | BBB+ | 902,850 | ||||||||||||||
| 3,000 | Jackson County, Missouri, Special Obligation Bonds, Harry S. Truman Sports Complex, Series 2006, 5.000%, 12/01/28 – AMBAC Insured | 12/16 at 100.00 | Aa3 | 3,247,890 | ||||||||||||||
| 925 | Kansas City Industrial Development Authority, Missouri, Downtown Redevelopment District Revenue Bonds, Series 2011A, 5.000%, 9/01/32 | 9/21 at 100.00 | AA– | 989,593 | ||||||||||||||
| 1,200 | Kansas City Industrial Development Authority, Missouri, Special Obligation Revenue Bonds, Plaza Library Project, Refunding Series 2014., 4.250%, 3/01/23 | No Opt. Call | N/R | 1,225,992 | ||||||||||||||
| 2,000 | Kansas City Municipal Assistance Corporation, Missouri, Leasehold Revenue Bonds, Series 2004B-1, 0.000%, 4/15/27 – AMBAC Insured | No Opt. Call | AA– | 1,219,200 | ||||||||||||||
| 2,525 | Kansas City Tax Increment Financing Commission, Missouri, Tax Increment Revenue Bonds, Briarcliff West Project, Series 2006A, 5.400%, 6/01/24 | 6/14 at 102.00 | N/R | 2,578,379 | ||||||||||||||
| 1,750 | Kansas City, Missouri, Special Obligation Bonds, Downtown Redevelopment District, Series 2014C., 5.000%, 9/01/33 | 9/23 at 100.00 | AA– | 1,918,875 | ||||||||||||||
| 68 | Nuveen Investments |
| Principal Amount (000) | Description (1) | Optional Call Provisions (2) | Ratings (3) | Value | ||||||||||||||
Tax Obligation/Limited (continued) | ||||||||||||||||||
| $ | 1,025 | Kansas City, Missouri, Special Obligation Bonds, Kansas City Missouri Projects, Series 2012A, 5.000%, 3/01/26 | 3/22 at 100.00 | AA– | $ | 1,155,390 | ||||||||||||
| 2,000 | Lakeside 370 Levee District, Saint Charles, Missouri, Levee District Improvement Bonds, Series 2008, 7.000%, 4/01/28 (4) | 4/16 at 100.00 | N/R | 1,250,600 | ||||||||||||||
| 4,920 | Missouri Development Finance Board, Infrastructure Facilities Revenue Bonds, Branson Landing Project, Series 2005A, 5.000%, 6/01/35 | 6/15 at 100.00 | A | 5,088,362 | ||||||||||||||
| 1,000 | Missouri Development Finance Board, Infrastructure Facilities Revenue Bonds, City of Independence, Centerpoint Project, Series 2007E, 5.130%, 4/01/25 | 4/17 at 100.00 | A– | 1,046,290 | ||||||||||||||
| 1,000 | Missouri Development Finance Board, Infrastructure Facilities Revenue Bonds, City of Independence, Crackerneck Creek Project, Series 2008B, 5.000%, 3/01/25 | 3/18 at 100.00 | A– | 1,048,340 | ||||||||||||||
| 1,000 | Missouri Development Finance Board, Infrastructure Facilities Revenue Bonds, City of Saint JosephSewerage System Improvement Projects, Series 2011E, 5.380%, 5/01/36 | 5/20 at 100.00 | AA– | 1,051,620 | ||||||||||||||
| 245 | Monarch-Chesterfield Levee District, St. Louis County, Missouri, Levee District Improvement Bonds, Series 1999, 5.750%, 3/01/19 – NPFG Insured | 9/14 at 100.00 | AA– | 246,000 | ||||||||||||||
| 1,000 | Oak Grove, Missouri, Refunding and Improvement Certificates of Participation Series 2012, 5.000%, 1/01/33 | 1/22 at 100.00 | Baa1 | 1,017,320 | ||||||||||||||
| 3,955 | Osage Beach, Missouri, Tax Increment Revenue Bonds, Prewitts Point Transportation Development District, Series 2006, 5.000%, 5/01/23 | 11/14 at 100.00 | N/R | 3,955,751 | ||||||||||||||
| 1,000 | Pevely, Missouri, Neighborhood Improvement District Bonds, Southern Heights Project, Series 2004, 5.250%, 3/01/24 – RAAI Insured | 9/14 at 100.00 | N/R | 1,001,690 | ||||||||||||||
| 520 | Poplar Bluff Regional Transportation Development District, Missouri, Transportation Sales Tax Revenue Bonds, Series 2012, 4.750%, 12/01/42 | No Opt. Call | BBB | 524,524 | ||||||||||||||
| 3,490 | Puerto Rico Sales Tax Financing Corporation, Sales Tax Revenue Bonds, First Subordinate Series 2009A, 6.000%, 8/01/42 | 8/19 at 100.00 | A+ | 3,036,021 | ||||||||||||||
| 1,000 | Puerto Rico Sales Tax Financing Corporation, Sales Tax Revenue Bonds, First Subordinate Series 2011A-1, 5.250%, 8/01/43 | 8/21 at 100.00 | A+ | 790,710 | ||||||||||||||
Puerto Rico Sales Tax Financing Corporation, Sales Tax Revenue Bonds, Series 2007A: | ||||||||||||||||||
| 15,780 | 0.000%, 8/01/41 – NPFG Insured | No Opt. Call | AA– | 2,812,312 | ||||||||||||||
| 8,935 | 0.000%, 8/01/42 – FGIC Insured | No Opt. Call | AA– | 1,494,379 | ||||||||||||||
| 540 | Raymore, Missouri, Tax Increment Revenue Bonds, Raymore Galleria Project, Refunding & Improvement Series 2014A., 5.375%, 5/01/28 | 5/23 at 100.00 | N/R | 561,465 | ||||||||||||||
| 1,000 | Raytown, Missouri, Annual Appropriation Supported Tax Increment and Sales Tax Revenue Bonds, Raytown Live Redevelopment Project Area 1, Series 2007, 5.130%, 12/01/31 | 6/17 at 100.00 | A+ | 1,048,410 | ||||||||||||||
| 1,700 | Riverside Industrial Development Authority, Missouri, Industrial Development Revenue Bonds, Riverside Horizon, Series 2007A, 5.000%, 5/01/27 – ACA Insured | 5/17 at 100.00 | A | 1,743,299 | ||||||||||||||
| 2,170 | Riverside, Missouri, L-385 Levee Redevelopment Plan Tax Increment Revenue Bonds, Series 2004, 5.250%, 5/01/20 | 5/15 at 100.00 | A | 2,228,547 | ||||||||||||||
Saint Joseph Industrial Development Authority, Missouri, Special Obligation Revenue Bonds, Sewerage System Improvements Project, Series 2007: | ||||||||||||||||||
| 500 | 4.750%, 4/01/20 | 4/17 at 100.00 | AA– | 544,630 | ||||||||||||||
| 390 | 4.750%, 4/01/21 | 4/17 at 100.00 | AA– | 424,811 | ||||||||||||||
| 3,225 | Saint Louis Industrial Development Authority, Missouri, Compound Interest Leasehold Revenue Bonds, St. Louis Convention Center Headquarters Hotel, Series 2000, 0.000%, 7/15/15 – AMBAC Insured | No Opt. Call | A | 3,148,148 | ||||||||||||||
Saint Louis Municipal Finance Corporation, Missouri, Leasehold Revenue Bonds, Convention Center, Series 2009A: | ||||||||||||||||||
| 1,000 | 0.000%, 7/15/26 – AGC Insured | No Opt. Call | AA | 615,170 | ||||||||||||||
| Nuveen Investments | 69 |
Nuveen Missouri Municipal Bond Fund (continued)
Portfolio of Investments May 31, 2014
| Principal Amount (000) | Description (1) | Optional Call Provisions (2) | Ratings (3) | Value | ||||||||||||||
Tax Obligation/Limited (continued) | ||||||||||||||||||
| $ | 1,000 | 0.000%, 7/15/27 – AGC Insured | No Opt. Call | AA | $ | 577,190 | ||||||||||||
| 1,000 | 0.000%, 7/15/28 – AGC Insured | No Opt. Call | AA | 543,770 | ||||||||||||||
| 1,000 | 0.000%, 7/15/29 – AGC Insured | No Opt. Call | AA | 515,450 | ||||||||||||||
| 1,945 | Springfield Center City Development Corporation, Missouri, Lease Revenue Bonds, Jordan Valley Park Exposition Center, Series 2002A, 5.000%, 6/01/27 – AMBAC Insured | 6/14 at 100.00 | Aa3 | 1,952,216 | ||||||||||||||
St. Joseph Industrial Development Authority, Missouri, Tax Increment Bonds, Shoppes at North Village Project, Series 2005A: | ||||||||||||||||||
| 660 | 5.380%, 11/01/24 | 11/14 at 100.00 | N/R | 660,251 | ||||||||||||||
| 1,600 | 5.500%, 11/01/27 | 11/14 at 100.00 | N/R | 1,600,176 | ||||||||||||||
| 1,800 | St. Joseph Industrial Development Authority, Missouri, Tax Increment Bonds, Shoppes at North Village Project, Series 2005B, 5.500%, 11/01/27 | 11/14 at 100.00 | N/R | 1,806,138 | ||||||||||||||
| 1,595 | Texas County, Missouri, Certificates of Participation, Justice Center Project, Series 2006, 4.500%, 12/01/25 – AGC Insured | 12/16 at 100.00 | AA | 1,733,271 | ||||||||||||||
| 1,000 | Virgin Islands Public Finance Authority, Matching Fund Loan Notes Revenue Bonds, Series 2012A, 5.000%, 10/01/32 | 10/22 at 100.00 | BBB | 1,079,880 | ||||||||||||||
| 108,435 | Total Tax Obligation/Limited | 87,828,883 | ||||||||||||||||
Transportation – 3.3% | ||||||||||||||||||
| 665 | Guam International Airport Authority, Revenue Bonds, Series 2013B, 5.500%, 10/01/33 – AGM Insured | 10/23 at 100.00 | AA | 739,573 | ||||||||||||||
| 3,500 | Saint Louis, Missouri, Airport Revenue Bonds, Lambert-St. Louis International Airport, Refunding Series 2012, 5.000%, 7/01/32 – FGIC Insured (Alternative Minimum Tax) | 7/22 at 100.00 | A– | 3,666,950 | ||||||||||||||
| 2,000 | St. Louis, Missouri, Airport Revenue Bonds, Lambert-St Louis International Series 2009A-2, 6.130%, 7/01/24 | 7/19 at 100.00 | A– | 2,356,580 | ||||||||||||||
| 3,210 | St. Louis, Missouri, Airport Revenue Bonds, Lambert-St. Louis International Airport, Series 2005, 5.500%, 7/01/18 – NPFG Insured | No Opt. Call | AA– | 3,755,250 | ||||||||||||||
St. Louis, Missouri, Airport Revenue Bonds, Lambert-St. Louis International Airport, Series 2007A: | ||||||||||||||||||
| 1,035 | 5.000%, 7/01/20 – AGM Insured | 7/17 at 100.00 | AA | 1,151,831 | ||||||||||||||
| 2,000 | 5.000%, 7/01/21 – AGM Insured | 7/17 at 100.00 | AA | 2,213,580 | ||||||||||||||
| 12,410 | Total Transportation | 13,883,764 | ||||||||||||||||
U.S. Guaranteed – 6.0% (5) | ||||||||||||||||||
| 4,500 | Cape Girardeau County, Missouri, Single Family Mortgage Revenue Bonds, Series 1983, 0.000%, 12/01/14 (ETM) | No Opt. Call | Aaa | 4,496,175 | ||||||||||||||
Columbia, Missouri, Special Obligation Electric Utility Improvement Bonds, Annual Appropriation Obligation, Series 2008A: | ||||||||||||||||||
| 400 | 5.000%, 10/01/21 (Pre-refunded 10/01/17) | 10/17 at 100.00 | AA (5) | 457,468 | ||||||||||||||
| 500 | 5.130%, 10/01/30 (Pre-refunded 10/01/17) | 10/17 at 100.00 | AA (5) | 573,890 | ||||||||||||||
Cottleville, Missouri, Certificates of Participation, Series 2006: | ||||||||||||||||||
| 200 | 5.130%, 8/01/26 (Pre-refunded 8/01/14) | 8/14 at 100.00 | N/R (5) | 201,688 | ||||||||||||||
| 2,120 | 5.250%, 8/01/31 (Pre-refunded 8/01/14) | 8/14 at 100.00 | N/R (5) | 2,138,359 | ||||||||||||||
| 1,000 | Curators of the University of Missouri, System Facilities Revenue Bonds, Series 2007A, 5.000%, 11/01/33 (Pre-refunded 11/01/17) | 11/17 at 100.00 | AA+ (5) | 1,144,710 | ||||||||||||||
| 810 | Kansas City Tax Increment Financing Commission, Missouri, Tax Increment Revenue Bonds, Maincor Project, Series 2007A, 5.250%, 3/01/18 (ETM) | No Opt. Call | N/R (5) | 891,332 | ||||||||||||||
| 4,000 | Kansas City, Missouri, Special Facility Revenue Bonds, MCI Overhaul Base Project, Series 2005G, 4.750%, 9/01/28 (Alternative Minimum Tax) (Pre-refunded 9/01/15) | 9/15 at 100.00 | AA– (5) | 4,226,280 | ||||||||||||||
| 70 | Nuveen Investments |
| Principal Amount (000) | Description (1) | Optional Call Provisions (2) | Ratings (3) | Value | ||||||||||||||
U.S. Guaranteed (5) (continued) | ||||||||||||||||||
| $ | 2,600 | Missouri Development Finance Board, Independence, Infrastructure Facilities Revenue Bonds, Water System Improvement Projects, Series 2004, 5.000%, 11/01/24 – AMBAC Insured (Pre-refunded 11/01/14) | 11/14 at 100.00 | A– (5) | $ | 2,652,754 | ||||||||||||
| 500 | Missouri Development Finance Board, Independence, Infrastructure Facilities Revenue Bonds, Water System Improvement Projects, Series 2009C, 5.750%, 11/01/29 (Pre-refunded 11/01/14) | 11/14 at 100.00 | A– (5) | 511,715 | ||||||||||||||
Missouri Health and Educational Facilities Authority, Revenue Bonds, Lester E. Cox Medical Center, Series 1992H: | ||||||||||||||||||
| 1,000 | 0.000%, 9/01/17 – NPFG Insured (ETM) | No Opt. Call | AA– (5) | 967,430 | ||||||||||||||
| 1,800 | 0.000%, 9/01/21 – NPFG Insured (ETM) | No Opt. Call | AA– (5) | 1,539,162 | ||||||||||||||
| 2,385 | 0.000%, 9/01/22 – NPFG Insured (ETM) | No Opt. Call | AA– (5) | 1,954,484 | ||||||||||||||
| 2,055 | Springfield Public Building Corporation, Missouri, Lease Revenue Bonds, Jordan Valley Park Projects, Series 2000A, 6.125%, 6/01/21 – AMBAC Insured (ETM) | 8/14 at 100.00 | N/R (5) | 2,536,630 | ||||||||||||||
| 520 | Union, Missouri, Certificates of Participation, Series 2006A, 5.200%, 7/01/23 (Pre-refunded 7/01/14) | 7/14 at 100.00 | N/R (5) | 522,247 | ||||||||||||||
| 24,390 | Total U.S. Guaranteed | 24,814,324 | ||||||||||||||||
Utilities – 3.6% | ||||||||||||||||||
| 425 | Missouri Development Finance Board, Infrastructure Facilities Leasehold Revenue Bonds, City of Independence, Missouri, Annual Appropriation Electric System Revenue Bonds - Dogwood Project, Series 2012A, 5.000%, 6/01/26 | 6/22 at 100.00 | AA | 470,415 | ||||||||||||||
| 1,000 | Missouri Joint Municipal Electric Utility Commission, Iatan 2 Power Project Revenue Bonds, Series 2006A, 5.000%, 1/01/28 – AMBAC Insured | 1/16 at 100.00 | A2 | 1,050,200 | ||||||||||||||
Missouri Joint Municipal Electric Utility Commission, Plum Point Project, Revenue Bonds, Series 2006: | ||||||||||||||||||
| 1,500 | 5.000%, 1/01/16 – NPFG Insured | No Opt. Call | AA– | 1,586,460 | ||||||||||||||
| 405 | 5.000%, 1/01/17 – NPFG Insured | 1/16 at 100.00 | AA– | 426,902 | ||||||||||||||
| 4,720 | 5.000%, 1/01/34 – NPFG Insured | 1/16 at 100.00 | AA– | 4,938,017 | ||||||||||||||
| 2,025 | Missouri Joint Municipal Electric Utility Commission, Power Project Revenue Bonds, Iatan 2 Project, Series 2009A, 6.000%, 1/01/39 | 1/16 at 100.00 | A2 | 2,243,599 | ||||||||||||||
Missouri Joint Municipal Electric Utility Commission, Power Supply System Revenue Bonds, MoPEP Facilities, Series 2012: | ||||||||||||||||||
| 2,200 | 5.000%, 1/01/32 | 1/21 at 100.00 | A2 | 2,358,444 | ||||||||||||||
| 2,000 | 5.000%, 1/01/37 | 1/21 at 100.00 | A2 | 2,117,700 | ||||||||||||||
| 14,275 | Total Utilities | 15,191,737 | ||||||||||||||||
Water and Sewer – 5.3% | ||||||||||||||||||
| 725 | Cape Girardeau, Missouri, Waterworks System Refunding Revenue Bonds, Series 2012A, 3.380%, 1/01/26 | 1/20 at 100.00 | A+ | 735,512 | ||||||||||||||
| 1,500 | Carroll County Public Water Supply District 1, Missouri, Water System Revenue Bonds, Refunding Series 2009, 6.000%, 3/01/39 | 3/18 at 100.00 | A | 1,615,665 | ||||||||||||||
| 1,370 | Guam Government Waterworks Authority, Water and Wastewater System Revenue Bonds, Series 2010, 5.630%, 7/01/40 | 7/20 at 100.00 | A– | 1,419,471 | ||||||||||||||
| 745 | Jefferson County Consolidated Public Water Supply District C1, Missouri, Waterworks Revenue Bonds, Refunding Series 2010, 4.130%, 12/01/24 | 12/17 at 100.00 | A+ | 812,638 | ||||||||||||||
| 2,000 | Kansas City, Missouri, Sanitary Sewer System Revenue Bonds, Series 2009A, 5.250%, 1/01/34 | 1/19 at 100.00 | AA | 2,255,840 | ||||||||||||||
| 500 | Kansas City, Missouri, Water Revenue Bonds, Refunding & Improvement Series 2009A, 5.250%, 12/01/32 | 12/18 at 100.00 | AA+ | 566,275 | ||||||||||||||
| Nuveen Investments | 71 |
Nuveen Missouri Municipal Bond Fund (continued)
Portfolio of Investments May 31, 2014
| Principal Amount (000) | Description (1) | Optional Call Provisions (2) | Ratings (3) | Value | ||||||||||||||
Water and Sewer (continued) | ||||||||||||||||||
| $ | 1,500 | Lincoln County Public Water Supply District 1, Missouri, Certificates of Participation, Refunding Series 2009, 6.750%, 6/15/35 | 6/16 at 100.00 | A– | $ | 1,571,205 | ||||||||||||
| 500 | Metropolitan St. Louis Sewerage District, Missouri, Wastewater System Revenue Bonds, Series 2008A, 5.750%, 5/01/38 | 5/17 at 100.00 | AAA | 560,195 | ||||||||||||||
| 4,665 | Metropolitan St. Louis Sewerage District, Missouri, Wastewater System Revenue Bonds, Series 2012A, 5.000%, 5/01/42 | 5/22 at 100.00 | AAA | 5,191,259 | ||||||||||||||
| 2,965 | Missouri Environmental Improvement and Energy Resources Authority, Water Facility Revenue Bonds, Missouri-American Water Company, Series 2006, 4.600%, 12/01/36 – AMBAC Insured (Alternative Minimum Tax) (UB) (6) | 12/16 at 100.00 | AA+ | 3,039,273 | ||||||||||||||
| 470 | Missouri Environmental Improvement and Energy Resources Authority, Water Pollution Control and Drinking Water Revenue Bonds, State Revolving Fund Program, Series 2001C, 4.750%, 7/01/23 | 7/14 at 100.00 | Aaa | 471,852 | ||||||||||||||
| 50 | Missouri Environmental Improvement and Energy Resources Authority, Water Pollution Control and Drinking Water Revenue Bonds, State Revolving Fund Program, Series 2005C, 5.750%, 1/01/29 | 1/16 at 100.00 | Aaa | 53,357 | ||||||||||||||
| 1,000 | Missouri Environmental Improvement and Energy Resources Authority, Water Pollution Control and Drinking Water Revenue Bonds, State Revolving Fund Program, Series 2008A, 5.000%, 7/01/23 | 1/19 at 100.00 | Aaa | 1,174,800 | ||||||||||||||
| 65 | Missouri Environmental Improvement and Energy Resources Authority, Water Pollution Control Revenue Bonds, State Revolving Fund Program - Multi-Participants, Series 1998B, 5.250%, 1/01/15 | 7/14 at 100.00 | Aaa | 65,279 | ||||||||||||||
| 2,070 | North Central Missouri Regional Water Commission, Waterworks System Revenue Bonds, Series 2006, 5.000%, 1/01/37 | 1/17 at 100.00 | N/R | 2,107,819 | ||||||||||||||
| 590 | Taney County Public Water Supply District 3, Missouri, Certificates of Participation, Refunded Series 2010, 4.500%, 7/01/25 | 7/15 at 101.00 | A+ | 603,110 | ||||||||||||||
| 20,715 | Total Water and Sewer | 22,243,550 | ||||||||||||||||
| $ | 419,830 | Total Long-Term Investments (cost $387,981,196) | 415,597,721 | |||||||||||||||
Floating Rate Obligations – (0.5)% | (2,225,000 | ) | ||||||||||||||||
Other Assets Less Liabilities – 1.0% | 4,102,862 | |||||||||||||||||
Net Assets – 100% | $ | 417,475,583 | ||||||||||||||||
| (1) | All percentages shown in the Portfolio of Investments are based on net assets. |
| (2) | Optional Call Provisions (not covered by the report of independent registered public accounting firm): Dates (month and year) and prices of the earliest optional call or redemption. There may be other call provisions at varying prices at later dates. Certain mortgage-backed securities may be subject to periodic principal paydowns. |
| (3) | Ratings (not covered by the report of independent registered public accounting firm): Using the highest of Standard & Poor’s Group (“Standard & Poor’s”), Moody’s Investors Service, Inc. (“Moody’s”) or Fitch, Inc. (“Fitch”) rating. Ratings below BBB by Standard & Poor’s, Baa by Moody’s or BBB by Fitch are considered to be below investment grade. Holdings designated N/R are not rated by any of these national rating agencies. |
| (4) | On October 1, 2013, the Fund’s Adviser determined it was unlikely that this borrower would fulfill its entire obligation on this security, and therefore reduced the security’s interest rate of the accrual from 7.000% to 3.150%. |
| (5) | Backed by an escrow or trust containing sufficient U.S. Government or U.S. Government agency securities, which ensure the timely payment of principal and interest. Certain bonds backed by U.S. Government or agency securities are regarded as having an implied rating equal to the rating of such securities. |
| (6) | Investment, or portion of investment, has been pledged to collateralize the net payment obligations for investments in inverse floating rate transactions. |
| WI/DD | Investment, or portion of investment, purchased on a when-issued or delayed delivery basis. |
| (ETM) | Escrowed to maturity. |
| (UB) | Underlying bond of an inverse floating rate trust reflected as a financing transaction. See Notes to Financial Statements, Note 3 – Portfolio Securities and Investments in Derivatives, Inverse Floating Rate Securities for more information. |
See accompanying notes to financial statements.
| 72 | Nuveen Investments |
Nuveen Ohio Municipal Bond Fund
Portfolio of Investments May 31, 2014
| Principal Amount (000) | Description (1) | Optional Call Provisions (2) | Ratings (3) | Value | ||||||||||||||
LONG-TERM INVESTMENTS – 99.4% | ||||||||||||||||||
MUNICIPAL BONDS – 99.4% | ||||||||||||||||||
Consumer Staples – 3.1% | ||||||||||||||||||
| $ | 250 | Buckeye Tobacco Settlement Financing Authority, Ohio, Tobacco Settlement Asset-Backed Revenue Bonds, Senior Lien, Series 2007A-1, 5.000%, 6/01/16 | No Opt. Call | A1 | $ | 267,297 | ||||||||||||
Buckeye Tobacco Settlement Financing Authority, Ohio, Tobacco Settlement Asset-Backed Revenue Bonds, Senior Lien, Series 2007A-2: | ||||||||||||||||||
| 6,850 | 5.130%, 6/01/24 | 6/17 at 100.00 | B– | 5,937,101 | ||||||||||||||
| 11,465 | 5.880%, 6/01/47 | 6/17 at 100.00 | B | 9,436,956 | ||||||||||||||
| 18,565 | Total Consumer Staples | 15,641,354 | ||||||||||||||||
Education and Civic Organizations – 5.4% | ||||||||||||||||||
| 2,465 | Miami University of Ohio, General Receipts Bonds, Refunding Series 2014, 5.000%, 9/01/30 (WI/DD, Settling 6/05/14) | 9/24 at 100.00 | AA | 2,881,832 | ||||||||||||||
| 1,925 | Miami University of Ohio, General Receipts Bonds, Series 2011, 5.000%, 9/01/36 | 9/21 at 100.00 | AA | 2,098,789 | ||||||||||||||
| 1,600 | Ohio Higher Education Facilities Commission, General Revenue Bonds, Kenyon College, Series 2006, 5.000%, 7/01/41 | 7/16 at 100.00 | A+ | 1,633,424 | ||||||||||||||
| 910 | Ohio Higher Education Facilities Commission, Revenue Bonds, Case Western Reserve University, Series 1990B, 6.500%, 10/01/20 | No Opt. Call | AA– | 1,065,747 | ||||||||||||||
| 400 | Ohio Higher Education Facilities Commission, Revenue Bonds, College of Wooster Project, Series 2005, 5.000%, 9/01/20 | 9/15 at 100.00 | A1 | 420,008 | ||||||||||||||
| 1,000 | Ohio Higher Education Facilities Commission, Revenue Bonds, John Carroll University, Series 1997, 5.000%, 4/01/19 | 4/16 at 100.00 | A3 | 1,053,610 | ||||||||||||||
| 1,000 | Ohio Higher Education Facilities Commission, Revenue Bonds, Mount Union College, Series 2006, 5.000%, 10/01/31 | 10/16 at 100.00 | A3 | 1,030,260 | ||||||||||||||
Ohio Higher Education Facilities Commission, Revenue Bonds, Ohio Northern University, Series 2005: | ||||||||||||||||||
| 760 | 5.000%, 5/01/20 | 5/15 at 100.00 | Baa2 | 774,212 | ||||||||||||||
| 1,000 | 5.000%, 5/01/26 | 5/15 at 100.00 | Baa2 | 1,007,690 | ||||||||||||||
Ohio Higher Education Facilities Commission, Revenue Bonds, Wittenberg University, Series 2005: | ||||||||||||||||||
| 1,505 | 5.000%, 12/01/24 | 12/15 at 100.00 | B1 | 1,464,260 | ||||||||||||||
| 1,000 | 5.000%, 12/01/29 | 12/15 at 100.00 | B1 | 947,290 | ||||||||||||||
Ohio Higher Educational Facilities Commission, Revenue Bonds, Denison University Project, Series 2012: | ||||||||||||||||||
| 1,140 | 5.000%, 11/01/27 | 5/22 at 100.00 | AA | 1,315,537 | ||||||||||||||
| 1,000 | 5.000%, 11/01/30 | 5/22 at 100.00 | AA | 1,133,620 | ||||||||||||||
| 645 | Ohio Higher Educational Facilities Commission, Revenue Bonds, University of Dayton, Refunding Series 2009, 5.380%, 12/01/29 | 12/18 at 100.00 | A | 735,203 | ||||||||||||||
| 1,250 | Ohio Higher Educational Facilities Commission, Revenue Bonds, University of Dayton, Tender Option Bond Trust 1144, 20.335%, 12/01/43 (IF) (4) | 12/22 at 100.00 | A | 1,620,450 | ||||||||||||||
Ohio Higher Educational Facilities Commission, Revenue Bonds, Wittenberg University, Series 2001: | ||||||||||||||||||
| 1,200 | 5.500%, 12/01/21 | 6/14 at 100.00 | B1 | 1,200,228 | ||||||||||||||
| 2,100 | 5.000%, 12/01/26 | 6/14 at 100.00 | B1 | 2,011,464 | ||||||||||||||
| Nuveen Investments | 73 |
Nuveen Ohio Municipal Bond Fund (continued)
Portfolio of Investments May 31, 2014
| Principal Amount (000) | Description (1) | Optional Call Provisions (2) | Ratings (3) | Value | ||||||||||||||
Education and Civic Organizations (continued) | ||||||||||||||||||
| $ | 500 | Ohio Higher Educational Facility Commission, Higher Educational Facility Revenue Bonds, Xavier University Project, Series 2010, 5.000%, 5/01/40 | 5/20 at 100.00 | A– | $ | 531,660 | ||||||||||||
| 1,885 | Ohio State Higher Education Facilities, Revenue Bonds, Case Western Reserve University, Series 2006, 5.000%, 12/01/44 – NPFG Insured | 12/16 at 100.00 | AA– | 2,029,843 | ||||||||||||||
| 500 | Ohio State, Higher Educational Facility Revenue Bonds, Otterbein College Project, Series 2008A, 5.500%, 12/01/28 | 12/18 at 100.00 | A3 | 546,660 | ||||||||||||||
| 1,000 | Ohio University at Athens, General Receipts Bonds, Series 2013, 5.000%, 12/01/39 | 12/22 at 100.00 | Aa3 | 1,086,120 | ||||||||||||||
| 1,030 | Port of Greater Cincinnati Development Authority, Ohio, Economic Development Revenue Bonds, Sisters of Mercy of the Americas, Series 2006, 5.000%, 10/01/25 | 10/16 at 100.00 | A+ | 1,104,438 | ||||||||||||||
| 25,815 | Total Education and Civic Organizations | 27,692,345 | ||||||||||||||||
Health Care – 20.9% | ||||||||||||||||||
Akron, Bath and Copley Joint Township Hospital District, Ohio, Hospital Facilities Revenue Bonds, Summa Health System, Series 2004A: | ||||||||||||||||||
| 1,220 | 5.250%, 11/15/31 – RAAI Insured | 11/14 at 100.00 | Baa1 | 1,228,308 | ||||||||||||||
| 150 | 5.500%, 11/15/34 – RAAI Insured | 11/14 at 100.00 | Baa1 | 151,122 | ||||||||||||||
Allen County, Ohio, Hospital Facilities Revenue Bonds, Catholic Healthcare Partners, Series 2010A: | ||||||||||||||||||
| 250 | 5.000%, 6/01/38 | 6/20 at 100.00 | AA– | 266,175 | ||||||||||||||
| 3,050 | 5.250%, 6/01/38 | 6/20 at 100.00 | AA– | 3,306,657 | ||||||||||||||
| 500 | Allen County, Ohio, Hospital Facilities Revenue Bonds, Catholic Healthcare Partners, Series 2010B, 4.130%, 9/01/20 | No Opt. Call | AA– | 559,795 | ||||||||||||||
Butler County, Ohio, Hospital Facilities Revenue Bonds, UC Health, Series 2010: | ||||||||||||||||||
| 750 | 5.500%, 11/01/22 | 11/20 at 100.00 | A– | 869,947 | ||||||||||||||
| 4,140 | 5.500%, 11/01/40 | 11/20 at 100.00 | A– | 4,539,924 | ||||||||||||||
| 850 | Butler County, Ohio, Hospital Faciliteis Revenue Bonds, Kettering Health Network Obligated Group Project, Series 2011, 5.630%, 4/01/41 | No Opt. Call | A | 935,051 | ||||||||||||||
| 1,600 | Fairfield County, Ohio, Hospital Facilities Revenue Bonds, Fairfield Medical Center Project, Series 2013, 5.000%, 6/15/43 | 6/23 at 100.00 | Baa2 | 1,680,688 | ||||||||||||||
Franklin County, Ohio, Hospital Revenue Bonds, Nationwide Children’s Hospital Project, Improvement Series 2009: | ||||||||||||||||||
| 3,000 | 5.000%, 11/01/34 | 11/19 at 100.00 | Aa2 | 3,242,610 | ||||||||||||||
| 3,000 | 5.250%, 11/01/40 | 11/19 at 100.00 | Aa2 | 3,242,430 | ||||||||||||||
Franklin County, Ohio, Hospital Revenue Bonds, Nationwide Children’s Hospital Project, Series 2008A: | ||||||||||||||||||
| 365 | 4.750%, 11/01/23 | 11/18 at 100.00 | Aa2 | 410,665 | ||||||||||||||
| 3,180 | 5.000%, 11/01/40 | 11/18 at 100.00 | Aa2 | 3,323,927 | ||||||||||||||
| 10,300 | Franklin County, Ohio, Hospital Revenue Bonds, OhioHealth Corporation, Series 2011A, 5.000%, 11/15/41 | 11/21 at 100.00 | AA+ | 11,120,292 | ||||||||||||||
| 500 | Franklin County, Ohio, Revenue Bonds, Trinity Health Credit Group, Refunding Series 2010C, 4.500%, 12/01/37 | 12/20 at 100.00 | Aa2 | 516,940 | ||||||||||||||
| 470 | Hancock County, Ohio, Hospital Revenue Bonds, Blanchard Valley Regional Health Center, Series 2011A, 6.250%, 12/01/34 | 6/21 at 100.00 | A2 | 541,778 | ||||||||||||||
| 750 | Lake County, Ohio, Hospital Facilities Revenue Bonds, Lake Hospital System, Inc., Refunding Series 2008C, 5.630%, 8/15/29 | 8/18 at 100.00 | A3 | 809,078 | ||||||||||||||
| 74 | Nuveen Investments |
| Principal Amount (000) | Description (1) | Optional Call Provisions (2) | Ratings (3) | Value | ||||||||||||||
Health Care (continued) | ||||||||||||||||||
Lucas County, Ohio, Hospital Revenue Bonds, ProMedica Healthcare Obligated Group, Series 2008D: | ||||||||||||||||||
| $ | 400 | 5.000%, 11/15/38 | 11/18 at 100.00 | AA | $ | 420,764 | ||||||||||||
| 305 | 5.130%, 11/15/40 | 11/18 at 100.00 | AA | 322,001 | ||||||||||||||
| 3,240 | Lucas County, Ohio, Hospital Revenue Bonds, ProMedica Healthcare Obligated Group, Series 2011A, 6.000%, 11/15/41 | 11/21 at 100.00 | AA | 3,759,534 | ||||||||||||||
| 2,530 | Miami County, Ohio, Hospital Facilities Revenue Refunding Bonds, Upper Valley Medical Center Inc., Series 2006, 5.250%, 5/15/26 | 5/16 at 100.00 | A | 2,697,081 | ||||||||||||||
| 930 | Middleburg Heights, Ohio, Hospital Facilities Revenue Bonds, Southwest General Health Center Project, Refunding Series 2011, 5.250%, 8/01/41 | 8/21 at 100.00 | A2 | 989,269 | ||||||||||||||
| 7,000 | Montgomery County, Ohio, Hospital Facilities Revenue Refunding and Improvement Bonds, Kettering Medical Center, Series 1996, 6.250%, 4/01/20 – NPFG Insured | No Opt. Call | AA– | 8,079,680 | ||||||||||||||
| 750 | Montgomery County, Ohio, Revenue Bonds, Catholic Health Initiatives, Refunding Series 2009A, 5.000%, 5/01/39 | 5/19 at 100.00 | A+ | 783,848 | ||||||||||||||
| 2,270 | Montgomery County, Ohio, Revenue Bonds, Catholic Health Initiatives, Series 2004A, 5.000%, 5/01/32 | 11/14 at 100.00 | A+ | 2,273,110 | ||||||||||||||
| 100 | Montgomery County, Ohio, Revenue Bonds, Catholic Health Initiatives, Series 2008D, 6.250%, 10/01/33 | 10/18 at 100.00 | A+ | 115,415 | ||||||||||||||
| 2,000 | Muskingum County, Ohio, Hospital Facilities Revenue Bonds, Genesis HealthCare System Obligated Group Project, Series 2013, 5.000%, 2/15/44 | 2/23 at 100.00 | BB+ | 1,969,420 | ||||||||||||||
| 2,480 | Ohio State Higher Educational Facilities Commission, Hospital Revenue Bonds, Summa Health System Project, Series 2010, 5.250%, 11/15/40 – AGM Insured | 5/20 at 100.00 | AA | 2,650,996 | ||||||||||||||
| 11,150 | Ohio State, Hospital Facility Revenue Refunding Bonds, Cleveland Clinic Health System Obligated Group, Series 2009A, 5.500%, 1/01/39 (WI/DD, Settling 6/05/14) | 1/19 at 100.00 | Aa2 | 12,470,049 | ||||||||||||||
Ohio State, Hospital Facility Revenue Refunding Bonds, Cleveland Clinic Health System Obligated Group, Tender Option Bond Trust 3551: | ||||||||||||||||||
| 700 | 20.218%, 1/01/17 (IF) | No Opt. Call | Aa2 | 1,003,100 | ||||||||||||||
| 5,625 | 20.335%, 1/01/33 (IF) | 1/19 at 100.00 | Aa2 | 8,288,775 | ||||||||||||||
Ohio State, Hospital Revenue Bonds, University Hospitals Health System, Inc., Series 2013A: | ||||||||||||||||||
| 1,465 | 5.000%, 1/15/28 | 1/23 at 100.00 | A | 1,641,225 | ||||||||||||||
| 4,390 | 5.000%, 1/15/29 | 1/23 at 100.00 | A | 4,890,241 | ||||||||||||||
| 3,235 | Richland County, Ohio, Hospital Revenue Bonds, MidCentral Health System Group, Series 2006, 5.250%, 11/15/36 | 11/16 at 100.00 | A– | 3,337,905 | ||||||||||||||
Ross County, Ohio, Hospital Revenue Refunding Bonds, Adena Health System Series 2008: | ||||||||||||||||||
| 500 | 5.500%, 12/01/28 | 12/18 at 100.00 | A– | 545,895 | ||||||||||||||
| 1,305 | 5.750%, 12/01/35 | 12/18 at 100.00 | A– | 1,427,474 | ||||||||||||||
| 800 | Scioto County, Ohio, Hospital Facilities Refunding Revenue Bonds, Southern Ohio Medical Center, Series 2008, 5.750%, 2/15/38 | 2/18 at 100.00 | A2 | 856,864 | ||||||||||||||
| 2,000 | Southeastern Ohio Port Authority, Hospital Facilities Revenue Bonds, Memorial Health System Obligated Group Project, Refunding and Improvement Series 2012, 6.000%, 12/01/42 | 12/22 at 100.00 | N/R | 2,019,860 | ||||||||||||||
Wood County, Ohio, Hospital Facilities Refunding and Improvement Revenue Bonds, Wood County Hospital Project, Series 2012: | ||||||||||||||||||
| 3,500 | 5.000%, 12/01/37 | No Opt. Call | Baa2 | 3,592,645 | ||||||||||||||
| 5,500 | 5.000%, 12/01/42 | No Opt. Call | Baa2 | 5,610,715 | ||||||||||||||
| 96,250 | Total Health Care | 106,491,253 | ||||||||||||||||
| Nuveen Investments | 75 |
Nuveen Ohio Municipal Bond Fund (continued)
Portfolio of Investments May 31, 2014
| Principal Amount (000) | Description (1) | Optional Call Provisions (2) | Ratings (3) | Value | ||||||||||||||
Housing/Multifamily – 1.7% | ||||||||||||||||||
| $ | 500 | Bowling Green, Ohio, Student Housing Revenue Bonds, CFP I LLC – Bowling Green State University Project, Series 2010, 5.750%, 6/01/31 | 6/20 at 100.00 | BBB– | $ | 528,655 | ||||||||||||
| 890 | Clark County, Ohio, Multifamily Housing Revenue Bonds, Church of God Retirement Home, Series 1998, 6.250%, 11/01/30 (Alternative Minimum Tax) | 11/14 at 100.00 | N/R | 791,245 | ||||||||||||||
| 1,805 | Montgomery County, Ohio, GNMA Guaranteed Multifamily Housing Revenue Bonds, Canterbury Court Project, Series 2007, 5.500%, 10/20/42 (Alternative Minimum Tax) | 10/18 at 101.00 | Aa1 | 1,909,293 | ||||||||||||||
| 2,175 | Summit County Port Authority, Ohio, Multifamily Housing Revenue Bonds, Callis Tower Apartments Project, Series 2007, 5.250%, 9/20/47 (Alternative Minimum Tax) | 9/17 at 102.00 | AA+ | 2,262,370 | ||||||||||||||
| 3,000 | Trumbull County, Ohio, Multifamily Housing Revenue Bonds, Royal Mall Apartments, Series 2007, 5.000%, 5/20/49 (Alternative Minimum Tax) | 11/17 at 102.00 | Aa1 | 3,086,670 | ||||||||||||||
| 8,370 | Total Housing/Multifamily | 8,578,233 | ||||||||||||||||
Housing/Single Family – 0.1% | ||||||||||||||||||
| 60 | Ohio Housing Finance Agency, Residential Mortgage Revenue Bonds, Mortgage-Backed Securities Program, Series 2008F, 5.450%, 9/01/33 | 3/18 at 100.00 | Aaa | 61,378 | ||||||||||||||
| 590 | Ohio Housing Finance Agency, Residential Mortgage Revenue Bonds, Mortgage-Backed Securities Program, Series 2009C, 5.200%, 9/01/29 | 9/18 at 100.00 | Aaa | 628,203 | ||||||||||||||
| 650 | Total Housing/Single Family | 689,581 | ||||||||||||||||
Industrials – 2.2% | ||||||||||||||||||
| 500 | Cleveland-Cuyahoga County Port Authority, Ohio, Common Bond Fund Revenue Bonds, Cleveland Christian Home Project, Series 2002C, 5.950%, 5/15/22 | 11/14 at 100.00 | BBB+ | 501,480 | ||||||||||||||
| 215 | Cleveland-Cuyahoga County Port Authority, Ohio, Development Revenue Bonds, Bond Fund Program – Columbia National Group Project, Series 2005D, 5.000%, 5/15/20 (Alternative Minimum Tax) | 11/15 at 100.00 | BBB+ | 216,161 | ||||||||||||||
| 75 | Cleveland-Cuyahoga County Port Authority, Ohio, Development Revenue Bonds, Port Cleveland Bond Fund, Series 1997A, 5.800%, 5/15/27 (Alternative Minimum Tax) | 11/14 at 100.00 | BBB+ | 75,196 | ||||||||||||||
| 3,500 | Lorain County Port Authority, Ohio, Recovery Zone Facility Economic Development Revenue Bonds, United State Steel Corporation Project, Series 2010, 6.750%, 12/01/40 | 12/20 at 100.00 | BB– | 3,736,495 | ||||||||||||||
| 1,020 | Ohio State, Economic Development Revenue Bonds, Enterprise Bond Fund Loan Pool, Series 2002-7, 5.850%, 12/01/22 (Alternative Minimum Tax) | 12/14 at 100.00 | AA+ | 1,045,836 | ||||||||||||||
Ohio State, Economic Development Revenue Bonds, Ohio Enterprise Bond Fund, Shearer’s Foods Inc. Project, Series 2009-5: | ||||||||||||||||||
| 1,455 | 5.000%, 6/01/22 | 12/19 at 100.00 | AA+ | 1,676,058 | ||||||||||||||
| 1,645 | 5.000%, 12/01/24 | 12/19 at 100.00 | AA+ | 1,887,539 | ||||||||||||||
| 1,600 | Toledo-Lucas County Port Authority, Ohio, Revenue Refunding Bonds, CSX Transportation Inc., Series 1992, 6.450%, 12/15/21 | No Opt. Call | Baa2 | 2,016,176 | ||||||||||||||
| 10,010 | Total Industrials | 11,154,941 | ||||||||||||||||
Long-Term Care – 1.3% | ||||||||||||||||||
| 800 | Franklin County, Ohio, Healthcare Facilities Revenue Bonds, Ohio Presbyterian Retirement Services, Improvement Series 2005A, 5.000%, 7/01/26 | 7/15 at 100.00 | BBB– | 808,008 | ||||||||||||||
| 1,505 | Franklin County, Ohio, Healthcare Facilities Revenue Bonds, Ohio Presbyterian Retirement Services, Improvement Series 2010A, 5.630%, 7/01/26 | 7/21 at 100.00 | BBB– | 1,632,955 | ||||||||||||||
| 190 | Franklin County, Ohio, Healthcare Facilities Revenue Bonds, Ohio Presbyterian Retirement Services, Series 2002A, 5.130%, 7/01/22 – RAAI Insured | 7/14 at 100.00 | BBB– | 190,219 | ||||||||||||||
| 76 | Nuveen Investments |
| Principal Amount (000) | Description (1) | Optional Call Provisions (2) | Ratings (3) | Value | ||||||||||||||
Long-Term Care (continued) | ||||||||||||||||||
| $ | 400 | Hamilton County, Ohio, Health Care Revenue Refunding Bonds, Life Enriching Communities Project, Series 2006A, 5.000%, 1/01/27 | 1/17 at 100.00 | BBB | $ | 416,108 | ||||||||||||
| 3,080 | Montgomery County, Ohio, Health Care and Multifamily Housing Revenue Bonds, Saint Leonard, Refunding & improvement Series 2010, 6.630%, 4/01/40 | 4/20 at 100.00 | BBB– | 3,355,968 | ||||||||||||||
| 5,975 | Total Long-Term Care | 6,403,258 | ||||||||||||||||
Tax Obligation/General – 15.5% | ||||||||||||||||||
| 2,325 | Adams County-Ohio Valley School District, Adams and Highland Counties, Ohio, Unlimited Tax School Improvement General Obligation Bonds, Series 1995, 7.000%, 12/01/15 – NPFG Insured | No Opt. Call | AA– | 2,464,616 | ||||||||||||||
| 25 | Barberton City School District, Summit County, Ohio, General Obligation Bonds, School Improvement Series 2008, 5.250%, 12/01/31 | 6/18 at 100.00 | AA | 27,916 | ||||||||||||||
| 1,000 | Beavercreek City School District, Ohio, General Obligation Bonds, Series 2009, 5.000%, 12/01/36 | 6/19 at 100.00 | Aa1 | 1,112,300 | ||||||||||||||
| 630 | Buckeye Valley Local School District, Ohio, Unlimited Tax General Obligation Bonds, Series 1995A, 6.850%, 12/01/15 – NPFG Insured | No Opt. Call | AA– | 664,650 | ||||||||||||||
| 1,180 | Canal Winchester Local School District, Franklin and Fairfield Counties, Ohio, General Obligation Bonds, Series 2005B, 0.000%, 12/01/33 – NPFG Insured | No Opt. Call | Aa3 | 545,042 | ||||||||||||||
| 300 | Cincinnati City School District, Hamilton County, Ohio, General Obligation Bonds, School Improvement, Refunding Series 2010, 5.250%, 6/01/21 | 6/20 at 100.00 | Aa2 | 356,994 | ||||||||||||||
Cincinnati City School District, Hamilton County, Ohio, General Obligation Bonds, Series 2006: | ||||||||||||||||||
| 535 | 5.250%, 12/01/19 – FGIC Insured | No Opt. Call | AA+ | 640,315 | ||||||||||||||
| 380 | 5.250%, 12/01/27 – FGIC Insured | No Opt. Call | AA+ | 475,194 | ||||||||||||||
| 150 | Cincinnati, Ohio, General Obligation Bonds, Various Purpose Series 2009A, 4.500%, 12/01/29 | 6/19 at 100.00 | Aa2 | 161,790 | ||||||||||||||
| 1,000 | Clyde-Green Springs Exempt Village School District, Summit County, Ohio, General Obligation Bonds, Series 2008, 5.000%, 12/01/27 – AGM Insured | 6/18 at 100.00 | Aa2 | 1,110,440 | ||||||||||||||
| 1,000 | Columbus City School District, Franklin County, Ohio, General Obligation Bonds, Series 2006, 0.000%, 12/01/28 – AGM Insured | No Opt. Call | AA+ | 609,780 | ||||||||||||||
| 1,100 | Cuyahoga County, Ohio, Limited Tax General Obligation Bonds, Series 1993, 5.650%, 5/15/18 | No Opt. Call | AAA | 1,223,442 | ||||||||||||||
| 1,005 | Findlay, Ohio, General Obligation Bonds, Series 2004, 5.250%, 7/01/15 – NPFG Insured | 7/14 at 100.00 | AA | 1,009,402 | ||||||||||||||
| 6,000 | Franklin County, Ohio, General Obligation Bonds, Refunding Series 2014., 5.000%, 6/01/24 | 12/23 at 100.00 | AAA | 7,441,320 | ||||||||||||||
| 3,160 | Franklin County, Ohio, General Obligation Bonds, Series 2007, 5.000%, 12/01/28 | 12/17 at 100.00 | AAA | 3,535,250 | ||||||||||||||
| 400 | Gahanna, Ohio, General Obligation Bonds, Various Purpose Series 2007, 5.000%, 12/01/27 – NPFG Insured | 12/17 at 100.00 | AA+ | 445,208 | ||||||||||||||
Graham Local School District, Champaign and Shelby Counties, Ohio, General Obligation Bonds, School Improvement Series 2013: | ||||||||||||||||||
| 500 | 0.000%, 12/01/29 | No Opt. Call | Aa2 | 267,785 | ||||||||||||||
| 850 | 0.000%, 12/01/30 | No Opt. Call | Aa2 | 429,530 | ||||||||||||||
| 1,000 | Greene County, Ohio, General Obligation Bonds, General Infrastructure Series 2007, 5.250%, 12/01/26 – AMBAC Insured | 12/17 at 100.00 | Aa2 | 1,129,870 | ||||||||||||||
| 1,000 | Greenville City School District, Drake County, Ohio, General Obligaiton Bonds, School Improvement Series 2013., 5.250%, 1/01/38 | 1/22 at 100.00 | AA | 1,106,210 | ||||||||||||||
| Nuveen Investments | 77 |
Nuveen Ohio Municipal Bond Fund (continued)
Portfolio of Investments May 31, 2014
| Principal Amount (000) | Description (1) | Optional Call Provisions (2) | Ratings (3) | Value | ||||||||||||||
Tax Obligation/General (continued) | ||||||||||||||||||
Highland Local School District, Morrow and Delaware Counties, Ohio, General Obligation Bonds, School Facilities Construction and Improvement Series 2008: | ||||||||||||||||||
| $ | 100 | 0.000%, 12/01/22 | No Opt. Call | Aa2 | $ | 79,882 | ||||||||||||
| 1,000 | 5.375%, 12/01/33 | 12/18 at 100.00 | Aa2 | 1,140,200 | ||||||||||||||
| 1,095 | Hilliard, Ohio, General Obligation Bonds, Various Purpose Series 2012, 5.000%, 12/01/23 | 12/22 at 100.00 | Aa1 | 1,303,970 | ||||||||||||||
Indian Creek Local School District, Jefferson County, Ohio, General Obligation Bonds, School Facilities Construction and Improvements, Series 2009: | ||||||||||||||||||
| 1,750 | 5.000%, 12/01/34 | 6/19 at 100.00 | Aa2 | 1,889,930 | ||||||||||||||
| 1,100 | 5.130%, 12/01/36 | 6/19 at 100.00 | Aa2 | 1,188,979 | ||||||||||||||
| 1,095 | Kenston Local School District, Geauga County, Ohio, General Obligation Bonds, School improvement Series 2012, 0.000%, 12/01/27 | 6/19 at 100.00 | Aa1 | 665,464 | ||||||||||||||
| 755 | Kenston Local School District, Geauga County, Ohio, General Obligation Bonds, Series 2011, 5.000%, 12/01/19 | No Opt. Call | Aa1 | 887,578 | ||||||||||||||
| 1,560 | Kettering City School District, Montgomery County, Ohio, General Obligation Bonds, Series 2007, 5.250%, 12/01/31 – AGM Insured | No Opt. Call | AA | 1,917,817 | ||||||||||||||
| 395 | Lake County, Ohio, Limited Tax Sewer District Improvement Bonds, Series 2000, 5.600%, 12/01/20 | No Opt. Call | Aa1 | 460,491 | ||||||||||||||
| 1,725 | Lakewood City School District, Cuyahoga County, Ohio, General Obligation Bonds, Series 2007, 5.000%, 12/01/30 – FGIC Insured | 12/17 at 100.00 | Aa2 | 1,901,881 | ||||||||||||||
| 1,000 | Lorain, Ohio, General Obligation Bonds, Pellet Terminal Improvement Series 2008, 6.750%, 12/01/28 – AMBAC Insured | 12/14 at 100.00 | A3 | 1,131,900 | ||||||||||||||
| 2,380 | Lucas County, Ohio, General Obligation Bonds, Various Purpose Series 2010, 5.000%, 10/01/40 | 10/18 at 100.00 | Aa2 | 2,595,961 | ||||||||||||||
| 665 | Marysville Exempted Village School District, Union County, Ohio, General Obligation Bonds, Series 2006., 5.000%, 12/01/24 – AGM Insured | 12/15 at 100.00 | AA | 709,276 | ||||||||||||||
| 1,000 | Mason City School District, Warren and Butler Counties, Ohio, General Obligation Bonds, Refunding Series 2013A, 0.000%, 12/01/22 | No Opt. Call | Aa1 | 794,250 | ||||||||||||||
| 1,000 | Maumee City School District, Lucas County, Ohio, General Obligation Bonds, Capital Apprication Refunding Series 2012, 0.000%, 12/01/23 | No Opt. Call | AA– | 745,300 | ||||||||||||||
| 1,000 | Milford Exempted Village School District, Ohio, General Obligation Bonds, Series 2008, 5.250%, 12/01/36 | 12/18 at 100.00 | Aa3 | 1,123,410 | ||||||||||||||
| 1,265 | Monroe Local School District, Butler County, Ohio, General Obligation Bonds, Series 2002, 5.750%, 12/01/20 – AMBAC Insured | No Opt. Call | Baa1 | 1,501,618 | ||||||||||||||
| 275 | Napoleon City School District, Henry County, Ohio, General Obligation Bonds, Facilities Construction & Improvement Series 2012, 5.000%, 12/01/36 | 6/22 at 100.00 | Aa3 | 299,071 | ||||||||||||||
| 1,585 | New Albany, Ohio, General Obligation Bonds, Series 2012, 5.000%, 12/01/29 | 6/22 at 100.00 | Aa1 | 1,809,658 | ||||||||||||||
| 530 | Newark, Ohio, General Obligation Bonds, Storm Sewer Improvement Series 2009, 5.500%, 12/01/34 | 12/19 at 100.00 | Aa3 | 590,918 | ||||||||||||||
Oak Hills Local School District, Hamilton County, Ohio, General Obligation Bonds, Refunding Series 2005: | ||||||||||||||||||
| 3,740 | 5.000%, 12/01/23 – AGM Insured | 12/15 at 100.00 | AA | 3,983,437 | ||||||||||||||
| 500 | 5.000%, 12/01/24 – AGM Insured | 12/15 at 100.00 | AA | 531,850 | ||||||||||||||
| 1,000 | 5.000%, 12/01/25 – AGM Insured | 12/15 at 100.00 | AA | 1,062,550 | ||||||||||||||
| 925 | Oakwood City School District, Montgomery County, Ohio, General Obligation Bonds, Series 2012, 0.000%, 12/01/21 | No Opt. Call | Aa2 | 753,783 | ||||||||||||||
| 78 | Nuveen Investments |
| Principal Amount (000) | Description (1) | Optional Call Provisions (2) | Ratings (3) | Value | ||||||||||||||
Tax Obligation/General (continued) | ||||||||||||||||||
| $ | 3,280 | Ohio State, General Obligation Bonds, Refunding Common Schools Series 2012A, 5.000%, 9/15/23 | No Opt. Call | AA+ | $ | 4,044,863 | ||||||||||||
| 2,000 | Ohio State, General Obligation Highway Capital Improvement Bonds, Series 2014R, 5.000%, 5/01/29 (WI/DD, Settling 6/11/14) | 5/24 at 100.00 | AAA | 2,379,700 | ||||||||||||||
| 1,000 | Ohio, General Obligation Bonds, Infrastructure Improvements, Refunding Series 2002A, 5.500%, 2/01/20 | No Opt. Call | AA+ | 1,211,480 | ||||||||||||||
| 1,000 | Olmsted Falls City School District, Cuyahoga County, Ohio, General Obligation Bonds, Series 2007, 5.000%, 12/01/35 – SYNCORA GTY Insured | 6/17 at 100.00 | A+ | 1,088,950 | ||||||||||||||
| 1,500 | Pettisville Local School District, Fulton County, Ohio, General Obligation Bonds, School Facilities Construction and Improvement Bonds, Series 2009, 5.000%, 12/01/36 | 6/19 at 100.00 | Aa2 | 1,612,770 | ||||||||||||||
Princeton City School District, Hamilton County, Ohio, Certificates of Participation, Series 2013: | ||||||||||||||||||
| 610 | 5.000%, 12/01/33 | 12/22 at 100.00 | AA– | 656,561 | ||||||||||||||
| 1,305 | 5.000%, 12/01/42 | 12/22 at 100.00 | AA– | 1,399,743 | ||||||||||||||
| 600 | Saint Marys City School District, Auglaize County, Ohio, General Obligation Bonds, School Facilities Construction and Improvement, Series 2008, 5.000%, 12/01/28 – AGM Insured | 6/18 at 100.00 | Aa2 | 672,276 | ||||||||||||||
| 1,710 | South Euclid, Ohio, General Obligation Bonds, Real Estate Acquisition and Urban Redevelopment, Series 2012, 5.000%, 6/01/32 | 6/22 at 100.00 | Aa2 | 1,904,718 | ||||||||||||||
| 30 | Strongsville, Ohio, Limited Tax General Obligation Various Purpose Improvement Bonds, Series 1996, 5.950%, 12/01/21 | 12/14 at 100.00 | Aaa | 30,141 | ||||||||||||||
| 3,435 | Summit County, Ohio, General Obligation Bonds, Series 2002R, 5.500%, 12/01/21 – FGIC Insured | No Opt. Call | Aa1 | 4,282,243 | ||||||||||||||
| 1,300 | Sylvania City School District, Lucas County, Ohio, General Obligation Bonds, School Improvement Series 1995, 5.250%, 12/01/36 – AGC Insured | 6/17 at 100.00 | AA | 1,424,670 | ||||||||||||||
| 735 | Symmes Township, Hamilton County, Ohio, General Obligation Bonds, Parkland Acquistion & Improvment Series 2010, 5.250%, 12/01/37 | 12/20 at 100.00 | Aa1 | 823,516 | ||||||||||||||
| 1,000 | Vandalia Butler City School District, Montgomery County, Ohio, General Obligation Bonds, School Improvment Series 2009, 5.130%, 12/01/37 | 6/19 at 100.00 | Aa3 | 1,073,310 | ||||||||||||||
| 500 | Wadsworth City School District, Medina County, Ohio, General Obligation Bonds, School Improvement Series 2009, 5.000%, 12/01/37 – AGC Insured | 12/17 at 100.00 | AA | 531,900 | ||||||||||||||
| 2,000 | West Clermont Local School District, Clermont County, Ohio, General Obligation Bonds, Series 2008, 5.000%, 12/01/31 – AGM Insured | 12/18 at 100.00 | AA | 2,239,200 | ||||||||||||||
| 72,985 | Total Tax Obligation/General | 79,202,269 | ||||||||||||||||
Tax Obligation/Limited – 19.1% | ||||||||||||||||||
Blue Ash, Ohio, Tax Increment Financing Revenue Bonds, Duke Realty Ohio, Series 2006: | ||||||||||||||||||
| 950 | 5.000%, 12/01/25 | 12/16 at 102.00 | N/R | 976,210 | ||||||||||||||
| 1,165 | 5.000%, 12/01/30 | 12/16 at 102.00 | N/R | 1,173,167 | ||||||||||||||
| 650 | 5.000%, 12/01/35 | 12/16 at 102.00 | N/R | 638,657 | ||||||||||||||
| 1,150 | Cincinnati, Ohio, Economic Development Revenue Bonds, Keystone Parke Project, Series 2008A, 5.000%, 11/01/38 | 11/14 at 100.00 | Aa3 | 1,170,527 | ||||||||||||||
Cleveland, Ohio, Income Tax Revenue Bonds, Bridges & Roadways Improvements, Subordinate Lien Series 2013A-2: | ||||||||||||||||||
| 990 | 5.000%, 10/01/27 | 10/23 at 100.00 | AA | 1,147,964 | ||||||||||||||
| 1,150 | 5.000%, 10/01/30 | 10/23 at 100.00 | AA | 1,304,456 | ||||||||||||||
| 1,205 | 5.000%, 10/01/31 | 10/23 at 100.00 | AA | 1,355,504 | ||||||||||||||
| Nuveen Investments | 79 |
Nuveen Ohio Municipal Bond Fund (continued)
Portfolio of Investments May 31, 2014
| Principal Amount (000) | Description (1) | Optional Call Provisions (2) | Ratings (3) | Value | ||||||||||||||
Tax Obligation/Limited (continued) | ||||||||||||||||||
| $ | 2,600 | Cleveland-Cuyahoga County Port Authority, Ohio, Development Revenue Bonds, R.I.T.A. Project, Series 2004, 5.000%, 11/15/19 – RAAI Insured | 11/14 at 100.00 | A– | $ | 2,633,644 | ||||||||||||
Columbiana Exempted Village School District, Columbiana County, Ohio, Certificates of Participation, Series 2010: | ||||||||||||||||||
| 1,400 | 5.000%, 12/01/26 – AGM Insured | 12/20 at 100.00 | AA | 1,552,082 | ||||||||||||||
| 1,645 | 5.000%, 12/01/28 – AGM Insured | 12/20 at 100.00 | AA | 1,816,146 | ||||||||||||||
Columbus-Franklin County Finance Authority, Ohio, Development Revenue Bonds, Hubbard Avenue Parking Facility Project, Series 2012A: | ||||||||||||||||||
| 500 | 4.500%, 12/01/27 | 12/19 at 100.00 | BBB | 497,995 | ||||||||||||||
| 685 | 5.000%, 12/01/32 | 12/19 at 100.00 | BBB | 688,432 | ||||||||||||||
| 555 | 5.000%, 12/01/36 | 12/19 at 100.00 | BBB | 547,985 | ||||||||||||||
Cuyhoga County, Ohio, Recovery Zone Facility Economic Development Revenue Bonds, Medical Mart-Convention Center Project, Series 2010F: | ||||||||||||||||||
| 2,710 | 5.250%, 12/01/25 | 12/20 at 100.00 | Aa2 | 3,094,007 | ||||||||||||||
| 3,250 | 5.000%, 12/01/27 | 12/20 at 100.00 | Aa2 | 3,599,018 | ||||||||||||||
| 1,700 | Delaware County District Library, Delaware, Franklin, Marion, Morrow and Union Counties, Ohio, Library Fund Library Facilities Special Obligation Notes, Series 2009, 5.000%, 12/01/34 | 12/19 at 100.00 | Aa2 | 1,835,014 | ||||||||||||||
| 5,615 | Franklin County Convention Facilities Authority, Ohio, Excise Tax and Lease Revenue Anticipation Bonds, Series 2005, 5.000%, 12/01/25 – AMBAC Insured | 12/15 at 100.00 | Aaa | 5,988,847 | ||||||||||||||
Franklin County Convention Facilities Authority, Ohio, Excise Tax and Lease Revenue Refunding Anticipation Bonds, Series 2007: | ||||||||||||||||||
| 2,215 | 5.000%, 12/01/26 | 12/17 at 100.00 | Aaa | 2,473,358 | ||||||||||||||
| 2,000 | 5.000%, 12/01/27 | 12/17 at 100.00 | Aaa | 2,233,280 | ||||||||||||||
| 1,675 | Greater Cleveland Regional Transit Authority, Ohio, Sales Tax Supported Capital Improvement Bonds, Refunding Series 2014A., 5.000%, 12/01/25 | No Opt. Call | AAA | 2,076,531 | ||||||||||||||
Hamilton County Convention Facilities Authority, Ohio, First Lien Revenue Bonds, Series 2004: | ||||||||||||||||||
| 2,300 | 5.000%, 12/01/20 – FGIC Insured | 6/14 at 100.00 | AA– | 2,308,326 | ||||||||||||||
| 2,535 | 5.000%, 12/01/22 – FGIC Insured | 6/14 at 100.00 | AA– | 2,544,405 | ||||||||||||||
| 5,800 | Hamilton County, Ohio, Sales Tax Bonds, Subordinate Lien, Series 2006A, 5.000%, 12/01/32 – AMBAC Insured | 12/16 at 100.00 | A+ | 6,230,882 | ||||||||||||||
Hamilton County, Ohio, Sales Tax Bonds, Subordinate Series 2000B: | ||||||||||||||||||
| 500 | 0.000%, 12/01/26 – AMBAC Insured | No Opt. Call | A+ | 312,905 | ||||||||||||||
| 3,300 | 0.000%, 12/01/28 – AMBAC Insured | No Opt. Call | A+ | 1,863,345 | ||||||||||||||
| 1,750 | 0.000%, 12/01/28 – AGM Insured | No Opt. Call | AA | 988,138 | ||||||||||||||
Hamilton County, Ohio, Sales Tax Revenue Bonds, Refunding Series 2011A: | ||||||||||||||||||
| 1,235 | 5.000%, 12/01/25 | 12/21 at 100.00 | A+ | 1,381,570 | ||||||||||||||
| 5,375 | 5.000%, 12/01/31 | 12/21 at 100.00 | A+ | 5,834,616 | ||||||||||||||
| 26,700 | JobsOhio Beverage System, Ohio, Statewide Liquor Profits Revenue Bonds, Senior Lien Series 2013A, 5.000%, 1/01/38 (Mandatory Put 1/01/23) | 1/23 at 100.00 | AA | 28,875,249 | ||||||||||||||
| 475 | Mahoning Career and Technology Center, Ohio, Certificate of Participation, Series 2009B, 4.750%, 12/01/36 | 12/17 at 100.00 | AA– | 494,969 | ||||||||||||||
Mayfield City School District, Ohio, Certificates of Participation, Middle School Project, Series 2009B: | ||||||||||||||||||
| 435 | 0.000%, 9/01/27 | No Opt. Call | Aa2 | 271,923 | ||||||||||||||
| 855 | 0.000%, 9/01/28 | No Opt. Call | Aa2 | 509,871 | ||||||||||||||
| 2,635 | 5.000%, 9/01/31 | 9/19 at 100.00 | Aa2 | 2,806,723 | ||||||||||||||
| 80 | Nuveen Investments |
| Principal Amount (000) | Description (1) | Optional Call Provisions (2) | Ratings (3) | Value | ||||||||||||||
Tax Obligation/Limited (continued) | ||||||||||||||||||
| $ | 2,015 | Milton Union Exempt Village School District, Ohio, Special Limited Obligation Bonds, Series 2009, 5.000%, 12/01/32 | 12/19 at 100.00 | A+ | $ | 2,171,888 | ||||||||||||
New Albany Community Authority, Ohio, Community Facilities Revenue Refunding Bonds, Series 2012C: | ||||||||||||||||||
| 1,100 | 5.000%, 10/01/23 | 10/22 at 100.00 | A1 | 1,272,788 | ||||||||||||||
| 110 | 5.000%, 10/01/24 | 10/22 at 100.00 | A1 | 125,635 | ||||||||||||||
| 400 | Riversouth Authority, Ohio, Lazarus Building Redevelopment Bonds, Series 2007A, 5.750%, 12/01/27 | 12/17 at 100.00 | N/R | 408,808 | ||||||||||||||
Riversouth Authority, Ohio, Riversouth Area Redevelopment Bonds, Refunding Series 2012A: | ||||||||||||||||||
| 1,400 | 5.000%, 12/01/23 | 12/22 at 100.00 | AA+ | 1,627,570 | ||||||||||||||
| 800 | 5.000%, 12/01/24 | 12/22 at 100.00 | AA+ | 923,344 | ||||||||||||||
| 93,530 | Total Tax Obligation/Limited | 97,755,779 | ||||||||||||||||
Transportation – 6.0% | ||||||||||||||||||
Cleveland, Ohio, Airport System Revenue Bonds, Series 2012A: | ||||||||||||||||||
| 7,000 | 5.000%, 1/01/29 | No Opt. Call | A– | 7,667,170 | ||||||||||||||
| 1,000 | 5.000%, 1/01/30 | 1/22 at 100.00 | A– | 1,091,840 | ||||||||||||||
| 3,450 | 5.000%, 1/01/31 – AGM Insured | 1/22 at 100.00 | AA | 3,771,643 | ||||||||||||||
| 1,000 | Columbus Regional Airport Authority, Ohio, Revenue Bonds, Refunding Series 2007, 5.000%, 1/01/28 – NPFG Insured | 1/17 at 100.00 | AA– | 1,086,180 | ||||||||||||||
Dayton, Ohio, Airport Revenue Bonds, James M. Cox International Airport, Series 2003C: | ||||||||||||||||||
| 1,025 | 5.250%, 12/01/27 – RAAI Insured (Alternative Minimum Tax) | 12/14 at 100.00 | A– | 1,026,353 | ||||||||||||||
| 1,000 | 5.350%, 12/01/32 – RAAI Insured (Alternative Minimum Tax) | 12/14 at 100.00 | A– | 1,000,780 | ||||||||||||||
| 10,000 | Ohio Turnpike Commission, Revenue Refunding Bonds, Series 1998A, 5.500%, 2/15/24 – FGIC Insured | No Opt. Call | AA | 12,397,100 | ||||||||||||||
| 2,450 | Ohio Turnpike Commission, Turnpike Revenue Bonds, Infrastructure Project, Junior Lien Series 2013A-1, 5.250%, 2/15/39 | 2/23 at 100.00 | A+ | 2,744,907 | ||||||||||||||
| 26,925 | Total Transportation | 30,785,973 | ||||||||||||||||
U.S. Guaranteed – 8.7% (5) | ||||||||||||||||||
| 3,590 | Canal Winchester Local School District, Franklin and Fairfield Counties, Ohio, General Obligation Bonds, Series 2005B, 5.000%, 12/01/27 – NPFG Insured (Pre-refunded 6/01/15) | 6/15 at 100.00 | Aa3 (5) | 3,762,428 | ||||||||||||||
| 2,515 | Canton City School District, Stark County, Ohio, General Obligation Bonds, Series 2005, 5.000%, 12/01/19 – NPFG Insured (Pre-refunded 6/01/15) | 6/15 at 100.00 | AA– (5) | 2,637,103 | ||||||||||||||
| 1,235 | Dayton, Ohio, Airport Revenue Bonds, James M. Cox International Airport, Series 2005B, 5.000%, 12/01/14 – SYNCORA GTY Insured (ETM) | No Opt. Call | A– (5) | 1,265,257 | ||||||||||||||
| 1,000 | Fairview Park, Ohio, General Obligation Bonds, Series 2005, 5.000%, 12/01/25 – NPFG Insured (Pre-refunded 12/01/15) | 12/15 at 100.00 | Aa2 (5) | 1,071,910 | ||||||||||||||
| 1,670 | Greater Cleveland Regional Transit Authority, Ohio, General Obligation Bonds, Capital Improvement Refunding Series 2004, 5.000%, 12/01/17 – NPFG Insured (Pre-refunded 12/01/14) | 12/14 at 100.00 | Aa2 (5) | 1,710,831 | ||||||||||||||
| 2,500 | Hubbard Exempt Village School District, Trumbull County, Ohio, General Obligation Bonds, Classroom Facilities Improvements, Series 2007, 5.000%, 12/01/34 – CIFG Insured (Pre-refunded 6/01/17) | 6/17 at 100.00 | A+ (5) | 2,821,525 | ||||||||||||||
| 1,400 | Kent City School District, Portage County, Ohio, General Obligation Library Improvement Bonds, Series 2004, 5.000%, 12/01/20 – FGIC Insured (Pre-refunded 12/01/14) | 12/14 at 100.00 | AA (5) | 1,434,300 | ||||||||||||||
| Nuveen Investments | 81 |
Nuveen Ohio Municipal Bond Fund (continued)
Portfolio of Investments May 31, 2014
| Principal Amount (000) | Description (1) | Optional Call Provisions (2) | Ratings (3) | Value | ||||||||||||||
U.S. Guaranteed (5) (continued) | ||||||||||||||||||
Kings Local School District, Warren County, Ohio, General Obligation Bonds, School Improvement Series 2005: | ||||||||||||||||||
| $ | 1,000 | 5.000%, 12/01/22 – NPFG Insured (Pre-refunded 12/01/15) | 12/15 at 100.00 | Aaa | $ | 1,071,910 | ||||||||||||
| 1,480 | 5.000%, 12/01/24 – NPFG Insured (Pre-refunded 12/01/15) | 12/15 at 100.00 | Aaa | 1,586,427 | ||||||||||||||
| 1,260 | Lancaster, Ohio, Wastewater System Improvement Revenue Bonds, Series 2004, 5.000%, 12/01/25 – AMBAC Insured (Pre-refunded 12/01/14) | 12/14 at 100.00 | N/R (5) | 1,290,870 | ||||||||||||||
| 1,190 | Marysville Exempted Village School District, Union County, Ohio, General Obligation Bonds, Series 2006., 5.000%, 12/01/24 – AGM Insured (Pre-refunded 12/01/15) | 12/15 at 100.00 | AA (5) | 1,275,573 | ||||||||||||||
| 1,000 | Mason City School District, Warren and Butler Counties, Ohio, General Obligation Bonds, Series 2007, 5.000%, 12/01/31 (Pre-refunded 6/01/17) | 6/17 at 100.00 | Aa1 (5) | 1,131,490 | ||||||||||||||
Montgomery County, Ohio, Revenue Bonds, Miami Valley Hospital, Series 2009A: | ||||||||||||||||||
| 2,000 | 6.250%, 11/15/33 (Pre-refunded 11/15/14) | 11/14 at 100.00 | Aa3 (5) | 2,054,880 | ||||||||||||||
| 1,125 | 6.250%, 11/15/39 (Pre-refunded 11/15/14) | 11/14 at 100.00 | Aa3 (5) | 1,155,870 | ||||||||||||||
Ohio Higher Educational Facilities Commission, Revenue Bonds, University of Dayton, Series 2004: | ||||||||||||||||||
| 1,315 | 5.000%, 12/01/25 – AMBAC Insured (Pre-refunded 12/01/14) | 12/14 at 100.00 | A (5) | 1,347,152 | ||||||||||||||
| 1,060 | 5.000%, 12/01/27 – AMBAC Insured (Pre-refunded 12/01/14) | 12/14 at 100.00 | A (5) | 1,085,917 | ||||||||||||||
| 1,900 | Ohio State Building Authority, State Facilities Bonds, Administrative Building Fund Projects, Series 2005A, 5.000%, 4/01/25 – AGM Insured (Pre-refunded 4/01/15) | 4/15 at 100.00 | AA (5) | 1,976,646 | ||||||||||||||
| 3,135 | Ohio State Building Authority, State Facilities Bonds, Adult Correctional Building Fund Project, Series 2005A, 5.000%, 4/01/23 – AGM Insured (Pre-refunded 4/01/15) | 4/15 at 100.00 | AA (5) | 3,261,466 | ||||||||||||||
| 1,650 | Ohio State Higher Educational Facilities Commission, Hospital Revenue Bonds, University Hospitals Health System, Series 2009, 6.750%, 1/15/39 (Pre-refunded 1/15/15) | 1/15 at 100.00 | A (5) | 1,718,260 | ||||||||||||||
| 1,580 | Ohio Water Development Authority, Loan Revenue Bonds, Pure Water Development, Series 1990I, 6.000%, 12/01/16 – AMBAC Insured (ETM) | No Opt. Call | Aaa | 1,670,945 | ||||||||||||||
| 530 | Ohio Water Development Authority, Revenue Bonds, Drinking Water Assistance Fund, State Match, Series 2008, 5.000%, 6/01/28 – AGM Insured (Pre-refunded 6/01/18) | 6/18 at 100.00 | AAA | 616,263 | ||||||||||||||
Ohio Water Development Authority, Water Pollution Control Loan Fund Revenue Bonds, Water Quality Project, Series 2005B: | ||||||||||||||||||
| 1,000 | 5.000%, 6/01/25 (Pre-refunded 6/01/15) | 6/15 at 100.00 | AAA | 1,048,550 | ||||||||||||||
| 645 | 5.000%, 6/01/25 (Pre-refunded 6/01/15) | 6/15 at 100.00 | AAA | 676,315 | ||||||||||||||
| 1,845 | Ohio, General Obligation Bonds, Infrastructure Improvement Series 2005A, 5.000%, 9/01/16 (Pre-refunded 3/01/15) | 3/15 at 100.00 | AA+ (5) | 1,912,324 | ||||||||||||||
Ohio, State Appropriation Lease Bonds, Parks and Recreation Capital Facilities, Series 2005A-II: | ||||||||||||||||||
| 1,000 | 5.250%, 2/01/19 – AGM Insured (Pre-refunded 2/01/15) | 2/15 at 100.00 | AA (5) | 1,034,130 | ||||||||||||||
| 1,000 | 5.250%, 2/01/20 – AGM Insured (Pre-refunded 2/01/15) | 2/15 at 100.00 | AA (5) | 1,034,130 | ||||||||||||||
| 1,495 | Otsego Local School District, Wood, Henry and Lucas Counties, Ohio, General Obligation Bonds, Series 2004, 5.380%, 12/01/22 – AGM Insured (Pre-refunded 12/01/14) | 12/14 at 100.00 | Aa3 (5) | 1,534,453 | ||||||||||||||
| 1,025 | University of Cincinnati, Ohio, General Receipts Bonds, Series 2004E, 5.000%, 6/01/21 – AMBAC Insured (Pre-refunded 12/01/14) | 12/14 at 100.00 | AA– (5) | 1,049,754 | ||||||||||||||
| 42,145 | Total U.S. Guaranteed | 44,236,679 | ||||||||||||||||
Utilities – 4.3% | ||||||||||||||||||
American Municipal Power Ohio Inc., General Revenue Bonds, Prairie State Energy Campus Project Series 2008A: | ||||||||||||||||||
| 1,000 | 5.000%, 2/15/31 | 2/18 at 100.00 | A1 | 1,081,190 | ||||||||||||||
| 5,000 | 5.250%, 2/15/43 | 2/18 at 100.00 | A1 | 5,510,950 | ||||||||||||||
| 82 | Nuveen Investments |
| Principal Amount (000) | Description (1) | Optional Call Provisions (2) | Ratings (3) | Value | ||||||||||||||
Utilities (continued) | ||||||||||||||||||
Cleveland, Ohio, Public Power System Revenue Bonds, Series 2008B: | ||||||||||||||||||
| $ | 4,740 | 0.000%, 11/15/34 – NPFG Insured | No Opt. Call | AA– | $ | 1,839,736 | ||||||||||||
| 2,000 | 5.000%, 11/15/38 – NPFG Insured | 5/18 at 100.00 | AA– | 2,155,500 | ||||||||||||||
| 7,500 | 0.000%, 11/15/38 – NPFG Insured | No Opt. Call | AA– | 2,251,950 | ||||||||||||||
| 2,800 | Ohio Air Quality Development Authority, Air Quality Revenue Refunding Bonds, Columbus Southern Power Company Project, Series 2009B, 5.800%, 12/01/38 (Mandatory Put 12/01/19) | 12/14 at 100.00 | Baa1 | 3,054,380 | ||||||||||||||
| 500 | Ohio Air Quality Development Authority, Ohio, Pollution Control Revenue Refunding Bonds, FirstEnergy Generation Corp. Project, Series 2010A, 3.380%, 7/01/33 (Mandatory Put 7/01/15) | 7/14 at 100.00 | BBB– | 510,930 | ||||||||||||||
| 500 | Ohio Air Quality Development Authority, Ohio, Revenue Bonds, FirstEnergy Generation Corp. Project, Series 2009A, 5.700%, 8/01/20 | No Opt. Call | BBB– | 579,155 | ||||||||||||||
| 4,400 | Ohio Air Quality Development Authority, Ohio, Revenue Bonds, Ohio Valley Electric Corporation Project, Series 2009E, 5.630%, 10/01/19 | No Opt. Call | BBB– | 4,989,732 | ||||||||||||||
| 28,440 | Total Utilities | 21,973,523 | ||||||||||||||||
Water and Sewer – 11.1% | ||||||||||||||||||
| 1,390 | Akron, Ohio, Waterworks System Mortgage Revenue Improvement Bonds, Refunding Series 2009, 5.000%, 3/01/34 – AGC Insured | 3/19 at 100.00 | A3 | 1,468,326 | ||||||||||||||
| 1,730 | Butler County, Ohio, Sewerage System Revenue Bonds, Series 2005, 5.000%, 12/01/23 – AGM Insured | No Opt. Call | Aa3 | 2,038,840 | ||||||||||||||
| 4,355 | Cincinnati, Ohio, Water System Revenue Bonds, Series 2007B, 5.000%, 12/01/32 | 12/17 at 100.00 | AAA | 4,875,335 | ||||||||||||||
| 865 | City of Marysville, Ohio, Water System Mortgage Revenue Bonds, Series 2007, 5.000%, 12/01/32 – AMBAC Insured | 12/17 at 100.00 | A1 | 953,083 | ||||||||||||||
Cleveland, Ohio, Water Revenue Bonds, Second Lien Series 2012A: | ||||||||||||||||||
| 1,500 | 5.000%, 1/01/24 | 1/22 at 100.00 | Aa2 | 1,778,700 | ||||||||||||||
| 775 | 5.000%, 1/01/26 | 1/22 at 100.00 | Aa2 | 905,487 | ||||||||||||||
| 1,000 | 5.000%, 1/01/27 | 1/22 at 100.00 | Aa2 | 1,160,890 | ||||||||||||||
| 10,280 | Cleveland, Ohio, Waterworks First Mortgage Revenue Refunding and Improvement Bonds, Series 1993G, 5.500%, 1/01/21 – NPFG Insured | No Opt. Call | Aa1 | 12,112,410 | ||||||||||||||
| 930 | Hamilton County, Ohio, Sewer System Revenue and Improvement Bonds, Metropolitan Sewer District of Greater Cincinnati, Series 2006A, 5.000%, 12/01/26 – NPFG Insured | 12/16 at 100.00 | AA+ | 1,030,142 | ||||||||||||||
| 450 | Ironton, Ohio, Sewer System Improvement Revenue Bonds, Series 2011, 5.250%, 12/01/40 – AGM Insured | 12/20 at 100.00 | A2 | 487,957 | ||||||||||||||
| 1,745 | Lebanon, Ohio, Waterworks System Revenue Bonds, Improvement and Refunding Series 2012, 5.000%, 12/01/31 | 12/21 at 100.00 | Aa3 | 1,931,575 | ||||||||||||||
| 5,590 | Marysville, Ohio, Wastewater Treatement System Revenue Bonds, Series 2007, 4.750%, 12/01/47 – SYNCORA GTY Insured | 12/17 at 100.00 | A– | 5,791,408 | ||||||||||||||
Marysville, Ohio, Wastewater Treatment System Revenue Bonds, Series 2006: | ||||||||||||||||||
| 1,755 | 5.250%, 12/01/25 – SYNCORA GTY Insured | 12/16 at 100.00 | A– | 1,944,663 | ||||||||||||||
| 80 | 4.750%, 12/01/46 – SYNCORA GTY Insured | 12/16 at 100.00 | A– | 82,932 | ||||||||||||||
| 8,500 | Northeast Ohio Regional Sewer District, Wastewater Improvement Revenue Bonds, Series 2013., 5.000%, 11/15/38 | 5/23 at 100.00 | AA+ | 9,581,030 | ||||||||||||||
| 3,125 | Northeast Ohio Regional Sewer District, Wastewater Improvement Revenue Bonds, Tender Option Bond Trust 3A, 17.998%, 11/15/43 (IF) | 5/23 at 100.00 | AA+ | 4,622,375 | ||||||||||||||
| Nuveen Investments | 83 |
Nuveen Ohio Municipal Bond Fund (continued)
Portfolio of Investments May 31, 2014
| Principal Amount (000) | Description (1) | Optional Call Provisions (2) | Ratings (3) | Value | ||||||||||||||
Water and Sewer (continued) | ||||||||||||||||||
Ohio Water Development Authority, Revenue Bonds, Water Development Community Assistance Program, Refunding Series 2009: | ||||||||||||||||||
| $ | 1,405 | 5.000%, 12/01/25 | 12/19 at 100.00 | Aa1 | $ | 1,637,542 | ||||||||||||
| 1,475 | 5.000%, 12/01/26 | 12/19 at 100.00 | Aa1 | 1,712,416 | ||||||||||||||
| 200 | Ohio Water Development Authority, Water Pollution Control Loan Fund Revenue Bonds, Water Quality Project, Series 2010A, 5.000%, 6/01/30 | 12/19 at 100.00 | AAA | 230,420 | ||||||||||||||
| 2,060 | Springboro, Ohio, Sewer System Mortgage Revenue Bonds, Refunding Series 2012, 5.000%, 6/01/27 | 6/22 at 100.00 | Aa3 | 2,349,636 | ||||||||||||||
| 49,210 | Total Water and Sewer | 56,695,167 | ||||||||||||||||
| $ | 478,870 | Total Long-Term Investments (cost $474,767,132) | 507,300,355 | |||||||||||||||
Other Assets Less Liabilities – 0.6% | 3,281,649 | |||||||||||||||||
Net Assets – 100% | $ | 510,582,004 | ||||||||||||||||
| (1) | All percentages shown in the Portfolio of Investments are based on net assets. |
| (2) | Optional Call Provisions (not covered by the report of independent registered public accounting firm): Dates (month and year) and prices of the earliest optional call or redemption. There may be other call provisions at varying prices at later dates. Certain mortgage-backed securities may be subject to periodic principal paydowns. |
| (3) | Ratings (not covered by the report of independent registered public accounting firm): Using the highest of Standard & Poor’s Group (“Standard & Poor’s”), Moody’s Investors Service, Inc. (“Moody’s”) or Fitch, Inc. (“Fitch”) rating. Ratings below BBB by Standard & Poor’s, Baa by Moody’s or BBB by Fitch are considered to be below investment grade. Holdings designated N/R are not rated by any of these national rating agencies. |
| (4) | Investment, or portion of investment, has been pledged to collateralize the net payment obligations for investments in inverse floating rate transactions. |
| (5) | Backed by an escrow or trust containing sufficient U.S. Government or U.S. Government agency securities, which ensure the timely payment of principal and interest. Certain bonds backed by U.S. Government or agency securities are regarded as having an implied rating equal to the rating of such securities. |
| (IF) | Inverse floating rate investment. |
| WI/DD | Investment, or portion of investment, purchased on a when-issued or delayed delivery basis. |
| (ETM) | Escrowed to maturity. |
See accompanying notes to financial statements.
| 84 | Nuveen Investments |
Nuveen Wisconsin Municipal Bond Fund
Portfolio of Investments May 31, 2014
| Principal Amount (000) | Description (1) | Optional Call Provisions (2) | Ratings (3) | Value | ||||||||||||||
LONG-TERM INVESTMENTS – 98.0% | ||||||||||||||||||
MUNICIPAL BONDS – 98.0% | ||||||||||||||||||
Education and Civic Organizations – 6.3% | ||||||||||||||||||
Madison Community Development Authority, Wisconsin, Revenue Bonds, The Wisconsin Alumni Research Foundation, Series 2009: | ||||||||||||||||||
| $ | 300 | 5.000%, 10/01/28 | 10/19 at 100.00 | AAA | $ | 351,000 | ||||||||||||
| 1,000 | 5.000%, 10/01/34 | 10/19 at 100.00 | AAA | 1,145,230 | ||||||||||||||
| 1,000 | Milwaukee Redevelopment Authority, Wisconsin, Milwaukee Science Education Consortium, Inc Project, Series 2013A, 6.000%, 8/01/33 | 8/23 at 100.00 | BBB– | 1,076,560 | ||||||||||||||
| 1,300 | Milwaukee Redevelopment Authority, Wisconsin, Revenue Bonds, Milwaukee School of Engineering Project, Series 2012, 4.100%, 4/01/32 – AGM Insured | 4/22 at 100.00 | AA | 1,358,357 | ||||||||||||||
| 550 | Puerto Rico Industrial, Tourist, Educational, Medical and Environmental Control Facilities Fin Authority, Higher Ed Rev and Rev Refunding Bonds, University of the Sacred Heart Project, Series 2012, 5.000%, 10/01/42 | No Opt. Call | BBB | 451,055 | ||||||||||||||
| 250 | Puerto Rico Industrial, Tourist, Educational, Medical and Environmental Control Facilities Financing Authority, Higher Education Revenue Refunding Bonds, Ana G. Mendez University System, Series 2002, 5.500%, 12/01/31 | 6/14 at 100.00 | BBB– | 228,478 | ||||||||||||||
| 1,060 | Puerto Rico Industrial, Tourist, Educational, Medical and Environmental Control Facilities Financing Authority, Higher Education Revenue Refunding Bonds, Ana G. Mendez University System, Series 2006, 5.000%, 3/01/36 | 3/16 at 100.00 | BBB– | 868,670 | ||||||||||||||
| 5,460 | Total Education and Civic Organizations | 5,479,350 | ||||||||||||||||
Health Care – 17.4% | ||||||||||||||||||
Monroe Redevelopment Authority, Wisconsin, Development Revenue Bonds, The Monroe Clinic, Inc., Series 2009: | ||||||||||||||||||
| 1,150 | 5.500%, 2/15/29 | 2/19 at 100.00 | A3 | 1,236,054 | ||||||||||||||
| 2,550 | 5.880%, 2/15/39 | 2/19 at 100.00 | A3 | 2,772,539 | ||||||||||||||
| 750 | Wisconsin Health and Educational Facilities Authority, Revenue Bonds, Beaver Dam Community Hospitals Inc., Series 2013A, 5.250%, 8/15/34 | 8/23 at 100.00 | BBB– | 789,660 | ||||||||||||||
| 1,230 | Wisconsin Health and Educational Facilities Authority, Revenue Bonds, Divine Savior Healthcare, Series 2006, 5.000%, 5/01/32 | 5/16 at 100.00 | BBB | 1,249,286 | ||||||||||||||
| 1,000 | Wisconsin Health and Educational Facilities Authority, Revenue Bonds, Froedtert Community Health, Inc. Obligated Group, Tender Option Bond Trust 3592, 18.160%, 4/01/17 (IF) (4) | No Opt. Call | AA– | 1,280,240 | ||||||||||||||
| 250 | Wisconsin Health and Educational Facilities Authority, Revenue Bonds, Froedtert Health Inc. Obligated Group, Tender option Bond Trust 3592, 14.179%, 10/01/20 (IF) (4) | No Opt. Call | AA– | 239,180 | ||||||||||||||
| 665 | Wisconsin Health and Educational Facilities Authority, Revenue Bonds, Howard Young Health Care, Inc., Refunding Series 2012, 5.000%, 8/15/22 | No Opt. Call | BBB+ | 724,105 | ||||||||||||||
| 1,000 | Wisconsin Health and Educational Facilities Authority, Revenue Bonds, Marshfield Clinic, Series 2006A, 5.380%, 2/15/34 | 2/16 at 100.00 | A– | 1,023,590 | ||||||||||||||
| 890 | Wisconsin Health and Educational Facilities Authority, Revenue Bonds, Marshfield Clinic, Series 2012B, 5.000%, 2/15/40 | 2/22 at 100.00 | A– | 941,825 | ||||||||||||||
| 1,350 | Wisconsin Health and Educational Facilities Authority, Revenue Bonds, Ministry Health Care, Inc., Refunding 2012C, 5.000%, 8/15/32 | 8/22 at 100.00 | A+ | 1,477,184 | ||||||||||||||
| 1,000 | Wisconsin Health and Educational Facilities Authority, Revenue Bonds, ThedaCare, Inc., Series 2009A, 5.500%, 12/15/38 | 12/19 at 100.00 | AA– | 1,075,940 | ||||||||||||||
| Nuveen Investments | 85 |
Nuveen Wisconsin Municipal Bond Fund (continued)
Portfolio of Investments May 31, 2014
| Principal Amount (000) | Description (1) | Optional Call Provisions (2) | Ratings (3) | Value | ||||||||||||||
Health Care (continued) | ||||||||||||||||||
| $ | 2,000 | Wisconsin Health and Educational Facilities Authority, Revenue Bonds, Wheaton Franciscan Healthcare System, Series 2006A, 5.250%, 8/15/19 | 8/16 at 100.00 | A– | $ | 2,162,560 | ||||||||||||
| 13,835 | Total Health Care | 14,972,163 | ||||||||||||||||
Housing/Multifamily – 9.4% | ||||||||||||||||||
| 2,000 | Hudson Housing Authority, Wisconsin, Multifamily Housing Revenue Bonds, Cedar Ridge Apartments Project, Series 2013A, 5.130%, 6/01/30 | 6/23 at 100.00 | N/R | 2,041,920 | ||||||||||||||
| 1,500 | Platteville Redevelopment Authority, Wisconsin, Revenue Bonds, University of Wisconsin – Platteville Real Estate Foundation Project, Series 2012A, 5.000%, 7/01/42 | 7/22 at 100.00 | BBB– | 1,531,515 | ||||||||||||||
| 1,380 | Puerto Rico Housing Finance Authority, Subordinate Lien Capital Fund Program Revenue Bonds, Modernization Series 2008, 5.130%, 12/01/27 | 12/18 at 100.00 | A+ | 1,387,424 | ||||||||||||||
| 2,000 | Wisconsin Housing and Economic Development Authority Multi Family Housing Bonds, Western Technical College Student Housing Project, Series 2013B, 4.700%, 4/01/38 | No Opt. Call | A | 2,145,580 | ||||||||||||||
| 970 | Wisconsin Housing and Economic Development Authority, Housing Revenue Bonds, Series 2006A, 4.550%, 5/01/27 (Alternative Minimum Tax) | 5/16 at 100.00 | AA | 982,300 | ||||||||||||||
| 7,850 | Total Housing/Multifamily | 8,088,739 | ||||||||||||||||
Housing/Single Family – 2.8% | ||||||||||||||||||
Wisconsin Housing and Economic Development Authority, Home Ownership Revenue Bonds, Series 2005E: | ||||||||||||||||||
| 1,000 | 4.900%, 11/01/35 | 5/15 at 100.00 | AA | 1,009,680 | ||||||||||||||
| 1,375 | 4.900%, 11/01/35 – AMBAC Insured | 5/15 at 100.00 | AA | 1,389,548 | ||||||||||||||
| 2,375 | Total Housing/Single Family | 2,399,228 | ||||||||||||||||
Long-Term Care – 3.0% | ||||||||||||||||||
| 1,000 | New Richmond Community Development Authority, Wisconsin, Health Care Facilities Revenue Bonds, PHM/New Richmond Senior Housing, Inc., Series 2011, 6.650%, 9/01/43 | 9/18 at 101.00 | N/R | 1,032,430 | ||||||||||||||
| 1,500 | Wisconsin Health and Educational Facilities Authority, Revenue Bonds, Three Pillars Senior Living Communities, Refunding Series 2013, 5.000%, 8/15/43 | 8/23 at 100.00 | A– | 1,554,780 | ||||||||||||||
| 2,500 | Total Long-Term Care | 2,587,210 | ||||||||||||||||
Tax Obligation/General – 1.8% | ||||||||||||||||||
| 500 | Guam Government, General Obligation Bonds, Series 2007A., 5.125%, 11/15/27 | 11/17 at 100.00 | BB– | 505,985 | ||||||||||||||
| 1,000 | Guam, General Obligation Bonds, Series 2007A, 5.000%, 11/15/23 | 11/17 at 100.00 | BB– | 1,020,800 | ||||||||||||||
| 1,500 | Total Tax Obligation/General | 1,526,785 | ||||||||||||||||
Tax Obligation/Limited – 45.8% | ||||||||||||||||||
| 650 | Beloit Community Development Authority, Rock County, Wisconsin, Lease Revenue Bonds, Series 2009, 5.000%, 3/01/25 | 3/18 at 100.00 | N/R | 694,207 | ||||||||||||||
| 2,000 | Glendale Community Development Authority, Wisconsin, Community Development Lease Revenue Bonds, Bayshore Public Parking Project, Series 2004A, 5.000%, 10/01/24 | 10/14 at 100.00 | A1 | 2,015,960 | ||||||||||||||
Glendale Community Development Authority, Wisconsin, Community Development Lease Revenue Refunding Bonds, Tax Increment District 7, Series 2011B: | ||||||||||||||||||
| 1,000 | 3.850%, 9/01/20 | 9/18 at 100.00 | A1 | 1,070,730 | ||||||||||||||
| 500 | 3.700%, 9/01/21 | 9/18 at 100.00 | A1 | 526,355 | ||||||||||||||
Glendale Community Development Authority, Wisconsin, Community Development Lease Revenue Refunding Bonds, Tax Increment District 7, Series 2012: | ||||||||||||||||||
| 100 | 1.850%, 9/01/18 | No Opt. Call | A1 | 101,970 | ||||||||||||||
| 500 | 2.750%, 9/01/22 | 9/20 at 100.00 | A1 | 505,635 | ||||||||||||||
| 86 | Nuveen Investments |
| Principal Amount (000) | Description (1) | Optional Call Provisions (2) | Ratings (3) | Value | ||||||||||||||
Tax Obligation/Limited (continued) | ||||||||||||||||||
Government of Guam, Business Privilege Tax Bonds, Series 2011A: | ||||||||||||||||||
| $ | 1,000 | 5.000%, 1/01/31 | 1/22 at 100.00 | A | $ | 1,055,800 | ||||||||||||
| 440 | 5.130%, 1/01/42 | 1/22 at 100.00 | A | 459,936 | ||||||||||||||
| 675 | Milwaukee Redevelopment Authority, Wisconsin, HSI Industrial I LLC Project Revenue Bonds, Series 2008, 5.130%, 6/01/29 | 6/16 at 100.00 | A2 | 720,853 | ||||||||||||||
| 1,300 | Milwaukee Redevelopment Authority, Wisconsin, Lease Revenue Bonds, Neighborhood Public Schools Initiative, Series 2007A, 4.000%, 8/01/23 – AMBAC Insured | 8/17 at 100.00 | Aa3 | 1,362,244 | ||||||||||||||
| 275 | Milwaukee Redevelopment Authority, Wisconsin, Lease Revenue Bonds, Public Schools, Series 2005A, 4.600%, 8/01/22 | 8/15 at 100.00 | A1 | 282,260 | ||||||||||||||
Neenah Community Development Authority, Wisconsin, Lease Revenue Bonds, Series 2008A: | ||||||||||||||||||
| 500 | 4.630%, 12/01/28 | 12/18 at 100.00 | A1 | 541,565 | ||||||||||||||
| 1,000 | 4.750%, 12/01/32 | 12/18 at 100.00 | A1 | 1,066,030 | ||||||||||||||
Oneida Tribe of Indians of Wisconsin, Retail Sales Revenue Bonds, Series 2011 – 144A: | ||||||||||||||||||
| 895 | 5.500%, 2/01/21 | No Opt. Call | AA– | 1,008,629 | ||||||||||||||
| 2,500 | 6.500%, 2/01/31 | 2/19 at 102.00 | AA– | 2,796,650 | ||||||||||||||
| 500 | Puerto Rico Convention Center District Authority, Hotel Occupancy Tax Revenue Bonds, Series 2006A, 5.000%, 7/01/31 – AMBAC Insured | 7/16 at 100.00 | BB+ | 452,945 | ||||||||||||||
Saint Francis Community Development Authority, Wisconsin, Lease Revenue Bonds, Series 2007: | ||||||||||||||||||
| 400 | 4.150%, 3/01/20 | 3/17 at 100.00 | A1 | 423,432 | ||||||||||||||
| 300 | 4.350%, 3/01/22 | 3/17 at 100.00 | A1 | 313,461 | ||||||||||||||
| 280 | 4.500%, 3/01/24 | 3/17 at 100.00 | A1 | 291,586 | ||||||||||||||
| 520 | 4.600%, 3/01/27 | 3/17 at 100.00 | A1 | 539,432 | ||||||||||||||
| 1,935 | Southeast Wisconsin Professional Baseball Park District, Sales Tax Revenue Refunding Bonds, Series 1998A, 5.500%, 12/15/26 – NPFG Insured | No Opt. Call | AA– | 2,379,141 | ||||||||||||||
| 1,220 | Sturgeon Bay Waterfront Redevelopment Authority, Wisconsin, Lease Revenue Bonds, Series 2006A, 4.500%, 10/01/21 | 10/16 at 100.00 | N/R | 1,274,571 | ||||||||||||||
| 1,305 | Sun Prairie Community Development Authority, Wisconsin, Lease Revenue Bonds, Tax Increment District 8, Series 2006, 4.250%, 8/01/25 | 8/16 at 100.00 | A1 | 1,396,063 | ||||||||||||||
| 1,000 | Virgin Islands Public Finance Authority, Gross Receipts Taxes Loan Note, Refunding Series 2012A., 5.000%, 10/01/32 – AGM Insured | No Opt. Call | AA | 1,098,110 | ||||||||||||||
| 1,000 | Virgin Islands Public Finance Authority, Gross Receipts Taxes Loan Note, Series 2012C, 5.000%, 10/01/42 | No Opt. Call | BBB+ | 1,061,140 | ||||||||||||||
| 1,145 | Virgin Islands Public Finance Authority, Matching Fund Loan Notes Revenue Bonds, Subordinate Lien Series 2010B, 5.250%, 10/01/29 | 10/20 at 100.00 | Baa2 | 1,225,333 | ||||||||||||||
Virgin Islands Public Finance Authority, Matching Fund Revenue Loan Note – Diageo Project, Series 2009A: | ||||||||||||||||||
| 1,130 | 6.630%, 10/01/29 | 10/19 at 100.00 | BBB | 1,264,854 | ||||||||||||||
| 240 | 6.750%, 10/01/37 | 10/19 at 100.00 | BBB | 267,029 | ||||||||||||||
| 1,000 | Weston Community Development Authority, Wisconsin, Lease Revenue Bonds, Series 2004A, 5.250%, 10/01/21 | 10/14 at 100.00 | A1 | 1,010,640 | ||||||||||||||
| 1,000 | Weston Community Development Authority, Wisconsin, Lease Revenue Bonds, Series 2005A, 5.000%, 10/01/21 | 10/15 at 100.00 | A1 | 1,028,480 | ||||||||||||||
| 320 | Winnebago County Housing Authority, Wisconsin, Housing Revenue Bonds, Group Home III Project, Series 1992A, 7.130%, 3/01/22 | 9/14 at 100.00 | N/R | 321,373 | ||||||||||||||
| Nuveen Investments | 87 |
Nuveen Wisconsin Municipal Bond Fund (continued)
Portfolio of Investments May 31, 2014
| Principal Amount (000) | Description (1) | Optional Call Provisions (2) | Ratings (3) | Value | ||||||||||||||
Tax Obligation/Limited (continued) | ||||||||||||||||||
Wisconsin Center District, Junior Dedicated Tax Revenue Bonds, Refunding Series 2013A: | ||||||||||||||||||
| $ | 785 | 4.000%, 12/15/25 | 12/22 at 100.00 | Baa1 | $ | 799,161 | ||||||||||||
| 3,170 | 5.000%, 12/15/28 | 12/22 at 100.00 | Baa1 | 3,559,466 | ||||||||||||||
Wisconsin Center District, Junior Dedicated Tax Revenue Refunding Bonds, Series 1999: | ||||||||||||||||||
| 2,985 | 5.250%, 12/15/23 – AGM Insured | No Opt. Call | AA | 3,526,718 | ||||||||||||||
| 765 | 5.250%, 12/15/27 – AGM Insured | No Opt. Call | A2 | 904,215 | ||||||||||||||
Wisconsin Center District, Senior Dedicated Tax Revenue Refunding Bonds, Series 2003A: | ||||||||||||||||||
| 1,945 | 0.000%, 7/10/14 – AGM Insured | No Opt. Call | A2 | 966,373 | ||||||||||||||
| 2,035 | 0.000%, 12/15/28 – AGM Insured | No Opt. Call | A2 | 1,219,921 | ||||||||||||||
| 38,315 | Total Tax Obligation/Limited | 39,532,268 | ||||||||||||||||
Transportation – 2.8% | ||||||||||||||||||
| 1,000 | Public Finance Authority, Wisconsin, Senior Airport Facilities Revenue and Refunding Bonds, TrIPS Obligated Group, Series 2012B, 5.000%, 7/01/42 (Alternative Minimum Tax) | 7/22 at 100.00 | BBB– | 1,014,570 | ||||||||||||||
| 1,000 | Virginia Small Business Financing Authority, Senior Lien Revenue Bonds, 95 Express Lanes LLC Project, Series 2012, 5.000%, 1/01/40 (Alternative Minimum Tax) | 1/22 at 100.00 | BBB– | 1,029,720 | ||||||||||||||
| 355 | Virginia Small Business Financing Authority, Senior Lien Revenue Bonds, Elizabeth River Crossing, Opco LLC Project, Series 2012, 5.250%, 1/01/32 (Alternative Minimum Tax) | 7/22 at 100.00 | BBB– | 380,219 | ||||||||||||||
| 2,355 | Total Transportation | 2,424,509 | ||||||||||||||||
U.S. Guaranteed – 4.4% (5) | ||||||||||||||||||
Southeast Wisconsin Professional Baseball Park District, Sales Tax Revenue Refunding Bonds, Series 1998A: | ||||||||||||||||||
| 900 | 5.500%, 12/15/18 – NPFG Insured (ETM) | No Opt. Call | AA– (5) | 1,073,034 | ||||||||||||||
| 1,220 | 5.500%, 12/15/20 – NPFG Insured (ETM) | No Opt. Call | AA– (5) | 1,507,920 | ||||||||||||||
| 1,000 | Wisconsin Health and Educational Facilities Authority, Revenue Bonds, Meriter Hospital, Inc., Series 2011A, 5.750%, 5/01/35 (Pre-refunded 5/01/21) | 5/21 at 100.00 | A (5) | 1,261,500 | ||||||||||||||
| 3,120 | Total U.S. Guaranteed | 3,842,454 | ||||||||||||||||
Utilities – 3.1% | ||||||||||||||||||
| 1,375 | Guam Power Authority, Revenue Bonds, Series 2012A., 5.000%, 10/01/30 – AGM Insured | 10/22 at 100.00 | AA | 1,527,666 | ||||||||||||||
| 1,200 | Virgin Islands Water and Power Authority, Electric System Revenue Bonds, Refunding Series 2007A, 5.000%, 7/01/25 | 7/17 at 100.00 | BB+ | 1,136,328 | ||||||||||||||
| 2,575 | Total Utilities | 2,663,994 | ||||||||||||||||
Water And Sewer – 1.2% | ||||||||||||||||||
| 1,000 | Guam Government Waterworks Authority, Water and Wastewater System Revenue Bonds, Series 2010, 5.630%, 7/01/40 | 7/20 at 100.00 | A– | 1,036,110 | ||||||||||||||
| $ | 80,885 | Total Long-Term Investments (cost $79,867,842) | 84,552,810 | |||||||||||||||
Other Assets Less Liabilities – 2.0% | 1,721,338 | |||||||||||||||||
Net Assets – 100% | $ | 86,274,148 | ||||||||||||||||
| 88 | Nuveen Investments |
| (1) | All percentages shown in the Portfolio of Investments are based on net assets. |
| (2) | Optional Call Provisions (not covered by the report of independent registered public accounting firm): Dates (month and year) and prices of the earliest optional call or redemption. There may be other call provisions at varying prices at later dates. Certain mortgage-backed securities may be subject to periodic principal paydowns. |
| (3) | Ratings (not covered by the report of independent registered public accounting firm): Using the highest of Standard & Poor’s Group (“Standard & Poor’s”), Moody’s Investors Service, Inc. (“Moody’s”) or Fitch, Inc. (“Fitch”) rating. Ratings below BBB by Standard & Poor’s, Baa by Moody’s or BBB by Fitch are considered to be below investment grade. Holdings designated N/R are not rated by any of these national rating agencies. |
| (4) | Investment, or portion of investment, has been pledged to collateralize the net payment obligations for investments in inverse floating rate transactions. |
| (5) | Backed by an escrow or trust containing sufficient U.S. Government or U.S. Government agency securities, which ensure the timely payment of principal and interest. Certain bonds backed by U.S. Government or agency securities are regarded as having an implied rating equal to the rating of such securities. |
| (IF) | Inverse floating rate investment. |
| 144A | Investment is exempt from registration under Rule 144A of the Securities Act of 1933, as amended. These investments may only be resold in transactions exempt from registration, which are normally those transactions with qualified institutional buyers. |
| (ETM) | Escrowed to maturity. |
See accompanying notes to financial statements.
| Nuveen Investments | 89 |
| Assets and Liabilities | May 31, 2014 |
| Kansas | Kentucky | Michigan | Missouri | Ohio | Wisconsin | |||||||||||||||||||
Assets | ||||||||||||||||||||||||
Long-term investments, at value (cost $188,861,773, $348,686,663, $146,977,539, $387,981,196, $474,767,132 and $79,867,842, respectively) | $ | 202,567,155 | $ | 374,086,474 | $ | 156,352,759 | $ | 415,597,721 | $ | 507,300,355 | $ | 84,552,810 | ||||||||||||
Short-term investments, at value (cost approximates value) | — | 7,000,000 | — | — | — | — | ||||||||||||||||||
Cash | — | 3,610,646 | 2,004,302 | — | — | 1,086,691 | ||||||||||||||||||
Receivable for: | ||||||||||||||||||||||||
Interest | 2,336,228 | 5,665,622 | 1,905,240 | 4,882,714 | 9,485,079 | 1,227,954 | ||||||||||||||||||
Investments sold | 2,933,078 | 8,506,950 | 1,431,526 | 4,338,922 | 21,452,256 | 500,000 | ||||||||||||||||||
Shares sold | 236,193 | 272,984 | 171,451 | 304,010 | 282,932 | 120,142 | ||||||||||||||||||
Other assets | 273 | 61,106 | 32,841 | 26,122 | 75,823 | 129 | ||||||||||||||||||
Total assets | 208,072,927 | 399,203,782 | 161,898,119 | 425,149,489 | 538,596,445 | 87,487,726 | ||||||||||||||||||
Liabilities | ||||||||||||||||||||||||
Cash overdraft | 68,057 | — | — | 1,000,833 | 10,498,703 | — | ||||||||||||||||||
Floating rate obligations | 9,420,000 | 5,650,000 | — | 2,225,000 | — | — | ||||||||||||||||||
Payable for: | ||||||||||||||||||||||||
Dividends | 124,501 | 196,749 | 165,339 | 529,381 | 542,025 | 64,504 | ||||||||||||||||||
Investments purchased | — | 12,591,470 | — | 2,790,059 | 15,620,871 | 966,373 | ||||||||||||||||||
Shares redeemed | 257,698 | 981,924 | 251,239 | 765,534 | 823,484 | 82,500 | ||||||||||||||||||
Accrued expenses: | ||||||||||||||||||||||||
Management fees | 85,674 | 161,625 | 69,858 | 181,340 | 223,335 | 37,048 | ||||||||||||||||||
Trustees fees | 2,045 | 63,791 | 33,971 | 29,007 | 79,408 | 851 | ||||||||||||||||||
12b-1 distribution and service fees | 54,229 | 87,382 | 34,609 | 60,986 | 92,291 | 18,171 | ||||||||||||||||||
Other | 69,164 | 93,142 | 61,449 | 91,766 | 134,324 | 44,131 | ||||||||||||||||||
Total liabilities | 10,081,368 | 19,826,083 | 616,465 | 7,673,906 | 28,014,441 | 1,213,578 | ||||||||||||||||||
Net assets | $ | 197,991,559 | $ | 379,377,699 | $ | 161,281,654 | $ | 417,475,583 | $ | 510,582,004 | $ | 86,274,148 | ||||||||||||
Class A Shares | ||||||||||||||||||||||||
Net assets | $ | 132,188,234 | $ | 309,200,155 | $ | 109,052,525 | $ | 226,752,524 | $ | 290,868,387 | $ | 49,057,056 | ||||||||||||
Shares outstanding | 12,169,340 | 27,821,474 | 9,409,734 | 19,996,556 | 25,260,335 | 4,593,347 | ||||||||||||||||||
Net asset value (“NAV”) per share | $ | 10.86 | $ | 11.11 | $ | 11.59 | $ | 11.34 | $ | 11.51 | $ | 10.68 | ||||||||||||
Offering price per share (NAV per share plus maximum sales charge of 4.20% of offering price) | $ | 11.34 | $ | 11.60 | $ | 12.10 | $ | 11.84 | $ | 12.01 | $ | 11.15 | ||||||||||||
Class C Shares | ||||||||||||||||||||||||
Net assets | $ | 1,177,088 | $ | 814,120 | $ | 387,849 | $ | 846,968 | $ | 1,648,340 | $ | 656,095 | ||||||||||||
Shares outstanding | 108,504 | 73,268 | 33,527 | 74,913 | 143,793 | 61,395 | ||||||||||||||||||
NAV and offering price per share | $ | 10.85 | $ | 11.11 | $ | 11.57 | $ | 11.31 | $ | 11.46 | $ | 10.69 | ||||||||||||
Class C2 Shares | ||||||||||||||||||||||||
Net assets | $ | 48,519,920 | $ | 53,886,497 | $ | 24,872,142 | $ | 32,307,779 | $ | 65,007,826 | $ | 15,195,789 | ||||||||||||
Shares outstanding | 4,472,083 | 4,848,861 | 2,149,083 | 2,855,706 | 5,665,601 | 1,421,716 | ||||||||||||||||||
NAV and offering price per share | $ | 10.85 | $ | 11.11 | $ | 11.57 | $ | 11.31 | $ | 11.47 | $ | 10.69 | ||||||||||||
Class I Shares | ||||||||||||||||||||||||
Net assets | $ | 16,106,317 | $ | 15,476,927 | $ | 26,969,138 | $ | 157,568,312 | $ | 153,057,451 | $ | 21,365,208 | ||||||||||||
Shares outstanding | 1,476,549 | 1,392,617 | 2,328,839 | 13,901,221 | 13,331,124 | 1,995,261 | ||||||||||||||||||
NAV and offering price per share | $ | 10.91 | $ | 11.11 | $ | 11.58 | $ | 11.33 | $ | 11.48 | $ | 10.71 | ||||||||||||
Net assets consist of: | ||||||||||||||||||||||||
Capital paid-in | $ | 189,866,003 | $ | 362,145,911 | $ | 150,574,652 | $ | 394,052,803 | $ | 482,277,660 | $ | 85,245,055 | ||||||||||||
Undistributed (Over-distribution of) net investment income | 906,411 | 446,041 | 601,952 | 1,362,291 | 2,053,060 | 391,190 | ||||||||||||||||||
Accumulated net realized gain (loss) | (6,486,237 | ) | (8,614,064 | ) | 729,830 | (5,556,036 | ) | (6,281,939 | ) | (4,047,065 | ) | |||||||||||||
Net unrealized appreciation (depreciation) | 13,705,382 | 25,399,811 | 9,375,220 | 27,616,525 | 32,533,223 | 4,684,968 | ||||||||||||||||||
Net assets | $ | 197,991,559 | $ | 379,377,699 | $ | 161,281,654 | $ | 417,475,583 | $ | 510,582,004 | $ | 86,274,148 | ||||||||||||
Authorized shares – per class | Unlimited | Unlimited | Unlimited | Unlimited | Unlimited | Unlimited | ||||||||||||||||||
Par value per share | $ | 0.01 | $ | 0.01 | $ | 0.01 | $ | 0.01 | $ | 0.01 | $ | 0.01 | ||||||||||||
See accompanying notes to financial statements.
| 90 | Nuveen Investments |
| Operations | Year Ended May 31, 2014 |
| Kansas | Kentucky | Michigan | Missouri | Ohio | Wisconsin | |||||||||||||||||||
Investment Income | $ | 10,015,708 | $ | 18,263,289 | $ | 8,335,730 | $ | 20,569,598 | $ | 26,128,978 | $ | 4,436,759 | ||||||||||||
Expenses | ||||||||||||||||||||||||
Management fees | 1,058,468 | 1,971,587 | 865,702 | 2,165,082 | 2,644,197 | 467,889 | ||||||||||||||||||
12b-1 service fees – Class A(1) | 275,048 | 634,926 | 231,547 | 454,359 | 597,445 | 100,719 | ||||||||||||||||||
12b-1 distribution and service fees – Class C(2) | 2,032 | 1,462 | 445 | 1,222 | 2,119 | 651 | ||||||||||||||||||
12b-1 distribution and service fees – Class C2(3) | 387,763 | 433,292 | 197,546 | 251,920 | 525,403 | 124,723 | ||||||||||||||||||
Interest expense | 54,222 | 31,391 | — | 5,464 | — | 4,427 | ||||||||||||||||||
Shareholder servicing agent fees and expenses | 99,256 | 147,060 | 91,158 | 149,220 | 254,717 | 45,879 | ||||||||||||||||||
Custodian fees and expenses | 42,889 | 66,367 | 35,180 | 75,489 | 98,634 | 26,816 | ||||||||||||||||||
Trustees fees and expenses | 5,734 | 10,913 | 4,692 | 11,791 | 14,625 | 2,472 | ||||||||||||||||||
Professional fees | 41,526 | 54,520 | 39,371 | 59,880 | 65,916 | 32,863 | ||||||||||||||||||
Shareholder reporting expenses | 27,850 | 42,780 | 25,367 | 33,426 | 59,682 | 13,418 | ||||||||||||||||||
Federal and state registration fees | 8,809 | 9,610 | 12,775 | 13,503 | 11,996 | 21,243 | ||||||||||||||||||
Other expenses | 11,774 | 16,814 | 11,000 | 15,586 | 19,110 | 8,573 | ||||||||||||||||||
Total expenses | 2,015,371 | 3,420,722 | 1,514,783 | 3,236,942 | 4,293,844 | 849,673 | ||||||||||||||||||
Net investment income (loss) | 8,000,337 | 14,842,567 | 6,820,947 | 17,332,656 | 21,835,134 | 3,587,086 | ||||||||||||||||||
Realized and Unrealized Gain (Loss) | ||||||||||||||||||||||||
Net realized gain (loss) from investments | (6,410,276 | ) | (5,289,277 | ) | 1,482,602 | (4,911,530 | ) | (4,273,553 | ) | (3,485,950 | ) | |||||||||||||
Change in net unrealized appreciation (depreciation) of investments | (629,259 | ) | (5,181,117 | ) | (6,399,762 | ) | (4,636,149 | ) | (10,813,011 | ) | (1,858,849 | ) | ||||||||||||
Net realized and unrealized gain (loss) | (7,039,535 | ) | (10,470,394 | ) | (4,917,160 | ) | (9,547,679 | ) | (15,086,564 | ) | (5,344,799 | ) | ||||||||||||
Net increase (decrease) in net assets from operations | $ | 960,802 | $ | 4,372,173 | $ | 1,903,787 | $ | 7,784,977 | $ | 6,748,570 | $ | (1,757,713 | ) | |||||||||||
| (1) | Includes distributions to shareholders of Kentucky, Missouri and Ohio’s Class B Shares during the period. Class B Shares of Kentucky and Missouri converted to Class A Shares at close of business on October 28, 2013, while Class B Shares of Ohio converted to Class A Shares on February 20, 2014. Class B Shares are no longer available through an exchange from other Nuveen mutual funds. |
| (2) | Class C Shares were established and commenced operations on February 10, 2014. |
| (3) | Class C2 Shares (formerly Class C Shares and renamed to Class C2 Shares on February 10, 2014) are available only through exchanges from other Nuveen municipal bond funds or for purposes of dividend reinvestment, but Class C2 Shares are not available for new accounts or for additional investment into existing accounts. |
See accompanying notes to financial statements.
| Nuveen Investments | 91 |
| Changes in Net Assets |
| Kansas | Kentucky | |||||||||||||||||
Year Ended 5/31/14 | Year Ended 5/31/13 | Year Ended 5/31/14 | Year Ended 5/31/13 | |||||||||||||||
Operations | ||||||||||||||||||
Net investment income (loss) | $ | 8,000,337 | $ | 8,211,161 | $ | 14,842,567 | $ | 16,599,477 | ||||||||||
Net realized gain (loss) from investments | (6,410,276 | ) | (166,829 | ) | (5,289,277 | ) | 363,961 | |||||||||||
Change in net unrealized appreciation (depreciation) of investments | (629,259 | ) | (1,350,702 | ) | (5,181,117 | ) | (4,705,356 | ) | ||||||||||
Net increase (decrease) in net assets from operations | 960,802 | 6,693,630 | 4,372,173 | 12,258,082 | ||||||||||||||
Distributions to Shareholders | ||||||||||||||||||
From net investment income: | ||||||||||||||||||
Class A(1) | (5,110,228 | ) | (5,819,165 | ) | (11,805,338 | ) | (13,658,037 | ) | ||||||||||
Class B | — | — | — | (33,590 | ) | |||||||||||||
Class C(2) | (5,910 | ) | — | (4,053 | ) | — | ||||||||||||
Class C2(3) | (1,627,406 | ) | (1,824,475 | ) | (1,831,539 | ) | (2,234,825 | ) | ||||||||||
Class I | (665,875 | ) | (673,549 | ) | (627,212 | ) | (751,938 | ) | ||||||||||
From accumulated net realized gains: | ||||||||||||||||||
Class A(1) | — | (1,152,232 | ) | — | — | |||||||||||||
Class B | — | — | — | — | ||||||||||||||
Class C(2) | — | — | — | — | ||||||||||||||
Class C2(3) | — | (425,220 | ) | — | — | |||||||||||||
Class I | — | (119,580 | ) | — | — | |||||||||||||
Decrease in net assets from distributions to shareholders | (7,409,419 | ) | (10,014,223 | ) | (14,268,142 | ) | (16,678,390 | ) | ||||||||||
Fund Share Transactions | ||||||||||||||||||
Proceeds from sale of shares | 19,492,391 | 55,533,352 | 19,906,293 | 59,774,700 | ||||||||||||||
Proceeds from shares issued to shareholders due to reinvestment of distributions | 5,747,147 | 7,416,690 | 11,829,046 | 12,915,623 | ||||||||||||||
| 25,239,538 | 62,950,042 | 31,735,339 | 72,690,323 | |||||||||||||||
Cost of shares redeemed | (70,375,954 | ) | (28,205,590 | ) | (107,069,891 | ) | (44,615,443 | ) | ||||||||||
Net increase (decrease) in net assets from Fund share transactions | (45,136,416 | ) | 34,744,452 | (75,334,552 | ) | 28,074,880 | ||||||||||||
Net increase (decrease) in net assets | (51,585,033 | ) | 31,423,859 | (85,230,521 | ) | 23,654,572 | ||||||||||||
Net assets at the beginning of period | 249,576,592 | 218,152,733 | 464,608,220 | 440,953,648 | ||||||||||||||
Net assets at the end of period | $ | 197,991,559 | $ | 249,576,592 | $ | 379,377,699 | $ | 464,608,220 | ||||||||||
Undistributed (Over-distribution of) net investment income at the end of period | $ | 906,411 | $ | 328,633 | $ | 446,041 | $ | (112,308 | ) | |||||||||
| (1) | Includes distributions to shareholders of Kentucky’s Class B Shares during the fiscal year ended May 31, 2014. Class B Shares of Kentucky converted to Class A Shares at the close of business on October 28, 2013 and are no longer available through an exchange from other Nuveen mutual funds. |
| (2) | Class C Shares were established and commenced operations on February 10, 2014. |
| (3) | Class C2 Shares (formerly Class C Shares and renamed to Class C2 Shares on February 10, 2014) are available only through exchanges from other Nuveen municipal bond funds or for purposes of dividend reinvestment, but Class C2 Shares are not available for new accounts or for additional investment into existing accounts. |
See accompanying notes to financial statements.
| 92 | Nuveen Investments |
| Michigan | Missouri | |||||||||||||||||
Year Ended 5/31/14 | Year Ended 5/31/13 | Year Ended 5/31/14 | Year Ended 5/31/13 | |||||||||||||||
Operations | ||||||||||||||||||
Net investment income (loss) | $ | 6,820,947 | $ | 7,992,560 | $ | 17,332,656 | $ | 18,437,018 | ||||||||||
Net realized gain (loss) from investments | 1,482,602 | 1,508,729 | (4,911,530 | ) | 351,660 | |||||||||||||
Change in net unrealized appreciation (depreciation) of investments | (6,399,762 | ) | (1,574,943 | ) | (4,636,149 | ) | (348,366 | ) | ||||||||||
Net increase (decrease) in net assets from operations | 1,903,787 | 7,926,346 | 7,784,977 | 18,440,312 | ||||||||||||||
Distributions to Shareholders | ||||||||||||||||||
From net investment income: | ||||||||||||||||||
Class A(1) | (4,650,286 | ) | (5,827,390 | ) | (9,043,327 | ) | (9,519,539 | ) | ||||||||||
Class B | — | — | — | (13,470 | ) | |||||||||||||
Class C(2) | (1,328 | ) | — | (3,690 | ) | — | ||||||||||||
Class C2(3) | (913,835 | ) | (1,049,372 | ) | (1,159,713 | ) | (1,204,090 | ) | ||||||||||
Class I | (1,105,433 | ) | (1,081,158 | ) | (6,747,777 | ) | (7,654,812 | ) | ||||||||||
From accumulated net realized gains: | ||||||||||||||||||
Class A(1) | (212,661 | ) | — | — | — | |||||||||||||
Class B | — | — | — | — | ||||||||||||||
Class C(2) | — | — | — | — | ||||||||||||||
Class C2(3) | (49,067 | ) | — | — | — | |||||||||||||
Class I | (49,322 | ) | — | — | — | |||||||||||||
Decrease in net assets from distributions to shareholders | (6,981,932 | ) | (7,957,920 | ) | (16,954,507 | ) | (18,391,911 | ) | ||||||||||
Fund Share Transactions | ||||||||||||||||||
Proceeds from sale of shares | 22,439,091 | 30,416,919 | 54,335,220 | 83,469,668 | ||||||||||||||
Proceeds from shares issued to shareholders due to reinvestment of distributions | 4,829,487 | 5,577,481 | 10,158,050 | 12,170,971 | ||||||||||||||
| 27,268,578 | 35,994,400 | 64,493,270 | 95,640,639 | |||||||||||||||
Cost of shares redeemed | (72,769,885 | ) | (31,585,272 | ) | (112,898,208 | ) | (75,700,488 | ) | ||||||||||
Net increase (decrease) in net assets from Fund share transactions | (45,501,307 | ) | 4,409,128 | (48,404,938 | ) | 19,940,151 | ||||||||||||
Net increase (decrease) in net assets | (50,579,452 | ) | 4,377,554 | (57,574,468 | ) | 19,988,552 | ||||||||||||
Net assets at the beginning of period | 211,861,106 | 207,483,552 | 475,050,051 | 455,061,499 | ||||||||||||||
Net assets at the end of period | $ | 161,281,654 | $ | 211,861,106 | $ | 417,475,583 | $ | 475,050,051 | ||||||||||
Undistributed (Over-distribution of) net investment income at the end of period | $ | 601,952 | $ | 458,650 | $ | 1,362,291 | $ | 1,012,344 | ||||||||||
| (1) | Includes distributions to shareholders of Missouri’s Class B Shares during the fiscal year ended May 31, 2014. Class B Shares of Missouri converted to Class A Shares at the close of business on October 28, 2013 and are no longer available through an exchange from other Nuveen mutual funds. |
| (2) | Class C Shares were established and commenced operations on February 10, 2014. |
| (3) | Class C2 Shares (formerly Class C Shares and renamed to Class C2 Shares on February 10, 2014) are available only through exchanges from other Nuveen municipal bond funds or for purposes of dividend reinvestment, but Class C2 Shares are not available for new accounts or for additional investment into existing accounts. |
See accompanying notes to financial statements.
| Nuveen Investments | 93 |
Statement of Changes in Net Assets (continued)
| Ohio | Wisconsin | |||||||||||||||||
Year Ended 5/31/14 | Year Ended 5/31/13 | Year Ended 5/31/14 | Year Ended 5/31/13 | |||||||||||||||
Operations | ||||||||||||||||||
Net investment income (loss) | $ | 21,835,134 | $ | 22,740,459 | $ | 3,587,086 | $ | 4,042,245 | ||||||||||
Net realized gain (loss) from investments | (4,273,553 | ) | 583,166 | (3,485,950 | ) | (166,198 | ) | |||||||||||
Change in net unrealized appreciation (depreciation) of investments | (10,813,011 | ) | 180,990 | (1,858,849 | ) | (917,537 | ) | |||||||||||
Net increase (decrease) in net assets from operations | 6,748,570 | 23,504,615 | (1,757,713 | ) | 2,958,510 | |||||||||||||
Distributions to Shareholders | ||||||||||||||||||
From net investment income: | ||||||||||||||||||
Class A(1) | (12,109,435 | ) | (12,999,178 | ) | (1,955,633 | ) | (2,042,055 | ) | ||||||||||
Class B | — | (58,881 | ) | — | — | |||||||||||||
Class C(2) | (6,459 | ) | — | (1,895 | ) | — | ||||||||||||
Class C2(3) | (2,466,152 | ) | (2,599,834 | ) | (554,005 | ) | (521,397 | ) | ||||||||||
Class I | (6,779,459 | ) | (7,575,470 | ) | (950,536 | ) | (1,399,753 | ) | ||||||||||
From accumulated net realized gains: | ||||||||||||||||||
Class A(1) | — | — | — | — | ||||||||||||||
Class B | — | — | — | — | ||||||||||||||
Class C(2) | — | — | — | — | ||||||||||||||
Class C2(3) | — | — | — | — | ||||||||||||||
Class I | — | — | — | — | ||||||||||||||
Decrease in net assets from distributions to shareholders | (21,361,505 | ) | (23,233,363 | ) | (3,462,069 | ) | (3,963,205 | ) | ||||||||||
Fund Share Transactions | ||||||||||||||||||
Proceeds from sale of shares | 66,020,153 | 113,249,153 | 15,614,994 | 46,774,815 | ||||||||||||||
Proceeds from shares issued to shareholders due to reinvestment of distributions | 14,317,138 | 14,946,825 | 2,593,371 | 2,855,941 | ||||||||||||||
| 80,337,291 | 128,195,978 | 18,208,365 | 49,630,756 | |||||||||||||||
Cost of shares redeemed | (168,924,167 | ) | (71,484,840 | ) | (46,606,606 | ) | (25,180,968 | ) | ||||||||||
Net increase (decrease) in net assets from Fund share transactions | (88,586,876 | ) | 56,711,138 | (28,398,241 | ) | 24,449,788 | ||||||||||||
Net increase (decrease) in net assets | (103,199,811 | ) | 56,982,390 | (33,618,023 | ) | 23,445,093 | ||||||||||||
Net assets at the beginning of period | 613,781,815 | 556,799,425 | 119,892,171 | 96,447,078 | ||||||||||||||
Net assets at the end of period | $ | 510,582,004 | $ | 613,781,815 | $ | 86,274,148 | $ | 119,892,171 | ||||||||||
Undistributed (Over-distribution of) net investment income at the end of period | $ | 2,053,060 | $ | 1,682,314 | $ | 391,190 | $ | 281,054 | ||||||||||
| (1) | Includes distributions to shareholders of Ohio’s Class B Shares during the fiscal year ended May 31, 2014. Class B Shares of Ohio converted to Class A Shares at the close of business on February 20, 2014 and are no longer available through an exchange from other Nuveen mutual funds. |
| (2) | Class C Shares were established and commenced operations on February 10, 2014. |
| (3) | Class C2 Shares (formerly Class C Shares and renamed to Class C2 Shares on February 10, 2014) are available only through exchanges from other Nuveen municipal bond funds or for purposes of dividend reinvestment, but Class C2 Shares are not available for new accounts or for additional investment into existing accounts. |
See accompanying notes to financial statements.
| 94 | Nuveen Investments |
THIS PAGE INTENTIONALLY LEFT BLANK
| Nuveen Investments | 95 |
Highlights
Kansas
Selected data for a share outstanding throughout each period:
| Investment Operations | Less Distributions | |||||||||||||||||||||||||||||||||
Class (Commencement Date)
Year Ended May 31, | Beginning NAV | Net Investment Income (Loss)(a) | Net Realized/ Unrealized Gain (Loss) | Total | From Net Investment Income | From Accumulated Net Realized Gains | Total | Ending NAV | ||||||||||||||||||||||||||
Class A (01/92) | ||||||||||||||||||||||||||||||||||
2014 | $ | 11.08 | $ | 0.42 | $ | (0.25 | ) | $ | 0.17 | $ | (0.39 | ) | $ | — | $ | (0.39 | ) | $ | 10.86 | |||||||||||||||
2013 | 11.21 | 0.40 | (0.05 | ) | 0.35 | (0.40 | ) | (0.08 | ) | (0.48 | ) | 11.08 | ||||||||||||||||||||||
2012 | 10.37 | 0.44 | 0.83 | 1.27 | (0.43 | ) | — | (0.43 | ) | 11.21 | ||||||||||||||||||||||||
2011 | 10.48 | 0.43 | (0.11 | ) | 0.32 | (0.43 | ) | — | (0.43 | ) | 10.37 | |||||||||||||||||||||||
2010 | 10.03 | 0.44 | 0.44 | 0.88 | (0.43 | ) | — | (0.43 | ) | 10.48 | ||||||||||||||||||||||||
Class C (02/14) | ||||||||||||||||||||||||||||||||||
2014(e) | 10.49 | 0.05 | 0.41 | 0.46 | (0.10 | ) | — | (0.10 | ) | 10.85 | ||||||||||||||||||||||||
Class C2 (02/97)(f) | ||||||||||||||||||||||||||||||||||
2014 | 11.06 | 0.36 | (0.24 | ) | 0.12 | (0.33 | ) | — | (0.33 | ) | 10.85 | |||||||||||||||||||||||
2013 | 11.20 | 0.34 | (0.06 | ) | 0.28 | (0.34 | ) | (0.08 | ) | (0.42 | ) | 11.06 | ||||||||||||||||||||||
2012 | 10.36 | 0.37 | 0.84 | 1.21 | (0.37 | ) | — | (0.37 | ) | 11.20 | ||||||||||||||||||||||||
2011 | 10.48 | 0.37 | (0.12 | ) | 0.25 | (0.37 | ) | — | (0.37 | ) | 10.36 | |||||||||||||||||||||||
2010 | 10.03 | 0.38 | 0.44 | 0.82 | (0.37 | ) | — | (0.37 | ) | 10.48 | ||||||||||||||||||||||||
Class I (02/97) | ||||||||||||||||||||||||||||||||||
2014 | 11.13 | 0.44 | (0.25 | ) | 0.19 | (0.41 | ) | — | (0.41 | ) | 10.91 | |||||||||||||||||||||||
2013 | 11.26 | 0.42 | (0.04 | ) | 0.38 | (0.43 | ) | (0.08 | ) | (0.51 | ) | 11.13 | ||||||||||||||||||||||
2012 | 10.42 | 0.46 | 0.83 | 1.29 | (0.45 | ) | — | (0.45 | ) | 11.26 | ||||||||||||||||||||||||
2011 | 10.53 | 0.45 | (0.11 | ) | 0.34 | (0.45 | ) | — | (0.45 | ) | 10.42 | |||||||||||||||||||||||
2010 | 10.07 | 0.46 | 0.45 | 0.91 | (0.45 | ) | — | (0.45 | ) | 10.53 | ||||||||||||||||||||||||
| 96 | Nuveen Investments |
| Ratios/Supplemental Data | ||||||||||||||||||||||||
| Ratios to Average Net Assets | ||||||||||||||||||||||||
| Total Return(b) | Ending Net Assets (000) | Expenses Including Interest(c) | Expenses Excluding Interest | Net Investment Income (Loss) | Portfolio Turnover Rate(d) | |||||||||||||||||||
| 1.72 | % | $ | 132,188 | 0.86 | % | 0.83 | % | 4.00 | % | 15 | % | |||||||||||||
| 3.13 | 166,022 | 0.84 | 0.81 | 3.53 | 10 | |||||||||||||||||||
| 12.43 | 151,334 | 0.86 | 0.83 | 4.03 | 36 | |||||||||||||||||||
| 3.10 | 122,629 | 0.83 | 0.82 | 4.12 | 16 | |||||||||||||||||||
| 8.67 | 120,162 | 0.84 | 0.84 | 4.27 | 18 | |||||||||||||||||||
| 4.37 | 1,177 | 1.66 | * | 1.63 | * | 3.08 | * | 15 | ||||||||||||||||
| 1.24 | 48,520 | 1.41 | 1.38 | 3.45 | 15 | |||||||||||||||||||
| 2.50 | 63,429 | 1.39 | 1.36 | 2.98 | 10 | |||||||||||||||||||
| 11.86 | 52,451 | 1.40 | 1.37 | 3.47 | 36 | |||||||||||||||||||
| 2.47 | 36,864 | 1.38 | 1.37 | 3.58 | 16 | |||||||||||||||||||
| 8.10 | 33,948 | 1.39 | 1.39 | 3.71 | 18 | |||||||||||||||||||
| 1.95 | 16,106 | 0.66 | 0.63 | 4.19 | 15 | |||||||||||||||||||
| 3.34 | 20,126 | 0.64 | 0.61 | 3.73 | 10 | |||||||||||||||||||
| 12.62 | 14,368 | 0.65 | 0.62 | 4.22 | 36 | |||||||||||||||||||
| 3.32 | 10,648 | 0.63 | 0.62 | 4.29 | 16 | |||||||||||||||||||
| 8.96 | 7,960 | 0.64 | 0.64 | 4.47 | 18 | |||||||||||||||||||
| (a) | Per share Net Investment Income (Loss) is calculated using the average daily shares method. |
| (b) | Total return is the combination of changes in NAV without any sales charge, reinvested dividend income at NAV and reinvested capital gains distributions at NAV, if any. Total returns are not annualized. |
| (c) | The expense ratios reflect, among other things, the interest expense deemed to have been paid by the Fund on the floating rate certificates issued by the special purpose trusts for the self-deposited inverse floaters held by the Fund, where applicable, as described in Note 3 – Portfolio Securities and Investments in Derivatives, Inverse Floating Rate Securities. |
| (d) | Portfolio Turnover Rate is calculated based on the lesser of long-term purchases or sales (as disclosed in Note 5 – Investment Transactions) divided by the average long-term market value during the period. |
| (e) | For the period February 10, 2014 (commencement of operations) through May 31, 2014. |
| (f) | Class C2 Shares (formerly Class C Shares and renamed to Class C2 Shares on February 10, 2014) are available only through exchanges from other Nuveen municipal bond funds or for purposes of dividend reinvestment, but Class C2 Shares are not available for new accounts or for additional investment into existing accounts. |
| * | Annualized. |
See accompanying notes to financial statements.
| Nuveen Investments | 97 |
Financial Highlights (continued)
Kentucky
Selected data for a share outstanding throughout each period:
| Investment Operations | Less Distributions | |||||||||||||||||||||||||||||||||
Class (Commencement Date)
Year Ended May 31, | Beginning NAV | Net Investment Income (Loss)(a) | Net Realized/ Unrealized Gain (Loss) | Total | From Net Investment | From Accumulated Net Realized Gains | Total | Ending NAV | ||||||||||||||||||||||||||
Class A (05/87) | ||||||||||||||||||||||||||||||||||
2014 | $ | 11.30 | $ | 0.42 | $ | (0.21 | ) | $ | 0.21 | $ | (0.40 | ) | $ | — | $ | (0.40 | ) | $ | 11.11 | |||||||||||||||
2013 | 11.40 | 0.42 | (0.09 | ) | 0.33 | (0.43 | ) | — | (0.43 | ) | 11.30 | |||||||||||||||||||||||
2012 | 10.69 | 0.46 | 0.70 | 1.16 | (0.45 | ) | — | (0.45 | ) | 11.40 | ||||||||||||||||||||||||
2011 | 10.85 | 0.46 | (0.18 | ) | 0.28 | (0.44 | ) | — | (0.44 | ) | 10.69 | |||||||||||||||||||||||
2010 | 10.39 | 0.44 | 0.46 | 0.90 | (0.44 | ) | — | ** | (0.44 | ) | 10.85 | |||||||||||||||||||||||
Class C (02/14) | ||||||||||||||||||||||||||||||||||
2014(e) | 10.83 | 0.04 | 0.34 | 0.38 | (0.10 | ) | — | (0.10 | ) | 11.11 | ||||||||||||||||||||||||
Class C2 (10/93)(f) | ||||||||||||||||||||||||||||||||||
2014 | 11.30 | 0.36 | (0.21 | ) | 0.15 | (0.34 | ) | — | (0.34 | ) | 11.11 | |||||||||||||||||||||||
2013 | 11.40 | 0.36 | (0.09 | ) | 0.27 | (0.37 | ) | — | (0.37 | ) | 11.30 | |||||||||||||||||||||||
2012 | 10.70 | 0.39 | 0.71 | 1.10 | (0.40 | ) | — | (0.40 | ) | 11.40 | ||||||||||||||||||||||||
2011 | 10.85 | 0.40 | (0.16 | ) | 0.24 | (0.39 | ) | — | (0.39 | ) | 10.70 | |||||||||||||||||||||||
2010 | 10.39 | 0.38 | 0.46 | 0.84 | (0.38 | ) | — | (0.38 | ) | 10.85 | ||||||||||||||||||||||||
Class I (02/97) | ||||||||||||||||||||||||||||||||||
2014 | 11.30 | 0.44 | (0.20 | ) | 0.24 | (0.43 | ) | — | (0.43 | ) | 11.11 | |||||||||||||||||||||||
2013 | 11.40 | 0.45 | (0.10 | ) | 0.35 | (0.45 | ) | — | (0.45 | ) | 11.30 | |||||||||||||||||||||||
2012 | 10.70 | 0.48 | 0.70 | 1.18 | (0.48 | ) | — | (0.48 | ) | 11.40 | ||||||||||||||||||||||||
2011 | 10.85 | 0.48 | (0.16 | ) | 0.32 | (0.47 | ) | — | (0.47 | ) | 10.70 | |||||||||||||||||||||||
2010 | 10.39 | 0.47 | 0.45 | 0.92 | (0.46 | ) | — | (0.46 | ) | 10.85 | ||||||||||||||||||||||||
| 98 | Nuveen Investments |
| Ratios/Supplemental Data | ||||||||||||||||||||||||
| Ratios to Average Net Assets | ||||||||||||||||||||||||
| Total Return(b) | Ending Net Assets (000) | Expenses Including Interest(c) | Expenses Excluding Interest | Net Investment Income (Loss) | Portfolio Turnover Rate(d) | |||||||||||||||||||
| 2.14 | % | $ | 309,200 | 0.80 | % | 0.79 | % | 3.87 | % | 12 | % | |||||||||||||
| 2.78 | 370,392 | 0.78 | 0.77 | 3.71 | 11 | |||||||||||||||||||
| 11.10 | 360,084 | 0.80 | 0.80 | 4.12 | 16 | |||||||||||||||||||
| 2.68 | 334,809 | 0.80 | 0.80 | 4.26 | 7 | |||||||||||||||||||
| 8.81 | 376,621 | 0.81 | 0.81 | 4.15 | 9 | |||||||||||||||||||
| 3.49 | 814 | 1.60 | * | 1.59 | * | 2.83 | * | 12 | ||||||||||||||||
| 1.66 | 53,886 | 1.35 | 1.34 | 3.32 | 12 | |||||||||||||||||||
| 2.16 | 72,984 | 1.33 | 1.32 | 3.15 | 11 | |||||||||||||||||||
| 10.44 | 63,378 | 1.35 | 1.35 | 3.56 | 16 | |||||||||||||||||||
| 2.22 | 51,820 | 1.35 | 1.35 | 3.71 | 7 | |||||||||||||||||||
| 8.20 | 55,515 | 1.36 | 1.36 | 3.59 | 9 | |||||||||||||||||||
| 2.36 | 15,477 | 0.60 | 0.59 | 4.07 | 12 | |||||||||||||||||||
| 3.00 | 20,609 | 0.58 | 0.57 | 3.90 | 11 | |||||||||||||||||||
| 11.24 | 15,992 | 0.60 | 0.60 | 4.30 | 16 | |||||||||||||||||||
| 3.01 | 10,967 | 0.60 | 0.60 | 4.46 | 7 | |||||||||||||||||||
| 9.00 | 7,453 | 0.61 | 0.61 | 4.35 | 9 | |||||||||||||||||||
| (a) | Per share Net Investment Income (Loss) is calculated using the average daily shares method. |
| (b) | Total return is the combination of changes in NAV without any sales charge, reinvested dividend income at NAV and reinvested capital gains distributions at NAV, if any. Total returns are not annualized. |
| (c) | The expense ratios reflect, among other things, the interest expense deemed to have been paid by the Fund on the floating rate certificates issued by the special purpose trusts for the self-deposited inverse floaters held by the Fund, where applicable, as described in Note 3 – Portfolio Securities and Investments in Derivatives, Inverse Floating Rate Securities. |
| (d) | Portfolio Turnover Rate is calculated based on the lesser of long-term purchases or sales (as disclosed in Note 5 – Investment Transactions) divided by the average long-term market value during the period. |
| (e) | For the period February 10, 2014 (commencement of operations) through May 31, 2014. |
| (f) | Class C2 Shares (formerly Class C Shares and renamed to Class C2 Shares on February 10, 2014) are available only through exchanges from other Nuveen municipal bond funds or for purposes of dividend reinvestment, but Class C2 Shares are not available for new accounts or for additional investment into existing accounts. |
| * | Annualized. |
| ** | Rounds to less than $.01 per share. |
See accompanying notes to financial statements.
| Nuveen Investments | 99 |
Financial Highlights (continued)
Michigan
Selected data for a share outstanding throughout each period:
| Investment Operations | Less Distributions | |||||||||||||||||||||||||||||||||
Class (Commencement Date)
Year Ended May 31, | Beginning NAV | Net Investment Income (Loss)(a) | Net Realized/ Unrealized Gain (Loss) | Total | From Net | From Accumulated Net Realized Gains | Total | Ending NAV | ||||||||||||||||||||||||||
Class A (06/85) | ||||||||||||||||||||||||||||||||||
2014 | $ | 11.77 | $ | 0.46 | $ | (0.17 | ) | $ | 0.29 | $ | (0.45 | ) | $ | (0.02 | ) | $ | (0.47 | ) | $ | 11.59 | ||||||||||||||
2013 | 11.77 | 0.45 | — | 0.45 | (0.45 | ) | — | (0.45 | ) | 11.77 | ||||||||||||||||||||||||
2012 | 11.08 | 0.47 | 0.67 | 1.14 | (0.45 | ) | — | (0.45 | ) | 11.77 | ||||||||||||||||||||||||
2011 | 11.19 | 0.47 | (0.12 | ) | 0.35 | (0.46 | ) | — | (0.46 | ) | 11.08 | |||||||||||||||||||||||
2010 | 10.83 | 0.46 | 0.36 | 0.82 | (0.46 | ) | — | (0.46 | ) | 11.19 | ||||||||||||||||||||||||
Class C (02/14) | ||||||||||||||||||||||||||||||||||
2014(e) | 11.22 | 0.03 | 0.43 | 0.46 | (0.11 | ) | — | (0.11 | ) | 11.57 | ||||||||||||||||||||||||
Class C2 (06/93)(f) | ||||||||||||||||||||||||||||||||||
2014 | 11.76 | 0.40 | (0.18 | ) | 0.22 | (0.39 | ) | (0.02 | ) | (0.41 | ) | 11.57 | ||||||||||||||||||||||
2013 | 11.76 | 0.39 | — | ** | 0.39 | (0.39 | ) | — | (0.39 | ) | 11.76 | |||||||||||||||||||||||
2012 | 11.08 | 0.41 | 0.66 | 1.07 | (0.39 | ) | — | (0.39 | ) | 11.76 | ||||||||||||||||||||||||
2011 | 11.18 | 0.41 | (0.11 | ) | 0.30 | (0.40 | ) | — | (0.40 | ) | 11.08 | |||||||||||||||||||||||
2010 | 10.83 | 0.40 | 0.35 | 0.75 | (0.40 | ) | — | (0.40 | ) | 11.18 | ||||||||||||||||||||||||
Class I (02/97) | ||||||||||||||||||||||||||||||||||
2014 | 11.77 | 0.48 | (0.18 | ) | 0.30 | (0.47 | ) | (0.02 | ) | (0.49 | ) | 11.58 | ||||||||||||||||||||||
2013 | 11.76 | 0.48 | — | ** | 0.48 | (0.47 | ) | — | (0.47 | ) | 11.77 | |||||||||||||||||||||||
2012 | 11.08 | 0.49 | 0.66 | 1.15 | (0.47 | ) | — | (0.47 | ) | 11.76 | ||||||||||||||||||||||||
2011 | 11.18 | 0.49 | (0.11 | ) | 0.38 | (0.48 | ) | — | (0.48 | ) | 11.08 | |||||||||||||||||||||||
2010 | 10.83 | 0.48 | 0.36 | 0.84 | (0.49 | ) | — | (0.49 | ) | 11.18 | ||||||||||||||||||||||||
| 100 | Nuveen Investments |
| Ratios/Supplemental Data | ||||||||||||||||||||||||
| Ratios to Average Net Assets | ||||||||||||||||||||||||
| Total Return(b) | Ending Net Assets (000) | Expenses Including Interest(c) | Expenses Excluding Interest | Net Investment Income (Loss) | Portfolio Turnover Rate(d) | |||||||||||||||||||
| 2.70 | % | $ | 109,053 | 0.84 | % | 0.84 | % | 4.11 | % | 10 | % | |||||||||||||
| 3.85 | 149,466 | 0.81 | 0.81 | 3.80 | 15 | |||||||||||||||||||
| 10.48 | 153,467 | 0.84 | 0.84 | 4.12 | 12 | |||||||||||||||||||
| 3.16 | 148,020 | 0.84 | 0.84 | 4.22 | 6 | |||||||||||||||||||
| 7.73 | 159,191 | 0.85 | 0.85 | 4.18 | 11 | |||||||||||||||||||
| 4.11 | 388 | 1.64 | * | 1.64 | * | 2.96 | * | 10 | ||||||||||||||||
| 2.05 | 24,872 | 1.40 | 1.40 | 3.57 | 10 | |||||||||||||||||||
| 3.33 | 32,084 | 1.36 | 1.36 | 3.25 | 15 | |||||||||||||||||||
| 9.81 | 30,129 | 1.38 | 1.38 | 3.58 | 12 | |||||||||||||||||||
| 2.70 | 29,681 | 1.39 | 1.39 | 3.67 | 6 | |||||||||||||||||||
| 7.05 | 30,655 | 1.40 | 1.40 | 3.63 | 11 | |||||||||||||||||||
| 2.84 | 26,969 | 0.65 | 0.65 | 4.31 | 10 | |||||||||||||||||||
| 4.15 | 30,311 | 0.61 | 0.61 | 4.00 | 15 | |||||||||||||||||||
| 10.59 | 23,887 | 0.63 | 0.63 | 4.32 | 12 | |||||||||||||||||||
| 3.46 | 19,397 | 0.64 | 0.64 | 4.42 | 6 | |||||||||||||||||||
| 7.87 | 19,888 | 0.65 | 0.65 | 4.38 | 11 | |||||||||||||||||||
| (a) | Per share Net Investment Income (Loss) is calculated using the average daily shares method. |
| (b) | Total return is the combination of changes in NAV without any sales charge, reinvested dividend income at NAV and reinvested capital gains distributions at NAV, if any. Total returns are not annualized. |
| (c) | The expense ratios reflect, among other things, the interest expense deemed to have been paid by the Fund on the floating rate certificates issued by the special purpose trusts for the self-deposited inverse floaters held by the Fund, where applicable, as described in Note 3 – Portfolio Securities and Investments in Derivatives, Inverse Floating Rate Securities. |
| (d) | Portfolio Turnover Rate is calculated based on the lesser of long-term purchases or sales (as disclosed in Note 5 – Investment Transactions) divided by the average long-term market value during the period. |
| (e) | For the period February 10, 2014 (commencement of operations) through May 31, 2014. |
| (f) | Class C2 Shares (formerly Class C Shares and renamed to Class C2 Shares on February 10, 2014) are available only through exchanges from other Nuveen municipal bond funds or for purposes of dividend reinvestment, but Class C2 Shares are not available for new accounts or for additional investment into existing accounts. |
| * | Annualized. |
| ** | Rounds to less than $.01 per share. |
See accompanying notes to financial statements.
| Nuveen Investments | 101 |
Financial Highlights (continued)
Missouri
Selected data for a share outstanding throughout each period:
| Investment Operations | Less Distributions | |||||||||||||||||||||||||||||||||
Class (Commencement Date)
Year Ended May 31, | Beginning NAV | Net Investment Income (Loss)(a) | Net Realized/ Unrealized Gain (Loss) | Total | From Net | From Accumulated Net Realized Gains | Total | Ending NAV | ||||||||||||||||||||||||||
Class A (08/87) | ||||||||||||||||||||||||||||||||||
2014 | $ | 11.51 | $ | 0.45 | $ | (0.18 | ) | $ | 0.27 | $ | (0.44 | ) | $ | — | $ | (0.44 | ) | $ | 11.34 | |||||||||||||||
2013 | 11.50 | 0.45 | 0.01 | 0.46 | (0.45 | ) | — | (0.45 | ) | 11.51 | ||||||||||||||||||||||||
2012 | 10.70 | 0.48 | 0.79 | 1.27 | (0.47 | ) | — | (0.47 | ) | 11.50 | ||||||||||||||||||||||||
2011 | 10.82 | 0.48 | (0.13 | ) | 0.35 | (0.47 | ) | — | (0.47 | ) | 10.70 | |||||||||||||||||||||||
2010 | 10.14 | 0.48 | 0.66 | 1.14 | (0.46 | ) | — | (0.46 | ) | 10.82 | ||||||||||||||||||||||||
Class C (02/14) | ||||||||||||||||||||||||||||||||||
2014(e) | 10.98 | 0.05 | 0.39 | 0.44 | (0.11 | ) | — | (0.11 | ) | 11.31 | ||||||||||||||||||||||||
Class C2 (02/94)(f) | ||||||||||||||||||||||||||||||||||
2014 | 11.48 | 0.39 | (0.18 | ) | 0.21 | (0.38 | ) | — | (0.38 | ) | 11.31 | |||||||||||||||||||||||
2013 | 11.48 | 0.38 | 0.01 | 0.39 | (0.39 | ) | — | (0.39 | ) | 11.48 | ||||||||||||||||||||||||
2012 | 10.68 | 0.41 | 0.80 | 1.21 | (0.41 | ) | — | (0.41 | ) | 11.48 | ||||||||||||||||||||||||
2011 | 10.80 | 0.42 | (0.13 | ) | 0.29 | (0.41 | ) | — | (0.41 | ) | 10.68 | |||||||||||||||||||||||
2010 | 10.13 | 0.42 | 0.66 | 1.08 | (0.41 | ) | — | (0.41 | ) | 10.80 | ||||||||||||||||||||||||
Class I (02/97) | ||||||||||||||||||||||||||||||||||
2014 | 11.50 | 0.47 | (0.18 | ) | 0.29 | (0.46 | ) | — | (0.46 | ) | 11.33 | |||||||||||||||||||||||
2013 | 11.50 | 0.47 | — | ** | 0.47 | (0.47 | ) | — | (0.47 | ) | 11.50 | |||||||||||||||||||||||
2012 | 10.70 | 0.48 | 0.81 | 1.29 | (0.49 | ) | — | (0.49 | ) | 11.50 | ||||||||||||||||||||||||
2011 | 10.82 | 0.50 | (0.13 | ) | 0.37 | (0.49 | ) | — | (0.49 | ) | 10.70 | |||||||||||||||||||||||
2010 | 10.14 | 0.50 | 0.67 | 1.17 | (0.49 | ) | — | (0.49 | ) | 10.82 | ||||||||||||||||||||||||
| 102 | Nuveen Investments |
| Ratios/Supplemental Data | ||||||||||||||||||||||||||
| Ratios to Average Net Assets | ||||||||||||||||||||||||||
| Total Return(b) | Ending (000) | Expenses Including Interest(c) | Expenses Excluding Interest | Net Investment Income (Loss) | Portfolio Turnover Rate(d) | |||||||||||||||||||||
| 2.53 | % | $ | 226,753 | 0.80 | % | 0.80 | % | 4.09 | % | 16 | % | |||||||||||||||
| 4.01 | 248,317 | 0.79 | 0.79 | 3.87 | 9 | |||||||||||||||||||||
| 12.08 | 233,521 | 0.83 | 0.83 | 4.28 | 8 | |||||||||||||||||||||
| 3.30 | 187,844 | 0.82 | 0.82 | 4.48 | 6 | |||||||||||||||||||||
| 11.49 | 196,974 | 0.83 | 0.83 | 4.52 | 6 | |||||||||||||||||||||
| 3.98 | 847 | 1.59 | * | 1.59 | * | 3.07 | * | 16 | ||||||||||||||||||
| 1.97 | 32,308 | 1.35 | 1.35 | 3.54 | 16 | |||||||||||||||||||||
| 3.39 | 37,936 | 1.34 | 1.34 | 3.31 | 9 | |||||||||||||||||||||
| 11.50 | 33,690 | 1.38 | 1.38 | 3.73 | 8 | |||||||||||||||||||||
| 2.74 | 26,958 | 1.37 | 1.37 | 3.93 | 6 | |||||||||||||||||||||
| 10.83 | 26,957 | 1.38 | 1.38 | 3.97 | 6 | |||||||||||||||||||||
| 2.75 | 157,568 | 0.60 | 0.60 | 4.28 | 16 | |||||||||||||||||||||
| 4.14 | 188,399 | 0.59 | 0.59 | 4.07 | 9 | |||||||||||||||||||||
| 12.28 | 187,304 | 0.63 | 0.63 | 4.34 | 8 | |||||||||||||||||||||
| 3.52 | 11,115 | 0.62 | 0.62 | 4.67 | 6 | |||||||||||||||||||||
| 11.74 | 9,235 | 0.63 | 0.63 | 4.72 | 6 | |||||||||||||||||||||
| (a) | Per share Net Investment Income (Loss) is calculated using the average daily shares method. |
| (b) | Total return is the combination of changes in NAV without any sales charge, reinvested dividend income at NAV and reinvested capital gains distributions at NAV, if any. Total returns are not annualized. |
| (c) | The expense ratios reflect, among other things, the interest expense deemed to have been paid by the Fund on the floating rate certificates issued by the special purpose trusts for the self-deposited inverse floaters held by the Fund, where applicable, as described in Note 3 – Portfolio Securities and Investments in Derivatives, Inverse Floating Rate Securities. |
| (d) | Portfolio Turnover Rate is calculated based on the lesser of long-term purchases or sales (as disclosed in Note 5 – Investment Transactions) divided by the average long-term market value during the period. |
| (e) | For the period February 10, 2014 (commencement of operations) through May 31, 2014. |
| (f) | Class C2 Shares (formerly Class C Shares and renamed to Class C2 Shares on February 10, 2014) are available only through exchanges from other Nuveen municipal bond funds or for purposes of dividend reinvestment, but Class C2 Shares are not available for new accounts or for additional investment into existing accounts. |
| * | Annualized. |
| ** | Rounds to less than $.01 per share. |
See accompanying notes to financial statements.
| Nuveen Investments | 103 |
Financial Highlights (continued)
Ohio
Selected data for a share outstanding throughout each period:
| Investment Operations | Less Distributions | |||||||||||||||||||||||||||||||||
Class (Commencement Date)
Year Ended May 31, | Beginning NAV | Net Investment Income (Loss)(a) | Net Realized/ Unrealized Gain (Loss) | Total | From Net | From Accumulated Net Realized Gains | Total | Ending NAV | ||||||||||||||||||||||||||
Class A (06/85) | ||||||||||||||||||||||||||||||||||
2014 | $ | 11.72 | $ | 0.47 | $ | (0.22 | ) | $ | 0.25 | $ | (0.46 | ) | $ | — | $ | (0.46 | ) | $ | 11.51 | |||||||||||||||
2013 | 11.70 | 0.45 | 0.03 | 0.48 | (0.46 | ) | — | (0.46 | ) | 11.72 | ||||||||||||||||||||||||
2012 | 11.01 | 0.49 | 0.67 | 1.16 | (0.47 | ) | — | (0.47 | ) | 11.70 | ||||||||||||||||||||||||
2011 | 11.18 | 0.48 | (0.18 | ) | 0.30 | (0.47 | ) | — | (0.47 | ) | 11.01 | |||||||||||||||||||||||
2010 | 10.77 | 0.48 | 0.39 | 0.87 | (0.46 | ) | — | (0.46 | ) | 11.18 | ||||||||||||||||||||||||
Class C (02/14) | ||||||||||||||||||||||||||||||||||
2014(e) | 11.15 | 0.05 | 0.37 | 0.42 | (0.11 | ) | — | (0.11 | ) | 11.46 | ||||||||||||||||||||||||
Class C2 (08/93)(f) | ||||||||||||||||||||||||||||||||||
2014 | 11.67 | 0.40 | (0.21 | ) | 0.19 | (0.39 | ) | — | (0.39 | ) | 11.47 | |||||||||||||||||||||||
2013 | 11.65 | 0.39 | 0.03 | 0.42 | (0.40 | ) | — | (0.40 | ) | 11.67 | ||||||||||||||||||||||||
2012 | 10.97 | 0.42 | 0.67 | 1.09 | (0.41 | ) | — | (0.41 | ) | 11.65 | ||||||||||||||||||||||||
2011 | 11.15 | 0.42 | (0.19 | ) | 0.23 | (0.41 | ) | — | (0.41 | ) | 10.97 | |||||||||||||||||||||||
2010 | 10.74 | 0.42 | 0.39 | 0.81 | (0.40 | ) | — | (0.40 | ) | 11.15 | ||||||||||||||||||||||||
Class I (02/97) | ||||||||||||||||||||||||||||||||||
2014 | 11.68 | 0.49 | (0.21 | ) | 0.28 | (0.48 | ) | — | (0.48 | ) | 11.48 | |||||||||||||||||||||||
2013 | 11.66 | 0.48 | 0.03 | 0.51 | (0.49 | ) | — | (0.49 | ) | 11.68 | ||||||||||||||||||||||||
2012 | 10.98 | 0.51 | 0.67 | 1.18 | (0.50 | ) | — | (0.50 | ) | 11.66 | ||||||||||||||||||||||||
2011 | 11.15 | 0.51 | (0.19 | ) | 0.32 | (0.49 | ) | — | (0.49 | ) | 10.98 | |||||||||||||||||||||||
2010 | 10.75 | 0.50 | 0.38 | 0.88 | (0.48 | ) | — | (0.48 | ) | 11.15 | ||||||||||||||||||||||||
| 104 | Nuveen Investments |
| Ratios/Supplemental Data | ||||||||||||||||||||||||||
| Ratios to Average Net Assets(g) | ||||||||||||||||||||||||||
| Total Return(b) | Ending Net Assets (000) | Expenses Including Interest(c) | Expenses Excluding Interest | Net Investment Income (Loss) | Portfolio Turnover Rate(d) | |||||||||||||||||||||
| 2.31 | % | $ | 290,868 | 0.81 | % | 0.81 | % | 4.18 | % | 16 | % | |||||||||||||||
| 4.16 | 339,849 | 0.79 | 0.79 | 3.83 | 9 | |||||||||||||||||||||
| 10.77 | 317,442 | 0.82 | 0.82 | 4.28 | 13 | |||||||||||||||||||||
| 2.75 | 292,694 | 0.82 | 0.82 | 4.40 | 10 | |||||||||||||||||||||
| 8.18 | 330,410 | 0.82 | 0.82 | 4.33 | 10 | |||||||||||||||||||||
| 3.79 | 1,648 | 1.59 | * | 1.59 | * | 3.11 | * | 16 | ||||||||||||||||||
| 1.80 | 65,008 | 1.36 | 1.36 | 3.63 | 16 | |||||||||||||||||||||
| 3.60 | 83,753 | 1.34 | 1.34 | 3.27 | 9 | |||||||||||||||||||||
| 10.13 | 68,344 | 1.37 | 1.37 | 3.73 | 13 | |||||||||||||||||||||
| 2.11 | 60,016 | 1.37 | 1.37 | 3.85 | 10 | |||||||||||||||||||||
| 7.62 | 63,181 | 1.37 | 1.37 | 3.78 | 10 | |||||||||||||||||||||
| 2.58 | 153,057 | 0.60 | 0.60 | 4.38 | 16 | |||||||||||||||||||||
| 4.38 | 188,571 | 0.59 | 0.59 | 4.03 | 9 | |||||||||||||||||||||
| 10.94 | 168,949 | 0.62 | 0.62 | 4.48 | 13 | |||||||||||||||||||||
| 2.98 | 109,802 | 0.62 | 0.62 | 4.60 | 10 | |||||||||||||||||||||
| 8.33 | 115,162 | 0.62 | 0.62 | 4.54 | 10 | |||||||||||||||||||||
| (a) | Per share Net Investment Income (Loss) is calculated using the average daily shares method. |
| (b) | Total return is the combination of changes in NAV without any sales charge, reinvested dividend income at NAV and reinvested capital gains distributions at NAV, if any. Total returns are not annualized. |
| (c) | The expense ratios reflect, among other things, the interest expense deemed to have been paid by the Fund on the floating rate certificates issued by the special purpose trusts for the self-deposited inverse floaters held by the Fund, where applicable, as described in Note 3 – Portfolio Securities and Investments in Derivatives, Inverse Floating Rate Securities. |
| (d) | Portfolio Turnover Rate is calculated based on the lesser of long-term purchases or sales (as disclosed in Note 5 – Investment Transactions) divided by the average long-term market value during the period. |
| (e) | For the period February 10, 2014 (commencement of operations) through May 31, 2014. |
| (f) | Class C2 Shares (formerly Class C Shares and renamed to Class C2 Shares on February 10, 2014) are available only through exchanges from other Nuveen municipal bond funds or for purposes of dividend reinvestment, but Class C2 Shares are not available for new accounts or for additional investment into existing accounts. |
| (g) | The Fund has a contractual fee waiver/expense reimbursement agreement with the Adviser, but did not receive a fee waiver and/or expense reimbursement during the periods presented herein. |
| * | Annualized. |
See accompanying notes to financial statements.
| Nuveen Investments | 105 |
Financial Highlights (continued)
Wisconsin
Selected data for a share outstanding throughout each period:
| Investment Operations | Less Distributions | |||||||||||||||||||||||||||||||||
Class (Commencement Date)
Year Ended May 31, | Beginning NAV | Net Investment Income (Loss)(a) | Net Realized/ Unrealized Gain (Loss) | Total | From Net | From Accumulated Net Realized Gains | Total | Ending NAV | ||||||||||||||||||||||||||
Class A (06/94) | ||||||||||||||||||||||||||||||||||
2014 | $ | 11.02 | $ | 0.41 | $ | (0.35 | ) | $ | 0.06 | $ | (0.40 | ) | $ | — | $ | (0.40 | ) | $ | 10.68 | |||||||||||||||
2013 | 11.09 | 0.40 | (0.07 | ) | 0.33 | (0.40 | ) | — | (0.40 | ) | 11.02 | |||||||||||||||||||||||
2012 | 10.28 | 0.43 | 0.78 | 1.21 | (0.40 | ) | — | (0.40 | ) | 11.09 | ||||||||||||||||||||||||
2011 | 10.39 | 0.39 | (0.12 | ) | 0.27 | (0.38 | ) | — | (0.38 | ) | 10.28 | |||||||||||||||||||||||
2010 | 9.95 | 0.38 | 0.44 | 0.82 | (0.38 | ) | — | (0.38 | ) | 10.39 | ||||||||||||||||||||||||
Class C (02/14) | ||||||||||||||||||||||||||||||||||
2014(e) | 10.27 | 0.04 | 0.48 | 0.52 | (0.10 | ) | — | (0.10 | ) | 10.69 | ||||||||||||||||||||||||
Class C2 (02/97)(f) | ||||||||||||||||||||||||||||||||||
2014 | 11.03 | 0.36 | (0.36 | ) | — | (0.34 | ) | — | (0.34 | ) | 10.69 | |||||||||||||||||||||||
2013 | 11.10 | 0.34 | (0.07 | ) | 0.27 | (0.34 | ) | — | (0.34 | ) | 11.03 | |||||||||||||||||||||||
2012 | 10.30 | 0.36 | 0.78 | 1.14 | (0.34 | ) | — | (0.34 | ) | 11.10 | ||||||||||||||||||||||||
2011 | 10.41 | 0.33 | (0.11 | ) | 0.22 | (0.33 | ) | — | (0.33 | ) | 10.30 | |||||||||||||||||||||||
2010 | 9.96 | 0.33 | 0.45 | 0.78 | (0.33 | ) | — | (0.33 | ) | 10.41 | ||||||||||||||||||||||||
Class I (02/97) | ||||||||||||||||||||||||||||||||||
2014 | 11.05 | 0.44 | (0.36 | ) | 0.08 | (0.42 | ) | — | (0.42 | ) | 10.71 | |||||||||||||||||||||||
2013 | 11.12 | 0.43 | (0.08 | ) | 0.35 | (0.42 | ) | — | (0.42 | ) | 11.05 | |||||||||||||||||||||||
2012 | 10.31 | 0.44 | 0.79 | 1.23 | (0.42 | ) | — | (0.42 | ) | 11.12 | ||||||||||||||||||||||||
2011 | 10.42 | 0.42 | (0.12 | ) | 0.30 | (0.41 | ) | — | (0.41 | ) | 10.31 | |||||||||||||||||||||||
2010 | 9.97 | 0.40 | 0.46 | 0.86 | (0.41 | ) | — | (0.41 | ) | 10.42 | ||||||||||||||||||||||||
| 106 | Nuveen Investments |
| Ratios/Supplemental Data | ||||||||||||||||||||||||||
| Ratios to Average Net Assets | ||||||||||||||||||||||||||
| Total Return(b) | Ending Net Assets (000) | Expenses Including Interest(c) | Expenses Excluding Interest | Net Investment Income (Loss) | Portfolio Turnover Rate(d) | |||||||||||||||||||||
| 0.76 | % | $ | 49,057 | 0.89 | % | 0.89 | % | 4.02 | % | 14 | % | |||||||||||||||
| 2.94 | 62,029 | 0.84 | 0.84 | 3.60 | 9 | |||||||||||||||||||||
| 11.96 | 51,124 | 0.87 | 0.87 | 3.94 | 19 | |||||||||||||||||||||
| 2.71 | 45,101 | 0.87 | 0.87 | 3.81 | 14 | |||||||||||||||||||||
| 8.42 | 50,270 | 0.90 | 0.90 | 3.75 | 6 | |||||||||||||||||||||
| 5.07 | 656 | 1.68 | * | 1.68 | * | 2.70 | * | 14 | ||||||||||||||||||
| 0.21 | 15,196 | 1.44 | 1.44 | 3.48 | 14 | |||||||||||||||||||||
| 2.39 | 20,924 | 1.39 | 1.39 | 3.04 | 9 | |||||||||||||||||||||
| 11.27 | 12,542 | 1.41 | 1.41 | 3.38 | 19 | |||||||||||||||||||||
| 2.17 | 9,105 | 1.42 | 1.42 | 3.26 | 14 | |||||||||||||||||||||
| 7.94 | 9,329 | 1.45 | 1.45 | 3.19 | 6 | |||||||||||||||||||||
| 0.99 | 21,365 | 0.68 | 0.68 | 4.21 | 14 | |||||||||||||||||||||
| 3.15 | 36,939 | 0.65 | 0.65 | 3.81 | 9 | |||||||||||||||||||||
| 12.16 | 32,782 | 0.66 | 0.66 | 4.13 | 19 | |||||||||||||||||||||
| 2.92 | 18,236 | 0.67 | 0.67 | 4.14 | 14 | |||||||||||||||||||||
| 8.73 | 2,605 | 0.70 | 0.70 | 3.94 | 6 | |||||||||||||||||||||
| (a) | Per share Net Investment Income (Loss) is calculated using the average daily shares method. |
| (b) | Total return is the combination of changes in NAV without any sales charge, reinvested dividend income at NAV and reinvested capital gains distributions at NAV, if any. Total returns are not annualized. |
| (c) | The expense ratios reflect, among other things, the interest expense deemed to have been paid by the Fund on the floating rate certificates issued by the special purpose trusts for the self-deposited inverse floaters held by the Fund, where applicable, as described in Note 3 – Portfolio Securities and Investments in Derivatives, Inverse Floating Rate Securities. |
| (d) | Portfolio Turnover Rate is calculated based on the lesser of long-term purchases or sales (as disclosed in Note 5 – Investment Transactions) divided by the average long-term market value during the period. |
| (e) | For the period February 10, 2014 (commencement of operations) through May 31, 2014. |
| (f) | Class C2 Shares (formerly Class C Shares and renamed to Class C2 Shares on February 10, 2014) are available only through exchanges from other Nuveen municipal bond funds or for purposes of dividend reinvestment, but Class C2 Shares are not available for new accounts or for additional investment into existing accounts. |
| * | Annualized. |
See accompanying notes to financial statements.
| Nuveen Investments | 107 |
Financial Statements
1. General Information and Significant Accounting Policies
General Information
Trust Information
The Nuveen Multistate Trust IV (the “Trust”), is an open-end investment company registered under the Investment Company Act of 1940, as amended. The Trust is comprised of the Nuveen Kansas Municipal Bond Fund (“Kansas”), Nuveen Kentucky Municipal Bond Fund (“Kentucky”), Nuveen Michigan Municipal Bond Fund (“Michigan”), Nuveen Missouri Municipal Bond Fund (“Missouri”), Nuveen Ohio Municipal Bond Fund (“Ohio”) and Nuveen Wisconsin Municipal Bond Fund (“Wisconsin”) (each a “Fund” and collectively, the “Funds”), as diversified funds (non-diversified for Wisconsin). The Trust was organized as a Massachusetts business trust on July 1, 1996. The Funds were each organized as a series of predecessor trusts or corporations prior to that date.
Investment Adviser
The Funds’ investment adviser is Nuveen Fund Advisors, LLC (the “Adviser”), a wholly-owned subsidiary of Nuveen Investments, Inc. (“Nuveen”). The Adviser is responsible for each Fund’s overall investment strategy and asset allocation decisions. The Adviser has entered into sub-advisory agreements with Nuveen Asset Management, LLC (the “Sub-Adviser”), a subsidiary of the Adviser, under which the Sub-Adviser manages the investment portfolios of the Funds.
Agreement and Plan of Merger
On April 14, 2014, TIAA-CREF, a national financial services organization, announced that it had entered into an agreement (the “Purchase Agreement”) to acquire Nuveen, the parent company of the Adviser. The transaction is expected to be completed by the end of the year, subject to customary closing conditions, including obtaining necessary Nuveen fund and client consents sufficient to satisfy the terms of the Purchase Agreement and obtaining customary regulatory approvals. There can be no assurance that the transaction described above will be consummated as contemplated or that necessary conditions will be satisfied.
The consummation of the transaction will be deemed to be an “assignment” (as defined in the Investment Company Act of 1940) of the investment management agreements between the Nuveen funds and the Adviser and the investment sub-advisory agreements between the Adviser and each Nuveen fund’s sub-adviser or sub-advisers, and will result in automatic termination of each agreement. It is anticipated that the Board of Directors/Trustees of the Nuveen funds will consider a new investment management agreement with the Adviser and new investment sub-advisory agreements with each sub-adviser. If approved by the Board of Directors/Trustees, the new agreements will be presented to the Nuveen funds’ shareholders for approval, and, if so approved by shareholders, will take effect upon consummation of the transaction or such later time as shareholder approval is obtained.
The transaction is not expected to result in any change in the portfolio management of the Funds or in the Funds’ investment objectives or policies.
Investment Objectives and Principal Investment Strategies
Each Fund’s investment objective is to provide as high a level of current interest income exempt from regular federal, its respective state and, in some cases, local income taxes as is consistent with preservation of capital. Under normal market conditions, each Fund invests at least 80% of the sum of its net assets and the amount of any borrowings for investment purposes in municipal bonds that pay interest that is exempt from regular federal and its respective state personal income tax. These municipal bonds include obligations issued by its respective state and its subdivisions, authorities, instrumentalities and corporations, as well as obligations issued by U.S. territories (such as Puerto Rico, the U.S. Virgin Islands and Guam) that pay interest that is exempt from regular federal and its respective state personal income tax. Each Fund may invest without limit in securities that generate income subject to the alternative minimum tax. Each Fund will generally maintain, under normal market conditions, an investment portfolio with an overall weighted average maturity in excess of 10 years.
Under normal market conditions, each Fund invests at least 80% of its net assets in investment grade municipal bonds rated BBB/Baa or higher at the time of purchase by at least one independent rating agency, or, if unrated, judged by the Sub-Adviser to be of comparable quality. Each Fund may invest up to 20% of its net assets in below investment grade municipal bonds, commonly referred to as “high yield” or “junk” bonds. Each Fund may invest in all types of municipal bonds, including general obligation bonds, revenue bonds and participation interests in municipal leases. Each Fund may invest in zero coupon bonds, which are issued at substantial discounts from their value at maturity and pay no cash income to their holders until they mature. Each Fund may invest up to 15% of its net assets in municipal securities whose interest payments vary inversely with changes in short-term tax-exempt interest rates (“inverse floaters”). Inverse floaters are derivative securities that provide leveraged exposure to underlying municipal bonds. Each Fund’s investments in inverse floaters are designed to increase the Fund’s income and returns through this leveraged exposure. These investments are speculative, however, and also create the possibility that income and returns will be diminished.
| 108 | Nuveen Investments |
Each Fund may utilize futures contracts, swap contracts, options on futures contracts and options on swap contracts in an attempt to manage market risk, credit risk and yield curve risk, and to manage the effective maturity or duration of securities in each Fund’s portfolio.
Class B Shares
During the current fiscal period, Kentucky, Missouri and Ohio offered Class B Shares. Effective at the close of business on October 28, 2013, Class B Shares of Kentucky and Missouri were converted to Class A Shares and effective at the close of business on February 20, 2014, Class B Shares of Ohio converted to Class A Shares. Class B Shares are no longer available through an exchange from other Nuveen mutual funds.
Class C and C2 Shares
Effective at the close of business on February 10, 2014, Class C Shares of the Funds were renamed to Class C2 Shares, and are available only through exchanges from other Nuveen municipal bond funds or for purposes of dividend reinvestment, but Class C2 Shares are not available for new accounts or for additional investment into existing accounts. On February 10, 2014, the Funds began offering a new form of Class C Shares.
Significant Accounting Policies
The following is a summary of significant accounting policies followed by the Funds in the preparation of their financial statements in accordance with accounting principles generally accepted in the United States (“U.S. GAAP”).
Investment Transactions
Investment transactions are recorded on a trade date basis. Realized gains and losses from investment transactions are determined on the specific identification method, which is the same basis used for federal income tax purposes. Investments purchased on a when-issued/delayed delivery basis may have extended settlement periods. Any investments so purchased are subject to market fluctuation during this period. The Funds have instructed the custodian to earmark securities in the Funds’ portfolios with a current value at least equal to the amount of the when-issued/delayed delivery purchase commitments.
As of May 31, 2014, the Funds’ outstanding when-issued/delayed delivery purchase commitments were as follows:
| Kansas | Kentucky | Michigan | Missouri | Ohio | Wisconsin | |||||||
| Outstanding when-issued/delayed delivery purchase commitments | $ — | $ — | $ — | $2,084,445 | $15,620,871 | $ — |
Investment Income
Interest income, which reflects the amortization of premiums and includes accretion of discounts for financial reporting purposes, is recorded on an accrual basis. Interest income also reflects paydowns gains and losses, if any.
Professional Fees
Professional fees presented on the Statement of Operations consist of legal fees incurred in the normal course of operations, audit fees, tax consulting fees and, in some cases, workout expenditures. Workout expenditures are incurred in an attempt to protect or enhance an investment or to pursue other claims or legal actions on behalf of Fund shareholders. If a refund is received for workout expenditures paid in a prior reporting period, such amounts will be recognized as “Legal fee refund” on the Statement of Operations.
Dividends and Distributions to Shareholders
Dividends from net investment income are declared daily and distributed to shareholders monthly. Fund shares begin to accrue dividends on the business day after the day when the monies used to purchase Fund shares are collected by the transfer agent.
Net realized capital gains and/or market discount from investment transactions, if any, are declared and distributed to shareholders at least annually. Furthermore, capital gains are distributed only to the extent they exceed available capital loss carryforwards.
Distributions to shareholders of net investment income, net realized capital gains and/or market discount, if any, are recorded on the ex-dividend date. The amount and timing of distributions are determined in accordance with federal income tax regulations, which may differ from U.S. GAAP.
Share Classes and Sales Charges
Class A Shares are generally sold with an up-front sales charge and incur a .20% annual 12b-1 service fee. Class A Share purchases of $1 million or more are sold at net asset value (“NAV”) without an up-front sales charge but may be subject to a contingent deferred sales charge (“CDSC”) if redeemed within eighteen months of purchase. Kentucky, Missouri and Ohio issued Class B Shares upon the exchange of Class B Shares from another Nuveen mutual fund or for purposes of dividend reinvestment, but Class B Shares were not available for new accounts or for additional investment into existing accounts.
| Nuveen Investments | 109 |
Notes to Financial Statements (continued)
Class B Shares were sold without an up-front sales charge but incurred a .75% annual 12b-1 distribution fee and a .20% annual 12b-1 service fee. Class B Shares were subject to a CDSC of up to 5% depending upon the length of time the shares were held by the investor (CDSC was reduced to 0% at the end of six years). Class B Shares automatically converted to Class A Shares eight years after purchase. Class C Shares are sold without an up-front sales charge but incur a .75% annual 12b-1 distribution fee and a .25% annual 12b-1 service fee. The Funds will issue Class C2 Shares upon the exchange of Class C2 Shares from another Nuveen mutual fund or for the purpose of dividend reinvestment, but Class C2 Shares are not available for new accounts or for additional investment into existing accounts. Class C2 Shares incur a .55% annual 12b-1 distribution fee and a .20% annual 12b-1
service fee. Class C and Class C2 Shares are subject to a CDSC of 1% if redeemed within twelve months of purchase. Class I Shares are not subject to any sales charge or 12b-1 distribution or service fees.
Multiclass Operations and Allocations
Income and expenses of the Funds that are not directly attributable to a specific class of shares are prorated among the classes based on the relative settled shares of each class. Expenses directly attributable to a class of shares, which presently only include 12b-1 distribution and service fees, are recorded to the specific class.
Realized and unrealized capital gains and losses of the Funds are prorated among the classes based on the relative net assets of each class.
Indemnifications
Under the Trust’s organizational documents, its officers and trustees are indemnified against certain liabilities arising out of the performance of their duties to the Trust. In addition, in the normal course of business, the Trust enters into contracts that provide general indemnifications to other parties. The Trust’s maximum exposure under these arrangements is unknown as this would involve future claims that may be made against the Trust that have not yet occurred. However, the Trust has not had prior claims or losses pursuant to these contracts and expects the risk of loss to be remote.
Netting Agreements
In the ordinary course of business, the Funds may enter into transactions subject to enforceable master repurchase agreements, International Swaps and Derivative Association, Inc. (“ISDA”) master agreements or other similar arrangements (“netting agreements”). Generally, the right to offset in netting agreements allows each Fund to offset any exposure to a specific counterparty with any collateral received or delivered to that counterparty based on the terms of the agreements. Generally, each Fund manages its cash collateral and securities collateral on a counterparty basis.
As of May 31, 2014, the Funds were not invested in any portfolio securities or derivative instruments that are subject to netting agreements.
Use of Estimates
The preparation of financial statements in conformity with U.S. GAAP requires management to make estimates and assumptions that affect the reported amounts of assets and liabilities at the date of the financial statements and the reported amounts of increases and decreases in net assets from operations during the reporting period. Actual results may differ from those estimates.
2. Investment Valuation and Fair Value Measurements
The fair valuation input levels as described below are for fair value measurement purposes.
Investment Valuation
Prices of fixed income securities are provided by a pricing service approved by the Nuveen funds’ Board of Directors/Trustees. The pricing service establishes a security’s fair value using methods that may include consideration of the following: yields or prices of investments of comparable quality, type of issue, coupon, maturity and rating, market quotes or indications of value from security dealers, evaluations of anticipated cash flows or collateral, general market conditions and other information and analysis, including the obligor’s credit characteristics considered relevant. These securities are generally classified as Level 2. In pricing certain securities, particularly less liquid and lower quality securities, the pricing service may consider information about a security, its issuer or market activity, provided by the Adviser. These securities are generally classified as Level 2 or Level 3 depending on the priority of the significant inputs.
Certain securities may not be able to be priced by the pre-established pricing methods as described above. Such securities may be valued by the Nuveen funds’ Board of Directors/Trustees or its designee at fair value. These securities generally include, but are not limited to, restricted securities (securities which may not be publicly sold without registration under the Securities Act of 1933, as amended) for which a pricing service is unable to provide a market price; securities whose trading has been formally suspended; debt securities that have gone into default and for which there is no current market quotation; a security whose market price is not available from a pre-established pricing source; a security with respect to which an event has occurred that is likely to materially affect the value of the security after the market has closed but before the calculation of a fund’s NAV (as may be
| 110 | Nuveen Investments |
the case in non-U.S. markets on which the security is primarily traded) or make it difficult or impossible to obtain a reliable market quotation; and a security whose price, as provided by the pricing service, is not deemed to reflect the security’s fair value. As a general principle, the fair value of a security would appear to be the amount that the owner might reasonably expect to receive for it in a current sale. A variety of factors may be considered in determining the fair value of such securities, which may include consideration of the following: yields or prices of investments of comparable quality, type of issue, coupon, maturity and rating, market quotes or indications of value from security dealers, evaluations of anticipated cash flows or collateral, general market conditions and other information and analysis, including the obligor’s credit characteristics considered relevant. These securities are generally classified as Level 2 or Level 3 depending on the priority of the significant inputs. Regardless of the method employed to value a particular security, all valuations are subject to review by the Nuveen funds’ Board of Directors/Trustees or its designee.
Fair Value Measurements
Fair value is defined as the price that would be received upon selling an investment or transferring a liability in an orderly transaction to an independent buyer in the principal or most advantageous market for the investment. A three-tier hierarchy is used to maximize the use of observable
market data and minimize the use of unobservable inputs and to establish classification of fair value measurements for disclosure purposes. Observable inputs reflect the assumptions market participants would use in pricing the asset or liability. Observable inputs are based on market data obtained from sources independent of the reporting entity. Unobservable inputs reflect the reporting entity’s own assumptions about the assumptions market participants would use in pricing the asset or liability. Unobservable inputs are based on the best information available in the circumstances. The following is a summary of the three-tiered hierarchy of valuation input levels.
| Level 1 – | Inputs are unadjusted and prices are determined using quoted prices in active markets for identical securities. | |
| Level 2 – | Prices are determined using other significant observable inputs (including quoted prices for similar securities, interest rates, prepayment speeds, credit risk, etc.). | |
| Level 3 – | Prices are determined using significant unobservable inputs (including management’s assumptions in determining the fair value of investments). |
The inputs or methodologies used for valuing securities are not an indication of the risks associated with investing in those securities. The following is a summary of each Fund’s fair value measurements as of the end of the reporting period:
| Kansas | Level 1 | Level 2 | Level 3 | Total | ||||||||||||
| Long-Term Investments*: | ||||||||||||||||
Municipal Bonds | $ | — | $ | 202,567,155 | $ | — | $ | 202,567,155 | ||||||||
| Kentucky | ||||||||||||||||
| Long-Term Investments*: | ||||||||||||||||
Municipal Bonds | $ | — | $ | 374,086,474 | $ | — | $ | 374,086,474 | ||||||||
| Short-Term Investments*: | ||||||||||||||||
Municipal Bonds | — | 7,000,000 | — | 7,000,000 | ||||||||||||
| Total | $ | — | $ | 381,086,474 | $ | — | $ | 381,086,474 | ||||||||
| Michigan | ||||||||||||||||
| Long-Term Investments*: | ||||||||||||||||
Municipal Bonds | $ | — | $ | 156,352,759 | $ | — | $ | 156,352,759 | ||||||||
| Missouri | ||||||||||||||||
| Long-Term Investments*: | ||||||||||||||||
Municipal Bonds | $ | — | $ | 415,597,721 | $ | — | $ | 415,597,721 | ||||||||
| Ohio | ||||||||||||||||
| Long-Term Investments*: | ||||||||||||||||
Municipal Bonds | $ | — | $ | 507,300,355 | $ | — | $ | 507,300,355 | ||||||||
| Wisconsin | ||||||||||||||||
| Long-Term Investments*: | ||||||||||||||||
Municipal Bonds | $ | — | $ | 84,552,810 | $ | — | $ | 84,552,810 | ||||||||
| * | Refer to the Fund’s Portfolio of Investments for industry classifications. |
| Nuveen Investments | 111 |
Notes to Financial Statements (continued)
The Nuveen funds’ Board of Directors/Trustees is responsible for the valuation process and has delegated the oversight of the daily valuation process to the Adviser’s Valuation Committee. The Valuation Committee, pursuant to the valuation policies and procedures adopted by the Board of Directors/ Trustees, is responsible for making fair value determinations, evaluating the effectiveness of the funds’ pricing policies and reporting to the Board of Directors/Trustees. The Valuation Committee is aided in its efforts by the Adviser’s dedicated Securities Valuation Team, which is responsible for administering the daily valuation process and applying fair value methodologies as approved by the Valuation Committee. When determining the reliability of independent pricing services for investments owned by the funds, the Valuation Committee, among other things, conducts due diligence reviews of the pricing services and monitors the quality of security prices received through various testing reports conducted by the Securities Valuation Team.
The Valuation Committee will consider pricing methodologies it deems relevant and appropriate when making a fair value determination, based on the facts and circumstances specific to the portfolio instrument. Fair value determinations generally will be derived as follows, using public or private market information:
| (i) | If available, fair value determinations shall be derived by extrapolating from recent transactions or quoted prices for identical or comparable securities. |
| (ii) | If such information is not available, an analytical valuation methodology may be used based on other available information including, but not limited to: analyst appraisals, research reports, corporate action information, issuer financial statements and shelf registration statements. Such analytical valuation methodologies may include, but are not limited to: multiple of earnings, discount from market value of a similar freely-traded security, discounted cash flow analysis, book value or a multiple thereof, risk premium/yield analysis, yield to maturity and/or fundamental investment analysis. |
The purchase price of a portfolio instrument will be used to fair value the instrument only if no other valuation methodology is available or deemed appropriate, and it is determined that the purchase price fairly reflects the instrument’s current value.
For each portfolio security that has been fair valued pursuant to the policies adopted by the Board of Directors/Trustees, the fair value price is compared against the last available and next available market quotations. The Valuation Committee reviews the results of such testing and fair valuation occurrences are reported to the Board of Directors/Trustees.
3. Portfolio Securities and Investments in Derivatives
Portfolio Securities
Inverse Floating Rate Securities
Each Fund is authorized to invest in inverse floating rate securities. An inverse floating rate security is created by depositing a municipal bond, typically with a fixed interest rate, into a special purpose trust created by a broker-dealer. In turn, this trust (a) issues floating rate certificates, in face amounts equal to some fraction of the deposited bond’s par amount or market value, that typically pay short-term tax-exempt interest rates to third parties, and (b) issues to a long-term investor (such as one of the Funds) an inverse floating rate certificate (sometimes referred to as an “inverse floater”) that represents all remaining or residual interest in the trust. The income received by the inverse floater holder varies inversely with the short-term rate paid to the floating rate certificates’ holders, and in most circumstances the inverse floater holder bears substantially all of the underlying bond’s downside investment risk and also benefits disproportionately from any potential appreciation of the underlying bond’s value. The price of an inverse floating rate security will be more volatile than that of the underlying bond because the interest rate is dependent on not only the fixed coupon rate of the underlying bond but also on the short-term interest paid on the floating rate certificates, and because the inverse floating rate security essentially bears the risk of loss of the greater face value of the underlying bond.
The inverse floater held by a Fund gives the Fund the right (a) to cause the holders of the floating rate certificates to tender their notes at par, and (b) to have the broker transfer the fixed-rate bond held by the trust to the Fund, thereby collapsing the trust.
A Fund may purchase an inverse floating rate security in a secondary market transaction without first owning the underlying bond (referred to as an “externally-deposited inverse floater”), or instead by first selling a fixed-rate bond to a broker-dealer for deposit into the special purpose trust and receiving in turn the residual interest in the trust (referred to as a “self-deposited inverse floater”).
An investment in an externally-deposited inverse floater is identified in the Portfolio of Investments as “(IF) – Inverse floating rate investment.” The Fund’s Statement of Assets and Liabilities shows only the inverse floaters and not the underlying bonds as an asset, and does not reflect the short-term floating rate certificates as liabilities. Also, the Fund reflects in “Investment Income” only the net amount of earnings on its inverse floater investment (net of the interest paid to the holders of the short-term floating rate certificates and the expenses of the trust), and does not show the amount of that interest paid as an interest expense on the Statement of Operations.
| 112 | Nuveen Investments |
An investment in a self-deposited inverse floater is accounted for as a financing transaction. In such instances, a fixed-rate bond deposited into a special purpose trust is identified in the Portfolio of Investments as “(UB) – Underlying bond of an inverse floating rate trust reflected as a financing transaction,” with the Fund accounting for the short-term floating rate certificates issued by the trust, at their liquidation value, as “Floating rate obligations” on the Statement of Assets and Liabilities. In addition, the Fund reflects in “Investment Income” the entire earnings of the underlying bond and recognizes the related interest paid to the holders of the short-term floating rate certificates as a component of “Interest expense” on the Statement of Operations.
The average floating rate obligations outstanding and average annual interest rate and fees related to self-deposited inverse floaters during the fiscal year ended May 31, 2014, were as follows:
| Kansas | Kentucky | Michigan | Missouri | Ohio | Wisconsin | |||||||||||||||||||
Average floating rate obligations outstanding | $ | 9,420,000 | $ | 5,650,000 | $ | — | $ | 2,225,000 | $ | — | $ | 789,041 | ||||||||||||
| Average annual interest rate and fees | 0.58% | 0.56% | — | % | 0.25% | — | % | 0.56% | ||||||||||||||||
As of May 31, 2014, the total amount of floating rate obligations issued by each Fund’s self-deposited inverse floaters and externally-deposited inverse floaters was as follows:
| Kansas | Kentucky | Michigan | Missouri | Ohio | Wisconsin | |||||||||||||||||||
Floating rate obligations: self-deposited inverse floaters | $ | 9,420,000 | $ | 5,650,000 | $ | — | $ | 2,225,000 | $ | — | $ | — | ||||||||||||
Floating rate obligations: externally-deposited inverse floaters | 5,250,000 | 22,500,000 | 3,150,000 | — | 32,100,000 | 3,750,000 | ||||||||||||||||||
| Total | $ | 14,670,000 | $ | 28,150,000 | $ | 3,150,000 | $ | 2,225,000 | $ | 32,100,000 | $ | 3,750,000 | ||||||||||||
Each Fund may also enter into shortfall and forbearance agreements (sometimes referred to as a “recourse trust” or “credit recovery swap”) (such agreements are referred to herein as “Recourse Trusts”), with a broker-dealer by which a Fund agrees to reimburse the broker-dealer, in certain circumstances, for the difference between the liquidation value of the fixed-rate bond held by the trust and the liquidation value of the floating rate certificates issued by the trust plus any shortfalls in interest cash flows. Under these agreements, a Fund’s potential exposure to losses related to or on inverse floaters may increase beyond the value of a Fund’s inverse floater investments as a Fund may potentially be liable to fulfill all amounts owed to holders of the floating rate certificates. At period end, any such shortfall is denoted as “Unrealized depreciation on Recourse Trusts” on the Statement of Assets and Liabilities.
As of May 31, 2014, each Fund’s maximum exposure to the floating rate obligations issued by externally-deposited Recourse Trusts was as follows:
| Kansas | Kentucky | Michigan | Missouri | Ohio | Wisconsin | |||||||||||||||||||
| Maximum exposure to Recourse Trusts | $ | 5,250,000 | $ | 15,000,000 | $ | 3,150,000 | $ | — | $ | 13,125,000 | $ | 3,750,000 | �� | |||||||||||
Zero Coupon Securities
A zero coupon security does not pay a regular interest coupon to its holders during the life of the security. Income to the holder of the security comes from accretion of the difference between the original purchase price of the security at issuance and the par value of the security at maturity and is effectively paid at maturity. The market prices of zero coupon securities generally are more volatile than the market prices of securities that pay interest periodically.
Investments in Derivatives
Each Fund is authorized to invest in certain derivative instruments. The Funds record derivative instruments at fair value, with changes in fair value recognized on the Statement of Operations, when applicable. Even though the Funds’ investments in derivatives may represent economic hedges, they are not considered to be hedge transactions for financial reporting purposes.
Although the Funds are authorized to invest in derivative instruments, and may do so in the future, they did not make any such investments during the fiscal year ended May 31, 2014.
Market and Counterparty Credit Risk
In the normal course of business each Fund may invest in financial instruments and enter into financial transactions where risk of potential loss exists due to changes in the market (market risk) or failure of the other party to the transaction to perform (counterparty credit risk). The potential loss could exceed the value of the financial assets recorded on the financial statements. Financial assets, which potentially expose each Fund to counterparty credit risk, consist principally of cash due from counterparties on forward, option and swap transactions, when applicable. The extent of each Fund’s exposure to counterparty credit risk in respect to these financial assets approximates their carrying value as recorded on the Statement of Assets and Liabilities.
| Nuveen Investments | 113 |
Notes to Financial Statements (continued)
Each Fund helps manage counterparty credit risk by entering into agreements only with counterparties the Adviser believes have the financial resources to honor their obligations and by having the Adviser monitor the financial stability of the counterparties. Additionally, counterparties may be required to pledge collateral daily (based on the daily valuation of the financial asset) on behalf of each Fund with a value approximately equal to the amount of any unrealized gain above a pre-determined threshold. Reciprocally, when each Fund has an unrealized loss, the Funds have instructed the custodian to pledge assets of the Funds as collateral with a value approximately equal to the amount of the unrealized loss above a pre-determined threshold. Collateral pledges are monitored and subsequently adjusted if and when the valuations fluctuate, either up or down, by at least the pre-determined threshold amount.
4. Fund Shares
Transactions in Fund shares were as follows:
| Kansas | ||||||||||||||||
| Year Ended 5/31/14 | Year Ended 5/31/13 | |||||||||||||||
| Shares | Amount | Shares | Amount | |||||||||||||
| Shares sold: | ||||||||||||||||
Class A | 939,239 | $ | 9,898,414 | 2,805,718 | $ | 31,756,679 | ||||||||||
Class C | 108,045 | 1,145,606 | — | — | ||||||||||||
Class C2 | 317,111 | 3,313,077 | 1,464,331 | 16,543,709 | ||||||||||||
Class I | 484,255 | 5,135,294 | 637,827 | 7,232,964 | ||||||||||||
| Shares issued to shareholders due to reinvestment of distributions: | ||||||||||||||||
Class A | 390,601 | 4,096,341 | 468,879 | 5,307,088 | ||||||||||||
Class C | 488 | 5,235 | — | — | ||||||||||||
Class C2 | 122,392 | 1,281,911 | 144,904 | 1,638,522 | ||||||||||||
Class I | 34,543 | 363,660 | 41,460 | 471,080 | ||||||||||||
| 2,396,674 | 25,239,538 | 5,563,119 | 62,950,042 | |||||||||||||
| Shares redeemed: | ||||||||||||||||
Class A | (4,144,768 | ) | (43,723,654 | ) | (1,791,002 | ) | (20,199,747 | ) | ||||||||
Class C | (29 | ) | (315 | ) | — | — | ||||||||||
Class C2 | (1,700,002 | ) | (17,761,711 | ) | (561,025 | ) | (6,340,112 | ) | ||||||||
Class I | (850,901 | ) | (8,890,274 | ) | (146,974 | ) | (1,665,731 | ) | ||||||||
| (6,695,700 | ) | (70,375,954 | ) | (2,499,001 | ) | (28,205,590 | ) | |||||||||
| Net increase (decrease) | (4,299,026 | ) | $ | (45,136,416 | ) | 3,064,118 | $ | 34,744,452 | ||||||||
| 114 | Nuveen Investments |
| Kentucky | ||||||||||||||||
| Year Ended 5/31/14 | Year Ended 5/31/13 | |||||||||||||||
| Shares | Amount | Shares | Amount | |||||||||||||
| Shares sold: | ||||||||||||||||
Class A | 1,060,852 | $ | 11,434,756 | 3,115,456 | $ | 35,689,099 | ||||||||||
Class A – automatic conversion of Class B Shares | 30,733 | 329,407 | 3,004 | 34,268 | ||||||||||||
Class B – exchanges | 28 | 301 | — | — | ||||||||||||
Class C | 73,048 | 795,972 | — | — | ||||||||||||
Class C2 | 205,588 | 2,216,611 | 1,370,178 | 15,692,219 | ||||||||||||
Class I | 477,087 | 5,129,246 | 730,151 | 8,359,114 | ||||||||||||
| Shares issued to shareholders due to reinvestment of distributions: | ||||||||||||||||
Class A | 927,501 | 10,003,818 | 936,743 | 10,720,139 | ||||||||||||
Class B | 373 | 4,001 | 2,684 | 30,715 | ||||||||||||
Class C | 325 | 3,571 | — | — | ||||||||||||
Class C2 | 138,724 | 1,496,218 | 150,646 | 1,723,887 | ||||||||||||
Class I | 29,787 | 321,438 | 38,492 | 440,882 | ||||||||||||
| 2,944,046 | 31,735,339 | 6,347,354 | 72,690,323 | |||||||||||||
| Shares redeemed: | ||||||||||||||||
Class A | (6,978,185 | ) | (75,334,822 | ) | (2,855,928 | ) | (32,671,116 | ) | ||||||||
Class B | (24,744 | ) | (266,517 | ) | (76,070 | ) | (869,371 | ) | ||||||||
Class B – automatic conversion to Class A Shares | (30,705 | ) | (329,407 | ) | (3,004 | ) | (34,268 | ) | ||||||||
Class C | (105 | ) | (1,157 | ) | — | — | ||||||||||
Class C2 | (1,955,587 | ) | (21,046,628 | ) | (618,307 | ) | (7,073,520 | ) | ||||||||
Class I | (938,011 | ) | (10,091,360 | ) | (347,195 | ) | (3,967,168 | ) | ||||||||
| (9,927,337 | ) | (107,069,891 | ) | (3,900,504 | ) | (44,615,443 | ) | |||||||||
| Net increase (decrease) | (6,983,291 | ) | $ | (75,334,552 | ) | 2,446,850 | $ | 28,074,880 | ||||||||
| Michigan | ||||||||||||||||
| Year Ended 5/31/14 | Year Ended 5/31/13 | |||||||||||||||
| Shares | Amount | Shares | Amount | |||||||||||||
| Shares sold: | ||||||||||||||||
Class A | 1,359,650 | $ | 15,426,687 | 1,381,597 | $ | 16,448,266 | ||||||||||
Class C | 33,481 | 383,198 | — | — | ||||||||||||
Class C2 | 117,725 | 1,308,163 | 426,830 | 5,081,332 | ||||||||||||
Class I | 474,548 | 5,321,043 | 741,878 | 8,887,321 | ||||||||||||
| Shares issued to shareholders due to reinvestment of distributions: | ||||||||||||||||
Class A | 311,728 | 3,490,115 | 356,694 | 4,246,247 | ||||||||||||
Class C | 84 | 966 | — | — | ||||||||||||
Class C2 | 46,875 | 524,105 | 47,013 | 558,958 | ||||||||||||
Class I | 72,764 | 814,301 | 64,899 | 772,276 | ||||||||||||
| 2,416,855 | 27,268,578 | 3,018,911 | 35,994,400 | |||||||||||||
| Shares redeemed: | ||||||||||||||||
Class A | (4,957,261 | ) | (55,628,547 | ) | (2,084,103 | ) | (24,813,360 | ) | ||||||||
Class C | (38 | ) | (441 | ) | — | — | ||||||||||
Class C2 | (744,566 | ) | (8,312,002 | ) | (307,508 | ) | (3,658,229 | ) | ||||||||
Class I | (794,583 | ) | (8,828,895 | ) | (261,631 | ) | (3,113,683 | ) | ||||||||
| (6,496,448 | ) | (72,769,885 | ) | (2,653,242 | ) | (31,585,272 | ) | |||||||||
| Net increase (decrease) | (4,079,593 | ) | $ | (45,501,307 | ) | 365,669 | $ | 4,409,128 | ||||||||
| Nuveen Investments | 115 |
Notes to Financial Statements (continued)
| Missouri | ||||||||||||||||
| Year Ended 5/31/14 | Year Ended 5/31/13 | |||||||||||||||
| Shares | Amount | Shares | Amount | |||||||||||||
| Shares sold: | ||||||||||||||||
Class A | 2,197,180 | $ | 24,025,849 | 3,355,596 | $ | 38,994,528 | ||||||||||
Class A – automatic conversion of Class B Shares | 26,783 | 291,932 | 4,532 | 54,964 | ||||||||||||
Class B – exchanges | 26 | 285 | — | — | ||||||||||||
Class C | 74,940 | 833,909 | — | — | ||||||||||||
Class C2 | 286,088 | 3,113,786 | 758,391 | 8,800,515 | ||||||||||||
Class I | 2,365,960 | 26,069,459 | 3,066,071 | 35,619,661 | ||||||||||||
| Shares issued to shareholders due to reinvestment of distributions: | ||||||||||||||||
Class A | 681,060 | 7,474,470 | 633,259 | 7,354,509 | ||||||||||||
Class B | 325 | 3,537 | 1,099 | 12,878 | ||||||||||||
Class C | 291 | 3,267 | — | — | ||||||||||||
Class C2 | 78,574 | 860,322 | 71,332 | 826,860 | ||||||||||||
Class I | 165,619 | 1,816,454 | 341,709 | 3,976,724 | ||||||||||||
| 5,876,846 | 64,493,270 | 8,231,989 | 95,640,639 | |||||||||||||
| Shares redeemed: | ||||||||||||||||
Class A | (4,490,053 | ) | (49,088,779 | ) | (2,719,373 | ) | (31,593,350 | ) | ||||||||
Class B | (8,067 | ) | (87,083 | ) | (9,604 | ) | (108,115 | ) | ||||||||
Class B – automatic conversion to Class A Shares | (26,734 | ) | (291,932 | ) | (4,519 | ) | (54,964 | ) | ||||||||
Class C | (318 | ) | (3,554 | ) | — | — | ||||||||||
Class C2 | (813,335 | ) | (8,890,960 | ) | (460,384 | ) | (5,340,635 | ) | ||||||||
Class I | (5,007,763 | ) | (54,535,900 | ) | (3,321,050 | ) | (38,603,424 | ) | ||||||||
| (10,346,270 | ) | (112,898,208 | ) | (6,514,930 | ) | (75,700,488 | ) | |||||||||
| Net increase (decrease) | (4,469,424 | ) | $ | (48,404,938 | ) | 1,717,059 | $ | 19,940,151 | ||||||||
| Ohio | ||||||||||||||||
| Year Ended 5/31/14 | Year Ended 5/31/13 | |||||||||||||||
| Shares | Amount | Shares | Amount | |||||||||||||
| Shares sold: | ||||||||||||||||
Class A | 3,965,505 | $ | 44,306,775 | 4,594,182 | $ | 54,465,233 | ||||||||||
Class A – automatic conversion of Class B Shares | 50,160 | 562,082 | 3,191 | 37,833 | ||||||||||||
Class B – exchanges | 64 | 703 | — | — | ||||||||||||
Class C | 146,215 | 1,654,627 | — | — | ||||||||||||
Class C2 | 410,663 | 4,545,422 | 1,894,271 | 22,386,252 | ||||||||||||
Class I | 1,348,924 | 14,950,544 | 3,075,918 | 36,359,835 | ||||||||||||
| Shares issued to shareholders due to reinvestment of distributions: | ||||||||||||||||
Class A | 797,043 | 8,880,056 | 761,304 | 9,023,087 | ||||||||||||
Class B | 2,122 | 23,357 | 4,756 | 56,185 | ||||||||||||
Class C | 412 | 4,696 | — | — | ||||||||||||
Class C2 | 152,609 | 1,693,380 | 141,005 | 1,664,753 | ||||||||||||
Class I | 334,458 | 3,715,649 | 355,754 | 4,202,800 | ||||||||||||
| 7,208,175 | 80,337,291 | 10,830,381 | 128,195,978 | |||||||||||||
| Shares redeemed: | ||||||||||||||||
Class A | (8,555,058 | ) | (94,780,640 | ) | (3,492,940 | ) | (41,416,013 | ) | ||||||||
Class B | (89,635 | ) | (988,940 | ) | (40,785 | ) | (482,623 | ) | ||||||||
Class B – automatic conversion to Class A Shares | (50,295 | ) | (562,082 | ) | (3,201 | ) | (37,833 | ) | ||||||||
Class C | (2,834 | ) | (32,243 | ) | — | — | ||||||||||
Class C2 | (2,072,634 | ) | (22,894,120 | ) | (724,347 | ) | (8,547,914 | ) | ||||||||
Class I | (4,493,982 | ) | (49,666,142 | ) | (1,774,710 | ) | (21,000,457 | ) | ||||||||
| (15,264,438 | ) | (168,924,167 | ) | (6,035,983 | ) | (71,484,840 | ) | |||||||||
| Net increase (decrease) | (8,056,263 | ) | $ | (88,586,876 | ) | 4,794,398 | $ | 56,711,138 | ||||||||
| 116 | Nuveen Investments |
| Wisconsin | ||||||||||||||||
| Year Ended 5/31/14 | Year Ended 5/31/13 | |||||||||||||||
| Shares | Amount | Shares | Amount | |||||||||||||
| Shares sold: | ||||||||||||||||
Class A | 574,468 | $ | 5,938,441 | 1,702,360 | $ | 19,009,154 | ||||||||||
Class C | 61,282 | 643,775 | — | — | ||||||||||||
Class C2 | 86,348 | 899,574 | 927,100 | 10,377,801 | ||||||||||||
Class I | 776,912 | 8,133,204 | 1,551,300 | 17,387,860 | ||||||||||||
| Shares issued to shareholders due to reinvestment of distributions: | ||||||||||||||||
Class A | 175,832 | 1,808,409 | 163,752 | 1,828,740 | ||||||||||||
Class C | 156 | 1,656 | — | — | ||||||||||||
Class C2 | 46,290 | 476,396 | 37,501 | 419,144 | ||||||||||||
Class I | 29,763 | 306,910 | 54,252 | 608,057 | ||||||||||||
| 1,751,051 | 18,208,365 | 4,436,265 | 49,630,756 | |||||||||||||
| Shares redeemed: | ||||||||||||||||
Class A | (1,787,153 | ) | (18,255,428 | ) | (846,364 | ) | (9,435,783 | ) | ||||||||
Class C | (43 | ) | (451 | ) | — | — | ||||||||||
Class C2 | (608,645 | ) | (6,241,038 | ) | (196,915 | ) | (2,208,783 | ) | ||||||||
Class I | (2,154,953 | ) | (22,109,689 | ) | (1,210,009 | ) | (13,536,402 | ) | ||||||||
| (4,550,794 | ) | (46,606,606 | ) | (2,253,288 | ) | (25,180,968 | ) | |||||||||
| Net increase (decrease) | (2,799,743 | ) | $ | (28,398,241 | ) | 2,182,977 | $ | 24,449,788 | ||||||||
5. Investment Transactions
Long-term purchases and sales (including maturities) during the fiscal year ended May 31, 2014, were as follows:
| Kansas | Kentucky | Michigan | Missouri | Ohio | Wisconsin | |||||||||||||||||||
| Purchases | $ | 31,642,257 | $ | 47,135,707 | $ | 16,971,869 | $ | 65,311,667 | $ | 81,413,534 | $ | 11,991,153 | ||||||||||||
| Sales and maturities | 76,399,220 | 121,991,625 | 65,098,203 | 116,092,549 | 164,694,602 | 41,973,499 | ||||||||||||||||||
6. Income Tax Information
Each Fund is a separate taxpayer for federal income tax purposes. Each Fund intends to distribute substantially all of its net investment income and net capital gains to shareholders and to otherwise comply with the requirements of Subchapter M of the Internal Revenue Code applicable to regulated investment companies. Therefore, no federal income tax provision is required. Furthermore, each Fund intends to satisfy conditions that will enable interest from municipal securities, which is exempt from regular federal and designated state income taxes, to retain such tax-exempt status when distributed to shareholders of the Funds. Net realized capital gains and ordinary income distributions paid by the Funds are subject to federal taxation.
For all open tax years and all major taxing jurisdictions, management of the Funds has concluded that there are no significant uncertain tax positions that would require recognition in the financial statements. Open tax years are those that are open for examination by taxing authorities (i.e., generally the last four tax year ends and the interim tax period since then). Furthermore, management of the Funds is also not aware of any tax positions for which it is reasonably possible that the total amounts of unrecognized tax benefits will significantly change in the next twelve months.
The following information is presented on an income tax basis. Differences between amounts for financial statement and federal income tax purposes are primarily due to timing differences in recognizing taxable market discount, timing differences in recognizing certain gains and losses on investment transactions and the treatment of investments in inverse floating rate securities reflected as financing transactions, if any. To the extent that differences arise that are permanent in nature, such amounts are reclassified within the capital accounts as detailed below. Temporary differences do not require reclassification. Temporary and permanent differences do not impact the NAVs of the Funds.
| Nuveen Investments | 117 |
Notes to Financial Statements (continued)
As of May 31, 2014, the cost and unrealized appreciation (depreciation) of investments in securities, as determined on a federal income tax basis, were as follows:
| Kansas | Kentucky | Michigan | Missouri | Ohio | Wisconsin | |||||||||||||||||||
| Cost of investments | $ | 178,938,989 | $ | 349,970,377 | $ | 146,777,869 | $ | 384,888,117 | $ | 475,438,034 | $ | 79,708,764 | ||||||||||||
| Gross unrealized: | ||||||||||||||||||||||||
Appreciation | $ | 14,755,654 | $ | 25,763,657 | $ | 10,374,035 | $ | 31,046,592 | $ | 34,245,686 | $ | 5,428,423 | ||||||||||||
Depreciation | (547,266 | ) | (297,260 | ) | (799,145 | ) | (2,562,143 | ) | (2,383,365 | ) | (584,377 | ) | ||||||||||||
| Net unrealized appreciation (depreciation) of investments | $ | 14,208,388 | $ | 25,466,397 | $ | 9,574,890 | $ | 28,484,449 | $ | 31,862,321 | $ | 4,844,046 | ||||||||||||
Permanent differences, primarily due to federal taxes paid and taxable market discount, resulted in reclassifications among the Funds’ components of net assets as of May 31, 2014, the Funds’ tax year end, as follows:
| Kansas | Kentucky | Michigan | Missouri | Ohio | Wisconsin | |||||||||||||||||||
| Capital paid-in | $ | (7 | ) | $ | — | $ | — | $ | (5 | ) | $ | 166 | $ | — | ||||||||||
| Undistributed (Over-distribution of) net investment income | (13,140 | ) | (16,076 | ) | (6,763 | ) | (28,202 | ) | (102,883 | ) | (14,881 | ) | ||||||||||||
| Accumulated net realized gain (loss) | 13,147 | 16,076 | 6,763 | 28,207 | 102,717 | 14,881 | ||||||||||||||||||
The tax components of undistributed net tax-exempt income, net ordinary income and net long-term capital gains as of May 31, 2014, the Funds’ tax year end, were as follows:
| Kansas | Kentucky | Michigan | Missouri | Ohio | Wisconsin | |||||||||||||||||||
| Undistributed net tax-exempt income1 | $ | 1,057,806 | $ | 1,539,557 | $ | 909,461 | $ | 1,839,402 | $ | 3,363,049 | $ | 486,236 | ||||||||||||
| Undistributed net ordinary income2 | 13,888 | — | 6,967 | 23,365 | 47,834 | 13,918 | ||||||||||||||||||
| Undistributed net long-term capital gains | — | — | 730,036 | — | — | — | ||||||||||||||||||
| 1 | Undistributed net tax-exempt income (on a tax basis) has not been reduced for the dividends declared during the period May 1, 2014 through May 31, 2014, and paid on June 2, 2014. |
| 2 | Net ordinary income consists of taxable market discount income and net short-term capital gains, if any. |
The tax character of distributions paid during the Funds’ tax years ended May 31, 2014 and May 31, 2013 was designated for purposes of the dividends paid deduction as follows:
| 2014 | Kansas | Kentucky | Michigan | Missouri | Ohio | Wisconsin | ||||||||||||||||||
| Distributions from net tax-exempt income3 | $ | 7,476,513 | $ | 14,481,803 | $ | 6,806,977 | $ | 17,128,858 | $ | 21,630,756 | $ | 3,539,588 | ||||||||||||
| Distributions from net ordinary income2 | 27,386 | 5,142 | 13,885 | — | 32,338 | 2,512 | ||||||||||||||||||
| Distributions from net long-term capital gains4 | — | — | 311,050 | — | — | — | ||||||||||||||||||
| 2013 | Kansas | Kentucky | Michigan | Missouri | Ohio | Wisconsin | ||||||||||||||||||
| Distributions from net tax-exempt income | $ | 8,230,799 | $ | 16,716,057 | $ | 7,942,854 | $ | 18,405,598 | $ | 23,000,518 | $ | 3,901,379 | ||||||||||||
| Distributions from net ordinary income2 | 41,387 | 226 | — | — | 103,868 | 2,218 | ||||||||||||||||||
| Distributions from net long-term capital gains | 1,697,215 | — | — | — | — | — | ||||||||||||||||||
| 2 | Net ordinary income consists of taxable market discount income and net short-term capital gains, if any. |
| 3 | The Funds hereby designate these amounts paid during the fiscal year ended May 31, 2014, as Exempt Interest Dividends. |
| 4 | The Funds designate as long-term capital gain dividend, pursuant to the Internal Revenue Code Section 852(b)(3), the amount necessary to reduce earnings and profits of the Funds related to net capital gain to zero for the tax year ended May 31, 2014. |
As of May 31, 2014, the Funds’ tax year end, the following Funds had unused capital loss carryforwards available for federal income tax purposes to be applied against future capital gains, if any. If not applied, the carryforwards will expire as shown in the following table. The losses not subject to expiration will be utilized first by a Fund.
| Kansas | Kentucky | Missouri5 | Ohio5 | Wisconsin | ||||||||||||||||
| Expiration: | ||||||||||||||||||||
May 31, 2016 | $ | — | $ | — | $ | — | $ | 224,658 | $ | — | ||||||||||
May 31, 2017 | — | — | 9,357 | 204,682 | — | |||||||||||||||
May 31, 2018 | — | 3,377,319 | 663,355 | 30,607 | 40,757 | |||||||||||||||
May 31, 2019 | — | — | — | 1,552,586 | — | |||||||||||||||
| Not subject to expiration | 4,391,458 | 3,225,239 | 3,212,313 | 2,917,052 | 3,185,605 | |||||||||||||||
| Total | $ | 4,391,458 | $ | 6,602,558 | $ | 3,885,025 | $ | 4,929,585 | $ | 3,226,362 | ||||||||||
| 5 | A portion of Missouri’s and Ohio’s capital loss carryforward is subject to an annual limitation under Internal Revenue Code and related regulations. |
| 118 | Nuveen Investments |
During the Funds’ tax year ended May 31, 2014, the following Fund utilized capital loss carryforwards as follows:
| Michigan | ||||
| Utilized capital loss carryforwards | $ | 448,279 | ||
The Funds have elected to defer late-year losses in accordance with federal income tax rules. These losses are treated as having arisen on the first day of the following fiscal year. The following Funds have elected to defer losses as follows:
| Kansas | Kentucky | Missouri | Ohio | Wisconsin | ||||||||||||||||
| Post-October capital losses6 | $ | 2,172,285 | $ | 2,047,962 | $ | 1,671,010 | $ | 350,076 | $ | 820,701 | ||||||||||
| Late-year ordinary losses7 | — | — | — | — | — | |||||||||||||||
| 6 | Capital losses incurred from November 1, 2013 through May 31, 2014, the Funds’ tax year end. |
| 7 | Ordinary losses incurred from January 1, 2014 through May 31, 2014 and specified losses incurred from November 1, 2013 through May 31, 2014. |
7. Management Fees and Other Transactions with Affiliates
Each Fund’s management fee compensates the Adviser for the overall investment advisory and administrative services and general office facilities. The Sub-Adviser is compensated for its services to the Funds from the management fees paid to the Adviser.
Each Fund’s management fee consists of two components – a fund-level fee, based only on the amount of assets within each individual Fund, and a complex-level fee, based on the aggregate amount of all eligible fund assets managed by the Adviser. This pricing structure enables each Fund’s shareholders to benefit from growth in the assets within their respective Fund as well as from growth in the amount of complex-wide assets managed by the Adviser.
The annual fund-level fee for each Fund, payable monthly, is calculated according to the following schedule:
| Average Daily Net Assets | Fund-Level Fee Rate | |||
| For the first $125 million | 0.3500 | % | ||
| For the next $125 million | 0.3375 | |||
| For the next $250 million | 0.3250 | |||
| For the next $500 million | 0.3125 | |||
| For the next $1 billion | 0.3000 | |||
| For the next $3 billion | 0.2750 | |||
| For net assets over $5 billion | 0.2500 | |||
| Nuveen Investments | 119 |
Notes to Financial Statements (continued)
The annual complex-level fee for each Fund, payable monthly, is calculated according to the following schedule:
| Complex-Level Asset Breakpoint Level* | Effective Rate at Breakpoint Level | |||
| $55 billion | 0.2000 | % | ||
| $56 billion | 0.1996 | |||
| $57 billion | 0.1989 | |||
| $60 billion | 0.1961 | |||
| $63 billion | 0.1931 | |||
| $66 billion | 0.1900 | |||
| $71 billion | 0.1851 | |||
| $76 billion | 0.1806 | |||
| $80 billion | 0.1773 | |||
| $91 billion | 0.1691 | |||
| $125 billion | 0.1599 | |||
| $200 billion | 0.1505 | |||
| $250 billion | 0.1469 | |||
| $300 billion | 0.1445 | |||
| * | The complex-level fee is calculated based upon the aggregate daily “eligible assets” of all Nuveen Funds. Eligible assets do not include assets attributable to investments in other Nuveen Funds or assets in excess of $2 billion added to the Nuveen Fund complex in connection with the Adviser’s assumption of the management of the former First American Funds effective January 1, 2011. Eligible assets include closed-end fund assets managed by the Adviser that are attributable to certain types of leverage. For these purposes, leverage includes the closed-end funds’ use of preferred stock and borrowings and certain investments in the residual interest certificates (also called inverse floating rate securities) in tender option bond (TOB) trusts, including the portion of assets held by a TOB trust that has been effectively financed by the trust’s issuance of floating rate securities, subject to an agreement by the Adviser as to certain funds to limit the amount of such assets for determining eligible assets in certain circumstances. As of May 31, 2014, the complex-level fee rate for each of these Funds was as follows: |
| Fund | Complex-Level Fee Rate | |||
| Kansas | 0.1657 | % | ||
| Kentucky | 0.1657 | |||
| Michigan | 0.1657 | |||
| Missouri | 0.1770 | |||
| Ohio | 0.1694 | |||
| Wisconsin | 0.1657 | |||
The Adviser has contractually agreed to waive fees and/or reimburse expenses so that total annual Fund operating expenses, (excluding 12b-1 distribution and/or service fees, interest expenses, taxes, acquired fund fees and expenses, fees incurred in acquiring and disposing of portfolio securities and extraordinary expenses) for Ohio do not exceed 0.750% of the average daily net assets of any class of Fund shares.
The Trust pays no compensation directly to those of its trustees who are affiliated with the Adviser or to its officers, all of whom receive remuneration for their services to the Trust from the Adviser or its affiliates. The Board of Trustees has adopted a deferred compensation plan for independent trustees that enables trustees to elect to defer receipt of all or a portion of the annual compensation they are entitled to receive from certain Nuveen-advised funds. Under the plan, deferred amounts are treated as though equal dollar amounts had been invested in shares of select Nuveen-advised funds.
During the fiscal year ended May 31, 2014, Nuveen Securities, LLC (the “Distributor”), a wholly-owned subsidiary of Nuveen, collected sales charges on purchases of Class A Shares, the majority of which were paid out as concessions to financial intermediaries as follows:
| Kansas | Kentucky | Michigan | Missouri | Ohio | Wisconsin | |||||||||||||||||||
| Sales charges collected (Unaudited) | $ | 195,944 | $ | 172,332 | $ | 52,930 | $ | 266,789 | $ | 204,070 | $ | 92,604 | ||||||||||||
| Paid to financial intermediaries (Unaudited) | 170,670 | 146,716 | 46,443 | 234,160 | 180,221 | 80,186 | ||||||||||||||||||
The Distributor also received 12b-1 service fees on Class A Shares, substantially all of which were paid to compensate financial intermediaries for providing services to shareholders relating to their investments.
During the fiscal year ended May 31, 2014, the Distributor compensated financial intermediaries directly with commission advances at the time of purchase as follows:
| Kansas | Kentucky | Michigan | Missouri | Ohio | Wisconsin | |||||||||||||||||||
| Commission advances (Unaudited) | $ | 48,310 | $ | 24,046 | $ | 18,975 | $ | 65,091 | $ | 101,621 | $ | 18,012 | ||||||||||||
To compensate for commissions advanced to financial intermediaries, all 12b-1 service fees collected on Class B Shares during the first year following a purchase, all 12b-1 distribution fees collected on Class B Shares, and all 12b-1 service and distribution fees collected on Class C and Class C2 Shares during the first year following a purchase are retained by the Distributor. During the fiscal year ended May 31, 2014, the Distributor retained such 12b-1 fees as follows:
| Kansas | Kentucky | Michigan | Missouri | Ohio | Wisconsin | |||||||||||||||||||
| 12b-1 fees retained (Unaudited) | $ | 56,507 | $ | 57,517 | $ | 23,432 | $ | 43,741 | $ | 96,683 | $ | 32,231 | ||||||||||||
The remaining 12b-1 fees charged to the Funds were paid to compensate financial intermediaries for providing services to shareholders relating to their investments.
The Distributor also collected and retained CDSC on share redemptions during the fiscal year ended May 31, 2014, as follows:
| Kansas | Kentucky | Michigan | Missouri | Ohio | Wisconsin | |||||||||||||||||||
| CDSC retained (Unaudited) | $ | 15,301 | $ | 40,127 | $ | 473 | $ | 9,568 | $ | 15,367 | $ | 3,982 | ||||||||||||
| 120 | Nuveen Investments |
Fund Information (Unaudited)
Fund Manager Nuveen Fund Advisors, LLC 333 West Wacker Drive Chicago, IL 60606
Sub-Adviser Nuveen Asset Management, LLC 333 West Wacker Drive Chicago, IL 60606
Legal Counsel Chapman and Cutler LLP Chicago, IL 60603 | Independent Registered PricewaterhouseCoopers LLP Chicago, IL 60606
Custodian State Street Bank & Trust Boston, MA 02111 | Transfer Agent and Boston Financial Nuveen Investor Services P.O. Box 8530 Boston, MA 02266-8530 (800) 257-8787 | ||||||||
| ||||||||||||||
| Quarterly Form N-Q Portfolio of Investments Information: Each Fund is required to file its complete schedule of portfolio holdings with the Securities and Exchange Commission (SEC) for the first and third quarters of each fiscal year on Form N-Q. You may obtain this information directly from the SEC. Visit the SEC on-line at http://www.sec.gov or in person at the SEC’s Public Reference Room in Washington, D.C. Call the SEC toll-free at (800) SEC-0330 for room hours and operation. | ||||||||||||||
| ||||||||||||||
| Nuveen Funds’ Proxy Voting Information: You may obtain (i) information regarding how each fund voted proxies relating to portfolio securities held during the most recent twelve-month period ended June 30, without charge, upon request, by calling Nuveen Investments toll-free at (800) 257-8787 or on Nuveen’s website at www.nuveen.com and (ii) a description of the policies and procedures that each fund used to determine how to vote proxies relating to portfolio securities without charge, upon request, by calling Nuveen Investments toll-free at (800) 257-8787. You may also obtain this information directly from the SEC. Visit the SEC on-line at http://www.sec.gov. | ||||||||||||||
| ||||||||||||||
FINRA BrokerCheck: The Financial Industry Regulatory Authority (FINRA) provides information regarding the disciplinary history of FINRA member firms and associated investment professionals. This information as well as an investor brochure describing FINRA BrokerCheck is available to the public by calling the FINRA BrokerCheck Hotline number at (800) 289-9999 or by visiting www.FINRA.org. | ||||||||||||||
| Nuveen Investments | 121 |
Used in this Report (Unaudited)
Average Annual Total Return: This is a commonly used method to express an investment’s performance over a particular, usually multi-year time period. It expresses the return that would have been necessary each year to equal the investment’s actual cumulative performance (including change in NAV or offer price and reinvested dividends and capital gains distributions, if any) over the time period being considered.
Duration: Duration is a measure of the expected period over which a bond’s principal and interest will be paid, and consequently is a measure of the sensitivity of a bond’s (or bond fund’s) value to changes when market interest rates change. Generally, the longer a bond or fund’s duration, the more the price of the bond or Fund will change as interest rates change.
Effective Leverage (Effective Leverage Ratio): Effective leverage is investment exposure created either through borrowings or indirectly through inverse floaters, divided by the assets invested, including those assets that were purchased with the proceeds of the leverage, or referenced by the levered instrument.
Gross Domestic Product (GDP): The total market value of all final goods and services produced in a country/region in a given year, equal to total consumer, investment and government spending, plus the value of exports, minus the value of imports.
Inverse Floating Rate Securities: Inverse floating rate securities, also known as inverse floaters or tender option bonds (TOBs), are created by depositing a municipal bond, typically with a fixed interest rate, into a special purpose trust created by a broker-dealer. This trust, in turn, (a) issues floating rate certificates typically paying short-term tax-exempt interest rates to third parties in amounts equal to some fraction of the deposited bond’s par amount or market value, and (b) issues an inverse floating rate certificate (sometimes referred to as an “inverse floater”) to an investor (such as a fund) interested in gaining investment exposure to a long-term municipal bond. The income received by the holder of the inverse floater varies inversely with the short-term rate paid to the floating rate certificates’ holders, and in most circumstances the holder of the inverse floater bears substantially all of the underlying bond’s downside investment risk. The holder of the inverse floater typically also benefits disproportionately from any potential appreciation of the underlying bond’s value. Hence, an inverse floater essentially represents an investment in the underlying bond on a leveraged basis.
Leverage: Leverage is created whenever a fund has investment exposure (both reward and/or risk) equivalent to more than 100% of the investment capital.
Lipper Ohio Municipal Debt Funds Classification Average: Represents the average annualized total return for all reporting funds in the Lipper Ohio Municipal Debt Funds Classification. Lipper returns account for the effects of management fees and assume reinvestment of distributions, but do not reflect any applicable sales charge.
Lipper Other States Municipal Debt Funds Classification Average: Represents the average annualized total return for all reporting funds in the Lipper Other States Municipal Debt Funds Classification. Shareholders should note that the performance of the Lipper Other States Average represents the overall average of returns for funds from multiple states with a wide variety of municipal market conditions, making direct comparisons less meaningful. Lipper returns account for the effects of management fees and assume reinvestment of distributions, but do not reflect any applicable sales charge.
Net Asset Value (NAV) Per Share: A fund’s Net Assets is equal to its total assets (securities, cash and accrued earnings) less its total liabilities. For funds with multiple classes, Net Assets are determined separately for each share class. NAV per share is equal to the fund’s (or share class’) Net Assets divided by its number of shares outstanding.
| 122 | Nuveen Investments |
Pre-Refundings: Pre-Refundings, also known as advance refundings or refinancings, occur when an issuer sells new bonds and uses the proceeds to fund principal and interest payments of older existing bonds. This process often results in lower borrowing costs for bond issuers.
S&P Municipal Bond Index: An unleveraged, market value-weighted index designed to measure the performance of the tax-exempt, investment-grade U.S. municipal bond market. Index returns assume reinvestment of distributions, but do not reflect any applicable sales charges or management fees.
Total Investment Exposure: Total investment exposure is a fund’s assets managed by the Adviser that are attributable to financial leverage. For these purposes, financial leverage includes a fund’s use of preferred stock and borrowings and investments in the residual interest certificates (also called inverse floating rate securities) in tender option bond (TOB) trusts, including the portion of assets held by a TOB trust that has been effectively financed by the trust’s issuance of floating rate securities.
Zero Coupon Bond: A zero coupon bond does not pay a regular interest coupon to its holders during the life of the bond. Income to the holder of the bond comes from accretion of the difference between the original purchase price of the bond at issuance and the par value of the bond at maturity and is effectively paid at maturity. The market prices of zero coupon bonds generally are more volatile than the market prices of bonds that pay interest periodically.
| Nuveen Investments | 123 |
Annual Investment Management Agreement
Approval Process (Unaudited)
I. The Approval Process
The Board of Trustees of each Fund (each, a “Board” and each Trustee, a “Board Member”), including the Board Members who are not parties to the Funds’ advisory or sub-advisory agreements or “interested persons” of any such parties (the “Independent Board Members”), is responsible for over-seeing the performance of the investment adviser and the sub-adviser to the respective Fund and determining whether to approve or continue such Fund’s advisory agreement (each, an “Original Investment Management Agreement”) between the Fund and Nuveen Fund Advisors, LLC (the “Adviser”) and sub-advisory agreement (each, an “Original Sub-Advisory Agreement” and, together with the Original Investment Management Agreement, the “Original Advisory Agreements”) between the Adviser and Nuveen Asset Management, LLC (the “Sub-Adviser”). Pursuant to the Investment Company Act of 1940, as amended (the “1940 Act”), each Board is required to consider the continuation of the respective Original Advisory Agreements on an annual basis. In addition, prior to its annual review, the Board Members were advised of the potential acquisition of Nuveen Investments, Inc. (“Nuveen”) by TIAA-CREF (the “Transaction”). For purposes of this section, references to “Nuveen” herein include all affiliates of Nuveen Investments, Inc. providing advisory, sub-advisory, distribution or other services to the Funds and references to the “Board” refer to the Board of each Fund. In accordance with the 1940 Act and the terms of the Original Advisory Agreements, the completion of the Transaction would terminate each of the Original Investment Management Agreements and the Original Sub-Advisory Agreements. Accordingly, at an in-person meeting held on April 30, 2014 (the “April Meeting”), the Board, including all of the Independent Board Members, performed its annual review of the Original Advisory Agreements and approved the continuation of the Original Advisory Agreements for the Funds. Furthermore, in anticipation of the termination of the Original Advisory Agreements that would occur upon the consummation of the Transaction, the Board also approved for each Fund a new advisory agreement (each, a “New Investment Management Agreement”) between the Fund and the Adviser and a new sub-advisory agreement (each, a “New Sub-Advisory Agreement” and, together with the New Investment Management Agreement, the “New Advisory Agreements”) between the Adviser and the Sub-Adviser, each on behalf of the respective Fund to be effective following the completion of the Transaction and the receipt of the requisite shareholder approval.
Leading up to the April Meeting, the Independent Board Members had several meetings and deliberations, with and without management from Nuveen present and with the advice of legal counsel, regarding the Original Advisory Agreements, the Transaction and its impact and the New Advisory Agreements. At its meeting held on February 25-27, 2014 (the “February Meeting”), the Board Members met with a senior executive representative of TIAA-CREF to discuss the proposed Transaction. At the February Meeting, the Independent Board Members also established an ad hoc committee comprised solely of the Independent Board Members to monitor and evaluate the Transaction and to keep the Independent Board Members updated with developments regarding the Transaction. On March 20, 2014, the ad hoc committee met telephonically to discuss with management of Nuveen, and separately with independent legal counsel, the terms of the proposed Transaction and its impact on, among other things: the governance structure of Nuveen; the strategic plans for Nuveen; the operations of the Nuveen funds (which include the Funds); the quality or level of services provided to the Nuveen funds; key personnel that service the Nuveen funds and/or the Board and the compensation or incentive arrangements to retain such personnel; Nuveen’s capital structure; the regulatory requirements applicable to Nuveen or fund operations; and the Nuveen funds’ fees and expenses, including the funds’ complex-wide fee arrangement. Following the meeting of the ad hoc committee, the Board met in person (two Independent Board Members participating telephonically) in an executive session on March 26, 2014 to further discuss the proposed Transaction. At the executive session, the Board met privately with independent legal counsel to review its duties with respect to reviewing advisory agreements, particularly in the context of a change of control, and to evaluate further the Transaction and its impact on the Nuveen funds, the Adviser and the Sub-Adviser (collectively, the “Fund Advisers” and each, a “Fund Adviser��) and the services provided. Representatives of Nuveen also met with the Board to update the Board Members on developments regarding the Transaction, to respond to questions and to discuss, among other things: the governance of the Fund Advisers following the Transaction; the background, culture (including with respect to regulatory and compliance matters) and resources of TIAA-CREF; the general plans and intentions of TIAA-CREF for Nuveen; the terms and conditions of the Transaction (including financing terms); any benefits or detriments the Transaction may impose on the Nuveen funds, TIAA-CREF or the Fund Advisers; the reaction from the Fund Advisers’ employees knowledgeable of the Transaction; the incentive and retention plans for key personnel of the Fund Advisers; the potential access to additional distribution platforms and economies of scale; and the impact of any additional regulatory schemes that may be applicable to the Nuveen funds given the banking and insurance businesses operated in the TIAA-CREF enterprise. As part of its review, the Board also held a separate meeting on April 15-16, 2014 to review the Nuveen funds’ investment performance and consider an analysis provided by the Adviser of each sub-adviser of the Nuveen funds (including the Sub-Adviser) and the Transaction and its implications to the Nuveen funds. During their review of the materials and discussions, the Independent Board Members presented the Adviser with questions and the Adviser responded. Further, the Independent Board Members met in an executive session with independent legal counsel on April 29, 2014 and April 30, 2014.
| 124 | Nuveen Investments |
In connection with their review of the Original Advisory Agreements and the New Advisory Agreements, the Independent Board Members received extensive information regarding the Funds and the Fund Advisers including, among other things: the nature, extent and quality of services provided by each Fund Adviser; the organization and operations of any Fund Adviser; the expertise and background of relevant personnel of each Fund Adviser; a review of each Fund’s performance (including performance comparisons against the performance of peer groups and appropriate benchmarks); a comparison of Fund fees and expenses relative to peers; a description and assessment of shareholder service levels for the Funds; a summary of the performance of certain service providers; a review of fund initiatives and shareholder communications; and an analysis of the Adviser’s profitability with comparisons to peers in the managed fund business. In light of the proposed Transaction, the Independent Board Members, through their independent legal counsel, also requested in writing and received additional information regarding the proposed Transaction and its impact on the provision of services by the Fund Advisers.
The Independent Board Members received, well in advance of the April Meeting, materials which responded to the request for information regarding the Transaction and its impact on Nuveen and the Nuveen funds including, among other things: the structure and terms of the Transaction; the impact of the Transaction on Nuveen, its operations and the nature, quality and level of services provided to the Nuveen funds, including, in particular, any changes to those services that the Nuveen funds may experience following the Transaction; the strategic plan for Nuveen, including any financing arrangements following the Transaction and any cost-cutting efforts that may impact services; the organizational structure of TIAA-CREF, including the governance structure of Nuveen following the Transaction; any anticipated effect on each Nuveen fund’s expense ratios (including changes to advisory and sub-advisory fees) and economies of scale that may be expected; any benefits or conflicts of interest that TIAA-CREF, Nuveen or their affiliates can expect from the Transaction; any benefits or undue burdens or other negative implications that may be imposed on the Nuveen funds as a result of the Transaction; the impact on Nuveen or the Nuveen funds as a result of being subject to additional regulatory schemes that TIAA-CREF must comply with in operating its various businesses; and the costs associated with obtaining necessary shareholder approvals and the bearer of such costs. The Independent Board Members also received a memorandum describing the applicable laws, regulations and duties in approving advisory contracts, including in conjunction with a change of control, from their independent legal counsel.
The materials and information prepared in connection with the review of the Original Advisory Agreements and New Advisory Agreements supplemented the information and analysis provided to the Board during the year. In this regard, throughout the year, the Board, acting directly or through its committees, regularly reviewed the performance and various services provided by the Adviser and Sub-Adviser. The Board met at least quarterly as well as at other times as the need arose. At its quarterly meetings, the Board reviewed reports by the Adviser regarding, among other things, fund performance, fund expenses, premium and discount levels of closed-end funds, the performance of the investment teams and compliance, regulatory and risk management matters. In addition to regular reports, the Adviser provided special reports to the Board or a committee thereof from time to time to enhance the Board’s understanding of various topics that impact some or all the Nuveen funds (such as distribution channels, oversight of omnibus accounts and leverage management topics), to update the Board on regulatory developments impacting the investment company industry or to update the Board on the business plans or other matters impacting the Adviser. The Board also met with key investment personnel managing certain Nuveen fund portfolios during the year.
In addition, the Board has created several standing committees (the Executive Committee; the Dividend Committee; the Audit Committee; the Compliance, Risk Management and Regulatory Oversight Committee; the Nominating and Governance Committee; the Open-End Funds Committee; and the Closed-End Funds Committee). The Open-End Funds Committee and Closed-End Funds Committee are intended to assist the full Board in monitoring and gaining a deeper insight into the distinctive business practices of closed-end and open-end funds. These two Committees have met prior to each quarterly Board meeting, and the Adviser provided presentations to these Committees permitting them to delve further into specific matters or initiatives impacting the respective product line.
Further, the Board continued its program of seeking to have the Board Members or a subset thereof visit each sub-adviser to the Nuveen funds and meet key investment and business personnel at least once over a multiple year rotation. In this regard, the Independent Board Members made site visits to certain equity and fixed income teams of the Sub-Adviser in September 2013 and met with the Sub-Adviser’s municipal team at the August and November 2013 quarterly meetings.
The Board considered the information provided and knowledge gained at these meetings and visits during the year when performing its annual review of the Original Advisory Agreements and its review of the New Advisory Agreements. The Independent Board Members also were assisted throughout the process by independent legal counsel. During the course of the year and during their deliberations regarding the review of advisory contracts, the Independent Board Members met with independent legal counsel in executive sessions without management present. In addition, it is important to recognize that the management arrangements for the funds are the result of many years of review and discussion between the Independent Board Members and Nuveen fund management and that the Board Members’ conclusions may be based, in part, on their consideration of fee arrangements and other factors developed in previous years.
| Nuveen Investments | 125 |
Annual Investment Management Agreement Approval Process (Unaudited) (continued)
The Board considered all factors it believed relevant with respect to each Fund, including, among other things: (a) the nature, extent and quality of the services provided by the Fund Advisers, (b) the investment performance of the Fund and the Fund Advisers, (c) the advisory fees and costs of the services to be provided to the Fund and the profitability of the Fund Advisers, (d) the extent of any economies of scale, (e) any benefits derived by the Fund Advisers from the relationship with the Fund and (f) other factors. With respect to the New Advisory Agreements, the Board also considered the Transaction and its impact on the foregoing factors. Each Board Member may have accorded different weight to the various factors in reaching his or her conclusions with respect to a Fund’s Original Advisory Agreements and New Advisory Agreements. The Independent Board Members did not identify any single factor as all-important or controlling. The Independent Board Members’ considerations were instead based on a comprehensive consideration of all the information presented. The principal factors considered by the Board and its conclusions are described below.
A. Nature, Extent and Quality of Services
1. The Original Advisory Agreements
In considering renewal of each Original Advisory Agreement, the Independent Board Members considered the nature, extent and quality of the respective Fund Adviser’s services, including portfolio management services (and the resulting Fund performance) and administrative services. The Independent Board Members further considered the overall reputation and capabilities of the Adviser and its affiliates, the commitment of the Adviser to provide high quality service to the Funds, their overall confidence in the capability and integrity of the Adviser and its staff and the Adviser’s responsiveness to questions and concerns raised by them. The Independent Board Members reviewed materials outlining, among other things: each Fund Adviser’s organization and business; the types of services that each Fund Adviser or its affiliates provide to each Fund; the performance record of each Fund (as described in further detail below); and any initiatives Nuveen had taken for the open-end fund product line.
In considering the services provided by the Fund Advisers, the Board recognized that the Adviser provides a myriad of investment management, administrative, compliance, oversight and other services for the Funds, and the Sub-Adviser generally provides the portfolio advisory services to the Funds under the oversight of the Adviser. The Board considered the wide range of services provided by the Adviser to the Nuveen funds beginning with developing the fund and monitoring and analyzing its performance to providing or overseeing the services necessary to support a fund’s daily operations. The Board recognized the Adviser, among other things, provides: (a) product management (such as analyzing ways to better position a fund in the marketplace, maintaining relationships to gain access to distribution platforms and setting dividends); (b) fund administration (such as preparing a fund’s tax returns, regulatory filings and shareholder communications; managing fund budgets and expenses; overseeing a fund’s various service providers; and supporting and analyzing new and existing funds); (c) Board administration (such as supporting the Board and its committees, in relevant part, by organizing and administering the Board and committee meetings and preparing the necessary reports to assist the Board in its duties); (d) compliance (such as monitoring adherence to a fund’s investment policies and procedures and applicable law; reviewing the compliance program periodically and developing new policies or updating existing compliance policies and procedures as considered necessary or appropriate; responding to regulatory requests; and overseeing compliance testing of sub-advisers); (e) legal support (such as preparing or reviewing fund registration statements, proxy statements and other necessary materials; interpreting regulatory requirements and compliance thereof; and maintaining applicable registrations); and (f) investment services (such as overseeing and reviewing sub-advisers and their investment teams; analyzing performance of the funds; overseeing investment and risk management; overseeing the daily valuation process for portfolio securities and developing and recommending valuation policies and methodologies and changes thereto; and participating in fund development, leverage management and the development of investment policies and parameters).
In its review, the Board also considered the new services, initiatives or other changes adopted since the last advisory contract review that were designed to enhance the services and support the Adviser provides to the Nuveen funds. The Board recognized that some initiatives are a multi-year process. In reviewing the activities of 2013, the Board recognized that the year reflected the Adviser’s continued focus on fund rationalization for both closed-end and open-end funds, consolidating certain funds through mergers that were designed to improve efficiencies and economies of scale for shareholders, repositioning various funds through updates in their investment policies and guidelines with the expectation of bringing greater value to shareholders, and liquidating certain funds. As in the past, the Board recognized the Adviser’s significant investment in its technology initiatives, including the continued progress toward a central repository for fund and other Nuveen product data and implementing a data system to support the risk oversight group enabling it to provide more detailed risk analysis for the Nuveen funds. The Board noted the new data system has permitted more in-depth analysis of the investment risks of the Funds and across the complex providing additional feedback and insights to the investment teams and more comprehensive risk reporting to the Board. The Adviser also conducted several workshops for the Board regarding the new data system, including explaining the risk measures being applied and their purpose. The Board also recognized the enhancements in the valuation group within the Adviser, including centralizing the fund pricing process within the valuation group, trending to more automated and expedient reviews and continuing to expand its valuation team. The Board further considered the expansion of personnel in the compliance department enhancing the collective expertise of the group, investments in additional compliance systems and the updates of various compliance policies.
| 126 | Nuveen Investments |
In addition to the foregoing actions, the Board also considered other initiatives related to the open-end funds, including, among other things: the continued focus on enhancing the product line through the development of new funds, including the development of alternative strategies reflecting trends in the industry; the enhanced support provided to the Board by providing comprehensive in-depth presentations to the Open-End Funds Committee; and the development of a new class of shares for certain funds.
As noted, the Adviser also oversees the Sub-Adviser who provides the portfolio advisory services to the Funds. In reviewing the portfolio advisory services provided to each Fund, the Nuveen Investment Services Oversight Team of the Adviser analyzes the performance of the Sub-Adviser and may recommend changes to the investment team or investment strategies as appropriate. In assisting the Board’s review of the Sub-Adviser, the Adviser provides a report analyzing, among other things, the Sub-Adviser’s investment team and changes thereto, organization and history, assets under management, the investment team’s philosophy and strategies in managing each Fund, developments affecting the Sub-Adviser or the Funds and their performance. In their review of the Sub-Adviser, the Independent Board Members considered, among other things, the experience and qualifications of the relevant investment personnel, their investment philosophy and strategies, the Sub-Adviser’s organization and stability, its capabilities and any initiatives taken or planned to enhance its current capabilities or support potential growth of business and, as outlined in further detail below, the performance of the Funds. The Independent Board Members also reviewed portfolio manager compensation arrangements to evaluate each Fund Adviser’s ability to attract and retain high quality investment personnel, preserve stability, and reward performance while not providing an inappropriate incentive to take undue risks.
Given the importance of compliance, the Independent Board Members also considered Nuveen’s compliance program, including the report of the chief compliance officer regarding the Nuveen funds’ compliance policies and procedures; the resources dedicated to compliance; the record of compliance with the policies and procedures; and Nuveen’s supervision of the Funds’ service providers. The Board recognized Nuveen’s commitment to compliance and strong commitment to a culture of compliance. Given the Adviser’s emphasis on monitoring investment risk, the Board has also appointed two Independent Board Members as point persons to review and keep the Board apprised of developments in this area and work with applicable Fund Adviser personnel.
Based on their review, the Independent Board Members found that, overall, the nature, extent and quality of services provided to each Fund under the respective Original Advisory Agreement were satisfactory.
2. The New Advisory Agreements
In evaluating the nature, quality and extent of the services expected to be provided by the Fund Advisers under the New Investment Management Agreements and the New Sub-Advisory Agreements, the Board Members concluded that no diminution in the nature, quality and extent of services provided to each Fund and its shareholders by the respective Fund Advisers is expected as a result of the Transaction. In making their determination, the Independent Board Members considered, among other things: the expected impact, if any, of the Transaction on the operations, facilities, organization and personnel of each Fund Adviser; the ability of each Fund Adviser to perform its duties after the Transaction, including any changes to the level or quality of services provided to the Funds; the potential implications of any additional regulatory requirements imposed on the Fund Advisers or the Nuveen funds following the Transaction; and any anticipated changes to the investment and other practices of the Nuveen funds.
The Board noted that the terms of each New Investment Management Agreement, including the fees payable thereunder, are substantially identical to those of the Original Investment Management Agreement relating to the same Fund. Similarly, the terms of each New Sub-Advisory Agreement, including fees payable thereunder, are substantially identical to those of the Original Sub-Advisory Agreement relating to the same Fund. The Board considered that the services to be provided and the standard of care under the New Investment Management Agreements and the New Sub-Advisory Agreements are the same as the corresponding original agreements. The Board Members noted the Transaction also does not alter the allocation of responsibilities between the Adviser and the Sub-Adviser. The Sub-Adviser will continue to furnish an investment program, make investment decisions and place all orders for the purchase and sale of securities, all on behalf of each Fund and subject to oversight of the Board and the Adviser. The Board noted that TIAA-CREF did not anticipate any material changes to the advisory, sub-advisory or other services provided to the Nuveen funds as a result of the Transaction. The Independent Board Members recognized that there were not any planned “cost cutting” measures that could be expected to reduce the nature, extent or quality of services. The Independent Board Members further noted that there were currently no plans for material changes to senior personnel at Nuveen or key personnel who provide services to the Nuveen funds and the Board following the Transaction. The key personnel who have responsibility for the Nuveen funds in each area, including portfolio management, investment oversight, fund management, fund operations, product management, legal/compliance and board support functions, are expected to be the same following the Transaction, although such personnel may have additional reporting requirements to TIAA-CREF. The Board also considered the anticipated incentive plans designed to retain such key personnel. Notwithstanding the foregoing, the Board Members recognized that personnel changes may occur in the future as a result of normal business developments or personal career decisions.
| Nuveen Investments | 127 |
Annual Investment Management Agreement Approval Process (Unaudited) (continued)
The Board Members also considered Nuveen’s proposed governance structure following the Transaction and noted that Nuveen was expected to remain a stand-alone business within the TIAA-CREF enterprise and operate relatively autonomously from the other TIAA-CREF businesses, but would receive the general support and oversight from certain TIAA-CREF functional groups (such as legal, finance, internal audit, compliance, and risk management groups). The Board recognized, however, that Nuveen may be subject to additional reporting requirements as it keeps TIAA-CREF abreast of developments affecting the Nuveen business, may be required to modify certain of its reports, policies and procedures as necessary to conform to the practices followed in the TIAA-CREF enterprise and may need to collaborate with TIAA-CREF with respect to strategic planning for its business.
In considering the implications of the Transaction, the Board Members also recognized the reputation and size of TIAA-CREF and the benefits that the Transaction may bring to the Nuveen funds and Nuveen. In this regard, the Board recognized, among other things, that the increased resources and support that may be available to Nuveen from TIAA-CREF and the improved capital structure of Nuveen Investments, Inc. (the parent of the Adviser) that would result from the significant reduction in its debt level may reinforce and enhance Nuveen’s ability to provide quality services to the Nuveen funds and to invest further into its infrastructure.
Further, with the consummation of the Transaction, the Board recognized the enhanced distribution capabilities for the Nuveen funds as the funds may gain access to TIAA-CREF’s distribution network, particularly through TIAA-CREF’s retirement platform and institutional client base. The Board also considered that investors in TIAA-CREF’s retirement platform may choose to roll their investments as they exit their retirement plans into the Nuveen funds. The Independent Board Members recognized the potential cost savings to the benefit of all shareholders of the Nuveen funds from reduced expenses as assets in the Nuveen fund complex rise pursuant to the complex-wide fee arrangement described in further detail below.
Based on their review, the Independent Board Members found that the expected nature, extent and quality of services to be provided to each Fund under its New Advisory Agreements were satisfactory and supported approval of the New Advisory Agreements.
B. The Investment Performance of the Funds and Fund Advisers
1. The Original Advisory Agreements
The Board, including the Independent Board Members, considered the performance history of each Fund over various time periods. The Board reviewed reports, including an analysis of each Fund’s performance and the applicable investment team. In considering each Fund’s performance, the Board recognized that a fund’s performance can be reviewed through various measures including the fund’s absolute return, the fund’s return compared to the performance of other peer funds and the fund’s performance compared to its respective benchmark. Accordingly, the Board reviewed, among other things, each Fund’s historic investment performance as well as information comparing the Fund’s performance information with that of other funds (the “Performance Peer Group”) and with recognized and/or customized benchmarks (i.e., generally benchmarks derived from multiple recognized benchmarks) for the quarter, one-, three- and five-year periods ending December 31, 2013, as well as performance information reflecting the first quarter of 2014. This information supplemented the Nuveen fund performance information provided to the Board at each of its quarterly meetings.
In evaluating performance, the Board recognized several factors that may impact the performance data as well as the consideration given to particular performance data.
| • | The performance data reflects a snapshot in time, in this case as of the end of the most recent calendar year or quarter. A different performance period, however, could generate significantly different results. |
| • | Long-term performance can be adversely affected by even one period of significant underperformance so that a single investment decision or theme has the ability to disproportionately affect long-term performance. |
| • | The investment experience of a particular shareholder in a fund will vary depending on when such shareholder invests in such fund, the class held (if multiple classes offered in the fund) and the performance of the fund (or respective class) during that shareholder’s investment period. |
| • | Open-end funds offer multiple classes and the performance of the various classes of a fund should be substantially similar on a relative basis because all of the classes are invested in the same portfolio of securities and differences in performance among classes could be principally attributed to the variations in distribution and servicing expenses of each class. |
| • | The usefulness of comparative performance data as a frame of reference to measure a fund’s performance may be limited because the Performance Peer Group, among other things, does not adequately reflect the objectives and strategies of the fund, has a different investable universe, or the composition of the peer set may be limited in size or number as well as other factors. In this regard, the Board noted that the Adviser classified the Performance Peer Groups of the Nuveen funds from highly relevant to less relevant. Funds classified with less relevant Performance Peer Groups include: Nuveen Kansas Municipal Bond Fund (the “Kansas Fund”), Nuveen Kentucky Municipal Bond Fund (the |
| 128 | Nuveen Investments |
“Kentucky Fund”), Nuveen Michigan Municipal Bond Fund (the “Michigan Fund”), Nuveen Missouri Municipal Bond Fund (the “Missouri Fund”) and Nuveen Wisconsin Municipal Bond Fund (the “Wisconsin Fund”). For these Funds, the Board considered a Fund’s performance compared to its benchmark to help assess the Fund’s comparative performance. A fund was generally considered to have performed comparably to its benchmark if the fund’s performance was within certain thresholds compared to the performance of its benchmark and was considered to have outperformed or underperformed its benchmark if the fund’s performance was beyond these thresholds for the one- and three-year periods, subject to certain exceptions.i While the Board is cognizant of the relative performance of a fund’s peer set and/or benchmark(s), the Board evaluated fund performance in light of the respective fund’s investment objectives, investment parameters and guidelines and considered that the variations between the objectives and investment parameters or guidelines of the fund with its peers and/or benchmarks result in differences in performance results. |
With respect to any Nuveen funds for which the Board has identified performance concerns, the Board monitors such funds closely until performance improves, discusses with the Adviser the reasons for such results, considers those steps necessary or appropriate to address such issues and reviews the results of any efforts undertaken. The Board is aware, however, that shareholders chose to invest or remain invested in a fund knowing that the Adviser manages the fund and knowing the fund’s fee structure.
In considering the performance data, the Independent Board Members noted the following:
Nuveen Ohio Municipal Bond Fund (the “Ohio Fund”) demonstrated generally favorable performance in comparison to peers; although the Fund was in the third quartile in the one-year period, it was in the first quartile in the three- and five-year periods.
With respect to the Funds with Performance Peer Groups classified as less relevant as noted above, the Board considered each Fund’s performance compared to its respective benchmark. It noted that the Missouri Fund’s performance over time was satisfactory compared to the performance of its benchmark. In this regard, although the Missouri Fund underperformed its benchmark in the one-year period, it provided generally comparable performance in the three-year period and outperformed its benchmark in the five-year period.
The Board noted that certain other Funds with Performance Peer Groups classified as less relevant, including the Kansas Fund, the Kentucky Fund, the Michigan Fund and the Wisconsin Fund, underperformed their respective benchmarks over the one- and three-year periods. With respect to the Kansas Fund, the Kentucky Fund, the Michigan Fund and the Wisconsin Fund, the Board also noted the following:
| • | Although the Kansas Fund underperformed its benchmark in the one- and three-year periods, it provided comparable performance to its benchmark in the five-year period. Such Fund’s underperformance compared to its benchmark in 2013 was primarily due to an overweight in longer duration bonds as well as exposure to Puerto Rico securities and a small amount of leverage. The Board recognized that the Fund’s exposure to Puerto Rico was slightly reduced in 2013. The Kansas Fund outperformed its benchmark in the first quarter of 2014. |
| • | The Kentucky Fund’s underperformance compared to its benchmark in 2013 was primarily due to an overweight in longer duration bonds as well as exposure to Puerto Rico securities and a small amount of leverage. The Fund’s exposure to Puerto Rico securities was eliminated in 2013. The Kentucky Fund provided comparable performance to its benchmark in the first quarter of 2014. |
| • | The Michigan Fund’s underperformance compared to its benchmark was generally due to security selection driven in part by the underperformance of the Michigan municipal market following the Detroit bankruptcy filing. The Michigan Fund, however, outperformed its benchmark in the first quarter of 2014. |
| • | The Wisconsin Fund’s underperformance compared to its benchmark in 2013 was primarily driven by an overweight in longer duration bonds as well as exposure to Puerto Rico securities. The Fund’s exposure to Puerto Rico was reduced in 2013. The Wisconsin Fund outperformed its benchmark in the first quarter of 2014. |
With respect to the Kansas Fund, the Kentucky Fund and the Wisconsin Fund, exposure to longer duration bonds was a contributor to each Fund’s underperformance compared to its respective benchmark in the one-year period. The Board noted, however, that longer duration bonds had been additive to performance for each such Fund in the three-year period. The Board considered the market conditions, the objectives of such Funds and the investment philosophy underlying the emphasis of longer duration bonds and determined that the performance of the Kansas Fund, the Kentucky Fund and the Wisconsin Fund over time was satisfactory.
Based on their review, the Independent Board Members determined that each Fund’s investment performance had been satisfactory.
2. The New Advisory Agreements
With respect to the performance of each Fund, the Board considered that the portfolio investment personnel responsible for the management of the respective Fund portfolios were expected to continue to manage such portfolios following the completion of the Transaction and the
| Nuveen Investments | 129 |
Annual Investment Management Agreement Approval Process (Unaudited) (continued)
investment strategies of the Funds were not expected to change as a result of the Transaction. Accordingly, the findings regarding performance outlined above for the Original Advisory Agreements are applicable to the review of the New Advisory Agreements.
C. Fees, Expenses and Profitability
1. Fees and Expenses
The Board evaluated the management fees and expenses of each Fund, reviewing, among other things, such Fund’s gross management fees, net management fees and net expense ratios in absolute terms as well as compared to the fees and expenses of a comparable universe of funds provided by an independent fund data provider (the “Peer Universe”) and to a more focused subset of funds in the Peer Universe (the “Peer Group”) and any expense limitations.
The Independent Board Members further reviewed the methodology regarding the construction of the applicable Peer Universe and Peer Group. In reviewing the comparisons of fee and expense information, the Independent Board Members took into account that in certain instances various factors such as the limited size and particular composition of the Peer Universe or Peer Group (including the inclusion of other Nuveen funds in the peer set); expense anomalies; changes in the funds comprising the Peer Universe or Peer Group from year to year; levels of reimbursement or fee waivers; the timing of information used; and the differences in the states reflected in the Peer Universe or Peer Group (with respect to state municipal funds) may impact the comparative data thereby limiting somewhat the ability to make a meaningful comparison with peers.
In reviewing the fee schedule for a fund, the Independent Board Members also considered the fund-level and complex-wide breakpoint schedules (described in further detail below) and any fee waivers and reimbursements provided by Nuveen. In reviewing fees and expenses, the Board considered the expenses and fees to be higher if they were over 10 basis points higher, slightly higher if they were approximately 6 to 10 basis points higher, in line if they were within approximately 5 basis points higher than the peer average and below if they were below the peer average of the Peer Group. In reviewing the reports, the Board noted that the majority of the Nuveen funds were at, close to or below their peer average based on the net total expense ratio. The Independent Board Members observed that the Funds had net management fees slightly higher than their respective peer averages, but net expense ratios (including fee waivers and expense reimbursements) below or in line with their respective peer averages, except for the Ohio Fund, which had a net management fee and a net expense ratio in line with its peer averages.
Based on their review of the fee and expense information provided, the Independent Board Members determined that each Fund’s management fees (as applicable) to a Fund Adviser were reasonable in light of the nature, extent and quality of services provided to the Fund.
2. Comparisons with the Fees of Other Clients
The Board recognized that all Nuveen funds have a sub-adviser, either affiliated or non-affiliated, and therefore the overall fund management fee can be divided into two components, the fee retained by the Adviser and the fee paid to the sub-adviser. In general terms, the fee to the Adviser reflects the administrative and other services it provides to support the Nuveen fund (as described above) and, while some administrative services may occur at the sub-adviser level, the fee to the sub-adviser generally reflects the portfolio management services provided by the sub-adviser. The Independent Board Members considered the fees a Fund Adviser assesses to the Funds compared to that of other clients. With respect to municipal funds, such other clients of a Fund Adviser may include: municipal separately managed accounts and passively managed exchange traded funds (ETFs) sub-advised by the Adviser.
The Independent Board Members reviewed the nature of services provided by the Adviser, including through its affiliated sub-advisers and the average fee the affiliated sub-advisers assessed such clients as well as the range of fees assessed to the different types of separately managed accounts (such as retail, institutional or wrap accounts) to the extent applicable to the respective sub-adviser. In their review, the Independent Board Members considered the differences in the product types, including, but not limited to: the services provided, the structure and operations, product distribution and costs thereof, portfolio investment policies, investor profiles, account sizes and regulatory requirements. In evaluating the comparisons of fees, the Independent Board Members noted that the fee rates charged to the Nuveen funds and other clients vary, among other things, because of the different services involved and the additional regulatory and compliance requirements associated with registered investment companies, such as the Funds. The Independent Board Members noted that, as a general matter, higher fee levels reflect higher levels of service, increased investment management complexity, greater product management requirements and higher levels of risk or a combination of the foregoing. The Independent Board Members further noted, in particular, that the range of services provided to the Funds (as discussed above) is generally much more extensive than that provided to separately managed accounts. Many of the additional administrative services provided by the Adviser are not required for institutional clients. The Independent Board Members also recognized that the management fee rates of the foreign funds advised by the Adviser may vary due to, among other things, differences in the client base, governing bodies, operational complexities and services covered by the management fee. Given the inherent differences in the various products, particularly the extensive services provided to the Funds, the Independent Board Members believe such facts justify the different levels of fees.
| 130 | Nuveen Investments |
3. Profitability of Fund Advisers
In conjunction with their review of fees, the Independent Board Members also considered the profitability of Nuveen for its advisory activities and its financial condition. The Independent Board Members reviewed the revenues and expenses of Nuveen’s advisory activities for the last two calendar years, the allocation methodology used in preparing the profitability data, an analysis of the key drivers behind the changes in revenues and expenses that impacted profitability in 2013 and Nuveen’s consolidated financial statements for 2013. The Independent Board Members noted this information supplemented the profitability information requested and received during the year to help keep them apprised of developments affecting profitability (such as changes in fee waivers and expense reimbursement commitments). In this regard, the Independent Board Members noted that two Independent Board Members served as point persons to review the profitability analysis and methodologies employed, and any changes thereto, and to keep the Board apprised of such changes. The Independent Board Members also considered Nuveen’s revenues for advisory activities, expenses and profit margin compared to that of various unaffiliated management firms.
In reviewing profitability, the Independent Board Members noted the Adviser’s continued investment in its business with expenditures to, among other things, upgrade its investment technology and compliance systems and provide for additional personnel and other resources. The Independent Board Members recognized the Adviser’s continued commitment to its business should enhance the Adviser’s capacity and capabilities in providing the services necessary to meet the needs of the Nuveen funds as they grow or change over time. In addition, in evaluating profitability, the Independent Board Members also noted the subjective nature of determining profitability which may be affected by numerous factors including the allocation of expenses and that various allocation methodologies may each be reasonable but yield different results. Further, the Independent Board Members recognized the difficulties in making comparisons as the profitability of other advisers generally is not publicly available, and the profitability information that is available for certain advisers or management firms may not be representative of the industry and may be affected by, among other things, an adviser’s particular business mix, capital costs, size, types of funds managed and expense allocations. Notwithstanding the foregoing, the Independent Board Members noted the Adviser’s adjusted operating margin appears to be reasonable in relation to other investment advisers and sufficient to operate as a viable investment management firm meeting its obligations to the Nuveen funds. Based on their review, the Independent Board Members concluded that the Adviser’s level of profitability for its advisory activities was reasonable in light of the services provided.
With respect to sub-advisers affiliated with Nuveen, including the Sub-Adviser, the Independent Board Members reviewed such sub-advisers’ revenues, expenses and profitability margins (pre- and post-tax) for their advisory activities and the methodology used for allocating expenses among the internal sub-advisers. Based on their review, the Independent Board Members were satisfied that the Sub-Adviser’s level of profitability was reasonable in light of the services provided.
In evaluating the reasonableness of the compensation, the Independent Board Members also considered other amounts paid to a Fund Adviser by the funds as well as indirect benefits (such as soft dollar arrangements), if any, the Fund Adviser and its affiliates receive or are expected to receive that are directly attributable to the management of a Nuveen fund. See Section E below for additional information on indirect benefits the Fund Advisers may receive as a result of its relationship with a Nuveen fund. Based on their review of the overall fee arrangements of each Fund, the Independent Board Members determined that the advisory fees and expenses of the Funds were reasonable.
4. The New Advisory Agreements
As noted above, the terms of the New Advisory Agreements are substantially identical to their corresponding Original Advisory Agreements. The fee schedule, including the breakpoint schedule and complex-wide fee schedule, in each New Advisory Agreement is identical to that under the corresponding Original Advisory Agreement. The Board Members also noted that Nuveen has committed for a period of two years from the date of closing the Transaction (i) not to increase contractual management fee rates for any Nuveen fund and (ii) not to raise expense cap levels for any Nuveen fund from levels currently in effect or scheduled to go into effect prior to the Transaction. This commitment shall not limit or otherwise affect mergers or liquidations of any funds in the ordinary course. Based on the information provided, the Board Members did not believe that the overall expenses would increase as a result of the Transaction. In addition, the Board Members recognized that the Nuveen funds may gain access to the retirement platform and institutional client base of TIAA-CREF, and the investors in the retirement platforms may roll their investments into one or more Nuveen funds as they exit their retirement plans. The enhanced distribution access may result in additional sales of the Nuveen funds resulting in an increase in total assets under management in the complex and a corresponding decrease in overall management fees if additional breakpoints at the fund-level or complex-wide level are met. Based on its review, the Board determined that the management fees and expenses under each New Advisory Agreement were reasonable.
Further, other than from a potential reduction in the debt level of Nuveen Investments, Inc., the Board recognized that it is difficult to predict with any degree of certainty the impact of the Transaction on Nuveen’s profitability. Given the fee schedule was not expected to change under the New Advisory Agreements, however, the Independent Board Members concluded that each Fund Adviser’s level of profitability for its advisory activities under the respective New Advisory Agreements would continue to be reasonable in light of the services provided.
| Nuveen Investments | 131 |
Annual Investment Management Agreement Approval Process (Unaudited) (continued)
D. Economies of Scale and Whether Fee Levels Reflect These Economies of Scale
1. The Original Advisory Agreements
With respect to economies of scale, the Independent Board Members have recognized the potential benefits resulting from the costs of a fund being spread over a larger asset base, although economies of scale are difficult to measure and predict with precision, particularly on a fund-by-fund basis. One method to help ensure the shareholders share in these benefits is to include breakpoints in the advisory fee schedule. Generally, management fees for funds in the Nuveen complex are comprised of a fund-level component and a complex-level component, subject to certain exceptions. Accordingly, the Independent Board Members reviewed and considered the applicable fund-level breakpoints in the advisory fee schedules that reduce advisory fees as asset levels increase.
In addition to fund-level advisory fee breakpoints, the Board also considered the Nuveen funds’ complex-wide fee arrangement. Pursuant to the complex-wide fee arrangement, the fees of the funds in the Nuveen complex are reduced as the assets in the fund complex reach certain levels. The complex-wide fee arrangement seeks to provide the benefits of economies of scale to fund shareholders when total fund complex assets increase, even if assets of a particular fund are unchanged or have decreased. The approach reflects the notion that some of Nuveen’s costs are attributable to services provided to all its funds in the complex and therefore all funds benefit if these costs are spread over a larger asset base.
Based on their review, the Independent Board Members concluded that the breakpoint schedules and complex-wide fee arrangement (as applicable) were acceptable and reflect economies of scale to be shared with shareholders when assets under management increase.
2. The New Advisory Agreements
As noted, the Independent Board Members recognized that the fund-level and complex-wide schedules will not change under the New Advisory Agreements. Assets in the funds advised by TIAA-CREF or its current affiliates will not be included in the complex-wide fee calculation. Nevertheless, the Nuveen funds may have access to TIAA-CREF’s retirement platform and institutional client base. The access to this distribution network may enhance the distribution of the Nuveen funds which, in turn, may lead to reductions in management and sub-advisory fees if the Nuveen funds reach additional fund-level and complex-wide breakpoint levels. Based on their review, including the considerations in the annual review of the Original Advisory Agreements, the Independent Board Members determined that the fund-level breakpoint schedules and complex-wide fee schedule continue to be appropriate and desirable in ensuring that shareholders participate in the benefits derived from economies of scale under the New Advisory Agreements.
E. Indirect Benefits
1. The Original Advisory Agreements
In evaluating fees, the Independent Board Members received and considered information regarding potential “fall out” or ancillary benefits the respective Fund Adviser or its affiliates may receive as a result of its relationship with each Fund. In this regard, the Independent Board Members considered, among other things, any sales charges, distribution fees and shareholder services fees received and retained by the Funds’ principal underwriter, an affiliate of the Adviser, which include fees received pursuant to any 12b-1 plan. The Independent Board Members, therefore, considered the 12b-1 fees retained by Nuveen during the last calendar year.
In addition to the above, the Independent Board Members considered whether the Fund Advisers received any benefits from soft dollar arrangements whereby a portion of the commissions paid by a fund for brokerage may be used to acquire research that may be useful to a Fund Adviser in managing the assets of the fund and other clients. Each Fund’s portfolio transactions are allocated by the Sub-Adviser. Accordingly, the Independent Board Members considered that the Sub-Adviser may benefit from its soft dollar arrangements pursuant to which it receives research from brokers that execute the applicable Fund’s portfolio transactions. With respect to any fixed income securities, however, the Board recognized that such securities generally trade on a principal basis that does not generate soft dollar credits. Similarly, the Board recognized that the research received pursuant to soft dollar arrangements by the Sub-Adviser may also benefit the Funds and their shareholders to the extent the research enhances the ability of the Sub-Adviser to manage the Funds. The Independent Board Members noted that the Sub-Adviser’s profitability may be somewhat lower if it did not receive the research services pursuant to the soft dollar arrangements and had to acquire such services directly.
Based on their review, the Independent Board Members concluded that any indirect benefits received by a Fund Adviser as a result of its relationship with the Funds were reasonable and within acceptable parameters.
2. The New Advisory Agreements
The Independent Board Members noted that, as the applicable policies and operations of the Fund Advisers with respect to the Nuveen funds were not anticipated to change significantly after the Transaction, such indirect benefits should remain after the Transaction. The Independent Board Members further noted the benefits the Transaction would provide to TIAA-CREF and Nuveen, including a larger-scale fund complex, certain
| 132 | Nuveen Investments |
shared services (noted above) and a broader range of investment capabilities, distribution capabilities and product line. Further, the Independent Board Members noted that Nuveen Investments, Inc. (the parent of the Adviser) would benefit from an improved capital structure through a reduction in its debt level.
F. Other Considerations for the New Advisory Agreements
In addition to the factors above, the Board Members also considered the following with respect to the Nuveen funds:
| • | Nuveen would rely on the provisions of Section 15(f) of the 1940 Act. In this regard, to help ensure that an unfair burden is not imposed on the Nuveen funds, Nuveen has committed for a period of two years from the date of the closing of the Transaction (i) not to increase contractual management fee rates for any fund and (ii) not to raise expense cap levels for any fund from levels currently in effect or scheduled to go into effect prior to the Transaction. This commitment shall not limit or otherwise affect mergers or liquidations of any funds in the ordinary course. |
| • | The Nuveen funds would not incur any costs in seeking the necessary shareholder approvals for the New Investment Management Agreements or the New Sub-Advisory Agreements (except for any costs attributed to seeking shareholder approvals of fund specific matters unrelated to the Transaction, such as election of Board Members or changes to investment policies, in which case a portion of such costs will be borne by the applicable funds). |
| • | The reputation, financial strength and resources of TIAA-CREF. |
| • | The long-term investment philosophy of TIAA-CREF and anticipated plans to grow Nuveen’s business to the benefit of the Nuveen funds. |
| • | The benefits to the Nuveen funds as a result of the Transaction including: (i) increased resources and support available to Nuveen as well as an improved capital structure that may reinforce and enhance the quality and level of services it provides to the funds; (ii) potential additional distribution capabilities for the funds to access new markets and customer segments through TIAA-CREF’s distribution network, including, in particular, its retirement platforms and institutional client base; and (iii) access to TIAA-CREF’s expertise and investment capabilities in additional asset classes. |
G. Other Considerations
The Independent Board Members did not identify any single factor discussed previously as all-important or controlling. The Board Members, including the Independent Board Members, unanimously concluded that the terms of each Original Advisory Agreement and New Advisory Agreement are fair and reasonable, that the respective Fund Adviser’s fees are reasonable in light of the services provided to each Fund and that the Original Advisory Agreements be renewed and the New Advisory Agreements be approved.
II. Approval of Interim Advisory Agreements
At the April Meeting, the Board Members, including the Independent Board Members, unanimously approved for each Fund an interim advisory agreement (the “Interim Investment Management Agreement”) between the respective Fund and the Adviser and an interim sub-advisory agreement (the “Interim Sub-Advisory Agreement”) between the Adviser and the Sub-Adviser. If necessary to assure continuity of advisory services, each respective Interim Investment Management Agreement and Interim Sub-Advisory Agreement will take effect upon the closing of the Transaction if shareholders have not yet approved the corresponding New Investment Management Agreement or New Sub-Advisory Agreement. The terms of each Interim Investment Management Agreement and Interim Sub-Advisory Agreement are substantially identical to those of the corresponding Original Investment Management Agreement and New Investment Management Agreement and the corresponding Original Sub Advisory Agreement and New Sub Advisory Agreement, respectively, except for certain term and fee escrow provisions. In light of the foregoing, the Board Members, including the Independent Board Members, unanimously determined that the scope and quality of services to be provided to the Funds under the respective Interim Investment Management Agreements and Interim Sub Advisory Agreements are at least equivalent to the scope and quality of services provided under the applicable Original Investment Management Agreements and Original Sub Advisory Agreements.
i The Board recognized that the Adviser considered a fund to have outperformed or underperformed its benchmark if the fund’s performance was higher or lower than the performance of the benchmark by the following thresholds: for open-end funds (+/- 100 basis points for equity funds excluding index funds; +/- 30 basis points for tax exempt fixed income funds; +/- 40 basis points for taxable fixed income funds) and for closed-end funds (assuming 30% leverage) (+/- 130 basis points for equity funds excluding index funds; +/- 39 basis points for tax exempt funds and +/- 52 basis points for taxable fixed income funds).
| Nuveen Investments | 133 |
and Officers (Unaudited)
The management of the Funds, including general supervision of the duties performed for the Funds by the Adviser, is the responsibility of the Board of Trustees of the Funds. The number of directors of the Funds is currently set at ten. None of the trustees who are not “interested” persons of the Funds (referred to herein as “independent trustees”) has ever been a director or employee of, or consultant to, Nuveen or its affiliates. The names and business addresses of the trustees and officers of the Funds, their principal occupations and other affiliations during the past five years, the number of portfolios each oversees and other directorships they hold are set forth below.
The Funds’ Statement of Additional Information (“SAI”) includes more information about the trustees. To request a free copy, call Nuveen Investments at (800) 257-8787 or visit the Funds’ website at www.nuveen.com.
Name, Year of Birth & Address | Position(s) Held with the Funds | Year First Elected or Appointed (1) | Principal Occupation(s) Including other Directorships During Past 5 Years | Number of Portfolios in Fund Complex Overseen by Director | ||||
| Independent Trustee: | ||||||||
William J. Schneider 1944 333 W. Wacker Drive Chicago, IL 60606 | Chairman of the Board and Trustee | 1996 | Chairman of Miller-Valentine Partners Med, a real estate investment company; formerly, Senior Partner and Chief Operating Officer (retired 2004) of Miller-Valentine Group; owner in several other Miller-Valentine entities; Board Member of Mid-America Health System, Tech Town, Inc., a not-for-profit community development company, and WDPR Public Radio Station; formerly, member, Business Advisory Council, Cleveland Federal Reserve Bank and University of Dayton Business School Advisory Council. | 201 | ||||
Robert P. Bremner 1940 333 W. Wacker Drive Chicago, IL 60606 | Trustee | 1996 | Private Investor and Management Consultant; Treasurer and Director, Humanities Council of Washington, D.C.; Board Member, Independent Directors Council affiliated with the Investment Company Institute. | 201 | ||||
Jack B. Evans 1948 333 W. Wacker Drive Chicago, IL 60606 | Trustee | 1999 | President, The Hall-Perrine Foundation, a private philanthropic corporation (since 1996); Chairman, United Fire Group, a publicly held company; formerly, President Pro-Tem of the Board of Regents for the State of Iowa University System; Director, Source Media Group; Life Trustee of Coe College; formerly, Director, Alliant Energy; formerly, Director, Federal Reserve Bank of Chicago; formerly, President and Chief Operating Officer, SCI Financial Group, Inc., a regional financial services firm. | 201 | ||||
William C. Hunter 1948 333 W. Wacker Drive Chicago, IL 60606 | Trustee | 2004 | Dean Emeritus (since June 30, 2012), formerly, Dean, Tippie College of Business, University of Iowa (2006-2012); Director (since 2004) of Xerox Corporation; Director (since 2005), and President (since July 2012) Beta Gamma Sigma, Inc., The International Honor Society; Director of Wellmark, Inc. (since 2009); formerly, Dean and Distinguished Professor of Finance, School of Business at the University of Connecticut (2003-2006); previously, Senior Vice President and Director of Research at the Federal Reserve Bank of Chicago (1995-2003); formerly, Director (1997-2007), Credit Research Center at Georgetown University. | 201 | ||||
| 134 | Nuveen Investments |
Name, Year of Birth & Address | Position(s) Held with the Funds | Year First Elected or Appointed (1) | Principal Occupation(s) Including other Directorships During Past 5 Years | Number of Portfolios in Fund Complex Overseen by Director | ||||
David J. Kundert 1942 333 W. Wacker Drive Chicago, IL 60606 | Trustee | 2005 | Formerly, Director, Northwestern Mutual Wealth Management Company (2006-2013); retired (since 2004) as Chairman, JPMorgan Fleming Asset Management, President and CEO, Banc One Investment Advisors Corporation, and President, One Group Mutual Funds; prior thereto, Executive Vice President, Banc One Corporation and Chairman and CEO, Banc One Investment Management Group; Regent Emeritus, Member of Investment Committee, Luther College; member of the Wisconsin Bar Association; member of Board of Directors, Friends of Boerner Botanical Gardens; member of Board of Directors and Chair of Investment Committee, Greater Milwaukee Foundation; member of the Board of Directors (Milwaukee), College Possible. | 201 | ||||
John K. Nelson 1962 333 West Wacker Drive Chicago, IL 60606 | Trustee | 2013 | Senior external advisor to the financial services practice of Deloitte Consulting LLP (since 2012); Member of Board of Directors of Core12 LLC (since 2008), a private firm which develops branding, marketing and communications strategies for clients; Director of The Curran Center for Catholic American Studies (since 2009) and The President’s Council, Fordham University (since 2010); formerly, Chairman of the Board of Trustees of Marian University (2010 as trustee, 2011-2014 as Chairman); formerly, Chief Executive Officer of ABN AMRO N.V. North America, and Global Head of its Financial Markets Division (2007-2008); prior senior positions held at ABN AMRO include Corporate Executive Vice President and Head of Global Markets—the Americas (2006-2007), CEO of Wholesale Banking—North America and Global Head of Foreign Exchange and Futures Markets (2001-2006), and Regional Commercial Treasurer and Senior Vice President Trading—North America (1996-2001); formerly, Trustee at St. Edmund Preparatory School in New York City. | 201 | ||||
Judith M. Stockdale 1947 333 W. Wacker Drive Chicago, IL 60606 | Trustee | 1997 | Board Member, Land Trust Alliance (since June 2013) and U.S. Endowment for Forestry and Communities (since November 2013); formerly, Executive Director (1994-2012), Gaylord and Dorothy Donnelley Foundation (since 1994); prior thereto, Executive Director, Great Lakes Protection Fund (1990-1994). | 201 | ||||
Carole E. Stone 1947 333 W. Wacker Drive Chicago, IL 60606 | Trustee | 2007 | Director, Chicago Board Options Exchange (since 2006), C2 Options Exchange, Incorporated (since 2009) Director, CBOE Holdings, Inc. (since 2010); formerly, Commissioner, New York State Commission on Public Authority Reform (2005-2010); formerly, Chair, New York Racing Association Oversight Board (2005-2007). | 201 | ||||
Virginia L. Stringer 1944 333 W. Wacker Drive Chicago, IL 60606 | Trustee | 2011 | Board Member, Mutual Fund Directors Forum; former governance consultant and non-profit board member; former Owner and President, Strategic Management Resources, Inc., a management consulting firm; former Member, Governing Board, Investment Company Institute’s Independent Directors Council; previously, held several executive positions in general management, marketing and human resources at IBM and The Pillsbury Company; Independent Director, First American Fund Complex (1987-2010) and Chair (1997-2010). | 201 |
| Nuveen Investments | 135 |
Trustees and Officers (Unaudited) (continued)
Name, Year of Birth & Address | Position(s) Held with the Funds | Year First Elected or Appointed (1) | Principal Occupation(s) Including other Directorships During Past 5 Years | Number of Portfolios in Fund Complex Overseen by Director | ||||
Terence J. Toth 1959 333 W. Wacker Drive Chicago, IL 60606 | Trustee | 2008 | Managing Partner, Promus Capital (since 2008); Director, Fulcrum IT Service LLC (since 2010), Quality Control Corporation (since 2012) and LogicMark LLC (since 2012); formerly, Director, Legal & General Investment Management America, Inc. (2008-2013); formerly, CEO and President, Northern Trust Global Investments (2004-2007); Executive Vice President, Quantitative Management & Securities Lending (2000-2004); prior thereto, various positions with Northern Trust Company (since 1994); member: Chicago Fellowship Board (since 2005), Catalyst Schools of Chicago Board (since 2008) and Mather Foundation Board (since 2012), and a member of its investment committee; formerly, Member, Northern Trust Mutual Funds Board (2005-2007), Northern Trust Global Investments Board (2004-2007), Northern Trust Japan Board (2004-2007), Northern Trust Securities Inc. Board (2003-2007) and Northern Trust Hong Kong Board (1997-2004). | 201 |
Name, Year of Birth & Address | Position(s) Held with the Funds | Year First Elected or Appointed (2) | Principal Occupation(s) During Past 5 Years | Number of Portfolios in Fund Complex Overseen by Director | ||||
| Officers of the Funds: | ||||||||
Gifford R. Zimmerman 1956 333 W. Wacker Drive Chicago, IL 60606 | Chief Administrative Officer | 1988 | Managing Director (since 2002), and Assistant Secretary of Nuveen Securities, LLC; Managing Director (since 2004) and Assistant Secretary (since 1994) of Nuveen Investments, Inc.; Managing Director (since 2002), Assistant Secretary (since 1997) and Co-General Counsel (since 2011) of Nuveen Fund Advisors, LLC; Managing Director, Assistant Secretary and Associate General Counsel of Nuveen Asset Management, LLC (since 2011); Managing Director, Associate General Counsel and Assistant Secretary of Symphony Asset Management LLC (since 2003); Vice President and Assistant Secretary of NWQ Investment Management Company, LLC (since 2002), Nuveen Investments Advisers Inc. (since 2002), Santa Barbara Asset Management, LLC (since 2006) and of Winslow Capital Management, LLC, (since 2010); Vice President and Assistant Secretary (since 2013), formerly, Chief Administrative Officer and Chief Compliance Officer (2006-2013) of Nuveen Commodities Asset Management, LLC; Chartered Financial Analyst. | 201 | ||||
Margo L. Cook 1964 333 W. Wacker Drive Chicago, IL 60606 | Vice President | 2009 | Executive Vice President (since 2008) of Nuveen Investments, Inc. and of Nuveen Fund Advisors, LLC (since 2011); Managing Director – Investment Services of Nuveen Commodities Asset Management, LLC (since August 2011), previously, Head of Institutional Asset Management (2007-2008) of Bear Stearns Asset Management; Head of Institutional Asset Management (1986-2007) of Bank of NY Mellon; Chartered Financial Analyst. | 201 | ||||
Lorna C. Ferguson 1945 333 W. Wacker Drive Chicago, IL 60606 | Vice President | 1998 | Managing Director (since 2005) of Nuveen Fund Advisors, LLC and Nuveen Securities, LLC (since 2004). | 201 | ||||
| 136 | Nuveen Investments |
Name, Year of Birth & Address | Position(s) Held with the Funds | Year First Elected or Appointed (2) | Principal Occupation(s) During Past 5 Years | Number of Portfolios in Fund Complex Overseen by Director | ||||
Stephen D. Foy 1954 333 W. Wacker Drive Chicago, IL 60606 | Vice President and Controller | 1998 | Managing Director (since 2014), formerly, Senior Vice President (2013-2014), and Vice President of Nuveen Fund Advisors, LLC; Chief Financial Officer of Nuveen Commodities Asset Management, LLC (since 2010); Senior Vice President (2010-2011), Formerly Vice President (2005-2010) and Funds Controller of Nuveen Securities, LLC; Certified Public Accountant. | 201 | ||||
Scott S. Grace 1970 333 W. Wacker Drive Chicago, IL 60606 | Vice President and Treasurer | 2009 | Managing Director, Corporate Finance & Development, Treasurer (since 2009) of Nuveen Securities, LLC; Managing Director and Treasurer (since 2009) of Nuveen Fund Advisors, LLC, Nuveen Investments Advisers, Inc., Nuveen Investments Holdings Inc. and (since 2011) Nuveen Asset Management, LLC; Vice President and Treasurer of NWQ Investment Management Company, LLC, Tradewinds Global Investors, LLC, Symphony Asset Management LLC and Winslow Capital Management, LLC.; Vice President of Santa Barbara Asset Management, LLC; formerly, Treasurer (2006-2009), Senior Vice President (2008-2009), previously, Vice President (2006-2008) of Janus Capital Group, Inc.; formerly, Senior Associate in Morgan Stanley’s Global Financial Services Group (2000-2003); Chartered Accountant Designation. | 201 | ||||
Walter M. Kelly 1970 333 W. Wacker Drive Chicago, IL 60606 | Chief Compliance Officer and Vice President | 2003 | Senior Vice President (since 2008) of Nuveen Investments Holdings, Inc. | 201 | ||||
Tina M. Lazar 1961 333 W. Wacker Drive Chicago, IL 60606 | Vice President | 2002 | Senior Vice President of Nuveen Investment Holdings, Inc. | 201 | ||||
Kevin J. McCarthy 1966 333 W. Wacker Drive Chicago, IL 60606 | Vice President and Secretary | 2007 | Managing Director and Assistant Secretary (since 2008), Nuveen Securities, LLC; Managing Director (since 2008), Assistant Secretary (since 2007) and Co-General Counsel (since 2011) of Nuveen Fund Advisors, LLC; Managing Director, Assistant Secretary and Associate General Counsel (since 2011) of Nuveen Asset Management, LLC; Managing Director (since 2008), and Assistant Secretary, Nuveen Investment Holdings, Inc.; Vice President (since 2007) and Assistant Secretary of Nuveen Investments Advisers Inc., NWQ Investment Management Company, LLC, Tradewinds Global Investors LLC, Symphony Asset Management LLC, Santa Barbara Asset Management, LLC, and of Winslow Capital Management, LLC. (since 2010); Vice President and Secretary (since 2010) of Nuveen Commodities Asset Management, LLC. | 201 | ||||
Kathleen L. Prudhomme 1953 901 Marquette Avenue Minneapolis, MN 55402 | Vice President and Assistant Secretary | 2011 | Managing Director, Assistant Secretary and Co-General Counsel (since 2011) of Nuveen Fund Advisors, LLC; Managing Director, Assistant Secretary and Associate General Counsel (since 2011) of Nuveen Asset Management, LLC; Managing Director and Assistant Secretary (since 2011) of Nuveen Securities, LLC; formerly, Deputy General Counsel, FAF Advisors, Inc. (2004-2010). | 201 | ||||
Joel T. Slager 1978 333 West Wacker Drive Chicago, IL 60606 | Vice President and Assistant Secretary | 2013 | Fund Tax Director for Nuveen Funds (since May, 2013); previously, Vice President of Morgan Stanley Investment Management, Inc., Assistant Treasurer of the Morgan Stanley Funds (from 2010 to 2013); Tax Director at PricewaterhouseCoopers LLP (from 2008 to 2010). | 201 |
| Nuveen Investments | 137 |
Trustees and Officers (Unaudited) (continued)
Name, Year of Birth & Address | Position(s) Held with the Funds | Year First Elected or Appointed (2) | Principal Occupation(s) During Past 5 Years | Number of Portfolios in Fund Complex Overseen by Director | ||||
Jeffery M. Wilson 1956 333 West Wacker Drive Chicago, IL 60606 | Vice President | 2011 | Senior Vice President of Nuveen Securities, LLC (since 2011); formerly, Senior Vice President of FAF Advisors, Inc. (2000-2010). | 108 |
| (1) | Trustees serve an indefinite term until his/her successor is elected or appointed. The year first elected or appointed represents the year in which the trustee was first elected or appointed to any fund in the Nuveen Fund Complex. |
| (2) | Officers serve one year terms through August of each year. The year first elected or appointed represents the year in which the officer was first elected or appointed to any fund in the Nuveen Fund Complex. |
| 138 | Nuveen Investments |
Notes
| Nuveen Investments | 139 |
| ||||||||||||||
| ||||||||||||||
| Nuveen Investments: | ||||||||||||||
| Serving Investors for Generations | ||||||||||||||
| ||||||||||||||
| Since 1898, financial advisors and their clients have relied on Nuveen Investments to provide dependable investment solutions through continued adherence to proven, long-term investing principles. Today, we offer a range of high quality equity and fixed-income solutions designed to be integral components of a well-diversified core portfolio. | ||||||||||||||
| ||||||||||||||
Focused on meeting investor needs.
Nuveen Investments provides high-quality investment services designed to help secure the long- term goals of institutional and individual investors as well as the consultants and financial advisors who serve them. Nuveen Investments markets a wide range of specialized investment solutions which provide investors access to capabilities of its high-quality boutique investment affiliates- Nuveen Asset Management, Symphony Asset Management, NWQ Investment Management Company, Santa Barbara Asset Management, Tradewinds Global Investors, Winslow Capital Management, and Gresham Investment Management. In total, Nuveen Investments managed $225 billion as of March 31, 2014. | ||||||||||||||
| ||||||||||||||
Find out how we can help you. To learn more about how the products and services of Nuveen Investments may be able to help you meet your financial goals, talk to your financial advisor, or call us at (800) 257-8787. Please read the information provided carefully before you invest. Investors should consider the investment objective and policies, risk considerations, charges and expenses of any investment carefully. Where applicable, be sure to obtain a prospectus, which contains this and other relevant information. To obtain a prospectus, please contact your securities representative or Nuveen Investments, 333 W. Wacker Dr., Chicago, IL 60606. Please read the prospectus carefully before you invest or send money.
Learn more about Nuveen Funds at: www.nuveen.com/mf | ||||||||||||||
| ||||||||||||||
| Distributed by Nuveen Securities, LLC | 333 West Wacker Drive Chicago, IL 60606 | www.nuveen.com/mf | ||||||||||||||
MAN-MS6-0514D 2094-INV-Y07/15
ITEM 2. CODE OF ETHICS.
As of the end of the period covered by this report, the registrant has adopted a code of ethics that applies to the registrant’s principal executive officer, principal financial officer, principal accounting officer or controller, or persons performing similar functions. There were no amendments to or waivers from the code during the period covered by this report. The registrant has posted the code of ethics on its website at www.nuveen.com/MutualFunds/ShareholderResources/FundGovernance.aspx. (To view the code, click on Code of Conduct.)
ITEM 3. AUDIT COMMITTEE FINANCIAL EXPERT.
The registrant’s Board of Directors determined that the registrant has at least one “audit committee financial expert” (as defined in Item 3 of Form N-CSR) serving on its Audit Committee. The registrant’s audit committee financial expert is Carole E. Stone, who is “independent” for purposes of Item 3 of Form N-CSR.
Ms. Stone served for five years as Director of the New York State Division of the Budget. As part of her role as Director, Ms. Stone was actively involved in overseeing the development of the State’s operating, local assistance and capital budgets, its financial plan and related documents; overseeing the development of the State’s bond-related disclosure documents and certifying that they fairly presented the State’s financial position; reviewing audits of various State and local agencies and programs; and coordinating the State’s system of internal audit and control. Prior to serving as Director, Ms. Stone worked as a budget analyst/examiner with increasing levels of responsibility over a 30 year period, including approximately five years as Deputy Budget Director. Ms. Stone has also served as Chair of the New York State Racing Association Oversight Board, as Chair of the Public Authorities Control Board, as a Commissioner on the New York State Commission on Public Authority Reform and as a member of the Boards of Directors of several New York State public authorities. These positions have involved overseeing operations and finances of certain entities and assessing the adequacy of project/entity financing and financial reporting. Currently, Ms. Stone is on the Board of Directors of CBOE Holdings, Inc., of the Chicago Board Options Exchange, and of C2 Options Exchange. Ms. Stone’s position on the boards of these entities and as a member of both CBOE Holdings’ Audit Committee and its Finance Committee has involved, among other things, the oversight of audits, audit plans and preparation of financial statements.
ITEM 4. PRINCIPAL ACCOUNTANT FEES AND SERVICES.
The following tables show the amount of fees that PricewaterhouseCoopers LLP, the Funds’ auditor, billed to the Funds’ during the Funds’ last two full fiscal years. The Audit Committee approved in advance all audit services and non-audit services that PricewaterhouseCoopers LLP provided to the Funds, except for those non-audit services that were subject to the pre-approval exception under Rule 2-01 of Regulation S-X (the “pre-approval exception”). The preapproval exception for services provided directly to the Funds waives the pre-approval requirement for services other than audit, review or attest services if: (A) the aggregate amount of all such services provided constitutes no more than 5% of the total amount of revenues paid by the Funds during the fiscal year in which the services are provided; (B) the Funds did not recognize the services as non-audit services at the time of the engagement; and (C) the services are promptly brought to the Audit Committee’s attention, and the Committee (or its delegate) approves the services before the audit is completed.
The Audit Committee has delegated certain pre-approval responsibilities to its Chairman (or, in his absence, any other member of the Audit Committee).
SERVICES THAT THE AUDITOR BILLED TO THE FUNDS
Fiscal Year Ended May 31, 2014 | Audit Fees Billed to Funds 1 | Audit-Related Fees Billed to Funds 2 | Tax Fees Billed to Funds 3 | All Other Fees Billed to Funds 4 | ||||||||||||
Fund Name | ||||||||||||||||
Nuveen Kansas Municipal Bond Fund | 26,375 | 0 | 0 | 0 | ||||||||||||
Nuveen Kentucky Municipal Bond Fund | 27,156 | 0 | 0 | 0 | ||||||||||||
Nuveen Missouri Municipal Bond Fund | 27,318 | 0 | 0 | 0 | ||||||||||||
Nuveen Michigan Municipal Bond Fund | 26,215 | 0 | 0 | 0 | ||||||||||||
Nuveen Ohio Municipal Bond Fund | 27,716 | 0 | 1,500 | 0 | ||||||||||||
Nuveen Wisconsin Municipal Bond Fund | 25,882 | 0 | 0 | 0 | ||||||||||||
|
|
|
|
|
|
|
| |||||||||
Total | $ | 160,661 | $ | 0 | $ | 1,500 | $ | 0 | ||||||||
| 1 | “Audit Fees” are the aggregate fees billed for professional services for the audit of the Fund’s annual financial statements and services provided in connection with statutory and regulatory filings or engagements. |
| 2 | “Audit-Related Fees” are the aggregate fees billed for assurance and related services reasonably related to the performance of the audit or review of financial statements that are not reported under “Audit Fees”. These fees include offerings related to the Fund’s common shares and leverage. |
| 3 | “Tax Fees” are the aggregate fees billed for professional services for tax advice, tax compliance, and tax planning. These fees include: all global withholding tax services; excise and state tax reviews; capital gain, tax equalization and taxable basis calculations performed by the principal accountant. |
| 4 | “All Other Fees” are the aggregate fees billed for products and services other than “Audit Fees”, “Audit-Related Fees” and “Tax Fees”. These fees represent all “Agreed-Upon Procedures” engagements pertaining to the Fund’s use of leverage. |
| Percentage Approved Pursuant to Pre-approval Exception | ||||||||||||||||
| Audit Fees Billed to Funds | Audit-Related Fees Billed to Funds | Tax Fees Billed to Funds | All Other Fees Billed to Funds | |||||||||||||
Fund Name | ||||||||||||||||
Nuveen Kansas Municipal Bond Fund | 0 | % | 0 | % | 0 | % | 0 | % | ||||||||
Nuveen Kentucky Municipal Bond Fund | 0 | % | 0 | % | 0 | % | 0 | % | ||||||||
Nuveen Missouri Municipal Bond Fund | 0 | % | 0 | % | 0 | % | 0 | % | ||||||||
Nuveen Michigan Municipal Bond Fund | 0 | % | 0 | % | 0 | % | 0 | % | ||||||||
Nuveen Ohio Municipal Bond Fund | 0 | % | 0 | % | 0 | % | 0 | % | ||||||||
Nuveen Wisconsin Municipal Bond Fund | 0 | % | 0 | % | 0 | % | 0 | % | ||||||||
May 31, 2013 | Audit Fees Billed to Funds 1 | Audit-Related Fees Billed to Funds 2 | Tax Fees Billed to Funds 3 | All Other Fees Billed to Funds 4 | ||||||||||||
Fund Name | ||||||||||||||||
Nuveen Kansas Municipal Bond Fund | 25,620 | 0 | 600 | 0 | ||||||||||||
Nuveen Kentucky Municipal Bond Fund | 26,490 | 0 | 600 | 0 | ||||||||||||
Nuveen Missouri Municipal Bond Fund | 26,559 | 0 | 600 | 0 | ||||||||||||
Nuveen Michigan Municipal Bond Fund | 25,486 | 0 | 600 | 0 | ||||||||||||
Nuveen Ohio Municipal Bond Fund | 27,097 | 0 | 600 | 0 | ||||||||||||
Nuveen Wisconsin Municipal Bond Fund | 25,083 | 0 | 600 | 0 | ||||||||||||
|
|
|
|
|
|
|
| |||||||||
Total | $ | 156,335 | $ | 0 | $ | 3,600 | $ | 0 | ||||||||
| 1 | “Audit Fees” are the aggregate fees billed for professional services for the audit of the Fund’s annual financial statements and services provided in connection with statutory and regulatory filings or engagements. |
| 2 | “Audit-Related Fees” are the aggregate fees billed for assurance and related services reasonably related to the performance of the audit or review of financial statements that are not reported under “Audit Fees”. These fees include offerings related to the Fund’s common shares and leverage. |
| 3 | “Tax Fees” are the aggregate fees billed for professional services for tax advice, tax compliance, and tax planning. These fees include: all global withholding tax services; excise and state tax reviews; capital gain, tax equalization and taxable basis calculations performed by the principal accountant. |
| 4 | “All Other Fees” are the aggregate fees billed for products and services other than “Audit Fees”, “Audit-Related Fees” and “Tax Fees”. These fees represent all “Agreed-Upon Procedures” engagements pertaining to the Fund’s use of leverage. |
| Percentage Approved Pursuant to Pre-approval Exception | ||||||||||||||||
| Audit Fees Billed to Funds | Audit-Related Fees Billed to Funds | Tax Fees Billed to Funds | All Other Fees Billed to Funds | |||||||||||||
Fund Name | ||||||||||||||||
Nuveen Kansas Municipal Bond Fund | 0 | % | 0 | % | 0 | % | 0 | % | ||||||||
Nuveen Kentucky Municipal Bond Fund | 0 | % | 0 | % | 0 | % | 0 | % | ||||||||
Nuveen Missouri Municipal Bond Fund | 0 | % | 0 | % | 0 | % | 0 | % | ||||||||
Nuveen Michigan Municipal Bond Fund | 0 | % | 0 | % | 0 | % | 0 | % | ||||||||
Nuveen Ohio Municipal Bond Fund | 0 | % | 0 | % | 0 | % | 0 | % | ||||||||
Nuveen Wisconsin Municipal Bond Fund | 0 | % | 0 | % | 0 | % | 0 | % | ||||||||
Fiscal Year Ended May 31, 2014 | Audit-Related Fees Billed to Adviser and Affiliated Fund Service Providers | Tax Fees Billed to Adviser and Affiliated Fund Service Providers | All Other Fees Billed to Adviser and Affiliated Fund Service Providers | |||||||||
Nuveen MultiState Trust 4 | $ | 0 | $ | 0 | $ | 0 | ||||||
| Percentage Approved Pursuant to Pre-approval Exception | ||||||||||||
| Audit-Related Fees Billed to Adviser and Affiliated Fund Service Providers | Tax Fees Billed to Adviser and Affiliated Fund Service Providers | All Other Fees Billed to Adviser and Affiliated Fund Service Providers | ||||||||||
| 0 | % | 0 | % | 0 | % | |||||||
Fiscal Year Ended May 31, 2013 | Audit-Related Fees Billed to Adviser and Affiliated Fund Service Providers | Tax Fees Billed to Adviser and Affiliated Fund Service Providers | All Other Fees Billed to Adviser and Affiliated Fund Service Providers | |||||||||
Nuveen MultiState Trust 4 | $ | 0 | $ | 0 | $ | 0 | ||||||
| Percentage Approved Pursuant to Pre-approval Exception | ||||||||||||
| Audit-Related Fees Billed to Adviser and Affiliated Fund Service Providers | Tax Fees Billed to Adviser and Affiliated Fund Service Providers | All Other Fees Billed to Adviser and Affiliated Fund Service Providers | ||||||||||
| 0 | % | 0 | % | 0 | % | |||||||
Fiscal Year Ended May 31, 2014 | Total Non-Audit Fees Billed to Trust | Total Non-Audit Fees billed to Adviser and Affiliated Fund Service Providers (engagements related directly to the operations and financial reporting of the Trust) | Total Non-Audit Fees billed to Adviser and Affiliated Fund Service Providers (all other engagements) | Total | ||||||||||||
Fund Name | ||||||||||||||||
Nuveen Kansas Municipal Bond Fund | 0 | 0 | 0 | 0 | ||||||||||||
Nuveen Kentucky Municipal Bond Fund | 0 | 0 | 0 | 0 | ||||||||||||
Nuveen Missouri Municipal Bond Fund | 0 | 0 | 0 | 0 | ||||||||||||
Nuveen Michigan Municipal Bond Fund | 0 | 0 | 0 | 0 | ||||||||||||
Nuveen Ohio Municipal Bond Fund | 1,500 | 0 | 0 | 1,500 | ||||||||||||
Nuveen Wisconsin Municipal Bond Fund | 0 | 0 | 0 | 0 | ||||||||||||
|
|
|
|
|
|
|
| |||||||||
Total | $ | 1,500 | $ | 0 | $ | 0 | $ | 1,500 | ||||||||
“Non-Audit Fees billed to Fund” for both fiscal year ends represent “Tax Fees” and “All Other Fees” billed to Fund in their respective amounts from the previous table.
Less than 50 percent of the hours expended on the principal accountant’s engagement to audit the registrant’s financial statements for the most recent fiscal year were attributed to work performed by persons other than the principal accountant’s full-time, permanent employees.
Fiscal Year Ended May 31, 2013 | Total Non-Audit Fees Billed to Trust | Total Non-Audit Fees billed to Adviser and Affiliated Fund Service Providers (engagements related directly to the operations and financial reporting of the Trust) | Total Non-Audit Fees billed to Adviser and Affiliated Fund Service Providers (all other engagements) | Total | ||||||||||||
Fund Name | ||||||||||||||||
Nuveen Kansas Municipal Bond Fund | 600 | 0 | 0 | 600 | ||||||||||||
Nuveen Kentucky Municipal Bond Fund | 600 | 0 | 0 | 600 | ||||||||||||
Nuveen Missouri Municipal Bond Fund | 600 | 0 | 0 | 600 | ||||||||||||
Nuveen Michigan Municipal Bond Fund | 600 | 0 | 0 | 600 | ||||||||||||
Nuveen Ohio Municipal Bond Fund | 600 | 0 | 0 | 600 | ||||||||||||
Nuveen Wisconsin Municipal Bond Fund | 600 | 0 | 0 | 600 | ||||||||||||
|
|
|
|
|
|
|
| |||||||||
Total | $ | 3,600 | $ | 0 | $ | 0 | $ | 3,600 | ||||||||
“Non-Audit Fees billed to Fund” for both fiscal year ends represent “Tax Fees” and “All Other Fees” billed to Fund in their respective amounts from the previous table.
Audit Committee Pre-Approval Policies and Procedures. Generally, the Audit Committee must approve (i) all non-audit services to be performed for the Funds by the Funds’ independent accountant and (ii) all audit and non-audit services to be performed by the Funds’ independent accountant for the Affiliated Fund Service Providers with respect to the operations and financial reporting of the Funds. Regarding tax and research projects conducted by the independent accountant for the Funds and Affiliated Fund Service Providers (with respect to operations and financial reports of the Trust), such engagements will be (i) pre-approved by the Audit Committee if they are expected to be for amounts greater than $10,000; (ii) reported to the Audit Committee Chairman for his verbal approval prior to engagement if they are expected to be for amounts under $10,000 but greater than $5,000; and (iii) reported to the Audit Committee at the next Audit Committee meeting if they are expected to be for an amount under $5,000.
ITEM 5. AUDIT COMMITTEE OF LISTED REGISTRANTS.
Not applicable to this registrant.
ITEM 6. SCHEDULE OF INVESTMENTS.
| a) | See Portfolio of Investments in Item 1. |
| b) | Not applicable. |
ITEM 7. DISCLOSURE OF PROXY VOTING POLICIES AND PROCEDURES FOR CLOSED-END
MANAGEMENT INVESTMENT COMPANIES.
Not applicable to this registrant.
ITEM 8. PORTFOLIO MANAGERS OF CLOSED-END MANAGEMENT INVESTMENT COMPANIES.
Not applicable to this registrant.
ITEM 9. PURCHASES OF EQUITY SECURITIES BY CLOSED-END MANAGEMENT INVESTMENT COMPANY AND AFFILIATED PURCHASERS.
Not applicable to this registrant.
ITEM 10. SUBMISSION OF MATTERS TO A VOTE OF SECURITY HOLDERS.
There have been no material changes to the procedures by which shareholders may recommend nominees to the registrant’s Board of Trustees implemented after the registrant last provided disclosure in response to this Item.
ITEM 11. CONTROLS AND PROCEDURES.
| (a) | The registrant’s principal executive and principal financial officers, or persons performing similar functions, have concluded that the registrant’s disclosure controls and procedures (as defined in Rule 30a-3(c) under the Investment Company Act of 1940, as amended (the “1940 Act”) (17 CFR 270.30a-3(c))) are effective, as of a date within 90 days of the filing date of this report that includes the disclosure required by this paragraph, based on their evaluation of the controls and procedures required by Rule 30a-3(b) under the 1940 Act (17 CFR 270.30a-3(b)) and Rules 13a-15(b) or 15d-15(b) under the Securities Exchange Act of 1934, as amended (the “Exchange Act”) (17 CFR 240.13a-15(b) or 240.15d-15(b)). |
| (b) | There were no changes in the registrant’s internal control over financial reporting (as defined in Rule 30a-3(d) under the 1940 Act (17 CFR 270.30a-3(d)) that occurred during the second fiscal quarter of the period covered by this report that has materially affected, or is reasonably likely to materially affect, the registrant’s internal control over financial reporting. |
ITEM 12. EXHIBITS.
File the exhibits listed below as part of this Form.
| (a)(1) | Any code of ethics, or amendment thereto, that is the subject of the disclosure required by Item 2, to the extent that the registrant intends to satisfy the Item 2 requirements through filing of an exhibit: Not applicable because the code is posted on registrant’s website at www.nuveen.com/MutualFunds/ShareholderResources/FundGovernance.aspx and there were no amendments during the period covered by this report. (To view the code, click on Code of Conduct.) | |
| (a)(2) | A separate certification for each principal executive officer and principal financial officer of the registrant as required by Rule 30a-2(a) under the 1940 Act (17 CFR 270.30a-2(a)) in the exact form set forth below: See EX-99.CERT attached hereto. | |
| (a)(3) | Any written solicitation to purchase securities under Rule 23c-1 under the 1940 Act (17 CFR 270.23c-1) sent or given during the period covered by the report by or on behalf of the registrant to 10 or more persons: Not applicable to this registrant. | |
| (b) | If the report is filed under Section 13(a) or 15(d) of the Exchange Act, provide the certifications required by Rule 30a-2(b) under the 1940 Act (17 CFR 270.30a-2(b)), Rule 13a-14(b) or Rule 15d-14(b) under the Exchange Act (17 CFR 240.13a-14(b) or 240.15d-14(b)), and Section 1350 of Chapter 63 of Title 18 of the United States Code (18 U.S.C. 1350) as an Exhibit. A certification furnished pursuant to this paragraph will not be deemed “filed” for purposes of Section 18 of the Exchange Act (15 U.S.C. 78r), or otherwise subject to the liability of that section. Such certification will not be deemed to be incorporated by reference into any filing under the Securities Act of 1933 or the Exchange Act, except to the extent that the registration specifically incorporates it by reference: See EX-99.906 CERT attached hereto. | |
SIGNATURES
Pursuant to the requirements of the Securities Exchange Act of 1934 and the Investment Company Act of 1940, the registrant has duly caused this report to be signed on its behalf by the undersigned, thereunto duly authorized.
(Registrant) Nuveen Multistate Trust IV
By (Signature and Title)
| /s/ Kevin J. McCarthy | |
| Kevin J. McCarthy | ||
| Vice President and Secretary | ||
Date: August 7, 2014
Pursuant to the requirements of the Securities Exchange Act of 1934 and the Investment Company Act of 1940, this report has been signed below by the following persons on behalf of the registrant and in the capacities and on the dates indicated.
By (Signature and Title)
| /s/ Gifford R. Zimmerman | |
| Gifford R. Zimmerman | ||
| Chief Administrative Officer | ||
| (principal executive officer) | ||
Date: August 7, 2014
| By (Signature and Title) | /s/ Stephen D. Foy | |
| Stephen D. Foy | ||
| Vice President and Controller | ||
| (principal financial officer) | ||
Date: August 7, 2014