UNITED STATES
SECURITIES AND EXCHANGE COMMISSION
Washington, D.C. 20549
FORM N-CSR
CERTIFIED SHAREHOLDER REPORT OF REGISTERED MANAGEMENT
INVESTMENT COMPANIES
Investment Company Act file number 811-07755
Nuveen Multistate Trust II
(Exact name of registrant as specified in charter)
Nuveen Investments
333 West Wacker Drive Chicago, IL 60606
(Address of principal executive offices) (Zip code)
Kevin J. McCarthy
Nuveen Investments
333 West Wacker Drive Chicago, IL 60606
(Name and address of agent for service)
Registrant’s telephone number, including area code: (312) 917-7700
Date of fiscal year end: February 28
Date of reporting period: August 31, 2007
Form N-CSR is to be used by management investment companies to file reports with the Commission not later than 10 days after the transmission to stockholders of any report that is required to be transmitted to stockholders under Rule 30e-1 under the Investment Company Act of 1940 (17 CFR 270.30e-1). The Commission may use the information provided on Form N-CSR in its regulatory, disclosure review, inspection, and policy making roles.
A registrant is required to disclose the information specified by Form N-CSR, and the Commission will make this information public. A registrant is not required to respond to the collection of information contained in Form N-CSR unless the Form displays a currently valid Office of Management and Budget (“OMB”) control number. Please direct comments concerning the accuracy of the information collection burden estimate and any suggestions for reducing the burden to Secretary, Securities and Exchange Commission, 450 Fifth Street, NW, Washington, DC 20549-0609. The OMB has reviewed this collection of information under the clearance requirements of 44 U.S.C. ss.3507.
Item 1. Reports to Stockholders.
NUVEEN INVESTMENTS MUTUAL FUNDS
Semiannual Report dated August 31, 2007 | Dependable, tax-free income because it’s not what you earn, it’s what you keep.® | |

Nuveen Investments
Municipal Bond Funds
Nuveen California High Yield Municipal Bond Fund
Nuveen California Municipal Bond Fund
Nuveen California Insured Municipal Bond Fund


NOW YOU CAN RECEIVE YOUR
NUVEEN INVESTMENTS FUND REPORTS FASTER.
NO MORE WAITING.
SIGN UP TODAY TO RECEIVE NUVEEN INVESTMENTS FUND INFORMATION BY
E-MAIL.
It only takes a minute to sign up for E-Reports. Once enrolled, you’ll receive an e-mail as soon as your Nuveen Investments Fund information is ready — no more waiting for delivery by regular mail. Just click on the link within the e-mail to see the report, and save it on your computer if your wish.

IT’S FAST, EASY & FREE:
www.investordelivery.com
if you get your Nuveen Investments Fund dividends and statements from your financial advisor or brokerage account.
(Be sure to have the address sheet that accompanied this report handy. You’ll need it to complete the enrollment process.)
OR
www.nuveen.com/accountaccess
if you get your Nuveen Investments Fund dividends and statements directly from Nuveen Investments.

| Must be preceded by or accompanied by a prospectus. | NOT FDIC INSURED | MAY LOSE VALUE | NO BANK GUARANTEE |
Dear Shareholder,
Once again, I am pleased to report that during the period covered by this report your Fund provided tax-free income and solid performance from a carefully selected portfolio of California municipal bonds. Detailed information on your Fund’s performance can be found in the Portfolio Manager’s Comments and Fund Spotlight sections of this report.
I also wanted to take this opportunity to report some important news about Nuveen Investments. The company has accepted a buyout offer from a private equity investment firm. While this may affect the corporate structure of Nuveen Investments, it will have no impact on the investment objectives of the Funds, their portfolio management strategies or their dividend policies. We will provide you with additional information about this transaction as more details become available.
With the recent volatility in the market, you may be thinking about adjusting your current portfolios. We believe that it’s times like these that prove the true value of a trusted financial advisor. With the help of your advisor, you may be able to structure a well-balanced portfolio that can become an important component in achieving your long-term financial goals. In fact, a well-diversified portfolio may actually help to reduce your overall investment risk. Your advisor can help you understand how a municipal bond investment like your Nuveen Fund can be an important building block in a portfolio crafted to perform well through a variety of market conditions.
Since 1898, Nuveen Investments has offered financial products and solutions that incorporate careful research, diversification, and the application of conservative risk-management principles. We are grateful that you have chosen us as a partner as you pursue your financial goals. We look forward to continuing to earn your trust in the months and years ahead.
Sincerely,

Timothy R. Schwertfeger
Chairman of the Board
October 15, 2007

“In fact, a
well-diversified
portfolio may
actually help
to reduce
your overall
investment risk.”
Semiannual Report Page 1
Portfolio Managers’ Comments for the Nuveen California High Yield
Municipal Bond Fund, the Nuveen California Municipal Bond Fund and the Nuveen California Insured Municipal Bond Fund.
Portfolio managers John Miller, Johnathan N. Wilhelm, and Scott Romans examine key investment strategies and the performance of the Nuveen California High Yield Municipal Bond Fund, the Nuveen California Municipal Bond Fund, and the Nuveen California Insured Municipal Bond Fund. John Miller, who has 14 years of investment experience, has managed the Nuveen California High Yield Municipal Bond Fund since its inception in March 2006, while John Wilhelm, who has 17 years of investment experience, joined the Fund in March 2007. Scott Romans, who has 7 years of investment experience, has managed the Nuveen California Municipal Bond Fund since 2003 and the Nuveen California Insured Municipal Bond Fund since 2005.
How did the Funds perform during the six months ended August 31, 2007?
The chart on page three provides total return performance information for the three Funds and compares that performance with their corresponding Lipper peer fund category averages and the appropriate national and California-specific Lehman Brothers indexes.
For the six-month reporting period, the Nuveen California High Yield Municipal Bond Fund’s Class A shares at net asset value significantly trailed the Fund’s Lipper peer group average as well as the national Lehman Brothers High Yield and the California-specific Lehman Brothers Municipal Bond Indexes. The Fund’s relative underperformance over the period can be attributed to two main factors. First, the Fund’s duration in comparison to our internal target was relatively long, meaning that the portfolio was more sensitive to changes in interest rates. This greater exposure to interest rate risk was a negative in a difficult market environment. Falling municipal bond prices were triggered by a combination of heavy selling pressure, significant new issue volume in recent years, and an increasingly illiquid high-yield municipal market. As a result, longer-duration bonds underperformed their shorter-duration counterparts over this six-month period. Second, the Fund was more heavily weighted in bonds rated BBB and lower than the comparative indexes. This positioning detracted from performance because market investors became very risk-averse during the period and preferred higher-rated securities. On the positive side, some of our individual positions performed very well, as their underlying financial strength improved during the period. A strong performer was an assessment-bond-district issue for the City of Hesperia, California. The dollar price of this bond stayed relatively stable during the time period. Given that, and given the very high 8.50% coupon, the total return of the bond was relatively strong in a bear market in municipals. Another strong-performing holding was a California pollution-control bond issue backed by Browning-Ferris Industries.
For the same reporting period, the Nuveen California Municipal Bond Fund’s Class A shares at net asset value lagged the Fund’s Lipper peer group average as well as both its national and California-specific Lehman Brothers indexes. Like the California High Yield Fund, the Fund was hurt by its relatively long duration, which hampered performance in an environment favoring shorter-duration bonds. Our inverse-floating-rate bonds (“inverse floaters”) were particular underperformers because of their long durations. Another negative was having significant exposure to long-duration, lower-rated bonds. As investors became more risk-averse and credit spreads widened – meaning that investors in lower-rated debt were demanding more income as compensation for buying riskier bonds – these holdings hampered the Fund’s results. The performance of our forward interest rate swaps was also a negative factor. As part of a strategy to hedge interest rate risk, the Fund entered into swap agreements whereby the Fund was exposed to a short position in long, taxable rate markets in exchange for receiving interest based on a shorter,
Discussions of specific investments are for illustration only and are not intended as recommendations of individual investments. The views expressed herein represent those of the portfolio managers as of the date of this report and are subject to change at any time, based on market conditions and other factors. The Funds disclaim any obligation to advise shareholders of such changes.
Semiannual Report Page 2
Class A Shares—
Average Annual Total Returns
as of 8/31/07
| 6-Month | 1-Year | 5-Year | 10-Year | |||||
Nuveen California High Yield Municipal Bond Fund | -7.15% -11.07% | -3.35% -7.42% | N/A N/A | N/A N/A | ||||
Lipper California Municipal Debt Funds Category Average1 | -2.00% | 0.66% | 3.62% | 4.52% | ||||
Lehman Brothers California Municipal Bond Index2 | -0.91% | 2.08% | 4.31% | 5.37% | ||||
Lehman Brothers High Yield Municipal Bond Index3 | -1.89% | 2.71% | 8.26% | 6.32% | ||||
Nuveen California Municipal Bond Fund | -2.38% -6.48% | 0.58% -3.68% | 3.99% 3.10% | 4.34% 3.90% | ||||
Lipper California Municipal Debt Funds Category Average1 | -2.00% | 0.66% | 3.62% | 4.52% | ||||
Lehman Brothers California Municipal Bond Index2 | -0.91% | 2.08% | 4.31% | 5.37% | ||||
Lehman Brothers Municipal Bond Index2 | -0.57% | 2.30% | 4.16% | 5.28% | ||||
Nuveen California Insured Municipal Bond Fund | -1.46% -5.64% | 1.29% -2.93% | 3.50% 2.61% | 4.53% 4.09% | ||||
Lipper California Insured Municipal Debt Funds Category Average1 | -1.63% | 0.90% | 3.24% | 4.34% | ||||
Lehman Brothers California Insured Municipal Bond Index2 | -0.98% | 2.11% | 4.24% | 5.43% | ||||
Lehman Brothers Municipal Bond Index2 | -0.57% | 2.30% | 4.16% | 5.28% | ||||
Returns quoted represent past performance, which is no guarantee of future results. Returns at NAV would be lower if the sales charge were included. Returns less than one year are cumulative. Current performance
may be higher or lower than the performance shown. Investment returns and principal value will fluctuate so that when shares are redeemed, they may be worth more or less than their original cost. Class A shares have a 4.2% maximum sales charge. Returns do not reflect the deduction of taxes that a shareholder would pay on Fund distributions or the redemption of shares. For the most recent month-end performance, visit www.nuveen.com or call (800) 257-8787.
Please see each Fund’s Spotlight Page later in this report for more complete performance data and expense ratios.
floating rate. These swaps were designed to reduce relative price volatility without income consequences. Contrary to historical trends, however, interest rates in the taxable and tax-exempt markets moved in opposite directions in July and August, causing our forward interest rate swaps to underperform our expectations and to sharply reduce the protection these hedges were designed to provide. On the positive side, the Fund’s short-duration, high-coupon bonds were some of our best performers during the past six months.
Many of these same factors had an equally significant performance impact on the Nuveen California Insured Municipal Bond Fund, whose Class A shares at net asset value slightly outpaced the Fund’s Lipper peer group average but trailed its California-specific and national Lehman Brothers indexes. Because this Fund is invested almost exclusively in AAA-rated insured municipal bonds, recent credit spread widening had a more muted impact on this Fund’s performance. The Fund’s very high credit quality was a positive in relative terms, because yields on insured bonds were much
| 1 | The Lipper category averages shown represent the average annualized total return for all reporting funds in the respective categories. The Lipper California Municipal Debt Funds Category contained 119, 118, 105 and 97 funds for the six-month, one-year, five-year and ten-year periods ended August 31, 2007, and the Lipper California Insured Municipal Debt Funds Category had 22, 22, 19 and 19 funds, respectively. The returns account for the effects of management fees and assume reinvestment of dividends, but do not reflect any applicable sales charges. You cannot invest directly in a Lipper Category. |
| 2 | The Lehman Brothers Municipal Bond Index is an unmanaged index comprised of a broad range of investment-grade municipal bonds. The Lehman Brothers California Municipal Bond Index is an unmanaged index comprised of investment grade, tax-exempt California bonds with maturities of two years or greater. The Lehman Brothers California Insured Municipal Bond Index is comprised of insured California municipal bond issues. The indexes do not reflect any initial or ongoing expenses and are not available for direct investment. |
| 3 | The Lehman Brothers High-Yield Municipal Bond Index is an unleveraged, unmanaged national index comprising municipal bonds rated below investment grade (i.e., below Baa by Moody’s Investors Service and below BBB by Standard & Poor’s or Fitch Ratings). Results for the Lehman indexes do not reflect any expenses. An index is not available for direct investment. |
Semiannual Report Page 3
more stable than those of lower-rated bonds during the period. As in the uninsured California Fund, however, our inverse-floater positions did particularly poorly because of their long durations. Our other long-duration holdings – including zero-coupon bonds, noncallable bonds, and long-maturity issues priced to long call dates – were the Fund’s worst performers overall. Conversely, our shortest-duration holdings – such as prerefunded bonds – tended to perform best.
What strategies were used to manage the Funds?
Nuveen California High Yield Municipal Bond Fund
During the six-month reporting period, the municipal market’s significant decline, accompanied by widening credit spreads, provided us with an opportunity to establish positions in securities that we believed offered excellent value to our shareholders.
We continued our bottom-up investment strategy – meaning we chose bonds one-by-one based on our evaluation of their financial condition and ability to provide shareholders with attractive total returns relative to their risk. As we have discussed before, we regularly favor essential service bonds – securities that go to fund vital community projects and, because they are so essential to their communities, are less likely to experience deteriorating financial strength. Among our new purchases during the six-month period were waste-disposal, higher-education, and charter-school bonds – all essential services. We also very selectively added special-taxing-district bonds when we believed that these districts offered adequate land values, strong developers, and attractive locations.
Nuveen California Municipal Bond Fund
In the Nuveen California Municipal Bond Fund, we took advantage of credit spreads at their widest levels in several years to actively add new lower-rated positions to the Fund. In fact, spreads widened even further after some of these purchases – leading to further underperformance but also offering additional opportunities to purchase bonds at even better values. As an example, the spread widening opened up new opportunities in community facilities district bonds. Until recently, we believed that yields on these bonds were too low to compensate us for the securities’ risk. However, following the municipal market’s challenges, yields on these securities reached six percent, providing what we believed were compelling opportunities in this sector for the first time in several years. Other recent purchases included lower-rated health care and tobacco issues. To fund these acquisitions, we generally were selling some of our shortest-duration holdings because we believed the acquired bonds had better long-term performance potential.
Nuveen California Insured Municipal Bond Fund
In the insured California Fund, we favored bonds from sectors that, if they had been uninsured, would have seen significant spread widening. Specifically, we took advantage of value opportunities in insured health care, tobacco, and redevelopment agency bonds. In general, most of our new purchases tended to be on the long end of the yield curve – especially 25 years and longer. To finance our new purchases and to manage the portfolio’s call risk, as in the uninsured California Fund, we were selling some of our very short-dated bonds. In this Fund, as well as in the uninsured California Fund, we executed swaps on bonds that we had originally purchased earlier in the period when interest rates were much lower. As municipal yields rose, we saw opportunities to swap existing holdings for bonds offering similar levels of risk but higher prevailing yields. This strategy provided two benefits: we were able to add yield to the portfolio while also booking capital losses that we can apply against future capital gains.
Dividend Information
During the reporting period, there were no dividend changes to any of the three Funds. Each Fund seeks to pay dividends at a rate that reflects the past and projected performance of the Fund. To permit a
Semiannual Report Page 4
Fund to maintain a more stable monthly dividend, the Fund may pay dividends at a rate that may be more or less than the amount of net investment income actually earned by the Fund during the period. If the Fund has cumulatively earned more than it has paid in dividends, it will hold the excess in reserve as undistributed net investment income (UNII) as part of the Fund’s net asset value. Conversely, if the Fund has cumulatively paid in dividends more than it has earned, the excess will constitute a negative UNII that will likewise be reflected in the Fund’s net asset value. Each Fund will, over time, pay all its net investment income as dividends to shareholders. As of August 31, 2007, all three Funds had negative UNII for financial statement purposes and positive UNII balances, based upon our best estimate, for tax purposes.
Semiannual Report Page 5
Fund Spotlight as of 8/31/07 Nuveen California High Yield Municipal Bond Fund
| Quick Facts | ||||||||
| A Shares | B Shares | C Shares | R Shares | |||||
NAV | $9.48 | $9.47 | $9.47 | $9.47 | ||||
Latest Monthly Dividend1 | $0.0375 | $0.0310 | $0.0325 | $0.0390 | ||||
Inception Date | 3/28/06 | 3/28/06 | 3/28/06 | 3/28/06 |
Returns quoted represent past performance which is no guarantee of future results. Returns without sales charges would be lower if the sales charge were included. Current performance may be higher or lower than the performance shown. Investment returns and principal value will fluctuate so that when shares are redeemed, they may be worth more or less than their original cost. Returns do not reflect the deduction of taxes that a shareholder would pay on Fund distributions or the redemption of shares. Income is generally exempt from regular federal income taxes. Some income may be subject to state and local taxes and to the federal alternative minimum tax. Capital gains, if any, are subject to tax. For the most recent month-end performance visit www.nuveen.com or call (800) 257-8787.
Fund returns assume reinvestment of dividends and capital gains. Class A shares have a 4.2% maximum sales charge. Class B shares have a contingent deferred sales charge (CDSC), also known as a back-end sales charge, that for redemptions begins at 5% and declines periodically until after 6 years when the charge becomes 0%. Class B shares automatically convert to Class A shares eight years after purchase. Class C shares have a 1% CDSC for redemptions within less than one year. Class R shares have no sales charge and may be purchased under limited circumstances or by specified classes of investors.
| Average Annual Total Returns as of 8/31/07 | ||||
| A Shares | NAV | Offer | ||
1-Year | -3.35% | -7.42% | ||
Since Inception | 0.32% | -2.66% | ||
| B Shares | w/o CDSC | w/CDSC | ||
1-Year | -4.09% | -7.79% | ||
Since Inception | -0.47% | -3.14% | ||
| C Shares | NAV | |||
1-Year | -3.82% | |||
Since Inception | -0.23% | |||
| R Shares | NAV | |||
1-Year | -3.18% | |||
Since Inception | 0.48% | |||
| Tax-Free Yields | ||||
| A Shares | NAV | Offer | ||
Dividend Yield2 | 4.75% | 4.55% | ||
SEC 30-Day Yield2 | — | 5.04% | ||
30-Day Yield2 | 5.27% | — | ||
Taxable-Equivalent Yield3 | 8.07% | 7.72% | ||
| B Shares | NAV | |||
Dividend Yield2 | 3.93% | |||
30-Day Yield2 | 4.54% | |||
Taxable-Equivalent Yield3 | 6.95% | |||
| C Shares | NAV | |||
Dividend Yield2 | 4.12% | |||
30-Day Yield2 | 4.73% | |||
Taxable-Equivalent Yield3 | 7.24% | |||
| R Shares | NAV | |||
Dividend Yield2 | 4.94% | |||
SEC 30-Day Yield2 | 5.49% | |||
Taxable-Equivalent Yield3 | 8.41% | |||
| Average Annual Total Returns as of 9/30/07 | ||||
| A Shares | NAV | Offer | ||
1-Year | -2.58% | -6.67% | ||
Since Inception | 1.33% | -1.52% | ||
| B Shares | w/o CDSC | w/CDSC | ||
1-Year | -3.33% | -7.06% | ||
Since Inception | 0.54% | -2.01% | ||
| C Shares | NAV | |||
1-Year | -3.16% | |||
Since Inception | 0.70% | |||
| R Shares | NAV | |||
1-Year | -2.41% | |||
Since Inception | 1.50% | |||
| Portfolio Statistics | ||
Net Assets ($000) | $39,231 | |
Average Effective Maturity on Securities (Years) | 25.39 | |
Average Duration | 14.88 | |
| Expense Ratios | ||||||
| Share Class | Gross Expense Ratios | Net Expense Ratios | As of Date | |||
Class A | 1.84% | 1.43% | 2/28/07 | |||
Class B | 2.69% | 2.19% | 2/28/07 | |||
Class C | 2.44% | 1.99% | 2/28/07 | |||
Class R | 1.58% | 1.23% | 2/28/07 | |||
The expense ratios shown factor in Annual Fund Operating Expenses including management fees and other fees and expenses. The Net Expense Ratios reflect a contractual commitment by the fund’s investment adviser to waive fees and reimburse expenses through June 30, 2009. The Net Expense Ratios also reflect custodian fee credits from the custodian bank whereby certain fees and expenses are reduced by credits earned on the Fund’s cash on deposit with the bank. There is no guarantee that the Fund will earn such credits in the future. Absent the waiver and reimbursement and custodian fee credit, the Net Expense Ratios would be higher and total returns would be less. These expense ratios may vary from the expense ratios shown elsewhere in this report because they are based on a different time period, and, if applicable, do not include expense waivers and reimbursements or custodian fee credits.
| 1 | Paid September 4, 2007. This is the latest monthly tax-exempt dividend declared during the period ended August 31, 2007. |
| 2 | Dividend Yield is the most recent dividend per share (annualized) divided by the appropriate price per share. The SEC 30-Day Yield is computed under an SEC standardized formula and is based on the maximum offer price per share. The 30-Day Yield is computed under the same formula but is based on the Net Asset Value (NAV) per share. The Dividend Yield may differ from the SEC 30-Day Yield because the Fund may be paying out more or less than it is earning and it may not include the effect of amortization of bond premium. |
| 3 | The Taxable-Equivalent Yield represents the yield that must be earned on a fully taxable investment in order to equal the yield of the Fund on an after-tax basis at a specified tax rate. With respect to investments that generate qualified dividend income that is taxable at a maximum rate of 15%, the Taxable-Equivalent Yield is lower. The Taxable-Equivalent Yield is based on the Fund’s 30-Day Yield on the indicated date and a combined federal and state income tax rate of 34.7%. |
Semiannual Report Page 6
Fund Spotlight as of 8/31/07 Nuveen California High Yield Municipal Bond Fund
Bond Credit Quality1
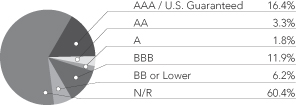
Industries1
Tax Obligation/Limited | 56.7% | |
Housing/Multifamily | 9.4% | |
Education and Civic Organizations | 8.4% | |
Industrials | 7.6% | |
Health Care | 6.7% | |
Other | 11.2% |
| 1 | As a percentage of total Investments as of August 31, 2007. Holdings are subject to change. |
Expense Example
As a shareholder of the Fund, you incur two types of costs: (1) transaction costs, including front and back end sales charges (loads) or redemption fees, where applicable; and (2) ongoing costs, including management fees; distribution and service (12b-1) fees, where applicable; and other Fund expenses. This Example is intended to help you understand your ongoing costs (in dollars) of investing in the Fund and to compare these costs with the ongoing costs of investing in other mutual funds.
The Example below is based on an investment of $1,000 invested at the beginning of the period and held for the period.
The information under “Actual Performance,” together with the amount you invested, allows you to estimate actual expenses incurred over the reporting period. Simply divide your account value by $1,000 (for example, an $8,600 account value divided by $1,000 = 8.60) and multiply the result by the cost shown for your share class, in the row entitled “Expenses Incurred During Period” to estimate the expenses incurred on your account during this period.
The information under “Hypothetical Performance,” provides information about hypothetical account values and hypothetical expenses based on the Fund’s actual expense ratio and an assumed rate of return of 5% per year before expenses, which is not the Fund’s actual return. The hypothetical account values and expenses may not be used to estimate the actual ending account balance or expense you incurred for the period. You may use this information to compare the ongoing costs of investing in the Fund and other Funds. To do so, compare this 5% hypothetical example with the 5% hypothetical examples that appear in the shareholder reports of the other funds.
Please note that the expenses shown in the table are meant to highlight your ongoing costs only and do not reflect any transactional costs, such as front and back end sales charges (loads) or redemption fees, where applicable. Therefore, the hypothetical information is useful in comparing ongoing costs only, and will not help you determine the relative total costs of owning different funds or share classes. In addition, if these transactional costs were included, your costs would have been higher.
| Hypothetical Performance | ||||||||||||||||||||||||
| Actual Performance | (5% annualized return before expenses) | |||||||||||||||||||||||
| A Shares | B Shares | C Shares | R Shares | A Shares | B Shares | C Shares | R Shares | |||||||||||||||||
Beginning Account Value (3/01/07) | $ | 1,000.00 | $ | 1,000.00 | $ | 1,000.00 | $ | 1,000.00 | $ | 1,000.00 | $ | 1,000.00 | $ | 1,000.00 | $ | 1,000.00 | ||||||||
Ending Account Value (8/31/07) | $ | 928.50 | $ | 924.80 | $ | 926.60 | $ | 929.30 | $ | 1,017.68 | $ | 1,013.90 | $ | 1,014.91 | $ | 1,018.64 | ||||||||
Expenses Incurred During Period | $ | 7.25 | $ | 10.88 | $ | 9.92 | $ | 6.28 | $ | 7.59 | $ | 11.38 | $ | 10.37 | $ | 6.57 | ||||||||
For each class of the Fund, expenses are equal to the Fund’s annualized net expense ratio of 1.49%, 2.24%, 2.04% and 1.29% for Classes A, B, C and R, respectively, multiplied by the average account value over the period, multiplied by 184/365 (to reflect the one-half year period).
Semiannual Report Page 7
Fund Spotlight as of 8/31/07 Nuveen California Municipal Bond Fund
| Quick Facts | ||||||||
| A Shares | B Shares | C Shares | R Shares | |||||
NAV | $10.04 | $10.03 | $10.02 | $10.03 | ||||
Latest Monthly Dividend1 | $0.0355 | $0.0290 | $0.0310 | $0.0375 | ||||
Inception Date | 9/07/94 | 3/07/97 | 9/19/94 | 7/01/86 |
Returns quoted represent past performance which is no guarantee of future results. Returns without sales charges would be lower if the sales charge were included. Current performance may be higher or lower than the performance shown. Investment returns and principal value will fluctuate so that when shares are redeemed, they may be worth more or less than their original cost. Returns do not reflect the deduction of taxes that a shareholder would pay on Fund distributions or the redemption of shares. Income is generally exempt from regular federal income taxes. Some income may be subject to state and local taxes and to the federal alternative minimum tax. Capital gains, if any, are subject to tax. For the most recent month-end performance visit www.nuveen.com or call (800) 257-8787.
Class A, C and R share returns are actual. Class B share returns are actual for the period since class inception; returns prior to class inception are Class R share returns adjusted for differences in sales charges and expenses, which are primarily differences in distribution and service fees. Class A shares have a 4.2% maximum sales charge. Class B shares have a contingent deferred sales charge (CDSC), also known as a back-end sales charge, that for redemptions begins at 5% and declines periodically until after 6 years when the charge becomes 0%. Class B shares automatically convert to Class A shares eight years after purchase. Class C shares have a 1% CDSC for redemptions within less than one year, which is not reflected in the one-year total return. Class R shares have no sales charge and may be purchased under limited circumstances or by specified classes of investors.
| Average Annual Total Returns as of 8/31/07 | ||||
| A Shares | NAV | Offer | ||
1-Year | 0.58% | -3.68% | ||
5-Year | 3.99% | 3.10% | ||
10-Year | 4.34% | 3.90% | ||
| B Shares | w/o CDSC | w/CDSC | ||
1-Year | -0.17% | -4.03% | ||
5-Year | 3.22% | 3.04% | ||
10-Year | 3.72% | 3.72% | ||
| C Shares | NAV | |||
1-Year | 0.06% | |||
5-Year | 3.43% | |||
10-Year | 3.78% | |||
| R Shares | NAV | |||
1-Year | 0.81% | |||
5-Year | 4.19% | |||
10-Year | 4.55% | |||
| Tax-Free Yields | ||||
| A Shares | NAV | Offer | ||
Dividend Yield2 | 4.24% | 4.06% | ||
SEC 30-Day Yield2 | — | 3.70% | ||
30-Day Yield2 | 3.86% | — | ||
Taxable-Equivalent Yield3 | 5.91% | 5.67% | ||
| B Shares | NAV | |||
Dividend Yield2 | 3.47% | |||
30-Day Yield2 | 3.11% | |||
Taxable-Equivalent Yield3 | 4.76% | |||
| C Shares | NAV | |||
Dividend Yield2 | 3.71% | |||
30-Day Yield2 | 3.31% | |||
Taxable-Equivalent Yield3 | 5.07% | |||
| R Shares | NAV | |||
Dividend Yield2 | 4.49% | |||
SEC 30-Day Yield2 | 4.06% | |||
Taxable-Equivalent Yield3 | 6.22% | |||
| Average Annual Total Returns as of 9/30/07 | ||||
| A Shares | NAV | Offer | ||
1-Year | 1.60% | -2.69% | ||
5-Year | 3.90% | 3.02% | ||
10-Year | 4.41% | 3.97% | ||
| B Shares | w/o CDSC | w/CDSC | ||
1-Year | 0.94% | -2.97% | ||
5-Year | 3.15% | 2.98% | ||
10-Year | 3.78% | 3.78% | ||
| C Shares | NAV | |||
1-Year | 1.07% | |||
5-Year | 3.35% | |||
10-Year | 3.85% | |||
| R Shares | NAV | |||
1-Year | 1.83% | |||
5-Year | 4.10% | |||
10-Year | 4.62% | |||
| Portfolio Statistics | ||
Net Assets ($000) | $317,140 | |
Average Effective Maturity on Securities (Years) | 19.53 | |
Average Duration | 7.13 | |
| Expense Ratios | ||||||
| Share Class | Gross Expense Ratios | Net Expense Ratios | As of Date | |||
Class A | 1.09% | 1.08% | 2/28/07 | |||
Class B | 1.85% | 1.83% | 2/28/07 | |||
Class C | 1.64% | 1.63% | 2/28/07 | |||
Class R | 0.89% | 0.88% | 2/28/07 | |||
The expense ratios shown factor in Annual Fund Operating Expenses including management fees and other fees and expenses. The Net Expense Ratios reflect custodian fee credits from the custodian bank whereby certain fees and expenses are reduced by credits earned on the Fund’s cash on deposit with the bank. There is no guarantee that the Fund will earn such credits in the future. Absent the custodian fee credit, expenses would be higher and total returns would be less. These expense ratios may vary from the expense ratios shown elsewhere in this report.
| 1 | Paid September 4, 2007. This is the latest monthly tax-exempt dividend declared during the period ended August 31, 2007. |
| 2 | Dividend Yield is the most recent dividend per share (annualized) divided by the appropriate price per share. The SEC 30-Day Yield is computed under an SEC standardized formula and is based on the maximum offer price per share. The 30-Day Yield is computed under the same formula but is based on the Net Asset Value (NAV) per share. The Dividend Yield may differ from the SEC 30-Day Yield because the Fund may be paying out more or less than it is earning and it may not include the effect of amortization of bond premium. |
| 3 | The Taxable-Equivalent Yield represents the yield that must be earned on a fully taxable investment in order to equal the yield of the Fund on an after-tax basis at a specified tax rate. With respect to investments that generate qualified dividend income that is taxable at a maximum rate of 15%, the Taxable-Equivalent Yield is lower. The Taxable-Equivalent Yield is based on the Fund’s 30-Day Yield on the indicated date and a combined federal and state income tax rate of 34.7%. |
Semiannual Report Page 8
Fund Spotlight as of 8/31/07 Nuveen California Municipal Bond Fund
Bond Credit Quality1
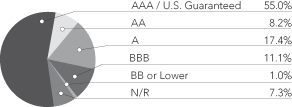
Industries1
Tax Obligation/Limited | 22.0% | |
Health Care | 16.5% | |
Tax Obligation/General | 16.1% | |
U.S. Guaranteed | 8.9% | |
Utilities | 8.7% | |
Water and Sewer | 6.4% | |
Transportation | 4.7% | |
Consumer Staples | 3.7% | |
Other | 13.0% |
| 1 | As a percentage of total investments as of August 31, 2007. Holdings are subject to change. |
Expense Example
As a shareholder of the Fund, you incur two types of costs: (1) transaction costs, including front and back end sales charges (loads) or redemption fees, where applicable; and (2) ongoing costs, including management fees; distribution and service (12b-1) fees, where applicable; and other Fund expenses. This Example is intended to help you understand your ongoing costs (in dollars) of investing in the Fund and to compare these costs with the ongoing costs of investing in other mutual funds.
The Example below is based on an investment of $1,000 invested at the beginning of the period and held for the period.
The information under “Actual Performance,” together with the amount you invested, allows you to estimate actual expenses incurred over the reporting period. Simply divide your account value by $1,000 (for example, an $8,600 account value divided by $1,000 = 8.60) and multiply the result by the cost shown for your share class, in the row entitled “Expenses Incurred During Period” to estimate the expenses incurred on your account during this period.
The information under “Hypothetical Performance,” provides information about hypothetical account values and hypothetical expenses based on the Fund’s actual expense ratio and an assumed rate of return of 5% per year before expenses, which is not the Fund’s actual return. The hypothetical account values and expenses may not be used to estimate the actual ending account balance or expense you incurred for the period. You may use this information to compare the ongoing costs of investing in the Fund and other Funds. To do so, compare this 5% hypothetical example with the 5% hypothetical examples that appear in the shareholder reports of the other funds.
Please note that the expenses shown in the table are meant to highlight your ongoing costs only and do not reflect any transactional costs, such as front and back end sales charges (loads) or redemption fees, where applicable. Therefore, the hypothetical information is useful in comparing ongoing costs only, and will not help you determine the relative total costs of owning different funds or share classes. In addition, if these transactional costs were included, your costs would have been higher.
| Hypothetical Performance | ||||||||||||||||||||||||
| Actual Performance | (5% annualized return before expenses) | |||||||||||||||||||||||
| A Shares | B Shares | C Shares | R Shares | A Shares | B Shares | C Shares | R Shares | |||||||||||||||||
Beginning Account Value (3/01/07) | $ | 1,000.00 | $ | 1,000.00 | $ | 1,000.00 | $ | 1,000.00 | $ | 1,000.00 | $ | 1,000.00 | $ | 1,000.00 | $ | 1,000.00 | ||||||||
Ending Account Value (8/31/07) | $ | 976.20 | $ | 972.50 | $ | 974.50 | $ | 977.30 | $ | 1,019.94 | $ | 1,016.21 | $ | 1,017.22 | $ | 1,020.95 | ||||||||
Expenses Incurred During Period | $ | 5.20 | $ | 8.87 | $ | 7.88 | $ | 4.21 | $ | 5.31 | $ | 9.07 | $ | 8.05 | $ | 4.30 | ||||||||
For each class of the Fund, expenses are equal to the Fund’s annualized net expense ratio of 1.04%, 1.78%, 1.58% and ..84% for Classes A, B, C and R, respectively, multiplied by the average account value over the period, multiplied by 184/365 (to reflect the one-half year period).
Semiannual Report Page 9
Fund Spotlight as of 8/31/07 Nuveen California Insured Municipal Bond Fund
| Quick Facts | ||||||||
| A Shares | B Shares | C Shares | R Shares | |||||
NAV | $10.47 | $10.50 | $10.43 | $10.49 | ||||
Latest Monthly Dividend1 | $0.0355 | $0.0285 | $0.0305 | $0.0370 | ||||
Latest Capital Gain Distribution2 | $0.0511 | $0.0511 | $0.0511 | $0.0511 | ||||
Inception Date | 9/07/94 | 3/07/97 | 9/13/94 | 7/01/86 |
Returns quoted represent past performance which is no guarantee of future results. Returns without sales charges would be lower if the sales charge were included. Current performance may be higher or lower than the performance shown. Investment returns and principal value will fluctuate so that when shares are redeemed, they may be worth more or less than their original cost. Returns do not reflect the deduction of taxes that a shareholder would pay on Fund distributions or the redemption of shares. Income is generally exempt from regular federal income taxes. Some income may be subject to state and local taxes and to the federal alternative minimum tax. Capital gains, if any, are subject to tax. For the most recent month-end performance visit www.nuveen.com or call (800) 257-8787.
Class A, C and R share returns are actual. Class B share returns are actual for the period since class inception; returns prior to class inception are Class R share returns adjusted for differences in sales charges and expenses, which are primarily differences in distribution and service fees. Class A shares have a 4.2% maximum sales charge. Class B shares have a contingent deferred sales charge (CDSC), also known as a back-end sales charge, that for redemptions begins at 5% and declines periodically until after 6 years when the charge becomes 0%. Class B shares automatically convert to Class A shares eight years after purchase. Class C shares have a 1% CDSC for redemptions within less than one year, which is not reflected in the one-year total return. Class R shares have no sales charge and may be purchased under limited circumstances or by specified classes of investors.
| Average Annual Total Returns as of 8/31/07 | ||||
| A Shares | NAV | Offer | ||
1-Year | 1.29% | -2.93% | ||
5-Year | 3.50% | 2.61% | ||
10-Year | 4.53% | 4.09% | ||
| B Shares | w/o CDSC | w/CDSC | ||
1-Year | 0.59% | -3.28% | ||
5-Year | 2.72% | 2.55% | ||
10-Year | 3.91% | 3.91% | ||
| C Shares | NAV | |||
1-Year | 0.77% | |||
5-Year | 2.95% | |||
10-Year | 3.97% | |||
| R Shares | NAV | |||
1-Year | 1.55% | |||
5-Year | 3.71% | |||
10-Year | 4.75% | |||
| Tax-Free Yields | ||||
| A Shares | NAV | Offer | ||
Dividend Yield3 | 4.07% | 3.90% | ||
SEC 30-Day Yield3 | — | 3.75% | ||
30-Day Yield3 | 3.92% | — | ||
Taxable-Equivalent Yield4 | 6.00% | 5.74% | ||
| B Shares | NAV | |||
Dividend Yield3 | 3.26% | |||
30-Day Yield3 | 3.17% | |||
Taxable-Equivalent Yield4 | 4.85% | |||
| C Shares | NAV | |||
Dividend Yield3 | 3.51% | |||
30-Day Yield3 | 3.37% | |||
Taxable-Equivalent Yield4 | 5.16% | |||
| R Shares | NAV | |||
Dividend Yield3 | 4.23% | |||
SEC 30-Day Yield3 | 4.12% | |||
Taxable-Equivalent Yield4 | 6.31% | |||
| Average Annual Total Returns as of 9/30/07 | ||||
| A Shares | NAV | Offer | ||
1-Year | 2.26% | -2.07% | ||
5-Year | 3.27% | 2.38% | ||
10-Year | 4.60% | 4.14% | ||
| B Shares | w/o CDSC | w/CDSC | ||
1-Year | 1.46% | -2.45% | ||
5-Year | 2.49% | 2.32% | ||
10-Year | 3.97% | 3.97% | ||
| C Shares | NAV | |||
1-Year | 1.65% | |||
5-Year | 2.70% | |||
10-Year | 4.03% | |||
| R Shares | NAV | |||
1-Year | 2.43% | |||
5-Year | 3.48% | |||
10-Year | 4.80% | |||
| Portfolio Statistics | ||
Net Assets ($000) | $232,215 | |
Average Effective Maturity on Securities (Years) | 19.61 | |
Average Duration | 5.95 | |
| Expense Ratios | ||||||
| Share Class | Gross Expense Ratios | Net Expense Ratios | As of Date | |||
Class A | 0.86% | 0.85% | 2/28/07 | |||
Class B | 1.61% | 1.61% | 2/28/07 | |||
Class C | 1.41% | 1.40% | 2/28/07 | |||
Class R | 0.66% | 0.66% | 2/28/07 | |||
The expense ratios shown factor in Annual Fund Operating Expenses including management fees and other fees and expenses. The Net Expense Ratios reflect custodian fee credits from the custodian bank whereby certain fees and expenses are reduced by credits earned on the Fund’s cash on deposit with the bank. There is no guarantee that the Fund will earn such credits in the future. Absent the custodian fee credit, expenses would be higher and total returns would be less. These expense ratios may vary from the expense ratios shown elsewhere in this report.
| 1 | Paid September 4, 2007. This is the latest monthly tax-exempt dividend declared during the period ended August 31, 2007. |
| 2 | Paid December 1, 2006. Capital gains are subject to federal taxation. |
| 3 | Dividend Yield is the most recent dividend per share (annualized) divided by the appropriate price per share. The SEC 30-Day Yield is computed under an SEC standardized formula and is based on the maximum offer price per share. The 30-Day Yield is computed under the same formula but is based on the Net Asset Value (NAV) per share. The Dividend Yield may differ from the SEC 30-Day Yield because the Fund may be paying out more or less than it is earning and it may not include the effect of amortization of bond premium. |
| 4 | The Taxable-Equivalent Yield represents the yield that must be earned on a fully taxable investment in order to equal the yield of the Fund on an after-tax basis at a specified tax rate. With respect to investments that generate qualified dividend income that is taxable at a maximum rate of 15%, the Taxable-Equivalent Yield is lower. The Taxable-Equivalent Yield is based on the Fund’s 30-Day Yield on the indicated date and a combined federal and state income tax rate of 34.7%. |
Semiannual Report Page 10
Fund Spotlight as of 8/31/07 Nuveen California Insured Municipal Bond Fund
Bond Credit Quality1
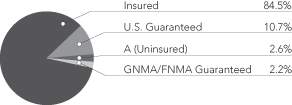
The Fund features a portfolio of primarily investment-grade, long-term municipal investments. These investments are covered by insurance, guaranteeing the timely payment of principal and interest, or by an escrow or trust account containing enough U.S. government or U.S. government agency securities to ensure timely payment of principal and interest.
Industries1
Tax Obligation/General | 24.8% | |
Tax Obligation/Limited | 20.4% | |
U.S. Guaranteed | 10.8% | |
Transportation | 9.9% | |
Water and Sewer | 7.1% | |
Utilities | 6.3% | |
Health Care | 6.0% | |
Housing/Single Family | 5.7% | |
Education and Civic Organizations | 5.1% | |
Housing/Multifamily | 3.9% |
| 1 | As a percentage of total investments as of August 31, 2007. Holdings are subject to change. |
Expense Example
As a shareholder of the Fund, you incur two types of costs: (1) transaction costs, including front and back end sales charges (loads) or redemption fees, where applicable; and (2) ongoing costs, including management fees; distribution and service (12b-1) fees, where applicable; and other Fund expenses. This Example is intended to help you understand your ongoing costs (in dollars) of investing in the Fund and to compare these costs with the ongoing costs of investing in other mutual funds.
The Example below is based on an investment of $1,000 invested at the beginning of the period and held for the period.
The information under “Actual Performance,” together with the amount you invested, allows you to estimate actual expenses incurred over the reporting period. Simply divide your account value by $1,000 (for example, an $8,600 account value divided by $1,000 = 8.60) and multiply the result by the cost shown for your share class, in the row entitled “Expenses Incurred During Period” to estimate the expenses incurred on your account during this period.
The information under “Hypothetical Performance,” provides information about hypothetical account values and hypothetical expenses based on the Fund’s actual expense ratio and an assumed rate of return of 5% per year before expenses, which is not the Fund’s actual return. The hypothetical account values and expenses may not be used to estimate the actual ending account balance or expense you incurred for the period. You may use this information to compare the ongoing costs of investing in the Fund and other Funds. To do so, compare this 5% hypothetical example with the 5% hypothetical examples that appear in the shareholder reports of the other funds.
Please note that the expenses shown in the table are meant to highlight your ongoing costs only and do not reflect any transactional costs, such as front and back end sales charges (loads) or redemption fees, where applicable. Therefore, the hypothetical information is useful in comparing ongoing costs only, and will not help you determine the relative total costs of owning different funds or share classes. In addition, if these transactional costs were included, your costs would have been higher.
| Hypothetical Performance | ||||||||||||||||||||||||
| Actual Performance | (5% annualized return before expenses) | |||||||||||||||||||||||
| A Shares | B Shares | C Shares | R Shares | A Shares | B Shares | C Shares | R Shares | |||||||||||||||||
Beginning Account Value (3/01/07) | $ | 1,000.00 | $ | 1,000.00 | $ | 1,000.00 | $ | 1,000.00 | $ | 1,000.00 | $ | 1,000.00 | $ | 1,000.00 | $ | 1,000.00 | ||||||||
Ending Account Value (8/31/07) | $ | 985.40 | $ | 982.50 | $ | 983.20 | $ | 987.20 | $ | 1,020.45 | $ | 1,016.67 | $ | 1,017.68 | $ | 1,021.46 | ||||||||
Expenses Incurred During Period | $ | 4.72 | $ | 8.46 | $ | 7.47 | $ | 3.72 | $ | 4.80 | $ | 8.61 | $ | 7.59 | $ | 3.79 | ||||||||
For each class of the Fund, expenses are equal to the Fund’s annualized net expense ratio of .94%, 1.69%, 1.49% and ..74% for Classes A, B, C and R, respectively, multiplied by the average account value over the period, multiplied by 184/365 (to reflect the one-half year period).
Semiannual Report Page 11
Portfolio of Investments (Unaudited)
Nuveen California High Yield Municipal Bond Fund
August 31, 2007
| Principal Amount (000) | Description | Optional Call Provisions (1) | Ratings (2) | Value | ||||||
| Consumer Discretionary – 1.4% | ||||||||||
| $ | 135 | California Pollution Control Financing Authority, Revenue Bonds, General Motors Corporation, Series 1984, 5.500%, 4/01/08 | 10/07 at 100.00 | B– | $ | 134,721 | ||||
| 420 | Norfolk Economic Development Authority, Virginia, Empowerment Zone Facility Revenue Bonds, BBL Old Dominion University LLC Project Revenue Bonds, Series 2006A, 5.625%, 11/01/15 (Alternative Minimum Tax) | No Opt. Call | N/R | 410,836 | ||||||
| 555 | Total Consumer Discretionary | 545,557 | ||||||||
| Consumer Staples – 4.6% | ||||||||||
| 1,000 | California County Tobacco Securitization Agency, Tobacco Settlement Asset-Backed Bonds, Golden Gate Tobacco Funding Corporation, Turbo, Series 2007A, 5.000%, 6/01/47 | 6/17 at 100.00 | N/R | 867,240 | ||||||
| 250 | Golden State Tobacco Securitization Corporation, California, Enhanced Tobacco Settlement Asset-Backed Bonds, Series 2007A-1, 5.125%, 6/01/47 | 6/17 at 100.00 | BBB | 221,603 | ||||||
| Tobacco Securitization Authority of Southern California, Tobacco Settlement Asset-Backed Bonds, San Diego County Tobacco Asset Securitization Corporation, Senior Series 2001A: | ||||||||||
| 50 | 5.000%, 6/01/37 | 6/14 at 100.00 | BBB | 44,649 | ||||||
| 750 | 5.125%, 6/01/46 | 6/14 at 100.00 | BBB | 665,378 | ||||||
| 2,050 | Total Consumer Staples | 1,798,870 | ||||||||
| Education and Civic Organizations – 9.0% | ||||||||||
| 65 | California Educational Facilities Authority, Revenue Bonds, Dominican University, Series 2006, 5.000%, 12/01/36 | 12/16 at 100.00 | Baa3 | 59,984 | ||||||
| 75 | California Educational Facilities Authority, Revenue Bonds, University of Redlands, Series 2005A, 5.000%, 10/01/35 | 10/15 at 100.00 | A3 | 73,664 | ||||||
| 100 | California Educational Facilities Authority, Revenue Bonds, University of the Pacific, Series 2006, 5.000%, 11/01/36 | 11/15 at 100.00 | A2 | 100,493 | ||||||
| 100 | California Municipal Finance Authority, Education Revenue Bonds, American Heritage Education Foundation Project, Series 2006A, 5.250%, 6/01/36 | 6/16 at 100.00 | BBB– | 93,866 | ||||||
| 1,065 | California Statewide Community Development Authority, Revenue Bonds, Drew School, Series 2007, 5.300%, 10/01/37 | 10/15 at 102.00 | N/R | 1,006,179 | ||||||
| 200 | California Statewide Community Development Authority, Revenue Bonds, International School of the Peninsula, Palo Alto, California, Series 2006, 5.000%, 11/01/29 | 11/16 at 100.00 | N/R | 181,904 | ||||||
| 400 | California Statewide Community Development Authority, Revenue Bonds, Montessori in Redlands School, Series 2007A, 5.125%, 12/01/36 | 12/16 at 100.00 | N/R | 362,936 | ||||||
| 125 | California Statewide Community Development Authority, Revenue Bonds, Thomas Jefferson School of Law, Series 2005A, 4.875%, 10/01/35 | 10/15 at 100.00 | BBB– | 111,161 | ||||||
| 100 | California Statewide Community Development Authority, Revenue Bonds, Viewpoint School, Series 2004, 5.000%, 10/01/28 – ACA Insured | 10/14 at 100.00 | A | 93,860 | ||||||
| 200 | Hawaii State Department of Budget and Finance, Private School Revenue Bonds, Montessori of Maui, Series 2007, 5.500%, 1/01/37 | 2/17 at 100.00 | N/R | 186,648 | ||||||
| 600 | La Vernia Education Financing Corporation, Texas, Charter School Revenue Bonds, Riverwalk Education Foundation, Series 2007A, 5.450%, 8/15/36 | 8/11 at 100.00 | N/R | 547,650 | ||||||
| 110 | Pima County Industrial Development Authority, Arizona, Charter School Revenue Bonds, Franklin Phonetic Charter School, Series 2006, 5.750%, 7/01/36 | 7/16 at 100.00 | N/R | 104,012 | ||||||
| 100 | Pima County Industrial Development Authority, Arizona, Choice Education and Development Charter School Revenue Bonds, Series 2006, 6.375%, 6/01/36 | 6/16 at 100.00 | N/R | 101,426 | ||||||
| 65 | Pima County Industrial Development Authority, Arizona, Educational Revenue Bonds, Paradise Education Center Charter School, Series 2006, 6.000%, 6/01/36 | 6/16 at 100.00 | BB | 62,794 | ||||||
| 400 | Pingree Grove Village, Illinois, Charter School Revenue Bonds, Cambridge Lakes Learning Center, Series 2007, 6.000%, 6/01/36 | 6/16 at 102.00 | N/R | 377,788 | ||||||
| 60 | San Diego County, California, Certificates of Participation, Burnham Institute, Series 2006, 5.000%, 9/01/34 | 9/15 at 102.00 | Baa3 | 56,488 | ||||||
| 3,765 | Total Education and Civic Organizations | 3,520,853 | ||||||||
12
| Principal Amount (000) | Description | Optional Call Provisions (1) | Ratings (2) | Value | ||||||
| Energy – 1.2% | ||||||||||
| $ | 500 | Virgin Islands Public Finance Authority, Revenue Bonds, Refinery Project Hovensa LLC, Series 2007, 4.700%, 7/01/22 (Alternative Minimum Tax) | 1/15 at 100.00 | BBB | $ | 459,710 | ||||
| Health Care – 7.2% | ||||||||||
| 50 | California Health Facilities Financing Authority, Health Facility Revenue Bonds, Adventist Health System/West, Series 2003A, 5.000%, 3/01/33 | 3/13 at 100.00 | A | 49,047 | ||||||
| 345 | California Health Facilities Financing Authority, Hospital Revenue Bonds, Downey Community Hospital, Series 1993, 5.750%, 5/15/15 | 11/07 at 100.00 | BB | 344,983 | ||||||
| 500 | California Health Facilities Financing Authority, Revenue Bonds, Sutter Health, Series 2007A, Residuals 1801, 5.171%, 11/15/46 (IF) | 11/16 at 100.00 | AA– | 528,500 | ||||||
| 500 | California Municipal Financing Authority, Certificates of Participation, Community Hospitals of Central California, Series 2007, 5.250%, 2/01/46 | 2/17 at 100.00 | Baa2 | 473,600 | ||||||
| 1,000 | California Statewide Communities Development Authority, Revenue Bonds, ValleyCare Health System, Series 2007A, 5.125%, 7/15/31 | 7/17 at 100.00 | N/R | 909,080 | ||||||
| California Statewide Community Development Authority, Revenue Bonds, Daughters of Charity Health System, Series 2005A: | ||||||||||
| 100 | 5.250%, 7/01/24 | 7/15 at 100.00 | BBB+ | 99,165 | ||||||
| 15 | 5.250%, 7/01/35 | 7/15 at 100.00 | BBB+ | 14,499 | ||||||
| 50 | 5.000%, 7/01/39 | 7/15 at 100.00 | BBB+ | 46,294 | ||||||
| 200 | Illinois Finance Authority, Revenue Bonds, Midwest Regional Medical Center Galena-Stauss Hospital, Series 2006, 6.750%, 10/01/46 | 10/16 at 100.00 | N/R | 193,198 | ||||||
| 100 | Sierra Kings Health Care District, Fresno County, California, Revenue Bonds, Series 2006A, 5.750%, 12/01/36 | 12/16 at 100.00 | N/R | 99,919 | ||||||
| 60 | Weatherford Hospital Authority, Oklahoma, Sales Tax Revenue Bonds, Series 2006, 6.000%, 5/01/31 | 5/16 at 103.00 | N/R | 60,169 | ||||||
| 2,920 | Total Health Care | 2,818,454 | ||||||||
| Housing/Multifamily – 10.0% | ||||||||||
| 200 | California Mobile Home Park Financing Authority, Union City Tropics Mobile Home Park Subrodinate Revenue Bonds, Series 2006B, 5.375%, 12/15/31 | 12/16 at 100.00 | N/R | 180,680 | ||||||
| 900 | California Municipal Finance Authority, Revenue Bonds, University Students Coop Association, Series 2007, 4.750%, 4/01/27 | 4/17 at 100.00 | BBB– | 821,151 | ||||||
| 1,000 | California Statewide Community Development Authority, Lancer Educational Student Housing Revenue Bonds, California Baptist University, Series 2007, 5.625%, 6/01/33 | 6/17 at 102.00 | N/R | 970,149 | ||||||
| 100 | Independent Cities Lease Finance Authority, California, Mobile Home Park Revenue Bonds, San Juan Mobile Estates, Series 2006B, 5.850%, 5/15/41 | 5/16 at 100.00 | N/R | 93,584 | ||||||
| 120 | Multifamily Housing Revenue Bond Pass-Through Certificates, Series 2001-17, Stanford Arms Seniors Apartments 01-P2, 5.750%, 11/01/34 (Mandatory put 11/01/16) (Alternative Minimum Tax) | 12/11 at 100.00 | N/R | 123,042 | ||||||
| 600 | Richmond, California, Joint Powers Financing Agency Multifamily Housing Revenue Bonds, Westridge Hilltop Apartments, Series 2007, 5.000%, 12/15/33 | 12/12 at 100.00 | Baa3 | 545,736 | ||||||
| 750 | Ventura County Area Housing Authority, California, Mira Vista Senior Apartments Project, Junior Subordinate Series 2006C, 6.500%, 12/01/39 (Mandatory put 7/01/16) (Alternative Minimum Tax) | No Opt. Call | N/R | 731,903 | ||||||
| 500 | Wilson County Health and Educational Facilities Board, Tennessee, Senior Living Revenue Bonds, | 7/17 at 100.00 | N/R | 482,445 | ||||||
| 4,170 | Total Housing/Multifamily | 3,948,690 | ||||||||
| Housing/Single Family – 2.2% | ||||||||||
| 500 | California Housing Finance Agency, California, Home Mortgage Revenue Bonds, Series 2007E, 4.800%, 8/01/37 (Alternative Minimum Tax) | 2/17 at 100.00 | Aa2 | 480,420 | ||||||
| 500 | California Housing Finance Agency, Home Mortgage Revenue Bonds, Series 2007M, ROLS 11113-1, 5.501%, 8/01/31 (Alternative Minimum Tax) (IF) | 2/16 at 100.00 | Aa2 | 392,615 | ||||||
| 1,000 | Total Housing/Single Family | 873,035 | ||||||||
13
Portfolio of Investments (Unaudited)
Nuveen California High Yield Municipal Bond Fund (continued)
August 31, 2007
| Principal Amount (000) | Description | Optional Call Provisions (1) | Ratings (2) | Value | ||||||
| Industrials – 8.1% | ||||||||||
| $ | 20 | California Pollution Control Financing Authority, Solid Waste Disposal Revenue Bonds, Browning Ferris Industries Inc., Series 1989, 6.750%, 9/01/19 (Alternative Minimum Tax) | 3/08 at 100.00 | N/R | $ | 20,093 | ||||
| 180 | California Pollution Control Financing Authority, Solid Waste Disposal Revenue Bonds, Browning Ferris Industries Inc., Series 1996A, 5.800%, 12/01/16 (Alternative Minimum Tax) | 12/07 at 101.00 | BB– | 181,073 | ||||||
| 150 | California Pollution Control Financing Authority, Solid Waste Disposal Revenue Bonds, Republic Services Inc., Series 2002C, 5.250%, 6/01/23 (Mandatory put 12/01/17) (Alternative Minimum Tax) | No Opt. Call | BBB+ | 153,099 | ||||||
| 500 | California Pollution Control Financing Authority, Solid Waste Disposal Revenue Bonds, Waste Management Inc., Series 2002B, 5.000%, 7/01/27 (Alternative Minimum Tax) | 7/15 at 101.00 | BBB | 455,655 | ||||||
| 1,000 | California Statewide Communities Development Authority, Revenue Bonds, EnerTech Regional Biosolids Project, Series 2007A, 5.500%, 12/01/33 (Alternative Minimum Tax) | No Opt. Call | BB | 906,250 | ||||||
| 265 | Kootenai County Industrial Development Corporation, Idaho, Industrial Development Revenue Bonds, Coer d’Alene Fiber Fuels, Inc., Series 2006, 6.750%, 12/01/26 | 12/16 at 100.00 | N/R | 254,771 | ||||||
| 100 | Louisiana Local Government Environmental Facilities and Community Development Authority, Carter Plantation Hotel Project Revenue Bonds, Series 2006A, 6.000%, 9/01/36 | 9/16 at 100.00 | N/R | 96,594 | ||||||
| 400 | Mission Economic Development Corporation, Texas, Solid Waste Disposal Revenue Bonds, Allied Waste Industries, Inc., Series 2007A, 5.200%, 4/01/18 (Alternative Minimum Tax) | 4/12 at 100.00 | B+ | 390,604 | ||||||
| 750 | Western Reserve Port Authority, Ohio, Solid Waste Facility Revenue Bonds, Central Waste Inc., Series 2007A, 6.350%, 7/01/27 (Alternative Minimum Tax) | 7/17 at 102.00 | N/R | 736,905 | ||||||
| 3,365 | Total Industrials | 3,195,044 | ||||||||
| Long-Term Care – 0.2% | ||||||||||
| 40 | ABAG Finance Authority for Non-Profit Corporations, California, Certificates of Participation Refunding, American Baptist Homes of the West, Series 1998A, 6.200%, 10/01/27 | 10/07 at 102.00 | BB+ | 40,469 | ||||||
| 50 | Louisiana Local Government Environmental Facilities and Community Development Authority, Revenue Bonds, CDF Healthcare of Louisiana LLC, Series 2006A, 7.000%, 6/01/36 | 6/16 at 101.00 | N/R | 49,401 | ||||||
| 90 | Total Long-Term Care | 89,870 | ||||||||
| Tax Obligation/General – 1.0% | ||||||||||
| 400 | Bessemer, Alabama, General Obligation Warrants, Series 2007, 6.500%, 2/01/37 | 2/17 at 102.00 | N/R | 375,880 | ||||||
| Tax Obligation/Limited – 60.9% | ||||||||||
| ABAG Finance Authority for Non-Profit Corporations, California, Community Facilities District 2006-1 Rincon Hills Special Tax Bonds, Series 2006A: | ||||||||||
| 100 | 5.200%, 9/01/26 | 9/16 at 100.00 | N/R | 98,517 | ||||||
| 100 | 5.250%, 9/01/36 | 9/16 at 100.00 | N/R | 96,467 | ||||||
| 200 | Alvord Unified School District, Riverside County, California, Community Facilities District Special Tax Revenue Bonds, Series 2006-1A, 5.000%, 9/01/36 | 9/07 at 102.00 | N/R | 185,724 | ||||||
| 300 | Austin Convention Enterprises Inc., Texas, Convention Center Hotel Revenue Bonds, First Tier Series 2001A, 9.750%, 1/01/26 | 1/11 at 100.00 | N/R | 305,601 | ||||||
| 1,000 | Azusa Redevelopment Agency, California, Tax Allocation Refunding Bonds, Merged West End Development, Series 2007B, 5.300%, 8/01/36 | No Opt. Call | N/R | 971,859 | ||||||
| 100 | Beaumont Financing Authority, California, Local Agency Revenue Bonds, Series 2005A, 5.600%, 9/01/25 | 9/15 at 102.00 | N/R | 102,328 | ||||||
| 300 | Beaumont Financing Authority, California, Local Agency Revenue Bonds, Series 2006B, 5.050%, 9/01/37 | 9/08 at 103.00 | N/R | 280,480 | ||||||
| 1,000 | Borrego Water District, California, Community Facilities District 2007-1 Montesoro, Special Tax Bonds, Series 2007, 5.750%, 8/01/32 | 8/17 at 102.00 | N/R | 957,247 | ||||||
| 7,475 | Calabasas, California, Certificates of Participation, Series 2006, 4.500%, 12/01/41 – AMBAC Insured (UB) | 12/16 at 100.00 | AAA | 6,904,957 | ||||||
| 150 | Calaveras County Community Facilities District 2, California, Special Tax Bonds, Saddle Creek, Series 2006, 5.000%, 9/01/26 | 9/07 at 103.00 | N/R | 143,355 | ||||||
| 135 | Carson Public Financing Authority, California, Reassessment Revenue Bonds, Series 2006B, 5.000%, 9/02/31 | 9/07 at 102.00 | N/R | 126,149 | ||||||
14
| Principal Amount (000) | Description | Optional Call Provisions (1) | Ratings (2) | Value | ||||||
| Tax Obligation/Limited (continued) | ||||||||||
| $ | 240 | Chino Hills, California, Certificates of Participation, Civic Center Interim Financing Project, Series 2007, 5.000%, 9/01/26 | 9/07 at 100.00 | A | $ | 240,053 | ||||
| 100 | Chino Public Financing Authority, California, Revenue Refunding Bonds, Series 2006, 5.000%, 9/01/30 | 9/14 at 102.00 | N/R | 93,829 | ||||||
| 200 | Chino, California, Special Tax Bonds, Community Facilities District 06-2, Series 2006, 5.000%, 9/01/36 | 9/07 at 102.00 | N/R | 185,724 | ||||||
| 125 | Corona, California, Community Facilities District 2003-2, Special Tax Bonds, Highlands Collection, Series 2006, 5.150%, 9/01/26 | 9/16 at 100.00 | N/R | 121,678 | ||||||
| 200 | Corona, California, Special Tax Bonds, Community Facilities District 2002-1, Dos Lagos, Series 2007, 5.000%, 9/01/37 | 9/07 at 103.00 | N/R | 185,526 | ||||||
| 500 | Corona-Norco Inified School District Public Financing Authority, California, Special Tax Revenue Bonds, Series 2006B, 5.000%, 9/01/36 | 9/14 at 102.00 | N/R | 464,310 | ||||||
| 200 | Eastern California Municipal Water District, Community Facilities District 2005-40 Mahogany Special Tax Bonds, Series 2006, 5.000%, 9/01/36 | 9/07 at 102.00 | N/R | 185,724 | ||||||
| 100 | Eastern Municipal Water District, California, Community Facilities District 2001-1 Improvement Area A, Special Tax Bonds, Series 2006, 5.125%, 9/01/36 | 9/07 at 102.00 | N/R | 94,665 | ||||||
| 100 | Eastern Municipal Water District, California, Community Facility District No 2004-34, Faircrest, Special Tax Bonds, Series 2006, 5.250%, 9/01/36 | 3/17 at 100.00 | N/R | 96,467 | ||||||
| 100 | Eastern Municipal Water District, California, Community Facility District No 2005-38 Improvement Area A, Special Tax Bonds, Series 2006, 5.200%, 9/01/36 | 9/07 at 102.00 | N/R | 95,746 | ||||||
| 50 | El Dorado County, California, Special Tax Bonds, Community Facilities District 2005-2, Series 2006, 5.100%, 9/01/36 | 9/14 at 102.00 | N/R | 47,152 | ||||||
| 200 | Escondido, California, Special Tax Bonds, Community Facilities District 2006-1 Eureka Ranch, Series 2006, 5.150%, 9/01/36 | 9/16 at 100.00 | N/R | 190,050 | ||||||
| 500 | Folsom Public Financing Authority, California, Subordinate Special Tax Revenue Bonds, Series 2007B, 5.200%, 9/01/32 | 9/07 at 103.00 | N/R | 479,425 | ||||||
| 600 | Fontana, California, Special Tax Bonds, Community Facilities District 31 Citrus Heights North Special Tax Bonds, Series 2006, 5.000%, 9/01/36 | 9/07 at 103.00 | N/R | 557,172 | ||||||
| 200 | Golden State Tobacco Securitization Corporation, California, Tobacco Settlement Asset-Backed Revenue Bonds, Series 2005A, 5.000%, 6/01/45 | 6/15 at 100.00 | A | 196,156 | ||||||
| 200 | Hemet Unified School District, California, Community Facilities District 2005-1 Special Tax Bonds, Series 2006, 5.125%, 9/01/36 | 9/07 at 103.00 | N/R | 177,458 | ||||||
| 300 | Hesperia Unified School District, San Bernardino County, California, Community Facilities District 2006-5 Special Tax Bonds, Series 2007, 5.000%, 9/01/37 | 9/07 at 102.00 | N/R | 278,289 | ||||||
| 560 | Hesperia, California, Improvement Act of 1915, Assessment District, 91-1, Joshua West Main Street, Series 1992, 8.500%, 9/02/24 | 3/08 at 103.00 | N/R | 585,038 | ||||||
| 125 | Irvine, California, Community Facilities District 2005-2 Special Tax Bonds, Series 2006, 5.250%, 9/01/36 | 9/16 at 100.00 | N/R | 120,584 | ||||||
| 125 | Irvine, California, Unified School District, Community Facilities District Special Tax Bonds, Series 2006A, 5.125%, 9/01/36 | 9/16 at 100.00 | N/R | 118,331 | ||||||
| 50 | Lake Elsinore, California, Special Tax Bonds, Community Facilities District 2005-6, Center Townhomes, Series 2006, 5.350%, 9/01/36 | 9/12 at 102.00 | N/R | 48,955 | ||||||
| 100 | Lammersville School District, San Joaquin County, California, Community Facilities District 2002, Mountain House Special Tax Bonds, Series 2006, 5.125%, 9/01/35 | 9/16 at 100.00 | N/R | 94,199 | ||||||
| 745 | Lincoln Public Financing Authority, California, Community Facilities District 2003-1 Special Tax Bonds, Series 2007B, 5.000%, 9/01/34 | 9/07 at 103.00 | N/R | 690,459 | ||||||
| 200 | Menifee Union School District, Riverside County, California, Special Tax Bonds, Community Facility District 2003-2, Improvement Area A, 5.000%, 9/01/36 | 9/14 at 102.00 | N/R | 185,724 | ||||||
| 130 | Merced, California, Community Facilities District 2005-1, Special Tax Bonds, Bellevue Ranch West, Series 2006, 5.300%, 9/01/36 | 9/07 at 103.00 | N/R | 126,344 | ||||||
| 125 | Moorpark, California, Special Tax Bonds, Community Facilities District 2004-1, Moorpark Highlands Project, Series 2006, 5.300%, 9/01/38 | 9/16 at 100.00 | N/R | 121,210 | ||||||
15
Portfolio of Investments (Unaudited)
Nuveen California High Yield Municipal Bond Fund (continued)
August 31, 2007
| Principal Amount (000) | Description | Optional Call Provisions (1) | Ratings (2) | Value | ||||||
| Tax Obligation/Limited (continued) | ||||||||||
| $ | 65 | Moreno Valley Unified School District, Riverside County, California, Special Tax Bonds, Community Facilities District, Series 2006, 5.200%, 9/01/36 | 3/16 at 100.00 | N/R | $ | 62,235 | ||||
| 1,000 | Moreno Valley, California, Community Facilities District 5, Special Tax Bonds, Series 2007, 5.000%, 9/01/37 | 9/17 at 100.00 | N/R | 927,630 | ||||||
| 125 | Murrieta Valley Unified School District, Riverside County, California, Special Tax Bonds, Community Facilities District 2002-4, Series 2006B, 5.450%, 9/01/38 | 9/16 at 100.00 | N/R | 123,983 | ||||||
| 500 | North Natomas Community Facilities District 4, Sacramento, California, Special Tax Bonds, Series 2006D, 5.000%, 9/01/33 | 9/14 at 102.00 | N/R | 467,930 | ||||||
| 300 | Perris, California, Community Facilities District 2001-1 Improvement Area 5-A Special Tax Bonds, Series 2006, 5.000%, 9/01/37 | 9/08 at 103.00 | N/R | 278,289 | ||||||
| 750 | Pomona Public Financing Authority, California, Merged Projects Revenue Bonds, Series 2007, 5.125%, 2/01/33 | 2/12 at 100.00 | BBB– | 715,155 | ||||||
| 600 | Poway Unified School District, San Diego County, California, Special Tax Bonds, Community Facilities District 11, Stonebridge Estates Improvement Area B, Series 2005, 5.000%, 9/01/30 | 9/14 at 100.00 | N/R | 566,718 | ||||||
| 125 | Poway Unified School District, San Diego County, California, Special Tax Bonds, Community Facilities District 6, Improvement Area B, Series 2005, 5.125%, 9/01/36 | 9/15 at 100.00 | N/R | 118,331 | ||||||
| 1,000 | Rancho Santa Fe Community Services District, California, Community Facilities District 1, Special Tax Bonds, Series 2007, 5.125%, 9/01/30 | 9/07 at 103.00 | N/R | 954,530 | ||||||
| 125 | Riverside Unified School District, California, Community Facilities District 24 Special Tax Bonds, Series 2006, 5.100%, 9/01/36 | 9/14 at 102.00 | N/R | 117,880 | ||||||
| 750 | Roseville Financing Authority, California, Special Tax Revenue Bonds, Series 2007B, 5.000%, 9/01/33 | 9/07 at 103.00 | N/R | 701,895 | ||||||
| 125 | Roseville, California, Special Tax Bonds, Community Facilities District 1 Westpark, Series 2006, 5.250%, 9/01/37 | 9/16 at 100.00 | N/R | 120,523 | ||||||
| 480 | Saint Louis, Missouri, Tax Increment Financing Reveneu Bonds, Grace Lofts Redevelopment Projects, Series 2007A, 6.000%, 3/27/26 | 12/07 at 100.00 | N/R | 452,578 | ||||||
| 100 | San Jacinto Unified School District, Riverside County, California, Community Facilities District 2006-1 Special Tax Bonds, Infrastructure Projects, Series 2006, 5.200%, 9/01/36 | 9/07 at 102.00 | N/R | 95,746 | ||||||
| 700 | Santa Ana Unified School District, Orange County, California, Special Tax Bonds, Community Facilities District 2004-1, Central Park Project, Series 2005, 5.050%, 9/01/30 | 9/15 at 100.00 | N/R | 661,353 | ||||||
| 800 | West Patterson Financing Authority, California, Special Tax Bonds, Community Facilities District 01-1, Series 2007A, 5.250%, 8/01/09 | 2/08 at 100.00 | N/R | 799,168 | ||||||
| 300 | Westside Union School District, California, Community Facilities District 2005-3 Special Tax Bonds, Series 2006, 5.000%, 9/01/36 | 9/14 at 102.00 | N/R | 278,586 | ||||||
| 390 | Yorkville United City Business District, Illinois, Storm Water and Water Improvement Project Revenue Bonds, Series 2007, 6.000%, 1/01/27 | 1/17 at 102.00 | N/R | 368,055 | ||||||
| 135 | Yuba County, California, Special Tax Bonds, Community Facilities District 2004-1, Edgewater, Series 2005, 5.125%, 9/01/35 | 3/15 at 100.00 | N/R | 127,169 | ||||||
| 25,305 | Total Tax Obligation/Limited | 23,890,706 | ||||||||
| Transportation – 1.6% | ||||||||||
| 150 | New Jersey Economic Development Authority, Special Facilities Revenue Bonds, Continental Airlines Inc., Series 1999, 6.250%, 9/15/29 (Alternative Minimum Tax) | 9/09 at 101.00 | B | 152,099 | ||||||
| Palm Springs Financing Authority, California, Palm Springs International Airport Revenue Bonds, Series 2006: | ||||||||||
| 25 | 5.450%, 7/01/20 (Alternative Minimum Tax) | 7/14 at 102.00 | N/R | 24,512 | ||||||
| 50 | 5.550%, 7/01/28 (Alternative Minimum Tax) | 7/14 at 102.00 | N/R | 48,501 | ||||||
| 230 | Puerto Rico Industrial, Tourist, Educational, Medical and Environmental Control Facilities Financing Authority, Revenue Bonds, American Airlines Inc., Series 1985A, 6.450%, 12/01/25 | 6/10 at 100.00 | CCC+ | 231,578 | ||||||
| 15 | Puerto Rico Ports Authority, Special Facilities Revenue Bonds, American Airlines Inc., Series 1993A, 6.300%, 6/01/23 (Alternative Minimum Tax) | 12/07 at 100.00 | CCC+ | 14,999 | ||||||
16
| Principal Amount (000) | Description | Optional Call Provisions (1) | Ratings (2) | Value | |||||||
| Transportation (continued) | |||||||||||
| $ | 145 | Puerto Rico Ports Authority, Special Facilities Revenue Bonds, American Airlines Inc., Series 1996A, 6.250%, 6/01/26 (Alternative Minimum Tax) | 12/07 at 101.00 | CCC+ | $ | 145,051 | |||||
| 615 | Total Transportation | 616,740 | |||||||||
| U.S. Guaranteed – 0.1% (3) | |||||||||||
| Golden State Tobacco Securitization Corporation, California, Tobacco Settlement Asset-Backed Bonds, Series 2003A-1: | |||||||||||
| 10 | 6.250%, 6/01/33 (Pre-refunded 6/01/13) | 6/13 at 100.00 | AAA | 10,958 | |||||||
| 15 | 6.625%, 6/01/40 (Pre-refunded 6/01/13) | 6/13 at 100.00 | AAA | 17,142 | |||||||
| 25 | Total U.S. Guaranteed | 28,100 | |||||||||
| $ | 44,760 | Total Investments (cost $44,597,519) – 107.5% | 42,161,509 | ||||||||
Floating Rate Obligations – (12.7)% | (4,980,000 | ) | |||||||||
Other Assets Less Liabilities – 5.2% | 2,049,224 | ||||||||||
Net Assets – 100% | $ | 39,230,733 | |||||||||
Futures Contracts outstanding at August 31, 2007:
| Type | Contract Position | Number of Contracts | Contract Expiration | Value at August 31, 2007 | Unrealized Appreciation (Depreciation) | ||||||||||
| U.S. Treasury Bonds | Short | (68 | ) | 12/07 | $ | (7,586,250 | ) | $ | (87,318 | ) | |||||
| (1) | Optional Call Provisions: Dates (month and year) and prices of the earliest optional call or redemption. There may be other call provisions at varying prices at later dates. Certain mortgage-backed securities may be subject to periodic principal paydowns. |
| (2) | Ratings: Using the higher of Standard & Poor’s or Moody’s rating. Ratings below BBB by Standard & Poor’s Group or Baa by Moody’s Investor Service, Inc. are considered to be below investment grade. |
| (3) | Backed by an escrow or trust containing sufficient U.S. Government or U.S. Government agency securities which ensure the timely payment of principal and interest. |
| N/R | Not rated. |
| (IF) | Inverse floating rate investment. |
| (UB) | Underlying bond of an inverse floating rate trust reflected as a financing transaction pursuant to the provisions of SFAS No. 140. |
See accompanying notes to financial statements.
17
Portfolio of Investments (Unaudited)
Nuveen California Municipal Bond Fund
August 31, 2007
| Principal Amount (000) | Description | Optional Call Provisions (1) | Ratings (2) | Value | ||||||
| Consumer Staples – 3.8% | ||||||||||
| $ | 3,500 | California County Tobacco Securitization Agency, Tobacco Settlement Asset-Backed Bonds, Alameda County Tobacco Asset Securitization Corporation, Series 2002, 5.750%, 6/01/29 | 6/12 at 100.00 | Baa3 | $ | 3,488,870 | ||||
| 615 | California County Tobacco Securitization Agency, Tobacco Settlement Asset-Backed Bonds, Sonoma County Tobacco Securitization Corporation, Series 2005, 4.250%, 6/01/21 | 6/15 at 100.00 | BBB | 570,185 | ||||||
| 12,135 | Golden State Tobacco Securitization Corporation, California, Enhanced Tobacco Settlement Asset-Backed Bonds, Series 2007A-2, 0.000%, 6/01/37 | 6/22 at 100.00 | BBB | 7,983,858 | ||||||
| 16,250 | Total Consumer Staples | 12,042,913 | ||||||||
| Education and Civic Organizations – 2.9% | ||||||||||
| 1,775 | California Educational Facilities Authority, Revenue Bonds, Occidental College, Series 2005A, 5.000%, 10/01/33 – MBIA Insured | 10/15 at 100.00 | Aaa | 1,821,807 | ||||||
| 150 | California Educational Facilities Authority, Revenue Bonds, University of Redlands, Series 2005A, 5.000%, 10/01/35 | 10/15 at 100.00 | A3 | 147,327 | ||||||
| California Educational Facilities Authority, Revenue Bonds, University of the Pacific, Series 2006: | ||||||||||
| 105 | 5.000%, 11/01/21 | 11/15 at 100.00 | A2 | 108,079 | ||||||
| 135 | 5.000%, 11/01/25 | 11/15 at 100.00 | A2 | 137,299 | ||||||
| 2,960 | California Educational Facilities Authority, Revenue Bonds, Woodbury University, Series 2006, 5.000%, 1/01/36 | 1/15 at 100.00 | BBB– | 2,734,566 | ||||||
| 2,500 | California State Public Works Board, Lease Revenue Bonds, University of California, Institute Projects, Series 2005C, 5.000%, 4/01/30 – AMBAC Insured | 4/15 at 100.00 | AAA | 2,567,350 | ||||||
| 1,500 | California Statewide Community Development Authority, Certificates of Participation, San Diego Space and Science Foundation, Series 1996, 7.500%, 12/01/26 | 12/07 at 104.00 | N/R | 1,566,525 | ||||||
| 9,125 | Total Education and Civic Organizations | 9,082,953 | ||||||||
| Health Care – 16.7% | ||||||||||
| 3,080 | California Health Facilities Financing Authority, Hospital Revenue Bonds, Downey Community Hospital, Series 1993, 5.750%, 5/15/15 | 11/07 at 100.00 | BB | 3,079,846 | ||||||
| 875 | California Health Facilities Financing Authority, Insured Loan Program Small Facilities Revenue Bonds, Series 1994B, 7.500%, 4/01/22 | 10/07 at 100.00 | A+ | 877,188 | ||||||
| 2,055 | California Health Facilities Financing Authority, Revenue Bonds, Cedars-Sinai Medical Center, Series 2005, 5.000%, 11/15/34 | 11/15 at 100.00 | A2 | 2,044,252 | ||||||
| 2,000 | California Health Facilities Financing Authority, Revenue Bonds, Kaiser Permanante System, Series 2006, 5.250%, 3/01/45 | 3/16 at 100.00 | A+ | 2,003,400 | ||||||
| 4,530 | California Health Facilities Financing Authority, Revenue Bonds, Sutter Health, Series 2007A, Residuals 1802, 7.195%, 11/15/46 (IF) | 11/16 at 100.00 | AA- | 4,788,210 | ||||||
| 6,360 | California Health Facilities Financing Authority, Revenue Bonds, Sutter Health, Series 2007A, 5.250%, 11/15/46 (UB) | 11/16 at 100.00 | AA- | 6,473,780 | ||||||
| 4,000 | California Statewide Community Development Authority, Insured Health Facility Revenue Bonds, Henry Mayo Newhall Memorial Hospital, Series 2007A, 5.000%, 10/01/37 | 10/17 at 100.00 | A+ | 3,899,600 | ||||||
| 3,670 | California Statewide Community Development Authority, Revenue Bonds, Daughters of Charity Health System, Series 2005G, 5.000%, 7/01/22 | 7/15 at 100.00 | BBB+ | 3,570,470 | ||||||
| 5,315 | California Statewide Community Development Authority, Revenue Bonds, Kaiser Permanante System, Series 2006, 5.000%, 3/01/41 | 3/16 at 100.00 | A+ | 5,134,928 | ||||||
| 1,615 | California Statewide Community Development Authority, Revenue Bonds, Kaiser Permanente System, Series 2001C, 5.250%, 8/01/31 | 8/16 at 100.00 | A+ | 1,630,375 | ||||||
| 6,670 | California Statewide Community Development Authority, Revenue Bonds, Kaiser Permanente System, Series 2007A, 4.750%, 4/01/33 | 4/17 at 100.00 | A+ | 6,172,285 | ||||||
| 5,825 | California Statewide Community Development Authority, Revenue Bonds, Sutter Health, Series 2007C, Residuals 1975, 6.450%, 8/15/38 – AMBAC Insured (IF) | 8/17 at 100.00 | AAA | 6,091,785 | ||||||
| 6,460 | Rancho Mirage Joint Powers Financing Authority, California, Revenue Bonds, Eisenhower Medical Center, Series 2007A, 5.000%, 7/01/38 | 7/17 at 100.00 | A3 | 6,281,446 | ||||||
18
| Principal Amount (000) | Description | Optional Call Provisions (1) | Ratings (2) | Value | ||||||
| Health Care (continued) | ||||||||||
| $ | 1,000 | Sierra View Local Health Care District, California, Revenue Bonds, Series 2007, 5.250%, 7/01/37 (WI/DD, Settling 9/18/07) | 9/17 at 100.00 | N/R | $ | 978,540 | ||||
| 53,455 | Total Health Care | 53,026,105 | ||||||||
| Housing/Multifamily – 3.7% | ||||||||||
| 1,950 | ABAG Finance Authority for Non-Profit Corporations, California, Multifamily Housing Revenue Refunding Bonds, United Dominion/2000 Post Apartments, Series 2000B, 6.250%, 8/15/30 (Mandatory put 8/15/08) | No Opt. Call | BBB | 1,986,231 | ||||||
| 3,125 | California Statewide Community Development Authority, Revenue Refunding Bonds, Irvine Apartment Communities Development, Series 1998A, 5.100%, 5/15/25 (Mandatory put 5/17/10) | 7/08 at 101.00 | BBB | 3,178,438 | ||||||
| 2,500 | Daly City Housing Development Finance Agency, California, Mobile Home Park Revenue Bonds, Franciscan Mobile Home Park Project, Series 2002A, 5.800%, 12/15/25 | 12/13 at 102.00 | A– | 2,550,325 | ||||||
| 2,000 | Riverside County, California, Mobile Home Park Revenue Bonds, Bravo Mobile Home Park Project, Series 1999A, 5.900%, 3/20/29 | 3/09 at 102.00 | N/R | 2,003,400 | ||||||
| 2,000 | San Dimas Housing Authority, California, Mobile Home Park Revenue Bonds, Charter Oak Mobile Home Estates Acquisition Project, Series 1998A, 5.700%, 7/01/28 | 7/08 at 102.00 | N/R | 2,011,180 | ||||||
| 11,575 | Total Housing/Multifamily | 11,729,574 | ||||||||
| Housing/Single Family – 2.4% | ||||||||||
| 5,900 | California Health Facilities Financing Authority, Sutter Health Revenue Bonds, Lehman Municipal Trust Receipts K43W, Series 2007, 4.713%, 8/01/26 (Alternative Minimum Tax) (IF) | 2/16 at 100.00 | Aa2 | 4,590,082 | ||||||
| 445 | California Housing Finance Agency, Home Mortgage Revenue Bonds, Series 2006H, 5.750%, 8/01/30 – FGIC Insured (Alternative Minimum Tax) | 2/16 at 100.00 | AAA | 465,501 | ||||||
| 40 | California Rural Home Mortgage Finance Authority, Mortgage-Backed Securities Program Single Family Mortgage Revenue Bonds, Series 1997A, 7.000%, 9/01/29 (Alternative Minimum Tax) | No Opt. Call | AAA | 40,586 | ||||||
| 2,500 | California Rural Home Mortgage Finance Authority, Single Family Mortgage Revenue Bonds, Mortgage Backed Securities Program, Series 2007C, 5.400%, 8/01/35 (Alternative Minimum Tax) | 2/17 at 104.00 | Aaa | 2,622,250 | ||||||
| 8,885 | Total Housing/Single Family | 7,718,419 | ||||||||
| Industrials – 0.5% | ||||||||||
| 750 | California Pollution Control Financing Authority, Solid Waste Disposal Revenue Bonds, Republic Services Inc., Series 2002C, 5.250%, 6/01/23 (Mandatory put 12/01/17) (Alternative Minimum Tax) | No Opt. Call | BBB+ | 765,495 | ||||||
| 1,000 | California Pollution Control Financing Authority, Solid Waste Disposal Revenue Bonds, Waste Management Inc., Series 2002A, 5.000%, 1/01/22 (Alternative Minimum Tax) | 1/16 at 102.00 | BBB | 956,040 | ||||||
| 1,750 | Total Industrials | 1,721,535 | ||||||||
| Long-Term Care – 2.6% | ||||||||||
| ABAG Finance Authority for Non-Profit Corporations, California, Cal-Mortgage Revenue Bonds, Elder Care Alliance of Union City, Series 2004: | ||||||||||
| 1,850 | 5.400%, 8/15/24 | 8/14 at 100.00 | A+ | 1,899,210 | ||||||
| 2,130 | 5.600%, 8/15/34 | 8/14 at 100.00 | A+ | 2,190,513 | ||||||
| 4,250 | ABAG Finance Authority for Non-Profit Corporations, California, Certificates of Participation, American Baptist Homes of the West, Series 1997A, 5.850%, 10/01/27 | 10/07 at 102.00 | BBB– | 4,251,148 | ||||||
| 8,230 | Total Long-Term Care | 8,340,871 | ||||||||
| Tax Obligation/General – 16.4% | ||||||||||
| 1,425 | Bassett Unified School District, Los Angeles County, California, General Obligation Bonds, Series 2006B, 5.250%, 8/01/30 – FGIC Insured | 8/16 at 100.00 | AAA | 1,494,725 | ||||||
| 5,000 | California State, General Obligation Bonds, Series 2007, 4.250%, 8/01/33 – MBIA Insured | 2/17 at 100.00 | AAA | 4,495,250 | ||||||
| 10,000 | California, General Obligation Bonds, Series 2002, 6.000%, 2/01/15 – FSA Insured (UB) | No Opt. Call | AAA | 11,349,800 | ||||||
| California, General Obligation Bonds, Series 2004: | ||||||||||
| 2,500 | 5.000%, 2/01/20 | 2/14 at 100.00 | A+ | 2,580,850 | ||||||
| 1,000 | 5.000%, 4/01/21 | 4/14 at 100.00 | A+ | 1,030,190 | ||||||
| 6,000 | 5.125%, 4/01/23 | 4/14 at 100.00 | A+ | 6,202,740 | ||||||
19
Portfolio of Investments (Unaudited)
Nuveen California Municipal Bond Fund (continued)
August 31, 2007
| Principal Amount (000) | Description | Optional Call Provisions (1) | Ratings (2) | Value | ||||||
| Tax Obligation/General (continued) | ||||||||||
| Central Unified School District, Fresno County, California, General Obligation Bonds, Series 2004A: | ||||||||||
| $ | 1,000 | 5.500%, 7/01/22 – FGIC Insured | 7/14 at 100.00 | AAA | $ | 1,093,540 | ||||
| 1,500 | 5.500%, 7/01/24 – FGIC Insured | 7/14 at 100.00 | AAA | 1,640,310 | ||||||
| Glendora Unified School District, Los Angeles County, California, General Obligation Bonds, Series 2006A: | ||||||||||
| 1,475 | 5.250%, 8/01/22 – MBIA Insured | 8/16 at 100.00 | AAA | 1,571,627 | ||||||
| 1,120 | 5.250%, 8/01/25 – MBIA Insured | 8/16 at 100.00 | AAA | 1,184,893 | ||||||
| Grossmont-Cuyamaca Community College District, California, General Obligation Bonds, Series 2005B: | ||||||||||
| 5,080 | 5.000%, 8/01/21 – FGIC Insured | 8/15 at 100.00 | AAA | 5,291,379 | ||||||
| 2,350 | 5.000%, 8/01/26 – FGIC Insured | 8/15 at 100.00 | AAA | 2,425,083 | ||||||
| 2,545 | Hemet Unified School District, Riverside County, California, General Obligation Bonds, Series 2007, 4.250%, 8/01/32 – FSA Insured | 8/15 at 100.00 | AAA | 2,263,065 | ||||||
| 2,000 | Murrieta Valley Unified School District, Riverside County, California, General Obligation Bonds, Series 2003A, 5.000%, 9/01/26 – FGIC Insured | 9/13 at 100.00 | AAA | 2,043,640 | ||||||
| 1,350 | Riverside Community College District, California, General Obligation Bonds, Series 2005, | 8/15 at 100.00 | AAA | 1,406,174 | ||||||
| 275 | Roseville Joint Union High School District, Placer County, California, General Obligation Bonds, Series 2006B, 5.000%, 8/01/27 – FGIC Insured | 8/15 at 100.00 | AAA | 283,599 | ||||||
| 2,000 | San Diego Unified School District, California, General Obligation Bonds, Election of 1998, Series 2000B, 5.125%, 7/01/22 – MBIA Insured | 7/10 at 100.00 | AAA | 2,072,900 | ||||||
| 1,355 | San Jose-Evergreen Community College District, Santa Clara County, California, General Obligation Bonds, Series 2005A, 5.000%, 9/01/25 – MBIA Insured | 9/15 at 100.00 | AAA | 1,401,477 | ||||||
| 2,000 | West Contra Costa Unified School District, Contra Costa County, California, General Obligation Bonds, Series 2003B, 5.000%, 8/01/20 – FSA Insured | 8/11 at 101.00 | AAA | 2,079,440 | ||||||
| 49,975 | Total Tax Obligation/General | 51,910,682 | ||||||||
| Tax Obligation/Limited – 22.0% | ||||||||||
| 3,000 | Alameda County Redevelopment Agency, California, Eden Area Redevelopment Project, Tax Allocation Bonds, Series 2006A, 5.000%, 8/01/36 – MBIA Insured | 8/16 at 100.00 | AAA | 3,050,610 | ||||||
| 525 | California, Economic Recovery Revenue Bonds, Series 2004A, 5.000%, 7/01/15 | 7/14 at 100.00 | AA+ | 559,482 | ||||||
| 350 | Capistrano Unified School District, Orange County, California, Special Tax Bonds, Community Facilities District, Series 2005, 5.000%, 9/01/24 – FGIC Insured | 9/15 at 100.00 | AAA | 361,057 | ||||||
| 2,500 | Golden State Tobacco Securitization Corporation, California, Tobacco Settlement Asset-Backed Revenue Bonds, Series 2005A, 5.000%, 6/01/45 – AMBAC Insured | 6/15 at 100.00 | AAA | 2,519,775 | ||||||
| 2,075 | Hesperia Community Redevelopment Agency, California, Tax Allocation Bonds, | 9/15 at 100.00 | AAA | 2,101,622 | ||||||
| Irvine, California, Unified School District, Community Facilities District Special Tax Bonds, Series 2006A: | ||||||||||
| 180 | 5.000%, 9/01/26 | 9/16 at 100.00 | N/R | 173,061 | ||||||
| 420 | 5.125%, 9/01/36 | 9/16 at 100.00 | N/R | 397,593 | ||||||
| 2,000 | La Mirada Redevelopment Agency, California, Special Tax Refunding Bonds, Community Facilities District 89-1, Civic Theatre Project, Series 1998, 5.700%, 10/01/20 | 10/08 at 102.00 | N/R | 2,013,400 | ||||||
| 2,500 | Lancaster Redevelopment Agency, California, Subordinate Lien Tax Allocation Bonds, Combined Redevelopment Project Areas, Series 2003B, 5.000%, 8/01/34 – FGIC Insured | 8/13 at 100.00 | AAA | 2,532,200 | ||||||
| 1,870 | Lancaster Redevelopment Agency, California, Tax Allocation Refunding Bonds, Combined Area Sheriff’s Facilities Projects, Series 2004, 5.000%, 12/01/23 – XLCA Insured | 12/14 at 100.00 | AAA | 1,913,795 | ||||||
| 1,120 | Lancaster Redevelopment Agency, California, Tax Allocation Refunding Bonds, Combined Fire Protection Facilities Project, Series 2004, 5.000%, 12/01/23 – XLCA Insured | 12/14 at 100.00 | AAA | 1,146,230 | ||||||
| 630 | Los Angeles Community Redevelopment Agency, California, Lease Revenue Bonds, Manchester Social Services Project, Series 2005, 5.000%, 9/01/37 – AMBAC Insured | 9/15 at 100.00 | Aaa | 633,919 | ||||||
| 2,500 | Los Angeles County Schools, California, Certificates of Participation, Pooled Financing Program, Regionalized Business Services Corporation, Series 2003A, 5.000%, 9/01/22 – FSA Insured | 9/13 at 100.00 | AAA | 2,553,875 | ||||||
20
| Principal Amount (000) | Description | Optional Call Provisions (1) | Ratings (2) | Value | ||||||
| Tax Obligation/Limited (continued) | ||||||||||
| $ | 995 | Milpitas, California, Local Improvement District 20 Limited Obligation Bonds, Series 1998A, 5.700%, 9/02/18 | 9/07 at 103.00 | N/R | $ | 1,027,158 | ||||
| Moreno Valley Unified School District, Riverside County, California, Special Tax Bonds, Community Facilities District, Series 2004: | ||||||||||
| 805 | 5.550%, 9/01/29 | 9/14 at 100.00 | N/R | 809,122 | ||||||
| 1,250 | 5.650%, 9/01/34 | 9/14 at 100.00 | N/R | 1,259,838 | ||||||
| 7,100 | Murrieta Redevelopment Agency, California, Tax Allocation Bonds, Series 2007A, 5.000%, 8/01/37 – MBIA Insured | 8/17 at 100.00 | AAA | 7,235,964 | ||||||
| 575 | Ontario, California, Assessment District 100C Limited Obligation Improvement Bonds, California Commerce Center Phase III, Series 1991, 8.000%, 9/02/11 | 9/07 at 103.00 | N/R | 600,714 | ||||||
| 1,600 | Pomona Public Financing Authority, California, Merged Projects Revenue Bonds, Series 2007AS, 5.000%, 2/01/31 – AMBAC Insured | 2/17 at 100.00 | AAA | 1,633,072 | ||||||
| 1,150 | Poway Redevelopment Agency, California, Tax Allocation Bonds, Paugay Redevelopment Project, Series 2007, 5.000%, 6/15/30 – MBIA Insured | 6/17 at 100.00 | AAA | 1,176,289 | ||||||
| 2,000 | Poway, California, Community Facilities District 88-1, Special Tax Refunding Bonds, Parkway Business Centre, Series 1998, 6.750%, 8/15/15 | 8/08 at 102.00 | N/R | 2,072,740 | ||||||
| 1,645 | Rancho Cucamonga, California, Limited Obligation Improvement Bonds, Masi Plaza Assessment District 93-1, Series 1997, 6.250%, 9/02/22 | 9/07 at 100.00 | N/R | 1,653,258 | ||||||
| 305 | Rialto Redevelopment Agency, California, Tax Allocation Bonds, Merged Project Area, Series 2005A, 5.000%, 9/01/35 – XLCA Insured | 9/15 at 100.00 | AAA | 308,913 | ||||||
| 380 | Roseville, California, Certificates of Participation, Public Facilities, Series 2003A, 5.000%, 8/01/25 – AMBAC Insured | 8/13 at 100.00 | AAA | 386,304 | ||||||
| 1,000 | Sacramento City Financing Authority, California, Lease Revenue Refunding Bonds, Series 1993A, 5.400%, 11/01/20 – AMBAC Insured | No Opt. Call | AAA | 1,103,290 | ||||||
| 500 | Sacramento City Financing Authority, California, Lease Revenue Refunding Bonds, Series 1993B, 5.400%, 11/01/20 | No Opt. Call | AA– | 547,125 | ||||||
| 995 | Sacramento County, Laguna, California, Special Tax Refunding Bonds, Community Facilities District 1 – Laguna Creek Ranch, Series 1997, 5.700%, 12/01/20 | 12/07 at 102.00 | N/R | 1,008,313 | ||||||
| 2,880 | San Francisco Redevelopment Agency, California, Lease Revenue Bonds, Moscone Convention Center, Series 2004, 5.250%, 7/01/24 – AMBAC Insured | 7/11 at 102.00 | AAA | 2,990,765 | ||||||
| 7,090 | San Marcos Redevelopment Agency, California, Tax Allocation Bonds, Affordable Housing Project, Series 1997A, 6.000%, 10/01/27 (Alternative Minimum Tax) | 10/07 at 102.00 | A | 7,241,229 | ||||||
| 2,805 | San Mateo County Transit District, California, Sales Tax Revenue Bonds, Series 2005A, 5.000%, 6/01/21 – MBIA Insured | 6/15 at 100.00 | AAA | 2,920,314 | ||||||
| 4,000 | Shafter Joint Powers Financing Authority, California, Lease Revenue Bonds, Community Correctional Facility Acquisition Project, Series 1997A, 6.050%, 1/01/17 | 1/08 at 100.50 | A | 4,045,320 | ||||||
| 1,025 | Stockton Public Financing Authority, California, Lease Revenue Bonds, Series 2004, 5.250%, 9/01/23 – FGIC Insured | 9/14 at 100.00 | AAA | 1,072,294 | ||||||
| 6,700 | Travis Unified School District, Solano County, California, Certificates of Participation, Series 2006, 5.000%, 9/01/31 – FGIC Insured | 9/16 at 100.00 | Aaa | 6,809,276 | ||||||
| 2,000 | Tustin, California, Community Facilities District 2007-1, Legacy-Retail Center Special Tax Bonds, 6.000%, 9/01/37 (WI/DD, Settling 9/11/07) | 9/17 at 100.00 | N/R | 2,041,440 | ||||||
| 835 | Vallejo Public Financing Authority, California, Limited Obligation Revenue Refinancing Bonds, Fairground Drive Assessment District 65, Series 1998, 5.700%, 9/02/11 | No Opt. Call | N/R | 851,116 | ||||||
| 1,120 | Washington Unified School District, Yolo County, California, Certificates of Participation, Series 2007, 5.125%, 8/01/37 – AMBAC Insured | 8/17 at 100.00 | AAA | 1,146,186 | ||||||
| 68,425 | Total Tax Obligation/Limited | 69,896,659 | ||||||||
| Transportation – 4.8% | ||||||||||
| 2,750 | Foothill/Eastern Transportation Corridor Agency, California, Toll Road Revenue Refunding Bonds, Series 1999, 0.000%, 1/15/28 | 1/14 at 101.00 | BBB– | 2,557,583 | ||||||
21
Portfolio of Investments (Unaudited)
Nuveen California Municipal Bond Fund (continued)
August 31, 2007
| Principal Amount (000) | Description | Optional Call Provisions (1) | Ratings (2) | Value | |||||||
| Transportation (continued) | |||||||||||
| Palm Springs Financing Authority, California, Palm Springs International Airport Revenue Bonds, Series 2006: | |||||||||||
| $ | 285 | 5.450%, 7/01/20 (Alternative Minimum Tax) | 7/14 at 102.00 | N/R | $ | 279,440 | |||||
| 240 | 5.550%, 7/01/28 (Alternative Minimum Tax) | 7/14 at 102.00 | N/R | 232,805 | |||||||
| Port of Oakland, California, Revenue Bonds, Series 2000K: | |||||||||||
| 2,000 | 5.500%, 11/01/09 – FGIC Insured (Alternative Minimum Tax) | No Opt. Call | AAA | 2,073,040 | |||||||
| 4,000 | 5.750%, 11/01/29 – FGIC Insured (Alternative Minimum Tax) | 5/10 at 100.00 | AAA | 4,156,160 | |||||||
| 5,500 | Port of Oakland, California, Revenue Bonds, Series 2002M, 5.250%, 11/01/19 – FGIC Insured | 11/12 at 100.00 | AAA | 5,826,975 | |||||||
| 14,775 | Total Transportation | 15,126,003 | |||||||||
| U.S. Guaranteed – 9.1% (3) | |||||||||||
| 3,000 | Bay Area Toll Authority, California, Revenue Bonds, San Francisco Bay Area Toll Bridge, Series 2001D, 5.000%, 4/01/16 (Pre-refunded 4/01/11) | 4/11 at 100.00 | AA | (3) | 3,143,520 | ||||||
| 4,200 | California Department of Water Resources, Power Supply Revenue Bonds, Series 2002A, 5.125%, 5/01/18 (Pre-refunded 5/01/12) | 5/12 at 101.00 | Aaa | 4,505,970 | |||||||
| 3,115 | California Educational Facilities Authority, Revenue Bonds, Pooled College and University Projects, Series 2000C, 6.750%, 6/01/30 (ETM) | 6/10 at 101.00 | Baa3 | (3) | 3,368,748 | ||||||
| 4,460 | California Infrastructure Economic Development Bank, First Lien Revenue Bonds, San Francisco Bay Area Toll Bridge, Series 2003A, 5.000%, 7/01/22 – FSA Insured (ETM) | No Opt. Call | AAA | 4,751,506 | |||||||
| 1,000 | Central California Joint Powers Health Finance Authority, Certificates of Participation, Community Hospitals of Central California, Series 2001, 5.625%, 2/01/21 (Pre-refunded 2/01/11) | 2/11 at 101.00 | AAA | 1,073,540 | |||||||
| 1,035 | Escondido Union School District, San Diego County, California, General Obligation Bonds, Series 2002A, 5.250%, 8/01/23 (Pre-refunded 8/01/12) – FSA Insured | 8/12 at 100.00 | AAA | 1,112,501 | |||||||
| 5,000 | Golden State Tobacco Securitization Corporation, California, Tobacco Settlement Asset-Backed Bonds, Series 2003A-1, 6.250%, 6/01/33 (Pre-refunded 6/01/13) | 6/13 at 100.00 | AAA | 5,478,850 | |||||||
| 2,190 | Los Angeles Harbors Department, California, Revenue Bonds, Series 1988, 7.600%, 10/01/18 (ETM) | No Opt. Call | AAA | 2,615,123 | |||||||
| 2,475 | San Francisco Airports Commission, California, Revenue Refunding Bonds, San Francisco International Airport, Second Series 2002, Issue 28B, 5.250%, 5/01/22 (Pre-refunded 5/01/12) – MBIA Insured | 5/12 at 100.00 | AAA | 2,651,938 | |||||||
| 26,475 | Total U.S. Guaranteed | 28,701,696 | |||||||||
| Utilities – 8.9% | |||||||||||
| 2,595 | California Statewide Community Development Authority, Certificates of Participation Refunding, Rio Bravo Fresno Project, Series 1999A, 6.300%, 12/01/18 | 12/07 at 100.50 | N/R | 2,497,713 | |||||||
| Los Angeles Department of Water and Power, California, Power System Revenue Bonds, Series 2001A-1: | |||||||||||
| 5,000 | 5.250%, 7/01/15 | 7/11 at 100.00 | AA– | 5,262,500 | |||||||
| 10,000 | 5.250%, 7/01/21 – FSA Insured | 7/11 at 100.00 | AAA | 10,396,296 | |||||||
| 500 | Los Angeles Department of Water and Power, California, Power System Revenue Bonds, Series 2003A-2, 5.000%, 7/01/21 – MBIA Insured | 7/13 at 100.00 | AAA | 518,330 | |||||||
| 5,000 | Los Angeles Department of Water and Power, California, Power System Revenue Bonds, Series 2005A-1, 5.000%, 7/01/31 – FSA Insured | 7/15 at 100.00 | AAA | 5,131,650 | |||||||
| 615 | Merced Irrigation District, California, Electric System Revenue Bonds, Series 2005, 5.125%, 9/01/31 – XLCA Insured | 9/15 at 100.00 | AAA | 629,994 | |||||||
| 3,470 | Puerto Rico Industrial, Tourist, Educational, Medical and Environmental Control Facilities Financing Authority, Co-Generation Facility Revenue Bonds, Series 2000A, 6.625%, 6/01/26 (Alternative Minimum Tax) | 6/10 at 101.00 | Baa3 | 3,690,900 | |||||||
| 27,180 | Total Utilities | 28,127,383 | |||||||||
| Water and Sewer – 6.5% | |||||||||||
| 2,000 | California Statewide Community Development Authority, Water and Wastewater Revenue Bonds, Pooled Financing Program, Series 2003A, 5.250%, 10/01/23 – FSA Insured | 10/13 at 100.00 | AAA | 2,083,840 | |||||||
| 1,680 | Castaic Lake Water Agency, California, Revenue Certificates of Participation, Series 2004A, 5.000%, 8/01/20 – AMBAC Insured | 8/14 at 100.00 | AAA | 1,734,936 | |||||||
| 1,250 | Cucamonga Valley Water District, California, Certificates of Participation, Series 2006, 5.000%, 9/01/36 – MBIA Insured | 9/16 at 100.00 | AAA | 1,266,725 | |||||||
22
| Principal Amount (000) | Description | Optional Call Provisions (1) | Ratings (2) | Value | |||||||
| Water and Sewer (continued) | |||||||||||
| $ | 5,000 | Fortuna Public Financing Authority, California, Wastewater Revenue Bonds, Series 2006, 5.000%, 10/01/36 – FSA Insured | 10/16 at 100.00 | AAA | $ | 5,133,850 | |||||
| 455 | Healdsburg Public Financing Authority, California, Wastewater Revenue Bonds, Series 2006, 5.000%, 4/01/36 – MBIA Insured | 4/16 at 100.00 | AAA | 464,692 | |||||||
| 4,250 | Los Angeles Department of Water and Power, California, Waterworks Revenue Refunding Bonds, Series 2001A, 5.125%, 7/01/41 | 7/11 at 100.00 | AA | 4,287,953 | |||||||
| 435 | Marina Coast Water District, California, Enterprise Certificate of Participation, Series 2006, 5.000%, 6/01/31 – MBIA Insured | 6/16 at 100.00 | AAA | 441,903 | |||||||
| 1,500 | Metropolitan Water District of Southern California, Water Revenue Bonds, Series 2004B-3, 5.000%, 10/01/29 – MBIA Insured | 10/14 at 100.00 | AAA | 1,541,790 | |||||||
| 1,190 | Pasadena, California, Water Revenue Refunding Bonds, Series 2003, 5.000%, 6/01/20 – FGIC Insured | 6/13 at 100.00 | AAA | 1,236,993 | |||||||
| 1,770 | Pomona Public Finance Authority, California, Revenue Bonds, Water Facilities Project, Series 2007AY, 5.000%, 5/01/27 – AMBAC Insured | 5/17 at 100.00 | AAA | 1,830,923 | |||||||
| 625 | Sacramento County Sanitation District Financing Authority, California, Revenue Bonds, Series 2006, 5.000%, 12/01/31 – FGIC Insured | 6/16 at 100.00 | AAA | 645,300 | |||||||
| 20,155 | Total Water and Sewer | 20,668,905 | |||||||||
| $ | 316,255 | Total Long-Term Investments (cost $318,215,097) – 100.3% | 318,093,698 | ||||||||
| Short-Term Investments – 1.3% | |||||||||||
| 3,000 | California Infrastructure and Economic Development Bank, Insured Revenue Bonds, Rand Corporation, Variable Rate Demand Obligations, Series 2002B, 3.910%, 4/01/42 – AMBAC Insured (4) | A-1+ | 3,000,000 | ||||||||
| 1,000 | California, Variable Rate Demand Obligations, Series 2004C-16, 3.860%, 7/01/23 – FSA Insured (4) | A-1+ | 1,000,000 | ||||||||
| $ | 4,000 | Total Short-Term Investments (cost $4,000,000) | 4,000,000 | ||||||||
Total Investments (cost $322,215,097) – 101.6% | 322,093,698 | ||||||||||
Floating Rate Obligations – (3.5)% | (10,905,000 | ) | |||||||||
Other Assets Less Liabilities – 1.9% | 5,951,707 | ||||||||||
Net Assets – 100% | $ | 317,140,405 | |||||||||
Forward Swaps outstanding at August 31, 2007:
| Counterparty | Notional Amount | Fund Pay/Receive Floating Rate | Floating Rate Index | Fixed Rate (Annualized) | Fixed Rate Payment Frequency | Effective Date (5) | Termination Date | Unrealized Appreciation (Depreciation) | ||||||||||||
| Goldman Sachs | $ | 10,000,000 | Receive | 3-Month USD-LIBOR | 5.449 | % | Semi-Annually | 4/23/08 | 4/23/18 | $ | (170,586 | ) | ||||||||
| Goldman Sachs | 5,000,000 | Receive | 3-Month USD-LIBOR | 5.614 | Semi-Annually | 4/23/08 | 4/23/38 | (116,156 | ) | |||||||||||
| $ | (286,742 | ) | ||||||||||||||||||
USD-LIBOR (United States Dollar-London Inter-Bank Offered Rate)
| The Fund may invest in “zero coupon” securities. A zero coupon security does not pay a regular interest coupon to its holders during the life of the security. Tax-exempt income to the holder of the security comes from accretion of the difference between the original purchase price of the security at issuance and the par value of the security at maturity and is effectively paid at maturity. Such securities are included in the Portfolio of Investments with a 0.000% coupon rate in their description. The market prices of zero coupon securities generally are more volatile than the market prices of securities that pay interest periodically. |
| (1) | Optional Call Provisions: Dates (month and year) and prices of the earliest optional call or redemption. There may be other call provisions at varying prices at later dates. Certain mortgage-backed securities may be subject to periodic principal paydowns. |
| (2) | Ratings: Using the higher of Standard & Poor’s or Moody’s rating. Ratings below BBB by Standard & Poor’s Group or Baa by Moody’s Investor Service, Inc. are considered to be below investment grade. |
| (3) | Backed by an escrow or trust containing sufficient U.S. Government or U.S. Government agency securities which ensure the timely payment of principal and interest. Such investments are normally considered to be equivalent to AAA rated securities. |
| (4) | Investment has a maturity of more than one year, but has variable rate and demand features which qualify it as a short-term investment. The rate disclosed is that in effect at the end of the reporting period. This rate changes periodically based on market conditions or a specified market index. |
| (5) | Effective date represents the date on which both the Fund and counterparty commence interest payment accruals on each forward swap contract. |
| N/R | Not rated. |
| WI/DD | Purchased on a when-issued or delayed delivery basis. |
| (ETM) | Escrowed to maturity. |
| (IF) | Inverse floating rate investment. |
| (UB) | Underlying bond of an inverse floating rate trust reflected as a financing transaction pursuant to the provisions of SFAS No. 140. |
See accompanying notes to financial statements.
23
Portfolio of Investments (Unaudited)
Nuveen California Insured Municipal Bond Fund
August 31, 2007
| Principal Amount (000) | Description | Optional Call Provisions (1) | Ratings (2) | Value | ||||||
| Education and Civic Organizations – 5.3% | ||||||||||
| $ | 2,125 | California Educational Facilities Authority, Student Loan Revenue Bonds, Cal Loan Program, Series 2001A, 5.400%, 3/01/21 – MBIA Insured (Alternative Minimum Tax) | 3/08 at 102.00 | Aaa | $ | 2,170,156 | ||||
| 2,500 | California State Public Works Board, Lease Revenue Bonds, University of California, Institute Projects, Series 2005C, 5.000%, 4/01/30 – AMBAC Insured | 4/15 at 100.00 | AAA | 2,567,350 | ||||||
| 2,250 | California State University, Systemwide Revenue Bonds, Series 2005A, 5.000%, 11/01/25 – AMBAC Insured | 5/15 at 100.00 | AAA | 2,319,930 | ||||||
| 5,000 | Long Beach Bond Financing Authority, California, Lease Revenue Refunding Bonds, Long Beach Aquarium of the South Pacific, Series 2001, 5.250%, 11/01/30 – AMBAC Insured | 11/11 at 101.00 | AAA | 5,153,400 | ||||||
| 11,875 | Total Education and Civic Organizations | 12,210,836 | ||||||||
| Health Care – 6.2% | ||||||||||
| 2,000 | Antelope Valley Healthcare District, California, Insured Revenue Refunding Bonds, Series 1997A, 5.200%, 1/01/27 – FSA Insured | 1/08 at 102.00 | AAA | 2,046,540 | ||||||
| 2,000 | California Health Facilities Financing Authority, Revenue Bonds, Sutter Health, Series 2007A, 5.000%, 11/15/42 – MBIA Insured | 11/16 at 100.00 | AAA | 2,010,840 | ||||||
| 4,000 | California Statewide Community Development Authority, Certificates of Participation, Sutter Health Obligated Group, Series 1999, 5.500%, 8/15/31 – FSA Insured | 8/09 at 101.00 | AAA | 4,141,080 | ||||||
| 6,670 | California Statewide Community Development Authority, Revenue Bonds, Kaiser Permanente System, Series 2007A, 4.750%, 4/01/33 | 4/17 at 100.00 | A+ | 6,172,285 | ||||||
| 14,670 | Total Health Care | 14,370,745 | ||||||||
| Housing/Multifamily – 4.0% | ||||||||||
| 4,180 | California Statewide Community Development Authority, Multifamily Housing Revenue Senior Bonds, Westgate Courtyards Apartments, Series 2001X-1, 5.420%, 12/01/34 – AMBAC Insured (Alternative Minimum Tax) | 12/11 at 100.00 | AAA | 4,212,897 | ||||||
| 3,865 | Los Angeles, California, GNMA Mortgage-Backed Securities Program Multifamily Housing Revenue Bonds, Park Plaza West Senior Apartments, Series 2001B, 5.400%, 1/20/31 (Alternative Minimum Tax) | 7/11 at 102.00 | AAA | 3,904,500 | ||||||
| 1,285 | Santa Cruz County Housing Authority, California, GNMA Collateralized Multifamily Housing Revenue Bonds, Northgate Apartments, Series 1999A, 5.500%, 7/20/40 (Alternative Minimum Tax) | 7/09 at 102.00 | AAA | 1,295,858 | ||||||
| 9,330 | Total Housing/Multifamily | 9,413,255 | ||||||||
| Housing/Single Family – 5.9% | ||||||||||
| California Department of Veterans Affairs, Home Purchase Revenue Bonds, Series 2002A: | ||||||||||
| 3,500 | 5.300%, 12/01/21 – AMBAC Insured | 6/12 at 101.00 | AAA | 3,655,890 | ||||||
| 5,000 | 5.350%, 12/01/27 – AMBAC Insured | 6/12 at 101.00 | AAA | 5,186,450 | ||||||
| 380 | California Housing Finance Agency, Home Mortgage Revenue Bonds, Series 2006H, 5.750%, 8/01/30 – FGIC Insured (Alternative Minimum Tax) | 2/16 at 100.00 | AAA | 397,507 | ||||||
| 1,905 | California Rural Home Mortgage Finance Authority, FNMA Mortgage-Backed Securities Program Single Family Mortgage Revenue Bonds, Series 2002D, 5.250%, 6/01/34 (Alternative Minimum Tax) | 6/12 at 101.00 | Aaa | 1,925,612 | ||||||
| 2,500 | California Rural Home Mortgage Finance Authority, Single Family Mortgage Revenue Bonds, Mortgage Backed Securities Program, Series 2007C, 5.400%, 8/01/35 (Alternative Minimum Tax) | 2/17 at 104.00 | Aaa | 2,622,250 | ||||||
| 13,285 | Total Housing/Single Family | 13,787,709 | ||||||||
| Tax Obligation/General – 25.6% | ||||||||||
| Bonita Unified School District, San Diego County, California, General Obligation Bonds, Series 2004A: | ||||||||||
| 1,425 | 5.250%, 8/01/20 – MBIA Insured | 8/14 at 100.00 | AAA | 1,530,593 | ||||||
| 1,570 | 5.250%, 8/01/21 – MBIA Insured | 8/14 at 100.00 | AAA | 1,678,110 | ||||||
| 6,900 | Central Unified School District, Fresno County, California, General Obligation Bonds, Series 2006B, 5.000%, 8/01/31 – FSA Insured | 8/16 at 100.00 | AAA | 7,117,557 | ||||||
| 2,040 | Chaffey Joint Union High School District, San Bernardino County, California, General Obligation Bonds, Series 2005, 5.000%, 8/01/23 – FGIC Insured | 8/15 at 100.00 | AAA | 2,117,540 | ||||||
| 1,365 | El Segundo Unified School District, Los Angeles County, California, General Obligation Bonds, Series 2004, 5.250%, 9/01/20 – FGIC Insured | 9/14 at 100.00 | AAA | 1,466,638 | ||||||
24
| Principal Amount (000) | Description | Optional Call Provisions (1) | Ratings (2) | Value | ||||||
| Tax Obligation/General (continued) | ||||||||||
| $ | 1,610 | Eureka Unified School District, Humboldt County, California, General Obligation Bonds, Series 2002, 5.250%, 8/01/23 – FSA Insured | 8/12 at 101.00 | AAA | $ | 1,693,479 | ||||
| 1,000 | Fremont Unified School District, Alameda County, California, General Obligation Bonds, Series 2002A, 5.000%, 8/01/21 – FGIC Insured | 8/12 at 101.00 | AAA | 1,036,880 | ||||||
| Glendora Unified School District, Los Angeles County, California, General Obligation Bonds, Series 2006A: | ||||||||||
| 1,900 | 5.250%, 8/01/24 – MBIA Insured | 8/16 at 100.00 | AAA | 2,015,824 | ||||||
| 1,000 | 5.250%, 8/01/25 – MBIA Insured | 8/16 at 100.00 | AAA | 1,057,940 | ||||||
| Golden West Schools Financing Authority, California, General Obligation Revenue Refunding Bonds, School District Program, Series 1998A: | ||||||||||
| 2,650 | 0.000%, 8/01/19 – MBIA Insured | 8/13 at 68.56 | AAA | 1,375,430 | ||||||
| 2,755 | 0.000%, 8/01/20 – MBIA Insured | 8/13 at 63.85 | AAA | 1,325,486 | ||||||
| 11,225 | Greenfield Redevelopment Agency, California, Tax Allocation Bonds, Series 2006, | 2/16 at 100.00 | AAA | 10,904,077 | ||||||
| 5,000 | Grossmont Healthcare District, California, General Obligation Bonds, Series 2007A, 5.000%, 7/15/37 – AMBAC Insured | 7/17 at 100.00 | Aaa | 5,087,450 | ||||||
| 2,500 | Huntington Beach Union High School District, Orange County, California, General Obligation Bonds, Series 2004, 5.000%, 8/01/22 – FSA Insured | 8/14 at 100.00 | AAA | 2,588,075 | ||||||
| Imperial Community College District, Imperial County, California, General Obligation Bonds, Series 2005: | ||||||||||
| 1,330 | 5.000%, 8/01/23 – FGIC Insured | 8/14 at 100.00 | AAA | 1,380,553 | ||||||
| 1,510 | 5.000%, 8/01/24 – FGIC Insured | 8/14 at 100.00 | AAA | 1,565,357 | ||||||
| 1,460 | Jurupa Unified School District, Riverside County, California, General Obligation Bonds, Series 2004, 5.000%, 8/01/24 – FGIC Insured | 8/13 at 100.00 | AAA | 1,497,493 | ||||||
| 1,255 | Los Angeles Community College District, Los Angeles County, California, General Obligation Bonds, Series 2005A, 5.000%, 8/01/24 – FSA Insured | 8/15 at 100.00 | AAA | 1,301,008 | ||||||
| 2,405 | Oak Valley Hospital District, Stanislaus County, California, General Obligation Bonds, Series 2005, 5.000%, 7/01/31 – FGIC Insured | 7/14 at 101.00 | Aaa | 2,442,999 | ||||||
| 270 | Roseville Joint Union High School District, Placer County, California, General Obligation Bonds, Series 2006B, 5.000%, 8/01/27 – FGIC Insured | 8/15 at 100.00 | AAA | 278,443 | ||||||
| 1,590 | Sacramento City Unified School District, Sacramento County, California, General Obligation Bonds, Series 2005, 5.000%, 7/01/27 – MBIA Insured | 7/15 at 100.00 | Aaa | 1,639,258 | ||||||
| 4,070 | San Benito Health Care District, California, General Obligation Bonds, Series 2005, 5.000%, 7/01/31 – XLCA Insured | 7/14 at 101.00 | AAA | 4,129,015 | ||||||
| 1,000 | San Ramon Valley Unified School District, Contra Costa County, California, General Obligation Bonds, | 8/14 at 100.00 | AAA | 1,030,000 | ||||||
| 3,040 | Sulphur Springs Union School District, Los Angeles County, California, General Obligation Bonds, Series 1991A, 0.000%, 9/01/15 – MBIA Insured | No Opt. Call | AAA | 2,192,022 | ||||||
| 1,000 | Washington Unified School District, Yolo County, California, General Obligation Bonds, Series 2004A, 5.000%, 8/01/22 – FGIC Insured | 8/13 at 100.00 | AAA | 1,029,870 | ||||||
| 61,870 | Total Tax Obligation/General | 59,481,097 | ||||||||
| Tax Obligation/Limited – 21.0% | ||||||||||
| 1,915 | Alameda County Redevelopment Agency, California, Eden Area Redevelopment Project, Tax Allocation Bonds, Series 2006A, 5.000%, 8/01/36 – MBIA Insured | 8/16 at 100.00 | AAA | 1,947,306 | ||||||
| 315 | Barstow Redevelopment Agency, California, Tax Allocation Bonds, Central Redevelopment Project, Series 1994A, 7.000%, 9/01/14 – MBIA Insured | No Opt. Call | AAA | 347,798 | ||||||
| 1,655 | Bell Community Housing Authority, California, Lease Revenue Bonds, Series 2005, 5.000%, 10/01/36 – AMBAC Insured | 10/15 at 100.00 | AAA | 1,675,241 | ||||||
| 2,250 | Brea and Olinda Unified School District, Orange County, California, Certificates of Participation Refunding, Series 2002A, 5.125%, 8/01/26 – FSA Insured | 8/11 at 101.00 | AAA | 2,297,385 | ||||||
25
Portfolio of Investments (Unaudited)
Nuveen California Insured Municipal Bond Fund (continued)
August 31, 2007
| Principal Amount (000) | Description | Optional Call Provisions (1) | Ratings (2) | Value | ||||||
| Tax Obligation/Limited (continued) | ||||||||||
| $ | 1,960 | California Infrastructure Economic Development Bank, Revenue Bonds, North County Center for Self-Sufficiency Corporation, Series 2004, 5.000%, 12/01/25 – AMBAC Insured | 12/13 at 100.00 | AAA | $ | 2,009,529 | ||||
| 335 | Capistrano Unified School District, Orange County, California, Special Tax Bonds, Community Facilities District, Series 2005, 5.000%, 9/01/24 – FGIC Insured | 9/15 at 100.00 | AAA | 345,583 | ||||||
| 960 | Chino Redevelopment Agency, California, Merged Chino Redevelopment Project Area Tax Allocation Bonds, Series 2006, 5.000%, 9/01/38 – AMBAC Insured | 9/16 at 101.00 | AAA | 987,014 | ||||||
| 1,400 | Chula Vista Public Financing Authority, California, Pooled Community Facility District Assessment Revenue Bonds, Series 2005A, 5.000%, 9/01/29 – MBIA Insured | 9/15 at 100.00 | AAA | 1,423,534 | ||||||
| 2,285 | Folsom Cordova Unified School District, Sacramento County, California, General Obligation Bonds, School Facilities Improvement District 1, Series 2004B, 5.000%, 10/01/21 – MBIA Insured | 10/14 at 100.00 | AAA | 2,373,772 | ||||||
| 1,185 | Folsom Cordova Unified School District, Sacramento County, California, General Obligation Bonds, School Facilities Improvement District 2, Series 2004B, 5.000%, 10/01/27 – FSA Insured | 10/14 at 100.00 | AAA | 1,214,767 | ||||||
| 2,500 | Golden State Tobacco Securitization Corporation, California, Tobacco Settlement Asset-Backed Revenue Bonds, Series 2005A, 5.000%, 6/01/45 – AMBAC Insured | 6/15 at 100.00 | AAA | 2,519,775 | ||||||
| 1,840 | Hawthorne Community Redevelopment Agency, California, Project Area 2 Tax Allocation Bonds, Series 2006, 5.000%, 9/01/26 – XLCA Insured | 9/16 at 100.00 | AAA | 1,879,450 | ||||||
| 4,555 | Long Beach Bond Finance Authority, California, Multiple Project Tax Allocation Bonds, Housing and Gas Utility Financing Project Areas, Series 2005A-1, 5.000%, 8/01/35 – AMBAC Insured | 8/15 at 100.00 | AAA | 4,603,784 | ||||||
| 1,830 | Los Angeles Community Redevelopment Agency, California, Lease Revenue Bonds, Manchester Social Services Project, Series 2005, 5.000%, 9/01/37 – AMBAC Insured | 9/15 at 100.00 | Aaa | 1,841,383 | ||||||
| 1,000 | Los Angeles Community Redevelopment Agency, California, Tax Allocation Bonds, Bunker Hill Project, Series 2004A, 5.000%, 12/01/20 – FSA Insured | 12/14 at 100.00 | AAA | 1,038,410 | ||||||
| 1,460 | Moreno Valley Unified School District, Riverside County, California, Certificates of Participation, Series 2005, 5.000%, 3/01/23 – FSA Insured | 3/14 at 100.00 | AAA | 1,491,259 | ||||||
| 14,050 | Paramount Redevelopment Agency, California, Tax Allocation Refunding Bonds, Redevelopment Project Area 1, Series 1998, 0.000%, 8/01/26 – MBIA Insured | No Opt. Call | AAA | 5,550,874 | ||||||
| 1,150 | Poway Redevelopment Agency, California, Tax Allocation Bonds, Paugay Redevelopment Project, Series 2007, 5.000%, 6/15/30 – MBIA Insured | 6/17 at 100.00 | AAA | 1,176,289 | ||||||
| 290 | Rialto Redevelopment Agency, California, Tax Allocation Bonds, Merged Project Area, Series 2005A, 5.000%, 9/01/35 – XLCA Insured | 9/15 at 100.00 | AAA | 293,721 | ||||||
| 8,000 | Riverside County, California, Asset Leasing Corporate Leasehold Revenue Bonds, Riverside County Hospital Project, Series 1997B, 5.000%, 6/01/19 – MBIA Insured | 6/12 at 101.00 | AAA | 8,285,996 | ||||||
| 360 | Roseville, California, Certificates of Participation, Public Facilities, Series 2003A, 5.000%, 8/01/25 – AMBAC Insured | 8/13 at 100.00 | AAA | 365,972 | ||||||
| 3,560 | Roseville, California, Special Tax Bonds, Community Facilities District 1 – Woodcreek West, Series 2005, 5.000%, 9/01/30 – AMBAC Insured | 9/15 at 100.00 | AAA | 3,617,494 | ||||||
| 1,490 | Tulare Public Financing Authority, California, Lease Revenue Bonds, Capital Facilities Project, Series 1997, 5.125%, 10/01/22 – MBIA Insured | 10/07 at 102.00 | AAA | 1,521,230 | ||||||
| 56,345 | Total Tax Obligation/Limited | 48,807,566 | ||||||||
| Transportation – 10.3% | ||||||||||
| 6,500 | Foothill/Eastern Transportation Corridor Agency, California, Toll Road Revenue Bonds, Series 1995A, 5.000%, 1/01/35 – MBIA Insured | 1/10 at 100.00 | AAA | 6,530,810 | ||||||
| 3,255 | Foothill/Eastern Transportation Corridor Agency, California, Toll Road Revenue Refunding Bonds, | 1/10 at 101.00 | AAA | 3,408,376 | ||||||
| 2,000 | Port of Oakland, California, Revenue Bonds, Series 2000K, 5.750%, 11/01/29 – FGIC Insured (Alternative Minimum Tax) | 5/10 at 100.00 | AAA | 2,078,080 | ||||||
| 625 | San Francisco Airports Commission, California, Revenue Bonds, San Francisco International Airport, Second Series 2000, Issue 26B, 5.000%, 5/01/21 – FGIC Insured | 5/10 at 101.00 | AAA | 639,550 | ||||||
| 3,470 | San Francisco Airports Commission, California, Revenue Bonds, San Francisco International Airport, Second Series Issue 16A, 5.375%, 5/01/16 – FSA Insured (Alternative Minimum Tax) | 5/08 at 101.00 | AAA | 3,529,476 | ||||||
26
| Principal Amount (000) | Description | Optional Call Provisions (1) | Ratings (2) | Value | ||||||
| Transportation (continued) | ||||||||||
| $ | 5,000 | San Francisco Airports Commission, California, Revenue Refunding Bonds, San Francisco International Airport, Second Series 2001, Issue 27A, 5.250%, 5/01/31 – MBIA Insured (Alternative Minimum Tax) | 5/11 at 100.00 | AAA | $ | 5,041,050 | ||||
| 1,290 | San Francisco Airports Commission, California, Special Facilities Lease Revenue Bonds, San Francisco International Airport, SFO Fuel Company LLC, Series 1997A, 5.250%, 1/01/22 – AMBAC Insured (Alternative Minimum Tax) | 1/08 at 101.00 | AAA | 1,306,525 | ||||||
| 1,320 | San Francisco Airports Commission, California, Special Facilities Lease Revenue Bonds, San Francisco International Airport, SFO Fuel Company LLC, Series 2000A, 6.100%, 1/01/20 – FSA Insured (Alternative Minimum Tax) | 1/08 at 102.00 | AAA | 1,354,703 | ||||||
| 23,460 | Total Transportation | 23,888,570 | ||||||||
| U.S. Guaranteed – 11.2% (3) | ||||||||||
| 620 | Barstow Redevelopment Agency, California, Tax Allocation Bonds, Central Redevelopment Project, Series 1994A, 7.000%, 9/01/14 – MBIA Insured (ETM) | No Opt. Call | AAA | 691,784 | ||||||
| 3,200 | California, Various Purpose General Obligation Bonds, Series 2000, 5.750%, 3/01/27 (Pre-refunded 3/01/10) – MBIA Insured | 3/10 at 101.00 | AAA | 3,394,080 | ||||||
| 3,305 | Centinela Valley Union High School District, Los Angeles County, California, General Obligation Bonds, Series 2002C, 5.200%, 8/01/32 – FGIC Insured (ETM) | 8/10 at 102.00 | AAA | 3,428,310 | ||||||
| 3,195 | Desert Community College District, Riverside County, California, General Obligation Bonds, Series 2004A, 5.000%, 8/01/23 (Pre-refunded 8/01/14) – MBIA Insured | 8/14 at 100.00 | AAA | 3,432,804 | ||||||
| 5,000 | Los Angeles Unified School District, California, General Obligation Bonds, Series 2002E, 5.125%, 1/01/27 (Pre-refunded 7/01/12) – MBIA Insured | 7/12 at 100.00 | AAA | 5,340,950 | ||||||
| 1,280 | Los Angeles Unified School District, California, General Obligation Bonds, Series 2003A, 5.000%, 7/01/24 (Pre-refunded 7/01/13) – FSA Insured | 7/13 at 100.00 | AAA | 1,366,182 | ||||||
| 5,000 | Oakland, California, Insured Revenue Bonds, 1800 Harrison Foundation – Kaiser Permanente, Series 1999A, 6.000%, 1/01/29 (Pre-refunded 1/01/10) – AMBAC Insured | 1/10 at 100.00 | AAA | 5,271,150 | ||||||
| 1,000 | Sacramento City Unified School District, Sacramento County, California, General Obligation Bonds, Series 2000A, 6.000%, 7/01/29 (Pre-refunded 7/01/09) – FGIC Insured | 7/09 at 102.00 | Aaa | 1,061,900 | ||||||
| 1,930 | San Bernardino County Transportation Authority, California, Limited Sales Tax Revenue Bonds, Series 1992A, 6.000%, 3/01/10 – FGIC Insured (ETM) | No Opt. Call | AAA | 1,984,503 | ||||||
| 24,530 | Total U.S. Guaranteed | 25,971,663 | ||||||||
| Utilities – 6.6% | ||||||||||
| 5,000 | California Pollution Control Financing Authority, Remarketed Revenue Bonds, Pacific Gas and Electric Company, Series 1996A, 5.350%, 12/01/16 – MBIA Insured (Alternative Minimum Tax) | 4/11 at 102.00 | AAA | 5,254,150 | ||||||
| 1,000 | California Pollution Control Financing Authority, Revenue Refunding Bonds, Southern California Edison Company, Series 1999B, 5.450%, 9/01/29 – MBIA Insured | 9/09 at 101.00 | AAA | 1,034,030 | ||||||
| 595 | Merced Irrigation District, California, Electric System Revenue Bonds, Series 2005, 5.125%, 9/01/31 – XLCA Insured | 9/15 at 100.00 | AAA | 609,506 | ||||||
| 3,500 | Northern California Power Agency, Revenue Refunding Bonds, Hydroelectric Project 1, Series 1998A, 5.125%, 7/01/23 – MBIA Insured | 7/08 at 101.00 | AAA | 3,564,470 | ||||||
| 1,950 | Salinas Valley Solid Waste Authority, California, Revenue Bonds, Series 2002, 5.250%, 8/01/27 – AMBAC Insured (Alternative Minimum Tax) | 8/12 at 100.00 | AAA | 1,983,677 | ||||||
| 2,700 | Santa Clara, California, Subordinate Electric Revenue Bonds, Series 2003A, 5.000%, 7/01/23 – MBIA Insured | 7/13 at 100.00 | AAA | 2,771,199 | ||||||
| 14,745 | Total Utilities | 15,217,032 | ||||||||
| Water and Sewer – 7.4% | ||||||||||
| 3,070 | California Special District Finance Program, Certificates of Participation, Water and Wastewater Revenue Bonds, Jurupa Community Services District, Series 2001NN, 5.250%, 9/01/32 – MBIA Insured | 9/10 at 100.00 | AAA | 3,140,764 | ||||||
| 1,000 | Fortuna Public Financing Authority, California, Wastewater Revenue Bonds, Series 2006, 5.000%, 10/01/36 – FSA Insured | 10/16 at 100.00 | AAA | 1,026,770 | ||||||
27
Portfolio of Investments (Unaudited)
Nuveen California Insured Municipal Bond Fund (continued)
August 31, 2007
| Principal Amount (000) | Description | Optional Call Provisions (1) | Ratings (2) | Value | |||||||
| Water and Sewer (continued) | |||||||||||
| $ | 400 | Healdsburg Public Financing Authority, California, Wastewater Revenue Bonds, Series 2006, 5.000%, 4/01/36 – MBIA Insured | 4/16 at 100.00 | AAA | $ | 408,520 | |||||
| 2,850 | Metropolitan Water District of Southern California, Water Revenue Bonds, Series 1997A, | 1/08 at 101.00 | AAA | 2,873,826 | |||||||
| 6,000 | Orange County Sanitation District, California, Certificates of Participation, Series 2003, | 8/13 at 100.00 | AAA | 6,065,520 | |||||||
| 1,000 | Orange County Water District, California, Revenue Certificates of Participation, Series 2005B, 5.000%, 8/15/24 – MBIA Insured | 2/15 at 100.00 | AAA | 1,022,770 | |||||||
| 2,500 | Westlands Water District, California, Revenue Certificates of Participation, Series 2005A, | 3/15 at 100.00 | AAA | 2,566,825 | |||||||
| 16,820 | Total Water and Sewer | 17,104,995 | |||||||||
| $ | 246,930 | Total Investments (cost $234,794,406) – 103.5% | 240,253,468 | ||||||||
Floating Rate Obligations – (3.2)% | (7,475,000 | ) | |||||||||
Other Assets Less Liabilities – (0.3)% | (563,038 | ) | |||||||||
Net Assets – 100% | $ | 232,215,430 | |||||||||
| The Fund primarily invests in bonds that are either covered by Original Issue Insurance, Secondary Market Insurance or Portfolio Insurance, or are backed by an escrow or trust containing sufficient U.S. Government or U.S. Government agency securities, any of which ensure the timely payment of principal and interest. |
| The Fund may invest in “zero coupon” securities. A zero coupon security does not pay a regular interest coupon to its holders during the life of the security. Tax-exempt income to the holder of the security comes from accretion of the difference between the original purchase price of the security at issuance and the par value of the security at maturity and is effectively paid at maturity. Such securities are included in the Portfolio of Investments with a 0.000% coupon rate in their description. The market prices of zero coupon securities generally are more volatile than the market prices of securities that pay interest periodically. |
| (1) | Optional Call Provisions: Dates (month and year) and prices of the earliest optional call or redemption. There may be other call provisions at varying prices at later dates. Certain mortgage-backed securities may be subject to periodic principal paydowns. |
| (2) | Ratings: Using the higher of Standard & Poor’s or Moody’s rating. Ratings below BBB by Standard & Poor’s Group or Baa by Moody’s Investor Service, Inc. are considered to be below investment grade. |
| (3) | Backed by an escrow or trust containing sufficient U.S. Government or U.S. Government agency securities which ensure the timely payment of principal and interest. |
| (ETM) | Escrowed to maturity. |
| (UB) | Underlying bond of an inverse floating rate trust reflected as a financing transaction pursuant to the provisions of SFAS No. 140. |
See accompanying notes to financial statements.
28
Statement of Assets and Liabilities (Unaudited)
August 31, 2007
| California High Yield | California | California Insured | ||||||||||
Assets | ||||||||||||
Investments, at value (cost $44,597,519, $322,215,097 and $234,794,406, respectively) | $ | 42,161,509 | $ | 322,093,698 | $ | 240,253,468 | ||||||
Cash | — | 1,528,127 | — | |||||||||
Receivables: | ||||||||||||
Interest | 605,167 | 4,091,401 | 2,625,959 | |||||||||
Investments sold | 117,850 | 3,881,792 | 105,000 | |||||||||
Shares sold | 3,745,218 | 1,828,771 | 36,754 | |||||||||
Variation margin on futures contracts | 25,500 | — | — | |||||||||
Other assets | — | 13,824 | 18,349 | |||||||||
Total assets | 46,655,244 | 333,437,613 | 243,039,530 | |||||||||
Liabilities | ||||||||||||
Cash overdraft | 2,160,978 | — | 2,166,729 | |||||||||
Unrealized depreciation on forward swaps | — | 286,742 | — | |||||||||
Floating rate obligations | 4,980,000 | 10,905,000 | 7,475,000 | |||||||||
Payables: | ||||||||||||
Investments purchased | — | 2,989,780 | — | |||||||||
Shares redeemed | 113,374 | 750,323 | 176,998 | |||||||||
Accrued expenses: | ||||||||||||
Management fees | 9,088 | 138,931 | 104,317 | |||||||||
12b-1 distribution and service fees | 9,004 | 40,170 | 31,608 | |||||||||
Other | 4,577 | 72,139 | 72,892 | |||||||||
Dividends payable | 147,490 | 1,114,123 | 796,556 | |||||||||
Total liabilities | 7,424,511 | 16,297,208 | 10,824,100 | |||||||||
Net assets | $ | 39,230,733 | $ | 317,140,405 | $ | 232,215,430 | ||||||
Class A Shares | ||||||||||||
Net assets | $ | 31,892,501 | $ | 112,298,366 | $ | 88,480,836 | ||||||
Shares outstanding | 3,365,930 | 11,184,850 | 8,448,119 | |||||||||
Net asset value per share | $ | 9.48 | $ | 10.04 | $ | 10.47 | ||||||
Offering price per share (net asset value per share plus | $ | 9.90 | $ | 10.48 | $ | 10.93 | ||||||
Class B Shares | ||||||||||||
Net assets | $ | 162,056 | $ | 8,162,398 | $ | 9,891,817 | ||||||
Shares outstanding | 17,118 | 813,422 | 942,266 | |||||||||
Net asset value and offering price per share | $ | 9.47 | $ | 10.03 | $ | 10.50 | ||||||
Class C Shares | ||||||||||||
Net assets | $ | 6,111,435 | $ | 24,554,630 | $ | 13,396,673 | ||||||
Shares outstanding | 645,380 | 2,451,703 | 1,284,965 | |||||||||
Net asset value and offering price per share | $ | 9.47 | $ | 10.02 | $ | 10.43 | ||||||
Class R Shares | ||||||||||||
Net assets | $ | 1,064,741 | $ | 172,125,011 | $ | 120,446,104 | ||||||
Shares outstanding | 112,378 | 17,158,674 | 11,486,669 | |||||||||
Net asset value and offering price per share | $ | 9.47 | $ | 10.03 | $ | 10.49 | ||||||
Net Assets Consist of: | ||||||||||||
Capital paid-in | $ | 42,258,828 | $ | 322,553,110 | $ | 225,413,554 | ||||||
Undistributed (Over-distribution of) net investment income | (7,512 | ) | (414,106 | ) | (187,094 | ) | ||||||
Accumulated net realized gain (loss) from investments and derivative transactions | (497,255 | ) | (4,590,458 | ) | 1,529,908 | |||||||
Net unrealized appreciation (depreciation) of investments and derivative transactions | (2,523,328 | ) | (408,141 | ) | 5,459,062 | |||||||
Net assets | $ | 39,230,733 | $ | 317,140,405 | $ | 232,215,430 | ||||||
See accompanying notes to financial statements.
29
Statement of Operations (Unaudited)
Six Months Ended August 31, 2007
| California High Yield | California | California Insured | ||||||||||
Investment Income | $ | 948,410 | $ | 7,792,073 | $ | 5,974,774 | ||||||
Expenses | ||||||||||||
Management fees | 93,797 | 789,042 | 634,247 | |||||||||
12b-1 service fees – Class A | 26,522 | 98,166 | 89,742 | |||||||||
12b-1 distribution and service fees – Class B | 455 | 44,351 | 54,367 | |||||||||
12b-1 distribution and service fees – Class C | 17,284 | 86,163 | 50,821 | |||||||||
Shareholders’ servicing agent fees and expenses | 1,362 | 62,776 | 49,872 | |||||||||
Interest expense on floating rate obligations | 98,648 | 352,738 | 160,782 | |||||||||
Custodian’s fees and expenses | 13,954 | 48,792 | 31,318 | |||||||||
Trustees’ fees and expenses | 266 | 4,896 | 2,779 | |||||||||
Professional fees | 11,511 | 10,642 | 8,372 | |||||||||
Shareholders’ reports – printing and mailing expenses | 1,169 | 18,821 | 16,400 | |||||||||
Federal and state registration fees | 4,749 | 2,687 | 2,812 | |||||||||
Other expenses | 111 | 4,442 | 4,723 | |||||||||
Total expenses before custodian fee credit and expense reimbursement | 269,828 | 1,523,516 | 1,106,235 | |||||||||
Custodian fee credit | (7,169 | ) | (27,473 | ) | (11,181 | ) | ||||||
Expense reimbursement | (9,661 | ) | — | — | ||||||||
Net expenses | 252,998 | 1,496,043 | 1,095,054 | |||||||||
Net investment income | 695,412 | 6,296,030 | 4,879,720 | |||||||||
Realized and Unrealized Gain (Loss) | ||||||||||||
Net realized gain (loss) from: | ||||||||||||
Investments | (378,043 | ) | 1,264,887 | 1,228,988 | ||||||||
Futures | (118,896 | ) | — | — | ||||||||
Net change in unrealized appreciation (depreciation) of: | ||||||||||||
Investments | (2,836,903 | ) | (14,329,037 | ) | (9,510,423 | ) | ||||||
Futures | (88,544 | ) | — | — | ||||||||
Forward swaps | — | (286,742 | ) | — | ||||||||
Net realized and unrealized gain (loss) | (3,422,386 | ) | (13,350,892 | ) | (8,281,435 | ) | ||||||
Net increase (decrease) in net assets from operations | $ | (2,726,974 | ) | $ | (7,054,862 | ) | $ | (3,401,715 | ) | |||
See accompanying notes to financial statements.
30
Statement of Changes in Net Assets (Unaudited)
| California High Yield | California | California Insured | ||||||||||||||||||||||
| Six Months Ended 8/31/07 | For the period 3/28/06 (commencement of operations) through 2/28/07 | Six Months Ended | Year Ended 2/28/07 | Six Months Ended | Year Ended 2/28/07 | |||||||||||||||||||
Operations | ||||||||||||||||||||||||
Net investment income | $ | 695,412 | $ | 317,546 | $ | 6,296,030 | $ | 11,808,032 | $ | 4,879,720 | $ | 10,038,256 | ||||||||||||
Net realized gain (loss) from: | ||||||||||||||||||||||||
Investments | (378,043 | ) | (316 | ) | 1,264,887 | 1,111,507 | 1,228,988 | 1,146,837 | ||||||||||||||||
Futures | (118,896 | ) | — | — | — | — | — | |||||||||||||||||
Net change in unrealized appreciation (depreciation) of: | ||||||||||||||||||||||||
Investments | (2,836,903 | ) | 400,893 | (14,329,037 | ) | 814,867 | (9,510,423 | ) | (623,653 | ) | ||||||||||||||
Futures | (88,544 | ) | 1,226 | — | — | — | — | |||||||||||||||||
Forward swaps | — | — | (286,742 | ) | — | — | — | |||||||||||||||||
Net increase (decrease) in net assets from operations | (2,726,974 | ) | 719,349 | (7,054,862 | ) | 13,734,406 | (3,401,715 | ) | 10,561,440 | |||||||||||||||
Distributions to Shareholders | ||||||||||||||||||||||||
From net investment income: | ||||||||||||||||||||||||
Class A | (589,581 | ) | (261,484 | ) | (1,997,490 | ) | (3,602,213 | ) | (1,786,764 | ) | (3,548,915 | ) | ||||||||||||
Class B | (1,612 | ) | (778 | ) | (157,661 | ) | (373,717 | ) | (182,190 | ) | (448,392 | ) | ||||||||||||
Class C | (86,597 | ) | (60,912 | ) | (408,076 | ) | (786,140 | ) | (229,770 | ) | (442,081 | ) | ||||||||||||
Class R | (21,566 | ) | (1,321 | ) | (3,703,266 | ) | (7,010,240 | ) | (2,609,579 | ) | (5,648,298 | ) | ||||||||||||
From accumulated net realized gains: | ||||||||||||||||||||||||
Class A | — | — | — | — | — | (418,252 | ) | |||||||||||||||||
Class B | — | — | — | — | — | (61,892 | ) | |||||||||||||||||
Class C | — | — | — | — | — | (60,807 | ) | |||||||||||||||||
Class R | — | �� | — | — | — | (618,275 | ) | |||||||||||||||||
Decrease in net assets from distributions to shareholders | (699,356 | ) | (324,495 | ) | (6,266,493 | ) | (11,772,310 | ) | (4,808,303 | ) | (11,246,912 | ) | ||||||||||||
Fund Share Transactions | ||||||||||||||||||||||||
Proceeds from sale of shares | 36,639,788 | 18,049,490 | 70,330,676 | 47,505,864 | 7,319,201 | 15,098,958 | ||||||||||||||||||
Proceeds from shares issued to shareholders due to | 307,429 | 106,767 | 3,570,900 | 6,718,385 | 2,871,031 | 6,580,713 | ||||||||||||||||||
| 36,947,217 | 18,156,257 | 73,901,576 | 54,224,249 | 10,190,232 | 21,679,671 | |||||||||||||||||||
Cost of shares redeemed | (12,067,955 | ) | (773,310 | ) | (35,347,549 | ) | (35,928,294 | ) | (14,729,109 | ) | (31,006,451 | ) | ||||||||||||
Net increase (decrease) in net assets from Fund share transactions | 24,879,262 | 17,382,947 | 38,554,027 | 18,295,955 | (4,538,877 | ) | (9,326,780 | ) | ||||||||||||||||
Net increase (decrease) in net assets | 21,452,932 | 17,777,801 | 25,232,672 | 20,257,951 | (12,748,895 | ) | (10,012,252 | ) | ||||||||||||||||
Net assets at the beginning of period | 17,777,801 | — | 291,907,733 | 271,649,782 | 244,964,325 | 254,976,577 | ||||||||||||||||||
Net assets at the end of period | $ | 39,230,733 | $ | 17,777,801 | $ | 317,140,405 | $ | 291,907,733 | $ | 232,215,430 | $ | 244,964,325 | ||||||||||||
Undistributed (Over-distribution of) net investment income at the end of period | $ | (7,512 | ) | $ | (3,568 | ) | $ | (414,106 | ) | $ | (443,643 | ) | $ | (187,094 | ) | $ | (258,511 | ) | ||||||
See accompanying notes to financial statements.
31
Statement of Cash Flows (Unaudited)
Six Months Ended August 31, 2007
| California High Yield | ||||
Cash Flows from Operating Activities: | ||||
Net Increase (Decrease) in Net Assets from Operations | $ | (2,726,974 | ) | |
Adjustments to reconcile the net increase (decrease) in net assets from operations to net cash provided by (used in) operating activities: | ||||
Purchases of investments | (27,562,763 | ) | ||
Proceeds from sales of investments | 5,165,399 | |||
Proceeds from sales of futures contracts | (118,896 | ) | ||
Amortization/(Accretion) of premiums and discounts, net | 5,371 | |||
(Increase) Decrease in receivable for interest | (313,404 | ) | ||
(Increase) Decrease in receivable for investments sold | (117,850 | ) | ||
(Increase) Decrease in receivable for variation margin on futures contracts | (24,274 | ) | ||
(Increase) Decrease in other assets | 3 | |||
Increase (Decrease) in payable for investments purchased | (317,224 | ) | ||
Increase (Decrease) in accrued management fees | 8,765 | |||
Increase (Decrease) in accrued 12b-1 distribution and service fees | 5,027 | |||
Increase (Decrease) in accrued other liabilities | (6,143 | ) | ||
Net realized (gain) loss from investments | 378,043 | |||
Net realized (gain) loss from futures | 118,896 | |||
Change in net unrealized (appreciation) depreciation of investments | 2,836,903 | |||
Net cash provided by (used in) operating activities | (22,669,121 | ) | ||
Cash Flows from Financing Activities: | ||||
Increase (Decrease) in cash overdraft balance | 2,149,008 | |||
Cash distributions paid to shareholders | (306,147 | ) | ||
Proceeds from sale of shares | 32,915,565 | |||
Cost of shares redeemed | (12,089,305 | ) | ||
Net cash provided by (used in) financing activities | 22,669,121 | |||
Net Increase (Decrease) in Cash | — | |||
Cash at the beginning of period | — | |||
Cash at the End of Period | $ | — | ||
Supplemental Disclosure of Cash Flow Information
Non-cash financing activities not included herein consist of reinvestments of share distributions of $307,429.
See accompanying notes to financial statements.
32
Notes to Financial Statements (Unaudited)
1. General Information and Significant Accounting Policies
The Nuveen Multistate Trust II (the “Trust”) is an open-end management investment company registered under the Investment Company Act of 1940, as amended. The Trust is comprised of Nuveen California High Yield Municipal Bond Fund (“California High Yield”), Nuveen California Municipal Bond Fund (“California”) and Nuveen California Insured Municipal Bond Fund (“California Insured”) (collectively, the “Funds”), among others. The Trust was organized as a Massachusetts business trust on July 1, 1996. The Funds were each organized as a series of predecessor trusts or corporations prior to that date.
California High Yield seeks to provide a high level of tax-free income through investments in a diversified portfolio of high yield municipal bonds.
California and California Insured seek to provide tax-free income and preservation of capital through investments in diversified portfolios of municipal bonds.
The following is a summary of significant accounting policies followed by the Funds in the preparation of their financial statements in accordance with accounting principles generally accepted in the United States.
Investment Valuation
The prices of municipal bonds in each Fund’s investment portfolio are provided by a pricing service approved by the Fund’s Board of Trustees. When market price quotes are not readily available (which is usually the case for municipal securities), the pricing service may establish fair value based on yields or prices of municipal bonds of comparable quality, type of issue, coupon, maturity and rating, indications of value from securities dealers, evaluations of anticipated cash flows or collateral and general market conditions. Prices of forward swap contracts are also provided by an independent pricing service approved by each Fund’s Board of Trustees. Futures contracts are valued using the closing settlement price, or, in the absence of such price, at the mean of the bid and asked prices. If the pricing service is unable to supply a price for a municipal bond, forward swap contract or futures contract, each Fund may use a market price or fair market value quote provided by a major broker/dealer in such investments. If it is determined that the market price or fair market value for an investment or derivative transaction is unavailable or inappropriate, the Board of Trustees of the Funds, or its designee, may establish a fair value for the investment. Temporary investments in securities that have variable rate and demand features qualifying them as short-term investments are valued at amortized cost, which approximates market value.
Investment Transactions
Investment transactions are recorded on a trade date basis. Realized gains and losses from transactions are determined on the specific identification method. Investments purchased on a when-issued/delayed delivery basis may have extended settlement periods. Any investments so purchased are subject to market fluctuation during this period. The Funds have instructed the custodian to segregate assets with a current value at least equal to the amount of the when-issued/delayed delivery purchase commitments. At August 31, 2007, California had outstanding when-issued/delayed delivery purchase commitments of $2,989,780. There were no such outstanding purchase commitments in California High Yield or California Insured.
Investment Income
Interest income, which includes the amortization of premiums and accretion of discounts for financial reporting purposes, is recorded on an accrual basis. Investment income also includes paydown gains and losses, if any.
Dividends and Distributions to Shareholders
Tax-exempt net investment income is declared monthly as a dividend. Generally, payment is made or reinvestment is credited to shareholder accounts on the first business day after month-end. Net realized capital gains and/or market discount from investment transactions, if any, are distributed to shareholders not less frequently than annually. Furthermore, capital gains are distributed only to the extent they exceed available capital loss carryforwards.
Distributions to shareholders of tax-exempt net investment income, net realized capital gains and/or market discount, if any, are recorded on the ex-dividend date. The amount and timing of distributions are determined in accordance with federal income tax regulations, which may differ from accounting principles generally accepted in the United States.
Income Taxes
Each Fund is a separate taxpayer for federal income tax purposes. Each Fund intends to distribute substantially all net investment income and net capital gains to shareholders and to otherwise comply with the requirements of Subchapter M of the Internal Revenue Code applicable to regulated investment companies. Therefore, no federal income tax provision is required. Furthermore, each Fund intends to satisfy conditions which will enable interest from municipal securities, which is exempt from regular federal and California state income taxes, to retain such tax-exempt status when distributed to shareholders of the Funds. Net realized capital gains and ordinary income distributions paid by the Funds are subject to federal taxation.
Insurance
California Insured invests primarily in municipal securities which are either covered by insurance or backed by an escrow or trust account containing sufficient U.S. Government or U.S. Government agency securities, both of which ensure the timely payment of principal and interest. Each insured municipal security is covered by Original Issue Insurance, Secondary Market Insurance or Portfolio Insurance. Such insurance does not guarantee the market value of the municipal securities or the value of the Fund’s shares. Original Issue Insurance and Secondary Market Insurance remain in effect as long as the municipal securities covered thereby remain outstanding and the insurer remains in business, regardless of whether the Fund ultimately disposes of such municipal securities. Consequently, the market value of the municipal securities covered by Original Issue Insurance or Secondary Market Insurance may reflect value attributable to the insurance. Portfolio Insurance, in contrast, is effective only while the municipal securities are held by the Fund. Accordingly, neither the prices used in determining the market value of the underlying municipal securities nor the net asset value of the Fund’s shares include value, if any, attributable to the Portfolio Insurance. Each policy of the Portfolio Insurance does, however, give the Fund the right to obtain permanent insurance with respect to the municipal security covered by the Portfolio Insurance policy at the time of its sale.
33
Notes to Financial Statements (Unaudited) (continued)
Flexible Sales Charge Program
Each Fund offers Class A, B, C and R Shares. Class A Shares are generally sold with an up-front sales charge and incur a .20% annual 12b-1 service fee. Class A Share purchases of $1 million or more are sold at net asset value without an up-front sales charge but may be subject to a contingent deferred sales charge (“CDSC”) if redeemed within 18 months of purchase. Class B Shares are sold without an up-front sales charge but incur a .75% annual 12b-1 distribution fee and a .20% annual 12b-1 service fee. An investor purchasing Class B Shares agrees to pay a CDSC of up to 5% depending upon the length of time the shares are held by the investor (CDSC is reduced to 0% at the end of six years). Class B Shares convert to Class A Shares eight years after purchase. Class C Shares are sold without an up-front sales charge but incur a .55% annual 12b-1 distribution fee and a .20% annual 12b-1 service fee. An investor purchasing Class C Shares agrees to pay a CDSC of 1% if Class C Shares are redeemed within one year of purchase. Class R Shares are not subject to any sales charge or 12b-1 distribution or service fees. Class R Shares are available only under limited circumstances.
Inverse Floating Rate Securities
Each Fund may invest in inverse floating rate securities. An inverse floating rate security is created by depositing a municipal bond, typically with a fixed interest rate, into a special purpose trust created by a broker-dealer. In turn, this trust (a) issues floating rate certificates, in face amounts equal to some fraction of the deposited bond’s par amount or market value, that typically pay short-term tax-exempt interest rates to third parties, and (b) issues to a long-term investor (such as one of the Funds) an inverse floating rate certificate (sometimes referred to as an “inverse floater”) that represents all remaining or residual interest in the trust. The income received by the inverse floater holder varies inversely with the short-term rate paid to the floating rate certificates’ holders, and in most circumstances the inverse floater holder bears substantially all of the underlying bond’s downside investment risk and also benefits disproportionately from any potential appreciation of the underlying bond’s value. The price of an inverse floating rate security will be more volatile than that of the underlying bond because the interest rate is dependent on not only the fixed coupon rate of the underlying bond but also on the short-term interest paid on the floating rate certificates, and because the inverse floating rate security essentially bears the risk of loss of the greater face value of the underlying bond.
A Fund may purchase an inverse floating rate security in a secondary market transaction without first owning the underlying bond (referred to as an “externally-deposited inverse floater”), or instead by first selling a fixed-rate bond to a broker-dealer for deposit into the special purpose trust and receiving in turn the residual interest in the trust (referred to as a “self-deposited inverse floater”). An investment in an externally-deposited inverse floater is identified in the Portfolio of Investments as an “Inverse floating rate investment”. An investment in a self-deposited inverse floater is accounted for as a financing transaction in accordance with Statement of Financial Accounting Standards (SFAS) No. 140 “Accounting for Transfers and Servicing of Financial Assets and Extinguishment of Liabilities”. In such instances, a fixed-rate bond deposited into a special purpose trust is identified in the Portfolio of Investments as an “Underlying bond of an inverse floating rate trust”, with the Fund accounting for the short-term floating rate certificates issued by the trust as “Floating rate obligations” on the Statement of Assets and Liabilities. In addition, the Fund reflects in Investment Income the entire earnings of the underlying bond and accounts for the related interest paid to the holders of the short-term floating rate certificates as “Interest expense on floating rate obligations” in the Statement of Operations.
During the six months ended August 31, 2007, each Fund invested in externally-deposited inverse floaters and/or self-deposited inverse floaters.
The average floating rate obligations outstanding and average annual interest rate related to self-deposited inverse floaters during the six months ended August 31, 2007, were as follows:
| California High Yield | California | California Insured | ||||||||||
Average floating rate obligations | $ | 4,980,000 | $ | 17,839,103 | $ | 8,111,522 | ||||||
Average annual interest rate and fees | 3.93 | % | 3.92 | % | 3.93 | % | ||||||
Forward Swap Transactions
The Funds are authorized to invest in forward interest rate swap transactions. The Fund’s use of forward interest rate swap transactions is intended to help the Fund manage its overall interest rate sensitivity, either shorter or longer, generally to more closely align the Fund’s interest rate sensitivity with that of the broader municipal market. Forward interest rate swap transactions involve each Fund’s agreement with a counterparty to pay, in the future, a fixed or variable rate payment in exchange for the counterparty paying the Fund a variable or fixed rate payment, the accruals for which would begin at a specified date in the future (the “effective date”). The amount of the payment obligation is based on the notional amount of the forward swap contract and the termination date of the swap (which is akin to a bond’s maturity). The value of the Fund’s swap commitment would increase or decrease based primarily on the extent to which long-term interest rates for bonds having a maturity of the swap’s termination date increases or decreases. The Funds may terminate a swap contract prior to the effective date, at which point a realized gain or loss is recognized. When a forward swap is terminated, it ordinarily does not involve the delivery of securities or other underlying assets or principal, but rather is settled in cash on a net basis. Each Fund intends, but is not obligated, to terminate its forward swaps before the effective date. Accordingly, the risk of loss with respect to the swap counterparty on such transactions is limited to the credit risk associated with a counterparty failing to honor its commitment to pay any realized gain to the Fund upon termination. To reduce such credit risk, all counterparties are required to pledge collateral daily (based on the daily valuation of each swap) on behalf of each Fund with a value approximately equal to the amount of any unrealized gain above a pre-determined threshold. Reciprocally, when any of the Funds have an unrealized loss on a swap contract, the Funds have instructed the custodian to pledge assets of the Funds as collateral with a value approximately equal to the amount of the unrealized loss above a pre-determined threshold. Collateral pledges are monitored and subsequently adjusted if and when the swap valuations fluctuate, either up or down, by at least the predetermined threshold amount.
34
Futures Contracts
The Funds are authorized to invest in futures contracts. Upon entering into a futures contract, a Fund is required to deposit with the broker an amount of cash or liquid securities equal to a specified percentage of the contract amount. This is known as the “initial margin.” Subsequent payments (“variation margin”) are made or received by a Fund each day, depending on the daily fluctuation of the value of the contract.
During the period the futures contract is open, changes in the value of the contract are recognized as an unrealized gain or loss by “marking-to-market” on a daily basis to reflect the changes in market value of the contract. When the contract is closed or expired, a Fund records a realized gain or loss equal to the difference between the value of the contract on the closing date and value of the contract when originally entered into. Cash held by the broker to cover initial margin requirements on open futures contracts, if any, is recognized in the Statement of Assets and Liabilities. Additionally, the Statement of Assets and Liabilities reflects a receivable or payable for the variation margin when applicable. California High Yield was the only Fund to invest in futures contracts during the six months ended August 31, 2007.
Risks of investments in futures contracts include the possible adverse movement of the securities or indices underlying the contracts, the possibility that there may not be a liquid secondary market for the contracts and/or that a change in the value of the contract may not correlate with a change in the value of the underlying securities or indices.
Expense Allocation
Expenses of the Funds that are not directly attributable to a specific class of shares are prorated among the classes based on the relative net assets of each class. Expenses directly attributable to a class of shares, which presently only include 12b-1 distribution and service fees, are recorded to the specific class.
Custodian Fee Credit
Each Fund has an arrangement with the custodian bank whereby certain custodian fees and expenses are reduced by net credits earned on each Fund’s cash on deposit with the bank. Such deposit arrangements are an alternative to overnight investments. Credits for cash balances may be offset by charges for any days on which the Fund overdraws its account at the custodian bank.
Indemnifications
Under the Trust’s organizational documents, its Officers and Trustees are indemnified against certain liabilities arising out of the performance of their duties to the Trust. In addition, in the normal course of business, the Trust enters into contracts that provide general indemnifications to other parties. The Trust’s maximum exposure under these arrangements is unknown as this would involve future claims that may be made against the Trust that have not yet occurred. However, the Trust has not had prior claims or losses pursuant to these contracts and expects the risk of loss to be remote.
Use of Estimates
The preparation of financial statements in conformity with accounting principles generally accepted in the United States requires management to make estimates and assumptions that affect the reported amounts of assets and liabilities at the date of the financial statements and the reported amounts of increases and decreases in net assets from operations during the reporting period. Actual results may differ from those estimates.
2. Fund Shares
Transactions in Fund shares were as follows:
| California High Yield | ||||||||||||||
Six Months Ended 8/31/07 | For the Period 3/28/06 (commencement of operations) through 2/28/07 | |||||||||||||
| Shares | Amount | Shares | Amount | |||||||||||
Shares sold: | ||||||||||||||
Class A | 3,020,327 | $ | 30,495,132 | 1,452,634 | $ | 14,836,462 | ||||||||
Class B | 10,081 | 100,000 | 6,877 | 69,995 | ||||||||||
Class C | 395,077 | 3,950,782 | 299,699 | 3,038,033 | ||||||||||
Class R | 204,341 | 2,093,874 | 10,088 | 105,000 | ||||||||||
Shares issued to shareholders due to reinvestment | ||||||||||||||
Class A | 23,846 | 241,670 | 8,585 | 87,854 | ||||||||||
Class B | 118 | 1,203 | 42 | 424 | ||||||||||
Class C | 4,634 | 47,040 | 1,728 | 17,740 | ||||||||||
Class R | 1,721 | 17,516 | 73 | 749 | ||||||||||
| 3,660,145 | 36,947,217 | 1,779,726 | 18,156,257 | |||||||||||
Shares redeemed: | ||||||||||||||
Class A | (1,072,280 | ) | (10,550,491 | ) | (67,182 | ) | (694,263 | ) | ||||||
Class B | — | — | — | — | ||||||||||
Class C | (48,061 | ) | (463,990 | ) | (7,697 | ) | (79,047 | ) | ||||||
Class R | (103,845 | ) | (1,053,474 | ) | — | — | ||||||||
| (1,224,186 | ) | (12,067,955 | ) | (74,879 | ) | (773,310 | ) | |||||||
Net increase (decrease) | 2,435,959 | $ | 24,879,262 | 1,704,847 | $ | 17,382,947 | ||||||||
35
Notes to Financial Statements (Unaudited) (continued)
| California | ||||||||||||||
Six Months Ended | Year Ended 2/28/07 | |||||||||||||
| Shares | Amount | Shares | Amount | |||||||||||
Shares sold: | ||||||||||||||
Class A | 4,525,293 | $ | 45,951,795 | 2,784,912 | $ | 28,729,699 | ||||||||
Class A – automatic conversion of Class B shares | 19,427 | 201,523 | 46,646 | 484,144 | ||||||||||
Class B | 8,515 | 88,437 | 30,137 | 312,531 | ||||||||||
Class C | 472,755 | 4,776,574 | 442,294 | 4,580,104 | ||||||||||
Class R | 1,882,856 | 19,312,347 | 1,293,534 | 13,399,386 | ||||||||||
Shares issued to shareholders due to reinvestment | ||||||||||||||
Class A | 82,072 | 849,259 | 145,262 | 1,506,868 | ||||||||||
Class B | 8,051 | 83,338 | 17,609 | 182,452 | ||||||||||
Class C | 16,415 | 169,576 | 30,912 | 319,957 | ||||||||||
Class R | 238,710 | 2,468,727 | 454,123 | 4,709,108 | ||||||||||
| 7,254,094 | 73,901,576 | 5,245,429 | 54,224,249 | |||||||||||
Shares redeemed: | ||||||||||||||
Class A | (2,156,903 | ) | (21,829,119 | ) | (1,779,755 | ) | (18,406,960 | ) | ||||||
Class B | (144,335 | ) | (1,470,556 | ) | (300,059 | ) | (3,104,843 | ) | ||||||
Class B – automatic conversion to Class A shares | (19,438 | ) | (201,523 | ) | (46,689 | ) | (484,144 | ) | ||||||
Class C | (240,316 | ) | (2,457,736 | ) | (305,031 | ) | (3,158,249 | ) | ||||||
Class R | (915,168 | ) | (9,388,615 | ) | (1,040,380 | ) | (10,774,098 | ) | ||||||
| (3,476,160 | ) | (35,347,549 | ) | (3,471,914 | ) | (35,928,294 | ) | |||||||
Net increase (decrease) | 3,777,934 | $ | 38,554,027 | 1,773,515 | $ | 18,295,955 | ||||||||
| California Insured | ||||||||||||||
Six Months Ended | Year Ended 2/28/07 | |||||||||||||
| Shares | Amount | Shares | Amount | |||||||||||
Shares sold: | ||||||||||||||
Class A | 536,679 | $ | 5,668,803 | 960,841 | $ | 10,319,857 | ||||||||
Class A – automatic conversion of Class B shares | 63,792 | 689,440 | 111,280 | 1,191,344 | ||||||||||
Class B | 9,219 | 97,276 | 24,612 | 266,031 | ||||||||||
Class C | 67,378 | 712,903 | 214,128 | 2,297,258 | ||||||||||
Class R | 14,073 | 150,779 | 95,619 | 1,024,468 | ||||||||||
Shares issued to shareholders due to reinvestment | ||||||||||||||
Class A | 88,506 | 946,422 | 174,280 | 1,880,477 | ||||||||||
Class B | 6,098 | 65,419 | 16,579 | 179,186 | ||||||||||
Class C | 11,806 | 125,659 | 24,497 | 262,963 | ||||||||||
Class R | 161,892 | 1,733,531 | 394,452 | 4,258,087 | ||||||||||
| 959,443 | 10,190,232 | 2,016,288 | 21,679,671 | |||||||||||
Shares redeemed: | ||||||||||||||
Class A | (483,344 | ) | (5,111,490 | ) | (938,737 | ) | (10,075,035 | ) | ||||||
Class B | (191,919 | ) | (2,032,053 | ) | (155,498 | ) | (1,670,535 | ) | ||||||
Class B – automatic conversion to Class A shares | (63,674 | ) | (689,440 | ) | (111,073 | ) | (1,191,344 | ) | ||||||
Class C | (45,596 | ) | (480,383 | ) | (178,001 | ) | (1,901,975 | ) | ||||||
Class R | (604,046 | ) | (6,415,743 | ) | (1,502,070 | ) | (16,167,562 | ) | ||||||
| (1,388,579 | ) | (14,729,109 | ) | (2,885,379 | ) | (31,006,451 | ) | |||||||
Net increase (decrease) | (429,136 | ) | $ | (4,538,877 | ) | (869,091 | ) | $ | (9,326,780 | ) | ||||
36
3. Investment Transactions
Purchases and sales (including maturities but excluding short-term investments and derivative transactions) during the six months ended August 31, 2007, were as follows:
| California High Yield | California | California Insured | |||||||
Purchases | $ | 27,562,763 | $ | 91,032,913 | $ | 30,697,713 | |||
Sales and maturities | 5,165,399 | 40,092,634 | 33,116,077 | ||||||
4. Income Tax Information
The following information is presented on an income tax basis. Differences between amounts for financial statement and federal income tax purposes are primarily due to the treatment of paydown gains and losses, timing differences in recognizing taxable market discount, timing differences in recognizing certain gains and losses on investment transactions and the treatment of investments in inverse floating rate transactions subject to SFAS No. 140. To the extent that differences arise that are permanent in nature, such amounts are reclassified within the capital accounts on the Statement of Assets and Liabilities presented in the annual report, based on their federal tax basis treatment; temporary differences do not require reclassification. Temporary and permanent differences do not impact the net asset values of the Funds.
At August 31, 2007, the cost of investments was as follows:
| California High Yield | California | California Insured | |||||||
Cost of investments | $ | 39,615,348 | $ | 311,302,277 | $ | 227,108,948 | |||
Gross unrealized appreciation and gross unrealized depreciation of investments at August 31, 2007, were as follows:
| California High Yield | California | California Insured | ||||||||||
Gross unrealized: | ||||||||||||
Appreciation | $ | 51,496 | $ | 5,419,212 | $ | 7,526,306 | ||||||
Depreciation | (2,486,123 | ) | (5,525,056 | ) | (1,857,500 | ) | ||||||
Net unrealized appreciation (depreciation) of investments | $ | (2,434,627 | ) | $ | (105,844 | ) | $ | 5,668,806 | ||||
The tax components of undistributed net tax-exempt income, net ordinary income and net long-term capital gains at February 28, 2007, the Funds’ last tax year end, were as follows:
| California High Yield | California | California Insured | |||||||
Undistributed net tax-exempt income* | $ | 57,560 | $ | 521,376 | $ | 358,082 | |||
Undistributed net ordinary income** | 174 | — | 35 | ||||||
Undistributed net long-term capital gains | 736 | — | 300,885 | ||||||
| * | Undistributed net tax-exempt income (on a tax basis) has not been reduced for the dividend declared on February 9, 2007, paid on March 1, 2007. |
| ** | Net ordinary income consists of taxable market discount income and net short-term capital gains, if any. |
The tax character of distributions paid during the Funds’ last tax year ended February 28, 2007, was designated for purposes of the dividends paid deduction as follows:
| California High Yield* | California | California Insured | |||||||
Distributions from net tax-exempt income | $ | 262,784 | $ | 11,703,523 | $ | 10,137,262 | |||
Distributions from net ordinary income** | — | — | — | ||||||
Distribution from net long-term capital gains | — | — | 1,159,226 | ||||||
| * | For the period March 28, 2006 (commencement of operations) through February 28, 2007. |
| ** | Net ordinary income consists of taxable market discount income and net short-term capital gains, if any. |
37
Notes to Financial Statements (Unaudited) (continued)
At February 28, 2007, the Funds’ last tax year end, California had unused capital loss carryforwards available for federal income tax purposes to be applied against future capital gains, if any. If not applied, the carryforwards will expire as follows:
Expiration year: | |||
2011 | $ | 657,896 | |
2012 | 5,101,139 | ||
2013 | 84,061 | ||
Total | $ | 5,843,096 |
5. Management Fees and Other Transactions with Affiliates
Each Fund’s management fee is separated into two components – a complex-level component, based on the aggregate amount of all fund assets managed by Nuveen Asset Management (the “Adviser”), a wholly owned subsidiary of Nuveen Investments, Inc., (“Nuveen”), and a specific fund-level component, based only on the amount of assets within each individual Fund. This pricing structure enables Nuveen fund shareholders to benefit from growth in the assets within each individual fund as well as from growth in the amount of complex-wide assets managed by the Adviser.
The annual fund-level fee, payable monthly, for each Fund is based upon the average daily net assets of each Fund as follows:
| Average Daily Net Assets | California High Yield Fund-Level Fee Rate | ||
For the first $125 million | .4000 | % | |
For the next $125 million | .3875 | ||
For the next $250 million | .3750 | ||
For the next $500 million | .3625 | ||
For the next $1 billion | .3500 | ||
For net assets over $2 billion | .3250 |
| Average Daily Net Assets | California California Insured Fund-Level Fee Rate | ||
For the first $125 million | .3500 | % | |
For the next $125 million | .3375 | ||
For the next $250 million | .3250 | ||
For the next $500 million | .3125 | ||
For the next $1 billion | .3000 | ||
For the next $3 billion | .2750 | ||
For net assets over $5 billion | .2500 |
The annual complex-level fee, payable monthly, which is additive to the fund-level fee, for all Nuveen sponsored funds in the U.S., is based on the aggregate amount of total fund assets managed as stated in the table below. As of August 31, 2007, the complex-level fee rate was .1841%.
Effective August 20, 2007, the complex-level fee schedule is as follows:
| Complex-Level Asset Breakpoint Level(1) | Effective Rate at Breakpoint Level | ||
$55 billion | .2000 | % | |
$56 billion | .1996 | ||
$57 billion | .1989 | ||
$60 billion | .1961 | ||
$63 billion | .1931 | ||
$66 billion | .1900 | ||
$71 billion | .1851 | ||
$76 billion | .1806 | ||
$80 billion | .1773 | ||
$91 billion | .1691 | ||
$125 billion | .1599 | ||
$200 billion | .1505 | ||
$250 billion | .1469 | ||
| $300 billion | .1445 |
38
Prior to August 20, 2007, the complex-level fee schedule was as follows:
| Complex-Level Asset Breakpoint Level(1) | Effective Rate at Breakpoint Level | ||
$55 billion | .2000 | % | |
$56 billion | .1996 | ||
$57 billion | .1989 | ||
$60 billion | .1961 | ||
$63 billion | .1931 | ||
$66 billion | .1900 | ||
$71 billion | .1851 | ||
$76 billion | .1806 | ||
$80 billion | .1773 | ||
$91 billion | .1698 | ||
$125 billion | .1617 | ||
$200 billion | .1536 | ||
$250 billion | .1509 | ||
| $300 billion | .1490 |
| (1) | The complex-level fee component of the management fee for the funds is calculated based upon the aggregate Managed Assets (“Managed Assets” means the average daily net assets of each fund including assets attributable to preferred stock issued by or borrowings by the Nuveen funds) of Nuveen-sponsored funds in the U.S. |
The management fee compensates the Adviser for overall investment advisory and administrative services and general office facilities. The Trust pays no compensation directly to those of its Trustees who are affiliated with the Adviser or to its Officers, all of whom receive remuneration for their services to the Trust from the Adviser or its affiliates. The Board of Trustees has adopted a deferred compensation plan for independent Trustees that enables Trustees to elect to defer receipt of all or a portion of the annual compensation they are entitled to receive from certain Nuveen advised funds. Under the plan, deferred amounts are treated as though equal dollar amounts had been invested in shares of select Nuveen advised funds.
The Adviser agreed to waive part of its management fees or reimburse certain expenses of each Fund in order to limit total expenses (excluding 12b-1 distribution and service fees, interest expense, taxes, fees incurred in acquiring and disposing of portfolio securities and extraordinary expenses) from exceeding .75% of the average daily net assets of California High Yield through June 30, 2009 (1.00% after June 30, 2009), .75% of the average daily net assets of California and .975% of the average daily net assets of California Insured. The Adviser may also voluntarily reimburse additional expenses from time to time. Voluntary reimbursements may be terminated at any time at the Adviser’s discretion.
During the six months ended August 31, 2007, Nuveen Investments, LLC (the “Distributor”), a wholly owned subsidiary of Nuveen, collected sales charges on purchases of Class A Shares, the majority of which were paid out as concessions to financial intermediaries as follows:
California High Yield | California | California Insured | |||||||
Sales charges collected | $ | 807,270 | $ | 72,459 | $ | 94,313 | |||
Paid to financial intermediaries | 719,029 | 65,616 | 80,979 | ||||||
The Distributor also received 12b-1 service fees on Class A Shares, substantially all of which were paid to compensate financial intermediaries for providing services to shareholders relating to their investments.
During the six months ended August 31, 2007, the Distributor compensated financial intermediaries directly with commission advances at the time of purchase as follows:
California High Yield | California | California Insured | |||||||
Commission advances | $ | 143,593 | $ | 39,765 | $ | 27,829 | |||
To compensate for commissions advanced to financial intermediaries, all 12b-1 service fees collected on Class B Shares during the first year following a purchase, all 12b-1 distribution fees collected on Class B Shares, and all 12b-1 service and distribution fees collected on Class C Shares during the first year following a purchase are retained by the Distributor. During the six months ended August 31, 2007, the Distributor retained such 12b-1 fees as follows:
California High Yield | California | California Insured | |||||||
12b-1 fees retained | $ | 14,281 | $ | 50,176 | $ | 52,081 | |||
The remaining 12b-1 fees charged to the Funds were paid to compensate financial intermediaries for providing services to shareholders relating to their investments.
39
Notes to Financial Statements (Unaudited) (continued)
The Distributor also collected and retained CDSC on share redemptions during the six months ended August 31, 2007, as follows:
California High Yield | California | California Insured | |||||||
CDSC retained | $ | 10,212 | $ | 20,503 | $ | 11,927 | |||
At August 31, 2007, the Adviser owned 500 shares of each class of California High Yield.
Agreement and Plan of Merger
On June 20, 2007, Nuveen Investments announced that it had entered into a definitive Agreement and Plan of Merger (“Merger Agreement”) with Windy City Investments, Inc. (“Windy City”), a corporation formed by investors led by Madison Dearborn Partners, LLC, pursuant to which Windy City would acquire Nuveen Investments. Madison Dearborn Partners, LLC is a private equity investment firm based in Chicago, Illinois. The investors include an affiliate of Merrill Lynch. It is anticipated that Merrill Lynch and its affiliates will be indirect “affiliated persons” (as that term is defined in the Investment Company Act of 1940) of the Funds upon and after the acquisition. One important implication of this is that the Funds will not be able to buy securities from or sell securities to Merrill Lynch; however, the portfolio management teams and Fund management do not expect that this will significantly impact the ability of the Funds to pursue their investment objectives and policies. Under the terms of the merger, each outstanding share of Nuveen Investments’ common stock (other than dissenting shares) will be converted into the right to receive a specified amount of cash, without interest. The merger is expected to be completed by the end of the year, subject to customary conditions. The obligations of Windy City to consummate the merger are not conditioned on its obtaining financing.
The consummation of the merger will be deemed to be an “assignment” (as defined in the 1940 Act) of the investment management agreement between each Fund and the Adviser, and will result in the automatic termination of each Fund’s agreement. The Board of Trustees of each Fund has approved a new investment management agreement with the Adviser. On October 12, 2007, at a meeting of the respective Funds’ shareholders, California and California Insured received the required number of shareholder votes to approve the new investment management agreements. The new agreements will take effect upon consummation of the merger of Nuveen Investments and Windy City. California High Yield adjourned its shareholder meeting prior to obtaining the necessary shareholder approval, and will continue to solicit shareholder votes until they reconvene on November 8, 2007. There can be no assurance that the merger described above will be consummated as contemplated or that necessary shareholder approvals will be obtained.
6. New Accounting Pronouncements
Financial Accounting Standards Board Interpretation No. 48
Effective August 31, 2007, the Funds adopted Financial Accounting Standards Board Interpretation No. 48, “Accounting for Uncertainty in Income Taxes” (FIN 48). FIN 48 provides guidance regarding how uncertain tax positions should be recognized, measured, presented and disclosed in the financial statements. FIN 48 requires the evaluation of tax positions taken or expected to be taken in the course of preparing the Funds’ tax returns to determine whether the tax positions are “more-likely-than-not” of being sustained by the applicable tax authority. Tax positions not deemed to meet the more-likely-than-not threshold would be recorded as a tax benefit or expense in the current year. Management of the Funds has concluded that there are no significant uncertain tax positions that require recognition in the Funds’ financial statements. Consequently, the adoption of FIN 48 had no impact on the net assets or results of operations of the Funds.
Financial Accounting Standards Board Statement of Financial Accounting Standards No. 157
In September 2006, the Financial Accounting Standards Board (FASB) issued Statement of Financial Accounting Standards (SFAS) No. 157, “Fair Value Measurements.” This standard establishes a single authoritative definition of fair value, sets out a framework for measuring fair value and requires additional disclosures about fair value measurements. SFAS No. 157 applies to fair value measurements already required or permitted by existing standards. SFAS No. 157 is effective for financial statements issued for fiscal years beginning after November 15, 2007, and interim periods within those fiscal years. The changes to current generally accepted accounting principles from the application of this standard relate to the definition of fair value, the methods used to measure fair value, and the expanded disclosures about fair value measurements. As of August 31, 2007, management does not believe the adoption of SFAS No. 157 will impact the financial statement amounts; however, additional disclosures may be required about the inputs used to develop the measurements and the effect of certain of the measurements included within the Statement of Operations for the period.
7. Subsequent Events
Distributions to Shareholders
The Funds declared dividend distributions from their tax-exempt net investment income which were paid on October 1, 2007, to shareholders of record on September 7, 2007, as follows:
California High Yield | California | California Insured | |||||||
Dividend per share: | |||||||||
Class A | $ | .0375 | $ | .0355 | $ | .0355 | |||
Class B | .0310 | .0290 | .0285 | ||||||
Class C | .0325 | .0310 | .0305 | ||||||
Class R | .0390 | .0375 | .0370 | ||||||
40
Financial Highlights (Unaudited)
Selected data for a share outstanding throughout each period:
| Class (Commencement Date) | |||||||||||||||||||||||||||||||||||||||||||||||||||||||
| Investment Operations | Less Distributions | Ratios/Supplemental Data | |||||||||||||||||||||||||||||||||||||||||||||||||||||
| CALIFORNIA HIGH YIELD | Ratios to Average Net Assets Before Credit/ Reimbursement | Ratios to Average Net Assets After Reimbursement(c) | Ratios to Average Net Assets After Credit/ Reimbursement(d) | ||||||||||||||||||||||||||||||||||||||||||||||||||||
| Year Ended February 28/29, | Beginning Net Asset Value | Net Invest- ment Income(a) | Net Realized/ Unrealized Gain (Loss) | Total | Net Invest- ment Income | Capital Gains | Total | Ending Net Asset Value | Total Return(b) | Ending Net Assets (000) | Expenses(f) | Net Invest- ment Income | Expenses(f) | Net Invest- ment Income | Expenses(f) | Net Invest- ment Income | Portfolio Turnover Rate | ||||||||||||||||||||||||||||||||||||||
| Class A (3/06) | |||||||||||||||||||||||||||||||||||||||||||||||||||||||
2008(g) | $ | 10.43 | $ | .22 | $ | (.94 | ) | $ | (.72 | ) | $ | (.23 | ) | $ | — | $ | (.23 | ) | $ | 9.48 | (7.15 | )% | $ | 31,893 | 1.60 | %* | 4.29 | %* | 1.54 | %* | 4.35 | %* | 1.49 | %* | 4.39 | %* | 14 | % | |||||||||||||||||
2007(e) | 10.00 | .39 | .42 | .81 | (.38 | ) | — | (.38 | ) | 10.43 | 8.19 | 14,539 | 1.84 | * | 3.63 | * | 1.52 | * | 3.96 | * | 1.43 | * | 4.04 | * | 3 | ||||||||||||||||||||||||||||||
| Class B (3/06) | |||||||||||||||||||||||||||||||||||||||||||||||||||||||
2008(g) | 10.42 | .18 | (.94 | ) | (.76 | ) | (.19 | ) | — | (.19 | ) | 9.47 | (7.52 | ) | 162 | 2.37 | * | 3.58 | * | 2.28 | * | 3.67 | * | 2.24 | * | 3.71 | * | 14 | |||||||||||||||||||||||||||
2007(e) | 10.00 | .31 | .42 | .73 | (.31 | ) | — | (.31 | ) | 10.42 | 7.40 | 72 | 2.69 | * | 2.80 | * | 2.27 | * | 3.22 | * | 2.19 | * | 3.30 | * | 3 | ||||||||||||||||||||||||||||||
| Class C (3/06) | |||||||||||||||||||||||||||||||||||||||||||||||||||||||
2008(g) | 10.42 | .19 | (.94 | ) | (.75 | ) | (.20 | ) | — | (.20 | ) | 9.47 | (7.34 | ) | 6,111 | 2.15 | * | 3.74 | * | 2.09 | * | 3.81 | * | 2.04 | * | 3.85 | * | 14 | |||||||||||||||||||||||||||
2007(e) | 10.00 | .33 | .42 | .75 | (.33 | ) | — | (.33 | ) | 10.42 | 7.56 | 3,061 | 2.44 | * | 2.99 | * | 2.07 | * | 3.36 | * | 1.99 | * | 3.45 | * | 3 | ||||||||||||||||||||||||||||||
| Class R (3/06) | |||||||||||||||||||||||||||||||||||||||||||||||||||||||
2008(g) | 10.43 | .23 | (.96 | ) | (.73 | ) | (.23 | ) | — | (.23 | ) | 9.47 | (7.07 | ) | 1,065 | 1.39 | * | 4.41 | * | 1.34 | * | 4.46 | * | 1.29 | * | 4.51 | * | 14 | |||||||||||||||||||||||||||
2007(e) | 10.00 | .45 | .37 | .82 | (.39 | ) | — | (.39 | ) | 10.43 | 8.35 | 106 | 1.58 | * | 4.32 | * | 1.31 | * | 4.58 | * | 1.23 | * | 4.66 | * | 3 | ||||||||||||||||||||||||||||||
| * | Annualized. |
| (a) | Per share Net Investment Income is calculated using the average daily shares method. |
| (b) | Total return is the combination of changes in net asset value, reinvested dividend income at net asset value and reinvested capital gains distributions at net asset value, if any. The last dividend declared in the period, which is typically paid on the first business day of the following month, is assumed to be reinvested at the ending net asset value. The actual reinvest price for the last dividend declared in the period may be different from the price used in the calculation. Total returns are not annualized. |
| (c) | After expense reimbursement from the Adviser, where applicable. |
| (d) | After custodian fee credit and expense reimbursement, where applicable. |
| (e) | For the period March 28, 2006 (commencement of operations) through February 28, 2007. |
| (f) | The expense ratios in the above table reflect, among other things, the interest expense deemed to have been paid by the Fund on the floating rate certificates issued by the special purpose trusts for the self-deposited inverse floaters held by the Fund, as described in Footnote 1 – Inverse Floating Rate Securities. The amount of this deemed interest expense for such periods expressed as a percentage of average net assets for each share class was as follows: |
Interest Expense | ||
2008(g) | .61%* | |
2007(e) | .58* | |
| (g) | For the six months ended August 31, 2007. |
See accompanying notes to financial statements.
41
Financial Highlights (Unaudited) (continued)
Selected data for a share outstanding throughout each period:
| Class (Commencement Date) | |||||||||||||||||||||||||||||||||||||||||||||||||||||||
| Investment Operations | Less Distributions | Ratios/Supplemental Data | |||||||||||||||||||||||||||||||||||||||||||||||||||||
| CALIFORNIA | Ratios to Average Net Assets Before Credit/ Reimbursement | Ratios to Average Net Assets After Reimbursement(c) | Ratios to Average Net Assets After Credit/ Reimbursement(d) | ||||||||||||||||||||||||||||||||||||||||||||||||||||
| Year Ended February 28/29, | Beginning Net Asset Value | Net Invest- ment Income(a) | Net Realized/ Unrealized Gain (Loss) | Total | Net Invest- ment Income | Capital Gains | Total | Ending Net Asset Value | Total Return(b) | Ending Net Assets (000) | Expenses(e) | Net Invest- ment Income | Expenses(e) | Net Invest- ment Income | Expenses(e) | Net Invest- ment Income | Portfolio Turnover Rate | ||||||||||||||||||||||||||||||||||||||
| Class A (9/94) | |||||||||||||||||||||||||||||||||||||||||||||||||||||||
2008(f) | $ | 10.50 | $ | .21 | $ | (.46 | ) | $ | (.25 | ) | $ | (.21 | ) | $ | — | $ | (.21 | ) | $ | 10.04 | (2.38 | )% | $ | 112,298 | 1.05 | %* | 4.11 | %* | 1.05 | %* | 4.11 | %* | 1.04 | %* | 4.12 | %* | 13 | % | |||||||||||||||||
2007 | 10.43 | .43 | .07 | .50 | (.43 | ) | — | (.43 | ) | 10.50 | 4.88 | 91,465 | 1.09 | 4.13 | 1.09 | 4.13 | 1.08 | 4.14 | 20 | ||||||||||||||||||||||||||||||||||||
2006 | 10.45 | .45 | (.01 | ) | .44 | (.46 | ) | — | (.46 | ) | 10.43 | 4.28 | 78,408 | .85 | 4.30 | .85 | 4.30 | .85 | 4.30 | 15 | |||||||||||||||||||||||||||||||||||
2005 | 10.52 | .48 | (.08 | ) | .40 | (.47 | ) | — | (.47 | ) | 10.45 | 4.02 | 69,151 | .86 | 4.62 | .86 | 4.62 | .86 | 4.62 | 16 | |||||||||||||||||||||||||||||||||||
2004 | 10.30 | .49 | .22 | .71 | (.49 | ) | — | (.49 | ) | 10.52 | 7.08 | 58,671 | .88 | 4.74 | .88 | 4.74 | .87 | 4.75 | 28 | ||||||||||||||||||||||||||||||||||||
2003 | 10.25 | .50 | .06 | .56 | (.51 | ) | — | (.51 | ) | 10.30 | 5.67 | 53,441 | .89 | 4.91 | .89 | 4.91 | .88 | 4.92 | 25 | ||||||||||||||||||||||||||||||||||||
| Class B (3/97) | |||||||||||||||||||||||||||||||||||||||||||||||||||||||
2008(f) | 10.49 | .18 | (.47 | ) | (.29 | ) | (.17 | ) | — | (.17 | ) | 10.03 | (2.75 | ) | 8,162 | 1.80 | * | 3.36 | * | 1.80 | * | 3.36 | * | 1.78 | * | 3.38 | * | 13 | |||||||||||||||||||||||||||
2007 | 10.42 | .35 | .07 | .42 | (.35 | ) | — | (.35 | ) | 10.49 | 4.10 | 10,076 | 1.85 | 3.38 | 1.85 | 3.38 | 1.83 | 3.39 | 20 | ||||||||||||||||||||||||||||||||||||
2006 | 10.44 | .37 | (.01 | ) | .36 | (.38 | ) | — | (.38 | ) | 10.42 | 3.51 | 13,129 | 1.60 | 3.55 | 1.60 | 3.55 | 1.60 | 3.55 | 15 | |||||||||||||||||||||||||||||||||||
2005 | 10.51 | .40 | (.07 | ) | .33 | (.40 | ) | — | (.40 | ) | 10.44 | 3.24 | 16,258 | 1.61 | 3.87 | 1.61 | 3.87 | 1.61 | 3.87 | 16 | |||||||||||||||||||||||||||||||||||
2004 | 10.29 | .41 | .22 | .63 | (.41 | ) | — | (.41 | ) | 10.51 | 6.30 | 17,139 | 1.63 | 3.99 | 1.63 | 3.99 | 1.62 | 4.00 | 28 | ||||||||||||||||||||||||||||||||||||
2003 | 10.24 | .43 | .06 | .49 | (.44 | ) | — | (.44 | ) | 10.29 | 4.88 | 18,431 | 1.64 | 4.16 | 1.64 | 4.16 | 1.63 | 4.17 | 25 | ||||||||||||||||||||||||||||||||||||
| Class C (9/94) | |||||||||||||||||||||||||||||||||||||||||||||||||||||||
2008(f) | 10.47 | .18 | (.44 | ) | (.26 | ) | (.19 | ) | — | (.19 | ) | 10.02 | (2.55 | ) | 24,555 | 1.60 | * | 3.56 | * | 1.60 | * | 3.56 | * | 1.58 | * | 3.58 | * | 13 | |||||||||||||||||||||||||||
2007 | 10.41 | .37 | .06 | .43 | (.37 | ) | — | (.37 | ) | 10.47 | 4.25 | 23,067 | 1.64 | 3.58 | 1.64 | 3.58 | 1.63 | 3.59 | 20 | ||||||||||||||||||||||||||||||||||||
2006 | 10.43 | .39 | (.01 | ) | .38 | (.40 | ) | — | (.40 | ) | 10.41 | 3.75 | 21,180 | 1.40 | 3.75 | 1.40 | 3.75 | 1.40 | 3.75 | 15 | |||||||||||||||||||||||||||||||||||
2005 | 10.50 | .42 | (.07 | ) | .35 | (.42 | ) | — | (.42 | ) | 10.43 | 3.49 | 19,165 | 1.41 | 4.07 | 1.41 | 4.07 | 1.41 | 4.07 | 16 | |||||||||||||||||||||||||||||||||||
2004 | 10.29 | .43 | .21 | .64 | (.43 | ) | — | (.43 | ) | 10.50 | 6.42 | 18,341 | 1.43 | 4.19 | 1.43 | 4.19 | 1.42 | 4.20 | 28 | ||||||||||||||||||||||||||||||||||||
2003 | 10.25 | .45 | .05 | .50 | (.46 | ) | — | (.46 | ) | 10.29 | 5.02 | 17,320 | 1.44 | 4.37 | 1.44 | 4.37 | 1.43 | 4.37 | 25 | ||||||||||||||||||||||||||||||||||||
| Class R (7/86) | |||||||||||||||||||||||||||||||||||||||||||||||||||||||
2008(f) | 10.49 | .22 | (.45 | ) | (.23 | ) | (.23 | ) | — | (.23 | ) | 10.03 | (2.27 | ) | 172,125 | .85 | * | 4.31 | * | .85 | * | 4.31 | * | .84 | * | 4.32 | * | 13 | |||||||||||||||||||||||||||
2007 | 10.43 | .45 | .06 | .51 | (.45 | ) | — | (.45 | ) | 10.49 | 5.03 | 167,300 | .89 | 4.33 | .89 | 4.33 | .88 | 4.34 | 20 | ||||||||||||||||||||||||||||||||||||
2006 | 10.45 | .47 | (.01 | ) | .46 | (.48 | ) | — | (.48 | ) | 10.43 | 4.52 | 158,933 | .65 | 4.50 | .65 | 4.50 | .65 | 4.50 | 15 | |||||||||||||||||||||||||||||||||||
2005 | 10.52 | .50 | (.07 | ) | .43 | (.50 | ) | — | (.50 | ) | 10.45 | 4.26 | 164,422 | .66 | 4.82 | .66 | 4.82 | .66 | 4.82 | 16 | |||||||||||||||||||||||||||||||||||
2004 | 10.31 | .51 | .21 | .72 | (.51 | ) | — | (.51 | ) | 10.52 | 7.22 | 172,001 | .68 | 4.94 | .68 | 4.94 | .67 | 4.95 | 28 | ||||||||||||||||||||||||||||||||||||
2003 | 10.26 | .52 | .07 | .59 | (.54 | ) | — | (.54 | ) | 10.31 | 5.92 | 176,687 | .69 | 5.12 | .69 | 5.12 | .68 | 5.12 | 25 | ||||||||||||||||||||||||||||||||||||
| * | Annualized. |
| (a) | Per share Net Investment Income is calculated using the average daily shares method. |
| (b) | Total return is the combination of changes in net asset value, reinvested dividend income at net asset value and reinvested capital gains distributions at net asset value, if any. The last dividend declared in the period, which is typically paid on the first business day of the following month, is assumed to be reinvested at the ending net asset value. The actual reinvest price for the last dividend declared in the period may be different from the price used in the calculation. Total returns are not annualized. |
| (c) | After expense reimbursement from the Adviser, where applicable. |
| (d) | After custodian fee credit and expense reimbursement, where applicable. |
| (e) | The expense ratios in the above table reflect, among other things, the interest expense deemed to have been paid by the Fund on the floating rate certificates issued by the special purpose trusts for the self-deposited inverse floaters held by the Fund, as described in Footnote 1 – Inverse Floating Rate Securities. The amount of this deemed interest expense for such periods expressed as a percentage of average net assets for each share class was as follows: |
| Interest Expense on Floating Rate Obligations to Average Net Assets | ||
2008(g) | .23%* | |
2007 | .26 | |
2006 | — | |
2005 | — | |
2004 | — | |
2003 | — | |
| (f) | For the six months ended August 31, 2007. |
See accompanying notes to financial statements.
42
| Class (Commencement Date) | ||||||||||||||||||||||||||||||||||||||||||||||||||||||||
| Investment Operations | Less Distributions | Ratios/Supplemental Data | ||||||||||||||||||||||||||||||||||||||||||||||||||||||
| CALIFORNIA INSURED | Ratios to Average Net Assets Before Credit/ Reimbursement | Ratios to Average Net Assets After Reimbursement(c) | Ratios to Average Net Assets After Credit/ Reimbursement(d) | |||||||||||||||||||||||||||||||||||||||||||||||||||||
| Year Ended February 28/29, | Beginning Net Asset Value | Net Invest- ment Income(a) | Net Realized/ Unrealized Gain (Loss) | Total | Net Invest- ment Income | Capital Gains | Total | Ending Net Asset Value | Total Return(b) | Ending Net Assets (000) | Expenses(e) | Net Invest- ment Income | Expenses(e) | Net Invest- ment Income | Expenses(e) | Net Invest- ment Income | Portfolio Turnover Rate | |||||||||||||||||||||||||||||||||||||||
| Class A (9/94) | ||||||||||||||||||||||||||||||||||||||||||||||||||||||||
2008(f) | $ | 10.84 | $ | .22 | $ | (.38 | ) | $ | (.16 | ) | $ | (.21 | ) | $ | — | $ | (.21 | ) | $ | 10.47 | (1.46 | )% | $ | 88,481 | .95 | %* | 4.00 | %* | .95 | %* | 4.00 | %* | .94 | %* | 4.01 | %* | 12 | % | ||||||||||||||||||
2007 | 10.87 | .43 | .03 | .46 | (.44 | ) | (.05 | ) | (.49 | ) | 10.84 | 4.33 | 89,343 | .86 | 4.02 | .86 | 4.02 | .85 | 4.03 | 16 | ||||||||||||||||||||||||||||||||||||
2006 | 10.91 | .45 | — | .45 | (.45 | ) | (.04 | ) | (.49 | ) | 10.87 | 4.19 | 86,224 | .84 | 4.10 | .84 | 4.10 | .83 | 4.10 | 14 | ||||||||||||||||||||||||||||||||||||
2005 | 11.19 | .46 | (.26 | ) | .20 | (.47 | ) | (.01 | ) | (.48 | ) | 10.91 | 1.88 | 81,346 | .84 | 4.25 | .84 | 4.25 | .84 | 4.26 | 22 | |||||||||||||||||||||||||||||||||||
2004 | 11.06 | .48 | .15 | .63 | (.48 | ) | (.02 | ) | (.50 | ) | 11.19 | 5.84 | 83,966 | .86 | 4.38 | .86 | 4.38 | .86 | 4.38 | 14 | ||||||||||||||||||||||||||||||||||||
2003 | 10.92 | .49 | .23 | .72 | (.50 | ) | (.08 | ) | (.58 | ) | 11.06 | 6.73 | 77,312 | .86 | 4.47 | .86 | 4.47 | .86 | 4.48 | 25 | ||||||||||||||||||||||||||||||||||||
| Class B (3/97) | ||||||||||||||||||||||||||||||||||||||||||||||||||||||||
2008(f) | 10.86 | .18 | (.37 | ) | (.19 | ) | (.17 | ) | — | (.17 | ) | 10.50 | (1.75 | ) | 9,892 | 1.70 | * | 3.25 | * | 1.70 | * | 3.25 | * | 1.69 | * | 3.26 | * | 12 | ||||||||||||||||||||||||||||
2007 | 10.89 | .35 | .02 | .37 | (.35 | ) | (.05 | ) | (.40 | ) | 10.86 | 3.52 | 12,845 | 1.61 | 3.27 | 1.61 | 3.27 | 1.61 | 3.28 | 16 | ||||||||||||||||||||||||||||||||||||
2006 | 10.92 | .36 | .02 | .38 | (.37 | ) | (.04 | ) | (.41 | ) | 10.89 | 3.48 | 15,325 | 1.58 | 3.34 | 1.58 | 3.34 | 1.58 | 3.35 | 14 | ||||||||||||||||||||||||||||||||||||
2005 | 11.20 | .38 | (.26 | ) | .12 | (.39 | ) | (.01 | ) | (.40 | ) | 10.92 | 1.10 | 18,560 | 1.59 | 3.50 | 1.59 | 3.50 | 1.59 | 3.51 | 22 | |||||||||||||||||||||||||||||||||||
2004 | 11.07 | .40 | .15 | .55 | (.40 | ) | (.02 | ) | (.42 | ) | 11.20 | 5.04 | 21,346 | 1.61 | 3.63 | 1.61 | 3.63 | 1.61 | 3.63 | 14 | ||||||||||||||||||||||||||||||||||||
2003 | 10.94 | .41 | .21 | .62 | (.41 | ) | (.08 | ) | (.49 | ) | 11.07 | 5.82 | 21,602 | 1.61 | 3.72 | 1.61 | 3.72 | 1.61 | 3.73 | 25 | ||||||||||||||||||||||||||||||||||||
| Class C (9/94) | ||||||||||||||||||||||||||||||||||||||||||||||||||||||||
2008(f) | 10.79 | .18 | (.36 | ) | (.18 | ) | (.18 | ) | — | (.18 | ) | 10.43 | (1.68 | ) | 13,397 | 1.50 | * | 3.45 | * | 1.50 | * | 3.45 | * | 1.49 | * | 3.46 | * | 12 | ||||||||||||||||||||||||||||
2007 | 10.81 | .37 | .03 | .40 | (.37 | ) | (.05 | ) | (.42 | ) | 10.79 | 3.81 | 13,500 | 1.41 | 3.47 | 1.41 | 3.47 | 1.40 | 3.48 | 16 | ||||||||||||||||||||||||||||||||||||
2006 | 10.85 | .38 | — | .38 | (.38 | ) | (.04 | ) | (.42 | ) | 10.81 | 3.58 | 12,872 | 1.39 | 3.55 | 1.39 | 3.55 | 1.38 | 3.55 | 14 | ||||||||||||||||||||||||||||||||||||
2005 | 11.12 | .40 | (.25 | ) | .15 | (.41 | ) | (.01 | ) | (.42 | ) | 10.85 | 1.37 | 12,952 | 1.40 | 3.70 | 1.40 | 3.70 | 1.39 | 3.71 | 22 | |||||||||||||||||||||||||||||||||||
2004 | 10.99 | .42 | .14 | .56 | (.41 | ) | (.02 | ) | (.43 | ) | 11.12 | 5.25 | 13,751 | 1.41 | 3.83 | 1.41 | 3.83 | 1.41 | 3.83 | 14 | ||||||||||||||||||||||||||||||||||||
2003 | 10.86 | .43 | .21 | .64 | (.43 | ) | (.08 | ) | (.51 | ) | 10.99 | 6.04 | 13,082 | 1.41 | 3.93 | 1.41 | 3.93 | 1.41 | 3.93 | 25 | ||||||||||||||||||||||||||||||||||||
| Class R (7/86) | ||||||||||||||||||||||||||||||||||||||||||||||||||||||||
2008(f) | 10.85 | .23 | (.37 | ) | (.14 | ) | (.22 | ) | — | (.22 | ) | 10.49 | (1.28 | ) | 120,446 | .75 | * | 4.20 | * | .75 | * | 4.20 | * | .74 | * | 4.21 | * | 12 | ||||||||||||||||||||||||||||
2007 | 10.87 | .45 | .04 | .49 | (.46 | ) | (.05 | ) | (.51 | ) | 10.85 | 4.60 | 129,276 | .66 | 4.22 | .66 | 4.22 | .66 | 4.22 | 16 | ||||||||||||||||||||||||||||||||||||
2006 | 10.91 | .47 | — | .47 | (.47 | ) | (.04 | ) | (.51 | ) | 10.87 | 4.36 | 140,555 | .64 | 4.29 | .64 | 4.29 | .63 | 4.30 | 14 | ||||||||||||||||||||||||||||||||||||
2005 | 11.19 | .49 | (.27 | ) | .22 | (.49 | ) | (.01 | ) | (.50 | ) | 10.91 | 2.05 | 146,949 | .65 | 4.45 | .65 | 4.45 | .64 | 4.46 | 22 | |||||||||||||||||||||||||||||||||||
2004 | 11.05 | .50 | .16 | .66 | (.50 | ) | (.02 | ) | (.52 | ) | 11.19 | 6.11 | 154,110 | .66 | 4.58 | .66 | 4.58 | .66 | 4.58 | 14 | ||||||||||||||||||||||||||||||||||||
2003 | 10.91 | .51 | .22 | .73 | (.51 | ) | (.08 | ) | (.59 | ) | 11.05 | 6.91 | 160,678 | .66 | 4.67 | .66 | 4.67 | .66 | 4.68 | 25 | ||||||||||||||||||||||||||||||||||||
| * | Annualized. |
| (a) | Per share Net Investment Income is calculated using the average daily shares method. |
| (b) | Total return is the combination of changes in net asset value, reinvested dividend income at net asset value and reinvested capital gains distributions at net asset value, if any. The last dividend declared in the period, which is typically paid on the first business day of the following month, is assumed to be reinvested at the ending net asset value. The actual reinvest price for the last dividend declared in the period may be different from the price used in the calculation. Total returns are not annualized. |
| (c) | After expense reimbursement from the Adviser, where applicable. |
| (d) | After custodian fee credit and expense reimbursement, where applicable. |
| (e) | The expense ratios in the above table reflect, among other things, the interest expense deemed to have been paid by the Fund on the floating rate certificates issued by the special purpose trusts for the self-deposited inverse floaters held by the Fund, as described in Footnote 1 – Inverse Floating Rate Securities. The amount of this deemed interest expense for such period expressed as a percentage of average net assets for each share class was as follows: |
| Interest Expense on Floating Rate Obligations to Average Net Assets | ||
2008(g) | .13%* | |
2007 | .03 | |
2006 | — | |
2005 | — | |
2004 | — | |
2003 | — | |
| (f) | For the six months ended August 31, 2007. |
See accompanying notes to financial statements.
43
Annual Investment Management Agreement Approval Process
The Board Members are responsible for overseeing the performance of the investment adviser to the Funds and determining whether to continue the advisory arrangements. At the annual review meeting held on May 21, 2007 (the “May Meeting”), the Board Members of the Funds, including the Independent Board Members, unanimously approved the continuance of the Investment Management Agreement between each Fund (each, a “Fund”) and Nuveen Asset Management (“NAM”). The foregoing Investment Management Agreements with NAM are hereafter referred to as “Original Investment Management Agreements.”
Subsequent to the May Meeting, Nuveen Investments, Inc. (“Nuveen”), the parent company of NAM, entered into a merger agreement providing for the acquisition of Nuveen by Windy City Investments, Inc., a corporation formed by investors led by Madison Dearborn Partners, LLC (“MDP”), a private equity investment firm (the “Transaction”). Each Original Investment Management Agreement, as required by Section 15 of the Investment Company Act of 1940 (the “1940 Act”), provides for its automatic termination in the event of its “assignment” (as defined in the 1940 Act). Any change in control of the adviser is deemed to be an assignment. The consummation of the Transaction will result in a change of control of NAM as well as its affiliated sub-advisers and therefore cause the automatic termination of each Original Investment Management Agreement, as required by the 1940 Act. Accordingly, in anticipation of the Transaction, at a meeting held on July 31, 2007 (the “July Meeting”), the Board Members, including the Independent Board Members, unanimously approved new Investment Management Agreements (the “New Investment Management Agreements”) with NAM on behalf of each Fund to take effect immediately after the Transaction or shareholder approval of the new advisory contracts, whichever is later. The 1940 Act also requires that each New Investment Management Agreement be approved by the respective Fund’s shareholders in order for it to become effective. Accordingly, to ensure continuity of advisory services, the Board Members, including the Independent Board Members, unanimously approved Interim Investment Management Agreements to take effect upon the closing of the Transaction if shareholders have not yet approved the New Investment Management Agreements.
Because the information provided and considerations made at the annual review at the May Meeting continue to be relevant with respect to the evaluation of the New Investment Management Agreements, the Board considered the foregoing as part of its deliberations of the New Investment Management Agreements. Accordingly, as indicated, the discussions immediately below outline the materials and information presented to the Board in connection with the Board’s prior annual review and the analysis undertaken and the conclusions reached by the Board Members when determining to continue the Original Investment Management Agreements.
I. Approval of the Original Investment Management Agreements
During the course of the year, the Board received a wide variety of materials relating to the services provided by NAM and the performance of the Funds. At each of its quarterly meetings, the Board reviewed investment performance and various matters relating to the operations of the Funds and other Nuveen funds, including the compliance program, shareholder services, valuation, custody, distribution and other information relating to the nature, extent and quality of services provided by NAM. Between the regularly scheduled quarterly meetings, the Board Members received information on particular matters as the need arose.
In preparation for their considerations at the May Meeting, the Independent Board Members also received extensive materials, well in advance of the meeting, which outlined or are related to, among other things:
| • | the nature, extent and quality of services provided by NAM; |
| • | the organization and business operations of NAM, including the responsibilities of various departments and key personnel; |
| • | each Fund’s past performance as well as the Fund’s performance compared to funds with similar investment objectives based on data and information provided by an independent third party and to customized benchmarks; |
| • | the profitability of Nuveen and certain industry profitability analyses for unaffiliated advisers; |
| • | the expenses of Nuveen in providing the various services; |
| • | the advisory fees and total expense ratios of each Fund, including comparisons of such fees and expenses with those of comparable, unaffiliated funds based on information and data provided by an independent third party (the “Peer Universe”) as well as compared to a subset of funds within the Peer Universe (the “Peer Group”) of the respective Fund (as applicable); |
| • | the advisory fees NAM assesses to other types of investment products or clients; |
| • | the soft dollar practices of NAM, if any; and |
| • | from independent legal counsel, a legal memorandum describing among other things, applicable laws, regulations and duties in reviewing and approving advisory contracts. |
At the May Meeting, NAM made a presentation to, and responded to questions from, the Board. The Independent Board Members also met privately with their legal counsel to review the Board’s duties in reviewing advisory contracts and considering the renewal of the advisory contracts. The Independent Board Members, in consultation with independent counsel, reviewed the factors set out
44
in judicial decisions and Securities and Exchange Commission (“SEC”) directives relating to the renewal of advisory contracts. As outlined in more detail below, the Board Members considered all factors they believed relevant with respect to each Fund, including, but not limited to, the following: (a) the nature, extent and quality of the services to be provided by NAM; (b) the investment performance of the Fund and NAM; (c) the costs of the services to be provided and profits to be realized by Nuveen and its affiliates; (d) the extent to which economies of scale would be realized; and (e) whether fee levels reflect those economies of scale for the benefit of the Fund’s investors. In addition, as noted, the Board Members met regularly throughout the year to oversee the Funds. In evaluating the Original Investment Management Agreements, the Board Members also relied upon their knowledge of NAM, its services and the Funds resulting from their meetings and other interactions throughout the year. It is with this background that the Board Members considered each Original Investment Management Agreement.
A. Nature, Extent and Quality of Services
In considering the renewal of the Original Investment Management Agreements, the Board Members considered the nature, extent and quality of NAM’s services. The Board Members reviewed materials outlining, among other things, Nuveen’s organization and business; the types of services that NAM or its affiliates provide or are expected to provide to the Funds; the performance record of the applicable Fund (as described in further detail below); and at the annual review, any initiatives Nuveen had taken for the municipal fund product line. As noted, the Board Members were already familiar with the organization, operations and personnel of NAM due to the Board Members’ experience in governing the respective Funds and working with NAM on matters relating to the Funds.
At the May Meeting, the Board Members also recognized NAM’s investment in additional qualified personnel throughout the various groups in the organization and recommended to NAM that it continue to review staffing needs as necessary. In addition, the Board Members reviewed materials describing the current status, and, in particular, the developments in 2006 with respect to NAM’s investment process, investment strategies (including additional tools used in executing such strategies), personnel (including portfolio management and research teams), trading process, hedging activities, risk management operations (e.g., reviewing credit quality, duration limits, and derivatives use, as applicable), and investment operations (such as enhancements to trading procedures, pricing procedures, and client services). The Board Members also recognized NAM’s investment of resources and efforts to continue to enhance and refine its investment processes.
In addition to advisory services, the Independent Board Members considered the quality of administrative and non-advisory services provided by NAM and noted that NAM and its affiliates provide the Funds with a wide variety of services and officers and other personnel as are necessary for the operations of the Funds, including:
| • | product management; |
| • | fund administration; |
| • | oversight by shareholder services and other fund service providers; |
| • | administration of Board relations; |
| • | regulatory and portfolio compliance; and |
| • | legal support. |
As the Funds operate in a highly regulated industry and given the importance of compliance, the Board Members considered, in particular, NAM’s compliance activities for the Funds and enhancements thereto. In this regard, the Board Members recognized the quality of NAM’s compliance team. The Board Members further noted NAM’s negotiations with other service providers and the corresponding reduction in certain service providers’ fees at the May Meeting.
Based on their review, the Board Members found that, overall, the nature, extent and quality of services provided (and expected to be provided) to the Funds under the respective Original Investment Management Agreement were satisfactory.
B. The Investment Performance of the Funds and NAM
At the May Meeting, the Board considered the investment performance for each Fund, including the Fund’s historic performance as well as its performance compared to funds with similar investment objectives (the “Performance Peer Group”) based on data provided by an independent third party (as described below). In addition, the Board Members reviewed portfolio level performance (which does not reflect fund level fees and expenses) against customized benchmarks, as described in further detail below.
In evaluating the performance information during the annual review at the May Meeting, in certain instances, the Board Members noted that the closest Performance Peer Group for a fund may not adequately reflect such fund’s investment objectives and strategies, thereby limiting the usefulness of the comparisons of such fund’s performance with that of the Performance Peer Group. These Performance Peer Groups include those for the Nuveen Intermediate Duration Municipal Bond Fund (although such Fund has been reclassified in a more appropriate peer group for 2007).
In addition to the foregoing, with respect to state specific municipal funds, the Board Members also recognized that certain funds do not have a corresponding state specific Performance Peer Group in which case their performance is measured against a more
45
Annual Investment Management Agreement Approval Process (continued)
general municipal category for various states. The open-end state municipal funds that utilize the more general category are the Nuveen New Mexico Municipal Bond Fund and the Nuveen Wisconsin Municipal Bond Fund.
Further, with respect to each Fund, the Board Members reviewed performance information including, among other things, total return information compared with such Fund’s Performance Peer Group for the one-, three- and five-year periods (as applicable) ending December 31, 2006. The Board Members also reviewed each Fund’s portfolio level performance (which does not reflect fund level fees and expenses) compared to customized portfolio level benchmarks for the one- and three-year periods ending December 31, 2006 (as applicable). The analysis was used to assess the efficacy of investment decisions against appropriate measures of risk and total return, within specific market segments. This information supplemented the Fund performance information provided to the Board at each of its quarterly meetings. Based on their review, the Board Members determined that each Fund’s investment performance over time had been satisfactory.
C. Fees, Expenses and Profitability
1. Fees and Expenses
During the annual review, the Board evaluated the management fees and expenses of each Fund reviewing, among other things, such Fund’s advisory fees (net and gross management fees) and total expense ratios (before and after expense reimbursements and/or waivers) in absolute terms as well as comparisons to the gross management fees (before waivers), net management fees (after waivers) and total expense ratios (before and after waivers) of comparable funds in the Peer Universe and the Peer Group. In reviewing the fee schedule for a Fund, the Board Members considered the fund-level and complex-wide breakpoint schedules (described in further detail below) and any fee waivers and reimbursements provided by Nuveen. The Board Members further reviewed data regarding the construction of Peer Groups as well as the methods of measurement for the fee and expense analysis and the performance analysis. In certain cases, due to the small number of peers in the Peer Universe, the Peer Universe and Peer Group had significant overlap or even consisted entirely of the same unaffiliated funds. In reviewing the comparisons of fee and expense information, the Board Members recognized that in certain cases, the size of the fund relative to peers, the small size and odd composition of the Peer Group (including differences in objectives and strategies), expense anomalies, timing of information used or other factors impacting the comparisons thereby limited some of the usefulness of the comparative data. Based on their review of the fee and expense information provided, the Board Members determined that each Fund’s net total expense ratio was within an acceptable range compared to peers.
2. Comparisons with the Fees of Other Clients
At the annual review, the Board Members further reviewed data comparing the advisory fees of NAM with fees NAM charges to other clients. Such clients include NAM’s municipal separately managed accounts. In general, the advisory fees charged for separate accounts are somewhat lower than the advisory fees assessed to the Funds. The Board Members considered the differences in the product types, including, but not limited to, the services provided, the structure and operations, product distribution and costs thereof, portfolio investment policies, investor profiles, account sizes and regulatory requirements. The Board Members noted, in particular, that the range of services provided to the Funds (as discussed above) is much more extensive than that provided to separately managed accounts. As described in further detail above, such additional services include, but are not limited to: product management, fund administration, oversight of third party service providers, administration of Board relations, and legal support. The Board Members noted that the Funds operate in a highly regulated industry requiring extensive compliance functions compared to other investment products. Given the inherent differences in the products, particularly the extensive services provided to the Funds, the Board Members believe such facts justify the different levels of fees.
3. Profitability of Nuveen
In conjunction with its review of fees, the Board Members also considered the profitability of Nuveen for its advisory activities (which incorporated Nuveen’s wholly-owned affiliated sub-advisers) and its financial condition. At the annual review, the Board Members reviewed the revenues and expenses of Nuveen’s advisory activities for the last three years, the allocation methodology used in preparing the profitability data as well as the 2006 Annual Report for Nuveen. The Board Members noted this information supplemented the profitability information requested and received during the year to help keep them apprised of developments affecting profitability (such as changes in fee waivers and expense reimbursement commitments). In this regard, the Board Members noted the enhanced dialogue and information regarding profitability with NAM during the year, including more frequent meetings and updates from Nuveen’s corporate finance group. The Board Members considered Nuveen’s profitability compared with other fund sponsors prepared by three independent third party service providers as well as comparisons of the revenues, expenses and profit margins of various unaffiliated management firms with similar amounts of assets under management prepared by Nuveen.
In reviewing profitability, the Board Members recognized the subjective nature of determining profitability which may be affected by numerous factors including the allocation of expenses. Further, the Board Members recognized the difficulties in making comparisons as the profitability of other advisers generally is not publicly available and the profitability information that is available for certain advisers or management firms may not be representative of the industry and may be affected by, among other things, the adviser’s particular business mix, capital costs, types of funds managed and expense allocations.
46
Notwithstanding the foregoing, the Board Members reviewed Nuveen’s methodology at the annual review and assumptions for allocating expenses across product lines to determine profitability. Last year, the Board Members also designated an Independent Board Member as a point person for the Board to review the methodology determinations during the year and any refinements thereto, which relevant information produced from such process was reported to the full Board. In reviewing profitability, the Board Members recognized Nuveen’s increased investment in its fund business. Based on its review, the Board Members concluded that Nuveen’s level of profitability for its advisory activities was reasonable in light of the services provided.
In evaluating the reasonableness of the compensation, the Board Members also considered other amounts paid to NAM by the Funds as well as any indirect benefits (such as soft dollar arrangements, if any) NAM and its affiliates receive, or are expected to receive, that are directly attributable to the management of the Funds, if any. See Section E below for additional information on indirect benefits NAM may receive as a result of its relationship with the Funds. Based on their review of the overall fee arrangement of each Fund, the Board Members determined that the advisory fees and expenses were reasonable.
D. Economies of Scale and Whether Fee Levels Reflect These Economies of Scale
With respect to economies of scale, the Board Members recognized the potential benefits resulting from the costs of a Fund being spread over a larger asset base. To help ensure the shareholders share in these benefits, the Board Members reviewed and considered the breakpoints in the advisory fee schedules that reduce advisory fees. In addition to advisory fee breakpoints, the Board also approved a complex-wide fee arrangement in 2004. Pursuant to the complex-wide fee arrangement, the fees of the funds in the Nuveen complex, including the Funds, are reduced as the assets in the fund complex reach certain levels. In evaluating the complex-wide fee arrangement, the Board Members noted that the last complex-wide asset level breakpoint for the complex-wide fee schedule was at $91 billion and that the Board Members anticipated further review and/or negotiations prior to the assets of the Nuveen complex reaching such threshold. Based on their review, the Board Members concluded that the breakpoint schedule and complex-wide fee arrangement were acceptable and desirable in providing benefits from economies of scale to shareholders, subject to further evaluation of the complex-wide fee schedule as assets in the complex increase. See Section II, Paragraph D –“Approval of the New Investment Management Agreements – Economies of Scale and Whether Fee Levels Reflect These Economies of Scale” for information regarding subsequent modifications to the complex-wide fee.
E. Indirect Benefits
In evaluating fees, the Board Members also considered any indirect benefits or profits NAM or its affiliates may receive as a result of its relationship with each Fund. In this regard, during the annual review, the Board Members considered, among other things, any sales charges and distribution fees received and retained by the Funds’ principal underwriter, Nuveen Investments, LLC, an affiliate of NAM. The Board Members also recognized that an affiliate of NAM provides distribution and shareholder services to the Funds and their shareholders for which it may be compensated pursuant to a 12b-1 plan. The Board Members, therefore, considered the 12b-1 fees retained by Nuveen during the last calendar year.
In addition to the above, the Board Members considered whether NAM received any benefits from soft dollar arrangements whereby a portion of the commissions paid by a Fund for brokerage may be used to acquire research that may be useful to NAM in managing the assets of the Funds and other clients. With respect to NAM, the Board Members noted that NAM does not currently have any soft dollar arrangements; however, to the extent certain bona fide agency transactions that occur on markets that traditionally trade on a principal basis and riskless principal transactions are considered as generating “commissions,” NAM intends to comply with the applicable safe harbor provisions.
Based on their review, the Board Members concluded that any indirect benefits received by NAM as a result of its relationship with the Funds were reasonable and within acceptable parameters.
F. Other Considerations
The Board Members did not identify any single factor discussed previously as all-important or controlling in their considerations to continue an advisory contract. The Board Members, including the Independent Board Members, unanimously concluded that the terms of the Original Investment Management Agreements are fair and reasonable, that NAM’s fees are reasonable in light of the services provided to each Fund and that the Original Investment Management Agreements be renewed.
II. Approval of the New Investment Management Agreements
Following the May Meeting, the Board Members were advised of the potential Transaction. As noted above, the completion of the Transaction would terminate each of the Original Investment Management Agreements. Accordingly, at the July Meeting, the Board of each Fund, including the Independent Board Members, unanimously approved the New Investment Management Agreements on behalf of the respective Funds. Leading up to the July Meeting, the Board Members had several meetings and deliberations with and without Nuveen management present, and with the advice of legal counsel, regarding the proposed Transaction as outlined below.
On June 8, 2007, the Board Members held a special telephonic meeting to discuss the proposed Transaction. At that meeting, the Board Members established a special ad hoc committee comprised solely of Independent Board Members to focus on the Transaction and to keep the Independent Board Members updated with developments regarding the Transaction. On June 15, 2007, the ad hoc committee discussed with representatives of NAM the Transaction and modifications to the complex-wide fee schedule that would generate additional fee savings at specified levels of complex-wide asset growth. Following the foregoing meetings and
47
Annual Investment Management Agreement Approval Process (continued)
several subsequent telephonic conferences among Independent Board Members and independent counsel, and between Independent Board Members and representatives of Nuveen, the Board met on June 18, 2007 to further discuss the proposed Transaction. Immediately prior to and then again during the June 18, 2007 meeting, the Independent Board Members met privately with their independent legal counsel. At that meeting, the Board met with representatives of MDP, of Goldman Sachs, Nuveen’s financial adviser in the Transaction, and of the Nuveen Board to discuss, among other things, the history and structure of MDP, the terms of the proposed Transaction (including the financing terms), and MDP’s general plans and intentions with respect to Nuveen (including with respect to management, employees, and future growth prospects). On July 9, 2007, the Board also met to be updated on the Transaction as part of a special telephonic Board meeting. The Board Members were further updated at a special in-person Board meeting held on July 19, 2007 (one Independent Board Member participated telephonically). Subsequently, on July 27, 2007, the ad hoc committee held a telephonic conference with representatives of Nuveen and MDP to further discuss, among other things, the Transaction, the financing of the Transaction, retention and incentive plans for key employees, the effect of regulatory restrictions on transactions with affiliates after the Transaction, and current volatile market conditions and their impact on the Transaction.
In connection with their review of the New Investment Management Agreements, the Independent Board Members, through their independent legal counsel, also requested in writing and received additional information regarding the proposed Transaction and its impact on the provision of services by NAM and its affiliates.
The Independent Board Members received, well in advance of the July Meeting, materials which outlined, among other things:
| • | the structure and terms of the Transaction, including MDP’s co-investor entities and their expected ownership interests, and the financing arrangements that will exist for Nuveen following the closing of the Transaction; |
| • | the strategic plan for Nuveen following the Transaction; |
| • | the governance structure for Nuveen following the Transaction; |
| • | any anticipated changes in the operations of the Nuveen funds following the Transaction, including changes to NAM’s and Nuveen’s day-to-day management, infrastructure and ability to provide advisory, distribution or other applicable services to the Funds; |
| • | any changes to senior management or key personnel who work on Fund related matters (including portfolio management, investment oversight, and legal/compliance) and any retention or incentive arrangements for such persons; |
| • | any anticipated effect on each Fund’s expense ratio (including advisory fees) following the Transaction; |
| • | any benefits or undue burdens imposed on the Funds as a result of the Transaction; |
| • | any legal issues for the Funds as a result of the Transaction; |
| • | the nature, quality and extent of services expected to be provided to the Funds following the Transaction, changes to any existing services and policies affecting the Funds, and cost-cutting efforts, if any, that may impact such services or policies; |
| • | any conflicts of interest that may arise for Nuveen or MDP with respect to the Funds; |
| • | the costs associated with obtaining necessary shareholder approvals and who would bear those costs; and |
| • | from legal counsel, a memorandum describing the applicable laws, regulations and duties in approving advisory contracts, including, in particular, with respect to a change of control. |
Immediately preceding the July Meeting, representatives of MDP met with the Board to further respond to questions regarding the Transaction. After the meeting with MDP, the Independent Board Members met with independent legal counsel in executive session. At the July Meeting, Nuveen also made a presentation and responded to questions. Following the presentations and discussions of the materials presented to the Board, the Independent Board Members met again in executive session with their counsel. As outlined in more detail below, the Independent Board Members considered all factors they believed relevant with respect to each Fund, including the impact that the Transaction could be expected to have on the following: (a) the nature, extent and quality of services to be provided; (b) the investment performance of the Funds; (c) the costs of the services and profits to be realized by Nuveen and its affiliates; (d) the extent to which economies of scale would be realized; and (e) whether fee levels reflect those economies of scale for the benefit of investors. As noted above, during the past year, the Board Members had completed their annual review of the respective Original Investment Management Agreements and many of the factors considered at such reviews were applicable to their evaluation of the New Investment Management Agreements. Accordingly, in evaluating such agreements, the Board Members relied upon their knowledge and experience with NAM and considered the information received and their evaluations and conclusions drawn at the reviews. While the Board reviewed many Nuveen funds at the July Meeting, the Independent Board Members evaluated all information available to them on a fund-by-fund basis, and their determinations were made separately in respect of each Fund.
48
A. Nature, Extent and Quality of Services
In evaluating the nature, quality and extent of the services expected to be provided by NAM under the New Investment Management Agreements, the Independent Board Members considered, among other things, the expected impact, if any, of the Transaction on the operations, facilities, organization and personnel of NAM; the potential implications of regulatory restrictions on the Funds following the Transaction; the ability of NAM and its affiliates to perform their duties after the Transaction; and any anticipated changes to the current investment and other practices of the Funds.
The Board noted that the terms of each New Investment Management Agreement, including the fees payable thereunder, are substantially identical to those of the Original Investment Management Agreement relating to the same Fund (with both reflecting reductions to fee levels in the complex-wide fee schedule for complex-wide assets in excess of $80 billion that have an effective date of August 20, 2007). The Board considered that the services to be provided and the standard of care under the New Investment Management Agreements are the same as the corresponding Original Investment Management Agreements. The Board Members further noted that key personnel of NAM who have responsibility for the Funds in each area, including portfolio management, investment oversight, fund management, fund operations, product management, legal/compliance and board support functions, are expected to be the same following the Transaction. The Board Members considered and are familiar with the qualifications, skills and experience of such personnel. The Board also considered certain information regarding any anticipated retention or incentive plans designed to retain key personnel. Further, the Board Members noted that no changes to Nuveen’s infrastructure or operations as a result of the Transaction were anticipated other than potential enhancements as a result of an expected increase in the level of investment in such infrastructure and personnel. The Board noted MDP’s representations that it does not plan to have a direct role in the management of Nuveen, appointing new management personnel, or directly impacting individual staffing decisions. The Board Members also noted that there were not any planned “cost cutting” measures that could be expected to reduce the nature, extent or quality of services. After consideration of the foregoing, the Board Members concluded that no diminution in the nature, quality and extent of services provided to the Funds and their shareholders by NAM is expected.
In addition to the above, the Board Members considered potential changes in the operations of each Fund. In this regard, the Board Members considered the potential effect of regulatory restrictions on the Funds’ transactions with future affiliated persons. During their deliberations, it was noted that, after the Transaction, a subsidiary of Merrill Lynch is expected to have an ownership interest in Nuveen at a level that will make Merrill Lynch an affiliated person of Nuveen. The Board Members recognized that applicable law would generally prohibit the Funds from engaging in securities transactions with Merrill Lynch as principal, and would also impose restrictions on using Merrill Lynch for agency transactions. They recognized that having MDP and Merrill Lynch as affiliates may restrict the Nuveen funds’ ability to invest in securities of issuers controlled by MDP or issued by Merrill Lynch and its affiliates even if not bought directly from MDP or Merrill Lynch as principal. They also recognized that various regulations may require the Nuveen funds to apply investment limitations on a combined basis with affiliates of Merrill Lynch. The Board Members considered information provided by NAM regarding the potential impact on the Nuveen funds’ operations as a result of these regulatory restrictions. The Board Members considered, in particular, the Nuveen funds that may be impacted most by the restricted access to Merrill Lynch, including: municipal funds (particularly certain state-specific funds), senior loan funds, taxable fixed income funds, preferred security funds and funds that heavily use derivatives. The Board Members considered such funds’ historic use of Merrill Lynch as principal in their transactions and information provided by NAM regarding the expected impact resulting from Merrill Lynch’s affiliation with Nuveen and available measures that could be taken to minimize such impact. NAM informed the Board Members that, although difficult to determine with certainty, its management did not believe that MDP’s or Merrill Lynch’s status as an affiliate of Nuveen would have a material adverse effect on any Nuveen fund’s ability to pursue its investment objectives and policies.
In addition to the regulatory restrictions considered by the Board, the Board Members also considered potential conflicts of interest that could arise between the Nuveen funds and various parties to the Transaction and discussed possible ways of addressing such conflicts.
Based on its review along with its considerations regarding services at the annual review, the Board concluded that the Transaction was not expected to adversely affect the nature, quality or extent of services provided by NAM and that the expected nature, quality and extent of such services supported approval of the New Investment Management Agreements.
B. Performance of the Funds
With respect to the performance of the Funds, the Board considered that the portfolio management personnel responsible for the management of the Funds’ portfolios were expected to continue to manage the portfolios following the completion of the Transaction.
In addition, the Board Members recently reviewed Fund performance at the May Meeting as described above and determined such Funds’ performance was satisfactory or better. The Board Members further noted that the investment policies and strategies were not expected to change as a result of the Transaction.
In light of the foregoing factors, along with the prior findings regarding performance at the annual review, the Board concluded that its findings with respect to performance supported approval of the New Investment Management Agreements.
49
Annual Investment Management Agreement Approval Process (continued)
C. Fees, Expenses and Profitability
As described in more detail above, during the annual review, the Board Members considered, among other things, the management fees and expenses of the Funds, the breakpoint schedules, and comparisons of such fees and expenses with peers. At the annual review, the Board Members determined that the respective Fund’s advisory fees and expenses were reasonable. In evaluating the profitability of Nuveen under the New Investment Management Agreements, the Board Members considered their conclusions at their prior reviews and whether the management fees or other expenses would change as a result of the Transaction. As described above, the investment management fee for NAM is composed of two components – a fund-level component and complex-wide level component. The fee schedule under the New Investment Management Agreements to be paid to NAM is identical to that under the Original Investment Management Agreements, including the modified complex-wide fee schedule. As noted above, the Board recently approved a modified complex-wide fee schedule that would generate additional fee savings on complex-wide assets above $80 billion. The modifications have an effective date of August 20, 2007 and are part of the Original Investment Management Agreements. Accordingly, the terms of the complex-wide component under the New Investment Management Agreements are the same as under the Original Investment Management Agreements. The Board Members also noted that Nuveen has committed for a period of two years from the date of closing of the Transaction that it will not increase gross management fees for any Nuveen fund and will not reduce voluntary expense reimbursement levels for any Nuveen fund from their currently scheduled prospective levels (subject to certain potential adjustments noted below). Based on the information provided, the Board Members did not expect that overall Fund expenses would increase as a result of the Transaction.
In addition, the Board Members considered that additional fund launches were anticipated after the Transaction which would result in an increase in total assets under management in the complex and a corresponding decrease in overall management fees under the complex-wide fee schedule. Taking into consideration the Board’s prior evaluation of fees and expenses at the annual renewal, and the modification to the complex-wide fee schedule, the Board determined that the management fees and expenses were reasonable.
While it is difficult to predict with any degree of certainty the impact of the Transaction on Nuveen’s profitability for its advisory activities, at the recent annual review, the Board Members were satisfied that Nuveen’s level of profitability for its advisory activities was reasonable. During the year, the Board Members had noted the enhanced dialogue regarding profitability and the appointment of an Independent Board Member as a point person to review methodology determinations and refinements in calculating profitability. Given their considerations at the annual review and the modifications to the complex-wide fee schedule, the Board Members were satisfied that Nuveen’s level of profitability for its advisory activities continues to be reasonable.
D. Economies of Scale and Whether Fee Levels Reflect These Economies of Scale
The Board Members have been cognizant of economies of scale and the potential benefits resulting from the costs of a Fund being spread over a larger asset base. To help ensure that shareholders share in the benefits derived from economies of scale, the Board adopted the complex-wide fee arrangement in 2004. At the May Meeting, the Board Members reviewed the complex-wide fee arrangements and noted that additional negotiations may be necessary or appropriate as the assets in the complex approached the $91 billion threshold. In light of this assessment coupled with the upcoming Transaction, at the June 15, 2007 meeting, the ad hoc committee met with representatives of Nuveen to further discuss modifications to the complex-wide fee schedule that would generate additional savings for shareholders as the assets of the complex grow. The proposed terms for the complex-wide fee schedule are expressed in terms of targeted cumulative savings at specified levels of complex-wide assets, rather than in terms of targeted marginal complex-wide fee rates. Under the modified schedule, the schedule would generate additional fee savings beginning at complex-wide assets of $80 billion in order to achieve targeted cumulative annual savings at $91 billion of $28 million on a complex-wide level (approximately $0.6 million higher than those generated under the then current schedule) and generate additional fee savings for asset growth above complex-wide assets of $91 billion in order to achieve targeted annual savings at $125 billion of assets of approximately $50 million on a complex-wide level (approximately $2.2 million higher annually than that generated under the then current schedule). At the July Meeting, the Board approved the modified complex-wide fee schedule for the Original Investment Management Agreements and these same terms will apply to the New Investment Management Agreements. Accordingly, the Board Members believe that the breakpoint schedules and revised complex-wide fee schedule are appropriate and desirable in ensuring that shareholders participate in the benefits derived from economies of scale.
E. Indirect Benefits
During their recent annual review, the Board Members considered any indirect benefits that NAM may receive as a result of its relationship with the Funds, as described above. As the policies and operations of Nuveen are not anticipated to change significantly after the Transaction, such indirect benefits should remain after the Transaction. The Board Members further considered any additional indirect benefits to be received by NAM or its affiliates after the Transaction. The Board Members noted that other than benefits from its ownership interest in Nuveen and indirect benefits from fee revenues paid by the Funds under the management agreements and other Board-approved relationships, it was currently not expected that MDP or its affiliates would derive any benefit from the Funds as a result of the Transaction or transact any business with or on behalf of the Funds (other than perhaps potential Fund acquisitions, in secondary market transactions, of securities issued by MDP portfolio companies); or that Merrill Lynch or its affiliates would derive any benefits from the Funds as a result of the Transaction (noting that, indeed, Merrill Lynch would stand to experience the discontinuation of principal transaction activity with the Nuveen funds and likely would experience a noticeable reduction in the volume of agency transactions with the Nuveen funds).
50
F. Other Considerations
In addition to the factors above, the Board Members also considered the following with respect to the Funds:
| • | Nuveen would rely on the provisions of Section 15(f) of the 1940 Act. Section 15(f) provides, in substance, that when a sale of a controlling interest in an investment adviser occurs, the investment adviser or any of its affiliated persons may receive any amount or benefit in connection with the sale so long as (i) during the three-year period following the consummation of a transaction, at least 75% of the investment company’s board of directors must not be “interested persons” (as defined in the 1940 Act) of the investment adviser or predecessor adviser and (ii) an “unfair burden” (as defined in the 1940 Act, including any interpretations or no-action letters of the SEC) must not be imposed on the investment company as a result of the transaction relating to the sale of such interest, or any express or implied terms, conditions or understanding applicable thereto. In this regard, to help ensure that an unfair burden is not imposed on the Nuveen funds, Nuveen has committed for a period of two years from the date of the closing of the Transaction (i) not to increase gross management fees for any Nuveen fund; (ii) not to reduce voluntary expense reimbursement levels for any Nuveen fund from their currently scheduled prospective levels during that period (such commitment, however, may exclude or be adjusted for the impact of future class-specific expense allocation protocol changes for a particular mutual fund); (iii) that no Nuveen fund whose portfolio is managed by a Nuveen affiliate shall use Merrill Lynch as a broker with respect to portfolio transactions done on an agency basis, except as may be approved in the future by the Compliance Committee of the Board; and (iv) that NAM shall not cause the Funds and other municipal funds that NAM manages, as a whole, to enter into portfolio transactions with or through the other minority owners of Nuveen, on either a principal or an agency basis, to a significantly greater extent than both what one would expect an investment team to use such firm in the normal course of business, and what NAM has historically done, without prior Board or Compliance Committee approval (excluding the impact of proportionally increasing the use of such other “minority owners” to fill the void necessitated by not being able to use Merrill Lynch). |
| • | The Funds would not incur any costs in seeking the necessary shareholder approvals for the New Investment Management Agreements (except for any costs attributed to seeking shareholder approvals of Fund specific matters unrelated to the Transaction, such as approval of Board Members, in which case a portion of such costs will be borne by the applicable Funds). |
| • | The reputation, financial strength and resources of MDP. |
| • | The long-term investment philosophy of MDP and anticipated plans to grow Nuveen’s business to the benefit of the Nuveen funds. |
| • | The benefits to the Nuveen funds as a result of the Transaction including: (i) as a private company, Nuveen may have more flexibility in making additional investments in its business; (ii) as a private company, Nuveen may be better able to structure compensation packages to attract and retain talented personnel; (iii) as certain of Nuveen’s distribution partners are expected to be equity or debt investors in Nuveen, Nuveen may be able to take advantage of new or enhanced distribution arrangements with such partners; and (iv) MDP’s experience, capabilities and resources that may help Nuveen identify and acquire investment teams or firms and finance such acquisitions. |
G. Conclusion
The Board Members did not identify any single factor discussed previously as all-important or controlling. The Board Members, including the Independent Board Members, unanimously concluded that the terms of the New Investment Management Agreements are fair and reasonable, that the fees therein are reasonable in light of the services to be provided to each Fund and that the New Investment Management Agreements should be approved and recommended to shareholders.
III. Approval of Interim Contracts
As noted above, at the July Meeting, the Board Members, including the Independent Board Members, unanimously approved the Interim Investment Management Agreements. If necessary to assure continuity of advisory services, the Interim Investment Management Agreements will take effect upon the closing of the Transaction if shareholders have not yet approved the New Investment Management Agreements. The terms of each Interim Investment Management Agreement are substantially identical to those of the corresponding Original Investment Management Agreement and New Investment Management Agreement, respectively, except for certain term and escrow provisions. In light of the foregoing, the Board Members, including the Independent Board Members, unanimously determined that the scope and quality of services to be provided to the Funds under the respective Interim Investment Management Agreement are at least equivalent to the scope and quality of services provided under the applicable Original Investment Management Agreement.
51
Glossary of Terms Used in this Report
Average Annual Total Return: This is a commonly used method to express an investment’s performance over a particular, usually multi-year time period. It expresses the return that would have been necessary each year to equal the investment’s actual cumulative performance (including change in NAV or offer price and reinvested dividends and capital gains distributions, if any) over the time period being considered.
Average Effective Maturity: The average of the number of years to maturity of the bonds in a Fund’s portfolio, computed by weighting each bond’s time to maturity (the date the security comes due) by the market value of the security. This figure does not account for the likelihood of prepayments or the exercise of call provisions unless an escrow account has been established to redeem the bond before maturity. The market value weighting for an investment in an inverse floating rate security is the value of the portfolio’s residual interest in the inverse floating rate trust, and does not include the value of the floating rate securities issued by the trust.
Average Duration: Duration is a measure of the expected period over which a bond’s principal and interest will be paid, and consequently is a measure of the sensitivity of a bond’s (or bond fund’s) value to changes when market interest rates change. Generally, the longer a bond or Fund’s duration, the more the price of the bond or Fund will change as interest rates change.
Dividend Yield (also known as Market Yield or Current Yield): An investment’s current annualized dividend divided by its current offering price.
Net Asset Value (NAV): A Fund’s NAV is the dollar value of one share in the Fund. It is calculated by subtracting the liabilities of the Fund from its total assets and then dividing the remainder by the number of shares outstanding. Fund NAVs are calculated at the end of each business day.
Inverse Floaters: Inverse floating rate securities are created by depositing a municipal bond, typically with a fixed interest rate, into a special purpose trust created by a broker-dealer. This trust, in turn, (a) issues floating rate certificates typically paying short-term tax-exempt interest rates to third parties in amounts equal to some fraction of the deposited bond’s par amount or market value, and (b) issues an inverse floating rate certificate (sometimes referred to as an “inverse floater”) to an investor (such as a Fund) interested in gaining investment exposure to a long-term municipal bond. The income received by the holder of the inverse floater varies inversely with the short-term rate paid to the floating rate certificates’ holders, and in most circumstances the holder of the inverse floater bears substantially all of the underlying bond’s downside investment risk. The holder of the inverse floater typically also benefits disproportionately from any potential appreciation of the underlying bond’s value. Hence, an inverse floater essentially represents an investment in the underlying bond on a leveraged basis.
SEC 30-Day Yield: A standardized measure of a Fund’s yield that accounts for the future amortization of premiums or discounts of bonds held in the Fund’s portfolio.
Taxable-Equivalent Yield: The yield necessary from a fully taxable investment to equal, on an after-tax basis at a specified assumed tax rate, the yield of a municipal bond investment.
Zero Coupon Bond: A zero coupon bond does not pay a regular interest coupon to its holders during the life of the bond. Tax-exempt income to the holder of the bond comes from accretion of the difference between the original purchase price of the bond at issuance and the par value of the bond at maturity and is effectively paid at maturity. The market prices of zero coupon bonds generally are more volatile than the market prices of bonds that pay interest periodically.
52
Fund Information
Fund Manager Nuveen Asset Management 333 West Wacker Drive Chicago, IL 60606 | Legal Counsel Chapman and Cutler LLP Chicago, IL
Independent Registered Public Accounting Firm PricewaterhouseCoopers LLP Chicago, IL
Custodian State Street Bank & Trust Company Boston, MA | Transfer Agent and Shareholder Services Boston Financial Data Services, Inc.
Nuveen Investor Services P.O. Box 8530 Boston, MA 02266-8530 (800) 257-8787 | ||
Investment Policy Change: On September 19, 2007, the Board of Trustees voted to authorize all of Nuveen’s non-insured open-end municipal bond Funds not already so authorized the capability of investing up to 20% of their net assets in below-investment grade (“high yield” or “junk”) municipal securities. This investment policy change, effective October 31, 2007, will give the Funds’ portfolio managers greater flexibility to enhance: (1) income, (2) potential total return, both absolute and on a risk-adjusted basis, and (3) portfolio diversification.
Quarterly Portfolio of Investments and Proxy Voting Information: Each Fund’s (i) quarterly portfolio of investments, (ii) information regarding how the Funds voted proxies relating to portfolio securities held during the most recent 12-month period ended June 30, 2007, and (iii) a description of the policies and procedures that the Funds used to determine how to vote proxies relating to portfolio securities are available without charge, upon request, by calling Nuveen Investments at (800) 257-8787 or on Nuveen’s website at www.nuveen.com.
You may also obtain this and other Fund information directly from the Securities and Exchange Commission (“SEC”). The SEC may charge a copying fee for this information. Visit the SEC on-line at http://www.sec.gov or in person at the SEC’s Public Reference Room in Washington, D.C. Call the SEC at 1-202-942-8090 for room hours and operation. You may also request Fund information by sending an e-mail request to publicinfo@sec.gov or by writing to the SEC’s Public Reference Section at 450 Fifth Street NW, Washington, D.C. 20549.
NASD Regulation, Inc. provides a Public Disclosure Program which supplies certain information regarding the disciplinary history of NASD members and their associated persons in response to either telephone inquiries at (800) 289-9999 or written inquiries at www.nasdr.com. NASD Regulation, Inc. also provides an investor brochure that includes information describing the Public Disclosure Program.
53
Learn more
about Nuveen Funds at
www.nuveen.com/mf
Nuveen Investments:
SERVING Investors
For GENERATIONS
Since 1898, financial advisors and their clients have relied on Nuveen Investments to provide dependable investment solutions. Over this time, Nuveen Investments has adhered to the belief that the best approach to investing is to apply conservative risk-management principles to help minimize volatility.
Building on this tradition, we today offer a range of high quality equity and fixed-income solutions that can be integral parts of a well-diversified core portfolio. Our clients have come to appreciate this diversity, as well as our continued adherence to proven, long-term investing principles.
We offer many different investing solutions for our clients’ different needs.
Managing approximately $170 billion in assets as of September 30, 2007, Nuveen Investments offers access to a number of different asset classes and investing solutions through a variety of products. Nuveen Investments markets its capabilities under six distinct brands: NWQ, specializing in value-style equities; Nuveen, managing fixed-income investments; Santa Barbara, committed to growth equities; Tradewinds specializing in global value equities; Rittenhouse, focused on “blue-chip” growth equities; and Symphony, with expertise in alternative investments as well as equity and income portfolios.
Find out how we can help you reach your financial goals.
An investor should carefully consider the Fund’s objectives, risks, charges and expenses before investing. For a prospectus containing this and other information about the Fund, please contact your financial advisor or Nuveen Investments at (800) 257-8787. Read the prospectus carefully before you invest or send money.
| • | Share prices |
| • | Fund details |
| • | Daily financial news |
| • | Investor education |
MSA-CA-0807D
NUVEEN INVESTMENTS MUTUAL FUNDS
Semiannual Report dated August 31, 2007 | Dependable, tax-free income because it’s not what you earn, it’s what you keep.® | |

Nuveen Investments
Municipal Bond Funds
Nuveen Connecticut Municipal Bond Fund
Nuveen New Jersey Municipal Bond Fund
Nuveen New York Municipal Bond Fund
Nuveen New York Insured Municipal Bond Fund


NOW YOU CAN RECEIVE YOUR
NUVEEN INVESTMENTS FUND REPORTS FASTER.
NO MORE WAITING.
SIGN UP TODAY TO RECEIVE NUVEEN INVESTMENTS FUND INFORMATION BY
E-MAIL.
It only takes a minute to sign up for E-Reports. Once enrolled, you’ll receive an e-mail as soon as your Nuveen Investments Fund information is ready — no more waiting for delivery by regular mail. Just click on the link within the e-mail to see the report, and save it on your computer if your wish.

IT’S FAST, EASY & FREE:
www.investordelivery.com
if you get your Nuveen Investments Fund dividends and statements from your financial advisor or brokerage account.
(Be sure to have the address sheet that accompanied this report handy. You’ll need it to complete the enrollment process.)
OR
www.nuveen.com/accountaccess
if you get your Nuveen Investments Fund dividends and statements directly from Nuveen Investments.

| Must be preceded by or accompanied by a prospectus. | NOT FDIC INSURED | MAY LOSE VALUE | NO BANK GUARANTEE |
Dear Shareholder,
Once again, I am pleased to report that during the period covered by this report your Fund provided tax-free income and solid performance from a carefully selected portfolio of municipal bonds. Detailed information on your Fund’s performance can be found in the Portfolio Manager’s Comments and Fund Spotlight sections of this report.
I also wanted to take this opportunity to report some important news about Nuveen Investments. The company has accepted a buyout offer from a private equity investment firm. While this may affect the corporate structure of Nuveen Investments, it will have no impact on the investment objectives of the Funds, their portfolio management strategies or their dividend policies. We will provide you with additional information about this transaction as more details become available.
With the recent volatility in the market, you may be thinking about adjusting your current portfolios. We believe that it’s times like these that prove the true value of a trusted financial advisor. With the help of your advisor, you may be able to structure a well-balanced portfolio that can become an important component in achieving your long-term financial goals. In fact, a well-diversified portfolio may actually help to reduce your overall investment risk. Your advisor can help you understand how a municipal bond investment like your Nuveen Fund can be an important building block in a portfolio crafted to perform well through a variety of market conditions.
Since 1898, Nuveen Investments has offered financial products and solutions that incorporate careful research, diversification, and the application of conservative risk-management principles. We are grateful that you have chosen us as a partner as you pursue your financial goals. We look forward to continuing to earn your trust in the months and years ahead.
Sincerely,

Timothy R. Schwertfeger
Chairman of the Board
October 15, 2007

“In fact, a well-diversified portfolio may actually help to reduce your overall investment risk.”
Semiannual Report l Page 1
Portfolio Manager’s Comments for the Nuveen Connecticut,
New Jersey, New York and New York Insured Municipal Bond Funds
Portfolio manager Cathryn Steeves discusses key investment strategies and the performance of the Nuveen Connecticut, New Jersey, New York, and New York Insured Municipal Bond Funds for the six months ending August 31, 2007. Cathryn, who has 11 years of investment experience, has managed the Funds since July 2006.
How did the Funds perform during the six months ended August 31, 2007?
The chart on page three provides the Funds’ total return performance information for the six-month, one-year, five-year, and ten-year periods ended August 31, 2007. Each Fund’s total return performance is compared with the Fund’s corresponding Lipper peer fund category, as well as with the national Lehman Brothers Municipal Bond Index and state-specific Lehman Brothers Municipal Bond Indexes.
For the six-month period ended August 31, 2007, the Nuveen Connecticut, New York and New York Insured Municipal Bond Funds all saw their Class A shares at net asset value outperform their respective Lipper peer group averages, while all three Funds trailed the national Lehman Brothers Municipal Bond Index and their corresponding state-specific Lehman Brothers Municipal Bonds Index. During the same period, the Nuveen New Jersey Municipal Bond Fund outperformed the Lipper peer group average and underperformed the national Lehman Brothers Municipal Bond Index while producing a return relatively in line with the Lehman Brothers New Jersey Municipal Bond Index.
For the six-month reporting period, yield curve positioning contributed favorably to performance across all four Funds. Although the returns were negative, the Funds benefited from their relative overweight in intermediate-duration bonds, which enjoyed favorable results. Similarly, in the New Jersey, New York, and New York Insured Funds, a slight underweight in the market’s longest bonds added to performance as these holdings were poor performers during the period. On the other hand, in the Connecticut Fund, the positive impact from the intermediate segment of the yield curve was counterbalanced by the significant underweighting of this Fund in short–duration bonds. Owning more of these strong performers would have been beneficial in a market environment in which investors favored securities with less interest-rate risk.
Our derivative positions in all four Funds were helpful. For most of the period, we held forward interest-rate swaps in all of these Funds. In Connecticut, we also owned U.S. Treasury bond futures that we sold later in the period. Contrary to historical trends, the U.S. Treasury market moved in the opposite direction of the municipal market during the period, performing quite well and helping the performance of our derivative investments.
Security selection in all the Funds had a mixed impact on results. Because high-quality bonds make-up a significant portion of the Connecticut municipal market, the Fund tended to be underweighted in lower- and sub-investment-grade bonds – which resulted in a positive influence on performance in a highly risk-averse investment environment. Not surprisingly, the New York Insured portfolio benefited as well from its near-total allocation to insured municipal bonds, which investors were favoring during this period for their additional security. By contrast, the New Jersey and New York uninsured Funds maintained a somewhat higher relative allocation to lower-grade municipal securities, hampering results. Some of the New Jersey Fund’s lower-rated tobacco bonds did not perform as well as we would have liked during the past six months. Another negative factor was our position in bonds backed by lower-rated municipal insurers – especially Radian Asset
Discussions of specific investments are for illustration only and are not intended as recommendations of individual investments. The views expressed herein represent those of the portfolio manager as of the date of this report and are subject to change at any time, based on market conditions and other factors. The Funds disclaim any obligation to advise shareholders of such changes.
Semiannual Report l Page 2
Class A Shares—
Average Annual Total Returns
as of 8/31/07
| 6-Month | 1-Year | 5-Year | 10-Year | |||||
Nuveen Connecticut Municipal Bond Fund | -1.04% -5.21% | 1.60% -2.70% | 3.93% 3.05% | 4.72% 4.27% | ||||
Lipper Connecticut Municipal Debt Funds Category Average1 | -1.18% | 1.29% | 3.17% | 4.35% | ||||
Lehman Brothers Connecticut Municipal Bond Index2 | 0.42% | 2.84% | 3.55% | 4.90% | ||||
Lehman Brothers Municipal Bond Index2 | -0.57% | 2.30% | 4.16% | 5.28% | ||||
Nuveen New Jersey Municipal Bond Fund | -1.05% -5.17% | 1.63% -2.62% | 3.87% 2.98% | 4.71% 4.25% | ||||
Lipper New Jersey Municipal Debt Funds Category Average1 | -1.42% | 1.28% | 3.61% | 4.36% | ||||
Lehman Brothers New Jersey Municipal Bond Index2 | -1.01% | 2.22% | 4.26% | 5.34% | ||||
Lehman Brothers Municipal Bond Index2 | -0.57% | 2.30% | 4.16% | 5.28% | ||||
Nuveen New York Municipal Bond Fund | -0.94% -5.13% | 1.56% -2.67% | 4.17% 3.28% | 4.91% 4.46% | ||||
Lipper New York Municipal Debt Funds Category Average1 | -1.45% | 1.14% | 3.51% | 4.42% | ||||
Lehman Brothers New York Municipal Bond Index2 | -0.35% | 2.45% | 4.10% | 5.31% | ||||
Lehman Brothers Municipal Bond Index2 | -0.57% | 2.30% | 4.16% | 5.28% | ||||
| 6-Month | 1-Year | 5-Year | 10-Year | |||||
Nuveen New York Insured Municipal Bond Fund | -0.77% -4.89% | 1.61% -2.62% | 3.90% 3.01% | 4.67% 4.23% | ||||
Lipper Insured Municipal Debt Funds Category Average1 | -1.36% | 1.05% | 3.23% | 4.27% | ||||
Lehman Brothers New York Insured Municipal Bond Index2 | -0.71% | 2.24% | 4.32% | 5.49% | ||||
Lehman Brothers Municipal Bond Index2 | -0.57% | 2.30% | 4.16% | 5.28% |
Returns quoted represent past performance, which is no guarantee of future results. Returns at NAV would be lower if the sales charge were included. Returns less than one year are cumulative. Current performance may be higher or lower than the performance shown. Investment returns and principal value will fluctuate so that when shares are redeemed, they may be worth more or less than their original cost. Class A shares have a 4.2% maximum sales charge. Returns do not reflect the deduction of taxes that a shareholder would pay on Fund distributions or the redemption of shares. For the most recent month-end performance, visit www.nuveen.com or call (800) 257-8787.
Please see each Fund’s Spotlight Page later in this report for more complete performance data and expense ratios.
| 1 | For each Fund, the Lipper category average shown represents the average annualized total return for all reporting funds for the periods ended August 31, 2007. The Lipper categories contained 24, 23, 22 and 22 funds in the Lipper Connecticut Municipal Debt Funds Category, 50, 50, 44 and 42 funds in the Lipper New Jersey Municipal Debt Funds Category, 99, 99, 94 and 89 funds in the Lipper New York Municipal Debt Funds Category and 56, 56, 53 and 53 funds in the Lipper Insured Municipal Debt Funds Category for the respective six-month and one-, five- and ten-year periods ended August 31, 2007. The returns account for the effects of management fees and assume reinvestment of dividends, but do not reflect any applicable sales charges. You cannot invest directly in a Lipper Category. |
| 2 | The Lehman Brothers Municipal Bond Index is an unmanaged index comprised of a broad range of investment-grade municipal bonds. The Lehman Brothers Connecticut Municipal Bond Index is an unmanaged index comprised of investment grade, tax-exempt Connecticut bonds with maturities of two years or greater. The Lehman Brothers New Jersey Municipal Bond Index is an unmanaged index comprised of investment grade, tax-exempt New Jersey bonds with maturities of two years or greater. The Lehman Brothers New York Municipal Bond Index is an unmanaged index comprised of investment grade, tax-exempt New York bonds with maturities of two years or greater. The Lehman Brothers New York Insured Municipal Bond Index is comprised of insured New York municipal bond issues. The indexes do not reflect any initial or ongoing expenses and are not available for direct investment. |
Semiannual Report l Page 3
Assurance. Radian Asset Assurance is owned by Radian Group, which also provides mortgage insurance; because of this, investors worried how the subprime mortgage crisis would affect this company’s financial statements. Since we didn’t believe that Radian Asset Assurance was at significant risk, we continued to buy Radian-insured bonds, even as those holdings cheapened and detracted from the Fund’s performance during the period.
What strategies were used to manage the Funds, and how did these strategies influence performance?
During the six-month reporting period, careful duration management remained our focus in all four Funds. To keep each portfolio’s interest-rate sensitivity in line with target levels, we took advantage of suitable opportunities to sell some of our holdings in shorter-duration bonds and reinvest the proceeds in longer-dated securities. A particular focus was on bonds with maturities between 2027 and 2037, which broadly represented the part of the municipal yield curve that we believed offered particular value for shareholders. As an example of our duration-management efforts, we also invested a small portion of the Connecticut Fund in long-dated Puerto Rico bonds.3 These holdings helped us maintain our desired interest-rate sensitivity amid the relatively limited supply of new Connecticut bonds during the period. Similarly, we also invested in some very-long-duration, Puerto Rico sales-tax bonds for the New Jersey Fund. We believed that these securities – maturing in 2057 and offering 5.25 percent in coupon interest – offered shareholders good value and a solid income stream.
As an additional part of our duration-management efforts, we also invested small portions of the four Funds in forward interest-rate swaps. For most of the past six months, the forward interest-rate swaps were tied to LIBOR (London Inter-bank Offered Rate), a widely used interest-rate index. Late in the period, however, we did diversify our exposure and take advantage of better values by shifting some of this allocation into Securities Industry and Financial Markets (SIFM) Municipal Swap Index swaps (previously referred to as the Bond Market Association Index or BMA). These derivative positions enabled us to reduce portfolio volatility and manage duration without having to sell positions in the portfolios that we believed were attractive.
As the period progressed, investors seemingly became more risk averse and started to demand additional income as compensation for buying lower-rated bonds. In light of this credit spread widening, we took advantage of a variety of opportunities that began to surface in the month of August, at the tail end of the municipal market’s significant decline. While we saw relatively fewer opportunities to add attractive new lower-rated bonds to the Connecticut Fund – in part because of tight supplies in the state – we were able to find numerous values for the New Jersey Fund, including several hospital bond issues that we believed offered our shareholders a particularly favorable risk/reward balance. In the New York uninsured Fund, recent lower-rated purchase opportunities included charter school bonds as well as securities issued to help finance the new headquarters of investment bank Goldman Sachs – part of the redevelopment project for Lower Manhattan. The latter bonds were available at attractive values because of the market’s concern about the subprime mortgage crisis and its effect on Goldman’s finances; however we remained confident in these holdings. We also added some higher-rated, longer-dated hospital and multifamily housing project bonds that allowed us to accomplish both our duration and income-generation objectives.
Another strategy actively pursued in all four Funds was to implement tax-loss swaps when appropriate. As interest rates rose during the summer, market
| 3 | The Puerto Rico zero coupon and non-callable bonds are used in all the portfolios as an efficient duration management tool. They are generally available in greater quantities than specialty state paper and because of their structure, allow us to reduce duration risk in relation to the benchmark while holding onto higher coupon bonds that are in the portfolios. |
Semiannual Report l Page 4
conditions provided us with an opportunity to sell existing bonds in the portfolio and reinvest in newer bonds offering similar risk characteristics but more attractive yields. With this approach, we were able to improve the Funds’ yields while simultaneously booking capital losses that can be used to offset future realized capital gains.
Dividend Information
During the reporting period, there were no dividend changes to any of the four Funds. Each Fund seeks to pay dividends at a rate that reflects the past and projected performance of the Fund. To permit a Fund to maintain a more stable monthly dividend, the Fund may pay dividends at a rate that may be more or less than the amount of net investment income actually earned by the Fund during the period. If the Fund has cumulatively earned more than it has paid in dividends, it will hold the excess in reserve as undistributed net investment income (UNII) as part of the Fund’s net asset value. Conversely, if the Fund has cumulatively paid in dividends more than it has earned, the excess will constitute a negative UNII that will likewise be reflected in the Fund’s net asset value. Each Fund will, over time, pay all its net investment income as dividends to shareholders. As of August 31, 2007, the Connecticut, New Jersey and New York Insured Funds had negative UNII balances for financial statement purposes and positive UNII balances, based upon our best estimate, for tax purposes. The uninsured New York Fund had a positive UNII balance for financial statement purposes and a positive UNII balance, based upon our best estimates, for tax purposes.
Semiannual Report Page 5
Fund Spotlight as of 8/31/07 Nuveen Connecticut Municipal Bond Fund
| Quick Facts | ||||||||
| A Shares | B Shares | C Shares | R Shares | |||||
NAV | $10.35 | $10.34 | $10.34 | $10.39 | ||||
Latest Monthly Dividend1 | $0.0350 | $0.0285 | $0.0300 | $0.0370 | ||||
Latest Capital Gain and Ordinary Income Distribution2 | $0.0318 | $0.0318 | $0.0318 | $0.0318 | ||||
Inception Date | 7/13/87 | 2/11/97 | 10/04/93 | 2/25/97 |
Returns quoted represent past performance which is no guarantee of future results. Returns without sales charges would be lower if the sales charge were included. Current performance may be higher or lower than the performance shown. Investment returns and principal value will fluctuate so that when shares are redeemed, they may be worth more or less than their original cost. Returns do not reflect the deduction of taxes that a shareholder would pay on Fund distributions or the redemption of shares. Income is generally exempt from regular federal income taxes. Some income may be subject to state and local taxes and to the federal alternative minimum tax. Capital gains, if any, are subject to tax. For the most recent month-end performance visit www.nuveen.com or call (800) 257-8787.
Class A and C share returns are actual. Class B and R share returns are actual for the period since class inception; returns prior to class inception are Class A share returns adjusted for differences in sales charges and (in the case of Class B) expenses, which are primarily differences in distribution and service fees. Class A shares have a 4.2% maximum sales charge. Class B shares have a contingent deferred sales charge (CDSC), also known as a back-end sales charge, that for redemptions begins at 5% and declines periodically until after 6 years when the charge becomes 0%. Class B shares automatically convert to Class A shares eight years after purchase. Class C shares have a 1% CDSC for redemptions within less than one year, which is not reflected in the one-year total return. Class R shares have no sales charge and may be purchased under limited circumstances or by specified classes of investors.
| Average Annual Total Returns as of 8/31/07 | ||||
| A Shares | NAV | Offer | ||
1-Year | 1.60% | -2.70% | ||
5-Year | 3.93% | 3.05% | ||
10-Year | 4.72% | 4.27% | ||
| B Shares | w/o CDSC | w/CDSC | ||
1-Year | 0.86% | -3.03% | ||
5-Year | 3.14% | 2.97% | ||
10-Year | 4.10% | 4.10% | ||
| C Shares | NAV | |||
1-Year | 1.03% | |||
5-Year | 3.35% | |||
10-Year | 4.15% | |||
| R Shares | NAV | |||
1-Year | 1.83% | |||
5-Year | 4.12% | |||
10-Year | 4.93% | |||
| Tax-Free Yields | ||||
| A Shares | NAV | Offer | ||
Dividend Yield3 | 4.06% | 3.89% | ||
SEC 30-Day Yield3 | — | 3.42% | ||
30-Day Yield3 | 3.72% | — | ||
Taxable-Equivalent Yield4 | 5.44% | 5.00% | ||
| B Shares | NAV | |||
Dividend Yield3 | 3.31% | |||
30-Day Yield3 | 2.98% | |||
Taxable-Equivalent Yield4 | 4.36% | |||
| C Shares | NAV | |||
Dividend Yield3 | 3.48% | |||
30-Day Yield3 | 3.18% | |||
Taxable-Equivalent Yield4 | 4.65% | |||
| R Shares | NAV | |||
Dividend Yield3 | 4.27% | |||
SEC 30-Day Yield3 | 3.92% | |||
Taxable-Equivalent Yield4 | 5.73% | |||
| Average Annual Total Returns as of 9/30/07 | ||||
| A Shares | NAV | Offer | ||
1-Year | 2.50% | -1.82% | ||
5-Year | 3.74% | 2.86% | ||
10-Year | 4.79% | 4.33% | ||
| B Shares | w/o CDSC | w/CDSC | ||
1-Year | 1.75% | -2.18% | ||
5-Year | 2.97% | 2.80% | ||
10-Year | 4.17% | 4.17% | ||
| C Shares | NAV | |||
1-Year | 1.92% | |||
5-Year | 3.18% | |||
10-Year | 4.21% | |||
| R Shares | NAV | |||
1-Year | 2.72% | |||
5-Year | 3.95% | |||
10-Year | 4.98% | |||
| Portfolio Statistics | ||
Net Assets ($000) | $310,814 | |
Average Effective Maturity on Securities (Years) | 15.79 | |
Average Duration | 6.27 | |
| Expense Ratios | ||||||
| Share Class | Gross Expense Ratios | Net Expense Ratios | As of Date | |||
Class A | 1.12% | 1.11% | 2/28/07 | |||
Class B | 1.87% | 1.86% | 2/28/07 | |||
Class C | 1.67% | 1.66% | 2/28/07 | |||
Class R | 0.92% | 0.91% | 2/28/07 | |||
The expense ratios shown factor in Annual Fund Operating Expenses including management fees and other fees and expenses. The Net Expense Ratios reflect custodian fee credits from the custodian bank whereby certain fees and expenses are reduced by credits earned on the Fund’s cash on deposit with the bank. There is no guarantee that the Fund will earn such credits in the future. Absent the credit, expenses would be higher and total returns would be less. These expense ratios may vary from the expense ratios shown elsewhere in this report.
| 1 | Paid September 4, 2007. This is the latest monthly tax-exempt dividend declared during the period ended August 31, 2007. |
| 2 | Paid December 1, 2006. Capital gains and/or ordinary income are subject to federal taxation. |
| 3 | Dividend Yield is the most recent dividend per share (annualized) divided by the appropriate price per share. The SEC 30-Day Yield is computed under an SEC standardized formula and is based on the maximum offer price per share. The 30-Day Yield is computed under the same formula but is based on the Net Asset Value (NAV) per share. The Dividend Yield may differ from the SEC 30-Day Yield because the Fund may be paying out more or less than it is earning and it may not include the effect of amortization of bond premium. |
| 4 | The Taxable-Equivalent Yield represents the yield that must be earned on a fully taxable investment in order to equal the yield of the Fund on an after-tax basis at a specified tax rate. With respect to investments that generate qualified dividend income that is taxable at a maximum rate of 15%, the Taxable-Equivalent Yield is lower. The Taxable-Equivalent Yield is based on the Fund’s 30-Day Yield on the indicated date and a combined federal and state income tax rate of 31.6%. |
Semiannual Report Page 6
Fund Spotlight as of 8/31/07 Nuveen Connecticut Municipal Bond Fund
Bond Credit Quality1
Industries1
Tax Obligation/General | 21.9% | |
Education and Civic Organizations | 17.3% | |
U.S. Guaranteed | 14.2% | |
Tax Obligation/Limited | 7.8% | |
Health Care | 7.8% | |
Utilities | 7.4% | |
Water and Sewer | 7.0% | |
Long-Term Care | 5.1% | |
Other | 11.5% |
| 1 | As a percentage of total investments as of August 31, 2007. Holdings are subject to change. |
Expense Example
As a shareholder of the Fund, you incur two types of costs: (1) transaction costs, including front and back end sales charges (loads) or redemption fees, where applicable; and (2) ongoing costs, including management fees; distribution and service (12b-1) fees, where applicable; and other Fund expenses. This Example is intended to help you understand your ongoing costs (in dollars) of investing in the Fund and to compare these costs with the ongoing costs of investing in other mutual funds.
The Example below is based on an investment of $1,000 invested at the beginning of the period and held for the period.
The information under “Actual Performance,” together with the amount you invested, allows you to estimate actual expenses incurred over the reporting period. Simply divide your account value by $1,000 (for example, an $8,600 account value divided by $1,000 = 8.60) and multiply the result by the cost shown for your share class, in the row entitled “Expenses Incurred During Period” to estimate the expenses incurred on your account during this period.
The information under “Hypothetical Performance,” provides information about hypothetical account values and hypothetical expenses based on the Fund’s actual expense ratio and an assumed rate of return of 5% per year before expenses, which is not the Fund’s actual return. The hypothetical account values and expenses may not be used to estimate the actual ending account balance or expense you incurred for the period. You may use this information to compare the ongoing costs of investing in the Fund and other Funds. To do so, compare this 5% hypothetical example with the 5% hypothetical examples that appear in the shareholder reports of the other funds.
Please note that the expenses shown in the table are meant to highlight your ongoing costs only and do not reflect any transactional costs, such as front and back end sales charges (loads) or redemption fees, where applicable. Therefore, the hypothetical information is useful in comparing ongoing costs only, and will not help you determine the relative total costs of owning different funds or share classes. In addition, if these transactional costs were included, your costs would have been higher.
| Hypothetical Performance | ||||||||||||||||||||||||
| Actual Performance | (5% annualized return before expenses) | |||||||||||||||||||||||
| A Shares | B Shares | C Shares | R Shares | A Shares | B Shares | C Shares | R Shares | |||||||||||||||||
Beginning Account Value (3/01/07) | $ | 1,000.00 | $ | 1,000.00 | $ | 1,000.00 | $ | 1,000.00 | $ | 1,000.00 | $ | 1,000.00 | $ | 1,000.00 | $ | 1,000.00 | ||||||||
Ending Account Value (8/31/07) | $ | 989.60 | $ | 985.90 | $ | 986.80 | $ | 990.80 | $ | 1,019.76 | $ | 1,015.98 | $ | 1,016.99 | $ | 1,020.77 | ||||||||
Expenses Incurred During Period | $ | 5.42 | $ | 9.16 | $ | 8.16 | $ | 4.42 | $ | 5.50 | $ | 9.30 | $ | 8.29 | $ | 4.48 | ||||||||
For each class of the Fund, expenses are equal to the Fund’s annualized net expense ratio of 1.08%, 1.83%, 1.63% and ..88% for Classes A, B, C and R, respectively, multiplied by the average account value over the period, multiplied by 184/365 (to reflect the one-half year period).
Semiannual Report Page 7
Fund Spotlight as of 8/31/07 Nuveen New Jersey Municipal Bond Fund
| Quick Facts | ||||||||
| A Shares | B Shares | C Shares | R Shares | |||||
NAV | $10.50 | $10.51 | $10.47 | $10.53 | ||||
Latest Monthly Dividend1 | $0.0345 | $0.0275 | $0.0295 | $0.0360 | ||||
Latest Capital Gain Distribution2 | $0.0129 | $0.0129 | $0.0129 | $0.0129 | ||||
Inception Date | 9/06/94 | 2/03/97 | 9/21/94 | 2/28/92 |
Returns quoted represent past performance which is no guarantee of future results. Returns without sales charges would be lower if the sales charge were included. Current performance may be higher or lower than the performance shown. Investment returns and principal value will fluctuate so that when shares are redeemed, they may be worth more or less than their original cost. Returns do not reflect the deduction of taxes that a shareholder would pay on Fund distributions or the redemption of shares. Income is generally exempt from regular federal income taxes. Some income may be subject to state and local taxes and to the federal alternative minimum tax. Capital gains, if any, are subject to tax. For the most recent month-end performance visit www.nuveen.com or call (800) 257-8787.
Class A, C and R share returns are actual. Class B share returns are actual for the period since class inception; returns prior to class inception are Class R share returns adjusted for differences in sales charges and expenses, which are primarily differences in distribution and service fees. Class A shares have a 4.2% maximum sales charge. Class B shares have a contingent deferred sales charge (CDSC), also known as a back-end sales charge, that for redemptions begins at 5% and declines periodically until after 6 years when the charge becomes 0%. Class B shares automatically convert to Class A shares eight years after purchase. Class C shares have a 1% CDSC for redemptions within less than one year, which is not reflected in the one-year total return. Class R shares have no sales charge and may be purchased under limited circumstances or by specified classes of investors.
| Average Annual Total Returns as of 8/31/07 | ||||
| A Shares | NAV | Offer | ||
1-Year | 1.63% | -2.62% | ||
5-Year | 3.87% | 2.98% | ||
10-Year | 4.71% | 4.25% | ||
| B Shares | w/o CDSC | w/CDSC | ||
1-Year | 0.84% | -3.06% | ||
5-Year | 3.11% | 2.93% | ||
10-Year | 4.06% | 4.06% | ||
| C Shares | NAV | |||
1-Year | 1.07% | |||
5-Year | 3.32% | |||
10-Year | 4.13% | |||
| R Shares | NAV | |||
1-Year | 1.80% | |||
5-Year | 4.09% | |||
10-Year | 4.91% | |||
| Tax-Free Yields | ||||
| A Shares | NAV | Offer | ||
Dividend Yield3 | 3.94% | 3.78% | ||
SEC 30-Day Yield3 | — | 3.68% | ||
30-Day Yield3 | 3.85% | — | ||
Taxable-Equivalent Yield4 | 5.71% | 5.46% | ||
| B Shares | NAV | |||
Dividend Yield3 | 3.14% | |||
30-Day Yield3 | 3.27% | |||
Taxable-Equivalent Yield4 | 4.85% | |||
| C Shares | NAV | |||
Dividend Yield3 | 3.38% | |||
30-Day Yield3 | 3.47% | |||
Taxable-Equivalent Yield4 | 5.15% | |||
| R Shares | NAV | |||
Dividend Yield3 | 4.10% | |||
30-Day Yield3 | 4.21% | |||
Taxable-Equivalent Yield4 | 6.25% | |||
| Average Annual Total Returns as of 9/30/07 | ||||
| A Shares | NAV | Offer | ||
1-Year | 2.32% | -1.95% | ||
5-Year | 3.73% | 2.84% | ||
10-Year | 4.73% | 4.28% | ||
| B Shares | w/o CDSC | w/CDSC | ||
1-Year | 1.62% | -2.32% | ||
5-Year | 2.97% | 2.79% | ||
10-Year | 4.09% | 4.09% | ||
| C Shares | NAV | |||
1-Year | 1.76% | |||
5-Year | 3.16% | |||
10-Year | 4.15% | |||
| R Shares | NAV | |||
1-Year | 2.58% | |||
5-Year | 3.94% | |||
10-Year | 4.94% | |||
| Portfolio Statistics | ||
Net Assets ($000) | $193,131 | |
Average Effective Maturity on Securities (Years) | 15.64 | |
Average Duration | 6.44 | |
| Expense Ratios | ||||||
| Share Class | Gross Expense Ratios | Net Expense Ratios | As of Date | |||
Class A | 1.00% | 0.98% | 2/28/07 | |||
Class B | 1.75% | 1.73% | 2/28/07 | |||
Class C | 1.55% | 1.53% | 2/28/07 | |||
Class R | 0.80% | 0.78% | 2/28/07 | |||
The expense ratios shown factor in Annual Fund Operating Expenses including management fees and other fees and expenses. The Net Expense Ratios reflect custodian fee credits from the custodian bank whereby certain fees and expenses are reduced by credits earned on the Fund’s cash on deposit with the bank. There is no guarantee that the Fund will earn such credits in the future. Absent the credit, expenses would be higher and total returns would be less. These expense ratios may vary from the expense ratios shown elsewhere in this report.
| 1 | Paid September 4, 2007. This is the latest monthly tax-exempt dividend declared during the period ended August 31, 2007. |
| 2 | Paid December 1, 2006. Capital gains are subject to federal taxation. |
| 3 | Dividend Yield is the most recent dividend per share (annualized) divided by the appropriate price per share. The SEC 30-Day Yield is computed under an SEC standardized formula and is based on the maximum offer price per share. The 30-Day Yield is computed under the same formula but is based on the Net Asset Value (NAV) per share. The Dividend Yield may differ from the SEC 30-Day Yield because the Fund may be paying out more or less than it is earning and it may not include the effect of amortization of bond premium. |
| 4 | The Taxable-Equivalent Yield represents the yield that must be earned on a fully taxable investment in order to equal the yield of the Fund on an after-tax basis at a specified tax rate. With respect to investments that generate qualified dividend income that is taxable at a maximum rate of 15%, the Taxable-Equivalent Yield is lower. The Taxable-Equivalent Yield is based on the Fund’s 30-Day Yield on the indicated date and a combined federal and state income tax rate of 32.6%. |
Semiannual Report Page 8
Fund Spotlight as of 8/31/07 Nuveen New Jersey Municipal Bond Fund
Bond Credit Quality1
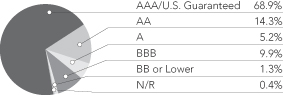
Industries1
Tax Obligation/Limited | 20.4% | |
Transportation | 18.3% | |
U.S. Guaranteed | 16.6% | |
Health Care | 11.5% | |
Tax Obligation/General | 8.3% | |
Education and Civic Organizations | 7.9% | |
Long-Term Care | 5.8% | |
Other | 11.2% |
| 1 | As a percentage of total investments as of August 31, 2007. Holdings are subject to change. |
Expense Example
As a shareholder of the Fund, you incur two types of costs: (1) transaction costs, including front and back end sales charges (loads) or redemption fees, where applicable; and (2) ongoing costs, including management fees; distribution and service (12b-1) fees, where applicable; and other Fund expenses. This Example is intended to help you understand your ongoing costs (in dollars) of investing in the Fund and to compare these costs with the ongoing costs of investing in other mutual funds.
The Example below is based on an investment of $1,000 invested at the beginning of the period and held for the period.
The information under “Actual Performance,” together with the amount you invested, allows you to estimate actual expenses incurred over the reporting period. Simply divide your account value by $1,000 (for example, an $8,600 account value divided by $1,000 = 8.60) and multiply the result by the cost shown for your share class, in the row entitled “Expenses Incurred During Period” to estimate the expenses incurred on your account during this period.
The information under “Hypothetical Performance,” provides information about hypothetical account values and hypothetical expenses based on the Fund’s actual expense ratio and an assumed rate of return of 5% per year before expenses, which is not the Fund’s actual return. The hypothetical account values and expenses may not be used to estimate the actual ending account balance or expense you incurred for the period. You may use this information to compare the ongoing costs of investing in the Fund and other Funds. To do so, compare this 5% hypothetical example with the 5% hypothetical examples that appear in the shareholder reports of the other funds.
Please note that the expenses shown in the table are meant to highlight your ongoing costs only and do not reflect any transactional costs, such as front and back end sales charges (loads) or redemption fees, where applicable. Therefore, the hypothetical information is useful in comparing ongoing costs only, and will not help you determine the relative total costs of owning different funds or share classes. In addition, if these transactional costs were included, your costs would have been higher.
| Hypothetical Performance | ||||||||||||||||||||||||
| Actual Performance | (5% annualized return before expenses) | |||||||||||||||||||||||
| A Shares | B Shares | C Shares | R Shares | A Shares | B Shares | C Shares | R Shares | |||||||||||||||||
Beginning Account Value (3/01/07) | $ | 1,000.00 | $ | 1,000.00 | $ | 1,000.00 | $ | 1,000.00 | $ | 1,000.00 | $ | 1,000.00 | $ | 1,000.00 | $ | 1,000.00 | ||||||||
Ending Account Value (8/31/07) | $ | 989.50 | $ | 985.60 | $ | 986.70 | $ | 990.30 | $ | 1,020.42 | $ | 1,016.64 | $ | 1,017.64 | $ | 1,021.42 | ||||||||
Expenses Incurred During Period | $ | 4.76 | $ | 8.51 | $ | 7.51 | $ | 3.76 | $ | 4.84 | $ | 8.64 | $ | 7.63 | $ | 3.82 | ||||||||
For each class of the Fund, expenses are equal to the Fund’s annualized net expense ratio of .95%, 1.70%, 1.50% and ..75% for Classes A, B, C and R, respectively, multiplied by the average account value over the period, multiplied by 184/365 (to reflect the one-half year period).
Semiannual Report Page 9
Fund Spotlight as of 8/31/07 Nuveen New York Municipal Bond Fund
| Quick Facts | ||||||||
| A Shares | B Shares | C Shares | R Shares | |||||
NAV | $10.54 | $10.54 | $10.55 | $10.57 | ||||
Latest Monthly Dividend1 | $0.0365 | $0.0300 | $0.0320 | $0.0385 | ||||
Latest Capital Gain and Ordinary Income Distribution2 | $0.0115 | $0.0115 | $0.0115 | $0.0115 | ||||
Inception Date | 9/07/94 | 2/03/97 | 9/14/94 | 12/22/86 |
Returns quoted represent past performance which is no guarantee of future results. Returns without sales charges would be lower if the sales charge were included. Current performance may be higher or lower than the performance shown. Investment returns and principal value will fluctuate so that when shares are redeemed, they may be worth more or less than their original cost. Returns do not reflect the deduction of taxes that a shareholder would pay on Fund distributions or the redemption of shares. Income is generally exempt from regular federal income taxes. Some income may be subject to state and local taxes and to the federal alternative minimum tax. Capital gains, if any, are subject to tax. For the most recent month-end performance visit www.nuveen.com or call (800) 257-8787.
Class A, C and R share returns are actual. Class B share returns are actual for the period since class inception; returns prior to class inception are Class R share returns adjusted for differences in sales charges and expenses, which are primarily differences in distribution and service fees. Class A shares have a 4.2% maximum sales charge. Class B shares have a contingent deferred sales charge (CDSC), also known as a back-end sales charge, that for redemptions begins at 5% and declines periodically until after 6 years when the charge becomes 0%. Class B shares automatically convert to Class A shares eight years after purchase. Class C shares have a 1% CDSC for redemptions within less than one year, which is not reflected in the one-year total return. Class R shares have no sales charge and may be purchased under limited circumstances or by specified classes of investors.
| Average Annual Total Returns as of 8/31/07 | ||||
| A Shares | NAV | Offer | ||
1-Year | 1.56% | -2.67% | ||
5-Year | 4.17% | 3.28% | ||
10-Year | 4.91% | 4.46% | ||
| B Shares | w/o CDSC | w/CDSC | ||
1-Year | 0.83% | -3.07% | ||
5-Year | 3.38% | 3.21% | ||
10-Year | 4.28% | 4.28% | ||
| C Shares | NAV | |||
1-Year | 1.05% | |||
5-Year | 3.60% | |||
10-Year | 4.34% | |||
| R Shares | NAV | |||
1-Year | 1.78% | |||
5-Year | 4.37% | |||
10-Year | 5.11% | |||
| Tax-Free Yields | ||||
| A Shares | NAV | Offer | ||
Dividend Yield3 | 4.16% | 3.98% | ||
SEC 30-Day Yield3 | — | 3.44% | ||
30-Day Yield3 | 3.59% | — | ||
Taxable-Equivalent Yield4 | 5.35% | 5.13% | ||
| B Shares | NAV | |||
Dividend Yield3 | 3.42% | |||
30-Day Yield3 | 3.00% | |||
Taxable-Equivalent Yield4 | 4.47% | |||
| C Shares | NAV | |||
Dividend Yield3 | 3.64% | |||
30-Day Yield3 | 3.20% | |||
Taxable-Equivalent Yield4 | 4.77% | |||
| R Shares | NAV | |||
Dividend Yield3 | 4.37% | |||
30-Day Yield3 | 3.94% | |||
Taxable-Equivalent Yield4 | 5.87% | |||
| Average Annual Total Returns as of 9/30/07 | ||||
| A Shares | NAV | Offer | ||
1-Year | 2.25% | -2.08% | ||
5-Year | 3.97% | 3.09% | ||
10-Year | 4.94% | 4.49% | ||
| B Shares | w/o CDSC | w/CDSC | ||
1-Year | 1.51% | -2.41% | ||
5-Year | 3.20% | 3.03% | ||
10-Year | 4.31% | 4.31% | ||
| C Shares | NAV | |||
1-Year | 1.73% | |||
5-Year | 3.41% | |||
10-Year | 4.37% | |||
| R Shares | NAV | |||
1-Year | 2.47% | |||
5-Year | 4.17% | |||
10-Year | 5.15% | |||
| Portfolio Statistics | ||
Net Assets ($000) | $400,397 | |
Average Effective Maturity on Securities (Years) | 15.97 | |
Average Duration | 6.26 | |
| Expense Ratios | ||||||
| Share Class | Gross Expense Ratios | Net Expense Ratios | As of Date | |||
Class A | 1.14% | 1.13% | 2/28/07 | |||
Class B | 1.89% | 1.88% | 2/28/07 | |||
Class C | 1.69% | 1.68% | 2/28/07 | |||
Class R | 0.94% | 0.93% | 2/28/07 | |||
The expense ratios shown factor in Annual Fund Operating Expenses including management fees and other fees and expenses. The Net Expense Ratios reflect custodian fee credits from the custodian bank whereby certain fees and expenses are reduced by credits earned on the Fund’s cash on deposit with the bank. There is no guarantee that the Fund will earn such credits in the future. Absent the credit, expenses would be higher and total returns would be less. These expense ratios may vary from the expense ratios shown elsewhere in this report.
| 1 | Paid September 4, 2007. This is the latest monthly tax-exempt dividend declared during the period ended August 31, 2007. |
| 2 | Paid December 1, 2006. Capital gains and/or ordinary income are subject to federal taxation. |
| 3 | Dividend Yield is the most recent dividend per share (annualized) divided by the appropriate price per share. The SEC 30-Day Yield is computed under an SEC standardized formula and is based on the maximum offer price per share. The 30-Day Yield is computed under the same formula but is based on the Net Asset Value (NAV) per share. The Dividend Yield may differ from the SEC 30-Day Yield because the Fund may be paying out more or less than it is earning and it may not include the effect of amortization of bond premium. |
| 4 | The Taxable-Equivalent Yield represents the yield that must be earned on a fully taxable investment in order to equal the yield of the Fund on an after-tax basis at a specified tax rate. With respect to investments that generate qualified dividend income that is taxable at a maximum rate of 15%, the Taxable-Equivalent Yield is lower. The Taxable-Equivalent Yield is based on the Fund’s 30-Day Yield on the indicated date and a combined federal and state income tax rate of 32.9%. |
Semiannual Report Page 10
Fund Spotlight as of 8/31/07 Nuveen New York Municipal Bond Fund
Bond Credit Quality1
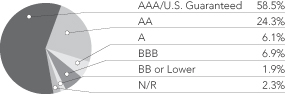
Industries1
Tax Obligation/Limited | 20.8% | |
U.S. Guaranteed | 17.0% | |
Health Care | 13.0% | |
Education and Civic Organizations | 11.2% | |
Transportation | 11.0% | |
Utilities | 7.8% | |
Housing/Multifamily | 5.0% | |
Tax Obligation/General | 4.5% | |
Other | 9.7% |
| 1 | As a percentage of total investments as of August 31, 2007. Holdings are subject to change. |
Expense Example
As a shareholder of the Fund, you incur two types of costs: (1) transaction costs, including front and back end sales charges (loads) or redemption fees, where applicable; and (2) ongoing costs, including management fees; distribution and service (12b-1) fees, where applicable; and other Fund expenses. This Example is intended to help you understand your ongoing costs (in dollars) of investing in the Fund and to compare these costs with the ongoing costs of investing in other mutual funds.
The Example below is based on an investment of $1,000 invested at the beginning of the period and held for the period.
The information under “Actual Performance,” together with the amount you invested, allows you to estimate actual expenses incurred over the reporting period. Simply divide your account value by $1,000 (for example, an $8,600 account value divided by $1,000 = 8.60) and multiply the result by the cost shown for your share class, in the row entitled “Expenses Incurred During Period” to estimate the expenses incurred on your account during this period.
The information under “Hypothetical Performance,” provides information about hypothetical account values and hypothetical expenses based on the Fund’s actual expense ratio and an assumed rate of return of 5% per year before expenses, which is not the Fund’s actual return. The hypothetical account values and expenses may not be used to estimate the actual ending account balance or expense you incurred for the period. You may use this information to compare the ongoing costs of investing in the Fund and other Funds. To do so, compare this 5% hypothetical example with the 5% hypothetical examples that appear in the shareholder reports of the other funds.
Please note that the expenses shown in the table are meant to highlight your ongoing costs only and do not reflect any transactional costs, such as front and back end sales charges (loads) or redemption fees, where applicable. Therefore, the hypothetical information is useful in comparing ongoing costs only, and will not help you determine the relative total costs of owning different funds or share classes. In addition, if these transactional costs were included, your costs would have been higher.
| Hypothetical Performance | ||||||||||||||||||||||||
| Actual Performance | (5% annualized return before expenses) | |||||||||||||||||||||||
| A Shares | B Shares | C Shares | R Shares | A Shares | B Shares | C Shares | R Shares | |||||||||||||||||
Beginning Account Value (3/01/07) | $ | 1,000.00 | $ | 1,000.00 | $ | 1,000.00 | $ | 1,000.00 | $ | 1,000.00 | $ | 1,000.00 | $ | 1,000.00 | $ | 1,000.00 | ||||||||
Ending Account Value (8/31/07) | $ | 990.60 | $ | 987.00 | $ | 988.10 | $ | 991.70 | $ | 1,019.46 | $ | 1,015.68 | $ | 1,016.69 | $ | 1,020.47 | ||||||||
Expenses Incurred During Period | $ | 5.72 | $ | 9.47 | $ | 8.47 | $ | 4.72 | $ | 5.80 | $ | 9.60 | $ | 8.59 | $ | 4.79 | ||||||||
For each class of the Fund, expenses are equal to the Fund’s annualized net expense ratio of 1.14%, 1.89%, 1.69% and ..94% for Classes A, B, C and R, respectively, multiplied by the average account value over the period, multiplied by 184/365 (to reflect the one-half year period).
Semiannual Report Page 11
Fund Spotlight as of 8/31/07 Nuveen New York Insured Municipal Bond Fund
| Quick Facts | ||||||||
| A Shares | B Shares | C Shares | R Shares | |||||
NAV | $10.09 | $10.12 | $10.10 | $10.13 | ||||
Latest Monthly Dividend1 | $0.0335 | $0.0270 | $0.0285 | $0.0350 | ||||
Latest Capital Gain and Ordinary Income Distribution2 | $0.0452 | $0.0452 | $0.0452 | $0.0452 | ||||
Inception Date | 9/07/94 | 2/11/97 | 9/14/94 | 12/22/86 |
Returns quoted represent past performance which is no guarantee of future results. Returns without sales charges would be lower if the sales charge were included. Current performance may be higher or lower than the performance shown. Investment returns and principal value will fluctuate so that when shares are redeemed, they may be worth more or less than their original cost. Returns do not reflect the deduction of taxes that a shareholder would pay on Fund distributions or the redemption of shares. Income is generally exempt from regular federal income taxes. Some income may be subject to state and local taxes and to the federal alternative minimum tax. Capital gains, if any, are subject to tax. For the most recent month-end performance visit www.nuveen.com or call (800) 257-8787.
Class A, C and R share returns are actual. Class B share returns are actual for the period since class inception; returns prior to class inception are Class R share returns adjusted for differences in sales charges and expenses, which are primarily differences in distribution and service fees. Class A shares have a 4.2% maximum sales charge. Class B shares have a contingent deferred sales charge (CDSC), also known as a back-end sales charge, that for redemptions begins at 5% and declines periodically until after 6 years when the charge becomes 0%. Class B shares automatically convert to Class A shares eight years after purchase. Class C shares have a 1% CDSC for redemptions within less than one year, which is not reflected in the one-year total return. Class R shares have no sales charge and may be purchased under limited circumstances or by specified classes of investors.
| Average Annual Total Returns as of 8/31/07 | ||||
| A Shares | NAV | Offer | ||
1-Year | 1.61% | -2.62% | ||
5-Year | 3.90% | 3.01% | ||
10-Year | 4.67% | 4.23% | ||
| B Shares | w/o CDSC | w/CDSC | ||
1-Year | 0.94% | -2.96% | ||
5-Year | 3.13% | 2.97% | ||
10-Year | 4.06% | 4.06% | ||
| C Shares | NAV | |||
1-Year | 1.12% | |||
5-Year | 3.33% | |||
10-Year | 4.10% | |||
| R Shares | NAV | |||
1-Year | 1.78% | |||
5-Year | 4.08% | |||
10-Year | 4.87% | |||
| Tax-Free Yields | ||||
| A Shares | NAV | Offer | ||
Dividend Yield3 | 3.98% | 3.82% | ||
SEC 30-Day Yield3 | — | 3.31% | ||
30-Day Yield3 | 3.45% | — | ||
Taxable-Equivalent Yield4 | 5.14% | 4.93% | ||
| B Shares | NAV | |||
Dividend Yield3 | 3.20% | |||
30-Day Yield3 | 2.86% | |||
Taxable-Equivalent Yield4 | 4.26% | |||
| C Shares | NAV | |||
Dividend Yield3 | 3.39% | |||
30-Day Yield3 | 3.05% | |||
Taxable-Equivalent Yield4 | 4.55% | |||
| R Shares | NAV | |||
Dividend Yield3 | 4.15% | |||
30-Day Yield3 | 3.80% | |||
Taxable-Equivalent Yield4 | 5.66% | |||
| Average Annual Total Returns as of 9/30/07 | ||||
| A Shares | NAV | Offer | ||
1-Year | 2.42% | -1.91% | ||
5-Year | 3.60% | 2.73% | ||
10-Year | 4.71% | 4.26% | ||
| B Shares | w/o CDSC | w/CDSC | ||
1-Year | 1.65% | -2.28% | ||
5-Year | 2.84% | 2.67% | ||
10-Year | 4.09% | 4.09% | ||
| C Shares | NAV | |||
1-Year | 1.83% | |||
5-Year | 3.06% | |||
10-Year | 4.14% | |||
| R Shares | NAV | |||
1-Year | 2.60% | |||
5-Year | 3.83% | |||
10-Year | 4.92% | |||
| Portfolio Statistics | ||
Net Assets ($000) | $308,424 | |
Average Effective Maturity on Securities (Years) | 16.60 | |
Average Duration | 5.59 | |
| Expense Ratios | ||||||
| Share Class | Gross Expense Ratios | Net Expense Ratios | As of Date | |||
Class A | 1.03% | 1.02% | 2/28/07 | |||
Class B | 1.78% | 1.77% | 2/28/07 | |||
Class C | 1.58% | 1.57% | 2/28/07 | |||
Class R | 0.83% | 0.82% | 2/28/07 | |||
The expense ratios shown factor in Annual Fund Operating Expenses including management fees and other fees and expenses. The Net Expense Ratios reflect custodian fee credits from the custodian bank whereby certain fees and expenses are reduced by credits earned on the Fund’s cash on deposit with the bank. There is no guarantee that the Fund will earn such credits in the future. Absent the credit, expenses would be higher and total returns would be less. These expense ratios may vary from the expense ratios shown elsewhere in this report.
| 1 | Paid September 4, 2007. This is the latest monthly tax-exempt dividend declared during the period ended August 31, 2007. |
| 2 | Paid December 1, 2006. Capital gains and/or ordinary income are subject to federal taxation. |
| 3 | Dividend Yield is the most recent dividend per share (annualized) divided by the appropriate price per share. The SEC 30-Day Yield is computed under an SEC standardized formula and is based on the maximum offer price per share. The 30-Day Yield is computed under the same formula but is based on the Net Asset Value (NAV) per share. The Dividend Yield may differ from the SEC 30-Day Yield because the Fund may be paying out more or less than it is earning and it may not include the effect of amortization of bond premium. |
| 4 | The Taxable-Equivalent Yield represents the yield that must be earned on a fully taxable investment in order to equal the yield of the Fund on an after-tax basis at a specified tax rate. With respect to investments that generate qualified dividend income that is taxable at a maximum rate of 15%, the Taxable-Equivalent Yield is lower. The Taxable-Equivalent Yield is based on the Fund’s 30-Day Yield on the indicated date and a combined federal and state income tax rate of 32.9%. |
Semiannual Report Page 12
Fund Spotlight as of 8/31/07 Nuveen New York Insured Municipal Bond Fund
Bond Credit Quality1

The Fund features a portfolio of primarily investment-grade, long-term municipal investments. These investments are covered by insurance, guaranteeing the timely payment of principal and interest, or by an escrow or trust account containing enough U.S. government or U.S. government agency securities to ensure timely payment of principal and interest.
Industries1
Tax Obligation/Limited | 26.4% | |
Transportation | 17.1% | |
Health Care | 14.1% | |
Tax Obligation/General | 12.1% | |
Education and Civic Organizations | 9.7% | |
Utilities | 5.6% | |
U.S. Guaranteed | 5.0% | |
Other | 10.0% |
| 1 | As a percentage of total investments as of August 31, 2007. Holdings are subject to change. |
Expense Example
As a shareholder of the Fund, you incur two types of costs: (1) transaction costs, including front and back end sales charges (loads) or redemption fees, where applicable; and (2) ongoing costs, including management fees; distribution and service (12b-1) fees, where applicable; and other Fund expenses. This Example is intended to help you understand your ongoing costs (in dollars) of investing in the Fund and to compare these costs with the ongoing costs of investing in other mutual funds.
The Example below is based on an investment of $1,000 invested at the beginning of the period and held for the period.
The information under “Actual Performance,” together with the amount you invested, allows you to estimate actual expenses incurred over the reporting period. Simply divide your account value by $1,000 (for example, an $8,600 account value divided by $1,000 = 8.60) and multiply the result by the cost shown for your share class, in the row entitled “Expenses Incurred During Period” to estimate the expenses incurred on your account during this period.
The information under “Hypothetical Performance,” provides information about hypothetical account values and hypothetical expenses based on the Fund’s actual expense ratio and an assumed rate of return of 5% per year before expenses, which is not the Fund’s actual return. The hypothetical account values and expenses may not be used to estimate the actual ending account balance or expense you incurred for the period. You may use this information to compare the ongoing costs of investing in the Fund and other Funds. To do so, compare this 5% hypothetical example with the 5% hypothetical examples that appear in the shareholder reports of the other funds.
Please note that the expenses shown in the table are meant to highlight your ongoing costs only and do not reflect any transactional costs, such as front and back end sales charges (loads) or redemption fees, where applicable. Therefore, the hypothetical information is useful in comparing ongoing costs only, and will not help you determine the relative total costs of owning different funds or share classes. In addition, if these transactional costs were included, your costs would have been higher.
| Hypothetical Performance | ||||||||||||||||||||||||
| Actual Performance | (5% annualized return before expenses) | |||||||||||||||||||||||
| A Shares | B Shares | C Shares | R Shares | A Shares | B Shares | C Shares | R Shares | |||||||||||||||||
Beginning Account Value (3/01/07) | $ | 1,000.00 | $ | 1,000.00 | $ | 1,000.00 | $ | 1,000.00 | $ | 1,000.00 | $ | 1,000.00 | $ | 1,000.00 | $ | 1,000.00 | ||||||||
Ending Account Value (8/31/07) | $ | 992.30 | $ | 988.60 | $ | 990.40 | $ | 993.20 | $ | 1,019.61 | $ | 1,015.88 | $ | 1,016.89 | $ | 1,020.62 | ||||||||
Expenses Incurred During Period | $ | 5.57 | $ | 9.27 | $ | 8.28 | $ | 4.57 | $ | 5.65 | $ | 9.40 | $ | 8.39 | $ | 4.63 | ||||||||
For each class of the Fund, expenses are equal to the Fund’s annualized net expense ratio of 1.11%, 1.85%, 1.65% and ..91% for Classes A, B, C and R, respectively, multiplied by the average account value over the period, multiplied by 184/365 (to reflect the one-half year period).
Semiannual Report Page 13
Portfolio of Investments (Unaudited)
Nuveen Connecticut Municipal Bond Fund
August 31, 2007
| Principal Amount (000) | Description | Optional Call Provisions (1) | Ratings (2) | Value | ||||||
| Consumer Staples – 1.4% | ||||||||||
| $ | 4,505 | Puerto Rico, The Children’s Trust Fund, Tobacco Settlement Asset-Backed Refunding Bonds, Series 2002, 5.375%, 5/15/33 | 5/12 at 100.00 | BBB | $ | 4,224,699 | ||||
| Education and Civic Organizations – 18.1% | ||||||||||
| 2,000 | Connecticut Health and Education Facilities Authority, Revenue Bonds, Connecticut College, Series 2007G, 4.500%, 7/01/37 – MBIA Insured | 7/17 at 100.00 | AAA | 1,879,600 | ||||||
| 2,000 | Connecticut Health and Education Facilities Authority, Revenue Bonds, Quinnipiac University, Series 2006, 5.000%, 7/01/36 – AMBAC Insured | 7/16 at 100.00 | AAA | 2,055,220 | ||||||
| 2,000 | Connecticut Health and Education Facilities Authority, Revenue Bonds, Trinity College, Series 2007J, 4.500%, 7/01/37 – MBIA Insured | 7/17 at 100.00 | AAA | 1,879,600 | ||||||
| Connecticut Health and Education Facilities Authority, University of Hartford Revenue Bonds, Series 2006G: | ||||||||||
| 4,995 | 5.250%, 7/01/26 – RAAI Insured | 7/16 at 100.00 | AA | 5,005,140 | ||||||
| 2,250 | 5.250%, 7/01/36 – RAAI Insured | 7/16 at 100.00 | AA | 2,191,163 | ||||||
| 1,540 | Connecticut Health and Educational Facilities Authority, Revenue Bonds, Brunswick School, Series 2003B, 5.000%, 7/01/33 – MBIA Insured | 7/13 at 100.00 | AAA | 1,575,451 | ||||||
| 1,490 | Connecticut Health and Educational Facilities Authority, Revenue Bonds, Canterbury School, Series 1998A, 5.000%, 7/01/18 – RAAI Insured | 7/08 at 101.00 | AA | 1,493,010 | ||||||
| 450 | Connecticut Health and Educational Facilities Authority, Revenue Bonds, Canterbury School, Series 2006B, 5.000%, 7/01/36 – RAAI Insured | 7/16 at 100.00 | AA | 420,075 | ||||||
| 1,000 | Connecticut Health and Educational Facilities Authority, Revenue Bonds, Connecticut State University System, Series 2003F, 5.000%, 11/01/13 – FSA Insured | No Opt. Call | AAA | 1,071,500 | ||||||
| 2,000 | Connecticut Health and Educational Facilities Authority, Revenue Bonds, Horace Bushnell Memorial Hall, Series 1999A, 5.625%, 7/01/29 – MBIA Insured | 7/09 at 101.00 | Aaa | 2,073,940 | ||||||
| 650 | Connecticut Health and Educational Facilities Authority, Revenue Bonds, Kent School, Series 2004D, 5.000%, 7/01/16 – MBIA Insured | 1/15 at 100.00 | Aaa | 688,591 | ||||||
| 900 | Connecticut Health and Educational Facilities Authority, Revenue Bonds, Loomis Chaffee School, Series 2001E, 5.250%, 7/01/21 | 7/11 at 101.00 | A2 | 928,773 | ||||||
| 1,000 | Connecticut Health and Educational Facilities Authority, Revenue Bonds, Loomis Chaffee School, Series 2005F, 5.250%, 7/01/18 – AMBAC Insured | No Opt. Call | Aaa | 1,089,210 | ||||||
| 1,125 | Connecticut Health and Educational Facilities Authority, Revenue Bonds, Sacred Heart University, Series 1998E, 5.000%, 7/01/28 – RAAI Insured | 7/08 at 101.00 | AA | 1,079,910 | ||||||
| 1,000 | Connecticut Health and Educational Facilities Authority, Revenue Bonds, Suffield Academy, Series 1997A, 5.400%, 7/01/27 – MBIA Insured | 1/08 at 102.00 | AAA | 1,021,040 | ||||||
| 650 | Connecticut Health and Educational Facilities Authority, Revenue Bonds, Trinity College, Series 2004H, 5.000%, 7/01/17 – MBIA Insured | 7/14 at 100.00 | AAA | 690,294 | ||||||
| Connecticut Health and Educational Facilities Authority, Revenue Bonds, University of Hartford, Series 2002E: | ||||||||||
| 1,000 | 5.500%, 7/01/22 – RAAI Insured | 7/12 at 101.00 | AA | 1,060,170 | ||||||
| 6,000 | 5.250%, 7/01/32 – RAAI Insured | 7/12 at 101.00 | AA | 5,893,319 | ||||||
| 4,500 | Connecticut Health and Educational Facilities Authority, Revenue Bonds, Yale University, Series 2002W, 5.125%, 7/01/27 | 7/09 at 100.00 | AAA | 4,581,225 | ||||||
| 735 | Connecticut Higher Education Supplemental Loan Authority, Revenue Bonds, Family Education Loan Program, Series 2001A, 5.250%, 11/15/18 – MBIA Insured (Alternative Minimum Tax) | 11/11 at 100.00 | Aaa | 753,030 | ||||||
| Connecticut State Health and Educational Facilities Authority, Revenue Bonds, Chase Collegiate School, Series 2007A: | ||||||||||
| 360 | 5.000%, 7/01/27 – RAAI Insured | 7/17 at 100.00 | AA | 348,102 | ||||||
| 400 | 5.000%, 7/01/32 – RAAI Insured | 7/17 at 100.00 | AA | 377,708 | ||||||
| 1,435 | University of Connecticut, General Obligation Bonds, Series 2004A, 5.000%, 1/15/16 – MBIA Insured | 1/14 at 100.00 | AAA | 1,520,253 | ||||||
| 2,670 | University of Connecticut, General Obligation Bonds, Series 2005A, 5.000%, 2/15/17 – FSA Insured | 2/15 at 100.00 | AAA | 2,847,528 | ||||||
14
| Principal Amount (000) | Description | Optional Call Provisions (1) | Ratings (2) | Value | ||||||
| Education and Civic Organizations (continued) | ||||||||||
| University of Connecticut, General Obligation Bonds, Series 2006A: | ||||||||||
| $ | 6,200 | 5.000%, 2/15/19 – FGIC Insured | 2/16 at 100.00 | AAA | $ | 6,569,767 | ||||
| 1,605 | 5.000%, 2/15/23 – FGIC Insured | 2/16 at 100.00 | AAA | 1,677,546 | ||||||
| 2,160 | University of Connecticut, Student Fee Revenue Bonds, Series 2002A, 5.250%, 5/15/18 | 5/12 at 100.00 | AA– | 2,275,106 | ||||||
| 3,120 | University of Connecticut, Student Fee Revenue Refunding Bonds, Series 2002A, 5.250%, 11/15/20 – FGIC Insured | 11/12 at 101.00 | AAA | 3,321,989 | ||||||
| 55,235 | Total Education and Civic Organizations | 56,368,260 | ||||||||
| Energy – 0.2% | ||||||||||
| 500 | Virgin Islands Public Finance Authority, Revenue Bonds, Refinery Project Hovensa LLC, Series 2007, 4.700%, 7/01/22 (Alternative Minimum Tax) | 1/15 at 100.00 | BBB | 459,710 | ||||||
| Health Care – 8.1% | ||||||||||
| 2,000 | Connecticut Health and Educational Facilities Authority, Revenue Bonds, Bridgeport Hospital Issue, Series 1992A, 6.625%, 7/01/18 – MBIA Insured | 1/08 at 100.00 | AAA | 2,008,240 | ||||||
| 2,000 | Connecticut Health and Educational Facilities Authority, Revenue Bonds, Bristol Hospital, Series 2002B, 5.500%, 7/01/32 – RAAI Insured | 7/12 at 101.00 | AA | 2,023,660 | ||||||
| 1,500 | Connecticut Health and Educational Facilities Authority, Revenue Bonds, Catholic Health East, Series 1999F, 5.750%, 11/15/29 – MBIA Insured | 11/09 at 101.00 | AAA | 1,565,625 | ||||||
| Connecticut Health and Educational Facilities Authority, Revenue Bonds, Danbury Hospital, Series 1999G: | ||||||||||
| 500 | 5.700%, 7/01/22 – AMBAC Insured | 7/09 at 101.00 | AAA | 519,250 | ||||||
| 1,000 | 5.625%, 7/01/25 – AMBAC Insured | 7/09 at 101.00 | AAA | 1,036,970 | ||||||
| 640 | Connecticut Health and Educational Facilities Authority, Revenue Bonds, Eastern Connecticut Health Network, Series 2000A, 6.000%, 7/01/25 – RAAI Insured | 7/10 at 101.00 | AA | 675,149 | ||||||
| 950 | Connecticut Health and Educational Facilities Authority, Revenue Bonds, Hospital For Special Care, Series 2007C, 5.250%, 7/01/32 – RAAI Insured | 7/17 at 100.00 | AA | 933,109 | ||||||
| 800 | Connecticut Health and Educational Facilities Authority, Revenue Bonds, New Britain General Hospital Issue, Series 1994B, 6.000%, 7/01/24 – AMBAC Insured | 1/08 at 100.00 | AAA | 812,456 | ||||||
| 90 | Connecticut Health and Educational Facilities Authority, Revenue Bonds, St. Francis Hospital and Medical Center, Series 2002D, 5.000%, 7/01/22 – RAAI Insured | 7/12 at 101.00 | AA | 89,158 | ||||||
| 1,000 | Connecticut Health and Educational Facilities Authority, Revenue Bonds, Stamford Hospital, Series 1999G, 5.000%, 7/01/18 – MBIA Insured | 7/09 at 101.00 | Aaa | 1,027,380 | ||||||
| 2,725 | Connecticut Health and Educational Facilities Authority, Revenue Bonds, Waterbury Hospital, Series 1999C, 5.750%, 7/01/20 – RAAI Insured | 7/09 at 101.00 | AA | 2,822,146 | ||||||
| 11,460 | Connecticut Health and Educational Facilities Authority, Revenue Bonds, Yale-New Haven Hospital, Series 2006J-1, 5.000%, 7/01/31 – AMBAC Insured | 7/16 at 100.00 | AAA | 11,709,594 | ||||||
| 24,665 | Total Health Care | 25,222,737 | ||||||||
| Housing/Multifamily – 2.7% | ||||||||||
| 1,885 | Bridgeport Housing Authority, Connecticut, Multifamily Housing Revenue Bonds, Stratfield Apartments, Series 1999, 7.250%, 12/01/24 (Alternative Minimum Tax) | 12/09 at 102.00 | N/R | 1,981,116 | ||||||
| 2,000 | Connecticut Housing Finance Authority, Housing Mortgage Finance Program Bonds, Series 1999D-2, 6.200%, 11/15/41 (Alternative Minimum Tax) | 12/09 at 100.00 | AAA | 2,065,560 | ||||||
| 3,000 | Connecticut Housing Finance Authority, Multifamily Housing Mortgage Finance Program Bonds, Series 2006G-2, 4.800%, 11/15/27 (Alternative Minimum Tax) | 11/15 at 100.00 | AAA | 2,870,700 | ||||||
| 1,350 | New Britain Senior Citizens Housing Development Corporation, Connecticut, FHA-Insured Section 8 Assisted Mortgage Revenue Refunding Bonds, Nathan Hale Apartments, Series 1992A, 6.875%, 7/01/24 | 1/08 at 100.00 | AAA | 1,401,840 | ||||||
| 65 | Stamford Housing Authority, Connecticut, Multifamily Housing Revenue Bonds, Fairfield Apartments, Series 1998, 4.750%, 12/01/28 (Mandatory put 12/01/08) (Alternative Minimum Tax) | No Opt. Call | A– | 65,449 | ||||||
| 8,300 | Total Housing/Multifamily | 8,384,665 | ||||||||
15
Portfolio of Investments (Unaudited)
Nuveen Connecticut Municipal Bond Fund (continued)
August 31, 2007
| Principal Amount (000) | Description | Optional Call Provisions (1) | Ratings (2) | Value | ||||||
| Housing/Single Family – 4.3% | ||||||||||
| Connecticut Housing Finance Authority, Housing Mortgage Finance Program Bonds, Series 2001C: | ||||||||||
| $ | 1,595 | 5.300%, 11/15/33 (Alternative Minimum Tax) | 11/10 at 100.00 | AAA | $ | 1,600,694 | ||||
| 5,160 | 5.450%, 11/15/43 (Alternative Minimum Tax) | 11/10 at 100.00 | AAA | 5,176,822 | ||||||
| Connecticut Housing Finance Authority, Housing Mortgage Finance Program Bonds, Series 2006-A1: | ||||||||||
| 1,610 | 4.700%, 11/15/26 (Alternative Minimum Tax) | 11/15 at 100.00 | AAA | 1,528,776 | ||||||
| 1,735 | 4.800%, 11/15/31 (Alternative Minimum Tax) | 11/15 at 100.00 | AAA | 1,643,357 | ||||||
| 3,500 | Connecticut Housing Finance Authority, Housing Mortgage Finance Program Bonds, Series 2006D, 4.650%, 11/15/27 | 5/16 at 100.00 | AAA | 3,444,350 | ||||||
| 13,600 | Total Housing/Single Family | 13,393,999 | ||||||||
| Industrials – 2.0% | ||||||||||
| 5,250 | Connecticut Resource Recovery Authority, Revenue Bonds, American Ref-Fuel Company of Southeastern Connecticut LP, Series 1992A, 6.450%, 11/15/22 (Alternative Minimum Tax) | 11/07 at 100.00 | BB+ | 5,255,093 | ||||||
| 1,000 | Connecticut Resource Recovery Authority, Revenue Bonds, American Ref-Fuel Company of Southeastern Connecticut LP, Series 1998A-II, 5.500%, 11/15/15 (Alternative Minimum Tax) | 12/11 at 102.00 | Baa2 | 1,021,090 | ||||||
| 6,250 | Total Industrials | 6,276,183 | ||||||||
| Long-Term Care – 5.3% | ||||||||||
| Connecticut Development Authority, First Mortgage Gross Revenue Refunding Healthcare Bonds, Church Homes Inc. – Congregational Avery Heights, Series 1997: | ||||||||||
| 1,700 | 5.700%, 4/01/12 | 10/07 at 102.00 | BBB– | 1,747,651 | ||||||
| 2,560 | 5.800%, 4/01/21 | 10/07 at 102.00 | BBB– | 2,638,182 | ||||||
| Connecticut Development Authority, First Mortgage Gross Revenue Refunding Healthcare Bonds, Connecticut Baptist Homes Inc., Series 1999: | ||||||||||
| 1,000 | 5.500%, 9/01/15 – RAAI Insured | 9/09 at 102.00 | AA | 1,043,040 | ||||||
| 500 | 5.625%, 9/01/22 – RAAI Insured | 9/09 at 102.00 | AA | 521,900 | ||||||
| 1,875 | Connecticut Development Authority, First Mortgage Gross Revenue Refunding Healthcare Bonds, Elim Park Baptist Home Inc., Series 1998A, 5.375%, 12/01/18 | 12/07 at 102.00 | BBB+ | 1,883,494 | ||||||
| 1,000 | Connecticut Development Authority, First Mortgage Gross Revenue Refunding Healthcare Bonds, Mary Wade Home Inc., Series 1999A, 6.375%, 12/01/18 | 12/09 at 102.00 | N/R | 1,064,810 | ||||||
| Connecticut Development Authority, Revenue Refunding Bonds, Duncaster Inc., Series 1999A: | ||||||||||
| 2,200 | 5.250%, 8/01/19 – RAAI Insured | 2/10 at 102.00 | AA | 2,221,582 | ||||||
| 3,910 | 5.375%, 8/01/24 – RAAI Insured | 2/10 at 102.00 | AA | 3,938,465 | ||||||
| 1,000 | Connecticut Health and Educational Facilities Authority, FHA-Insured Mortgage Revenue Bonds, Hebrew Home and Hospital, Series 1999B, 5.200%, 8/01/38 | 8/08 at 102.00 | AAA | 1,013,030 | ||||||
| 500 | Connecticut Housing Finance Authority, Group Home Mortgage Finance Program Special Obligation Bonds, Series 2000GH-5, 5.850%, 6/15/30 – AMBAC Insured | 6/10 at 102.00 | AAA | 524,415 | ||||||
| 16,245 | Total Long-Term Care | 16,596,569 | ||||||||
| Materials – 0.3% | ||||||||||
| 1,000 | Sprague, Connecticut, Environmental Improvement Revenue Bonds, International Paper Company, Series 1997A, 5.700%, 10/01/21 (Alternative Minimum Tax) | 10/07 at 102.00 | BBB | 1,005,880 | ||||||
| Tax Obligation/General – 22.4% | ||||||||||
| 1,500 | Bridgeport, Connecticut, General Obligation Refunding Bonds, Series 2002A, 5.375%, 8/15/19 – FGIC Insured | 8/12 at 100.00 | Aaa | 1,594,980 | ||||||
| 325 | Canterbury, Connecticut, General Obligation Bonds, Series 1989, 7.200%, 5/01/09 | No Opt. Call | A3 | 342,407 | ||||||
| 395 | Colchester, Connecticut, General Obligation Bonds, Series 2001, 5.500%, 6/15/14 – FGIC Insured | 6/11 at 102.00 | Aaa | 426,406 | ||||||
| 8,565 | Connecticut State, General Obligation Bonds, Series 2007B, 5.000%, 5/01/16 | No Opt. Call | AA | 9,198,295 | ||||||
| 3,330 | Connecticut, General Obligation Bonds, Series 2004C, 5.000%, 4/01/23 – FGIC Insured | 4/14 at 100.00 | AAA | 3,445,884 | ||||||
| 5,500 | Connecticut, General Obligation Bonds, Series 2006A, 4.750%, 12/15/24 | 12/16 at 100.00 | AA | 5,617,755 | ||||||
| 2,200 | Connecticut, General Obligation Bonds, Series 2006C, 5.000%, 6/01/23 – FSA Insured | 6/16 at 100.00 | AAA | 2,297,306 | ||||||
16
| Principal Amount (000) | Description | Optional Call Provisions (1) | Ratings (2) | Value | ||||||
| Tax Obligation/General (continued) | ||||||||||
| Connecticut, General Obligation Bonds, Series 2001C: | ||||||||||
| $ | 5,000 | 5.500%, 12/15/13 (UB) | No Opt. Call | AA | $ | 5,481,750 | ||||
| 10,000 | 5.500%, 12/15/14 (UB) | No Opt. Call | AA | 11,050,100 | ||||||
| 545 | East Lyme, Connecticut, General Obligation Bonds, Series 2001, 5.000%, 7/15/16 – FGIC Insured | 7/11 at 102.00 | Aaa | 577,313 | ||||||
| Hartford, Connecticut, General Obligation Bonds, Series 2005A: | ||||||||||
| 1,195 | 5.000%, 8/01/20 – FSA Insured | 8/15 at 100.00 | AAA | 1,248,954 | ||||||
| 595 | 5.000%, 8/01/21 – FSA Insured | 8/15 at 100.00 | AAA | 619,758 | ||||||
| 1,210 | 4.375%, 8/01/24 – FSA Insured | 8/15 at 100.00 | AAA | 1,177,923 | ||||||
| 100 | New London, Connecticut, General Obligation Bonds, Series 1988, 7.300%, 12/01/07 | No Opt. Call | A+ | 100,873 | ||||||
| North Haven, Connecticut, General Obligation Bonds, Series 2006: | ||||||||||
| 1,200 | 5.000%, 7/15/20 | No Opt. Call | Aa2 | 1,284,156 | ||||||
| 1,455 | 5.000%, 7/15/21 | No Opt. Call | Aa2 | 1,558,145 | ||||||
| 485 | 5.000%, 7/15/24 | No Opt. Call | Aa2 | 518,480 | ||||||
| Old Saybrook, Connecticut, General Obligation Bonds, Series 1989: | ||||||||||
| 160 | 7.400%, 5/01/08 | No Opt. Call | Aa3 | 163,821 | ||||||
| 160 | 7.400%, 5/01/09 | No Opt. Call | Aa3 | 169,235 | ||||||
| Old Saybrook, Connecticut, General Obligation Bonds, Series 1991: | ||||||||||
| 275 | 6.500%, 2/15/10 – AMBAC Insured | No Opt. Call | AAA | 293,277 | ||||||
| 270 | 6.500%, 2/15/11 – AMBAC Insured | No Opt. Call | AAA | 294,800 | ||||||
| Puerto Rico, General Obligation and Public Improvement Bonds, Series 2001A: | ||||||||||
| 700 | 5.500%, 7/01/14 – FSA Insured (UB) | No Opt. Call | AAA | 770,770 | ||||||
| 2,125 | 5.500%, 7/01/16 – FSA Insured (UB) | No Opt. Call | AAA | 2,367,633 | ||||||
| 2,500 | 5.500%, 7/01/17 – FSA Insured (UB) | No Opt. Call | AAA | 2,799,025 | ||||||
| 2,870 | 5.500%, 7/01/18 – FSA Insured (UB) | No Opt. Call | AAA | 3,201,169 | ||||||
| 1,875 | 5.500%, 7/01/19 – FSA Insured (UB) | No Opt. Call | AAA | 2,092,931 | ||||||
| 420 | Regional School District 15, Connecticut, General Obligation Bonds, Series 2002, 5.000%, 8/15/22 – FSA Insured | 8/10 at 101.00 | Aaa | 429,185 | ||||||
| Regional School District 16, Beacon Falls and Prospect, Connecticut, General Obligation Bonds, Series 2000: | ||||||||||
| 650 | 5.500%, 3/15/18 – FSA Insured | 3/10 at 101.00 | Aaa | 682,156 | ||||||
| 650 | 5.625%, 3/15/19 – FSA Insured | 3/10 at 101.00 | Aaa | 684,268 | ||||||
| 650 | 5.700%, 3/15/20 – FSA Insured | 3/10 at 101.00 | Aaa | 685,438 | ||||||
| 2,050 | Stratford, Connecticut, General Obligation Bonds, Series 2002, 4.000%, 2/15/16 – FSA Insured | 2/12 at 100.00 | AAA | 2,054,367 | ||||||
| Suffield, Connecticut, General Obligation Bonds, Series 2005: | ||||||||||
| 600 | 5.000%, 6/15/17 | No Opt. Call | AA | 645,654 | ||||||
| 600 | 5.000%, 6/15/19 | No Opt. Call | AA | 643,656 | ||||||
| Watertown, Connecticut, General Obligation Bonds, Series 2005: | ||||||||||
| 1,055 | 5.000%, 8/01/14 – MBIA Insured | No Opt. Call | Aaa | 1,128,228 | ||||||
| 1,060 | 5.000%, 8/01/15 – MBIA Insured | No Opt. Call | Aaa | 1,136,712 | ||||||
| 2,170 | West Hartford, Connecticut, General Obligation Bonds, Series 2005B, 5.000%, 10/01/17 | 10/15 at 100.00 | AAA | 2,323,658 | ||||||
Winchester, Connecticut, General Obligation Bonds, Series 1990: | ||||||||||
| 140 | 6.750%, 4/15/08 | No Opt. Call | A2 | 142,590 | ||||||
| 140 | 6.750%, 4/15/09 | No Opt. Call | A2 | 146,644 | ||||||
| 140 | 6.750%, 4/15/10 | No Opt. Call | A2 | 150,552 | ||||||
| 64,860 | Total Tax Obligation/General | 69,546,254 | ||||||||
| Tax Obligation/Limited – 8.2% | ||||||||||
| 2,600 | Connecticut Health and Educational Facilities Authority, Child Care Facilities Program Revenue Bonds, Series 2006F, 5.000%, 7/01/36 – AGC Insured | 7/16 at 100.00 | AAA | 2,626,650 | ||||||
| 825 | Connecticut Health and Educational Facilities Authority, Revenue Bonds, Child Care Facilities Program, Series 1998A, 5.000%, 7/01/28 – AMBAC Insured | 7/08 at 102.00 | AAA | 833,077 | ||||||
| 2,895 | Connecticut Health and Educational Facilities Authority, Revenue Bonds, New Opportunities for Waterbury Inc., Series 1998A, 6.750%, 7/01/28 | 7/08 at 105.00 | A | 3,073,390 | ||||||
17
Portfolio of Investments (Unaudited)
Nuveen Connecticut Municipal Bond Fund (continued)
August 31, 2007
| Principal Amount (000) | Description | Optional Call Provisions (1) | Ratings (2) | Value | |||||||
| Tax Obligation/Limited (continued) | |||||||||||
| Connecticut, Certificates of Participation, Juvenile Training School, Series 2001: | |||||||||||
| $ | 1,275 | 5.000%, 12/15/20 | 12/11 at 101.00 | AA– | $ | 1,308,545 | |||||
| 1,000 | 5.000%, 12/15/30 | 12/11 at 101.00 | AA– | 1,014,070 | |||||||
| 1,150 | Connecticut, Special Tax Obligation Transportation Infrastructure Purpose Bonds, Series 1992B, 6.125%, 9/01/12 | No Opt. Call | AA | 1,245,243 | |||||||
| 4,000 | Connecticut, Special Tax Obligation Transportation Infrastructure Purpose Bonds, Series 2002B, 5.000%, 12/01/20 – AMBAC Insured | 12/12 at 100.00 | AAA | 4,161,920 | |||||||
| 1,000 | Connecticut, Special Tax Obligation Transportation Infrastructure Purpose Bonds, Series 2003B, 5.000%, 1/01/23 – FGIC Insured | 1/14 at 100.00 | AAA | 1,026,670 | |||||||
| 4,000 | Puerto Rico Highway and Transportation Authority, Highway Revenue Bonds, Series 2007N, 5.250%, 7/01/33 – MBIA Insured | No Opt. Call | AAA | 4,361,640 | |||||||
| 4,650 | Puerto Rico Municipal Finance Agency, Series 2005C, 5.000%, 8/01/16 – FSA Insured | 8/15 at 100.00 | AAA | 4,976,709 | |||||||
| 700 | Puerto Rico Sales Tax Financing Corporation, Sales Tax Revenue Bonds, Series 2007A, | 8/17 at 100.00 | A+ | 717,094 | |||||||
| 24,095 | Total Tax Obligation/Limited | 25,345,008 | |||||||||
| Transportation – 1.2% | |||||||||||
| 2,100 | Connecticut, General Airport Revenue Bonds, Bradley International Airport, Series 2001A, 5.125%, 10/01/26 – FGIC Insured (Alternative Minimum Tax) | 4/11 at 101.00 | AAA | 2,119,950 | |||||||
| 1,360 | New Haven, Connecticut, Revenue Refunding Bonds, Air Rights Parking Facility, Series 2002, 5.375%, 12/01/14 – AMBAC Insured | No Opt. Call | AAA | 1,487,065 | |||||||
| 250 | Puerto Rico Ports Authority, Special Facilities Revenue Bonds, American Airlines Inc., Series 1996A, 6.250%, 6/01/26 (Alternative Minimum Tax) | 12/07 at 101.00 | CCC+ | 250,088 | |||||||
| 3,710 | Total Transportation | 3,857,103 | |||||||||
| U.S. Guaranteed – 14.9% (3) | |||||||||||
| 1,000 | Bridgeport, Connecticut, General Obligation Bonds, Series 2000A, 6.000%, 7/15/19 | 7/10 at 101.00 | AAA | 1,072,070 | |||||||
| 1,440 | Bridgeport, Connecticut, General Obligation Bonds, Series 2003A, 5.250%, 9/15/22 | 9/13 at 100.00 | AAA | 1,554,523 | |||||||
| Cheshire, Connecticut, General Obligation Bonds, Series 1999: | |||||||||||
| 660 | 5.625%, 10/15/18 (Pre-refunded 10/15/09) | 10/09 at 101.00 | Aa2 | (3) | 691,984 | ||||||
| 660 | 5.625%, 10/15/19 (Pre-refunded 10/15/09) | 10/09 at 101.00 | Aa2 | (3) | 691,984 | ||||||
| 750 | Connecticut Health and Educational Facilities Authority, Revenue Bonds, Connecticut College, Series 2000D, 5.750%, 7/01/30 (Pre-refunded 7/01/10) – MBIA Insured | 7/10 at 101.00 | AAA | 797,820 | |||||||
| Connecticut Health and Educational Facilities Authority, Revenue Bonds, Eastern Connecticut Health Network, Series 2000A: | |||||||||||
| 1,305 | 6.000%, 7/01/25 (Pre-refunded 7/01/10) – RAAI Insured | 7/10 at 101.00 | AA | (3) | 1,396,898 | ||||||
| 55 | 6.000%, 7/01/25 (Pre-refunded 7/01/10) – RAAI Insured | 7/10 at 101.00 | N/R | (3) | 58,842 | ||||||
| 925 | Connecticut Health and Educational Facilities Authority, Revenue Bonds, Greenwich Academy, Series 2001B, 5.000%, 3/01/32 (Pre-refunded 3/01/11) – FSA Insured | 3/11 at 101.00 | AAA | 973,674 | |||||||
| 1,000 | Connecticut Health and Educational Facilities Authority, Revenue Bonds, Loomis Chaffee School, Series 2001D, 5.500%, 7/01/23 (Pre-refunded 7/01/11) | 7/11 at 101.00 | A2 | (3) | 1,073,720 | ||||||
| 1,140 | Connecticut Health and Educational Facilities Authority, Revenue Bonds, Lutheran General Healthcare System – Parkside Lodges Projects, Series 1989, 7.375%, 7/01/19 (ETM) | 1/08 at 100.00 | AAA | 1,362,448 | |||||||
| 2,250 | Connecticut Health and Educational Facilities Authority, Revenue Bonds, Trinity College, Series 2001G, 5.000%, 7/01/31 (Pre-refunded 7/01/11) – AMBAC Insured | 7/11 at 101.00 | AAA | 2,373,503 | |||||||
| 1,000 | Connecticut, General Obligation Bonds, Series 2001D, 5.000%, 11/15/20 (Pre-refunded 11/15/11) | 11/11 at 100.00 | AA | (3) | 1,051,940 | ||||||
| 1,000 | Connecticut, General Obligation Bonds, Series 2002A, 5.375%, 4/15/19 (Pre-refunded 4/15/12) | 4/12 at 100.00 | AA | (3) | 1,072,940 | ||||||
| 2,000 | Connecticut, General Obligation Bonds, Series 2002B, 5.500%, 6/15/21 (Pre-refunded 6/15/12) | 6/12 at 100.00 | AA | (3) | 2,161,560 | ||||||
| 470 | East Lyme, Connecticut, General Obligation Bonds, Series 2001, 5.000%, 7/15/16 | 7/11 at 102.00 | Aaa | 500,644 | |||||||
18
| Principal Amount (000) | Description | Optional Call Provisions (1) | Ratings (2) | Value | |||||||
| U.S. Guaranteed (3) (continued) | |||||||||||
| $ | 1,000 | Hartford, Connecticut, Parking System Revenue Bonds, Series 2000A, 6.500%, 7/01/25 (Pre-refunded 7/01/10) | 7/10 at 100.00 | Baa2 | (3) | $ | 1,073,620 | ||||
| New Haven, Connecticut, General Obligation Bonds, Series 2001A: | |||||||||||
| 365 | 5.000%, 11/01/20 (Pre-refunded 11/01/11) – FGIC Insured | 11/11 at 100.00 | AAA | 382,454 | |||||||
| 1,265 | 5.000%, 11/01/20 (Pre-refunded 11/01/10) – FGIC Insured | 11/10 at 101.00 | AAA | 1,326,277 | |||||||
| 975 | Northern Mariana Islands, General Obligation Bonds, Series 2000A, 6.000%, 6/01/20 | 6/10 at 100.00 | AAA | 1,035,811 | |||||||
| 1,000 | Puerto Rico Highway and Transportation Authority, Highway Revenue Bonds, Series 2000B, | 7/10 at 101.00 | AAA | 1,065,990 | |||||||
| Puerto Rico Infrastructure Financing Authority, Special Obligation Bonds, Series 2000A: | |||||||||||
| 2,540 | 5.500%, 10/01/32 | 10/10 at 101.00 | AAA | 2,668,473 | |||||||
| 4,500 | 5.500%, 10/01/40 | 10/10 at 101.00 | AAA | 4,722,255 | |||||||
| 1,300 | Puerto Rico, The Children’s Trust Fund, Tobacco Settlement Asset-Backed Bonds, Series 2000, 5.750%, 7/01/20 (Pre-refunded 7/01/10) | 7/10 at 100.00 | AAA | 1,342,406 | |||||||
| 1,460 | Regional School District 8, Andover, Hebron and Marlborough, Connecticut, General Obligation Bonds, Series 2002, 5.000%, 5/01/21 (Pre-refunded 5/01/11) – FSA Insured | 5/11 at 101.00 | Aaa | 1,539,380 | |||||||
| 2,105 | Stamford, Connecticut, General Obligation Bonds, Series 2002, 5.000%, 8/15/15 (Pre-refunded 8/15/12) | 8/12 at 100.00 | AAA | 2,233,026 | |||||||
| 135 | University of Connecticut, General Obligation Bonds, Series 2000A, 5.550%, 3/01/18 | 3/10 at 101.00 | AAA | 142,259 | |||||||
| University of Connecticut, General Obligation Bonds, Series 2002A: | |||||||||||
| 3,065 | 5.375%, 4/01/17 (Pre-refunded 4/01/12) | 4/12 at 100.00 | AA | (3) | 3,286,845 | ||||||
| 1,000 | 5.375%, 4/01/18 (Pre-refunded 4/01/12) | 4/12 at 100.00 | AA | (3) | 1,072,380 | ||||||
| 1,000 | 5.375%, 4/01/19 (Pre-refunded 4/01/12) | 4/12 at 100.00 | AA | (3) | 1,072,380 | ||||||
| 500 | University of Connecticut, Special Obligation Student Fee Revenue Bonds, Series 2000A, 5.750%, 11/15/29 (Pre-refunded 11/15/10) – FGIC Insured | 11/10 at 101.00 | AAA | 535,680 | |||||||
| 2,000 | Virgin Islands Public Finance Authority, Gross Receipts Taxes Loan Note, Series 1999A, 6.500%, 10/01/24 (Pre-refunded 10/01/10) | 10/10 at 101.00 | BBB+ | (3) | 2,182,920 | ||||||
| Waterbury, Connecticut, General Obligation Bonds, Series 2002A: | |||||||||||
| 1,500 | 5.375%, 4/01/16 (Pre-refunded 4/01/12) – FSA Insured | 4/12 at 100.00 | AAA | 1,608,570 | |||||||
| 1,090 | 5.375%, 4/01/17 (Pre-refunded 4/01/12) – FSA Insured | 4/12 at 100.00 | AAA | 1,168,894 | |||||||
| 910 | Waterbury, Connecticut, General Obligation Tax Revenue Intercept Bonds, Series 2000, 6.000%, 2/01/18 (Pre-refunded 2/01/09) – RAAI Insured | 2/09 at 101.00 | AA | (3) | 947,647 | ||||||
| 43,365 | Total U.S. Guaranteed | 46,241,817 | |||||||||
| Utilities – 7.8% | |||||||||||
| 3,800 | Bristol Resource Recovery Facility Operating Committee, Connecticut, Solid Waste Revenue Bonds, Covanta Bristol Inc., Series 2005, 5.000%, 7/01/12 – AMBAC Insured | No Opt. Call | AAA | 4,000,298 | |||||||
| 2,025 | Connecticut Development Authority, Pollution Control Revenue Refunding Bonds, Connecticut Light and Power Company, Series 1993A, 5.850%, 9/01/28 | 10/08 at 102.00 | Baa1 | 2,084,373 | |||||||
| Eastern Connecticut Resource Recovery Authority, Solid Waste Revenue Bonds, Wheelabrator Lisbon Project, Series 1993A: | |||||||||||
| 1,370 | 5.500%, 1/01/14 (Alternative Minimum Tax) | 1/08 at 100.00 | BBB | 1,370,534 | |||||||
| 2,705 | 5.500%, 1/01/20 (Alternative Minimum Tax) | 1/08 at 100.00 | BBB | 2,706,055 | |||||||
| Guam Power Authority, Revenue Bonds, Series 1999A: | |||||||||||
| 2,280 | 5.125%, 10/01/29 – MBIA Insured | 10/09 at 101.00 | AAA | 2,309,891 | |||||||
| 1,000 | 5.125%, 10/01/29 – AMBAC Insured | 10/09 at 101.00 | AAA | 1,013,110 | |||||||
| Puerto Rico Electric Power Authority, Power Revenue Refunding Bonds, Series 2002: | |||||||||||
| 5,000 | 5.000%, 7/01/19 – MBIA Insured (UB) | No Opt. Call | AAA | 5,350,450 | |||||||
| 5,000 | 5.000%, 7/01/20 – MBIA Insured (UB) | No Opt. Call | AAA | 5,349,850 | |||||||
| 23,180 | Total Utilities | 24,184,561 | |||||||||
19
Portfolio of Investments (Unaudited)
Nuveen Connecticut Municipal Bond Fund (continued)
August 31, 2007
| Principal Amount (000) | Description | Optional Call Provisions (1) | Ratings (2) | Value | ||||||
| Water and Sewer – 7.3% | ||||||||||
| $ | 1,750 | Connecticut Development Authority, Water Facilities Revenue Bonds, Bridgeport Hydraulic Company, Series 1995, 6.150%, 4/01/35 (Alternative Minimum Tax) | 10/07 at 102.00 | N/R | $ | 1,786,803 | ||||
| 1,550 | Connecticut, State Revolving Fund General Revenue Bonds, Series 2003A, 5.000%, 10/01/16 | 10/13 at 100.00 | AAA | 1,642,535 | ||||||
| Greater New Haven Water Pollution Control Authority, Connecticut, Regional Wastewater System Revenue Bonds, Series 2005A: | ||||||||||
| 3,840 | 5.000%, 11/15/30 – MBIA Insured | 11/15 at 100.00 | AAA | 3,939,763 | ||||||
| 4,670 | 5.000%, 8/15/35 – MBIA Insured | 11/15 at 100.00 | AAA | 4,775,309 | ||||||
| South Central Connecticut Regional Water Authority, Water System Revenue Bonds, Eighteenth Series 2003A: | ||||||||||
| 3,000 | 5.000%, 8/01/20 – MBIA Insured | 8/13 at 100.00 | AAA | 3,119,700 | ||||||
| 3,955 | 5.000%, 8/01/33 – MBIA Insured | 8/13 at 100.00 | AAA | 4,043,157 | ||||||
| 2,760 | South Central Connecticut Regional Water Authority, Water System Revenue Bonds, Twentieth Series, 2007A, 5.000%, 8/01/30 – MBIA Insured | 8/16 at 100.00 | AAA | 2,853,178 | ||||||
| 550 | Stamford, Connecticut, Water Pollution Control System and Facility Revenue Bonds, Series 2003A, 5.000%, 11/15/32 | 11/13 at 100.00 | AA+ | 556,979 | ||||||
| 22,075 | Total Water and Sewer | 22,717,424 | ||||||||
| $ | 311,585 | Total Long-Term Investments (cost $319,455,657) – 104.2% | 323,824,869 | |||||||
| Short-Term Investments – 0.5% | ||||||||||
| $ | 1,550 | Puerto Rico Government Development Bank, Adjustable Refunding Bonds, Variable Rate Demand Obligations, Series 1985, 3.730%, 12/01/15 – MBIA Insured (4) | VMIG-1 | 1,550,000 | ||||||
Total Short-Term Investments (cost $1,550,000) | 1,550,000 | |||||||||
Total Investments (cost $321,005,657) – 104.7% | 325,374,869 | |||||||||
Floating Rate Obligations – (7.2)% | (22,370,000) | |||||||||
Other Assets Less Liabilities – 2.5% | 7,809,321 | |||||||||
Net Assets – 100% | $ | 310,814,190 | ||||||||
Forward Swaps outstanding at August 31, 2007:
| Counterparty | Notional Amount | Fund Pay/Receive Floating Rate | Floating Rate Index | Fixed Rate (Annualized) | Fixed Rate Payment Frequency | Effective Date (5) | Termination Date | Unrealized Appreciation (Depreciation) | |||||||||||
| Morgan Stanley | $ | 3,800,000 | Pay | 3-Month USD-LIBOR | 5.559 | % | Semi-Annually | 4/23/08 | 4/23/23 | $ | 72,284 | ||||||||
| Royal Bank of Canada | 4,200,000 | Pay | SIFM | 4.335 | Quarterly | 8/06/08 | 8/06/37 | 88,790 | |||||||||||
| $ | 161,074 | ||||||||||||||||||
USD – LIBOR (United States Dollar-London Inter-Bank Offered Rate)
SIFM – The daily arithmetic average of the weekly SIFM (the Securities Industry and Financial Markets) Municipal Sweep Index.
| (1) | Optional Call Provisions: Dates (month and year) and prices of the earliest optional call or redemption. There may be other call provisions at varying prices at later dates. Certain mortgage-backed securities may be subject to periodic principal paydowns. |
| (2) | Ratings: Using the higher of Standard & Poor’s or Moody’s rating. Ratings below BBB by Standard & Poor’s Group or Baa by Moody’s Investor Service, Inc. are considered to be below investment grade. |
| (3) | Backed by an escrow or trust containing sufficient U.S. Government or U.S. Government agency securities which ensure the timely payment of principal and interest. Such investments are normally considered to be equivalent to AAA rated securities. |
| (4) | Investment has a maturity of more than one year, but has variable rate and demand features which qualify it as a short-term investment. The rate disclosed is that in effect at the end of the reporting period. This rate changes periodically based on market conditions or a specified market index. |
| (5) | Effective date represents the date on which both the Fund and counterparty commence interest payment accruals on each forward swap contract. |
| N/R | Not rated. |
| (ETM) | Escrowed to maturity. |
| (UB) | Underlying bond of an inverse floating rate trust reflected as a financing transaction pursuant to the provisions of SFAS No. 140. |
20
See accompanying notes to financial statements.
Portfolio of Investments (Unaudited)
Nuveen New Jersey Municipal Bond Fund
August 31, 2007
| Principal Amount (000) | Description | Optional Call Provisions (1) | Ratings (2) | Value | ||||||
| Consumer Discretionary – 0.4% | ||||||||||
| Middlesex County Improvement Authority, New Jersey, Senior Revenue Bonds, Heldrich Center Hotel/Conference Center Project, Series 2005A: | ||||||||||
| $ | 280 | 5.000%, 1/01/32 | 1/15 at 100.00 | Baa3 | $ | 261,856 | ||||
| 240 | 5.125%, 1/01/37 | 1/15 at 100.00 | Baa3 | 226,450 | ||||||
| 520 | Total Consumer Discretionary | 488,306 | ||||||||
| Consumer Staples – 2.7% | ||||||||||
| Tobacco Settlement Financing Corporation, New Jersey, Tobacco Settlement Asset-Backed Bonds, Series 2007-1A: | ||||||||||
| 1,635 | 4.750%, 6/01/34 | 6/17 at 100.00 | BBB | 1,380,545 | ||||||
| 4,500 | 5.000%, 6/01/41 | 6/17 at 100.00 | BBB | 3,900,825 | ||||||
| 6,135 | Total Consumer Staples | 5,281,370 | ||||||||
| Education and Civic Organizations – 8.1% | ||||||||||
| 1,000 | New Brunswick Housing Authority, New Jersey, Lease Revenue Refunding Bonds, Rutgers University, Series 1998, 4.750%, 7/01/18 – FGIC Insured | 1/09 at 101.00 | AAA | 1,017,280 | ||||||
| 375 | New Jersey Economic Development Authority, Revenue Bonds, The Seeing Eye Inc., Series 2005, 5.000%, 12/01/24 – AMBAC Insured | 6/15 at 100.00 | AAA | 387,746 | ||||||
| 2,500 | New Jersey Educational Facilities Authority, Revenue Bonds, Fairleigh Dickinson University, Series 2002D, 5.250%, 7/01/32 – ACA Insured | 7/13 at 100.00 | A | 2,410,775 | ||||||
| 425 | New Jersey Educational Facilities Authority, Revenue Bonds, Georgian Court University, Series 2007D, 5.250%, 7/01/37 | 7/17 at 100.00 | BBB+ | 421,800 | ||||||
| 1,495 | New Jersey Educational Facilities Authority, Revenue Bonds, Kean University, Series 2007D, 5.000%, 7/01/32 – FGIC Insured | 7/17 at 100.00 | AAA | 1,542,975 | ||||||
| 45 | New Jersey Educational Facilities Authority, Revenue Bonds, Montclair State University, Series 2004L, 5.125%, 7/01/21 – MBIA Insured | 7/14 at 100.00 | AAA | 47,167 | ||||||
| 1,400 | New Jersey Educational Facilities Authority, Revenue Bonds, Montclair State University, Series 2005F, 5.000%, 7/01/16 – FGIC Insured | 7/15 at 100.00 | AAA | 1,495,214 | ||||||
| 1,035 | New Jersey Educational Facilities Authority, Revenue Bonds, Montclair State University, Series 2006, 5.000%, 7/01/36 – AMBAC Insured | 7/16 at 100.00 | Aaa | 1,063,576 | ||||||
| New Jersey Educational Facilities Authority, Revenue Bonds, New Jersey Institute of Technology, Series 2004B: | ||||||||||
| 930 | 5.000%, 7/01/18 – AMBAC Insured | 1/14 at 100.00 | AAA | 975,161 | ||||||
| 425 | 5.000%, 7/01/19 – AMBAC Insured | 1/14 at 100.00 | AAA | 443,207 | ||||||
| 1,030 | 4.750%, 7/01/20 – AMBAC Insured | 1/14 at 100.00 | AAA | 1,054,545 | ||||||
| 815 | 4.250%, 7/01/24 – AMBAC Insured | 1/14 at 100.00 | AAA | 782,245 | ||||||
| 290 | New Jersey Educational Facilities Authority, Revenue Bonds, Rider University, Series 2004A, 5.500%, 7/01/23 – RAAI Insured | 7/14 at 100.00 | AA | 296,096 | ||||||
| 290 | New Jersey Educational Facilities Authority, Revenue Bonds, Rider University, Series 2007C, 5.000%, 7/01/37 – RAAI Insured | 7/12 at 100.00 | AA | 268,241 | ||||||
| 500 | New Jersey Educational Facilities Authority, Revenue Bonds, Rowan College, Series 2007B, 4.250%, 7/01/34 – FGIC Insured | 7/17 at 100.00 | AAA | 461,845 | ||||||
| 115 | New Jersey Educational Facilities Authority, Revenue Bonds, Trenton State College Issue, Series 1976D, 6.750%, 7/01/08 | 1/08 at 100.00 | A– | 115,223 | ||||||
| 1,000 | New Jersey Educational Facilities Authority, Revenue Bonds, William Paterson University, Series 2004A, 5.125%, 7/01/21 – FGIC Insured | 7/14 at 100.00 | AAA | 1,048,160 | ||||||
| 365 | New Jersey Educational Facilities Authority, Revenue Refunding Bonds, Monmouth College, Series 1993A, 5.625%, 7/01/13 | 1/08 at 100.00 | BBB+ | 365,350 | ||||||
| 1,500 | Puerto Rico Industrial, Tourist, Educational, Medical and Environmental Control Facilities Financing Authority, Higher Education Revenue Refunding Bonds, Ana G. Mendez University System, Series 2002, 5.500%, 12/01/31 | 12/12 at 101.00 | BBB– | 1,503,390 | ||||||
| 15,535 | Total Education and Civic Organizations | 15,699,996 | ||||||||
21
Portfolio of Investments (Unaudited)
Nuveen New Jersey Municipal Bond Fund (continued)
August 31, 2007
| Principal Amount (000) | Description | Optional Call Provisions (1) | Ratings (2) | Value | ||||||
| Financials – 0.5% | ||||||||||
| $ | 1,000 | New Jersey Economic Development Authority, Revenue Refunding Bonds, Kapkowski Road Landfill Project, Series 2002, 5.750%, 10/01/21 | No Opt. Call | Baa3 | $ | 1,039,670 | ||||
| Health Care – 11.8% | ||||||||||
| 350 | Camden County Improvement Authority, New Jersey, Revenue Bonds, Cooper Health System, Series 2004A, 5.750%, 2/15/34 | 8/14 at 100.00 | BBB | 355,093 | ||||||
| 4,375 | New Jersey Health Care Facilities Financing Authority, FHA-Insured Mortgage Revenue Bonds, Jersey City Medical Center, Series 2001, 5.000%, 8/01/31 – AMBAC Insured | 8/11 at 100.00 | AAA | 4,523,049 | ||||||
| 1,160 | New Jersey Health Care Facilities Financing Authority, Revenue Bonds, Atlanticare Regional Medical Center, Series 2007, 5.000%, 7/01/37 | 7/17 at 100.00 | A+ | 1,125,803 | ||||||
| 1,500 | New Jersey Health Care Facilities Financing Authority, Revenue Bonds, CentraState Medical Center, Series 2006A, 5.000%, 7/01/30 – AGC Insured | 7/17 at 100.00 | Aaa | 1,539,180 | ||||||
| 140 | New Jersey Health Care Facilities Financing Authority, Revenue Bonds, Children’s Specialized Hospital, Series 2005A, 5.500%, 7/01/36 | 7/15 at 100.00 | Baa3 | 138,491 | ||||||
| 450 | New Jersey Health Care Facilities Financing Authority, Revenue Bonds, Hunterdon Medical Center, Series 2006B, 5.000%, 7/01/36 | 7/16 at 100.00 | A– | 437,256 | ||||||
| 210 | New Jersey Health Care Facilities Financing Authority, Revenue Bonds, Hunterdon Medical Center, Series 2006, 5.125%, 7/01/35 | 7/16 at 100.00 | A– | 208,293 | ||||||
| New Jersey Health Care Facilities Financing Authority, Revenue Bonds, Kennedy Health System Obligated Group, Series 2001: | ||||||||||
| 600 | 5.500%, 7/01/21 | 7/11 at 100.00 | A2 | 613,974 | ||||||
| 265 | 5.625%, 7/01/31 | 7/11 at 100.00 | A2 | 269,908 | ||||||
| 305 | New Jersey Health Care Facilities Financing Authority, Revenue Bonds, Palisades Medical Center of New York Presbyterian Healthcare System, Series 2002, 6.625%, 7/01/31 | 7/12 at 101.00 | BBB– | 324,105 | ||||||
| 2,000 | New Jersey Health Care Facilities Financing Authority, Revenue Bonds, Robert Wood Johnson University Hospital, Series 2000, 5.750%, 7/01/31 | 7/10 at 100.00 | A2 | 2,075,100 | ||||||
| 900 | New Jersey Health Care Facilities Financing Authority, Revenue Bonds, RWJ Health Care Corporation, Series 2005B, 5.000%, 7/01/35 – RAAI Insured | 7/15 at 100.00 | AA | 841,644 | ||||||
| 750 | New Jersey Health Care Facilities Financing Authority, Revenue Bonds, Saint Barnabas Health Care System, Series 2006A, 5.000%, 7/01/29 | 1/17 at 100.00 | BBB | 707,618 | ||||||
| New Jersey Health Care Facilities Financing Authority, Revenue Bonds, Somerset Medical Center, Series 2003: | ||||||||||
| 125 | 5.500%, 7/01/23 | 7/13 at 100.00 | Ba1 | 121,264 | ||||||
| 1,125 | 5.500%, 7/01/33 | 7/13 at 100.00 | Ba1 | 1,047,330 | ||||||
| New Jersey Health Care Facilities Financing Authority, Revenue Bonds, South Jersey Hospital System, Series 2006: | ||||||||||
| 860 | 5.000%, 7/01/36 | 7/16 at 100.00 | Baa1 | 806,955 | ||||||
| 830 | 5.000%, 7/01/46 | 7/16 at 100.00 | Baa1 | 755,425 | ||||||
| 845 | New Jersey Health Care Facilities Financing Authority, Revenue Bonds, St. Clare’s Hospital, Series 2004A, 5.250%, 7/01/20 – RAAI Insured | 7/14 at 100.00 | AA | 852,174 | ||||||
| 1,660 | New Jersey Health Care Facilities Financing Authority, Revenue Bonds, St. Peter’s University Hospital, Series 2000A, 6.875%, 7/01/30 | 7/10 at 100.00 | Baa1 | 1,730,666 | ||||||
| 1,500 | New Jersey Health Care Facilities Financing Authority, Revenue Bonds, Virtua Health System, Series 1998, 5.250%, 7/01/10 – FSA Insured | 1/09 at 101.00 | AAA | 1,546,260 | ||||||
| 1,710 | New Jersey Health Care Facilities Financing Authority, Revenue Refunding Bonds, Bayshore Community Hospital, Series 2002, 5.000%, 7/01/22 – RAAI Insured | 1/12 at 100.00 | AA | 1,720,140 | ||||||
| 1,000 | Puerto Rico Industrial, Tourist, Educational, Medical and Environmental Control Facilities Financing Authority, Hospital Revenue Bonds, Auxilio Mutuo Hospital, Series 1995A, 6.250%, 7/01/16 – MBIA Insured | 1/08 at 100.00 | AAA | 1,002,030 | ||||||
| 22,660 | Total Health Care | 22,741,758 | ||||||||
22
| Principal Amount (000) | Description | Optional Call Provisions (1) | Ratings (2) | Value | ||||||
| Housing/Multifamily – 2.1% | ||||||||||
| $ | 1,000 | Essex County Improvement Authority, New Jersey, FNMA Enhanced Multifamily Housing Revenue Bonds, Ballantyne House Project, Series 2002, 4.750%, 11/01/22 (Alternative Minimum Tax) | 11/12 at 100.00 | Aaa | $ | 967,900 | ||||
| 1,500 | New Jersey Housing and Mortgage Finance Agency, Multifamily Housing Revenue Bonds, | 3/10 at 100.00 | AAA | 1,540,125 | ||||||
| 630 | New Jersey Housing and Mortgage Finance Agency, Multifamily Housing Revenue Bonds, Series 2000E-1, 5.750%, 5/01/25 – FSA Insured | 8/10 at 100.00 | AAA | 646,336 | ||||||
| 925 | Newark Housing Authority, New Jersey, GNMA Collateralized Housing Revenue Bonds, Fairview Apartments Project, Series 2000A, 6.300%, 10/20/19 (Alternative Minimum Tax) | 10/09 at 102.00 | Aaa | 965,830 | ||||||
| 4,055 | Total Housing/Multifamily | 4,120,191 | ||||||||
| Housing/Single Family – 2.9% | ||||||||||
| 3,085 | New Jersey Housing and Mortgage Finance Agency, Home Buyer Program Revenue Bonds, Series 1997U, 5.700%, 10/01/14 – MBIA Insured (Alternative Minimum Tax) | 10/07 at 101.50 | AAA | 3,133,465 | ||||||
| 510 | New Jersey Housing and Mortgage Finance Agency, Home Buyer Program Revenue Bonds, Series 2000CC, 5.875%, 10/01/31 – MBIA Insured (Alternative Minimum Tax) | 10/10 at 100.00 | AAA | 518,318 | ||||||
| 2,000 | New Jersey Housing and Mortgage Finance Agency, Single Family Housing Revenue Bonds, Series 2007T, 4.700%, 10/01/37 (Alternative Minimum Tax) | 4/17 at 100.00 | AA | 1,835,880 | ||||||
| 205 | Virgin Islands Housing Finance Corporation, GNMA Mortgage-Backed Securities Program Single Family Mortgage Revenue Refunding Bonds, Series 1995A, 6.450%, 3/01/16 (Alternative Minimum Tax) | 9/07 at 100.00 | N/R | 207,001 | ||||||
| 5,800 | Total Housing/Single Family | 5,694,664 | ||||||||
| Industrials – 1.1% | ||||||||||
| 2,000 | Gloucester County Improvement Authority, New Jersey, Solid Waste Resource Recovery Revenue Refunding Bonds, Waste Management Inc. Project, Series 1999B, 6.850%, 12/01/29 (Mandatory put 12/01/09) | No Opt. Call | BBB | 2,101,720 | ||||||
| Long-Term Care – 6.0% | ||||||||||
| 1,300 | New Jersey Economic Development Authority, First Mortgage Fixed Rate Revenue Bonds, Cadbury Corporation, Series 1998A, 5.500%, 7/01/18 – ACA Insured | 7/08 at 102.00 | A | 1,316,016 | ||||||
| 375 | New Jersey Economic Development Authority, First Mortgage Revenue Bonds, Winchester Gardens at Wards Homestead, Series 2004A, 5.750%, 11/01/24 | 11/14 at 100.00 | N/R | 380,790 | ||||||
| 5,100 | New Jersey Economic Development Authority, Revenue Bonds, Jewish Community Housing Corporation of Metropolitan New Jersey, Series 1999, 5.900%, 12/01/31 | 12/09 at 101.00 | Aa3 | 5,303,234 | ||||||
| 600 | New Jersey Economic Development Authority, Revenue Bonds, Masonic Charity Foundation of New Jersey, Series 2001, 5.875%, 6/01/18 | 6/11 at 102.00 | A– | 641,748 | ||||||
| 140 | New Jersey Economic Development Authority, Revenue Bonds, Masonic Charity Foundation of New Jersey, Series 2002, 5.250%, 6/01/32 | 6/13 at 102.00 | A– | 144,402 | ||||||
| 1,500 | New Jersey Economic Development Authority, Revenue Bonds, United Methodist Homes of New Jersey Obligated Group, Series 1998, 5.125%, 7/01/25 | 1/08 at 102.00 | BB+ | 1,408,095 | ||||||
| New Jersey Health Care Facilities Financing Authority, Revenue Bonds, House of the Good Shepherd Obligated Group, Series 2001: | ||||||||||
| 1,000 | 5.100%, 7/01/21 – RAAI Insured | 7/11 at 100.00 | AA | 1,008,060 | ||||||
| 1,350 | 5.200%, 7/01/31 – RAAI Insured | 7/11 at 100.00 | AA | 1,353,618 | ||||||
| 11,365 | Total Long-Term Care | 11,555,963 | ||||||||
| Materials – 0.2% | ||||||||||
| 250 | Union County Pollution Control Financing Authority, New Jersey, Revenue Refunding Bonds, American Cyanamid Company, Series 1994, 5.800%, 9/01/09 | No Opt. Call | Baa1 | 254,500 | ||||||
| Tax Obligation/General – 7.7% | ||||||||||
| 1,445 | Clifton, New Jersey, General Obligation Bonds, Series 2002, 5.000%, 1/15/19 – FGIC Insured | 1/11 at 100.00 | AAA | 1,489,867 | ||||||
| 500 | Hillsborough Township School District, Somerset County, New Jersey, General Obligation School Bonds, Series 1992, 5.875%, 8/01/11 | No Opt. Call | AA | 540,150 | ||||||
23
Portfolio of Investments (Unaudited)
Nuveen New Jersey Municipal Bond Fund (continued)
August 31, 2007
| Principal Amount (000) | Description | Optional Call Provisions (1) | Ratings (2) | Value | ||||||
| Tax Obligation/General (continued) | ||||||||||
| $ | 1,500 | Jersey City, New Jersey, General Obligation Bonds, Series 2006A, 5.000%, 9/01/22 – AMBAC Insured | 9/16 at 100.00 | AAA | $ | 1,565,730 | ||||
| 250 | Union City, Hudson County, New Jersey, General Obligation Bonds, Series 1992, 6.375%, 11/01/10 – FSA Insured | No Opt. Call | AAA | 270,768 | ||||||
| 5,000 | Union County Utilities Authority, New Jersey, Solid Waste System County Deficiency Revenue Bonds, Series 1998A, 5.000%, 6/15/28 (Alternative Minimum Tax) | 6/08 at 102.00 | AA+ | 5,017,699 | ||||||
| 1,000 | Washington Township Board of Education, Gloucester County, New Jersey, General Obligation Bonds, Series 2004, 5.000%, 2/01/15 – MBIA Insured | 2/13 at 100.00 | Aaa | 1,053,360 | ||||||
| Washington Township Board of Education, Mercer County, New Jersey, General Obligation Bonds, Series 2005: | ||||||||||
| 2,550 | 5.000%, 1/01/16 – FSA Insured | No Opt. Call | Aaa | 2,733,728 | ||||||
| 2,110 | 5.000%, 1/01/21 – FSA Insured | 1/16 at 100.00 | Aaa | 2,207,144 | ||||||
| 14,355 | Total Tax Obligation/General | 14,878,446 | ||||||||
| Tax Obligation/Limited – 20.9% | ||||||||||
| 650 | Bergen County Improvement Authority, New Jersey, Guaranteed Lease Revenue Bonds, County Administration Complex Project, Series 2005, 5.000%, 11/15/26 | No Opt. Call | Aaa | 693,622 | ||||||
| 1,005 | Burlington County Bridge Commission, New Jersey, Governmental Leasing Program Revenue Bonds, County Guaranteed, Series 2003, 5.000%, 8/15/15 | 8/13 at 100.00 | AA | 1,058,476 | ||||||
| Burlington County Bridge Commission, New Jersey, Guaranteed Pooled Loan Bonds, Series 2003: | ||||||||||
| 1,000 | 5.000%, 12/01/20 – MBIA Insured | 12/13 at 100.00 | AAA | 1,041,670 | ||||||
| 695 | 5.000%, 12/01/21 – MBIA Insured | 12/13 at 100.00 | AAA | 721,792 | ||||||
| 345 | Essex County Improvement Authority, New Jersey, Guaranteed Pooled Revenue Bonds, Series 1992A, 6.500%, 12/01/12 | 12/07 at 100.00 | A1 | 345,618 | ||||||
| 3,000 | Essex County Improvement Authority, New Jersey, Lease Revenue Bonds, Series 2003, | No Opt. Call | Aaa | 3,183,390 | ||||||
| 825 | Essex County Improvement Authority, New Jersey, Project Consolidation Revenue Bonds, Series 2007, 5.250%, 12/15/22 – AMBAC Insured | No Opt. Call | Aaa | 901,907 | ||||||
| 900 | Garden State Preservation Trust, New Jersey, Open Space and Farmland Preservation Bonds, Series 2005C, 5.125%, 11/01/18 – FSA Insured | No Opt. Call | AAA | 976,473 | ||||||
| 1,000 | Gloucester County Improvement Authority, New Jersey, Lease Revenue Bonds, Series 2005A, | 9/15 at 100.00 | AAA | 1,035,660 | ||||||
| Hudson County Improvement Authority, New Jersey, County Secured Lease Revenue Bonds, County Services Building Project, Series 2005: | ||||||||||
| 395 | 5.000%, 4/01/25 – AMBAC Insured | 4/15 at 100.00 | AAA | 406,660 | ||||||
| 920 | 5.000%, 4/01/35 – AMBAC Insured | 4/15 at 100.00 | AAA | 939,458 | ||||||
| 220 | Little Ferry Board of Education, Bergen County, New Jersey, Certificates of Participation, Series 1994, 6.300%, 1/15/08 | No Opt. Call | N/R | 220,893 | ||||||
| 3,025 | Middlesex County Improvement Authority, New Jersey, County Guaranteed Open Space Trust Fund Revenue Bonds, Series 1999, 5.250%, 9/15/15 | 9/09 at 100.00 | AAA | 3,108,430 | ||||||
| 3,000 | Middlesex County, New Jersey, Certificates of Participation, Series 2001, 5.000%, 8/01/22 – MBIA Insured | 8/11 at 100.00 | AAA | 3,057,510 | ||||||
| 1,560 | New Jersey Economic Development Authority, Cigarette Tax Revenue Bonds, Series 2004, 5.750%, 6/15/34 | 6/14 at 100.00 | BBB | 1,622,431 | ||||||
| 1,000 | New Jersey Economic Development Authority, Lease Revenue Bonds, Liberty State Park Project, Series 2005C, 5.000%, 3/01/27 – FSA Insured | 3/15 at 100.00 | AAA | 1,027,370 | ||||||
| 2,600 | New Jersey Economic Development Authority, Revenue Bonds, Motor Vehicle Surcharge, Series 2004A, 5.250%, 7/01/15 – MBIA Insured | 7/14 at 100.00 | AAA | 2,801,370 | ||||||
| New Jersey Economic Development Authority, Revenue Bonds, Newark Downtown District Management Corporation Prject, Series 2007: | ||||||||||
| 85 | 5.125%, 6/15/27 | 6/17 at 100.00 | Baa3 | 83,031 | ||||||
| 145 | 5.125%, 6/15/37 | 6/17 at 100.00 | Baa3 | 138,186 | ||||||
24
| Principal Amount (000) | Description | Optional Call Provisions (1) | Ratings (2) | Value | ||||||
| Tax Obligation/Limited (continued) | ||||||||||
| $ | 700 | New Jersey Educational Facilities Authority, Revenue Bonds, Higher Education Capital Improvement Fund, Series 2005A, 5.000%, 9/01/15 – FSA Insured | No Opt. Call | AAA | $ | 751,086 | ||||
| New Jersey Health Care Facilities Financing Authority, Lease Revenue Bonds, Department of Human Services – Greystone Park Psychiatric Hospital, Series 2005: | ||||||||||
| 1,050 | 5.000%, 9/15/18 – AMBAC Insured | 9/15 at 100.00 | AAA | 1,104,957 | ||||||
| 1,875 | 5.000%, 9/15/24 – AMBAC Insured | 9/15 at 100.00 | AAA | 1,935,694 | ||||||
| 1,325 | 5.000%, 9/15/28 – AMBAC Insured | 9/15 at 100.00 | AAA | 1,361,597 | ||||||
| 1,295 | New Jersey Transit Corporation, Lease Appropriation Bonds, Series 2005A, 5.000%, 9/15/18 – FGIC Insured | 9/15 at 100.00 | AAA | 1,355,865 | ||||||
| New Jersey Transportation Trust Fund Authority, Federal Highway Aid Grant Anticipation Bonds, Series 2006: | ||||||||||
| 560 | 5.000%, 6/15/17 – FGIC Insured | 6/16 at 100.00 | AAA | 596,249 | ||||||
| 1,000 | 5.000%, 6/15/18 – FGIC Insured | 6/16 at 100.00 | AAA | 1,059,730 | ||||||
| 1,500 | New Jersey Transportation Trust Fund Authority, Transportation System Bonds, Series 2004B, | No Opt. Call | AAA | 1,671,195 | ||||||
| 1,390 | New Jersey Transportation Trust Fund Authority, Transportation System Bonds, Series 2005D, | 6/15 at 100.00 | AAA | 1,458,430 | ||||||
| 1,900 | New Jersey Transportation Trust Fund Authority, Transportation System Bonds, Series 2006A, | No Opt. Call | AA– | 2,096,042 | ||||||
| New Jersey Transportation Trust Fund Authority, Transportation System Bonds, Series 2006C: | ||||||||||
| 4,000 | 0.000%, 12/15/32 – FSA Insured | No Opt. Call | AAA | 1,152,960 | ||||||
| 5,450 | 0.000%, 12/15/34 – FSA Insured | No Opt. Call | AAA | 1,416,183 | ||||||
| 170 | Puerto Rico Aqueduct and Sewerage Authority, Revenue Refunding Bonds, Series 1995, 5.000%, 7/01/15 | 1/08 at 100.75 | BBB– | 170,989 | ||||||
| 485 | Puerto Rico Convention Center District Authority, Hotel Occupancy Tax Revenue Bonds, Series 2006A, 4.500%, 7/01/36 – CIFG Insured | 7/16 at 100.00 | AAA | 478,414 | ||||||
| 450 | Puerto Rico Sales Tax Financing Corporation, Sales Tax Revenue Bonds, Series 2007A, | 8/17 at 100.00 | A+ | 460,989 | ||||||
| 45,520 | Total Tax Obligation/Limited | 40,434,327 | ||||||||
| Transportation – 18.8% | ||||||||||
| Delaware River and Bay Authority, Delaware and New Jersey, Revenue Bonds, Series 2005: | ||||||||||
| 1,335 | 5.000%, 1/01/26 – MBIA Insured | 1/15 at 100.00 | AAA | 1,376,639 | ||||||
| 500 | 5.000%, 1/01/27 – MBIA Insured | 1/15 at 100.00 | AAA | 514,335 | ||||||
| 500 | 5.000%, 1/01/28 – MBIA Insured | 1/15 at 100.00 | AAA | 514,335 | ||||||
| 3,500 | Delaware River Port Authority, New Jersey and Pennsylvania, Revenue Bonds, Series 1999, | 1/10 at 100.00 | AAA | 3,637,305 | ||||||
| 10,000 | New Jersey Turnpike Authority, Revenue Bonds, Series 2003A, | 7/13 at 100.00 | AAA | 10,425,300 | ||||||
| New Jersey Turnpike Authority, Revenue Bonds, Series 1991C: | ||||||||||
| 40 | 6.500%, 1/01/16 | No Opt. Call | A | 45,354 | ||||||
| 485 | 6.500%, 1/01/16 – MBIA Insured | No Opt. Call | AAA | 552,328 | ||||||
| 1,300 | New Jersey Turnpike Authority, Revenue Bonds, Series 2005A, 5.250%, 1/01/29 – FSA Insured | No Opt. Call | AAA | 1,428,011 | ||||||
| 2,500 | Port Authority of New York and New Jersey, Consolidated Revenue Bonds, One Hundred Fortieth | 6/15 at 101.00 | AAA | 2,582,650 | ||||||
| 6,000 | �� | Port Authority of New York and New Jersey, Consolidated Revenue Bonds, One Hundred Thirty-Fourth Series 2004, 5.000%, 7/15/34 | 1/14 at 101.00 | AA– | 6,103,978 | |||||
| 565 | Port Authority of New York and New Jersey, One Hundred and Forty Eighth Consolidated Revenue Bonds, RITES Trust 1516, 6.431%, 8/15/32 – FSA Insured (IF) | 8/17 at 100.00 | AAA | 619,867 | ||||||
25
Portfolio of Investments (Unaudited)
Nuveen New Jersey Municipal Bond Fund (continued)
August 31, 2007
| Principal Amount (000) | Description | Optional Call Provisions (1) | Ratings (2) | Value | |||||||
| Transportation (continued) | |||||||||||
| Port Authority of New York and New Jersey, Special Project Bonds, JFK International Air Terminal LLC, Sixth Series 1997: | |||||||||||
| $ | 2,125 | 6.250%, 12/01/08 – MBIA Insured (Alternative Minimum Tax) | No Opt. Call | AAA | $ | 2,188,601 | |||||
| 1,000 | 7.000%, 12/01/12 – MBIA Insured (Alternative Minimum Tax) | No Opt. Call | AAA | 1,142,750 | |||||||
| 2,000 | 5.750%, 12/01/22 – MBIA Insured (Alternative Minimum Tax) | 12/07 at 102.00 | AAA | 2,047,700 | |||||||
| 3,125 | 5.750%, 12/01/25 – MBIA Insured (Alternative Minimum Tax) | 12/07 at 100.00 | AAA | 3,137,656 | |||||||
| 34,975 | Total Transportation | 36,316,809 | |||||||||
| U.S. Guaranteed – 17.0% (3) | |||||||||||
| 2,500 | Bergen County Improvement Authority, New Jersey, Revenue Bonds, Yeshiva Ktana of Passaic Project, Series 2002, 6.000%, 9/15/27 (Pre-refunded 9/01/12) | 9/12 at 101.00 | N/R | (3) | 2,740,900 | ||||||
| 1,550 | Essex County Improvement Authority, New Jersey, General Obligation Lease Revenue Bonds, Correctional Facilities Project, Series 2003A, 5.000%, 10/01/28 (Pre-refunded 10/01/13) – FGIC Insured | 10/13 at 100.00 | Aaa | 1,652,300 | |||||||
| 750 | Garden State Preservation Trust, New Jersey, Open Space and Farmland Preservation Bonds, | 11/13 at 100.00 | AAA | 810,315 | |||||||
| 755 | New Jersey Economic Development Authority, Revenue Bonds, Yeshiva Ktana of Passaic, Series 1993, 8.000%, 9/15/18 (ETM) | No Opt. Call | N/R | (3) | 908,220 | ||||||
| 1,000 | New Jersey Economic Development Authority, School Facilities Construction Bonds, Series 2003F, | 6/13 at 100.00 | AAA | 1,076,000 | |||||||
| 420 | New Jersey Educational Facilities Authority, Revenue Bonds, Kean University, Series 2005B, | 7/16 at 100.00 | AAA | 450,488 | |||||||
| 515 | New Jersey Educational Facilities Authority, Revenue Bonds, Montclair State University, Series 2004L, 5.125%, 7/01/21 (Pre-refunded 7/01/14) – MBIA Insured | 7/14 at 100.00 | Aaa | 555,222 | |||||||
| New Jersey Educational Facilities Authority, Revenue Bonds, Montclair State University, Series 2005F: | |||||||||||
| 1,825 | 5.000%, 7/01/24 (Pre-refunded 7/01/15) – FGIC Insured | 7/15 at 100.00 | AAA | 1,956,108 | |||||||
| 625 | 5.000%, 7/01/32 (Pre-refunded 7/01/15) – FGIC Insured | 7/15 at 100.00 | AAA | 669,900 | |||||||
| 1,025 | New Jersey Educational Facilities Authority, Revenue Bonds, Ramapo College, Series 2001D, | 7/11 at 100.00 | AAA | 1,073,841 | |||||||
| 500 | New Jersey Educational Facilities Authority, Revenue Bonds, Rowan University, Series 2003I, | 7/13 at 100.00 | AAA | 535,020 | |||||||
| 335 | New Jersey Health Care Facilities Financing Authority, Revenue Bonds, Hackensack Hospital, Series 1979A, 8.750%, 7/01/09 (ETM) | No Opt. Call | Aaa | 351,974 | |||||||
| 1,250 | New Jersey Health Care Facilities Financing Authority, Revenue Bonds, South Jersey Hospital System, Series 2002, 5.875%, 7/01/21 (Pre-refunded 7/01/12) | 7/12 at 100.00 | Baa1 | (3) | 1,362,025 | ||||||
| 510 | New Jersey Health Care Facilities Financing Authority, Revenue Bonds, Trinitas Hospital Obligated Group, Series 2000, 7.500%, 7/01/30 (Pre-refunded 7/01/10) | 7/10 at 101.00 | BBB– | (3) | 564,856 | ||||||
| 1,110 | New Jersey Transportation Trust Fund Authority, Transportation System Bonds, Series 2005D, | 6/15 at 100.00 | Aaa | 1,189,343 | |||||||
| New Jersey Turnpike Authority, Revenue Bonds, Series 1991C: | |||||||||||
| 10 | 6.500%, 1/01/16 (ETM) | No Opt. Call | AAA | 11,438 | |||||||
| 165 | 6.500%, 1/01/16 – MBIA Insured (ETM) | No Opt. Call | AAA | 188,720 | |||||||
| 600 | 6.500%, 1/01/16 (ETM) | No Opt. Call | AAA | 686,256 | |||||||
| 165 | 6.500%, 1/01/16 – AMBAC Insured (ETM) | No Opt. Call | AAA | 188,720 | |||||||
| 115 | 6.500%, 1/01/16 – MBIA Insured (ETM) | No Opt. Call | AAA | 131,532 | |||||||
| 10 | 6.500%, 1/01/16 – AMBAC Insured (ETM) | No Opt. Call | AAA | 11,438 | |||||||
| 375 | Newark Housing Authority, New Jersey, Port Authority Terminal Revenue Bonds, Series 2004, | 1/14 at 100.00 | AAA | 405,004 | |||||||
| 3,900 | Puerto Rico Infrastructure Financing Authority, Special Obligation Bonds, Series 2000A, 5.375%, 10/01/24 | 10/10 at 101.00 | AAA | 4,096,014 | |||||||
| 4,000 | Puerto Rico Public Finance Corporation, Commonwealth Appropriation Bonds, Series 1998A, | No Opt. Call | AAA | 4,277,479 | |||||||
| Tobacco Settlement Financing Corporation, New Jersey, Tobacco Settlement Asset-Backed Bonds, Series 2002: | |||||||||||
| 3,985 | 5.750%, 6/01/32 (Pre-refunded 6/01/12) | 6/12 at 100.00 | AAA | 4,266,779 | |||||||
| 1,000 | 6.000%, 6/01/37 (Pre-refunded 6/01/12) | 6/12 at 100.00 | AAA | 1,099,050 | |||||||
26
| Principal Amount (000) | Description | Optional Call Provisions (1) | Ratings (2) | Value | ||||||
| U.S. Guaranteed (3) (continued) | ||||||||||
| Tobacco Settlement Financing Corporation, New Jersey, Tobacco Settlement Asset-Backed Bonds, Series 2003: | ||||||||||
| $ | 710 | 6.125%, 6/01/24 (Pre-refunded 6/01/12) | 6/12 at 100.00 | AAA | $ | 755,823 | ||||
| 750 | 6.375%, 6/01/32 (Pre-refunded 6/01/13) | 6/13 at 100.00 | AAA | 844,530 | ||||||
| 30,455 | Total U.S. Guaranteed | 32,859,295 | ||||||||
| Utilities – 0.6% | ||||||||||
| 1,250 | New Jersey Economic Development Authority, Pollution Control Revenue Refunding Bonds, Public Service Electric and Gas Company, Series 2001A, 5.000%, 3/01/12 | No Opt. Call | Baa1 | 1,252,738 | ||||||
| Water and Sewer – 1.0% | ||||||||||
| 1,380 | Bayonne Municipal Utilities Authority, New Jersey, Water System Revenue Refunding Bonds, Series 2003A, 5.000%, 4/01/18 – XLCA Insured | 4/13 at 100.00 | Aaa | 1,435,297 | ||||||
| 500 | North Hudson Sewerage Authority, New Jersey, Sewerage Revenue Refunding Bonds, Series 2002A, 5.250%, 8/01/19 – FGIC Insured | 8/12 at 100.00 | Aaa | 527,745 | ||||||
| 1,880 | Total Water and Sewer | 1,963,042 | ||||||||
| $ | 197,755 | Total Long-Term Investments (cost $195,079,941) – 101.8% | 196,682,795 | |||||||
| Short-Term Investments – 0.8% | ||||||||||
| $ | 1,500 | Puerto Rico Government Development Bank, Adjustable Refunding Bonds, Variable Rate Demand Obligations, Series 1985, 3.730%, 12/01/15 – MBIA Insured (4) | VMIG-1 | 1,500,000 | ||||||
Total Short-Term Investments (cost $1,500,000) | 1,500,000 | |||||||||
Total Investments (cost $196,579,941) – 102.6% | 198,182,795 | |||||||||
Floating Rate Obligations – (3.4)% | (6,600,000) | |||||||||
Other Assets Less Liabilities – 0.8% | 1,548,446 | |||||||||
Net Assets – 100% | $ | 193,131,241 | ||||||||
Forward Swaps outstanding at August 31, 2007:
| Counterparty | Notional Amount | Fund Pay/Receive Floating Rate | Floating Rate Index | Fixed Rate (Annualized) | Fixed Rate Payment Frequency | Effective Date (5) | Termination Date | Unrealized Appreciation (Depreciation) | ||||||||||||
| JPMorgan | $ | 1,750,000 | Pay | 3-Month USD-LIBOR | 5.388 | % | Semi-Annually | 4/25/08 | 4/25/35 | $ | (14,956 | ) | ||||||||
| Royal Bank of Canada | 2,600,000 | Pay | SIFM | 4.335 | Quarterly | 8/06/08 | 8/06/37 | 54,966 | ||||||||||||
| $ | 40,010 | |||||||||||||||||||
USD – LIBOR (United States Dollar-London Inter-Bank Offered Rate)
SIFM – The daily arithmetic average of the weekly SIFM (the Securities Industry and Financial Markets) Municipal Swap Index.
| The Fund may invest in “zero coupon” securities. A zero coupon security does not pay a regular interest coupon to its holders during the life of the security. Tax-exempt income to the holder of the security comes from accretion of the difference between the original purchase price of the security at issuance and the par value of the security at maturity and is effectively paid at maturity. Such securities are included in the Portfolio of Investments with a 0.000% coupon rate in their description. The market prices of zero coupon securities generally are more volatile than the market prices of securities that pay interest periodically. |
| (1) | Optional Call Provisions: Dates (month and year) and prices of the earliest optional call or redemption. There may be other call provisions at varying prices at later dates. Certain mortgage-backed securities may be subject to periodic principal paydowns. |
| (2) | Ratings: Using the higher of Standard & Poor’s or Moody’s rating. Ratings below BBB by Standard & Poor’s Group or Baa by Moody’s Investor Service, Inc. are considered to be below investment grade. |
| (3) | Backed by an escrow or trust containing sufficient U.S. Government or U.S. Government agency securities which ensure the timely payment of principal and interest. Such investments are normally considered to be equivalent to AAA rated securities. |
| (4) | Investment has a maturity of more than one year, but has variable rate and demand features which qualify it as a short-term investment. The rate disclosed is that in effect at the end of the reporting period. This rate changes periodically based on market conditions or a specified market index. |
| (5) | Effective date represents the date on which both the Fund and counterparty commence interest payment accruals on each forward swap contract. |
| N/R | Not rated. |
| (ETM) | Escrowed to maturity. |
| (IF) | Inverse floating rate investment. |
| (UB) | Underlying bond of an inverse floating rate trust reflected as a financing transaction pursuant to the provisions of SFAS No. 140. |
27
See accompanying notes to financial statements.
Portfolio of Investments (Unaudited)
Nuveen New York Municipal Bond Fund
August 31, 2007
| Principal Amount (000) | Description | Optional Call Provisions (1) | Ratings (2) | Value | ||||||
| Consumer Discretionary – 0.2% | ||||||||||
| $ | 665 | New York City Industrial Development Agency, New York, Liberty Revenue Bonds, IAC/InterActiveCorp, Series 2005, 5.000%, 9/01/35 | 9/15 at 100.00 | BBB– | $ | 626,729 | ||||
| Consumer Staples – 1.5% | ||||||||||
| 915 | New York Counties Tobacco Trust II, Tobacco Settlement Pass-Through Bonds, Series 2001, | 6/11 at 101.00 | BBB | 905,036 | ||||||
| 1,305 | Puerto Rico, The Children’s Trust Fund, Tobacco Settlement Asset-Backed Refunding Bonds, Series 2002, 5.375%, 5/15/33 | 5/12 at 100.00 | BBB | 1,223,803 | ||||||
| 505 | Rensselaer Tobacco Asset Securitization Corporation, New York, Tobacco Settlement Asset-Backed Bonds, Series 2001A, 5.200%, 6/01/25 | 6/12 at 100.00 | BBB | 493,799 | ||||||
| TSASC Inc., New York, Tobacco Asset-Backed Bonds, Series 2006: | ||||||||||
| 2,545 | 4.750%, 6/01/22 | 6/16 at 100.00 | BBB | 2,399,070 | ||||||
| 1,225 | 5.000%, 6/01/26 | 6/16 at 100.00 | BBB | 1,169,103 | ||||||
| 6,495 | Total Consumer Staples | 6,190,811 | ||||||||
| Education and Civic Organizations – 11.0% | ||||||||||
| 2,000 | Albany Industrial Development Agency, New York, Revenue Bonds, Albany Law School, Series 2000A, 5.750%, 10/01/30 – RAAI Insured | 10/10 at 100.00 | AA | 2,080,780 | ||||||
| 660 | Albany Industrial Development Agency, New York, Revenue Bonds, Albany Law School, Series 2007A, 5.000%, 7/01/31 | 7/17 at 100.00 | BBB | 627,766 | ||||||
| 290 | Albany Industrial Development Agency, New York, Revenue Bonds, Brighter Choice Charter Schools, Series 2007A, 5.000%, 4/01/37 | 4/17 at 100.00 | N/R | 259,797 | ||||||
| 215 | Cattaraugus County Industrial Development Agency, New York, Revenue Bonds, St. Bonaventure University, Series 2006, 5.000%, 5/01/23 | 5/16 at 100.00 | BBB– | 205,422 | ||||||
| 2,820 | Dormitory Authority of the State of New York, General Revenue Bonds, Manhattan College, Series 2007A, 5.000%, 7/01/41 – RAAI Insured | 7/17 at 100.00 | AA | 2,674,657 | ||||||
| 1,880 | Dormitory Authority of the State of New York, General Revenue Bonds, Saint Johns University, | 7/17 at 100.00 | AAA | 1,984,039 | ||||||
| 685 | Dormitory Authority of the State of New York, Insured Revenue Bonds, D’Youville College, Series 2001, 5.250%, 7/01/20 – RAAI Insured | 7/11 at 102.00 | AA | 699,954 | ||||||
| 1,850 | Dormitory Authority of the State of New York, Insured Revenue Bonds, New York Medical College, | 7/08 at 101.00 | AAA | 1,886,482 | ||||||
| Dormitory Authority of the State of New York, Lease Revenue Bonds, State University Dormitory Facilities, Series 2003B: | ||||||||||
| 1,250 | 5.250%, 7/01/31 (Mandatory put 7/01/13) – FGIC Insured | No Opt. Call | AAA | 1,336,213 | ||||||
| 2,000 | 5.250%, 7/01/32 (Mandatory put 7/01/13) – XLCA Insured | No Opt. Call | AAA | 2,137,940 | ||||||
| 1,000 | Dormitory Authority of the State of New York, Revenue Bonds, City University of New York, Series 2005A, 5.500%, 7/01/18 – FGIC Insured | No Opt. Call | AAA | 1,115,390 | ||||||
| 2,700 | Dormitory Authority of the State of New York, Revenue Bonds, Marymount Manhattan College, | 7/09 at 101.00 | AA | 2,819,799 | ||||||
| 1,250 | Dormitory Authority of the State of New York, Revenue Bonds, Pratt Institute, Series 1999, | 7/09 at 102.00 | AA | 1,310,913 | ||||||
| 4,000 | Dormitory Authority of the State of New York, Revenue Bonds, State University Educational Facilities, 1989 Resolution, Series 2000C, 5.750%, 5/15/16 – FSA Insured (UB) | No Opt. Call | AAA | 4,516,960 | ||||||
| 1,000 | Dormitory Authority of the State of New York, Revenue Bonds, State University Educational Facilities, Series 1993C, 5.250%, 5/15/19 | 5/14 at 100.00 | AA– | 1,072,400 | ||||||
| 550 | Dormitory Authority of the State of New York, Second General Resolution Consolidated Revenue Bonds, City University System, Series 1990C, 7.500%, 7/01/10 | No Opt. Call | A1 | 583,539 | ||||||
| 2,845 | Dutchess County Industrial Development Agency, New York, Civic Facility Revenue Bonds, Bard College Project, Series 2007-A2, 4.500%, 8/01/36 | 8/17 at 100.00 | A3 | 2,564,398 | ||||||
| 615 | Hempstead Town Industrial Development Agency, New York, Revenue Bonds, Adelphi University, Civic Facility Project, Series 2005, 5.000%, 10/01/35 | 10/15 at 100.00 | A– | 607,294 | ||||||
28
| Principal Amount (000) | Description | Optional Call Provisions (1) | Ratings (2) | Value | ||||||
| Education and Civic Organizations (continued) | ||||||||||
| $ | 1,565 | New York City Industrial Development Agency, New York, Civic Facility Revenue Bonds, American Council of Learned Societies, Series 2002, 5.250%, 7/01/27 | 7/12 at 100.00 | A1 | $ | 1,611,606 | ||||
| New York City Industrial Development Agency, New York, Civic Facility Revenue Bonds, College of New Rochelle, Series 1995: | ||||||||||
| 630 | 6.200%, 9/01/10 | 9/07 at 100.00 | Baa2 | 631,140 | ||||||
| 1,000 | 6.300%, 9/01/15 | 9/07 at 100.00 | Baa2 | 1,001,610 | ||||||
| 3,910 | New York City Industrial Development Agency, New York, PILOT Revenue Bonds Yankee Stadium Project, 4.500%, 3/01/39 – FGIC Insured (UB) | 9/16 at 100.00 | AAA | 3,660,268 | ||||||
| 700 | New York City Trust for Cultural Resources, New York, Revenue Bonds, Museum of American Folk Art, Series 2000, 6.000%, 7/01/22 – ACA Insured | 7/10 at 101.00 | A | 738,444 | ||||||
| 1,000 | New York City Trust for Cultural Resources, New York, Revenue Bonds, Museum of Modern Art, Series 2001D, 5.125%, 7/01/31 – AMBAC Insured | 7/12 at 100.00 | AAA | 1,015,530 | ||||||
| 300 | New York City Industrial Development Agency, Revenue Bonds, Yankee Stadium, Series 2006, Residuals 1875, 6.431%, 3/01/46 – FGIC Insured (IF) | 9/16 at 100.00 | AAA | 310,668 | ||||||
| Niagara County Industrial Development Agency, New York, Civic Facility Revenue Bonds, Niagara University, Series 2001A: | ||||||||||
| 3,000 | 5.500%, 11/01/16 – RAAI Insured | 11/11 at 101.00 | AA | 3,150,960 | ||||||
| 1,000 | 5.350%, 11/01/23 – RAAI Insured | 11/11 at 101.00 | AA | 1,031,710 | ||||||
| 430 | Seneca County Industrial Development Authority, New York, Revenue Bonds, New York Chiropractic College, Series 2007, 5.000%, 10/01/27 | 10/17 at 100.00 | BBB | 402,794 | ||||||
| 1,000 | Suffolk County Industrial Development Agency, New York, Revenue Bonds, Dowling College, Series 1996, 6.700%, 12/01/20 | 12/07 at 101.00 | BB+ | 1,019,610 | ||||||
| Utica Industrial Development Agency, New York, Revenue Bonds, Utica College, Series 1998A: | ||||||||||
| 70 | 5.300%, 8/01/08 | No Opt. Call | N/R | 70,012 | ||||||
| 1,000 | 5.750%, 8/01/28 | 8/08 at 102.00 | N/R | 1,004,600 | ||||||
| 43,215 | Total Education and Civic Organizations | 44,132,695 | ||||||||
| Energy – 0.1% | ||||||||||
| 500 | Virgin Islands Public Finance Authority, Revenue Bonds, Refinery Project Hovensa LLC, Series 2007, 4.700%, 7/01/22 (Alternative Minimum Tax) | 1/15 at 100.00 | BBB | 459,710 | ||||||
| Financials – 1.1% | ||||||||||
| 500 | Liberty Development Corporation, New York, Goldman Sachs Headquarter Revenue Bonds, Series 2005, 5.250%, 10/01/35 | No Opt. Call | AA– | 522,995 | ||||||
| 3,475 | Liberty Development Corporation, New York, Goldman Sachs Headquarters Revenue Bonds Series 2007, 5.500%, 10/01/37 | No Opt. Call | AA– | 3,798,245 | ||||||
| 3,975 | Total Financials | 4,321,240 | ||||||||
| Health Care – 13.8% | ||||||||||
| 3,300 | Dormitory Authority of the State of New York, FHA-Insured Mortgage Nursing Home Revenue Bonds, Menorah Campus Inc., Series 1997, 5.950%, 2/01/17 | 2/08 at 101.00 | AAA | 3,371,280 | ||||||
| 2,250 | Dormitory Authority of the State of New York, FHA-Insured Mortgage Nursing Home Revenue Bonds, Rosalind and Joseph Gurwin Jewish Geriatric Center of Long Island, Series 1997, 5.700%, 2/01/37 – AMBAC Insured | 2/08 at 101.00 | AAA | 2,298,015 | ||||||
| 5,000 | Dormitory Authority of the State of New York, FHA-Insured Mortgage Revenue Bonds, New York Hospital Medical Center of Queens, Series 1999, 4.750%, 2/15/37 | 2/17 at 100.00 | AA | 4,895,050 | ||||||
| Dormitory Authority of the State of New York, FHA-Insured Revenue Bonds, Montefiore Medical Center, Series 2005: | ||||||||||
| 3,000 | 5.000%, 2/01/22 – FGIC Insured | 2/15 at 100.00 | AAA | 3,096,450 | ||||||
| 1,775 | 5.000%, 2/01/28 – FGIC Insured | 2/15 at 100.00 | AAA | 1,814,086 | ||||||
| 4,400 | Dormitory Authority of the State of New York, FHA-Insured Revenue Bonds, St. Lukes Roosevelt Hospital, Series 2005, 4.900%, 8/15/31 | 8/15 at 100.00 | AA | 4,412,276 | ||||||
29
Portfolio of Investments (Unaudited)
Nuveen New York Municipal Bond Fund (continued)
August 31, 2007
| Principal Amount (000) | Description | Optional Call Provisions (1) | Ratings (2) | Value | ||||||
| Health Care (continued) | ||||||||||
| $ | 3,000 | Dormitory Authority of the State of New York, Revenue Bonds, Catholic Health Services of Long Island Obligated Group – St. Catherine of Siena Medical Center, Series 2000A, 6.500%, 7/01/20 | 7/10 at 101.00 | Baa1 | $ | 3,188,670 | ||||
| 2,400 | Dormitory Authority of the State of New York, Revenue Bonds, Lenox Hill Hospital Obligated Group, Series 2001, 5.500%, 7/01/30 | 7/11 at 101.00 | Ba2 | 2,403,336 | ||||||
| 7,465 | Dormitory Authority of the State of New York, Revenue Bonds, Memorial Sloan Kettering Cancer Center, Series 2006-1, 5.000%, 7/01/35 | 7/16 at 100.00 | AA | 7,595,186 | ||||||
| 1,650 | Dormitory Authority of the State of New York, Revenue Bonds, Mount Sinai NYU Health Obligated Group, Series 2000A, 6.500%, 7/01/25 | 7/10 at 101.00 | Baa1 | 1,718,855 | ||||||
| 3,205 | Dormitory Authority of the State of New York, Revenue Bonds, New York and Presbyterian Hospital, Series 2004A, 5.250%, 8/15/15 – FSA Insured | 8/14 at 100.00 | AAA | 3,438,645 | ||||||
| 600 | Dormitory Authority of the State of New York, Revenue Bonds, North Shore Long Island Jewish Obligated Group, Series 2005A, 5.000%, 11/01/34 | 11/16 at 100.00 | A3 | 583,452 | ||||||
| 1,500 | Dormitory Authority of the State of New York, Revenue Bonds, South Nassau Communities Hospital, Series 2003B, 5.500%, 7/01/23 | 7/13 at 100.00 | Baa1 | 1,515,135 | ||||||
| 2,400 | Dormitory Authority of the State of New York, Revenue Bonds, The New York and Presbyterian Hospital Project, Series 2007, 5.000%, 8/15/36 (WI/DD, Settling 9/20/07) – FSA Insured | 8/14 at 100.00 | AAA | 2,431,584 | ||||||
| 1,000 | Dormitory Authority of the State of New York, Revenue Bonds, Winthrop-South Nassau University Hospital Association, Series 2003A, 5.500%, 7/01/32 | 7/13 at 100.00 | Baa1 | 1,001,650 | ||||||
| 2,550 | New York City Health and Hospitals Corporation, New York, Health System Revenue Bonds, Series 2003A, 5.250%, 2/15/22 – AMBAC Insured | 2/13 at 100.00 | AAA | 2,673,828 | ||||||
| 735 | New York City Industrial Development Agency, New York, Civic Facility Revenue Bonds, Staten Island University Hospital, Series 2001B, 6.375%, 7/01/31 | 7/12 at 100.00 | B2 | 741,902 | ||||||
| 2,150 | New York City Industrial Development Agency, New York, Civic Facility Revenue Bonds, Staten Island University Hospital, Series 2002C, 6.450%, 7/01/32 | 7/12 at 101.00 | B2 | 2,183,519 | ||||||
| 1,260 | New York State Dormitory Authority, Revenue Bonds, North Shore Jewish Obligated Group, Series 2007A, 5.000%, 5/01/32 | 5/17 at 100.00 | A3 | 1,230,239 | ||||||
| 165 | New York State Medical Care Facilities Finance Agency, FHA-Insured Mortgage Revenue Bonds, Hospital and Nursing Home Projects, Series 1992B, 6.200%, 8/15/22 | 2/08 at 100.00 | AAA | 166,023 | ||||||
| 1,380 | Newark-Wayne Community Hospital, New York, Hospital Revenue Refunding and Improvement Bonds, Series 1993A, 7.600%, 9/01/15 | 9/07 at 100.00 | N/R | 1,381,380 | ||||||
| Suffolk County Industrial Development Agency, New York, Revenue Bonds, Huntington Hospital, Series 2002C: | ||||||||||
| 850 | 6.000%, 11/01/22 | 11/12 at 100.00 | Baa1 | 876,316 | ||||||
| 1,220 | 5.875%, 11/01/32 | 11/12 at 100.00 | Baa1 | 1,238,044 | ||||||
| 1,000 | Yonkers Industrial Development Agency, New York, Revenue Bonds, St. John’s Riverside Hospital, Series 2001A, 7.125%, 7/01/31 | 7/11 at 101.00 | B+ | 1,054,960 | ||||||
| 54,255 | Total Health Care | 55,309,881 | ||||||||
| Housing/Multifamily – 5.3% | ||||||||||
| 335 | East Syracuse Housing Authority, New York, FHA-Insured Section 8 Assisted Revenue Refunding Bonds, Bennet Project, Series 2001A, 6.700%, 4/01/21 | 4/10 at 102.00 | AAA | 355,941 | ||||||
| 1,000 | Madison County Industrial Development Agency, New York, Civic Facility Revenue Bonds, Morrisville State College Foundation, Series 2005A, 5.000%, 6/01/37 – CIFG Insured | 6/15 at 101.00 | AAA | 1,019,450 | ||||||
| New York City Housing Development Corporation, New York, Multifamily Housing Revenue Bonds, Series 2001A: | ||||||||||
| 2,000 | 5.500%, 11/01/31 | 5/11 at 101.00 | AA | 2,049,800 | ||||||
| 2,000 | 5.600%, 11/01/42 | 5/11 at 101.00 | AA | 2,048,820 | ||||||
| 2,000 | New York City Housing Development Corporation, New York, Multifamily Housing Revenue Bonds, Series 2001C-2, 5.400%, 11/01/33 (Alternative Minimum Tax) | 11/11 at 100.00 | AA | 2,012,800 | ||||||
30
| Principal Amount (000) | Description | Optional Call Provisions (1) | Ratings (2) | Value | ||||||
| Housing/Multifamily (continued) | ||||||||||
| New York City Housing Development Corporation, New York, Multifamily Housing Revenue Bonds, Series 2002A: | ||||||||||
| $ | 910 | 5.375%, 11/01/23 (Alternative Minimum Tax) | 5/12 at 100.00 | AA | $ | 919,419 | ||||
| 450 | 5.500%, 11/01/34 (Alternative Minimum Tax) | 5/12 at 100.00 | AA | 454,662 | ||||||
| 2,000 | New York City Housing Development Corporation, New York, Multifamily Housing Revenue Bonds, Series 2004A, 5.250%, 11/01/30 | 5/14 at 100.00 | AA | 2,057,020 | ||||||
| 1,080 | New York City Housing Development Corporation, New York, Multifamily Housing Revenue Bonds, Series 2005F-1, 4.750%, 11/01/35 | 11/15 at 100.00 | AA | 1,060,992 | ||||||
| New York State Housing Finance Agency, FHA-Insured Multifamily Housing Mortgage Revenue Bonds, Series 1992A: | ||||||||||
| 85 | 6.950%, 8/15/12 | 2/08 at 100.00 | AA | 86,204 | ||||||
| 45 | 7.000%, 8/15/22 | 2/08 at 100.00 | AA | 45,517 | ||||||
| 1,920 | New York State Housing Finance Agency, Mortgage Revenue Refunding Bonds, Housing Project, Series 1996A, 6.125%, 11/01/20 – FSA Insured | 11/07 at 101.00 | AAA | 1,942,445 | ||||||
| 1,860 | New York State Housing Finance Agency, Multifamily Housing Revenue Bonds, Cannon Street Senior Housing Project, Series 2007A, 5.300%, 2/15/39 (Alternative Minimum Tax) | 2/17 at 100.00 | Aa1 | 1,863,367 | ||||||
| 1,000 | New York State Housing Finance Agency, Secured Mortgage Program Multifamily Housing Revenue Bonds, Series 2001G, 5.400%, 8/15/33 (Alternative Minimum Tax) | 8/11 at 100.00 | Aa1 | 1,006,150 | ||||||
| 1,220 | Tonawanda Housing Authority, New York, Housing Revenue Bonds, Kibler Senior Housing LP, Series 1999A, 7.750%, 9/01/31 | 9/09 at 103.00 | N/R | 1,112,542 | ||||||
| 3,030 | Westchester County Industrial Development Agency, New York, GNMA Collateralized Mortgage Loan Revenue Bonds, Living Independently for the Elderly Inc., Series 2001A, 5.400%, 8/20/32 | 8/11 at 102.00 | Aaa | 3,143,534 | ||||||
| 20,935 | Total Housing/Multifamily | 21,178,663 | ||||||||
| Housing/Single Family – 1.6% | ||||||||||
| 2,375 | New York State Mortgage Agency, Homeowner Mortgage Revenue Bonds, Series 130, 4.650%, 4/01/27 (Alternative Minimum Tax) | 4/15 at 100.00 | Aa1 | 2,228,106 | ||||||
| 690 | New York State Mortgage Agency, Homeowner Mortgage Revenue Bonds, Series 82, 5.650%, 4/01/30 (Alternative Minimum Tax) | 10/09 at 100.00 | Aa1 | 712,894 | ||||||
| 1,470 | New York State Mortgage Agency, Homeowner Mortgage Revenue Bonds, Series 95, 5.625%, 4/01/22 | 4/10 at 100.00 | Aa1 | 1,503,016 | ||||||
| 1,660 | New York State Mortgage Agency, Mortgage Revenue Bonds, Thirty-Third Series A, 4.750%, 4/01/23 (Alternative Minimum Tax) | 4/13 at 101.00 | Aaa | 1,604,041 | ||||||
| 280 | New York State Mortgage Agency, Mortgage Revenue Bonds, Twenty-Ninth Series, 5.450%, 4/01/31 (Alternative Minimum Tax) | 10/10 at 100.00 | Aaa | 281,758 | ||||||
| 6,475 | Total Housing/Single Family | 6,329,815 | ||||||||
| Long-Term Care – 3.0% | ||||||||||
| 300 | Dormitory Authority of the State of New York, FHA-Insured Mortgage Revenue Bonds, Augustana Lutheran Home for the Aged Inc., Series 2001, 5.400%, 2/01/31 – MBIA Insured | 2/12 at 101.00 | AAA | 311,046 | ||||||
| 1,670 | Dormitory Authority of the State of New York, FHA-Insured Mortgage Revenue Bonds, W.K. Nursing Home Corporation, Series 1996, 5.950%, 2/01/16 | 2/08 at 101.00 | AAA | 1,675,110 | ||||||
| 1,100 | Dormitory Authority of the State of New York, GNMA Collateralized Revenue Bonds, Cabrini of Westchester Project, Series 2006, 5.200%, 2/15/41 | 2/17 at 103.00 | AA | 1,134,925 | ||||||
| 650 | Dormitory Authority of the State of New York, Non-State Supported Debt, Ozanam Hall of Queens Nursing Home Revenue Bonds, Series 2006, 5.000%, 11/01/31 | 11/16 at 100.00 | Aa3 | 653,140 | ||||||
| 1,000 | Dormitory Authority of the State of New York, Revenue Bonds, Miriam Osborn Memorial Home Association, Series 2000B, 6.375%, 7/01/29 – ACA Insured | 7/10 at 102.00 | A | 1,073,430 | ||||||
| Dormitory Authority of the State of New York, Revenue Bonds, Providence Rest, Series 2005: | ||||||||||
| 50 | 5.125%, 7/01/30 – ACA Insured | 7/15 at 100.00 | A | 48,109 | ||||||
| 415 | 5.000%, 7/01/35 – ACA Insured | 7/15 at 100.00 | A | 386,971 | ||||||
| 1,320 | East Rochester Housing Authority, New York, GNMA Secured Revenue Refunding Bonds, Genesee Valley Presbyterian Nursing Center, Series 2001, 5.200%, 12/20/24 | 12/11 at 101.00 | Aaa | 1,365,487 | ||||||
31
Portfolio of Investments (Unaudited)
Nuveen New York Municipal Bond Fund (continued)
August 31, 2007
| Principal Amount (000) | Description | Optional Call Provisions (1) | Ratings (2) | Value | ||||||
| Long-Term Care (continued) | ||||||||||
| $ | 250 | Suffolk County Industrial Development Agency, New York, Revenue Bonds, Special Needs Facilities Pooled Program, Series 2001C-1, 7.250%, 7/01/16 | 7/11 at 101.00 | N/R | $ | 263,533 | ||||
| 5,000 | Syracuse Housing Authority, New York, FHA-Insured Mortgage Revenue Bonds, Loretto Rest Residential Healthcare Facility, Series 1997A, 5.800%, 8/01/37 | 2/08 at 102.00 | AAA | 5,131,700 | ||||||
| 11,755 | Total Long-Term Care | 12,043,451 | ||||||||
| Materials – 0.2% | ||||||||||
| 700 | Essex County Industrial Development Agency, New York, Environmental Improvement Revenue Bonds, International Paper Company, Series 1999A, 6.450%, 11/15/23 (Alternative Minimum Tax) | 11/09 at 101.00 | BBB | 723,674 | ||||||
| Tax Obligation/General – 4.8% | ||||||||||
| 1,000 | Erie County, New York, General Obligation Bonds, Series 2005A, 5.000%, 12/01/18 – MBIA Insured | 12/15 at 100.00 | AAA | 1,056,660 | ||||||
| 855 | New York City, New York, General Obligation Bonds, Fiscal Series 1997D, 5.875%, 11/01/11 | 11/08 at 100.00 | AA | 869,202 | ||||||
| 1,650 | New York City, New York, General Obligation Bonds, Fiscal Series 2004C, 5.250%, 8/15/16 | 8/14 at 100.00 | AA | 1,770,401 | ||||||
| 3,000 | New York City, New York, General Obligation Bonds, Fiscal Series 2004E, 5.000%, 11/01/19 – FSA Insured | 11/14 at 100.00 | AAA | 3,131,940 | ||||||
| 3,620 | New York City, New York, General Obligation Bonds, Fiscal Series 2005F-1, 5.000%, 9/01/19 – XLCA Insured | 9/15 at 100.00 | AAA | 3,794,484 | ||||||
| 1,725 | New York City, New York, General Obligation Bonds, Fiscal Series 2006C, 5.000%, 8/01/16 – FSA Insured | 8/15 at 100.00 | AAA | 1,836,556 | ||||||
| South Orangetown Central School District, Rockland County, New York, General Obligation Bonds, Series 1990: | ||||||||||
| 390 | 6.875%, 10/01/08 | No Opt. Call | Aa3 | 402,823 | ||||||
| 390 | 6.875%, 10/01/09 | No Opt. Call | Aa3 | 414,231 | ||||||
| United Nations Development Corporation, New York, Senior Lien Revenue Bonds, Series 2004A: | ||||||||||
| 880 | 5.250%, 7/01/23 | 1/08 at 100.00 | A3 | 883,168 | ||||||
| 750 | 5.250%, 7/01/24 | 1/08 at 100.00 | A3 | 752,700 | ||||||
| 2,150 | West Islip Union Free School District, Suffolk County, New York, General Obligation Bonds, Series 2005, 5.000%, 10/01/18 – FSA Insured | 10/15 at 100.00 | Aaa | 2,269,798 | ||||||
| 2,085 | Yonkers, New York, General Obligation Bonds, Series 2005B, 5.000%, 8/01/18 – MBIA Insured | 8/15 at 100.00 | AAA | 2,194,713 | ||||||
| 18,495 | Total Tax Obligation/General | 19,376,676 | ||||||||
| Tax Obligation/Limited – 22.2% | ||||||||||
| 300 | Albany Housing Authority, Albany, New York, Limited Obligation Bonds, Series 1995, 5.850%, 10/01/07 | 9/07 at 101.00 | A3 | 300,441 | ||||||
| 1,500 | Albany Parking Authority, New York, Revenue Refunding Bonds, Series 1992A, 0.000%, 11/01/17 | No Opt. Call | Baa1 | 884,985 | ||||||
| 3,000 | Battery Park City Authority, New York, Senior Revenue Bonds, Series 2003A, 5.250%, 11/01/22 | 11/13 at 100.00 | AAA | 3,177,240 | ||||||
| Canton Human Services Initiative Inc., New York, Facility Revenue Bonds, Series 2001: | ||||||||||
| 920 | 5.700%, 9/01/24 | 9/11 at 102.00 | Baa2 | 957,085 | ||||||
| 1,155 | 5.750%, 9/01/32 | 9/11 at 102.00 | Baa2 | 1,195,194 | ||||||
| 5 | Dormitory Authority of the State of New York, Improvement Revenue Bonds, Mental Health Services Facilities, Series 1997A, 5.750%, 8/15/22 – MBIA Insured | 2/08 at 101.00 | Aaa | 5,108 | ||||||
| 190 | Dormitory Authority of the State of New York, Revenue Bonds, Mental Health Services Facilities Improvements, Series 1997B, 5.625%, 2/15/21 | 2/08 at 101.00 | AA– | 194,028 | ||||||
| 570 | Dormitory Authority of the State of New York, Revenue Bonds, Mental Health Services Facilities Improvements, Series 2005B, 5.000%, 2/15/30 – AMBAC Insured | 2/15 at 100.00 | AAA | 581,178 | ||||||
| 375 | Dormitory Authority of the State of New York, State Personal Income Tax Revenue Bonds, Series 2005F, 5.000%, 3/15/21 – FSA Insured | 3/15 at 100.00 | AAA | 390,176 | ||||||
| Metropolitan Transportation Authority, New York, Dedicated Tax Fund Bonds, Series 2002A: | ||||||||||
| 4,400 | 5.250%, 11/15/25 – FSA Insured | 11/12 at 100.00 | AAA | 4,599,056 | ||||||
| 2,000 | 5.000%, 11/15/30 | 11/12 at 100.00 | AA | 2,030,520 | ||||||
| Metropolitan Transportation Authority, New York, State Service Contract Refunding Bonds, Series 2002A: | ||||||||||
| 1,825 | 5.750%, 7/01/18 | No Opt. Call | AA– | 2,061,429 | ||||||
| 4,400 | 5.125%, 1/01/29 | 7/12 at 100.00 | AA– | 4,468,332 | ||||||
32
| Principal Amount (000) | Description | Optional Call Provisions (1) | Ratings (2) | Value | ||||||
| Tax Obligation/Limited (continued) | ||||||||||
| $ | 1,680 | Monroe Newpower Corporation, New York, Power Facilities Revenue Bonds, Series 2003, 5.500%, 1/01/34 | 1/13 at 102.00 | BBB | $ | 1,651,188 | ||||
| New York City Industrial Development Agency, New York, Civic Facility Revenue Bonds, YMCA of Greater New York, Series 2006: | ||||||||||
| 5,520 | 5.000%, 8/01/26 | 8/16 at 100.00 | A– | 5,557,260 | ||||||
| 2,000 | 5.000%, 8/01/36 | 8/16 at 100.00 | A– | 1,971,320 | ||||||
| 2,000 | New York City Industrial Development Agency, New York, PILOT Revenue Bonds, Queens Baseball Stadium Project, Series 2006, 5.000%, 1/01/46 – AMBAC Insured | 1/17 at 100.00 | AAA | 2,024,420 | ||||||
| New York City Sales Tax Asset Receivable Corporation, New York, Dedicated Revenue Bonds, Local Government Assistance Corporation, Series 2004A: | ||||||||||
| 3,900 | 5.000%, 10/15/25 – MBIA Insured | 10/14 at 100.00 | AAA | 4,035,525 | ||||||
| 1,930 | 5.000%, 10/15/26 – MBIA Insured | 10/14 at 100.00 | AAA | 1,993,497 | ||||||
| 4,300 | New York City Transitional Finance Authority, New York, Building Aid Revenue Bonds, Fiscal Series 2007S-2, 5.000%, 1/15/28 – FGIC Insured | 1/17 at 100.00 | AAA | 4,447,748 | ||||||
| 2,665 | New York City Transitional Finance Authority, New York, Future Tax Secured Bonds, Fiscal Series 2003E, 5.000%, 2/01/23 | 2/13 at 100.00 | AAA | 2,733,464 | ||||||
| 3,705 | New York City Transitional Finance Authority, New York, Future Tax Secured Bonds, Fiscal Series 2007C-1, 5.000%, 11/01/27 | 11/17 at 100.00 | AAA | 3,843,863 | ||||||
| 2,000 | New York City Transitional Finance Authority, New York, Future Tax Secured Refunding Bonds, Fiscal Series 2003D, 5.000%, 2/01/22 – MBIA Insured | 2/13 at 100.00 | AAA | 2,055,260 | ||||||
| 1,000 | New York Convention Center Development Corporation, Hotel Unit Fee Revenue Bonds, Series 2005, | 11/15 at 100.00 | AAA | 1,010,520 | ||||||
| 1,180 | New York State Environmental Facilities Corporation, Infrastructure Revenue Bonds, Series 2003A, | 3/14 at 100.00 | AA– | 1,218,138 | ||||||
| 1,000 | New York State Housing Finance Agency, Revenue Refunding Bonds, New York City Health Facilities, Series 1996A, 6.000%, 11/01/08 | 11/07 at 100.75 | AA– | 1,009,200 | ||||||
| 10 | New York State Housing Finance Agency, Service Contract Obligation Revenue Bonds, Series 1995A, 6.375%, 9/15/15 | 9/07 at 100.00 | AA– | 10,020 | ||||||
| 2,100 | New York State Housing Finance Agency, State Personal Income Tax Revenue Bonds, Economic Development and Housing, Series 2006A, 5.000%, 3/15/36 | 9/15 at 100.00 | AAA | 2,143,848 | ||||||
| 3,125 | New York State Local Government Assistance Corporation, Revenue Bonds, Series 1993E, 5.250%, 4/01/16 – FSA Insured | No Opt. Call | AAA | 3,382,938 | ||||||
| 5,500 | New York State Thruway Authority, Highway and Bridge Trust Fund Bonds, Second Generation, Series 2005B, 5.500%, 4/01/20 – AMBAC Insured | No Opt. Call | AAA | 6,150,263 | ||||||
| 2,850 | New York State Thruway Authority, Highway and Bridge Trust Fund Bonds, Series 2007, 5.000%, 4/01/27 | 10/17 at 100.00 | AA | 2,946,843 | ||||||
| New York State Tobacco Settlement Financing Corporation, Tobacco Settlement Asset-Backed and State Contingency Contract-Backed Bonds, Series 2003A-1: | ||||||||||
| 3,300 | 5.250%, 6/01/20 – AMBAC Insured | 6/13 at 100.00 | AAA | 3,470,841 | ||||||
| 2,755 | 5.250%, 6/01/21 – AMBAC Insured | 6/13 at 100.00 | AAA | 2,891,896 | ||||||
| 4,945 | 5.250%, 6/01/22 – AMBAC Insured | 6/13 at 100.00 | AAA | 5,183,003 | ||||||
| 3,000 | New York State Tobacco Settlement Financing Corporation, Tobacco Settlement Asset-Backed and State Contingency Contract-Backed Bonds, Series 2003B-1C, 5.500%, 6/01/21 | 6/13 at 100.00 | AA– | 3,175,980 | ||||||
| 3,255 | New York State Urban Development Corporation, Service Contract Revenue Bonds, Correctional and Youth Facilities, Series 2002A, 5.500%, 1/01/17 (Mandatory put 1/01/11) | No Opt. Call | AA– | 3,421,851 | ||||||
| 5,000 | Puerto Rico Infrastructure Financing Authority, Special Tax Revenue Bonds, Series 2005A, 0.000%, 7/01/44 – AMBAC Insured | No Opt. Call | AAA | 762,900 | ||||||
| 840 | Triborough Bridge and Tunnel Authority, New York, Convention Center Bonds, Series 1990E, | No Opt. Call | AA– | 877,052 | ||||||
| 90,200 | Total Tax Obligation/Limited | 88,813,610 | ||||||||
33
Portfolio of Investments (Unaudited)
Nuveen New York Municipal Bond Fund (continued)
August 31, 2007
| Principal Amount (000) | Description | Optional Call Provisions (1) | Ratings (2) | Value | |||||||
| Transportation – 11.7% | |||||||||||
| $ | 7,000 | Metropolitan Transportation Authority New York, Transportation Revenue Bonds, Series 2006, 5.000%, 11/15/31 | 11/16 at 100.00 | A | $ | 7,110,528 | |||||
| 1,500 | Metropolitan Transportation Authority, New York, Transportation Revenue Bonds, Series 2003A, 5.000%, 11/15/15 – FGIC Insured | No Opt. Call | AAA | 1,609,170 | |||||||
| Metropolitan Transportation Authority, New York, Transportation Revenue Refunding Bonds, Series 2002A: | |||||||||||
| 1,500 | 5.500%, 11/15/19 – AMBAC Insured | 11/12 at 100.00 | AAA | 1,613,820 | |||||||
| 1,000 | 5.125%, 11/15/22 – FGIC Insured | 11/12 at 100.00 | AAA | 1,035,640 | |||||||
| 500 | New York City Industrial Development Agency, New York, Special Facilities Revenue Bonds, British Airways PLC, Series 1998, 5.250%, 12/01/32 (Alternative Minimum Tax) | 12/08 at 102.00 | BB+ | 456,030 | |||||||
| New York State Thruway Authority, General Revenue Bonds, Series 2005F: | |||||||||||
| 5,265 | 5.000%, 1/01/20 – AMBAC Insured | 1/15 at 100.00 | AAA | 5,487,657 | |||||||
| 1,000 | 5.000%, 1/01/30 – AMBAC Insured | 1/15 at 100.00 | AAA | 1,026,160 | |||||||
| 600 | New York State Thruway Authority, General Revenue Bonds, Series 2005G, 5.000%, 1/01/30 – FSA Insured | 7/15 at 100.00 | AAA | 616,992 | |||||||
| 1,000 | Niagara Frontier Airport Authority, New York, Airport Revenue Bonds, Buffalo Niagara International Airport, Series 1999A, 5.625%, 4/01/29 – MBIA Insured (Alternative Minimum Tax) | 4/09 at 101.00 | AAA | 1,031,790 | |||||||
| Port Authority of New York and New Jersey, Consolidated Revenue Bonds, One Hundred Fortieth Series 2005: | |||||||||||
| 2,500 | 5.000%, 12/01/28 – XLCA Insured | 6/15 at 101.00 | AAA | 2,582,650 | |||||||
| 625 | 5.000%, 12/01/31 – XLCA Insured | 6/15 at 101.00 | AAA | 642,194 | |||||||
| 1,150 | Port Authority of New York and New Jersey, One Hundred and Forty Eighth Consolidated Revenue Bonds, RITES Trust 1516, 6.431%, 8/15/32 – FSA Insured (IF) | 8/17 at 100.00 | AAA | 1,261,677 | |||||||
| 1,500 | Port Authority of New York and New Jersey, Special Project Bonds, JFK International Air Terminal LLC, Sixth Series 1997, 5.750%, 12/01/25 – MBIA Insured (Alternative Minimum Tax) | 12/07 at 100.00 | AAA | 1,506,075 | |||||||
| 250 | Puerto Rico Ports Authority, Special Facilities Revenue Bonds, American Airlines Inc., Series 1996A, | 12/07 at 101.00 | CCC+ | 250,088 | |||||||
| 15,000 | Triborough Bridge and Tunnel Authority, New York, General Purpose Revenue Refunding Bonds, Series 2002B, 5.250%, 11/15/19 (UB) | 11/12 at 100.00 | Aa2 | | 15,904,950 | ||||||
| 1,500 | Triborough Bridge and Tunnel Authority, New York, General Purpose Revenue Bonds, Series 2001A, | 1/12 at 100.00 | Aa2 | 1,544,310 | |||||||
| Triborough Bridge and Tunnel Authority, New York, Subordinate Lien General Purpose Revenue Refunding Bonds, Series 2002E: | |||||||||||
| 780 | 5.500%, 11/15/20 – MBIA Insured | No Opt. Call | AAA | 875,605 | |||||||
| 2,300 | 5.250%, 11/15/22 – MBIA Insured | 11/12 at 100.00 | AAA | 2,415,345 | |||||||
| 44,970 | Total Transportation | 46,970,681 | |||||||||
| U.S. Guaranteed – 18.1% (3) | |||||||||||
| 1,000 | Cattaraugus County Industrial Development Agency, New York, Revenue Bonds, Jamestown Community College, Series 2000A, 6.500%, 7/01/30 (Pre-refunded 7/01/10) | 7/10 at 102.00 | Baa1 | (3) | 1,094,190 | ||||||
| 1,520 | Dormitory Authority of the State of New York, FHA-Insured Nursing Home Mortgage Revenue Bonds, Shorefront Jewish Geriatric Center Inc., Series 2002, 5.200%, 2/01/32 (Pre-refunded 2/01/13) | 2/13 at 102.00 | AAA | 1,650,766 | |||||||
| 1,250 | Dormitory Authority of the State of New York, Revenue Bonds, North Shore Long Island Jewish Group, Series 2003, 5.375%, 5/01/23 (Pre-refunded 5/01/13) | 5/13 at 100.00 | Aaa | 1,351,775 | |||||||
| Dormitory Authority of the State of New York, Revenue Bonds, State University Educational Facilities Revenue Bonds, 1999 Resolution, Series 2000B: | |||||||||||
| 2,500 | 5.750%, 5/15/14 (Pre-refunded 5/15/10) – FSA Insured (UB) | 5/10 at 101.00 | AAA | 2,660,600 | |||||||
| 1,500 | 5.750%, 5/15/16 (Pre-refunded 5/15/10) – FSA Insured (UB) | 5/10 at 101.00 | AAA | 1,596,360 | |||||||
| 2,000 | 5.750%, 5/15/17 (Pre-refunded 5/15/10) – FSA Insured (UB) | 5/10 at 101.00 | AAA | 2,128,480 | |||||||
| 1,750 | Dormitory Authority of the State of New York, Revenue Bonds, University of Rochester, Series 1999B, 5.625%, 7/01/24 (Pre-refunded 7/01/09) | 7/09 at 101.00 | A+ | (3) | 1,826,878 | ||||||
| 220 | Dormitory Authority of the State of New York, Suffolk County, Lease Revenue Bonds, Judicial Facilities, Series 1991A, 9.500%, 4/15/14 (ETM) | 10/07 at 108.43 | Baa1 | (3) | 289,333 | ||||||
34
| Principal Amount (000) | Description | Optional Call Provisions (1) | Ratings (2) | Value | |||||||
| U.S. Guaranteed (continued) | |||||||||||
| $ | 980 | Erie County Tobacco Asset Securitization Corporation, New York, Senior Tobacco Settlement Asset-Backed Bonds, Series 2000, 6.000%, 7/15/20 (Pre-refunded 7/15/10) | 7/10 at 101.00 | AAA | $ | 1,050,629 | |||||
| 2,000 | Long Island Power Authority, New York, Electric System General Revenue Bonds, Series 2001A, | 9/11 at 100.00 | A– | (3) | 2,133,620 | ||||||
| 1,000 | Long Island Power Authority, New York, Electric System General Revenue Bonds, Series 2001L, | 5/11 at 100.00 | AAA | 1,061,540 | |||||||
| 855 | Metropolitan Transportation Authority, New York, Commuter Facilities Revenue Bonds, Series 1997B, 5.000%, 7/01/20 – AMBAC Insured (ETM) | 11/07 at 102.00 | AAA | 872,989 | |||||||
| Metropolitan Transportation Authority, New York, Dedicated Tax Fund Bonds, Series 1999A: | |||||||||||
| 1,000 | 5.250%, 4/01/23 (Pre-refunded 10/01/14) – FSA Insured | 10/14 at 100.00 | AAA | 1,091,550 | |||||||
| 2,000 | 5.000%, 4/01/29 (Pre-refunded 10/01/14) – FSA Insured | 10/14 at 100.00 | AAA | 2,152,260 | |||||||
| Monroe Tobacco Asset Securitization Corporation, New York, Tobacco Settlement Asset-Backed Bonds, Series 2000: | |||||||||||
| 250 | 6.000%, 6/01/15 (Pre-refunded 6/01/10) | 6/10 at 101.00 | AAA | 267,678 | |||||||
| 775 | 6.150%, 6/01/25 (Pre-refunded 6/01/10) | 6/10 at 101.00 | AAA | 819,470 | |||||||
| 965 | Nassau County Industrial Development Agency, New York, Revenue Bonds, Special Needs Facilities Pooled Program, Series 2001B-1, 7.250%, 7/01/16 (Pre-refunded 7/01/11) | 7/11 at 101.00 | AAA | 1,084,206 | |||||||
| 1,500 | Nassau County Tobacco Settlement Corporation, New York, Tobacco Settlement Asset-Backed Bonds, Series 1999A, 6.500%, 7/15/27 (Pre-refunded 7/15/09) | 7/09 at 101.00 | AAA | 1,589,640 | |||||||
| 855 | New York City Industrial Development Agency, New York, Civic Facility Revenue Bonds, Special Needs Facilities Pooled Program, Series 2000, 8.125%, 7/01/19 (Pre-refunded 7/01/10) | 7/10 at 102.00 | N/R | (3) | 939,474 | ||||||
| 4,000 | New York City Transitional Finance Authority, New York, Future Tax Secured Bonds, Fiscal Series 2000C: | ||||||||||
5.875%, 11/01/16 (Pre-refunded 5/01/10) (UB) | 5/10 at 101.00 | AAA | 4,264,921 | ||||||||
| 585 | New York City Transitional Finance Authority, New York, Future Tax Secured Bonds, Residual Interest Certificates, Series 319: 8.962%, 11/01/16 (Pre-refunded 5/01/10) (IF) | 5/10 at 101.00 | AAA | 700,275 | |||||||
| 180 | New York State Housing Finance Agency, Construction Fund Bonds, State University, Series 1986A, | No Opt. Call | AAA | 193,954 | |||||||
| New York State Thruway Authority, Highway and Bridge Trust Fund Bonds, Series 2000B: | |||||||||||
| 2,210 | 5.750%, 4/01/15 (Pre-refunded 4/01/10) – FGIC Insured (UB) | 4/10 at 101.00 | AAA | 2,347,153 | |||||||
| 3,230 | 5.750%, 4/01/16 (Pre-refunded 4/01/10) – FGIC Insured (UB) | 4/10 at 101.00 | AAA | 3,430,454 | |||||||
| 1,520 | New York State Thruway Authority, Highway and Bridge Trust Fund Bonds, Residual Interest Certificates, Series 368, 8.673%, 4/01/14 (Pre-refunded 4/01/10) – FGIC Insured (IF) | 4/10 at 101.00 | AAA | 1,802,811 | |||||||
| 1,500 | New York State Thruway Authority, Highway and Bridge Trust Fund Bonds, Second Generation, Series 2003A, 5.250%, 4/01/23 (Pre-refunded 4/01/13) – MBIA Insured | 4/13 at 100.00 | AAA | 1,613,520 | |||||||
| 2,170 | New York State Thruway Authority, Highway and Bridge Trust Fund Bonds, Second Generation, Series 2004, 5.000%, 4/01/20 (Pre-refunded 4/01/14) – MBIA Insured | 4/14 at 100.00 | AAA | 2,324,916 | |||||||
| 1,535 | New York State Thruway Authority, Highway and Bridge Trust Fund Bonds, Series 2002A, | 4/12 at 100.00 | AAA | 1,640,424 | |||||||
| 2,415 | New York State Thruway Authority, Local Highway and Bridge Service Contract Bonds, DRIVERS, Series 145, 8.713% 4/01/16 (Pre-refunded 4/01/10) – AMBAC Insured (IF) | 4/10 at 101.00 | AAA | 2,864,601 | |||||||
New York State Thruway Authority, Local Highway and Bridge Service Contract Bonds, Series 2000: | |||||||||||
| 5,000 | 5.750%, 4/01/16 (Pre-refunded 4/01/10) – AMBAC Insured (UB) | 4/10 at 101.00 | AAA | 5,310,300 | |||||||
| 5,000 | 5.750%, 4/01/17 (Pre-refunded 4/01/10) – AMBAC Insured (UB) | 4/10 at 101.00 | AAA | 5,310,300 | |||||||
35
Portfolio of Investments (Unaudited)
Nuveen New York Municipal Bond Fund (continued)
August 31, 2007
| Principal Amount (000) | Description | Optional Call Provisions (1) | Ratings (2) | Value | |||||||
| U.S. Guaranteed (3) (continued) | |||||||||||
| $ | 1,500 | New York State Urban Development Corporation, State Personal Income Tax Revenue Bonds, State Facilities and Equipment, Series 2002A, 5.375%, 3/15/18 (Pre-refunded 3/15/12) | 3/12 at 100.00 | AAA | $ | 1,609,965 | |||||
| 2,000 | New York State Urban Development Corporation, State Personal Income Tax Revenue Bonds, State Facilities and Equipment, Series 2002C-1, 5.000%, 3/15/33 (Pre-refunded 3/15/13) | 3/13 at 100.00 | AAA | 2,125,500 | |||||||
| 1,420 | Niagara Falls City School District, Niagara County, New York, Certificates of Participation, High School Facility, Series 2000, 6.625%, 6/15/28 (Pre-refunded 6/15/09) | 6/09 at 101.00 | BBB– | (3) | 1,505,654 | ||||||
| 2,750 | TSASC Inc., New York, Tobacco Flexible Amortization Bonds, Series 1999-1, 6.250%, 7/15/27 | 7/09 at 101.00 | AAA | 2,902,020 | |||||||
| 1,250 | Virgin Islands Public Finance Authority, Gross Receipts Taxes Loan Note, Series 1999A, 6.500%, 10/01/24 (Pre-refunded 10/01/10) | 10/10 at 101.00 | BBB+ | (3) | 1,364,325 | ||||||
| 2,500 | Westchester Tobacco Asset Securitization Corporation, New York, Tobacco Settlement Asset-Backed Bonds, Series 1999, 6.750%, 7/15/29 (Pre-refunded 7/15/10) | 7/10 at 101.00 | AAA | 2,733,700 | |||||||
| 505 | White Plains, New York, General Obligation Bonds, Series 2004A, 5.000%, 5/15/22 (Pre-refunded 5/15/11) | 5/11 at 100.00 | AA+ | (3) | 529,831 | ||||||
| 1,960 | Yonkers Industrial Development Agency, New York, Revenue Bonds, Community Development Properties – Yonkers Inc. Project, Series 2001A, 6.625%, 2/01/26 (Pre-refunded 2/01/11) | 2/11 at 100.00 | BBB– | (3) | 2,151,257 | ||||||
| 67,150 | Total U.S. Guaranteed | 72,387,319 | |||||||||
| Utilities – 8.3% | |||||||||||
| 2,350 | Long Island Power Authority, New York, Electric System General Revenue Bonds, Series 2000A, | No Opt. Call | AAA | 1,335,787 | |||||||
| 6,000 | Long Island Power Authority, New York, Electric System General Revenue Bonds, Series 2003C, | 9/13 at 100.00 | AAA | 6,364,198 | |||||||
| Long Island Power Authority, New York, Electric System General Revenue Bonds, Series 2006A: | |||||||||||
| 5,500 | 5.000%, 12/01/23 – FGIC Insured | 6/16 at 100.00 | AAA | 5,714,885 | |||||||
| 1,200 | 5.000%, 12/01/24 – FGIC Insured | 6/16 at 100.00 | AAA | 1,244,244 | |||||||
| 215 | 5.000%, 12/01/25 – FGIC Insured | 6/16 at 100.00 | AAA | 222,297 | |||||||
| 500 | Long Island Power Authority, New York, Electric System General Revenue Bonds, Series 2006B, | 6/16 at 100.00 | AAA | 510,445 | |||||||
| 2,450 | New York City Industrial Development Agency, New York, Revenue Bonds, Brooklyn Navy Yard Cogeneration Partners LP, Series 1997, 5.750%, 10/01/36 (Alternative Minimum Tax) | 10/08 at 102.00 | BBB– | 2,450,882 | |||||||
| 3,500 | New York State Energy Research and Development Authority, Pollution Control Revenue Bonds, New York State Electric and Gas Corporation, Series 2005A, 4.100%, 3/15/15 – MBIA Insured | 3/08 at 101.50 | AAA | 3,514,490 | |||||||
| 1,500 | Niagara County Industrial Development Agency, New York, Solid Waste Disposal Facility Revenue Bonds, American Ref-Fuel Company of Niagara LP, Series 2001A, 5.450%, 11/15/26 (Mandatory put 11/15/12) (Alternative Minimum Tax) | 11/11 at 101.00 | Baa3 | 1,527,525 | |||||||
| 200 | Niagara County Industrial Development Agency, New York, Solid Waste Disposal Facility Revenue Refunding Bonds, American Ref-Fuel Company of Niagara LP, Series 2001D, 5.550%, 11/15/24 (Mandatory put 11/15/15) | 11/11 at 101.00 | Baa3 | 205,200 | |||||||
| 3,000 | Power Authority of the State of New York, General Revenue Bonds, Series 2000A, 5.250%, 11/15/40 | 11/10 at 100.00 | Aa2 | 3,058,620 | |||||||
| Power Authority of the State of New York, General Revenue Bonds, Series 2006A: | |||||||||||
| 780 | 5.000%, 11/15/18 – FGIC Insured | 11/15 at 100.00 | AAA | 823,992 | |||||||
| 520 | 5.000%, 11/15/19 – FGIC Insured | 11/15 at 100.00 | AAA | 546,380 | |||||||
| Suffolk County Industrial Development Agency, New York, Revenue Bonds, Nissequogue Cogeneration Partners Facility, Series 1998: | |||||||||||
| 1,800 | 5.300%, 1/01/13 (Alternative Minimum Tax) | 1/09 at 101.00 | N/R | 1,757,861 | |||||||
| 4,000 | 5.500%, 1/01/23 (Alternative Minimum Tax) | 1/09 at 101.00 | N/R | 3,817,159 | |||||||
| 100 | Westchester County Industrial Development Agency, Westchester County, New York, Resource Recovery Revenue Bonds, RESCO Company, Series 1996, 5.500%, 7/01/09 (Alternative Minimum Tax) | 7/08 at 100.00 | BBB | 100,887 | |||||||
| 33,615 | Total Utilities | 33,194,852 | |||||||||
36
| Principal Amount (000) | Description | Optional Call Provisions (1) | Ratings (2) | Value | ||||||
| Water and Sewer – 2.8% | ||||||||||
| $ | 2,225 | New York City Municipal Water Finance Authority, New York, Water and Sewerage System Revenue Bonds, Fiscal Series 2003A, 5.375%, 6/15/19 | 6/12 at 100.00 | AA+ | $ | 2,364,462 | ||||
| 4,000 | New York State Environmental Facilities Corporation, State Clean Water and Drinking Water Revolving Funds Revenue Bonds, Pooled Loan Issue, Series 2002F, 5.250%, 11/15/18 | 11/12 at 100.00 | AAA | 4,249,039 | ||||||
| 2,950 | Niagara Falls Public Water Authority, New York, Water and Sewerage Revenue Bonds, Series 2005, | 7/15 at 100.00 | AAA | 3,018,233 | ||||||
| 1,455 | Western Nassau County Water Authority, New York, Water System Revenue Bonds, Series 2005, 5.000%, 5/01/18 – AMBAC Insured | 5/15 at 100.00 | Aaa | 1,532,492 | ||||||
| 10,630 | Total Water and Sewer | 11,164,226 | ||||||||
| $ | 414,030 | Total Long-Term Investments (cost $416,625,842) – 105.7% | 423,224,033 | |||||||
| Short-Term Investments – 0.9% | ||||||||||
| $ | 3,600 | Dormitory Authority of the State of New York, Variable Rate Demand Revenue Bonds, Pratt Institute Project, Series 2005, 5.900%, 7/01/34 (4) | VMIG-1 | 3,600,000 | ||||||
Total Short-Term Investments (cost $3,600,000) | 3,600,000 | |||||||||
Total Investments (cost $420,225,842) – 106.6% | 426,824,033 | |||||||||
Floating Rate Obligations – (8.0)% | (32,075,000) | |||||||||
Other Assets Less Liabilities – 1.4% | 5,647,675 | |||||||||
Net Assets – 100% | $ | 400,396,708 | ||||||||
Forward Swaps outstanding at August 31, 2007:
| Counterparty | Notional Amount | Fund Pay/Receive Floating Rate | Floating Rate Index | Fixed Rate (Annualized) | Fixed Rate Payment Frequency | Effective Date (5) | Termination Date | Unrealized Appreciation (Depreciation) | |||||||||||
| Goldman Sachs | $ | 4,400,000 | Pay | 3-Month USD-LIBOR | 5.902 | % | Semi-Annually | 7/01/08 | 7/01/33 | $ | 255,740 | ||||||||
| Royal Bank of Canada | 6,600,000 | Pay | SIFM | 4.335 | Quarterly | 8/06/08 | 8/06/37 | 139,528 | |||||||||||
| $ | 395,268 | ||||||||||||||||||
USD – LIBOR (United States Dollar-London Inter-Bank Offered Rate)
SIFM – The daily arithmetic average of the weekly SIFM (the Securities Industry and Financial Markets) Municipal Swap Index.
| The Fund may invest in “zero coupon” securities. A zero coupon security does not pay a regular interest coupon to its holders during the life of the security. Tax-exempt income to the holder of the security comes from accretion of the difference between the original purchase price of the security at issuance and the par value of the security at maturity and is effectively paid at maturity. Such securities are included in the Portfolio of Investments with a 0.000% coupon rate in their description. The market prices of zero coupon securities generally are more volatile than the market prices of securities that pay interest periodically. |
| (1) | Optional Call Provisions: Dates (month and year) and prices of the earliest optional call or redemption. There may be other call provisions at varying prices at later dates. Certain mortgage-backed securities may be subject to periodic principal paydowns. |
| (2) | Ratings: Using the higher of Standard & Poor’s or Moody’s rating. Ratings below BBB by Standard & Poor’s Group or Baa by Moody’s Investor Service, Inc. are considered to be below investment grade. |
| (3) | Backed by an escrow or trust containing sufficient U.S. Government or U.S. Government agency securities which ensure the timely payment of principal and interest. Such investments are normally considered to be equivalent to AAA rated securities. |
| (4) | Investment has a maturity of more than one year, but has variable rate and demand features which qualify it as a short-term investment. The rate disclosed is that in effect at the end of the reporting period. This rate changes periodically based on market conditions or a specified market index. |
| (5) | Effective date represents the date on which both the Fund and counterparty commence interest payment accruals on each forward swap contract. |
| N/R | Not rated. |
| WI/DD | Purchased on a when-issued or delayed delivery basis. |
| (ETM) | Escrowed to maturity. |
| (IF) | Inverse floating rate investment. |
| (UB) | Underlying bond of an inverse floating rate trust reflected as a financing transaction pursuant to the provisions of SFAS No. 140. |
37
See accompanying notes to financial statements.
Portfolio of Investments (Unaudited)
Nuveen New York Insured Municipal Bond Fund
August 31, 2007
| Principal Amount (000) | Description | Optional Call Provisions (1) | Ratings (2) | Value | ||||||
| Education and Civic Organizations – 10.2% | ||||||||||
| $ | 1,000 | Allegany County Industrial Development Agency, New York, Revenue Bonds, Alfred University, Series 1998, 5.000%, 8/01/28 – MBIA Insured | 8/08 at 102.00 | Aaa | $ | 1,009,130 | ||||
| 1,110 | Amherst Industrial Development Agency, New York, Revenue Bonds, UBF Faculty/Student Housing Corporation, University of Buffalo Creekside Project, Series 2002A, 5.000%, 8/01/22 – AMBAC Insured | 8/12 at 101.00 | AAA | 1,143,156 | ||||||
| 3,095 | Amherst Industrial Development Agency, New York, Revenue Bonds, UBF Faculty/Student Housing Corporation, University of Buffalo Project, Series 2000A, 5.750%, 8/01/30 – AMBAC Insured | 8/10 at 102.00 | AAA | 3,296,856 | ||||||
| 4,000 | Dormitory Authority of the State of New York, Consolidated Revenue Bonds, City University System, Series 1993A, 5.750%, 7/01/13 – MBIA Insured | No Opt. Call | AAA | 4,291,040 | ||||||
| 2,610 | Dormitory Authority of the State of New York, General Revenue Bonds, Manhattan College, Series 2007A, 5.000%, 7/01/32 – RAAI Insured | 7/17 at 100.00 | AA | 2,526,872 | ||||||
| 1,000 | Dormitory Authority of the State of New York, General Revenue Bonds, New York University, | No Opt. Call | AAA | 1,133,840 | ||||||
| 605 | Dormitory Authority of the State of New York, Insured Revenue Bonds, Fordham University, Series 2002, 5.000%, 7/01/21 – FGIC Insured | 7/12 at 100.00 | AAA | 627,681 | ||||||
| 2,890 | Dormitory Authority of the State of New York, Insured Revenue Bonds, Ithaca College, Series 1998, 5.000%, 7/01/21 – AMBAC Insured | 7/08 at 101.00 | Aaa | 2,946,991 | ||||||
| 1,000 | Dormitory Authority of the State of New York, Insured Revenue Bonds, Yeshiva University, Series 2001, 5.000%, 7/01/30 – AMBAC Insured | 7/11 at 100.00 | AAA | 1,014,730 | ||||||
| 1,000 | Dormitory Authority of the State of New York, Lease Revenue Bonds, State University Dormitory Facilities, Series 2003B, 5.250%, 7/01/32 (Mandatory put 7/01/13) – XLCA Insured | No Opt. Call | AAA | 1,068,970 | ||||||
| 435 | Dormitory Authority of the State of New York, Revenue Bonds, Barnard College, Series 2007A, | 7/17 at 100.00 | AAA | 446,362 | ||||||
| 1,000 | Dormitory Authority of the State of New York, Revenue Bonds, Canisius College, Series 2000, | 7/11 at 101.00 | AAA | 1,033,240 | ||||||
| 1,345 | Dormitory Authority of the State of New York, Revenue Bonds, City University of New York, Series 2005A, 5.500%, 7/01/18 – FGIC Insured | No Opt. Call | AAA | 1,500,200 | ||||||
| 2,500 | New York City Industrial Development Agency, New York, Civic Facility Revenue Bonds, Polytechnic University, Series 2007, 5.250%, 11/01/37 – ACA Insured | 11/17 at 100.00 | A | 2,399,400 | ||||||
| 3,555 | New York City Industrial Development Agency, New York, PILOT Revenue Bonds, Yankee Stadium Project, 4.500%, 3/01/39 – FGIC Insured (UB) | 9/16 at 100.00 | AAA | 3,327,942 | ||||||
| 1,500 | New York City Industrial Development Agency, Revenue Bonds, Ethical Culture Fieldston School, Series 2005B-1, 5.000%, 6/01/35 – XLCA Insured | 6/15 at 100.00 | AAA | 1,533,240 | ||||||
| 720 | New York City Industrial Development Authority, New York, PILOT Revenue Bonds, Yankee Stadium Project, Series 2006, 5.000%, 3/01/31 – FGIC Insured | 9/16 at 100.00 | AAA | 739,692 | ||||||
| 735 | New York City Industrial Development Agency, Revenue Bonds, Yankee Stadium, Series 2006, Residuals 1875: | |||||||||
6.431%, 3/01/46 – FGIC Insured (IF) | 9/16 at 100.00 | AAA | 761,137 | |||||||
| 585 | New York State Dormitory Authority, Revenue Bonds, New York University, Series 2007, 5.000%, 7/01/32 – AMBAC Insured | 7/17 at 100.00 | Aaa | 602,609 | ||||||
| 30,685 | Total Education and Civic Organizations | 31,403,088 | ||||||||
| Health Care – 14.8% | ||||||||||
| 400 | Dormitory Authority of the State of New York, FHA-Insured Mortgage Hospital Revenue Bonds, Hospital for Special Surgery, Series 2005, 5.000%, 8/15/33 – MBIA Insured | 2/15 at 100.00 | AAA | 406,332 | ||||||
| 3,305 | Dormitory Authority of the State of New York, FHA-Insured Mortgage Hospital Revenue Bonds, Millard Fillmore Hospitals, Series 1997, 5.375%, 2/01/32 – AMBAC Insured | 2/08 at 102.00 | AAA | 3,374,570 | ||||||
| 2,000 | Dormitory Authority of the State of New York, FHA-Insured Mortgage Hospital Revenue Bonds, Montefiore Medical Center, Series 1999, 5.500%, 8/01/38 – AMBAC Insured | 8/09 at 101.00 | AAA | 2,069,540 | ||||||
| 6,115 | Dormitory Authority of the State of New York, FHA-Insured Mortgage Hospital Revenue Bonds, New York and Presbyterian Hospital, Series 1998, 4.750%, 8/01/27 – AMBAC Insured | 2/08 at 101.00 | AAA | 6,119,585 | ||||||
38
| Principal Amount (000) | Description | Optional Call Provisions (1) | Ratings (2) | Value | ||||||
| Health Care (continued) | ||||||||||
| $ | 1,910 | Dormitory Authority of the State of New York, FHA-Insured Mortgage Hospital Revenue Bonds, St. Barnabas Hospital, Series 2002A, 5.125%, 2/01/22 – AMBAC Insured | 8/12 at 100.00 | AAA | $ | 1,960,367 | ||||
| 1,910 | Dormitory Authority of the State of New York, FHA-Insured Mortgage Revenue Bonds, Montefiore Hospital, Series 2004, 5.000%, 8/01/29 – FGIC Insured | 2/15 at 100.00 | AAA | 1,948,448 | ||||||
| 4,000 | Dormitory Authority of the State of New York, FHA-Insured Mortgage Revenue Refunding Bonds, United Health Services, Series 1997, 5.375%, 8/01/27 – AMBAC Insured | 2/08 at 102.00 | AAA | 4,101,240 | ||||||
| 2,260 | Dormitory Authority of the State of New York, Hospital Revenue Bonds, Catholic Health Services of Long Island Obligated Group – St. Francis Hospital, Series 1999A, 5.500%, 7/01/29 – MBIA Insured | 7/09 at 101.00 | AAA | 2,338,603 | ||||||
| 3,125 | Dormitory Authority of the State of New York, Revenue Bonds, Catholic Health Services of Long Island Obligated Group – St. Charles Hospital and Rehabilitation Center, Series 1999A, 5.500%, 7/01/22 – MBIA Insured | 7/09 at 101.00 | AAA | 3,241,563 | ||||||
| 2,000 | Dormitory Authority of the State of New York, Revenue Bonds, Memorial Sloan-Kettering Cancer Center, Series 2003-1, 5.000%, 7/01/21 – MBIA Insured | 7/13 at 100.00 | AAA | 2,075,400 | ||||||
| 1,020 | Dormitory Authority of the State of New York, Revenue Bonds, New York and Presbyterian Hospital, Series 2004A, 5.250%, 8/15/15 – FSA Insured | 8/14 at 100.00 | AAA | 1,094,358 | ||||||
| 1,650 | Dormitory Authority of the State of New York, Revenue Bonds, North Shore Health System Obligated Group, Series 1998, 5.000%, 11/01/23 – MBIA Insured | 11/08 at 101.00 | AAA | 1,677,786 | ||||||
| 5,000 | Dormitory Authority of the State of New York, Revenue Bonds, Winthrop South Nassau University Health System Obligated Group, Series 2001A, 5.250%, 7/01/31 – AMBAC Insured | 7/11 at 101.00 | AAA | 5,127,550 | ||||||
| 2,500 | Dormitory Authority of the State of New York, Secured Hospital Insured Revenue Bonds, Southside Hospital, Series 1998, 5.000%, 2/15/25 – MBIA Insured | 2/08 at 101.50 | AAA | 2,526,950 | ||||||
| New York City Health and Hospitals Corporation, New York, Health System Revenue Bonds, Series 2003A: | ||||||||||
| 2,000 | 5.250%, 2/15/21 – AMBAC Insured | 2/13 at 100.00 | AAA | 2,100,400 | ||||||
| 1,750 | 5.250%, 2/15/22 – AMBAC Insured | 2/13 at 100.00 | AAA | 1,834,980 | ||||||
| 735 | New York State Dormitory Authority, Revenue Bonds, North Shore Jewish Obligated Group, Series 2007A, 5.250%, 7/01/34 – FGIC Insured | No Opt. Call | AAA | 807,559 | ||||||
| 2,890 | New York State Medical Care Facilities Finance Agency, FHA-Insured Mortgage Revenue Bonds, Montefiore Medical Center, Series 1995A, 5.750%, 2/15/15 – AMBAC Insured | 2/08 at 100.00 | AAA | 2,947,367 | ||||||
| 44,570 | Total Health Care | 45,752,598 | ||||||||
| Housing/Multifamily – 4.7% | ||||||||||
| New York City Housing Development Corporation, New York, Capital Fund Program Revenue Bonds, Series 2005A: | ||||||||||
| 400 | 5.000%, 7/01/14 – FGIC Insured | No Opt. Call | AAA | 426,768 | ||||||
| 400 | 5.000%, 7/01/16 – FGIC Insured | 7/15 at 100.00 | AAA | 425,128 | ||||||
| 4,030 | 5.000%, 7/01/25 – FGIC Insured | 7/15 at 100.00 | AAA | 4,146,789 | ||||||
| 889 | New York City Housing Development Corporation, New York, Multifamily Housing Revenue Bonds, Pass-Through Certificates, Series 1991C, 6.500%, 2/20/19 – AMBAC Insured | 9/07 at 105.00 | AAA | 935,616 | ||||||
| New York State Housing Finance Agency, Mortgage Revenue Refunding Bonds, Housing Project, Series 1996A: | ||||||||||
| 4,335 | 6.100%, 11/01/15 – FSA Insured | 11/07 at 101.00 | AAA | 4,386,240 | ||||||
| 4,270 | 6.125%, 11/01/20 – FSA Insured | 11/07 at 101.00 | AAA | 4,319,916 | ||||||
| 14,324 | Total Housing/Multifamily | 14,640,457 | ||||||||
| Industrials – 0.8% | ||||||||||
| 2,235 | Syracuse Industrial Development Authority, New York, PILOT Mortgage Revenue Bonds, Carousel Center Project, Series 2007A, 5.000%, 1/01/36 – XLCA Insured (Alternative Minimum Tax) | 1/17 at 100.00 | AAA | 2,246,443 | ||||||
| Long-Term Care – 2.6% | ||||||||||
| 2,000 | Dormitory Authority of the State of New York, FHA-Insured Nursing Home Mortgage Revenue Bonds, Augustana Lutheran Home for the Aged Inc., Series 2000A, 5.500%, 8/01/38 – MBIA Insured | 8/10 at 101.00 | AAA | 2,093,360 | ||||||
| 3,665 | Dormitory Authority of the State of New York, FHA-Insured Nursing Home Mortgage Revenue Bonds, Norwegian Christian Home and Health Center, Series 2001, 5.200%, 8/01/36 – MBIA Insured | 8/11 at 101.00 | AAA | 3,742,222 | ||||||
39
Portfolio of Investments (Unaudited)
Nuveen New York Insured Municipal Bond Fund (continued)
August 31, 2007
| Principal Amount (000) | Description | Optional Call Provisions (1) | Ratings (2) | Value | ||||||
| Long-Term Care (continued) | ||||||||||
| $ | 2,000 | Dormitory Authority of the State of New York, Insured Revenue Bonds, NYSARC Inc., Series 2005A, | 7/15 at 100.00 | AAA | $ | 2,040,660 | ||||
| 7,665 | Total Long-Term Care | 7,876,242 | ||||||||
| Tax Obligation/General – 12.8% | ||||||||||
| 1,000 | Erie County, New York, General Obligation Bonds, Series 2003A, 5.250%, 3/15/16 – FGIC Insured | 3/13 at 100.00 | Aaa | 1,069,120 | ||||||
| 2,000 | Erie County, New York, General Obligation Bonds, Series 2005A, 5.000%, 12/01/18 – MBIA Insured | 12/15 at 100.00 | AAA | 2,113,320 | ||||||
| 8,675 | Hudson Yards Infrastructure Corporation, New York, Revenue Bonds, Series 2006A, | 2/17 at 100.00 | AAA | 8,785,693 | ||||||
| 2,250 | Monroe County, New York, General Obligation Public Improvement Bonds, Series 2002, | 3/12 at 100.00 | AAA | 2,366,235 | ||||||
| 2,000 | Monroe-Woodbury Central School District, Orange County, New York, General Obligation Bonds, Series 2004A, 4.250%, 5/15/22 – FGIC Insured | 5/14 at 100.00 | AAA | 1,949,680 | ||||||
| Mount Sinai Union Free School District, Suffolk County, New York, General Obligation Refunding Bonds, Series 1992: | ||||||||||
| 500 | 6.200%, 2/15/15 – AMBAC Insured | No Opt. Call | AAA | 574,465 | ||||||
| 1,035 | 6.200%, 2/15/16 – AMBAC Insured | No Opt. Call | AAA | 1,201,325 | ||||||
| 1,505 | Nassau County, North Hempstead, New York, General Obligation Refunding Bonds, Series 1992B, | No Opt. Call | AAA | 1,725,302 | ||||||
| 60 | New York City, New York, General Obligation Bonds, Fiscal Series 1992C, 6.250%, 8/01/10 – FSA Insured | 2/08 at 100.00 | AAA | 60,120 | ||||||
| 3,000 | New York City, New York, General Obligation Bonds, Fiscal Series 2001D, 5.250%, 8/01/15 – MBIA Insured | 8/10 at 101.00 | AAA | 3,138,510 | ||||||
| 2,460 | New York City, New York, General Obligation Bonds, Fiscal Series 2002A, 5.250%, 11/01/15 – MBIA Insured | 11/11 at 101.00 | AAA | 2,608,559 | ||||||
| New York City, New York, General Obligation Bonds, Fiscal Series 2004E: | ||||||||||
| 2,500 | 5.000%, 11/01/19 – FSA Insured | 11/14 at 100.00 | AAA | 2,609,950 | ||||||
| 1,050 | 5.000%, 11/01/20 – FSA Insured | 11/14 at 100.00 | AAA | 1,092,357 | ||||||
| 600 | New York City, New York, General Obligation Bonds, Fiscal Series 2005J, 5.000%, 3/01/19 – FGIC Insured | 3/15 at 100.00 | AAA | 628,248 | ||||||
| Rensselaer County, New York, General Obligation Bonds, Series 1991: | ||||||||||
| 960 | 6.700%, 2/15/13 – AMBAC Insured | No Opt. Call | AAA | 1,096,752 | ||||||
| 960 | 6.700%, 2/15/14 – AMBAC Insured | No Opt. Call | AAA | 1,114,637 | ||||||
| 960 | 6.700%, 2/15/15 – AMBAC Insured | No Opt. Call | AAA | 1,133,789 | ||||||
| Rondout Valley Central School District, Ulster County, New York, General Obligation Bonds, Series 1991: | ||||||||||
| 550 | 6.850%, 6/15/09 – FGIC Insured | No Opt. Call | AAA | 580,047 | ||||||
| 550 | 6.850%, 6/15/10 – FGIC Insured | No Opt. Call | AAA | 595,634 | ||||||
| Saratoga County, Half Moon, New York, Public Improvement Bonds, Series 1991: | ||||||||||
| 385 | 6.500%, 6/01/09 – AMBAC Insured | No Opt. Call | AAA | 403,376 | ||||||
| 395 | 6.500%, 6/01/10 – AMBAC Insured | No Opt. Call | AAA | 424,119 | ||||||
| 395 | 6.500%, 6/01/11 – AMBAC Insured | No Opt. Call | AAA | 433,963 | ||||||
| 1,500 | West Islip Union Free School District, Suffolk County, New York, General Obligation Bonds, Series 2005, 5.000%, 10/01/16 – FSA Insured | 10/15 at 100.00 | Aaa | 1,601,610 | ||||||
| 1,985 | Yonkers, New York, General Obligation Bonds, Series 2005B, 5.000%, 8/01/17 – MBIA Insured | 8/15 at 100.00 | AAA | 2,100,408 | ||||||
| 37,275 | Total Tax Obligation/General | 39,407,219 | ||||||||
| Tax Obligation/Limited – 27.8% | ||||||||||
| 245 | Dormitory Authority of the State of New York, Improvement Revenue Bonds, Mental Health Services Facilities, Series 1999D, 5.250%, 2/15/29 – FSA Insured | 8/09 at 101.00 | AAA | 252,115 | ||||||
| 115 | Dormitory Authority of the State of New York, Improvement Revenue Bonds, Mental Health Services Facilities, Series 2000D, 5.250%, 8/15/30 – FSA Insured | 8/10 at 100.00 | AAA | 118,482 | ||||||
| 1,000 | Dormitory Authority of the State of New York, Lease Revenue Bonds, Wayne-Finger Lakes Board of Cooperative Education Services, Series 2004, 5.000%, 8/15/23 – FSA Insured | 8/14 at 100.00 | AAA | 1,028,650 | ||||||
40
| Principal Amount (000) | Description | Optional Call Provisions (1) | Ratings (2) | Value | ||||||
| Tax Obligation/Limited (continued) | ||||||||||
| $ | 2,410 | Dormitory Authority of the State of New York, Revenue Bonds, Department of Health, Series 2004-2, | 7/14 at 100.00 | AAA | $ | 2,512,594 | ||||
| 950 | Dormitory Authority of the State of New York, Revenue Bonds, Mental Health Services Facilities Improvements, Series 2005B, 5.000%, 2/15/30 – AMBAC Insured | 2/15 at 100.00 | AAA | 968,630 | ||||||
| 1,000 | Dormitory Authority of the State of New York, Revenue Bonds, Mental Health Services Facilities Improvements, Series 2005D1, 5.000%, 8/15/23 – FGIC Insured | 2/15 at 100.00 | AAA | 1,030,390 | ||||||
| Dormitory Authority of the State of New York, Revenue Bonds, School Districts Financing Program, Series 2002D: | ||||||||||
| 6,275 | 5.250%, 10/01/23 – MBIA Insured | 10/12 at 100.00 | AAA | 6,572,936 | ||||||
| 875 | 5.000%, 10/01/30 – MBIA Insured | 10/12 at 100.00 | AAA | 886,716 | ||||||
| 310 | Dormitory Authority of the State of New York, State Personal Income Tax Revenue Bonds, Series 2005F, 5.000%, 3/15/21 – FSA Insured | 3/15 at 100.00 | AAA | 322,546 | ||||||
| 1,000 | Erie County Industrial Development Agency, New York, School Facility Revenue Bonds, Buffalo City School District, Series 2003, 5.750%, 5/01/19 – FSA Insured | 5/12 at 100.00 | AAA | 1,079,730 | ||||||
| 1,100 | Erie County Industrial Development Agency, New York, School Facility Revenue Bonds, Buffalo City School District, Series 2004, 5.750%, 5/01/26 – FSA Insured | 5/14 at 100.00 | AAA | 1,212,486 | ||||||
| 5,000 | Metropolitan Transportation Authority, New York, Dedicated Tax Fund Bonds, Series 2002A, 5.250%, 11/15/25 – FSA Insured | 11/12 at 100.00 | AAA | 5,226,200 | ||||||
| Metropolitan Transportation Authority, New York, State Service Contract Refunding Bonds, Series 2002A: | ||||||||||
| 2,000 | 5.500%, 1/01/20 – MBIA Insured | 7/12 at 100.00 | AAA | 2,140,060 | ||||||
| 1,350 | 5.000%, 7/01/25 – FGIC Insured | 7/12 at 100.00 | AAA | 1,377,189 | ||||||
| 1,000 | New York City Industrial Development Agency, New York, PILOT Revenue Bonds, Queens Baseball Stadium Project, Series 2006, 5.000%, 1/01/46 – AMBAC Insured | 1/17 at 100.00 | AAA | 1,012,210 | ||||||
| New York City Sales Tax Asset Receivable Corporation, New York, Dedicated Revenue Bonds, Local Government Assistance Corporation, Series 2004A: | ||||||||||
| 1,670 | 5.000%, 10/15/25 – MBIA Insured | 10/14 at 100.00 | AAA | 1,728,033 | ||||||
| 1,225 | 5.000%, 10/15/26 – MBIA Insured | 10/14 at 100.00 | AAA | 1,265,303 | ||||||
| 4,020 | 5.000%, 10/15/29 – AMBAC Insured | 10/14 at 100.00 | AAA | 4,139,876 | ||||||
| 500 | 5.000%, 10/15/32 – AMBAC Insured | 10/14 at 100.00 | AAA | 513,685 | ||||||
| 3,500 | New York City Transitional Finance Authority, New York, Building Aid Revenue Bonds, Fiscal Series 2007S-2, 5.000%, 1/15/28 – FGIC Insured | 1/17 at 100.00 | AAA | 3,620,260 | ||||||
| 1,645 | New York City Transitional Finance Authority, New York, Future Tax Secured Bonds, Fiscal Series 2002B, 5.000%, 5/01/30 – MBIA Insured | 11/11 at 101.00 | AAA | 1,676,749 | ||||||
| New York City Transitional Finance Authority, New York, Future Tax Secured Bonds, Fiscal Series 2003C: | ||||||||||
| 1,435 | 5.250%, 8/01/20 – AMBAC Insured | 8/12 at 100.00 | AAA | 1,519,220 | ||||||
| 1,700 | 5.250%, 8/01/22 – AMBAC Insured | 8/12 at 100.00 | AAA | 1,787,737 | ||||||
| 1,330 | New York City Transitional Finance Authority, New York, Future Tax Secured Bonds, Fiscal Series 2003E, 5.250%, 2/01/22 – MBIA Insured | 2/13 at 100.00 | AAA | 1,398,961 | ||||||
| 3,000 | New York City Transitional Finance Authority, New York, Future Tax Secured Refunding Bonds, Fiscal Series 2003D, 5.000%, 2/01/22 – MBIA Insured | 2/13 at 100.00 | AAA | 3,082,890 | ||||||
| New York Convention Center Development Corporation, Hotel Unit Fee Revenue Bonds, Series 2005: | ||||||||||
| 1,330 | 5.000%, 11/15/30 – AMBAC Insured | 11/15 at 100.00 | AAA | 1,365,471 | ||||||
| 3,170 | 5.000%, 11/15/44 – AMBAC Insured | 11/15 at 100.00 | AAA | 3,203,348 | ||||||
| 2,000 | New York State Local Government Assistance Corporation, Revenue Bonds, Series 1993E, 5.250%, 4/01/16 – FSA Insured | No Opt. Call | AAA | 2,165,080 | ||||||
| New York State Municipal Bond Bank Agency, Buffalo, Special Program Revenue Bonds, Series 2001A: | ||||||||||
| 1,185 | 5.250%, 5/15/25 – AMBAC Insured | 5/11 at 100.00 | AAA | 1,228,039 | ||||||
| 1,250 | 5.250%, 5/15/26 – AMBAC Insured | 5/11 at 100.00 | AAA | 1,295,400 | ||||||
| 1,000 | New York State Thruway Authority, Highway and Bridge Trust Fund Bonds, Second Generation, Series 2004, 5.000%, 4/01/23 – MBIA Insured | 4/14 at 100.00 | AAA | 1,033,650 | ||||||
41
Portfolio of Investments (Unaudited)
Nuveen New York Insured Municipal Bond Fund (continued)
August 31, 2007
| Principal Amount (000) | Description | Optional Call Provisions (1) | Ratings (2) | Value | ||||||
| Tax Obligation/Limited (continued) | ||||||||||
| New York State Thruway Authority, Highway and Bridge Trust Fund Bonds, Second Generation, Series 2005B: | ||||||||||
| $ | 5,385 | 5.500%, 4/01/20 – AMBAC Insured | No Opt. Call | AAA | $ | 6,021,668 | ||||
| 1,500 | 5.000%, 4/01/21 – AMBAC Insured | 10/15 at 100.00 | AAA | 1,564,230 | ||||||
| 1,500 | New York State Thruway Authority, State Personal Income Tax Revenue Bonds, Series 2004A, | 9/14 at 100.00 | AAA | 1,550,730 | ||||||
| New York State Tobacco Settlement Financing Corporation, Tobacco Settlement Asset-Backed and State Contingency Contract-Backed Bonds, Series 2003A-1: | ||||||||||
| 3,900 | 5.250%, 6/01/20 – AMBAC Insured | 6/13 at 100.00 | AAA | 4,101,903 | ||||||
| 250 | 5.250%, 6/01/21 – AMBAC Insured | 6/13 at 100.00 | AAA | 262,423 | ||||||
| 5,400 | 5.250%, 6/01/22 – AMBAC Insured | 6/13 at 100.00 | AAA | 5,659,901 | ||||||
| 1,200 | New York State Urban Development Corporation, State Personal Income Tax Revenue Bonds, Series 2005B, 5.000%, 3/15/30 – FSA Insured | 3/15 at 100.00 | AAA | 1,231,416 | ||||||
| 675 | Niagara Falls City School District, Niagara County, New York, Certificates of Participation, High School Facility, Series 2005, 5.000%, 6/15/28 – FSA Insured | 6/15 at 100.00 | AAA | 690,464 | ||||||
| Puerto Rico Highway and Transportation Authority, Highway Revenue Refunding Bonds, Series 2002E: | ||||||||||
| 1,525 | 5.500%, 7/01/14 – FSA Insured | No Opt. Call | AAA | 1,679,162 | ||||||
| 4,000 | 5.500%, 7/01/18 – FSA Insured | No Opt. Call | AAA | 4,461,560 | ||||||
| 1,850 | Puerto Rico Sales Tax Financing Corporation, Sales Tax Revenue Bonds, Series 2007A, 5.250%, 8/01/57 – MBIA Insured | 8/17 at 100.00 | A+ | 1,895,177 | ||||||
| 81,775 | Total Tax Obligation/Limited | 85,883,270 | ||||||||
| Transportation – 18.0% | ||||||||||
| 2,500 | Albany County Airport Authority, New York, Airport Revenue Bonds, Series 1997, 5.500%, 12/15/19 – FSA Insured (Alternative Minimum Tax) | 12/07 at 102.00 | AAA | 2,558,450 | ||||||
| Metropolitan Transportation Authority, New York, Transportation Revenue Refunding Bonds, Series 2002E: | ||||||||||
| 3,185 | 5.500%, 11/15/18 – MBIA Insured (UB) | 11/12 at 100.00 | AAA | 3,426,678 | ||||||
| 7,155 | 5.500%, 11/15/19 – MBIA Insured (UB) | 11/12 at 100.00 | AAA | 7,697,921 | ||||||
| 1,500 | Metropolitan Transportation Authority, New York, Transportation Revenue Bonds, Series 2003A, 5.000%, 11/15/15 – FGIC Insured | No Opt. Call | AAA | 1,609,170 | ||||||
| 4,250 | Metropolitan Transportation Authority, New York, Transportation Revenue Refunding Bonds, Series 2002A, 5.500%, 11/15/18 – AMBAC Insured | 11/12 at 100.00 | AAA | 4,572,490 | ||||||
| 1,415 | New York State Thruway Authority, General Revenue Bonds, Series 2005F, 5.000%, 1/01/30 – AMBAC Insured | 1/15 at 100.00 | AAA | 1,452,016 | ||||||
| 1,000 | New York State Thruway Authority, General Revenue Bonds, Series 2005G, 5.000%, 1/01/30 – FSA Insured | 7/15 at 100.00 | AAA | 1,028,320 | ||||||
| Niagara Frontier Airport Authority, New York, Airport Revenue Bonds, Buffalo Niagara International Airport, Series 1998: | ||||||||||
| 1,000 | 5.000%, 4/01/18 – FGIC Insured (Alternative Minimum Tax) | 4/08 at 101.00 | AAA | 1,012,270 | ||||||
| 1,500 | 5.000%, 4/01/28 – FGIC Insured (Alternative Minimum Tax) | 4/08 at 101.00 | AAA | 1,503,900 | ||||||
| 3,000 | Niagara Frontier Airport Authority, New York, Airport Revenue Bonds, Buffalo Niagara International Airport, Series 1999A, 5.625%, 4/01/29 – MBIA Insured (Alternative Minimum Tax) | 4/09 at 101.00 | AAA | 3,095,370 | ||||||
| Port Authority of New York and New Jersey, Consolidated Revenue Bonds, One Hundred Fortieth Series 2005: | ||||||||||
| 1,000 | 5.000%, 12/01/19 – FSA Insured | 6/15 at 101.00 | AAA | 1,055,560 | ||||||
| 2,000 | 5.000%, 12/01/28 – XLCA Insured | 6/15 at 101.00 | AAA | 2,066,120 | ||||||
| 1,100 | 5.000%, 12/01/31 – XLCA Insured | 6/15 at 101.00 | AAA | 1,130,261 | ||||||
| 2,000 | Port Authority of New York and New Jersey, Consolidated Revenue Bonds, One Hundred Twentieth Series 2000, 5.750%, 10/15/26 – MBIA Insured (Alternative Minimum Tax) | 10/07 at 101.00 | AAA | 2,023,920 | ||||||
| 900 | Port Authority of New York and New Jersey, One Hundred and Forty Eighth Consolidated Revenue Bonds, RITES Trust 1516, 6.431%, 8/15/32 – FSA Insured (IF) | 8/17 at 100.00 | AAA | 987,399 | ||||||
42
| Principal Amount (000) | Description | Optional Call Provisions (1) | Ratings (2) | Value | ||||||
| Transportation (continued) | ||||||||||
| $ | 3,000 | Port Authority of New York and New Jersey, Special Project Bonds, JFK International Air Terminal LLC, Sixth Series 1997, 5.750%, 12/01/25 – MBIA Insured (Alternative Minimum Tax) | 12/07 at 100.00 | AAA | $ | 3,012,150 | ||||
Triborough Bridge and Tunnel Authority, New York, Subordinate Lien General Purpose Revenue Bonds, Series 2003A: | ||||||||||
| 5,320 | 5.250%, 11/15/19 – AMBAC Insured (UB) | 11/13 at 100.00 | AAA | 5,674,365 | ||||||
| 5,275 | 5.250%, 11/15/20 – AMBAC Insured (UB) | 11/13 at 100.00 | AAA | 5,626,368 | ||||||
| 2,500 | Triborough Bridge and Tunnel Authority, New York, General Purpose Revenue Bonds, Series 2002A, | 1/12 at 100.00 | AAA | 2,623,575 | ||||||
| Triborough Bridge and Tunnel Authority, New York, Subordinate Lien General Purpose Revenue Refunding Bonds, Series 2002E: | ||||||||||
| 780 | 5.500%, 11/15/20 – MBIA Insured | No Opt. Call | AAA | 875,605 | ||||||
| 2,300 | 5.250%, 11/15/22 – MBIA Insured | 11/12 at 100.00 | AAA | 2,415,345 | ||||||
| 52,680 | Total Transportation | 55,447,253 | ||||||||
| U.S. Guaranteed – 5.2% (3) | ||||||||||
| Camden Central School District, Oneida County, New York, General Obligation Bonds, Series 1991: | ||||||||||
| 600 | 7.100%, 6/15/09 – AMBAC Insured (ETM) | No Opt. Call | AAA | 635,736 | ||||||
| 275 | 7.100%, 6/15/10 – AMBAC Insured (ETM) | No Opt. Call | AAA | 300,218 | ||||||
| 105 | Dormitory Authority of the State of New York, Improvement Revenue Bonds, Mental Health Services Facilities, Series 2000D, 5.250%, 8/15/30 (Pre-refunded 8/15/10) – FSA Insured | 8/10 at 100.00 | Aaa | 109,830 | ||||||
| 1,350 | Dormitory Authority of the State of New York, Revenue Bonds, North Shore Health System Obligated Group, Series 1998, 5.000%, 11/01/23 (Pre-refunded 11/01/08) – MBIA Insured | 11/08 at 101.00 | Aaa | 1,384,047 | ||||||
| 5,280 | Dormitory Authority of the State of New York, Revenue Bonds, University of Rochester, Series 2000A, 6.050%, 7/01/25 (Pre-refunded 7/01/10) – MBIA Insured | 7/10 at 101.00 | AAA | 4,790,650 | ||||||
| 1,000 | Erie County Water Authority, New York, Water Revenue Bonds, Series 1990B, 6.750%, 12/01/14 – AMBAC Insured (ETM) | 12/09 at 100.00 | AAA | 1,119,410 | ||||||
| 500 | Greece Central School District, Monroe County, New York, General Obligation Bonds, School District Bonds, Series 1992, 6.000%, 6/15/09 – FGIC Insured (ETM) | No Opt. Call | AAA | 520,465 | ||||||
| 1,295 | Metropolitan Transportation Authority, New York, Commuter Facilities Revenue Bonds, Series 1997B, | 11/07 at 102.00 | AAA | 1,322,273 | ||||||
| 3,500 | Metropolitan Transportation Authority, New York, Commuter Facilities Revenue Bonds, Series 1997E, | 7/13 at 100.00 | AAA | 3,729,985 | ||||||
| 500 | Metropolitan Transportation Authority, New York, Dedicated Tax Fund Bonds, Series 1999A, 5.000%, 4/01/29 (Pre-refunded 10/01/14) – FSA Insured | 10/14 at 100.00 | AAA | 538,065 | ||||||
| 55 | New York City Transitional Finance Authority, New York, Future Tax Secured Bonds, Fiscal Series 2002B, 5.000%, 5/01/30 (Pre-refunded 11/01/11) – MBIA Insured | 11/11 at 101.00 | Aaa | 58,386 | ||||||
| 565 | New York City Transitional Finance Authority, New York, Future Tax Secured Bonds, Fiscal Series 2003C, 5.250%, 8/01/20 (Pre-refunded 8/01/12) – AMBAC Insured | 8/12 at 100.00 | Aaa | 605,725 | ||||||
| 1,000 | New York State Thruway Authority, Highway and Bridge Trust Fund Bonds, Series 2002A, 5.250%, 4/01/19 (Pre-refunded 4/01/12) – FSA Insured | 4/12 at 100.00 | AAA | 1,068,680 | ||||||
| 16,025 | Total U.S. Guaranteed | 16,183,470 | ||||||||
| Utilities – 5.9% | ||||||||||
| 6,000 | Long Island Power Authority, New York, Electric System General Revenue Bonds, Series 1998A, | No Opt. Call | AAA | 3,512,100 | ||||||
| Long Island Power Authority, New York, Electric System General Revenue Bonds, Series 2000A: | ||||||||||
| 2,000 | 0.000%, 6/01/24 – FSA Insured | No Opt. Call | AAA | 917,020 | ||||||
| 2,000 | 0.000%, 6/01/25 – FSA Insured | No Opt. Call | AAA | 866,240 | ||||||
| 1,500 | Long Island Power Authority, New York, Electric System General Revenue Bonds, Series 2001A, | 9/11 at 100.00 | AAA | 1,521,150 | ||||||
43
Portfolio of Investments (Unaudited)
Nuveen New York Insured Municipal Bond Fund (continued)
August 31, 2007
| Principal Amount (000) | Description | Optional Call Provisions (1) | Ratings (2) | Value | ||||||
| Utilities (continued) | ||||||||||
| Long Island Power Authority, New York, Electric System General Revenue Bonds, Series 2006A: | ||||||||||
| $ | 3,300 | 5.000%, 12/01/23 – FGIC Insured | 6/16 at 100.00 | AAA | $ | 3,428,931 | ||||
| 6,400 | 5.000%, 12/01/25 – FGIC Insured | 6/16 at 100.00 | AAA | 6,617,213 | ||||||
| 250 | Long Island Power Authority, New York, Electric System General Revenue Bonds, Series 2006B, | 6/16 at 100.00 | AAA | 255,223 | ||||||
| 1,000 | New York State Energy Research and Development Authority, Electric Facilities Revenue Bonds, Long Island Lighting Company, Series 1995A, 5.300%, 8/01/25 – MBIA Insured (Alternative Minimum Tax) | 3/09 at 102.00 | AAA | 1,028,820 | ||||||
| 22,450 | Total Utilities | 18,146,697 | ||||||||
| Water and Sewer – 2.6% | ||||||||||
| 405 | New York City Municipal Water Finance Authority, New York, Water and Sewerage System Revenue Bonds, Fiscal Series 2000B, 6.000%, 6/15/33 – MBIA Insured | 6/10 at 101.00 | AAA | 431,487 | ||||||
| 3,340 | New York City Municipal Water Finance Authority, New York, Water and Sewerage System Revenue Bonds, Fiscal Series 2005C, 5.000%, 6/15/27 – MBIA Insured | 6/15 at 100.00 | AAA | 3,440,733 | ||||||
| 25 | New York State Environmental Facilities Corporation, State Water Pollution Control Revolving Fund Pooled Revenue Bonds, Series 1990C, 7.200%, 3/15/11 – MBIA Insured | 9/07 at 100.00 | AAA | 25,069 | ||||||
| 4,000 | Suffolk County Water Authority, New York, Waterworks Revenue Bonds, Series 2005C, | 6/15 at 100.00 | AAA | 4,120,119 | ||||||
| 7,770 | Total Water and Sewer | 8,017,408 | ||||||||
| $ | 317,454 | Total Investments (cost $318,287,811) – 105.4% | 325,004,145 | |||||||
Floating Rate Obligations – (7.1)% | (21,965,000) | |||||||||
Other Assets Less Liabilities – 1.7% | 5,384,811 | |||||||||
Net Assets – 100% | $ | 308,423,956 | ||||||||
Forward Swaps outstanding at August 31, 2007:
| Counterparty | Notional Amount | Fund Pay/Receive Floating Rate | Floating Rate Index | Fixed Rate (Annualized) | Fixed Rate Payment Frequency | Effective Date (4) | Termination Date | Unrealized Appreciation (Depreciation) | ||||||||||||
| JPMorgan | $ | 700,000 | Pay | 3-Month USD-LIBOR | 5.388 | % | Semi-Annually | 4/25/08 | 4/25/35 | $ | (5,982 | ) | ||||||||
| Royal Bank of Canada | 1,100,000 | Pay | SIFM | 4.335 | Quarterly | 8/06/08 | 8/06/37 | 23,254 | ||||||||||||
| $ | 17,272 | |||||||||||||||||||
USD – LIBOR (United States Dollar-London Inter-Bank Offered Rate)
SIFM – The daily arithmetic average of the weekly SIFM (the Securities Industry and Financial Markets) Municipal Swap Index.
| The Fund may invest in “zero coupon” securities. A zero coupon security does not pay a regular interest coupon to its holders during the life of the security. Tax-exempt income to the holder of the security comes from accretion of the difference between the original purchase price of the security at issuance and the par value of the security at maturity and is effectively paid at maturity. Such securities are included in the Portfolio of Investments with a 0.000% coupon rate in their description. The market prices of zero coupon securities generally are more volatile than the market prices of securities that pay interest periodically. |
| The Fund primarily invests in bonds that are either covered by Original Issue Insurance, Secondary Market Insurance or Portfolio Insurance, or are backed by an escrow or trust containing sufficient U.S. Government or U.S. Government agency securities, any of which ensure the timely payment of principal and interest. |
| (1) | Optional Call Provisions: Dates (month and year) and prices of the earliest optional call or redemption. There may be other call provisions at varying prices at later dates. Certain mortgage-backed securities may be subject to periodic principal paydowns. |
| (2) | Ratings: Using the higher of Standard & Poor’s or Moody’s rating. Ratings below BBB by Standard & Poor’s Group or Baa by Moody’s Investor Service, Inc. are considered to be below investment grade. |
| (3) | Backed by an escrow or trust containing sufficient U.S. Government or U.S. Government agency securities which ensure the timely payment of principal and interest. |
| (4) | Effective date represents the date on which both the Fund and counterparty commence interest payment accruals on each forward swap contract. |
| (ETM) | Escrowed to maturity. |
| (IF) | Inverse floating rate investment. |
| (UB) | Underlying bond of an inverse floating rate trust reflected as a financing transaction pursuant to the provisions of SFAS No. 140. |
44
See accompanying notes to financial statements.
Statement of Assets and Liabilities (Unaudited)
August 31, 2007
| Connecticut | New Jersey | New York | New York Insured | |||||||||||||
Assets | ||||||||||||||||
Investments, at value (cost $321,005,657, $196,579,941, $420,225,842 and | $ | 325,374,869 | $ | 198,182,795 | $ | 426,824,033 | $ | 325,004,145 | ||||||||
Cash | 1,244,307 | — | 6,648,243 | 3,275,679 | ||||||||||||
Receivables: | ||||||||||||||||
Interest | 3,548,480 | 2,350,618 | 5,208,037 | 3,459,411 | ||||||||||||
Investments sold | — | — | 330,000 | 5,000 | ||||||||||||
Shares sold | 4,831,888 | 115,330 | 1,054,306 | 55,233 | ||||||||||||
Unrealized appreciation on forward swaps | 161,074 | 54,966 | 395,268 | 23,254 | ||||||||||||
Other assets | 17,762 | 68 | 24,095 | 37,891 | ||||||||||||
Total assets | 335,178,380 | 200,703,777 | 440,483,982 | 331,860,613 | ||||||||||||
Liabilities | ||||||||||||||||
Cash overdraft | — | 23,660 | — | — | ||||||||||||
Floating rate obligations | 22,370,000 | 6,600,000 | 32,075,000 | 21,965,000 | ||||||||||||
Unrealized depreciation on forward swaps | — | 14,956 | — | 5,982 | ||||||||||||
Payables: | ||||||||||||||||
Investments purchased | — | — | 5,977,164 | — | ||||||||||||
Shares redeemed | 703,602 | 134,489 | 290,198 | 147,254 | ||||||||||||
Accrued expenses: | ||||||||||||||||
Management fees | 136,000 | 86,357 | 175,252 | 136,865 | ||||||||||||
12b-1 distribution and service fees | 78,780 | 44,969 | 80,478 | 32,217 | ||||||||||||
Other | 67,681 | 49,664 | 123,910 | 111,682 | ||||||||||||
Dividends payable | 1,008,127 | 618,441 | 1,365,272 | 1,037,657 | ||||||||||||
Total liabilities | 24,364,190 | 7,572,536 | 40,087,274 | 23,436,657 | ||||||||||||
Net assets | $ | 310,814,190 | $ | 193,131,241 | $ | 400,396,708 | $ | 308,423,956 | ||||||||
Class A Shares | ||||||||||||||||
Net assets | $ | 238,297,042 | $ | 84,950,270 | $ | 187,318,578 | $ | 87,250,830 | ||||||||
Shares outstanding | 23,020,674 | 8,091,473 | 17,766,225 | 8,647,896 | ||||||||||||
Net asset value per share | $ | 10.35 | $ | 10.50 | $ | 10.54 | $ | 10.09 | ||||||||
Offering price per share (net asset value per share plus | $ | 10.80 | $ | 10.96 | $ | 11.00 | $ | 10.53 | ||||||||
Class B Shares | ||||||||||||||||
Net assets | $ | 16,147,816 | $ | 16,210,965 | $ | 23,296,398 | $ | 11,267,532 | ||||||||
Shares outstanding | 1,560,935 | 1,543,064 | 2,209,909 | 1,113,648 | ||||||||||||
Net asset value and offering price per share | $ | 10.34 | $ | 10.51 | $ | 10.54 | $ | 10.12 | ||||||||
Class C Shares | ||||||||||||||||
Net assets | $ | 41,543,796 | $ | 27,810,735 | $ | 47,744,544 | $ | 13,489,978 | ||||||||
Shares outstanding | 4,016,091 | 2,657,496 | 4,526,325 | 1,336,058 | ||||||||||||
Net asset value and offering price per share | $ | 10.34 | $ | 10.47 | $ | 10.55 | $ | 10.10 | ||||||||
Class R Shares | ||||||||||||||||
Net assets | $ | 14,825,536 | $ | 64,159,271 | $ | 142,037,188 | $ | 196,415,616 | ||||||||
Shares outstanding | 1,426,241 | 6,095,530 | 13,443,881 | 19,398,579 | ||||||||||||
Net asset value and offering price per share | $ | 10.39 | $ | 10.53 | $ | 10.57 | $ | 10.13 | ||||||||
Net Assets Consist of: | ||||||||||||||||
Capital paid-in | $ | 306,708,417 | $ | 191,126,714 | $ | 393,366,003 | $ | 301,118,542 | ||||||||
Undistributed (Over-distribution of) net investment income | (266,684 | ) | (84,885 | ) | 109,429 | (469,797 | ) | |||||||||
Accumulated net realized gain (loss) from investments and derivative transactions | (157,829 | ) | 446,548 | (72,183 | ) | 1,041,605 | ||||||||||
Net unrealized appreciation (depreciation) of investments and derivative transactions | 4,530,286 | 1,642,864 | 6,993,459 | 6,733,606 | ||||||||||||
Net assets | $ | 310,814,190 | $ | 193,131,241 | $ | 400,396,708 | $ | 308,423,956 | ||||||||
See accompanying notes to financial statements.
45
Statement of Operations (Unaudited)
Six Months Ended August 31, 2007
| Connecticut | New Jersey | New York | New York Insured | |||||||||||||
Investment Income | $ | 7,705,365 | $ | 4,719,182 | $ | 10,371,337 | $ | 7,916,779 | ||||||||
Expenses | ||||||||||||||||
Management fees | 803,228 | 515,040 | 1,032,644 | 832,570 | ||||||||||||
12b-1 service fees – Class A | 234,497 | 85,212 | 182,418 | 89,100 | ||||||||||||
12b-1 distribution and service fees – Class B | 84,994 | 80,504 | 117,614 | 57,924 | ||||||||||||
12b-1 distribution and service fees – Class C | 152,602 | 106,875 | 181,134 | 51,512 | ||||||||||||
Shareholders’ servicing agent fees and expenses | 60,321 | 53,850 | 104,591 | 86,920 | ||||||||||||
Interest expense on floating rate obligations | 446,153 | 130,847 | 648,948 | 432,731 | ||||||||||||
Custodian’s fees and expenses | 36,257 | 20,930 | 51,188 | 64,420 | ||||||||||||
Trustees’ fees and expenses | 3,515 | 2,349 | 5,169 | 3,821 | ||||||||||||
Professional fees | 9,650 | 7,545 | 11,356 | 10,723 | ||||||||||||
Shareholders’ reports – printing and mailing expenses | 18,576 | 14,456 | 31,034 | 24,483 | ||||||||||||
Federal and state registration fees | 2,721 | 1,644 | 3,148 | 2,168 | ||||||||||||
Other expenses | 3,906 | 2,343 | 4,815 | 3,617 | ||||||||||||
Total expenses before custodian fee credit | 1,856,420 | 1,021,595 | 2,374,059 | 1,659,989 | ||||||||||||
Custodian fee credit | (24,106 | ) | (14,596 | ) | (25,126 | ) | (14,839 | ) | ||||||||
Net expenses | 1,832,314 | 1,006,999 | 2,348,933 | | 1,645,150 | | ||||||||||
Net investment income | 5,873,051 | 3,712,183 | 8,022,404 | 6,271,629 | ||||||||||||
Realized and Unrealized Gain (Loss) | ||||||||||||||||
Net realized gain (loss) from: | ||||||||||||||||
Investments | (189,760 | ) | 360,263 | (75,323 | ) | 639,447 | ||||||||||
Forward swaps | (9,189 | ) | — | (33,425 | ) | (24,965 | ) | |||||||||
Futures | (86,560 | ) | — | — | — | |||||||||||
Change in net unrealized appreciation (depreciation) of: | ||||||||||||||||
Investments | (8,912,312 | ) | (6,335,221 | ) | (11,734,947 | ) | (9,208,407 | ) | ||||||||
Forward swaps | 161,074 | 40,010 | 152,136 | 17,272 | ||||||||||||
Futures | (48,548 | ) | — | — | — | |||||||||||
Net realized and unrealized gain (loss) | (9,085,295 | ) | (5,934,948 | ) | (11,691,559 | ) | (8,576,653 | ) | ||||||||
Net increase (decrease) in net assets from operations | $ | (3,212,244 | ) | $ | (2,222,765 | ) | $ | (3,669,155 | ) | $ | (2,305,024 | ) | ||||
See accompanying notes to financial statements.
46
Statement of Changes in Net Assets (Unaudited)
| Connecticut | New Jersey | |||||||||||||||
| Six Months Ended 8/31/07 | Year Ended | Six Months Ended 8/31/07 | Year Ended | |||||||||||||
Operations | ||||||||||||||||
Net investment income | $ | 5,873,051 | $ | 11,332,103 | $ | 3,712,183 | $ | 6,934,050 | ||||||||
Net realized gain (loss) from: | ||||||||||||||||
Investments | (189,760 | ) | 570,517 | 360,263 | 183,798 | |||||||||||
Forward swaps | (9,189 | ) | — | — | — | |||||||||||
Futures | (86,560 | ) | 144,513 | — | — | |||||||||||
Change in net unrealized appreciation (depreciation) of: | ||||||||||||||||
Investments | (8,912,312 | ) | 318,646 | (6,335,221 | ) | 890,749 | ||||||||||
Forward swaps | 161,074 | — | 40,010 | — | ||||||||||||
Futures | (48,548 | ) | 48,548 | — | — | |||||||||||
Net increase (decrease) in net assets from operations | (3,212,244 | ) | 12,414,327 | (2,222,765 | ) | 8,008,597 | ||||||||||
Distributions to Shareholders | ||||||||||||||||
From net investment income: | ||||||||||||||||
Class A | (4,666,980 | ) | (8,929,302 | ) | (1,648,572 | ) | (3,156,809 | ) | ||||||||
Class B | (290,796 | ) | (713,167 | ) | (260,681 | ) | (603,392 | ) | ||||||||
Class C | (694,624 | ) | (1,320,161 | ) | (473,988 | ) | (931,006 | ) | ||||||||
Class R | (281,471 | ) | (326,053 | ) | (1,288,393 | ) | (2,161,344 | ) | ||||||||
From accumulated net realized gains: | ||||||||||||||||
Class A | — | (614,542 | ) | — | (99,858 | ) | ||||||||||
Class B | — | (57,137 | ) | — | (22,633 | ) | ||||||||||
Class C | — | (106,191 | ) | — | (34,159 | ) | ||||||||||
Class R | — | (27,738 | ) | — | (71,737 | ) | ||||||||||
Decrease in net assets from distributions to shareholders | (5,933,871 | ) | (12,094,291 | ) | (3,671,634 | ) | (7,080,938 | ) | ||||||||
Fund Share Transactions | ||||||||||||||||
Proceeds from sale of shares | 38,601,127 | 47,243,649 | 16,259,445 | 42,048,774 | ||||||||||||
Proceeds from shares issued to shareholders due | 2,935,666 | 5,742,107 | 2,239,838 | 4,551,028 | ||||||||||||
| 41,536,793 | 52,985,756 | 18,499,283 | 46,599,802 | |||||||||||||
Cost of shares redeemed | (22,066,798 | ) | (46,047,260 | ) | (14,698,798 | ) | (25,742,288 | ) | ||||||||
Net increase (decrease) in net assets from Fund share transactions | 19,469,995 | 6,938,496 | 3,800,485 | 20,857,514 | ||||||||||||
Net increase (decrease) in net assets | 10,323,880 | 7,258,532 | (2,093,914 | ) | 21,785,173 | |||||||||||
Net assets at the beginning of period | 300,490,310 | 293,231,778 | 195,225,155 | 173,439,982 | ||||||||||||
Net assets at the end of period | $ | 310,814,190 | $ | 300,490,310 | $ | 193,131,241 | $ | 195,225,155 | ||||||||
Undistributed (Over-distribution of) net investment income | $ | (266,684 | ) | $ | (205,864 | ) | $ | (84,885 | ) | $ | (125,434 | ) | ||||
See accompanying notes to financial statements.
47
Statement of Changes in Net Assets (Unaudited) (continued)
| New York | New York Insured | |||||||||||||||
| Six Months Ended 8/31/07 | Year Ended 2/28/07 | Six Months Ended 8/31/07 | Year Ended 2/28/07 | |||||||||||||
Operations | ||||||||||||||||
Net investment income | $ | 8,022,404 | $ | 15,536,142 | $ | 6,271,629 | $ | 13,171,133 | ||||||||
Net realized gain (loss) from: | ||||||||||||||||
Investments | (75,323 | ) | 533,873 | 639,447 | 1,581,968 | |||||||||||
Forward swaps | (33,425 | ) | — | (24,965 | ) | — | ||||||||||
Futures | — | — | — | — | ||||||||||||
Net change in unrealized appreciation (depreciation) of: | ||||||||||||||||
Investments | (11,734,947 | ) | 308,049 | (9,208,407 | ) | (1,869,948 | ) | |||||||||
Forward swaps | 152,136 | 243,132 | 17,272 | — | ||||||||||||
Futures | — | — | — | — | ||||||||||||
Net increase (decrease) in net assets from operations | (3,669,155 | ) | 16,621,196 | (2,305,024 | ) | 12,883,153 | ||||||||||
Distributions to Shareholders | ||||||||||||||||
From net investment income: | ||||||||||||||||
Class A | (3,708,825 | ) | (6,756,557 | ) | (1,747,460 | ) | (3,511,068 | ) | ||||||||
Class B | (415,300 | ) | (955,404 | ) | (191,927 | ) | (474,465 | ) | ||||||||
Class C | (865,131 | ) | (1,584,875 | ) | (229,033 | ) | (494,502 | ) | ||||||||
Class R | (3,037,298 | ) | (5,909,837 | ) | (4,149,302 | ) | (8,648,662 | ) | ||||||||
From accumulated net realized gains: | ||||||||||||||||
Class A | — | (176,765 | ) | — | (394,162 | ) | ||||||||||
Class B | — | (28,337 | ) | — | (61,300 | ) | ||||||||||
Class C | — | (48,412 | ) | — | (62,591 | ) | ||||||||||
Class R | — | (145,842 | ) | — | (903,073 | ) | ||||||||||
Decrease in net assets from distributions to shareholders | (8,026,554 | ) | (15,606,029 | ) | (6,317,722 | ) | (14,549,823 | ) | ||||||||
Fund Share Transactions | ||||||||||||||||
Proceeds from sale of shares | 51,642,618 | 72,572,501 | 5,217,946 | 17,476,007 | ||||||||||||
Proceeds from shares issued to shareholders due | 4,803,411 | 9,604,181 | 4,516,158 | 10,587,473 | ||||||||||||
| 56,446,029 | 82,176,682 | 9,734,104 | 28,063,480 | |||||||||||||
Cost of shares redeemed | (41,645,547 | ) | (58,080,677 | ) | (18,452,476 | ) | (45,875,001 | ) | ||||||||
Net increase (decrease) in net assets from Fund share transactions | 14,800,482 | 24,096,005 | (8,718,372 | ) | (17,811,521 | ) | ||||||||||
Net increase (decrease) in net assets | 3,104,773 | 25,111,172 | (17,341,118 | ) | (19,478,191 | ) | ||||||||||
Net assets at the beginning of period | 397,291,935 | 372,180,763 | 325,765,074 | 345,243,265 | ||||||||||||
Net assets at the end of period | $ | 400,396,708 | $ | 397,291,935 | $ | 308,423,956 | $ | 325,765,074 | ||||||||
Undistributed (Over-distribution of) net investment income | $ | 109,429 | $ | 113,579 | $ | (469,797 | ) | $ | (423,704 | ) | ||||||
See accompanying notes to financial statements.
48
Notes to Financial Statements (Unaudited)
1. General Information and Significant Accounting Policies
The Nuveen Multistate Trust II (the “Trust”) is an open-end management investment company registered under the Investment Company Act of 1940, as amended. The Trust is comprised of Nuveen Connecticut Municipal Bond Fund (“Connecticut”), Nuveen New Jersey Municipal Bond Fund (“New Jersey”), Nuveen New York Municipal Bond Fund (“New York”) and Nuveen New York Insured Municipal Bond Fund (“New York Insured”) (collectively, the “Funds”), among others. The Trust was organized as a Massachusetts business trust on July 1, 1996. The Funds were each organized as a series of predecessor trusts or corporations prior to that date.
The Funds seek to provide tax-free income and preservation of capital through investments in diversified portfolios of municipal bonds.
The following is a summary of significant accounting policies followed by the Funds in the preparation of their financial statements in accordance with accounting principles generally accepted in the United States.
Investment Valuation
The prices of municipal bonds in each Fund’s investment portfolio are provided by a pricing service approved by the Fund’s Board of Trustees. When market price quotes are not readily available (which is usually the case for municipal securities), the pricing service may establish fair value based on yields or prices of municipal bonds of comparable quality, type of issue, coupon, maturity and rating, indications of value from securities dealers, evaluations of anticipated cash flows or collateral and general market conditions. Prices of forward swap contacts are also provided by an independent pricing service approved by each Fund’s Board of Trustees. Futures contracts are valued using the closing settlement price or, in the absence of such a price, at the mean of the bid and asked prices. If the pricing service is unable to supply a price for a municipal bond, forward swap contact or futures contract, each Fund may use a market price or fair market value quote provided by a major broker/dealer in such investments. If it is determined that the market price or fair market value for an investment or derivative transaction is unavailable or inappropriate, the Board of Trustees of the Funds, or its designee, may establish a fair value for the investment. Temporary investments in securities that have variable rate and demand features qualifying them as short-term investments are valued at amortized cost, which approximates market value.
Investment Transactions
Investment transactions are recorded on a trade date basis. Realized gains and losses from transactions are determined on the specific identification method. Investments purchased on a when-issued/delayed delivery basis may have extended settlement periods. Any investments so purchased are subject to market fluctuation during this period. The Funds have instructed the custodian to segregate assets with a current value at least equal to the amount of the when-issued/delayed delivery purchase commitments. At August 31, 2007, New York had outstanding when-issued/delayed delivery purchase commitments of $2,376,000. There were no such outstanding purchase commitments in Connecticut, New Jersey or New York Insured.
Investment Income
Interest income, which includes the amortization of premiums and accretion of discounts for financial reporting purposes, is recorded on an accrual basis. Investment income also includes paydown gains and losses, if any.
Dividends and Distributions to Shareholders
Tax-exempt net investment income is declared monthly as a dividend. Generally, payment is made or reinvestment is credited to shareholder accounts on the first business day after month-end. Net realized capital gains and/or market discount from investment transactions, if any, are distributed to shareholders not less frequently than annually. Furthermore, capital gains are distributed only to the extent they exceed available capital loss carryforwards.
Distributions to shareholders of tax-exempt net investment income, net realized capital gains and/or market discount, if any, are recorded on the ex-dividend date. The amount and timing of distributions are determined in accordance with federal income tax regulations, which may differ from accounting principles generally accepted in the United States.
Income Taxes
Each Fund is a separate taxpayer for federal income tax purposes. Each Fund intends to distribute substantially all net investment income and net capital gains to shareholders and to otherwise comply with the requirements of Subchapter M of the Internal Revenue Code applicable to regulated investment companies. Therefore, no federal income tax provision is required. Furthermore, each Fund intends to satisfy conditions which will enable interest from municipal securities, which is exempt from regular federal and designated state income taxes, to retain such tax-exempt status when distributed to shareholders of the Funds. Net realized capital gains and ordinary income distributions paid by the Funds are subject to federal taxation.
Insurance
New York Insured invests primarily in municipal securities which are either covered by insurance or backed by an escrow or trust account containing sufficient U.S. Government or U.S. Government agency securities, both of which ensure the timely payment of principal and interest. Each insured municipal security is covered by Original Issue Insurance, Secondary Market Insurance or Portfolio Insurance. Such insurance does not guarantee the market value of the municipal securities or the value of the Fund’s shares. Original Issue Insurance and Secondary Market Insurance remain in effect as long as the municipal securities covered
49
Notes to Financial Statements (Unaudited) (continued)
thereby remain outstanding and the insurer remains in business, regardless of whether the Fund ultimately disposes of such municipal securities. Consequently, the market value of the municipal securities covered by Original Issue Insurance or Secondary Market Insurance may reflect value attributable to the insurance. Portfolio Insurance, in contrast, is effective only while the municipal securities are held by the Fund. Accordingly, neither the prices used in determining the market value of the underlying municipal securities nor the net asset value of the Fund’s shares include value, if any, attributable to the Portfolio Insurance. Each policy of the Portfolio Insurance does, however, give the Fund the right to obtain permanent insurance with respect to the municipal security covered by the Portfolio Insurance policy at the time of its sale.
Flexible Sales Charge Program
Each Fund offers Class A, B, C and R Shares. Class A Shares are generally sold with an up-front sales charge and incur a .20% annual 12b-1 service fee. Class A Share purchases of $1 million or more are sold at net asset value without an up-front sales charge but may be subject to a contingent deferred sales charge (“CDSC”) if redeemed within 18 months of purchase. Class B Shares are sold without an up-front sales charge but incur a .75% annual 12b-1 distribution fee and a .20% annual 12b-1 service fee. An investor purchasing Class B Shares agrees to pay a CDSC of up to 5% depending upon the length of time the shares are held by the investor (CDSC is reduced to 0% at the end of six years). Class B Shares convert to Class A Shares eight years after purchase. Class C Shares are sold without an up-front sales charge but incur a .55% annual 12b-1 distribution fee and a .20% annual 12b-1 service fee. An investor purchasing Class C Shares agrees to pay a CDSC of 1% if Class C Shares are redeemed within one year of purchase. Class R Shares are not subject to any sales charge or 12b-1 distribution or service fees. Class R Shares are available only under limited circumstances.
Inverse Floating Rate Securities
Each Fund may invest in inverse floating rate securities. An inverse floating rate security is created by depositing a municipal bond, typically with a fixed interest rate, into a special purpose trust created by a broker-dealer. In turn, this trust (a) issues floating rate certificates, in face amounts equal to some fraction of the deposited bond’s par amount or market value, that typically pay short-term tax-exempt interest rates to third parties, and (b) issues to a long-term investor (such as one of the Funds) an inverse floating rate certificate (sometimes referred to as an “inverse floater”) that represents all remaining or residual interest in the trust. The income received by the inverse floater holder varies inversely with the short-term rate paid to the floating rate certificates’ holders, and in most circumstances the inverse floater holder bears substantially all of the underlying bond’s downside investment risk and also benefits disproportionately from any potential appreciation of the underlying bond’s value. The price of an inverse floating rate security will be more volatile than that of the underlying bond because the interest rate is dependent on not only the fixed coupon rate of the underlying bond but also on the short-term interest paid on the floating rate certificates, and because the inverse floating rate security essentially bears the risk of loss of the greater face value of the underlying bond.
A Fund may purchase an inverse floating rate security in a secondary market transaction without first owning the underlying bond (referred to as an “externally-deposited inverse floater”), or instead by first selling a fixed-rate bond to a broker-dealer for deposit into the special purpose trust and receiving in turn the residual interest in the trust (referred to as a “self-deposited inverse floater”). An investment in an externally-deposited inverse floater is identified in the Portfolio of Investments as an “Inverse floating rate investment”. An investment in a self-deposited inverse floater is accounted for as a financing transaction in accordance with Statement of Financial Accounting Standards (SFAS) No. 140 “Accounting for Transfers and Servicing of Financial Assets and Extinguishment of Liabilities”. In such instances, a fixed-rate bond deposited into a special purpose trust is identified in the Portfolio of Investments as an “Underlying bond of an inverse floating rate trust”, with the Fund accounting for the short-term floating rate certificates issued by the trust as “Floating rate obligations” on the Statement of Assets and Liabilities. In addition, the Fund reflects in Investment Income the entire earnings of the underlying bond and accounts for the related interest paid to the holders of the short-term floating rate certificates as “Interest expense on floating rate obligations” in the Statement of Operations.
During the six months ended August 31, 2007, each Fund invested in externally deposited inverse floaters and/or self-deposited inverse floaters.
The average floating rate obligations outstanding and average annual interest rate and fees related to self-deposited inverse floaters during the six months ended August 31, 2007, were as follows:
| Connecticut | New Jersey | New York | New York Insured | |||||
Average floating rate obligations | 22,370,000 | 6,600,000 | 32,735,842 | 21,839,348 | ||||
Average annual interest rate and fees | 3.96% | 3.93% | 3.93% | 3.93% |
50
Forward Swap Transactions
The Funds are authorized to invest in forward interest rate swap transactions. Each Fund’s use of forward interest rate swap transactions is intended to help the Fund manage its overall interest rate sensitivity, either shorter or longer, generally to more closely align the Fund’s interest rate sensitivity with that of the broader municipal market. Forward interest rate swap transactions involve each Fund’s agreement with a counterparty to pay, in the future, a fixed or variable rate payment in exchange for the counterparty paying the Fund a variable or fixed rate payment, the accruals for which would begin at a specified date in the future (the “effective date”). The amount of the payment obligation is based on the notional amount of the forward swap contract and the termination date of the swap (which is akin to a bond’s maturity). The value of the Fund’s swap commitment would increase or decrease based primarily on the extent to which long-term interest rates for bonds having a maturity of the swap’s termination date increases or decreases. The Funds may terminate a swap contract prior to the effective date, at which point a realized gain or loss is recognized. When a forward swap is terminated, it ordinarily does not involve the delivery of securities or other underlying assets or principal, but rather is settled in cash on a net basis. Each Fund intends, but is not obligated, to terminate its forward swaps before the effective date. Accordingly, the risk of loss with respect to the swap counterparty on such transactions is limited to the credit risk associated with a counterparty failing to honor its commitment to pay any realized gain to the Fund upon termination. To reduce such credit risk, all counterparties are required to pledge collateral daily (based on the daily valuation of each swap) on behalf of each Fund with a value approximately equal to the amount of any unrealized gain above a pre-determined threshold. Reciprocally, when any of the Funds have an unrealized loss on a swap contract, the Funds have instructed the custodian to pledge assets of the Funds as collateral with a value approximately equal to the amount of the unrealized loss above a pre-determined threshold. Collateral pledges are monitored and subsequently adjusted if and when the swap valuations fluctuate, either up or down, by at least the predetermined threshold amount.
Futures Contracts
The Funds are authorized to invest in futures contracts. Upon entering into a futures contract, a Fund is required to deposit with the broker an amount of cash or liquid securities equal to a specified percentage of the contract amount. This is known as the “initial margin.” Subsequent payments (“variation margin”) are made or received by a Fund each day, depending on the daily fluctuation of the value of the contract.
51
Notes to Financial Statements (Unaudited) (continued)
During the period the futures contract is open, changes in the value of the contract are recognized as an unrealized gain or loss by “marking-to-market” on a daily basis to reflect the changes in market value of the contract. When the contract is closed or expired, a Fund records a realized gain or loss equal to the difference between the value of the contract on the closing date and value of the contract when originally entered into. Cash held by the broker to cover initial margin requirements on open futures contracts, if any, is recognized in the Statement of Assets and Liabilities. Additionally, the Statement of Assets and Liabilities reflects a receivable or payable for the variation margin when applicable. None of the Funds invested in any new futures contracts during the six months ended August 31, 2007.
Risks of investments in futures contracts include the possible adverse movement of the securities or indices underlying the contracts, the possibility that there may not be a liquid secondary market for the contracts and/or that a change in the value of the contract may not correlate with a change in the value of the underlying securities or indices.
Expense Allocation
Expenses of the Funds that are not directly attributable to a specific class of shares are prorated among the classes based on the relative net assets of each class. Expenses directly attributable to a class of shares, which presently only include 12b-1 distribution and service fees, are recorded to the specific class.
Custodian Fee Credit
Each Fund has an arrangement with the custodian bank whereby certain custodian fees and expenses are reduced by net credits earned on each Fund’s cash on deposit with the bank. Such deposit arrangements are an alternative to overnight investments. Credits for cash balances may be offset by charges for any days on which the Fund overdraws its account at the custodian bank.
Indemnifications
Under the Trust’s organizational documents, its Officers and Trustees are indemnified against certain liabilities arising out of the performance of their duties to the Trust. In addition, in the normal course of business, the Trust enters into contracts that provide general indemnifications to other parties. The Trust’s maximum exposure under these arrangements is unknown as this would involve future claims that may be made against the Trust that have not yet occurred. However, the Trust has not had prior claims or losses pursuant to these contracts and expects the risk of loss to be remote.
Use of Estimates
The preparation of financial statements in conformity with accounting principles generally accepted in the United States requires management to make estimates and assumptions that affect the reported amounts of assets and liabilities at the date of the financial statements and the reported amounts of increases and decreases in net assets from operations during the reporting period. Actual results may differ from those estimates.
52
2. Fund Shares
Transactions in Fund shares were as follows:
| Connecticut | ||||||||||||||
| Six Months Ended 8/31/07 | Year Ended 2/28/07 | |||||||||||||
| Shares | Amount | Shares | Amount | |||||||||||
Shares sold: | ||||||||||||||
Class A | 2,656,781 | $ | 27,847,571 | 2,658,640 | $ | 28,153,881 | ||||||||
Class A – automatic conversion of Class B shares | 80,480 | 847,014 | 207,835 | 2,206,329 | ||||||||||
Class B | 31,709 | 334,819 | 31,726 | 335,772 | ||||||||||
Class C | 555,782 | 5,823,946 | 723,228 | 7,640,536 | ||||||||||
Class R | 356,430 | 3,747,777 | 838,440 | 8,907,131 | ||||||||||
Shares issued to shareholders due to reinvestment of distributions: | ||||||||||||||
Class A | 230,760 | 2,430,124 | 442,065 | 4,683,997 | ||||||||||
Class B | 13,455 | 141,656 | 31,626 | 334,918 | ||||||||||
Class C | 27,658 | 290,956 | 56,100 | 593,864 | ||||||||||
Class R | 6,891 | 72,930 | 12,152 | 129,328 | ||||||||||
| 3,959,946 | 41,536,793 | 5,001,812 | 52,985,756 | |||||||||||
Shares redeemed: | ||||||||||||||
Class A | (1,377,266 | ) | (14,411,841 | ) | (3,074,045 | ) | (32,447,496 | ) | ||||||
Class B | (229,364 | ) | (2,399,323 | ) | (360,529 | ) | (3,805,315 | ) | ||||||
Class B – automatic conversion to Class A shares | (80,517 | ) | (847,014 | ) | (207,975 | ) | (2,206,329 | ) | ||||||
Class C | (315,549 | ) | (3,311,767 | ) | (623,110 | ) | (6,573,426 | ) | ||||||
Class R | (103,703 | ) | (1,096,853 | ) | (95,486 | ) | (1,014,694 | ) | ||||||
| (2,106,399 | ) | (22,066,798 | ) | (4,361,145 | ) | (46,047,260 | ) | |||||||
Net increase (decrease) | 1,853,547 | $ | 19,469,995 | 640,667 | $ | 6,938,496 | ||||||||
| New Jersey | ||||||||||||||
| Six Months Ended 8/31/07 | Year Ended 2/28/07 | |||||||||||||
| Shares | Amount | Shares | Amount | |||||||||||
Shares sold: | ||||||||||||||
Class A | 631,627 | $ | 6,708,260 | 1,025,662 | $ | 10,980,530 | ||||||||
Class A – automatic conversion of Class B shares | 33,593 | 357,549 | 177,422 | 1,897,867 | ||||||||||
Class B | 58,647 | 622,407 | 107,021 | 1,146,305 | ||||||||||
Class C | 139,493 | 1,485,938 | 416,461 | 4,440,866 | ||||||||||
Class R | 663,542 | 7,085,291 | 2,200,700 | 23,583,206 | ||||||||||
Shares issued to shareholders due to reinvestment of distributions: | ||||||||||||||
Class A | 105,890 | 1,131,966 | 210,344 | 2,255,175 | ||||||||||
Class B | 12,807 | 137,033 | 29,190 | 313,017 | ||||||||||
Class C | 24,108 | 256,925 | 49,374 | 527,639 | ||||||||||
Class R | 66,596 | 713,914 | 135,420 | 1,455,197 | ||||||||||
| 1,736,303 | 18,499,283 | 4,351,594 | 46,599,802 | |||||||||||
Shares redeemed: | ||||||||||||||
Class A | (479,096 | ) | (5,087,635 | ) | (1,033,930 | ) | (11,068,893 | ) | ||||||
Class B | (153,291 | ) | (1,639,999 | ) | (331,816 | ) | (3,548,252 | ) | ||||||
Class B – automatic conversion to Class A shares | (33,562 | ) | (357,549 | ) | (177,382 | ) | (1,897,867 | ) | ||||||
Class C | (196,567 | ) | (2,090,628 | ) | (386,672 | ) | (4,118,636 | ) | ||||||
Class R | (516,594 | ) | (5,522,987 | ) | (476,371 | ) | (5,108,640 | ) | ||||||
| (1,379,110 | ) | (14,698,798 | ) | (2,406,171 | ) | (25,742,288 | ) | |||||||
Net increase (decrease) | 357,193 | $ | 3,800,485 | 1,945,423 | $ | 20,857,514 | ||||||||
53
Notes to Financial Statements (Unaudited) (continued)
| New York | ||||||||||||||
| Six Months Ended 8/31/07 | Year Ended 2/28/07 | |||||||||||||
| Shares | Amount | Shares | Amount | |||||||||||
Shares sold: | ||||||||||||||
Class A | 3,550,624 | $ | 37,691,717 | 4,347,224 | $ | 46,760,681 | ||||||||
Class A – automatic conversion of Class B shares | 93,799 | 1,002,677 | 124,161 | 1,340,449 | ||||||||||
Class B | 41,982 | 450,195 | 115,486 | 1,245,586 | ||||||||||
Class C | 342,286 | 3,659,077 | 1,106,466 | 11,933,099 | ||||||||||
Class R | 830,256 | 8,838,952 | 1,046,736 | 11,292,686 | ||||||||||
Shares issued to shareholders due to reinvestment of distributions: | ||||||||||||||
Class A | 190,679 | 2,044,915 | 362,948 | 3,912,210 | ||||||||||
Class B | 18,313 | 196,449 | 45,436 | 489,582 | ||||||||||
Class C | 38,616 | 414,316 | 70,809 | 764,133 | ||||||||||
Class R | 199,829 | 2,147,731 | 410,881 | 4,438,256 | ||||||||||
| 5,306,384 | 56,446,029 | 7,630,147 | 82,176,682 | |||||||||||
Shares redeemed: | ||||||||||||||
Class A | (2,762,201 | ) | (29,398,117 | ) | (2,901,947 | ) | (31,215,418 | ) | ||||||
Class B | (141,140 | ) | (1,506,520 | ) | (569,624 | ) | (6,131,485 | ) | ||||||
Class B – automatic conversion to Class A shares | (93,804 | ) | (1,002,677 | ) | (124,169 | ) | (1,340,449 | ) | ||||||
Class C | (319,260 | ) | (3,409,191 | ) | (670,210 | ) | (7,213,713 | ) | ||||||
Class R | (591,600 | ) | (6,329,042 | ) | (1,129,022 | ) | (12,179,612 | ) | ||||||
| (3,908,005 | ) | (41,645,547 | ) | (5,394,972 | ) | (58,080,677 | ) | |||||||
Net increase (decrease) | 1,398,379 | $ | 14,800,482 | 2,235,175 | $ | 24,096,005 | ||||||||
| New York Insured | ||||||||||||||
| Six Months Ended 8/31/07 | Year Ended 2/28/07 | |||||||||||||
| Shares | Amount | Shares | Amount | |||||||||||
Shares sold: | ||||||||||||||
Class A | 386,203 | $ | 3,929,069 | 1,390,593 | $ | 14,363,000 | ||||||||
Class A – automatic conversion of Class B shares | 27,038 | 278,091 | 128,618 | 1,323,889 | ||||||||||
Class B | 14,847 | 150,559 | 39,631 | 408,625 | ||||||||||
Class C | 50,460 | 512,936 | 65,122 | 672,072 | ||||||||||
Class R | 33,877 | 347,291 | 68,570 | 708,421 | ||||||||||
Shares issued to shareholders due to reinvestment of distributions: | ||||||||||||||
Class A | 113,275 | 1,160,383 | 262,141 | 2,708,770 | ||||||||||
Class B | 11,426 | 117,417 | 29,804 | 308,713 | ||||||||||
Class C | 10,211 | 104,667 | 25,627 | 264,889 | ||||||||||
Class R | 304,885 | 3,133,691 | 704,781 | 7,305,101 | ||||||||||
| 952,222 | 9,734,104 | 2,714,887 | 28,063,480 | |||||||||||
Shares redeemed: | ||||||||||||||
Class A | (598,406 | ) | (6,095,087 | ) | (1,770,925 | ) | (18,259,690 | ) | ||||||
Class B | (179,216 | ) | (1,838,004 | ) | (359,035 | ) | (3,719,314 | ) | ||||||
Class B – automatic conversion to Class A shares | (26,982 | ) | (278,091 | ) | (128,330 | ) | (1,323,889 | ) | ||||||
Class C | (115,309 | ) | (1,183,446 | ) | (215,144 | ) | (2,216,948 | ) | ||||||
Class R | (886,966 | ) | (9,057,848 | ) | (1,971,601 | ) | (20,355,160 | ) | ||||||
| (1,806,879 | ) | (18,452,476 | ) | (4,445,035 | ) | (45,875,001 | ) | |||||||
Net increase (decrease) | (854,657 | ) | $ | (8,718,372 | ) | (1,730,148 | ) | $ | (17,811,521 | ) | ||||
54
3. Investment Transactions
Purchases and sales (including maturities but excluding short-term investments and derivative transactions) during the six months ended August 31, 2007, were as follows:
| Connecticut | New Jersey | New York | New York Insured | |||||||||
Purchases | $ | 34,663,668 | $ | 19,351,452 | $ | 56,872,230 | $ | 30,511,003 | ||||
Sales and maturities | 21,172,546 | 13,050,438 | 35,084,886 | 29,912,988 | ||||||||
4. Income Tax Information
The following information is presented on an income tax basis. Differences between amounts for financial statement and federal income tax purposes are primarily due to the treatment of paydown gains and losses, timing differences in recognizing taxable market discount, timing differences in recognizing certain gains and losses on investment transactions and the treatment of investments in inverse floating rate transactions subject to SFAS No. 140. To the extent that differences arise that are permanent in nature, such amounts are reclassified within the capital accounts on the Statement of Assets and Liabilities presented in the annual report, based on their federal tax basis treatment; temporary differences do not require reclassification. Temporary and permanent differences do not impact the net asset values of the Funds.
At August 31, 2007, the cost of investments was as follows:
| Connecticut | New Jersey | New York | New York Insured | |||||||||
Cost of investments | $ | 298,531,935 | $ | 189,930,433 | $ | 387,945,656 | $ | 296,297,027 | ||||
Gross unrealized appreciation and gross unrealized depreciation of investments at August 31, 2007, were as follows:
| Connecticut | New Jersey | New York | New York Insured | |||||||||||||
Gross unrealized: | ||||||||||||||||
Appreciation | $ | 7,161,327 | $ | 4,255,674 | $ | 10,253,169 | $ | 8,348,920 | ||||||||
Depreciation | (2,675,073 | ) | (2,601,878 | ) | (3,448,517 | ) | (1,600,300 | ) | ||||||||
Net unrealized appreciation (depreciation) of investments | $ | 4,486,254 | $ | 1,653,796 | $ | 6,804,652 | $ | 6,748,620 | ||||||||
The tax components of undistributed net tax-exempt income, net ordinary income and net long-term capital gains at February 28, 2007, the Funds’ last tax year end, were as follows:
| Connecticut | New Jersey | New York | New York Insured | |||||||||
Undistributed net tax-exempt income* | $ | 624,949 | $ | 433,470 | $ | 1,091,564 | $ | 578,876 | ||||
Undistributed net ordinary income** | 2,344 | — | 359 | 69 | ||||||||
Undistributed net long-term capital gains | 173,883 | 86,286 | 50,696 | 427,120 | ||||||||
* Undistributed net tax-exempt income (on a tax basis) has not been reduced for the dividend declared on February 9, 2007, paid on March 1, 2007.
** Net ordinary income consists of taxable market discount income and net short-term capital gains, if any.
The tax character of distributions paid during the Funds’ last tax year ended February 28, 2007, was designated for purposes of the dividends paid deduction as follows:
| Connecticut | New Jersey | New York | New York Insured | |||||||||
Distributions from net tax-exempt income | $ | 11,182,792 | $ | 6,780,511 | $ | 15,109,485 | $ | 13,164,067 | ||||
Distributions from net ordinary income ** | 108,558 | — | 8,596 | 21,291 | ||||||||
Distributions from net long-term capital gains | 769,028 | 228,387 | 399,356 | 1,421,126 | ||||||||
** Net ordinary income consists of taxable market discount income and net short-term capital gains, if any.
5. Management Fees and Other Transactions with Affiliates
Each Fund’s management fee is separated into two components – a complex-level component, based on the aggregate amount of all fund assets managed by Nuveen Asset Management (the “Adviser”), a wholly owned subsidiary of Nuveen Investments, Inc, (“Nuveen”), and a specific fund-level component, based only on the amount of assets within each individual Fund. This pricing structure enables Nuveen fund shareholders to benefit from growth in the assets within each individual fund as well as from growth in the amount of complex-wide assets managed by the Adviser.
55
Notes to Financial Statements (Unaudited) (continued)
The annual fund-level fee, payable monthly, for each Fund is based upon the average daily net assets of each Fund as follows:
| Average Daily Net Assets | Fund-Level Fee Rate | ||
For the first $125 million | .3500 | % | |
For the next $125 million | .3375 | ||
For the next $250 million | .3250 | ||
For the next $500 million | .3125 | ||
For the next $1 billion | .3000 | ||
For the next $3 billion | .2750 | ||
For net assets over $5 billion | .2500 |
The annual complex-level fee, payable monthly, which is additive to the fund-level fee, for all Nuveen sponsored funds in the U.S., is based on the aggregate amount of total fund assets managed as stated in the tables below. As of August 31, 2007, the complex-level fee rate was .1841%.
Effective August 20, 2007, the complex-level fee schedule is as follows:
| Complex-Level Asset Breakpoint Level(1) | Effective Rate at Breakpoint Level | ||
$55 billion | .2000 | % | |
$56 billion | .1996 | ||
$57 billion | .1989 | ||
$60 billion | .1961 | ||
$63 billion | .1931 | ||
$66 billion | .1900 | ||
$71 billion | .1851 | ||
$76 billion | .1806 | ||
$80 billion | .1773 | ||
$91 billion | .1691 | ||
$125 billion | .1599 | ||
$200 billion | .1505 | ||
$250 billion | .1469 | ||
$300 billion | .1445 |
Prior to August 20, 2007, the complex-level fee schedule was as follows:
| Complex-Level Asset Breakpoint Level(1) | Effective Rate at Breakpoint Level | ||
$55 billion | .2000 | % | |
$56 billion | .1996 | ||
$57 billion | .1989 | ||
$60 billion | .1961 | ||
$63 billion | .1931 | ||
$66 billion | .1900 | ||
$71 billion | .1851 | ||
$76 billion | .1806 | ||
$80 billion | .1773 | ||
$91 billion | .1698 | ||
$125 billion | .1617 | ||
$200 billion | .1536 | ||
$250 billion | .1509 | ||
$300 billion | .1490 |
| (1) | The complex-level fee component of the management fee for the funds is calculated based upon the aggregate Managed Assets (“Managed Assets” means the average daily net assets of each fund including assets attributable to preferred stock issued by or borrowings by the Nuveen funds) of Nuveen-sponsored funds in the U.S. |
The management fee compensates the Adviser for overall investment advisory and administrative services and general office facilities. The Trust pays no compensation directly to those of its Trustees who are affiliated with the Adviser or to its Officers, all of whom receive remuneration for their services to the Trust from the Adviser or its affiliates. The Board of Trustees has adopted a deferred compensation plan for independent Trustees that enables Trustees to elect to defer receipt of all or a portion of the annual compensation they are entitled to receive from certain Nuveen advised funds. Under the plan, deferred amounts are treated as though equal dollar amounts had been invested in shares of select Nuveen advised funds.
The Adviser agreed to waive part of its management fees or reimburse certain expenses of New York and New York Insured in order to limit total expenses (excluding 12b-1 distribution and service fees, interest expense, taxes, fees incurred in acquiring and
56
disposing of portfolio securities and extraordinary expenses) from exceeding .75% of the average daily net assets of New York and .975% of the average daily net assets of New York Insured. The Adviser may also voluntarily reimburse additional expenses from time to time in any of the Funds. Voluntary reimbursements may be terminated at any time at the Adviser’s discretion.
During the six months ended August 31, 2007, Nuveen Investments, LLC (the “Distributor”), a wholly owned subsidiary of Nuveen, collected sales charges on purchases of Class A Shares, the majority of which were paid out as concessions to financial intermediaries as follows:
| Connecticut | New Jersey | New York | New York Insured | |||||||||
Sales charges collected | $ | 199,084 | $ | 33,986 | $ | 142,586 | $ | 47,992 | ||||
Paid to financial intermediaries | 178,506 | 29,624 | 122,490 | 41,541 | ||||||||
The Distributor also received 12b-1 service fees on Class A Shares, substantially all of which were paid to compensate financial intermediaries for providing services to shareholders relating to their investments.
During the six months ended August 31, 2007, the Distributor compensated financial intermediaries directly with commission advances at the time of purchase as follows:
| Connecticut | New Jersey | New York | New York Insured | |||||||||
Commission advances | $ | 125,878 | $ | 30,859 | $ | 59,361 | $ | 14,344 | ||||
To compensate for commissions advanced to financial intermediaries, all 12b-1 service fees collected on Class B Shares during the first year following a purchase, all 12b-1 distribution fees collected on Class B Shares, and all 12b-1 service and distribution fees collected on Class C Shares during the first year following a purchase are retained by the Distributor. During the six months ended August 31, 2007, the Distributor retained such 12b-1 fees as follows:
| Connecticut | New Jersey | New York | New York Insured | |||||||||
12b-1 fees retained | $ | 101,659 | $ | 80,129 | $ | 136,909 | $ | 50,123 | ||||
The remaining 12b-1 fees charged to the Funds were paid to compensate financial intermediaries for providing services to shareholders relating to their investments.
The Distributor also collected and retained CDSC on share redemptions during the six months ended August 31, 2007, as follows:
| Connecticut | New Jersey | New York | New York Insured | |||||||||
CDSC retained | $ | 15,866 | $ | 10,733 | $ | 12,654 | $ | 15,874 | ||||
Agreement and Plan of Merger
On June 20, 2007, Nuveen Investments announced that it had entered into a definitive Agreement and Plan of Merger (“Merger Agreement”) with Windy City Investments, Inc. (“Windy City”), a corporation formed by investors led by Madison Dearborn Partners, LLC, pursuant to which Windy City would acquire Nuveen Investments. Madison Dearborn Partners, LLC is a private equity investment firm based in Chicago, Illinois. The investors include an affiliate of Merrill Lynch. It is anticipated that Merrill Lynch and its affiliates will be indirect “affiliated persons” (as that term is defined in the Investment Company Act of 1940) of the Funds upon and after the acquisition. One important implication of this is that the Funds will not be able to buy securities from or sell securities to Merrill Lynch; however, the portfolio management teams and Fund management do not expect that this will significantly impact the ability of the Funds to pursue their investment objectives and policies. Under the terms of the merger, each outstanding share of Nuveen Investments’ common stock (other than dissenting shares) will be converted into the right to receive a specified amount of cash, without interest. The merger is expected to be completed by the end of the year, subject to customary conditions. The obligations of Windy City to consummate the merger are not conditioned on its obtaining financing.
The consummation of the merger will be deemed to be an “assignment” (as defined in the 1940 Act) of the investment management agreement between each Fund and the Adviser, and will result in the automatic termination of each Fund’s agreement. The Board of Trustees of each Fund has approved a new investment management agreement with the Adviser. On October 12, 2007, at a meeting of the respective Funds’ shareholders, Connecticut, New Jersey and New York Insured received the required number of shareholder votes to approve the new investment management agreements. On October 22, 2007, at a meeting of New York’s shareholders, the Fund received the required number of shareholder votes to approve the new investment management agreement. The new agreements will take effect upon consummation of the merger of Nuveen Investments and Windy City.
57
Notes to Financial Statements (Unaudited) (continued)
6. New Accounting Pronouncements
Financial Accounting Standards Board Interpretation No. 48
Effective August 31, 2007, the Funds adopted Financial Accounting Standards Board Interpretation No. 48, “Accounting for Uncertainty in Income Taxes” (FIN 48). FIN 48 provides guidance regarding how uncertain tax positions should be recognized, measured, presented and disclosed in the financial statements. FIN 48 requires the evaluation of tax positions taken or expected to be taken in the course of preparing the Funds’ tax returns to determine whether the tax positions are “more-likely-than-not” of being sustained by the applicable tax authority. Tax positions not deemed to meet the more-likely-than-not threshold would be recorded as a tax benefit or expense in the current year. Management of the Funds has concluded that there are no significant uncertain tax positions that require recognition in the Funds’ financial statements. Consequently, the adoption of FIN 48 had no impact on the net assets or results of operations of the Funds.
Financial Accounting Standards Board Statement of Financial Accounting Standards No. 157
In September 2006, the Financial Accounting Standards Board (FASB) issued Statement of Financial Accounting Standards (SFAS) No. 157, “Fair Value Measurements.” This standard establishes a single authoritative definition of fair value, sets out a framework for measuring fair value and requires additional disclosures about fair value measurements. SFAS No. 157 applies to fair value measurements already required or permitted by existing standards. SFAS No. 157 is effective for financial statements issued for fiscal years beginning after November 15, 2007, and interim periods within those fiscal years. The changes to current generally accepted accounting principles from the application of this standard relate to the definition of fair value, the methods used to measure fair value, and the expanded disclosures about fair value measurements. As of August 31, 2007, management does not believe the adoption of SFAS No. 157 will impact the financial statement amounts; however, additional disclosures may be required about the inputs used to develop the measurements and the effect of certain of the measurements included within the Statement of Operations for the period.
7. Subsequent Events
Distributions to Shareholders
The Funds declared dividend distributions from their tax-exempt net investment income which were paid on October 1, 2007, to shareholders of record on September 7, 2007, as follows:
| Connecticut | New Jersey | New York | New York Insured | |||||||||
Dividend per share: | ||||||||||||
Class A | $ | .0350 | $ | .0345 | $ | .0365 | $ | .0335 | ||||
Class B | .0285 | .0275 | .0300 | .0270 | ||||||||
Class C | .0300 | .0295 | .0320 | .0285 | ||||||||
Class R | .0370 | .0360 | .0385 | .0350 | ||||||||
58
Financial Highlights (Unaudited)
Selected data for a share outstanding throughout each period:
| Class (Commencement Date) | ||||||||||||||||||||||||||||||||||||||||||||||||||||||||
| Investment Operations | Less Distributions | Ratios/Supplemental Data | ||||||||||||||||||||||||||||||||||||||||||||||||||||||
| CONNECTICUT | Ratios to Average Net Assets Before Credit/ Reimbursement | Ratios to Average Net Assets After Reimbursement(c) | Ratios to Average Net Assets After Credit/ Reimbursement(d) | |||||||||||||||||||||||||||||||||||||||||||||||||||||
| Year Ended February 28/29, | Beginning Net Asset Value | Net Invest- | Net Realized/ Unrealized Gain (Loss) | Total | Net Invest- ment Income | Capital Gains | Total | Ending Net Asset Value | Total Return(b) | Ending Net Assets (000) | Expenses(e) | Net Invest- ment Income | Expenses(e) | Net Invest- ment Income | Expenses(e) | Net Invest- ment Income | Portfolio Turnover Rate | |||||||||||||||||||||||||||||||||||||||
| Class A (7/87) | ||||||||||||||||||||||||||||||||||||||||||||||||||||||||
2008(g) | $ | 10.67 | $ | .21 | $ | (.32 | ) | $ | (.11 | ) | $ | (.21 | ) | $ | — | $ | (.21 | ) | $ | 10.35 | (1.04 | )% | $ | 238,297 | 1.10 | %* | 3.91 | %* | 1.10 | %* | 3.91 | %* | 1.08 | %* | 3.93 | %* | 7 | % | ||||||||||||||||||
2007 | 10.65 | .42 | .05 | .47 | (.42 | ) | (.03 | ) | (.45 | ) | 10.67 | 4.54 | 228,582 | 1.12 | 4.00 | 1.12 | 4.00 | 1.11 | 4.01 | 14 | ||||||||||||||||||||||||||||||||||||
2006(f) | 10.77 | .44 | (.06 | ) | .38 | (.45 | ) | (.05 | ) | (.50 | ) | 10.65 | 3.55 | 225,785 | 1.05 | 4.13 | 1.05 | 4.13 | 1.04 | 4.14 | 12 | |||||||||||||||||||||||||||||||||||
2005 | 10.99 | .48 | (.18 | ) | .30 | (.48 | ) | (.04 | ) | (.52 | ) | 10.77 | 2.89 | 221,463 | .83 | 4.45 | .83 | 4.45 | .83 | 4.45 | 8 | |||||||||||||||||||||||||||||||||||
2004 | 10.88 | .50 | .15 | .65 | (.50 | ) | (.04 | ) | (.54 | ) | 10.99 | 6.21 | 227,787 | .85 | 4.60 | .85 | 4.60 | .84 | 4.60 | 8 | �� | |||||||||||||||||||||||||||||||||||
2003 | 10.67 | .52 | .26 | .78 | (.53 | ) | (.04 | ) | (.57 | ) | 10.88 | 7.51 | 234,133 | .85 | 4.82 | .85 | 4.82 | .84 | 4.82 | 19 | ||||||||||||||||||||||||||||||||||||
| Class B (2/97) | ||||||||||||||||||||||||||||||||||||||||||||||||||||||||
2008(g) | 10.66 | .17 | (.32 | ) | (.15 | ) | (.17 | ) | — | (.17 | ) | 10.34 | (1.41 | ) | 16,148 | 1.85 | * | 3.16 | * | 1.85 | * | 3.16 | * | 1.83 | * | 3.18 | * | 7 | ||||||||||||||||||||||||||||
2007 | 10.65 | .34 | .04 | .38 | (.34 | ) | (.03 | ) | (.37 | ) | 10.66 | 3.67 | 19,462 | 1.87 | 3.25 | 1.87 | 3.25 | 1.86 | 3.27 | 14 | ||||||||||||||||||||||||||||||||||||
2006(f) | 10.76 | .36 | (.06 | ) | .30 | (.36 | ) | (.05 | ) | (.41 | ) | 10.65 | 2.84 | 24,816 | 1.80 | 3.38 | 1.80 | 3.38 | 1.79 | 3.39 | 12 | |||||||||||||||||||||||||||||||||||
2005 | 10.98 | .40 | (.18 | ) | .22 | (.40 | ) | (.04 | ) | (.44 | ) | 10.76 | 2.09 | 29,587 | 1.58 | 3.70 | 1.58 | 3.70 | 1.58 | 3.70 | 8 | |||||||||||||||||||||||||||||||||||
2004 | 10.87 | .42 | .15 | .57 | (.42 | ) | (.04 | ) | (.46 | ) | 10.98 | 5.40 | 31,678 | 1.60 | 3.85 | 1.60 | 3.85 | 1.59 | 3.85 | 8 | ||||||||||||||||||||||||||||||||||||
2003 | 10.65 | .43 | .27 | .70 | (.44 | ) | (.04 | ) | (.48 | ) | 10.87 | 6.78 | 31,987 | 1.60 | 4.06 | 1.60 | 4.06 | 1.59 | 4.07 | 19 | ||||||||||||||||||||||||||||||||||||
| Class C (10/93) | ||||||||||||||||||||||||||||||||||||||||||||||||||||||||
2008(g) | 10.66 | .18 | (.32 | ) | (.14 | ) | (.18 | ) | — | (.18 | ) | 10.34 | (1.32 | ) | 41,544 | 1.65 | * | 3.37 | * | 1.65 | * | 3.37 | * | 1.63 | * | 3.38 | * | 7 | ||||||||||||||||||||||||||||
2007 | 10.64 | .37 | .04 | .41 | (.36 | ) | (.03 | ) | (.39 | ) | 10.66 | 3.96 | 39,949 | 1.67 | 3.45 | 1.67 | 3.45 | 1.66 | 3.46 | 14 | ||||||||||||||||||||||||||||||||||||
2006(f) | 10.76 | .38 | (.06 | ) | .32 | (.39 | ) | (.05 | ) | (.44 | ) | 10.64 | 2.98 | 38,228 | 1.60 | 3.58 | 1.60 | 3.58 | 1.59 | 3.59 | 12 | |||||||||||||||||||||||||||||||||||
2005 | 10.98 | .42 | (.18 | ) | .24 | (.42 | ) | (.04 | ) | (.46 | ) | 10.76 | 2.32 | 35,767 | 1.38 | 3.90 | 1.38 | 3.90 | 1.38 | 3.90 | 8 | |||||||||||||||||||||||||||||||||||
2004 | 10.87 | .44 | .15 | .59 | (.44 | ) | (.04 | ) | (.48 | ) | 10.98 | 5.62 | 41,194 | 1.40 | 4.05 | 1.40 | 4.05 | 1.39 | 4.05 | 8 | ||||||||||||||||||||||||||||||||||||
2003 | 10.66 | .46 | .26 | .72 | (.47 | ) | (.04 | ) | (.51 | ) | 10.87 | 6.92 | 38,312 | 1.40 | 4.26 | 1.40 | 4.26 | 1.39 | 4.27 | 19 | ||||||||||||||||||||||||||||||||||||
| Class R (2/97) | ||||||||||||||||||||||||||||||||||||||||||||||||||||||||
2008(g) | 10.71 | .22 | (.32 | ) | (.10 | ) | (.22 | ) | — | (.22 | ) | 10.39 | (.92 | ) | 14,826 | .90 | * | 4.11 | * | .90 | * | 4.11 | * | .88 | * | 4.13 | * | 7 | ||||||||||||||||||||||||||||
2007 | 10.70 | .45 | .04 | .49 | (.45 | ) | (.03 | ) | (.48 | ) | 10.71 | 4.66 | 12,497 | .92 | 4.19 | .92 | 4.19 | .91 | 4.20 | 14 | ||||||||||||||||||||||||||||||||||||
2006(f) | 10.82 | .47 | (.07 | ) | .40 | (.47 | ) | (.05 | ) | (.52 | ) | 10.70 | 3.77 | 4,403 | .85 | 4.33 | .85 | 4.33 | .84 | 4.34 | 12 | |||||||||||||||||||||||||||||||||||
2005 | 11.03 | .50 | (.17 | ) | .33 | (.50 | ) | (.04 | ) | (.54 | ) | 10.82 | 3.16 | 3,666 | .63 | 4.65 | .63 | 4.65 | .63 | 4.65 | 8 | |||||||||||||||||||||||||||||||||||
2004 | 10.92 | .52 | .15 | .67 | (.52 | ) | (.04 | ) | (.56 | ) | 11.03 | 6.36 | 4,005 | .65 | 4.79 | .65 | 4.79 | .64 | 4.80 | 8 | ||||||||||||||||||||||||||||||||||||
2003 | 10.70 | .54 | .27 | .81 | (.55 | ) | (.04 | ) | (.59 | ) | 10.92 | 7.76 | 3,878 | .65 | 5.01 | .65 | 5.01 | .64 | 5.02 | 19 | ||||||||||||||||||||||||||||||||||||
| * | Annualized |
| (a) | Per share Net Investment Income is calculated using the average daily shares method. |
| (b) | Total return is the combination of changes in net asset value, reinvested dividend income at net asset value and reinvested capital gains distributions at net asset value, if any. The last dividend declared in the period, which is typically paid on the first business day of the following month, is assumed to be reinvested at the ending net asset value. The actual reinvest price for the last dividend declared in the period may be different from the price used in the calculation. Total returns are not annualized. |
| (c) | After expense reimbursement from the Adviser, where applicable. |
| (d) | After custodian fee credit and expense reimbursement, where applicable. |
| (e) | The expense ratios in the above table reflect, among other things, the interest expense deemed to have been paid by the Fund on the floating rate certificates issued by the special purpose trusts for the self-deposited inverse floaters held by the Fund, as described in Footnote 1 – Inverse Floating Rate Securities. The amount of this deemed interest expense for such periods expressed as a percentage of average net assets for each share class was as follows: |
| Interest Expense on Floating Rate Obligations to Average Net Assets | ||
2008(g) | .29%* | |
2007 | .29 | |
2006(f) | .22 | |
2005 | — | |
2004 | — | |
2003 | — | |
| (f) | Each Ratio of Expenses to Average Net Assets and the Portfolio Turnover Rate for the fiscal year ended February 28, 2006, in the above table have been restated to give effect to recording the self-deposited inverse floaters as financing transactions. |
| (g) | For the six months ended August 31, 2007. |
See accompanying notes to financial statements.
59
Financial Highlights (Unaudited) (continued)
Selected data for a share outstanding throughout each period:
| Class (Commencement Date) | ||||||||||||||||||||||||||||||||||||||||||||||||||||||||
| Investment Operations | Less Distributions | Ratios/Supplemental Data | ||||||||||||||||||||||||||||||||||||||||||||||||||||||
| NEW JERSEY | Ratios to Average Net Assets Before Credit/ Reimbursement | Ratios to Average Net Assets After Reimbursement(c) | Ratios to Average Net Assets After Credit/ Reimbursement(d) | |||||||||||||||||||||||||||||||||||||||||||||||||||||
| Year Ended February 28/29, | Beginning Net Asset Value | Net Invest- ment Income(a) | Net Realized/ Unrealized Gain (Loss) | Total | Net Invest- ment Income | Capital Gains | Total | Ending Net Asset Value | Total Return(b) | Ending Net Assets (000) | Expenses(e) | Net Invest- ment Income | Expenses(e) | Net Invest- ment Income | Expenses(e) | Net Invest- ment Income | Portfolio Turnover Rate | |||||||||||||||||||||||||||||||||||||||
| Class A (9/94) | ||||||||||||||||||||||||||||||||||||||||||||||||||||||||
2008(f) | $ | 10.82 | $ | .21 | $ | (.32 | ) | $ | (.11 | ) | $ | (.21 | ) | $ | — | $ | (.21 | ) | $ | 10.50 | (1.05 | )% | $ | 84,950 | .96 | %* | 3.87 | %* | .96 | %* | 3.87 | %* | .95 | %* | 3.88 | %* | 7 | % | ||||||||||||||||||
2007 | 10.78 | .42 | .04 | .46 | (.41 | ) | (.01 | ) | (.42 | ) | 10.82 | 4.44 | 84,421 | 1.00 | 3.88 | 1.00 | 3.88 | .98 | 3.90 | 7 | ||||||||||||||||||||||||||||||||||||
2006 | 10.85 | .43 | (.02 | ) | .41 | (.44 | ) | (.04 | ) | (.48 | ) | 10.78 | 3.89 | 80,009 | .86 | 3.96 | .86 | 3.96 | .85 | 3.97 | 15 | |||||||||||||||||||||||||||||||||||
2005 | 10.97 | .45 | (.11 | ) | .34 | (.46 | ) | — | (.46 | ) | 10.85 | 3.20 | 73,687 | .88 | 4.22 | .88 | 4.22 | .87 | 4.23 | 15 | ||||||||||||||||||||||||||||||||||||
2004 | 10.79 | .46 | .18 | .64 | (.46 | ) | — | (.46 | ) | 10.97 | 6.07 | 77,021 | .90 | 4.26 | .90 | 4.26 | .89 | 4.27 | 17 | |||||||||||||||||||||||||||||||||||||
2003 | 10.60 | .46 | .20 | .66 | (.47 | ) | — | (.47 | ) | 10.79 | 6.36 | 74,067 | .91 | 4.29 | .91 | 4.29 | .90 | 4.30 | 6 | |||||||||||||||||||||||||||||||||||||
| Class B (2/97) | ||||||||||||||||||||||||||||||||||||||||||||||||||||||||
2008(f) | 10.83 | .17 | (.32 | ) | (.15 | ) | (.17 | ) | — | (.17 | ) | 10.51 | (1.44 | ) | 16,211 | 1.71 | * | 3.12 | * | 1.71 | * | 3.12 | * | 1.70 | * | 3.13 | * | 7 | ||||||||||||||||||||||||||||
2007 | 10.78 | .34 | .05 | .39 | (.33 | ) | (.01 | ) | (.34 | ) | 10.83 | 3.72 | 17,960 | 1.75 | 3.13 | 1.75 | 3.13 | 1.73 | 3.15 | 7 | ||||||||||||||||||||||||||||||||||||
2006 | 10.85 | .35 | (.02 | ) | .33 | (.36 | ) | (.04 | ) | (.40 | ) | 10.78 | 3.09 | 21,908 | 1.61 | 3.21 | 1.61 | 3.21 | 1.60 | 3.22 | 15 | |||||||||||||||||||||||||||||||||||
2005 | 10.96 | .37 | (.11 | ) | .26 | (.37 | ) | — | (.37 | ) | 10.85 | 2.49 | 25,273 | 1.63 | 3.47 | 1.63 | 3.47 | 1.62 | 3.48 | 15 | ||||||||||||||||||||||||||||||||||||
2004 | 10.78 | .38 | .17 | .55 | (.37 | ) | — | (.37 | ) | 10.96 | 5.26 | 27,140 | 1.65 | 3.51 | 1.65 | 3.51 | 1.64 | 3.52 | 17 | |||||||||||||||||||||||||||||||||||||
2003 | 10.59 | .38 | .20 | .58 | (.39 | ) | — | (.39 | ) | 10.78 | 5.58 | 26,926 | 1.66 | 3.54 | 1.66 | 3.54 | 1.65 | 3.55 | 6 | |||||||||||||||||||||||||||||||||||||
| Class C (9/94) | ||||||||||||||||||||||||||||||||||||||||||||||||||||||||
2008(f) | 10.79 | .18 | (.32 | ) | (.14 | ) | (.18 | ) | — | (.18 | ) | 10.47 | (1.33 | ) | 27,811 | 1.51 | * | 3.32 | * | 1.51 | * | 3.32 | * | 1.50 | * | 3.34 | * | 7 | ||||||||||||||||||||||||||||
2007 | 10.75 | .36 | .04 | .40 | (.35 | ) | (.01 | ) | (.36 | ) | 10.79 | 3.87 | 29,028 | 1.55 | 3.33 | 1.55 | 3.33 | 1.53 | 3.35 | 7 | ||||||||||||||||||||||||||||||||||||
2006 | 10.82 | .37 | (.02 | ) | .35 | (.38 | ) | (.04 | ) | (.42 | ) | 10.75 | 3.33 | 28,068 | 1.41 | 3.41 | 1.41 | 3.41 | 1.40 | 3.42 | 15 | |||||||||||||||||||||||||||||||||||
2005 | 10.94 | .39 | (.11 | ) | .28 | (.40 | ) | — | (.40 | ) | 10.82 | 2.63 | 27,914 | 1.43 | 3.67 | 1.43 | 3.67 | 1.42 | 3.68 | 15 | ||||||||||||||||||||||||||||||||||||
2004 | 10.76 | .40 | .18 | .58 | (.40 | ) | — | (.40 | ) | 10.94 | 5.50 | 28,226 | 1.45 | 3.72 | 1.45 | 3.72 | 1.44 | 3.73 | 17 | |||||||||||||||||||||||||||||||||||||
2003 | 10.56 | .40 | .21 | .61 | (.41 | ) | — | (.41 | ) | 10.76 | 5.88 | 21,192 | 1.46 | 3.74 | 1.46 | 3.74 | 1.45 | 3.75 | 6 | |||||||||||||||||||||||||||||||||||||
| Class R (2/92) | ||||||||||||||||||||||||||||||||||||||||||||||||||||||||
2008(f) | 10.85 | .22 | (.32 | ) | (.10 | ) | (.22 | ) | — | (.22 | ) | 10.53 | (.97 | ) | 64,159 | .76 | * | 4.07 | * | .76 | * | 4.07 | * | .75 | * | 4.08 | * | 7 | ||||||||||||||||||||||||||||
2007 | 10.80 | .44 | .05 | .49 | (.43 | ) | (.01 | ) | (.44 | ) | 10.85 | 4.70 | 63,816 | .80 | 4.08 | .80 | 4.08 | .78 | 4.10 | 7 | ||||||||||||||||||||||||||||||||||||
2006 | 10.87 | .45 | (.02 | ) | .43 | (.46 | ) | (.04 | ) | (.50 | ) | 10.80 | 4.06 | 43,455 | .67 | 4.16 | .67 | 4.16 | .65 | 4.17 | 15 | |||||||||||||||||||||||||||||||||||
2005 | 10.98 | .48 | (.12 | ) | .36 | (.47 | ) | — | (.47 | ) | 10.87 | 3.46 | 43,464 | .68 | 4.42 | .68 | 4.42 | .67 | 4.43 | 15 | ||||||||||||||||||||||||||||||||||||
2004 | 10.80 | .48 | .17 | .65 | (.47 | ) | — | (.47 | ) | 10.98 | 6.24 | 45,807 | .70 | 4.46 | .70 | 4.46 | .69 | 4.47 | 17 | |||||||||||||||||||||||||||||||||||||
2003 | 10.60 | .48 | .21 | .69 | (.49 | ) | — | (.49 | ) | 10.80 | 6.63 | 45,043 | .71 | 4.49 | .71 | 4.49 | .70 | 4.50 | 6 | |||||||||||||||||||||||||||||||||||||
| * | Annualized |
| (a) | Per share Net Investment Income is calculated using the average daily shares method. |
| (b) | Total return is the combination of changes in net asset value, reinvested dividend income at net asset value and reinvested capital gains distributions at net asset value, if any. The last dividend declared in the period, which is typically paid on the first business day of the following month, is assumed to be reinvested at the ending net asset value. The actual reinvest price for the last dividend declared in the period may be different from the price used in the calculation. Total returns are not annualized. |
| (c) | After expense reimbursement from the Adviser, where applicable. |
| (d) | After custodian fee credit and expense reimbursement, where applicable. |
| (e) | The expense ratios in the above table reflect, among other things, the interest expense deemed to have been paid by the Fund on the floating rate certificates issued by the special purpose trusts for the self-deposited inverse floaters held by the Fund, as described in Footnote 1 – Inverse Floating Rate Securities. The amount of this deemed interest expense for such periods expressed as a percentage of average net assets for each share class was as follows: |
| Interest Expense on Floating Rate Obligations to Average Net Assets | ||
2008(f) | .13%* | |
2007 | .14 | |
2006 | — | |
2005 | — | |
2004 | — | |
2003 | — | |
| (f) | For the six months ended August 31, 2007. |
See accompanying notes to financial statements.
60
Selected data for a share outstanding throughout each period:
| Class (Commencement Date) | ||||||||||||||||||||||||||||||||||||||||||||||||||||||||
| Investment Operations | Less Distributions | Ratios/Supplemental Data | ||||||||||||||||||||||||||||||||||||||||||||||||||||||
| NEW YORK | Ratios to Average Net Assets Before Credit/ Reimbursement | Ratios to Average Net Assets After Reimbursement(c) | Ratios to Average Net Assets After Credit/ Reimbursement(d) | |||||||||||||||||||||||||||||||||||||||||||||||||||||
| Year Ended February 28/29, | Beginning Net Asset Value | Net Invest- ment Income(a) | Net Realized/ Unrealized Gain (Loss) | Total | Net Invest- ment Income | Capital Gains | Total | Ending Net Asset Value | Total Return(b) | Ending Net Assets (000) | Expenses(e) | Net Invest- ment Income | Expenses(e) | Net Invest- ment Income | Expenses(e) | Net Invest- ment Income | Portfolio Turnover Rate | |||||||||||||||||||||||||||||||||||||||
| Class A (9/94) | ||||||||||||||||||||||||||||||||||||||||||||||||||||||||
2008(g) | $ | 10.86 | $ | .22 | $ | (.32 | ) | $ | (.10 | ) | $ | (.22 | ) | $ | — | $ | (.22 | ) | $ | 10.54 | (.94 | )% | $ | 187,319 | 1.15 | %* | 4.06 | %* | 1.15 | %* | 4.06 | %* | 1.14 | %* | 4.08 | %* | 8 | % | ||||||||||||||||||
2007 | 10.84 | .45 | .02 | .47 | (.44 | ) | (.01 | ) | (.45 | ) | 10.86 | 4.44 | 181,313 | 1.14 | 4.15 | 1.14 | 4.15 | 1.13 | 4.17 | 9 | ||||||||||||||||||||||||||||||||||||
2006(f) | 10.93 | .47 | (.05 | ) | .42 | (.46 | ) | (.05 | ) | (.51 | ) | 10.84 | 3.88 | 159,947 | 1.08 | 4.29 | 1.08 | 4.29 | 1.06 | 4.31 | 12 | |||||||||||||||||||||||||||||||||||
2005 | 11.10 | .50 | (.17 | ) | .33 | (.50 | ) | — | (.50 | ) | 10.93 | 3.12 | 127,502 | .86 | 4.59 | .86 | 4.59 | .85 | 4.60 | 8 | ||||||||||||||||||||||||||||||||||||
2004 | 10.88 | .52 | .22 | .74 | (.52 | ) | — | (.52 | ) | 11.10 | 6.94 | 122,569 | .88 | 4.76 | .88 | 4.76 | .88 | 4.76 | 12 | |||||||||||||||||||||||||||||||||||||
2003 | 10.72 | .52 | .22 | .74 | (.54 | ) | (.04 | ) | (.58 | ) | 10.88 | 7.11 | 113,197 | .88 | 4.87 | .88 | 4.87 | .87 | 4.87 | 23 | ||||||||||||||||||||||||||||||||||||
| Class B (2/97) | ||||||||||||||||||||||||||||||||||||||||||||||||||||||||
2008(g) | 10.86 | .18 | (.32 | ) | (.14 | ) | (.18 | ) | — | (.18 | ) | 10.54 | (1.30 | ) | 23,296 | 1.90 | * | 3.31 | * | 1.90 | * | 3.31 | * | 1.89 | * | 3.33 | * | 8 | ||||||||||||||||||||||||||||
2007 | 10.84 | .37 | .02 | .39 | (.36 | ) | (.01 | ) | (.37 | ) | 10.86 | 3.69 | 25,898 | 1.89 | 3.41 | 1.89 | 3.41 | 1.88 | 3.42 | 9 | ||||||||||||||||||||||||||||||||||||
2006(f) | 10.94 | .39 | (.06 | ) | .33 | (.38 | ) | (.05 | ) | (.43 | ) | 10.84 | 3.05 | 31,620 | 1.83 | 3.54 | 1.83 | 3.54 | 1.81 | 3.56 | 12 | |||||||||||||||||||||||||||||||||||
2005 | 11.11 | .42 | (.17 | ) | .25 | (.42 | ) | — | (.42 | ) | 10.94 | 2.38 | 36,125 | 1.61 | 3.84 | 1.61 | 3.84 | 1.60 | 3.85 | 8 | ||||||||||||||||||||||||||||||||||||
2004 | 10.90 | .44 | .21 | .65 | (.44 | ) | — | (.44 | ) | 11.11 | 6.07 | 41,579 | 1.63 | 4.01 | 1.63 | 4.01 | 1.63 | 4.01 | 12 | |||||||||||||||||||||||||||||||||||||
2003 | 10.73 | .44 | .23 | .67 | (.46 | ) | (.04 | ) | (.50 | ) | 10.90 | 6.43 | 40,951 | 1.63 | 4.11 | 1.63 | 4.11 | 1.62 | 4.12 | 23 | ||||||||||||||||||||||||||||||||||||
| Class C (9/94) | ||||||||||||||||||||||||||||||||||||||||||||||||||||||||
2008(g) | 10.87 | .19 | (.32 | ) | (.13 | ) | (.19 | ) | — | (.19 | ) | 10.55 | (1.19 | ) | 47,745 | 1.70 | * | 3.51 | * | 1.70 | * | 3.51 | * | 1.69 | * | 3.53 | * | 8 | ||||||||||||||||||||||||||||
2007 | 10.85 | .39 | .02 | .41 | (.38 | ) | (.01 | ) | (.39 | ) | 10.87 | 3.92 | 48,525 | 1.69 | 3.60 | 1.69 | 3.60 | 1.68 | 3.62 | 9 | ||||||||||||||||||||||||||||||||||||
2006(f) | 10.95 | .41 | (.06 | ) | .35 | (.40 | ) | (.05 | ) | (.45 | ) | 10.85 | 3.27 | 42,934 | 1.63 | 3.74 | 1.63 | 3.74 | 1.61 | 3.76 | 12 | |||||||||||||||||||||||||||||||||||
2005 | 11.12 | .44 | (.16 | ) | .28 | (.45 | ) | — | (.45 | ) | 10.95 | 2.60 | 37,221 | 1.41 | 4.04 | 1.41 | 4.04 | 1.40 | 4.05 | 8 | ||||||||||||||||||||||||||||||||||||
2004 | 10.91 | .46 | .22 | .68 | (.47 | ) | — | (.47 | ) | 11.12 | 6.30 | 35,832 | 1.43 | 4.21 | 1.43 | 4.21 | 1.43 | 4.21 | 12 | |||||||||||||||||||||||||||||||||||||
2003 | 10.75 | .46 | .23 | .69 | (.49 | ) | (.04 | ) | (.53 | ) | 10.91 | 6.56 | 27,687 | 1.43 | 4.31 | 1.43 | 4.31 | 1.42 | 4.32 | 23 | ||||||||||||||||||||||||||||||||||||
| Class R (12/86) | ||||||||||||||||||||||||||||||||||||||||||||||||||||||||
2008(g) | 10.88 | .23 | (.31 | ) | (.08 | ) | (.23 | ) | — | (.23 | ) | 10.57 | (.83 | ) | 142,037 | .96 | * | 4.26 | * | .96 | * | 4.26 | * | .94 | * | 4.27 | * | 8 | ||||||||||||||||||||||||||||
2007 | 10.86 | .47 | .02 | .49 | (.46 | ) | (.01 | ) | (.47 | ) | 10.88 | 4.66 | 141,556 | .94 | 4.35 | .94 | 4.35 | .93 | 4.37 | 9 | ||||||||||||||||||||||||||||||||||||
2006(f) | 10.96 | .49 | (.06 | ) | .43 | (.48 | ) | (.05 | ) | (.53 | ) | 10.86 | 4.01 | 137,680 | .88 | 4.49 | .88 | 4.49 | .86 | 4.51 | 12 | |||||||||||||||||||||||||||||||||||
2005 | 11.13 | .52 | (.17 | ) | .35 | (.52 | ) | — | (.52 | ) | 10.96 | 3.34 | 139,964 | .66 | 4.79 | .66 | 4.79 | .65 | 4.80 | 8 | ||||||||||||||||||||||||||||||||||||
2004 | 10.91 | .54 | .23 | .77 | (.55 | ) | — | (.55 | ) | 11.13 | 7.06 | 150,963 | .68 | 4.96 | .68 | 4.96 | .68 | 4.96 | 12 | |||||||||||||||||||||||||||||||||||||
2003 | 10.75 | .55 | .22 | .77 | (.57 | ) | (.04 | ) | (.61 | ) | 10.91 | 7.33 | 146,759 | .68 | 5.07 | .68 | 5.07 | .67 | 5.07 | 23 | ||||||||||||||||||||||||||||||||||||
| * | Annualized |
| (a) | Per share Net Investment Income is calculated using the average daily shares method. |
| (b) | Total return is the combination of changes in net asset value, reinvested dividend income at net asset value and reinvested capital gains distributions at net asset value, if any. The last dividend declared in the period, which is typically paid on the first business day of the following month, is assumed to be reinvested at the ending net asset value. The actual reinvest price for the last dividend declared in the period may be different from the price used in the calculation. Total returns are not annualized. |
| (c) | After expense reimbursement from the Adviser, where applicable. |
| (d) | After custodian fee credit and expense reimbursement, where applicable. |
| (e) | The expense ratios in the above table reflect, among other things, the interest expense deemed to have been paid by the Fund on the floating rate certificates issued by the special purpose trusts for the self-deposited inverse floaters held by the Fund, as described in Footnote 1 – Inverse Floating Rate Securities. The amount of this deemed interest expense for such periods expressed as a percentage of average net assets for each share class was as follows: |
| Interest Expense on Floating Rate Obligations to Average Net Assets | ||
2008(g) | .33%* | |
2007 | .30 | |
2006(f) | .24 | |
2005 | — | |
2004 | — | |
2003 | — | |
| (f) | Each Ratio of Expenses to Average Net Assets and the Portfolio Turnover Rate for the fiscal year ended February 28, 2006, in the above table have been restated to give effect to recording the self-deposited inverse floaters as financing transactions. |
| (g) | For the six months ended August 31, 2007. |
See accompanying notes to financial statements.
61
Financial Highlights (Unaudited) (continued)
Selected data for a share outstanding throughout each period:
| Class (Commencement Date) | ||||||||||||||||||||||||||||||||||||||||||||||||||||||||
| Investment Operations | Less Distributions | Ratios/Supplemental Data | ||||||||||||||||||||||||||||||||||||||||||||||||||||||
| NEW YORK INSURED | Ratios to Average Net Assets Before Credit/ Reimbursement | Ratios to Average Net Assets After Reimbursement(c) | Ratios to Average Net Assets After Credit/ Reimbursement(d) | |||||||||||||||||||||||||||||||||||||||||||||||||||||
| Year Ended February 28/29, | Beginning Net Asset Value | Net Invest- ment Income(a) | Net Realized/ Unrealized Gain (Loss) | Total | Net Invest- ment Income | Capital Gains | Total | Ending Net Asset Value | Total Return(b) | Ending Net Assets (000) | Expenses(e) | Net Invest- ment Income | Expenses(e) | Net Invest- ment Income | Expenses(e) | Net Invest- ment Income | Portfolio Turnover Rate | |||||||||||||||||||||||||||||||||||||||
| Class A (9/94) | ||||||||||||||||||||||||||||||||||||||||||||||||||||||||
2008(f) | $ | 10.37 | $ | .20 | $ | (.28 | ) | $ | (.08 | ) | $ | (.20 | ) | $ | — | $ | (.20 | ) | $ | 10.09 | (.77 | )% | $ | 87,251 | 1.11 | %* | 3.85 | %* | 1.11 | %* | 3.85 | %* | 1.11 | %* | 3.86 | %* | 9 | % | ||||||||||||||||||
2007 | 10.41 | .40 | — | .40 | (.40 | ) | (.04 | ) | (.44 | ) | 10.37 | 4.02 | 90,400 | 1.03 | 3.89 | 1.03 | 3.89 | 1.02 | 3.90 | 9 | ||||||||||||||||||||||||||||||||||||
2006 | 10.71 | .42 | (.09 | ) | .33 | (.42 | ) | (.21 | ) | (.63 | ) | 10.41 | 3.19 | 90,706 | .84 | 3.93 | .84 | 3.93 | .83 | 3.94 | 22 | |||||||||||||||||||||||||||||||||||
2005 | 10.98 | .45 | (.18 | ) | .27 | (.45 | ) | (.09 | ) | (.54 | ) | 10.71 | 2.59 | 87,032 | .85 | 4.17 | .85 | 4.17 | .85 | 4.18 | 12 | |||||||||||||||||||||||||||||||||||
2004 | 10.92 | .46 | .21 | .67 | (.47 | ) | (.14 | ) | (.61 | ) | 10.98 | 6.37 | 78,526 | .86 | 4.28 | .86 | 4.28 | .86 | 4.28 | 10 | ||||||||||||||||||||||||||||||||||||
2003 | 10.59 | .47 | .40 | .87 | (.48 | ) | (.06 | ) | (.54 | ) | 10.92 | 8.46 | 73,936 | .88 | 4.40 | .88 | 4.40 | .87 | 4.40 | 21 | ||||||||||||||||||||||||||||||||||||
| Class B (2/97) | ||||||||||||||||||||||||||||||||||||||||||||||||||||||||
2008(f) | 10.40 | .16 | (.28 | ) | (.12 | ) | (.16 | ) | — | (.16 | ) | 10.12 | (1.14 | ) | 11,268 | 1.86 | * | 3.10 | * | 1.86 | * | 3.10 | * | 1.85 | * | 3.11 | * | 9 | ||||||||||||||||||||||||||||
2007 | 10.44 | .33 | (.01 | ) | .32 | (.32 | ) | (.04 | ) | (.36 | ) | 10.40 | 3.23 | 13,447 | 1.78 | 3.14 | 1.78 | 3.14 | 1.77 | 3.15 | 9 | |||||||||||||||||||||||||||||||||||
2006 | 10.73 | .34 | (.09 | ) | .25 | (.33 | ) | (.21 | ) | (.54 | ) | 10.44 | 2.47 | 17,871 | 1.59 | 3.17 | 1.59 | 3.17 | 1.58 | 3.18 | 22 | |||||||||||||||||||||||||||||||||||
2005 | 11.00 | .37 | (.18 | ) | .19 | (.37 | ) | (.09 | ) | (.46 | ) | 10.73 | 1.79 | 22,881 | 1.60 | 3.42 | 1.60 | 3.42 | 1.60 | 3.42 | 12 | |||||||||||||||||||||||||||||||||||
2004 | 10.93 | .38 | .22 | .60 | (.39 | ) | (.14 | ) | (.53 | ) | 11.00 | 5.64 | 27,104 | 1.61 | 3.53 | 1.61 | 3.53 | 1.61 | 3.53 | 10 | ||||||||||||||||||||||||||||||||||||
2003 | 10.60 | .39 | .40 | .79 | (.40 | ) | (.06 | ) | (.46 | ) | 10.93 | 7.64 | 27,786 | 1.63 | 3.65 | 1.63 | 3.65 | 1.62 | 3.66 | 21 | ||||||||||||||||||||||||||||||||||||
| Class C (9/94) | ||||||||||||||||||||||||||||||||||||||||||||||||||||||||
2008(f) | 10.37 | .17 | (.27 | ) | (.10 | ) | (.17 | ) | — | (.17 | ) | 10.10 | (.96 | ) | 13,490 | 1.66 | * | 3.30 | * | 1.66 | * | 3.30 | * | 1.65 | * | 3.31 | * | 9 | ||||||||||||||||||||||||||||
2007 | 10.42 | .35 | (.02 | ) | .33 | (.34 | ) | (.04 | ) | (.38 | ) | 10.37 | 3.31 | 14,426 | 1.58 | 3.34 | 1.58 | 3.34 | 1.57 | 3.35 | 9 | |||||||||||||||||||||||||||||||||||
2006 | 10.71 | .36 | (.08 | ) | .28 | (.36 | ) | (.21 | ) | (.57 | ) | 10.42 | 2.70 | 15,783 | 1.39 | 3.37 | 1.39 | 3.37 | 1.38 | 3.38 | 22 | |||||||||||||||||||||||||||||||||||
2005 | 10.98 | .39 | (.18 | ) | .21 | (.39 | ) | (.09 | ) | (.48 | ) | 10.71 | 2.02 | 17,470 | 1.40 | 3.62 | 1.40 | 3.62 | 1.40 | 3.63 | 12 | |||||||||||||||||||||||||||||||||||
2004 | 10.92 | .40 | .21 | .61 | (.41 | ) | (.14 | ) | (.55 | ) | 10.98 | 5.78 | 21,246 | 1.42 | 3.73 | 1.42 | 3.73 | 1.41 | 3.73 | 10 | ||||||||||||||||||||||||||||||||||||
2003 | 10.59 | .41 | .40 | .81 | (.42 | ) | (.06 | ) | (.48 | ) | 10.92 | 7.85 | 14,446 | 1.43 | 3.84 | 1.43 | 3.84 | 1.42 | 3.85 | 21 | ||||||||||||||||||||||||||||||||||||
| Class R (12/86) | ||||||||||||||||||||||||||||||||||||||||||||||||||||||||
2008(f) | 10.40 | .21 | (.27 | ) | (.06 | ) | (.21 | ) | — | (.21 | ) | 10.13 | (.68 | ) | 196,416 | .92 | * | 4.05 | * | .92 | * | 4.05 | * | .91 | * | 4.06 | * | 9 | ||||||||||||||||||||||||||||
2007 | 10.45 | .42 | (.01 | ) | .41 | (.42 | ) | (.04 | ) | (.46 | ) | 10.40 | 4.08 | 207,492 | .83 | 4.09 | .83 | 4.09 | .82 | 4.10 | 9 | |||||||||||||||||||||||||||||||||||
2006 | 10.74 | .44 | (.08 | ) | .36 | (.44 | ) | (.21 | ) | (.65 | ) | 10.45 | 3.45 | 220,883 | .64 | 4.13 | .64 | 4.13 | .63 | 4.13 | 22 | |||||||||||||||||||||||||||||||||||
2005 | 11.00 | .47 | (.17 | ) | .30 | (.47 | ) | (.09 | ) | (.56 | ) | 10.74 | 2.85 | 237,657 | .65 | 4.37 | .65 | 4.37 | .65 | 4.37 | 12 | |||||||||||||||||||||||||||||||||||
2004 | 10.94 | .49 | .20 | .69 | (.49 | ) | (.14 | ) | (.63 | ) | 11.00 | 6.53 | 258,263 | .66 | 4.48 | .66 | 4.48 | .66 | 4.48 | 10 | ||||||||||||||||||||||||||||||||||||
2003 | 10.60 | .49 | .41 | .90 | (.50 | ) | (.06 | ) | (.56 | ) | 10.94 | 8.72 | 263,572 | .68 | 4.60 | .68 | 4.60 | .67 | 4.61 | 21 | ||||||||||||||||||||||||||||||||||||
| * | Annualized |
| (a) | Per share Net Investment Income is calculated using the average daily shares method. |
| (b) | Total return is the combination of changes in net asset value, reinvested dividend income at net asset value and reinvested capital gains distributions at net asset value, if any. The last dividend declared in the period, which is typically paid on the first business day of the following month, is assumed to be reinvested at the ending net asset value. The actual reinvest price for the last dividend declared in the period may be different from the price used in the calculation. Total returns are not annualized. |
| (c) | After expense reimbursement from the Adviser, where applicable. |
| (d) | After custodian fee credit and expense reimbursement, where applicable. |
| (e) | The expense ratios in the above table reflect, among other things, the interest expense deemed to have been paid by the Fund on the floating rate certificates issued by the special purpose trusts for the self-deposited inverse floaters held by the Fund, as described in Footnote 1 – Inverse Floating Rate Securities. The amount of this deemed interest expense for such periods expressed as a percentage of average net assets for each share class was as follows: |
Interest Expense on Floating Rate Obligations to Average Net Assets | ||
2008(f) | .27%* | |
2007 | .18 | |
2006 | — | |
2005 | — | |
2004 | — | |
2003 | — | |
| (f) | For the six months ended August 31, 2007. |
See accompanying notes to financial statements.
62
Annual Investment Management Agreement Approval Process
The Board Members are responsible for overseeing the performance of the investment adviser to the Funds and determining whether to continue the advisory arrangements. At the annual review meeting held on May 21, 2007 (the “May Meeting”), the Board Members of the Funds, including the Independent Board Members, unanimously approved the continuance of the Investment Management Agreement between each Fund (each, a “Fund”) and Nuveen Asset Management (“NAM”). The foregoing Investment Management Agreements with NAM are hereafter referred to as “Original Investment Management Agreements.”
Subsequent to the May Meeting, Nuveen Investments, Inc. (“Nuveen”), the parent company of NAM, entered into a merger agreement providing for the acquisition of Nuveen by Windy City Investments, Inc., a corporation formed by investors led by Madison Dearborn Partners, LLC (“MDP”), a private equity investment firm (the “Transaction”). Each Original Investment Management Agreement, as required by Section 15 of the Investment Company Act of 1940 (the “1940 Act”), provides for its automatic termination in the event of its “assignment” (as defined in the 1940 Act). Any change in control of the adviser is deemed to be an assignment. The consummation of the Transaction will result in a change of control of NAM as well as its affiliated sub-advisers and therefore cause the automatic termination of each Original Investment Management Agreement, as required by the 1940 Act. Accordingly, in anticipation of the Transaction, at a meeting held on July 31, 2007 (the “July Meeting”), the Board Members, including the Independent Board Members, unanimously approved new Investment Management Agreements (the “New Investment Management Agreements”) with NAM on behalf of each Fund to take effect immediately after the Transaction or shareholder approval of the new advisory contracts, whichever is later. The 1940 Act also requires that each New Investment Management Agreement be approved by the respective Fund’s shareholders in order for it to become effective. Accordingly, to ensure continuity of advisory services, the Board Members, including the Independent Board Members, unanimously approved Interim Investment Management Agreements to take effect upon the closing of the Transaction if shareholders have not yet approved the New Investment Management Agreements.
Because the information provided and considerations made at the annual review at the May Meeting continue to be relevant with respect to the evaluation of the New Investment Management Agreements, the Board considered the foregoing as part of its deliberations of the New Investment Management Agreements. Accordingly, as indicated, the discussions immediately below outline the materials and information presented to the Board in connection with the Board’s prior annual review and the analysis undertaken and the conclusions reached by the Board Members when determining to continue the Original Investment Management Agreements.
I. Approval of the Original Investment Management Agreements
During the course of the year, the Board received a wide variety of materials relating to the services provided by NAM and the performance of the Funds. At each of its quarterly meetings, the Board reviewed investment performance and various matters relating to the operations of the Funds and other Nuveen funds, including the compliance program, shareholder services, valuation, custody, distribution and other information relating to the nature, extent and quality of services provided by NAM. Between the regularly scheduled quarterly meetings, the Board Members received information on particular matters as the need arose.
In preparation for their considerations at the May Meeting, the Independent Board Members also received extensive materials, well in advance of the meeting, which outlined or are related to, among other things:
| • | the nature, extent and quality of services provided by NAM; |
| • | the organization and business operations of NAM, including the responsibilities of various departments and key personnel; |
| • | each Fund’s past performance as well as the Fund’s performance compared to funds with similar investment objectives based on data and information provided by an independent third party and to customized benchmarks; |
| • | the profitability of Nuveen and certain industry profitability analyses for unaffiliated advisers; |
| • | the expenses of Nuveen in providing the various services; |
| • | the advisory fees and total expense ratios of each Fund, including comparisons of such fees and expenses with those of comparable, unaffiliated funds based on information and data provided by an independent third party (the “Peer Universe”) as well as compared to a subset of funds within the Peer Universe (the “Peer Group”) of the respective Fund (as applicable); |
| • | the advisory fees NAM assesses to other types of investment products or clients; |
| • | the soft dollar practices of NAM, if any; and |
| • | from independent legal counsel, a legal memorandum describing among other things, applicable laws, regulations and duties in reviewing and approving advisory contracts. |
At the May Meeting, NAM made a presentation to, and responded to questions from, the Board. The Independent Board Members also met privately with their legal counsel to review the Board’s duties in reviewing advisory contracts and considering the renewal of the advisory contracts. The Independent Board Members, in consultation with independent counsel, reviewed the factors set out
63
Annual Investment Management Agreement Approval Process (continued)
in judicial decisions and Securities and Exchange Commission (“SEC”) directives relating to the renewal of advisory contracts. As outlined in more detail below, the Board Members considered all factors they believed relevant with respect to each Fund, including, but not limited to, the following: (a) the nature, extent and quality of the services to be provided by NAM; (b) the investment performance of the Fund and NAM; (c) the costs of the services to be provided and profits to be realized by Nuveen and its affiliates; (d) the extent to which economies of scale would be realized; and (e) whether fee levels reflect those economies of scale for the benefit of the Fund’s investors. In addition, as noted, the Board Members met regularly throughout the year to oversee the Funds. In evaluating the Original Investment Management Agreements, the Board Members also relied upon their knowledge of NAM, its services and the Funds resulting from their meetings and other interactions throughout the year. It is with this background that the Board Members considered each Original Investment Management Agreement.
A. Nature, Extent and Quality of Services
In considering the renewal of the Original Investment Management Agreements, the Board Members considered the nature, extent and quality of NAM’s services. The Board Members reviewed materials outlining, among other things, Nuveen’s organization and business; the types of services that NAM or its affiliates provide or are expected to provide to the Funds; the performance record of the applicable Fund (as described in further detail below); and at the annual review, any initiatives Nuveen had taken for the municipal fund product line. As noted, the Board Members were already familiar with the organization, operations and personnel of NAM due to the Board Members’ experience in governing the respective Funds and working with NAM on matters relating to the Funds.
At the May Meeting, the Board Members also recognized NAM’s investment in additional qualified personnel throughout the various groups in the organization and recommended to NAM that it continue to review staffing needs as necessary. In addition, the Board Members reviewed materials describing the current status, and, in particular, the developments in 2006 with respect to NAM’s investment process, investment strategies (including additional tools used in executing such strategies), personnel (including portfolio management and research teams), trading process, hedging activities, risk management operations (e.g., reviewing credit quality, duration limits, and derivatives use, as applicable), and investment operations (such as enhancements to trading procedures, pricing procedures, and client services). The Board Members also recognized NAM’s investment of resources and efforts to continue to enhance and refine its investment processes.
In addition to advisory services, the Independent Board Members considered the quality of administrative and non-advisory services provided by NAM and noted that NAM and its affiliates provide the Funds with a wide variety of services and officers and other personnel as are necessary for the operations of the Funds, including:
| • | product management; |
| • | fund administration; |
| • | oversight by shareholder services and other fund service providers; |
| • | administration of Board relations; |
| • | regulatory and portfolio compliance; and |
| • | legal support. |
As the Funds operate in a highly regulated industry and given the importance of compliance, the Board Members considered, in particular, NAM’s compliance activities for the Funds and enhancements thereto. In this regard, the Board Members recognized the quality of NAM’s compliance team. The Board Members further noted NAM’s negotiations with other service providers and the corresponding reduction in certain service providers’ fees at the May Meeting.
Based on their review, the Board Members found that, overall, the nature, extent and quality of services provided (and expected to be provided) to the Funds under the respective Original Investment Management Agreement were satisfactory.
B. The Investment Performance of the Funds and NAM
At the May Meeting, the Board considered the investment performance for each Fund, including the Fund’s historic performance as well as its performance compared to funds with similar investment objectives (the “Performance Peer Group”) based on data provided by an independent third party (as described below). In addition, the Board Members reviewed portfolio level performance (which does not reflect fund level fees and expenses) against customized benchmarks, as described in further detail below.
In evaluating the performance information during the annual review at the May Meeting, in certain instances, the Board Members noted that the closest Performance Peer Group for a fund may not adequately reflect such fund’s investment objectives and strategies, thereby limiting the usefulness of the comparisons of such fund’s performance with that of the Performance Peer Group. These Performance Peer Groups include those for the Nuveen Intermediate Duration Municipal Bond Fund (although such Fund has been reclassified in a more appropriate peer group for 2007).
In addition to the foregoing, with respect to state specific municipal funds, the Board Members also recognized that certain funds do not have a corresponding state specific Performance Peer Group in which case their performance is measured against a more
64
general municipal category for various states. The open-end state municipal funds that utilize the more general category are the Nuveen New Mexico Municipal Bond Fund and the Nuveen Wisconsin Municipal Bond Fund.
Further, with respect to each Fund, the Board Members reviewed performance information including, among other things, total return information compared with such Fund’s Performance Peer Group for the one-, three- and five-year periods (as applicable) ending December 31, 2006. The Board Members also reviewed each Fund’s portfolio level performance (which does not reflect fund level fees and expenses) compared to customized portfolio level benchmarks for the one- and three-year periods ending December 31, 2006 (as applicable). The analysis was used to assess the efficacy of investment decisions against appropriate measures of risk and total return, within specific market segments. This information supplemented the Fund performance information provided to the Board at each of its quarterly meetings. Based on their review, the Board Members determined that each Fund’s investment performance over time had been satisfactory.
C. Fees, Expenses and Profitability
1. Fees and Expenses
During the annual review, the Board evaluated the management fees and expenses of each Fund reviewing, among other things, such Fund’s advisory fees (net and gross management fees) and total expense ratios (before and after expense reimbursements and/or waivers) in absolute terms as well as comparisons to the gross management fees (before waivers), net management fees (after waivers) and total expense ratios (before and after waivers) of comparable funds in the Peer Universe and the Peer Group. In reviewing the fee schedule for a Fund, the Board Members considered the fund-level and complex-wide breakpoint schedules (described in further detail below) and any fee waivers and reimbursements provided by Nuveen. The Board Members further reviewed data regarding the construction of Peer Groups as well as the methods of measurement for the fee and expense analysis and the performance analysis. In certain cases, due to the small number of peers in the Peer Universe, the Peer Universe and Peer Group had significant overlap or even consisted entirely of the same unaffiliated funds. In reviewing the comparisons of fee and expense information, the Board Members recognized that in certain cases, the size of the fund relative to peers, the small size and odd composition of the Peer Group (including differences in objectives and strategies), expense anomalies, timing of information used or other factors impacting the comparisons thereby limited some of the usefulness of the comparative data. Based on their review of the fee and expense information provided, the Board Members determined that each Fund’s net total expense ratio was within an acceptable range compared to peers.
2. Comparisons with the Fees of Other Clients
At the annual review, the Board Members further reviewed data comparing the advisory fees of NAM with fees NAM charges to other clients. Such clients include NAM’s municipal separately managed accounts. In general, the advisory fees charged for separate accounts are somewhat lower than the advisory fees assessed to the Funds. The Board Members considered the differences in the product types, including, but not limited to, the services provided, the structure and operations, product distribution and costs thereof, portfolio investment policies, investor profiles, account sizes and regulatory requirements. The Board Members noted, in particular, that the range of services provided to the Funds (as discussed above) is much more extensive than that provided to separately managed accounts. As described in further detail above, such additional services include, but are not limited to: product management, fund administration, oversight of third party service providers, administration of Board relations, and legal support. The Board Members noted that the Funds operate in a highly regulated industry requiring extensive compliance functions compared to other investment products. Given the inherent differences in the products, particularly the extensive services provided to the Funds, the Board Members believe such facts justify the different levels of fees.
3. Profitability of Nuveen
In conjunction with its review of fees, the Board Members also considered the profitability of Nuveen for its advisory activities (which incorporated Nuveen’s wholly-owned affiliated sub-advisers) and its financial condition. At the annual review, the Board Members reviewed the revenues and expenses of Nuveen’s advisory activities for the last three years, the allocation methodology used in preparing the profitability data as well as the 2006 Annual Report for Nuveen. The Board Members noted this information supplemented the profitability information requested and received during the year to help keep them apprised of developments affecting profitability (such as changes in fee waivers and expense reimbursement commitments). In this regard, the Board Members noted the enhanced dialogue and information regarding profitability with NAM during the year, including more frequent meetings and updates from Nuveen’s corporate finance group. The Board Members considered Nuveen’s profitability compared with other fund sponsors prepared by three independent third party service providers as well as comparisons of the revenues, expenses and profit margins of various unaffiliated management firms with similar amounts of assets under management prepared by Nuveen.
In reviewing profitability, the Board Members recognized the subjective nature of determining profitability which may be affected by numerous factors including the allocation of expenses. Further, the Board Members recognized the difficulties in making comparisons as the profitability of other advisers generally is not publicly available and the profitability information that is available for certain advisers or management firms may not be representative of the industry and may be affected by, among other things, the adviser’s particular business mix, capital costs, types of funds managed and expense allocations.
65
Annual Investment Management Agreement Approval Process (continued)
Notwithstanding the foregoing, the Board Members reviewed Nuveen’s methodology at the annual review and assumptions for allocating expenses across product lines to determine profitability. Last year, the Board Members also designated an Independent Board Member as a point person for the Board to review the methodology determinations during the year and any refinements thereto, which relevant information produced from such process was reported to the full Board. In reviewing profitability, the Board Members recognized Nuveen’s increased investment in its fund business. Based on its review, the Board Members concluded that Nuveen’s level of profitability for its advisory activities was reasonable in light of the services provided.
In evaluating the reasonableness of the compensation, the Board Members also considered other amounts paid to NAM by the Funds as well as any indirect benefits (such as soft dollar arrangements, if any) NAM and its affiliates receive, or are expected to receive, that are directly attributable to the management of the Funds, if any. See Section E below for additional information on indirect benefits NAM may receive as a result of its relationship with the Funds. Based on their review of the overall fee arrangement of each Fund, the Board Members determined that the advisory fees and expenses were reasonable.
D. Economies of Scale and Whether Fee Levels Reflect These Economies of Scale
With respect to economies of scale, the Board Members recognized the potential benefits resulting from the costs of a Fund being spread over a larger asset base. To help ensure the shareholders share in these benefits, the Board Members reviewed and considered the breakpoints in the advisory fee schedules that reduce advisory fees. In addition to advisory fee breakpoints, the Board also approved a complex-wide fee arrangement in 2004. Pursuant to the complex-wide fee arrangement, the fees of the funds in the Nuveen complex, including the Funds, are reduced as the assets in the fund complex reach certain levels. In evaluating the complex-wide fee arrangement, the Board Members noted that the last complex-wide asset level breakpoint for the complex-wide fee schedule was at $91 billion and that the Board Members anticipated further review and/or negotiations prior to the assets of the Nuveen complex reaching such threshold. Based on their review, the Board Members concluded that the breakpoint schedule and complex-wide fee arrangement were acceptable and desirable in providing benefits from economies of scale to shareholders, subject to further evaluation of the complex-wide fee schedule as assets in the complex increase. See Section II, Paragraph D –“Approval of the New Investment Management Agreements – Economies of Scale and Whether Fee Levels Reflect These Economies of Scale” for information regarding subsequent modifications to the complex-wide fee.
E. Indirect Benefits
In evaluating fees, the Board Members also considered any indirect benefits or profits NAM or its affiliates may receive as a result of its relationship with each Fund. In this regard, during the annual review, the Board Members considered, among other things, any sales charges and distribution fees received and retained by the Funds’ principal underwriter, Nuveen Investments, LLC, an affiliate of NAM. The Board Members also recognized that an affiliate of NAM provides distribution and shareholder services to the Funds and their shareholders for which it may be compensated pursuant to a 12b-1 plan. The Board Members, therefore, considered the 12b-1 fees retained by Nuveen during the last calendar year.
In addition to the above, the Board Members considered whether NAM received any benefits from soft dollar arrangements whereby a portion of the commissions paid by a Fund for brokerage may be used to acquire research that may be useful to NAM in managing the assets of the Funds and other clients. With respect to NAM, the Board Members noted that NAM does not currently have any soft dollar arrangements; however, to the extent certain bona fide agency transactions that occur on markets that traditionally trade on a principal basis and riskless principal transactions are considered as generating “commissions,” NAM intends to comply with the applicable safe harbor provisions.
Based on their review, the Board Members concluded that any indirect benefits received by NAM as a result of its relationship with the Funds were reasonable and within acceptable parameters.
F. Other Considerations
The Board Members did not identify any single factor discussed previously as all-important or controlling in their considerations to continue an advisory contract. The Board Members, including the Independent Board Members, unanimously concluded that the terms of the Original Investment Management Agreements are fair and reasonable, that NAM’s fees are reasonable in light of the services provided to each Fund and that the Original Investment Management Agreements be renewed.
II. Approval of the New Investment Management Agreements
Following the May Meeting, the Board Members were advised of the potential Transaction. As noted above, the completion of the Transaction would terminate each of the Original Investment Management Agreements. Accordingly, at the July Meeting, the Board of each Fund, including the Independent Board Members, unanimously approved the New Investment Management Agreements on behalf of the respective Funds. Leading up to the July Meeting, the Board Members had several meetings and deliberations with and without Nuveen management present, and with the advice of legal counsel, regarding the proposed Transaction as outlined below.
On June 8, 2007, the Board Members held a special telephonic meeting to discuss the proposed Transaction. At that meeting, the Board Members established a special ad hoc committee comprised solely of Independent Board Members to focus on the Transaction and to keep the Independent Board Members updated with developments regarding the Transaction. On June 15, 2007, the ad hoc committee discussed with representatives of NAM the Transaction and modifications to the complex-wide fee schedule that would generate additional fee savings at specified levels of complex-wide asset growth. Following the foregoing meetings and
66
several subsequent telephonic conferences among Independent Board Members and independent counsel, and between Independent Board Members and representatives of Nuveen, the Board met on June 18, 2007 to further discuss the proposed Transaction. Immediately prior to and then again during the June 18, 2007 meeting, the Independent Board Members met privately with their independent legal counsel. At that meeting, the Board met with representatives of MDP, of Goldman Sachs, Nuveen’s financial adviser in the Transaction, and of the Nuveen Board to discuss, among other things, the history and structure of MDP, the terms of the proposed Transaction (including the financing terms), and MDP’s general plans and intentions with respect to Nuveen (including with respect to management, employees, and future growth prospects). On July 9, 2007, the Board also met to be updated on the Transaction as part of a special telephonic Board meeting. The Board Members were further updated at a special in-person Board meeting held on July 19, 2007 (one Independent Board Member participated telephonically). Subsequently, on July 27, 2007, the ad hoc committee held a telephonic conference with representatives of Nuveen and MDP to further discuss, among other things, the Transaction, the financing of the Transaction, retention and incentive plans for key employees, the effect of regulatory restrictions on transactions with affiliates after the Transaction, and current volatile market conditions and their impact on the Transaction.
In connection with their review of the New Investment Management Agreements, the Independent Board Members, through their independent legal counsel, also requested in writing and received additional information regarding the proposed Transaction and its impact on the provision of services by NAM and its affiliates.
The Independent Board Members received, well in advance of the July Meeting, materials which outlined, among other things:
| • | the structure and terms of the Transaction, including MDP’s co-investor entities and their expected ownership interests, and the financing arrangements that will exist for Nuveen following the closing of the Transaction; |
| • | the strategic plan for Nuveen following the Transaction; |
| • | the governance structure for Nuveen following the Transaction; |
| • | any anticipated changes in the operations of the Nuveen funds following the Transaction, including changes to NAM’s and Nuveen’s day-to-day management, infrastructure and ability to provide advisory, distribution or other applicable services to the Funds; |
| • | any changes to senior management or key personnel who work on Fund related matters (including portfolio management, investment oversight, and legal/compliance) and any retention or incentive arrangements for such persons; |
| • | any anticipated effect on each Fund’s expense ratio (including advisory fees) following the Transaction; |
| • | any benefits or undue burdens imposed on the Funds as a result of the Transaction; |
| • | any legal issues for the Funds as a result of the Transaction; |
| • | the nature, quality and extent of services expected to be provided to the Funds following the Transaction, changes to any existing services and policies affecting the Funds, and cost-cutting efforts, if any, that may impact such services or policies; |
| • | any conflicts of interest that may arise for Nuveen or MDP with respect to the Funds; |
| • | the costs associated with obtaining necessary shareholder approvals and who would bear those costs; and |
| • | from legal counsel, a memorandum describing the applicable laws, regulations and duties in approving advisory contracts, including, in particular, with respect to a change of control. |
Immediately preceding the July Meeting, representatives of MDP met with the Board to further respond to questions regarding the Transaction. After the meeting with MDP, the Independent Board Members met with independent legal counsel in executive session. At the July Meeting, Nuveen also made a presentation and responded to questions. Following the presentations and discussions of the materials presented to the Board, the Independent Board Members met again in executive session with their counsel. As outlined in more detail below, the Independent Board Members considered all factors they believed relevant with respect to each Fund, including the impact that the Transaction could be expected to have on the following: (a) the nature, extent and quality of services to be provided; (b) the investment performance of the Funds; (c) the costs of the services and profits to be realized by Nuveen and its affiliates; (d) the extent to which economies of scale would be realized; and (e) whether fee levels reflect those economies of scale for the benefit of investors. As noted above, during the past year, the Board Members had completed their annual review of the respective Original Investment Management Agreements and many of the factors considered at such reviews were applicable to their evaluation of the New Investment Management Agreements. Accordingly, in evaluating such agreements, the Board Members relied upon their knowledge and experience with NAM and considered the information received and their evaluations and conclusions drawn at the reviews. While the Board reviewed many Nuveen funds at the July Meeting, the Independent Board Members evaluated all information available to them on a fund-by-fund basis, and their determinations were made separately in respect of each Fund.
67
Annual Investment Management Agreement Approval Process (continued)
A. Nature, Extent and Quality of Services
In evaluating the nature, quality and extent of the services expected to be provided by NAM under the New Investment Management Agreements, the Independent Board Members considered, among other things, the expected impact, if any, of the Transaction on the operations, facilities, organization and personnel of NAM; the potential implications of regulatory restrictions on the Funds following the Transaction; the ability of NAM and its affiliates to perform their duties after the Transaction; and any anticipated changes to the current investment and other practices of the Funds.
The Board noted that the terms of each New Investment Management Agreement, including the fees payable thereunder, are substantially identical to those of the Original Investment Management Agreement relating to the same Fund (with both reflecting reductions to fee levels in the complex-wide fee schedule for complex-wide assets in excess of $80 billion that have an effective date of August 20, 2007). The Board considered that the services to be provided and the standard of care under the New Investment Management Agreements are the same as the corresponding Original Investment Management Agreements. The Board Members further noted that key personnel of NAM who have responsibility for the Funds in each area, including portfolio management, investment oversight, fund management, fund operations, product management, legal/compliance and board support functions, are expected to be the same following the Transaction. The Board Members considered and are familiar with the qualifications, skills and experience of such personnel. The Board also considered certain information regarding any anticipated retention or incentive plans designed to retain key personnel. Further, the Board Members noted that no changes to Nuveen’s infrastructure or operations as a result of the Transaction were anticipated other than potential enhancements as a result of an expected increase in the level of investment in such infrastructure and personnel. The Board noted MDP’s representations that it does not plan to have a direct role in the management of Nuveen, appointing new management personnel, or directly impacting individual staffing decisions. The Board Members also noted that there were not any planned “cost cutting” measures that could be expected to reduce the nature, extent or quality of services. After consideration of the foregoing, the Board Members concluded that no diminution in the nature, quality and extent of services provided to the Funds and their shareholders by NAM is expected.
In addition to the above, the Board Members considered potential changes in the operations of each Fund. In this regard, the Board Members considered the potential effect of regulatory restrictions on the Funds’ transactions with future affiliated persons. During their deliberations, it was noted that, after the Transaction, a subsidiary of Merrill Lynch is expected to have an ownership interest in Nuveen at a level that will make Merrill Lynch an affiliated person of Nuveen. The Board Members recognized that applicable law would generally prohibit the Funds from engaging in securities transactions with Merrill Lynch as principal, and would also impose restrictions on using Merrill Lynch for agency transactions. They recognized that having MDP and Merrill Lynch as affiliates may restrict the Nuveen funds’ ability to invest in securities of issuers controlled by MDP or issued by Merrill Lynch and its affiliates even if not bought directly from MDP or Merrill Lynch as principal. They also recognized that various regulations may require the Nuveen funds to apply investment limitations on a combined basis with affiliates of Merrill Lynch. The Board Members considered information provided by NAM regarding the potential impact on the Nuveen funds’ operations as a result of these regulatory restrictions. The Board Members considered, in particular, the Nuveen funds that may be impacted most by the restricted access to Merrill Lynch, including: municipal funds (particularly certain state-specific funds), senior loan funds, taxable fixed income funds, preferred security funds and funds that heavily use derivatives. The Board Members considered such funds’ historic use of Merrill Lynch as principal in their transactions and information provided by NAM regarding the expected impact resulting from Merrill Lynch’s affiliation with Nuveen and available measures that could be taken to minimize such impact. NAM informed the Board Members that, although difficult to determine with certainty, its management did not believe that MDP’s or Merrill Lynch’s status as an affiliate of Nuveen would have a material adverse effect on any Nuveen fund’s ability to pursue its investment objectives and policies.
In addition to the regulatory restrictions considered by the Board, the Board Members also considered potential conflicts of interest that could arise between the Nuveen funds and various parties to the Transaction and discussed possible ways of addressing such conflicts.
Based on its review along with its considerations regarding services at the annual review, the Board concluded that the Transaction was not expected to adversely affect the nature, quality or extent of services provided by NAM and that the expected nature, quality and extent of such services supported approval of the New Investment Management Agreements.
B. Performance of the Funds
With respect to the performance of the Funds, the Board considered that the portfolio management personnel responsible for the management of the Funds’ portfolios were expected to continue to manage the portfolios following the completion of the Transaction.
In addition, the Board Members recently reviewed Fund performance at the May Meeting as described above and determined such Funds’ performance was satisfactory or better. The Board Members further noted that the investment policies and strategies were not expected to change as a result of the Transaction.
In light of the foregoing factors, along with the prior findings regarding performance at the annual review, the Board concluded that its findings with respect to performance supported approval of the New Investment Management Agreements.
68
C. Fees, Expenses and Profitability
As described in more detail above, during the annual review, the Board Members considered, among other things, the management fees and expenses of the Funds, the breakpoint schedules, and comparisons of such fees and expenses with peers. At the annual review, the Board Members determined that the respective Fund’s advisory fees and expenses were reasonable. In evaluating the profitability of Nuveen under the New Investment Management Agreements, the Board Members considered their conclusions at their prior reviews and whether the management fees or other expenses would change as a result of the Transaction. As described above, the investment management fee for NAM is composed of two components – a fund-level component and complex-wide level component. The fee schedule under the New Investment Management Agreements to be paid to NAM is identical to that under the Original Investment Management Agreements, including the modified complex-wide fee schedule. As noted above, the Board recently approved a modified complex-wide fee schedule that would generate additional fee savings on complex-wide assets above $80 billion. The modifications have an effective date of August 20, 2007 and are part of the Original Investment Management Agreements. Accordingly, the terms of the complex-wide component under the New Investment Management Agreements are the same as under the Original Investment Management Agreements. The Board Members also noted that Nuveen has committed for a period of two years from the date of closing of the Transaction that it will not increase gross management fees for any Nuveen fund and will not reduce voluntary expense reimbursement levels for any Nuveen fund from their currently scheduled prospective levels (subject to certain potential adjustments noted below). Based on the information provided, the Board Members did not expect that overall Fund expenses would increase as a result of the Transaction.
In addition, the Board Members considered that additional fund launches were anticipated after the Transaction which would result in an increase in total assets under management in the complex and a corresponding decrease in overall management fees under the complex-wide fee schedule. Taking into consideration the Board’s prior evaluation of fees and expenses at the annual renewal, and the modification to the complex-wide fee schedule, the Board determined that the management fees and expenses were reasonable.
While it is difficult to predict with any degree of certainty the impact of the Transaction on Nuveen’s profitability for its advisory activities, at the recent annual review, the Board Members were satisfied that Nuveen’s level of profitability for its advisory activities was reasonable. During the year, the Board Members had noted the enhanced dialogue regarding profitability and the appointment of an Independent Board Member as a point person to review methodology determinations and refinements in calculating profitability. Given their considerations at the annual review and the modifications to the complex-wide fee schedule, the Board Members were satisfied that Nuveen’s level of profitability for its advisory activities continues to be reasonable.
D. Economies of Scale and Whether Fee Levels Reflect These Economies of Scale
The Board Members have been cognizant of economies of scale and the potential benefits resulting from the costs of a Fund being spread over a larger asset base. To help ensure that shareholders share in the benefits derived from economies of scale, the Board adopted the complex-wide fee arrangement in 2004. At the May Meeting, the Board Members reviewed the complex-wide fee arrangements and noted that additional negotiations may be necessary or appropriate as the assets in the complex approached the $91 billion threshold. In light of this assessment coupled with the upcoming Transaction, at the June 15, 2007 meeting, the ad hoc committee met with representatives of Nuveen to further discuss modifications to the complex-wide fee schedule that would generate additional savings for shareholders as the assets of the complex grow. The proposed terms for the complex-wide fee schedule are expressed in terms of targeted cumulative savings at specified levels of complex-wide assets, rather than in terms of targeted marginal complex-wide fee rates. Under the modified schedule, the schedule would generate additional fee savings beginning at complex-wide assets of $80 billion in order to achieve targeted cumulative annual savings at $91 billion of $28 million on a complex-wide level (approximately $0.6 million higher than those generated under the then current schedule) and generate additional fee savings for asset growth above complex-wide assets of $91 billion in order to achieve targeted annual savings at $125 billion of assets of approximately $50 million on a complex-wide level (approximately $2.2 million higher annually than that generated under the then current schedule). At the July Meeting, the Board approved the modified complex-wide fee schedule for the Original Investment Management Agreements and these same terms will apply to the New Investment Management Agreements. Accordingly, the Board Members believe that the breakpoint schedules and revised complex-wide fee schedule are appropriate and desirable in ensuring that shareholders participate in the benefits derived from economies of scale.
E. Indirect Benefits
During their recent annual review, the Board Members considered any indirect benefits that NAM may receive as a result of its relationship with the Funds, as described above. As the policies and operations of Nuveen are not anticipated to change significantly after the Transaction, such indirect benefits should remain after the Transaction. The Board Members further considered any additional indirect benefits to be received by NAM or its affiliates after the Transaction. The Board Members noted that other than benefits from its ownership interest in Nuveen and indirect benefits from fee revenues paid by the Funds under the management agreements and other Board-approved relationships, it was currently not expected that MDP or its affiliates would derive any benefit from the Funds as a result of the Transaction or transact any business with or on behalf of the Funds (other than perhaps potential Fund acquisitions, in secondary market transactions, of securities issued by MDP portfolio companies); or that Merrill Lynch or its affiliates would derive any benefits from the Funds as a result of the Transaction (noting that, indeed, Merrill Lynch would stand to experience the discontinuation of principal transaction activity with the Nuveen funds and likely would experience a noticeable reduction in the volume of agency transactions with the Nuveen funds).
69
Annual Investment Management Agreement Approval Process (continued)
F. Other Considerations
In addition to the factors above, the Board Members also considered the following with respect to the Funds:
| • | Nuveen would rely on the provisions of Section 15(f) of the 1940 Act. Section 15(f) provides, in substance, that when a sale of a controlling interest in an investment adviser occurs, the investment adviser or any of its affiliated persons may receive any amount or benefit in connection with the sale so long as (i) during the three-year period following the consummation of a transaction, at least 75% of the investment company’s board of directors must not be “interested persons” (as defined in the 1940 Act) of the investment adviser or predecessor adviser and (ii) an “unfair burden” (as defined in the 1940 Act, including any interpretations or no-action letters of the SEC) must not be imposed on the investment company as a result of the transaction relating to the sale of such interest, or any express or implied terms, conditions or understanding applicable thereto. In this regard, to help ensure that an unfair burden is not imposed on the Nuveen funds, Nuveen has committed for a period of two years from the date of the closing of the Transaction (i) not to increase gross management fees for any Nuveen fund; (ii) not to reduce voluntary expense reimbursement levels for any Nuveen fund from their currently scheduled prospective levels during that period (such commitment, however, may exclude or be adjusted for the impact of future class-specific expense allocation protocol changes for a particular mutual fund); (iii) that no Nuveen fund whose portfolio is managed by a Nuveen affiliate shall use Merrill Lynch as a broker with respect to portfolio transactions done on an agency basis, except as may be approved in the future by the Compliance Committee of the Board; and (iv) that NAM shall not cause the Funds and other municipal funds that NAM manages, as a whole, to enter into portfolio transactions with or through the other minority owners of Nuveen, on either a principal or an agency basis, to a significantly greater extent than both what one would expect an investment team to use such firm in the normal course of business, and what NAM has historically done, without prior Board or Compliance Committee approval (excluding the impact of proportionally increasing the use of such other “minority owners” to fill the void necessitated by not being able to use Merrill Lynch). |
| • | The Funds would not incur any costs in seeking the necessary shareholder approvals for the New Investment Management Agreements (except for any costs attributed to seeking shareholder approvals of Fund specific matters unrelated to the Transaction, such as approval of Board Members, in which case a portion of such costs will be borne by the applicable Funds). |
| • | The reputation, financial strength and resources of MDP. |
| • | The long-term investment philosophy of MDP and anticipated plans to grow Nuveen’s business to the benefit of the Nuveen funds. |
| • | The benefits to the Nuveen funds as a result of the Transaction including: (i) as a private company, Nuveen may have more flexibility in making additional investments in its business; (ii) as a private company, Nuveen may be better able to structure compensation packages to attract and retain talented personnel; (iii) as certain of Nuveen’s distribution partners are expected to be equity or debt investors in Nuveen, Nuveen may be able to take advantage of new or enhanced distribution arrangements with such partners; and (iv) MDP’s experience, capabilities and resources that may help Nuveen identify and acquire investment teams or firms and finance such acquisitions. |
G. Conclusion
The Board Members did not identify any single factor discussed previously as all-important or controlling. The Board Members, including the Independent Board Members, unanimously concluded that the terms of the New Investment Management Agreements are fair and reasonable, that the fees therein are reasonable in light of the services to be provided to each Fund and that the New Investment Management Agreements should be approved and recommended to shareholders.
III. Approval of Interim Contracts
As noted above, at the July Meeting, the Board Members, including the Independent Board Members, unanimously approved the Interim Investment Management Agreements. If necessary to assure continuity of advisory services, the Interim Investment Management Agreements will take effect upon the closing of the Transaction if shareholders have not yet approved the New Investment Management Agreements. The terms of each Interim Investment Management Agreement are substantially identical to those of the corresponding Original Investment Management Agreement and New Investment Management Agreement, respectively, except for certain term and escrow provisions. In light of the foregoing, the Board Members, including the Independent Board Members, unanimously determined that the scope and quality of services to be provided to the Funds under the respective Interim Investment Management Agreement are at least equivalent to the scope and quality of services provided under the applicable Original Investment Management Agreement.
70
Glossary of Terms Used in this Report
Average Annual Total Return: This is a commonly used method to express an investment’s performance over a particular, usually multi-year time period. It expresses the return that would have been necessary each year to equal the investment’s actual cumulative performance (including change in NAV or offer price and reinvested dividends and capital gains distributions, if any) over the time period being considered.
Average Effective Maturity: The average of the number of years to maturity of the bonds in a Fund’s portfolio, computed by weighting each bond’s time to maturity (the date the security comes due) by the market value of the security. This figure does not account for the likelihood of prepayments or the exercise of call provisions unless an escrow account has been established to redeem the bond before maturity. The market value weighting for an investment in an inverse floating rate security is the value of the portfolio’s residual interest in the inverse floating rate trust, and does not include the value of the floating rate securities issued by the trust.
Average Duration: Duration is a measure of the expected period over which a bond’s principal and interest will be paid, and consequently is a measure of the sensitivity of a bond’s (or bond fund’s) value to changes when market interest rates change. Generally, the longer a bond or Fund’s duration, the more the price of the bond or Fund will change as interest rates change.
Dividend Yield (also known as Market Yield or Current Yield): An investment’s current annualized dividend divided by its current offering price.
Inverse Floaters: Inverse floating rate securities are created by depositing a municipal bond, typically with a fixed interest rate, into a special purpose trust created by a broker-dealer. This trust, in turn, (a) issues floating rate certificates typically paying short-term tax-exempt interest rates to third parties in amounts equal to some fraction of the deposited bond’s par amount or market value, and (b) issues an inverse floating rate certificate (sometimes referred to as an “inverse floater”) to an investor (such as a Fund) interested in gaining investment exposure to a long-term municipal bond. The income received by the holder of the inverse floater varies inversely with the short-term rate paid to the floating rate certificates’ holders, and in most circumstances the holder of the inverse floater bears substantially all of the underlying bond’s downside investment risk. The holder of the inverse floater typically also benefits disproportionately from any potential appreciation of the underlying bond’s value. Hence, an inverse floater essentially represents an investment in the underlying bond on a leveraged basis.
Net Asset Value (NAV): A Fund’s NAV is the dollar value of one share in the Fund. It is calculated by subtracting the liabilities of the Fund from its total assets and then dividing the remainder by the number of shares outstanding. Fund NAVs are calculated at the end of each business day.
SEC 30-Day Yield: A standardized measure of a Fund’s yield that accounts for the future amortization of premiums or discounts of bonds held in the Fund’s portfolio.
Taxable-Equivalent Yield: The yield necessary from a fully taxable investment to equal, on an after-tax basis at a specified assumed tax rate, the yield of a municipal bond investment.
BMA Index: The Bond Market Association Municipal Swap Index (“BMA Index”) is the market benchmark for short-term, tax-exempt rates comprised of over 200 active high-grade, governmental, tax-exempt, variable rate demand obligation bonds with weekly interest resets.
Zero Coupon Bond: A zero coupon bond does not pay a regular interest coupon to its holders during the life of the bond. Tax-exempt income to the holder of the bond comes from accretion of the difference between the original purchase price of the bond at issuance and the par value of the bond at maturity and is effectively paid at maturity. The market prices of zero coupon bonds generally are more volatile than the market prices of bonds that pay interest periodically.
71
Notes
72
Fund Information
Fund Manager Nuveen Asset Management 333 West Wacker Drive Chicago, IL 60606 | Legal Counsel Chapman and Cutler LLP Chicago, IL
Independent Registered Public Accounting Firm PricewaterhouseCoopers LLP Chicago, IL
Custodian State Street Bank & Trust Company Boston, MA | Transfer Agent and Shareholder Services Boston Financial Data Services, Inc.
Nuveen Investor Services P.O. Box 8530 Boston, MA 02266-8530 (800) 257-8787 | ||
Investment Policy Change: On September 19, 2007, the Board of Trustees voted to authorize all of Nuveen’s non-insured open-end municipal bond Funds not already so authorized the capability of investing up to 20% of their net assets in below-investment grade (“high yield” or “junk”) municipal securities. This investment policy change, effective October 31, 2007, will give the Funds’ portfolio managers greater flexibility to enhance: (1) income, (2) potential total return, both absolute and on a risk-adjusted basis, and (3) portfolio diversification.
Quarterly Portfolio of Investments and Proxy Voting information: Each Fund’s (i) quarterly portfolio of investments, (ii) information regarding how the Funds voted proxies relating to portfolio securities held during the most recent 12-month period ended June 30, 2007, and (iii) a description of the policies and procedures that the Funds used to determine how to vote proxies relating to portfolio securities are available without charge, upon request, by calling Nuveen Investments at (800) 257-8787 or on Nuveen’s website at www.nuveen.com.
You may also obtain this and other Fund information directly from the Securities and Exchange Commission (“SEC”). The SEC may charge a copying fee for this information. Visit the SEC on-line at http://www.sec.gov or in person at the SEC’s Public Reference Room in Washington, D.C. Call the SEC at 1-202-942-8090 for room hours and operation. You may also request Fund information by sending an e-mail request to publicinfo@sec.gov or by writing to the SEC’s Public Reference Section at 450 Fifth Street NW, Washington, D.C. 20549.
NASD Regulation, Inc. provides a Public Disclosure Program which supplies certain information regarding the disciplinary history of NASD members and their associated persons in response to either telephone inquiries at (800) 289-9999 or written inquiries at www.nasdr.com. NASD Regulation, Inc. also provides an investor brochure that includes information describing the Public Disclosure Program.
73
Learn more
about Nuveen Funds at
www.nuveen.com/mf
Nuveen Investments:
SERVING Investors
For GENERATIONS
Since 1898, financial advisors and their clients have relied on Nuveen Investments to provide dependable investment solutions. Over this time, Nuveen Investments has adhered to the belief that the best approach to investing is to apply conservative risk-management principles to help minimize volatility.
Building on this tradition, we today offer a range of high quality equity and fixed-income solutions that can be integral parts of a well-diversified core portfolio. Our clients have come to appreciate this diversity, as well as our continued adherence to proven, long-term investing principles.
We offer many different investing solutions for our clients’ different needs.
Managing approximately $170 billion in assets as of September 30, 2007, Nuveen Investments offers access to a number of different asset classes and investing solutions through a variety of products. Nuveen Investments markets its capabilities under six distinct brands: NWQ, specializing in value-style equities; Nuveen, managing fixed-income investments; Santa Barbara, committed to growth equities; Tradewinds, specializing in global value equities; Rittenhouse, focused on “blue-chip” growth equities; and Symphony, with expertise in alternative investments as well as equity and income portfolios.
Find out how we can help you reach your financial goals.
An investor should carefully consider the Fund’s objectives, risks, charges and expenses before investing. For a prospectus containing this and other information about the Fund, please contact your financial advisor or Nuveen Investments at (800) 257-8787. Read the prospectus carefully before you invest or send money.
| • | Share prices |
| • | Fund details |
| • | Daily financial news |
| • | Investor education |
MSA-MS3-0807D
NUVEEN INVESTMENTS MUTUAL FUNDS
Semiannual Report dated August 31, 2007 | Dependable, tax-free income because it’s not what you earn, it’s what you keep.® | |

Nuveen Investments
Municipal Bond Funds
Nuveen Massachusetts Municipal Bond Fund
Nuveen Massachusetts Insured Municipal Bond Fund


NOW YOU CAN RECEIVE YOUR
NUVEEN INVESTMENTS FUND REPORTS FASTER.
NO MORE WAITING.
SIGN UP TODAY TO RECEIVE NUVEEN INVESTMENTS FUND INFORMATION BY
E-MAIL.
It only takes a minute to sign up for E-Reports. Once enrolled, you’ll receive an e-mail as soon as your Nuveen Investments Fund information is ready — no more waiting for delivery by regular mail. Just click on the link within the e-mail to see the report, and save it on your computer if your wish.

IT’S FAST, EASY & FREE:
www.investordelivery.com
if you get your Nuveen Investments Fund dividends and statements from your financial advisor or brokerage account.
(Be sure to have the address sheet that accompanied this report handy. You’ll need it to complete the enrollment process.)
OR
www.nuveen.com/accountaccess
if you get your Nuveen Investments Fund dividends and statements directly from Nuveen Investments.

Must be preceded by or accompanied by a prospectus.
NOT FDIC INSURED MAY LOSE VALUE NO BANK GUARANTEE

Dear Shareholder,
Once again, I am pleased to report that during the period covered by this report your Fund provided tax-free income and solid performance from a carefully selected portfolio of Massachusetts municipal bonds. Detailed information on your Fund’s performance can be found in the Portfolio Manager’s Comments and Fund Spotlight sections of this report.
I also wanted to take this opportunity to report some important news about Nuveen Investments. The company has accepted a buyout offer from a private equity investment firm. While this may affect the corporate structure of Nuveen Investments, it will have no impact on the investment objectives of the Funds, their portfolio management strategies or their dividend policies. We will provide you with additional information about this transaction as more details become available.
With the recent volatility in the market, you may be thinking about adjusting your current portfolios. We believe that it’s times like these that prove the true value of a trusted financial advisor. With the help of your advisor, you may be able to structure a well-balanced portfolio that can become an important component in achieving your long-term financial goals. In fact, a well-diversified portfolio may actually help to reduce your overall investment risk. Your advisor can help you understand how a municipal bond investment like your Nuveen Fund can be an important building block in a portfolio crafted to perform well through a variety of market conditions.
Since 1898, Nuveen Investments has offered financial products and solutions that incorporate careful research, diversification, and the application of conservative risk-management principles. We are grateful that you have chosen us as a partner as you pursue your financial goals. We look forward to continuing to earn your trust in the months and years ahead.
Sincerely,

Timothy R. Schwertfeger
Chairman of the Board
October 15, 2007
“In fact, a well-diversified portfolio may actually help to reduce your overall investment risk.”
Semiannual Report l Page 1
Portfolio Manager’s Comments for the Nuveen Massachusetts
Municipal Bond Fund, and the Nuveen Massachusetts Insured Municipal Bond Fund
Portfolio manager Cathryn Steeves discusses key investment strategies and the performance of the Nuveen Massachusetts Municipal Bond Fund and the Nuveen Massachusetts Insured Municipal Bond Fund. Cathryn, who has 11 years of investment experience, has managed the Funds since July 2006.
How did the Funds perform during the six-months ended August 31, 2007?
The chart on page three provides the Funds’ total return performance information for the six-month, one-year, five-year, and ten-year periods ended August 31, 2007, along with comparisons to the Lipper Massachusetts Municipal Debt Funds category average as well as the national Lehman Brothers Municipal Bond Index and the Lehman Brothers Massachusetts and Massachusetts Insured Municipal Bond Indexes.
For the six-month period ended August 31, 2007, the total return of the Nuveen Massachusetts Municipal Bond Fund’s Class A shares at net asset value produced a return relatively in line with the Lipper peer group average and underperformed the national Lehman Brothers Municipal Bond Index and the Lehman Brothers Massachusetts Municipal Bond Index. During the same period, the Nuveen Massachusetts Insured Municipal Bond Fund’s Class A shares at net asset value outperformed the Lipper peer group average as well as the national Lehman Brothers Municipal Bond Index and Lehman Brothers Massachusetts Insured Municipal Bond Index.
The uninsured Massachusetts Fund was hampered by its relatively long duration throughout this period, meaning it had greater exposure to interest-rate risk than the national municipal market. Our overweight position in more-interest-rate-sensitive securities was a negative factor for performance in a risk-averse market environment. Similarly, our relative underweighting in shorter-duration bonds – those with maturities of up to two years – was another source of underperformance for the Fund, as the short duration holdings performed well during the period. On the positive side, however, our relative overweighting in the stronger-performing intermediate portion of the yield curve was helpful.
On the other hand, our duration positioning contributed favorably to performance in the Massachusetts Insured Fund. Specifically, the Fund benefited from our relative underweighting in the long end of the yield curve, which tended to be poor performers during this period, and from our relative overweighting in intermediate-duration bonds, which performed well. The positive impact from the intermediate segment of the yield curve was counterbalanced by the significant underweighting of this Fund in short-duration bonds.
Security selection in both Funds had a mixed impact on results. A negative factor was our position in bonds backed by lower-rated municipal insurers – especially Radian Asset Assurance. Radian Asset Assurance is owned by Radian Group, which also provides mortgage insurance; because of this, investors worried how the subprime mortgage crisis would affect this company’s financial statements. Since we didn’t believe that Radian Asset Assurance was at significant risk, we
continued to hold Radian-insured bonds in the uninsured Massachusetts Fund, even as those holdings cheapened and detracted from the Fund’s performance during the period.
Discussions of specific investments are for illustration only and are not intended as recommendations of individual investments. The views expressed herein represent those of the portfolio manager as of the date of this report and are subject to change at any time, based on market conditions and other factors. The Funds disclaim any obligation to advise shareholders of such changes.
Semiannual Report l Page 2
Class A Shares—
Average Annual Total Returns as of 8/31/07
| 6-Month | 1-Year | 5-Year | 10-Year | |||||
Nuveen Massachusetts Municipal Bond Fund | ||||||||
A Shares at NAV | -1.44% | 1.29% | 3.98% | 4.54% | ||||
A Shares at Offer | -5.55% | -2.97% | 3.10% | 4.09% | ||||
Lipper Massachusetts Municipal Debt Funds Category Average1 | -1.38% | 1.18% | 3.36% | 4.34% | ||||
Lehman Brothers Massachusetts Municipal Bond Index2 | -0.46% | 2.44% | 4.02% | 5.29% | ||||
Lehman Brothers Municipal Bond Index2 | -0.57% | 2.30% | 4.16% | 5.28% | ||||
Nuveen Massachusetts Insured Municipal Bond Fund | ||||||||
A Shares at NAV | -0.46% | 2.01% | 3.54% | 4.41% | ||||
A Shares at Offer | -4.60% | -2.25% | 2.66% | 3.96% | ||||
Lipper Massachusetts Municipal Debt Funds Category Average1 | -1.38% | 1.18% | 3.36% | 4.34% | ||||
Lehman Brothers Massachusetts Insured Municipal Bond Index2 | -1.07% | 2.07% | 4.35% | 5.61% | ||||
Lehman Brothers Municipal Bond Index2 | -0.57% | 2.30% | 4.16% | 5.28% | ||||
Returns quoted represent past performance, which is no guarantee of future results. Returns at NAV would be lower if the sales charge were included. Returns less than one year are cumulative. Current performance may be higher or lower than the performance shown. Investment returns and principal value will fluctuate so that when shares are redeemed, they may be worth more or less than their original cost. Class A shares have a 4.2% maximum sales charge. Returns do not reflect the deduction of taxes that a shareholder would pay on Fund distributions or the redemption of shares. For the most recent month-end performance, visit www.nuveen.com or call (800) 257-8787.
Please see each Fund’s Spotlight Page later in this report for more complete performance data and expense ratios.
What strategies were used to manage the Funds and how did these strategies influence performance?
During the six-month reporting period, careful duration management remained a significant theme for both Funds. As the period went on, we took advantage of suitable opportunities to sell some of the holdings in shorter-duration bonds and reinvest the proceeds in longer-dated securities. A particular focus was on bonds with maturities between 2027 and 2037, which allowed us to keep the portfolio’s interest-rate sensitivity in line with target levels as well as provide additional income to the Funds. Specifically, in the uninsured Massachusetts Fund, we invested in a AAA-rated housing bond deal that offered some extra yield over other bonds of comparable credit quality because of their perceived call risk. In the Massachusetts Insured Fund, we sought to take advantage of investing in longer-duration bonds as they became available. However, we were not particularly active in adding new positions because of a relative lack of insured Massachusetts issuance during the period.
As the period progressed, investors seemingly became more risk averse and started to demand additional income as compensation for buying lower-rated bonds. In light of this credit spread widening, we took advantage of a variety of opportunities – like our investment in a new bond issue for a continuing care facility for the uninsured Fund – that began to surface in August, at the tail end of the municipal market’s significant decline. Then, when credit spreads widened even further, we invested in more of these bonds because we continued to believe these securities provided our shareholders with a favorable risk-reward tradeoff.
Another strategy actively pursued in both Funds was to implement tax-loss swaps when appropriate.
1 | The Lipper Massachusetts Municipal Debt Funds category average shown represents the average annualized total return for all reporting funds for the periods ended August 31, 2007. The Lipper Massachusetts Municipal Debt Funds Category contained 55, 55, 50 and 49 funds for the respective six-month and one-, five- and ten-year periods ended August 31, 2007. The returns account for the effects of management fees and assume reinvestment of dividends, but do not reflect any applicable sales charges. You cannot invest directly in a Lipper Category. |
2 | The Lehman Brothers Municipal Bond Index is an unmanaged index comprised of a broad range of investment-grade municipal bonds. The Lehman Brothers Massachusetts Municipal Bond Index is an unmanaged index comprised of investment grade, Massachusetts tax-exempt bonds with maturities of two years or greater. The Lehman Brothers Massachusetts Insured Municipal Bond Index is comprised of insured Massachusetts municipal bond issues. The indexes do not reflect any initial or ongoing expenses and are not available for direct investment. |
Semiannual Report l Page 3
As interest rates rose during the summer, market conditions provided us with an opportunity to sell existing bonds in the portfolio and reinvest in newer bonds offering similar risk characteristics but more attractive yields. With this approach, we were able to improve the Funds’ yields while simultaneously booking capital losses that can be used to offset future realized capital gains.
Dividend Information
During the reporting period, there were no dividend changes to either Fund. Each Fund seeks to pay dividends at a rate that reflects the past and projected performance of the Fund. To permit a Fund to maintain a more stable monthly dividend, the Fund may pay dividends at a rate that may be more or less than the amount of net investment income actually earned by the Fund during the period. If the Fund has cumulatively earned more than it has paid in dividends, it will hold the excess in reserve as undistributed net investment income (UNII) as part of the Fund’s net asset value. Conversely, if the Fund has cumulatively paid in dividends more than it has earned, the excess will constitute a negative UNII that will likewise be reflected in the Fund’s net asset value. Each Fund will, over time, pay all its net investment income as dividends to shareholders. As of August 31, 2007, both Funds had positive UNII balances for financial statement purposes and positive UNII balances, based upon our best estimates, for tax purposes.
Semiannual Report l Page 4
Fund Spotlight as of 8/31/07 Nuveen Massachusetts Municipal Bond Fund
| Quick Facts | ||||||||
| A Shares | B Shares | C Shares | R Shares | |||||
NAV | $9.78 | $9.79 | $9.70 | $9.76 | ||||
Latest Monthly Dividend1 | $0.0310 | $0.0250 | $0.0265 | $0.0325 | ||||
Inception Date | 9/07/94 | 3/07/97 | 10/06/94 | 12/22/86 |
Returns quoted represent past performance which is no guarantee of future results. Returns without sales charges would be lower if the sales charge were included. Current performance may be higher or lower than the performance shown. Investment returns and principal value will fluctuate so that when shares are redeemed, they may be worth more or less than their original cost. Returns do not reflect the deduction of taxes that a shareholder would pay on Fund distributions or the redemption of shares. Income is generally exempt from regular federal income taxes. Some income may be subject to state and local taxes and to the federal alternative minimum tax. Capital gains, if any, are subject to tax. For the most recent month-end performance visit www.nuveen.com or call (800) 257-8787.
Class A, C and R share returns are actual. Class B share returns are actual for the period since class inception; returns prior to class inception are Class R share returns adjusted for differences in sales charges and expenses, which are primarily differences in distribution and service fees. Class A shares have a 4.2% maximum sales charge. Class B shares have a contingent deferred sales charge (CDSC), also known as a back-end sales charge, that for redemptions begins at 5% and declines periodically until after 6 years when the charge becomes 0%. Class B shares automatically convert to Class A shares eight years after purchase. Class C shares have a 1% CDSC for redemptions within less than one year, which is not reflected in the one-year total return. Class R shares have no sales charge and may be purchased under limited circumstances or by specified classes of investors.
| Average Annual Total Returns as of 8/31/07 | ||||
| A Shares | NAV | Offer | ||
1-Year | 1.29% | -2.97% | ||
5-Year | 3.98% | 3.10% | ||
10-Year | 4.54% | 4.09% | ||
| B Shares | w/o CDSC | w/CDSC | ||
1-Year | 0.47% | -3.43% | ||
5-Year | 3.21% | 3.03% | ||
10-Year | 3.93% | 3.93% | ||
| C Shares | NAV | |||
1-Year | 0.65% | |||
5-Year | 3.42% | |||
10-Year | 3.97% | |||
| R Shares | NAV | |||
1-Year | 1.48% | |||
5-Year | 4.19% | |||
10-Year | 4.75% | |||
| Tax-Free Yields | ||||
| A Shares | NAV | Offer | ||
Dividend Yield2 | 3.80% | 3.64% | ||
SEC 30-Day Yield2 | — | 3.86% | ||
30-Day Yield2 | 4.03% | — | ||
Taxable-Equivalent Yield3 | 5.91% | 5.66% | ||
| B Shares | NAV | |||
Dividend Yield2 | 3.06% | |||
30-Day Yield2 | 3.29% | |||
Taxable-Equivalent Yield3 | 4.82% | |||
| C Shares | NAV | |||
Dividend Yield2 | 3.28% | |||
30-Day Yield2 | 3.49% | |||
Taxable-Equivalent Yield3 | 5.12% | |||
| R Shares | NAV | |||
Dividend Yield2 | 4.00% | |||
SEC 30-Day Yield2 | 4.24% | |||
Taxable-Equivalent Yield3 | 6.22% | |||
| Average Annual Total Returns as of 9/30/07 | ||||
| A Shares | NAV | Offer | ||
1-Year | 2.14% | -2.14% | ||
5-Year | 3.80% | 2.92% | ||
10-Year | 4.62% | 4.17% | ||
| B Shares | w/o CDSC | w/CDSC | ||
1-Year | 1.40% | -2.53% | ||
5-Year | 3.05% | 2.87% | ||
10-Year | 4.01% | 4.01% | ||
| C Shares | NAV | |||
1-Year | 1.70% | |||
5-Year | 3.24% | |||
10-Year | 4.06% | |||
| R Shares | NAV | |||
1-Year | 2.42% | |||
5-Year | 4.02% | |||
10-Year | 4.84% | |||
| Portfolio Statistics | ||
Net Assets ($000) | $158,431 | |
Average Effective Maturity on Securities (Years) | 17.55 | |
Average Duration | 6.76 | |
| Expense Ratios | ||||||
| Share Class | Gross Expense Ratios | Net Expense Ratios | As of Date | |||
Class A | 0.87% | 0.85% | 2/28/07 | |||
Class B | 1.62% | 1.60% | 2/28/07 | |||
Class C | 1.42% | 1.40% | 2/28/07 | |||
Class R | 0.67% | 0.65% | 2/28/07 |
The expense ratios shown factor in Annual Fund Operating Expenses including management fees and other fees and expenses. The Net Expense Ratios reflect custodian fee credits from the custodian bank whereby certain fees and expenses are reduced by credits earned on the Fund’s cash on deposit with the bank. There is no guarantee that the Fund will earn such credits in the future. Absent the credit, expenses would be higher and total returns would be less. These expense ratios may vary from the expense ratios shown elsewhere in this report.
| 1 | Paid September 4, 2007. This is the latest monthly tax-exempt dividend declared during the period ended August 31, 2007. |
| 2 | Dividend Yield is the most recent dividend per share (annualized) divided by the appropriate price per share. The SEC 30-Day Yield is computed under an SEC standardized formula and is based on the maximum offer price per share. The 30-Day Yield is computed under the same formula but is based on the Net Asset Value (NAV) per share. The Dividend Yield may differ from the SEC 30-Day Yield because the Fund may be paying out more or less than it is earning and it may not include the effect of amortization of bond premium. |
| 3 | The Taxable-Equivalent Yield represents the yield that must be earned on a fully taxable investment in order to equal the yield of the Fund on an after-tax basis at a specified tax rate. With respect to investments that generate qualified dividend income that is taxable at a maximum rate of 15%, the Taxable-Equivalent Yield is lower. The Taxable-Equivalent Yield is based on the Fund’s 30-Day Yield on the indicated date and a combined federal and state income tax rate of 31.8%. |
Semiannual Report Page 5
Fund Spotlight as of 8/31/07 Nuveen Massachusetts Municipal Bond Fund
Bond Credit Quality1
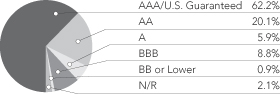
Industries1
Health Care | 16.6% | |
Tax Obligation/General | 16.2% | |
Education and Civic Organizations | 14.6% | |
Tax Obligation/Limited | 11.4% | |
U.S. Guaranteed | 8.0% | |
Water and Sewer | 7.6% | |
Transportation | 7.4% | |
Long-Term Care | 7.1% | |
Housing/Multifamily | 5.1% | |
Other | 6.0% |
| 1 | As a percentage of total investments as of August 31, 2007. Holdings are subject to change. |
Expense Example
As a shareholder of the Fund, you incur two types of costs: (1) transaction costs, including front and back end sales charges (loads) or redemption fees, where applicable; and (2) ongoing costs, including management fees; distribution and service (12b-1) fees, where applicable; and other Fund expenses. This Example is intended to help you understand your ongoing costs (in dollars) of investing in the Fund and to compare these costs with the ongoing costs of investing in other mutual funds.
The Example below is based on an investment of $1,000 invested at the beginning of the period and held for the period.
The information under “Actual Performance,” together with the amount you invested, allows you to estimate actual expenses incurred over the reporting period. Simply divide your account value by $1,000 (for example, an $8,600 account value divided by $1,000 = 8.60) and multiply the result by the cost shown for your share class, in the row entitled “Expenses Incurred During Period” to estimate the expenses incurred on your account during this period.
The information under “Hypothetical Performance,” provides information about hypothetical account values and hypothetical expenses based on the Fund’s actual expense ratio and an assumed rate of return of 5% per year before expenses, which is not the Fund’s actual return. The hypothetical account values and expenses may not be used to estimate the actual ending account balance or expense you incurred for the period. You may use this information to compare the ongoing costs of investing in the Fund and other Funds. To do so, compare this 5% hypothetical example with the 5% hypothetical examples that appear in the shareholder reports of the other funds.
Please note that the expenses shown in the table are meant to highlight your ongoing costs only and do not reflect any transactional costs, such as front and back end sales charges (loads) or redemption fees, where applicable. Therefore, the hypothetical information is useful in comparing ongoing costs only, and will not help you determine the relative total costs of owning different funds or share classes. In addition, if these transactional costs were included, your costs would have been higher.
| Hypothetical Performance | ||||||||||||||||||||||||
| Actual Performance | (5% annualized return before expenses) | |||||||||||||||||||||||
| A Shares | B Shares | C Shares | R Shares | A Shares | B Shares | C Shares | R Shares | |||||||||||||||||
Beginning Account Value (3/01/07) | $ | 1,000.00 | $ | 1,000.00 | $ | 1,000.00 | $ | 1,000.00 | $ | 1,000.00 | $ | 1,000.00 | $ | 1,000.00 | $ | 1,000.00 | ||||||||
Ending Account Value (8/31/07) | $ | 985.60 | $ | 981.10 | $ | 981.80 | $ | 986.50 | $ | 1,020.92 | $ | 1,017.19 | $ | 1,018.20 | $ | 1,021.93 | ||||||||
Expenses Incurred During Period | $ | 4.25 | $ | 7.94 | $ | 6.94 | $ | 3.25 | $ | 4.33 | $ | 8.08 | $ | 7.07 | $ | 3.31 | ||||||||
For each class of the Fund, expenses are equal to the Fund’s annualized net expense ratio of .85%, 1.59%, 1.39% and ..65% for Classes A, B, C and R, respectively, multiplied by the average account value over the period, multiplied by 184/365 (to reflect the one-half year period).
Semiannual Report Page 6
Fund Spotlight as of 8/31/07 Nuveen Massachusetts Insured Municipal Bond Fund
| Quick Facts | ||||||||
| A Shares | B Shares | C Shares | R Shares | |||||
NAV | $10.13 | $10.15 | $10.14 | $10.17 | ||||
Latest Monthly Dividend1 | $0.0320 | $0.0255 | $0.0270 | $0.0335 | ||||
Latest Capital Gain and Ordinary Income Distribution2 | $0.0328 | $0.0328 | $0.0328 | $0.0328 | ||||
Inception Date | 9/07/94 | 3/06/97 | 9/15/94 | 12/22/86 |
Returns quoted represent past performance which is no guarantee of future results. Returns without sales charges would be lower if the sales charge were included. Current performance may be higher or lower than the performance shown. Investment returns and principal value will fluctuate so that when shares are redeemed, they may be worth more or less than their original cost. Returns do not reflect the deduction of taxes that a shareholder would pay on Fund distributions or the redemption of shares. Income is generally exempt from regular federal income taxes. Some income may be subject to state and local taxes and to the federal alternative minimum tax. Capital gains, if any, are subject to tax. For the most recent month-end performance visit www.nuveen.com or call (800) 257-8787.
Class A, C and R share returns are actual. Class B share returns are actual for the period since class inception; returns prior to class inception are Class R share returns adjusted for differences in sales charges and expenses, which are primarily differences in distribution and service fees. Class A shares have a 4.2% maximum sales charge. Class B shares have a contingent deferred sales charge (CDSC), also known as a back-end sales charge, that for redemptions begins at 5% and declines periodically until after 6 years when the charge becomes 0%. Class B shares automatically convert to Class A shares eight years after purchase. Class C shares have a 1% CDSC for redemptions within less than one year, which is not reflected in the one-year total return. Class R shares have no sales charge and may be purchased under limited circumstances or by specified classes of investors.
| Average Annual Total Returns as of 8/31/07 | ||||
| A Shares | NAV | Offer | ||
1-Year | 2.01% | -2.25% | ||
5-Year | 3.54% | 2.66% | ||
10-Year | 4.41% | 3.96% | ||
| B Shares | w/o CDSC | w/CDSC | ||
1-Year | 1.34% | -2.59% | ||
5-Year | 2.79% | 2.61% | ||
10-Year | 3.77% | 3.77% | ||
| C Shares | NAV | |||
1-Year | 1.61% | |||
5-Year | 2.99% | |||
10-Year | 3.85% | |||
| R Shares | NAV | |||
1-Year | 2.28% | |||
5-Year | 3.75% | |||
10-Year | 4.62% | |||
| Tax-Free Yields | ||||
| A Shares | NAV | Offer | ||
Dividend Yield3 | 3.79% | 3.63% | ||
SEC 30-Day Yield3 | — | 3.38% | ||
30-Day Yield3 | 3.53% | — | ||
Taxable-Equivalent Yield4 | 5.18% | 4.96% | ||
| B Shares | NAV | |||
Dividend Yield3 | 3.01% | |||
30-Day Yield3 | 2.78% | |||
Taxable-Equivalent Yield4 | 4.08% | |||
| C Shares | NAV | |||
Dividend Yield3 | 3.20% | |||
30-Day Yield3 | 2.98% | |||
Taxable-Equivalent Yield4 | 4.37% | |||
| R Shares | NAV | |||
Dividend Yield3 | 3.95% | |||
SEC 30-Day Yield3 | 3.73% | |||
Taxable-Equivalent Yield4 | 5.47% | |||
| Average Annual Total Returns as of 9/30/07 | ||||
| A Shares | NAV | Offer | ||
1-Year | 2.82% | -1.46% | ||
5-Year | 3.33% | 2.44% | ||
10-Year | 4.45% | 4.00% | ||
| B Shares | w/o CDSC | w/CDSC | ||
1-Year | 1.95% | -2.00% | ||
5-Year | 2.55% | 2.38% | ||
10-Year | 3.82% | 3.82% | ||
| C Shares | NAV | |||
1-Year | 2.22% | |||
5-Year | 2.77% | |||
10-Year | 3.89% | |||
| R Shares | NAV | |||
1-Year | 2.99% | |||
5-Year | 3.53% | |||
10-Year | 4.67% | |||
| Portfolio Statistics | ||
Net Assets ($000) | $77,402 | |
Average Effective Maturity on Securities (Years) | 14.93 | |
Average Duration | 5.85 | |
| Expense Ratios | ||||||
| Share Class | Gross Expense Ratios | Net Expense Ratios | As of Date | |||
Class A | 1.06% | 1.05% | 2/28/07 | |||
Class B | 1.81% | 1.80% | 2/28/07 | |||
Class C | 1.61% | 1.60% | 2/28/07 | |||
Class R | 0.86% | 0.85% | 2/28/07 |
The expense ratios shown factor in Annual Fund Operating Expenses including management fees and other fees and expenses. The Net Expense Ratios reflect custodian fee credits from the custodian bank whereby certain fees and expenses are reduced by credits earned on the Fund’s cash on deposit with the bank. There is no guarantee that the Fund will earn such credits in the future. Absent the credit, expenses would be higher and total returns would be less. These expense ratios may vary from the expense ratios shown elsewhere in this report.
| 1 | Paid September 4, 2007. This is the latest monthly tax-exempt dividend declared during the period ended August 31, 2007. |
| 2 | Paid December 1, 2006. Capital gains and/or ordinary income are subject to federal taxation. |
| 3 | Dividend Yield is the most recent dividend per share (annualized) divided by the appropriate price per share. The SEC 30-Day Yield is computed under an SEC standardized formula and is based on the maximum offer price per share. The 30-Day Yield is computed under the same formula but is based on the Net Asset Value (NAV) per share. The Dividend Yield may differ from the SEC 30-Day Yield because the Fund may be paying out more or less than it is earning and it may not include the effect of amortization of bond premium. |
| 4 | The Taxable-Equivalent Yield represents the yield that must be earned on a fully taxable investment in order to equal the yield of the Fund on an after-tax basis at a specified tax rate. With respect to investments that generate qualified dividend income that is taxable at a maximum rate of 15%, the Taxable-Equivalent Yield is lower. The Taxable-Equivalent Yield is based on the Fund’s 30-Day Yield on the indicated date and a combined federal and state income tax rate of 31.8%. |
Semiannual Report Page 7
Fund Spotlight as of 8/31/07 Nuveen Massachusetts Insured Municipal Bond Fund
Bond Credit Quality1
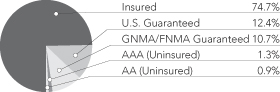
The Fund features a portfolio of primarily investment-grade, long-term municipal investments. These investments are covered by insurance, guaranteeing the timely payment of principal and interest, or by an escrow or trust account containing enough U.S. government or U.S. government agency securities to ensure timely payment of principal and interest.
Industries1
Tax Obligation/General | 33.4% | |
U.S. Guaranteed | 12.4% | |
Health Care | 10.8% | |
Tax Obligation/Limited | 8.4% | |
Education and Civic Organizations | 7.7% | |
Transportation | 7.5% | |
Long-Term Care | 7.4% | |
Housing/Multifamily | �� | 5.9% |
Other | 6.5% |
| 1 | As a percentage of total investments as of August 31, 2007. Holdings are subject to change. |
Expense Example
As a shareholder of the Fund, you incur two types of costs: (1) transaction costs, including front and back end sales charges (loads) or redemption fees, where applicable; and (2) ongoing costs, including management fees; distribution and service (12b-1) fees, where applicable; and other Fund expenses. This Example is intended to help you understand your ongoing costs (in dollars) of investing in the Fund and to compare these costs with the ongoing costs of investing in other mutual funds.
The Example below is based on an investment of $1,000 invested at the beginning of the period and held for the period.
The information under “Actual Performance,” together with the amount you invested, allows you to estimate actual expenses incurred over the reporting period. Simply divide your account value by $1,000 (for example, an $8,600 account value divided by $1,000 = 8.60) and multiply the result by the cost shown for your share class, in the row entitled “Expenses Incurred During Period” to estimate the expenses incurred on your account during this period.
The information under “Hypothetical Performance,” provides information about hypothetical account values and hypothetical expenses based on the Fund’s actual expense ratio and an assumed rate of return of 5% per year before expenses, which is not the Fund’s actual return. The hypothetical account values and expenses may not be used to estimate the actual ending account balance or expense you incurred for the period. You may use this information to compare the ongoing costs of investing in the Fund and other Funds. To do so, compare this 5% hypothetical example with the 5% hypothetical examples that appear in the shareholder reports of the other funds.
Please note that the expenses shown in the table are meant to highlight your ongoing costs only and do not reflect any transactional costs, such as front and back end sales charges (loads) or redemption fees, where applicable. Therefore, the hypothetical information is useful in comparing ongoing costs only, and will not help you determine the relative total costs of owning different funds or share classes. In addition, if these transactional costs were included, your costs would have been higher.
| Hypothetical Performance | ||||||||||||||||||||||||
| Actual Performance | (5% annualized return before expenses) | |||||||||||||||||||||||
| A Shares | B Shares | C Shares | R Shares | A Shares | B Shares | C Shares | R Shares | |||||||||||||||||
Beginning Account Value (3/01/07) | $ | 1,000.00 | $ | 1,000.00 | $ | 1,000.00 | $ | 1,000.00 | $ | 1,000.00 | $ | 1,000.00 | $ | 1,000.00 | $ | 1,000.00 | ||||||||
Ending Account Value (8/31/07) | $ | 995.40 | $ | 992.60 | $ | 993.40 | $ | 996.30 | $ | 1,019.72 | $ | 1,015.94 | $ | 1,016.95 | $ | 1,020.73 | ||||||||
Expenses Incurred During Period | $ | 5.47 | $ | 9.23 | $ | 8.23 | $ | 4.47 | $ | 5.54 | $ | 9.34 | $ | 8.33 | $ | 4.52 | ||||||||
For each class of the Fund, expenses are equal to the Fund’s annualized net expense ratio of .1.09%, 1.84%, 1.64% and ..89% for Classes A, B, C and R, respectively, multiplied by the average account value over the period, multiplied by 184/365 (to reflect the one-half year period).
Semiannual Report Page 8
Portfolio of Investments (Unaudited)
Nuveen Massachusetts Municipal Bond Fund
August 31, 2007
| Principal Amount (000) | Description | Optional Call Provisions (1) | Ratings (2) | Value | ||||||
| Consumer Discretionary – 0.9% | ||||||||||
| $ | 1,485 | Boston Industrial Development Financing Authority, Massachusetts, Senior Revenue Bonds, Crosstown Center Project, Series 2002, 6.500%, 9/01/35 (Alternative Minimum Tax) | 9/12 at 102.00 | Ba3 | $ | 1,498,677 | ||||
| Consumer Staples – 0.6% | ||||||||||
| 875 | Puerto Rico, The Children’s Trust Fund, Tobacco Settlement Asset-Backed Refunding Bonds, Series 2002, 5.375%, 5/15/33 | 5/12 at 100.00 | BBB | 820,558 | ||||||
| Education and Civic Organizations – 14.9% | ||||||||||
| 2,000 | Massachusetts Development Finance Agency, Revenue Bonds, Boston College, Series 2007P, 5.000%, 7/01/38 | 7/17 at 100.00 | AA– | 2,016,100 | ||||||
| 1,135 | Massachusetts Development Finance Agency, Revenue Bonds, Boston University, Series 2005T-1, 5.000%, 10/01/39 – AMBAC Insured | 10/15 at 100.00 | AAA | 1,154,965 | ||||||
| 1,800 | Massachusetts Development Finance Agency, Revenue Bonds, Western New England College, Series 2005A, 5.000%, 9/01/33 – AGC Insured | 9/15 at 100.00 | AAA | 1,831,464 | ||||||
| 1,500 | Massachusetts Development Finance Agency, Revenue Bonds, Williston Northampton School, Series 2005B, 5.000%, 10/01/37 – XLCA Insured | 10/15 at 100.00 | Aaa | 1,519,335 | ||||||
| 3,000 | Massachusetts Development Finance Authority, Revenue Bonds, Curry College, Series 1999A, 5.500%, 3/01/29 – ACA Insured | 3/09 at 101.00 | A | 3,000,480 | ||||||
| 50 | Massachusetts Development Finance Authority, Revenue Bonds, Massachusetts College of Pharmacy and Allied Health Sciences, Series 2003C, 6.375%, 7/01/23 | 7/13 at 101.00 | A– | 54,808 | ||||||
| 3,075 | Massachusetts Development Finance Authority, Revenue Bonds, Massachusetts College of Pharmacy and Allied Health Sciences, Series 2005D, 5.000%, 7/01/27 – AGC Insured | 7/15 at 100.00 | AAA | 3,131,641 | ||||||
| 750 | Massachusetts Development Finance Authority, Revenue Bonds, Milton Academy, Series 2003A, 5.000%, 9/01/19 | 9/13 at 100.00 | AA– | 787,823 | ||||||
| 895 | Massachusetts Educational Finance Authority, Educational Loan Revenue Bonds, Series 2002E, 5.000%, 1/01/13 – AMBAC Insured (Alternative Minimum Tax) | 1/12 at 100.00 | AAA | 907,637 | ||||||
| 1,000 | Massachusetts Health and Educational Facilities Authority, Revenue Bonds, Boston College, Series 1993K, 5.375%, 6/01/14 | No Opt. Call | AA– | 1,085,310 | ||||||
| 1,000 | Massachusetts Health and Educational Facilities Authority, Revenue Bonds, Massachusetts Institute of Technology, Series 2004M, 5.250%, 7/01/15 | No Opt. Call | AAA | 1,094,910 | ||||||
| 500 | Massachusetts Health and Educational Facilities Authority, Revenue Bonds, Wellesley College, Series 2003H, 5.000%, 7/01/26 | 7/13 at 100.00 | AA+ | 510,615 | ||||||
| 500 | Massachusetts Health and Educational Facilities Authority, Revenue Bonds, Williams College, Series 2003H, 5.000%, 7/01/21 | 7/13 at 100.00 | AA+ | 517,285 | ||||||
| 2,230 | Massachusetts Health and Educational Facilities Authority, Revenue Bonds, Williams College, Series 2007L, 5.000%, 7/01/31 | 7/16 at 100.00 | AA+ | 2,296,454 | ||||||
| 425 | Puerto Rico Industrial, Tourist, Educational, Medical and Environmental Control Facilities Financing Authority, Higher Education Revenue Bonds, Ana G. Mendez University System, Series 1999, 5.375%, 2/01/19 | 2/09 at 101.00 | BBB– | 429,599 | ||||||
| University of Massachusetts Building Authority, Senior Lien Project Revenue Bonds, Series 2005-1: | ||||||||||
| 1,495 | 5.000%, 5/01/14 – AMBAC Insured | No Opt. Call | AAA | 1,595,898 | ||||||
| 1,585 | 5.000%, 5/01/15 – AMBAC Insured | No Opt. Call | AAA | 1,696,029 | ||||||
| 22,940 | Total Education and Civic Organizations | 23,630,353 | ||||||||
| Health Care – 16.9% | ||||||||||
| 2,900 | Massachusetts Development Finance Authority, Revenue Bonds, Northern Berkshire Community Services Inc., Series 1999A, 6.250%, 8/15/29 – ACA Insured | 8/09 at 101.00 | A | 2,969,861 | ||||||
| 1,250 | Massachusetts Health and Educational Facilities Authority, Revenue Bonds, Berkshire Health System, Series 2001E, 6.250%, 10/01/31 | 10/11 at 101.00 | BBB+ | 1,307,100 | ||||||
| 3,000 | Massachusetts Health and Educational Facilities Authority, Revenue Bonds, Cape Cod Health Care Inc., Series 2001C, 5.250%, 11/15/31 – RAAI Insured | 11/11 at 101.00 | AA | 2,903,940 | ||||||
| 50 | Massachusetts Health and Educational Facilities Authority, Revenue Bonds, Caritas Christi Obligated Group, Series 1999A, 5.750%, 7/01/28 | 1/09 at 101.00 | BBB | 51,337 | ||||||
9
Portfolio of Investments (Unaudited)
Nuveen Massachusetts Municipal Bond Fund (continued)
August 31, 2007
| Principal Amount (000) | Description | Optional Call Provisions (1) | Ratings (2) | Value | ||||||
| Health Care (continued) | ||||||||||
| $ | 1,000 | Massachusetts Health and Educational Facilities Authority, Revenue Bonds, Caritas Christi Obligated Group, Series 2002B, 6.250%, 7/01/22 | 7/12 at 101.00 | BBB | $ | 1,041,710 | ||||
| 1,000 | Massachusetts Health and Educational Facilities Authority, Revenue Bonds, Covenant Health Systems Obligated Group, Series 2002, 6.000%, 7/01/31 | 1/12 at 101.00 | A | 1,042,950 | ||||||
| 1,000 | Massachusetts Health and Educational Facilities Authority, Revenue Bonds, Dartmouth-Hitchcock Obligated Group, Series 2002, 5.125%, 8/01/22 – FSA Insured | 8/12 at 100.00 | AAA | 1,035,190 | ||||||
| 1,250 | Massachusetts Health and Educational Facilities Authority, Revenue Bonds, Emerson Hospital, Series 2005E, 5.000%, 8/15/35 – RAAI Insured | 8/15 at 100.00 | AA | 1,142,988 | ||||||
| 1,500 | Massachusetts Health and Educational Facilities Authority, Revenue Bonds, Harvard Pilgrim Healthcare, Series 1998A, 4.750%, 7/01/22 – FSA Insured | 7/08 at 101.00 | AAA | 1,501,290 | ||||||
| 2,000 | Massachusetts Health and Educational Facilities Authority, Revenue Bonds, Lahey Clinic Medical Center, Series 2005C, 5.000%, 8/15/21 – FGIC Insured | 8/15 at 100.00 | AAA | 2,056,100 | ||||||
| 2,000 | Massachusetts Health and Educational Facilities Authority, Revenue Bonds, Lahey Medical Center, Series 2007D, 5.250%, 8/15/28 | 8/17 at 100.00 | A | 2,016,920 | ||||||
| 2,040 | Massachusetts Health and Educational Facilities Authority, Revenue Bonds, Milford Regional Medical Center, Series 2007E, 5.000%, 7/15/32 | 7/17 at 100.00 | BBB– | 1,842,487 | ||||||
| 1,400 | Massachusetts Health and Educational Facilities Authority, Revenue Bonds, Milton Hospital Project, Series 2005D, 5.250%, 7/01/30 | 7/15 at 100.00 | BBB– | 1,294,776 | ||||||
| 600 | Massachusetts Health and Educational Facilities Authority, Revenue Bonds, New England Medical Center Hospitals, Series 2002H, 5.375%, 5/15/19 – FGIC Insured | 5/12 at 100.00 | AAA | 633,054 | ||||||
| 105 | Massachusetts Health and Educational Facilities Authority, Revenue Bonds, Partners HealthCare System Inc., Series 2001C, 5.750%, 7/01/32 | 7/11 at 101.00 | AA | 113,045 | ||||||
| 375 | Massachusetts Health and Educational Facilities Authority, Revenue Bonds, UMass Memorial Health Care, Series 2001C, 6.625%, 7/01/32 | 7/11 at 100.00 | BBB | 393,323 | ||||||
| 2,565 | Massachusetts Health and Educational Facilities Authority, Revenue Bonds, UMass Memorial Health Care, Series 2005D, 5.000%, 7/01/33 | 7/15 at 100.00 | BBB | 2,427,901 | ||||||
| 3,000 | Massachusetts State, Health and Educational Facilities Authority, Partners HealthCare System Inc., Series 2007G, 5.000%, 7/01/32 | 7/17 at 100.00 | AA | 3,000,960 | ||||||
| 27,035 | Total Health Care | 26,774,932 | ||||||||
| Housing/Multifamily – 5.2% | ||||||||||
| 1,115 | Framingham Housing Authority, Massachusetts, GNMA Collateralized Mortgage Revenue Refunding Bonds, Beaver Terrace Apartments, Series 2000A, 6.350%, 2/20/32 | 8/10 at 105.00 | AAA | 1,204,211 | ||||||
| 2,160 | Massachusetts Development Finance Authority, Multifamily Housing Revenue Bonds, Emerson Manor Project, Series 2007, 4.800%, 7/20/48 | 7/17 at 100.00 | AAA | 2,090,426 | ||||||
| 2,795 | Massachusetts Development Financing Authority, Assisted Living Revenue Bonds, Prospect House Apartments, Series 1999, 7.000%, 12/01/31 | 12/09 at 102.00 | N/R | 2,868,145 | ||||||
| 530 | Massachusetts Housing Finance Agency, Housing Bonds, Series 2006A, 5.100%, 12/01/37 (Alternative Minimum Tax) | 6/15 at 100.00 | AA– | 516,792 | ||||||
| 500 | Massachusetts Housing Finance Agency, Housing Revenue Bonds, Series 2003S, 5.050%, 12/01/23 (Alternative Minimum Tax) | 6/13 at 100.00 | AA– | 500,085 | ||||||
| 1,000 | Massachusetts Industrial Finance Agency, FHA-Insured Mortgage Loan Bonds, Hudner Associates Projects, Series 1997, 5.650%, 1/01/22 – MBIA Insured | 1/08 at 102.00 | AAA | 1,025,390 | ||||||
| 8,100 | Total Housing/Multifamily | 8,205,049 | ||||||||
| Housing/Single Family – 1.1% | ||||||||||
| 1,590 | Massachusetts Housing Finance Agency, Single Family Housing Revenue Bonds, Series 2006-122, 4.875%, 12/01/37 (Alternative Minimum Tax) | 6/15 at 100.00 | AA | 1,496,556 | ||||||
| 290 | Puerto Rico Housing Finance Authority, Mortgage-Backed Securities Program Home Mortgage Revenue Bonds, Series 2003A, 4.875%, 6/01/34 (Alternative Minimum Tax) | 6/13 at 100.00 | AAA | 291,813 | ||||||
| 1,880 | Total Housing/Single Family | 1,788,369 | ||||||||
10
| Principal Amount (000) | Description | Optional Call Provisions (1) | Ratings (2) | Value | ||||||
| Industrials – 0.6% | ||||||||||
| $ | 565 | Massachusetts Development Finance Agency, Pioneer Valley Resource Recovery Revenue Bonds, Eco/Springfield LLC, Series 2006, 5.875%, 7/01/14 (Alternative Minimum Tax) | No Opt. Call | N/R | $ | 561,407 | ||||
| 400 | Massachusetts Development Finance Agency, Solid Waste Disposal Revenue Bonds, Waste Management Inc., Series 2003, 5.450%, 6/01/14 | No Opt. Call | BBB | 407,304 | ||||||
| 965 | Total Industrials | 968,711 | ||||||||
| Long-Term Care – 7.2% | ||||||||||
| 1,500 | Massachusetts Development Finance Agency, Human Service Provider Revenue Bonds, Seven Hills Foundation and Affiliates Issue, Series 2005, 5.000%, 9/01/35 – RAAI Insured | 9/15 at 100.00 | AA | 1,393,485 | ||||||
| 1,590 | Massachusetts Development Finance Agency, Revenue Bonds, Orchard Cove, Series 2007, 5.250%, 10/01/26 | 10/12 at 102.00 | BBB– | 1,495,888 | ||||||
| 50 | Massachusetts Development Finance Authority, First Mortgage Revenue Bonds, Berkshire Retirement Community – Edgecombe Project, Series 2001A, 6.750%, 7/01/21 | 7/11 at 102.00 | BBB– | 53,165 | ||||||
| 1,790 | Massachusetts Development Finance Authority, Revenue Bonds, May Institute, Series 1999, 5.750%, 9/01/24 – RAAI Insured | 9/09 at 102.00 | �� | AA | 1,873,342 | |||||
| 885 | Massachusetts Health and Educational Facilities Authority, Revenue Bonds, Cable Housing and Health Services, Series 1993A, 5.625%, 7/01/13 – MBIA Insured | 1/08 at 100.00 | AAA | 886,159 | ||||||
| 250 | Massachusetts Industrial Finance Agency, FHA-Insured Project Revenue Bonds, Heights Crossing LP, Series 1995, 6.000%, 2/01/15 (Alternative Minimum Tax) | 2/08 at 100.00 | AAA | 251,403 | ||||||
| 610 | Massachusetts Industrial Finance Agency, First Mortgage Revenue Bonds, Berkshire Retirement Community, Series 1994B, 4.750%, 7/01/17 | 1/11 at 101.00 | BBB– | 589,718 | ||||||
| 2,020 | Massachusetts Industrial Finance Agency, GNMA Collateralized Assisted Living Facility Revenue Bonds, Arbors at Taunton LP, Series 1999, 5.500%, 6/20/40 (Alternative Minimum Tax) | 6/09 at 102.00 | AAA | 2,056,946 | ||||||
| Massachusetts Industrial Finance Agency, GNMA Collateralized Assisted Living Facility Revenue Bonds, TNG Draper Place Project, Series 1998: | ||||||||||
| 205 | 5.400%, 8/20/12 (Alternative Minimum Tax) | 8/08 at 105.00 | AA | 206,210 | ||||||
| 2,490 | 6.450%, 8/20/39 (Alternative Minimum Tax) | 8/08 at 105.00 | AA | 2,648,862 | ||||||
| 11,390 | Total Long-Term Care | 11,455,178 | ||||||||
| Tax Obligation/General – 16.4% | ||||||||||
| 1,085 | Amherst-Pelham Regional School District, Massachusetts, General Obligation Bonds, Series 2005, 5.000%, 11/15/17 – FSA Insured | 11/15 at 101.00 | AAA | 1,166,505 | ||||||
| 500 | Ashland, Massachusetts, General Obligation Bonds, Series 2004, 5.250%, 5/15/23 – AMBAC Insured | 5/15 at 100.00 | Aaa | 532,025 | ||||||
| 1,160 | Beverly, Massachusetts, General Obligation Bonds, Series 2003, 5.000%, 11/01/21 – MBIA Insured | 11/13 at 100.00 | Aaa | 1,200,844 | ||||||
| 1,000 | Boston, Massachusetts, General Obligation Bonds, Series 2001B, 5.000%, 8/01/15 | 8/11 at 100.00 | AA+ | 1,044,890 | ||||||
| 1,500 | Boston, Massachusetts, General Obligation Bonds, Series 2005A, 5.000%, 1/01/17 | 1/15 at 100.00 | AA+ | 1,599,345 | ||||||
| 3,130 | Boston, Massachusetts, General Obligation Bonds, Series 2006A, 5.000%, 1/01/20 | 1/16 at 100.00 | AA+ | 3,291,977 | ||||||
| 1,000 | Erving, Massachusetts, General Obligation Bonds, Series 2002, 5.500%, 6/15/16 | 6/12 at 101.00 | BBB | 1,046,260 | ||||||
| 1,000 | Fall River, Massachusetts, General Obligation Bonds, Series 2003, 5.000%, 2/01/21 – FSA Insured | 2/13 at 101.00 | AAA | 1,040,110 | ||||||
| 1,145 | Falmouth, Massachusetts, General Obligation Bonds, Series 2002, 5.000%, 2/01/19 | 2/12 at 101.00 | AA+ | 1,197,052 | ||||||
| 2,500 | Massachusetts Bay Transportation Authority, General Obligation Transportation System Bonds, Series 1991A, 7.000%, 3/01/21 | No Opt. Call | AAA | 3,022,375 | ||||||
| 1,250 | Massachusetts, General Obligation Bonds, Consolidated Loan, Series 2002D, 5.500%, 8/01/19 | No Opt. Call | AA | 1,392,263 | ||||||
| 1,490 | Northbridge, Massachusetts, General Obligation Bonds, Series 2002, 5.250%, 2/15/18 – AMBAC Insured | 2/12 at 101.00 | AAA | 1,580,607 | ||||||
| 1,700 | Puerto Rico, General Obligation and Public Improvement Bonds, Series 2001A, 5.500%, 7/01/29 – FGIC Insured | No Opt. Call | AAA | 1,913,044 | ||||||
| 1,000 | Randolph, Massachusetts, General Obligation Bonds, Series 2004, 5.000%, 9/01/13 – AMBAC Insured | No Opt. Call | AAA | 1,067,270 | ||||||
| 1,000 | Reading, Massachusetts, General Obligation Bonds, Series 2004, 5.000%, 3/15/15 – MBIA Insured | 3/14 at 100.00 | AAA | 1,063,590 | ||||||
11
Portfolio of Investments (Unaudited)
Nuveen Massachusetts Municipal Bond Fund (continued)
August 31, 2007
| Principal Amount (000) | Description | Optional Call Provisions (1) | Ratings (2) | Value | ||||||
| Tax Obligation/General (continued) | ||||||||||
| Westfield, Massachusetts, General Obligation Bonds, Series 2004: | ||||||||||
| $ | 695 | 5.000%, 8/01/18 – AMBAC Insured | 8/14 at 100.50 | AAA | $ | 734,080 | ||||
| 690 | 5.000%, 8/01/19 – AMBAC Insured | 8/14 at 100.50 | AAA | 725,404 | ||||||
| 500 | Woburn, Massachusetts, General Obligation Bonds, Series 2005, 5.000%, 11/15/19 – MBIA Insured | 11/15 at 100.00 | Aaa | 527,490 | ||||||
| 1,825 | Worcester, Massachusetts, General Obligation Bonds, Series 2005A, 5.000%, 7/01/19 – FGIC Insured | 7/15 at 100.00 | AAA | 1,914,042 | ||||||
| 24,170 | Total Tax Obligation/General | 26,059,173 | ||||||||
| Tax Obligation/Limited – 11.6% | ||||||||||
| 680 | Martha’s Vineyard Land Bank, Massachusetts, Revenue Bonds, Series 2002, 5.000%, 5/01/32 – AMBAC Insured | 5/13 at 100.00 | AAA | 688,650 | ||||||
| 395 | Martha’s Vineyard Land Bank, Massachusetts, Revenue Bonds, Series 2004, 5.000%, 5/01/26 – AMBAC Insured | 5/14 at 100.00 | AAA | 406,814 | ||||||
| 770 | Massachusetts Bay Transportation Authority, Senior Lien Sales Tax Revenue Refunding Bonds, Series 2004C, 5.250%, 7/01/21 | No Opt. Call | AAA | 840,162 | ||||||
| 2,925 | Massachusetts Bay Transportation Authority, Senior Sales Tax Revenue Bonds, Series 2006, 5.000%, 7/01/26 | 7/18 at 100.00 | AAA | 3,032,611 | ||||||
| 550 | Massachusetts College Building Authority, Project Revenue Bonds, Series 2004A, | 5/14 at 100.00 | AAA | 573,375 | ||||||
| 815 | Massachusetts College Building Authority, Project Revenue Bonds, Series 2006A, | 5/16 at 100.00 | AAA | 837,739 | ||||||
| Massachusetts College Building Authority, Project Revenue Refunding Bonds, Series 2003B: | ||||||||||
| 1,025 | 5.375%, 5/01/22 – XLCA Insured | No Opt. Call | AAA | 1,125,686 | ||||||
| 1,125 | 5.375%, 5/01/23 – XLCA Insured | No Opt. Call | AAA | 1,236,746 | ||||||
| Massachusetts School Building Authority, Dedicated Sales Tax Revenue Bonds, Series 2005A: | ||||||||||
| 2,100 | 5.000%, 8/15/20 – FSA Insured | 8/15 at 100.00 | AAA | 2,189,481 | ||||||
| 2,000 | 5.000%, 8/15/22 – FSA Insured | 8/15 at 100.00 | AAA | 2,071,620 | ||||||
| 670 | Massachusetts, Special Obligation Dedicated Tax Revenue Bonds, Series 2005, 5.000%, 1/01/20 – FGIC Insured | No Opt. Call | AAA | 714,823 | ||||||
| 2,000 | Massachusetts, Special Obligation Refunding Notes, Federal Highway Grant Anticipation Note Program, Series 2003A, 5.000%, 12/15/13 – FSA Insured | No Opt. Call | Aaa | 2,127,960 | ||||||
| Puerto Rico Highway and Transportation Authority, Highway Revenue Bonds, Series 2007N: | ||||||||||
| 200 | 5.250%, 7/01/31 – AMBAC Insured | No Opt. Call | AAA | 217,316 | ||||||
| 100 | 5.250%, 7/01/33 – MBIA Insured | No Opt. Call | AAA | 109,041 | ||||||
| 350 | Puerto Rico Sales Tax Financing Corporation, Sales Tax Revenue Bonds, Series 2007A, | 8/17 at 100.00 | A+ | 358,547 | ||||||
| 1,700 | Puerto Rico, Highway Revenue Bonds, Highway and Transportation Authority, Series 2003AA, 5.500%, 7/01/19 – MBIA Insured | No Opt. Call | AAA | 1,897,591 | ||||||
| 17,405 | Total Tax Obligation/Limited | 18,428,162 | ||||||||
| Transportation – 7.5% | ||||||||||
| 1,800 | Massachusetts Port Authority, Special Facilities Revenue Bonds, BOSFUEL Corporation, Series 2007, 5.000%, 7/01/32 – FGIC Insured (Alternative Minimum Tax) | 7/17 at 100.00 | Aaa | 1,801,260 | ||||||
| 3,835 | Massachusetts Port Authority, Revenue Bonds, Series 2003A, 5.000%, 7/01/24 – MBIA Insured | 7/13 at 100.00 | AAA | 3,932,175 | ||||||
| 2,500 | Massachusetts Port Authority, Revenue Bonds, Series 2005A, 5.000%, 7/01/23 – AMBAC Insured | 7/15 at 100.00 | AAA | 2,589,125 | ||||||
| 3,525 | Massachusetts Port Authority, Special Facilities Revenue Bonds, Delta Air Lines Inc., Series 2001A, 5.000%, 1/01/27 – AMBAC Insured (Alternative Minimum Tax) | 1/11 at 101.00 | AAA | 3,544,528 | ||||||
| 11,660 | Total Transportation | 11,867,088 | ||||||||
| U.S. Guaranteed – 8.2% (3) | ||||||||||
| 90 | Lawrence, Massachusetts, General Obligation Bonds, Series 2001, 5.000%, 2/01/21 | 2/11 at 100.00 | Aaa | 93,823 | ||||||
12
| Principal Amount (000) | Description | Optional Call Provisions (1) | Ratings (2) | Value | |||||||
| U.S. Guaranteed (3) (continued) | |||||||||||
| $ | 75 | Massachusetts Bay Transportation Authority, Senior Sales Tax Revenue Bonds, Series 2006, 5.000%, 7/01/26 (Pre-refunded 7/01/18) | 7/18 at 100.00 | Aa2 | (3) | $ | 80,750 | ||||
| 2,000 | Massachusetts Development Finance Authority, Revenue Bonds, Massachusetts College of Pharmacy and Allied Health Sciences, Series 1999B, 6.625%, 7/01/20 (Pre-refunded 1/01/10) | 1/10 at 101.00 | AAA | 2,148,080 | |||||||
| 1,240 | Massachusetts Health and Educational Facilities Authority, FHA-Insured Revenue Bonds, Malden Hospital, Series 1982A, 5.000%, 8/01/16 (Pre-refunded 8/01/10) | 8/10 at 100.00 | AAA | 1,259,294 | |||||||
| 2,680 | Massachusetts Health and Educational Facilities Authority, Revenue Bonds, Partners HealthCare System Inc., Series 2001C, 5.750%, 7/01/32 (Pre-refunded 7/01/11) | 7/11 at 101.00 | Aa2 | (3) | 2,897,321 | ||||||
| 2,945 | Massachusetts Health and Educational Facilities Authority, Revenue Bonds, Winchester Hospital, Series 2000E, 6.750%, 7/01/30 (Pre-refunded 7/01/10) | 7/10 at 101.00 | N/R | (3) | 3,171,793 | ||||||
| 445 | Massachusetts Port Authority, Revenue Bonds, Series 1982, 13.000%, 7/01/13 (ETM) | 1/08 at 100.00 | AAA | 574,998 | |||||||
| 1,500 | Massachusetts, Special Obligation Dedicated Tax Revenue Bonds, Series 2004, 5.250%, 1/01/25 (Pre-refunded 1/01/14) – FGIC Insured | 1/14 at 100.00 | AAA | 1,615,635 | |||||||
| 1,000 | University of Massachusetts Building Authority, Senior Lien Project Revenue Bonds, Series 2004-1, 5.250%, 11/01/24 (Pre-refunded 11/01/14) – AMBAC Insured | 11/14 at 100.00 | AAA | 1,089,840 | |||||||
| 11,975 | Total U.S. Guaranteed | 12,931,534 | |||||||||
| Utilities – 3.0% | |||||||||||
| 1,000 | Massachusetts Development Finance Agency, Resource Recovery Revenue Bonds, SEMass System, Series 2001A, 5.625%, 1/01/16 – MBIA Insured | 1/12 at 101.00 | AAA | 1,074,080 | |||||||
| 1,000 | Massachusetts Industrial Finance Agency, Resource Recovery Revenue Refunding Bonds, Ogden Haverhill Project, Series 1998A, 5.600%, 12/01/19 (Alternative Minimum Tax) | 12/08 at 102.00 | BBB | 1,021,710 | |||||||
| 2,500 | Puerto Rico Electric Power Authority, Power Revenue Bonds, Series 2004PP, 5.000%, 7/01/22 – FGIC Insured | 7/14 at 100.00 | AAA | 2,593,525 | |||||||
| 4,500 | Total Utilities | 4,689,315 | |||||||||
| Water and Sewer – 7.7% | |||||||||||
| 2,000 | Boston Water and Sewerage Commission, Massachusetts, General Revenue Bonds, Senior Series 2004A, 5.000%, 11/01/25 | 11/14 at 100.00 | AAA | 2,063,660 | |||||||
| 380 | Massachusetts Water Pollution Abatement Trust, Pooled Loan Program Bonds, Series 10, 5.000%, 8/01/26 | 8/14 at 100.00 | AAA | 389,356 | |||||||
| 1,750 | Massachusetts Water Pollution Abatement Trust, Pooled Loan Program Bonds, Series 11, 4.500%, 8/01/29 | 8/15 at 100.00 | AAA | 1,694,455 | |||||||
| 60 | Massachusetts Water Pollution Abatement Trust, Pooled Loan Program Bonds, Series 9, 5.000%, 8/01/22 | 8/13 at 100.00 | AAA | 61,792 | |||||||
| 1,500 | Massachusetts Water Pollution Abatement Trust, Revenue Bonds, MWRA Loan Program, Series 2002A, 5.250%, 8/01/20 | 8/12 at 100.00 | AAA | 1,581,855 | |||||||
| Massachusetts Water Resources Authority, General Revenue Bonds, Series 2005A: | |||||||||||
| 1,650 | 5.000%, 8/01/27 – MBIA Insured | 8/17 at 100.00 | AAA | 1,704,005 | |||||||
| 1,585 | 5.000%, 8/01/28 – MBIA Insured | 8/17 at 100.00 | AAA | 1,638,161 | |||||||
| 2,080 | 5.000%, 8/01/29 – MBIA Insured | 8/17 at 100.00 | AAA | 2,148,078 | |||||||
| 1,125 | Massachusetts Water Resources Authority, General Revenue Bonds, Series 2006A, 4.000%, 8/01/46 | 8/16 at 100.00 | AA | 931,388 | |||||||
| 12,130 | Total Water and Sewer | 12,212,750 | |||||||||
| $ | 156,510 | Total Investments (cost $160,694,899) – 101.8% | 161,329,849 | ||||||||
Other Assets Less Liabilities – (1.8)% | (2,898,854) | ||||||||||
Net Assets – 100% | $ | 158,430,995 | |||||||||
| (1) | Optional Call Provisions: Dates (month and year) and prices of the earliest optional call or redemption. There may be other call provisions at varying prices at later dates. Certain mortgage-backed securities may be subject to periodic principal paydowns. |
| (2) | Ratings: Using the higher of Standard & Poor’s or Moody’s rating. Ratings below BBB by Standard & Poor’s Group or Baa by Moody’s Investor Service, Inc. are considered to be below investment grade. |
| (3) | Backed by an escrow or trust containing sufficient U.S. Government or U.S. Government agency securities which ensure the timely payment of principal and interest. Such investments are normally considered to be equivalent to AAA rated securities. |
| N/R | Not rated. |
| (ETM) | Escrowed to maturity. |
See accompanying notes to financial statements.
13
Portfolio of Investments (Unaudited)
Nuveen Massachusetts Insured Municipal Bond Fund
August 31, 2007
| Principal Amount (000) | Description | Optional Call Provisions (1) | Ratings (2) | Value | ||||||
| Education and Civic Organizations – 8.0% | ||||||||||
| $ | 865 | Massachusetts Development Finance Agency, Revenue Bonds, Boston University, Series 2005T-1, | 10/15 at 100.00 | AAA | $ | 880,215 | ||||
| 1,500 | Massachusetts Development Finance Agency, Revenue Bonds, Williston Northampton School, Series 2005B, 5.000%, 10/01/37 – XLCA Insured | 10/15 at 100.00 | Aaa | 1,519,335 | ||||||
| 895 | Massachusetts Development Finance Agency, Revenue Bonds, Worcester Polytecnic Institute, Series 2007, 5.000%, 9/01/37 – MBIA Insured | 9/17 at 100.00 | AAA | 914,439 | ||||||
| 1,790 | Massachusetts Educational Finance Authority, Educational Loan Revenue Bonds, Series 2002E, | 1/12 at 100.00 | AAA | 1,815,275 | ||||||
| 1,000 | Massachusetts Health and Educational Facilities Authority, Revenue Bonds, University of Massachusetts, Series 2005D, 5.250%, 10/01/24 – FGIC Insured | 10/14 at 100.00 | AAA | 1,050,900 | ||||||
| 6,050 | Total Education and Civic Organizations | 6,180,164 | ||||||||
| Health Care – 11.3% | ||||||||||
| 2,000 | Boston, Massachusetts, Special Obligation Bonds, Boston Medical Center, Series 2002, | 8/12 at 100.00 | AAA | 2,080,700 | ||||||
| 10 | Massachusetts Health and Educational Facilities Authority, Revenue Bonds, Capital Asset Program, Series 1989G-2, 7.200%, 7/01/09 – MBIA Insured | 1/08 at 100.00 | AAA | 10,026 | ||||||
| 1,205 | Massachusetts Health and Educational Facilities Authority, Revenue Bonds, CareGroup Inc., Series 1998A, 5.000%, 7/01/25 – MBIA Insured | 7/08 at 102.00 | AAA | 1,219,822 | ||||||
| 1,000 | Massachusetts Health and Educational Facilities Authority, Revenue Bonds, Dartmouth-Hitchcock Obligated Group, Series 2002, 5.125%, 8/01/22 – FSA Insured | 8/12 at 100.00 | AAA | 1,035,190 | ||||||
| 1,400 | Massachusetts Health and Educational Facilities Authority, Revenue Bonds, Lahey Clinic Medical Center, Series 2005C, 5.000%, 8/15/21 – FGIC Insured | 8/15 at 100.00 | AAA | 1,439,270 | ||||||
| 600 | Massachusetts Health and Educational Facilities Authority, Revenue Bonds, New England Medical Center Hospitals, Series 2002H, 5.375%, 5/15/19 – FGIC Insured | 5/12 at 100.00 | AAA | 633,054 | ||||||
| 2,290 | Puerto Rico Industrial, Tourist, Educational, Medical and Environmental Control Facilities Financing Authority, Hospital Revenue Bonds, Auxilio Mutuo Hospital, Series 1995A, 6.250%, 7/01/16 – MBIA Insured | 1/08 at 100.00 | AAA | 2,294,649 | ||||||
| 8,505 | Total Health Care | 8,712,711 | ||||||||
| Housing/Multifamily – 6.1% | ||||||||||
| 1,125 | Massachusetts Development Finance Authority, Multifamily Housing Revenue Bonds, Emerson Manor Project, Series 2007, 4.800%, 7/20/48 | 7/17 at 100.00 | AAA | 1,088,764 | ||||||
| 340 | Massachusetts Housing Finance Agency, Housing Development Revenue Bonds, Series 1998A, 5.375%, 6/01/16 – MBIA Insured (Alternative Minimum Tax) | 6/08 at 101.00 | AAA | 342,254 | ||||||
| 640 | Massachusetts Industrial Finance Agency, FHA-Insured Mortgage Loan Bonds, Hudner Associates Projects, Series 1997, 5.650%, 1/01/22 – MBIA Insured | 1/08 at 102.00 | AAA | 656,250 | ||||||
| 2,575 | Somerville Housing Authority, Massachusetts, GNMA Collateralized Mortgage Revenue Bonds, Clarendon Hill Towers, Series 2002, 5.200%, 11/20/22 | 5/12 at 103.00 | AAA | 2,651,143 | ||||||
| 4,680 | Total Housing/Multifamily | 4,738,411 | ||||||||
| Long-Term Care – 7.7% | ||||||||||
| 2,500 | Massachusetts Development Finance Authority, GNMA Collateralized Assisted Living Facility Revenue Bonds, Arbors at Chicopee, Series 2001A, 6.250%, 9/20/42 (Alternative Minimum Tax) | 3/12 at 105.00 | AAA | 2,688,275 | ||||||
| 3,185 | Massachusetts Industrial Finance Agency, GNMA Collateralized Assisted Living Facility Revenue Bonds, Arbors at Amherst LP, Series 1997, 5.950%, 6/20/39 (Alternative Minimum Tax) | 12/07 at 102.00 | AAA | 3,258,796 | ||||||
| 5,685 | Total Long-Term Care | 5,947,071 | ||||||||
| Tax Obligation/General – 33.8% | ||||||||||
| 1,520 | Fall River, Massachusetts, General Obligation Bonds, Series 2003, 5.250%, 2/01/17 – FSA Insured | 2/13 at 101.00 | AAA | 1,631,522 | ||||||
| 1,265 | Freetown Lakeville Regional School District, Plymouth County, Massachusetts, General Obligation Bonds, Series 2003, 5.000%, 1/01/15 – MBIA Insured | 1/13 at 101.00 | AAA | 1,346,365 | ||||||
14
| Principal Amount (000) | Description | Optional Call Provisions (1) | Ratings (2) | Value | ||||||
| Tax Obligation/General (continued) | ||||||||||
| $ | 1,000 | Massachusetts Bay Transportation Authority, General Obligation Transportation System Bonds, Series 1998A, 5.000%, 3/01/18 – MBIA Insured | 3/08 at 101.00 | AAA | $ | 1,015,170 | ||||
| 3,000 | Massachusetts, General Obligation Bonds, Consolidated Loan, Series 2001D, 6.000%, 11/01/13 – MBIA Insured | No Opt. Call | AAA | 3,362,759 | ||||||
| 1,500 | Monson, Massachusetts, Unlimited Tax General Obligation School Refunding Bonds, Series 1993, 5.500%, 10/15/10 – MBIA Insured | No Opt. Call | AAA | 1,580,445 | ||||||
| 1,250 | Northampton, Massachusetts, General Obligation Bonds, Series 2002, 5.000%, 9/01/19 – MBIA Insured | 9/12 at 101.00 | Aaa | 1,301,850 | ||||||
| 190 | Northfield, Massachusetts, General Obligation Bonds, Series 1992, 6.350%, 10/15/09 – MBIA Insured | 10/07 at 100.00 | AAA | 190,597 | ||||||
| 1,350 | Norwell, Massachusetts, General Obligation Bonds, Series 2005, 5.000%, 2/15/25 – AMBAC Insured | No Opt. Call | AAA | 1,402,299 | ||||||
| 1,230 | Pioneer Valley Regional School District, Massachusetts, General Obligation Bonds, Series 2002, 5.375%, 6/15/19 – AMBAC Insured | 6/12 at 101.00 | Aaa | 1,317,871 | ||||||
Puerto Rico, General Obligation and Public Improvement Bonds, Series 2001A: | ||||||||||
| 420 | 5.500%, 7/01/14 – FSA Insured (UB) | No Opt. Call | AAA | 462,462 | ||||||
| 1,275 | 5.500%, 7/01/16 – FSA Insured (UB) | No Opt. Call | AAA | 1,420,580 | ||||||
| 1,500 | 5.500%, 7/01/17 – FSA Insured (UB) | No Opt. Call | AAA | 1,679,415 | ||||||
| 1,725 | 5.500%, 7/01/18 – FSA Insured (UB) | No Opt. Call | AAA | 1,924,048 | ||||||
| 1,125 | 5.500%, 7/01/19 – FSA Insured (UB) | No Opt. Call | AAA | 1,255,759 | ||||||
| 1,800 | 5.500%, 7/01/29 – FGIC Insured | No Opt. Call | AAA | 2,025,576 | ||||||
| 1,770 | Reading, Massachusetts, General Obligation Bonds, Series 2004, 5.000%, 3/15/16 – MBIA Insured | 3/14 at 100.00 | AAA | 1,873,120 | ||||||
| 1,000 | Tantasqua Regional School District, Massachusetts, General Obligation Bonds, Series 2005, 5.000%, 10/01/16 – FSA Insured | 10/15 at 100.00 | Aaa | 1,069,170 | ||||||
| 220 | Taunton, Massachusetts, General Obligation Bonds, Series 1991, 6.800%, 9/01/09 – MBIA Insured | 9/07 at 100.00 | AAA | 220,552 | ||||||
| 500 | Woburn, Massachusetts, General Obligation Bonds, Series 2005, 5.000%, 11/15/19 – MBIA Insured | 11/15 at 100.00 | Aaa | 527,490 | ||||||
| 545 | Worcester, Massachusetts, General Obligation Bonds, Series 2001A, 5.500%, 8/15/18 – FGIC Insured | 8/11 at 100.00 | AAA | 578,000 | ||||||
| 24,185 | Total Tax Obligation/General | 26,185,050 | ||||||||
| Tax Obligation/Limited – 8.8% | ||||||||||
| 560 | Massachusetts College Building Authority, Project Revenue Bonds, Series 2006A, 5.000%, 5/01/31 – AMBAC Insured | 5/16 at 100.00 | AAA | 575,624 | ||||||
| 1,000 | Massachusetts College Building Authority, Project Revenue Refunding Bonds, Series 2003B, 5.375%, 5/01/22 – XLCA Insured | No Opt. Call | AAA | 1,098,230 | ||||||
| 1,100 | Massachusetts School Building Authority, Dedicated Sales Tax Revenue Bonds, Series 2005A, 5.000%, 8/15/20 – FSA Insured | 8/15 at 100.00 | AAA | 1,146,871 | ||||||
| 900 | Massachusetts School Building Authority, Dedicated Sales Tax Revenue Bonds, Series 2007A, 4.750%, 8/15/32 – AMBAC Insured | 8/17 at 100.00 | AAA | 899,325 | ||||||
| 460 | Massachusetts, Special Obligation Dedicated Tax Revenue Bonds, Series 2005, 5.000%, 1/01/20 – FGIC Insured | No Opt. Call | AAA | 490,774 | ||||||
| 475 | Puerto Rico Convention Center District Authority, Hotel Occupancy Tax Revenue Bonds, Series 2006A, 4.500%, 7/01/36 – CIFG Insured | 7/16 at 100.00 | AAA | 468,550 | ||||||
| 2,000 | Puerto Rico Highway and Transportation Authority, Highway Revenue Bonds, Series 2004J, 5.000%, 7/01/18 – MBIA Insured | 7/14 at 100.00 | AAA | 2,103,780 | ||||||
| 6,495 | Total Tax Obligation/Limited | 6,783,154 | ||||||||
| Transportation – 7.8% | ||||||||||
| 800 | Massachusetts Port Authority, Special Facilities Revenue Bonds, BOSFUEL Corporation, Series 2007, 5.000%, 7/01/32 – FGIC Insured (Alternative Minimum Tax) | 7/17 at 100.00 | Aaa | 800,560 | ||||||
| 1,000 | Massachusetts Port Authority, Revenue Bonds, Series 2003C, 5.000%, 7/01/18 – MBIA Insured | 7/13 at 100.00 | AAA | 1,045,430 | ||||||
| 1,630 | Massachusetts Port Authority, Revenue Bonds, Series 2005A, 5.000%, 7/01/23 – AMBAC Insured | 7/15 at 100.00 | AAA | 1,688,110 | ||||||
| 530 | Massachusetts Port Authority, Special Facilities Revenue Bonds, Delta Air Lines Inc., Series 2001A, 5.000%, 1/01/27 – AMBAC Insured (Alternative Minimum Tax) | 1/11 at 101.00 | AAA | 532,936 | ||||||
| 2,000 | Massachusetts Turnpike Authority, Metropolitan Highway System Revenue Bonds, Senior Series 1997A, 5.000%, 1/01/37 – MBIA Insured | 1/08 at 101.00 | AAA | 2,006,900 | ||||||
| 5,960 | Total Transportation | 6,073,936 | ||||||||
15
Portfolio of Investments (Unaudited)
Nuveen Massachusetts Insured Municipal Bond Fund (continued)
August 31, 2007
| Principal Amount (000) | Description | Optional Call Provisions (1) | Ratings (2) | Value | ||||||
| U.S. Guaranteed – 12.9% (3) | ||||||||||
| $ | 455 | Lawrence, Massachusetts, General Obligation Bonds, Series 2001, 5.000%, 2/01/21 | 2/11 at 100.00 | Aaa | $ | 474,328 | ||||
| 2,500 | Massachusetts Development Finance Authority, GNMA Collateralized Revenue Bonds, VOA Concord Assisted Living Inc., Series 2000A, 6.900%, 10/20/41 (Pre-refunded 10/20/11) | 10/11 at 105.00 | AAA | 2,911,375 | ||||||
| 295 | Massachusetts Health and Educational Facilities Authority, Revenue Bonds, CareGroup Inc., Series 1998A, 5.000%, 7/01/25 (Pre-refunded 7/01/21) – MBIA Insured | 7/21 at 100.00 | AAA | 313,650 | ||||||
| 850 | Massachusetts Municipal Wholesale Electric Company, Power Supply System Revenue Bonds, Nuclear Project 6, Series 1993A, 5.000%, 7/01/10 – AMBAC Insured (ETM) | 11/07 at 100.00 | AAA | 865,368 | ||||||
| 1,000 | Massachusetts, General Obligation Bonds, Consolidated Loan, Series 2002B, 5.500%, 3/01/17 (Pre-refunded 3/01/12) – FSA Insured | 3/12 at 100.00 | AAA | 1,072,490 | ||||||
| 2,000 | Massachusetts, Special Obligation Dedicated Tax Revenue Bonds, Series 2004, 5.250%, 1/01/21 (Pre-refunded 1/01/14) – FGIC Insured | 1/14 at 100.00 | AAA | 2,154,180 | ||||||
| 2,000 | University of Massachusetts Building Authority, Senior Lien Project Revenue Bonds, Series 2004-1, 5.375%, 11/01/18 (Pre-refunded 11/01/14) – AMBAC Insured | 11/14 at 100.00 | AAA | 2,195,240 | ||||||
| 9,100 | Total U.S. Guaranteed | 9,986,631 | ||||||||
| Utilities – 2.1% | ||||||||||
| 1,500 | Massachusetts Development Finance Agency, Resource Recovery Revenue Bonds, SEMass System, Series 2001A, 5.625%, 1/01/16 – MBIA Insured | 1/12 at 101.00 | AAA | 1,611,120 | ||||||
| Water and Sewer – 4.7% | ||||||||||
| 1,000 | Massachusetts Water Resources Authority, General Revenue Bonds, Series 2002J, 5.250%, 8/01/19 – FSA Insured | No Opt. Call | AAA | 1,093,590 | ||||||
| 750 | Massachusetts Water Resources Authority, General Revenue Bonds, Series 2005A, 5.000%, 8/01/28 – MBIA Insured | 8/17 at 100.00 | AAA | 775,155 | ||||||
| 875 | Massachusetts Water Resources Authority, General Revenue Bonds, Series 2006A, 4.000%, 8/01/46 | 8/16 at 100.00 | AA | 724,413 | ||||||
| 1,000 | Springfield Water and Sewerage Commission, Massachusetts, General Revenue Bonds, Series 2003A, 5.000%, 7/01/23 – MBIA Insured | 7/14 at 100.00 | AAA | 1,031,740 | ||||||
| 3,625 | Total Water and Sewer | 3,624,898 | ||||||||
| $ | 75,785 | Total Long-Term Investments (cost $78,269,488) – 103.2% | 79,843,146 | |||||||
| Short-Term Investments – 0.9% | ||||||||||
| $ | 700 | Puerto Rico Government Development Bank, Adjustable Refunding Bonds, Variable Rate Demand Obligations, Series 1985, 3.730%, 12/01/15 – MBIA Insured (4) | VMIG-1 | 700,000 | ||||||
Total Short-Term Investments (cost $700,000) | 700,000 | |||||||||
Total Investments (cost $78,969,488) – 104.1% | 80,543,146 | |||||||||
Floating Rate Obligations – (5.0)% | (3,845,000) | |||||||||
Other Assets Less Liabilities – 0.9% | 703,780 | |||||||||
Net Assets – 100% | $ | 77,401,926 | ||||||||
16
Forward Swaps outstanding at August 31, 2007:
| Counterparty | Notional Amount | Fund Pay/Receive Floating Rate | Floating Rate Index | Fixed Rate (Annualized) | Fixed Rate Payment Frequency | Effective Date (5) | Termination Date | Unrealized Appreciation (Depreciation) | ||||||||||||
| JPMorgan | $ | 1,000,000 | Pay | 3-Month USD-LIBOR | 5.388 | % | Semi-Annually | 4/25/08 | 4/25/35 | $ | (8,546 | ) | ||||||||
USD-LIBOR (United States Dollar-London Inter-Bank Offered Rate)
| The Fund primarily invests in bonds that are either covered by Original Issue Insurance, Secondary Market Insurance or Portfolio Insurance, or are backed by an escrow or trust containing sufficient U.S. Government or U.S. Government agency securities, any of which ensure the timely payment of principal and interest. |
| (1) | Optional Call Provisions: Dates (month and year) and prices of the earliest optional call or redemption. There may be other call provisions at varying prices at later dates. Certain mortgage-backed securities may be subject to periodic principal paydowns. |
| (2) | Ratings: Using the higher of Standard & Poor’s or Moody’s rating. Ratings below BBB by Standard & Poor’s Group or Baa by Moody’s Investor Service, Inc. are considered to be below investment grade. |
| (3) | Backed by an escrow or trust containing sufficient U.S. Government or U.S. Government agency securities which ensure the timely payment of principal and interest. |
| (4) | Investment has a maturity of more than one year, but has variable rate and demand features which qualify it as a short-term investment. The rate disclosed is that in effect at the end of the reporting period. This rate changes periodically based on market conditions or a specified market index. |
| (5) | Effective date represents the date on which both the Fund and counterparty commence interest payment accruals on each forward swap contract. |
| (ETM) | Escrowed to maturity. |
| (UB) | Underlying bond of an inverse floating rate trust reflected as a financing transaction pursuant to the provisions of SFAS No. 140. |
See accompanying notes to financial statements.
17
Statement of Assets and Liabilities (Unaudited)
August 31, 2007
| Massachusetts | Massachusetts Insured | |||||
Assets | ||||||
Investments, at value (cost $160,694,899 and $78,969,488, respectively) | $ | 161,329,849 | $ | 80,543,146 | ||
Cash | — | 125,168 | ||||
Receivables: | ||||||
Interest | 1,723,001 | 927,169 | ||||
Investments sold | 5,388,500 | — | ||||
Shares sold | 29,408 | 206 | ||||
Other assets | 60 | 35 | ||||
Total assets | 168,470,818 | 81,595,724 | ||||
Liabilities | ||||||
Cash overdraft | 8,601,707 | — | ||||
Unrealized depreciation on forward swaps | — | 8,546 | ||||
Floating Rate obligations | — | 3,845,000 | ||||
Payable for Fund shares redeemed | 753,160 | 23,000 | ||||
Accrued expenses: | ||||||
Management fees | 74,305 | 34,894 | ||||
12b-1 distribution and service fees | 26,110 | 13,470 | ||||
Other | 49,787 | 26,447 | ||||
Dividends payable | 534,754 | 242,441 | ||||
Total liabilities | 10,039,823 | 4,193,798 | ||||
Net assets | $ | 158,430,995 | $ | 77,401,926 | ||
Class A Shares | ||||||
Net assets | $ | 87,100,450 | $ | 20,040,475 | ||
Shares outstanding | 8,907,855 | 1,977,525 | ||||
Net asset value per share | $ | 9.78 | $ | 10.13 | ||
Offering price per share (net asset value per share plus | $ | 10.21 | $ | 10.57 | ||
Class B Shares | ||||||
Net assets | $ | 4,124,263 | $ | 5,246,736 | ||
Shares outstanding | 421,149 | 517,131 | ||||
Net asset value and offering price per share | $ | 9.79 | $ | 10.15 | ||
Class C Shares | ||||||
Net assets | $ | 11,065,530 | $ | 9,532,906 | ||
Shares outstanding | 1,140,510 | 940,560 | ||||
Net asset value and offering price per share | $ | 9.70 | $ | 10.14 | ||
Class R Shares | ||||||
Net assets | $ | 56,140,752 | $ | 42,581,809 | ||
Shares outstanding | 5,751,310 | 4,186,330 | ||||
Net asset value and offering price per share | $ | 9.76 | $ | 10.17 | ||
Net Assets Consist of: | ||||||
Capital paid-in | $ | 157,031,391 | $ | 75,444,521 | ||
Undistributed (over-distribution of) net investment income | 107,110 | 101,905 | ||||
Accumulated net realized gain (loss) from investments | 657,544 | 290,388 | ||||
Net unrealized appreciation (depreciation) of investments and derivative transactions | 634,950 | 1,565,112 | ||||
Net assets | $ | 158,430,995 | $ | 77,401,926 | ||
See accompanying notes to financial statements.
18
Statement of Operations (Unaudited)
Six Months Ended August 31, 2007
| Massachusetts | Massachusetts Insured | |||||||
Investment Income | $ | 4,046,646 | $ | 1,934,419 | ||||
Expenses | ||||||||
Management fees | 457,613 | 212,294 | ||||||
12b-1 service fees – Class A | 98,854 | 20,602 | ||||||
12b-1 distribution and service fees – Class B | 20,836 | 25,933 | ||||||
12b-1 distribution and service fees – Class C | 42,039 | 34,597 | ||||||
Shareholders’ servicing agent fees and expenses | 45,678 | 25,487 | ||||||
Interest expense on floating rate obligations | — | 78,862 | ||||||
Custodian’s fees and expenses | 33,391 | 24,695 | ||||||
Trustees’ fees and expenses | 1,962 | 1,030 | ||||||
Professional fees | 7,604 | 5,346 | ||||||
Shareholders’ reports – printing and mailing expenses | 17,364 | 9,000 | ||||||
Federal and state registration fees | 3,596 | 2,990 | ||||||
Other expenses | 2,137 | 1,308 | ||||||
Total expenses before custodian fee credit | 731,074 | 442,144 | ||||||
Custodian fee credit | (9,751 | ) | (5,834 | ) | ||||
Net expenses | 721,323 | 436,310 | ||||||
Net investment income | 3,325,323 | 1,498,109 | ||||||
Realized and Unrealized Gain (Loss) | ||||||||
Net realized gain (loss) from investments | 452,437 | 151,746 | ||||||
Net change in unrealized appreciation (depreciation) of: | ||||||||
Investments | (6,411,828 | ) | (1,989,255 | ) | ||||
Forward swaps | — | (8,546 | ) | |||||
Net realized and unrealized gain (loss) | (5,959,391 | ) | (1,846,055 | ) | ||||
Net increase (decrease) in net assets from operations | $ | (2,634,068 | ) | $ | (347,946 | ) | ||
See accompanying notes to financial statements.
19
Statement of Changes in Net Assets (Unaudited)
| Massachusetts | Massachusetts Insured | |||||||||||||||
| Six Months Ended 8/31/07 | Year Ended 2/28/07 | Six Months Ended 8/31/07 | Year Ended 2/28/07 | |||||||||||||
Operations | ||||||||||||||||
Net investment income | $ | 3,325,323 | $ | 6,450,407 | $ | 1,498,109 | $ | 3,203,105 | ||||||||
Net realized gain (loss) from investments | 452,437 | 215,621 | 151,746 | 138,762 | ||||||||||||
Net change in unrealized appreciation (depreciation) of: | ||||||||||||||||
Investments | (6,411,828 | ) | 1,372,320 | (1,989,255 | ) | 50,473 | ||||||||||
Forward swaps | — | — | (8,546 | ) | — | |||||||||||
Net increase (decrease) in net assets from operations | (2,634,068 | ) | 8,038,348 | (347,946 | ) | 3,392,340 | ||||||||||
Distributions to Shareholders | ||||||||||||||||
From net investment income: | ||||||||||||||||
Class A | (1,849,405 | ) | (3,355,123 | ) | (385,158 | ) | (882,629 | ) | ||||||||
Class B | (65,495 | ) | (159,330 | ) | (81,294 | ) | (176,509 | ) | ||||||||
Class C | (180,268 | ) | (390,834 | ) | (145,310 | ) | (282,435 | ) | ||||||||
Class R | (1,139,235 | ) | (2,354,731 | ) | (865,437 | ) | (1,822,106 | ) | ||||||||
From accumulated net realized gains: | ||||||||||||||||
Class A | — | — | — | (74,035 | ) | |||||||||||
Class B | — | — | — | (18,358 | ) | |||||||||||
Class C | — | — | — | (26,500 | ) | |||||||||||
Class R | — | — | — | (144,728 | ) | |||||||||||
Decrease in net assets from distributions to shareholders | (3,234,403 | ) | (6,260,018 | ) | (1,477,199 | ) | (3,427,300 | ) | ||||||||
Fund Share Transactions | ||||||||||||||||
Net proceeds from sale of shares | 14,050,111 | 48,525,877 | 2,914,404 | 2,972,935 | ||||||||||||
Net proceeds from shares issued to shareholders due | 1,310,547 | 2,636,778 | 1,009,557 | 2,270,324 | ||||||||||||
| 15,360,658 | 51,162,655 | 3,923,961 | 5,243,259 | |||||||||||||
Cost of shares redeemed | (29,564,219 | ) | (26,282,798 | ) | (5,490,578 | ) | (13,269,081 | ) | ||||||||
Net increase (decrease) in net assets from Fund share transactions | (14,203,561 | ) | 24,879,857 | (1,566,617 | ) | (8,025,822 | ) | |||||||||
Net increase (decrease) in net assets | (20,072,032 | ) | 26,658,187 | (3,391,762 | ) | (8,060,782 | ) | |||||||||
Net assets at the beginning of period | 178,503,027 | 151,844,840 | 80,793,688 | 88,854,470 | ||||||||||||
Net assets at the end of period | $ | 158,430,995 | $ | 178,503,027 | $ | 77,401,926 | $ | 80,793,688 | ||||||||
Undistributed (Over-distribution of) net investment income at the end of period | $ | 107,110 | $ | 16,190 | $ | 101,905 | $ | 80,995 | ||||||||
See accompanying notes to financial statements.
20
Notes to Financial Statements (Unaudited)
1. General Information and Significant Accounting Policies
The Nuveen Multistate Trust II (the “Trust”) is an open-end investment company registered under the Investment Company Act of 1940, as amended. The Trust is comprised of Nuveen Massachusetts Municipal Bond Fund (“Massachusetts”) and Nuveen Massachusetts Insured Municipal Bond Fund (“Massachusetts Insured”) (collectively, the “Funds”), among others. The Trust was organized as a Massachusetts business trust on July 1, 1996. The Funds were each organized as a series of predecessor trusts or corporations prior to that date.
The Funds seek to provide tax-free income and preservation of capital through investments in diversified portfolios of municipal bonds.
The following is a summary of significant accounting policies followed by the Funds in the preparation of their financial statements in accordance with accounting principles generally accepted in the United States.
Investment Valuation
The prices of municipal bonds in each Fund’s investment portfolio are provided by a pricing service approved by the Fund’s Board of Trustees. When market price quotes are not readily available (which is usually the case for municipal securities), the pricing service may establish fair value based on yields or prices of municipal bonds of comparable quality, type of issue, coupon, maturity and rating, indications of value from securities dealers, evaluations of anticipated cash flows or collateral and general market conditions. Prices of forward swap contracts are also provided by an independent pricing service approved by each Fund’s Board of Trustees. If the pricing service is unable to supply a price for a municipal bond or forward swap contract, each Fund may use a market price or fair market value quote provided by a major broker/dealer in such investments. If it is determined that the market price or fair market value for an investment or derivative transaction is unavailable or inappropriate, the Board of Trustees of the Funds, or its designee, may establish a fair value for the investment. Temporary investments in securities that have variable rate and demand features qualifying them as short-term investments are valued at amortized cost, which approximates market value.
Investment Transactions
Investment transactions are recorded on a trade date basis. Realized gains and losses from transactions are determined on the specific identification method. Investments purchased on a when-issued/delayed delivery basis may have extended settlement periods. Any investments so purchased are subject to market fluctuation during this period. The Funds have instructed the custodian to segregate assets with a current value at least equal to the amount of the when-issued/delayed delivery purchase commitments. At August 31, 2007, there were no such outstanding purchase commitments in either of the Funds.
Investment Income
Interest income, which includes the amortization of premiums and accretion of discounts for financial reporting purposes, is recorded on an accrual basis. Investment income also includes paydown gains and losses, if any.
Dividends and Distributions to Shareholders
Tax-exempt net investment income is declared monthly as a dividend. Generally, payment is made or reinvestment is credited to shareholder accounts on the first business day after month-end. Net realized capital gains and/or market discount from investment transactions, if any, are distributed to shareholders not less frequently than annually. Furthermore, capital gains are distributed only to the extent they exceed available capital loss carryforwards.
Distributions to shareholders of tax-exempt net investment income, net realized capital gains and/or market discount, if any, are recorded on the ex-dividend date. The amount and timing of distributions are determined in accordance with federal income tax regulations, which may differ from accounting principles generally accepted in the United States.
Income Taxes
Each Fund is a separate taxpayer for federal income tax purposes. Each Fund intends to distribute substantially all net investment income and net capital gains to shareholders and to otherwise comply with the requirements of Subchapter M of the Internal Revenue Code applicable to regulated investment companies. Therefore, no federal income tax provision is required. Furthermore, each Fund intends to satisfy conditions which will enable interest from municipal securities, which is exempt from regular federal and Massachusetts state income taxes, to retain such tax-exempt status when distributed to shareholders of the Funds. Net realized capital gains and ordinary income distributions paid by the Funds are subject to federal taxation.
Insurance
Massachusetts Insured invests primarily in municipal securities which are either covered by insurance or backed by an escrow or trust account containing sufficient U.S. Government or U.S. Government agency securities, both of which ensure the timely payment of principal and interest. Each insured municipal security is covered by Original Issue Insurance, Secondary Market Insurance or Portfolio Insurance. Such insurance does not guarantee the market value of the municipal securities or the value of the Fund’s shares. Original Issue Insurance and Secondary Market Insurance remain in effect as long as the municipal securities covered thereby remain outstanding and the insurer remains in business, regardless of whether the Fund ultimately disposes of such municipal securities. Consequently, the market value of the municipal securities covered by Original Issue Insurance or Secondary Market Insurance may reflect value attributable to the insurance. Portfolio Insurance, in contrast, is effective only while the
21
Notes to Financial Statements (Unaudited) (continued)
municipal securities are held by the Fund. Accordingly, neither the prices used in determining the market value of the underlying municipal securities nor the net asset value of the Fund’s shares include value, if any, attributable to the Portfolio Insurance. Each policy of the Portfolio Insurance does, however, give the Fund the right to obtain permanent insurance with respect to the municipal security covered by the Portfolio Insurance policy at the time of its sale.
Flexible Sales Charge Program
Each Fund offers Class A, B, C and R Shares. Class A Shares are generally sold with an up-front sales charge and incur a .20% annual 12b-1 service fee. Class A Share purchases of $1 million or more are sold at net asset value without an up-front sales charge but may be subject to a contingent deferred sales charge (“CDSC”) if redeemed within 18 months of purchase. Class B Shares are sold without an up-front sales charge but incur a .75% annual 12b-1 distribution fee and a .20% annual 12b-1 service fee. An investor purchasing Class B Shares agrees to pay a CDSC of up to 5% depending upon the length of time the shares are held by the investor (CDSC is reduced to 0% at the end of six years). Class B Shares convert to Class A Shares eight years after purchase. Class C Shares are sold without an up-front sales charge but incur a .55% annual 12b-1 distribution fee and a .20% annual 12b-1 service fee. An investor purchasing Class C Shares agrees to pay a CDSC of 1% if Class C Shares are redeemed within one year of purchase. Class R Shares are not subject to any sales charge or 12b-1 distribution or service fees. Class R Shares are available only under limited circumstances.
Inverse Floating Rate Securities
Each Fund may invest in inverse floating rate securities. An inverse floating rate security is created by depositing a municipal bond, typically with a fixed interest rate, into a special purpose trust created by a broker-dealer. In turn, this trust (a) issues floating rate certificates, in face amounts equal to some fraction of the deposited bond’s par amount or market value, that typically pay short-term tax-exempt interest rates to third parties, and (b) issues to a long-term investor (such as one of the Funds) an inverse floating rate certificate (sometimes referred to as an “inverse floater”) that represents all remaining or residual interest in the trust. The income received by the inverse floater holder varies inversely with the short-term rate paid to the floating rate certificates’ holders, and in most circumstances the inverse floater holder bears substantially all of the underlying bond’s downside investment risk and also benefits disproportionately from any potential appreciation of the underlying bond’s value. The price of an inverse floating rate security will be more volatile than that of the underlying bond because the interest rate is dependent on not only the fixed coupon rate of the underlying bond but also on the short-term interest paid on the floating rate certificates, and because the inverse floating rate security essentially bears the risk of loss of the greater face value of the underlying bond.
A Fund may purchase an inverse floating rate security in a secondary market transaction without first owning the underlying bond (referred to as an “externally-deposited inverse floater”), or instead by first selling a fixed-rate bond to a broker-dealer for deposit into the special purpose trust and receiving in turn the residual interest in the trust (referred to as a “self-deposited inverse floater”). An investment in an externally-deposited inverse floater is identified in the Portfolio of Investments as an “Inverse floating rate investment”. An investment in a self-deposited inverse floater is accounted for as a financing transaction in accordance with Statement of Financial Accounting Standards (SFAS) No. 140 “Accounting for Transfers and Servicing of Financial Assets and Extinguishment of Liabilities”. In such instances, a fixed-rate bond deposited into a special purpose trust is identified in the Portfolio of Investments as an “Underlying bond of an inverse floating rate trust”, with the Fund accounting for the short-term floating rate certificates issued by the trust as “Floating rate obligations” on the Statement of Assets and Liabilities. In addition, the Fund reflects in Investment Income the entire earnings of the underlying bond and accounts for the related interest paid to the holders of the short-term floating rate certificates as “Interest expense on floating rate obligations” in the Statement of Operations.
During the six months ended August 31, 2007, Massachusetts Insured invested in externally-deposited and/or self-deposited inverse floaters. Massachusetts did not invest in any such instruments during the six months ended August 31, 2007.
The average floating rate obligations outstanding and average annual interest rate and fees related to self-deposited inverse floaters during the six months ended August 31, 2007, were as follows:
| Massachusetts Insured | |||
Average floating rate obligations | $ | 3,845,000 | |
Average annual interest rate and fees | 4.07% | ||
Forward Swap Transactions
The Funds are authorized to invest in forward interest rate swap transactions. The Fund’s use of forward interest rate swap transactions is intended to help the Fund manage its overall interest rate sensitivity, either shorter or longer, generally to more closely align the Fund’s interest rate sensitivity with that of the broader municipal market. Forward interest rate swap transactions involve each Fund’s agreement with a counterparty to pay, in the future, a fixed or variable rate payment in exchange for the counterparty paying the Fund a variable or fixed rate payment, the accruals for which would begin at a specified date in the future (the “effective date”). The amount of the payment obligation is based on the notional amount of the forward swap contract and the termination date of the swap (which is akin to a bond’s maturity). The value of the Fund’s swap commitment would increase or decrease based primarily on the extent to which long-term interest rates for bonds having a maturity of the swap’s termination date
22
increases or decreases. The Funds may terminate a swap contract prior to the effective date, at which point a realized gain or loss is recognized. When a forward swap is terminated, it ordinarily does not involve the delivery of securities or other underlying assets or principal, but rather is settled in cash on a net basis. Each Fund intends, but is not obligated, to terminate its forward swaps before the effective date. Accordingly, the risk of loss with respect to the swap counterparty on such transactions is limited to the credit risk associated with a counterparty failing to honor its commitment to pay any realized gain to the Fund upon termination. To reduce such credit risk, all counterparties are required to pledge collateral daily (based on the daily valuation of each swap) on behalf of each Fund with a value approximately equal to the amount of any unrealized gain above a pre-determined threshold. Reciprocally, when any of the Funds have an unrealized loss on a swap contract, the Funds have instructed the custodian to pledge assets of the Funds as collateral with a value approximately equal to the amount of the unrealized loss above a pre-determined threshold. Collateral pledges are monitored and subsequently adjusted if and when the swap valuations fluctuate, either up or down, by at least the predetermined threshold amount. Massachusetts did not invest in forward interest rate swap contracts during the six months ended August 31, 2007.
Expense Allocation
Expenses of the Funds that are not directly attributable to a specific class of shares are prorated among the classes based on the relative net assets of each class. Expenses directly attributable to a class of shares, which presently only include 12b-1 distribution and service fees, are recorded to the specific class.
Custodian Fee Credit
Each Fund has an arrangement with the custodian bank whereby certain custodian fees and expenses are reduced by net credits earned on each Fund’s cash on deposit with the bank. Such deposit arrangements are an alternative to overnight investments. Credits for cash balances may be offset by charges for any days on which the Fund overdraws its account at the custodian bank.
Indemnifications
Under the Trust’s organizational documents, its Officers and Trustees are indemnified against certain liabilities arising out of the performance of their duties to the Trust. In addition, in the normal course of business, the Trust enters into contracts that provide general indemnifications to other parties. The Trust’s maximum exposure under these arrangements is unknown as this would involve future claims that may be made against the Trust that have not yet occurred. However, the Trust has not had prior claims or losses pursuant to these contracts and expects the risk of loss to be remote.
Use of Estimates
The preparation of financial statements in conformity with accounting principles generally accepted in the United States requires management to make estimates and assumptions that affect the reported amounts of assets and liabilities at the date of the financial statements and the reported amounts of increases and decreases in net assets from operations during the reporting period. Actual results may differ from those estimates.
2. Fund Shares
Transactions in Fund shares were as follows:
| Massachusetts | ||||||||||||||
Six Months Ended 8/31/07 | Year Ended 2/28/07 | |||||||||||||
| Shares | Amount | Shares | Amount | |||||||||||
Shares sold: | ||||||||||||||
Class A | 1,211,144 | $ | 11,930,214 | 4,518,079 | $ | 44,861,404 | ||||||||
Class A – automatic conversion of Class B shares | 12,676 | 127,137 | 54,003 | 539,806 | ||||||||||
Class B | 18,161 | 181,641 | 15,367 | 152,516 | ||||||||||
Class C | 146,400 | 1,430,520 | 251,755 | 2,490,719 | ||||||||||
Class R | 38,125 | 380,599 | 48,477 | 481,432 | ||||||||||
Shares issued to shareholders due to reinvestment | ||||||||||||||
Class A | 39,069 | 390,175 | 73,593 | 734,649 | ||||||||||
Class B | 2,914 | 29,163 | 7,826 | 78,207 | ||||||||||
Class C | 9,067 | 89,888 | 18,058 | 178,864 | ||||||||||
Class R | 80,349 | 801,321 | 165,096 | 1,645,058 | ||||||||||
| 1,557,905 | 15,360,658 | 5,152,254 | 51,162,655 | |||||||||||
Shares redeemed: | ||||||||||||||
Class A | (2,445,953 | ) | (23,996,615 | ) | (1,787,873 | ) | (17,743,859 | ) | ||||||
Class B | (39,669 | ) | (395,020 | ) | (113,156 | ) | (1,133,161 | ) | ||||||
Class B – automatic conversion to Class A shares | (12,660 | ) | (127,137 | ) | (53,915 | ) | (539,806 | ) | ||||||
Class C | (195,985 | ) | (1,932,607 | ) | (310,529 | ) | (3,073,099 | ) | ||||||
Class R | (313,189 | ) | (3,112,840 | ) | (381,218 | ) | (3,792,873 | ) | ||||||
| (3,007,456 | ) | (29,564,219 | ) | (2,646,691 | ) | (26,282,798 | ) | |||||||
Net increase (decrease) | (1,449,551 | ) | $ | (14,203,561 | ) | 2,505,563 | $ | 24,879,857 | ||||||
23
Notes to Financial Statements (Unaudited) (continued)
| Massachusetts Insured | ||||||||||||||
Six Months Ended 8/31/07 | Year Ended 2/28/07 | |||||||||||||
| Shares | Amount | Shares | Amount | |||||||||||
Shares sold: | ||||||||||||||
Class A | 100,619 | $ | 1,029,917 | 171,749 | $ | 1,764,504 | ||||||||
Class A – automatic conversion of Class B shares | 8,283 | 85,747 | 13,607 | 140,568 | ||||||||||
Class B | 6,702 | 68,705 | 16,540 | 169,360 | ||||||||||
Class C | 155,926 | 1,592,010 | 59,940 | 616,247 | ||||||||||
Class R | 13,501 | 138,025 | 27,463 | 282,256 | ||||||||||
Shares issued to shareholders due to reinvestment | ||||||||||||||
Class A | 24,612 | 252,288 | 55,656 | 573,182 | ||||||||||
Class B | 4,664 | 47,859 | 7,628 | 78,692 | ||||||||||
Class C | 8,496 | 87,077 | 17,481 | 180,007 | ||||||||||
Class R | 60,491 | 622,333 | 139,208 | 1,438,443 | ||||||||||
| 383,294 | 3,923,961 | 509,272 | 5,243,259 | |||||||||||
Shares redeemed: | ||||||||||||||
Class A | (177,143 | ) | (1,810,750 | ) | (549,883 | ) | (5,647,219 | ) | ||||||
Class B | (28,785 | ) | (293,428 | ) | (57,692 | ) | (594,495 | ) | ||||||
Class B – automatic conversion to Class A shares | (8,275 | ) | (85,747 | ) | (13,594 | ) | (140,568 | ) | ||||||
Class C | (62,924 | ) | (638,493 | ) | (193,337 | ) | (1,978,540 | ) | ||||||
Class R | (260,377 | ) | (2,662,160 | ) | (476,122 | ) | (4,908,259 | ) | ||||||
| (537,504 | ) | (5,490,578 | ) | (1,290,628 | ) | (13,269,081 | ) | |||||||
Net increase (decrease) | (154,210 | ) | $ | (1,566,617 | ) | (781,356 | ) | $ | (8,025,822 | ) | ||||
3. Investment Transactions
Purchases and sales (including maturities but excluding short-term investments and derivative transactions) during the six months ended August 31, 2007, were as follows:
| Massachusetts | Massachusetts Insured | |||||
Purchases | $ | 17,638,165 | $ | 5,819,169 | ||
Sales and maturities | 25,974,494 | 9,792,538 | ||||
4. Income Tax Information
The following information is presented on an income tax basis. Differences between amounts for financial statement and federal income tax purposes are primarily due to the treatment of paydown gains and losses, timing differences in recognizing taxable market discount, timing differences in recognizing certain gains and losses on investment transactions and the treatment of investments in inverse floating rate transactions subject to SFAS No. 140. To the extent that differences arise that are permanent in nature, such amounts are reclassified within the capital accounts on the Statement of Assets and Liabilities presented in the annual report, based on their federal tax basis treatment; temporary differences do not require classification. Temporary and permanent differences do not impact the net asset values of the Funds.
At August 31, 2007, the cost of investments was as follows:
| Massachusetts | Massachusetts Insured | |||||
Cost of investments | $ | 160,683,650 | $ | 75,069,881 | ||
Gross unrealized appreciation and gross unrealized depreciation of investments at August 31, 2007, were as follows:
| Massachusetts | Massachusetts Insured | |||||||
Gross unrealized: | ||||||||
Appreciation | $ | 2,759,775 | $ | 2,032,799 | ||||
Depreciation | (2,113,576 | ) | (402,990 | ) | ||||
Net unrealized appreciation (depreciation) of investments | $ | 646,199 | $ | 1,629,809 | ||||
24
The tax components of undistributed net tax-exempt income, net ordinary income and net long-term capital gains at February 28, 2007, the Funds’ last tax year end, were as follows:
| Massachusetts | Massachusetts Insured | |||||
Undistributed net tax-exempt income* | $ | 533,966 | $ | 268,524 | ||
Undistributed net ordinary income** | 6,153 | — | ||||
Undistributed net long-term capital gains | 205,121 | 138,642 | ||||
* Undistributed net tax-exempt income (on a tax basis) has not been reduced for the dividend declared on February 9, 2007, paid on March 1, 2007.
** Net ordinary income consists of taxable market discount income and net short-term capital gains, if any.
The tax character of distributions paid during the Funds’ last tax year ended February 28, 2007, was designated for purposes of the dividends paid deduction as follows:
| Massachusetts | Massachusetts Insured | |||||
Distributions from net tax-exempt income | $ | 6,174,799 | $ | 3,179,642 | ||
Distributions from net ordinary income** | — | 2,043 | ||||
Distributions from net long-term capital gains | — | 263,621 | ||||
** Net ordinary income consists of taxable market discount income and net short-term capital gains, if any.
5. Management Fee and Other Transactions with Affiliates
Each Fund’s management fee is separated into two components – a complex-level component, based on the aggregate amount of all fund assets managed by Nuveen Asset Management (the “Adviser”), a wholly owned subsidiary of Nuveen Investments, Inc. (“Nuveen”), and a specific fund-level component, based only on the amount of assets within each individual Fund. This pricing structure enables Nuveen fund shareholders to benefit from growth in the assets within each individual fund as well as from growth in the amount of complex-wide assets managed by the Adviser.
The annual fund-level fee, payable monthly, for each Fund is based upon the average daily net assets of each Fund as follows:
| Average Daily Net Assets | Fund-Level Fee Rate | ||
For the first $125 million | .3500 | % | |
For the next $125 million | .3375 | ||
For the next $250 million | .3250 | ||
For the next $500 million | .3125 | ||
For the next $1 billion | .3000 | ||
For the next $3 billion | .2750 | ||
For net assets over $5 billion | .2500 |
The annual complex-level fee, payable monthly, which is additive to the fund-level fee, for all Nuveen sponsored funds in the U.S., is based on the aggregate amount of total fund assets managed as stated in the table below. As of August 31, 2007, the complex-level fee rate was .1841%.
Effective August 20, 2007, the complex-level fee schedule is as follows:
| Complex-Level Assets Breakpoint Level(1) | Effective Rate at Breakpoint Level | ||
$55 billion | .2000 | % | |
$56 billion | .1996 | ||
$57 billion | .1989 | ||
$60 billion | .1961 | ||
$63 billion | .1931 | ||
$66 billion | .1900 | ||
$71 billion | .1851 | ||
$76 billion | .1806 | ||
$80 billion | .1773 | ||
$91 billion | .1691 | ||
$125 billion | .1599 | ||
$200 billion | .1505 | ||
$250 billion | .1469 | ||
$300 billion | .1445 |
25
Notes to Financial Statements (Unaudited) (continued)
Prior to August 20, 2007, the complex-level fee schedule was as follows:
| Complex-Level Assets Breakpoint Level(1) | Effective Rate at Breakpoint Level | ||
$55 billion | .2000 | % | |
$56 billion | .1996 | ||
$57 billion | .1989 | ||
$60 billion | .1961 | ||
$63 billion | .1931 | ||
$66 billion | .1900 | ||
$71 billion | .1851 | ||
$76 billion | .1806 | ||
$80 billion | .1773 | ||
$91 billion | .1698 | ||
$125 billion | .1617 | ||
$200 billion | .1536 | ||
$250 billion | .1509 | ||
$300 billion | .1490 |
| (1) | The complex-level fee component of the management fee for the funds is calculated based upon the aggregate Managed Assets (“Managed Assets” means the average daily net assets of each fund including assets attributable to preferred stock issued by or borrowings by the Nuveen funds) of Nuveen-sponsored funds in the U.S. |
The management fee compensates the Adviser for overall investment advisory and administrative services and general office facilities. The Trust pays no compensation directly to those of its Trustees who are affiliated with the Adviser or to its Officers, all of whom receive remuneration for their services to the Trust from the Adviser or its affiliates. The Board of Trustees has adopted a deferred compensation plan for independent Trustees that enables Trustees to elect to defer receipt of all or a portion of the annual compensation they are entitled to receive from certain Nuveen advised funds. Under the plan, deferred amounts are treated as though equal dollar amounts had been invested in shares of select Nuveen advised funds.
The Adviser has agreed to waive part of its management fees or reimburse certain expenses of each Fund in order to limit total expenses (excluding 12b-1 distribution and service fees, interest expense, taxes, fees incurred in acquiring and disposing of portfolio securities and extraordinary expenses) from exceeding .75% of the average daily net assets of Massachusetts and .975% of the average daily net assets of Massachusetts Insured. The Adviser may also voluntarily reimburse additional expenses from time to time. Voluntary reimbursements may be terminated at any time at the Adviser’s discretion.
During the six months ended August 31, 2007, Nuveen Investments, LLC (the “Distributor”), a wholly owned subsidiary of Nuveen, collected sales charges on purchases of Class A Shares, the majority of which were paid out as concessions to financial intermediaries as follows:
| Massachusetts | Massachusetts Insured | |||||
Sales charges collected | $ | 46,984 | $ | 13,338 | ||
Paid to financial intermediaries | 40,313 | 10,383 | ||||
The Distributor also received 12b-1 service fees on Class A Shares, substantially all of which were paid to compensate financial intermediaries for providing services to shareholders relating to their investments.
During the six months ended August 31, 2007, the Distributor compensated financial intermediaries directly with commission advances at the time of purchase as follows:
| Massachusetts | Massachusetts Insured | |||||
Commission advances | $ | 16,774 | $ | 15,461 | ||
To compensate for commissions advanced to financial intermediaries, all 12b-1 service fees collected on Class B Shares during the first year following a purchase, all 12b-1 distribution fees collected on Class B Shares, and all 12b-1 service and distribution fees collected on Class C Shares during the first year following a purchase are retained by the Distributor. During the six months ended August 31, 2007, the Distributor retained such 12b-1 fees as follows:
| Massachusetts | Massachusetts Insured | |||||
12b-1 fees retained | $ | 25,454 | $ | 24,920 | ||
26
The remaining 12b-1 fees charged to the Funds were paid to compensate financial intermediaries for providing services to shareholders relating to their investments.
The Distributor also collected and retained CDSC on share redemptions during the six months ended August 31, 2007, as follows:
| Massachusetts | Massachusetts Insured | |||||
CDSC retained | $ | 9,568 | $ | 2,440 | ||
Agreement and Plan of Merger
On June 20, 2007, Nuveen Investments announced that it had entered into a definitive Agreement and Plan of Merger (“Merger Agreement”) with Windy City Investments, Inc. (“Windy City”), a corporation formed by investors led by Madison Dearborn Partners, LLC, pursuant to which Windy City would acquire Nuveen Investments. Madison Dearborn Partners, LLC is a private equity investment firm based in Chicago, Illinois. The investors include an affiliate of Merrill Lynch. It is anticipated that Merrill Lynch and its affiliates will be indirect “affiliated persons” (as that term is defined in the Investment Company Act of 1940) of the Funds upon and after the acquisition. One important implication of this is that the Funds will not be able to buy securities from or sell securities to Merrill Lynch; however, the portfolio management teams and Fund management do not expect that this will significantly impact the ability of the Funds to pursue their investment objectives and policies. Under the terms of the merger, each outstanding share of Nuveen Investments’ common stock (other than dissenting shares) will be converted into the right to receive a specified amount of cash, without interest. The merger is expected to be completed by the end of the year, subject to customary conditions. The obligations of Windy City to consummate the merger are not conditioned on its obtaining financing.
The consummation of the merger will be deemed to be an “assignment” (as defined in the 1940 Act) of the investment management agreement between each Fund and the Adviser, and will result in the automatic termination of each Fund’s agreement. The Board of Trustees of each Fund has approved a new investment management agreement with the Adviser. On October 12, 2007, at a meeting of the respective Funds’ shareholders, Massachusetts and Massachusetts Insured received the required number of shareholder votes to approve the new investment management agreements. The new agreements will take effect upon consummation of the merger of Nuveen Investments and Windy City.
6. New Accounting Pronouncement
Financial Accounting Standards Board Interpretation No. 48
Effective August 31, 2007, the Funds adopted Financial Accounting Standards Board Interpretation No. 48, “Accounting for Uncertainty in Income Taxes” (FIN 48). FIN 48 provides guidance regarding how uncertain tax positions should be recognized, measured, presented and disclosed in the financial statements. FIN 48 requires the evaluation of tax positions taken or expected to be taken in the course of preparing the Funds’ tax returns to determine whether the tax positions are “more-likely-than-not” of being sustained by the applicable tax authority. Tax positions not deemed to meet the more-likely-than-not threshold would be recorded as a tax benefit or expense in the current year. Management of the Funds has concluded that there are no significant uncertain tax positions that require recognition in the Funds’ financial statements. Consequently, the adoption of FIN 48 had no impact on the net assets or results of operations of the Funds.
Financial Accounting Standards Board Statement of Financial Accounting Standards No. 157
In September 2006, the Financial Accounting Standards Board (FASB) issued Statement of Financial Accounting Standards (SFAS) No. 157, “Fair Value Measurements.” This standard establishes a single authoritative definition of fair value, sets out a framework for measuring fair value and requires additional disclosures about fair value measurements. SFAS No. 157 applies to fair value measurements already required or permitted by existing standards. SFAS No. 157 is effective for financial statements issued for fiscal years beginning after November 15, 2007, and interim periods within those fiscal years. The changes to current generally accepted accounting principles from the application of this standard relate to the definition of fair value, the methods used to measure fair value, and the expanded disclosures about fair value measurements. As of August 31, 2007, management does not believe the adoption of SFAS No. 157 will impact the financial statement amounts; however, additional disclosures may be required about the inputs used to develop the measurements and the effect of certain of the measurements included within the Statement of Operations for the period.
7. Subsequent Events
Distributions to Shareholders
The Funds declared dividend distributions from their tax-exempt net investment income which were paid on October 1, 2007, to shareholders of record on September 7, 2007, as follows:
| Massachusetts | Massachusetts Insured | |||||
Dividend per share: | ||||||
Class A | $ | .0310 | $ | .0320 | ||
Class B | .0250 | .0255 | ||||
Class C | .0265 | .0270 | ||||
Class R | .0325 | .0335 | ||||
27
Financial Highlights (Unaudited)
Selected data for a share outstanding throughout each period:
| Class (Commencement Date) | ||||||||||||||||||||||||||||||||||||||||||||||||||||||||
| Investment Operations | Less Distributions | Ratios/Supplemental Data | ||||||||||||||||||||||||||||||||||||||||||||||||||||||
| MASSACHUSETTS | Ratios to Average | Ratios to Average Net Assets After Reimbursement(c) | Ratios to Average Net Assets After Credit/ Reimbursement(d) | |||||||||||||||||||||||||||||||||||||||||||||||||||||
| Year Ended February 28/29, | Beginning Net Asset Value | Net Invest- ment Income(a) | Net Realized/ Unrealized Gain (Loss) | Total | Net Invest- ment Income | Capital Gains | Total | Ending Net Asset Value | Total Return(b) | Ending Net Assets (000) | Expenses | Net Invest- ment Income | Expenses | Net Invest- ment Income | Expenses | Net Invest- ment Income | Portfolio Turnover Rate | |||||||||||||||||||||||||||||||||||||||
| Class A (9/94) | ||||||||||||||||||||||||||||||||||||||||||||||||||||||||
2008(e) | $ | 10.11 | $ | .19 | $ | (.33 | ) | $ | (.14 | ) | $ | (.19 | ) | $ | — | $ | (.19 | ) | $ | 9.78 | (1.44 | )% | $ | 87,100 | .86 | %* | 3.82 | %* | .86 | %* | 3.82 | %* | .85 | %* | 3.83 | %* | 10 | % | ||||||||||||||||||
2007 | 10.03 | .38 | .07 | .45 | (.37 | ) | — | (.37 | ) | 10.11 | 4.62 | 102,045 | .87 | 3.82 | .87 | 3.82 | .85 | 3.84 | 4 | |||||||||||||||||||||||||||||||||||||
2006 | 10.09 | .39 | (.03 | ) | .36 | (.39 | ) | (.03 | ) | (.42 | ) | 10.03 | 3.65 | 72,519 | .88 | 3.86 | .88 | 3.86 | .86 | 3.87 | 9 | |||||||||||||||||||||||||||||||||||
2005 | 10.13 | .41 | (.04 | ) | .37 | (.41 | ) | — | (.41 | ) | 10.09 | 3.75 | 45,302 | .91 | 4.06 | .91 | 4.06 | .91 | 4.06 | 11 | ||||||||||||||||||||||||||||||||||||
2004 | 9.98 | .42 | .16 | .58 | (.43 | ) | — | (.43 | ) | 10.13 | 5.95 | 28,720 | .94 | 4.25 | .94 | 4.25 | .93 | 4.25 | 22 | |||||||||||||||||||||||||||||||||||||
2003 | 9.75 | .45 | .24 | .69 | (.46 | ) | — | (.46 | ) | 9.98 | 7.27 | 21,751 | .95 | 4.62 | .95 | 4.62 | .94 | 4.63 | 14 | |||||||||||||||||||||||||||||||||||||
| Class B (3/97) | ||||||||||||||||||||||||||||||||||||||||||||||||||||||||
2008(e) | 10.13 | .15 | (.34 | ) | (.19 | ) | (.15 | ) | — | (.15 | ) | 9.79 | (1.89 | ) | 4,124 | 1.61 | * | 3.07 | * | 1.61 | * | 3.07 | * | 1.59 | * | 3.08 | * | 10 | ||||||||||||||||||||||||||||
2007 | 10.04 | .31 | .08 | .39 | (.30 | ) | — | (.30 | ) | 10.13 | 3.96 | 5,989 | 1.62 | 3.07 | 1.62 | 3.07 | 1.60 | 3.09 | 4 | |||||||||||||||||||||||||||||||||||||
2006 | 10.11 | .31 | (.03 | ) | .28 | (.32 | ) | (.03 | ) | (.35 | ) | 10.04 | 2.80 | 5,989 | 1.64 | 3.09 | 1.64 | 3.09 | 1.62 | 3.11 | 9 | |||||||||||||||||||||||||||||||||||
2005 | 10.15 | .33 | (.04 | ) | .29 | (.33 | ) | — | (.33 | ) | 10.11 | 3.00 | 7,300 | 1.66 | 3.30 | 1.66 | 3.30 | 1.65 | 3.31 | 11 | ||||||||||||||||||||||||||||||||||||
2004 | 10.01 | .35 | .15 | .50 | (.36 | ) | — | (.36 | ) | 10.15 | 5.07 | 7,976 | 1.68 | 3.49 | 1.68 | 3.49 | 1.68 | 3.50 | 22 | |||||||||||||||||||||||||||||||||||||
2003 | 9.77 | .38 | .25 | .63 | (.39 | ) | — | (.39 | ) | 10.01 | 6.58 | 8,031 | 1.70 | 3.87 | 1.70 | 3.87 | 1.69 | 3.88 | 14 | |||||||||||||||||||||||||||||||||||||
| Class C (10/94) | ||||||||||||||||||||||||||||||||||||||||||||||||||||||||
2008(e) | 10.04 | .16 | (.34 | ) | (.18 | ) | (.16 | ) | — | (.16 | ) | 9.70 | (1.82 | ) | 11,066 | 1.41 | * | 3.27 | * | 1.41 | * | 3.27 | * | 1.39 | * | 3.28 | * | 10 | ||||||||||||||||||||||||||||
2007 | 9.95 | .33 | .08 | .41 | (.32 | ) | — | (.32 | ) | 10.04 | 4.19 | 11,853 | 1.44 | 3.30 | 1.44 | 3.30 | 1.40 | 3.29 | 4 | |||||||||||||||||||||||||||||||||||||
2006 | 10.02 | .33 | (.03 | ) | .30 | (.34 | ) | (.03 | ) | (.37 | ) | 9.95 | 3.01 | 12,160 | 1.44 | 3.30 | 1.44 | 3.30 | 1.42 | 3.32 | 9 | |||||||||||||||||||||||||||||||||||
2005 | 10.06 | .35 | (.04 | ) | .31 | (.35 | ) | — | (.35 | ) | 10.02 | 3.21 | 11,160 | 1.46 | 3.50 | 1.46 | 3.50 | 1.45 | 3.51 | 11 | ||||||||||||||||||||||||||||||||||||
2004 | 9.92 | .37 | .14 | .51 | (.37 | ) | — | (.37 | ) | 10.06 | 5.31 | 11,025 | 1.48 | 3.69 | 1.48 | 3.69 | 1.48 | 3.70 | 22 | |||||||||||||||||||||||||||||||||||||
2003 | 9.69 | .40 | .24 | .64 | (.41 | ) | — | (.41 | ) | 9.92 | 6.73 | 9,703 | 1.50 | 4.07 | 1.50 | 4.07 | 1.49 | 4.08 | 14 | |||||||||||||||||||||||||||||||||||||
| Class R (12/86) | ||||||||||||||||||||||||||||||||||||||||||||||||||||||||
2008(e) | 10.09 | .20 | (.33 | ) | (.13 | ) | (.20 | ) | — | (.20 | ) | 9.76 | (1.35 | ) | 56,141 | .66 | * | 4.02 | * | .66 | * | 4.02 | * | .65 | * | 4.03 | * | 10 | ||||||||||||||||||||||||||||
2007 | 10.01 | .40 | .07 | .47 | (.39 | ) | — | (.39 | ) | 10.09 | 4.81 | 60,022 | .67 | 4.02 | .67 | 4.02 | .65 | 4.04 | 4 | |||||||||||||||||||||||||||||||||||||
2006 | 10.07 | .41 | (.03 | ) | .38 | (.41 | ) | (.03 | ) | (.44 | ) | 10.01 | 3.84 | 61,177 | .68 | 4.05 | .68 | 4.05 | .67 | 4.06 | 9 | |||||||||||||||||||||||||||||||||||
2005 | 10.11 | .42 | (.04 | ) | .38 | (.42 | ) | — | (.42 | ) | 10.07 | 3.95 | 63,379 | .71 | 4.25 | .71 | 4.25 | .70 | 4.26 | 11 | ||||||||||||||||||||||||||||||||||||
2004 | 9.96 | .44 | .16 | .60 | (.45 | ) | — | (.45 | ) | 10.11 | 6.16 | 65,483 | .73 | 4.45 | .73 | 4.45 | .72 | 4.45 | 22 | |||||||||||||||||||||||||||||||||||||
2003 | 9.73 | .47 | .24 | .71 | (.48 | ) | — | (.48 | ) | 9.96 | 7.59 | 66,545 | .75 | 4.83 | .75 | 4.83 | .74 | 4.84 | 14 | |||||||||||||||||||||||||||||||||||||
| * | Annualized. |
| (a) | Per share Net Investment Income is calculated using the average daily shares method. |
| (b) | Total return is the combination of changes in net asset value, reinvested dividend income at net asset value and reinvested capital gains distributions at net asset value, if any. The last dividend declared in the period, which is typically paid on the first business day of the following month, is assumed to be reinvested at the ending net asset value. The actual reinvest price for the last dividend declared in the period may be different from the price used in the calculation. Total returns are not annualized. |
| (c) | After expense reimbursement from the Adviser, where applicable. |
| (d) | After custodian fee credit and expense reimbursement, where applicable. |
| (e) | For the six months ended August 31, 2007. |
See accompanying notes to financial statements.
28
Selected data for a share outstanding throughout each period:
| Class (Commencement Date) | ||||||||||||||||||||||||||||||||||||||||||||||||||||||||
| Investment Operations | Less Distributions | Ratios/Supplemental Data | ||||||||||||||||||||||||||||||||||||||||||||||||||||||
| MASSACHUSETTS INSURED | Ratios to Average | Ratios to Average | Ratios to Average | |||||||||||||||||||||||||||||||||||||||||||||||||||||
| Year Ended February 28/29, | Beginning Net Asset Value | Net Invest- ment Income(a) | Net Realized/ Unrealized Gain (Loss) | Total | Net Invest- ment Income | Capital Gains | Total | Ending Net Asset Value | Total Return(b) | Ending Net Assets (000) | Expenses(e) | Net Invest- ment Income | Expenses(e) | Net Invest- ment Income | Expenses(e) | Net Invest- ment Income | Portfolio Turnover Rate | |||||||||||||||||||||||||||||||||||||||
| Class A (9/94) | ||||||||||||||||||||||||||||||||||||||||||||||||||||||||
2008(f) | $ | 10.37 | $ | .19 | $ | (.24 | ) | $ | (.05 | ) | $ | (.19 | ) | $ | — | $ | (.19 | ) | $ | 10.13 | (.46 | )% | $ | 20,040 | 1.11 | * | 3.74 | %* | 1.11 | %* | 3.74 | %* | 1.09 | %* | 3.76 | %* | 7 | % | ||||||||||||||||||
2007 | 10.37 | .39 | .02 | .41 | (.38 | ) | (.03 | ) | (.41 | ) | 10.37 | 3.48 | 20,958 | 1.06 | 3.75 | 1.06 | 3.75 | 1.05 | 3.76 | 6 | ||||||||||||||||||||||||||||||||||||
2006 | 10.44 | .40 | (.04 | ) | .36 | (.39 | ) | (.04 | ) | (.43 | ) | 10.37 | 3.48 | 24,153 | .90 | 3.79 | .90 | 3.79 | .89 | 3.81 | 14 | |||||||||||||||||||||||||||||||||||
2005 | 10.72 | .41 | (.21 | ) | .20 | (.42 | ) | (.06 | ) | (.48 | ) | 10.44 | 1.95 | 21,233 | .91 | 3.95 | .91 | 3.95 | .90 | 3.95 | 26 | |||||||||||||||||||||||||||||||||||
2004 | 10.54 | .43 | .19 | .62 | (.44 | ) | — | (.44 | ) | 10.72 | 6.03 | 21,179 | .93 | 4.11 | .93 | 4.11 | .92 | 4.12 | 36 | |||||||||||||||||||||||||||||||||||||
2003 | 10.36 | .45 | .23 | .68 | (.47 | ) | (.03 | ) | (.50 | ) | 10.54 | 6.74 | 23,212 | .93 | 4.36 | .93 | 4.36 | .92 | 4.38 | 18 | ||||||||||||||||||||||||||||||||||||
| Class B (3/97) | ||||||||||||||||||||||||||||||||||||||||||||||||||||||||
2008(f) | 10.38 | .16 | (.24 | ) | (.08 | ) | (.15 | ) | — | (.15 | ) | 10.15 | (.74 | ) | 5,247 | 1.85 | * | 3.00 | * | 1.85 | * | 3.00 | * | 1.84 | * | 3.01 | * | 7 | ||||||||||||||||||||||||||||
2007 | 10.38 | .31 | .03 | .34 | (.31 | ) | (.03 | ) | (.34 | ) | 10.38 | 3.33 | 5,635 | 1.81 | 3.00 | 1.81 | 3.00 | 1.80 | 3.02 | 6 | ||||||||||||||||||||||||||||||||||||
2006 | 10.45 | .32 | (.04 | ) | .28 | (.31 | ) | (.04 | ) | (.35 | ) | 10.38 | 2.70 | 6,121 | 1.65 | 3.04 | 1.65 | 3.04 | 1.64 | 3.05 | 14 | |||||||||||||||||||||||||||||||||||
2005 | 10.73 | .33 | (.21 | ) | .12 | (.34 | ) | (.06 | ) | (.40 | ) | 10.45 | 1.19 | 6,759 | 1.66 | 3.20 | 1.66 | 3.20 | 1.65 | 3.20 | 26 | |||||||||||||||||||||||||||||||||||
2004 | 10.55 | .35 | .19 | .54 | (.36 | ) | — | (.36 | ) | 10.73 | 5.24 | 7,183 | 1.68 | 3.37 | 1.68 | 3.37 | 1.67 | 3.37 | 36 | |||||||||||||||||||||||||||||||||||||
2003 | 10.37 | .38 | .23 | .61 | (.40 | ) | (.03 | ) | (.43 | ) | 10.55 | 5.94 | 6,361 | 1.68 | 3.59 | 1.68 | 3.59 | 1.67 | 3.61 | 18 | ||||||||||||||||||||||||||||||||||||
| Class C (9/94) | ||||||||||||||||||||||||||||||||||||||||||||||||||||||||
2008(f) | 10.37 | .17 | (.24 | ) | (.07 | ) | (.16 | ) | — | (.16 | ) | 10.14 | (.66 | ) | 9,533 | 1.66 | * | 3.20 | * | 1.66 | * | 3.20 | * | 1.64 | * | 3.21 | * | 7 | ||||||||||||||||||||||||||||
2007 | 10.36 | .33 | .03 | .36 | (.32 | ) | (.03 | ) | (.35 | ) | 10.37 | 3.62 | 8,700 | 1.61 | 3.21 | 1.61 | 3.21 | 1.60 | 3.22 | 6 | ||||||||||||||||||||||||||||||||||||
2006 | 10.44 | .34 | (.05 | ) | .29 | (.33 | ) | (.04 | ) | (.37 | ) | 10.36 | 2.78 | 9,895 | 1.45 | 3.24 | 1.45 | 3.24 | 1.44 | 3.25 | 14 | |||||||||||||||||||||||||||||||||||
2005 | 10.71 | .35 | (.20 | ) | .15 | (.36 | ) | (.06 | ) | (.42 | ) | 10.44 | 1.46 | 11,981 | 1.46 | 3.40 | 1.46 | 3.40 | 1.45 | 3.40 | 26 | |||||||||||||||||||||||||||||||||||
2004 | 10.53 | .37 | .19 | .56 | (.38 | ) | — | (.38 | ) | 10.71 | 5.43 | 12,879 | 1.48 | 3.56 | 1.48 | 3.56 | 1.47 | 3.57 | 36 | |||||||||||||||||||||||||||||||||||||
2003 | 10.35 | .40 | .22 | .62 | (.41 | ) | (.03 | ) | (.44 | ) | 10.53 | 6.14 | 12,935 | 1.48 | 3.79 | 1.48 | 3.79 | 1.47 | 3.81 | 18 | ||||||||||||||||||||||||||||||||||||
| Class R (12/86) | ||||||||||||||||||||||||||||||||||||||||||||||||||||||||
2008(f) | 10.41 | .20 | (.24 | ) | (.04 | ) | (.20 | ) | — | (.20 | ) | 10.17 | (.37 | ) | 42,582 | .91 | * | 3.94 | * | .91 | * | 3.94 | * | .89 | * | 3.96 | * | 7 | ||||||||||||||||||||||||||||
2007 | 10.40 | .41 | .03 | .44 | (.40 | ) | (.03 | ) | (.43 | ) | 10.41 | 4.39 | 45,501 | .86 | 3.96 | .86 | 3.96 | .85 | 3.97 | 6 | ||||||||||||||||||||||||||||||||||||
2006 | 10.47 | .42 | (.04 | ) | .38 | (.41 | ) | (.04 | ) | (.45 | ) | 10.40 | 3.64 | 48,685 | .70 | 3.99 | .70 | 3.99 | .69 | 4.00 | 14 | |||||||||||||||||||||||||||||||||||
2005 | 10.75 | .43 | (.21 | ) | .22 | (.44 | ) | (.06 | ) | (.50 | ) | 10.47 | 2.12 | 50,432 | .71 | 4.15 | .71 | 4.15 | .70 | 4.15 | 26 | |||||||||||||||||||||||||||||||||||
2004 | 10.56 | .45 | .20 | .65 | (.46 | ) | — | (.46 | ) | 10.75 | 6.30 | 54,344 | .73 | 4.31 | .73 | 4.31 | .72 | 4.32 | 36 | |||||||||||||||||||||||||||||||||||||
2003 | 10.38 | .48 | .22 | .70 | (.49 | ) | (.03 | ) | (.52 | ) | 10.56 | 6.91 | 56,496 | .73 | 4.58 | .73 | 4.58 | .72 | 4.59 | 18 | ||||||||||||||||||||||||||||||||||||
| * | Annualized. |
| (a) | Per share Net Investment Income is calculated using the average daily shares method. |
| (b) | Total return is the combination of changes in net asset value, reinvested dividend income at net asset value and reinvested capital gains distributions at net asset value, if any. The last dividend declared in the period, which is typically paid on the first business day of the following month, is assumed to be reinvested at the ending net asset value. The actual reinvest price for the last dividend declared in the period may be different from the price used in the calculation. Total returns are not annualized. |
| (c) | After expense reimbursement from the Adviser, where applicable. |
| (d) | After custodian fee credit and expense reimbursement, where applicable. |
| (e) | The expense ratios in the above table reflect, among other things, the interest expense deemed to have been paid by the Fund on the floating rate certificates issued by the special purpose trusts for the self-deposited inverse floaters held by the Fund, as described in Footnote 1 – Inverse Floating Rate Securities. The amount of this deemed interest expense for such periods expressed as a percentage of average net assets for each share class was as follows: |
Interest Expense on Floating Rate Obligations to Average Net Assets | ||
2008(f) | .20%* | |
2007 | .17 | |
2006 | — | |
2005 | — | |
2004 | — | |
2003 | — | |
| (f) | For the six months ended August 31, 2007. |
See accompanying notes to financial statements.
29
Annual Investment Management Agreement Approval Process
The Board Members are responsible for overseeing the performance of the investment adviser to the Funds and determining whether to continue the advisory arrangements. At the annual review meeting held on May 21, 2007 (the “May Meeting”), the Board Members of the Funds, including the Independent Board Members, unanimously approved the continuance of the Investment Management Agreement between each Fund (each, a “Fund”) and Nuveen Asset Management (“NAM”). The foregoing Investment Management Agreements with NAM are hereafter referred to as “Original Investment Management Agreements.”
Subsequent to the May Meeting, Nuveen Investments, Inc. (“Nuveen”), the parent company of NAM, entered into a merger agreement providing for the acquisition of Nuveen by Windy City Investments, Inc., a corporation formed by investors led by Madison Dearborn Partners, LLC (“MDP”), a private equity investment firm (the “Transaction”). Each Original Investment Management Agreement, as required by Section 15 of the Investment Company Act of 1940 (the “1940 Act”), provides for its automatic termination in the event of its “assignment” (as defined in the 1940 Act). Any change in control of the adviser is deemed to be an assignment. The consummation of the Transaction will result in a change of control of NAM as well as its affiliated sub-advisers and therefore cause the automatic termination of each Original Investment Management Agreement, as required by the 1940 Act.
Accordingly, in anticipation of the Transaction, at a meeting held on July 31, 2007 (the “July Meeting”), the Board Members, including the Independent Board Members, unanimously approved new Investment Management Agreements (the “New Investment Management Agreements”) with NAM on behalf of each Fund to take effect immediately after the Transaction or shareholder approval of the new advisory contracts, whichever is later. The 1940 Act also requires that each New Investment Management Agreement be approved by the respective Fund’s shareholders in order for it to become effective. Accordingly, to ensure continuity of advisory services, the Board Members, including the Independent Board Members, unanimously approved Interim Investment Management Agreements to take effect upon the closing of the Transaction if shareholders have not yet approved the New Investment Management Agreements.
Because the information provided and considerations made at the annual review at the May Meeting continue to be relevant with respect to the evaluation of the New Investment Management Agreements, the Board considered the foregoing as part of its deliberations of the New Investment Management Agreements. Accordingly, as indicated, the discussions immediately below outline the materials and information presented to the Board in connection with the Board’s prior annual review and the analysis undertaken and the conclusions reached by the Board Members when determining to continue the Original Investment Management Agreements.
I. Approval of the Original Investment Management Agreements
During the course of the year, the Board received a wide variety of materials relating to the services provided by NAM and the performance of the Funds. At each of its quarterly meetings, the Board reviewed investment performance and various matters relating to the operations of the Funds and other Nuveen funds, including the compliance program, shareholder services, valuation, custody, distribution and other information relating to the nature, extent and quality of services provided by NAM. Between the regularly scheduled quarterly meetings, the Board Members received information on particular matters as the need arose.
In preparation for their considerations at the May Meeting, the Independent Board Members also received extensive materials, well in advance of the meeting, which outlined or are related to, among other things:
| • | the nature, extent and quality of services provided by NAM; |
| • | the organization and business operations of NAM, including the responsibilities of various departments and key personnel; |
| • | each Fund’s past performance as well as the Fund’s performance compared to funds with similar investment objectives based on data and information provided by an independent third party and to customized benchmarks; |
| • | the profitability of Nuveen and certain industry profitability analyses for unaffiliated advisers; |
| • | the expenses of Nuveen in providing the various services; |
| • | the advisory fees and total expense ratios of each Fund, including comparisons of such fees and expenses with those of comparable, unaffiliated funds based on information and data provided by an independent third party (the “Peer Universe”) as well as compared to a subset of funds within the Peer Universe (the “Peer Group”) of the respective Fund (as applicable); |
| • | the advisory fees NAM assesses to other types of investment products or clients; |
| • | the soft dollar practices of NAM, if any; and |
| • | from independent legal counsel, a legal memorandum describing among other things, applicable laws, regulations and duties in reviewing and approving advisory contracts. |
At the May Meeting, NAM made a presentation to, and responded to questions from, the Board. The Independent Board Members also met privately with their legal counsel to review the Board’s duties in reviewing advisory contracts and considering the renewal of the advisory contracts. The Independent Board Members, in consultation with independent counsel, reviewed the factors set out
30
in judicial decisions and Securities and Exchange Commission (“SEC”) directives relating to the renewal of advisory contracts. As outlined in more detail below, the Board Members considered all factors they believed relevant with respect to each Fund, including, but not limited to, the following: (a) the nature, extent and quality of the services to be provided by NAM; (b) the investment performance of the Fund and NAM; (c) the costs of the services to be provided and profits to be realized by Nuveen and its affiliates; (d) the extent to which economies of scale would be realized; and (e) whether fee levels reflect those economies of scale for the benefit of the Fund’s investors. In addition, as noted, the Board Members met regularly throughout the year to oversee the Funds. In evaluating the Original Investment Management Agreements, the Board Members also relied upon their knowledge of NAM, its services and the Funds resulting from their meetings and other interactions throughout the year. It is with this background that the Board Members considered each Original Investment Management Agreement.
A. Nature, Extent and Quality of Services
In considering the renewal of the Original Investment Management Agreements, the Board Members considered the nature, extent and quality of NAM’s services. The Board Members reviewed materials outlining, among other things, Nuveen’s organization and business; the types of services that NAM or its affiliates provide or are expected to provide to the Funds; the performance record of the applicable Fund (as described in further detail below); and at the annual review, any initiatives Nuveen had taken for the municipal fund product line. As noted, the Board Members were already familiar with the organization, operations and personnel of NAM due to the Board Members’ experience in governing the respective Funds and working with NAM on matters relating to the Funds.
At the May Meeting, the Board Members also recognized NAM’s investment in additional qualified personnel throughout the various groups in the organization and recommended to NAM that it continue to review staffing needs as necessary. In addition, the Board Members reviewed materials describing the current status, and, in particular, the developments in 2006 with respect to NAM’s investment process, investment strategies (including additional tools used in executing such strategies), personnel (including portfolio management and research teams), trading process, hedging activities, risk management operations (e.g., reviewing credit quality, duration limits, and derivatives use, as applicable), and investment operations (such as enhancements to trading procedures, pricing procedures, and client services). The Board Members also recognized NAM’s investment of resources and efforts to continue to enhance and refine its investment processes.
In addition to advisory services, the Independent Board Members considered the quality of administrative and non-advisory services provided by NAM and noted that NAM and its affiliates provide the Funds with a wide variety of services and officers and other personnel as are necessary for the operations of the Funds, including:
| • | product management; |
| • | fund administration; |
| • | oversight by shareholder services and other fund service providers; |
| • | administration of Board relations; |
| • | regulatory and portfolio compliance; and |
| • | legal support. |
As the Funds operate in a highly regulated industry and given the importance of compliance, the Board Members considered, in particular, NAM’s compliance activities for the Funds and enhancements thereto. In this regard, the Board Members recognized the quality of NAM’s compliance team. The Board Members further noted NAM’s negotiations with other service providers and the corresponding reduction in certain service providers’ fees at the May Meeting.
Based on their review, the Board Members found that, overall, the nature, extent and quality of services provided (and expected to be provided) to the Funds under the respective Original Investment Management Agreement were satisfactory.
B. The Investment Performance of the Funds and NAM
At the May Meeting, the Board considered the investment performance for each Fund, including the Fund’s historic performance as well as its performance compared to funds with similar investment objectives (the “Performance Peer Group”) based on data provided by an independent third party (as described below). In addition, the Board Members reviewed portfolio level performance (which does not reflect fund level fees and expenses) against customized benchmarks, as described in further detail below.
In evaluating the performance information during the annual review at the May Meeting, in certain instances, the Board Members noted that the closest Performance Peer Group for a fund may not adequately reflect such fund’s investment objectives and strategies, thereby limiting the usefulness of the comparisons of such fund’s performance with that of the Performance Peer Group. These Performance Peer Groups include those for the Nuveen Intermediate Duration Municipal Bond Fund (although such Fund has been reclassified in a more appropriate peer group for 2007).
In addition to the foregoing, with respect to state specific municipal funds, the Board Members also recognized that certain funds do not have a corresponding state specific Performance Peer Group in which case their performance is measured against a more
31
Annual Investment Management Agreement Approval Process (continued)
general municipal category for various states. The open-end state municipal funds that utilize the more general category are the Nuveen New Mexico Municipal Bond Fund and the Nuveen Wisconsin Municipal Bond Fund.
Further, with respect to each Fund, the Board Members reviewed performance information including, among other things, total return information compared with such Fund’s Performance Peer Group for the one-, three- and five-year periods (as applicable) ending December 31, 2006. The Board Members also reviewed each Fund’s portfolio level performance (which does not reflect fund level fees and expenses) compared to customized portfolio level benchmarks for the one- and three-year periods ending December 31, 2006 (as applicable). The analysis was used to assess the efficacy of investment decisions against appropriate measures of risk and total return, within specific market segments. This information supplemented the Fund performance information provided to the Board at each of its quarterly meetings. Based on their review, the Board Members determined that each Fund’s investment performance over time had been satisfactory.
C. Fees, Expenses and Profitability
1. Fees and Expenses
During the annual review, the Board evaluated the management fees and expenses of each Fund reviewing, among other things, such Fund’s advisory fees (net and gross management fees) and total expense ratios (before and after expense reimbursements and/or waivers) in absolute terms as well as comparisons to the gross management fees (before waivers), net management fees (after waivers) and total expense ratios (before and after waivers) of comparable funds in the Peer Universe and the Peer Group. In reviewing the fee schedule for a Fund, the Board Members considered the fund-level and complex-wide breakpoint schedules (described in further detail below) and any fee waivers and reimbursements provided by Nuveen. The Board Members further reviewed data regarding the construction of Peer Groups as well as the methods of measurement for the fee and expense analysis and the performance analysis. In certain cases, due to the small number of peers in the Peer Universe, the Peer Universe and Peer Group had significant overlap or even consisted entirely of the same unaffiliated funds. In reviewing the comparisons of fee and expense information, the Board Members recognized that in certain cases, the size of the fund relative to peers, the small size and odd composition of the Peer Group (including differences in objectives and strategies), expense anomalies, timing of information used or other factors impacting the comparisons thereby limited some of the usefulness of the comparative data. Based on their review of the fee and expense information provided, the Board Members determined that each Fund’s net total expense ratio was within an acceptable range compared to peers.
2. Comparisons with the Fees of Other Clients
At the annual review, the Board Members further reviewed data comparing the advisory fees of NAM with fees NAM charges to other clients. Such clients include NAM’s municipal separately managed accounts. In general, the advisory fees charged for separate accounts are somewhat lower than the advisory fees assessed to the Funds. The Board Members considered the differences in the product types, including, but not limited to, the services provided, the structure and operations, product distribution and costs thereof, portfolio investment policies, investor profiles, account sizes and regulatory requirements. The Board Members noted, in particular, that the range of services provided to the Funds (as discussed above) is much more extensive than that provided to separately managed accounts. As described in further detail above, such additional services include, but are not limited to: product management, fund administration, oversight of third party service providers, administration of Board relations, and legal support. The Board Members noted that the Funds operate in a highly regulated industry requiring extensive compliance functions compared to other investment products. Given the inherent differences in the products, particularly the extensive services provided to the Funds, the Board Members believe such facts justify the different levels of fees.
3. Profitability of Nuveen
In conjunction with its review of fees, the Board Members also considered the profitability of Nuveen for its advisory activities (which incorporated Nuveen’s wholly-owned affiliated sub-advisers) and its financial condition. At the annual review, the Board Members reviewed the revenues and expenses of Nuveen’s advisory activities for the last three years, the allocation methodology used in preparing the profitability data as well as the 2006 Annual Report for Nuveen. The Board Members noted this information supplemented the profitability information requested and received during the year to help keep them apprised of developments affecting profitability (such as changes in fee waivers and expense reimbursement commitments). In this regard, the Board Members noted the enhanced dialogue and information regarding profitability with NAM during the year, including more frequent meetings and updates from Nuveen’s corporate finance group. The Board Members considered Nuveen’s profitability compared with other fund sponsors prepared by three independent third party service providers as well as comparisons of the revenues, expenses and profit margins of various unaffiliated management firms with similar amounts of assets under management prepared by Nuveen.
In reviewing profitability, the Board Members recognized the subjective nature of determining profitability which may be affected by numerous factors including the allocation of expenses. Further, the Board Members recognized the difficulties in making comparisons as the profitability of other advisers generally is not publicly available and the profitability information that is available for certain advisers or management firms may not be representative of the industry and may be affected by, among other things, the adviser’s particular business mix, capital costs, types of funds managed and expense allocations.
32
Notwithstanding the foregoing, the Board Members reviewed Nuveen’s methodology at the annual review and assumptions for allocating expenses across product lines to determine profitability. Last year, the Board Members also designated an Independent Board Member as a point person for the Board to review the methodology determinations during the year and any refinements thereto, which relevant information produced from such process was reported to the full Board. In reviewing profitability, the Board Members recognized Nuveen’s increased investment in its fund business. Based on its review, the Board Members concluded that Nuveen’s level of profitability for its advisory activities was reasonable in light of the services provided.
In evaluating the reasonableness of the compensation, the Board Members also considered other amounts paid to NAM by the Funds as well as any indirect benefits (such as soft dollar arrangements, if any) NAM and its affiliates receive, or are expected to receive, that are directly attributable to the management of the Funds, if any. See Section E below for additional information on indirect benefits NAM may receive as a result of its relationship with the Funds. Based on their review of the overall fee arrangement of each Fund, the Board Members determined that the advisory fees and expenses were reasonable.
D. Economies of Scale and Whether Fee Levels Reflect These Economies of Scale
With respect to economies of scale, the Board Members recognized the potential benefits resulting from the costs of a Fund being spread over a larger asset base. To help ensure the shareholders share in these benefits, the Board Members reviewed and considered the breakpoints in the advisory fee schedules that reduce advisory fees. In addition to advisory fee breakpoints, the Board also approved a complex-wide fee arrangement in 2004. Pursuant to the complex-wide fee arrangement, the fees of the funds in the Nuveen complex, including the Funds, are reduced as the assets in the fund complex reach certain levels. In evaluating the complex-wide fee arrangement, the Board Members noted that the last complex-wide asset level breakpoint for the complex-wide fee schedule was at $91 billion and that the Board Members anticipated further review and/or negotiations prior to the assets of the Nuveen complex reaching such threshold. Based on their review, the Board Members concluded that the breakpoint schedule and complex-wide fee arrangement were acceptable and desirable in providing benefits from economies of scale to shareholders, subject to further evaluation of the complex-wide fee schedule as assets in the complex increase. See Section II, Paragraph D –“Approval of the New Investment Management Agreements – Economies of Scale and Whether Fee Levels Reflect These Economies of Scale” for information regarding subsequent modifications to the complex-wide fee.
E. Indirect Benefits
In evaluating fees, the Board Members also considered any indirect benefits or profits NAM or its affiliates may receive as a result of its relationship with each Fund. In this regard, during the annual review, the Board Members considered, among other things, any sales charges and distribution fees received and retained by the Funds’ principal underwriter, Nuveen Investments, LLC, an affiliate of NAM. The Board Members also recognized that an affiliate of NAM provides distribution and shareholder services to the Funds and their shareholders for which it may be compensated pursuant to a 12b-1 plan. The Board Members, therefore, considered the 12b-1 fees retained by Nuveen during the last calendar year.
In addition to the above, the Board Members considered whether NAM received any benefits from soft dollar arrangements whereby a portion of the commissions paid by a Fund for brokerage may be used to acquire research that may be useful to NAM in managing the assets of the Funds and other clients. With respect to NAM, the Board Members noted that NAM does not currently have any soft dollar arrangements; however, to the extent certain bona fide agency transactions that occur on markets that traditionally trade on a principal basis and riskless principal transactions are considered as generating “commissions,” NAM intends to comply with the applicable safe harbor provisions.
Based on their review, the Board Members concluded that any indirect benefits received by NAM as a result of its relationship with the Funds were reasonable and within acceptable parameters.
F. Other Considerations
The Board Members did not identify any single factor discussed previously as all-important or controlling in their considerations to continue an advisory contract. The Board Members, including the Independent Board Members, unanimously concluded that the terms of the Original Investment Management Agreements are fair and reasonable, that NAM’s fees are reasonable in light of the services provided to each Fund and that the Original Investment Management Agreements be renewed.
II. Approval of the New Investment Management Agreements
Following the May Meeting, the Board Members were advised of the potential Transaction. As noted above, the completion of the Transaction would terminate each of the Original Investment Management Agreements. Accordingly, at the July Meeting, the Board of each Fund, including the Independent Board Members, unanimously approved the New Investment Management Agreements on behalf of the respective Funds. Leading up to the July Meeting, the Board Members had several meetings and deliberations with and without Nuveen management present, and with the advice of legal counsel, regarding the proposed Transaction as outlined below.
On June 8, 2007, the Board Members held a special telephonic meeting to discuss the proposed Transaction. At that meeting, the Board Members established a special ad hoc committee comprised solely of Independent Board Members to focus on the Transaction and to keep the Independent Board Members updated with developments regarding the Transaction. On June 15, 2007, the ad hoc committee discussed with representatives of NAM the Transaction and modifications to the complex-wide fee schedule that would generate additional fee savings at specified levels of complex-wide asset growth. Following the foregoing meetings and
33
Annual Investment Management Agreement Approval Process (continued)
several subsequent telephonic conferences among Independent Board Members and independent counsel, and between Independent Board Members and representatives of Nuveen, the Board met on June 18, 2007 to further discuss the proposed Transaction. Immediately prior to and then again during the June 18, 2007 meeting, the Independent Board Members met privately with their independent legal counsel. At that meeting, the Board met with representatives of MDP, of Goldman Sachs, Nuveen’s financial adviser in the Transaction, and of the Nuveen Board to discuss, among other things, the history and structure of MDP, the terms of the proposed Transaction (including the financing terms), and MDP’s general plans and intentions with respect to Nuveen (including with respect to management, employees, and future growth prospects). On July 9, 2007, the Board also met to be updated on the Transaction as part of a special telephonic Board meeting. The Board Members were further updated at a special in-person Board meeting held on July 19, 2007 (one Independent Board Member participated telephonically). Subsequently, on July 27, 2007, the ad hoc committee held a telephonic conference with representatives of Nuveen and MDP to further discuss, among other things, the Transaction, the financing of the Transaction, retention and incentive plans for key employees, the effect of regulatory restrictions on transactions with affiliates after the Transaction, and current volatile market conditions and their impact on the Transaction.
In connection with their review of the New Investment Management Agreements, the Independent Board Members, through their independent legal counsel, also requested in writing and received additional information regarding the proposed Transaction and its impact on the provision of services by NAM and its affiliates.
The Independent Board Members received, well in advance of the July Meeting, materials which outlined, among other things:
| • | the structure and terms of the Transaction, including MDP’s co-investor entities and their expected ownership interests, and the financing arrangements that will exist for Nuveen following the closing of the Transaction; |
| • | the strategic plan for Nuveen following the Transaction; |
| • | the governance structure for Nuveen following the Transaction; |
| • | any anticipated changes in the operations of the Nuveen funds following the Transaction, including changes to NAM’s and Nuveen’s day-to-day management, infrastructure and ability to provide advisory, distribution or other applicable services to the Funds; |
| • | any changes to senior management or key personnel who work on Fund related matters (including portfolio management, investment oversight, and legal/compliance) and any retention or incentive arrangements for such persons; |
| • | any anticipated effect on each Fund’s expense ratio (including advisory fees) following the Transaction; |
| • | any benefits or undue burdens imposed on the Funds as a result of the Transaction; |
| • | any legal issues for the Funds as a result of the Transaction; |
| • | the nature, quality and extent of services expected to be provided to the Funds following the Transaction, changes to any existing services and policies affecting the Funds, and cost-cutting efforts, if any, that may impact such services or policies; |
| • | any conflicts of interest that may arise for Nuveen or MDP with respect to the Funds; |
| • | the costs associated with obtaining necessary shareholder approvals and who would bear those costs; and |
| • | from legal counsel, a memorandum describing the applicable laws, regulations and duties in approving advisory contracts, including, in particular, with respect to a change of control. |
Immediately preceding the July Meeting, representatives of MDP met with the Board to further respond to questions regarding the Transaction. After the meeting with MDP, the Independent Board Members met with independent legal counsel in executive session. At the July Meeting, Nuveen also made a presentation and responded to questions. Following the presentations and discussions of the materials presented to the Board, the Independent Board Members met again in executive session with their counsel. As outlined in more detail below, the Independent Board Members considered all factors they believed relevant with respect to each Fund, including the impact that the Transaction could be expected to have on the following: (a) the nature, extent and quality of services to be provided; (b) the investment performance of the Funds; (c) the costs of the services and profits to be realized by Nuveen and its affiliates; (d) the extent to which economies of scale would be realized; and (e) whether fee levels reflect those economies of scale for the benefit of investors. As noted above, during the past year, the Board Members had completed their annual review of the respective Original Investment Management Agreements and many of the factors considered at such reviews were applicable to their evaluation of the New Investment Management Agreements. Accordingly, in evaluating such agreements, the Board Members relied upon their knowledge and experience with NAM and considered the information received and their evaluations and conclusions drawn at the reviews. While the Board reviewed many Nuveen funds at the July Meeting, the Independent Board Members evaluated all information available to them on a fund-by-fund basis, and their determinations were made separately in respect of each Fund.
34
A. Nature, Extent and Quality of Services
In evaluating the nature, quality and extent of the services expected to be provided by NAM under the New Investment Management Agreements, the Independent Board Members considered, among other things, the expected impact, if any, of the Transaction on the operations, facilities, organization and personnel of NAM; the potential implications of regulatory restrictions on the Funds following the Transaction; the ability of NAM and its affiliates to perform their duties after the Transaction; and any anticipated changes to the current investment and other practices of the Funds.
The Board noted that the terms of each New Investment Management Agreement, including the fees payable thereunder, are substantially identical to those of the Original Investment Management Agreement relating to the same Fund (with both reflecting reductions to fee levels in the complex-wide fee schedule for complex-wide assets in excess of $80 billion that have an effective date of August 20, 2007). The Board considered that the services to be provided and the standard of care under the New Investment Management Agreements are the same as the corresponding Original Investment Management Agreements. The Board Members further noted that key personnel of NAM who have responsibility for the Funds in each area, including portfolio management, investment oversight, fund management, fund operations, product management, legal/compliance and board support functions, are expected to be the same following the Transaction. The Board Members considered and are familiar with the qualifications, skills and experience of such personnel. The Board also considered certain information regarding any anticipated retention or incentive plans designed to retain key personnel. Further, the Board Members noted that no changes to Nuveen’s infrastructure or operations as a result of the Transaction were anticipated other than potential enhancements as a result of an expected increase in the level of investment in such infrastructure and personnel. The Board noted MDP’s representations that it does not plan to have a direct role in the management of Nuveen, appointing new management personnel, or directly impacting individual staffing decisions. The Board Members also noted that there were not any planned “cost cutting” measures that could be expected to reduce the nature, extent or quality of services. After consideration of the foregoing, the Board Members concluded that no diminution in the nature, quality and extent of services provided to the Funds and their shareholders by NAM is expected.
In addition to the above, the Board Members considered potential changes in the operations of each Fund. In this regard, the Board Members considered the potential effect of regulatory restrictions on the Funds’ transactions with future affiliated persons. During their deliberations, it was noted that, after the Transaction, a subsidiary of Merrill Lynch is expected to have an ownership interest in Nuveen at a level that will make Merrill Lynch an affiliated person of Nuveen. The Board Members recognized that applicable law would generally prohibit the Funds from engaging in securities transactions with Merrill Lynch as principal, and would also impose restrictions on using Merrill Lynch for agency transactions. They recognized that having MDP and Merrill Lynch as affiliates may restrict the Nuveen funds’ ability to invest in securities of issuers controlled by MDP or issued by Merrill Lynch and its affiliates even if not bought directly from MDP or Merrill Lynch as principal. They also recognized that various regulations may require the Nuveen funds to apply investment limitations on a combined basis with affiliates of Merrill Lynch. The Board Members considered information provided by NAM regarding the potential impact on the Nuveen funds’ operations as a result of these regulatory restrictions. The Board Members considered, in particular, the Nuveen funds that may be impacted most by the restricted access to Merrill Lynch, including: municipal funds (particularly certain state-specific funds), senior loan funds, taxable fixed income funds, preferred security funds and funds that heavily use derivatives. The Board Members considered such funds’ historic use of Merrill Lynch as principal in their transactions and information provided by NAM regarding the expected impact resulting from Merrill Lynch’s affiliation with Nuveen and available measures that could be taken to minimize such impact. NAM informed the Board Members that, although difficult to determine with certainty, its management did not believe that MDP’s or Merrill Lynch’s status as an affiliate of Nuveen would have a material adverse effect on any Nuveen fund’s ability to pursue its investment objectives and policies.
In addition to the regulatory restrictions considered by the Board, the Board Members also considered potential conflicts of interest that could arise between the Nuveen funds and various parties to the Transaction and discussed possible ways of addressing such conflicts.
Based on its review along with its considerations regarding services at the annual review, the Board concluded that the Transaction was not expected to adversely affect the nature, quality or extent of services provided by NAM and that the expected nature, quality and extent of such services supported approval of the New Investment Management Agreements.
B. Performance of the Funds
With respect to the performance of the Funds, the Board considered that the portfolio management personnel responsible for the management of the Funds’ portfolios were expected to continue to manage the portfolios following the completion of the Transaction.
In addition, the Board Members recently reviewed Fund performance at the May Meeting as described above and determined such Funds’ performance was satisfactory or better. The Board Members further noted that the investment policies and strategies were not expected to change as a result of the Transaction.
In light of the foregoing factors, along with the prior findings regarding performance at the annual review, the Board concluded that its findings with respect to performance supported approval of the New Investment Management Agreements.
35
Annual Investment Management Agreement Approval Process (continued)
C. Fees, Expenses and Profitability
As described in more detail above, during the annual review, the Board Members considered, among other things, the management fees and expenses of the Funds, the breakpoint schedules, and comparisons of such fees and expenses with peers. At the annual review, the Board Members determined that the respective Fund’s advisory fees and expenses were reasonable. In evaluating the profitability of Nuveen under the New Investment Management Agreements, the Board Members considered their conclusions at their prior reviews and whether the management fees or other expenses would change as a result of the Transaction. As described above, the investment management fee for NAM is composed of two components – a fund-level component and complex-wide level component. The fee schedule under the New Investment Management Agreements to be paid to NAM is identical to that under the Original Investment Management Agreements, including the modified complex-wide fee schedule. As noted above, the Board recently approved a modified complex-wide fee schedule that would generate additional fee savings on complex-wide assets above $80 billion. The modifications have an effective date of August 20, 2007 and are part of the Original Investment Management Agreements. Accordingly, the terms of the complex-wide component under the New Investment Management Agreements are the same as under the Original Investment Management Agreements. The Board Members also noted that Nuveen has committed for a period of two years from the date of closing of the Transaction that it will not increase gross management fees for any Nuveen fund and will not reduce voluntary expense reimbursement levels for any Nuveen fund from their currently scheduled prospective levels (subject to certain potential adjustments noted below). Based on the information provided, the Board Members did not expect that overall Fund expenses would increase as a result of the Transaction.
In addition, the Board Members considered that additional fund launches were anticipated after the Transaction which would result in an increase in total assets under management in the complex and a corresponding decrease in overall management fees under the complex-wide fee schedule. Taking into consideration the Board’s prior evaluation of fees and expenses at the annual renewal, and the modification to the complex-wide fee schedule, the Board determined that the management fees and expenses were reasonable.
While it is difficult to predict with any degree of certainty the impact of the Transaction on Nuveen’s profitability for its advisory activities, at the recent annual review, the Board Members were satisfied that Nuveen’s level of profitability for its advisory activities was reasonable. During the year, the Board Members had noted the enhanced dialogue regarding profitability and the appointment of an Independent Board Member as a point person to review methodology determinations and refinements in calculating profitability. Given their considerations at the annual review and the modifications to the complex-wide fee schedule, the Board Members were satisfied that Nuveen’s level of profitability for its advisory activities continues to be reasonable.
D. Economies of Scale and Whether Fee Levels Reflect These Economies of Scale
The Board Members have been cognizant of economies of scale and the potential benefits resulting from the costs of a Fund being spread over a larger asset base. To help ensure that shareholders share in the benefits derived from economies of scale, the Board adopted the complex-wide fee arrangement in 2004. At the May Meeting, the Board Members reviewed the complex-wide fee arrangements and noted that additional negotiations may be necessary or appropriate as the assets in the complex approached the $91 billion threshold. In light of this assessment coupled with the upcoming Transaction, at the June 15, 2007 meeting, the ad hoc committee met with representatives of Nuveen to further discuss modifications to the complex-wide fee schedule that would generate additional savings for shareholders as the assets of the complex grow. The proposed terms for the complex-wide fee schedule are expressed in terms of targeted cumulative savings at specified levels of complex-wide assets, rather than in terms of targeted marginal complex-wide fee rates. Under the modified schedule, the schedule would generate additional fee savings beginning at complex-wide assets of $80 billion in order to achieve targeted cumulative annual savings at $91 billion of $28 million on a complex-wide level (approximately $0.6 million higher than those generated under the then current schedule) and generate additional fee savings for asset growth above complex-wide assets of $91 billion in order to achieve targeted annual savings at $125 billion of assets of approximately $50 million on a complex-wide level (approximately $2.2 million higher annually than that generated under the then current schedule). At the July Meeting, the Board approved the modified complex-wide fee schedule for the Original Investment Management Agreements and these same terms will apply to the New Investment Management Agreements. Accordingly, the Board Members believe that the breakpoint schedules and revised complex-wide fee schedule are appropriate and desirable in ensuring that shareholders participate in the benefits derived from economies of scale.
E. Indirect Benefits
During their recent annual review, the Board Members considered any indirect benefits that NAM may receive as a result of its relationship with the Funds, as described above. As the policies and operations of Nuveen are not anticipated to change significantly after the Transaction, such indirect benefits should remain after the Transaction. The Board Members further considered any additional indirect benefits to be received by NAM or its affiliates after the Transaction. The Board Members noted that other than benefits from its ownership interest in Nuveen and indirect benefits from fee revenues paid by the Funds under the management agreements and other Board-approved relationships, it was currently not expected that MDP or its affiliates would derive any benefit from the Funds as a result of the Transaction or transact any business with or on behalf of the Funds (other than perhaps potential Fund acquisitions, in secondary market transactions, of securities issued by MDP portfolio companies); or that Merrill Lynch or its affiliates would derive any benefits from the Funds as a result of the Transaction (noting that, indeed, Merrill Lynch would stand to experience the discontinuation of principal transaction activity with the Nuveen funds and likely would experience a noticeable reduction in the volume of agency transactions with the Nuveen funds).
36
F. Other Considerations
In addition to the factors above, the Board Members also considered the following with respect to the Funds:
| • | Nuveen would rely on the provisions of Section 15(f) of the 1940 Act. Section 15(f) provides, in substance, that when a sale of a controlling interest in an investment adviser occurs, the investment adviser or any of its affiliated persons may receive any amount or benefit in connection with the sale so long as (i) during the three-year period following the consummation of a transaction, at least 75% of the investment company’s board of directors must not be “interested persons” (as defined in the 1940 Act) of the investment adviser or predecessor adviser and (ii) an “unfair burden” (as defined in the 1940 Act, including any interpretations or no-action letters of the SEC) must not be imposed on the investment company as a result of the transaction relating to the sale of such interest, or any express or implied terms, conditions or understanding applicable thereto. In this regard, to help ensure that an unfair burden is not imposed on the Nuveen funds, Nuveen has committed for a period of two years from the date of the closing of the Transaction (i) not to increase gross management fees for any Nuveen fund; (ii) not to reduce voluntary expense reimbursement levels for any Nuveen fund from their currently scheduled prospective levels during that period (such commitment, however, may exclude or be adjusted for the impact of future class-specific expense allocation protocol changes for a particular mutual fund); (iii) that no Nuveen fund whose portfolio is managed by a Nuveen affiliate shall use Merrill Lynch as a broker with respect to portfolio transactions done on an agency basis, except as may be approved in the future by the Compliance Committee of the Board; and (iv) that NAM shall not cause the Funds and other municipal funds that NAM manages, as a whole, to enter into portfolio transactions with or through the other minority owners of Nuveen, on either a principal or an agency basis, to a significantly greater extent than both what one would expect an investment team to use such firm in the normal course of business, and what NAM has historically done, without prior Board or Compliance Committee approval (excluding the impact of proportionally increasing the use of such other “minority owners” to fill the void necessitated by not being able to use Merrill Lynch). |
| • | The Funds would not incur any costs in seeking the necessary shareholder approvals for the New Investment Management Agreements (except for any costs attributed to seeking shareholder approvals of Fund specific matters unrelated to the Transaction, such as approval of Board Members, in which case a portion of such costs will be borne by the applicable Funds). |
| • | The reputation, financial strength and resources of MDP. |
| • | The long-term investment philosophy of MDP and anticipated plans to grow Nuveen’s business to the benefit of the Nuveen funds. |
| • | The benefits to the Nuveen funds as a result of the Transaction including: (i) as a private company, Nuveen may have more flexibility in making additional investments in its business; (ii) as a private company, Nuveen may be better able to structure compensation packages to attract and retain talented personnel; (iii) as certain of Nuveen’s distribution partners are expected to be equity or debt investors in Nuveen, Nuveen may be able to take advantage of new or enhanced distribution arrangements with such partners; and (iv) MDP’s experience, capabilities and resources that may help Nuveen identify and acquire investment teams or firms and finance such acquisitions. |
G. Conclusion
The Board Members did not identify any single factor discussed previously as all-important or controlling. The Board Members, including the Independent Board Members, unanimously concluded that the terms of the New Investment Management Agreements are fair and reasonable, that the fees therein are reasonable in light of the services to be provided to each Fund and that the New Investment Management Agreements should be approved and recommended to shareholders.
III. Approval of Interim Contracts
As noted above, at the July Meeting, the Board Members, including the Independent Board Members, unanimously approved the Interim Investment Management Agreements. If necessary to assure continuity of advisory services, the Interim Investment Management Agreements will take effect upon the closing of the Transaction if shareholders have not yet approved the New Investment Management Agreements. The terms of each Interim Investment Management Agreement are substantially identical to those of the corresponding Original Investment Management Agreement and New Investment Management Agreement, respectively, except for certain term and escrow provisions. In light of the foregoing, the Board Members, including the Independent Board Members, unanimously determined that the scope and quality of services to be provided to the Funds under the respective Interim Investment Management Agreement are at least equivalent to the scope and quality of services provided under the applicable Original Investment Management Agreement.
37
Glossary of Terms Used in this Report
Average Annual Total Return: This is a commonly used method to express an investment’s performance over a particular, usually multi-year time period. It expresses the return that would have been necessary each year to equal the investment’s actual cumulative performance (including change in NAV or offer price and reinvested dividends and capital gains distributions, if any) over the time period being considered.
Average Effective Maturity: The average of the number of years to maturity of the bonds in a Fund’s portfolio, computed by weighting each bond’s time to maturity (the date the security comes due) by the market value of the security. This figure does not account for the likelihood of prepayments or the exercise of call provisions unless an escrow account has been established to redeem the bond before maturity. The market value weighting for an investment in an inverse floating rate security is the value of the portfolio’s residual interest in the inverse floating rate trust, and does not include the value of the floating rate securities issued by the trust.
Average Duration: Duration is a measure of the expected period over which a bond’s principal and interest will be paid, and consequently is a measure of the sensitivity of a bond’s (or bond fund’s) value to changes when market interest rates change. Generally, the longer a bond or Fund’s duration, the more the price of the bond or Fund will change as interest rates change.
Dividend Yield (also known as Market Yield or Current Yield): An investment’s current annualized dividend divided by its current offering price.
Inverse Floaters: Inverse floating rate securities are created by depositing a municipal bond, typically with a fixed interest rate, into a special purpose trust created by a broker-dealer. This trust, in turn, (a) issues floating rate certificates typically paying short-term tax-exempt interest rates to third parties in amounts equal to some fraction of the deposited bond’s par amount or market value, and (b) issues an inverse floating rate certificate (sometimes referred to as an “inverse floater”) to an investor (such as a Fund) interested in gaining investment exposure to a long-term municipal bond. The income received by the holder of the inverse floater varies inversely with the short-term rate paid to the floating rate certificates’ holders, and in most circumstances the holder of the inverse floater bears substantially all of the underlying bond’s downside investment risk. The holder of the inverse floater typically also benefits disproportionately from any potential appreciation of the underlying bond’s value. Hence, an inverse floater essentially represents an investment in the underlying bond on a leveraged basis.
Net Asset Value (NAV): A Fund’s NAV is the dollar value of one share in the Fund. It is calculated by subtracting the liabilities of the Fund from its total assets and then dividing the remainder by the number of shares outstanding. Fund NAVs are calculated at the end of each business day.
SEC 30-Day Yield: A standardized measure of a Fund’s yield that accounts for the future amortization of premiums or discounts of bonds held in the Fund’s portfolio.
Taxable-Equivalent Yield: The yield necessary from a fully taxable investment to equal, on an after-tax basis at a specified assumed tax rate, the yield of a municipal bond investment.
Zero Coupon Bond: A zero coupon bond does not pay a regular interest coupon to its holders during the life of the bond. Tax-exempt income to the holder of the bond comes from accretion of the difference between the original purchase price of the bond at issuance and the par value of the bond at maturity and is effectively paid at maturity. The market prices of zero coupon bonds generally are more volatile than the market prices of bonds that pay interest periodically.
38
Notes
39
Notes
40
Fund Information
Fund Manager Nuveen Asset Management 333 West Wacker Drive Chicago, IL 60606 | Legal Counsel Chapman and Cutler LLP Chicago, IL
Independent Registered Public Accounting Firm PricewaterhouseCoopers LLP Chicago, IL
Custodian State Street Bank & Trust Company Boston, MA | Transfer Agent and Shareholder Services Boston Financial Data Services, Inc.
Nuveen Investor Services P.O. Box 8530 Boston, MA 02266-8530 (800) 257-8787 | ||
Investment Policy Change: On September 19, 2007, the Board of Trustees voted to authorize all of Nuveen’s non-insured open-end municipal bond Funds not already so authorized the capability of investing up to 20% of their net assets in below-investment grade (“high yield” or “junk”) municipal securities. This investment policy change, effective October 31, 2007, will give the Funds’ portfolio managers greater flexibility to enhance: (1) income, (2) potential total return, both absolute and on a risk-adjusted basis, and (3) portfolio diversification.
Quarterly Portfolio of Investments and Proxy Voting information: Each Fund’s (i) quarterly portfolio of investments, (ii) information regarding how the Funds voted proxies relating to portfolio securities held during the most recent 12-month period ended June 30, 2007, and (iii) a description of the policies and procedures that the Funds used to determine how to vote proxies relating to portfolio securities are available without charge, upon request, by calling Nuveen Investments at (800) 257-8787 or on Nuveen’s website at www.nuveen.com.
You may also obtain this and other Fund information directly from the Securities and Exchange Commission (“SEC”). The SEC may charge a copying fee for this information. Visit the SEC on-line at http://www.sec.gov or in person at the SEC’s Public Reference Room in Washington, D.C. Call the SEC at 1-202-942-8090 for room hours and operation. You may also request Fund information by sending an e-mail request to publicinfo@sec.gov or by writing to the SEC’s Public Reference Section at 450 Fifth Street NW, Washington, D.C. 20549.
NASD Regulation, Inc. provides a Public Disclosure Program which supplies certain information regarding the disciplinary history of NASD members and their associated persons in response to either telephone inquiries at (800) 289-9999 or written inquiries at www.nasdr.com. NASD Regulation, Inc. also provides an investor brochure that includes information describing the Public Disclosure Program.
41
Learn more
about Nuveen Funds at
www.nuveen.com/mf
Nuveen Investments:
SERVING Investors
For GENERATIONS
Since 1898, financial advisors and their clients have relied on Nuveen Investments to provide dependable investment solutions. Over this time, Nuveen Investments has adhered to the belief that the best approach to investing is to apply conservative risk-management principles to help minimize volatility.
Building on this tradition, we today offer a range of high quality equity and fixed-income solutions that can be integral parts of a well-diversified core portfolio. Our clients have come to appreciate this diversity, as well as our continued adherence to proven, long-term investing principles.
We offer many different investing solutions for our clients’ different needs.
Managing approximately $170 billion in assets as of September 30, 2007, Nuveen Investments offers access to a number of different asset classes and investing solutions through a variety of products. Nuveen Investments markets its capabilities under six distinct brands: NWQ, specializing in value-style equities; Nuveen, managing fixed-income investments; Santa Barbara, committed to growth equities; Tradewinds, specializing in global value equities; Rittenhouse, focused on “blue-chip” growth equities; and Symphony, with expertise in alternative investments as well as equity and income portfolios.
Find out how we can help you reach your financial goals.
An investor should carefully consider the Fund’s objectives, risks, charges and expenses before investing. For a prospectus containing this and other information about the Fund, please contact your financial advisor or Nuveen Investments at (800) 257-8787. Read the prospectus carefully before you invest or send money.
| • | Share prices |
| • | Fund details |
| • | Daily financial news |
| • | Investor education |
MSA-MA-0807D
Item 2. Code of Ethics.
Not applicable to this filing.
Item 3. Audit Committee Financial Expert.
Not applicable to this filing.
Item 4. Principal Accountant Fees and Services.
Not applicable to this filing.
Item 5. Audit Committee of Listed Registrants
Not applicable to this registrant.
Item 6. Schedule of Investments
See Portfolio of Investments in Item 1
Item 7. Disclosure of Proxy Voting Policies and Procedures for Closed-End Management Investment Companies
Not applicable to this registrant.
Item 8. Portfolio Managers of Closed-End Management Investment Companies
Not applicable to this registrant.
Item 9. Purchases of Equity Securities by Closed-End Management Investment Company and Affiliated Purchasers
Not applicable to this registrant.
Item 10. Submission of Matters to a Vote of Security Holders
There have been no material changes to the procedures by which shareholders may recommend nominees to the registrant’s Board implemented after the registrant last provided disclosure in response to this Item.
Item 11. Controls and Procedures.
| (a) | The registrant’s principal executive and principal financial officers, or persons performing similar functions, have concluded that the registrant’s disclosure controls and procedures (as defined in Rule 30a-3(c) under the Investment Company Act of 1940, as amended (the “1940 Act”) (17 CFR 270.30a-3(c))) are effective, as of a date within 90 days of the filing date of this report that includes the disclosure required by this paragraph, based on their evaluation of the controls and procedures required by Rule 30a-3(b) under the 1940 Act (17 CFR 270.30a-3(b)) and Rules 13a-15(b) or 15d-15(b) under the Securities Exchange Act of 1934, as amended (the “Exchange Act”) (17 CFR 240.13a-15(b) or 240.15d-15(b)). |
| (b) | There were no changes in the registrant’s internal control over financial reporting (as defined in Rule 30a-3(d) under the 1940 Act (17 CFR 270.30a-3(d)) that occurred during the second fiscal quarter of the period covered by this report that has materially affected, or is reasonably likely to materially affect, the registrant’s internal control over financial reporting. |
Item 12. Exhibits
File the exhibits listed below as part of this Form.
(a)(1) Any code of ethics, or amendment thereto, that is the subject of the disclosure required by Item 2, to the extent that the registrant intends to satisfy the Item 2 requirements through filing of an exhibit: Not applicable to this filing.
(a)(2) A separate certification for each principal executive officer and principal financial officer of the registrant as required by Rule 30a-2(a) under the 1940 Act (17 CFR 270.30a-2(a)) in the exact form set forth below: EX-99.CERT Attached hereto.
(a)(3) Any written solicitation to purchase securities under Rule 23c-1 under the 1940 Act (17 CFR 270.23c-1) sent or given during the period covered by the report by or on behalf of the registrant to 10 or more persons: Not applicable to this registrant.
(b) If the report is filed under Section 13(a) or 15(d) of the Exchange Act, provide the certifications required by Rule 30a-2(b) under the 1940 Act (17 CFR 270.30a-2(b)), Rule 13a-14(b) or Rule 15d-14(b) under the Exchange Act (17 CFR 240.13a-14(b) or 240.15d-14(b)), and Section 1350 of Chapter 63 of Title 18 of the United States Code (18 U.S.C. 1350) as an Exhibit. A certification furnished pursuant to this paragraph will not be deemed “filed” for purposes of Section 18 of the Exchange Act (15 U.S.C. 78r), or otherwise subject to the liability of that section. Such certification will not be deemed to be incorporated by reference into any filing under the Securities Act of 1933 or the Exchange Act, except to the extent that the registration specifically incorporates it by reference. EX-99.906 CERT attached hereto.
SIGNATURES
Pursuant to the requirements of the Securities Exchange Act of 1934 and the Investment Company Act of 1940, the registrant has duly caused this report to be signed on its behalf by the undersigned, thereunto duly authorized.
(Registrant) Nuveen Multistate Trust II
| By | (Signature and Title)* | /s/ Kevin J. McCarthy | ||||
Kevin J. McCarthy Vice President and Secretary |
Date November 9, 2007
Pursuant to the requirements of the Securities Exchange Act of 1934 and the Investment Company Act of 1940, this report has been signed below by the following persons on behalf of the registrant and in the capacities and on the dates indicated.
| By | (Signature and Title)* | /s/ Gifford R. Zimmerman | ||||
Gifford R. Zimmerman Chief Administrative Officer (principal executive officer) |
Date November 9, 2007
| By | (Signature and Title)* | /s/ Stephen D. Foy | ||||
Stephen D. Foy Vice President and Controller (principal financial officer) |
Date November 9, 2007
| * | Print the name and title of each signing officer under his or her signature. |