UNITED STATES
SECURITIES AND EXCHANGE COMMISSION
Washington, D.C. 20549
FORM N-CSR
CERTIFIED SHAREHOLDER REPORT OF REGISTERED MANAGEMENT
INVESTMENT COMPANIES
Investment Company Act file number 811-07755
Nuveen Multistate Trust II
(Exact name of registrant as specified in charter)
Nuveen Investments
333 West Wacker Drive Chicago, IL 60606
(Address of principal executive offices) (Zip code)
Kevin J. McCarthy
Nuveen Investments
333 West Wacker Drive Chicago, IL 60606
(Name and address of agent for service)
Registrant’s telephone number, including area code: (312) 917-7700
Date of fiscal year end: February 28
Date of reporting period: August 31, 2009
Form N-CSR is to be used by management investment companies to file reports with the Commission not later than 10 days after the transmission to stockholders of any report that is required to be transmitted to stockholders under Rule 30e-1 under the Investment Company Act of 1940 (17 CFR 270.30e-1). The Commission may use the information provided on Form N-CSR in its regulatory, disclosure review, inspection, and policy making roles.
A registrant is required to disclose the information specified by Form N-CSR, and the Commission will make this information public. A registrant is not required to respond to the collection of information contained in Form N-CSR unless the Form displays a currently valid Office of Management and Budget (“OMB”) control number. Please direct comments concerning the accuracy of the information collection burden estimate and any suggestions for reducing the burden to Secretary, Securities and Exchange Commission, 450 Fifth Street, NW, Washington, DC 20549-0609. The OMB has reviewed this collection of information under the clearance requirements of 44 U.S.C. ss.3507.
Item 1. Reports to Stockholders.
Mutual Funds

Nuveen Municipal Bond Funds
Dependable, tax-free income because it’s not what you earn, it’s what you keep.®
Semi-Annual Report
August 31, 2009
| Nuveen Connecticut Municipal Bond Fund | Nuveen New Jersey Municipal Bond Fund | Nuveen New York Municipal Bond Fund | Nuveen New York Insured Municipal Bond Fund |
LIFE IS COMPLEX.
Nuveen makes things e-simple.
It only takes a minute to sign up for e-Reports. Once enrolled, you’ll receive an e-mail as soon as your Nuveen Investments Fund information is ready. No more waiting for delivery by regular mail. Just click on the link within the e-mail to see the report and save it on your computer if you wish.
Free e-Reports right to your e-mail!
www.investordelivery.com
If you receive your Nuveen Fund dividends and statements from your financial advisor or brokerage account.
OR
www.nuveen.com/accountaccess
If you receive your Nuveen Fund dividends and statements directly from Nuveen.
| Must be preceded by or accompanied by a prospectus. | NOT FDIC INSURED | MAY LOSE VALUE | NO BANK GUARANTEE |
Chairman’s
Letter to Shareholders

Dear Shareholder,
The financial markets in which your Fund operates continue to reflect the larger economic crosscurrents. The illiquidity that infected global credit markets over the last year appears to be slowly but steadily receding. The major institutions that are the linchpin of the international financial system are strengthening their capital structures, but many still struggle with losses in their various portfolios. There are encouraging signs of recovery in European and Asian economies, while the U.S. economy continues to feel the impact of job losses and an over-borrowed consumer. Global trends include modestly increasing trade and increased concern about the ability of the U.S. government to address its substantial budgetary deficits. Identifying those developments that will define the future is never easy, but rarely is it more difficult than at present.
After considerable volatility in the first few months of 2009, both the fixed-income and equity markets have seen a partial recovery. A fundamental component of a successful long-term investment program is a commitment to remain invested during market downturns in order to be better positioned to benefit from any recovery. Another component is to re-evaluate investment disciplines and tactics and to confirm their validity following periods of extreme volatility and market dislocation, such as we have recently experienced. Your Board carried out an intensive review of investment performance with these objectives in mind during April and May of this year as part of the annual management contract renewal process. I encourage you to read the description of this process in the Annual Investment Management Agreement Approval Process section of this report.
Remaining invested through market downturns and reconfirming the appropriateness of a long term investment strategy is as important for our shareholders as it is for professional investment managers. For that reason, I again encourage you to remain in communication with your financial consultant on these subjects. For recent developments on all your Nuveen Funds, please visit the Nuveen web site: www.nuveen.com.
On behalf of the other members of your Fund’s Board, we look forward to continuing to earn your trust in the months and years ahead.
Sincerely,

Robert P. Bremner
Chairman of the Nuveen Fund Board
October 20, 2009
| Nuveen Investments | 1 |
Portfolio Manager’s Comments for the Nuveen Connecticut, New Jersey, New York and New York Insured Municipal Bond Funds
Certain statements in this report are forward-looking statements. Discussions of specific investments are for illustration only and are not intended as recommendations of individual investments. The forward-looking statements and other views expressed herein are those of the portfolio manager as of the date of this report. Actual future results or occurrences may differ significantly from those anticipated in any forward-looking statements and the views expressed herein are subject to change at any time, due to numerous market and other factors. The Funds disclaim any obligation to update publicly or revise any forward-looking statements or views expressed herein.
Portfolio manager Cathryn Steeves discusses key investment strategies and each Fund’s performance during the six months ending August 31, 2009. Cathryn, who has 13 years of investment experience, has managed the Funds since 2006.
How did the Funds perform during the six-month reporting period?
The chart on page three provides total return performance information for the Funds for the six-month, one-year, five-year and ten-year periods ended August 31, 2009. During that time frame, the Class A Shares of the Connecticut, New York and New York Insured Funds all outperformed their respective Lipper peer fund averages, while the New Jersey Fund modestly trailed its Lipper average. Three of the four Funds – the Connecticut, New Jersey and uninsured New York Fund – outperformed their respective Standard & Poor’s (S&P) state indexes. The Insured New York Fund underperformed its S&P state index, although the comparison to an uninsured index is imperfect. To varying degrees, all of the Funds outperformed the national Barclays Capital Municipal Bond Index while the three uninsured Funds outperformed the S&P National Municipal Bond Index.
The big story in the municipal bond market during the six month period was the dramatic tightening of credit spreads. This measures the amount of additional income that investors were demanding in exchange for purchasing lower-rated, higher-risk bonds. Credit spreads were extraordinarily wide at the start of the period, meaning that investors wanted a considerable premium when buying lower rated securities. As credit became more available and investors became less pessimistic in their economic outlook, the markets became considerably less risk-averse. In turn, this drove a strong rally in the municipal market generally, and among lower rated securities in particular. Credit spreads narrowed sharply, and the lowest-rated bonds – which had been hit the hardest prior to the reporting period – fared the best overall in this environment.
During the worst of last fall’s credit crisis, we believed that spreads on all but the highest-quality municipal bonds seemed far too wide relative to their risks. Depending on the availability within each state, we took advantage of opportunities to add bonds trading for what we believed were undeservedly low prices. In many cases, our investments were in BBB-rated and non-rated bonds – two credit rating categories in which we were overweighted and that especially boosted the relative performance of the Connecticut, New Jersey and uninsured New York Funds.
All four Funds benefited from having relatively long durations, meaning that the portfolios had increased price sensitivity to changes in interest rates. As investors became more comfortable assuming interest rate risk, they were willing to invest in longer-dated securities, boosting their performance. In particular, the Funds were relatively
| 2 | Nuveen Investments |
| 1 | For each Fund, the Lipper average shown represents the average annualized total return for all reporting funds for the periods ended August 31, 2009. The Lipper categories contained 21, 20, 16 and 16 funds in the Lipper Connecticut Municipal Debt Funds Average, 47, 46, 34 and 30 funds in the Lipper New Jersey Municipal Debt Funds Average, 95, 94, 86 and 70 funds in the Lipper New York Municipal Debt Funds Average and 61, 60, 57 and 56 funds in the Lipper Single-State Insured Municipal Debt Funds Average for the respective six-month, one-year, five-year and ten-year periods ended August 31, 2009. The returns account for the effects of management fees and assume reinvestment of dividends, but do not reflect any applicable sales charges. You cannot invest directly in a Lipper Category. |
| 2 | The Standard & Poor’s (S&P) National Municipal Bond Index is an unleveraged, market value weighted index designed to measure the performance of the investment-grade municipal bond market. The index does not reflect any initial or ongoing expenses and is not available for direct investment. |
| The Standard & Poor’s (S&P) Connecticut Municipal Bond Index is an unleveraged, market value-weighted index designed to measure the performance of the investment-grade Connecticut municipal bond market. The index does not reflect any initial or ongoing expenses and is not available for direct investment. The Standard & Poor’s (S&P) New Jersey Municipal Bond Index is an unleveraged, market value-weighted index designed to measure the performance of the investment-grade New Jersey municipal bond market. The index does not reflect any initial or ongoing expenses and is not available for direct investment. The Standard & Poor’s (S&P) New York Municipal Bond Index is an unleveraged, market value-weighted index designed to measure the performance of the investment-grade New York municipal bond market. The index does not reflect any initial or ongoing expenses and is not available for direct investment. |
| 3 | The Barclays Capital Municipal Bond Index is an unmanaged, unleveraged index comprised of a broad range of investment-grade municipal bonds. The Barclays Capital New York Insured Municipal Bond Index is an unmanaged, unleveraged index comprised of insured New York municipal bond issues. The indexes do not reflect any initial or ongoing expenses and are not available for direct investment. |
Class A Shares – Average Annual Total Returns
As of 8/31/09
Cumulative Six-Month | Average Annual | |||||||
| 1-Year | 5-Year | 10-Year | ||||||
Nuveen Connecticut Municipal Bond Fund | ||||||||
A Shares at NAV | 7.34% | 4.98% | 3.57% | 4.79% | ||||
A Shares at Offer | 2.82% | 0.56% | 2.69% | 4.34% | ||||
Lipper Connecticut Municipal Debt Funds Average1 | 6.78% | 4.07% | 2.96% | 4.30% | ||||
Standard & Poor’s (S&P) Connecticut Municipal Bond Index2 | 4.20% | 5.28% | 3.95% | 5.20% | ||||
Standard & Poor’s (S&P) National Municipal Bond Index2 | 6.49% | 4.68% | 4.00% | 5.30% | ||||
Barclays Capital Municipal Bond Index3 | 5.61% | 5.67% | 4.16% | 5.40% | ||||
Nuveen New Jersey Municipal Bond Fund | ||||||||
A Shares at NAV | 8.10% | 5.02% | 3.62% | 4.73% | ||||
A Shares at Offer | 3.56% | 0.64% | 2.74% | 4.28% | ||||
Lipper New Jersey Municipal Debt Funds Average1 | 8.16% | 3.15% | 3.19% | 4.25% | ||||
Standard & Poor’s (S&P) New Jersey Municipal Bond Index2 | 6.68% | 5.58% | 4.58% | 5.44% | ||||
Standard & Poor’s (S&P) National Municipal Bond Index2 | 6.49% | 4.68% | 4.00% | 5.30% | ||||
Barclays Capital Municipal Bond Index3 | 5.61% | 5.67% | 4.16% | 5.40% | ||||
Nuveen New York Municipal Bond Fund | ||||||||
A Shares at NAV | 8.10% | 4.54% | 3.63% | 4.85% | ||||
A Shares at Offer | 3.57% | 0.13% | 2.74% | 4.40% | ||||
Lipper New York Municipal Debt Funds Average1 | 7.55% | 2.86% | 2.88% | 4.28% | ||||
Standard & Poor’s (S&P) New York Municipal Bond Index2 | 6.31% | 5.32% | 4.27% | 5.45% | ||||
Standard & Poor’s (S&P) National Municipal Bond Index2 | 6.49% | 4.68% | 4.00% | 5.30% | ||||
Barclays Capital Municipal Bond Index3 | 5.61% | 5.67% | 4.16% | 5.40% | ||||
Nuveen New York Insured Municipal Bond Fund | ||||||||
A Shares at NAV | 5.73% | 4.39% | 3.25% | 4.72% | ||||
A Shares at Offer | 1.30% | -0.02% | 2.38% | 4.27% | ||||
Lipper Single-State Insured Municipal Debt Funds Average1 | 4.81% | 4.07% | 2.94% | 4.30% | ||||
Standard & Poor’s (S&P) New York Municipal Bond Index2 | 6.31% | 5.32% | 4.27% | 5.45% | ||||
Standard & Poor’s (S&P) National Municipal Bond Index2 | 6.49% | 4.68% | 4.00% | 5.30% | ||||
Barclays Capital New York Insured Municipal Bond Index3 | 4.99% | 5.83% | 4.22% | 5.66% | ||||
Barclays Capital Municipal Bond Index3 | 5.61% | 5.67% | 4.16% | 5.40% | ||||
Returns quoted represent past performance, which is no guarantee of future results. Investment returns and principal value will fluctuate so that when shares are redeemed, they may be worth more or less than their original cost. Returns less than one year are cumulative. Current performance may be higher or lower than the performance shown. Returns at NAV would be lower if the sales charge were included. Class A Shares have a 4.2% maximum sales charge. Returns do not reflect the deduction of taxes that a shareholder would pay on Fund distributions or the redemption of shares. For the most recent month-end performance, visit www.nuveen.com or call (800) 257-8787.
Please see each Fund’s Spotlight Page later in this report for more complete performance data and expense ratios.
| Nuveen Investments | 3 |
underweighted on the short end of the yield curve as well as overweighted in intermediate-duration bonds – two positive factors for performance. A slight overweighting in longer-dated issues was a modest counterbalancing negative for all four portfolios.
Tobacco bonds provided very strong returns during the past six months, in part because of their generally lower credit quality and higher yields. Unfortunately, all four Funds were underexposed to this category, hampering relative performance. The Funds also lacked exposure to natural gas prepayment bonds, in which public utilities contract with Wall Street financial firms to prepay for natural gas supplies. As investor sentiment about the financial industry improved, these bonds performed well. Unfortunately, they were not available for purchase in Connecticut, New Jersey and New York, detracting from returns on a relative basis.
What strategies were used to manage the Funds?
As previously mentioned, credit spreads narrowed dramatically but still were wider than normal for much of the period. With the help of Nuveen’s credit research team, we continued to find numerous opportunities to invest in lower-rated bonds that we thought could provide strong long-term value potential for our shareholders. We pursued this opportunistic investment approach throughout the majority of the period for the three uninsured Funds. In July and August, however, spreads were tighter – making value somewhat harder to identify – and this curtailed our buying activity. Another factor limiting activity was the introduction of Build America Bonds. Build America Bonds are a new class of taxable municipal debt created as part of the February 2009 economic stimulus package. They provide municipal issuers with a federal subsidy equal to 35% of the security’s interest payments and therefore offer issuers an attractive alternative to traditional tax-exempt debt.
Our purchases varied from portfolio to portfolio, depending on the availability of bonds within each state. In all three uninsured Funds, for example, we added various health care and higher education bonds, many of which were lower-rated. Other noteworthy purchases included mental health, income-tax-backed, housing and parking bonds for Yankee Stadium in the uninsured New York Fund; water and long-term-care bonds in the Connecticut Fund; and state appropriation and general obligation bonds in the New Jersey Fund. When making purchases, we emphasized bonds with maturities of 20 to 30 years – a portion of the yield curve we felt was offering favorable long-term values. To fund our purchases, we generally sold shorter-dated issues whose appreciation potential we felt was more limited and also invested the proceeds of bond calls.
In the New York Insured Fund, purchase activity was quite limited during the six month period. Following the credit rating downgrade of most major municipal bond insurers, it has become increasingly difficult to find suitable AAA-rated insured bonds, which, must make up 80% of the portfolio’s assets. Given this criterion, we made only a few purchases during the six-month period, buying an issue of dedicated tax-backed New York State Convention Center bonds as well as some insured water bonds and student loan bonds.
| 4 | Nuveen Investments |
Recent Developments Regarding Bond Insurance Companies
Another factor that had an impact on the performance of these Funds was their positions in bonds backed by municipal bond insurers that experienced downgrades in their credit ratings. During the period covered by this report, all bond insurers experienced one or more rating reductions by at least one or more rating agencies. At the time this report was prepared, there are no longer any bond insurers rated AAA by more than one of the major rating agencies (Moody’s Investor Service, S&P and Fitch) and at least one rating agency has placed each insurer on “negative credit watch,” “credit outlook/watch developing” “credit outlook/watch negative,” “credit watch evolving,” “rating withdrawn” or “regulatory supervision” which may presage one or more rating reductions for any insurer in the future. As concern increased about the balance sheets of insurers, prices on insured bonds - especially those bonds issued by weaker underlying credits - declined, detracting from the Funds’ performances. By the end of this period, most insured bonds were being valued according to their fundamentals as if they were uninsured. On the whole, the holdings of all of these Funds continued to be well diversified and it is important to note that municipal bonds historically have had a very low rate of default.
Dividend Information
During the reporting period, the Class I Shares of the New Jersey Fund experienced one dividend increase in August 2009. There were no other dividend changes to any of the other share classes of the Funds during the past six months.
Each Fund seeks to pay dividends at a rate that reflects the past and projected performance of the Fund. To permit a Fund to maintain a more stable monthly dividend, the Fund may pay dividends at a rate that may be more or less than the amount of net investment income actually earned by the Fund during the period. If the Fund has cumulatively earned more than it has paid in dividends, it will hold the excess in reserve as undistributed net investment income (UNII) as part of the Fund’s net asset value. Conversely, if the Fund has cumulatively paid in dividends more than it has earned, the excess will constitute a negative UNII that will likewise be reflected in the Fund’s net asset value. Each Fund will, over time, pay all its net investment income as dividends to shareholders. As of August 31, 2009, all of the Funds in this report had a positive UNII balance, based upon our best estimate, for tax purposes. The New Jersey, New York and New York Insured Funds had positive UNII balances and the Connecticut Fund had a negative UNII balance for financial statement purposes.
| Nuveen Investments | 5 |
Fund Spotlight as of 8/31/09 Nuveen Connecticut Municipal Bond Fund
| Quick Facts | ||||||||
| A Shares | B Shares | C Shares | I Shares | |||||
Fund Symbols | FCTTX | FCTBX | FCTCX | FCTRX | ||||
NAV | $10.27 | $10.26 | $10.27 | $10.31 | ||||
Latest Monthly Dividend1 | $0.0350 | $0.0290 | $0.0305 | $0.0370 | ||||
Latest Capital Gain and Ordinary Income Distribution2 | $0.0346 | $0.0346 | $0.0346 | $0.0346 | ||||
Inception Date | 7/13/87 | 2/11/97 | 10/04/93 | 2/25/97 |
Returns quoted represent past performance which is no guarantee of future results. Investment returns and principal value will fluctuate so that when shares are redeemed, they may be worth more or less than their original cost. Current performance may be higher or lower than the performance shown. Returns without sales charges would be lower if the sales charge were included. Returns do not reflect the deduction of taxes that a shareholder would pay on Fund distributions or the redemption of shares. Income is generally exempt from regular federal income taxes. Some income may be subject to state and local taxes and to the federal alternative minimum tax. Capital gains, if any, are subject to tax. For the most recent month-end performance visit www.nuveen.com or call (800) 257-8787.
Returns reflect differences in sales charges and expenses, which are primarily differences in distribution and service fees. Fund returns assume reinvestment of dividends and capital gains. Class A Shares have a 4.2% maximum sales charge. Class A Share purchases of $1 million or more are sold at net asset value without an up-front sales charge but may be subject to a contingent deferred sales charge (CDSC), also known as a backend sales charge, if redeemed within 12 months of purchase. Class B Shares have a CDSC that begins at 5% for redemptions during the first year and declines periodically until after 6 years when the charge becomes 0%. Class B Shares automatically convert to Class A Shares eight years after purchase. Class C Shares have a 1% CDSC for redemptions within less than one year, which is not reflected in the one-year total return. Class I Shares have no sales charge and may be purchased under limited circumstances or by specified classes of investors.
| Average Annual Total Returns as of 8/31/09 | ||||
| A Shares | NAV | Offer | ||
1-Year | 4.98% | 0.56% | ||
5-Year | 3.57% | 2.69% | ||
10-Year | 4.79% | 4.34% | ||
| B Shares | w/o CDSC | w/CDSC | ||
1-Year | 4.10% | 0.10% | ||
5-Year | 2.79% | 2.62% | ||
10-Year | 4.16% | 4.16% | ||
| C Shares | NAV | |||
1-Year | 4.40% | |||
5-Year | 3.01% | |||
10-Year | 4.22% | |||
| I Shares | NAV | |||
1-Year | 5.21% | |||
5-Year | 3.77% | |||
10-Year | 4.99% | |||
| Tax-Free Yields | ||||
| A Shares | NAV | Offer | ||
Dividend Yield3 | 4.09% | 3.92% | ||
30-Day Yield3 | 3.58% | — | ||
SEC 30-Day Yield3,4 | — | 3.42% | ||
Taxable-Equivalent Yield4,5 | 5.23% | 5.00% | ||
| B Shares | NAV | |||
Dividend Yield3 | 3.39% | |||
30-Day Yield3 | 2.83% | |||
Taxable-Equivalent Yield5 | 4.14% | |||
| C Shares | NAV | |||
Dividend Yield3 | 3.56% | |||
30-Day Yield3 | 3.03% | |||
Taxable-Equivalent Yield5 | 4.43% | |||
| I Shares | NAV | |||
Dividend Yield3 | 4.31% | |||
SEC 30-Day Yield3 | 3.77% | |||
Taxable-Equivalent Yield5 | 5.51% | |||
| Average Annual Total Returns as of 9/30/09 | ||||
| A Shares | NAV | Offer | ||
1-Year | 14.34% | 9.49% | ||
5-Year | 4.18% | 3.29% | ||
10-Year | 5.19% | 4.74% | ||
| B Shares | w/o CDSC | w/CDSC | ||
1-Year | 13.62% | 9.62% | ||
5-Year | 3.42% | 3.24% | ||
10-Year | 4.56% | 4.56% | ||
| C Shares | NAV | |||
1-Year | 13.83% | |||
5-Year | 3.62% | |||
10-Year | 4.62% | |||
| I Shares | NAV | |||
1-Year | 14.56% | |||
5-Year | 4.38% | |||
10-Year | 5.40% | |||
| Portfolio Statistics | ||
| Net Assets ($000) | $342,692 | |
| Average Effective Maturity on Securities (Years) | 16.73 | |
| Average Duration | 6.43 | |
| Expense Ratios | ||||
| Share Class | Gross Expense Ratios | As of Date | ||
| Class A | 0.83% | 2/28/09 | ||
| Class B | 1.58% | 2/28/09 | ||
| Class C | 1.38% | 2/28/09 | ||
| Class I | 0.63% | 2/28/09 |
The expense ratios shown factor in Total Annual Fund Operating Expenses including management fees and other fees and expenses but excluding interest expense on floating rate obligations, if any.
| 1 | Paid September 1, 2009. This is the latest monthly tax-exempt dividend declared during the period ended August 31, 2009. |
| 2 | Paid November 12, 2008. Capital gains and/or ordinary income are subject to federal taxation. |
| 3 | Dividend Yield is the most recent dividend per share (annualized) divided by the appropriate price per share. The SEC 30-Day Yield is computed under an SEC standardized formula and is based on the maximum offer price per share. The 30-Day Yield is computed under the same formula but is based on the Net Asset Value (NAV) per share. The Dividend Yield may differ from the SEC 30-Day Yield because the Fund may be paying out more or less than it is earning and it may not include the effect of amortization of bond premium. |
| 4 | The SEC 30-Day Yield and Taxable-Equivalent Yield on A Shares at NAV applies only to A Shares purchased at no-load pursuant to the Fund’s policy permitting waiver of the A Share load in certain specified circumstances. |
| 5 | The Taxable-Equivalent Yield represents the yield that must be earned on a fully taxable investment in order to equal the yield of the Fund on an after-tax basis at a specified tax rate. With respect to investments that generate qualified dividend income that is taxable at a maximum rate of 15%, the Taxable-Equivalent Yield is lower. The Taxable-Equivalent Yield is based on the Fund’s 30-Day Yield on the indicated date and a combined federal and state income tax rate of 31.6%. |
| 6 | Nuveen Investments |
Fund Spotlight as of 8/31/09 Nuveen Connecticut Municipal Bond Fund
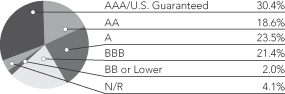
Bond Credit Quality1
| Portfolio Composition1 | ||
Education and Civic Organizations | 21.1% | |
Tax Obligation/General | 15.5% | |
Tax Obligation/Limited | 11.9% | |
Utilities | 9.5% | |
U.S. Guaranteed | 8.7% | |
Health Care | 8.5% | |
Water and Sewer | 8.2% | |
Housing/Single Family | 5.3% | |
Other | 11.3% |
| 1 | As a percentage of total investments as of August 31, 2009. Holdings are subject to change. |
Expense Example
As a shareholder of the Fund, you incur two types of costs: (1) transaction costs, including front and back end sales charges (loads) or redemption fees, where applicable; and (2) ongoing costs, including management fees; distribution and service (12b-1) fees, where applicable; and other Fund expenses. This Example is intended to help you understand your ongoing costs (in dollars) of investing in the Fund and to compare these costs with the ongoing costs of investing in other mutual funds.
The Example below is based on an investment of $1,000 invested at the beginning of the period and held for the period.
The information under “Actual Performance,” together with the amount you invested, allows you to estimate actual expenses incurred over the reporting period. Simply divide your account value by $1,000 (for example, an $8,600 account value divided by $1,000 = 8.60) and multiply the result by the cost shown for your share class, in the row entitled “Expenses Incurred During Period” to estimate the expenses incurred on your account during this period.
The information under “Hypothetical Performance,” provides information about hypothetical account values and hypothetical expenses based on the Fund’s actual expense ratio and an assumed rate of return of 5% per year before expenses, which is not the Fund’s actual return. The hypothetical account values and expenses may not be used to estimate the actual ending account balance or expense you incurred for the period. You may use this information to compare the ongoing costs of investing in the Fund and other Funds. To do so, compare this 5% hypothetical example with the 5% hypothetical examples that appear in the shareholder reports of the other funds.
Please note that the expenses shown in the table are meant to highlight your ongoing costs only and do not reflect any transactional costs, such as front and back end sales charges (loads) or redemption fees, where applicable. Therefore, the hypothetical information is useful in comparing ongoing costs only, and will not help you determine the relative total costs of owning different funds or share classes. In addition, if these transactional costs were included, your costs would have been higher.
| Hypothetical Performance | ||||||||||||||||||||||||||
| Actual Performance | (5% annualized return before expenses) | |||||||||||||||||||||||||
| A Shares | B Shares | C Shares | I Shares | A Shares | B Shares | C Shares | I Shares | |||||||||||||||||||
| Beginning Account Value (3/01/09) | $ | 1,000.00 | $ | 1,000.00 | $ | 1,000.00 | $ | 1,000.00 | $ | 1,000.00 | $ | 1,000.00 | $ | 1,000.00 | $ | 1,000.00 | ||||||||||
| Ending Account Value (8/31/09) | $ | 1,073.40 | $ | 1,068.60 | $ | 1,070.50 | $ | 1,074.40 | $ | 1,020.92 | $ | 1,017.14 | $ | 1,018.15 | $ | 1,021.93 | ||||||||||
| Expenses Incurred During Period | $ | 4.44 | $ | 8.34 | $ | 7.31 | $ | 3.40 | $ | 4.33 | $ | 8.13 | $ | 7.12 | $ | 3.31 | ||||||||||
For each class of the Fund, expenses are equal to the Fund’s annualized net expense ratio of .85%, 1.60%, 1.40% and .65% for Classes A, B, C and I, respectively, multiplied by the average account value over the period, multiplied by 184/365 (to reflect the one-half year period).
| Nuveen Investments | 7 |
Fund Spotlight as of 8/31/09 Nuveen New Jersey Municipal Bond Fund
| Quick Facts | ||||||||
| A Shares | B Shares | C Shares | I Shares | |||||
Fund Symbols | NNJAX | NNJBX | NNJCX | NMNJX | ||||
NAV | $10.38 | $10.39 | $10.35 | $10.42 | ||||
Latest Monthly Dividend1 | $0.0360 | $0.0300 | $0.0315 | $0.0380 | ||||
Latest Capital Gain and Ordinary Income Distribution2 | $0.0283 | $0.0283 | $0.0283 | $0.0283 | ||||
Inception Date | 9/06/94 | 2/03/97 | 9/21/94 | 2/28/92 |
Returns quoted represent past performance which is no guarantee of future results. Investment returns and principal value will fluctuate so that when shares are redeemed, they may be worth more or less than their original cost. Current performance may be higher or lower than the performance shown. Returns without sales charges would be lower if the sales charge were included. Returns do not reflect the deduction of taxes that a shareholder would pay on Fund distributions or the redemption of shares. Income is generally exempt from regular federal income taxes. Some income may be subject to state and local taxes and to the federal alternative minimum tax. Capital gains, if any, are subject to tax. For the most recent month-end performance visit www.nuveen.com or call (800) 257-8787.
Returns reflect differences in sales charges and expenses, which are primarily differences in distribution and service fees. Fund returns assume reinvestment of dividends and capital gains. Class A Shares have a 4.2% maximum sales charge. Class A Share purchases of $1 million or more are sold at net asset value without an up-front sales charge but may be subject to a contingent deferred sales charge (CDSC), also known as a backend sales charge, if redeemed within 12 months of purchase. Class B Shares have a CDSC that begins at 5% for redemptions during the first year and declines periodically until after 6 years when the charge becomes 0%. Class B Shares automatically convert to Class A Shares eight years after purchase. Class C Shares have a 1% CDSC for redemptions within less than one year, which is not reflected in the one-year total return. Class I Shares have no sales charge and may be purchased under limited circumstances or by specified classes of investors.
| Average Annual Total Returns as of 8/31/09 | ||||
| A Shares | NAV | Offer | ||
1-Year | 5.02% | 0.64% | ||
5-Year | 3.62% | 2.74% | ||
10-Year | 4.73% | 4.28% | ||
| B Shares | w/o CDSC | w/CDSC | ||
1-Year | 4.24% | 0.24% | ||
5-Year | 2.86% | 2.69% | ||
10-Year | 4.11% | 4.11% | ||
| C Shares | NAV | |||
1-Year | 4.45% | |||
5-Year | 3.07% | |||
10-Year | 4.16% | |||
| I Shares | NAV | |||
1-Year | 5.30% | |||
5-Year | 3.85% | |||
10-Year | 4.94% | |||
| Tax-Free Yields | ||||
| A Shares | NAV | Offer | ||
Dividend Yield3 | 4.16% | 3.99% | ||
30-Day Yield3 | 3.88% | — | ||
SEC 30-Day Yield3,4 | — | 3.72% | ||
Taxable-Equivalent Yield4,5 | 5.76% | 5.52% | ||
| B Shares | NAV | |||
Dividend Yield3 | 3.46% | |||
30-Day Yield3 | 3.14% | |||
Taxable-Equivalent Yield5 | 4.66% | |||
| C Shares | NAV | |||
Dividend Yield3 | 3.65% | |||
30-Day Yield3 | 3.34% | |||
Taxable-Equivalent Yield5 | 4.96% | |||
| I Shares | NAV | |||
Dividend Yield3 | 4.38% | |||
SEC 30-Day Yield3 | 4.08% | |||
Taxable-Equivalent Yield5 | 6.05% | |||
| Average Annual Total Returns as of 9/30/09 | ||||
| A Shares | NAV | Offer | ||
1-Year | 15.50% | 10.64% | ||
5-Year | 4.38% | 3.49% | ||
10-Year | 5.24% | 4.79% | ||
| B Shares | w/o CDSC | w/CDSC | ||
1-Year | 14.64% | 10.64% | ||
5-Year | 3.60% | 3.42% | ||
10-Year | 4.61% | 4.61% | ||
| C Shares | NAV | |||
1-Year | 14.81% | |||
5-Year | 3.81% | |||
10-Year | 4.65% | |||
| I Shares | NAV | |||
1-Year | 15.79% | |||
5-Year | 4.59% | |||
10-Year | 5.44% | |||
| Portfolio Statistics | ||
| Net Assets ($000) | $224,117 | |
| Average Effective Maturity on Securities (Years) | 16.91 | |
| Average Duration | 6.43 | |
| Expense Ratios | ||||
| Share Class | Gross Expense Ratios | As of Date | ||
| Class A | 0.85% | 2/28/09 | ||
| Class B | 1.60% | 2/28/09 | ||
| Class C | 1.40% | 2/28/09 | ||
| Class I | 0.65% | 2/28/09 |
The expense ratios shown factor in Total Annual Fund Operating Expenses including management fees and other fees and expenses but excluding interest expense on floating rate obligations, if any.
| 1 | Paid September 1, 2009. This is the latest monthly tax-exempt dividend declared during the period ended August 31, 2009. |
| 2 | Paid November 12, 2008. Capital gains and/or ordinary income are subject to federal taxation. |
| 3 | Dividend Yield is the most recent dividend per share (annualized) divided by the appropriate price per share. The SEC 30-Day Yield is computed under an SEC standardized formula and is based on the maximum offer price per share. The 30-Day Yield is computed under the same formula but is based on the Net Asset Value (NAV) per share. The Dividend Yield may differ from the SEC 30-Day Yield because the Fund may be paying out more or less than it is earning and it may not include the effect of amortization of bond premium. |
| 4 | The SEC 30-Day Yield and Taxable-Equivalent Yield on A Shares at NAV applies only to A Shares purchased at no-load pursuant to the Fund’s policy permitting waiver of the A Share load in certain specified circumstances. |
| 5 | The Taxable-Equivalent Yield represents the yield that must be earned on a fully taxable investment in order to equal the yield of the Fund on an after-tax basis at a specified tax rate. With respect to investments that generate qualified dividend income that is taxable at a maximum rate of 15%, the Taxable-Equivalent Yield is lower. The Taxable-Equivalent Yield is based on the Fund’s 30-Day Yield on the indicated date and a combined federal and state income tax rate of 32.6%. |
| 8 | Nuveen Investments |
Fund Spotlight as of 8/31/09 Nuveen New Jersey Municipal Bond Fund
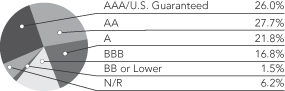
Bond Credit Quality1
| Portfolio Composition1 | ||
Tax Obligation/Limited | 22.8% | |
Health Care | 20.6% | |
Transportation | 14.2% | |
U.S. Guaranteed | 11.7% | |
Education and Civic Organizations | 9.9% | |
Tax Obligation/General | 4.8% | |
Housing Single Family | 4.1% | |
Other | 11.9% |
| 1 | As a percentage of total investments as of August 31, 2009. Holdings are subject to change. |
Expense Example
As a shareholder of the Fund, you incur two types of costs: (1) transaction costs, including front and back end sales charges (loads) or redemption fees, where applicable; and (2) ongoing costs, including management fees; distribution and service (12b-1) fees, where applicable; and other Fund expenses. This Example is intended to help you understand your ongoing costs (in dollars) of investing in the Fund and to compare these costs with the ongoing costs of investing in other mutual funds.
The Example below is based on an investment of $1,000 invested at the beginning of the period and held for the period.
The information under “Actual Performance,” together with the amount you invested, allows you to estimate actual expenses incurred over the reporting period. Simply divide your account value by $1,000 (for example, an $8,600 account value divided by $1,000 = 8.60) and multiply the result by the cost shown for your share class, in the row entitled “Expenses Incurred During Period” to estimate the expenses incurred on your account during this period.
The information under “Hypothetical Performance,” provides information about hypothetical account values and hypothetical expenses based on the Fund’s actual expense ratio and an assumed rate of return of 5% per year before expenses, which is not the Fund’s actual return. The hypothetical account values and expenses may not be used to estimate the actual ending account balance or expense you incurred for the period. You may use this information to compare the ongoing costs of investing in the Fund and other Funds. To do so, compare this 5% hypothetical example with the 5% hypothetical examples that appear in the shareholder reports of the other funds.
Please note that the expenses shown in the table are meant to highlight your ongoing costs only and do not reflect any transactional costs, such as front and back end sales charges (loads) or redemption fees, where applicable. Therefore, the hypothetical information is useful in comparing ongoing costs only, and will not help you determine the relative total costs of owning different funds or share classes. In addition, if these transactional costs were included, your costs would have been higher.
| Hypothetical Performance | ||||||||||||||||||||||||||
| Actual Performance | (5% annualized return before expenses) | |||||||||||||||||||||||||
| A Shares | B Shares | C Shares | I Shares | A Shares | B Shares | C Shares | I Shares | |||||||||||||||||||
| Beginning Account Value (3/01/09) | $ | 1,000.00 | $ | 1,000.00 | $ | 1,000.00 | $ | 1,000.00 | $ | 1,000.00 | $ | 1,000.00 | $ | 1,000.00 | $ | 1,000.00 | ||||||||||
| Ending Account Value (8/31/09) | $ | 1,081.00 | $ | 1,076.00 | $ | 1,077.30 | $ | 1,081.70 | $ | 1,020.92 | $ | 1,017.14 | $ | 1,018.15 | $ | 1,021.93 | ||||||||||
| Expenses Incurred During Period | $ | 4.46 | $ | 8.37 | $ | 7.33 | $ | 3.41 | $ | 4.33 | $ | 8.13 | $ | 7.12 | $ | 3.31 | ||||||||||
For each class of the Fund, expenses are equal to the Fund’s annualized net expense ratio of .85%, 1.60%, 1.40% and .65% for Classes A, B, C and I, respectively, multiplied by the average account value over the period, multiplied by 184/365 (to reflect the one-half year period).
| Nuveen Investments | 9 |
Fund Spotlight as of 8/31/09 Nuveen New York Municipal Bond Fund
| Quick Facts | ||||||||
| A Shares | B Shares | C Shares | I Shares | |||||
Fund Symbols | NNYAX | NNYBX | NNYCX | NTNYX | ||||
NAV | $10.40 | $10.40 | $10.40 | $10.42 | ||||
Latest Monthly Dividend1 | $0.0380 | $0.0320 | $0.0335 | $0.0400 | ||||
Latest Capital Gain and Ordinary Income Distribution2 | $0.0360 | $0.0360 | $0.0360 | $0.0360 | ||||
Inception Date | 9/07/94 | 2/03/97 | 9/14/94 | 12/22/86 |
Returns quoted represent past performance which is no guarantee of future results. Investment returns and principal value will fluctuate so that when shares are redeemed, they may be worth more or less than their original cost. Current performance may be higher or lower than the performance shown. Returns without sales charges would be lower if the sales charge were included. Returns do not reflect the deduction of taxes that a shareholder would pay on Fund distributions or the redemption of shares. Income is generally exempt from regular federal income taxes. Some income may be subject to state and local taxes and to the federal alternative minimum tax. Capital gains, if any, are subject to tax. For the most recent month-end performance visit www.nuveen.com or call (800) 257-8787.
Returns reflect differences in sales charges and expenses, which are primarily differences in distribution and service fees. Fund returns assume reinvestment of dividends and capital gains. Class A Shares have a 4.2% maximum sales charge. Class A Share purchases of $1 million or more are sold at net asset value without an up-front sales charge but may be subject to a contingent deferred sales charge (CDSC), also known as a backend sales charge, if redeemed within 12 months of purchase. Class B Shares have a CDSC that begins at 5% for redemptions during the first year and declines periodically until after 6 years when the charge becomes 0%. Class B Shares automatically convert to Class A Shares eight years after purchase. Class C Shares have a 1% CDSC for redemptions within less than one year, which is not reflected in the one-year total return. Class I Shares have no sales charge and may be purchased under limited circumstances or by specified classes of investors. Returns may reflect an expense limitation by the Fund’s investment adviser.
| Average Annual Total Returns as of 8/31/09 | ||||
| A Shares | NAV | Offer | ||
1-Year | 4.54% | 0.13% | ||
5-Year | 3.63% | 2.74% | ||
10-Year | 4.85% | 4.40% | ||
| B Shares | w/o CDSC | w/CDSC | ||
1-Year | 3.87% | -0.11% | ||
5-Year | 2.87% | 2.69% | ||
10-Year | 4.23% | 4.23% | ||
| C Shares | NAV | |||
1-Year | 3.97% | |||
5-Year | 3.07% | |||
10-Year | 4.28% | |||
| I Shares | NAV | |||
1-Year | 4.79% | |||
5-Year | 3.86% | |||
10-Year | 5.06% | |||
| Tax-Free Yields | ||||
| A Shares | NAV | Offer | ||
Dividend Yield3 | 4.38% | 4.20% | ||
30-Day Yield3 | 4.08% | — | ||
SEC 30-Day Yield3,4 | — | 3.91% | ||
Taxable-Equivalent Yield4,5 | 6.08% | 5.83% | ||
| B Shares | NAV | |||
Dividend Yield3 | 3.69% | |||
30-Day Yield3 | 3.34% | |||
Taxable-Equivalent Yield5 | 4.98% | |||
| C Shares | NAV | |||
Dividend Yield3 | 3.87% | |||
30-Day Yield3 | 3.54% | |||
Taxable-Equivalent Yield5 | 5.28% | |||
| I Shares | NAV | |||
Dividend Yield3 | 4.61% | |||
SEC 30-Day Yield3 | 4.28% | |||
Taxable-Equivalent Yield5 | 6.38% | |||
| Average Annual Total Returns as of 9/30/09 | ||||
| A Shares | NAV | Offer | ||
1-Year | 15.69% | 10.85% | ||
5-Year | 4.45% | 3.55% | ||
10-Year | 5.35% | 4.90% | ||
| B Shares | w/o CDSC | w/CDSC | ||
1-Year | 14.97% | 10.97% | ||
5-Year | 3.68% | 3.50% | ||
10-Year | 4.73% | 4.73% | ||
| C Shares | NAV | |||
1-Year | 15.07% | |||
5-Year | 3.88% | |||
P10-Year | 4.78% | |||
| I Shares | NAV | |||
1-Year | 16.06% | |||
5-Year | 4.66% | |||
10-Year | 5.56% | |||
| Portfolio Statistics | ||
| Net Assets ($000) | $418,168 | |
| Average Effective Maturity on Securities (Years) | 18.02 | |
| Average Duration | 6.52 | |
| Expense Ratios | ||||
| Share Class | Gross Expense Ratios | As of Date | ||
| Class A | 0.84% | 2/28/09 | ||
| Class B | 1.59% | 2/28/09 | ||
| Class C | 1.39% | 2/28/09 | ||
| Class I | 0.64% | 2/28/09 |
The expense ratios shown factor in Total Annual Fund Operating Expenses including management fees and other fees and expenses but excluding interest expense on floating rate obligations, if any.
| 1 | Paid September 1, 2009. This is the latest monthly tax-exempt dividend declared during the period ended August 31, 2009. |
| 2 | Paid November 12, 2008. Capital gains and/or ordinary income are subject to federal taxation. |
| 3 | Dividend Yield is the most recent dividend per share (annualized) divided by the appropriate price per share. The SEC 30-Day Yield is computed under an SEC standardized formula and is based on the maximum offer price per share. The 30-Day Yield is computed under the same formula but is based on the Net Asset Value (NAV) per share. The Dividend Yield may differ from the SEC 30-Day Yield because the Fund may be paying out more or less than it is earning and it may not include the effect of amortization of bond premium. |
| 4 | The SEC 30-Day Yield and Taxable-Equivalent Yield on A Shares at NAV applies only to A Shares purchased at no-load pursuant to the Fund’s policy permitting waiver of the A Share load in certain specified circumstances. |
| 5 | The Taxable-Equivalent Yield represents the yield that must be earned on a fully taxable investment in order to equal the yield of the Fund on an after-tax basis at a specified tax rate. With respect to investments that generate qualified dividend income that is taxable at a maximum rate of 15%, the Taxable-Equivalent Yield is lower. The Taxable-Equivalent Yield is based on the Fund’s 30-Day Yield on the indicated date and a combined federal and state income tax rate of 32.9%. |
| 10 | Nuveen Investments |
Fund Spotlight as of 8/31/09 Nuveen New York Municipal Bond Fund
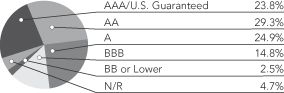
Bond Credit Quality1
| Portfolio Composition1 | ||
Tax Obligation/Limited | 22.1% | |
Health Care | 15.6% | |
Education and Civic Organizations | 11.8% | |
Transportation | 10.7% | |
Utilities | 9.8% | |
Tax Obligation/General | 6.3% | |
Housing/Multifamily | 5.4% | |
Long-Term Care | 4.6% | |
Other | 13.7% |
| 1 | As a percentage of total investments as of August 31, 2009. Holdings are subject to change. |
Expense Example
As a shareholder of the Fund, you incur two types of costs: (1) transaction costs, including front and back end sales charges (loads) or redemption fees, where applicable; and (2) ongoing costs, including management fees; distribution and service (12b-1) fees, where applicable; and other Fund expenses. This Example is intended to help you understand your ongoing costs (in dollars) of investing in the Fund and to compare these costs with the ongoing costs of investing in other mutual funds.
The Example below is based on an investment of $1,000 invested at the beginning of the period and held for the period.
The information under “Actual Performance,” together with the amount you invested, allows you to estimate actual expenses incurred over the reporting period. Simply divide your account value by $1,000 (for example, an $8,600 account value divided by $1,000 = 8.60) and multiply the result by the cost shown for your share class, in the row entitled “Expenses Incurred During Period” to estimate the expenses incurred on your account during this period.
The information under “Hypothetical Performance,” provides information about hypothetical account values and hypothetical expenses based on the Fund’s actual expense ratio and an assumed rate of return of 5% per year before expenses, which is not the Fund’s actual return. The hypothetical account values and expenses may not be used to estimate the actual ending account balance or expense you incurred for the period. You may use this information to compare the ongoing costs of investing in the Fund and other Funds. To do so, compare this 5% hypothetical example with the 5% hypothetical examples that appear in the shareholder reports of the other funds.
Please note that the expenses shown in the table are meant to highlight your ongoing costs only and do not reflect any transactional costs, such as front and back end sales charges (loads) or redemption fees, where applicable. Therefore, the hypothetical information is useful in comparing ongoing costs only, and will not help you determine the relative total costs of owning different funds or share classes. In addition, if these transactional costs were included, your costs would have been higher.
| Hypothetical Performance | ||||||||||||||||||||||||||
| Actual Performance | (5% annualized return before expenses) | |||||||||||||||||||||||||
| A Shares | B Shares | C Shares | I Shares | A Shares | B Shares | C Shares | I Shares | |||||||||||||||||||
| Beginning Account Value (3/01/09) | $ | 1,000.00 | $ | 1,000.00 | $ | 1,000.00 | $ | 1,000.00 | $ | 1,000.00 | $ | 1,000.00 | $ | 1,000.00 | $ | 1,000.00 | ||||||||||
| Ending Account Value (8/31/09) | $ | 1,081.00 | $ | 1,077.20 | $ | 1,078.10 | $ | 1,082.10 | $ | 1,020.82 | $ | 1,017.04 | $ | 1,018.05 | $ | 1,021.83 | ||||||||||
| Expenses Incurred During Period | $ | 4.56 | $ | 8.48 | $ | 7.44 | $ | 3.52 | $ | 4.43 | $ | 8.24 | $ | 7.22 | $ | 3.41 | ||||||||||
For each class of the Fund, expenses are equal to the Fund’s annualized net expense ratio of .87%, 1.62%, 1.42% and .67% for Classes A, B, C and I, respectively, multiplied by the average account value over the period, multiplied by 184/365 (to reflect the one-half year period).
| Nuveen Investments | 11 |
Fund Spotlight as of 8/31/09 Nuveen New York Insured Municipal Bond Fund
| Quick Facts | ||||||||
| A Shares | B Shares | C Shares | I Shares | |||||
Fund Symbols | NNYIX | NNIMX | NNYKX | NINYX | ||||
NAV | $9.96 | $9.99 | $9.97 | $10.00 | ||||
Latest Monthly Dividend1 | $0.0325 | $0.0265 | $0.0280 | $0.0340 | ||||
Latest Capital Gain and Ordinary Income Distribution2 | $0.0306 | $0.0306 | $0.0306 | $0.0306 | ||||
Inception Date | 9/07/94 | 2/11/97 | 9/14/94 | 12/22/86 |
Returns quoted represent past performance which is no guarantee of future results. Investment returns and principal value will fluctuate so that when shares are redeemed, they may be worth more or less than their original cost. Current performance may be higher or lower than the performance shown. Returns without sales charges would be lower if the sales charge were included. Returns do not reflect the deduction of taxes that a shareholder would pay on Fund distributions or the redemption of shares. Income is generally exempt from regular federal income taxes. Some income may be subject to state and local taxes and to the federal alternative minimum tax. Capital gains, if any, are subject to tax. For the most recent month-end performance visit www.nuveen.com or call (800) 257-8787.
Returns reflect differences in sales charges and expenses, which are primarily differences in distribution and service fees. Fund returns assume reinvestment of dividends and capital gains. Class A Shares have a 4.2% maximum sales charge. Class A Share purchases of $1 million or more are sold at net asset value without an up-front sales charge but may be subject to a contingent deferred sales charge (CDSC), also known as a backend sales charge, if redeemed within 12 months of purchase. Class B Shares have a CDSC that begins at 5% for redemptions during the first year and declines periodically until after 6 years when the charge becomes 0%. Class B Shares automatically convert to Class A Shares eight years after purchase. Class C Shares have a 1% CDSC for redemptions within less than one year, which is not reflected in the one-year total return. Class I Shares have no sales charge and may be purchased under limited circumstances or by specified classes of investors. Returns may reflect an expense limitation by the Fund’s investment adviser.
| Average Annual Total Returns as of 8/31/09 | ||||
| A Shares | NAV | Offer | ||
1-Year | 4.39% | -0.02% | ||
5-Year | 3.25% | 2.38% | ||
10-Year | 4.72% | 4.27% | ||
| B Shares | w/o CDSC | w/CDSC | ||
1-Year | 3.60% | -0.39% | ||
5-Year | 2.48% | 2.31% | ||
10-Year | 4.10% | 4.10% | ||
| C Shares | NAV | |||
1-Year | 3.80% | |||
5-Year | 2.68% | |||
10-Year | 4.14% | |||
| I Shares | NAV | |||
1-Year | 4.57% | |||
5-Year | 3.44% | |||
10-Year | 4.92% | |||
| Tax-Free Yields | ||||
| A Shares | NAV | Offer | ||
Dividend Yield3 | 3.92% | 3.75% | ||
30-Day Yield3 | 3.67% | — | ||
SEC 30-Day Yield3,4 | — | 3.51% | ||
Taxable-Equivalent Yield4,5 | 5.47% | 5.23% | ||
| B Shares | NAV | |||
Dividend Yield3 | 3.18% | |||
30-Day Yield3 | 2.92% | |||
Taxable-Equivalent Yield5 | 4.35% | |||
| C Shares | NAV | |||
Dividend Yield3 | 3.37% | |||
30-Day Yield3 | 3.12% | |||
Taxable-Equivalent Yield5 | 4.65% | |||
| I Shares | NAV | |||
Dividend Yield3 | 4.08% | |||
SEC 30-Day Yield3 | 3.87% | |||
Taxable-Equivalent Yield5 | 5.77% | |||
| Average Annual Total Returns as of 9/30/09 | ||||
| A Shares | NAV | Offer | ||
1-Year | 13.55% | 8.82% | ||
5-Year | 3.78% | 2.90% | ||
10-Year | 5.09% | 4.63% | ||
| B Shares | w/o CDSC | w/CDSC | ||
1-Year | 12.67% | 8.67% | ||
5-Year | 3.01% | 2.84% | ||
10-Year | 4.46% | 4.46% | ||
| C Shares | NAV | |||
1-Year | 12.91% | |||
5-Year | 3.21% | |||
10-Year | 4.50% | |||
| I Shares | NAV | |||
1-Year | 13.71% | |||
5-Year | 3.99% | |||
10-Year | 5.29% | |||
| Portfolio Statistics | ||
| Net Assets ($000) | $292,285 | |
| Average Effective Maturity on Securities (Years) | 15.81 | |
| Average Duration | 5.28 | |
| Expense Ratios | ||||
| Share Class | Gross Expense Ratios | As of Date | ||
| Class A | 0.85% | 2/28/09 | ||
| Class B | 1.59% | 2/28/09 | ||
| Class C | 1.40% | 2/28/09 | ||
| Class I | 0.65% | 2/28/09 |
The expense ratios shown factor in Total Annual Fund Operating Expenses including management fees and other fees and expenses but excluding interest expense on floating rate obligations, if any.
| 1 | Paid September 1, 2009. This is the latest monthly tax-exempt dividend declared during the period ended August 31, 2009. |
| 2 | Paid November 12, 2008. Capital gains and/or ordinary income are subject to federal taxation. |
| 3 | Dividend Yield is the most recent dividend per share (annualized) divided by the appropriate price per share. The SEC 30-Day Yield is computed under an SEC standardized formula and is based on the maximum offer price per share. The 30-Day Yield is computed under the same formula but is based on the Net Asset Value (NAV) per share. The Dividend Yield may differ from the SEC 30-Day Yield because the Fund may be paying out more or less than it is earning and it may not include the effect of amortization of bond premium. |
| 4 | The SEC 30-Day Yield and Taxable-Equivalent Yield on A Shares at NAV applies only to A Shares purchased at no-load pursuant to the Fund’s policy permitting waiver of the A Share load in certain specified circumstances. |
| 5 | The Taxable-Equivalent Yield represents the yield that must be earned on a fully taxable investment in order to equal the yield of the Fund on an after-tax basis at a specified tax rate. With respect to investments that generate qualified dividend income that is taxable at a maximum rate of 15%, the Taxable-Equivalent Yield is lower. The Taxable-Equivalent Yield is based on the Fund’s 30-Day Yield on the indicated date and a combined federal and state income tax rate of 32.9%. |
| 12 | Nuveen Investments |
Fund Spotlight as of 8/31/09 Nuveen New York Insured Municipal Bond Fund
Bond Credit Quality1,2

| * | U.S. Guaranteed includes 3.1% (as a % of total investments) of Insured securities. |
At least 80% of the Fund’s net assets are invested in municipal securities that guarantee the timely payment of principal and interest. See Notes to Financial Statements, Footnote 1 — Insurance, for more information.
| Insurers3 | ||
AMBAC | 31.6% | |
NPFG4 | 26.2% | |
FGIC | 16.8% | |
FSA | 14.8% | |
Other | 10.6% |
| Portfolio Composition2 | ||
Tax Obligation/Limited | 27.9% | |
Transportation | 15.9% | |
Health Care | 13.8% | |
Tax Obligation/General | 11.1% | |
Utilities | 8.7% | |
Education and Civic Organizations | 8.6% | |
Other | 14.0% |
| 1 | The percentages shown in the foregoing chart may reflect the ratings on certain bonds whose insurer has experienced downgrades. Please see the Portfolio Manager’s Comments for an expanded discussion of the affect on the Fund of changes to the ratings of certain bonds in the portfolio resulting from changes to the ratings of the underlying insurers both during the period and after period end. |
| 2 | As a percentage of total investments as of August 31, 2009. Holdings are subject to change. |
| 3 | As a percentage of total Insured investments as of August 31, 2009. Holdings are subject to change. |
| 4 | MBIA’s public finance subsidiary. |
Expense Example
As a shareholder of the Fund, you incur two types of costs: (1) transaction costs, including front and back end sales charges (loads) or redemption fees, where applicable; and (2) ongoing costs, including management fees; distribution and service (12b-1) fees, where applicable; and other Fund expenses. This Example is intended to help you understand your ongoing costs (in dollars) of investing in the Fund and to compare these costs with the ongoing costs of investing in other mutual funds.
The Example below is based on an investment of $1,000 invested at the beginning of the period and held for the period.
The information under “Actual Performance,” together with the amount you invested, allows you to estimate actual expenses incurred over the reporting period. Simply divide your account value by $1,000 (for example, an $8,600 account value divided by $1,000 = 8.60) and multiply the result by the cost shown for your share class, in the row entitled “Expenses Incurred During Period” to estimate the expenses incurred on your account during this period.
The information under “Hypothetical Performance,” provides information about hypothetical account values and hypothetical expenses based on the Fund’s actual expense ratio and an assumed rate of return of 5% per year before expenses, which is not the Fund’s actual return. The hypothetical account values and expenses may not be used to estimate the actual ending account balance or expense you incurred for the period. You may use this information to compare the ongoing costs of investing in the Fund and other Funds. To do so, compare this 5% hypothetical example with the 5% hypothetical examples that appear in the shareholder reports of the other funds.
Please note that the expenses shown in the table are meant to highlight your ongoing costs only and do not reflect any transactional costs, such as front and back end sales charges (loads) or redemption fees, where applicable. Therefore, the hypothetical information is useful in comparing ongoing costs only, and will not help you determine the relative total costs of owning different funds or share classes. In addition, if these transactional costs were included, your costs would have been higher.
| Hypothetical Performance | ||||||||||||||||||||||||||
| Actual Performance | (5% annualized return before expenses) | |||||||||||||||||||||||||
| A Shares | B Shares | C Shares | I Shares | A Shares | B Shares | C Shares | I Shares | |||||||||||||||||||
| Beginning Account Value (3/01/09) | $ | 1,000.00 | $ | 1,000.00 | $ | 1,000.00 | $ | 1,000.00 | $ | 1,000.00 | $ | 1,000.00 | $ | 1,000.00 | $ | 1,000.00 | ||||||||||
| Ending Account Value (8/31/09) | $ | 1,057.30 | $ | 1,053.20 | $ | 1,054.30 | $ | 1,058.00 | $ | 1,020.82 | $ | 1,017.04 | $ | 1,018.05 | $ | 1,021.83 | ||||||||||
| Expenses Incurred During Period | $ | 4.51 | $ | 8.38 | $ | 7.35 | $ | 3.48 | $ | 4.43 | $ | 8.24 | $ | 7.22 | $ | 3.41 | ||||||||||
For each class of the Fund, expenses are equal to the Fund’s annualized net expense ratio of .87%, 1.62%, 1.42% and .67% for Classes A, B, C and I, respectively, multiplied by the average account value over the period, multiplied by 184/365 (to reflect the one-half year period).
| Nuveen Investments | 13 |
Portfolio of Investments (Unaudited)
Nuveen Connecticut Municipal Bond Fund
August 31, 2009
| Principal Amount (000) | Description (1) | Optional Call Provisions (2) | Ratings (3) | Value | ||||||||
Consumer Staples – 2.0% | ||||||||||||
| $ | 4,060 | Puerto Rico, The Children’s Trust Fund, Tobacco Settlement Asset-Backed Refunding Bonds, Series 2002, 5.375%, 5/15/33 | 5/12 at 100.00 | BBB | $ | 3,889,236 | ||||||
| 3,000 | Virgin Islands Public Finance Authority, Matching Fund Revenue Loan | 10/19 at 100.00 | Baa3 | 3,067,470 | ||||||||
| 7,060 | Total Consumer Staples | 6,956,706 | ||||||||||
Education and Civic Organizations – 21.1% | ||||||||||||
| 210 | Albany Industrial Development Agency, New York, Revenue Bonds, Brighter Choice Charter Schools, Series 2007A, 5.000%, 4/01/20 | 4/17 at 100.00 | N/R | 189,139 | ||||||||
| 2,000 | Connecticut Health and Education Facilities Authority, Revenue Bonds, Connecticut College, Series 2007G, 4.500%, 7/01/37 – NPFG Insured | 7/17 at 100.00 | A | 1,763,100 | ||||||||
| 4,000 | Connecticut Health and Education Facilities Authority, Revenue Bonds, Quinnipiac University, Series 2006, 5.000%, 7/01/36 – AMBAC Insured | 7/16 at 100.00 | A2 | 4,031,960 | ||||||||
| 4,450 | Connecticut Health and Education Facilities Authority, Revenue Bonds, Quinnipiac University, Series 2007-I, 5.000%, 7/01/25 – NPFG Insured | 7/17 at 100.00 | A | 4,568,637 | ||||||||
| 4,000 | Connecticut Health and Education Facilities Authority, Revenue Bonds, Quinnipiac University, Series 2007K-2, 5.000%, 7/01/31 – NPFG Insured | 7/18 at 100.00 | A | 4,108,960 | ||||||||
| 2,000 | Connecticut Health and Education Facilities Authority, Revenue Bonds, Trinity College, Series 2007J, 4.500%, 7/01/37 – NPFG Insured | 7/17 at 100.00 | A1 | 1,822,500 | ||||||||
| Connecticut Health and Education Facilities Authority, University of Hartford Revenue Bonds, Series 2006G: | ||||||||||||
| 4,995 | 5.250%, 7/01/26 – RAAI Insured | 7/16 at 100.00 | BBB– | 4,722,373 | ||||||||
| 2,250 | 5.250%, 7/01/36 – RAAI Insured | 7/16 at 100.00 | BBB– | 1,977,345 | ||||||||
| 1,540 | Connecticut Health and Educational Facilities Authority, Revenue Bonds, Brunswick School, Series 2003B, 5.000%, 7/01/33 – NPFG Insured | 7/13 at 100.00 | A | 1,518,794 | ||||||||
| 1,490 | Connecticut Health and Educational Facilities Authority, Revenue Bonds, Canterbury School, Series 1998A, 5.000%, 7/01/18 – RAAI Insured | 1/10 at 100.50 | BBB– | 1,481,492 | ||||||||
| 1,275 | Connecticut Health and Educational Facilities Authority, Revenue Bonds, Canterbury School, Series 2006B, 5.000%, 7/01/36 – RAAI Insured | 7/16 at 100.00 | BBB– | 1,078,994 | ||||||||
| Connecticut Health and Educational Facilities Authority, Revenue Bonds, Chase Collegiate School, Series 2007A: | ||||||||||||
| 360 | 5.000%, 7/01/27 – RAAI Insured | 7/17 at 100.00 | BBB– | 327,856 | ||||||||
| 400 | 5.000%, 7/01/32 – RAAI Insured | 7/17 at 100.00 | BBB– | 347,456 | ||||||||
| 2,000 | Connecticut Health and Educational Facilities Authority, Revenue Bonds, Horace Bushnell Memorial Hall, Series 1999A, 5.625%, 7/01/29 – NPFG Insured | 1/10 at 101.00 | Baa1 | 2,011,060 | ||||||||
| 650 | Connecticut Health and Educational Facilities Authority, Revenue Bonds, Kent School, Series 2004D, 5.000%, 7/01/16 – NPFG Insured | 1/15 at 100.00 | Baa1 | 686,342 | ||||||||
| 900 | Connecticut Health and Educational Facilities Authority, Revenue Bonds, Loomis Chaffee School, Series 2001E, 5.250%, 7/01/21 | 7/11 at 101.00 | A2 | 922,644 | ||||||||
| Connecticut Health and Educational Facilities Authority, Revenue Bonds, Renbrook School, Series 2007A: | ||||||||||||
| 395 | 5.000%, 7/01/30 – AMBAC Insured | 7/17 at 100.00 | N/R | 395,482 | ||||||||
| 265 | 5.000%, 7/01/37 – AMBAC Insured | 7/17 at 100.00 | N/R | 253,478 | ||||||||
| 1,125 | Connecticut Health and Educational Facilities Authority, Revenue Bonds, Sacred Heart University, Series 1998E, 5.000%, 7/01/28 – RAAI Insured | 1/10 at 100.50 | BBB– | 1,003,658 | ||||||||
| 650 | Connecticut Health and Educational Facilities Authority, Revenue Bonds, Trinity College, Series 2004H, 5.000%, 7/01/17 – NPFG Insured | 7/14 at 100.00 | A+ | 717,139 | ||||||||
| Connecticut Health and Educational Facilities Authority, Revenue Bonds, University of Hartford, Series 2002E: | ||||||||||||
| 1,400 | 5.500%, 7/01/22 – RAAI Insured | 7/12 at 101.00 | BBB– | 1,398,614 | ||||||||
| 6,000 | 5.250%, 7/01/32 – RAAI Insured | 7/12 at 101.00 | BBB– | 5,164,320 | ||||||||
| 14 | Nuveen Investments |
| Principal Amount (000) | Description (1) | Optional Call Provisions (2) | Ratings (3) | Value | ||||||||
Education and Civic Organizations (continued) | ||||||||||||
| $ | 4,500 | Connecticut Health and Educational Facilities Authority, Revenue Bonds, Yale University, Series 2002W, 5.125%, 7/01/27 | 11/09 at 100.00 | AAA | $ | 4,504,860 | ||||||
| 685 | Connecticut Health and Educational Facilities Authority, Revenue Bonds, Yale University, Series 2003X-1, 5.000%, 7/01/42 | 7/13 at 100.00 | AAA | 698,344 | ||||||||
| 10,050 | Connecticut Health and Educational Facilities Authority, Revenue Bonds, Yale University, Series 2007Z-1, 5.000%, 7/01/42 | 7/16 at 100.00 | AAA | 10,378,031 | ||||||||
| 3,000 | Connecticut Health and Educational Facilities Authority, Revenue Bonds, Yale University, Series 2007Z-3, 5.050%, 7/01/42 | 7/17 at 100.00 | AAA | 3,120,600 | ||||||||
| 610 | Connecticut Higher Education Supplemental Loan Authority, Revenue Bonds, Family Education Loan Program, Series 2001A, 5.250%, 11/15/18 – NPFG Insured (Alternative Minimum Tax) | 11/11 at 100.00 | Aa3 | 610,049 | ||||||||
| 1,435 | University of Connecticut, General Obligation Bonds, Series 2004A, | 1/14 at 100.00 | AA | 1,583,609 | ||||||||
| 2,670 | University of Connecticut, General Obligation Bonds, Series 2005A, | 2/15 at 100.00 | AAA | 2,987,597 | ||||||||
| University of Connecticut, General Obligation Bonds, Series 2009A: | ||||||||||||
| 1,000 | 5.000%, 2/15/27 | 2/19 at 100.00 | AA | 1,081,340 | ||||||||
| 1,000 | 5.000%, 2/15/28 | 2/19 at 100.00 | AA | 1,074,000 | ||||||||
| 2,160 | University of Connecticut, Student Fee Revenue Bonds, Series 2002A, | 5/12 at 100.00 | AA– | 2,323,361 | ||||||||
| 3,120 | University of Connecticut, Student Fee Revenue Refunding Bonds, | 11/12 at 101.00 | AA– | 3,416,806 | ||||||||
| 72,585 | Total Education and Civic Organizations | 72,269,940 | ||||||||||
Energy – 0.2% | ||||||||||||
| 500 | Virgin Islands Public Finance Authority, Revenue Bonds, Refinery Project Hovensa LLC, Series 2007, 4.700%, 7/01/22 (Alternative Minimum Tax) | 1/15 at 100.00 | BBB | 421,460 | ||||||||
Health Care – 8.5% | ||||||||||||
| 2,000 | Connecticut Health and Educational Facilities Authority, Revenue Bonds, Bridgeport Hospital Issue, Series 1992A, 6.625%, 7/01/18 – NPFG Insured | 1/10 at 100.00 | A | 2,008,280 | ||||||||
| 4,000 | Connecticut Health and Educational Facilities Authority, Revenue Bonds, Bristol Hospital, Series 2002B, 5.500%, 7/01/32 – RAAI Insured | 7/12 at 101.00 | BBB– | 3,340,440 | ||||||||
| 1,500 | Connecticut Health and Educational Facilities Authority, Revenue Bonds, Catholic Health East, Series 1999F, 5.750%, 11/15/29 – NPFG Insured | 11/09 at 101.00 | A1 | 1,503,540 | ||||||||
| Connecticut Health and Educational Facilities Authority, Revenue Bonds, Danbury Hospital, Series 1999G: | ||||||||||||
| 500 | 5.700%, 7/01/22 – AMBAC Insured | 1/10 at 101.00 | N/R | 498,155 | ||||||||
| 1,000 | 5.625%, 7/01/25 – AMBAC Insured | 1/10 at 101.00 | N/R | 967,870 | ||||||||
| 640 | Connecticut Health and Educational Facilities Authority, Revenue Bonds, Eastern Connecticut Health Network, Series 2000A, 6.000%, 7/01/25 – RAAI Insured | 7/10 at 101.00 | BBB– | 609,798 | ||||||||
| 2,240 | Connecticut Health and Educational Facilities Authority, Revenue Bonds, Eastern Connecticut Health Network, Series 2005,, 5.000%, 7/01/25 – RAAI Insured | 7/15 at 100.00 | BBB– | 1,914,573 | ||||||||
| 1,005 | Connecticut Health and Educational Facilities Authority, Revenue Bonds, Hospital For Special Care, Series 2007C, 5.250%, 7/01/32 – RAAI Insured | 7/17 at 100.00 | BBB– | 813,668 | ||||||||
| 90 | Connecticut Health and Educational Facilities Authority, Revenue Bonds, | 7/12 at 101.00 | BBB– | 86,934 | ||||||||
| Connecticut Health and Educational Facilities Authority, Revenue Bonds, Stamford Hospital, Series 1999G: | ||||||||||||
| 1,000 | 5.000%, 7/01/18 – NPFG Insured | 1/10 at 101.00 | Baa1 | 962,260 | ||||||||
| 175 | 5.000%, 7/01/24 – NPFG Insured | 1/10 at 101.00 | Baa1 | 155,586 | ||||||||
| Nuveen Investments | 15 |
Portfolio of Investments (Unaudited)
Nuveen Connecticut Municipal Bond Fund (continued)
August 31, 2009
| Principal Amount (000) | Description (1) | Optional Call Provisions (2) | Ratings (3) | Value | ||||||||
Health Care (continued) | ||||||||||||
| $ | 2,725 | Connecticut Health and Educational Facilities Authority, Revenue Bonds, Waterbury Hospital, Series 1999C, 5.750%, 7/01/20 – RAAI Insured | 1/10 at 101.00 | BBB– | $ | 2,568,558 | ||||||
| 2,000 | Connecticut Health and Educational Facilities Authority, Revenue Bonds, William W. Backus Hospital, Series 1998, 5.000%, 7/01/28 – FSA Insured | 7/18 at 100.00 | AAA | 2,026,960 | ||||||||
| 11,460 | Connecticut Health and Educational Facilities Authority, Revenue Bonds, Yale-New Haven Hospital, Series 2006J-1, 5.000%, 7/01/31 – AMBAC Insured | 7/16 at 100.00 | A1 | 11,459,194 | ||||||||
| 240 | Connecticut Health and Educational Facilities Authority, Revenue Refunding Bonds, Middlesex Health Services, Series 1997H, 5.125%, 7/01/27 – NPFG Insured | 1/10 at 100.00 | A3 | 208,865 | ||||||||
| 30,575 | Total Health Care | 29,124,681 | ||||||||||
Housing/Multifamily – 1.9% | ||||||||||||
| 1,785 | Bridgeport Housing Authority, Connecticut, Multifamily Housing Revenue Bonds, Stratfield Apartments, Series 1999, 7.250%, 12/01/24 (Alternative Minimum Tax) | 12/09 at 102.00 | N/R | 1,641,486 | ||||||||
| 2,000 | Connecticut Housing Finance Authority, Housing Mortgage Finance Program Bonds, Series 1999D-2, 6.200%, 11/15/41 (Alternative Minimum Tax) | 12/09 at 100.00 | AAA | 2,003,200 | ||||||||
| 3,000 | Connecticut Housing Finance Authority, Multifamily Housing Mortgage Finance Program Bonds, Series 2006G-2, 4.800%, 11/15/27 (Alternative Minimum Tax) | 11/15 at 100.00 | AAA | 2,859,630 | ||||||||
| 6,785 | Total Housing/Multifamily | 6,504,316 | ||||||||||
Housing/Single Family – 5.3% | ||||||||||||
| Connecticut Housing Finance Authority, Housing Mortgage Finance Program Bonds, Series 2001C: | ||||||||||||
| 1,595 | 5.300%, 11/15/33 (Alternative Minimum Tax) | 11/10 at 100.00 | AAA | 1,571,346 | ||||||||
| 5,160 | 5.450%, 11/15/43 (Alternative Minimum Tax) | 11/10 at 100.00 | AAA | 5,073,106 | ||||||||
| 5,000 | Connecticut Housing Finance Authority, Housing Mortgage Finance Program Bonds, Series 2004-A5, 5.050%, 11/15/34 | 5/13 at 100.00 | AAA | 5,043,650 | ||||||||
| Connecticut Housing Finance Authority, Housing Mortgage Finance Program Bonds, Series 2006-A1: | ||||||||||||
| 1,610 | 4.700%, 11/15/26 (Alternative Minimum Tax) | 11/15 at 100.00 | AAA | 1,512,096 | ||||||||
| 1,735 | 4.800%, 11/15/31 (Alternative Minimum Tax) | 11/15 at 100.00 | AAA | 1,611,312 | ||||||||
| 3,500 | Connecticut Housing Finance Authority, Housing Mortgage Finance Program Bonds, Series 2006D, 4.650%, 11/15/27 | 5/16 at 100.00 | AAA | 3,502,555 | ||||||||
| 18,600 | Total Housing/Single Family | 18,314,065 | ||||||||||
Industrials – 1.7% | ||||||||||||
| 5,250 | Connecticut Resource Recovery Authority, Revenue Bonds, American Ref-Fuel Company of Southeastern Connecticut LP, Series 1992A, 6.450%, 11/15/22 (Alternative Minimum Tax) | 11/09 at 100.00 | BB+ | 5,056,800 | ||||||||
| 1,000 | Connecticut Resource Recovery Authority, Revenue Bonds, American Ref-Fuel Company of Southeastern Connecticut LP, Series 1998A-II, | 12/11 at 102.00 | Ba1 | 922,820 | ||||||||
| 6,250 | Total Industrials | 5,979,620 | ||||||||||
Long-Term Care – 4.2% | ||||||||||||
| Connecticut Development Authority, First Mortgage Gross Revenue Refunding Healthcare Bonds, Church Homes Inc. – Congregational Avery Heights, Series 1997: | ||||||||||||
| 1,070 | 5.700%, 4/01/12 | 10/09 at 100.00 | BBB– | 1,069,305 | ||||||||
| 2,560 | 5.800%, 4/01/21 | 10/09 at 100.00 | BBB– | 2,352,077 | ||||||||
| Connecticut Development Authority, First Mortgage Gross Revenue Refunding Healthcare Bonds, Connecticut Baptist Homes Inc., Series 1999: | ||||||||||||
| 1,000 | 5.500%, 9/01/15 – RAAI Insured | 9/09 at 102.00 | BBB– | 991,960 | ||||||||
| 500 | 5.625%, 9/01/22 – RAAI Insured | 9/09 at 102.00 | BBB– | 466,145 | ||||||||
| 16 | Nuveen Investments |
| Principal Amount (000) | Description (1) | Optional Call Provisions (2) | Ratings (3) | Value | ||||||||
Long-Term Care (continued) | ||||||||||||
| $ | 1,875 | Connecticut Development Authority, First Mortgage Gross Revenue Refunding Healthcare Bonds, Elim Park Baptist Home Inc., Series 1998A, 5.375%, 12/01/18 | 12/09 at 100.00 | BBB+ | $ | 1,802,831 | ||||||
| 1,000 | Connecticut Development Authority, First Mortgage Gross Revenue Refunding Healthcare Bonds, Mary Wade Home Inc., Series 1999A, 6.375%, 12/01/18 | 12/09 at 102.00 | N/R | 1,022,440 | ||||||||
| 65 | Connecticut Development Authority, Revenue Bonds, Duncaster Inc., Series 2002, 4.750%, 8/01/32 – RAAI Insured | 8/12 at 101.00 | BBB | 53,754 | ||||||||
| Connecticut Development Authority, Revenue Refunding Bonds, Duncaster Inc., Series 1999A: | ||||||||||||
| 2,200 | 5.250%, 8/01/19 – RAAI Insured | 2/10 at 102.00 | BBB | 2,206,644 | ||||||||
| 3,910 | 5.375%, 8/01/24 – RAAI Insured | 2/10 at 102.00 | BBB | 3,852,679 | ||||||||
| 500 | Connecticut Housing Finance Authority, Group Home Mortgage Finance Program Special Obligation Bonds, Series 2000GH-5, 5.850%, 6/15/30 – AMBAC Insured | 6/10 at 102.00 | N/R | 504,935 | ||||||||
| 14,680 | Total Long-Term Care | 14,322,770 | ||||||||||
Materials – 0.3% | ||||||||||||
| 1,000 | Sprague, Connecticut, Environmental Improvement Revenue Bonds, International Paper Company, Series 1997A, 5.700%, 10/01/21 (Alternative Minimum Tax) | 10/09 at 100.00 | BBB | 913,740 | ||||||||
Tax Obligation/General – 15.5% | ||||||||||||
| 1,500 | Bridgeport, Connecticut, General Obligation Refunding Bonds, Series 2002A, 5.375%, 8/15/19 – FGIC Insured | 8/12 at 100.00 | Baa1 | 1,518,525 | ||||||||
| 395 | Colchester, Connecticut, General Obligation Bonds, Series 2001, 5.500%, 6/15/14 – FGIC Insured | 6/11 at 102.00 | A1 | 424,270 | ||||||||
| 2,330 | Connecticut State, General Obligation Bonds, Series 2004C, 5.000%, 4/01/23 – FGIC Insured | 4/14 at 100.00 | AA | 2,470,965 | ||||||||
| 5,000 | Connecticut State, General Obligation Bonds, Series 2006A, 4.750%, 12/15/24 | 12/16 at 100.00 | AA | 5,332,799 | ||||||||
| 2,200 | Connecticut State, General Obligation Bonds, Series 2006C, 5.000%, 6/01/23 – FSA Insured | 6/16 at 100.00 | AAA | 2,402,004 | ||||||||
| Connecticut State, General Obligation Bonds, Series 2008C: | ||||||||||||
| 1,000 | 5.000%, 11/01/26 | 11/18 at 100.00 | AA | 1,096,970 | ||||||||
| 1,000 | 5.000%, 11/01/27 | 11/18 at 100.00 | AA | 1,090,490 | ||||||||
| 1,000 | 5.000%, 11/01/28 | 11/18 at 100.00 | AA | 1,084,040 | ||||||||
Connecticut, General Obligation Bonds, Series 2001C: | ||||||||||||
| 5,000 | 5.500%, 12/15/13 (UB) | No Opt. Call | AA | 5,797,850 | ||||||||
| 10,000 | 5.500%, 12/15/14 (UB) | No Opt. Call | AA | 11,740,300 | ||||||||
| 545 | East Lyme, Connecticut, General Obligation Bonds, Series 2001, | 7/11 at 102.00 | Aa3 | 588,796 | ||||||||
| Hartford, Connecticut, General Obligation Bonds, Series 2005A: | ||||||||||||
| 1,195 | 5.000%, 8/01/20 – FSA Insured | 8/15 at 100.00 | AAA | 1,299,598 | ||||||||
| 595 | 5.000%, 8/01/21 – FSA Insured | 8/15 at 100.00 | AAA | 640,827 | ||||||||
| 1,210 | 4.375%, 8/01/24 – FSA Insured | 8/15 at 100.00 | AAA | 1,223,358 | ||||||||
| 485 | North Haven, Connecticut, General Obligation Bonds, Series 2006, | No Opt. Call | Aa2 | 557,803 | ||||||||
| Old Saybrook, Connecticut, General Obligation Bonds, Series 1991: | ||||||||||||
| 275 | 6.500%, 2/15/10 – AMBAC Insured | No Opt. Call | Aa3 | 282,158 | ||||||||
| 270 | 6.500%, 2/15/11 – AMBAC Insured | No Opt. Call | Aa3 | 290,895 | ||||||||
| Puerto Rico, General Obligation and Public Improvement Bonds, Series 2001A: | ||||||||||||
| 700 | 5.500%, 7/01/14 – FSA Insured | No Opt. Call | AAA | 757,512 | ||||||||
| 2,125 | 5.500%, 7/01/16 – FSA Insured | No Opt. Call | AAA | 2,341,835 | ||||||||
| 2,500 | 5.500%, 7/01/17 – FSA Insured | No Opt. Call | AAA | 2,740,225 | ||||||||
| 2,870 | 5.500%, 7/01/18 – FSA Insured | No Opt. Call | AAA | 3,131,744 | ||||||||
| 1,875 | 5.500%, 7/01/19 – FSA Insured | No Opt. Call | AAA | 2,033,400 | ||||||||
| 1,700 | 5.500%, 7/01/29 – FGIC Insured | No Opt. Call | Baa3 | 1,624,792 | ||||||||
| Nuveen Investments | 17 |
Portfolio of Investments (Unaudited)
Nuveen Connecticut Municipal Bond Fund (continued)
August 31, 2009
| Principal Amount (000) | Description (1) | Optional Call Provisions (2) | Ratings (3) | Value | ||||||||
Tax Obligation/General (continued) | ||||||||||||
| $ | 420 | Regional School District 15, Connecticut, General Obligation Bonds, | 8/10 at 101.00 | Aa3 | $ | 432,092 | ||||||
| Regional School District 16, Beacon Falls and Prospect, Connecticut, General Obligation Bonds, Series 2000: | ||||||||||||
| 650 | 5.500%, 3/15/18 – FSA Insured | 3/10 at 101.00 | Aa3 | 669,949 | ||||||||
| 650 | 5.625%, 3/15/19 – FSA Insured | 3/10 at 101.00 | Aa3 | 670,384 | ||||||||
| 650 | 5.700%, 3/15/20 – FSA Insured | 3/10 at 101.00 | Aa3 | 670,859 | ||||||||
| 140 | Winchester, Connecticut, General Obligation Bonds, Series 1990, | No Opt. Call | A2 | 145,184 | ||||||||
| 48,280 | Total Tax Obligation/General | 53,059,624 | ||||||||||
Tax Obligation/Limited – 11.9% | ||||||||||||
| 2,600 | Connecticut Health and Educational Facilities Authority, Child Care Facilities Program Revenue Bonds, Series 2006F, 5.000%, 7/01/36 – AGC Insured | 7/16 at 100.00 | AAA | 2,622,282 | ||||||||
| 1,250 | Connecticut Health and Educational Facilities Authority, Child Care Facilities Program Revenue Bonds, Series 2008G, 6.000%, 7/01/28 – AGC Insured | 7/18 at 100.00 | AAA | 1,352,188 | ||||||||
| 825 | Connecticut Health and Educational Facilities Authority, Revenue Bonds, Child Care Facilities Program, Series 1998A, 5.000%, 7/01/28 – AMBAC Insured | 1/10 at 101.00 | N/R | 825,809 | ||||||||
| 2,895 | Connecticut Health and Educational Facilities Authority, Revenue Bonds, New Opportunities for Waterbury Inc., Series 1998A, 6.750%, 7/01/28 | 1/10 at 104.00 | A | 3,032,484 | ||||||||
| Connecticut, Certificates of Participation, Juvenile Training School, Series 2001: | ||||||||||||
| 1,275 | 5.000%, 12/15/20 | 12/11 at 101.00 | AA– | 1,328,257 | ||||||||
| 1,000 | 5.000%, 12/15/30 | 12/11 at 101.00 | AA– | 1,015,060 | ||||||||
| 5,000 | Connecticut, Special Tax Obligation Transportation Infrastructure Bonds, Series 2008A, 5.000%, 11/01/28 | No Opt. Call | AA | 5,247,100 | ||||||||
| 1,150 | Connecticut, Special Tax Obligation Transportation Infrastructure Purpose Bonds, Series 1992B, 6.125%, 9/01/12 | No Opt. Call | AA | 1,245,393 | ||||||||
| 4,000 | Connecticut, Special Tax Obligation Transportation Infrastructure Purpose Bonds, Series 2002B, 5.000%, 12/01/20 – AMBAC Insured | 12/12 at 100.00 | AA | 4,182,200 | ||||||||
| 1,000 | Connecticut, Special Tax Obligation Transportation Infrastructure Purpose Bonds, Series 2003B, 5.000%, 1/01/23 – FGIC Insured | 1/14 at 100.00 | AA | 1,046,790 | ||||||||
| 5,000 | Connecticut, Special Tax Obligation Transportation Infrastructure Purpose Revenue Bonds, Series 2007A, 5.000%, 8/01/26 – AMBAC Insured | 8/17 at 100.00 | AA | 5,291,050 | ||||||||
| 1,900 | Guam Government, Limited Obligation Section 30 Revenue Bonds, Series 2009A, 5.750%, 12/01/34 | 12/19 at 100.00 | BBB– | 1,917,385 | ||||||||
| Puerto Rico Highway and Transportation Authority, Highway Revenue Bonds, Series 2007N: | ||||||||||||
| 200 | 5.250%, 7/01/31 – AMBAC Insured | No Opt. Call | BBB | 188,584 | ||||||||
| 4,100 | 5.250%, 7/01/33 – NPFG Insured | No Opt. Call | A | 3,850,638 | ||||||||
| 4,650 | Puerto Rico Municipal Finance Agency, Series 2005C, 5.000%, 8/01/16 – FSA Insured | 8/15 at 100.00 | AAA | 4,955,226 | ||||||||
| 1,050 | Puerto Rico Sales Tax Financing Corporation, Sales Tax Revenue Bonds, Series 2007A, 5.250%, 8/01/57 | 8/17 at 100.00 | AA– | 1,056,027 | ||||||||
| 1,700 | Puerto Rico, Highway Revenue Bonds, Highway and Transportation Authority, Series 2003AA, 5.500%, 7/01/19 – NPFG Insured | No Opt. Call | A | 1,730,872 | ||||||||
| 39,595 | Total Tax Obligation/Limited | 40,887,345 | ||||||||||
Transportation – 1.1% | ||||||||||||
| 2,100 | Connecticut, General Airport Revenue Bonds, Bradley International Airport, Series 2001A, 5.125%, 10/01/26 – FGIC Insured (Alternative Minimum Tax) | 4/11 at 101.00 | A | 2,002,203 | ||||||||
| 1,360 | New Haven, Connecticut, Revenue Refunding Bonds, Air Rights Parking Facility, Series 2002, 5.375%, 12/01/14 – AMBAC Insured | No Opt. Call | N/R | 1,524,519 | ||||||||
| 18 | Nuveen Investments |
| Principal Amount (000) | Description (1) | Optional Call Provisions (2) | Ratings (3) | Value | |||||||||
Transportation (continued) | |||||||||||||
| $ | 250 | Puerto Rico Ports Authority, Special Facilities Revenue Bonds, American Airlines Inc., Series 1996A, 6.250%, 6/01/26 (Alternative Minimum Tax) | 12/09 at 100.00 | CCC+ | $ | 109,630 | |||||||
| 3,710 | Total Transportation | 3,636,352 | |||||||||||
U.S. Guaranteed – 8.7% (4) | |||||||||||||
| 1,000 | Bridgeport, Connecticut, General Obligation Bonds, Series 2000A, | 7/10 at 101.00 | AAA | 1,059,380 | |||||||||
| 1,440 | Bridgeport, Connecticut, General Obligation Bonds, Series 2003A, | 9/13 at 100.00 | AAA | 1,655,726 | |||||||||
| Cheshire, Connecticut, General Obligation Bonds, Series 1999: | |||||||||||||
| 660 | 5.625%, 10/15/18 (Pre-refunded 10/15/09) | 10/09 at 101.00 | Aa2 | (4) | 670,857 | ||||||||
| 660 | 5.625%, 10/15/19 (Pre-refunded 10/15/09) | 10/09 at 101.00 | Aa2 | (4) | 670,857 | ||||||||
| 1,000 | Connecticut Health and Educational Facilities Authority, FHA-Insured Mortgage Revenue Bonds, Hebrew Home and Hospital, Series 1999B, 5.200%, 8/01/38 (Pre-refunded 11/20/09) | 11/09 at 101.00 | N/R | (4) | 1,018,770 | ||||||||
| Connecticut Health and Educational Facilities Authority, Revenue Bonds, Eastern Connecticut Health Network, Series 2000A: | |||||||||||||
| 1,305 | 6.000%, 7/01/25 (Pre-refunded 7/01/10) – RAAI Insured | 7/10 at 101.00 | BBB– | (4) | 1,379,476 | ||||||||
| 55 | 6.000%, 7/01/25 (Pre-refunded 7/01/10) – RAAI Insured | 7/10 at 101.00 | BBB– | (4) | 58,120 | ||||||||
| 925 | Connecticut Health and Educational Facilities Authority, Revenue Bonds, Greenwich Academy, Series 2001B, 5.000%, 3/01/32 | 3/11 at 101.00 | AAA | 991,693 | |||||||||
| 1,005 | Connecticut Health and Educational Facilities Authority, Revenue Bonds, Lutheran General Healthcare System – Parkside Lodges Projects, Series 1989, 7.375%, 7/01/19 (ETM) | 11/09 at 100.00 | AAA | 1,266,109 | |||||||||
| 2,000 | Connecticut, General Obligation Bonds, Series 2002B, 5.500%, 6/15/21 (Pre-refunded 6/15/12) | 6/12 at 100.00 | AA | (4) | 2,241,600 | ||||||||
| 470 | East Lyme, Connecticut, General Obligation Bonds, Series 2001, 5.000%, 7/15/16 (Pre-refunded 7/15/11) – FGIC Insured | 7/11 at 102.00 | Aa3 | (4) | 516,323 | ||||||||
| 1,000 | Hartford, Connecticut, Parking System Revenue Bonds, Series 2000A, 6.500%, 7/01/25 (Pre-refunded 7/01/10) | 7/10 at 100.00 | Baa2 | (4) | 1,050,560 | ||||||||
| 365 | New Haven, Connecticut, General Obligation Bonds, Series 2001A, 5.000%, 11/01/20 (Pre-refunded 11/01/11) – FGIC Insured | 11/11 at 100.00 | A– | (4) | 386,250 | ||||||||
| 975 | Northern Mariana Islands, General Obligation Bonds, Series 2000A, | 6/10 at 100.00 | AAA | 1,015,882 | |||||||||
| Puerto Rico Infrastructure Financing Authority, Special Obligation Bonds, Series 2000A: | |||||||||||||
| 2,540 | 5.500%, 10/01/32 | 10/10 at 101.00 | AAA | 2,703,576 | |||||||||
| 4,500 | 5.500%, 10/01/40 | 10/10 at 101.00 | AAA | 4,789,800 | |||||||||
| 590 | Puerto Rico, The Children’s Trust Fund, Tobacco Settlement Asset-Backed Bonds, Series 2000, 5.750%, 7/01/20 (Pre-refunded 7/01/10) | 7/10 at 100.00 | AAA | 615,647 | |||||||||
| 1,460 | Regional School District 8, Andover, Hebron and Marlborough, Connecticut, General Obligation Bonds, Series 2002, 5.000%, 5/01/21 (Pre-refunded 5/01/11) – FSA Insured | 5/11 at 101.00 | Aa3 | (4) | 1,577,807 | ||||||||
| 135 | University of Connecticut, General Obligation Bonds, Series 2000A, 5.550%, 3/01/18 (Pre-refunded 3/01/10) – FGIC Insured | 3/10 at 101.00 | AA | (4) | 139,829 | ||||||||
| 1,000 | University of Connecticut, General Obligation Bonds, Series 2002A, | 4/12 at 100.00 | AA | (4) | 1,109,530 | ||||||||
| 2,000 | Virgin Islands Public Finance Authority, Gross Receipts Taxes Loan Note, Series 1999A, 6.500%, 10/01/24 (Pre-refunded 10/01/10) | 10/10 at 101.00 | BBB+ | (4) | 2,151,080 | ||||||||
| Waterbury, Connecticut, General Obligation Bonds, Series 2002A: | |||||||||||||
| 1,500 | 5.375%, 4/01/16 (Pre-refunded 4/01/12) – FSA Insured | 4/12 at 100.00 | AAA | 1,664,295 | |||||||||
| 1,090 | 5.375%, 4/01/17 (Pre-refunded 4/01/12) – FSA Insured | 4/12 at 100.00 | AAA | 1,209,388 | |||||||||
| 27,675 | Total U.S. Guaranteed | 29,942,555 | |||||||||||
| Nuveen Investments | 19 |
Portfolio of Investments (Unaudited)
Nuveen Connecticut Municipal Bond Fund (continued)
August 31, 2009
| Principal Amount (000) | Description (1) | Optional Call Provisions (2) | Ratings (3) | Value | ||||||||
Utilities – 9.5% | ||||||||||||
| $ | 3,800 | Bristol Resource Recovery Facility Operating Committee, Connecticut, Solid Waste Revenue Bonds, Covanta Bristol Inc., Series 2005, | No Opt. Call | A+ | $ | 4,147,016 | ||||||
| 2,025 | Connecticut Development Authority, Pollution Control Revenue Refunding Bonds, Connecticut Light and Power Company, Series 1993A, 5.850%, 9/01/28 | 10/09 at 101.50 | Baa1 | 2,040,512 | ||||||||
| 3,000 | Connecticut Development Authority, Pollution Control Revenue Refunding Bonds, Western Massachusetts Electric Company, Series 1993A, 5.850%, 9/01/28 | 10/09 at 101.50 | BBB | 3,022,980 | ||||||||
| 3,040 | Connecticut Development Authority, Solid Waste Disposal Facilities Revenue Bonds, PSEG Power LLC Project, Series 2007A, 5.750%, 11/01/37 (Alternative Minimum Tax) | 11/12 at 100.00 | Baa1 | 2,813,034 | ||||||||
| Eastern Connecticut Resource Recovery Authority, Solid Waste Revenue Bonds, Wheelabrator Lisbon Project, Series 1993A: | ||||||||||||
| 1,080 | 5.500%, 1/01/14 (Alternative Minimum Tax) | 1/10 at 100.00 | BBB | 1,070,701 | ||||||||
| 6,550 | 5.500%, 1/01/20 (Alternative Minimum Tax) | 1/10 at 100.00 | BBB | 6,336,600 | ||||||||
| Guam Power Authority, Revenue Bonds, Series 1999A: | ||||||||||||
| 2,280 | 5.125%, 10/01/29 – NPFG Insured | 10/09 at 101.00 | A | 2,084,809 | ||||||||
| 1,000 | 5.125%, 10/01/29 – AMBAC Insured | 10/09 at 101.00 | Ba1 | 875,450 | ||||||||
| Puerto Rico Electric Power Authority, Power Revenue Refunding Bonds, Series 2002: | ||||||||||||
| 5,000 | 5.000%, 7/01/19 – NPFG Insured | No Opt. Call | A | 5,108,800 | ||||||||
| 5,000 | 5.000%, 7/01/20 – NPFG Insured | No Opt. Call | A | 5,089,750 | ||||||||
| 32,775 | Total Utilities | 32,589,652 | ||||||||||
Water and Sewer – 8.3% | ||||||||||||
| 1,750 | Connecticut Development Authority, Water Facilities Revenue Bonds, Bridgeport Hydraulic Company, Series 1995, 6.150%, 4/01/35 (Alternative Minimum Tax) | 10/09 at 101.00 | N/R | 1,626,800 | ||||||||
| 150 | Connecticut Development Authority, Water Facility Revenue Bonds, Aquarion Water Company Project, Refunding Series 2005B, 4.400%, 8/01/29 – SYNCORA GTY Insured | 8/12 at 102.00 | N/R | 135,911 | ||||||||
| 5,625 | Connecticut Development Authority, Water Facility Revenue Bonds, Aquarion Water Company Project, Series 200.7, 5.100%, 9/01/37 – SYNCORA GTY Insured (Alternative Minimum Tax) | 9/17 at 100.00 | N/R | 4,646,700 | ||||||||
| 1,550 | Connecticut, State Revolving Fund General Revenue Bonds, Series 2003A, 5.000%, 10/01/16 | 10/13 at 100.00 | AAA | 1,708,875 | ||||||||
| Greater New Haven Water Pollution Control Authority, Connecticut, Regional Wastewater System Revenue Bonds, Series 2005A: | ||||||||||||
| 3,840 | 5.000%, 11/15/30 – NPFG Insured | 11/15 at 100.00 | A | 3,882,586 | ||||||||
| 4,670 | 5.000%, 8/15/35 – NPFG Insured | 11/15 at 100.00 | A | 4,643,007 | ||||||||
| 1,140 | Puerto Rico Aqueduct and Sewerage Authority, Revenue Bonds, Senior Lien Series 2008A, 6.000%, 7/01/38 | 7/18 at 100.00 | BBB– | 1,148,436 | ||||||||
| South Central Connecticut Regional Water Authority, Water System Revenue Bonds, Eighteenth Series 2003A: | ||||||||||||
| 3,000 | 5.000%, 8/01/20 – NPFG Insured | 8/13 at 100.00 | A+ | 3,133,440 | ||||||||
| 3,955 | 5.000%, 8/01/33 – NPFG Insured | 8/13 at 100.00 | A+ | 3,986,996 | ||||||||
| 2,760 | South Central Connecticut Regional Water Authority, Water System Revenue Bonds, Twentieth Series, 2007A, 5.000%, 8/01/30 – NPFG Insured | 8/16 at 100.00 | A+ | 2,831,236 | ||||||||
| 550 | Stamford, Connecticut, Water Pollution Control System and Facility Revenue Bonds, Series 2003A, 5.000%, 11/15/32 | 11/13 at 100.00 | AA+ | 554,938 | ||||||||
| 28,990 | Total Water and Sewer | 28,298,925 | ||||||||||
| $ | 339,060 | Total Investments (cost $342,215,694) – 100.2% | 343,221,751 | |||||||||
Floating Rate Obligations – (2.9)% | (10,000,000) | |||||||||||
Other Assets Less Liabilities – 2.7% | 9,469,998 | |||||||||||
Net Assets – 100% | $ | 342,691,749 | ||||||||||
| 20 | Nuveen Investments |
| (1) | All percentages shown in the Portfolio of Investments are based on net assets. |
| (2) | Optional Call Provisions: Dates (month and year) and prices of the earliest optional call or redemption. There may be other call provisions at varying prices at later dates. Certain mortgage-backed securities may be subject to periodic principal paydowns. |
| (3) | Ratings: Using the higher of Standard & Poor’s Group (“Standard & Poor’s”) or Moody’s Investor Service, Inc. (“Moody’s”) rating. Ratings below BBB by Standard & Poor’s or Baa by Moody’s are considered to be below investment grade. |
| (4) | Backed by an escrow or trust containing sufficient U.S. Government or U.S. Government agency securities which ensure the timely payment of principal and interest. Such investments are normally considered to be equivalent to AAA rated securities. |
| N/R | Not rated. |
| (ETM) | Escrowed to maturity. |
| (UB) | Underlying bond of an inverse floating rate trust reflected as a financing transaction pursuant to the provisions of SFAS No. 140. |
See accompanying notes to financial statements.
| Nuveen Investments | 21 |
Portfolio of Investments (Unaudited)
Nuveen New Jersey Municipal Bond Fund
August 31, 2009
| Principal Amount (000) | Description (1) | Optional Call Provisions (2) | Ratings (3) | Value | ||||||||
Consumer Discretionary – 0.1% | ||||||||||||
| Middlesex County Improvement Authority, New Jersey, Senior Revenue Bonds, Heldrich Center Hotel/Conference Center Project, Series 2005A: | ||||||||||||
| $ | 280 | 5.000%, 1/01/32 | 1/15 at 100.00 | B3 | $ | 142,276 | ||||||
| 240 | 5.125%, 1/01/37 | 1/15 at 100.00 | B3 | 121,966 | ||||||||
| 520 | Total Consumer Discretionary | 264,242 | ||||||||||
Consumer Staples – 2.5% | ||||||||||||
| Tobacco Settlement Financing Corporation, New Jersey, Tobacco Settlement Asset-Backed Bonds, Series 2007-1A: | ||||||||||||
| 1,635 | 4.750%, 6/01/34 | 6/17 at 100.00 | BBB | 1,137,813 | ||||||||
| 6,500 | 5.000%, 6/01/41 | 6/17 at 100.00 | BBB | 4,449,575 | ||||||||
| 8,135 | Total Consumer Staples | 5,587,388 | ||||||||||
Education and Civic Organizations – 9.3% | ||||||||||||
| 360 | New Brunswick Housing Authority, New Jersey, Lease Revenue Refunding Bonds, Rutgers University, Series 1998, 4.750%, 7/01/18 – FGIC Insured | 1/10 at 100.00 | AA | 363,042 | ||||||||
| 375 | New Jersey Economic Development Authority, Revenue Bonds, The Seeing Eye Inc., Series 2005, 5.000%, 12/01/24 – AMBAC Insured | 6/15 at 100.00 | N/R | 367,140 | ||||||||
| 2,000 | New Jersey Educational Facilities Authority Revenue Bonds, The Richard Stockton College of New Jersey Issue Series 2008A, 5.375%, 7/01/38 | 7/18 at 100.00 | A3 | 2,041,420 | ||||||||
| 2,500 | New Jersey Educational Facilities Authority Revenue Refunding Bonds, University of Medicine and Dentistry of New Jersey Issue, Series 2009 B, 7.500%, 12/01/32 | 6/19 at 100.00 | Baa2 | 2,763,725 | ||||||||
| 2,500 | New Jersey Educational Facilities Authority, Revenue Bonds, Fairleigh Dickinson University, Series 2002D, 5.250%, 7/01/32 – ACA Insured | 7/13 at 100.00 | N/R | 2,196,525 | ||||||||
| 1,000 | New Jersey Educational Facilities Authority, Revenue Bonds, Fairleigh Dickinson University, Series 2004C, 5.500%, 7/01/23 | 7/14 at 100.00 | N/R | 960,160 | ||||||||
| 425 | New Jersey Educational Facilities Authority, Revenue Bonds, Georgian Court University, Series 2007D, 5.250%, 7/01/37 | 7/17 at 100.00 | BBB+ | 392,870 | ||||||||
| 1,495 | New Jersey Educational Facilities Authority, Revenue Bonds, Kean University, Series 2007D, 5.000%, 7/01/32 – FGIC Insured | 7/17 at 100.00 | A | 1,506,467 | ||||||||
| 45 | New Jersey Educational Facilities Authority, Revenue Bonds, Montclair State University, Series 2004L, 5.125%, 7/01/21 – NPFG Insured | 7/14 at 100.00 | A | 46,931 | ||||||||
| 1,400 | New Jersey Educational Facilities Authority, Revenue Bonds, Montclair State University, Series 2005F, 5.000%, 7/01/16 – FGIC Insured | 7/15 at 100.00 | A2 | 1,530,732 | ||||||||
| 1,035 | New Jersey Educational Facilities Authority, Revenue Bonds, Montclair State University, Series 2006A, 5.000%, 7/01/36 – AMBAC Insured | 7/16 at 100.00 | A2 | 1,019,889 | ||||||||
| New Jersey Educational Facilities Authority, Revenue Bonds, New Jersey Institute of Technology, Series 2004B: | ||||||||||||
| 125 | 5.000%, 7/01/18 – AMBAC Insured | 1/14 at 100.00 | A+ | 131,726 | ||||||||
| 265 | 5.000%, 7/01/19 – AMBAC Insured | 1/14 at 100.00 | A+ | 277,365 | ||||||||
| 815 | 4.250%, 7/01/24 – AMBAC Insured | 1/14 at 100.00 | A+ | 788,879 | ||||||||
| 290 | New Jersey Educational Facilities Authority, Revenue Bonds, Rider University, Series 2004A, 5.500%, 7/01/23 – RAAI Insured | 7/14 at 100.00 | Baa1 | 291,931 | ||||||||
| 190 | New Jersey Educational Facilities Authority, Revenue Bonds, Rider University, Series 2007C, 5.000%, 7/01/37 – RAAI Insured | 7/12 at 100.00 | Baa1 | 162,156 | ||||||||
| 500 | New Jersey Educational Facilities Authority, Revenue Bonds, Rowan College, Series 2007B, 4.250%, 7/01/34 – FGIC Insured | 7/17 at 100.00 | A+ | 432,775 | ||||||||
| 255 | New Jersey Educational Facilities Authority, Revenue Refunding Bonds, Monmouth College, Series 1993A, 5.625%, 7/01/13 | 1/10 at 100.00 | A3 | 255,344 | ||||||||
| 4,000 | New Jersey Higher Education Assistance Authority, Student Loan Revenue Bonds, Series 2008A, 6.125%, 6/01/30 - AGC Insured (Alternative Minimum Tax) | 6/18 at 100.00 | AAA | 4,154,480 | ||||||||
| 22 | Nuveen Investments |
| Principal Amount (000) | Description (1) | Optional Call Provisions (2) | Ratings (3) | Value | ||||||||
Education and Civic Organizations (continued) | ||||||||||||
| $ | 1,500 | Puerto Rico Industrial, Tourist, Educational, Medical and Environmental Control Facilities Financing Authority, Higher Education Revenue Refunding Bonds, Ana G. Mendez University System, Series 2002, 5.500%, 12/01/31 | 12/12 at 101.00 | BBB– | $ | 1,170,165 | ||||||
| 21,075 | Total Education and Civic Organizations | 20,853,722 | ||||||||||
Financials – 0.7% | ||||||||||||
| 750 | New Jersey Economic Development Authority, Industrial Development Revenue Refunding Bonds, Newark Airport Marriott Hotel, Series 1996, 7.000%, 10/01/14 | 11/09 at 100.00 | Ba1 | 733,305 | ||||||||
| 1,000 | New Jersey Economic Development Authority, Revenue Refunding Bonds, Kapkowski Road Landfill Project, Series 2002, 5.750%, 10/01/21 | No Opt. Call | Baa3 | 817,670 | ||||||||
| 1,750 | Total Financials | 1,550,975 | ||||||||||
Health Care – 19.4% | ||||||||||||
| 2,500 | Camden County Improvement Authority, New Jersey, Healthcare Revenue Bonds, Cooper Health System, Series 2005B, 5.250%, 2/15/27 | 2/15 at 100.00 | BBB | 2,027,275 | ||||||||
| Camden County Improvement Authority, New Jersey, Revenue Bonds, Cooper Health System, Series 2004A: | ||||||||||||
| 3,000 | 5.000%, 2/15/25 | 2/15 at 100.00 | BBB | 2,422,890 | ||||||||
| 350 | 5.750%, 2/15/34 | 8/14 at 100.00 | BBB | 280,658 | ||||||||
| 4,000 | New Jersey Health Care Facilities Finance Authority, Revenue Bonds, AHS Hospital Corporation, Series 2008A, 5.000%, 7/01/27 | 7/18 at 100.00 | A1 | 3,871,320 | ||||||||
| 4,235 | New Jersey Health Care Facilities Financing Authority, FHA-Insured Mortgage Revenue Bonds, Jersey City Medical Center, Series 2001, 5.000%, 8/01/31 – AMBAC Insured | 8/11 at 100.00 | N/R | 4,249,399 | ||||||||
| 1,160 | New Jersey Health Care Facilities Financing Authority, Revenue Bonds, Atlanticare Regional Medical Center, Series 2007, 5.000%, 7/01/37 | 7/17 at 100.00 | A+ | 1,084,008 | ||||||||
| 1,500 | New Jersey Health Care Facilities Financing Authority, Revenue Bonds, CentraState Medical Center, Series 2006A, 5.000%, 7/01/30 – AGC Insured | 7/17 at 100.00 | Aa2 | 1,505,685 | ||||||||
| 140 | New Jersey Health Care Facilities Financing Authority, Revenue Bonds, Children’s Specialized Hospital, Series 2005A, 5.500%, 7/01/36 | 7/15 at 100.00 | Baa3 | 118,122 | ||||||||
| 2,000 | New Jersey Health Care Facilities Financing Authority, Revenue Bonds, Hunterdon Medical Center, Series 2006B, 5.000%, 7/01/26 | 7/16 at 100.00 | A– | 1,880,520 | ||||||||
| 1,710 | New Jersey Health Care Facilities Financing Authority, Revenue Bonds, Hunterdon Medical Center, Series 2006, 5.125%, 7/01/35 | 7/16 at 100.00 | A– | 1,539,428 | ||||||||
| New Jersey Health Care Facilities Financing Authority, Revenue Bonds, Kennedy Health System Obligated Group, Series 2001: | ||||||||||||
| 600 | 5.500%, 7/01/21 | 7/11 at 100.00 | A2 | 605,880 | ||||||||
| 265 | 5.625%, 7/01/31 | 7/11 at 100.00 | A2 | 265,138 | ||||||||
| 305 | New Jersey Health Care Facilities Financing Authority, Revenue Bonds, Palisades Medical Center of New York Presbyterian Healthcare System, Series 2002, 6.625%, 7/01/31 | 7/12 at 101.00 | BB+ | 242,795 | ||||||||
| 2,000 | New Jersey Health Care Facilities Financing Authority, Revenue Bonds, Robert Wood Johnson University Hospital, Series 2000, 5.750%, 7/01/31 | 7/10 at 100.00 | A2 | 2,003,840 | ||||||||
| 900 | New Jersey Health Care Facilities Financing Authority, Revenue Bonds, RWJ Health Care Corporation, Series 2005B, 5.000%, 7/01/35 – RAAI Insured | 7/15 at 100.00 | BBB– | 706,752 | ||||||||
| New Jersey Health Care Facilities Financing Authority, Revenue Bonds, Saint Barnabas Health Care System, Series 2006A: | ||||||||||||
| 750 | 5.000%, 7/01/29 | 1/17 at 100.00 | Baa2 | 617,550 | ||||||||
| 15,000 | 0.000%, 7/01/35 | 1/17 at 39.39 | Baa2 | 1,635,600 | ||||||||
| 3,000 | New Jersey Health Care Facilities Financing Authority, Revenue Bonds, Saint Joseph’s Healthcare System Obligated Group Issue, Series 2008, | 7/18 at 100.00 | BBB– | 2,742,270 | ||||||||
| 1,300 | New Jersey Health Care Facilities Financing Authority, Revenue Bonds, Shore Memorial Health System, Series 2003, 5.000%, 7/01/23 – RAAI Insured | 7/13 at 100.00 | BBB– | 1,186,861 | ||||||||
| Nuveen Investments | 23 |
Portfolio of Investments (Unaudited)
Nuveen New Jersey Municipal Bond Fund (continued)
August 31, 2009
| Principal Amount (000) | Description (1) | Optional Call Provisions (2) | Ratings (3) | Value | ||||||||
Health Care (continued) | ||||||||||||
| New Jersey Health Care Facilities Financing Authority, Revenue Bonds, Somerset Medical Center, Series 2003: | ||||||||||||
| $ | 125 | 5.500%, 7/01/23 | 7/13 at 100.00 | Ba2 | $ | 94,773 | ||||||
| 1,125 | 5.500%, 7/01/33 | 7/13 at 100.00 | Ba2 | 744,604 | ||||||||
| New Jersey Health Care Facilities Financing Authority, Revenue Bonds, South Jersey Hospital System, Series 2006: | ||||||||||||
| 830 | 5.000%, 7/01/25 | 7/16 at 100.00 | A2 | 810,429 | ||||||||
| 860 | 5.000%, 7/01/36 | 7/16 at 100.00 | A2 | 784,286 | ||||||||
| 1,660 | New Jersey Health Care Facilities Financing Authority, Revenue Bonds, St. Peter’s University Hospital, Series 2000A, 6.875%, 7/01/30 | 7/10 at 100.00 | Baa2 | 1,661,311 | ||||||||
| 1,500 | New Jersey Health Care Facilities Financing Authority, Revenue Bonds, Virtua Health System, Series 1998, 5.250%, 7/01/10 – FSA Insured | 11/09 at 101.00 | AAA | 1,519,305 | ||||||||
| 1,000 | New Jersey Health Care Facilities Financing Authority, Revenue Refunding Bonds, Atlantic City Medical Center, Series 2002, 5.750%, 7/01/25 | 7/12 at 100.00 | A+ | 1,017,390 | ||||||||
| 1,710 | New Jersey Health Care Facilities Financing Authority, Revenue Refunding Bonds, Bayshore Community Hospital, Series 2002, 5.000%, 7/01/22 – RAAI Insured | 1/12 at 100.00 | BBB– | 1,474,123 | ||||||||
| 5,500 | New Jersey Health Facilities Financing Authority, Revenue Bonds, Meridian Health, Series 2007-I, 5.000%, 7/01/38 – AGC Insured | 7/18 at 100.00 | AAA | 5,586,019 | ||||||||
| 900 | Puerto Rico Industrial, Tourist, Educational, Medical and Environmental Control Facilities Financing Authority, Hospital Revenue Bonds, Auxilio Mutuo Hospital, Series 1995A, 6.250%, 7/01/16 – NPFG Insured | 1/10 at 100.00 | A | 901,206 | ||||||||
| 59,925 | Total Health Care | 43,579,437 | ||||||||||
Housing/Multifamily – 1.8% | ||||||||||||
| 1,000 | Essex County Improvement Authority, New Jersey, FNMA Enhanced Multifamily Housing Revenue Bonds, Ballantyne House Project, Series 2002, | 11/12 at 100.00 | Aaa | 1,002,360 | ||||||||
| 1,500 | New Jersey Housing and Mortgage Finance Agency, Multifamily Housing Revenue Bonds, Series 2000A-1, 6.350%, 11/01/31 – FSA Insured (Alternative Minimum Tax) | 3/10 at 100.00 | AAA | 1,507,455 | ||||||||
| 570 | New Jersey Housing and Mortgage Finance Agency, Multifamily Housing Revenue Bonds, Series 2000E-1, 5.750%, 5/01/25 – FSA Insured | 8/10 at 100.00 | AAA | 574,343 | ||||||||
| 825 | Newark Housing Authority, New Jersey, GNMA Collateralized Housing Revenue Bonds, Fairview Apartments Project, Series 2000A, 6.300%, 10/20/19 (Alternative Minimum Tax) | 10/09 at 102.00 | Aaa | 843,068 | ||||||||
| 3,895 | Total Housing/Multifamily | 3,927,226 | ||||||||||
Housing/Single Family – 3.8% | ||||||||||||
| 2,965 | New Jersey Housing and Mortgage Finance Agency, Home Buyer Program Revenue Bonds, Series 1997U, 5.700%, 10/01/14 – NPFG Insured (Alternative Minimum Tax) | 10/09 at 100.00 | Aaa | 2,968,232 | ||||||||
| 510 | New Jersey Housing and Mortgage Finance Agency, Home Buyer Program Revenue Bonds, Series 2000CC, 5.875%, 10/01/31 – NPFG Insured (Alternative Minimum Tax) | 10/10 at 100.00 | Aaa | 512,861 | ||||||||
| 2,000 | New Jersey Housing and Mortgage Finance Agency, Single Family Housing Revenue Bonds, Series 2007T, 4.700%, 10/01/37 (Alternative Minimum Tax) | 4/17 at 100.00 | AA | 1,764,340 | ||||||||
| 3,000 | New Jersey Housing and Mortgage Finance Agency, Single Family Housing Revenue Bonds, Series 2008AA, 6.375%, 10/01/28 | 10/18 at 100.00 | AA | 3,278,580 | ||||||||
| 115 | Virgin Islands Housing Finance Corporation, GNMA Mortgage-Backed Securities Program Single Family Mortgage Revenue Refunding Bonds, Series 1995A, 6.450%, 3/01/16 (Alternative Minimum Tax) | 9/09 at 100.00 | N/R | 115,139 | ||||||||
| 8,590 | Total Housing/Single Family | 8,639,152 | ||||||||||
| 24 | Nuveen Investments |
| Principal Amount (000) | Description (1) | Optional Call Provisions (2) | Ratings (3) | Value | ||||||||
Industrials – 0.9% | ||||||||||||
| $ | 2,000 | Gloucester County Improvement Authority, New Jersey, Solid Waste Resource Recovery Revenue Refunding Bonds, Waste Management Inc. Project, Series 1999B, 6.850%, 12/01/29 (Mandatory put 12/01/09) | No Opt. Call | BBB | $ | 2,015,940 | ||||||
Long-Term Care – 3.2% | ||||||||||||
| 785 | Burlington County Bridge Commission, New Jersey, Economic Development Revenue Bonds, The Evergreens Project, Series 2007, 5.625%, 1/01/38 | 1/18 at 100.00 | N/R | 545,112 | ||||||||
| 1,200 | New Jersey Economic Development Authority, First Mortgage Fixed Rate Revenue Bonds, Cadbury Corporation, Series 1998A, 5.500%, 7/01/18 – ACA Insured | 1/10 at 101.00 | N/R | 1,016,808 | ||||||||
| 1,975 | New Jersey Economic Development Authority, First Mortgage Revenue Bonds, Winchester Gardens at Wards Homestead, Series 2004A, 5.750%, 11/01/24 | 11/14 at 100.00 | N/R | 1,866,000 | ||||||||
| 600 | New Jersey Economic Development Authority, Revenue Bonds, Masonic Charity Foundation of New Jersey, Series 2001, 5.875%, 6/01/18 | 6/11 at 102.00 | A– | 623,550 | ||||||||
| 140 | New Jersey Economic Development Authority, Revenue Bonds, Masonic Charity Foundation of New Jersey, Series 2002, 5.250%, 6/01/32 | 6/13 at 102.00 | A– | 135,300 | ||||||||
| 1,500 | New Jersey Economic Development Authority, Revenue Bonds, United Methodist Homes of New Jersey Obligated Group, Series 1998, 5.125%, 7/01/25 | 1/10 at 100.00 | BB+ | 1,062,120 | ||||||||
| New Jersey Health Care Facilities Financing Authority, Revenue Bonds, House of the Good Shepherd Obligated Group, Series 2001: | ||||||||||||
| 1,000 | 5.100%, 7/01/21 – RAAI Insured | 7/11 at 100.00 | BBB– | 914,920 | ||||||||
| 1,350 | 5.200%, 7/01/31 – RAAI Insured | 7/11 at 100.00 | BBB– | 1,102,032 | ||||||||
| 8,550 | Total Long-Term Care | 7,265,842 | ||||||||||
Materials – 0.2% | ||||||||||||
| 500 | Union County Pollution Control Financing Authority, New Jersey, Revenue Refunding Bonds, American Cyanamid Company, Series 1994, 5.800%, 9/01/09 | No Opt. Call | Baa1 | 500,000 | ||||||||
Tax Obligation/General – 4.5% | ||||||||||||
| 1,445 | Clifton, New Jersey, General Obligation Bonds, Series 2002, 5.000%, 1/15/19 – FGIC Insured | 1/11 at 100.00 | AA– | 1,499,794 | ||||||||
| 500 | Hillsborough Township School District, Somerset County, New Jersey, General Obligation School Bonds, Series 1992, 5.875%, 8/01/11 | No Opt. Call | AA | 548,365 | ||||||||
| 750 | Newark Housing Authority, New Jersey, City-Secured Police Facility Revenue Bonds, South Ward Police Facility, Series 2009A, 6.750%, 12/01/38 – AGC Insured | 12/19 at 100.00 | Aa2 | 824,483 | ||||||||
| 250 | Union City, Hudson County, New Jersey, General Obligation Bonds, Series 1992, 6.375%, 11/01/10 – FSA Insured | No Opt. Call | AAA | 267,060 | ||||||||
| 5,000 | Union County Utilities Authority, New Jersey, Solid Waste System County Deficiency Revenue Bonds, Series 1998A, 5.000%, 6/15/28 (Alternative Minimum Tax) | 12/09 at 101.00 | AA+ | 4,748,349 | ||||||||
| 2,110 | Washington Township Board of Education, Mercer County, New Jersey, General Obligation Bonds, Series 2005, 5.000%, 1/01/21 – FSA Insured | 1/16 at 100.00 | Aa2 | 2,303,318 | ||||||||
| 10,055 | Total Tax Obligation/General | 10,191,369 | ||||||||||
Tax Obligation/Limited – 21.6% | ||||||||||||
| 650 | Bergen County Improvement Authority, New Jersey, Guaranteed Lease Revenue Bonds, County Administration Complex Project, Series 2005, 5.000%, 11/15/26 | No Opt. Call | Aaa | 754,995 | ||||||||
| Burlington County Bridge Commission, New Jersey, Guaranteed Pooled Loan Bonds, Series 2003: | ||||||||||||
| 1,000 | 5.000%, 12/01/20 – NPFG Insured | 12/13 at 100.00 | AA | 1,089,210 | ||||||||
| 695 | 5.000%, 12/01/21 – NPFG Insured | 12/13 at 100.00 | AA | 752,094 | ||||||||
| Nuveen Investments | 25 |
Portfolio of Investments (Unaudited)
Nuveen New Jersey Municipal Bond Fund (continued)
August 31, 2009
| Principal Amount (000) | Description (1) | Optional Call Provisions (2) | Ratings (3) | Value | ||||||||
Tax Obligation/Limited (continued) | ||||||||||||
| $ | 825 | Essex County Improvement Authority, New Jersey, Project Consolidation Revenue Bonds, Series 2007, 5.250%, 12/15/22 – AMBAC Insured | No Opt. Call | A1 | $ | 929,726 | ||||||
| 900 | Garden State Preservation Trust, New Jersey, Open Space and Farmland Preservation Bonds, Series 2005C, 5.125%, 11/01/18 – FSA Insured | No Opt. Call | AAA | 1,056,420 | ||||||||
| Hudson County Improvement Authority, New Jersey, County Secured Lease Revenue Bonds, County Services Building Project, Series 2005: | ||||||||||||
| 395 | 5.000%, 4/01/25 – AMBAC Insured | 4/15 at 100.00 | AA– | 415,141 | ||||||||
| 920 | 5.000%, 4/01/35 – AMBAC Insured | 4/15 at 100.00 | AA– | 937,903 | ||||||||
| 1,750 | Middlesex County, New Jersey, Certificates of Participation, Series 2001, 5.000%, 8/01/22 – NPFG Insured | 8/11 at 100.00 | Aa2 | 1,756,580 | ||||||||
| 2,255 | New Jersey Building Authority, State Building Revenue Bonds, Series 2007A, 5.000%, 6/15/27 | 6/16 at 100.00 | AA– | 2,322,830 | ||||||||
| New Jersey Economic Development Authority, Cigarette Tax Revenue Bonds, Series 2004: | ||||||||||||
| 830 | 5.500%, 6/15/24 | 6/12 at 100.00 | BBB | 771,917 | ||||||||
| 1,560 | 5.750%, 6/15/34 | 6/14 at 100.00 | BBB | 1,429,210 | ||||||||
| 1,000 | New Jersey Economic Development Authority, Lease Revenue Bonds, Liberty State Park Project, Series 2005C, 5.000%, 3/01/27 – FSA Insured | 3/15 at 100.00 | AAA | 1,040,420 | ||||||||
| 2,600 | New Jersey Economic Development Authority, Revenue Bonds, Motor Vehicle Surcharge, Series 2004A, 5.250%, 7/01/15 – NPFG Insured | 7/14 at 100.00 | A | 2,858,830 | ||||||||
| New Jersey Economic Development Authority, Revenue Bonds, Newark Downtown District Management Corporation Project, Series 2007: | ||||||||||||
| 85 | 5.125%, 6/15/27 | 6/17 at 100.00 | Baa3 | 71,587 | ||||||||
| 145 | 5.125%, 6/15/37 | 6/17 at 100.00 | Baa3 | 111,741 | ||||||||
| 830 | New Jersey Economic Development Authority, School Facilities Construction Financing Program Bonds, Series 2007U, 5.000%, 9/01/37 – AMBAC Insured | 9/17 at 100.00 | AA– | 834,349 | ||||||||
| 700 | New Jersey Educational Facilities Authority, Revenue Bonds, Higher Education Capital Improvement Fund, Series 2005A, 5.000%, 9/01/15 – FSA Insured | No Opt. Call | AAA | 794,024 | ||||||||
| New Jersey Health Care Facilities Financing Authority, Lease Revenue Bonds, Department of Human Services – Greystone Park Psychiatric Hospital, Series 2005: | ||||||||||||
| 1,050 | 5.000%, 9/15/18 – AMBAC Insured | 9/15 at 100.00 | AA– | 1,098,941 | ||||||||
| 1,875 | 5.000%, 9/15/24 – AMBAC Insured | 9/15 at 100.00 | AA– | 1,891,481 | ||||||||
| 4,495 | 5.000%, 9/15/26 – AMBAC Insured | No Opt. Call | AA– | 4,532,174 | ||||||||
| 1,325 | 5.000%, 9/15/28 – AMBAC Insured | 9/15 at 100.00 | AA– | 1,330,446 | ||||||||
| 2,000 | New Jersey Health Care Facilities Financing Authority, State Contract Bonds, Hospital Asset Transformatiom Program, Series 2009A, 5.750%, 10/01/31 | 10/19 at 100.00 | AA– | 2,114,320 | ||||||||
| New Jersey Health Care Facilities Financing Authority, State Contract Bonds, Hospital Asset Transformation Program, Series 2008A: | ||||||||||||
| 3,000 | 5.000%, 10/01/28 | 10/18 at 100.00 | AA– | 3,072,480 | ||||||||
| 1,950 | 5.250%, 10/01/38 | 10/18 at 100.00 | AA– | 1,979,465 | ||||||||
| 1,295 | New Jersey Transit Corporation, Lease Appropriation Bonds, Series 2005A, 5.000%, 9/15/18 – FGIC Insured | 9/15 at 100.00 | A | 1,347,344 | ||||||||
| New Jersey Transportation Trust Fund Authority, Federal Highway Aid Grant Anticipation Bonds, Series 2006: | ||||||||||||
| 560 | 5.000%, 6/15/17 – FGIC Insured | 6/16 at 100.00 | A1 | 612,321 | ||||||||
| 1,000 | 5.000%, 6/15/18 – FGIC Insured | 6/16 at 100.00 | A1 | 1,081,100 | ||||||||
| 1,500 | New Jersey Transportation Trust Fund Authority, Transportation System Bonds, Series 2004B, 5.500%, 12/15/16 – NPFG Insured | No Opt. Call | AA– | 1,708,515 | ||||||||
| 1,900 | New Jersey Transportation Trust Fund Authority, Transportation System Bonds, Series 2006A, 5.500%, 12/15/22 | No Opt. Call | AA– | 2,110,900 | ||||||||
| New Jersey Transportation Trust Fund Authority, Transportation System Bonds, Series 2006C: | ||||||||||||
| 5,800 | 0.000%, 12/15/28 – AMBAC Insured | No Opt. Call | AA– | 1,847,416 | ||||||||
| 4,000 | 0.000%, 12/15/32 – FSA Insured | No Opt. Call | AAA | 1,004,080 | ||||||||
| 5,450 | 0.000%, 12/15/34 – FSA Insured | No Opt. Call | AAA | 1,207,230 | ||||||||
| 26 | Nuveen Investments |
| Principal Amount (000) | Description (1) | Optional Call Provisions (2) | Ratings (3) | Value | |||||||||
Tax Obligation/Limited (continued) | |||||||||||||
| $ | 500 | New Jersey Transportation Trust Fund Authority, Transportation System Bonds, Series 2007A, 5.000%, 12/15/26 – AMBAC Insured | 12/17 at 100.00 | AA– | $ | 516,055 | |||||||
| 485 | Puerto Rico Convention Center District Authority, Hotel Occupancy Tax Revenue Bonds, Series 2006A, 4.500%, 7/01/36 – CIFG Insured | 7/16 at 100.00 | BBB+ | 390,178 | |||||||||
| 2,000 | Puerto Rico Sales Tax Financing Corporation, Sales Tax Revenue Bonds, First Subordinate Series 2009A, 6.000%, 8/01/42 | 8/19 at 100.00 | A+ | 2,089,540 | |||||||||
| 450 | Puerto Rico Sales Tax Financing Corporation, Sales Tax Revenue Bonds, Series 2007A, 5.250%, 8/01/57 | 8/17 at 100.00 | AA– | 452,583 | |||||||||
| 57,775 | Total Tax Obligation/Limited | 48,313,546 | |||||||||||
Transportation – 13.4% | |||||||||||||
| Delaware River and Bay Authority, Delaware and New Jersey, Revenue Bonds, Series 2005: | |||||||||||||
| 1,335 | 5.000%, 1/01/26 – NPFG Insured | 1/15 at 100.00 | A+ | 1,365,625 | |||||||||
| 500 | 5.000%, 1/01/27 – NPFG Insured | 1/15 at 100.00 | A+ | 512,420 | |||||||||
| 3,500 | Delaware River Port Authority, New Jersey and Pennsylvania, Revenue Bonds, Series 1999, 5.750%, 1/01/22 – FSA Insured | 1/10 at 100.00 | AAA | 3,518,655 | |||||||||
| New Jersey Turnpike Authority, Revenue Bonds, Series 1991C: | |||||||||||||
| 40 | 6.500%, 1/01/16 | No Opt. Call | A+ | 47,435 | |||||||||
| 485 | 6.500%, 1/01/16 – NPFG Insured | No Opt. Call | A+ | 582,228 | |||||||||
| 5,000 | New Jersey Turnpike Authority, Revenue Bonds, Series 2003A, 5.000%, 1/01/19 – FGIC Insured | 7/13 at 100.00 | A+ | 5,377,399 | |||||||||
| 1,300 | New Jersey Turnpike Authority, Revenue Bonds, Series 2005A, 5.250%, 1/01/29 – FSA Insured | No Opt. Call | AAA | 1,451,840 | |||||||||
| 2,000 | Port Authority of New York and New Jersey, Consolidated Revenue Bonds, One Hundred Fifty Third Series 2008, 5.000%, 7/15/38 | 7/18 at 100.00 | AA– | 2,069,420 | |||||||||
| 2,500 | Port Authority of New York and New Jersey, Consolidated Revenue Bonds, One Hundred Fortieth Series 2005, 5.000%, 12/01/28 – SYNCORA GTY Insured | 6/15 at 101.00 | AA– | 2,627,300 | |||||||||
| 420 | Port Authority of New York and New Jersey, Consolidated Revenue Bonds, One Hundred Forty Eighth Series 2008, Trust 2920, 16.992%, 8/15/32 – FSA Insured (IF) | 8/17 at 100.00 | AAA | 488,956 | |||||||||
| 6,000 | Port Authority of New York and New Jersey, Consolidated Revenue Bonds, One Hundred Thirty-Fourth Series 2004, 5.000%, 7/15/34 | 1/14 at 101.00 | AA– | 6,182,159 | |||||||||
| Port Authority of New York and New Jersey, Special Project Bonds, JFK International Air Terminal LLC, Sixth Series 1997: | |||||||||||||
| 1,000 | 7.000%, 12/01/12 – NPFG Insured (Alternative Minimum Tax) | No Opt. Call | A | 1,072,840 | |||||||||
| 2,000 | 5.750%, 12/01/22 – NPFG Insured (Alternative Minimum Tax) | 12/09 at 100.00 | A | 1,872,940 | |||||||||
| 3,125 | 5.750%, 12/01/25 – NPFG Insured (Alternative Minimum Tax) | 12/09 at 100.00 | A | 2,839,125 | |||||||||
| 29,205 | Total Transportation | 30,008,342 | |||||||||||
U.S. Guaranteed – 11.1% (4) | |||||||||||||
| 2,500 | Bergen County Improvement Authority, New Jersey, Revenue Bonds, Yeshiva Ktana of Passaic Project, Series 2002, 6.000%, 9/15/27 (Pre-refunded 9/01/12) | 9/12 at 101.00 | N/R | (4) | 2,849,150 | ||||||||
| 625 | New Jersey Economic Development Authority, Revenue Bonds, Yeshiva Ktana of Passaic, Series 1993, 8.000%, 9/15/18 (ETM) | No Opt. Call | N/R | (4) | 786,394 | ||||||||
| 420 | New Jersey Educational Facilities Authority, Revenue Bonds, Kean University, Series 2005B, 5.000%, 7/01/30 (Pre-refunded 7/01/16) – MBIA Insured | 7/16 at 100.00 | A | (4) | 492,332 | ||||||||
| New Jersey Educational Facilities Authority, Revenue Bonds, Montclair State University, Series 2005F: | |||||||||||||
| 1,825 | 5.000%, 7/01/24 (Pre-refunded 7/01/15) – FGIC Insured | 7/15 at 100.00 | A2 | (4) | 2,122,256 | ||||||||
| 525 | 5.000%, 7/01/32 (Pre-refunded 7/01/15) – FGIC Insured | 7/15 at 100.00 | A2 | (4) | 610,512 | ||||||||
| 500 | New Jersey Educational Facilities Authority, Revenue Bonds, Rowan University, Series 2003I, 5.125%, 7/01/21 (Pre-refunded 7/01/13) – FGIC Insured | 7/13 at 100.00 | A+ | (4) | 567,965 | ||||||||
| Nuveen Investments | 27 |
Portfolio of Investments (Unaudited)
Nuveen New Jersey Municipal Bond Fund (continued)
August 31, 2009
| Principal Amount (000) | Description (1) | Optional Call Provisions (2) | Ratings (3) | Value | |||||||||
U.S. Guaranteed (4) (continued) | |||||||||||||
| $ | 1,195 | New Jersey Health Care Facilities Financing Authority, Revenue Bonds, Capital Health System Obligated Group, Series 2003A, 5.375%, 7/01/33 (Pre-refunded 7/01/13) | 7/13 at 100.00 | N/R | (4) | $ | 1,348,032 | ||||||
| 845 | New Jersey Health Care Facilities Financing Authority, Revenue Bonds, St. Clare’s Hospital, Series 2004A, 5.250%, 7/01/20 – RAAI Insured (ETM) | No Opt. Call | BBB– | (4) | 985,633 | ||||||||
| 510 | New Jersey Health Care Facilities Financing Authority, Revenue Bonds, Trinitas Hospital Obligated Group, Series 2000, 7.500%, 7/01/30 (Pre-refunded 7/01/10) | 7/10 at 101.00 | BBB– | (4) | 544,660 | ||||||||
| New Jersey Turnpike Authority, Revenue Bonds, Series 1991C: | |||||||||||||
| 10 | 6.500%, 1/01/16 (ETM) | No Opt. Call | AAA | 12,365 | |||||||||
| 165 | 6.500%, 1/01/16 – MBIA Insured (ETM) | No Opt. Call | A+ | (4) | 206,780 | ||||||||
| 600 | 6.500%, 1/01/16 (ETM) | No Opt. Call | AAA | 703,950 | |||||||||
| 165 | 6.500%, 1/01/16 – AMBAC Insured (ETM) | No Opt. Call | AAA | 192,738 | |||||||||
| 115 | 6.500%, 1/01/16 – MBIA Insured (ETM) | No Opt. Call | A+ | (4) | 133,638 | ||||||||
| 10 | 6.500%, 1/01/16 – AMBAC Insured (ETM) | No Opt. Call | A3 | (4) | 11,681 | ||||||||
| 375 | Newark Housing Authority, New Jersey, Port Authority Terminal Revenue Bonds, Series 2004, 5.250%, 1/01/21 (Pre-refunded 1/01/14) – MBIA Insured | 1/14 at 100.00 | AA– | (4) | 427,766 | ||||||||
| 3,900 | Puerto Rico Infrastructure Financing Authority, Special Obligation Bonds, Series 2000A, 5.375%, 10/01/24 | 10/10 at 101.00 | AAA | 4,145,934 | |||||||||
| 4,000 | Puerto Rico Public Finance Corporation, Commonwealth Appropriation Bonds, Series 1998A, 5.125%, 6/01/24 – AMBAC Insured | No Opt. Call | AAA | 4,536,279 | |||||||||
| 2,510 | Tobacco Settlement Financing Corporation, New Jersey, Tobacco Settlement Asset-Backed Bonds, Series 2002, 5.750%, 6/01/32 (Pre-refunded 6/01/12) | 6/12 at 100.00 | AAA | 2,745,639 | |||||||||
| Tobacco Settlement Financing Corporation, New Jersey, Tobacco Settlement Asset-Backed Bonds, Series 2003: | |||||||||||||
| 475 | 6.125%, 6/01/24 (Pre-refunded 6/01/12) | 6/12 at 100.00 | AAA | 500,118 | |||||||||
| 750 | 6.375%, 6/01/32 (Pre-refunded 6/01/13) | 6/13 at 100.00 | AAA | 860,978 | |||||||||
| 22,020 | Total U.S. Guaranteed | 24,784,800 | |||||||||||
Utilities – 0.6% | |||||||||||||
| 1,250 | New Jersey Economic Development Authority, Pollution Control Revenue Refunding Bonds, Public Service Electric and Gas Company, Series 2001A, 5.000%, 3/01/12 | No Opt. Call | Baa1 | 1,308,150 | |||||||||
Water and Sewer – 1.2% | |||||||||||||
| 1,380 | Bayonne Municipal Utilities Authority, New Jersey, Water System Revenue Refunding Bonds, Series 2003A, 5.000%, 4/01/18 – SYNCORA GTY Insured | 4/13 at 100.00 | N/R | 1,384,568 | |||||||||
| 500 | North Hudson Sewerage Authority, New Jersey, Sewerage Revenue Refunding Bonds, Series 2002A, 5.250%, 8/01/19 – FGIC Insured | 8/12 at 100.00 | N/R | 502,000 | |||||||||
| 760 | Puerto Rico Aqueduct and Sewerage Authority, Revenue Bonds, Senior Lien Series 2008A, 6.000%, 7/01/38 | 7/18 at 100.00 | BBB– | 765,624 | |||||||||
| 2,640 | Total Water and Sewer | 2,652,192 | |||||||||||
| $ | 237,885 | Total Investments (cost $213,653,189) – 94.3% | 211,442,323 | ||||||||||
Other Assets Less Liabilities – 5.7% | 12,674,330 | ||||||||||||
Net Assets – 100% | $ | 224,116,653 | |||||||||||
| (1) | All percentages shown in the Portfolio of Investments are based on net assets. |
| (2) | Optional Call Provisions: Dates (month and year) and prices of the earliest optional call or redemption. There may be other call provisions at varying prices at later dates. Certain mortgage-backed securities may be subject to periodic principal paydowns. |
| (3) | Ratings: Using the higher of Standard & Poor’s Group (“Standard & Poor’s”) or Moody’s Investor Service, Inc. (“Moody’s”) rating. Ratings below BBB by Standard & Poor’s or Baa by Moody’s are considered to be below investment grade. |
| (4) | Backed by an escrow or trust containing sufficient U.S. Government or U.S. Government agency securities which ensure the timely payment of principal and interest. Such investments are normally considered to be equivalent to AAA rated securities. |
| N/R | Not rated. |
| (ETM) | Escrowed to maturity. |
| (IF) | Inverse floating rate investment. |
See accompanying notes to financial statements.
| 28 | Nuveen Investments |
Portfolio of Investments (Unaudited)
Nuveen New York Municipal Bond Fund
August 31, 2009
| Principal Amount (000) | Description (1) | Optional Call Provisions (2) | Ratings (3) | Value | ||||||||
Consumer Discretionary – 0.1% | ||||||||||||
| $ | 665 | New York City Industrial Development Agency, New York, Liberty Revenue Bonds, IAC/InterActiveCorp, Series 2005, 5.000%, 9/01/35 | 9/15 at 100.00 | BB+ | $ | 420,440 | ||||||
Consumer Staples – 2.7% | ||||||||||||
| 690 | New York Counties Tobacco Trust II, Tobacco Settlement Pass-Through Bonds, Series 2001, 5.250%, 6/01/25 | 6/11 at 101.00 | BBB | 640,996 | ||||||||
| 1,175 | Puerto Rico, The Children’s Trust Fund, Tobacco Settlement Asset-Backed Refunding Bonds, Series 2002, 5.375%, 5/15/33 | 5/12 at 100.00 | BBB | 1,125,580 | ||||||||
| 370 | Rensselaer Tobacco Asset Securitization Corporation, New York, Tobacco Settlement Asset-Backed Bonds, Series 2001A, 5.200%, 6/01/25 | 6/12 at 100.00 | BBB | 341,847 | ||||||||
| 1,000 | Suffolk Tobacco Asset Securitization Corporation, New York, Tobacco Settlement Asset-Backed Bonds, Series 2008B, 6.000%, 6/01/48 | 6/18 at 100.00 | N/R | 830,660 | ||||||||
| 6,650 | Suffolk Tobacco Asset Securitization Corporation, New York, Tobacco Settlement Asset-Backed Bonds, Series 2008C, 0.000%, 6/01/44 | 6/22 at 100.00 | N/R | 3,894,240 | ||||||||
TSASC Inc., New York, Tobacco Asset-Backed Bonds, Series 2006: | ||||||||||||
| 2,100 | 4.750%, 6/01/22 | 6/16 at 100.00 | BBB | 2,010,666 | ||||||||
| 1,225 | 5.000%, 6/01/26 | 6/16 at 100.00 | BBB | 1,043,467 | ||||||||
| 1,500 | Virgin Islands Public Finance Authority, Matching Fund Revenue Loan | 10/19 at 100.00 | Baa3 | 1,533,735 | ||||||||
| 14,710 | Total Consumer Staples | 11,421,191 | ||||||||||
Education and Civic Organizations – 12.1% | ||||||||||||
| 660 | Albany Industrial Development Agency, New York, Revenue Bonds, Albany Law School, Series 2007A, 5.000%, 7/01/31 | 7/17 at 100.00 | BBB | 567,996 | ||||||||
| Albany Industrial Development Agency, New York, Revenue Bonds, Brighter Choice Charter Schools, Series 2007A: | ||||||||||||
| 520 | 5.000%, 4/01/20 | 4/17 at 100.00 | N/R | 468,343 | ||||||||
| 1,000 | 5.000%, 4/01/27 | 4/17 at 100.00 | N/R | 810,300 | ||||||||
| 290 | 5.000%, 4/01/37 | 4/17 at 100.00 | N/R | 211,929 | ||||||||
| 215 | Cattaraugus County Industrial Development Agency, New York, Revenue Bonds, St. Bonaventure University, Series 2006, 5.000%, 5/01/23 | 5/16 at 100.00 | BBB– | 181,823 | ||||||||
| 1,750 | Dormitory Authority of the State of New York Brooklyn Law School Revenue Bonds, Series 2009, 5.750%, 7/01/33 | 7/19 at 100.00 | BBB+ | 1,773,450 | ||||||||
| 2,820 | Dormitory Authority of the State of New York, General Revenue Bonds, Manhattan College, Series 2007A, 5.000%, 7/01/41 – RAAI Insured | 7/17 at 100.00 | BBB– | 2,400,243 | ||||||||
| 1,880 | Dormitory Authority of the State of New York, General Revenue Bonds, Saint Johns University, Series 2007A, 5.250%, 7/01/32 – NPFG Insured | 7/17 at 100.00 | A | 1,905,154 | ||||||||
| 685 | Dormitory Authority of the State of New York, Insured Revenue Bonds, D’Youville College, Series 2001, 5.250%, 7/01/20 – RAAI Insured | 7/11 at 102.00 | BBB– | 684,945 | ||||||||
| 1,850 | Dormitory Authority of the State of New York, Insured Revenue Bonds, New York Medical College, Series 1998, 5.000%, 7/01/21 – NPFG Insured | 1/10 at 100.50 | A | 1,863,986 | ||||||||
| Dormitory Authority of the State of New York, Lease Revenue Bonds, State University Dormitory Facilities, Series 2003B: | ||||||||||||
| 1,250 | 5.250%, 7/01/31 (Mandatory put 7/01/13) – FGIC Insured | No Opt. Call | AA– | 1,376,788 | ||||||||
| 2,000 | 5.250%, 7/01/32 (Mandatory put 7/01/13) – SYNCORA GTY Insured | No Opt. Call | AA– | 2,202,860 | ||||||||
| 1,000 | Dormitory Authority of the State of New York, Lease Revenue Bonds, State University Dormitory Facilities, Series 2004A, 5.000%, 7/01/29 – NPFG Insured | 7/15 at 100.00 | AA– | 994,950 | ||||||||
| 2,700 | Dormitory Authority of the State of New York, Revenue Bonds, Marymount Manhattan College, Series 1999, 6.250%, 7/01/29 – RAAI Insured | 1/10 at 101.00 | BBB– | 2,724,786 | ||||||||
| 4,000 | Dormitory Authority of the State of New York, Revenue Bonds, State University Educational Facilities, 1989 Resolution, Series 2000C, | No Opt. Call | AAA | 4,703,840 | ||||||||
| 1,000 | Dormitory Authority of the State of New York, Revenue Bonds, State University Educational Facilities, Series 1993C, 5.250%, 5/15/19 | 5/14 at 100.00 | AA– | 1,098,480 | ||||||||
| Nuveen Investments | 29 |
Portfolio of Investments (Unaudited)
Nuveen New York Municipal Bond Fund (continued)
August 31, 2009
| Principal Amount (000) | Description (1) | Optional Call Provisions (2) | Ratings (3) | Value | ||||||||
Education and Civic Organizations (continued) | ||||||||||||
| $ | 195 | Dormitory Authority of the State of New York, Second General Resolution Consolidated Revenue Bonds, City University System, Series 1990C, 7.500%, 7/01/10 | No Opt. Call | A1 | $ | 205,337 | ||||||
| 2,845 | Dutchess County Industrial Development Agency, New York, Civic Facility Revenue Bonds, Bard College Project, Series 2007-A2, 4.500%, 8/01/36 | 8/17 at 100.00 | Baa1 | 2,155,230 | ||||||||
| 615 | Hempstead Town Industrial Development Agency, New York, Revenue Bonds, Adelphi University, Civic Facility Project, Series 2005, 5.000%, 10/01/35 | 10/15 at 100.00 | A | 612,306 | ||||||||
| 1,475 | New York City Industrial Development Agency, New York, Civic Facility Revenue Bonds, American Council of Learned Societies, Series 2002, 5.250%, 7/01/27 | 7/12 at 100.00 | A1 | 1,491,697 | ||||||||
| 2,000 | New York City Industrial Development Agency, New York, Civic Facility Revenue Bonds, Bronx Parking Development Company, LLC Project, Series 2007, 5.750%, 10/01/37 | 10/17 at 100.00 | N/R | 1,283,040 | ||||||||
| New York City Industrial Development Agency, New York, Civic Facility Revenue Bonds, YMCA of Greater New York, Series 2006: | ||||||||||||
| 5,520 | 5.000%, 8/01/26 | 8/16 at 100.00 | A– | 5,470,044 | ||||||||
| 2,000 | 5.000%, 8/01/36 | 8/16 at 100.00 | A– | 1,808,400 | ||||||||
| New York City Industrial Development Agency, New York, PILOT Revenue Bonds, Queens Baseball Stadium Project, Series 2006: | ||||||||||||
| 2,845 | 4.750%, 1/01/42 – AMBAC Insured | 1/17 at 100.00 | BBB | 2,425,476 | ||||||||
| 2,000 | 5.000%, 1/01/46 – AMBAC Insured | 1/17 at 100.00 | BBB | 1,764,000 | ||||||||
| New York City Industrial Development Authority, New York, PILOT Revenue Bonds, Yankee Stadium Project, Series 2006: | ||||||||||||
| 900 | 5.000%, 3/01/36 – NPFG Insured | 9/16 at 100.00 | A | 817,821 | ||||||||
| 1,840 | 4.500%, 3/01/39 – FGIC Insured | 9/16 at 100.00 | BBB– | 1,487,401 | ||||||||
| 1,000 | New York City Trust for Cultural Resources, New York, Revenue Bonds, Museum of Modern Art, Series 2001D, 5.125%, 7/01/31 – AMBAC Insured | 7/12 at 100.00 | Aa2 | 1,002,670 | ||||||||
| Niagara County Industrial Development Agency, New York, Civic Facility Revenue Bonds, Niagara University, Series 2001A: | ||||||||||||
| 3,000 | 5.500%, 11/01/16 – RAAI Insured | 11/11 at 101.00 | BBB | 3,071,430 | ||||||||
| 1,000 | 5.350%, 11/01/23 – RAAI Insured | 11/11 at 101.00 | BBB | 994,040 | ||||||||
| 430 | Seneca County Industrial Development Authority, New York, Revenue Bonds, New York Chiropractic College, Series 2007, 5.000%, 10/01/27 | 10/17 at 100.00 | BBB | 334,243 | ||||||||
| 905 | Suffolk County Industrial Development Agency, New York, Revenue Bonds, Dowling College, Series 1996, 6.700%, 12/01/20 | 12/09 at 100.00 | BB+ | 817,333 | ||||||||
| 975 | Utica Industrial Development Agency, New York, Revenue Bonds, Utica College, Series 1998A, 5.750%, 8/01/28 | 8/10 at 100.00 | N/R | 765,658 | ||||||||
| 53,165 | Total Education and Civic Organizations | 50,475,999 | ||||||||||
Energy – 0.1% | ||||||||||||
| 500 | Virgin Islands Public Finance Authority, Revenue Bonds, Refinery Project Hovensa LLC, Series 2007, 4.700%, 7/01/22 (Alternative Minimum Tax) | 1/15 at 100.00 | BBB | 421,460 | ||||||||
Financials – 1.0% | ||||||||||||
| 500 | Liberty Development Corporation, New York, Goldman Sachs Headquarter Revenue Bonds, Series 2005, 5.250%, 10/01/35 | No Opt. Call | A1 | 489,545 | ||||||||
| 3,475 | Liberty Development Corporation, New York, Goldman Sachs Headquarters Revenue Bonds Series 2007, 5.500%, 10/01/37 | No Opt. Call | A1 | 3,514,685 | ||||||||
| 3,975 | Total Financials | 4,004,230 | ||||||||||
Health Care – 16.0% | ||||||||||||
| 3,500 | Albany Industrial Development Agency, New York, Revenue Bonds, Saint Peter’s Hospital, Series 2008A, 5.250%, 11/15/32 | 11/17 at 100.00 | BBB+ | 3,016,510 | ||||||||
| 2,950 | Dormitory Authority of the State of New York, FHA-Insured Mortgage Nursing Home Revenue Bonds, Menorah Campus Inc., Series 1997, 5.950%, 2/01/17 | 2/10 at 100.00 | AAA | 2,956,077 | ||||||||
| 30 | Nuveen Investments |
| Principal Amount (000) | Description (1) | Optional Call Provisions (2) | Ratings (3) | Value | ||||||||
Health Care (continued) | ||||||||||||
| $ | 3,500 | Dormitory Authority of the State of New York, FHA-Insured Mortgage Revenue Bonds, New York Hospital Medical Center of Queens, Series 1999, 4.750%, 2/15/37 | 2/17 at 100.00 | BBB | $ | 3,049,970 | ||||||
| Dormitory Authority of the State of New York, FHA-Insured Revenue Bonds, Montefiore Medical Center, Series 2005: | ||||||||||||
| 3,000 | 5.000%, 2/01/22 – FGIC Insured | 2/15 at 100.00 | A | 3,110,670 | ||||||||
| 1,775 | 5.000%, 2/01/28 – FGIC Insured | 2/15 at 100.00 | A | 1,801,838 | ||||||||
| 4,400 | Dormitory Authority of the State of New York, FHA-Insured Revenue Bonds, St. Lukes Roosevelt Hospital, Series 2005, 4.900%, 8/15/31 | 8/15 at 100.00 | A– | 4,402,156 | ||||||||
| 3,000 | Dormitory Authority of the State of New York, Insured Revenue Bonds, Franciscan Health Partnership Obligated Group – Frances Shervier Home and Hospital, Series 1997, 5.500%, 7/01/27 – RAAI Insured | 1/10 at 100.00 | A3 | 2,874,840 | ||||||||
| 3,000 | Dormitory Authority of the State of New York, Revenue Bonds, Catholic Health Services of Long Island Obligated Group – St. Catherine of Siena Medical Center, Series 2000A, 6.500%, 7/01/20 | 7/10 at 101.00 | BBB+ | 3,053,430 | ||||||||
| 7,400 | Dormitory Authority of the State of New York, Revenue Bonds, Lenox Hill Hospital Obligated Group, Series 2001, 5.500%, 7/01/30 | 7/11 at 101.00 | Ba1 | 5,738,774 | ||||||||
| 7,465 | Dormitory Authority of the State of New York, Revenue Bonds, Memorial Sloan Kettering Cancer Center, Series 2006-1, 5.000%, 7/01/35 | 7/16 at 100.00 | AA | 7,516,061 | ||||||||
| 1,650 | Dormitory Authority of the State of New York, Revenue Bonds, Mount Sinai NYU Health Obligated Group, Series 2000A, 6.500%, 7/01/25 | 7/10 at 101.00 | A2 | 1,682,654 | ||||||||
| 3,205 | Dormitory Authority of the State of New York, Revenue Bonds, New York and Presbyterian Hospital, Series 2004A, 5.250%, 8/15/15 – FSA Insured | 8/14 at 100.00 | AAA | 3,479,797 | ||||||||
| 600 | Dormitory Authority of the State of New York, Revenue Bonds, North Shore Long Island Jewish Obligated Group, Series 2005A, 5.000%, 11/01/34 | 11/16 at 100.00 | Baa1 | 547,914 | ||||||||
| 500 | Dormitory Authority of the State of New York, Revenue Bonds, North Shore Long Island Jewish Obligated Group, Series 2006B, 5.000%, 11/01/34 | 11/16 at 100.00 | A3 | 466,755 | ||||||||
| 1,000 | Dormitory Authority of the State of New York, Revenue Bonds, North Shore Long Island Jewish Obligated Group, Series 2009A, 5.500%, 5/01/37 (WI/DD, Settling 9/17/09) | 5/19 at 100.00 | A– | 990,100 | ||||||||
| 5,600 | Dormitory Authority of the State of New York, Revenue Bonds, NYU Hospitals Center, Series 2007B, 5.625%, 7/01/37 | 7/17 at 100.00 | Baa2 | 5,202,960 | ||||||||
| 1,500 | Dormitory Authority of the State of New York, Revenue Bonds, South Nassau Communities Hospital, Series 2003B, 5.500%, 7/01/23 | 7/13 at 100.00 | Baa1 | 1,415,235 | ||||||||
| 2,400 | Dormitory Authority of the State of New York, Revenue Bonds, The New York and Presbyterian Hospital Project, Series 2007, 5.000%, 8/15/36 – FSA Insured | 8/14 at 100.00 | AAA | 2,417,736 | ||||||||
| 1,000 | Dormitory Authority of the State of New York, Revenue Bonds, Winthrop-South Nassau University Hospital Association, Series 2003A, 5.500%, 7/01/32 | 7/13 at 100.00 | Baa1 | 868,960 | ||||||||
| Madison County Industrial Development Agency, New York, Civic Facility Revenue Bonds, Oneida Health System, Series 2007A: | ||||||||||||
| 410 | 4.500%, 2/01/17 | No Opt. Call | BBB– | 381,263 | ||||||||
| 710 | 5.250%, 2/01/27 | No Opt. Call | BBB– | 608,321 | ||||||||
| 635 | 5.500%, 2/01/32 | No Opt. Call | BBB– | 536,188 | ||||||||
| 545 | Nassau County Industrial Development Agency, New York, Revenue Refunding Bonds, North Shore Health System Obligated Group, Series 2001B, 5.875%, 11/01/11 | No Opt. Call | Baa1 | 563,089 | ||||||||
| 2,550 | New York City Health and Hospitals Corporation, New York, Health System Revenue Bonds, Series 2003A, 5.250%, 2/15/22 – AMBAC Insured | 2/13 at 100.00 | A+ | 2,610,027 | ||||||||
| 775 | New York City Industrial Development Agency, New York, Civic Facility Revenue Bonds, Staten Island University Hospital, Series 2001B, 6.375%, 7/01/31 | 7/12 at 100.00 | Ba2 | 621,325 | ||||||||
| 2,100 | New York City Industrial Development Agency, New York, Civic Facility Revenue Bonds, Staten Island University Hospital, Series 2002C, 6.450%, 7/01/32 | 7/12 at 101.00 | Ba2 | 1,680,777 | ||||||||
| Nuveen Investments | 31 |
Portfolio of Investments (Unaudited)
Nuveen New York Municipal Bond Fund (continued)
August 31, 2009
| Principal Amount (000) | Description (1) | Optional Call Provisions (2) | Ratings (3) | Value | ||||||||
Health Care (continued) | ||||||||||||
| $ | 1,105 | Newark-Wayne Community Hospital, New York, Hospital Revenue Refunding and Improvement Bonds, Series 1993A, 7.600%, 9/01/15 | 9/09 at 100.00 | N/R | $ | 1,086,049 | ||||||
| Saratoga County Industrial Development Agency, New York, Civic Facility Revenue Bonds. Saratoga Hospital Project, Series 2007B: | ||||||||||||
| 1,000 | 5.125%, 12/01/27 | 12/17 at 100.00 | BBB+ | 918,190 | ||||||||
| 500 | 5.250%, 12/01/32 | 12/17 at 100.00 | BBB+ | 445,805 | ||||||||
| Suffolk County Industrial Development Agency, New York, Revenue Bonds, Huntington Hospital, Series 2002C: | ||||||||||||
| 850 | 6.000%, 11/01/22 | 11/12 at 100.00 | Baa1 | 862,861 | ||||||||
| 1,220 | 5.875%, 11/01/32 | 11/12 at 100.00 | Baa1 | 1,189,012 | ||||||||
| 1,000 | Yonkers Industrial Development Agency, New York, Revenue Bonds, St. John’s Riverside Hospital, Series 2001A, 7.125%, 7/01/31 | 7/11 at 101.00 | B– | 850,850 | ||||||||
| 70,845 | Total Health Care | 66,946,194 | ||||||||||
Housing/Multifamily – 5.5% | ||||||||||||
| 335 | East Syracuse Housing Authority, New York, FHA-Insured Section 8 Assisted Revenue Refunding Bonds, Bennet Project, Series 2001A, 6.700%, 4/01/21 | 4/10 at 102.00 | AAA | 345,486 | ||||||||
| 1,000 | Madison County Industrial Development Agency, New York, Civic Facility Revenue Bonds, Morrisville State College Foundation, Series 2005A, 5.000%, 6/01/37 – CIFG Insured | 6/15 at 101.00 | BBB– | 846,560 | ||||||||
| New York City Housing Development Corporation, New York, Multifamily Housing Revenue Bonds, Series 2001A: | ||||||||||||
| 2,000 | 5.500%, 11/01/31 | 5/11 at 101.00 | AA | 2,019,560 | ||||||||
| 2,000 | 5.600%, 11/01/42 | 5/11 at 101.00 | AA | 2,015,560 | ||||||||
| 2,000 | New York City Housing Development Corporation, New York, Multifamily Housing Revenue Bonds, Series 2001C-2, 5.400%, 11/01/33 (Alternative Minimum Tax) | 11/11 at 100.00 | AA | 1,996,360 | ||||||||
| New York City Housing Development Corporation, New York, Multifamily Housing Revenue Bonds, Series 2002A: | ||||||||||||
| 910 | 5.375%, 11/01/23 (Alternative Minimum Tax) | 5/12 at 100.00 | AA | 919,036 | ||||||||
| 450 | 5.500%, 11/01/34 (Alternative Minimum Tax) | 5/12 at 100.00 | AA | 448,142 | ||||||||
| 2,000 | New York City Housing Development Corporation, New York, Multifamily Housing Revenue Bonds, Series 2004A, 5.250%, 11/01/30 | 5/14 at 100.00 | AA | 2,029,580 | ||||||||
| 540 | New York City Housing Development Corporation, New York, Multifamily Housing Revenue Bonds, Series 2004-H2, 5.125%, 11/01/34 (Alternative Minimum Tax) | 11/14 at 100.00 | AA | 517,504 | ||||||||
| 2,500 | New York State Housing Finance Agency, Affordable Housing Revenue Bonds, Series 2007B, 5.300%, 11/01/37 (Alternative Minimum Tax) | 11/17 at 100.00 | Aa2 | 2,481,725 | ||||||||
| 705 | New York State Housing Finance Agency, Affordable Housing Revenue, Series 2007A, 5.250%, 11/01/38 (Alternative Minimum Tax) | 11/17 at 100.00 | Aa2 | 682,468 | ||||||||
| 1,900 | New York State Housing Finance Agency, Mortgage Revenue Refunding Bonds, Housing Project, Series 1996A, 6.125%, 11/01/20 – FSA Insured | 11/09 at 100.00 | AAA | 1,902,090 | ||||||||
| 1,850 | New York State Housing Finance Agency, Multifamily Housing Revenue Bonds, Cannon Street Senior Housing Project, Series 2007A, 5.300%, 2/15/39 (Alternative Minimum Tax) | 2/17 at 100.00 | Aa1 | 1,804,176 | ||||||||
| 1,000 | New York State Housing Finance Agency, Secured Mortgage Program Multifamily Housing Revenue Bonds, Series 2001G, 5.400%, 8/15/33 (Alternative Minimum Tax) | 8/11 at 100.00 | Aa1 | 1,000,340 | ||||||||
| 1,220 | Tonawanda Housing Authority, New York, Housing Revenue Bonds, Kibler Senior Housing LP, Series 1999A, 7.750%, 9/01/31 (4) | 9/09 at 103.00 | N/R | 853,756 | ||||||||
| 3,030 | Westchester County Industrial Development Agency, New York, GNMA Collateralized Mortgage Loan Revenue Bonds, Living Independently for the Elderly Inc., Series 2001A, 5.400%, 8/20/32 | 8/11 at 102.00 | Aaa | 3,082,904 | ||||||||
| 23,440 | Total Housing/Multifamily | 22,945,247 | ||||||||||
| 32 | Nuveen Investments |
| Principal Amount (000) | Description (1) | Optional Call Provisions (2) | Ratings (3) | Value | ||||||||
Housing/Single Family – 1.9% | ||||||||||||
| $ | 845 | New York State Mortgage Agency, Homeowner Mortgage Revenue Bonds, 2007 Series 145, 5.125%, 10/01/37 (Alternative Minimum Tax) | 4/17 at 100.00 | Aa1 | $ | 805,699 | ||||||
| 2,375 | New York State Mortgage Agency, Homeowner Mortgage Revenue Bonds, Series 130, 4.650%, 4/01/27 (Alternative Minimum Tax) | 4/15 at 100.00 | Aa1 | 2,187,470 | ||||||||
| 890 | New York State Mortgage Agency, Homeowner Mortgage Revenue Bonds, Series 148, 2007, 5.200%, 10/01/32 (Alternative Minimum Tax) | 10/17 at 100.00 | Aa1 | 871,230 | ||||||||
| 615 | New York State Mortgage Agency, Homeowner Mortgage Revenue Bonds, Series 82, 5.650%, 4/01/30 (Alternative Minimum Tax) | 10/09 at 100.00 | Aa1 | 615,111 | ||||||||
| 1,470 | New York State Mortgage Agency, Homeowner Mortgage Revenue Bonds, Series 95, 5.625%, 4/01/22 | 4/10 at 100.00 | Aa1 | 1,477,644 | ||||||||
| 1,660 | New York State Mortgage Agency, Mortgage Revenue Bonds, Thirty-Third Series A, 4.750%, 4/01/23 (Alternative Minimum Tax) | 4/13 at 101.00 | Aaa | 1,644,861 | ||||||||
| 280 | New York State Mortgage Agency, Mortgage Revenue Bonds, Twenty-Ninth Series, 5.450%, 4/01/31 (Alternative Minimum Tax) | 10/10 at 100.00 | Aaa | 280,160 | ||||||||
| 8,135 | Total Housing/Single Family | 7,882,175 | ||||||||||
Long-Term Care – 4.7% | ||||||||||||
| 2,250 | Dormitory Authority of the State of New York, FHA-Insured Mortgage Nursing Home Revenue Bonds, Rosalind and Joseph Gurwin Jewish Geriatric Center of Long Island, Series 1997, 5.700%, 2/01/37 – AMBAC Insured | 2/10 at 100.00 | N/R | 2,250,923 | ||||||||
| 265 | Dormitory Authority of the State of New York, FHA-Insured Mortgage Revenue Bonds, Augustana Lutheran Home for the Aged Inc., Series 2001, 5.400%, 2/01/31 – NPFG Insured | 2/12 at 101.00 | A | 270,287 | ||||||||
| 1,335 | Dormitory Authority of the State of New York, FHA-Insured Mortgage Revenue Bonds, W.K. Nursing Home Corporation, Series 1996, 5.950%, 2/01/16 | 2/10 at 100.00 | AAA | 1,338,030 | ||||||||
| 1,100 | Dormitory Authority of the State of New York, GNMA Collateralized Revenue Bonds, Cabrini of Westchester Project, Series 2006, 5.200%, 2/15/41 | 2/17 at 103.00 | A– | 1,113,156 | ||||||||
| Dormitory Authority of the State of New York, Insured Revenue Bonds, NYSARC Inc Projects, Series 2007B: | ||||||||||||
| 290 | 6.000%, 7/01/26 – AMBAC Insured | 7/19 at 100.00 | A | 308,119 | ||||||||
| 310 | 6.000%, 7/01/27 – AMBAC Insured | 7/19 at 100.00 | A | 327,410 | ||||||||
| 330 | 6.000%, 7/01/28 – AMBAC Insured | 7/19 at 100.00 | A | 347,497 | ||||||||
| 350 | 6.000%, 7/01/29 – AMBAC Insured | 7/19 at 100.00 | A | 367,192 | ||||||||
| 1,460 | 6.000%, 7/01/36 – AMBAC Insured | 7/19 at 100.00 | A | 1,499,128 | ||||||||
| 1,000 | Dormitory Authority of the State of New York, Insured Revenue Bonds, NYSARC Inc Projects, Series 2009A, 6.000%, 7/01/38 | 7/19 at 100.00 | A | 1,024,520 | ||||||||
| 650 | Dormitory Authority of the State of New York, Non-State Supported Debt, Ozanam Hall of Queens Nursing Home Revenue Bonds, Series 2006, 5.000%, 11/01/31 | 11/16 at 100.00 | A1 | 618,196 | ||||||||
| 1,000 | Dormitory Authority of the State of New York, Revenue Bonds, Miriam Osborn Memorial Home Association, Series 2000B, 6.375%, 7/01/29 – ACA Insured | 7/10 at 102.00 | BBB | 920,870 | ||||||||
| Dormitory Authority of the State of New York, Revenue Bonds, Providence Rest, Series 2005: | ||||||||||||
| 50 | 5.125%, 7/01/30 – ACA Insured | 7/15 at 100.00 | N/R | 32,881 | ||||||||
| 415 | 5.000%, 7/01/35 – ACA Insured | 7/15 at 100.00 | N/R | 251,009 | ||||||||
| 1,290 | East Rochester Housing Authority, New York, GNMA Secured Revenue Refunding Bonds, Genesee Valley Presbyterian Nursing Center, Series 2001, 5.200%, 12/20/24 | 12/11 at 101.00 | Aaa | 1,319,683 | ||||||||
| New York City Industrial Development Agency, New York, Civic Facility Revenue Bonds, Special Needs Facilities Pooled Program, Series 2008A-1: | ||||||||||||
| 1,000 | 5.800%, 7/01/23 | 7/16 at 101.00 | N/R | 832,070 | ||||||||
| 1,175 | 6.100%, 7/01/28 | 7/16 at 101.00 | N/R | 949,271 | ||||||||
| 800 | 6.200%, 7/01/33 | 7/16 at 101.00 | N/R | 633,160 | ||||||||
| 250 | Suffolk County Industrial Development Agency, New York, Revenue Bonds, Special Needs Facilities Pooled Program, Series 2001C-1, 7.250%, 7/01/16 | 7/11 at 101.00 | N/R | 247,915 | ||||||||
| Nuveen Investments | 33 |
Portfolio of Investments (Unaudited)
Nuveen New York Municipal Bond Fund (continued)
August 31, 2009
| Principal Amount (000) | Description (1) | Optional Call Provisions (2) | Ratings (3) | Value | ||||||||
Long-Term Care (continued) | ||||||||||||
| $ | 5,000 | Syracuse Housing Authority, New York, FHA-Insured Mortgage Revenue Bonds, Loretto Rest Residential Healthcare Facility, Series 1997A, 5.800%, 8/01/37 | 2/10 at 100.00 | AAA | $ | 5,021,800 | ||||||
| 20,320 | Total Long-Term Care | 19,673,117 | ||||||||||
Materials – 0.2% | ||||||||||||
| 700 | Essex County Industrial Development Agency, New York, Environmental Improvement Revenue Bonds, International Paper Company, Series 1999A, 6.450%, 11/15/23 (Alternative Minimum Tax) | 11/09 at 101.00 | BBB | 694,456 | ||||||||
Tax Obligation/General – 6.4% | ||||||||||||
| 1,000 | Erie County, New York, General Obligation Bonds, Series 2005A, 5.000%, 12/01/18 – NPFG Insured | 12/15 at 100.00 | A | 1,092,120 | ||||||||
| 6,000 | Hudson Yards Infrastructure Corporation, New York, Revenue Bonds, Series 2006A, 5.000%, 2/15/47 – FGIC Insured | 2/17 at 100.00 | A | 5,387,520 | ||||||||
| 5 | New York City, New York, General Obligation Bonds, Fiscal Series 1997D, 5.875%, 11/01/11 | 11/09 at 100.00 | AA | 5,019 | ||||||||
| 3,620 | New York City, New York, General Obligation Bonds, Fiscal Series 2005F-1, 5.000%, 9/01/19 – SYNCORA GTY Insured | 9/15 at 100.00 | AA | 3,876,586 | ||||||||
| 1,725 | New York City, New York, General Obligation Bonds, Fiscal Series 2006C, 5.000%, 8/01/16 – FSA Insured | 8/15 at 100.00 | AAA | 1,928,274 | ||||||||
| 10,000 | New York City, New York, General Obligation Bonds, Series D, 5.125%, 12/01/26 | 12/17 at 100.00 | AA | 10,553,000 | ||||||||
| 390 | South Orangetown Central School District, Rockland County, New York, General Obligation Bonds, Series 1990, 6.875%, 10/01/09 | No Opt. Call | Aa3 | 391,938 | ||||||||
| United Nations Development Corporation, New York, Senior Lien Revenue Bonds, Series 2004A: | ||||||||||||
| 880 | 5.250%, 7/01/23 | 11/09 at 100.00 | A3 | 880,590 | ||||||||
| 750 | 5.250%, 7/01/24 | 11/09 at 100.00 | A3 | 750,458 | ||||||||
| 2,085 | Yonkers, New York, General Obligation Bonds, Series 2005B, 5.000%, 8/01/18 – NPFG Insured | 8/15 at 100.00 | A | 2,152,533 | ||||||||
| 26,455 | Total Tax Obligation/General | 27,018,038 | ||||||||||
Tax Obligation/Limited – 22.7% | ||||||||||||
| 1,500 | Albany Parking Authority, New York, Revenue Refunding Bonds, Series 1992A, 0.000%, 11/01/17 | No Opt. Call | Baa1 | 1,010,490 | ||||||||
| Canton Human Services Initiative Inc., New York, Facility Revenue Bonds, Series 2001: | ||||||||||||
| 920 | 5.700%, 9/01/24 | 9/11 at 102.00 | Baa2 | 855,140 | ||||||||
| 1,155 | 5.750%, 9/01/32 | 9/11 at 102.00 | Baa2 | 1,007,726 | ||||||||
| Dormitory Authority of the State of New York, Residential Institutions for Children, Revenue Bonds, Series 2008-A1: | ||||||||||||
| 2,000 | 5.000%, 6/01/33 | 6/18 at 100.00 | Aa1 | 2,037,180 | ||||||||
| 2,500 | 5.000%, 6/01/38 | 6/18 at 100.00 | Aa1 | 2,533,425 | ||||||||
| 1,500 | Dormitory Authority of the State of New York, Revenue Bonds, School Districts Financing Program, Series 2009C, 5.125%, 10/01/36 | 10/19 at 100.00 | AAA | 1,519,380 | ||||||||
| 375 | Dormitory Authority of the State of New York, State Personal Income Tax Revenue Bonds, Series 2005F, 5.000%, 3/15/21 – FSA Insured | 3/15 at 100.00 | AAA | 403,016 | ||||||||
| 4,000 | Dormitory Authority of the State of New York, State Personal Income Tax Revenue Bonds, Series 2008A, 5.000%, 3/15/28 | 3/18 at 100.00 | AAA | 4,224,640 | ||||||||
| 3,000 | Dormitory Authority of the State of New York, State Personal Income Tax Revenue Bonds, Series 2009A, 5.000%, 2/15/34 | 2/19 at 100.00 | AAA | 3,088,800 | ||||||||
| 34 | Nuveen Investments |
| Principal Amount (000) | Description (1) | Optional Call Provisions (2) | Ratings (3) | Value | ||||||||
Tax Obligation/Limited (continued) | ||||||||||||
| Metropolitan Transportation Authority, New York, Dedicated Tax Fund Bonds, Series 2002A: | ||||||||||||
| $ | 4,400 | 5.250%, 11/15/25 – FSA Insured | 11/12 at 100.00 | AAA | $ | 4,521,000 | ||||||
| 2,000 | 5.000%, 11/15/30 | 11/12 at 100.00 | AA | 2,010,440 | ||||||||
| Metropolitan Transportation Authority, New York, State Service Contract Refunding Bonds, Series 2002A: | ||||||||||||
| 1,825 | 5.750%, 7/01/18 | No Opt. Call | AA– | 2,102,382 | ||||||||
| 4,400 | 5.125%, 1/01/29 | 7/12 at 100.00 | AA– | 4,430,228 | ||||||||
| 1,680 | Monroe Newpower Corporation, New York, Power Facilities Revenue Bonds, Series 2003, 5.500%, 1/01/34 | 1/13 at 102.00 | BBB | 1,144,030 | ||||||||
| New York City Sales Tax Asset Receivable Corporation, New York, Dedicated Revenue Bonds, Local Government Assistance Corporation, Series 2004A: | ||||||||||||
| 3,900 | 5.000%, 10/15/25 – NPFG Insured | 10/14 at 100.00 | AAA | 4,110,600 | ||||||||
| 1,870 | 5.000%, 10/15/26 – NPFG Insured | 10/14 at 100.00 | AAA | 1,964,585 | ||||||||
| 905 | 5.000%, 10/15/29 – AMBAC Insured | 10/14 at 100.00 | AAA | 939,281 | ||||||||
| 4,300 | New York City Transitional Finance Authority, New York, Building Aid Revenue Bonds, Fiscal Series 2007S-2, 5.000%, 1/15/28 – FGIC Insured | 1/17 at 100.00 | AA– | 4,392,794 | ||||||||
| 4,500 | New York City Transitional Finance Authority, New York, Building Aid Revenue Bonds, Fiscal Series 2009-S1, 5.500%, 7/15/31 | 7/18 at 100.00 | AA– | 4,738,455 | ||||||||
| 1,065 | New York City Transitional Finance Authority, New York, Future Tax Secured Bonds, Fiscal Series 2003E, 5.000%, 2/01/23 | 2/13 at 100.00 | AAA | 1,121,253 | ||||||||
| 3,705 | New York City Transitional Finance Authority, New York, Future Tax Secured Bonds, Fiscal Series 2007C-1, 5.000%, 11/01/27 | 11/17 at 100.00 | AAA | 3,936,859 | ||||||||
| 2,400 | New York City Transitional Finance Authority, New York, Future Tax Secured | 5/19 at 100.00 | AAA | 2,588,256 | ||||||||
| 360 | New York Convention Center Development Corporation, Hotel Fee Revenue Bonds, Tender Option Bond Trust 3126, 12.220%, 11/15/44 – BHAC Insured (IF) (5) | 11/15 at 100.00 | AAA | 379,632 | ||||||||
| 335 | New York Convention Center Development Corporation, Hotel Fee Revenue Bonds, Tender Option Bonds Trust 3095, 13.236%, 11/15/44 – AMBAC Insured (IF) | 11/15 at 100.00 | AAA | 347,341 | ||||||||
| 180 | New York State Environmental Facilities Corporation, Infrastructure Revenue Bonds, Series 2003A, 5.000%, 3/15/21 | 3/14 at 100.00 | AA– | 188,512 | ||||||||
| 60 | New York State Environmental Facilities Corporation, State Personal Income Tax Revenue Bonds, Series 2008A, 5.000%, 12/15/27 (UB) | 12/17 at 100.00 | AAA | 63,456 | ||||||||
| 5,050 | New York State Environmental Facilities Corporation, State Personal Income Tax Revenue Bonds, Series 2008A, 5.000%, 12/15/26 (UB) | 12/17 at 100.00 | AAA | 5,373,655 | ||||||||
| 2,100 | New York State Housing Finance Agency, State Personal Income Tax Revenue Bonds, Economic Development and Housing, Series 2006A, 5.000%, 3/15/36 | 9/15 at 100.00 | AAA | 2,133,852 | ||||||||
| 3,125 | New York State Local Government Assistance Corporation, Revenue Bonds, Series 1993E, 5.250%, 4/01/16 – FSA Insured | No Opt. Call | AAA | 3,571,406 | ||||||||
| 5,500 | New York State Thruway Authority, Highway and Bridge Trust Fund Bonds, Series 2005B, 5.500%, 4/01/20 – AMBAC Insured (UB) | No Opt. Call | AA | 6,411,680 | ||||||||
| 2,750 | New York State Thruway Authority, Highway and Bridge Trust Fund Bonds, Series 2007, 5.000%, 4/01/27 | 10/17 at 100.00 | AA | 2,882,083 | ||||||||
| New York State Tobacco Settlement Financing Corporation, Tobacco Settlement Asset-Backed and State Contingency Contract-Backed Bonds, Series 2003A-1: | ||||||||||||
| 3,300 | 5.250%, 6/01/20 – AMBAC Insured | 6/13 at 100.00 | AA– | 3,469,950 | ||||||||
| 2,755 | 5.250%, 6/01/21 – AMBAC Insured | 6/13 at 100.00 | AA– | 2,883,521 | ||||||||
| 4,945 | 5.250%, 6/01/22 – AMBAC Insured | 6/13 at 100.00 | AA– | 5,152,542 | ||||||||
| 3,000 | New York State Tobacco Settlement Financing Corporation, Tobacco Settlement Asset-Backed and State Contingency Contract-Backed Bonds, Series 2003B-1C, 5.500%, 6/01/21 | 6/13 at 100.00 | AA– | 3,166,950 | ||||||||
| Nuveen Investments | 35 |
Portfolio of Investments (Unaudited)
Nuveen New York Municipal Bond Fund (continued)
August 31, 2009
| Principal Amount (000) | Description (1) | Optional Call Provisions (2) | Ratings (3) | Value | |||||||||
Tax Obligation/Limited (continued) | |||||||||||||
| $ | 5,000 | Puerto Rico Infrastructure Financing Authority, Special Tax Revenue Bonds, Series 2005A, 0.000%, 7/01/44 – AMBAC Insured | No Opt. Call | BBB+ | $ | 392,250 | |||||||
| 3,250 | Puerto Rico Sales Tax Financing Corporation, Sales Tax Revenue Bonds, First Subordinate Series 2009A, 6.000%, 8/01/42 | 8/19 at 100.00 | A+ | 3,395,503 | |||||||||
| 300 | Triborough Bridge and Tunnel Authority, New York, Convention Center Bonds, Series 1990E, 7.250%, 1/01/10 | No Opt. Call | AA– | 306,471 | |||||||||
| 95,910 | Total Tax Obligation/Limited | 94,798,764 | |||||||||||
Transportation – 10.9% | |||||||||||||
| 1,500 | Metropolitan Transportation Authority, New York, Transportation Revenue Bonds, Series 2003A, 5.000%, 11/15/15 – FGIC Insured | No Opt. Call | A | 1,653,015 | |||||||||
| 7,000 | Metropolitan Transportation Authority, New York, Transportation Revenue Bonds, Series 2006A, 5.000%, 11/15/31 | 11/16 at 100.00 | A | 7,045,780 | |||||||||
| Metropolitan Transportation Authority, New York, Transportation Revenue Refunding Bonds, Series 2002A: | |||||||||||||
| 1,500 | 5.500%, 11/15/19 – AMBAC Insured | 11/12 at 100.00 | A | 1,568,895 | |||||||||
| 1,000 | 5.125%, 11/15/22 – FGIC Insured | 11/12 at 100.00 | A | 1,020,670 | |||||||||
| 500 | New York City Industrial Development Agency, New York, Special Facilities Revenue Bonds, British Airways PLC, Series 1998, 5.250%, 12/01/32 (Alternative Minimum Tax) | 12/09 at 101.00 | BB | 280,305 | |||||||||
| 5,265 | New York State Thruway Authority, General Revenue Bonds, Series 2005F, 5.000%, 1/01/20 – AMBAC Insured | 1/15 at 100.00 | A+ | 5,609,015 | |||||||||
| 600 | New York State Thruway Authority, General Revenue Bonds, Series 2005G, 5.000%, 1/01/30 – FSA Insured | 7/15 at 100.00 | AAA | 610,890 | |||||||||
| 1,000 | Niagara Frontier Airport Authority, New York, Airport Revenue Bonds, Buffalo Niagara International Airport, Series 1999A, 5.625%, 4/01/29 – NPFG Insured (Alternative Minimum Tax) | 10/09 at 101.00 | A | 970,520 | |||||||||
| 5,000 | Port Authority of New York and New Jersey, Consolidated Revenue Bonds, One Hundred Fifty Second Series 2007, 5.000%, 11/01/28 (Alternative Minimum Tax) | 5/18 at 100.00 | AA– | 5,013,600 | |||||||||
| 625 | Port Authority of New York and New Jersey, Consolidated Revenue Bonds, One Hundred Fortieth Series 2005, 5.000%, 12/01/31 – SYNCORA GTY Insured | 6/15 at 101.00 | AA– | 649,019 | |||||||||
| 865 | Port Authority of New York and New Jersey, Consolidated Revenue Bonds, One Hundred Forty Eighth Series 2008, Trust 2920, 16.992%, 8/15/32 – FSA Insured (IF) | 8/17 at 100.00 | AAA | 1,007,016 | |||||||||
| 1,500 | Port Authority of New York and New Jersey, Special Project Bonds, JFK International Air Terminal LLC, Sixth Series 1997, 5.750%, 12/01/25 – NPFG Insured (Alternative Minimum Tax) | 12/09 at 100.00 | A | 1,362,780 | |||||||||
| 250 | Puerto Rico Ports Authority, Special Facilities Revenue Bonds, American Airlines Inc., Series 1996A, 6.250%, 6/01/26 (Alternative Minimum Tax) | 12/09 at 100.00 | CCC+ | 109,630 | |||||||||
| 15,000 | Triborough Bridge and Tunnel Authority, New York, General Purpose Revenue Bonds, Series 2002B, 5.250%, 11/15/19 (UB) | 11/12 at 100.00 | Aa2 | 16,354,050 | |||||||||
| 780 | Triborough Bridge and Tunnel Authority, New York, Subordinate Lien General Purpose Revenue Refunding Bonds, Series 2002E, 5.500%, 11/15/20 – NPFG Insured | No Opt. Call | Aa3 | 914,909 | |||||||||
| 1,500 | Triborough Bridge and Tunnel Authority, New York, Subordinate Lien General Purpose Revenue Refunding Bonds, Tender Option Bond Trust 1184, 9.041%, 11/15/33 (IF) | 11/18 at 100.00 | Aa2 | 1,582,245 | |||||||||
| 43,885 | Total Transportation | 45,752,339 | |||||||||||
U.S. Guaranteed – 4.6% (6) | |||||||||||||
| 2,000 | Albany Industrial Development Agency, New York, Revenue Bonds, Albany Law School, Series 2000A, 5.750%, 10/01/30 (Pre-refunded 10/01/10) – RAAI Insured | 10/10 at 100.00 | BBB– | (6) | 2,114,760 | ||||||||
| 36 | Nuveen Investments |
| Principal Amount (000) | Description (1) | Optional Call Provisions (2) | Ratings (3) | Value | |||||||||
U.S. Guaranteed (6) (continued) | |||||||||||||
| $ | 1,000 | Cattaraugus County Industrial Development Agency, New York, Revenue Bonds, Jamestown Community College, Series 2000A, 6.500%, 7/01/30 (Pre-refunded 7/01/10) | 7/10 at 102.00 | N/R | (6) | $ | 1,069,610 | ||||||
| 1,520 | Dormitory Authority of the State of New York, FHA-Insured Nursing Home Mortgage Revenue Bonds, Shorefront Jewish Geriatric Center Inc., Series 2002, 5.200%, 2/01/32 (Pre-refunded 2/01/13) | 2/13 at 102.00 | Aaa | 1,751,602 | |||||||||
| 1,250 | Dormitory Authority of the State of New York, Revenue Bonds, North Shore Long Island Jewish Group, Series 2003, 5.375%, 5/01/23 (Pre-refunded 5/01/13) | 5/13 at 100.00 | Aaa | 1,431,263 | |||||||||
| 220 | Dormitory Authority of the State of New York, Suffolk County, Lease Revenue Bonds, Judicial Facilities, Series 1991A, 9.500%, 4/15/14 (ETM) | 10/09 at 106.27 | Baa1 | (6) | 287,426 | ||||||||
| 850 | Erie County Tobacco Asset Securitization Corporation, New York, Senior Tobacco Settlement Asset-Backed Bonds, Series 2000, 6.000%, 7/15/20 (Pre-refunded 7/15/10) | 7/10 at 101.00 | AAA | 899,819 | |||||||||
| 855 | Metropolitan Transportation Authority, New York, Commuter Facilities Revenue Bonds, Series 1997B, 5.000%, 7/01/20 – AMBAC Insured (ETM) | 11/09 at 100.00 | N/R | (6) | 857,437 | ||||||||
| 595 | Monroe Tobacco Asset Securitization Corporation, New York, Tobacco Settlement Asset-Backed Bonds, Series 2000, 6.150%, 6/01/25 | 6/10 at 101.00 | AAA | 623,673 | |||||||||
| 965 | Nassau County Industrial Development Agency, New York, Revenue Bonds, Special Needs Facilities Pooled Program, Series 2001B-1, 7.250%, 7/01/16 (Pre-refunded 7/01/11) | 7/11 at 101.00 | AAA | 1,080,250 | |||||||||
| 690 | New York City Industrial Development Agency, New York, Civic Facility Revenue Bonds, Special Needs Facilities Pooled Program, Series 2000, 8.125%, 7/01/19 (Pre-refunded 7/01/10) | 7/10 at 102.00 | N/R | (6) | 740,204 | ||||||||
| 95 | New York State Housing Finance Agency, Construction Fund Bonds, State University, Series 1986A, 8.000%, 5/01/11 (ETM) | No Opt. Call | AAA | 101,233 | |||||||||
| 2,000 | New York State Urban Development Corporation, State Personal Income Tax Revenue Bonds, State Facilities and Equipment, Series 2002C-1, | 3/13 at 100.00 | AAA | 2,259,420 | |||||||||
| 1,250 | Virgin Islands Public Finance Authority, Gross Receipts Taxes Loan Note, | 10/10 at 101.00 | BBB+ | (6) | 1,344,425 | ||||||||
| 2,500 | Westchester Tobacco Asset Securitization Corporation, New York, Tobacco Settlement Asset-Backed Bonds, Series 1999, 6.750%, 7/15/29 | 7/10 at 101.00 | AAA | 2,663,750 | |||||||||
| 1,960 | Yonkers Industrial Development Agency, New York, Revenue Bonds, Community Development Properties – Yonkers Inc. Project, Series 2001A, 6.625%, 2/01/26 (Pre-refunded 2/01/11) | 2/11 at 100.00 | BBB– | (6) | 2,111,920 | ||||||||
| 17,750 | Total U.S. Guaranteed | 19,336,792 | |||||||||||
Utilities – 10.0% | |||||||||||||
| 2,350 | Long Island Power Authority, New York, Electric System General Revenue Bonds, Series 2000A, 0.000%, 6/01/20 – FSA Insured | No Opt. Call | AAA | 1,546,089 | |||||||||
| 6,000 | Long Island Power Authority, New York, Electric System General Revenue Bonds, Series 2003C, 5.000%, 9/01/16 – CIFG Insured | 9/13 at 100.00 | A3 | 6,312,600 | |||||||||
| Long Island Power Authority, New York, Electric System General Revenue Bonds, Series 2006A: | |||||||||||||
| 5,500 | 5.000%, 12/01/23 – FGIC Insured | 6/16 at 100.00 | A | 5,690,520 | |||||||||
| 1,200 | 5.000%, 12/01/24 – FGIC Insured | 6/16 at 100.00 | A | 1,235,220 | |||||||||
| 500 | Long Island Power Authority, New York, Electric System General Revenue Bonds, Series 2006B, 5.000%, 12/01/35 – CIFG Insured | 6/16 at 100.00 | A– | 500,815 | |||||||||
| 10,000 | Long Island Power Authority, New York, Electric System Revenue Bonds, Series 2008A, 6.000%, 5/01/33 | 5/19 at 100.00 | A– | 11,040,800 | |||||||||
| Nuveen Investments | 37 |
Portfolio of Investments (Unaudited)
Nuveen New York Municipal Bond Fund (continued)
August 31, 2009
| Principal Amount (000) | Description (1) | Optional Call Provisions (2) | Ratings (3) | Value | ||||||||
Utilities (continued) | ||||||||||||
| $ | 2,400 | Nassau County Industrial Development Authority, New York, Keyspan Glenwood Energy Project, Series 2003, 5.250%, 6/01/27 | 6/13 at 100.00 | A– | $ | 2,199,912 | ||||||
| 3,500 | New York State Energy Research and Development Authority, Pollution Control Revenue Bonds, New York State Electric and Gas Corporation, Series 2005A, 4.100%, 3/15/15 – NPFG Insured | 3/11 at 100.00 | A | 3,510,395 | ||||||||
| 1,500 | Niagara County Industrial Development Agency, New York, Solid Waste Disposal Facility Revenue Bonds, American Ref-Fuel Company of Niagara LP, Series 2001A, 5.450%, 11/15/26 (Mandatory put 11/15/12) | 11/11 at 101.00 | Baa2 | 1,463,145 | ||||||||
| 200 | Niagara County Industrial Development Agency, New York, Solid Waste Disposal Facility Revenue Refunding Bonds, American Ref-Fuel Company of Niagara LP, Series 2001D, 5.550%, 11/15/24 (Mandatory put 11/15/15) | 11/11 at 101.00 | Baa2 | 188,988 | ||||||||
| 3,000 | Power Authority of the State of New York, General Revenue Bonds, Series 2000A, 5.250%, 11/15/40 | 11/10 at 100.00 | Aa2 | 3,016,830 | ||||||||
| 520 | Power Authority of the State of New York, General Revenue Bonds, Series 2006A, 5.000%, 11/15/19 – FGIC Insured | 11/15 at 100.00 | Aa2 | 562,749 | ||||||||
| Suffolk County Industrial Development Agency, New York, Revenue Bonds, Nissequogue Cogeneration Partners Facility, Series 1998: | ||||||||||||
| 1,550 | 5.300%, 1/01/13 (Alternative Minimum Tax) | 1/10 at 100.50 | N/R | 1,444,848 | ||||||||
| 4,000 | 5.500%, 1/01/23 (Alternative Minimum Tax) | 1/10 at 100.50 | N/R | 3,308,960 | ||||||||
| 42,220 | Total Utilities | 42,021,871 | ||||||||||
Water and Sewer – 3.6% | ||||||||||||
| 4,500 | New York City Municipal Water Finance Authority, New York, Water and Sewerage System Revenue Bonds, Fiscal Series 2006A, 5.000%, 6/15/39 | 6/15 at 100.00 | AAA | 4,551,480 | ||||||||
| 4,000 | New York State Environmental Facilities Corporation, State Clean Water and Drinking Water Revolving Funds Revenue Bonds, Pooled Loan Issue, Series 2002F, 5.250%, 11/15/18 | 11/12 at 100.00 | AAA | 4,274,840 | ||||||||
| 2,950 | Niagara Falls Public Water Authority, New York, Water and Sewerage Revenue Bonds, Series 2005, 5.000%, 7/15/27 – SYNCORA GTY Insured | 7/15 at 100.00 | BBB– | 3,014,517 | ||||||||
| 1,520 | Puerto Rico Aqueduct and Sewerage Authority, Revenue Bonds, Senior Lien Series 2008A, 6.000%, 7/01/38 | 7/18 at 100.00 | BBB– | 1,531,249 | ||||||||
| 1,455 | Western Nassau County Water Authority, New York, Water System Revenue Bonds, Series 2005, 5.000%, 5/01/18 – AMBAC Insured | 5/15 at 100.00 | A3 | 1,572,900 | ||||||||
| 14,425 | Total Water and Sewer | 14,944,986 | ||||||||||
| $ | 437,100 | Total Investments (cost $430,982,912) – 102.5% | 428,757,299 | |||||||||
Floating Rate Obligations – (4.3)% | (17,955,000) | |||||||||||
Other Assets Less Liabilities – 1.8% | 7,365,425 | |||||||||||
Net Assets – 100% | $ | 418,167,724 | ||||||||||
| (1) | All percentages shown in the Portfolio of Investments are based on net assets. |
| (2) | Optional Call Provisions: Dates (month and year) and prices of the earliest optional call or redemption. There may be other call provisions at varying prices at later dates. Certain mortgage-backed securities may be subject to periodic principal paydowns. |
| (3) | Ratings: Using the higher of Standard & Poor’s Group (“Standard & Poor’s”) or Moody’s Investor Service, Inc. (“Moody’s”) rating. Ratings below BBB by Standard & Poor’s or Baa by Moody’s are considered to be below investment grade. |
| (4) | Non-income producing security, in the case of a bond, generally denotes that the issuer has defaulted on the payment of principal or interest or has filed for bankruptcy. |
| (5) | Investment valued at fair value using methods determined in good faith by, or at the discretion of, the Board of Trustees. For SFAS No. 157 disclosure purposes, investment categorized as Level 3. See Notes to Financial Statements, Footnote 2 – Fair Value Measurements for more information. |
| (6) | Backed by an escrow or trust containing sufficient U.S. Government or U.S. Government agency securities which ensure the timely payment of principal and interest. Such investments are normally considered to be equivalent to AAA rated securities. |
| N/R | Not rated. |
| WI/DD | Purchased on a when-issued or delayed delivery basis. |
| (ETM) | Escrowed to maturity. |
| (IF) | Inverse floating rate investment. |
| (UB) | Underlying bond of an inverse floating rate trust reflected as a financing transaction pursuant to the provisions of SFAS No. 140. |
See accompanying notes to financial statements.
| 38 | Nuveen Investments |
Portfolio of Investments (Unaudited)
Nuveen New York Insured Municipal Bond Fund
August 31, 2009
| Principal Amount (000) | Description (1) | Optional Call Provisions (2) | Ratings (3) | Value | ||||||||
Education and Civic Organizations – 8.6% | ||||||||||||
| $ | 1,000 | Allegany County Industrial Development Agency, New York, Revenue Bonds, Alfred University, Series 1998, 5.000%, 8/01/28 – NPFG Insured | 2/10 at 101.00 | Baa1 | $ | 946,110 | ||||||
| 1,110 | Amherst Industrial Development Agency, New York, Revenue Bonds, UBF Faculty/Student Housing Corporation, University of Buffalo Creekside Project, Series 2002A, 5.000%, 8/01/22 – AMBAC Insured | 8/12 at 101.00 | N/R | 1,118,192 | ||||||||
| 3,095 | Amherst Industrial Development Agency, New York, Revenue Bonds, UBF Faculty/Student Housing Corporation, University of Buffalo Project, Series 2000A, 5.750%, 8/01/30 – AMBAC Insured | 8/10 at 102.00 | A3 | 3,156,281 | ||||||||
| 4,000 | Dormitory Authority of the State of New York, Consolidated Revenue Bonds, City University System, Series 1993A, 5.750%, 7/01/13 – NPFG Insured | No Opt. Call | A1 | 4,296,120 | ||||||||
| 2,610 | Dormitory Authority of the State of New York, General Revenue Bonds, Manhattan College, Series 2007A, 5.000%, 7/01/32 – RAAI Insured | 7/17 at 100.00 | BBB– | 2,326,189 | ||||||||
| 1,000 | Dormitory Authority of the State of New York, General Revenue Bonds, New York University, Series 2001-1, 5.500%, 7/01/40 – AMBAC Insured | No Opt. Call | AA– | 1,137,530 | ||||||||
| 605 | Dormitory Authority of the State of New York, Insured Revenue Bonds, Fordham University, Series 2002, 5.000%, 7/01/21 – FGIC Insured | 7/12 at 100.00 | A2 | 620,942 | ||||||||
| 1,000 | Dormitory Authority of the State of New York, Insured Revenue Bonds, Yeshiva University, Series 2001, 5.000%, 7/01/30 – AMBAC Insured | 7/11 at 100.00 | Aa3 | 1,002,360 | ||||||||
| 1,000 | Dormitory Authority of the State of New York, Lease Revenue Bonds, State University Dormitory Facilities, Series 2003B, 5.250%, 7/01/32 (Mandatory put 7/01/13) – SYNCORA GTY Insured | No Opt. Call | AA– | 1,101,430 | ||||||||
| 1,120 | Dormitory Authority of the State of New York, Lease Revenue Bonds, State University Dormitory Facilities, Series 2004A, 5.000%, 7/01/29 – NPFG Insured | 7/15 at 100.00 | AA– | 1,114,344 | ||||||||
| 435 | Dormitory Authority of the State of New York, Revenue Bonds, Barnard College, Series 2007A, 5.000%, 7/01/37 – FGIC Insured | 7/17 at 100.00 | A | 439,463 | ||||||||
| 1,000 | Dormitory Authority of the State of New York, Revenue Bonds, Canisius College, Series 2000, 5.250%, 7/01/30 – NPFG Insured | 7/11 at 101.00 | A | 961,950 | ||||||||
| 940 | Madison County Industrial Development Agency, New York, Civic Facility Revenue Bonds, Colgate University, Tender Option Bond Trust 3127, 12.509%, 7/01/40 – BHAC Insured (IF) | 7/15 at 100.00 | AAA | 999,887 | ||||||||
| 2,500 | New York City Industrial Development Agency, New York, Civic Facility Revenue Bonds, Polytechnic University, Series 2007, 5.250%, 11/01/37 – ACA Insured | 11/17 at 100.00 | BB+ | 2,023,175 | ||||||||
| 1,000 | New York City Industrial Development Agency, New York, PILOT Revenue Bonds, Queens Baseball Stadium Project, Series 2006, 5.000%, 1/01/46 – AMBAC Insured | 1/17 at 100.00 | BBB | 882,000 | ||||||||
| New York City Industrial Development Authority, New York, PILOT Revenue Bonds, Yankee Stadium Project, Series 2006: | ||||||||||||
| 720 | 5.000%, 3/01/31 – FGIC Insured | 9/16 at 100.00 | BBB– | 670,637 | ||||||||
| 450 | 5.000%, 3/01/36 – NPFG Insured | 9/16 at 100.00 | A | 408,911 | ||||||||
| 1,710 | 4.500%, 3/01/39 – FGIC Insured | 9/16 at 100.00 | BBB– | 1,382,313 | ||||||||
| 585 | New York State Dormitory Authority, Revenue Bonds, New York University, Series 2007, 5.000%, 7/01/32 – AMBAC Insured | 7/17 at 100.00 | AA– | 598,280 | ||||||||
| 25,880 | Total Education and Civic Organizations | 25,186,114 | ||||||||||
Health Care – 13.8% | ||||||||||||
| 3,305 | Dormitory Authority of the State of New York, FHA-Insured Mortgage Hospital Revenue Bonds, Millard Fillmore Hospitals, Series 1997, 5.375%, 2/01/32 – AMBAC Insured | 2/10 at 100.00 | N/R | 3,306,719 | ||||||||
| 2,000 | Dormitory Authority of the State of New York, FHA-Insured Mortgage Hospital Revenue Bonds, Montefiore Medical Center, Series 1999, 5.500%, 8/01/38 – AMBAC Insured | 2/10 at 101.00 | N/R | 2,021,280 | ||||||||
| Nuveen Investments | 39 |
Portfolio of Investments (Unaudited)
Nuveen New York Insured Municipal Bond Fund (continued)
August 31, 2009
| Principal Amount (000) | Description (1) | Optional Call Provisions (2) | Ratings (3) | Value | ||||||||
Health Care (continued) | ||||||||||||
| $ | 5,940 | Dormitory Authority of the State of New York, FHA-Insured Mortgage Hospital Revenue Bonds, New York and Presbyterian Hospital, Series 1998, 4.750%, 8/01/27 – AMBAC Insured | 2/10 at 100.00 | N/R | $ | 5,918,497 | ||||||
| 1,910 | Dormitory Authority of the State of New York, FHA-Insured Mortgage Hospital Revenue Bonds, St. Barnabas Hospital, Series 2002A, 5.125%, 2/01/22 – AMBAC Insured | 8/12 at 100.00 | N/R | 1,968,542 | ||||||||
| 1,455 | Dormitory Authority of the State of New York, FHA-Insured Mortgage Revenue Bonds, Hudson Valley Hospital Center, Series 2007, 5.000%, 8/15/27 – FSA Insured | 8/17 at 100.00 | AAA | 1,524,971 | ||||||||
| 1,910 | Dormitory Authority of the State of New York, FHA-Insured Mortgage Revenue Bonds, Montefiore Hospital, Series 2004, 5.000%, 8/01/29 – FGIC Insured | 2/15 at 100.00 | A | 1,942,527 | ||||||||
| 4,000 | Dormitory Authority of the State of New York, FHA-Insured Mortgage Revenue Refunding Bonds, United Health Services, Series 1997, 5.375%, 8/01/27 – AMBAC Insured | 2/10 at 100.00 | N/R | 4,008,880 | ||||||||
| 2,260 | Dormitory Authority of the State of New York, Hospital Revenue Bonds, Catholic Health Services of Long Island Obligated Group - St. Francis Hospital, Series 1999A, 5.500%, 7/01/29 – NPFG Insured | 1/10 at 101.00 | A | 2,177,939 | ||||||||
| 735 | Dormitory Authority of the State of New York, Housing Revenue Bonds, Fashion Institute of Technology, Series 2007, 5.250%, 7/01/34 – FGIC Insured | No Opt. Call | A | 729,899 | ||||||||
| 3,125 | Dormitory Authority of the State of New York, Revenue Bonds, Catholic Health Services of Long Island Obligated Group- St. Charles Hospital and Rehabilitation Center, Series 1999A, 5.500%, 7/01/22 – NPFG Insured | 1/10 at 101.00 | A | 3,048,969 | ||||||||
| 2,000 | Dormitory Authority of the State of New York, Revenue Bonds, Memorial Sloan-Kettering Cancer Center, Series 2003-1, 5.000%, 7/01/21 – NPFG Insured | 7/13 at 100.00 | AA | 2,077,160 | ||||||||
| 1,020 | Dormitory Authority of the State of New York, Revenue Bonds, New York and Presbyterian Hospital, Series 2004A, 5.250%, 8/15/15 – FSA Insured | 8/14 at 100.00 | AAA | 1,107,455 | ||||||||
| 1,650 | Dormitory Authority of the State of New York, Revenue Bonds, North Shore Health System Obligated Group, Series 1998, 5.000%, 11/01/23 – NPFG Insured | 11/09 at 100.50 | A | 1,664,504 | ||||||||
| 5,000 | Dormitory Authority of the State of New York, Revenue Bonds, Winthrop South Nassau University Health System Obligated Group, Series 2001A, 5.250%, 7/01/31 – AMBAC Insured | 7/11 at 101.00 | N/R | 5,063,900 | ||||||||
| New York City Health and Hospitals Corporation, New York, Health System Revenue Bonds, Series 2003A: | ||||||||||||
| 2,000 | 5.250%, 2/15/21 – AMBAC Insured | 2/13 at 100.00 | A+ | 2,052,220 | ||||||||
| 1,750 | 5.250%, 2/15/22 – AMBAC Insured | 2/13 at 100.00 | A+ | 1,791,195 | ||||||||
| 40,060 | Total Health Care | 40,404,657 | ||||||||||
Housing/Multifamily – 4.9% | ||||||||||||
| New York City Housing Development Corporation, New York, Capital Fund Program Revenue Bonds, Series 2005A: | ||||||||||||
| 400 | 5.000%, 7/01/14 – FGIC Insured | No Opt. Call | AA+ | 444,092 | ||||||||
| 400 | 5.000%, 7/01/16 – FGIC Insured | 7/15 at 100.00 | AA+ | 439,360 | ||||||||
| 4,030 | 5.000%, 7/01/25 – FGIC Insured | 7/15 at 100.00 | AA+ | 4,159,242 | ||||||||
| 581 | New York City Housing Development Corporation, New York, Multifamily Housing Revenue Bonds, Pass-Through Certificates, Series 1991C, 6.500%, 2/20/19 – AMBAC Insured | 9/09 at 105.00 | N/R | 611,517 | ||||||||
| New York State Housing Finance Agency, Mortgage Revenue Refunding Bonds, Housing Project, Series 1996A: | ||||||||||||
| 4,290 | 6.100%, 11/01/15 – FSA Insured | 11/09 at 100.00 | AAA | 4,306,860 | ||||||||
| 4,225 | 6.125%, 11/01/20 – FSA Insured | 11/09 at 100.00 | AAA | 4,229,648 | ||||||||
| 13,926 | Total Housing/Multifamily | �� | 14,190,719 | |||||||||
| 40 | Nuveen Investments |
| Principal Amount (000) | Description (1) | Optional Call Provisions (2) | Ratings (3) | Value | ||||||||
Long-Term Care – 2.6% | ||||||||||||
| $ | 2,000 | Dormitory Authority of the State of New York, FHA-Insured Nursing Home Mortgage Revenue Bonds, Augustana Lutheran Home for the Aged Inc., Series 2000A, 5.500%, 8/01/38 – NPFG Insured | 8/10 at 101.00 | A | $ | 2,022,700 | ||||||
| 3,385 | Dormitory Authority of the State of New York, FHA-Insured Nursing Home Mortgage Revenue Bonds, Norwegian Christian Home and Health Center, Series 2001, 5.200%, 8/01/36 – NPFG Insured | 8/11 at 101.00 | A | 3,438,720 | ||||||||
| 2,000 | Dormitory Authority of the State of New York, Insured Revenue Bonds, NYSARC Inc., Series 2005A, 5.000%, 7/01/34 – FSA Insured | 7/15 at 100.00 | AAA | 2,011,920 | ||||||||
| 7,385 | Total Long-Term Care | 7,473,340 | ||||||||||
Tax Obligation/General – 11.1% | ||||||||||||
| 1,000 | Erie County, New York, General Obligation Bonds, Series 2003A, 5.250%, 3/15/16 – FGIC Insured | 3/13 at 100.00 | Baa2 | 1,030,130 | ||||||||
| 2,000 | Erie County, New York, General Obligation Bonds, Series 2005A, 5.000%, 12/01/18 – NPFG Insured | 12/15 at 100.00 | A | 2,184,240 | ||||||||
| 8,675 | Hudson Yards Infrastructure Corporation, New York, Revenue Bonds, Series 2006A, 5.000%, 2/15/47 – FGIC Insured | 2/17 at 100.00 | A | 7,789,456 | ||||||||
| 2,250 | Monroe County, New York, General Obligation Public Improvement Bonds, Series 2002, 5.000%, 3/01/16 – FGIC Insured | 3/12 at 100.00 | A | 2,328,053 | ||||||||
| 2,000 | Monroe-Woodbury Central School District, Orange County, New York, General Obligation Bonds, Series 2004A, 4.250%, 5/15/22 – FGIC Insured | 5/14 at 100.00 | A | 2,034,200 | ||||||||
| Mount Sinai Union Free School District, Suffolk County, New York, General Obligation Refunding Bonds, Series 1992: | ||||||||||||
| 500 | 6.200%, 2/15/15 – AMBAC Insured | No Opt. Call | A2 | 596,750 | ||||||||
| 1,035 | 6.200%, 2/15/16 – AMBAC Insured | No Opt. Call | A2 | 1,249,700 | ||||||||
| 1,505 | Nassau County, North Hempstead, New York, General Obligation Refunding Bonds, Series 1992B, 6.400%, 4/01/14 – FGIC Insured | No Opt. Call | Aa2 | 1,780,566 | ||||||||
| 60 | New York City, New York, General Obligation Bonds, Fiscal Series 1992C, 6.250%, 8/01/10 – FSA Insured | 2/10 at 100.00 | AAA | 60,279 | ||||||||
| 3,000 | New York City, New York, General Obligation Bonds, Fiscal Series 2001D, 5.250%, 8/01/15 – NPFG Insured | 8/10 at 101.00 | AA | 3,134,070 | ||||||||
| New York City, New York, General Obligation Bonds, Fiscal Series 2004E: | ||||||||||||
| 1,600 | 5.000%, 11/01/19 – FSA Insured | 11/14 at 100.00 | AAA | 1,718,560 | ||||||||
| 1,050 | 5.000%, 11/01/20 – FSA Insured | 11/14 at 100.00 | AAA | 1,121,096 | ||||||||
| 600 | New York City, New York, General Obligation Bonds, Fiscal Series 2005J, 5.000%, 3/01/19 – FGIC Insured | 3/15 at 100.00 | AA | 640,710 | ||||||||
| Rensselaer County, New York, General Obligation Bonds, Series 1991: | ||||||||||||
| 960 | 6.700%, 2/15/13 – AMBAC Insured | No Opt. Call | AA– | 1,123,238 | ||||||||
| 960 | 6.700%, 2/15/14 – AMBAC Insured | No Opt. Call | AA– | 1,151,597 | ||||||||
| 960 | 6.700%, 2/15/15 – AMBAC Insured | No Opt. Call | AA– | 1,178,765 | ||||||||
| 550 | Rondout Valley Central School District, Ulster County, New York, General Obligation Bonds, Series 1991, 6.850%, 6/15/10 – FGIC Insured | No Opt. Call | N/R | 577,203 | ||||||||
| Saratoga County, Half Moon, New York, Public Improvement Bonds, Series 1991: | ||||||||||||
| 395 | 6.500%, 6/01/10 – AMBAC Insured | No Opt. Call | N/R | 411,321 | ||||||||
| 395 | 6.500%, 6/01/11 – AMBAC Insured | No Opt. Call | N/R | 430,084 | ||||||||
| 1,985 | Yonkers, New York, General Obligation Bonds, Series 2005B, 5.000%, 8/01/17 – NPFG Insured | 8/15 at 100.00 | A | 2,069,680 | ||||||||
| 31,480 | Total Tax Obligation/General | 32,609,698 | ||||||||||
Tax Obligation/Limited – 28.0% | ||||||||||||
| 80 | Dormitory Authority of the State of New York, Improvement Revenue Bonds, Mental Health Services Facilities, Series 2000D, 5.250%, 8/15/30 – FSA Insured | 8/10 at 100.00 | AAA | 80,516 | ||||||||
| Nuveen Investments | 41 |
Portfolio of Investments (Unaudited)
Nuveen New York Insured Municipal Bond Fund (continued)
August 31, 2009
| Principal Amount (000) | Description (1) | Optional Call Provisions (2) | Ratings (3) | Value | ||||||||
Tax Obligation/Limited (continued) | ||||||||||||
| $ | 1,000 | Dormitory Authority of the State of New York, Lease Revenue Bonds, Wayne-Finger Lakes Board of Cooperative Education Services, Series 2004, 5.000%, 8/15/23 – FSA Insured | 8/14 at 100.00 | AAA | $ | 1,046,870 | ||||||
| 2,410 | Dormitory Authority of the State of New York, Revenue Bonds, Department of Health, Series 2004-2, 5.000%, 7/01/20 – FGIC Insured | 7/14 at 100.00 | AA– | 2,544,092 | ||||||||
| 1,000 | Dormitory Authority of the State of New York, Revenue Bonds, Mental Health Services Facilities Improvements, Series 2005D-1, 5.000%, 8/15/23 – FGIC Insured | 2/15 at 100.00 | AA– | 1,033,700 | ||||||||
| Dormitory Authority of the State of New York, Revenue Bonds, School Districts Financing Program, Series 2002D: | ||||||||||||
| 5,675 | 5.250%, 10/01/23 – NPFG Insured | 10/12 at 100.00 | A+ | 5,771,532 | ||||||||
| 875 | 5.000%, 10/01/30 – NPFG Insured | 10/12 at 100.00 | A+ | 879,428 | ||||||||
| 2,500 | Dormitory Authority of the State of New York, Secured Hospital Insured Revenue Bonds, Southside Hospital, Series 1998, 5.000%, 2/15/25 – NPFG Insured | 2/10 at 100.00 | A1 | 2,506,150 | ||||||||
| 310 | Dormitory Authority of the State of New York, State Personal Income Tax Revenue Bonds, Series 2005F, 5.000%, 3/15/21 – FSA Insured | 3/15 at 100.00 | AAA | 333,160 | ||||||||
| 1,460 | Erie County Industrial Development Agency, New York, School Facility Revenue Bonds, Buffalo City School District Project, Series 2008A, 5.750%, 5/01/27 – FSA Insured | 5/18 at 100.00 | AAA | 1,566,916 | ||||||||
| 1,000 | Erie County Industrial Development Agency, New York, School Facility Revenue Bonds, Buffalo City School District, Series 2003, 5.750%, 5/01/19 – FSA Insured | 5/12 at 100.00 | AAA | 1,092,970 | ||||||||
| 1,100 | Erie County Industrial Development Agency, New York, School Facility Revenue Bonds, Buffalo City School District, Series 2004, 5.750%, 5/01/26 – FSA Insured | 5/14 at 100.00 | AAA | 1,151,095 | ||||||||
| 3,000 | Metropolitan Transportation Authority, New York, Dedicated Tax Fund Bonds, Series 2002A, 5.250%, 11/15/25 – FSA Insured | 11/12 at 100.00 | AAA | 3,082,500 | ||||||||
| Metropolitan Transportation Authority, New York, State Service Contract Refunding Bonds, Series 2002A: | ||||||||||||
| 2,000 | 5.500%, 1/01/20 – NPFG Insured | 7/12 at 100.00 | AA– | 2,081,120 | ||||||||
| 1,350 | 5.000%, 7/01/25 – FGIC Insured | 7/12 at 100.00 | AA– | 1,366,254 | ||||||||
| New York City Sales Tax Asset Receivable Corporation, New York, Dedicated Revenue Bonds, Local Government Assistance Corporation, Series 2004A: | ||||||||||||
| 1,670 | 5.000%, 10/15/25 – NPFG Insured | 10/14 at 100.00 | AAA | 1,760,180 | ||||||||
| 1,225 | 5.000%, 10/15/26 – NPFG Insured | 10/14 at 100.00 | AAA | 1,286,961 | ||||||||
| 4,970 | 5.000%, 10/15/29 – AMBAC Insured | 10/14 at 100.00 | AAA | 5,158,264 | ||||||||
| 500 | 5.000%, 10/15/32 – AMBAC Insured | 10/14 at 100.00 | AAA | 514,985 | ||||||||
| 3,500 | New York City Transitional Finance Authority, New York, Building Aid Revenue Bonds, Fiscal Series 2007S-2, 5.000%, 1/15/28 – FGIC Insured | 1/17 at 100.00 | AA– | 3,575,530 | ||||||||
| 1,645 | New York City Transitional Finance Authority, New York, Future Tax Secured Bonds, Fiscal Series 2002B, 5.000%, 5/01/30 – MBIA Insured | 11/11 at 101.00 | AAA | 1,676,699 | ||||||||
| New York City Transitional Finance Authority, New York, Future Tax Secured Bonds, Fiscal Series 2003C: | ||||||||||||
| 1,435 | 5.250%, 8/01/20 – AMBAC Insured | 8/12 at 100.00 | AAA | 1,545,811 | ||||||||
| 1,700 | 5.250%, 8/01/22 – AMBAC Insured | 8/12 at 100.00 | AAA | 1,771,264 | ||||||||
| 1,330 | New York City Transitional Finance Authority, New York, Future Tax Secured Bonds, Fiscal Series 2003E, 5.250%, 2/01/22 – NPFG Insured | 2/13 at 100.00 | AAA | 1,412,234 | ||||||||
| 1,000 | New York City Transitional Finance Authority, New York, Future Tax Secured Refunding Bonds, Fiscal Series 2003D, 5.000%, 2/01/22 – NPFG Insured | 2/13 at 100.00 | AAA | 1,046,900 | ||||||||
| New York Convention Center Development Corporation, Hotel Fee Revenue Bonds, Tender Option Bond Trust 3126: | ||||||||||||
| 435 | 13.374%, 11/15/30 – BHAC Insured (IF) (5) | 11/15 at 100.00 | AAA | 490,750 | ||||||||
| 1,150 | 12.220%, 11/15/44 – BHAC Insured (IF) (5) | 11/15 at 100.00 | AAA | 1,212,605 | ||||||||
| 42 | Nuveen Investments |
| Principal Amount (000) | Description (1) | Optional Call Provisions (2) | Ratings (3) | Value | ||||||||
Tax Obligation/Limited (continued) | ||||||||||||
| New York Convention Center Development Corporation, Hotel Fee Revenue Bonds, Tender Option Bonds Trust 3095: | ||||||||||||
| $ | 440 | 13.250%, 11/15/30 – AMBAC Insured (IF) | 11/15 at 100.00 | AAA | $ | 483,393 | ||||||
| 1,060 | 13.326%, 11/15/44 – AMBAC Insured (IF) | 11/15 at 100.00 | AAA | 1,099,050 | ||||||||
| New York State Municipal Bond Bank Agency, Buffalo, Special Program Revenue Bonds, Series 2001A: | ||||||||||||
| 1,185 | 5.250%, 5/15/25 – AMBAC Insured | 5/11 at 100.00 | A | 1,206,567 | ||||||||
| 1,250 | 5.250%, 5/15/26 – AMBAC Insured | 5/11 at 100.00 | A | 1,272,750 | ||||||||
| 1,000 | New York State Thruway Authority, Highway and Bridge Trust Fund Bonds, Second Genera1 Series 2004, 5.000%, 4/01/23 – NPFG Insured | 4/14 at 100.00 | AA | 1,044,150 | ||||||||
| New York State Thruway Authority, Highway and Bridge Trust Fund Bonds, Second General, Series 2005B: | ||||||||||||
| 5,385 | 5.500%, 4/01/20 – AMBAC Insured | No Opt. Call | AA | 6,277,618 | ||||||||
| 1,500 | 5.000%, 4/01/21 – AMBAC Insured | 10/15 at 100.00 | AA | 1,610,625 | ||||||||
| 1,500 | New York State Thruway Authority, State Personal Income Tax Revenue Bonds, Series 2004A, 5.000%, 3/15/24 – AMBAC Insured | 9/14 at 100.00 | AAA | 1,579,425 | ||||||||
| New York State Tobacco Settlement Financing Corporation, Tobacco Settlement Asset-Backed and State Contingency Contract-Backed Bonds, Series 2003A-1: | ||||||||||||
| 3,900 | 5.250%, 6/01/20 – AMBAC Insured | 6/13 at 100.00 | AA– | 4,100,850 | ||||||||
| 250 | 5.250%, 6/01/21 – AMBAC Insured | 6/13 at 100.00 | AA– | 261,663 | ||||||||
| 5,400 | 5.250%, 6/01/22 – AMBAC Insured | 6/13 at 100.00 | AA– | 5,626,638 | ||||||||
| 1,200 | New York State Urban Development Corporation, State Personal Income Tax Revenue Bonds, Series 2005B, 5.000%, 3/15/30 – FSA Insured | 3/15 at 100.00 | AAA | 1,240,392 | ||||||||
| 675 | Niagara Falls City School District, Niagara County, New York, Certificates of Participation, High School Facility, Series 2005, 5.000%, 6/15/28 – FSA Insured | 6/15 at 100.00 | AAA | 638,746 | ||||||||
| Puerto Rico Highway and Transportation Authority, Highway Revenue Refunding Bonds, Series 2002E: | ||||||||||||
| 1,525 | 5.500%, 7/01/14 – FSA Insured | No Opt. Call | AAA | 1,650,294 | ||||||||
| 4,000 | 5.500%, 7/01/18 – FSA Insured | No Opt. Call | AAA | 4,364,800 | ||||||||
| 1,850 | Puerto Rico Sales Tax Financing Corporation, Sales Tax Revenue Bonds, Series 2007A, 5.250%, 8/01/57 | 8/17 at 100.00 | AA– | 1,860,619 | ||||||||
| 2,235 | Syracuse Industrial Development Authority, New York, PILOT Mortgage Revenue Bonds, Carousel Center Project, Series 2007A, 5.000%, 1/01/36 – SYNCORA GTY Insured (Alternative Minimum Tax) | 1/17 at 100.00 | BBB– | 1,478,944 | ||||||||
| 78,675 | Total Tax Obligation/Limited | 81,785,010 | ||||||||||
Transportation – 15.9% | ||||||||||||
| 1,500 | Metropolitan Transportation Authority, New York, Transportation Revenue Bonds, Series 2003A, 5.000%, 11/15/15 – FGIC Insured | No Opt. Call | A | 1,653,015 | ||||||||
| 4,250 | Metropolitan Transportation Authority, New York, Transportation Revenue Refunding Bonds, Series 2002A, 5.500%, 11/15/18 – AMBAC Insured | 11/12 at 100.00 | A | 4,488,468 | ||||||||
| Metropolitan Transportation Authority, New York, Transportation Revenue Refunding Bonds, Series 2002E: | ||||||||||||
| 3,185 | 5.500%, 11/15/18 – NPFG Insured | 11/12 at 100.00 | A | 3,417,792 | ||||||||
| 7,155 | 5.500%, 11/15/19 – NPFG Insured | 11/12 at 100.00 | A | 7,607,768 | ||||||||
| 295 | New York State Thruway Authority, General Revenue Bonds, Series 2005F, 5.000%, 1/01/30 – AMBAC Insured | 1/15 at 100.00 | A+ | 299,947 | ||||||||
| 1,000 | New York State Thruway Authority, General Revenue Bonds, Series 2005G, 5.000%, 1/01/30 – FSA Insured | 7/15 at 100.00 | AAA | 1,018,150 | ||||||||
| 580 | New York State Thruway Authority, General Revenue Bonds, Series 2007H, 5.000%, 1/01/25 – FGIC Insured | 1/18 at 100.00 | A+ | 612,729 | ||||||||
| Nuveen Investments | 43 |
Portfolio of Investments (Unaudited)
Nuveen New York Insured Municipal Bond Fund (continued)
August 31, 2009
| Principal Amount (000) | Description (1) | Optional Call Provisions (2) | Ratings (3) | Value | |||||||||
Transportation (continued) | |||||||||||||
| Niagara Frontier Airport Authority, New York, Airport Revenue Bonds, Buffalo Niagara International Airport, Series 1998: | |||||||||||||
| $ | 1,000 | 5.000%, 4/01/18 – FGIC Insured (Alternative Minimum Tax) | 10/09 at 100.50 | A | $ | 994,650 | |||||||
| 1,500 | 5.000%, 4/01/28 – FGIC Insured (Alternative Minimum Tax) | 10/09 at 100.50 | A | 1,331,715 | |||||||||
| 3,000 | Niagara Frontier Airport Authority, New York, Airport Revenue Bonds, Buffalo Niagara International Airport, Series 1999A, 5.625%, 4/01/29 – NPFG Insured (Alternative Minimum Tax) | 10/09 at 101.00 | A | 2,911,560 | |||||||||
| Port Authority of New York and New Jersey, Consolidated Revenue Bonds, One Hundred Fortieth Series 2005: | |||||||||||||
| 500 | 5.000%, 12/01/19 – FSA Insured | 6/15 at 101.00 | AAA | 548,665 | |||||||||
| 2,000 | 5.000%, 12/01/28 – SYNCORA GTY Insured | 6/15 at 101.00 | AA– | 2,101,840 | |||||||||
| 1,100 | 5.000%, 12/01/31 – SYNCORA GTY Insured | 6/15 at 101.00 | AA– | 1,142,273 | |||||||||
| 670 | Port Authority of New York and New Jersey, Consolidated Revenue Bonds, One Hundred Forty Eighth Series 2008, Trust 2920, 16.992%, 8/15/32 – FSA Insured (IF) | 8/17 at 100.00 | AAA | 780,001 | |||||||||
| 3,000 | Port Authority of New York and New Jersey, Special Project Bonds, JFK International Air Terminal LLC, Sixth Series 1997, 5.750%, 12/01/25 – NPFG Insured (Alternative Minimum Tax) | 12/09 at 100.00 | A | 2,725,560 | |||||||||
| Triborough Bridge and Tunnel Authority, New York, Subordinate Lien General Purpose Revenue Bonds, Series 2003A: | |||||||||||||
| 5,320 | 5.250%, 11/15/19 – AMBAC Insured (UB) | 11/13 at 100.00 | Aa3 | 5,679,792 | |||||||||
| 5,275 | 5.250%, 11/15/20 – AMBAC Insured (UB) | 11/13 at 100.00 | Aa3 | 5,607,536 | |||||||||
| 2,500 | Triborough Bridge and Tunnel Authority, New York, General Purpose Revenue Bonds, Series 2002A, 5.250%, 1/01/19 – FGIC Insured | 1/12 at 100.00 | Aa2 | 2,657,150 | |||||||||
| 780 | Triborough Bridge and Tunnel Authority, New York, Subordinate Lien General Purpose Revenue Refunding Bonds, Series 2002E, 5.500%, 11/15/20 – NPFG Insured | No Opt. Call | Aa3 | 914,909 | |||||||||
| 44,610 | Total Transportation | 46,493,520 | |||||||||||
U.S. Guaranteed – 3.0% (4) | |||||||||||||
| 275 | Camden Central School District, Oneida County, New York, General Obligation Bonds, Series 1991, 7.100%, 6/15/10 - AMBAC Insured (ETM) | No Opt. Call | A2 | (4) | 289,625 | ||||||||
| Dormitory Authority of the State of New York, Improvement Revenue Bonds, Mental Health Services Facilities, Series 2000D: | |||||||||||||
| 35 | 5.250%, 8/15/30 (Pre-refunded 8/15/10) - FSA Insured | 8/10 at 100.00 | Aa3 | (4) | 36,619 | ||||||||
| 105 | 5.250%, 8/15/30 (Pre-refunded 8/15/10) - FSA Insured | 8/10 at 100.00 | Aa3 | (4) | 109,889 | ||||||||
| 5,280 | Dormitory Authority of the State of New York, Revenue Bonds, University of Rochester, Series 2000A, 0.000%, 7/01/25 (Pre-refunded 7/01/10) – MBIA Insured | 7/10 at 101.00 | A+ | (4) | 5,293,464 | ||||||||
| 1,000 | Erie County Water Authority, New York, Water Revenue Bonds, Series 1990B, 6.750%, 12/01/14 – AMBAC Insured (ETM) | No Opt. Call | N/R | (4) | 1,134,200 | ||||||||
| 1,295 | Metropolitan Transportation Authority, New York, Commuter Facilities Revenue Bonds, Series 1997B, 5.125%, 7/01/24 – AMBAC Insured (ETM) | 11/09 at 100.00 | N/R | (4) | 1,298,820 | ||||||||
| 500 | Metropolitan Transportation Authority, New York, Dedicated Tax Fund Bonds, Series 1999A, 5.000%, 4/01/29 (Pre-refunded 10/01/14) – FSA Insured | 10/14 at 100.00 | AAA | 576,990 | |||||||||
| 55 | New York City Transitional Finance Authority, New York, Future Tax Secured Bonds, Fiscal Series 2002B, 5.000%, 5/01/30 (Pre-refunded 11/01/11) – MBIA Insured | 11/11 at 101.00 | AAA | 60,556 | |||||||||
| 8,545 | Total U.S. Guaranteed | 8,800,163 | |||||||||||
Utilities – 8.7% | |||||||||||||
| 6,000 | Long Island Power Authority, New York, Electric System General Revenue Bonds, Series 1998A, 0.000%, 12/01/19 – FSA Insured | No Opt. Call | AAA | 4,062,060 | |||||||||
| Long Island Power Authority, New York, Electric System General Revenue Bonds, Series 2000A: | |||||||||||||
| 2,000 | 0.000%, 6/01/24 – FSA Insured | No Opt. Call | AAA | 1,051,900 | |||||||||
| 2,000 | 0.000%, 6/01/25 – FSA Insured | No Opt. Call | AAA | 995,340 | |||||||||
| 44 | Nuveen Investments |
| Principal Amount (000) | Description (1) | Optional Call Provisions (2) | Ratings (3) | Value | ||||||||
Utilities (continued) | ||||||||||||
| $ | 1,500 | Long Island Power Authority, New York, Electric System General Revenue Bonds, Series 2001A, 5.000%, 9/01/27 – FSA Insured | 9/11 at 100.00 | AAA | $ | 1,520,205 | ||||||
| Long Island Power Authority, New York, Electric System General Revenue Bonds, Series 2006A: | ||||||||||||
| 3,300 | 5.000%, 12/01/23 – FGIC Insured | 6/16 at 100.00 | A | 3,414,312 | ||||||||
| 2,615 | 5.000%, 12/01/25 – FGIC Insured | 6/16 at 100.00 | A | 2,679,486 | ||||||||
| 250 | Long Island Power Authority, New York, Electric System General Revenue Bonds, Series 2006B, 5.000%, 12/01/35 – CIFG Insured | 6/16 at 100.00 | A– | 250,408 | ||||||||
| 5,000 | Long Island Power Authority, New York, Electric System General Revenue Bonds, Series 2006C, 5.000%, 9/01/35 – BHAC Insured | 9/16 at 100.00 | AAA | 5,157,800 | ||||||||
| 5,000 | Long Island Power Authority, New York, Electric System Revenue Bonds, Series 2008A, 5.500%, 5/01/33 – BHAC Insured | 5/19 at 100.00 | AAA | 5,449,500 | ||||||||
| 1,000 | New York State Energy Research and Development Authority, Electric Facilities Revenue Bonds, Long Island Lighting Company, Series 1995A, | 9/09 at 102.00 | A | 986,210 | ||||||||
| 28,665 | Total Utilities | 25,567,221 | ||||||||||
Water and Sewer – 3.5% | ||||||||||||
| 405 | New York City Municipal Water Finance Authority, New York, Water and Sewerage System Revenue Bonds, Fiscal Series 2000B, 6.000%, 6/15/33 (Mandatory put 6/15/10) – NPFG Insured | 6/10 at 101.00 | AAA | 425,015 | ||||||||
| 3,340 | New York City Municipal Water Finance Authority, New York, Water and Sewerage System Revenue Bonds, Fiscal Series 2005C, | 6/15 at 100.00 | AAA | 3,477,575 | ||||||||
| 2,105 | New York City Municipal Water Finance Authority, New York, Water and Sewerage System Revenue Bonds, Series 2006B, 5.000%, 6/15/36 – NPFG Insured | 6/16 at 100.00 | AAA | 2,137,522 | ||||||||
| 5 | New York State Environmental Facilities Corporation, State Water Pollution Control Revolving Fund Pooled Revenue Bonds, Series 1990C, | 9/09 at 100.00 | Aa2 | 5,026 | ||||||||
| 4,000 | Suffolk County Water Authority, New York, Waterworks Revenue Bonds, Series 2005C, 5.000%, 6/01/28 – NPFG Insured | 6/15 at 100.00 | AA+ | 4,155,472 | ||||||||
| 9,855 | Total Water and Sewer | 10,200,610 | ||||||||||
| $ | 289,081 | Total Investments (cost $286,961,615) – 100.1% | 292,711,052 | |||||||||
Floating Rate Obligations – (2.4)% | (7,060,000) | |||||||||||
Other Assets Less Liabilities – 2.3% | 6,633,962 | |||||||||||
Net Assets – 100% | $ | 292,285,014 | ||||||||||
At least 80% of the Fund’s net assets are invested in municipal securities that guarantee the timely payment of principal and interest. See Notes to Financial Statements, Footnote 1 – Insurance, for more information.
| (1) | All percentages shown in the Portfolio of Investments are based on net assets. |
| (2) | Optional Call Provisions: Dates (month and year) and prices of the earliest optional call or redemption. There may be other call provisions at varying prices at later dates. Certain mortgage-backed securities may be subject to periodic principal paydowns. |
| (3) | Ratings: Using the higher of Standard & Poor’s Group (“Standard & Poor’s”) or Moody’s Investor Service, Inc. (“Moody’s”) rating. Ratings below BBB by Standard & Poor’s or Baa by Moody’s are considered to be below investment grade. |
| The Portfolio of Investments may reflect the ratings on certain bonds whose insurer has experienced downgrades as of the end of the reporting period. Please see the Portfolio Manager’s Comments for an expanded discussion of the affect on the Fund of changes to the ratings of certain bonds in the portfolio resulting from changes to the ratings of the underlying insurers both during the period and after period end. |
| (4) | Backed by an escrow or trust containing sufficient U.S. Government or U.S. Government agency securities which ensure the timely payment of principal and interest. Such investments are normally considered to be equivalent to AAA rated securities. |
| (5) | Investment valued at fair value using methods determined in good faith by, or at the discretion of, the Board of Trustees. For SFAS No. 157 disclosure purposes, investment categorized as Level 3. See Notes to Financial Statements, Footnote 2 – Fair Value Measurements for more information. |
| N/R | Not rated. |
| (ETM) | Escrowed to maturity. |
| (IF) | Inverse floating rate investment. |
| (UB) | Underlying bond of an inverse floating rate trust reflected as a financing transaction pursuant to the provisions of SFAS No. 140. |
See accompanying notes to financial statements.
| Nuveen Investments | 45 |
Statement of Assets and Liabilities (Unaudited)
August 31, 2009
| Connecticut | New Jersey | New York | New York Insured | |||||||||||||
Assets | ||||||||||||||||
Investments, at value (cost $342,215,694, $213,653,189, $430,982,912 and $286,961,615, respectively) | $ | 343,221,751 | $ | 211,442,323 | $ | 428,757,299 | $ | 292,711,052 | ||||||||
Cash | 5,678,923 | 9,980,774 | 4,469,564 | 5,398,888 | ||||||||||||
Receivables: | ||||||||||||||||
Interest | 4,037,880 | 2,650,016 | 5,387,744 | 3,411,787 | ||||||||||||
Investments sold | — | 45,000 | 145,000 | 181,224 | ||||||||||||
Shares sold | 903,226 | 674,704 | 557,516 | 26,179 | ||||||||||||
Other assets | 15,083 | 73 | 19,607 | 24,409 | ||||||||||||
Total assets | 353,856,863 | 224,792,890 | 439,336,730 | 301,753,539 | ||||||||||||
Liabilities | ||||||||||||||||
Floating rate obligations | 10,000,000 | — | 17,955,000 | 7,060,000 | ||||||||||||
Payables: | ||||||||||||||||
Dividends | 508,054 | 366,157 | 600,865 | 288,918 | ||||||||||||
Investment purchased | 193,572 | — | 1,807,266 | 1,649,957 | ||||||||||||
Shares redeemed | 122,093 | 89,517 | 379,743 | 177,752 | ||||||||||||
Accrued expenses: | ||||||||||||||||
Management fees | 153,371 | 100,508 | 193,034 | 133,938 | ||||||||||||
12b-1 distribution and service fees | 83,076 | 46,925 | 78,439 | 31,526 | ||||||||||||
Other | 104,948 | 73,130 | 154,659 | 126,434 | ||||||||||||
Total liabilities | 11,165,114 | 676,237 | 21,169,006 | 9,468,525 | ||||||||||||
Net assets | $ | 342,691,749 | $ | 224,116,653 | $ | 418,167,724 | $ | 292,285,014 | ||||||||
Class A Shares | ||||||||||||||||
Net assets | $ | 262,699,253 | $ | 110,652,809 | $ | 209,646,558 | $ | 93,445,879 | ||||||||
Shares outstanding | 25,576,556 | 10,659,521 | 20,150,495 | 9,386,031 | ||||||||||||
Net asset value per share | $ | 10.27 | $ | 10.38 | $ | 10.40 | $ | 9.96 | ||||||||
Offering price per share (net asset value per share plus maximum sales charge of 4.20% of offering price) | $ | 10.72 | $ | 10.84 | $ | 10.86 | $ | 10.40 | ||||||||
Class B Shares | ||||||||||||||||
Net assets | $ | 7,690,276 | $ | 9,549,949 | $ | 10,401,545 | $ | 6,336,107 | ||||||||
Shares outstanding | 749,214 | 918,996 | 1,000,142 | 634,452 | ||||||||||||
Net asset value and offering price per share | $ | 10.26 | $ | 10.39 | $ | 10.40 | $ | 9.99 | ||||||||
Class C Shares | ||||||||||||||||
Net assets | $ | 52,153,710 | $ | 33,429,492 | $ | 56,185,041 | $ | 17,119,364 | ||||||||
Shares outstanding | 5,079,854 | 3,230,009 | 5,399,893 | 1,717,299 | ||||||||||||
Net asset value and offering price per share | $ | 10.27 | $ | 10.35 | $ | 10.40 | $ | 9.97 | ||||||||
Class I Shares | ||||||||||||||||
Net assets | $ | 20,148,510 | $ | 70,484,403 | $ | 141,934,580 | $ | 175,383,664 | ||||||||
Shares outstanding | 1,954,155 | 6,767,354 | 13,620,768 | 17,541,149 | ||||||||||||
Net asset value and offering price per share | $ | 10.31 | $ | 10.42 | $ | 10.42 | $ | 10.00 | ||||||||
Net Assets Consist of: | ||||||||||||||||
Capital paid-in | $ | 342,084,968 | $ | 225,665,309 | $ | 419,657,134 | $ | 289,426,508 | ||||||||
Undistributed (Over-distribution of) net investment income | (96,744 | ) | 569,386 | 790,292 | 181,178 | |||||||||||
Accumulated net realized gain (loss) from investments and derivative transactions | (302,532 | ) | 92,824 | (54,089 | ) | (3,072,109 | ) | |||||||||
Net unrealized appreciation (depreciation) of investments | 1,006,057 | (2,210,866 | ) | (2,225,613 | ) | 5,749,437 | ||||||||||
Net assets | $ | 342,691,749 | $ | 224,116,653 | $ | 418,167,724 | $ | 292,285,014 | ||||||||
See accompanying notes to financial statements.
| 46 | Nuveen Investments |
Statement of Operations (Unaudited)
Six Months Ended August 31, 2009
| Connecticut | New Jersey | New York | New York Insured | |||||||||||||
Investment Income | $ | 8,370,472 | $ | 5,617,906 | $ | 10,763,536 | $ | 7,161,670 | ||||||||
Expenses | ||||||||||||||||
Management fees | 882,387 | 569,285 | 1,060,325 | 775,396 | ||||||||||||
12b-1 service fees – Class A | 252,529 | 99,693 | 194,486 | 90,212 | ||||||||||||
12b-1 distribution and service fees – Class B | 39,811 | 50,769 | 52,272 | 32,889 | ||||||||||||
12b-1 distribution and service fees – Class C | 184,126 | 116,819 | 203,007 | 60,295 | ||||||||||||
Shareholders’ servicing agent fees and expenses | 65,869 | 55,906 | 110,111 | 79,239 | ||||||||||||
Interest expense on floating rate obligations | 34,037 | — | 63,111 | 24,208 | ||||||||||||
Custodian’s fees and expenses | 39,430 | 23,401 | 35,033 | 28,020 | ||||||||||||
Trustees’ fees and expenses | 5,139 | 3,239 | 6,216 | 4,525 | ||||||||||||
Professional fees | 10,602 | 7,992 | 11,853 | 10,117 | ||||||||||||
Shareholders’ reports – printing and mailing expenses | 19,345 | 16,132 | 30,271 | 22,284 | ||||||||||||
Federal and state registration fees | 8,550 | 6,533 | 9,086 | 7,523 | ||||||||||||
Other expenses | 5,683 | 3,288 | 7,160 | 4,559 | ||||||||||||
Total expenses before custodian fee credit | 1,547,508 | 953,057 | 1,782,931 | 1,139,267 | ||||||||||||
Custodian fee credit | (162 | ) | (59 | ) | (171 | ) | (86 | ) | ||||||||
Net expenses | 1,547,346 | 952,998 | 1,782,760 | 1,139,181 | ||||||||||||
Net investment income | 6,823,126 | 4,664,908 | 8,980,776 | 6,022,489 | ||||||||||||
Realized and Unrealized Gain (Loss) | ||||||||||||||||
Net realized gain (loss) from investments | 6,618 | 61,625 | 34,135 | 25,840 | ||||||||||||
Change in net unrealized appreciation (depreciation) of investments | 16,269,765 | 11,532,263 | 22,007,459 | 9,859,882 | ||||||||||||
Net realized and unrealized gain (loss) | 16,276,383 | 11,593,888 | 22,041,594 | 9,885,722 | ||||||||||||
Net increase (decrease) in net assets from operations | $ | 23,099,509 | $ | 16,258,796 | $ | 31,022,370 | $ | 15,908,211 | ||||||||
See accompanying notes to financial statements.
| Nuveen Investments | 47 |
Statement of Changes in Net Assets (Unaudited)
| Connecticut | New Jersey | |||||||||||||||
| Six Months Ended 8/31/09 | Year Ended 2/28/09 | Six Months Ended 8/31/09 | Year Ended 2/28/09 | |||||||||||||
Operations | ||||||||||||||||
Net investment income | $ | 6,823,126 | $ | 13,487,347 | $ | 4,664,908 | $ | 8,969,341 | ||||||||
Net realized gain (loss) from: | ||||||||||||||||
Investments | 6,618 | (207,205 | ) | 61,625 | (190,645 | ) | ||||||||||
Forward swaps | — | — | — | 334,055 | ||||||||||||
Futures | — | — | — | 183,810 | ||||||||||||
Change in net unrealized appreciation (depreciation) of: | ||||||||||||||||
Investments | 16,269,765 | (7,431,972 | ) | 11,532,263 | (7,083,369 | ) | ||||||||||
Forward swaps | — | — | — | (283,051 | ) | |||||||||||
Net increase (decrease) in net assets from operations | 23,099,509 | 5,848,170 | 16,258,796 | 1,930,141 | ||||||||||||
Distributions to Shareholders | ||||||||||||||||
From net investment income: | ||||||||||||||||
Class A | (5,273,011 | ) | (10,569,324 | ) | (2,147,847 | ) | (3,812,004 | ) | ||||||||
Class B(1) | (144,084 | ) | (393,794 | ) | (187,836 | ) | (452,057 | ) | ||||||||
Class C | (898,168 | ) | (1,594,084 | ) | (588,067 | ) | (1,034,648 | ) | ||||||||
Class I (2) | (407,592 | ) | (856,803 | ) | (1,512,888 | ) | (3,317,810 | ) | ||||||||
From accumulated net realized gains: | ||||||||||||||||
Class A | — | (871,869 | ) | — | (272,943 | ) | ||||||||||
Class B(1) | — | (36,821 | ) | — | (37,033 | ) | ||||||||||
Class C | — | (154,202 | ) | — | (84,347 | ) | ||||||||||
Class I (2) | — | (68,780 | ) | — | (219,349 | ) | ||||||||||
Decrease in net assets from distributions to shareholders | (6,722,855 | ) | (14,545,677 | ) | (4,436,638 | ) | (9,230,191 | ) | ||||||||
Fund Share Transactions | ||||||||||||||||
Proceeds from sale of shares | 29,916,366 | 68,329,161 | 27,619,215 | 74,670,388 | ||||||||||||
Proceeds from shares issued to shareholders due | 3,535,850 | 7,619,192 | 2,285,921 | 4,924,171 | ||||||||||||
| 33,452,216 | 75,948,353 | 29,905,136 | 79,594,559 | |||||||||||||
Cost of shares redeemed | (22,071,539 | ) | (70,305,636 | ) | (16,881,165 | ) | (67,634,807 | ) | ||||||||
Net increase (decrease) in net assets from Fund share transactions | 11,380,677 | 5,642,717 | 13,023,971 | 11,959,752 | ||||||||||||
Net increase (decrease) in net assets | 27,757,331 | (3,054,790 | ) | 24,846,129 | 4,659,702 | |||||||||||
Net assets at the beginning of period | 314,934,418 | 317,989,208 | 199,270,524 | 194,610,822 | ||||||||||||
Net assets at the end of period | $ | 342,691,749 | $ | 314,934,418 | $ | 224,116,653 | $ | 199,270,524 | ||||||||
Undistributed (Over-distribution of) net investment income at the end of period | $ | (96,744 | ) | $ | (197,015 | ) | $ | 569,386 | $ | 341,116 | ||||||
| 48 | Nuveen Investments |
| New York | New York Insured | |||||||||||||||
| Six Months Ended 8/31/09 | Year Ended 2/28/09 | Six Months Ended 8/31/09 | Year Ended 2/28/09 | |||||||||||||
Operations | ||||||||||||||||
Net investment income | $ | 8,980,776 | $ | 18,258,956 | $ | 6,022,489 | $ | 12,112,186 | ||||||||
Net realized gain (loss) from: | ||||||||||||||||
Investments | 34,135 | 287,885 | 25,840 | (3,102,012 | ) | |||||||||||
Forward swaps | — | — | — | — | ||||||||||||
Futures | — | — | — | — | ||||||||||||
Change in net unrealized appreciation (depreciation) of: | ||||||||||||||||
Investments | 22,007,459 | (14,452,563 | ) | 9,859,882 | 2,589,601 | |||||||||||
Forward swaps | — | — | — | — | ||||||||||||
Net increase (decrease) in net assets from operations | 31,022,370 | 4,094,278 | 15,908,211 | 11,599,775 | ||||||||||||
Distributions to Shareholders | ||||||||||||||||
From net investment income: | ||||||||||||||||
Class A | (4,404,619 | ) | (8,715,042 | ) | (1,795,334 | ) | (3,414,194 | ) | ||||||||
Class B (1) | (207,197 | ) | (556,053 | ) | (110,510 | ) | (277,888 | ) | ||||||||
Class C | (1,073,495 | ) | (2,008,878 | ) | (275,730 | ) | (498,682 | ) | ||||||||
Class I (2) | (3,233,691 | ) | (6,366,546 | ) | (3,596,146 | ) | (7,519,659 | ) | ||||||||
From accumulated net realized gains: | ||||||||||||||||
Class A | — | (718,725 | ) | — | (280,713 | ) | ||||||||||
Class B (1) | — | (50,140 | ) | — | (25,935 | ) | ||||||||||
Class C | — | (191,613 | ) | — | (45,382 | ) | ||||||||||
Class I (2) | — | (492,565 | ) | — | (555,793 | ) | ||||||||||
Decrease in net assets from distributions to shareholders | (8,919,002 | ) | (19,099,562 | ) | (5,777,720 | ) | (12,618,246 | ) | ||||||||
Fund Share Transactions | ||||||||||||||||
Proceeds from sale of shares | 39,465,637 | 127,688,895 | 7,031,853 | 18,719,806 | ||||||||||||
Proceeds from shares issued to shareholders due | 5,336,221 | 11,256,889 | 3,994,712 | 8,925,918 | ||||||||||||
| 44,801,858 | 138,945,784 | 11,026,565 | 27,645,724 | |||||||||||||
Cost of shares redeemed | (26,673,120 | ) | (143,376,450 | ) | (10,688,034 | ) | (32,233,422 | ) | ||||||||
Net increase (decrease) in net assets from Fund share transactions | 18,128,738 | (4,430,666 | ) | 338,531 | (4,587,698 | ) | ||||||||||
Net increase (decrease) in net assets | 40,232,106 | (19,435,950 | ) | 10,469,022 | (5,606,169 | ) | ||||||||||
Net assets at the beginning of period | 377,935,618 | 397,371,568 | 281,815,992 | 287,422,161 | ||||||||||||
Net assets at the end of period | $ | 418,167,724 | $ | 377,935,618 | $ | 292,285,014 | $ | 281,815,992 | ||||||||
Undistributed (Over-distribution of) net investment income at the end of period | $ | 790,292 | $ | 728,518 | $ | 181,178 | $ | (63,591 | ) | |||||||
| (1) | Effective May 1, 2008, Class B Shares will only be issued upon exchange of Class B Shares from another Nuveen Investments, Inc. (“Nuveen”) fund or for purposes of dividend reinvestment. The reinstatement privilege for Class B Shares is no longer available as of December 31, 2008. |
| (2) | Effective May 1, 2008, Class R Shares were renamed Class I Shares. |
See accompanying notes to financial statements.
| Nuveen Investments | 49 |
Notes to Financial Statements (Unaudited)
1. General Information and Significant Accounting Policies
The Nuveen Multistate Trust II (the “Trust”) is an open-end management investment company registered under the Investment Company Act of 1940, as amended. The Trust is comprised of Nuveen Connecticut Municipal Bond Fund (“Connecticut”), Nuveen New Jersey Municipal Bond Fund (“New Jersey”), Nuveen New York Municipal Bond Fund (“New York”) and Nuveen New York Insured Municipal Bond Fund (“New York Insured”) (collectively, the “Funds”), among others. The Trust was organized as a Massachusetts business trust on July 1, 1996. The Funds were each organized as a series of predecessor trusts or corporations prior to that date.
Connecticut’s, New Jersey’s and New York’s investment objective is to provide as high a level of current interest income exempt from regular federal, state and, in some cases, local income taxes as is consistent with preservation of capital. Each Fund invests substantially all of its assets in municipal bonds that pay interest that is exempt from regular federal and Connecticut, New Jersey and New York, respectively, personal income tax. Each Fund invests at least 80% of its net assets in investment grade municipal bonds rated BBB-/Baa3 or higher at the time of purchase. Each Fund may invest up to 20% of its net assets in below investment grade municipal bonds, commonly referred to as “high yield,” “high risk” or “junk” bonds. Each Fund may invest up to 15% of its net assets in municipal securities whose interest payments vary inversely with changes in short-term tax-exempt interest rates (i.e., inverse floating rate securities). Nuveen Asset Management (the “Adviser”), a wholly owned subsidiary of Nuveen Investments, Inc. (“Nuveen”), uses a value-oriented strategy and looks for higher-yielding and undervalued municipal bonds that offer the potential for above-average total return. The Adviser may choose to sell municipal bonds with deteriorating credit or limited upside potential compared to other available bonds.
New York Insured’s investment objective is to provide as high a level of current interest income exempt from regular federal, state and, in some cases, local income taxes as is consistent with preservation of capital. The Fund invests substantially all of its assets in municipal bonds that pay interest that is exempt from regular federal and New York personal income tax. Under normal circumstances, the Fund invests at least 80% of its net assets in municipal securities that are covered by insurance guaranteeing the timely payment of principal and interest. In addition, the fund invests at least 80% of its net assets in municipal securities that are rated at least AA at the time of purchase (based on the higher of the rating of the insurer, if any, or the underlying security), or are backed by an escrow or trust account containing sufficient U.S. government or U.S. government agency securities or U.S. Treasury-issued State and Local Government Series (SLGS) securities to ensure timely payment of principal and interest. The Fund may invest up to 15% of its net assets in municipal securities whose interest payments vary inversely with changes in short-term tax-exempt interest rates (i.e., inverse floating rate securities). The Adviser uses a value-oriented strategy and looks for higher-yielding and undervalued insured municipal bonds that offer the potential for above-average total return. The Adviser may choose to sell municipal bonds with deteriorating credit or limited upside potential compared to other available bonds.
The following is a summary of significant accounting policies followed by the Funds in the preparation of their financial statements in accordance with accounting principles generally accepted in the United States.
Investment Valuation
The prices of municipal bonds in each Fund’s investment portfolio are provided by a pricing service approved by the Fund’s Board of Trustees. Prices of forward swap contracts are also provided by an independent pricing service approved by each Fund’s Board of Trustees. Futures contracts are valued using the closing settlement price, or, in the absence of such price, at the mean of the bid and asked prices. When market price quotes are not readily available (which is usually the case for municipal securities), the pricing service or, in the absence of a pricing service for a particular investment or derivative instrument, the Board of Trustees of the Fund, or its designee, may establish fair value using a wide variety of market data including yields or prices of investments of comparable quality, type of issue, coupon, maturity and rating, market quotes or indications of value from security dealers, evaluations of anticipated cash flows or collateral, general market conditions and other information and analysis, including the obligor’s credit characteristics considered relevant. Temporary investments in securities that have variable rate and demand features qualifying them as short-term investments are valued at amortized cost, which approximates value.
Investment Transactions
Investment transactions are recorded on a trade date basis. Realized gains and losses from transactions are determined on the specific identification method. Investments purchased on a when-issued/delayed delivery basis may have extended settlement periods. Any investments so purchased are subject to market fluctuation during this period. The Funds have instructed the custodian to segregate assets with a current value at least equal to the amount of the when-issued/delayed delivery purchase commitments. At August 31, 2009, New York had outstanding when-issued/delayed delivery purchase commitments of $965,530. There were no such outstanding purchase commitments in any of the other Funds.
Investment Income
Interest income, which includes the amortization of premiums and accretion of discounts for financial reporting purposes, is recorded on an accrual basis. Investment income also includes paydown gains and losses, if any.
Income Taxes
Each Fund is a separate taxpayer for federal income tax purposes. Each Fund intends to distribute substantially all of its net investment income and net capital gains to shareholders and to otherwise comply with the requirements of Subchapter M of the Internal Revenue Code applicable to regulated investment companies. Therefore, no federal income tax provision is required.
| 50 | Nuveen Investments |
Furthermore, each Fund intends to satisfy conditions which will enable interest from municipal securities, which is exempt from regular federal and designated state income taxes, to retain such tax-exempt status when distributed to shareholders of the Funds. Net realized capital gains and ordinary income distributions paid by the Funds are subject to federal taxation.
For all open tax years and all major taxing jurisdictions, management of the Funds has concluded that there are no significant uncertain tax positions that would require recognition in the financial statements. Open tax years are those that are open for examination by taxing authorities (i.e., generally the last four tax year ends and the interim tax period since then). Furthermore, management of the Funds is also not aware of any tax positions for which it is reasonably possible that the total amounts of unrecognized tax benefits will significantly change in the next twelve months.
Dividends and Distributions to Shareholders
Dividends from tax-exempt net investment income are declared monthly. Net realized capital gains and/or market discount from investment transactions, if any, are declared and distributed to shareholders at least annually. Furthermore, capital gains are distributed only to the extent they exceed available capital loss carryforwards.
Distributions to shareholders of tax-exempt net investment income, net realized capital gains and/or market discount, if any, are recorded on the ex-dividend date. The amount and timing of distributions are determined in accordance with federal income tax regulations, which may differ from accounting principles generally accepted in the United States.
Insurance
Under normal circumstances, New York Insured invests at least 80% of its net assets in municipal securities that are covered by insurance guaranteeing the timely payment of principal and interest. For purposes of this 80% test, insurers must have a claims-paying ability rated at least A at the time of purchase by at least one independent rating agency. In addition, the Fund invests at least 80% of its net assets in municipal securities that are rated at least AA at the time of purchase (based on the higher of the rating of the insurer, if any, or the underlying security) by at least one independent rating agency, or are unrated but judged to be of similar credit quality by the Adviser, or municipal bonds backed by an escrow or trust account containing sufficient U.S. government or U.S. government agency securities or U.S. Treasury-issued State and Local Government Series securities to ensure timely payment of principal and interest. Inverse floating rate securities whose underlying bonds are covered by insurance are included for purposes of the 80% test.
Each insured municipal security is covered by Original Issue Insurance, Secondary Market Insurance or Portfolio Insurance. Such insurance does not guarantee the market value of the municipal securities or the value of the Fund’s shares. Original Issue Insurance and Secondary Market Insurance remain in effect as long as the municipal securities covered thereby remain outstanding and the insurer remains in business, regardless of whether the Fund ultimately disposes of such municipal securities. Consequently, the market value of the municipal securities covered by Original Issue Insurance or Secondary Market Insurance may reflect value attributable to the insurance. Portfolio Insurance, in contrast, is effective only while the municipal securities are held by the Fund. Accordingly, neither the prices used in determining the market value of the underlying municipal securities nor the net asset value of the Fund’s shares include value, if any, attributable to the Portfolio Insurance. Each policy of the Portfolio Insurance does, however, give the Fund the right to obtain permanent insurance with respect to the municipal security covered by the Portfolio Insurance policy at the time of its sale.
Flexible Sales Charge Program
Class A Shares are generally sold with an up-front sales charge and incur a .20% annual 12b-1 service fee. Class A Share purchases of $1 million or more are sold at net asset value without an up-front sales charge but may be subject to a Contingent deferred sales charge (“CDSC”) if redeemed within twelve months of purchase. Class B Shares were sold without an up-front sales charge but incur a .75% annual 12b-1 distribution fee and a .20% annual 12b-1 service fee. Class B Shares are subject to a CDSC of up to 5% depending upon the length of time the shares are held by the investor (CDSC is reduced to 0% at the end of six years). Class B Shares convert to Class A Shares eight years after purchase. Class C Shares are sold without an up-front sales charge but incur a .55% annual 12b-1 distribution fee and a .20% annual 12b-1 service fee. Class C Shares are subject to a CDSC of 1% if redeemed within one year of purchase. Class I Shares are not subject to any sales charge or 12b-1 distribution or service fees.
Inverse Floating Rate Securities
Each Fund is authorized to invest in inverse floating rate securities. An inverse floating rate security is created by depositing a municipal bond, typically with a fixed interest rate, into a special purpose trust created by a broker-dealer. In turn, this trust (a) issues floating rate certificates, in face amounts equal to some fraction of the deposited bond’s par amount or market value, that typically pay short-term tax-exempt interest rates to third parties, and (b) issues to a long-term investor (such as one of the Funds) an inverse floating rate certificate (sometimes referred to as an “inverse floater”) that represents all remaining or residual interest in the trust. The income received by the inverse floater holder varies inversely with the short-term rate paid to the floating rate certificates’ holders, and in most circumstances the inverse floater holder bears substantially all of the underlying bond’s downside investment risk and also benefits disproportionately from any potential appreciation of the underlying bond’s value. The price of an inverse floating rate security will be more volatile than that of the underlying bond because the interest rate is dependent on not only the fixed coupon rate of the underlying bond but also on the short-term interest paid on the floating rate certificates, and because the inverse floating rate security essentially bears the risk of loss of the greater face value of the underlying bond.
| Nuveen Investments | 51 |
Notes to Financial Statements (Unaudited) (continued)
A Fund may purchase an inverse floating rate security in a secondary market transaction without first owning the underlying bond (referred to as an “externally-deposited inverse floater”), or instead by first selling a fixed-rate bond to a broker-dealer for deposit into the special purpose trust and receiving in turn the residual interest in the trust (referred to as a “self-deposited inverse floater”). The inverse floater held by a Fund gives the Fund the right (a) to cause the holders of the floating rate certificates to tender their notes at par, and (b) to have the broker transfer the fixed-rate bond held by the trust to the Fund, thereby collapsing the trust. An investment in an externally-deposited inverse floater is identified in the Portfolio of Investments as “(IF) – Inverse floating rate investment.” An investment in a self-deposited inverse floater is accounted for as a financing transaction in accordance with Statement of Financial Accounting Standards (SFAS No. 140) “Accounting for Transfers and Servicing of Financial Assets and Extinguishment of Liabilities.” In such instances, a fixed-rate bond deposited into a special purpose trust is identified in the Portfolio of Investments as “(UB) – Underlying bond of an inverse floating rate trust,” with the Fund accounting for the short-term floating rate certificates issued by the trust as “Floating rate obligations” on the Statement of Assets and Liabilities. In addition, the Fund reflects in “Investment Income” the entire earnings of the underlying bond and recognizes the related interest paid to the holders of the short-term floating rate certificates as “Interest expense on floating rate obligations” on the Statement of Operations.
During the six months year ended August 31, 2009, each Fund invested in externally-deposited inverse floaters and/or self-deposited inverse floaters.
Each Fund may also enter into shortfall and forbearance agreements (sometimes referred to as a “recourse trust” or “credit recovery swap”) (such agreements referred to herein as “Recourse Trusts”) with a broker-dealer by which a Fund agrees to reimburse the broker-dealer, in certain circumstances, for the difference between the liquidation value of the fixed-rate bond held by the trust and the liquidation value of the floating rate certificates issued by the trust plus any shortfalls in interest cash flows. Under these agreements, a Fund’s potential exposure to losses related to or on inverse floaters may increase beyond the value of a Fund’s inverse floater investments as a Fund may potentially be liable to fulfill all amounts owed to holders of the floating rate certificates. At period end, any such shortfall is recognized as “Unrealized depreciation on Recourse Trusts” on the Statement of Assets and Liabilities.
At August 31, 2009, the Funds were not invested in externally-deposited Recourse Trusts.
| Connecticut | New Jersey | New York | New York Insured | |||||||||
Maximum exposure to Recourse Trusts | $ | — | $ | — | $ | — | $ | — | ||||
The average floating rate obligations outstanding and average annual interest rate and fees related to self-deposited inverse floaters during the six months ended August 31, 2009, were as follows:
| Connecticut | New Jersey | New York | New York Insured | |||||||||||||
Average floating rate obligations | $ | 10,000,000 | $ | — | $ | 17,955,000 | $ | 7,060,000 | ||||||||
Average annual interest rate and fees | .68 | % | — | % | .70 | % | .68 | % | ||||||||
Each Fund is authorized to enter into swap contracts consistent with their investment objectives and policies to reduce, increase or otherwise alter its risk profile or to alter its portfolio characteristics (i.e. duration, yield curve positioning and credit quality).
Each Fund is subject to interest rate risk in the normal course of pursuing its investment objectives. Each Fund’s use of forward interest rate swap transactions is intended to help the Fund manage its overall interest rate sensitivity, either shorter or longer, generally to more closely align the Fund’s interest rate sensitivity with that of the broader municipal market. Forward interest rate swap transactions involve each Fund’s agreement with a counterparty to pay, in the future, a fixed or variable rate payment in exchange for the counterparty paying the Fund a variable or fixed rate payment, the accruals for which would begin at a specified date in the future (the “effective date”). The amount of the payment obligation is based on the notional amount of the forward swap contract and the termination date of the swap (which is akin to a bond’s maturity). The value of the Fund’s swap commitment would increase or decrease based primarily on the extent to which long-term interest rates for bonds having a maturity of the swap’s termination date increases or decreases. The Funds may terminate a swap contract prior to the effective date, at which point a realized gain or loss is recognized. When a forward swap is terminated, it ordinarily does not involve the delivery of securities or other underlying assets or principal, but rather is settled in cash on a net basis. Each Fund intends, but is not obligated, to terminate its forward swaps before the effective date. Accordingly, the risk of loss with respect to the swap counterparty on such transactions is limited to the credit risk associated with a counterparty failing to honor its commitment to pay any realized gain to the Fund upon termination. The Funds did not invest in forward interest rate swap transactions during the six months ended August 31, 2009.
Each Fund is subject to interest rate risk in the normal course of pursuing its investment objectives and is authorized to invest in futures contracts in order to gain exposure to, or hedge against changes in interest rates. Upon entering into a futures contract, a Fund is required to deposit with the broker an amount of cash or liquid securities equal to a specified percentage of the contract amount. This is known as the “initial margin.” Cash held by the broker to cover initial margin requirements on open futures contracts, if any, is recognized as “Deposits with brokers for open futures contracts” on the Statement of Assets and Liabilities. Subsequent payments (“variation margin”) are made or received by a Fund each day, depending on the daily fluctuation of the value of the contract. Variation margin is recognized as a receivable or payable for “Variation Margin on futures contracts” on the Statement of Assets and Liabilities, when applicable.
| 52 | Nuveen Investments |
During the period the futures contract is open, changes in the value of the contract are recorded as an unrealized gain or loss by “marking-to-market” on a daily basis to reflect the changes in market value of the contract and is recognized as “Change in net unrealized appreciation (depreciation) of futures contracts” on the Statement of Operations. When the contract is closed or expired, a Fund records a realized gain or loss equal to the difference between the value of the contract on the closing date and value of the contract when originally entered into and is recognized as “Net realized gain (loss) from futures contracts” on the Statement of Operations. The Funds did not invest in futures contracts during the six months ended August 31, 2009.
Risks of investments in futures contracts include the possible adverse movement of the securities or indices underlying the contracts, the possibility that there may not be a liquid secondary market for the contracts and/or that a change in the value of the contract may not correlate with a change in the value of the underlying securities or indices.
Market and Counterparty Credit Risk
In the normal course of business each Fund may invest in financial instruments and enter into financial transactions where risk of potential loss exists due to changes in the market (market risk) or failure of the other party to the transaction to perform (counterparty credit risk). The potential loss could exceed the value of the financial assets recorded on the financial statements. Financial assets, which potentially expose each Fund to counterparty credit risk, consist principally of cash due from counterparties on forward, option and swap transactions. The extent of each Fund’s exposure to counterparty credit risk in respect to these financial assets approximates their carrying value as recorded on the Statement of Assets and Liabilities. Futures contracts expose a Fund to minimal counterparty credit risk as they are exchange traded and the exchange’s clearing house, which is counterparty to all exchange traded futures, guarantees the futures contracts against default.
Each Fund helps manage counterparty credit risk by entering into agreements only with counterparties Nuveen Asset Management (“the Adviser”), a wholly-owned subsidiary of Nuveen, believes have the financial resources to honor their obligations and by having the Adviser monitor the financial stability of the counterparties. Additionally, counterparties may be required to pledge collateral daily (based on the daily valuation of the financial asset) on behalf of each Fund with a value approximately equal to the amount of any unrealized gain above a pre-determined threshold. Reciprocally, when each Fund has an unrealized loss, the Funds have instructed the custodian to pledge assets of the Funds as collateral with a value approximately equal to the amount of the unrealized loss above a pre-determined threshold. Collateral pledges are monitored and subsequently adjusted if and when the valuations fluctuate, either up or down, by at least the predetermined threshold amount.
Zero Coupon Securities
Each Fund is authorized to invest in zero coupon securities. A zero coupon security does not pay a regular interest coupon to its holders during the life of the security. Tax-exempt income to the holder of the security comes from accretion of the difference between the original purchase price of the security at issuance and the par value of the security at maturity and is effectively paid at maturity. Such securities are included in the Portfolios of Investments with a 0.000% coupon rate in their description. The market prices of zero coupon securities generally are more volatile than the market prices of securities that pay interest periodically.
Expense Allocation
Expenses of the Funds that are not directly attributable to a specific class of shares are prorated among the classes based on the relative net assets of each class. Expenses directly attributable to a class of shares, which presently only include 12b-1 distribution and service fees, are recorded to the specific class.
Custodian Fee Credit
Each Fund has an arrangement with the custodian bank whereby certain custodian fees and expenses are reduced by net credits earned on each Fund’s cash on deposit with the bank. Such deposit arrangements are an alternative to overnight investments. Credits for cash balances may be offset by charges for any days on which a Fund overdraws its account at the custodian bank.
Indemnifications
Under the Trust’s organizational documents, its Officers and Trustees are indemnified against certain liabilities arising out of the performance of their duties to the Trust. In addition, in the normal course of business, the Trust enters into contracts that provide general indemnifications to other parties. The Trust’s maximum exposure under these arrangements is unknown as this would involve future claims that may be made against the Trust that have not yet occurred. However, the Trust has not had prior claims or losses pursuant to these contracts and expects the risk of loss to be remote.
Use of Estimates
The preparation of financial statements in conformity with accounting principles generally accepted in the United States requires management to make estimates and assumptions that affect the reported amounts of assets and liabilities at the date of the financial statements and the reported amounts of increases and decreases in net assets from operations during the reporting period. Actual results may differ from those estimates.
| Nuveen Investments | 53 |
Notes to Financial Statements (Unaudited) (continued)
2. Fair Value Measurements
In determining the value of each Fund’s investments various inputs are used. These inputs are summarized in the three broad levels listed below:
| Level 1 – | Quoted prices in active markets for identical securities. | |
| Level 2 – | Other significant observable inputs (including quoted prices for similar securities, interest rates, prepayment speeds, credit risk, etc.). | |
| Level 3 – | Significant unobservable inputs (including management’s assumptions in determining the fair value of investments). |
The inputs or methodology used for valuing securities are not an indication of the risk associated with investing in those securities.
The following is a summary of each Fund’s fair value measurements as of August 31, 2009:
| Connecticut | Level 1 | Level 2 | Level 3 | Total | ||||||||
Investments: | ||||||||||||
Municipal Bonds | $ | — | $ | 343,221,751 | $ — | $ | 343,221,751 | |||||
| New Jersey | Level 1 | Level 2 | Level 3 | Total | ||||||||
Investments: | ||||||||||||
Municipal Bonds | $ | — | $ | 211,442,323 | $ — | $ | 211,442,323 | |||||
| New York | Level 1 | Level 2 | Level 3 | Total | ||||||||
Investments: | ||||||||||||
Municipal Bonds* | $ | — | $ | 428,377,667 | $379,632 | $ | 428,757,299 | |||||
| New York Insured | Level 1 | Level 2 | Level 3 | Total | ||||||||
Investments: | ||||||||||||
Municipal Bonds* | $ | — | $ | 291,007,697 | $ | 1,703,355 | $ | 292,711,052 | ||||
| * | Refer to the Fund’s Portfolio of Investments for industry breakdown of Municipal Bonds classified as Level 3. |
The following is a reconciliation of each Fund's Level 3 investments held at the beginning and end of the measurement period:
| New York Level 3 Investments | New York Insured Level 3 Investments | |||||
Balance at beginning of period | $ | — | $ | — | ||
Gains (losses): | ||||||
Net realized gains (losses) | — | — | ||||
Net change in unrealized appreciation (depreciation) | — | — | ||||
Net purchases at cost (sales at proceeds) | — | — | ||||
Net discounts (premiums) | — | — | ||||
Net transfers in to (out of) at end of period fair value | 379,632 | 1,703,355 | ||||
Balance at end of period | $ | 379,632 | $ | 1,703,355 | ||
“Change in net unrealized appreciation (depreciation) of investments” presented on the Statement of Operations includes net appreciation (depreciation) related to securities classified as Level 3 at period end as follows:
| New York | New York Insured | |||||
Level 3 net appreciation (depreciation) | $ | 35,028 | $ | 156,298 | ||
3. Derivative Instruments and Hedging Activities
During the current fiscal period, the Funds adopted the provisions of Statement of Financial Accounting Standards No. 161 (SFAS No. 161) “Disclosures about Derivative Instruments and Hedging Activities.” This standard is intended to enhance financial statement disclosures for derivative instruments and hedging activities and enable investors to better understand: a) how and why a fund uses derivative instruments; b) how derivative instruments are accounted for; and c) how derivative instruments affect a fund’s financial position, results of operations and cash flows, if any. The Funds record derivative instruments at fair value with changes in fair value recognized on the Statement of Operations, when applicable. Even though the Funds’ investments in derivatives may represent economic hedges, they are considered to be non-hedge transactions for SFAS No. 161 disclosure purposes. The Funds did not invest in derivative instruments during the six months ended August 31, 2009.
| 54 | Nuveen Investments |
4. Fund Shares
Transactions in Fund shares were as follows:
| Connecticut | ||||||||||||||
| Six Months Ended 8/31/09 | Year Ended 2/28/09 | |||||||||||||
| Shares | Amount | Shares | Amount | |||||||||||
Shares sold: | ||||||||||||||
Class A | 1,915,700 | $ | 19,152,977 | 4,631,365 | $ | 46,017,611 | ||||||||
Class A – automatic conversion of Class B Shares | 104,719 | 1,035,172 | 103,753 | 1,006,583 | ||||||||||
Class B | 1,620 | 16,194 | 22,261 | 212,485 | ||||||||||
Class C | 681,865 | 6,806,501 | 1,271,572 | 12,580,523 | ||||||||||
Class I | 288,104 | 2,905,522 | 856,690 | 8,511,959 | ||||||||||
Shares issued to shareholders due to reinvestment of distributions: | ||||||||||||||
Class A | 295,562 | 2,960,644 | 650,399 | 6,405,614 | ||||||||||
Class B | 5,839 | 58,360 | 20,121 | 198,638 | ||||||||||
Class C | 42,681 | 427,483 | 83,476 | 820,410 | ||||||||||
Class I | 8,866 | 89,363 | 19,666 | 194,530 | ||||||||||
| 3,344,956 | 33,452,216 | 7,659,303 | 75,948,353 | |||||||||||
Shares redeemed: | ||||||||||||||
Class A | (1,505,116 | ) | (15,025,337 | ) | (5,370,676 | ) | (52,420,796 | ) | ||||||
Class B | (109,997 | ) | (1,086,501 | ) | (307,621 | ) | (3,032,129 | ) | ||||||
Class B – automatic conversion to Class A Shares | (104,739 | ) | (1,035,172 | ) | (103,835 | ) | (1,006,583 | ) | ||||||
Class C | (330,047 | ) | (3,281,313 | ) | (625,693 | ) | (6,125,635 | ) | ||||||
Class I | (165,182 | ) | (1,643,216 | ) | (797,562 | ) | (7,720,493 | ) | ||||||
| (2,215,081 | ) | (22,071,539 | ) | (7,205,387 | ) | (70,305,636 | ) | |||||||
Net increase (decrease) | 1,129,875 | $ | 11,380,677 | 453,916 | $ | 5,642,717 | ||||||||
| New Jersey | ||||||||||||||
| Six Months Ended 8/31/09 | Year Ended 2/28/09 | |||||||||||||
| Shares | Amount | Shares | Amount | |||||||||||
Shares sold: | ||||||||||||||
Class A | 1,803,506 | $ | 18,137,598 | 4,372,898 | $ | 43,282,308 | ||||||||
Class A – automatic conversion of Class B Shares | 157,036 | 1,566,801 | 23,913 | 233,303 | ||||||||||
Class B | 3,656 | 36,313 | 23,037 | 238,021 | ||||||||||
Class C | 357,338 | 3,573,989 | 571,204 | 5,594,141 | ||||||||||
Class I | 429,748 | 4,304,514 | 2,458,370 | 25,322,615 | ||||||||||
Shares issued to shareholders due to reinvestment of distributions: | ||||||||||||||
Class A | 115,792 | 1,166,446 | 254,597 | 2,528,119 | ||||||||||
Class B | 9,695 | 97,638 | 26,974 | 268,265 | ||||||||||
Class C | 31,399 | 315,437 | 61,245 | 605,137 | ||||||||||
Class I | 69,914 | 706,400 | 152,811 | 1,522,650 | ||||||||||
| 2,978,084 | 29,905,136 | 7,945,049 | 79,594,559 | |||||||||||
Shares redeemed: | ||||||||||||||
Class A | (724,993 | ) | (7,216,430 | ) | (3,593,168 | ) | (34,765,865 | ) | ||||||
Class B | (146,530 | ) | (1,471,360 | ) | (257,305 | ) | (2,553,840 | ) | ||||||
Class B – automatic conversion to Class A Shares | (156,845 | ) | (1,566,801 | ) | (23,889 | ) | (233,303 | ) | ||||||
Class C | (136,732 | ) | (1,361,098 | ) | (475,411 | ) | (4,625,665 | ) | ||||||
Class I | (527,396 | ) | (5,265,476 | ) | (2,588,936 | ) | (25,456,134 | ) | ||||||
| (1,692,496 | ) | (16,881,165 | ) | (6,938,709 | ) | (67,634,807 | ) | |||||||
Net increase (decrease) | 1,285,588 | $ | 13,023,971 | 1,006,340 | $ | 11,959,752 | ||||||||
| Nuveen Investments | 55 |
Notes to Financial Statements (Unaudited) (continued)
| New York | ||||||||||||||
| Six Months Ended 8/31/09 | Year Ended 2/28/09 | |||||||||||||
| Shares | Amount | Shares | Amount | |||||||||||
Shares sold: | ||||||||||||||
Class A | 2,675,084 | $ | 26,940,893 | 9,836,918 | $ | 98,557,100 | ||||||||
Class A – automatic conversion of Class B Shares | 131,160 | 1,305,329 | 255,580 | 2,576,176 | ||||||||||
Class B | 3,212 | 32,373 | 27,601 | 279,750 | ||||||||||
Class C | 496,666 | 5,004,328 | 1,322,977 | 13,364,919 | ||||||||||
Class I | 615,741 | 6,182,714 | 1,252,703 | 12,910,950 | ||||||||||
Shares issued to shareholders due to reinvestment of distributions: | ||||||||||||||
Class A | 233,929 | 2,362,053 | 505,943 | 5,050,642 | ||||||||||
Class B | 10,632 | 107,215 | 31,044 | 310,295 | ||||||||||
Class C | 51,749 | 522,969 | 102,086 | 1,016,920 | ||||||||||
Class I | 231,742 | 2,343,984 | 488,084 | 4,879,032 | ||||||||||
| 4,449,915 | 44,801,858 | 13,822,936 | 138,945,784 | |||||||||||
Shares redeemed: | ||||||||||||||
Class A | (1,289,332 | ) | (12,909,260 | ) | (10,983,239 | ) | (107,527,851 | ) | ||||||
Class B | (111,728 | ) | (1,116,371 | ) | (459,862 | ) | (4,615,811 | ) | ||||||
Class B – automatic conversion to Class A Shares | (131,189 | ) | (1,305,329 | ) | (255,625 | ) | (2,576,176 | ) | ||||||
Class C | (429,982 | ) | (4,321,775 | ) | (1,061,057 | ) | (10,480,830 | ) | ||||||
Class I | (701,393 | ) | (7,020,385 | ) | (1,813,248 | ) | (18,175,782 | ) | ||||||
| (2,663,624 | ) | (26,673,120 | ) | (14,573,031 | ) | (143,376,450 | ) | |||||||
Net increase (decrease) | 1,786,291 | $ | 18,128,738 | (750,095 | ) | $ | (4,430,666 | ) | ||||||
| New York Insured | ||||||||||||||
| Six Months Ended 8/31/09 | Year Ended 2/28/09 | |||||||||||||
| Shares | Amount | Shares | Amount | |||||||||||
Shares sold: | ||||||||||||||
Class A | 467,028 | $ | 4,574,049 | 1,492,616 | $ | 14,624,303 | ||||||||
Class A – automatic conversion of Class B Shares | 27,374 | 267,520 | 51,610 | 494,930 | ||||||||||
Class B | 1,051 | 10,091 | 12,679 | 123,068 | ||||||||||
Class C | 185,890 | 1,828,486 | 311,041 | 2,946,570 | ||||||||||
Class I | 36,143 | 351,707 | 53,673 | 530,935 | ||||||||||
Shares issued to shareholders due to reinvestment of distributions: | ||||||||||||||
Class A | 114,633 | 1,119,697 | 244,735 | 2,353,860 | ||||||||||
Class B | 6,799 | 66,587 | 20,287 | 196,146 | ||||||||||
Class C | 13,478 | 131,899 | 25,633 | 246,812 | ||||||||||
Class I | 272,926 | 2,676,529 | 633,952 | 6,129,100 | ||||||||||
| 1,125,322 | 11,026,565 | 2,846,226 | 27,645,724 | |||||||||||
Shares redeemed: | ||||||||||||||
Class A | (292,090 | ) | (2,844,282 | ) | (984,665 | ) | (9,418,494 | ) | ||||||
Class B | (102,044 | ) | (998,310 | ) | (187,313 | ) | (1,769,845 | ) | ||||||
Class B – automatic conversion to Class A Shares | (27,293 | ) | (267,520 | ) | (51,451 | ) | (494,930 | ) | ||||||
Class C | (79,940 | ) | (781,057 | ) | (177,601 | ) | (1,683,278 | ) | ||||||
Class I | (592,983 | ) | (5,796,865 | ) | (1,966,347 | ) | (18,866,875 | ) | ||||||
| (1,094,350 | ) | (10,688,034 | ) | (3,367,377 | ) | (32,233,422 | ) | |||||||
Net increase (decrease) | 30,972 | $ | 338,531 | (521,151 | ) | $ | (4,587,698 | ) | ||||||
5. Investment Transactions
Purchases and sales (including maturities but excluding short-term investments) during the six months ended August 31, 2009, were as follows:
| Connecticut | New Jersey | New York | New York Insured | |||||||||
Purchases | $ | 10,659,530 | $ | 11,423,805 | $ | 21,464,549 | $ | 1,582,443 | ||||
Sales and maturities | 1,655,000 | 10,489,021 | 4,319,200 | 2,565,413 | ||||||||
| 56 | Nuveen Investments |
6. Income Tax Information
The following information is presented on an income tax basis. Differences between amounts for financial statement and federal income tax purposes are primarily due to timing differences in recognizing taxable market discount, timing differences in recognizing certain gains and losses on investment transactions and the treatment of investments in inverse floating rate transactions subject to SFAS No. 140, if any. To the extent that differences arise that are permanent in nature, such amounts are reclassified within the capital accounts on the Statement of Assets and Liabilities presented in the annual report, based on their federal tax basis treatment; temporary differences do not require reclassification. Temporary and permanent differences do not impact the net asset values of the Funds.
At August 31, 2009, the cost of investments was as follows:
| Connecticut | New Jersey | New York | New York Insured | |||||||||
Cost of investments | $ | 332,026,374 | $ | 213,477,078 | $ | 412,734,238 | $ | 279,856,208 | ||||
Gross unrealized appreciation and gross unrealized depreciation of investments at August 31, 2009, were as follows:
| Connecticut | New Jersey | New York | New York Insured | |||||||||||||
Gross unrealized: | ||||||||||||||||
Appreciation | $ | 9,562,161 | $ | 7,002,814 | $ | 11,000,750 | $ | 8,995,096 | ||||||||
Depreciation | (8,366,784 | ) | (9,037,569 | ) | (12,933,258 | ) | (3,201,417 | ) | ||||||||
Net unrealized appreciation (depreciation) of investments | $ | 1,195,377 | $ | (2,034,755 | ) | $ | (1,932,508 | ) | $ | 5,793,679 | ||||||
The tax components of undistributed net tax-exempt income, net ordinary income and net long-term capital gains at February 28, 2009, the Funds’ last tax year end, were as follows:
| Connecticut | New Jersey | New York | New York Insured | |||||||||
Undistributed net tax-exempt income* | $ | 748,748 | $ | 945,675 | $ | 1,917,597 | $ | 859,863 | ||||
Undistributed net ordinary income** | 2,503 | 35,727 | 6,405 | — | ||||||||
Undistributed net long-term capital gains | — | — | 139,092 | — | ||||||||
| * | Undistributed net tax-exempt income (on a tax basis) has not been reduced for the dividend declared on February 10, 2009, paid on March 2, 2009. |
| ** | Net ordinary income consists of taxable market discount income and net short-term capital gains, if any. |
The tax character of distributions paid during the Funds’ last tax year ended February 28, 2009, was designated for purposes of the dividends paid deduction as follows:
| Connecticut | New Jersey | New York | New York Insured | |||||||||
Distributions from net tax-exempt income | $ | 13,392,501 | $ | 8,535,475 | $ | 17,611,586 | $ | 11,733,808 | ||||
Distributions from net ordinary income** | 721,194 | 299,839 | 508,565 | 240,880 | ||||||||
Distributions from net long-term capital gains | 412,584 | 313,833 | 944,478 | 664,611 | ||||||||
| ** | Net ordinary income consists of taxable market discount income and net short-term capital gains, if any. |
At February 28, 2009, the Fund’s last tax year end, New York Insured had an unused capital loss carryforward of $203,963 available for federal income tax purposes to be applied against future capital gains, if any. If not applied, the carryforward will expire on February 28, 2017.
The following Funds have elected to defer net realized losses from investments incurred from November 1, 2008 through February 28, 2009, the Funds’ last tax year end, (“post-October losses”) in accordance with federal income tax regulations. Post-October losses are treated as having arisen on the first day of the current fiscal year:
| Connecticut | New York | New York Insured | |||||||
Post-October capital losses | $ | 309,527 | $ | 232,816 | $ | 2,893,987 | |||
7. Management Fees and Other Transactions with Affiliates
Each Fund’s management fee is separated into two components – a complex-level component, based on the aggregate amount of all fund assets managed by the Adviser, and a specific fund-level component, based only on the amount of assets within each individual Fund. This pricing structure enables Nuveen fund shareholders to benefit from growth in the assets within each individual fund as well as from growth in the amount of complex-wide assets managed by the Adviser.
| Nuveen Investments | 57 |
Notes to Financial Statements (Unaudited) (continued)
The annual fund-level fee, payable monthly, for each Fund is based upon the average daily net assets of each Fund as follows:
| Average Daily Net Assets (1) | Fund-Level Fee Rate | ||
For the first $125 million | .3500 | % | |
For the next $125 million | .3375 | ||
For the next $250 million | .3250 | ||
For the next $500 million | .3125 | ||
For the next $1 billion | .3000 | ||
For the next $3 billion | .2750 | ||
For net assets over $5 billion | .2500 |
The annual complex-level fee, payable monthly, which is additive to the fund-level fee, for all Nuveen sponsored funds in the U.S., is based on the aggregate amount of total fund net assets managed as stated in the following table. As of August 31, 2009, the complex-level fee rate was .1936%.
The complex-level fee schedule is as follows:
| Complex-Level Net Asset Breakpoint Level (1) | Effective Rate at Breakpoint Level | ||
$55 billion | .2000 | % | |
$56 billion | .1996 | ||
$57 billion | .1989 | ||
$60 billion | .1961 | ||
$63 billion | .1931 | ||
$66 billion | .1900 | ||
$71 billion | .1851 | ||
$76 billion | .1806 | ||
$80 billion | .1773 | ||
$91 billion | .1691 | ||
$125 billion | .1599 | ||
$200 billion | .1505 | ||
$250 billion | .1469 | ||
$300 billion | .1445 |
| (1) | The complex-level fee component of the management fee for the funds is calculated based upon the aggregate daily managed net assets of all Nuveen funds, with such daily managed net assets defined separately for each fund in its management agreement, but excluding assets attributable to investments in other Nuveen funds. For the complex-level and fund-level fee components, daily managed net assets include assets managed by the Adviser that are attributable to financial leverage. For these purposes, financial leverage includes the funds use of preferred stock and borrowings and investments in the residual interest certificates (also called inverse floating rate securities) in tender option bond (TOB) trusts, including the portion of assets held by the TOB trust that has been effectively financed by the trust’s issuance of floating rate securities, subject to an agreement by the Adviser to limit the amount of such assets for determining managed net assets in certain circumstances. |
The management fee compensates the Adviser for overall investment advisory and administrative services and general office facilities. The Trust pays no compensation directly to those of its Trustees who are affiliated with the Adviser or to its Officers, all of whom receive remuneration for their services to the Trust from the Adviser or its affiliates. The Board of Trustees has adopted a deferred compensation plan for independent Trustees that enables Trustees to elect to defer receipt of all or a portion of the annual compensation they are entitled to receive from certain Nuveen advised funds. Under the plan, deferred amounts are treated as though equal dollar amounts had been invested in shares of select Nuveen advised funds.
The Adviser has agreed to waive fees and reimburse expenses of New York and New York Insured so that total annual fund operating expenses (excluding 12b-1 distribution and service fees, interest expenses, taxes, fees incurred, in acquiring and disposing of portfolio securities and extraordinary expenses do not exceed .75% and .975% of the average daily net assets of any class of fund shares of New York and New York Insured, respectively. The Adviser may also voluntarily reimburse additional expenses from time to time in any of the Funds. Voluntary reimbursements may be terminated at any time at the Adviser’s discretion.
During the six months ended August 31, 2009, Nuveen Investments, LLC (the “Distributor”), a wholly owned subsidiary of Nuveen, collected sales charges on purchases of Class A Shares, the majority of which were paid out as concessions to financial intermediaries as follows:
| Connecticut | New Jersey | New York | New York Insured | |||||||||
Sales charges collected | $ | 184,298 | $ | 48,036 | $ | 104,578 | $ | 74,448 | ||||
Paid to financial intermediaries | 158,048 | 41,337 | 91,225 | 62,384 | ||||||||
The Distributor also received 12b-1 service fees on Class A Shares, substantially all of which were paid to compensate financial intermediaries for providing services to shareholders relating to their investments.
| 58 | Nuveen Investments |
During the six months ended August 31, 2009, the Distributor compensated financial intermediaries directly with commission advances at the time of purchase as follows:
| Connecticut | New Jersey | New York | New York Insured | |||||||||
Commission advances | $ | 72,451 | $ | 38,230 | $ | 64,286 | $ | 20,744 | ||||
To compensate for commissions advanced to financial intermediaries, all 12b-1 service fees collected on Class B Shares during the first year following a purchase, all 12b-1 distribution fees collected on Class B Shares, and all 12b-1 service and distribution fees collected on Class C Shares during the first year following a purchase are retained by the Distributor. During the six months ended August 31, 2009, the Distributor retained such 12b-1 fees as follows:
| Connecticut | New Jersey | New York | New York Insured | |||||||||
12b-1 fees retained | $ | 64,871 | $ | 60,808 | $ | 83,628 | $ | 35,932 | ||||
The remaining 12b-1 fees charged to the Funds were paid to compensate financial intermediaries for providing services to shareholders relating to their investments.
The Distributor also collected and retained CDSC on share redemptions during the six months ended August 31, 2009, as follows:
| Connecticut | New Jersey | New York | New York Insured | |||||||||
CDSC retained | $ | 3,790 | $ | 6,098 | $ | 4,629 | $ | 3,177 | ||||
8. New Accounting Pronouncements
Financial Accounting Standards Board Statement of Financial Accounting Standards No. 166 (SFAS No. 166)
During June 2009, the Financial Accounting Standards Board issued SFAS No. 166, “Accounting for Transfers of Financial Assets – an amendment of SFAS No. 140.” The objective of SFAS No. 166 is to improve the relevance, representational faithfulness, and comparability of the information that a reporting entity provides in its financial statements about a transfer of financial assets; the effects of a transfer on its financial position, financial performance, and cash flows; and a transferor’s continuing involvement, if any, in transferred financial assets.
SFAS No. 166 is effective as of the beginning of each reporting entity’s first annual reporting period that begins after November 15, 2009, for interim periods within that first annual reporting period and for interim and annual reporting periods thereafter. Earlier application is prohibited. The recognition and measurement provisions of SFAS No. 166 must be applied to transfers occurring on or after the effective date. Additionally, the disclosure provisions of SFAS No. 166 should be applied to transfers that occurred both before and after the effective date of SFAS No. 166. At this time, management is evaluating the implications of SFAS No. 166 and the impact it will have on the financial statement amounts and disclosures, if any.
9. Subsequent Events
Distributions to Shareholders
The Funds declared dividend distributions from their tax-exempt net investment income which were paid on October 1, 2009, to shareholders of record on September 29, 2009, as follows:
| Connecticut | New Jersey | New York | New York Insured | |||||||||
Dividend per share: | ||||||||||||
Class A | $ | .0350 | $ | .0360 | $ | .0380 | $ | .0325 | ||||
Class B | .0290 | .0300 | .0320 | .0265 | ||||||||
Class C | .0305 | .0315 | .0335 | .0280 | ||||||||
Class I | .0370 | .0380 | .0400 | .0340 | ||||||||
Financial Accounting Standards Board Statement of Financial Accounting Standards No. 165 (SFAS No. 165)
In May 2009, the Financial Accounting Standards Board issued SFAS No. 165 “Subsequent Events.” SFAS No. 165 requires an entity to recognize in the financial statements the effects of all subsequent events that provide additional evidence about conditions that existed at the date of the balance sheet. SFAS No. 165 is intended to establish general standards of accounting and for disclosure of events that occur after the balance sheet date but before financial statements are issued or are available to be issued. SFAS No. 165 requires the disclosure of the date through which an entity has evaluated subsequent events and the basis for that date – that is, whether that date represents the date the financial statements were issued or were available to be issued. SFAS No. 165 is effective for interim and annual periods ending after June 15, 2009. The Funds have performed an evaluation of subsequent events through October 27, 2009, which is the date the financial statements were issued.
| Nuveen Investments | 59 |
Financial Highlights (Unaudited)
| Selected data for a share outstanding throughout each period: | ||||||||||||||||||||||||||||||||
| Class (Commencement Date) | ||||||||||||||||||||||||||||||||
| Investment Operations | Less Distributions | |||||||||||||||||||||||||||||||
| CONNECTICUT | ||||||||||||||||||||||||||||||||
| Year Ended February 28/29, | Beginning Net Asset Value | Net Invest- | Net Realized/ Unrealized Gain (Loss) | Total | Net Invest- ment Income | Capital Gains | Total | Ending Net Asset Value | Total Return(b) | |||||||||||||||||||||||
Class A (7/87) | ||||||||||||||||||||||||||||||||
2010(f) | $ | 9.77 | $ | .21 | $ | .50 | $ | .71 | $ | (.21 | ) | $ | — | $ | (.21 | ) | $ | 10.27 | 7.34 | % | ||||||||||||
2009 | 10.01 | .42 | (.21 | ) | .21 | (.42 | ) | (.03 | ) | (.45 | ) | 9.77 | 2.20 | |||||||||||||||||||
2008 | 10.67 | .42 | (.65 | ) | (.23 | ) | (.42 | ) | (.01 | ) | (.43 | ) | 10.01 | (2.24 | ) | |||||||||||||||||
2007 | 10.65 | .42 | .05 | .47 | (.42 | ) | (.03 | ) | (.45 | ) | 10.67 | 4.54 | ||||||||||||||||||||
2006(g) | 10.77 | .44 | (.06 | ) | .38 | (.45 | ) | (.05 | ) | (.50 | ) | 10.65 | 3.55 | |||||||||||||||||||
2005 | 10.99 | .48 | (.18 | ) | .30 | (.48 | ) | (.04 | ) | (.52 | ) | 10.77 | 2.89 | |||||||||||||||||||
Class B (2/97) | ||||||||||||||||||||||||||||||||
2010(f) | 9.77 | .18 | .48 | .66 | (.17 | ) | — | (.17 | ) | 10.26 | 6.86 | |||||||||||||||||||||
2009 | 10.00 | .35 | (.21 | ) | .14 | (.34 | ) | (.03 | ) | (.37 | ) | 9.77 | 1.53 | |||||||||||||||||||
2008 | 10.66 | .34 | (.65 | ) | (.31 | ) | (.34 | ) | (.01 | ) | (.35 | ) | 10.00 | (2.97 | ) | |||||||||||||||||
2007 | 10.65 | .34 | .04 | .38 | (.34 | ) | (.03 | ) | (.37 | ) | 10.66 | 3.67 | ||||||||||||||||||||
2006(g) | 10.76 | .36 | (.06 | ) | .30 | (.36 | ) | (.05 | ) | (.41 | ) | 10.65 | 2.84 | |||||||||||||||||||
2005 | 10.98 | .40 | (.18 | ) | .22 | (.40 | ) | (.04 | ) | (.44 | ) | 10.76 | 2.09 | |||||||||||||||||||
Class C (10/93) | ||||||||||||||||||||||||||||||||
2010(f) | 9.77 | .19 | .49 | .68 | (.18 | ) | — | (.18 | ) | 10.27 | 7.05 | |||||||||||||||||||||
2009 | 10.00 | .37 | (.21 | ) | .16 | (.36 | ) | (.03 | ) | (.39 | ) | 9.77 | 1.73 | |||||||||||||||||||
2008 | 10.66 | .36 | (.65 | ) | (.29 | ) | (.36 | ) | (.01 | ) | (.37 | ) | 10.00 | (2.80 | ) | |||||||||||||||||
2007 | 10.64 | .37 | .04 | .41 | (.36 | ) | (.03 | ) | (.39 | ) | 10.66 | 3.96 | ||||||||||||||||||||
2006(g) | 10.76 | .38 | (.06 | ) | .32 | (.39 | ) | (.05 | ) | (.44 | ) | 10.64 | 2.98 | |||||||||||||||||||
2005 | 10.98 | .42 | (.18 | ) | .24 | (.42 | ) | (.04 | ) | (.46 | ) | 10.76 | 2.32 | |||||||||||||||||||
Class I (2/97)(h) | ||||||||||||||||||||||||||||||||
2010(f) | 9.81 | .22 | .50 | .72 | (.22 | ) | — | (.22 | ) | 10.31 | 7.44 | |||||||||||||||||||||
2009 | 10.05 | .44 | (.21 | ) | .23 | (.44 | ) | (.03 | ) | (.47 | ) | 9.81 | 2.44 | |||||||||||||||||||
2008 | 10.71 | .44 | (.65 | ) | (.21 | ) | (.44 | ) | (.01 | ) | (.45 | ) | 10.05 | (2.01 | ) | |||||||||||||||||
2007 | 10.70 | .45 | .04 | .49 | (.45 | ) | (.03 | ) | (.48 | ) | 10.71 | 4.66 | ||||||||||||||||||||
2006(g) | 10.82 | .47 | (.07 | ) | .40 | (.47 | ) | (.05 | ) | (.52 | ) | 10.70 | 3.77 | |||||||||||||||||||
2005 | 11.03 | .50 | (.17 | ) | .33 | (.50 | ) | (.04 | ) | (.54 | ) | 10.82 | 3.16 | |||||||||||||||||||
| 60 | Nuveen Investments |
| Ratios/Supplemental Data | |||||||||||||||||||||||||||||||
| Ratios to Average Net Assets Before Credit/ Reimbursement | Ratios to Average Net Assets After Reimbursement(c) | Ratios to Average Net Assets After Credit/ Reimbursement(d) | |||||||||||||||||||||||||||||
| Ending Net Assets (000) | Expenses Including Interest(e) | Expenses Excluding Interest | Net Invest- ment Income | Expenses Including Interest(e) | Expenses Excluding Interest | Net Invest- ment Income | Expenses Including Interest(e) | Expenses Excluding Interest | Net Invest- ment Income | Portfolio Turnover Rate | |||||||||||||||||||||
| $ | 262,699 | .85 | %* | .83 | %* | 4.24 | %* | .85 | %* | .83 | %* | 4.24 | %* | .85 | %* | .83 | %* | 4.24 | %* | 1 | % | ||||||||||
| 241,958 | .93 | .83 | 4.22 | .93 | .83 | 4.22 | .92 | .82 | 4.24 | 14 | |||||||||||||||||||||
| 247,654 | 1.07 | .81 | 3.96 | 1.07 | .81 | 3.96 | 1.06 | .80 | 3.98 | 16 | |||||||||||||||||||||
| 228,582 | 1.12 | .83 | 4.00 | 1.12 | .83 | 4.00 | 1.11 | .82 | 4.01 | 14 | |||||||||||||||||||||
| 225,785 | 1.05 | .83 | 4.13 | 1.05 | .83 | 4.13 | 1.04 | .82 | 4.14 | 12 | |||||||||||||||||||||
| 221,463 | .83 | .83 | 4.45 | .83 | .83 | 4.45 | .83 | .83 | 4.45 | 8 | |||||||||||||||||||||
| 7,690 | 1.60 | * | 1.58 | * | 3.50 | * | 1.60 | * | 1.58 | * | 3.50 | * | 1.60 | * | 1.58 | * | 3.50 | * | 1 | ||||||||||||
| 9,341 | 1.68 | 1.58 | 3.46 | 1.68 | 1.58 | 3.46 | 1.66 | 1.56 | 3.47 | 14 | |||||||||||||||||||||
| 13,256 | 1.82 | 1.56 | 3.21 | 1.82 | 1.56 | 3.21 | 1.81 | 1.55 | 3.22 | 16 | |||||||||||||||||||||
| 19,462 | 1.87 | 1.58 | 3.25 | 1.87 | 1.58 | 3.25 | 1.86 | 1.57 | 3.27 | 14 | |||||||||||||||||||||
| 24,816 | 1.80 | 1.58 | 3.38 | 1.80 | 1.58 | 3.38 | 1.79 | 1.57 | 3.39 | 12 | |||||||||||||||||||||
| 29,587 | 1.58 | 1.58 | 3.70 | 1.58 | 1.58 | 3.70 | 1.58 | 1.58 | 3.70 | 8 | |||||||||||||||||||||
| 52,154 | 1.40 | * | 1.38 | * | 3.69 | * | 1.40 | * | 1.38 | * | 3.69 | * | 1.40 | * | 1.38 | * | 3.69 | * | 1 | ||||||||||||
| 45,761 | 1.48 | 1.38 | 3.68 | 1.48 | 1.38 | 3.68 | 1.47 | 1.37 | 3.69 | 14 | |||||||||||||||||||||
| 39,561 | 1.62 | 1.36 | 3.41 | 1.62 | 1.36 | 3.41 | 1.61 | 1.35 | 3.43 | 16 | |||||||||||||||||||||
| 39,949 | 1.67 | 1.38 | 3.45 | 1.67 | 1.38 | 3.45 | 1.66 | 1.37 | 3.46 | 14 | |||||||||||||||||||||
| 38,228 | 1.60 | 1.38 | 3.58 | 1.60 | 1.38 | 3.58 | 1.59 | 1.37 | 3.59 | 12 | |||||||||||||||||||||
| 35,767 | 1.38 | 1.38 | 3.90 | 1.38 | 1.38 | 3.90 | 1.38 | 1.38 | 3.90 | 8 | |||||||||||||||||||||
| 20,149 | .65 | * | .63 | * | 4.44 | * | .65 | * | .63 | * | 4.44 | * | .65 | * | .63 | * | 4.44 | * | 1 | ||||||||||||
| 17,875 | .73 | .63 | 4.43 | .73 | .63 | 4.43 | .71 | .61 | 4.44 | 14 | |||||||||||||||||||||
| 17,518 | .87 | .61 | 4.17 | .87 | .61 | 4.17 | .86 | .60 | 4.18 | 16 | |||||||||||||||||||||
| 12,497 | .92 | .63 | 4.19 | .92 | .63 | 4.19 | .91 | .62 | 4.20 | 14 | |||||||||||||||||||||
| 4,403 | .85 | .63 | 4.33 | .85 | .63 | 4.33 | .84 | .62 | 4.34 | 12 | |||||||||||||||||||||
| 3,666 | .63 | .63 | 4.65 | .63 | .63 | 4.65 | .63 | .63 | 4.65 | 8 | |||||||||||||||||||||
| * | Annualized. |
| (a) | Per share Net Investment Income is calculated using the average daily shares method. |
| (b) | Total return is the combination of changes in net asset value without any sales charge, reinvested dividend income at net asset value and reinvested capital gains distributions at net asset value, if any. Total returns are not annualized. |
| (c) | After expense reimbursement from the Adviser, where applicable. |
| (d) | After custodian fee credit and expense reimbursement, where applicable. |
| (e) | Each Ratio of Expenses Including Interest to Average Net Assets in the above table reflect, among other things, the interest expense deemed to have been paid by the Fund on the floating rate certificates issued by the special purpose trusts for the self-deposited inverse floaters held by the Fund, as described in Footnote 1 – Inverse Floating Rate Securities. |
| (f) | For the six months ended August 31, 2009. |
| (g) | Each Ratio of Expenses Including Interest to Average Net Assets and the Portfolio Turnover Rate for the fiscal year ended February 28, 2006, in the above table have been restated to give effect to recording the self-deposited inverse floaters as financing transactions. |
| (h) | Effective May 1, 2008, Class R Shares were renamed Class I Shares. |
See accompanying notes to financial statements.
| Nuveen Investments | 61 |
Financial Highlights (Unaudited) (continued)
| Selected data for a share outstanding throughout each period: | ||||||||||||||||||||||||||||||||
| Class (Commencement Date) | ||||||||||||||||||||||||||||||||
| Investment Operations | Less Distributions | |||||||||||||||||||||||||||||||
| NEW JERSEY | ||||||||||||||||||||||||||||||||
| Year Ended February 28/29, | Beginning Net Asset Value | Net Invest- ment Income(a) | Net Realized/ Unrealized Gain (Loss) | Total | Net Invest- ment Income | Capital Gains | Total | Ending Net Asset Value | Total Return(b) | |||||||||||||||||||||||
Class A (9/94) | ||||||||||||||||||||||||||||||||
2010(f) | $ | 9.81 | $ | .23 | $ | .56 | $ | .79 | $ | (.22 | ) | $ | — | $ | (.22 | ) | $ | 10.38 | 8.10 | % | ||||||||||||
2009 | 10.09 | .43 | (.26 | ) | .17 | (.42 | ) | (.03 | ) | (.45 | ) | 9.81 | 1.66 | |||||||||||||||||||
2008 | 10.82 | .42 | (.72 | ) | (.30 | ) | (.41 | ) | (.02 | ) | (.43 | ) | 10.09 | (2.82 | ) | |||||||||||||||||
2007 | 10.78 | .42 | .04 | .46 | (.41 | ) | (.01 | ) | (.42 | ) | 10.82 | 4.44 | ||||||||||||||||||||
2006 | 10.85 | .43 | (.02 | ) | .41 | (.44 | ) | (.04 | ) | (.48 | ) | 10.78 | 3.89 | |||||||||||||||||||
2005 | 10.97 | .45 | (.11 | ) | .34 | (.46 | ) | — | (.46 | ) | 10.85 | 3.20 | ||||||||||||||||||||
Class B (2/97) | ||||||||||||||||||||||||||||||||
2010(f) | 9.83 | .19 | .55 | .74 | (.18 | ) | — | (.18 | ) | 10.39 | 7.60 | |||||||||||||||||||||
2009 | 10.10 | .36 | (.26 | ) | .10 | (.34 | ) | (.03 | ) | (.37 | ) | 9.83 | .98 | |||||||||||||||||||
2008 | 10.83 | .34 | (.72 | ) | (.38 | ) | (.33 | ) | (.02 | ) | (.35 | ) | 10.10 | (3.58 | ) | |||||||||||||||||
2007 | 10.78 | .34 | .05 | .39 | (.33 | ) | (.01 | ) | (.34 | ) | 10.83 | 3.72 | ||||||||||||||||||||
2006 | 10.85 | .35 | (.02 | ) | .33 | (.36 | ) | (.04 | ) | (.40 | ) | 10.78 | 3.09 | |||||||||||||||||||
2005 | 10.96 | .37 | (.11 | ) | .26 | (.37 | ) | — | (.37 | ) | 10.85 | 2.49 | ||||||||||||||||||||
Class C (9/94) | ||||||||||||||||||||||||||||||||
2010(f) | 9.79 | .20 | .55 | .75 | (.19 | ) | — | (.19 | ) | 10.35 | 7.73 | |||||||||||||||||||||
2009 | 10.05 | .38 | (.25 | ) | .13 | (.36 | ) | (.03 | ) | (.39 | ) | 9.79 | 1.28 | |||||||||||||||||||
2008 | 10.79 | .36 | (.73 | ) | (.37 | ) | (.35 | ) | (.02 | ) | (.37 | ) | 10.05 | (3.47 | ) | |||||||||||||||||
2007 | 10.75 | .36 | .04 | .40 | (.35 | ) | (.01 | ) | (.36 | ) | 10.79 | 3.87 | ||||||||||||||||||||
2006 | 10.82 | .37 | (.02 | ) | .35 | (.38 | ) | (.04 | ) | (.42 | ) | 10.75 | 3.33 | |||||||||||||||||||
2005 | 10.94 | .39 | (.11 | ) | .28 | (.40 | ) | — | (.40 | ) | 10.82 | 2.63 | ||||||||||||||||||||
Class I (2/92)(g) | ||||||||||||||||||||||||||||||||
2010(f) | 9.85 | .24 | .56 | .80 | (.23 | ) | — | (.23 | ) | 10.42 | 8.17 | |||||||||||||||||||||
2009 | 10.11 | .45 | (.25 | ) | .20 | (.43 | ) | (.03 | ) | (.46 | ) | 9.85 | 2.05 | |||||||||||||||||||
2008 | 10.85 | .44 | (.73 | ) | (.29 | ) | (.43 | ) | (.02 | ) | (.45 | ) | 10.11 | (2.74 | ) | |||||||||||||||||
2007 | 10.80 | .44 | .05 | .49 | (.43 | ) | (.01 | ) | (.44 | ) | 10.85 | 4.70 | ||||||||||||||||||||
2006 | 10.87 | .45 | (.02 | ) | .43 | (.46 | ) | (.04 | ) | (.50 | ) | 10.80 | 4.06 | |||||||||||||||||||
2005 | 10.98 | .48 | (.12 | ) | .36 | (.47 | ) | — | (.47 | ) | 10.87 | 3.46 | ||||||||||||||||||||
| 62 | Nuveen Investments |
| Ratios/Supplemental Data | |||||||||||||||||||||||||||||||
| Ratios to Average Net Assets Before Credit/ Reimbursement | Ratios to Average Net Assets After Reimbursement(c) | Ratios to Average Net Assets After Credit/ Reimbursement(d) | |||||||||||||||||||||||||||||
| Ending Net Assets (000) | Expenses Including Interest(e) | Expenses Excluding Interest | Net Invest- ment Income | Expenses Including Interest(e) | Expenses Excluding Interest | Net Invest- ment Income | Expenses Including Interest(e) | Expenses Excluding Interest | Net Invest- ment Income | Portfolio Turnover Rate | |||||||||||||||||||||
| $ | 110,653 | .85 | %* | .85 | %* | 4.50 | %* | .85 | %* | .85 | %* | 4.50 | %* | .85 | %* | .85 | %* | 4.50 | %* | 5 | % | ||||||||||
| 91,348 | .87 | .85 | 4.31 | .87 | .85 | 4.31 | .85 | .83 | 4.33 | 21 | |||||||||||||||||||||
| 83,210 | .96 | .84 | 3.91 | .96 | .84 | 3.91 | .94 | .82 | 3.93 | 11 | |||||||||||||||||||||
| 84,421 | 1.00 | .86 | 3.88 | 1.00 | .86 | 3.88 | .98 | .84 | 3.90 | 7 | |||||||||||||||||||||
| 80,009 | .86 | .86 | 3.96 | .86 | .86 | 3.96 | .85 | .85 | 3.97 | 15 | |||||||||||||||||||||
| 73,687 | .88 | .88 | 4.22 | .88 | .88 | 4.22 | .87 | .87 | 4.23 | 15 | |||||||||||||||||||||
| 9,550 | 1.60 | * | 1.60 | * | 3.77 | * | 1.60 | * | 1.60 | * | 3.77 | * | 1.60 | * | 1.60 | * | 3.77 | * | 5 | ||||||||||||
| 11,881 | 1.62 | 1.60 | 3.52 | 1.62 | 1.60 | 3.52 | 1.60 | 1.58 | 3.54 | 21 | |||||||||||||||||||||
| 14,539 | 1.71 | 1.59 | 3.16 | 1.71 | 1.59 | 3.16 | 1.69 | 1.57 | 3.18 | 11 | |||||||||||||||||||||
| 17,960 | 1.75 | 1.61 | 3.13 | 1.75 | 1.61 | 3.13 | 1.73 | 1.59 | 3.15 | 7 | |||||||||||||||||||||
| 21,908 | 1.61 | 1.61 | 3.21 | 1.61 | 1.61 | 3.21 | 1.60 | 1.60 | 3.22 | 15 | |||||||||||||||||||||
| 25,273 | 1.63 | 1.63 | 3.47 | 1.63 | 1.63 | 3.47 | 1.62 | 1.62 | 3.48 | 15 | |||||||||||||||||||||
| 33,430 | 1.40 | * | 1.40 | * | 3.95 | * | 1.40 | * | 1.40 | * | 3.95 | * | 1.40 | * | 1.40 | * | 3.95 | * | 5 | ||||||||||||
| 29,143 | 1.42 | 1.40 | 3.75 | 1.42 | 1.40 | 3.75 | 1.40 | 1.38 | 3.77 | 21 | |||||||||||||||||||||
| 28,363 | 1.51 | 1.39 | 3.37 | 1.51 | 1.39 | 3.37 | 1.49 | 1.37 | 3.38 | 11 | |||||||||||||||||||||
| 29,028 | 1.55 | 1.41 | 3.33 | 1.55 | 1.41 | 3.33 | 1.53 | 1.39 | 3.35 | 7 | |||||||||||||||||||||
| 28,068 | 1.41 | 1.41 | 3.41 | 1.41 | 1.41 | 3.41 | 1.40 | 1.40 | 3.42 | 15 | |||||||||||||||||||||
| 27,914 | 1.43 | 1.43 | 3.67 | 1.43 | 1.43 | 3.67 | 1.42 | 1.42 | 3.68 | 15 | |||||||||||||||||||||
| 70,484 | .65 | * | .65 | * | 4.71 | * | .65 | * | .65 | * | 4.71 | * | .65 | * | .65 | * | 4.71 | * | 5 | ||||||||||||
| 66,899 | .67 | .65 | 4.48 | .67 | .65 | 4.48 | .65 | .63 | 4.50 | 21 | |||||||||||||||||||||
| 68,499 | .76 | .64 | 4.11 | .76 | .64 | 4.11 | .74 | .62 | 4.13 | 11 | |||||||||||||||||||||
| 63,816 | .80 | .66 | 4.08 | .80 | .66 | 4.08 | .78 | .64 | 4.10 | 7 | |||||||||||||||||||||
| 43,455 | .67 | .67 | 4.16 | .67 | .67 | 4.16 | .65 | .65 | 4.17 | 15 | |||||||||||||||||||||
| 43,464 | .68 | .68 | 4.42 | .68 | .68 | 4.42 | .67 | .67 | 4.43 | 15 | |||||||||||||||||||||
| * | Annualized. |
| (a) | Per share Net Investment Income is calculated using the average daily shares method. |
| (b) | Total return is the combination of changes in net asset value without any sales charge, reinvested dividend income at net asset value and reinvested capital gains distributions at net asset value, if any. Total returns are not annualized. |
| (c) | After expense reimbursement from the Adviser, where applicable. |
| (d) | After custodian fee credit and expense reimbursement, where applicable. |
| (e) | Each Ratio of Expenses Including Interest to Average Net Assets in the above table reflect, among other things, the interest expense deemed to have been paid by the Fund on the floating rate certificates issued by the special purpose trusts for the self-deposited inverse floaters held by the Fund, as described in Footnote 1 – Inverse Floating Rate Securities. |
| (f) | For the six months ended August 31, 2009. |
| (g) | Effective May 1, 2008, Class R Shares were renamed Class I Shares. |
See accompanying notes to financial statements.
| Nuveen Investments | 63 |
Financial Highlights (Unaudited) (continued)
| Selected data for a share outstanding throughout each period: | ||||||||||||||||||||||||||||||||
| Class (Commencement Date) | ||||||||||||||||||||||||||||||||
| Investment Operations | Less Distributions | |||||||||||||||||||||||||||||||
| NEW YORK | ||||||||||||||||||||||||||||||||
| Year Ended February 28/29, | Beginning Net Asset Value | Net Invest- ment Income(a) | Net Realized/ Unrealized Gain (Loss) | Total | Net Invest- ment Income | Capital Gains | Total | Ending Net Asset Value | Total Return(b) | |||||||||||||||||||||||
Class A (9/94) | ||||||||||||||||||||||||||||||||
2010(f) | $ | 9.84 | $ | .23 | $ | .56 | $ | .79 | $ | (.23 | ) | $ | — | $ | (.23 | ) | $ | 10.40 | 8.10 | % | ||||||||||||
2009 | 10.15 | .45 | (.28 | ) | .17 | (.44 | ) | (.04 | ) | (.48 | ) | 9.84 | 1.67 | |||||||||||||||||||
2008 | 10.86 | .44 | (.70 | ) | (.26 | ) | (.44 | ) | (.01 | ) | (.45 | ) | 10.15 | (2.53 | ) | |||||||||||||||||
2007 | 10.84 | .45 | .02 | .47 | (.44 | ) | (.01 | ) | (.45 | ) | 10.86 | 4.44 | ||||||||||||||||||||
2006(g) | 10.93 | .47 | (.05 | ) | .42 | (.46 | ) | (.05 | ) | (.51 | ) | 10.84 | 3.88 | |||||||||||||||||||
2005 | 11.10 | .50 | (.17 | ) | .33 | (.50 | ) | — | (.50 | ) | 10.93 | 3.12 | ||||||||||||||||||||
Class B (2/97) | ||||||||||||||||||||||||||||||||
2010(f) | 9.84 | .19 | .56 | .75 | (.19 | ) | — | (.19 | ) | 10.40 | 7.72 | |||||||||||||||||||||
2009 | 10.14 | .38 | (.28 | ) | .10 | (.36 | ) | (.04 | ) | (.40 | ) | 9.84 | 1.00 | |||||||||||||||||||
2008 | 10.86 | .36 | (.71 | ) | (.35 | ) | (.36 | ) | (.01 | ) | (.37 | ) | 10.14 | (3.34 | ) | |||||||||||||||||
2007 | 10.84 | .37 | .02 | .39 | (.36 | ) | (.01 | ) | (.37 | ) | 10.86 | 3.69 | ||||||||||||||||||||
2006(g) | 10.94 | .39 | (.06 | ) | .33 | (.38 | ) | (.05 | ) | (.43 | ) | 10.84 | 3.05 | |||||||||||||||||||
2005 | 11.11 | .42 | (.17 | ) | .25 | (.42 | ) | — | (.42 | ) | 10.94 | 2.38 | ||||||||||||||||||||
Class C (9/94) | ||||||||||||||||||||||||||||||||
2010(f) | 9.84 | .20 | .56 | .76 | (.20 | ) | — | (.20 | ) | 10.40 | 7.81 | |||||||||||||||||||||
2009 | 10.15 | .40 | (.28 | ) | .12 | (.39 | ) | (.04 | ) | (.43 | ) | 9.84 | 1.12 | |||||||||||||||||||
2008 | 10.87 | .39 | (.71 | ) | (.32 | ) | (.39 | ) | (.01 | ) | (.40 | ) | 10.15 | (3.12 | ) | |||||||||||||||||
2007 | 10.85 | .39 | .02 | .41 | (.38 | ) | (.01 | ) | (.39 | ) | 10.87 | 3.92 | ||||||||||||||||||||
2006(g) | 10.95 | .41 | (.06 | ) | .35 | (.40 | ) | (.05 | ) | (.45 | ) | 10.85 | 3.27 | |||||||||||||||||||
2005 | 11.12 | .44 | (.16 | ) | .28 | (.45 | ) | — | (.45 | ) | 10.95 | 2.60 | ||||||||||||||||||||
Class I (12/86)(h) | ||||||||||||||||||||||||||||||||
2010(f) | 9.86 | .24 | .56 | .80 | (.24 | ) | — | (.24 | ) | 10.42 | 8.21 | |||||||||||||||||||||
2009 | 10.17 | .48 | (.29 | ) | .19 | (.46 | ) | (.04 | ) | (.50 | ) | 9.86 | 1.91 | |||||||||||||||||||
2008 | 10.88 | .47 | (.71 | ) | (.24 | ) | (.46 | ) | (.01 | ) | (.47 | ) | 10.17 | (2.31 | ) | |||||||||||||||||
2007 | 10.86 | .47 | .02 | .49 | (.46 | ) | (.01 | ) | (.47 | ) | 10.88 | 4.66 | ||||||||||||||||||||
2006(g) | 10.96 | .49 | (.06 | ) | .43 | (.48 | ) | (.05 | ) | (.53 | ) | 10.86 | 4.01 | |||||||||||||||||||
2005 | 11.13 | .52 | (.17 | ) | .35 | (.52 | ) | — | (.52 | ) | 10.96 | 3.34 | ||||||||||||||||||||
| 64 | Nuveen Investments |
| Ratios/Supplemental Data | |||||||||||||||||||||||||||||||
| Ratios to Average Net Assets Before Credit/ Reimbursement | Ratios to Average Net Assets After Reimbursement(c) | Ratios to Average Net Assets After Credit/ Reimbursement(d) | |||||||||||||||||||||||||||||
| Ending Net Assets (000) | Expenses Including Interest(e) | Expenses Excluding Interest | Net Invest- ment Income | Expenses Including Interest(e) | Expenses Excluding Interest | Net Invest- ment Income | Expenses Including Interest(e) | Expenses Excluding Interest | Net Invest- ment Income | Portfolio Turnover Rate | |||||||||||||||||||||
| $ | 209,646 | .87 | %* | .84 | %* | 4.55 | %* | .87 | %* | .84 | %* | 4.55 | %* | .87 | %* | .84 | %* | 4.55 | %* | 1 | % | ||||||||||
| 181,049 | .97 | .84 | 4.49 | .97 | .84 | 4.49 | .96 | .83 | 4.50 | 30 | |||||||||||||||||||||
| 190,598 | 1.12 | .83 | 4.13 | 1.12 | .83 | 4.13 | 1.11 | .82 | 4.14 | 17 | |||||||||||||||||||||
| 181,313 | 1.14 | .84 | 4.15 | 1.14 | .84 | 4.15 | 1.13 | .83 | 4.17 | 9 | |||||||||||||||||||||
| 159,947 | 1.08 | .84 | 4.29 | 1.08 | .84 | 4.29 | 1.06 | .82 | 4.31 | 12 | |||||||||||||||||||||
| 127,502 | .86 | .86 | 4.59 | .86 | .86 | 4.59 | .85 | .85 | 4.60 | 8 | |||||||||||||||||||||
| 10,402 | 1.62 | * | 1.59 | * | 3.81 | * | 1.62 | * | 1.59 | * | 3.81 | * | 1.62 | * | 1.59 | * | 3.81 | * | 1 | ||||||||||||
| 12,094 | 1.72 | 1.59 | 3.71 | 1.72 | 1.59 | 3.71 | 1.71 | 1.58 | 3.72 | 30 | |||||||||||||||||||||
| 19,133 | 1.87 | 1.58 | 3.38 | 1.87 | 1.58 | 3.38 | 1.86 | 1.57 | 3.39 | 17 | |||||||||||||||||||||
| 25,898 | 1.89 | 1.59 | 3.41 | 1.89 | 1.59 | 3.41 | 1.88 | 1.58 | 3.42 | 9 | |||||||||||||||||||||
| 31,620 | 1.83 | 1.59 | 3.54 | 1.83 | 1.59 | 3.54 | 1.81 | 1.57 | 3.56 | 12 | |||||||||||||||||||||
| 36,125 | 1.61 | 1.61 | 3.84 | 1.61 | 1.61 | 3.84 | 1.60 | 1.60 | 3.85 | 8 | |||||||||||||||||||||
| 56,185 | 1.42 | * | 1.39 | * | 4.01 | * | 1.42 | * | 1.39 | * | 4.01 | * | 1.42 | * | 1.39 | * | 4.01 | * | 1 | ||||||||||||
| 51,978 | 1.52 | 1.39 | 3.95 | 1.52 | 1.39 | 3.95 | 1.51 | 1.38 | 3.96 | 30 | |||||||||||||||||||||
| 49,910 | 1.67 | 1.38 | 3.58 | 1.67 | 1.38 | 3.58 | 1.66 | 1.37 | 3.60 | 17 | |||||||||||||||||||||
| 48,525 | 1.69 | 1.39 | 3.60 | 1.69 | 1.39 | 3.60 | 1.68 | 1.38 | 3.62 | 9 | |||||||||||||||||||||
| 42,934 | 1.63 | 1.39 | 3.74 | 1.63 | 1.39 | 3.74 | 1.61 | 1.37 | 3.76 | 12 | |||||||||||||||||||||
| 37,221 | 1.41 | 1.41 | 4.04 | 1.41 | 1.41 | 4.04 | 1.40 | 1.40 | 4.05 | 8 | |||||||||||||||||||||
| 141,935 | .67 | * | .64 | * | 4.76 | * | .67 | * | .64 | * | 4.76 | * | .67 | * | .64 | * | 4.76 | * | 1 | ||||||||||||
| 132,815 | .77 | .64 | 4.69 | .77 | .64 | 4.69 | .76 | .63 | 4.71 | 30 | |||||||||||||||||||||
| 137,731 | .92 | .63 | 4.33 | .92 | .63 | 4.33 | .91 | .62 | 4.34 | 17 | |||||||||||||||||||||
| 141,556 | .94 | .64 | 4.35 | .94 | .64 | 4.35 | .93 | .63 | 4.37 | 9 | |||||||||||||||||||||
| 137,680 | .88 | .64 | 4.49 | .88 | .64 | 4.49 | .86 | .62 | 4.51 | 12 | |||||||||||||||||||||
| 139,964 | .66 | .66 | 4.79 | .66 | .66 | 4.79 | .65 | .65 | 4.80 | 8 | |||||||||||||||||||||
| * | Annualized. |
| (a) | Per share Net Investment Income is calculated using the average daily shares method. |
| (b) | Total return is the combination of changes in net asset value without any sales charge, reinvested dividend income at net asset value and reinvested capital gains distributions at net asset value, if any. Total returns are not annualized. |
| (c) | After expense reimbursement from the Adviser, where applicable. |
| (d) | After custodian fee credit and expense reimbursement, where applicable. |
| (e) | Each Ratio of Expenses Including Interest to Average Net Assets in the above table reflect, among other things, the interest expense deemed to have been paid by the Fund on the floating rate certificates issued by the special purpose trusts for the self-deposited inverse floaters held by the Fund, as described in Footnote 1 – Inverse Floating Rate Securities. |
| (f) | For the six months ended August 31, 2009. |
| (g) | Each Ratio of Expenses Including Interest to Average Net Assets and the Portfolio Turnover Rate for the fiscal year ended February 28, 2006, in the above table have been restated to give effect to recording the self-deposited inverse floaters as financing transactions. |
| (h) | Effective May 1, 2008, Class R Shares were renamed Class I Shares. |
See accompanying notes to financial statements.
| Nuveen Investments | 65 |
Financial Highlights (Unaudited) (continued)
| Selected data for a share outstanding throughout each period: | ||||||||||||||||||||||||||||||||
| Class (Commencement Date) | ||||||||||||||||||||||||||||||||
| Investment Operations | Less Distributions | |||||||||||||||||||||||||||||||
| NEW YORK INSURED | ||||||||||||||||||||||||||||||||
| Year Ended February 28/29, | Beginning Net Asset Value | Net Invest- ment Income(a) | Net Realized/ Unrealized Gain (Loss) | Total | Net Invest- ment Income | Capital Gains | Total | Ending Net Asset Value | Total Return(b) | |||||||||||||||||||||||
Class A (9/94) | ||||||||||||||||||||||||||||||||
2010(f) | $ | 9.61 | $ | .20 | $ | .35 | $ | .55 | $ | (.20 | ) | $ | — | $ | (.20 | ) | $ | 9.96 | 5.73 | % | ||||||||||||
2009 | 9.63 | .40 | — | * | .40 | (.39 | ) | (.03 | ) | (.42 | ) | 9.61 | 4.24 | |||||||||||||||||||
2008 | 10.37 | .40 | (.71 | ) | (.31 | ) | (.40 | ) | (.03 | ) | (.43 | ) | 9.63 | (3.07 | ) | |||||||||||||||||
2007 | 10.41 | .40 | — | .40 | (.40 | ) | (.04 | ) | (.44 | ) | 10.37 | 4.02 | ||||||||||||||||||||
2006 | 10.71 | .42 | (.09 | ) | .33 | (.42 | ) | (.21 | ) | (.63 | ) | 10.41 | 3.19 | |||||||||||||||||||
2005 | 10.98 | .45 | (.18 | ) | .27 | (.45 | ) | (.09 | ) | (.54 | ) | 10.71 | 2.59 | |||||||||||||||||||
Class B (2/97) | ||||||||||||||||||||||||||||||||
2010(f) | 9.64 | .17 | .34 | .51 | (.16 | ) | — | (.16 | ) | 9.99 | 5.32 | |||||||||||||||||||||
2009 | 9.66 | .33 | — | * | .33 | (.32 | ) | (.03 | ) | (.35 | ) | 9.64 | 3.45 | |||||||||||||||||||
2008 | 10.40 | .32 | (.71 | ) | (.39 | ) | (.32 | ) | (.03 | ) | (.35 | ) | 9.66 | (3.79 | ) | |||||||||||||||||
2007 | 10.44 | .33 | (.01 | ) | .32 | (.32 | ) | (.04 | ) | (.36 | ) | 10.40 | 3.23 | |||||||||||||||||||
2006 | 10.73 | .34 | (.09 | ) | .25 | (.33 | ) | (.21 | ) | (.54 | ) | 10.44 | 2.47 | |||||||||||||||||||
2005 | 11.00 | .37 | (.18 | ) | .19 | (.37 | ) | (.09 | ) | (.46 | ) | 10.73 | 1.79 | |||||||||||||||||||
Class C (9/94) | ||||||||||||||||||||||||||||||||
2010(f) | 9.62 | .18 | .34 | .52 | (.17 | ) | — | (.17 | ) | 9.97 | 5.43 | |||||||||||||||||||||
2009 | 9.64 | .35 | — | * | .35 | (.34 | ) | (.03 | ) | (.37 | ) | 9.62 | 3.65 | |||||||||||||||||||
2008 | 10.37 | .34 | (.70 | ) | (.36 | ) | (.34 | ) | (.03 | ) | (.37 | ) | 9.64 | (3.54 | ) | |||||||||||||||||
2007 | 10.42 | .35 | (.02 | ) | .33 | (.34 | ) | (.04 | ) | (.38 | ) | 10.37 | 3.31 | |||||||||||||||||||
2006 | 10.71 | .36 | (.08 | ) | .28 | (.36 | ) | (.21 | ) | (.57 | ) | 10.42 | 2.70 | |||||||||||||||||||
2005 | 10.98 | .39 | (.18 | ) | .21 | (.39 | ) | (.09 | ) | (.48 | ) | 10.71 | 2.02 | |||||||||||||||||||
Class I (12/86)(g) | ||||||||||||||||||||||||||||||||
2010(f) | 9.65 | .21 | .34 | .55 | (.20 | ) | — | (.20 | ) | 10.00 | 5.80 | |||||||||||||||||||||
2009 | 9.67 | .42 | — | * | .42 | (.41 | ) | (.03 | ) | (.44 | ) | 9.65 | 4.42 | |||||||||||||||||||
2008 | 10.40 | .42 | (.70 | ) | (.28 | ) | (.42 | ) | (.03 | ) | (.45 | ) | 9.67 | (2.79 | ) | |||||||||||||||||
2007 | 10.45 | .42 | (.01 | ) | .41 | (.42 | ) | (.04 | ) | (.46 | ) | 10.40 | 4.08 | |||||||||||||||||||
2006 | 10.74 | .44 | (.08 | ) | .36 | (.44 | ) | (.21 | ) | (.65 | ) | 10.45 | 3.45 | |||||||||||||||||||
2005 | 11.00 | .47 | (.17 | ) | .30 | (.47 | ) | (.09 | ) | (.56 | ) | 10.74 | 2.85 | |||||||||||||||||||
| 66 | Nuveen Investments |
| Ratios/Supplemental Data | |||||||||||||||||||||||||||||||
| Ratios to Average Net Assets Before Credit/ Reimbursement | Ratios to Average Net Assets After Reimbursement(c) | Ratios to Average Net Assets After Credit/ Reimbursement(d) | |||||||||||||||||||||||||||||
| Ending Net Assets (000) | Expenses Including Interest(e) | Expenses Excluding Interest | Net Invest- ment Income | Expenses Including Interest(e) | Expenses Excluding Interest | Net Invest- ment Income | Expenses Including Interest(e) | Expenses Excluding Interest | Net Invest- ment Income | Portfolio Turnover Rate | |||||||||||||||||||||
| $ | 93,446 | .87 | %** | .85 | %** | 4.11 | %** | .87 | %** | .85 | %** | 4.11 | %** | .87 | %** | .85 | %** | 4.11 | %** | 1 | % | ||||||||||
| 87,154 | .96 | .85 | 4.12 | .96 | .85 | 4.12 | .94 | .83 | % | 4.14 | 11 | ||||||||||||||||||||
| 79,593 | 1.08 | .84 | 3.89 | 1.08 | .84 | 3.89 | 1.07 | .83 | 3.90 | 13 | |||||||||||||||||||||
| 90,400 | 1.03 | .85 | 3.89 | 1.03 | .85 | 3.89 | 1.02 | .84 | 3.90 | 9 | |||||||||||||||||||||
| 90,706 | .84 | .84 | 3.93 | .84 | .84 | 3.93 | .83 | .83 | 3.94 | 22 | |||||||||||||||||||||
| 87,032 | .85 | .85 | 4.17 | .85 | .85 | 4.17 | .85 | .85 | 4.18 | 12 | |||||||||||||||||||||
| 6,336 | 1.62 | ** | 1.60 | ** | 3.37 | ** | 1.62 | ** | 1.60 | ** | 3.37 | ** | 1.62 | ** | 1.60 | ** | 3.37 | ** | 1 | ||||||||||||
| 7,288 | 1.70 | 1.59 | 3.35 | 1.70 | 1.59 | 3.35 | 1.69 | 1.58 | 3.37 | 11 | |||||||||||||||||||||
| 9,290 | 1.83 | 1.59 | 3.14 | 1.83 | 1.59 | 3.14 | 1.82 | 1.58 | 3.15 | 13 | |||||||||||||||||||||
| 13,447 | 1.78 | 1.60 | 3.14 | 1.78 | 1.60 | 3.14 | 1.77 | 1.59 | 3.15 | 9 | |||||||||||||||||||||
| 17,871 | 1.59 | 1.59 | 3.17 | 1.59 | 1.59 | 3.17 | 1.58 | 1.58 | 3.18 | 22 | |||||||||||||||||||||
| 22,881 | 1.60 | 1.60 | 3.42 | 1.60 | 1.60 | 3.42 | 1.60 | 1.60 | 3.42 | 12 | |||||||||||||||||||||
| 17,119 | 1.42 | ** | 1.40 | ** | 3.56 | ** | 1.42 | ** | 1.40 | ** | 3.56 | ** | 1.42 | ** | 1.40 | ** | 3.56 | ** | 1 | ||||||||||||
| 15,374 | 1.51 | 1.40 | 3.57 | 1.51 | 1.40 | 3.57 | 1.49 | 1.38 | 3.58 | 11 | |||||||||||||||||||||
| 13,870 | 1.63 | 1.39 | 3.34 | 1.63 | 1.39 | 3.34 | 1.62 | 1.38 | 3.35 | 13 | |||||||||||||||||||||
| 14,426 | 1.58 | 1.40 | 3.34 | 1.58 | 1.40 | 3.34 | 1.57 | 1.39 | 3.35 | 9 | |||||||||||||||||||||
| 15,783 | 1.39 | 1.39 | 3.37 | 1.39 | 1.39 | 3.37 | 1.38 | 1.38 | 3.38 | 22 | |||||||||||||||||||||
| 17,470 | 1.40 | 1.40 | 3.62 | 1.40 | 1.40 | 3.62 | 1.40 | 1.40 | 3.63 | 12 | |||||||||||||||||||||
| 175,384 | .67 | ** | .65 | ** | 4.32 | ** | .67 | ** | .65 | ** | 4.32 | ** | .67 | ** | .65 | ** | 4.32 | ** | 1 | ||||||||||||
| 172,000 | .76 | .65 | 4.31 | .76 | .65 | 4.31 | .74 | .63 | 4.32 | 11 | |||||||||||||||||||||
| 184,670 | .88 | .64 | 4.09 | .88 | .64 | 4.09 | .87 | .63 | 4.10 | 13 | |||||||||||||||||||||
| 207,492 | .83 | .65 | 4.09 | .83 | .65 | 4.09 | .82 | .64 | 4.10 | 9 | |||||||||||||||||||||
| 220,883 | .64 | .64 | 4.13 | .64 | .64 | 4.13 | .63 | .63 | 4.13 | 22 | |||||||||||||||||||||
| 237,657 | .65 | .65 | 4.37 | .65 | .65 | 4.37 | .65 | .65 | 4.37 | 12 | |||||||||||||||||||||
| * | Rounds to less than $.01 per share. |
| ** | Annualized. |
| (a) | Per share Net Investment Income is calculated using the average daily shares method. |
| (b) | Total return is the combination of changes in net asset value without any sales charge, reinvested dividend income at net asset value and reinvested capital gains distributions at net asset value, if any. Total returns are not annualized. |
| (c) | After expense reimbursement from the Adviser, where applicable. |
| (d) | After custodian fee credit and expense reimbursement, where applicable. |
| (e) | Each Ratio of Expenses Including Interest to Average Net Assets in the above table reflect, among other things, the interest expense deemed to have been paid by the Fund on the floating rate certificates issued by the special purpose trusts for the self-deposited inverse floaters held by the Fund, as described in Footnote 1 – Inverse Floating Rate Securities. |
| (f) | For the six months ended August 31, 2009. |
| (g) | Effective May 1, 2008, Class R Shares were renamed Class I Shares. |
See accompanying notes to financial statements.
| Nuveen Investments | 67 |
Annual Investment Management Agreement Approval Process
The Investment Company Act of 1940, as amended (the “1940 Act”), provides, in substance, that each investment advisory agreement between a fund and its investment adviser will continue in effect from year to year only if its continuance is approved at least annually by the fund’s board members, including by a vote of a majority of the board members who are not parties to the advisory agreement or “interested persons” of any parties (the “Independent Board Members”), cast in person at a meeting called for the purpose of considering such approval. In connection with such approvals, the fund’s board members must request and evaluate, and the investment adviser is required to furnish, such information as may be reasonably necessary to evaluate the terms of the advisory agreement. Accordingly, at a meeting held on May 27-29, 2009 (the “May Meeting”), the Boards of Trustees (each a “Board” and each Trustee, a “Board Member”) of the Funds, including a majority of the Independent Board Members, considered and approved the continuation of the advisory agreements (each an “Advisory Agreement”) between each Fund and Nuveen Asset Management (“NAM”) for an additional one-year period. In preparation for their considerations at the May Meeting, the Board also held a separate meeting on April 21-22, 2009 (the “April Meeting”). Accordingly, the factors considered and determinations made regarding the renewals by the Independent Board Members include those made at the April Meeting.
In addition, in evaluating the Advisory Agreements, the Independent Board Members reviewed a broad range of information relating to the Funds and NAM, including absolute performance, fee and expense information for the Funds as well as comparative performance, fee and expense information for a comparable peer group of funds, the performance information of recognized and/or customized benchmarks (as applicable) of the Funds, the profitability of Nuveen for its advisory activities (which includes its wholly owned subsidiaries other than Winslow Capital Management, Inc. (“Winslow Capital”), which was recently acquired in December 2008), and other information regarding the organization, personnel, and services provided by NAM. The Independent Board Members also met quarterly as well as at other times as the need arose during the year and took into account the information provided at such meetings and the knowledge gained therefrom. Prior to approving the renewal of the Advisory Agreements, the Independent Board Members reviewed the foregoing information with their independent legal counsel and with management, reviewed materials from independent legal counsel describing applicable law and their duties in reviewing advisory contracts, and met with independent legal counsel in private sessions without management present. The Independent Board Members considered the legal advice provided by independent legal counsel and relied upon their knowledge of NAM, its services and the Funds resulting from their meetings and other interactions throughout the year and their own business judgment in determining the factors to be considered in evaluating the Advisory Agreements. Each Board Member may have accorded different weight to the various factors in reaching his or her conclusions with respect to a Fund’s Advisory Agreement. The Independent Board Members did not identify any single factor as all-important or controlling. The Independent Board Members’ considerations were instead based on a comprehensive consideration of all the information presented. The principal factors considered by the Board and its conclusions are described below.
A. Nature, Extent and Quality of Services
In considering renewal of the Advisory Agreements, the Independent Board Members considered the nature, extent and quality of NAM’s services, including advisory services and administrative services. The Independent Board Members reviewed materials outlining, among other things, NAM’s organization and business; the types of services that NAM or its affiliates provide and are expected to provide to the Funds; the performance record of the applicable Fund (as described in further detail below); and any initiatives Nuveen had taken for the applicable fund product line.
In reviewing the services provided and the initiatives undertaken during the past year, the Independent Board Members recognized the severe market turmoil experienced in the capital markets during recent periods, including sustained periods of high volatility, credit disruption and government intervention. The Independent Board Members considered NAM’s efforts, expertise and other actions taken to address matters as they arose that impacted the Funds. The Independent Board Members recognized the role of the Investment Services group which, among other things, monitors the various positions throughout the Nuveen fund complex to identify and address any systematic risks. In addition, the Capital Markets Committee of NAM provides a multi-departmental venue for developing new policies to mitigate any risks. The Independent Board Members further recognized NAM’s continuous review of the Nuveen funds’ investment strategies and mandates in seeking to continue to refine and improve the investment process for the funds, particularly in light of market conditions. In this regard, the Independent Board Members noted the changes recommended by NAM to various investment mandates for the Nuveen funds in seeking to take advantage of market opportunities and to improve the tools available for managing liquidity and market exposure; the establishment of a team responsible for coordinating the handling of large trades in or out of the Nuveen funds; and the ongoing monitoring of investment management processes.
As part of their review, the Independent Board Members also evaluated the background, experience and track record of NAM’s investment personnel. In this regard, the Independent Board Members considered any changes in the personnel, and the impact on the level of services provided to the Funds, if any. The Independent Board Members also reviewed information regarding portfolio manager compensation arrangements to evaluate NAM’s ability to attract and retain high quality investment personnel, preserve stability, and reward performance but not provide an incentive for taking undue risks.
In addition to advisory services, the Independent Board Members considered the quality of administrative services provided by NAM and its affiliates including product management, fund administration, oversight of service providers, shareholder services, administration of Board relations, regulatory and portfolio compliance and legal support. Given the importance of compliance, the Independent Board Members considered NAM’s compliance program, including the report of the chief compliance officer regarding the Funds’ compliance policies and procedures.
| 68 | Nuveen Investments |
Based on their review, the Independent Board Members found that, overall, the nature, extent and quality of services provided (and expected to be provided) to the respective Funds under the Advisory Agreements were satisfactory.
B. The Investment Performance of the Funds and NAM
The Board considered the investment performance of each Fund, including the Fund’s historic performance as well as its performance compared to funds with similar investment objectives (the “Performance Peer Group”) based on data provided by an independent provider of mutual fund data as well as recognized and/or customized benchmarks (as applicable). The Independent Board Members reviewed performance information including, among other things, total return information compared with the Fund’s Performance Peer Group and recognized and/or customized benchmarks (as applicable) for the quarter-, one-, three- and five-year periods (as applicable) ending December 31, 2008 and for the same periods (as applicable) ending March 31, 2009. The Independent Board Members also reviewed performance information of the Nuveen municipal funds managed by NAM in the aggregate ranked by peer group and the performance of such funds, in the aggregate, relative to their benchmark. This information supplemented the Fund performance information provided to the Board at each of its quarterly meetings.
In comparing a fund’s performance with that of its Performance Peer Group, the Independent Board Members took into account that the closest Performance Peer Group in certain instances may not adequately reflect the respective fund’s investment objectives and strategies thereby hindering a meaningful comparison of the fund’s performance with that of the Performance Peer Group. The Independent Board Members further considered the performance of the Funds in the context of the volatile market conditions during the past year, and their impact on various asset classes and the portfolio management of the Funds.
Based on their review and factoring in the severity of market turmoil in 2008, the Independent Board Members determined that each Fund’s investment performance over time had been satisfactory.
C. Fees, Expenses and Profitability
1. Fees and Expenses
The Board evaluated the management fees and expenses of each Fund reviewing, among other things, such Fund’s gross management fees, net management fees and total expense ratios (before and after expense reimbursements and/or waivers) in absolute terms as well as compared to the fee and expenses of a comparable universe of unaffiliated funds based on data provided by an independent fund data provider (the “Peer Universe”) and in certain cases, to a more focused subset of funds in the Peer Universe (the “Peer Group”).
The Independent Board Members further reviewed data regarding the construction of the applicable Peer Universe and Peer Group. In reviewing the comparisons of fee and expense information, the Independent Board Members took into account that in certain instances various factors such as the asset level of a fund relative to peers, the size and particular composition of the Peer Universe or Peer Group, the investment objectives of the peers, expense anomalies, changes in the funds comprising the Peer Universe or Peer Group from year to year, levels of reimbursement and the timing of information used may impact the comparative data, thereby limiting the ability to make a meaningful comparison. The Independent Board Members also considered, among other things, the differences in the states reflected in the respective Peer Group. In reviewing the fee schedule for a Fund, the Independent Board Members also considered the fund-level and complex-wide breakpoint schedules (described in further detail below) and any fee waivers and reimbursements provided by Nuveen.
Based on their review of the fee and expense information provided, the Independent Board Members determined that each Fund’s management fees and net total expense ratio were reasonable in light of the nature, extent and quality of services provided to the Fund.
2. Comparisons with the Fees of Other Clients
The Independent Board Members further reviewed information regarding the nature of services and fee rates offered by NAM to other clients. Such other clients include NAM’s municipal separately managed accounts. In evaluating the comparisons of fees, the Independent Board Members noted that the fee rates charged to the Funds and other clients vary, among other things, because of the different services involved and the additional regulatory and compliance requirements associated with registered investment companies, such as the Funds. Accordingly, the Independent Board Members considered the differences in the product types, including, but not limited to, the services provided, the structure and operations, product distribution and costs thereof, portfolio investment policies, investor profiles, account sizes and regulatory requirements. The Independent Board Members noted, in particular, that the range of services provided to the Funds (as discussed above) is much more extensive than that provided to separately managed accounts. Given the inherent differences in the products, particularly the extensive services provided to the Funds, the Independent Board Members believe such facts justify the different levels of fees.
3. Profitability of Nuveen
In conjunction with its review of fees, the Independent Board Members also considered the profitability of Nuveen for its advisory activities (which incorporated Nuveen’s wholly-owned affiliated sub-advisers other than Winslow Capital) and its financial condition. The Independent Board Members reviewed the revenues and expenses of Nuveen’s advisory activities for the last two years, the allocation methodology used in preparing the profitability data and an analysis of the key drivers behind the changes in revenues and expenses that impacted profitability in 2008. In addition, the Independent Board Members reviewed information regarding the
| Nuveen Investments | 69 |
Annual Investment Management Agreement Approval Process (continued)
financial results of Nuveen for 2008 based on its Form 8-K filed on March 31, 2009. The Independent Board Members noted this information supplemented the profitability information requested and received during the year to help keep them apprised of developments affecting profitability (such as changes in fee waivers and expense reimbursement commitments). In this regard, the Independent Board Members noted that they had also appointed an Independent Board Member as a point person to review and keep them apprised of changes to the profitability analysis and/or methodologies during the year. The Independent Board Members also considered Nuveen’s revenues for advisory activities, expenses, and profit margin compared to that of various unaffiliated management firms with similar amounts of assets under management and relatively comparable asset composition prepared by Nuveen.
In reviewing profitability, the Independent Board Members recognized the subjective nature of determining profitability which may be affected by numerous factors including the allocation of expenses. Further, the Independent Board Members recognized the difficulties in making comparisons as the profitability of other advisers generally is not publicly available and the profitability information that is available for certain advisers or management firms may not be representative of the industry and may be affected by, among other things, the adviser’s particular business mix, capital costs, types of funds managed and expense allocations. Notwithstanding the foregoing, the Independent Board Members reviewed Nuveen’s methodology and assumptions for allocating expenses across product lines to determine profitability. In reviewing profitability, the Independent Board Members recognized Nuveen’s investment in its fund business.
Based on their review, the Independent Board Members concluded that Nuveen’s level of profitability for its advisory activities was reasonable in light of the services provided.
In evaluating the reasonableness of the compensation, the Independent Board Members also considered other amounts paid to NAM by the Funds as well as any indirect benefits (such as soft dollar arrangements, if any) NAM and its affiliates receive, or are expected to receive, that are directly attributable to the management of the Funds, if any. See Section E below for additional information on indirect benefits NAM may receive as a result of its relationship with the Funds. Based on their review of the overall fee arrangements of each Fund, the Independent Board Members determined that the advisory fees and expenses of the respective Fund were reasonable.
D. Economies of Scale and Whether Fee Levels Reflect These Economies of Scale
With respect to economies of scale, the Independent Board Members have recognized the potential benefits resulting from the costs of a fund being spread over a larger asset base, although economies of scale are difficult to measure and predict with precision, particularly on a fund-by-fund basis. One method to help ensure the shareholders share in these benefits is to include breakpoints in the advisory fee schedule. Generally, management fees for funds in the Nuveen complex are comprised of a fund-level component and a complex-level component, subject to certain exceptions. Accordingly, the Independent Board Members reviewed and considered the applicable fund-level breakpoints in the advisory fee schedules that reduce advisory fees as asset levels increase. While economies of scale result when costs can be spread over a larger asset base, the Independent Board Members also recognized that the asset levels generally declined in 2008 due to, among other things, the market downturn. Accordingly, for funds with a reduction in assets under management, advisory fee levels may have increased as breakpoints in the fee schedule were no longer surpassed.
In addition to fund-level advisory fee breakpoints, the Board also considered the Funds’ complex-wide fee arrangement. Pursuant to the complex-wide fee arrangement, the fees of the funds in the Nuveen complex generally are reduced as the assets in the fund complex reach certain levels. The complex-wide fee arrangement seeks to provide the benefits of economies of scale to fund shareholders when total fund complex assets increase, even if assets of a particular fund are unchanged or have decreased. The approach reflects the notion that some of Nuveen’s costs are attributable to services provided to all its funds in the complex and therefore all funds benefit if these costs are spread over a larger asset base. Generally, the complex-wide pricing reduces Nuveen’s revenue because total complex fund assets have consistently grown in prior years. As noted, however, total fund assets declined in 2008 resulting in a smaller downward adjustment of revenues due to complex-wide pricing compared to the prior year.
Based on their review, the Independent Board Members concluded that the breakpoint schedules and complex-wide fee arrangement were acceptable and reflect economies of scale to be shared with shareholders when assets under management increase.
E. Indirect Benefits
In evaluating fees, the Independent Board Members received and considered information regarding potential “fall out” or ancillary benefits NAM or its affiliates may receive as a result of its relationship with each Fund. In this regard, the Independent Board Members considered, among other things, any sales charges, distribution fees and shareholder services fees received and retained by the Funds’ principal underwriter, an affiliate of NAM, which includes fees received pursuant to any 12b-1 plan. The Independent Board Members, therefore, considered the 12b-1 fees retained by Nuveen during the last calendar year.
In addition to the above, the Independent Board Members considered whether NAM received any benefits from soft dollar arrangements whereby a portion of the commissions paid by a Fund for brokerage may be used to acquire research that may be useful to NAM in managing the assets of the Funds and other clients. The Independent Board Members noted that NAM does not currently have any soft dollar arrangements; however, to the extent certain bona fide agency transactions that occur on markets that traditionally trade on a principal basis and riskless principal transactions are considered as generating “commissions,” NAM intends to comply with the applicable safe harbor provisions.
| 70 | Nuveen Investments |
Based on their review, the Independent Board Members concluded that any indirect benefits received by NAM as a result of its relationship with the Funds were reasonable and within acceptable parameters.
F. Other Considerations
The Independent Board Members did not identify any single factor discussed previously as all-important or controlling. The Board Members, including the Independent Board Members, unanimously concluded that the terms of the Advisory Agreements are fair and reasonable, that NAM’s fees are reasonable in light of the services provided to each Fund and that the Advisory Agreements be renewed.
| Nuveen Investments | 71 |
Glossary of Terms Used in this Report
Auction Rate Bond: An auction rate bond is a security whose interest payments are adjusted periodically through an auction process, which process typically also serves as a means for buying and selling the bond. Auctions that fail to attract enough buyers for all the shares offered for sale are deemed to have “failed,” with current holders receiving a formula-based interest rate until the next scheduled auction.
Pre-refundings: Pre-refundings, also known as advance refundings or refinancings, occur when an issuer sells new bonds and uses the proceeds to fund principal and interest payments of older existing bonds. This process often results in lower borrowing costs for bond issuers.
Average Annual Total Return: This is a commonly used method to express an investment’s performance over a particular, usually multi-year time period. It expresses the return that would have been necessary each year to equal the investment’s actual cumulative performance (including change in NAV or offer price and reinvested dividends and capital gains distributions, if any) over the time period being considered.
Average Effective Maturity: The average of the number of years to maturity of the bonds in a Fund’s portfolio, computed by weighting each bond’s time to maturity (the date the security comes due) by the market value of the security. This figure does not account for the likelihood of prepayments or the exercise of call provisions unless an escrow account has been established to redeem the bond before maturity. The market value weighting for an investment in an inverse floating rate security is the value of the portfolio’s residual interest in the inverse floating rate trust, and does not include the value of the floating rate securities issued by the trust.
Average Duration: Duration is a measure of the expected period over which a bond’s principal and interest will be paid, and consequently is a measure of the sensitivity of a bond’s (or bond fund’s) value to changes when market interest rates change. Generally, the longer a bond or Fund’s duration, the more the price of the bond or Fund will change as interest rates change.
Dividend Yield (also known as Market Yield or Current Yield): An investment’s current annualized dividend divided by its current offering price.
Inverse Floaters: Inverse floating rate securities are created by depositing a municipal bond, typically with a fixed interest rate, into a special purpose trust created by a broker-dealer. This trust, in turn, (a) issues floating rate certificates typically paying short-term tax-exempt interest rates to third parties in amounts equal to some fraction of the deposited bond’s par amount or market value, and (b) issues an inverse floating rate certificate (sometimes referred to as an “inverse floater”) to an investor (such as a Fund) interested in gaining investment exposure to a long-term municipal bond. The income received by the holder of the inverse floater varies inversely with the short-term rate paid to the floating rate certificates’ holders, and in most circumstances the holder of the inverse floater bears substantially all of the underlying bond’s downside investment risk. The holder of the inverse floater typically also benefits disproportionately from any potential appreciation of the underlying bond’s value. Hence, an inverse floater essentially represents an investment in the underlying bond on a leveraged basis.
Net Asset Value (NAV): A Fund’s NAV is the dollar value of one share in the Fund. It is calculated by subtracting the liabilities of the Fund from its total assets and then dividing the remainder by the number of shares outstanding. Fund NAVs are calculated at the end of each business day.
SEC 30-Day Yield: A standardized measure of a Fund’s yield that accounts for the future amortization of premiums or discounts of bonds held in the Fund’s portfolio.
Taxable-Equivalent Yield: The yield necessary from a fully taxable investment to equal, on an after-tax basis at a specified assumed tax rate, the yield of a municipal bond investment.
Zero Coupon Bond: A zero coupon bond does not pay a regular interest coupon to its holders during the life of the bond. Tax-exempt income to the holder of the bond comes from accretion of the difference between the original purchase price of the bond at issuance and the par value of the bond at maturity and is effectively paid at maturity. The market prices of zero coupon bonds generally are more volatile than the market prices of bonds that pay interest periodically.
| 72 | Nuveen Investments |
Fund Information
Fund Manager
Nuveen Asset Management
333 West Wacker Drive
Chicago, IL 60606
Legal Counsel
Chapman and Cutler LLP
Chicago, IL
Independent Registered Public Accounting Firm
PricewaterhouseCoopers LLP
Chicago, IL
Custodian
State Street Bank & Trust Company
Boston, MA
Transfer Agent and Shareholder Services
Boston Financial
Data Services, Inc.
Nuveen Investor Services
P.O. Box 8530
Boston, MA 02266-8530
(800) 257-8787
Quarterly Portfolio of Investments and Proxy Voting Information: You may obtain (i) each Fund’s quarterly portfolio of investments, (ii) information regarding how the Funds voted proxies relating to portfolio securities held during the most recent twelve-month period ended June 30, 2009, and (iii) a description of the policies and procedures that the Funds used to determine how to vote proxies relating to portfolio securities without charge, upon request, by calling Nuveen Investments at (800) 257-8787 or on Nuveen’s website at www.nuveen.com.
You may also obtain this and other Fund information directly from the Securities and Exchange Commission (“SEC”). The SEC may charge a copying fee for this information. Visit the SEC on-line at http://www.sec.gov or in person at the SEC’s Public Reference Room in Washington, D.C. Call the SEC at (202) 942-8090 for room hours and operation. You may also request Fund information by sending an e-mail request to publicinfo@sec.gov or by writing to the SEC’s Public Reference Section at 100 F Street NE, Washington, D.C. 20549.
The Financial Industry Regulatory Authority (FINRA) provides a Public Disclosure Program which supplies certain information regarding the disciplinary history of FINRA members and their associated persons in response to either telephone inquiries at (800) 289-9999 or written inquiries at www.finra.org. Financial Industry Regulatory Authority also provides an investor brochure that includes information describing the Public Disclosure Program.
| Nuveen Investments | 73 |
Nuveen Investments:
Serving Investors For Generations
Since 1898, financial advisors and their clients have relied on Nuveen Investments to provide dependable investment solutions. Over this time, Nuveen Investments has adhered to the belief that the best approach to investing is to apply conservative risk-management principles to help minimize volatility.
Building on this tradition, we today offer a range of high quality equity and fixed-income solutions that can be integral parts of a well-diversified core portfolio. Our clients have come to appreciate this diversity, as well as our continued adherence to proven, long-term investing principles.
We offer many different investing solutions
for our clients’ different needs.
Nuveen Investments is a global investment management firm that seeks to help secure the long-term goals of institutions and high net worth investors as well as the consultants and financial advisors who serve them. Nuveen Investments markets its growing range of specialized investment solutions under the high-quality brands of HydePark, NWQ, Nuveen, Santa Barbara, Symphony, Tradewinds and Winslow Capital. In total, the Company managed $128 billion of assets on June 30, 2009.
Find out how we can help you reach your financial goals.
An investor should carefully consider the Fund’s objectives, risks, charges and expenses before investing. For a prospectus containing this and other information about the Fund, please contact your financial advisor or Nuveen Investments at (800) 257-8787. Read the prospectus carefully before you invest or send money.
Learn more about Nuveen Funds at www.nuveen.com/mf
| • | Share prices |
| • | Fund details |
| • | Daily financial news |
| • | Investor education |
Distributed by Nuveen Investments, LLC 333 West Wacker Drive Chicago, IL 60606 www.nuveen.com |
MSA-MS3-0809D
Mutual Funds

Nuveen Municipal Bond Funds
Dependable, tax-free income because it’s not what you earn, it’s what you keep.®
Semi-Annual Report
August 31, 2009
| Nuveen California High Yield Municipal Bond Fund | Nuveen California Municipal Bond Fund | Nuveen California Insured Municipal Bond Fund |
LIFE IS COMPLEX.
Nuveen makes things e-simple.
It only takes a minute to sign up for e-Reports. Once enrolled, you’ll receive an e-mail as soon as your Nuveen Investments Fund information is ready. No more waiting for delivery by regular mail. Just click on the link within the e-mail to see the report and save it on your computer if you wish.
Free e-Reports right to your e-mail!
www.investordelivery.com
If you receive your Nuveen Fund dividends and statements from your financial advisor or brokerage account.
OR
www.nuveen.com/accountaccess
If you receive your Nuveen Fund dividends and statements directly from Nuveen.
| Must be preceded by or accompanied by a prospectus. | NOT FDIC INSURED | MAY LOSE VALUE | NO BANK GUARANTEE |
Chairman’s
Letter to Shareholders

Dear Shareholder,
The financial markets in which your Fund operates continue to reflect the larger economic crosscurrents. The illiquidity that infected global credit markets over the last year appears to be slowly but steadily receding. The major institutions that are the linchpin of the international financial system are strengthening their capital structures, but many still struggle with losses in their various portfolios. There are encouraging signs of recovery in European and Asian economies, while the U.S. economy continues to feel the impact of job losses and an over-borrowed consumer. Global trends include modestly increasing trade and increased concern about the ability of the U.S. government to address its substantial budgetary deficits. Identifying those developments that will define the future is never easy, but rarely is it more difficult than at present.
After considerable volatility in the first few months of 2009, both the fixed-income and equity markets have seen a partial recovery. A fundamental component of a successful long-term investment program is a commitment to remain invested during market downturns in order to be better positioned to benefit from any recovery. Another component is to re-evaluate investment disciplines and tactics and to confirm their validity following periods of extreme volatility and market dislocation, such as we have recently experienced. Your Board carried out an intensive review of investment performance with these objectives in mind during April and May of this year as part of the annual management contract renewal process. I encourage you to read the description of this process in the Annual Investment Management Agreement Approval Process section of this report.
Remaining invested through market downturns and reconfirming the appropriateness of a long term investment strategy is as important for our shareholders as it is for professional investment managers. For that reason, I again encourage you to remain in communication with your financial consultant on these subjects. For recent developments on all your Nuveen Funds, please visit the Nuveen web site: www.nuveen.com.
On behalf of the other members of your Fund’s Board, we look forward to continuing to earn your trust in the months and years ahead.
Sincerely,

Robert P. Bremner
Chairman of the Nuveen Fund Board
October 20, 2009
| Nuveen Investments | 1 |
Portfolio Managers’ Comments
Certain statements in this report are forward-looking statements. Discussions of specific investments are for illustration only and are not intended as recommendations of individual investments. The forward-looking statements and other views expressed herein are those of the portfolio managers as of the date of this report. Actual future results or occurrences may differ significantly from those anticipated in any forward-looking statements and the views expressed herein are subject to change at any time, due to numerous market and other factors. The Funds disclaim any obligation to update publicly or revise any forward-looking statements or views expressed herein.
Portfolio managers John Miller and Scott Romans examine key investment strategies and the Funds’ performance during the six months ending August 31, 2009. John Miller, who has 16 years of investment experience, has managed the Nuveen California High Yield Municipal Bond Fund since its inception in 2006, while Scott Romans, who has nine years of investment experience, has managed the Nuveen California Municipal Bond Fund since 2003 and the Nuveen California Insured Municipal Bond Fund since 2005.
How did the Funds perform during the six-month reporting period?
The chart on page five provides total return performance information for the Funds for the six-month, one-year, five-year and ten-year periods ended August 31, 2009. It compares that performance with each Fund’s corresponding Lipper peer fund average as well as the appropriate national and California-specific Standard & Poor’s (S&P) indexes and the Barclays Capital Municipal Bond Index.
Nuveen California High Yield Municipal Bond Fund
In contrast to the very challenging market backdrop last fall and in early 2009, this six-month period offered an extremely positive environment for investors in high-yield municipal securities. During the six months ended August 31, 2009, the Class A Shares at net asset value of the Nuveen California High Yield Municipal Bond Fund outpaced the Lipper California Municipal Debt Funds Average, the Barclays Capital Municipal Bond Index, the Standard & Poor’s (S&P) Municipal Bond Index and the S&P California Municipal Bond Index.
Several broad trends helped the municipal market as well as the Fund during the six-month period. As the economic prospects of states and municipalities improved, liquidity returned to the municipal bond market and credit spreads – meaning the amount of additional income paid to investors for taking on credit risk – narrowed dramatically from historically wide levels. As spreads narrowed, the prices of lower-rated bonds rose sharply. Secondly, the new “Build America” bond program is a new class of taxable municipal debt created as part of the February 2009 economic stimulus package. They provide municipal issuers with a federal subsidy equal to 35% of the security’s interest payments and therefore offer issuers an attractive alternative to traditional tax-exempt debt.
As investors became more confident about the economy and credit risk, lower-rated, higher-yielding bonds ended up being the market’s best-performing securities as credit spreads narrowed. Throughout the period, the vast majority of the Fund’s assets were held in bonds with credit ratings of BBB and below. These were the securities that did the
| 2 | Nuveen Investments |
worst in the downturn, and they also enjoyed the strongest recovery when conditions turned much more favorable during the six-month period.
Other factors added to performance as well. The Fund benefited from having a relatively long duration compared to our benchmark, meaning that the portfolio had greater price sensitivity to changes in interest rates. This positioning magnified our gains in an environment in which municipal bond investors were willing to assume greater interest rate risk in exchange for higher levels of income.
In addition, roughly 25% of the portfolio was held in land-secured bonds – also called community-development district or “dirt” deals. These bonds make up a significant portion of the California high-yield municipal market. Although many of these development projects continued to underperform as the housing market remained depressed, the ones we chose for the portfolio did considerably better than average – in part because they were recovering off of very low price levels, and in part because they restored investor confidence by continuing to make their interest payments throughout the downturn. In short, the bonds had been priced at significantly distressed levels that never materialized. Once liquidity became more widely available and investors’ risk-aversion abated, our holdings in these land-secured bonds ended up performing very well.
Of final note, health care bonds were a positive source of performance for the Fund. The sector’s credit quality proved more resilient than many investors expected, and our focus on lower-rated health care bonds with stable financial positions added to total returns.
Nuveen California Municipal Bond Fund
Over the six-month period, the Class A Shares at net asset value of the Nuveen California Municipal Bond Fund outperformed the Lipper California Municipal Debt Funds Average, the Barclays Capital Municipal Bond Index, the Standard & Poor’s (S&P) National Municipal Bond Index and the S&P California Municipal Bond Index.
By far, the portfolio was helped the most during this period by its credit-quality make-up. In most market environments, we prefer to be somewhat overweighted in lower-rated bonds to take advantage of what we see as Nuveen’s credit-research advantage. Specifically, we had a higher allocation to bonds with credit ratings of BBB and also, at period end, had more than 11% of the portfolio allocated to non-rated bonds whose financial strength we had thoroughly investigated. As investors became more willing to assume credit risk throughout the period, these lower-rated positions ended up performing quite well. At the same time, the Fund was underweighted in AAA-rated and AA-rated bonds. Both categories also earned positive returns, but their gains were significantly less than those of their lower-rated counterparts.
The Fund’s duration positioning also contributed to positive results, though to a lesser extent than our credit-quality allocations. Our duration was slightly longer than our benchmark, enabling us to benefit to a greater extent from the more-favorable interest rate environment. Allocations to individual bonds in the health care and utility sectors further helped our performance, while an underexposure to toll road bonds – whose long durations typically outperform in market rallies – had a corresponding negative impact on results.
| Nuveen Investments | 3 |
Nuveen California Insured Municipal Bond Fund
Over the six-month period, the Nuveen California Insured Municipal Bond Fund Class A Shares at net asset value outperformed the Lipper Single-State Insured Municipal Debt Funds Average, the national Barclays Capital Municipal Bond index, and the Standard & Poor’s (S&P) National Municipal Bond Index. The Fund lagged the S&P California Municipal Bond Index during the same time frame.
The Fund’s relatively long duration was a positive factor for performance. Owning a greater portion of the portfolio in longer-dated holdings, which are more sensitive to interest rate changes, was helpful during an environment of increasing investor comfort with interest rate risk.
In keeping with our investment mandate, the vast majority of the Fund’s assets were held in insured municipal bonds. By prospectus, however, we can own up to 20% of the portfolio in uninsured issues, which outperformed insured debt during the past six months. To the extent that we did own uninsured bonds, the Fund’s performance was positively affected, as securities with more credit risk outperformed their higher-quality counterparts. We saw especially strong results from some of our health care investments.
| 4 | Nuveen Investments |
| 1 | The Lipper averages shown represent the average annualized total return for all reporting funds in the respective categories for the period ended August 31, 2009. The Lipper California Municipal Debt Funds Average contained 124, 123, 100 and 78 funds and the Lipper Single-State Insured Municipal Debt Funds Average contained 61, 60, 57 and 56 funds for the six-month, one-, five- and ten-year periods, respectively, for the period ended August 31, 2009. The returns account for the effects of management fees and assume reinvestment of dividends, but do not reflect any applicable sales charges. You cannot invest directly in a Lipper Average. |
| 2 | The Standard & Poor’s (S&P) California Municipal Bond Index is an unleveraged, market value-weighted index designed to measure the performance of the investment-grade California municipal bond market. The index does not reflect any initial or ongoing expenses and is not available for direct investment. The Standard & Poor’s (S&P) National Municipal Bond Index is an unleveraged, market value weighted index designed to measure the performance of the investment-grade municipal bond market. The index does not reflect any initial or ongoing expenses and is not available for direct investment. |
| 3 | The Barclays Capital (formerly Lehman Brothers) Municipal Bond Index is an unmanaged, unleveraged index comprised of a broad range of investment-grade municipal bonds. The index does not reflect any initial or ongoing expenses and is not available for direct investment. |
Class A Shares – Average Annual Total Returns
As of 8/31/09
Cumulative Six-Month | Average Annual | |||||||
| 1-Year | 5-Year | 10-Year | ||||||
Nuveen California High Yield Municipal Bond Fund | ||||||||
A Shares at NAV | 15.69% | -9.03% | N/A | N/A | ||||
A Shares at Offer | 10.76% | -12.89% | N/A | N/A | ||||
Lipper California Municipal Debt Funds Average1 | 6.83% | 0.78% | 2.43% | 4.03% | ||||
Standard & Poor’s (S&P) California Municipal Bond Index2 | 5.77% | 3.47% | 3.84% | 5.19% | ||||
Standard & Poor’s (S&P) National Municipal Bond Index2 | 6.49% | 4.68% | 4.00% | 5.30% | ||||
Barclays Capital Municipal Bond Index3 | 5.61% | 5.67% | 4.16% | 5.40% | ||||
Nuveen California Municipal Bond Fund | ||||||||
A Shares at NAV | 7.45% | 0.75% | 2.51% | 3.84% | ||||
A Shares at Offer | 2.96% | -3.49% | 1.64% | 3.39% | ||||
Lipper California Municipal Debt Funds Average1 | 6.83% | 0.78% | 2.43% | 4.03% | ||||
Standard & Poor’s (S&P) California Municipal Bond Index2 | 5.77% | 3.47% | 3.84% | 5.19% | ||||
Standard & Poor’s (S&P) Municipal Bond Index2 | 6.49% | 4.68% | 4.00% | 5.30% | ||||
Barclays Capital Municipal Bond Index3 | 5.61% | 5.67% | 4.16% | 5.40% | ||||
Nuveen California Insured Municipal Bond Fund | ||||||||
A Shares at NAV | 5.67% | 0.33% | 2.17% | 4.00% | ||||
A Shares at Offer | 1.25% | -3.84% | 1.30% | 3.56% | ||||
Lipper Single-State Insured Municipal Debt Funds Average1 | 4.81% | 4.07% | 2.94% | 4.30% | ||||
Standard & Poor’s (S&P) California Municipal Bond Index2 | 5.77% | 3.47% | 3.84% | 5.19% | ||||
Standard & Poor’s (S&P) Municipal Bond Index2 | 6.49% | 4.68% | 4.00% | 5.30% | ||||
Barclays Capital Municipal Bond Index3 | 5.61% | 5.67% | 4.16% | 5.40% | ||||
Returns quoted represent past performance, which is no guarantee of future results. Investment returns and principal value will fluctuate so that when shares are redeemed, they may be worth more or less than their original cost. Returns less than one year are cumulative. Current performance may be higher or lower than the performance shown. Returns at NAV would be lower if the sales charge were included. Class A Shares have a 4.2% maximum sales charge. Returns do not reflect the deduction of taxes that a shareholder would pay on Fund distributions or the redemption of shares. For the most recent month-end performance, visit www.nuveen.com or call (800) 257-8787.
Please see each Fund’s Spotlight Page later in this report for more complete performance data and expense ratios.
| Nuveen Investments | 5 |
What strategies were used to manage the Funds?
Nuveen California High Yield Municipal Bond Fund
Entering the reporting period, many high-yield bonds were trading at extremely depressed prices. In many cases, our research and credit analysis convinced us that the prices were much lower than warranted. We took advantage of the market’s risk aversion to add to existing portfolio positions as well as purchase new bonds that we believed offered our shareholders a particularly favorable risk/reward tradeoff.
While we found more of these value opportunities early in the initial stages of the market’s strong rally, they continued to be evident at various times throughout the past six months. After the market recovery was well underway, for example, we added a BBB-rated health care bond issue with coupon interest of 8.25% and priced at a discount – an extremely favorable structure for a bond issue with a stable financial picture, as our analysis convinced us was the case.
Another area of activity was to add natural gas pre-payment bonds to the portfolio. With these bonds, public utilities enter into financial instruments with Wall Street firms to pre-pay for natural gas supplies. During the financial crisis, the markets became increasingly concerned about Wall Street, causing these gas pre-payment bonds to lag badly. In our opinion, these securities provided very strong long-term values. While we recognized the risks involved, we also felt that those risks were being more than reflected in the extremely low prices at which the securities were trading. In retrospect, our participation in this sector proved helpful. As the market bounced back from its challenges and investors regained confidence in the underlying strength of many large financial institutions, credit spreads on the gas-oriented bonds narrowed and their prices rose, adding nicely to the Fund’s performance.
Elsewhere, we continued to purchase land-secured bonds when we felt their low prices fully compensated investors for the risks involved. Because of problems associated with certain of these development projects, the entire sector has operated under a taint. That perception has started to ease, but to invest successfully in this area, it’s necessary to evaluate individual purchase opportunities on a case-by-case basis, conducting exhaustive research to identify the most creditworthy projects. We did so and, as we mentioned earlier, enjoyed strong results from our investments in this sector.
To manage the portfolio’s risk, we kept it well-diversified across economic sectors, credit quality and regions in the state. We also were cautious about investing in California general obligation (GO) debt, despite those securities’ positive returns during the period, as we saw better value opportunities elsewhere in the market.
Nuveen California Municipal Bond Fund
Our management approach during the six-month period can be divided into two main themes – taking advantage of available opportunities to buy bonds at unusually attractive prices and yields, and monitoring the portfolio’s liquidity in a highly volatile investment environment.
| 6 | Nuveen Investments |
Overall, purchase activity was moderate compared to that in recent years, as investor inflows into the Fund slowed down and bonds regained some of their previously lost value. That said, we were still periodically able to add what we felt were good values to the portfolio. When possible, we continued our approach of opportunistic investing, buying very-low-priced bonds offering high income relative to their credit risk. Many of the best opportunities took place prior to the reporting period, as we wrote about in our last shareholder report. However, we were able to continue this opportunistic buying strategy to a lesser extent early in this six-month time frame. As the municipal market rebounded, many of our recently added positions ended up being very strong performers.
Many of the Fund’s recent purchases were health care bonds, which were widely available during the period because of the sector’s ineligibility to participate in the federal Build America bond program. This ineligibility led to increased health care bond supply, which in turn put downward pressure on prices. Many of the issues available were names that we have long followed and in whose credit quality we had confidence. We believe these bonds can add substantial long-term value for our shareholders.
Given the volatility we have observed in the municipal market, we felt it was prudent to keep the portfolio highly liquid. We were seeing some signs that California investors were diversifying away from bonds in their home state and increasingly toward those in other parts of the country. Accordingly, purchase activity during the period was focused on high-quality, highly liquid bonds – such as water district issues – expected to benefit from strong investor demand, and which we felt would be relatively easy to sell quickly if volatile market conditions demanded it.
Nuveen California Insured Municipal Bond Fund
Portfolio activity was quite limited in the California Insured Fund during the six-month period. As in the uninsured California Fund, we were focused on owning highly liquid bonds just in case investors sought to diversify away from in-state issuers. As we mentioned, we saw preliminary signs that this was occurring. While we weren’t necessarily expecting the trend to accelerate, we saw it as a possibility and wanted to ready the portfolio for increased market volatility.
Accordingly, we avoided selling our pre-refunded bonds, among the most liquid in the portfolio, because of their very strong credit quality and relatively high levels of income. Other sales during the period focused on bonds with structures that have historically seen strong demand from individual investors – typically, those with coupons around 5% and selling at modest discounts – and we were able to obtain decent prices in exchange for these issues.
In the past several years, following the credit rating downgrade of most major municipal bond insurers, it has become increasingly difficult to find suitable AAA-rated insured bonds, which, by prospectus, must make up 80% of the portfolio. Given this criterion, we found no appropriate purchase opportunities during the period but continue to monitor the municipal market for attractively valued bonds we believe can accomplish our portfolio-management objectives.
| Nuveen Investments | 7 |
Recent Developments Regarding Bond Insurance Companies
Another factor that had an impact on the performance of these Funds was their positions in bonds backed by municipal bond insurers that experienced downgrades in their credit ratings. During the period covered by this report, all bond insurers experienced one or more rating reductions by at least one or more rating agencies. At the time this report was prepared, there are no longer any bond insurers rated AAA by more than one of the major rating agencies (Moody’s Investor Service, S&P and Fitch) and at least one rating agency has placed each insurer on “negative credit watch,” “credit outlook/watch developing” “credit outlook/watch negative,” “credit watch evolving,” “rating withdrawn” or “regulatory supervision” which may presage one or more rating reductions for any insurer in the future. As concern increased about the balance sheets of insurers, prices on insured bonds – especially those bonds issued by weaker underlying credits – declined, detracting from the Funds’ performances. By the end of this period, most insured bonds were being valued according to their fundamentals as if they were uninsured. On the whole, the holdings of all of these Funds continued to be well diversified and it is important to note that municipal bonds historically have had a very low rate of default.
Dividend Information
During the reporting period, the Class I Shares of the Nuveen California High Yield Municipal Bond Fund experienced one dividend increase in August 2009. There were no other dividend changes to any of the Funds.
Each Fund seeks to pay dividends at a rate that reflects the past and projected performance of the Fund. To permit a Fund to maintain a more stable monthly dividend, the Fund may pay dividends at a rate that may be more or less than the amount of net investment income actually earned by the Fund during the period. If the Fund has cumulatively earned more than it has paid in dividends, it will hold the excess in reserve as undistributed net investment income (UNII) as part of the Fund’s net asset value. Conversely, if the Fund has cumulatively paid in dividends more than it has earned, the excess will constitute a negative UNII that will likewise be reflected in the Fund’s net asset value. Each Fund will, over time, pay all its net investment income as dividends to shareholders. As of August 31, 2009, all three Funds had a positive UNII balance, based upon our best estimate, for tax purposes and positive UNII balances for financial reporting purposes.
| 8 | Nuveen Investments |
Fund Spotlight as of 8/31/09 Nuveen California High Yield Municipal Bond Fund
| Quick Facts | ||||||||
| A Shares | B Shares | C Shares | I Shares | |||||
Fund Symbols | NCHAX | NCHBX | NCHCX | NCHRX | ||||
NAV | $7.27 | $7.27 | $7.27 | $7.27 | ||||
Latest Monthly Dividend1 | $0.0405 | $0.0365 | $0.0375 | $0.0420 | ||||
Inception Date | 3/28/06 | 3/28/06 | 3/28/06 | 3/28/06 |
Returns quoted represent past performance which is no guarantee of future results. Investment returns and principal value will fluctuate so that when shares are redeemed, they may be worth more or less than their original cost. Current performance may be higher or lower than the performance shown. Returns without sales charges would be lower if the sales charge were included. Returns do not reflect the deduction of taxes that a shareholder would pay on Fund distributions or the redemption of shares. Income is generally exempt from regular federal income taxes. Some income may be subject to state and local taxes and to the federal alternative minimum tax. Capital gains, if any, are subject to tax. For the most recent month-end performance visit www.nuveen.com or call (800) 257-8787.
Returns reflect differences in sales charges and expenses, which are primarily differences in distribution and service fees. Fund returns assume reinvestment of dividends and capital gains. Class A Shares have a 4.2% maximum sales charge. Class A Share purchases of $1 million or more are sold at net asset value without an up-front sales charge but may be subject to a contingent deferred sales charge (CDSC), also known as a backend sales charge, if redeemed within twelve months of purchase. Class B Shares have a CDSC that begins at 5% for redemptions during the first year and declines periodically until after six years when the charge becomes 0%. Class B Shares automatically convert to Class A Shares eight years after purchase. Class C Shares have a 1% CDSC for redemptions within less than one year, which is not reflected in the one-year total return. Class I Shares have no sales charge and may be purchased under limited circumstances or by specified classes of investors. Returns may reflect an expense limitation by the Fund’s investment adviser.
| Average Annual Total Returns as of 8/31/09 | ||||
| A Shares | NAV | Offer | ||
1-Year | -9.03% | -12.89% | ||
Since Inception | -3.98% | -5.18% | ||
| B Shares | w/o CDSC | w/CDSC | ||
1-Year | -9.63% | -13.03% | ||
Since Inception | -4.70% | -5.43% | ||
| C Shares | NAV | |||
1-Year | -9.54% | |||
Since Inception | -4.52% | |||
| I Shares | NAV | |||
1-Year | -8.85% | |||
Since Inception | -3.80% | |||
| Tax-Free Yields | ||||
| A Shares | NAV | Offer | ||
Dividend Yield2 | 6.69% | 6.40% | ||
30-Day Yield2 | 6.87% | — | ||
SEC 30-Day Yield2,3 | — | 6.58% | ||
Taxable-Equivalent Yield3,4 | 10.55% | 10.11% | ||
| B Shares | NAV | |||
Dividend Yield2 | 6.02% | |||
30-Day Yield2 | 6.14% | |||
Taxable-Equivalent Yield4 | 9.43% | |||
| C Shares | NAV | |||
Dividend Yield2 | 6.19% | |||
30-Day Yield2 | 6.38% | |||
Taxable-Equivalent Yield4 | 9.80% | |||
| I Shares | NAV | |||
Dividend Yield2 | 6.93% | |||
SEC 30-Day Yield2 | 7.11% | |||
Taxable-Equivalent Yield4 | 10.92% | |||
| Average Annual Total Returns as of 9/30/09 | ||||
| A Shares | NAV | Offer | ||
1-Year | 9.57% | -4.92% | ||
Since Inception | -0.88% | -2.09% | ||
| B Shares | w/o CDSC | w/CDSC | ||
1-Year | 8.62% | -4.62% | ||
Since Inception | -1.66% | -2.38% | ||
| C Shares | NAV | |||
1-Year | 8.84% | |||
Since Inception | -1.44% | |||
| I Shares | NAV | |||
1-Year | 9.66% | |||
Since Inception | -0.73% | |||
| Portfolio Statistics | ||
Net Assets ($000) | $66,194 | |
Average Effective Maturity on Securities (Years) | 25.44 | |
Average Duration | 11.78 | |
| Expense Ratios | ||||
| Share Class | Gross Expense Ratios | As of Date | ||
| Class A | 0.92% | 2/28/09 | ||
| Class B | 1.67% | 2/28/09 | ||
| Class C | 1.47% | 2/28/09 | ||
| Class I | 0.72% | 2/28/09 |
The expense ratios shown factor in Total Annual Fund Operating Expenses including management fees and other fees and expenses but excluding interest expense on floating rate obligations, if any.
| 1 | Paid September 1, 2009. This is the latest monthly tax-exempt dividend declared during the period ended August 31, 2009. |
| 2 | Dividend Yield is the most recent dividend per share (annualized) divided by the appropriate price per share. The SEC 30-Day Yield is computed under an SEC standardized formula and is based on the maximum offer price per share. The 30-Day Yield is computed under the same formula but is based on the Net Asset Value (NAV) per share. The Dividend Yield may differ from the SEC 30-Day Yield because the Fund may be paying out more or less than it is earning and it may not include the effect of amortization of bond premium. |
| 3 | The SEC 30-Day Yield and Taxable-Equivalent Yield on A Shares at NAV applies only to A Shares purchased at no-load pursuant to the Fund’s policy permitting waiver of the A Share load in certain specified circumstances. |
| 4 | The Taxable-Equivalent Yield represents the yield that must be earned on a fully taxable investment in order to equal the yield of the Fund on an after-tax basis at a specified tax rate. With respect to investments that generate qualified dividend income that is taxable at a maximum rate of 15%, the Taxable-Equivalent Yield is lower. The Taxable-Equivalent Yield is based on the Fund’s 30-Day Yield on the indicated date and a combined federal and state income tax rate of 34.9%. |
| Nuveen Investments | 9 |
Fund Spotlight as of 8/31/09 Nuveen California High Yield Municipal Bond Fund
Bond Credit Quality1
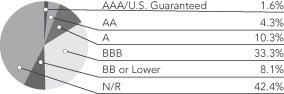
| Portfolio Composition1 | ||
Tax Obligation/Limited | 26.9% | |
Health Care | 19.3% | |
Education and Civic Organizations | 13.6% | |
Utilities | 6.8% | |
Industrials | 6.5% | |
Consumer Staples | 5.6% | |
Long-Term Care | 5.1% | |
Housing/Multifamily | 4.5% | |
Other | 11.7% |
| 1 | As a percentage of total investments, excluding investments in derivatives, as of August 31, 2009. Holdings are subject to change. |
Expense Example
As a shareholder of the Fund, you incur two types of costs: (1) transaction costs, including front and back end sales charges (loads) or redemption fees, where applicable; and (2) ongoing costs, including management fees; distribution and service (12b-1) fees, where applicable; and other Fund expenses. This Example is intended to help you understand your ongoing costs (in dollars) of investing in the Fund and to compare these costs with the ongoing costs of investing in other mutual funds.
The Example below is based on an investment of $1,000 invested at the beginning of the period and held for the period.
The information under “Actual Performance,” together with the amount you invested, allows you to estimate actual expenses incurred over the reporting period. Simply divide your account value by $1,000 (for example, an $8,600 account value divided by $1,000 = 8.60) and multiply the result by the cost shown for your share class, in the row entitled “Expenses Incurred During Period” to estimate the expenses incurred on your account during this period.
The information under “Hypothetical Performance,” provides information about hypothetical account values and hypothetical expenses based on the Fund’s actual expense ratio and an assumed rate of return of 5% per year before expenses, which is not the Fund’s actual return. The hypothetical account values and expenses may not be used to estimate the actual ending account balance or expense you incurred for the period. You may use this information to compare the ongoing costs of investing in the Fund and other Funds. To do so, compare this 5% hypothetical example with the 5% hypothetical examples that appear in the shareholder reports of the other funds.
Please note that the expenses shown in the table are meant to highlight your ongoing costs only and do not reflect any transactional costs, such as front and back end sales charges (loads) or redemption fees, where applicable. Therefore, the hypothetical information is useful in comparing ongoing costs only, and will not help you determine the relative total costs of owning different funds or share classes. In addition, if these transactional costs were included, your costs would have been higher.
| Hypothetical Performance | ||||||||||||||||||||||||||
| Actual Performance | (5% annualized return before expenses) | |||||||||||||||||||||||||
| A Shares | B Shares | C Shares | I Shares | A Shares | B Shares | C Shares | I Shares | |||||||||||||||||||
| Beginning Account Value (3/01/09) | $ | 1,000.00 | $ | 1,000.00 | $ | 1,000.00 | $ | 1,000.00 | $ | 1,000.00 | $ | 1,000.00 | $ | 1,000.00 | $ | 1,000.00 | ||||||||||
| Ending Account Value (8/31/09) | $ | 1,156.90 | $ | 1,152.90 | $ | 1,153.90 | $ | 1,159.80 | $ | 1,020.42 | $ | 1,016.64 | $ | 1,017.64 | $ | 1,021.42 | ||||||||||
| Expenses Incurred During Period | $ | 5.16 | $ | 9.23 | $ | 8.14 | $ | 4.08 | $ | 4.84 | $ | 8.64 | $ | 7.63 | $ | 3.82 | ||||||||||
For each class of the Fund, expenses are equal to the Fund’s annualized net expense ratio of .95%, 1.70%, 1.50% and .75% for Classes A, B, C and I, respectively, multiplied by the average account value over the period, multiplied by 184/365 (to reflect the one-half year period).
| 10 | Nuveen Investments |
Fund Spotlight as of 8/31/09 Nuveen California Municipal Bond Fund
| Quick Facts | ||||||||
| A Shares | B Shares | C Shares | I Shares | |||||
Fund Symbols | NCAAX | NCBBX | NCACX | NCSPX | ||||
NAV | $9.40 | $9.39 | $9.37 | $9.38 | ||||
Latest Monthly Dividend1 | $0.0365 | $0.0310 | $0.0325 | $0.0380 | ||||
Inception Date | 9/07/94 | 3/07/97 | 9/19/94 | 7/01/86 |
Returns quoted represent past performance which is no guarantee of future results. Investment returns and principal value will fluctuate so that when shares are redeemed, they may be worth more or less than their original cost. Current performance may be higher or lower than the performance shown. Returns without sales charges would be lower if the sales charge were included. Returns do not reflect the deduction of taxes that a shareholder would pay on Fund distributions or the redemption of shares. Income is generally exempt from regular federal income taxes. Some income may be subject to state and local taxes and to the federal alternative minimum tax. Capital gains, if any, are subject to tax. For the most recent month-end performance visit www.nuveen.com or call (800) 257-8787.
Returns reflect differences in sales charges and expenses, which are primarily differences in distribution and service fees. Fund returns assume reinvestment of dividends and capital gains. Class A Shares have a 4.2% maximum sales charge. Class A Share purchases of $1 million or more are sold at net asset value without an up-front sales charge but may be subject to a contingent deferred sales charge (CDSC), also known as a backend sales charge, if redeemed within twelve months of purchase. Class B Shares have a CDSC that begins at 5% for redemptions during the first year and declines periodically until after six years when the charge becomes 0%. Class B Shares automatically convert to Class A Shares eight years after purchase. Class C Shares have a 1% CDSC for redemptions within less than one year, which is not reflected in the one-year total return. Class I Shares have no sales charge and may be purchased under limited circumstances or by specified classes of investors. Returns may reflect an expense limitation by the Fund’s investment adviser.
| Average Annual Total Returns as of 8/31/09 | ||||
| A Shares | NAV | Offer | ||
1-Year | 0.75% | -3.49% | ||
5-Year | 2.51% | 1.64% | ||
10-Year | 3.84% | 3.39% | ||
| B Shares | w/o CDSC | w/CDSC | ||
1-Year | -0.10% | -3.94% | ||
5-Year | 1.73% | 1.56% | ||
10-Year | 3.22% | 3.22% | ||
| C Shares | NAV | |||
1-Year | 0.10% | |||
5-Year | 1.94% | |||
10-Year | 3.26% | |||
| I Shares | NAV | |||
1-Year | 0.86% | |||
5-Year | 2.71% | |||
10-Year | 4.03% | |||
| Tax-Free Yields | ||||
| A Shares | NAV | Offer | ||
Dividend Yield2 | 4.66% | 4.46% | ||
30-Day Yield2 | 4.61% | — | ||
SEC 30-Day Yield2,3 | — | 4.42% | ||
Taxable-Equivalent Yield3,4 | 7.08% | 6.79% | ||
| B Shares | NAV | |||
Dividend Yield2 | 3.96% | |||
30-Day Yield2 | 3.87% | |||
Taxable-Equivalent Yield4 | 5.94% | |||
| C Shares | NAV | |||
Dividend Yield2 | 4.16% | |||
30-Day Yield2 | 4.07% | |||
Taxable-Equivalent Yield4 | 6.25% | |||
| I Shares | NAV | |||
Dividend Yield2 | 4.86% | |||
SEC 30-Day Yield2 | 4.81% | |||
Taxable-Equivalent Yield4 | 7.39% | |||
| Average Annual Total Returns as of 9/30/09 | ||||
| A Shares | NAV | Offer | ||
1-Year | 13.43% | 8.72% | ||
5-Year | 3.64% | 2.75% | ||
10-Year | 4.50% | 4.06% | ||
| B Shares | w/o CDSC | w/CDSC | ||
1-Year | 12.49% | 8.49% | ||
5-Year | 2.88% | 2.70% | ||
10-Year | 3.89% | 3.89% | ||
| C Shares | NAV | |||
1-Year | 12.75% | |||
5-Year | 3.09% | |||
10-Year | 3.93% | |||
| I Shares | NAV | |||
1-Year | 13.68% | |||
5-Year | 3.86% | |||
10-Year | 4.72% | |||
| Portfolio Statistics | ||
| Net Assets ($000) | $290,454 | |
| Average Effective Maturity on Securities (Years) | 18.89 | |
| Average Duration | 7.84 | |
| Expense Ratios | ||||
| Share Class | Gross Expense Ratios | As of Date | ||
| Class A | 0.85% | 2/28/09 | ||
| Class B | 1.60% | 2/28/09 | ||
| Class C | 1.40% | 2/28/09 | ||
| Class I | 0.65% | 2/28/09 |
The expense ratios shown factor in Total Annual Fund Operating Expenses including management fees and other fees and expenses but excluding interest expense on floating rate obligations, if any.
| 1 | Paid September 1, 2009. This is the latest monthly tax-exempt dividend declared during the period ended August 31, 2009. |
| 2 | Dividend Yield is the most recent dividend per share (annualized) divided by the appropriate price per share. The SEC 30-Day Yield is computed under an SEC standardized formula and is based on the maximum offer price per share. The 30-Day Yield is computed under the same formula but is based on the Net Asset Value (NAV) per share. The Dividend Yield may differ from the SEC 30-Day Yield because the Fund may be paying out more or less than it is earning and it may not include the effect of amortization of bond premium. |
| 3 | The SEC 30-Day Yield and Taxable-Equivalent Yield on A Shares at NAV applies only to A Shares purchased at no-load pursuant to the Fund’s policy permitting waiver of the A Share load in certain specified circumstances. |
| 4 | The Taxable-Equivalent Yield represents the yield that must be earned on a fully taxable investment in order to equal the yield of the Fund on an after-tax basis at a specified tax rate. With respect to investments that generate qualified dividend income that is taxable at a maximum rate of 15%, the Taxable-Equivalent Yield is lower. The Taxable-Equivalent Yield is based on the Fund’s 30-Day Yield on the indicated date and a combined federal and state income tax rate of 34.9%. |
| Nuveen Investments | 11 |
Fund Spotlight as of 8/31/09 Nuveen California Municipal Bond Fund
Bond Credit Quality1
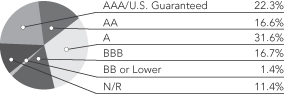
| Portfolio Composition1 | ||
Tax Obligation/Limited | 24.3% | |
Health Care | 23.9% | |
U.S. Guaranteed | 10.9% | |
Tax Obligation/General | 7.3% | |
Utilities | 7.2% | |
Transportation | 5.6% | |
Water and Sewer | 5.1% | |
Long-Term Care | 5.0% | |
Other | 10.7% |
| 1 | As a percentage of total investments as of August 31, 2009. Holdings are subject to change. |
Expense Example
As a shareholder of the Fund, you incur two types of costs: (1) transaction costs, including front and back end sales charges (loads) or redemption fees, where applicable; and (2) ongoing costs, including management fees; distribution and service (12b-1) fees, where applicable; and other Fund expenses. This Example is intended to help you understand your ongoing costs (in dollars) of investing in the Fund and to compare these costs with the ongoing costs of investing in other mutual funds.
The Example below is based on an investment of $1,000 invested at the beginning of the period and held for the period.
The information under “Actual Performance,” together with the amount you invested, allows you to estimate actual expenses incurred over the reporting period. Simply divide your account value by $1,000 (for example, an $8,600 account value divided by $1,000 = 8.60) and multiply the result by the cost shown for your share class, in the row entitled “Expenses Incurred During Period” to estimate the expenses incurred on your account during this period.
The information under “Hypothetical Performance,” provides information about hypothetical account values and hypothetical expenses based on the Fund’s actual expense ratio and an assumed rate of return of 5% per year before expenses, which is not the Fund’s actual return. The hypothetical account values and expenses may not be used to estimate the actual ending account balance or expense you incurred for the period. You may use this information to compare the ongoing costs of investing in the Fund and other Funds. To do so, compare this 5% hypothetical example with the 5% hypothetical examples that appear in the shareholder reports of the other funds.
Please note that the expenses shown in the table are meant to highlight your ongoing costs only and do not reflect any transactional costs, such as front and back end sales charges (loads) or redemption fees, where applicable. Therefore, the hypothetical information is useful in comparing ongoing costs only, and will not help you determine the relative total costs of owning different funds or share classes. In addition, if these transactional costs were included, your costs would have been higher.
| Hypothetical Performance | ||||||||||||||||||||||||||
| Actual Performance | (5% annualized return before expenses) | |||||||||||||||||||||||||
| A Shares | B Shares | C Shares | I Shares | A Shares | B Shares | C Shares | I Shares | |||||||||||||||||||
| Beginning Account Value (3/01/09) | $ | 1,000.00 | $ | 1,000.00 | $ | 1,000.00 | $ | 1,000.00 | $ | 1,000.00 | $ | 1,000.00 | $ | 1,000.00 | $ | 1,000.00 | ||||||||||
| Ending Account Value (8/31/09) | $ | 1,074.50 | $ | 1,069.50 | $ | 1,070.70 | $ | 1,074.50 | $ | 1,020.87 | $ | 1,017.14 | $ | 1,018.10 | $ | 1,021.88 | ||||||||||
| Expenses Incurred During Period | $ | 4.50 | $ | 8.35 | $ | 7.36 | $ | 3.45 | $ | 4.38 | $ | 8.13 | $ | 7.17 | $ | 3.36 | ||||||||||
For each class of the Fund, expenses are equal to the Fund’s annualized net expense ratio of .86%, 1.60%, 1.41% and .66% for Classes A, B, C and I, respectively, multiplied by the average account value over the period, multiplied by 184/365 (to reflect the one-half year period).
| 12 | Nuveen Investments |
Fund Spotlight as of 8/31/09 Nuveen California Insured Municipal Bond Fund
| Quick Facts | ||||||||
| A Shares | B Shares | C Shares | I Shares | |||||
Fund Symbols | NCAIX | NCABX | NCAKX | NCIBX | ||||
NAV | $9.72 | $9.75 | $9.68 | $9.74 | ||||
Latest Monthly Dividend1 | $0.0345 | $0.0285 | $0.0300 | $0.0360 | ||||
Latest Capital Gain Distribution2 | $0.0142 | $0.0142 | $0.0142 | $0.0142 | ||||
Inception Date | 9/07/94 | 3/07/97 | 9/13/94 | 7/01/86 |
Returns quoted represent past performance which is no guarantee of future results. Investment returns and principal value will fluctuate so that when shares are redeemed, they may be worth more or less than their original cost. Current performance may be higher or lower than the performance shown. Returns without sales charges would be lower if the sales charge were included. Returns do not reflect the deduction of taxes that a shareholder would pay on Fund distributions or the redemption of shares. Income is generally exempt from regular federal income taxes. Some income may be subject to state and local taxes and to the federal alternative minimum tax. Capital gains, if any, are subject to tax. For the most recent month-end performance visit www.nuveen.com or call (800) 257-8787.
Returns reflect differences in sales charges and expenses, which are primarily differences in distribution and service fees. Fund returns assume reinvestment of dividends and capital gains. Class A Shares have a 4.2% maximum sales charge. Class A Share purchases of $1 million or more are sold at net asset value without an up-front sales charge but may be subject to a contingent deferred sales charge (CDSC), also known as a backend sales charge, if redeemed within twelve months of purchase. Class B Shares have a CDSC that begins at 5% for redemptions during the first year and declines periodically until after six years when the charge becomes 0%. Class B Shares automatically convert to Class A Shares eight years after purchase. Class C Shares have a 1% CDSC for redemptions within less than one year, which is not reflected in the one-year total return. Class I Shares have no sales charge and may be purchased under limited circumstances or by specified classes of investors. Returns may reflect an expense limitation by the Fund’s investment adviser.
| Average Annual Total Returns as of 8/31/09 | ||||
| A Shares | NAV | Offer | ||
1-Year | 0.33% | -3.84% | ||
5-Year | 2.17% | 1.30% | ||
10-Year | 4.00% | 3.56% | ||
| B Shares | w/o CDSC | w/CDSC | ||
1-Year | -0.44% | -4.28% | ||
5-Year | 1.42% | 1.25% | ||
10-Year | 3.38% | 3.38% | ||
| C Shares | NAV | |||
1-Year | -0.25% | |||
5-Year | 1.63% | |||
10-Year | 3.44% | |||
| I Shares | NAV | |||
1-Year | 0.53% | |||
5-Year | 2.38% | |||
10-Year | 4.21% | |||
| Tax-Free Yields | ||||
| A Shares | NAV | Offer | ||
Dividend Yield3 | 4.26% | 4.08% | ||
30-Day Yield3 | 4.38% | — | ||
SEC 30-Day Yield3,4 | — | 4.19% | ||
Taxable-Equivalent Yield4,5 | 6.73% | 6.44% | ||
| B Shares | NAV | |||
Dividend Yield3 | 3.51% | |||
30-Day Yield3 | 3.63% | |||
Taxable-Equivalent Yield5 | 5.58% | |||
| C Shares | NAV | |||
Dividend Yield3 | 3.72% | |||
30-Day Yield3 | 3.83% | |||
Taxable-Equivalent Yield5 | 5.88% | |||
| I Shares | NAV | |||
Dividend Yield3 | 4.44% | |||
SEC 30-Day Yield3 | 4.57% | |||
Taxable-Equivalent Yield5 | 7.02% | |||
| Average Annual Total Returns as of 9/30/09 | ||||
| A Shares | NAV | Offer | ||
1-Year | 13.46% | 8.65% | ||
5-Year | 3.30% | 2.42% | ||
10-Year | 4.66% | 4.20% | ||
| B Shares | w/o CDSC | w/CDSC | ||
1-Year | 12.55% | 8.55% | ||
5-Year | 2.52% | 2.35% | ||
10-Year | 4.02% | 4.02% | ||
| C Shares | NAV | |||
1-Year | 12.75% | |||
5-Year | 2.72% | |||
10-Year | 4.08% | |||
| I Shares | NAV | |||
1-Year | 13.54% | |||
5-Year | 3.49% | |||
10-Year | 4.86% | |||
| Portfolio Statistics | ||
| Net Assets ($000) | $187,871 | |
| Average Effective Maturity on Securities (Years) | 19.96 | |
| Average Duration | 8.48 | |
| Expense Ratios | ||||
| Share Class | Gross Expense Ratios | As of Date | ||
| Class A | 0.85% | 2/28/09 | ||
| Class B | 1.60% | 2/28/09 | ||
| Class C | 1.40% | 2/28/09 | ||
| Class I | 0.65% | 2/28/09 |
The expense ratios shown factor in Total Annual Fund Operating Expenses including management fees and other fees and expenses but excluding interest expense on floating rate obligations, if any.
| 1 | Paid September 1, 2009. This is the latest monthly tax-exempt dividend declared during the period ended August 31, 2009. |
| 2 | Paid November 12, 2008. Capital gains are subject to federal taxation. |
| 3 | Dividend Yield is the most recent dividend per share (annualized) divided by the appropriate price per share. The SEC 30-Day Yield is computed under an SEC standardized formula and is based on the maximum offer price per share. The 30-Day Yield is computed under the same formula but is based on the Net Asset Value (NAV) per share. The Dividend Yield may differ from the SEC 30-Day Yield because the Fund may be paying out more or less than it is earning and it may not include the effect of amortization of bond premium. |
| 4 | The SEC 30-Day Yield and Taxable-Equivalent Yield on A Shares at NAV applies only to A Shares purchased at no-load pursuant to the Fund’s policy permitting waiver of the A Share load in certain specified circumstances. |
| 5 | The Taxable-Equivalent Yield represents the yield that must be earned on a fully taxable investment in order to equal the yield of the Fund on an after-tax basis at a specified tax rate. With respect to investments that generate qualified dividend income that is taxable at a maximum rate of 15%, the Taxable-Equivalent Yield is lower. The Taxable-Equivalent Yield is based on the Fund’s 30-Day Yield on the indicated date and a combined federal and state income tax rate of 34.9%. |
| Nuveen Investments | 13 |
Fund Spotlight as of 8/31/09 Nuveen California Insured Municipal Bond Fund
Bond Credit Quality1,2
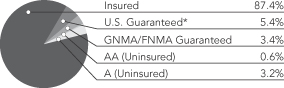
At least 80% of the Fund’s net assets are invested in municipal securities that guarantee the timely payment of principal and interest. See Notes to Financial Statements, Footnote 1 – Insurance, for more information.
| * | U.S. Guaranteed includes 5.4% (as a % of total investments) of Insured securities. |
| Portfolio Composition2 | ||
Tax Obligation/Limited | 25.6% | |
Tax Obligation/General | 18.4% | |
Health Care | 14.3% | |
Transportation | 9.3% | |
Utilities | 6.9% | |
Housing/Single Family | 5.5% | |
U.S. Guaranteed | 5.4% | |
Education and Civic Organizations | 5.1% | |
Other | 9.5% |
| Insurers3 | ||
NPFG4 | 36.3% | |
AMBAC | 25.2% | |
FGIC | 15.7% | |
FSA | 14.8% | |
Other | 8.0% |
| 1 | The percentages shown in the foregoing chart may reflect the ratings on certain bonds whose insurer has experienced downgrades as of the end of the reporting period. Please see the Portfolio Managers’ Comments for an expanded discussion of the affect on the Fund of changes to the ratings of certain bonds in the portfolio resulting from changes to the ratings of the underlying insurers both during the period and after period end. |
| 2 | As a percentage of total investments as of August 31, 2009. Holdings are subject to change. |
| 3 | As a percentage of total Insured investments as of August 31, 2009. Holdings are subject to change. |
| 4 | MBIA’s public finance subsidiary. |
Expense Example
As a shareholder of the Fund, you incur two types of costs: (1) transaction costs, including front and back end sales charges (loads) or redemption fees, where applicable; and (2) ongoing costs, including management fees; distribution and service (12b-1) fees, where applicable; and other Fund expenses. This Example is intended to help you understand your ongoing costs (in dollars) of investing in the Fund and to compare these costs with the ongoing costs of investing in other mutual funds.
The Example below is based on an investment of $1,000 invested at the beginning of the period and held for the period.
The information under “Actual Performance,” together with the amount you invested, allows you to estimate actual expenses incurred over the reporting period. Simply divide your account value by $1,000 (for example, an $8,600 account value divided by $1,000 = 8.60) and multiply the result by the cost shown for your share class, in the row entitled “Expenses Incurred During Period” to estimate the expenses incurred on your account during this period.
The information under “Hypothetical Performance,” provides information about hypothetical account values and hypothetical expenses based on the Fund’s actual expense ratio and an assumed rate of return of 5% per year before expenses, which is not the Fund’s actual return. The hypothetical account values and expenses may not be used to estimate the actual ending account balance or expense you incurred for the period. You may use this information to compare the ongoing costs of investing in the Fund and other Funds. To do so, compare this 5% hypothetical example with the 5% hypothetical examples that appear in the shareholder reports of the other funds.
Please note that the expenses shown in the table are meant to highlight your ongoing costs only and do not reflect any transactional costs, such as front and back end sales charges (loads) or redemption fees, where applicable. Therefore, the hypothetical information is useful in comparing ongoing costs only, and will not help you determine the relative total costs of owning different funds or share classes. In addition, if these transactional costs were included, your costs would have been higher.
| Hypothetical Performance | ||||||||||||||||||||||||||
| Actual Performance | (5% annualized return before expenses) | |||||||||||||||||||||||||
| A Shares | B Shares | C Shares | I Shares | A Shares | B Shares | C Shares | I Shares | |||||||||||||||||||
| Beginning Account Value (3/01/09) | $ | 1,000.00 | $ | 1,000.00 | $ | 1,000.00 | $ | 1,000.00 | $ | 1,000.00 | $ | 1,000.00 | $ | 1,000.00 | $ | 1,000.00 | ||||||||||
| Ending Account Value (8/31/09) | $ | 1,056.70 | $ | 1,052.60 | $ | 1,054.00 | $ | 1,057.60 | $ | 1,020.87 | $ | 1,017.09 | $ | 1,018.10 | $ | 1,021.88 | ||||||||||
| Expenses Incurred During Period | $ | 4.46 | $ | 8.33 | $ | 7.30 | $ | 3.42 | $ | 4.38 | $ | 8.19 | $ | 7.17 | $ | 3.36 | ||||||||||
For each class of the Fund, expenses are equal to the Fund’s annualized net expense ratio of .86%, 1.61%, 1.41% and .66% for Classes A, B, C and I, respectively, multiplied by the average account value over the period, multiplied by 184/365 (to reflect the one-half year period).
| 14 | Nuveen Investments |
Portfolio of Investments (Unaudited)
Nuveen California High Yield Municipal Bond Fund
August 31, 2009
| Principal Amount (000) | Description (1) | Optional Call Provisions (2) | Ratings (3) | Value | ||||||
Consumer Discretionary – 3.5% | ||||||||||
| $ | 300 | Austin Convention Enterprises Inc., Texas, Convention Center Hotel Revenue Bonds, First Tier Series 2001C-1, 9.750%, 1/01/26 | 1/11 at 100.00 | N/R | $ | 245,664 | ||||
| 1,000 | Lombard Public Facilities Corporation, Illinois, First Tier Conference Center and Hotel Revenue Bonds, Series 2005A-2, 5.500%, 1/01/36 – ACA Insured | 1/16 at 100.00 | B+ | 606,700 | ||||||
| 1,000 | Louisiana Local Government Environmental Facilities and Community Development Authority, Revenue Bonds, Southgate Suites Hotel LLC Project, Series 2007A, 6.750%, 12/15/37 | 12/17 at 100.00 | N/R | 715,100 | ||||||
| 500 | Morongo Band of Mission Indians, California, Enterprise Revenue Bonds, | 3/18 at 100.00 | N/R | 412,920 | ||||||
| 420 | Norfolk Economic Development Authority, Virginia, Empowerment Zone Facility Revenue Bonds, BBL Old Dominion University LLC Project Revenue Bonds, Series 2006B, 5.625%, 11/01/15 (Alternative Minimum Tax) | No Opt. Call | N/R | 347,945 | ||||||
| 3,220 | Total Consumer Discretionary | 2,328,329 | ||||||||
Consumer Staples – 5.6% | ||||||||||
| 1,000 | California County Tobacco Securitization Agency, Tobacco Settlement Asset-Backed Bonds, Golden Gate Tobacco Funding Corporation, Turbo, Series 2007A, 5.000%, 6/01/47 | 6/17 at 100.00 | N/R | 672,960 | ||||||
| Golden State Tobacco Securitization Corporation, California, Enhanced Tobacco Settlement Asset-Backed Bonds, Series 2007A-1: | ||||||||||
| 250 | 5.125%, 6/01/47 | 6/17 at 100.00 | BBB | 175,488 | ||||||
| 2,100 | 5.750%, 6/01/47 | 6/17 at 100.00 | BBB | 1,638,021 | ||||||
| Tobacco Securitization Authority of Southern California, Tobacco Settlement Asset-Backed Bonds, San Diego County Tobacco Asset Securitization Corporation, Senior Series 2001A: | ||||||||||
| 50 | 5.000%, 6/01/37 | 6/14 at 100.00 | BBB | 38,023 | ||||||
| 750 | 5.125%, 6/01/46 | 6/14 at 100.00 | BBB | 517,373 | ||||||
| 620 | Virgin Islands Public Finance Authority, Matching Fund Revenue Loan Note – Diageo Project, Series 2009A, 6.750%, 10/01/37 | 10/19 at 100.00 | Baa3 | 632,939 | ||||||
| 4,770 | Total Consumer Staples | 3,674,804 | ||||||||
Education and Civic Organizations – 13.5% | ||||||||||
| 1,325 | California Educational Facilities Authority Revenue Bonds (California Lutheran University) Series 2008, 5.750%, 10/01/38 | 10/18 at 100.00 | Baa1 | 1,250,124 | ||||||
| 1,065 | California Educational Facilities Authority, Revenue Bonds, Dominican University, Series 2006, 5.000%, 12/01/36 | 12/16 at 100.00 | Baa3 | 785,320 | ||||||
| 75 | California Educational Facilities Authority, Revenue Bonds, University of Redlands, Series 2005A, 5.000%, 10/01/35 | 10/15 at 100.00 | A3 | 69,541 | ||||||
| 100 | California Educational Facilities Authority, Revenue Bonds, University of the Pacific, Series 2006, 5.000%, 11/01/36 | 11/15 at 100.00 | A2 | 86,550 | ||||||
| 1,165 | California Educational Facilities Authority, Revenue Bonds, Woodbury University, Series 2006, 5.000%, 1/01/30 | 1/15 at 100.00 | BBB– | 886,786 | ||||||
| 1,000 | California Municipal Finance Authority, Education Revenue Bonds, American Heritage Education Foundation Project, Series 2006A, 5.250%, 6/01/36 | 6/16 at 100.00 | BBB– | 746,770 | ||||||
| 1,335 | California Municipal Finance Authority, Educational Facilities Revenue Bonds, OCEAA Project, Series 2008A, 7.000%, 10/01/39 | No Opt. Call | N/R | 1,139,369 | ||||||
| 1,000 | California Municipal Finance Authority, Revenue Refunding Bonds, Biola University, Series 2008A, 5.875%, 10/01/34 | 4/18 at 100.00 | Baa1 | 965,010 | ||||||
| 1,065 | California Statewide Community Development Authority, Revenue Bonds, Drew School, Series 2007, 5.300%, 10/01/37 | 10/15 at 102.00 | N/R | 731,580 | ||||||
| 200 | California Statewide Community Development Authority, Revenue Bonds, International School of the Peninsula, Palo Alto, California, Series 2006, 5.000%, 11/01/29 | 11/16 at 100.00 | N/R | 135,370 | ||||||
| Nuveen Investments | 15 |
Portfolio of Investments (Unaudited)
Nuveen California High Yield Municipal Bond Fund (continued)
August 31, 2009
| Principal Amount (000) | Description (1) | Optional Call Provisions (2) | Ratings (3) | Value | ||||||
Education and Civic Organizations (continued) | ||||||||||
| $ | 400 | California Statewide Community Development Authority, Revenue Bonds, Montessori in Redlands School, Series 2007A, 5.125%, 12/01/36 | 12/16 at 100.00 | N/R | $ | 257,708 | ||||
| 100 | California Statewide Community Development Authority, Revenue Bonds, Viewpoint School, Series 2004, 5.000%, 10/01/28 – ACA Insured | 10/14 at 100.00 | BBB | 78,447 | ||||||
| 200 | Hawaii State Department of Budget and Finance, Private School Revenue Bonds, Montessori of Maui, Series 2007, 5.500%, 1/01/37 | 2/17 at 100.00 | N/R | 140,542 | ||||||
| 600 | La Vernia Education Financing Corporation, Texas, Charter School Revenue Bonds, Riverwalk Education Foundation, Series 2007A, 5.450%, 8/15/36 | 8/11 at 100.00 | N/R | 407,280 | ||||||
| 110 | Pima County Industrial Development Authority, Arizona, Charter School Revenue Bonds, Franklin Phonetic Charter School, Series 2006, 5.750%, 7/01/36 | 7/16 at 100.00 | N/R | 77,815 | ||||||
| 100 | Pima County Industrial Development Authority, Arizona, Choice Education and Development Charter School Revenue Bonds, Series 2006, 6.375%, 6/01/36 | 6/16 at 100.00 | N/R | 74,534 | ||||||
| 65 | Pima County Industrial Development Authority, Arizona, Educational Revenue Bonds, Paradise Education Center Charter School, Series 2006, 6.000%, 6/01/36 | 6/16 at 100.00 | BB | 43,515 | ||||||
| 400 | Pingree Grove Village, Illinois, Charter School Revenue Bonds, Cambridge Lakes Learning Center, Series 2007, 6.000%, 6/01/36 | 6/16 at 102.00 | N/R | 286,472 | ||||||
| 1,060 | San Diego County, California, Certificates of Participation, Burnham Institute, Series 2006, 5.000%, 9/01/34 | 9/15 at 102.00 | Baa3 | 803,279 | ||||||
| 11,365 | Total Education and Civic Organizations | 8,966,012 | ||||||||
Health Care – 19.1% | ||||||||||
| 50 | California Health Facilities Financing Authority, Health Facility Revenue Bonds, Adventist Health System/West, Series 2003A, 5.000%, 3/01/33 | 3/13 at 100.00 | A | 43,915 | ||||||
| 1,240 | California Health Facilities Financing Authority, Hospital Revenue Bonds, Downey Community Hospital, Series 1993, 5.750%, 5/15/15 | 11/09 at 100.00 | CCC | 820,384 | ||||||
| California Municipal Financing Authority, Certificates of Participation, Community Hospitals of Central California, Series 2007: | ||||||||||
| 1,000 | 5.250%, 2/01/27 | 2/17 at 100.00 | Baa2 | 882,150 | ||||||
| 1,500 | 5.250%, 2/01/46 | 2/17 at 100.00 | Baa2 | 1,174,635 | ||||||
| 1,000 | California Statewide Communities Development Authority, Revenue Bonds, Saint Joseph Health System, Trust 2554, 18.290%, 7/01/47 – FSA Insured (IF) | 7/18 at 100.00 | AAA | 1,001,120 | ||||||
| 1,000 | California Statewide Communities Development Authority, Revenue Bonds, ValleyCare Health System, Series 2007A, 5.125%, 7/15/31 | 7/17 at 100.00 | N/R | 659,530 | ||||||
| 2,000 | California Statewide Community Development Authority, Revenue Bonds, Childrens Hospital of Los Angeles, Series 2007, 5.000%, 8/15/47 | 8/17 at 100.00 | BBB+ | 1,378,400 | ||||||
| California Statewide Community Development Authority, Revenue Bonds, Daughters of Charity Health System, Series 2005A: | ||||||||||
| 750 | 5.250%, 7/01/30 | 7/15 at 100.00 | BBB | 633,188 | ||||||
| 515 | 5.250%, 7/01/35 | 7/15 at 100.00 | BBB | 418,958 | ||||||
| 495 | 5.000%, 7/01/39 | 7/15 at 100.00 | BBB | 375,156 | ||||||
| California Statewide Community Development Authority, Revenue Bonds, Sutter Health, Tender Option Bond Trust 3046: | ||||||||||
| 450 | 12.220%, 11/15/46 (IF) | 11/16 at 100.00 | Aa3 | 304,047 | ||||||
| 1,545 | 12.217%, 11/15/48 (IF) | 5/18 at 100.00 | Aa3 | 1,022,435 | ||||||
| 860 | California Statewide Community Development Authority, Revenue Bonds, Sutter Health, Tender Option Bond Trust 3048, 12.849%, 11/15/48 (IF) | 5/18 at 100.00 | Aa3 | 569,122 | ||||||
| 500 | Loma Linda, California, Hospital Revenue Bonds, Loma Linda University Medical Center, Series 2005A, 5.000%, 12/01/21 | 12/15 at 100.00 | BBB | 426,865 | ||||||
| 1,490 | Loma Linda, California, Hospital Revenue Bonds, Loma Linda University Medical Center, Series 2008A, 8.250%, 12/01/38 | 12/18 at 100.00 | BBB | 1,559,777 | ||||||
| 100 | Sierra Kings Health Care District, Fresno County, California, Revenue Bonds, Series 2006A, 5.750%, 12/01/36 | 12/16 at 100.00 | N/R | 68,227 | ||||||
| 16 | Nuveen Investments |
| Principal Amount (000) | Description (1) | Optional Call Provisions (2) | Ratings (3) | Value | ||||||
Health Care (continued) | ||||||||||
| $ | 500 | Sierra View Local Health Care District, Tulare County, California, Refunding Revenue Bonds, Series 1998, 5.400%, 7/01/22 | 1/10 at 100.00 | A– | $ | 491,790 | ||||
| 1,000 | Tulare Local Health Care District, California, Revenue Bonds, Series 2007, 5.200%, 11/01/32 | 11/17 at 100.00 | N/R | 794,030 | ||||||
| 60 | Weatherford Hospital Authority, Oklahoma, Sales Tax Revenue Bonds, Series 2006, 6.000%, 5/01/31 | 5/16 at 103.00 | N/R | 43,832 | ||||||
| 16,055 | Total Health Care | 12,667,561 | ||||||||
Housing/Multifamily – 4.5% | ||||||||||
| 400 | California Municipal Finance Authority, Revenue Bonds, University Students Coop Association, Series 2007, 4.750%, 4/01/27 | 4/17 at 100.00 | BBB– | 309,924 | ||||||
| 1,000 | California Statewide Community Development Authority, Lancer Educational Student Housing Revenue Bonds, California Baptist University, Series 2007, 5.625%, 6/01/33 | 6/17 at 102.00 | N/R | 682,410 | ||||||
| 120 | Multifamily Housing Revenue Bond Pass-Through Certificates, California, | 12/11 at 100.00 | N/R | 111,104 | ||||||
| 1,250 | Richmond, California, Joint Powers Financing Agency Multifamily Housing Revenue Bonds, Westridge Hilltop Apartments, Series 2007, 5.000%, 12/15/33 | 12/12 at 100.00 | Baa3 | 866,475 | ||||||
| 750 | Ventura County Area Housing Authority, California, Mira Vista Senior Apartments Project, Junior Subordinate Series 2006C, 6.500%, 12/01/39 (Mandatory put 7/01/16) (Alternative Minimum Tax) | No Opt. Call | N/R | 629,093 | ||||||
| 490 | Wilson County Health and Educational Facilities Board, Tennessee, Senior Living Revenue Bonds, Rutland Place, Series 2007A, 6.300%, 7/01/37 | 7/17 at 100.00 | N/R | 367,912 | ||||||
| 4,010 | Total Housing/Multifamily | 2,966,918 | ||||||||
Housing/Single Family – 1.4% | ||||||||||
| 500 | California Housing Finance Agency, California, Home Mortgage Revenue Bonds, Series 2007E, 4.800%, 8/01/37 (Alternative Minimum Tax) | 2/17 at 100.00 | AA– | 389,065 | ||||||
| 855 | California Housing Finance Agency, Home Mortgage Revenue Bonds, Series 2007M, Trust 1021, 7.286%, 8/01/31 (Alternative Minimum Tax) (IF) | 2/16 at 100.00 | AA– | 535,803 | ||||||
| 1,355 | Total Housing/Single Family | 924,868 | ||||||||
Industrials – 6.4% | ||||||||||
| 90 | California Pollution Control Financing Authority, Solid Waste Disposal Revenue Bonds, Browning Ferris Industries Inc., Series 1989, 6.750%, 9/01/19 (Alternative Minimum Tax) | 9/09 at 100.00 | Baa3 | 90,312 | ||||||
| 580 | California Pollution Control Financing Authority, Solid Waste Disposal Revenue Bonds, Browning Ferris Industries Inc., Series 1996A, 5.800%, 12/01/16 (Alternative Minimum Tax) | 12/09 at 100.00 | BBB | 577,065 | ||||||
| 565 | California Pollution Control Financing Authority, Solid Waste Disposal Revenue Bonds, Waste Management Inc., Series 2002A, 5.000%, 1/01/22 (Alternative Minimum Tax) | 1/16 at 102.00 | BBB | 520,794 | ||||||
| 500 | California Pollution Control Financing Authority, Solid Waste Disposal Revenue Bonds, Waste Management Inc., Series 2002B, 5.000%, 7/01/27 (Alternative Minimum Tax) | 7/15 at 101.00 | BBB | 443,410 | ||||||
| 1,000 | California Pollution Control Financing Authority, Solid Waste Revenue Bonds, Keller Canyon Landfill Company, Series 1992, 6.875%, 11/01/27 (Alternative Minimum Tax) | 11/09 at 100.00 | BBB | 1,000,470 | ||||||
| 1,000 | California Statewide Communities Development Authority, Revenue Bonds, EnerTech Regional Biosolids Project, Series 2007A, 5.500%, 12/01/33 (Alternative Minimum Tax) | No Opt. Call | BB | 650,300 | ||||||
| 250 | California Statewide Communities Development Authority, Sewer and Solid Waste Disposal Facilities Revenue Bonds, Anheuser Busch Project, Series 2007, 4.800%, 9/01/46 (Alternative Minimum Tax) | 3/12 at 100.00 | BBB+ | 183,448 | ||||||
| Nuveen Investments | 17 |
Portfolio of Investments (Unaudited)
Nuveen California High Yield Municipal Bond Fund (continued)
August 31, 2009
| Principal Amount (000) | Description (1) | Optional Call Provisions (2) | Ratings (3) | Value | ||||||
Industrials (continued) | ||||||||||
| $ | 260 | Kootenai County Industrial Development Corporation, Idaho, Industrial Development Revenue Bonds, Coer d’Alene Fiber Fuels, Inc., Series 2006, 6.750%, 12/01/26 | 12/16 at 100.00 | N/R | $ | 163,358 | ||||
| 100 | Louisiana Local Government Environmental Facilities and Community Development Authority, Carter Plantation Hotel Project Revenue Bonds, Series 2006A, 6.000%, 9/01/36 | 9/16 at 100.00 | N/R | 61,091 | ||||||
| 750 | Western Reserve Port Authority, Ohio, Solid Waste Facility Revenue Bonds, Central Waste Inc., Series 2007A, 6.350%, 7/01/27 (Alternative Minimum Tax) | 7/17 at 102.00 | N/R | 557,340 | ||||||
| 5,095 | Total Industrials | 4,247,588 | ||||||||
Long-Term Care – 5.1% | ||||||||||
| 40 | ABAG Finance Authority for Non-Profit Corporations, California, Certificates of Participation Refunding, American Baptist Homes of the West, Series 1998A, 6.200%, 10/01/27 | 10/09 at 100.00 | BBB– | 36,495 | ||||||
| 1,500 | California Statewide Communities Development Authority, Revenue Bonds, Inland Regional Center Project, Series 2007, 5.375%, 12/01/37 | 12/17 at 100.00 | Ba1 | 1,082,550 | ||||||
| 1,000 | California Statewide Community Development Authority, Revenue Bonds, Hollenbeck Palms, Magnolia Assisted Living, Series 2007A, 4.600%, 2/01/37 – RAAI Insured (Alternative Minimum Tax) | 2/17 at 100.00 | BBB– | 749,430 | ||||||
| 1,000 | Fulton County Residential Care Facilities Authority, Georgia, Revenue Bonds, Elderly Care, Lenbrook Square Project, Series 2006A, 5.125%, 7/01/37 | 7/17 at 100.00 | N/R | 644,350 | ||||||
| 50 | Louisiana Local Government Environmental Facilities and Community Development Authority, Revenue Bonds, CDF Healthcare of Louisiana LLC, Series 2006A, 7.000%, 6/01/36 | 6/16 at 101.00 | N/R | 40,720 | ||||||
| 1,000 | San Diego County, California, Certificates of Participation, San Diego-Imperial Counties Developmental Services Foundation Project, Series 2002, 5.500%, 9/01/27 | 9/12 at 100.00 | Ba1 | 807,140 | ||||||
| 4,590 | Total Long-Term Care | 3,360,685 | ||||||||
Tax Obligation/General – 2.1% | ||||||||||
| 400 | Bessemer, Alabama, General Obligation Warrants, Series 2007, 6.500%, 2/01/37 | 2/17 at 102.00 | N/R | 275,456 | ||||||
| 725 | Guam Government, General Obligation Bonds, 2009 Series A, 7.000%, 11/15/39 | No Opt. Call | B+ | 730,938 | ||||||
| 500 | Guam, General Obligation Bonds, Series 2007A, 5.250%, 11/15/37 | 11/17 at 100.00 | B+ | 387,175 | ||||||
| 1,625 | Total Tax Obligation/General | 1,393,569 | ||||||||
Tax Obligation/Limited – 26.7% | ||||||||||
| 1,000 | Azusa Redevelopment Agency, California, Tax Allocation Refunding Bonds, Merged West End Development, Series 2007B, 5.300%, 8/01/36 | No Opt. Call | N/R | 623,740 | ||||||
| Beaumont Financing Authority, California, Local Agency Revenue Bonds, Improvement Area 8D & 17B, Series 2009B: | ||||||||||
| 225 | 8.875%, 9/01/34 | 9/12 at 103.00 | N/R | 227,907 | ||||||
| 450 | 8.625%, 9/01/39 | 9/12 at 103.00 | N/R | 447,750 | ||||||
| 100 | Beaumont Financing Authority, California, Local Agency Revenue Bonds, Series 2005A, 5.600%, 9/01/25 | 9/15 at 102.00 | N/R | 79,799 | ||||||
| 300 | Beaumont Financing Authority, California, Local Agency Revenue Bonds, Series 2006B, 5.050%, 9/01/37 | 9/09 at 102.50 | N/R | 194,697 | ||||||
| 1,000 | Borrego Water District, California, Community Facilities District 2007-1 Montesoro, Special Tax Bonds, Series 2007, 5.750%, 8/01/32 | 8/17 at 102.00 | N/R | 753,070 | ||||||
| 150 | Chawanakee Unified School District, Madera County, California, Certificates of Participation, Series 2009B, 7.125%, 5/01/34 | 12/09 at 100.00 | A– | 150,083 | ||||||
| 500 | Dinuba Financing Authority, California, Measure R Road Improvement Lease Revenue Bonds, Series 2007, 5.375%, 9/01/38 | 9/17 at 100.00 | N/R | 343,885 | ||||||
| 100 | Eastern Municipal Water District, California, Community Facility District No 2005-38 Improvement Area A, Special Tax Bonds, Series 2006, 5.200%, 9/01/36 | 9/09 at 102.00 | N/R | 69,251 | ||||||
| 18 | Nuveen Investments |
| Principal Amount (000) | Description (1) | Optional Call Provisions (2) | Ratings (3) | Value | ||||||
Tax Obligation/Limited (continued) | ||||||||||
| $ | 250 | El Dorado County, California, Special Tax Bonds, Community Facilities District 2005-2, Series 2006, 5.100%, 9/01/36 | 9/14 at 102.00 | N/R | $ | 174,533 | ||||
| Elk Grove Community Facilities District 2005-1, California, Special Tax Bonds, Series 2007: | ||||||||||
| 80 | 5.000%, 9/01/18 | 9/09 at 103.00 | N/R | 49,705 | ||||||
| 10 | 5.000%, 9/01/20 | 9/09 at 103.00 | N/R | 6,222 | ||||||
| 50 | 5.125%, 9/01/22 | No Opt. Call | N/R | 31,129 | ||||||
| 1,000 | 5.200%, 9/01/27 | 9/15 at 102.00 | N/R | 623,950 | ||||||
| 1,225 | 5.250%, 9/01/37 | 9/15 at 102.00 | N/R | 741,027 | ||||||
| 500 | Fairfield, California, Community Facilities District 2007-1 Special Tax Bonds, Fairfield Commons Project, Series 2008, 6.875%, 9/01/38 | 9/18 at 100.00 | N/R | 397,690 | ||||||
| 500 | Folsom Public Financing Authority, California, Subordinate Special Tax Revenue Bonds, Series 2007B, 5.200%, 9/01/32 | 9/17 at 100.00 | N/R | 348,035 | ||||||
| 1,000 | Golden State Tobacco Securitization Corporation, California, Tobacco Settlement Asset-Backed Revenue Bonds, Series 2005A, 5.000%, 6/01/45 | 6/15 at 100.00 | A– | 862,490 | ||||||
| 1,000 | Hemet Unified School District Community Facilities District 2005-3, Riverside County, California, Special Tax Bonds, Series 2007, 5.750%, 9/01/39 | 9/09 at 102.50 | N/R | 664,490 | ||||||
| 200 | Hemet Unified School District, California, Community Facilities District 2005-1 Special Tax Bonds, Series 2006, 5.125%, 9/01/36 | 9/13 at 100.00 | N/R | 133,644 | ||||||
| 300 | Hesperia Unified School District, San Bernardino County, California, Community Facilities District 2006-5 Special Tax Bonds, Series 2007, 5.000%, 9/01/37 | 9/17 at 100.00 | N/R | 194,916 | ||||||
| 405 | Hesperia, California, Improvement Act of 1915, Assessment District, 91-1, Joshua West Main Street, Series 1992, 8.500%, 9/02/24 | 9/09 at 100.00 | N/R | 396,795 | ||||||
| 120 | Irvine, California, Unified School District, Community Facilities District Special Tax Bonds, Series 2006A, 5.125%, 9/01/36 | 9/16 at 100.00 | N/R | 98,801 | ||||||
| 1,090 | Jurupa Community Facilites District 29, California, Eastvale Area Special Tax Bonds, 8.625%, 9/01/39 | 9/09 at 103.00 | N/R | 1,097,456 | ||||||
| 1,115 | Jurupa Community Services District, California, Community Facilities District 25 Earstvale Area Special Tax Bonds, Series 2008A, 8.375%, 9/01/28 | 9/18 at 100.00 | N/R | 1,125,135 | ||||||
| 335 | Lancaster, California, Redevelopment Agency Combined Project Areas, Housing Programs, Tax Allocation Bonds 2009, 6.875%, 8/01/39 (WI/DD, Settling 9/03/09) | 8/19 at 100.00 | A | 337,077 | ||||||
| 130 | Merced, California, Community Facilities District 2005-1, Special Tax Bonds, Bellevue Ranch West, Series 2006, 5.300%, 9/01/36 | 9/09 at 103.00 | N/R | 88,026 | ||||||
| 65 | Moreno Valley Unified School District, Riverside County, California, Special Tax Bonds, Community Facilities District, Series 2006, 5.200%, 9/01/36 | 3/16 at 100.00 | N/R | 43,961 | ||||||
| 1,000 | Moreno Valley, California, Community Facilities District 5, Special Tax Bonds, Series 2007, 5.000%, 9/01/37 | 9/17 at 100.00 | N/R | 649,720 | ||||||
| 125 | Murrieta Valley Unified School District, Riverside County, California, Special Tax Bonds, Community Facilities District 2002-4, Series 2006B, 5.450%, 9/01/38 | 9/16 at 100.00 | N/R | 87,579 | ||||||
| 1,000 | Murrieta, California, Special Tax Bonds, Community Facilities District 2003-3, Creekside Village Improvement Area 1, Series 2005, 5.100%, 9/01/26 | 9/09 at 103.00 | N/R | 746,200 | ||||||
| 1,100 | Perris Public Finance Authority, California, Local Agency Revenue Bonds, Perris Valley Vistas IA3, Series 2008B, 6.625%, 9/01/38 | 9/16 at 100.00 | N/R | 875,644 | ||||||
| 495 | Perris Public Financing Authority, California, Local Agency Revenue Bonds, Series 2007D, 5.800%, 9/01/38 | 9/14 at 100.00 | N/R | 323,265 | ||||||
| 590 | Perris, California, Community Facilities District 2001-1 Improvement Area 5-A Special Tax Bonds, Series 2006, 5.000%, 9/01/37 | 9/09 at 102.50 | N/R | 336,943 | ||||||
| 125 | Riverside Unified School District, California, Community Facilities District 24 Special Tax Bonds, Series 2006, 5.100%, 9/01/36 | 9/14 at 102.00 | N/R | 88,876 | ||||||
| 500 | Riverside, California, Improvement Bond Act of 1915, Special Assessment Bonds, Hunter Park Assessment District, Series 2006, 5.200%, 9/02/36 | 9/16 at 101.00 | N/R | 331,130 | ||||||
| 1,000 | Roseville Financing Authority, California, Special Tax Revenue Bonds, Refunding Series 2007B, 5.000%, 9/01/33 | 9/17 at 100.00 | N/R | 672,260 | ||||||
| Nuveen Investments | 19 |
Portfolio of Investments (Unaudited)
Nuveen California High Yield Municipal Bond Fund (continued)
August 31, 2009
| Principal Amount (000) | Description (1) | Optional Call Provisions (2) | Ratings (3) | Value | ||||||
Tax Obligation/Limited (continued) | ||||||||||
| $ | 425 | Roseville, California, Special Tax Bonds, Community Facilities District 1 – Westpark, Series 2005, 5.250%, 9/01/25 | 9/15 at 100.00 | N/R | $ | 296,072 | ||||
| 125 | Roseville, California, Special Tax Bonds, Community Facilities District 1 Westpark, Series 2006, 5.250%, 9/01/37 | 9/16 at 100.00 | N/R | 75,698 | ||||||
| 995 | Sacramento, California, Community Facilities District 05-1, College Square Special Tax Bonds, Series 2007, 5.900%, 9/01/37 | 9/17 at 100.00 | N/R | 669,366 | ||||||
| 461 | Saint Louis, Missouri, Tax Increment Financing Revenue Bonds, Grace Lofts Redevelopment Projects, Series 2007A, 6.000%, 3/27/26 | 12/09 at 100.00 | N/R | 299,230 | ||||||
| 100 | San Jacinto Unified School District, Riverside County, California, Community Facilities District 2006-1 Special Tax Bonds, Infrastructure Projects, Series 2006, 5.200%, 9/01/36 | 9/16 at 100.00 | N/R | 67,632 | ||||||
| 500 | Val Verde Unified School District Financing Authority, California, Special Tax Revenue, Junior Lien Refunding Series 2003, 6.250%, 10/01/28 | 10/13 at 102.00 | N/R | 458,595 | ||||||
| 500 | Victor Elementary School District, Los Angeles County, California, Community Facilities District 2005-1 Special Tax Bonds, Series 2007A, 5.500%, 9/01/37 | 9/15 at 102.00 | N/R | 352,920 | ||||||
| 600 | West Patterson Financing Authority, California, Special Tax Bonds, Community Facilities District 01-1, Refunding Series 2009B, 10.000%, 9/01/32 | 9/14 at 105.00 | N/R | 602,118 | ||||||
| 300 | Westside Union School District, California, Community Facilities District 2005-3 Special Tax Bonds, Series 2006, 5.000%, 9/01/36 | 9/14 at 102.00 | N/R | 196,413 | ||||||
| 390 | Yorkville United City Business District, Illinois, Storm Water and Water Improvement Project Revenue Bonds, Series 2007, 6.000%, 1/01/27 | 1/17 at 102.00 | N/R | 173,164 | ||||||
| 135 | Yuba County, California, Special Tax Bonds, Community Facilities District 2004-1, Edgewater, Series 2005, 5.125%, 9/01/35 | 3/15 at 100.00 | N/R | 85,058 | ||||||
| 23,666 | Total Tax Obligation/Limited | 17,693,147 | ||||||||
Transportation – 4.0% | ||||||||||
| 8,275 | Foothill/Eastern Transportation Corridor Agency, California, Toll Road Revenue Bonds, Refunding Series 1999, 0.000%, 1/15/30 | 1/10 at 30.97 | BBB– | 1,705,478 | ||||||
| Palm Springs Financing Authority, California, Palm Springs International Airport Revenue Bonds, Series 2006: | ||||||||||
| 35 | 5.450%, 7/01/20 (Alternative Minimum Tax) | 7/14 at 102.00 | N/R | 29,819 | ||||||
| 45 | 5.550%, 7/01/28 (Alternative Minimum Tax) | 7/14 at 102.00 | N/R | 32,369 | ||||||
| Palm Springs, California, Airport Passenger Facility Charge Subordinate Refunding Revenue Bonds, Palm Springs International Airport, Series 2008: | ||||||||||
| 250 | 6.400%, 7/01/23 (Alternative Minimum Tax) | 7/14 at 102.00 | N/R | 207,815 | ||||||
| 275 | 6.500%, 7/01/27 (Alternative Minimum Tax) | 7/14 at 102.00 | N/R | 220,751 | ||||||
| 250 | Port of Oakland, California, Revenue Bonds, Series 2000K, 5.875%, 11/01/30 – FGIC Insured | 5/10 at 100.00 | A1 | 250,065 | ||||||
| 140 | Puerto Rico Industrial, Tourist, Educational, Medical and Environmental Control Facilities Financing Authority, Revenue Bonds, American Airlines Inc., Series 1985A, 6.450%, 12/01/25 | 6/10 at 100.00 | CCC+ | 61,379 | ||||||
| 15 | Puerto Rico Ports Authority, Special Facilities Revenue Bonds, American Airlines Inc., Series 1993A, 6.300%, 6/01/23 (Alternative Minimum Tax) | 12/09 at 100.00 | CCC+ | 6,575 | ||||||
| 245 | Puerto Rico Ports Authority, Special Facilities Revenue Bonds, American Airlines Inc., Series 1996A, 6.250%, 6/01/26 (Alternative Minimum Tax) | 12/09 at 100.00 | CCC+ | 107,437 | ||||||
| 9,530 | Total Transportation | 2,621,688 | ||||||||
U.S. Guaranteed – 0.0% (4) | ||||||||||
| Golden State Tobacco Securitization Corporation, California, Tobacco Settlement Asset-Backed Bonds, Series 2003A-1: | ||||||||||
| 10 | 6.250%, 6/01/33 (Pre-refunded 6/01/13) | 6/13 at 100.00 | AAA | 11,172 | ||||||
| 15 | 6.625%, 6/01/40 (Pre-refunded 6/01/13) | 6/13 at 100.00 | AAA | 17,608 | ||||||
| 25 | Total U.S. Guaranteed | 28,780 | ||||||||
| 20 | Nuveen Investments |
| Principal Amount (000) | Description (1) | Optional Call Provisions (2) | Ratings (3) | Value | ||||||
Utilities – 6.8% | ||||||||||
| Long Beach Bond Finance Authority, California, Natural Gas Purchase Revenue Bonds, Series 2007A: | ||||||||||
| $ | 75 | 5.250%, 11/15/23 | No Opt. Call | A | $ | 70,830 | ||||
| 25 | 5.500%, 11/15/30 | No Opt. Call | A | 24,387 | ||||||
| 1,000 | 5.500%, 11/15/37 | No Opt. Call | A | 966,159 | ||||||
| 7,890 | Merced Irrigation District, California, Certificates of Participation, Water Hydroelectric Series 2008B, 0.000%, 9/01/33 | 9/16 at 32.62 | A | 1,411,757 | ||||||
| 600 | M-S-R Energy Authority, California, Gas Revenue Bonds, Citigroup Prepay Contracts, Series 2009C, 6.500%, 11/01/39 (WI/DD, Settling 9/10/09) | No Opt. Call | A | 604,811 | ||||||
| Southern California Public Power Authority, Natural Gas Project 1 Revenue Bonds, Series 2007A: | ||||||||||
| 445 | 5.250%, 11/01/22 | No Opt. Call | A | 433,215 | ||||||
| 995 | 5.250%, 11/01/27 | No Opt. Call | A | 963,796 | ||||||
| 11,030 | Total Utilities | 4,474,955 | ||||||||
Water and Sewer – 0.5% | ||||||||||
| 500 | Dinuba Financing Authority, California, Wastewater System Revenue Bonds, Series 2007, 5.375%, 9/01/38 | 9/17 at 100.00 | N/R | 343,884 | ||||||
| $ | 96,836 | Total Investments (cost $75,948,600) – 99.2% | 65,692,788 | |||||||
Other Assets Less Liabilities – 0.8% | 500,977 | |||||||||
Net Assets – 100% | $ | 66,193,765 | ||||||||
Investments in Derivatives
Forward Swaps outstanding at August 31, 2009:
| Counterparty | Notional Amount | Fund Pay/Receive Floating Rate | Floating Rate Index | Fixed Rate (Annualized) | Fixed Rate Payment Frequency | Effective Date (5) | Termination Date | Unrealized Appreciation (Depreciation) | |||||||||||
JPMorgan | $ | 1,000,000 | Receive | 3-Month USD-LIBOR | 3.265 | % | Semi-Annually | 1/15/10 | 1/15/39 | $ | 167,100 | ||||||||
JPMorgan | 1,000,000 | Receive | 3-Month USD-LIBOR | 3.367 | Semi-Annually | 1/15/10 | 1/15/39 | 150,200 | |||||||||||
RBC | 1,000,000 | Receive | 3-Month USD-LIBOR | 3.327 | Semi-Annually | 4/23/10 | 4/23/39 | 164,200 | |||||||||||
| $ | 481,500 | ||||||||||||||||||
| (1) | All percentages shown in the Portfolio of Investments are based on net assets. |
| (2) | Optional Call Provisions: Dates (month and year) and prices of the earliest optional call or redemption. There may be other call provisions at varying prices at later dates. Certain mortgage-backed securities may be subject to periodic principal paydowns. |
| (3) | Ratings: Using the higher of Standard & Poor’s Group (“Standard & Poor’s”) or Moody’s Investor Service, Inc. (“Moody’s”) rating. Ratings below BBB by Standard & Poor’s or Baa by Moody’s are considered to be below investment grade. |
| (4) | Backed by an escrow or trust containing sufficient U.S. Government or U.S. Government agency securities which ensure the timely payment of principal and interest. |
| (5) | Effective date represents the date on which both the Fund and Counterparty commence interest payment accruals on each forward swap contract. |
| N/R | Not rated. |
| WI/DD | Purchased on a when-issued or delayed delivery basis. |
| (IF) | Inverse floating rate investment. |
| USD-LIBOR | United States Dollar-London Inter-Bank Offered Rate. |
See accompanying notes to financial statements.
| Nuveen Investments | 21 |
Portfolio of Investments (Unaudited)
Nuveen California Municipal Bond Fund
August 31, 2009
| Principal Amount (000) | Description (1) | Optional Call Provisions (2) | Ratings (3) | Value | ||||||
Consumer Staples – 4.3% | ||||||||||
| $ | 3,500 | California County Tobacco Securitization Agency, Tobacco Settlement Asset-Backed Bonds, Alameda County Tobacco Asset Securitization Corporation, Series 2002, 5.750%, 6/01/29 | 6/12 at 100.00 | Baa3 | $ | 2,927,155 | ||||
| 485 | California County Tobacco Securitization Agency, Tobacco Settlement Asset-Backed Bonds, Sonoma County Tobacco Securitization Corporation, Series 2005, 4.250%, 6/01/21 | 6/15 at 100.00 | BBB | 443,077 | ||||||
| 3,500 | Golden State Tobacco Securitization Corporation, California, Enhanced Tobacco Settlement Asset-Backed Bonds, Series 2007A-1, 5.750%, 6/01/47 | 6/17 at 100.00 | BBB | 2,730,035 | ||||||
| 12,135 | Golden State Tobacco Securitization Corporation, California, Enhanced Tobacco Settlement Asset-Backed Bonds, Series 2007A-2, 0.000%, 6/01/37 | 6/22 at 100.00 | BBB | 6,392,718 | ||||||
| 19,620 | Total Consumer Staples | 12,492,985 | ||||||||
Education and Civic Organizations – 3.3% | ||||||||||
| California Educational Facilities Authority, Revenue Bonds, University of the Pacific, Series 2006: | ||||||||||
| 105 | 5.000%, 11/01/21 | 11/15 at 100.00 | A2 | 105,769 | ||||||
| 135 | 5.000%, 11/01/25 | 11/15 at 100.00 | A2 | 130,772 | ||||||
| 2,960 | California Educational Facilities Authority, Revenue Bonds, Woodbury University, Series 2006, 5.000%, 1/01/36 | 1/15 at 100.00 | BBB– | 2,142,685 | ||||||
| California Municipal Finance Authority, Educational Facilities Revenue Bonds, OCEAA Project, Series 2008A: | ||||||||||
| 1,000 | 6.750%, 10/01/28 | No Opt. Call | N/R | 871,610 | ||||||
| 1,500 | 7.000%, 10/01/39 | No Opt. Call | N/R | 1,280,190 | ||||||
| 1,000 | California State Public Works Board, Lease Revenue Bonds, University of California Department of Education Riverside Campus Project, Series 2009B, 5.750%, 4/01/23 | 4/19 at 100.00 | A– | 1,028,500 | ||||||
| 1,000 | California State Public Works Board, Lease Revenue Bonds, University of California, Institute Projects, Series 2005C, 5.000%, 4/01/30 – AMBAC Insured | 4/15 at 100.00 | Aa2 | 1,002,370 | ||||||
| 1,500 | California Statewide Community Development Authority, Certificates of Participation, San Diego Space and Science Foundation, Series 1996, 7.500%, 12/01/26 | 12/09 at 102.00 | N/R | 1,435,050 | ||||||
| 2,000 | San Diego County, California, Certificates of Participation, Burnham Institute, Series 2006, 5.000%, 9/01/34 | 9/15 at 102.00 | Baa3 | 1,515,620 | ||||||
| 11,200 | Total Education and Civic Organizations | 9,512,566 | ||||||||
Health Care – 24.1% | ||||||||||
| 1,000 | California Health Facilities Financing Authority Revenue Bonds, Series 2009A, Childrens Hospital of Orange County, 6.500%, 11/01/38 | 11/19 at 100.00 | A | 1,021,510 | ||||||
| 2,675 | California Health Facilities Financing Authority, Hospital Revenue Bonds, Downey Community Hospital, Series 1993, 5.750%, 5/15/15 | 11/09 at 100.00 | CCC | 1,769,780 | ||||||
| 5,000 | California Health Facilities Financing Authority, Insured Revenue Bonds, Catholic Healthcare West, Series 1994-5, 5.000%, 7/01/14 – NPFG Insured | 1/10 at 100.00 | A2 | 5,004,550 | ||||||
| 1,475 | California Health Facilities Financing Authority, Revenue Bonds, Catholic Healthcare West, Series 2008J, 5.625%, 7/01/32 | 7/15 at 100.00 | A | 1,436,960 | ||||||
| 1,360 | California Health Facilities Financing Authority, Revenue Bonds, Kaiser Permanante System, Series 2006, 5.000%, 4/01/37 | 4/16 at 100.00 | A+ | 1,211,094 | ||||||
| 10,000 | California Health Facilities Financing Authority, Revenue Bonds, Sutter Health, Series 2007A, 5.000%, 11/15/42 – NPFG Insured | 11/16 at 100.00 | Aa3 | 8,681,999 | ||||||
| 2,000 | California Municipal Financing Authority, Certificates of Participation, Community Hospitals of Central California, Series 2007, 5.250%, 2/01/46 | 2/17 at 100.00 | Baa2 | 1,566,180 | ||||||
| 1,000 | California Statewide Communities Development Authority, Revenue Bonds, Adventist Health System West, Series 2005A, 5.000%, 3/01/35 | 3/15 at 100.00 | A | 874,950 | ||||||
| 22 | Nuveen Investments |
| Principal Amount (000) | Description (1) | Optional Call Provisions (2) | Ratings (3) | Value | ||||||
Health Care (continued) | ||||||||||
| California Statewide Communities Development Authority, Revenue Bonds, ValleyCare Health System, Series 2007A: | ||||||||||
| $ | 2,340 | 4.800%, 7/15/17 | No Opt. Call | N/R | $ | 1,955,093 | ||||
| 1,000 | 5.000%, 7/15/22 | 7/17 at 100.00 | N/R | 746,740 | ||||||
| 7,740 | California Statewide Community Development Authority, Health Facility Revenue Refunding Bonds, Memorial Health Services, Series 2003A, 6.000%, 10/01/23 | 4/13 at 100.00 | A+ | 7,960,048 | ||||||
| 5,540 | California Statewide Community Development Authority, Insured Health Facility Revenue Bonds, Catholic Healthcare West, Series 2008K, 5.500%, 7/01/41 – AGC Insured | 7/17 at 100.00 | AAA | 5,531,247 | ||||||
| California Statewide Community Development Authority, Revenue Bonds, Daughters of Charity Health System, Series 2005A: | ||||||||||
| 1,000 | 5.250%, 7/01/30 | 7/15 at 100.00 | BBB | 844,250 | ||||||
| 2,000 | 5.000%, 7/01/39 | 7/15 at 100.00 | BBB | 1,515,780 | ||||||
| 3,670 | California Statewide Community Development Authority, Revenue Bonds, Daughters of Charity Health System, Series 2005G, 5.000%, 7/01/22 | 7/15 at 100.00 | BBB | 3,320,029 | ||||||
| 1,615 | California Statewide Community Development Authority, Revenue Bonds, Kaiser Permanente System, Series 2001C, 5.250%, 8/01/31 | 8/16 at 100.00 | A+ | 1,563,869 | ||||||
| 3,170 | California Statewide Community Development Authority, Revenue Bonds, Kaiser Permanente System, Series 2007A, 4.750%, 4/01/33 | 4/17 at 100.00 | A+ | 2,774,447 | ||||||
| 3,000 | California Statewide Community Development Authority, Revenue Bonds, Kaiser Permanente System, Series 2007B, 1.180%, 4/01/36 | 4/17 at 100.00 | A+ | 1,717,500 | ||||||
| 2,250 | California Statewide Community Development Authority, Revenue Bonds, Methodist Hospital Project, Series 2009, 6.750%, 2/01/38 | 8/19 at 100.00 | AA | 2,381,490 | ||||||
| 4,540 | California Statewide Community Development Authority, Revenue Bonds, St. Joseph Health System, Series 2007A, 5.750%, 7/01/47 – FGIC Insured | 7/18 at 100.00 | AA– | 4,586,535 | ||||||
| 2,065 | Loma Linda, California, Hospital Revenue Bonds, Loma Linda University Medical Center, Series 2008A, 8.250%, 12/01/38 | 12/18 at 100.00 | BBB | 2,161,704 | ||||||
| 5,390 | Rancho Mirage Joint Powers Financing Authority, California, Certificates of Participation, Eisenhower Medical Center, Series 1997B, 4.875%, 7/01/22 – NPFG Insured | 7/15 at 102.00 | Baa1 | 4,947,265 | ||||||
| 4,500 | Santa Clara County Financing Authority, California, Insured Revenue Bonds, El Camino Hospital, Series 2007A, 5.750%, 2/01/41 – AMBAC Insured | 8/17 at 100.00 | A+ | 4,540,995 | ||||||
| 1,000 | Sierra View Local Health Care District, Tulare County, California, Refunding Revenue Bonds, Series 1998, 5.400%, 7/01/22 | 1/10 at 100.00 | A– | 983,580 | ||||||
| 1,000 | Sierra View Local Health Care District, California, Revenue Bonds, Series 2007, 5.250%, 7/01/37 | 9/17 at 100.00 | N/R | 886,740 | ||||||
| 76,330 | Total Health Care | 69,984,335 | ||||||||
Housing/Multifamily – 1.1% | ||||||||||
| 2,000 | Riverside County, California, Mobile Home Park Revenue Bonds, Bravo Mobile Home Park Project, Series 1999A, 5.900%, 3/20/29 | 9/09 at 102.00 | N/R | 1,641,680 | ||||||
| 1,940 | San Dimas Housing Authority, California, Mobile Home Park Revenue Bonds, Charter Oak Mobile Home Estates Acquisition Project, Series 1998A, 5.700%, 7/01/28 | 1/10 at 101.00 | N/R | 1,588,006 | ||||||
| 3,940 | Total Housing/Multifamily | 3,229,686 | ||||||||
Housing/Single Family – 1.0% | ||||||||||
| 345 | California Housing Finance Agency, Home Mortgage Revenue Bonds, Series 2006H, 5.750%, 8/01/30 – FGIC Insured (Alternative Minimum Tax) | 2/16 at 100.00 | AA– | 349,071 | ||||||
| 25 | California Rural Home Mortgage Finance Authority, Mortgage-Backed Securities Program Single Family Mortgage Revenue Bonds, Series 1997A, 7.000%, 9/01/29 (Alternative Minimum Tax) | No Opt. Call | AAA | 25,468 | ||||||
| Nuveen Investments | 23 |
Portfolio of Investments (Unaudited)
Nuveen California Municipal Bond Fund (continued)
August 31, 2009
| Principal Amount (000) | Description (1) | Optional Call Provisions (2) | Ratings (3) | Value | ||||||
Housing/Single Family (continued) | ||||||||||
| $ | 3,000 | California State Department of Veteran Affairs, Home Purchase Revenue Bonds, Series 2007, 5.000%, 12/01/42 (Alternative Minimum Tax) | 12/16 at 100.00 | Aa2 | $ | 2,445,930 | ||||
| 3,370 | Total Housing/Single Family | 2,820,469 | ||||||||
Industrials – 1.2% | ||||||||||
| 610 | California Pollution Control Financing Authority, Solid Waste Disposal Revenue Bonds, Republic Services Inc., Series 2002C, 5.250%, 6/01/23 (Mandatory put 12/01/17) (Alternative Minimum Tax) | No Opt. Call | BBB | 592,273 | ||||||
| 3,000 | California Pollution Control Financing Authority, Solid Waste Disposal Revenue Bonds, Waste Management Inc., Series 2002A, 5.000%, 1/01/22 (Alternative Minimum Tax) | 1/16 at 102.00 | BBB | 2,765,280 | ||||||
| 3,610 | Total Industrials | 3,357,553 | ||||||||
Long-Term Care – 5.0% | ||||||||||
| ABAG Finance Authority for Non-Profit Corporations, California, Cal-Mortgage Revenue Bonds, Elder Care Alliance of Union City, Series 2004: | ||||||||||
| 1,850 | 5.400%, 8/15/24 | 8/14 at 100.00 | A | 1,853,922 | ||||||
| 2,130 | 5.600%, 8/15/34 | 8/14 at 100.00 | A | 2,110,148 | ||||||
| 4,250 | ABAG Finance Authority for Non-Profit Corporations, California, Certificates of Participation, American Baptist Homes of the West, Series 1997A, 5.850%, 10/01/27 | 10/09 at 100.00 | BBB– | 3,630,690 | ||||||
| 3,000 | ABAG Finance Authority for Non-Profit Corporations, California, Health Facility Revenue Bonds, The Institute on Aging, Series 2008A, 5.650%, 8/15/38 | 8/18 at 100.00 | A | 2,809,710 | ||||||
| 2,000 | California Municipal Finance Authority, Senior Living Revenue Bonds, Pilgrim Place at Claremont, Series 2009A, 6.125%, 5/15/39 | 5/19 at 100.00 | A | 2,039,340 | ||||||
| 2,750 | San Diego County, California, Certificates of Participation, San Diego-Imperial Counties Developmental Services Foundation Project, Series 2002, 5.500%, 9/01/27 | 9/12 at 100.00 | Ba1 | 2,219,635 | ||||||
| 15,980 | Total Long-Term Care | 14,663,445 | ||||||||
Tax Obligation/General – 7.3% | ||||||||||
| 1,425 | Bassett Unified School District, Los Angeles County, California, General Obligation Bonds, Series 2006B, 5.250%, 8/01/30 – FGIC Insured | 8/16 at 100.00 | A | 1,443,055 | ||||||
| 10,000 | California, General Obligation Bonds, Series 2002, 6.000%, 2/01/15 – FSA Insured (UB) | No Opt. Call | AAA | 11,213,500 | ||||||
| Central Unified School District, Fresno County, California, General Obligation Bonds, Series 2004A: | ||||||||||
| 1,000 | 5.500%, 7/01/22 – FGIC Insured | 7/14 at 100.00 | A | 1,132,340 | ||||||
| 1,500 | 5.500%, 7/01/24 – FGIC Insured | 7/14 at 100.00 | A | 1,698,510 | ||||||
| 2,000 | Murrieta Valley Unified School District, Riverside County, California, General Obligation Bonds, Series 2003A, 5.000%, 9/01/26 – FGIC Insured | 9/13 at 100.00 | A+ | 2,033,300 | ||||||
| 275 | Roseville Joint Union High School District, Placer County, California, General Obligation Bonds, Series 2006B, 5.000%, 8/01/27 – FGIC Insured | 8/15 at 100.00 | AA– | 282,351 | ||||||
| 2,000 | San Diego Unified School District, California, General Obligation Bonds, Election of 1998, Series 2000B, 5.125%, 7/01/22 – NPFG Insured | 7/10 at 100.00 | AA | 2,068,100 | ||||||
| 1,355 | San Jose-Evergreen Community College District, Santa Clara County, California, General Obligation Bonds, Series 2005A, 5.000%, 9/01/25 – NPFG Insured | 9/15 at 100.00 | Aa2 | 1,406,151 | ||||||
| 19,555 | Total Tax Obligation/General | 21,277,307 | ||||||||
Tax Obligation/Limited – 24.4% | ||||||||||
| 3,000 | Alameda County Redevelopment Agency, California, Eden Area Redevelopment Project, Tax Allocation Bonds, Series 2006A, 5.000%, 8/01/36 – NPFG Insured | 8/16 at 100.00 | A | 2,470,620 | ||||||
Brea Public Finance Authority, California, Revenue Bonds, Series 2008A: | ||||||||||
| 2,105 | 7.000%, 9/01/23 | 9/16 at 102.00 | BBB+ | 2,140,785 | ||||||
| 2,000 | 7.125%, 9/01/26 | 9/16 at 102.00 | BBB+ | 2,021,140 | ||||||
| 24 | Nuveen Investments |
| Principal Amount (000) | Description (1) | Optional Call Provisions (2) | Ratings (3) | Value | ||||||
Tax Obligation/Limited (continued) | ||||||||||
| $ | 350 | Capistrano Unified School District, Orange County, California, Special Tax Bonds, Community Facilities District, Series 2005, 5.000%, 9/01/24 – FGIC Insured | 9/15 at 100.00 | A | $ | 323,855 | ||||
| 2,000 | Golden State Tobacco Securitization Corporation, California, Tobacco Settlement Asset-Backed Revenue Bonds, Series 2005A, 5.000%, 6/01/35 – FGIC Insured | 6/15 at 100.00 | A– | 1,775,060 | ||||||
| 2,075 | Hesperia Community Redevelopment Agency, California, Tax Allocation Bonds, Series 2005A, 5.000%, 9/01/35 – SYNCORA GTY Insured | 9/15 at 100.00 | Baa1 | 1,565,256 | ||||||
| Irvine, California, Unified School District, Community Facilities District Special Tax Bonds, Series 2006A: | ||||||||||
| 170 | 5.000%, 9/01/26 | 9/16 at 100.00 | N/R | 148,668 | ||||||
| 395 | 5.125%, 9/01/36 | 9/16 at 100.00 | N/R | 325,219 | ||||||
| Jurupa Community Services District, California, Community Facilities District 25 Earstvale Area Special Tax Bonds, Series 2008A: | ||||||||||
| 1,000 | 8.375%, 9/01/28 | 9/18 at 100.00 | N/R | 1,009,090 | ||||||
| 3,205 | 8.875%, 9/01/38 | 9/18 at 100.00 | N/R | 3,276,536 | ||||||
| 1,800 | La Mirada Redevelopment Agency, California, Special Tax Refunding Bonds, Community Facilities District 89-1, Civic Theatre Project, Series 1998, 5.700%, 10/01/20 | 10/09 at 101.00 | N/R | 1,584,936 | ||||||
| 2,500 | Lancaster Redevelopment Agency, California, Subordinate Lien Tax Allocation Bonds, Combined Redevelopment Project Areas, Series 2003B, 5.000%, 8/01/34 – FGIC Insured | 8/13 at 100.00 | A | 2,088,500 | ||||||
| 1,870 | Lancaster Redevelopment Agency, California, Tax Allocation Refunding Bonds, Combined Area Sheriff’s Facilities Projects, Series 2004, 5.000%, 12/01/23 – SYNCORA GTY Insured | 12/14 at 100.00 | A | 1,736,389 | ||||||
| 1,120 | Lancaster Redevelopment Agency, California, Tax Allocation Refunding Bonds, Combined Fire Protection Facilities Project, Series 2004, 5.000%, 12/01/23 – SYNCORA GTY Insured | 12/14 at 100.00 | A | 1,039,976 | ||||||
| 630 | Los Angeles Community Redevelopment Agency, California, Lease Revenue Bonds, Manchester Social Services Project, Series 2005, 5.000%, 9/01/37 – AMBAC Insured | 9/15 at 100.00 | A2 | 532,325 | ||||||
| 2,500 | Los Angeles County Schools, California, Certificates of Participation, Pooled Financing Program, Regionalized Business Services Corporation, Series 2003A, 5.000%, 9/01/22 – FSA Insured | 9/13 at 100.00 | AAA | 2,582,875 | ||||||
| 985 | Milpitas, California, Local Improvement District 20 Limited Obligation Bonds, Series 1998A, 5.700%, 9/02/18 | 9/09 at 103.00 | N/R | 882,984 | ||||||
| Moreno Valley Unified School District, Riverside County, California, Special Tax Bonds, Community Facilities District, Series 2004: | ||||||||||
| 805 | 5.550%, 9/01/29 | 9/14 at 100.00 | N/R | 639,420 | ||||||
| 1,250 | 5.650%, 9/01/34 | 9/14 at 100.00 | N/R | 968,338 | ||||||
| 7,100 | Murrieta Redevelopment Agency, California, Tax Allocation Bonds, Series 2007A, 5.000%, 8/01/37 – NPFG Insured | 8/17 at 100.00 | A | 5,814,048 | ||||||
| 315 | Ontario, California, Assessment District 100C Limited Obligation Improvement Bonds, California Commerce Center Phase III, Series 1991, 8.000%, 9/02/11 | 9/09 at 103.00 | N/R | 326,453 | ||||||
| 1,600 | Pomona Public Financing Authority, California, Merged Projects Revenue Bonds, Series 2007AS, 5.000%, 2/01/31 – AMBAC Insured | 2/17 at 100.00 | A | 1,384,192 | ||||||
| 1,150 | Poway Redevelopment Agency, California, Tax Allocation Bonds, Paugay Redevelopment Project, Series 2007, 5.000%, 6/15/30 – NPFG Insured | 6/17 at 100.00 | A | 1,003,203 | ||||||
| 1,645 | Rancho Cucamonga, California, Limited Obligation Improvement Bonds, Masi Plaza Assessment District 93-1, Series 1997, 6.250%, 9/02/22 | 9/09 at 100.00 | N/R | 1,456,746 | ||||||
| 305 | Rialto Redevelopment Agency, California, Tax Allocation Bonds, Merged Project Area, Series 2005A, 5.000%, 9/01/35 – SYNCORA GTY Insured | 9/15 at 100.00 | A– | 252,921 | ||||||
| 2,345 | Richmond Redevelopment Agency, California, Harbour Project Tax Allocation Bonds, Series 1998A Refunding, 5.500%, 7/01/18 – NPFG Insured | 7/10 at 100.00 | AA– | 2,371,780 | ||||||
| 380 | Roseville, California, Certificates of Participation, Public Facilities, Series 2003A, 5.000%, 8/01/25 – AMBAC Insured | 8/13 at 100.00 | AA– | 355,790 | ||||||
| Nuveen Investments | 25 |
Portfolio of Investments (Unaudited)
Nuveen California Municipal Bond Fund (continued)
August 31, 2009
| Principal Amount (000) | Description (1) | Optional Call Provisions (2) | Ratings (3) | Value | |||||||
Tax Obligation/Limited (continued) | |||||||||||
| $ | 1,000 | Sacramento City Financing Authority, California, Lease Revenue Refunding Bonds, Series 1993A, 5.400%, 11/01/20 – AMBAC Insured | No Opt. Call | A | $ | 1,007,260 | |||||
| 500 | Sacramento City Financing Authority, California, Lease Revenue Refunding Bonds, Series 1993B, 5.400%, 11/01/20 | No Opt. Call | A | 503,630 | |||||||
| 2,880 | San Francisco Redevelopment Agency, California, Lease Revenue Bonds, Moscone Convention Center, Series 2004, 5.250%, 7/01/24 – AMBAC Insured | 7/11 at 102.00 | AA– | 2,975,990 | |||||||
| 6,900 | San Marcos Redevelopment Agency, California, Tax Allocation Bonds, Affordable Housing Project, Series 1997A, 6.000%, 10/01/27 (Alternative Minimum Tax) | 10/09 at 100.00 | AA | 6,902,415 | |||||||
| 1,505 | San Mateo Union High School District, San Mateo County, California, Certificates of Participation, Phase 1, Series 2007A, 5.000%, 12/15/30 – AMBAC Insured | 12/17 at 100.00 | N/R | 1,310,599 | |||||||
| 4,000 | Shafter Joint Powers Financing Authority, California, Lease Revenue Bonds, Community Correctional Facility Acquisition Project, Series 1997A, 6.050%, 1/01/17 | 1/10 at 100.00 | A– | 4,005,280 | |||||||
| 6,700 | Travis Unified School District, Solano County, California, Certificates of Participation, Series 2006, 5.000%, 9/01/31 – FGIC Insured | 9/16 at 100.00 | N/R | 5,684,749 | |||||||
| 2,500 | Tulare Public Financing Authority, California, Lease Revenue Bonds, Series 2008, 5.250%, 4/01/27 – AGC Insured | 4/18 at 100.00 | AAA | 2,532,625 | |||||||
| 2,000 | Tustin, California, Community Facilities District 2007-1, Legacy-Retail Center Special Tax Bonds, 6.000%, 9/01/37 | 9/17 at 100.00 | N/R | 1,811,260 | |||||||
| 445 | Vallejo Public Financing Authority, California, Limited Obligation Revenue Refinancing Bonds, Fairground Drive Assessment District 65, Series 1998, 5.700%, 9/02/11 | No Opt. Call | N/R | 447,995 | |||||||
| 4,000 | Western Placer Unified School District, Placer County, California, Certificates of Participation, Series 2008, 5.000%, 8/01/47 – AGC Insured | 8/18 at 100.00 | AAA | 3,737,320 | |||||||
| 77,030 | Total Tax Obligation/Limited | 70,996,228 | |||||||||
Transportation – 5.7% | |||||||||||
| 2,750 | Foothill/Eastern Transportation Corridor Agency, California, Toll Road Revenue Refunding Bonds, Series 1999, 5.875%, 1/15/28 | 1/14 at 101.00 | BBB– | 2,311,045 | |||||||
| Palm Springs Financing Authority, California, Palm Springs International Airport Revenue Bonds, Series 2006: | |||||||||||
| 285 | 5.450%, 7/01/20 (Alternative Minimum Tax) | 7/14 at 102.00 | N/R | 242,814 | |||||||
| 220 | 5.550%, 7/01/28 (Alternative Minimum Tax) | 7/14 at 102.00 | N/R | 158,246 | |||||||
| 3,970 | Port of Oakland, California, Revenue Bonds, Series 2000K, 5.750%, 11/01/29 – FGIC Insured | 5/10 at 100.00 | A1 | 3,950,904 | |||||||
| 550 | San Francisco Airports Commission, California, Revenue Bonds, San Francisco International Airport, Second Series 1999, Issue 23A, 5.000%, 5/01/30 – FGIC Insured (Alternative Minimum Tax) | 5/11 at 100.00 | A1 | 496,144 | |||||||
| 4,000 | San Francisco Airports Commission, California, Revenue Bonds, San Francisco International Airport, Second Series 2002, Issue 32G, 5.000%, 5/01/24 – FGIC Insured | 5/16 at 100.00 | A1 | 4,022,240 | |||||||
| 2,000 | San Francisco Airports Commission, California, Revenue Bonds, San Francisco International Airport, Second Series A of 2008, 6.500%, 5/01/19 (Mandatory put 5/01/12) (Alternative Minimum Tax) | No Opt. Call | A1 | 2,128,260 | |||||||
| 3,000 | San Francisco Airports Commission, California, Revenue Bonds, San Francisco International Airport, Second Series, Issue 34E, 5.750%, 5/01/25 – FSA Insured (Alternative Minimum Tax) | 5/18 at 100.00 | AAA | 3,101,010 | |||||||
| 16,775 | Total Transportation | 16,410,663 | |||||||||
U.S. Guaranteed – 11.0% (4) | |||||||||||
| 3,000 | California Department of Water Resources, Power Supply Revenue Bonds, Series 2002A, 5.125%, 5/01/18 (Pre-refunded 5/01/12) | 5/12 at 101.00 | Aaa | 3,346,830 | |||||||
| 3,115 | California Educational Facilities Authority, Revenue Bonds, Pooled College and University Projects, Series 2000C, 6.750%, 6/01/30 (ETM) | 6/10 at 101.00 | Baa3 | (4) | 3,268,071 | ||||||
| 26 | Nuveen Investments |
| Principal Amount (000) | Description (1) | Optional Call Provisions (2) | Ratings (3) | Value | |||||||
U.S. Guaranteed (4) (continued) | |||||||||||
| $ | 1,000 | Central California Joint Powers Health Finance Authority, Certificates of Participation, Community Hospitals of Central California, Series 2001, 5.625%, 2/01/21 (Pre-refunded 2/01/11) | 2/11 at 101.00 | AAA | $ | 1,077,890 | |||||
| 2,500 | Daly City Housing Development Finance Agency, California, Mobile Home Park Revenue Bonds, Franciscan Mobile Home Park Project, Series 2002A, 5.800%, 12/15/25 (Pre-refunded 12/15/13) | 12/13 at 102.00 | N/R | (4) | 2,968,675 | ||||||
| 1,035 | Escondido Union School District, San Diego County, California, General Obligation Bonds, Series 2002A, 5.250%, 8/01/23 (Pre-refunded 8/01/12) – FSA Insured | 8/12 at 100.00 | AAA | 1,154,398 | |||||||
| 4,205 | Golden State Tobacco Securitization Corporation, California, Tobacco Settlement Asset-Backed Bonds, Series 2003A-1, 6.250%, 6/01/33 (Pre-refunded 6/01/13) | 6/13 at 100.00 | AAA | 4,697,616 | |||||||
| Grossmont-Cuyamaca Community College District, California, General Obligation Bonds, Series 2005B: | |||||||||||
| 5,080 | 5.000%, 8/01/21 (Pre-refunded 8/01/15) – FGIC Insured | 8/15 at 100.00 | AA | (4) | 5,951,982 | ||||||
| 2,350 | 5.000%, 8/01/26 (Pre-refunded 8/01/15) – FGIC Insured | 8/15 at 100.00 | AA | (4) | 2,753,378 | ||||||
| 1,940 | Los Angeles Harbors Department, California, Revenue Bonds, Series 1988, 7.600%, 10/01/18 (ETM) | No Opt. Call | AAA | 2,369,497 | |||||||
| 30 | Port of Oakland, California, Revenue Bonds, Series 2000K, 5.750%, 11/01/29 (Pre-refunded 5/01/10) – FGIC Insured | 5/10 at 100.00 | A1 | (4) | 30,920 | ||||||
| 1,400 | Port of Oakland, California, Revenue Bonds, Series 2002M, 5.250%, 11/01/19 (Pre-refunded 11/01/12) – FGIC Insured | 11/12 at 100.00 | A1 | (4) | 1,578,668 | ||||||
| 2,475 | San Francisco Airports Commission, California, Revenue Refunding Bonds, San Francisco International Airport, Second Series 2002, Issue 28B, 5.250%, 5/01/22 (Pre-refunded 5/01/12) – MBIA Insured | 5/12 at 100.00 | A1 | (4) | 2,743,117 | ||||||
| 28,130 | Total U.S. Guaranteed | 31,941,042 | |||||||||
Utilities – 7.3% | |||||||||||
| 2,445 | California Statewide Community Development Authority, Certificates of Participation Refunding, Rio Bravo Fresno Project, Series 1999A, 6.500%, 12/01/18 (5) | 12/09 at 100.00 | N/R | 2,147,761 | |||||||
| 3,550 | Los Angeles Department of Water and Power, California, Power System Revenue Bonds, Series 2001A-1, 5.250%, 7/01/15 | 7/11 at 100.00 | AA– | 3,754,267 | |||||||
| 500 | Los Angeles Department of Water and Power, California, Power System Revenue Bonds, Series 2003A-2, 5.000%, 7/01/21 – NPFG Insured | 7/13 at 100.00 | AA– | 535,600 | |||||||
| 4,535 | Merced Irrigation District, California, Certificates of Participation, Water and Hydroelectric System Projects, Series 2008A, 0.000%, 9/01/23 | 9/16 at 64.56 | A | 1,802,526 | |||||||
| Merced Irrigation District, California, Certificates of Participation, Water Hydroelectric Series 2008B: | |||||||||||
| 27,110 | 0.000%, 9/01/33 | 9/16 at 32.62 | A | 4,850,792 | |||||||
| 12,000 | 0.000%, 9/01/38 | 9/16 at 23.21 | A | 1,521,360 | |||||||
| 615 | Merced Irrigation District, California, Electric System Revenue Bonds, Series 2005, 5.125%, 9/01/31 – SYNCORA GTY Insured | 9/15 at 100.00 | N/R | 516,120 | |||||||
| 3,470 | Puerto Rico Industrial, Tourist, Educational, Medical and Environmental Control Facilities Financing Authority, Co-Generation Facility Revenue Bonds, Series 2000A, 6.625%, 6/01/26 (Alternative Minimum Tax) | 6/10 at 101.00 | Baa3 | 3,483,776 | |||||||
| 2,485 | Southern California Public Power Authority, Natural Gas Project 1 Revenue Bonds, Series 2007A, 5.250%, 11/01/24 | No Opt. Call | A | 2,452,869 | |||||||
| 56,710 | Total Utilities | 21,065,071 | |||||||||
Water and Sewer – 5.1% | |||||||||||
| 2,000 | Brentwood Infrastructure Financing Authority, California, Water Revenue Bonds, Series 2008, 5.750%, 7/01/38 | 7/18 at 100.00 | AA | 2,147,260 | |||||||
| 2,000 | California Statewide Community Development Authority, Water and Wastewater Revenue Bonds, Pooled Financing Program, Series 2003A, 5.250%, 10/01/23 – FSA Insured | 10/13 at 100.00 | AAA | 2,080,100 | |||||||
| Nuveen Investments | 27 |
Portfolio of Investments (Unaudited)
Nuveen California Municipal Bond Fund (continued)
August 31, 2009
| Principal Amount (000) | Description (1) | Optional Call Provisions (2) | Ratings (3) | Value | ||||||
Water and Sewer (continued) | ||||||||||
| $ | 1,680 | Castaic Lake Water Agency, California, Certificates of Participation, Series 2004A, 5.000%, 8/01/20 – AMBAC Insured | 8/14 at 100.00 | AA | $ | 1,733,290 | ||||
| 1,250 | Cucamonga Valley Water District, California, Certificates of Participation, Series 2006, 5.000%, 9/01/36 – NPFG Insured | 9/16 at 100.00 | AA– | 1,224,600 | ||||||
| 2,500 | Fortuna Public Financing Authority, California, Wastewater Revenue Bonds, Series 2006, 5.000%, 10/01/36 – FSA Insured | 10/16 at 100.00 | AAA | 2,496,200 | ||||||
| 1,770 | Pomona Public Finance Authority, California, Revenue Bonds, Water Facilities Project, Series 2007AY, 5.000%, 5/01/27 – AMBAC Insured | 5/17 at 100.00 | A+ | 1,737,308 | ||||||
| 3,500 | Western Municipal Water District Facilities Authority, California, Water Revenue Bonds, Series 2009B, 5.000%, 10/01/39 | 10/19 at 100.00 | AA+ | 3,521,910 | ||||||
| 14,700 | Total Water and Sewer | 14,940,668 | ||||||||
| $ | 346,950 | Total Investments (cost $307,148,255) – 100.8% | 292,692,018 | |||||||
Floating Rate Obligations – (1.7)% | (5,000,000) | |||||||||
Other Assets Less Liabilities – 0.9% | 2,761,488 | |||||||||
Net Assets – 100% | $ | 290,453,506 | ||||||||
| (1) | All percentages shown in the Portfolio of Investments are based on net assets. |
| (2) | Optional Call Provisions: Dates (month and year) and prices of the earliest optional call or redemption. There may be other call provisions at varying prices at later dates. Certain mortgage-backed securities may be subject to periodic principal paydowns. |
| (3) | Ratings: Using the higher of Standard & Poor’s Group (“Standard & Poor’s”) or Moody’s Investor Service, Inc. (“Moody’s”) rating. Ratings below BBB by Standard & Poor’s or Baa by Moody’s are considered to be below investment grade. |
| (4) | Backed by an escrow or trust containing sufficient U.S. Government or U.S. Government agency securities which ensure the timely payment of principal and interest. Such investments are normally considered to be equivalent to AAA rated securities. |
| (5) | This debt has been restructured to accommodate capital maintenance at the facility. Major highlights of the debt restructuring include the following: (1) the principal balance outstanding on and after December 1, 2007, shall accrue interest at a rate of 6.500% per annum commencing December 1, 2007; (2) the interest shall accrue but not be payable on June 1, 2008 or December 1, 2008, but shall instead be deferred and paid by the end of calendar year 2011; (3) no principal component shall be pre-payable from the Minimum Sinking Fund Account during calendar years 2008 and 2009 but such pre-payments shall recommence beginning in calendar year 2010 according to a revised schedule. Management believes that the restructuring is in the best interest of Fund shareholders and that it is more-likely-than-not that the borrower will fulfill its obligation. Consequently, the Fund continues to accrue interest on this obligation. |
| N/R | Not rated. |
| (ETM) | Escrowed to maturity. |
| (UB) | Underlying bond of an inverse floating rate trust reflected as a financing transaction pursuant to the provisions of SFAS No. 140. See Notes to Financial Statements, Footnote 1 – Inverse Floating Rate Securities for more information. |
See accompanying notes to financial statements.
| 28 | Nuveen Investments |
Portfolio of Investments (Unaudited)
Nuveen California Insured Municipal Bond Fund
August 31, 2009
| Principal Amount (000) | Description (1) | Optional Call Provisions (2) | Ratings (3) | Value | ||||||
Education and Civic Organizations – 5.0% | ||||||||||
| $ | 1,250 | California Educational Facilities Authority, Student Loan Revenue Bonds, Cal Loan Program, Series 2001A, 5.400%, 3/01/21 – NPFG Insured (Alternative Minimum Tax) | 9/09 at 101.00 | Baa1 | $ | 1,231,613 | ||||
| 1,500 | California State Public Works Board, Lease Revenue Bonds, University of California, Institute Projects, Series 2005C, 5.000%, 4/01/30 – AMBAC Insured | 4/15 at 100.00 | Aa2 | 1,503,555 | ||||||
| 2,250 | California State University, Systemwide Revenue Bonds, Series 2005A, 5.000%, 11/01/25 – AMBAC Insured | 5/15 at 100.00 | Aa3 | 2,290,928 | ||||||
| 5,000 | Long Beach Bond Financing Authority, California, Lease Revenue Refunding Bonds, Long Beach Aquarium of the South Pacific, Series 2001, 5.250%, 11/01/30 – AMBAC Insured | 11/11 at 101.00 | BBB | 4,427,700 | ||||||
| 10,000 | Total Education and Civic Organizations | 9,453,796 | ||||||||
Health Care – 14.2% | ||||||||||
| 2,000 | Antelope Valley Healthcare District, California, Insured Revenue Refunding Bonds, Series 1997A, 5.200%, 1/01/27 – FSA Insured | 1/10 at 100.00 | AAA | 1,808,880 | ||||||
| 2,500 | California Health Facilities Financing Authority, Revenue Bonds, Kaiser Permanante System, Series 2006, 5.250%, 3/01/45 | 3/16 at 100.00 | A+ | 2,318,750 | ||||||
| 5,000 | California Health Facilities Financing Authority, Revenue Bonds, Sutter Health, Series 2007A, 5.000%, 11/15/42 – NPFG Insured | 11/16 at 100.00 | Aa3 | 4,341,000 | ||||||
| 4,000 | California Statewide Community Development Authority, Certificates of Participation, Sutter Health Obligated Group, Series 1999, 5.500%, 8/15/31 – FSA Insured | 2/10 at 101.00 | AAA | 4,026,440 | ||||||
| 4,170 | California Statewide Community Development Authority, Revenue Bonds, Kaiser Permanente System, Series 2007A, 4.750%, 4/01/33 | 4/17 at 100.00 | A+ | 3,649,667 | ||||||
| 5,685 | California Statewide Community Development Authority, Revenue Bonds, St. Joseph Health System, Series 2007A, 5.750%, 7/01/47 – FGIC Insured | 7/18 at 100.00 | AA– | 5,743,271 | ||||||
| 5,000 | Grossmont Healthcare District, California, General Obligation Bonds, Series 2007A, 5.000%, 7/15/37 – AMBAC Insured | 7/17 at 100.00 | A1 | 4,761,550 | ||||||
| 28,355 | Total Health Care | 26,649,558 | ||||||||
Housing/Multifamily – 4.8% | ||||||||||
| 4,180 | California Statewide Community Development Authority, Multifamily Housing Revenue Senior Bonds, Westgate Courtyards Apartments, Series 2001X-1, 5.420%, 12/01/34 – AMBAC Insured (Alternative Minimum Tax) | 12/11 at 100.00 | N/R | 3,756,441 | ||||||
| 3,865 | Los Angeles, California, GNMA Mortgage-Backed Securities Program Multifamily Housing Revenue Bonds, Park Plaza West Senior Apartments, Series 2001B, 5.400%, 1/20/31 (Alternative Minimum Tax) | 7/11 at 102.00 | AAA | 3,916,057 | ||||||
| 1,285 | Santa Cruz County Housing Authority, California, GNMA Collateralized Multifamily Housing Revenue Bonds, Northgate Apartments, Series 1999A, 5.500%, 7/20/40 (Alternative Minimum Tax) | 1/10 at 102.00 | AAA | 1,286,503 | ||||||
| 9,330 | Total Housing/Multifamily | 8,959,001 | ||||||||
Housing/Single Family – 5.4% | ||||||||||
| California Department of Veterans Affairs, Home Purchase Revenue Bonds, Series 2002A: | ||||||||||
| 3,500 | 5.300%, 12/01/21 – AMBAC Insured | 6/12 at 101.00 | Aa2 | 3,628,695 | ||||||
| 5,000 | 5.350%, 12/01/27 – AMBAC Insured | 6/12 at 101.00 | Aa2 | 5,095,700 | ||||||
| 300 | California Housing Finance Agency, Home Mortgage Revenue Bonds, Series 2006H, 5.750%, 8/01/30 – FGIC Insured (Alternative Minimum Tax) | 2/16 at 100.00 | AA– | 303,540 | ||||||
| 1,205 | California Rural Home Mortgage Finance Authority, FNMA Mortgage-Backed Securities Program Single Family Mortgage Revenue Bonds, Series 2002D, 5.250%, 6/01/34 (Alternative Minimum Tax) | 6/12 at 101.00 | Aaa | 1,201,252 | ||||||
| 10,005 | Total Housing/Single Family | 10,229,187 | ||||||||
| Nuveen Investments | 29 |
Portfolio of Investments (Unaudited)
Nuveen California Insured Municipal Bond Fund (continued)
August 31, 2009
| Principal Amount (000) | Description (1) | Optional Call Provisions (2) | Ratings (3) | Value | ||||||
Tax Obligation/General – 18.2% | ||||||||||
| $ | 1,000 | Bonita Unified School District, San Diego County, California, General Obligation Bonds, Series 2004A, 5.250%, 8/01/20 – NPFG Insured | 8/14 at 100.00 | AA– | $ | 1,069,020 | ||||
| 6,900 | Central Unified School District, Fresno County, California, General Obligation Bonds, Series 2006B, 5.000%, 8/01/31 – FSA Insured | 8/16 at 100.00 | AAA | 6,899,724 | ||||||
| 2,040 | Chaffey Joint Union High School District, San Bernardino County, California, General Obligation Bonds, Series 2005, 5.000%, 8/01/23 – FGIC Insured | 8/15 at 100.00 | AA– | 2,100,935 | ||||||
| 1,365 | El Segundo Unified School District, Los Angeles County, California, General Obligation Bonds, Series 2004, 5.250%, 9/01/20 – FGIC Insured | 9/14 at 100.00 | AA– | 1,488,410 | ||||||
| Glendora Unified School District, Los Angeles County, California, General Obligation Bonds, Series 2006A: | ||||||||||
| 1,900 | 5.250%, 8/01/24 – NPFG Insured | 8/16 at 100.00 | AA– | 1,982,669 | ||||||
| 1,000 | 5.250%, 8/01/25 – NPFG Insured | 8/16 at 100.00 | AA– | 1,039,900 | ||||||
| 2,650 | 0.000%, 8/01/19 – NPFG Insured | 8/13 at 68.56 | A | 1,482,622 | ||||||
| 2,755 | 0.000%, 8/01/20 – NPFG Insured | 8/13 at 63.85 | A | 1,424,555 | ||||||
| Imperial Community College District, Imperial County, California, General Obligation Bonds, Series 2005: | ||||||||||
| 1,330 | 5.000%, 8/01/23 – FGIC Insured | 8/14 at 100.00 | A | 1,361,388 | ||||||
| 1,510 | 5.000%, 8/01/24 – FGIC Insured | 8/14 at 100.00 | A | 1,538,569 | ||||||
| 1,460 | Jurupa Unified School District, Riverside County, California, General Obligation Bonds, Series 2004, 5.000%, 8/01/24 – FGIC Insured | 8/13 at 100.00 | A | 1,489,039 | ||||||
| 2,405 | Oak Valley Hospital District, Stanislaus County, California, General Obligation Bonds, Series 2005, 5.000%, 7/01/31 – FGIC Insured | 7/14 at 101.00 | A3 | 2,321,186 | ||||||
| 270 | Roseville Joint Union High School District, Placer County, California, General Obligation Bonds, Series 2006B, 5.000%, 8/01/27 – FGIC Insured | 8/15 at 100.00 | AA– | 277,217 | ||||||
| 1,590 | Sacramento City Unified School District, Sacramento County, California, General Obligation Bonds, Series 2005, 5.000%, 7/01/27 – NPFG Insured | 7/15 at 100.00 | Aa3 | 1,633,582 | ||||||
| 4,070 | San Benito Health Care District, California, General Obligation Bonds, Series 2005, 5.000%, 7/01/31 – SYNCORA GTY Insured | 7/14 at 101.00 | BBB+ | 3,605,043 | ||||||
| 1,000 | San Ramon Valley Unified School District, Contra Costa County, California, General Obligation Bonds, Series 2004, 5.000%, 8/01/24 – FSA Insured | 8/14 at 100.00 | AAA | 1,032,030 | ||||||
| 3,040 | Sulphur Springs Union School District, Los Angeles County, California, General Obligation Bonds, Series 1991A, 0.000%, 9/01/15 – NPFG Insured | No Opt. Call | A | 2,398,864 | ||||||
| 1,000 | Washington Unified School District, Yolo County, California, General Obligation Bonds, Series 2004A, 5.000%, 8/01/22 – FGIC Insured | 8/13 at 100.00 | A | 1,031,820 | ||||||
| 37,285 | Total Tax Obligation/General | 34,176,573 | ||||||||
Tax Obligation/Limited – 25.3% | ||||||||||
| 1,915 | Alameda County Redevelopment Agency, California, Eden Area Redevelopment Project, Tax Allocation Bonds, Series 2006A, 5.000%, 8/01/36 – NPFG Insured | 8/16 at 100.00 | A | 1,577,079 | ||||||
| Anaheim Public Finance Authority, California, Subordinate Lease Revenue Bonds, Public Improvement Project, Series 1997C: | ||||||||||
| 15,000 | 0.000%, 9/01/34 – FSA Insured | No Opt. Call | AAA | 3,097,800 | ||||||
| 10,000 | 0.000%, 9/01/36 – FSA Insured | No Opt. Call | AAA | 1,829,900 | ||||||
| 235 | Barstow Redevelopment Agency, California, Tax Allocation Bonds, Central Redevelopment Project, Series 1994A, 7.000%, 9/01/14 – NPFG Insured | No Opt. Call | A | 262,871 | ||||||
| 1,655 | Bell Community Housing Authority, California, Lease Revenue Bonds, Series 2005, 5.000%, 10/01/36 – AMBAC Insured | 10/15 at 100.00 | BBB+ | 1,405,443 | ||||||
| 2,250 | Brea and Olinda Unified School District, Orange County, California, Certificates of Participation Refunding, Series 2002A, 5.125%, 8/01/26 – FSA Insured | 8/11 at 101.00 | AAA | 2,281,815 | ||||||
| 1,960 | California Infrastructure Economic Development Bank, Revenue Bonds, North County Center for Self-Sufficiency Corporation, Series 2004, 5.000%, 12/01/25 – AMBAC Insured | 12/13 at 100.00 | AA– | 1,994,359 | ||||||
| 335 | Capistrano Unified School District, Orange County, California, Special Tax Bonds, Community Facilities District, Series 2005, 5.000%, 9/01/24 – FGIC Insured | 9/15 at 100.00 | A | 309,976 | ||||||
| 960 | Chino Redevelopment Agency, California, Merged Chino Redevelopment Project Area Tax Allocation Bonds, Series 2006, 5.000%, 9/01/38 – AMBAC Insured | 9/16 at 101.00 | BBB | 782,717 | ||||||
| 30 | Nuveen Investments |
| Principal Amount (000) | Description (1) | Optional Call Provisions (2) | Ratings (3) | Value | ||||||
Tax Obligation/Limited (continued) | ||||||||||
| $ | 1,400 | Chula Vista Public Financing Authority, California, Pooled Community Facility District Assessment Revenue Bonds, Series 2005A, 5.000%, 9/01/29 – NPFG Insured | 9/15 at 100.00 | A | $ | 1,230,796 | ||||
| 2,285 | Folsom Cordova Unified School District, Sacramento County, California, General Obligation Bonds, School Facilities Improvement District 1, Series 2004B, 5.000%, 10/01/21 – NPFG Insured | 10/14 at 100.00 | A+ | 2,378,525 | ||||||
| 1,185 | Folsom Cordova Unified School District, Sacramento County, California, General Obligation Bonds, School Facilities Improvement District 2, Series 2004B, 5.000%, 10/01/27 – FSA Insured | 10/14 at 100.00 | AAA | 1,210,525 | ||||||
| 2,500 | Golden State Tobacco Securitization Corporation, California, Tobacco Settlement Asset-Backed Revenue Bonds, Series 2005A, 5.000%, 6/01/45 – AMBAC Insured | 6/15 at 100.00 | A– | 2,156,225 | ||||||
| 1,840 | Hawthorne Community Redevelopment Agency, California, Project Area 2 Tax Allocation Bonds, Series 2006, 5.000%, 9/01/26 – SYNCORA GTY Insured | 9/16 at 100.00 | A– | 1,669,285 | ||||||
| 4,555 | Long Beach Bond Finance Authority, California, Multiple Project Tax Allocation Bonds, Housing and Gas Utility Financing Project Areas, Series 2005A-1, 5.000%, 8/01/35 – AMBAC Insured | 8/15 at 100.00 | BBB | 3,699,024 | ||||||
| 1,830 | Los Angeles Community Redevelopment Agency, California, Lease Revenue Bonds, Manchester Social Services Project, Series 2005, 5.000%, 9/01/37 – AMBAC Insured | 9/15 at 100.00 | A2 | 1,546,277 | ||||||
| 1,000 | Los Angeles Community Redevelopment Agency, California, Tax Allocation Bonds, Bunker Hill Project, Series 2004A, 5.000%, 12/01/20 – FSA Insured | 12/14 at 100.00 | AAA | 1,020,600 | ||||||
| 14,050 | Paramount Redevelopment Agency, California, Tax Allocation Refunding Bonds, Redevelopment Project Area 1, Series 1998, 0.000%, 8/01/26 – NPFG Insured | No Opt. Call | A | 4,944,336 | ||||||
| 1,150 | Poway Redevelopment Agency, California, Tax Allocation Bonds, Paugay Redevelopment Project, Series 2007, 5.000%, 6/15/30 – NPFG Insured | 6/17 at 100.00 | A | 1,003,203 | ||||||
| 290 | Rialto Redevelopment Agency, California, Tax Allocation Bonds, Merged Project Area, Series 2005A, 5.000%, 9/01/35 – SYNCORA GTY Insured | 9/15 at 100.00 | A– | 240,483 | ||||||
| 8,000 | Riverside County, California, Asset Leasing Corporate Leasehold Revenue Bonds, Riverside County Hospital Project, Series 1997B, 5.000%, 6/01/19 – NPFG Insured | 6/12 at 101.00 | A | 7,746,877 | ||||||
| 360 | Roseville, California, Certificates of Participation, Public Facilities, Series 2003A, 5.000%, 8/01/25 – AMBAC Insured | 8/13 at 100.00 | AA– | 337,064 | ||||||
| 3,560 | Roseville, California, Special Tax Bonds, Community Facilities District 1 – Woodcreek West, Series 2005, 5.000%, 9/01/30 – AMBAC Insured | 9/15 at 100.00 | A– | 3,103,608 | ||||||
| 1,840 | Western Placer Unified School District, Placer County, California, Certificates of Participation, Series 2008, 5.000%, 8/01/47 – AGC Insured | 8/18 at 100.00 | AAA | 1,719,167 | ||||||
| 80,155 | Total Tax Obligation/Limited | 47,547,955 | ||||||||
Transportation – 9.2% | ||||||||||
| 6,500 | Foothill/Eastern Transportation Corridor Agency, California, Toll Road Revenue Bonds, Series 1995A, 5.000%, 1/01/35 – NPFG Insured | 1/10 at 100.00 | A | 4,853,290 | ||||||
| 3,255 | Foothill/Eastern Transportation Corridor Agency, California, Toll Road Revenue Refunding Bonds, Series 1999, 5.750%, 1/15/40 – NPFG Insured | 1/10 at 101.00 | A | 2,646,868 | ||||||
| 1,985 | Port of Oakland, California, Revenue Bonds, Series 2000K, 5.750%, 11/01/29 – FGIC Insured | 5/10 at 100.00 | A1 | 1,975,452 | ||||||
| 625 | San Francisco Airports Commission, California, Revenue Bonds, San Francisco International Airport, Second Series 2000, Issue 26B, 5.000%, 5/01/21 – FGIC Insured | 5/10 at 101.00 | A1 | 631,744 | ||||||
| 5,000 | San Francisco Airports Commission, California, Revenue Refunding Bonds, San Francisco International Airport, Second Series 2001, Issue 27A, 5.250%, 5/01/31 – NPFG Insured (Alternative Minimum Tax) | 5/11 at 100.00 | A1 | 4,622,250 | ||||||
| 1,290 | San Francisco Airports Commission, California, Special Facilities Lease Revenue Bonds, San Francisco International Airport, SFO Fuel Company LLC, Series 1997A, 5.250%, 1/01/22 – AMBAC Insured (Alternative Minimum Tax) | 1/10 at 100.00 | A3 | 1,260,162 | ||||||
| Nuveen Investments | 31 |
Portfolio of Investments (Unaudited)
Nuveen California Insured Municipal Bond Fund (continued)
August 31, 2009
| Principal Amount (000) | Description (1) | Optional Call Provisions (2) | Ratings (3) | Value | |||||||
Transportation (continued) | |||||||||||
| $ | 1,320 | San Francisco Airports Commission, California, Special Facilities Lease Revenue Bonds, San Francisco International Airport, SFO Fuel Company LLC, Series 2000A, 6.100%, 1/01/20 – FSA Insured (Alternative Minimum Tax) | 1/10 at 100.00 | AAA | $ | 1,324,528 | |||||
| 19,975 | Total Transportation | 17,314,294 | |||||||||
U.S. Guaranteed – 5.3% (4) | |||||||||||
| 475 | Barstow Redevelopment Agency, California, Tax Allocation Bonds, Central Redevelopment Project, Series 1994A, 7.000%, 9/01/14 – MBIA Insured (ETM) | No Opt. Call | A | (4) | 543,139 | ||||||
| 500 | California, Various Purpose General Obligation Bonds, Series 2000, 5.750%, 3/01/27 (Pre-refunded 3/01/10) – NPFG Insured | 3/10 at 101.00 | AAA | 518,015 | |||||||
| 3,305 | Centinela Valley Union High School District, Los Angeles County, California, General Obligation Bonds, Series 2002C, 5.200%, 8/01/32 – FGIC Insured (ETM) | 8/10 at 102.00 | A | (4) | 3,392,616 | ||||||
| 5,000 | Los Angeles Unified School District, California, General Obligation Bonds, Series 2002E, 5.125%, 1/01/27 (Pre-refunded 7/01/12) – MBIA Insured | 7/12 at 100.00 | AA– | (4) | 5,562,050 | ||||||
| 15 | Port of Oakland, California, Revenue Bonds, Series 2000K, 5.750%, 11/01/29 (Pre-refunded 5/01/10) – FGIC Insured | 5/10 at 100.00 | A1 | (4) | 15,460 | ||||||
| 9,295 | Total U.S. Guaranteed | 10,031,280 | |||||||||
Utilities – 6.9% | |||||||||||
| 4,000 | California Pollution Control Financing Authority, Remarketed Revenue Bonds, Pacific Gas and Electric Company, Series 1996A, 5.350%, 12/01/16 – NPFG Insured (Alternative Minimum Tax) | 4/11 at 102.00 | A | 4,047,720 | |||||||
| 1,000 | California Pollution Control Financing Authority, Revenue Refunding Bonds, Southern California Edison Company, Series 1999B, 5.450%, 9/01/29 – NPFG Insured | 9/09 at 101.00 | A1 | 1,002,810 | |||||||
| 595 | Merced Irrigation District, California, Electric System Revenue Bonds, Series 2005, 5.125%, 9/01/31 – SYNCORA GTY Insured | 9/15 at 100.00 | N/R | 499,336 | |||||||
| 2,875 | Northern California Power Agency, Revenue Refunding Bonds, Hydroelectric Project 1, Series 1998A, 5.125%, 7/01/23 – NPFG Insured | 7/10 at 100.00 | A2 | 2,879,801 | |||||||
| 1,950 | Salinas Valley Solid Waste Authority, California, Revenue Bonds, Series 2002, 5.250%, 8/01/27 – AMBAC Insured (Alternative Minimum Tax) | 8/12 at 100.00 | A– | 1,755,059 | |||||||
| 2,700 | Santa Clara, California, Subordinate Electric Revenue Bonds, Series 2003A, 5.000%, 7/01/23 – NPFG Insured | 7/13 at 100.00 | A1 | 2,722,275 | |||||||
| 13,120 | Total Utilities | 12,907,001 | |||||||||
Water and Sewer – 4.6% | |||||||||||
| 1,000 | Brentwood Infrastructure Financing Authority, California, Water Revenue Bonds, Series 2008, 5.750%, 7/01/38 | 7/18 at 100.00 | AA | 1,073,630 | |||||||
| 1,000 | Fortuna Public Financing Authority, California, Wastewater Revenue Bonds, Series 2006, 5.000%, 10/01/36 – FSA Insured | 10/16 at 100.00 | AAA | 998,480 | |||||||
| 3,000 | Orange County Sanitation District, California, Certificates of Participation, Series 2003, 5.000%, 2/01/33 – FGIC Insured | 8/13 at 100.00 | AAA | 3,027,450 | |||||||
| 1,000 | Orange County Water District, California, Revenue Certificates of Participation, Series 2005B, 5.000%, 8/15/24 – NPFG Insured | 2/15 at 100.00 | AAA | 1,028,800 | |||||||
| 2,500 | Westlands Water District, California, Revenue Certificates of Participation, Series 2005A, 5.000%, 9/01/30 – NPFG Insured | 3/15 at 100.00 | A+ | 2,452,225 | |||||||
| 8,500 | Total Water and Sewer | 8,580,585 | |||||||||
| $ | 226,020 | Total Investments (cost $195,060,393) – 98.9% | 185,849,230 | ||||||||
Other Assets Less Liabilities – 1.1% | 2,021,944 | ||||||||||
Net Assets – 100% | $ | 187,871,174 | |||||||||
| 32 | Nuveen Investments |
| At least 80% of the Fund’s net assets are invested in municipal securities that guarantee the timely payment of principal and interest. See Notes to Financial Statements, Footnote 1 - Insurance, for more information. |
| (1) | All percentages shown in the Portfolio of Investments are based on net assets. |
| (2) | Optional Call Provisions: Dates (month and year) and prices of the earliest optional call or redemption. There may be other call provisions at varying prices at later dates. Certain mortgage-backed securities may be subject to periodic principal paydowns. |
| (3) | Ratings: Using the higher of Standard & Poor’s Group (“Standard & Poor’s”) or Moody’s Investor Service, Inc. (“Moody’s”) rating. Ratings below BBB by Standard & Poor’s or Baa by Moody’s are considered to be below investment grade. |
| The Portfolio of Investments may reflect the ratings on certain bonds whose insurer has experienced downgrades as of the end of the reporting period. Please see the Portfolio Managers’ Comments for an expanded discussion of the affect on the Fund of changes to the ratings of certain bonds in the portfolio resulting from changes to the ratings of the underlying insurers both during the period and after period end. |
| (4) | Backed by an escrow or trust containing sufficient U.S. Government or U.S. Government agency securities which ensure the timely payment of principal and interest. Such investments are normally considered to be equivalent to AAA rated securities. |
| N/R | Not rated. |
| (ETM) | Escrowed to maturity. |
See accompanying notes to financial statements.
| Nuveen Investments | 33 |
Statement of Assets and Liabilities (Unaudited)
August 31, 2009
| California High Yield | California | California Insured | ||||||||||
Assets | ||||||||||||
Investments, at value (cost $75,948,600, $307,148,255 and $195,060,393, respectively) | $ | 65,692,788 | $ | 292,692,018 | $ | 185,849,230 | ||||||
Cash | — | — | 170,281 | |||||||||
Unrealized appreciation on forward swaps | 481,500 | — | — | |||||||||
Receivables: | ||||||||||||
Interest | 1,432,720 | 4,423,321 | 2,115,805 | |||||||||
Investments sold | 30,525 | 386,350 | 115,000 | |||||||||
Shares sold | 409,421 | 168,784 | 218,390 | |||||||||
Other assets | 21 | 12,745 | 12,208 | |||||||||
Total assets | 68,046,975 | 297,683,218 | 188,480,914 | |||||||||
Liabilities | ||||||||||||
Cash overdraft | 183,540 | 1,097,205 | — | |||||||||
Floating rate obligations | — | 5,000,000 | — | |||||||||
Payables: | ||||||||||||
Dividends | 143,375 | 497,815 | 262,923 | |||||||||
Investments purchased | 1,385,979 | — | — | |||||||||
Shares redeemed | 61,196 | 355,259 | 156,685 | |||||||||
Accrued expenses: | ||||||||||||
Management fees | 40,390 | 134,066 | 86,889 | |||||||||
12b-1 distribution and service fees | 10,929 | 36,475 | 22,945 | |||||||||
Other | 27,801 | 108,892 | 80,298 | |||||||||
Total liabilities | 1,853,210 | 7,229,712 | 609,740 | |||||||||
Net assets | $ | 66,193,765 | $ | 290,453,506 | $ | 187,871,174 | ||||||
Class A Shares | ||||||||||||
Net assets | $ | 30,041,857 | $ | 114,946,515 | $ | 75,732,364 | ||||||
Shares outstanding | 4,130,803 | 12,231,408 | 7,789,120 | |||||||||
Net asset value per share | $ | 7.27 | $ | 9.40 | $ | 9.72 | ||||||
Offering price per share (net asset value per share plus maximum sales charge of 4.20% of offering price) | $ | 7.59 | $ | 9.81 | $ | 10.15 | ||||||
Class B Shares | ||||||||||||
Net assets | $ | 138,258 | $ | 3,752,566 | $ | 3,508,964 | ||||||
Shares outstanding | 19,022 | 399,639 | 359,853 | |||||||||
Net asset value and offering price per share | $ | 7.27 | $ | 9.39 | $ | 9.75 | ||||||
Class C Shares | ||||||||||||
Net assets | $ | 10,069,025 | $ | 22,988,195 | $ | 11,865,546 | ||||||
Shares outstanding | 1,384,242 | 2,453,262 | 1,225,683 | |||||||||
Net asset value and offering price per share | $ | 7.27 | $ | 9.37 | $ | 9.68 | ||||||
Class I Shares | ||||||||||||
Net assets | $ | 25,944,625 | $ | 148,766,230 | $ | 96,764,300 | ||||||
Shares outstanding | 3,569,100 | 15,855,179 | 9,936,093 | |||||||||
Net asset value and offering price per share | $ | 7.27 | $ | 9.38 | $ | 9.74 | ||||||
Net Assets Consist of: | ||||||||||||
Capital paid-in | $ | 83,018,811 | $ | 318,935,180 | $ | 197,615,236 | ||||||
Undistributed (Over-distribution of) net investment income | 318,371 | 448,147 | 422,526 | |||||||||
Accumulated net realized gain (loss) from investments and | (7,369,105 | ) | (14,473,584 | ) | (955,425 | ) | ||||||
Net unrealized appreciation (depreciation) of investments and derivative transactions | (9,774,312 | ) | (14,456,237 | ) | (9,211,163 | ) | ||||||
Net assets | $ | 66,193,765 | $ | 290,453,506 | $ | 187,871,174 | ||||||
See accompanying notes to financial statements.
| 34 | Nuveen Investments |
Statement of Operations (Unaudited)
Six Months Ended August 31, 2009
| California High Yield | California | California Insured | ||||||||||
Investment Income | $ | 2,558,980 | $ | 8,436,826 | $ | 5,063,554 | ||||||
Expenses | ||||||||||||
Management fees | 180,189 | 777,548 | 514,786 | |||||||||
12b-1 service fees – Class A | 30,046 | 110,066 | 76,976 | |||||||||
12b-1 distribution and service fees – Class B | 616 | 19,225 | 20,579 | |||||||||
12b-1 distribution and service fees – Class C | 29,962 | 81,435 | 43,810 | |||||||||
Shareholders’ servicing agent fees and expenses | 12,046 | 70,664 | 46,897 | |||||||||
Interest expense on floating rate obligations | — | 14,835 | — | |||||||||
Custodian’s fees and expenses | 14,458 | 26,242 | 20,438 | |||||||||
Trustees’ fees and expenses | 953 | 4,584 | 3,008 | |||||||||
Professional fees | 7,109 | 9,642 | 8,045 | |||||||||
Shareholders’ reports – printing and mailing expenses | 4,668 | 28,129 | 19,499 | |||||||||
Federal and state registration fees | 9,776 | 8,171 | 6,692 | |||||||||
Other expenses | 1,339 | 5,815 | 3,092 | |||||||||
Total expenses before custodian fee credit and expense reimbursement | 291,162 | 1,156,356 | 763,822 | |||||||||
Custodian fee credit | (15 | ) | (55 | ) | (11 | ) | ||||||
Expense reimbursement | (5,021 | ) | — | — | ||||||||
Net expenses | 286,126 | 1,156,301 | 763,811 | |||||||||
Net investment income | 2,272,854 | 7,280,525 | 4,299,743 | |||||||||
Realized and Unrealized Gain (Loss) | ||||||||||||
Net realized gain (loss) from investments | 348,156 | (2,095,343 | ) | 106,756 | ||||||||
Change in net unrealized appreciation (depreciation) of: | ||||||||||||
Investments | 5,964,403 | 15,144,671 | 6,005,135 | |||||||||
Forward swaps | 391,080 | — | — | |||||||||
Net realized and unrealized gain (loss) | 6,703,639 | 13,049,328 | 6,111,891 | |||||||||
Net increase (decrease) in net assets from operations | $ | 8,976,493 | $ | 20,329,853 | $ | 10,411,634 | ||||||
See accompanying notes to financial statements.
| Nuveen Investments | 35 |
Statement of Changes in Net Assets (Unaudited)
| California High Yield | California | California Insured | ||||||||||||||||||||||
| Six Months Ended 8/31/09 | Year Ended 2/28/09 | Six Months Ended 8/31/09 | Year Ended 2/28/09 | Six Months Ended 8/31/09 | Year Ended 2/28/09 | |||||||||||||||||||
Operations | ||||||||||||||||||||||||
Net investment income | $ | 2,272,854 | $ | 3,736,184 | $ | 7,280,525 | $ | 14,920,404 | $ | 4,299,743 | $ | 9,136,790 | ||||||||||||
Net realized gain (loss) from: | ||||||||||||||||||||||||
Investments | 348,156 | (4,386,523 | ) | (2,095,343 | ) | (4,719,324 | ) | 106,756 | (1,062,179 | ) | ||||||||||||||
Forward swaps | — | — | — | (727,000 | ) | — | — | |||||||||||||||||
Futures | — | (1,621,125 | ) | — | — | — | — | |||||||||||||||||
Change in net unrealized appreciation (depreciation) of: | ||||||||||||||||||||||||
Investments | 5,964,403 | (6,964,051 | ) | 15,144,671 | (15,006,886 | ) | 6,005,135 | (7,929,625 | ) | |||||||||||||||
Forward swaps | 391,080 | 90,420 | — | 577,960 | — | — | ||||||||||||||||||
Futures | — | 2,006 | — | — | — | — | ||||||||||||||||||
Net increase (decrease) in net assets from operations | 8,976,493 | (9,143,089 | ) | 20,329,853 | (4,954,846 | ) | 10,411,634 | 144,986 | ||||||||||||||||
Distributions to Shareholders | ||||||||||||||||||||||||
From net investment income: | ||||||||||||||||||||||||
Class A | (1,045,475 | ) | (2,503,803 | ) | (2,622,366 | ) | (5,470,063 | ) | (1,656,342 | ) | (3,439,616 | ) | ||||||||||||
Class B (1) | (4,130 | ) | (7,190 | ) | (81,362 | ) | (220,077 | ) | (76,392 | ) | (212,964 | ) | ||||||||||||
Class C | (267,433 | ) | (380,026 | ) | (463,232 | ) | (970,405 | ) | (219,801 | ) | (447,131 | ) | ||||||||||||
Class I (2) | (819,065 | ) | (643,542 | ) | (3,762,092 | ) | (7,856,246 | ) | (2,161,159 | ) | (4,656,504 | ) | ||||||||||||
From accumulated net realized gains: | ||||||||||||||||||||||||
Class A | — | — | — | — | — | (118,574 | ) | |||||||||||||||||
Class B (1) | — | — | — | — | — | (8,721 | ) | |||||||||||||||||
Class C | — | — | — | — | — | (17,315 | ) | |||||||||||||||||
Class I (2) | — | — | — | — | — | (148,633 | ) | |||||||||||||||||
Decrease in net assets from distributions to shareholders | (2,136,103 | ) | (3,534,561 | ) | (6,929,052 | ) | (14,516,791 | ) | (4,113,694 | ) | (9,049,458 | ) | ||||||||||||
Fund Share Transactions | ||||||||||||||||||||||||
Proceeds from sale of shares | 16,331,378 | 58,806,201 | 22,957,567 | 165,092,451 | 6,972,091 | 15,787,214 | ||||||||||||||||||
Proceeds from shares issued to shareholders due to reinvestment of distributions | 1,255,550 | 2,356,121 | 3,811,670 | 7,530,027 | 2,443,013 | 5,370,672 | ||||||||||||||||||
| 17,586,928 | 61,162,322 | 26,769,237 | 172,622,478 | 9,415,104 | 21,157,886 | |||||||||||||||||||
Cost of shares redeemed | (13,511,123 | ) | (46,879,507 | ) | (32,304,848 | ) | (174,648,665 | ) | (17,149,286 | ) | (36,441,074 | ) | ||||||||||||
Net increase (decrease) in net assets from Fund share transactions | 4,075,805 | 14,282,815 | (5,535,611 | ) | (2,026,187 | ) | (7,734,182 | ) | (15,283,188 | ) | ||||||||||||||
Net increase (decrease) in net assets | 10,916,195 | 1,605,165 | 7,865,190 | (21,497,824 | ) | (1,436,242 | ) | (24,187,660 | ) | |||||||||||||||
Net assets at the beginning of period | 55,277,570 | 53,672,405 | 282,588,316 | 304,086,140 | 189,307,416 | 213,495,076 | ||||||||||||||||||
Net assets at the end of period | $ | 66,193,765 | $ | 55,277,570 | $ | 290,453,506 | $ | 282,588,316 | $ | 187,871,174 | $ | 189,307,416 | ||||||||||||
Undistributed (Over-distribution of) net investment income at the end of period | $ | 318,371 | $ | 181,620 | $ | 448,147 | $ | 96,674 | $ | 422,526 | $ | 236,477 | ||||||||||||
(1) Effective May 1, 2008, Class B Shares will only be issued upon exchange of Class B Shares from another Nuveen fund or for purposes of dividend reinvestment. The reinvestment privilege for Class B Shares is no longer available as of December 31, 2008.
(2) Effective May 1, 2008, Class R Shares were renamed Class I Shares.
See accompanying notes to financial statements.
| 36 | Nuveen Investments |
Notes to Financial Statements (Unaudited)
1. General Information and Significant Accounting Policies
The Nuveen Multistate Trust II (the “Trust”) is an open-end management investment company registered under the Investment Company Act of 1940, as amended. The Trust is comprised of Nuveen California High Yield Municipal Bond Fund (“California High Yield”), Nuveen California Municipal Bond Fund (“California”) and Nuveen California Insured Municipal Bond Fund (“California Insured”) (collectively, the “Funds”), among others. The Trust was organized as a Massachusetts business trust on July 1, 1996. California and California Insured were each organized as a series of predecessor trusts or corporations prior to that date.
California High Yield’s investment objective is to provide high current income exempt from regular federal, state and, in some cases, local income taxes. Total return is a secondary objective when consistent with the Fund’s primary objective. The Fund invests substantially all of its assets in municipal bonds that pay interest that is exempt from regular federal and California personal income tax. Under normal circumstances, the Fund invests at least 65% of its net assets in medium- to low-quality bonds rated BBB/Baa or lower. The Fund may invest up to 10% of its net assets in defaulted municipal bonds. For diversification purposes or when after-tax yields merit, the Fund may invest up to 20% of its net assets in municipal securities that are not exempt from California personal income tax (e.g., municipal securities issued by issuers outside of California). The Fund may invest up to 15% of its net assets in municipal securities whose interest payments vary inversely with changes in short-term tax-exempt interest rates (i.e., inverse floating rate securities). Nuveen Asset Management (the “Adviser”), a wholly owned subsidiary of Nuveen Investments, Inc. (“Nuveen”), uses a research-intensive investment process to identify high-yielding municipal bonds that offer attractive value in terms of their current yields, prices, credit quality, liquidity and future prospects. The Adviser may choose to sell municipal bonds with deteriorating credit or limited upside potential compared to other available bonds.
California’s investment objective is to provide as high a level of current interest income exempt from regular federal, state and, in some cases, local income taxes as is consistent with preservation of capital. The Fund invests substantially all of its assets in municipal bonds that pay interest that is exempt from regular federal and California personal income tax. The Fund invests at least 80% of its net assets in investment grade municipal bonds rated BBB-/Baa3 or higher at the time of purchase. The Fund may invest up to 20% of its net assets in below investment grade municipal bonds, commonly referred to as “high yield,” “high risk” or “junk” bonds. The Fund may invest up to 15% of its net assets in municipal securities whose interest payments vary inversely with changes in short-term tax-exempt interest rates (i.e., inverse floating rate securities). The Adviser uses a value-oriented strategy and looks for higher-yielding and undervalued municipal bonds that offer the potential for above-average total return. The Adviser may choose to sell municipal bonds with deteriorating credit or limited upside potential compared to other available bonds.
California Insured’s investment objective is to provide as high a level of current interest income exempt from regular federal, state and, in some cases, local income taxes as is consistent with preservation of capital. The Fund invests substantially all of its assets in municipal bonds that pay interest that is exempt from regular federal and California personal income tax. Under normal circumstances, the Fund invests at least 80% of its net assets in municipal securities that are covered by insurance guaranteeing the timely payment of principal and interest. In addition, the Fund invests at least 80% of its net assets in municipal securities that are rated at least AA at the time of purchase (based on the higher of the rating of the insurer, if any, or the underlying security) or municipal bonds backed by an escrow or trust account containing sufficient U.S. government or U.S. government agency securities or U.S. Treasury-issued State and Local Government Series (SLGS) securities to ensure timely payment of principal and interest. The Fund may invest up to 15% of its net assets in municipal securities whose interest payments vary inversely with changes in short-term tax-exempt interest rates (i.e., inverse floating rate securities). The Adviser uses a value-oriented strategy and looks for higher-yielding and undervalued insured municipal bonds that offer the potential for above-average total return. The Adviser may choose to sell municipal bonds with deteriorating credit or limited upside potential compared to other available bonds.
The following is a summary of significant accounting policies followed by the Funds in the preparation of their financial statements in accordance with accounting principles generally accepted in the United States.
Investment Valuation
The prices of municipal bonds in each Fund’s investment portfolio are provided by a pricing service approved by the Fund’s Board of Trustees. Prices of forward swap contracts are also provided by an independent pricing service approved by each Fund’s Board of Trustees. Futures contracts are valued using the closing settlement price, or, in the absence of such price, at the mean of the bid and asked prices. When market price quotes are not readily available (which is usually the case for municipal securities), the pricing service or, in the absence of a pricing service for a particular investment or derivative instrument, the Board of Trustees of the Fund, or its designee, may establish fair value using a wide variety of market data including yields or prices of investments of comparable quality, type of issue, coupon, maturity and rating, market quotes or indications of value from security dealers, evaluations of anticipated cash flows or collateral, general market conditions and other information and analysis, including the obligor’s credit characteristics considered relevant. Temporary investments in securities that have variable rate and demand features qualifying them as short-term investments are valued at amortized cost, which approximates value.
Investment Transactions
Investment transactions are recorded on a trade date basis. Realized gains and losses from investment transactions are determined on the specific identification method. Investments purchased on a when-issued/delayed delivery basis may have extended settlement periods. Any investments so purchased are subject to market fluctuation during this period. The Funds have instructed the custodian to segregate assets with a current value at least equal to the amount of the when-issued/delayed delivery purchase commitments. At August 31, 2009, California High Yield had outstanding when-issued/delayed delivery commitments of $913,408. There were no such outstanding purchase commitments in either of the other Funds.
| Nuveen Investments | 37 |
Notes to Financial Statements (Unaudited) (continued)
Investment Income
Interest income, which includes the amortization of premiums and accretion of discounts for financial reporting purposes, is recorded on an accrual basis. Investment income also includes paydown gains and losses, if any.
Income Taxes
Each Fund is a separate taxpayer for federal income tax purposes. Each Fund intends to distribute substantially all of its net investment income and net capital gains to shareholders and to otherwise comply with the requirements of Subchapter M of the Internal Revenue Code applicable to regulated investment companies. Therefore, no federal income tax provision is required. Furthermore, each Fund intends to satisfy conditions which will enable interest from municipal securities, which is exempt from regular federal and California state income taxes, to retain such tax-exempt status when distributed to shareholders of the Funds. Net realized capital gains and ordinary income distributions paid by the Funds are subject to federal taxation.
For all open tax years and all major taxing jurisdictions, management of the Funds has concluded that there are no significant uncertain tax positions that would require recognition in the financial statements. Open tax years are those that are open for examination by taxing authorities (i.e., generally the last four tax year ends and the interim tax period since then). Furthermore, management of the Funds is also not aware of any tax positions for which it is reasonably possible that the total amounts of unrecognized tax benefits will significantly change in the next twelve months.
Dividends and Distributions to Shareholders
Dividends from tax-exempt net investment income are declared monthly. Net realized capital gains and/or market discount from investment transactions, if any, are declared and distributed to shareholders at least annually. Furthermore, capital gains are distributed only to the extent they exceed available capital loss carryforwards.
Distributions to shareholders of tax-exempt net investment income, net realized capital gains and/or market discount, if any, are recorded on the ex-dividend date. The amount and timing of distributions are determined in accordance with federal income tax regulations, which may differ from accounting principles generally accepted in the United States.
Insurance
Under normal circumstances, California Insured will invest at least 80% of its net assets in municipal securities that are covered by insurance guaranteeing the timely payment of principal and interest. For purposes of this 80% test, insurers must have a claims-paying ability rated at least A at the time of purchase by at least one independent rating agency. In addition, the Fund will invest at least 80% of its net assets in municipal securities that are rated at least AA at the time of purchase (based on the higher of the rating of the insurer, if any, or the underlying security) by at least one independent rating agency, or are unrated but judged to be of similar credit quality by the Adviser, or are backed by an escrow or trust account containing sufficient U.S. government or U.S. government agency securities or U.S. Treasury-issued State and Local Government Series (SLGS) securities to ensure timely payment of principal and interest. Inverse floating rate securities whose underlying bonds are covered by insurance are included for purposes of the 80% test.
Each insured municipal security is covered by Original Issue Insurance, Secondary Market Insurance or Portfolio Insurance. Such insurance does not guarantee the market value of the municipal securities or the value of the Fund’s shares. Original Issue Insurance and Secondary Market Insurance remain in effect as long as the municipal securities covered thereby remain outstanding and the insurer remains in business, regardless of whether the Fund ultimately disposes of such municipal securities. Consequently, the market value of the municipal securities covered by Original Issue Insurance or Secondary Market Insurance may reflect value attributable to the insurance. Portfolio Insurance, in contrast, is effective only while the municipal securities are held by the Fund. Accordingly, neither the prices used in determining the market value of the underlying municipal securities nor the net asset value of the Fund’s shares include value, if any, attributable to the Portfolio Insurance. Each policy of the Portfolio Insurance does, however, give the Fund the right to obtain permanent insurance with respect to the municipal security covered by the Portfolio Insurance policy at the time of its sale.
Flexible Sales Charge Program
Class A Shares are generally sold with an up-front sales charge and incur a .20% annual 12b-1 service fee. Class A Share purchases of $1 million or more are sold at net asset value without an up-front sales charge but may be subject to a CDSC if redeemed within twelve months of purchase. Class B Shares are sold without an up-front sales charge but incur a .75% annual 12b-1 distribution fee and a .20% annual 12b-1 service fee. Class B Shares are subject to a CDSC of up to 5% depending upon the length of time the shares are held by the investor (CDSC is reduced to 0% at the end of six years). Class B Shares convert to Class A Shares eight years after purchase. Class C Shares are sold without an up-front sales charge but incur a .55% annual 12b-1 distribution fee and a .20% annual 12b-1 service fee. Class C Shares are subject to a CDSC of 1% if redeemed within one year of purchase. Class I Shares are not subject to any sales charge or 12b-1 distribution or service fees.
Inverse Floating Rate Securities
Each Fund is authorized to invest in inverse floating rate securities. An inverse floating rate security is created by depositing a municipal bond, typically with a fixed interest rate, into a special purpose trust created by a broker-dealer. In turn, this trust (a) issues floating rate certificates, in face amounts equal to some fraction of the deposited bond’s par amount or market value, that typically pay short-term tax-exempt interest rates to third parties, and (b) issues to a long-term investor (such as one of the Funds) an inverse floating rate certificate (sometimes referred to as an “inverse floater”) that represents all remaining or residual interest in the trust. The income received by the inverse floater holder varies inversely with the short-term rate paid to the floating rate certificates’ holders, and in most circumstances the inverse floater holder bears substantially all of the underlying bond’s downside investment risk and also benefits disproportionately from any potential appreciation of the underlying bond’s value. The price of an inverse floating rate
| 38 | Nuveen Investments |
security will be more volatile than that of the underlying bond because the interest rate is dependent on not only the fixed coupon rate of the underlying bond but also on the short-term interest paid on the floating rate certificates, and because the inverse floating rate security essentially bears the risk of loss of the greater face value of the underlying bond.
A Fund may purchase an inverse floating rate security in a secondary market transaction without first owning the underlying bond (referred to as an “externally-deposited inverse floater”), or instead by first selling a fixed-rate bond to a broker-dealer for deposit into the special purpose trust and receiving in turn the residual interest in the trust (referred to as a “self-deposited inverse floater”). The inverse floater held by a Fund gives the Fund the right (a) to cause the holders of the floating rate certificates to tender their notes at par, and (b) to have the broker transfer the fixed-rate bond held by the trust to the Fund, thereby collapsing the trust. An investment in an externally-deposited inverse floater is identified in the Portfolio of Investments as “(IF) – Inverse floating rate investment.” An investment in a self-deposited inverse floater is accounted for as a financing transaction in accordance with Statement of Financial Accounting Standards No. 140 (SFAS No. 140) “Accounting for Transfers and Servicing of Financial Assets and Extinguishment of Liabilities.” In such instances, a fixed-rate bond deposited into a special purpose trust is identified in the Portfolio of Investments as “(UB) – Underlying bond of an inverse floating rate trust,” with the Fund accounting for the short-term floating rate certificates issued by the trust as “Floating rate obligations” on the Statement of Assets and Liabilities. In addition, the Fund reflects in “Investment Income” the entire earnings of the underlying bond and recognizes the related interest paid to the holders of the short-term floating rate certificates as “Interest expense on floating rate obligations” on the Statement of Operations.
During the six months ended August 31, 2009, California High Yield and California invested in externally-deposited inverse floaters and/or self-deposited inverse floaters.
Each Fund may also enter into shortfall and forbearance agreements (sometimes referred to as a “recourse trust” or “credit recovery swap”) (such agreements referred to herein as “Recourse Trusts”) with a broker-dealer by which a Fund agrees to reimburse the broker-dealer, in certain circumstances, for the difference between the liquidation value of the fixed-rate bond held by the trust and the liquidation value of the floating rate certificates issued by the trust plus any shortfalls in interest cash flows. Under these agreements, a Fund’s potential exposure to losses related to or on inverse floaters may increase beyond the value of a Fund’s inverse floater investments as a Fund may potentially be liable to fulfill all amounts owed to holders of the floating rate certificates. At period end, any such shortfall is recognized as “Unrealized depreciation on Recourse Trusts” on the Statement of Assets and Liabilities.
At August 31, 2009, the Funds were not invested in externally-deposited Recourse Trusts.
| California High Yield | California | |||||
Maximum exposure to Recourse Trusts | $ | — | $ | — | ||
The average floating rate obligations outstanding and average annual interest rate and fees related to self-deposited inverse floaters during the six months ended August 31, 2009, were as follows:
| California | ||
Average floating rate obligations | $5,289,565 | |
Average annual interest rate and fees | 0.56% |
Swap Contracts
Each Fund is authorized to enter into forward interest rate swap contracts consistent with their investment objectives and policies to reduce, increase or otherwise alter its risk profile or to alter its portfolio characteristics (i.e. duration, yield curve positioning and credit quality).
Each Fund is subject to interest rate risk in the normal course of pursuing its investment objectives. Each Fund’s use of forward interest rate swap transactions is intended to help the Fund manage its overall interest rate sensitivity, either shorter or longer, generally to more closely align the Fund’s interest rate sensitivity with that of the broader municipal market. Forward interest rate swap transactions involve each Fund’s agreement with a counterparty to pay, in the future, a fixed or variable rate payment in exchange for the counterparty paying the Fund a variable or fixed rate payment, the accruals for which would begin at a specified date in the future (the “effective date”). The amount of the payment obligation is based on the notional amount of the swap contract and the termination date of the swap (which is akin to a bond’s maturity). The value of the Fund’s swap commitment would increase or decrease based primarily on the extent to which long-term interest rates for bonds having a maturity of the swap’s termination date increases or decreases. Forward interest rate swap contracts are valued daily. The net amount recorded on these transactions for each counterparty is recognized on the Statement of Assets and Liabilities as “Unrealized appreciation or depreciation on forward swaps” with the change during the fiscal period recognized on the Statement of Operations as “Change in net unrealized appreciation (depreciation) of forward swaps.”
The Funds may terminate a swap contract prior to the effective date, at which point a realized gain or loss is recognized. When a forward swap is terminated, it ordinarily does not involve the delivery of securities or other underlying assets or principal, but rather is settled in cash on a net basis. Net realized gains and losses during the fiscal period are recognized on the Statement of Operations as “Net realized gain (loss) from forward swaps.” Each Fund intends, but is not obligated, to terminate its forward swaps before the effective date. Accordingly, the risk of loss with respect to the swap counterparty on such transactions is limited to the credit risk associated with a counterparty failing to honor its commitment to pay any realized gain to the Fund upon termination. California High Yield was the only Fund to invest in forward interest rate swap transactions during the six months ended August 31, 2009.
| Nuveen Investments | 39 |
Notes to Financial Statements (Unaudited) (continued)
The average notional amount of forward swap contracts outstanding during the six months ended August 31, 2009, were as follows:
| California High Yield | |||
Forward swap contracts average notional amount outstanding | $ | 2,666,667 | |
| Refer | to Footnote 3 – Derivative Instruments and Hedging Activities for further details on forward swap contract activity. |
Futures Contracts
Each Fund is subject to interest rate risk in the normal course of pursuing its investment objectives and is authorized to invest in futures contracts in an attempt to manage such risk. Upon entering into a futures contract, a Fund is required to deposit with the broker an amount of cash or liquid securities equal to a specified percentage of the contract amount. This is known as the “initial margin.” Cash held by the broker to cover initial margin requirements on open futures contracts, if any, is recognized as “Deposits with brokers for open futures contracts” on the Statement of Assets and Liabilities. Subsequent payments (“variation margin”) are made or received by a Fund each day, depending on the daily fluctuation of the value of the contract. Variation margin is recognized as a receivable or payable for “Variation margin on futures contracts” on the Statement of Assets and Liabilities, when applicable.
During the period the futures contract is open, changes in the value of the contract are recorded as an unrealized gain or loss by “marking-to-market” on a daily basis to reflect the changes in market value of the contract and is recognized as “Change in net unrealized appreciation (depreciation) of futures contracts” on the Statement of Operations. When the contract is closed or expired, a Fund records a realized gain or loss equal to the difference between the value of the contract on the closing date and value of the contract when originally entered into and is recognized as “Net realized gain (loss) from futures contracts” on the Statement of Operations. The Funds did not invest in futures contracts during the six months ended August 31, 2009.
Risks of investments in futures contracts include the possible adverse movement of the securities or indices underlying the contracts, the possibility that there may not be a liquid secondary market for the contracts and/or that a change in the value of the contract may not correlate with a change in the value of the underlying securities or indices.
Market and Counterparty Credit Risk
In the normal course of business each Fund may invest in financial instruments and enter into financial transactions where risk of potential loss exists due to changes in the market (market risk) or failure of the other party to the transaction to perform (counterparty credit risk). The potential loss could exceed the value of the financial assets recorded on the financial statements. Financial assets, which potentially expose each Fund to counterparty credit risk, consist principally of cash due from counterparties on forward, option and swap transactions. The extent of each Fund’s exposure to counterparty credit risk in respect to these financial assets approximates their carrying value as recorded on the Statement of Assets and Liabilities. Futures contracts expose a Fund to minimal counterparty credit risk as they are exchange traded and the exchange’s clearinghouse, which is counterparty to all exchange traded futures, guarantees the futures contracts against default.
Each Fund helps manage counterparty credit risk by entering into agreements only with counterparties the Adviser believes have the financial resources to honor their obligations and by having the Adviser monitor the financial stability of the counterparties. Additionally, counterparties may be required to pledge collateral daily (based on the daily valuation of the financial asset) on behalf of each Fund with a value approximately equal to the amount of any unrealized gain above a pre-determined threshold. Reciprocally, when each Fund has an unrealized loss, the Funds have instructed the custodian to pledge assets of the Funds as collateral with a value approximately equal to the amount of the unrealized loss above a pre-determined threshold. Collateral pledges are monitored and subsequently adjusted if and when the valuations fluctuate, either up or down, by at least the predetermined threshold amount.
Zero Coupon Securities
Each Fund is authorized to invest in zero coupon securities. A zero coupon security does not pay a regular interest coupon to its holders during the life of the security. Tax-exempt income to the holder of the security comes from accretion of the difference between the original purchase price of the security at issuance and the par value of the security at maturity and is effectively paid at maturity. Such securities are included in the Portfolios of Investments with a 0.000% coupon rate in their description. The market prices of zero coupon securities generally are more volatile than the market prices of securities that pay interest periodically.
Expense Allocation
Expenses of the Funds that are not directly attributable to a specific class of shares are prorated among the classes based on the relative net assets of each class. Expenses directly attributable to a class of shares, which presently only include 12b-1 distribution and service fees, are recorded to the specific class.
Custodian Fee Credit
Each Fund has an arrangement with the custodian bank whereby certain custodian fees and expenses are reduced by net credits earned on each Fund’s cash on deposit with the bank. Such deposit arrangements are an alternative to overnight investments. Credits for cash balances may be offset by charges for any days on which a Fund overdraws its account at the custodian bank.
Indemnifications
Under the Trust’s organizational documents, its Officers and Trustees are indemnified against certain liabilities arising out of the performance of their duties to the Trust. In addition, in the normal course of business, the Trust enters into contracts that provide general indemnifications to other parties. The Trust’s maximum exposure under these arrangements is unknown as this would involve
| 40 | Nuveen Investments |
future claims that may be made against the Trust that have not yet occurred. However, the Trust has not had prior claims or losses pursuant to these contracts and expects the risk of loss to be remote.
Use of Estimates
The preparation of financial statements in conformity with accounting principles generally accepted in the United States requires management to make estimates and assumptions that affect the reported amounts of assets and liabilities at the date of the financial statements and the reported amounts of increases and decreases in net assets from operations during the reporting period. Actual results may differ from those estimates.
2. Fair Value Measurements
In determining the value of each Fund’s investments various inputs are used. These inputs are summarized in the three broad levels listed below:
| Level 1 – | Quoted prices in active markets for identical securities. | |
| Level 2 – | Other significant observable inputs (including quoted prices for similar securities, interest rates, prepayment speeds, credit risk, etc.). | |
| Level 3 – | Significant unobservable inputs (including management’s assumptions in determining the fair value of investments). |
The inputs or methodology used for valuing securities are not an indication of the risk associated with investing in those securities. The following is a summary of each Fund’s fair value measurements as of August 31, 2009:
| California High Yield | Level 1 | Level 2 | Level 3 | Total | ||||||||
Investments: | ||||||||||||
Municipal Bonds | $ | — | $ | 65,692,788 | $ | — | $ | 65,692,788 | ||||
Derivatives: | ||||||||||||
Forward Swaps* | — | 481,500 | — | 481,500 | ||||||||
Total | $ | — | $ | 66,174,288 | $ | — | $ | 66,174,288 | ||||
| California | Level 1 | Level 2 | Level 3 | Total | ||||||||
Investments: | ||||||||||||
Municipal Bonds | $ | — | $ | 292,692,018 | $ | — | $ | 292,692,018 | ||||
| California Insured | Level 1 | Level 2 | Level 3 | Total | ||||||||
Investments: | ||||||||||||
Municipal Bonds | $ | — | $ | 185,849,230 | $ | — | $ | 185,849,230 | ||||
| * | Represents net unrealized appreciation (depreciation). |
3. Derivative Instruments and Hedging Activities
During the current fiscal period, the Funds adopted the provisions of Statement of Financial Accounting Standards No. 161 (SFAS No. 161) “Disclosures about Derivative Instruments and Hedging Activities.” This standard is intended to enhance financial statement disclosures for derivative instruments and hedging activities and enable investors to better understand: a) how and why a fund uses derivative instruments; b) how derivative instruments are accounted for; and c) how derivative instruments affect a fund’s financial position, results of operations and cash flows, if any. The Fund records derivative instruments at fair value with changes in fair value recognized in the Statement of Operations, when applicable. Even though the Funds’ investments in derivatives may represent economic hedges, they are considered to be non-hedge transactions for SFAS No. 161 disclosure purposes. For additional information on the derivative instruments in which the Funds were invested during and at the end of the reporting period, refer to the Portfolio of Investments, Financial Statements and Footnote 1 – General Information and Significant Accounting Policies.
The following table presents the fair value of all derivative instruments held by California High Yield as of August 31, 2009, the location of these instruments on the Statement of Assets and Liabilities, and the primary underlying risk exposure. California High Yield was the only Fund to invest in derivative instruments during the six months ended August 31, 2009.
| California High Yield | ||||||||||||
Location on the Statement of Assets and Liabilities | ||||||||||||
Underlying Risk Exposure | Derivative Instrument | Asset Derivatives | Liability Derivatives | |||||||||
| Location | Value | Location | Value | |||||||||
Interest Rate | Swaps | Unrealized appreciation on forward swaps* | $ | 481,500 | Unrealized depreciation on forward swaps* | $ | — | |||||
| * | Represents cumulative appreciation (depreciation) of swap contracts as reported in the Portfolio of Investments. |
| Nuveen Investments | 41 |
Notes to Financial Statements (Unaudited) (continued)
The following table presents the change in net unrealized appreciation (depreciation) recognized for the six months ended August 31, 2009, on derivative instruments, as well as the primary risk exposure associated with each.
| Change in Net Unrealized Appreciation (Depreciation) of Forward Swaps | California High Yield | ||
| Risk Exposure | |||
Interest Rate | $ | 391,080 | |
4. Fund Shares
Transactions in Fund shares were as follows:
| California High Yield | ||||||||||||||
| Six Months Ended 8/31/09 | Year Ended 2/28/09 | |||||||||||||
| Shares | Amount | Shares | Amount | |||||||||||
Shares sold: | ||||||||||||||
Class A | 1,029,619 | $ | 6,974,547 | 3,918,654 | $ | 29,724,609 | ||||||||
Class B | — | — | — | — | ||||||||||
Class C | 390,135 | 2,697,073 | 674,880 | 5,033,854 | ||||||||||
Class I | 1,019,280 | 6,659,758 | 3,199,856 | 24,047,738 | ||||||||||
Shares issued to shareholders due to reinvestment | ||||||||||||||
Class A | 80,476 | 549,969 | 208,245 | 1,560,241 | ||||||||||
Class B | 580 | 3,981 | 915 | 6,794 | ||||||||||
Class C | 22,638 | 156,198 | 29,594 | 218,355 | ||||||||||
Class I | 79,178 | 545,402 | 81,121 | 570,731 | ||||||||||
| 2,621,906 | 17,586,928 | 8,113,265 | 61,162,322 | |||||||||||
Shares redeemed: | ||||||||||||||
Class A | (1,941,417 | ) | (13,018,362 | ) | (4,292,746 | ) | (31,843,779 | ) | ||||||
Class B | (506 | ) | (3,555 | ) | — | — | ||||||||
Class C | (60,571 | ) | (406,962 | ) | (447,396 | ) | (3,247,021 | ) | ||||||
Class I | (11,629 | ) | (82,244 | ) | (1,392,264 | ) | (11,788,707 | ) | ||||||
| (2,014,123 | ) | (13,511,123 | ) | (6,132,406 | ) | (46,879,507 | ) | |||||||
Net increase (decrease) | 607,783 | $ | 4,075,805 | 1,980,859 | $ | 14,282,815 | ||||||||
| California | ||||||||||||||
| Six Months Ended 8/31/09 | Year Ended 2/28/09 | |||||||||||||
| Shares | Amount | Shares | Amount | |||||||||||
Shares sold: | ||||||||||||||
Class A | 1,626,048 | $ | 14,837,298 | 14,600,044 | $ | 135,705,187 | ||||||||
Class A – automatic conversion of Class B Shares | — | — | 69,530 | 643,696 | ||||||||||
Class B | 1,086 | 9,829 | 1,660 | 15,604 | ||||||||||
Class C | 251,874 | 2,296,906 | 563,390 | 5,293,478 | ||||||||||
Class I | 643,026 | 5,813,534 | 2,471,052 | 23,434,486 | ||||||||||
Shares issued to shareholders due to reinvestment | ||||||||||||||
Class A | 113,378 | 1,037,863 | 221,818 | 2,057,581 | ||||||||||
Class B | 4,944 | 45,258 | 12,685 | 118,609 | ||||||||||
Class C | 23,400 | 213,833 | 40,551 | 375,609 | ||||||||||
Class I | 275,055 | 2,514,716 | 536,300 | 4,978,228 | ||||||||||
| 2,938,811 | 26,769,237 | 18,517,030 | 172,622,478 | |||||||||||
Shares redeemed: | ||||||||||||||
Class A | (1,345,733 | ) | (12,164,756 | ) | (14,337,821 | ) | (132,187,342 | ) | ||||||
Class B | (90,488 | ) | (823,110 | ) | (215,952 | ) | (2,020,386 | ) | ||||||
Class B – automatic conversion to Class A Shares | — | — | (69,575 | ) | (643,696 | ) | ||||||||
Class C | (113,178 | ) | (1,031,532 | ) | (982,401 | ) | (8,826,392 | ) | ||||||
Class I | (2,006,075 | ) | (18,285,450 | ) | (3,378,229 | ) | (30,970,849 | ) | ||||||
| (3,555,474 | ) | (32,304,848 | ) | (18,983,978 | ) | (174,648,665 | ) | |||||||
Net increase (decrease) | (616,663 | ) | $ | (5,535,611 | ) | (466,948 | ) | $ | (2,026,187 | ) | ||||
| 42 | Nuveen Investments |
| California Insured | ||||||||||||||
| Six Months Ended 8/31/09 | Year Ended 2/28/09 | |||||||||||||
| Shares | Amount | Shares | Amount | |||||||||||
Shares sold: | ||||||||||||||
Class A | 470,517 | $ | 4,447,607 | 1,193,211 | $ | 11,721,189 | ||||||||
Class A – automatic conversion of Class B Shares | — | — | 41,507 | 396,237 | ||||||||||
Class B | 688 | 6,563 | 12,376 | 118,847 | ||||||||||
Class C | 64,840 | 621,465 | 231,175 | 2,165,411 | ||||||||||
Class I | 200,092 | 1,896,456 | 142,516 | 1,385,530 | ||||||||||
Shares issued to shareholders due to reinvestment | ||||||||||||||
Class A | 89,492 | 852,845 | 193,243 | 1,872,427 | ||||||||||
Class B | 2,571 | 24,569 | 8,291 | 80,781 | ||||||||||
Class C | 13,535 | 128,448 | 27,047 | 261,024 | ||||||||||
Class I | 150,562 | 1,437,151 | 324,737 | 3,156,440 | ||||||||||
| 992,297 | 9,415,104 | 2,174,103 | 21,157,886 | |||||||||||
Shares redeemed: | ||||||||||||||
Class A | (1,013,876 | ) | (9,650,228 | ) | (1,413,317 | ) | (13,661,347 | ) | ||||||
Class B | (159,438 | ) | (1,517,011 | ) | (263,988 | ) | (2,614,809 | ) | ||||||
Class B – automatic conversion to Class A Shares | — | — | (41,379 | ) | (396,237 | ) | ||||||||
Class C | (98,776 | ) | (939,178 | ) | (285,258 | ) | (2,700,035 | ) | ||||||
Class I | (528,124 | ) | (5,042,869 | ) | (1,763,331 | ) | (17,068,646 | ) | ||||||
| (1,800,214 | ) | (17,149,286 | ) | (3,767,273 | ) | (36,441,074 | ) | |||||||
Net increase (decrease) | (807,917 | ) | $ | (7,734,182 | ) | (1,593,170 | ) | $ | (15,283,188 | ) | ||||
5. Investment Transactions
Purchases and sales (including maturities but excluding short-term investments and derivative transactions) during the six months ended August 31, 2009, were as follows:
| California High Yield | California | California Insured | |||||||
Purchases | $ | 14,953,733 | $ | 16,759,231 | $ | — | |||
Sales and maturities | 9,555,830 | 23,287,086 | 8,314,400 | ||||||
6. Income Tax Information
The following information is presented on an income tax basis. Differences between amounts for financial statement and federal income tax purposes are primarily due to timing differences in recognizing taxable market discount, timing differences in recognizing certain gains and losses on investment transactions and the treatment of investments in inverse floating rate transactions subject to SFAS No. 140, if any. To the extent that differences arise that are permanent in nature, such amounts are reclassified within the capital accounts on the Statement of Assets and Liabilities presented in the annual report, based on their federal tax basis treatment; temporary differences do not require reclassification. Temporary and permanent differences do not impact the net asset values of the Funds.
At August 31, 2009, the cost of investments was as follows:
| California High Yield | California | California Insured | |||||||
Cost of investments | $ | 76,303,542 | $ | 302,007,416 | $ | 194,792,362 | |||
Gross unrealized appreciation and gross unrealized depreciation of investments at August 31, 2009, were as follows:
| California High Yield | California | California Insured | ||||||||||
Gross unrealized: | ||||||||||||
Appreciation | $ | 2,427,878 | $ | 8,107,424 | $ | 2,364,295 | ||||||
Depreciation | (13,038,632 | ) | (22,422,772 | ) | (11,307,427 | ) | ||||||
Net unrealized appreciation (depreciation) of investments | $ | (10,610,754 | ) | $ | (14,315,348 | ) | $ | (8,943,132 | ) | |||
| Nuveen Investments | 43 |
Notes to Financial Statements (Unaudited) (continued)
The tax components of undistributed net tax-exempt income, net ordinary income and net long-term capital gains at February 28, 2009, the Funds’ last tax year end, were as follows:
| California High Yield | California | California Insured | |||||||
Undistributed net tax-exempt income* | $ | 467,242 | $ | 1,185,890 | $ | 682,349 | |||
Undistributed net ordinary income** | 1,330 | — | — | ||||||
Undistributed net long-term capital gains | — | — | — | ||||||
| * | Undistributed net tax-exempt income (on a tax basis) has not been reduced for the dividend declared on February 10, 2009, paid on March 2, 2009. |
| ** | Net ordinary income consists of taxable market discount income and net short-term capital gains, if any. |
The tax character of distributions paid during the Funds’ last tax year ended February 28, 2009, was designated for purposes of the dividends paid deduction as follows:
| California High Yield | California | California Insured | |||||||
Distributions from net tax-exempt income | $ | 3,434,162 | $ | 14,496,826 | $ | 8,809,608 | |||
Distributions from net ordinary income** | — | — | — | ||||||
Distributions from net long-term capital gains | — | — | 292,940 | ||||||
| ** | Net ordinary income consists of taxable market discount income and net short-term capital gains, if any. |
At February 28, 2009, the Funds’ last tax year end, the Funds had unused capital loss carryforwards available for federal income tax purposes to be applied against future capital gains, if any. If not applied, the carryforwards will expire as follows:
| California High Yield | California | California Insured | |||||||
Expiration: | |||||||||
February 28, 2011 | $ | — | $ | 582,408 | $ | — | |||
February 29, 2012 | — | 5,101,139 | — | ||||||
February 28, 2013 | — | 84,061 | — | ||||||
February 29, 2016 | 809,648 | — | — | ||||||
February 28, 2017 | 3,792,828 | 3,965,451 | 316,570 | ||||||
Total | $ | 4,602,476 | $ | 9,733,059 | $ | 316,570 | |||
The Funds have elected to defer net realized losses from investments incurred from November 1, 2008 through February 28, 2009, the Funds’ last tax year end, (“post-October losses”) in accordance with federal income tax regulations. Post-October losses are treated as having arisen on the first day of the current fiscal year:
| California High Yield | California | California Insured | |||||||
Post-October capital losses | $ | 2,657,577 | $ | 2,632,935 | $ | 745,609 | |||
7. Management Fees and Other Transactions with Affiliates
Each Fund’s management fee is separated into two components – a complex-level component, based on the aggregate amount of all fund assets managed by the Adviser, and a specific fund-level component, based only on the amount of assets within each individual Fund. This pricing structure enables Nuveen fund shareholders to benefit from growth in the assets within each individual fund as well as from growth in the amount of complex-wide assets managed by the Adviser.
The annual fund-level fee, payable monthly, for each Fund is based upon the average daily net assets of each Fund as follows:
| Average Daily Net Assets (1) | California High Yield Fund-Level Fee Rate | ||
For the first $125 million | .4000 | % | |
For the next $125 million | .3875 | ||
For the next $250 million | .3750 | ||
For the next $500 million | .3625 | ||
For the next $1 billion | .3500 | ||
For net assets over $2 billion | .3250 |
| 44 | Nuveen Investments |
| Average Daily Net Assets (1) | California California Insured Fund-Level Fee Rate | ||
For the first $125 million | .3500 | % | |
For the next $125 million | .3375 | ||
For the next $250 million | .3250 | ||
For the next $500 million | .3125 | ||
For the next $1 billion | .3000 | ||
For the next $3 billion | .2750 | ||
For net assets over $5 billion | .2500 |
The annual complex-level fee, payable monthly, which is additive to the fund-level fee, for all Nuveen sponsored funds in the U.S., is based on the aggregate amount of total fund net assets managed as stated in the following table. As of August 31, 2009, the complex-level fee rate was .1936%.
The complex-level fee schedule is as follows:
| Complex-Level Net Asset Breakpoint Level (1) | Effective Rate at Breakpoint Level | ||
$55 billion | .2000 | % | |
$56 billion | .1996 | ||
$57 billion | .1989 | ||
$60 billion | .1961 | ||
$63 billion | .1931 | ||
$66 billion | .1900 | ||
$71 billion | .1851 | ||
$76 billion | .1806 | ||
$80 billion | .1773 | ||
$91 billion | .1691 | ||
$125 billion | .1599 | ||
$200 billion | .1505 | ||
$250 billion | .1469 | ||
$300 billion | .1445 |
| (1) | The complex-level fee component of the management fee for the funds is calculated based upon the aggregate daily managed net assets of all Nuveen funds, with such daily managed net assets defined separately for each fund in its management agreement, but excluding assets attributable to investments in other Nuveen funds. For the complex-level and fund-level fee components, daily managed net assets include assets managed by the Adviser that are attributable to financial leverage. For these purposes, financial leverage includes the funds use of preferred stock and borrowings and investments in the residual interest certificates (also called inverse floating rate securities) in tender option bond (TOB) trusts, including the portion of assets held by the TOB trust that has been effectively financed by the trust’s issuance of floating rate securities, subject to an agreement by the Adviser to limit the amount of such assets for determining managed net assets in certain circumstances. |
The management fee compensates the Adviser for overall investment advisory and administrative services and general office facilities. The Funds pay no compensation directly to those of its Trustees who are affiliated with the Adviser or to its Officers, all of whom receive remuneration for their services to the Trust from the Adviser or its affiliates. The Board of Trustees has adopted a deferred compensation plan for independent Trustees that enables Trustees to elect to defer receipt of all or a portion of the annual compensation they are entitled to receive from certain Nuveen advised funds. Under the plan, deferred amounts are treated as though equal dollar amounts had been invested in shares of select Nuveen advised funds.
The Adviser has agreed to waive fees and reimburse expenses of the Funds so that total annual fund operating expenses (excluding 12b-1 distribution and service fees, interest expenses, taxes, fees incurred in acquiring and disposing of portfolio securities and extraordinary expenses) do not exceed the average daily net assets of any class of Fund shares in the amounts and for the time periods stated in the following table.
Current Expense Cap | Current Expiration Date | Permanent Expense Cap | ||||||
California High Yield | 0.750 | % | July 31, 2010 | 1.000 | % | |||
California | 0.750 | N/A | 0.750 | |||||
California Insured | 0.975 | N/A | 0.975 |
The Adviser may also voluntarily reimburse expenses from time to time in any of the Funds. Voluntary reimbursements may be terminated at any time at the Adviser’s discretion.
During the six months ended August 31, 2009, Nuveen Investments, LLC (the “Distributor”), a wholly owned subsidiary of Nuveen, collected sales charges on purchases of Class A Shares, the majority of which were paid out as concessions to financial intermediaries as follows:
California High Yield | California | California Insured | |||||||
Sales charges collected | $ | 69,329 | $ | 32,500 | $ | 46,743 | |||
Paid to financial intermediaries | 62,386 | 27,182 | 40,420 | ||||||
| Nuveen Investments | 45 |
Notes to Financial Statements (Unaudited) (continued)
The Distributor also received 12b-1 service fees on Class A Shares, substantially all of which were paid to compensate financial intermediaries for providing services to shareholders relating to their investments.
During the six months ended August 31, 2009, the Distributor compensated financial intermediaries directly with commission advances at the time of purchase as follows:
California High Yield | California | California Insured | |||||||
Commission advances | $ | 42,660 | $ | 20,659 | $ | 12,251 | |||
To compensate for commissions advanced to financial intermediaries, all 12b-1 service fees collected on Class B Shares during the first year following a purchase, all 12b-1 distribution fees collected on Class B Shares, and all 12b-1 service and distribution fees collected on Class C Shares during the first year following a purchase are retained by the Distributor. During the six months ended August 31, 2009, the Distributor retained such 12b-1 fees as follows:
California High Yield | California | California Insured | |||||||
12b-1 fees retained | $ | 8,545 | $ | 30,183 | $ | 21,380 | |||
The remaining 12b-1 fees charged to the Funds were paid to compensate financial intermediaries for providing services to shareholders relating to their investments.
The Distributor also collected and retained CDSC on share redemptions during the six months ended August 31, 2009, as follows:
California High Yield | California | California Insured | |||||||
CDSC retained | $ | 978 | $ | 2,333 | $ | 904 | |||
8. New Accounting Pronouncements
Financial Accounting Standards Board Statement of Financial Accounting Standards No. 166 (SFAS No. 166)
During June 2009, the Financial Accounting Standards Board issued SFAS No. 166, “Accounting for Transfers of Financial Assets – an amendment of SFAS No. 140.” The objective of SFAS No. 166 is to improve the relevance, representational faithfulness, and comparability of the information that a reporting entity provides in its financial statements about a transfer of financial assets; the effects of a transfer on its financial position, financial performance, and cash flows; and a transferor’s continuing involvement, if any, in transferred financial assets.
SFAS No. 166 is effective as of the beginning of each reporting entity’s first annual reporting period that begins after November 15, 2009, for interim periods within that first annual reporting period and for interim and annual reporting periods thereafter. Earlier application is prohibited. The recognition and measurement provisions of SFAS No. 166 must be applied to transfers occurring on or after the effective date. Additionally, the disclosure provisions of SFAS No. 166 should be applied to transfers that occurred both before and after the effective date of SFAS No. 166. At this time, management is evaluating the implications of SFAS No. 166 and the impact it will have on the financial statement amounts and disclosures, if any.
9. Subsequent Events
Distributions to Shareholders
The Funds declared dividend distributions from their tax-exempt net investment income which were paid on October 1, 2009, to shareholders of record on September 29, 2009, as follows:
California High Yield | California | California Insured | |||||||
Dividend per share: | |||||||||
Class A | $ | .0405 | $ | .0365 | $ | .0345 | |||
Class B | .0365 | .0310 | .0285 | ||||||
Class C | .0375 | .0325 | .0300 | ||||||
Class I | .0420 | .0380 | .0360 | ||||||
| 46 | Nuveen Investments |
Financial Accounting Standards Board Statement of Financial Accounting Standards No. 165 (SFAS No. 165)
In May 2009, the Financial Accounting Standards Board issued SFAS No. 165 “Subsequent Events.” SFAS No. 165 requires an entity to recognize in the financial statements the effects of all subsequent events that provide additional evidence about conditions that existed at the date of the balance sheet. SFAS No. 165 is intended to establish general standards of accounting and for disclosure of events that occur after the balance sheet date but before financial statements are issued or are available to be issued. SFAS No. 165 requires the disclosure of the date through which an entity has evaluated subsequent events and the basis for that date – that is, whether that date represents the date the financial statements were issued or were available to be issued. SFAS No. 165 is effective for interim and annual periods ending after June 15, 2009. The Funds have performed an evaluation of subsequent events through October 27, 2009, which is the date the financial statements were issued.
| Nuveen Investments | 47 |
Financial Highlights (Unaudited)
| Selected data for a share outstanding throughout each period: | ||||||||||||||||||||||||||||||||
| Class (Commencement Date) | ||||||||||||||||||||||||||||||||
| Investment Operations | Less Distributions | |||||||||||||||||||||||||||||||
| CALIFORNIA HIGH YIELD | ||||||||||||||||||||||||||||||||
| Year Ended February 28/29, | Beginning Net Asset Value | Net Invest- ment Income(a) | Net Realized/ Unrealized Gain (Loss) | Total | Net Invest- ment Income | Capital Gains | Total | Ending Net Asset Value | Total Return(b) | |||||||||||||||||||||||
Class A (3/06) | ||||||||||||||||||||||||||||||||
2010(f) | $ | 6.51 | $ | .26 | $ | .74 | $ | 1.00 | $ | (.24 | ) | $ | — | $ | (.24 | ) | $ | 7.27 | 15.69 | % | ||||||||||||
2009 | 8.24 | .48 | (1.76 | ) | (1.28 | ) | (.45 | ) | — | (.45 | ) | 6.51 | (16.06 | ) | ||||||||||||||||||
2008 | 10.43 | .45 | (2.19 | ) | (1.74 | ) | (.45 | ) | — | ** | (.45 | ) | 8.24 | (17.19 | ) | |||||||||||||||||
2007(g) | 10.00 | .39 | .42 | .81 | (.38 | ) | — | (.38 | ) | 10.43 | 8.19 | |||||||||||||||||||||
Class B (3/06) | ||||||||||||||||||||||||||||||||
2010(f) | 6.51 | .23 | .75 | .98 | (.22 | ) | — | (.22 | ) | 7.27 | 15.29 | |||||||||||||||||||||
2009 | 8.23 | .42 | (1.75 | ) | (1.33 | ) | (.39 | ) | — | (.39 | ) | 6.51 | (16.64 | ) | ||||||||||||||||||
2008 | 10.42 | .38 | (2.20 | ) | (1.82 | ) | (.37 | ) | — | ** | (.37 | ) | 8.23 | (17.86 | ) | |||||||||||||||||
2007(g) | 10.00 | .31 | .42 | .73 | (.31 | ) | — | (.31 | ) | 10.42 | 7.40 | |||||||||||||||||||||
Class C (3/06) | ||||||||||||||||||||||||||||||||
2010(f) | 6.51 | .24 | .75 | .99 | (.23 | ) | — | (.23 | ) | 7.27 | 15.39 | |||||||||||||||||||||
2009 | 8.24 | .44 | (1.76 | ) | (1.32 | ) | (.41 | ) | — | (.41 | ) | 6.51 | (16.55 | ) | ||||||||||||||||||
2008 | 10.42 | .40 | (2.19 | ) | (1.79 | ) | (.39 | ) | — | ** | (.39 | ) | 8.24 | (17.61 | ) | |||||||||||||||||
2007(g) | 10.00 | .33 | .42 | .75 | (.33 | ) | — | (.33 | ) | 10.42 | 7.56 | |||||||||||||||||||||
Class I (3/06)(h) | ||||||||||||||||||||||||||||||||
2010(f) | 6.50 | .27 | .75 | 1.02 | (.25 | ) | — | (.25 | ) | 7.27 | 15.98 | |||||||||||||||||||||
2009 | 8.24 | .50 | (1.77 | ) | (1.27 | ) | (.47 | ) | — | (.47 | ) | 6.50 | (16.01 | ) | ||||||||||||||||||
2008 | 10.43 | .47 | (2.19 | ) | (1.72 | ) | (.47 | ) | — | ** | (.47 | ) | 8.24 | (17.04 | ) | |||||||||||||||||
2007(g) | 10.00 | .45 | .37 | .82 | (.39 | ) | — | (.39 | ) | 10.43 | 8.35 | |||||||||||||||||||||
| 48 | Nuveen Investments |
| Ratios/Supplemental Data | |||||||||||||||||||||||||||||||
| Ratios to Average Net Assets Before Credit/ Reimbursement | Ratios to Average Net Assets After Reimbursement(c) | Ratios to Average Net Assets After Credit/ Reimbursement(d) | |||||||||||||||||||||||||||||
| Ending Net Assets (000) | Expenses Including Interest(e) | Expenses Excluding Interest | Net Invest- ment Income | Expenses Including Interest(e) | Expenses Excluding Interest | Net Invest- ment Income | Expenses Including Interest(e) | Expenses Excluding Interest | Net Invest- ment Income | Portfolio Turnover Rate | |||||||||||||||||||||
| $ | 30,042 | .96 | %* | .96 | %* | 7.55 | %* | .95 | %* | .95 | %* | 7.56 | %* | .95 | %* | .95 | %* | 7.56 | %* | 16 | % | ||||||||||
| 32,290 | 1.01 | .92 | 6.13 | 1.01 | .92 | 6.13 | .96 | .87 | 6.17 | 55 | |||||||||||||||||||||
| 42,252 | 1.43 | .99 | 4.58 | 1.37 | .93 | 4.64 | 1.32 | .88 | 4.69 | 25 | |||||||||||||||||||||
| 14,539 | 1.84 | * | 1.26 | * | 3.63 | * | 1.52 | * | .94 | * | 3.96 | * | 1.43 | * | .85 | * | 4.04 | * | 3 | ||||||||||||
| 138 | 1.71 | * | 1.71 | * | 6.78 | * | 1.70 | * | 1.70 | * | 6.80 | * | 1.70 | * | 1.70 | * | 6.80 | * | 16 | ||||||||||||
| 123 | 1.76 | 1.67 | 5.45 | 1.76 | 1.67 | 5.45 | 1.71 | 1.62 | 5.49 | 55 | |||||||||||||||||||||
| 148 | 2.18 | 1.74 | 3.85 | 2.12 | 1.68 | 3.91 | 2.07 | 1.63 | 3.96 | 25 | |||||||||||||||||||||
| 72 | 2.69 | * | 2.11 | * | 2.80 | * | 2.27 | * | 1.69 | * | 3.22 | * | 2.19 | * | 1.61 | * | 3.30 | * | 3 | ||||||||||||
| 10,069 | 1.52 | * | 1.52 | * | 6.96 | * | 1.50 | * | 1.50 | * | 6.97 | * | 1.50 | * | 1.50 | * | 6.97 | * | 16 | ||||||||||||
| 6,718 | 1.56 | 1.47 | 5.69 | 1.56 | 1.47 | 5.69 | 1.52 | 1.43 | 5.74 | 55 | |||||||||||||||||||||
| 6,382 | 1.97 | 1.53 | 4.02 | 1.92 | 1.48 | 4.08 | 1.87 | 1.43 | 4.13 | 25 | |||||||||||||||||||||
| 3,061 | 2.44 | * | 1.86 | * | 2.99 | * | 2.07 | * | 1.49 | * | 3.36 | * | 1.99 | * | 1.41 | * | 3.45 | * | 3 | ||||||||||||
| 25,945 | .77 | * | .77 | * | 7.70 | * | .75 | * | .75 | * | 7.72 | * | .75 | * | .75 | * | 7.72 | * | 16 | ||||||||||||
| 16,146 | .81 | .72 | 6.80 | .81 | .72 | 6.80 | .77 | .68 | 6.84 | 55 | |||||||||||||||||||||
| 4,889 | 1.21 | .77 | 4.89 | 1.17 | .73 | 4.92 | 1.12 | .68 | 4.98 | 25 | |||||||||||||||||||||
| 106 | 1.58 | * | 1.00 | * | 4.32 | * | 1.31 | * | .73 | * | 4.58 | * | 1.23 | * | .65 | * | 4.66 | * | 3 | ||||||||||||
| * | Annualized. |
| ** | Rounds to less than $.01 per share. |
| (a) | Per share Net Investment Income is calculated using the average daily shares method. |
| (b) | Total return is the combination of changes in net asset value without any sales charge, reinvested dividend income at net asset value and reinvested capital gains distributions at net asset value, if any. Total returns are not annualized. |
| (c) | After expense reimbursement from the Adviser, where applicable. |
| (d) | After custodian fee credit and expense reimbursement, where applicable. |
| (e) | Each Ratio of Expenses Including Interest to Average Net Assets in the above table reflect, among other things, the interest expense deemed to have been paid by the Fund on the floating rate certificates issued by the special purpose trusts for the self-deposited inverse floaters held by the Fund, as described in Footnote 1 – Inverse Floating Rate Securities. |
| (f) | For the six months ended August 31, 2009. |
| (g) | For the period March 28, 2006 (commencement of operations) through February 28, 2007. |
| (h) | Effective May 1, 2008, Class R Shares were renamed Class I Shares. |
See accompanying notes to financial statements.
| Nuveen Investments | 49 |
Financial Highlights (Unaudited) (continued)
| Selected data for a share outstanding throughout each period: | |||||||||||||||||||||||||||||||
| Class (Commencement Date) | |||||||||||||||||||||||||||||||
| Investment Operations | Less Distributions | ||||||||||||||||||||||||||||||
| CALIFORNIA | |||||||||||||||||||||||||||||||
| Year Ended February 28/29, | Beginning Net Asset Value | Net Invest- ment Income(a) | Net Realized/ Unrealized Gain (Loss) | Total | Net Invest- ment Income | Capital Gains | Total | Ending Net Asset Value | Total Return(b) | ||||||||||||||||||||||
Class A (9/94) | |||||||||||||||||||||||||||||||
2010(f) | $ | 8.96 | $ | .23 | $ | .43 | $ | .66 | $ | (.22 | ) | $ | — | $ | (.22 | ) | $ | 9.40 | 7.45 | % | |||||||||||
2009 | 9.50 | .44 | (.55 | ) | (.11 | ) | (.43 | ) | — | (.43 | ) | 8.96 | (1.25 | ) | |||||||||||||||||
2008 | 10.50 | .43 | (1.00 | ) | (.57 | ) | (.43 | ) | — | (.43 | ) | 9.50 | (5.65 | ) | |||||||||||||||||
2007 | 10.43 | .43 | .07 | .50 | (.43 | ) | — | (.43 | ) | 10.50 | 4.88 | ||||||||||||||||||||
2006 | 10.45 | .45 | (.01 | ) | .44 | (.46 | ) | — | (.46 | ) | 10.43 | 4.28 | |||||||||||||||||||
2005 | 10.52 | .48 | (.08 | ) | .40 | (.47 | ) | — | (.47 | ) | 10.45 | 4.02 | |||||||||||||||||||
Class B (3/97) | |||||||||||||||||||||||||||||||
2010(f) | 8.96 | .20 | .42 | .62 | (.19 | ) | — | (.19 | ) | 9.39 | 6.95 | ||||||||||||||||||||
2009 | 9.50 | .37 | (.55 | ) | (.18 | ) | (.36 | ) | — | (.36 | ) | 8.96 | (1.99 | ) | |||||||||||||||||
2008 | 10.49 | .36 | (1.00 | ) | (.64 | ) | (.35 | ) | — | (.35 | ) | 9.50 | (6.28 | ) | |||||||||||||||||
2007 | 10.42 | .35 | .07 | .42 | (.35 | ) | — | (.35 | ) | 10.49 | 4.10 | ||||||||||||||||||||
2006 | 10.44 | .37 | (.01 | ) | .36 | (.38 | ) | — | (.38 | ) | 10.42 | 3.51 | |||||||||||||||||||
2005 | 10.51 | .40 | (.07 | ) | .33 | (.40 | ) | — | (.40 | ) | 10.44 | 3.24 | |||||||||||||||||||
Class C (9/94) | |||||||||||||||||||||||||||||||
2010(f) | 8.94 | .20 | .43 | .63 | (.20 | ) | — | (.20 | ) | 9.37 | 7.07 | ||||||||||||||||||||
2009 | 9.48 | .39 | (.55 | ) | (.16 | ) | (.38 | ) | — | (.38 | ) | 8.94 | (1.80 | ) | |||||||||||||||||
2008 | 10.47 | .38 | (1.00 | ) | (.62 | ) | (.37 | ) | — | (.37 | ) | 9.48 | (6.07 | ) | |||||||||||||||||
2007 | 10.41 | .37 | .06 | .43 | (.37 | ) | — | (.37 | ) | 10.47 | 4.25 | ||||||||||||||||||||
2006 | 10.43 | .39 | (.01 | ) | .38 | (.40 | ) | — | (.40 | ) | 10.41 | 3.75 | |||||||||||||||||||
2005 | 10.50 | .42 | (.07 | ) | .35 | (.42 | ) | — | (.42 | ) | 10.43 | 3.49 | |||||||||||||||||||
Class I (7/86)(g) | |||||||||||||||||||||||||||||||
2010(f) | 8.95 | .24 | .42 | .66 | (.23 | ) | — | (.23 | ) | 9.38 | 7.45 | ||||||||||||||||||||
2009 | 9.49 | .46 | (.55 | ) | (.09 | ) | (.45 | ) | — | (.45 | ) | 8.95 | (1.02 | ) | |||||||||||||||||
2008 | 10.49 | .45 | (1.00 | ) | (.55 | ) | (.45 | ) | — | (.45 | ) | 9.49 | (5.43 | ) | |||||||||||||||||
2007 | 10.43 | .45 | .06 | .51 | (.45 | ) | — | (.45 | ) | 10.49 | 5.03 | ||||||||||||||||||||
2006 | 10.45 | .47 | (.01 | ) | .46 | (.48 | ) | — | (.48 | ) | 10.43 | 4.52 | |||||||||||||||||||
2005 | 10.52 | .50 | (.07 | ) | .43 | (.50 | ) | — | (.50 | ) | 10.45 | 4.26 | |||||||||||||||||||
| 50 | Nuveen Investments |
| Ratios/Supplemental Data | |||||||||||||||||||||||||||||||
| Ratios to Average Net Assets Before Credit/ Reimbursement | Ratios to Average Net Assets After Reimbursement(c) | Ratios to Average Net Assets After Credit/ Reimbursement(d) | |||||||||||||||||||||||||||||
| Ending Net Assets (000) | Expenses Including Interest(e) | Expenses Excluding Interest | Net Invest- ment Income | Expenses | Expenses Excluding Interest | Net Invest- ment Income | Expenses Including Interest(e) | Expenses Excluding Interest | Net Invest- ment Income | Portfolio Turnover Rate | |||||||||||||||||||||
| $ | 114,947 | .86 | %* | .85 | %* | 4.99 | %* | .86 | %* | .85 | %* | 4.99 | %* | .86 | %* | .85 | %* | 4.99 | %* | 6 | % | ||||||||||
| 106,117 | .90 | .85 | 4.66 | .90 | .85 | 4.66 | .88 | .83 | 4.67 | 40 | |||||||||||||||||||||
| 107,241 | .97 | .82 | 4.23 | .97 | .82 | 4.23 | .95 | .80 | 4.25 | 50 | |||||||||||||||||||||
| 91,465 | 1.09 | .83 | 4.13 | 1.09 | .83 | 4.13 | 1.08 | .82 | 4.14 | 20 | |||||||||||||||||||||
| 78,408 | .85 | .85 | 4.30 | .85 | .85 | 4.30 | .85 | .85 | 4.30 | 15 | |||||||||||||||||||||
| 69,151 | .86 | .86 | 4.62 | .86 | .86 | 4.62 | .86 | .86 | 4.62 | 16 | |||||||||||||||||||||
| 3,753 | 1.60 | * | 1.59 | * | 4.25 | * | 1.60 | * | 1.59 | * | 4.25 | * | 1.60 | * | 1.59 | * | 4.25 | * | 6 | ||||||||||||
| 4,337 | 1.65 | 1.60 | 3.87 | 1.65 | 1.60 | 3.87 | 1.63 | 1.58 | 3.89 | 40 | |||||||||||||||||||||
| 7,175 | 1.72 | 1.57 | 3.46 | 1.72 | 1.57 | 3.46 | 1.71 | 1.56 | 3.48 | 50 | |||||||||||||||||||||
| 10,076 | 1.85 | 1.59 | 3.38 | 1.85 | 1.59 | 3.38 | 1.83 | 1.57 | 3.39 | 20 | |||||||||||||||||||||
| 13,129 | 1.60 | 1.60 | 3.55 | 1.60 | 1.60 | 3.55 | 1.60 | 1.60 | 3.55 | 15 | |||||||||||||||||||||
| 16,258 | 1.61 | 1.61 | 3.87 | 1.61 | 1.61 | 3.87 | 1.61 | 1.61 | 3.87 | 16 | |||||||||||||||||||||
| 22,988 | 1.41 | * | 1.40 | * | 4.44 | * | 1.41 | * | 1.40 | * | 4.44 | * | 1.41 | * | 1.40 | * | 4.44 | * | 6 | ||||||||||||
| 20,484 | 1.45 | 1.40 | 4.10 | 1.45 | 1.40 | 4.10 | 1.44 | 1.39 | 4.11 | 40 | |||||||||||||||||||||
| 25,306 | 1.52 | 1.37 | 3.68 | 1.52 | 1.37 | 3.68 | 1.51 | 1.36 | 3.70 | 50 | |||||||||||||||||||||
| 23,067 | 1.64 | 1.38 | 3.58 | 1.64 | 1.38 | 3.58 | 1.63 | 1.37 | 3.59 | 20 | |||||||||||||||||||||
| 21,180 | 1.40 | 1.40 | 3.75 | 1.40 | 1.40 | 3.75 | 1.40 | 1.40 | 3.75 | 15 | |||||||||||||||||||||
| 19,165 | 1.41 | 1.41 | 4.07 | 1.41 | 1.41 | 4.07 | 1.41 | 1.41 | 4.07 | 16 | |||||||||||||||||||||
| 148,766 | .66 | * | .65 | * | 5.20 | * | .66 | * | .65 | * | 5.20 | * | .66 | * | .65 | * | 5.20 | * | 6 | ||||||||||||
| 151,650 | .70 | .65 | 4.87 | .70 | .65 | 4.87 | .69 | .64 | 4.89 | 40 | |||||||||||||||||||||
| 164,365 | .77 | .62 | 4.43 | .77 | .62 | 4.43 | .76 | .61 | 4.44 | 50 | |||||||||||||||||||||
| 167,300 | .89 | .63 | 4.33 | .89 | .63 | 4.33 | .88 | .62 | 4.34 | 20 | |||||||||||||||||||||
| 158,933 | .65 | .65 | 4.50 | .65 | .65 | 4.50 | .65 | .65 | 4.50 | 15 | |||||||||||||||||||||
| 164,422 | .66 | .66 | 4.82 | .66 | .66 | 4.82 | .66 | .66 | 4.82 | 16 | |||||||||||||||||||||
| * | Annualized. |
| (a) | Per share Net Investment Income is calculated using the average daily shares method. |
| (b) | Total return is the combination of changes in net asset value without any sales charge, reinvested dividend income at net asset value and reinvested capital gains distributions at net asset value, if any. Total returns are not annualized. |
| (c) | After expense reimbursement from the Adviser, where applicable. |
| (d) | After custodian fee credit and expense reimbursement, where applicable. |
| (e) | Each Ratio of Expenses Including Interest to Average Net Assets in the above table reflect, among other things, the interest expense deemed to have been paid by the Fund on the floating rate certificates issued by the special purpose trusts for the self-deposited inverse floaters held by the Fund, as described in Footnote 1 – Inverse Floating Rate Securities. |
| (f) | For the six months ended August 31, 2009. |
| (g) | Effective May 1, 2008, Class R Shares were renamed Class I Shares. |
See accompanying notes to financial statements.
| Nuveen Investments | 51 |
Financial Highlights (Unaudited) (continued)
| Selected data for a share outstanding throughout each period: | ||||||||||||||||||||||||||||||||
| Class (Commencement Date) | ||||||||||||||||||||||||||||||||
| Investment Operations | Less Distributions | |||||||||||||||||||||||||||||||
| CALIFORNIA INSURED | ||||||||||||||||||||||||||||||||
| Year Ended February 28/29, | Beginning Net Asset Value | Net Invest- ment Income(a) | Net Realized/ Unrealized Gain (Loss) | Total | Net Invest- ment Income | Capital Gains | Total | Ending Net Asset Value | Total Return(b) | |||||||||||||||||||||||
Class A (9/94) | ||||||||||||||||||||||||||||||||
2010(f) | $ | 9.40 | $ | .22 | $ | .31 | $ | .53 | $ | (.21 | ) | $ | — | $ | (.21 | ) | $ | 9.72 | 5.67 | % | ||||||||||||
2009 | 9.83 | .43 | (.44 | ) | (.01 | ) | (.41 | ) | (.01 | ) | (.42 | ) | 9.40 | (.06 | ) | |||||||||||||||||
2008 | 10.84 | .43 | (.95 | ) | (.52 | ) | (.43 | ) | (.06 | ) | (.49 | ) | 9.83 | (5.04 | ) | |||||||||||||||||
2007 | 10.87 | .43 | .03 | .46 | (.44 | ) | (.05 | ) | (.49 | ) | 10.84 | 4.33 | ||||||||||||||||||||
2006 | 10.91 | .45 | — | .45 | (.45 | ) | (.04 | ) | (.49 | ) | 10.87 | 4.19 | ||||||||||||||||||||
2005 | 11.19 | .46 | (.26 | ) | .20 | (.47 | ) | (.01 | ) | (.48 | ) | 10.91 | 1.88 | |||||||||||||||||||
Class B (3/97) | ||||||||||||||||||||||||||||||||
2010(f) | 9.43 | .18 | .31 | .49 | (.17 | ) | — | (.17 | ) | 9.75 | 5.26 | |||||||||||||||||||||
2009 | 9.85 | .36 | (.43 | ) | (.07 | ) | (.34 | ) | (.01 | ) | (.35 | ) | 9.43 | (.73 | ) | |||||||||||||||||
2008 | 10.86 | .35 | (.96 | ) | (.61 | ) | (.34 | ) | (.06 | ) | (.40 | ) | 9.85 | (5.77 | ) | |||||||||||||||||
2007 | 10.89 | .35 | .02 | .37 | (.35 | ) | (.05 | ) | (.40 | ) | 10.86 | 3.52 | ||||||||||||||||||||
2006 | 10.92 | .36 | .02 | .38 | (.37 | ) | (.04 | ) | (.41 | ) | 10.89 | 3.48 | ||||||||||||||||||||
2005 | 11.20 | .38 | (.26 | ) | .12 | (.39 | ) | (.01 | ) | (.40 | ) | 10.92 | 1.10 | |||||||||||||||||||
Class C (9/94) | ||||||||||||||||||||||||||||||||
2010(f) | 9.36 | .19 | .31 | .50 | (.18 | ) | — | (.18 | ) | 9.68 | 5.40 | |||||||||||||||||||||
2009 | 9.78 | .37 | (.42 | ) | (.05 | ) | (.36 | ) | (.01 | ) | (.37 | ) | 9.36 | (.55 | ) | |||||||||||||||||
2008 | 10.79 | .37 | (.96 | ) | (.59 | ) | (.36 | ) | (.06 | ) | (.42 | ) | 9.78 | (5.62 | ) | |||||||||||||||||
2007 | 10.81 | .37 | .03 | .40 | (.37 | ) | (.05 | ) | (.42 | ) | 10.79 | 3.81 | ||||||||||||||||||||
2006 | 10.85 | .38 | — | .38 | (.38 | ) | (.04 | ) | (.42 | ) | 10.81 | 3.58 | ||||||||||||||||||||
2005 | 11.12 | .40 | (.25 | ) | .15 | (.41 | ) | (.01 | ) | (.42 | ) | 10.85 | 1.37 | |||||||||||||||||||
Class I (7/86)(g) | ||||||||||||||||||||||||||||||||
2010(f) | 9.42 | .23 | .31 | .54 | (.22 | ) | — | (.22 | ) | 9.74 | 5.76 | |||||||||||||||||||||
2009 | 9.84 | .45 | (.43 | ) | .02 | (.43 | ) | (.01 | ) | (.44 | ) | 9.42 | .23 | |||||||||||||||||||
2008 | 10.85 | .45 | (.96 | ) | (.51 | ) | (.44 | ) | (.06 | ) | (.50 | ) | 9.84 | (4.87 | ) | |||||||||||||||||
2007 | 10.87 | .45 | .04 | .49 | (.46 | ) | (.05 | ) | (.51 | ) | 10.85 | 4.60 | ||||||||||||||||||||
2006 | 10.91 | .47 | — | .47 | (.47 | ) | (.04 | ) | (.51 | ) | 10.87 | 4.36 | ||||||||||||||||||||
2005 | 11.19 | .49 | (.27 | ) | .22 | (.49 | ) | (.01 | ) | (.50 | ) | 10.91 | 2.05 | |||||||||||||||||||
| 52 | Nuveen Investments |
| Ratios/Supplemental Data | |||||||||||||||||||||||||||||||
| Ratios to Average Net Assets Before Credit/ Reimbursement | Ratios to Average Net Assets After Reimbursement(c) | Ratios to Average Net Assets After Credit/ Reimbursement(d) | |||||||||||||||||||||||||||||
| Ending Net Assets (000) | Expenses Including Interest(e) | Expenses Excluding Interest | Net Invest- ment Income | Expenses Including Interest(e) | Expenses Excluding Interest | Net Invest- ment Income | Expenses Including Interest(e) | Expenses Excluding Interest | Net Invest- ment Income | Portfolio Turnover Rate | |||||||||||||||||||||
| $ | 75,732 | .86 | %* | .86 | %* | 4.49 | %* | .86 | %* | .86 | %* | 4.49 | %* | .86 | %* | .86 | %* | 4.49 | %* | 0 | % | ||||||||||
| 77,517 | .85 | .85 | 4.38 | .85 | .85 | 4.38 | .85 | .85 | 4.38 | 9 | |||||||||||||||||||||
| 80,867 | .91 | .83 | 4.03 | .91 | .83 | 4.03 | .90 | .82 | 4.04 | 21 | |||||||||||||||||||||
| 89,343 | .86 | .83 | 4.02 | .86 | .83 | 4.02 | .85 | .82 | 4.03 | 16 | |||||||||||||||||||||
| 86,224 | .84 | .84 | 4.10 | .84 | .84 | 4.10 | .83 | .83 | 4.10 | 14 | |||||||||||||||||||||
| 81,346 | .84 | .84 | 4.25 | .84 | .84 | 4.25 | .84 | .84 | 4.26 | 22 | |||||||||||||||||||||
| 3,509 | 1.61 | * | 1.61 | * | 3.75 | * | 1.61 | * | 1.61 | * | 3.75 | * | 1.61 | * | 1.61 | * | 3.75 | * | 0 | ||||||||||||
| 4,867 | 1.60 | 1.60 | 3.60 | 1.60 | 1.60 | 3.60 | 1.59 | 1.59 | 3.61 | 9 | |||||||||||||||||||||
| 7,890 | 1.66 | 1.58 | 3.28 | 1.66 | 1.58 | 3.28 | 1.65 | 1.57 | 3.29 | 21 | |||||||||||||||||||||
| 12,845 | 1.61 | 1.58 | 3.27 | 1.61 | 1.58 | 3.27 | 1.61 | 1.58 | 3.28 | 16 | |||||||||||||||||||||
| 15,325 | 1.58 | 1.58 | 3.34 | 1.58 | 1.58 | 3.34 | 1.58 | 1.58 | 3.35 | 14 | |||||||||||||||||||||
| 18,560 | 1.59 | 1.59 | 3.50 | 1.59 | 1.59 | 3.50 | 1.59 | 1.59 | 3.51 | 22 | |||||||||||||||||||||
| 11,866 | 1.41 | * | 1.41 | * | 3.94 | * | 1.41 | * | 1.41 | * | 3.94 | * | 1.41 | * | 1.41 | * | 3.94 | * | 0 | ||||||||||||
| 11,668 | 1.40 | 1.40 | 3.83 | 1.40 | 1.40 | 3.83 | 1.40 | 1.40 | 3.83 | 9 | |||||||||||||||||||||
| 12,455 | 1.46 | 1.38 | 3.48 | 1.46 | 1.38 | 3.48 | 1.45 | 1.37 | 3.49 | 21 | |||||||||||||||||||||
| 13,500 | 1.41 | 1.38 | 3.47 | 1.41 | 1.38 | 3.47 | 1.40 | 1.37 | 3.48 | 16 | |||||||||||||||||||||
| 12,872 | 1.39 | 1.39 | 3.55 | 1.39 | 1.39 | 3.55 | 1.38 | 1.38 | 3.55 | 14 | |||||||||||||||||||||
| 12,952 | 1.40 | 1.40 | 3.70 | 1.40 | 1.40 | 3.70 | 1.39 | 1.39 | 3.71 | 22 | |||||||||||||||||||||
| 96,764 | .66 | * | .66 | * | 4.69 | * | .66 | * | .66 | * | 4.69 | * | .66 | * | .66 | * | 4.69 | * | 0 | ||||||||||||
| 95,255 | .65 | .65 | 4.57 | .65 | .65 | 4.57 | .65 | .65 | 4.57 | 9 | |||||||||||||||||||||
| 112,282 | .71 | .63 | 4.23 | .71 | .63 | 4.23 | .70 | .62 | 4.24 | 21 | |||||||||||||||||||||
| 129,276 | .66 | .63 | 4.22 | .66 | .63 | 4.22 | .66 | .63 | 4.22 | 16 | |||||||||||||||||||||
| 140,555 | .64 | .64 | 4.29 | .64 | .64 | 4.29 | .63 | .63 | 4.30 | 14 | |||||||||||||||||||||
| 146,949 | .65 | .65 | 4.45 | .65 | .65 | 4.45 | .64 | .64 | 4.46 | 22 | |||||||||||||||||||||
| * | Annualized. |
| (a) | Per share Net Investment Income is calculated using the average daily shares method. |
| (b) | Total return is the combination of changes in net asset value without any sales charge, reinvested dividend income at net asset value and reinvested capital gains distributions at net asset value, if any. Total returns are not annualized. |
| (c) | After expense reimbursement from the Adviser, where applicable. |
| (d) | After custodian fee credit and expense reimbursement, where applicable. |
| (e) | Each Ratio of Expenses Including Interest to Average Net Assets in the above table reflect, among other things, the interest expense deemed to have been paid by the Fund on the floating rate certificates issued by the special purpose trusts for the self-deposited inverse floaters held by the Fund, as described in Footnote 1 – Inverse Floating Rate Securities. |
| (f) | For the six months ended August 31, 2009. |
| (g) | Effective May 1, 2008, Class R Shares were renamed Class I Shares. |
See accompanying notes to financial statements.
| Nuveen Investments | 53 |
Annual Investment Management Agreement Approval Process
The Investment Company Act of 1940, as amended (the “1940 Act”), provides, in substance, that each investment advisory agreement between a fund and its investment adviser will continue in effect from year to year only if its continuance is approved at least annually by the fund’s board members, including by a vote of a majority of the board members who are not parties to the advisory agreement or “interested persons” of any parties (the “Independent Board Members”), cast in person at a meeting called for the purpose of considering such approval. In connection with such approvals, the fund’s board members must request and evaluate, and the investment adviser is required to furnish, such information as may be reasonably necessary to evaluate the terms of the advisory agreement. Accordingly, at a meeting held on May 27-29, 2009 (the “May Meeting”), the Boards of Trustees (each a “Board” and each Trustee, a “Board Member”) of the Funds, including a majority of the Independent Board Members, considered and approved the continuation of the advisory agreements (each an “Advisory Agreement”) between each Fund and Nuveen Asset Management (“NAM”) for an additional one-year period. In preparation for their considerations at the May Meeting, the Board also held a separate meeting on April 21-22, 2009 (the “April Meeting”). Accordingly, the factors considered and determinations made regarding the renewals by the Independent Board Members include those made at the April Meeting.
In addition, in evaluating the Advisory Agreements, the Independent Board Members reviewed a broad range of information relating to the Funds and NAM, including absolute performance, fee and expense information for the Funds as well as comparative performance, fee and expense information for a comparable peer group of funds, the performance information of recognized and/or customized benchmarks (as applicable) of the Funds, the profitability of Nuveen for its advisory activities (which includes its wholly owned subsidiaries other than Winslow Capital Management, Inc. (“Winslow Capital”), which was recently acquired in December 2008), and other information regarding the organization, personnel, and services provided by NAM. The Independent Board Members also met quarterly as well as at other times as the need arose during the year and took into account the information provided at such meetings and the knowledge gained therefrom. Prior to approving the renewal of the Advisory Agreements, the Independent Board Members reviewed the foregoing information with their independent legal counsel and with management, reviewed materials from independent legal counsel describing applicable law and their duties in reviewing advisory contracts, and met with independent legal counsel in private sessions without management present. The Independent Board Members considered the legal advice provided by independent legal counsel and relied upon their knowledge of NAM, its services and the Funds resulting from their meetings and other interactions throughout the year and their own business judgment in determining the factors to be considered in evaluating the Advisory Agreements. Each Board Member may have accorded different weight to the various factors in reaching his or her conclusions with respect to a Fund’s Advisory Agreement. The Independent Board Members did not identify any single factor as all-important or controlling. The Independent Board Members’ considerations were instead based on a comprehensive consideration of all the information presented. The principal factors considered by the Board and its conclusions are described below.
A. Nature, Extent and Quality of Services
In considering renewal of the Advisory Agreements, the Independent Board Members considered the nature, extent and quality of NAM’s services, including advisory services and administrative services. The Independent Board Members reviewed materials outlining, among other things, NAM’s organization and business; the types of services that NAM or its affiliates provide and are expected to provide to the Funds; the performance record of the applicable Fund (as described in further detail below); and any initiatives Nuveen had taken for the applicable fund product line.
In reviewing the services provided and the initiatives undertaken during the past year, the Independent Board Members recognized the severe market turmoil experienced in the capital markets during recent periods, including sustained periods of high volatility, credit disruption and government intervention. The Independent Board Members considered NAM’s efforts, expertise and other actions taken to address matters as they arose that impacted the Funds. The Independent Board Members recognized the role of the Investment Services group which, among other things, monitors the various positions throughout the Nuveen fund complex to identify and address any systematic risks. In addition, the Capital Markets Committee of NAM provides a multi-departmental venue for developing new policies to mitigate any risks. The Independent Board Members further recognized NAM’s continuous review of the Nuveen funds’ investment strategies and mandates in seeking to continue to refine and improve the investment process for the funds, particularly in light of market conditions. In this regard, the Independent Board Members noted the changes recommended by NAM to various investment mandates for the Nuveen funds in seeking to take advantage of market opportunities and to improve the tools available for managing liquidity and market exposure; the establishment of a team responsible for coordinating the handling of large trades in or out of the Nuveen funds; and the ongoing monitoring of investment management processes.
As part of their review, the Independent Board Members also evaluated the background, experience and track record of NAM’s investment personnel. In this regard, the Independent Board Members considered any changes in the personnel, and the impact on the level of services provided to the Funds, if any. The Independent Board Members also reviewed information regarding portfolio manager compensation arrangements to evaluate NAM’s ability to attract and retain high quality investment personnel, preserve stability, and reward performance but not provide an incentive for taking undue risks.
In addition to advisory services, the Independent Board Members considered the quality of administrative services provided by NAM and its affiliates including product management, fund administration, oversight of service providers, shareholder services, administration of Board relations, regulatory and portfolio compliance and legal support. Given the importance of compliance, the Independent Board Members considered NAM’s compliance program, including the report of the chief compliance officer regarding the Funds’ compliance policies and procedures.
| 54 | Nuveen Investments |
Based on their review, the Independent Board Members found that, overall, the nature, extent and quality of services provided (and expected to be provided) to the respective Funds under the Advisory Agreements were satisfactory.
B. The Investment Performance of the Funds and NAM
The Board considered the investment performance of each Fund, including the Fund’s historic performance as well as its performance compared to funds with similar investment objectives (the “Performance Peer Group”) based on data provided by an independent provider of mutual fund data as well as recognized and/or customized benchmarks (as applicable). The Independent Board Members reviewed performance information including, among other things, total return information compared with the Fund’s Performance Peer Group and recognized and/or customized benchmarks (as applicable) for the quarter-, one-, three- and five-year periods (as applicable) ending December 31, 2008 and for the same periods (as applicable) ending March 31, 2009. The Independent Board Members also reviewed performance information of the Nuveen municipal funds managed by NAM in the aggregate ranked by peer group and the performance of such funds, in the aggregate, relative to their benchmark. This information supplemented the Fund performance information provided to the Board at each of its quarterly meetings.
In comparing a fund’s performance with that of its Performance Peer Group, the Independent Board Members took into account that the closest Performance Peer Group in certain instances may not adequately reflect the respective fund’s investment objectives and strategies thereby hindering a meaningful comparison of the fund’s performance with that of the Performance Peer Group. The Independent Board Members further considered the performance of the Funds in the context of the volatile market conditions during the past year, and their impact on various asset classes and the portfolio management of the Funds.
Based on their review and factoring in the severity of market turmoil in 2008, the Independent Board Members determined that each Fund’s investment performance over time had been satisfactory, except as noted. With respect to the Nuveen California High Yield Municipal Bond Fund, based on their review and factoring in the severity of market turmoil in 2008, the Independent Board Members were satisfied with the steps taken to address performance issues during extraordinary times.
C. Fees, Expenses and Profitability
1. Fees and Expenses
The Board evaluated the management fees and expenses of each Fund reviewing, among other things, such Fund’s gross management fees, net management fees and total expense ratios (before and after expense reimbursements and/or waivers) in absolute terms as well as compared to the fee and expenses of a comparable universe of unaffiliated funds based on data provided by an independent fund data provider (the “Peer Universe”) and in certain cases, to a more focused subset of funds in the Peer Universe (the “Peer Group”).
The Independent Board Members further reviewed data regarding the construction of the applicable Peer Universe and Peer Group. In reviewing the comparisons of fee and expense information, the Independent Board Members took into account that in certain instances various factors such as the asset level of a fund relative to peers, the size and particular composition of the Peer Universe or Peer Group, the investment objectives of the peers, expense anomalies, changes in the funds comprising the Peer Universe or Peer Group from year to year, levels of reimbursement and the timing of information used may impact the comparative data, thereby limiting the ability to make a meaningful comparison. The Independent Board Members also considered, among other things, the differences in the states reflected in the respective Peer Group. In reviewing the fee schedule for a Fund, the Independent Board Members also considered the fund-level and complex-wide breakpoint schedules (described in further detail below) and any fee waivers and reimbursements provided by Nuveen.
Based on their review of the fee and expense information provided, the Independent Board Members determined that each Fund’s management fees and net total expense ratio were reasonable in light of the nature, extent and quality of services provided to the Fund.
2. Comparisons with the Fees of Other Clients
The Independent Board Members further reviewed information regarding the nature of services and fee rates offered by NAM to other clients. Such other clients include NAM’s municipal separately managed accounts. In evaluating the comparisons of fees, the Independent Board Members noted that the fee rates charged to the Funds and other clients vary, among other things, because of the different services involved and the additional regulatory and compliance requirements associated with registered investment companies, such as the Funds. Accordingly, the Independent Board Members considered the differences in the product types, including, but not limited to, the services provided, the structure and operations, product distribution and costs thereof, portfolio investment policies, investor profiles, account sizes and regulatory requirements. The Independent Board Members noted, in particular, that the range of services provided to the Funds (as discussed above) is much more extensive than that provided to separately managed accounts. Given the inherent differences in the products, particularly the extensive services provided to the Funds, the Independent Board Members believe such facts justify the different levels of fees.
3. Profitability of Nuveen
In conjunction with its review of fees, the Independent Board Members also considered the profitability of Nuveen for its advisory activities (which incorporated Nuveen’s wholly-owned affiliated sub-advisers other than Winslow Capital) and its financial condition. The Independent Board Members reviewed the revenues and expenses of Nuveen’s advisory activities for the last two years, the
| Nuveen Investments | 55 |
Annual Investment Management Agreement Approval Process (continued)
allocation methodology used in preparing the profitability data and an analysis of the key drivers behind the changes in revenues and expenses that impacted profitability in 2008. In addition, the Independent Board Members reviewed information regarding the financial results of Nuveen for 2008 based on its Form 8-K filed on March 31, 2009. The Independent Board Members noted this information supplemented the profitability information requested and received during the year to help keep them apprised of developments affecting profitability (such as changes in fee waivers and expense reimbursement commitments). In this regard, the Independent Board Members noted that they had also appointed an Independent Board Member as a point person to review and keep them apprised of changes to the profitability analysis and/or methodologies during the year. The Independent Board Members also considered Nuveen’s revenues for advisory activities, expenses, and profit margin compared to that of various unaffiliated management firms with similar amounts of assets under management and relatively comparable asset composition prepared by Nuveen.
In reviewing profitability, the Independent Board Members recognized the subjective nature of determining profitability which may be affected by numerous factors including the allocation of expenses. Further, the Independent Board Members recognized the difficulties in making comparisons as the profitability of other advisers generally is not publicly available and the profitability information that is available for certain advisers or management firms may not be representative of the industry and may be affected by, among other things, the adviser’s particular business mix, capital costs, types of funds managed and expense allocations. Notwithstanding the foregoing, the Independent Board Members reviewed Nuveen’s methodology and assumptions for allocating expenses across product lines to determine profitability. In reviewing profitability, the Independent Board Members recognized Nuveen’s investment in its fund business.
Based on their review, the Independent Board Members concluded that Nuveen’s level of profitability for its advisory activities was reasonable in light of the services provided.
In evaluating the reasonableness of the compensation, the Independent Board Members also considered other amounts paid to NAM by the Funds as well as any indirect benefits (such as soft dollar arrangements, if any) NAM and its affiliates receive, or are expected to receive, that are directly attributable to the management of the Funds, if any. See Section E below for additional information on indirect benefits NAM may receive as a result of its relationship with the Funds. Based on their review of the overall fee arrangements of each Fund, the Independent Board Members determined that the advisory fees and expenses of the respective Fund were reasonable.
D. Economies of Scale and Whether Fee Levels Reflect These Economies of Scale
With respect to economies of scale, the Independent Board Members have recognized the potential benefits resulting from the costs of a fund being spread over a larger asset base, although economies of scale are difficult to measure and predict with precision, particularly on a fund-by-fund basis. One method to help ensure the shareholders share in these benefits is to include breakpoints in the advisory fee schedule. Generally, management fees for funds in the Nuveen complex are comprised of a fund-level component and a complex-level component, subject to certain exceptions. Accordingly, the Independent Board Members reviewed and considered the applicable fund-level breakpoints in the advisory fee schedules that reduce advisory fees as asset levels increase. While economies of scale result when costs can be spread over a larger asset base, the Independent Board Members also recognized that the asset levels generally declined in 2008 due to, among other things, the market downturn. Accordingly, for funds with a reduction in assets under management, advisory fee levels may have increased as breakpoints in the fee schedule were no longer surpassed.
In addition to fund-level advisory fee breakpoints, the Board also considered the Funds’ complex-wide fee arrangement. Pursuant to the complex-wide fee arrangement, the fees of the funds in the Nuveen complex generally are reduced as the assets in the fund complex reach certain levels. The complex-wide fee arrangement seeks to provide the benefits of economies of scale to fund shareholders when total fund complex assets increase, even if assets of a particular fund are unchanged or have decreased. The approach reflects the notion that some of Nuveen’s costs are attributable to services provided to all its funds in the complex and therefore all funds benefit if these costs are spread over a larger asset base. Generally, the complex-wide pricing reduces Nuveen’s revenue because total complex fund assets have consistently grown in prior years. As noted, however, total fund assets declined in 2008 resulting in a smaller downward adjustment of revenues due to complex-wide pricing compared to the prior year.
Based on their review, the Independent Board Members concluded that the breakpoint schedules and complex-wide fee arrangement were acceptable and reflect economies of scale to be shared with shareholders when assets under management increase.
E. Indirect Benefits
In evaluating fees, the Independent Board Members received and considered information regarding potential “fall out” or ancillary benefits NAM or its affiliates may receive as a result of its relationship with each Fund. In this regard, the Independent Board Members considered, among other things, any sales charges, distribution fees and shareholder services fees received and retained by the Funds’ principal underwriter, an affiliate of NAM, which includes fees received pursuant to any 12b-1 plan. The Independent Board Members, therefore, considered the 12b-1 fees retained by Nuveen during the last calendar year.
In addition to the above, the Independent Board Members considered whether NAM received any benefits from soft dollar arrangements whereby a portion of the commissions paid by a Fund for brokerage may be used to acquire research that may be useful to NAM in managing the assets of the Funds and other clients. The Independent Board Members noted that NAM does not currently have any soft dollar arrangements; however, to the extent certain bona fide agency transactions that occur on markets that
| 56 | Nuveen Investments |
traditionally trade on a principal basis and riskless principal transactions are considered as generating “commissions,” NAM intends to comply with the applicable safe harbor provisions.
Based on their review, the Independent Board Members concluded that any indirect benefits received by NAM as a result of its relationship with the Funds were reasonable and within acceptable parameters.
F. Other Considerations
The Independent Board Members did not identify any single factor discussed previously as all-important or controlling. The Board Members, including the Independent Board Members, unanimously concluded that the terms of the Advisory Agreements are fair and reasonable, that NAM’s fees are reasonable in light of the services provided to each Fund and that the Advisory Agreements be renewed.
| Nuveen Investments | 57 |
Notes
| 58 | Nuveen Investments |
Notes
| Nuveen Investments | 59 |
Glossary of Terms Used in this Report
Auction Rate Bond: An auction rate bond is a security whose interest payments are adjusted periodically through an auction process, which process typically also serves as a means for buying and selling the bond. Auctions that fail to attract enough buyers for all the shares offered for sale are deemed to have “failed,” with current holders receiving a formula-based interest rate until the next scheduled auction.
Pre-refundings: Pre-refundings, also known as advance refundings or refinancings, occur when an issuer sells new bonds and uses the proceeds to fund principal and interest payments of older existing bonds. This process often results in lower borrowing costs for bond issuers.
Average Annual Total Return: This is a commonly used method to express an investment’s performance over a particular, usually multi-year time period. It expresses the return that would have been necessary each year to equal the investment’s actual cumulative performance (including change in NAV or offer price and reinvested dividends and capital gains distributions, if any) over the time period being considered.
Average Effective Maturity: The average of the number of years to maturity of the bonds in a Fund’s portfolio, computed by weighting each bond’s time to maturity (the date the security comes due) by the market value of the security. This figure does not account for the likelihood of prepayments or the exercise of call provisions unless an escrow account has been established to redeem the bond before maturity. The market value weighting for an investment in an inverse floating rate security is the value of the portfolio’s residual interest in the inverse floating rate trust, and does not include the value of the floating rate securities issued by the trust.
Average Duration: Duration is a measure of the expected period over which a bond’s principal and interest will be paid, and consequently is a measure of the sensitivity of a bond’s (or bond fund’s) value to changes when market interest rates change. Generally, the longer a bond or Fund’s duration, the more the price of the bond or Fund will change as interest rates change.
Dividend Yield (also known as Market Yield or Current Yield): An investment’s current annualized dividend divided by its current offering price.
Inverse Floaters: Inverse floating rate securities are created by depositing a municipal bond, typically with a fixed interest rate, into a special purpose trust created by a broker-dealer. This trust, in turn, (a) issues floating rate certificates typically paying short-term tax-exempt interest rates to third parties in amounts equal to some fraction of the deposited bond’s par amount or market value, and (b) issues an inverse floating rate certificate (sometimes referred to as an “inverse floater”) to an investor (such as a Fund) interested in gaining investment exposure to a long-term municipal bond. The income received by the holder of the inverse floater varies inversely with the short-term rate paid to the floating rate certificates’ holders, and in most circumstances the holder of the inverse floater bears substantially all of the underlying bond’s downside investment risk. The holder of the inverse floater typically also benefits disproportionately from any potential appreciation of the underlying bond’s value. Hence, an inverse floater essentially represents an investment in the underlying bond on a leveraged basis.
Net Asset Value (NAV): A Fund’s NAV is the dollar value of one share in the Fund. It is calculated by subtracting the liabilities of the Fund from its total assets and then dividing the remainder by the number of shares outstanding. Fund NAVs are calculated at the end of each business day.
SEC 30-Day Yield: A standardized measure of a Fund’s yield that accounts for the future amortization of premiums or discounts of bonds held in the Fund’s portfolio.
Taxable-Equivalent Yield: The yield necessary from a fully taxable investment to equal, on an after-tax basis at a specified assumed tax rate, the yield of a municipal bond investment.
Zero Coupon Bond: A zero coupon bond does not pay a regular interest coupon to its holders during the life of the bond. Tax-exempt income to the holder of the bond comes from accretion of the difference between the original purchase price of the bond at issuance and the par value of the bond at maturity and is effectively paid at maturity. The market prices of zero coupon bonds generally are more volatile than the market prices of bonds that pay interest periodically.
| 60 | Nuveen Investments |
Fund Information
Fund Manager
Nuveen Asset Management
333 West Wacker Drive
Chicago, IL 60606
Legal Counsel
Chapman and Cutler LLP
Chicago, IL
Independent Registered Public Accounting Firm
PricewaterhouseCoopers LLP
Chicago, IL
Custodian
State Street Bank & Trust Company
Boston, MA
Transfer Agent and Shareholder Services
Boston Financial
Data Services, Inc.
Nuveen Investor Services
P.O. Box 8530
Boston, MA 02266-8530
(800) 257-8787
Quarterly Portfolio of Investments and Proxy Voting Information: You may obtain (i) each Fund’s quarterly portfolio of investments, (ii) information regarding how the Funds voted proxies relating to portfolio securities held during the most recent twelve-month period ended June 30, 2009, and (iii) a description of the policies and procedures that the Funds used to determine how to vote proxies relating to portfolio securities without charge, upon request, by calling Nuveen Investments at (800) 257-8787 or on Nuveen’s website at www.nuveen.com.
You may also obtain this and other Fund information directly from the Securities and Exchange Commission (“SEC”). The SEC may charge a copying fee for this information. Visit the SEC on-line at http://www.sec.gov or in person at the SEC’s Public Reference Room in Washington, D.C. Call the SEC at (202) 942-8090 for room hours and operation. You may also request Fund information by sending an e-mail request to publicinfo@sec.gov or by writing to the SEC’s Public Reference Section at 100 F Street NE, Washington, D.C. 20549.
The Financial Industry Regulatory Authority (FINRA) provides a Public Disclosure Program which supplies certain information regarding the disciplinary history of FINRA members and their associated persons in response to either telephone inquiries at (800) 289-9999 or written inquiries at www.finra.org. Financial Industry Regulatory Authority also provides an investor brochure that includes information describing the Public Disclosure Program.
| Nuveen Investments | 61 |
Nuveen Investments:
Serving Investors For Generations
Since 1898, financial advisors and their clients have relied on Nuveen Investments to provide dependable investment solutions. Over this time, Nuveen Investments has adhered to the belief that the best approach to investing is to apply conservative risk-management principles to help minimize volatility.
Building on this tradition, we today offer a range of high quality equity and fixed-income solutions that can be integral parts of a well-diversified core portfolio. Our clients have come to appreciate this diversity, as well as our continued adherence to proven, long-term investing principles.
We offer many different investing solutions
for our clients’ different needs.
Nuveen Investments is a global investment management firm that seeks to help secure the long-term goals of institutions and high net worth investors as well as the consultants and financial advisors who serve them. Nuveen Investments markets its growing range of specialized investment solutions under the high-quality brands of HydePark, NWQ, Nuveen, Santa Barbara, Symphony, Tradewinds and Winslow Capital. In total, the Company managed $128 billion of assets on June 30, 2009.
Find out how we can help you reach your financial goals.
An investor should carefully consider the Fund’s objectives, risks, charges and expenses before investing. For a prospectus containing this and other information about the Fund, please contact your financial advisor or Nuveen Investments at (800) 257-8787. Read the prospectus carefully before you invest or send money.
Learn more about Nuveen Funds at www.nuveen.com/mf
| • | Share prices |
| • | Fund details |
| • | Daily financial news |
| • | Investor education |
Distributed by Nuveen Investments, LLC 333 West Wacker Drive Chicago, IL 60606 www.nuveen.com |
MSA-CA-0809D
Mutual Funds

Nuveen Municipal Bond Funds
Dependable, tax-free income because it’s not what you earn, it’s what you keep.®
Semi-Annual Report
August 31, 2009
| Nuveen Massachusetts Municipal Bond Fund | Nuveen Massachusetts Insured Municipal Bond Fund |
LIFE IS COMPLEX.
Nuveen makes things e-simple.
It only takes a minute to sign up for e-Reports. Once enrolled, you’ll receive an e-mail as soon as your Nuveen Investments Fund information is ready. No more waiting for delivery by regular mail. Just click on the link within the e-mail to see the report and save it on your computer if you wish.
Free e-Reports right to your e-mail!
www.investordelivery.com
If you receive your Nuveen Fund dividends and statements from your financial advisor or brokerage account.
OR
www.nuveen.com/accountaccess
If you receive your Nuveen Fund dividends and statements directly from Nuveen.
| Must be preceded by or accompanied by a prospectus. | NOT FDIC INSURED | MAY LOSE VALUE | NO BANK GUARANTEE |
Chairman’s
Letter to Shareholders

Dear Shareholder,
The financial markets in which your Fund operates continue to reflect the larger economic crosscurrents. The illiquidity that infected global credit markets over the last year appears to be slowly but steadily receding. The major institutions that are the linchpin of the international financial system are strengthening their capital structures, but many still struggle with losses in their various portfolios. There are encouraging signs of recovery in European and Asian economies, while the U.S. economy continues to feel the impact of job losses and an over-borrowed consumer. Global trends include modestly increasing trade and increased concern about the ability of the U.S. government to address its substantial budgetary deficits. Identifying those developments that will define the future is never easy, but rarely is it more difficult than at present.
After considerable volatility in the first few months of 2009, both the fixed-income and equity markets have seen a partial recovery. A fundamental component of a successful long-term investment program is a commitment to remain invested during market downturns in order to be better positioned to benefit from any recovery. Another component is to re-evaluate investment disciplines and tactics and to confirm their validity following periods of extreme volatility and market dislocation, such as we have recently experienced. Your Board carried out an intensive review of investment performance with these objectives in mind during April and May of this year as part of the annual management contract renewal process. I encourage you to read the description of this process in the Annual Investment Management Agreement Approval Process section of this report.
Remaining invested through market downturns and reconfirming the appropriateness of a long term investment strategy is as important for our shareholders as it is for professional investment managers. For that reason, I again encourage you to remain in communication with your financial consultant on these subjects. For recent developments on all your Nuveen Funds, please visit the Nuveen web site: www.nuveen.com.
On behalf of the other members of your Fund’s Board, we look forward to continuing to earn your trust in the months and years ahead.
Sincerely,

Robert P. Bremner
Chairman of the Nuveen Fund Board
October 20, 2009
| Nuveen Investments | 1 |
Portfolio Manager’s Comments
Certain statements in this report are forward-looking statements. Discussions of specific investments are for illustration only and are not intended as recommendations of individual investments. The forward-looking statements and other views expressed herein are those of the portfolio manager as of the date of this report. Actual future results or occurrences may differ significantly from those anticipated in any forward-looking statements and the views expressed herein are subject to change at any time, due to numerous market and other factors. The Funds disclaim any obligation to update publicly or revise any forward-looking statements or views expressed herein.
Portfolio manager Cathryn Steeves examines key investment strategies and each Fund’s performance during the six months ending August 31, 2009. Cathryn, who has 13 years of investment experience, has managed the Funds since 2006.
How did the Funds perform during the six-month reporting period?
The chart on page three provides total return performance information for the Funds for the six-month, one-year, five-year and ten-year periods ended August 31, 2009. The Class A Shares at NAV performance of the Massachusetts Municipal Bond Fund and the Massachusetts Insured Municipal Bond Fund both outperformed their respective Lipper peer fund averages. Both Funds also exceeded the Standard & Poor’s (S&P) Massachusetts Municipal Bond Index and the national Barclays Capital Municipal Bond Index. The uninsured Massachusetts Fund’s return exceeded the S&P National Municipal Bond Index, while the Insured Massachusetts Fund performed closely in line with it.
The big story in the municipal bond market during the six-month period was the dramatic tightening of credit spreads. These spreads measure the amount of additional income that investors were demanding in exchange for purchasing lower-rated, higher-risk bonds. Credit spreads were extraordinarily wide at the start of the period, meaning that investors wanted a considerable premium when buying lower-rated securities. As credit became more available and investors became less pessimistic in their economic outlook, the markets became considerably less risk-averse. In turn, this drove a strong rally in the municipal market generally, and among lower-rated securities in particular. Credit spreads narrowed sharply, and the lower-rated bonds – which had been hit the hardest prior to the reporting period – fared the best overall in this environment.
During the first part of the period, we believed that spreads on all but the highest-quality municipal bonds seemed far too wide relative to their risks. In the uninsured Massachusetts Fund, we took advantage of opportunities to add bonds trading for what we believed were attractively low prices. In many cases, our investments were in BBB-rated and non-rated bonds – this proved to be beneficial to performance over the period.
The uninsured Massachusetts Fund also benefited from having a relatively long duration, meaning that the portfolio had increased price sensitivity to changes in interest rates. As investors became more comfortable assuming interest rate risk, they were willing to invest in longer-dated securities. This boosted the performance of these funds. The Fund was relatively underweighted on the short end of the yield curve as well as overweighted in intermediate-duration bonds – two positive factors for performance. A slight overweighting in longer-dated issues was a modest counterbalancing negative.
| 2 | Nuveen Investments |
| 1 | The Lipper category averages shown represent the average annualized total return for all reporting funds in the respective categories for the period ended August 31, 2009. The Lipper Massachusetts Municipal Debt Funds Average contained 43, 43, 36 and 32 funds and the Lipper Single-State Insured Municipal Debt Funds Average contained 61, 60, 57 and 56 funds for the six-month, one-year, five-year and ten-year periods, respectively, for the period ended August 31, 2009. The returns account for the effects of management fees and assume reinvestment of dividends, but do not reflect any applicable sales charges. You cannot invest directly in a Lipper Average. |
| 2 | The Standard & Poor’s (S&P) Massachusetts Municipal Bond Index is an unleveraged, market value weighted index designed to measure the performance of the investment-grade Massachusetts municipal bond market. The index does not reflect any initial or ongoing expenses and is not available for direct investment. The Standard & Poor’s (S&P) National Municipal Bond Index is an unleveraged, market value weighted index designed to measure the performance of the investment-grade National municipal bond market. The index does not reflect any initial or ongoing expenses and is not available for direct investment. |
| 3 | The Barclays Capital (formerly Lehman Brothers) Municipal Bond Index is an unmanaged, unleveraged index comprised of a broad range of investment-grade municipal bonds. The Barclays Capital (formerly Lehman Brothers) Massachusetts Municipal Bond Index is an unmanaged, unleveraged index comprised of investment grade, Massachusetts tax-exempt bonds with maturities of two years or greater. The Barclays Capital (formerly Lehman Brothers) Massachusetts Insured Municipal Bond Index is comprised of insured Massachusetts municipal bond issues. The indexes do not reflect any initial or ongoing expenses and are not available for direct investment. |
In contrast, the Insured Massachusetts Fund’s duration was somewhat shorter-than-desired because of the limited supply of insured bonds available for purchase within the state. However, offsetting the negative impact of the Fund’s interest rate positioning were our investments in uninsured hospital and housing bonds, both of which performed very well. Favorable security selection also contributed to the Insured Massachusetts Fund’s performance, as some of our individual insured bond holdings bounced back from lower price levels at the start of the period.
Tobacco bonds provided very strong returns during the past six months, in part because of their generally lower credit quality and higher yields. Unfortunately, the uninsured Massachusetts Fund was underexposed to this category, hampering relative performance. We also lacked exposure to natural gas pre-payment bonds, in which public utilities contract with Wall Street financial firms to pre-pay for natural gas supplies. As investor sentiment about the financial industry improved, these bonds performed well. Unfortunately, they were not available for purchase in the uninsured Massachusetts Fund, detracting from returns on a relative basis.
Class A Shares – Average Annual Total Returns
As of 8/31/09
Cumulative Six-Month | Average Annual | |||||||
| 1-Year | 5-Year | 10-Year | ||||||
Nuveen Massachusetts Municipal Bond Fund | ||||||||
A Shares at NAV | 8.96% | 3.23% | 2.99% | 4.40% | ||||
A Shares at Offer | 4.34% | -1.12% | 2.11% | 3.95% | ||||
Lipper Massachusetts Municipal Debt Funds Average1 | 7.68% | 2.61% | 3.06% | 4.44% | ||||
Standard & Poor’s (S&P) Massachusetts Municipal Bond Index2 | 5.55% | 6.55% | 4.55% | 5.67% | ||||
Standard & Poor’s (S&P) National Municipal Bond Index2 | 6.49% | 4.68% | 4.00% | 5.30% | ||||
Barclays Capital Municipal Bond Index3 | 5.61% | 5.67% | 4.16% | 5.40% | ||||
Nuveen Massachusetts Insured Municipal Bond Fund | ||||||||
A Shares at NAV | 6.47% | 4.64% | 3.48% | 4.61% | ||||
A Shares at Offer | 2.03% | 0.26% | 2.59% | 4.16% | ||||
Lipper Single-State Insured Municipal Debt Funds Average1 | 4.81% | 4.07% | 2.94% | 4.30% | ||||
Standard & Poor’s (S&P) Massachusetts Municipal Bond Index2 | 5.55% | 6.55% | 4.55% | 5.67% | ||||
Standard & Poor’s (S&P) National Municipal Bond Index2 | 6.49% | 4.68% | 4.00% | 5.30% | ||||
Barclays Capital Municipal Bond Index3 | 5.61% | 5.67% | 4.16% | 5.40% | ||||
Returns quoted represent past performance, which is no guarantee of future results. Investment returns and principal value will fluctuate so that when shares are redeemed, they may be worth more or less than their original cost. Returns less than one year are cumulative. Current performance may be higher or lower than the performance shown. Returns at NAV would be lower if the sales charge were included. Class A Shares have a 4.2% maximum sales charge. Returns do not reflect the deduction of taxes that a shareholder would pay on Fund distributions or the redemption of shares. For the most recent month-end performance, visit www.nuveen.com or call (800) 257-8787.
Please see each Fund’s Spotlight Page later in this report for more complete performance data and expense ratios.
| Nuveen Investments | 3 |
What strategies were used to manage the Funds?
As previously mentioned, credit spreads narrowed dramatically but still were wider than normal for much of the period. With the help of Nuveen’s credit research team, we continued to find opportunities to invest in lower-rated bonds that we thought could provide strong long-term value potential for our shareholders in the uninsured Massachusetts Fund. We pursued this opportunistic investment approach throughout the majority of the period. By July and August, however, spreads were tighter – making value somewhat harder to find – and this curtailed our buying activity. Another factor limiting activity was the introduction of Build America Bonds. Build America Bonds are a new class of taxable municipal debt created as part of the February 2009 economic stimulus package. They provide municipal issuers with a federal subsidy equal to 35% of the security’s interest payments and therefore offer issuers an attractive alternative to traditional tax-exempt debt.
Recent purchases included various health care and higher education bonds, many of which were lower-rated. When making purchases, we emphasized bonds with maturities of 20 to 30 years – a portion of the yield curve we felt was offering favorable long-term values. To fund our purchases, we generally sold shorter-dated issues – whose appreciation potential we felt was more limited and also invested the proceeds of bond calls.
In the Insured Massachusetts Fund, purchase activity was quite limited during the six-month period. Following the credit rating downgrade of most major municipal bond insurers, it has become increasingly difficult to find suitable AAA-rated insured bonds, which, must make up 80% of the portfolio’s assets. Given this criterion, we made only a few purchases during the six-month period, buying some student loan as well as some water-resource bonds.
Recent Developments Regarding Bond Insurance Companies
Another factor that had an impact on the performance of these Funds was their positions in bonds backed by municipal bond insurers that experienced downgrades in their credit ratings. During the period covered by this report, all bond insurers experienced one or more rating reductions by at least one or more rating agencies. At the time this report was prepared, there are no longer any bond insurers rated AAA by more than one of the major rating agencies (Moody’s Investor Service, S&P and Fitch) and at least one rating agency has placed each insurer on “negative credit watch,” “credit outlook/watch developing” “credit outlook/watch negative,” “credit watch evolving,” “rating withdrawn” or “regulatory supervision” which may presage one or more rating reductions for any insurer in the future. As concern increased about the balance sheets of insurers, prices on insured bonds – especially those bonds issued by weaker underlying credits – declined, detracting from the Funds’ performances. By the end of this period, most insured bonds were being valued according to their fundamentals as if they were uninsured. On the whole, the holdings of all of these Funds continued to be well diversified and it is important to note that municipal bonds historically have had a very low rate of default.
| 4 | Nuveen Investments |
Dividend Information
During the reporting period, all share classes of the Nuveen Massachusetts Municipal Bond Fund experienced an increase to its monthly dividend in August 2009. For all share classes of the Nuveen Massachusetts Insured Municipal Bond Fund, the dividend remained the same throughout the period.
Each Fund seeks to pay dividends at a rate that reflects the past and projected performance of the Fund. To permit a Fund to maintain a more stable monthly dividend, the Fund may pay dividends at a rate that may be more or less than the amount of net investment income actually earned by the Fund during the period. If the Fund has cumulatively earned more than it has paid in dividends, it will hold the excess in reserve as undistributed net investment income (UNII) as part of the Fund’s net asset value. Conversely, if the Fund has cumulatively paid in dividends more than it has earned, the excess will constitute a negative UNII that will likewise be reflected in the Fund’s net asset value. Each Fund will, over time, pay all its net investment income as dividends to shareholders. As of August 31, 2009, both Funds had positive UNII balances, based upon our best estimate, for tax purposes, and positive UNII balances for financial statement purposes.
| Nuveen Investments | 5 |
Fund Spotlight as of 8/31/09 Nuveen Massachusetts Municipal Bond Fund
| Quick Facts | ||||||||
| A Shares | B Shares | C Shares | I Shares | |||||
Fund Symbol | NMAAX | NMABX | NMACX | NBMAX | ||||
NAV | $9.37 | $9.38 | $9.29 | $9.35 | ||||
Latest Monthly Dividend1 | $0.0375 | $0.0320 | $0.0330 | $0.0390 | ||||
Latest Capital Gain Distribution2 | $0.0411 | $0.0411 | $0.0411 | $0.0411 | ||||
Inception Date | 9/07/94 | 3/07/97 | 10/06/94 | 12/22/86 |
Returns quoted represent past performance which is no guarantee of future results. Investment returns and principal value will fluctuate so that when shares are redeemed, they may be worth more or less than their original cost. Current performance may be higher or lower than the performance shown. Returns without sales charges would be lower if the sales charge were included. Returns do not reflect the deduction of taxes that a shareholder would pay on Fund distributions or the redemption of shares. Income is generally exempt from regular federal income taxes. Some income may be subject to state and local taxes and to the federal alternative minimum tax. Capital gains, if any, are subject to tax. For the most recent month-end performance visit www.nuveen.com or call (800) 257-8787.
Returns reflect differences in sales charges and expenses, which are primarily differences in distribution and service fees. Fund returns assume reinvestment of dividends and capital gains. Class A Shares have a 4.2% maximum sales charge. Class A Share purchases of $1 million or more are sold at net asset value without an up-front sales charge but may be subject to a contingent deferred sales charge (CDSC), also known as a backend sales charge, if redeemed within twelve months of purchase. Class B Shares have a CDSC that begins at 5% for redemptions during the first year and declines periodically until after six years when the charge becomes 0%. Class B Shares automatically convert to Class A Shares eight years after purchase. Class C Shares have a 1% CDSC for redemptions within less than one year, which is not reflected in the one-year total return. Class I Shares have no sales charge and may be purchased under limited circumstances or by specified classes of investors. Returns may reflect an expense limitation by the Fund’s investment advisor.
| Average Annual Total Returns as of 8/31/09 | ||||
| A Shares | NAV | Offer | ||
1-Year | 3.23% | -1.12% | ||
5-Year | 2.99% | 2.11% | ||
10-Year | 4.40% | 3.95% | ||
| B Shares | w/o CDSC | w/CDSC | ||
1-Year | 2.45% | -1.48% | ||
5-Year | 2.22% | 2.05% | ||
10-Year | 3.77% | 3.77% | ||
| C Shares | NAV | |||
1-Year | 2.62% | |||
5-Year | 2.42% | |||
10-Year | 3.81% | |||
| I Shares | NAV | |||
1-Year | 3.44% | |||
5-Year | 3.19% | |||
10-Year | 4.60% | |||
| Tax-Free Yields | ||||
| A Shares | NAV | Offer | ||
Dividend Yield3 | 4.80% | 4.60% | ||
30-Day Yield3 | 4.58% | — | ||
SEC 30-Day Yield3,4 | — | 4.38% | ||
Taxable-Equivalent Yield4,5 | 6.72% | 6.42% | ||
| B Shares | NAV | |||
Dividend Yield3 | 4.09% | |||
30-Day Yield3 | 3.83% | |||
Taxable-Equivalent Yield5 | 5.62% | |||
| C Shares | NAV | |||
Dividend Yield3 | 4.26% | |||
30-Day Yield3 | 4.03% | |||
Taxable-Equivalent Yield5 | 5.91% | |||
| I Shares | NAV | |||
Dividend Yield3 | 5.01% | |||
SEC 30-Day Yield3 | 4.78% | |||
Taxable-Equivalent Yield5 | 7.01% | |||
| Average Annual Total Returns as of 9/30/09 | ||||
| A Shares | NAV | Offer | ||
1-Year | 15.49% | 10.59% | ||
5-Year | 4.10% | 3.21% | ||
10-Year | 5.03% | 4.58% | ||
| B Shares | w/o CDSC | w/CDSC | ||
1-Year | 14.61% | 10.61% | ||
5-Year | 3.32% | 3.15% | ||
10-Year | 4.41% | 4.41% | ||
| C Shares | NAV | |||
1-Year | 14.93% | |||
5-Year | 3.53% | |||
10-Year | 4.46% | |||
| I Shares | NAV | |||
1-Year | 15.75% | |||
5-Year | 4.30% | |||
10-Year | 5.24% | |||
| Portfolio Statistics | ||
| Net Assets ($000) | $119,988 | |
| Average Effective Maturity on Securities (Years) | 18.65 | |
| Average Duration | 7.44 | |
| Expense Ratios | ||||
| Share Class | Gross Expense Ratios | As of Date | ||
| Class A | 0.91% | 2/28/09 | ||
| Class B | 1.67% | 2/28/09 | ||
| Class C | 1.47% | 2/28/09 | ||
| Class I | 0.72% | 2/28/09 |
The expense ratios shown factor in Total Annual Fund Operating Expenses including management fees and other fees and expenses but excluding interest expense on floating rate obligations, if any.
| 1 | Paid September 1, 2009. This is the latest monthly tax-exempt dividend declared during the period ended August 31, 2009. |
| 2 | Paid November 12, 2008. Capital gains are subject to federal taxation. |
| 3 | Dividend Yield is the most recent dividend per share (annualized) divided by the appropriate price per share. The SEC 30-Day Yield is computed under an SEC standardized formula and is based on the maximum offer price per share. The 30-Day Yield is computed under the same formula but is based on the Net Asset Value (NAV) per share. The Dividend Yield may differ from the SEC 30-Day Yield because the Fund may be paying out more or less than it is earning and it may not include the effect of amortization of bond premium. |
| 4 | The SEC 30-Day Yield and Taxable-Equivalent Yield on A Shares at NAV applies only to A Shares purchased at no-load pursuant to the Fund’s policy permitting waiver of the A Share load in certain specified circumstances. |
| 5 | The Taxable-Equivalent Yield represents the yield that must be earned on a fully taxable investment in order to equal the yield of the Fund on an after-tax basis at a specified tax rate. With respect to investments that generate qualified dividend income that is taxable at a maximum rate of 15%, the Taxable-Equivalent Yield is lower. The Taxable-Equivalent Yield is based on the Fund’s 30-Day Yield on the indicated date and a combined federal and state income tax rate of 31.8%. |
| 6 | Nuveen Investments |
Fund Spotlight as of 8/31/09 Nuveen Massachusetts Municipal Bond Fund
Bond Credit Quality1
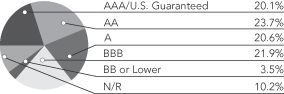
Portfolio Composition1 | ||
Education and Civic Organizations | 25.5% | |
Health Care | 24.4% | |
Long-Term Care | 7.7% | |
Housing/Multifamily | 6.4% | |
Transportation | 6.4% | |
Tax Obligation/General | 6.3% | |
Tax Obligation/Limited | 5.8% | |
Utilities | 5.0% | |
Other | 12.5% |
| 1 | As a percentage of total investments as of August 31, 2009. Holdings are subject to change. |
Expense Example
As a shareholder of the Fund, you incur two types of costs: (1) transaction costs, including front and back end sales charges (loads) or redemption fees, where applicable; and (2) ongoing costs, including management fees; distribution and service (12b-1) fees, where applicable; and other Fund expenses. This Example is intended to help you understand your ongoing costs (in dollars) of investing in the Fund and to compare these costs with the ongoing costs of investing in other mutual funds.
The Example below is based on an investment of $1,000 invested at the beginning of the period and held for the period.
The information under “Actual Performance,” together with the amount you invested, allows you to estimate actual expenses incurred over the reporting period. Simply divide your account value by $1,000 (for example, an $8,600 account value divided by $1,000 = 8.60) and multiply the result by the cost shown for your share class, in the row entitled “Expenses Incurred During Period” to estimate the expenses incurred on your account during this period.
The information under “Hypothetical Performance,” provides information about hypothetical account values and hypothetical expenses based on the Fund’s actual expense ratio and an assumed rate of return of 5% per year before expenses, which is not the Fund’s actual return. The hypothetical account values and expenses may not be used to estimate the actual ending account balance or expense you incurred for the period. You may use this information to compare the ongoing costs of investing in the Fund and other Funds. To do so, compare this 5% hypothetical example with the 5% hypothetical examples that appear in the shareholder reports of the other funds.
Please note that the expenses shown in the table are meant to highlight your ongoing costs only and do not reflect any transactional costs, such as front and back end sales charges (loads) or redemption fees, where applicable. Therefore, the hypothetical information is useful in comparing ongoing costs only, and will not help you determine the relative total costs of owning different funds or share classes. In addition, if these transactional costs were included, your costs would have been higher.
| Hypothetical Performance | ||||||||||||||||||||||||||
| Actual Performance | (5% annualized return before expenses) | |||||||||||||||||||||||||
| A Shares | B Shares | C Shares | I Shares | A Shares | B Shares | C Shares | I Shares | |||||||||||||||||||
| Beginning Account Value (3/01/09) | $ | 1,000.00 | $ | 1,000.00 | $ | 1,000.00 | $ | 1,000.00 | $ | 1,000.00 | $ | 1,000.00 | $ | 1,000.00 | $ | 1,000.00 | ||||||||||
| Ending Account Value (8/31/09) | $ | 1,089.60 | $ | 1,084.30 | $ | 1,085.90 | $ | 1,089.60 | $ | 1,020.62 | $ | 1,016.84 | $ | 1,017.85 | $ | 1,021.63 | ||||||||||
| Expenses Incurred During Period | $ | 4.79 | $ | 8.72 | $ | 7.68 | $ | 3.74 | $ | 4.63 | $ | 8.44 | $ | 7.43 | $ | 3.62 | ||||||||||
For each class of the Fund, expenses are equal to the Fund’s annualized net expense ratio of .91%, 1.66%, 1.46% and .71% for Classes A, B, C and I, respectively, multiplied by the average account value over the period, multiplied by 184/365 (to reflect the one-half year period).
| Nuveen Investments | 7 |
Fund Spotlight as of 8/31/09 Nuveen Massachusetts Insured Municipal Bond Fund
| Quick Facts | ||||||||
| A Shares | B Shares | C Shares | I Shares | |||||
Fund Symbol | NMAIX | NINSX | NMAKX | NIMAX | ||||
NAV | $10.06 | $10.08 | $10.06 | $10.10 | ||||
Latest Monthly Dividend1 | $0.0330 | $0.0270 | $0.0285 | $0.0345 | ||||
Latest Capital Gain and Ordinary Income Distribution2 | $0.0501 | $0.0501 | $0.0501 | $0.0501 | ||||
Inception Date | 9/07/94 | 3/06/97 | 9/15/94 | 12/22/86 |
Returns quoted represent past performance which is no guarantee of future results. Investment returns and principal value will fluctuate so that when shares are redeemed, they may be worth more or less than their original cost. Current performance may be higher or lower than the performance shown. Returns without sales charges would be lower if the sales charge were included. Returns do not reflect the deduction of taxes that a shareholder would pay on Fund distributions or the redemption of shares. Income is generally exempt from regular federal income taxes. Some income may be subject to state and local taxes and to the federal alternative minimum tax. Capital gains, if any, are subject to tax. For the most recent month-end performance visit www.nuveen.com or call (800) 257-8787.
Returns reflect differences in sales charges and expenses, which are primarily differences in distribution and service fees. Fund returns assume reinvestment of dividends and capital gains. Class A Shares have a 4.2% maximum sales charge. Class A Share purchases of $1 million or more are sold at net asset value without an up-front sales charge but may be subject to a contingent deferred sales charge (CDSC), also known as a backend sales charge, if redeemed within twelve months of purchase. Class B Shares have a CDSC that begins at 5% for redemptions during the first year and declines periodically until after six years when the charge becomes 0%. Class B Shares automatically convert to Class A Shares eight years after purchase. Class C Shares have a 1% CDSC for redemptions within less than one year, which is not reflected in the one-year total return. Class I Shares have no sales charge and may be purchased under limited circumstances or by specified classes of investors. Returns may reflect an expense limitation by the Fund’s investment advisor.
| Average Annual Total Returns as of 8/31/09 | ||||
| A Shares | NAV | Offer | ||
1-Year | 4.64% | 0.26% | ||
5-Year | 3.48% | 2.59% | ||
10-Year | 4.61% | 4.16% | ||
| B Shares | w/o CDSC | w/CDSC | ||
1-Year | 3.95% | -0.05% | ||
5-Year | 2.71% | 2.54% | ||
10-Year | 3.99% | 3.99% | ||
| C Shares | NAV | |||
1-Year | 4.06% | |||
5-Year | 2.89% | |||
10-Year | 4.03% | |||
| I Shares | NAV | |||
1-Year | 4.82% | |||
5-Year | 3.67% | |||
10-Year | 4.81% | |||
| Tax-Free Yields | ||||
| A Shares | NAV | Offer | ||
Dividend Yield3 | 3.94% | 3.77% | ||
30-Day Yield3 | 2.93% | — | ||
SEC 30-Day Yield3,4 | — | 2.81% | ||
Taxable-Equivalent Yield4,5 | 4.30% | 4.12% | ||
| B Shares | NAV | |||
Dividend Yield3 | 3.21% | |||
30-Day Yield3 | 2.18% | |||
Taxable-Equivalent Yield5 | 3.20% | |||
| C Shares | NAV | |||
Dividend Yield3 | 3.40% | |||
30-Day Yield3 | 2.39% | |||
Taxable-Equivalent Yield5 | 3.50% | |||
| I Shares | NAV | |||
Dividend Yield3 | 4.10% | |||
SEC 30-Day Yield3 | 3.13% | |||
Taxable-Equivalent Yield5 | 4.59% | |||
| Average Annual Total Returns as of 9/30/09 | ||||
| A Shares | NAV | Offer | ||
1-Year | 13.72% | 8.92% | ||
5-Year | 4.04% | 3.16% | ||
10-Year | 4.97% | 4.51% | ||
| B Shares | w/o CDSC | w/CDSC | ||
1-Year | 12.97% | 8.97% | ||
5-Year | 3.28% | 3.10% | ||
10-Year | 4.33% | 4.33% | ||
| C Shares | NAV | |||
1-Year | 13.20% | |||
5-Year | 3.49% | |||
10-Year | 4.40% | |||
| I Shares | NAV | |||
1-Year | 13.98% | |||
5-Year | 4.27% | |||
10-Year | 5.18% | |||
| Portfolio Statistics | ||
| Net Assets ($000) | $91,236 | |
| Average Effective Maturity on Securities (Years) | 15.46 | |
| Average Duration | 5.90 | |
| Expense Ratios | ||||
| Share Class | Gross Expense Ratios | As of Date | ||
| Class A | 0.89% | 2/28/09 | ||
| Class B | 1.64% | 2/28/09 | ||
| Class C | 1.44% | 2/28/09 | ||
| Class I | 0.69% | 2/28/09 |
The expense ratios shown factor in Total Annual Fund Operating Expenses including management fees and other fees and expenses but excluding interest expense on floating rate obligations, if any.
| 1 | Paid September 1, 2009. This is the latest monthly tax-exempt dividend declared during the period ended August 31, 2009. |
| 2 | Paid November 12, 2008. Capital gains and ordinary income are subject to federal taxation. |
| 3 | Dividend Yield is the most recent dividend per share (annualized) divided by the appropriate price per share. The SEC 30-Day Yield is computed under an SEC standardized formula and is based on the maximum offer price per share. The 30-Day Yield is computed under the same formula but is based on the Net Asset Value (NAV) per share. The Dividend Yield may differ from the SEC 30-Day Yield because the Fund may be paying out more or less than it is earning and it may not include the effect of amortization of bond premium. |
| 4 | The SEC 30-Day Yield and Taxable-Equivalent Yield on A Shares at NAV applies only to A Shares purchased at no-load pursuant to the Fund’s policy permitting waiver of the A Share load in certain specified circumstances. |
| 5 | The Taxable-Equivalent Yield represents the yield that must be earned on a fully taxable investment in order to equal the yield of the Fund on an after-tax basis at a specified tax rate. With respect to investments that generate qualified dividend income that is taxable at a maximum rate of 15%, the Taxable-Equivalent Yield is lower. The Taxable-Equivalent Yield is based on the Fund’s 30-Day Yield on the indicated date and a combined federal and state income tax rate of 31.8%. |
| 8 | Nuveen Investments |
Fund Spotlight as of 8/31/09 Nuveen Massachusetts Insured Municipal Bond Fund
Bond Credit Quality1,2
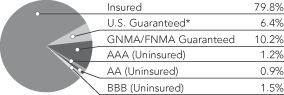
At least 80% of the Fund’s net assets are invested in municipal securities that guarantee the timely payment of principal and interest. See Notes to Financial Statements, Footnote 1 – Insurance, for more information.
| * | U.S. Guaranteed includes 6.4% (as a % of total investments) of Insured securities. |
Portfolio Composition2 | ||
Tax Obligation/General | 25.4% | |
Tax Obligation/Limited | 12.9% | |
Health Care | 12.7% | |
Water and Sewer | 11.6% | |
Education and Civic Organizations | 9.6% | |
Transportation | 7.1% | |
Long-Term Care | 7.0% | |
U.S. Guaranteed | 6.4% | |
Housing/Multifamily | 5.5% | |
Other | 1.8% | |
| Insurers3 | ||
NPFG4 | 38.2% | |
FSA | 17.9% | |
FGIC | 15.8% | |
AMBAC | 15.0% | |
AGC | 6.5% | |
Other | 6.6% | |
| 1 | The percentages shown in the foregoing chart may reflect the ratings on certain bonds whose insurer has experienced downgrades as of the end of the reporting period. Please see the Portfolio Manager’s Comments for an expanded discussion of the affect on the Fund of changes to the ratings of certain bonds in the portfolio resulting from changes to the ratings of the underlying insurers both during the period and after period end. |
| 2 | As a percentage of total investments as of August 31, 2009. Holdings are subject to change. |
| 3 | As a percentage of total Insured investments as of August 31, 2009. Holdings are subject to change. |
| 4 | MBIA’s public finance subsidiary. |
Expense Example
As a shareholder of the Fund, you incur two types of costs: (1) transaction costs, including front and back end sales charges (loads) or redemption fees, where applicable; and (2) ongoing costs, including management fees; distribution and service (12b-1) fees, where applicable; and other Fund expenses. This Example is intended to help you understand your ongoing costs (in dollars) of investing in the Fund and to compare these costs with the ongoing costs of investing in other mutual funds.
The Example below is based on an investment of $1,000 invested at the beginning of the period and held for the period.
The information under “Actual Performance,” together with the amount you invested, allows you to estimate actual expenses incurred over the reporting period. Simply divide your account value by $1,000 (for example, an $8,600 account value divided by $1,000 = 8.60) and multiply the result by the cost shown for your share class, in the row entitled “Expenses Incurred During Period” to estimate the expenses incurred on your account during this period.
The information under “Hypothetical Performance,” provides information about hypothetical account values and hypothetical expenses based on the Fund’s actual expense ratio and an assumed rate of return of 5% per year before expenses, which is not the Fund’s actual return. The hypothetical account values and expenses may not be used to estimate the actual ending account balance or expense you incurred for the period. You may use this information to compare the ongoing costs of investing in the Fund and other Funds. To do so, compare this 5% hypothetical example with the 5% hypothetical examples that appear in the shareholder reports of the other funds.
Please note that the expenses shown in the table are meant to highlight your ongoing costs only and do not reflect any transactional costs, such as front and back end sales charges (loads) or redemption fees, where applicable. Therefore, the hypothetical information is useful in comparing ongoing costs only, and will not help you determine the relative total costs of owning different funds or share classes. In addition, if these transactional costs were included, your costs would have been higher.
| Hypothetical Performance | ||||||||||||||||||||||||||
| Actual Performance | (5% annualized return before expenses) | |||||||||||||||||||||||||
| A Shares | B Shares | C Shares | I Shares | A Shares | B Shares | C Shares | I Shares | |||||||||||||||||||
| Beginning Account Value (3/01/09) | $ | 1,000.00 | $ | 1,000.00 | $ | 1,000.00 | $ | 1,000.00 | $ | 1,000.00 | $ | 1,000.00 | $ | 1,000.00 | $ | 1,000.00 | ||||||||||
| Ending Account Value (8/31/09) | $ | 1,064.70 | $ | 1,061.80 | $ | 1,061.80 | $ | 1,065.40 | $ | 1,020.67 | $ | 1,016.94 | $ | 1,017.90 | $ | 1,021.73 | ||||||||||
| Expenses Incurred During Period | $ | 4.68 | $ | 8.52 | $ | 7.54 | $ | 3.59 | $ | 4.58 | $ | 8.34 | $ | 7.37 | $ | 3.52 | ||||||||||
For each class of the Fund, expenses are equal to the Fund’s annualized net expense ratio of .90%, 1.64%, 1.45% and .69% for Classes A, B, C and I, respectively, multiplied by the average account value over the period, multiplied by 184/365 (to reflect the one-half year period).
| Nuveen Investments | 9 |
Portfolio of Investments (Unaudited)
Nuveen Massachusetts Municipal Bond Fund
August 31, 2009
| Principal Amount (000) | Description (1) | Optional Call Provisions (2) | Ratings (3) | Value | ||||||||
Consumer Discretionary – 0.8% | ||||||||||||
| $ | 1,425 | Boston Industrial Development Financing Authority, Massachusetts, Senior Revenue Bonds, Crosstown Center Project, Series 2002, 6.500%, 9/01/35 (Alternative Minimum Tax) | 9/12 at 102.00 | B3 | $ | 962,759 | ||||||
Consumer Staples – 1.5% | ||||||||||||
| 790 | Puerto Rico, The Children’s Trust Fund, Tobacco Settlement Asset-Backed Refunding Bonds, Series 2002, 5.375%, 5/15/33 | 5/12 at 100.00 | BBB | 756,773 | ||||||||
| 1,000 | Virgin Islands Public Finance Authority, Matching Fund Revenue Loan Note – Diageo Project, Series 2009A, 6.625%, 10/01/29 | 10/19 at 100.00 | Baa3 | 1,022,490 | ||||||||
| 1,790 | Total Consumer Staples | 1,779,263 | ||||||||||
Education and Civic Organizations – 24.9% | ||||||||||||
| 1,000 | Massachusetts Development Finance Agency, Revenue Bonds, Boston University, Series 2008U-4, 5.600%, 10/01/35 | No Opt. Call | A2 | 1,034,210 | ||||||||
| 6,000 | Massachusetts Development Finance Agency, Revenue Bonds, Draper Laboratory, Series 2008, 5.875%, 9/01/30 | No Opt. Call | Aa3 | 6,367,859 | ||||||||
| 1,000 | Massachusetts Development Finance Agency, Revenue Bonds, The Sabis International Charter School Issue, Series 2009, 8.000%, 4/15/39 | 10/19 at 100.00 | BBB | 1,069,290 | ||||||||
| Massachusetts Development Finance Agency, Revenue Bonds, Williston Northampton School, Series 2005B: | ||||||||||||
| 100 | 5.000%, 10/01/25 – SYNCORA GTY Insured | 10/15 at 100.00 | Baa1 | 93,086 | ||||||||
| 1,500 | 5.000%, 10/01/37 – SYNCORA GTY Insured | 10/15 at 100.00 | Baa1 | 1,253,190 | ||||||||
| 3,000 | Massachusetts Development Finance Authority, Revenue Bonds, Curry College, Series 1999A, 5.500%, 3/01/29 – ACA Insured | 9/09 at 101.00 | BBB | 2,793,120 | ||||||||
| Massachusetts Development Finance Authority, Revenue Bonds, Hampshire College, Series 2004: | ||||||||||||
| 1,000 | 5.625%, 10/01/24 | 10/14 at 100.00 | BBB | 907,680 | ||||||||
| 1,000 | 5.700%, 10/01/34 | 10/14 at 100.00 | BBB | 839,050 | ||||||||
| 3,075 | Massachusetts Development Finance Authority, Revenue Bonds, Massachusetts College of Pharmacy and Allied Health Sciences, Series 2005D, 5.000%, 7/01/27 – AGC Insured | 7/15 at 100.00 | Aa2 | 3,192,865 | ||||||||
| 750 | Massachusetts Development Finance Authority, Revenue Bonds, Milton Academy, Series 2003A, 5.000%, 9/01/19 | 9/13 at 100.00 | AA– | 795,765 | ||||||||
| 895 | Massachusetts Educational Finance Authority, Educational Loan Revenue Bonds, Series 2002E, 5.000%, 1/01/13 – AMBAC Insured (Alternative Minimum Tax) | 1/12 at 100.00 | AA | 918,118 | ||||||||
| 2,000 | Massachusetts Educational Financing Authority, Educaton Loan Revenue Bonds, Series 2008H, 6.350%, 1/01/30 – AGC Insured (Alternative Minimum Tax) | 1/18 at 100.00 | AAA | 2,049,120 | ||||||||
| 2,000 | Massachusetts Educational Financing Authority, Educaton Loan Revenue Bonds, Series 2009I, 6.000%, 1/01/28 | 1/20 at 100.00 | AA | 2,093,920 | ||||||||
| 3,000 | Massachusetts Health and Educational Facilities Authority, Revenue Bonds, Tufts University, Series 2008O, 5.375%, 8/15/38 | 8/18 at 100.00 | Aa2 | 3,198,510 | ||||||||
| 500 | Massachusetts Health and Educational Facilities Authority, Revenue Bonds, Wellesley College, Series 2003H, 5.000%, 7/01/26 | 7/13 at 100.00 | Aaa | 522,460 | ||||||||
| 2,230 | Massachusetts Health and Educational Facilities Authority, Revenue Bonds, Williams College, Series 2007L, 5.000%, 7/01/31 | 7/16 at 100.00 | AAA | 2,334,899 | ||||||||
| 425 | Puerto Rico Industrial, Tourist, Educational, Medical and Environmental Control Facilities Financing Authority, Higher Education Revenue Bonds, Ana G. Mendez University System, Series 1999, 5.375%, 2/01/19 | 2/10 at 100.50 | BBB– | 380,494 | ||||||||
| 29,475 | Total Education and Civic Organizations | 29,843,636 | ||||||||||
| 10 | Nuveen Investments |
| Principal Amount (000) | Description (1) | Optional Call Provisions (2) | Ratings (3) | Value | ||||||||
Health Care – 23.8% | ||||||||||||
| $ | 2,900 | Massachusetts Development Finance Authority, Revenue Bonds, Northern Berkshire Community Services Inc., Series 1999A, 6.250%, 8/15/29 – ACA Insured | 2/10 at 101.00 | N/R | $ | 2,189,355 | ||||||
| 3,000 | Massachusetts Health and Educational Facilities Authority Revenue Bonds, Boston Medical Center Issue, Series B (2008), 5.250%, 7/01/38 | 7/18 at 100.00 | A– | 2,477,130 | ||||||||
| 1,500 | Massachusetts Health and Educational Facilities Authority Revenue Bonds, Quincy Medical Center Issue, Series A (2008), 6.500%, 1/15/38 | 1/18 at 100.00 | N/R | 1,113,225 | ||||||||
| 2,000 | Massachusetts Health and Educational Facilities Authority, Revenue Bonds, Baystate Medical Center Issue Series 2009I, 5.750%, 7/01/36 | 7/19 at 100.00 | A+ | 2,028,320 | ||||||||
| 1,250 | Massachusetts Health and Educational Facilities Authority, Revenue Bonds, Berkshire Health System, Series 2001E, 6.250%, 10/01/31 | 10/11 at 101.00 | BBB+ | 1,195,238 | ||||||||
| 3,000 | Massachusetts Health and Educational Facilities Authority, Revenue Bonds, Cape Cod Health Care Inc., Series 2001C, 5.250%, 11/15/31 – RAAI Insured | 11/11 at 101.00 | BBB– | 2,367,210 | ||||||||
| 50 | Massachusetts Health and Educational Facilities Authority, Revenue Bonds, Caritas Christi Obligated Group, Series 1999A, 5.750%, 7/01/28 | 1/11 at 100.00 | BBB | 42,927 | ||||||||
| 1,000 | Massachusetts Health and Educational Facilities Authority, Revenue Bonds, Caritas Christi Obligated Group, Series 2002B, 6.250%, 7/01/22 | 7/12 at 101.00 | BBB | 957,000 | ||||||||
| 790 | Massachusetts Health and Educational Facilities Authority, Revenue Bonds, Covenant Health Systems Obligated Group, Series 2002, 6.000%, 7/01/31 | 1/12 at 101.00 | A | 799,820 | ||||||||
| 1,000 | Massachusetts Health and Educational Facilities Authority, Revenue Bonds, Dartmouth-Hitchcock Obligated Group, Series 2002, 5.125%, 8/01/22 – FSA Insured | 8/12 at 100.00 | AAA | 1,018,260 | ||||||||
| 1,350 | Massachusetts Health and Educational Facilities Authority, Revenue Bonds, Emerson Hospital, Series 2005E, 5.000%, 8/15/35 – RAAI Insured | 8/15 at 100.00 | BBB– | 948,348 | ||||||||
| 1,500 | Massachusetts Health and Educational Facilities Authority, Revenue Bonds, Harvard Pilgrim Healthcare, Series 1998A, 4.750%, 7/01/22 – FSA Insured | 1/10 at 100.50 | AAA | 1,470,960 | ||||||||
| 2,000 | Massachusetts Health and Educational Facilities Authority, Revenue Bonds, Lahey Clinic Medical Center, Series 2005C, 5.000%, 8/15/21 – FGIC Insured | 8/15 at 100.00 | A | 1,971,660 | ||||||||
| 2,000 | Massachusetts Health and Educational Facilities Authority, Revenue Bonds, Lahey Medical Center, Series 2007D, 5.250%, 8/15/28 | 8/17 at 100.00 | A | 1,878,820 | ||||||||
| Massachusetts Health and Educational Facilities Authority, Revenue Bonds, Milford Regional Medical Center, Series 2007E: | ||||||||||||
| 2,040 | 5.000%, 7/15/32 | 7/17 at 100.00 | BBB– | 1,573,962 | ||||||||
| 1,000 | 5.000%, 7/15/37 | 7/17 at 100.00 | BBB– | 743,570 | ||||||||
| 1,400 | Massachusetts Health and Educational Facilities Authority, Revenue Bonds, Milton Hospital Project, Series 2005D, 5.250%, 7/01/30 | 7/15 at 100.00 | BB– | 873,362 | ||||||||
| 3,000 | Massachusetts Health and Educational Facilities Authority, Revenue Bonds, Northern Berkshire Community Services Inc., Series 2004A, 6.375%, 7/01/34 | 7/14 at 100.00 | BB | 2,252,280 | ||||||||
| 105 | Massachusetts Health and Educational Facilities Authority, Revenue Bonds, Partners HealthCare System Inc., Series 2001C, 5.750%, 7/01/32 | 7/11 at 101.00 | AA | 107,965 | ||||||||
| 375 | Massachusetts Health and Educational Facilities Authority, Revenue Bonds, UMass Memorial Health Care, Series 2001C, 6.625%, 7/01/32 | 7/11 at 100.00 | BBB+ | 377,423 | ||||||||
| 2,565 | Massachusetts Health and Educational Facilities Authority, Revenue Bonds, UMass Memorial Health Care, Series 2005D, 5.000%, 7/01/33 | 7/15 at 100.00 | BBB+ | 2,167,322 | ||||||||
| 33,825 | Total Health Care | 28,554,157 | ||||||||||
Housing/Multifamily – 6.3% | ||||||||||||
| 1,115 | Framingham Housing Authority, Massachusetts, GNMA Collateralized Mortgage Revenue Refunding Bonds, Beaver Terrace Apartments, Series 2000A, 6.350%, 2/20/32 | 8/10 at 105.00 | Aaa | 1,245,265 | ||||||||
| 2,145 | Massachusetts Development Finance Authority, Multifamily Housing Revenue Bonds, Emerson Manor Project, Series 2007, 4.800%, 7/20/48 | 7/17 at 100.00 | AAA | 1,959,179 | ||||||||
| Nuveen Investments | 11 |
Portfolio of Investments (Unaudited)
Nuveen Massachusetts Municipal Bond Fund (continued)
August 31, 2009
| Principal Amount (000) | Description (1) | Optional Call Provisions (2) | Ratings (3) | Value | ||||||||
Housing/Multifamily (continued) | ||||||||||||
| $ | 2,700 | Massachusetts Development Financing Authority, Assisted Living Revenue Bonds, Prospect House Apartments, Series 1999, 7.000%, 12/01/31 | 12/09 at 102.00 | N/R | $ | 2,391,741 | ||||||
| 530 | Massachusetts Housing Finance Agency, Housing Bonds, Series 2006A, 5.100%, 12/01/37 (Alternative Minimum Tax) | 6/15 at 100.00 | AA– | 485,565 | ||||||||
| 500 | Massachusetts Housing Finance Agency, Housing Revenue Bonds, Series 2003S, 5.050%, 12/01/23 (Alternative Minimum Tax) | 6/13 at 100.00 | AA– | 490,015 | ||||||||
| 950 | Massachusetts Industrial Finance Agency, FHA-Insured Mortgage Loan Bonds, Hudner Associates Projects, Series 1997, 5.650%, 1/01/22 – NPFG Insured | 1/10 at 100.00 | Aaa | 953,867 | ||||||||
| 7,940 | Total Housing/Multifamily | 7,525,632 | ||||||||||
Housing/Single Family – 1.2% | ||||||||||||
| 1,120 | Massachusetts Housing Finance Agency, Single Family Housing Revenue Bonds, Series 2008, Trust 3145, 15.116%, 12/01/33 (IF) | 6/18 at 100.00 | Aa2 | 1,164,430 | ||||||||
| 285 | Puerto Rico Housing Finance Authority, Mortgage-Backed Securities Program Home Mortgage Revenue Bonds, Series 2003A, 4.875%, 6/01/34 (Alternative Minimum Tax) | 6/13 at 100.00 | AAA | 264,312 | ||||||||
| 1,405 | Total Housing/Single Family | 1,428,742 | ||||||||||
Industrials – 0.6% | ||||||||||||
| 450 | Massachusetts Development Finance Agency, Pioneer Valley Resource Recovery Revenue Bonds, Eco/Springfield LLC, Series 2006, 5.875%, 7/01/14 (Alternative Minimum Tax) | No Opt. Call | N/R | 396,383 | ||||||||
| 400 | Massachusetts Development Finance Agency, Solid Waste Disposal Revenue Bonds, Waste Management Inc., Series 2003, 5.450%, 6/01/14 | No Opt. Call | BBB | 394,628 | ||||||||
| 850 | Total Industrials | 791,011 | ||||||||||
Long-Term Care – 7.5% | ||||||||||||
| 1,500 | Massachusetts Development Finance Agency, Human Service Provider Revenue Bonds, Seven Hills Foundation and Affiliates Issue, Series 2005, 5.000%, 9/01/35 – RAAI Insured | 9/15 at 100.00 | BBB– | 1,252,170 | ||||||||
| 4,220 | Massachusetts Development Finance Agency, Revenue Bonds, Orchard Cove, Series 2007, 5.250%, 10/01/26 | 10/12 at 102.00 | N/R | 2,952,776 | ||||||||
| 50 | Massachusetts Development Finance Authority, First Mortgage Revenue Bonds, Berkshire Retirement Community – Edgecombe Project, Series 2001A, 6.750%, 7/01/21 | 7/11 at 102.00 | BBB– | 49,853 | ||||||||
| 1,790 | Massachusetts Development Finance Authority, Revenue Bonds, May Institute, Series 1999, 5.750%, 9/01/24 – RAAI Insured | 9/09 at 102.00 | BBB– | 1,667,439 | ||||||||
| 590 | Massachusetts Health and Educational Facilities Authority, Revenue Bonds, Cable Housing and Health Services, Series 1993A, 5.625%, 7/01/13 – NPFG Insured | 1/10 at 100.00 | Baa1 | 590,460 | ||||||||
| 610 | Massachusetts Industrial Finance Agency, First Mortgage Revenue Bonds, Berkshire Retirement Community, Series 1994B, 4.750%, 7/01/17 | 1/11 at 101.00 | BBB– | 569,356 | ||||||||
| 2,020 | Massachusetts Industrial Finance Agency, GNMA Collateralized Assisted Living Facility Revenue Bonds, Arbors at Taunton LP, Series 1999, 5.500%, 6/20/40 (Alternative Minimum Tax) | 12/09 at 102.00 | AAA | 1,947,300 | ||||||||
| 10,780 | Total Long-Term Care | 9,029,354 | ||||||||||
Tax Obligation/General – 6.1% | ||||||||||||
| 500 | Ashland, Massachusetts, General Obligation Bonds, Series 2004, 5.250%, 5/15/23 – AMBAC Insured | 5/15 at 100.00 | A1 | 533,145 | ||||||||
| 850 | Beverly, Massachusetts, General Obligation Bonds, Series 2003, 5.000%, 11/01/21 – NPFG Insured | 11/13 at 100.00 | A1 | 918,612 | ||||||||
| 1,000 | Erving, Massachusetts, General Obligation Bonds, Series 2002, 5.500%, 6/15/16 | 6/12 at 101.00 | A | 1,060,520 | ||||||||
| 12 | Nuveen Investments |
| Principal Amount (000) | Description (1) | Optional Call Provisions (2) | Ratings (3) | Value | |||||||||
Tax Obligation/General (continued) | |||||||||||||
| $ | 1,000 | Fall River, Massachusetts, General Obligation Bonds, Series 2003, 5.000%, 2/01/21 – FSA Insured | 2/13 at 101.00 | AAA | $ | 1,015,940 | |||||||
| 2,500 | Massachusetts Bay Transportation Authority, General Obligation Transportation System Bonds, Series 1991A, 7.000%, 3/01/21 | No Opt. Call | AAA | 3,069,500 | |||||||||
| 690 | Westfield, Massachusetts, General Obligation Bonds, Series 2004, 5.000%, 8/01/19 – AMBAC Insured | 8/14 at 100.50 | A– | 749,940 | |||||||||
| 6,540 | Total Tax Obligation/General | 7,347,657 | |||||||||||
Tax Obligation/Limited – 5.7% | |||||||||||||
| 680 | Martha’s Vineyard Land Bank, Massachusetts, Revenue Bonds, Series 2002, 5.000%, 5/01/32 – AMBAC Insured | 5/13 at 100.00 | A | 686,297 | |||||||||
| 395 | Martha’s Vineyard Land Bank, Massachusetts, Revenue Bonds, Series 2004, 5.000%, 5/01/26 – AMBAC Insured | 5/14 at 100.00 | A | 406,893 | |||||||||
| 815 | Massachusetts College Building Authority, Project Revenue Bonds, Series 2006A, 5.000%, 5/01/31 – AMBAC Insured | 5/16 at 100.00 | A1 | 810,672 | |||||||||
| Massachusetts College Building Authority, Project Revenue Refunding Bonds, Series 2003B: | |||||||||||||
| 1,025 | 5.375%, 5/01/22 – SYNCORA GTY Insured | No Opt. Call | A1 | 1,126,424 | |||||||||
| 1,125 | 5.375%, 5/01/23 – SYNCORA GTY Insured | No Opt. Call | A1 | 1,231,841 | |||||||||
| 670 | Massachusetts, Special Obligation Dedicated Tax Revenue Bonds, Series 2005, 5.000%, 1/01/20 – FGIC Insured | No Opt. Call | A | 736,343 | |||||||||
| 1,650 | Massachusetts, Special Obligation Refunding Notes, Federal Highway Grant Anticipation Note Program, Series 2003A, 5.000%, 12/15/13 – FSA Insured | No Opt. Call | Aa3 | 1,840,047 | |||||||||
| 6,360 | Total Tax Obligation/Limited | 6,838,517 | |||||||||||
Transportation – 6.2% | |||||||||||||
| 3,835 | Massachusetts Port Authority, Revenue Bonds, Series 2003A, 5.000%, 7/01/24 – NPFG Insured | 7/13 at 100.00 | AA– | 3,913,771 | |||||||||
| 1,800 | Massachusetts Port Authority, Special Facilities Revenue Bonds, BOSFUEL Corporation, Series 2007, 5.000%, 7/01/32 – FGIC Insured (Alternative Minimum Tax) | 7/17 at 100.00 | A | 1,631,538 | |||||||||
| 3,525 | Massachusetts Port Authority, Special Facilities Revenue Bonds, Delta Air Lines Inc., Series 2001A, 5.000%, 1/01/27 – AMBAC Insured (Alternative Minimum Tax) | 1/11 at 101.00 | N/R | 1,893,489 | |||||||||
| 9,160 | Total Transportation | 7,438,798 | |||||||||||
U.S. Guaranteed – 4.3% (4) | |||||||||||||
| 90 | Lawrence, Massachusetts, General Obligation Bonds, Series 2001, 5.000%, 2/01/21 (Pre-refunded 2/01/11) – AMBAC Insured | 2/11 at 100.00 | Aa3 | (4) | 95,425 | ||||||||
| 75 | Massachusetts Bay Transportation Authority, Senior Sales Tax Revenue Bonds, Series 2006, 5.000%, 7/01/26 (Pre-refunded 7/01/18) | 7/18 at 100.00 | Aa2 | (4) | 88,055 | ||||||||
| 50 | Massachusetts Development Finance Authority, Revenue Bonds, Massachusetts College of Pharmacy and Allied Health Sciences, Series 2003C, 6.375%, 7/01/23 (Pre-refunded 7/01/13) | 7/13 at 101.00 | A– | (4) | 59,487 | ||||||||
| 630 | Massachusetts Health and Educational Facilities Authority, FHA-Insured Revenue Bonds, Malden Hospital, Series 1982A, 5.000%, 8/01/16 (Pre-refunded 8/01/10) | 8/10 at 100.00 | AAA | 648,982 | |||||||||
| 210 | Massachusetts Health and Educational Facilities Authority, Revenue Bonds, Covenant Health Systems Obligated Group, Series 2002, 6.000%, 7/01/31 (Pre-refunded 1/01/12) | 1/12 at 101.00 | A | (4) | 235,918 | ||||||||
| 600 | Massachusetts Health and Educational Facilities Authority, Revenue Bonds, New England Medical Center Hospitals, Series 2002H, 5.375%, 5/15/19 (Pre-refunded 5/15/12) – FGIC Insured | 5/12 at 100.00 | N/R | (4) | 662,670 | ||||||||
| Nuveen Investments | 13 |
Portfolio of Investments (Unaudited)
Nuveen Massachusetts Municipal Bond Fund (continued)
August 31, 2009
| Principal Amount (000) | Description (1) | Optional Call Provisions (2) | Ratings (3) | Value | |||||||||
U.S. Guaranteed (continued) | |||||||||||||
| $ | 2,830 | Massachusetts Health and Educational Facilities Authority, Revenue Bonds, Winchester Hospital, Series 2000E, 6.750%, 7/01/30 (Pre-refunded 7/01/10) | 7/10 at 101.00 | N/R | (4) | $ | 3,002,715 | ||||||
| 330 | Massachusetts Port Authority, Revenue Bonds, Series 1982, 13.000%, 7/01/13 (ETM) | 1/10 at 100.00 | AAA | 417,638 | |||||||||
| 4,815 | Total U.S. Guaranteed | 5,210,890 | |||||||||||
Utilities – 4.9% | |||||||||||||
| 1,000 | Massachusetts Development Finance Agency, Resource Recovery Revenue Bonds, SEMass System, Series 2001A, 5.625%, 1/01/16 – NPFG Insured | 1/12 at 101.00 | A | 1,005,790 | |||||||||
| 500 | Massachusetts Development Finance Agency, Solid Waste Disposal Revenue Bonds, Dominion Energy Brayton Point Project, Refunding Series 2009, 5.750%, 12/01/42 (Mandatory put 5/01/19) | No Opt. Call | A– | 519,760 | |||||||||
| 1,000 | Massachusetts Industrial Finance Agency, Resource Recovery Revenue Refunding Bonds, Ogden Haverhill Project, Series 1998A, 5.600%, 12/01/19 (Alternative Minimum Tax) | 12/09 at 101.00 | BBB | 864,680 | |||||||||
| 2,500 | Puerto Rico Electric Power Authority, Power Revenue Bonds, Series 2004PP, 5.000%, 7/01/22 – FGIC Insured | 7/14 at 100.00 | A | 2,511,000 | |||||||||
| 1,000 | Virgin Islands Water and Power Authority, Electric System Revenue Refunding Bonds, Series 1998, 5.300%, 7/01/18 | 1/01/10 at 100.50 | N/R | 933,910 | |||||||||
| 6,000 | Total Utilities | 5,835,140 | |||||||||||
Water and Sewer – 3.6% | |||||||||||||
| 60 | Massachusetts Water Pollution Abatement Trust, Pooled Loan Program Bonds, Series 2003-9, 5.000%, 8/01/22 | 8/13 at 100.00 | AAA | 63,502 | |||||||||
| 380 | Massachusetts Water Pollution Abatement Trust, Pooled Loan Program Bonds, Series 2004-10, 5.000%, 8/01/26 | 8/14 at 100.00 | AAA | 401,485 | |||||||||
| 2,080 | Massachusetts Water Resources Authority, General Revenue Bonds, Series 2005A, 5.000%, 8/01/29 – NPFG Insured | 8/17 at 100.00 | AA+ | 2,173,912 | |||||||||
| 1,125 | Massachusetts Water Resources Authority, General Revenue Bonds, Series 2006A, 4.000%, 8/01/46 | 8/16 at 100.00 | AA+ | 922,039 | |||||||||
| 760 | Puerto Rico Aqueduct and Sewerage Authority, Revenue Bonds, Senior Lien Series 2008A, 6.000%, 7/01/38 | 7/18 at 100.00 | BBB– | 765,624 | |||||||||
| 4,405 | Total Water and Sewer | 4,326,562 | |||||||||||
| $ | 124,770 | Total Investments (cost $122,000,991) – 97.4% | 116,912,118 | ||||||||||
Other Assets Less Liabilities – 2.6% | 3,075,797 | ||||||||||||
Net Assets – 100% | $ | 119,987,915 | |||||||||||
| (1) | All percentages shown in the Portfolio of Investments are based on net assets. |
| (2) | Optional Call Provisions: Dates (month and year) and prices of the earliest optional call or redemption. There may be other call provisions at varying prices at later dates. Certain mortgage-backed securities may be subject to periodic principal paydowns. |
| (3) | Ratings: Using the higher of Standard & Poor’s Group (“Standard & Poor’s”) or Moody’s Investor Service, Inc. (“Moody’s”) rating. Ratings below BBB by Standard & Poor’s or Baa by Moody’s are considered to be below investment grade. |
| (4) | Backed by an escrow or trust containing sufficient U.S. Government or U.S. Government agency securities which ensure the timely payment of principal and interest. Such investments are normally considered to be equivalent to AAA rated securities. |
| N/R | Not rated. |
| (ETM) | Escrowed to maturity. |
| (IF) | Inverse floating rate investment. |
See accompanying notes to financial statements.
| 14 | Nuveen Investments |
Portfolio of Investments (Unaudited)
Nuveen Massachusetts Insured Municipal Bond Fund
August 31, 2009
| Principal Amount (000) | Description (1) | Optional Call Provisions (2) | Ratings (3) | Value | ||||||||
Education and Civic Organizations – 8.6% | ||||||||||||
| $ | 865 | Massachusetts Development Finance Agency, Revenue Bonds, Boston University, Series 2005T-1, 5.000%, 10/01/39 – AMBAC Insured | 10/15 at 100.00 | A2 | $ | 820,548 | ||||||
| 1,500 | Massachusetts Development Finance Agency, Revenue Bonds, Williston Northampton School, Series 2005B, 5.000%, 10/01/37 – SYNCORA GTY Insured | 10/15 at 100.00 | Baa1 | 1,253,190 | ||||||||
| 895 | Massachusetts Development Finance Agency, Revenue Bonds, Worcester Polytechnic Institute, Series 2007, 5.000%, 9/01/37 – NPFG Insured | 9/17 at 100.00 | A+ | 875,212 | ||||||||
| 1,790 | Massachusetts Educational Finance Authority, Educational Loan Revenue Bonds, Series 2002E, 5.000%, 1/01/13 – AMBAC Insured | 1/12 at 100.00 | AA | 1,836,236 | ||||||||
| 1,000 | Massachusetts Educational Financing Authority, Educaton Loan Revenue Bonds, Series 2008H, 6.350%, 1/01/30 – AGC Insured | 1/18 at 100.00 | AAA | 1,024,560 | ||||||||
| 1,000 | Massachusetts Health and Educational Facilities Authority Revenue Bonds Lesley University Issue, Series A (2009), 5.000%, 7/01/29 – AGC Insured | No Opt. Call | AAA | 1,028,900 | ||||||||
| 1,000 | Massachusetts Health and Educational Facilities Authority, Revenue Bonds, University of Massachusetts, Series 2005D, 5.250%, 10/01/24 – FGIC Insured | 10/14 at 100.00 | A+ | 1,034,160 | ||||||||
| 8,050 | Total Education and Civic Organizations | 7,872,806 | ||||||||||
Health Care – 11.4% | ||||||||||||
| 2,000 | Boston, Massachusetts, Special Obligation Bonds, Boston Medical Center, Series 2002, 5.000%, 8/01/18 – NPFG Insured | 8/12 at 100.00 | AA+ | 2,066,160 | ||||||||
| 250 | Massachusetts Health and Educational Facilities Authority, Revenue Bonds, Capital Asset Program, Series 1998B-1, 5.375%, 2/01/28 – MBIA Insured | 8/18 at 100.00 | A | 236,168 | ||||||||
| 500 | Massachusetts Health and Educational Facilities Authority, Revenue Bonds, Capital Asset Program, Series 1998B-2, 5.000%, 2/01/25 – MBIA Insured | 8/18 at 100.00 | A | 462,935 | ||||||||
| 1,000 | Massachusetts Health and Educational Facilities Authority, Revenue Bonds, CareGroup Inc., Auction Rate Series 2004D, 5.250%, 7/01/24 – NPFG Insured | 7/18 at 100.00 | A | 952,380 | ||||||||
| 1,100 | Massachusetts Health and Educational Facilities Authority, Revenue Bonds, CareGroup Inc., Series 1998A, 5.000%, 7/01/25 – MBIA Insured | 1/10 at 101.00 | A | 991,606 | ||||||||
| 1,000 | Massachusetts Health and Educational Facilities Authority, Revenue Bonds, Dartmouth-Hitchcock Obligated Group, Series 2002, 5.125%, 8/01/22 – FSA Insured | 8/12 at 100.00 | AAA | 1,018,260 | ||||||||
| 1,400 | Massachusetts Health and Educational Facilities Authority, Revenue Bonds, Lahey Clinic Medical Center, Series 2005C, 5.000%, 8/15/21 – FGIC Insured | 8/15 at 100.00 | A | 1,380,162 | ||||||||
| 1,500 | Massachusetts Health and Educational Facilities Authority, Revenue Bonds, UMass Memorial Health Care, Series 2005D, 5.000%, 7/01/33 | 7/15 at 100.00 | BBB+ | 1,267,440 | ||||||||
| 2,060 | Puerto Rico Industrial, Tourist, Educational, Medical and Environmental Control Facilities Financing Authority, Hospital Revenue Bonds, Auxilio Mutuo Hospital, Series 1995A, 6.250%, 7/01/16 – NPFG Insured | 1/10 at 100.00 | A | 2,062,760 | ||||||||
| 10,810 | Total Health Care | 10,437,871 | ||||||||||
Housing/Multifamily – 4.9% | ||||||||||||
| 1,115 | Massachusetts Development Finance Authority, Multifamily Housing Revenue Bonds, Emerson Manor Project, Series 2007, 4.800%, 7/20/48 | 7/17 at 100.00 | AAA | 1,018,408 | ||||||||
| 190 | Massachusetts Housing Finance Agency, Housing Development Revenue Bonds, Series 1998A, 5.375%, 6/01/16 – NPFG Insured (Alternative Minimum Tax) | 12/09 at 100.50 | A | 188,965 | ||||||||
| 610 | Massachusetts Industrial Finance Agency, FHA-Insured Mortgage Loan Bonds, Hudner Associates Projects, Series 1997, 5.650%, 1/01/22 – NPFG Insured | 1/10 at 100.00 | Aaa | 612,483 | ||||||||
| 2,575 | Somerville Housing Authority, Massachusetts, GNMA Collateralized Mortgage Revenue Bonds, Clarendon Hill Towers, Series 2002, 5.200%, 11/20/22 | 5/12 at 103.00 | AAA | 2,673,494 | ||||||||
| 4,490 | Total Housing/Multifamily | 4,493,350 | ||||||||||
| Nuveen Investments | 15 |
Portfolio of Investments (Unaudited)
Nuveen Massachusetts Insured Municipal Bond Fund (continued)
August 31, 2009
| Principal Amount (000) | Description (1) | Optional Call Provisions (2) | Ratings (3) | Value | ||||||||
Long-Term Care – 6.3% | ||||||||||||
| $ | 2,500 | Massachusetts Development Finance Authority, GNMA Collateralized Assisted Living Facility Revenue Bonds, Arbors at Chicopee, Series 2001A, 6.250%, 9/20/42 (Alternative Minimum Tax) | 3/12 at 105.00 | AAA | $ | 2,547,900 | ||||||
| 3,185 | Massachusetts Industrial Finance Agency, GNMA Collateralized Assisted Living Facility Revenue Bonds, Arbors at Amherst LP, Series 1997, 5.950%, 6/20/39 (Alternative Minimum Tax) | 12/09 at 100.00 | AA+ | 3,186,370 | ||||||||
| 5,685 | Total Long-Term Care | 5,734,270 | ||||||||||
Tax Obligation/General – 23.0% | ||||||||||||
| 1,520 | Fall River, Massachusetts, General Obligation Bonds, Series 2003, 5.250%, 2/01/17 – FSA Insured | 2/13 at 101.00 | AAA | 1,676,378 | ||||||||
| 1,265 | Freetown Lakeville Regional School District, Plymouth County, Massachusetts, General Obligation Bonds, Series 2003, 5.000%, 1/01/15 – NPFG Insured | 1/13 at 101.00 | A+ | 1,364,884 | ||||||||
| 3,000 | Massachusetts, General Obligation Bonds, Consolidated Loan, Series 2001D, 6.000%, 11/01/13 – NPFG Insured | No Opt. Call | AA | 3,516,180 | ||||||||
| 1,025 | Monson, Massachusetts, Unlimited Tax General Obligation School Refunding Bonds, Series 1993, 5.500%, 10/15/10 – NPFG Insured | No Opt. Call | A | 1,076,568 | ||||||||
| 1,250 | Northampton, Massachusetts, General Obligation Bonds, Series 2002, 5.000%, 9/01/19 – NPFG Insured | 9/12 at 101.00 | A1 | 1,352,250 | ||||||||
| 190 | Northfield, Massachusetts, General Obligation Bonds, Series 1992, 6.350%, 10/15/09 – NPFG Insured | No Opt. Call | A | 191,303 | ||||||||
| 1,350 | Norwell, Massachusetts, General Obligation Bonds, Series 2005, 5.000%, 2/15/25 – AMBAC Insured | No Opt. Call | AAA | 1,451,102 | ||||||||
| 1,230 | Pioneer Valley Regional School District, Massachusetts, General Obligation Bonds, Series 2002, 5.375%, 6/15/19 – AMBAC Insured | 6/12 at 101.00 | Aa3 | 1,291,808 | ||||||||
Puerto Rico, General Obligation and Public Improvement Bonds, Series 2001A: | ||||||||||||
| 275 | 5.500%, 7/01/16 – FSA Insured | No Opt. Call | AAA | 303,061 | ||||||||
| 1,490 | 5.500%, 7/01/17 – FSA Insured | No Opt. Call | AAA | 1,633,174 | ||||||||
| 980 | 5.500%, 7/01/19 – FSA Insured | No Opt. Call | AAA | 1,062,790 | ||||||||
| 4,300 | 5.500%, 7/01/29 – FGIC Insured | No Opt. Call | Baa3 | 4,109,764 | ||||||||
| 1,000 | Tantasqua Regional School District, Massachusetts, General Obligation Bonds, Series 2005, 5.000%, 10/01/16 – FSA Insured | 10/15 at 100.00 | Aa3 | 1,139,950 | ||||||||
| 220 | Taunton, Massachusetts, General Obligation Bonds, Series 1991, 6.800%, 9/01/09 – NPFG Insured | No Opt. Call | A | 220,000 | ||||||||
| 545 | Worcester, Massachusetts, General Obligation Bonds, Series 2001A, 5.500%, 8/15/18 – FGIC Insured | 8/11 at 100.00 | A | 566,070 | ||||||||
| 19,640 | Total Tax Obligation/General | 20,955,282 | ||||||||||
Tax Obligation/Limited – 11.7% | ||||||||||||
| 560 | Massachusetts College Building Authority, Project Revenue Bonds, Series 2006A, 5.000%, 5/01/31 – AMBAC Insured | 5/16 at 100.00 | A1 | 557,026 | ||||||||
| 2,500 | Massachusetts College Building Authority, Project Revenue Bonds, Series 2008A, 5.000%, 5/01/33 – AGC Insured | 5/18 at 100.00 | AAA | 2,559,875 | ||||||||
| 1,000 | Massachusetts College Building Authority, Project Revenue Refunding Bonds, Series 2003B, 5.375%, 5/01/22 – SYNCORA GTY Insured | No Opt. Call | A1 | 1,098,950 | ||||||||
| 3,200 | Massachusetts School Building Authority, Dedicated Sales Tax Revenue Bonds, Series 2005A, 5.000%, 8/15/20 – FSA Insured | 8/15 at 100.00 | AAA | 3,571,392 | ||||||||
| 460 | Massachusetts, Special Obligation Dedicated Tax Revenue Bonds, Series 2005, 5.000%, 1/01/20 – FGIC Insured | No Opt. Call | A | 505,549 | ||||||||
| 475 | Puerto Rico Convention Center District Authority, Hotel Occupancy Tax Revenue Bonds, Series 2006A, 4.500%, 7/01/36 – CIFG Insured | 7/16 at 100.00 | BBB+ | 382,133 | ||||||||
| 2,000 | Puerto Rico Highway and Transportation Authority, Highway Revenue Bonds, Series 2004J, 5.000%, 7/01/18 – NPFG Insured | 7/14 at 100.00 | A | 1,999,160 | ||||||||
| 10,195 | Total Tax Obligation/Limited | 10,674,085 | ||||||||||
| 16 | Nuveen Investments |
| Principal Amount (000) | Description (1) | Optional Call Provisions (2) | Ratings (3) | Value | |||||||||
Transportation – 6.4% | |||||||||||||
| $ | 1,000 | Massachusetts Port Authority, Revenue Bonds, Series 2003C, 5.000%, 7/01/18 – NPFG Insured | 7/13 at 100.00 | AA– | $ | 1,083,000 | |||||||
| 800 | Massachusetts Port Authority, Special Facilities Revenue Bonds, BOSFUEL Corporation, Series 2007, 5.000%, 7/01/32 – FGIC Insured | 7/17 at 100.00 | A | 725,128 | |||||||||
| 530 | Massachusetts Port Authority, Special Facilities Revenue Bonds, Delta Air Lines Inc., Series 2001A, 5.000%, 1/01/27 – AMBAC Insured | 1/11 at 101.00 | N/R | 284,695 | |||||||||
| 2,000 | Massachusetts Turnpike Authority, Metropolitan Highway System Revenue Bonds, Senior Series 1997A, 5.000%, 1/01/37 – NPFG Insured | 1/10 at 100.00 | A | 1,883,520 | |||||||||
| 2,000 | Massachusetts Turnpike Authority, Metropolitan Highway System Revenue Bonds, Subordinate Series 1999A, 5.000%, 1/01/39 – AMBAC Insured | 1/10 at 100.00 | AA | 1,905,340 | |||||||||
| 6,330 | Total Transportation | 5,881,683 | |||||||||||
U.S. Guaranteed – 5.8% (4) | |||||||||||||
| 455 | Lawrence, Massachusetts, General Obligation Bonds, Series 2001, 5.000%, 2/01/21 (Pre-refunded 2/01/11) – AMBAC Insured | 2/11 at 100.00 | Aa3 | (4) | 482,427 | ||||||||
| 295 | Massachusetts Health and Educational Facilities Authority, Revenue Bonds, CareGroup Inc., Series 1998A, 5.000%, 7/01/25 (Pre-refunded 7/01/21) – MBIA Insured | 7/21 at 100.00 | AAA | 330,565 | |||||||||
| 600 | Massachusetts Health and Educational Facilities Authority, Revenue Bonds, New England Medical Center Hospitals, Series 2002H, 5.375%, 5/15/19 (Pre-refunded 5/15/12) – FGIC Insured | 5/12 at 100.00 | N/R | (4) | 662,670 | ||||||||
| 435 | Massachusetts Municipal Wholesale Electric Company, Power Supply System Revenue Bonds, Nuclear Project 6, Series 1993A, 5.000%, 7/01/10 – AMBAC Insured (ETM) | 1/10 at 100.00 | Aaa | 445,684 | |||||||||
| 1,000 | Massachusetts, General Obligation Bonds, Consolidated Loan, Series 2002B, 5.500%, 3/01/17 (Pre-refunded 3/01/12) – FSA Insured | 3/12 at 100.00 | AAA | 1,100,250 | |||||||||
| 2,000 | Massachusetts, Special Obligation Dedicated Tax Revenue Bonds, Series 2004, 5.250%, 1/01/21 (Pre-refunded 1/01/14) – FGIC Insured | 1/14 at 100.00 | A | (4) | 2,254,720 | ||||||||
| 4,785 | Total U.S. Guaranteed | 5,276,316 | |||||||||||
Utilities – 1.7% | |||||||||||||
| 1,500 | Massachusetts Development Finance Agency, Resource Recovery Revenue Bonds, SEMass System, Series 2001A, 5.625%, 1/01/16 – NPFG Insured | 1/12 at 101.00 | A | 1,508,685 | |||||||||
Water and Sewer – 10.5% | |||||||||||||
| 1,000 | Massachusetts Water Resources Authority, General Revenue Bonds, Series 2002J, 5.250%, 8/01/19 – FSA Insured | No Opt. Call | AAA | 1,176,900 | |||||||||
| Massachusetts Water Resources Authority, General Revenue Bonds, Series 2005A: | |||||||||||||
| 1,650 | 5.000%, 8/01/27 – NPFG Insured | 8/17 at 100.00 | AA+ | 1,752,911 | |||||||||
| 750 | 5.000%, 8/01/28 – NPFG Insured | 8/17 at 100.00 | AA+ | 791,063 | |||||||||
| 2,500 | Massachusetts Water Resources Authority, General Revenue Bonds, Series 2005B, 5.000%, 8/01/35 – NPFG Insured | 8/17 at 100.00 | AA+ | 2,572,325 | |||||||||
| Massachusetts Water Resources Authority, General Revenue Bonds, Series 2006A: | |||||||||||||
| 1,500 | 5.000%, 8/01/31 – AMBAC Insured | 8/16 at 100.00 | AA+ | 1,547,700 | |||||||||
| 875 | 4.000%, 8/01/46 | 8/16 at 100.00 | AA+ | 717,141 | |||||||||
| 1,000 | Springfield Water and Sewerage Commission, Massachusetts, General Revenue Bonds, Series 2003A, 5.000%, 7/01/23 – NPFG Insured | 7/14 at 100.00 | A+ | 1,031,960 | |||||||||
| 9,275 | Total Water and Sewer | 9,590,000 | |||||||||||
| $ | 80,760 | Total Investments (cost $82,019,402) – 90.3% | 82,424,348 | ||||||||||
Other Assets Less Liabilities – 9.7% | 8,811,438 | ||||||||||||
Net Assets – 100% | $ | 91,235,786 | |||||||||||
| Nuveen Investments | 17 |
Portfolio of Investments (Unaudited)
Nuveen Massachusetts Insured Municipal Bond Fund (continued)
August 31, 2009
| At least 80% of the Fund’s net assets are invested in municipal securities that guarantee the timely payment of principal and interest. See Notes to Financial Statements, Footnote 1 – Insurance, for more information. |
| (1) | All percentages shown in the Portfolio of Investments are based on net assets. |
| (2) | Optional Call Provisions: Dates (month and year) and prices of the earliest optional call or redemption. There may be other call provisions at varying prices at later dates. Certain mortgage-backed securities may be subject to periodic principal paydowns. |
| (3) | Ratings: Using the higher of Standard & Poor’s Group (“Standard & Poor’s”) or Moody’s Investor Service, Inc. (“Moody’s”) rating. Ratings below BBB by Standard & Poor’s or Baa by Moody’s are considered to be below investment grade. |
| The Portfolio of Investments may reflect the ratings on certain bonds whose insurer has experienced downgrades as of the end of the reporting period. Please see the Portfolio Manager’s Comments for an expanded discussion of the affect on the Fund of changes to the ratings of certain bonds in the portfolio resulting from changes to the ratings of the underlying insurers both during the period and after period end. |
| (4) | Backed by an escrow or trust containing sufficient U.S. Government or U.S. Government agency securities which ensure the timely payment of principal and interest. Such investments are normally considered to be equivalent to AAA rated securities. |
| N/R | Not rated. |
| (ETM) | Escrowed to maturity. |
See accompanying notes to financial statements.
| 18 | Nuveen Investments |
Statement of Assets and Liabilities (Unaudited)
August 31, 2009
| Massachusetts | Massachusetts Insured | ||||||
Assets | |||||||
Investments, at value (cost $122,000,991 and $82,019,402, respectively) | $ | 116,912,118 | $ | 82,424,348 | |||
Cash | 1,394,133 | 7,827,409 | |||||
Receivables: | |||||||
Interest | 1,629,831 | 874,508 | |||||
Investments sold | 20,000 | — | |||||
Shares sold | 449,858 | 383,772 | |||||
Other assets | 50 | 29 | |||||
Total assets | 120,405,990 | 91,510,066 | |||||
Liabilities | |||||||
Payables: | |||||||
Dividends | 209,935 | 93,584 | |||||
Shares redeemed | 62,694 | 76,957 | |||||
Accrued expenses: | |||||||
Management fees | 62,094 | 43,281 | |||||
12b-1 distribution and service fees | 18,535 | 16,924 | |||||
Other | 64,817 | 43,534 | |||||
Total liabilities | 418,075 | 274,280 | |||||
Net assets | $ | 119,987,915 | $ | 91,235,786 | |||
Class A Shares | |||||||
Net assets | $ | 55,222,391 | $ | 35,520,936 | |||
Shares outstanding | 5,896,654 | 3,530,979 | |||||
Net asset value per share | $ | 9.37 | $ | 10.06 | |||
Offering price per share (net asset value per share plus | $ | 9.78 | $ | 10.50 | |||
Class B Shares | |||||||
Net assets | $ | 2,585,731 | $ | 3,863,308 | |||
Shares outstanding | 275,647 | 383,454 | |||||
Net asset value and offering price per share | $ | 9.38 | $ | 10.08 | |||
Class C Shares | |||||||
Net assets | $ | 11,591,177 | $ | 12,852,983 | |||
Shares outstanding | 1,247,360 | 1,277,048 | |||||
Net asset value and offering price per share | $ | 9.29 | $ | 10.06 | |||
Class I Shares | |||||||
Net assets | $ | 50,588,616 | $ | 38,998,559 | |||
Shares outstanding | 5,410,899 | 3,859,408 | |||||
Net asset value and offering price per share | $ | 9.35 | $ | 10.10 | |||
Net Assets Consist of: | |||||||
Capital paid-in | $ | 125,063,204 | $ | 89,892,564 | |||
Undistributed (Over-distribution of) net investment income | 446,808 | 130,650 | |||||
Accumulated net realized gain (loss) from investments and derivative transactions | (433,224 | ) | 807,626 | ||||
Net unrealized appreciation (depreciation) of investments | (5,088,873 | ) | 404,946 | ||||
Net assets | $ | 119,987,915 | $ | 91,235,786 | |||
See accompanying notes to financial statements.
| Nuveen Investments | 19 |
Statement of Operations (Unaudited)
Six Months Ended August 31, 2009
| Massachusetts | Massachusetts Insured | |||||||
Investment Income | $ | 3,334,886 | $ | 1,946,246 | ||||
Expenses | ||||||||
Management fees | 314,822 | 225,416 | ||||||
12b-1 service fees – Class A | 52,143 | 28,015 | ||||||
12b-1 distribution and service fees – Class B | 12,459 | 18,620 | ||||||
12b-1 distribution and service fees – Class C | 42,100 | 43,684 | ||||||
Shareholders’ servicing agent fees and expenses | 38,862 | 23,837 | ||||||
Custodian’s fees and expenses | 16,271 | 9,949 | ||||||
Trustees’ fees and expenses | 1,748 | 1,269 | ||||||
Professional fees | 6,604 | 5,643 | ||||||
Shareholders’ reports – printing and mailing expenses | 18,259 | 12,591 | ||||||
Federal and state registration fees | 9,527 | 6,411 | ||||||
Other expenses | 1,539 | 1,247 | ||||||
Total expenses before custodian fee credit | 514,334 | 376,682 | ||||||
Custodian fee credit | (155 | ) | (80 | ) | ||||
Net expenses | 514,179 | 376,602 | ||||||
Net investment income | 2,820,707 | 1,569,644 | ||||||
Realized and Unrealized Gain (Loss) | ||||||||
Net realized gain (loss) from investments | 95,681 | 1,022 | ||||||
Change in net unrealized appreciation (depreciation) of investments | 6,911,335 | 3,652,992 | ||||||
Net realized and unrealized gain (loss) | 7,007,016 | 3,654,014 | ||||||
Net increase (decrease) in net assets from operations | $ | 9,827,723 | $ | 5,223,658 | ||||
See accompanying notes to financial statements.
| 20 | Nuveen Investments |
Statement of Changes in Net Assets (Unaudited)
| Massachusetts | Massachusetts Insured | |||||||||||||||
| Six Months Ended 8/31/09 | Year Ended 2/28/09 | Six Months Ended 8/31/09 | Year Ended 2/28/09 | |||||||||||||
Operations | ||||||||||||||||
Net investment income | $ | 2,820,707 | $ | 5,373,099 | $ | 1,569,644 | $ | 3,248,520 | ||||||||
Net realized gain (loss) from: | ||||||||||||||||
Investments | 95,681 | (529,716 | ) | 1,022 | 417,486 | |||||||||||
Forward swaps | — | — | — | 516,000 | ||||||||||||
Change in net unrealized appreciation (depreciation) of: | ||||||||||||||||
Investments | 6,911,335 | (6,363,769 | ) | 3,652,992 | (2,066,708 | ) | ||||||||||
Forward swaps | — | — | — | (44,837 | ) | |||||||||||
Net increase (decrease) in net assets from operations | 9,827,723 | (1,520,386 | ) | 5,223,658 | 2,070,461 | |||||||||||
Distributions to Shareholders | ||||||||||||||||
From net investment income: | ||||||||||||||||
Class A | (1,265,390 | ) | (2,322,360 | ) | (564,349 | ) | (990,611 | ) | ||||||||
Class B (1) | (53,318 | ) | (108,250 | ) | (63,956 | ) | (146,247 | ) | ||||||||
Class C | (239,474 | ) | (443,847 | ) | (203,018 | ) | (379,580 | ) | ||||||||
Class I (2) | (1,230,426 | ) | (2,248,142 | ) | (805,268 | ) | (1,666,803 | ) | ||||||||
From accumulated net realized gains: | ||||||||||||||||
Class A | — | (319,743 | ) | — | (131,304 | ) | ||||||||||
Class B (1) | — | (13,600 | ) | — | (21,349 | ) | ||||||||||
Class C | — | (54,065 | ) | — | (56,122 | ) | ||||||||||
Class I (2) | — | (222,151 | ) | — | (203,526 | ) | ||||||||||
Decrease in net assets from distributions to shareholders | (2,788,608 | ) | (5,732,158 | ) | (1,636,591 | ) | (3,595,542 | ) | ||||||||
Fund Share Transactions | ||||||||||||||||
Proceeds from sale of shares | 12,356,474 | 69,953,918 | 11,060,645 | 9,481,837 | ||||||||||||
Proceeds from shares issued to shareholders due to reinvestment of distributions | 1,503,225 | 3,054,159 | 1,074,683 | 2,464,579 | ||||||||||||
| 13,859,699 | 73,008,077 | 12,135,328 | 11,946,416 | |||||||||||||
Cost of shares redeemed | (7,266,458 | ) | (94,708,494 | ) | (3,361,278 | ) | (10,258,196 | ) | ||||||||
Net increase (decrease) in net assets from Fund share transactions | 6,593,241 | (21,700,417 | ) | 8,774,050 | 1,688,220 | |||||||||||
Net increase (decrease) in net assets | 13,632,356 | (28,952,961 | ) | 12,361,117 | 163,139 | |||||||||||
Net assets at the beginning of period | 106,355,559 | 135,308,520 | 78,874,669 | 78,711,530 | ||||||||||||
Net assets at the end of period | $ | 119,987,915 | $ | 106,355,559 | $ | 91,235,786 | $ | 78,874,669 | ||||||||
Undistributed (Over-distribution of) net investment income at the end of period | $ | 446,808 | $ | 414,709 | $ | 130,650 | $ | 197,597 | ||||||||
(1) Effective May 1, 2008, Class B Shares will only be issued upon exchange of Class B Shares from another Nuveen fund or for purposes of dividend reinvestment. The reinstatement privilege for Class B Shares is no longer available as of December 31, 2008.
(2) Effective May 1, 2008, Class R Shares were renamed Class I Shares.
See accompanying notes to financial statements.
| Nuveen Investments | 21 |
Notes to Financial Statements (Unaudited)
1. General Information and Significant Accounting Policies
The Nuveen Multistate Trust II (the “Trust”) is an open-end management investment company registered under the Investment Company Act of 1940, as amended. The Trust is comprised of Nuveen Massachusetts Municipal Bond Fund (“Massachusetts”) and Nuveen Massachusetts Insured Municipal Bond Fund (“Massachusetts Insured”) (collectively, the “Funds”), among others. The Trust was organized as a Massachusetts business trust on July 1, 1996. The Funds were each organized as a series of predecessor trusts or corporations prior to that date.
Massachusetts’ investment objective is to provide as high a level of current interest income exempt from regular federal, state and, in some cases, local income taxes as is consistent with preservation of capital. The Fund invests substantially all of its assets in municipal bonds that pay interest that is exempt from regular federal and Massachusetts personal income tax. The Fund invests at least 80% of its net assets in investment grade municipal bonds rated BBB-/Baa3 or higher at the time of purchase. The Fund may invest up to 20% of its net assets in below investment grade municipal bonds, commonly referred to as “high yield”, “high risk” or “junk” bonds. The Fund may invest up to 15% of its net assets in municipal securities whose interest payments vary inversely with changes in short-term tax-exempt interest rates (i.e., inverse floating rate securities). Nuveen Asset Management (the “Adviser”) a wholly owned subsidiary of Nuveen Investment, Inc. (“Nuveen”) uses a value-oriented strategy and looks for higher-yielding and undervalued municipal bonds that offer the potential for above-average total return. The Adviser may choose to sell municipal bonds with deteriorating credit or limited upside potential compared to other available bonds.
Massachusetts Insured’s investment objective is to provide as high a level of current interest income exempt from regular federal, state and, in some cases, local income taxes as is consistent with preservation of capital. The Fund invests substantially all of its assets in municipal bonds that pay interest that is exempt from regular federal and Massachusetts personal income tax. Under normal circumstances, the Fund invests at least 80% of its net assets in municipal securities that are covered by insurance guaranteeing the timely payment of principal and interest. In addition, the Fund invests at least 80% of its net assets in municipal securities that are rated at least AA at the time of purchase (based on the higher of the rating of the insurer, if any, or the underlying security), or municipal bonds backed by an escrow or trust account containing sufficient U.S. government or U.S. government agency securities or U.S. Treasury-issued State and Local Government Series (SLGS) securities to ensure timely payment of principal and interest. The Fund may invest up to 15% of its net assets in municipal securities whose interest payments vary inversely with changes in short-term tax-exempt interest rates (i.e., inverse floating rate securities). The Adviser uses a value-oriented strategy and looks for higher-yielding and undervalued insured municipal bonds that offer the potential for above-average total return. The Adviser may choose to sell municipal bonds with deteriorating credit or limited upside potential compared to other available bonds.
The following is a summary of significant accounting policies followed by the Funds in the preparation of their financial statements in accordance with accounting principles generally accepted in the United States.
Investment Valuation
The prices of municipal bonds in each Fund’s investment portfolio are provided by a pricing service approved by the Fund’s Board of Trustees. Prices of forward swap contracts are also provided by an independent pricing service approved by each Fund’s Board of Trustees. When market price quotes are not readily available (which is usually the case for municipal securities), the pricing service or in the absence of a pricing service for a particular investment or derivative instrument, the Board of Trustees of the Fund, or its designee, may establish fair value using a wide variety of market data including yields or prices of investments of comparable quality, type of issue, coupon, maturity and rating, market quotes or indications of value from securities dealers, evaluations of anticipated cash flows or collateral, general market conditions and other information and analysis, including the obligor’s credit characteristics considered relevant. Temporary investments in securities that have variable rate and demand features qualifying them as short-term investments are valued at amortized cost, which approximates value.
Investment Transactions
Investment transactions are recorded on a trade date basis. Realized gains and losses from investment transactions are determined on the specific identification method. Investments purchased on a when-issued/delayed delivery basis may have extended settlement periods. Any investments so purchased are subject to market fluctuation during this period. The Funds have instructed the custodian to segregate assets with a current value at least equal to the amount of the when-issued/delayed delivery purchase commitments. At August 31, 2009, the Funds had no such outstanding purchase commitments.
Investment Income
Interest income, which includes the amortization of premiums and accretion of discounts for financial reporting purposes, is recorded on an accrual basis. Investment income also includes paydown gains and losses, if any.
Income Taxes
Each Fund is a separate taxpayer for federal income tax purposes. Each Fund intends to distribute substantially all of its net investment income and net capital gains to shareholders and to otherwise comply with the requirements of Subchapter M of the Internal Revenue Code applicable to regulated investment companies. Therefore, no federal income tax provision is required. Furthermore, each Fund intends to satisfy conditions which will enable interest from municipal securities, which is exempt from regular federal and Massachusetts state income taxes, to retain such tax-exempt status when distributed to shareholders of the Funds. Net realized capital gains and ordinary income distributions paid by the Funds are subject to federal taxation.
| 22 | Nuveen Investments |
For all open tax years and all major taxing jurisdictions, management of the Funds has concluded that there are no significant uncertain tax positions that would require recognition in the financial statements. Open tax years are those that are open for examination by taxing authorities (i.e., generally the last four tax year ends and the interim tax period since then). Furthermore, management of the Funds is also not aware of any tax positions for which it is reasonably possible that the total amounts of unrecognized tax benefits will significantly change in the next twelve months.
Dividends and Distributions to Shareholders
Dividends from tax-exempt net investment income are declared monthly. Net realized capital gains and/or market discount from investment transactions, if any, are declared and distributed to shareholders at least annually. Furthermore, capital gains are distributed only to the extent they exceed available capital loss carryforwards.
Distributions to shareholders of tax-exempt net investment income, net realized capital gains and/or market discount, if any, are recorded on the ex-dividend date. The amount and timing of distributions are determined in accordance with federal income tax regulations, which may differ from accounting principles generally accepted in the United States.
Insurance
Under normal circumstances, Massachusetts Insured invests at least 80% of its net assets in municipal securities that are covered by insurance guaranteeing the timely payment of principal and interest. For purposes of this 80% test, insurers must have a claims-paying ability rated at least A at the time of purchase by at least one independent rating agency. In addition, the Fund invests at least 80% of its net assets in municipal securities that are rated at least AA at the time of purchase (based on the higher of the rating of the insurer, if any, or the underlying security) by at least one independent rating agency, or are unrated but judged to be of similar credit quality by the Adviser, or are backed by an escrow or trust account containing sufficient U.S. government or U.S. government agency securities or U.S. Treasury-issued State and Local Government Series (SLGS) securities to ensure timely payment of principal and interest. Inverse floating rate securities whose underlying bonds are covered by insurance are included for purposes of the 80% test.
Each insured municipal security is covered by Original Issue Insurance, Secondary Market Insurance or Portfolio Insurance. Such insurance does not guarantee the market value of the municipal securities or the value of the Fund’s shares. Original Issue Insurance and Secondary Market Insurance remain in effect as long as the municipal securities covered thereby remain outstanding and the insurer remains in business, regardless of whether the Fund ultimately disposes of such municipal securities. Consequently, the market value of the municipal securities covered by Original Issue Insurance or Secondary Market Insurance may reflect value attributable to the insurance. Portfolio Insurance, in contrast, is effective only while the municipal securities are held by the Fund. Accordingly, neither the prices used in determining the market value of the underlying municipal securities nor the net asset value of the Fund’s shares include value, if any, attributable to the Portfolio Insurance. Each policy of the Portfolio Insurance does, however, give the Fund the right to obtain permanent insurance with respect to the municipal security covered by the Portfolio Insurance policy at the time of its sale.
Flexible Sales Charge Program
Class A Shares are generally sold with an up-front sales charge and incur a .20% annual 12b-1 service fee. Class A Share purchases of $1 million or more are sold at net asset value without an up-front sales charge but may be subject to a contingent deferred sales charge (“CDSC”) if redeemed within twelve months of purchase. Class B Shares are sold without an up-front sales charge but incur a .75% annual 12b-1 distribution fee and a .20% annual 12b-1 service fee. Class B Shares are subject to a CDSC of up to 5% depending upon the length of time the shares are held by the investor (CDSC is reduced to 0% at the end of six years). Class B Shares convert to Class A Shares eight years after purchase. Class C Shares are sold without an up-front sales charge but incur a .55% annual 12b-1 distribution fee and a .20% annual 12b-1 service fee. Class C Shares are subject to a CDSC of 1% if redeemed within one year of purchase. Class I Shares are not subject to any sales charge or 12b-1 distribution or service fees.
Inverse Floating Rate Securities
Each Fund is authorized to invest in inverse floating rate securities. An inverse floating rate security is created by depositing a municipal bond, typically with a fixed interest rate, into a special purpose trust created by a broker-dealer. In turn, this trust (a) issues floating rate certificates, in face amounts equal to some fraction of the deposited bond’s par amount or market value, that typically pay short-term tax-exempt interest rates to third parties, and (b) issues to a long-term investor (such as one of the Funds) an inverse floating rate certificate (sometimes referred to as an “inverse floater”) that represents all remaining or residual interest in the trust. The income received by the inverse floater holder varies inversely with the short-term rate paid to the floating rate certificates’ holders, and in most circumstances the inverse floater holder bears substantially all of the underlying bond’s downside investment risk and also benefits disproportionately from any potential appreciation of the underlying bond’s value. The price of an inverse floating rate security will be more volatile than that of the underlying bond because the interest rate is dependent on not only the fixed coupon rate of the underlying bond but also on the short-term interest paid on the floating rate certificates, and because the inverse floating rate security essentially bears the risk of loss of the greater face value of the underlying bond.
A Fund may purchase an inverse floating rate security in a secondary market transaction without first owning the underlying bond (referred to as an “externally-deposited inverse floater”), or instead by first selling a fixed-rate bond to a broker-dealer for deposit into the special purpose trust and receiving in turn the residual interest in the trust (referred to as a “self-deposited inverse floater”). The inverse floater held by a Fund gives the Fund the right (a) to cause the holders of the floating rate certificates to tender their notes at par, and (b) to have the broker transfer the fixed-rate bond held by the trust to the Fund, thereby collapsing the trust. An investment
| Nuveen Investments | 23 |
Notes to Financial Statements (Unaudited) (continued)
in an externally-deposited inverse floater is identified in the Portfolio of Investments as “(IF) - Inverse floating rate investment.” An investment in a self-deposited inverse floater is accounted for as a financing transaction in accordance with Statement of Financial Accounting Standards No. 140 (SFAS No. 140) “Accounting for Transfers and Servicing of Financial Assets and Extinguishment of Liabilities.” In such instances, a fixed-rate bond deposited into a special purpose trust is identified in the Portfolio of Investments as “(UB) - Underlying bond of an inverse floating rate trust,” with the Fund accounting for the short-term floating rate certificates issued by the trust as “Floating rate obligations” on the Statement of Assets and Liabilities. In addition, the Fund reflects in “Investment Income” the entire earnings of the underlying bond and recognizes the related interest paid to the holders of the short-term floating rate certificates as “Interest expense on floating rate obligations” on the Statement of Operations.
During the six months ended August 31, 2009, Massachusetts invested in externally-deposited inverse floaters. The Funds did not invested in self-deposited inverse floaters during the six months ended August 31, 2009.
Each Fund may also enter into shortfall and forbearance agreements (sometimes referred to as a “recourse trust” or “credit recovery swap”) (such agreements referred to herein as “Resourse Trusts”) with a broker-dealer by which a Fund agrees to reimburse the broker-dealer, in certain circumstances, for the difference between the liquidation value of the fixed-rate bond held by the trust and the liquidation value of the floating rate certificates issued by the trust plus any shortfalls in interest cash flows. Under these agreements, a Fund’s potential exposure to losses related to or on inverse floaters may increase beyond the value of a Fund’s inverse floater investments as a Fund may potentially be liable to fulfill all amounts owed to holders of the floating rate certificates. At period end, any such shortfall is recognized as “Unrealized depreciation on Recourse Trusts” on the Statement of Assets and Liabilities. At August 31, 2009, the Funds were not invested in externally-deposited Resourse Trusts.
The average floating rate obligations outstanding and average annual interest rate and fees related to self-deposited inverse floaters during the six months ended August 31, 2009, were as follows:
| Massachusetts | Massachusetts Insured | |||||||
Average floating rate obligations | $ | 0 | $ | 0 | ||||
Average annual interest rate and fees | 0 | % | 0 | % | ||||
Swap Contracts
Each Fund is authorized to enter into forward interest rate swap contracts consistent with their investment objectives and policies to reduce, increase or otherwise alter its risk profile or to alter its portfolio characteristics (i.e. duration, yield curve positioning and credit quality).
Each Fund is subject to interest rate risk in the normal course of pursuing its investment objectives. Each Fund’s use of forward interest rate swap transactions is intended to help the Fund manage its overall interest rate sensitivity, either shorter or longer, generally to more closely align the Fund’s interest rate sensitivity with that of the broader municipal market. Forward interest rate swap transactions involve each Fund’s agreement with a counterparty to pay, in the future, a fixed or variable rate payment in exchange for the counterparty paying the Fund a variable or fixed rate payment, the accruals for which would begin at a specified date in the future (the “effective date”). The amount of the payment obligation is based on the notional amount of the swap contract and the termination date of the swap (which is akin to a bond’s maturity). The value of the Fund’s swap commitment would increase or decrease based primarily on the extent to which long-term interest rates for bonds having a maturity of the swap’s termination date increases or decreases. Forward interest rate swap contracts are valued daily. The net amount recorded on these transactions for each counterparty is recognized on the Statement of Assets and Liabilities as “Unrealized appreciation or depreciation on forward swaps” with the change during the fiscal period recognized on the Statement of Operations as “Change in net unrealized appreciation (depreciation) of forward swaps.”
The Funds may terminate a swap contract prior to the effective date, at which point a realized gain or loss is recognized. When a forward swap is terminated, it ordinarily does not involve the delivery of securities or other underlying assets or principal, but rather is settled in cash on a net basis. Net realized gains and losses during the fiscal period are recognized on the Statement of Operations as “Net realized gain (loss) from forward swaps.” Each Fund intends, but is not obligated, to terminate its forward swaps before the effective date. Accordingly, the risk of loss with respect to the swap counterparty on such transactions is limited to the credit risk associated with a counterparty failing to honor its commitment to pay any realized gain to the Fund upon termination. The Funds did not invest in forward interest rate swap transactions during the six months ended August 31, 2009.
Market and Counterparty Credit Risk
In the normal course of business each Fund may invest in financial instruments and enter into financial transactions where risk of potential loss exists due to changes in the market (market risk) or failure of the other party to the transaction to perform (counterparty credit risk). The potential loss could exceed the value of the financial assets recorded on the financial statements. Financial assets, which potentially expose each Fund to counterparty credit risk, consist principally of cash due from counterparties on forward, option and swap transactions. The extent of each Fund’s exposure to counterparty credit risk in respect to these financial assets approximates their carrying value as recorded on the Statement of Assets and Liabilities. Futures contracts expose a Fund to minimal counterparty credit risk as they are exchange traded and the exchange’s clearinghouse, which is counterparty to all exchange traded futures, guarantees the futures contracts against default.
Each Fund helps manage counterparty credit risk by entering into agreements only with counterparties the Adviser believes have the financial resources to honor their obligations and by having the Adviser monitor the financial stability of the counterparties.
| 24 | Nuveen Investments |
Additionally, counterparties may be required to pledge collateral daily (based on the daily valuation of the financial asset) on behalf of each Fund with a value approximately equal to the amount of any unrealized gain above a pre-determined threshold. Reciprocally, when each Fund has an unrealized loss, the Funds have instructed the custodian to pledge assets of the Funds as collateral with a value approximately equal to the amount of the unrealized loss above a pre-determined threshold. Collateral pledges are monitored and subsequently adjusted if and when the valuations fluctuate, either up or down, by at least the predetermined threshold amount.
Zero Coupon Securities
Each Fund is authorized to invest in zero coupon securities. A zero coupon security does not pay a regular interest coupon to its holders during the life of the security. Tax-exempt income to the holder of the security comes from accretion of the difference between the original purchase price of the security at issuance and the par value of the security at maturity and is effectively paid at maturity. Such securities are included in the Portfolios of Investments with a 0.000% coupon rate in their description. The market prices of zero coupon securities generally are more volatile than the market prices of securities that pay interest periodically.
Expense Allocation
Expenses of the Funds that are not directly attributable to a specific class of shares are prorated among the classes based on the relative net assets of each class. Expenses directly attributable to a class of shares, which presently only include 12b-1 distribution and service fees, are recorded to the specific class.
Custodian Fee Credit
Each Fund has an arrangement with the custodian bank whereby certain custodian fees and expenses are reduced by net credits earned on each Fund’s cash on deposit with the bank. Such deposit arrangements are an alternative to overnight investments. Credits for cash balances may be offset by charges for any days on which a Fund overdraws its account at the custodian bank.
Indemnifications
Under the Trust’s organizational documents, its Officers and Trustees are indemnified against certain liabilities arising out of the performance of their duties to the Trust. In addition, in the normal course of business, the Trust enters into contracts that provide general indemnifications to other parties. The Trust’s maximum exposure under these arrangements is unknown as this would involve future claims that may be made against the Trust that have not yet occurred. However, the Trust has not had prior claims or losses pursuant to these contracts and expects the risk of loss to be remote.
Use of Estimates
The preparation of financial statements in conformity with accounting principles generally accepted in the United States requires management to make estimates and assumptions that affect the reported amounts of assets and liabilities at the date of the financial statements and the reported amounts of increases and decreases in net assets from operations during the reporting period. Actual results may differ from those estimates.
2. Fair Value Measurements
In determining the value of each Fund’s investments various inputs are used. These inputs are summarized in the three broad levels listed below:
| Level 1 – | Quoted prices in active markets for identical securities. | |
| Level 2 – | Other significant observable inputs (including quoted prices for similar securities, interest rates, prepayment speeds, credit risk, etc.). | |
| Level 3 – | Significant unobservable inputs (including management’s assumptions in determining the fair value of investments). |
The inputs or methodology used for valuing securities are not an indication of the risk associated with investing in those securities. The following is a summary of each Fund’s fair value measurements as of August 31, 2009:
| Massachusetts | Level 1 | Level 2 | Level 3 | Total | ||||||||
Investments: | ||||||||||||
Municipal Bonds | $ | — | $ | 116,912,118 | $ | — | $ | 116,912,118 | ||||
| Massachusetts Insured | Level 1 | Level 2 | Level 3 | Total | ||||||||
Investments: | ||||||||||||
Municipal Bonds | $ | — | $ | 82,424,348 | $ | — | $ | 82,424,348 | ||||
3. Derivative Instruments and Hedging Activities
During the current fiscal period, the Funds adopted the provisions of Statement of Financial Accounting Standards No. 161 (SFAS No. 161) “Disclosures about Derivative Instruments and Hedging Activities.” This standard is intended to enhance financial statement disclosures for derivative instruments and hedging activities and enable investors to better understand: a) how and why a fund uses derivative instruments; b) how derivative instruments are accounted for; and c) how derivative instruments affect a fund’s financial position, results of operations and cash flows, if any. The Funds record derivative instruments at fair value with changes in fair value recognized on the Statement of Operations, when applicable. Even though the Funds’ investments in derivatives may represent economic hedges, they are considered to be non-hedge transactions for SFAS No. 161 disclosure purposes. The Funds did not invest in derivative instruments during the six months ended August 31, 2009.
| Nuveen Investments | 25 |
Notes to Financial Statements (Unaudited) (continued)
4. Fund Shares
Transactions in Fund shares were as follows:
| Massachusetts | ||||||||||||||
| Six Months Ended 8/31/09 | Year Ended 2/28/09 | |||||||||||||
| Shares | Amount | Shares | Amount | |||||||||||
Shares sold: | ||||||||||||||
Class A | 1,161,513 | $ | 10,341,104 | 7,343,940 | $ | 65,971,734 | ||||||||
Class A – automatic conversion of Class B Shares | 3,989 | 35,970 | 12,906 | 118,909 | ||||||||||
Class B | 1,173 | 10,653 | 5,521 | 51,625 | ||||||||||
Class C | 80,011 | 722,158 | 292,676 | 2,693,997 | ||||||||||
Class I | 138,585 | 1,246,589 | 130,129 | 1,117,653 | ||||||||||
Shares issued to shareholders due to reinvestment of distributions: | ||||||||||||||
Class A | 50,726 | 460,809 | 105,327 | 955,645 | ||||||||||
Class B | 2,254 | 20,504 | 5,503 | 49,914 | ||||||||||
Class C | 13,907 | 125,360 | 27,477 | 246,751 | ||||||||||
Class I | 98,915 | 896,552 | 199,237 | 1,801,849 | ||||||||||
| 1,551,073 | 13,859,699 | 8,122,716 | 73,008,077 | |||||||||||
Shares redeemed: | ||||||||||||||
Class A | (475,873 | ) | (4,274,445 | ) | (9,514,052 | ) | (85,424,878 | ) | ||||||
Class B | (34,340 | ) | (306,783 | ) | (63,911 | ) | (591,591 | ) | ||||||
Class B – automatic conversion to Class A Shares | (3,984 | ) | (35,970 | ) | (12,891 | ) | (118,909 | ) | ||||||
Class C | (98,309 | ) | (876,218 | ) | (327,348 | ) | (2,862,875 | ) | ||||||
Class I | (196,723 | ) | (1,773,042 | ) | (627,408 | ) | (5,710,241 | ) | ||||||
| (809,229 | ) | (7,266,458 | ) | (10,545,610 | ) | (94,708,494 | ) | |||||||
Net increase (decrease) | 741,844 | $ | 6,593,241 | (2,422,894 | ) | $ | (21,700,417 | ) | ||||||
| Massachusetts Insured | ||||||||||||||
| Six Months Ended 8/31/09 | Year Ended 2/28/09 | |||||||||||||
| Shares | Amount | Shares | Amount | |||||||||||
Shares sold: | ||||||||||||||
Class A | 928,843 | $ | 9,210,420 | 554,971 | $ | 5,417,104 | ||||||||
Class A – automatic conversion of Class B Shares | 14,445 | 141,525 | 51,709 | 511,541 | ||||||||||
Class B | 275 | 2,951 | 14,265 | 142,380 | ||||||||||
Class C | 148,845 | 1,472,492 | 218,015 | 2,155,400 | ||||||||||
Class I | 23,510 | 233,257 | 129,993 | 1,255,412 | ||||||||||
Shares issued to shareholders due to reinvestment of distributions: | ||||||||||||||
Class A | 36,258 | 357,233 | 73,945 | 715,151 | ||||||||||
Class B | 2,609 | 25,714 | 8,946 | 87,365 | ||||||||||
Class C | 13,375 | 131,751 | 28,826 | 278,937 | ||||||||||
Class I | 56,669 | 559,985 | 142,245 | 1,383,126 | ||||||||||
| 1,224,829 | 12,135,328 | 1,222,915 | 11,946,416 | |||||||||||
Shares redeemed: | ||||||||||||||
Class A | (159,400 | ) | (1,571,463 | ) | (271,001 | ) | (2,581,885 | ) | ||||||
Class B | (13,631 | ) | (133,849 | ) | (79,214 | ) | (767,500 | ) | ||||||
Class B – automatic conversion to Class A Shares | (14,427 | ) | (141,525 | ) | (51,621 | ) | (511,541 | ) | ||||||
Class C | (20,820 | ) | (203,763 | ) | (192,780 | ) | (1,838,078 | ) | ||||||
Class I | (132,562 | ) | (1,310,678 | ) | (472,459 | ) | (4,559,192 | ) | ||||||
| (340,840 | ) | (3,361,278 | ) | (1,067,075 | ) | (10,258,196 | ) | |||||||
Net increase (decrease) | 883,989 | $ | 8,774,050 | 155,840 | $ | 1,688,220 | ||||||||
| 26 | Nuveen Investments |
5. Investment Transactions
Purchases and sales (including maturities but excluding short-term investments) during the six months ended August 31, 2009, were as follows:
| Massachusetts | Massachusetts Insured | |||||
Purchases | $ | 7,600,809 | $ | 3,555,350 | ||
Sales and maturities | 1,379,140 | 1,710,980 | ||||
6. Income Tax Information
The following information is presented on an income tax basis. Differences between amounts for financial statement and federal income tax purposes are primarily due to timing differences in recognizing taxable market discount, timing differences in recognizing certain gains and losses on investment transactions and the treatment of investments in inverse floating rate transactions subject to SFAS No. 140, if any. To the extent that differences arise that are permanent in nature, such amounts are reclassified within the capital accounts on the Statement of Assets and Liabilities presented in the annual report, based on their federal tax basis treatment; temporary differences do not require reclassification. Temporary and permanent differences do not impact the net asset values of the Funds.
At August 31, 2009, the cost of investments was as follows:
| Massachusetts | Massachusetts Insured | |||||
Cost of investments | $ | 121,939,043 | $ | 81,971,144 | ||
Gross unrealized appreciation and gross unrealized depreciation of investments at August 31, 2009, were as follows:
| Massachusetts | Massachusetts Insured | |||||||
Gross unrealized: | ||||||||
Appreciation | $ | 3,485,674 | $ | 2,675,916 | ||||
Depreciation | (8,512,599 | ) | (2,222,712 | ) | ||||
Net unrealized appreciation (depreciation) of investments | $ | (5,026,925 | ) | $ | 453,204 | |||
The tax components of undistributed net tax-exempt income, net ordinary income and net long-term capital gains at February 28, 2009, the Funds’ last tax year end, were as follows:
| Massachusetts | Massachusetts Insured | |||||
Undistributed net tax-exempt income* | $ | 820,898 | $ | 397,994 | ||
Undistributed net ordinary income** | — | 577,719 | ||||
Undistributed net long-term capital gains | — | 228,888 | ||||
| * | Undistributed net tax-exempt income (on a tax basis) has not been reduced for the dividend declared on February 10, 2009, paid on March 2, 2009. |
| ** | Net ordinary income consists of taxable market discount income and net short-term capital gains, if any. |
The tax character of distributions paid during the Funds’ last tax year ended February 28, 2009, was designated for purposes of the dividends paid deduction as follows:
| Massachusetts | Massachusetts Insured | |||||
Distributions from net tax-exempt income | $ | 5,152,441 | $ | 3,169,238 | ||
Distributions from net ordinary income** | — | 158,831 | ||||
Distributions from net long-term capital gains | 611,361 | 253,470 | ||||
| ** | Net ordinary income consists of taxable market discount income and net short-term capital gains, if any. |
At February 28, 2009, the Funds’ last tax year end, Massachusetts had unused capital loss carryforwards of $282,414 available for federal income tax purposes to be applied against future capital gains, if any. If not applied, the carryforwards will expire February 28, 2017.
Massachusetts elected to defer net realized losses from investments incurred from November 1, 2008 through February 28, 2009, the Fund’s last tax year end, (“post-October losses”) in accordance with federal income tax regulations. Post-October capital losses of $246,478 are treated as having arisen on the first day of the current fiscal year.
| Nuveen Investments | 27 |
Notes to Financial Statements (Unaudited) (continued)
7. Management Fees and Other Transactions with Affiliates
Each Fund’s management fee is separated into two components – a complex-level component, based on the aggregate amount of all fund assets managed by the Adviser, and a specific fund-level component, based only on the amount of assets within each individual Fund. This pricing structure enables Nuveen fund shareholders to benefit from growth in the assets within each individual fund as well as from growth in the amount of complex-wide assets managed by the Adviser.
The annual fund-level fee, payable monthly, for each Fund is based upon the average daily net assets of each Fund as follows:
| Average Daily Net Assets (1) | Fund-Level Fee Rate | ||
For the first $125 million | .3500 | % | |
For the next $125 million | .3375 | ||
For the next $250 million | .3250 | ||
For the next $500 million | .3125 | ||
For the next $1 billion | .3000 | ||
For the next $3 billion | .2750 | ||
For net assets over $5 billion | .2500 |
The annual complex-level fee, payable monthly, which is additive to the fund-level fee, for all Nuveen sponsored funds in the U.S., is based on the aggregate amount of total fund net assets managed as stated in the following table. As of August 31, 2009, the complex-level fee rate was .1936%.
The complex-level fee schedule is as follows:
| Complex-Level Net Asset Breakpoint Level (1) | Effective Rate at Breakpoint Level | ||
$55 billion | .2000 | % | |
$56 billion | .1996 | ||
$57 billion | .1989 | ||
$60 billion | .1961 | ||
$63 billion | .1931 | ||
$66 billion | .1900 | ||
$71 billion | .1851 | ||
$76 billion | .1806 | ||
$80 billion | .1773 | ||
$91 billion | .1691 | ||
$125 billion | .1599 | ||
$200 billion | .1505 | ||
$250 billion | .1469 | ||
$300 billion | .1445 |
| (1) | The complex-level fee component of the management fee for the funds is calculated based upon the aggregate daily managed net assets of all Nuveen funds, with such daily managed net assets defined separately for each fund in its management agreement, but excluding assets attributable to investments in other Nuveen funds. For the complex-level and fund-level fee components, daily managed net assets include assets managed by the Adviser that are attributable to financial leverage. For these purposes, financial leverage includes the funds use of preferred stock and borrowings and investments in the residual interest certificates (also called inverse floating rate securities) in tender option bond (TOB) trusts, including the portion of assets held by the TOB trust that has been effectively financed by the trust’s issuance of floating rate securities, subject to an agreement by the Adviser to limit the amount of such assets for determining managed net assets in certain circumstances. |
The management fee compensates the Adviser for overall investment advisory and administrative services and general office facilities. The Trust pays no compensation directly to those of its Trustees who are affiliated with the Adviser or to its Officers, all of whom receive remuneration for their services to the Trust from the Adviser or its affiliates. The Board of Trustees has adopted a deferred compensation plan for independent Trustees that enables Trustees to elect to defer receipt of all or a portion of the annual compensation they are entitled to receive from certain Nuveen advised funds. Under the plan, deferred amounts are treated as though equal dollar amounts had been invested in shares of select Nuveen advised funds.
The Adviser has agreed to waive fees and reimburse expenses of each Fund so that total annual Fund operating expenses (excluding 12b-1 distribution and service fees, interest expenses, taxes, fees incurred in acquiring and disposing of portfolio securities and extraordinary expenses) do not exceed .75% and .975% of the average daily net assets of any class of Fund shares of Massachusetts and Massachusetts Insured, respectively. The Adviser may also voluntarily reimburse additional expenses from time to time in either of the Funds. Voluntary reimbursements may be terminated at any time at the Adviser’s discretion.
During the six months ended August 31, 2009, Nuveen Investments, LLC (the “Distributor”), a wholly owned subsidiary of Nuveen, collected sales charges on purchases of Class A Shares, the majority of which were paid out as concessions to financial intermediaries as follows:
| Massachusetts | Massachusetts Insured | |||||
Sales charges collected | $ | 42,288 | $ | 33,616 | ||
Paid to financial intermediaries | 36,433 | 29,393 | ||||
| 28 | Nuveen Investments |
The Distributor also received 12b-1 service fees on Class A Shares, substantially all of which were paid to compensate financial intermediaries for providing services to shareholders relating to their investments.
During the six months ended August 31, 2009, the Distributor compensated financial intermediaries directly with commission advances at the time of purchase as follows:
| Massachusetts | Massachusetts Insured | |||||
Commission advances | $ | 10,492 | $ | 25,493 | ||
To compensate for commissions advanced to financial intermediaries, all 12b-1 service fees collected on Class B Shares during the first year following a purchase, all 12b-1 distribution fees collected on Class B Shares, and all 12b-1 service and distribution fees collected on Class C Shares during the first year following a purchase are retained by the Distributor. During the six months ended August 31, 2009, the Distributor retained such 12b-1 fees as follows:
| Massachusetts | Massachusetts Insured | |||||
12b-1 fees retained | $ | 19,492 | $ | 22,333 | ||
The remaining 12b-1 fees charged to the Funds were paid to compensate financial intermediaries for providing services to shareholders relating to their investments.
The Distributor also collected and retained CDSC on share redemptions during the six months ended August 31, 2009, as follows:
| Massachusetts | Massachusetts Insured | |||||
CDSC retained | $ | 4,222 | $ | 3,050 | ||
8. New Accounting Pronouncements
Financial Accounting Standards Board Statement of Financial Accounting Standards No. 166 (SFAS No. 166)
During June 2009, the Financial Accounting Standards Board issued SFAS No. 166, “Accounting for Transfers of Financial Assets – an amendment of SFAS No. 140.” The objective of SFAS No. 166 is to improve the relevance, representational faithfulness, and comparability of the information that a reporting entity provides in its financial statements about a transfer of financial assets; the effects of a transfer on its financial position, financial performance, and cash flows; and a transferor’s continuing involvement, if any, in transferred financial assets.
SFAS No. 166 is effective as of the beginning of each reporting entity’s first annual reporting period that begins after November 15, 2009, for interim periods within that first annual reporting period and for interim and annual reporting periods thereafter. Earlier application is prohibited. The recognition and measurement provisions of SFAS No. 166 must be applied to transfers occurring on or after the effective date. Additionally, the disclosure provisions of SFAS No. 166 should be applied to transfers that occurred both before and after the effective date of SFAS No. 166. At this time, management is evaluating the implications of SFAS No. 166 and the impact it will have on the financial statement amounts and disclosures, if any.
9. Subsequent Events
Distributions to Shareholders
The Funds declared dividend distributions from their tax-exempt net investment income which were paid on October 1, 2009, to shareholders of record on September 29, 2009, as follows:
| Massachusetts | Massachusetts Insured | |||||
Dividend per share: | ||||||
Class A | $ | .0375 | $ | .0330 | ||
Class B | .0320 | .0270 | ||||
Class C | .0330 | .0285 | ||||
Class I | .0390 | .0345 | ||||
Financial Accounting Standards Board Statement of Financial Accounting Standards No. 165 (SFAS No. 165)
In May 2009, the Financial Accounting Standards Board issued SFAS No. 165 “Subsequent Events.” SFAS No. 165 requires an entity to recognize in the financial statements the effects of all subsequent events that provide additional evidence about conditions that existed at the date of the balance sheet. SFAS No. 165 is intended to establish general standards of accounting and for disclosure of events that occur after the balance sheet date but before financial statements are issued or are available to be issued. SFAS No. 165 requires the disclosure of the date through which an entity has evaluated subsequent events and the basis for that date – that is, whether that date represents the date the financial statements were issued or were available to be issued. SFAS No. 165 is effective for interim and annual periods ending after June 15, 2009. The Funds have performed an evaluation of subsequent events through October 27, 2009, which is the date the financial statements were issued.
| Nuveen Investments | 29 |
Financial Highlights (Unaudited)
| Selected data for a share outstanding throughout each period: | ||||||||||||||||||||||||||||||||
| Class (Commencement Date) | ||||||||||||||||||||||||||||||||
| Investment Operations | Less Distributions | |||||||||||||||||||||||||||||||
| MASSACHUSETTS | ||||||||||||||||||||||||||||||||
| Year Ended February 28/29 | Beginning Net Asset Value | Net Invest- ment Income(a) | Net Realized/ Unrealized Gain (Loss) | Total | Net Invest- ment Income | Capital Gains | Total | Ending Net Asset Value | Total Return(b) | |||||||||||||||||||||||
Class A (9/94) | ||||||||||||||||||||||||||||||||
2010(g) | $ | 8.81 | $ | .22 | $ | .56 | $ | .78 | $ | (.22 | ) | $ | — | $ | (.22 | ) | $ | 9.37 | 8.96 | % | ||||||||||||
2009 | 9.34 | .41 | (.51 | ) | (.10 | ) | (.39 | ) | (.04 | ) | (.43 | ) | 8.81 | (1.05 | ) | |||||||||||||||||
2008 | 10.11 | .39 | (.74 | ) | (.35 | ) | (.38 | ) | (.04 | ) | (.42 | ) | 9.34 | (3.61 | ) | |||||||||||||||||
2007 | 10.03 | .38 | .07 | .45 | (.37 | ) | — | (.37 | ) | 10.11 | 4.62 | |||||||||||||||||||||
2006 | 10.09 | .39 | (.03 | ) | .36 | (.39 | ) | (.03 | ) | (.42 | ) | 10.03 | 3.65 | |||||||||||||||||||
2005 | 10.13 | .41 | (.04 | ) | .37 | (.41 | ) | — | (.41 | ) | 10.09 | 3.75 | ||||||||||||||||||||
Class B (3/97) | ||||||||||||||||||||||||||||||||
2010(g) | 8.83 | .19 | .55 | .74 | (.19 | ) | — | (.19 | ) | 9.38 | 8.43 | |||||||||||||||||||||
2009 | 9.35 | .34 | (.50 | ) | (.16 | ) | (.32 | ) | (.04 | ) | (.36 | ) | 8.83 | (1.69 | ) | |||||||||||||||||
2008 | 10.13 | .31 | (.74 | ) | (.43 | ) | (.31 | ) | (.04 | ) | (.35 | ) | 9.35 | (4.41 | ) | |||||||||||||||||
2007 | 10.04 | .31 | .08 | .39 | (.30 | ) | — | (.30 | ) | 10.13 | 3.96 | |||||||||||||||||||||
2006 | 10.11 | .31 | (.03 | ) | .28 | (.32 | ) | (.03 | ) | (.35 | ) | 10.04 | 2.80 | |||||||||||||||||||
2005 | 10.15 | .33 | (.04 | ) | .29 | (.33 | ) | — | (.33 | ) | 10.11 | 3.00 | ||||||||||||||||||||
Class C (10/94) | ||||||||||||||||||||||||||||||||
2010(g) | 8.74 | .20 | .54 | .74 | (.19 | ) | — | (.19 | ) | 9.29 | 8.59 | |||||||||||||||||||||
2009 | 9.26 | .36 | (.50 | ) | (.14 | ) | (.34 | ) | (.04 | ) | (.38 | ) | 8.74 | (1.53 | ) | |||||||||||||||||
2008 | 10.04 | .33 | (.75 | ) | (.42 | ) | (.32 | ) | (.04 | ) | (.36 | ) | 9.26 | (4.27 | ) | |||||||||||||||||
2007 | 9.95 | .33 | .08 | .41 | (.32 | ) | — | (.32 | ) | 10.04 | 4.19 | |||||||||||||||||||||
2006 | 10.02 | .33 | (.03 | ) | .30 | (.34 | ) | (.03 | ) | (.37 | ) | 9.95 | 3.01 | |||||||||||||||||||
2005 | 10.06 | .35 | (.04 | ) | .31 | (.35 | ) | — | (.35 | ) | 10.02 | 3.21 | ||||||||||||||||||||
Class I (12/86)(f) | ||||||||||||||||||||||||||||||||
2010(g) | 8.80 | .23 | .55 | .78 | (.23 | ) | — | (.23 | ) | 9.35 | 8.96 | |||||||||||||||||||||
2009 | 9.32 | .43 | (.50 | ) | (.07 | ) | (.41 | ) | (.04 | ) | (.45 | ) | 8.80 | (.74 | ) | |||||||||||||||||
2008 | 10.09 | .41 | (.74 | ) | (.33 | ) | (.40 | ) | (.04 | ) | (.44 | ) | 9.32 | (3.45 | ) | |||||||||||||||||
2007 | 10.01 | .40 | .07 | .47 | (.39 | ) | — | (.39 | ) | 10.09 | 4.81 | |||||||||||||||||||||
2006 | 10.07 | .41 | (.03 | ) | .38 | (.41 | ) | (.03 | ) | (.44 | ) | 10.01 | 3.84 | |||||||||||||||||||
2005 | 10.11 | .42 | (.04 | ) | .38 | (.42 | ) | — | (.42 | ) | 10.07 | 3.95 | ||||||||||||||||||||
| 30 | Nuveen Investments |
| Ratios/Supplemental Data | |||||||||||||||||||||||||||||||
| Ratios to Average Net Assets Before Credit/ Reimbursement | Ratios to Average Net Assets After Reimbursement(c) | Ratios to Average Net Assets After Credit/ Reimbursement(d) | |||||||||||||||||||||||||||||
Ending | Expenses Including Interest(e) | Expenses Excluding Interest | Net Invest- ment Income | Expenses Including Interest(e) | Expenses Excluding Interest | Net Invest- ment Income | Expenses Including Interest(e) | Expenses Excluding Interest | Net Invest- ment Income | Portfolio Turnover Rate | |||||||||||||||||||||
| $ | 55,222 | .91 | %* | .91 | %* | 4.89 | %* | .91 | %* | .91 | %* | 4.89 | %* | .91 | %* | .91 | %* | 4.89 | %* | 1 | % | ||||||||||
| 45,433 | .91 | .91 | 4.47 | .91 | .91 | 4.47 | .90 | .90 | 4.48 | 20 | |||||||||||||||||||||
| 67,297 | .88 | .88 | 3.90 | .88 | .88 | 3.90 | .87 | .87 | 3.90 | 12 | |||||||||||||||||||||
| 102,045 | .87 | .87 | 3.82 | .87 | .87 | 3.82 | .85 | .85 | 3.84 | 4 | |||||||||||||||||||||
| 72,519 | .88 | .88 | 3.86 | .88 | .88 | 3.86 | .86 | .86 | 3.87 | 9 | |||||||||||||||||||||
| 45,302 | .91 | .91 | 4.06 | .91 | .91 | 4.06 | .91 | .91 | 4.06 | 11 | |||||||||||||||||||||
| 2,586 | 1.66 | * | 1.66 | * | 4.15 | * | 1.66 | * | 1.66 | * | 4.15 | * | 1.66 | * | 1.66 | * | 4.15 | * | 1 | ||||||||||||
| 2,741 | 1.67 | 1.67 | 3.71 | 1.67 | 1.67 | 3.71 | 1.66 | 1.66 | 3.72 | 20 | |||||||||||||||||||||
| 3,519 | 1.63 | 1.63 | 3.15 | 1.63 | 1.63 | 3.15 | 1.63 | 1.63 | 3.15 | 12 | |||||||||||||||||||||
| 5,989 | 1.62 | 1.62 | 3.07 | 1.62 | 1.62 | 3.07 | 1.60 | 1.60 | 3.09 | 4 | |||||||||||||||||||||
| 5,989 | 1.64 | 1.64 | 3.09 | 1.64 | 1.64 | 3.09 | 1.62 | 1.62 | 3.11 | 9 | |||||||||||||||||||||
| 7,300 | 1.66 | 1.66 | 3.30 | 1.66 | 1.66 | 3.30 | 1.65 | 1.65 | 3.31 | 11 | |||||||||||||||||||||
| 11,591 | 1.46 | * | 1.46 | * | 4.34 | * | 1.46 | * | 1.46 | * | 4.34 | * | 1.46 | * | 1.46 | * | 4.35 | * | 1 | ||||||||||||
| 10,944 | 1.47 | 1.47 | 3.91 | 1.47 | 1.47 | 3.91 | 1.46 | 1.46 | 3.92 | 20 | |||||||||||||||||||||
| 11,661 | 1.44 | 1.44 | 3.35 | 1.44 | 1.44 | 3.35 | 1.43 | 1.43 | 3.36 | 12 | |||||||||||||||||||||
| 11,853 | 1.42 | 1.42 | 3.27 | 1.42 | 1.42 | 3.27 | 1.40 | 1.40 | 3.29 | 4 | |||||||||||||||||||||
| 12,160 | 1.44 | 1.44 | 3.30 | 1.44 | 1.44 | 3.30 | 1.42 | 1.42 | 3.32 | 9 | |||||||||||||||||||||
| 11,160 | 1.46 | 1.46 | 3.50 | 1.46 | 1.46 | 3.50 | 1.45 | 1.45 | 3.51 | 11 | |||||||||||||||||||||
| 50,589 | .71 | * | .71 | * | 5.10 | * | .71 | * | .71 | * | 5.10 | * | .71 | * | .71 | * | 5.10 | * | 1 | ||||||||||||
| 47,238 | .72 | .72 | 4.67 | .72 | .72 | 4.67 | .71 | .71 | 4.68 | 20 | |||||||||||||||||||||
| 52,832 | .69 | .69 | 4.10 | .69 | .69 | 4.10 | .68 | .68 | 4.11 | 12 | |||||||||||||||||||||
| 60,022 | .67 | .67 | 4.02 | .67 | .67 | 4.02 | .65 | .65 | 4.04 | 4 | |||||||||||||||||||||
| 61,177 | .68 | .68 | 4.05 | .68 | .68 | 4.05 | .67 | .67 | 4.06 | 9 | |||||||||||||||||||||
| 63,379 | .71 | .71 | 4.25 | .71 | .71 | 4.25 | .70 | .70 | 4.26 | 11 | |||||||||||||||||||||
| * | Annualized |
| (a) | Per share Net Investment Income is calculated using the average daily shares method. |
| (b) | Total return is the combination of changes in net asset value without any sales charge, reinvested dividend income at net asset value and reinvested capital gains distributions at net asset value, if any. Total returns are not annualized. |
| (c) | After expense reimbursement from the Adviser, where applicable. |
| (d) | After custodian fee credit and expense reimbursement, where applicable. |
| (e) | Each Ratio of Expenses Including Interest to Average Net Assets in the above table reflect, among other things, the interest expense deemed to have been paid by the Fund on the floating rate certificates issued by the special purpose trusts for the self-deposited inverse floaters held by the Fund, as described in Footnote 1 – Inverse Floating Rate Securities. |
| (f) | Effective May 1, 2008, Class R Shares were renamed Class I Shares. |
| (g) | For the six months ended August 31, 2009. |
See accompanying notes to financial statements.
| Nuveen Investments | 31 |
Financial Highlights (Unaudited) (continued)
| Selected data for a share outstanding throughout each period: | ||||||||||||||||||||||||||||||||
| Class (Commencement Date) | ||||||||||||||||||||||||||||||||
| Investment Operations | Less Distributions | |||||||||||||||||||||||||||||||
| MASSACHUSETTS INSURED | ||||||||||||||||||||||||||||||||
| Year Ended February 28/29 | Beginning Net Asset Value | Net Invest- ment Income(a) | Net Realized/ Unrealized Gain (Loss) | Total | Net Invest- ment Income | Capital Gains | Total | Ending Net Asset Value | Total Return(b) | |||||||||||||||||||||||
Class A (9/94) | ||||||||||||||||||||||||||||||||
2010(g) | $ | 9.64 | $ | .19 | $ | .43 | $ | .62 | $ | (.20 | ) | $ | — | $ | (.20 | ) | $ | 10.06 | 6.47 | % | ||||||||||||
2009 | 9.80 | .40 | (.12 | ) | .28 | (.39 | ) | (.05 | ) | (.44 | ) | 9.64 | 2.94 | |||||||||||||||||||
2008 | 10.37 | .39 | (.53 | ) | (.14 | ) | (.38 | ) | (.05 | ) | (.43 | ) | 9.80 | (1.42 | ) | |||||||||||||||||
2007 | 10.37 | .39 | .02 | .41 | (.38 | ) | (.03 | ) | (.41 | ) | 10.37 | 4.12 | ||||||||||||||||||||
2006 | 10.44 | .40 | (.04 | ) | .36 | (.39 | ) | (.04 | ) | (.43 | ) | 10.37 | 3.48 | |||||||||||||||||||
2005 | 10.72 | .41 | (.21 | ) | .20 | (.42 | ) | (.06 | ) | (.48 | ) | 10.44 | 1.95 | |||||||||||||||||||
Class B (3/97) | ||||||||||||||||||||||||||||||||
2010(g) | 9.65 | .15 | .44 | .59 | (.16 | ) | — | (.16 | ) | 10.08 | 6.18 | |||||||||||||||||||||
2009 | 9.82 | .32 | (.12 | ) | .20 | (.32 | ) | (.05 | ) | (.37 | ) | 9.65 | 2.04 | |||||||||||||||||||
2008 | 10.38 | .31 | (.51 | ) | (.20 | ) | (.31 | ) | (.05 | ) | (.36 | ) | 9.82 | (2.07 | ) | |||||||||||||||||
2007 | 10.38 | .31 | .03 | .34 | (.31 | ) | (.03 | ) | (.34 | ) | 10.38 | 3.33 | ||||||||||||||||||||
2006 | 10.45 | .32 | (.04 | ) | .28 | (.31 | ) | (.04 | ) | (.35 | ) | 10.38 | 2.70 | |||||||||||||||||||
2005 | 10.73 | .33 | (.21 | ) | .12 | (.34 | ) | (.06 | ) | (.40 | ) | 10.45 | 1.19 | |||||||||||||||||||
Class C (9/94) | ||||||||||||||||||||||||||||||||
2010(g) | 9.64 | .16 | .43 | .59 | (.17 | ) | — | (.17 | ) | 10.06 | 6.18 | |||||||||||||||||||||
2009 | 9.81 | .34 | (.12 | ) | .22 | (.34 | ) | (.05 | ) | (.39 | ) | 9.64 | 2.26 | |||||||||||||||||||
2008 | 10.37 | .33 | (.52 | ) | (.19 | ) | (.32 | ) | (.05 | ) | (.37 | ) | 9.81 | (1.90 | ) | |||||||||||||||||
2007 | 10.36 | .33 | .03 | .36 | (.32 | ) | (.03 | ) | (.35 | ) | 10.37 | 3.62 | ||||||||||||||||||||
2006 | 10.44 | .34 | (.05 | ) | .29 | (.33 | ) | (.04 | ) | (.37 | ) | 10.36 | 2.78 | |||||||||||||||||||
2005 | 10.71 | .35 | (.20 | ) | .15 | (.36 | ) | (.06 | ) | (.42 | ) | 10.44 | 1.46 | |||||||||||||||||||
Class I (12/86)(f) | ||||||||||||||||||||||||||||||||
2010(g) | 9.68 | .20 | .43 | .63 | (.21 | ) | — | (.21 | ) | 10.10 | 6.54 | |||||||||||||||||||||
2009 | 9.84 | .42 | (.12 | ) | .30 | (.41 | ) | (.05 | ) | (.46 | ) | 9.68 | 3.12 | |||||||||||||||||||
2008 | 10.41 | .41 | (.53 | ) | (.12 | ) | (.40 | ) | (.05 | ) | (.45 | ) | 9.84 | (1.24 | ) | |||||||||||||||||
2007 | 10.40 | .41 | .03 | .44 | (.40 | ) | (.03 | ) | (.43 | ) | 10.41 | 4.39 | ||||||||||||||||||||
2006 | 10.47 | .42 | (.04 | ) | .38 | (.41 | ) | (.04 | ) | (.45 | ) | 10.40 | 3.64 | |||||||||||||||||||
2005 | 10.75 | .43 | (.21 | ) | .22 | (.44 | ) | (.06 | ) | (.50 | ) | 10.47 | 2.12 | |||||||||||||||||||
| 32 | Nuveen Investments |
| Ratios/Supplemental Data | |||||||||||||||||||||||||||||||
| Ratios to Average Net Assets Before Credit/ Reimbursement | Ratios to Average Net Assets After Reimbursement(c) | Ratios to Average Net Assets After Credit/ Reimbursement(d) | |||||||||||||||||||||||||||||
| Ending Net Assets (000) | Expenses Including Interest(e) | Expenses Excluding Interest | Net Invest- ment Income | Expenses Including Interest(e) | Expenses Excluding Interest | Net Invest- ment Income | Expenses Including Interest(e) | Expenses Excluding Interest | Net Invest- ment Income | Portfolio Turnover Rate | |||||||||||||||||||||
| $ | 35,521 | .90 | %* | .90 | %* | 3.82 | %* | .90 | %* | .90 | %* | 3.82 | %* | .90 | %* | .90 | %* | 3.82 | %* | 2 | % | ||||||||||
| 26,123 | .98 | .89 | 4.05 | .98 | .89 | 4.05 | .96 | .87 | 4.06 | 20 | |||||||||||||||||||||
| 22,561 | 1.08 | .90 | 3.79 | 1.08 | .90 | 3.79 | 1.06 | .88 | 3.80 | 18 | |||||||||||||||||||||
| 20,958 | 1.06 | .89 | 3.75 | 1.06 | .89 | 3.75 | 1.05 | .88 | 3.76 | 6 | |||||||||||||||||||||
| 24,153 | .90 | .90 | 3.79 | .90 | .90 | 3.79 | .89 | .89 | 3.81 | 14 | |||||||||||||||||||||
| 21,233 | .91 | .91 | 3.95 | .91 | .91 | 3.95 | .90 | .90 | 3.95 | 26 | |||||||||||||||||||||
| 3,863 | 1.64 | * | 1.64 | * | 3.10 | * | 1.64 | * | 1.64 | * | 3.10 | * | 1.64 | * | 1.64 | * | 3.10 | * | 2 | ||||||||||||
| 3,944 | 1.73 | 1.64 | 3.28 | 1.73 | 1.64 | 3.28 | 1.71 | 1.62 | 3.30 | 20 | |||||||||||||||||||||
| 5,068 | 1.83 | 1.65 | 3.04 | 1.83 | 1.65 | 3.04 | 1.81 | 1.63 | 3.05 | 18 | |||||||||||||||||||||
| 5,635 | 1.81 | 1.64 | 3.00 | 1.81 | 1.64 | 3.00 | 1.80 | 1.63 | 3.02 | 6 | |||||||||||||||||||||
| 6,121 | 1.65 | 1.65 | 3.04 | 1.65 | 1.65 | 3.04 | 1.64 | 1.64 | 3.05 | 14 | |||||||||||||||||||||
| 6,759 | 1.66 | 1.66 | 3.20 | 1.66 | 1.66 | 3.20 | 1.65 | 1.65 | 3.20 | 26 | |||||||||||||||||||||
| 12,853 | 1.45 | * | 1.45 | * | 3.28 | * | 1.45 | * | 1.45 | * | 3.28 | * | 1.45 | * | 1.45 | * | 3.28 | * | 2 | ||||||||||||
| 10,949 | 1.53 | 1.44 | 3.49 | 1.53 | 1.44 | 3.49 | 1.51 | 1.42 | 3.51 | 20 | |||||||||||||||||||||
| 10,608 | 1.63 | 1.45 | 3.24 | 1.63 | 1.45 | 3.24 | 1.61 | 1.43 | 3.25 | 18 | |||||||||||||||||||||
| 8,700 | 1.61 | 1.44 | 3.21 | 1.61 | 1.44 | 3.21 | 1.60 | 1.43 | 3.22 | 6 | |||||||||||||||||||||
| 9,895 | 1.45 | 1.45 | 3.24 | 1.45 | 1.45 | 3.24 | 1.44 | 1.44 | 3.25 | 14 | |||||||||||||||||||||
| 11,981 | 1.46 | 1.46 | 3.40 | 1.46 | 1.46 | 3.40 | 1.45 | 1.45 | 3.40 | 26 | |||||||||||||||||||||
| 38,999 | .70 | * | .70 | * | 4.05 | * | .70 | * | .70 | * | 4.05 | * | .69 | * | .69 | * | 4.05 | * | 2 | ||||||||||||
| 37,858 | .78 | .69 | 4.24 | .78 | .69 | 4.24 | .76 | .67 | 4.26 | 20 | |||||||||||||||||||||
| 40,474 | .88 | .70 | 3.99 | .88 | .70 | 3.99 | .86 | .68 | 4.00 | 18 | |||||||||||||||||||||
| 45,501 | .86 | .69 | 3.96 | .86 | .69 | 3.96 | .85 | .68 | 3.97 | 6 | |||||||||||||||||||||
| 48,685 | .70 | .70 | 3.99 | .70 | .70 | 3.99 | .69 | .69 | 4.00 | 14 | |||||||||||||||||||||
| 50,432 | .71 | .71 | 4.15 | .71 | .71 | 4.15 | .70 | .70 | 4.15 | 26 | |||||||||||||||||||||
| * | Annualized |
| (a) | Per share Net Investment Income is calculated using the average daily shares method. |
| (b) | Total return is the combination of changes in net asset value without any sales charge, reinvested dividend income at net asset value and reinvested capital gains distributions at net asset value, if any. Total returns are not annualized. |
| (c) | After expense reimbursement from the Adviser, where applicable. |
| (d) | After custodian fee credit and expense reimbursement, where applicable. |
| (e) | Each Ratio of Expenses Including Interest to Average Net Assets in the above table reflect, among other things, the interest expense deemed to have been paid by the Fund on the floating rate certificates issued by the special purpose trusts for the self-deposited inverse floaters held by the Fund, as described in Footnote 1 – Inverse Floating Rate Securities. |
| (f) | Effective May 1, 2008, Class R Shares were renamed Class I Shares. |
| (g) | For the six months ended August 31, 2009. |
See accompanying notes to financial statements.
| Nuveen Investments | 33 |
Annual Investment Management Agreement Approval Process
The Investment Company Act of 1940, as amended (the “1940 Act”), provides, in substance, that each investment advisory agreement between a fund and its investment adviser will continue in effect from year to year only if its continuance is approved at least annually by the fund’s board members, including by a vote of a majority of the board members who are not parties to the advisory agreement or “interested persons” of any parties (the “Independent Board Members”), cast in person at a meeting called for the purpose of considering such approval. In connection with such approvals, the fund’s board members must request and evaluate, and the investment adviser is required to furnish, such information as may be reasonably necessary to evaluate the terms of the advisory agreement. Accordingly, at a meeting held on May 27-29, 2009 (the “May Meeting”), the Boards of Trustees (each a “Board” and each Trustee, a “Board Member”) of the Funds, including a majority of the Independent Board Members, considered and approved the continuation of the advisory agreements (each an “Advisory Agreement”) between each Fund and Nuveen Asset Management (“NAM”) for an additional one-year period. In preparation for their considerations at the May Meeting, the Board also held a separate meeting on April 21-22, 2009 (the “April Meeting”). Accordingly, the factors considered and determinations made regarding the renewals by the Independent Board Members include those made at the April Meeting.
In addition, in evaluating the Advisory Agreements, the Independent Board Members reviewed a broad range of information relating to the Funds and NAM, including absolute performance, fee and expense information for the Funds as well as comparative performance, fee and expense information for a comparable peer group of funds, the performance information of recognized and/or customized benchmarks (as applicable) of the Funds, the profitability of Nuveen for its advisory activities (which includes its wholly owned subsidiaries other than Winslow Capital Management, Inc. (“Winslow Capital”), which was recently acquired in December 2008), and other information regarding the organization, personnel, and services provided by NAM. The Independent Board Members also met quarterly as well as at other times as the need arose during the year and took into account the information provided at such meetings and the knowledge gained therefrom. Prior to approving the renewal of the Advisory Agreements, the Independent Board Members reviewed the foregoing information with their independent legal counsel and with management, reviewed materials from independent legal counsel describing applicable law and their duties in reviewing advisory contracts, and met with independent legal counsel in private sessions without management present. The Independent Board Members considered the legal advice provided by independent legal counsel and relied upon their knowledge of NAM, its services and the Funds resulting from their meetings and other interactions throughout the year and their own business judgment in determining the factors to be considered in evaluating the Advisory Agreements. Each Board Member may have accorded different weight to the various factors in reaching his or her conclusions with respect to a Fund’s Advisory Agreement. The Independent Board Members did not identify any single factor as all-important or controlling. The Independent Board Members’ considerations were instead based on a comprehensive consideration of all the information presented. The principal factors considered by the Board and its conclusions are described below.
A. Nature, Extent and Quality of Services
In considering renewal of the Advisory Agreements, the Independent Board Members considered the nature, extent and quality of NAM’s services, including advisory services and administrative services. The Independent Board Members reviewed materials outlining, among other things, NAM’s organization and business; the types of services that NAM or its affiliates provide and are expected to provide to the Funds; the performance record of the applicable Fund (as described in further detail below); and any initiatives Nuveen had taken for the applicable fund product line.
In reviewing the services provided and the initiatives undertaken during the past year, the Independent Board Members recognized the severe market turmoil experienced in the capital markets during recent periods, including sustained periods of high volatility, credit disruption and government intervention. The Independent Board Members considered NAM’s efforts, expertise and other actions taken to address matters as they arose that impacted the Funds. The Independent Board Members recognized the role of the Investment Services group which, among other things, monitors the various positions throughout the Nuveen fund complex to identify and address any systematic risks. In addition, the Capital Markets Committee of NAM provides a multi-departmental venue for developing new policies to mitigate any risks. The Independent Board Members further recognized NAM’s continuous review of the Nuveen funds’ investment strategies and mandates in seeking to continue to refine and improve the investment process for the funds, particularly in light of market conditions. In this regard, the Independent Board Members noted the changes recommended by NAM to various investment mandates for the Nuveen funds in seeking to take advantage of market opportunities and to improve the tools available for managing liquidity and market exposure; the establishment of a team responsible for coordinating the handling of large trades in or out of the Nuveen funds; and the ongoing monitoring of investment management processes.
As part of their review, the Independent Board Members also evaluated the background, experience and track record of NAM’s investment personnel. In this regard, the Independent Board Members considered any changes in the personnel, and the impact on the level of services provided to the Funds, if any. The Independent Board Members also reviewed information regarding portfolio manager compensation arrangements to evaluate NAM’s ability to attract and retain high quality investment personnel, preserve stability, and reward performance but not provide an incentive for taking undue risks.
In addition to advisory services, the Independent Board Members considered the quality of administrative services provided by NAM and its affiliates including product management, fund administration, oversight of service providers, shareholder services, administration of Board relations, regulatory and portfolio compliance and legal support. Given the importance of compliance, the Independent Board Members considered NAM’s compliance program, including the report of the chief compliance officer regarding the Funds’ compliance policies and procedures.
| 34 | Nuveen Investments |
Based on their review, the Independent Board Members found that, overall, the nature, extent and quality of services provided (and expected to be provided) to the respective Funds under the Advisory Agreements were satisfactory.
B. The Investment Performance of the Funds and NAM
The Board considered the investment performance of each Fund, including the Fund’s historic performance as well as its performance compared to funds with similar investment objectives (the “Performance Peer Group”) based on data provided by an independent provider of mutual fund data as well as recognized and/or customized benchmarks (as applicable). The Independent Board Members reviewed performance information including, among other things, total return information compared with the Fund’s Performance Peer Group and recognized and/or customized benchmarks (as applicable) for the quarter-, one-, three- and five-year periods (as applicable) ending December 31, 2008 and for the same periods (as applicable) ending March 31, 2009. The Independent Board Members also reviewed performance information of the Nuveen municipal funds managed by NAM in the aggregate ranked by peer group and the performance of such funds, in the aggregate, relative to their benchmark. This information supplemented the Fund performance information provided to the Board at each of its quarterly meetings.
In comparing a fund’s performance with that of its Performance Peer Group, the Independent Board Members took into account that the closest Performance Peer Group in certain instances may not adequately reflect the respective fund’s investment objectives and strategies thereby hindering a meaningful comparison of the fund’s performance with that of the Performance Peer Group. The Independent Board Members further considered the performance of the Funds in the context of the volatile market conditions during the past year, and their impact on various asset classes and the portfolio management of the Funds.
Based on their review and factoring in the severity of market turmoil in 2008, the Independent Board Members determined that each Fund’s investment performance over time had been satisfactory.
C. Fees, Expenses and Profitability
1. Fees and Expenses
The Board evaluated the management fees and expenses of each Fund reviewing, among other things, such Fund’s gross management fees, net management fees and total expense ratios (before and after expense reimbursements and/or waivers) in absolute terms as well as compared to the fee and expenses of a comparable universe of unaffiliated funds based on data provided by an independent fund data provider (the “Peer Universe”) and in certain cases, to a more focused subset of funds in the Peer Universe (the “Peer Group”).
The Independent Board Members further reviewed data regarding the construction of the applicable Peer Universe and Peer Group. In reviewing the comparisons of fee and expense information, the Independent Board Members took into account that in certain instances various factors such as the asset level of a fund relative to peers, the size and particular composition of the Peer Universe or Peer Group, the investment objectives of the peers, expense anomalies, changes in the funds comprising the Peer Universe or Peer Group from year to year, levels of reimbursement and the timing of information used may impact the comparative data, thereby limiting the ability to make a meaningful comparison. The Independent Board Members also considered, among other things, the differences in the states reflected in the respective Peer Group. In reviewing the fee schedule for a Fund, the Independent Board Members also considered the fund-level and complex-wide breakpoint schedules (described in further detail below) and any fee waivers and reimbursements provided by Nuveen.
Based on their review of the fee and expense information provided, the Independent Board Members determined that each Fund’s management fees and net total expense ratio were reasonable in light of the nature, extent and quality of services provided to the Fund.
2. Comparisons with the Fees of Other Clients
The Independent Board Members further reviewed information regarding the nature of services and fee rates offered by NAM to other clients. Such other clients include NAM’s municipal separately managed accounts. In evaluating the comparisons of fees, the Independent Board Members noted that the fee rates charged to the Funds and other clients vary, among other things, because of the different services involved and the additional regulatory and compliance requirements associated with registered investment companies, such as the Funds. Accordingly, the Independent Board Members considered the differences in the product types, including, but not limited to, the services provided, the structure and operations, product distribution and costs thereof, portfolio investment policies, investor profiles, account sizes and regulatory requirements. The Independent Board Members noted, in particular, that the range of services provided to the Funds (as discussed above) is much more extensive than that provided to separately managed accounts. Given the inherent differences in the products, particularly the extensive services provided to the Funds, the Independent Board Members believe such facts justify the different levels of fees.
3. Profitability of Nuveen
In conjunction with its review of fees, the Independent Board Members also considered the profitability of Nuveen for its advisory activities (which incorporated Nuveen’s wholly-owned affiliated sub-advisers other than Winslow Capital) and its financial condition. The Independent Board Members reviewed the revenues and expenses of Nuveen’s advisory activities for the last two years, the allocation methodology used in preparing the profitability data and an analysis of the key drivers behind the changes in revenues and expenses that impacted profitability in 2008. In addition, the Independent Board Members reviewed information regarding the
| Nuveen Investments | 35 |
Annual Investment Management Agreement Approval Process (continued)
financial results of Nuveen for 2008 based on its Form 8-K filed on March 31, 2009. The Independent Board Members noted this information supplemented the profitability information requested and received during the year to help keep them apprised of developments affecting profitability (such as changes in fee waivers and expense reimbursement commitments). In this regard, the Independent Board Members noted that they had also appointed an Independent Board Member as a point person to review and keep them apprised of changes to the profitability analysis and/or methodologies during the year. The Independent Board Members also considered Nuveen’s revenues for advisory activities, expenses, and profit margin compared to that of various unaffiliated management firms with similar amounts of assets under management and relatively comparable asset composition prepared by Nuveen.
In reviewing profitability, the Independent Board Members recognized the subjective nature of determining profitability which may be affected by numerous factors including the allocation of expenses. Further, the Independent Board Members recognized the difficulties in making comparisons as the profitability of other advisers generally is not publicly available and the profitability information that is available for certain advisers or management firms may not be representative of the industry and may be affected by, among other things, the adviser’s particular business mix, capital costs, types of funds managed and expense allocations. Notwithstanding the foregoing, the Independent Board Members reviewed Nuveen’s methodology and assumptions for allocating expenses across product lines to determine profitability. In reviewing profitability, the Independent Board Members recognized Nuveen’s investment in its fund business.
Based on their review, the Independent Board Members concluded that Nuveen’s level of profitability for its advisory activities was reasonable in light of the services provided.
In evaluating the reasonableness of the compensation, the Independent Board Members also considered other amounts paid to NAM by the Funds as well as any indirect benefits (such as soft dollar arrangements, if any) NAM and its affiliates receive, or are expected to receive, that are directly attributable to the management of the Funds, if any. See Section E below for additional information on indirect benefits NAM may receive as a result of its relationship with the Funds. Based on their review of the overall fee arrangements of each Fund, the Independent Board Members determined that the advisory fees and expenses of the respective Fund were reasonable.
D. Economies of Scale and Whether Fee Levels Reflect These Economies of Scale
With respect to economies of scale, the Independent Board Members have recognized the potential benefits resulting from the costs of a fund being spread over a larger asset base, although economies of scale are difficult to measure and predict with precision, particularly on a fund-by-fund basis. One method to help ensure the shareholders share in these benefits is to include breakpoints in the advisory fee schedule. Generally, management fees for funds in the Nuveen complex are comprised of a fund-level component and a complex-level component, subject to certain exceptions. Accordingly, the Independent Board Members reviewed and considered the applicable fund-level breakpoints in the advisory fee schedules that reduce advisory fees as asset levels increase. While economies of scale result when costs can be spread over a larger asset base, the Independent Board Members also recognized that the asset levels generally declined in 2008 due to, among other things, the market downturn. Accordingly, for funds with a reduction in assets under management, advisory fee levels may have increased as breakpoints in the fee schedule were no longer surpassed.
In addition to fund-level advisory fee breakpoints, the Board also considered the Funds’ complex-wide fee arrangement. Pursuant to the complex-wide fee arrangement, the fees of the funds in the Nuveen complex generally are reduced as the assets in the fund complex reach certain levels. The complex-wide fee arrangement seeks to provide the benefits of economies of scale to fund shareholders when total fund complex assets increase, even if assets of a particular fund are unchanged or have decreased. The approach reflects the notion that some of Nuveen’s costs are attributable to services provided to all its funds in the complex and therefore all funds benefit if these costs are spread over a larger asset base. Generally, the complex-wide pricing reduces Nuveen’s revenue because total complex fund assets have consistently grown in prior years. As noted, however, total fund assets declined in 2008 resulting in a smaller downward adjustment of revenues due to complex-wide pricing compared to the prior year.
Based on their review, the Independent Board Members concluded that the breakpoint schedules and complex-wide fee arrangement were acceptable and reflect economies of scale to be shared with shareholders when assets under management increase.
E. Indirect Benefits
In evaluating fees, the Independent Board Members received and considered information regarding potential “fall out” or ancillary benefits NAM or its affiliates may receive as a result of its relationship with each Fund. In this regard, the Independent Board Members considered, among other things, any sales charges, distribution fees and shareholder services fees received and retained by the Funds’ principal underwriter, an affiliate of NAM, which includes fees received pursuant to any 12b-1 plan. The Independent Board Members, therefore, considered the 12b-1 fees retained by Nuveen during the last calendar year.
In addition to the above, the Independent Board Members considered whether NAM received any benefits from soft dollar arrangements whereby a portion of the commissions paid by a Fund for brokerage may be used to acquire research that may be useful to NAM in managing the assets of the Funds and other clients. The Independent Board Members noted that NAM does not currently have any soft dollar arrangements; however, to the extent certain bona fide agency transactions that occur on markets that traditionally trade on a principal basis and riskless principal transactions are considered as generating “commissions,” NAM intends to comply with the applicable safe harbor provisions.
| 36 | Nuveen Investments |
Based on their review, the Independent Board Members concluded that any indirect benefits received by NAM as a result of its relationship with the Funds were reasonable and within acceptable parameters.
F. Other Considerations
The Independent Board Members did not identify any single factor discussed previously as all-important or controlling. The Board Members, including the Independent Board Members, unanimously concluded that the terms of the Advisory Agreements are fair and reasonable, that NAM’s fees are reasonable in light of the services provided to each Fund and that the Advisory Agreements be renewed.
| Nuveen Investments | 37 |
Notes
| 38 | Nuveen Investments |
Notes
| Nuveen Investments | 39 |
Glossary of Terms Used in this Report
Auction Rate Bond: An auction rate bond is a security whose interest payments are adjusted periodically through an auction process, which process typically also serves as a means for buying and selling the bond. Auctions that fail to attract enough buyers for all the shares offered for sale are deemed to have “failed,” with current holders receiving a formula-based interest rate until the next scheduled auction.
Pre-refundings: Pre-refundings, also known as advance refundings or refinancings, occur when an issuer sells new bonds and uses the proceeds to fund principal and interest payments of older existing bonds. This process often results in lower borrowing costs for bond issuers.
Average Annual Total Return: This is a commonly used method to express an investment’s performance over a particular, usually multi-year time period. It expresses the return that would have been necessary each year to equal the investment’s actual cumulative performance (including change in NAV or offer price and reinvested dividends and capital gains distributions, if any) over the time period being considered.
Average Effective Maturity: The average of the number of years to maturity of the bonds in a Fund’s portfolio, computed by weighting each bond’s time to maturity (the date the security comes due) by the market value of the security. This figure does not account for the likelihood of prepayments or the exercise of call provisions unless an escrow account has been established to redeem the bond before maturity. The market value weighting for an investment in an inverse floating rate security is the value of the portfolio’s residual interest in the inverse floating rate trust, and does not include the value of the floating rate securities issued by the trust.
Average Duration: Duration is a measure of the expected period over which a bond’s principal and interest will be paid, and consequently is a measure of the sensitivity of a bond’s (or bond fund’s) value to changes when market interest rates change. Generally, the longer a bond or Fund’s duration, the more the price of the bond or Fund will change as interest rates change.
Dividend Yield (also known as Market Yield or Current Yield): An investment’s current annualized dividend divided by its current offering price.
Inverse Floaters: Inverse floating rate securities are created by depositing a municipal bond, typically with a fixed interest rate, into a special purpose trust created by a broker-dealer. This trust, in turn, (a) issues floating rate certificates typically paying short-term tax-exempt interest rates to third parties in amounts equal to some fraction of the deposited bond’s par amount or market value, and (b) issues an inverse floating rate certificate (sometimes referred to as an “inverse floater”) to an investor (such as a Fund) interested in gaining investment exposure to a long-term municipal bond. The income received by the holder of the inverse floater varies inversely with the short-term rate paid to the floating rate certificates’ holders, and in most circumstances the holder of the inverse floater bears substantially all of the underlying bond’s downside investment risk. The holder of the inverse floater typically also benefits disproportionately from any potential appreciation of the underlying bond’s value. Hence, an inverse floater essentially represents an investment in the underlying bond on a leveraged basis.
Net Asset Value (NAV): A Fund’s NAV is the dollar value of one share in the Fund. It is calculated by subtracting the liabilities of the Fund from its total assets and then dividing the remainder by the number of shares outstanding. Fund NAVs are calculated at the end of each business day.
SEC 30-Day Yield: A standardized measure of a Fund’s yield that accounts for the future amortization of premiums or discounts of bonds held in the Fund’s portfolio.
Taxable-Equivalent Yield: The yield necessary from a fully taxable investment to equal, on an after-tax basis at a specified assumed tax rate, the yield of a municipal bond investment.
Zero Coupon Bond: A zero coupon bond does not pay a regular interest coupon to its holders during the life of the bond. Tax-exempt income to the holder of the bond comes from accretion of the difference between the original purchase price of the bond at issuance and the par value of the bond at maturity and is effectively paid at maturity. The market prices of zero coupon bonds generally are more volatile than the market prices of bonds that pay interest periodically.
| 40 | Nuveen Investments |
Fund Information
Fund Manager
Nuveen Asset Management
333 West Wacker Drive
Chicago, IL 60606
Legal Counsel
Chapman and Cutler LLP
Chicago, IL
Independent Registered Public Accounting Firm
PricewaterhouseCoopers LLP
Chicago, IL
Custodian
State Street Bank & Trust Company
Boston, MA
Transfer Agent and Shareholder Services
Boston Financial
Data Services, Inc.
Nuveen Investor Services
P.O. Box 8530
Boston, MA 02266-8530
(800) 257-8787
Quarterly Portfolio of Investments and Proxy Voting Information: You may obtain (i) each Fund’s quarterly portfolio of investments, (ii) information regarding how the Funds voted proxies relating to portfolio securities held during the most recent twelve-month period ended June 30, 2009, and (iii) a description of the policies and procedures that the Funds used to determine how to vote proxies relating to portfolio securities without charge, upon request, by calling Nuveen Investments at (800) 257-8787 or on Nuveen’s website at www.nuveen.com.
You may also obtain this and other Fund information directly from the Securities and Exchange Commission (“SEC”). The SEC may charge a copying fee for this information. Visit the SEC on-line at http://www.sec.gov or in person at the SEC’s Public Reference Room in Washington, D.C. Call the SEC at (202) 942-8090 for room hours and operation. You may also request Fund information by sending an e-mail request to publicinfo@sec.gov or by writing to the SEC’s Public Reference Section at 100 F Street NE, Washington, D.C. 20549.
The Financial Industry Regulatory Authority (FINRA) provides a Public Disclosure Program which supplies certain information regarding the disciplinary history of FINRA members and their associated persons in response to either telephone inquiries at (800) 289-9999 or written inquiries at www.finra.org. Financial Industry Regulatory Authority also provides an investor brochure that includes information describing the Public Disclosure Program.
| Nuveen Investments | 41 |
Nuveen Investments:
Serving Investors For Generations
Since 1898, financial advisors and their clients have relied on Nuveen Investments to provide dependable investment solutions. Over this time, Nuveen Investments has adhered to the belief that the best approach to investing is to apply conservative risk-management principles to help minimize volatility.
Building on this tradition, we today offer a range of high quality equity and fixed-income solutions that can be integral parts of a well-diversified core portfolio. Our clients have come to appreciate this diversity, as well as our continued adherence to proven, long-term investing principles.
We offer many different investing solutions
for our clients’ different needs.
Nuveen Investments is a global investment management firm that seeks to help secure the long-term goals of institutions and high net worth investors as well as the consultants and financial advisors who serve them. Nuveen Investments markets its growing range of specialized investment solutions under the high-quality brands of HydePark, NWQ, Nuveen, Santa Barbara, Symphony, Tradewinds and Winslow Capital. In total, the Company managed $128 billion of assets on June 30, 2009.
Find out how we can help you reach your financial goals.
An investor should carefully consider the Fund’s objectives, risks, charges and expenses before investing. For a prospectus containing this and other information about the Fund, please contact your financial advisor or Nuveen Investments at (800) 257-8787. Read the prospectus carefully before you invest or send money.
Learn more about Nuveen Funds at www.nuveen.com/mf
| • | Share prices |
| • | Fund details |
| • | Daily financial news |
| • | Investor education |
Distributed by Nuveen Investments, LLC 333 West Wacker Drive Chicago, IL 60606 www.nuveen.com |
MSA-MA-0809D
Item 2. Code of Ethics.
Not applicable to this filing.
Item 3. Audit Committee Financial Expert.
Not applicable to this filing.
Item 4. Principal Accountant Fees and Services.
Not applicable to this filing.
Item 5. Audit Committee of Listed Registrants.
Not applicable to this registrant.
Item 6. Schedule of Investments.
| (a) | See Portfolio of Investments in Item 1. |
| (b) | Not applicable. |
Item 7. Disclosure of Proxy Voting Policies and Procedures for Closed-End Management Investment Companies.
Not applicable to this registrant.
Item 8. Portfolio Managers of Closed-End Management Investment Companies.
Not applicable to this registrant.
Item 9. Purchases of Equity Securities by Closed-End Management Investment Company and Affiliated Purchasers.
Not applicable to this registrant.
Item 10. Submission of Matters to a Vote of Security Holders.
There have been no material changes to the procedures by which shareholders may recommend nominees to the registrant’s Board implemented after the registrant last provided disclosure in response to this Item.
Item 11. Controls and Procedures.
| (a) | The registrant’s principal executive and principal financial officers, or persons performing similar functions, have concluded that the registrant’s disclosure controls and procedures (as defined in Rule 30a-3(c) under the Investment Company Act of 1940, as amended (the “1940 Act”) (17 CFR 270.30a-3(c))) are effective, as of a date within 90 days of the filing date of this report that includes the disclosure required by this paragraph, based on their evaluation of the controls and procedures required by Rule 30a-3(b) under the 1940 Act (17 CFR 270.30a-3(b)) and Rules 13a-15(b) or 15d-15(b) under the Securities Exchange Act of 1934, as amended (the “Exchange Act”) (17 CFR 240.13a-15(b) or 240.15d-15(b)). |
| (b) | There were no changes in the registrant’s internal control over financial reporting (as defined in Rule 30a-3(d) under the 1940 Act (17 CFR 270.30a-3(d)) that occurred during the second fiscal quarter of the period covered by this report that has materially affected, or is reasonably likely to materially affect, the registrant’s internal control over financial reporting. |
Item 12. Exhibits.
File the exhibits listed below as part of this Form.
(a)(1) Any code of ethics, or amendment thereto, that is the subject of the disclosure required by Item 2, to the extent that the registrant intends to satisfy the Item 2 requirements through filing of an exhibit: Not applicable to this filing.
(a)(2) A separate certification for each principal executive officer and principal financial officer of the registrant as required by Rule 30a-2(a) under the 1940 Act (17 CFR 270.30a-2(a)) in the exact form set forth below: See EX-99.CERT attached hereto.
(a)(3) Any written solicitation to purchase securities under Rule 23c-1 under the 1940 Act (17 CFR 270.23c-1) sent or given during the period covered by the report by or on behalf of the registrant to 10 or more persons: Not applicable to this registrant.
(b) If the report is filed under Section 13(a) or 15(d) of the Exchange Act, provide the certifications required by Rule 30a-2(b) under the 1940 Act (17 CFR 270.30a-2(b)), Rule 13a-14(b) or Rule 15d-14(b) under the Exchange Act (17 CFR 240.13a-14(b) or 240.15d-14(b)), and Section 1350 of Chapter 63 of Title 18 of the United States Code (18 U.S.C. 1350) as an Exhibit. A certification furnished pursuant to this paragraph will not be deemed “filed” for purposes of Section 18 of the Exchange Act (15 U.S.C. 78r), or otherwise subject to the liability of that section. Such certification will not be deemed to be incorporated by reference into any filing under the Securities Act of 1933 or the Exchange Act, except to the extent that the registration specifically incorporates it by reference: See EX-99.906 CERT attached hereto.
SIGNATURES
Pursuant to the requirements of the Securities Exchange Act of 1934 and the Investment Company Act of 1940, the registrant has duly caused this report to be signed on its behalf by the undersigned, thereunto duly authorized.
(Registrant) Nuveen Multistate Trust II
| By | (Signature and Title) | /s/ Kevin J. McCarthy | ||||
Kevin J. McCarthy Vice President and Secretary |
Date November 6, 2009
Pursuant to the requirements of the Securities Exchange Act of 1934 and the Investment Company Act of 1940, this report has been signed below by the following persons on behalf of the registrant and in the capacities and on the dates indicated.
| By | (Signature and Title) | /s/ Gifford R. Zimmerman | ||||
Gifford R. Zimmerman Chief Administrative Officer (principal executive officer) |
Date November 6, 2009
| By | (Signature and Title) | /s/ Stephen D. Foy | ||||
Stephen D. Foy Vice President and Controller (principal financial officer) |
Date November 6, 2009