UNITED STATES
SECURITIES AND EXCHANGE COMMISSION
Washington, D.C. 20549
FORM N-CSR
CERTIFIED SHAREHOLDER REPORT OF REGISTERED MANAGEMENT
INVESTMENT COMPANIES
Investment Company Act file number 811-07755
Nuveen Multistate Trust II
(Exact name of registrant as specified in charter)
Nuveen Investments
333 West Wacker Drive Chicago, IL 60606
(Address of principal executive offices) (Zip code)
Kevin J. McCarthy
Nuveen Investments
333 West Wacker Drive Chicago, IL 60606
(Name and address of agent for service)
Registrant’s telephone number, including area code: (312) 917-7700
Date of fiscal year end: February 28
Date of reporting period: August 31, 2011
Form N-CSR is to be used by management investment companies to file reports with the Commission not later than 10 days after the transmission to stockholders of any report that is required to be transmitted to stockholders under Rule 30e-1 under the Investment Company Act of 1940 (17 CFR 270.30e-1). The Commission may use the information provided on Form N-CSR in its regulatory, disclosure review, inspection, and policy making roles.
A registrant is required to disclose the information specified by Form N-CSR, and the Commission will make this information public. A registrant is not required to respond to the collection of information contained in Form N-CSR unless the Form displays a currently valid Office of Management and Budget (“OMB”) control number. Please direct comments concerning the accuracy of the information collection burden estimate and any suggestions for reducing the burden to Secretary, Securities and Exchange Commission, 450 Fifth Street, NW, Washington, DC 20549-0609. The OMB has reviewed this collection of information under the clearance requirements of 44 U.S.C. ss.3507.
Item 1. Reports to Stockholders.

Mutual Funds
Nuveen Municipal Bond Funds
Dependable, tax-free income because it’s not what you earn, it’s what you keep.®
Semi-Annual Report
August 31, 2011
| Share Class / Ticker Symbol | ||||||||
| Fund Name | Class A | Class B | Class C | Class I | ||||
Nuveen California High Yield Municipal Bond Fund | NCHAX | — | NCHCX | NCHRX | ||||
Nuveen California Municipal Bond Fund | NCAAX | NCBBX | NCACX | NCSPX | ||||
Nuveen California Municipal Bond Fund 2 (formerly Nuveen California Insured Municipal Bond Fund) | NCAIX | NCABX | NCAKX | NCIBX | ||||
LIFE IS COMPLEX.
Nuveen makes things e-simple.
It only takes a minute to sign up for e-Reports. Once enrolled, you’ll receive an e-mail as soon as your Nuveen Fund information is ready. No more waiting for delivery by regular mail. Just click on the link within the e-mail to see the report and save it on your computer if you wish.
Free e-Reports right to your e-mail!
www.investordelivery.com
If you receive your Nuveen Fund dividends and statements from your financial advisor or brokerage account.
OR
www.nuveen.com/accountaccess
If you receive your Nuveen Fund dividends and statements directly from Nuveen.
| Must be preceded by or accompanied by a prospectus. | NOT FDIC INSURED | MAY LOSE VALUE | NO BANK GUARANTEE |
| 4 | ||||
| 5 | ||||
| 11 | ||||
| 15 | ||||
| 16 | ||||
| 17 | ||||
| 19 | ||||
| 39 | ||||
| 40 | ||||
| 41 | ||||
| 42 | ||||
| 48 | ||||
| 59 | ||||
| 66 | ||||
| 67 | ||||
Letter to Shareholders

Dear Shareholders,
The global economy continues to be weighed down by an unusual combination of pressures facing the larger developed economies. Japanese leaders continue to work through the economic aftereffects of the March 2011 earthquake and tsunami. Political leaders in Europe and the U.S. have resolved some of the near term fiscal problems, but the financial markets are not convinced that these leaders are able to address more complex longer term fiscal issues. Despite improved earnings and capital increases, the largest banks in these countries continue to be vulnerable to deteriorating mortgage portfolios and sovereign credit exposure, adding another source of uncertainty to the global financial system.
In the U.S., recent economic statistics indicate that the economic recovery may be losing momentum. Consumption, which represents about 70% of the gross domestic product, faces an array of challenges from seemingly intractable declines in housing values, increased energy costs and limited growth in the job market. The failure of Congress and the administration to agree on the debt ceiling increase on a timely basis and the deep divisions between the political parties over fashioning a balanced program to address growing fiscal imbalances that led to the recent S&P ratings downgrade add considerable uncertainty to the domestic economic picture.
On a more positive note, corporate earnings continue to hold up well and the municipal bond market is recovering from recent weakness as states and municipalities implement various programs to reduce their budgetary deficits. In addition, the Federal Reserve System has made it clear that it stands ready to take additional steps should the economic recovery falter. However, there are concerns that the Fed is approaching the limits of its resources to intervene in the economy.
These perplexing times highlight the importance of professional investment management. Your Nuveen investment team is working hard to develop an appropriate response to increased risk, and they continue to seek out opportunities created by stressful markets using proven investment disciplines designed to help your Fund achieve its investment objectives. On your behalf, we monitor their activities to assure that they maintain their investment disciplines.
As always, I encourage you to contact your financial consultant if you have any questions about your investment in a Nuveen Fund. On behalf of the other members of your Fund Board, we look forward to continuing to earn your trust in the months and years ahead.
Sincerely,

Robert P. Bremner
Chairman of the Board
October 21, 2011
| 4 | Nuveen Investments |
Certain statements in this report are forward-looking statements. Discussions of specific investments are for illustration only and are not intended as recommendations of individual investments. The forward-looking statements and other views expressed herein are those of the portfolio managers as of the date of this report. Actual future results or occurrences may differ significantly from those anticipated in any forward-looking statements, and the views expressed herein are subject to change at any time, due to numerous market and other factors. The Funds disclaim any obligation to update publicly or revise any forward-looking statements or views expressed herein.
Ratings shown are the highest rating given by one of the following national rating agencies: Standard & Poor’s Group, Moody’s Investor Services, Inc. or Fitch, Inc. Credit ratings are subject to change. AAA, AA, A, and BBB are investment grade ratings; BB, B, CCC, CC, C and D are below-investment grade ratings. Bonds backed by U.S. Government or agency securities are given an implied rating equal to the rating of such securities. Holdings designated N/R are not rated by a national rating agency.
Portfolio managers John Miller and Scott Romans examine key investment strategies and the Funds’ performance during the six months ending August 31, 2011. John has 18 years of investment experience and has managed the Nuveen California High Yield Municipal Bond Fund since its inception in 2006. Scott has eleven years of investment experience and has managed the Nuveen California Municipal Bond Fund since 2003 and the Nuveen California Municipal Bond Fund 2 (formerly the Nuveen California Insured Municipal Bond Fund) since 2005.
How did the Funds perform during the six-month reporting period ending August 31, 2011?
The tables in the Fund Performance and Expense Ratios section of this report provide total return performance information for the six-month, one-year, five-year, ten-year and since inception periods ending August 31, 2011. Each Fund’s Class A Share total returns at net asset value (NAV) are compared with the performance of the California-specific and National Standard & Poor’s (S&P) Municipal Bond Indexes and the corresponding Lipper peer fund average. Over the six-month period, all three Funds outpaced the National S&P Index by varying degrees. Meanwhile, the Nuveen California High Yield Municipal Bond Fund also beat the S&P California Municipal Bond Index, the S&P High Yield Municipal Bond Index and its Lipper average by very wide margins. The Nuveen California Municipal Bond Fund surpassed the S&P California Municipal Bond Index and its Lipper peer group average, while the Nuveen California Municipal Bond Fund 2 trailed both of these measures.
During this reporting period, tax-exempt bonds benefited from a favorable investment environment, as this time span began just a few weeks after the municipal market bottomed after a deep downturn in late 2010 and early 2011. In addition, the Funds were helped by their emphasis on California-based securities — the state outperformed the national municipal market as a whole, thanks to an improved fiscal picture and significantly constrained supply that pushed bond prices upward. During the six months ending August 31, 2011, municipal bond issuance totaled roughly $135 billion nationwide, a 34% year-over-year decline. In comparison, new supply of California tax-exempt debt was about $19 billion during the same time span, reflecting a 37% year-over-year drop.
Nuveen California High Yield Municipal Bond Fund
As noted above, the Fund’s Class A Shares at NAV outpaced the national high-yield municipal bond market by a very wide margin. One notably helpful influence was the portfolio’s longer-than-average duration, meaning that it was more sensitive to changes in interest rates than the national index. The decline in rates fueled the tax-exempt bond market’s strong rally. As rates fall, bond prices generally rise, so the Fund’s performance
| Nuveen Investments | 5 |
was aided to a great extent by its relatively high sensitivity to interest rate movement. Similarly, as a high-yield portfolio, we were able to offer our shareholders a relatively high level of income, which can be especially valuable to investors seeking additional yield in such a low-interest-rate environment. Both of these factors contributed nicely to the Fund’s positive performance.
In addition, a number of the best-performing positions were higher-rated bonds that enjoyed healthy price growth during the period as municipal bond investors’ sentiment seemingly improved. Some of these higher-rated securities had been among the Fund’s biggest underperformers prior to the period. For example, we owned AA-rated hospital bonds issued by Sutter Health, a dominant health care provider in Northern California. These bonds had seen sizeable price depreciation during the market’s downturn in December 2010 and January 2011, but they made a nice recovery that boosted the Fund’s return. Other high-quality bonds that enjoyed similar price increases included securities issued for the Los Angeles International Airport, the University of Southern California and Bay Area Rapid Transit.
The Fund was also supported by relative price improvement among lower-rated, higher-yielding securities, including BBB-rated Children’s Hospital of Los Angeles bonds, whose financial position we believed was sound given the institution’s large endowment, fundraising capabilities and essential-service function. The portfolio also saw strong performance from bonds issued by the Drew School. Although these securities were unrated by major rating agencies, we conducted our own research and concluded the issuer was fundamentally solid and offered a very favorable risk/reward tradeoff. In fact, as market conditions improved, these bonds enjoyed very good price appreciation.
Nuveen California Municipal Bond Fund and Nuveen California Municipal Bond Fund 2
As noted, the Class A Shares at NAV of the Nuveen California Municipal Bond Fund outpaced the comparative indexes during the six-month reporting period ending August 31, 2011, while the Class A Shares at NAV of the Nuveen California Municipal Bond Fund 2 beat the national index and lagged the state index and Lipper peer group average.
The strongest positive contribution to the Funds’ results came from their interest-rate positioning. Due to the portfolios’ longer durations than the national index, the Funds’ performance was rewarded when municipal bond prices rose in response to falling interest rates. Yield curve positioning further added to results in relative terms. The California Municipal Bond Fund had less exposure to bonds with relatively short maturities, which proved helpful given the outperformance of longer-dated securities. While the Fund had good representation among longer-duration bonds, its slight underweighting in the longest bonds on the yield curve partially offset what was otherwise a very good performance story. Duration was a universally positive performance factor for the California Municipal Bond Fund 2, as the portfolio was both substantially underweighted in very-short-maturity bonds and overweighted on the long end of the yield curve.
To a lesser extent, sector positioning also proved helpful. An overweighting in the health care sector was a plus for both Funds, as California health care securities performed well
| 6 | Nuveen Investments |
compared to the rest of the tax-exempt bond market. Both Funds benefited from underweighting pre-refunded bonds, given that these very-short-duration, very-high-quality securities did not fare as well as bonds with longer maturities and lower credit ratings in an environment of decreased investor risk aversion. A modest overweighting in outperforming California tobacco-securitization bonds was helpful for the California Municipal Bond Fund’s performance, but the California Municipal Bond Fund 2 was underweighted in tobacco bonds for most of the period, which hampered this portfolio’s relative performance. On the other hand, a modest drawback for the California Municipal Bond Fund was the portfolio’s relative underweighting in local general obligation (GO) bonds. In California, local GOs are primarily school district bonds, and recently they have been zero-coupon bonds, which are very sensitive to interest-rate changes. As prices rallied during the period, this category disproportionately outperformed the municipal bond market as a whole. Being underweighted here was a disappointment for the California Municipal Bond Fund’s performance, while the California Municipal Bond Fund 2 was at an advantage by being overweighted in this category.
What strategies were used to manage the Funds during the six-month period?
Nuveen California High Yield Municipal Bond Fund
The Fund’s investment objective is to provide high current income exempt from regular federal, California state and, in some cases, California local income taxes. The Fund seeks to purchase below investment grade or medium to lower rated, high-yielding municipal bonds that offer attractive value in terms of current yields, prices, credit quality, liquidity or future prospects.
The Fund was fortunate to receive a moderate level of investment inflows during the period. This situation worked to the portfolio’s benefit because it enabled us to add new securities at a time when we saw some good investment opportunities at attractive prices in the tax-exempt municipal marketplace. With these inflows, we were able to buy bonds we believed could provide significant long-term value.
We invested a large portion of the Fund’s incoming assets into newly issued redevelopment district bonds, which raise tax-exempt money for community development projects. As we discussed in our last report to shareholders six months ago, redevelopment bonds were commonplace in California until recently, when their continued existence was put into question by an early proposal for a state budget resolution that called for their elimination. Although there was great confusion in the marketplace about the potential impact on bonds issued by these agencies, we viewed the development as a credit positive. As new issues were brought to market, we took advantage of their wider spreads and attractive structures. In all, we bought about a dozen redevelopment district bond issues for the portfolio — both new issues and from the secondary municipal bond market — and believed they provided the potential to help the Fund’s shareholders over the long term.
The rest of our new additions to the portfolio focused on “essential service” bonds, which we often favor because we believe these securities benefit from their vital nature to the communities they serve. Recent purchases included a variety of non-rated issues in health
| Nuveen Investments | 7 |
care, charter schools and community facilities districts that we believed represented good value at a reasonable amount of risk. The Fund also utilized derivatives (forward interest rate swaps) to reduce price volatility risk to movement in U.S. interest rates relative to the Fund’s benchmarks. During this period, the derivatives functioned as intended, and we continued to use these derivatives at the end of the period.
Nuveen California Municipal Bond Fund and Nuveen California Municipal Bond Fund 2
Effective as of the close of business on April 27, 2011, the Nuveen California Municipal Bond Fund 2 closed to new investors. Investors in the Fund as of that date may continue to invest in the Fund, including through the reinvestment of dividends and capital gains distributions.
In addition, effective May 31, 2011:
| • | The Fund is no longer required to invest at least 80% of its net assets in municipal securities that are covered by insurance guaranteeing the timely payment of principal and interest thereon. The Fund continues to be subject to the requirement that it invest at least 80% of its net assets in municipal bonds that pay interest that is exempt from regular federal and California personal income tax. |
| • | The Fund’s name changed from Nuveen California Insured Municipal Bond Fund. |
The Funds invest primarily in investment-grade municipal bonds in an effort to provide interest income exempt from regular federal, California state and, in some cases, California local income taxes.
New purchases for the Nuveen California Municipal Bond Fund and the Nuveen California Municipal Bond Fund 2 were relatively few during the period, reflecting both the limited supply in the municipal bond market and the low-interest-rate environment. These factors made it unattractive to try to restructure the portfolio, given that the bonds available for purchase were generally less desirable than the bonds we already owned in the portfolios. For the most part, our recent purchases were opportunistic in nature, occurring when we believed we had uncovered individual bond issues that gave the portfolio an unusual degree of value relative to the securities’ underlying risk. In the California Municipal Bond Fund, for example, we added to the portfolio’s exposure to health care and charter school bonds that we felt were favorable, as well as a non-rated charter school bond issue and a special-taxing-district bond issue we thought offered good value. Meanwhile, in the portfolio of the California Municipal Bond Fund 2, we took advantage of the Fund’s broadened ability to invest in non-insured municipal debt to add a position in California tobacco-securitization bonds that we were unable to own previously. We also bought a special-taxing district bond issue and a highly rated community college district local GO bond.
One unique opportunity that surfaced during the period was among redevelopment district bonds, in which we invested to the extent possible in both Funds. As mentioned earlier, in the Nuveen High Yield California Municipal Bond Fund, unusual circumstances led to a significant number of tax-exempt bond deals from redevelopment districts, which had previously been a popular source of issuance in California but whose future was put in doubt by a budget proposal that called for the elimination of redevelopment agencies. Because of this uncertainty, new issue supply came with wider spreads (and more
| 8 | Nuveen Investments |
attractive prices) relative to comparable AAA-rated tax-exempt bonds. Our ability to purchase these bonds was somewhat constrained by the fact that most of these deals were relatively small. Since we viewed the changes in this sector as broadly positive for redevelopment district bonds, we did find a lot of value in these types of bonds, given their high level of income, attractive structures (with ten years of call protection) and, we believe, substantial upside potential.
To fund our purchases for the California Municipal Bond Fund portfolio, we relied primarily on the proceeds of called bonds, as well as the sale of some very-short-maturity bonds that had strong demand in the marketplace and would have soon been leaving the portfolio anyway. Another approach was to realize profits on some of the bonds we bought at extremely low prices during the municipal bond market’s downturn in 2008 and 2009, as they now had achieved what we believed was their fair value and therefore had modest prospects for further appreciation.
Selling activity was somewhat more robust in the California Municipal Bond Fund 2 portfolio. In addition to utilizing the proceeds of called bonds and sales of short-maturity issues , we sold insured AA-rated and A-rated bonds whose outlook we saw as more limited than other opportunities available in the marketplace.
Risk Considerations
Mutual fund investing involves risk; principal loss is possible. Debt or fixed income securities are subject to credit risk and interest rate risk. The value of, and income generated by debt securities will decrease or increase based on changes in market interest rates. As interest rates rise, bond prices fall. Credit risk refers to an issuer’s ability to make interest and principal payments when due. Below investment grade bonds carry heightened credit risk and potential for default.
Dividend Information
All of the share classes of Nuveen California High Yield Municipal Bond Fund and Nuveen California Municipal Bond Fund 2 saw an increase in their monthly dividend in March 2011. Nuveen California Municipal Bond Fund had a dividend increase in Class B Shares in March 2011 and had an additional increase in all share classes in June 2011. There were no other dividend changes to any of the Funds’ share classes during the six-month period ending August 31, 2011.
Each Fund seeks to pay dividends at a rate that reflects the past and projected performance of the Fund. To permit a Fund to maintain a more stable monthly dividend, the Fund may pay dividends at a rate that may be more or less than the amount of net investment income actually earned by the Fund during the period. If the Fund has cumulatively earned more than it has paid in dividends, it will hold the excess in reserve as undistributed net investment income (UNII) as part of the Fund’s net asset value. Conversely, if the Fund has cumulatively paid in dividends more than it has earned, the excess will constitute a negative UNII that will likewise be reflected in the Fund’s net asset value. Each Fund will, over time, pay all its net investment income as dividends to shareholders. As of August 31, 2011, all three Funds had a positive UNII balances, based upon our best estimate, for tax purposes and a positive UNII balance for financial reporting purposes.
| Nuveen Investments | 9 |
[THIS PAGE INTENTIONALLY LEFT BLANK]
| 10 | Nuveen Investments |
Fund Performance and Expense Ratios (Unaudited)
The Fund Performance and Expense Ratios for each Fund are shown on the following three pages.
Returns quoted represent past performance, which is no guarantee of future results. Current performance may be higher or lower than the performance shown. Investment returns and principal value will fluctuate so that when shares are redeemed, they may be worth more or less than their original cost. Returns without sales charges would be lower if the sales charge were included. Returns do not reflect the deduction of taxes that a shareholder would pay on Fund distributions or the redemption of Fund shares. Income is generally exempt from regular federal income taxes. Some income may be subject to state and local income taxes and to the federal alternative minimum tax. Capital gains, if any, are subject to tax.
Returns may reflect a contractual agreement between certain Funds and the investment adviser to waive certain fees and expenses; see Notes to Financial Statements, Footnote 7 — Management Fees and Other Transactions with Affiliates for more information. In addition, returns may reflect a voluntary expense limitation by the Funds’ investment adviser that may be modified or discontinued at any time without notice. For the most recent month-end performance visit www.nuveen.com or call (800) 257-8787.
Returns reflect differences in sales charges and expenses, which are primarily differences in distribution and service fees. Fund returns assume reinvestment of dividends and capital gains.
Comparative index and Lipper return information is provided for the Funds’ Class A Shares at net asset value (NAV) only.
The expense ratios shown reflect the Funds’ total operating expenses (before fee waivers or expense reimbursements, if any) as shown in the Funds’ most recent prospectus. The expense ratios include management fees and other fees and expenses.
| Nuveen Investments | 11 |
Fund Performance and Expense Ratios (Unaudited) (continued)
Nuveen California High Yield Municipal Bond Fund
Refer to the first page of this Fund Performance and Expense Ratios section for further explanation of the information included within this page.
Fund Performance
Average Annual Total Returns as of August 31, 2011*
| Cumulative | Average Annual | |||||||||||||||
| 6-Month | 1-Year | 5-Year | Since Inception* | |||||||||||||
Class A Shares at NAV | 11.06% | 0.77% | 0.64% | 1.31% | ||||||||||||
Class A Shares at maximum Offering Price | 6.43% | -3.49% | -0.22% | 0.51% | ||||||||||||
Standard & Poor’s (S&P) California Municipal Bond Index** | 7.33% | 2.68% | 4.39% | 4.60% | ||||||||||||
Standard & Poor’s (S&P) High Yield Municipal Bond Index** | 7.15% | 3.03% | 2.24% | 2.84% | ||||||||||||
Standard & Poor’s (S&P) National Municipal Bond Index** | 6.56% | 2.62% | 4.60% | 4.93% | ||||||||||||
Lipper California Municipal Debt Classification Average** | 7.44% | 1.30% | 3.09% | 3.27% | ||||||||||||
Class C Shares | 10.79% | 0.27% | 0.11% | 0.76% | ||||||||||||
Class I Shares | 11.20% | 1.01% | 0.83% | 1.49% | ||||||||||||
Latest Calendar Quarter – Average Annual Total Returns as of September 30, 2011*
| Cumulative | Average Annual | |||||||||||||||
| 6-Month | 1-Year | 5-Year | Since Inception* | |||||||||||||
Class A Shares at NAV | 15.12% | 3.23% | 1.03% | 1.78% | ||||||||||||
Class A Shares at maximum Offering Price | 10.25% | -1.15% | 0.17% | 0.99% | ||||||||||||
Class C Shares | 14.84% | 2.71% | 0.49% | 1.23% | ||||||||||||
Class I Shares | 15.27% | 3.35% | 1.22% | 1.97% | ||||||||||||
Class A Shares have a maximum 4.20% sales charge (Offering Price). Class A Share purchases of $1 million or more are sold at net asset value without an up-front sales charge but may be subject to a contingent deferred sales charge (CDSC), also known as a back-end sales charge, if redeemed within eighteen months of purchase. Class C Shares have a 1% CDSC for redemptions within less than twelve months, which is not reflected in the one-year total return. Class I Shares have no sales charge and may be purchased under limited circumstances or by specified classes of investors.
Expense Ratios as of Most Recent Prospectus
| Expense Ratios | ||
Class A Shares | 0.90% | |
Class C Shares | 1.45% | |
Class I Shares | 0.70% | |
| * | Six-month returns are cumulative; all other returns are annualized. Since inception returns are from 3/28/06. |
| ** | Refer to the Glossary of Terms Used in this Report for definitions. |
| 12 | Nuveen Investments |
Nuveen California Municipal Bond Fund
Refer to the first page of this Fund Performance and Expense Ratios section for further explanation of the information included within this page.
Fund Performance
Average Annual Total Returns as of August 31, 2011*
| Cumulative | Average Annual | |||||||||||||||
| 6-Month | 1-Year | 5-Year | 10-Year | |||||||||||||
Class A Shares at NAV | 7.82% | 2.64% | 3.68% | 4.20% | ||||||||||||
Class A Shares at maximum Offering Price | 3.34% | -1.71% | 2.79% | 3.75% | ||||||||||||
Standard & Poor’s (S&P) California Municipal Bond Index** | 7.33% | 2.68% | 4.39% | 4.81% | ||||||||||||
Standard & Poor’s (S&P) National Municipal Bond Index** | 6.56% | 2.62% | 4.60% | 4.93% | ||||||||||||
Lipper California Municipal Debt Classification Average** | 7.44% | 1.30% | 3.09% | 3.78% | ||||||||||||
Class B Shares w/o CDSC | 7.43% | 1.87% | 2.92% | 3.57% | ||||||||||||
Class B Shares w/CDSC | 2.43% | -2.05% | 2.74% | 3.57% | ||||||||||||
Class C Shares | 7.55% | 2.08% | 3.11% | 3.63% | ||||||||||||
Class I Shares | 7.93% | 2.93% | 3.90% | 4.41% | ||||||||||||
Latest Calendar Quarter – Average Annual Total Returns as of September 30, 2011*
| Cumulative | Average Annual | |||||||||||||||
| 6-Month | 1-Year | 5-Year | 10-Year | |||||||||||||
Class A Shares at NAV | 10.60% | 4.41% | 3.94% | 4.41% | ||||||||||||
Class A Shares at maximum Offering Price | 5.96% | 0.07% | 3.05% | 3.96% | ||||||||||||
Class B Shares w/o CDSC | 10.21% | 3.62% | 3.17% | 3.79% | ||||||||||||
Class B Shares w/CDSC | 5.21% | -0.36% | 3.00% | 3.79% | ||||||||||||
Class C Shares | 10.33% | 3.84% | 3.37% | 3.85% | ||||||||||||
Class I Shares | 10.60% | 4.50% | 4.14% | 4.62% | ||||||||||||
Class A Shares have a maximum 4.20% sales charge (Offering Price). Class A Share purchases of $1 million or more are sold at net asset value without an up-front sales charge but may be subject to a contingent deferred sales charge (CDSC), also known as a back-end sales charge, if redeemed within eighteen months of purchase. Class B Shares have a CDSC that begins at 5% for redemptions during the first year and declines periodically until after six years when the charge becomes 0%. Class B Shares automatically convert to Class A Shares eight years after purchase. Class C Shares have a 1% CDSC for redemptions within less than twelve months, which is not reflected in the one-year total return. Class I Shares have no sales charge and may be purchased under limited circumstances or by specified classes of investors.
Expense Ratios as of Most Recent Prospectus
| Expense Ratios | ||||
Class A Shares | 0.81% | |||
Class B Shares | 1.56% | |||
Class C Shares | 1.36% | |||
Class I Shares | 0.61% | |||
| * | Six-month returns are cumulative; all other returns are annualized. |
| ** | Refer to the Glossary of Terms Used in this Report for definitions. |
| Nuveen Investments | 13 |
Fund Performance and Expense Ratios (Unaudited) (continued)
Nuveen California Municipal Bond Fund 2
Refer to the first page of this Fund Performance and Expense Ratios section for further explanation of the information included within this page.
Fund Performance
Average Annual Total Returns as of August 31, 2011*
| Cumulative | Average Annual | |||||||||||||||
| 6-Month | 1-Year | 5-Year | 10-Year | |||||||||||||
Class A Shares at NAV | 7.21% | 0.22% | 2.81% | 3.53% | ||||||||||||
Class A Shares at maximum Offering Price | 2.67% | -3.95% | 1.94% | 3.09% | ||||||||||||
Standard & Poor’s (S&P) California Municipal Bond Index** | 7.33% | 2.68% | 4.39% | 4.81% | ||||||||||||
Standard & Poor’s (S&P) National Municipal Bond Index** | 6.56% | 2.62% | 4.60% | 4.93% | ||||||||||||
Lipper California Municipal Debt Classification Average** | 7.44% | 1.30% | 3.09% | 3.78% | ||||||||||||
Class B Shares w/o CDSC | 6.91% | -0.51% | 2.05% | 2.91% | ||||||||||||
Class B Shares w/CDSC | 1.91% | -4.35% | 1.88% | 2.91% | ||||||||||||
Class C Shares | 6.95% | -0.34% | 2.23% | 2.96% | ||||||||||||
Class I Shares | 7.30% | 0.43% | 3.01% | 3.74% | ||||||||||||
Latest Calendar Quarter – Average Annual Total Returns as of September 30, 2011*
| Cumulative | Average Annual | |||||||||||||||
| 6-Month | 1-Year | 5-Year | 10-Year | |||||||||||||
Class A Shares at NAV | 10.44% | 2.05% | 3.02% | 3.75% | ||||||||||||
Class A Shares at maximum Offering Price | 5.79% | -2.21% | 2.13% | 3.31% | ||||||||||||
Class B Shares w/o CDSC | 10.00% | 1.29% | 2.26% | 3.12% | ||||||||||||
Class B Shares w/CDSC | 5.00% | -2.61% | 2.09% | 3.12% | ||||||||||||
Class C Shares | 10.07% | 1.49% | 2.45% | 3.18% | ||||||||||||
Class I Shares | 10.52% | 2.25% | 3.23% | 3.96% | ||||||||||||
Class A Shares have a maximum 4.20% sales charge (Offering Price). Class A Share purchases of $1 million or more are sold at net asset value without an up-front sales charge but may be subject to a contingent deferred sales charge (CDSC), also known as a back-end sales charge, if redeemed within eighteen months of purchase. Class B Shares have a CDSC that begins at 5% for redemptions during the first year and declines periodically until after six years when the charge becomes 0%. Class B Shares automatically convert to Class A Shares eight years after purchase. Class C Shares have a 1% CDSC for redemptions within less than twelve months, which is not reflected in the one-year total return. Class I Shares have no sales charge and may be purchased under limited circumstances or by specified classes of investors.
Expense Ratios as of Most Recent Prospectus
| Expense Ratios | ||||
Class A Shares | 0.83% | |||
Class B Shares | 1.58% | |||
Class C Shares | 1.38% | |||
Class I Shares | 0.63% | |||
| * | Six-month returns are cumulative; all other returns are annualized. |
| ** | Refer to the Glossary of Terms Used in this Report for definitions. |
| 14 | Nuveen Investments |
Yields (Unaudited) as of August 31, 2011
Dividend Yield is the most recent dividend per share (annualized) divided by the offering price per share.
The SEC 30-Day Yield is a standardized measure of a Fund’s yield that accounts for the future amortization of premiums or discounts of bonds held in the Fund’s portfolio. The SEC 30-Day Yield is computed under an SEC standardized formula and is based on the maximum offer price per share. Dividend Yield may differ from the SEC 30-Day Yield because the Fund may be paying out more or less than it is earning and it may not include the effect of amortization of bond premium.
The Taxable-Equivalent Yield represents the yield that must be earned on a fully taxable investment in order to equal the yield of the Fund on an after-tax basis at a specified tax rate. With respect to investments that generate qualified dividend income that is taxable at a maximum rate of 15%, the Taxable-Equivalent Yield is lower.
Nuveen California High Yield Municipal Bond Fund
| Dividend Yield | SEC 30-Day Yield | Taxable- Equivalent Yield1 | ||||||||||
Class A Shares2 | 6.25% | 6.52% | 9.98% | |||||||||
Class C Shares | 5.99% | 6.27% | 9.60% | |||||||||
Class I Shares | 6.76% | 7.01% | 10.74% | |||||||||
Nuveen California Municipal Bond Fund
| Dividend Yield | SEC 30-Day Yield | Taxable- Equivalent Yield1 | ||||||||||
Class A Shares2 | 4.50% | 4.20% | 6.43% | |||||||||
Class B Shares | 3.98% | 3.62% | 5.54% | |||||||||
Class C Shares | 4.17% | 3.86% | 5.91% | |||||||||
Class I Shares | 4.88% | 4.59% | 7.03% | |||||||||
Nuveen California Municipal Bond Fund 2
| Dividend Yield | SEC 30-Day Yield | Taxable- Equivalent Yield1 | ||||||||||
Class A Shares2 | 4.16% | 3.92% | 6.00% | |||||||||
Class B Shares | 3.61% | 3.33% | 5.10% | |||||||||
Class C Shares | 3.82% | 3.54% | 5.42% | |||||||||
Class I Shares | 4.51% | 4.29% | 6.57% | |||||||||
| 1 | The Taxable-Equivalent Yield is based on the Fund’s SEC 30-Day Yield on the indicated date and a combined federal and state income tax rate of 34.7%. |
| 2 | The SEC Yield for Class A shares quoted in the table reflects the maximum sales load. Investors paying a reduced load because of volume discounts, investors paying no load because they qualify for one of the several exclusions from the load, and existing shareholders who previously paid a load but would like to know the SEC Yield applicable to their shares on a going-forward basis, should understand that the SEC Yield effectively applicable to them would be higher than the figure quoted in the table. |
| Nuveen Investments | 15 |
Holding Summaries (Unaudited) as of August 31, 2011
This data relates to the securities held in each Fund’s portfolio of investments. It should not be construed as a measure of performance for the Fund itself.
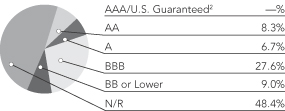
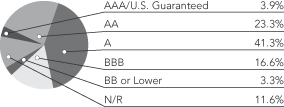
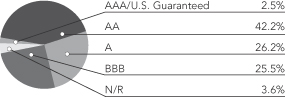
Ratings shown are the highest rating given by one of the following national rating agencies: Standard & Poor’s Group, Moody’s Investor Services, Inc. or Fitch, Inc. Credit ratings are subject to change. AAA, AA, A, and BBB are investment grade ratings; BB, B, CCC, CC, C and D are below-investment grade ratings. Bonds backed by U.S. Government or agency securities are given an implied rating equal to the rating of such securities. Holdings designated N/R are not rated by a national rating agency.
Nuveen California High Yield Municipal Bond Fund
Bond Credit Quality1
Nuveen California Municipal Bond Fund
Bond Credit Quality3
Nuveen California Municipal Bond Fund 2
Bond Credit Quality3
| Portfolio Composition1 | ||||
| Tax Obligation/Limited | 44.0% | |||
| Health Care | 13.3% | |||
| Education and Civic Organizations | 12.6% | |||
| Transportation | 8.9% | |||
| Long-Term Care | 4.6% | |||
| Consumer Staples | 4.5% | |||
| Other | 12.1% | |||
| Portfolio Composition3 | ||||
| Tax Obligation/Limited | 33.5% | |||
| Health Care | 20.0% | |||
| Tax Obligation/General | 13.3% | |||
| Utilities | 5.8% | |||
| Consumer Staples | 4.6% | |||
| Education and Civic Organizations | 4.5% | |||
| Water and Sewer | 4.5% | |||
| Other | 13.8% | |||
| Portfolio Composition3 | ||||
| Tax Obligation/Limited | 33.3% | |||
| Tax Obligation/General | 26.8% | |||
| Transportation | 8.6% | |||
| Health Care | 8.4% | |||
| Education and Civic Organizations | 6.3% | |||
| Utilities | 6.2% | |||
| Housing/Multifamily | 5.9% | |||
| Other | 4.5% | |||
| 1 | As a percentage of total investments (excluding investments in derivatives) as of August 31, 2011. Holdings are subject to change. |
| 2 | Rounds to less than 0.1%. |
| 3 | As a percentage of total investments as of August 31, 2011. Holdings are subject to change. |
| 16 | Nuveen Investments |
As a shareholder of one or more of the Funds, you incur two types of costs: (1) transaction costs, including up-front and back-end sales charges (loads) or redemption fees, where applicable; and (2) ongoing costs, including management fees; distribution and service (12b-1) fees, where applicable; and other Fund expenses. The Examples below are intended to help you understand your ongoing costs (in dollars) of investing in the Funds and to compare these costs with the ongoing costs of investing in other mutual funds.
The Examples below are based on an investment of $1,000 invested at the beginning of the period and held for the period.
The information under “Actual Performance,” together with the amount you invested, allows you to estimate actual expenses incurred over the reporting period. Simply divide your account value by $1,000 (for example, an $8,600 account value divided by $1,000 = 8.60) and multiply the result by the cost shown for your share class, in the row entitled “Expenses Incurred During Period” to estimate the expenses incurred on your account during this period.
The information under “Hypothetical Performance,” provides information about hypothetical account values and hypothetical expenses based on the respective Fund’s actual expense ratio and an assumed rate of return of 5% per year before expenses, which is not the Fund’s actual return. The hypothetical account values and expenses may not be used to estimate the actual ending account balance or expense you incurred for the period. You may use this information to compare the ongoing costs of investing in the Fund and other Funds. To do so, compare this 5% hypothetical example with the 5% hypothetical examples that appear in the shareholder reports of the other funds.
Please note that the expenses shown in the table are meant to highlight your ongoing costs only and do not reflect any transaction costs. Therefore, the hypothetical information is useful in comparing ongoing costs only, and will not help you determine the relative total costs of owning different funds or share classes. In addition, if these transaction costs were included, your costs would have been higher.
Nuveen California High Yield Municipal Bond Fund
| Hypothetical Performance | ||||||||||||||||||||||||||
| Actual Performance | (5% annualized return before expenses) | |||||||||||||||||||||||||
| A Shares | C Shares | I Shares | A Shares | C Shares | I Shares | |||||||||||||||||||||
| Beginning Account Value (3/01/11) | $ | 1,000.00 | $ | 1,000.00 | $ | 1,000.00 | $ | 1,000.00 | $ | 1,000.00 | $ | 1,000.00 | ||||||||||||||
| Ending Account Value (8/31/11) | $ | 1,110.60 | $ | 1,107.90 | $ | 1,112.00 | $ | 1,020.66 | $ | 1,017.90 | $ | 1,021.67 | ||||||||||||||
| Expenses Incurred During Period | $ | 4.72 | $ | 7.63 | $ | 3.66 | $ | 4.52 | $ | 7.30 | $ | 3.51 | ||||||||||||||
For each class of the Fund, expenses are equal to the Fund’s annualized net expense ratio of .89%, 1.44% and .69% for Classes A, C and I, respectively, multiplied by the average account value over the period, multiplied by 184/366 (to reflect the one-half year period).
Nuveen California Municipal Bond Fund
| Hypothetical Performance | ||||||||||||||||||||||||||||||||||
| Actual Performance | (5% annualized return before expenses) | |||||||||||||||||||||||||||||||||
| A Shares | B Shares | C Shares | I Shares | A Shares | B Shares | C Shares | I Shares | |||||||||||||||||||||||||||
| Beginning Account Value (3/01/11) | $ | 1,000.00 | $ | 1,000.00 | $ | 1,000.00 | $ | 1,000.00 | $ | 1,000.00 | $ | 1,000.00 | $ | 1,000.00 | $ | 1,000.00 | ||||||||||||||||||
| Ending Account Value (8/31/11) | $ | 1,078.20 | $ | 1,074.30 | $ | 1,075.50 | $ | 1,079.30 | $ | 1,021.01 | $ | 1,017.24 | $ | 1,018.25 | $ | 1,022.02 | ||||||||||||||||||
| Expenses Incurred During Period | $ | 4.28 | $ | 8.19 | $ | 7.15 | $ | 3.24 | $ | 4.17 | $ | 7.96 | $ | 6.95 | $ | 3.15 | ||||||||||||||||||
For each class of the Fund, expenses are equal to the Fund’s annualized net expense ratio of .82%, 1.57%, 1.37% and .62% for Classes A, B, C and I, respectively, multiplied by the average account value over the period, multiplied by 184/366 (to reflect the one-half year period).
| Nuveen Investments | 17 |
Expense Examples (Unaudited) (continued)
Nuveen California Municipal Bond Fund 2
| Hypothetical Performance | ||||||||||||||||||||||||||||||||||
| Actual Performance | (5% annualized return before expenses) | |||||||||||||||||||||||||||||||||
| A Shares | B Shares | C Shares | I Shares | A Shares | B Shares | C Shares | I Shares | |||||||||||||||||||||||||||
| Beginning Account Value (3/01/11) | $ | 1,000.00 | $ | 1,000.00 | $ | 1,000.00 | $ | 1,000.00 | $ | 1,000.00 | $ | 1,000.00 | $ | 1,000.00 | $ | 1,000.00 | ||||||||||||||||||
| Ending Account Value (8/31/11) | $ | 1,072.10 | $ | 1,069.10 | $ | 1,069.50 | $ | 1,073.00 | $ | 1,020.91 | $ | 1,017.14 | $ | 1,018.15 | $ | 1,021.92 | ||||||||||||||||||
| Expenses Incurred During Period | $ | 4.38 | $ | 8.27 | $ | 7.23 | $ | 3.33 | $ | 4.27 | $ | 8.06 | $ | 7.05 | $ | 3.25 | ||||||||||||||||||
For each class of the Fund, expenses are equal to the Fund’s annualized net expense ratio of .84%, 1.59%, 1.39% and .64% for Classes A, B, C and I, respectively, multiplied by the average account value over the period, multiplied by 184/366 (to reflect the one-half year period).
| 18 | Nuveen Investments |
Portfolio of Investments (Unaudited)
Nuveen California High Yield Municipal Bond Fund
August 31, 2011
| Principal Amount (000) | Description (1) | Optional Call Provisions (2) | Ratings (3) | Value | ||||||||||||||
Consumer Discretionary – 1.9% | ||||||||||||||||||
| $ | 280 | Austin Convention Enterprises Inc., Texas, Convention Center Hotel Revenue Bonds, Third Tier Series 2001C, 9.750%, 1/01/26 | 1/12 at 100.00 | N/R | $ | 283,377 | ||||||||||||
| 1,000 | Lombard Public Facilities Corporation, Illinois, First Tier Conference Center and Hotel Revenue Bonds, Series 2005A-2, 5.500%, 1/01/36 – ACA Insured | 1/16 at 100.00 | B– | 696,190 | ||||||||||||||
| 1,000 | Louisiana Local Government Environmental Facilities and Community Development Authority, Revenue Bonds, Southgate Suites Hotel LLC Project, Series 2007A, 6.750%, 12/15/37 (5), (6) | 12/17 at 100.00 | N/R | 505,320 | ||||||||||||||
| 500 | Morongo Band of Mission Indians, California, Enterprise Revenue Bonds, Series 2008B, 6.500%, 3/01/28 | 3/18 at 100.00 | N/R | 470,415 | ||||||||||||||
| 345 | Norfolk Economic Development Authority, Virginia, Empowerment Zone Facility Revenue Bonds, BBL Old Dominion University LLC Project Revenue Bonds, Series 2006B, 5.625%, 11/01/15 (Alternative Minimum Tax) | No Opt. Call | N/R | 302,617 | ||||||||||||||
| 3,125 | Total Consumer Discretionary | 2,257,919 | ||||||||||||||||
Consumer Staples – 4.5% | ||||||||||||||||||
| 1,000 | California County Tobacco Securitization Agency, Tobacco Settlement Asset-Backed Bonds, Golden Gate Tobacco Funding Corporation, Turbo, Series 2007A, 5.000%, 6/01/47 | 6/17 at 100.00 | N/R | 599,760 | ||||||||||||||
Golden State Tobacco Securitization Corporation, California, Tobacco Settlement Asset-Backed Bonds, Series 2007A-1: | ||||||||||||||||||
| 2,750 | 5.000%, 6/01/33 | 6/17 at 100.00 | Baa3 | 1,925,165 | ||||||||||||||
| 1,000 | 5.125%, 6/01/47 | 6/17 at 100.00 | Baa3 | 645,280 | ||||||||||||||
| 1,600 | 5.750%, 6/01/47 | 6/17 at 100.00 | Baa3 | 1,133,696 | ||||||||||||||
| 1,000 | Golden State Tobacco Securitization Corporation, California, Tobacco Settlement Asset-Backed Bonds, Series 2007A-2, 0.000%, 6/01/37 | 6/22 at 100.00 | BB+ | 620,020 | ||||||||||||||
Tobacco Securitization Authority of Southern California, Tobacco Settlement Asset-Backed Bonds, San Diego County Tobacco Asset Securitization Corporation, Senior Series 2001A: | ||||||||||||||||||
| 50 | 5.000%, 6/01/37 | 6/14 at 100.00 | BBB | 33,893 | ||||||||||||||
| 750 | 5.125%, 6/01/46 | 6/14 at 100.00 | BBB | 477,113 | ||||||||||||||
| 8,150 | Total Consumer Staples | 5,434,927 | ||||||||||||||||
Education and Civic Organizations – 12.6% | ||||||||||||||||||
| 1,065 | California Educational Facilities Authority, Revenue Bonds, Dominican University, Series 2006, 5.000%, 12/01/36 | 12/16 at 100.00 | Baa3 | 910,106 | ||||||||||||||
| 75 | California Educational Facilities Authority, Revenue Bonds, University of Redlands, Series 2005A, 5.000%, 10/01/35 | 10/15 at 100.00 | A3 | 70,500 | ||||||||||||||
| 1,250 | California Educational Facilities Authority, Revenue Bonds, University of Southern California, Tender Option Bond Trust 3144, | No Opt. Call | Aa1 | 1,535,050 | ||||||||||||||
| 100 | California Educational Facilities Authority, Revenue Bonds, University of the Pacific, Series 2006, 5.000%, 11/01/36 | 11/15 at 100.00 | A2 | 99,709 | ||||||||||||||
California Educational Facilities Authority, Revenue Bonds, Woodbury University, Series 2006: | ||||||||||||||||||
| 1,165 | 5.000%, 1/01/30 | 1/15 at 100.00 | Baa3 | 1,003,881 | ||||||||||||||
| 500 | 5.000%, 1/01/36 | 1/15 at 100.00 | Baa3 | 412,065 | ||||||||||||||
| 1,000 | California Municipal Finance Authority, Education Revenue Bonds, American Heritage Education Foundation Project, Series 2006A, 5.250%, 6/01/36 | 6/16 at 100.00 | BBB– | 811,430 | ||||||||||||||
| 1,335 | California Municipal Finance Authority, Educational Facilities Revenue Bonds, OCEAA Project, Series 2008A, 7.000%, 10/01/39 | No Opt. Call | N/R | 1,279,691 | ||||||||||||||
| 1,500 | California Municipal Finance Authority, Revenue Refunding Bonds, Biola University, Series 2008A, 5.875%, 10/01/34 | 4/18 at 100.00 | Baa1 | 1,506,810 | ||||||||||||||
| 1,000 | California Statewide Communitities Development Authority, Charter School Revenue Bonds, Rocketship 4 - Mosaic Elementary Charter School, | 12/21 at 100.00 | N/R | 1,005,200 | ||||||||||||||
| Nuveen Investments | 19 |
Portfolio of Investments (Unaudited)
Nuveen California High Yield Municipal Bond Fund (continued)
August 31, 2011
| Principal Amount (000) | Description (1) | Optional Call Provisions (2) | Ratings (3) | Value | ||||||||||||||
Education and Civic Organizations (continued) | ||||||||||||||||||
| $ | 750 | California Statewide Communitities Development Authority, School Facility Revenue Bonds, Alliance College-Ready Public Schools, Series 2011A, 7.000%, 7/01/46 | 7/21 at 100.00 | N/R | $ | 728,048 | ||||||||||||
| 815 | California Statewide Community Development Authority, Charter School Revenue Bonds, Rocklin Academy Charter, Series 2011A, 8.250%, 6/01/41 | 6/21 at 100.00 | BB+ | 820,787 | ||||||||||||||
| 500 | California Statewide Community Development Authority, Revenue Bonds, California Baptist University, Series 2007A, 5.500%, 11/01/38 | No Opt. Call | N/R | 424,245 | ||||||||||||||
| 2,135 | California Statewide Community Development Authority, Revenue Bonds, Drew School, Series 2007, 5.300%, 10/01/37 | 10/15 at 102.00 | N/R | 2,000,431 | ||||||||||||||
| 200 | California Statewide Community Development Authority, Revenue Bonds, International School of the Peninsula, Palo Alto, California, Series 2006, 5.000%, 11/01/29 | 11/16 at 100.00 | N/R | 162,214 | ||||||||||||||
| 400 | California Statewide Community Development Authority, Revenue Bonds, Montessori in Redlands School, Series 2007A, 5.125%, 12/01/36 | 12/16 at 100.00 | N/R | 294,808 | ||||||||||||||
| 100 | California Statewide Community Development Authority, Revenue Bonds, Viewpoint School, Series 2004, 5.000%, 10/01/28 – ACA Insured | 10/14 at 100.00 | BBB | 92,725 | ||||||||||||||
| 200 | Hawaii State Department of Budget and Finance, Private School Revenue Bonds, Montessori of Maui, Series 2007, 5.500%, 1/01/37 | 2/17 at 100.00 | N/R | 166,676 | ||||||||||||||
| 600 | La Vernia Education Financing Corporation, Texas, Charter School Revenue Bonds, Riverwalk Education Foundation, Series 2007A, 5.450%, 8/15/36 | 2/12 at 100.00 | N/R | 473,898 | ||||||||||||||
| 100 | Pima County Industrial Development Authority, Arizona, Choice Education and Development Charter School Revenue Bonds, Series 2006, 6.375%, 6/01/36 | 6/16 at 100.00 | N/R | 81,356 | ||||||||||||||
| 65 | Pima County Industrial Development Authority, Arizona, Educational Revenue Bonds, Paradise Education Center Charter School, Series 2006, 6.000%, 6/01/36 | 6/16 at 100.00 | BBB– | 56,375 | ||||||||||||||
| 390 | Pingree Grove Village, Illinois, Charter School Revenue Bonds, Cambridge Lakes Learning Center, Series 2007, 6.000%, 6/01/36 | 6/16 at 102.00 | N/R | 300,632 | ||||||||||||||
| 1,060 | San Diego County, California, Certificates of Participation, Burnham Institute, Series 2006, 5.000%, 9/01/34 | 9/15 at 102.00 | Baa3 | 900,618 | ||||||||||||||
| 16,305 | Total Education and Civic Organizations | 15,137,255 | ||||||||||||||||
Health Care – 13.4% | ||||||||||||||||||
| 50 | California Health Facilities Financing Authority, Health Facility Revenue Bonds, Adventist Health System/West, Series 2003A, 5.000%, 3/01/33 | 3/13 at 100.00 | A | 48,526 | ||||||||||||||
| 830 | California Health Facilities Financing Authority, Hospital Revenue Bonds, Downey Community Hospital, Series 1993, 5.750%, 5/15/15 (4) | 11/11 at 100.00 | N/R | 676,334 | ||||||||||||||
| 1,000 | California Municipal Financing Authority, Certificates of Participation, Community Hospitals of Central California, Series 2007, 5.250%, 2/01/27 | 2/17 at 100.00 | Baa2 | 941,480 | ||||||||||||||
| 1,000 | California Statewide Communities Development Authority, Revenue Bonds, ValleyCare Health System, Series 2007A, 5.125%, 7/15/31 | 7/17 at 100.00 | N/R | 858,680 | ||||||||||||||
| 495 | California Statewide Community Development Authority, Health Facility Revenue Bonds, Catholic Healthcare West, Series 2008A, 5.500%, 7/01/30 | 7/17 at 100.00 | A | 509,117 | ||||||||||||||
| 2,000 | California Statewide Community Development Authority, Revenue Bonds, Childrens Hospital of Los Angeles, Series 2007, 5.000%, 8/15/47 | 8/17 at 100.00 | BBB+ | 1,627,280 | ||||||||||||||
California Statewide Community Development Authority, Revenue Bonds, Daughters of Charity Health System, Series 2005A: | ||||||||||||||||||
| 750 | 5.250%, 7/01/30 | 7/15 at 100.00 | BBB | 636,668 | ||||||||||||||
| 515 | 5.250%, 7/01/35 | 7/15 at 100.00 | BBB | 421,929 | ||||||||||||||
| 495 | 5.000%, 7/01/39 | 7/15 at 100.00 | BBB | 382,531 | ||||||||||||||
| 715 | California Statewide Community Development Authority, Revenue Bonds, Sutter Health, Tender Option Bond Trust 3048, 18.112%, 11/15/32 (IF) | 5/18 at 100.00 | AA– | 670,155 | ||||||||||||||
California Statewide Community Development Authority, Revenue Bonds, Sutter Health, Tender Option Bond Trust 3102: | ||||||||||||||||||
| 375 | 18.317%, 11/15/46 (IF) | 11/16 at 100.00 | AA– | 353,089 | ||||||||||||||
| 1,285 | 18.322%, 11/15/48 (IF) | 5/18 at 100.00 | AA– | 1,204,405 | ||||||||||||||
| 20 | Nuveen Investments |
| Principal Amount (000) | Description (1) | Optional Call Provisions (2) | Ratings (3) | Value | ||||||||||||||
Health Care (continued) | ||||||||||||||||||
| $ | 1,000 | California Statewide Communities Development Authority, Revenue Bonds, Saint Joseph Health System, Trust 2554, 18.324%, 7/01/47 – AGM Insured (IF) | 7/18 at 100.00 | AA+ | $ | 1,022,040 | ||||||||||||
| 1,490 | Loma Linda, California, Hospital Revenue Bonds, Loma Linda University Medical Center, Series 2008A, 8.250%, 12/01/38 | 12/17 at 100.00 | BBB | 1,642,814 | ||||||||||||||
| 1,060 | Oak Valley Hospital District, Stanislaus County, California, Revenue Bonds, Series 2010A, 7.000%, 11/01/35 | 11/20 at 100.00 | BBB– | 1,078,486 | ||||||||||||||
| 500 | Palomar Pomerado Health Care District, California, Certificates of Participation, Series 2009, 6.750%, 11/01/39 | 11/19 at 100.00 | Baa3 | 510,045 | ||||||||||||||
| 500 | Palomar Pomerado Health Care District, California, Certificates of Participation, Series 2010, 6.000%, 11/01/41 | 11/20 at 100.00 | Baa3 | 468,945 | ||||||||||||||
| 1,000 | San Buenaventura, California, Revenue Bonds, Community Memorial Health System, Series 2011, 8.000%, 12/01/26 | 12/21 at 100.00 | BB | 1,065,330 | ||||||||||||||
| 100 | Sierra Kings Health Care District, Fresno County, California, Revenue Bonds, Series 2006A, 5.750%, 12/01/36 | 12/16 at 100.00 | N/R | 59,835 | ||||||||||||||
| 2,000 | Tulare Local Health Care District, California, Revenue Bonds, Series 2007, 5.200%, 11/01/32 | 11/17 at 100.00 | N/R | 1,811,680 | ||||||||||||||
| 60 | Weatherford Hospital Authority, Oklahoma, Sales Tax Revenue Bonds, Series 2006, 6.000%, 5/01/31 | 5/16 at 103.00 | N/R | 50,061 | ||||||||||||||
| 17,220 | Total Health Care | 16,039,430 | ||||||||||||||||
Housing/Multifamily – 4.2% | ||||||||||||||||||
| 1,400 | California Municipal Finance Authority, Mobile Home Park Revenue Bonds, Caritas Projects Series 2010B, 7.250%, 8/15/45 | 8/20 at 100.00 | N/R | 1,397,298 | ||||||||||||||
| 400 | California Municipal Finance Authority, Revenue Bonds, University Students Coop Association, Series 2007, 4.750%, 4/01/27 | 4/17 at 100.00 | BBB– | 367,284 | ||||||||||||||
| 1,000 | California Statewide Community Development Authority, Lancer Educational Student Housing Revenue Bonds, California Baptist University, Series 2007, 5.625%, 6/01/33 | 6/17 at 102.00 | N/R | 858,350 | ||||||||||||||
| 375 | California Statewide Community Development Authority, Multifamily Housing Revenue Bonds, Magnolia City Lights, Series 1999X, 6.650%, 7/01/39 | 11/11 at 100.00 | N/R | 335,651 | ||||||||||||||
| 120 | Multifamily Housing Revenue Bond Pass-Through Certificates, California, Series 2001-17, Stanford Arms Seniors Apartments 01-P2, 5.750%, 11/01/34 (Mandatory put 11/01/16) (Alternative Minimum Tax) | 12/11 at 100.00 | N/R | 120,068 | ||||||||||||||
| 1,250 | Richmond, California, Joint Powers Financing Agency Multifamily Housing Revenue Bonds, Westridge Hilltop Apartments, Series 2007, 5.000%, 12/15/33 | 12/12 at 100.00 | Baa1 | 1,026,938 | ||||||||||||||
| 734 | Ventura County Area Housing Authority, California, Mira Vista Senior Apartments Project, Junior Subordinate Series 2006C, 6.500%, 12/01/39 (Mandatory put 7/01/16) (Alternative Minimum Tax) | No Opt. Call | N/R | 675,148 | ||||||||||||||
| 485 | Wilson County Health and Educational Facilities Board, Tennessee, Senior Living Revenue Bonds, Rutland Place, Series 2007A, 6.300%, 7/01/37 (4) | 7/17 at 100.00 | N/R | 293,289 | ||||||||||||||
| 5,764 | Total Housing/Multifamily | 5,074,026 | ||||||||||||||||
Housing/Single Family – 0.7% | ||||||||||||||||||
| 500 | California Housing Finance Agency, California, Home Mortgage Revenue Bonds, Series 2007E, 4.800%, 8/01/37 (Alternative Minimum Tax) | 2/17 at 100.00 | Baa1 | 426,530 | ||||||||||||||
| 600 | California Housing Finance Agency, Home Mortgage Revenue Bonds, Tender Option Bond Trust 3206, 8.115%, 2/01/24 (Alternative Minimum Tax) (IF) | 2/16 at 100.00 | BBB | 393,816 | ||||||||||||||
| 1,100 | Total Housing/Single Family | 820,346 | ||||||||||||||||
Industrials – 0.4% | ||||||||||||||||||
| 65 | California Pollution Control Financing Authority, Solid Waste Disposal Revenue Bonds, Waste Management Inc., Series 2002A, 5.000%, 1/01/22 (Alternative Minimum Tax) | 1/16 at 102.00 | BBB | 66,146 | ||||||||||||||
| Nuveen Investments | 21 |
Portfolio of Investments (Unaudited)
Nuveen California High Yield Municipal Bond Fund (continued)
August 31, 2011
| Principal Amount (000) | Description (1) | Optional Call Provisions (2) | Ratings (3) | Value | ||||||||||||||
Industrials (continued) | ||||||||||||||||||
| $ | 1,000 | California Statewide Communities Development Authority, Revenue Bonds, EnerTech Regional Biosolids Project, Series 2007A, 5.500%, 12/01/33 (Alternative Minimum Tax) (5) | No Opt. Call | CCC+ | $ | 220,340 | ||||||||||||
| 250 | Kootenai County Industrial Development Corporation, Idaho, Industrial Development Revenue Bonds, Coer d’Alene Fiber Fuels, Inc., Series 2006, 6.750%, 12/01/26 (4), (5) | 12/16 at 100.00 | N/R | 62,125 | ||||||||||||||
| 100 | Louisiana Local Government Environmental Facilities and Community Development Authority, Carter Plantation Hotel Project Revenue Bonds, Series 2006A, 6.000%, 9/01/36 (4), (5) | 9/16 at 100.00 | N/R | 18,800 | ||||||||||||||
| 750 | Western Reserve Port Authority, Ohio, Solid Waste Facility Revenue Bonds, Central Waste Inc., Series 2007A, 6.350%, 7/01/27 (Alternative Minimum Tax) (4), (5) | 7/17 at 102.00 | N/R | 135,225 | ||||||||||||||
| 2,165 | Total Industrials | 502,636 | ||||||||||||||||
Long-Term Care – 4.6% | ||||||||||||||||||
California Municipal Finance Authority, Revenue Bonds, Harbor Regional Center Project, Series 2009: | ||||||||||||||||||
| 500 | 8.000%, 11/01/29 | 11/19 at 100.00 | Baa1 | 543,580 | ||||||||||||||
| 1,040 | 8.500%, 11/01/39 | 11/19 at 100.00 | Baa1 | 1,143,095 | ||||||||||||||
| 1,500 | California Statewide Communities Development Authority, Revenue Bonds, Inland Regional Center Project, Series 2007, 5.375%, 12/01/37 | 12/17 at 100.00 | Baa1 | 1,391,625 | ||||||||||||||
| 1,000 | California Statewide Community Development Authority, Revenue Bonds, Hollenbeck Palms, Magnolia Assisted Living, Series 2007A, 4.600%, 2/01/37 – RAAI Insured (Alternative Minimum Tax) | 2/17 at 100.00 | N/R | 736,500 | ||||||||||||||
| 1,000 | Fulton County Residential Care Facilities Authority, Georgia, Revenue Bonds, Elderly Care, Lenbrook Square Project, Series 2006A, 5.125%, 7/01/37 | 7/17 at 100.00 | N/R | 678,790 | ||||||||||||||
| 50 | Louisiana Local Government Environmental Facilities and Community Development Authority, Revenue Bonds, CDF Healthcare of Louisiana LLC, Series 2006A, 7.000%, 6/01/36 | 6/16 at 101.00 | N/R | 41,452 | ||||||||||||||
| 1,000 | San Diego County, California, Certificates of Participation, San Diego-Imperial Counties Developmental Services Foundation Project, Series 2002, 5.500%, 9/01/27 | 9/12 at 100.00 | Baa1 | 984,340 | ||||||||||||||
| 6,090 | Total Long-Term Care | 5,519,382 | ||||||||||||||||
Tax Obligation/General – 2.1% | ||||||||||||||||||
| 390 | Bessemer, Alabama, General Obligation Warrants, Series 2007, 6.500%, 2/01/37 | 2/17 at 102.00 | N/R | 276,530 | ||||||||||||||
| 725 | Guam Government, General Obligation Bonds, 2009 Series A, 7.000%, 11/15/39 | No Opt. Call | B+ | 748,563 | ||||||||||||||
| 500 | Guam, General Obligation Bonds, Series 2007A, 5.250%, 11/15/37 | 11/17 at 100.00 | B+ | 427,910 | ||||||||||||||
| 250 | Palomar Pomerado Health, California, General Obligation Bonds, Tender Option Bond Trust 4683, 16.768%, 8/01/37 – NPFG Insured (IF) (7) | 8/17 at 100.00 | AA | 247,820 | ||||||||||||||
| 2,295 | William S. Hart Union High School District, Los Angeles County, California, General Obligation Bonds, Election 2001 Series 2005B, 0.000%, 9/01/27 – AGM Insured (7) | No Opt. Call | AA+ | 854,910 | ||||||||||||||
| 4,160 | Total Tax Obligation/General | 2,555,733 | ||||||||||||||||
Tax Obligation/Limited – 44.1% | ||||||||||||||||||
| 1,000 | Azusa Redevelopment Agency, California, Tax Allocation Refunding Bonds, Merged West End Development, Series 2007B, 5.300%, 8/01/36 | No Opt. Call | N/R | 762,010 | ||||||||||||||
| 740 | Azusa, California, Special Tax Bonds, Community Facilities District 2005-1 Rosedale Improvement Area 1, Series 2007, 5.000%, 9/01/27 | 9/17 at 100.00 | N/R | 615,739 | ||||||||||||||
| 1,000 | Beaumont Financing Authority, California, Local Agency Revenue Bonds, Improvement Area 8C, Series 2007E, 6.250%, 9/01/38 | No Opt. Call | N/R | 954,950 | ||||||||||||||
Beaumont Financing Authority, California, Local Agency Revenue Bonds, Improvement Area 8D & 17B, Series 2009B: | ||||||||||||||||||
| 225 | 8.875%, 9/01/34 | 9/12 at 103.00 | N/R | 236,158 | ||||||||||||||
| 450 | 8.625%, 9/01/39 | 9/12 at 103.00 | N/R | 470,885 | ||||||||||||||
| 300 | Beaumont Financing Authority, California, Local Agency Revenue Bonds, Series 2006B, 5.050%, 9/01/37 | 9/12 at 101.00 | N/R | 239,745 | ||||||||||||||
| 22 | Nuveen Investments |
| Principal Amount (000) | Description (1) | Optional Call Provisions (2) | Ratings (3) | Value | ||||||||||||||
Tax Obligation/Limited (continued) | ||||||||||||||||||
| $ | 1,000 | Borrego Water District, California, Community Facilities District 2007-1 Montesoro, Special Tax Bonds, Series 2007, 5.750%, 8/01/32 (4), (5) | 8/17 at 102.00 | N/R | $ | 370,000 | ||||||||||||
| 1,000 | California Statewide Communities Development Authority, Recovery Zone Facility Bonds, SunEdison Huntington Beach Solar Projects, Series 2010, 7.500%, 1/01/31 | 1/21 at 100.00 | N/R | 1,013,350 | ||||||||||||||
| 1,415 | California Statewide Communities Development Authority, Recovery Zone Facility Bonds, SunEdison Irvine Unified School District Solar Projects, Series 2010, 7.500%, 7/01/30 | 1/20 at 100.00 | N/R | 1,432,320 | ||||||||||||||
| 250 | California Statewide Community Development Authority, Revenue Bonds, Epidaurus Project, Series 2004A, 7.750%, 3/01/34 | 3/14 at 102.00 | N/R | 251,408 | ||||||||||||||
| 800 | Chino, California, Community Facilities District 2009-1, Watson Commerce Center, Special Tax Bonds, Series 2010, 6.750%, 9/01/40 | 9/20 at 100.00 | N/R | 809,128 | ||||||||||||||
| 490 | Davis Redevelopment Agency, California, Tax Allocation Bonds, Davis Redevelopment Project, Subordinate Series 2011A, 7.000%, 12/01/36 | 12/21 at 100.00 | A+ | 530,170 | ||||||||||||||
| 100 | Eastern Municipal Water District, California, Community Facility District No 2005-38 Improvement Area A, Special Tax Bonds, Series 2006, 5.200%, 9/01/36 | 3/12 at 102.00 | N/R | 88,414 | ||||||||||||||
| 200 | El Dorado County, California, Special Tax Bonds, Blackstone Community Facilities District 2005-1, Series 2005, 5.250%, 9/01/35 | 9/14 at 102.00 | N/R | 152,052 | ||||||||||||||
| 250 | El Dorado County, California, Special Tax Bonds, Community Facilities District 2005-2, Series 2006, 5.100%, 9/01/36 | 9/14 at 102.00 | N/R | 202,308 | ||||||||||||||
Elk Grove Community Facilities District 2005-1, California, Special Tax Bonds, Series 2007: | ||||||||||||||||||
| 80 | 5.000%, 9/01/18 | 9/17 at 100.00 | N/R | 71,837 | ||||||||||||||
| 10 | 5.000%, 9/01/20 | 9/17 at 100.00 | N/R | 8,449 | ||||||||||||||
| 50 | 5.125%, 9/01/22 | No Opt. Call | N/R | 40,466 | ||||||||||||||
| 1,000 | 5.200%, 9/01/27 | 9/15 at 102.00 | N/R | 728,880 | ||||||||||||||
| 1,225 | 5.250%, 9/01/37 | 9/15 at 102.00 | N/R | 794,964 | ||||||||||||||
| 500 | Fairfield, California, Community Facilities District 2007-1 Special Tax Bonds, Fairfield Commons Project, Series 2008, 6.875%, 9/01/38 | 9/18 at 100.00 | N/R | 483,075 | ||||||||||||||
| 500 | Folsom Public Financing Authority, California, Subordinate Special Tax Revenue Bonds, Series 2007B, 5.200%, 9/01/32 | 9/17 at 100.00 | N/R | 436,955 | ||||||||||||||
| 1,000 | Fontana, California, Special Tax Bonds, Community Facilities District 31 Citrus Heights North Special Tax Bonds, Series 2006, 5.000%, 9/01/36 | 9/14 at 102.00 | N/R | 762,570 | ||||||||||||||
| 750 | Golden State Tobacco Securitization Corporation, California, Enhanced Tobacco Settlement Asset-Backed Revenue Bonds, Tender Option Bond Trust 1011, 17.391%, 6/01/45 (WI/DD, Settling 9/08/11) (IF) | 6/15 at 100.00 | A2 | 400,020 | ||||||||||||||
| 1,000 | Hawthorne, California, Special Tax Bonds, Community Facilities District 2006-1, Three Sixty Degrees @ South Bay, Series 2006, 5.000%, 9/01/36 | 9/16 at 102.00 | N/R | 687,450 | ||||||||||||||
| 1,000 | Hemet Unified School District Community Facilities District 2005-3, Riverside County, California, Special Tax Bonds, Series 2007, 5.750%, 9/01/39 | 9/12 at 101.00 | N/R | 834,720 | ||||||||||||||
| 200 | Hemet Unified School District, California, Community Facilities District 2005-1 Special Tax Bonds, Series 2006, 5.125%, 9/01/36 | 9/13 at 100.00 | N/R | 168,186 | ||||||||||||||
Hercules Redevelopment Agency, California, Tax Allocation Bonds, Merged Project Area, Series 2005: | ||||||||||||||||||
| 1,000 | 5.000%, 8/01/25 – AMBAC Insured | 8/15 at 100.00 | CCC | 676,350 | ||||||||||||||
| 500 | 4.750%, 8/01/35 – AMBAC Insured | No Opt. Call | CCC | 281,325 | ||||||||||||||
| 295 | Hesperia Unified School District, San Bernardino County, California, Community Facilities District 2006-5 Special Tax Bonds, Series 2007, 5.000%, 9/01/37 | 9/17 at 100.00 | N/R | 237,012 | ||||||||||||||
| 325 | Hesperia, California, Improvement Act of 1915, Assessment District, 91-1, Joshua West Main Street, Series 1992, 8.500%, 9/02/24 | 3/12 at 100.00 | N/R | 335,855 | ||||||||||||||
| 150 | Indio, California, Special Tax Bonds, Community Facilities District 2006-1 Sonora Wells, Series 2006, 5.050%, 9/01/26 | 9/16 at 100.00 | N/R | 129,746 | ||||||||||||||
| 120 | Irvine, California, Unified School District, Community Facilities District Special Tax Bonds, Series 2006A, 5.125%, 9/01/36 | 9/16 at 100.00 | N/R | 107,777 | ||||||||||||||
| Nuveen Investments | 23 |
Portfolio of Investments (Unaudited)
Nuveen California High Yield Municipal Bond Fund (continued)
August 31, 2011
| Principal Amount (000) | Description (1) | Optional Call Provisions (2) | Ratings (3) | Value | ||||||||||||||
Tax Obligation/Limited (continued) | ||||||||||||||||||
| $ | 1,115 | Jurupa Community Services District, California, Community Facilities District 25 Earstvale Area Special Tax Bonds, Series 2008A, 8.375%, 9/01/28 | 9/18 at 100.00 | N/R | $ | 1,230,101 | ||||||||||||
| 500 | Jurupa Community Services District, California, Special Tax Bonds, Community Facilities District 34 Eastvale Area , Series 2010A, 6.500%, 9/01/40 | 9/20 at 100.00 | N/R | 502,705 | ||||||||||||||
| 500 | Jurupa Community Services District, California, Special Tax Bonds, Community Facilities District 38 Eastvale Improvement Area 2, Series 2010A, 6.375%, 9/01/40 | 3/12 at 100.00 | N/R | 503,910 | ||||||||||||||
| 750 | Lake Elsinore Public Financing Authority, California, Local Agency Revenue Bonds, Canyon Hills Improvement Area C, Series 2010A, 6.250%, 9/01/40 | 9/12 at 103.00 | N/R | 699,848 | ||||||||||||||
| 1,000 | Lake Elsinore Public Financing Authority, California, Local Agency Revenue Bonds, Villages at Wasson Canyon, Series 2009B, 6.875%, 9/01/38 | 9/13 at 100.00 | N/R | 1,005,760 | ||||||||||||||
| 1,000 | Lake Elsinore, California, Special Tax Bonds, Community Facilities District 2005-2 Improvement Area A, Series 2005A, 5.450%, 9/01/36 | 9/12 at 102.00 | N/R | 869,550 | ||||||||||||||
| 335 | Lancaster Redevelopment Agency, California, Combined Project Areas Housing Programs, Tax Allocation Bonds, Series 2009, 6.875%, 8/01/39 | 8/19 at 100.00 | BBB+ | 339,844 | ||||||||||||||
| 1,275 | Lynwood Redevelopment Agency, California, Project A Revenue Bonds, Subordinate Lien Series 2011A, 7.250%, 9/01/38 | 9/21 at 100.00 | A– | 1,337,832 | ||||||||||||||
March Joint Powers Redevelopment Agency, California, March Air Force Base Redevelopment Project Series 2011A: | ||||||||||||||||||
| 300 | 7.250%, 8/01/31 | No Opt. Call | BBB+ | 320,988 | ||||||||||||||
| 1,000 | 7.500%, 8/01/41 | 8/21 at 100.00 | BBB+ | 1,069,920 | ||||||||||||||
| 130 | Merced, California, Community Facilities District 2005-1, Special Tax Bonds, Bellevue Ranch West, Series 2006, 5.300%, 9/01/36 | 9/12 at 103.00 | N/R | 79,238 | ||||||||||||||
| 65 | Moreno Valley Unified School District, Riverside County, California, Special Tax Bonds, Community Facilities District, Series 2006, 5.200%, 9/01/36 | 3/16 at 100.00 | N/R | 56,720 | ||||||||||||||
| 1,000 | Moreno Valley, California, Community Facilities District 5, Special Tax Bonds, Series 2007, 5.000%, 9/01/37 | 9/17 at 100.00 | N/R | 734,690 | ||||||||||||||
| 125 | Murrieta Valley Unified School District, Riverside County, California, Special Tax Bonds, Community Facilities District 2002-4, Series 2006B, 5.450%, 9/01/38 | 9/16 at 100.00 | N/R | 98,699 | ||||||||||||||
| 330 | Novato Redevelopment Agency, California, Tax Allocation Bonds, Hamilton Field Redevelopment Project, Series 2011, 6.750%, 9/01/40 | 9/21 at 100.00 | A– | 344,378 | ||||||||||||||
| 1,500 | Palm Desert, California, Community Facilities District 2005-1, University Park Special Tax Bonds, Series 2006, 5.500%, 9/01/36 | 9/16 at 100.00 | N/R | 1,148,385 | ||||||||||||||
| 1,600 | Palm Drive Health Care District, Sonoma County, California, Certificates of Participation, Parcel Tax Secured Financing Program, Series 2010, 7.500%, 4/01/35 | No Opt. Call | BB | 1,556,816 | ||||||||||||||
| 1,000 | Palm Drive Health Care District, Sonoma County, California, Parcel Tax Revenue Bonds, Series 2005, 5.250%, 4/01/30 | 4/13 at 102.00 | BB | 742,800 | ||||||||||||||
| 1,100 | Perris Public Finance Authority, California, Local Agency Revenue Bonds, Perris Vally Vistas IA3, Series 2008B, 6.625%, 9/01/38 | 9/16 at 100.00 | N/R | 1,105,324 | ||||||||||||||
| 495 | Perris Public Financing Authority, California, Local Agency Revenue Bonds, Series 2007D, 5.800%, 9/01/38 | 9/14 at 100.00 | N/R | 439,169 | ||||||||||||||
| 575 | Perris, California, Community Facilities District 2001-1 Improvement Area 5-A Special Tax Bonds, Series 2006, 5.000%, 9/01/37 | 9/12 at 101.00 | N/R | 450,127 | ||||||||||||||
| 500 | Rancho Cardova, California, Special Tax Bonds, Sunridge Anatolia Area Community Facilities District 2003-1, Series 2005, 5.500%, 9/01/37 | 9/13 at 102.00 | N/R | 430,965 | ||||||||||||||
| 1,000 | Rancho Cardova, California, Special Tax Bonds, Sunridge Park Area Community Facilities District 2004-1, Series, 6.125%, 9/01/37 | 9/17 at 100.00 | N/R | 935,460 | ||||||||||||||
| 500 | Redwood City, California, Special Tax Bonds, Community Facilities District 2010-1 One Marina, Series 2011, 7.500%, 9/01/31 | 9/16 at 103.00 | N/R | 521,010 | ||||||||||||||
| 2,000 | Riverside County Community Facilities District 05-8 Scott Road, California, Special Tax Bonds, Series 2008, 7.250%, 9/01/38 | 9/17 at 100.00 | N/R | 1,967,460 | ||||||||||||||
| 24 | Nuveen Investments |
| Principal Amount (000) | Description (1) | Optional Call Provisions (2) | Ratings (3) | Value | ||||||||||||||
Tax Obligation/Limited (continued) | ||||||||||||||||||
| $ | 710 | Riverside County Public Financing Authority, California, Tax Allocation Bonds, Multiple Projects, Series 2004, 5.000%, 10/01/35 – SYNCORA GTY Insured | 10/14 at 100.00 | BBB | $ | 590,230 | ||||||||||||
| 500 | Riverside County Redevelopment Agency, California, Interstate 215 Corridor Redevelopment Project Area Tax Allocation Bonds, Series 2010E, 6.500%, 10/01/40 | 10/20 at 100.00 | A– | 516,570 | ||||||||||||||
| 205 | Riverside County Redevelopment Agency, California, Tax Allocation Housing Bonds, Series 2011A, 7.125%, 10/01/42 | No Opt. Call | A– | 220,318 | ||||||||||||||
| 125 | Riverside Unified School District, California, Community Facilities District 24 Special Tax Bonds, Series 2006, 5.100%, 9/01/36 | 9/14 at 102.00 | N/R | 105,413 | ||||||||||||||
| 1,000 | Riverside, California, Improvement Bond Act of 1915, Special Assessment Bonds, Hunter Park Assessment District, Series 2006, 5.200%, 9/02/36 | 9/16 at 101.00 | N/R | 790,860 | ||||||||||||||
| 1,000 | Roseville Financing Authority, California, Special Tax Revenue Bonds, Refunding Series 2007B, 5.000%, 9/01/33 | 9/17 at 100.00 | N/R | 820,680 | ||||||||||||||
| 1,700 | Roseville, California, Special Tax Bonds, Community Facilities District 1 – Westpark, Series 2005, 5.200%, 9/01/36 | 9/15 at 100.00 | N/R | 1,423,206 | ||||||||||||||
| 125 | Roseville, California, Special Tax Bonds, Community Facilities District 1 Westpark, Series 2006, 5.250%, 9/01/37 | 9/16 at 100.00 | N/R | 104,971 | ||||||||||||||
| 1,800 | Roseville, California, Special Tax Bonds, Community Facilities District 1, Fiddyment Ranch, Series 2006, 5.125%, 9/01/26 | 9/16 at 100.00 | N/R | 1,625,832 | ||||||||||||||
| 1,510 | Sacramento City Financing Authority California, Lease Revenue Bonds, Master Lease Program Facilities Projects, Tender Option Bond Trust 4698, | No Opt. Call | Aa3 | 1,470,317 | ||||||||||||||
| 1,495 | Sacramento, California, Community Facilities District 05-1, College Square Special Tax Bonds, Series 2007, 5.900%, 9/01/37 | 9/17 at 100.00 | N/R | 1,283,517 | ||||||||||||||
| 461 | Saint Louis, Missouri, Tax Increment Financing Revenue Bonds, Grace Lofts Redevelopment Projects, Series 2007A, 6.000%, 3/27/26 | 12/11 at 100.00 | N/R | 378,343 | ||||||||||||||
| 100 | San Jacinto Unified School District, Riverside County, California, Community Facilities District 2006-1 Special Tax Bonds, Infrastructure Projects, Series 2006, 5.200%, 9/01/36 | 9/16 at 100.00 | N/R | 84,366 | ||||||||||||||
| 2,500 | Stockton, California, Special Tax Bonds, Arch Road Community Facilities District 99-02, Refunding Series 2007, 5.875%, 9/01/37 | 9/17 at 102.00 | N/R | 2,205,925 | ||||||||||||||
| 1,000 | Temecula Redevelopment Agency, California, Tax Allocation Revenue Bonds, Redevelopment Project 1, Series 2002, 5.250%, 8/01/36 – NPFG Insured | 11/11 at 100.00 | A– | 898,850 | ||||||||||||||
| 530 | Turlock Public Financing Authority, California, Tax Allocation Revenue Bonds, Series 2011, 7.250%, 9/01/29 | 3/21 at 100.00 | BBB+ | 556,701 | ||||||||||||||
| 650 | Twentynine Palms Redevelopment Agency, California, Tax Allocation Bonds, Four Corners Project Area, Series 2011A, 7.650%, 9/01/42 | 9/21 at 100.00 | BBB+ | 690,586 | ||||||||||||||
| 500 | Union City Community Redevelopment Agency, California, Tax Allocation Revenue Bonds, Redevelopment Project, Subordinate Lien Series 2011, 6.875%, 12/01/33 | 12/21 at 100.00 | A | 533,865 | ||||||||||||||
| 500 | Val Verde Unified School District Financing Authority, California, Special Tax Revenue, Junior Lien Refunding Series 2003, 6.250%, 10/01/28 | 10/13 at 102.00 | N/R | 490,210 | ||||||||||||||
| 500 | Victor Elementary School District, Los Angeles County, California, Community Facilities District 2005-1 Special Tax Bonds, Series 2007A, 5.500%, 9/01/37 | 9/15 at 102.00 | N/R | 409,745 | ||||||||||||||
| 600 | West Hollywood Community Development Commission, California, East Side Redevelopment Project Series 2011 Tax Allocation Bonds Series 2011A, 7.500%, 9/01/42 | 9/21 at 100.00 | BBB | 639,984 | ||||||||||||||
| 595 | West Patterson Financing Authority, California, Special Tax Bonds, Community Facilities District 01-1, Refunding Series 2009B, 10.000%, 9/01/32 | 9/14 at 105.00 | N/R | 645,028 | ||||||||||||||
| 965 | West Sacramento Financing Authority, California, Special Tax Revenue Bonds, Refunding Series 1999F, 6.100%, 9/01/29 | 3/12 at 100.00 | N/R | 947,447 | ||||||||||||||
| 500 | Westminster Redevelopment Agency, California, Tax Allocation Bonds, Commercial Redevelopment Project 1, Subordinate Lien Series 2011A, 5.875%, 11/01/41 | 11/21 at 100.00 | A | 506,715 | ||||||||||||||
| Nuveen Investments | 25 |
Portfolio of Investments (Unaudited)
Nuveen California High Yield Municipal Bond Fund (continued)
August 31, 2011
| Principal Amount (000) | Description (1) | Optional Call Provisions (2) | Ratings (3) | Value | ||||||||||||||
Tax Obligation/Limited (continued) | ||||||||||||||||||
Westside Union School District, California, Community Facilities District 2005-3 Special Tax Bonds, Series 2006: | ||||||||||||||||||
| $ | 700 | 5.000%, 9/01/26 | 9/14 at 102.00 | N/R | $ | 602,154 | ||||||||||||
| 295 | 5.000%, 9/01/36 | 9/14 at 102.00 | N/R | 229,247 | ||||||||||||||
| 290 | Yorkville United City Business District, Illinois, Storm Water and Water Improvement Project Revenue Bonds, Series 2007, 6.000%, 1/01/27 | 1/17 at 102.00 | N/R | 178,333 | ||||||||||||||
| 135 | Yuba County, California, Special Tax Bonds, Community Facilities District 2004-1, Edgewater, Series 2005, 5.125%, 9/01/35 | 3/15 at 100.00 | N/R | 95,633 | ||||||||||||||
| 59,611 | Total Tax Obligation/Limited | 52,851,019 | ||||||||||||||||
Transportation – 8.9% | ||||||||||||||||||
| 500 | Bay Area Governments Association, California, BART SFO Extension, Airport Premium Fare Revenue Bonds, Series 2002A, 5.000%, 8/01/32 – AMBAC Insured | 8/12 at 100.00 | N/R | 428,095 | ||||||||||||||
| 1,125 | Bay Area Toll Authority, California, Revenue Bonds, San Francisco Bay Area Toll Bridge, Tender Option Bond Trust 2985, 17.375%, 4/01/17 (IF) | No Opt. Call | AA | 1,321,751 | ||||||||||||||
| 8,275 | Foothill/Eastern Transportation Corridor Agency, California, Toll Road Revenue Bonds, Refunding Series 1999, 0.000%, 1/15/30 | 1/11 at 34.18 | BBB– | 2,443,856 | ||||||||||||||
| 1,125 | Los Angeles Department of Airports, California, Revenue Bonds, Los Angeles International Airport, Tender Option Bond Trust 10-27B, 17.680%, 5/15/40 (IF) (7) | 5/20 at 100.00 | AA | 1,257,525 | ||||||||||||||
Palm Springs Financing Authority, California, Palm Springs International Airport Revenue Bonds, Series 2006: | ||||||||||||||||||
| 35 | 5.450%, 7/01/20 (Alternative Minimum Tax) | 7/14 at 102.00 | N/R | 31,509 | ||||||||||||||
| 45 | 5.550%, 7/01/28 (Alternative Minimum Tax) | 7/14 at 102.00 | N/R | 38,285 | ||||||||||||||
Palm Springs, California, Airport Passenger Facility Charge Subordinate Refunding Revenue Bonds, Palm Springs International Airport, Series 2008: | ||||||||||||||||||
| 250 | 6.400%, 7/01/23 (Alternative Minimum Tax) | 7/14 at 102.00 | N/R | 231,688 | ||||||||||||||
| 265 | 6.500%, 7/01/27 (Alternative Minimum Tax) | 7/14 at 102.00 | N/R | 243,281 | ||||||||||||||
| 140 | Puerto Rico Industrial, Tourist, Educational, Medical and Environmental Control Facilities Financing Authority, Revenue Bonds, American Airlines Inc., | 11/11 at 100.00 | CCC+ | 122,725 | ||||||||||||||
| 35 | Puerto Rico Ports Authority, Special Facilities Revenue Bonds, American Airlines Inc., Series 1993A, 6.300%, 6/01/23 (Alternative Minimum Tax) | 12/11 at 100.00 | CCC+ | 29,804 | ||||||||||||||
| 2,320 | Puerto Rico Ports Authority, Special Facilities Revenue Bonds, American Airlines Inc., Series 1996A, 6.250%, 6/01/26 (Alternative Minimum Tax) | 12/11 at 100.00 | CCC+ | 1,911,586 | ||||||||||||||
San Joaquin Hills Transportation Corridor Agency, Orange County, California, Toll Road Revenue Refunding Bonds, Series 1997A: | ||||||||||||||||||
| 2,000 | 0.000%, 1/15/25 – NPFG Insured | No Opt. Call | Baa1 | 662,119 | ||||||||||||||
| 6,500 | 0.000%, 1/15/26 – NPFG Insured | No Opt. Call | Baa1 | 1,954,029 | ||||||||||||||
| 22,615 | Total Transportation | 10,676,253 | ||||||||||||||||
U.S. Guaranteed – 0.0% (8) | ||||||||||||||||||
| 10 | Golden State Tobacco Securitization Corporation, California, Tobacco Settlement Asset-Backed Bonds, Series 2003A-1, 6.250%, 6/01/33 (Pre-refunded 6/01/13) | 6/13 at 100.00 | Aaa | 10,830 | ||||||||||||||
Utilities – 1.7% | ||||||||||||||||||
Long Beach Bond Finance Authority, California, Natural Gas Purchase Revenue Bonds, Series 2007A: | ||||||||||||||||||
| 25 | 5.500%, 11/15/30 | No Opt. Call | A | 23,757 | ||||||||||||||
| 250 | 5.500%, 11/15/37 | No Opt. Call | A | 230,852 | ||||||||||||||
| 7,890 | Merced Irrigation District, California, Certificates of Participation, Water and Hydroelectric Series 2008B, 0.000%, 9/01/33 | 9/16 at 32.62 | A | 1,808,229 | ||||||||||||||
| 8,165 | Total Utilities | 2,062,838 | ||||||||||||||||
| 26 | Nuveen Investments |
| Principal Amount (000) | Description (1) | Optional Call Provisions (2) | Ratings (3) | Value | ||||||||||||||
Water and Sewer – 1.2% | ||||||||||||||||||
| $ | 500 | Dinuba Financing Authority, California, Wastewater System Revenue Bonds, Series 2007, 5.375%, 9/01/38 | 9/17 at 100.00 | N/R | $ | 405,119 | ||||||||||||
| 1,000 | Guam Government Waterworks Authority, Water and Wastewater System Revenue Bonds, Series 2010, 5.500%, 7/01/30 | No Opt. Call | Ba2 | 961,379 | ||||||||||||||
| 1,500 | Total Water and Sewer | 1,366,498 | ||||||||||||||||
| $ | 155,980 | Total Investments (cost $124,065,372) – 100.3% | 120,309,092 | |||||||||||||||
Other Assets Less Liabilities – (0.3)% (9) | (417,688) | |||||||||||||||||
Net Assets – 100% | $ | 119,891,404 | ||||||||||||||||
Investment in Derivatives
Forward Swaps outstanding:
| Counterparty | Notional Amount | Fund Pay/Receive Floating Rate | Floating Rate Index | Fixed Rate (Annualized) | Fixed Rate Payment Frequency | Effective Date (10) | Termination Date | Unrealized Appreciation (Depreciation) | ||||||||||||||||||||||||
Barclays Bank PLC | $ | 3,600,000 | Receive | 3-Month USD-LIBOR | 4.259 | % | Semi-Annually | 6/28/12 | 6/28/41 | $ | (601,019 | ) | ||||||||||||||||||||
Morgan Stanley | 2,000,000 | Receive | 3-Month USD-LIBOR | 4.228 | Semi-Annually | 7/09/12 | 7/09/41 | (319,853 | ) | |||||||||||||||||||||||
| $ | (920,872 | ) | ||||||||||||||||||||||||||||||
| (1) | All percentages shown in the Portfolio of Investments are based on net assets. |
| (2) | Optional Call Provisions: Dates (month and year) and prices of the earliest optional call or redemption. There may be other call provisions at varying prices at later dates. Certain mortgage-backed securities may be subject to periodic principal paydowns. |
| (3) | Ratings: Using the highest of Standard & Poor’s Group (“Standard & Poor’s”), Moody’s Investor Service, Inc. (“Moody’s”) or Fitch, Inc. (“Fitch”) rating. Ratings below BBB by Standard & Poor’s, Baa by Moody’s or BBB by Fitch are considered to be below investment grade. Holdings designated N/R are not rated by any of these national rating agencies. |
| (4) | For fair value measurement disclosure purposes, investment categorized as Level 3. See Notes to Financial Statements, Footnote 1 – General Information and Significant Accounting Policies, Investment Valuation for more information. |
| (5) | At or subsequent to the end of the reporting period, this security is non-income producing. Non-income producing security, in the case of a bond, generally denotes that the issuer has (1) defaulted on the payment of principal or interest, (2) is under the protection of the Federal Bankruptcy Court or (3) the Fund’s Adviser has concluded that the issue is not likely to meet its future interest payment obligations and has directed the Fund’s custodian to cease accruing additional income on the Fund’s records. |
| (6) | Investment valued at fair value using methods determined in good faith by, or at the discretion of, the Board of Trustees. |
| (7) | Investment, or portion of investment, has been pledged to collateralize the net payment obligations for investments in derivatives and/or inverse floating rate transactions. |
| (8) | Backed by an escrow or trust containing sufficient U.S. Government or U.S. Government agency securities, which ensure the timely payment of principal and interest. |
| (9) | Other Assets Less Liabilities includes Value and/or Net Unrealized Appreciation (Depreciation) of derivative instruments as noted within Investments in Derivatives. |
| (10) | Effective date represents the date on which both the Fund and Counterparty commence interest payment accruals on each forward swap contract. |
| N/R | Not rated. |
| WI/DD | Purchased on a when-issued or delayed delivery basis. |
| (IF) | Inverse floating rate investment. |
| USD-LIBOR | United States Dollar-London Inter-Bank Offered Rate. |
See accompanying notes to financial statements.
| Nuveen Investments | 27 |
Portfolio of Investments (Unaudited)
Nuveen California Municipal Bond Fund
August 31, 2011
| Principal Amount (000) | Description (1) | Optional Call Provisions (2) | Ratings (3) | Value | ||||||||||||||
Consumer Staples – 4.4% | ||||||||||||||||||
| $ | 3,500 | California County Tobacco Securitization Agency, Tobacco Settlement Asset-Backed Bonds, Alameda County Tobacco Asset Securitization Corporation, Series 2002, 5.750%, 6/01/29 | 6/12 at 100.00 | Baa3 | $ | 3,235,890 | ||||||||||||
| 425 | California County Tobacco Securitization Agency, Tobacco Settlement Asset-Backed Bonds, Sonoma County Tobacco Securitization Corporation, Series 2005, 4.250%, 6/01/21 | 6/15 at 100.00 | BBB | 395,815 | ||||||||||||||
| 3,500 | Golden State Tobacco Securitization Corporation, California, Tobacco Settlement Asset-Backed Bonds, Series 2007A-1, 5.750%, 6/01/47 | 6/17 at 100.00 | Baa3 | 2,479,960 | ||||||||||||||
| 12,135 | Golden State Tobacco Securitization Corporation, California, Tobacco Settlement Asset-Backed Bonds, Series 2007A-2, 0.000%, 6/01/37 | 6/22 at 100.00 | BB+ | 7,523,943 | ||||||||||||||
| 19,560 | Total Consumer Staples | 13,635,608 | ||||||||||||||||
Education and Civic Organizations – 4.3% | ||||||||||||||||||
| 105 | California Educational Facilities Authority, Revenue Bonds, University of the Pacific, Series 2006, 5.000%, 11/01/21 | 11/15 at 100.00 | A2 | 111,379 | ||||||||||||||
| 2,960 | California Educational Facilities Authority, Revenue Bonds, Woodbury University, Series 2006, 5.000%, 1/01/36 | 1/15 at 100.00 | Baa3 | 2,439,425 | ||||||||||||||
California Municipal Finance Authority, Educational Facilities Revenue Bonds, OCEAA Project, Series 2008A: | ||||||||||||||||||
| 1,000 | 6.750%, 10/01/28 | No Opt. Call | N/R | 967,030 | ||||||||||||||
| 1,500 | 7.000%, 10/01/39 | No Opt. Call | N/R | 1,437,855 | ||||||||||||||
| 1,500 | California Municipal Finance Authority, Revenue Bonds, University of La Verne, Series 2010A, 6.125%, 6/01/30 | 6/20 at 100.00 | Baa2 | 1,542,240 | ||||||||||||||
| 1,000 | California State Public Works Board, Lease Revenue Bonds, University of California Department of Education Riverside Campus Project, Series 2009B, 5.750%, 4/01/23 | 4/19 at 100.00 | A2 | 1,102,800 | ||||||||||||||
| 1,000 | California State Public Works Board, Lease Revenue Bonds, University of California, Institute Projects, Series 2005C, 5.000%, 4/01/30 – AMBAC Insured | 4/15 at 100.00 | Aa2 | 1,016,170 | ||||||||||||||
| 1,600 | California Statewide Communitities Development Authority, School Facility Revenue Bonds, Alliance College-Ready Public Schools, Series 2011A, 7.000%, 7/01/46 | 7/21 at 100.00 | N/R | 1,553,168 | ||||||||||||||
| 1,500 | California Statewide Community Development Authority, Certificates of Participation, San Diego Space and Science Foundation, Series 1996, 7.500%, 12/01/26 | 12/11 at 100.00 | N/R | 1,465,350 | ||||||||||||||
| 2,000 | San Diego County, California, Certificates of Participation, Burnham Institute, Series 2006, 5.000%, 9/01/34 | 9/15 at 102.00 | Baa3 | 1,699,280 | ||||||||||||||
| 14,165 | Total Education and Civic Organizations | 13,334,697 | ||||||||||||||||
Health Care – 19.4% | ||||||||||||||||||
| 1,800 | California Health Facilities Financing Authority, Hospital Revenue Bonds, Downey Community Hospital, Series 1993, 5.750%, 5/15/15 (4) | 11/11 at 100.00 | N/R | 1,466,748 | ||||||||||||||
| 3,000 | California Health Facilities Financing Authority, Revenue Bonds, Catholic Healthcare West, Series 2009F, 5.625%, 7/01/25 | 7/19 at 100.00 | A | 3,200,130 | ||||||||||||||
| 1,000 | California Health Facilities Financing Authority, Revenue Bonds, Childrens Hospital of Orange County, Series 2009A, 6.500%, 11/01/38 | 11/19 at 100.00 | A | 1,072,460 | ||||||||||||||
| 1,360 | California Health Facilities Financing Authority, Revenue Bonds, Kaiser Permanante System, Series 2006, 5.000%, 4/01/37 | 4/16 at 100.00 | A+ | 1,303,152 | ||||||||||||||
| 2,000 | California Health Facilities Financing Authority, Revenue Bonds, Sutter Health, Series 2011B, 6.000%, 8/15/42 | 8/20 at 100.00 | AA– | 2,159,400 | ||||||||||||||
| 2,000 | California Municipal Finance Authority, Certificates of Participation, Community Hospitals of Central California Obligated Group, Series 2009, 5.500%, 2/01/39 | 2/19 at 100.00 | Baa2 | 1,804,040 | ||||||||||||||
| 1,500 | California Statewide Communities Development Authority, Health Facility Revenue Bonds, Community Hospital of the Monterey Peninsula, Series 2011A, 6.000%, 6/01/33 | 6/21 at 100.00 | A+ | 1,566,225 | ||||||||||||||
| 28 | Nuveen Investments |
| Principal Amount (000) | Description (1) | Optional Call Provisions (2) | Ratings (3) | Value | ||||||||||||||
Health Care (continued) | ||||||||||||||||||
| $ | 1,000 | California Statewide Communities Development Authority, Revenue Bonds, Adventist Health System West, Series 2005A, 5.000%, 3/01/35 | 3/15 at 100.00 | A | $ | 952,210 | ||||||||||||
| 1,000 | California Statewide Communities Development Authority, Revenue Bonds, ValleyCare Health System, Series 2007A, 5.000%, 7/15/22 | �� | 7/17 at 100.00 | N/R | 940,690 | |||||||||||||
| 7,740 | California Statewide Community Development Authority, Health Facility Revenue Refunding Bonds, Memorial Health Services, Series 2003A, 6.000%, 10/01/23 | 4/13 at 100.00 | AA– | 8,043,718 | ||||||||||||||
| 5,540 | California Statewide Community Development Authority, Insured Health Facility Revenue Bonds, Catholic Healthcare West, Series 2008K, 5.500%, 7/01/41 – AGC Insured | 7/17 at 100.00 | AA+ | 5,634,789 | ||||||||||||||
| 1,000 | California Statewide Community Development Authority, Revenue Bonds, Daughters of Charity Health System, Series 2005A, 5.250%, 7/01/30 | 7/15 at 100.00 | BBB | 848,890 | ||||||||||||||
| 3,670 | California Statewide Community Development Authority, Revenue Bonds, Daughters of Charity Health System, Series 2005G, 5.000%, 7/01/22 | 7/15 at 100.00 | BBB | 3,452,883 | ||||||||||||||
| 1,615 | California Statewide Community Development Authority, Revenue Bonds, Kaiser Permanente System, Series 2001C, 5.250%, 8/01/31 | 8/16 at 100.00 | A+ | 1,635,850 | ||||||||||||||
| 3,000 | California Statewide Community Development Authority, Revenue Bonds, Kaiser Permanente System, Series 2007B, 0.974%, 4/01/36 | 4/17 at 100.00 | A+ | 2,190,000 | ||||||||||||||
| 2,250 | California Statewide Community Development Authority, Revenue Bonds, Methodist Hospital Project, Series 2009, 6.750%, 2/01/38 | 8/19 at 100.00 | Aa2 | 2,540,768 | ||||||||||||||
| 4,540 | California Statewide Community Development Authority, Revenue Bonds, St. Joseph Health System, Series 2007A, 5.750%, 7/01/47 – FGIC Insured | 7/18 at 100.00 | AA– | 4,576,819 | ||||||||||||||
| 2,065 | Loma Linda, California, Hospital Revenue Bonds, Loma Linda University Medical Center, Series 2008A, 8.250%, 12/01/38 | 12/17 at 100.00 | BBB | 2,276,786 | ||||||||||||||
| 1,580 | Oak Valley Hospital District, Stanislaus County, California, Revenue Bonds, Series 2010A, 7.000%, 11/01/35 | 11/20 at 100.00 | BBB– | 1,607,555 | ||||||||||||||
| 3,625 | Palomar Pomerado Health Care District, California, Certificates of Participation, Series 2010, 6.000%, 11/01/41 | 11/20 at 100.00 | Baa3 | 3,399,851 | ||||||||||||||
| 4,500 | Santa Clara County Financing Authority, California, Insured Revenue Bonds, El Camino Hospital, Series 2007A, 5.750%, 2/01/41 – AMBAC Insured | 8/17 at 100.00 | A+ | 4,580,910 | ||||||||||||||
| 1,000 | Sierra View Local Health Care District, California, Revenue Bonds, Series 2007, 5.250%, 7/01/37 | 9/17 at 100.00 | N/R | 934,340 | ||||||||||||||
| 3,000 | Upland, California, Certificates of Participation, San Antonio Community Hospital, Series 2011, 6.500%, 1/01/41 | 1/21 at 100.00 | A | 3,180,480 | ||||||||||||||
| 59,785 | Total Health Care | 59,368,694 | ||||||||||||||||
Housing/Multifamily – 1.0% | ||||||||||||||||||
| 1,295 | California Municipal Finance Authority, Mobile Home Park Revenue Bonds, Caritas Projects Series 2010A, 6.400%, 8/15/45 | 8/20 at 100.00 | BBB– | 1,269,994 | ||||||||||||||
| 1,815 | San Dimas Housing Authority, California, Mobile Home Park Revenue Bonds, Charter Oak Mobile Home Estates Acquisition Project, Series 1998A, 5.700%, 7/01/28 | 1/12 at 100.00 | N/R | 1,746,484 | ||||||||||||||
| 3,110 | Total Housing/Multifamily | 3,016,478 | ||||||||||||||||
Housing/Single Family – 1.0% | ||||||||||||||||||
| 215 | California Housing Finance Agency, Home Mortgage Revenue Bonds, Series 2006H, 5.750%, 8/01/30 – FGIC Insured (Alternative Minimum Tax) | 2/16 at 100.00 | Baa1 | 215,138 | ||||||||||||||
| 3,000 | California State Department of Veteran Affairs, Home Purchase Revenue Bonds, Series 2007, 5.000%, 12/01/42 (Alternative Minimum Tax) | 12/16 at 100.00 | AA | 2,791,830 | ||||||||||||||
| 3,215 | Total Housing/Single Family | 3,006,968 | ||||||||||||||||
Industrials – 0.2% | ||||||||||||||||||
| 610 | California Pollution Control Financing Authority, Solid Waste Disposal Revenue Bonds, Republic Services Inc., Series 2002C, 5.250%, 6/01/23 (Mandatory put 12/01/17) (Alternative Minimum Tax) | No Opt. Call | BBB | 654,725 | ||||||||||||||
| Nuveen Investments | 29 |
Portfolio of Investments (Unaudited)
Nuveen California Municipal Bond Fund (continued)
August 31, 2011
| Principal Amount (000) | Description (1) | Optional Call Provisions (2) | Ratings (3) | Value | ||||||||||||||
Long-Term Care – 4.2% | ||||||||||||||||||
ABAG Finance Authority for Non-Profit Corporations, California, Cal-Mortgage Revenue Bonds, Elder Care Alliance of Union City, Series 2004: | ||||||||||||||||||
| $ | 1,850 | 5.400%, 8/15/24 | 8/14 at 100.00 | A– | $ | 1,873,347 | ||||||||||||
| 2,130 | 5.600%, 8/15/34 | 8/14 at 100.00 | A– | 2,116,325 | ||||||||||||||
| 3,000 | ABAG Finance Authority for Non-Profit Corporations, California, Health Facility Revenue Bonds, The Insitute on Aging, Series 2008A, 5.650%, 8/15/38 | 8/18 at 100.00 | A– | 2,959,050 | ||||||||||||||
| 1,000 | California Municipal Finance Authority, Revenue Bonds, Harbor Regional Center Project, Series 2009, 8.000%, 11/01/29 | 11/19 at 100.00 | Baa1 | 1,087,160 | ||||||||||||||
| 2,000 | California Municipal Finance Authority, Senior Living Revenue Bonds, Pilgrim Place at Claremont, Series 2009A, 6.125%, 5/15/39 | 5/19 at 100.00 | A– | 2,116,700 | ||||||||||||||
| 2,750 | San Diego County, California, Certificates of Participation, San Diego-Imperial Counties Developmental Services Foundation Project, Series 2002, 5.500%, 9/01/27 | 9/12 at 100.00 | Baa1 | 2,706,935 | ||||||||||||||
| 12,730 | Total Long-Term Care | 12,859,517 | ||||||||||||||||
Tax Obligation/General – 12.8% | ||||||||||||||||||
| 1,425 | Bassett Unified School District, Los Angeles County, California, General Obligation Bonds, Series 2006B, 5.250%, 8/01/30 – FGIC Insured | 8/16 at 100.00 | A– | 1,465,598 | ||||||||||||||
California State, General Obligation Bonds, Various Purpose Series 2009: | ||||||||||||||||||
| 5,000 | 5.500%, 11/01/34 | 11/19 at 100.00 | A1 | 5,256,250 | ||||||||||||||
| 4,060 | 6.000%, 11/01/39 | 11/19 at 100.00 | A1 | 4,447,365 | ||||||||||||||
| 10,000 | California State, General Obligation Bonds, Various Purpose Series 2010, 5.500%, 3/01/40 | 3/20 at 100.00 | A1 | 10,416,600 | ||||||||||||||
Central Unified School District, Fresno County, California, General Obligation Bonds, Series 2004A: | ||||||||||||||||||
| 1,000 | 5.500%, 7/01/22 – FGIC Insured | 7/14 at 100.00 | A | 1,115,410 | ||||||||||||||
| 1,500 | 5.500%, 7/01/24 – FGIC Insured | 7/14 at 100.00 | A | 1,673,115 | ||||||||||||||
| 2,435 | East Side Union High School District, Santa Clara County, California, General Obligation Bonds, 2008 Election Series 2010B, 5.000%, 8/01/25 – AGC Insured | 8/19 at 100.00 | AA+ | 2,615,507 | ||||||||||||||
| 2,000 | Murrieta Valley Unified School District, Riverside County, California, General Obligation Bonds, Series 2003A, 5.000%, 9/01/26 – FGIC Insured | 9/13 at 100.00 | A+ | 2,091,160 | ||||||||||||||
| 1,685 | Peralta Community College District, Alameda County, California, General Obligation Bonds, Refunding Series 2010, 5.250%, 8/01/26 | 8/20 at 100.00 | AA– | 1,851,545 | ||||||||||||||
| 275 | Roseville Joint Union High School District, Placer County, California, General Obligation Bonds, Series 2006B, 5.000%, 8/01/27 – FGIC Insured | 8/15 at 100.00 | AA– | 284,719 | ||||||||||||||
| 1,355 | San Jose-Evergreen Community College District, Santa Clara County, California, General Obligation Bonds, Series 2005A, 5.000%, 9/01/25 – NPFG Insured | 9/15 at 100.00 | Aa1 | 1,416,097 | ||||||||||||||
| 5,500 | Tahoe Forest Hospital District, Placer and Nevada Counties, California, General Obligation Bonds, Series 2010B, 5.500%, 8/01/35 | 8/18 at 100.00 | Aa3 | 5,758,665 | ||||||||||||||
| 3,500 | Yosemite Community College District, California, General Obligation Bonds, Capital Appreciation, Election 2004, Series 2010D, 0.000%, 8/01/42 | No Opt. Call | Aa2 | 999,075 | ||||||||||||||
| 39,735 | Total Tax Obligation/General | 39,391,106 | ||||||||||||||||
Tax Obligation/Limited – 32.6% | ||||||||||||||||||
| 3,000 | Alameda County Redevelopment Agency, California, Eden Area Redevelopment Project, Tax Allocation Bonds, Series 2006A, 5.000%, 8/01/36 – NPFG Insured | 8/16 at 100.00 | A2 | 2,628,480 | ||||||||||||||
Brea Public Finance Authority, California, Revenue Bonds, Series 2008A: | ||||||||||||||||||
| 2,105 | 7.000%, 9/01/23 | 9/16 at 102.00 | BBB+ | 2,222,670 | ||||||||||||||
| 2,000 | 7.125%, 9/01/26 | 9/16 at 102.00 | BBB+ | 2,091,100 | ||||||||||||||
| 1,000 | California State Public Works Board, Lease Revenue Bonds, Various Capital Projects, Series 2009G-1, 5.750%, 10/01/30 | 10/19 at 100.00 | A2 | 1,050,340 | ||||||||||||||
| 30 | Nuveen Investments |
| Principal Amount (000) | Description (1) | Optional Call Provisions (2) | Ratings (3) | Value | ||||||||||||||
Tax Obligation/Limited (continued) | ||||||||||||||||||
| $ | 2,000 | California State Public Works Board, Lease Revenue Bonds, Various Capital Projects, Series 2009I-1, 6.375%, 11/01/34 | 11/19 at 100.00 | A2 | $ | 2,174,680 | ||||||||||||
| 3,000 | California State Public Works Board, Lease Revenue Bonds, Various Capital Projects, Series 2010A-1, 6.000%, 3/01/35 | 3/20 at 100.00 | A2 | 3,179,040 | ||||||||||||||
| 350 | Capistrano Unified School District, Orange County, California, Special Tax Bonds, Community Facilities District, Series 2005, 5.000%, 9/01/24 – FGIC Insured | 9/15 at 100.00 | BBB | 346,374 | ||||||||||||||
Community Development Commission Of City of National City, California, National City Redevelopment Project 2011, Tax Allocation Bonds: | ||||||||||||||||||
| 470 | 6.500%, 8/01/24 | 8/21 at 100.00 | A– | 490,196 | ||||||||||||||
| 1,705 | 7.000%, 8/01/32 | 8/21 at 100.00 | A– | 1,786,789 | ||||||||||||||
| 2,075 | Hesperia Community Redevelopment Agency, California, Tax Allocation Bonds, Series 2005A, 5.000%, 9/01/35 – SYNCORA GTY Insured | 9/15 at 100.00 | BBB– | 1,679,962 | ||||||||||||||
| 1,660 | Highland, California, Special Tax Bonds, Communitiy Facilities District 01-1, Refunding, Series 2011, 5.500%, 9/01/28 | 9/21 at 100.00 | BBB | 1,650,040 | ||||||||||||||
| 1,445 | Irvine, California, Unified School District, Community Facilities District 06-1 Special Tax Bonds, Series 2010, 6.700%, 9/01/35 | 9/20 at 100.00 | N/R | 1,534,157 | ||||||||||||||
Irvine, California, Unified School District, Community Facilities District Special Tax Bonds, Series 2006A: | ||||||||||||||||||
| 170 | 5.000%, 9/01/26 | 9/16 at 100.00 | N/R | 161,395 | ||||||||||||||
| 395 | 5.125%, 9/01/36 | 9/16 at 100.00 | N/R | 354,765 | ||||||||||||||
Jurupa Community Services District, California, Community Facilities District 25 Earstvale Area Special Tax Bonds, Series 2008A: | ||||||||||||||||||
| 1,000 | 8.375%, 9/01/28 | 9/18 at 100.00 | N/R | 1,103,230 | ||||||||||||||
| 3,205 | 8.875%, 9/01/38 | 9/18 at 100.00 | N/R | 3,563,031 | ||||||||||||||
| 1,300 | Lake Elsinore Public Financing Authority, California, Local Agency Revenue Bonds, Canyon Hills Improvement Area C, Series 2010A, 6.250%, 9/01/40 | 9/12 at 103.00 | N/R | 1,213,069 | ||||||||||||||
| 2,500 | Lancaster Redevelopment Agency, California, Subordinate Lien Tax Allocation Bonds, Combined Redevelopment Project Areas, Series 2003B, 5.000%, 8/01/34 – FGIC Insured | 8/13 at 100.00 | BBB+ | 2,040,800 | ||||||||||||||
| 1,870 | Lancaster Redevelopment Agency, California, Tax Allocation Refunding Bonds, Combined Area Sheriff’s Facilities Projects, Series 2004, 5.000%, 12/01/23 – SYNCORA GTY Insured | 12/14 at 100.00 | A | 1,874,582 | ||||||||||||||
| 1,120 | Lancaster Redevelopment Agency, California, Tax Allocation Refunding Bonds, Combined Fire Protection Facilities Project, Series 2004, 5.000%, 12/01/23 – SYNCORA GTY Insured | 12/14 at 100.00 | A | 1,122,744 | ||||||||||||||
| 630 | Los Angeles Community Redevelopment Agency, California, Lease Revenue Bonds, Manchester Social Services Project, Series 2005, 5.000%, 9/01/37 – AMBAC Insured | 9/15 at 100.00 | A1 | 568,216 | ||||||||||||||
| 2,500 | Los Angeles County Schools, California, Certificates of Participation, Pooled Financing Program, Regionalized Business Services Corporation, Series 2003A, 5.000%, 9/01/22 – AGM Insured | 9/13 at 100.00 | AA+ | 2,578,775 | ||||||||||||||
| 985 | Milpitas, California, Local Improvement District 20 Limited Obligation Bonds, Series 1998A, 5.700%, 9/02/18 | 3/12 at 103.00 | N/R | 1,012,206 | ||||||||||||||
Moreno Valley Unified School District, Riverside County, California, Special Tax Bonds, Community Facilities District, Series 2004: | ||||||||||||||||||
| 805 | 5.550%, 9/01/29 | 9/14 at 100.00 | N/R | 773,492 | ||||||||||||||
| 1,250 | 5.650%, 9/01/34 | 9/14 at 100.00 | N/R | 1,181,238 | ||||||||||||||
| 7,100 | Murrieta Redevelopment Agency, California, Tax Allocation Bonds, Series 2007A, 5.000%, 8/01/37 – NPFG Insured | 8/17 at 100.00 | A– | 6,180,408 | ||||||||||||||
| 170 | Novato Redevelopment Agency, California, Tax Allocation Bonds, Hamilton Field Redevelopment Project, Series 2011, 6.750%, 9/01/40 | 9/21 at 100.00 | A– | 177,407 | ||||||||||||||
| 170 | Ontario, California, Assessment District 100C Limited Obligation Improvement Bonds, California Commerce Center Phase III, Series 1991, 8.000%, 9/02/11 | No Opt. Call | N/R | 170,024 | ||||||||||||||
| 2,500 | Palm Drive Health Care District, Sonoma County, California, Certificates of Participation, Parcel Tax Secured Financing Program, Series 2010, 7.500%, 4/01/35 | No Opt. Call | BB | 2,432,525 | ||||||||||||||
| Nuveen Investments | 31 |
Portfolio of Investments (Unaudited)
Nuveen California Municipal Bond Fund (continued)
August 31, 2011
| Principal Amount (000) | Description (1) | Optional Call Provisions (2) | Ratings (3) | Value | ||||||||||||||
Tax Obligation/Limited (continued) | ||||||||||||||||||
| $ | 1,600 | Pomona Public Financing Authority, California, Merged Projects Revenue Bonds, Series 2007AS, 5.000%, 2/01/31 – AMBAC Insured | 2/17 at 100.00 | A | $ | 1,481,808 | ||||||||||||
| 1,150 | Poway Redevelopment Agency, California, Tax Allocation Bonds, Paugay Redevelopment Project, Series 2007, 5.000%, 6/15/30 – NPFG Insured | 6/17 at 100.00 | A | 1,056,551 | ||||||||||||||
| 1,645 | Rancho Cucamonga, California, Limited Obligation Improvement Bonds, Masi Plaza Assessment District 93-1, Series 1997, 6.250%, 9/02/22 | 3/12 at 100.00 | N/R | 1,651,925 | ||||||||||||||
| 560 | Rancho Santa Fe CSD Financing Authority, California, Revenue Bonds, Superior Lien Series 2011A, 5.750%, 9/01/30 | 9/21 at 100.00 | BBB+ | 568,081 | ||||||||||||||
| 305 | Rialto Redevelopment Agency, California, Tax Allocation Bonds, Merged Project Area, Series 2005A, 5.000%, 9/01/35 – SYNCORA GTY Insured | 9/15 at 100.00 | A– | 267,522 | ||||||||||||||
| 2,345 | Richmond Redevelopment Agency, California, Harbour Project Tax Allocation Bonds, Series 1998A Refunding, 5.500%, 7/01/18 – NPFG Insured | 11/11 at 100.00 | AA– | 2,353,043 | ||||||||||||||
| 100 | Riverside County Redevelopment Agency, California, Jurupa Valley Project Area 2011 Tax Allocation Bonds Series B, 6.500%, 10/01/25 | 10/21 at 100.00 | A– | 103,735 | ||||||||||||||
| 2,950 | Riverside County Redevelopment Agency, California, Interstate 215 Corridor Redevelopment Project Area Tax Allocation Bonds, Series 2010E, 6.250%, 10/01/30 | 10/20 at 100.00 | A– | 3,061,510 | ||||||||||||||
| 380 | Roseville, California, Certificates of Participation, Public Facilities, Series 2003A, 5.000%, 8/01/25 – AMBAC Insured | 8/13 at 100.00 | AA– | 383,367 | ||||||||||||||
| 1,000 | Sacramento City Financing Authority, California, Lease Revenue Refunding Bonds, Series 1993A, 5.400%, 11/01/20 – AMBAC Insured | No Opt. Call | A1 | 1,087,680 | ||||||||||||||
| 500 | Sacramento City Financing Authority, California, Lease Revenue Refunding Bonds, Series 1993B, 5.400%, 11/01/20 | No Opt. Call | A1 | 543,840 | ||||||||||||||
| 2,880 | San Francisco Redevelopment Agency, California, Lease Revenue Bonds, Moscone Convention Center, Series 2004, 5.250%, 7/01/24 – AMBAC Insured | 7/13 at 100.00 | AA– | 2,947,190 | ||||||||||||||
| 85 | San Francisco Redevelopment Finance Authority, California, Tax Allocation Revenue Bonds, Mission Bay North Redevelopment Project, Series 2011C, 6.750%, 8/01/41 | 2/21 at 100.00 | A– | 90,120 | ||||||||||||||
San Francisco Redevelopment Financing Authority, California, Tax Allocation Revenue Bonds, Mission Bay South Redevelopment Project, Series 2011D: | ||||||||||||||||||
| 80 | 7.000%, 8/01/33 | 2/21 at 100.00 | BBB | 84,217 | ||||||||||||||
| 105 | 7.000%, 8/01/41 | 2/21 at 100.00 | BBB | 110,153 | ||||||||||||||
| 6,475 | San Marcos Redevelopment Agency, California, Tax Allocation Bonds, Affordable Housing Project, Series 1997A, 6.000%, 10/01/27 (Alternative Minimum Tax) | 10/11 at 100.00 | AA– | 6,480,828 | ||||||||||||||
| 2,140 | Santa Ana Community Redevelopment Agency, California, Tax Allocation Bonds, Merged Project Area, Series 2011A, 6.750%, 9/01/28 | 3/21 at 100.00 | A | 2,316,957 | ||||||||||||||
| 1,500 | Santee Community Development Commission, California, Santee Redevelopment Project Tax Allocation Bonds, Series 2011A, 6.500%, 8/01/26 | 2/21 at 100.00 | A | 1,605,600 | ||||||||||||||
| 4,000 | Shafter Joint Powers Financing Authority, California, Lease Revenue Bonds, Community Correctional Facility Acquisition Project, Series 1997A, 6.050%, 1/01/17 | 1/12 at 100.00 | A2 | 4,010,400 | ||||||||||||||
| 135 | Signal Hill Redevelopment Agency, California, Project 1 Tax Allocation Bonds, Series 2011, 7.000%, 10/01/26 | 4/21 at 100.00 | N/R | 135,830 | ||||||||||||||
| 500 | Temecula Redevelopment Agency, California, Redevelopment Project 1 Tax Allocation Housing Bonds Series 2011A, 6.750%, 8/01/31 | 8/21 at 100.00 | A | 528,455 | ||||||||||||||
| 6,700 | Travis Unified School District, Solano County, California, Certificates of Participation, Series 2006, 5.000%, 9/01/31 – FGIC Insured | 9/16 at 100.00 | N/R | 5,758,181 | ||||||||||||||
| 2,500 | Tulare Public Financing Authority, California, Lease Revenue Bonds, Series 2008, 5.250%, 4/01/27 – AGC Insured | 4/18 at 100.00 | AA+ | 2,676,225 | ||||||||||||||
| 1,225 | Turlock Public Financing Authority, California, Tax Allocation Revenue Bonds, Series 2011, 7.000%, 9/01/25 | 3/21 at 100.00 | BBB+ | 1,294,568 | ||||||||||||||
| 32 | Nuveen Investments |
| Principal Amount (000) | Description (1) | Optional Call Provisions (2) | Ratings (3) | Value | ||||||||||||||
Tax Obligation/Limited (continued) | ||||||||||||||||||
| $ | 2,000 | Tustin, California, Community Facilities District 2007-1, Legacy-Retail Center Special Tax Bonds, 6.000%, 9/01/37 | 9/17 at 100.00 | N/R | $ | 1,941,140 | ||||||||||||
| 1,045 | Ukiah Redevelopment Agency, California, Tax Allocation Bonds, Ukiah Redevelopment Project, Series 2011A, 6.500%, 12/01/28 | 6/21 at 100.00 | A | 1,069,087 | ||||||||||||||
Vista Community Development Commission Taxable Non-Housing Tax Allocation Revenue Bonds, California, Vista Redevelopment Project, Series 2011: | ||||||||||||||||||
| 4,045 | 6.000%, 9/01/33 | 9/21 at 100.00 | A– | 4,127,275 | ||||||||||||||
| 4,210 | 6.125%, 9/01/37 | 9/21 at 100.00 | A– | 4,277,613 | ||||||||||||||
| 230 | Vallejo Public Financing Authority, California, Limited Obligation Revenue Refinancing Bonds, Fairground Drive Assessment District 65, Series 1998, 5.700%, 9/02/11 | No Opt. Call | N/R | 230,021 | ||||||||||||||
| 240 | Yorba Linda Redevelopment Agency, Orange County, California, Tax Allocation Revenue Bonds, Yorba Linda Redevelopment Project, Subordinate Lien Series 2011A, 6.500%, 9/01/32 | 9/21 at 100.00 | A– | 250,210 | ||||||||||||||
| 101,110 | Total Tax Obligation/Limited | 99,834,867 | ||||||||||||||||
Transportation – 3.3% | ||||||||||||||||||
| 2,750 | Foothill/Eastern Transportation Corridor Agency, California, Toll Road Revenue Refunding Bonds, Series 1999, 5.875%, 1/15/28 | 1/14 at 101.00 | BBB– | 2,714,250 | ||||||||||||||
Palm Springs Financing Authority, California, Palm Springs International Airport Revenue Bonds, Series 2006: | ||||||||||||||||||
| 285 | 5.450%, 7/01/20 (Alternative Minimum Tax) | 7/14 at 102.00 | N/R | 256,577 | ||||||||||||||
| 215 | 5.550%, 7/01/28 (Alternative Minimum Tax) | 7/14 at 102.00 | N/R | 182,918 | ||||||||||||||
| 550 | San Francisco Airports Commission, California, Revenue Bonds, San Francisco International Airport, Second Series 1999, Issue 23A, 5.000%, 5/01/30 – FGIC Insured (Alternative Minimum Tax) | 11/11 at 100.00 | A+ | 544,698 | ||||||||||||||
| 4,000 | San Francisco Airports Commission, California, Revenue Bonds, San Francisco International Airport, Second Series 2002, Issue 32G, 5.000%, 5/01/24 – FGIC Insured | 5/16 at 100.00 | A+ | 4,207,680 | ||||||||||||||
| 2,000 | San Francisco Airports Commission, California, Revenue Bonds, San Francisco International Airport, Second Series A of 2008, 6.500%, 5/01/19 (Mandatory put 5/01/12) (Alternative Minimum Tax) | No Opt. Call | A+ | 2,079,400 | ||||||||||||||
| 9,800 | Total Transportation | 9,985,523 | ||||||||||||||||
U.S. Guaranteed – 3.8% (5) | ||||||||||||||||||
| 2,500 | Daly City Housing Development Finance Agency, California, Mobile Home Park Revenue Bonds, Franciscan Mobile Home Park Project, Series 2002A, 5.800%, 12/15/25 (Pre-refunded 12/15/13) | 12/13 at 102.00 | N/R | (5) | 2,847,600 | |||||||||||||
| 3,130 | Golden State Tobacco Securitization Corporation, California, Tobacco Settlement Asset-Backed Bonds, Series 2003A-1, 6.250%, 6/01/33 (Pre-refunded 6/01/13) | 6/13 at 100.00 | Aaa | 3,389,665 | ||||||||||||||
| 1,655 | Los Angeles Harbors Department, California, Revenue Bonds, Series 1988, 7.600%, 10/01/18 (ETM) | No Opt. Call | AA+ | (5) | 1,998,628 | |||||||||||||
| 1,400 | Port of Oakland, California, Revenue Bonds, Series 2002M, 5.250%, 11/01/19 (Pre-refunded 11/01/12) – FGIC Insured | 11/12 at 100.00 | A | (5) | 1,482,376 | |||||||||||||
| 1,505 | San Mateo Union High School District, San Mateo County, California, Certificates of Participation, Phase 1, Series 2007A, 5.000%, 12/15/30 (Pre-refunded 12/15/17) – AMBAC Insured | 12/17 at 100.00 | AA– | (5) | 1,859,548 | |||||||||||||
| 10,190 | Total U.S. Guaranteed | 11,577,817 | ||||||||||||||||
Utilities – 5.6% | ||||||||||||||||||
| 2,445 | California Statewide Community Development Authority, Certificates of Participation Refunding, Rio Bravo Fresno Project, Series 1999A, 6.500%, 12/01/18 (6) | 12/11 at 100.00 | N/R | 2,221,014 | ||||||||||||||
| 500 | Los Angeles Department of Water and Power, California, Power System Revenue Bonds, Series 2003A-2, 5.000%, 7/01/21 – NPFG Insured | 7/13 at 100.00 | AA– | 530,490 | ||||||||||||||
| Nuveen Investments | 33 |
Portfolio of Investments (Unaudited)
Nuveen California Municipal Bond Fund (continued)
August 31, 2011
| Principal Amount (000) | Description (1) | Optional Call Provisions (2) | Ratings (3) | Value | ||||||||||||||
Utilities (continued) | ||||||||||||||||||
Merced Irrigation District, California, Certificates of Participation, Water and Hydroelectric Series 2008B: | ||||||||||||||||||
| $ | 4,535 | 0.000%, 9/01/23 | 9/16 at 64.56 | A | $ | 2,173,263 | ||||||||||||
| 27,110 | 0.000%, 9/01/33 | 9/16 at 32.62 | A | 6,213,070 | ||||||||||||||
| 12,000 | 0.000%, 9/01/38 | 9/16 at 23.21 | A | 1,942,079 | ||||||||||||||
| 615 | Merced Irrigation District, California, Electric System Revenue Bonds, Series 2005, 5.125%, 9/01/31 – SYNCORA GTY Insured | 9/15 at 100.00 | N/R | 555,455 | ||||||||||||||
| 3,470 | Puerto Rico Industrial, Tourist, Educational, Medical and Environmental Control Facilities Financing Authority, Co-Generation Facility Revenue Bonds, Series 2000A, 6.625%, 6/01/26 (Alternative Minimum Tax) | 12/11 at 100.00 | Baa3 | 3,497,759 | ||||||||||||||
| 50,675 | Total Utilities | 17,133,130 | ||||||||||||||||
Water and Sewer – 4.4% | ||||||||||||||||||
| 2,000 | Brentwood Infrastructure Financing Authority, California, Water Revenue Bonds, Series 2008, 5.750%, 7/01/38 | 7/18 at 100.00 | AA | 2,134,019 | ||||||||||||||
| 2,000 | California Statewide Community Development Authority, Water and Wastewater Revenue Bonds, Pooled Financing Program, Series 2003A, 5.250%, 10/01/23 – AGM Insured | 10/13 at 100.00 | AA+ | 2,062,279 | ||||||||||||||
| 1,680 | Castaic Lake Water Agency, California, Certificates of Participation, Series 2004A, 5.000%, 8/01/20 – AMBAC Insured | 8/14 at 100.00 | AA | 1,847,680 | ||||||||||||||
| 1,250 | Cucamonga Valley Water District, California, Certificates of Participation, Series 2006, 5.000%, 9/01/36 – NPFG Insured | 9/16 at 100.00 | AA– | 1,266,537 | ||||||||||||||
| 3,745 | Los Angeles, California, Wastewater System Revenue Bonds, Refunding Series 2009A, 5.750%, 6/01/26 | 6/19 at 100.00 | AA | 4,286,451 | ||||||||||||||
| 1,770 | Pomona Public Finance Authority, California, Revenue Bonds, Water Facilities Project, Series 2007AY, 5.000%, 5/01/27 – AMBAC Insured | 5/17 at 100.00 | A+ | 1,842,905 | ||||||||||||||
| 12,445 | Total Water and Sewer | 13,439,871 | ||||||||||||||||
| $ | 337,130 | Total Investments (cost $298,139,291) – 97.0% | 297,239,001 | |||||||||||||||
Other Assets Less Liabilities – 3.0% | 9,164,859 | |||||||||||||||||
Net Assets – 100% | $ | 306,403,860 | ||||||||||||||||
| (1) | All percentages shown in the Portfolio of Investments are based on net assets. |
| (2) | Optional Call Provisions: Dates (month and year) and prices of the earliest optional call or redemption. There may be other call provisions at varying prices at later dates. Certain mortgage-backed securities may be subject to periodic principal paydowns. |
| (3) | Ratings: Using the highest of Standard & Poor’s Group (“Standard & Poor’s”), Moody’s Investor Service, Inc. (“Moody’s”) or Fitch, Inc. (“Fitch”) rating. Ratings below BBB by Standard & Poor’s, Baa by Moody’s or BBB by Fitch are considered to be below investment grade. Holdings designated N/R are not rated by any of these national rating agencies. |
| (4) | For fair value measurement disclosure purposes, investment categorized as Level 3. See Notes to Financial Statements, Footnote 1 – General Information and Significant Accounting Policies, Investment Valuation for more information. |
| (5) | Backed by an escrow or trust containing sufficient U.S. Government or U.S. Government agency securities, which ensure the timely payment of principal and interest. Bonds backed by U.S. Government or agency securities are given an implied rating equal to the rating of such securities. |
| (6) | This debt has been restructured to accommodate capital maintenance at the facility. Major highlights of the debt restructuring include the following: (1) the principal balance outstanding on and after December 1, 2007, shall accrue interest at a rate of 6.500% per annum commencing December 1, 2007; (2) the interest shall accrue but not be payable on June 1, 2008 or December 1, 2008, but shall instead be deferred and paid by the end of calendar year 2011; (3) no principal component shall be pre-payable from the Minimum Sinking Fund Account during calendar years 2008 and 2009 but such pre-payments shall recommence beginning in calendar year 2010 according to a revised schedule. Management believes that the restructuring is in the best interest of Fund shareholders and that it is more-likely-than-not that the borrower will fulfill its obligation. Consequently, the Fund continues to accrue interest on this obligation. |
| N/R | Not rated. |
| (ETM) | Escrowed to maturity. |
See accompanying notes to financial statements.
| 34 | Nuveen Investments |
Portfolio of Investments (Unaudited)
Nuveen California Municipal Bond Fund 2
(formerly Nuveen California Insured Municipal Bond Fund)
August 31, 2011
| Principal Amount (000) | Description (1) | Optional Call Provisions (2) | Ratings (3) | Value | ||||||||||||||
Consumer Staples – 2.1% | ||||||||||||||||||
| $ | 5,000 | Golden State Tobacco Securitization Corporation, California, Tobacco Settlement Asset-Backed Bonds, Series 2007A-1, 5.125%, 6/01/47 | 6/17 at 100.00 | Baa3 | $ | 3,226,400 | ||||||||||||
Education and Civic Organizations – 6.1% | ||||||||||||||||||
| 750 | California Educational Facilities Authority, Student Loan Revenue Bonds, Cal Loan Program, Series 2001A, 5.400%, 3/01/21 – NPFG Insured (Alternative Minimum Tax) | 3/12 at 100.00 | Baa1 | 750,488 | ||||||||||||||
| 1,500 | California State Public Works Board, Lease Revenue Bonds, University of California, Institute Projects, Series 2005C, 5.000%, 4/01/30 – AMBAC Insured | 4/15 at 100.00 | Aa2 | 1,524,255 | ||||||||||||||
| 2,250 | California State University, Systemwide Revenue Bonds, Series 2005A, 5.000%, 11/01/25 – AMBAC Insured | 5/15 at 100.00 | Aa2 | 2,355,210 | ||||||||||||||
| 5,000 | Long Beach Bond Financing Authority, California, Lease Revenue Refunding Bonds, Long Beach Aquarium of the South Pacific, Series 2001, 5.250%, 11/01/30 – AMBAC Insured | 11/11 at 101.00 | BBB | 4,841,150 | ||||||||||||||
| 9,500 | Total Education and Civic Organizations | 9,471,103 | ||||||||||||||||
Health Care – 8.2% | ||||||||||||||||||
| 2,000 | Antelope Valley Healthcare District, California, Insured Revenue Refunding Bonds, Series 1997A, 5.200%, 1/01/27 – AGM Insured | 1/12 at 100.00 | AA+ | 1,999,960 | ||||||||||||||
| 2,000 | California Health Facilities Financing Authority, Refunding Revenue Bonds, Stanford Hospital and Clinics, Series 2010B, 5.750%, 11/15/31 | 11/20 at 100.00 | Aa3 | 2,166,200 | ||||||||||||||
| 4,000 | California Statewide Community Development Authority, Certificates of Participation, Sutter Health Obligated Group, Series 1999, 5.500%, 8/15/31 – AGM Insured | 2/12 at 100.00 | AA+ | 4,001,480 | ||||||||||||||
| 1,000 | California Statewide Community Development Authority, Revenue Bonds, Daughters of Charity Health System, Series 2005A, 5.250%, 7/01/30 | 7/15 at 100.00 | BBB | 848,890 | ||||||||||||||
| 3,685 | California Statewide Community Development Authority, Revenue Bonds, St. Joseph Health System, Series 2007A, 5.750%, 7/01/47 – FGIC Insured | 7/18 at 100.00 | AA– | 3,714,885 | ||||||||||||||
| 12,685 | Total Health Care | 12,731,415 | ||||||||||||||||
Housing/Multifamily – 5.8% | ||||||||||||||||||
| 4,180 | California Statewide Community Development Authority, Multifamily Housing Revenue Senior Bonds, Westgate Courtyards Apartments, Series 2001X-1, 5.420%, 12/01/34 – AMBAC Insured (Alternative Minimum Tax) | 12/11 at 100.00 | N/R | 3,715,100 | ||||||||||||||
| 3,865 | Los Angeles, California, GNMA Mortgage-Backed Securities Program Multifamily Housing Revenue Bonds, Park Plaza West Senior Apartments, Series 2001B, 5.400%, 1/20/31 (Alternative Minimum Tax) | 1/12 at 102.00 | AA+ | 3,901,486 | ||||||||||||||
| 1,285 | Santa Cruz County Housing Authority, California, GNMA Collateralized Multifamily Housing Revenue Bonds, Northgate Apartments, Series 1999A, 5.500%, 7/20/40 (Alternative Minimum Tax) | 1/12 at 100.00 | Aaa | 1,285,334 | ||||||||||||||
| 9,330 | Total Housing/Multifamily | 8,901,920 | ||||||||||||||||
Housing/Single Family – 0.8% | ||||||||||||||||||
| 190 | California Housing Finance Agency, Home Mortgage Revenue Bonds, Series 2006H, 5.750%, 8/01/30 – FGIC Insured (Alternative Minimum Tax) | 2/16 at 100.00 | Baa1 | 190,122 | ||||||||||||||
| 1,005 | California Rural Home Mortgage Finance Authority, FNMA Mortgage-Backed Securities Program Single Family Mortgage Revenue Bonds, Series 2002D, 5.250%, 6/01/34 (Alternative Minimum Tax) | 6/12 at 101.00 | Aaa | 1,038,798 | ||||||||||||||
| 1,195 | Total Housing/Single Family | 1,228,920 | ||||||||||||||||
Tax Obligation/General – 26.2% | ||||||||||||||||||
| 1,000 | Bonita Unified School District, San Diego County, California, General Obligation Bonds, Series 2004A, 5.250%, 8/01/20 – NPFG Insured | 8/14 at 100.00 | AA– | 1,091,620 | ||||||||||||||
| 6,900 | Central Unified School District, Fresno County, California, General Obligation Bonds, Series 2006B, 5.000%, 8/01/31 – AGM Insured | 8/16 at 100.00 | AA+ | 7,061,115 | ||||||||||||||
| Nuveen Investments | 35 |
Portfolio of Investments (Unaudited)
Nuveen California Municipal Bond Fund 2 (continued)
August 31, 2011
| Principal Amount (000) | Description (1) | Optional Call Provisions (2) | Ratings (3) | Value | ||||||||||||||
Tax Obligation/General (continued) | ||||||||||||||||||
| $ | 1,365 | El Segundo Unified School District, Los Angeles County, California, General Obligation Bonds, Series 2004, 5.250%, 9/01/20 – FGIC Insured | 9/14 at 100.00 | AA– | $ | 1,499,835 | ||||||||||||
| 2,285 | Folsom Cordova Unified School District, Sacramento County, California, General Obligation Bonds, School Facilities Improvement District 1, Series 2004B, 5.000%, 10/01/21 – NPFG Insured | 10/14 at 100.00 | �� | Aa3 | 2,483,087 | |||||||||||||
| 1,185 | Folsom Cordova Unified School District, Sacramento County, California, General Obligation Bonds, School Facilities Improvement District 2, Series 2004B, 5.000%, 10/01/27 – AGM Insured | 10/14 at 100.00 | AA+ | 1,257,072 | ||||||||||||||
Glendora Unified School District, Los Angeles County, California, General Obligation Bonds, Series 2006A: | ||||||||||||||||||
| 1,900 | 5.250%, 8/01/24 – NPFG Insured | 8/16 at 100.00 | Aa2 | 2,050,708 | ||||||||||||||
| 1,000 | 5.250%, 8/01/25 – NPFG Insured | 8/16 at 100.00 | Aa2 | 1,041,370 | ||||||||||||||
| 1,330 | Imperial Community College District, Imperial County, California, General Obligation Bonds, Series 2005, 5.000%, 8/01/23 – FGIC Insured | 8/15 at 100.00 | Aa3 | 1,399,306 | ||||||||||||||
| 1,460 | Jurupa Unified School District, Riverside County, California, General Obligation Bonds, Series 2004, 5.000%, 8/01/24 – FGIC Insured | 8/13 at 100.00 | A+ | 1,492,310 | ||||||||||||||
| 2,405 | Oak Valley Hospital District, Stanislaus County, California, General Obligation Bonds, Series 2005, 5.000%, 7/01/31 – FGIC Insured | 7/14 at 101.00 | A1 | 2,351,561 | ||||||||||||||
| 270 | Roseville Joint Union High School District, Placer County, California, General Obligation Bonds, Series 2006B, 5.000%, 8/01/27 – FGIC Insured | 8/15 at 100.00 | AA– | 279,542 | ||||||||||||||
| 1,590 | Sacramento City Unified School District, Sacramento County, California, General Obligation Bonds, Series 2005, 5.000%, 7/01/27 – NPFG Insured | 7/15 at 100.00 | Aa3 | 1,645,046 | ||||||||||||||
| 4,070 | San Benito Health Care District, California, General Obligation Bonds, Series 2005, 5.000%, 7/01/31 – SYNCORA GTY Insured | 7/14 at 101.00 | BBB+ | 3,733,818 | ||||||||||||||
| 1,000 | San Ramon Valley Unified School District, Contra Costa County, California, General Obligation Bonds, Series 2004, 5.000%, 8/01/24 – AGM Insured | 8/14 at 100.00 | AA+ | 1,074,670 | ||||||||||||||
| 5,000 | Southwestern Community College District, San Diego County, California, General Obligation Bonds, Election of 2008, Series 2011C, 5.250%, 8/01/36 | 8/21 at 100.00 | Aa2 | 5,229,900 | ||||||||||||||
| 3,040 | Sulphur Springs Union School District, Los Angeles County, California, General Obligation Bonds, Series 1991A, 0.000%, 9/01/15 – NPFG Insured | No Opt. Call | Baa1 | 2,717,122 | ||||||||||||||
| 3,000 | Tahoe Forest Hospital District, Placer and Nevada Counties, California, General Obligation Bonds, Series 2010B, 5.500%, 8/01/35 | 8/18 at 100.00 | Aa3 | 3,141,090 | ||||||||||||||
| 1,000 | Washington Unified School District, Yolo County, California, General Obligation Bonds, Series 2004A, 5.000%, 8/01/22 – FGIC Insured | 8/13 at 100.00 | A+ | 1,059,910 | ||||||||||||||
| 39,800 | Total Tax Obligation/General | 40,609,082 | ||||||||||||||||
Tax Obligation/Limited – 32.4% | ||||||||||||||||||
| 1,915 | Alameda County Redevelopment Agency, California, Eden Area Redevelopment Project, Tax Allocation Bonds, Series 2006A, 5.000%, 8/01/36 – NPFG Insured | 8/16 at 100.00 | A2 | 1,677,846 | ||||||||||||||
Anaheim Public Finance Authority, California, Subordinate Lease Revenue Bonds, Public Improvement Project, Series 1997C: | ||||||||||||||||||
| 15,000 | 0.000%, 9/01/34 – AGM Insured | No Opt. Call | AA+ | 3,014,250 | ||||||||||||||
| 10,000 | 0.000%, 9/01/36 – AGM Insured | No Opt. Call | AA+ | 1,743,600 | ||||||||||||||
| 150 | Barstow Redevelopment Agency, California, Tax Allocation Bonds, Central Redevelopment Project, Series 1994A, 7.000%, 9/01/14 – NPFG Insured | No Opt. Call | Baa1 | 161,024 | ||||||||||||||
| 1,655 | Bell Community Housing Authority, California, Lease Revenue Bonds, Series 2005, 5.000%, 10/01/36 – AMBAC Insured | 10/15 at 100.00 | N/R | 1,222,797 | ||||||||||||||
| 2,250 | Brea and Olinda Unified School District, Orange County, California, Certificates of Participation Refunding, Series 2002A, 5.125%, 8/01/26 – AGM Insured | 8/12 at 100.00 | AA+ | 2,278,215 | ||||||||||||||
| 1,960 | California Infrastructure Economic Development Bank, Revenue Bonds, North County Center for Self-Sufficiency Corporation, Series 2004, 5.000%, 12/01/25 – AMBAC Insured | 12/13 at 100.00 | AA | 2,075,954 | ||||||||||||||
| 335 | Capistrano Unified School District, Orange County, California, Special Tax Bonds, Community Facilities District, Series 2005, 5.000%, 9/01/24 – FGIC Insured | 9/15 at 100.00 | BBB | 331,529 | ||||||||||||||
| 36 | Nuveen Investments |
| Principal Amount (000) | Description (1) | Optional Call Provisions (2) | Ratings (3) | Value | ||||||||||||||
Tax Obligation/Limited (continued) | ||||||||||||||||||
| $ | 1,400 | Chula Vista Public Financing Authority, California, Pooled Community Facility District Assessment Revenue Bonds, Series 2005A, 5.000%, 9/01/29 – NPFG Insured | 9/15 at 100.00 | Baa1 | $ | 1,270,080 | ||||||||||||
| 2,480 | Golden State Tobacco Securitization Corporation, California, Enhanced Tobacco Settlement Asset-Backed Revenue Bonds, Series 2005A, 5.000%, 6/01/45 – AMBAC Insured | 6/15 at 100.00 | A2 | 2,190,683 | ||||||||||||||
| 1,840 | Hawthorne Community Redevelopment Agency, California, Project Area 2 Tax Allocation Bonds, Series 2006, 5.000%, 9/01/26 – SYNCORA GTY Insured | 9/16 at 100.00 | A– | 1,721,854 | ||||||||||||||
| 4,555 | Long Beach Bond Finance Authority, California, Multiple Project Tax Allocation Bonds, Housing and Gas Utility Financing Project Areas, Series 2005A-1, 5.000%, 8/01/35 – AMBAC Insured | 8/15 at 100.00 | BBB+ | 3,712,325 | ||||||||||||||
| 1,830 | Los Angeles Community Redevelopment Agency, California, Lease Revenue Bonds, Manchester Social Services Project, Series 2005, 5.000%, 9/01/37 – AMBAC Insured | 9/15 at 100.00 | A1 | 1,650,532 | ||||||||||||||
| 1,000 | Los Angeles Community Redevelopment Agency, California, Tax Allocation Bonds, Bunker Hill Project, Series 2004A, 5.000%, 12/01/20 – AGM Insured | 12/14 at 100.00 | AA+ | 1,092,590 | ||||||||||||||
| 14,050 | Paramount Redevelopment Agency, California, Tax Allocation Refunding Bonds, Redevelopment Project Area 1, Series 1998, 0.000%, 8/01/26 – NPFG Insured | No Opt. Call | A– | 5,103,944 | ||||||||||||||
| 1,150 | Poway Redevelopment Agency, California, Tax Allocation Bonds, Paugay Redevelopment Project, Series 2007, 5.000%, 6/15/30 – NPFG Insured | 6/17 at 100.00 | A | 1,056,551 | ||||||||||||||
| 295 | Rancho Santa Fe CSD Financing Authority, California, Revenue Bonds, Superior Lien Series 2011A, 5.750%, 9/01/30 | 9/21 at 100.00 | BBB+ | 299,257 | ||||||||||||||
| 290 | Rialto Redevelopment Agency, California, Tax Allocation Bonds, Merged Project Area, Series 2005A, 5.000%, 9/01/35 – SYNCORA GTY Insured | 9/15 at 100.00 | A– | 254,365 | ||||||||||||||
| 8,000 | Riverside County, California, Asset Leasing Corporate Leasehold Revenue Bonds, Riverside County Hospital Project, Series 1997B, 5.000%, 6/01/19 – NPFG Insured | 6/12 at 101.00 | Baa1 | 8,198,640 | ||||||||||||||
| 360 | Roseville, California, Certificates of Participation, Public Facilities, Series 2003A, 5.000%, 8/01/25 – AMBAC Insured | 8/13 at 100.00 | AA– | 363,190 | ||||||||||||||
| 3,560 | Roseville, California, Special Tax Bonds, Community Facilities District 1 – Woodcreek West, Series 2005, 5.000%, 9/01/30 – AMBAC Insured | 9/15 at 100.00 | A– | 3,412,509 | ||||||||||||||
| 1,955 | San Francisco City and County Redevelopment Agency, California, Hotel Occupancy Tax Revenue Bonds, Refunding Series 2011, 5.000%, 6/01/25 – AGM Insured | 6/21 at 100.00 | AA+ | 2,056,562 | ||||||||||||||
| 1,000 | Temecula Redevelopment Agency, California, Tax Allocation Revenue Bonds, Redevelopment Project 1, Series 2002, 5.250%, 8/01/36 – NPFG Insured | 11/11 at 100.00 | A– | 898,850 | ||||||||||||||
Vista Community Development Commission Taxable Non-Housing Tax Allocation Revenue Bonds, California, Vista Redevelopment Project, Series 2011: | ||||||||||||||||||
| 2,165 | 6.000%, 9/01/33 | 9/21 at 100.00 | A– | 2,209,036 | ||||||||||||||
| 2,260 | 6.125%, 9/01/37 | 9/21 at 100.00 | A– | 2,296,296 | ||||||||||||||
| 81,455 | Total Tax Obligation/Limited | 50,292,479 | ||||||||||||||||
Transportation – 8.4% | ||||||||||||||||||
| 6,500 | Foothill/Eastern Transportation Corridor Agency, California, Toll Road Revenue Bonds, Series 1995A, 5.000%, 1/01/35 – NPFG Insured | 1/12 at 100.00 | Baa1 | 5,316,480 | ||||||||||||||
| 3,255 | Foothill/Eastern Transportation Corridor Agency, California, Toll Road Revenue Refunding Bonds, Series 1999, 5.750%, 1/15/40 – NPFG Insured | 1/12 at 100.00 | Baa1 | 2,909,547 | ||||||||||||||
| 2,150 | San Francisco Airports Commission, California, Revenue Refunding Bonds, San Francisco International Airport, Second Series 2001, Issue 27A, 5.250%, 5/01/31 – NPFG Insured (Alternative Minimum Tax) | 11/11 at 100.00 | A+ | 2,149,979 | ||||||||||||||
| 1,290 | San Francisco Airports Commission, California, Special Facilities Lease Revenue Bonds, San Francisco International Airport, SFO Fuel Company LLC, Series 1997A, 5.250%, 1/01/22 – AMBAC Insured (Alternative Minimum Tax) | 1/12 at 100.00 | A3 | 1,290,942 | ||||||||||||||
| Nuveen Investments | 37 |
Portfolio of Investments (Unaudited)
Nuveen California Municipal Bond Fund 2 (continued)
August 31, 2011
| Principal Amount (000) | Description (1) | Optional Call Provisions (2) | Ratings (3) | Value | ||||||||||||||
Transportation (continued) | ||||||||||||||||||
| $ | 1,320 | San Francisco Airports Commission, California, Special Facilities Lease Revenue Bonds, San Francisco International Airport, SFO Fuel Company LLC, Series 2000A, 6.100%, 1/01/20 – AGM Insured (Alternative Minimum Tax) | 1/12 at 100.00 | AA+ | $ | 1,322,851 | ||||||||||||
| 14,515 | Total Transportation | 12,989,799 | ||||||||||||||||
U.S. Guaranteed – 0.2% (4) | ||||||||||||||||||
| 305 | Barstow Redevelopment Agency, California, Tax Allocation Bonds, Central Redevelopment Project, Series 1994, 7.000%, 9/01/14 – NPFG Insured (ETM) | No Opt. Call | BBB | (4) | 334,649 | |||||||||||||
Utilities – 6.0% | ||||||||||||||||||
| 4,000 | California Pollution Control Financing Authority, Remarketed Revenue Bonds, Pacific Gas and Electric Company, Series 1996A, 5.350%, 12/01/16 – NPFG Insured (Alternative Minimum Tax) | No Opt. Call | A3 | 4,086,240 | ||||||||||||||
| 595 | Merced Irrigation District, California, Electric System Revenue Bonds, Series 2005, 5.125%, 9/01/31 – SYNCORA GTY Insured | 9/15 at 100.00 | N/R | 537,391 | ||||||||||||||
| 1,950 | Salinas Valley Solid Waste Authority, California, Revenue Bonds, Series 2002, 5.250%, 8/01/27 – AMBAC Insured (Alternative Minimum Tax) | 8/12 at 100.00 | A+ | 1,927,126 | ||||||||||||||
| 2,700 | Santa Clara, California, Subordinate Electric Revenue Bonds, Series 2003A, 5.000%, 7/01/23 – NPFG Insured | 7/13 at 100.00 | A1 | 2,781,134 | ||||||||||||||
| 9,245 | Total Utilities | 9,331,891 | ||||||||||||||||
Water and Sewer – 1.4% | ||||||||||||||||||
| 1,000 | Brentwood Infrastructure Financing Authority, California, Water Revenue Bonds, Series 2008, 5.750%, 7/01/38 | 7/18 at 100.00 | AA | 1,067,009 | ||||||||||||||
| 1,000 | Orange County Water District, California, Revenue Certificates of Participation, Series 2005B, 5.000%, 8/15/24 – NPFG Insured | 2/15 at 100.00 | AAA | 1,089,569 | ||||||||||||||
| 2,000 | Total Water and Sewer | 2,156,578 | ||||||||||||||||
| $ | 185,030 | Total Investments (cost $155,801,980) – 97.6% | 151,274,236 | |||||||||||||||
Other Assets Less Liabilities – 2.4% | 3,777,470 | |||||||||||||||||
Net Assets – 100% | $ | 155,051,706 | ||||||||||||||||
| (1) | All percentages shown in the Portfolio of Investments are based on net assets. |
| (2) | Optional Call Provisions: Dates (month and year) and prices of the earliest optional call or redemption. There may be other call provisions at varying prices at later dates. Certain mortgage-backed securities may be subject to periodic principal paydowns. |
| (3) | Ratings: Using the highest of Standard & Poor’s Group (“Standard & Poor’s”), Moody’s Investor Service, Inc. (“Moody’s”) or Fitch, Inc. (“Fitch”) rating. Ratings below BBB by Standard & Poor’s, Baa by Moody’s or BBB by Fitch are considered to be below investment grade. Holdings designated N/R are not rated by any of these national rating agencies. |
| (4) | Backed by an escrow or trust containing sufficient U.S. Government or U.S. Government agency securities, which ensure the timely payment of principal and interest. Bonds backed by U.S. Government or agency securities are given an implied rating equal to the rating of such securities. |
| N/R | Not rated. |
| (ETM) | Escrowed to maturity. |
See accompanying notes to financial statements.
| 38 | Nuveen Investments |
Statement of Assets and Liabilities (Unaudited)
August 31, 2011
| California High Yield | California | California 2 | ||||||||||
Assets | ||||||||||||
Investments, at value (cost $124,065,372, $298,139,291 and $155,801,980, respectively) | $ | 120,309,092 | $ | 297,239,001 | $ | 151,274,236 | ||||||
Cash | — | 5,075,080 | — | |||||||||
Receivables: | ||||||||||||
Interest | 2,882,531 | 4,725,644 | 1,579,786 | |||||||||
Investments sold | 464,840 | — | 3,039,019 | |||||||||
Shares sold | 377,221 | 526,046 | 42,416 | |||||||||
Other assets | — | 25,477 | 22,428 | |||||||||
Total assets | 124,033,684 | 307,591,248 | 155,957,885 | |||||||||
Liabilities | ||||||||||||
Cash overdraft | 1,265,696 | — | 442,521 | |||||||||
Unrealized depreciation on forward swaps | 920,872 | — | — | |||||||||
Payables: | ||||||||||||
Dividends | 229,581 | 590,701 | 182,187 | |||||||||
Investments purchased | 1,437,624 | — | — | |||||||||
Shares redeemed | 163,307 | 281,013 | 106,073 | |||||||||
Accrued expense: | ||||||||||||
Management fees | 58,942 | 139,142 | 71,051 | |||||||||
12b-1 distribution and service fees | 24,113 | 43,916 | 18,475 | |||||||||
Other | 42,145 | 132,616 | 85,872 | |||||||||
Total liabilities | 4,142,280 | 1,187,388 | 906,179 | |||||||||
Net assets | $ | 119,891,404 | $ | 306,403,860 | $ | 155,051,706 | ||||||
Class A Shares | ||||||||||||
Net assets | $ | 53,656,807 | $ | 132,374,269 | $ | 56,746,148 | ||||||
Shares outstanding | 6,780,909 | 13,291,556 | 5,702,825 | |||||||||
Net asset value per share | $ | 7.91 | $ | 9.96 | $ | 9.95 | ||||||
Offering price per share (net asset value per share plus | $ | 8.26 | $ | 10.40 | $ | 10.39 | ||||||
Class B Shares | ||||||||||||
Net assets | N/A | $ | 1,308,780 | $ | 906,248 | |||||||
Shares outstanding | N/A | 131,561 | 90,779 | |||||||||
Net asset value and offering price per share | N/A | $ | 9.95 | $ | 9.98 | |||||||
Class C Shares | ||||||||||||
Net assets | $ | 23,778,593 | $ | 32,627,594 | $ | 12,626,760 | ||||||
Shares outstanding | 3,006,721 | 3,286,528 | 1,274,943 | |||||||||
Net asset value and offering price per share | $ | 7.91 | $ | 9.93 | $ | 9.90 | ||||||
Class I Shares | ||||||||||||
Net assets | $ | 42,456,004 | $ | 140,093,217 | $ | 84,772,550 | ||||||
Shares outstanding | 5,370,813 | 14,085,795 | 8,503,536 | |||||||||
Net asset value and offering price per share | $ | 7.90 | $ | 9.95 | $ | 9.97 | ||||||
Net Assets Consist of: | ||||||||||||
Capital paid-in | $ | 131,520,095 | $ | 317,564,969 | $ | 161,092,852 | ||||||
Undistributed (Over-distribution of ) net investment income | 1,032,302 | 1,578,025 | 894,301 | |||||||||
Accumulated net realized gain (loss) | (7,983,841 | ) | (11,838,844 | ) | (2,407,703 | ) | ||||||
Net unrealized appreciation (depreciation) | (4,677,152 | ) | (900,290 | ) | (4,527,744 | ) | ||||||
Net assets | $ | 119,891,404 | $ | 306,403,860 | $ | 155,051,706 | ||||||
Authorized shares | Unlimited | Unlimited | Unlimited | |||||||||
Par value per share | $ | 0.01 | $ | 0.01 | $ | 0.01 | ||||||
N/A – California High Yield does not issue Class B Shares.
See accompanying notes to financial statements.
| Nuveen Investments | 39 |
Statement of Operations (Unaudited)
Six Months Ended August 31, 2011
| California High Yield | California | California 2 | ||||||||||
Investment Income | $ | 4,676,802 | $ | 8,593,250 | $ | 4,156,254 | ||||||
Expenses | ||||||||||||
Management fees | 339,839 | 776,252 | 412,381 | |||||||||
12b-1 service fees – Class A | 56,186 | 132,243 | 56,950 | |||||||||
12b-1 distribution and service fees – Class B | N/A | 7,544 | 6,178 | |||||||||
12b-1 distribution and service fees – Class C | 78,670 | 107,852 | 46,762 | |||||||||
Shareholders’ servicing agent fees and expenses | 18,895 | 74,023 | 38,978 | |||||||||
Custodian’s fees and expenses | 15,952 | 31,085 | 13,519 | |||||||||
Trustees’ fee and expenses | 1,422 | 3,678 | 1,870 | |||||||||
Professional fees | 12,414 | 8,856 | 7,871 | |||||||||
Shareholders’ reports – printing and mailing expenses | 12,439 | 32,084 | 22,415 | |||||||||
Federal and state registration fees | 4,796 | 1,615 | 1,812 | |||||||||
Other expenses | 1,159 | 2,616 | 1,168 | |||||||||
Total expenses before custodian fee credit | 541,772 | 1,177,848 | 609,904 | |||||||||
Custodian fee credit | (131 | ) | (294 | ) | (1,114 | ) | ||||||
Net expenses | 541,641 | 1,177,554 | 608,790 | |||||||||
Net investment income (loss) | 4,135,161 | 7,415,696 | 3,547,464 | |||||||||
Realized and Unrealized Gain (Loss) | ||||||||||||
Net realized gain (loss) from: | ||||||||||||
Investments | (540,112 | ) | 2,125,733 | (105,028 | ) | |||||||
Forward swaps | (125,800 | ) | — | — | ||||||||
Change in net unrealized appreciation (depreciation) of: | ||||||||||||
Investments | 9,698,919 | 12,896,045 | 7,496,017 | |||||||||
Forward swaps | (853,238 | ) | — | — | ||||||||
Net realized and unrealized gain (loss) | 8,179,769 | 15,021,778 | 7,390,989 | |||||||||
Net increase (decrease) in net assets from operations | $ | 12,314,930 | $ | 22,437,474 | $ | 10,938,453 | ||||||
N/A – California High Yield does not issue Class B Shares.
See accompanying notes to financial statements.
| 40 | Nuveen Investments |
Statement of Changes in Net Assets (Unaudited)
| California High Yield | California | California 2 | ||||||||||||||||||||||
| Six Months Ended 8/31/11 | Year Ended 2/28/11 | Six Months Ended 8/31/11 | Year Ended 2/28/11 | Six Months Ended 8/31/11 | Year Ended 2/28/11 | |||||||||||||||||||
Operations | ||||||||||||||||||||||||
Net investment income (loss) | $ | 4,135,161 | $ | 7,644,750 | $ | 7,415,696 | $ | 14,487,219 | $ | 3,547,464 | $ | 8,043,735 | ||||||||||||
Net realized gain (loss) from: | ||||||||||||||||||||||||
Investments | (540,112 | ) | 69,782 | 2,125,733 | 673,815 | (105,028 | ) | (1,164,351 | ) | |||||||||||||||
Forward swaps | (125,800 | ) | (248,571 | ) | — | — | — | — | ||||||||||||||||
Change in net unrealized appreciation (depreciation) of: | ||||||||||||||||||||||||
Investments | 9,698,919 | (9,054,186 | ) | 12,896,045 | (11,914,496 | ) | 7,496,017 | (8,126,684 | ) | |||||||||||||||
Forward swaps | (853,238 | ) | (124,834 | ) | — | — | — | — | ||||||||||||||||
Net increase (decrease) in net assets from operations | 12,314,930 | (1,713,059 | ) | 22,437,474 | 3,246,538 | 10,938,453 | (1,247,300 | ) | ||||||||||||||||
Distributions to Shareholders | ||||||||||||||||||||||||
From net investment income: | ||||||||||||||||||||||||
Class A | (1,842,684 | ) | (3,786,851 | ) | (3,142,610 | ) | (5,943,619 | ) | (1,268,786 | ) | (3,010,759 | ) | ||||||||||||
Class B | N/A | N/A | (31,819 | ) | (98,949 | ) | (24,120 | ) | (74,298 | ) | ||||||||||||||
Class C | (634,906 | ) | (1,037,625 | ) | (604,155 | ) | (1,111,252 | ) | (244,041 | ) | (480,390 | ) | ||||||||||||
Class I | (1,367,478 | ) | (2,351,189 | ) | (3,367,578 | ) | (6,760,241 | ) | (1,989,790 | ) | (4,159,824 | ) | ||||||||||||
Decrease in net assets from distributions to shareholders | (3,845,068 | ) | (7,175,665 | ) | (7,146,162 | ) | (13,914,061 | ) | (3,526,737 | ) | (7,725,271 | ) | ||||||||||||
Fund Share Transactions | ||||||||||||||||||||||||
Proceeds from sale of shares | 21,532,238 | 70,666,004 | 19,531,891 | 75,312,274 | 2,624,255 | 9,322,551 | ||||||||||||||||||
Proceeds from shares issued to shareholders due to reinvestment of distributions | 2,570,813 | 4,491,282 | 3,574,722 | 7,310,079 | 2,328,099 | 4,671,188 | ||||||||||||||||||
| 24,103,051 | 75,157,286 | 23,106,613 | 82,622,353 | 4,952,354 | 13,993,739 | |||||||||||||||||||
Cost of shares redeemed | (28,898,087 | ) | (39,251,927 | ) | (29,148,622 | ) | (77,261,765 | ) | (14,562,674 | ) | (40,215,641 | ) | ||||||||||||
Net increase (decrease) in net assets from Fund share transactions | (4,795,036 | ) | 35,905,359 | (6,042,009 | ) | 5,360,588 | (9,610,320 | ) | (26,221,902 | ) | ||||||||||||||
Net increase (decrease) in net assets | 3,674,826 | 27,016,635 | 9,249,303 | (5,306,935 | ) | (2,198,604 | ) | (35,194,473 | ) | |||||||||||||||
Net assets at the beginning of period | 116,216,578 | 89,199,943 | 297,154,557 | 302,461,492 | 157,250,310 | 192,444,783 | ||||||||||||||||||
Net assets at the end of period | $ | 119,891,404 | $ | 116,216,578 | $ | 306,403,860 | $ | 297,154,557 | $ | 155,051,706 | $ | 157,250,310 | ||||||||||||
Undistributed (Over-distribution of) net investment income at the end of period | $ | 1,032,302 | $ | 742,209 | $ | 1,578,025 | $ | 1,308,491 | $ | 894,301 | $ | 873,574 | ||||||||||||
N/A – California High Yield does not issue Class B Shares.
See accompanying notes to financial statements.
| Nuveen Investments | 41 |
Financial Highlights (Unaudited)
| Selected data for a share outstanding throughout each period: | ||||||||||||||||||||||||||||||||||||
| Class (Commencement Date) | ||||||||||||||||||||||||||||||||||||
| Investment Operations | Less Distributions | |||||||||||||||||||||||||||||||||||
| CALIFORNIA HIGH YIELD | ||||||||||||||||||||||||||||||||||||
| Year Ended February 28/29, | Beginning Net Asset Value | Net Invest- ment Income (Loss)(a) | Net Realized/ Unrealized Gain (Loss) | Total | Net Invest- ment Income | Capital Gains(b) | Total | Ending Net Asset Value | Total Return(c) | |||||||||||||||||||||||||||
Class A (3/06) |
| |||||||||||||||||||||||||||||||||||
2012(i) | $ | 7.36 | $ | .28 | $ | .52 | $ | .80 | $ | (.25 | ) | $ | — | $ | (.25 | ) | $ | 7.91 | 11.06 | % | ||||||||||||||||
2011 | 7.87 | .52 | (.54 | ) | (.02 | ) | (.49 | ) | — | (.49 | ) | 7.36 | (.56 | ) | ||||||||||||||||||||||
2010 | 6.51 | .51 | 1.34 | 1.85 | (.49 | ) | — | (.49 | ) | 7.87 | 29.23 | |||||||||||||||||||||||||
2009 | 8.24 | .48 | (1.76 | ) | (1.28 | ) | (.45 | ) | — | (.45 | ) | 6.51 | (16.06 | ) | ||||||||||||||||||||||
2008 | 10.43 | .45 | (2.19 | ) | (1.74 | ) | (.45 | ) | — | ** | (.45 | ) | 8.24 | (17.19 | ) | |||||||||||||||||||||
2007(g) | 10.00 | .39 | .42 | .81 | (.38 | ) | — | (.38 | ) | 10.43 | 8.19 | |||||||||||||||||||||||||
Class C (3/06) |
| |||||||||||||||||||||||||||||||||||
2012(i) | 7.36 | .25 | .53 | .78 | (.23 | ) | — | (.23 | ) | 7.91 | 10.79 | |||||||||||||||||||||||||
2011 | 7.87 | .48 | (.54 | ) | (.06 | ) | (.45 | ) | — | (.45 | ) | 7.36 | (1.07 | ) | ||||||||||||||||||||||
2010 | 6.51 | .47 | 1.34 | 1.81 | (.45 | ) | — | (.45 | ) | 7.87 | 28.56 | |||||||||||||||||||||||||
2009 | 8.24 | .44 | (1.76 | ) | (1.32 | ) | (.41 | ) | — | (.41 | ) | 6.51 | (16.55 | ) | ||||||||||||||||||||||
2008 | 10.42 | .40 | (2.19 | ) | (1.79 | ) | (.39 | ) | — | ** | (.39 | ) | 8.24 | (17.61 | ) | |||||||||||||||||||||
2007(g) | 10.00 | .33 | .42 | .75 | (.33 | ) | — | (.33 | ) | 10.42 | 7.56 | |||||||||||||||||||||||||
Class I (3/06)(h) |
| |||||||||||||||||||||||||||||||||||
2012(i) | 7.35 | .28 | .53 | .81 | (.26 | ) | — | (.26 | ) | 7.90 | 11.20 | |||||||||||||||||||||||||
2011 | 7.86 | .53 | (.53 | ) | — | (.51 | ) | — | (.51 | ) | 7.35 | (.34 | ) | |||||||||||||||||||||||
2010 | 6.50 | .52 | 1.34 | 1.86 | (.50 | ) | — | (.50 | ) | 7.86 | 29.54 | |||||||||||||||||||||||||
2009 | 8.24 | .50 | (1.77 | ) | (1.27 | ) | (.47 | ) | — | (.47 | ) | 6.50 | (16.01 | ) | ||||||||||||||||||||||
2008 | 10.43 | .47 | (2.19 | ) | (1.72 | ) | (.47 | ) | — | ** | (.47 | ) | 8.24 | (17.04 | ) | |||||||||||||||||||||
2007(g) | 10.00 | .45 | .37 | .82 | (.39 | ) | — | (.39 | ) | 10.43 | 8.35 | |||||||||||||||||||||||||
| 42 | Nuveen Investments |
| Ratios/Supplemental Data | ||||||||||||||||||||||||||||||
| Ratios to Average Net Assets Before Reimbursement(d) | Ratios to Average Net Assets After Reimbursement(d)(e) | |||||||||||||||||||||||||||||
| Ending Net Assets (000) | Expenses Including Interest(f) | Expenses Excluding Interest | Net Invest- ment Income (Loss) | Expenses Including Interest(f) | Expenses Excluding Interest | Net (Loss) | Portfolio Turnover Rate | |||||||||||||||||||||||
| $ | 53,657 | .89 | %* | .89 | %* | 7.08 | %* | .89 | %* | .89 | %* | 7.08 | %* | 16 | % | |||||||||||||||
| 60,178 | .90 | .90 | 6.53 | .90 | .90 | 6.53 | 17 | |||||||||||||||||||||||
| 40,864 | .94 | .94 | 6.91 | .94 | .94 | 6.91 | 23 | |||||||||||||||||||||||
| 32,290 | 1.01 | .92 | 6.13 | 1.01 | .92 | 6.13 | 55 | |||||||||||||||||||||||
| 42,252 | 1.43 | .99 | 4.58 | 1.37 | .93 | 4.64 | 25 | |||||||||||||||||||||||
| 14,539 | 1.84 | * | 1.26 | * | 3.63 | * | 1.52 | * | .94 | * | 3.96 | * | 3 | |||||||||||||||||
| 23,779 | 1.44 | * | 1.44 | * | 6.51 | * | 1.44 | %* | 1.44 | %* | 6.51 | %* | 16 | |||||||||||||||||
| 19,035 | 1.45 | 1.45 | 6.00 | 1.45 | 1.45 | 6.00 | 17 | |||||||||||||||||||||||
| 15,971 | 1.49 | 1.49 | 6.25 | 1.49 | 1.49 | 6.25 | 23 | |||||||||||||||||||||||
| 6,718 | 1.56 | 1.47 | 5.69 | 1.56 | 1.47 | 5.69 | 55 | |||||||||||||||||||||||
| 6,382 | 1.97 | 1.53 | 4.02 | 1.92 | 1.48 | 4.08 | 25 | |||||||||||||||||||||||
| 3,061 | 2.44 | * | 1.86 | * | 2.99 | * | 2.07 | * | 1.49 | * | 3.36 | * | 3 | |||||||||||||||||
| 42,456 | .69 | * | .69 | * | 7.28 | * | .69 | %* | .69 | %* | 7.28 | %* | 16 | |||||||||||||||||
| 37,004 | .70 | .70 | 6.74 | .70 | .70 | 6.74 | 17 | |||||||||||||||||||||||
| 32,212 | .74 | .74 | 7.09 | .74 | .74 | 7.09 | 23 | |||||||||||||||||||||||
| 16,146 | .81 | .72 | 6.80 | .81 | .72 | 6.80 | 55 | |||||||||||||||||||||||
| 4,889 | 1.21 | .77 | 4.89 | 1.17 | .73 | 4.92 | 25 | |||||||||||||||||||||||
| 106 | 1.58 | * | 1.00 | * | 4.32 | * | 1.31 | * | .73 | * | 4.58 | * | 3 | |||||||||||||||||
| (a) | Per share Net Investment Income (Loss) is calculated using the average daily shares method. |
| (b) | Distributions from Capital Gains include short-term capital gains, if any. |
| (c) | Total return is the combination of changes in net asset value without any sales charge, reinvested dividend income at net asset value and reinvested capital gains distributions at net asset value, if any. Total returns are not annualized. |
| (d) | Ratios do not reflect the effect of custodian fee credits earned on the Fund’s net cash on deposit with the custodian bank, where applicable. |
| (e) | After expense reimbursement from the Adviser, where applicable. |
| (f) | The expense ratios reflect, among other things, the interest expense deemed to have been paid by the Fund on the floating rate certificates issued by the special purpose trusts for the self-deposited inverse floaters held by the Fund, where applicable, as described in Footnote 1 – General Information and Significant Accounting Policies, Inverse Floating Rate Securities. |
| (g) | For the period March 28, 2006 (commencement of operations) through February 28, 2007. |
| (h) | Effective May 1, 2008, Class R Shares were renamed Class I Shares. |
| (i) | For the six months ended August 31, 2011. |
| * | Annualized. |
| ** | Rounds to less than $.01 per share. |
See accompanying notes to financial statements.
| Nuveen Investments | 43 |
Financial Highlights (Unaudited) (continued)
| Selected data for a share outstanding throughout each period: | ||||||||||||||||||||||||||||||||||||
| Class (Commencement Date) | ||||||||||||||||||||||||||||||||||||
| Investment Operations | Less Distributions | |||||||||||||||||||||||||||||||||||
| CALIFORNIA | ||||||||||||||||||||||||||||||||||||
| Year Ended February 28/29, | Beginning Net Asset Value | Net Income | Net Realized/ Unrealized Gain (Loss) | Total | Net Invest- ment Income | Capital Gains(b) | Total | Ending Net Asset Value | Total Return(c) | |||||||||||||||||||||||||||
Class A (9/94) |
| |||||||||||||||||||||||||||||||||||
2012(g) | $ | 9.46 | $ | .24 | $ | .49 | $ | .73 | $ | (.23 | ) | $ | — | $ | (.23 | ) | $ | 9.96 | 7.82 | % | ||||||||||||||||
2011 | 9.80 | .47 | (.36 | ) | .11 | (.45 | ) | — | (.45 | ) | 9.46 | 1.05 | ||||||||||||||||||||||||
2010 | 8.96 | .46 | .82 | 1.28 | (.44 | ) | — | (.44 | ) | 9.80 | 14.56 | |||||||||||||||||||||||||
2009 | 9.50 | .44 | (.55 | ) | (.11 | ) | (.43 | ) | — | (.43 | ) | 8.96 | (1.25 | ) | ||||||||||||||||||||||
2008 | 10.50 | .43 | (1.00 | ) | (.57 | ) | (.43 | ) | — | (.43 | ) | 9.50 | (5.65 | ) | ||||||||||||||||||||||
2007 | 10.43 | .43 | .07 | .50 | (.43 | ) | — | (.43 | ) | 10.50 | 4.88 | |||||||||||||||||||||||||
Class B (3/97) |
| |||||||||||||||||||||||||||||||||||
2012(g) | 9.45 | .21 | .49 | .70 | (.20 | ) | — | (.20 | ) | 9.95 | 7.43 | |||||||||||||||||||||||||
2011 | 9.80 | .39 | (.36 | ) | .03 | (.38 | ) | — | (.38 | ) | 9.45 | .19 | ||||||||||||||||||||||||
2010 | 8.96 | .39 | .82 | 1.21 | (.37 | ) | — | (.37 | ) | 9.80 | 13.75 | |||||||||||||||||||||||||
2009 | 9.50 | .37 | (.55 | ) | (.18 | ) | (.36 | ) | — | (.36 | ) | 8.96 | (1.99 | ) | ||||||||||||||||||||||
2008 | 10.49 | .36 | (1.00 | ) | (.64 | ) | (.35 | ) | — | (.35 | ) | 9.50 | (6.28 | ) | ||||||||||||||||||||||
2007 | 10.42 | .35 | .07 | .42 | (.35 | ) | — | (.35 | ) | 10.49 | 4.10 | |||||||||||||||||||||||||
Class C (9/94) |
| |||||||||||||||||||||||||||||||||||
2012(g) | 9.43 | .21 | .49 | .70 | (.20 | ) | — | (.20 | ) | 9.93 | 7.55 | |||||||||||||||||||||||||
2011 | 9.78 | .41 | (.36 | ) | .05 | (.40 | ) | — | (.40 | ) | 9.43 | .39 | ||||||||||||||||||||||||
2010 | 8.94 | .41 | .82 | 1.23 | (.39 | ) | — | (.39 | ) | 9.78 | 14.00 | |||||||||||||||||||||||||
2009 | 9.48 | .39 | (.55 | ) | (.16 | ) | (.38 | ) | — | (.38 | ) | 8.94 | (1.80 | ) | ||||||||||||||||||||||
2008 | 10.47 | .38 | (1.00 | ) | (.62 | ) | (.37 | ) | — | (.37 | ) | 9.48 | (6.07 | ) | ||||||||||||||||||||||
2007 | 10.41 | .37 | .06 | .43 | (.37 | ) | — | (.37 | ) | 10.47 | 4.25 | |||||||||||||||||||||||||
Class I (7/86)(f) |
| |||||||||||||||||||||||||||||||||||
2012(g) | 9.45 | .25 | .49 | .74 | (.24 | ) | — | (.24 | ) | 9.95 | 7.93 | |||||||||||||||||||||||||
2011 | 9.79 | .49 | (.36 | ) | .13 | (.47 | ) | — | (.47 | ) | 9.45 | 1.23 | ||||||||||||||||||||||||
2010 | 8.95 | .48 | .82 | 1.30 | (.46 | ) | — | (.46 | ) | 9.79 | 14.80 | |||||||||||||||||||||||||
2009 | 9.49 | .46 | (.55 | ) | (.09 | ) | (.45 | ) | — | (.45 | ) | 8.95 | (1.02 | ) | ||||||||||||||||||||||
2008 | 10.49 | .45 | (1.00 | ) | (.55 | ) | (.45 | ) | — | (.45 | ) | 9.49 | (5.43 | ) | ||||||||||||||||||||||
2007 | 10.43 | .45 | .06 | .51 | (.45 | ) | — | (.45 | ) | 10.49 | 5.03 | |||||||||||||||||||||||||
| 44 | Nuveen Investments |
| Ratios/Supplemental Data | ||||||||||||||||||
| Ratios to Average Net Assets(d) | ||||||||||||||||||
| Ending Net Assets (000) | Expenses Including Interest(e) | Expenses Excluding Interest | Net Invest- ment Income (Loss) | Portfolio Turnover Rate | ||||||||||||||
| $ | 132,374 | .82 | %* | .82 | %* | 4.93 | %* | 7 | % | |||||||||
| 136,513 | .81 | .81 | 4.77 | 18 | ||||||||||||||
| 128,672 | .86 | .85 | 4.86 | 14 | ||||||||||||||
| 106,117 | .90 | .85 | 4.66 | 40 | ||||||||||||||
| 107,241 | .97 | .82 | 4.23 | 50 | ||||||||||||||
| 91,465 | 1.09 | .83 | 4.13 | 20 | ||||||||||||||
| 1,309 | 1.57 | * | 1.57 | * | 4.16 | * | 7 | |||||||||||
| 1,960 | 1.56 | 1.56 | 4.00 | 18 | ||||||||||||||
| 3,276 | 1.61 | 1.60 | 4.13 | 14 | ||||||||||||||
| 4,337 | 1.65 | 1.60 | 3.87 | 40 | ||||||||||||||
| 7,175 | 1.72 | 1.57 | 3.46 | 50 | ||||||||||||||
| 10,076 | 1.85 | 1.59 | 3.38 | 20 | ||||||||||||||
| 32,628 | 1.37 | * | 1.37 | * | 4.37 | * | 7 | |||||||||||
| 26,338 | 1.36 | 1.36 | 4.21 | 18 | ||||||||||||||
| 25,552 | 1.41 | 1.40 | 4.31 | 14 | ||||||||||||||
| 20,484 | 1.45 | 1.40 | 4.10 | 40 | ||||||||||||||
| 25,306 | 1.52 | 1.37 | 3.68 | 50 | ||||||||||||||
| 23,067 | 1.64 | 1.38 | 3.58 | 20 | ||||||||||||||
| 140,093 | .62 | * | .62 | * | 5.13 | * | 7 | |||||||||||
| 132,344 | .61 | .61 | 4.96 | 18 | ||||||||||||||
| 144,962 | .66 | .65 | 5.07 | 14 | ||||||||||||||
| 151,650 | .70 | .65 | 4.87 | 40 | ||||||||||||||
| 164,365 | .77 | .62 | 4.43 | 50 | ||||||||||||||
| 167,300 | .89 | .63 | 4.33 | 20 | ||||||||||||||
| (a) | Per share Net Investment Income (Loss) is calculated using the average daily shares method. |
| (b) | Distributions from Capital Gains include short-term capital gains, if any. |
| (c) | Total return is the combination of changes in net asset value without any sales charge, reinvested dividend income at net asset value and reinvested capital gains distributions at net asset value, if any. Total returns are not annualized. |
| (d) | Ratios do not reflect the effect of custodian fee credits earned on the Fund’s net cash on deposit with the custodian bank, where applicable. The Fund did not receive an expense reimbursement from the Adviser during the periods presented herein. |
| (e) | The expense ratios reflect, among other things, the interest expense deemed to have been paid by the Fund on the floating rate certificates issued by the special purpose trusts for the self-deposited inverse floaters held by the Fund, where applicable, as described in Footnote 1 – General Information and Significant Accounting Policies, Inverse Floating Rate Securities. |
| (f) | Effective May 1, 2008, Class R Shares were renamed Class I Shares. |
| (g) | For the six months ended August 31, 2011. |
| * | Annualized. |
See accompanying notes to financial statements.
| Nuveen Investments | 45 |
Financial Highlights (Unaudited) (continued)
| Selected data for a share outstanding throughout each period: | ||||||||||||||||||||||||||||||||||||
| Class (Commencement Date) | ||||||||||||||||||||||||||||||||||||
| Investment Operations | Less Distributions | |||||||||||||||||||||||||||||||||||
| CALIFORNIA 2 | ||||||||||||||||||||||||||||||||||||
| Year Ended February 28/29, | Beginning Net Asset Value | Net Invest- ment Income (Loss)(a) | Net Realized/ Unrealized Gain (Loss) | Total | Net Invest- ment Income | Capital Gains(b) | Total | Ending Net Asset Value | Total Return(c) | |||||||||||||||||||||||||||
Class A (9/94) | ||||||||||||||||||||||||||||||||||||
2012(g) | $ | 9.49 | $ | .22 | $ | .46 | $ | .68 | $ | (.22 | ) | $ | — | $ | (.22 | ) | $ | 9.95 | 7.21 | % | ||||||||||||||||
2011 | 9.99 | .43 | (.51 | ) | (.08 | ) | (.42 | ) | — | (.42 | ) | 9.49 | (.96 | ) | ||||||||||||||||||||||
2010 | 9.40 | .43 | .57 | 1.00 | (.41 | ) | — | (.41 | ) | 9.99 | 10.87 | |||||||||||||||||||||||||
2009 | 9.83 | .43 | (.44 | ) | (.01 | ) | (.41 | ) | (.01 | ) | (.42 | ) | 9.40 | (.06 | ) | |||||||||||||||||||||
2008 | 10.84 | .43 | (.95 | ) | (.52 | ) | (.43 | ) | (.06 | ) | (.49 | ) | 9.83 | (5.04 | ) | |||||||||||||||||||||
2007 | 10.87 | .43 | .03 | .46 | (.44 | ) | (.05 | ) | (.49 | ) | 10.84 | 4.33 | ||||||||||||||||||||||||
Class B (3/97) | ||||||||||||||||||||||||||||||||||||
2012(g) | 9.51 | .19 | .46 | .65 | (.18 | ) | — | (.18 | ) | 9.98 | 6.91 | |||||||||||||||||||||||||
2011 | 10.02 | .36 | (.53 | ) | (.17 | ) | (.34 | ) | — | (.34 | ) | 9.51 | (1.77 | ) | ||||||||||||||||||||||
2010 | 9.43 | .36 | .57 | .93 | (.34 | ) | — | (.34 | ) | 10.02 | 10.03 | |||||||||||||||||||||||||
2009 | 9.85 | .36 | (.43 | ) | (.07 | ) | (.34 | ) | (.01 | ) | (.35 | ) | 9.43 | (.73 | ) | |||||||||||||||||||||
2008 | 10.86 | .35 | (.96 | ) | (.61 | ) | (.34 | ) | (.06 | ) | (.40 | ) | 9.85 | (5.77 | ) | |||||||||||||||||||||
2007 | 10.89 | .35 | .02 | .37 | (.35 | ) | (.05 | ) | (.40 | ) | 10.86 | 3.52 | ||||||||||||||||||||||||
Class C (9/94) | ||||||||||||||||||||||||||||||||||||
2012(g) | 9.44 | .19 | .46 | .65 | (.19 | ) | — | (.19 | ) | 9.90 | 6.95 | |||||||||||||||||||||||||
2011 | 9.95 | .38 | (.53 | ) | (.15 | ) | (.36 | ) | — | (.36 | ) | 9.44 | (1.60 | ) | ||||||||||||||||||||||
2010 | 9.36 | .37 | .58 | .95 | (.36 | ) | — | (.36 | ) | 9.95 | 10.31 | |||||||||||||||||||||||||
2009 | 9.78 | .37 | (.42 | ) | (.05 | ) | (.36 | ) | (.01 | ) | (.37 | ) | 9.36 | (.55 | ) | |||||||||||||||||||||
2008 | 10.79 | .37 | (.96 | ) | (.59 | ) | (.36 | ) | (.06 | ) | (.42 | ) | 9.78 | (5.62 | ) | |||||||||||||||||||||
2007 | 10.81 | .37 | .03 | .40 | (.37 | ) | (.05 | ) | (.42 | ) | 10.79 | 3.81 | ||||||||||||||||||||||||
Class I (7/86)(f) |
| |||||||||||||||||||||||||||||||||||
2012(g) | 9.51 | .23 | .46 | .69 | (.23 | ) | — | (.23 | ) | 9.97 | 7.30 | |||||||||||||||||||||||||
2011 | 10.01 | .45 | (.51 | ) | (.06 | ) | (.44 | ) | — | (.44 | ) | 9.51 | (.75 | ) | ||||||||||||||||||||||
2010 | 9.42 | .45 | .57 | 1.02 | (.43 | ) | — | (.43 | ) | 10.01 | 11.05 | |||||||||||||||||||||||||
2009 | 9.84 | .45 | (.43 | ) | .02 | (.43 | ) | (.01 | ) | (.44 | ) | 9.42 | .23 | |||||||||||||||||||||||
2008 | 10.85 | .45 | (.96 | ) | (.51 | ) | (.44 | ) | (.06 | ) | (.50 | ) | 9.84 | (4.87 | ) | |||||||||||||||||||||
2007 | 10.87 | .45 | .04 | .49 | (.46 | ) | (.05 | ) | (.51 | ) | 10.85 | 4.60 | ||||||||||||||||||||||||
| 46 | Nuveen Investments |
| Ratios/Supplemental Data | ||||||||||||||||||
| Ratios to Average Net Assets(d) | ||||||||||||||||||
| Ending Net Assets (000) | Expenses Including Interest(e) | Expenses Excluding Interest | Net Invest- ment Income (Loss) | Portfolio Turnover Rate | ||||||||||||||
| $ | 56,746 | .84 | %* | .84 | %* | 4.47 | %* | 10 | % | |||||||||
| 57,581 | .83 | .83 | 4.34 | 3 | ||||||||||||||
| 78,338 | .86 | .86 | 4.39 | 1 | ||||||||||||||
| 77,517 | .85 | .85 | 4.38 | 9 | ||||||||||||||
| 80,867 | .91 | .83 | 4.03 | 21 | ||||||||||||||
| 89,343 | .86 | .83 | 4.02 | 16 | ||||||||||||||
| 906 | 1.59 | * | 1.59 | * | 3.70 | * | 10 | |||||||||||
| 1,691 | 1.58 | 1.58 | 3.58 | 3 | ||||||||||||||
| 2,851 | 1.61 | 1.61 | 3.66 | 1 | ||||||||||||||
| 4,867 | 1.60 | 1.60 | 3.60 | 9 | ||||||||||||||
| 7,890 | 1.66 | 1.58 | 3.28 | 21 | ||||||||||||||
| 12,845 | 1.61 | 1.58 | 3.27 | 16 | ||||||||||||||
| 12,627 | 1.39 | * | 1.39 | * | 3.92 | * | 10 | |||||||||||
| 12,624 | 1.38 | 1.38 | 3.80 | 3 | ||||||||||||||
| 12,599 | 1.41 | 1.41 | 3.84 | 1 | ||||||||||||||
| 11,668 | 1.40 | 1.40 | 3.83 | 9 | ||||||||||||||
| 12,455 | 1.46 | 1.38 | 3.48 | 21 | ||||||||||||||
| 13,500 | 1.41 | 1.38 | 3.47 | 16 | ||||||||||||||
| 84,773 | .64 | * | .64 | * | 4.67 | * | 10 | |||||||||||
| 85,354 | .63 | .63 | 4.54 | 3 | ||||||||||||||
| 98,657 | .66 | .66 | 4.59 | 1 | ||||||||||||||
| 95,255 | .65 | .65 | 4.57 | 9 | ||||||||||||||
| 112,282 | .71 | .63 | 4.23 | 21 | ||||||||||||||
| 129,276 | .66 | .63 | 4.22 | 16 | ||||||||||||||
| (a) | Per share Net Investment Income (Loss) is calculated using the average daily shares method. |
| (b) | Distributions from Capital Gains include short-term capital gains, if any. |
| (c) | Total return is the combination of changes in net asset value without any sales charge, reinvested dividend income at net asset value and reinvested capital gains distributions at net asset value, if any. Total returns are not annualized. |
| (d) | Ratios do not reflect the effect of custodian fee credits earned on the Fund’s net cash on deposit with the custodian bank, where applicable. The Fund did not receive an expense reimbursement from the Adviser during the periods presented herein. |
| (e) | The expense ratios reflect, among other things, the interest expense deemed to have been paid by the Fund on the floating rate certificates issued by the special purpose trusts for the self-deposited inverse floaters held by the Fund, where applicable, as described in Footnote 1 – General Information and Significant Accounting Policies, Inverse Floating Rate Securities. |
| (f) | Effective May 1, 2008, Class R Shares were renamed Class I Shares. |
| (g) | For the six months ended August 31, 2011. |
| * | Annualized. |
See accompanying notes to financial statements.
| Nuveen Investments | 47 |
Notes to Financial Statements (Unaudited)
1. General Information and Significant Accounting Policies
General Information
The Nuveen Multistate Trust II (the “Trust”) is an open-end investment company registered under the Investment Company Act of 1940, as amended. The Trust is comprised of Nuveen California High Yield Municipal Bond Fund (“California High Yield”), Nuveen California Municipal Bond Fund (“California”) and Nuveen California Municipal Bond Fund 2 (“California 2”) (formerly, Nuveen California Insured Municipal Bond Fund) (each a “Fund” and collectively, the “Funds”), among others. The Trust was organized as a Massachusetts business trust on July 1, 1996. California and California 2 were each organized as a series of predecessor trusts or corporations prior to that date.
Effective April 27, 2011, California 2 was closed to new investors. Investors in the Fund as of April 27, 2011, are able to continue investing in the Fund, through the reinvestment of dividends and capital gains distributions.
Effective April 30, 2011, Nuveen Investments, LLC, a wholly-owned subsidiary of Nuveen Investments, Inc. (“Nuveen”), changed its name to Nuveen Securities, LLC (the “Distributor”).
California High Yield’s investment objective is to provide high current income exempt from regular federal, California state and, in some cases, California local income taxes. Total return is a secondary objective when consistent with the Fund’s primary objective. Under normal market conditions, the Fund invests at least 80% of its net assets in municipal bonds that pay interest that is exempt from regular federal and California personal income tax. The Fund invests at least 65% of its net assets in medium- to low-quality bonds rated BBB/Baa or lower and may invest up to 10% of its net assets in defaulted municipal bonds (ie., bonds on which the issuer has not paid principal or interest on time). The Fund may invest up to 15% of its net assets in municipal securities whose interest payments vary inversely with changes in short-term tax-exempt interest rates (i.e., inverse floating rate securities).
California’s investment objective is to provide as high a level of current interest income exempt from regular federal, California state and, in some cases, California local income taxes as is consistent with preservation of capital. Under normal market conditions, the Fund invests at least 80% of its net assets in municipal bonds that pay interest that is exempt from regular federal and California personal income tax. The Fund invests at least 80% of its net assets in investment grade municipal bonds rated BBB/Baa or higher at the time of purchase by at least one independent rating agency, or, if unrated, judged by the Nuveen Asset Management, LLC (the “Sub-Adviser”), a wholly-owned subsidiary of Nuveen Fund Advisors, Inc., (the “Adviser”), a wholly-owned subsidiary of Nuveen, to be of comparable quality. The Fund may invest up to 20% of its net assets in below investment grade municipal bonds, commonly referred to as “high yield” or “junk” bonds. The Fund may invest up to 15% of its net assets in municipal securities whose interest payments vary inversely with changes in short-term tax-exempt interest rates (i.e., inverse floating rate securities).
California 2’s investment objective is to provide as high a level of current interest income exempt from regular federal, California state and, in some cases, California local income taxes as is consistent with preservation of capital. Under normal market conditions, the Fund invests at least 80% of its net assets in municipal bonds that pay interest that is exempt from regular federal and California personal income tax. The municipal securities in which the Fund invests are, at the time of purchase, (i) rated BBB/Baa or higher, (ii) unrated, but judged to be of comparable quality by the Sub-Adviser; or (iii) backed by an escrow or trust account containing sufficient U.S. Government or U.S. government agency securities to ensure timely payment of principle and interest. The Fund may invest up to 15% of its net assets in municipal securities whose interest payments vary inversely with changes in short-term tax-exempt interest rates (i.e., inverse floating rate securities).
The Funds’ most recent prospectus provides further descriptions of each Fund’s investment objective, principal investment strategies and principal risks.
After the close of business on June 30, 2010, all outstanding Class B Shares of California High Yield were converted to Class A Shares, and Class B Shares are no longer issued by the Fund.
Significant Accounting Policies
The following is a summary of significant accounting policies followed by the Funds in the preparation of their financial statements in accordance with accounting principles generally accepted in the United States (“U.S. GAAP”).
Investment Valuation
Prices of municipal bonds and forward swaps are provided by a pricing service approved by the Funds’ Board of Trustees. These securities are generally classified as Level 2 for fair value measurement purposes. When price quotes are not readily available (which is usually the case for municipal bonds) the pricing service establishes a security’s fair value using methods that may include consideration of the following: yields or prices of investments of comparable quality, type of issue, coupon, maturity and rating, market quotes or indications of value from security dealers, evaluations of anticipated cash flows or collateral, general market conditions and other information and analysis, including the obligor’s credit characteristics considered relevant. In pricing certain securities, particularly less liquid and lower quality securities, the pricing service may consider information about a security, its issuer, or market activity, provided by the Adviser. These securities are generally classified as Level 2 or Level 3 depending on the priority of the significant inputs.
| 48 | Nuveen Investments |
Certain securities may not be able to be priced by the pre-established pricing methods as described above. Such securities may be valued by the Funds’ Board of Trustees or its designee at fair value. These securities generally include, but are not limited to, restricted securities (securities which may not be publicly sold without registration under the Securities Act of 1933, as amended) for which a pricing service is unable to provide a market price; securities whose trading has been formally suspended; debt securities that have gone into default and for which there is no current market quotation; a security whose market price is not available from a pre-established pricing source; a security with respect to which an event has occurred that is likely to materially affect the value of the security after the market has closed but before the calculation of a Fund’s net asset value (as may be the case in non-U.S. markets on which the security is primarily traded) or make it difficult or impossible to obtain a reliable market quotation; and a security whose price, as provided by the pricing service, is not deemed to reflect the security’s fair value. As a general principle, the fair value of a security would appear to be the amount that the owner might reasonably expect to receive for it in a current sale. A variety of factors may be considered in determining the fair value of such securities, which may include consideration of the following: yields or prices of investments of comparable quality, type of issue, coupon, maturity and rating, market quotes or indications of value from security dealers, evaluations of anticipated cash flows or collateral, general market conditions and other information and analysis, including the obligor’s credit characteristics considered relevant. These securities are generally classified as Level 2 or Level 3 depending on the priority of the significant inputs. Regardless of the method employed to value a particular security, all valuations are subject to review by the Funds’ Board of Trustees or its designee.
Refer to Footnote 2 – Fair Value Measurements for further details on the leveling of securities held by the Funds as of the end of the reporting period.
Investment Transactions
Investment transactions are recorded on a trade date basis. Realized gains and losses from investment transactions are determined on the specific identification method, which is the same basis used for federal income tax purposes. Investments purchased on a when-issued/delayed delivery basis may have extended settlement periods. Any investments so purchased are subject to market fluctuation during this period. The Funds have instructed the custodian to segregate assets with a current value at least equal to the amount of the when-issued/delayed delivery purchase commitments. At August 31, 2011, California High Yield had outstanding when-issued/delayed delivery purchase commitments of $1,437,624. There were no such outstanding purchase commitments in any of the other funds.
Investment Income
Investment income, which reflects the amortization of premiums and accretion of discounts for financial reporting purposes, is recorded on an accrual basis. Investment income also includes paydown gains and losses, if any.
Professional Fees
Professional fees presented on the Statement of Operations consist of legal fees incurred in the normal course of operations, audit fees, tax consulting fees and, in some cases, workout expenditures. Workout expenditures are incurred in an attempt to protect or enhance an investment, or to pursue other claims or legal actions on behalf of Fund shareholders.
Income Taxes
Each Fund is a separate taxpayer for federal income tax purposes. Each Fund intends to distribute substantially all of its net investment income and net capital gains to shareholders and to otherwise comply with the requirements of Subchapter M of the Internal Revenue Code applicable to regulated investment companies. Therefore, no federal income tax provision is required. Furthermore, each Fund intends to satisfy conditions that will enable interest from municipal securities, which is exempt from regular federal and California state income taxes, to retain such tax-exempt status when distributed to shareholders of the Funds. Net realized capital gains and ordinary income distributions paid by the Funds are subject to federal taxation.
For all open tax years and all major taxing jurisdictions, management of the Funds has concluded that there are no significant uncertain tax positions that would require recognition in the financial statements. Open tax years are those that are open for examination by taxing authorities (i.e., generally the last four tax year ends and the interim tax period since then). Furthermore, management of the Funds is also not aware of any tax positions for which it is reasonably possible that the total amounts of unrecognized tax benefits will significantly change in the next twelve months.
Dividends and Distributions to Shareholders
The Funds declare dividends from their net investment income daily and pay shareholders monthly. Fund shares begin to accrue dividends on the business day after the day when the monies used to purchase Fund shares are collected by the Funds’ transfer agent.
Net realized capital gains and/or market discount from investment transactions, if any, are declared and distributed to shareholders at least annually. Furthermore, capital gains are distributed only to the extent they exceed available capital loss carryforwards.
Distributions to shareholders of net investment income, net realized capital gains and/or market discount, if any, are recorded on the ex-dividend date. The amount and timing of distributions are determined in accordance with federal income tax regulations, which may differ from U.S. GAAP.
| Nuveen Investments | 49 |
Notes to Financial Statements (Unaudited) (continued)
Insurance
During the period March 1, 2011 through May 31, 2011, California 2 invested at least 80% of its net assets in municipal securities that were covered by insurance guaranteeing the timely payment of principal and interest thereon. Inverse floating rate securities whose underlying bonds are covered by insurance were included for purposes of the 80%. Insured municipal bonds are either covered by individual, permanent insurance policies (obtained either at the time of issuance or subsequently), or covered “while in fund” under a master portfolio insurance policy purchased by the Fund. Insurance guarantees only the timely payment of interest and principal on the bonds; it does not guarantee the value of either individual bonds or Fund shares. The Adviser may obtain master policies from insurers that specialize in insuring municipal bonds.
Each insured municipal security is covered by Original Issue Insurance, Secondary Market Insurance or Portfolio Insurance. Such insurance does not guarantee the market value of the municipal securities or the value of the Fund’s shares. Original Issue Insurance and Secondary Market Insurance remain in effect as long as the municipal securities covered thereby remain outstanding and the insurer remains in business, regardless of whether the Fund ultimately disposes of such municipal securities. Consequently, the market value of the municipal securities covered by Original Issue Insurance or Secondary Market Insurance may reflect value attributable to the insurance. Portfolio Insurance, in contrast, is effective only while the municipal securities are held by the Fund, and is reflected as an expense over the term of the policy, when applicable. Accordingly, neither the prices used in determining the market value of the underlying municipal securities nor the net asset value of the Fund’s shares include value, if any, attributable to the Portfolio Insurance. Each policy of the Portfolio Insurance does, however, give the Fund the right to obtain permanent insurance with respect to the municipal security covered by the Portfolio Insurance policy at the time of its sale.
Flexible Sales Charge Program
Class A Shares are generally sold with an up-front sales charge and incur a .20% annual 12b-1 service fee. Class A Share purchases of $1 million or more are sold at net asset value without an up-front sales charge but may be subject to a contingent deferred sales charge (“CDSC”) if redeemed within eighteen months of purchase. Class B Shares were sold without an up-front sales charge but incur a .75% annual 12b-1 distribution fee and a .20% annual 12b-1 service fee. Class B Shares are subject to a CDSC of up to 5% depending upon the length of time the shares are held by the investor (CDSC is reduced to 0% at the end of six years). Class B Shares convert to Class A Shares eight years after purchase. Class C Shares are sold without an up-front sales charge but incur a .55% annual 12b-1 distribution fee and a .20% annual 12b-1 service fee. Class C Shares are subject to a CDSC of 1% if redeemed within twelve months of purchase. Class I Shares are not subject to any sales charge or 12b-1 distribution or service fees.
Inverse Floating Rate Securities
Each Fund is authorized to invest in inverse floating rate securities. An inverse floating rate security is created by depositing a municipal bond, typically with a fixed interest rate, into a special purpose trust created by a broker-dealer. In turn, this trust (a) issues floating rate certificates, in face amounts equal to some fraction of the deposited bond’s par amount or market value, that typically pay short-term tax-exempt interest rates to third parties, and (b) issues to a long-term investor (such as one of the Funds) an inverse floating rate certificate (sometimes referred to as an “inverse floater”) that represents all remaining or residual interest in the trust. The income received by the inverse floater holder varies inversely with the short-term rate paid to the floating rate certificates’ holders, and in most circumstances the inverse floater holder bears substantially all of the underlying bond’s downside investment risk and also benefits disproportionately from any potential appreciation of the underlying bond’s value. The price of an inverse floating rate security will be more volatile than that of the underlying bond because the interest rate is dependent on not only the fixed coupon rate of the underlying bond but also on the short-term interest paid on the floating rate certificates, and because the inverse floating rate security essentially bears the risk of loss of the greater face value of the underlying bond.
A Fund may purchase an inverse floating rate security in a secondary market transaction without first owning the underlying bond (referred to as an “externally-deposited inverse floater”), or instead by first selling a fixed-rate bond to a broker-dealer for deposit into the special purpose trust and receiving in turn the residual interest in the trust (referred to as a “self-deposited inverse floater”). The inverse floater held by a Fund gives the Fund the right (a) to cause the holders of the floating rate certificates to tender their notes at par, and (b) to have the broker transfer the fixed-rate bond held by the trust to the Fund, thereby collapsing the trust. An investment in an externally-deposited inverse floater is identified in the Portfolio of Investments as “(IF) – Inverse floating rate investment.” An investment in a self-deposited inverse floater is accounted for as a financing transaction. In such instances, a fixed-rate bond deposited into a special purpose trust is identified in the Portfolio of Investments as “(UB) – Underlying bond of an inverse floating rate trust reflected as a financing transaction,” with the Fund accounting for the short-term floating rate certificates issued by the trust as “Floating rate obligations” on the Statement of Assets and Liabilities. In addition, the Fund reflects in “Investment Income” the entire earnings of the underlying bond and recognizes the related interest paid to the holders of the short-term floating rate certificates as a component of “Interest expense on floating rate obligations” on the Statement of Operations.
During the six months ended August 31, 2011, California High Yield invested in externally-deposited inverse floaters and/or self-deposited inverse floaters.
Each Fund may also enter into shortfall and forbearance agreements (sometimes referred to as a “recourse trust” or “credit recovery swap”) (such agreements referred to herein as “Recourse Trusts”) with a broker-dealer by which a Fund agrees to reimburse the broker-dealer, in certain circumstances, for the difference between the liquidation value of the fixed-rate bond held by the trust and the liquidation value of the floating rate certificates issued by the trust plus any shortfalls in interest cash flows. Under these
| 50 | Nuveen Investments |
agreements, a Fund’s potential exposure to losses related to or on inverse floaters may increase beyond the value of a Fund’s inverse floater investments as a Fund may potentially be liable to fulfill all amounts owed to holders of the floating rate certificates. At period end, any such shortfall is recognized as “Unrealized depreciation on Recourse Trusts” on the Statement of Assets and Liabilities.
At August 31, 2011, each Fund’s maximum exposure to externally-deposited Recourse Trusts was as follows:
| California High Yield | California | California 2 | ||||||||||
Maximum exposure to Recourse Trusts | $ | 26,040,000 | $ | — | $ | — | ||||||
Forward Swap Contracts
Each Fund is authorized to enter into forward interest rate swap contracts consistent with their investment objectives and policies to reduce, increase or otherwise alter its risk profile or to alter its portfolio characteristics (i.e. duration, yield curve positioning and credit quality).
Each Fund is subject to interest rate risk in the normal course of pursuing its investment objectives. Each Fund’s use of forward interest rate swap transactions is intended to help the Fund manage its overall interest rate sensitivity, either shorter or longer, generally to more closely align the Fund’s interest rate sensitivity with that of the broader market. Forward interest rate swap transactions involve each Fund’s agreement with a counterparty to pay, in the future, a fixed or variable rate payment in exchange for the counterparty paying the Fund a variable or fixed rate payment, the accruals for which would begin at a specified date in the future (the “effective date”). The amount of the payment obligation is based on the notional amount of the swap contract and the termination date of the swap (which is akin to a bond’s maturity). The value of the Fund’s swap commitment would increase or decrease based primarily on the extent to which long-term interest rates for bonds having a maturity of the swap’s termination date increases or decreases. Forward interest rate swap contracts are valued daily. The net amount recorded on these transactions for each counterparty is recognized on the Statement of Assets and Liabilities as a component of “Unrealized appreciation or depreciation on forward swaps” with the change during the fiscal period recognized on the Statement of Operations as a component of “Change in net unrealized appreciation (depreciation) of forward swaps.”
Each Fund may terminate a swap contract prior to the effective date, at which point a realized gain or loss is recognized. When a forward swap is terminated, it ordinarily does not involve the delivery of securities or other underlying assets or principal, but rather is settled in cash on a net basis. Net realized gains and losses during the fiscal period are recognized on the Statement of Operations as a component of “Net realized gain (loss) from forward swaps.” Each Fund intends, but is not obligated, to terminate its forward swaps before the effective date. Accordingly, the risk of loss with respect to the swap counterparty on such transactions is limited to the credit risk associated with a counterparty failing to honor its commitment to pay any realized gain to the Fund upon termination.
During the six months ended August 31, 2011, California High Yield entered into forward interest rate swap transactions to broadly reduce the sensitivity of the Fund to movements in U.S. interest rates. The average notional amount of forward interest rate swap contracts outstanding during the six months ended August 31, 2011, was as follows:
| California High Yield | ||||
Average notional amount of forward interest rate swap contracts outstanding* | $ | 3,400,000 | ||
| * | The average notional amount is calculated based on the outstanding notional amount at the beginning of the fiscal year and at the end of each fiscal quarter within the current fiscal year. |
Refer to Footnote 3 – Derivative Instruments and Hedging Activities for further details on forward interest rate swap contract activity.
Market and Counterparty Credit Risk
In the normal course of business each Fund may invest in financial instruments and enter into financial transactions where risk of potential loss exists due to changes in the market (market risk) or failure of the other party to the transaction to perform (counterparty credit risk). The potential loss could exceed the value of the financial assets recorded on the financial statements. Financial assets, which potentially expose each Fund to counterparty credit risk, consist principally of cash due from counterparties on forward, option and swap transactions, when applicable. The extent of each Fund’s exposure to counterparty credit risk in respect to these financial assets approximates their carrying value as recorded on the Statement of Assets and Liabilities. Futures contracts, when applicable, expose a Fund to minimal counterparty credit risk as they are exchange traded and the exchange’s clearinghouse, which is counterparty to all exchange traded futures, guarantees the futures contracts against default.
Each Fund helps manage counterparty credit risk by entering into agreements only with counterparties the Adviser believes have the financial resources to honor their obligations and by having the Adviser monitor the financial stability of the counterparties. Additionally, counterparties may be required to pledge collateral daily (based on the daily valuation of the financial asset) on behalf of each Fund with a value approximately equal to the amount of any unrealized gain above a pre-determined threshold. Reciprocally, when each Fund has an unrealized loss, the Funds have instructed the custodian to pledge assets of the Funds as collateral with a value approximately equal to the amount of the unrealized loss above a pre-determined threshold. Collateral pledges are monitored and subsequently adjusted if and when the valuations fluctuate, either up or down, by at least the pre-determined threshold amount.
| Nuveen Investments | 51 |
Notes to Financial Statements (Unaudited) (continued)
Zero Coupon Securities
Each Fund is authorized to invest in zero coupon securities. A zero coupon security does not pay a regular interest coupon to its holders during the life of the security. Tax-exempt income to the holder of the security comes from accretion of the difference between the original purchase price of the security at issuance and the par value of the security at maturity and is effectively paid at maturity. The market prices of zero coupon securities generally are more volatile than the market prices of securities that pay interest periodically.
Multiclass Operations and Allocations
Income and expenses of the Funds that were not directly attributable to a specific class of shares were prorated among the classes based on the relative settled shares of each class. Expenses directly attributable to a class of shares, which presently only include 12b-1 distribution and service fees, are recorded to the specific class.
Realized and unrealized capital gains and losses of the Funds are prorated among the classes based on the relative net assets of each class.
Custodian Fee Credit
Each Fund has an arrangement with the custodian bank whereby certain custodian fees and expenses are reduced by net credits earned on each Fund’s cash on deposit with the bank. Such deposit arrangements are an alternative to overnight investments. Credits for cash balances may be offset by charges for any days on which a Fund overdraws its account at the custodian bank.
Indemnifications
Under the Trust’s organizational documents, its officers and trustees are indemnified against certain liabilities arising out of the performance of their duties to the Trust. In addition, in the normal course of business, the Trust enters into contracts that provide general indemnifications to other parties. The Trust’s maximum exposure under these arrangements is unknown as this would involve future claims that may be made against the Trust that have not yet occurred. However, the Trust has not had prior claims or losses pursuant to these contracts and expects the risk of loss to be remote.
Use of Estimates
The preparation of financial statements in conformity with U.S. GAAP requires management to make estimates and assumptions that affect the reported amounts of assets and liabilities at the date of the financial statements and the reported amounts of increases and decreases in net assets from operations during the reporting period. Actual results may differ from those estimates.
2. Fair Value Measurements
Fair value is defined as the price that the Funds would receive upon selling an investment or transferring a liability in an orderly transaction to an independent buyer in the principal or most advantageous market for the investment. A three-tier hierarchy is used to maximize the use of observable market data and minimize the use of unobservable inputs and to establish classification of fair value measurements for disclosure purposes. Observable inputs reflect the assumptions market participants would use in pricing the asset or liability. Observable inputs are based on market data obtained from sources independent of the reporting entity. Unobservable inputs reflect the reporting entity’s own assumptions about the assumptions market participants would use in pricing the asset or liability. Unobservable inputs are based on the best information available in the circumstances. The three-tier hierarchy of inputs is summarized in the three broad levels listed below:
| Level 1 – | Quoted prices in active markets for identical securities. | |
| Level 2 – | Other significant observable inputs (including quoted prices for similar securities, interest rates, prepayment speeds, credit risk, etc.). | |
| Level 3 – | Significant unobservable inputs (including management’s assumptions in determining the fair value of investments). |
The inputs or methodologies used for valuing securities are not an indication of the risk associated with investing in those securities. The following is a summary of each Fund’s fair value measurements as of August 31, 2011:
| California High Yield | Level 1 | Level 2 | Level 3 | Total | ||||||||||||
Investments: | ||||||||||||||||
Municipal Bonds | $ | — | $ | 118,247,999 | $ | 2,061,093 | $ | 120,309,092 | ||||||||
Derivatives: | ||||||||||||||||
Forward Swaps* | — | (920,872 | ) | — | (920,872 | ) | ||||||||||
Total | $ | — | $ | 117,327,127 | $ | 2,061,093 | $ | 119,388,220 | ||||||||
| California | Level 1 | Level 2 | Level 3 | Total | ||||||||||||
Investments: | ||||||||||||||||
Municipal Bonds | $ | — | $ | 295,772,253 | $1,466,748 | $ | 297,239,001 | |||||||||
| California 2 | Level 1 | Level 2 | Level 3 | Total | ||||||||||||
Investments: | ||||||||||||||||
Municipal Bonds | $ | — | $ | 151,274,236 | $ | — | $ | 151,274,236 | ||||||||
| * | Represents net unrealized appreciation (depreciation) as reported in the Fund’s Portfolio of Investments. |
| 52 | Nuveen Investments |
The following is a reconciliation of each Fund’s Level 3 investments held at the beginning and end of the measurement period:
| California High Yield Level 3 Municipal Bonds | California Level 3 Municipal Bonds | |||||||
Balance at the beginning of period | $ | 1,942,634 | $ | 1,799,325 | ||||
Gains (losses): | ||||||||
Net realized gains (losses) | 122 | 171 | ||||||
Net change in unrealized appreciation (depreciation) | (177,099 | ) | 116,547 | |||||
Purchases at cost | — | — | ||||||
Sales at proceeds | (210,000 | ) | (450,000 | ) | ||||
Net discounts (premiums) | 116 | 705 | ||||||
Transfers in to | 505,320 | — | ||||||
Transfers out of | — | — | ||||||
Balance at the end of period | $ | 2,061,093 | $ | 1,466,748 | ||||
Change in net unrealized appreciation (depreciation) during the period of Level 3 securities held at the end of period | $ | (324,829 | ) | $ | 116,547 | |||
During the six months ended August 31, 2011, the Funds recognized no significant transfers to or from Level 1 or Level 2. Transfers in and/or out of Level 3 are shown using end of period values.
3. Derivative Instruments and Hedging Activities
The Funds record derivative instruments at fair value, with changes in fair value recognized on the Statement of Operations, when applicable. Even though the Funds’ investments in derivatives may represent economic hedges, they are not considered to be hedge transactions for financial reporting purposes. For additional information on the derivative instruments in which each Fund was invested during and at the end of the reporting period, refer to the Portfolios of Investments, Financial Statements and Footnote 1 – General Information and Significant Accounting Policies.
The following table presents the fair value of all derivative instruments held by the Funds as of August 31, 2011, the location of these instruments on the Statement of Assets and Liabilities, and the primary underlying risk exposure. California High Yield invested in derivative instruments during the six months ended August 31, 2011.
| California High Yield | ||||||||||||||
Location on the Statement of Assets and Liabilities | ||||||||||||||
Underlying Risk Exposure | Derivative Instrument | Asset Derivatives | Liability Derivatives | |||||||||||
| Location | Value | Location | Value | |||||||||||
Interest Rate | Forward Swaps | Unrealized appreciation on forward swaps* | $ | — | Unrealized depreciation on forward swaps* | $ | 920,872 | |||||||
| * | Represents cumulative gross unrealized appreciation (depreciation) of forward swap contracts as reported in the Portfolio of Investments. |
The following tables present the amount of net realized gain (loss) and change in net unrealized appreciation (depreciation) recognized for the six months ended August 31, 2011, on derivative instruments, as well as the primary risk exposure associated with each.
| Net Realized Gain (Loss) from Forward Swaps | California High Yield | |||
| Risk Exposure | ||||
Interest Rate | $ | (125,800 | ) | |
| Change in Net Unrealized Appreciation (Depreciation) of Forward Swaps | California High Yield | |||
| Risk Exposure | ||||
Interest Rate | $ | (853,238 | ) | |
| Nuveen Investments | 53 |
Notes to Financial Statements (Unaudited) (continued)
4. Fund Shares
Transactions in Fund shares were as follows:
| California High Yield | ||||||||||||||||
| Six Months Ended 8/31/11 | Year Ended 2/28/11 | |||||||||||||||
| Shares | Amount | Shares | Amount | |||||||||||||
Shares sold: | ||||||||||||||||
Class A | 1,428,800 | $ | 10,849,754 | 5,763,877 | $ | 45,707,390 | ||||||||||
Class A – automatic conversion of Class B Shares | — | — | 18,156 | 145,432 | ||||||||||||
Class B | — | — | — | — | ||||||||||||
Class C | 645,390 | 4,933,558 | 1,166,998 | 9,301,894 | ||||||||||||
Class I | 759,535 | 5,748,926 | 1,947,423 | 15,511,288 | ||||||||||||
Shares issued to shareholders due to reinvestment | ||||||||||||||||
Class A | 165,912 | 1,257,707 | 301,015 | 2,378,965 | ||||||||||||
Class B | — | — | 257 | 2,056 | ||||||||||||
Class C | 54,331 | 414,062 | 87,194 | 688,899 | ||||||||||||
Class I | 118,034 | 899,044 | 180,447 | 1,421,362 | ||||||||||||
| 3,172,002 | 24,103,051 | 9,465,367 | 75,157,286 | |||||||||||||
Shares redeemed: | ||||||||||||||||
Class A | (2,990,707 | ) | (22,611,663 | ) | (3,099,382 | ) | (24,204,633 | ) | ||||||||
Class B | — | — | (1,627 | ) | (13,020 | ) | ||||||||||
Class B – automatic conversion to Class A Shares | — | — | (18,179 | ) | (145,432 | ) | ||||||||||
Class C | (279,917 | ) | (2,110,586 | ) | (696,801 | ) | (5,430,680 | ) | ||||||||
Class I | (538,900 | ) | (4,175,838 | ) | (1,191,548 | ) | (9,458,162 | ) | ||||||||
| (3,809,524 | ) | (28,898,087 | ) | (5,007,537 | ) | (39,251,927 | ) | |||||||||
Net increase (decrease) | (637,522 | ) | $ | (4,795,036 | ) | 4,457,830 | $ | 35,905,359 | ||||||||
| California | ||||||||||||||||
| Six Months Ended 8/31/11 | Year Ended 2/28/11 | |||||||||||||||
| Shares | Amount | Shares | Amount | |||||||||||||
Shares sold: | ||||||||||||||||
Class A | 586,283 | $ | 5,701,048 | 5,970,886 | $ | 57,108,652 | ||||||||||
Class A – automatic conversion of Class B Shares | 38,199 | 381,001 | 49,193 | 488,102 | ||||||||||||
Class B | 262 | 2,534 | 4,155 | 40,974 | ||||||||||||
Class C | 627,526 | 6,074,767 | 738,009 | 7,306,756 | ||||||||||||
Class I | 769,334 | 7,372,541 | 1,055,240 | 10,367,790 | ||||||||||||
Shares issued to shareholders due to reinvestment | ||||||||||||||||
Class A | 95,301 | 922,449 | 207,829 | 2,042,441 | ||||||||||||
Class B | 1,738 | 16,778 | 6,005 | 59,110 | ||||||||||||
Class C | 31,183 | 301,328 | 55,508 | 543,392 | ||||||||||||
Class I | 241,292 | 2,334,167 | 475,489 | 4,665,136 | ||||||||||||
| 2,391,118 | 23,106,613 | 8,562,314 | 82,622,353 | |||||||||||||
Shares redeemed: | ||||||||||||||||
Class A | (1,858,994 | ) | (17,820,232 | ) | (4,920,663 | ) | (47,269,994 | ) | ||||||||
Class B | (39,612 | ) | (370,024 | ) | (87,922 | ) | (874,096 | ) | ||||||||
Class B – automatic conversion to Class A Shares | (38,237 | ) | (381,001 | ) | (49,242 | ) | (488,102 | ) | ||||||||
Class C | (165,128 | ) | (1,584,274 | ) | (614,502 | ) | (5,961,491 | ) | ||||||||
Class I | (934,383 | ) | (8,993,091 | ) | (2,328,425 | ) | (22,668,082 | ) | ||||||||
| (3,036,354 | ) | (29,148,622 | ) | (8,000,754 | ) | (77,261,765 | ) | |||||||||
Net increase (decrease) | (645,236 | ) | $ | (6,042,009 | ) | 561,560 | $ | 5,360,588 | ||||||||
| 54 | Nuveen Investments |
| California 2 | ||||||||||||||||
| Six Months Ended 8/31/11 | Year Ended 2/28/11 | |||||||||||||||
| Shares | Amount | Shares | Amount | |||||||||||||
Shares sold: | ||||||||||||||||
Class A | 107,663 | $ | 1,028,578 | 383,367 | $ | 3,836,017 | ||||||||||
Class A – automatic conversion of Class B Shares | 18,299 | 184,334 | 33,973 | 342,022 | ||||||||||||
Class B | 439 | 4,226 | 1,057 | 10,514 | ||||||||||||
Class C | 47,376 | 448,819 | 189,066 | 1,878,664 | ||||||||||||
Class I | 100,574 | 958,298 | 328,171 | 3,255,334 | ||||||||||||
Shares issued to shareholders due to reinvestment | ||||||||||||||||
Class A | 74,095 | 715,439 | 156,968 | 1,564,026 | ||||||||||||
Class B | 1,065 | 10,264 | 2,924 | 29,210 | ||||||||||||
Class C | 15,829 | 152,151 | 29,683 | 293,878 | ||||||||||||
Class I | 149,885 | 1,450,245 | 279,292 | 2,784,074 | ||||||||||||
| 515,225 | 4,952,354 | 1,404,501 | 13,993,739 | |||||||||||||
Shares redeemed: | ||||||||||||||||
Class A | (565,395 | ) | (5,433,127 | ) | (2,345,545 | ) | (23,023,556 | ) | ||||||||
Class B | (70,236 | ) | (670,571 | ) | (76,857 | ) | (776,421 | ) | ||||||||
Class B – automatic conversion to Class A Shares | (18,251 | ) | (184,334 | ) | (33,874 | ) | (342,022 | ) | ||||||||
Class C | (124,836 | ) | (1,184,105 | ) | (148,578 | ) | (1,445,051 | ) | ||||||||
Class I | (726,398 | ) | (7,090,537 | ) | (1,483,481 | ) | (14,628,591 | ) | ||||||||
| (1,505,116 | ) | (14,562,674 | ) | (4,088,335 | ) | (40,215,641 | ) | |||||||||
Net increase (decrease) | (989,891 | ) | $ | (9,610,320 | ) | (2,683,834 | ) | $ | (26,221,902 | ) | ||||||
5. Investment Transactions
Purchases and sales (including maturities but excluding short-term investments and derivative transactions, where applicable) during the six months ended August 31, 2011, were as follows:
| California High Yield | California | California 2 | ||||||||||
Purchases | $ | 18,541,906 | $ | 19,303,126 | $ | 15,740,904 | ||||||
Sales and maturities | 20,971,855 | 27,770,672 | 21,283,881 | |||||||||
6. Income Tax Information
The following information is presented on an income tax basis. Differences between amounts for financial statement and federal income tax purposes are primarily due to timing differences in recognizing taxable market discount, timing differences in recognizing certain gains and losses on investment transactions and the treatment of investments in inverse floating rate securities reflected as financing transactions, if any. To the extent that differences arise that are permanent in nature, such amounts are reclassified within the capital accounts as detailed below. Temporary differences do not require reclassification. Temporary and permanent differences do not impact the net asset values of the Funds.
At August 31, 2011, the cost and unrealized appreciation (depreciation) of investments (excluding investments in derivatives, where applicable), as determined on a federal income tax basis, were as follows:
| California High Yield | California | California 2 | ||||||||||
Cost of investments | $ | 123,735,698 | $ | 297,897,285 | $ | 155,472,610 | ||||||
Gross unrealized: | ||||||||||||
Appreciation | $ | 5,686,359 | $ | 11,126,322 | $ | 3,025,482 | ||||||
Depreciation | (9,112,965 | ) | (11,784,606 | ) | (7,223,856 | ) | ||||||
Net unrealized appreciation (depreciation) of investments | $ | (3,426,606 | ) | $ | (658,284 | ) | $ | (4,198,374 | ) | |||
Permanent differences, primarily due to federal taxes paid, taxable market discount and distribution character reclassifications, resulted in reclassifications among the Funds’ components of net assets at February 28, 2011, the Funds’ last tax year end, as follows:
| California High Yield | California | California 2 | ||||||||||
Capital paid-in | $ | 6,539 | $ | 2,697 | $ | 1,287 | ||||||
Undistributed (Over-distribution of) net investment income | (19,237 | ) | (5,000 | ) | (4,671 | ) | ||||||
Accumulated net realized gain (loss) | 12,698 | 2,303 | 3,384 | |||||||||
| Nuveen Investments | 55 |
Notes to Financial Statements (Unaudited) (continued)
The tax components of undistributed net tax-exempt income, net ordinary income and net long-term capital gains at February 28, 2011, the Funds’ last tax year end, were as follows:
| California High Yield | California | California 2 | ||||||||||
Undistributed net tax-exempt income* | $ | 987,063 | $ | 2,112,247 | $ | 1,166,334 | ||||||
Undistributed net ordinary income** | 29,407 | 19,056 | — | |||||||||
Undistributed net long-term capital gains | — | — | — | |||||||||
| * | Undistributed net tax-exempt income (on a tax basis) has not been reduced for the dividends declared during the period February 1, 2011, through February 28, 2011, and paid on March 1, 2011. |
| ** | Net ordinary income consists of taxable market discount income and net short-term capital gains, if any. |
The tax character of distributions paid during the Funds’ last tax year ended February 28, 2011, was designated for purposes of the dividends paid deduction as follows:
| California High Yield | California | California 2 | ||||||||||
Distributions from net tax-exempt income | $ | 6,981,434 | $ | 13,898,835 | $ | 7,790,512 | ||||||
Distributions from net ordinary income ** | — | — | — | |||||||||
Distributions from net long-term capital gains | — | — | — | |||||||||
| ** | Net ordinary income consists of taxable market discount income and net short-term capital gains, if any. |
At February 28, 2011, the Funds’ last tax year end, the Funds had unused capital loss carryforwards available for federal income tax purposes to be applied against future capital gains, if any. If not applied, the carryforwards will expire as follows:
| California High Yield | California | California 2 | ||||||||||
Expiration: | ||||||||||||
February 29, 2012 | $ | — | $ | 5,007,429 | $ | — | ||||||
February 28, 2013 | — | 84,061 | — | |||||||||
February 29, 2016 | 320,899 | — | — | |||||||||
February 28, 2017 | 3,792,828 | 3,965,451 | 316,570 | |||||||||
February 28, 2018 | 2,097,482 | 4,898,247 | 825,136 | |||||||||
February 28, 2019 | — | — | 75,788 | |||||||||
Total | $ | 6,211,209 | $ | 13,955,188 | $ | 1,217,494 | ||||||
During the last tax year ended February 28, 2011, California High Yield and California utilized $488,749 and $676,118 of their capital loss carryforwards, respectively.
The Funds have elected to defer net realized losses from investments incurred from November 1, 2010 through February 28, 2011, the Funds’ last tax year end, (“post-October losses”) in accordance with federal income tax regulations. Post-October losses are treated as having arisen on the first day of the current fiscal year. The following Funds have elected to defer post-October losses as follows:
| California High Yield | California 2 | |||||||
Post-October capital losses | $ | 960,847 | $ | 1,085,179 | ||||
7. Management Fees and Other Transactions with Affiliates
Each Fund’s management fee consists of two components – a fund-level fee, based only on the amount of assets within the Fund, and a complex-level fee, based on the aggregate amount of all eligible fund assets managed by the Adviser. This pricing structure enables Fund shareholders to benefit from growth in the assets within their Fund as well as from growth in the amount of complex-wide assets managed by the Adviser.
The annual fund-level fee for each Fund, payable monthly, is calculated according to the following schedule:
| Average Daily Net Assets | California | California California 2 Fund-Level Fee Rate | ||||||
For the first $125 million | .4000 | % | .3500 | % | ||||
For the next $125 million | .3875 | .3375 | ||||||
For the next $250 million | .3750 | .3250 | ||||||
For the next $500 million | .3625 | .3125 | ||||||
For the next $1 billion | .3500 | .3000 | ||||||
For net assets over $2 billion | .3250 | .2750 | ||||||
For net assets over $5 billion | — | .2500 | ||||||
| 56 | Nuveen Investments |
The annual complex-level fee for each Fund, payable monthly, is calculated according to the following schedule:
| Complex-Level Asset Breakpoint Level* | Effective Rate at Breakpoint Level | |||
$55 billion | .2000 | % | ||
$56 billion | .1996 | |||
$57 billion | .1989 | |||
$60 billion | .1961 | |||
$63 billion | .1931 | |||
$66 billion | .1900 | |||
$71 billion | .1851 | |||
$76 billion | .1806 | |||
$80 billion | .1773 | |||
$91 billion | .1691 | |||
$125 billion | .1599 | |||
$200 billion | .1505 | |||
$250 billion | .1469 | |||
$300 billion | .1445 | |||
| * | The complex-level fee is calculated based upon the aggregate daily “eligible assets” of all Nuveen Funds. Eligible assets do not include assets attributable to investments in other Nuveen Funds or assets in excess of $2 billion added to the Nuveen Fund complex in connection with the Adviser’s assumption of the management of the former First American Funds effective January 1, 2011. Eligible assets include closed-end fund assets managed by the Adviser that are attributable to financial leverage. For these purposes, financial leverage includes the closed-end funds’ use of preferred stock and borrowings and certain investments in the residual interest certificates (also called inverse floating rate securities) in tender option bond (TOB) trusts, including the portion of assets held by a TOB trust that has been effectively financed by the trust’s issuance of floating rate securities, subject to an agreement by the Adviser as to certain funds to limit the amount of such assets for determining eligible assets in certain circumstances. As of August 31, 2011, the complex-level fee rate for these Funds was .1781%. |
The management fee compensates the Adviser for overall investment advisory and administrative services and general office facilities it provides for the Funds. The Adviser has entered into sub-advisory agreements with the Sub-Adviser under which the Sub-Adviser manages the investment portfolios of the Funds. The Sub-Adviser is compensated for its services to the Funds from the management fees paid to the Adviser.
The Trust pays no compensation directly to those of its trustees who are affiliated with the Adviser or to its officers, all of whom receive remuneration for their services to the Trust from the Adviser or its affiliates. The Board of Trustees has adopted a deferred compensation plan for independent trustees that enables trustees to elect to defer receipt of all or a portion of the annual compensation they are entitled to receive from certain Nuveen-advised funds. Under the plan, deferred amounts are treated as though equal dollar amounts had been invested in shares of select Nuveen-advised funds.
The Adviser has agreed to waive fees and/or reimburse expenses (“Expense Cap”) of the Funds so that total annual fund operating expenses (excluding 12b-1 distribution and service fees, interest expenses, taxes, fees incurred in acquiring and disposing of portfolio securities and extraordinary expenses) do not exceed the average daily net assets of any class of Fund shares in the amounts and for the time periods stated in the following table.
| Fund | Temporary Expense Cap | Temporary Expiration Date | Permanent Expense Cap | |||||||||
California High Yield | 0.700 | % | July 31, 2012 | 1.000 | % | |||||||
California | N/A | N/A | 0.750 | |||||||||
California 2 | N/A | N/A | 0.975 | |||||||||
The Adviser may also voluntarily reimburse expenses from time to time in any of the Funds. Voluntary reimbursements may be terminated at any time at the Adviser’s discretion.
During the six months ended August 31, 2011, the Distributor collected sales charges on purchases of Class A Shares, the majority of which were paid out as concessions to financial intermediaries as follows:
California High Yield | California | California 2 | ||||||||||
Sales charges collected | $ | 84,029 | $ | 58,294 | $ | 12,267 | ||||||
Paid to financial intermediaries | 76,455 | 51,240 | 10,557 | |||||||||
The Distributor also received 12b-1 service fees on Class A Shares, substantially all of which were paid to compensate financial intermediaries for providing services to shareholders relating to their investments.
During the six months ended August 31, 2011, the Distributor compensated financial intermediaries directly with commission advances at the time of purchase as follows:
California High Yield | California | California 2 | ||||||||||
Commission advances | $ | 76,757 | $ | 50,804 | $ | 4,188 | ||||||
| Nuveen Investments | 57 |
Notes to Financial Statements (Unaudited) (continued)
To compensate for commissions advanced to financial intermediaries, all 12b-1 service fees collected on Class B Shares during the first year following a purchase, all 12b-1 distribution fees collected on Class B Shares, and all 12b-1 service and distribution fees collected on Class C Shares during the first year following a purchase are retained by the Distributor. During the six months ended August 31, 2011, the Distributor retained such 12b-1 fees as follows:
California High Yield | California | California 2 | ||||||||||
12b-1 fees retained | $ | 27,570 | $ | 29,741 | $ | 9,389 | ||||||
The remaining 12b-1 fees charged to the Funds were paid to compensate financial intermediaries for providing services to shareholders relating to their investments.
The Distributor also collected and retained CDSC on share redemptions during the six months ended August 31, 2011, as follows:
California High Yield | California | California 2 | ||||||||||
CDSC retained | $ | 17,616 | $ | 10,741 | $ | 4,423 | ||||||
8. New Accounting Pronouncements
Fair Value Measurements and Disclosures
On May 12, 2011, the Financial Accounting Standards Board (“FASB”) issued Accounting Standard Update (“ASU”) No. 2011-04 (“ASU No. 2011-04”) modifying Topic 820, Fair Value Measurements and Disclosures. At the same time, the International Accounting Standards Board (“IASB”) issued International Financial Reporting Standard (“IFRS”) 13, Fair Value Measurement. The objective of the FASB and IASB is convergence of their guidance on fair value measurements and disclosures. Specifically, ASU No. 2011-04 requires reporting entities to disclose i) the amounts of any transfers between Level 1 and Level 2, and the reasons for the transfers, ii) for Level 3 fair value measurements, a) quantitative information about significant unobservable inputs used, b) a description of the valuation processes used by the reporting entity and c) a narrative description of the sensitivity of the fair value measurement to changes in unobservable inputs if a change in those inputs might result in a significantly higher or lower fair value measurement. The effective date of ASU No. 2011-04 is for interim and annual periods beginning after December 15, 2011. At this time, management is evaluating the implications of this guidance and the impact it will have on the financial statement amounts and footnote disclosures, if any.
| 58 | Nuveen Investments |
Annual Investment Management Agreement Approval Process
(Unaudited)
The Board of Trustees (each, a “Board” and each Trustee, a “Board Member”) of the Funds, including the Board Members who are not parties to the Funds’ advisory or sub-advisory agreements or “interested persons” of any such parties (the “Independent Board Members”), are responsible for approving the advisory agreements (each, an “Investment Management Agreement”) between each Fund and Nuveen Fund Advisors, Inc. (the “Advisor”) and the sub-advisory agreements (each a “Sub-Advisory Agreement”) between the Advisor and Nuveen Asset Management, LLC (the “Sub-Advisor”) (the Investment Management Agreements and the Sub-Advisory Agreements are referred to collectively as the “Advisory Agreements”) and their periodic continuation. Pursuant to the Investment Company Act of 1940, as amended (the “1940 Act”), the Board is generally required to consider the continuation of advisory agreements and sub-advisory agreements on an annual basis. Accordingly, at an in-person meeting held on May 23-25, 2011 (the “May Meeting”), the Board, including a majority of the Independent Board Members, considered and approved the continuation of the Advisory Agreements for the Funds for an additional one-year period.
In preparation for their considerations at the May Meeting, the Board requested and received extensive materials prepared in connection with the review of the Advisory Agreements. The materials provided a broad range of information regarding the Funds, the Advisor and the Sub-Advisor (the Advisor and the Sub-Advisor are collectively, the “Fund Advisers” and each, a “Fund Adviser”). As described in more detail below, the information provided included, among other things, a review of Fund performance, including Fund investment performance assessments against peer groups and appropriate benchmarks, a comparison of Fund fees and expenses relative to peers, a description and assessment of shareholder service levels for the Funds, a summary of the performance of certain service providers, a review of product initiatives and shareholder communications and an analysis of the Advisor’s profitability with comparisons to comparable peers in the managed fund business. As part of their annual review, the Board also held a separate meeting on April 19-20, 2011, to review the Funds’ investment performance and consider an analysis provided by the Advisor of the Sub-Advisor which generally evaluated the Sub-Advisor’s investment team, investment mandate, organizational structure and history, investment philosophy and process, performance of the applicable Fund, and significant changes to the foregoing. As a result of their review of the materials and discussions, the Board presented the Advisor with questions and the Advisor responded.
The materials and information prepared in connection with the review of the Advisory Agreements at the May Meeting supplemented the information provided to the Board during the year. In this regard, throughout the year, the Board, acting directly or through its committees, regularly reviews the performance and various services provided by the Advisor and, since the internal restructuring described in Section A below, the Sub-Advisor. The Board meets at least quarterly as well as at other times as the need arises. At its quarterly meetings, the Board reviews reports by the Advisor which include, among other things, Fund performance, a review of the investment teams and compliance reports. The Board also meets with key investment personnel managing the Fund portfolios during the year. In addition, the Board continues its program of seeking to visit each sub-advisor to the Nuveen funds at least once over a multiple year rotation, meeting with key investment and business personnel. The Board also met with State Street Bank & Trust Company, the Funds’ accountant and custodian, in 2010. The Board considers factors and information that are relevant to its consideration of the renewal of the Advisory Agreements at these meetings held throughout the year. Accordingly, the Board considered the information provided and knowledge gained at these meetings when performing its review at the May Meeting of the Advisory Agreements. The Independent Board Members are assisted throughout the process by independent legal counsel who provided materials describing applicable law and the duties of directors or trustees in reviewing advisory contracts and met with the Independent Board Members in executive sessions without management present.
The Board considered all factors it believed relevant with respect to each Fund, including among other factors: (a) the nature, extent and quality of the services provided by the Fund Advisers, (b) the investment performance of the Fund and Fund Advisers, (c) the advisory fees and costs of the services to be provided to the Funds and the profitability of the Fund Advisers, (d) the extent of any economies of scale, (e) any benefits derived by the Fund Advisers from the relationship with the Fund and (f) other factors. Each Board Member may have accorded different weight to the various factors in reaching his or her conclusions with respect to a Fund’s Advisory Agreements. The Independent Board Members did not identify any single factor as all important or controlling. The Independent Board Members’ considerations were instead based on a comprehensive consideration of all the information presented. The principal factors considered by the Board and its conclusions are described below.
A. Nature, Extent and Quality of Services
In considering renewal of the Advisory Agreements, the Independent Board Members considered the nature, extent and quality of the Fund Adviser’s services, including advisory services and the resulting Fund performance and administrative services. The Independent Board Members reviewed materials outlining, among other things, the Fund Adviser’s organization and business; the types of services that the Fund Adviser or its affiliates provide to the Funds; the performance record of the applicable Fund (as described in further detail below); and any initiatives Nuveen had taken for the applicable fund product line.
In considering advisory services, the Board recognized that the Advisor provides various oversight, administrative, compliance and other services for the Funds and the Sub-Advisor provides the portfolio investment management services to the Funds. The Board recognized that Nuveen engaged in an internal restructuring in 2010 pursuant to which portfolio management services the Advisor had provided directly to the Funds were transferred to the Sub-Advisor, a newly-organized, wholly-owned subsidiary of the Advisor consisting of largely the same investment personnel. Accordingly, in reviewing the portfolio management services provided to each Fund, the Board reviewed the materials provided by the Nuveen Investment Services Oversight Team analyzing, among other things, the Sub-Advisor’s investment team and changes thereto, organization and history, assets under management, Fund objectives and
| Nuveen Investments | 59 |
Annual Investment Management Agreement Approval Process
(Unaudited) (continued)
mandate, the investment team’s philosophy and strategies in managing the Fund, developments affecting the Sub-Advisor or Fund and Fund performance. The Independent Board Members also reviewed portfolio manager compensation arrangements to evaluate each Fund Adviser’s ability to attract and retain high quality investment personnel, preserve stability, and reward performance but not provide an incentive to take undue risks. In addition, the Board considered the Advisor’s execution of its oversight responsibilities over the Sub-Advisor. Given the importance of compliance, the Independent Board Members also considered Nuveen’s compliance program, including the report of the chief compliance officer regarding the Funds’ compliance policies and procedures.
In addition to advisory services, the Board considered the quality and extent of administrative and other non-investment advisory services the Advisor and its affiliates provide to the Funds, including product management, investment services (such as oversight of investment policies and procedures, risk management, and pricing), fund administration, oversight of service providers, shareholder services, administration of Board relations, regulatory and portfolio compliance and legal support. In reviewing the services provided, the Board also reviewed materials describing various notable initiatives and projects the Advisor performed in connection with the open-end fund product line. These initiatives included operations necessary to effect the acquisition of FAF Advisors, Inc.’s (“FAF”) long-term asset management business by Nuveen and the subsequent integration of FAF and the funds FAF advised into the Nuveen family of funds; changes in dividend declaration policies; and adding funds to various distribution platforms.
Based on their review, the Independent Board Members found that, overall, the nature, extent and quality of services provided to the respective Funds under each applicable Advisory Agreement were satisfactory.
B. The Investment Performance of the Funds and Fund Advisers
The Board, including the Independent Board Members, reviewed and considered the performance history of each Fund over various time periods. The Board reviewed, among other things, each Fund’s historic investment performance as well as information comparing the Fund’s performance information with that of other funds (the “Performance Peer Group”) based on data provided by an independent provider of mutual fund data and with recognized and/or customized benchmarks.
The Board reviewed reports, including a comprehensive analysis of the Funds’ performance and the applicable investment team. In this regard, the Board reviewed each Fund’s total return information compared to its Performance Peer Group for the quarter, one-, three- and five-year periods ending December 31, 2010 and for the same periods ending March 31, 2011 (or for the periods available for the Nuveen California High Yield Municipal Bond Fund (the “High Yield Fund”), which did not exist for part of the foregoing time frame). In addition, the Board reviewed each Fund’s total return information compared to recognized and/or customized benchmarks for the quarter, one- and three-year periods ending December 31, 2010 and for the same periods ending March 31, 2011.
In reviewing performance comparison information, the Independent Board Members recognized that the usefulness of the comparisons of the performance of certain funds with the performance of their respective Performance Peer Group may be limited because the Performance Peer Group may not adequately represent the objectives and strategies of the applicable funds or may be limited in size or number. In this regard, the Independent Board Members noted that the Performance Peer Groups of the High Yield Fund and the Nuveen California Municipal Bond Fund 2 (the “Municipal Fund 2”) were classified as having significant differences from such Funds based on various considerations such as special fund objectives, potential investable universe and the composition of the peer set (e.g., the number and size of competing funds and number of competing managers). The Independent Board Members also noted that the investment experience of a particular shareholder in the Nuveen funds will vary depending on when such shareholder invests in the applicable fund, the class held (if multiple classes are offered) and the performance of the fund (or respective class) during that shareholder’s investment period.
In considering the results of the comparisons, the Independent Board Members observed, among other things, that the Nuveen California Municipal Bond Fund (the “Municipal Fund”) had demonstrated satisfactory performance in comparison to peers, performing in the second or third quartile over various periods. With respect to the High Yield Fund and the Municipal Fund 2 which, as noted above, had significant differences with their Performance Peer Groups, the Independent Board Members noted that each such Fund underperformed its benchmark in the one- and three-year periods.
With respect to any Nuveen funds that underperformed their peers and/or benchmarks from time to time, the Board monitors such funds closely and considers any steps necessary or appropriate to address such issues.
Based on their review, the Independent Board Members determined that each Fund’s investment performance had been satisfactory.
C. Fees, Expenses and Profitability
1. Fees and Expenses
The Board evaluated the management fees and expenses of each Fund reviewing, among other things, such Fund’s gross management fees, net management fees and net expense ratios in absolute terms as well as compared to the fee and expenses of a comparable universe of funds based on data provided by an independent fund data provider (the “Peer Universe”) and in certain cases, to a more focused subset of funds in the Peer Universe (the “Peer Group”) and any expense limitations.
The Independent Board Members further reviewed the methodology regarding the construction of the applicable Peer Universe and Peer Group (if any). In reviewing the comparisons of fee and expense information, the Independent Board Members took into account that in certain instances various factors such as: the asset level of a fund relative to peers; the limited size and particular composition of the Peer Universe or Peer Group; the investment objectives of the peers; expense anomalies; changes in the funds
| 60 | Nuveen Investments |
comprising the Peer Universe or Peer Group from year to year; levels of reimbursement; the timing of information used; and differences in the states reflected in the Peer Universe or Peer Group may impact the comparative data thereby limiting the ability to make a meaningful comparison with peers.
In reviewing the fee schedule for a Fund, the Independent Board Members also considered the fund-level and complex-wide breakpoint schedules (described in further detail below) and any fee waivers and reimbursements provided by Nuveen. In reviewing fees and expenses, the Board considered the expenses and fees to be higher if they were over 10 basis points higher, slightly higher if they were 6 to 10 basis points higher, in line if they were within 5 basis points higher than the peer average and below if they were below the peer average of the Peer Group (if available) or Peer Universe if there was no separate Peer Group. The Independent Board Members noted that the Municipal Fund and the Municipal Fund 2 each had net management fees slightly higher or higher than the peer average but net expense ratios below or in line with the peer average, while the High Yield Fund had net management fees and a net expense ratio higher than the peer average. In addition, with respect to the High Yield Fund, the Independent Board Members noted that the Advisor was instituting an expense cap for Class A shares of such Fund in seeking to lower expenses and reduce variability in expenses from year to year.
Based on their review of the fee and expense information provided, the Independent Board Members determined that each Fund’s management fees were reasonable in light of the nature, extent and quality of services provided to the Fund.
2. Comparisons with the Fees of Other Clients
The Independent Board Members further reviewed information regarding the nature of services and fee rates offered by the Advisor to other clients, including municipal separately managed accounts and passively managed exchange traded funds (ETFs) sub-advised by the Advisor. In evaluating the comparisons of fees, the Independent Board Members noted that the fee rates charged to the Funds and other clients vary, among other things, because of the different services involved and the additional regulatory and compliance requirements associated with registered investment companies, such as the Funds. Accordingly, the Independent Board Members considered the differences in the product types, including, but not limited to, the services provided, the structure and operations, product distribution and costs thereof, portfolio investment policies, investor profiles, account sizes and regulatory requirements. The Independent Board Members noted, in particular, that the range of services provided to the Funds (as discussed above) is much more extensive than that provided to separately managed accounts. Given the inherent differences in the products, particularly the extensive services provided to the Funds, the Independent Board Members believe such facts justify the different levels of fees.
In considering the fees of the Sub-Advisor, the Independent Board Members also considered the pricing schedule or fees that the Sub-Advisor charges for similar investment management services for other Nuveen funds.
3. Profitability of Fund Advisers
In conjunction with its review of fees, the Independent Board Members also considered the profitability of Nuveen for its advisory activities (which incorporated Nuveen’s wholly-owned affiliated sub-advisers) and its financial condition. The Independent Board Members reviewed the revenues and expenses of Nuveen’s advisory activities for the last two years, the allocation methodology used in preparing the profitability data and an analysis of the key drivers behind the changes in revenues and expenses that impacted profitability in 2010. The Independent Board Members noted this information supplemented the profitability information requested and received during the year to help keep them apprised of developments affecting profitability (such as changes in fee waivers and expense reimbursement commitments). In this regard, the Independent Board Members noted that they have an Independent Board Member serve as a point person to review and keep them apprised of changes to the profitability analysis and/or methodologies during the year. The Independent Board Members also considered Nuveen’s revenues for advisory activities, expenses, and profit margin compared to that of various unaffiliated management firms with similar amounts of assets under management and relatively comparable asset composition prepared by Nuveen.
In reviewing profitability, the Independent Board Members recognized the subjective nature of determining profitability which may be affected by numerous factors including the allocation of expenses. Further, the Independent Board Members recognized the difficulties in making comparisons as the profitability of other advisers generally is not publicly available and the profitability information that is available for certain advisers or management firms may not be representative of the industry and may be affected by, among other things, the adviser’s particular business mix, capital costs, types of funds managed and expense allocations. Notwithstanding the foregoing, the Independent Board Members reviewed Nuveen’s methodology and assumptions for allocating expenses across product lines to determine profitability. In reviewing profitability, the Independent Board Members recognized Nuveen’s investment in its fund business. Based on their review, the Independent Board Members concluded that the Advisor’s level of profitability for its advisory activities was reasonable in light of the services provided.
In evaluating the reasonableness of the compensation, the Independent Board Members also considered other amounts paid to a Fund Adviser by the Funds as well as any indirect benefits (such as soft dollar arrangements, if any) the Fund Adviser and its affiliates receive, or are expected to receive, that are directly attributable to the management of the Funds, if any. See Section E below for additional information on indirect benefits a Fund Adviser may receive as a result of its relationship with the Funds. Based on their review of the overall fee arrangements of each Fund, the Independent Board Members determined that the advisory fees and expenses of the respective Fund were reasonable.
| Nuveen Investments | 61 |
Annual Investment Management Agreement Approval Process
(Unaudited) (continued)
D. Economies of Scale and Whether Fee Levels Reflect These Economies of Scale
With respect to economies of scale, the Independent Board Members have recognized the potential benefits resulting from the costs of a fund being spread over a larger asset base, although economies of scale are difficult to measure and predict with precision, particularly on a fund-by-fund basis. One method to help ensure the shareholders share in these benefits is to include breakpoints in the advisory fee schedule. Generally, management fees for funds in the Nuveen complex are comprised of a fund-level component and a complex-level component, subject to certain exceptions. Accordingly, the Independent Board Members reviewed and considered the applicable fund-level breakpoints in the advisory fee schedules that reduce advisory fees as asset levels increase.
In addition to fund-level advisory fee breakpoints, the Board also considered the Funds’ complex-wide fee arrangement. Pursuant to the complex-wide fee arrangement, the fees of the funds in the Nuveen complex are generally reduced as the assets in the fund complex reach certain levels. The complex-wide fee arrangement seeks to provide the benefits of economies of scale to fund shareholders when total fund complex assets increase, even if assets of a particular fund are unchanged or have decreased. The approach reflects the notion that some of Nuveen’s costs are attributable to services provided to all its funds in the complex and therefore all funds benefit if these costs are spread over a larger asset base. In this regard, the Independent Board Members also noted that a portion of the assets acquired pursuant to the transaction with FAF are included in determining the level of assets for calculating the complex-wide fee, which helps reduce such fee to the benefit of all shareholders.
Based on their review, the Independent Board Members concluded that the breakpoint schedules and complex-wide fee arrangement were acceptable and reflect economies of scale to be shared with shareholders when assets under management increase.
E. Indirect Benefits
In evaluating fees, the Independent Board Members received and considered information regarding potential “fall out” or ancillary benefits the respective Fund Adviser or its affiliates may receive as a result of its relationship with each Fund. In this regard, the Independent Board Members considered, among other things, any sales charges, distribution fees and shareholder services fees received and retained by the Funds’ principal underwriter, an affiliate of the Advisor, which includes fees received pursuant to any 12b-1 plan. The Independent Board Members, therefore, considered the 12b-1 fees retained by Nuveen during the last calendar year.
In addition to the above, the Independent Board Members considered whether the Fund Advisers received any benefits from soft dollar arrangements whereby a portion of the commissions paid by a Fund for brokerage may be used to acquire research that may be useful to the Fund Adviser in managing the assets of the Funds and other clients. The Independent Board Members recognized that each Fund Adviser has the authority to pay a higher commission in return for brokerage and research services if it determines in good faith that the commission paid is reasonable in relation to the value of the brokerage and research services provided. Nevertheless, the Independent Board Members noted that commissions are generally not paid in connection with municipal securities transactions typically executed on a principal basis.
Based on their review, the Independent Board Members concluded that any indirect benefits received by a Fund Adviser as a result of its relationship with the Funds were reasonable and within acceptable parameters.
F. Other Considerations
The Independent Board Members did not identify any single factor discussed previously as all-important or controlling. The Board Members, including the Independent Board Members, unanimously concluded that the terms of each Advisory Agreement are fair and reasonable, that the respective Fund Adviser’s fees are reasonable in light of the services provided to each Fund and that the Advisory Agreements be renewed.
| 62 | Nuveen Investments |
Notes
| Nuveen Investments | 63 |
Notes
| 64 | Nuveen Investments |
Notes
| Nuveen Investments | 65 |
Glossary of Terms Used in this Report
Average Annual Total Return: This is a commonly used method to express an investment’s performance over a particular, usually multi-year time period. It expresses the return that would have been necessary each year to equal the investment’s actual cumulative performance (including change in NAV or offer price and reinvested dividends and capital gains distributions, if any) over the time period being considered.
Average Duration: Duration is a measure of the expected period over which a bond’s principal and interest will be paid, and consequently is a measure of the sensitivity of a bond’s (or bond fund’s) value to changes when market interest rates change. Generally, the longer a bond or Fund’s duration, the more the price of the bond or Fund will change as interest rates change.
Average Effective Maturity: The market-value-weighted average of the effective maturity dates of the individual securities including cash. In the case of a bond that has been advance-refunded to a call date, the effective maturity is the date on which the bond is scheduled to be redeemed using the proceeds of an escrow account. In most other cases the effective maturity is the stated maturity date of the security.
Inverse Floaters: Inverse floating rate securities are created by depositing a municipal bond, typically with a fixed interest rate, into a special purpose trust created by a broker-dealer. This trust, in turn, (a) issues floating rate certificates typically paying short-term tax-exempt interest rates to third parties in amounts equal to some fraction of the deposited bond’s par amount or market value, and (b) issues an inverse floating rate certificate (sometimes referred to as an “inverse floater”) to an investor (such as a Fund) interested in gaining investment exposure to a long-term municipal bond. The income received by the holder of the inverse floater varies inversely with the short-term rate paid to the floating rate certificates’ holders, and in most circumstances the holder of the inverse floater bears substantially all of the underlying bond’s downside investment risk. The holder of the inverse floater typically also benefits disproportionately from any potential appreciation of the underlying bond’s value. Hence, an inverse floater essentially represents an investment in the underlying bond on a leveraged basis.
Lipper California Municipal Debt Classification Average: Represents the average annualized total return for all reporting funds in the Lipper California Municipal Debt category. The Lipper California Municipal Debt Classification Average contained 119, 117, 97, 80 and 98 funds for the 6-month, 1-year, 5-year, 10-year and since inception periods, respectively, ended August 31, 2011. Lipper returns account for the effects of management fees and assume reinvestment of dividends but do not reflect any applicable sales charges. The Lipper average is not available for direct investment.
Net Asset Value (NAV): The net market value of all securities held in a portfolio.
Net Asset Value (NAV) Per Share: The market value of one share of a mutual fund or closed-end fund. For a Fund, the NAV is calculated daily by taking the Fund’s total assets (securities, cash, and accrued earnings), subtracting the Fund’s liabilities, and dividing by the number of shares outstanding.
Pre-Refundings: Pre-Refundings, also known as advance refundings or refinancings, occur when an issuer sells new bonds and uses the proceeds to fund principal and interest payments of older existing bonds. This process often results in lower borrowing costs for bond issuers.
Standard & Poor’s (S&P) California Municipal Bond Index: An unleveraged, market value-weighted index designed to measure the performance of the tax-exempt, investment grade California municipal bond market. The index returns assume reinvestment of dividends but do not reflect any applicable sales charges. You cannot invest directly in an index.
Standard & Poor’s (S&P) High Yield Municipal Bond Index: An unleveraged, market-value-weighted index designed to measure the performance of the tax-exempt, investment grade U.S. high yield municipal bond market. The index returns assume reinvestment of dividends but do not reflect any applicable sales charges. You cannot invest directly in an index.
Standard & Poor’s (S&P) National Municipal Bond Index: An unleveraged, market value-weighted index designed to measure the performance of the tax-exempt, investment grade U.S. municipal bond market. The index returns assume reinvestment of dividends but do not reflect any applicable sales charges. You cannot invest directly in an index.
Zero Coupon Bond: A zero coupon bond does not pay a regular interest coupon to its holders during the life of the bond. Tax-exempt income to the holder of the bond comes from accretion of the difference between the original purchase price of the bond at issuance and the par value of the bond at maturity and is effectively paid at maturity. The market prices of zero coupon bonds generally are more volatile than the market prices of bonds that pay interest periodically.
| 66 | Nuveen Investments |
Fund Manager
Nuveen Fund Advisors, Inc.
333 West Wacker Drive
Chicago, IL 60606
Sub-Adviser
Nuveen Asset Management, LLC
333 West Wacker Drive
Chicago, IL 60606
Legal Counsel
Chapman and Cutler LLP
Chicago, IL
Independent Registered
Public Accounting Firm
PricewaterhouseCoopers LLP
Chicago, IL
Custodian
State Street Bank & Trust Company
Boston, MA
Transfer Agent and Shareholder Services
Boston Financial
Data Services, Inc.
Nuveen Investor Services
P.O. Box 8530
Boston, MA 02266-8530
(800) 257-8787
Quarterly Portfolio of Investments and Proxy Voting Information: You may obtain (i) each Fund’s quarterly portfolio of investments, (ii) information regarding how each Fund voted proxies relating to portfolio securities held during the most recent twelve-month period ended June 30, and (iii) a description of the policies and procedures that each Fund used to determine how to vote proxies relating to portfolio securities without charge, upon request, by calling Nuveen Investments at (800) 257-8787 or on Nuveen’s website at www.nuveen.com.
You may also obtain this and other Fund information directly from the Securities and Exchange Commission (SEC). The SEC may charge a copying fee for this information. Visit the SEC on-line at http://www.sec.gov or in person at the SEC’s Public Reference Room in Washington, D.C. Call the SEC at (202) 942-8090 for room hours and operation. You may also request Fund information by sending an e-mail request to publicinfo@sec.gov or by writing to the SEC’s Public Reference Section at 100 F Street NE, Washington, D.C. 20549.
The Financial Industry Regulatory Authority (FINRA) provides a Public Disclosure Program which supplies certain information regarding the disciplinary history of FINRA members and their associated persons in response to either telephone inquiries at (800) 289-9999 or written inquiries at www.finra.org. FINRA also provides an investor brochure that includes information describing the Public Disclosure Program.
| Nuveen Investments | 67 |
Nuveen Investments:
Serving Investors for Generations
Since 1898, financial advisors and their clients have relied on Nuveen Investments to provide dependable investment solutions through continued adherence to proven, long-term investing principles. Today, we offer a range of high quality equity and fixed-income solutions designed to be integral components of a well-diversified core portfolio.
Focused on meeting investor needs.
Nuveen Investments is a global investment management firm that seeks to help secure the long-term goals of institutions and high net worth investors as well as the consultants and financial advisors who serve them. We market our growing range of specialized investment solutions under the high-quality brands of HydePark, NWQ, Nuveen Asset Management, Santa Barbara, Symphony, Tradewinds and Winslow Capital. In total, Nuveen Investments managed approximately $210 billion of assets as of June 30, 2011.
Find out how we can help you.
To learn more about how the products and services of Nuveen Investments may be able to help you meet your financial goals, talk to your financial advisor, or call us at (800) 257-8787. Please read the information provided carefully before you invest. Investors should consider the investment objective and policies, risk considerations, charges and expenses of any investment carefully. Where applicable, be sure to obtain a prospectus, which contains this and other relevant information. To obtain a prospectus, please contact your securities representative or Nuveen Investments, 333 W. Wacker Dr., Chicago, IL 60606. Please read the prospectus carefully before you invest or send money.
Learn more about Nuveen Funds at: www.nuveen.com/mf
Nuveen makes things e-simple.
It only takes a minute to sign up for e-Reports. Once enrolled, you’ll receive an e-mail as soon as your Nuveen Fund information is ready — no more waiting for delivery by regular mail. Just click on the link within the e-mail to see the report and save it on your computer if you wish.
Free e-Reports right to your e-mail!
www.investordelivery.com
If you receive your Nuveen Fund distributions and statements from your financial advisor or brokerage account.
OR
www.nuveen.com/accountaccess
If you receive your Nuveen Fund distributions and statements directly from Nuveen.
Distributed by Nuveen Securities, LLC 333 West Wacker Drive Chicago, IL 60606 www.nuveen.com |
MSA-CA-0811P

Mutual Funds
Nuveen Municipal Bond Funds
Dependable, tax-free income because it’s not what you earn, it’s what you keep.®
Semi-Annual Report
August 31, 2011
| Class / Ticker Symbol | ||||||||
| Fund Name | Class A | Class B | Class C | Class I | ||||
Nuveen Connecticut Municipal Bond Fund | FCTTX | FCTBX | FCTCX | FCTRX | ||||
Nuveen New Jersey Municipal Bond Fund | NNJAX | NNJBX | NNJCX | NMNJX | ||||
Nuveen New York Municipal Bond Fund | NNYAX | NNYBX | NNYCX | NTNYX | ||||
Nuveen New York Municipal Bond Fund 2 (formerly Nuveen New York Insured Municipal Bond Fund) | NNYIX | NNIMX | NNYKX | NINYX | ||||
LIFE IS COMPLEX.
Nuveen makes things e-simple.
It only takes a minute to sign up for e-Reports. Once enrolled, you’ll receive an e-mail as soon as your Nuveen Fund information is ready. No more waiting for delivery by regular mail. Just click on the link within the e-mail to see the report and save it on your computer if you wish.
Free e-Reports right to your e-mail!
www.investordelivery.com
If you receive your Nuveen Fund dividends and statements from your financial advisor or brokerage account.
OR
www.nuveen.com/accountaccess
If you receive your Nuveen Fund dividends and statements directly from Nuveen.
| Must be preceded by or accompanied by a prospectus. | NOT FDIC INSURED | MAY LOSE VALUE | NO BANK GUARANTEE |
| 4 | ||||
| 5 | ||||
| 11 | ||||
| 16 | ||||
| 17 | ||||
| 18 | ||||
| 20 | ||||
| 52 | ||||
| 53 | ||||
| 54 | ||||
| 56 | ||||
| 64 | ||||
| 74 | ||||
| 78 | ||||
| 79 | ||||
Letter to Shareholders

Dear Shareholders,
The global economy continues to be weighed down by an unusual combination of
pressures facing the larger developed economies. Japanese leaders continue to work through the economic aftereffects of the March 2011 earthquake and tsunami. Political leaders in Europe and the U.S. have resolved some of the near term fiscal problems, but the financial markets are not convinced that these leaders are able to address more complex longer term fiscal issues. Despite improved earnings and capital increases, the largest banks in these countries continue to be vulnerable to deteriorating mortgage portfolios and sovereign credit exposure, adding another source of uncertainty to the global financial system.
In the U.S., recent economic statistics indicate that the economic recovery may be losing momentum. Consumption, which represents about 70% of the gross domestic product, faces an array of challenges from seemingly intractable declines in housing values, increased energy costs and limited growth in the job market. The failure of Congress and the administration to agree on the debt ceiling increase on a timely basis and the deep divisions between the political parties over fashioning a balanced program to address growing fiscal imbalances that led to the recent S&P ratings downgrade add considerable uncertainty to the domestic economic picture.
On a more positive note, corporate earnings continue to hold up well and the municipal bond market is recovering from recent weakness as states and municipalities implement various programs to reduce their budgetary deficits. In addition, the Federal Reserve System has made it clear that it stands ready to take additional steps should the economic recovery falter. However, there are concerns that the Fed is approaching the limits of its resources to intervene in the economy.
These perplexing times highlight the importance of professional investment management. Your Nuveen investment team is working hard to develop an appropriate response to increased risk, and they continue to seek out opportunities created by stressful markets using proven investment disciplines designed to help your Fund achieve its investment objectives. On your behalf, we monitor their activities to assure that they maintain their investment disciplines.
As always, I encourage you to contact your financial consultant if you have any questions about your investment in a Nuveen Fund. On behalf of the other members of your Fund Board, we look forward to continuing to earn your trust in the months and years ahead.
Sincerely,

Robert P. Bremner
Chairman of the Board
October 21, 2011
| 4 | Nuveen Investments |
The Board of Trustees of Nuveen Multistate Trust II has approved, subject to shareholder approval, the reorganization of the Nuveen New York Municipal Bond Fund 2 into the Nuveen New York Municipal Bond Fund. The Nuveen New York Municipal Bond Fund 2 will hold a special meeting of shareholders for the purpose of voting on the merger on November 7, 2011. A joint Proxy Statement/Prospectus containing important information relating to the proposed reorganization has been mailed to those who were Fund shareholders as of the close of business on September 9, 2011, the record date for the special meeting. Shareholders are urged to read such joint Proxy Statement/Prospectus carefully. Free copies of the Proxy Statement/Prospectus are available on the SEC’s web site at www.sec.gov.
Certain statements in this report are forward-looking statements. Discussions of specific investments are for illustration only and are not intended as recommendations of individual investments. The forward-looking statements and other views expressed herein are those of the portfolio managers as of the date of this report. Actual future results or occurrences may differ significantly from those anticipated in any forward-looking statements, and the views expressed herein are subject to change at any time, due to numerous market and other factors. The Funds disclaim any obligation to update publicly or revise any forward-looking statements or views expressed herein.
Ratings shown are the highest rating given by one of the following national rating agencies: Standard & Poor’s Group, Moody’s Investor Services, Inc. or Fitch, Inc. Credit ratings are subject to change. AAA, AA, A, and BBB are investment grade ratings; BB, B, CCC, CC, C and D are below-investment grade ratings. Bonds backed by U.S. Government or agency securities are given an implied rating equal to the rating of such securities. Holdings designated N/R are not rated by a national rating agency.
Portfolio managers Michael Hamilton, Paul Brennan and Scott Romans examine key investment strategies and the Funds’ performance during the six months ending August 31, 2011. Michael has 22 years of investment experience and manages the Nuveen Connecticut Municipal Bond Fund. Paul has 23 years of investment experience and manages the Nuveen New Jersey Municipal Bond Fund. Scott has 12 years of investment experience and manages the Nuveen New York Municipal Bond Fund and the Nuveen New York Municipal Bond Fund 2 (formerly the Nuveen New York Insured Municipal Bond Fund). They have managed their respective Funds since January 2011.
How did the Funds perform during the six-month reporting period ending August 31, 2011?
The tables in the Fund Performance and Expense Ratios section of this report provide total return performance information for the six-month, one-year, five-year and ten-year periods ending August 31, 2011. Each Fund’s Class A Share total returns are compared with the performance of the national and corresponding state-specific Standard & Poor’s (S&P) municipal bond indexes and relevant Lipper average.
The Connecticut, New York and New York 2 Funds trailed the national S&P Index, while the New Jersey Fund outperformed this index during the six-month period. The Connecticut, New Jersey and New York Funds surpassed the results of their respective state-specific S&P indexes, but the New York 2 Fund (which, until May 31, 2011, had an investment mandate requiring 80% of its assets to be held in insured municipal bonds) did not keep pace with the S&P New York Municipal Bond Index. The New Jersey and New York Funds beat their respective Lipper averages, while the Connecticut and New York 2 Funds underperformed theirs.
During this reporting period, tax-exempt bonds benefited from a favorable investment environment, as this time span began just a few weeks after the municipal market bottomed after a deep downturn in late 2010 and early 2011. In addition, the Funds were helped by limited new issuance of tax-exempt bonds — which helped boost prices amid healthy demand for the securities — and a substantial decline in interest rates that pushed up bond prices. During the six months ending August 31, 2011, municipal bond issuance totaled roughly $135 billion nationwide, a 34% year-over-year decline. In comparison, new supply of Connecticut tax-exempt debt was about $2.8 billion during the same time span, reflecting a modest 7% increase. Meanwhile, new supply in New Jersey and New York totaled $3.1 billion and $14.8 billion, respectively. New Jersey issuance was down 44%, compared with a 17% decline in new New York.
| Nuveen Investments | 5 |
Nuveen Connecticut Municipal Bond Fund
As noted earlier, the Fund’s Class A Shares at net asset value (NAV) lagged the S&P National Municipal Bond Index during the six-month period ending August 31, 2011. The Fund’s relative performance was hampered by disappointing sector and security selection. For example, the portfolio struggled from an overweighting in single-family housing bonds, which were relatively weak performers amid a challenging residential real estate market. Another negative was being underweighted in transportation debt, especially airport bonds, which were lifted by the improved health of the airline industry. On the positive side, an emphasis on education debt was helpful, given the category’s strong performance during the period.
The Fund was bolstered by its duration positioning, meaning its sensitivity to changes in interest rates. During the period, longer bonds were helped the most by the declining-rate environment, while shorter-maturity issues did not perform well. Compared with the national index, the Fund had less exposure to the market’s very shortest bonds, which supported relative portfolio performance. Somewhat offsetting that positive contribution, however, was a modest underweighting in the outperforming longest-duration issues, which weighed upon results.
The Fund enjoyed favorable credit-rating positioning on balance. An overweighting in relatively successful unrated bonds proved helpful, as did underweightings in bonds with AAA and AA credit ratings (the two highest rating categories), which lagged the market. In contrast, the Fund was underweighted in A-rated bonds, which turned out to be the best-performing rating category of the six-month period.
Nuveen New Jersey Municipal Bond Fund
As noted, the Class A Shares at net asset value (NAV) did very well relative to the S&P National Municipal Bond Index during the six-month reporting period. As interest rates declined, this portfolio was very well situated. Specifically, the Fund’s duration was fairly long, which made the portfolio sensitive to the favorable effect of falling rates and pushed up the prices of the Fund’s holdings, especially those with longer maturities.
Another notable positive factor resulted from investors’ increased tolerance for taking on credit risk. As investors became more confident in the municipal market, bonds with lower credit ratings, especially those rated A or lower, generally did very well because investors were willing to accept lower yield premiums to purchase riskier debt. The Fund was well positioned in this environment, with healthy exposure to bonds with credit ratings of A or lower (more than 60% of the portfolio as of period end, including the Fund’s allocation to non-rated bonds).
The Fund’s exposure to tobacco-securitization bonds, which had a nice run during the period, also helped performance. These issues benefited from an improving legal backdrop that had the potential to increase the cash flows supporting the bond’s debt service payments. The Fund also saw good performance from its health care allocation, in part because a number of the portfolio’s positions in this sector were in the strong-performing A-rated credit category. Although very little detracted during this strong period of performance, one minor negative came from the Fund’s position in
| 6 | Nuveen Investments |
pre-refunded bonds, which made up about 8% of the portfolio at period end. These very-high-quality, very-short-maturity bonds provided positive absolute returns but nevertheless lagged the market and slightly slowed the Fund’s performance relative to the national municipal bond market.
Nuveen New York Municipal Bond Fund and Nuveen New York Municipal Bond Fund 2
Both Funds’ Class A Shares at net asset value (NAV) trailed the S&P National Municipal Bond Index during the six-month reporting period ending August 31, 2011.
The strongest positive contribution to the Nuveen New York Municipal Bond Fund came from its interest-rate positioning. Due to the portfolio’s longer duration than the national index, the Fund was rewarded when municipal bond prices rose in response to falling interest rates. Yield curve positioning further added to results in relative terms. The Fund had less exposure to bonds with shorter maturities, which proved helpful when longer-dated securities outperformed. A counterbalancing negative, however, was the Fund’s relatively modest representation among more-robust-performing longer-duration bonds. The Nuveen New York Municipal Bond Fund 2 also benefited from its longer-than-average duration stance in an environment of falling rates, but the portfolio’s yield curve positioning was not optimal. An underweighting in short-dated bonds proved helpful, although an additional underweighting in the market’s longest-duration bonds tempered the impact.
What strategies were used to manage the Funds during the six-month period?
Nuveen Connecticut Municipal Bond Fund
The Fund invests primarily in investment-grade municipal bonds in an effort to provide interest income exempt from regular federal, Connecticut state and, in some cases, Connecticut local income taxes.
Despite the modest increase in new issuance in Connecticut, municipal bond supply in that state was still highly constrained and this limited our purchase activity for the portfolio during the six-month period. When possible, we focused on buying bonds with credit ratings of A and maturities of 15 years and longer — characteristics we believed were providing the best relative value for investors. Because the yield curve was so steep — meaning bonds with longer maturities were paying much higher interest rates than their shorter dated counterparts — bonds on the longer end of the curve offered better total-return prospects, in our opinion.
With the lack of bond supply and an environment of historically low yields, it was often difficult to maintain our goal of obtaining longer-dated A-rated bonds, and we faced significant competition from retail investors who also were seeking increased income in the low-rate environment. Accordingly, we made very few purchases during the period, participating in only five bond deals in the new issue market and making some isolated acquisitions in the secondary municipal bond market.
To fund the portfolio’s purchase activity as well as meet some outflows of investment funds during the period, we applied the proceeds of bond calls or maturities. We also
| Nuveen Investments | 7 |
selectively sold bonds with very short maturities, as market conditions made these particularly good sale candidates. In other words, we were able to improve the income-generating capability of the portfolio by selling short-dated bonds paying very low interest rates and reinvesting the proceeds in longer-dated bonds offering higher rates.
Nuveen New Jersey Municipal Bond Fund
The Fund invests primarily in investment-grade municipal bonds in an effort to provide interest income exempt from regular federal, New Jersey state and, in some cases, New Jersey local income taxes.
With very light issuance of New Jersey municipal bonds, mirroring national trends, we made relatively few new purchases and sales during the period. The lack of substantial changes reflected both the low-supply environment and a belief that the portfolio was already well positioned for current market conditions and the Fund’s objectives. Accordingly, we maintained the Fund’s emphasis on lower-rated bonds. Riskier bonds were considerably hurt during the municipal bond market’s sharp selloff in late 2010 and early 2011, given the underlying risks in the market. We took advantage of those conditions to add to our stake in lower-rated bonds that in our view offered a good risk/reward tradeoff for our shareholders. Our decision to maintain this position throughout the reporting period proved helpful, as investors gradually re-embraced these riskier securities.
The main change to the portfolio’s characteristics was to allow its duration to drift slightly shorter. We believed that allowing duration to decline modestly was prudent in light of the rally in the municipal bond market, as a shorter duration would provide the portfolio with some additional protection in the event of a change in market conditions or an increase in rates.
Our minimal trading activity during the period included a few purchases in the health care sector, which replaced some bonds that had been called from the portfolio. Early in the period, we added slightly to the Fund’s exposure to tobacco bonds at what we believed were favorable prices relative to these securities’ risks. We also participated in a small number of general obligation bond purchases. The proceeds for this purchase activity came from new investment inflows from shareholders and from the redemption of several bonds in the portfolio.
Nuveen New York Municipal Bond Fund and Nuveen New York Municipal Bond Fund 2
Effective as of the close of business on April 27, 2011, the Nuveen New York Municipal Bond Fund 2 closed to new investors. Investors in the Fund as of that date may continue to invest in the Fund, including through the reinvestment of dividends and capital gains distributions.
In addition, effective May 31, 2011:
| • | The Fund is no longer required to invest at least 80% of its net assets in municipal securities that are covered by insurance guaranteeing the timely payment of principal and interest thereon. The Fund will continue to be subject to the requirement that it invest at least 80% of its net assets in municipal bonds that pay interest that is exempt from regular federal and New York personal income tax. |
| 8 | Nuveen Investments |
| • | The Fund’s name changed from Nuveen New York Insured Municipal Bond Fund. |
The Funds invest primarily in investment-grade municipal bonds in an effort to provide interest income exempt from regular federal, New York state and, in some cases, New York local taxes.
New purchases for both Funds were relatively few during the period, reflecting both the limited supply in the municipal bond market and the low-interest-rate environment. These factors made it unattractive to try to restructure the portfolio, because the bonds available for purchase were generally less desirable than the bonds we already owned.
In the Nuveen New York Municipal Bond Fund, most of our purchases during the period were very liquid bond issues with a high degree of credit quality, which reflected the vast majority of what came to market during a time of relatively little new issuance. Among the new purchases during the period were New York City water/sewer bonds and New York State Thruway transportation bonds. In the current market environment, where it is challenging to find exceptional value, these types of securities offer an attractive place to invest temporarily. Because these securities have a high degree of liquidity, we anticipate being able to sell them readily and reinvest the proceeds in other securities when the market presents better long-term opportunities. The only exception to this pattern was our decision to add to the portfolio’s existing position in a senior-living-facility bond issue that we believed was attractive.
A number of bond calls provided some of the proceeds that funded our recent purchases. To improve the structural characteristics of the portfolio, we selectively sold some of the Fund’s longer bonds and sought to replace them with modestly shorter-dated positions. This approach reduced the Fund’s interest-rate exposure while providing the portfolio with better call protection.
Meanwhile, in the New York Municipal Bond Fund 2, we took advantage of the Fund’s broadened ability to invest in non-insured municipal debt to add a position in lower-rated health care bonds that we believed provided good value. Other purchases included a bond issue by the Whitney Museum of American Art in New York City and some tobacco-securitization bonds that we had been unable to own previously. When possible, these “opportunistic” purchases were focused on the long end of the yield curve, with maturities ranging from 20 to 30 years. Other recent purchases included many of the same high-quality, very liquid bonds we added to the other New York Fund.
To fund our purchases for New York Municipal Bond Fund 2, we relied primarily on the proceeds of called bonds, as well as some very-short-maturity bonds that had strong demand in the marketplace and would have been leaving the portfolio soon anyway.
Risk Considerations
Mutual fund investing involves risk; principal loss is possible. Debt or fixed income securities are subject to credit risk and interest rate risk. The value of, and income generated by debt securities will decrease or increase based on changes in market interest rates. As interest rates rise, bond prices fall. Credit risk refers to an issuer’s ability to make interest and principal payments when due. Below investment grade bonds carry heightened credit risk and potential for default.
| Nuveen Investments | 9 |
Dividend Information
The Class I Shares of the Nuveen New Jersey Municipal Bond Fund and the Nuveen New York Municipal Bond Fund saw increases to their monthly dividends in August 2011. There were no other dividend changes to any of the Funds’ share classes during the six-month period ending August 31, 2011.
Each Fund seeks to pay dividends at a rate that reflects the past and projected performance of the Fund. To permit a Fund to maintain a more stable monthly dividend, the Fund may pay dividends at a rate that may be more or less than the amount of net investment income actually earned by the Fund during the period. If the Fund has cumulatively earned more than it has paid in dividends, it will hold the excess in reserve as undistributed net investment income (UNII) as part of the Fund’s net asset value. Conversely, if the Fund has cumulatively paid in dividends more than it has earned, the excess will constitute a negative UNII that will likewise be reflected in the Fund’s net asset value. Each Fund will, over time, pay all its net investment income as dividends to shareholders. As of August 31, 2011, all four Funds had a positive UNII balance, based upon our best estimate, for tax purposes and a positive UNII balance for financial reporting purposes.
| 10 | Nuveen Investments |
Fund Performance and Expense Ratios (Unaudited)
The Fund Performance and Expense Ratios for each Fund are shown on the following four pages.
Returns quoted represent past performance, which is no guarantee of future results. Current performance may be higher or lower than the performance shown. Investment returns and principal value will fluctuate so that when shares are redeemed, they may be worth more or less than their original cost. Returns without sales charges would be lower if the sales charge were included. Returns do not reflect the deduction of taxes that a shareholder would pay on Fund distributions or the redemption of Fund shares. Income is generally exempt from regular federal income taxes. Some income may be subject to state and local income taxes and to the federal alternative minimum tax. Capital gains, if any, are subject to tax.
Returns may reflect a contractual agreement between certain Funds and the investment adviser to waive certain fees and expenses; see Notes to Financial Statements, Footnote 7 — Management Fees and Other Transactions with Affiliates for more information. In addition, returns may reflect a voluntary expense limitation by the Funds’ investment adviser that may be modified or discontinued at any time without notice. For the most recent month-end performance visit www.nuveen.com or call (800) 257-8787.
Returns reflect differences in sales charges and expenses, which are primarily differences in distribution and service fees. Fund returns assume reinvestment of dividends and capital gains.
Comparative index and Lipper return information is provided for the Funds’ Class A Shares at net asset value (NAV) only.
The expense ratios shown reflect the Funds’ total operating expenses (before fee waivers or expense reimbursements, if any) as shown in the Funds’ most recent prospectus. The expense ratios include management fees and other fees and expenses.
| Nuveen Investments | 11 |
Fund Performance and Expense Ratios (Unaudited) (continued)
Nuveen Connecticut Municipal Bond Fund
Refer to the first page of this Fund Performance and Expense Ratios section for further explanation of the information included within this page.
Fund Performance
Average Annual Total Returns as of August 31, 2011*
| Cumulative | Average Annual | |||||||||||||||
| 6-Month | 1-Year | 5-Year | 10-Year | |||||||||||||
Class A Shares at NAV | 6.15% | 2.41% | 4.26% | 4.48% | ||||||||||||
Class A Shares at maximum Offering Price | 1.66% | -1.87% | 3.36% | 4.03% | ||||||||||||
Standard & Poor’s (S&P) Connecticut Municipal Bond Index** | 5.16% | 2.45% | 4.57% | 4.61% | ||||||||||||
Standard & Poor’s (S&P) National Municipal Bond Index** | 6.56% | 2.62% | 4.60% | 4.93% | ||||||||||||
Lipper Connecticut Municipal Debt Classification Average** | 6.26% | 1.77% | 3.66% | 3.89% | ||||||||||||
Class B Shares w/o CDSC | 5.65% | 1.64% | 3.49% | 3.85% | ||||||||||||
Class B Shares w/CDSC | 0.65% | -2.29% | 3.32% | 3.85% | ||||||||||||
Class C Shares | 5.77% | 1.78% | 3.69% | 3.91% | ||||||||||||
Class I Shares | 6.24% | 2.63% | 4.48% | 4.69% | ||||||||||||
Latest Calendar Quarter – Average Annual Total Returns as of September 30, 2011*
| Cumulative | Average Annual | |||||||||||||||
| 6-Month | 1-Year | 5-Year | 10-Year | |||||||||||||
Class A Shares at NAV | | 7.66% | | 3.47% | 4.36% | 4.62% | ||||||||||
Class A Shares at maximum Offering Price | | 3.18% | | -0.86% | 3.46% | 4.17% | ||||||||||
Class B Shares w/o CDSC | | 7.27% | | 2.70% | 3.59% | 4.00% | ||||||||||
Class B Shares w/CDSC | | 2.27% | | -1.27% | 3.41% | 4.00% | ||||||||||
Class C Shares | | 7.39% | | 2.94% | 3.79% | 4.06% | ||||||||||
Class I Shares | | 7.75% | | 3.69% | 4.58% | 4.83% | ||||||||||
Class A Shares have a maximum 4.20% sales charge (Offering Price). Class A Share purchases of $1 million or more are sold at net asset value without an up-front sales charge but may be subject to a contingent deferred sales charge (CDSC), also known as a back-end sales charge, if redeemed within eighteen months of purchase. Class B Shares have a CDSC that begins at 5% for redemptions during the first year and declines periodically until after six years when the charge becomes 0%. Class B Shares automatically convert to Class A Shares eight years after purchase. Class C Shares have a 1% CDSC for redemptions within less than twelve months, which is not reflected in the one-year total return. Class I Shares have no sales charge and may be purchased under limited circumstances or by specified classes of investors.
Expense Ratios as of Most Recent Prospectus
| Expense Ratios | ||||
Class A Shares | 0.80% | |||
Class B Shares | 1.55% | |||
Class C Shares | 1.35% | |||
Class I Shares | 0.60% | |||
| * | Six-month returns are cumulative; all other returns are annualized. |
| ** | Refer to the Glossary of Terms Used in the Report for definitions. |
| 12 | Nuveen Investments |
Nuveen New Jersey Municipal Bond Fund
Refer to the first page of this Fund Performance and Expense Ratios section for further explanation of the information included within this page.
Fund Performance
Average Annual Total Returns as of August 31, 2011*
| Cumulative | Average Annual | |||||||||||||||
| 6-Month | 1-Year | 5-Year | 10-Year | |||||||||||||
Class A Shares at NAV | 7.04% | 1.57% | 4.24% | 4.38% | ||||||||||||
Class A Shares at maximum Offering Price | 2.52% | -2.68% | 3.35% | 3.94% | ||||||||||||
Standard & Poor’s (S&P) New Jersey Municipal Bond Index** | 6.60% | 1.98% | 4.55% | 5.00% | ||||||||||||
Standard & Poor’s (S&P) National Municipal Bond Index** | 6.56% | 2.62% | 4.60% | 4.93% | ||||||||||||
Lipper New Jersey Municipal Debt Classification Average** | 6.38% | 0.98% | 3.42% | 3.98% | ||||||||||||
Class B Shares w/o CDSC | 6.63% | 0.82% | 3.45% | 3.75% | ||||||||||||
Class B Shares w/CDSC | 1.63% | -3.08% | 3.28% | 3.75% | ||||||||||||
Class C Shares | 6.65% | 0.90% | 3.65% | 3.81% | ||||||||||||
Class I Shares | 7.01% | 1.67% | 4.42% | 4.58% | ||||||||||||
Latest Calendar Quarter – Average Annual Total Returns as of September 30, 2011*
| Cumulative | Average Annual | |||||||||||||||
| 6-Month | 1-Year | 5-Year | 10-Year | |||||||||||||
Class A Shares at NAV | 8.96% | 2.80% | 4.40% | 4.60% | ||||||||||||
Class A Shares at maximum Offering Price | 4.43% | -1.50% | 3.51% | 4.15% | ||||||||||||
Class B Shares w/o CDSC | 8.45% | 1.95% | 3.61% | 3.98% | ||||||||||||
Class B Shares w/CDSC | 3.45% | -1.99% | 3.44% | 3.98% | ||||||||||||
Class C Shares | 8.58% | 2.13% | 3.81% | 4.03% | ||||||||||||
Class I Shares | 8.93% | 2.91% | 4.60% | 4.80% | ||||||||||||
Class A Shares have a maximum 4.20% sales charge (Offering Price). Class A Share purchases of $1 million or more are sold at net asset value without an up-front sales charge but may be subject to a contingent deferred sales charge (CDSC), also known as a back-end sales charge, if redeemed within eighteen months of purchase. Class B Shares have a CDSC that begins at 5% for redemptions during the first year and declines periodically until after six years when the charge becomes 0%. Class B Shares automatically convert to Class A Shares eight years after purchase. Class C Shares have a 1% CDSC for redemptions within less than twelve months, which is not reflected in the one-year total return. Class I Shares have no sales charge and may be purchased under limited circumstances or by specified classes of investors.
Expense Ratios as of Most Recent Prospectus
| Expense Ratios | ||||
Class A | 0.82% | |||
Class B | 1.57% | |||
Class C | 1.37% | |||
Class I | 0.62% | |||
| * | Six-month returns are cumulative; all others returns are annualized. |
| ** | Refer to the Glossary of Terms Used in the Report for definitions. |
| Nuveen Investments | 13 |
Fund Performance and Expense Ratios (Unaudited) (continued)
Nuveen New York Municipal Bond Fund
Refer to the first page of this Fund Performance and Expense Ratios section for further explanation of the information included within this page.
Fund Performance
Average Annual Total Returns as of August 31, 2011*
| Cumulative | Average Annual | |||||||||||||||
| 6-Month | 1-Year | 5-Year | 10-Year | |||||||||||||
Class A Shares at NAV | 6.30% | 1.75% | 4.45% | 4.65% | ||||||||||||
Class A Shares at maximum Offering Price | 1.80% | -2.56% | 3.57% | 4.20% | ||||||||||||
Standard & Poor’s (S&P) New York Municipal Bond Index** | 6.17% | 2.59% | 4.82% | 4.98% | ||||||||||||
Standard & Poor’s (S&P) National Municipal Bond Index** | 6.56% | 2.62% | 4.60% | 4.93% | ||||||||||||
Lipper New York Municipal Debt Classification Average** | 6.15% | 1.03% | 3.49% | 3.88% | ||||||||||||
Class B Shares w/o CDSC | 5.92% | 0.92% | 3.68% | 4.01% | ||||||||||||
Class B Shares w/CDSC | 0.92% | -2.98% | 3.50% | 4.01% | ||||||||||||
Class C Shares | 6.00% | 1.18% | 3.89% | 4.08% | ||||||||||||
Class I Shares | 6.38% | 1.95% | 4.68% | 4.86% | ||||||||||||
Latest Calendar Quarter – Average Annual Total Returns as of September 30, 2011*
| Cumulative | Average Annual | |||||||||||||||
| 6-Month | 1-Year | 5-Year | 10-Year | |||||||||||||
Class A Shares at NAV | 8.10% | 3.07% | 4.57% | 4.85% | ||||||||||||
Class A Shares at maximum Offering Price | 3.58% | -1.22% | 3.67% | 4.41% | ||||||||||||
Class B Shares w/o CDSC | 7.71% | 2.32% | 3.79% | 4.23% | ||||||||||||
Class B Shares w/CDSC | 2.71% | -1.63% | 3.62% | 4.23% | ||||||||||||
Class C Shares | 7.79% | 2.58% | 4.00% | 4.28% | ||||||||||||
Class I Shares | 8.18% | 3.36% | 4.80% | 5.07% | ||||||||||||
Class A Shares have a maximum 4.20% sales charge (Offering Price). Class A Share purchases of $1 million or more are sold at net asset value without an up-front sales charge but may be subject to a contingent deferred sales charge (CDSC), also known as a back-end sales charge, if redeemed within eighteen months of purchase. Class B Shares have a CDSC that begins at 5% for redemptions during the first year and declines periodically until after six years when the charge becomes 0%. Class B Shares automatically convert to Class A Shares eight years after purchase. Class C Shares have a 1% CDSC for redemptions within less than twelve months, which is not reflected in the one-year total return. Class I Shares have no sales charge and may be purchased under limited circumstances or by specified classes of investors.
Expense Ratios as of Most Recent Prospectus
| Expense Ratios | ||||
Class A Shares | 0.81% | |||
Class B Shares | 1.56% | |||
Class C Shares | 1.36% | |||
Class I Shares | 0.61% | |||
| * | Six-month returns are cumulative; all other returns are annualized. |
| ** | Refer to the Glossary of Terms Used in the Report for definitions. |
| 14 | Nuveen Investments |
s
Nuveen New York Municipal Bond Fund 2
Refer to the first page of this Fund Performance and Expense Ratios section for further explanation of the information included within this page.
Fund Performance
Average Annual Total Returns as of August 31, 2011*
| Cumulative | Average Annual | |||||||||||||||
| 6-Month | 1-Year | 5-Year | 10-Year | |||||||||||||
Class A Shares at NAV | 5.57% | 2.16% | 3.95% | 4.33% | ||||||||||||
Class A Shares at maximum Offering Price | 1.17% | -2.17% | 3.07% | 3.88% | ||||||||||||
Standard & Poor’s (S&P) New York Municipal Bond Index** | 6.17% | 2.59% | 4.82% | 4.98% | ||||||||||||
Standard & Poor’s (S&P) National Municipal Bond Index** | 6.56% | 2.62% | 4.60% | 4.93% | ||||||||||||
Lipper New York Municipal Debt Classification Average** | 6.15% | 1.03% | 3.49% | 3.88% | ||||||||||||
Class B Shares w/o CDSC | 5.28% | 1.42% | 3.20% | 3.70% | ||||||||||||
Class B Shares w/CDSC | 0.28% | -2.51% | 3.02% | 3.70% | ||||||||||||
Class C Shares | 5.28% | 1.61% | 3.39% | 3.76% | ||||||||||||
Class I Shares | 5.67% | 2.39% | 4.16% | 4.54% | ||||||||||||
Latest Calendar Quarter – Average Annual Total Returns as of September 30, 2011*
| Cumulative | Average Annual | |||||||||||||||
| 6-Month | 1-Year | 5-Year | 10-Year | |||||||||||||
Class A Shares at NAV | �� | 7.14% | 3.25% | 4.03% | 4.49% | |||||||||||
Class A Shares at maximum Offering Price | 2.64% | -1.04% | 3.13% | 4.05% | ||||||||||||
Class B Shares w/o CDSC | 6.64% | 2.41% | 3.24% | 3.87% | ||||||||||||
Class B Shares w/CDSC | 1.64% | -1.56% | 3.06% | 3.87% | ||||||||||||
Class C Shares | 6.85% | 2.60% | 3.45% | 3.93% | ||||||||||||
Class I Shares | 7.24% | 3.39% | 4.22% | 4.70% | ||||||||||||
Class A Shares have a maximum 4.20% sales charge (Offering Price). Class A Share purchases of $1 million or more are sold at net asset value without an up-front sales charge but may be subject to a contingent deferred sales charge (CDSC), also known as a back-end sales charge, if redeemed within eighteen months of purchase. Class B Shares have a CDSC that begins at 5% for redemptions during the first year and declines periodically until after six years when the charge becomes 0%. Class B Shares automatically convert to Class A Shares eight years after purchase. Class C Shares have a 1% CDSC for redemptions within less than twelve months, which is not reflected in the one-year total return. Class I Shares have no sales charge and may be purchased under limited circumstances or by specified classes of investors.
Expense Ratios as of Most Recent Prospectus
| Expense Ratios | ||||
Class A Shares | 0.82% | |||
Class B Shares | 1.57% | |||
Class C Shares | 1.37% | |||
Class I Shares | 0.62% | |||
| * | Six-month returns are cumulative; all other returns are annualized. |
| ** | Refer to the Glossary of Terms Used in the Report for definitions. |
| Nuveen Investments | 15 |
Yields (Unaudited) as of August 31, 2011
Dividend Yield is the most recent dividend per share (annualized) divided by the offering price per share.
The SEC 30-Day Yield is a standardized measure of a Fund’s yield that accounts for the future amortization of premiums or discounts of bonds held in the Fund’s portfolio. The SEC 30-Day Yield is computed under an SEC standardized formula and is based on the maximum offer price per share. Dividend Yield may differ from the SEC 30-Day Yield because the Fund may be paying out more or less than it is earning and it may not include the effect of amortization of bond premium.
The Taxable-Equivalent Yield represents the yield that must be earned on a fully taxable investment in order to equal the yield of the Fund on an after-tax basis at a specified tax rate. With respect to investments that generate qualified dividend income that is taxable at a maximum rate of 15%, the Taxable-Equivalent Yield is lower.
Nuveen Connecticut Municipal Bond Fund
| Dividend Yield | SEC 30-Day Yield | Taxable- Equivalent Yield1 | ||||||||||
Class A Shares at maximum Offering Price4 | 3.80% | 3.15% | 4.61% | |||||||||
Class B Shares at NAV | 3.23% | 2.53% | 3.70% | |||||||||
Class C Shares at NAV | 3.46% | 2.73% | 3.99% | |||||||||
Class I Shares at NAV | 4.17% | 3.48% | 5.09% | |||||||||
Nuveen New Jersey Municipal Bond Fund
| Dividend Yield | SEC 30-Day Yield | Taxable- Equivalent Yield2 | ||||||||||
Class A Shares at maximum Offering Price4 | 3.97% | 3.52% | 5.22% | |||||||||
Class B Shares at NAV | 3.41% | 3.91% | 4.32% | |||||||||
Class C Shares at NAV | 3.60% | 3.12% | 4.63% | |||||||||
Class I Shares at NAV | 4.36% | 3.87% | 5.74% | |||||||||
Nuveen New York Municipal Bond Fund
| Dividend Yield | SEC 30-Day Yield | Taxable- Equivalent Yield3 | ||||||||||
Class A Shares at maximum Offering Price4 | 4.04% | 3.11% | 4.63% | |||||||||
Class B Shares at NAV | 3.50% | 2.49% | 3.71% | |||||||||
Class C Shares at NAV | 3.66% | 2.70% | 4.02% | |||||||||
Class I Shares at NAV | 4.43% | 3.44% | 5.13% | |||||||||
Nuveen New York Municipal Bond Fund 2
| Dividend Yield | SEC 30-Day Yield | Taxable- Equivalent Yield3 | ||||||||||
Class A Shares at maximum Offering Price4 | 3.65% | 2.56% | 3.82% | |||||||||
Class B Shares at NAV | 3.10% | 1.92% | 2.86% | |||||||||
Class C Shares at NAV | 3.28% | 2.12% | 3.16% | |||||||||
Class I Shares at NAV | 4.03% | 2.87% | 4.28% | |||||||||
| 1 | The Taxable-Equivalent Yield is based on the Fund’s SEC 30-Day Yield on the indicated date and a combined federal and state income tax rate of 31.6% |
| 2 | The Taxable-Equivalent Yield is based on the Fund’s SEC 30-Day Yield on the indicated date and a combined federal and state income tax rate of 32.6% |
| 3 | The Taxable-Equivalent Yield is based on the Fund’s SEC 30-Day Yield on the indicated date and a combined federal and state income tax rate of 32.9% |
| 4 | The SEC Yield for Class A shares quoted in the table reflects the maximum sales load. Investors paying a reduced load because of volume discounts, investors paying no load because they qualify for one of the several exclusions from the load, and existing shareholders who previously paid a load but would like to know the SEC Yield applicable to their shares on a going-forward basis, should understand that the SEC Yield effectively applicable to them would be higher than the figure quoted in the table. |
| 16 | Nuveen Investments |
Holding Summaries (Unaudited) as of August 31, 2011
This data relates to the securities held in each Fund’s portfolio of investments. It should not be construed as a measure of performance for the Fund itself.
Ratings shown are the highest rating given by one of the following national rating agencies: Standard & Poor’s Group, Moody’s Investor Services, Inc. or Fitch, Inc. Credit ratings are subject to change. AAA, AA, A, and BBB are investment grade ratings; BB, B, CCC, CC, C and D are below-investment grade ratings. Bonds backed by U.S. Government or agency securities are given an implied rating equal to the rating of such securities. Holdings designated N/R are not rated by a national rating agency.
Nuveen Connecticut Municipal Bond Fund
Bond Credit Quality1
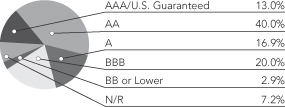
Nuveen New Jersey Municipal Bond Fund
Bond Credit Quality1
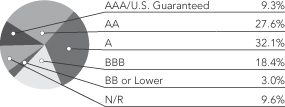
Nuveen New York Municipal Bond Fund
Bond Credit Quality1
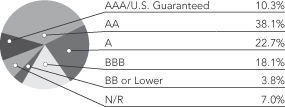
Nuveen New York Municipal Bond Fund 2
Bond Credit Quality1
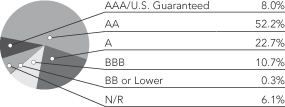
| Portfolio Composition1 | ||||
| Education and Civic Organizations | 23.2% | |||
| Tax Obligated/General | 16.5% | |||
| Health Care | 12.7% | |||
| Utilities | 11.9% | |||
| Tax Obligated/Limited | 10.9% | |||
| Water and Sewer | 10.7% | |||
| Housing/Single Family | 5.4% | |||
| Other | 8.7% | |||
| Portfolio Composition1 | ||||
| Tax Obligation/Limited | 25.0% | |||
| Health Care | 19.8% | |||
| Transportation | 13.8% | |||
| Education and Civic Organizations | 10.9% | |||
| U.S. Guaranteed | 7.7% | |||
| Tax Obligation/General | 5.0% | |||
| Housing/Multifamily | 4.1% | |||
| Consumer Staples | 4.0% | |||
| Other | 9.7% | |||
| Portfolio Composition1 | ||||
| Tax Obligation/Limited | 22.7% | |||
| Health Care | 14.9% | |||
| Education and Civic Organizations | 14.0% | |||
| Transportation | 12.6% | |||
| Utilities | 10.7% | |||
| Water and Sewer | 5.9% | |||
Housing/Multifamily | 4.8% | |||
| Tax Obligation/General | 4.7% | |||
| Other | 9.7% | |||
| Portfolio Composition1 | ||||
| Tax Obligation/Limited | 32.5% | |||
| Transportation | 16.3% | |||
| Health Care | 12.8% | |||
| Utilities | 10.4% | |||
| Education and Civic Organizations | 8.5% | |||
| Tax Obligation/General | 8.1% | |||
| Water and Sewer | 4.9% | |||
| Other | 6.5% | |||
| 1 | As a percentage of total investments, as of August 31, 2011. Holdings are subject to change. |
| Nuveen Investments | 17 |
As a shareholder of one or more of the Funds, you incur two types of costs: (1) transaction costs, including up-front and back-end sales charges (loads) or redemption fees, where applicable; and (2) ongoing costs, including management fees; distribution and service (12b-1) fees, where applicable; and other Fund expenses. The Examples below are intended to help you understand your ongoing costs (in dollars) of investing in the Funds and to compare these costs with the ongoing costs of investing in other mutual funds.
The Examples below are based on an investment of $1,000 invested at the beginning of the period and held for the period.
The information under “Actual Performance,” together with the amount you invested, allows you to estimate actual expenses incurred over the reporting period. Simply divide your account value by $1,000 (for example, an $8,600 account value divided by $1,000 = 8.60) and multiply the result by the cost shown for your share class, in the row entitled “Expenses Incurred During Period” to estimate the expenses incurred on your account during this period.
The information under “Hypothetical Performance,” provides information about hypothetical account values and hypothetical expenses based on the respective Fund’s actual expense ratio and an assumed rate of return of 5% per year before expenses, which is not the Fund’s actual return. The hypothetical account values and expenses may not be used to estimate the actual ending account balance or expense you incurred for the period. You may use this information to compare the ongoing costs of investing in the Fund and other Funds. To do so, compare this 5% hypothetical example with the 5% hypothetical examples that appear in the shareholder reports of the other funds.
Please note that the expenses shown in the table are meant to highlight your ongoing costs only and do not reflect any transaction costs. Therefore, the hypothetical information is useful in comparing ongoing costs only, and will not help you determine the relative total costs of owning different funds or share classes. In addition, if these transaction costs were included, your costs would have been higher.
Nuveen Connecticut Municipal Bond Fund
| Hypothetical Performance | ||||||||||||||||||||||||||||||||||
| Actual Performance | (5% annualized return before expenses) | |||||||||||||||||||||||||||||||||
| A Shares | B Shares | C Shares | I Shares | A Shares | B Shares | C Shares | I Shares | |||||||||||||||||||||||||||
| Beginning Account Value (3/01/11) | $ | 1,000.00 | $ | 1,000.00 | $ | 1,000.00 | $ | 1,000.00 | $ | 1,000.00 | $ | 1,000.00 | $ | 1,000.00 | $ | 1,000.00 | ||||||||||||||||||
| Ending Account Value (8/31/11) | $ | 1,061.50 | $ | 1,056.50 | $ | 1,057.70 | $ | 1,062.40 | $ | 1,021.06 | $ | 1,017.29 | $ | 1,018.30 | $ | 1,022.07 | ||||||||||||||||||
| Expenses Incurred During Period | $ | 4.20 | $ | 8.06 | $ | 7.03 | $ | 3.16 | $ | 4.12 | $ | 7.91 | $ | 6.90 | $ | 3.10 | ||||||||||||||||||
For each class of the Fund, expenses are equal to the Fund’s annualized net expense ratio of .81%, 1.56%, 1.36% and .61% for Classes A, B, C and I, respectively, multiplied by the average account value over the period, multiplied by 184/366 (to reflect the one-half year period).
Nuveen New Jersey Municipal Bond Fund
| Hypothetical Performance | ||||||||||||||||||||||||||||||||||
| Actual Performance | (5% annualized return before expenses) | |||||||||||||||||||||||||||||||||
| A Shares | B Shares | C Shares | I Shares | A Shares | B Shares | C Shares | I Shares | |||||||||||||||||||||||||||
| Beginning Account Value (3/01/11) | $ | 1,000.00 | $ | 1,000.00 | $ | 1,000.00 | $ | 1,000.00 | $ | 1,000.00 | $ | 1,000.00 | $ | 1,000.00 | $ | 1,000.00 | ||||||||||||||||||
| Ending Account Value (8/31/11) | $ | 1,070.40 | $ | 1,066.30 | $ | 1,066.50 | $ | 1,070.10 | $ | 1,020.96 | $ | 1,017.14 | $ | 1,018.20 | $ | 1,021.97 | ||||||||||||||||||
| Expenses Incurred During Period | $ | 4.32 | $ | 8.26 | $ | 7.17 | $ | 3.28 | $ | 4.22 | $ | 8.06 | $ | 7.00 | $ | 3.20 | ||||||||||||||||||
For each class of the Fund, expenses are equal to the Fund’s annualized net expense ratio of .83%, 1.58%, 1.38% and .63% for Classes A, B, C and I, respectively, multiplied by the average account value over the period, multiplied by 184/366 (to reflect the one-half year period).
| 18 | Nuveen Investments |
Nuveen New York Municipal Bond Fund
| Hypothetical Performance | ||||||||||||||||||||||||||||||||||
| Actual Performance | (5% annualized return before expenses) | |||||||||||||||||||||||||||||||||
| A Shares | B Shares | C Shares | I Shares | A Shares | B Shares | C Shares | I Shares | |||||||||||||||||||||||||||
| Beginning Account Value (3/01/11) | $ | 1,000.00 | $ | 1,000.00 | $ | 1,000.00 | $ | 1,000.00 | $ | 1,000.00 | $ | 1,000.00 | $ | 1,000.00 | $ | 1,000.00 | ||||||||||||||||||
| Ending Account Value (8/31/11) | $ | 1,063.00 | $ | 1,059.20 | $ | 1,060.00 | $ | 1,063.80 | $ | 1,020.96 | $ | 1,017.19 | $ | 1,018.20 | $ | 1,021.97 | ||||||||||||||||||
| Expenses Incurred During Period | $ | 4.30 | $ | 8.18 | $ | 7.15 | $ | 3.27 | $ | 4.22 | $ | 8.01 | $ | 7.00 | $ | 3.20 | ||||||||||||||||||
For each class of the Fund, expenses are equal to the Fund’s annualized net expense ratio of .83%, 1.58%, 1.38% and .63% for Classes A, B, C and I, respectively, multiplied by the average account value over the period, multiplied by 184/366 (to reflect the one-half year period).
Nuveen New York Municipal Bond Fund 2
| Hypothetical Performance | ||||||||||||||||||||||||||||||||||
| Actual Performance | (5% annualized return before expenses) | |||||||||||||||||||||||||||||||||
| A Shares | B Shares | C Shares | I Shares | A Shares | B Shares | C Shares | I Shares | |||||||||||||||||||||||||||
| Beginning Account Value (3/01/11) | $ | 1,000.00 | $ | 1,000.00 | $ | 1,000.00 | $ | 1,000.00 | $ | 1,000.00 | $ | 1,000.00 | $ | 1,000.00 | $ | 1,000.00 | ||||||||||||||||||
| Ending Account Value (8/31/11) | $ | 1,055.70 | $ | 1,052.80 | $ | 1,052.80 | $ | 1,056.70 | $ | 1,020.96 | $ | 1,017.14 | $ | 1,018.15 | $ | 1,021.97 | ||||||||||||||||||
| Expenses Incurred During Period | $ | 4.29 | $ | 8.20 | $ | 7.17 | $ | 3.26 | $ | 4.22 | $ | 8.06 | $ | 7.05 | $ | 3.20 | ||||||||||||||||||
For each class of the Fund, expenses are equal to the Fund’s annualized net expense ratio of .83%, 1.58%, 1.38% and .63% for Classes A, B, C and I, respectively, multiplied by the average account value over the period, multiplied by 184/366 (to reflect the one-half year period).
| Nuveen Investments | 19 |
Portfolio of Investments (Unaudited)
Nuveen Connecticut Municipal Bond Fund
August 31, 2011
| Principal Amount (000) | Description (1) | Optional Call Provisions (2) | Ratings (3) | Value | ||||||||||||||
Consumer Staples – 2.0% | ||||||||||||||||||
| $ | 3,850 | Puerto Rico, The Children’s Trust Fund, Tobacco Settlement Asset-Backed Refunding Bonds, Series 2002, 5.375%, 5/15/33 | 5/12 at 100.00 | BBB | $ | 3,590,664 | ||||||||||||
| 3,000 | Virgin Islands Public Finance Authority, Matching Fund Revenue Loan | 10/19 at 100.00 | BBB | 3,167,040 | ||||||||||||||
| 6,850 | Total Consumer Staples | 6,757,704 | ||||||||||||||||
Education and Civic Organizations – 23.3% | ||||||||||||||||||
| 210 | Albany Industrial Development Agency, New York, Revenue Bonds, Brighter Choice Charter Schools, Series 2007A, 5.000%, 4/01/20 | 4/17 at 100.00 | N/R | 201,772 | ||||||||||||||
| 1,185 | Connecticut Health and Education Facilities Authority, Revenue Bonds, Connecticut College, Series 2011H, 5.000%, 7/01/41 | 7/21 at 100.00 | A2 | 1,227,305 | ||||||||||||||
| 1,540 | Connecticut Health and Educational Facilities Authority, Revenue Bonds, Brunswick School, Series 2003B, 5.000%, 7/01/33 – NPFG Insured | 7/13 at 100.00 | Baa1 | 1,552,905 | ||||||||||||||
| 1,490 | Connecticut Health and Educational Facilities Authority, Revenue Bonds, Canterbury School, Series 1998A, 5.000%, 7/01/18 – RAAI Insured | 1/12 at 100.00 | N/R | 1,491,132 | ||||||||||||||
| 1,435 | Connecticut Health and Educational Facilities Authority, Revenue Bonds, Canterbury School, Series 2006B, 5.000%, 7/01/36 – RAAI Insured | 7/16 at 100.00 | N/R | 1,316,555 | ||||||||||||||
Connecticut Health and Educational Facilities Authority, Revenue Bonds, Chase Collegiate School, Series 2007A: | ||||||||||||||||||
| 960 | 5.000%, 7/01/27 – RAAI Insured | 7/17 at 100.00 | N/R | 936,355 | ||||||||||||||
| 400 | 5.000%, 7/01/32 – RAAI Insured | 7/17 at 100.00 | N/R | 376,768 | ||||||||||||||
| 2,000 | Connecticut Health and Educational Facilities Authority, Revenue Bonds, Connecticut College, Series 2007G, 4.500%, 7/01/37 – NPFG Insured | 7/17 at 100.00 | A2 | 1,933,140 | ||||||||||||||
| 3,200 | Connecticut Health and Educational Facilities Authority, Revenue Bonds, Fairfield University, Series 2010-O, 5.000%, 7/01/35 | 7/20 at 100.00 | A– | 3,304,768 | ||||||||||||||
| 2,000 | Connecticut Health and Educational Facilities Authority, Revenue Bonds, Horace Bushnell Memorial Hall, Series 1999A, 5.625%, 7/01/29 – NPFG Insured | 1/12 at 100.00 | Baa1 | 2,000,860 | ||||||||||||||
| 650 | Connecticut Health and Educational Facilities Authority, Revenue Bonds, Kent School, Series 2004D, 5.000%, 7/01/16 – NPFG Insured | 1/15 at 100.00 | Baa1 | 709,261 | ||||||||||||||
| 4,000 | Connecticut Health and Educational Facilities Authority, Revenue Bonds, Quinnipiac University, Series 2006H, 5.000%, 7/01/36 – AMBAC Insured | 7/16 at 100.00 | A– | 4,051,960 | ||||||||||||||
| 4,450 | Connecticut Health and Educational Facilities Authority, Revenue Bonds, Quinnipiac University, Series 2007-I, 5.000%, 7/01/25 – NPFG Insured | 7/17 at 100.00 | A– | 4,694,661 | ||||||||||||||
| 4,000 | Connecticut Health and Educational Facilities Authority, Revenue Bonds, Quinnipiac University, Series 2007-K2, 5.000%, 7/01/31 – NPFG Insured | 7/18 at 100.00 | A– | 4,150,840 | ||||||||||||||
Connecticut Health and Educational Facilities Authority, Revenue Bonds, Renbrook School, Series 2007A: | ||||||||||||||||||
| 395 | 5.000%, 7/01/30 – AMBAC Insured | 7/17 at 100.00 | N/R | 400,759 | ||||||||||||||
| 965 | 5.000%, 7/01/37 – AMBAC Insured | 7/17 at 100.00 | N/R | 936,340 | ||||||||||||||
| 1,230 | Connecticut Health and Educational Facilities Authority, Revenue Bonds, Sacred Heart University, Series 1998E, 5.000%, 7/01/28 – RAAI Insured | 1/12 at 100.00 | BBB | 1,181,206 | ||||||||||||||
Connecticut Health and Educational Facilities Authority, Revenue Bonds, Sacred Heart University, Series 2011G: | ||||||||||||||||||
| 1,000 | 5.125%, 7/01/26 | 7/21 at 100.00 | BBB | 1,014,200 | ||||||||||||||
| 2,500 | 5.625%, 7/01/41 | 7/21 at 100.00 | BBB | 2,563,375 | ||||||||||||||
| 650 | Connecticut Health and Educational Facilities Authority, Revenue Bonds, Trinity College, Series 2004H, 5.000%, 7/01/17 – NPFG Insured | 7/14 at 100.00 | A+ | 719,362 | ||||||||||||||
| 2,000 | Connecticut Health and Educational Facilities Authority, Revenue Bonds, Trinity College, Series 2007J, 4.500%, 7/01/37 – NPFG Insured | 7/17 at 100.00 | A1 | 2,011,620 | ||||||||||||||
| 1,400 | Connecticut Health and Educational Facilities Authority, Revenue Bonds, Trinity College, Series 2010M, 4.250%, 7/01/28 | 7/20 at 100.00 | A+ | 1,441,006 | ||||||||||||||
| 20 | Nuveen Investments |
| Principal Amount (000) | Description (1) | Optional Call Provisions (2) | Ratings (3) | Value | ||||||||||||||
Education and Civic Organizations (continued) | ||||||||||||||||||
Connecticut Health and Educational Facilities Authority, Revenue Bonds, University of Hartford, Series 2002E: | ||||||||||||||||||
| $ | 1,400 | 5.500%, 7/01/22 – RAAI Insured | 7/12 at 101.00 | BBB– | $ | 1,420,006 | ||||||||||||
| 6,000 | 5.250%, 7/01/32 – RAAI Insured | 7/12 at 101.00 | BBB– | 5,728,979 | ||||||||||||||
Connecticut Health and Educational Facilities Authority, Revenue Bonds, University of Hartford, Series 2006G: | ||||||||||||||||||
| 4,995 | 5.250%, 7/01/26 – RAAI Insured | 7/16 at 100.00 | BBB– | 5,030,614 | ||||||||||||||
| 2,250 | 5.250%, 7/01/36 – RAAI Insured | 7/16 at 100.00 | BBB– | 2,096,415 | ||||||||||||||
| 685 | Connecticut Health and Educational Facilities Authority, Revenue Bonds, Yale University, Series 2003X-1, 5.000%, 7/01/42 | 7/13 at 100.00 | AAA | 699,207 | ||||||||||||||
| 10,050 | Connecticut Health and Educational Facilities Authority, Revenue Bonds, Yale University, Series 2007Z-1, 5.000%, 7/01/42 | 7/16 at 100.00 | AAA | 10,529,887 | ||||||||||||||
| 3,000 | Connecticut Health and Educational Facilities Authority, Revenue Bonds, Yale University, Series 2007Z-3, 5.050%, 7/01/42 | 7/17 at 100.00 | AAA | 3,175,890 | ||||||||||||||
| 2,000 | Connecticut Higher Education Supplemental Loan Authority, Revenue Bonds, Family Education Loan Program, Series 2010A, 4.000%, 11/15/30 | 11/20 at 100.00 | Aa2 | 1,898,140 | ||||||||||||||
| 1,435 | University of Connecticut, General Obligation Bonds, Series 2004A, 5.000%, 1/15/16 – NPFG Insured | 1/14 at 100.00 | AA | 1,574,195 | ||||||||||||||
| 2,670 | University of Connecticut, General Obligation Bonds, Series 2005A, 5.000%, 2/15/17 – AGM Insured | 2/15 at 100.00 | AA+ | 3,031,652 | ||||||||||||||
University of Connecticut, General Obligation Bonds, Series 2009A: | ||||||||||||||||||
| 1,000 | 5.000%, 2/15/27 | 2/19 at 100.00 | AA | 1,104,230 | ||||||||||||||
| 1,000 | 5.000%, 2/15/28 | 2/19 at 100.00 | AA | 1,097,330 | ||||||||||||||
| 630 | University of Connecticut, Student Fee Revenue Bonds, Refunding Series 2010A, 5.000%, 11/15/27 | 11/19 at 100.00 | Aa2 | 699,949 | ||||||||||||||
| 3,120 | University of Connecticut, Student Fee Revenue Refunding Bonds, Series 2002A, 5.250%, 11/15/20 – FGIC Insured | 11/12 at 101.00 | Aa2 | 3,319,368 | ||||||||||||||
| 77,895 | Total Education and Civic Organizations | 79,622,012 | ||||||||||||||||
Energy – 0.1% | ||||||||||||||||||
| 500 | Virgin Islands Public Finance Authority, Revenue Bonds, Refinery Project Hovensa LLC, Series 2007, 4.700%, 7/01/22 (Alternative Minimum Tax) | 1/15 at 100.00 | Ba2 | 423,075 | ||||||||||||||
Health Care – 12.7% | ||||||||||||||||||
| 2,000 | Connecticut Health and Educational Facilities Authority, Revenue Bonds, Bridgeport Hospital Issue, Series 1992A, 6.625%, 7/01/18 – NPFG Insured | 1/12 at 100.00 | Baa1 | 2,016,040 | ||||||||||||||
Connecticut Health and Educational Facilities Authority, Revenue Bonds, Bristol Hospital, Series 2002B: | ||||||||||||||||||
| 1,000 | 5.500%, 7/01/21 – RAAI Insured | 7/12 at 101.00 | N/R | 985,760 | ||||||||||||||
| 4,025 | 5.500%, 7/01/32 – RAAI Insured | 7/12 at 101.00 | N/R | 3,759,914 | ||||||||||||||
Connecticut Health and Educational Facilities Authority, Revenue Bonds, Danbury Hospital, Series 1999G: | ||||||||||||||||||
| 500 | 5.700%, 7/01/22 – AMBAC Insured | 1/12 at 100.00 | N/R | 500,540 | ||||||||||||||
| 1,255 | 5.625%, 7/01/25 – AMBAC Insured | 1/12 at 100.00 | N/R | 1,255,678 | ||||||||||||||
| 640 | Connecticut Health and Educational Facilities Authority, Revenue Bonds, Eastern Connecticut Health Network, Series 2000A, 6.000%, 7/01/25 – RAAI Insured | 11/11 at 100.00 | N/R | 640,128 | ||||||||||||||
| 2,240 | Connecticut Health and Educational Facilities Authority, Revenue Bonds, Eastern Connecticut Health Network, Series 2005, 5.000%, 7/01/25 – RAAI Insured | 7/15 at 100.00 | N/R | 2,093,190 | ||||||||||||||
Connecticut Health and Educational Facilities Authority, Revenue Bonds, Hospital For Special Care, Series 2007C: | ||||||||||||||||||
| 500 | 5.250%, 7/01/22 – RAAI Insured | No Opt. Call | BBB– | 515,655 | ||||||||||||||
| 1,005 | 5.250%, 7/01/32 – RAAI Insured | 7/17 at 100.00 | BBB– | 961,986 | ||||||||||||||
| Nuveen Investments | 21 |
Portfolio of Investments (Unaudited)
Nuveen Connecticut Municipal Bond Fund (continued)
August 31, 2011
| Principal Amount (000) | Description (1) | Optional Call Provisions (2) | Ratings (3) | Value | ||||||||||||||
Health Care (continued) | ||||||||||||||||||
| $ | 90 | Connecticut Health and Educational Facilities Authority, Revenue Bonds, St. Francis Hospital and Medical Center, Series 2002D, 5.000%, 7/01/22 – RAAI Insured | 7/12 at 101.00 | N/R | $ | 84,814 | ||||||||||||
| 3,620 | Connecticut Health and Educational Facilities Authority, Revenue Bonds, Stamford Hospital, Series 2010-I, 5.000%, 7/01/30 | 7/20 at 10.00 | A | 3,745,180 | ||||||||||||||
| 2,560 | Connecticut Health and Educational Facilities Authority, Revenue Bonds, Western Connecticut Health, Series 2011M, 5.375%, 7/01/41 | 7/21 at 100.00 | A | 2,619,674 | ||||||||||||||
| 2,000 | Connecticut Health and Educational Facilities Authority, Revenue Bonds, William W. Backus Hospital, Series 2005F, 5.000%, | 7/18 at 100.00 | AA+ | 2,085,020 | ||||||||||||||
| 11,460 | Connecticut Health and Educational Facilities Authority, Revenue Bonds, | 7/16 at 100.00 | Aa3 | 11,821,216 | ||||||||||||||
| 1,300 | Connecticut Health and Educational Facilities Authority, Revenue Bonds, | 7/20 at 100.00 | Aa3 | 1,375,348 | ||||||||||||||
| 2,500 | Connecticut Health and Eductaional Facilities Authority, Revenue Bonds, Ascension Health Series 2010A, 5.000%, 11/15/40 | 11/19 at 100.00 | AA+ | 2,552,100 | ||||||||||||||
| 590 | Massachusetts Health and Education Facilities Authority, Revenue Bonds, Partners HealthCare System, Series 2010J, 5.000%, 7/01/39 | 7/19 at 100.00 | AA | 598,360 | ||||||||||||||
| 3,900 | Monroe County Industrial Development Corporation, New York, FHA Insured Mortgage Revenue Bonds, Unity Hospital of Rochester Project, Series 2010, 5.500%, 8/15/40 | 2/21 at 100.00 | Aa2 | 4,219,761 | ||||||||||||||
| 1,670 | Orange County Health Facilities Authority, Florida, Orlando Regional Healthcare System Revenue Bonds, Series 2009, 5.125%, 10/01/26 | 10/19 at 100.00 | A | 1,675,962 | ||||||||||||||
| 42,855 | Total Health Care | 43,506,326 | ||||||||||||||||
Housing/Multifamily – 0.8% | ||||||||||||||||||
| 2,875 | Connecticut Housing Finance Authority, Multifamily Housing Mortgage Finance Program Bonds, Series 2006G-2, 4.800%, 11/15/27 (Alternative Minimum Tax) | 11/15 at 100.00 | AAA | 2,873,189 | ||||||||||||||
Housing/Single Family – 5.5% | ||||||||||||||||||
Connecticut Housing Finance Authority, Housing Mortgage Finance Program Bonds, Series 2001C: | ||||||||||||||||||
| 1,595 | 5.300%, 11/15/33 (Alternative Minimum Tax) | 11/11 at 100.00 | AAA | 1,595,287 | ||||||||||||||
| 5,160 | 5.450%, 11/15/43 (Alternative Minimum Tax) | 11/11 at 100.00 | AAA | 5,160,722 | ||||||||||||||
| 5,000 | Connecticut Housing Finance Authority, Housing Mortgage Finance Program Bonds, Series 2004-A5, 5.050%, 11/15/34 | 5/13 at 100.00 | AAA | 5,055,300 | ||||||||||||||
Connecticut Housing Finance Authority, Housing Mortgage Finance Program Bonds, Series 2006-A1: | ||||||||||||||||||
| 1,610 | 4.700%, 11/15/26 (Alternative Minimum Tax) | 11/15 at 100.00 | AAA | 1,609,034 | ||||||||||||||
| 1,735 | 4.800%, 11/15/31 (Alternative Minimum Tax) | 11/15 at 100.00 | AAA | 1,707,327 | ||||||||||||||
| 3,410 | Connecticut Housing Finance Authority, Housing Mortgage Finance Program Bonds, Series 2006D, 4.650%, 11/15/27 | 5/16 at 100.00 | AAA | 3,461,593 | ||||||||||||||
| 18,510 | Total Housing/Single Family | 18,589,263 | ||||||||||||||||
Long-Term Care – 3.2% | ||||||||||||||||||
Connecticut Development Authority, First Mortgage Gross Revenue Refunding Healthcare Bonds, Church Homes Inc. – Congregational Avery Heights, Series 1997: | ||||||||||||||||||
| 380 | 5.700%, 4/01/12 | 10/11 at 100.00 | BBB– | 380,726 | ||||||||||||||
| 2,560 | 5.800%, 4/01/21 | 10/11 at 100.00 | BBB– | 2,560,947 | ||||||||||||||
Connecticut Development Authority, First Mortgage Gross Revenue Refunding Healthcare Bonds, Connecticut Baptist Homes Inc., Series 1999: | ||||||||||||||||||
| 720 | 5.500%, 9/01/15 – RAAI Insured | 3/12 at 100.00 | BBB– | 721,066 | ||||||||||||||
| 500 | 5.625%, 9/01/22 – RAAI Insured | 3/12 at 100.00 | BBB– | 500,115 | ||||||||||||||
| 1,700 | Connecticut Development Authority, First Mortgage Gross Revenue Refunding Healthcare Bonds, Elim Park Baptist Home Inc., Series 1998A, 5.375%, 12/01/18 | 12/11 at 100.00 | BBB | 1,717,017 | ||||||||||||||
| 22 | Nuveen Investments |
| Principal Amount (000) | Description (1) | Optional Call Provisions (2) | Ratings (3) | Value | ||||||||||||||
Long-Term Care (continued) | ||||||||||||||||||
| $ | 3,270 | Connecticut Housing Finance Authority, State Supported Special Obligation Bonds, Refunding Series 2010-16, 5.000%, 6/15/30 | 6/20 at 100.00 | AA | $ | 3,448,117 | ||||||||||||
Hamden, Connecticut, Facility Revenue Bonds, Whitney Center Project, Series 2009A: | ||||||||||||||||||
| 250 | 6.125%, 1/01/14 | 11/11 at 100.00 | N/R | 250,318 | ||||||||||||||
| 830 | 7.625%, 1/01/30 | 1/20 at 100.00 | N/R | 867,541 | ||||||||||||||
| 350 | 7.750%, 1/01/43 | 1/20 at 100.00 | N/R | 363,185 | ||||||||||||||
| 10,560 | Total Long-Term Care | 10,809,032 | ||||||||||||||||
Tax Obligation/General – 16.6% | ||||||||||||||||||
| 1,500 | Bridgeport, Connecticut, General Obligation Refunding Bonds, Series 2002A, 5.375%, 8/15/19 – FGIC Insured | 8/12 at 100.00 | A1 | 1,540,845 | ||||||||||||||
| 2,330 | Connecticut State, General Obligation Bonds, Series 2004C, | 4/14 at 100.00 | AA | 2,520,105 | ||||||||||||||
| 5,000 | Connecticut State, General Obligation Bonds, Series 2006A, | 12/16 at 100.00 | AA | 5,487,350 | ||||||||||||||
| 2,200 | Connecticut State, General Obligation Bonds, Series 2006C, 5.000%, 6/01/23 – AGM Insured | 6/16 at 100.00 | AA+ | 2,426,754 | ||||||||||||||
| 1,000 | Connecticut State, General Obligation Bonds, Series 2006E, | 12/16 at 10.00 | AA | 1,160,890 | ||||||||||||||
Connecticut State, General Obligation Bonds, Series 2008C: | ||||||||||||||||||
| 1,000 | 5.000%, 11/01/26 | 11/18 at 100.00 | AA | 1,124,980 | ||||||||||||||
| 1,000 | 5.000%, 11/01/27 | 11/18 at 100.00 | AA | 1,113,400 | ||||||||||||||
| 1,000 | 5.000%, 11/01/28 | 11/18 at 100.00 | AA | 1,106,660 | ||||||||||||||
Connecticut, General Obligation Bonds, Series 2001C: | ||||||||||||||||||
| 5,000 | 5.500%, 12/15/13 (UB) | No Opt. Call | AA | 5,582,700 | ||||||||||||||
| 10,000 | 5.500%, 12/15/14 (UB) | No Opt. Call | AA | 11,621,400 | ||||||||||||||
Hartford, Connecticut, General Obligation Bonds, Series 2005A: | ||||||||||||||||||
| 1,195 | 5.000%, 8/01/20 – AGM Insured | 8/15 at 100.00 | AA+ | 1,337,719 | ||||||||||||||
| 595 | 5.000%, 8/01/21 – AGM Insured | 8/15 at 100.00 | AA+ | 660,867 | ||||||||||||||
| 1,210 | 4.375%, 8/01/24 – AGM Insured | 8/15 at 100.00 | AA+ | 1,254,516 | ||||||||||||||
| 485 | North Haven, Connecticut, General Obligation Bonds, Series 2006, 5.000%, 7/15/24 | No Opt. Call | Aa1 | 594,275 | ||||||||||||||
Puerto Rico, General Obligation and Public Improvement Bonds, Series 2001A: | ||||||||||||||||||
| 700 | 5.500%, 7/01/14 – AGM Insured | No Opt. Call | AA+ | 772,457 | ||||||||||||||
| 2,125 | 5.500%, 7/01/16 – AGM Insured | No Opt. Call | AA+ | 2,400,039 | ||||||||||||||
| 2,500 | 5.500%, 7/01/17 – AGM Insured | No Opt. Call | AA+ | 2,824,925 | ||||||||||||||
| 2,870 | 5.500%, 7/01/18 – AGM Insured | No Opt. Call | AA+ | 3,254,264 | ||||||||||||||
| 1,875 | 5.500%, 7/01/19 – AGM Insured | No Opt. Call | AA+ | 2,127,825 | ||||||||||||||
| 1,700 | Puerto Rico, General Obligation and Public Improvement Bonds, Series 2002A, 5.500%, 7/01/29 – FGIC Insured | No Opt. Call | Baa1 | 1,716,252 | ||||||||||||||
| 1,000 | Quincy, Massachusetts, General Obligation Bonds, Series 2011, 5.125%, 12/01/33 | 12/20 at 100.00 | Aa2 | 1,077,230 | ||||||||||||||
Williamson & Johnson Counties Community Unit School District 2, Marion, Illinois, General Obligation Bonds, Series 2011: | ||||||||||||||||||
| 1,280 | 7.000%, 12/01/24 – AGM Insured | 12/20 at 100.00 | AA+ | 1,488,435 | ||||||||||||||
| 1,415 | 7.000%, 12/01/25 – AGM Insured | 12/20 at 100.00 | AA+ | 1,629,203 | ||||||||||||||
| 1,725 | 7.000%, 12/01/27 – AGM Insured | 12/20 at 100.00 | AA+ | 1,966,861 | ||||||||||||||
| 50,705 | Total Tax Obligation/General | 56,789,952 | ||||||||||||||||
Tax Obligation/Limited – 11.0% | ||||||||||||||||||
| 2,600 | Connecticut Health and Educational Facilities Authority, Child Care Facilities Program Revenue Bonds, Series 2006F, 5.000%, 7/01/36 – AGC Insured | 7/16 at 100.00 | AA+ | 2,661,984 | ||||||||||||||
| 1,250 | Connecticut Health and Educational Facilities Authority, Child Care Facilities Program Revenue Bonds, Series 2008G, 6.000%, 7/01/28 – AGC Insured | 7/18 at 100.00 | AA+ | 1,385,113 | ||||||||||||||
Connecticut, Certificates of Participation, Juvenile Training School, Series 2001: | ||||||||||||||||||
| 1,275 | 5.000%, 12/15/20 | 12/11 at 101.00 | AA– | 1,302,476 | ||||||||||||||
| 1,000 | 5.000%, 12/15/30 | 12/11 at 101.00 | AA– | 1,012,570 | ||||||||||||||
| Nuveen Investments | 23 |
Portfolio of Investments (Unaudited)
Nuveen Connecticut Municipal Bond Fund (continued)
August 31, 2011
| Principal Amount (000) | Description (1) | Optional Call Provisions (2) | Ratings (3) | Value | ||||||||||||||
Tax Obligation/Limited (continued) | ||||||||||||||||||
| $ | 5,000 | Connecticut, Special Tax Obligation Transportation Infrastructure Bonds, Series 2008A, 5.000%, 11/01/28 | No Opt. Call | AA | $ | 5,433,550 | ||||||||||||
| 410 | Connecticut, Special Tax Obligation Transportation Infrastructure Purpose Bonds, Series 1992B, 6.125%, 9/01/12, DD1 | No Opt. Call | AA | 419,930 | ||||||||||||||
| 1,000 | Connecticut, Special Tax Obligation Transportation Infrastructure Purpose Bonds, Series 2003B, 5.000%, 1/01/23 – FGIC Insured | 1/14 at 100.00 | AA | 1,071,940 | ||||||||||||||
| 5,000 | Connecticut, Special Tax Obligation Transportation Infrastructure Purpose Revenue Bonds, Series 2007A, 5.000%, 8/01/26 – AMBAC Insured | 8/17 at 100.00 | AA | 5,437,950 | ||||||||||||||
| 1,900 | Guam Government, Limited Obligation Section 30 Revenue Bonds, Series 2009A, 5.750%, 12/01/34 | 12/19 at 100.00 | BBB– | 1,915,314 | ||||||||||||||
Puerto Rico Highway and Transportation Authority, Highway Revenue Bonds, Series 2007N: | ||||||||||||||||||
| 200 | 5.250%, 7/01/31 – AMBAC Insured | No Opt. Call | Baa1 | 191,780 | ||||||||||||||
| 4,100 | 5.250%, 7/01/33 – NPFG Insured | No Opt. Call | Baa1 | 3,868,432 | ||||||||||||||
| 4,650 | Puerto Rico Municipal Finance Agency, Series 2005C, 5.000%, 8/01/16 – AGM Insured | 8/15 at 100.00 | AA+ | 5,053,713 | ||||||||||||||
| 1,050 | Puerto Rico Sales Tax Financing Corporation, Sales Tax Revenue Bonds, Series 2007A, 5.250%, 8/01/57 | 8/17 at 100.00 | Aa2 | 1,069,121 | ||||||||||||||
| 13,230 | Puerto Rico Sales Tax Financing Corporation, Sales Tax Revenue Bonds, Series 2010A, 0.000%, 8/01/33 | No Opt. Call | A+ | 3,368,755 | ||||||||||||||
| 1,700 | Puerto Rico, Highway Revenue Bonds, Highway and Transportation Authority, Series 2003AA, 5.500%, 7/01/19 – NPFG Insured | No Opt. Call | A3 | 1,907,587 | ||||||||||||||
| 1,370 | Virgin Islands Public Finance Authority, Matching Fund Loan Notes Revenue Bonds, Senior Lien Series 2010A, 5.000%, 10/01/29 | 10/20 at 100.00 | BBB | 1,331,037 | ||||||||||||||
| 45,735 | Total Tax Obligation/Limited | 37,431,252 | ||||||||||||||||
Transportation – 0.5% | ||||||||||||||||||
| 1,360 | New Haven, Connecticut, Revenue Refunding Bonds, Air Rights Parking Facility, Series 2002, 5.375%, 12/01/14 – AMBAC Insured | No Opt. Call | N/R | 1,451,419 | ||||||||||||||
| 250 | Puerto Rico Ports Authority, Special Facilities Revenue Bonds, American Airlines Inc., Series 1996A, 6.250%, 6/01/26 (Alternative Minimum Tax) | 12/11 at 100.00 | CCC+ | 205,990 | ||||||||||||||
| 1,610 | Total Transportation | 1,657,409 | ||||||||||||||||
U.S. Guaranteed – 2.2% (4) | ||||||||||||||||||
| 1,440 | Bridgeport, Connecticut, General Obligation Bonds, Series 2003A, 5.250%, 9/15/22 (Pre-refunded 9/15/13) – AGM Insured | 9/13 at 100.00 | AA+ | (4) | 1,584,216 | |||||||||||||
| 65 | Connecticut Development Authority, Revenue Bonds, Duncaster Inc., Series 2002, 4.750%, 8/01/32 (Pre-refunded 8/01/12) – RAAI Insured | 8/12 at 101.00 | BBB | (4) | 68,208 | |||||||||||||
| 860 | Connecticut Health and Educational Facilities Authority, Revenue Bonds, Lutheran General Healthcare System-Parkside Lodges Projects, Series 1989, 7.375%, 7/01/19 (ETM) | 1/12 at 100.00 | Aaa | 1,077,425 | ||||||||||||||
| 605 | Connecticut Higher Education Supplemental Loan Authority, Revenue Bonds, Family Education Loan Program, Series 2001A, 5.250%, 11/15/18 (Pre-refunded 1/15/11) – NPFG Insured (Alternative Minimum Tax) | 11/11 at 100.00 | Aa2 | (4) | 607,245 | |||||||||||||
| 4,000 | Connecticut, Special Tax Obligation Transportation Infrastructure Purpose Bonds, Series 2002B, 5.000%, 12/01/20 (Pre-refunded 12/01/12) – AMBAC Insured | 12/12 at 100.00 | AA | (4) | 4,234,280 | |||||||||||||
| 6,970 | Total U.S. Guaranteed | 7,571,374 | ||||||||||||||||
Utilities – 12.0% | ||||||||||||||||||
| 3,800 | Bristol Resource Recovery Facility Operating Committee, Connecticut, Solid Waste Revenue Bonds, Covanta Bristol Inc., Series 2005, 5.000%, 7/01/12 – AMBAC Insured | No Opt. Call | AA | 3,931,290 | ||||||||||||||
| 2,725 | Connecticut Development Authority, Pollution Control Revenue Refunding Bonds, Connecticut Light and Power Company, Series 1993A, 5.850%, 9/01/28 | 10/11 at 100.50 | BBB+ | 2,746,419 | ||||||||||||||
| 24 | Nuveen Investments |
| Principal Amount (000) | Description (1) | Optional Call Provisions (2) | Ratings (3) | Value | ||||||||||||||
Utilities (continued) | ||||||||||||||||||
| $ | 3,000 | Connecticut Development Authority, Pollution Control Revenue Refunding Bonds, Western Massachusetts Electric Company, Series 1993A, 5.850%, 9/01/28 | 10/11 at 100.50 | BBB+ | $ | 3,023,580 | ||||||||||||
| 3,740 | Connecticut Development Authority, Solid Waste Disposal Facilities Revenue Bonds, PSEG Power LLC Project, Series 2007A, 5.750%, 11/01/37 (Alternative Minimum Tax) | 11/12 at 100.00 | Baa1 | 3,742,581 | ||||||||||||||
| 5,250 | Connecticut Resource Recovery Authority, Revenue Bonds, American | 11/11 at 100.00 | Ba1 | 5,249,580 | ||||||||||||||
| 1,000 | Connecticut Resource Recovery Authority, Revenue Bonds, American | 12/11 at 102.00 | Ba1 | 1,001,560 | ||||||||||||||
Eastern Connecticut Resource Recovery Authority, Solid Waste Revenue Bonds, Wheelabrator Lisbon Project, Series 1993A: | ||||||||||||||||||
| 715 | 5.500%, 1/01/14 (Alternative Minimum Tax) | 1/12 at 100.00 | BBB | 717,181 | ||||||||||||||
| 6,685 | 5.500%, 1/01/20 (Alternative Minimum Tax) | 1/12 at 100.00 | BBB | 6,626,840 | ||||||||||||||
Guam Power Authority, Revenue Bonds, Series 1999A: | ||||||||||||||||||
| 2,280 | 5.125%, 10/01/29 – NPFG Insured | 10/11 at 100.00 | Baa1 | 2,171,176 | ||||||||||||||
| 1,000 | 5.125%, 10/01/29 – AMBAC Insured | 10/11 at 100.00 | Ba1 | 886,020 | ||||||||||||||
Puerto Rico Electric Power Authority, Power Revenue Refunding Bonds, Series 2002: | ||||||||||||||||||
| 5,000 | 5.000%, 7/01/19 – NPFG Insured | No Opt. Call | A3 | 5,488,200 | ||||||||||||||
| 5,000 | 5.000%, 7/01/20 – NPFG Insured | No Opt. Call | A3 | 5,438,550 | ||||||||||||||
| 40,195 | Total Utilities | 41,022,977 | ||||||||||||||||
Water and Sewer – 10.8% | ||||||||||||||||||
| 1,750 | Connecticut Development Authority, Water Facilities Revenue Bonds, Bridgeport Hydraulic Company, Series 1995, 6.150%, 4/01/35 (Alternative Minimum Tax) | 10/11 at 100.00 | N/R | 1,750,245 | ||||||||||||||
| 160 | Connecticut Development Authority, Water Facility Revenue Bonds, Aquarion Water Company Project, Refunding Series 2005B, 4.400%, | 8/12 at 102.00 | N/R | 150,307 | ||||||||||||||
| 5,625 | Connecticut Development Authority, Water Facility Revenue Bonds, Aquarion Water Company Project, Series 2007, 5.100%, 9/01/37 – SYNCORA GTY Insured (Alternative Minimum Tax) | 9/17 at 100.00 | N/R | 5,044,219 | ||||||||||||||
| 1,550 | Connecticut, State Revolving Fund General Revenue Bonds, Series 2003A, 5.000%, 10/01/16 | 10/13 at 100.00 | AAA | 1,688,617 | ||||||||||||||
Greater New Haven Water Pollution Control Authority, Connecticut, Regional Wastewater System Revenue Bonds, Series 2005A: | ||||||||||||||||||
| 3,840 | 5.000%, 11/15/30 – NPFG Insured | 11/15 at 100.00 | A1 | 3,962,304 | ||||||||||||||
| 4,670 | 5.000%, 8/15/35 – NPFG Insured | 11/15 at 100.00 | A1 | 4,750,184 | ||||||||||||||
| 2,350 | Guam Government Waterworks Authority, Water and Wastewater System Revenue Bonds, Series 2010, 5.625%, 7/01/40 | 7/20 at 100.00 | Ba2 | 2,167,828 | ||||||||||||||
| 1,000 | New York City Municipal Water Finance Authority, New York, Water and Sewer System Revenue Bonds, Second Generation Resolution, Fiscal 2011 Series EE, 5.375%, 6/15/43 | 12/20 at 100.00 | AA+ | 1,098,820 | ||||||||||||||
| 1,140 | Puerto Rico Aqueduct and Sewerage Authority, Revenue Bonds, Senior Lien Series 2008A, 6.000%, 7/01/38 | 7/18 at 100.00 | Baa2 | 1,144,321 | ||||||||||||||
South Central Connecticut Regional Water Authority, Water System Revenue Bonds, Eighteenth Series 2003A: | ||||||||||||||||||
| 3,000 | 5.000%, 8/01/20 – NPFG Insured | 8/13 at 100.00 | Aa3 | 3,132,630 | ||||||||||||||
| 3,955 | 5.000%, 8/01/33 – NPFG Insured | 8/13 at 100.00 | Aa3 | 4,012,189 | ||||||||||||||
| 2,760 | South Central Connecticut Regional Water Authority, Water System Revenue Bonds, Twentieth Series, 2007A, 5.000%, 8/01/30 – NPFG Insured | 8/16 at 100.00 | Aa3 | 2,887,650 | ||||||||||||||
| 4,130 | South Central Connecticut Regional Water Authority, Water System Revenue Bonds, Twentieth-Sixth Series, 2011, 5.000%, 8/01/41 | 8/21 at 100.00 | Aa3 | 4,312,050 | ||||||||||||||
| Nuveen Investments | 25 |
Portfolio of Investments (Unaudited)
Nuveen Connecticut Municipal Bond Fund (continued)
August 31, 2011
| Principal Amount (000) | Description (1) | Optional Call Provisions (2) | Ratings (3) | Value | ||||||||||||||
Water and Sewer (continued) | ||||||||||||||||||
| $ | 550 | Stamford, Connecticut, Water Pollution Control System and Facility Revenue Bonds, Series 2003A, 5.000%, 11/15/32 | 11/13 at 100.00 | AA+ | $ | 583,253 | ||||||||||||
| 36,480 | Total Water and Sewer | 36,684,617 | ||||||||||||||||
| $ | 341,740 | Total Investments (cost $333,893,849) – 100.7% | 343,738,182 | |||||||||||||||
Floating Rate Obligations – (2.9)% | (10,000,000) | |||||||||||||||||
Other Assets Less Liabilities – 2.2% | 7,616,569 | |||||||||||||||||
Net Assets – 100% | $ | 341,354,751 | ||||||||||||||||
| (1) | All percentages shown in the Portfolio of Investments are based on net assets. |
| (2) | Optional Call Provisions: Dates (month and year) and prices of the earliest optional call or redemption. There may be other call provisions at varying prices at later dates. Certain mortgage-backed securities may be subject to periodic principal paydowns. |
| (3) | Ratings: Using the highest of Standard & Poor’s Group (“Standard & Poor’s”), Moody’s Investor Service, Inc. (“Moody’s”) or Fitch, Inc. (“Fitch”) rating. Ratings below BBB by Standard & Poor’s, Baa by Moody’s or BBB by Fitch are considered to be below investment grade. Holdings designated N/R are not rated by any of these national rating agencies. |
| (4) | Backed by an escrow or trust containing sufficient U.S. Government or U.S. Government agency securities, which ensure the timely payment of principal and interest. Bonds backed by U.S. Government or agency securities are given an implied rating equal to the rating of such securities. |
| DD1 | Investment or portion of investment purchased on a delayed delivery basis. |
| N/R | Not rated. |
| (ETM) | Escrowed to maturity. |
| (UB) | Underlying bond of an inverse floating rate trust reflected as a financing transaction. See Notes to Financial Statements, Footnote 1 – General Information and Significant Accounting Policies, Inverse Floating Rate Securities for more information. |
See accompanying notes to financial statements.
| 26 | Nuveen Investments |
Portfolio of Investments (Unaudited)
Nuveen New Jersey Municipal Bond Fund
August 31, 2011
| Principal Amount (000) | Description (1) | Optional Call Provisions (2) | Ratings (3) | Value | ||||||||||||||
Consumer Discretionary – 0.1% | ||||||||||||||||||
Middlesex County Improvement Authority, New Jersey, Senior Revenue Bonds, Heldrich Center Hotel/Conference Center Project, Series 2005A: | ||||||||||||||||||
| $ | 280 | 5.000%, 1/01/32 | 1/15 at 100.00 | B3 | $ | 158,676 | ||||||||||||
| 240 | 5.125%, 1/01/37 | 1/15 at 100.00 | B3 | 136,018 | ||||||||||||||
| 520 | Total Consumer Discretionary | 294,694 | ||||||||||||||||
Consumer Staples – 3.9% | ||||||||||||||||||
Tobacco Settlement Financing Corporation, New Jersey, Tobacco Settlement Asset-Backed Bonds, Series 2007-1A: | ||||||||||||||||||
| 4,290 | 4.500%, 6/01/23 | 6/17 at 100.00 | BBB | 3,799,095 | ||||||||||||||
| 7,010 | 4.750%, 6/01/34 | 6/17 at 100.00 | Baa3 | 4,634,101 | ||||||||||||||
| 1,715 | 5.000%, 6/01/41 | 6/17 at 100.00 | Baa3 | 1,136,788 | ||||||||||||||
| 13,015 | Total Consumer Staples | 9,569,984 | ||||||||||||||||
Education and Civic Organizations – 10.7% | ||||||||||||||||||
| 2,000 | District of Columbia, Revenue Bonds, National Public Radio, Series 2010A, 5.000%, 4/01/43 | 4/15 at 100.00 | AA– | 2,014,580 | ||||||||||||||
| 375 | New Jersey Economic Development Authority, Revenue Bonds, The Seeing Eye Inc., Series 2005, 5.000%, 12/01/24 – AMBAC Insured | 6/15 at 100.00 | N/R | 380,708 | ||||||||||||||
| 2,500 | New Jersey Educational Facilities Authority, Revenue Bonds, Fairleigh Dickinson University, Series 2002D, 5.250%, 7/01/32 – ACA Insured | 7/13 at 100.00 | N/R | 2,390,025 | ||||||||||||||
| 1,000 | New Jersey Educational Facilities Authority, Revenue Bonds, Fairleigh Dickinson University, Series 2004C, 5.500%, 7/01/23 | 7/14 at 100.00 | N/R | 1,019,860 | ||||||||||||||
| 425 | New Jersey Educational Facilities Authority, Revenue Bonds, Georgian Court University, Series 2007D, 5.250%, 7/01/37 | 7/17 at 100.00 | BBB+ | 414,409 | ||||||||||||||
| 1,495 | New Jersey Educational Facilities Authority, Revenue Bonds, Kean University, Series 2007D, 5.000%, 7/01/32 – FGIC Insured | 7/17 at 100.00 | A2 | 1,528,652 | ||||||||||||||
| 45 | New Jersey Educational Facilities Authority, Revenue Bonds, Montclair State University, Series 2004L, 5.125%, 7/01/21 – NPFG Insured | 7/14 at 100.00 | A1 | 47,314 | ||||||||||||||
| 1,400 | New Jersey Educational Facilities Authority, Revenue Bonds, Montclair State University, Series 2005F, 5.000%, 7/01/16 – FGIC Insured | 7/15 at 100.00 | A1 | 1,554,210 | ||||||||||||||
| 1,035 | New Jersey Educational Facilities Authority, Revenue Bonds, Montclair State University, Series 2006A, 5.000%, 7/01/36 – AMBAC Insured | 7/16 at 100.00 | A1 | 1,048,445 | ||||||||||||||
New Jersey Educational Facilities Authority, Revenue Bonds, New Jersey Institute of Technology, Series 2004B: | ||||||||||||||||||
| 125 | 5.000%, 7/01/18 – AMBAC Insured | 1/14 at 100.00 | A+ | 131,498 | ||||||||||||||
| 265 | 5.000%, 7/01/19 – AMBAC Insured | 1/14 at 100.00 | A+ | 277,121 | ||||||||||||||
| 815 | 4.250%, 7/01/24 – AMBAC Insured | 1/14 at 100.00 | A+ | 822,262 | ||||||||||||||
| 2,000 | New Jersey Educational Facilities Authority, Revenue Bonds, Richard Stockton College of New Jersey, Refunding Series 2008A, 5.375%, 7/01/38 | 7/18 at 100.00 | A2 | 2,094,640 | ||||||||||||||
| 290 | New Jersey Educational Facilities Authority, Revenue Bonds, Rider University, Series 2004A, 5.500%, 7/01/23 – RAAI Insured | 7/14 at 100.00 | BBB+ | 301,055 | ||||||||||||||
| 190 | New Jersey Educational Facilities Authority, Revenue Bonds, Rider University, Series 2007C, 5.000%, 7/01/37 – RAAI Insured | 7/12 at 100.00 | BBB+ | 178,710 | ||||||||||||||
| 500 | New Jersey Educational Facilities Authority, Revenue Bonds, Rowan College, Series 2007B, 4.250%, 7/01/34 – FGIC Insured | 7/17 at 100.00 | A+ | 458,630 | ||||||||||||||
| 1,840 | New Jersey Educational Facilities Authority, Revenue Refunding Bonds, Kean University, Series 2009A, 5.500%, 9/01/36 – AGC Insured | 9/19 at 100.00 | AA+ | 1,966,942 | ||||||||||||||
| 2,500 | New Jersey Educational Facilities Authority, Revenue Refunding Bonds, University of Medicine and Dentistry of New Jersey, Series 2009B, 7.500%, 12/01/32 | 6/19 at 100.00 | Baa1 | 2,900,700 | ||||||||||||||
| 510 | New Jersey Higher Education Assistance Authority Student Loan Revenue Bonds Series 2010-2, 5.000%, 12/01/30 | 12/20 at 100.00 | Aa3 | 520,950 | ||||||||||||||
| Nuveen Investments | 27 |
Portfolio of Investments (Unaudited)
Nuveen New Jersey Municipal Bond Fund (continued)
August 31, 2011
| Principal Amount (000) | Description (1) | Optional Call Provisions (2) | Ratings (3) | Value | ||||||||||||||
Education and Civic Organizations (continued) | ||||||||||||||||||
| $ | 4,000 | New Jersey Higher Education Assistance Authority, Student Loan Revenue Bonds, Series 2008A, 6.125%, 6/01/30 – AGC Insured (Alternative Minimum Tax) | 6/18 at 100.00 | AA+ | $ | 4,173,320 | ||||||||||||
| 630 | New Jersey Higher Education Assistance Authority, Student Loan Revenue Bonds, Series 2010-1A, 5.000%, 12/01/25 | 12/19 at 100.00 | AA | 651,029 | ||||||||||||||
| 1,500 | Puerto Rico Industrial, Tourist, Educational, Medical and Environmental Control Facilities Financing Authority, Higher Education Revenue Refunding Bonds, Ana G. Mendez University System, Series 2002, 5.500%, 12/01/31 | 12/12 at 101.00 | BBB– | 1,387,800 | ||||||||||||||
| 25,440 | Total Education and Civic Organizations | 26,262,860 | ||||||||||||||||
Financials – 0.7% | ||||||||||||||||||
| 750 | New Jersey Economic Development Authority, Industrial Development Revenue Refunding Bonds, Newark Airport Marriott Hotel, Series 1996, 7.000%, 10/01/14 | 11/11 at 100.00 | Ba1 | 753,098 | ||||||||||||||
| 1,000 | New Jersey Economic Development Authority, Revenue Refunding Bonds, Kapkowski Road Landfill Project, Series 2002, 5.750%, 10/01/21 | No Opt. Call | Ba2 | 981,600 | ||||||||||||||
| 1,750 | Total Financials | 1,734,698 | ||||||||||||||||
Health Care – 19.4% | ||||||||||||||||||
| 2,500 | Camden County Improvement Authority, New Jersey, Healthcare Revenue Bonds, Cooper Health System, Series 2005B, 5.250%, 2/15/27 | 2/15 at 100.00 | BBB | 2,358,400 | ||||||||||||||
Camden County Improvement Authority, New Jersey, Revenue Bonds, Cooper Health System, Series 2004A: | ||||||||||||||||||
| 3,000 | 5.000%, 2/15/25 | 2/15 at 100.00 | BBB | 2,825,940 | ||||||||||||||
| 350 | 5.750%, 2/15/34 | 8/14 at 100.00 | BBB | 337,600 | ||||||||||||||
| 4,000 | New Jersey Health Care Facilities Finance Authority, Revenue Bonds, AHS Hospital Corporation, Series 2008A, 5.000%, 7/01/27 | 7/18 at 100.00 | A1 | 4,099,720 | ||||||||||||||
| 3,480 | New Jersey Health Care Facilities Financing Authority, FHA-Insured Mortgage Revenue Bonds, Jersey City Medical Center, Series 2001, 5.000%, 8/01/31 – AMBAC Insured | 2/12 at 100.00 | N/R | 3,602,148 | ||||||||||||||
New Jersey Health Care Facilities Financing Authority, New Jersey, Revenue Bonds, Saint Peters University Hospital, Refunding Series 2011: | ||||||||||||||||||
| 800 | 6.000%, 7/01/26 | 7/21 at 100.00 | BBB– | 808,208 | ||||||||||||||
| 75 | 6.250%, 7/01/35 | 7/21 at 100.00 | BBB– | 74,716 | ||||||||||||||
| 1,160 | New Jersey Health Care Facilities Financing Authority, Revenue Bonds, Atlanticare Regional Medical Center, Series 2007, 5.000%, 7/01/37 | 7/17 at 100.00 | A+ | 1,161,079 | ||||||||||||||
| 1,500 | New Jersey Health Care Facilities Financing Authority, Revenue Bonds, CentraState Medical Center, Series 2006A, 5.000%, 7/01/30 – AGC Insured | 7/17 at 100.00 | Aa3 | 1,540,725 | ||||||||||||||
| 140 | New Jersey Health Care Facilities Financing Authority, Revenue Bonds, Children’s Specialized Hospital, Series 2005A, 5.500%, 7/01/36 | 7/15 at 100.00 | Baa3 | 133,260 | ||||||||||||||
| 2,000 | New Jersey Health Care Facilities Financing Authority, Revenue Bonds, Hunterdon Medical Center, Series 2006B, 5.000%, 7/01/26 | 7/16 at 100.00 | A– | 2,005,820 | ||||||||||||||
| 1,710 | New Jersey Health Care Facilities Financing Authority, Revenue Bonds, Hunterdon Medical Center, Series 2006, 5.125%, 7/01/35 | 7/16 at 100.00 | A– | 1,658,392 | ||||||||||||||
New Jersey Health Care Facilities Financing Authority, Revenue Bonds, Kennedy Health System Obligated Group, Series 2001: | ||||||||||||||||||
| 600 | 5.500%, 7/01/21 | 1/12 at 100.00 | A2 | 600,474 | ||||||||||||||
| 265 | 5.625%, 7/01/31 | 1/12 at 100.00 | A2 | 264,979 | ||||||||||||||
| 305 | New Jersey Health Care Facilities Financing Authority, Revenue Bonds, Palisades Medical Center of New York Presbyterian Healthcare System, Series 2002, 6.625%, 7/01/31 | 7/12 at 101.00 | BB+ | 288,679 | ||||||||||||||
New Jersey Health Care Facilities Financing Authority, Revenue Bonds, RWJ Health Care Corporation, Series 2005B: | ||||||||||||||||||
| 2,500 | 5.000%, 7/01/25 – RAAI Insured | 7/15 at 100.00 | N/R | 2,428,125 | ||||||||||||||
| 900 | 5.000%, 7/01/35 – RAAI Insured | 7/15 at 100.00 | N/R | 801,189 | ||||||||||||||
| 28 | Nuveen Investments |
| Principal Amount (000) | Description (1) | Optional Call Provisions (2) | Ratings (3) | Value | ||||||||||||||
Health Care (continued) | ||||||||||||||||||
New Jersey Health Care Facilities Financing Authority, Revenue Bonds, Saint Barnabas Health Care System, Series 2006A: | ||||||||||||||||||
| $ | 750 | 5.000%, 7/01/29 | 1/17 at 100.00 | BBB | $ | 652,178 | ||||||||||||
| 15,000 | 0.000%, 7/01/35 | 1/17 at 39.39 | BBB– | 2,648,400 | ||||||||||||||
| 3,000 | New Jersey Health Care Facilities Financing Authority, Revenue Bonds, Saint Joseph’s Healthcare System Obligated Group Issue, Series 2008, 6.625%, 7/01/38 | 7/18 at 100.00 | BBB– | 2,949,780 | ||||||||||||||
| 1,315 | New Jersey Health Care Facilities Financing Authority, Revenue Bonds, Shore Memorial Health System, Series 2003, 5.000%, 7/01/23 – RAAI Insured | 7/13 at 100.00 | N/R | 1,246,212 | ||||||||||||||
New Jersey Health Care Facilities Financing Authority, Revenue Bonds, Somerset Medical Center, Series 2003: | ||||||||||||||||||
| 1,255 | 5.500%, 7/01/23 | 7/13 at 100.00 | Ba2 | 1,110,625 | ||||||||||||||
| 1,725 | 5.500%, 7/01/33 | 7/13 at 100.00 | Ba2 | 1,326,629 | ||||||||||||||
New Jersey Health Care Facilities Financing Authority, Revenue Bonds, South Jersey Hospital System, Series 2006: | ||||||||||||||||||
| 830 | 5.000%, 7/01/25 | 7/16 at 100.00 | A2 | 850,152 | ||||||||||||||
| 810 | 5.000%, 7/01/36 | 7/16 at 100.00 | A2 | 795,250 | ||||||||||||||
| 1,000 | New Jersey Health Care Facilities Financing Authority, Revenue Refunding Bonds, Atlantic City Medical Center, Series 2002, 5.750%, 7/01/25 | 7/12 at 100.00 | A+ | 1,012,620 | ||||||||||||||
New Jersey Health Care Facilities Financing Authority, Revenue Refunding Bonds, Bayshore Community Hospital, Series 2002: | ||||||||||||||||||
| 1,710 | 5.000%, 7/01/22 – RAAI Insured | 1/12 at 100.00 | N/R | 1,593,139 | ||||||||||||||
| 1,000 | 5.125%, 7/01/32 – RAAI Insured | 1/12 at 100.00 | N/R | 837,170 | ||||||||||||||
| 5,475 | New Jersey Health Facilities Financing Authority, Revenue Bonds, Meridian Health, Series 2007-I, 5.000%, 7/01/38 – AGC Insured | 7/18 at 100.00 | AA+ | 5,536,210 | ||||||||||||||
| 2,000 | North Carolina Medical Care Commission, Healthcare Facilities Revenue Bonds, Duke University Health System, Series 2009A, 5.000%, 6/01/39 | 6/19 at 100.00 | AA | 2,038,460 | ||||||||||||||
| 61,155 | Total Health Care | 47,586,279 | ||||||||||||||||
Housing/Multifamily – 4.0% | ||||||||||||||||||
| 1,000 | Essex County Improvement Authority, New Jersey, FNMA Enhanced Multifamily Housing Revenue Bonds, Ballantyne House Project, Series 2002, 4.750%, 11/01/22 (Alternative Minimum Tax) | 11/12 at 100.00 | Aaa | 1,006,310 | ||||||||||||||
New Jersey Economic Development Authority, Student Housing Revenue Bonds, Provident Group-Montclair Properties LLC, Montclair State University Student Housing Project, Series 2010A: | ||||||||||||||||||
| 2,055 | 5.750%, 6/01/31 | 6/20 at 100.00 | Baa3 | 2,060,384 | ||||||||||||||
| 1,100 | 5.875%, 6/01/42 | 6/20 at 100.00 | Baa3 | 1,082,202 | ||||||||||||||
| 1,500 | New Jersey Housing and Mortgage Finance Agency, Multifamily Housing Revenue Bonds, Series 2000A-1, 6.350%, 11/01/31 – AGM Insured (Alternative Minimum Tax) | 3/12 at 100.00 | AA+ | 1,501,590 | ||||||||||||||
| 530 | New Jersey Housing and Mortgage Finance Agency, Multifamily Housing Revenue Bonds, Series 2000E-1, 5.750%, 5/01/25 – AGM Insured | 2/12 at 100.00 | AA+ | 530,541 | ||||||||||||||
| 3,000 | New Jersey Housing and Mortgage Finance Agency, Multifamily Housing Revenue Bonds, Series 2009A, 4.950%, 5/01/41 | 11/19 at 100.00 | A+ | 3,021,240 | ||||||||||||||
| 715 | Newark Housing Authority, New Jersey, GNMA Collateralized Housing Revenue Bonds, Fairview Apartments Project, Series 2000A, 6.300%, 10/20/19 (Alternative Minimum Tax) | 10/11 at 100.00 | Aaa | 717,124 | ||||||||||||||
| 9,900 | Total Housing/Multifamily | 9,919,391 | ||||||||||||||||
Housing/Single Family – 2.0% | ||||||||||||||||||
| 75 | New Jersey Housing and Mortgage Finance Agency, Home Buyer Program Revenue Bonds, Series 2000CC, 5.875%, 10/01/31 – NPFG Insured (Alternative Minimum Tax) | 10/11 at 100.00 | Aaa | 75,053 | ||||||||||||||
| 1,900 | New Jersey Housing and Mortgage Finance Agency, Single Family Housing Revenue Bonds, Series 2007T, 4.700%, 10/01/37 (Alternative Minimum Tax) | 4/17 at 100.00 | AA | 1,826,736 | ||||||||||||||
| Nuveen Investments | 29 |
Portfolio of Investments (Unaudited)
Nuveen New Jersey Municipal Bond Fund (continued)
August 31, 2011
| Principal Amount (000) | Description (1) | Optional Call Provisions (2) | Ratings (3) | Value | ||||||||||||||
Housing/Single family (continued) | ||||||||||||||||||
| $ | 2,775 | New Jersey Housing and Mortgage Finance Agency, Single Family Housing Revenue Bonds, Series 2008AA, 6.375%, 10/01/28 | 10/18 at 100.00 | AA | $ | 3,000,275 | ||||||||||||
| 70 | Virgin Islands Housing Finance Corporation, GNMA Mortgage-Backed Securities Program Single Family Mortgage Revenue Refunding Bonds, Series 1995A, 6.450%, 3/01/16 (Alternative Minimum Tax) | 3/12 at 100.00 | N/R | 70,141 | ||||||||||||||
| 4,820 | Total Housing/Single Family | 4,972,205 | ||||||||||||||||
Long-Term Care – 3.5% | ||||||||||||||||||
| 785 | Burlington County Bridge Commission, New Jersey, Economic Development Revenue Bonds, The Evergreens Project, Series 2007, 5.625%, 1/01/38 | 1/18 at 100.00 | N/R | 664,173 | ||||||||||||||
| 975 | New Jersey Economic Development Authority, First Mortgage Fixed Rate Revenue Bonds, Cadbury Corporation, Series 1998A, 5.500%, 7/01/18 – ACA Insured | 1/12 at 100.00 | N/R | 894,543 | ||||||||||||||
| 1,975 | New Jersey Economic Development Authority, First Mortgage Revenue Bonds, Winchester Gardens at Wards Homestead, Series 2004A, 5.750%, 11/01/24 | 11/14 at 100.00 | N/R | 1,978,042 | ||||||||||||||
| 600 | New Jersey Economic Development Authority, Revenue Bonds, Masonic Charity Foundation of New Jersey, Series 2001, 5.875%, 6/01/18 | 6/13 at 100.00 | A– | 613,122 | ||||||||||||||
| 140 | New Jersey Economic Development Authority, Revenue Bonds, Masonic Charity Foundation of New Jersey, Series 2002, 5.250%, 6/01/32 | 6/13 at 102.00 | A– | 140,272 | ||||||||||||||
New Jersey Economic Development Authority, Revenue Bonds, United Methodist Homes of New Jersey Obligated Group, Series 1998: | ||||||||||||||||||
| 1,500 | 5.125%, 7/01/25 | 1/12 at 100.00 | BB+ | 1,287,735 | ||||||||||||||
| 1,165 | 6.625%, 7/01/38 | 1/14 at 100.00 | BB+ | 1,138,170 | ||||||||||||||
New Jersey Health Care Facilities Financing Authority, Revenue Bonds, House of the Good Shepherd Obligated Group, Series 2001: | ||||||||||||||||||
| 1,000 | 5.100%, 7/01/21 – RAAI Insured | 1/12 at 100.00 | N/R | 892,120 | ||||||||||||||
| 1,350 | 5.200%, 7/01/31– RAAI Insured | 1/12 at 100.00 | N/R | 1,069,713 | ||||||||||||||
| 9,490 | Total Long-Term Care | 8,677,890 | ||||||||||||||||
Tax Obligation/General – 4.9% | ||||||||||||||||||
| 525 | Middletown Township Board of Education, Monmouth County, New Jersey, Refunding Series 2010, 5.000%, 8/01/27 | 8/20 at 100.00 | AA | 582,524 | ||||||||||||||
| 735 | Monmouth County Improvement Authority, New Jersey, Governmental Loan Revenue Bonds, Series 2005, 4.000%, 12/01/17 – AMBAC Insured | 12/15 at 100.00 | N/R | 758,189 | ||||||||||||||
| 620 | Monmouth County Improvement Authority, New Jersey, Governmental Loan Revenue Bonds, Series 2006, 5.000%, 12/01/15 – AMBAC Insured | No Opt. Call | N/R | 686,011 | ||||||||||||||
| 750 | Newark Housing Authority, New Jersey, City-Secured Police Facility Revenue Bonds, South Ward Police Facility, Series 2009A, 6.750%, 12/01/38 – AGC Insured | 12/19 at 100.00 | Aa3 | 866,055 | ||||||||||||||
Readington Township, New Jersey, General Obligation Bonds, General Improvement Series 2011: | ||||||||||||||||||
| 875 | 5.125%, 1/15/28 | 1/21 at 100.00 | AA | 950,915 | ||||||||||||||
| 875 | 5.250%, 1/15/30 | 1/21 at 100.00 | AA | 950,836 | ||||||||||||||
| 5,000 | Union County Utilities Authority, New Jersey, Solid Waste System County Deficiency Revenue Bonds, Series 1998A, 5.000%, 6/15/28 (Alternative Minimum Tax) | 12/11 at 100.00 | AA+ | 5,001,349 | ||||||||||||||
| 2,110 | Washington Township Board of Education, Mercer County, New Jersey, General Obligation Bonds, Series 2005, 5.000%, 1/01/21 – AGM Insured | 1/16 at 100.00 | Aa2 | 2,322,097 | ||||||||||||||
| 11,490 | Total Tax Obligation/General | 12,117,976 | ||||||||||||||||
Tax Obligation/Limited – 24.5% | ||||||||||||||||||
| 650 | Bergen County Improvement Authority, New Jersey, Guaranteed Lease Revenue Bonds, County Administration Complex Project, Series 2005, 5.000%, 11/15/26 | No Opt. Call | Aaa | 794,814 | ||||||||||||||
| 30 | Nuveen Investments |
| Principal Amount (000) | Description (1) | Optional Call Provisions (2) | Ratings (3) | Value | ||||||||||||||
Tax Obligation/Limited (continued) | ||||||||||||||||||
Burlington County Bridge Commission, New Jersey, Guaranteed Pooled Loan Bonds, Series 2003: | ||||||||||||||||||
| $ | 1,000 | 5.000%, 12/01/20 – NPFG Insured | 12/13 at 100.00 | AA | $ | 1,085,950 | ||||||||||||
| 695 | 5.000%, 12/01/21 – NPFG Insured | 12/13 at 100.00 | AA | 754,735 | ||||||||||||||
| 825 | Essex County Improvement Authority, New Jersey, Project Consolidation Revenue Bonds, Series 2007, 5.250%, 12/15/22 – AMBAC Insured | No Opt. Call | Aa2 | 966,125 | ||||||||||||||
| 900 | Garden State Preservation Trust, New Jersey, Open Space and Farmland Preservation Bonds, Series 2005C, 5.125%, 11/01/18 – AGM Insured | No Opt. Call | AAA | 1,098,711 | ||||||||||||||
Hudson County Improvement Authority, New Jersey, County Secured Lease Revenue Bonds, County Services Building Project, Series 2005: | ||||||||||||||||||
| 395 | 5.000%, 4/01/25 – AMBAC Insured | 4/15 at 100.00 | AA- | 412,412 | ||||||||||||||
| 920 | 5.000%, 4/01/35 – AMBAC Insured | 4/15 at 100.00 | AA- | 939,154 | ||||||||||||||
| 1,750 | Middlesex County, New Jersey, Certificates of Participation, Series 2001, 5.000%, 8/01/22 – NPFG Insured | 2/12 at 100.00 | Aa3 | 1,754,638 | ||||||||||||||
| 2,255 | New Jersey Building Authority, State Building Revenue Bonds, Series 2007A, 5.000%, 6/15/27 | 6/16 at 100.00 | A+ | 2,325,965 | ||||||||||||||
New Jersey Economic Development Authority, Cigarette Tax Revenue Bonds, Series 2004: | ||||||||||||||||||
| 930 | 5.500%, 6/15/24 | 6/12 at 100.00 | BBB | 906,601 | ||||||||||||||
| 1,595 | 5.750%, 6/15/29 | 6/14 at 100.00 | BBB | 1,539,765 | ||||||||||||||
| 2,560 | 5.750%, 6/15/34 | 6/14 at 100.00 | BBB | 2,387,686 | ||||||||||||||
| 1,000 | New Jersey Economic Development Authority, Lease Revenue Bonds, Liberty State Park Project, Series 2005C, 5.000%, 3/01/27 – AGM Insured | 3/15 at 100.00 | AA+ | 1,025,300 | ||||||||||||||
| 2,600 | New Jersey Economic Development Authority, Revenue Bonds, Motor Vehicle Surcharge, Series 2004A, 5.250%, 7/01/15 – NPFG Insured | 7/14 at 100.00 | A | 2,856,490 | ||||||||||||||
New Jersey Economic Development Authority, Revenue Bonds, Newark Downtown District Management Corporation Project, Series 2007: | ||||||||||||||||||
| 85 | 5.125%, 6/15/27 | 6/17 at 100.00 | Baa3 | 81,485 | ||||||||||||||
| 145 | 5.125%, 6/15/37 | 6/17 at 100.00 | Baa3 | 129,840 | ||||||||||||||
| 830 | New Jersey Economic Development Authority, School Facilities Construction Financing Program Bonds, Series 2007U, 5.000%, 9/01/37 – AMBAC Insured | 9/17 at 100.00 | A+ | 844,840 | ||||||||||||||
| 700 | New Jersey Educational Facilities Authority, Revenue Bonds, Higher Education Capital Improvement Fund, Refunding Series 2005A, 5.000%, 9/01/15 – AGM Insured | No Opt. Call | AA+ | 789,978 | ||||||||||||||
New Jersey Health Care Facilities Financing Authority, Lease Revenue Bonds, Department of Human Services - Greystone Park Psychiatric Hospital, Series 2005: | ||||||||||||||||||
| 1,050 | 5.000%, 9/15/18 – AMBAC Insured | 9/15 at 100.00 | A+ | 1,140,804 | ||||||||||||||
| 1,875 | 5.000%, 9/15/24 – AMBAC Insured | 9/15 at 100.00 | A+ | 1,942,838 | ||||||||||||||
| 4,495 | 5.000%, 9/15/26 – AMBAC Insured | No Opt. Call | A+ | 4,603,734 | ||||||||||||||
| 1,325 | 5.000%, 9/15/28 – AMBAC Insured | 9/15 at 100.00 | A+ | 1,347,724 | ||||||||||||||
New Jersey Health Care Facilities Financing Authority, State Contract Bonds, Hospital Asset Transformatiom Program, Series 2008A: | ||||||||||||||||||
| 3,145 | 5.000%, 10/01/28 | 10/18 at 100.00 | A+ | 3,254,792 | ||||||||||||||
| 1,950 | 5.250%, 10/01/38 | 10/18 at 100.00 | A+ | 1,990,346 | ||||||||||||||
| 2,000 | New Jersey Health Care Facilities Financing Authority, State Contract Bonds, Hospital Asset Transformatiom Program, Series 2009A, 5.750%, 10/01/31 | 10/19 at 100.00 | �� | A+ | 2,153,720 | |||||||||||||
New Jersey Transportation Trust Fund Authority, Federal Highway Aid Grant Anticipation Bonds, Series 2006: | ||||||||||||||||||
| 560 | 5.000%, 6/15/17 – FGIC Insured | 6/16 at 100.00 | Aa3 | 629,658 | ||||||||||||||
| 1,000 | 5.000%, 6/15/18 – FGIC Insured | 6/16 at 100.00 | Aa3 | 1,109,320 | ||||||||||||||
| 14,635 | New Jersey Transportation Trust Fund Authority, Transportation System Bonds, Capital Appreciation Series 2010A, 0.000%, 12/15/30 | No Opt. Call | A+ | 4,731,934 | ||||||||||||||
| 1,900 | New Jersey Transportation Trust Fund Authority, Transportation System Bonds, Refunding Series 2006A, 5.500%, 12/15/22 | No Opt. Call | A+ | 2,211,049 | ||||||||||||||
| Nuveen Investments | 31 |
Portfolio of Investments (Unaudited)
Nuveen New Jersey Municipal Bond Fund (continued)
August 31, 2011
| Principal Amount (000) | Description (1) | Optional Call Provisions (2) | Ratings (3) | Value | ||||||||||||||
Tax Obligation/Limited (continued) | ||||||||||||||||||
| $ | 1,500 | New Jersey Transportation Trust Fund Authority, Transportation System Bonds, Series 2004B, 5.500%, 12/15/16 – NPFG Insured | No Opt. Call | A+ | $ | 1,752,510 | ||||||||||||
New Jersey Transportation Trust Fund Authority, Transportation System Bonds, Series 2006C: | ||||||||||||||||||
| 4,000 | 0.000%, 12/15/32 – AGM Insured | No Opt. Call | AA+ | 1,127,600 | ||||||||||||||
| 4,000 | 0.000%, 12/15/33 – AGM Insured | No Opt. Call | AA+ | 1,054,480 | ||||||||||||||
| 5,450 | 0.000%, 12/15/34 – AGM Insured | No Opt. Call | AA+ | 1,341,136 | ||||||||||||||
| 500 | New Jersey Transportation Trust Fund Authority, Transportation System Bonds, Series 2007A, 5.000%, 12/15/26 – AMBAC Insured | 12/17 at 100.00 | A+ | 524,270 | ||||||||||||||
| 5,500 | New Jersey Transportation Trust Fund Authority, Transportation System Bonds, Series 2009A, 0.000%, 12/15/39 | No Opt. Call | A+ | 933,185 | ||||||||||||||
| 2,750 | New Jersey Transportation Trust Fund Authority, Transportation System Bonds, Series 2010D, 5.000%, 12/15/24 | No Opt. Call | A+ | 3,021,618 | ||||||||||||||
| 485 | Puerto Rico Convention Center District Authority, Hotel Occupancy Tax Revenue Bonds, Series 2006A, 4.500%, 7/01/36 – CIFG Insured | 7/16 at 100.00 | BBB+ | 401,153 | ||||||||||||||
| 2,000 | Puerto Rico Sales Tax Financing Corporation, Sales Tax Revenue Bonds, First Subordinate Series 2009A, 6.000%, 8/01/42 | 8/19 at 100.00 | A+ | 2,117,280 | ||||||||||||||
| 1,495 | Puerto Rico Sales Tax Financing Corporation, Sales Tax Revenue Bonds, First Subordinate Series 2010A, 5.500%, 8/01/42 | 2/20 at 100.00 | A+ | 1,516,543 | ||||||||||||||
| 450 | Puerto Rico Sales Tax Financing Corporation, Sales Tax Revenue Bonds, Series 2007A, 5.250%, 8/01/57 | 8/17 at 100.00 | Aa2 | 458,195 | ||||||||||||||
| 81,900 | Total Tax Obligation/Limited | 60,058,378 | ||||||||||||||||
Transportation – 13.6% | ||||||||||||||||||
Delaware River and Bay Authority, Delaware and New Jersey, Revenue Bonds, Series 2005: | ||||||||||||||||||
| 1,335 | 5.000%, 1/01/26 – NPFG Insured | 1/15 at 100.00 | A1 | 1,384,435 | ||||||||||||||
| 500 | 5.000%, 1/01/27 – NPFG Insured | 1/15 at 100.00 | A1 | 518,515 | ||||||||||||||
| 1,295 | New Jersey Transit Corporation, Certificates of Participation, Federal Transit Administration Grants, Series 2005A, 5.000%, 9/15/18 – FGIC Insured | 9/15 at 100.00 | A1 | 1,385,223 | ||||||||||||||
New Jersey Turnpike Authority, Revenue Bonds, Series 1991C: | ||||||||||||||||||
| 40 | 6.500%, 1/01/16 | No Opt. Call | A+ | 47,978 | ||||||||||||||
| 485 | 6.500%, 1/01/16 – NPFG Insured | No Opt. Call | A+ | 581,728 | ||||||||||||||
| 5,000 | New Jersey Turnpike Authority, Revenue Bonds, Series 2003A, 5.000%, 1/01/19 – FGIC Insured | 7/13 at 100.00 | A+ | 5,328,349 | ||||||||||||||
| 1,300 | New Jersey Turnpike Authority, Revenue Bonds, Series 2005A, 5.250%, 1/01/29 – AGM Insured | No Opt. Call | AA+ | 1,504,347 | ||||||||||||||
| 3,500 | New Jersey Turnpike Authority, Revenue Bonds, Series 2009I, 5.000%, 1/01/35 | 1/20 at 100.00 | A+ | 3,623,970 | ||||||||||||||
| 900 | Passaic County Improvement Authority, New Jersey, County Guaranteed Parking Revenue Bonds, 200 Hospital Plaza Project, Series 2010, 5.000%, 5/01/42 | 5/20 at 100.00 | Aa3 | 934,893 | ||||||||||||||
| 2,000 | Port Authority of New York and New Jersey, Consolidated Revenue Bonds, One Hundred Fifty Third Series 2008, 5.000%, 7/15/38 | 7/18 at 100.00 | Aa2 | 2,089,100 | ||||||||||||||
Port Authority of New York and New Jersey, Consolidated Revenue Bonds, One Hundred Fortieth Series 2005: | ||||||||||||||||||
| 2,500 | 5.000%, 12/01/28 – SYNCORA GTY Insured | 6/15 at 101.00 | Aa2 | 2,641,225 | ||||||||||||||
| 500 | 5.000%, 12/01/34 | No Opt. Call | Aa2 | 521,265 | ||||||||||||||
| 420 | Port Authority of New York and New Jersey, Consolidated Revenue Bonds, One Hundred Forty Eighth Series 2008, Trust 2920, 17.334%, 8/15/32 – AGM Insured (IF) | 8/17 at 100.00 | AA+ | 511,409 | ||||||||||||||
| 6,000 | Port Authority of New York and New Jersey, Consolidated Revenue Bonds, One Hundred Thirty-Fourth Series 2004, 5.000%, 7/15/34 | 1/14 at 101.00 | Aa2 | 6,195,056 | ||||||||||||||
Port Authority of New York and New Jersey, Special Project Bonds, JFK International Air Terminal LLC, Sixth Series 1997: | ||||||||||||||||||
| 1,000 | 7.000%, 12/01/12 – NPFG Insured (Alternative Minimum Tax) | No Opt. Call | Baa1 | 1,040,870 | ||||||||||||||
| 32 | Nuveen Investments |
| Principal Amount (000) | Description (1) | Optional Call Provisions (2) | Ratings (3) | Value | ||||||||||||||
Transportation (continued) | ||||||||||||||||||
| $ | 2,000 | 5.750%, 12/01/22 – NPFG Insured (Alternative Minimum Tax) | 12/11 at 100.00 | Baa1 | $ | 1,985,760 | ||||||||||||
| 3,125 | 5.750%, 12/01/25 – NPFG Insured (Alternative Minimum Tax) | 12/11 at 100.00 | Baa1 | 3,033,094 | ||||||||||||||
| 31,900 | Total Transportation | 33,327,217 | ||||||||||||||||
U.S. Guaranteed – 7.6% (4) | ||||||||||||||||||
| 2,500 | Bergen County Improvement Authority, New Jersey, Revenue Bonds, Yeshiva Ktana of Passaic Project, Series 2002, 6.000%, 9/15/27 (Pre-refunded 9/01/12) | 9/12 at 101.00 | N/R | (4) | 2,660,500 | |||||||||||||
| 520 | New Jersey Economic Development Authority, Revenue Bonds, Yeshiva Ktana of Passaic, Series 1993, 8.000%, 9/15/18 (ETM) | No Opt. Call | N/R | (4) | 642,538 | |||||||||||||
| 420 | New Jersey Educational Facilities Authority, Revenue Bonds, Kean University, Series 2005B, 5.000%, 7/01/30 (Pre-refunded 7/01/16) – NPFG Insured | 7/16 at 100.00 | A– | (4) | 502,471 | |||||||||||||
New Jersey Educational Facilities Authority, Revenue Bonds, Montclair State University, Series 2005F: | ||||||||||||||||||
| 1,825 | 5.000%, 7/01/24 (Pre-refunded 7/01/15) – FGIC Insured | 7/15 at 100.00 | A1 | (4) | 2,127,713 | |||||||||||||
| 525 | 5.000%, 7/01/32 (Pre-refunded 7/01/15) – FGIC Insured | 7/15 at 100.00 | A1 | (4) | 612,082 | |||||||||||||
| 500 | New Jersey Educational Facilities Authority, Revenue Bonds, Rowan University, Series 2003I, 5.125%, 7/01/21 (Pre-refunded 7/01/13) – FGIC Insured | 7/13 at 100.00 | A+ | (4) | 543,060 | |||||||||||||
| 1,195 | New Jersey Health Care Facilities Financing Authority, Revenue Bonds, Capital Health System Obligated Group, Series 2003A, 5.375%, 7/01/33 (Pre-refunded 7/01/13) | 7/13 at 100.00 | N/R | (4) | 1,293,492 | |||||||||||||
| 845 | New Jersey Health Care Facilities Financing Authority, Revenue Bonds, St. Clare’s Hospital, Series 2004A, 5.250%, 7/01/20 – RAAI Insured (ETM) | No Opt. Call | N/R | (4) | 1,039,037 | |||||||||||||
New Jersey Turnpike Authority, Revenue Bonds, Series 1991C: | ||||||||||||||||||
| 10 | 6.500%, 1/01/16 (ETM) | No Opt. Call | AA+ | (4) | 12,358 | |||||||||||||
| 165 | 6.500%, 1/01/16 – NPFG Insured (ETM) | No Opt. Call | A+ | (4) | 205,334 | |||||||||||||
| 600 | 6.500%, 1/01/16 (ETM) | No Opt. Call | AA+ | (4) | 668,790 | |||||||||||||
| 165 | 6.500%, 1/01/16 – AMBAC Insured (ETM) | No Opt. Call | A3 | (4) | 183,477 | |||||||||||||
| 115 | 6.500%, 1/01/16 – NPFG Insured (ETM) | No Opt. Call | A+ | (4) | 128,679 | |||||||||||||
| 10 | 6.500%, 1/01/16 – AMBAC Insured (ETM) | No Opt. Call | AAA | 11,120 | ||||||||||||||
| 375 | Newark Housing Authority, New Jersey, Port Authority Terminal Revenue Bonds, Series 2004, 5.250%, 1/01/21 (Pre-refunded 1/01/14) – NPFG Insured | 1/14 at 100.00 | AA– | (4) | 417,428 | |||||||||||||
| 4,000 | Puerto Rico Public Finance Corporation, Commonwealth Appropriation Bonds, Series 1998A, 5.125%, 6/01/24 – AMBAC Insured (ETM) | No Opt. Call | Aaa | 4,697,080 | ||||||||||||||
| 1,910 | Tobacco Settlement Financing Corporation, New Jersey, Tobacco Settlement Asset-Backed Bonds, Series 2002, 5.750%, 6/01/32 (Pre-refunded 6/01/12) | 6/12 at 100.00 | Aaa | 1,989,666 | ||||||||||||||
Tobacco Settlement Financing Corporation, New Jersey, Tobacco Settlement Asset-Backed Bonds, Series 2003: | ||||||||||||||||||
| 25 | 6.125%, 6/01/24 (Pre-refunded 6/01/12) | 6/12 at 100.00 | Aaa | 26,113 | ||||||||||||||
| 750 | 6.375%, 6/01/32 (Pre-refunded 6/01/13) | 6/13 at 100.00 | Aaa | 817,328 | ||||||||||||||
| 16,455 | Total U.S. Guaranteed | 18,578,266 | ||||||||||||||||
Utilities – 0.5% | ||||||||||||||||||
| 1,250 | New Jersey Economic Development Authority, Pollution Control Revenue Refunding Bonds, Public Service Electric and Gas Company, Series 2001A, 5.000%, 3/01/12 | No Opt. Call | Baa1 | 1,271,400 | ||||||||||||||
Water and Sewer – 2.6% | ||||||||||||||||||
| 2,550 | Atlanta, Georgia, Water and Wastewater Revenue Bonds, Series 2009B, 5.375%, 11/01/39 – AGM Insured | 11/19 at 100.00 | AA+ | 2,676,914 | ||||||||||||||
| 1,380 | Bayonne Municipal Utilities Authority, New Jersey, Water System Revenue Refunding Bonds, Series 2003A, 5.000%, 4/01/18 – SYNCORA GTY Insured | 4/13 at 100.00 | N/R | 1,401,666 | ||||||||||||||
| 960 | New Jersey Economic Development Authority, Water Facilities Revenue Bonds, New Jersey-American Water Company Inc. Project, Refunding Series 2010D, 4.875%, 11/01/29 (Alternative Minimum Tax) | 11/20 at 100.00 | A | 970,195 | ||||||||||||||
| Nuveen Investments | 33 |
Portfolio of Investments (Unaudited)
Nuveen New Jersey Municipal Bond Fund (continued)
August 31, 2011
| Principal Amount (000) | Description (1) | Optional Call Provisions (2) | Ratings (3) | Value | ||||||||||||||
Water and Sewer (continued) | ||||||||||||||||||
| $ | 500 | North Hudson Sewerage Authority, New Jersey, Sewerage Revenue Refunding Bonds, Series 2002A, 5.250%, 8/01/19 – FGIC Insured | 8/12 at 100.00 | N/R | $ | 510,840 | ||||||||||||
| 760 | Puerto Rico Aqueduct and Sewerage Authority, Revenue Bonds, Senior Lien Series 2008A, 6.000%, 7/01/38 | 7/18 at 100.00 | Baa2 | 762,880 | ||||||||||||||
| 6,150 | Total Water and Sewer | 6,322,495 | ||||||||||||||||
| $ | 275,235 | Total Investments (cost $234,734,989) – 98.0% | 240,693,733 | |||||||||||||||
Other Assets Less Liabilities – 2.0% | 4,930,197 | |||||||||||||||||
Net Assets – 100% | $ | 245,623,930 | ||||||||||||||||
| (1) | All percentages shown in the Portfolio of Investments are based on net assets. |
| (2) | Optional Call Provisions: Dates (month and year) and prices of the earliest optional call or redemption. There may be other call provisions at varying prices at later dates. Certain mortgage-backed securities may be subject to periodic principal paydowns. |
| (3) | Ratings: Using the highest of Standard & Poor’s Group (“Standard & Poor’s”), Moody’s Investor Service, Inc. (“Moody’s”) or Fitch, Inc. (“Fitch”) rating. Ratings below BBB by Standard & Poor’s, Baa by Moody’s or BBB by Fitch are considered to be below investment grade. Holdings designated N/R are not rated by any of these national rating agencies. |
| (4) | Backed by an escrow or trust containing sufficient U.S. Government or U.S. Government agency securities, which ensure the timely payment of principal and interest. Bonds backed by U.S. Government or agency securities are given an implied rating equal to the rating of such securities. |
| N/R | Not rated. |
| (ETM) | Escrowed to maturity. |
| (IF) | Inverse floating rate investment. |
| 34 | Nuveen Investments |
Portfolio of Investments (Unaudited)
Nuveen New York Municipal Bond Fund
August 31, 2011
| Principal Amount (000) | Description (1) | Optional Call Provisions (2) | Ratings (3) | Value | ||||||||||||||
Consumer Discretionary – 0.1% | ||||||||||||||||||
| $ | 665 | New York City Industrial Development Agency, New York, Liberty Revenue Bonds, IAC/InterActiveCorp, Series 2005, 5.000%, 9/01/35 | 9/15 at 100.00 | BB+ | $ | 588,685 | ||||||||||||
Consumer Staples – 2.7% | ||||||||||||||||||
| 540 | New York Counties Tobacco Trust II, Tobacco Settlement Pass-Through Bonds, Series 2001, 5.250%, 6/01/25 | 12/11 at 101.00 | BBB | 486,005 | ||||||||||||||
| 1,110 | Puerto Rico, The Children’s Trust Fund, Tobacco Settlement Asset-Backed Refunding Bonds, Series 2002, 5.375%, 5/15/33 | 5/12 at 100.00 | BBB | 1,035,230 | ||||||||||||||
| 260 | Rensselaer Tobacco Asset Securitization Corporation, New York, Tobacco Settlement Asset-Backed Bonds, Series 2001A, 5.200%, 6/01/25 | 6/12 at 100.00 | BBB | 237,050 | ||||||||||||||
| 6,650 | Suffolk Tobacco Asset Securitization Corporation, New York, Tobacco Settlement Asset-Backed Bonds, Series 2008C, 0.000%, 6/01/44 | 6/22 at 100.00 | | BB+ | | 5,242,062 | ||||||||||||
TSASC Inc., New York, Tobacco Asset-Backed Bonds, Series 2006: | ||||||||||||||||||
| 1,965 | 4.750%, 6/01/22 | 6/16 at 100.00 | BBB | 1,872,488 | ||||||||||||||
| 1,225 | 5.000%, 6/01/26 | 6/16 at 100.00 | BBB | 1,069,082 | ||||||||||||||
| 1,500 | Virgin Islands Public Finance Authority, Matching Fund Revenue Loan Note – Diageo Project, Series 2009A, 6.625%, 10/01/29 | 10/19 at 100.00 | BBB | 1,583,520 | ||||||||||||||
| 13,250 | Total Consumer Staples | 11,525,437 | ||||||||||||||||
Education and Civic Organizations – 14.5% | ||||||||||||||||||
| 660 | Albany Industrial Development Agency, New York, Revenue Bonds, Albany Law School, Series 2007A, 5.000%, 7/01/31 | 7/17 at 100.00 | BBB | 650,159 | ||||||||||||||
Albany Industrial Development Agency, New York, Revenue Bonds, Brighter Choice Charter Schools, Series 2007A: | ||||||||||||||||||
| 520 | 5.000%, 4/01/20 | 4/17 at 100.00 | N/R | 499,626 | ||||||||||||||
| 1,000 | 5.000%, 4/01/27 | 4/17 at 100.00 | N/R | 872,990 | ||||||||||||||
| 290 | 5.000%, 4/01/37 | 4/17 at 100.00 | N/R | 233,032 | ||||||||||||||
| 2,190 | Buffalo and Erie County, New York, Industrial Land Development Corporation Tax-Exempt Revenue Bonds (Enterprise Charter School Project), | 12/20 at 100.00 | N/R | 2,329,196 | ||||||||||||||
| 215 | Cattaraugus County Industrial Development Agency, New York, Revenue Bonds, St. Bonaventure University, Series 2006, 5.000%, 5/01/23 | 5/16 at 100.00 | BBB– | 214,798 | ||||||||||||||
| 1,750 | Dormitory Authority of the State of New York, Brooklyn Law School Revenue Bonds, Series 2009, 5.750%, 7/01/33 | 7/19 at 100.00 | BBB+ | 1,873,865 | ||||||||||||||
Dormitory Authority of the State of New York, General Revenue Bonds, Manhattan College, Series 2007A: | ||||||||||||||||||
| 45 | 5.000%, 7/01/32 – RAAI Insured | 7/17 at 100.00 | N/R | 42,440 | ||||||||||||||
| 2,820 | 5.000%, 7/01/41 – RAAI Insured | 7/17 at 100.00 | N/R | 2,541,948 | ||||||||||||||
| 1,880 | Dormitory Authority of the State of New York, General Revenue Bonds, Saint Johns University, Series 2007A, 5.250%, 7/01/32 - NPFG Insured | 7/17 at 100.00 | A– | 1,940,329 | ||||||||||||||
| 1,670 | Dormitory Authority of the State of New York, Housing Revenue Bonds, Fashion Institute of Technology, Series 2007, 5.250%, 7/01/29 – FGIC Insured | No Opt. Call | BBB | 1,761,316 | ||||||||||||||
| 685 | Dormitory Authority of the State of New York, Insured Revenue Bonds, D’Youville College, Series 2001, 5.250%, 7/01/20 - RAAI Insured | 1/12 at 102.00 | N/R | 697,405 | ||||||||||||||
| 1,850 | Dormitory Authority of the State of New York, Insured Revenue Bonds, New York Medical College, Series 1998, 5.000%, 7/01/21 - NPFG Insured | 1/12 at 100.00 | Baa1 | 1,855,421 | ||||||||||||||
Dormitory Authority of the State of New York, Lease Revenue Bonds, State University Dormitory Facilities, Series 2003B: | ||||||||||||||||||
| 1,250 | 5.250%, 7/01/31 (Mandatory put 7/01/13) – FGIC Insured | No Opt. Call | Aa2 | 1,353,288 | ||||||||||||||
| 2,000 | 5.250%, 7/01/32 (Mandatory put 7/01/13) – SYNCORA GTY Insured | No Opt. Call | Aa2 | 2,160,680 | ||||||||||||||
| 1,000 | Dormitory Authority of the State of New York, Lease Revenue Bonds, State University Dormitory Facilities, Series 2004A, 5.000%, 7/01/29 - NPFG Insured | 7/15 at 100.00 | Aa2 | 1,036,060 | ||||||||||||||
| 350 | Dormitory Authority of the State of New York, Revenue Bonds, New School University, Series 2010, 5.250%, 7/01/30 | 7/20 at 100.00 | A– | 363,507 | ||||||||||||||
| Nuveen Investments | 35 |
Portfolio of Investments (Unaudited)
Nuveen New York Municipal Bond Fund (continued)
August 31, 2011
| Principal Amount (000) | Description (1) | Optional Call Provisions (2) | Ratings (3) | Value | ||||||||||||||
Education and Civic Organizations (continued) | ||||||||||||||||||
| $ | 1,500 | Dormitory Authority of the State of New York, Revenue Bonds, New York University, Series 2009B, 5.000%, 7/01/39 | 7/19 at 100.00 | AA– | $ | 1,566,585 | ||||||||||||
| 4,000 | Dormitory Authority of the State of New York, Revenue Bonds, State University Educational Facilities, 1989 Resolution, Series 2000C, 5.750%, 5/15/16 – AGM Insured | No Opt. Call | AA+ | 4,796,880 | ||||||||||||||
| 1,000 | Dormitory Authority of the State of New York, Revenue Bonds, State University Educational Facilities, Series 1993C, 5.250%, 5/15/19 | 5/14 at 100.00 | AA– | 1,142,710 | ||||||||||||||
| 1,845 | Dutchess County Industrial Development Agency, New York, Civic Facility Revenue Bonds, Bard College Project, Series 2007-A2, 4.500%, 8/01/36 | 8/17 at 100.00 | Baa1 | 1,670,463 | ||||||||||||||
| 615 | Hempstead Town Industrial Development Agency, New York, Revenue Bonds, Adelphi University, Civic Facility Project, Series 2005, | 10/15 at 100.00 | A | 623,124 | ||||||||||||||
| 250 | Hempstead Town Local Development Corporation, New York, Revenue Bonds, Adelphi University Project, Series 2009B, 5.250%, 2/01/39 | 2/19 at 100.00 | A | 260,183 | ||||||||||||||
| 1,175 | Hempstead Town Local Development Corporation, New York, Revenue Bonds, Molloy College Project, Series 2009, 5.750%, 7/01/39 | 7/19 at 100.00 | BBB+ | 1,213,000 | ||||||||||||||
| 1,370 | New York City Industrial Development Agency, New York, Civic Facility Revenue Bonds, American Council of Learned Societies, Series 2002, 5.250%, 7/01/27 | 7/12 at 100.00 | A1 | 1,382,138 | ||||||||||||||
New York City Industrial Development Agency, New York, Civic Facility Revenue Bonds, YMCA of Greater New York, Series 2006: | ||||||||||||||||||
| 5,520 | 5.000%, 8/01/26 | 8/16 at 100.00 | A– | 5,669,702 | ||||||||||||||
| 2,000 | 5.000%, 8/01/36 | 8/16 at 100.00 | A– | 1,958,060 | ||||||||||||||
New York City Industrial Development Agency, New York, PILOT Revenue Bonds, Queens Baseball Stadium Project, Series 2006: | ||||||||||||||||||
| 1,060 | 5.000%, 1/01/39 – AMBAC Insured | 1/17 at 100.00 | BB+ | 900,788 | ||||||||||||||
| 2,845 | 4.750%, 1/01/42 – AMBAC Insured | 1/17 at 100.00 | BB+ | 2,213,552 | ||||||||||||||
| 1,000 | 5.000%, 1/01/46 – AMBAC Insured | 1/17 at 100.00 | BB+ | 806,320 | ||||||||||||||
New York City Industrial Development Authority, New York, PILOT Revenue Bonds, Yankee Stadium Project, Series 2006: | ||||||||||||||||||
| 900 | 5.000%, 3/01/36 – NPFG Insured | 9/16 at 100.00 | Baa1 | 867,978 | ||||||||||||||
| 1,840 | 4.500%, 3/01/39 – FGIC Insured | 9/16 at 100.00 | BBB– | 1,612,999 | ||||||||||||||
| 2,000 | New York City Trust for Cultural Resources, New York, Revenue Bonds, Carnegie Hall, Series 2009A, 5.000%, 12/01/39 | 12/19 at 100.00 | A+ | 2,031,600 | ||||||||||||||
| 1,000 | New York City Trust for Cultural Resources, New York, Revenue Bonds, Museum of Modern Art, Series 2001D, 5.125%, 7/01/31 – AMBAC Insured | 7/12 at 100.00 | Aa2 | 1,026,810 | ||||||||||||||
Niagara County Industrial Development Agency, New York, Civic Facility Revenue Bonds, Niagara University, Series 2001A: | ||||||||||||||||||
| 3,000 | 5.500%, 11/01/16 – RAAI Insured | 11/11 at 101.00 | BBB+ | 3,043,560 | ||||||||||||||
| 1,000 | 5.350%, 11/01/23 – RAAI Insured | 11/11 at 101.00 | BBB+ | 1,009,260 | ||||||||||||||
| 430 | Seneca County Industrial Development Authority, New York, Revenue Bonds, New York Chiropractic College, Series 2007, 5.000%, 10/01/27 | 10/17 at 100.00 | BBB | 429,983 | ||||||||||||||
| 800 | Suffolk County Industrial Development Agency, New York, Revenue Bonds, Dowling College, Series 1996, 6.700%, 12/01/20 | 12/11 at 100.00 | BB | 794,680 | ||||||||||||||
| 950 | Troy Capital Resource Corporation, New York, Revenue Bonds, Rensselaer Polytechnic Institute, Series 2010A, 5.125%, 9/01/40 | 9/20 at 100.00 | A– | 948,575 | ||||||||||||||
| 925 | Utica Industrial Development Agency, New York, Revenue Bonds, Utica College, Series 1998A, 5.750%, 8/01/28 | 11/11 at 100.00 | N/R | 894,864 | ||||||||||||||
Yonkers Economic Development Corporation, New York, Revenue Bonds, Charter School Educational Excellence Project, Series 2010A: | ||||||||||||||||||
| 1,340 | 6.000%, 10/15/30 | 10/20 at 100.00 | BB+ | 1,276,993 | ||||||||||||||
| 1,200 | 6.250%, 10/15/40 | 10/20 at 100.00 | BB+ | 1,139,928 | ||||||||||||||
| 1,000 | Yonkers Industrial Development Agency, New York, Civic Facility Revenue Bonds, Sarah Lawrence College Project, Series 2001A Remarketed, 6.000%, 6/01/41 | 6/19 at 100.00 | BBB | 1,047,800 | ||||||||||||||
| 60,740 | Total Education and Civic Organizations | 60,754,595 | ||||||||||||||||
| 36 | Nuveen Investments |
| Principal Amount (000) | Description (1) | Optional Call Provisions (2) | Ratings (3) | Value | ||||||||||||||
Energy – 0.1% | ||||||||||||||||||
| $ | 500 | Virgin Islands Public Finance Authority, Revenue Bonds, Refinery Project Hovensa LLC, Series 2007, 4.700%, 7/01/22 (Alternative Minimum Tax) | 1/15 at 100.00 | Ba2 | $ | 423,075 | ||||||||||||
Financials – 0.9% | ||||||||||||||||||
| 500 | Liberty Development Corporation, New York, Goldman Sachs Headquarter Revenue Bonds, Series 2005, 5.250%, 10/01/35 | No Opt. Call | A1 | 491,390 | ||||||||||||||
| 3,475 | Liberty Development Corporation, New York, Goldman Sachs Headquarters Revenue Bonds Series 2007, 5.500%, 10/01/37 | No Opt. Call | A1 | 3,487,788 | ||||||||||||||
| 3,975 | Total Financials | 3,979,178 | ||||||||||||||||
Health Care – 15.4% | ||||||||||||||||||
| 1,000 | Albany Capital Resource Corporation, New York, St. Peter’s Hospital Project, Series 2011, 6.125%, 11/15/30 | 11/20 at 100.00 | BBB+ | 1,049,730 | ||||||||||||||
| 3,575 | Albany Industrial Development Agency, New York, Revenue Bonds, Saint Peter’s Hospital, Series 2008A, 5.250%, 11/15/32 | 11/17 at 100.00 | BBB+ | 3,287,499 | ||||||||||||||
| 3,410 | Dormitory Authority of the State of New York, FHA-Insured Mortgage Revenue Bonds, New York Hospital Medical Center of Queens, Series 1999, 4.750%, 2/15/37 | 2/17 at 100.00 | N/R | 3,343,266 | ||||||||||||||
Dormitory Authority of the State of New York, FHA-Insured Revenue Bonds, Montefiore Medical Center, Series 2005: | ||||||||||||||||||
| 3,000 | 5.000%, 2/01/22 – FGIC Insured | 2/15 at 100.00 | BBB | 3,275,700 | ||||||||||||||
| 1,775 | 5.000%, 2/01/28 – FGIC Insured | 2/15 at 100.00 | BBB | 1,891,440 | ||||||||||||||
| 4,400 | Dormitory Authority of the State of New York, FHA-Insured Revenue Bonds, St. Lukes Roosevelt Hospital, Series 2005, 4.900%, 8/15/31 | 8/15 at 100.00 | N/R | 4,436,872 | ||||||||||||||
| 550 | Dormitory Authority of the State of New York, Highland Hospital of Rochester Revenue Bonds, Series 2010, 5.200%, 7/01/32 | 7/20 at 100.00 | A2 | 562,073 | ||||||||||||||
| 3,000 | Dormitory Authority of the State of New York, Insured Revenue Bonds, Franciscan Health Partnership Obligated Group – Frances Shervier Home and Hospital, Series 1997, 5.500%, 7/01/27 – RAAI Insured | 1/12 at 100.00 | A3 | 3,000,330 | ||||||||||||||
| 3,000 | Dormitory Authority of the State of New York, Revenue Bonds, Catholic Health Services of Long Island Obligated Group – St. Catherine of Siena Medical Center, Series 2000A, 6.500%, 7/01/20 | 1/12 at 100.00 | A– | 3,007,260 | ||||||||||||||
| 1,250 | Dormitory Authority of the State of New York, Revenue Bonds, Catholic Health Services of Long Island, Series 2004, 5.100%, 7/01/34 | 7/14 at 100.00 | A– | 1,253,838 | ||||||||||||||
| 7,400 | Dormitory Authority of the State of New York, Revenue Bonds, Lenox Hill Hospital Obligated Group, Series 2001, 5.500%, 7/01/30 | 1/12 at 101.00 | Baa3 | 7,414,874 | ||||||||||||||
| 3,055 | Dormitory Authority of the State of New York, Revenue Bonds, New York and Presbyterian Hospital, Series 2004A, 5.250%, 8/15/15 – AGM Insured | 8/14 at 100.00 | AA+ | 3,357,201 | ||||||||||||||
| 600 | Dormitory Authority of the State of New York, Revenue Bonds, North Shore Long Island Jewish Obligated Group, Series 2005A, 5.000%, 11/01/34 | 11/16 at 100.00 | A3 | 589,458 | ||||||||||||||
| 500 | Dormitory Authority of the State of New York, Revenue Bonds, North Shore Long Island Jewish Obligated Group, Series 2006B, 5.000%, 11/01/34 | 11/16 at 100.00 | A3 | 506,550 | ||||||||||||||
| 1,000 | Dormitory Authority of the State of New York, Revenue Bonds, North Shore Long Island Jewish Obligated Group, Series 2009A, 5.500%, 5/01/37 | 5/19 at 100.00 | A– | 1,019,960 | ||||||||||||||
| 5,600 | Dormitory Authority of the State of New York, Revenue Bonds, NYU Hospitals Center, Series 2007B, 5.625%, 7/01/37 | 7/17 at 100.00 | BBB+ | 5,684,224 | ||||||||||||||
| 1,500 | Dormitory Authority of the State of New York, Revenue Bonds, South Nassau Communities Hospital, Series 2003B, 5.500%, 7/01/23 | 7/13 at 100.00 | Baa1 | 1,529,715 | ||||||||||||||
| 2,400 | Dormitory Authority of the State of New York, Revenue Bonds, The New York and Presbyterian Hospital Project, Series 2007, 5.000%, | 8/14 at 100.00 | AA+ | 2,434,464 | ||||||||||||||
| 1,000 | Dormitory Authority of the State of New York, Revenue Bonds, Winthrop-South Nassau University Hospital Association, Series 2003A, 5.500%, 7/01/32 | 7/13 at 100.00 | Baa1 | 1,004,410 | ||||||||||||||
| Nuveen Investments | 37 |
Portfolio of Investments (Unaudited)
Nuveen New York Municipal Bond Fund (continued)
August 31, 2011
| Principal Amount (000) | Description (1) | Optional Call Provisions (2) | Ratings (3) | Value | ||||||||||||||
Health Care (continued) | ||||||||||||||||||
Madison County Industrial Development Agency, New York, Civic Facility Revenue Bonds, Oneida Health System, Series 2007A: | ||||||||||||||||||
| $ | 320 | 4.500%, 2/01/17 | No Opt. Call | BBB– | $ | 328,154 | ||||||||||||
| 710 | 5.250%, 2/01/27 | No Opt. Call | BBB– | 672,597 | ||||||||||||||
| 635 | 5.500%, 2/01/32 | No Opt. Call | BBB– | 601,447 | ||||||||||||||
| 1,625 | Monroe County Industrial Development Corporation, New York, FHA Insured Mortgage Revenue Bonds, Unity Hospital of Rochester Project, Series 2010, 5.750%, 8/15/35 | 2/21 at 100.00 | Aa2 | 1,851,151 | ||||||||||||||
| 190 | Nassau County Industrial Development Agency, New York, Revenue Refunding Bonds, North Shore Health System Obligated Group, | No Opt. Call | A3 | 191,024 | ||||||||||||||
| 2,550 | New York City Health and Hospitals Corporation, New York, Health System Revenue Bonds, Series 2003A, 5.250%, 2/15/22 – AMBAC Insured | 2/13 at 100.00 | Aa3 | 2,676,761 | ||||||||||||||
| 735 | New York City Industrial Development Agency, New York, Civic Facility Revenue Bonds, Staten Island University Hospital, Series 2001B, 6.375%, 7/01/31 | 7/12 at 100.00 | Baa3 | 737,962 | ||||||||||||||
| 2,005 | New York City Industrial Development Agency, New York, Civic Facility Revenue Bonds, Staten Island University Hospital, Series 2002C, 6.450%, 7/01/32 | 7/12 at 101.00 | Baa3 | 2,033,391 | ||||||||||||||
Saratoga County Industrial Development Agency, New York, Civic Facility Revenue Bonds, Saratoga Hospital Project, Series 2007B: | ||||||||||||||||||
| 1,000 | 5.125%, 12/01/27 | 12/17 at 100.00 | BBB+ | 1,004,960 | ||||||||||||||
| 500 | 5.250%, 12/01/32 | 12/17 at 100.00 | BBB+ | 500,220 | ||||||||||||||
Suffolk County Industrial Development Agency, New York, Revenue Bonds, Huntington Hospital, Series 2002C: | ||||||||||||||||||
| 850 | 6.000%, 11/01/22 | 11/12 at 100.00 | A– | 867,765 | ||||||||||||||
| 1,220 | 5.875%, 11/01/32 | 11/12 at 100.00 | A– | 1,228,967 | ||||||||||||||
| 1,150 | Westchester County Health Care Corporation, New York, Senior Lien Revenue Bonds, Series 2010-C2, 6.125%, 11/01/37 | 11/20 at 100.00 | A3 | 1,181,108 | ||||||||||||||
| 2,000 | Yonkers Industrial Development Agency, New York, Revenue Bonds, St. John’s Riverside Hospital, Series 2001A, 7.125%, 7/01/31 | 1/12 at 101.00 | B | 1,997,200 | ||||||||||||||
| 63,505 | Total Health Care | 64,521,571 | ||||||||||||||||
Housing/Multifamily – 4.9% | ||||||||||||||||||
| 1,000 | Canton Capital Resource Corporation, New York, Student Housing Facility Revenue Bonds, Grasse River LLC at SUNY Canton Project Series 2010A, 5.000%, 5/01/40 | 5/20 at 100.00 | AA+ | 993,900 | ||||||||||||||
| 305 | East Syracuse Housing Authority, New York, FHA-Insured Section 8 Assisted Revenue Refunding Bonds, Bennet Project, Series 2001A, 6.700%, 4/01/21 | 10/11 at 101.00 | AA+ | 308,678 | ||||||||||||||
| 1,000 | Madison County Industrial Development Agency, New York, Civic Facility Revenue Bonds, Morrisville State College Foundation, Series 2005A, 5.000%, 6/01/37 – CIFG Insured | 6/15 at 101.00 | BBB– | 897,310 | ||||||||||||||
New York City Housing Development Corporation, New York, Multifamily Housing Revenue Bonds, Series 2001A: | ||||||||||||||||||
| 2,000 | 5.500%, 11/01/31 | 11/11 at 101.00 | AA | 2,010,240 | ||||||||||||||
| 1,240 | 5.600%, 11/01/42 | 11/11 at 101.00 | AA | 1,246,014 | ||||||||||||||
| 2,000 | New York City Housing Development Corporation, New York, Multifamily Housing Revenue Bonds, Series 2001C-2, 5.400%, 11/01/33 (Alternative Minimum Tax) | 11/11 at 100.00 | AA | 2,001,200 | ||||||||||||||
New York City Housing Development Corporation, New York, Multifamily Housing Revenue Bonds, Series 2002A: | ||||||||||||||||||
| 910 | 5.375%, 11/01/23 (Alternative Minimum Tax) | 5/12 at 100.00 | AA | 915,979 | ||||||||||||||
| 450 | 5.500%, 11/01/34 (Alternative Minimum Tax) | 5/12 at 100.00 | AA | 451,467 | ||||||||||||||
| 2,000 | New York City Housing Development Corporation, New York, Multifamily Housing Revenue Bonds, Series 2004A, 5.250%, 11/01/30 | 5/14 at 100.00 | AA | 2,034,160 | ||||||||||||||
| 38 | Nuveen Investments |
| Principal Amount (000) | Description (1) | Optional Call Provisions (2) | Ratings (3) | Value | ||||||||||||||
Housing/Multifamily (continued) | ||||||||||||||||||
| $ | 540 | New York City Housing Development Corporation, New York, Multifamily Housing Revenue Bonds, Series 2004-H2, 5.125%, 11/01/34 (Alternative Minimum Tax) | 11/14 at 100.00 | AA | $ | 542,576 | ||||||||||||
| 140 | New York City Housing Development Corporation, New York, Multifamily Housing Revenue Bonds, Series 2010-D1A, 5.000%, 11/01/42 | 5/20 at 100.00 | AA | 143,254 | ||||||||||||||
| 2,500 | New York State Housing Finance Agency, Affordable Housing Revenue Bonds, Series 2007B, 5.300%, 11/01/37 (Alternative Minimum Tax) | 11/17 at 100.00 | Aa2 | 2,516,125 | ||||||||||||||
| 705 | New York State Housing Finance Agency, Affordable Housing Revenue, Series 2007A, 5.250%, 11/01/38 (Alternative Minimum Tax) | 11/17 at 100.00 | Aa2 | 707,707 | ||||||||||||||
| 110 | New York State Housing Finance Agency, Mortgage Revenue Refunding Bonds, Housing Project, Series 1996A, 6.125%, 11/01/20 – AGM Insured | 11/11 at 100.00 | AA+ | 110,180 | ||||||||||||||
| 1,790 | New York State Housing Finance Agency, Multifamily Housing Revenue Bonds, Cannon Street Senior Housing Project, Series 2007A, 5.300%, 2/15/39 (Alternative Minimum Tax) | 2/17 at 100.00 | Aa1 | 1,806,772 | ||||||||||||||
| 1,000 | New York State Housing Finance Agency, Secured Mortgage Program Multifamily Housing Revenue Bonds, Series 2001G, 5.400%, 8/15/33 (Alternative Minimum Tax) | 2/12 at 100.00 | Aa1 | 1,000,230 | ||||||||||||||
| 3,030 | Westchester County Industrial Development Agency, New York, GNMA Collateralized Mortgage Loan Revenue Bonds, Living Independently for the Elderly Inc., Series 2001A, 5.400%, 8/20/32 | 2/12 at 102.00 | Aaa | 3,089,661 | ||||||||||||||
| 20,720 | Total Housing/Multifamily | 20,775,453 | ||||||||||||||||
Housing/Single Family – 1.5% | ||||||||||||||||||
| 2,375 | New York State Mortgage Agency, Homeowner Mortgage Revenue Bonds, Series 130, 4.650%, 4/01/27 (Alternative Minimum Tax) | 4/15 at 100.00 | Aa1 | 2,322,109 | ||||||||||||||
| 845 | New York State Mortgage Agency, Homeowner Mortgage Revenue Bonds, Series 145, 5.125%, 10/01/37 (Alternative Minimum Tax) | 4/17 at 100.00 | Aa1 | 849,445 | ||||||||||||||
| 890 | New York State Mortgage Agency, Homeowner Mortgage Revenue Bonds, Series 148, 5.200%, 10/01/32 (Alternative Minimum Tax) | 10/17 at 100.00 | Aa1 | 901,757 | ||||||||||||||
| 420 | New York State Mortgage Agency, Homeowner Mortgage Revenue Bonds, Series 82, 5.650%, 4/01/30 (Alternative Minimum Tax) | 10/11 at 100.00 | Aa1 | 420,210 | ||||||||||||||
| 1,660 | New York State Mortgage Agency, Mortgage Revenue Bonds, Thirty-Third Series A, 4.750%, 4/01/23 (Alternative Minimum Tax) | 4/13 at 101.00 | Aaa | 1,683,406 | ||||||||||||||
| 210 | New York State Mortgage Agency, Mortgage Revenue Bonds, Twenty-Ninth Series, 5.450%, 4/01/31 (Alternative Minimum Tax) | 10/11 at 100.00 | Aaa | 210,086 | ||||||||||||||
| 6,400 | Total Housing/Single Family | 6,387,013 | ||||||||||||||||
Long-Term Care – 3.6% | ||||||||||||||||||
| 230 | Dormitory Authority of the State of New York, FHA-Insured Mortgage Revenue Bonds, Augustana Lutheran Home for the Aged Inc., Series 2001, 5.400%, 2/01/31 – NPFG Insured | 2/12 at 101.00 | Baa1 | 235,594 | ||||||||||||||
| 770 | Dormitory Authority of the State of New York, FHA-Insured Mortgage Revenue Bonds, W.K. Nursing Home Corporation, Series 1996, 5.950%, 2/01/16 | 2/12 at 100.00 | AAA | 788,103 | ||||||||||||||
| 1,070 | Dormitory Authority of the State of New York, GNMA Collateralized Revenue Bonds, Cabrini of Westchester Project, Series 2006, 5.200%, 2/15/41 | 2/17 at 103.00 | AA+ | 1,114,908 | ||||||||||||||
Dormitory Authority of the State of New York, Insured Revenue Bonds, NYSARC Inc Projects, Series 2007B: | ||||||||||||||||||
| 290 | 6.000%, 7/01/26 – AMBAC Insured | 7/19 at 100.00 | A | 318,229 | ||||||||||||||
| 310 | 6.000%, 7/01/27 – AMBAC Insured | 7/19 at 100.00 | A | 338,253 | ||||||||||||||
| 330 | 6.000%, 7/01/28 – AMBAC Insured | 7/19 at 100.00 | A | 358,944 | ||||||||||||||
| 350 | 6.000%, 7/01/29 – AMBAC Insured | 7/19 at 100.00 | A | 379,743 | ||||||||||||||
| 1,460 | 6.000%, 7/01/36 – AMBAC Insured | 7/19 at 100.00 | A | 1,559,411 | ||||||||||||||
| 1,000 | Dormitory Authority of the State of New York, Insured Revenue Bonds, NYSARC Inc Projects, Series 2009A, 6.000%, 7/01/38 | 7/19 at 100.00 | A | 1,064,080 | ||||||||||||||
| Nuveen Investments | 39 |
Portfolio of Investments (Unaudited)
Nuveen New York Municipal Bond Fund (continued)
August 31, 2011
| Principal Amount (000) | Description (1) | Optional Call Provisions (2) | Ratings (3) | Value | ||||||||||||||
Long-Term Care (continued) | ||||||||||||||||||
| $ | 650 | Dormitory Authority of the State of New York, Non-State Supported Debt, Ozanam Hall of Queens Nursing Home Revenue Bonds, Series 2006, 5.000%, 11/01/31 | 11/16 at 100.00 | Ba3 | $ | 497,322 | ||||||||||||
| 1,000 | Dormitory Authority of the State of New York, Revenue Bonds, Miriam Osborn Memorial Home Association, Series 2000B, 6.375%, 7/01/29 – ACA Insured | 1/12 at 101.00 | BBB | 1,003,380 | ||||||||||||||
Dormitory Authority of the State of New York, Revenue Bonds, Providence Rest, Series 2005: | ||||||||||||||||||
| 50 | 5.125%, 7/01/30 – ACA Insured | 7/15 at 100.00 | N/R | 37,667 | ||||||||||||||
| 415 | 5.000%, 7/01/35 – ACA Insured | 7/15 at 100.00 | N/R | 288,334 | ||||||||||||||
| 1,180 | East Rochester Housing Authority, New York, GNMA Secured Revenue Refunding Bonds, Genesee Valley Presbyterian Nursing Center, Series 2001, 5.200%, 12/20/24 | 12/11 at 101.00 | Aaa | 1,196,898 | ||||||||||||||
| 1,700 | East Rochester Housing Authority, New York, Senior Living Revenue Bonds, Woodland Village Project, Series 2006, 5.500%, 8/01/33 | 8/16 at 101.00 | N/R | 1,407,991 | ||||||||||||||
| 340 | New York City Industrial Development Agency, New York, Civic Facility Revenue Bonds, Special Needs Facilities Pooled Program, Series 2000, 8.125%, 7/01/19 | 7/12 at 100.00 | N/R | 343,822 | ||||||||||||||
New York City Industrial Development Agency, New York, Civic Facility Revenue Bonds, Special Needs Facilities Pooled Program, Series 2008A-1: | ||||||||||||||||||
| 1,000 | 5.800%, 7/01/23 | 7/16 at 101.00 | N/R | 894,110 | ||||||||||||||
| 1,175 | 6.100%, 7/01/28 | 7/16 at 101.00 | N/R | 1,023,178 | ||||||||||||||
| 800 | 6.200%, 7/01/33 | 7/16 at 101.00 | N/R | 683,704 | ||||||||||||||
| 1,225 | Suffolk County Economic Development Corporation, New York, Revenue Refunding Bonds, Peconic Landing At Southold, Inc. Project, Series 2010, 6.000%, 12/01/40 | 12/20 at 100.00 | N/R | 1,229,177 | ||||||||||||||
| 220 | Suffolk County Industrial Development Agency, New York, Revenue Bonds, Special Needs Facilities Pooled Program, Series 2001C-1, 7.250%, 7/01/16 | 1/12 at 101.00 | N/R | 222,675 | ||||||||||||||
| 15,565 | Total Long-Term Care | 14,985,523 | ||||||||||||||||
Materials – 0.2% | ||||||||||||||||||
| 700 | Essex County Industrial Development Agency, New York, Environmental Improvement Revenue Bonds, International Paper Company, Series 1999A, 6.450%, 11/15/23 (Alternative Minimum Tax) | 11/11 at 100.00 | BBB | 701,505 | ||||||||||||||
Tax Obligation/General – 4.8% | ||||||||||||||||||
| 1,000 | Erie County, New York, General Obligation Bonds, Series 2005A, 5.000%, 12/01/18 – NPFG Insured | 12/15 at 100.00 | A2 | 1,113,750 | ||||||||||||||
| 10,000 | New York City, New York, General Obligation Bonds, Fiscal 2008 Series D, 5.125%, 12/01/26 | 12/17 at 100.00 | AA | 10,856,100 | ||||||||||||||
| 3,620 | New York City, New York, General Obligation Bonds, Fiscal Series 2005F-1, 5.000%, 9/01/19 – SYNCORA GTY Insured | 9/15 at 100.00 | AA | 4,103,017 | ||||||||||||||
| 1,725 | New York City, New York, General Obligation Bonds, Fiscal Series 2006C, 5.000%, 8/01/16 – AGM Insured | 8/15 at 100.00 | AA+ | 1,977,264 | ||||||||||||||
| 2,085 | Yonkers, New York, General Obligation Bonds, Series 2005B, 5.000%, 8/01/18 – NPFG Insured | 8/15 at 100.00 | A2 | 2,252,863 | ||||||||||||||
| 18,430 | Total Tax Obligation/General | 20,302,994 | ||||||||||||||||
Tax Obligation/Limited – 23.5% | ||||||||||||||||||
| 1,500 | Albany Parking Authority, New York, Revenue Refunding Bonds, Series 1992A, 0.000%, 11/01/17 | No Opt. Call | | N/R | | 1,146,075 | ||||||||||||
Canton Human Services Initiative Inc., New York, Facility Revenue Bonds, Series 2001: | ||||||||||||||||||
| 920 | 5.700%, 9/01/24 | 3/12 at 102.00 | A3 | 922,576 | ||||||||||||||
| 1,155 | 5.750%, 9/01/32 | 3/12 at 102.00 | A3 | 1,114,113 | ||||||||||||||
Dormitory Authority of the State of New York, Residential Insitutions for Children Revenue Bonds, Series 2008-A1: | ||||||||||||||||||
| 2,000 | 5.000%, 6/01/33 | 6/18 at 100.00 | Aa1 | 2,096,060 | ||||||||||||||
| 2,500 | 5.000%, 6/01/38 | 6/18 at 100.00 | Aa1 | 2,597,700 | ||||||||||||||
| 40 | Nuveen Investments |
| Principal Amount (000) | Description (1) | Optional Call Provisions (2) | Ratings (3) | Value | ||||||||||||||
Tax Obligation/Limited (continued) | ||||||||||||||||||
| $ | 1,500 | Dormitory Authority of the State of New York, Revenue Bonds, School Districts Financing Program, Series 2009C, 5.125%, 10/01/36 – AGC Insured | 10/19 at 100.00 | AA+ | $ | 1,566,495 | ||||||||||||
| 4,000 | Dormitory Authority of the State of New York, State Personal Income Tax Revenue Bonds, Education Series 2008A, 5.000%, 3/15/28 | 3/18 at 100.00 | AAA | 4,341,840 | ||||||||||||||
| 3,000 | Dormitory Authority of the State of New York, State Personal Income Tax Revenue Bonds, General Purpose, Series 2009A, 5.000%, 2/15/34 | 2/19 at 100.00 | AAA | 3,186,720 | ||||||||||||||
| 375 | Dormitory Authority of the State of New York, State Personal Income Tax Revenue Bonds, Series 2005F, 5.000%, 3/15/21 – AGM Insured | 3/15 at 100.00 | AAA | 420,071 | ||||||||||||||
| 6,000 | Hudson Yards Infrastructure Corporation, New York, Revenue Bonds, Series 2006A, 5.000%, 2/15/47 – FGIC Insured | 2/17 at 100.00 | A | 5,747,513 | ||||||||||||||
Metropolitan Transportation Authority, New York, Dedicated Tax Fund Bonds, Series 2002A: | ||||||||||||||||||
| 4,400 | 5.250%, 11/15/25 – AGM Insured | 11/12 at 100.00 | AA+ | 4,586,472 | ||||||||||||||
| 2,000 | 5.000%, 11/15/30 | 11/12 at 100.00 | AA | 2,075,440 | ||||||||||||||
Metropolitan Transportation Authority, New York, State Service Contract Refunding Bonds, Series 2002A: | ||||||||||||||||||
| 1,825 | 5.750%, 7/01/18 | No Opt. Call | AA– | 2,242,341 | ||||||||||||||
| 4,400 | 5.125%, 1/01/29 | 7/12 at 100.00 | AA– | 4,508,328 | ||||||||||||||
| 1,680 | Monroe Newpower Corporation, New York, Power Facilities Revenue Bonds, Series 2003, 5.500%, 1/01/34 | 1/13 at 102.00 | BBB | 1,537,150 | ||||||||||||||
New York City Sales Tax Asset Receivable Corporation, New York, Dedicated Revenue Bonds, Local Government Assistance Corporation, Series 2004A: | ||||||||||||||||||
| 3,900 | 5.000%, 10/15/25 – NPFG Insured | 10/14 at 100.00 | AAA | 4,245,774 | ||||||||||||||
| 1,870 | 5.000%, 10/15/26 – NPFG Insured | 10/14 at 100.00 | AAA | 2,026,631 | ||||||||||||||
| 905 | 5.000%, 10/15/29 – AMBAC Insured | 10/14 at 100.00 | AAA | 959,001 | ||||||||||||||
| 4,300 | New York City Transitional Finance Authority, New York, Building Aid Revenue Bonds, Fiscal Series 2007S-2, 5.000%, 1/15/28 – FGIC Insured | 1/17 at 100.00 | AA– | 4,513,237 | ||||||||||||||
| 4,500 | New York City Transitional Finance Authority, New York, Building Aid Revenue Bonds, Fiscal Series 2009-S1, 5.500%, 7/15/31 | 7/18 at 100.00 | AA– | 4,855,590 | ||||||||||||||
| 1,065 | New York City Transitional Finance Authority, New York, Future Tax Secured Bonds, Fiscal Series 2003E, 5.000%, 2/01/23 – FGIC Insured | 2/13 at 100.00 | AAA | 1,120,199 | ||||||||||||||
| 3,705 | New York City Transitional Finance Authority, New York, Future Tax Secured Bonds, Fiscal Series 2007C-1, 5.000%, 11/01/27 | 11/17 at 100.00 | AAA | 4,063,422 | ||||||||||||||
| 335 | New York Convention Center Development Corporation, Hotel Fee Revenue Bonds, Tender Option Bonds Trust 3095, 13.199%, 11/15/44 – AMBAC Insured (IF) | 11/15 at 100.00 | AA+ | 363,100 | ||||||||||||||
| 180 | New York State Environmental Facilities Corporation, Infrastructure Revenue Bonds, Series 2003A, 5.000%, 3/15/21 | 3/14 at 100.00 | AA– | 195,430 | ||||||||||||||
New York State Environmental Facilities Corporation, State Personal Income Tax Revenue Bonds, Series 2008A: | ||||||||||||||||||
| 5,050 | 5.000%, 12/15/26 (UB) | 12/17 at 100.00 | AAA | 5,600,299 | ||||||||||||||
| 60 | 5.000%, 12/15/27 (UB) | 12/17 at 100.00 | AAA | 66,080 | ||||||||||||||
| 2,100 | New York State Housing Finance Agency, State Personal Income Tax Revenue Bonds, Economic Development and Housing, Series 2006A, 5.000%, 3/15/36 | 9/15 at 100.00 | AAA | 2,172,429 | ||||||||||||||
| 1,625 | New York State Local Government Assistance Corporation, Revenue Bonds, Series 1993E, 5.250%, 4/01/16 – AGM Insured | No Opt. Call | AAA | 1,870,863 | ||||||||||||||
| 2,750 | New York State Thruway Authority, Highway and Bridge Trust Fund Bonds, Series 2007, 5.000%, 4/01/27 | 10/17 at 100.00 | AA | 2,971,843 | ||||||||||||||
| 5,500 | New York State Thruway Authority, Highway and Bridge Trust Fund Bonds, Series 2005B, 5.500%, 4/01/20 – AMBAC Insured (UB) | No Opt. Call | AA | 6,773,580 | ||||||||||||||
| 1,500 | New York State Thruway Authority, Second General Highway and Bridge Trust Fund Bonds, Series 2011A-1, 5.000%, 4/01/31 | 4/21 at 100.00 | AA | 1,615,290 | ||||||||||||||
| Nuveen Investments | 41 |
Portfolio of Investments (Unaudited)
Nuveen New York Municipal Bond Fund (continued)
August 31, 2011
| Principal Amount (000) | Description (1) | Optional Call Provisions (2) | Ratings (3) | Value | ||||||||||||||
Tax Obligation/Limited (continued) | ||||||||||||||||||
New York State Tobacco Settlement Financing Corporation, Tobacco Settlement Asset-Backed and State Contingency Contract-Backed Bonds, Series 2003A-1: | ||||||||||||||||||
| $ | 3,300 | 5.250%, 6/01/20 – AMBAC Insured | 6/13 at 100.00 | AA– | $ | 3,513,477 | ||||||||||||
| 2,755 | 5.250%, 6/01/21 – AMBAC Insured | 6/13 at 100.00 | AA– | 2,931,733 | ||||||||||||||
| 4,945 | 5.250%, 6/01/22 – AMBAC Insured | 6/13 at 100.00 | AA– | 5,257,771 | ||||||||||||||
| 3,000 | New York State Tobacco Settlement Financing Corporation, Tobacco Settlement Asset-Backed and State Contingency Contract-Backed Bonds, Series 2003B-1C, 5.500%, 6/01/21 | 6/13 at 100.00 | AA– | 3,208,050 | ||||||||||||||
| 5,000 | Puerto Rico Infrastructure Financing Authority, Special Tax Revenue Bonds, Series 2005A, 0.000%, 7/01/44 – AMBAC Insured | No Opt. Call | BBB+ | 489,550 | ||||||||||||||
| 1,810 | Puerto Rico Sales Tax Financing Corporation, Sales Tax Revenue Bonds, First Subordinate Series 2010C, 5.250%, 8/01/41 | 8/20 at 100.00 | A+ | 1,800,443 | ||||||||||||||
| 97,410 | Total Tax Obligation/Limited | 98,702,686 | ||||||||||||||||
Transportation – 13.1% | ||||||||||||||||||
| 1,500 | Metropolitan Transportation Authority, New York, Transportation Revenue Bonds, Series 2003A, 5.000%, 11/15/15 – FGIC Insured | No Opt. Call | A | 1,720,830 | ||||||||||||||
| 7,000 | Metropolitan Transportation Authority, New York, Transportation Revenue Bonds, Series 2006A, 5.000%, 11/15/31 | 11/16 at 100.00 | A | 7,173,390 | ||||||||||||||
Metropolitan Transportation Authority, New York, Transportation Revenue Refunding Bonds, Series 2002A: | ||||||||||||||||||
| 1,500 | 5.500%, 11/15/19 – AMBAC Insured | 11/12 at 100.00 | A | 1,569,435 | ||||||||||||||
| 1,000 | 5.125%, 11/15/22 – FGIC Insured | 11/12 at 100.00 | A | 1,040,040 | ||||||||||||||
New York City Industrial Development Agency, New York, Civic Facility Revenue Bonds, Bronx Parking Development Company, LLC Project, Series 2007: | ||||||||||||||||||
| 2,800 | 5.750%, 10/01/37 | 10/17 at 100.00 | N/R | 1,492,232 | ||||||||||||||
| 2,000 | 5.875%, 10/01/46 | 10/17 at 102.00 | N/R | 1,065,840 | ||||||||||||||
| 500 | New York City Industrial Development Agency, New York, Special Facilities Revenue Bonds, British Airways PLC, Series 1998, 5.250%, 12/01/32 (Alternative Minimum Tax) | 12/11 at 100.00 | BB– | 407,230 | ||||||||||||||
| 2,200 | New York City Industrial Development Agency, New York, Special Facilities Revenue Bonds, Terminal One Group JFK Project, Series 2005, 5.500%, 1/01/24 (Alternative Minimum Tax) | 1/16 at 100.00 | A3 | 2,275,086 | ||||||||||||||
| 5,265 | New York State Thruway Authority, General Revenue Bonds, Series 2005F, 5.000%, 1/01/20 – AMBAC Insured | 1/15 at 100.00 | A+ | 5,787,815 | ||||||||||||||
| 600 | New York State Thruway Authority, General Revenue Bonds, Series 2005G, 5.000%, 1/01/30 – AGM Insured | 7/15 at 100.00 | AA+ | 628,812 | ||||||||||||||
| 1,000 | Niagara Frontier Airport Authority, New York, Airport Revenue Bonds, Buffalo Niagara International Airport, Series 1999A, 5.625%, 4/01/29 – NPFG Insured (Alternative Minimum Tax) | 10/11 at 100.00 | Baa1 | 969,570 | ||||||||||||||
| 5,000 | Port Authority of New York and New Jersey, Consolidated Revenue Bonds, One Hundred Fifty Second Series 2007, 5.000%, 11/01/28 (Alternative Minimum Tax) | 5/18 at 100.00 | Aa2 | 5,273,350 | ||||||||||||||
| 625 | Port Authority of New York and New Jersey, Consolidated Revenue Bonds, One Hundred Fortieth Series 2005, 5.000%, 12/01/31 – SYNCORA GTY Insured | 6/15 at 101.00 | Aa2 | 652,913 | ||||||||||||||
| 865 | Port Authority of New York and New Jersey, Consolidated Revenue Bonds, One Hundred Forty Eighth Series 2008, Trust 2920, 17.334%, 8/15/32 – AGM Insured (IF) | 8/17 at 100.00 | AA+ | 1,053,259 | ||||||||||||||
| 3,485 | Port Authority of New York and New Jersey, Special Project Bonds, JFK International Air Terminal LLC Project, Eighth Series 2010, 6.000%, 12/01/36 | 12/20 at 100.00 | BBB– | 3,556,477 | ||||||||||||||
| 1,545 | Port Authority of New York and New Jersey, Special Project Bonds, JFK International Air Terminal LLC, Sixth Series 1997, 5.750%, 12/01/25 – NPFG Insured (Alternative Minimum Tax) | 12/11 at 100.00 | Baa1 | 1,499,562 | ||||||||||||||
| 42 | Nuveen Investments |
| Principal Amount (000) | Description (1) | Optional Call Provisions (2) | Ratings (3) | Value | ||||||||||||||
Transportation (continued) | ||||||||||||||||||
| $ | 250 | Puerto Rico Ports Authority, Special Facilities Revenue Bonds, American Airlines Inc., Series 1996A, 6.250%, 6/01/26 (Alternative Minimum Tax) | 12/11 at 100.00 | CCC+ | $ | 205,990 | ||||||||||||
| 15,000 | Triborough Bridge and Tunnel Authority, New York, General Purpose Revenue Refunding Bonds, Series 2002B, 5.250%, 11/15/19 (UB) | 11/12 at 100.00 | Aa2 | 15,871,200 | ||||||||||||||
| 780 | Triborough Bridge and Tunnel Authority, New York, Subordinate Lien General Purpose Revenue Refunding Bonds, Series 2002E, 5.500%, 11/15/20 – NPFG Insured | No Opt. Call | Aa3 | 953,792 | ||||||||||||||
| 1,500 | Triborough Bridge and Tunnel Authority, New York, Subordinate Lien General Purpose Revenue Refunding Bonds, Tender Option Bond Trust 1184, 9.061%, 5/15/16 (IF) | No Opt. Call | Aa2 | 1,662,000 | ||||||||||||||
| 54,415 | Total Transportation | 54,858,823 | ||||||||||||||||
U.S. Guaranteed – 0.9% (4) | ||||||||||||||||||
| 1,250 | Dormitory Authority of the State of New York, Revenue Bonds, North Shore Long Island Jewish Group, Series 2003, 5.375%, 5/01/23 (Pre-refunded 5/01/13) | 5/13 at 100.00 | Aaa | 1,356,213 | ||||||||||||||
| 220 | Dormitory Authority of the State of New York, Suffolk County, Lease Revenue Bonds, Judicial Facilities, Series 1991A, 9.500%, 4/15/14 – FGIC Insured (ETM) | 10/11 at 103.75 | Baa1 | (4) | 265,463 | |||||||||||||
| 855 | Metropolitan Transportation Authority, New York, Commuter Facilities Revenue Bonds, Series 1997B, 5.000%, 7/01/20 – AMBAC Insured (ETM) | 1/12 at 100.00 | N/R | (4) | 893,586 | |||||||||||||
| 1,000 | New York State Urban Development Corporation, State Personal Income Tax Revenue Bonds, State Facilities and Equipment, Series 2002C-1, 5.000%, 3/15/33 (Pre-refunded 3/15/13) | 3/13 at 100.00 | AA+ | (4) | 1,072,090 | |||||||||||||
| 3,325 | Total U.S. Guaranteed | 3,587,352 | ||||||||||||||||
Utilities – 11.1% | ||||||||||||||||||
| 3,000 | Chautauqua County, New York, Industrial Development Agency, Exempt Facility Revenue Bonds, NRG Dunkirk Power Project, Series 2009, | 2/20 at 100.00 | Baa3 | 2,930,340 | ||||||||||||||
| 2,350 | Long Island Power Authority, New York, Electric System General Revenue Bonds, Series 2000A, 0.000%, 6/01/20 – AGM Insured | No Opt. Call | AA+ | 1,787,105 | ||||||||||||||
| 6,000 | Long Island Power Authority, New York, Electric System General Revenue Bonds, Series 2003C, 5.000%, 9/01/16 – CIFG Insured | 9/13 at 100.00 | A3 | 6,411,000 | ||||||||||||||
Long Island Power Authority, New York, Electric System General Revenue Bonds, Series 2006A: | ||||||||||||||||||
| 5,500 | 5.000%, 12/01/23 – FGIC Insured | 6/16 at 100.00 | A– | 5,918,220 | ||||||||||||||
| 1,200 | 5.000%, 12/01/24 – FGIC Insured | 6/16 at 100.00 | A– | 1,281,876 | ||||||||||||||
| 500 | Long Island Power Authority, New York, Electric System General Revenue Bonds, Series 2006B, 5.000%, 12/01/35 – CIFG Insured | 6/16 at 100.00 | A– | 509,800 | ||||||||||||||
| 10,000 | Long Island Power Authority, New York, Electric System Revenue Bonds, Series 2008A, 6.000%, 5/01/33 | 5/19 at 100.00 | A– | 11,221,000 | ||||||||||||||
| 2,400 | Nassau County Industrial Development Authority, New York, Keyspan Glenwood Energy Project, Series 2003, 5.250%, 6/01/27 (Alternative Minimum Tax) | 6/13 at 100.00 | A– | 2,431,800 | ||||||||||||||
| 3,500 | New York State Energy Research and Development Authority, Pollution Control Revenue Bonds, New York State Electric and Gas Corporation, Series 2005A, 4.100%, 3/15/15 – NPFG Insured | 11/11 at 100.00 | BBB+ | 3,506,720 | ||||||||||||||
| 1,500 | Niagara County Industrial Development Agency, New York, Solid Waste Disposal Facility Revenue Bonds, American Ref-Fuel Company of Niagara LP, Series 2001A, 5.450%, 11/15/26 (Mandatory put 11/15/12) (Alternative Minimum Tax) | 11/11 at 101.00 | Baa2 | 1,518,975 | ||||||||||||||
| 400 | Niagara County Industrial Development Agency, New York, Solid Waste Disposal Facility Revenue Bonds, American Ref-Fuel Company of Niagara LP, Series 2001C, 5.625%, 11/15/24 (Mandatory put 11/15/14) (Alternative Minimum Tax) | 11/11 at 101.00 | Baa2 | 405,048 | ||||||||||||||
| Nuveen Investments | 43 |
Portfolio of Investments (Unaudited)
Nuveen New York Municipal Bond Fund (continued)
August 31, 2011
| Principal Amount (000) | Description (1) | Optional Call Provisions (2) | Ratings (3) | Value | ||||||||||||||
Utilities (continued) | ||||||||||||||||||
| $ | 200 | Niagara County Industrial Development Agency, New York, Solid Waste Disposal Facility Revenue Refunding Bonds, American Ref-Fuel Company of Niagara LP, Series 2001D, 5.550%, 11/15/24 (Mandatory put 11/15/15) | 11/11 at 101.00 | Baa2 | $ | 202,482 | ||||||||||||
| 3,000 | Power Authority of the State of New York, General Revenue Bonds, Series 2000A, 5.250%, 11/15/40 | 11/11 at 100.00 | Aa2 | 3,002,280 | ||||||||||||||
| 520 | Power Authority of the State of New York, General Revenue Bonds, Series 2006A, 5.000%, 11/15/19 – FGIC Insured | 11/15 at 100.00 | Aa2 | 587,610 | ||||||||||||||
Suffolk County Industrial Development Agency, New York, Revenue Bonds, Nissequogue Cogeneration Partners Facility, Series 1998: | ||||||||||||||||||
| 930 | 5.300%, 1/01/13 (Alternative Minimum Tax) | 1/12 at 100.00 | N/R | 911,474 | ||||||||||||||
| 4,000 | 5.500%, 1/01/23 (Alternative Minimum Tax) | 1/12 at 100.00 | N/R | 3,799,360 | ||||||||||||||
| 45,000 | Total Utilities | 46,425,090 | ||||||||||||||||
Water and Sewer – 6.1% | ||||||||||||||||||
New York City Municipal Water Finance Authority, New York, Water and Sewer System Revenue Bonds, Second Generation Resolution, Series 2011HH: | ||||||||||||||||||
| 7,500 | 5.000%, 6/15/29 | No Opt. Call | AA+ | 8,252,100 | ||||||||||||||
| 4,500 | 5.000%, 6/15/31 | No Opt. Call | AA+ | 4,848,030 | ||||||||||||||
| 2,000 | 5.000%, 6/15/32 | 6/21 at 100.00 | AA+ | 2,144,640 | ||||||||||||||
| 4,000 | New York State Environmental Facilities Corporation, State Clean Water and Drinking Water Revolving Funds Revenue Bonds, Pooled Loan Issue, Series 2002F, 5.250%, 11/15/18 | 11/12 at 100.00 | AAA | 4,208,840 | ||||||||||||||
| 2,950 | Niagara Falls Public Water Authority, New York, Water and Sewerage Revenue Bonds, Series 2005, 5.000%, 7/15/27 – SYNCORA GTY Insured | 7/15 at 100.00 | BBB– | 3,010,121 | ||||||||||||||
| 1,520 | Puerto Rico Aqueduct and Sewerage Authority, Revenue Bonds, Senior Lien Series 2008A, 6.000%, 7/01/38 | 7/18 at 100.00 | Baa2 | 1,525,761 | ||||||||||||||
| 1,455 | Western Nassau County Water Authority, New York, Water System Revenue Bonds, Series 2005, 5.000%, 5/01/18 – AMBAC Insured | 5/15 at 100.00 | A1 | 1,616,010 | ||||||||||||||
| 23,925 | Total Water and Sewer | 25,605,502 | ||||||||||||||||
| $ | 428,525 | Total Investments (cost $421,678,985) – 103.4% | 434,124,482 | |||||||||||||||
Floating Rate Obligations – (4.3)% | (17,955,000) | |||||||||||||||||
Other Assets Less Liabilities – 0.9% | 3,602,789 | |||||||||||||||||
Net Assets – 100% | $ | 419,772,271 | ||||||||||||||||
| (1) | All percentages shown in the Portfolio of Investments are based on net assets. |
| (2) | Optional Call Provisions: Dates (month and year) and prices of the earliest optional call or redemption. There may be other call provisions at varying prices at later dates. Certain mortgage-backed securities may be subject to periodic principal paydowns. |
| (3) | Ratings: Using the highest of Standard & Poor’s Group (“Standard & Poor’s”), Moody’s Investor Service, Inc. (“Moody’s”) or Fitch, Inc. (“Fitch”) rating. Ratings below BBB by Standard & Poor’s, Baa by Moody’s or BBB by Fitch are considered to be below investment grade. Holdings designated N/R are not rated by any of these national rating agencies. |
| (4) | Backed by an escrow or trust containing sufficient U.S. Government or U.S. Government agency securities, which ensure the timely payment of principal and interest. Bonds backed by U.S. Government or agency securities are given an implied rating equal to the rating of such securities. |
| N/R | Not rated. |
| (ETM) | Escrowed to maturity. |
| (IF) | Inverse floating rate investment. |
| (UB) | Underlying bond of an inverse floating rate trust reflected as a financing transaction. See Notes to Financial Statements, Footnote I — General Information and Significant Accounting Policies, Inverse Floating Rate Securities for more information. |
See accompanying notes to financial statements.
| 44 | Nuveen Investments |
Portfolio of Investments (Unaudited)
Nuveen New York Municipal Bond Fund 2
(formerly Nuveen New York Insured Municipal Bond Fund)
August 31, 2011
| Principal Amount (000) | Description (1) | Optional Call Provisions (2) | Ratings (3) | Value | ||||||||||||||
Consumer Staples – 1.1% | ||||||||||||||||||
| $ | 4,410 | TSASC Inc., New York, Tobacco Asset-Backed Bonds, Series 2006, 5.125%, 6/01/42 | 6/16 at 100.00 | BBB– | $ | 3,052,293 | ||||||||||||
Education and Civic Organizations – 8.4% | ||||||||||||||||||
| 1,000 | Allegany County Industrial Development Agency, New York, Revenue Bonds, Alfred University, Series 1998, 5.000%, 8/01/28 – NPFG Insured | 2/12 at 100.00 | Baa1 | 1,000,180 | ||||||||||||||
| 2,255 | Dormitory Authority of the State of New York, Consolidated Revenue Bonds, City University System, Series 1993A, 5.750%, 7/01/13 – NPFG Insured | No Opt. Call | Aa3 | 2,374,763 | ||||||||||||||
| 2,610 | Dormitory Authority of the State of New York, General Revenue Bonds, Manhattan College, Series 2007A, 5.000%, 7/01/32 – RAAI Insured | 7/17 at 100.00 | N/R | 2,461,491 | ||||||||||||||
| 1,000 | Dormitory Authority of the State of New York, General Revenue Bonds, New York University, Series 2001-1, 5.500%, 7/01/40 – AMBAC Insured | No Opt. Call | AA– | 1,149,190 | ||||||||||||||
| 735 | Dormitory Authority of the State of New York, Housing Revenue Bonds, Fashion Institute of Technology, Series 2007, 5.250%, 7/01/34 – FGIC Insured | No Opt. Call | BBB | 741,791 | ||||||||||||||
| 605 | Dormitory Authority of the State of New York, Insured Revenue Bonds, Fordham University, Series 2002, 5.000%, 7/01/21 – FGIC Insured | 7/12 at 100.00 | A2 | 615,212 | ||||||||||||||
| 1,000 | Dormitory Authority of the State of New York, Insured Revenue Bonds, Yeshiva University, Series 2001, 5.000%, 7/01/30 – AMBAC Insured | 1/12 at 100.00 | A2 | 1,000,550 | ||||||||||||||
| 1,120 | Dormitory Authority of the State of New York, Lease Revenue Bonds, State University Dormitory Facilities, Series 2004A, 5.000%, 7/01/29 – NPFG Insured | 7/15 at 100.00 | Aa2 | 1,160,387 | ||||||||||||||
| 435 | Dormitory Authority of the State of New York, Revenue Bonds, Barnard College, Series 2007A, 5.000%, 7/01/37 – FGIC Insured | 7/17 at 100.00 | BBB | 435,513 | ||||||||||||||
| 1,000 | Dormitory Authority of the State of New York, Revenue Bonds, Canisius College, Series 2000, 5.250%, 7/01/30 – NPFG Insured | 1/12 at 101.00 | Baa1 | 1,002,920 | ||||||||||||||
| 750 | Dormitory Authority of the State of New York, Revenue Bonds, Convent of the Sacred Heart, Series 2011, 5.625%, 11/01/32 – AGM Insured | 5/21 at 100.00 | AA+ | 816,728 | ||||||||||||||
| 585 | Dormitory Authority of the State of New York, Revenue Bonds, New York University, Series 2007, 5.000%, 7/01/32 – AMBAC Insured | 7/17 at 100.00 | AA– | 610,956 | ||||||||||||||
| 1,200 | Dormitory Authority of the State of New York, Revenue Bonds, Non State Supported Debt, Cornell University, Series 2008C, 5.000%, 7/01/37 | 7/20 at 100.00 | Aa1 | 1,287,108 | ||||||||||||||
| 940 | Madison County Industrial Development Agency, New York, Civic Facility Revenue Bonds, Colgate University, Tender Option Bond Trust 3127, 12.894%, 1/01/14 – AMBAC Insured (IF) | No Opt. Call | AA+ | 1,014,119 | ||||||||||||||
| 2,500 | New York City Industrial Development Agency, New York, Civic Facility Revenue Bonds, Polytechnic University, Series 2007, 5.250%, 11/01/37 – ACA Insured | 11/17 at 100.00 | BBB– | 2,433,925 | ||||||||||||||
| 1,000 | New York City Industrial Development Agency, New York, PILOT Revenue Bonds, Queens Baseball Stadium Project, Series 2006, 5.000%, 1/01/46 – AMBAC Insured | 1/17 at 100.00 | BB+ | 806,320 | ||||||||||||||
New York City Industrial Development Authority, New York, PILOT Revenue Bonds, Yankee Stadium Project, Series 2006: | ||||||||||||||||||
| 720 | 5.000%, 3/01/31 – FGIC Insured | 9/16 at 100.00 | BBB– | 721,894 | ||||||||||||||
| 450 | 5.000%, 3/01/36 – NPFG Insured | 9/16 at 100.00 | Baa1 | 433,989 | ||||||||||||||
| 1,710 | 4.500%, 3/01/39 – FGIC Insured | 9/16 at 100.00 | BBB– | 1,499,037 | ||||||||||||||
| 600 | New York City Trust for Cultural Resources, New York, Revenue Bonds, Whitney Museum of American Art, Series 2011, 5.000%, 7/01/31 | 1/21 at 100.00 | A | 604,860 | ||||||||||||||
| 650 | Troy Capital Resource Corporation, New York, Revenue Bonds, Rensselaer Polytechnic Institute, Series 2010A, 5.125%, 9/01/40 | 9/20 at 100.00 | A– | 649,025 | ||||||||||||||
| 22,865 | Total Education and Civic Organizations | 22,819,958 | ||||||||||||||||
| Nuveen Investments | 45 |
Portfolio of Investments (Unaudited)
Nuveen New York Municipal Bond Fund 2 (continued)
(formerly Nuveen New York Insured Municipal Bond Fund)
August 31, 2011
| Principal Amount (000) | Description (1) | Optional Call Provisions (2) | Ratings (3) | Value | ||||||||||||||
Health Care – 12.6% | ||||||||||||||||||
Dormitory Authority of the State of New York, FHA-Insured Mortgage Hospital Revenue Bonds, St. Barnabas Hospital, Series 2002A: | ||||||||||||||||||
| $ | 1,910 | 5.125%, 2/01/22 – AMBAC Insured | 8/12 at 100.00 | N/R | $ | 1,971,120 | ||||||||||||
| 245 | 5.000%, 2/01/31 – AMBAC Insured | 8/12 at 100.00 | N/R | 246,198 | ||||||||||||||
| 1,405 | Dormitory Authority of the State of New York, FHA-Insured Mortgage Revenue Bonds, Hudson Valley Hospital Center, Series 2007, 5.000%, 8/15/27 – AGM Insured | 8/17 at 100.00 | AA+ | 1,489,089 | ||||||||||||||
| 1,910 | Dormitory Authority of the State of New York, FHA-Insured Mortgage Revenue Bonds, Montefiore Hospital, Series 2004, 5.000%, 8/01/29 – FGIC Insured | 2/15 at 100.00 | BBB | 2,023,301 | ||||||||||||||
| 4,000 | Dormitory Authority of the State of New York, FHA-Insured Revenue Bonds, St. Lukes Roosevelt Hospital, Series 2005, 4.900%, 8/15/31 | 8/15 at 100.00 | N/R | 4,033,520 | ||||||||||||||
| 2,260 | Dormitory Authority of the State of New York, Hospital Revenue Bonds, Catholic Health Services of Long Island Obligated Group – St. Francis Hospital, Series 1999A, 5.500%, 7/01/29 – NPFG Insured | 1/12 at 100.00 | A– | 2,260,768 | ||||||||||||||
| 3,125 | Dormitory Authority of the State of New York, Revenue Bonds, Catholic Health Services of Long Island Obligated Group - St. Charles Hospital and Rehabilitation Center, Series 1999A, 5.500%, 7/01/22 – NPFG Insured | 1/12 at 100.00 | A– | 3,128,563 | ||||||||||||||
| 1,870 | Dormitory Authority of the State of New York, Revenue Bonds, Lenox Hill Hospital Obligated Group, Series 2001, 5.500%, 7/01/30 | 1/12 at 101.00 | Baa3 | 1,873,759 | ||||||||||||||
| 2,000 | Dormitory Authority of the State of New York, Revenue Bonds, Memorial Sloan-Kettering Cancer Center, Series 2003-1, 5.000%, 7/01/21 – NPFG Insured | 7/13 at 100.00 | AA | 2,123,460 | ||||||||||||||
| 970 | Dormitory Authority of the State of New York, Revenue Bonds, New York and Presbyterian Hospital, Series 2004A, 5.250%, 8/15/15 – AGM Insured | 8/14 at 100.00 | AA+ | 1,065,952 | ||||||||||||||
| 1,650 | Dormitory Authority of the State of New York, Revenue Bonds, North Shore Health System Obligated Group, Series 1998, 5.000%, 11/01/23 – NPFG Insured | 11/11 at 100.00 | Baa1 | 1,650,941 | ||||||||||||||
| 5,000 | Dormitory Authority of the State of New York, Revenue Bonds, Winthrop South Nassau University Health System Obligated Group, Series 2001A, 5.250%, 7/01/31 – AMBAC Insured | 7/12 at 100.00 | N/R | 5,004,050 | ||||||||||||||
Dutchess County Industrial Development Agency, New York, Civic Facility Revenue Bonds, Vassar Brothers Medical Center Facility, Series 2005: | ||||||||||||||||||
| 545 | 5.500%, 4/01/30 | 10/20 at 100.00 | AA+ | 571,776 | ||||||||||||||
| 950 | 5.500%, 4/01/34 | 10/20 at 100.00 | AA+ | 991,696 | ||||||||||||||
| 1,095 | Monroe County Industrial Development Corporation, New York, FHA Insured Mortgage Revenue Bonds, Unity Hospital of Rochester Project, Series 2010, 5.750%, 8/15/35 | 2/21 at 100.00 | Aa2 | 1,247,391 | ||||||||||||||
New York City Health and Hospitals Corporation, New York, Health System Revenue Bonds, Series 2003A: | ||||||||||||||||||
| 2,000 | 5.250%, 2/15/21 – AMBAC Insured | 2/13 at 100.00 | Aa3 | 2,102,460 | ||||||||||||||
| 1,750 | 5.250%, 2/15/22 – AMBAC Insured | 2/13 at 100.00 | Aa3 | 1,836,993 | ||||||||||||||
| 765 | Westchester County Health Care Corporation, New York, Senior Lien Revenue Bonds, Series 2010-C2, 6.125%, 11/01/37 | 11/20 at 100.00 | A3 | 785,693 | ||||||||||||||
| 33,450 | Total Health Care | 34,406,730 | ||||||||||||||||
Housing/Multifamily – 3.1% | ||||||||||||||||||
| 1,110 | Amherst Industrial Development Agency, New York, Revenue Bonds, UBF Faculty/Student Housing Corporation, University of Buffalo Creekside Project, Series 2002A, 5.000%, 8/01/22 – AMBAC Insured | 8/12 at 101.00 | N/R | 1,118,780 | ||||||||||||||
| 600 | Canton Capital Resource Corporation, New York, Student Housing Facility Revenue Bonds, Grasse River LLC at SUNY Canton Project Series 2010A, 5.000%, 5/01/40 | 5/20 at 100.00 | AA+ | 596,340 | ||||||||||||||
New York City Housing Development Corporation, New York, Capital Fund Program Revenue Bonds, Series 2005A: | ||||||||||||||||||
| 400 | 5.000%, 7/01/14 – FGIC Insured | No Opt. Call | AA+ | 444,048 | ||||||||||||||
| 400 | 5.000%, 7/01/16 – FGIC Insured | 7/15 at 100.00 | AA+ | 451,796 | ||||||||||||||
| 4,030 | 5.000%, 7/01/25 – FGIC Insured | 7/15 at 100.00 | AA+ | 4,230,896 | ||||||||||||||
| 46 | Nuveen Investments |
| Principal Amount (000) | Description (1) | Optional Call Provisions (2) | Ratings (3) | Value | ||||||||||||||
Housing/Multifamily (continued) | ||||||||||||||||||
| $ | 328 | New York City Housing Development Corporation, New York, Multifamily Housing Revenue Bonds, Pass-Through Certificates, Series 1991C, 6.500%, 2/20/19 – AMBAC Insured | 9/11 at 105.00 | N/R | $ | 345,969 | ||||||||||||
| 715 | New York City Housing Development Corporation, New York, Multifamily Housing Revenue Bonds, Series 2010-D1A, 5.000%, 11/01/42 | 5/20 at 100.00 | AA | 731,617 | ||||||||||||||
New York State Housing Finance Agency, Mortgage Revenue Refunding Bonds, Housing Project, Series 1996A: | ||||||||||||||||||
| 310 | 6.100%, 11/01/15 – AGM Insured | 11/11 at 100.00 | AA+ | 311,414 | ||||||||||||||
| 245 | 6.125%, 11/01/20 – AGM Insured | 11/11 at 100.00 | AA+ | 245,402 | ||||||||||||||
| 8,138 | Total Housing/Multifamily | 8,476,262 | ||||||||||||||||
Long-Term Care – 1.5% | ||||||||||||||||||
| 2,000 | Dormitory Authority of the State of New York, FHA-Insured Nursing Home Mortgage Revenue Bonds, Augustana Lutheran Home for the Aged Inc., Series 2000A, 5.500%, 8/01/38 – NPFG Insured | 2/12 at 100.00 | Baa1 | 2,006,820 | ||||||||||||||
| 2,000 | Dormitory Authority of the State of New York, Insured Revenue Bonds, NYSARC Inc., Series 2005A, 5.000%, 7/01/34 – AGM Insured | 7/15 at 100.00 | AA+ | 2,048,520 | ||||||||||||||
| 4,000 | Total Long-Term Care | 4,055,340 | ||||||||||||||||
Tax Obligation/General – 8.0% | ||||||||||||||||||
| 1,000 | Erie County, New York, General Obligation Bonds, Series 2003A, 5.250%, 3/15/16 – NPFG Insured | 3/13 at 100.00 | A2 | 1,056,300 | ||||||||||||||
| 2,000 | Erie County, New York, General Obligation Bonds, Series 2005A, 5.000%, 12/01/18 – NPFG Insured | 12/15 at 100.00 | A2 | 2,227,500 | ||||||||||||||
| 2,250 | Monroe County, New York, General Obligation Public Improvement Bonds, Series 2002, 5.000%, 3/01/16 – FGIC Insured | 3/12 at 100.00 | A3 | 2,281,883 | ||||||||||||||
| 2,000 | Monroe-Woodbury Central School District, Orange County, New York, General Obligation Bonds, Series 2004A, 4.250%, 5/15/22 – FGIC Insured | 5/14 at 100.00 | Aa3 | 2,053,260 | ||||||||||||||
Mount Sinai Union Free School District, Suffolk County, New York, General Obligation Refunding Bonds, Series 1992: | ||||||||||||||||||
| 500 | 6.200%, 2/15/15 – AMBAC Insured | No Opt. Call | Aa3 | 593,155 | ||||||||||||||
| 1,035 | 6.200%, 2/15/16 – AMBAC Insured | No Opt. Call | Aa3 | 1,264,501 | ||||||||||||||
| 1,505 | Nassau County, North Hempstead, New York, General Obligation Refunding Bonds, Series 1992B, 6.400%, 4/01/14 – FGIC Insured | No Opt. Call | Aa1 | 1,724,444 | ||||||||||||||
| 400 | New York City, New York, General Obligation Bonds, Fiscal 2009 Series E, 5.000%, 8/01/28 | 8/19 at 100.00 | AA | 434,332 | ||||||||||||||
| 1,000 | New York City, New York, General Obligation Bonds, Fiscal 2010 Series C, 5.000%, 8/01/23 | 8/19 at 100.00 | AA | 1,127,960 | ||||||||||||||
New York City, New York, General Obligation Bonds, Fiscal Series 2004E: | ||||||||||||||||||
| 1,600 | 5.000%, 11/01/19 – AGM Insured | 11/14 at 100.00 | AA+ | 1,769,904 | ||||||||||||||
| 1,050 | 5.000%, 11/01/20 – AGM Insured | 11/14 at 100.00 | AA+ | 1,159,095 | ||||||||||||||
| 600 | New York City, New York, General Obligation Bonds, Fiscal Series 2005J, 5.000%, 3/01/19 – FGIC Insured | 3/15 at 100.00 | AA | 671,430 | ||||||||||||||
Rensselaer County, New York, General Obligation Bonds, Series 1991: | ||||||||||||||||||
| 960 | 6.700%, 2/15/13 – AMBAC Insured | No Opt. Call | AA– | 1,043,414 | ||||||||||||||
| 960 | 6.700%, 2/15/14 – AMBAC Insured | No Opt. Call | AA– | 1,095,552 | ||||||||||||||
| 960 | 6.700%, 2/15/15 – AMBAC Insured | No Opt. Call | AA– | 1,143,590 | ||||||||||||||
| 1,985 | Yonkers, New York, General Obligation Bonds, Series 2005B, 5.000%, | 8/15 at 100.00 | A2 | 2,168,712 | ||||||||||||||
| 19,805 | Total Tax Obligation/General | 21,815,032 | ||||||||||||||||
Tax Obligation/Limited – 32.2% | ||||||||||||||||||
| 80 | Dormitory Authority of the State of New York, Improvement Revenue Bonds, Mental Health Services Facilities, Series 2000D, 5.250%, 8/15/30 – AGM Insured | 11/11 at 100.00 | AA+ | 80,058 | ||||||||||||||
| Nuveen Investments | 47 |
Portfolio of Investments (Unaudited)
Nuveen New York Municipal Bond Fund 2 (continued)
(formerly Nuveen New York Insured Municipal Bond Fund)
August 31, 2011
| Principal Amount (000) | Description (1) | Optional Call Provisions (2) | Ratings (3) | Value | ||||||||||||||
Tax Obligation/Limited (continued) | ||||||||||||||||||
| $ | 1,000 | Dormitory Authority of the State of New York, Lease Revenue Bonds, Wayne-Finger Lakes Board of Cooperative Education Services, Series 2004, 5.000%, 8/15/23 – AGM Insured | 8/14 at 100.00 | AA+ | $ | 1,045,330 | ||||||||||||
| 2,410 | Dormitory Authority of the State of New York, Revenue Bonds, Department of Health, Series 2004-2, 5.000%, 7/01/20 – FGIC Insured | 7/14 at 100.00 | AA– | 2,582,628 | ||||||||||||||
| 1,000 | Dormitory Authority of the State of New York, Revenue Bonds, Mental Health Services Facilities Improvements, Series 2005D-1, 5.000%, 8/15/23 – FGIC Insured | 2/15 at 100.00 | AA– | 1,052,570 | ||||||||||||||
Dormitory Authority of the State of New York, Revenue Bonds, School Districts Financing Program, Series 2002D: | ||||||||||||||||||
| 5,675 | 5.250%, 10/01/23 – NPFG Insured | 10/12 at 100.00 | A+ | 5,893,374 | ||||||||||||||
| 875 | 5.000%, 10/01/30 – NPFG Insured | 10/12 at 100.00 | A+ | 882,350 | ||||||||||||||
| 2,500 | Dormitory Authority of the State of New York, Secured Hospital Insured Revenue Bonds, Southside Hospital, Series 1998, 5.000%, 2/15/25 – NPFG Insured | 2/12 at 100.00 | Aa3 | 2,501,300 | ||||||||||||||
| 310 | Dormitory Authority of the State of New York, State Personal Income Tax Revenue Bonds, Series 2005F, 5.000%, 3/15/21 – AGM Insured | 3/15 at 100.00 | AAA | 347,259 | ||||||||||||||
| 1,460 | Erie County Industrial Development Agency, New York, School Facility Revenue Bonds, Buffalo City School District Project, Series 2008A, 5.750%, 5/01/27 – AGM Insured | 5/18 at 100.00 | AA+ | 1,628,469 | ||||||||||||||
| 1,100 | Erie County Industrial Development Agency, New York, School Facility Revenue Bonds, Buffalo City School District, Series 2004, 5.750%, 5/01/26 – AGM Insured | 5/14 at 100.00 | AA+ | 1,167,683 | ||||||||||||||
| 8,675 | Hudson Yards Infrastructure Corporation, New York, Revenue Bonds, Series 2006A, 5.000%, 2/15/47 – FGIC Insured | 2/17 at 100.00 | A | 8,309,956 | ||||||||||||||
| 3,000 | Metropolitan Transportation Authority, New York, Dedicated Tax Fund Bonds, Series 2002A, 5.250%, 11/15/25 – AGM Insured | 11/12 at 100.00 | AA+ | 3,127,140 | ||||||||||||||
Metropolitan Transportation Authority, New York, State Service Contract Refunding Bonds, Series 2002A: | ||||||||||||||||||
| 2,000 | 5.500%, 1/01/20 – NPFG Insured | 7/12 at 100.00 | AA– | 2,071,240 | ||||||||||||||
| 1,350 | 5.000%, 7/01/25 – FGIC Insured | 7/12 at 100.00 | AA– | 1,387,530 | ||||||||||||||
New York City Sales Tax Asset Receivable Corporation, New York, Dedicated Revenue Bonds, Local Government Assistance Corporation, Series 2004A: | ||||||||||||||||||
| 1,670 | 5.000%, 10/15/25 – NPFG Insured | 10/14 at 100.00 | AAA | 1,818,062 | ||||||||||||||
| 1,225 | 5.000%, 10/15/26 – NPFG Insured | 10/14 at 100.00 | AAA | 1,327,606 | ||||||||||||||
| 4,970 | 5.000%, 10/15/29 – AMBAC Insured | 10/14 at 100.00 | AAA | 5,266,560 | ||||||||||||||
| 500 | 5.000%, 10/15/32 – AMBAC Insured | 10/14 at 100.00 | AAA | 521,665 | ||||||||||||||
| 3,500 | New York City Transitional Finance Authority, New York, Building Aid Revenue Bonds, Fiscal Series 2007S-2, 5.000%, 1/15/28 – FGIC Insured | 1/17 at 100.00 | AA– | 3,673,565 | ||||||||||||||
| 1,640 | New York City Transitional Finance Authority, New York, Future Tax Secured Bonds, Fiscal Series 2002B, 5.000%, 5/01/30 – NPFG Insured | 11/11 at 101.00 | AAA | 1,660,205 | ||||||||||||||
| 25 | New York City Transitional Finance Authority, New York, Future Tax Secured Bonds, Fiscal Series 2003E, 5.250%, 2/01/22 – NPFG Insured | 2/13 at 100.00 | AAA | 26,362 | ||||||||||||||
| 1,000 | New York City Transitional Finance Authority, New York, Future Tax Secured Refunding Bonds, Fiscal Series 2003D, 5.000%, 2/01/22 – NPFG Insured | 2/13 at 100.00 | AAA | 1,051,110 | ||||||||||||||
New York Convention Center Development Corporation, Hotel Fee Revenue Bonds, Tender Option Bonds Trust 3095: | ||||||||||||||||||
| 440 | 13.213%, 11/15/30 – AMBAC Insured (IF) | 11/15 at 100.00 | AA+ | 501,736 | ||||||||||||||
| 1,060 | 13.199%, 11/15/44 – AMBAC Insured (IF) | 11/15 at 100.00 | AA+ | 1,148,913 | ||||||||||||||
New York State Municipal Bond Bank Agency, Buffalo, Special Program Revenue Bonds, Series 2001A: | ||||||||||||||||||
| 1,185 | 5.250%, 5/15/25 – AMBAC Insured | 11/11 at 100.00 | A1 | 1,188,223 | ||||||||||||||
| 1,250 | 5.250%, 5/15/26 – AMBAC Insured | 11/11 at 100.00 | A1 | 1,253,400 | ||||||||||||||
| 1,000 | New York State Thruway Authority, Highway and Bridge Trust Fund Bonds, Second General, Series 2004A, 5.000%, 4/01/23 – NPFG Insured | 4/14 at 100.00 | AA | 1,058,920 | ||||||||||||||
| 48 | Nuveen Investments |
| Principal Amount (000) | Description (1) | Optional Call Provisions (2) | Ratings (3) | Value | ||||||||||||||
Tax Obligation/Limited (continued) | ||||||||||||||||||
New York State Thruway Authority, Highway and Bridge Trust Fund Bonds, Second General, Series 2005B: | ||||||||||||||||||
| $ | 5,385 | 5.500%, 4/01/20 – AMBAC Insured | No Opt. Call | AA | $ | 6,631,947 | ||||||||||||
| 1,500 | 5.000%, 4/01/21 – AMBAC Insured | 10/15 at 100.00 | AA | 1,652,955 | ||||||||||||||
| 3,500 | New York State Thruway Authority, Second General Highway and Bridge Trust Fund Bonds, Series 2011A-1, 5.000%, 4/01/31 | 4/21 at 100.00 | AA | 3,769,010 | ||||||||||||||
| 1,500 | New York State Thruway Authority, State Personal Income Tax Revenue Bonds, Series 2004A, 5.000%, 3/15/24 – AMBAC Insured | 9/14 at 100.00 | AAA | 1,641,555 | ||||||||||||||
New York State Tobacco Settlement Financing Corporation, Tobacco Settlement Asset-Backed and State Contingency Contract-Backed Bonds, Series 2003A-1: | ||||||||||||||||||
| 3,900 | 5.250%, 6/01/20 – AMBAC Insured | 6/13 at 100.00 | AA– | 4,152,291 | ||||||||||||||
| 250 | 5.250%, 6/01/21 – AMBAC Insured | 6/13 at 100.00 | AA– | 266,038 | ||||||||||||||
| 5,400 | 5.250%, 6/01/22 – AMBAC Insured | 6/13 at 100.00 | AA– | 5,741,550 | ||||||||||||||
| 1,200 | New York State Urban Development Corporation, State Personal Income Tax Revenue Bonds, Series 2005B, 5.000%, 3/15/30 – AGM Insured | 3/15 at 100.00 | AAA | 1,257,168 | ||||||||||||||
| 675 | Niagara Falls City School District, Niagara County, New York, Certificates of Participation, High School Facility, Series 2005, 5.000%, 6/15/28 – AGM Insured | 6/15 at 100.00 | AA+ | 689,897 | ||||||||||||||
| 4,000 | Puerto Rico Highway and Transportation Authority, Highway Revenue Refunding Bonds, Series 2002E, 5.500%, 7/01/18 – AGM Insured | No Opt. Call | AA+ | 4,535,560 | ||||||||||||||
| 1,055 | Puerto Rico Sales Tax Financing Corporation, Sales Tax Revenue Bonds, First Subordinate Series 2010C, 5.125%, 8/01/42 – AGM Insured | 8/20 at 100.00 | AA+ | 1,075,372 | ||||||||||||||
| 1,850 | Puerto Rico Sales Tax Financing Corporation, Sales Tax Revenue Bonds, Series 2007A, 5.250%, 8/01/57 | 8/17 at 100.00 | Aa2 | 1,883,689 | ||||||||||||||
| 2,235 | Syracuse Industrial Development Authority, New York, PILOT Mortgage Revenue Bonds, Carousel Center Project, Series 2007A, 5.000%, 1/01/36 – SYNCORA GTY Insured (Alternative Minimum Tax) | 1/17 at 100.00 | BBB– | 1,867,320 | ||||||||||||||
| 83,350 | Total Tax Obligation/Limited | 87,737,566 | ||||||||||||||||
Transportation – 16.1% | ||||||||||||||||||
Metropolitan Transportation Authority, New York, Transportation Revenue Bonds, Series 2003A: | ||||||||||||||||||
| 1,500 | 5.000%, 11/15/15 – FGIC Insured | No Opt. Call | A | 1,720,830 | ||||||||||||||
| 2,605 | 5.000%, 11/15/25 – AGM Insured | 11/13 at 100.00 | AA+ | 2,736,292 | ||||||||||||||
| 1,180 | Metropolitan Transportation Authority, New York, Transportation Revenue Bonds, Series 2005A, 4.750%, 11/15/27 – NPFG Insured | 11/15 at 100.00 | AA+ | 1,228,581 | ||||||||||||||
| 4,250 | Metropolitan Transportation Authority, New York, Transportation Revenue Refunding Bonds, Series 2002A, 5.500%, 11/15/18 – AMBAC Insured | 11/12 at 100.00 | A | 4,452,003 | ||||||||||||||
Metropolitan Transportation Authority, New York, Transportation Revenue Refunding Bonds, Series 2002E: | ||||||||||||||||||
| 3,185 | 5.500%, 11/15/18 – NPFG Insured | 11/12 at 100.00 | A | �� | 3,336,383 | |||||||||||||
| 7,155 | 5.500%, 11/15/19 – NPFG Insured | 11/12 at 100.00 | A | 7,486,205 | ||||||||||||||
| 1,470 | New York City Industrial Development Agency, New York, Special Facilities Revenue Bonds, Terminal One Group JFK Project, Series 2005, 5.500%, 1/01/24 (Alternative Minimum Tax) | 1/16 at 100.00 | A3 | 1,520,171 | ||||||||||||||
| 580 | New York State Thruway Authority, General Revenue Bonds, Refunding Series 2007H, 5.000%, 1/01/25 – FGIC Insured | 1/18 at 100.00 | A+ | 625,420 | ||||||||||||||
| 295 | New York State Thruway Authority, General Revenue Bonds, Series 2005F, 5.000%, 1/01/30 – AMBAC Insured | 1/15 at 100.00 | A+ | 309,355 | ||||||||||||||
New York State Thruway Authority, General Revenue Bonds, Series 2005G: | ||||||||||||||||||
| 1,000 | 5.000%, 1/01/30 – AGM Insured | 7/15 at 100.00 | AA+ | 1,048,020 | ||||||||||||||
| 3,000 | 5.000%, 1/01/32 – AGM Insured | 7/15 at 100.00 | AA+ | 3,126,600 | ||||||||||||||
| Nuveen Investments | 49 |
Portfolio of Investments (Unaudited)
Nuveen New York Municipal Bond Fund 2 (continued)
(formerly Nuveen New York Insured Municipal Bond Fund)
August 31, 2011
| Principal Amount (000) | Description (1) | Optional Call Provisions (2) | Ratings (3) | Value | ||||||||||||||
Transportation (continued) | ||||||||||||||||||
Niagara Frontier Airport Authority, New York, Airport Revenue Bonds, Buffalo Niagara International Airport, Series 1998: | ||||||||||||||||||
| $ | 1,000 | 5.000%, 4/01/18 – FGIC Insured (Alternative Minimum Tax) | 10/11 at 100.00 | BBB | $ | 993,870 | ||||||||||||
| 1,500 | 5.000%, 4/01/28 – FGIC Insured (Alternative Minimum Tax) | 10/11 at 100.00 | BBB | 1,372,440 | ||||||||||||||
| 3,000 | Niagara Frontier Airport Authority, New York, Airport Revenue Bonds, Buffalo Niagara International Airport, Series 1999A, 5.625%, 4/01/29 – NPFG Insured (Alternative Minimum Tax) | 10/11 at 100.00 | Baa1 | 2,908,710 | ||||||||||||||
Port Authority of New York and New Jersey, Consolidated Revenue Bonds, One Hundred Fortieth Series 2005: | ||||||||||||||||||
| 500 | 5.000%, 12/01/19 – AGM Insured | 6/15 at 101.00 | AA+ | 567,885 | ||||||||||||||
| 2,000 | 5.000%, 12/01/28 – SYNCORA GTY Insured | 6/15 at 101.00 | Aa2 | 2,112,980 | ||||||||||||||
| 1,100 | 5.000%, 12/01/31 – SYNCORA GTY Insured | 6/15 at 101.00 | Aa2 | 1,149,126 | ||||||||||||||
| 670 | Port Authority of New York and New Jersey, Consolidated Revenue Bonds, One Hundred Forty Eighth Series 2008, Trust 2920, 17.334%, 8/15/32 – AGM Insured (IF) | 8/17 at 100.00 | AA+ | 815,819 | ||||||||||||||
| 3,000 | Port Authority of New York and New Jersey, Special Project Bonds, JFK International Air Terminal LLC, Sixth Series 1997, 5.750%, 12/01/25 – NPFG Insured (Alternative Minimum Tax) | 12/11 at 100.00 | Baa1 | 2,911,770 | ||||||||||||||
| 2,500 | Triborough Bridge and Tunnel Authority, New York, General Purpose Revenue Bonds, Series 2002A, 5.250%, 1/01/19 – FGIC Insured | 1/12 at 100.00 | Aa2 | 2,540,500 | ||||||||||||||
| 780 | Triborough Bridge and Tunnel Authority, New York, Subordinate Lien General Purpose Revenue Refunding Bonds, Series 2002E, 5.500%, 11/15/20 – NPFG Insured | No Opt. Call | Aa3 | 953,792 | ||||||||||||||
| 42,270 | Total Transportation | 43,916,752 | ||||||||||||||||
U.S. Guaranteed – 0.7% (4) | ||||||||||||||||||
| 665 | Erie County Water Authority, New York, Water Revenue Bonds, Series 1990B, 6.750%, 12/01/14 – AMBAC Insured (ETM) | | No Opt. Call | | AAA | 731,487 | ||||||||||||
| 1,295 | Metropolitan Transportation Authority, New York, Commuter Facilities Revenue Bonds, Series 1997B, 5.125%, 7/01/24 – AMBAC Insured (ETM) | 1/12 at 100.00 | N/R | (4) | 1,355,464 | |||||||||||||
| 1,960 | Total U.S. Guaranteed | 2,086,951 | ||||||||||||||||
Utilities – 10.3% | ||||||||||||||||||
| 1,200 | Guam Power Authority, Revenue Bonds, Series 2010A, 5.000%, 10/01/37 – AGM Insured | 10/20 at 100.00 | AA+ | 1,221,876 | ||||||||||||||
| 6,000 | Long Island Power Authority, New York, Electric System General Revenue Bonds, Series 1998A, 0.000%, 12/01/19 – AGM Insured | No Opt. Call | AA+ | 4,739,880 | ||||||||||||||
Long Island Power Authority, New York, Electric System General Revenue Bonds, Series 2000A: | ||||||||||||||||||
| 2,000 | 0.000%, 6/01/24 – AGM Insured | No Opt. Call | AA+ | 1,225,760 | ||||||||||||||
| 2,000 | 0.000%, 6/01/25 – AGM Insured | No Opt. Call | AA+ | 1,158,920 | ||||||||||||||
| 1,500 | Long Island Power Authority, New York, Electric System General Revenue Bonds, Series 2001A, 5.000%, 9/01/27 – AGM Insured | 3/12 at 100.00 | AA+ | 1,502,130 | ||||||||||||||
Long Island Power Authority, New York, Electric System General Revenue Bonds, Series 2006A: | ||||||||||||||||||
| 3,300 | 5.000%, 12/01/23 – FGIC Insured | 6/16 at 100.00 | A– | 3,550,932 | ||||||||||||||
| 2,615 | 5.000%, 12/01/25 – FGIC Insured | 6/16 at 100.00 | A– | 2,778,673 | ||||||||||||||
| 250 | Long Island Power Authority, New York, Electric System General Revenue Bonds, Series 2006B, 5.000%, 12/01/35 – CIFG Insured | 6/16 at 100.00 | A– | 254,900 | ||||||||||||||
| 5,000 | Long Island Power Authority, New York, Electric System General Revenue Bonds, Series 2006C, 5.000%, 9/01/35 – BHAC Insured | 9/16 at 100.00 | AA+ | 5,139,000 | ||||||||||||||
| 5,000 | Long Island Power Authority, New York, Electric System Revenue Bonds, Series 2008A, 5.500%, 5/01/33 – BHAC Insured | 5/19 at 100.00 | AA+ | 5,447,650 | ||||||||||||||
| 50 | Nuveen Investments |
| Principal Amount (000) | Description (1) | Optional Call Provisions (2) | Ratings (3) | Value | ||||||||||||||
Utilities (continued) | ||||||||||||||||||
| $ | 1,000 | New York State Energy Research and Development Authority, Electric Facilities Revenue Bonds, Long Island Lighting Company, Series 1995A, 5.300%, 8/01/25 – NPFG Insured (Alternative Minimum Tax) | 3/12 at 100.00 | A– | $ | 1,000,390 | ||||||||||||
| 29,865 | Total Utilities | 28,020,111 | ||||||||||||||||
Water and Sewer – 4.9% | ||||||||||||||||||
| 3,000 | New York City Municipal Water Finance Authority, New York, Water and Sewer System Revenue Bonds, Second Generation Resolution, Series 2011HH, 5.000%, 6/15/29 | No Opt. Call | AA+ | 3,300,840 | ||||||||||||||
| 2,105 | New York City Municipal Water Finance Authority, New York, Water and Sewer System Revenue Bonds, Series 2006B, 5.000%, 6/15/36 – NPFG Insured | 6/16 at 100.00 | AAA | 2,177,707 | ||||||||||||||
| 3,340 | New York City Municipal Water Finance Authority, New York, Water and Sewerage System Revenue Bonds, Fiscal Series 2005C, 5.000%, 6/15/27 – NPFG Insured | 6/15 at 100.00 | AAA | 3,629,845 | ||||||||||||||
| 4,000 | Suffolk County Water Authority, New York, Waterworks Revenue Bonds, Series 2005C, 5.000%, 6/01/28 – NPFG Insured | 6/15 at 100.00 | AA+ | 4,181,000 | ||||||||||||||
| 12,445 | Total Water and Sewer | 13,289,392 | ||||||||||||||||
| $ | 262,558 | Total Investments (cost $258,314,945) – 98.9% | 269,676,387 | |||||||||||||||
Other Assets Less Liabilities – 1.1% | 3,034,540 | |||||||||||||||||
Net Assets – 100% | $ | 272,710,927 | ||||||||||||||||
| (1) | All percentages shown in the Portfolio of Investments are based on net assets. |
| (2) | Optional Call Provisions: Dates (month and year) and prices of the earliest optional call or redemption. There may be other call provisions at varying prices at later dates. Certain mortgage-backed securities may be subject to periodic principal paydowns. |
| (3) | Ratings: Using the highest of Standard & Poor’s Group (“Standard & Poor’s”), Moody’s Investor Service, Inc. (“Moody’s”) or Fitch, Inc. (“Fitch”) rating. Ratings below BBB by Standard & Poor’s, Baa by Moody’s or BBB by Fitch are considered to be below investment grade. Holdings designated N/R are not rated by any of these national rating agencies. |
| (4) | Backed by an escrow or trust containing sufficient U.S. Government or U.S. Government agency securities, which ensure the timely payment of principal and interest. Bonds backed by U.S. Government or agency securities are given an implied rating equal to the rating of such securities. |
| N/R | Not rated. |
| (ETM) | Escrowed to maturity. |
| (IF) | Inverse floating rate investment. |
See accompanying notes to financial statements.
| Nuveen Investments | 51 |
Statement of Assets and Liabilities (Unaudited)
August 31, 2011
Connecticut | New Jersey | New York | New York 2 | |||||||||||||
Assets | ||||||||||||||||
Investments, at value (cost $333,893,849, $234,734,989, $421,678,985 and $258,314,945, respectively) | $ | 343,738,182 | $ | 240,693,733 | $ | 434,124,482 | $ | 269,676,387 | ||||||||
Cash | 2,645,110 | 3,078,514 | 283,381 | 616,702 | ||||||||||||
Receivables: | ||||||||||||||||
Interest | 3,822,193 | 2,844,593 | 5,329,330 | 3,192,232 | ||||||||||||
Investments sold | 1,939,787 | 85,000 | — | — | ||||||||||||
Shares sold | 325,369 | 139,744 | 790,721 | 31,789 | ||||||||||||
Other assets | 30,050 | — | 39,049 | 43,934 | ||||||||||||
Total assets | 352,500,691 | 246,841,584 | 440,566,963 | 273,561,044 | ||||||||||||
Liabilities | ||||||||||||||||
Floating rate obligations | 10,000,000 | — | 17,955,000 | — | ||||||||||||
Payables: | ||||||||||||||||
Dividends | 500,113 | 423,272 | 633,336 | 235,284 | ||||||||||||
Investments purchased | — | 265,752 | 1,407,865 | — | ||||||||||||
Shares redeemed | 286,830 | 281,526 | 331,418 | 315,515 | ||||||||||||
Accrued expenses: | ||||||||||||||||
Management fees | 149,688 | 108,675 | 198,418 | 122,890 | ||||||||||||
12b-1 distribution and service fees | 78,332 | 49,780 | 78,230 | 28,572 | ||||||||||||
Other | 130,977 | 88,649 | 190,425 | 147,856 | ||||||||||||
Total liabilities | 11,145,940 | 1,217,654 | 20,794,692 | 850,117 | ||||||||||||
Net assets | $ | 341,354,751 | $ | 245,623,930 | $ | 419,772,271 | $ | 272,710,927 | ||||||||
Class A Shares | ||||||||||||||||
Net assets | $ | 252,126,638 | $ | 132,620,706 | $ | 207,713,909 | $ | 84,936,311 | ||||||||
Shares outstanding | 23,780,241 | 12,386,125 | 19,210,255 | 8,300,583 | ||||||||||||
Net asset value per share | $ | 10.60 | $ | 10.71 | $ | 10.81 | $ | 10.23 | ||||||||
Offering price per share (net asset value per share plus maximum sales charge of 4.20% of offering price) | $ | 11.06 | $ | 11.18 | $ | 11.28 | $ | 10.68 | ||||||||
Class B Shares | ||||||||||||||||
Net assets | $ | 1,804,174 | $ | 3,257,198 | $ | 4,011,488 | $ | 1,585,353 | ||||||||
Shares outstanding | 170,321 | 303,983 | 371,323 | 154,541 | ||||||||||||
Net asset value and offering price per share | $ | 10.59 | $ | 10.72 | $ | 10.80 | $ | 10.26 | ||||||||
Class C Shares | ||||||||||||||||
Net assets | $ | 53,583,463 | $ | 38,795,899 | $ | 62,494,238 | $ | 20,092,326 | ||||||||
Shares outstanding | 5,058,769 | 3,635,136 | 5,780,812 | 1,961,468 | ||||||||||||
Net asset value and offering price per share | $ | 10.59 | $ | 10.67 | $ | 10.81 | $ | 10.24 | ||||||||
Class I Shares | ||||||||||||||||
Net assets | $ | 33,840,476 | $ | 70,950,127 | $ | 145,552,636 | $ | 166,096,937 | ||||||||
Shares outstanding | 3,180,080 | 6,604,159 | 13,441,194 | 16,165,633 | ||||||||||||
Net asset value and offering price per share | $ | 10.64 | $ | 10.74 | $ | 10.83 | $ | 10.27 | ||||||||
Net assets consist of: | ||||||||||||||||
Capital paid-in | $ | 330,390,750 | $ | 240,753,442 | $ | 406,027,018 | $ | 262,517,699 | ||||||||
Undistributed (Over-distribution of) net investment income | 304,461 | 1,227,718 | 1,663,363 | 455,469 | ||||||||||||
Accumulated net realized gain (loss) | 815,207 | (2,315,974 | ) | (363,607 | ) | (1,623,683 | ) | |||||||||
Net unrealized appreciation (depreciation) | 9,844,333 | 5,958,744 | 12,445,497 | 11,361,442 | ||||||||||||
Net assets | $ | 341,354,751 | $ | 245,623,930 | $ | 419,772,271 | $ | 272,710,927 | ||||||||
Authorized shares | Unlimited | Unlimited | Unlimited | Unlimited | ||||||||||||
Par value per share | $ | 0.01 | $ | 0.01 | $ | 0.01 | $ | 0.01 | ||||||||
See accompanying notes to financial statements.
| 52 | Nuveen Investments |
Statement of Operations (Unaudited)
Six Months Ended August 31, 2011
| Connecticut | New Jersey | New York | New York 2 | |||||||||||||
Investment Income | $ | 8,399,836 | $ | 6,353,185 | $ | 10,959,294 | $ | 6,589,847 | ||||||||
Expenses | ||||||||||||||||
Management fees | 875,383 | 630,332 | 1,076,666 | 716,552 | ||||||||||||
12b-1 service fees – Class A | 250,277 | 129,139 | 208,621 | 86,707 | ||||||||||||
12b-1 distribution and service fees – Class B | 9,678 | 17,352 | 20,837 | 9,178 | ||||||||||||
12b-1 distribution and service fees – Class C | 199,793 | 143,228 | 231,209 | 76,122 | ||||||||||||
Shareholders’ servicing agent fees and expenses | 66,517 | 61,916 | 117,339 | 78,423 | ||||||||||||
Interest expense on floating rate obligations | 20,910 | — | 39,537 | 6,794 | ||||||||||||
Custodian’s fees and expenses | 36,448 | 26,887 | 48,815 | 31,236 | ||||||||||||
Trustees’ fees and expenses | 4,148 | 3,029 | 5,078 | 3,351 | ||||||||||||
Professional fees | 9,119 | 8,547 | 9,374 | 8,667 | ||||||||||||
Shareholders’ reports – printing and mailing expenses | 29,834 | 27,706 | 46,774 | 30,115 | ||||||||||||
Federal and state registration fees | 1,215 | 1,161 | 1,504 | 1,404 | ||||||||||||
Other expenses | 3,009 | 2,544 | 4,230 | 2,459 | ||||||||||||
Total expenses before custodian fee credit | 1,506,331 | 1,051,841 | 1,809,984 | 1,051,008 | ||||||||||||
Custodian fee credit | (2,131 | ) | (657 | ) | (76 | ) | (520 | ) | ||||||||
Net expenses | 1,504,200 | 1,051,184 | 1,809,908 | 1,050,488 | ||||||||||||
Net investment income (loss) | 6,895,636 | 5,302,001 | 9,149,386 | 5,539,359 | ||||||||||||
Realized and Unrealized Gain (Loss) | ||||||||||||||||
Net realized gain (loss) from investments | 481,437 | (2,128,166 | ) | (54,951 | ) | 951,663 | ||||||||||
Change in net unrealized appreciation (depreciation) of investments | 12,472,684 | 12,956,292 | 16,292,808 | 8,649,770 | ||||||||||||
Net realized and unrealized gain (loss) | 12,954,121 | 10,828,126 | 16,237,857 | 9,601,433 | ||||||||||||
Net increase (decrease) in net assets from operations | $ | 19,849,757 | $ | 16,130,127 | $ | 25,387,243 | $ | 15,140,792 | ||||||||
See accompanying notes to financial statements.
| Nuveen Investments | 53 |
Statement of Changes in Net Assets (Unaudited)
| Connecticut | New Jersey | |||||||||||||||
| Six Months Ended 8/31/11 | Year Ended 2/28/11 | Six Months Ended 8/31/11 | Year Ended 2/28/11 | |||||||||||||
Operations | ||||||||||||||||
Net investment income (loss) | $ | 6,895,636 | $ | 13,707,617 | $ | 5,302,001 | $ | 10,610,383 | ||||||||
Net realized gain (loss) from investments | 481,437 | 593,660 | (2,128,166 | ) | (54,839 | ) | ||||||||||
Change in net unrealized appreciation (depreciation) of investments | 12,472,684 | (10,670,226 | ) | 12,956,292 | (10,646,481 | ) | ||||||||||
Net increase (decrease) in net assets from operations | 19,849,757 | 3,631,051 | 16,130,127 | (90,937 | ) | |||||||||||
Distributions to Shareholders | ||||||||||||||||
From net investment income: | ||||||||||||||||
Class A | (5,044,465 | ) | (10,268,834 | ) | (2,727,063 | ) | (5,237,266 | ) | ||||||||
Class B | (33,466 | ) | (129,771 | ) | (63,742 | ) | (219,630 | ) | ||||||||
Class C | (936,595 | ) | (1,993,081 | ) | (700,287 | ) | (1,457,982 | ) | ||||||||
Class I | (690,364 | ) | (1,268,457 | ) | (1,539,674 | ) | (3,395,340 | ) | ||||||||
From accumulated net realized gains: | ||||||||||||||||
Class A | — | (61,243 | ) | — | — | |||||||||||
Class B | — | (760 | ) | — | — | |||||||||||
Class C | — | (14,290 | ) | — | — | |||||||||||
Class I | — | (7,785 | ) | — | — | |||||||||||
Decrease in net assets from distributions to shareholders | (6,704,890 | ) | (13,744,221 | ) | (5,030,766 | ) | (10,310,218 | ) | ||||||||
Fund Share Transactions | ||||||||||||||||
Proceeds from sale of shares | 15,147,359 | 75,890,386 | 18,718,769 | 62,151,938 | ||||||||||||
Proceeds from shares issued to shareholders due | 3,594,621 | 7,656,224 | 2,470,301 | 5,327,069 | ||||||||||||
| 18,741,980 | 83,546,610 | 21,189,070 | 67,479,007 | |||||||||||||
Cost of shares redeemed | (33,238,799 | ) | (75,036,986 | ) | (24,463,297 | ) | (63,745,709 | ) | ||||||||
Net increase (decrease) in net assets from Fund share transactions | (14,496,819 | ) | 8,509,624 | (3,274,227 | ) | 3,733,298 | ||||||||||
Net increase (decrease) in net assets | (1,351,952 | ) | (1,603,546 | ) | 7,825,134 | (6,667,857 | ) | |||||||||
Net assets at the beginning of period | 342,706,703 | 344,310,249 | 237,798,796 | 244,466,653 | ||||||||||||
Net assets at the end of period | $ | 341,354,751 | $ | 342,706,703 | $ | 245,623,930 | $ | 237,798,796 | ||||||||
Undistributed (Over-distribution of) net investment income at the end of period | $ | 304,461 | $ | 113,715 | $ | 1,227,718 | $ | 956,483 | ||||||||
See accompanying notes to financial statements.
| 54 | Nuveen Investments |
Statement of Changes in Net Assets (Unaudited) (continued)
| New York | New York 2 | |||||||||||||||
| Six Months Ended 8/31/11 | Year Ended 2/28/11 | Six Months Ended 8/31/11 | Year Ended 2/28/11 | |||||||||||||
Operations | ||||||||||||||||
Net investment income (loss) | $ | 9,149,386 | $ | 19,418,819 | $ | 5,539,359 | $ | 11,632,560 | ||||||||
Net realized gain (loss) from investments | (54,951 | ) | (195,747 | ) | 951,663 | 393,022 | ||||||||||
Change in net unrealized appreciation (depreciation) of investments | 16,292,808 | (14,294,940 | ) | 8,649,770 | (8,486,247 | ) | ||||||||||
Net increase (decrease) in net assets from operations | 25,387,243 | 4,928,132 | 15,140,792 | 3,539,335 | ||||||||||||
Distributions to Shareholders | ||||||||||||||||
From net investment income: | ||||||||||||||||
Class A | (4,470,156 | ) | (9,475,130 | ) | (1,677,002 | ) | (3,682,231 | ) | ||||||||
Class B | (77,958 | ) | (248,394 | ) | (30,344 | ) | (124,221 | ) | ||||||||
Class C | (1,147,412 | ) | (2,384,714 | ) | (337,784 | ) | (664,629 | ) | ||||||||
Class I | (3,194,998 | ) | (6,751,310 | ) | (3,395,665 | ) | (7,073,056 | ) | ||||||||
From accumulated net realized gains: | ||||||||||||||||
Class A | — | — | — | — | ||||||||||||
Class B | — | — | — | — | ||||||||||||
Class C | — | — | — | — | ||||||||||||
Class I | — | — | — | — | ||||||||||||
Decrease in net assets from distributions to shareholders | (8,890,524 | ) | (18,859,548 | ) | (5,440,795 | ) | (11,544,137 | ) | ||||||||
Fund Share Transactions | ||||||||||||||||
Proceeds from sale of shares | 27,030,723 | 76,108,260 | 3,174,998 | 19,129,686 | ||||||||||||
Proceeds from shares issued to shareholders due to reinvestment of distributions | 5,006,269 | 11,242,766 | 3,880,671 | 7,993,309 | ||||||||||||
| 32,036,992 | 87,351,026 | 7,055,669 | 27,122,995 | |||||||||||||
Cost of shares redeemed | (45,768,573 | ) | (103,288,694 | ) | (19,608,147 | ) | (40,992,440 | ) | ||||||||
Net increase (decrease) in net assets from Fund share transactions | (13,731,581 | ) | (15,937,668 | ) | (12,552,478 | ) | (13,869,445 | ) | ||||||||
Net increase (decrease) in net assets | 2,765,138 | (29,869,084 | ) | (2,852,481 | ) | (21,874,247 | ) | |||||||||
Net assets at the beginning of period | 417,007,133 | 446,876,217 | 275,563,408 | 297,437,655 | ||||||||||||
Net assets at the end of period | $ | 419,772,271 | $ | 417,007,133 | $ | 272,710,927 | $ | 275,563,408 | ||||||||
Undistributed (Over-distribution of) net investment income at the end of period | $ | 1,663,363 | $ | 1,404,501 | $ | 455,469 | $ | 356,905 | ||||||||
See accompanying notes to financial statements.
| Nuveen Investments | 55 |
Financial Highlights (Unaudited)
| Selected data for a share outstanding throughout each period: | ||||||||||||||||||||||||||||||||||||
| Class (Commencement Date) | ||||||||||||||||||||||||||||||||||||
| Investment Operations | Less Distributions | |||||||||||||||||||||||||||||||||||
| CONNECTICUT | ||||||||||||||||||||||||||||||||||||
| Year Ended February 28/29, | Beginning Net Asset Value | Net Invest- | Net Realized/ Unrealized Gain (Loss) | Total | Net Invest- ment Income | Capital Gains(b) | Total | Ending Net Asset Value | Total Return(c) | |||||||||||||||||||||||||||
Class A (7/87) |
| |||||||||||||||||||||||||||||||||||
2012(g) | $ | 10.19 | $ | .22 | $ | .40 | $ | .62 | $ | (.21 | ) | $ | — | $ | (.21 | ) | $ | 10.60 | 6.15 | % | ||||||||||||||||
2011 | 10.49 | .42 | (.30 | ) | .12 | (.42 | ) | — | ** | (.42 | ) | 10.19 | 1.13 | |||||||||||||||||||||||
2010 | 9.77 | .43 | .71 | 1.14 | (.42 | ) | — | (.42 | ) | 10.49 | 11.86 | |||||||||||||||||||||||||
2009 | 10.01 | .42 | (.21 | ) | .21 | (.42 | ) | (.03 | ) | (.45 | ) | 9.77 | 2.20 | |||||||||||||||||||||||
2008 | 10.67 | .42 | (.65 | ) | (.23 | ) | (.42 | ) | (.01 | ) | (.43 | ) | 10.01 | (2.24 | ) | |||||||||||||||||||||
2007 | 10.65 | .42 | .05 | .47 | (.42 | ) | (.03 | ) | (.45 | ) | 10.67 | 4.54 | ||||||||||||||||||||||||
Class B (2/97) |
| |||||||||||||||||||||||||||||||||||
2012(g) | 10.19 | .18 | .39 | .57 | (.17 | ) | — | (.17 | ) | 10.59 | 5.65 | |||||||||||||||||||||||||
2011 | 10.48 | .34 | (.29 | ) | .05 | (.34 | ) | — | ** | (.34 | ) | 10.19 | .48 | |||||||||||||||||||||||
2010 | 9.77 | .35 | .71 | 1.06 | (.35 | ) | — | (.35 | ) | 10.48 | 10.97 | |||||||||||||||||||||||||
2009 | 10.00 | .35 | (.21 | ) | .14 | (.34 | ) | (.03 | ) | (.37 | ) | 9.77 | 1.53 | |||||||||||||||||||||||
2008 | 10.66 | .34 | (.65 | ) | (.31 | ) | (.34 | ) | (.01 | ) | (.35 | ) | 10.00 | (2.97 | ) | |||||||||||||||||||||
2007 | 10.65 | .34 | .04 | .38 | (.34 | ) | (.03 | ) | (.37 | ) | 10.66 | 3.67 | ||||||||||||||||||||||||
Class C (10/93) |
| |||||||||||||||||||||||||||||||||||
2012(g) | 10.19 | .19 | .39 | .58 | (.18 | ) | — | (.18 | ) | 10.59 | 5.77 | |||||||||||||||||||||||||
2011 | 10.48 | .36 | (.28 | ) | .08 | (.37 | ) | — | ** | (.37 | ) | 10.19 | .71 | |||||||||||||||||||||||
2010 | 9.77 | .37 | .71 | 1.08 | (.37 | ) | — | (.37 | ) | 10.48 | 11.17 | |||||||||||||||||||||||||
2009 | 10.00 | .37 | (.21 | ) | .16 | (.36 | ) | (.03 | ) | (.39 | ) | 9.77 | 1.73 | |||||||||||||||||||||||
2008 | 10.66 | .36 | (.65 | ) | (.29 | ) | (.36 | ) | (.01 | ) | (.37 | ) | 10.00 | (2.80 | ) | |||||||||||||||||||||
2007 | 10.64 | .37 | .04 | .41 | (.36 | ) | (.03 | ) | (.39 | ) | 10.66 | 3.96 | ||||||||||||||||||||||||
Class I (2/97)(f) |
| |||||||||||||||||||||||||||||||||||
2012(g) | 10.23 | .23 | .40 | .63 | (.22 | ) | — | (.22 | ) | 10.64 | 6.24 | |||||||||||||||||||||||||
2011 | 10.53 | .45 | (.31 | ) | .14 | (.44 | ) | — | ** | (.44 | ) | 10.23 | 1.36 | |||||||||||||||||||||||
2010 | 9.81 | .45 | .71 | 1.16 | (.44 | ) | — | (.44 | ) | 10.53 | 12.07 | |||||||||||||||||||||||||
2009 | 10.05 | .44 | (.21 | ) | .23 | (.44 | ) | (.03 | ) | (.47 | ) | 9.81 | 2.44 | |||||||||||||||||||||||
2008 | 10.71 | .44 | (.65 | ) | (.21 | ) | (.44 | ) | (.01 | ) | (.45 | ) | 10.05 | (2.01 | ) | |||||||||||||||||||||
2007 | 10.70 | .45 | .04 | .49 | (.45 | ) | (.03 | ) | (.48 | ) | 10.71 | 4.66 | ||||||||||||||||||||||||
| 56 | Nuveen Investments |
| Ratios/Supplemental Data | ||||||||||||||||||
| Ratios to Average Net Assets(d) | ||||||||||||||||||
| Ending Net Assets (000) | Expenses Including Interest(e) | Expenses Excluding Interest | Net Invest- ment Income (Loss) | Portfolio Turnover Rate | ||||||||||||||
| $ | 252,127 | .82 | %* | .81 | %* | 4.15 | %* | 4 | % | |||||||||
| 255,092 | .81 | .80 | 4.01 | 10 | ||||||||||||||
| 257,989 | .85 | .83 | 4.20 | 4 | ||||||||||||||
| 241,958 | .93 | .83 | 4.22 | 14 | ||||||||||||||
| 247,654 | 1.07 | .81 | 3.96 | 16 | ||||||||||||||
| 228,582 | 1.12 | .83 | 4.00 | 14 | ||||||||||||||
| 1,804 | 1.57 | * | 1.56 | * | 3.41 | * | 4 | |||||||||||
| 2,537 | 1.56 | 1.55 | 3.28 | 10 | ||||||||||||||
| 5,784 | 1.60 | 1.58 | 3.45 | 4 | ||||||||||||||
| 9,341 | 1.68 | 1.58 | 3.46 | 14 | ||||||||||||||
| 13,256 | 1.82 | 1.56 | 3.21 | 16 | ||||||||||||||
| 19,462 | 1.87 | 1.58 | 3.25 | 14 | ||||||||||||||
| 53,583 | 1.37 | * | 1.36 | * | 3.60 | * | 4 | |||||||||||
| 53,317 | 1.36 | 1.35 | 3.48 | 10 | ||||||||||||||
| 54,948 | 1.40 | 1.38 | 3.65 | 4 | ||||||||||||||
| 45,761 | 1.48 | 1.38 | 3.68 | 14 | ||||||||||||||
| 39,561 | 1.62 | 1.36 | 3.41 | 16 | ||||||||||||||
| 39,949 | 1.67 | 1.38 | 3.45 | 14 | ||||||||||||||
| 33,840 | .62 | * | .61 | * | 4.35 | * | 4 | |||||||||||
| 31,761 | .61 | .60 | 4.22 | 10 | ||||||||||||||
| 25,590 | .65 | .63 | 4.40 | 4 | ||||||||||||||
| 17,875 | .73 | .63 | 4.43 | 14 | ||||||||||||||
| 17,518 | .87 | .61 | 4.17 | 16 | ||||||||||||||
| 12,497 | .92 | .63 | 4.19 | 14 | ||||||||||||||
| (a) | Per share Net Investment Income (Loss) is calculated using the average daily shares method. |
| (b) | Distributions from Capital Gains include short-term capital gains, if any. |
| (c) | Total return is the combination of changes in net asset value without any sales charge, reinvested dividend income at net asset value and reinvested capital gains distributions at net asset value, if any. Total returns are not annualized. |
| (d) | Ratios do not reflect the effect of custodian fee credits earned on the Fund’s net cash on deposit with the custodian bank, where applicable. |
| (e) | The expense ratios reflect, among other things, the interest expense deemed to have been paid by the Fund on the floating rate certificates issued by the special purpose trusts for the self-deposited inverse floaters held by the Fund, where applicable, as described in Footnote 1 – General Information and Significant Accounting Policies, Inverse Floating Rate Securities. |
| (f) | Effective May 1, 2008, Class R Shares were renamed Class I Shares. |
| (g) | For the six months ended August 31, 2011. |
| * | Annualized. |
| ** | Rounds to less than $.01 per share. |
See accompanying notes to financial statements.
| Nuveen Investments | 57 |
Financial Highlights (Unaudited) (continued)
| Selected data for a share outstanding throughout each period: | ||||||||||||||||||||||||||||||||||||
| Class (Commencement Date) | ||||||||||||||||||||||||||||||||||||
| Investment Operations | Less Distributions | |||||||||||||||||||||||||||||||||||
| NEW JERSEY | ||||||||||||||||||||||||||||||||||||
| Year Ended February 28/29, | Beginning Net Asset Value | Net Invest- ment Income (Loss)(a) | Net Realized/ Unrealized Gain (Loss) | Total | Net Invest- ment Income | Capital Gains(b) | Total | Ending Net Asset Value | Total Return(c) | |||||||||||||||||||||||||||
Class A (9/94) |
| |||||||||||||||||||||||||||||||||||
2012(g) | $ | 10.22 | $ | .23 | $ | .48 | $ | .71 | $ | (.22 | ) | $ | — | $ | (.22 | ) | $ | 10.71 | 7.04 | % | ||||||||||||||||
2011 | 10.64 | .46 | (.44 | ) | .02 | (.44 | ) | — | (.44 | ) | 10.22 | .14 | ||||||||||||||||||||||||
2010 | 9.81 | .45 | .81 | 1.26 | (.43 | ) | — | ** | (.43 | ) | 10.64 | 13.14 | ||||||||||||||||||||||||
2009 | 10.09 | .43 | (.26 | ) | .17 | (.42 | ) | (.03 | ) | (.45 | ) | 9.81 | 1.66 | |||||||||||||||||||||||
2008 | 10.82 | .42 | (.72 | ) | (.30 | ) | (.41 | ) | (.02 | ) | (.43 | ) | 10.09 | (2.82 | ) | |||||||||||||||||||||
2007 | 10.78 | .42 | .04 | .46 | (.41 | ) | (.01 | ) | (.42 | ) | 10.82 | 4.44 | ||||||||||||||||||||||||
Class B (2/97) |
| |||||||||||||||||||||||||||||||||||
2012(g) | 10.23 | .19 | .48 | .67 | (.18 | ) | — | (.18 | ) | 10.72 | 6.63 | |||||||||||||||||||||||||
2011 | 10.65 | .38 | (.43 | ) | (.05 | ) | (.37 | ) | — | (.37 | ) | 10.23 | (.59 | ) | ||||||||||||||||||||||
2010 | 9.83 | .37 | .81 | 1.18 | (.36 | ) | — | ** | (.36 | ) | 10.65 | 12.21 | ||||||||||||||||||||||||
2009 | 10.10 | .36 | (.26 | ) | .10 | (.34 | ) | (.03 | ) | (.37 | ) | 9.83 | .98 | |||||||||||||||||||||||
2008 | 10.83 | .34 | (.72 | ) | (.38 | ) | (.33 | ) | (.02 | ) | (.35 | ) | 10.10 | (3.58 | ) | |||||||||||||||||||||
2007 | 10.78 | .34 | .05 | .39 | (.33 | ) | (.01 | ) | (.34 | ) | 10.83 | 3.72 | ||||||||||||||||||||||||
Class C (9/94) |
| |||||||||||||||||||||||||||||||||||
2012(g) | 10.19 | .20 | .47 | .67 | (.19 | ) | — | (.19 | ) | 10.67 | 6.65 | |||||||||||||||||||||||||
2011 | 10.61 | .40 | (.43 | ) | (.03 | ) | (.39 | ) | — | (.39 | ) | 10.19 | (.41 | ) | ||||||||||||||||||||||
2010 | 9.79 | .39 | .81 | 1.20 | (.38 | ) | — | ** | (.38 | ) | 10.61 | 12.48 | ||||||||||||||||||||||||
2009 | 10.05 | .38 | (.25 | ) | .13 | (.36 | ) | (.03 | ) | (.39 | ) | 9.79 | 1.28 | |||||||||||||||||||||||
2008 | 10.79 | .36 | (.73 | ) | (.37 | ) | (.35 | ) | (.02 | ) | (.37 | ) | 10.05 | (3.47 | ) | |||||||||||||||||||||
2007 | 10.75 | .36 | .04 | .40 | (.35 | ) | (.01 | ) | (.36 | ) | 10.79 | 3.87 | ||||||||||||||||||||||||
Class I (2/92)(f) |
| |||||||||||||||||||||||||||||||||||
2012(g) | 10.26 | .24 | .47 | .71 | (.23 | ) | — | (.23 | ) | 10.74 | 7.01 | |||||||||||||||||||||||||
2011 | 10.68 | .48 | (.43 | ) | .05 | (.47 | ) | — | (.47 | ) | 10.26 | .36 | ||||||||||||||||||||||||
2010 | 9.85 | .47 | .81 | 1.28 | (.45 | ) | — | ** | (.45 | ) | 10.68 | 13.32 | ||||||||||||||||||||||||
2009 | 10.11 | .45 | (.25 | ) | .20 | (.43 | ) | (.03 | ) | (.46 | ) | 9.85 | 2.05 | |||||||||||||||||||||||
2008 | 10.85 | .44 | (.73 | ) | (.29 | ) | (.43 | ) | (.02 | ) | (.45 | ) | 10.11 | (2.74 | ) | |||||||||||||||||||||
2007 | 10.80 | .44 | .05 | .49 | (.43 | ) | (.01 | ) | (.44 | ) | 10.85 | 4.70 | ||||||||||||||||||||||||
| 58 | Nuveen Investments |
| Ratios/Supplemental Data | ||||||||||||||||||
| Ratios to Average Net Assets(d) | ||||||||||||||||||
| Ending Net Assets (000) | Expenses Including Interest(e) | Expenses Excluding Interest | Net Invest- ment Income (Loss) | Portfolio Turnover Rate | ||||||||||||||
| $ | 132,621 | .83 | %* | .83 | %* | 4.44 | %* | 3 | % | |||||||||
| 125,945 | .82 | .82 | 4.29 | 7 | ||||||||||||||
| 121,371 | .85 | .85 | 4.36 | 8 | ||||||||||||||
| 91,348 | .87 | .85 | 4.31 | 21 | ||||||||||||||
| 83,210 | .96 | .84 | 3.91 | 11 | ||||||||||||||
| 84,421 | 1.00 | .86 | 3.88 | 7 | ||||||||||||||
| 3,257 | 1.58 | * | 1.58 | * | 3.71 | * | 3 | |||||||||||
| 4,275 | 1.57 | 1.57 | 3.53 | 7 | ||||||||||||||
| 8,442 | 1.60 | 1.60 | 3.64 | 8 | ||||||||||||||
| 11,881 | 1.62 | 1.60 | 3.52 | 21 | ||||||||||||||
| 14,539 | 1.71 | 1.59 | 3.16 | 11 | ||||||||||||||
| 17,960 | 1.75 | 1.61 | 3.13 | 7 | ||||||||||||||
| 38,796 | 1.38 | * | 1.38 | * | 3.89 | * | 3 | |||||||||||
| 37,511 | 1.37 | 1.37 | 3.74 | 7 | ||||||||||||||
| 37,482 | 1.40 | 1.40 | 3.81 | 8 | ||||||||||||||
| 29,143 | 1.42 | 1.40 | 3.75 | 21 | ||||||||||||||
| 28,363 | 1.51 | 1.39 | 3.37 | 11 | ||||||||||||||
| 29,028 | 1.55 | 1.41 | 3.33 | 7 | ||||||||||||||
| 70,950 | .63 | * | .63 | * | 4.64 | * | 3 | |||||||||||
| 70,068 | .62 | .62 | 4.49 | 7 | ||||||||||||||
| 77,172 | .65 | .65 | 4.57 | 8 | ||||||||||||||
| 66,899 | .67 | .65 | 4.48 | 21 | ||||||||||||||
| 68,499 | .76 | .64 | 4.11 | 11 | ||||||||||||||
| 63,816 | .80 | .66 | 4.08 | 7 | ||||||||||||||
| (a) | Per share Net Investment Income (Loss) is calculated using the average daily shares method. |
| (b) | Distributions from Capital Gains include short-term capital gains, if any. |
| (c) | Total return is the combination of changes in net asset value without any sales charge, reinvested dividend income at net asset value and reinvested capital gains distributions at net asset value, if any. Total returns are not annualized. |
| (d) | Ratios do not reflect the effect of custodian fee credits earned on the Fund’s net cash on deposit with the custodian bank, where applicable. |
| (e) | The expense ratios reflect, among other things, the interest expense deemed to have been paid by the Fund on the floating rate certificates issued by the special purpose trusts for the self-deposited inverse floaters held by the Fund, where applicable, as described in Footnote 1 – General Information and Significant Accounting Policies, Inverse Floating Rate Securities. |
| (f) | Effective May 1, 2008, Class R Shares were renamed Class I Shares. |
| (g) | For the six months ended August 31, 2011. |
| * | Annualized. |
| ** | Rounds to less than $.01 per share. |
See accompanying notes to financial statements.
| Nuveen Investments | 59 |
Financial Highlights (Unaudited) (continued)
| Selected data for a share outstanding throughout each period: | ||||||||||||||||||||||||||||||||||||
| Class (Commencement Date) | ||||||||||||||||||||||||||||||||||||
| Investment Operations | Less Distributions | |||||||||||||||||||||||||||||||||||
| NEW YORK | ||||||||||||||||||||||||||||||||||||
| Year Ended February 28/29, | Beginning Net Asset Value | Net Invest- ment Income (Loss)(a) | Net Realized/ Unrealized Gain (Loss) | Total | Net Invest- ment Income | Capital Gains(b) | Total | Ending Net Asset Value | Total Return(c) | |||||||||||||||||||||||||||
Class A (9/94) |
| |||||||||||||||||||||||||||||||||||
2012(g) | $ | 10.39 | $ | .23 | $ | .42 | $ | .65 | $ | (.23 | ) | $ | — | $ | (.23 | ) | $ | 10.81 | 6.30 | % | ||||||||||||||||
2011 | 10.72 | .47 | (.34 | ) | .13 | (.46 | ) | — | (.46 | ) | 10.39 | 1.12 | ||||||||||||||||||||||||
2010 | 9.84 | .46 | .88 | 1.34 | (.46 | ) | — | ** | (.46 | ) | 10.72 | 13.87 | ||||||||||||||||||||||||
2009 | 10.15 | .45 | (.28 | ) | .17 | (.44 | ) | (.04 | ) | (.48 | ) | 9.84 | 1.67 | |||||||||||||||||||||||
2008 | 10.86 | .44 | (.70 | ) | (.26 | ) | (.44 | ) | (.01 | ) | (.45 | ) | 10.15 | (2.53 | ) | |||||||||||||||||||||
2007 | 10.84 | .45 | .02 | .47 | (.44 | ) | (.01 | ) | (.45 | ) | 10.86 | 4.44 | ||||||||||||||||||||||||
Class B (2/97) |
| |||||||||||||||||||||||||||||||||||
2012(g) | 10.38 | .19 | .42 | .61 | (.19 | ) | — | (.19 | ) | 10.80 | 5.92 | |||||||||||||||||||||||||
2011 | 10.71 | .39 | (.34 | ) | .05 | (.38 | ) | — | (.38 | ) | 10.38 | .39 | ||||||||||||||||||||||||
2010 | 9.84 | .38 | .87 | 1.25 | (.38 | ) | — | ** | (.38 | ) | 10.71 | 12.96 | ||||||||||||||||||||||||
2009 | 10.14 | .38 | (.28 | ) | .10 | (.36 | ) | (.04 | ) | (.40 | ) | 9.84 | 1.00 | |||||||||||||||||||||||
2008 | 10.86 | .36 | (.71 | ) | (.35 | ) | (.36 | ) | (.01 | ) | (.37 | ) | 10.14 | (3.34 | ) | |||||||||||||||||||||
2007 | 10.84 | .37 | .02 | .39 | (.36 | ) | (.01 | ) | (.37 | ) | 10.86 | 3.69 | ||||||||||||||||||||||||
Class C (9/94) |
| |||||||||||||||||||||||||||||||||||
2012(g) | 10.39 | .20 | .42 | .62 | (.20 | ) | — | (.20 | ) | 10.81 | 6.00 | |||||||||||||||||||||||||
2011 | 10.72 | .41 | (.34 | ) | .07 | (.40 | ) | — | (.40 | ) | 10.39 | .58 | ||||||||||||||||||||||||
2010 | 9.84 | .41 | .87 | 1.28 | (.40 | ) | — | ** | (.40 | ) | 10.72 | 13.28 | ||||||||||||||||||||||||
2009 | 10.15 | .40 | (.28 | ) | .12 | (.39 | ) | (.04 | ) | (.43 | ) | 9.84 | 1.12 | |||||||||||||||||||||||
2008 | 10.87 | .39 | (.71 | ) | (.32 | ) | (.39 | ) | (.01 | ) | (.40 | ) | 10.15 | (3.12 | ) | |||||||||||||||||||||
2007 | 10.85 | .39 | .02 | .41 | (.38 | ) | (.01 | ) | (.39 | ) | 10.87 | 3.92 | ||||||||||||||||||||||||
Class I (12/86)(f) |
| |||||||||||||||||||||||||||||||||||
2012(g) | 10.41 | .24 | .42 | .66 | (.24 | ) | — | (.24 | ) | 10.83 | 6.38 | |||||||||||||||||||||||||
2011 | 10.73 | .49 | (.33 | ) | .16 | (.48 | ) | — | (.48 | ) | 10.41 | 1.44 | ||||||||||||||||||||||||
2010 | 9.86 | .48 | .87 | 1.35 | (.48 | ) | — | ** | (.48 | ) | 10.73 | 14.00 | ||||||||||||||||||||||||
2009 | 10.17 | .48 | (.29 | ) | .19 | (.46 | ) | (.04 | ) | (.50 | ) | 9.86 | 1.91 | |||||||||||||||||||||||
2008 | 10.88 | .47 | (.71 | ) | (.24 | ) | (.46 | ) | (.01 | ) | (.47 | ) | 10.17 | (2.31 | ) | |||||||||||||||||||||
2007 | 10.86 | .47 | .02 | .49 | (.46 | ) | (.01 | ) | (.47 | ) | 10.88 | 4.66 | ||||||||||||||||||||||||
| 60 | Nuveen Investments |
| Ratios/Supplemental Data | ||||||||||||||||||
| Ratios to Average Net Assets(d) | ||||||||||||||||||
| Ending Net Assets (000) | Expenses Including Interest(e) | Expenses Excluding Interest | Net Invest- ment Income (Loss) | Portfolio Turnover Rate | ||||||||||||||
| $ | 207,714 | .85 | %* | .83 | %* | 4.40 | %* | 4 | % | |||||||||
| 209,283 | .83 | .81 | 4.38 | 7 | ||||||||||||||
| 226,162 | .87 | .84 | 4.46 | 3 | ||||||||||||||
| 181,049 | .97 | .84 | 4.49 | 30 | ||||||||||||||
| 190,598 | 1.12 | .83 | 4.13 | 17 | ||||||||||||||
| 181,313 | 1.14 | .84 | 4.15 | 9 | ||||||||||||||
| 4,011 | 1.60 | * | 1.58 | * | 3.66 | * | 4 | |||||||||||
| 5,114 | 1.58 | 1.56 | 3.62 | 7 | ||||||||||||||
| 8,898 | 1.62 | 1.59 | 3.73 | 3 | ||||||||||||||
| 12,094 | 1.72 | 1.59 | 3.71 | 30 | ||||||||||||||
| 19,133 | 1.87 | 1.58 | 3.38 | 17 | ||||||||||||||
| 25,898 | 1.89 | 1.59 | 3.41 | 9 | ||||||||||||||
| 62,494 | 1.40 | * | 1.38 | * | 3.85 | * | 4 | |||||||||||
| 61,439 | 1.38 | 1.36 | 3.82 | 7 | ||||||||||||||
| 60,840 | 1.42 | 1.39 | 3.91 | 3 | ||||||||||||||
| 51,978 | 1.52 | 1.39 | 3.95 | 30 | ||||||||||||||
| 49,910 | 1.67 | 1.38 | 3.58 | 17 | ||||||||||||||
| 48,525 | 1.69 | 1.39 | 3.60 | 9 | ||||||||||||||
| 145,553 | .65 | * | .63 | * | 4.60 | * | 4 | |||||||||||
| 141,171 | .63 | .61 | 4.58 | 7 | ||||||||||||||
| 150,977 | .67 | .64 | 4.66 | 3 | ||||||||||||||
| 132,815 | .77 | .64 | 4.69 | 30 | ||||||||||||||
| 137,731 | .92 | .63 | 4.33 | 17 | ||||||||||||||
| 141,556 | .94 | .64 | 4.35 | 9 | ||||||||||||||
| (a) | Per share Net Investment Income (Loss) is calculated using the average daily shares method. |
| (b) | Distributions from Capital Gains include short-term capital gains, if any. |
| (c) | Total return is the combination of changes in net asset value without any sales charge, reinvested dividend income at net asset value and reinvested capital gains distributions at net asset value, if any. Total returns are not annualized. |
| (d) | Ratios do not reflect the effect of custodian fee credits earned on the Fund’s net cash on deposit with the custodian bank, where applicable. The Fund did not receive an expense reimbursement from the Adviser during the periods presented herein. |
| (e) | The expense ratios reflect, among other things, the interest expense deemed to have been paid by the Fund on the floating rate certificates issued by the special purpose trusts for the self-deposited inverse floaters held by the Fund, where applicable, as described in Footnote 1 – General Information and Significant Accounting Policies, Inverse Floating Rate Securities. |
| (f) | Effective May 1, 2008, Class R Shares were renamed Class I Shares. |
| (g) | For the six months ended August 31, 2011. |
| * | Annualized. |
| ** | Rounds to less than $.01 per share. |
See accompanying notes to financial statements.
| Nuveen Investments | 61 |
Financial Highlights (Unaudited) (continued)
| Selected data for a share outstanding throughout each period: | ||||||||||||||||||||||||||||||||||||
| Class (Commencement Date) | ||||||||||||||||||||||||||||||||||||
| Investment Operations | Less Distributions | |||||||||||||||||||||||||||||||||||
| NEW YORK 2 | ||||||||||||||||||||||||||||||||||||
| Year Ended February 28/29, | Beginning Net Asset Value | Net Invest- ment Income (Loss)(a) | Net Realized/ Unrealized Gain (Loss) | Total | Net Invest- ment Income | Capital Gains(b) | Total | Ending Net Asset Value | Total Return(c) | |||||||||||||||||||||||||||
Class A (9/94) |
| |||||||||||||||||||||||||||||||||||
2012(g) | $ | 9.88 | $ | .20 | $ | .35 | $ | .55 | $ | (.20 | ) | $ | — | $ | (.20 | ) | $ | 10.23 | 5.57 | % | ||||||||||||||||
2011 | 10.15 | .39 | (.27 | ) | .12 | (.39 | ) | — | (.39 | ) | 9.88 | 1.16 | ||||||||||||||||||||||||
2010 | 9.61 | .40 | .53 | .93 | (.39 | ) | — | (.39 | ) | 10.15 | 9.84 | |||||||||||||||||||||||||
2009 | 9.63 | .40 | — | ** | .40 | (.39 | ) | (.03 | ) | (.42 | ) | 9.61 | 4.24 | |||||||||||||||||||||||
2008 | 10.37 | .40 | (.71 | ) | (.31 | ) | (.40 | ) | (.03 | ) | (.43 | ) | 9.63 | (3.07 | ) | |||||||||||||||||||||
2007 | 10.41 | .40 | — | .40 | (.40 | ) | (.04 | ) | (.44 | ) | 10.37 | 4.02 | ||||||||||||||||||||||||
Class B (2/97) |
| |||||||||||||||||||||||||||||||||||
2012(g) | 9.90 | .16 | .36 | .52 | (.16 | ) | — | (.16 | ) | 10.26 | 5.28 | |||||||||||||||||||||||||
2011 | 10.18 | .32 | (.28 | ) | .04 | (.32 | ) | — | (.32 | ) | 9.90 | .34 | ||||||||||||||||||||||||
2010 | 9.64 | .33 | .53 | .86 | (.32 | ) | — | (.32 | ) | 10.18 | 9.02 | |||||||||||||||||||||||||
2009 | 9.66 | .33 | — | ** | .33 | (.32 | ) | (.03 | ) | (.35 | ) | 9.64 | 3.45 | |||||||||||||||||||||||
2008 | 10.40 | .32 | (.71 | ) | (.39 | ) | (.32 | ) | (.03 | ) | (.35 | ) | 9.66 | (3.79 | ) | |||||||||||||||||||||
2007 | 10.44 | .33 | (.01 | ) | .32 | (.32 | ) | (.04 | ) | (.36 | ) | 10.40 | 3.23 | |||||||||||||||||||||||
Class C (9/94) |
| |||||||||||||||||||||||||||||||||||
2012(g) | 9.89 | .17 | .35 | .52 | (.17 | ) | — | (.17 | ) | 10.24 | 5.28 | |||||||||||||||||||||||||
2011 | 10.16 | .34 | (.27 | ) | .07 | (.34 | ) | — | (.34 | ) | 9.89 | .62 | ||||||||||||||||||||||||
2010 | 9.62 | .35 | .53 | .88 | (.34 | ) | — | (.34 | ) | 10.16 | 9.24 | |||||||||||||||||||||||||
2009 | 9.64 | .35 | — | ** | .35 | (.34 | ) | (.03 | ) | (.37 | ) | 9.62 | 3.65 | |||||||||||||||||||||||
2008 | 10.37 | .34 | (.70 | ) | (.36 | ) | (.34 | ) | (.03 | ) | (.37 | ) | 9.64 | (3.54 | ) | |||||||||||||||||||||
2007 | 10.42 | .35 | (.02 | ) | .33 | (.34 | ) | (.04 | ) | (.38 | ) | 10.37 | 3.31 | |||||||||||||||||||||||
Class I (12/86)(f) |
| |||||||||||||||||||||||||||||||||||
2012(g) | 9.92 | .21 | .35 | .56 | (.21 | ) | — | (.21 | ) | 10.27 | 5.67 | |||||||||||||||||||||||||
2011 | 10.19 | .42 | (.28 | ) | .14 | (.41 | ) | — | (.41 | ) | 9.92 | 1.39 | ||||||||||||||||||||||||
2010 | 9.65 | .42 | .53 | .95 | (.41 | ) | — | (.41 | ) | 10.19 | 10.00 | |||||||||||||||||||||||||
2009 | 9.67 | .42 | — | ** | .42 | (.41 | ) | (.03 | ) | (.44 | ) | 9.65 | 4.42 | |||||||||||||||||||||||
2008 | 10.40 | .42 | (.70 | ) | (.28 | ) | (.42 | ) | (.03 | ) | (.45 | ) | 9.67 | (2.79 | ) | |||||||||||||||||||||
2007 | 10.45 | .42 | (.01 | ) | .41 | (.42 | ) | (.04 | ) | (.46 | ) | 10.40 | 4.08 | |||||||||||||||||||||||
| 62 | Nuveen Investments |
| Ratios/Supplemental Data | ||||||||||||||||||
| Ratios to Average Net Assets(d) | ||||||||||||||||||
| Ending Net Assets (000) | Expenses Including Interest(e) | Expenses Excluding Interest | Net Invest- ment Income (Loss) | Portfolio Turnover Rate | ||||||||||||||
| $ | 84,936 | .83 | %* | .83 | %* | 3.95 | %* | 5 | % | |||||||||
| 87,314 | .83 | .82 | 3.89 | 6 | ||||||||||||||
| 98,131 | .86 | .85 | 4.03 | 4 | ||||||||||||||
| 87,154 | .96 | .85 | 4.12 | 11 | ||||||||||||||
| 79,593 | 1.08 | .84 | 3.89 | 13 | ||||||||||||||
| 90,400 | 1.03 | .85 | 3.89 | 9 | ||||||||||||||
| 1,585 | 1.58 | * | 1.58 | * | 3.22 | * | 5 | |||||||||||
| 2,620 | 1.58 | 1.57 | 3.13 | 6 | ||||||||||||||
| 5,023 | 1.60 | 1.59 | 3.30 | 4 | ||||||||||||||
| 7,288 | 1.70 | 1.59 | 3.35 | 11 | ||||||||||||||
| 9,290 | 1.83 | 1.59 | 3.14 | 13 | ||||||||||||||
| 13,447 | 1.78 | 1.60 | 3.14 | 9 | ||||||||||||||
| 20,092 | 1.38 | * | 1.38 | * | 3.40 | * | 5 | |||||||||||
| 20,100 | 1.38 | 1.37 | 3.33 | 6 | ||||||||||||||
| 18,437 | 1.40 | 1.39 | 3.48 | 4 | ||||||||||||||
| 15,374 | 1.51 | 1.40 | 3.57 | 11 | ||||||||||||||
| 13,870 | 1.63 | 1.39 | 3.34 | 13 | ||||||||||||||
| 14,426 | 1.58 | 1.40 | 3.34 | 9 | ||||||||||||||
| 166,097 | .63 | * | .63 | * | 4.15 | * | 5 | |||||||||||
| 165,529 | .63 | .62 | 4.09 | 6 | ||||||||||||||
| 175,847 | .66 | .65 | 4.23 | 4 | ||||||||||||||
| 172,000 | .76 | .65 | 4.31 | 11 | ||||||||||||||
| 184,670 | .88 | .64 | 4.09 | 13 | ||||||||||||||
| 207,492 | .83 | .65 | 4.09 | 9 | ||||||||||||||
| (a) | Per share Net Investment Income (Loss) is calculated using the average daily shares method. |
| (b) | Distributions from Capital Gains include short-term capital gains, if any. |
| (c) | Total return is the combination of changes in net asset value without any sales charge, reinvested dividend income at net asset value and reinvested capital gains distributions at net asset value, if any. Total returns are not annualized. |
| (d) | Ratios do not reflect the effect of custodian fee credits earned on the Fund’s net cash on deposit with the custodian bank, where applicable. The Fund did not receive an expense reimbursement from the Adviser during the periods presented herein. |
| (e) | The expense ratios reflect, among other things, the interest expense deemed to have been paid by the Fund on the floating rate certificates issued by the special purpose trusts for the self-deposited inverse floaters held by the Fund, where applicable, as described in Footnote 1 – General Information and Significant Accounting Policies, Inverse Floating Rate Securities. |
| (f) | Effective May 1, 2008, Class R Shares were renamed Class I Shares. |
| (g) | For the six months ended August 31, 2011. |
| * | Annualized. |
| ** | Rounds to less than $.01 per share. |
See accompanying notes to financial statements.
| Nuveen Investments | 63 |
Notes to Financial Statements (Unaudited)
1. General Information and Significant Accounting Policies
General Information
The Nuveen Multistate Trust II (the “Trust”) is an open-end investment company registered under the Investment Company Act of 1940, as amended. The Trust is comprised of the Nuveen Connecticut Municipal Bond Fund (“Connecticut”), Nuveen New Jersey Municipal Bond Fund (“New Jersey”), Nuveen New York Municipal Bond Fund (“New York”) and Nuveen New York Municipal Bond Fund 2 (“New York 2”) (formerly, Nuveen New York Insured Municipal Bond Fund) (each a “Fund” and collectively, the “Funds”), among others. The Trust was organized as a Massachusetts business trust on July 1, 1996. The Funds were each organized as a series of predecessor trusts or corporations prior to that date.
Effective April 27, 2011, New York 2 was closed to new investors. Investors in the Fund as of April 27, 2011, are able to continue investing in the Fund, through the reinvestment of dividends and capital gains distributions.
Effective April 30, 2011, Nuveen Investments, LLC, a wholly-owned subsidiary of Nuveen Investments, Inc. (“Nuveen”), changed its name to Nuveen Securities, LLC (the “Distributor”).
Effective May 31, 2011, New York 2 is no longer required to invest at least 80% of its net assets in municipal securities that are covered by insurance guaranteeing the timely payment of principal and interest thereon. The Fund continues to be subject to the requirement that it invest at least 80% of its net assets in municipal bonds that pay interest that is exempt from regular federal and New York personal income tax.
Connecticut’s, New Jersey’s and New York’s investment objective is to provide as high a level of current interest income exempt from regular federal, state and, in some cases, local income taxes as is consistent with preservation of capital. Under normal market conditions, Connecticut, New Jersey and New York each invest at least 80% of their net assets in municipal bonds that pay interest that is exempt from regular federal and each state’s respective personal income tax. Each Fund invests at least 80% of its net assets in investment grade municipal bonds rated BBB/Baa or higher at the time of purchase by at least one independent rating agency, or, if unrated, judged by Nuveen Asset Management, LLC (the “Sub-Adviser”), a wholly-owned subsidiary of Nuveen Fund Advisors, Inc., (the “Adviser”), a wholly-owned subsidiary of Nuveen to be of comparable quality. Each Fund may invest up to 20% of its net assets in below investment grade municipal bonds, commonly referred to as “high yield” or “junk” bonds. Each Fund may invest up to 15% of its net assets in municipal securities whose interest payments vary inversely with changes in short-term tax-exempt interest rates (i.e., inverse floating rate securities).
New York 2’s investment objective is to provide as high a level of current interest income exempt from regular federal, state and, in some cases, local income taxes as is consistent with preservation of capital. Under normal market conditions, the Fund invests at least 80% of its net assets in municipal bonds that pay interest that is exempt from regular federal and New York personal income tax. The municipal securities in which the Fund invests are, at the time of purchase, (i) rated BBB/Baa or higher; (ii) unrated, but judged to be of comparable quality by the Sub-Adviser; or (iii) backed by an escrow or trust account containing sufficient U.S. Government or U.S. government agency securities to ensure timely payment of principal and interest. The Fund may invest up to 15% of its net assets in municipal securities whose interest payments vary inversely with changes in short-term tax-exempt interest rates (i.e., inverse floating rate securities).
The Funds’ most recent prospectus provides further description of each Fund’s investment objective, principal investment strategies, and principal risks.
The Funds’ Board of Trustees has approved the reorganization of the Nuveen New York Municipal Bond Fund 2 (“Acquired Fund”) into Nuveen New York Municipal Bond Fund (“Acquiring Fund”).
The reorganization is subject to approval by the shareholders of the Acquired Fund. For the reorganization, upon shareholder approval, the Acquired Fund will transfer all of its assets and liabilities to the Acquiring Fund in exchange for Acquiring Fund shares of equal value. The Acquiring Fund shares will then be distributed to the Acquired Fund shareholders and the Acquired Fund will be terminated. As a result of the reorganization, the Acquired Fund shareholders will become shareholders of the Acquiring Fund. The Acquired Fund shareholders will receive Acquiring Fund shares with a total value equal to the total value of their Acquired Fund shares immediately prior to the closing of the reorganization.
A special meeting of the Acquired Fund shareholders will be held on November 7, 2011, for the purpose of voting on the reorganization. If the required shareholder approval is obtained on the meeting date, it is anticipated that the reorganization will be consummated at the close of business on November 18, 2011. Further information regarding the proposed reorganization is contained in proxy materials that were sent to those who were shareholders of the Acquired Fund as of the close of business on September 9, 2011, the record date for the special meeting.
Significant Accounting Policies
The following is a summary of significant accounting policies followed by the Funds in the preparation of their financial statements in accordance with accounting principles generally accepted in the United States (“U.S. GAAP”).
| 64 | Nuveen Investments |
Investment Valuation
Prices of municipal bonds are provided by a pricing service approved by the Funds’ Board of Trustees. These securities are generally classified as Level 2 for fair value measurement purposes. When price quotes are not readily available (which is usually the case for municipal bonds) the pricing service establishes a security’s fair value using methods that may include consideration of the following: yields or prices of investments of comparable quality, type of issue, coupon, maturity and rating, market quotes or indications of value from security dealers, evaluations of anticipated cash flows or collateral, general market conditions and other information and analysis, including the obligor’s credit characteristics considered relevant. In pricing certain securities, particularly less liquid and lower quality securities, the pricing service may consider information about a security, its issuer, or market activity provided by the Adviser. These securities are generally classified as Level 2 or Level 3 depending on the priority of the significant inputs.
Certain securities may not be able to be priced by the pre-established pricing methods as described above. Such securities may be valued by the Funds’ Board of Trustees or its designee at fair value. These securities generally include, but are not limited to, restricted securities (securities which may not be publicly sold without registration under the Securities Act of 1933, as amended) for which a pricing service is unable to provide a market price; securities whose trading has been formally suspended; debt securities that have gone into default and for which there is no current market quotation; a security whose market price is not available from a pre-established pricing source; a security with respect to which an event has occurred that is likely to materially affect the value of the security after the market has closed but before the calculation of a Fund’s net asset value (as may be the case in non-U.S. markets on which the security is primarily traded) or make it difficult or impossible to obtain a reliable market quotation; and a security whose price, as provided by the pricing service, is not deemed to reflect the security’s fair value. As a general principle, the fair value of a security would appear to be the amount that the owner might reasonably expect to receive for it in a current sale. A variety of factors may be considered in determining the fair value of these securities, which may include consideration of the following: yields or prices of investments of comparable quality, type of issue, coupon, maturity and rating, market quotes or indications of value from security dealers, evaluations of anticipated cash flows or collateral, general market conditions and other information and analysis, including the obligor’s credit characteristics considered relevant. These securities are generally classified as Level 2 or Level 3 depending on the priority of the significant inputs. Regardless of the method employed to value a particular security, all valuations are subject to review by the Funds’ Board of Trustees or its designee.
Refer to Footnote 2 – Fair Value Measurements for further details on the leveling of securities held by the Funds as of the end of the reporting period.
Investment Transactions
Investment transactions are recorded on a trade date basis. Realized gains and losses from investment transactions are determined on the specific identification method, which is the same basis used for federal income tax purposes. Investments purchased on a when-issued/delayed delivery basis may have extended settlement periods. Any investments so purchased are subject to market fluctuation during this period. The Funds have instructed the custodian to segregate assets with a current value at least equal to the amount of the when-issued/delayed delivery purchase commitments. At August 31, 2011, the Funds had no such outstanding purchase commitments.
Investment Income
Interest income, which reflects the amortization of premiums and includes accretion of discounts for financial reporting purposes, is recorded on an accrual basis. Investment income also reflects paydown gains and losses, if any.
Income Taxes
Each Fund is a separate taxpayer for federal income tax purposes. Each Fund intends to distribute substantially all of its net investment income and net capital gains to shareholders and to otherwise comply with the requirements of Subchapter M of the Internal Revenue Code applicable to regulated investment companies. Therefore, no federal income tax provision is required. Furthermore, each Fund intends to satisfy conditions that will enable interest from municipal securities, which is exempt from regular federal and designated state income taxes, to retain such tax-exempt status when distributed to shareholders of the Funds. Net realized capital gains and ordinary income distributions paid by the Funds are subject to federal taxation.
For all open tax years and all major taxing jurisdictions, management of the Funds has concluded that there are no significant uncertain tax positions that would require recognition in the financial statements. Open tax years are those that are open for examination by taxing authorities (i.e., generally the last four tax year ends and the interim tax period since then). Furthermore, management of the Funds is also not aware of any tax positions for which it is reasonably possible that the total amounts of unrecognized tax benefits will significantly change in the next twelve months.
Dividends and Distributions to Shareholders
The Funds declare dividends from their net investment income daily and pay shareholders monthly. Fund shares begin to accrue dividends on the business day after the day when the monies used to purchase Fund shares are collected by the Funds’ transfer agent.
Net realized capital gains and/or market discount from investment transactions, if any, are declared and distributed to shareholders at least annually. Furthermore, capital gains are distributed only to the extent they exceed available capital loss carryforwards.
| Nuveen Investments | 65 |
Notes to Financial Statements (Unaudited) (continued)
Distributions to shareholders of net investment income, net realized capital gains and/or market discount, if any, are recorded on the ex-dividend date. The amount and timing of distributions are determined in accordance with federal income tax regulations, which may differ from U.S. GAAP.
Insurance
During the period March 1, 2011 through May 31, 2011, New York 2 invested at least 80% of its net assets in municipal securities that were covered by insurance guaranteeing the timely payment of principal and interest thereon. Inverse floating rate securities whose underlying bonds are covered by insurance were included for purposes of the 80%. Insured municipal bonds are either covered by individual, permanent insurance policies (obtained either at the time of issuance or subsequently), or covered “while in fund” under a master portfolio insurance policy purchased by the Fund. Insurance guarantees only the timely payment of interest and principal on the bonds; it does not guarantee the value of either individual bonds or Fund shares. The Adviser may obtain master policies from insurers that specialize in insuring municipal bonds.
Each insured municipal security is covered by Original Issue Insurance, Secondary Market Insurance or Portfolio Insurance. Such insurance does not guarantee the market value of the municipal securities or the value of the Fund’s shares. Original Issue Insurance and Secondary Market Insurance remain in effect as long as the municipal securities covered thereby remain outstanding and the insurer remains in business, regardless of whether the Fund ultimately disposes of such municipal securities. Consequently, the market value of the municipal securities covered by Original Issue Insurance or Secondary Market Insurance may reflect value attributable to the insurance. Portfolio Insurance, in contrast, is effective only while the municipal securities are held by the Fund, and is reflected as an expense over the term of the policy, when applicable. Accordingly, neither the prices used in determining the market value of the underlying municipal securities nor the net asset value of the Fund’s shares include value, if any, attributable to the Portfolio Insurance. Each policy of the Portfolio Insurance does, however, give the Fund the right to obtain permanent insurance with respect to the municipal security covered by the Portfolio Insurance policy at the time of its sale.
Flexible Sales Charge Program
Class A Shares are generally sold with an up-front sales charge and incur a .20% annual 12b-1 service fee. Class A Share purchases of $1 million or more are sold at net asset value without an up-front sales charge but may be subject to a contingent deferred sales charge (“CDSC”) if redeemed within eighteen months of purchase. Class B Shares were sold without an up-front sales charge but incur a .75% annual 12b-1 distribution fee and a .20% annual 12b-1 service fee. Class B Shares are subject to a CDSC of up to 5% depending upon the length of time the shares are held by the investor (CDSC is reduced to 0% at the end of six years). Class B Shares convert to Class A Shares eight years after purchase. Class C Shares are sold without an up-front sales charge but incur a .55% annual 12b-1 distribution fee and a .20% annual 12b-1 service fee. Class C Shares are subject to a CDSC of 1% if redeemed within twelve months of purchase. Class I Shares are not subject to any sales charge or 12b-1 distribution or service fees.
Inverse Floating Rate Securities
Each Fund is authorized to invest in inverse floating rate securities. An inverse floating rate security is created by depositing a municipal bond, typically with a fixed interest rate, into a special purpose trust created by a broker-dealer. In turn, this trust (a) issues floating rate certificates, in face amounts equal to some fraction of the deposited bond’s par amount or market value, that typically pay short-term tax-exempt interest rates to third parties, and (b) issues to a long-term investor (such as one of the Funds) an inverse floating rate certificate (sometimes referred to as an “inverse floater”) that represents all remaining or residual interest in the trust. The income received by the inverse floater holder varies inversely with the short-term rate paid to the floating rate certificates’ holders, and in most circumstances the inverse floater holder bears substantially all of the underlying bond’s downside investment risk and also benefits disproportionately from any potential appreciation of the underlying bond’s value. The price of an inverse floating rate security will be more volatile than that of the underlying bond because the interest rate is dependent on not only the fixed coupon rate of the underlying bond but also on the short-term interest paid on the floating rate certificates, and because the inverse floating rate security essentially bears the risk of loss of the greater face value of the underlying bond.
A Fund may purchase an inverse floating rate security in a secondary market transaction without first owning the underlying bond (referred to as an “externally-deposited inverse floater”), or instead by first selling a fixed-rate bond to a broker-dealer for deposit into the special purpose trust and receiving in turn the residual interest in the trust (referred to as a “self-deposited inverse floater”). The inverse floater held by a Fund gives the Fund the right (a) to cause the holders of the floating rate certificates to tender their notes at par, and (b) to have the broker transfer the fixed-rate bond held by the trust to the Fund, thereby collapsing the trust. An investment in an externally-deposited inverse floater is identified in the Portfolio of Investments as “(IF) – Inverse floating rate investment.” An investment in a self-deposited inverse floater is accounted for as a financing transaction. In such instances, a fixed-rate bond deposited into a special purpose trust is identified in the Portfolio of Investments as “(UB) – Underlying bond of an inverse floating rate trust reflected as a financing transaction,” with the Fund accounting for the short-term floating rate certificates issued by the trust as “Floating rate obligations” on the Statement of Assets and Liabilities. In addition, the Fund reflects in “Investment Income” the entire earnings of the underlying bond and recognizes the related interest paid to the holders of the short-term floating rate certificates as “Interest expense on floating rate obligations” on the Statement of Operations.
During the six months ended August 31, 2011, each Fund invested in externally-deposited inverse floaters and/or self-deposited inverse floaters.
| 66 | Nuveen Investments |
Each Fund may also enter into shortfall and forbearance agreements (sometimes referred to as a “recourse trust” or “credit recovery swap”) (such agreements referred to herein as “Recourse Trusts”) with a broker-dealer by which a Fund agrees to reimburse the broker-dealer, in certain circumstances, for the difference between the liquidation value of the fixed-rate bond held by the trust and the liquidation value of the floating rate certificates issued by the trust plus any shortfalls in interest cash flows. Under these agreements, a Fund’s potential exposure to losses related to or on inverse floaters may increase beyond the value of a Fund’s inverse floater investments as a Fund may potentially be liable to fulfill all amounts owed to holders of the floating rate certificates. At period end, any such shortfall is recognized as “Unrealized depreciation on Recourse Trusts” on the Statement of Assets and Liabilities.
At August 31, 2011, each Fund’s maximum exposure to externally-deposited Recourse Trusts was as follows:
| Connecticut | New Jersey | New York | New York 2 | |||||||||||||
Maximum exposure to Recourse Trusts | $ | — | $ | — | $ | 670,000 | $ | 3,000,000 | ||||||||
The average floating rate obligations outstanding and average annual interest rate and fees related to self-deposited inverse floaters for the following Funds during the six months ended August 31, 2011, were as follows:
| Connecticut | New York | New York 2 | ||||||||||
Average floating rate obligations outstanding | $ | 10,000,000 | $ | 17,955,000 | $ | 2,800,978 | ||||||
Average annual interest rate and fees | .42 | % | .44 | % | .48 | % | ||||||
Derivative Financial Instruments
Each Fund is authorized to invest in certain derivative instruments, including foreign currency forwards, futures, options and swap contracts. Although each Fund is authorized to invest in such derivative instruments, and may do so in the future, they did not make any such investments during the six months ended August 31, 2011.
Market and Counterparty Credit Risk
In the normal course of business each Fund may invest in financial instruments and enter into financial transactions where risk of potential loss exists due to changes in the market (market risk) or failure of the other party to the transaction to perform (counterparty credit risk). The potential loss could exceed the value of the financial assets recorded on the financial statements. Financial assets, which potentially expose each Fund to counterparty credit risk, consist principally of cash due from counterparties on forward, option and swap transactions, when applicable. The extent of each Fund’s exposure to counterparty credit risk in respect to these financial assets approximates their carrying value as recorded on the Statement of Assets and Liabilities. Futures contracts, when applicable, expose a Fund to minimal counterparty credit risk as they are exchange traded and the exchange’s clearinghouse, which is counterparty to all exchange traded futures, guarantees the futures contracts against default.
Each Fund helps manage counterparty credit risk by entering into agreements only with counterparties the Adviser believes have the financial resources to honor their obligations and by having the Adviser monitor the financial stability of the counterparties. Additionally, counterparties may be required to pledge collateral daily (based on the daily valuation of the financial asset) on behalf of each Fund with a value approximately equal to the amount of any unrealized gain above a pre-determined threshold. Reciprocally, when each Fund has an unrealized loss, the Funds have instructed the custodian to pledge assets of the Funds as collateral with a value approximately equal to the amount of the unrealized loss above a pre-determined threshold. Collateral pledges are monitored and subsequently adjusted if and when the valuations fluctuate, either up or down, by at least the pre-determined threshold amount.
Zero Coupon Securities
Each Fund is authorized to invest in zero coupon securities. A zero coupon security does not pay a regular interest coupon to its holders during the life of the security. Tax-exempt income to the holder of the security comes from accretion of the difference between the original purchase price of the security at issuance and the par value of the security at maturity and is effectively paid at maturity. The market prices of zero coupon securities generally are more volatile than the market prices of securities that pay interest periodically.
Multiclass Operations and Allocations
Income and expenses of the Funds that are not directly attributable to a specific class of shares are prorated among the classes based on the relative settled shares of each class. Expenses directly attributable to a class of shares, which presently only include 12b-1 distribution and service fees, are recorded to the specific class.
Realized and unrealized capital gains and losses of the Funds are prorated among the classes based on the relative net assets of each class.
Custodian Fee Credit
Each Fund has an arrangement with the custodian bank whereby certain custodian fees and expenses are reduced by net credits earned on each Fund’s cash on deposit with the bank. Such deposit arrangements are an alternative to overnight investments. Credits for cash balances may be offset by charges for any days on which a Fund overdraws its account at the custodian bank.
| Nuveen Investments | 67 |
Notes to Financial Statements (Unaudited) (continued)
Indemnifications
Under the Trust’s organizational documents, its officers and trustees are indemnified against certain liabilities arising out of the performance of their duties to the Trust. In addition, in the normal course of business, the Trust enters into contracts that provide general indemnifications to other parties. The Trust’s maximum exposure under these arrangements is unknown as this would involve future claims that may be made against the Trust that have not yet occurred. However, the Trust has not had prior claims or losses pursuant to these contracts and expects the risk of loss to be remote.
Use of Estimates
The preparation of financial statements in conformity with U.S. GAAP requires management to make estimates and assumptions that affect the reported amounts of assets and liabilities at the date of the financial statements and the reported amounts of increases and decreases in net assets from operations during the reporting period. Actual results may differ from those estimates.
2. Fair Value Measurements
Fair value is defined as the price that the Funds would receive upon selling an investment or transferring a liability in an orderly transaction to an independent buyer in the principal or most advantageous market for the investment. A three-tier hierarchy is used to maximize the use of observable market data and minimize the use of unobservable inputs and to establish classification of fair value measurements for disclosure purposes. Observable inputs reflect the assumptions market participants would use in pricing the asset or liability. Observable inputs are based on market data obtained from sources independent of the reporting entity. Unobservable inputs reflect the reporting entity’s own assumptions about the assumptions market participants would use in pricing the asset or liability. Unobservable inputs are based on the best information available in the circumstances. The three-tier hierarchy of inputs is summarized in the three broad levels listed below:
| Level 1 – | Quoted prices in active markets for identical securities. | |
| Level 2 – | Other significant observable inputs (including quoted prices for similar securities, interest rates, prepayment speeds, credit risk, etc.). | |
| Level 3 – | Significant unobservable inputs (including management’s assumptions in determining the fair value of investments). |
The inputs or methodologies used for valuing securities are not an indication of the risk associated with investing in those securities.
The following is a summary of each Fund’s fair value measurements as of August 31, 2011:
| Connecticut | Level 1 | Level 2 | Level 3 | Total | ||||||||||||
Investments: | ||||||||||||||||
Municipal Bonds | $ | — | $ | 343,738,182 | $ — | $ | 343,738,182 | |||||||||
| New Jersey | Level 1 | Level 2 | Level 3 | Total | ||||||||||||
Investments: | ||||||||||||||||
Municipal Bonds | $ | — | $ | 240,693,733 | $ — | $ | 240,693,733 | |||||||||
| New York | Level 1 | Level 2 | Level 3 | Total | ||||||||||||
Investments: | ||||||||||||||||
Municipal Bonds | $ | — | $ | 434,124,482 | $ — | $ | 434,124,482 | |||||||||
| New York 2 | Level 1 | Level 2 | Level 3 | Total | ||||||||||||
Investments: | ||||||||||||||||
Municipal Bonds | $ | — | $ | 269,676,387 | $ — | $ | 269,676,387 | |||||||||
During the six months ended August 31, 2011, the Funds recognized no significant transfers to or from Level 1, Level 2 or Level 3.
3. Derivative Instruments and Hedging Activities
The Funds record derivative instruments at fair value, with changes in fair value recognized on the Statement of Operations, when applicable. Even though the Funds’ investments in derivatives may represent economic hedges, they are not considered to be hedge transactions for financial reporting purposes. The Funds did not invest in derivative instruments during the six months ended August 31, 2011.
| 68 | Nuveen Investments |
4. Fund Shares
Transactions in Fund shares were as follows:
| Connecticut | ||||||||||||||||
| Six Months Ended 8/31/11 | Year Ended 2/28/11 | |||||||||||||||
| Shares | Amount | Shares | Amount | |||||||||||||
Shares sold: | ||||||||||||||||
Class A | 725,038 | $ | 7,501,127 | 4,927,201 | $ | 50,950,249 | ||||||||||
Class A – automatic conversion of Class B Shares | 24,867 | 253,542 | 132,958 | 1,402,220 | ||||||||||||
Class B | 578 | 5,980 | 1,279 | 13,378 | ||||||||||||
Class C | 276,448 | 2,865,821 | 962,099 | 10,110,141 | ||||||||||||
Class I | 436,798 | 4,520,889 | 1,282,346 | 13,414,398 | ||||||||||||
Shares issued to shareholders due to reinvestment of distributions: | ||||||||||||||||
Class A | 279,114 | 2,896,070 | 594,719 | 6,235,595 | ||||||||||||
Class B | 1,615 | 16,734 | 6,012 | 63,167 | ||||||||||||
Class C | 44,943 | 466,028 | 90,865 | 952,356 | ||||||||||||
Class I | 20,708 | 215,789 | 38,496 | 405,106 | ||||||||||||
| 1,810,109 | 18,741,980 | 8,035,975 | 83,546,610 | |||||||||||||
Shares redeemed: | ||||||||||||||||
Class A | (2,272,751 | ) | (23,342,552 | ) | (5,222,261 | ) | (54,177,083 | ) | ||||||||
Class B | (56,021 | ) | (578,149 | ) | (176,982 | ) | (1,852,282 | ) | ||||||||
Class B – automatic conversion to Class A Shares | (24,891 | ) | (253,542 | ) | (133,083 | ) | (1,402,220 | ) | ||||||||
Class C | (497,040 | ) | (5,138,621 | ) | (1,059,247 | ) | (10,934,012 | ) | ||||||||
Class I | (381,523 | ) | (3,925,935 | ) | (646,883 | ) | (6,671,389 | ) | ||||||||
| (3,232,226 | ) | (33,238,799 | ) | (7,238,456 | ) | (75,036,986 | ) | |||||||||
Net increase (decrease) | (1,422,117 | ) | $ | (14,496,819 | ) | 797,519 | $ | 8,509,624 | ||||||||
| New Jersey | ||||||||||||||||
| Six Months Ended 8/31/11 | Year Ended 2/28/11 | |||||||||||||||
| Shares | Amount | Shares | Amount | |||||||||||||
Shares sold: | ||||||||||||||||
Class A | 1,068,277 | $ | 11,206,363 | 3,831,748 | $ | 40,106,932 | ||||||||||
Class A – automatic conversion of Class B Shares | 28,467 | 295,387 | 125,979 | 1,334,171 | ||||||||||||
Class B | 400 | 4,175 | 4,600 | 48,576 | ||||||||||||
Class C | 269,534 | 2,824,745 | 757,973 | 8,113,739 | ||||||||||||
Class I | 417,080 | 4,388,099 | 1,170,063 | 12,548,520 | ||||||||||||
Shares issued to shareholders due to reinvestment of distributions: | ||||||||||||||||
Class A | 131,953 | 1,380,568 | 274,467 | 2,920,372 | ||||||||||||
Class B | 4,211 | 44,019 | 12,722 | 135,729 | ||||||||||||
Class C | 38,118 | 397,557 | 75,628 | 801,640 | ||||||||||||
Class I | 61,735 | 648,157 | 137,613 | 1,469,328 | ||||||||||||
| 2,019,775 | 21,189,070 | 6,390,793 | 67,479,007 | |||||||||||||
Shares redeemed: | ||||||||||||||||
Class A | (1,162,090 | ) | (12,153,677 | ) | (3,314,503 | ) | (34,561,475 | ) | ||||||||
Class B | (90,037 | ) | (934,935 | ) | (265,916 | ) | (2,841,882 | ) | ||||||||
Class B – automatic conversion to Class A Shares | (28,439 | ) | (295,387 | ) | (125,906 | ) | (1,334,171 | ) | ||||||||
Class C | (353,850 | ) | (3,694,070 | ) | (684,820 | ) | (7,123,243 | ) | ||||||||
Class I | (706,686 | ) | (7,385,228 | ) | (1,701,741 | ) | (17,884,938 | ) | ||||||||
| (2,341,102 | ) | (24,463,297 | ) | (6,092,886 | ) | (63,745,709 | ) | |||||||||
Net increase (decrease) | (321,327 | ) | $ | (3,274,227 | ) | 297,907 | $ | 3,733,298 | ||||||||
| Nuveen Investments | 69 |
Notes to Financial Statements (Unaudited) (continued)
| New York | ||||||||||||||||
| Six Months Ended 8/31/11 | Year Ended 2/28/11 | |||||||||||||||
| Shares | Amount | Shares | Amount | |||||||||||||
Shares sold: | ||||||||||||||||
Class A | 1,451,461 | $ | 15,380,057 | 4,559,056 | $ | 48,190,715 | ||||||||||
Class A – automatic conversion of Class B Shares | 30,655 | 324,645 | 188,047 | 2,025,689 | ||||||||||||
Class B | 187 | 1,979 | 4,227 | 44,648 | ||||||||||||
Class C | 461,646 | 4,888,968 | 1,120,644 | 12,098,530 | ||||||||||||
Class I | 606,703 | 6,435,074 | 1,279,450 | 13,748,678 | ||||||||||||
Shares issued to shareholders due to reinvestment of distributions: | ||||||||||||||||
Class A | 201,679 | 2,135,326 | 475,611 | 5,109,488 | ||||||||||||
Class B | 4,292 | 45,381 | 13,019 | 139,905 | ||||||||||||
Class C | 61,791 | 654,546 | 120,133 | 1,288,820 | ||||||||||||
Class I | 204,605 | 2,171,016 | 437,547 | 4,704,553 | ||||||||||||
| 3,023,019 | 32,036,992 | 8,197,734 | 87,351,026 | |||||||||||||
Shares redeemed: | ||||||||||||||||
Class A | (2,611,375 | ) | (27,634,641 | ) | (6,185,389 | ) | (65,255,387 | ) | ||||||||
Class B | (95,030 | ) | (995,313 | ) | (167,110 | ) | (1,792,075 | ) | ||||||||
Class B – automatic conversion to Class A Shares | (30,678 | ) | (324,645 | ) | (188,195 | ) | (2,025,689 | ) | ||||||||
Class C | (656,229 | ) | (6,901,305 | ) | (1,004,248 | ) | (10,665,580 | ) | ||||||||
Class I | (935,642 | ) | (9,912,669 | ) | (2,216,471 | ) | (23,549,963 | ) | ||||||||
| (4,328,954 | ) | (45,768,573 | ) | (9,761,413 | ) | (103,288,694 | ) | |||||||||
Net increase (decrease) | (1,305,935 | ) | $ | (13,731,581 | ) | (1,563,679 | ) | $ | (15,937,668 | ) | ||||||
| New York 2 | ||||||||||||||||
| Six Months Ended 8/31/11 | Year Ended 2/28/11 | |||||||||||||||
| Shares | Amount | Shares | Amount | |||||||||||||
Shares sold: | ||||||||||||||||
Class A | 160,574 | $ | 1,602,792 | 844,051 | $ | 8,575,915 | ||||||||||
Class A – automatic conversion of Class B Shares | 48,534 | 481,690 | 76,882 | 785,139 | ||||||||||||
Class B | 156 | 1,574 | 390 | 3,981 | ||||||||||||
Class C | 71,705 | 712,249 | 468,395 | 4,795,342 | ||||||||||||
Class I | 37,252 | 376,693 | 488,114 | 4,969,309 | ||||||||||||
Shares issued to shareholders due to reinvestment of distributions: | ||||||||||||||||
Class A | 103,915 | 1,043,661 | 215,432 | 2,181,883 | ||||||||||||
Class B | 1,951 | 19,621 | 7,523 | 76,578 | ||||||||||||
Class C | 18,908 | 190,077 | 35,848 | 363,350 | ||||||||||||
Class I | 260,535 | 2,627,312 | 528,235 | 5,371,498 | ||||||||||||
| 703,530 | 7,055,669 | 2,664,870 | 27,122,995 | |||||||||||||
Shares redeemed: | ||||||||||||||||
Class A | (853,878 | ) | (8,574,298 | ) | (1,964,943 | ) | (19,723,961 | ) | ||||||||
Class B | (63,717 | ) | (636,393 | ) | (160,143 | ) | (1,626,360 | ) | ||||||||
Class B – automatic conversion to Class A Shares | (48,420 | ) | (481,690 | ) | (76,660 | ) | (785,139 | ) | ||||||||
Class C | (162,162 | ) | (1,630,511 | ) | (285,751 | ) | (2,899,723 | ) | ||||||||
Class I | (823,000 | ) | (8,285,255 | ) | (1,577,562 | ) | (15,957,257 | ) | ||||||||
| (1,951,177 | ) | (19,608,147 | ) | (4,065,059 | ) | (40,992,440 | ) | |||||||||
Net increase (decrease) | (1,247,647 | ) | $ | (12,552,478 | ) | (1,400,189 | ) | $ | (13,869,445 | ) | ||||||
5. Investment Transactions
Purchases and sales (including maturities but excluding short-term investments, where applicable) during the six months ended August 31, 2011, were as follows:
| Connecticut | New Jersey | New York | New York 2 | |||||||||||||
Purchases | $ | 12,540,405 | $ | 7,065,547 | $ | 17,914,884 | $ | 12,439,440 | ||||||||
Sales and maturities | 19,873,245 | 11,242,532 | 32,027,285 | 31,649,530 | ||||||||||||
| 70 | Nuveen Investments |
6. Income Tax Information
The following information is presented on an income tax basis. Differences between amounts for financial statement and federal income tax purposes are primarily due to timing differences in recognizing taxable market discount, timing differences in recognizing certain gains and losses on investment transactions and the treatment of investments in inverse floating rate securities reflected as financing transactions, if any. To the extent that differences arise that are permanent in nature, such amounts are reclassified within the capital accounts as detailed below. Temporary differences do not require reclassification. Temporary and permanent differences do not impact the net asset values of the Funds.
At August 31, 2011, the cost and unrealized appreciation (depreciation) of investments, as determined on a federal income tax basis, were as follows:
| Connecticut | New Jersey | New York | New York 2 | |||||||||||||
Cost of investments | $ | 323,548,056 | $ | 234,231,087 | $ | 403,267,079 | $ | 258,245,130 | ||||||||
Gross unrealized: | ||||||||||||||||
Appreciation | $ | 12,936,872 | $ | 10,299,897 | $ | 19,329,810 | $ | 12,876,650 | ||||||||
Depreciation | (2,746,746 | ) | (3,837,251 | ) | (6,428,063 | ) | (1,445,393 | ) | ||||||||
Net unrealized appreciation (depreciation) of investments | $ | 10,190,126 | $ | 6,462,646 | $ | 12,901,747 | $ | 11,431,257 | ||||||||
Permanent differences, primarily due to federal taxes paid, taxable market discount and distribution character reclassifications, resulted in reclassifications among the Funds’ components of net assets at February 28, 2011, the Funds’ last tax year end, as follows:
| Connecticut | New Jersey | New York | New York 2 | |||||||||||||
Capital paid-in | $ | 2,665 | $ | — | $ | 8,449 | $ | — | ||||||||
Undistributed (Over-distribution of) net investment income | (14,515 | ) | (409 | ) | (19,756 | ) | (15,265 | ) | ||||||||
Accumulated net realized gain (loss) | 11,850 | 409 | 11,307 | 15,265 | ||||||||||||
The tax components of undistributed net tax-exempt income, net ordinary income and net long-term capital gains at February 28, 2011, the Funds’ last tax year end, were as follows:
| Connecticut | New Jersey | New York | New York 2 | |||||||||||||
Undistributed net tax-exempt income* | $ | 958,118 | $ | 1,372,491 | $ | 2,498,449 | $ | 1,227,936 | ||||||||
Undistributed net ordinary income** | 5,219 | 17,026 | 15,496 | — | ||||||||||||
Undistributed net long-term capital gains | 332,779 | — | — | — | ||||||||||||
| * | Undistributed net tax-exempt income (on a tax basis) has not been reduced for the dividends declared during the period on February 1, 2011, through February 28, 2011 and paid on March 1, 2011. |
| ** | Net ordinary income consists of taxable market discount income and net short-term capital gains, if any. |
The tax character of distributions paid during the Funds’ last tax year ended February 28, 2011, was designated for purposes of the dividends paid deduction as follows:
| Connecticut | New Jersey | New York | New York 2 | |||||||||||||
Distributions from net tax-exempt income | $ | 13,635,179 | $ | 10,300,588 | $ | 18,921,417 | $ | 11,584,837 | ||||||||
Distributions from net ordinary income** | — | — | — | — | ||||||||||||
Distributions from net long-term capital gains | 84,078 | — | — | — | ||||||||||||
| ** | Net ordinary income consists of taxable market discount income and net short-term capital gains, if any. |
At February 28, 2011, the Funds’ last tax year end, the following Funds had unused capital loss carryforwards available for federal income tax purposes to be applied against future capital gains, if any. If not applied, the carryforwards will expire as follows:
| New Jersey | New York | New York 2 | ||||||||||
Expiration: | ||||||||||||
February 28, 2018 | $ | — | $ | 127,145 | $ | 2,575,349 | ||||||
February 28, 2019 | 80,823 | 60,379 | — | |||||||||
Total | $ | 80,823 | $ | 187,524 | $ | 2,575,349 | ||||||
During the last tax year ended February 28, 2011, Connecticut and New York 2 utilized $188,653 and $408,285 of their capital loss carryforwards, respectively.
The following Funds have elected to defer net realized losses from investments incurred from November 1, 2010 through February 28, 2011, the Funds’ last tax year end, (“post-October losses”) in accordance with federal income tax regulations. Post-October losses are treated as having arisen on the first day of the current fiscal year:
| New Jersey | New York | |||||||
Post-October capital losses | $ | 110,205 | $ | 124,061 | ||||
| Nuveen Investments | 71 |
Notes to Financial Statements (Unaudited) (continued)
7. Management Fees and Other Transactions with Affiliates
Each Fund’s management fee consists of two components – a fund-level fee, based only on the amount of assets within each individual Fund, and a complex-level fee, based on the aggregate amount of all eligible fund assets managed by the Adviser. This pricing structure enables each Fund’s shareholders to benefit from growth in the assets within their respective Fund as well as from growth in the amount of complex-wide assets managed by the Adviser.
The annual fund-level fee for each Fund, payable monthly, is calculated according to the following schedule:
| Average Daily Net Assets | Fund-Level Fee Rate | |||
For the first $125 million | .3500 | % | ||
For the next $125 million | .3375 | |||
For the next $250 million | .3250 | |||
For the next $500 million | .3125 | |||
For the next $1 billion | .3000 | |||
For net assets over $2 billion | .2750 | |||
For net assets over $5 billion | .2500 | |||
The annual complex-level fee for each Fund, payable monthly, is calculated according to the following schedule:
| Complex-Level Asset Breakpoint Level* | Effective Rate at Breakpoint Level | |||
$55 billion | .2000 | % | ||
$56 billion | .1996 | |||
$57 billion | .1989 | |||
$60 billion | .1961 | |||
$63 billion | .1931 | |||
$66 billion | .1900 | |||
$71 billion | .1851 | |||
$76 billion | .1806 | |||
$80 billion | .1773 | |||
$91 billion | .1691 | |||
$125 billion | .1599 | |||
$200 billion | .1505 | |||
$250 billion | .1469 | |||
$300 billion | .1445 | |||
| * | The complex-level fee is calculated based upon the aggregate daily “eligible assets” of all Nuveen Funds. Eligible assets do not include assets attributable to investments in other Nuveen Funds or assets in excess of $2 billion added to the Nuveen Fund complex in connection with the Adviser’s assumption of the management of the former First American Funds effective January 1, 2011. Eligible assets include closed-end fund assets managed by the Adviser that are attributable to financial leverage. For these purposes, financial leverage includes the closed-end funds’ use of preferred stock and borrowings and certain investments in the residual interest certificates (also called inverse floating rate securities) in tender option bond (TOB) trusts, including the portion of assets held by a TOB trust that has been effectively financed by the trust’s issuance of floating rate securities, subject to an agreement by the Adviser as to certain funds to limit the amount of such assets for determining eligible assets in certain circumstances. As of August 31, 2011, the complex-level fee rate for these Funds was .1781%. |
The management fee compensates the Adviser for overall investment advisory and administrative services and general office facilities it provides for the Funds. The Adviser has entered into sub-advisory agreements with the Sub-Adviser under which the Sub-Adviser manages the investment portfolios of the Funds. The Sub-Adviser is compensated for its services to the Funds from the management fees paid to the Adviser.
The Adviser has agreed to waive fees and/or reimburse expenses of New York and New York 2 so that total annual fund operating expenses (excluding 12b-1 distribution and service fees, interest expenses, taxes, fees incurred in acquiring and disposing of portfolio securities and extraordinary expenses) do not exceed .750% and .975% respectively, of the average daily net assets of any class of Fund shares. The Adviser may also voluntarily reimburse additional expenses from time to time in any of the Funds. Voluntary reimbursements may be terminated at any time at the Adviser’s discretion.
The Trust pays no compensation directly to those of its trustees who are affiliated with the Adviser or to its officers, all of whom receive remuneration for their services to the Trust from the Adviser or its affiliates. The Board of Trustees has adopted a deferred compensation plan for independent trustees that enables trustees to elect to defer receipt of all or a portion of the annual compensation they are entitled to receive from certain Nuveen-advised funds. Under the plan, deferred amounts are treated as though equal dollar amounts had been invested in shares of select Nuveen-advised funds.
During the six months ended August 31, 2011, the Distributor collected sales charges on purchases of Class A Shares, the majority of which were paid out as concessions to financial intermediaries as follows:
| Connecticut | New Jersey | New York | New York 2 | |||||||||||||
Sales charges collected | $ | 82,804 | $ | 73,088 | $ | 138,746 | $ | 20,678 | ||||||||
Paid to financial intermediaries | 70,366 | 64,051 | 121,663 | 16,992 | ||||||||||||
| 72 | Nuveen Investments |
The Distributor also received 12b-1 service fees on Class A Shares, substantially all of which were paid to compensate financial intermediaries for providing services to shareholders relating to their investments.
During the six months ended August 31, 2011, the Distributor compensated financial intermediaries directly with commission advances at the time of purchase as follows:
| Connecticut | New Jersey | New York | New York 2 | |||||||||||||
Commission advances | $ | 33,660 | $ | 44,205 | $ | 63,802 | $ | 7,272 | ||||||||
To compensate for commissions advanced to financial intermediaries, all 12b-1 service fees collected on Class B Shares during the first year following a purchase, all 12b-1 distribution fees collected on Class B Shares, and all 12b-1 service and distribution fees collected on Class C Shares during the first year following a purchase are retained by the Distributor. During the six months ended August 31, 2011, the Distributor retained such 12b-1 fees as follows:
| Connecticut | New Jersey | New York | New York 2 | |||||||||||||
12b-1 fees retained | $ | 37,854 | $ | 36,664 | $ | 50,839 | $ | 24,354 | ||||||||
The remaining 12b-1 fees charged to the Funds were paid to compensate financial intermediaries for providing services to shareholders relating to their investments.
The Distributor also collected and retained CDSC on share redemptions during the six months ended August 31, 2011, as follows:
| Connecticut | New Jersey | New York | New York 2 | |||||||||||||
CDSC retained | $ | 29,803 | $ | 7,338 | $ | 8,145 | $ | 6,431 | ||||||||
8. New Accounting Pronouncements
Fair Value Measurements and Disclosures
On May 12, 2011, the Financial Accounting Standards Board (“FASB”) issued Accounting Standard Update (“ASU”) No. 2011-04 (“ASU No. 2011-04”) modifying Topic 820, Fair Value Measurements and Disclosures. At the same time, the International Accounting Standards Board (“IASB”) issued International Financial Reporting Standard (“IFRS”) 13, Fair Value Measurement. The objective of the FASB and IASB is convergence of their guidance on fair value measurements and disclosures. Specifically, ASU No. 2011-04 requires reporting entities to disclose i) the amounts of any transfers between Level 1 and Level 2, the reasons for the transfers, ii) for Level 3 fair value measurements, a) quantitative information about significant unobservable inputs used, b) a description of the valuation processes used by the reporting entity and c) a narrative description of the sensitivity of the fair value measurement to changes in unobservable inputs if a change in those inputs might result in a significantly higher or lower fair value measurement. The effective date of ASU No. 2011-04 is for interim and annual periods beginning after December 15, 2011. At this time, management is evaluating the implications of this guidance and the impact it will have on the financial statement amounts and footnote disclosures, if any.
| Nuveen Investments | 73 |
Annual Investment Management Agreement Approval Process
(Unaudited)
The Board of Trustees (each, a “Board” and each Trustee, a “Board Member”) of the Funds, including the Board Members who are not parties to the Funds’ advisory or sub-advisory agreements or “interested persons” of any such parties (the “Independent Board Members”), are responsible for approving the advisory agreements (each, an “Investment Management Agreement”) between each Fund and Nuveen Fund Advisors, Inc. (the “Advisor”) and the sub-advisory agreements (each a “Sub-Advisory Agreement”) between the Advisor and Nuveen Asset Management, LLC (the “Sub-Advisor”) (the Investment Management Agreements and the Sub-Advisory Agreements are referred to collectively as the “Advisory Agreements”) and their periodic continuation. Pursuant to the Investment Company Act of 1940, as amended (the “1940 Act”), the Board is generally required to consider the continuation of advisory agreements and sub-advisory agreements on an annual basis. Accordingly, at an in-person meeting held on May 23-25, 2011 (the “May Meeting”), the Board, including a majority of the Independent Board Members, considered and approved the continuation of the Advisory Agreements for the Funds for an additional one-year period.
In preparation for their considerations at the May Meeting, the Board requested and received extensive materials prepared in connection with the review of the Advisory Agreements. The materials provided a broad range of information regarding the Funds, the Advisor and the Sub-Advisor (the Advisor and the Sub-Advisor are collectively, the “Fund Advisers” and each, a “Fund Adviser”). As described in more detail below, the information provided included, among other things, a review of Fund performance, including Fund investment performance assessments against peer groups and appropriate benchmarks, a comparison of Fund fees and expenses relative to peers, a description and assessment of shareholder service levels for the Funds, a summary of the performance of certain service providers, a review of product initiatives and shareholder communications and an analysis of the Advisor’s profitability with comparisons to comparable peers in the managed fund business. As part of their annual review, the Board also held a separate meeting on April 19-20, 2011, to review the Funds’ investment performance and consider an analysis provided by the Advisor of the Sub-Advisor which generally evaluated the Sub-Advisor’s investment team, investment mandate, organizational structure and history, investment philosophy and process, performance of the applicable Fund, and significant changes to the foregoing. As a result of their review of the materials and discussions, the Board presented the Advisor with questions and the Advisor responded.
The materials and information prepared in connection with the review of the Advisory Agreements at the May Meeting supplemented the information provided to the Board during the year. In this regard, throughout the year, the Board, acting directly or through its committees, regularly reviews the performance and various services provided by the Advisor and, since the internal restructuring described in Section A below, the Sub-Advisor. The Board meets at least quarterly as well as at other times as the need arises. At its quarterly meetings, the Board reviews reports by the Advisor which include, among other things, Fund performance, a review of the investment teams and compliance reports. The Board also meets with key investment personnel managing the Fund portfolios during the year. In addition, the Board continues its program of seeking to visit each sub-advisor to the Nuveen funds at least once over a multiple year rotation, meeting with key investment and business personnel. The Board also met with State Street Bank & Trust Company, the Funds’ accountant and custodian, in 2010. The Board considers factors and information that are relevant to its consideration of the renewal of the Advisory Agreements at these meetings held throughout the year. Accordingly, the Board considered the information provided and knowledge gained at these meetings when performing its review at the May Meeting of the Advisory Agreements. The Independent Board Members are assisted throughout the process by independent legal counsel who provided materials describing applicable law and the duties of directors or trustees in reviewing advisory contracts and met with the Independent Board Members in executive sessions without management present.
The Board considered all factors it believed relevant with respect to each Fund, including among other factors: (a) the nature, extent and quality of the services provided by the Fund Advisers, (b) the investment performance of the Fund and Fund Advisers, (c) the advisory fees and costs of the services to be provided to the Funds and the profitability of the Fund Advisers, (d) the extent of any economies of scale, (e) any benefits derived by the Fund Advisers from the relationship with the Fund and (f) other factors. Each Board Member may have accorded different weight to the various factors in reaching his or her conclusions with respect to a Fund’s Advisory Agreements. The Independent Board Members did not identify any single factor as all important or controlling. The Independent Board Members’ considerations were instead based on a comprehensive consideration of all the information presented. The principal factors considered by the Board and its conclusions are described below.
A. Nature, Extent and Quality of Services
In considering renewal of the Advisory Agreements, the Independent Board Members considered the nature, extent and quality of the Fund Adviser’s services, including advisory services and the resulting Fund performance and administrative services. The Independent Board Members reviewed materials outlining, among other things, the Fund Adviser’s organization and business; the types of services that the Fund Adviser or its affiliates provide to the Funds; the performance record of the applicable Fund (as described in further detail below); and any initiatives Nuveen had taken for the applicable fund product line.
In considering advisory services, the Board recognized that the Advisor provides various oversight, administrative, compliance and other services for the Funds and the Sub-Advisor provides the portfolio investment management services to the Funds. The Board recognized that Nuveen engaged in an internal restructuring in 2010 pursuant to which portfolio management services the Advisor had provided directly to the Funds were transferred to the Sub-Advisor, a newly-organized, wholly-owned subsidiary of the Advisor consisting of largely the same investment personnel. Accordingly, in reviewing the portfolio management services provided to each Fund, the Board reviewed the materials provided by the Nuveen Investment Services Oversight Team analyzing, among other things, the Sub-Advisor’s investment team and changes thereto, organization and history, assets under management, Fund objectives and
| 74 | Nuveen Investments |
mandate, the investment team’s philosophy and strategies in managing the Fund, developments affecting the Sub-Advisor or Fund and Fund performance. The Independent Board Members also reviewed portfolio manager compensation arrangements to evaluate each Fund Adviser’s ability to attract and retain high quality investment personnel, preserve stability, and reward performance but not provide an incentive to take undue risks. In addition, the Board considered the Advisor’s execution of its oversight responsibilities over the Sub-Advisor. Given the importance of compliance, the Independent Board Members also considered Nuveen’s compliance program, including the report of the chief compliance officer regarding the Funds’ compliance policies and procedures.
In addition to advisory services, the Board considered the quality and extent of administrative and other non-investment advisory services the Advisor and its affiliates provide to the Funds, including product management, investment services (such as oversight of investment policies and procedures, risk management, and pricing), fund administration, oversight of service providers, shareholder services, administration of Board relations, regulatory and portfolio compliance and legal support. In reviewing the services provided, the Board also reviewed materials describing various notable initiatives and projects the Advisor performed in connection with the open-end fund product line. These initiatives included operations necessary to effect the acquisition of FAF Advisors, Inc.’s (“FAF”) long-term asset management business by Nuveen and the subsequent integration of FAF and the funds FAF advised into the Nuveen family of funds; changes in dividend declaration policies; and adding funds to various distribution platforms.
Based on their review, the Independent Board Members found that, overall, the nature, extent and quality of services provided to the respective Funds under each applicable Advisory Agreement were satisfactory.
B. The Investment Performance of the Funds and Fund Advisers
The Board, including the Independent Board Members, reviewed and considered the performance history of each Fund over various time periods. The Board reviewed, among other things, each Fund’s historic investment performance as well as information comparing the Fund’s performance information with that of other funds (the “Performance Peer Group”) based on data provided by an independent provider of mutual fund data and with recognized and/or customized benchmarks.
The Board reviewed reports, including a comprehensive analysis of the Funds’ performance and the applicable investment team. In this regard, the Board reviewed each Fund’s total return information compared to its Performance Peer Group for the quarter, one-, three- and five-year periods ending December 31, 2010 and for the same periods ending March 31, 2011. In addition, the Board reviewed each Fund’s total return information compared to recognized and/or customized benchmarks for the quarter, one- and three-year periods ending December 31, 2010 and for the same periods ending March 31, 2011.
In reviewing performance comparison information, the Independent Board Members recognized that the usefulness of the comparisons of the performance of certain funds with the performance of their respective Performance Peer Group may be limited because the Performance Peer Group may not adequately represent the objectives and strategies of the applicable funds or may be limited in size or number. In this regard, the Independent Board Members noted that the Performance Peer Group of the Nuveen New York Municipal Bond Fund 2 (the “New York Fund 2”) was classified as having significant differences from such Fund based on various considerations such as special fund objectives, potential investable universe and the composition of the peer set (e.g., the number and size of competing funds and number of competing managers). The Independent Board Members also noted that the investment experience of a particular shareholder in the Nuveen funds will vary depending on when such shareholder invests in the applicable fund, the class held (if multiple classes are offered) and the performance of the fund (or respective class) during that shareholder’s investment period. With respect to any Nuveen funds that underperformed their peers and/or benchmarks from time to time, the Board monitors such funds closely and considers any steps necessary or appropriate to address such issues.
In considering the results of the comparisons, the Independent Board Members observed, among other things, that the Nuveen Connecticut Municipal Bond Fund (the “Connecticut Fund”), the Nuveen New Jersey Municipal Bond Fund (the “New Jersey Fund”) and the Nuveen New York Municipal Bond Fund (the “New York Fund”) had demonstrated generally favorable performance in comparison to peers, performing in the first or second quartile over various periods. With respect to the New York Fund 2 which, as noted above, had significant differences with its Performance Peer Group, the Independent Board Members noted that such Fund underperformed its benchmark in the one- and three-year periods.
Based on their review, the Independent Board Members determined that each Fund’s investment performance had been satisfactory.
C. Fees, Expenses and Profitability
1. Fees and Expenses
The Board evaluated the management fees and expenses of each Fund reviewing, among other things, such Fund’s gross management fees, net management fees and net expense ratios in absolute terms as well as compared to the fee and expenses of a comparable universe of funds based on data provided by an independent fund data provider (the “Peer Universe”) and in certain cases, to a more focused subset of funds in the Peer Universe (the “Peer Group”) and any expense limitations.
The Independent Board Members further reviewed the methodology regarding the construction of the applicable Peer Universe and Peer Group (if any). In reviewing the comparisons of fee and expense information, the Independent Board Members took into account that in certain instances various factors such as: the asset level of a fund relative to peers; the limited size and particular composition of the Peer Universe or Peer Group; the investment objectives of the peers; expense anomalies; changes in the funds comprising the Peer Universe or Peer Group from year to year; levels of reimbursement; the timing of information used; and
| Nuveen Investments | 75 |
Annual Investment Management Agreement Approval Process
(Unaudited) (continued)
differences in the states reflected in the Peer Universe or Peer Group may impact the comparative data thereby limiting the ability to make a meaningful comparison with peers, including for the Connecticut Fund and the New Jersey Fund.
In reviewing the fee schedule for a Fund, the Independent Board Members also considered the fund-level and complex-wide breakpoint schedules (described in further detail below) and any fee waivers and reimbursements provided by Nuveen. In reviewing fees and expenses, the Board considered the expenses and fees to be higher if they were over 10 basis points higher, slightly higher if they were 6 to 10 basis points higher, in line if they were within 5 basis points higher than the peer average and below if they were below the peer average of the Peer Group (if available) or Peer Universe if there was no separate Peer Group. The Independent Board Members noted that the New York Fund 2, the Connecticut Fund and the New Jersey Fund each had net management fees slightly higher or higher than the peer average but net expense ratios below or in line with the peer average, while the New York Fund had net management fees higher than the peer average and a net expense ratio slightly higher than the peer average.
Based on their review of the fee and expense information provided, the Independent Board Members determined that each Fund’s management fees were reasonable in light of the nature, extent and quality of services provided to the Fund.
2. Comparisons with the Fees of Other Clients
The Independent Board Members further reviewed information regarding the nature of services and fee rates offered by the Advisor to other clients, including municipal separately managed accounts and passively managed exchange traded funds (ETFs) sub-advised by the Advisor. In evaluating the comparisons of fees, the Independent Board Members noted that the fee rates charged to the Funds and other clients vary, among other things, because of the different services involved and the additional regulatory and compliance requirements associated with registered investment companies, such as the Funds. Accordingly, the Independent Board Members considered the differences in the product types, including, but not limited to, the services provided, the structure and operations, product distribution and costs thereof, portfolio investment policies, investor profiles, account sizes and regulatory requirements. The Independent Board Members noted, in particular, that the range of services provided to the Funds (as discussed above) is much more extensive than that provided to separately managed accounts. Given the inherent differences in the products, particularly the extensive services provided to the Funds, the Independent Board Members believe such facts justify the different levels of fees.
In considering the fees of the Sub-Advisor, the Independent Board Members also considered the pricing schedule or fees that the Sub-Advisor charges for similar investment management services for other Nuveen funds.
3. Profitability of Fund Advisers
In conjunction with its review of fees, the Independent Board Members also considered the profitability of Nuveen for its advisory activities (which incorporated Nuveen’s wholly-owned affiliated sub-advisers) and its financial condition. The Independent Board Members reviewed the revenues and expenses of Nuveen’s advisory activities for the last two years, the allocation methodology used in preparing the profitability data and an analysis of the key drivers behind the changes in revenues and expenses that impacted profitability in 2010. The Independent Board Members noted this information supplemented the profitability information requested and received during the year to help keep them apprised of developments affecting profitability (such as changes in fee waivers and expense reimbursement commitments). In this regard, the Independent Board Members noted that they have an Independent Board Member serve as a point person to review and keep them apprised of changes to the profitability analysis and/or methodologies during the year. The Independent Board Members also considered Nuveen’s revenues for advisory activities, expenses, and profit margin compared to that of various unaffiliated management firms with similar amounts of assets under management and relatively comparable asset composition prepared by Nuveen.
In reviewing profitability, the Independent Board Members recognized the subjective nature of determining profitability which may be affected by numerous factors including the allocation of expenses. Further, the Independent Board Members recognized the difficulties in making comparisons as the profitability of other advisers generally is not publicly available and the profitability information that is available for certain advisers or management firms may not be representative of the industry and may be affected by, among other things, the adviser’s particular business mix, capital costs, types of funds managed and expense allocations. Notwithstanding the foregoing, the Independent Board Members reviewed Nuveen’s methodology and assumptions for allocating expenses across product lines to determine profitability. In reviewing profitability, the Independent Board Members recognized Nuveen’s investment in its fund business. Based on their review, the Independent Board Members concluded that the Advisor’s level of profitability for its advisory activities was reasonable in light of the services provided.
In evaluating the reasonableness of the compensation, the Independent Board Members also considered other amounts paid to a Fund Adviser by the Funds as well as any indirect benefits (such as soft dollar arrangements, if any) the Fund Adviser and its affiliates receive, or are expected to receive, that are directly attributable to the management of the Funds, if any. See Section E below for additional information on indirect benefits a Fund Adviser may receive as a result of its relationship with the Funds. Based on their review of the overall fee arrangements of each Fund, the Independent Board Members determined that the advisory fees and expenses of the respective Fund were reasonable.
| 76 | Nuveen Investments |
D. Economies of Scale and Whether Fee Levels Reflect These Economies of Scale
With respect to economies of scale, the Independent Board Members have recognized the potential benefits resulting from the costs of a fund being spread over a larger asset base, although economies of scale are difficult to measure and predict with precision, particularly on a fund-by-fund basis. One method to help ensure the shareholders share in these benefits is to include breakpoints in the advisory fee schedule. Generally, management fees for funds in the Nuveen complex are comprised of a fund-level component and a complex-level component, subject to certain exceptions. Accordingly, the Independent Board Members reviewed and considered the applicable fund-level breakpoints in the advisory fee schedules that reduce advisory fees as asset levels increase.
In addition to fund-level advisory fee breakpoints, the Board also considered the Funds’ complex-wide fee arrangement. Pursuant to the complex-wide fee arrangement, the fees of the funds in the Nuveen complex are generally reduced as the assets in the fund complex reach certain levels. The complex-wide fee arrangement seeks to provide the benefits of economies of scale to fund shareholders when total fund complex assets increase, even if assets of a particular fund are unchanged or have decreased. The approach reflects the notion that some of Nuveen’s costs are attributable to services provided to all its funds in the complex and therefore all funds benefit if these costs are spread over a larger asset base. In this regard, the Independent Board Members also noted that a portion of the assets acquired pursuant to the transaction with FAF are included in determining the level of assets for calculating the complex-wide fee, which helps reduce such fee to the benefit of all shareholders.
Based on their review, the Independent Board Members concluded that the breakpoint schedules and complex-wide fee arrangement were acceptable and reflect economies of scale to be shared with shareholders when assets under management increase.
E. Indirect Benefits
In evaluating fees, the Independent Board Members received and considered information regarding potential “fall out” or ancillary benefits the respective Fund Adviser or its affiliates may receive as a result of its relationship with each Fund. In this regard, the Independent Board Members considered, among other things, any sales charges, distribution fees and shareholder services fees received and retained by the Funds’ principal underwriter, an affiliate of the Advisor, which includes fees received pursuant to any 12b-1 plan. The Independent Board Members, therefore, considered the 12b-1 fees retained by Nuveen during the last calendar year.
In addition to the above, the Independent Board Members considered whether the Fund Advisers received any benefits from soft dollar arrangements whereby a portion of the commissions paid by a Fund for brokerage may be used to acquire research that may be useful to the Fund Adviser in managing the assets of the Funds and other clients. The Independent Board Members recognized that each Fund Adviser has the authority to pay a higher commission in return for brokerage and research services if it determines in good faith that the commission paid is reasonable in relation to the value of the brokerage and research services provided. Nevertheless, the Independent Board Members noted that commissions are generally not paid in connection with municipal securities transactions typically executed on a principal basis.
Based on their review, the Independent Board Members concluded that any indirect benefits received by a Fund Adviser as a result of its relationship with the Funds were reasonable and within acceptable parameters.
F. Other Considerations
The Independent Board Members did not identify any single factor discussed previously as all-important or controlling. The Board Members, including the Independent Board Members, unanimously concluded that the terms of each Advisory Agreement are fair and reasonable, that the respective Fund Adviser’s fees are reasonable in light of the services provided to each Fund and that the Advisory Agreements be renewed.
| Nuveen Investments | 77 |
Glossary of Terms Used in this Report
Average Annual Total Return: This is a commonly used method to express an investment’s performance over a particular, usually multi-year time period. It expresses the return that would have been necessary each year to equal the investment’s actual cumulative performance (including change in NAV or offer price and reinvested dividends and capital gains distributions, if any) over the time period being considered.
Average Duration: Duration is a measure of the expected period over which a bond’s principal and interest will be paid, and consequently is a measure of the sensitivity of a bond’s (or bond fund’s) value to changes when market interest rates change. Generally, the longer a bond or Fund’s duration, the more the price of the bond or Fund will change as interest rates change.
Average Effective Maturity: The market-value-weighted average of the effective maturity dates of the individual securities including cash. In the case of a bond that has been advance-refunded to a call date, the effective maturity is the date on which the bond is scheduled to be redeemed using the proceeds of an escrow account. In most other cases the effective maturity is the stated maturity date of the security.
Inverse Floaters: Inverse floating rate securities are created by depositing a municipal bond, typically with a fixed interest rate, into a special purpose trust created by a broker-dealer. This trust, in turn, (a) issues floating rate certificates typically paying short-term tax-exempt interest rates to third parties in amounts equal to some fraction of the deposited bond’s par amount or market value, and (b) issues an inverse floating rate certificate (sometimes referred to as an “inverse floater”) to an investor (such as a Fund) interested in gaining investment exposure to a long-term municipal bond. The income received by the holder of the inverse floater varies inversely with the short-term rate paid to the floating rate certificates’ holders, and in most circumstances the holder of the inverse floater bears substantially all of the underlying bond’s downside investment risk. The holder of the inverse floater typically also benefits disproportionately from any potential appreciation of the underlying bond’s value. Hence, an inverse floater essentially represents an investment in the underlying bond on a leveraged basis.
Lipper Connecticut Municipal Debt Classification Average: Represents the average annualized total return for all reporting funds in the Lipper Connecticut Municipal Debt category. The Lipper Connecticut Municipal Debt Classification Average contained 21, 20, 16 and 15 funds for the 6-month, 1-year, 5-year and 10-year periods, respectively, ended August 31, 2011. Lipper returns account for the effects of management fees and assume reinvestment of dividends but do not reflect any applicable sales charges. The Lipper average is not available for direct investment.
Lipper New Jersey Municipal Debt Classification Average: Represents the average annualized total return for all reporting funds in the Lipper New Jersey Municipal Debt category. The Lipper New Jersey Municipal Debt Classification Average contained 50, 48, 34 and 33 funds for the 6-month, 1-year, 5-year and 10-year periods, respectively, ended August 31, 2011. Lipper returns account for the effects of management fees and assume reinvestment of dividends but do not reflect any applicable sales charges. The Lipper average is not available for direct investment.
Lipper New York Municipal Debt Classification Average: Represents the average annualized total return for all reporting funds in the Lipper New York Municipal Debt category. The Lipper New York Municipal Debt Classification Average contained 107, 99, 82 and 76 funds for the 6-month, 1-year, 5-year and 10-year periods, respectively, ended August 31, 2011. Lipper returns account for the effects of management fees and assume reinvestment of dividends but do not reflect any applicable sales charges. The Lipper average is not available for direct investment.
Net Asset Value (NAV): The net market value of all securities held in a portfolio.
Net Asset Value (NAV) Per Share: The market value of one share of a mutual fund or closed-end fund. For a Fund, the NAV is calculated daily by taking the Fund’s total assets (securities, cash, and accrued earnings), subtracting the Fund’s liabilities, and dividing by the number of shares outstanding.
Pre-Refundings: Pre-Refundings, also known as advance refundings or refinancings, occur when an issuer sells new bonds and uses the proceeds to fund principal and interest payments of older existing bonds. This process often results in lower borrowing costs for bond issuers.
Standard & Poor’s (S&P) Connecticut Municipal Bond Index: An unleveraged, market value-weighted index designed to measure the performance of the tax-exempt, investment-grade Connecticut municipal bond market. The index returns assume reinvestment of dividends but do not reflect any applicable sales charges. You cannot invest directly in an index.
Standard & Poor’s (S&P) National Municipal Bond Index: An unleveraged, market value-weighted index designed to measure the performance of the tax-exempt, investment-grade U.S. municipal bond market. The index returns assume reinvestment of dividends but do not reflect any applicable sales charges. You cannot invest directly in an index.
Standard & Poor’s (S&P) New Jersey Municipal Bond Index: An unleveraged, market value-weighted index designed to measure the performance of the tax-exempt, investment-grade New Jersey municipal bond market. The index returns assume reinvestment of dividends but do not reflect any applicable sales charges. You cannot invest directly in an index.
Standard & Poor’s (S&P) New York Municipal Bond Index: An unleveraged, market value-weighted index designed to measure the performance of the tax-exempt, investment-grade New York municipal bond market. The index returns assume reinvestment of dividends but do not reflect any applicable sales charges. You cannot invest directly in an index.
Zero Coupon Bond: A zero coupon bond does not pay a regular interest coupon to its holders during the life of the bond. Tax-exempt income to the holder of the bond comes from accretion of the difference between the original purchase price of the bond at issuance and the par value of the bond at maturity and is effectively paid at maturity. The market prices of zero coupon bonds generally are more volatile than the market prices of bonds that pay interest periodically.
| 78 | Nuveen Investments |
Fund Manager
Nuveen Fund Advisors, Inc.
333 West Wacker Drive
Chicago, IL 60606
Sub-Adviser
Nuveen Asset Management, LLC
333 West Wacker Drive
Chicago, IL 60606
Legal Counsel
Chapman and Cutler LLP
Chicago, IL
Independent Registered
Public Accounting Firm
PricewaterhouseCoopers LLP
Chicago, IL
Custodian
State Street Bank & Trust Company
Boston, MA
Transfer Agent and Shareholder Services
Boston Financial
Data Services, Inc.
Nuveen Investor Services
P.O. Box 8530
Boston, MA 02266-8530
(800) 257-8787
Quarterly Portfolio of Investments and Proxy Voting Information: You may obtain (i) each Fund’s quarterly portfolio of investments, (ii) information regarding how each Fund voted proxies relating to portfolio securities held during the most recent twelve-month period ended June 30, and (iii) a description of the policies and procedures that each Fund used to determine how to vote proxies relating to portfolio securities without charge, upon request, by calling Nuveen Investments at (800) 257-8787 or on Nuveen’s website at www.nuveen.com.
You may also obtain this and other Fund information directly from the Securities and Exchange Commission (SEC). The SEC may charge a copying fee for this information. Visit the SEC on-line at http://www.sec.gov or in person at the SEC’s Public Reference Room in Washington, D.C. Call the SEC at (202) 942-8090 for room hours and operation. You may also request Fund information by sending an e-mail request to publicinfo@sec.gov or by writing to the SEC’s Public Reference Section at 100 F Street NE, Washington, D.C. 20549.
The Financial Industry Regulatory Authority (FINRA) provides a Public Disclosure Program which supplies certain information regarding the disciplinary history of FINRA members and their associated persons in response to either telephone inquiries at (800) 289-9999 or written inquiries at www.finra.org. FINRA also provides an investor brochure that includes information describing the Public Disclosure Program.
| Nuveen Investments | 79 |
Nuveen Investments:
Serving Investors for Generations
Since 1898, financial advisors and their clients have relied on Nuveen Investments to provide dependable investment solutions through continued adherence to proven, long-term investing principles. Today, we offer a range of high quality equity and fixed-income solutions designed to be integral components of a well-diversified core portfolio.
Focused on meeting investor needs.
Nuveen Investments is a global investment management firm that seeks to help secure the long-term goals of institutions and high net worth investors as well as the consultants and financial advisors who serve them. We market our growing range of specialized investment solutions under the high-quality brands of HydePark, NWQ, Nuveen Asset Management, Santa Barbara, Symphony, Tradewinds and Winslow Capital. In total, Nuveen Investments managed approximately $210 billion of assets as of June 30, 2011.
Find out how we can help you.
To learn more about how the products and services of Nuveen Investments may be able to help you meet your financial goals, talk to your financial advisor, or call us at (800) 257-8787. Please read the information provided carefully before you invest. Investors should consider the investment objective and policies, risk considerations, charges and expenses of any investment carefully. Where applicable, be sure to obtain a prospectus, which contains this and other relevant information. To obtain a prospectus, please contact your securities representative or Nuveen Investments, 333 W. Wacker Dr., Chicago, IL 60606. Please read the prospectus carefully before you invest or send money.
Learn more about Nuveen Funds at: www.nuveen.com/mf
Nuveen makes things e-simple.
It only takes a minute to sign up for e-Reports. Once enrolled, you’ll receive an e-mail as soon as your Nuveen Fund information is ready — no more waiting for delivery by regular mail. Just click on the link within the e-mail to see the report and save it on your computer if you wish.
Free e-Reports right to your e-mail!
www.investordelivery.com
If you receive your Nuveen Fund distributions and statements from your financial advisor or brokerage account.
OR
www.nuveen.com/accountaccess
If you receive your Nuveen Fund distributions and statements directly from Nuveen.
Distributed by Nuveen Securities, LLC 333 West Wacker Drive Chicago, IL 60606 www.nuveen.com |
MSA-MS3-0811D

Mutual Funds
Nuveen Municipal Bond Funds
Dependable, tax-free income because it’s not what you earn, it’s what you keep.®
Semi-Annual Report
August 31, 2011
| Share Class / Ticker Symbol | ||||||||
| Fund Name | Class A | Class B | Class C | Class I | ||||
Nuveen Massachusetts Municipal Bond Fund | NMAAX | NMABX | NMACX | NBMAX | ||||
Nuveen Massachusetts Municipal Bond Fund 2 (formerly Nuveen Massachusetts Insured Municipal Bond Fund) | NMAIX | NINSX | NMAKX | NIMAX | ||||
LIFE IS COMPLEX.
Nuveen makes things e-simple.
It only takes a minute to sign up for e-Reports. Once enrolled, you’ll receive an e-mail as soon as your Nuveen Fund information is ready. No more waiting for delivery by regular mail. Just click on the link within the e-mail to see the report and save it on your computer if you wish.
Free e-Reports right to your e-mail!
www.investordelivery.com
If you receive your Nuveen Fund dividends and statements from your financial advisor or brokerage account.
OR
www.nuveen.com/accountaccess
If you receive your Nuveen Fund dividends and statements directly from Nuveen.
| Must be preceded by or accompanied by a prospectus. | NOT FDIC INSURED | MAY LOSE VALUE | NO BANK GUARANTEE |
| 4 | ||||
| 5 | ||||
| 9 | ||||
| 12 | ||||
| 13 | ||||
| 14 | ||||
| 15 | ||||
| 24 | ||||
| 25 | ||||
| 26 | ||||
| 27 | ||||
| 32 | ||||
| 41 | ||||
| 46 | ||||
| 47 | ||||
Letter to Shareholders

Dear Shareholders,
The global economy continues to be weighed down by an unusual combination of pressures facing the larger developed economies. Japanese leaders continue to work through the economic aftereffects of the March 2011 earthquake and tsunami. Political leaders in Europe and the U.S. have resolved some of the near term fiscal problems, but the financial markets are not convinced that these leaders are able to address more complex longer term fiscal issues. Despite improved earnings and capital increases, the largest banks in these countries continue to be vulnerable to deteriorating mortgage portfolios and sovereign credit exposure, adding another source of uncertainty to the global financial system.
In the U.S., recent economic statistics indicate that the economic recovery may be losing momentum. Consumption, which represents about 70% of the gross domestic product, faces an array of challenges from seemingly intractable declines in housing values, increased energy costs and limited growth in the job market. The failure of Congress and the administration to agree on the debt ceiling increase on a timely basis and the deep divisions between the political parties over fashioning a balanced program to address growing fiscal imbalances that led to the recent S&P ratings downgrade add considerable uncertainty to the domestic economic picture.
On a more positive note, corporate earnings continue to hold up well and the municipal bond market is recovering from recent weakness as states and municipalities implement various programs to reduce their budgetary deficits. In addition, the Federal Reserve System has made it clear that it stands ready to take additional steps should the economic recovery falter. However, there are concerns that the Fed is approaching the limits of its resources to intervene in the economy.
These perplexing times highlight the importance of professional investment management. Your Nuveen investment team is working hard to develop an appropriate response to increased risk, and they continue to seek out opportunities created by stressful markets using proven investment disciplines designed to help your Fund achieve its investment objectives. On your behalf, we monitor their activities to assure that they maintain their investment disciplines.
As always, I encourage you to contact your financial consultant if you have any questions about your investment in a Nuveen Fund. On behalf of the other members of your Fund Board, we look forward to continuing to earn your trust in the months and years ahead.
Sincerely,

Robert P. Bremner
Chairman of the Board
October 21, 2011
| 4 | Nuveen Investments |
The Board of Trustees of Nuveen Multistate Trust II has approved, subject to shareholder approval, the reorganization of the Nuveen Massachusetts Municipal Bond Fund 2 into the Nuveen Massachusetts Municipal Bond Fund. The Nuveen Massachusetts Municipal Bond Fund 2 will hold a special meeting of shareholders for the purpose of voting on the merger on November 7, 2011. A joint Proxy Statement/Prospectus containing important information relating to the proposed reorganization has been mailed to those who were Fund shareholders as of the close of business on September 9, 2011, the record date for the special meeting. Shareholders are urged to read such joint Proxy Statement/Prospectus carefully. Free copies of the Proxy Statement/Prospectus are available on the SEC’s web site at www.sec.gov.
Certain statements in this report are forward-looking statements. Discussions of specific investments are for illustration only and are not intended as recommendations of individual investments. The forward-looking statements and other views expressed herein are those of the portfolio manager as of the date of this report. Actual future results or occurrences may differ significantly from those anticipated in any forward-looking statements, and the views expressed herein are subject to change at any time, due to numerous market and other factors. The Funds disclaim any obligation to update publicly or revise any forward-looking statements or views expressed herein.
Ratings shown are the highest rating given by one of the following national rating agencies: Standard & Poor’s Group, Moody’s Investor Services, Inc. or Fitch, Inc. Credit ratings are subject to change. AAA, AA, A, and BBB are investment grade ratings; BB, B, CCC, CC, C and D are below-investment grade ratings. Bonds backed by U.S. Government or agency securities are given an implied rating equal to the rating of such securities. Holdings designated N/R are not rated by a national rating agency.
Portfolio manager Michael Hamilton examines key investment strategies and the Funds’ performance during the six months ending August 31, 2011. Michael has 22 years of investment experience and assumed management of the Nuveen Massachusetts Municipal Bond Fund and the Nuveen Massachusetts Municipal Bond Fund 2 (formerly the Nuveen Massachusetts Insured Municipal Bond Fund) in January 2011.
How did the Funds perform during the six-month reporting period ending August 31, 2011?
The tables in the Fund Performance and Expense Ratios section of this report provide total return performance information for the six-month, one-year, five-year and ten-year periods ending August 31, 2011. Over the six-month period, the Class A Shares of the Nuveen Massachusetts Municipal Bond Fund and Nuveen Massachusetts Municipal Bond Fund 2 at net asset value (NAV) lagged the national tax-exempt bond market while the Nuveen Massachusetts Municipal Bond Fund 2 outperformed the S&P Massachusetts Municipal Bond Index.
During this six-month reporting period, tax-exempt bonds benefited from a favorable investment environment, as this time span began just a few weeks after the municipal market bottomed after a deep downturn in late 2010 and early 2011. In addition, the Funds were helped by limited new issuance of tax-exempt municipal bonds — which helped boost prices amid healthy demand for the securities — and a substantial decline in interest rates that pushed up bond prices. During the six months ending August 31, 2011, municipal bond issuance totaled roughly $135 billion nationwide, a 34% year-over-year decline. In comparison, new supply of Massachusetts tax-exempt debt was about $4.4 billion during the same period, reflecting a 42% year-over-year drop.
Both Funds were bolstered by their duration positioning — meaning their sensitivity to changes in interest rates. This was especially true for the Nuveen Massachusetts Municipal Bond Fund. During the reporting period, longer bonds were helped the most by the declining-rate environment, while shorter-maturity issues did not perform well. Both Funds had less exposure to the market’s shortest bonds than the national index, which supported portfolio performance. Somewhat offsetting that positive contribution, however, was an underweighting of the strong-performing longest-duration issues, which weighed upon results.
Meanwhile, disappointing sector and security selection weighed heavily on both Funds’ relative performance. The Nuveen Massachusetts Municipal Bond Fund’s returns suffered when two health care bond issuers declared bankruptcy during the summer of 2011 — Quincy Medical Center and Northern Berkshire Community Hospital. As a result, the Fund’s holdings in their bonds lost significant value.
| Nuveen Investments | 5 |
Both Funds were hurt by their underweighting in transportation debt, especially airport bonds, which were lifted by the improved health of the airline industry. The Nuveen Massachusetts Municipal Bond Fund also was hampered by its overweighting in the lagging category of corporate-backed industrial-development revenue bonds. Although the Fund was overweighted in bonds from the struggling housing sector, strong performance of some of our individual holdings in that group offset the weakness of the category as a whole. The Nuveen Massachusetts Municipal Bond Fund 2, however, was overweighted in multi-family housing bonds, and this emphasis was a negative factor for performance. Another detractor for this Fund was its limited exposure to tax-supported bonds — especially strong-performing local general obligation bonds.
The Nuveen Massachusetts Municipal Bond Fund enjoyed favorable credit-rating positioning on balance. An overweighting in unrated and BBB-rated bonds proved helpful, as did underweightings in bonds with AAA and AA credit ratings. In contrast, the Fund was underweighted in A-rated bonds, which turned out to be the best-performing rating category of the six-month period. Credit-rating positioning was a modest negative for the Nuveen Massachusetts Municipal Bond Fund 2, as several of the Fund’s non-rated bond positions lagged our expectations.
Of final note, the Nuveen Massachusetts Municipal Bond Fund benefited from its position in an inverse-floating rate security, while the Nuveen Massachusetts Municipal Bond Fund 2 did not have this position.
What strategies were used to manage the Funds during the six-month reporting period?
Effective as of the close of business on April 27, 2011, the Nuveen Massachusetts Municipal Bond Fund 2 closed to new investors. Investors in the Fund as of that date may continue to invest in the Fund, including through the reinvestment of dividends and capital gains distributions.
In addition, effective May 31, 2011:
| • | The Fund is no longer required to invest at least 80% of its net assets in municipal securities that are covered by insurance guaranteeing the timely payment of principal and interest thereon. The Fund continued to be subject to the requirement that it invest at least 80% of its net assets in municipal bonds that pay interest that is exempt from regular federal and Massachusetts personal income tax. |
| • | The Fund’s name changed from Nuveen Massachusetts Insured Municipal Bond Fund. |
The Funds invest primarily in investment-grade municipal bonds in an effort to provide interest income exempt from regular federal, Massachusetts state and, in some cases, Massachusetts local income taxes.
Our purchase activity for both Funds during the reporting period was light, due to highly constrained new issuance of Massachusetts tax-exempt bonds and net investment outflows from the Funds. With the limited bond supply and an environment of historically low yields, it was often difficult to accomplish our goal of obtaining longer-dated A-rated
| 6 | Nuveen Investments |
bonds, and we faced significant competition from retail investors who also were seeking increased income in the low-rate environment. Our most notable new acquisitions for both Funds were bonds issued by the Broad Institute, a genomic medicine research center in Cambridge, Massachusetts, that represents a joint venture of Massachusetts Institute of Technology and Harvard University.
To fund the portfolio’s purchase activity as well as meet some investment outflows during the period, we applied the proceeds of bond calls or maturities. We also selectively sold higher-quality bonds for which there was good demand. In addition, in the Nuveen Massachusetts Municipal Bond Fund 2, we sold several out-of-state bond positions and replaced them with what we believed to be suitable Massachusetts securities.
Risk Considerations
Mutual fund investing involves risk; principal loss is possible. Debt or fixed income securities are subject to credit risk and interest rate risk. The value of, and income generated by debt securities will decrease or increase based on changes in market interest rates. As interest rates rise, bond prices fall. Credit risk refers to an issuer’s ability to make interest and principal payments when due. Below investment grade bonds carry heightened credit risk and potential for default.
Dividend Information
Each class of shares of the Nuveen Massachusetts Municipal Bond Fund saw a decrease to its monthly dividend in May 2011. The Nuveen Massachusetts Municipal Bond Fund 2’s Class B and C Shares saw their monthly dividends increase in August 2011. There were no other dividend changes to either of the Funds’ share classes during the six-month period ending August 31, 2011.
Each Fund seeks to pay dividends at a rate that reflects the past and projected performance of the Fund. To permit a Fund to maintain a more stable monthly dividend, the Fund may pay dividends at a rate that may be more or less than the amount of net investment income actually earned by the Fund during the period. If the Fund has cumulatively earned more than it has paid in dividends, it will hold the excess in reserve as undistributed net investment income (UNII) as part of the Fund’s net asset value. Conversely, if the Fund has cumulatively paid in dividends more than it has earned, the excess will constitute a negative UNII that will likewise be reflected in the Fund’s net asset value. Each Fund will, over time, pay all its net investment income as dividends to shareholders. As of August 31, 2011, both Funds had a positive UNII balance, based upon our best estimate, for tax purposes. Massachusetts Municipal Bond Fund had a positive UNII balance for financial reporting purposes, while Massachusetts Municipal Bond Fund 2 had a negative UNII balance for financial reporting purposes.
| Nuveen Investments | 7 |
[THIS PAGE INTENTIONALLY LEFT BLANK]
| 8 | Nuveen Investments |
Fund Performance and Expense Ratios (Unaudited)
The Fund Performance and Expense Ratios for each Fund are shown on the following two pages.
Returns quoted represent past performance, which is no guarantee of future results. Current performance may be higher or lower than the performance shown. Investment returns and principal value will fluctuate so that when shares are redeemed, they may be worth more or less than their original cost. Returns without sales charges would be lower if the sales charge were included. Returns do not reflect the deduction of taxes that a shareholder would pay on Fund distributions or the redemption of Fund shares. Income is generally exempt from regular federal income taxes. Some income may be subject to state and local income taxes and to the federal alternative minimum tax. Capital gains, if any, are subject to tax.
Returns may reflect a contractual agreement between certain Funds and the investment adviser to waive certain fees and expenses; see Notes to Financial Statements, Footnote 7 — Management Fees and Other Transactions with Affiliates for more information. In addition, returns may reflect a voluntary expense limitation by the Funds’ investment adviser that may be modified or discontinued at any time without notice. For the most recent month-end performance visit www.nuveen.com or call (800) 257-8787.
Returns reflect differences in sales charges and expenses, which are primarily differences in distribution and service fees. Fund returns assume reinvestment of dividends and capital gains.
Comparative index and Lipper return information is provided for the Funds’ Class A Shares at net asset value (NAV) only.
The expense ratios shown reflect the Funds’ total operating expenses (before fee waivers or expense reimbursements, if any) as shown in the Funds’ most recent prospectus. The expense ratios include management fees and other fees and expenses.
| Nuveen Investments | 9 |
Fund Performance and Expense Ratios (Unaudited) (continued)
Nuveen Massachusetts Municipal Bond Fund
Refer to the first page of this Fund Performance and Expense Ratios section for further explanation of the information included within this page.
Fund Performance
Average Annual Total Returns as of August 31, 2011*
Cumulative | Average Annual | |||||||||||||||
| 6-Month | 1-Year | 5-Year | 10-Year | |||||||||||||
Class A Shares at NAV | 5.68% | 0.72% | 4.10% | 4.39% | ||||||||||||
Class A Shares at maximum Offering Price | 1.19% | -3.55% | 3.20% | 3.95% | ||||||||||||
Standard & Poor’s (S&P) Massachusetts Municipal Bond Index** | 6.09% | 2.47% | 5.19% | 5.17% | ||||||||||||
Standard & Poor’s (S&P) National Municipal Bond Index** | 6.56% | 2.62% | 4.60% | 4.93% | ||||||||||||
Lipper Massachusetts Municipal Debt Classification Average** | 6.40% | 1.04% | 3.42% | 4.02% | ||||||||||||
Class B Shares w/o CDSC | 5.39% | -0.03% | 3.33% | 3.76% | ||||||||||||
Class B Shares w/CDSC | 0.39% | -3.88% | 3.16% | 3.76% | ||||||||||||
Class C Shares | 5.43% | 0.16% | 3.52% | 3.82% | ||||||||||||
Class I Shares | 5.90% | 0.94% | 4.33% | 4.61% | ||||||||||||
Latest Calendar Quarter – Average Annual Total Returns as of September 30, 2011*
Cumulative | Average Annual | |||||||||||||||
| 6-Month | 1-Year | 5-Year | 10-Year | |||||||||||||
Class A Shares at NAV | 8.21% | 2.96% | 4.24% | 4.57% | ||||||||||||
Class A Shares at maximum Offering Price | 3.66% | -1.36% | 3.35% | 4.12% | ||||||||||||
Class B Shares w/o CDSC | 7.80% | 2.19% | 3.45% | 3.94% | ||||||||||||
Class B Shares w/CDSC | 2.80% | -1.74% | 3.28% | 3.94% | ||||||||||||
Class C Shares | 7.98% | 2.51% | 3.68% | 4.00% | ||||||||||||
Class I Shares | 8.33% | 3.18% | 4.45% | 4.77% | ||||||||||||
Class A Shares have a maximum 4.20% sales charge (Offering Price). Class A Share purchases of $1 million or more are sold at net asset value without an up-front sales charge but may be subject to a contingent deferred sales charge (CDSC), also known as a back-end sales charge, if redeemed within eighteen months of purchase. Class B Shares have a CDSC that begins at 5% for redemptions during the first year and declines periodically until after six years when the charge becomes 0%. Class B Shares automatically convert to Class A Shares eight years after purchase. Class C Shares have a 1% CDSC for redemptions within less than twelve months, which is not reflected in the one-year total return. Class I Shares have no sales charge and may be purchased under limited circumstances or by specified classes of investors.
Expense Ratios as of Most Recent Prospectus
| Expense Ratios | ||||
Class A Shares | 0.85% | |||
Class B Shares | 1.60% | |||
Class C Shares | 1.40% | |||
Class I Shares | 0.65% | |||
| * | Six-month returns are cumulative; all other returns are annualized. |
| ** | Refer to the Glossary of Terms Used in the Report for definitions. |
| 10 | Nuveen Investments |
Nuveen Massachusetts Municipal Bond Fund 2
Refer to the first page of this Fund Performance and Expense Ratios section for further explanation of the information included within this page.
Fund Performance
Average Annual Total Returns as of August 31, 2011*
Cumulative | Average Annual | |||||||||||||||
| 6-Month | 1-Year | 5-Year | 10-Year | |||||||||||||
Class A Shares at NAV | 6.15 | % | 2.10% | 4.33% | 4.27% | |||||||||||
Class A Shares at maximum Offering Price | 1.70 | % | -2.19% | 3.45% | 3.82% | |||||||||||
Standard & Poor’s (S&P) Massachusetts Municipal Bond Index** | 6.09 | % | 2.47% | 5.19% | 5.17% | |||||||||||
Standard & Poor’s (S&P) National Municipal Bond Index** | 6.56 | % | 2.62% | 4.60% | 4.93% | |||||||||||
Lipper Massachusetts Municipal Debt Classification Average** | 6.40 | % | 1.04% | 3.42% | 4.02% | |||||||||||
Class B Shares w/o CDSC | 5.75 | % | 1.34% | 3.56% | 3.64% | |||||||||||
Class B Shares w/CDSC | 0.75 | % | -2.57% | 3.39% | 3.64% | |||||||||||
Class C Shares | 5.75 | % | 1.52% | 3.77% | 3.70% | |||||||||||
Class I Shares | 6.21 | % | 2.27% | 4.54% | 4.48% | |||||||||||
Latest Calendar Quarter – Average Annual Total Returns as of September 30, 2011*
Cumulative | Average Annual | |||||||||||||||
| 6-Month | 1-Year | 5-Year | 10-Year | |||||||||||||
Class A Shares at NAV | 8.14 | % | 3.69% | 4.49% | 4.48% | |||||||||||
Class A Shares at maximum Offering Price | 3.58 | % | -0.68% | 3.61% | 4.03% | |||||||||||
Class B Shares w/o CDSC | 7.85 | % | 2.92% | 3.70% | 3.85% | |||||||||||
Class B Shares w/CDSC | 2.85 | % | -1.05% | 3.53% | 3.85% | |||||||||||
Class C Shares | 7.95 | % | 3.10% | 3.93% | 3.91% | |||||||||||
Class I Shares | 8.30 | % | 3.96% | 4.70% | 4.69% | |||||||||||
Class A Shares have a maximum 4.20% sales charge (Offering Price). Class A Share purchases of $1 million or more are sold at net asset value without an up-front sales charge but may be subject to a contingent deferred sales charge (CDSC), also known as a back-end sales charge, if redeemed within eighteen months of purchase. Class B Shares have a CDSC that begins at 5% for redemptions during the first year and declines periodically until after six years when the charge becomes 0%. Class B Shares automatically convert to Class A Shares eight years after purchase. Class C Shares have a 1% CDSC for redemptions within less than twelve months, which is not reflected in the one-year total return. Class I Shares have no sales charge and may be purchased under limited circumstances or by specified classes of investors.
Expense Ratios as of Most Recent Prospectus
| Expense Ratios | ||||
Class A Shares | 0.86% | |||
Class B Shares | 1.61% | |||
Class C Shares | 1.41% | |||
Class I Shares | 0.66% | |||
| * | Six-month returns are cumulative; all other returns are annualized. |
| ** | Refer to the Glossary of Terms Used in the Report for definitions. |
| Nuveen Investments | 11 |
Yields (Unaudited) as of August 31, 2011
Dividend Yield is the most recent dividend per share (annualized) divided by the offering price per share.
The SEC 30-Day Yield is a standardized measure of a Fund’s yield that accounts for the future amortization of premiums or discounts of bonds held in the Fund’s portfolio. The SEC 30-Day Yield is computed under an SEC standardized formula and is based on the maximum offer price per share. Dividend Yield may differ from the SEC 30-Day Yield because the Fund may be paying out more or less than it is earning and it may not include the effect of amortization of bond premium.
The Taxable-Equivalent Yield represents the yield that must be earned on a fully taxable investment in order to equal the yield of the Fund on an after-tax basis at a specified tax rate. With respect to investments that generate qualified dividend income that is taxable at a maximum rate of 15%, the Taxable-Equivalent Yield is lower.
Nuveen Massachusetts Municipal Bond Fund
| Dividend Yield | SEC 30-Day Yield | Taxable- Equivalent Yield1 | ||||||||||
Class A Shares2 | 4.29% | 3.19% | 4.68% | |||||||||
Class B Shares | 3.73% | 2.55% | 3.74% | |||||||||
Class C Shares | 3.96% | 2.79% | 4.09% | |||||||||
Class I Shares | 4.67% | 3.53% | 5.18% | |||||||||
Nuveen Massachusetts Municipal Bond Fund 2
| Dividend Yield | SEC 30-Day Yield | Taxable- Equivalent Yield1 | ||||||||||
Class A Shares2 | 3.53% | 2.94% | 4.31% | |||||||||
Class B Shares | 2.92% | 2.30% | 3.37% | |||||||||
Class C Shares | 3.10% | 2.52% | 3.70% | |||||||||
Class I Shares | 3.84% | 3.27% | 4.79% | |||||||||
| 1 | The Taxable-Equivalent Yield is based on the Fund’s SEC 30-Day Yield on the indicated date and a federal and state income tax rate of 31.8%. |
| 2 | The SEC Yield for Class A shares quoted in the table reflects the maximum sales load. Investors paying a reduced load because of volume discounts, investors paying no load because they qualify for one of the several exclusions from the load, and existing shareholders who previously paid a load but would like to know the SEC Yield applicable to their shares on a going-forward basis, should understand that the SEC Yield effectively applicable to them would be higher than the figure quoted in the table. |
| 12 | Nuveen Investments |
Holding Summaries (Unaudited) as of August 31, 2011
This data relates to the securities held in each Fund’s portfolio of investments. It should not be construed as a measure of performance for the Fund itself.
Ratings shown are the highest rating given by one of the following national rating agencies: Standard & Poor’s Group, Moody’s Investor Services, Inc. or Fitch, Inc. Credit ratings are subject to change. AAA, AA, A, and BBB are investment grade ratings; BB, B, CCC, CC, C and D are below-investment grade ratings. Bonds backed by U.S. Government or agency securities are given an implied rating equal to the rating of such securities. Holdings designated N/R are not rated by a national rating agency.
Nuveen Massachusetts Municipal Bond Fund
Bond Credit Quality1
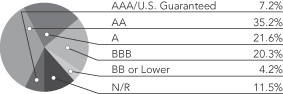
Nuveen Massachusetts Municipal Bond Fund 2
Bond Credit Quality1
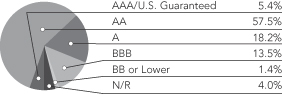
| Portfolio Composition1 | ||||
| Education and Civic Organizations | 31.9% | |||
| Health Care | 20.9% | |||
| Transportation | 9.8% | |||
| Tax Obligation/General | 6.2% | |||
| Long-Term Care | 5.7% | |||
| Tax Obligation/Limited | 5.4% | |||
| Housing/Multifamily | 4.7% | |||
| Other | 15.4% | |||
| Portfolio Composition1 | ||||
| Water and Sewer | 17.5% | |||
| Tax Obligation/Limited | 16.5% | |||
| Education and Civic Organizations | 16.3% | |||
| Tax Obligation/General | 15.0% | |||
| Health Care | 12.9% | |||
| Housing/Multifamily | 7.4% | |||
| Transportation | 7.2% | |||
| Other | 7.2% | |||
| 1 | As a percentage of total investments as of August 31, 2011. Holdings are subject to change. |
| Nuveen Investments | 13 |
As a shareholder of one or more of the Funds, you incur two types of costs: (1) transaction costs, including up-front and back-end sales charges (loads) or redemption fees, where applicable; and (2) ongoing costs, including management fees; distribution and service (12b-1) fees, where applicable; and other Fund expenses. The Examples below are intended to help you understand your ongoing costs (in dollars) of investing in the Funds and to compare these costs with the ongoing costs of investing in other mutual funds.
The Examples below are based on an investment of $1,000 invested at the beginning of the period and held for the period.
The information under “Actual Performance,” together with the amount you invested, allows you to estimate actual expenses incurred over the reporting period. Simply divide your account value by $1,000 (for example, an $8,600 account value divided by $1,000 = 8.60) and multiply the result by the cost shown for your share class, in the row entitled “Expenses Incurred During Period” to estimate the expenses incurred on your account during this period.
The information under “Hypothetical Performance,” provides information about hypothetical account values and hypothetical expenses based on the respective Fund’s actual expense ratio and an assumed rate of return of 5% per year before expenses, which is not the Fund’s actual return. The hypothetical account values and expenses may not be used to estimate the actual ending account balance or expense you incurred for the period. You may use this information to compare the ongoing costs of investing in the Fund and other Funds. To do so, compare this 5% hypothetical example with the 5% hypothetical examples that appear in the shareholder reports of the other funds.
Please note that the expenses shown in the table are meant to highlight your ongoing costs only and do not reflect any transaction costs. Therefore, the hypothetical information is useful in comparing ongoing costs only, and will not help you determine the relative total costs of owning different funds or share classes. In addition, if these transaction costs were included, your costs would have been higher.
Nuveen Massachusetts Municipal Bond Fund
| Hypothetical Performance | ||||||||||||||||||||||||||||||||||
| Actual Performance | (5% annualized return before expenses) | |||||||||||||||||||||||||||||||||
| A Shares | B Shares | C Shares | I Shares | A Shares | B Shares | C Shares | I Shares | |||||||||||||||||||||||||||
| Beginning Account Value (3/01/11) | $ | 1,000.00 | $ | 1,000.00 | $ | 1,000.00 | $ | 1,000.00 | $ | 1,000.00 | $ | 1,000.00 | $ | 1,000.00 | $ | 1,000.00 | ||||||||||||||||||
| Ending Account Value (8/31/11) | $ | 1,056.80 | $ | 1,053.90 | $ | 1,054.30 | $ | 1,059.00 | $ | 1,020.56 | $ | 1,016.74 | $ | 1,017.80 | $ | 1,021.57 | ||||||||||||||||||
| Expenses Incurred During Period | $ | 4.70 | $ | 8.62 | $ | 7.54 | $ | 3.67 | $ | 4.62 | $ | 8.47 | $ | 7.41 | $ | 3.61 | ||||||||||||||||||
For each class of the Fund, expenses are equal to the Fund’s annualized net expense ratio of .91%, 1.66%, 1.46% and .71% for Classes A, B, C and I, respectively, multiplied by the average account value over the period, multiplied by 184/366 (to reflect the one-half year period).
Nuveen Massachusetts Municipal Bond Fund 2
| Hypothetical Performance | ||||||||||||||||||||||||||||||||||
| Actual Performance | (5% annualized return before expenses) | |||||||||||||||||||||||||||||||||
| A Shares | B Shares | C Shares | I Shares | A Shares | B Shares | C Shares | I Shares | |||||||||||||||||||||||||||
| Beginning Account Value (3/01/11) | $ | 1,000.00 | $ | 1,000.00 | $ | 1,000.00 | $ | 1,000.00 | $ | 1,000.00 | $ | 1,000.00 | $ | 1,000.00 | $ | 1,000.00 | ||||||||||||||||||
| Ending Account Value (8/31/11) | $ | 1,061.50 | $ | 1,057.50 | $ | 1,057.50 | $ | 1,062.10 | $ | 1,020.81 | $ | 1,017.04 | $ | 1,018.05 | $ | 1,021.82 | ||||||||||||||||||
| Expenses Incurred During Period | $ | 4.46 | $ | 8.33 | $ | 7.29 | $ | 3.42 | $ | 4.37 | $ | 8.16 | $ | 7.15 | $ | 3.38 | ||||||||||||||||||
For each class of the Fund, expenses are equal to the Fund’s annualized net expense ratio of .86%, 1.61%, 1.41% and .66% for Classes A, B, C and I, respectively, multiplied by the average account value over the period, multiplied by 184/366 (to reflect the one-half year period).
| 14 | Nuveen Investments |
Portfolio of Investments (Unaudited)
Nuveen Massachusetts Municipal Bond Fund
August 31, 2011
| Principal Amount (000) | Description (1) | Optional Call Provisions (2) | Ratings (3) | Value | ||||||||||||||
Consumer Discretionary – 0.8% | ||||||||||||||||||
| $ | 1,425 | Boston Industrial Development Financing Authority, Massachusetts, Senior Revenue Bonds, Crosstown Center Project, Series 2002, 6.500%, 9/01/35 (Alternative Minimum Tax) | 9/12 at 102.00 | Caa3 | $ | 1,012,619 | ||||||||||||
Consumer Staples – 1.3% | ||||||||||||||||||
| 750 | Puerto Rico, The Children’s Trust Fund, Tobacco Settlement Asset-Backed Refunding Bonds, Series 2002, 5.375%, 5/15/33 | 5/12 at 100.00 | BBB | 699,480 | ||||||||||||||
| 1,000 | Virgin Islands Public Finance Authority, Matching Fund Revenue Loan Note – Diageo Project, Series 2009A, 6.625%, 10/01/29 | 10/19 at 100.00 | BBB | 1,055,680 | ||||||||||||||
| 1,750 | Total Consumer Staples | 1,755,160 | ||||||||||||||||
Education and Civic Organizations – 31.3% | ||||||||||||||||||
| 1,270 | Massachusetts Development Finance Agency, Revenue Bonds, Bentley University, Series 2010, 5.000%, 7/01/28 | 7/20 at 100.00 | A3 | 1,319,543 | ||||||||||||||
| 1,500 | Massachusetts Development Finance Agency, Revenue Bonds, Boston College, Series 2010R-1, 5.000%, 7/01/40 | 7/20 at 100.00 | AA– | 1,561,290 | ||||||||||||||
| 1,000 | Massachusetts Development Finance Agency, Revenue Bonds, Boston University, Series 2008U-4, 5.600%, 10/01/35 | No Opt. Call | A2 | 1,062,320 | ||||||||||||||
| 750 | Massachusetts Development Finance Agency, Revenue Bonds, Boston University, Series 2009V-1, 5.000%, 10/01/29 | 10/19 at 100.00 | A | 789,953 | ||||||||||||||
| 6,000 | Massachusetts Development Finance Agency, Revenue Bonds, Draper Laboratory, Series 2008, 5.875%, 9/01/30 | No Opt. Call | Aa3 | 6,530,098 | ||||||||||||||
| 1,000 | Massachusetts Development Finance Agency, Revenue Bonds, Emerson College, Series 2010A, 5.000%, 1/01/40 | 1/20 at 100.00 | A– | 999,930 | ||||||||||||||
| 3,000 | Massachusetts Development Finance Agency, Revenue Bonds, Harvard University, Series 2010B-1, 5.000%, 10/15/40 | 10/20 at 100.00 | AAA | 3,278,850 | ||||||||||||||
| 2,000 | Massachusetts Development Finance Agency, Revenue Bonds, The Broad Institute, Series 2011A, 5.250%, 4/01/37 | 4/21 at 100.00 | AA– | 2,047,560 | ||||||||||||||
| 1,000 | Massachusetts Development Finance Agency, Revenue Bonds, The Sabis International Charter School, Series 2009A, 8.000%, 4/15/39 | 10/19 at 100.00 | BBB | 1,111,380 | ||||||||||||||
Massachusetts Development Finance Agency, Revenue Bonds, Williston Northampton School, Series 2005B: | ||||||||||||||||||
| 100 | 5.000%, 10/01/25 – SYNCORA GTY Insured | 10/15 at 100.00 | Baa1 | 101,433 | ||||||||||||||
| 1,500 | 5.000%, 10/01/37 – SYNCORA GTY Insured | 10/15 at 100.00 | Baa1 | 1,377,270 | ||||||||||||||
| 3,000 | Massachusetts Development Finance Authority, Revenue Bonds, Curry College, Series 1999A, 5.500%, 3/01/29 – ACA Insured | 3/12 at 100.00 | BBB | 3,000,030 | ||||||||||||||
Massachusetts Development Finance Authority, Revenue Bonds, Hampshire College, Series 2004: | ||||||||||||||||||
| 1,000 | 5.625%, 10/01/24 | 10/14 at 100.00 | BBB | 1,013,900 | ||||||||||||||
| 1,000 | 5.700%, 10/01/34 | 10/14 at 100.00 | BBB | 994,860 | ||||||||||||||
| 3,075 | Massachusetts Development Finance Authority, Revenue Bonds, Massachusetts College of Pharmacy and Allied Health Sciences, Series 2005D, 5.000%, 7/01/27 – AGC Insured | 7/15 at 100.00 | AA+ | 3,209,224 | ||||||||||||||
| 2,100 | Massachusetts Development Finance Authority, Revenue Bonds, WGBH Educational Foundation, Series 2002A, 5.750%, 1/01/42 – AMBAC Insured | No Opt. Call | A | 2,258,298 | ||||||||||||||
| 1,355 | Massachusetts Educational Financing Authority, Education Loan Revenue Bonds, Series 2008H, 6.350%, 1/01/30 – AGC Insured (Alternative Minimum Tax) | 1/18 at 100.00 | AA+ | 1,444,064 | ||||||||||||||
| 1,825 | Massachusetts Educational Financing Authority, Education Loan Revenue Bonds, Series 2009I, 6.000%, 1/01/28 | 1/20 at 100.00 | AA | 1,996,112 | ||||||||||||||
| 650 | Massachusetts Educational Financing Authority, Educational Loan Revenue, Serie 2011J, 5.625%, 7/01/33 (Alternative Minimum Tax) | 7/21 at 100.00 | AA | 655,070 | ||||||||||||||
| 800 | Massachusetts Health and Educational Facilities Authority, Revenue Bonds, Harvard University, Tender Option Bond Trust 2010-20W, 13.338%, 12/15/34 (IF) (4) | 12/19 at 100.00 | AAA | 1,019,984 | ||||||||||||||
| Nuveen Investments | 15 |
Portfolio of Investments (Unaudited)
Nuveen Massachusetts Municipal Bond Fund (continued)
August 31, 2011
| Principal Amount (000) | Description (1) | Optional Call Provisions (2) | Ratings (3) | Value | ||||||||||||||
Education and Civic Organizations (continued) | ||||||||||||||||||
| $ | 3,000 | Massachusetts Health and Educational Facilities Authority, Revenue Bonds, Tufts University, Series 2008O, 5.375%, 8/15/38 | 8/18 at 100.00 | Aa2 | $ | 3,243,510 | ||||||||||||
| 500 | Massachusetts Health and Educational Facilities Authority, Revenue Bonds, Wellesley College, Series 2003H, 5.000%, 7/01/26 | 7/13 at 100.00 | Aaa | 515,115 | ||||||||||||||
| 610 | Massachusetts Health and Educational Facilities Authority, Revenue Bonds, Williams College, Series 2007L, 5.000%, 7/01/31 | 7/16 at 100.00 | AAA | 643,532 | ||||||||||||||
| 1,500 | Massachusetts Health and Educational Facilities Authority, Revenue Refunding Bonds, Suffolk University Issue, Series 2009A, 5.750%, 7/01/39 | 7/19 at 100.00 | BBB | 1,466,280 | ||||||||||||||
| 385 | Puerto Rico Industrial, Tourist, Educational, Medical and Environmental Control Facilities Financing Authority, Higher Education Revenue Bonds, Ana G. Mendez University System, Series 1999, 5.375%, 2/01/19 | 2/12 at 100.00 | BBB– | 385,096 | ||||||||||||||
| 39,920 | Total Education and Civic Organizations | 42,024,702 | ||||||||||||||||
Health Care – 20.6% | ||||||||||||||||||
| 2,410 | Massachusetts Development Finance Authority, Revenue Bonds, Northern Berkshire Community Services Inc., Series 1999A, 6.250%, 8/15/29 – ACA Insured | 2/12 at 100.00 | N/R | 1,076,668 | ||||||||||||||
| 1,500 | Massachusetts Health and Educational Facilities Authority Revenue Bonds, Quincy Medical Center Issue, Series 2008A, 6.500%, 1/15/38 (5) | 1/18 at 100.00 | N/R | 1,166,640 | ||||||||||||||
| 2,000 | Massachusetts Health and Educational Facilities Authority, Revenue Bonds, Baystate Medical Center, Series 2009I, 5.750%, 7/01/36 | 7/19 at 100.00 | A+ | 2,037,680 | ||||||||||||||
| 1,250 | Massachusetts Health and Educational Facilities Authority, Revenue Bonds, Berkshire Health System, Series 2001E, 6.250%, 10/01/31 | 10/11 at 101.00 | BBB+ | 1,256,200 | ||||||||||||||
| 3,000 | Massachusetts Health and Educational Facilities Authority, Revenue Bonds, Boston Medical Center, Series 2008B, 5.250%, 7/01/38 | 7/18 at 100.00 | BBB+ | 2,533,140 | ||||||||||||||
| 3,000 | Massachusetts Health and Educational Facilities Authority, Revenue Bonds, Cape Cod Health Care Inc., Series 2001C, 5.250%, 11/15/31 – RAAI Insured | 11/11 at 101.00 | BBB+ | 2,901,840 | ||||||||||||||
| 100 | Massachusetts Health and Educational Facilities Authority, Revenue Bonds, Caregroup Inc., Series B1 Capital Asset Program Converted June 13,2008, 5.375%, 2/01/28 – NPFG Insured | 8/18 at 100.00 | A– | 101,815 | ||||||||||||||
| 100 | Massachusetts Health and Educational Facilities Authority, Revenue Bonds, Caregroup Inc., Series B2, Capital Asset Program, Converted June 9, 2009, 5.375%, 2/01/27 – NPFG Insured | 8/18 at 100.00 | A– | 101,756 | ||||||||||||||
| 790 | Massachusetts Health and Educational Facilities Authority, Revenue Bonds, Covenant Health Systems Obligated Group, Series 2002, 6.000%, 7/01/31 | 1/12 at 101.00 | A | 799,196 | ||||||||||||||
| 1,000 | Massachusetts Health and Educational Facilities Authority, Revenue Bonds, Dartmouth-Hitchcock Obligated Group, Series 2002, 5.125%, 8/01/22 – AGM Insured | 8/12 at 100.00 | AA+ | 1,014,760 | ||||||||||||||
| 1,450 | Massachusetts Health and Educational Facilities Authority, Revenue Bonds, Emerson Hospital, Series 2005E, 5.000%, 8/15/35 – RAAI Insured | 8/15 at 100.00 | N/R | 1,159,377 | ||||||||||||||
| 1,500 | Massachusetts Health and Educational Facilities Authority, Revenue Bonds, Harvard Pilgrim Healthcare, Series 1998A, 4.750%, 7/01/22 – AGM Insured | 1/12 at 100.00 | AA+ | 1,501,290 | ||||||||||||||
| 2,000 | Massachusetts Health and Educational Facilities Authority, Revenue Bonds, Lahey Clinic Medical Center, Series 2005C, 5.000%, 8/15/21 – FGIC Insured | 8/15 at 100.00 | A+ | 2,082,480 | ||||||||||||||
| 2,000 | Massachusetts Health and Educational Facilities Authority, Revenue Bonds, Lahey Medical Center, Series 2007D, 5.250%, 8/15/28 | 8/17 at 100.00 | A+ | 2,039,860 | ||||||||||||||
Massachusetts Health and Educational Facilities Authority, Revenue Bonds, Milford Regional Medical Center, Series 2007E: | ||||||||||||||||||
| 2,040 | 5.000%, 7/15/32 | 7/17 at 100.00 | BBB– | 1,796,648 | ||||||||||||||
| 1,000 | 5.000%, 7/15/37 | 7/17 at 100.00 | BBB– | 845,120 | ||||||||||||||
| 220 | Massachusetts Health and Educational Facilities Authority, Revenue Bonds, Millford-Whitinsville Regional Hospital, Series 1998C, 5.750%, 7/15/13 | 10/11 at 100.00 | BBB– | 220,466 | ||||||||||||||
| 1,400 | Massachusetts Health and Educational Facilities Authority, Revenue Bonds, Milton Hospital Project, Series 2005D, 5.250%, 7/01/30 | 7/15 at 100.00 | BB– | 1,141,868 | ||||||||||||||
| 16 | Nuveen Investments |
| Principal Amount (000) | Description (1) | Optional Call Provisions (2) | Ratings (3) | Value | ||||||||||||||
Health Care (continued) | ||||||||||||||||||
| $ | 3,000 | Massachusetts Health and Educational Facilities Authority, Revenue Bonds, Northern Berkshire Community Services Inc., Series 2004A, 6.375%, 7/01/34 (5) | 7/14 at 100.00 | D | $ | 1,340,250 | ||||||||||||
| 105 | Massachusetts Health and Educational Facilities Authority, Revenue Bonds, Partners HealthCare System Inc., Series 2001C, 5.750%, 7/01/32 | 7/12 at 100.00 | AA | 106,020 | ||||||||||||||
| 2,565 | Massachusetts Health and Educational Facilities Authority, Revenue Bonds, UMass Memorial Health Care, Series 2005D, 5.000%, 7/01/33 | 7/15 at 100.00 | A– | 2,363,186 | ||||||||||||||
| 32,430 | Total Health Care | 27,586,260 | ||||||||||||||||
Housing/Multifamily – 4.6% | ||||||||||||||||||
| 1,115 | Framingham Housing Authority, Massachusetts, GNMA Collateralized Mortgage Revenue Refunding Bonds, Beaver Terrace Apartments, Series 2000A, 6.350%, 2/20/32 | 8/15 at 100.00 | Aaa | 1,235,565 | ||||||||||||||
| 2,105 | Massachusetts Development Finance Authority, Multifamily Housing Revenue Bonds, Emerson Manor Project, Series 2007, 4.800%, 7/20/48 | 7/17 at 100.00 | BB | 2,086,539 | ||||||||||||||
| 2,595 | Massachusetts Development Financing Authority, Assisted Living Revenue Bonds, Prospect House Apartments, Series 1999, 7.000%, 12/01/31 | 12/11 at 100.00 | N/R | 2,373,413 | ||||||||||||||
| 500 | Massachusetts Housing Finance Agency, Housing Revenue Bonds, Series 2003S, 5.050%, 12/01/23 (Alternative Minimum Tax) | 6/13 at 100.00 | AA– | 502,910 | ||||||||||||||
| 6,315 | Total Housing/Multifamily | 6,198,427 | ||||||||||||||||
Housing/Single Family – 1.1% | ||||||||||||||||||
| 1,120 | Massachusetts Housing Finance Agency, Single Family Housing Revenue Bonds, Series 2008, Trust 3145, 15.307%, 6/01/16 (IF) | No Opt. Call | AA | 1,243,861 | ||||||||||||||
| 255 | Puerto Rico Housing Finance Authority, Mortgage-Backed Securities Program Home Mortgage Revenue Bonds, Series 2003A, 4.875%, 6/01/34 (Alternative Minimum Tax) | 6/13 at 100.00 | Aaa | 253,248 | ||||||||||||||
| 1,375 | Total Housing/Single Family | 1,497,109 | ||||||||||||||||
Industrials – 0.6% | ||||||||||||||||||
| 320 | Massachusetts Development Finance Agency, Pioneer Valley Resource Recovery Revenue Bonds, Eco/Springfield LLC, Series 2006, 5.875%, 7/01/14 (Alternative Minimum Tax) | No Opt. Call | N/R | 308,874 | ||||||||||||||
| 400 | Massachusetts Development Finance Agency, Solid Waste Disposal Revenue Bonds, Waste Management Inc., Series 2003, 5.450%, 6/01/14 | No Opt. Call | BBB | 438,876 | ||||||||||||||
| 720 | Total Industrials | 747,750 | ||||||||||||||||
Long-Term Care – 5.6% | ||||||||||||||||||
| 1,500 | Massachusetts Development Finance Agency, Human Service Provider Revenue Bonds, Seven Hills Foundation and Affiliates Issue, Series 2005, 5.000%, 9/01/35 – RAAI Insured | 9/15 at 100.00 | BBB– | 1,247,415 | ||||||||||||||
| 240 | Massachusetts Development Finance Agency, Revenue Bonds, Carleton-Willard Village, Series 2010, 5.625%, 12/01/30 | 12/19 at 100.00 | A– | 244,495 | ||||||||||||||
| 4,220 | Massachusetts Development Finance Agency, Revenue Bonds, Orchard Cove, Series 2007, 5.250%, 10/01/26 | 10/12 at 102.00 | N/R | 3,535,010 | ||||||||||||||
| 50 | Massachusetts Development Finance Authority, First Mortgage Revenue Bonds, Berkshire Retirement Community – Edgecombe Project, Series 2001A, 6.750%, 7/01/21 | 1/12 at 102.00 | BBB | 51,048 | ||||||||||||||
| 1,790 | Massachusetts Development Finance Authority, Revenue Bonds, May Institute, Series 1999, 5.750%, 9/01/24 – RAAI Insured | 3/12 at 100.00 | BBB– | 1,618,733 | ||||||||||||||
| 255 | Massachusetts Health and Educational Facilities Authority, Revenue Bonds, Cable Housing and Health Services, Series 1993A, 5.625%, 7/01/13 – NPFG Insured | 1/12 at 100.00 | Baa1 | 255,732 | ||||||||||||||
| 610 | Massachusetts Industrial Finance Agency, First Mortgage Revenue Bonds, Berkshire Retirement Community, Series 1994B, 4.750%, 7/01/17 | 1/12 at 100.00 | BBB | 611,116 | ||||||||||||||
| 8,665 | Total Long-Term Care | 7,563,549 | ||||||||||||||||
| Nuveen Investments | 17 |
Portfolio of Investments (Unaudited)
Nuveen Massachusetts Municipal Bond Fund (continued)
August 31, 2011
| Principal Amount (000) | Description (1) | Optional Call Provisions (2) | Ratings (3) | Value | ||||||||||||||
Tax Obligation/General – 6.1% | ||||||||||||||||||
| $ | 500 | Ashland, Massachusetts, General Obligation Bonds, Series 2004, 5.250%, 5/15/23 – AMBAC Insured | 5/15 at 100.00 | Aa2 | $ | 537,445 | ||||||||||||
| 850 | Beverly, Massachusetts, General Obligation Bonds, Series 2003, 5.000%, 11/01/21 – NPFG Insured | 11/13 at 100.00 | Aa2 | 918,672 | ||||||||||||||
| 1,000 | Erving, Massachusetts, General Obligation Bonds, Series 2002, 5.500%, 6/15/16 | 6/12 at 101.00 | A1 | 1,036,350 | ||||||||||||||
| 1,000 | Fall River, Massachusetts, General Obligation Bonds, Series 2003, 5.000%, 2/01/21 – AGM Insured | 2/13 at 101.00 | AA+ | 1,037,960 | ||||||||||||||
| 1,000 | Hudson, Massachusetts, General Obligation Bonds, Municipal Purpose Loan Series 2011, 5.000%, 2/15/32 | 2/20 at 100.00 | AA | 1,070,750 | ||||||||||||||
| 1,385 | Massachusetts Bay Transportation Authority, General Obligation Transportation System Bonds, Series 1991A, 7.000%, 3/01/21 | No Opt. Call | Aa1 | 1,736,291 | ||||||||||||||
| 1,000 | Quincy, Massachusetts, General Obligation Bonds, Series 2011, 5.125%, 12/01/33 | 12/20 at 100.00 | Aa2 | 1,077,230 | ||||||||||||||
| 690 | Westfield, Massachusetts, General Obligation Bonds, Series 2004, 5.000%, 8/01/19 – AMBAC Insured | 8/14 at 100.50 | A+ | 761,546 | ||||||||||||||
| 7,425 | Total Tax Obligation/General | 8,176,244 | ||||||||||||||||
Tax Obligation/Limited – 5.4% | ||||||||||||||||||
| 680 | Martha’s Vineyard Land Bank, Massachusetts, Revenue Bonds, Series 2002, 5.000%, 5/01/32 – AMBAC Insured | 5/13 at 100.00 | A– | 694,348 | ||||||||||||||
| 395 | Martha’s Vineyard Land Bank, Massachusetts, Revenue Bonds, Series 2004, 5.000%, 5/01/26 – AMBAC Insured | 5/14 at 100.00 | A– | 414,793 | ||||||||||||||
| 815 | Massachusetts College Building Authority, Project Revenue Bonds, Series 2006A, 5.000%, 5/01/31 – AMBAC Insured | 5/16 at 100.00 | Aa2 | 850,216 | ||||||||||||||
Massachusetts College Building Authority, Project Revenue Refunding Bonds, Series 2003B: | ||||||||||||||||||
| 1,025 | 5.375%, 5/01/22 – SYNCORA GTY Insured | No Opt. Call | Aa2 | 1,254,057 | ||||||||||||||
| 1,125 | 5.375%, 5/01/23 – SYNCORA GTY Insured | No Opt. Call | Aa2 | 1,376,258 | ||||||||||||||
| 670 | Massachusetts State, Special Obligation Dedicated Tax Revenue Bonds, Series 2005, 5.000%, 1/01/20 – FGIC Insured | No Opt. Call | A1 | 772,128 | ||||||||||||||
| 1,650 | Massachusetts, Special Obligation Refunding Notes, Federal Highway Grant Anticipation Note Program, Series 2003A, 5.000%, 12/15/13 – AGM Insured | No Opt. Call | AAA | 1,820,396 | ||||||||||||||
| 6,360 | Total Tax Obligation/Limited | 7,182,196 | ||||||||||||||||
Transportation – 9.6% | ||||||||||||||||||
| 1,765 | Massachusetts Department of Transportation, Metropolitan Highway System Revenue Bonds, Senior Lien Series 2010B, 5.000%, 1/01/32 | 1/20 at 100.00 | A | 1,831,240 | ||||||||||||||
| 2,000 | Massachusetts Port Authority, Airport System Revenue Bonds, Series 2010A, 5.000%, 7/01/30 | 7/20 at 100.00 | AA– | 2,146,720 | ||||||||||||||
| 3,835 | Massachusetts Port Authority, Revenue Bonds, Series 2003A, 5.000%, 7/01/24 – NPFG Insured | 7/13 at 100.00 | AA– | 4,063,489 | ||||||||||||||
| 1,800 | Massachusetts Port Authority, Special Facilities Revenue Bonds, BOSFUEL Corporation, Series 2007, 5.000%, 7/01/32 – FGIC Insured (Alternative Minimum Tax) | 7/17 at 100.00 | A3 | 1,763,370 | ||||||||||||||
| 3,525 | Massachusetts Port Authority, Special Facilities Revenue Bonds, Delta Air Lines Inc., Series 2001A, 5.000%, 1/01/27 – AMBAC Insured (Alternative Minimum Tax) | 1/12 at 100.00 | N/R | 2,599,793 | ||||||||||||||
| 470 | Metropolitan Boston Transit Parking Corporation, Massachusetts Systemwide Parking Revenue Bonds, Senior Lien Series 2011, 5.000%, 7/01/41 | 7/21 at 100.00 | A+ | 472,327 | ||||||||||||||
| 13,395 | Total Transportation | 12,876,939 | ||||||||||||||||
| 18 | Nuveen Investments |
| Principal Amount (000) | Description (1) | Optional Call Provisions (2) | Ratings (3) | Value | ||||||||||||||
U.S. Guaranteed – 3.0% (6) | ||||||||||||||||||
| $ | 1,115 | Massachusetts Bay Transportation Authority, General Obligation Transportation System Bonds, Series 1991A, 7.000%, 3/01/21 (ETM) | No Opt. Call | N/R | (6) | $ | 1,325,612 | |||||||||||
| 75 | Massachusetts Bay Transportation Authority, Sales Tax Revenue Bonds, Senior Lien Series 2006C, 5.000%, 7/01/26 (Pre-refunded 7/01/18) | 7/18 at 100.00 | AAA | 92,288 | ||||||||||||||
| 50 | Massachusetts Development Finance Authority, Revenue Bonds, Massachusetts College of Pharmacy and Allied Health Sciences, Series 2003C, 6.375%, 7/01/23 (Pre-refunded 7/01/13) | 7/13 at 101.00 | A | (6) | 55,973 | |||||||||||||
| 750 | Massachusetts Development Finance Authority, Revenue Bonds, Milton Academy, Series 2003A, 5.000%, 9/01/19 (Pre-refunded 9/01/13) | 9/13 at 100.00 | AA– | (6) | 818,625 | |||||||||||||
| 1,000 | Massachusetts Health and Educational Facilities Authority, Revenue Bonds, Caritas Christi Obligated Group, Series 2002B, 6.250%, 7/01/22 (Pre-refunded 7/01/12) | 7/12 at 101.00 | N/R | (6) | 1,058,100 | |||||||||||||
| 500 | Massachusetts Health and Educational Facilities Authority, Revenue Bonds, New England Medical Center Hospitals, Series 2002H, 5.375%, 5/15/19 (Pre-refunded 5/15/12) – FGIC Insured | 5/12 at 100.00 | N/R | (6) | 517,435 | |||||||||||||
| 185 | Massachusetts Port Authority, Revenue Bonds, Series 1982, 13.000%, 7/01/13 (ETM) | 1/12 at 100.00 | AAA | 214,204 | ||||||||||||||
| 3,675 | Total U.S. Guaranteed | 4,082,237 | ||||||||||||||||
Utilities – 4.1% | ||||||||||||||||||
| 1,000 | Massachusetts Development Finance Agency, Resource Recovery Revenue Bonds, SEMass System, Series 2001A, 5.625%, 1/01/16 – NPFG Insured | 1/12 at 101.00 | Baa1 | 1,018,510 | ||||||||||||||
| 500 | Massachusetts Development Finance Agency, Solid Waste Disposal Revenue Bonds, Dominion Energy Brayton Point Project, Refunding Series 2009, 5.750%, 12/01/42 (Mandatory put 5/01/19) | No Opt. Call | A– | 568,385 | ||||||||||||||
| 1,000 | Massachusetts Industrial Finance Agency, Resource Recovery Revenue Refunding Bonds, Ogden Haverhill Project, Series 1998A, 5.600%, 12/01/19 (Alternative Minimum Tax) | 12/11 at 100.00 | A– | 1,003,010 | ||||||||||||||
| 2,900 | Puerto Rico Electric Power Authority, Power Revenue Bonds, Series 2004PP, 5.000%, 7/01/22 – FGIC Insured | 7/14 at 100.00 | A3 | 2,961,596 | ||||||||||||||
| 5,400 | Total Utilities | 5,551,501 | ||||||||||||||||
Water and Sewer – 4.2% | ||||||||||||||||||
| 1,000 | Boston Water and Sewerage Commission, Massachusetts, General Revenue Bonds, Senior Lien Refunding Series 2010A, 5.000%, 11/01/30 | 11/19 at 100.00 | AA+ | 1,106,830 | ||||||||||||||
| 60 | Massachusetts Water Pollution Abatement Trust, Pooled Loan Program Bonds, Series 2003-9, 5.000%, 8/01/22 | 8/13 at 100.00 | AAA | 62,833 | ||||||||||||||
| 380 | Massachusetts Water Pollution Abatement Trust, Pooled Loan Program Bonds, Series 2004-10, 5.000%, 8/01/26 | 8/14 at 100.00 | AAA | 399,923 | ||||||||||||||
| 2,080 | Massachusetts Water Resources Authority, General Revenue Bonds, Series 2005A, 5.000%, 8/01/29 – NPFG Insured | 8/17 at 100.00 | AA+ | 2,224,165 | ||||||||||||||
| 1,125 | Massachusetts Water Resources Authority, General Revenue Bonds, Series 2006A, 4.000%, 8/01/46 | 8/16 at 100.00 | AA+ | 1,059,986 | ||||||||||||||
| 760 | Puerto Rico Aqueduct and Sewerage Authority, Revenue Bonds, Senior Lien Series 2008A, 6.000%, 7/01/38 | 7/18 at 100.00 | Baa2 | 762,880 | ||||||||||||||
| 5,405 | Total Water and Sewer | 5,616,617 | ||||||||||||||||
| $ | 134,260 | Total Investments (cost $132,063,991) – 98.3% | 131,871,310 | |||||||||||||||
Other Assets Less Liabilities – 1.7% | 2,320,500 | |||||||||||||||||
Net Assets – 100% | $ | 134,191,810 | ||||||||||||||||
| Nuveen Investments | 19 |
Portfolio of Investments (Unaudited)
Nuveen Massachusetts Municipal Bond Fund (continued)
August 31, 2011
| (1) | All percentages shown in the Portfolio of Investments are based on net assets. |
| (2) | Optional Call Provisions: Dates (month and year) and prices of the earliest optional call or redemption. There may be other call provisions at varying prices at later dates. Certain mortgage-backed securities may be subject to periodic principal paydowns. |
| (3) | Ratings: Using the highest of Standard & Poor’s Group (“Standard & Poor’s”), Moody’s Investor Service, Inc. (“Moody’s”) or Fitch, Inc. (“Fitch”) rating. Ratings below BBB by Standard & Poor’s, Baa by Moody’s or BBB by Fitch are considered to be below investment grade. Holdings designated N/R are not rated by any of these national rating agencies. |
| (4) | Investment, or portion of investment, has been pledged to collateralize the net payment obligations for investments in inverse floating rate transactions. |
| (5) | At or subsequent to the end of the reporting period, this security is non-income producing. Non-income producing security, in the case of a bond, generally denotes that the issuer has (1) defaulted on the payment of principal or interest, (2) is under the protection of the Federal Bankruptcy Court or (3) the Fund’s Adviser has concluded that the issue is not likely to meet its future interest payment obligations and has directed the Fund’s custodian to cease accruing additional income on the Fund’s records. |
| (6) | Backed by an escrow or trust containing sufficient U.S. Government or U.S. Government agency securities, which ensure the timely payment of principal and interest. Bonds backed by U.S. Government or agency securities are given an implied rating equal to the rating of such securities. |
| N/R | Not rated. |
| (ETM) | Escrowed to maturity. |
| (IF) | Inverse floating rate investment. |
See accompanying notes to financial statements.
| 20 | Nuveen Investments |
Portfolio of Investments (Unaudited)
Nuveen Massachusetts Municipal Bond Fund 2
(formerly Nuveen Massachusetts Insured Municipal Bond Fund)
August 31, 2011
| Principal Amount (000) | Description (1) | Optional Call Provisions (2) | Ratings (3) | Value | ||||||||||||||
Education and Civic Organizations – 16.1% | ||||||||||||||||||
| $ | 1,000 | Massachusetts Development Finance Agency, Revenue Bonds, , Sterliong and Francine Clark Art Institute, Series 2011A, 5.000%, 7/01/41 | 7/21 at 100.00 | AA | $ | 1,034,890 | ||||||||||||
| 865 | Massachusetts Development Finance Agency, Revenue Bonds, Boston University, Series 2005T-1, 5.000%, 10/01/39 – AMBAC Insured | 10/15 at 100.00 | A | 872,750 | ||||||||||||||
| 3,000 | Massachusetts Development Finance Agency, Revenue Bonds, Brandeis University, Series 2008N, 5.000%, 10/01/39 | 10/18 at 100.00 | A1 | 3,014,970 | ||||||||||||||
| 1,500 | Massachusetts Development Finance Agency, Revenue Bonds, The Broad Institute, Series 2011A, 5.250%, 4/01/37 | 4/21 at 100.00 | AA– | 1,535,670 | ||||||||||||||
| 1,500 | Massachusetts Development Finance Agency, Revenue Bonds, Williston Northampton School, Series 2005B, 5.000%, 10/01/37 – SYNCORA GTY Insured | 10/15 at 100.00 | Baa1 | 1,377,270 | ||||||||||||||
| 895 | Massachusetts Development Finance Agency, Revenue Bonds, Worcester Polytechnic Institute, Series 2007, 5.000%, 9/01/37 – NPFG Insured | 9/17 at 100.00 | A+ | 907,727 | ||||||||||||||
| 675 | Massachusetts Educational Financing Authority, Education Loan Revenue Bonds, Series 2008H, 6.350%, 1/01/30 – AGC Insured (Alternative Minimum Tax) | 1/18 at 100.00 | AA+ | 719,368 | ||||||||||||||
| 850 | Massachusetts Educational Financing Authority, Educational Loan Revenue, Series 2011J, 5.625%, 7/01/33 (Alternative Minimum Tax) | 7/21 at 100.00 | AA | 856,630 | ||||||||||||||
| 1,000 | Massachusetts Health and Educational Facilities Authority, Revenue Bonds, Lesley University, Series 2009A, 5.000%, 7/01/29 – AGC Insured | No Opt. Call | AA+ | 1,044,390 | ||||||||||||||
| 1,000 | Massachusetts Health and Educational Facilities Authority, Revenue Bonds, University of Massachusetts, Series 2005D, 5.250%, 10/01/24 – FGIC Insured | 10/14 at 100.00 | AA– | 1,045,040 | ||||||||||||||
| 12,285 | Total Education and Civic Organizations | 12,408,705 | ||||||||||||||||
Health Care – 12.7% | ||||||||||||||||||
| 2,000 | Boston, Massachusetts, Special Obligation Bonds, Boston Medical Center, Series 2002, 5.000%, 8/01/18 – NPFG Insured | 8/12 at 100.00 | AA+ | 2,050,100 | ||||||||||||||
| 1,000 | Massachusetts Health and Educational Facilities Authority, Revenue Bonds, Cape Cod Healthcare Obligated Group, Series 2004D, 5.125%, 11/15/35 – AGC Insured | 11/19 at 100.00 | AA+ | 1,016,670 | ||||||||||||||
| 1,000 | Massachusetts Health and Educational Facilities Authority, Revenue Bonds, CareGroup Inc., Auction Rate Series 2004D, 5.250%, 7/01/24 – NPFG Insured | 7/18 at 100.00 | A– | 1,036,490 | ||||||||||||||
| 1,100 | Massachusetts Health and Educational Facilities Authority, Revenue Bonds, CareGroup Inc., Series 1998A, 5.000%, 7/01/25 – NPFG Insured | 1/12 at 100.00 | A– | 1,100,088 | ||||||||||||||
| 250 | Massachusetts Health and Educational Facilities Authority, Revenue Bonds, Caregroup Inc., Series B1 Capital Asset Program Converted June 13, 2008, 5.375%, 2/01/28 – NPFG Insured | 8/18 at 100.00 | A– | 254,538 | ||||||||||||||
| 500 | Massachusetts Health and Educational Facilities Authority, Revenue Bonds, Caregroup Inc., Series B2, Capital Asset Program, Converted June 9, 2009, 5.000%, 2/01/25 – NPFG Insured | 8/18 at 100.00 | A– | 506,275 | ||||||||||||||
| 1,000 | Massachusetts Health and Educational Facilities Authority, Revenue Bonds, Dartmouth-Hitchcock Obligated Group, Series 2002, 5.125%, 8/01/22 – AGM Insured | 8/12 at 100.00 | AA+ | 1,014,760 | ||||||||||||||
| 1,400 | Massachusetts Health and Educational Facilities Authority, Revenue Bonds, Lahey Clinic Medical Center, Series 2005C, 5.000%, 8/15/21 – FGIC Insured | 8/15 at 100.00 | A+ | 1,457,736 | ||||||||||||||
| 1,500 | Massachusetts Health and Educational Facilities Authority, Revenue Bonds, UMass Memorial Health Care, Series 2005D, 5.000%, 7/01/33 | 7/15 at 100.00 | A– | 1,381,980 | ||||||||||||||
| 9,750 | Total Health Care | 9,818,637 | ||||||||||||||||
Housing/Multifamily – 7.3% | ||||||||||||||||||
| 1,535 | Boston Housing Authority, Massachusetts, Capital Program Revenue Bonds, Series 2008, 5.000%, 4/01/20 – AGM Insured | 4/18 at 100.00 | AA+ | 1,692,338 | ||||||||||||||
| Nuveen Investments | 21 |
Portfolio of Investments (Unaudited)
Nuveen Massachusetts Municipal Bond Fund 2 (continued)
August 31, 2011
| Principal Amount (000) | Description (1) | Optional Call Provisions (2) | Ratings (3) | Value | ||||||||||||||
Housing/Multifamily (continued) | ||||||||||||||||||
| $ | 1,095 | Massachusetts Development Finance Authority, Multifamily Housing Revenue Bonds, Emerson Manor Project, Series 2007, 4.800%, 7/20/48 | 7/17 at 100.00 | BB | $ | 1,085,397 | ||||||||||||
| 190 | Massachusetts Housing Finance Agency, Housing Development Revenue Bonds, Series 1998A, 5.375%, 6/01/16 – NPFG Insured (Alternative Minimum Tax) | 12/11 at 100.00 | Baa1 | 190,118 | ||||||||||||||
| 2,575 | Somerville Housing Authority, Massachusetts, GNMA Collateralized Mortgage Revenue Bonds, Clarendon Hill Towers, Series 2002, 5.200%, 11/20/22 | 5/12 at 103.00 | N/R | 2,674,575 | ||||||||||||||
| 5,395 | Total Housing/Multifamily | 5,642,428 | ||||||||||||||||
Long-Term Care – 3.4% | ||||||||||||||||||
| 2,500 | Massachusetts Development Finance Authority, GNMA Collateralized Assisted Living Facility Revenue Bonds, Arbors at Chicopee, Series 2001A, 6.250%, 9/20/42 (Alternative Minimum Tax) | 3/12 at 105.00 | AAA | 2,630,575 | ||||||||||||||
Tax Obligation/General – 14.8% | ||||||||||||||||||
| 1,520 | Fall River, Massachusetts, General Obligation Bonds, Series 2003, 5.250%, 2/01/17 – AGM Insured | 2/13 at 101.00 | AA+ | 1,615,790 | ||||||||||||||
| 750 | Hudson, Massachusetts, General Obligation Bonds, Municipal Purpose Loan Series 2011, 5.000%, 2/15/32 | 2/20 at 100.00 | AA | 803,063 | ||||||||||||||
| 1,350 | Norwell, Massachusetts, General Obligation Bonds, Series 2005, 5.000%, 2/15/25 – AMBAC Insured | No Opt. Call | AAA | 1,450,764 | ||||||||||||||
Puerto Rico, General Obligation and Public Improvement Bonds, Series 2001A: | ||||||||||||||||||
| 275 | 5.500%, 7/01/16 – AGM Insured | No Opt. Call | AA+ | 310,593 | ||||||||||||||
| 1,490 | 5.500%, 7/01/17 – AGM Insured | No Opt. Call | AA+ | 1,683,655 | ||||||||||||||
| 980 | 5.500%, 7/01/19 – AGM Insured | No Opt. Call | AA+ | 1,112,143 | ||||||||||||||
| 4,300 | Puerto Rico, General Obligation and Public Improvement Bonds, Series 2002A, 5.500%, 7/01/29 – FGIC Insured | No Opt. Call | Baa1 | 4,341,105 | ||||||||||||||
| 120 | Worcester, Massachusetts, General Obligation Bonds, Series 2001A, 5.500%, 8/15/18 – FGIC Insured | 2/12 at 100.00 | A1 | 120,371 | ||||||||||||||
| 10,785 | Total Tax Obligation/General | 11,437,484 | ||||||||||||||||
Tax Obligation/Limited – 16.3% | ||||||||||||||||||
| 560 | Massachusetts College Building Authority, Project Revenue Bonds, Series 2006A, 5.000%, 5/01/31 – AMBAC Insured | 5/16 at 100.00 | Aa2 | 584,198 | ||||||||||||||
| 2,500 | Massachusetts College Building Authority, Project Revenue Bonds, Series 2008A, 5.000%, 5/01/33 – AGC Insured | 5/18 at 100.00 | AA+ | 2,606,975 | ||||||||||||||
| 1,000 | Massachusetts College Building Authority, Project Revenue Refunding Bonds, Series 2003B, 5.375%, 5/01/22 – SYNCORA GTY Insured | No Opt. Call | Aa2 | 1,223,470 | ||||||||||||||
| 3,200 | Massachusetts School Building Authority, Dedicated Sales Tax Revenue Bonds, Series 2005A, 5.000%, 8/15/20 – AGM Insured | 8/15 at 100.00 | AA+ | 3,623,008 | ||||||||||||||
| 1,350 | Massachusetts School Building Authority, Dedicated Sales Tax Revenue Bonds, Series 2007A, 5.000%, 8/15/22 – AMBAC Insured | 8/17 at 100.00 | AA+ | 1,528,079 | ||||||||||||||
| 460 | Massachusetts State, Special Obligation Dedicated Tax Revenue Bonds, Series 2005, 5.000%, 1/01/20 – FGIC Insured | No Opt. Call | A1 | 530,118 | ||||||||||||||
| 475 | Puerto Rico Convention Center District Authority, Hotel Occupancy Tax Revenue Bonds, Series 2006A, 4.500%, 7/01/36 – CIFG Insured | 7/16 at 100.00 | BBB+ | 392,882 | ||||||||||||||
| 2,000 | Puerto Rico Highway and Transportation Authority, Highway Revenue Bonds, Series 2004J, 5.000%, 7/01/18 – NPFG Insured | 7/14 at 100.00 | Baa1 | 2,074,740 | ||||||||||||||
| 11,545 | Total Tax Obligation/Limited | 12,563,470 | ||||||||||||||||
Transportation – 7.1% | ||||||||||||||||||
| 1,000 | Massachusetts Port Authority, Revenue Bonds, Series 2003C, 5.000%, 7/01/18 – NPFG Insured | 7/13 at 100.00 | AA– | 1,067,930 | ||||||||||||||
| 800 | Massachusetts Port Authority, Special Facilities Revenue Bonds, BOSFUEL Corporation, Series 2007, 5.000%, 7/01/32 – FGIC Insured (Alternative Minimum Tax) | 7/17 at 100.00 | A3 | 783,720 | ||||||||||||||
| 22 | Nuveen Investments |
| Principal Amount (000) | Description (1) | Optional Call Provisions (2) | Ratings (3) | Value | ||||||||||||||
Transportation (continued) | ||||||||||||||||||
| $ | 500 | Massachusetts Port Authority, Special Facilities Revenue Bonds, ConRac Project, Series 2011A, 5.125%, 7/01/41 | 7/21 at 100.00 | A | $ | 508,465 | ||||||||||||
| 530 | Massachusetts Port Authority, Special Facilities Revenue Bonds, Delta Air Lines Inc., Series 2001A, 5.000%, 1/01/27 – AMBAC Insured (Alternative Minimum Tax) | 1/12 at 100.00 | N/R | 390,891 | ||||||||||||||
| 350 | Metropolitan Boston Transit Parking Corporation, Massachusetts Systemwide Parking Revenue Bonds, Senior Lien Series 2011, 5.000%, 7/01/41 | 7/21 at 100.00 | A+ | 351,733 | ||||||||||||||
| 2,250 | New York State Thruway Authority, General Revenue Bonds, Series 2005G, 5.000%, 1/01/32 – AGM Insured | 7/15 at 100.00 | AA+ | 2,344,950 | ||||||||||||||
| 5,430 | Total Transportation | 5,447,689 | ||||||||||||||||
U.S. Guaranteed – 0.4% (4) | ||||||||||||||||||
| 295 | Massachusetts Health and Educational Facilities Authority, Revenue Bonds, CareGroup Inc., Series 1998A, 5.000%, 7/01/25 (Pre-refunded 7/01/21) – NPFG Insured | 7/21 at 100.00 | BBB | (4) | 345,731 | |||||||||||||
Utilities – 3.2% | ||||||||||||||||||
| 900 | Guam Power Authority, Revenue Bonds, Series 2010A, 5.000%, 10/01/37 – AGM Insured | 10/20 at 100.00 | AA+ | 916,407 | ||||||||||||||
| 1,500 | Massachusetts Development Finance Agency, Resource Recovery Revenue Bonds, SEMass System, Series 2001A, 5.625%, 1/01/16 – NPFG Insured | 1/12 at 101.00 | Baa1 | 1,527,765 | ||||||||||||||
| 2,400 | Total Utilities | 2,444,172 | ||||||||||||||||
Water and Sewer – 17.3% | ||||||||||||||||||
| 1,700 | Atlanta, Georgia, Water and Wastewater Revenue Bonds, Series 2009B, 5.375%, 11/01/39 – AGM Insured | 11/19 at 100.00 | AA+ | 1,784,609 | ||||||||||||||
| 1,000 | Massachusetts Water Resources Authority, General Revenue Bonds, Series 2002J, 5.250%, 8/01/19 – AGM Insured | No Opt. Call | AA+ | 1,236,430 | ||||||||||||||
Massachusetts Water Resources Authority, General Revenue Bonds, Series 2005A: | ||||||||||||||||||
| 1,650 | 5.000%, 8/01/27 – NPFG Insured | 8/17 at 100.00 | AA+ | 1,797,296 | ||||||||||||||
| 750 | 5.000%, 8/01/28 – NPFG Insured | 8/17 at 100.00 | AA+ | 812,760 | ||||||||||||||
| 2,500 | Massachusetts Water Resources Authority, General Revenue Bonds, Series 2005B, 5.000%, 8/01/35 – NPFG Insured | 8/17 at 100.00 | AA+ | 2,615,050 | ||||||||||||||
Massachusetts Water Resources Authority, General Revenue Bonds, Series 2006A: | ||||||||||||||||||
| 1,500 | 5.000%, 8/01/31 – AMBAC Insured | 8/16 at 100.00 | AA+ | 1,586,535 | ||||||||||||||
| 875 | 4.000%, 8/01/46 | 8/16 at 100.00 | AA+ | 824,434 | ||||||||||||||
| 1,500 | Springfield Water and Sewerage Commission, Massachusetts, General Revenue Bonds, Refunding Series 2010B, 5.000%, 11/15/30 – AGC Insured | No Opt. Call | AA+ | 1,634,385 | ||||||||||||||
| 1,000 | Springfield Water and Sewerage Commission, Massachusetts, General Revenue Bonds, Series 2003A, 5.000%, 7/01/23 – NPFG Insured | 7/14 at 100.00 | A+ | 1,043,510 | ||||||||||||||
| 12,475 | Total Water and Sewer | 13,335,009 | ||||||||||||||||
| $ | 72,860 | Total Investments (cost $73,910,348) – 98.6% | 76,073,900 | |||||||||||||||
Other Assets Less Liabilities – 1.4% | 1,104,803 | |||||||||||||||||
Net Assets – 100% | $ | 77,178,703 | ||||||||||||||||
| (1) | All percentages shown in the Portfolio of Investments are based on net assets. |
| (2) | Optional Call Provisions: Dates (month and year) and prices of the earliest optional call or redemption. There may be other call provisions at varying prices at later dates. Certain mortgage-backed securities may be subject to periodic principal paydowns. |
| (3) | Ratings: Using the highest of Standard & Poor’s Group (“Standard & Poor’s”), Moody’s Investor Service, Inc. (“Moody’s”) or Fitch, Inc. (“Fitch”) rating. Ratings below BBB by Standard & Poor’s, Baa by Moody’s or BBB by Fitch are considered to be below investment grade. Holdings designated N/R are not rated by any of these national rating agencies. |
| (4) | Backed by an escrow or trust containing sufficient U.S. Government or U.S. Government agency securities, which ensure the timely payment of principal and interest. Bonds backed by U.S. Government or agency securities are given an implied rating equal to the rating of such securities. |
| N/R | Not rated. |
See accompanying notes to financial statements.
| Nuveen Investments | 23 |
Statement of Assets and Liabilities (Unaudited)
August 31, 2011
| Massachusetts | Massachusetts 2 | |||||||
Assets | ||||||||
Investments, at value (cost $132,063,991 and $73,910,348, respectively) | $ | 131,871,310 | $ | 76,073,900 | ||||
Cash | 393,352 | 636,040 | ||||||
Receivables: | ||||||||
Interest | 1,865,828 | 782,402 | ||||||
Investments sold | 379,693 | — | ||||||
Shares sold | 199,746 | 49,837 | ||||||
Total assets | 134,709,929 | 77,542,179 | ||||||
Liabilities | ||||||||
Payables: | ||||||||
Dividends | 211,614 | 79,421 | ||||||
Shares redeemed | 92,336 | 187,220 | ||||||
Accrued expenses: | ||||||||
Management fees | 96,680 | 38,918 | ||||||
12b-1 distribution and service fees | 20,983 | 13,318 | ||||||
Other | 96,506 | 44,599 | ||||||
Total liabilities | 518,119 | 363,476 | ||||||
Net assets | $ | 134,191,810 | $ | 77,178,703 | ||||
Class A Shares | ||||||||
Net assets | $ | 63,229,894 | $ | 23,882,969 | ||||
Shares outstanding | 6,462,522 | 2,330,499 | ||||||
Net asset value per share | $ | 9.78 | $ | 10.25 | ||||
Offering price per share (net asset value per share plus | $ | 10.21 | $ | 10.70 | ||||
Class B Shares | ||||||||
Net assets | $ | 457,272 | $ | 1,061,179 | ||||
Shares outstanding | 46,671 | 103,375 | ||||||
Net asset value and offering price per share | $ | 9.80 | $ | 10.27 | ||||
Class C Shares | ||||||||
Net assets | $ | 15,497,059 | $ | 13,267,087 | ||||
Shares outstanding | 1,597,130 | 1,293,834 | ||||||
Net asset value and offering price per share | $ | 9.70 | $ | 10.25 | ||||
Class I Shares | ||||||||
Net assets | $ | 55,007,585 | $ | 38,967,468 | ||||
Shares outstanding | 5,632,479 | 3,782,115 | ||||||
Net asset value and offering price per share | $ | 9.77 | $ | 10.30 | ||||
Net assets consist of: | ||||||||
Capital paid-in | $ | 134,240,773 | $ | 74,554,947 | ||||
Undistributed (Over-distribution of ) net investment income | 275,823 | (33,370 | ) | |||||
Accumulated net realized gain (loss) | (132,105 | ) | 493,574 | |||||
Net unrealized appreciation (depreciation) | (192,681 | ) | 2,163,552 | |||||
Net assets | $ | 134,191,810 | $ | 77,178,703 | ||||
Authorized shares | Unlimited | Unlimited | ||||||
Par value per share | $ | 0.01 | $ | 0.01 | ||||
See accompanying notes to financial statements.
| 24 | Nuveen Investments |
Statement of Operations (Unaudited)
Six Months Ended August 31, 2011
| Massachusetts | Massachusetts 2 | |||||||
Investment Income | $ | 3,552,061 | $ | 1,803,610 | ||||
Expenses | ||||||||
Management fees | 348,563 | 206,042 | ||||||
12b-1 service fees – Class A | 62,382 | 24,692 | ||||||
12b-1 distribution and service fees – Class B | 2,654 | 5,875 | ||||||
12b-1 distribution and service fees – Class C | 57,318 | 48,918 | ||||||
Shareholders’ servicing agent fees and expenses | 38,186 | 13,542 | ||||||
Custodian’s fees and expenses | 15,525 | 9,252 | ||||||
Trustees’ fees and expenses | 1,614 | 941 | ||||||
Professional fees | 38,862 | 7,587 | ||||||
Shareholders’ reports – printing and mailing expenses | 24,379 | 17,256 | ||||||
Federal and state registration fees | 3,362 | 2,948 | ||||||
Other expenses | 1,077 | 857 | ||||||
Total expenses before custodian fee credit | 593,922 | 337,910 | ||||||
Custodian fee credit | (262 | ) | (559 | ) | ||||
Net expenses | 593,660 | 337,351 | ||||||
Net investment income (loss) | 2,958,401 | 1,466,259 | ||||||
Realized and Unrealized Gain (Loss) | ||||||||
Net realized gain (loss) from investments | (22,899 | ) | 218,169 | |||||
Change in net unrealized appreacation (deprediation) of investments | 4,461,203 | 2,915,199 | ||||||
Net realized and unrealized gain (loss) | 4,438,304 | 3,133,368 | ||||||
Net increase (decrease) in net assets from operations | $ | 7,396,705 | $ | 4,599,627 | ||||
See accompanying notes to financial statements.
| Nuveen Investments | 25 |
Statement of Changes in Net Assets (Unaudited)
| Massachusetts | Massachusetts 2 | |||||||||||||||
Six Months Ended | Year Ended 2/28/11 | Six Months Ended | Year Ended 2/28/11 | |||||||||||||
Operations | ||||||||||||||||
Net investment income (loss) | $ | 2,958,401 | $ | 6,108,750 | $ | 1,466,259 | $ | 3,265,047 | ||||||||
Net realized gain (loss) from investments | (22,899 | ) | 269,649 | 218,169 | 374,883 | |||||||||||
Change in net unrealized appreciation (depreciation) of investments | 4,461,203 | (4,401,248 | ) | 2,915,199 | (2,417,117 | ) | ||||||||||
Net increase (decrease) in net assets from operations | 7,396,705 | 1,977,151 | 4,599,627 | 1,222,813 | ||||||||||||
Distributions to Shareholders | ||||||||||||||||
From net investment income: | ||||||||||||||||
Class A | (1,432,270 | ) | (2,935,932 | ) | (463,812 | ) | (1,131,996 | ) | ||||||||
Class B | (10,775 | ) | (39,391 | ) | (18,730 | ) | (59,860 | ) | ||||||||
Class C | (310,220 | ) | (570,032 | ) | (209,259 | ) | (481,013 | ) | ||||||||
Class I | (1,287,442 | ) | (2,647,711 | ) | (762,271 | ) | (1,634,895 | ) | ||||||||
From accumulated net realized gains: | ||||||||||||||||
Class A | — | — | — | (178,241 | ) | |||||||||||
Class B | — | — | — | (8,457 | ) | |||||||||||
Class C | — | — | — | (90,967 | ) | |||||||||||
Class I | — | — | — | (247,462 | ) | |||||||||||
Decrease in net assets from distributions to shareholders | (3,040,707 | ) | (6,193,066 | ) | (1,454,072 | ) | (3,832,891 | ) | ||||||||
Fund Share Transactions | ||||||||||||||||
Proceeds from sale of shares | 7,564,241 | 20,358,389 | 1,492,492 | 9,052,157 | ||||||||||||
Proceeds from shares issued to shareholders due to reinvestment of distributions | 1,738,913 | 3,507,119 | 969,093 | 2,564,377 | ||||||||||||
| 9,303,154 | 23,865,508 | 2,461,585 | 11,616,534 | |||||||||||||
Cost of shares redeemed | (9,893,216 | ) | (18,256,041 | ) | (7,832,270 | ) | (19,080,393 | ) | ||||||||
Net increase (decrease) in net assets from Fund share transactions | (590,062 | ) | 5,609,467 | (5,370,685 | ) | (7,463,859 | ) | |||||||||
Net increase (decrease) in net assets | 3,765,936 | 1,393,552 | (2,225,130 | ) | (10,073,937 | ) | ||||||||||
Net assets at the beginning of period | 130,425,874 | 129,032,322 | 79,403,833 | 89,477,770 | ||||||||||||
Net assets at the end of period | $ | 134,191,810 | $ | 130,425,874 | $ | 77,178,703 | $ | 79,403,833 | ||||||||
Undistributed (Over-distribution of) net investment income at the end of period | $ | 275,823 | $ | 358,129 | $ | (33,370 | ) | $ | (45,557 | ) | ||||||
See accompanying notes to financial statements.
| 26 | Nuveen Investments |
Financial Highlights (Unaudited)
| Nuveen Investments | 27 |
Financial Highlights (Unaudited)
| Selected data for a share outstanding throughout each period: | ||||||||||||||||||||||||||||||||||||
| Class (Commencement Date) | ||||||||||||||||||||||||||||||||||||
| Investment Operations | Less Distributions | |||||||||||||||||||||||||||||||||||
| MASSACHUSETTS | ||||||||||||||||||||||||||||||||||||
| Year Ended February 28/29 | Beginning Net Asset Value | Net Invest- ment Income (Loss)(a) | Net Realized/ Unrealized Gain (Loss) | Total | Net Invest- ment Income | Capital Gains(b) | Total | Ending Net Asset Value | Total Return(c) | |||||||||||||||||||||||||||
Class A (9/94) |
| |||||||||||||||||||||||||||||||||||
2012(g) | $ | 9.47 | $ | .21 | $ | .32 | $ | .53 | $ | (.22 | ) | $ | — | $ | (.22 | ) | $ | 9.78 | 5.68 | % | ||||||||||||||||
2011 | 9.75 | .44 | (.27 | ) | .17 | (.45 | ) | — | (.45 | ) | 9.47 | 1.69 | ||||||||||||||||||||||||
2010 | 8.81 | .45 | .94 | 1.39 | (.45 | ) | — | (.45 | ) | 9.75 | 16.03 | |||||||||||||||||||||||||
2009 | 9.34 | .41 | (.51 | ) | (.10 | ) | (.39 | ) | (.04 | ) | (.43 | ) | 8.81 | (1.05 | ) | |||||||||||||||||||||
2008 | 10.11 | .39 | (.74 | ) | (.35 | ) | (.38 | ) | (.04 | ) | (.42 | ) | 9.34 | (3.61 | ) | |||||||||||||||||||||
2007 | 10.03 | .38 | .07 | .45 | (.37 | ) | — | (.37 | ) | 10.11 | 4.62 | |||||||||||||||||||||||||
Class B (3/97) |
| |||||||||||||||||||||||||||||||||||
2012(g) | 9.48 | .18 | .33 | .51 | (.19 | ) | — | (.19 | ) | 9.80 | 5.39 | |||||||||||||||||||||||||
2011 | 9.76 | .37 | (.27 | ) | .10 | (.38 | ) | — | (.38 | ) | 9.48 | .94 | ||||||||||||||||||||||||
2010 | 8.83 | .38 | .93 | 1.31 | (.38 | ) | — | (.38 | ) | 9.76 | 15.04 | |||||||||||||||||||||||||
2009 | 9.35 | .34 | (.50 | ) | (.16 | ) | (.32 | ) | (.04 | ) | (.36 | ) | 8.83 | (1.69 | ) | |||||||||||||||||||||
2008 | 10.13 | .31 | (.74 | ) | (.43 | ) | (.31 | ) | (.04 | ) | (.35 | ) | 9.35 | (4.41 | ) | |||||||||||||||||||||
2007 | 10.04 | .31 | .08 | .39 | (.30 | ) | — | (.30 | ) | 10.13 | 3.96 | |||||||||||||||||||||||||
Class C (10/94) |
| |||||||||||||||||||||||||||||||||||
2012(g) | 9.39 | .19 | .31 | .50 | (.19 | ) | — | (.19 | ) | 9.70 | 5.43 | |||||||||||||||||||||||||
2011 | 9.67 | .39 | (.27 | ) | .12 | (.40 | ) | — | (.40 | ) | 9.39 | 1.14 | ||||||||||||||||||||||||
2010 | 8.74 | .39 | .93 | 1.32 | (.39 | ) | — | (.39 | ) | 9.67 | 15.37 | |||||||||||||||||||||||||
2009 | 9.26 | .36 | (.50 | ) | (.14 | ) | (.34 | ) | (.04 | ) | (.38 | ) | 8.74 | (1.53 | ) | |||||||||||||||||||||
2008 | 10.04 | .33 | (.75 | ) | (.42 | ) | (.32 | ) | (.04 | ) | (.36 | ) | 9.26 | (4.27 | ) | |||||||||||||||||||||
2007 | 9.95 | .33 | .08 | .41 | (.32 | ) | — | (.32 | ) | 10.04 | 4.19 | |||||||||||||||||||||||||
Class I (12/86)(f) |
| |||||||||||||||||||||||||||||||||||
2012(g) | 9.45 | .22 | .33 | .55 | (.23 | ) | — | (.23 | ) | 9.77 | 5.90 | |||||||||||||||||||||||||
2011 | 9.73 | .46 | (.27 | ) | .19 | (.47 | ) | — | (.47 | ) | 9.45 | 1.91 | ||||||||||||||||||||||||
2010 | 8.80 | .47 | .92 | 1.39 | (.46 | ) | — | (.46 | ) | 9.73 | 16.15 | |||||||||||||||||||||||||
2009 | 9.32 | .43 | (.50 | ) | (.07 | ) | (.41 | ) | (.04 | ) | (.45 | ) | 8.80 | (.74 | ) | |||||||||||||||||||||
2008 | 10.09 | .41 | (.74 | ) | (.33 | ) | (.40 | ) | (.04 | ) | (.44 | ) | 9.32 | (3.45 | ) | |||||||||||||||||||||
2007 | 10.01 | .40 | .07 | .47 | (.39 | ) | — | (.39 | ) | 10.09 | 4.81 | |||||||||||||||||||||||||
| 28 | Nuveen Investments |
| Ratios/Supplemental Data | ||||||||||||||||||
| Ratios to Average Net Assets(d) | ||||||||||||||||||
Ending | Expenses Including Interest(e) | Expenses Excluding Interest | Net Invest- ment Income (Loss) | Portfolio Turnover Rate | ||||||||||||||
| $ | 63,230 | .91 | %* | .91 | %* | 4.47 | %* | 4 | % | |||||||||
| 61,883 | .85 | .85 | 4.54 | 7 | ||||||||||||||
| 61,382 | .91 | .91 | 4.77 | 5 | ||||||||||||||
| 45,433 | .91 | .91 | 4.47 | 20 | ||||||||||||||
| 67,297 | .88 | .88 | 3.90 | 12 | ||||||||||||||
| 102,045 | .87 | .87 | 3.82 | 4 | ||||||||||||||
| 457 | 1.66 | * | 1.66 | * | 3.76 | * | 4 | |||||||||||
| 741 | 1.60 | 1.60 | 3.80 | 7 | ||||||||||||||
| 1,402 | 1.65 | 1.65 | 4.03 | 5 | ||||||||||||||
| 2,741 | 1.67 | 1.67 | 3.71 | 20 | ||||||||||||||
| 3,519 | 1.63 | 1.63 | 3.15 | 12 | ||||||||||||||
| 4,582 | 1.62 | 1.62 | 3.07 | 4 | ||||||||||||||
| 15,497 | 1.46 | * | 1.46 | * | 3.91 | * | 4 | |||||||||||
| 14,872 | 1.40 | 1.40 | 3.98 | 7 | ||||||||||||||
| 12,550 | 1.46 | 1.46 | 4.23 | 5 | ||||||||||||||
| 10,944 | 1.47 | 1.47 | 3.91 | 20 | ||||||||||||||
| 11,661 | 1.44 | 1.44 | 3.35 | 12 | ||||||||||||||
| 11,853 | 1.42 | 1.42 | 3.27 | 4 | ||||||||||||||
| 55,008 | .71 | * | .71 | * | 4.67 | * | 4 | |||||||||||
| 52,930 | .65 | .65 | 4.74 | 7 | ||||||||||||||
| 53,698 | .71 | .71 | 4.98 | 5 | ||||||||||||||
| 47,238 | .72 | .72 | 4.67 | 20 | ||||||||||||||
| 52,832 | .69 | .69 | 4.10 | 12 | ||||||||||||||
| 60,022 | .67 | .67 | 4.02 | 4 | ||||||||||||||
| (a) | Per share Net Investment Income (Loss) is calculated using the average daily shares method. |
| (b) | Distributions from Capital Gains include short-term capital gains, if any. |
| (c) | Total return is the combination of changes in net asset value without any sales charge, reinvested dividend income at net asset value and reinvested capital gains distributions at net asset value, if any. Total returns are not annualized. |
| (d) | Ratios do not reflect the effect of custodian fee credits earned on the Fund’s net cash on deposit with the custodian bank, where applicable. The Fund did not receive an expense reimbursement from the Adviser during the periods presented herein. |
| (e) | The expense ratios reflect, among other things, the interest expense deemed to have been paid by the Fund on the floating rate certificates issued by the special purpose trusts for the self-deposited inverse floaters held by the Fund, where applicable, as described in Footnote 1 – General Information and Significant Accounting Policies, Inverse Floating Rate Securities. |
| (f) | Effective May 1, 2008, Class R Shares were renamed Class I Shares. |
| (g) | For the six months ended August 31, 2011. |
| * | Annualized. |
See accompanying notes to financial statements.
| Nuveen Investments | 29 |
Financial Highlights (Unaudited) (continued)
| Selected data for a share outstanding throughout each period: | ||||||||||||||||||||||||||||||||||||
| Class (Commencement Date) | ||||||||||||||||||||||||||||||||||||
| Investment Operations | Less Distributions | |||||||||||||||||||||||||||||||||||
| MASSACHUSETTS 2 | ||||||||||||||||||||||||||||||||||||
| Year Ended February 28/29 | Beginning Net Asset Value | Net Invest- ment Income (Loss)(a) | Net Realized/ Unrealized Gain (Loss) | Total | Net Invest- ment Income | Capital Gains(b) | Total | Ending Net Asset Value | Total Return(c) | |||||||||||||||||||||||||||
Class A (9/94) |
| |||||||||||||||||||||||||||||||||||
2012(g) | $ | 9.84 | $ | .19 | $ | .41 | $ | .60 | $ | (.19 | ) | $ | — | $ | (.19 | ) | $ | 10.25 | 6.15 | % | ||||||||||||||||
2011 | 10.15 | .38 | (.24 | ) | .14 | (.39 | ) | (.06 | ) | (.45 | ) | 9.84 | 1.33 | |||||||||||||||||||||||
2010 | 9.64 | .37 | .63 | 1.00 | (.40 | ) | (.09 | ) | (.49 | ) | 10.15 | 10.51 | ||||||||||||||||||||||||
2009 | 9.80 | .40 | (.12 | ) | .28 | (.39 | ) | (.05 | ) | (.44 | ) | 9.64 | 2.94 | |||||||||||||||||||||||
2008 | 10.37 | .39 | (.53 | ) | (.14 | ) | (.38 | ) | (.05 | ) | (.43 | ) | 9.80 | (1.42 | ) | |||||||||||||||||||||
2007 | 10.37 | .39 | .02 | .41 | (.38 | ) | (.03 | ) | (.41 | ) | 10.37 | 4.12 | ||||||||||||||||||||||||
Class B (3/97) |
| |||||||||||||||||||||||||||||||||||
2012(g) | 9.86 | .15 | .41 | .56 | (.15 | ) | — | (.15 | ) | 10.27 | 5.75 | |||||||||||||||||||||||||
2011 | 10.16 | .30 | (.23 | ) | .07 | (.31 | ) | (.06 | ) | (.37 | ) | 9.86 | .66 | |||||||||||||||||||||||
2010 | 9.65 | .30 | .62 | .92 | (.32 | ) | (.09 | ) | (.41 | ) | 10.16 | 9.70 | ||||||||||||||||||||||||
2009 | 9.82 | .32 | (.12 | ) | .20 | (.32 | ) | (.05 | ) | (.37 | ) | 9.65 | 2.04 | |||||||||||||||||||||||
2008 | 10.38 | .31 | (.51 | ) | (.20 | ) | (.31 | ) | (.05 | ) | (.36 | ) | 9.82 | (2.07 | ) | |||||||||||||||||||||
2007 | 10.38 | .31 | .03 | .34 | (.31 | ) | (.03 | ) | (.34 | ) | 10.38 | 3.33 | ||||||||||||||||||||||||
Class C (9/94) |
| |||||||||||||||||||||||||||||||||||
2012(g) | 9.85 | .16 | .40 | .56 | (.16 | ) | — | (.16 | ) | 10.25 | 5.75 | |||||||||||||||||||||||||
2011 | 10.15 | .33 | (.24 | ) | .09 | (.33 | ) | (.06 | ) | (.39 | ) | 9.85 | .86 | |||||||||||||||||||||||
2010 | 9.64 | .32 | .62 | .94 | (.34 | ) | (.09 | ) | (.43 | ) | 10.15 | 9.92 | ||||||||||||||||||||||||
2009 | 9.81 | .34 | (.12 | ) | .22 | (.34 | ) | (.05 | ) | (.39 | ) | 9.64 | 2.26 | |||||||||||||||||||||||
2008 | 10.37 | .33 | (.52 | ) | (.19 | ) | (.32 | ) | (.05 | ) | (.37 | ) | 9.81 | (1.90 | ) | |||||||||||||||||||||
2007 | 10.36 | .33 | .03 | .36 | (.32 | ) | (.03 | ) | (.35 | ) | 10.37 | 3.62 | ||||||||||||||||||||||||
Class I (12/86)(f) |
| |||||||||||||||||||||||||||||||||||
2012(g) | 9.89 | .20 | .41 | .61 | (.20 | ) | — | (.20 | ) | 10.30 | 6.21 | |||||||||||||||||||||||||
2011 | 10.19 | .40 | (.24 | ) | .16 | (.40 | ) | (.06 | ) | (.46 | ) | 9.89 | 1.60 | |||||||||||||||||||||||
2010 | 9.68 | .40 | .61 | 1.01 | (.41 | ) | (.09 | ) | (.50 | ) | 10.19 | 10.66 | ||||||||||||||||||||||||
2009 | 9.84 | .42 | (.12 | ) | .30 | (.41 | ) | (.05 | ) | (.46 | ) | 9.68 | 3.12 | |||||||||||||||||||||||
2008 | 10.41 | .41 | (.53 | ) | (.12 | ) | (.40 | ) | (.05 | ) | (.45 | ) | 9.84 | (1.24 | ) | |||||||||||||||||||||
2007 | 10.40 | .41 | .03 | .44 | (.40 | ) | (.03 | ) | (.43 | ) | 10.41 | 4.39 | ||||||||||||||||||||||||
| 30 | Nuveen Investments |
| Ratios/Supplemental Data | ||||||||||||||||||
| Ratios to Average Net Assets(d) | ||||||||||||||||||
| Ending Net Assets (000) | Expenses Including Interest(e) | Expenses Excluding Interest | Net Invest- ment Income (Loss) | Portfolio Turnover Rate | ||||||||||||||
| $ | 23,883 | .86 | %* | .86 | %* | 3.77 | %* | 6 | % | |||||||||
| 25,735 | .86 | .86 | 3.75 | 5 | ||||||||||||||
| 31,556 | .91 | .91 | 3.72 | 9 | ||||||||||||||
| 26,123 | .98 | .89 | 4.05 | 20 | ||||||||||||||
| 22,561 | 1.08 | .90 | 3.79 | 18 | ||||||||||||||
| 20,958 | 1.06 | .89 | 3.75 | 6 | ||||||||||||||
| 1,061 | 1.61 | * | 1.61 | * | 3.02 | * | 6 | |||||||||||
| 1,311 | 1.61 | 1.61 | 2.99 | 5 | ||||||||||||||
| 2,919 | 1.66 | 1.66 | 3.01 | 9 | ||||||||||||||
| 3,944 | 1.73 | 1.64 | 3.28 | 20 | ||||||||||||||
| 5,068 | 1.83 | 1.65 | 3.04 | 18 | ||||||||||||||
| 5,635 | 1.81 | 1.64 | 3.00 | 6 | ||||||||||||||
| 13,267 | 1.41 | * | 1.41 | * | 3.22 | * | 6 | |||||||||||
| 13,435 | 1.41 | 1.41 | 3.20 | 5 | ||||||||||||||
| 14,630 | 1.47 | 1.47 | 3.18 | 9 | ||||||||||||||
| 10,949 | 1.53 | 1.44 | 3.49 | 20 | ||||||||||||||
| 10,608 | 1.63 | 1.45 | 3.24 | 18 | ||||||||||||||
| 8,700 | 1.61 | 1.44 | 3.21 | 6 | ||||||||||||||
| 38,967 | .66 | * | .66 | * | 3.97 | * | 6 | |||||||||||
| 38,924 | .66 | .66 | 3.95 | 5 | ||||||||||||||
| 40,373 | .71 | .71 | 3.95 | 9 | ||||||||||||||
| 37,858 | .78 | .69 | 4.24 | 20 | ||||||||||||||
| 40,474 | .88 | .70 | 3.99 | 18 | ||||||||||||||
| 45,501 | .86 | .69 | 3.96 | 6 | ||||||||||||||
| (a) | Per share Net Investment Income (Loss) is calculated using the average daily shares method. |
| (b) | Distributions from Capital Gains include short-term capital gains, if any. |
| (c) | Total return is the combination of changes in net asset value without any sales charge, reinvested dividend income at net asset value and reinvested capital gains distributions at net asset value, if any. Total returns are not annualized. |
| (d) | Ratios do not reflect the effect of custodian fee credits earned on the Fund’s net cash on deposit with the custodian bank, where applicable. The Fund did not receive an expense reimbursement from the Adviser during the periods presented herein. |
| (e) | The expense ratios reflect, among other things, the interest expense deemed to have been paid by the Fund on the floating rate certificates issued by the special purpose trusts for the self-deposited inverse floaters held by the Fund, where applicable, as described in Footnote 1 – General Information and Significant Accounting Policies, Inverse Floating Rate Securities. |
| (f) | Effective May 1, 2008, Class R Shares were renamed Class I Shares. |
| (g) | For the six months ended August 31, 2011. |
| * | Annualized. |
See accompanying notes to financial statements.
| Nuveen Investments | 31 |
Notes to Financial Statements (Unaudited)
1. General Information and Significant Accounting Policies
General Information
The Nuveen Multistate Trust II (the “Trust”) is an open-end investment company registered under the Investment Company Act of 1940, as amended. The Trust is comprised of the Nuveen Massachusetts Municipal Bond Fund (“Massachusetts”) and Nuveen Massachusetts Municipal Bond Fund 2 (“Massachusetts 2”) (formerly, Nuveen Massachusetts Insured Municipal Bond Fund) (each a “Fund” and collectively, the “Funds”), among others. The Trust was organized as a Massachusetts business trust on July 1, 1996. The Funds were each organized as a series of predecessor trusts or corporations prior to that date.
Effective April 27, 2011, Massachusetts 2 was closed to new investors. Investors in the Fund as of April 27, 2011, are able to continue investing in the Fund, through the reinvestment of dividends and capital gains distributions.
Effective April 30, 2011, Nuveen Investments, LLC, a wholly-owned subsidiary of Nuveen Investments, Inc. (“Nuveen”), changed its name to Nuveen Securities, LLC (the “Distributor”).
Effective May 31, 2011, Massachusetts 2 is no longer required to invest at least 80% of its net assets in municipal securities that are covered by insurance guaranteeing the timely payment of principal and interest thereon. The Fund continues to be subject to the requirement that it invest at least 80% of its net assets in municipal bonds that pay interest that is exempt from regular federal and Massachusetts personal income tax.
Massachusetts’ investment objective is to provide as high a level of current interest income exempt from regular federal, Massachusetts state and, in some cases, Massachusetts local income taxes as is consistent with preservation of capital. Under normal market conditions, the Fund invests at least 80% of its net assets in municipal bonds that pay interest that is exempt from regular federal and Massachusetts personal income tax. The Fund invests at least 80% of its net assets in investment grade municipal bonds rated BBB/Baa or higher at the time of purchase by at least one independent rating agency, or, if unrated, judged by Nuveen Asset Management, LLC (the “Sub-Adviser”), a wholly-owned subsidiary of Nuveen Fund Advisors, Inc., (the “Adviser”), a wholly-owned subsidiary of Nuveen, to be of comparable quality. The Fund may invest up to 20% of its net assets in below investment grade municipal bonds, commonly referred to as “high yield” or “junk” bonds. The Fund may invest up to 15% of its net assets in municipal securities whose interest payments vary inversely with changes in short-term tax-exempt interest rates (i.e., inverse floating rate securities).
Massachusetts 2’s investment objective is to provide as high a level of current interest income exempt from regular federal, Massachusetts state and, in some cases, Massachusetts local income taxes as is consistent with preservation of capital. Under normal market conditions, the Fund invests at least 80% of its net assets in municipal bonds that pay interest that is exempt from regular federal and Massachusetts personal income tax. The municipal securities in which the Fund invests are, at the time of purchase, (i) rated BBB/Baa or higher (ii) unrated, but judged to be of comparable quality by the Sub-Adviser; or (iii) backed by an escrow or trust account containing sufficient U.S. Government or U.S. government agency securities to ensure timely payment of principal and interest. The Fund may invest up to 15% of its net assets in municipal securities whose interest payments vary inversely with changes in short-term tax-exempt interest rates (i.e., inverse floating rate securities).
The Funds’ most recent prospectus provides further descriptions of each Fund’s investment objective, principal investment strategies, and principal risks.
The Funds’ Board of Trustees has approved the reorganization of the Nuveen Massachusetts Municipal Bond Fund 2 (“Acquired Fund”) into Nuveen Massachusetts Municipal Bond Fund (“Acquiring Fund”).
The reorganization is subject to approval by the shareholders of the Acquired Fund. For the reorganization, upon shareholder approval, the Acquired Fund will transfer all of its assets and liabilities to the Acquiring Fund in exchange for Acquiring Fund shares of equal value. The Acquiring Fund shares will then be distributed to the Acquired Fund shareholders and the Acquired Fund will be terminated. As a result of the reorganization, the Acquired Fund shareholders will become shareholders of the Acquiring Fund. The Acquired Fund shareholders will receive Acquiring Fund shares with a total value equal to the total value of their Acquired Fund shares immediately prior to the closing of the reorganization.
A special meeting of the Acquired Fund shareholders will be held on November 7, 2011, for the purpose of voting on the reorganization. If the required shareholder approval is obtained on the meeting date, it is anticipated that the reorganization will be consummated at the close of business on November 18, 2011. Further information regarding the proposed reorganization is contained in proxy materials that were sent to those who were shareholders of the Acquired Fund as of the close of business on September 9, 2011, the record date for the special meeting.
Significant Accounting Policies
The following is a summary of significant accounting policies followed by the Funds in the preparation of their financial statements in accordance with accounting principles generally accepted in the United States (“U.S. GAAP”).
Investment Valuation
Prices of municipal bonds are provided by a pricing service approved by the Funds’ Board of Trustees. These securities are generally classified as Level 2 for fair value measurement purposes. When price quotes are not readily available (which is usually the case for
| 32 | Nuveen Investments |
municipal bonds ) the pricing service establishes a security’s fair value using methods that may include consideration of the following: yields or prices of investments of comparable quality, type of issue, coupon, maturity and rating, market quotes or indications of value from security dealers, evaluations of anticipated cash flows or collateral, general market conditions and other information and analysis, including the obligor’s credit characteristics considered relevant. In pricing certain securities, particularly less liquid and lower quality securities, the pricing service may consider information about a security, its issuer, or market activity, provided by the Adviser. These securities are generally classified as Level 2 or Level 3 depending on the priority of the significant inputs.
Certain securities may not be able to be priced by the pre-established pricing methods as described above. Such securities may be valued by the Funds’ Board of Trustees or its designee at fair value. These securities generally include, but are not limited to, restricted securities (securities which may not be publicly sold without registration under the Securities Act of 1933, as amended) for which a pricing service is unable to provide a market price; securities whose trading has been formally suspended; debt securities that have gone into default and for which there is no current market quotation; a security whose market price is not available from a pre-established pricing source; a security with respect to which an event has occurred that is likely to materially affect the value of the security after the market has closed but before the calculation of a Fund’s net asset value (as may be the case in non-U.S. markets on which the security is primarily traded) or make it difficult or impossible to obtain a reliable market quotation; and a security whose price, as provided by the pricing service, is not deemed to reflect the security’s fair value. As a general principle, the fair value of a security would appear to be the amount that the owner might reasonably expect to receive for it in a current sale. A variety of factors may be considered in determining the fair value of such securities, which may include consideration of the following: yields or prices of investments of comparable quality, type of issue, coupon, maturity and rating, market quotes or indications of value from security dealers, evaluations of anticipated cash flows or collateral, general market conditions and other information and analysis, including the obligor’s credit characteristics considered relevant. These securities are generally classified as Level 2 or Level 3 depending on the priority of the significant inputs. Regardless of the method employed to value a particular security, all valuations are subject to review by the Funds’ Board of Trustees or its designee.
Refer to Footnote 2 – Fair Value Measurements for further details on the leveling of securities held by the Funds as of the end of the reporting period.
Investment Transactions
Investment transactions are recorded on a trade date basis. Realized gains and losses from transactions are determined on the specific identification method, which is the same basis used for federal income tax purposes. Investments purchased on a when-issued/delayed delivery basis may have extended settlement periods. Any investments so purchased are subject to market fluctuation during this period. The Funds have instructed the custodian to segregate assets with a current value at least equal to the amount of the when-issued/delayed delivery purchase commitments. At August 31, 2011, the Funds had no such outstanding purchase commitments.
Investment Income
Investment income, which reflects the amortization of premiums and includes accretion of discounts for financial reporting purposes, is recorded on an accrual basis. Investment income also reflects paydown gains and losses, if any.
Income Taxes
Each Fund is a separate taxpayer for federal income tax purposes. Each Fund intends to distribute substantially all of its net investment income and net capital gains to shareholders and to otherwise comply with the requirements of Subchapter M of the Internal Revenue Code applicable to regulated investment companies. Therefore, no federal income tax provision is required. Furthermore, each Fund intends to satisfy conditions that will enable interest from municipal securities, which is exempt from regular federal and Massachusetts state income taxes, to retain such tax-exempt status when distributed to shareholders of the Funds. Net realized capital gains and ordinary income distributions paid by the Funds are subject to federal taxation.
For all open tax years and all major taxing jurisdictions, management of the Funds has concluded that there are no significant uncertain tax positions that would require recognition in the financial statements. Open tax years are those that are open for examination by taxing authorities (i.e., generally the last four tax year ends and the interim tax period since then). Furthermore, management of the Funds is also not aware of any tax positions for which it is reasonably possible that the total amounts of the unrecognized tax benefits will significantly change in the next twelve months.
Dividends and Distributions to Shareholders
The Funds declare dividends from their net investment income daily and pay shareholders monthly. Fund shares begin to accrue dividends on the business day after the day when the monies used to purchase Fund shares are collected by the Funds’ transfer agent.
Net realized capital gains and/or market discount from investment transactions, if any, are declared and distributed to shareholders at least annually. Furthermore, capital gains are distributed only to the extent they exceed available capital loss carryforwards.
Distributions to shareholders of net investment income, net realized capital gains and/or market discount, if any, are recorded on the ex-dividend date. The amount and timing of distributions are determined in accordance with federal income tax regulations, which may differ from U.S. GAAP.
| Nuveen Investments | 33 |
Notes to Financial Statements (Unaudited) (continued)
Insurance
During the period March 1, 2011 through May 31, 2011, Massachusetts 2 invested at least 80% of its net assets in municipal securities that were covered by insurance guaranteeing the timely payment of principal and interest thereon. Inverse floating rate securities whose underlying bonds are covered by insurance were included for purposes of the 80%. Insured municipal bonds are either covered by individual, permanent insurance policies (obtained either at the time of issuance or subsequently), or covered “while in fund” under a master portfolio insurance policy purchased by the Fund. Insurance guarantees only the timely payment of interest and principal on the bonds; it does not guarantee the value of either individual bonds or Fund shares. The Adviser may obtain master policies from insurers that specialize in insuring municipal bonds.
Each insured municipal security is covered by Original Issue Insurance, Secondary Market Insurance or Portfolio Insurance. Such insurance does not guarantee the market value of the municipal securities or the value of the Fund’s shares. Original Issue Insurance and Secondary Market Insurance remain in effect as long as the municipal securities covered thereby remain outstanding and the insurer remains in business, regardless of whether the Fund ultimately disposes of such municipal securities. Consequently, the market value of the municipal securities covered by Original Issue Insurance or Secondary Market Insurance may reflect value attributable to the insurance. Portfolio Insurance, in contrast, is effective only while the municipal securities are held by the Fund, and is reflected as an expense over the term of the policy, when applicable. Accordingly, neither the prices used in determining the market value of the underlying municipal securities nor the net asset value of the Fund’s shares include value, if any, attributable to the Portfolio Insurance. Each policy of the Portfolio Insurance does, however, give the Fund the right to obtain permanent insurance with respect to the municipal security covered by the Portfolio Insurance policy at the time of its sale.
Flexible Sales Charge Program
Class A Shares are generally sold with an up-front sales charge and incur a .20% annual 12b-1 service fee. Class A Share purchases of $1 million or more are sold at net asset value without an up-front sales charge but may be subject to a contingent deferred sales charge (“CDSC”) if redeemed within eighteen months of purchase. Class B Shares were sold without an up-front sales charge but incur a .75% annual 12b-1 distribution fee and a .20% annual 12b-1 service fee. Class B Shares are subject to a CDSC of up to 5% depending upon the length of time the shares are held by the investor (CDSC is reduced to 0% at the end of six years). Class B Shares convert to Class A Shares eight years after purchase. Class C Shares are sold without an up-front sales charge but incur a .55% annual 12b-1 distribution fee and a .20% annual 12b-1 service fee. Class C Shares are subject to a CDSC of 1% if redeemed within twelve months of purchase. Class I Shares are not subject to any sales charge or 12b-1 distribution or service fees.
Inverse Floating Rate Securities
Each Fund is authorized to invest in inverse floating rate securities. An inverse floating rate security is created by depositing a municipal bond, typically with a fixed interest rate, into a special purpose trust created by a broker-dealer. In turn, this trust (a) issues floating rate certificates, in face amounts equal to some fraction of the deposited bond’s par amount or market value, that typically pay short-term tax-exempt interest rates to third parties, and (b) issues to a long-term investor (such as one of the Funds) an inverse floating rate certificate (sometimes referred to as an “inverse floater”) that represents all remaining or residual interest in the trust. The income received by the inverse floater holder varies inversely with the short-term rate paid to the floating rate certificates’ holders, and in most circumstances the inverse floater holder bears substantially all of the underlying bond’s downside investment risk and also benefits disproportionately from any potential appreciation of the underlying bond’s value. The price of an inverse floating rate security will be more volatile than that of the underlying bond because the interest rate is dependent on not only the fixed coupon rate of the underlying bond but also on the short-term interest paid on the floating rate certificates, and because the inverse floating rate security essentially bears the risk of loss of the greater face value of the underlying bond.
A Fund may purchase an inverse floating rate security in a secondary market transaction without first owning the underlying bond (referred to as an “externally-deposited inverse floater”), or instead by first selling a fixed-rate bond to a broker-dealer for deposit into the special purpose trust and receiving in turn the residual interest in the trust (referred to as a “self-deposited inverse floater”). The inverse floater held by a Fund gives the Fund the right (a) to cause the holders of the floating rate certificates to tender their notes at par, and (b) to have the broker transfer the fixed-rate bond held by the trust to the Fund, thereby collapsing the trust. An investment in an externally-deposited inverse floater is identified in the Portfolio of Investments as “(IF) – Inverse floating rate investment.” An investment in a self-deposited inverse floater is accounted for as a financing transaction. In such instances, a fixed-rate bond deposited into a special purpose trust is identified in the Portfolio of Investments as “(UB) – Underlying bond of an inverse floating rate trust reflected as a financing transaction,” with the Fund accounting for the short-term floating rate certificates issued by the trust as “Floating rate obligations” on the Statement of Assets and Liabilities. In addition, the Fund reflects in “Investment Income” the entire earnings of the underlying bond and related interest paid to the holders of the short-term floating rate certificates as “Interest expense on floating rate obligations” on the Statement of Operations.
During the six months ended August 31, 2011, Massachusetts invested in externally-deposited inverse floaters. Neither Fund invested in self-deposited inverse floaters during the six months ended August 31, 2011.
Each Fund may also enter into shortfall and forbearance agreements (sometimes referred to as a “recourse trust” or “credit recovery swap”) (such agreements referred to herein as “Resourse Trusts”) with a broker-dealer by which a Fund agrees to reimburse the broker-dealer, in certain circumstances, for the difference between the liquidation value of the fixed-rate bond held by the trust and the liquidation value of the floating rate certificates issued by the trust plus any shortfalls in interest cash flows. Under these
| 34 | Nuveen Investments |
agreements, a Fund’s potential exposure to losses related to or on inverse floaters may increase beyond the value of a Fund’s inverse floater investments as a Fund may potentially be liable to fulfill all amounts owed to holders of the floating rate certificates. At period end, any such shortfall is recognized as “Unrealized depreciation on Recourse Trusts” on the Statement of Assets and Liabilities.
At August 31, 2011, each Fund’s maximum exposure to externally-deposited Recourse Trusts was as follows:
| Massachusetts | Massachusetts 2 | |||||||
Maximum exposure to Recourse Trusts | $ | 1,600,000 | $ | — | ||||
Derivative Financial Instruments
Each Fund is authorized to invest in certain derivative instruments, including foreign currency forwards, futures, options and swap contracts. Although each Fund is authorized to invest in such financial instruments, and may do so in the future, they did not make any such investments during the six months ended August 31, 2011.
Market and Counterparty Credit Risk
In the normal course of business each Fund may invest in financial instruments and enter into financial transactions where risk of potential loss exists due to changes in the market (market risk) or failure of the other party to the transaction to perform (counterparty credit risk). The potential loss could exceed the value of the financial assets recorded on the financial statements. Financial assets, which potentially expose each Fund to counterparty credit risk, consist principally of cash due from counterparties on forward, option and swap transactions, when applicable. The extent of each Fund’s exposure to counterparty credit risk in respect to these financial assets approximates their carrying value as recorded on the Statement of Assets and Liabilities. Futures contracts, when applicable, expose a Fund to minimal counterparty credit risk as they are exchange traded and the exchange’s clearinghouse, which is counterparty to all exchange traded futures, guarantees the futures contracts against default.
Each Fund helps manage counterparty credit risk by entering into agreements only with counterparties the Adviser believes have the financial resources to honor their obligations and by having the Adviser monitor the financial stability of the counterparties. Additionally, counterparties may be required to pledge collateral daily (based on the daily valuation of the financial asset) on behalf of each Fund with a value approximately equal to the amount of any unrealized gain above a pre-determined threshold. Reciprocally, when each Fund has an unrealized loss, the Funds have instructed the custodian to pledge assets of the Funds as collateral with a value approximately equal to the amount of the unrealized loss above a pre-determined threshold. Collateral pledges are monitored and subsequently adjusted if and when the valuations fluctuate, either up or down, by at least the pre-determined threshold amount.
Zero Coupon Securities
Each Fund is authorized to invest in zero coupon securities. A zero coupon security does not pay a regular interest coupon to its holders during the life of the security. Tax-exempt income to the holder of the security comes from accretion of the difference between the original purchase price of the security at issuance and the par value of the security at maturity and is effectively paid at maturity. The market prices of zero coupon securities generally are more volatile than the market prices of securities that pay interest periodically.
Multiclass Operations and Allocations
Income and expenses of the Funds that are not directly attributable to a specific class of shares are prorated among the classes based on the relative settled shares of each class. Expenses directly attributable to a class of shares, which presently only include 12b-1 distribution and service fees, are recorded to the specific class.
Realized and unrealized capital gains and losses of the Funds are prorated among the classes based on the relative net assets of each class.
Custodian Fee Credit
Each Fund has an arrangement with the custodian bank whereby certain custodian fees and expenses are reduced by net credits earned on each Fund’s cash on deposit with the bank. Such deposit arrangements are an alternative to overnight investments. Credits for cash balances may be offset by charges for any days on which a Fund overdraws its account at the custodian bank.
Indemnifications
Under the Trust’s organizational documents, its officers and trustees are indemnified against certain liabilities arising out of the performance of their duties to the Trust. In addition, in the normal course of business, the Trust enters into contracts that provide general indemnifications to other parties. The Trust’s maximum exposure under these arrangements is unknown as this would involve future claims that may be made against the Trust that have not yet occurred. However, the Trust has not had prior claims or losses pursuant to these contracts and expects the risk of loss to be remote.
Use of Estimates
The preparation of financial statements in conformity with U.S. GAAP requires management to make estimates and assumptions that affect the reported amounts of assets and liabilities at the date of the financial statements and the reported amounts of increases and decreases in net assets from operations during the reporting period. Actual results may differ from those estimates.
| Nuveen Investments | 35 |
Notes to Financial Statements (Unaudited) (continued)
2. Fair Value Measurements
Fair value is defined as the price that the Funds would receive upon selling an investment or transferring a liability in an orderly transaction to an independent buyer in the principal or most advantageous market for the investment. A three-tier hierarchy is used to maximize the use of observable market data and minimize the use of unobservable inputs and to establish classification of fair value measurements for disclosure purposes. Observable inputs reflect the assumptions market participants would use in pricing the asset or liability. Observable inputs are based on market data obtained from sources independent of the reporting entity. Unobservable inputs reflect the reporting entity’s own assumptions about the assumptions market participants would use in pricing the asset or liability. Unobservable inputs are based on the best information available in the circumstances. The three-tier hierarchy of inputs is summarized in the three broad levels listed below:
| Level 1 – | Quoted prices in active markets for identical securities. | |
| Level 2 – | Other significant observable inputs (including quoted prices for similar securities, interest rates, prepayment speeds, credit risk, etc.). | |
| Level 3 – | Significant unobservable inputs (including management’s assumptions in determining the fair value of investments). |
The inputs or methodologies used for valuing securities are not an indication of the risk associated with investing in those securities. The following is a summary of each Fund’s fair value measurements as of August 31, 2011:
| Massachusetts | Level 1 | Level 2 | Level 3 | Total | ||||||||||||
Investments: | ||||||||||||||||
Municipal Bonds | $ | — | $ | 131,871,310 | $ | — | $ | 131,871,310 | ||||||||
| Massachusetts 2 | Level 1 | Level 2 | Level 3 | Total | ||||||||||||
Investments: | ||||||||||||||||
Municipal Bonds | $ | — | $76,073,900 | $ | — | $76,073,900 | ||||||||||
During the six months ended August 31, 2011, the Funds recognized no significant transfers to or from Level 1, Level 2 or Level 3.
3. Derivative Instruments and Hedging Activities
The Funds record derivative instruments at fair value, with changes in fair value recognized on the Statement of Operations, when applicable. Even though the Funds’ investments in derivatives may represent economic hedges, they are not considered to be hedge transactions for financial reporting purposes. The Funds did not invest in derivative instruments during the six months ended August 31, 2011.
4. Fund Shares
Transactions in Fund shares were as follows:
| Massachusetts | ||||||||||||||||
| Six Months Ended 8/31/11 | Year Ended 2/28/11 | |||||||||||||||
Shares | Amount | Shares | Amount | |||||||||||||
Shares sold: | ||||||||||||||||
Class A | 357,166 | $ | 3,415,105 | 1,150,012 | $ | 11,294,385 | ||||||||||
Class A – automatic conversion of Class B Shares | 2,708 | 26,069 | 34,459 | 343,346 | ||||||||||||
Class B | 143 | 1,364 | 3,306 | 33,162 | ||||||||||||
Class C | 171,273 | 1,621,389 | 483,998 | 4,746,426 | ||||||||||||
Class I | 259,860 | 2,500,314 | 397,856 | 3,941,070 | ||||||||||||
Shares issued to shareholders due to reinvestment of distributions: | ||||||||||||||||
Class A | 63,584 | 608,450 | 128,024 | 1,252,928 | ||||||||||||
Class B | 760 | 7,263 | 2,201 | 21,578 | ||||||||||||
Class C | 16,545 | 157,022 | 30,467 | 295,641 | ||||||||||||
Class I | 101,142 | 966,178 | 198,244 | 1,936,972 | ||||||||||||
| 973,181 | 9,303,154 | 2,428,567 | 23,865,508 | |||||||||||||
Shares redeemed: | ||||||||||||||||
Class A | (498,681 | ) | (4,757,315 | ) | (1,072,214 | ) | (10,411,712 | ) | ||||||||
Class B | (29,715 | ) | (283,357 | ) | (36,524 | ) | (362,843 | ) | ||||||||
Class B – automatic conversion to Class A Shares | (2,704 | ) | (26,069 | ) | (34,425 | ) | (343,346 | ) | ||||||||
Class C | (174,777 | ) | (1,659,585 | ) | (228,199 | ) | (2,184,739 | ) | ||||||||
Class I | (330,773 | ) | (3,166,890 | ) | (512,149 | ) | (4,953,401 | ) | ||||||||
| (1,036,650 | ) | (9,893,216 | ) | (1,883,511 | ) | (18,256,041 | ) | |||||||||
Net increase (decrease) | (63,469 | ) | $ | (590,062 | ) | 545,056 | $ | 5,609,467 | ||||||||
| 36 | Nuveen Investments |
| Massachusetts 2 | ||||||||||||||||
| Six Months Ended 8/31/11 | Year Ended 2/28/11 | |||||||||||||||
Shares | Amount | Shares | Amount | |||||||||||||
Shares sold: | ||||||||||||||||
Class A | 77,406 | $ | 770,282 | 310,267 | $ | 3,171,691 | ||||||||||
Class A – automatic conversion of Class B Shares | 16,121 | 164,060 | 66,887 | 684,703 | ||||||||||||
Class B | 368 | 3,690 | 884 | 8,990 | ||||||||||||
Class C | 31,046 | 309,881 | 132,462 | 1,355,843 | ||||||||||||
Class I | 24,631 | 244,579 | 374,897 | 3,830,930 | ||||||||||||
Shares issued to shareholders due to reinvestment of distributions: | ||||||||||||||||
Class A | 28,611 | 286,447 | 79,593 | 808,321 | ||||||||||||
Class B | 974 | 9,766 | 2,639 | 26,810 | ||||||||||||
Class C | 12,405 | 124,334 | 36,844 | 374,676 | ||||||||||||
Class I | 54,458 | 548,546 | 132,752 | 1,354,570 | ||||||||||||
| 246,020 | 2,461,585 | 1,137,225 | 11,616,534 | |||||||||||||
Shares redeemed: | ||||||||||||||||
Class A | (406,858 | ) | (4,064,896 | ) | (951,377 | ) | (9,607,775 | ) | ||||||||
Class B | (14,824 | ) | (149,691 | ) | (91,046 | ) | (938,291 | ) | ||||||||
Class B – automatic conversion to Class A Shares | (16,102 | ) | (164,060 | ) | (66,812 | ) | (684,703 | ) | ||||||||
Class C | (114,079 | ) | (1,123,221 | ) | (246,112 | ) | (2,453,955 | ) | ||||||||
Class I | (232,239 | ) | (2,330,402 | ) | (532,649 | ) | (5,395,669 | ) | ||||||||
| (784,102 | ) | (7,832,270 | ) | (1,887,996 | ) | (19,080,393 | ) | |||||||||
Net increase (decrease) | (538,082 | ) | $ | (5,370,685 | ) | (750,771 | ) | $ | (7,463,859 | ) | ||||||
5. Investment Transactions
Purchases and sales (including maturities but excluding short-term investments, where applicable) during the six months ended August 31, 2011, were as follows:
| Massachusetts | Massachusetts 2 | |||||||
Purchases | $ | 4,822,184 | $ | 4,956,286 | ||||
Sales and maturities | 4,641,284 | 8,954,926 | ||||||
6. Income Tax Information
The following information is presented on an income tax basis. Differences between amounts for financial statement and federal income tax purposes are primarily due to timing differences in recognizing taxable market discount, timing differences in recognizing certain gains and losses on investment transactions and the treatment of investments in inverse floating rate securities reflected as financing transactions, if any. To the extent that differences arise that are permanent in nature, such amounts are reclassified within the capital accounts as detailed below. Temporary differences do not require reclassification. Temporary and permanent differences do not impact the net asset values of the Funds.
At August 31, 2011, the cost and unrealized appreciation (depreciation) of investments, as determined on a federal income tax basis, was as follows:
| Massachusetts | Massachusetts 2 | |||||||
Cost of investments | $ | 131,902,478 | $ | 73,869,999 | ||||
Gross unrealized: | ||||||||
Appreciation | $ | 5,576,061 | $ | 3,157,934 | ||||
Depreciation | (5,607,229 | ) | (954,033 | ) | ||||
Net unrealized appreciation (depreciation) of investments | $ | (31,168) | $ | 2,203,901 | ||||
Permanent differences, primarily due to federal taxes paid, taxable market discount and distribution character reclassifications, resulted in reclassifications among the Funds’ components of net assets at February 28, 2011, the Funds’ last tax year end, as follows:
| Massachusetts | Massachusetts 2 | |||||||
Capital paid-in | $ | 1,333 | $ | — | ||||
Undistributed (Over-distribution of) net investment income | (1,602 | ) | — | |||||
Accumulated net realized gain (loss) | 269 | — | ||||||
| Nuveen Investments | 37 |
Notes to Financial Statements (Unaudited) (continued)
The tax components of undistributed net tax-exempt income, net ordinary income and net long-term capital gains at February 28, 2011, the Funds’ last tax year end, were as follows:
| Massachusetts | Massachusetts 2 | |||||||
Undistributed net tax-exempt income* | $ | 731,197 | $ | 171,953 | ||||
Undistributed net ordinary income** | 10,801 | 221 | ||||||
Undistributed net long-term capital gains | — | 275,375 | ||||||
| * | Undistributed net tax-exempt income (on a tax basis) has not been reduced for the dividends declared during the period February 1, 2011, through February 28, 2011, and paid on March 1, 2011. |
| ** | Net ordinary income consists of taxable market discount income and net short-term capital gains, if any. |
The tax character of distributions paid during the Funds’ last tax year ended February 28, 2011, was designated for purposes of the dividends paid deduction as follows:
| Massachusetts | Massachusetts 2 | |||||||
Distributions from net tax-exempt income | $ | 6,174,180 | $ | 3,319,239 | ||||
Distributions from net ordinary income ** | — | 23,054 | ||||||
Distributions from net long-term capital gains | — | 525,127 | ||||||
| ** | Net ordinary income consists of taxable market discount income and net short-term capital gains, if any. |
At February 28, 2011, the Fund’s last tax year end, Massachusetts had unused capital loss carryforwards available for federal income tax purposes to be applied against future capital gains, if any. If not applied, the carryforwards will expire as follows:
| Massachusetts | ||||
Expiration: | ||||
February 28, 2017 | $ | 12,497 | ||
February 28, 2018 | 98,330 | |||
Total | $ | 110,827 | ||
7. Management Fees and Other Transactions with Affiliates
Each Fund’s management fee consists of two components – a fund-level fee, based only on the amount of assets within the Fund, and a complex-level fee, based on the aggregate amount of all eligible fund assets managed by the Adviser. This pricing structure enables Fund shareholders to benefit from growth in the assets within their Fund as well as from growth in the amount of complex-wide assets managed by the Adviser.
The annual fund-level fee for each Fund, payable monthly, is calculated according to the following schedule:
| Average Daily Net Assets | Fund-Level Fee Rate | |||
For the first $125 million | .3500 | % | ||
For the next $125 million | .3375 | |||
For the next $250 million | .3250 | |||
For the next $500 million | .3125 | |||
For the next $1 billion | .3000 | |||
For net assets over $2 billion | .2750 | |||
For net assets over $5 billion | .2500 | |||
The annual complex-level fee for each Fund, payable monthly, is calculated according to the following schedule:
| Complex-Level Asset Breakpoint Level* | Effective Rate at Breakpoint Level | |||
$55 billion | .2000 | % | ||
$56 billion | .1996 | |||
$57 billion | .1989 | |||
$60 billion | .1961 | |||
$63 billion | .1931 | |||
$66 billion | .1900 | |||
$71 billion | .1851 | |||
$76 billion | .1806 | |||
$80 billion | .1773 | |||
$91 billion | .1691 | |||
$125 billion | .1599 | |||
$200 billion | .1505 | |||
$250 billion | .1469 | |||
$300 billion | .1445 | |||
| 38 | Nuveen Investments |
| * | The complex-level fee is calculated based upon the aggregate daily “eligible assets” of all Nuveen Funds. Eligible assets do not include assets attributable to investments in other Nuveen Funds or assets in excess of $2 billion added to the Nuveen Fund complex in connection with the Adviser’s assumption of the management of the former First American Funds effective January 1, 2011. Eligible assets include closed-end fund assets managed by the Adviser that are attributable to financial leverage. For these purposes, financial leverage includes the closed-end funds’ use of preferred stock and borrowings and certain investments in the residual interest certificates (also called inverse floating rate securities) in tender option bond (TOB) trusts, including the portion of assets held by a TOB trust that has been effectively financed by the trust’s issuance of floating rate securities, subject to an agreement by the Adviser as to certain funds to limit the amount of such assets for determining eligible assets in certain circumstances. As of August 31, 2011, the complex-level fee rate for these Funds was .1781%. |
The management fee compensates the Adviser for overall investment advisory and administrative services and general office facilities it provides for the Funds. The Adviser has entered into sub-advisory agreements with the Sub-Adviser under which the Sub-Adviser manages the investment portfolios of the Funds. The Sub-Adviser is compensated for its services to the Funds from the management fees paid to the Adviser.
The Adviser has agreed to waive fees and/or reimburse expenses of Massachusetts and Massachusetts 2 so that total annual fund operating expenses (excluding 12b-1 distribution and service fees, interest expenses, taxes, fees incurred in acquiring and disposing of portfolio securities and extraordinary expenses) do not exceed .750% and .975%, respectively, of the average daily net assets of any class of Fund shares. The Adviser may voluntarily reimburse expenses from time to time in either of the Funds. Voluntary reimbursements may be terminated at any time at the Adviser’s discretion.
The Trust pays no compensation directly to those of its trustees who are affiliated with the Adviser or to its officers, all of whom receive remuneration for their services to the Trust from the Adviser or its affiliates. The Board of Trustees has adopted a deferred compensation plan for independent trustees that enables trustees to elect to defer receipt of all or a portion of the annual compensation they are entitled to receive from certain Nuveen-advised funds. Under the plan, deferred amounts are treated as though equal dollar amounts had been invested in shares of select Nuveen-advised funds.
During the six months ended August 31, 2011, the Distributor collected sales charges on purchases of Class A Shares, the majority of which were paid out as concessions to financial intermediaries as follows:
| Massachusetts | Massachusetts 2 | |||||||
Sales charges collected | $ | 20,753 | $ | 11,287 | ||||
Paid to financial intermediaries | 17,198 | 9,560 | ||||||
The Distributor also received 12b-1 service fees on Class A Shares, substantially all of which were paid to compensate financial intermediaries for providing services to shareholders relating to their investments.
During the six months ended August 31, 2011, the Distributor compensated financial intermediaries directly with commission advances at the time of purchase as follows:
| Massachusetts | Massachusetts 2 | |||||||
Commission advances | $ | 17,353 | $ | 2,283 | ||||
To compensate for commissions advanced to financial intermediaries, all 12b-1 service fees collected on Class B Shares during the first year following a purchase, all 12b-1 distribution fees collected on Class B Shares, and all 12b-1 service and distribution fees collected on Class C Shares during the first year following a purchase are retained by the Distributor. During the six months ended August 31, 2011, the Distributor retained such 12b-1 fees as follows:
| Massachusetts | Massachusetts 2 | |||||||
12b-1 fees retained | $ | 20,975 | $ | 7,263 | ||||
The remaining 12b-1 fees charged to the Funds were paid to compensate financial intermediaries for providing services to shareholders relating to their investments.
The Distributor also collected and retained CDSC on share redemptions during the six months ended August 31, 2011, as follows:
| Massachusetts | Massachusetts 2 | |||||||
CDSC retained | $ | 2,607 | $ | 3,782 | ||||
| Nuveen Investments | 39 |
Notes to Financial Statements (Unaudited) (continued)
8. New Accounting Pronouncements
Fair Value Measurements and Disclosures
On May 12, 2011, the Financial Accounting Standards Board (“FASB”) issued Accounting Standard Update (“ASU”) No. 2011-04 (“ASU No. 2011-04”) modifying Topic 820, Fair Value Measurements and Disclosures. At the same time, the International Accounting Standards Board (“IASB”) issued International Financial Reporting Standard (“IFRS”) 13, Fair Value Measurement. The objective of the FASB and IASB is convergence of their guidance on fair value measurements and disclosures. Specifically, ASU No. 2011-04 requires reporting entities to disclose i) the amounts of any transfers between Level 1 and Level 2, and the reasons for the transfers, ii) for Level 3 fair value measurements, a) quantitative information about significant unobservable inputs used, b) a description of the valuation processes used by the reporting entity and c) a narrative description of the sensitivity of the fair value measurement to changes in unobservable inputs if a change in those inputs might result in a significantly higher or lower fair value measurement. The effective date of ASU No. 2011-04 is for interim and annual periods beginning after December 15, 2011. At this time, management is evaluating the implications of this guidance and the impact it will have on the financial statement amounts and footnote disclosures, if any.
| 40 | Nuveen Investments |
Annual Investment Management Agreement Approval Process
(Unaudited)
The Board of Trustees (each, a “Board” and each Trustee, a “Board Member”) of the Funds, including the Board Members who are not parties to the Funds’ advisory or sub-advisory agreements or “interested persons” of any such parties (the “Independent Board Members”), are responsible for approving the advisory agreements (each, an “Investment Management Agreement”) between each Fund and Nuveen Fund Advisors, Inc. (the “Advisor”) and the sub-advisory agreements (each a “Sub-Advisory Agreement”) between the Advisor and Nuveen Asset Management, LLC (the “Sub-Advisor”) (the Investment Management Agreements and the Sub-Advisory Agreements are referred to collectively as the “Advisory Agreements”) and their periodic continuation. Pursuant to the Investment Company Act of 1940, as amended (the “1940 Act”), the Board is generally required to consider the continuation of advisory agreements and sub-advisory agreements on an annual basis. Accordingly, at an in-person meeting held on May 23-25, 2011 (the “May Meeting”), the Board, including a majority of the Independent Board Members, considered and approved the continuation of the Advisory Agreements for the Funds for an additional one-year period.
In preparation for their considerations at the May Meeting, the Board requested and received extensive materials prepared in connection with the review of the Advisory Agreements. The materials provided a broad range of information regarding the Funds, the Advisor and the Sub-Advisor (the Advisor and the Sub-Advisor are collectively, the “Fund Advisers” and each, a “Fund Adviser”). As described in more detail below, the information provided included, among other things, a review of Fund performance, including Fund investment performance assessments against peer groups and appropriate benchmarks, a comparison of Fund fees and expenses relative to peers, a description and assessment of shareholder service levels for the Funds, a summary of the performance of certain service providers, a review of product initiatives and shareholder communications and an analysis of the Advisor’s profitability with comparisons to comparable peers in the managed fund business. As part of their annual review, the Board also held a separate meeting on April 19-20, 2011, to review the Funds’ investment performance and consider an analysis provided by the Advisor of the Sub-Advisor which generally evaluated the Sub-Advisor’s investment team, investment mandate, organizational structure and history, investment philosophy and process, performance of the applicable Fund, and significant changes to the foregoing. As a result of their review of the materials and discussions, the Board presented the Advisor with questions and the Advisor responded.
The materials and information prepared in connection with the review of the Advisory Agreements at the May Meeting supplemented the information provided to the Board during the year. In this regard, throughout the year, the Board, acting directly or through its committees, regularly reviews the performance and various services provided by the Advisor and, since the internal restructuring described in Section A below, the Sub-Advisor. The Board meets at least quarterly as well as at other times as the need arises. At its quarterly meetings, the Board reviews reports by the Advisor which include, among other things, Fund performance, a review of the investment teams and compliance reports. The Board also meets with key investment personnel managing the Fund portfolios during the year. In addition, the Board continues its program of seeking to visit each sub-advisor to the Nuveen funds at least once over a multiple year rotation, meeting with key investment and business personnel. The Board also met with State Street Bank & Trust Company, the Funds’ accountant and custodian, in 2010. The Board considers factors and information that are relevant to its consideration of the renewal of the Advisory Agreements at these meetings held throughout the year. Accordingly, the Board considered the information provided and knowledge gained at these meetings when performing its review at the May Meeting of the Advisory Agreements. The Independent Board Members are assisted throughout the process by independent legal counsel who provided materials describing applicable law and the duties of directors or trustees in reviewing advisory contracts and met with the Independent Board Members in executive sessions without management present.
The Board considered all factors it believed relevant with respect to each Fund, including among other factors: (a) the nature, extent and quality of the services provided by the Fund Advisers, (b) the investment performance of the Fund and Fund Advisers, (c) the advisory fees and costs of the services to be provided to the Funds and the profitability of the Fund Advisers, (d) the extent of any economies of scale, (e) any benefits derived by the Fund Advisers from the relationship with the Fund and (f) other factors. Each Board Member may have accorded different weight to the various factors in reaching his or her conclusions with respect to a Fund’s Advisory Agreements. The Independent Board Members did not identify any single factor as all important or controlling. The Independent Board Members’ considerations were instead based on a comprehensive consideration of all the information presented. The principal factors considered by the Board and its conclusions are described below.
A. Nature, Extent and Quality of Services
In considering renewal of the Advisory Agreements, the Independent Board Members considered the nature, extent and quality of the Fund Adviser’s services, including advisory services and the resulting Fund performance and administrative services. The Independent Board Members reviewed materials outlining, among other things, the Fund Adviser’s organization and business; the types of services that the Fund Adviser or its affiliates provide to the Funds; the performance record of the applicable Fund (as described in further detail below); and any initiatives Nuveen had taken for the applicable fund product line.
In considering advisory services, the Board recognized that the Advisor provides various oversight, administrative, compliance and other services for the Funds and the Sub-Advisor provides the portfolio investment management services to the Funds. The Board recognized that Nuveen engaged in an internal restructuring in 2010 pursuant to which portfolio management services the Advisor had provided directly to the Funds were transferred to the Sub-Advisor, a newly-organized, wholly-owned subsidiary of the Advisor consisting of largely the same investment personnel. Accordingly, in reviewing the portfolio management services provided to each Fund, the Board reviewed the materials provided by the Nuveen Investment Services Oversight Team analyzing, among other things, the Sub-Advisor’s investment team and changes thereto, organization and history, assets under management, Fund objectives and
| Nuveen Investments | 41 |
Annual Investment Management Agreement Approval Process
(Unaudited) (continued)
mandate, the investment team’s philosophy and strategies in managing the Fund, developments affecting the Sub-Advisor or Fund and Fund performance. The Independent Board Members also reviewed portfolio manager compensation arrangements to evaluate each Fund Adviser’s ability to attract and retain high quality investment personnel, preserve stability, and reward performance but not provide an incentive to take undue risks. In addition, the Board considered the Advisor’s execution of its oversight responsibilities over the Sub-Advisor. Given the importance of compliance, the Independent Board Members also considered Nuveen’s compliance program, including the report of the chief compliance officer regarding the Funds’ compliance policies and procedures.
In addition to advisory services, the Board considered the quality and extent of administrative and other non-investment advisory services the Advisor and its affiliates provide to the Funds, including product management, investment services (such as oversight of investment policies and procedures, risk management, and pricing), fund administration, oversight of service providers, shareholder services, administration of Board relations, regulatory and portfolio compliance and legal support. In reviewing the services provided, the Board also reviewed materials describing various notable initiatives and projects the Advisor performed in connection with the open-end fund product line. These initiatives included operations necessary to effect the acquisition of FAF Advisors, Inc.’s (“FAF”) long-term asset management business by Nuveen and the subsequent integration of FAF and the funds FAF advised into the Nuveen family of funds; changes in dividend declaration policies; and adding funds to various distribution platforms.
Based on their review, the Independent Board Members found that, overall, the nature, extent and quality of services provided to the respective Funds under each applicable Advisory Agreement were satisfactory.
B. The Investment Performance of the Funds and Fund Advisers
The Board, including the Independent Board Members, reviewed and considered the performance history of each Fund over various time periods. The Board reviewed, among other things, each Fund’s historic investment performance as well as information comparing the Fund’s performance information with that of other funds (the “Performance Peer Group”) based on data provided by an independent provider of mutual fund data and with recognized and/or customized benchmarks.
The Board reviewed reports, including a comprehensive analysis of the Funds’ performance and the applicable investment team. In this regard, the Board reviewed each Fund’s total return information compared to its Performance Peer Group for the quarter, one-, three- and five-year periods ending December 31, 2010 and for the same periods ending March 31, 2011. In addition, the Board reviewed each Fund’s total return information compared to recognized and/or customized benchmarks for the quarter, one- and three-year periods ending December 31, 2010 and for the same periods ending March 31, 2011.
In reviewing performance comparison information, the Independent Board Members recognized that the usefulness of the comparisons of the performance of certain funds with the performance of their respective Performance Peer Group may be limited because the Performance Peer Group may not adequately represent the objectives and strategies of the applicable funds or may be limited in size or number. In this regard, the Independent Board Members noted that the Performance Peer Group of the Nuveen Massachusetts Municipal Bond Fund 2 (the “Municipal Fund 2”) was classified as having significant differences from such Fund based on various considerations such as special fund objectives, potential investable universe and the composition of the peer set (e.g., the number and size of competing funds and number of competing managers). The Independent Board Members also noted that the investment experience of a particular shareholder in the Nuveen funds will vary depending on when such shareholder invests in the applicable fund, the class held (if multiple classes are offered) and the performance of the fund (or respective class) during that shareholder’s investment period. With respect to any Nuveen funds that underperformed their peers and/or benchmarks from time to time, the Board monitors such funds closely and considers any steps necessary or appropriate to address such issues.
In considering the results of the comparisons, the Independent Board Members observed, among other things, that the Nuveen Massachusetts Municipal Bond Fund (the “Municipal Fund”) had demonstrated generally favorable performance in comparison to peers, performing in the first or second quartile over various periods. With respect to the Municipal Fund 2 which, as noted above, had significant differences with its Performance Peer Group, the Independent Board Members noted that such Fund underperformed its benchmark in the one- and three-year periods.
Based on their review, the Independent Board Members determined that each Fund’s investment performance had been satisfactory.
C. Fees, Expenses and Profitability
1. Fees and Expenses
The Board evaluated the management fees and expenses of each Fund reviewing, among other things, such Fund’s gross management fees, net management fees and net expense ratios in absolute terms as well as compared to the fee and expenses of a comparable universe of funds based on data provided by an independent fund data provider (the “Peer Universe”) and in certain cases, to a more focused subset of funds in the Peer Universe (the “Peer Group”) and any expense limitations.
The Independent Board Members further reviewed the methodology regarding the construction of the applicable Peer Universe and Peer Group (if any). In reviewing the comparisons of fee and expense information, the Independent Board Members took into account that in certain instances various factors such as: the asset level of a fund relative to peers; the limited size and particular composition of the Peer Universe or Peer Group; the investment objectives of the peers; expense anomalies; changes in the funds comprising the Peer Universe or Peer Group from year to year; levels of reimbursement; the timing of information used; and differences in the states reflected in the Peer Universe or Peer Group may impact the comparative data thereby limiting the ability to make a meaningful comparison with peers, including for each of the Funds.
| 42 | Nuveen Investments |
In reviewing the fee schedule for a Fund, the Independent Board Members also considered the fund-level and complex-wide breakpoint schedules (described in further detail below) and any fee waivers and reimbursements provided by Nuveen. In reviewing fees and expenses, the Board considered the expenses and fees to be higher if they were over 10 basis points higher, slightly higher if they were 6 to 10 basis points higher, in line if they were within 5 basis points higher than the peer average and below if they were below the peer average of the Peer Group (if available) or Peer Universe if there was no separate Peer Group. The Independent Board Members noted that the Municipal Fund had net management fees higher than the peer average and a net expense ratio slightly higher than the peer average, while the Municipal Fund 2 had net management fees slightly higher than the peer average but a net expense ratio below the peer average.
Based on their review of the fee and expense information provided, the Independent Board Members determined that each Fund’s management fees were reasonable in light of the nature, extent and quality of services provided to the Fund.
2. Comparisons with the Fees of Other Clients
The Independent Board Members further reviewed information regarding the nature of services and fee rates offered by the Advisor to other clients, including municipal separately managed accounts and passively managed exchange traded funds (ETFs) sub-advised by the Advisor. In evaluating the comparisons of fees, the Independent Board Members noted that the fee rates charged to the Funds and other clients vary, among other things, because of the different services involved and the additional regulatory and compliance requirements associated with registered investment companies, such as the Funds. Accordingly, the Independent Board Members considered the differences in the product types, including, but not limited to, the services provided, the structure and operations, product distribution and costs thereof, portfolio investment policies, investor profiles, account sizes and regulatory requirements. The Independent Board Members noted, in particular, that the range of services provided to the Funds (as discussed above) is much more extensive than that provided to separately managed accounts. Given the inherent differences in the products, particularly the extensive services provided to the Funds, the Independent Board Members believe such facts justify the different levels of fees.
In considering the fees of the Sub-Advisor, the Independent Board Members also considered the pricing schedule or fees that the Sub-Advisor charges for similar investment management services for other Nuveen funds.
3. Profitability of Fund Advisers
In conjunction with its review of fees, the Independent Board Members also considered the profitability of Nuveen for its advisory activities (which incorporated Nuveen’s wholly-owned affiliated sub-advisers) and its financial condition. The Independent Board Members reviewed the revenues and expenses of Nuveen’s advisory activities for the last two years, the allocation methodology used in preparing the profitability data and an analysis of the key drivers behind the changes in revenues and expenses that impacted profitability in 2010. The Independent Board Members noted this information supplemented the profitability information requested and received during the year to help keep them apprised of developments affecting profitability (such as changes in fee waivers and expense reimbursement commitments). In this regard, the Independent Board Members noted that they have an Independent Board Member serve as a point person to review and keep them apprised of changes to the profitability analysis and/or methodologies during the year. The Independent Board Members also considered Nuveen’s revenues for advisory activities, expenses, and profit margin compared to that of various unaffiliated management firms with similar amounts of assets under management and relatively comparable asset composition prepared by Nuveen.
In reviewing profitability, the Independent Board Members recognized the subjective nature of determining profitability which may be affected by numerous factors including the allocation of expenses. Further, the Independent Board Members recognized the difficulties in making comparisons as the profitability of other advisers generally is not publicly available and the profitability information that is available for certain advisers or management firms may not be representative of the industry and may be affected by, among other things, the adviser’s particular business mix, capital costs, types of funds managed and expense allocations. Notwithstanding the foregoing, the Independent Board Members reviewed Nuveen’s methodology and assumptions for allocating expenses across product lines to determine profitability. In reviewing profitability, the Independent Board Members recognized Nuveen’s investment in its fund business. Based on their review, the Independent Board Members concluded that the Advisor’s level of profitability for its advisory activities was reasonable in light of the services provided.
In evaluating the reasonableness of the compensation, the Independent Board Members also considered other amounts paid to a Fund Adviser by the Funds as well as any indirect benefits (such as soft dollar arrangements, if any) the Fund Adviser and its affiliates receive, or are expected to receive, that are directly attributable to the management of the Funds, if any. See Section E below for additional information on indirect benefits a Fund Adviser may receive as a result of its relationship with the Funds. Based on their review of the overall fee arrangements of each Fund, the Independent Board Members determined that the advisory fees and expenses of the respective Fund were reasonable.
D. Economies of Scale and Whether Fee Levels Reflect These Economies of Scale
With respect to economies of scale, the Independent Board Members have recognized the potential benefits resulting from the costs of a fund being spread over a larger asset base, although economies of scale are difficult to measure and predict with precision, particularly on a fund-by-fund basis. One method to help ensure the shareholders share in these benefits is to include breakpoints in
| Nuveen Investments | 43 |
Annual Investment Management Agreement Approval Process
(Unaudited) (continued)
the advisory fee schedule. Generally, management fees for funds in the Nuveen complex are comprised of a fund-level component and a complex-level component, subject to certain exceptions. Accordingly, the Independent Board Members reviewed and considered the applicable fund-level breakpoints in the advisory fee schedules that reduce advisory fees as asset levels increase.
In addition to fund-level advisory fee breakpoints, the Board also considered the Funds’ complex-wide fee arrangement. Pursuant to the complex-wide fee arrangement, the fees of the funds in the Nuveen complex are generally reduced as the assets in the fund complex reach certain levels. The complex-wide fee arrangement seeks to provide the benefits of economies of scale to fund shareholders when total fund complex assets increase, even if assets of a particular fund are unchanged or have decreased. The approach reflects the notion that some of Nuveen’s costs are attributable to services provided to all its funds in the complex and therefore all funds benefit if these costs are spread over a larger asset base. In this regard, the Independent Board Members also noted that a portion of the assets acquired pursuant to the transaction with FAF are included in determining the level of assets for calculating the complex-wide fee, which helps reduce such fee to the benefit of all shareholders.
Based on their review, the Independent Board Members concluded that the breakpoint schedules and complex-wide fee arrangement were acceptable and reflect economies of scale to be shared with shareholders when assets under management increase.
E. Indirect Benefits
In evaluating fees, the Independent Board Members received and considered information regarding potential “fall out” or ancillary benefits the respective Fund Adviser or its affiliates may receive as a result of its relationship with each Fund. In this regard, the Independent Board Members considered, among other things, any sales charges, distribution fees and shareholder services fees received and retained by the Funds’ principal underwriter, an affiliate of the Advisor, which includes fees received pursuant to any 12b-1 plan. The Independent Board Members, therefore, considered the 12b-1 fees retained by Nuveen during the last calendar year.
In addition to the above, the Independent Board Members considered whether the Fund Advisers received any benefits from soft dollar arrangements whereby a portion of the commissions paid by a Fund for brokerage may be used to acquire research that may be useful to the Fund Adviser in managing the assets of the Funds and other clients. The Independent Board Members recognized that each Fund Adviser has the authority to pay a higher commission in return for brokerage and research services if it determines in good faith that the commission paid is reasonable in relation to the value of the brokerage and research services provided. Nevertheless, the Independent Board Members noted that commissions are generally not paid in connection with municipal securities transactions typically executed on a principal basis.
Based on their review, the Independent Board Members concluded that any indirect benefits received by a Fund Adviser as a result of its relationship with the Funds were reasonable and within acceptable parameters.
F. Other Considerations
The Independent Board Members did not identify any single factor discussed previously as all-important or controlling. The Board Members, including the Independent Board Members, unanimously concluded that the terms of each Advisory Agreement are fair and reasonable, that the respective Fund Adviser’s fees are reasonable in light of the services provided to each Fund and that the Advisory Agreements be renewed.
| 44 | Nuveen Investments |
Notes
| Nuveen Investments | 45 |
Glossary of Terms Used in this Report
Average Annual Total Return: This is a commonly used method to express an investment’s performance over a particular, usually multi-year time period. It expresses the return that would have been necessary each year to equal the investment’s actual cumulative performance (including change in NAV or offer price and reinvested dividends and capital gains distributions, if any) over the time period being considered.
Average Duration: Duration is a measure of the expected period over which a bond’s principal and interest will be paid, and consequently is a measure of the sensitivity of a bond’s (or bond fund’s) value to changes when market interest rates change. Generally, the longer a bond or Fund’s duration, the more the price of the bond or Fund will change as interest rates change.
Average Effective Maturity: The market-value-weighted average of the effective maturity dates of the individual securities including cash. In the case of a bond that has been advance-refunded to a call date, the effective maturity is the date on which the bond is scheduled to be redeemed using the proceeds of an escrow account. In most other cases the effective maturity is the stated maturity date of the security.
Inverse Floaters: Inverse floating rate securities are created by depositing a municipal bond, typically with a fixed interest rate, into a special purpose trust created by a broker-dealer. This trust, in turn, (a) issues floating rate certificates typically paying short-term tax-exempt interest rates to third parties in amounts equal to some fraction of the deposited bond’s par amount or market value, and (b) issues an inverse floating rate certificate (sometimes referred to as an “inverse floater”) to an investor (such as a Fund) interested in gaining investment exposure to a long-term municipal bond. The income received by the holder of the inverse floater varies inversely with the short-term rate paid to the floating rate certificates’ holders, and in most circumstances the holder of the inverse floater bears substantially all of the underlying bond’s downside investment risk. The holder of the inverse floater typically also benefits disproportionately from any potential appreciation of the underlying bond’s value. Hence, an inverse floater essentially represents an investment in the underlying bond on a leveraged basis.
Lipper Massachusetts Municipal Debt Classification Average: Represents the average annualized total return for all reporting funds in the Lipper Massachusetts Municipal Debt category. The Lipper Massachusetts Municipal Debt Classification Average contained 38, 38, 33 and 31 funds for the 6-month, 1-year, 5-year and 10-year periods, respectively, ended August 31, 2011. Lipper returns account for the effects of management fees and assume reinvestment of dividends, but do not reflect any applicable sales charges. The Lipper average is not available for direct investment.
Net Asset Value (NAV): The net market value of all securities held in a portfolio.
Net Asset Value (NAV) Per Share: The market value of one share of a mutual fund or closed-end fund. For a Fund, the NAV is calculated daily by taking the Fund’s total assets (securities, cash, and accrued earnings), subtracting the Fund’s liabilities, and dividing by the number of shares outstanding.
Pre-Refundings: Pre-Refundings, also known as advance refundings or refinancings, occur when an issuer sells new bonds and uses the proceeds to fund principal and interest payments of older existing bonds. This process often results in lower borrowing costs for bond issuers.
Standard & Poor’s (S&P) Massachusetts Municipal Bond Index: An unleveraged, market value-weighted index designed to measure the performance of the tax-exempt, investment-grade Massachusetts municipal bond market. The index returns assume reinvestment of dividends but do not reflect any applicable sales charge. You cannot invest directly in an index.
Standard & Poor’s (S&P) National Municipal Bond Index: An unleveraged, market value-weighted index designed to measure the performance of the tax-exempt, investment-grade U.S. municipal bond market. The index returns assume reinvestment of dividends but do not reflect any applicable sales charge. You cannot invest directly in an index.
Zero Coupon Bond: A zero coupon bond does not pay a regular interest coupon to its holders during the life of the bond. Tax-exempt income to the holder of the bond comes from accretion of the difference between the original purchase price of the bond at issuance and the par value of the bond at maturity and is effectively paid at maturity. The market prices of zero coupon bonds generally are more volatile than the market prices of bonds that pay interest periodically.
| 46 | Nuveen Investments |
Fund Manager
Nuveen Fund Advisors, Inc.
333 West Wacker Drive
Chicago, IL 60606
Sub-Adviser
Nuveen Asset Management, LLC
333 West Wacker Drive
Chicago, IL 60606
Legal Counsel
Chapman and Cutler LLP
Chicago, IL
Independent Registered
Public Accounting Firm
PricewaterhouseCoopers LLP
Chicago, IL
Custodian
State Street Bank & Trust Company
Boston, MA
Transfer Agent and Shareholder Services
Boston Financial
Data Services, Inc.
Nuveen Investor Services
P.O. Box 8530
Boston, MA 02266-8530
(800) 257-8787
Quarterly Portfolio of Investments and Proxy Voting Information: You may obtain (i) each Fund’s quarterly portfolio of investments, (ii) information regarding how each Fund voted proxies relating to portfolio securities held during the most recent twelve-month period ended June 30, and (iii) a description of the policies and procedures that each Fund used to determine how to vote proxies relating to portfolio securities without charge, upon request, by calling Nuveen Investments at (800) 257-8787 or on Nuveen’s website at www.nuveen.com.
You may also obtain this and other Fund information directly from the Securities and Exchange Commission (SEC). The SEC may charge a copying fee for this information. Visit the SEC on-line at http://www.sec.gov or in person at the SEC’s Public Reference Room in Washington, D.C. Call the SEC at (202) 942-8090 for room hours and operation. You may also request Fund information by sending an e-mail request to publicinfo@sec.gov or by writing to the SEC’s Public Reference Section at 100 F Street NE, Washington, D.C. 20549.
The Financial Industry Regulatory Authority (FINRA) provides a Public Disclosure Program which supplies certain information regarding the disciplinary history of FINRA members and their associated persons in response to either telephone inquiries at (800) 289-9999 or written inquiries at www.finra.org. FINRA also provides an investor brochure that includes information describing the Public Disclosure Program.
| Nuveen Investments | 47 |
Nuveen Investments:
Serving Investors for Generations
Since 1898, financial advisors and their clients have relied on Nuveen Investments to provide dependable investment solutions through continued adherence to proven, long-term investing principles. Today, we offer a range of high quality equity and fixed-income solutions designed to be integral components of a well-diversified core portfolio.
Focused on meeting investor needs.
Nuveen Investments is a global investment management firm that seeks to help secure the long-term goals of institutions and high net worth investors as well as the consultants and financial advisors who serve them. We market our growing range of specialized investment solutions under the high-quality brands of HydePark, NWQ, Nuveen Asset Management, Santa Barbara, Symphony, Tradewinds and Winslow Capital. In total, Nuveen Investments managed approximately $210 billion of assets as of June 30, 2011.
Find out how we can help you.
To learn more about how the products and services of Nuveen Investments may be able to help you meet your financial goals, talk to your financial advisor, or call us at (800) 257-8787. Please read the information provided carefully before you invest. Investors should consider the investment objective and policies, risk considerations, charges and expenses of any investment carefully. Where applicable, be sure to obtain a prospectus, which contains this and other relevant information. To obtain a prospectus, please contact your securities representative or Nuveen Investments, 333 W. Wacker Dr., Chicago, IL 60606. Please read the prospectus carefully before you invest or send money.
Learn more about Nuveen Funds at: www.nuveen.com/mf
Nuveen makes things e-simple.
It only takes a minute to sign up for e-Reports. Once enrolled, you’ll receive an e-mail as soon as your Nuveen Fund information is ready — no more waiting for delivery by regular mail. Just click on the link within the e-mail to see the report and save it on your computer if you wish.
Free e-Reports right to your e-mail!
www.investordelivery.com
If you receive your Nuveen Fund distributions and statements from your financial advisor or brokerage account.
OR
www.nuveen.com/accountaccess
If you receive your Nuveen Fund distributions and statements directly from Nuveen.
Distributed by Nuveen Securities, LLC 333 West Wacker Drive Chicago, IL 60606 www.nuveen.com |
MSA-MA-0811P
Item 2. Code of Ethics.
Not applicable to this filing.
Item 3. Audit Committee Financial Expert.
Not applicable to this filing.
Item 4. Principal Accountant Fees and Services.
Not applicable to this filing.
Item 5. Audit Committee of Listed Registrants.
Not applicable to this registrant.
Item 6. Schedule of Investments.
(a) See Portfolio of Investments in Item 1.
(b) Not applicable.
Item 7. Disclosure of Proxy Voting Policies and Procedures for Closed-End Management Investment Companies.
Not applicable to this registrant.
Item 8. Portfolio Managers of Closed-End Management Investment Companies.
Not applicable to this registrant.
Item 9. Purchases of Equity Securities by Closed-End Management Investment Company and Affiliated Purchasers.
Not applicable to this registrant.
Item 10. Submission of Matters to a Vote of Security Holders.
There have been no material changes to the procedures by which shareholders may recommend nominees to the registrant’s Board implemented after the registrant last provided disclosure in response to this item.
Item 11. Controls and Procedures.
| (a) | The registrant’s principal executive and principal financial officers, or persons performing similar functions, have concluded that the registrant’s disclosure controls and procedures (as defined in Rule 30a-3(c) under the Investment Company Act of 1940, as amended (the “1940 Act”) (17 CFR 270.30a-3(c))) are effective, as of a date within 90 days of the filing date of this report that includes the disclosure required by this paragraph, based on their evaluation of the controls and procedures required by Rule 30a-3(b) under the 1940 Act (17 CFR 270.30a-3(b)) and Rules 13a-15(b) or 15d-15(b) under the Securities Exchange Act of 1934, as amended (the “Exchange Act”) (17 CFR 240.13a-15(b) or 240.15d-15(b)). |
| (b) | There were no changes in the registrant’s internal control over financial reporting (as defined in Rule 30a-3(d) under the 1940 Act (17 CFR 270.30a-3(d)) that occurred during the second fiscal quarter of the period covered by this report that has materially affected, or is reasonably likely to materially affect, the registrant’s internal control over financial reporting. |
Item 12. Exhibits.
File the exhibits listed below as part of this Form.
(a)(1) Any code of ethics, or amendment thereto, that is the subject of the disclosure required by Item 2, to the extent that the registrant intends to satisfy the Item 2 requirements through filing of an exhibit: Not applicable to this filing.
(a)(2) A separate certification for each principal executive officer and principal financial officer of the registrant as required by Rule 30a-2(a) under the 1940 Act (17 CFR 270.30a-2(a)) in the exact form set forth below: See EX-99.CERT attached hereto.
(a)(3) Any written solicitation to purchase securities under Rule 23c-1 under the 1940 Act (17 CFR 270.23c-1) sent or given during the period covered by the report by or on behalf of the registrant to 10 or more persons: Not applicable to this registrant.
(b) If the report is filed under Section 13(a) or 15(d) of the Exchange Act, provide the certifications required by Rule 30a-2(b) under the 1940 Act (17 CFR 270.30a-2(b)), Rule 13a-14(b) or Rule 15d-14(b) under the Exchange Act (17 CFR 240.13a-14(b) or 240.15d-14(b)), and Section 1350 of Chapter 63 of Title 18 of the United States Code (18 U.S.C. 1350) as an Exhibit. A certification furnished pursuant to this paragraph will not be deemed “filed” for purposes of Section 18 of the Exchange Act (15 U.S.C. 78r), or otherwise subject to the liability of that section. Such certification will not be deemed to be incorporated by reference into any filing under the Securities Act of 1933 or the Exchange Act, except to the extent that the registration specifically incorporates it by reference: See EX-99.906 CERT attached hereto.
SIGNATURES
Pursuant to the requirements of the Securities Exchange Act of 1934 and the Investment Company Act of 1940, the registrant has duly caused this report to be signed on its behalf by the undersigned, thereunto duly authorized.
(Registrant) Nuveen Multistate Trust II
| By | (Signature and Title) | /s/ Kevin J. McCarthy | ||||
Kevin J. McCarthy Vice President and Secretary |
Date November 7, 2011
Pursuant to the requirements of the Securities Exchange Act of 1934 and the Investment Company Act of 1940, this report has been signed below by the following persons on behalf of the registrant and in the capacities and on the dates indicated.
| By | (Signature and Title) | /s/ Gifford R. Zimmerman | ||||
Gifford R. Zimmerman Chief Administrative Officer (principal executive officer) |
Date November 7, 2011
| By | (Signature and Title) | /s/ Stephen D. Foy | ||||
Stephen D. Foy Vice President and Controller (principal financial officer) |
Date November 7, 2011