Table of Contents
UNITED STATES
SECURITIES AND EXCHANGE COMMISSION
Washington, D.C. 20549
FORM N-CSR
CERTIFIED SHAREHOLDER REPORT OF REGISTERED
MANAGEMENT INVESTMENT COMPANIES
Investment Company Act file number: 811-07763
LITMAN GREGORY FUNDS TRUST
(Exact name of registrant as specified in charter)
1676 N. California Blvd., Suite 500
Walnut Creek, CA 94596
(Address of principal executive offices)(Zip code)
(Name and Address of Agent for Service)
Jeremy L. DeGroot
1676 N. California Blvd., Suite 500
Walnut Creek, CA 94596
Registrant’s telephone number, including area code: (925) 254-8999
Date of fiscal year end: December 31
Date of reporting period: June 30, 2022
Table of Contents
Item 1. Report to Shareholders.
(a) The following is a copy of the report transmitted to shareholders pursuant to Rule 30e-1 under the Investment Company Act of 1940, as amended (the “Act”):
Table of Contents


Semi-Annual Report
iMGP Equity Fund
iMGP International Fund
iMGP Oldfield International Value Fund
iMGP SBH Focused Small Value Fund
iMGP Alternative Strategies Fund
iMGP High Income Alternatives Fund
iMGP Dolan McEniry Corporate Bond Fund
iMGP DBi Managed Futures Strategy ETF
iMGP DBi Hedge Strategy ETF
iMGP RBA Responsible Global Allocation ETF
June 30, 2022
Table of Contents
| ii | Litman Gregory Funds Trust | |||||
Table of Contents

| 2 | ||
| 5 | ||
| 6 | ||
iMGP Equity Fund | ||
| 8 | ||
| 13 | ||
| 14 | ||
iMGP International Fund | ||
| 16 | ||
| 21 | ||
| 22 | ||
iMGP Oldfield International Value Fund | ||
| 23 | ||
| 26 | ||
iMGP SBH Focused Small Value Fund | ||
| 27 | ||
| 31 | ||
iMGP Alternative Strategies Fund | ||
| 32 | ||
| 44 | ||
| 45 | ||
iMGP High Income Alternatives Fund | ||
| 87 | ||
| 92 | ||
| 93 | ||
iMGP Dolan McEniry Corporate Bond Fund | ||
| 109 | ||
Dolan McEniry Corporate Bond Fund Schedule of Investments | 112 | |
iMGP DBi Managed Futures Strategy ETF | ||
| 114 | ||
DBi Managed Futures Strategy ETF Consolidated Schedule of Investments | 116 | |
iMGP DBi Hedge Strategy ETF | ||
| 118 | ||
| 120 | ||
iMGP RBA Responsible Global Allocation ETF | ||
| 122 | ||
RBA Responsible Global Allocation ETF Schedule of Investments | 126 | |
| 127 | ||
| 129 | ||
| 133 | ||
| 136 | ||
| 136 | ||
| 137 | ||
| 137 | ||
| 138 | ||
| 138 | ||
| 139 | ||
| 140 | ||
| 140 | ||
| 141 | ||
Financial Highlights | ||
| 142 | ||
| 143 | ||
| 144 | ||
| 145 | ||
| 146 | ||
| 147 | ||
| 148 | ||
| 149 | ||
| 150 | ||
| 151 | ||
| 152 | ||
| 153 | ||
| 154 | ||
| 186 | ||
| 187 | ||
| 190 | ||
| 195 | ||
| 197 |
This report is intended for shareholders of the funds and may not be used as sales literature unless preceded or accompanied by a current prospectus for the iMGP Funds. Statements and other information in this report are dated and are subject to change.
iM Global Partner Fund Management, LLC has ultimate responsibility for the funds’ performance due to its responsibility to oversee its investment managers and recommend their hiring, termination and replacement.
| Table of Contents | 1 | |||||
Table of Contents
iM Global Partner Fund Management
We are deeply committed to making each iMGP Fund a highly satisfying long-term investment for shareholders. In following through on this commitment we are guided by our core values, which influence four specific areas of service:
First, we are committed to the IMGP concept.
| • | We will only hire managers who we strongly believe will deliver exceptional long-term returns relative to their benchmarks. We base this belief on extremely thorough due diligence research. This not only requires us to assess their stock-picking skills, but also to evaluate their ability to add incremental performance by investing in a concentrated portfolio of their highest conviction ideas. |
| • | We will monitor each of the managers so that we can maintain our confidence in their ability to deliver the long-term performance we expect. In addition, our monitoring will seek to assess whether they are staying true to their IMGP Funds mandate. Consistent with this mandate, we focus on long-term performance evaluation so that the IMGP managers will not be distracted by short-term performance pressure. |
Second, we will do all we can to ensure that the framework within which our stock pickers do their work further increases the odds of success.
| • | Investments from new shareholders in each fund are expected to be limited so that each fund’s asset base remains small enough to retain flexibility to add value. |
| • | The framework also includes either a single-manager or a multi-manager structure; the former allowing each fund an individual, highly disciplined investment process, and the latter making it possible for each manager to invest, when appropriate, in an opportunistic manner knowing that the potential volatility within his or her portfolio will be diluted at the fund level by the performance of the other managers. In this way, the multi-manager structure seeks to provide fund-level diversification. |
| • | We will work hard to discourage short-term speculators so that cash flows into the funds are not volatile. Lower volatility helps prevent our managers from being forced to sell stocks at inopportune times or to hold excessive cash for non-investment purposes. |
Third, is our commitment to do all we can from an operational standpoint to maximize shareholder returns.
| • | We will remain attentive to fund overhead, and whenever we achieve savings we will pass them through to shareholders. For example, we have had several manager changes that resulted in lower sub-advisory fees to our funds. In every case we have passed through the full savings to shareholders in the form of fee waivers. |
| • | We will provide investors with a low minimum, no-load, no 12b-1 Institutional share class for all iMGP Funds, and a low minimum, no-load Investor share class for the Alternative Strategies and Dolan McEniry Corporate Bond Fund. |
| • | We also will work closely with our managers to make sure they are aware of tax-loss selling opportunities (only to be taken if there are equally attractive stocks to swap into). We account for partial sales on a specific tax lot basis so that shareholders will benefit from the most favorable tax treatment. The goal is not to favor taxable shareholders over tax-exempt shareholders but to make sure that the managers are taking advantage of tax savings opportunities when doing so is not expected to reduce pre-tax returns. |
Fourth, is our commitment to communicate honestly about all relevant developments and expectations.
| • | We will continue to do this by providing thorough and educational shareholder reports. |
| • | We will continue to provide what we believe are realistic assessments of the investment environment. |
Our commitment to iMGP Funds is also evidenced by our own investment. Our retired founders and current employees have, collectively, substantial investments in the funds, as does our company retirement plan. In addition, we use the funds extensively in the client accounts of our investment advisor practice (through our affiliate Litman Gregory Wealth Management, LLC). We have no financial incentive to do so because the fees we receive from iMGPFunds held in client accounts are fully offset against the advisory fees paid by our clients. In fact, we have a disincentive to use the funds in our client accounts because each iMGP Fund is capacity constrained (they may be closed as mentioned above), and by using them in client accounts we are using up capacity for which we may not be paid. But we believe these funds offer value that we can’t get elsewhere and this is why we enthusiastically invest in them ourselves and on behalf of clients.
While we believe highly in the ability of the Funds’ sub-advisors, our commitments are not intended as guarantees of future results.
While the funds are no-load, there are management fees and operating expenses that do apply, as well as a 12b-1 fee that applies to Investor class shares. Please refer to the prospectus for further details.
Diversification does not assure a profit or protect against loss in a declining market.
Must be preceded or accompanied by a prospectus.
| 2 | Litman Gregory Funds Trust | |||||
Table of Contents
Must be preceded or accompanied by a prospectus.
Effective December 16, 2021 the name of the PartnerSelect Funds was changed to iMGP Funds.
Effective October 1, 2021 the name of the Advisor to the Funds was changed from Litman Gregory Fund Advisors LLC to iM Global Partner Fund Management LLC.
On September 20, 2021 the iM Dolan McEniry Corporate Bond Fund, iM DBI Managed Future Strategy ETF and iM DBI Hedge Strategy EFT were acquired by the Litman Gregory Funds Trust by merger. Performance reported for each of these funds for periods prior to the merger date represents the performance of the Predecessor Funds.
Each of the funds may invest in foreign securities. Investing in foreign securities exposes investors to economic, political, and market risks and fluctuations in foreign currencies. Each of the funds may invest in the securities of small companies. Small-company investing subjects investors to additional risks, including security price volatility and less liquidity than investing in larger companies. Debt obligations of distressed companies typically are unrated, lower rated, in default or close to default and may become worthless. The International Fund will invest in emerging markets. Investments in emerging market countries involve additional risks such as government dependence on a few industries or resources, government-imposed taxes on foreign investment or limits on the removal of capital from a country, unstable government, and volatile markets. Investments in debt securities typically decrease when interest rates rise. This risk is usually greater for longer-term debt securities. Investments in mortgage-backed securities include additional risks that investor should be aware of including credit risk, prepayment risk, possible illiquidity, and default, as well as increased susceptibility to adverse economic developments. Investments in lower-rated and non-rated securities present a greater risk of loss to principal and interest than higher-rated securities. The funds may invest in master limited partnership units. Investing in MLP units may expose investors to additional liability and tax risks. Derivatives may involve certain costs and risks such as liquidity, interest rate, market, credit, management, and the risk that a position could not be closed when most advantageous. Investing in derivatives could lose more than the amount invested. The funds may make short sales of securities, which involves the risk that losses may exceed the original amount invested.
A commission may apply when buying or selling an ETF.
© 2021 Morningstar, Inc. All Rights Reserved. The information contained herein: (1) is proprietary to Morningstar; (2) may not be copied or distributed; and (3) is not warranted to be accurate, complete or timely. Neither Morningstar nor its content providers are responsible for any damages or losses arising from any use of this information. Past performance is no guarantee of future results.
The iMGP International Fund uses the iShares MSCI AWCI ex U.S. ETF for weightings comparisons because of its readily available information. We believe this particular ETF is the most relevant to our fund and is widely recognized by investors. The iShares MSCI ACWI ex U.S. ETF seeks to track the investment results of an index composed of large- and mid-capitalization non-U.S. equities Its expenses are 0.34% gross and 0.32% net. It may invest up to an aggregate amount of 15% of its assets in illiquid investments. An investment in the ETF is not a bank deposit and it is not insured or guaranteed by the Federal Deposit Insurance Corporation or any other government agency, BFA or any of its affiliates. As with any investment, you could lose all or part of your investment in the ETF and the ETF’s performance could trail that of other investments. The ETF intends to make distributions that may be taxable to you as ordinary income or capital gains, unless you are investing through a tax-deferred arrangement such as a 401(k) plan or an IRA, in which case, your distributions generally will be taxed when withdrawn.
Merger arbitrage investments risk loss if a proposed reorganization in which the fund invests is renegotiated or terminated.
Investments in absolute return strategies are not untended to outperform stocks and bonds during strong market rallies.
Multi-investment management styles may lead to higher transaction expenses compared to single investment management styles. Outcomes depend on the skill of the sub-advisors and advisor and the allocation of assets amongst them.
Past performance does not guarantee future results.
Mutual fund investing involves risk; loss of principal is possible.
Performance discussion for the Alternative Strategies and Dolan McEniry Corporate Bond Funds is specifically related to the Institutional share class.
Some of the comments are based on current management expectation and are considered “forward-looking statements”. Actual future results, however, may prove to be different from our expectations. You can identify forward-looking statement by words such as “estimate”, “may”, “expect”, “should”, “could”, “believe”, “plan”, and similar terms. We cannot promise future returns and our opinions are a reflection of our best judgment at the time this report is compiled.
Opinions expressed are subject to change, are not guaranteed and should not be considered recommendations to buy or sell any security.
| Fund Summary | 3 | |||||
Table of Contents
See pages 10, 18, 23, and 29 for each equity fund’s top contributors. See pages 14, 22, 26, and 31 for each equity fund’s portfolio composition. See pages 34 for the Alternative Strategies Fund’s individual strategy portfolio allocations. See pages 91 for the High Income Alternative Fund’s individual strategy portfolio allocations. Fund holdings and/or sector allocations are subject to change at any time and are not recommendations to buy or sell any security.
Diversification does not assure a profit or protect against a loss in a declining market.
Leverage may cause the effect of an increase or decrease in the value of the portfolio securities to be magnified and the fund to be more volatile than if leverage was not used.
References to other mutual funds should not be interpreted as an offer of these securities.
iM Global Partner Fund Management LLC has ultimate responsibility for the performance of the iMGPFunds due to its responsibility to oversee the investment managers and recommend their hiring, termination and replacement.
Any tax or legal information provided is merely a summary of our understanding and interpretation of some of the current income tax regulations and it is not exhaustive. Investors must consult their tax advisor or legal counsel for advice and information concerning their particular situation. Neither the Funds nor any of their representatives may give legal or tax advice.
Please see page 187 for index definitions. You cannot invest directly in an index.
Please see page 190 for industry definitions.
| 4 | Litman Gregory Funds Trust | |||||
Table of Contents
iMGP Funds Performance as of June 30, 2022 |
| |||||||||||||||||||||||
| Average Annual Total Returns | ||||||||||||||||||||||||
| Year to Date Return | One-Year | Three-Year | Five-Year | Ten-Year | Since Inception | |||||||||||||||||||
iMGP Equity Fund (Inception 12/31/1996) | -27.13% | -26.41% | 3.17% | 5.76% | 9.91% | 7.58% | ||||||||||||||||||
Russell 3000 Index | -21.10% | -13.87% | 9.77% | 10.60% | 12.57% | 8.59% | ||||||||||||||||||
Morningstar US Large Blend Category | -19.26% | -11.87% | 8.42% | 9.21% | 10.99% | 7.13% | ||||||||||||||||||
Gross Expenses 1.29%, Net Expenses 1.16% | ||||||||||||||||||||||||
iMGP International Fund (Inception 12/1/1997) | -22.46% | -20.26% | 0.18% | 0.24% | 3.88% | 5.93% | ||||||||||||||||||
MSCI EAFE Index NET | -19.57% | -17.77% | 1.07% | 2.20% | 5.40% | 4.35% | ||||||||||||||||||
Morningstar Foreign Large Blend Category | -19.25% | -18.72% | 1.14% | 1.89% | 4.82% | 3.63% | ||||||||||||||||||
Gross Expenses 1.38%, Net Expenses 1.15% | ||||||||||||||||||||||||
iMGP Alternative Strategies Fund Instl (Inception 9/30/2011) | -8.51% | -8.78% | 1.16% | 1.82% | 3.27% | 3.72% | ||||||||||||||||||
iMGP Alternative Strategies Fund Inv | -8.62% | -9.09% | 0.90% | 1.56% | 3.02% | 3.47% | ||||||||||||||||||
ICE BofA US 3-Month Treasury Bill | 0.14% | 0.17% | 0.63% | 1.11% | 0.64% | 0.60% | ||||||||||||||||||
Bloomberg Aggregate Bond Index | -10.35% | -10.29% | -0.93% | 0.88% | 1.54% | 1.76% | ||||||||||||||||||
Morningstar Multistrategy Category | -4.18% | -3.08% | 1.90% | 1.99% | 2.57% | 2.71% | ||||||||||||||||||
Inst Class Gross Expenses 1.72%, Net Expenses 1.44%, Adjusted Expeneses 1.30% | ||||||||||||||||||||||||
iMGP High Income Alternatives Fund (inception 9/28/2018) | -7.85% | -6.02% | 2.02% | 2.27% | ||||||||||||||||||||
Bloomberg Aggregate Bond Index | -10.35% | -10.29% | -0.93% | 1.27% | ||||||||||||||||||||
ICE BofAML U.S. High Yield TR USD Index | -14.04% | -12.66% | -0.04% | 1.29% | ||||||||||||||||||||
Morningstar US Fund Nontraditional Bond Category | -6.68% | -6.96% | -0.07% | 0.62% | ||||||||||||||||||||
Gross Expenses 1.44%, Net Expenses 0.98% | ||||||||||||||||||||||||
iMGP SBH Focused Small Value Fund (Inception 7/31/2020) | -19.78% | -17.51% | 10.92% | |||||||||||||||||||||
Russell 2000 Value | -17.31% | -16.28% | 20.17% | |||||||||||||||||||||
Morningstar Small Value Category | -15.10% | -12.02% | 22.25% | |||||||||||||||||||||
Gross Expenses 1.48%, Net Expenses 1.15% | ||||||||||||||||||||||||
iMGP Oldfield Internatl Value Fund (Inception 11/30/2020) | -16.72% | -18.95% | -0.04% | |||||||||||||||||||||
MSCI EAFE Value NR USD | -12.12% | -11.95% | 1.77% | |||||||||||||||||||||
Morningstar Fund Foreign Large Value | -13.30% | -13.12% | 1.96% | |||||||||||||||||||||
Gross Expenses 1.52%, Net Expenses 0.94% | ||||||||||||||||||||||||
iMGP DBi Managed Futures Strategy ETF (NAV) (Inception 5/7/2019) | 26.24% | 25.04% | 15.03% | 15.25% | ||||||||||||||||||||
iMGP DBi Managed Futures Strategy ETF (Price) | 25.60% | 25.49% | 15.37% | 15.58% | ||||||||||||||||||||
SG CTA | 21.14% | 20.74% | 10.40% | 10.34% | ||||||||||||||||||||
Morningstar US Fund Systematic Trend | 15.94% | 14.34% | 7.73% | 7.78% | ||||||||||||||||||||
Gross Expenses 0.95%, Adjusted Expenses 0.85% | ||||||||||||||||||||||||
iMGP DBi Hedge Strategy ETF (NAV) (inception 12/17/2019) | -6.02% | -6.42% | 8.16% | |||||||||||||||||||||
iMGP DBi Hedge Strategy ETF (Price) | -6.07% | -6.42% | 8.08% | |||||||||||||||||||||
Morningstar US Fund Long-Short Equity Category | -9.65% | -6.58% | 2.90% | |||||||||||||||||||||
Gross Expenses 0.85% | ||||||||||||||||||||||||
iMGP Dolan McEniry Corporate Bond Instl (inception 9/28/2018) | -9.06% | -9.75% | -0.59% | 1.31% | ||||||||||||||||||||
iMGP Dolan McEniry Corporate Bond Inv (inception 5/17/2019) | -9.14% | -9.92% | -0.91% | -0.31% | ||||||||||||||||||||
Bloomberg US Intermediate Credit Index | -8.52% | -8.96% | -0.14% | 1.82% | ||||||||||||||||||||
Bloomberg US Aggregate Bond TR USD | -10.35% | -10.29% | -0.93% | 1.27% | ||||||||||||||||||||
US Fund Corporate Bond Category | -13.86% | -13.92% | -1.04% | 1.35% | ||||||||||||||||||||
Inst Class Gross Expenses 096%, Net Expenses 0.70% | ||||||||||||||||||||||||
iMGP RBA Responsible Global Allocation ETF (NAV) Inception 2.1.2022) | -11.61% | -11.61% | ||||||||||||||||||||||
iMGP RBA Responsible Global Allocation ETF (Price) | -11.72% | -11.72% | ||||||||||||||||||||||
65/35 Blend of MSCI ACWI Index & Bloomberg US Aggregate Bond Index | -13.35% | -13.35% | ||||||||||||||||||||||
Morningstar US Fund World Allocation Category | -11.32% | -11.32% | ||||||||||||||||||||||
Gross Expenses 0.75%, Net Expenses 0.69% | ||||||||||||||||||||||||
Past performance does not guarantee future results. Index performance is not illustrative of fund performance. An investment cannot be made directly in an index. The investment return and principal value of an investment will fluctuate so that an investor’s shares, when redeemed, may be worth more or less than their original cost. Current performance of the fund may be lower or higher than the performance quoted. To obtain the performance of the funds as of the most recently completed calendar month, please visit www.imgpfunds.com. Investment performance reflects fee waivers in effect. In the absence of such waivers, total return would be reduced.
The Equity, International and Alternative Strategies Funds all have contractual fee waivers in effect through April 30, 2023. The Advisor has agreed to limit the expenses of the High Income Alternatives, SBH Focused Small Value, Oldfield International Value and Dolan McEniry Corporate Bond Funds through April 30, 2023. See the Prospectus for more information.
Performance does not reflect taxes a shareholder might incur on the sale of shares. Performance does not reflect fees or commissions a shareholder may pay on the purchase or sale of shares.
A commission may apply when buying or selling shares of an ETF.
MSCI index returns source: MSCI. Neither MSCI nor any other party involved in or related to compiling, computing, or creating the MSCI data makes any express or implied warranties or representations with respect to such data (or the results to be obtained by the use thereof), and all such parties hereby expressly disclaim all warranties of originality, accuracy, completeness, merchantability, or fitness for a particular purpose with respect to any of such data. Without limiting any of the foregoing, in no event shall MSCI, any of its affiliates, or any third party involved in or related to compiling, computing, or creating the data have any liability for any direct, indirect, special, punitive, consequential, or any other damages (including lost profits) even if notified of the possibility of such damages. No further distribution or dissemination of the MSCI data is permitted without MSCI’s express written consent. Source note: Returns prior to 1999 are the MSCI ACWI ex-US GR index. Returns from 1999 onwards are MSCI ACWI ex-US NR index.
| Fund Summary | 5 | |||||
Table of Contents
It’s been a rough year, with equity markets down more than 20% and “low-risk” bond markets registering low double-digit losses. The S&P 500 dropped 16.1% for the second quarter and is down 20% for the year, after being down as much as 24% through mid-June. Foreign stocks fared slightly better with Developed international markets (MSCI EAFE Index) down 14.5% for the quarter and 19.6% YTD. Emerging Market stocks (MSCI Emerging Markets Index) held up a bit better, dropping 11.4% for the quarter, and down 17.6% YTD.
Core investment-grade bonds were pummeled again in the second quarter, with the benchmark Bloomberg U.S. Aggregate Bond Index (the “Agg”) dropping 4.7%. This puts the “safe-haven” Agg down an incredible 10.3% for the year to date — its worst first-half ever. In other segments of the fixed-income market, high-yield bonds (ICE BofA Merrill Lynch U.S. High Yield Cash Pay Index) fell 9.9% and floating rate loans (S&P/LSTA Leveraged Loan index) dropped 4.5% for the quarter. For the year to date through the end of June, these indexes are down 14.0% and 4.6%, respectively.
As we have long pointed out, core bonds are not low-risk or defensive assets in an inflationary (rising interest rate) environment. Taken together with the equity bear market, this is by far the worst first-half performance for a traditional “60/40” balanced portfolio (60% S&P 500/40% Aggregate Bond Index) since at least 1950, down 16.1%. The previous worst first half was in 1962, down 12%.
Portfolio diversification into “non-traditional” asset classes, non-core and flexible fixed-income strategies, and alternative strategies can be particularly valuable in an inflationary or stagflationary environment. We saw this in the first half of the year. Trend-following managed futures strategies led the way posting 20%-plus returns, benefiting from short positions in bond and stock markets, and long exposures to commodities and the US dollar. It’s worth noting the benchmark SG Trend Index has now outperformed both global stocks (MSCI ACWI) and core bonds (the Agg) by wide margins over the past three and five years through the end of June.
Given this macro backdrop, the iMGP Funds family offers several strong options that we believe can improve the risk-adjusted performance of a traditional stock/bond balanced portfolio: namely, our DBi Managed Futures Strategy ETF, DBi Hedge Strategy ETF, Alternative Strategies Fund, High Income Alternatives Fund, RBA Responsible Global Allocation ETF and Dolan McEniry Corporate Bond Fund.
For more risk-tolerant investors, our high-conviction, concentrated equity funds seek to generate long-term capital growth exceeding passive indexes. They can serve as core equity holdings, or as satellite positions around core equity-market index allocations.
We believe the iMGP Funds can fill a valuable role within diversified investment portfolios. Each Fund is sub-advised by highly disciplined, deeply experienced, and skilled investors who we believe can outperform their respective benchmarks and peer groups over full market cycles.
We strongly encourage shareholders to read the enclosed individual fund and ETF semi-annual reports for portfolio manager commentary and performance details.
As always, we thank you for your continued trust and confidence. Our commitment and confidence are reflected in the collective personal investments in the funds by iMGP management, employees, and the Funds’ trustees and portfolio managers of over $15 million, as of June 30, 2022.
| 6 | Litman Gregory Funds Trust | |||||
Table of Contents
Sincerely,
Jeremy DeGroot, President and Portfolio Manager

Jack Chee, Portfolio Manager

Jason Steuerwalt, Portfolio Manager

Kiko Vallarta, Portfolio Manager

| Fund Summary | 7 | |||||
Table of Contents
The iMGP Equity Fund lost 27.13% in the first half of 2022, lagging the 21.1% decline for the fund’s Russell 3000 Index benchmark and the 19.26% loss for the Morningstar Large Blend category. Since the fund’s inception on December 31, 1996, the fund’s 7.58% annualized return is slightly behind the benchmark return of 8.59% but ahead of its peer group’s 7.13% return.
Performance as of 6/30/2022 | ||||||||||||||||||||||||
| Average Annual Total Returns | ||||||||||||||||||||||||
| Year to Date Return | One- Year | Three- Year | Five- Year | Ten- Year | Since Inception (12/31/1996) | |||||||||||||||||||
iMGP Equity Fund | -27.13% | -26.41% | 3.17% | 5.76% | 9.91% | 7.58% | ||||||||||||||||||
Russell 3000 Index | -21.10% | -13.87% | 9.77% | 10.60% | 12.57% | 8.59% | ||||||||||||||||||
S&P 500 Index | -19.96% | -10.62% | 10.60% | 11.31% | 12.96% | 8.61% | ||||||||||||||||||
Morningstar Large Blend Category | -19.26% | -11.87% | 8.42% | 9.21% | 10.99% | 7.13% | ||||||||||||||||||
| Performance quoted represents past performance and does not guarantee future results. The investment return and principal value of an investment will fluctuate so that an investor’s shares, when redeemed, may be worth more or less than their original cost. Current performance of the funds may be lower or higher than the performance quoted. To obtain standardized performance of the funds, and performance as of the most recently completed calendar month, please visit www.imgpfunds.com. The Advisor has contractually agreed to waive fees or limit the expenses of the fund through April 30, 2023. |
| |||||||||||||||||||||||
Performance of Managers
Of the fund’s six sub-advisors, only one (Nuance Investments) outperformed their respective benchmark in the first half of 2022. Of the remaining managers, one manager (Fiduciary Management) performed in line, while the others underperformed. The fund’s sole growth manager, Sands Capital, suffered one of their worst absolute and relative performances in the six-month period, losing 50.11% and lagging the Russell 1000 Growth benchmark by 22.04% in the period. (Returns are net of sub-advisor management fees.)
Key Performance Drivers
In the first half of 2022, both sector allocation and stock selection had negative impacts on performance. It is important to understand that the portfolio is built stock by stock and that sector weightings are a residual of the bottom-up, fundamental stock-picking process employed by each sub-advisor. That said, we do report on the short-term relative performance of both sector weights and stock selection to help shareholders understand the drivers of recent performance. It is also important to remember that the performance of a stock over a relatively short period tells us nothing about whether it will be a successful position; that is only known at the point when the stock is sold.
At the overall sector level, Consumer Discretionary, Industrials, and Real Estate were the three contributors. The portfolio’s consumer discretionary exposure benefitted from better relative stock performance, but this was partially offset by an overweight (17.08% vs. 11.45%) to an underperforming sector relative to the benchmark. Within the sector, Amazon.com was a meaningful detractor (down 36.3%) in the period. The stock is owned by both Sands Capital and Davis Advisors. Davis says the stock’s performance reflects the near-term uncertainty in e-commerce growth following accelerated adoption of e-commerce during the pandemic. In addition, excess capacity along with wage and fuel inflation are negatively impacting Amazon’s current e-commerce margins, leading some investors to question whether the e-commerce business is structurally less profitable than previously thought. While Amazon’s cloud business continues to perform very well on both the top and bottom-lines, growth could slow over the next few quarters if concerns about the economy materialize.
Sectors that detracted most from performance in the period were communication services, health care, and energy. The negative impact from communication services was primarily due to stock selection. Sea Limited was a leading detractor, falling 70.11%. Sea is an internet business in Southeast Asia that operates leading platforms for video games (Garena), ecommerce (Shopee), and digital financial services (SeaMonkey). Sands Capital says Sea’s core geographic market benefits from several secular trends—including above-average economic growth, young demographics, and low digital adoption levels—that the team believes will underpin strong growth for its core businesses. Sands says Sea’s shares have contended with several headwinds over the past several quarters, including the sell-off in high-growth, high-valuation stocks and company-specific headwinds (e.g., Tencent’s stock sale and voting restructuring, India’s gaming ban and ecommerce exit, and slowing gaming growth). The market’s elevated focus on near-term profitability has also weighed on Sea, but the company’s first-quarter results strengthened Sands’ conviction in the profit potential of what they view as its biggest growth driver: Shopee, its ecommerce segment.
Shopee grew gross merchandise volume and revenue by 39% and 64%year-over-year, respectively, well ahead of consensus expectations. Loss per order improved in both Southeast Asia & Taiwan, and the company committed to the segment breaking even in 2023. Loss per order also improved in Brazil. Shopee remains the crux of the investment case. Sands believes that Shopee can ultimately account for nearly a fifth of total retail sales in Taiwan and Southeast Asia, with profitability driven by take-rate expansion and cost dilution.
| 8 | Litman Gregory Funds Trust | |||||
Table of Contents
Outside of ecommerce, Sea’s digital financial services business grew revenue 360% year-over-year and losses narrowed to $125 million from $150 million in the prior quarter. Gaming, which Sands doesn’t view as a core growth driver but still attracts investor focus due to its historical importance to the overall business, met expectations. Today, Sands views Sea’s long-term risk/reward profile as among the most attractive in their portfolio. They continue to view the company as the best-positioned business to capture the growth opportunity in Southeast Asia over the next decade as it caters to the population’s underserved retail, financial services, and digital entertainment needs.
Another detractor in communication services was Meta Platforms, which was owned by two managers, Bill Nygren of Harris Associates and Fiduciary Management. FMI’s view is that Meta is the #1 social media company globally, with incredible scale (2.7bn users), network effects, and best-in-class advertising ROI. The company’s ability to evolve its engagement models in a shifting social media landscape highlights its durability. As a result of its leading reach and high engagement, the company has built a dominant position in the secularly growing digital advertising market. There’s opportunity to improve monetization on multiple fronts including the messaging platforms and outside the United States. Meta’s e-commerce and augmented reality/virtual reality efforts also provide optionality. Pricing headwinds from Apple’s iOS changes, a shift of engagement towards Reels which monetizes at a lower rate than Feed and Stories, competition (TikTok), investment spend in the Metaverse, and recession fears have weighed on the stock. The stock has a great balance sheet, better than average long-term growth prospects, and trades at a discount to the market (~12x depressed earnings, before accounting for $44bn of net cash). FMI wants to give management some time to see how they navigate the current fundamental challenges before taking any further action.
While energy exposure was an overall detractor, EOG Resources, owned by Bill Nygren of Harris Associates was a top contributor in the period, gaining 28.83%. In the team’s view, EOG Resources is one of the best positioned U.S. energy companies as its focus on capital productivity made it a true low-cost producer. At a broad level, Nygren believes EOG Resources is a rare exploration and production company that generates unusually high returns on its acreage position while sustaining those returns by reloading the inventory base with additional unusually high-return acres. In his estimation, EOG Resource’s new CEO Ezra Yacob is off to a favorable start, adding on to a management team that strives to optimize operations for value creation and capitalize on positive developments in the external environment.
Specific to the stock’s recent performance, EOG Resources’ share price benefitted from the surge in energy prices in the first quarter due to the crisis in Ukraine. In addition, the company released its fourth-quarter earnings report revealing a 100 basis point increase in oil production year-over-year with capital expenditures flat sequentially and below consensus estimates. Guidance for 2022 remained in-line with estimates, and management plans to increase oil production by 4% year-over-year due to their belief that drilling is the best use of capital with 20 years of premium inventory. Management also believes the company will be able to offset inflation fully with drilling efficiencies. A $1 per share special dividend was awarded to shareholders for the second straight quarter while maintaining the regular $0.75 per share dividend. Despite its strong balance sheet relative to peers, management also said the company intends to build cash in 2022. Later, EOG Resources delivered good first-quarter earnings results, as production grew 2% quarter-over-quarter and finished above consensus expectations. Importantly, Nygren and his team find that the company’s absolute results are solid, and appreciated management’s commitment to returning 60% of its free cash flow to shareholders. They met with EOG’s new CEO Ezra Yacob in the second quarter, who reiterated the company’s goal to reduce finding and development costs every year and organically replenish drilling inventory. EOG also remains ready and willing to buy back stock in a downturn opportunistically.
Within industrials, CK Hutchison Holdings was leading performance contributor in the period. The FMI team says the company is a blue-chip holding conglomerate that owns relatively defensive, quality businesses (telecom, infrastructure, retail, etc.). The company has taken steps to create value over the past couple years (sale-and-leaseback of European tower assets, deconsolidation of Husky Energy, etc.), yet the stock price has barely budged. Despite a strong balance sheet, based on FMI’s estimates the stock trades at around a 50% discount to net asset value. Based on 2022 estimated earnings, the stock trades, at only ~5 times earnings and pays a healthy dividend (5% yield). FMI believes the current stock price undervalues the business. However, sentiment has been weak as the company has been less aggressive with shareholder returns (buying back stock, increasing the dividend) than investors had expected following the tower sale. FMI had written a letter to management and the board to encourage additional activity on this front, but was disappointed with their subsequent conversation with management, and have concerns they may pursue M&A. FMI sold their position in April, and rolled the proceeds into Sodexo, an investment where they have higher conviction: a simple, defensive compounder, which is cheap and out of favor, but one where they have greater confidence in management creating shareholder value.
| Fund Summary | 9 | |||||
Table of Contents
| Top Contributors for the Six Months Ended June 30, 2022 | ||||||||||||||||||
| Holding | Weight % | Return % | Contribution % | Benchmark Weight % | Sector | |||||||||||||
EOG Resources Inc | 1.25 | 28.83 | 0.31 | 0.16 | Endergy | |||||||||||||
CalMaine Foods | 0.51 | 33.58 | 0.20 | — | Consumer Staples | |||||||||||||
Cigna Corp | 1.14 | 15.81 | 0.14 | 0.19 | HealthCare | |||||||||||||
CK Hutchison Holdings Ltd | 0.64 | 11.71 | 0.12 | — | Industrials | |||||||||||||
Reinsurance Group of America | 1.24 | 8.48 | 0.10 | 0.02 | Financials | |||||||||||||
The Travelers Companies Inc | 0.62 | 9.26 | 0.10 | 0.10 | Financials | |||||||||||||
Dollar General Corp | 1.76 | 4.51 | 0.07 | 0.12 | Consumer Discretionary | |||||||||||||
American International Group Inc | 0.18 | 7.26 | 0.07 | 0.11 | Financials | |||||||||||||
Equity Commonwealth REIT | 1.00 | 6.29 | 0.06 | — | Real Estate | |||||||||||||
Clorox Co | 0.34 | 11.34 | 0.05 | 0.04 | Consumer Staples | |||||||||||||
| Top Detractors for the Six Months Ended June 30, 2022 | ||||||||||||||||||
| Holding | Weight % | Return % | Contribution % | Benchmark Weight % | Sector | |||||||||||||
Netflix Inc | 1.82 | (70.97 | ) | (1.99 | ) | 0.32 | Communication Services | |||||||||||
Sea Ltd ADR | 1.20 | (70.11 | ) | (1.42 | ) | — | Communication Services | |||||||||||
Dexcom Inc | 1.24 | (86.12 | ) | (1.29 | ) | 0.09 | HealthCare | |||||||||||
Amazon.com Inc | 3.36 | (36.29 | ) | (1.29 | ) | 2.84 | Consumer Discretionary | |||||||||||
Meta Platforms Inc Class A | 1.96 | (52.06 | ) | (1.14 | ) | 1.21 | Communication Services | |||||||||||
Alphabet Inc Class A | 4.62 | (24.78 | ) | (1.11 | ) | 1.79 | Communication Services | |||||||||||
Block Inc Class A | 1.13 | (61.95 | ) | (0.97 | ) | 0.12 | Information Technology | |||||||||||
GoHealth Inc Ordinary Shares - Class A | 0.49 | (84.22 | ) | (0.96 | ) | — | HealthCare | |||||||||||
Shopify Inc | 0.64 | (77.32 | ) | (0.92 | ) | — | Information Technology | |||||||||||
Capital One Financial Corp | 3.73 | (27.54 | ) | (0.89 | ) | 0.13 | Financials | |||||||||||
General Motors Co | 1.65 | (45.83 | ) | (0.88 | ) | 0.14 | Consumer Discretionary | |||||||||||
Portfolio Mix
The Equity Fund portfolio is the result of six bottom-up stock pickers with diverse investment approaches building concentrated portfolios. Therefore, the portfolio often looks quite different from its benchmark. For example, it is common for the fund to have meaningful sector over- or underweights. As of mid-year, the fund was 9.7% overweight to the consumer discretionary sector (20.3% vs. 10.6%) and underweight to the information technology sectors by an equal amount (15.7% vs. 25.5%). The fund is also overweight to the finance and communication services sectors—8.7% and 4.3% overweight relative to Russell 3000 Index, respectively.
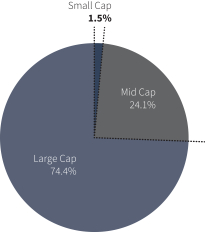
The fund’s position in foreign equities increased slightly from the start of the year (up from 15% to 16.2% through mid-year). The fund’s weighted-average market cap stands at close to $240 billion at the end of June, while its median market cap is $39.4 billion (both figures are lower than where they stood at the start of the year).
We believe the fund comprises an eclectic mix of highly skilled, disciplined, and opportunistic stock pickers who have the potential to add significant additional value through concentrating in only their highest-conviction names.
Portfolio Breakdown as of 06/30/2022
By Sector | Fund | Russell 3000 | +/- | |||||||||
Finance | 20.3% | 11.6% | 8.7% | |||||||||
Consumer Discretionary | 20.3% | 10.6% | 9.7% | |||||||||
Information Technology | 15.7% | 25.5% | -9.8% | |||||||||
Communication Services | 12.4% | 8.1% | 4.3% | |||||||||
Health Care & Pharmaceuticals | 13.4% | 14.9% | -1.5% | |||||||||
Industrials | 7.6% | 8.9% | -1.2% | |||||||||
Consumer Staples | 4.5% | 6.4% | -1.9% | |||||||||
Real Estate | 2.7% | 3.7% | -1.0% | |||||||||
Utilities | 0.3% | 3.0% | -2.8% | |||||||||
Energy | 1.2% | 4.4% | -3.2% | |||||||||
Materials | 0.0% | 2.9% | -2.9% | |||||||||
Cash | 1.6% | 0.0% | 1.6% | |||||||||
| 10 | Litman Gregory Funds Trust | |||||
Table of Contents
By Market Cap | By Region | |
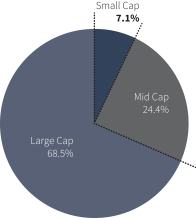 | 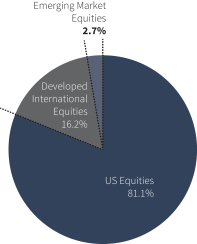 | |
Small Cap < $6.1 billion Mid Cap >$6.1 Billion<$33.9 billion Large Cap >$33.9 billion | ||
Significant Post June 30 Event
iM Global Partner Fund Management, the Investment Advisor for iMGP Equity Fund, is making significant changes to the fund’s line up of Subadvisors that includes the addition of a dedicated small/mid-cap manager as well as expanding each manager’s ability to own their highest-conviction ideas globally (the fund has always had the flexibility to invest globally but it is now a formal part of its investment objective). These changes were made with an effective date of August 1, 2022.
While these changes are material in scope, we believe them to be consistent with the fund’s original premise when it was launched back in 1996. It is with enthusiasm and confidence that we share details and rationale behind these changes.
Current managers Sands Capital, Fiduciary Management Inc., Harris Associates, and Davis [<<clean up names]—all long-time Subadvisors on the fund—were removed effective close of business on July 29, 2022. Polen Capital and Scharf Investments were being added and will manage sleeves alongside Nuance Investments, who will remain on the fund.
In total the new manager line-up includes four separate strategies as outlined below:
Strategy: Global Large-Cap Growth (20%)
Sub-Advisor: Polen Capital
Managers: Damon Ficklin and Jeff Mueller
Global Large-Cap Value (30%)
| • | Sub-Advisor: Scharf Investments |
| • | Managers: Brian Krawez and Gabe Houston |
Global Small and Midcap (SMID) Growth (20%)
| • | Sub-Advisor: Polen Capital |
| • | Manager: Rob Forker |
Global Mid-Cap Value (30%)
| • | Sub-Advisor: Nuance Investments |
| • | Managers: Scott Moore and Chad Baumler |
The changes are the result of an in-depth analysis focused on configuring a combination of managers we believe to be skilled in a way that can deliver the alpha we expected when we originally launched the fund. It reflects what we’ve learned after decades of research on active managers both in terms of the skills and discipline that give a manager an edge and how to craft and oversee mandates that individually and in combination maximize the odds of success—defined as materially beating a passive benchmark after fees.
| Fund Summary | 11 | |||||
Table of Contents
We continue to believe, as we did when the fund was launched in 1996, that allowing skilled managers to own only their highest-conviction ideas is better than owning more-diversified portfolios because owning a large number of names leads to more index-like performance. We don’t believe in paying fees that are higher than those charged by index funds to get index-like performance. An additional benefit to these changes is a reduction in the operating expense ratio as IM Global Partner Fund Management has contractually agreed to limit the expenses of the fund to 0.98% through at least April 30, 2023.
We also continue to believe that giving managers latitude in the types of stocks they can own can confer an advantage over managers who are more tightly constrained to a “style box.” Those beliefs underlay the original premise of the fund to seek skilled managers, give them broad flexibility, limit them to their highest-conviction ideas, and create diversification by choosing managers with complementary styles to reduce risk. We believe that the revised configuration of fund preserves, if not enhances, those foundational concepts.
| 12 | Litman Gregory Funds Trust | |||||
Table of Contents
| INVESTMENT MANAGER | FIRM | TARGET MANAGER ALLOCATION | MARKET CAPITALIZATION OF COMPANIES IN PORTFOLIO | STOCK-PICKING STYLE | BENCHMARK | |||||
| Christopher Davis Danton Goei | Davis Selected Advisers, L.P. | 15% | Mostly large companies | Blend | S&P 500 Index | |||||
| Pat English Jonathan Bloom | Fiduciary Management, Inc. | 15% | All sizes | Blend | S&P 500 Index | |||||
| Bill Nygren | Harris Associates L.P. | 15% | Mostly large- and mid-sized companies | Value | Russell 3000 Value Index | |||||
| Clyde McGregor | Harris Associates L.P. | 15% | All sizes, but mostly large- and mid-sized companies | Value | Russell 3000 Value Index | |||||
| Scott Moore Chad Baumler | Nuance Investments, LLC | 15% | All sizes | Value | Russell 3000 Value Index | |||||
| A. Michael Sramek | Sands Capital Management, LLC | 25% | All sizes, but mostly large- and mid-sized companies | Growth | Russell 1000 Growth Index |
iMGP Equity Fund Value of Hypothetical $10,000
The value of a hypothetical $10,000 investment in the iMGP Equity Fund from December 31, 1996 to June 30, 2022 compared with the Russell 3000 Index and Morningstar Large Blend Category
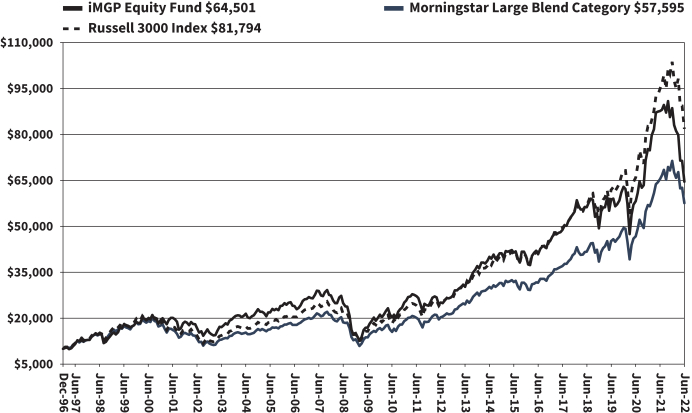
The hypothetical $10,000 investment at fund inception includes changes due to share price and reinvestment of dividends and capital gains. The chart does not imply future performance. Indexes are unmanaged, do not incur fees, expenses or taxes, and cannot be invested in directly.
Performance quoted does not include a deduction for taxes that a shareholder would pay on the redemption of fund shares.
| Fund Summary | 13 | |||||
Table of Contents
SCHEDULE OF INVESTMENTS IN SECURITIES at June 30, 2022 (Unaudited)
| Shares | Value | |||||||
COMMON STOCKS: 98.4% | ||||||||
| Communication Services: 12.4% | ||||||||
| 3,990 | Alphabet, Inc. - Class A* | $ | 8,695,247 | |||||
| 886 | Alphabet, Inc. - Class C* | 1,938,081 | ||||||
| 2,610 | Charter Communications, Inc. - Class A* | 1,222,863 | ||||||
| 5,600 | Liberty Broadband Corp. - Class C* | 647,584 | ||||||
| 23,850 | Meta Platforms, Inc. - Class A* | 3,845,813 | ||||||
| 10,790 | Netflix, Inc.* | 1,886,847 | ||||||
| 22,898 | Sea Ltd. - ADR* | 1,530,960 | ||||||
| 25,800 | Tencent Holdings Ltd. - ADR | 1,171,062 | ||||||
|
| |||||||
| 20,938,457 | ||||||||
|
| |||||||
| Consumer Discretionary: 20.3% | ||||||||
| 17,010 | Alibaba Group Holding Ltd. - ADR* | 1,933,697 | ||||||
| 50,580 | Amazon.com, Inc.* | 5,372,102 | ||||||
| 2,450 | Booking Holdings, Inc.* | 4,285,025 | ||||||
| 16,150 | Dollar General Corp. | 3,963,856 | ||||||
| 77,280 | General Motors Co.* | 2,454,413 | ||||||
| 25,810 | Hilton Worldwide Holdings, Inc. | 2,876,266 | ||||||
| 22,860 | JD.com, Inc. - ADR | 1,468,069 | ||||||
| 23,190 | Lear Corp. | 2,919,389 | ||||||
| 6,600 | Lithia Motors, Inc. | 1,813,746 | ||||||
| 42,440 | Prosus N.V. - ADR | 555,540 | ||||||
| 36,000 | Sodexo S.A.* | 2,527,263 | ||||||
| 25,900 | Sony Group Corp. | 2,117,772 | ||||||
| 28,355 | Thor Industries, Inc. | 2,118,969 | ||||||
|
| |||||||
| 34,406,107 | ||||||||
|
| |||||||
| Consumer Staples: 4.5% | ||||||||
| 76,290 | Beiersdorf AG - ADR | 1,556,316 | ||||||
| 14,097 | Cal-Maine Foods, Inc. | 696,533 | ||||||
| 8,744 | Clorox Co. (The) | 1,232,729 | ||||||
| 164,319 | Henkel AG & Co. KGaA - ADR | 2,507,508 | ||||||
| 12,181 | Kimberly-Clark Corp. | 1,646,262 | ||||||
|
| |||||||
| 7,639,348 | ||||||||
|
| |||||||
| Energy: 1.2% | ||||||||
| 18,400 | EOG Resources, Inc. | 2,032,096 | ||||||
|
| |||||||
| Financials: 20.3% | ||||||||
| 77,300 | Ally Financial, Inc. | 2,590,323 | ||||||
| 44,300 | Bank of America Corp. | 1,379,059 | ||||||
| 41,015 | Bank of New York Mellon Corp. (The) | 1,710,736 | ||||||
| 14 | Berkshire Hathaway, Inc. - Class A* | 5,725,300 | ||||||
| 11,400 | Berkshire Hathaway, Inc. - Class B* | 3,112,428 | ||||||
| 56,360 | Capital One Financial Corp. | 5,872,149 | ||||||
| 44,050 | Charles Schwab Corp. (The) | 2,783,079 | ||||||
| 44,600 | Citigroup, Inc. | 2,051,154 | ||||||
| 759,900 | GoHealth, Inc. - Class A* | 454,344 | ||||||
| 17,000 | Reinsurance Group of America, Inc. | 1,993,930 | ||||||
| 4,779 | Travelers Cos., Inc. (The) | 808,272 | ||||||
| 40,320 | US Bancorp | 1,855,526 | ||||||
| 104,640 | Wells Fargo & Co. | 4,098,749 | ||||||
|
| |||||||
| 34,435,049 | ||||||||
|
| |||||||
| Health Care: 13.4% | ||||||||
| 22,049 | Baxter International, Inc. | 1,416,207 | ||||||
| 9,730 | Cigna Corp. | 2,564,050 | ||||||
| 40,359 | Dentsply Sirona, Inc. | 1,442,027 | ||||||
| 27,772 | DexCom, Inc.* | 2,069,847 | ||||||
| 19,517 | Edwards Lifesciences Corp.* | 1,855,872 | ||||||
| 5,923 | ICU Medical, Inc.* | 973,682 | ||||||
| Shares | Value | |||||||
| Health Care (continued) | ||||||||
| 85,400 | Koninklijke Philips N.V. | $ | 1,837,637 | |||||
| 51,665 | LivaNova Plc* | 3,227,513 | ||||||
| 90,583 | Smith & Nephew Plc - ADR | 2,529,077 | ||||||
| 6,600 | UnitedHealth Group, Inc. | 3,389,958 | ||||||
| 8,852 | Universal Health Services, Inc. - Class B | 891,485 | ||||||
| 4,624 | Zimmer Biomet Holdings, Inc. | 485,797 | ||||||
|
| |||||||
| 22,683,152 | ||||||||
|
| |||||||
| Industrials: 7.6% | ||||||||
| 17,475 | Carlisle Cos., Inc. | 4,169,710 | ||||||
| 24,325 | Ferguson Plc | 2,718,518 | ||||||
| 24,575 | General Electric Co. | 1,564,690 | ||||||
| 95,900 | KAR Auction Services, Inc.* | 1,416,443 | ||||||
| 33,229 | Knorr-Bremse AG - ADR | 472,849 | ||||||
| 31,350 | PACCAR, Inc. | 2,581,359 | ||||||
|
| |||||||
| 12,923,569 | ||||||||
|
| |||||||
| Information Technology: 15.7% | ||||||||
| 1,019 | Adyen N.V.*(a) | 1,480,635 | ||||||
| 9,454 | Atlassian Corp. Plc - Class A* | 1,771,680 | ||||||
| 24,127 | Block, Inc.* | 1,482,845 | ||||||
| 15,040 | Cloudflare, Inc. - Class A* | 658,000 | ||||||
| 34,190 | Intel Corp. | 1,279,048 | ||||||
| 4,994 | Intuit, Inc. | 1,924,887 | ||||||
| 36,000 | Micron Technology, Inc. | 1,990,080 | ||||||
| 6,774 | ServiceNow, Inc.* | 3,221,172 | ||||||
| 27,500 | Shopify, Inc. - Class A* | 859,100 | ||||||
| 8,898 | Snowflake, Inc. - Class A* | 1,237,356 | ||||||
| 29,270 | TE Connectivity Ltd. | 3,311,901 | ||||||
| 9,512 | Twilio, Inc. - Class A* | 797,201 | ||||||
| 33,636 | Visa, Inc. - Class A | 6,622,592 | ||||||
|
| |||||||
| 26,636,497 | ||||||||
|
| |||||||
| Real Estate: 2.7% | ||||||||
| 22,300 | CBRE Group, Inc. - Class A* | 1,641,503 | ||||||
| 99,500 | Cushman & Wakefield Plc* | 1,516,380 | ||||||
| 49,303 | Equity Commonwealth - REIT* | 1,357,311 | ||||||
|
| |||||||
| 4,515,194 | ||||||||
|
| |||||||
| Utilities: 0.3% | ||||||||
| 19,065 | United Utilities Group Plc - ADR | 482,726 | ||||||
|
| |||||||
| | TOTAL COMMON STOCKS | 166,692,195 | ||||||
|
| |||||||
| Principal Amount | ||||||||
SHORT-TERM INVESTMENTS: 1.6% | ||||||||
REPURCHASE AGREEMENTS: 1.6% | ||||||||
| $2,682,037 | Fixed Income Clearing Corp. 0.240%, 6/30/2022, due 07/01/2022 [collateral: par value $1,313,900, U.S. Treasury Inflation Index Bond, 3.625%, due 04/15/2028 value $2,736,138] (proceeds $2,682,055) | 2,682,037 | ||||||
|
| |||||||
| | TOTAL SHORT-TERM INVESTMENTS | 2,682,037 | ||||||
|
| |||||||
| | TOTAL INVESTMENTS | 169,374,232 | ||||||
|
| |||||||
| Other Assets in Excess of Liabilities: 0.0% | 7,369 | |||||||
|
| |||||||
NET ASSETS: 100.0% | $ | 169,381,601 | ||||||
|
| |||||||
The accompanying notes are an integral part of these financial statements.
| 14 | Litman Gregory Funds Trust | |||||
Table of Contents
iMGP Equity Fund
SCHEDULE OF INVESTMENTS IN SECURITIES at June 30, 2022 (Unaudited) (Continued)
Percentages are stated as a percent of net assets.
| ADR | American Depositary Receipt |
| REIT | Real Estate Investment Trust |
| * | Non-Income Producing Security. |
| (a) | Security was purchased pursuant to Rule 144A under the Securities Act of 1933 and may be sold in transactions exempt from registration only to qualified institutional buyers or in a public offering registered under Securities Act of 1933. |
The accompanying notes are an integral part of these financial statements.
| Schedule of Investments | 15 | |||||
Table of Contents
iMGP International Fund (MSILX)
The iMGP International Fund lost 22.46% in the first half of 2022, lagging the 19.57% decline for the fund’s MSCI EAFE benchmark and the 19.25% loss for the Morningstar Foreign Large Blend category. Since the fund’s inception on December 1, 1997, the fund’s 5.93% annualized return is ahead of both the benchmark return of 4.35% and its peer group’s 3.63% return. Note that effective October 1, 2021 the fund changed its primary benchmark from the MSCI ACWI Index to the MSCI EAFE Index to reflect the current managers’ emphasis on investing in developed markets.
Performance as of 6/30/2022 | ||||||||||||||||||||||||
| Average Annual Total Returns | ||||||||||||||||||||||||
| Year to Date Return | One- Year | Three- Year | Five- Year | Ten- Year | Since Inception (12/1/1997) | |||||||||||||||||||
iMGP International Fund | -22.46% | -20.26% | 0.18% | 0.24% | 3.88% | 5.93% | ||||||||||||||||||
MSCI ACWI ex US Index NET | -18.42% | -19.42% | 1.35% | 2.50% | 4.83% | 4.71% | ||||||||||||||||||
MSCI EAFE Index NET | -19.57% | -17.77% | 1.07% | 2.20% | 5.40% | 4.35% | ||||||||||||||||||
Morningstar Foreign Large Blend Category | -19.25% | -18.72% | 1.14% | 1.89% | 4.82% | 3.63% | ||||||||||||||||||
| Performance quoted represents past performance and does not guarantee future results. The investment return and principal value of an investment will fluctuate so that an investor’s shares, when redeemed, may be worth more or less than their original cost. Current performance of the funds may be lower or higher than the performance quoted. To obtain standardized performance of the funds, and performance as of the most recently completed calendar month, please visit www.imgpfunds.com. The Advisor has contractually agreed to waive a portion of its management fee through April 30, 2023. |
| |||||||||||||||||||||||
Performance of Managers
Of the fund’s three sub-advisors, only one (Mark Little, Lazard Asset Management) outperformed their respective benchmark in the first half of 2022. David Herro (Harris Associates) underperformed his value benchmark, while the Polen Capital team trailed their growth benchmark.
Key Performance Drivers
In the first half of 2022, both sector allocation and stock selection had negative impacts on performance. It is important to understand that the portfolio is built stock by stock and that sector weightings are a residual of the bottom-up, fundamental stock-picking process employed by each sub-advisor. That said, we do report on the short-term relative performance of both sector weights and stock selection to help shareholders understand the drivers of recent performance. It is also important to remember that the performance of a stock over a relatively short period tells us nothing about whether it will be a successful position; that is only known at the point when the stock is sold.
Selection within three sectors—industrials, information technology, and materials—contributed to returns in the first half of 2022. The portfolio’s industrial exposure benefited from CAE, a Canadian provider of pilot training services primarily for the civil aviation and defense markets. This holding is owned by Mark Little, who believes the company has exposure to the structural increase in demand for pilots, given the growth in air travel, aging demographics of certified pilots, and the ongoing regulatory requirement to maintain pilot skills. As the pandemic ensued, management has taken costs out of the business and has made accretive acquisitions, positioning the company to be larger and more profitable in the recovery. Now, pilots laid off during the pandemic are starting to work again and have urgent training requirements, leading to significant order intake for CAE’s civil business. On the defense side, the company has won a record number of orders from their pipeline before defense budget increases were announced—putting its book-to-bill ratio above 1x for the first time in four years. Additionally, CAE is the training provider for the German Air Force so should benefit from material defense spending increases in coming years.
Glencore, owned by David Herro, had a strong first half and was a leading contributor within the materials sector.
Herro notes that his team likes that Glencore is run by smart, hyper-competitive and value-focused managers with a focus on improving asset returns. In his estimation, Glencore differentiates itself from other miners with its trading business that provides high returns and cash flow with low cyclicality and significant barriers to entry. They appreciate the company’s leading market positions in attractive commodities and believe existing mining operations will benefit from normalized prices, higher volumes, lower costs, and the move towards a low carbon economy.
In Herro’s view, Glencore delivered a solid fiscal year 2021 earnings report as financial metrics improved materially year-over-year. In the marketing segment, earnings handily bested expectations ($3.7 billion vs. $3.5 billion). In metals, earnings increased to $2.5 billion from $1.7 billion for the year-ago period due to strong demand, supply constraints and inventory drawdowns. Herro’s team met with CEO Gary Nagle and CFO Steve Kalmin and discussed the massive impact the crisis in Ukraine is having on Glencore’s markets. As customers bypass Russian oil, natural gas and coal, the tightened supply translated to large price increases. In particular, European nations are now buying coal at elevated prices as a replacement for Russian natural gas, leading to stronger than expected free cash flow. Management also noted that the company now has 27 assets either in sale processes or under consideration on top of the nine assets already sold as part of the
| 16 | Litman Gregory Funds Trust | |||||
Table of Contents
portfolio simplification. In April, the company’s first-quarter production report showed strong performance from coal, which Herro found important given the high prices in the first quarter. Later, Glencore reached settlements for the U.S., U.K. and Brazil investigations with figures that look to align with the $1.5 billion provision from fiscal year 2021. Herro appreciates that Glencore is in strong financial shape in terms of its balance sheet and current cash flow generation and believe the company is well positioned to move forward with dividends and share repurchase programs. In June, Glencore provided a positive trading update, as marketing earnings for the first-half are expected to exceeded $3.2 billion, which is the at the top end of the company’s long-term earnings range for a fiscal year.
Despite overall stock selection being negative in the health care sector, the fund’s top contributor in the first half of 2022 was Bayer (owned by Herro). In his determination, Bayer’s merger with Monsanto creates the best agriculture business in the world within its vertical markets in terms of size and quality. Despite some recent glyphosate-related litigation issues, he believes Bayer’s collaboration with Monsanto should deliver benefits to its crop sciences business from increased channel access in the U.S. thanks to Monsanto’s direct dealings with farmers and expanded application of its seed growth solutions on additional quantities of Monsanto seed, which would afford a pathway to near-term revenue synergies. Bayer’s pharmaceutical business developed blood thinning drug XARELTO®, which is in wide use and has an excellent outlook over the medium-term, in Herro’s view, given that its patent is held until at least 2023 (or beyond depending on the country). In addition to its crop sciences and pharmaceutical businesses, Bayer is a leading global provider of over-the-counter consumer health products and possesses a robust portfolio of brands (including Aleve™, Alka Seltzer™, Claritin™, Afrin™ and MiraLAX™, among others), which supports a healthy level of continuing cash flow.
Bayer reported strong earnings results for 2021, in Herro’s view, with growth exceeding expectations across divisions. Notably, the crop science division delivered 11% growth, staging a robust recovery following two years of an agriculture downcycle and competitive challenges. Management’s increased guidance for crop sciences in 2022 calls for 7% organic growth and a 25-26% margin, which Herro believes is a key positive for the segment as it signals a long-awaited favorable transition toward profitable growth. In the pharmaceuticals division, revenue growth of more than 7% also bested expectations, supported by a strong recovery of Eylea, continued growth of Xarelto and the ramp of new products. Moreover, Bayer’s pipeline enjoyed notable successes in the period, including a favorable read-out for cancer drug Nubeqa. The Harris Associate’s team spoke with Bayer CFO Wolfgang Nickl who noted that tailwinds are robust in the business today. Notably, he expressed confidence in both the pricing and competitive backdrop in the crop sciences business as rate increases are layering into sales growth and cost cuts begin to come through. Bayer’s first quarter earnings report showed strength, in Herro’s view, surpassing consensus estimates across the board. In the crop business, growth accelerated 60% from herbicides as industry-wide capacity shortages led to windfall pricing and volume share gains for the company. However, supply and demand for glyphosate is expected to normalize in the second half of 2022. Without the tailwind from herbicides, the crop business still grew over 10% and margins improved ahead of forecasts as well. Strong consumer growth persisted and is now 27% above pre-Covid-19 levels. The pharma segment was the weakest as sales were pressured by volume-based pricing impacts on Xarelto, this is consistent with expectations and management still expects roughly flat product revenue for the year.
Turning to portfolio detractors for the period, ICON was a material drag on performance within the health care sector. The co-portfolio manager team at Polen Capital contends that ICON remains one of the world’s largest contract research organizations, structuring, administering, and delivering successful drug trial outcomes for the global biopharma industry. ICON completed a transformational acquisition in July 2021 when it acquired PRA Health Sciences, a deal that roughly doubled the company’s breadth and reach. The integration is going well with minimal employee and customer attrition. The team believes the company is well positioned to grow sales and profits at a steady clip in the coming five years. Deal synergies are being realized, including the tax benefits accruing from ICON’s Ireland domicile being applied to PRA’s US operations. Shares have underperformed this year as ICON’s valuation multiple compressed. Though some investors harbor cyclical concerns about early-stage funding drying up for venture backed biotech companies, such businesses account for less than 15% of ICON’s revenues. Further, management does not believe this cohort is at risk for funding shortfalls. Polen is looking through investor concerns and believes ICON’s business has superior scale and process management capabilities enabling it to win share within a steadily growing market. These views support Polen’s conviction that ICON can continue growing its earnings at a mid-teens rate for the next five years. Shares trade at ~17x forward 12 months earnings.
Although overall stock selection within the information technology sector was positive for the fund in the first half of 2022, Worldline, owned by Herro, was a large detractor. Herro appreciates Worldline’s position as a leader in European payments, and believes it has a long growth runway ahead due to Europe’s lower cashless penetration and higher levels of bank payment in-sourcing when compared to the U.S. He believes the payments industry is structurally attractive with high recurring revenues, low customer churn and strong free cash flow generation. In Herro’s view, Worldline’s revenue acceleration, which is driven by e-commerce business, travel recovery and synergy opportunities, is underappreciated by the market.
Early in the first quarter, Worldline completed its acquisition of Axepta Italy, a strategic partnership with BNL. It now owns 80% of Axepta Italy, which is a significant bank acquirer in the country. The partnership with BNL is in merchant services and is part of Worldine’s strategy to increase its presence across Europe. Worldline later posted strong fiscal year earnings results as revenue (EUR 3.69 billion vs. EUR 3.66 billion) and free cash flow (EUR 407 million vs. EUR 390 million) exceeded analysts’ estimates. Herro appreciated that fourth-quarter organic growth reached 12% versus the year-ago period and improved about 7% on a two-year basis, driven by merchant services’ 15.1% organic growth year-over-year. Moreover, Worldline’s organic revenues continued to progressively improve each quarter in 2021, leading to 6.8% organic growth for the full year, and margins improved 220 basis points in 2021 to reach 25.3%. The company also entered into an
| Fund Summary | 17 | |||||
Table of Contents
agreement with Apollo Funds for the sale of its terminals, solutions & services business for a total consideration of EUR 2.3 billion in February. Management also struck a bullish tone on deal prospects in the coming year and highlighted that its pipeline is as full as it has ever been. Worldline also released an update on its exposure to the situation in Ukraine. It is enforcing all applicable sanctions and confirmed its exposure to business related to Russia was limited, accounting for just 1.5% of estimated 2021 pro forma revenue. Later, the company delivered a strong set of first-quarter earnings results, as exhibited by its 15.3% growth, of which 11.6% was organic growth. The merchant acquiring business drove much of this growth given: (1) the continued double-digit growth of the merchant count, (2) strong recovery in offline retail and travel, (3) ongoing cash to cashless transitions and (4) recent mergers and acquisitions. In addition, Worldline announced that CFO Eric Heurtaux would step down and be replaced by Gregory Lambertie who currently runs strategy, mergers and acquisitions and public/regulatory affairs at Worldline. In Herro’s estimation, the replacement could prove to be a good upgrade. The Harris Associates team met with CEO Gilles Grapinet in June, who expressed that the business is doing well, supported by a healthy European consumer in the second quarter. Overall, the investment thesis for the company remains intact.
Stock selection within the consumer discretionary sector was negative over the first six months. Evolution Gaming, owned by the team at Polen Capital, was a headwind to performance. They own Evolution Gaming because it is the world’s premier digital back-end solutions provider to the gaming industry. The business is poised to enjoy secular growth for a generation as gaming transforms from a destination-based experience to one enjoyed at home. Over the next 10-20 years, they believe gaming will increasingly shift out of the casino and into consumers’ homes via digital connectivity over the internet, cellular devices and connected TVs. This transition is just beginning in some important markets like the US and should largely flow through Evolution Gaming’s solutions. The company white labels live gaming so that casino operators can engage with consumers by offering a full suite of games from slots to game shows, to table games. The front-end experience bears the casino operator’s branding and management, but the games are administered by Evolution. Over the last quarter Evolution shares underperformed as investor sentiment soured on consumer discretionary businesses. This is linked to macro-oriented fears that consumer spending could wane from here. At roughly 20x forward 12-month earnings the team feels the stock is compellingly valued now given a long-term view that the company can compound earnings at greater than 20% per annum.
| Top Contributors for the Six Months Ended June 30, 2022 | ||||||||||||||||||
| Holding | Weight % | Return % | Contribution % | Benchmark Weight % | Sector | |||||||||||||
Bayer AG | 1.98 | 13.66 | 0.39 | 0.4 | Healthcare | |||||||||||||
Glencore PLC | 1.30 | 8.71 | 0.24 | 0.38 | Materials | |||||||||||||
Incitec Pivot | 0.45 | 31.62 | 0.23 | 0.00 | Materials | |||||||||||||
Hensoldt AG | 1.23 | 2.21 | 0.04 | 0 | Information Technology | |||||||||||||
Grupo Televisa SAB ADR | 1.45 | -12.00 | 0.02 | — | Communication Services | |||||||||||||
JD.com Inc | 0.01 | -22.41 | -0.01 | 0 | Consumer Discretionary | |||||||||||||
Kering | 0.18 | -1.10 | -0.04 | 0.3 | Consumer Discretionary | |||||||||||||
CAE Inc | 2.43 | -2.66 | -0.06 | — | Industrial | |||||||||||||
Informa PLC | 2.15 | -8.22 | -0.15 | 0.07 | Communication Services | |||||||||||||
Sampo Oyj Class A | 2.54 | -7.09 | -0.16 | 0.15 | Financials | |||||||||||||
CocaCola European Partners | 2.57 | -7.16 | -0.17 | 0.07 | Consumer Staples | |||||||||||||
| Top Detractors for the Six Months Ended June 30, 2022 | ||||||||||||||||||
| Holding | Weight % | Return % | Contribution % | Benchmark Weight % | Sector | |||||||||||||
SAP SE | 3.26 | -34.74 | -1.23 | 0.74 | Information Technology | |||||||||||||
Credit Suisse Group AG | 2.62 | -41.09 | -1.18 | 0.13 | Financials | |||||||||||||
Icon PLC | 3.38 | -30.03 | -1.16 | — | HealthCare | |||||||||||||
Evolution Gaming | 2.67 | -36.08 | -1.11 | 0.12 | Consumer Discretionary | |||||||||||||
adidas AG | 2.38 | -37.90 | -1.02 | 0.27 | Consumer Discretionary | |||||||||||||
Worldline SA | 2.68 | -33.64 | -0.97 | 0.07 | Information Technology | |||||||||||||
Siemens Healthineers AG | 2.76 | -31.50 | -0.95 | 0.11 | HealthCare | |||||||||||||
Ryanair Holdings PLC ADR | 3.23 | -34.28 | -0.94 | — | Industrials | |||||||||||||
Temenos AG | 1.82 | -37.95 | -0.81 | 0.04 | Information Technology | |||||||||||||
Accenture PLC Class A | 2.02 | -32.65 | -0.79 | — | Information Technology | |||||||||||||
| 18 | Litman Gregory Funds Trust | |||||
Table of Contents
Portfolio Mix
The International Fund portfolio is the result of three bottom-up stock pickers with diverse investment approaches building concentrated portfolios. Therefore, the portfolio often looks quite different from its benchmark. For example, it is common for the fund to have meaningful sector over- or underweights. As of mid-year, the fund was 8.3% overweight to the technology sector (16.1% vs. 7.8%) and underweight to the consumer staples and materials sectors by 6.0% and 6.3%, respectively. There were no significant changes in sector weightings over the first half of the year.
The fund’s position across different countries and regions did not materially change since the start of 2022. A significant overweight to Europe (84.4% versus 63.1% in the index) remains in place. The fund also remains without exposure to Japan—which is a 22.3% weighting with the index.
We believe the fund comprises an eclectic mix of highly skilled, disciplined, and opportunistic stock pickers who have the potential to add significant additional value through concentrating in only their highest-conviction names.
Portfolio Breakdown as of 06/30/2022
By Sector | Fund | iShares EAFE ETF | +/- | |||||||||
Finance | 20.3% | 17.6% | 2.7% | |||||||||
Consumer Discretionary | 14.2% | 11.3% | 2.9% | |||||||||
Information Technology | 16.1% | 7.8% | 8.3% | |||||||||
Communication Services | 9.0% | 5.0% | 4.0% | |||||||||
Health Care & Pharmaceuticals | 9.9% | 13.8% | -3.9% | |||||||||
Industrials | 14.4% | 14.9% | -0.5% | |||||||||
Consumer Staples | 4.8% | 10.9% | -6.0% | |||||||||
Real Estate | 0.0% | 2.9% | -2.9% | |||||||||
Utilities | 5.5% | 3.5% | 1.9% | |||||||||
Energy | 0.0% | 4.7% | -4.7% | |||||||||
Materials | 1.2% | 7.5% | -6.3% | |||||||||
Cash | 4.6% | 0.0% | 4.6% | |||||||||
By Region | By Market Cap | |
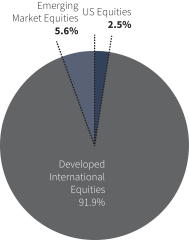 |  | |
| Fund Summary | 19 | |||||
Table of Contents
By Region | Fund | iShares EAFE ETF | +/- | |||||||||
Europe | 84.4% | 63.1% | 21.3% | |||||||||
North America | 5.4% | 1.0% | 4.3% | |||||||||
Asia ex-Japan | 5.4% | 4.8% | 0.7% | |||||||||
Japan | 0.0% | 22.3% | -22.3% | |||||||||
Latin America | 1.4% | 0.1% | 1.3% | |||||||||
Africa | 0.0% | 0.0% | 0.0% | |||||||||
Australia/New Zealand | 0.0% | 8.0% | -8.0% | |||||||||
Middle East | 3.4% | 0.7% | 2.7% | |||||||||
Other Countries | 0.0% | 0.0% | 0.0% | |||||||||
* Cash is excluded from calculation.
| 20 | Litman Gregory Funds Trust | |||||
Table of Contents
iMGP International Fund Managers
| INVESTMENT MANAGER | FIRM | TARGET MANAGER ALLOCATION | MARKET CAPITALIZATION OF COMPANIES IN PORTFOLIO | STOCK-PICKING STYLE | BENCHMARK | |||||
| David Herro | Harris Associates L.P. | 33.33% | All sizes, but mostly large- and mid-sized companies | Value | MSCI World ex U.S. Value Index | |||||
| Mark Little | Lazard Asset Management, LLC | 33.33% | All sizes | Blend/Relative Value | MSCI World ex U.S. Index | |||||
| Todd Morris, Daniel Fields | Polen Capital Management LLC | 33.33% | All sizes | Growth | MSCI EAFE Index |
iMGP International Fund Value of Hypothetical $10,000.
The value of a hypothetical $10,000 investment in the iMGP International Fund from December 1, 1997 to June 30, 2022 compared with the MSCI EAFE Index and Morningstar Foreign Large Blend Category.
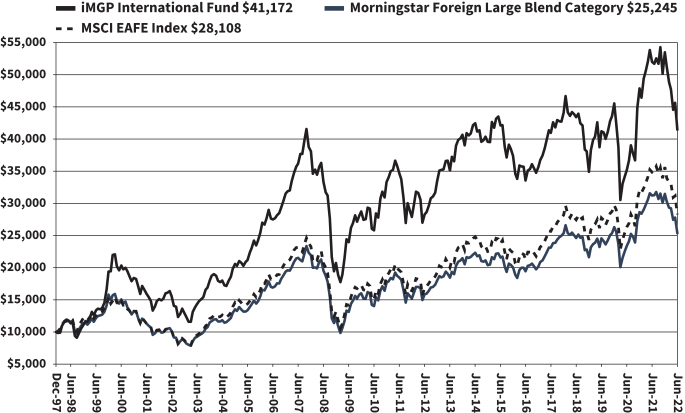
The hypothetical $10,000 investment at fund inception includes changes due to share price and reinvestment of dividends and capital gains. The chart does no imply future performance. Indexes are unmanaged, do not incur fees, expenses or taxes, and cannot be invested in directly.
Performance quoted does not include a deduction for taxes that a shareholder would pay on the redemption of fund shares.
| Fund Summary | 21 | |||||
Table of Contents
SCHEDULE OF INVESTMENTS IN SECURITIES at June 30, 2022 (Unaudited)
| Shares | Value | |||||||
COMMON STOCKS: 94.9% | ||||||||
| Argentina: 0.6% | ||||||||
| 2,300 | MercadoLibre, Inc.* | $ | 1,464,801 | |||||
|
| |||||||
| Australia: 1.2% | ||||||||
| 566,700 | Glencore Plc* | 3,068,475 | ||||||
|
| |||||||
| Canada: 2.7% | ||||||||
| 272,913 | CAE, Inc.* | 6,725,296 | ||||||
|
| |||||||
| China: 5.9% | ||||||||
| 3,562,000 | China Longyuan Power Group Corp. Ltd. - Class H | 6,947,418 | ||||||
| 73,314 | Prosus N.V.* | 4,840,111 | ||||||
| 66,300 | Tencent Holdings Ltd. | 3,010,761 | ||||||
|
| |||||||
| 14,798,290 | ||||||||
|
| |||||||
| Denmark: 2.0% | ||||||||
| 38,531 | Carlsberg A/S - Class B | 4,909,474 | ||||||
|
| |||||||
| Finland: 2.6% | ||||||||
| 150,318 | Sampo Oyj - Class A | 6,539,083 | ||||||
|
| |||||||
| France: 10.7% | ||||||||
| 120,000 | BNP Paribas S.A. | 5,707,554 | ||||||
| 567,425 | Engie S.A. | 6,578,855 | ||||||
| 6,290 | Kering S.A. | 3,264,592 | ||||||
| 7,510 | LVMH Moet Hennessy Louis Vuitton SE | 4,629,804 | ||||||
| 173,600 | Worldline S.A.*(a) | 6,415,218 | ||||||
|
| |||||||
| 26,596,023 | ||||||||
|
| |||||||
| Germany: 20.7% | ||||||||
| 30,575 | Adidas AG | 5,401,855 | ||||||
| 24,160 | Allianz SE | 4,607,158 | ||||||
| 58,300 | Bayer AG | 3,460,171 | ||||||
| 53,091 | Continental AG | 3,695,864 | ||||||
| 91,291 | CTS Eventim AG & Co. KGaA* | 4,778,455 | ||||||
| 94,115 | Daimler AG | 5,440,705 | ||||||
| 157,718 | Daimler Truck Holding AG* | 4,111,940 | ||||||
| 197,602 | Hensoldt AG | 4,985,760 | ||||||
| 90,780 | SAP SE | 8,261,616 | ||||||
| 132,520 | Siemens Healthineers AG(a) | 6,729,374 | ||||||
|
| |||||||
| 51,472,898 | ||||||||
|
| |||||||
| Ireland: 6.8% | ||||||||
| 41,110 | ICON Plc* | 8,908,537 | ||||||
| 120,314 | Ryanair Holdings Plc - ADR* | 8,091,117 | ||||||
|
| |||||||
| 16,999,654 | ||||||||
|
| |||||||
| Israel: 3.2% | ||||||||
| 1,526,215 | Israel Discount Bank Ltd. - Class A | 7,993,233 | ||||||
|
| |||||||
| Italy: 1.4% | ||||||||
| 434,618 | GVS SpA(a)* | 3,552,542 | ||||||
|
| |||||||
| Mexico: 1.4% | ||||||||
| 410,270 | Grupo Televisa SAB - ADR | 3,356,009 | ||||||
|
| |||||||
| Netherlands: 5.3% | ||||||||
| 8,660 | ASML Holding N.V. | 4,175,169 | ||||||
| 73,728 | EXOR N.V. | 4,622,483 | ||||||
| 222,163 | Universal Music Group N.V. | 4,483,910 | ||||||
|
| |||||||
| 13,281,562 | ||||||||
|
| |||||||
| South Korea: 1.2% | ||||||||
| 15,610 | NAVER Corp. | 2,896,096 | ||||||
|
| |||||||
| Shares | Value | |||||||
| Spain: 4.1% | ||||||||
| 110,740 | Amadeus IT Group S.A.* | $ | 6,215,320 | |||||
| 215,590 | Siemens Gamesa Renewable Energy S.A.* | 4,065,869 | ||||||
|
| |||||||
| 10,281,189 | ||||||||
|
| |||||||
| Sweden: 2.6% | ||||||||
| 71,582 | Evolution AB(a) | 6,511,239 | ||||||
|
| |||||||
| Switzerland: 4.3% | ||||||||
| 1,099,738 | Credit Suisse Group AG* | 6,257,993 | ||||||
| 51,650 | Temenos AG | 4,405,386 | ||||||
|
| |||||||
| 10,663,379 | ||||||||
|
| |||||||
| United Kingdom: 10.4% | ||||||||
| 358,184 | CNH Industrial N.V. | 4,152,855 | ||||||
| 138,595 | Coca-Cola European Partners Plc | 7,106,935 | ||||||
| 604,211 | Informa Plc* | 3,890,796 | ||||||
| 10,592,750 | Lloyds Banking Group Plc | 5,459,609 | ||||||
| 699,870 | Sage Group Plc (The) | 5,408,685 | ||||||
|
| |||||||
| 26,018,880 | ||||||||
|
| |||||||
| United States: 7.8% | ||||||||
| 17,743 | Accenture Plc - Class A | 4,926,344 | ||||||
| 33,916 | Aon Plc - Class A | 9,146,467 | ||||||
| 60,104 | Medtronic Plc | 5,394,334 | ||||||
|
| |||||||
| 19,467,145 | ||||||||
|
| |||||||
| | TOTAL COMMON STOCKS | 236,595,268 | ||||||
|
| |||||||
| Principal Amount | ||||||||
SHORT-TERM INVESTMENTS: 3.4% | ||||||||
REPURCHASE AGREEMENTS: 3.4% | ||||||||
| $8,588,473 | Fixed Income Clearing Corp. 0.240%, 6/30/2022, due 07/01/2022 [collateral: par value $4,207,100, U.S. Treasury Inflation Index Bond, 3.625%, due 04/15/2028 value $8,761,096] (proceeds $8,588,530) | 8,588,473 | ||||||
|
| |||||||
| | TOTAL SHORT-TERM INVESTMENTS | 8,588,473 | ||||||
|
| |||||||
| | TOTAL INVESTMENTS | 245,183,741 | ||||||
|
| |||||||
| Other Assets in Excess of Liabilities: 1.7% | 4,254,600 | |||||||
|
| |||||||
NET ASSETS: 100.0% | $ | 249,438,341 | ||||||
|
| |||||||
Percentages are stated as a percent of net assets.
| ADR | American Depositary Receipt |
| L.P. | Limited Partnership |
| * | Non-Income Producing Security. |
| (a) | Security was purchased pursuant to Rule 144A under the Securities Act of 1933 and may be sold in transactions exempt from registration only to qualified institutional buyers or in a public offering registered under Securities Act of 1933. |
The accompanying notes are an integral part of these financial statements.
| 22 | Litman Gregory Funds Trust | |||||
Table of Contents
iMGP Oldfield International Value Fund
The iMGP Oldfield International Value Fund declined 16.72% in the six-month period, compared to losses of 12.12% for the MSCI EAFE Value Index and a 13.30% decline for the Morningstar Foreign Large Value Category.
Performance as of 6/30/2022 | ||||||||||||
| Year to Date Return | One-Year | Average Annual Total Return Since Inception 11/30/2020) | ||||||||||
iMGP Oldfield International Value Fund | -16.72% | -18.95% | -0.04% | |||||||||
MSCI EAFE Value NR USD | -12.12% | -11.95% | 1.77% | |||||||||
MSCI EAFE NR USD | -19.57% | -17.77% | -6.35% | |||||||||
Morningstar Fund Foreign Large Value | -13.30% | -13.12% | 1.96% | |||||||||
| Past performance does not guarantee future results. Index performance is not illustrative of fund performance. An investment cannot be made directly in an index. The investment return and principal value of an investment will fluctuate so that an investor’s shares, when redeemed, may be worth more or less than their original cost. Current performance of the fund may be lower or higher than the performance quoted. To obtain the performance of the funds as of the most recently completed calendar month, please visit www.imgpfunds.com. Investment performance reflects fee waivers and expense limitations in effect through April 30, 2023. In the absence of such waivers, total return would be reduced. |
| |||||||||||
In the first six months of 2022, the iMGP Oldfield International Value Fund and its MSCI EAFE Value benchmark fell by less than the broader MSCI EAFE Index. Value is doing better, as one might expect, given its propensity to have lower starting valuations and is helping protect capital in the current environment. At the end of June, the Financial Times reported that equity markets had suffered their worst first half performance in more than 50 years after the declines seen so far in 2022, triggered by the Federal Reserve curtailing Quantitative Easing. Risks remain around further de-rating and earnings expectations. At the stock level, companies are facing severe margin pressures across the board owing to rising interest rates, wages, input costs, pricing pressures and concerns around end demand.
The stocks with the biggest negative impact on relative performance during the period were, Embraer (-51%, total return in local currency), Siemens (-34%), easyJet (-34%), E.on (31%) and Samsung Electronics (-27%).
The share price of Embraer, the Brazilian aircraft manufacturer and leading global producer of regional jets, has been weak given the month-long shutdown in production announced earlier in the year. This is due to a final re-integration of the commercial aviation unit after the aborted bid by Boeing. In addition, the collapse of investor appetite for Special Purpose Acquisition Companies, or SPACS, has also impacted Embraer’s SPAC for its EVE unit. EVE is developing a short range electric vertical take-off and landing ‘flying taxi’ seating five people that will aim to replace helicopters and some taxi routes primarily in urban settings. Whilst we acknowledge that this remains a somewhat speculative endeavour it has more chance of success than most with Embraer’s excellent engineering track record, a €5bn order backlog and targeting commercial operations by 2026. We do not include this in our valuation and yet some analysts are valuing this well in excess of the entire market value of Embraer. Embraer continues to recover from its COVID induced collapse and we see its intrinsic value as significantly higher than today’s level.
Siemens, as a German industrial, has been impacted by the ongoing conflict in the Ukraine which threatens the supply of energy to Germany which is heavily reliant on Russian gas which accounted for some 55% of Germany’s gas consumption (40% for Europe as a whole) before the war. These concerns were heightened by Russia curtailing supplies through the existing Nord Stream 1 pipeline seemingly to prevent Germany building gas inventories over the summer months. We believe the impact on the fundamentals of Siemens has been more than priced into the shares. Earnings projections for Siemens remain flat over the last six months and we note that it is now a global business with only 28% of its workforce based in Germany. If we strip out the current market value of the Siemens Healthineers business which has a separate listing, the forward PE for the Siemens group is around 8x which is very low for the quality of this business. Concerns around energy supply have also impacted E.on, which as the main German energy networks business which should be a relatively defensive share in more normal times. Its valuation has now fallen to 9x price-to-earnings when a more normalised valuation level of 14x is deemed appropriate. It now offers an attractive dividend yield of 6.3% which is 1.8x covered.
The global airline sector has been up ended by COVID followed by the oil price increase. We are witnessing the pent-up demand for foreign holidays recover which paradoxically is shown by the chaos at European airports. The recovery in demand is greater than available airport capacity. These issues should be ironed out over the next few months. Delays in giving airport staff security clearance were one of the main reasons highlighted by the industry for continued travel disruption. The UK’s Department for Transport states that the time taken for security clearance is now 10 days, half the time it took in March. Leisure travel is seen as discretionary spend and hence vulnerable in any downturn. However, given the recovery, as we emerge from two years of COVID induced lockdowns, it is evident that consumers are starting to prioritize services over goods in their spending. We hold a leading low-cost airline in easyJet, who will not only out-compete their legacy rivals but also benefit from consumers trading down.
The stocks with the largest positive impact on the strategy’s relative performance were, in order of their impact, Mitsubishi Heavy Industries (MHI) (+81%, total return in local currency), Bayer (+25%), BT Group (+10%), Sanofi (+13%) and Mitsubishi UFJ Financial (+19%).
| Fund Summary | 23 | |||||
Table of Contents
MHI, the Japanese industrial conglomerate covering sectors such as energy, aviation, and logistics, is the biggest contributor to fund performance year to date, providing a total return of +81% in local currency terms and, despite the weakness of the Yen, +54% in US dollar terms. In its Energy business it is one of the world’s largest suppliers of power installations from gas turbines to nuclear. Clearly in a world where energy security concerns will be elevated, it has numerous businesses which are highly relevant. It is also a leader in the growing areas of hydrogen and carbon capture technologies that will be needed to reach Net Zero targets. At the end of December last year, Seiji Izumisawa, the Chief Executive of MHI briefed reporters that the group could require a sweeping overhaul and restructuring to focus the group on businesses with the strongest opportunity set. We have been engaging on this issue with the company since we bought the shares in 2017. MHI’s shares were strong from the start of 2022 on the back of the CEO’s comments but since the war in Ukraine began investors have also noted that MHI is Japan’s largest defence contractor.
Over the period, we completed the sales of Nokia and Kansai Electric Power and the purchase of a new position in LG Household & Health Care (LG H&H). In March, we switched some of the Sanofi holding that had been defensive into Fresenius that had suffered a weak share price after its poorly handled results day announcement. LG H&H is a Korean consumer goods company with three core businesses: Home Care & Daily Beauty (HDB), Cosmetics, and Refreshments. Since IPO in 2001, Cosmetics comprise 70% of operating profit and has grown rapidly over the last decade at about 14% per annum, driven primarily by its luxury skin care brand “The History of Whoo” in China. A large part of Whoo sales are to Chinese consumers through resellers buying the products in duty free stores in Korea. This channel has been hit by COVID-related travel restrictions which has seen a 97% fall in Chinese tourist numbers visiting South Korea which has led resellers to seek price discounts. It continues to be impacted by the continued lockdowns in China. On any relaxation of the COVID-related travel restrictions between China and Korea, we expect the revenues to increase. LG H&H’s shares have more than halved in price since their January 2021 peak. We view fair value at 50% above the prevailing price on a two-year view. We have now also taken a third bite in easyJet and hence have reached our limits in adding to that position, with the second bite being the participation in the rights issue. The weighted average upside in the portfolio is now at 55% this this is one of the highest levels seen in recent years.
Portfolio Breakdown as of 06/30/2022
By Sector | Fund | iShares EAFE Value ETF | +/- | |||||||||
Finance | 21.7% | 25.1% | -3.4% | |||||||||
Consumer Discretionary | 9.6% | 8.5% | 1.1% | |||||||||
Information Technology | 4.3% | 2.6% | 1.7% | |||||||||
Communication Services | 7.5% | 6.4% | 1.2% | |||||||||
Health Care & Pharmaceuticals | 15.3% | 10.4% | 4.9% | |||||||||
Industrials | 17.8% | 10.2% | 7.6% | |||||||||
Consumer Staples | 12.1% | 8.0% | 4.0% | |||||||||
Real Estate | 0.0% | 4.6% | -4.6% | |||||||||
Utilities | 3.1% | 6.0% | -2.9% | |||||||||
Energy | 4.4% | 8.8% | -4.4% | |||||||||
Materials | 0.0% | 9.4% | -9.4% | |||||||||
Cash | 4.2% | 0.0% | 4.2% | |||||||||
By Region | Fund | iShares EAFE Value ETF | +/- | |||||||||
Europe | 60.4% | 63.5% | -3.1% | |||||||||
North America | 0.0% | 0.8% | -0.8% | |||||||||
Asia ex-Japan | 17.1% | 4.4% | 12.7% | |||||||||
Japan | 19.4% | 22.6% | -3.2% | |||||||||
Latin America | 3.1% | 0.2% | 2.9% | |||||||||
Africa | 0.0% | 0.0% | 0.0% | |||||||||
Australia/New Zealand | 0.0% | 7.9% | -7.9% | |||||||||
Middle East | 0.0% | 0.7% | -0.7% | |||||||||
Other Countries | 0.0% | 0.0% | 0.0% | |||||||||
* Cash is excluded from calculation.
| 24 | Litman Gregory Funds Trust | |||||
Table of Contents
iMGP Oldfield International Value Fund Value of Hypothetical $10,000
The value of a hypothetical $10,000 investment in the iMGP Oldfield International Value Fund from November 30, 2020 to June 30, 2022 compared with the MSCI EAFE Value Index and Morningstar Foreign Large Value Category.
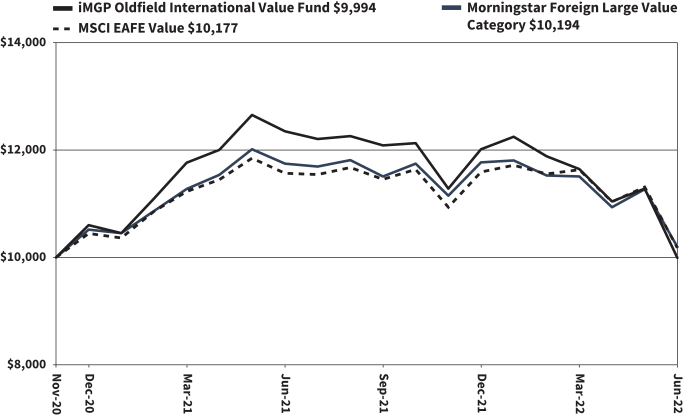
The hypothetical $10,000 investment at fund inception includes changes due to share price and reinvestment of dividends and capital gains. The chart does not imply future performance. Indexes are unmanaged, do not incur fees, expenses or taxes, and cannot be invested in directly.
Performance quoted does not include a deduction for taxes that a shareholder would pay on the redemption of fund shares.
| Fund Summary | 25 | |||||
Table of Contents
iMGP Oldfield International Value Fund
SCHEDULE OF INVESTMENTS IN SECURITIES at June 30, 2022 (Unaudited)
| Shares | Value | |||||||
COMMON STOCKS: 93.3% | ||||||||
| Brazil: 3.0% | ||||||||
| 72,300 | Embraer S.A. - ADR* | $ | 634,794 | |||||
|
| |||||||
| China: 3.9% | ||||||||
| 58,700 | Alibaba Group Holding Ltd.* | 837,296 | ||||||
|
| |||||||
| France: 4.4% | ||||||||
| 9,324 | Sanofi | 941,906 | ||||||
|
| |||||||
| Germany: 17.9% | ||||||||
| 22,397 | Bayer AG | 1,329,287 | ||||||
| 79,094 | E.ON SE | 662,899 | ||||||
| 32,623 | Fresenius SE & Co. KGaA | 987,447 | ||||||
| 8,244 | Siemens AG | 838,174 | ||||||
|
| |||||||
| 3,817,807 | ||||||||
|
| |||||||
| Italy: 4.4% | ||||||||
| 78,302 | Eni SpA | 929,234 | ||||||
|
| |||||||
| Japan: 18.6% | ||||||||
| 10,600 | East Japan Railway Co. | 542,314 | ||||||
| 26,500 | Mitsubishi Heavy Industries Ltd. | 927,481 | ||||||
| 212,800 | Mitsubishi UFJ Financial Group, Inc. | 1,138,501 | ||||||
| 188,600 | Nomura Holdings, Inc. | 689,770 | ||||||
| 42,700 | Toyota Motor Corp. | 657,562 | ||||||
|
| |||||||
| 3,955,628 | ||||||||
|
| |||||||
| Netherlands: 4.1% | ||||||||
| 14,037 | EXOR N.V. | 880,070 | ||||||
|
| |||||||
| South Korea: 12.5% | ||||||||
| 12,189 | KT&G Corp. | 771,569 | ||||||
| 1,842 | LG H&H Co. Ltd. | 965,301 | ||||||
| 847 | Samsung Electronics Co. Ltd. - GDR | 924,077 | ||||||
|
| |||||||
| 2,660,947 | ||||||||
|
| |||||||
| Sweden: 3.4% | ||||||||
| 85,855 | Svenska Handelsbanken AB - Class A | 733,641 | ||||||
|
| |||||||
| United Kingdom: 21.1% | ||||||||
| 708,527 | BT Group Plc | 1,606,534 | ||||||
| 191,899 | easyJet Plc* | 857,258 | ||||||
| 2,313,079 | Lloyds Banking Group Plc | 1,192,184 | ||||||
| 268,677 | Tesco Plc | 835,026 | ||||||
|
| |||||||
| 4,491,002 | ||||||||
|
| |||||||
| | TOTAL COMMON STOCKS | 19,882,325 | ||||||
|
| |||||||
PREFERRED STOCK: 2.6% | ||||||||
| Germany: 2.6% | ||||||||
| 8,319 | Porsche Automobil Holding SE - (Preference Shares) | 549,706 | ||||||
|
| |||||||
| | TOTAL PREFERRED STOCK | 549,706 | ||||||
|
| |||||||
| | TOTAL INVESTMENTS | 20,432,031 | ||||||
|
| |||||||
| Other Assets in Excess of Liabilities: 4.1% | 878,759 | |||||||
|
| |||||||
NET ASSETS: 100.0% | $ | 21,310,790 | ||||||
|
| |||||||
Percentages are stated as a percent of net assets.
| ADR | American Depositary Receipt |
| GDR | Global Depositary Receipt |
| * | Non-Income Producing Security. |
The accompanying notes are an integral part of these financial statements.
| 26 | Litman Gregory Funds Trust | |||||
Table of Contents
iMGP SBH Focused Small Value Fund (PFSVX)
The iMGP SBH Focused Small Value Fund fell 19.78% in the first half of 2022, finishing the period behind the 17.31% loss for the Russell 2000 Value Index benchmark, and the 15.10% decline for the Morningstar Small Value category. Since the fund’s inception in July 2020, the fund has gained 10.92% compared to the 20.17% gain for the benchmark.
Performance as of 6/30/2022 | ||||||||||||
| Year to Date Return | One-Year | Average Annual Total Return Since Inception (7/31/2020) | ||||||||||
iMGP SBH Focused Small Value Fund | -19.78% | -17.51% | 10.92% | |||||||||
Russell 2000 Value | -17.31% | -16.28% | 20.17% | |||||||||
Russell 2000 | -23.43% | -25.20% | 9.00% | |||||||||
Morningstar Small Value Category | -15.10% | -12.02% | 22.25% | |||||||||
Gross Expenses : 1.48%, Net Expenses: 1.15%
Performance quoted represents past performance and does not guarantee future results. The investment return and principal value of an investment will fluctuate so that an investor’s shares, when redeemed, may be worth more or less than their original cost. Current performance of the funds may be lower or higher than the performance quoted. Short term performance is not a good indication of the fund’s future performance and should not be the sole basis for investing in the fund. To obtain standardized performance of the funds, and performance as of the most recently completed calendar month, please visit www.imgpfunds.com. Returns less than one year are not annualized. The Advisor has contractually agreed to limit the expenses of the fund through April 30, 2023. |
| |||||||||||
Portfolio Commentary from SBH
When it comes to our outlook and positioning, there are two issues that currently frame our thinking. First, supply chain issues continue to plague corporate America. Many of the companies in the portfolio have struggled to show an effective turnaround. The economic slowdown should help this situation and lead to improved production runs, as well as demonstrate the improvements implemented by management teams in recent quarters. There were glimpses of the supply chain improvement and improving visibility of production efficiencies early this year until the Russia/Ukraine war occurred followed shortly by the zero-COVID lockdowns in China which wreaked havoc on normalcy. While we are disappointed by these circumstances, we believe the management teams are pragmatic and creative when identifying solutions that will service customers. Indeed, in meeting with management teams this quarter, we were taken aback to learn that many of them were hoping for a recession to help reset demand factors, in order to speed up the return to “normal” supply chains. The Federal Reserve (Fed) seems to be focused on facilitating this outcome given its recent tightening of interest rates and consequently the cost of capital and liquidity dynamics. While we do not wish for recessions, we believe the portfolio’s companies can manage downturns due to their focus on return improvement.
The other source of disappointment for us during the quarter was our downside capture. This was atypical for our portfolio and due almost exclusively to our significant underexposure to Energy. The sector was a significant headwind during the second quarter (and first half of the year), exacerbated by Energy being over 10% of the index weight (the June Russell index reconstitution cut Energy’s percentage in half). The Russia/Ukraine war materially benefited the sector’s outperformance which is highly dependent on the disruption continuing and global demand holding up. We focus on management teams that have self-help and significant improvement in rates of change on Return on Invested Capital (ROIC) through better decision making and an improved overall focus on culture, incentives, and governance. Companies in the Energy sector offer limited control on many of these factors with profit performance often predicated on the “spot” price of an underlying commodity as opposed to “good people doing the right thing.” For this reason, the portfolio has been historically underweight the sector. At times, this will hurt performance.
As we look to the second half of 2022, we are faced with the daunting task of trying to understand the macro environment and anticipate the effects of the many moving parts well outside the normal economic cycle factors. What we see is not encouraging from an overall economic perspective given the significant increase in interest rates and, accordingly, costs of capital. Additionally, margins broadly are being negatively impacted by the inflation backdrop while demand destruction has just begun. Historically, as companies’ margins degrade, employment starts to show weakening signs. The slew of companies which were able to raise capital over the last couple of years, companies that in our view should not have received a dime under normal capital outlay scenarios, will be facing a reckoning should policymakers be dedicated to getting things back into balance. Until the global central bankers stop the tightening of conditions on a rate of change basis, volatility will remain (inflation-driven bear markets historically are some of the most volatile).
If there is any bright spot in such a scenario, it is that companies executing on well-conceived plans to allocate capital will thrive while those who relied on perpetual easy money will fall by the wayside. Trying to determine whether the monetary authorities or Congress will have the political fortitude to stay the course and let inflationary pressures subside and allow interest rates to find their own level or not is close to being a fool’s errand. We think focusing on putting your capital with management teams that respect capital, proactively prepare
| Fund Summary | 27 | |||||
Table of Contents
for negative shocks, and can withstand a period of less than robust economic conditions are of utmost importance, and a far better use of our time. We have raised our cash levels over the last few months to improve liquidity in order to redeploy capital into an increasing number of what we feel are attractive opportunities, some of which have already pulled back 80% to 90% over the last year with plenty of financial flexibility and should be positioned for secular tailwinds. We believe the coming months will prove to be some of the most critical in our investment career given the rates of change and systemic risks. We clearly are not perfect, but we are constantly seeking ways to improve our growing team. As always, we appreciate your interest and vote of confidence in our philosophy and process.
Key Performance Drivers
The three sectors that contributed most to the portfolio’s performance relative to its benchmark in the first half of year were Real Estate (driven by selection), Health Care (driven by allocation), and Communication Services (driven by allocation). Real Estate holding Equity Commonwealth was a top contributor on an individual stock basis. Company management team has remained extremely patient in deploying capital over the last couple of years as it was not seeing attractive risk-adjusted return opportunities. As interest rates have risen and overall economic activity is at risk of entering a recession, we see a solid backdrop for the company to be in an enviable position of deploying its significant cash holdings into mispriced opportunities in the market.
Another key stock contributor in the period was Modine Manufacturing, a maker of automotive components. The stock’s performance was driven by the company’s new CEO’s significant rejuvenation of the organization. The management team has adopted a simplification approach to all revenue streams which is eliminating complexity and driving both pricing, margins, and Return on Invested Capital (ROIC) higher. We believe the stock is attractively valued based on the current run-rate of earnings and profitability being generated.
Mercury Systems, a technology company serving the aerospace and defense industry, was the second-largest individual contributor in the period. Our thesis for owning Mercury was driven by the company’s initiative to reduce internal costs, which should improve capital allocation and result in higher margins as defense spending across the globe provides a sizeable tailwind to the business. We believe the business should be attractive to strategic and/or financial organizations, as two activist investors now are represented on the board of directors. We believe the business remains undervalued.
The three sectors that detracted most from the portfolio’s performance relative to its benchmark in the quarter were Energy (driven by allocation), Materials (driven by selection) and Consumer Staples (driven by selection). Materials holding Compass Minerals was the top detractor during the quarter after having been a strong contributor in the first quarter. Compass has faced rapidly rising fuel costs this year, which they have not been able to pass along quickly to customers. We do expect that as their annual contracts renew over the next couple months, they will be able to recover most, if not all, of these higher expenses on a go-forward basis.
Within Consumer Staples, Hain Celestial was the largest detractor. HAIN faced facing significant inflationary and supply chain issues over the last year and the invasion of Ukraine has further accelerated some of these issues. Although HAIN has been very aggressively raising prices to offset these higher costs, the timing of a full recovery and the overall elasticity of their price increases are more in question as demand patterns become less clear going forward.
Six Flags Entertainment was at Consumer Discretionary company that declined in the period. Our thesis for owning Six Flags was driven by the new CEO’s strategy, which is to focus on premium pricing while upgrading the amusement parks to be more family friendly by providing higher quality food and drink offerings. The stock has underperformed as investors worry a recession will cause further pressure on park attendance. We believe the stock is attractively valued; however, the new premium pricing strategy is early in its rollout and therefore we will wait for further evidence it will add value.
Another Consumer Discretionary holding that detracted from relative performance was Gildan Activewear. The reason for adding Gildan to the portfolio centered around the company being the most vertically-scaled and integrated manufacturer of apparel in the U.S. The management team has implemented a “Back to Basics” strategy to focus on simplicity (e.g., reducing selling, general and administrative expenses (SG&A), massively reducing stock-keeping units (SKUs), and exiting an unproductive private label) which has driven ROICs from a historical 14-15% range to ~20%+. We believe the current valuation of the stock is very compelling as the business is not receiving credit for the structural improvements that have been made to its business model and its attractive ROIC profile. The stock has underperformed year-to-date primarily due to concerns around the consumer slowing, cotton price volatility, and the potential for channel destocking. We believe the concerns are reasonable and may be impactful in the short term; however, longer term prospects are compelling as Gildan maintains structurally higher margins and an attractive ROIC profile as more retailers look to near-shore their apparel sourcing for which Gildan is well positioned.
Materials holding, Glafelter Corp. was a top detractor in the period. Our thesis for owning Glafelter was driven by the company’s dominant market share globally in its core engineered material markets which we believed would significantly improve returns and growth; however, the rapid rise of European energy costs has caused a large cost headwind. The management team is aggressively renegotiating contracts with customers and implementing a dynamic pricing model in order to recapture these costs. The largest driver of the company’s underperformance was the worsening situation in Europe which caused earnings to miss expectations. We believe the stock is attractively valued; however, until we see some resolution of the Russia/Ukraine war, which would cause energy prices to fall, the company has to focus on paying down debt.
| 28 | Litman Gregory Funds Trust | |||||
Table of Contents
While the Energy sector was a large detractor in the period, one the portfolio’s top contributors in the period was PDC Energy. Our thesis for owning PDC Energy was driven by the company’s transformation of refocusing capital towards its highest-return acreage in Colorado while committing to paying down a significant amount of debt. Overall profitability and returns have been buoyed by higher oil and natural gas prices. We view its valuation as attractive given the current level of oil and gas prices; however, prices could remain volatile and influence valuation.
| Top Contributors for the Six Months Ended June 30, 2022 | ||||||||||||||||||
| Holding | Weight % | Return % | Contribution % | Benchmark Weight % | Sector | |||||||||||||
PDC Energy Inc | 2.21 | 27.28 | 0.43 | 0.46 | Energy | |||||||||||||
Mercury Systems | 1.34 | 20.51 | 0.28 | — | Information Technolgoy | |||||||||||||
SP Plus Corp | 2.96 | 8.86 | 0.21 | — | Industrials | |||||||||||||
Equity Commonwealth | 2.56 | 6.29 | 0.13 | 0.22 | Real Estate | |||||||||||||
Modine Manufacturing | 1.94 | 4.36 | 0.10 | — | Industrials | |||||||||||||
Helmerich & Payne Inc | 0.05 | 12.34 | 0.09 | 0.31 | Energy | |||||||||||||
KBR Inc | 3.46 | 2.10 | 0.09 | 0.06 | Industrials | |||||||||||||
CSG Systems Intl | 1.65 | 4.49 | 0.06 | 0.07 | Information Technolgoy | |||||||||||||
Lakeland Financial | 0.20 | 1.12 | 0.04 | 0.13 | Financials | |||||||||||||
Southstate Corp | 0.05 | 2.87 | 0.01 | 0.45 | Financials | |||||||||||||
| Top Detractors for the Six Months Ended June 30, 2022 | ||||||||||||||||||
| Holding | Weight % | Return % | Contribution % | Benchmark Weight % | Sector | |||||||||||||
Glatfelter Corp | 2.58 | -58.72 | -1.93 | 0.04 | Materials | |||||||||||||
The Hain Celestial Group | 3.04 | -44.29 | -1.57 | — | Consumer Staples | |||||||||||||
Coty Inc Class A | 4.22 | -23.71 | -1.22 | — | Consumer Discretionary | |||||||||||||
Faro Technologies Inc | 1.49 | -54.91 | -1.22 | 0.03 | Information Technolgoy | |||||||||||||
Regal Rexnord Corp | 3.04 | -32.94 | -1.08 | — | Industrials | |||||||||||||
Compass Minerals Intl | 3.65 | -30.29 | -1.00 | — | Materials | |||||||||||||
Six Flags Entertainment | 1.90 | -49.04 | -0.95 | — | Consumer Discretionary | |||||||||||||
Circor International Inc | 2.01 | -39.70 | -0.85 | — | Industrials | |||||||||||||
Gildan Activewear Inc | 2.36 | -31.41 | -0.81 | — | Consumer Discretionary | |||||||||||||
NCR Corp | 3.38 | -22.61 | -0.74 | — | Information Technology | |||||||||||||
Portfolio Breakdown as of 06/30/2022
By Sector | Fund | Russell 2000 Value | +/- | |||||||||
Finance | 16.6% | 28.4% | -11.8% | |||||||||
Consumer Discretionary | 7.1% | 9.6% | -2.5% | |||||||||
Information Technology | 12.9% | 6.1% | 6.8% | |||||||||
Communication Services | 0.0% | 3.3% | -3.3% | |||||||||
Health Care & Pharmaceuticals | 5.0% | 11.0% | -6.0% | |||||||||
Industrials | 34.4% | 12.7% | 21.6% | |||||||||
Consumer Staples | 6.3% | 2.9% | 3.4% | |||||||||
Real Estate | 3.2% | 11.9% | -8.7% | |||||||||
Utilities | 0.0% | 5.3% | -5.3% | |||||||||
Energy | 3.7% | 5.0% | -1.3% | |||||||||
Materials | 6.9% | 3.9% | 3.0% | |||||||||
Cash | 4.1% | 0.0% | 4.1% | |||||||||
| Fund Summary | 29 | |||||
Table of Contents
| Summary Statistics | ||||
Market Cap Median (bn) | 2.4 | |||
Weighted Average Market Cap (bn) | 2.9 | |||
# of Holdings | 40 | |||
iMGP SBH Focused Small Value Fund Value of Hypothetical $10,000.
The value of a hypothetical $10,000 investment in the iMGP SBH Focused Small Value Fund from July 31, 2020 to June 30, 2022 compared with the Russell 2000 Value Index and Morningstar Small Value Fund Category.
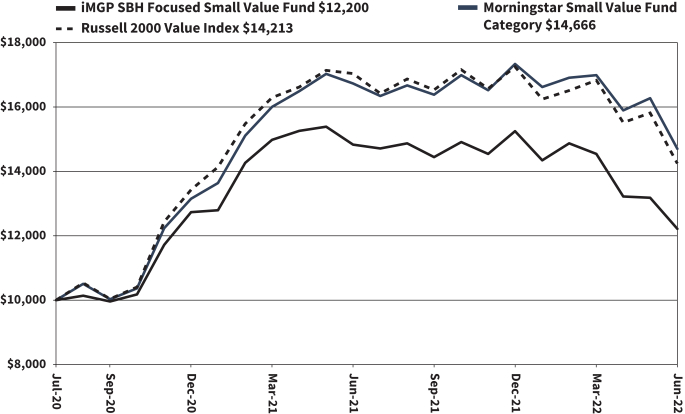
The hypothetical $10,000 investment at fund inception includes changes due to share price and reinvestment of dividends and capital gains. The chart does not imply future performance. Indexes are unmanaged, do not incur fees, expenses or taxes, and cannot be invested in directly.
Performance quoted does not include a deduction for taxes that a shareholder would pay on the redemption of fund shares.
| 30 | Litman Gregory Funds Trust | |||||
Table of Contents
iMGP SBH Focused Small Value Fund
SCHEDULE OF INVESTMENTS IN SECURITIES at June 30, 2022 (Unaudited)
| Shares | Value | |||||||
COMMON STOCKS: 95.9% | ||||||||
| Consumer Discretionary: 7.1% | ||||||||
| 39,054 | Gildan Activewear, Inc. | $ | 1,123,974 | |||||
| 24,234 | Harley-Davidson, Inc. | 767,248 | ||||||
| 118,634 | Modine Manufacturing Co.* | 1,249,216 | ||||||
| 18,718 | Six Flags Entertainment Corp.* | 406,181 | ||||||
|
| |||||||
| 3,546,619 | ||||||||
|
| |||||||
| Consumer Staples: 6.3% | ||||||||
| 266,468 | Coty, Inc. - Class A* | 2,134,409 | ||||||
| 41,534 | Hain Celestial Group, Inc. (The)* | 986,017 | ||||||
|
| |||||||
| 3,120,426 | ||||||||
|
| |||||||
| Energy: 3.7% | ||||||||
| 14,123 | Helmerich & Payne, Inc. | 608,136 | ||||||
| 19,608 | PDC Energy, Inc. | 1,208,049 | ||||||
|
| |||||||
| 1,816,185 | ||||||||
|
| |||||||
| Financials: 16.6% | ||||||||
| 28,235 | Glacier Bancorp, Inc. | 1,338,904 | ||||||
| 38,822 | National Bank Holdings Corp. - Class A | 1,485,718 | ||||||
| 27,989 | Pacific Premier Bancorp, Inc. | 818,398 | ||||||
| 47,570 | Seacoast Banking Corp. of Florida | 1,571,713 | ||||||
| 7,005 | SouthState Corp. | 540,436 | ||||||
| 64,688 | Umpqua Holdings Corp. | 1,084,818 | ||||||
| 46,542 | United Community Banks, Inc. | 1,405,103 | ||||||
|
| |||||||
| 8,245,090 | ||||||||
|
| |||||||
| Health Care: 4.9% | ||||||||
| 7,959 | ICU Medical, Inc.* | 1,308,380 | ||||||
| 49,000 | Orthofix Medical, Inc.* | 1,153,460 | ||||||
|
| |||||||
| 2,461,840 | ||||||||
|
| |||||||
| Industrials: 34.3% | ||||||||
| 36,075 | Apogee Enterprises, Inc. | 1,414,862 | ||||||
| 16,455 | Astec Industries, Inc. | 671,035 | ||||||
| 31,482 | AZZ, Inc. | 1,285,095 | ||||||
| 18,707 | Beacon Roofing Supply, Inc.* | 960,792 | ||||||
| 52,313 | CIRCOR International, Inc.* | 857,410 | ||||||
| 13,466 | EnerSys | 793,955 | ||||||
| 39,547 | KBR, Inc. | 1,913,679 | ||||||
| 15,799 | Mercury Systems, Inc.* | 1,016,350 | ||||||
| 45,016 | Quanex Building Products Corp. | 1,024,114 | ||||||
| 11,604 | Regal Beloit Corp. | 1,317,286 | ||||||
| 105,966 | REV Group, Inc. | 1,151,850 | ||||||
| 57,295 | SP Plus Corp.* | 1,760,102 | ||||||
| 31,446 | SPX Corp.* | 1,661,607 | ||||||
| 56,411 | Sterling Construction Co., Inc.* | 1,236,529 | ||||||
|
| |||||||
| 17,064,666 | ||||||||
|
| |||||||
| Information Technology: 12.9% | ||||||||
| 36,256 | Belden, Inc. | 1,931,357 | ||||||
| 116,908 | Conduent, Inc.* | 505,043 | ||||||
| 15,718 | CSG Systems International, Inc. | 938,050 | ||||||
| 50,267 | NCR Corp.* | 1,563,806 | ||||||
| 32,173 | Progress Software Corp. | 1,457,437 | ||||||
|
| |||||||
| 6,395,693 | ||||||||
|
| |||||||
| Materials: 6.9% | ||||||||
| 41,452 | Compass Minerals International, Inc. | 1,466,986 | ||||||
| 60,205 | Element Solutions, Inc. | 1,071,649 | ||||||
| Shares | Value | |||||||
| Materials (continued) | ||||||||
| 127,809 | Glatfelter Corp. | $ | 879,326 | |||||
|
| |||||||
| 3,417,961 | ||||||||
|
| |||||||
| Real Estate: 3.2% | ||||||||
| 57,269 | Equity Commonwealth - REIT* | 1,576,616 | ||||||
|
| |||||||
| | TOTAL COMMON STOCKS | 47,645,096 | ||||||
|
| |||||||
| | TOTAL INVESTMENTS | 47,645,096 | ||||||
|
| |||||||
| Other Assets in Excess of Liabilities: 4.1% | 2,030,260 | |||||||
|
| |||||||
NET ASSETS: 100.0% | $ | 49,675,356 | ||||||
|
| |||||||
Percentages are stated as a percent of net assets.
| REIT | Real Estate Investment Trust |
| * | Non-Income Producing Security. |
The accompanying notes are an integral part of these financial statements.
| Schedule of Investments | 31 | |||||
Table of Contents
iMGP Alternative Strategies Fund
The iMGP Alternative Strategies Fund (Institutional Share Class) declined 8.51% for the first six months of 2022. During the same period, the ICE BofA 3-Month Treasury Bill Index returned 0.14%, the Morningstar Multistrategy category declined 4.18%, the HFRX Global Hedge Fund Index lost 5.05%, and the Bloomberg U.S. Aggregate Bond Index dropped 10.35%.
Note: Given the phase-out of LIBOR indexes, the fund’s official benchmark has changed to the ICE BofA 3-Month Treasury Bill Index.
Performance as of 6/30/2022 |
| |||||||||||||||||||||||
| Average Annual Performance | ||||||||||||||||||||||||
Year to Date | One Year | Three Year | Five Year | Ten Year | Since Inception (9/30/11) | |||||||||||||||||||
iMGP Alternative Strategies Fund Instl | -8.51% | -8.78% | 1.16% | 1.82% | 3.27% | 3.72% | ||||||||||||||||||
iMGP Alternative Strategies Fund Inv | -8.62% | -9.09% | 0.90% | 1.56% | 3.02% | 3.47% | ||||||||||||||||||
ICE BofA US 3-Month Treasury Bill | 0.14% | 0.17% | 0.63% | 1.11% | 0.64% | 0.60% | ||||||||||||||||||
Bloomberg Aggregate Bond Index | -10.35% | -10.29% | -0.93% | 0.88% | 1.54% | 1.76% | ||||||||||||||||||
Morningstar Multistrategy Category | -4.18% | -3.08% | 1.90% | 1.99% | 2.57% | 2.71% | ||||||||||||||||||
| Performance quoted represents past performance and does not guarantee future results. The investment return and principal value of an investment will fluctuate so that an investor’s shares, when redeemed, may be worth more or less than their original cost. Current performance of the fund may be lower or higher than the performance quoted. Other share classes may impose other fees. To obtain standardized performance of the funds, and performance as of the most recently completed calendar month, please visit wwwpartnerselectfunds.com. The Advisor has contractually agreed to waive a portion of its management fee through April 30, 2023. |
| |||||||||||||||||||||||
Since its inception on September 30, 2011, the fund’s annualized return is 3.72% with a volatility (standard deviation) of 4.72%, and a beta to the U.S. stock market (Russell 3000) of 0.28. This compares to the 3-Month Treasury Bill Index return of 0.60%, the Morningstar Multistrategy category return of 2.71%, the HFRX Global Hedge Fund Index return of 1.86% and the U.S. Aggregate Bond Index return of 1.76%.
The Risk/Return Statistics table below presents some of the key performance metrics that we track for the fund.
| iMGP Alternative Strategies Fund, Risk/Return Statistics, 6/30/22 |
| |||||||||||||||
| MASFX | Bloomberg Barclays Agg | Morningstar Multistrategy | HFRX Global Hedge Fund | |||||||||||||
Annualized Return | 3.72 | 1.76 | 2.71 | 1.86 | ||||||||||||
Total Cumulative Return | 48.15 | 20.64 | 33.27 | 21.88 | ||||||||||||
Annualized Std. Deviation | 4.72 | 3.41 | 4.25 | 4.24 | ||||||||||||
Sharpe Ratio (Annualized) | 0.67 | 0.35 | 0.50 | 0.31 | ||||||||||||
Beta (to Russell 1000) | 0.28 | 0.03 | 0.27 | 0.25 | ||||||||||||
Correlation of MASFX to... | 1.00 | 0.26 | 0.91 | 0.87 | ||||||||||||
Worst 12-Month Return | -8.78 | -10.29 | -5.71 | -8.19 | ||||||||||||
% Positive 12-Month Periods | 0.83 | 0.70 | 0.78 | 0.71 | ||||||||||||
Upside Capture (vs. Russell 1000) | 27.34 | 6.65 | 25.38 | 22.12 | ||||||||||||
Downside Capture (vs. Russell 1000) | 27.74 | 0.04 | 31.45 | 31.27 | ||||||||||||
Upside Capture (vs. AGG) | 83.64 | 100.00 | 69.24 | 46.45 | ||||||||||||
Downside Capture (vs. AGG) | 22.07 | 100.00 | 28.36 | 17.70 | ||||||||||||
Source: Morningstar Inc. | ||||||||||||||||
Since inception (9/30/11) | ||||||||||||||||
Portfolio Commentary
The fund is down 8.5% for the first half of the year. Without mincing words, this is disappointing to us, both as stewards of your capital as well as fellow shareholders. Part of our goal is preserving capital while generating good absolute returns over a full market cycle. This recent absolute performance is short of what we would have hoped to deliver. But since the Fund’s inception, we have also been clear that shareholders could expect the fund to be down in the mid-single digits during an equity bear market. And we have seen that play out so far this year.
Although the fund trailed the Agg slightly in the second quarter, it is still outperforming by nearly 200 basis points through the first half of the year (and roughly 13 percentage points cumulatively over the last two years).
| 32 | Litman Gregory Funds Trust | |||||
Table of Contents
We all recognize the main drivers, clear in retrospect: stubbornly high and persistent inflation, exacerbated by Russia’s war in Ukraine, which drove accelerated aggressive monetary tightening by the Fed. This in turn punished long-duration assets: bonds obviously, but also previous market leaders like dominant large cap growth stocks, which had been seen as relative safe havens compared to more cyclical assets, resulting in rich valuation multiples that have been crushed by higher discount rates and fear of slowing growth.
The virtuous cycle of QE is also reversing, draining liquidity from the system and tightening financial conditions when consumer confidence is already extremely low. Much of the financial market commentary and discussion now is of the other shoe dropping, whether it be a technical recession or “just” slowing growth accompanied by falling corporate profits, which would presumably result in further equity market losses. Losses in one or multiple areas of financial markets often drives selling in other parts, causing risk premia to widen even in areas not directly impacted, even including those with reasonably strong fundamentals, producing contagion. The chances of the Fed “threading the needle” and controlling inflation without significantly hurting the economy seem remote at this point. None of this is breaking news, of course, but negative headlines abound. However, without minimizing the challenges (and of course the related “real-world” pain), we think there is reason for cautious optimism.
A lot of bad news and negative sentiment are already priced into financial markets. Things can always be worse than consensus expectations, and we fully recognize the Fed seems committed to breaking inflation almost regardless of the cost to equity markets. However, we think the Alternative Strategies Fund is set up to produce quite attractive performance over the next multiple quarters or more going forward. (This is not to say that returns couldn’t decline further from here in the short or even medium term—they absolutely could.) In the past we have bristled at managers seemingly brushing off periods of weak performance and focusing only on the glorious outlook going forward, as if no one experienced the painful road traveled to arrive at the precipice of the promising future. That is not our intention, but having acknowledged the challenges both in the fund’s recent performance and the economy and markets, we think it is important to maintain a balanced perspective.
The fund’s portfolio has rarely been as attractive as it is currently, in our view. The credit strategies are yielding in the upper single digits on a blended basis (and have some dry powder in cash) with a blended duration under three years. The merger arbitrage portfolio offers an average annualized deal spread well into the teens after holding up relatively well during the difficult first half of the year. Deals can break, spreads can widen, and defaults can increase, but these spread levels have historically been very attractive entry points even if they don’t necessarily mark “the bottom” for merger arbitrage returns, which is of course impossible to time with any precision. The long-short credit strategy has protected capital well through market turmoil, and its fundamental drivers now appear to be at their most attractive since late 2018/early 2019 (which preceded the strategy’s strongest year of performance): credit spreads are wide, volatility is increasing, and there is wide dispersion in company fundamentals and default probabilities, which are still in the early stages of being fully reflected by the market. Lastly, FPA’s portfolio, the largest contributor to returns since inception but the most volatile and highly correlated with the equity market, has unsurprisingly been hit the hardest this year. Without going into detail here, we believe it is also attractive, with a mix of value and quality growth businesses at reasonable valuations, pockets of special situations, and the optionality of a healthy cash balance. The FPA sleeve is the most market-sensitive, but is the smallest allocation within the fund. It also has the highest short-term upside in the event of positive surprises relative to market expectations.
Finally, we will also note that we are in the later innings of research and discussions about adding a new strategy to the fund and will very likely be able to announce something later this year. The strategy would have been extremely beneficial over the last two to four quarters, but is not so geared to a particular macro or market environment that it would have detracted from the fund’s performance in other periods. It should improve the fund’s risk-adjusted returns across different environments and reduce drawdowns like the current one. We have always tried to avoid overreacting to recent events (for example, we evaluated but didn’t add tail-risk strategies following March 2020, to the benefit of returns the rest of the year and in 2021), so we wouldn’t say this is a reaction to performance this year. In fact, strategies of this type have been the subject of our interest and research for several years, and 2022 certainly did nothing to temper our enthusiasm. We are excited about the prospects for the fund going forward, and even more so as we envision it with this likely addition.
Thank you for your investment in the fund. We look forward to updating you at year-end, hopefully with significantly better results.
Performance of Managers
For the first half of 2022, the returns by manager/strategy are as follows: Blackstone Credit Systematic Group down 1.07%; Water Island down 2.73%; DoubleLine down 10.50%; Loomis Sayles down 12.07%; and FPA Contrarian Opportunity strategy down 13.73%. (All returns are net of the management fee charged to the fund.)
Strategy Allocations
The fund’s capital is allocated according to its strategic target allocations: 25% to DoubleLine, 19% each to Blackstone Credit Systematic Group (DCI), Loomis Sayles, and Water Island, and 18% to FPA. We use the fund’s daily cash flows to bring the manager allocations toward their targets when differences in shorter-term relative performance cause divergences.
| Fund Summary | 33 | |||||
Table of Contents
CURRENT TARGET STRATEGY ALLOCATIONS AS OF JUNE 30, 2022
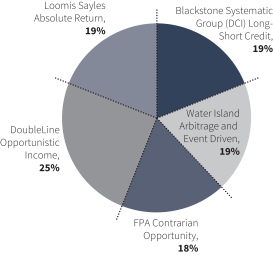
Manager Commentaries
Blackstone Credit Systematic Group (formerly DCI):
The Blackstone Long-Short Systematic Credit strategy returned -1.07% (net of fees) in H1, after returning -0.04% (net) in Q2, even as the S&P 500 declined 21%, credit indices dropped 14%, and the U.S. 10-year Treasury returned -11% for the first half. Risk-repricing dominated the market as valuations declined along with higher discount rates and on growing fears of a profits slowdown and potential recession. Rates moves have been very large as the Treasury yields rocketed higher on the torrid inflation data and the Fed’s move to jumbo-sized rate hikes; and interest rate volatility hit crisis levels as the MOVE index matched its Covid heights. High yield index spreads were nearly 300 bps wider over the 6 months and the VIX index jumped up to end the quarter at 29. Only oil bucked the trend as crude rallied further and WTI closed June at about $106.
The long-short systematic credit strategy continued to deliver mixed performance as both the bond sleeve and CDS overlay delivered only modest alpha gains for the first half and the contribution from residual betas was negative. The net contribution on credit beta, which is well matched in the portfolio, was a few bps negative. The rates contribution accounted for most of the strategy��s underperformance for H1. The portfolio is well-hedged out the rate curve but retains some residual exposure to front-end yields. This net duration has been close to 1⁄2 year, which accounts for about -0.80% to portfolio performance amidst the move higher in Fed funds this year. Given the aggressive Fed pricing already in the market, this exposure becomes a modest tailwind going forward and, indeed, was a small positive contributor in Q2.
The alpha environment has continued to be challenging amidst the beta-dominant market moves, and we are eagerly anticipating an opportunity to generate more consistent alpha as the market finally differentiates along fundamentals in the second half. The alpha potential has gotten large as spreads, volatilities, and dispersion of fundamentals and default probabilities are all elevated. The CDS strategy delivered small positive gains, led by gains from short retail and short autos positions and mostly offset by long transports and energy. Alpha in the bond sleeve was a small positive as our long positions, especially in energy held up well.
Our portfolio views have not changed much and we continue to see balanced positioning across recovery names in the portfolio, which remains comforting amidst the new reopening. Energy continues to be attractive to us, despite the market rally, because the sector recovery has gained traction and the longer-term prospects—particularly so given higher oil prices—look positive relative to spread levels. The portfolio risk spend is, as usual, concentrated in idiosyncratic names and the portfolio continues to be unusually neutral in most sectors. We are long in energy and newly long again in consumer goods (favoring some selective retail and consumer brands). We also are broadly neutral, running a bit underweight, in financials. We remain long in technology (especially consumer-facing and networking) and short in telecoms.
DoubleLine:
For the six months ended June 30, 2022, the DoubleLine Opportunistic Income portfolio performed approximately in-line with the Bloomberg US Aggregate Bond Index return of -10.35%.
| 34 | Litman Gregory Funds Trust | |||||
Table of Contents
Market Environment
This period in the markets was a rather unfavorable investment environment as inflation readings remained high and the Federal Reserve (Fed) consequently pursued hawkish monetary policy. Specifically, the Fed hiked its policy rate by 150 basis points during the period and also announced the official tapering of its asset purchasing (QE) program. US Treasury yields rose rapidly, with total increases of 222 basis points for 2-year notes and 150 basis points for 10-year notes. The response from financial assets was unfavorable across-the-board as both stocks and bonds experienced steep declines. In total for the period, the Bloomberg US Treasury Index fell 9.14%, the Bloomberg Investment Grade Corporate Bond Index fell 14.39%, the Bloomberg High Yield Bond Index fell 14.19%, and the S&P 500 Index fell 19.96%.
Relative Performance Discussion
The Opportunistic Income portfolio maintained a large allocation to fixed income credit throughout this period, consistent with its opportunistic mandate. The portfolio’s benchmark, the Bloomberg US Aggregate Bond Index, perennially maintains a roughly 70% allocation to government-backed assets. Our portfolio was able to perform in-line with the Agg Index, despite its higher credit risk, due to active duration management and asset allocation. In terms of duration management, the portfolio consistently maintained a lower duration than the Index which bolstered relatively performance as rates rose sharply. As for asset allocation, most of the credit sectors in the portfolio outperformed the credit allocation in the Index, resulting in some additional boost to relative performance.
The top-performing sectors in the portfolio over this period were non-Agency CMBS and non-Agency RMBS. These sectors generated high levels of monthly interest income which helped offset price declines from rising rates and rising credit risk premiums. In addition, strong property valuations caused generally high levels of borrower equity and therefore reduced or created non-existent incentives for default. The worst-performing sectors were Agency MBS and emerging market debt. The emerging market holdings experienced credit spread widening during the latter portion of this performance period as recessionary fears gripped global markets. Agency MBS experienced duration-related price declines as well as some negative sentiment in the market stemming from the Federal Reserve’s tapering of monthly asset purchases.
Forward Outlook
With the Federal Reserve taking strong measures to tighten financial conditions, we expect volatility in financial markets to remain elevated. Consequently, we will continue to manage the Opportunistic Income portfolio with a sizeable allocation to fully secured assets with low structural leverage, such as residential and commercial mortgage loans. On the corporate side, we see some risks to corporate earnings in the coming quarters and will therefore continue to take a more targeted approach to investing in these assets. Exposures will be selected on a line item basis and will often include out-of-index assets.
FPA:
Performance Overview
The FPA Contrarian Opportunity strategy declined 10.88% (net of fees) in 2022’s second quarter and declined 12.69% for the trailing twelve months. The Fund generated 85.0% of the average of the S&P 500 and MSCI ACWI NR USD’s (“MSCI ACWI”) return in the trailing twelve months, underperforming its 74.6% average net risk exposure.1
During the first half of 2022, from its peak on January 5th to the end of June, the MSCI ACWI declined more than 20%. As discussed in prior commentaries, we had been concerned about inflation and were running the portfolio more invested than the recent past in an effort to protect purchasing power. With an average net risk exposure of 73% during this same period, the Fund was not immune to the market selloff, capturing 67% of the average market decline (based on the average return of the S&P 500 and MSCI ACWI indices).2
The decline in global equity indexes was broad-based, leaving little unscathed, with energy as one of the few exceptions, as rising interest rates, high inflation, fears of a weakening economy, and greater caution around funding risky, money-losing companies. Market declines can be psychologically difficult, but are to be expected, and can be used to allocate capital towards re-priced and newly attractive opportunities. We are predisposed to lean into price weakness by adding to what we believe are quality businesses at increasingly attractive prices, acquiring debt at equity-like returns, building positions in long-admired franchises, and occasionally seeking out opportunities in distressed and deeply out-of-favor situations.
| 1 | Risk assets are any assets that are not risk free and generally refers to any financial security or instrument, such as equities, commodities, high-yield bonds, and other financial products that are likely to fluctuate in price. Risk exposure refers to the Fund’s exposure to risk assets as a percent of total assets. The Fund’s net risk exposure as of June 30, 2022 was 75.1%. |
| 2 | The recent market decline for the MSCI ACWI index began January 5, 2022 and is ongoing. During the period Jan 5, 2022 through June 30, 2022, the S&P 500 and the MSCI ACWI NR USD declined 20.42% and 20.57%, respectively; while the Fund declined 13.77% during the same period. |
| Fund Summary | 35 | |||||
Table of Contents
Portfolio discussion
Exhibit B: Trailing Twelve-Month Contributors and Detractors as of June 30, 20223
| Contributors | Perf. Cont. | Avg.% of Port. | Detractors | Perf. Cont. | Avg.% of Port. | |||||||||||||||||
Glencore | 0.56% | 2.2% | LG Corp | -2.63% | 1.1% | |||||||||||||||||
Meggitt | 0.51% | 0.2% | Meta Platforms | -1.51% | 2.5% | |||||||||||||||||
LPL Financial | 0.28% | 1.0% | Charter Communications | -0.83% | 2.4% | |||||||||||||||||
Aon | 0.28% | 2.2% | Naspers & Prosus | -0.77% | 2.2% | |||||||||||||||||
American International Group | 0.25% | 2.8% | Citigroup | -0.73% | 2.2% | |||||||||||||||||
|
|
|
|
|
|
|
|
|
| |||||||||||||
| 1.86% | 8.4% | -6.48% | 10.4% | |||||||||||||||||||
In the last twelve months, the Fund’s top five performers contributed 1.9% to its return, while its bottom five detracted 6.5%. We believe that some of these ups and downs might prove ephemeral, but we address where our thesis is being validated or where it might be broken.
Glencore is one of the largest globally diversified commodity businesses operating both industrial and marketing businesses. Importantly, we believe Glencore operates in a genuinely shareholder-oriented manner. We purchased Glencore off-and-on from 2018 through 2020 at what we believe is a single digit multiple of normal earnings power. The opportunity presented itself when investors were less willing to own commodity sensitive businesses due to a period of low inflation and general disregard for valuation. Net of distributions of above average cyclical profits likely to be earned in 2022, we believe the company still trades at an attractive valuation relative to its long-term earnings power, justifying its continued presence in the portfolio.
Our investment thesis on the names that have detracted from performance have not materially changed but we highlight the following two.
Prosus’ stock price has declined along with the values of their investment portfolio. Our thesis has somewhat improved as management recently announced a share repurchase program that will be funded, in part, by periodic and partial sales of its Tencent holding. Given that its stock price trades at a greater than 35% discount to its estimated net asset value (NAV), share repurchases should be accretive. The Company’s stock price has appreciated 26% since the announcement.4
Charter Communications, one of the portfolio’s investments in the US cable industry, is an example of us leaning into fear. This investment has underperformed in the last year but still trades above the Fund’s cost basis. The industry has been plagued by fears of video cord cutting, and competition from 5G and Fiber to the Home. This allowed us to buy and to continue to hold Charter Communications. This business trades at what we believe is a reasonable valuation and we think should have attractive growth in free cash flow over the next decade. We expect that it will allocate that free cash flow in the best interest of shareholders, given that it is controlled by owner-operators.
The Contrarian Opportunity portfolio had net risk exposure at the end of the second quarter of 75.51%, marginally higher (just 1%) than its exposure at the end of the first quarter. We added eight new positions to the portfolio and exited four in the quarter. Some of the new positions in the portfolio include CarMax and investments in convertible bonds.
CarMax has three operating segments: used retail, used wholesale, and used auto lending. The general market decline and recession concerns have caused its stock price to decline by almost half since it peaked in Q4 2021. CarMax is the largest US company in the used car retail space. We think CarMax has the opportunity to gain share in the market due to its strong wholesale business, historically good returns on capital, and an excellent management team that invests for the future and allocates capital with an owner-oriented mindset.5 Recessionary concerns are valid as their lending business, in particular, will likely be hurt. We would not be surprised to see its stock price decline as a result and would consider the opportunity to increase the portfolio’s stake at that time.
Convertible Bonds—High-yield exposure in the portfolio fell to just 1.0% in Q4 of last year. We explained in Q4 2021 this low exposure was because of historically low yields and spreads to Treasuries. Since Q4, the U.S. high-yield bond index has declined 10% as both Treasury yields have increased, and credit spreads have widened. We have begun to see some compelling risk-adjusted opportunities in convertible bonds specifically for the first time since 2000. Many stocks have seen a tremendous decline in price, particularly those companies that are still in their earlier stages with business models that have yet to be optimized. Some of these companies had raised money to fund their growth via convertible bonds initially with yields of 1% and lower. With the conversion price now well out of the money due the decline in
Past Performance is no guarantee, nor is it indicative, of future results. |
| 3 | Reflects the top five contributors and detractors to the Fund’s performance based on contribution to return for the trailing twelve months (“TTM”). Contribution is presented gross of investment management fees, transactions costs, and Fund operating expenses, which if included, would reduce the returns presented. The information provided does not reflect all positions purchased, sold or recommended by FPA during the quarter. It should not be assumed that recommendations made in the future will be profitable or will equal the performance of the securities listed. |
Past performance is no guarantee, nor is it indicative, of future results. |
| 4 | Source: Prosus announcement, June 27, 2022. Appreciation is in Euros, the local currency. https://www.prosus.com/news/the-group-announces-the-beginning-of-an-open-ended-share-repurchase-programme-of-prosus-and-naspers-shares/ |
| 5 | Source: FPA, recent Company filings, Automotive News. As of June 30, 2022. |
| 36 | Litman Gregory Funds Trust | |||||
Table of Contents
their stock prices, the bonds have traded down and now offer what we believe are attractive yields to intermediate term maturities that leave some optionality should these businesses succeed. If this is the case, we would expect the market to reward them with a higher stock price that should translate to a higher bond price; and an outside chance that the convertible feature pays off prior to maturity. The average yield-to-maturity of these bonds is currently 11.5%, 310 basis points better than the 8.4% yield currently offered in the U.S. high-yield market.6 The allocation to these bonds is small for now, but we are hopeful a combination of a further increase in interest rates and continued stock market volatility may allow us to increase the allocation to this space.
Outlook (observations on current environment)
We are often asked about our “outlook.” Which is kind of funny because we have never made a market forecast and, like everyone else, are regularly surprised by world events. While there is always plenty to worry about (insert list of worries), we agree with Jamie Dimon, who on JP Morgan’s second quarter 2022 call, in response to a question about pending economic hurricanes, observed “going through a storm,—that gives us opportunities, too. I always remind myself the economy will be a lot bigger in 10 years, we’re here to serve clients through thick or thin.” There will always be a place in the portfolio for good businesses at good prices, and you should expect to see the portfolio’s risk exposure increase should those prices become attractive. As always, we will be conservative in our underwriting, and let price be our guide.
Despite our no-market prediction philosophy, we do think it is useful to observe current conditions and pricing for financial assets, in order to avoid potholes, focus research attention and calibrate risk appetite.
In bonds, we mentioned the initial fruits of our labor in convertible bonds. Stepping back, we would observe that the U.S. high-yield market is approaching 2016 and 2020 yield levels, but credit spreads are still below the 800+ basis point spreads seen in both of those periods, despite there being no official recession in 2016.
Exhibit C: US High-Yield Effective Yield and Option-Adjusted Spread7
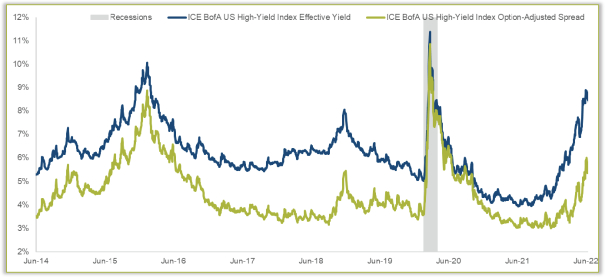
| 6 | Source: FPA, Bloomberg. As of June 30, 2022. |
Past performance is no guarantee, nor is it indicative, of future results. |
| 7 | Source: Federal Reserve Economic Data (FRED). As of June 30, 2022. |
Past performance is no guarantee, nor is it indicative, of future results. |
| Fund Summary | 37 | |||||
Table of Contents
In equities, more traditional value stocks are no longer as inexpensive, unlike March 2020 when value spreads (the cheapest 20% of the market versus the market average) got to 2008 levels of cheapness. We have therefore spent more time considering (and adding to) faster growing, better quality businesses, many of which are both less expensive than the market today and where they have historically been valued, as supported in the following Exhibits D and E
Exhibit D: Valuation Spreads—The Cheapest Quintile Compared to the Market Average (1926 – June 30, 2022)8
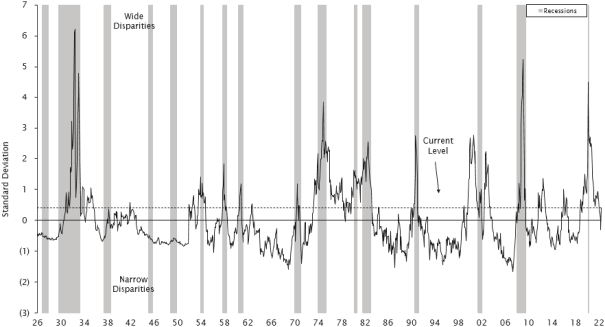
| 8 | Source: Empirical Research Analysis, National Bureau of Economic Research. As of June 30, 2022. Cheapest quintile refers to the most undervalued 20% of stocks in an analysis of large-capitalization US stocks. Standard Deviation is a measure of dispersion of a data set from its mean. Prior to 1952, the spread is measured using the price-to-book data of the largest 1,500 stocks. Current Level refers to the valuation spread as of June 30, 2022 which is 0.4 standard deviations above the mean. |
| 38 | Litman Gregory Funds Trust | |||||
Table of Contents
Exhibit E: The Big Growers—Relative Price to Sales Ratio9
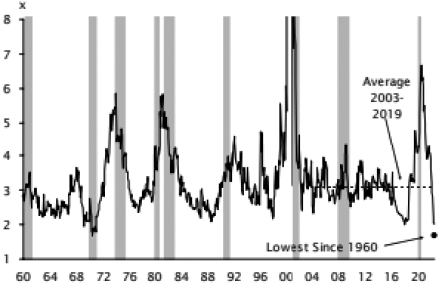
We will remain flexible and seek to take advantage of opportunities that present a margin of safety, whether they are perceived as “value” or “growth.”10
Relatively speaking, international markets continue to trade at lower valuations than that of the US, as shown in Exhibit F below. That explains, in part, the portfolio’s increase in international exposure from 19.1% to 26.7% of the portfolio’s net equities over the last three and a half years. We continue to find attractive opportunities outside of the U.S.
| 9 | Source: Empirical Research Partners (“ERP”) Analysis, National Bureau of Economic Research, as of June 5, 2022. Equally-weighted data. ERP categorized a group of 75 US large-capitalization stocks that they have faster and stronger growth credentials than the rest of the US large-cap universe as ‘Big Growers’. The analysis covers the period January 1960 through June 5, 2022. |
| 10 | Margin of Safety—Buying with a “margin of safety” is when a security is purchased at a discount to the portfolio manager’s estimate of its intrinsic value. Buying a security with a margin of safety is designed to protect against permanent capital loss in the case of an unexpected event or analytical mistake. A purchase made with a margin of safety does not guarantee the security will not decline in price. |
Past performance is no guarantee, nor is it indicative, of future results. |
| Fund Summary | 39 | |||||
Table of Contents
Exhibit F: Twelve-Month Forward Price to Earnings Ratio Discount MSCI AC World Index ex-US vs S&P 500 Index11
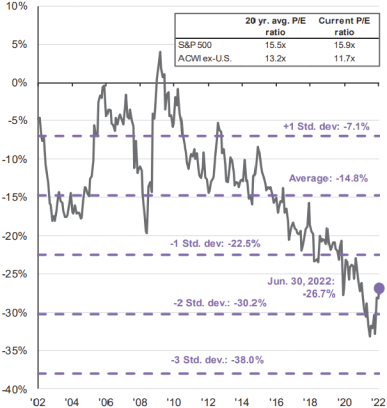
Closing
We are living through what is not our first volatile period. While we cannot tame volatility, we have learned to make friends with it. A decline in price can afford us the opportunity to buy as much as an increase can offer the chance to sell. We believe our hyper focus on price and business quality should allow us to successfully navigate this current turbulent moment in time.
Respectfully submitted,
FPA Contrarian Value Portfolio Management Team
| 11 | As of June 30, 2022. Source: Factset, MSCI, Standard & Poor’s, J.P. Morgan Asset Management Guide to the Markets. Forward Price to Earnings is a version of the ratio of price-to-earnings (P/E) that uses forecasted earnings for the P/E calculation. |
Past results are no guarantee, nor are they indicative, of future results. |
| 40 | Litman Gregory Funds Trust | |||||
Table of Contents
Loomis Sayles:
PORTFOLIO REVIEW
With a semi-annual net return of -12.07%, the portfolio trailed its benchmark, the three-month Treasury Bill Index, which returned 0.14%
High yield corporate bond spreads significantly widened during the first half of the year; reflecting risk- off sentiment driven by challenging macroeconomic and technical dynamics. Lingering covid effects contributed to supply chain issues and knock-on inflationary pressure. Within the portfolio, high yield corporates detracted from performance. Consumer and communications issues were primarily responsible for the sector’s negative performance.
During the period, emerging market assets faced headwinds caused by a US dollar, global growth concerns, inflationary pressures, and broad aversion to risk. Within the portfolio, emerging markets assets weighed on performance, with Chinese and Mexican exposures being primarily responsible.
Despite generally supportive fundamentals, investment grade corporate bond spreads meaningfully widened over the period amid uncertainty around the persistency of inflation and the pace of central bank tightening in response. For the portfolio, investment grade corporates detracted from performance, with financial and communications names being particularly responsible.
Our global rates tools, primarily through the usage of sovereign bonds and interest rate futures, contributed to performance. The yields of the benchmark 10-year and 30-year US treasuries experienced volatility during the period as a result of persistent elevated inflation and Fed hawkishness. These key yields increased from 1.52% to 2.98% and 1.93% to 3.14% respectively. Within the portfolio, our short exposure to US treasury futures was primarily responsible for the allocation’s positive performance over the period.
OUTLOOK
Throughout the first half of 2022, the macroeconomic environment and outlook became more challenging. Increased geopolitical risk, led by the Russian invasion of Ukraine, added a strong supply chain shock to an already concerning inflationary environment just as continued Covid-19 shutdowns in China created further uncertainty. The US Federal Reserve, in an effort to get ahead of these shocks, announced the end of its quantitative easing program and delivered increasingly aggressive rate hikes of 25 basis points in March, 50 basis points in May and 75 basis points in June. As investors priced in a more hawkish Fed and growth expectations diminished, interest rates continued their move higher and risk assets came under pressure.
In our view, the credit cycle has shifted from the “expansion” phase to “late cycle” with a macroeconomic environment that consists of potentially slower growth and inflation that will likely moderate but remain above the Fed’s target. In our base case, growth will likely trend lower but stay resilient as a healthy consumer, positive corporate fundamentals and a strong banking system should help provide a backdrop for continued economic activity. Inflationary pressures will potentially remain sticky, with expectations for elevated commodity prices and persistent supply issues combined with a tight labor market. We believe this environment warrants an accelerated process of normalizing monetary policy, which would increase the potential for a policy mistake as the Fed, and other global central banks, embark on tighter monetary policy to combat inflation even as growth concerns have been increasing.
We are mindful of the risks inherent to our credit cycle and macroeconomic outlook, such as ongoing global supply chain disruptions, tighter financial conditions resulting from global central bank rate hikes and quantitative tightening, slowing Chinese growth and increased geopolitical risk. All of the turmoil around the world leaves us with a wide range of potential outcomes, but the probability of a downturn in 2023 has risen. As a result, we have modestly reduced portfolio risk and increased the level of cash reserve-like, higher quality instruments that can offer flexibility. With increased uncertainty surrounding economic activity, the path of inflation and subsequent Fed policy, we expect volatility to remain elevated in the second half of 2022, which could help drive future opportunities for investors.
Given the upward movement of yields seen so far in 2022, fixed income markets currently offer higher levels of income that can help dampen downside risk for investors and have the potential to provide attractive total returns. As a result, we believe that future pockets of short-term market volatility can offer opportunities to reduce holdings of higher quality, liquid investments in favor of adding credit exposure; however, we will be patient and selective in doing so. We continue to favor issuers with strong carry potential, solid corporate profits and relatively low interest rate sensitivity and believe that increased volatility will help drive wider performance dispersion across sectors, industries and issuers.
In this environment, we believe that individual issuer selection will be key in seeking to deliver favorable performance for the remainder of 2022. We remain comfortable with corporate fundamentals, and while we expect the rate of defaults and losses to rise in the intermediate term we believe they should stay below their long-term averages.
With respect to interest rate risk, we expect an active Fed at each meeting for the rest of 2022 and have more modest expectations for rising nominal US Treasury rates following the significant increase seen in the first half of the year. We remain positioned shorter than broad market benchmarks from the perspective of duration and corresponding interest rate sensitivity to help minimize any negative performance impact from a further rise in interest rates. With the yield curve flattening experienced in 2022, short-dated maturity bonds currently offer favorable levels of income with potentially less volatility, without materially sacrificing yield relative to longer maturities.
| Fund Summary | 41 | |||||
Table of Contents
While we remain cautious on our outlook, we continue to focus on seeking to deliver higher levels of income and total return potential over time. As economic and central bank developments continue to unfold, we remain focused on our investing framework, philosophy and strategy to guide us.
Water Island:
As we reach the halfway point of 2022, we reflect on a difficult period not just for broader capital markets but also for event-driven strategies. After reaching all-time highs at the start of 2022, the S&P 500 index—a popular proxy for the stock market—embarked on a downturn that officially entered bear market territory. The Bloomberg US Aggregate Bond index, which is reflective of the broad investment grade bond market, was down more than 10% year-to-date through June 30, extending a drawdown that began in 2020 and is now the largest bond market drawdown in more than 40 years. There has been no shortage of pressures driving the volatility: a pandemic that has now entered its third year; malfunctioning supply chains; runaway inflation; rapidly rising interest rates; recession fears; domestic discord and imminent midterm elections in the US; and geopolitical tensions and the Russia/Ukraine conflict have all played a part.
More pertinent to our event-driven strategies, volatility began to spike about a year ago, in June 2021, when the Department of Justice (DOJ) sued to block the merger of insurance brokers Willis Towers Watson and Aon—a large, widely held deal that had already acquired necessary regulatory approvals in all jurisdictions but the US. Since then, competition regulation has remained at the forefront of merger arbitrage investors’ minds, as the Biden administration takes an increasingly strict view of antitrust. The DOJ, Federal Trade Commission (FTC), Federal Communications Commission (FCC), and Committee on Foreign Investment in the United States (CFIUS) are just a handful of a stable of global regulators—including the pro-consumer European Commission and the unpredictable State Administration for Market Regulation in China—whose views often must be properly assessed to predict deal success, and with US regulators now straying from historical precedent more frequently, deal spreads have been experiencing atypical spikes in volatility.
When the volatility within our strategy was met with broader capital market drawdowns, the impact was dramatic. Forced and panicked selling can often cause correlations to converge, and in late Q2 we saw spreads in our universe of announced mergers and acquisitions (M&A) gap wider, as arbitrageurs exited positions en masse—even in deals where there had been no change to the underlying fundamentals of the transaction. We have seen similar behavior before—for example, in the midst of the Global Financial Crisis of 2008, and more recently at the onset of the COVID-19 pandemic in the first quarter of 2020. That said, we view these movements as mere mark-to-market losses. We continue to have conviction that the vast majority of pending deals will reach a successful conclusion (as over 90% of announced M&A has done, historically, according to Dealogic data), at which point their spreads will narrow to zero and losses will reverse.
For the first six months of the year, our sleeve of the fund incurred losses in both its merger arbitrage investments and hard and soft catalyst special situations investments. The top detractor for the period was our position in the failed merger of Momentive Global and Zendesk. In October 2021, Zendesk—a US-based developer of software for customer support and customer communications—agreed to acquire Momentive Global—a US-based developer of software for conducting web-based surveys—for $4.1 billion in stock, after an activist investor in Momentive pushed for a sale process. In January, however, yet another activist investor—this time at Zendesk—began to push Zendesk’s board of directors and management to reject the acquisition, believing the company should instead be put up for sale itself. The very next month, Zendesk management rejected an offer from a private equity consortium that would have valued the company at $17 billion—yet Zendesk shareholders appear to have agreed with the activist, as they overwhelmingly rejected the Momentive deal mere days later. Subsequent share price volatility led to mark-to-market losses for the fund; however, we have maintained our Momentive exposure as not only has its activist reemerged, but the proxy background of the Zendesk merger indicated there were at least two other interested parties who put forth bids for the company before Zendesk won the initial sale process. We believe there is more left to this story.
Conversely, the top contributor in the portfolio was the fund’s investment in the merger of Xilinx and Advanced Micro Devices. In October 2020, Xilinx—a US-based semiconductor manufacturer—agreed to be acquired by local peer Advanced Micro Devices for $35.7 billion in stock. This transaction experienced ongoing volatility in the deal spread, in large part due to its lengthy timeline stemming from continued delays in receiving regulatory approval from China (a required condition to complete the deal, where antitrust reviews are a notoriously opaque process). The companies ultimately received approval from China in February 2022 and the merger subsequently closed successfully, leading to gains for the fund.
As we look ahead, with volatility extending throughout the credit and equity markets, we continue to believe merger arbitrage and other hard catalyst merger-related investments remain the appropriate area toward which to direct our focus. We anticipate M&A will remain an important avenue for corporations to drive growth, and we have no doubt dealmakers will adapt to model rising interest rates and high inflation into their valuations, fueling deal flow even if we enter a broader economic downturn. We also believe acquirers will continue to engage in M&A as a path to shore up weakened supply chains, diminished workforces, and inadequate technology infrastructure—common themes of the past year. Strategic acquirers in a position of strength can often find their best opportunities to deliver strong return on investment when valuations are dislocated, and deals with a strong strategic rationale can create long term value for shareholders. Lest we forget financial buyers, private equity (PE) acquisition activity—which now comprises nearly half of global deal value—should continue, as PE shops still have more than $2 trillion in dry powder on the books, waiting to be deployed. We intend to introduce select soft catalyst opportunities—which tend to be more sensitive to broader market moves—to the portfolio only with appropriate risk mitigation strategies in place.
| 42 | Litman Gregory Funds Trust | |||||
Table of Contents
As event-driven investors, our objective remains to generate returns sourced from the outcomes of idiosyncratic corporate events, rather than from the overall direction of broader credit or equity markets. We believe market volatility will remain heightened in the year ahead, but we are optimistic about the prospects for our strategies. Volatility can present opportunities to trade around positions and find attractive entry points. Furthermore, the risk-free interest rate is a fundamental building block of a deal spread, and rising interest rates have historically provided a tailwind to merger arbitrage returns. In this favorable environment, our goal, as always, remains to implement strong risk mitigation strategies as we seek to deliver non-correlated return streams with as little volatility as possible.
Sub-Advisor Portfolio Composition as of June 30, 2022
Blackstone Credit Systematic Group (DCI) Long-Short Credit Strategy
Bond Portfolio Top Five Sector Exposures
Energy | 14.7% | |||
Consumer Non-Discretionary | 11.7% | |||
Consumer Discretionary | 11.0% | |||
Materials | 9.1% | |||
Investment Vehicles/REITs | 8.2% |
CDS Portfolio Statistics
| Long | Short | |||||||
Number of Issuers | 73 | 73 | ||||||
Average Credit Duration | 4.5 | 4.5 | ||||||
Spread | 255 bps | 244 bps | ||||||
DoubleLine Opportunistic Income Strategy
Sector Exposures
Cash | 10.9% | |||
Government | 3.5% | |||
Agency Inverse Interest-Only | 6.9% | |||
Agency CMO | 0.3% | |||
Agency PO | 0.3% | |||
Non-Agency Residential MBS | 33.2% | |||
Commercial MBS | 14.4% | |||
Collateralized Loan Obligations | 10.8% | |||
ABS | 5.6% | |||
Bank Loan | 5.8% | |||
Emerging Markets | 5.4% | |||
Other | 2.9% | |||
|
| |||
TOTAL | 100.0% | |||
|
|
FPA Contrarian Opportunity Strategy
Asset Class Exposures
U.S. Stocks | 47.0% | |||
Foreign Stocks | 24.7% | |||
Bonds | 1.8% | |||
Limited Partnerships | 1.6% | |||
Cash | 24.9% | |||
|
| |||
TOTAL | 100.0% | |||
|
|
Loomis Sayles Absolute Return Strategy
Strategy Exposures
| Long Total | Short Total | Net Exposure | ||||||||||
Securitized | 29.4% | 0.0% | 29.4% | |||||||||
High-Yield Corporate | 26.2% | -0.7% | 25.6% | |||||||||
Investment-Grade Corp. | 17.4% | 0.0% | 17.4% | |||||||||
Dividend Equity | 10.0% | -0.7% | 9.4% | |||||||||
Emerging Market | 5.7% | -2.2% | 3.5% | |||||||||
Convertibles | 5.7% | 0.0% | 5.7% | |||||||||
Global Rates | 1.5% | 0.0% | 1.5% | |||||||||
Bank Loans | 0.4% | -0.2% | 0.2% | |||||||||
Global Credit | 0.3% | -0.3% | 0.0% | |||||||||
Subtotal | 96.7% | -4.1% | 92.6% | |||||||||
Cash & Equivalents | 6.3% | 0.0% | 6.3% | |||||||||
Water Island Arbitrage and Event-Driven Strategy
Sub-Strategy Exposures
| Long | Short | Net | ||||||||||
Merger Arbitrage – Equity | 91.7% | -2.0% | 89.7% | |||||||||
Merger Arbitrage – Credit | 2.9% | 0.0% | 2.9% | |||||||||
Total Merger-Related | 94.6% | -2.0% | 92.6% | |||||||||
Special Situations – Equity | 0.5% | 0.0% | 0.5% | |||||||||
Special Situations – Credit | 1.5% | 0.0% | 1.4% | |||||||||
Total Special Situations | 1.9% | 0.0% | 1.9% | |||||||||
|
|
|
|
|
| |||||||
Total | 96.5% | -2.0% | 94.5% | |||||||||
|
|
|
|
|
| |||||||
| Fund Summary | 43 | |||||
Table of Contents
iMGP Alternative Strategies Fund Managers
| INVESTMENT MANAGER | FIRM | TARGET MANAGER ALLOCATION | Strategy | |||
Stephen Kealhofer Paul Harrison Adam Dwinells | Blackstone Credit/DCI, LLC | 19% | Long-Short Credit | |||
Jeffrey Gundlach Jeffrey Sherman | DoubleLine Capital LP | 25% | Opportunistic Income | |||
Steven Romick Brian Selmo Mark Landecker | First Pacific Advisors, LLC | 18% | Contrarian Opportunity | |||
Matt Eagan Brian Kennedy Elaine Stokes Todd Vandam | Loomis Sayles & Company, LP | 19% | Absolute-Return | |||
John Orrico Todd Munn Roger Foltynowicz Gregg Loprete | Water Island Capital, LLP | 19% | Arbitrage |
iMGP Alternative Strategies Fund Value of Hypothetical $100,000
The value of a hypothetical $100,000 investment in the iMGP Alternative Strategies Fund from September 30, 2011, 1996 to June 30, 2022 compared with the ICE BofA 3 Month Treasury Index and Morningstar Multistrategy Category
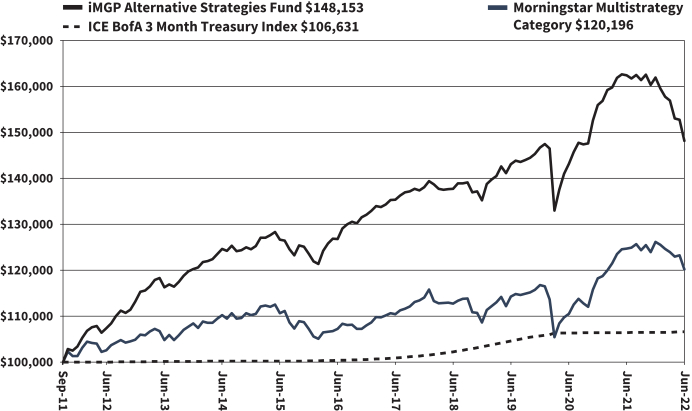
The hypothetical $100,000 investment at fund inception includes changes due to share price and reinvestment of dividends and capital gains. The chart does not imply future performance. Indexes are unmanaged, do not incur fees, expenses or taxes, and cannot be invested in directly.
Performance quoted does not include a deduction for taxes that a shareholder would pay on the redemption of fund shares.
| 44 | Litman Gregory Funds Trust | |||||
Table of Contents
iMGP Alternative Strategies Fund
SCHEDULE OF INVESTMENTS IN SECURITIES at June 30, 2022 (Unaudited)
| Shares | Value | |||||||
COMMON STOCKS: 30.5% | ||||||||
| Communication Services: 4.8% | ||||||||
| 131,856 | Activision Blizzard, Inc. | $ | 10,266,308 | |||||
| 3,896 | Alphabet, Inc. - Class A* | 8,490,397 | ||||||
| 2,733 | Alphabet, Inc. - Class C* | 5,978,301 | ||||||
| 84,001 | Altice USA, Inc. - Class A* | 777,009 | ||||||
| 33,347 | Baidu, Inc. - Class A* | 631,057 | ||||||
| 202,054 | Bollore SE | 934,919 | ||||||
| 11,701 | Charter Communications, Inc. - Class A* | 5,482,270 | ||||||
| 54,867 | Cineplex, Inc.* | 460,777 | ||||||
| 224,150 | Comcast Corp. - Class A | 8,795,646 | ||||||
| 114,390 | Escrow Altegrity, Inc.*(a) | 583,389 | ||||||
| 24,160 | iHeartMedia, Inc. - Class A* | 190,622 | ||||||
| 7,971 | Intelsat Emergence S.A.* | 215,217 | ||||||
| 31,687 | Meta Platforms, Inc. - Class A* | 5,109,529 | ||||||
| 8,836 | Netflix, Inc.* | 1,545,151 | ||||||
| 58,363 | Nexon Co. Ltd. | 1,194,874 | ||||||
| 2,898 | Nintendo Co. Ltd. | 1,253,259 | ||||||
| 19,071 | T-Mobile US, Inc.* | 2,565,812 | ||||||
| 331,213 | TEGNA, Inc.(b) | 6,945,537 | ||||||
| 95,329 | Twitter, Inc.* | 3,564,351 | ||||||
| 423,581 | Uniti Group Ltd.* | 1,439,015 | ||||||
|
| |||||||
| 66,423,440 | ||||||||
|
| |||||||
| Consumer Discretionary: 2.5% | ||||||||
| 2,951 | Airbnb, Inc. - Class A* | 262,875 | ||||||
| 123,962 | Alibaba Group Holding Ltd.* | 1,767,681 | ||||||
| 48,160 | Amazon.com, Inc.* | 5,115,074 | ||||||
| 187 | Booking Holdings, Inc.* | 327,061 | ||||||
| 27,257 | CarMax, Inc.* | 2,466,213 | ||||||
| 4,305 | Carnival Corp.* | 37,238 | ||||||
| 19,900 | Cie Financiere Richemont S.A. - Class A | 2,117,598 | ||||||
| 16,544 | Delivery Hero SE*(c) | 619,504 | ||||||
| 94,760 | Entain Plc* | 1,435,003 | ||||||
| 11,361 | Flutter Entertainment Plc* | 1,139,234 | ||||||
| 776 | Home Depot, Inc. (The) | 212,834 | ||||||
| 46,340 | Just Eat Takeaway.com N.V.*(c) | 730,867 | ||||||
| 530 | LVMH Moet Hennessy Louis Vuitton SE | 322,745 | ||||||
| 15,226 | Marriott International, Inc. - Class A* | 2,070,888 | ||||||
| 1,788 | McDonald’s Corp. | 441,422 | ||||||
| 329 | MercadoLibre, Inc.* | 209,530 | ||||||
| 2,525 | NIKE, Inc. - Class B | 258,055 | ||||||
| 4,011 | Norwegian Cruise Line Holdings Ltd.* | 44,602 | ||||||
| 70,869 | Prosus N.V. | 4,635,341 | ||||||
| 2,729 | Royal Caribbean Cruises Ltd.* | 95,269 | ||||||
| 7,656 | Starbucks Corp. | 584,842 | ||||||
| 228,170 | Tenneco, Inc. - Class A* | 3,915,397 | ||||||
| 54,491 | Terminix Global Holdings, Inc.* | 2,215,059 | ||||||
| 1,559,745 | Vivo Energy Plc(c) | 2,769,905 | ||||||
| 1,845 | Wynn Resorts Ltd.* | 105,128 | ||||||
|
| |||||||
| 33,899,365 | ||||||||
|
| |||||||
| Consumer Staples: 1.0% | ||||||||
| 15,012 | Coca-Cola Co. (The) | 944,405 | ||||||
| 1,243 | Estee Lauder Cos., Inc. (The) - Class A | 316,555 | ||||||
| 28,086 | Herbalife Nutrition Ltd.* | 574,359 | ||||||
| 119,500 | JDE Peet’s N.V. | 3,397,676 | ||||||
| 6,874 | Procter & Gamble Co. (The) | 988,412 | ||||||
| 22,397 | Sanderson Farms, Inc. | 4,827,225 | ||||||
| 132,577 | Swedish Match AB | 1,349,134 | ||||||
| Shares | Value | |||||||
| Consumer Staples (continued) | ||||||||
| 5,176 | Walmart, Inc. | $ | 629,298 | |||||
|
| |||||||
| 13,027,064 | ||||||||
|
| |||||||
| Energy: 0.3% | ||||||||
| 18,829 | Battalion Oil Corp.* | 160,611 | ||||||
| 17,596 | California Resources Corp. | 677,446 | ||||||
| 8,225 | Gulfport Energy Corp.* | 653,970 | ||||||
| 155,610 | Kinder Morgan, Inc. | 2,608,023 | ||||||
| 1,258 | Pioneer Natural Resources Co. | 280,635 | ||||||
| 7,419 | Williams Cos., Inc. (The) | 231,547 | ||||||
|
| |||||||
| 4,612,232 | ||||||||
|
| |||||||
| Financials: 4.2% | ||||||||
| 12,475 | Alleghany Corp.* | 10,392,922 | ||||||
| 560 | Alpha Partners Technology Merger Corp.* | 5,482 | ||||||
| 128,235 | American International Group, Inc. | 6,556,656 | ||||||
| 12,743 | Angel Pond Holdings Corp. - Class A* | 125,327 | ||||||
| 19,191 | Aon Plc - Class A | 5,175,429 | ||||||
| 2,792 | Apollo Strategic Growth Capital II* | 27,515 | ||||||
| 5,085 | Atlantic Coastal Acquisition Corp. II* | 50,748 | ||||||
| 68,106 | Avanti Acquisition Corp.* | 678,676 | ||||||
| 568 | BlackRock, Inc. | 345,935 | ||||||
| 280,770 | Brewin Dolphin Holdings Plc | 1,748,554 | ||||||
| 14,913 | BurTech Acquisition Corp.* | 149,950 | ||||||
| 3,884 | C5 Acquisition Corp.* | 38,801 | ||||||
| 105,610 | Citigroup, Inc. | 4,857,004 | ||||||
| 67,864 | Contra Zogenix, Inc. | 47,566 | ||||||
| 4,507 | COVA Acquisition Corp. - Class A* | 44,304 | ||||||
| 60,800 | Fast Sponsor Capital*(a) | 60,800 | ||||||
| 292,982 | First Horizon Corp.(b) | 6,404,587 | ||||||
| 58,037 | Groupe Bruxelles Lambert S.A. | 4,841,039 | ||||||
| 7 | GSR II Meteora Acquisition Corp.* | 71 | ||||||
| 12,520 | Hartford Financial Services Group, Inc. (The) | 819,184 | ||||||
| 77,470 | Jefferies Financial Group, Inc. | 2,139,721 | ||||||
| 8,893 | LPL Financial Holdings, Inc. | 1,640,581 | ||||||
| 14,054 | Macondray Capital Acquisition Corp. I* | 139,275 | ||||||
| 7,468 | Metals Acquisition Corp. - Class A* | 73,112 | ||||||
| 320,179 | Moneylion, Inc.* | 422,636 | ||||||
| 3,350 | Morgan Stanley | 254,801 | ||||||
| 6,266 | Pershing Square Tontine Holdings Ltd. - Class A* | 125,132 | ||||||
| 776 | PowerUp Acquisition Corp.* | 7,830 | ||||||
| 85,548 | Sanne Group Plc* | 942,750 | ||||||
| 1,174 | Signature Bank | 210,393 | ||||||
| 1,763 | Silver Spike Acquisition Corp. II - Class A* | 17,269 | ||||||
| 117,140 | Wells Fargo & Co. | 4,588,374 | ||||||
| 19,850 | Willis Towers Watson Plc | 3,918,191 | ||||||
|
| |||||||
| 56,850,615 | ||||||||
|
| |||||||
| Health Care: 2.9% | ||||||||
| 2,082 | Abbott Laboratories | 226,209 | ||||||
| 2,926 | AbbVie, Inc. | 448,146 | ||||||
| 22,209 | Biohaven Pharmaceutical Holding Co. Ltd.*(b) | 3,236,073 | ||||||
| 3,869 | Bristol-Myers Squibb Co. | 297,913 | ||||||
| 531,651 | Change Healthcare, Inc.* | 12,259,872 | ||||||
| 155,642 | Covetrus, Inc.* | 3,229,572 | ||||||
| 462 | Elevance Health, Inc. | 222,952 | ||||||
| 85,639 | Inovalon Holdings, Inc. - Class A* | 3,618,248 | ||||||
| 6,413 | Johnson & Johnson | 1,138,372 | ||||||
The accompanying notes are an integral part of these financial statements.
| Schedule of Investments | 45 | |||||
Table of Contents
iMGP Alternative Strategies Fund
SCHEDULE OF INVESTMENTS IN SECURITIES at June 30, 2022 (Unaudited) (Continued)
| Shares | Value | |||||||
COMMON STOCKS (CONTINUED) | ||||||||
| Health Care (continued) | ||||||||
| 35,075 | LHC Group, Inc.* | $ | 5,462,580 | |||||
| 5,619 | Merck & Co., Inc. | 512,284 | ||||||
| 50,092 | Natus Medical, Inc.* | 1,641,515 | ||||||
| 97,766 | Swedish Orphan Biovitrum AB* | 2,111,991 | ||||||
| 270 | Thermo Fisher Scientific, Inc. | 146,686 | ||||||
| 41,342 | Turning Point Therapeutics, Inc.* | 3,110,986 | ||||||
| 339 | UnitedHealth Group, Inc. | 174,121 | ||||||
| 20,451 | UpHealth, Inc.* | 12,117 | ||||||
| 12,855 | Vifor Pharma AG* | 2,227,168 | ||||||
|
| |||||||
| 40,076,805 | ||||||||
|
| |||||||
| Industrials: 4.2% | ||||||||
| 108,170 | Aerojet Rocketdyne Holdings, Inc.* | 4,391,702 | ||||||
| 77,763 | Atlantia SpA | 1,821,870 | ||||||
| 207,910 | Cornerstone Building Brands, Inc.* | 5,091,716 | ||||||
| 1,105 | Cummins, Inc. | 213,851 | ||||||
| 3,695 | CWT Travel Group, Inc. | 73,900 | ||||||
| 722 | Deere & Co. | 216,217 | ||||||
| 3,415 | Expeditors International of Washington, Inc. | 332,826 | ||||||
| 13,540 | Ferguson Plc | 1,499,013 | ||||||
| 75,543 | HomeServe Plc | 1,076,912 | ||||||
| 1 | Hornbeck Offshore Services, Inc. | 10 | ||||||
| 105,955 | Howmet Aerospace, Inc. | 3,332,285 | ||||||
| 130,915 | Intertrust N.V.*(c) | 2,623,105 | ||||||
| 217 | L3Harris Technologies, Inc. | 52,449 | ||||||
| 45,628 | LG Corp. | 2,737,539 | ||||||
| 896 | Lockheed Martin Corp. | 385,244 | ||||||
| 25,696 | ManTech International Corp. - Class A | 2,452,683 | ||||||
| 565,707 | McDermott International Ltd.* | 321,850 | ||||||
| 590,897 | McDermott International Ltd.* | 336,811 | ||||||
| 341,452 | Nielsen Holdings Plc | 7,928,515 | ||||||
| 42,919 | Rush Enterprises, Inc. - Class A | 2,068,696 | ||||||
| 27,722 | Safran S.A. | 2,734,046 | ||||||
| 20,938 | Samsung C&T Corp. | 1,983,498 | ||||||
| 51,080 | Siemens Gamesa Renewable Energy S.A.* | 957,703 | ||||||
| 17,500 | Sound Holding FP Luxemburg*(a) | 1,859,991 | ||||||
| 52,416 | Uber Technologies, Inc.* | 1,072,431 | ||||||
| 1,416 | Union Pacific Corp. | 302,005 | ||||||
| 1,633 | United Parcel Service, Inc. - Class B | 298,088 | ||||||
| 57,500 | Univar Solutions, Inc.* | 1,430,025 | ||||||
| 319,101 | Welbilt, Inc.* | 7,597,795 | ||||||
| 31,520 | Westinghouse Air Brake Technologies Corp. | 2,587,162 | ||||||
|
| |||||||
| 57,779,938 | ||||||||
|
| |||||||
| Information Technology: 6.8% | ||||||||
| 965 | Accenture Plc - Class A | 267,932 | ||||||
| 48,690 | Analog Devices, Inc. | 7,113,122 | ||||||
| 5,579 | Apple, Inc. | 762,761 | ||||||
| 2,262 | Applied Materials, Inc. | 205,797 | ||||||
| 832 | Autodesk, Inc.* | 143,071 | ||||||
| 204,898 | Avast Plc(c) | 1,288,507 | ||||||
| 14,183 | Black Knight, Inc.*(b) | 927,426 | ||||||
| 12,702 | Broadcom, Inc. | 6,170,759 | ||||||
| 28,844 | CDK Global, Inc. | 1,579,786 | ||||||
| 6,461 | Cisco Systems, Inc. | 275,497 | ||||||
| 68,273 | Citrix Systems, Inc. | 6,634,087 | ||||||
| Shares | Value | |||||||
| Information Technology (continued) | ||||||||
| 454,075 | Ideagen Plc | $ | 1,927,576 | |||||
| 321 | KLA Corp. | 102,425 | ||||||
| 91,341 | Magnachip Semiconductor Corp.* | 1,327,185 | ||||||
| 417,761 | Mandiant, Inc.*(b) | 9,115,545 | ||||||
| 1,300 | MasterCard, Inc. - Class A | 410,124 | ||||||
| 3,636 | Microchip Technology, Inc. | 211,179 | ||||||
| 1,363 | Microsoft Corp. | 350,059 | ||||||
| 336,781 | Momentive Global, Inc.* | 2,963,673 | ||||||
| 1,376 | NVIDIA Corp. | 208,588 | ||||||
| 14,376 | NXP Semiconductors N.V. | 2,128,079 | ||||||
| 70,530 | Open Text Corp. | 2,668,855 | ||||||
| 934 | PayPal Holdings, Inc.* | 65,231 | ||||||
| 172,800 | Plantronics, Inc.* | 6,856,704 | ||||||
| 4,094 | Qualcomm, Inc. | 522,968 | ||||||
| 24,822 | Rogers Corp.* | 6,505,598 | ||||||
| 87,230 | Sailpoint Technologies Holdings, Inc.* | 5,467,576 | ||||||
| 1,100 | salesforce.com, Inc.* | 181,544 | ||||||
| 15,047 | Silicon Motion Technology Corp. - ADR(b) | 1,259,434 | ||||||
| 124,433 | Switch, Inc. - Class A | 4,168,505 | ||||||
| 55,961 | TE Connectivity Ltd. | 6,331,987 | ||||||
| 2,151 | Visa, Inc. - Class A | 423,510 | ||||||
| 23,050 | VMware, Inc. - Class A* | 2,627,239 | ||||||
| 344,512 | Vonage Holdings Corp.* | 6,490,606 | ||||||
| 68,228 | Zendesk, Inc.* | 5,053,648 | ||||||
|
| |||||||
| 92,736,583 | ||||||||
|
| |||||||
| Materials: 1.3% | ||||||||
| 225,306 | Cemex SAB de C.V. - ADR* | 883,200 | ||||||
| 946,357 | Glencore Plc | 5,123,551 | ||||||
| 29,950 | HeidelbergCement AG | 1,437,228 | ||||||
| 164,687 | Holcim AG | 7,042,621 | ||||||
| 30,262 | International Flavors & Fragrances, Inc. | 3,604,809 | ||||||
| 4,442 | Newmont Corp. | 265,054 | ||||||
|
| |||||||
| 18,356,463 | ||||||||
|
| |||||||
| Real Estate: 0.7% | ||||||||
| 72,130 | American Campus Communities, Inc. - REIT | 4,650,221 | ||||||
| 1,366 | American Tower Corp. - REIT | 349,136 | ||||||
| 61,924 | Deutsche EuroShop AG | 1,439,118 | ||||||
| 31,812 | Duke Realty Corp. - REIT | 1,748,069 | ||||||
| 297,322 | Swire Pacific Ltd. - Class A | 1,771,308 | ||||||
|
| |||||||
| 9,957,852 | ||||||||
|
| |||||||
| Special Purpose Acquisition Companies: 0.3% | ||||||||
| 25 | Accelerate Acquisition Corp.* | 245 | ||||||
| 2,368 | African Gold Acquisition Corp.* | 23,372 | ||||||
| 13,096 | Agile Growth Corp.* | 128,799 | ||||||
| 6,668 | Ares Acquisition Corp.* | 65,747 | ||||||
| 16,681 | Atlantic Coastal Acquisition Corp. - Class A* | 163,140 | ||||||
| 11,288 | Broadscale Acquisition Corp. - Class A* | 110,848 | ||||||
| 8,316 | Churchill Capital Corp. VII* | 81,913 | ||||||
| 13,902 | Colonnade Acquisition Corp. II* | 136,240 | ||||||
| 7,012 | DHC Acquisition Corp.* | 68,648 | ||||||
| 972 | Digital Transformation Opportunities Corp.* | 9,487 | ||||||
| 13,902 | Disruptive Acquisition Corp. I* | 136,935 | ||||||
| 2 | ESM Acquisition Corp.* | 20 | ||||||
| 13,902 | Flame Acquisition Corp.* | 137,074 | ||||||
| 16,730 | Forest Road Acquisition Corp. II* | 163,954 | ||||||
| 6,664 | Fortress Value Acquisition Corp. IV* | 65,041 | ||||||
The accompanying notes are an integral part of these financial statements.
| 46 | Litman Gregory Funds Trust | |||||
Table of Contents
iMGP Alternative Strategies Fund
SCHEDULE OF INVESTMENTS IN SECURITIES at June 30, 2022 (Unaudited) (Continued)
| Shares | Value | |||||||
COMMON STOCKS (CONTINUED) | ||||||||
| Special Purpose Acquisition Companies (continued) | ||||||||
| 1,678 | FTAC Hera Acquisition Corp.* | $ | 16,587 | |||||
| 2,338 | Fusion Acquisition Corp. II* | 22,901 | ||||||
| 13,945 | Glenfarne Merger Corp.* | 139,868 | ||||||
| 5,221 | Global Partner Acquisition Corp. II* | 51,557 | ||||||
| 13,902 | Golden Arrow Merger Corp.* | 135,823 | ||||||
| 65 | Gores Holdings VII, Inc.* | 638 | ||||||
| 3,177 | Gores Holdings VIII, Inc. - Class A* | 31,293 | ||||||
| 88 | Gores Technology Partners II, Inc.* | 867 | ||||||
| 8,746 | GX Acquisition Corp. II - Class A* | 85,623 | ||||||
| 16,773 | Hudson Executive Investment Corp. III* | 164,375 | ||||||
| 11,615 | InterPrivate IV InfraTech Partners, Inc.* | 114,292 | ||||||
| 13,902 | Kismet Acquisition Three Corp.* | 135,962 | ||||||
| 16,705 | Landcadia Holdings IV, Inc.* | 164,294 | ||||||
| 506 | Lazard Growth Acquisition Corp. I* | 4,979 | ||||||
| 1,510 | Lead Edge Growth Opportunities Ltd.* | 14,881 | ||||||
| 10,143 | Mason Industrial Technology, Inc.* | 99,452 | ||||||
| 8,259 | Mission Advancement Corp.* | 80,690 | ||||||
| 940 | Monument Circle Acquisition Corp.* | 9,240 | ||||||
| 7,430 | Northern Star Investment Corp. III* | 73,297 | ||||||
| 5,739 | Northern Star Investment Corp. IV* | 56,443 | ||||||
| 3,367 | Orion Acquisition Corp.* | 33,030 | ||||||
| 7,873 | Peridot Acquisition Corp. II* | 77,155 | ||||||
| 13,031 | Pine Technology Acquisition Corp. - Class A* | 127,313 | ||||||
| 13,079 | Plum Acquisition Corp. I* | 128,305 | ||||||
| 3,118 | Ross Acquisition Corp. II* | 30,743 | ||||||
| 133 | RXR Acquisition Corp.* | 1,310 | ||||||
| 9,637 | Slam Corp.* | 95,117 | ||||||
| 9,063 | Stratim Cloud Acquisition Corp.* | 88,591 | ||||||
| 1,601 | TCW Special Purpose Acquisition Corp.* | 15,738 | ||||||
| 3,992 | Tio Tech A* | 39,261 | ||||||
| 16,730 | TLG Acquisition One Corp.* | 164,121 | ||||||
| 13,335 | Twelve Seas Investment Co. II* | 130,950 | ||||||
|
| |||||||
| 3,626,159 | ||||||||
|
| |||||||
| Utilities: 1.5% | ||||||||
| 28,145 | Albioma S.A. | 1,469,644 | ||||||
| 8,935 | Duke Energy Corp. | 957,921 | ||||||
| 73,324 | FirstEnergy Corp. | 2,814,908 | ||||||
| 4,694 | NextEra Energy, Inc. | 363,597 | ||||||
| 200,775 | PG&E Corp.* | 2,003,735 | ||||||
| 136,935 | PNM Resources, Inc.(b) | 6,542,754 | ||||||
| 178,658 | South Jersey Industries, Inc.(b) | 6,099,384 | ||||||
|
| |||||||
| 20,251,943 | ||||||||
|
| |||||||
| | TOTAL COMMON STOCKS | 417,598,459 | ||||||
|
| |||||||
RIGHTS/WARRANTS: 0.0% | ||||||||
| 4,247 | Angel Pond Holdings Corp. (Expiration date 12/31/27)* | 1,805 | ||||||
| 5,560 | Atlantic Coastal Acquisition Corp. (Expiration date 12/31/27)* | 445 | ||||||
| 3,595 | BigBear.ai Holdings, Inc. (Expiration date 12/31/28)* | 1,438 | ||||||
| 24 | Biote Corp. (Expiration date 02/12/27)* | 9 | ||||||
| 2,822 | Broadscale Acquisition Corp. (Expiration date 02/02/26)* | 668 | ||||||
| Shares | Value | |||||||
| 64,680 | Cie Financiere Richemont S.A. (Expiration date 11/22/23)* | $ | 35,209 | |||||
| 2,253 | COVA Acquisition Corp. (Expiration date 12/31/27)* | 226 | ||||||
| 397 | Gores Holdings VIII, Inc. (Expiration date 12/31/27)* | 241 | ||||||
| 2,915 | GX Acquisition Corp. II (Expiration date 12/31/28)* | 495 | ||||||
| 1,333 | Heliogen, Inc. (Expiration date 03/31/28)* | 351 | ||||||
| 389 | Hornbeck Offshore SRVC, Inc. (Expiration date 04/09/30)* | 0 | ||||||
| 11 | Hornbeck Offshore SRVC, Inc. (Expiration date 04/09/30)* | 106 | ||||||
| 834 | Intelsat Jackson Holdings S. A. (Expiration date 12/05/25)* | 3,128 | ||||||
| 834 | Intelsat Jackson Holdings S. A. (Expiration date 12/05/25)* | 3,336 | ||||||
| 2,489 | Metals Acquisition Corp. (Expiration date 07/12/26)* | 1,258 | ||||||
| 4,343 | Pine Technology Acquisition Corp. (Expiration date 03/31/28)* | 353 | ||||||
| 145 | Prenetics Global Ltd. (Expiration date 12/31/26)* | 43 | ||||||
| 440 | Silver Spike Acquisition Corp. II (Expiration date 02/26/26)* | 26 | ||||||
| 367 | Swvl Holdings Corp. (Expiration date 03/31/27)* | 201 | ||||||
| 2,045 | UpHealth, Inc. (Expiration date 07/01/24)* | 143 | ||||||
| 1,275 | Virgin Orbit Holdings, Inc. (Expiration date 12/29/26)* | 737 | ||||||
|
| |||||||
| | TOTAL RIGHTS/WARRANTS | 50,218 | ||||||
|
| |||||||
PREFERRED STOCKS: 0.1% | ||||||||
| Energy: 0.0% | ||||||||
| El Paso Energy Capital Trust I |
| |||||||
| 528 | 4.750%, 03/31/2028 | 24,526 | ||||||
| Gulfport Energy Operating Corp. |
| |||||||
| 18 | 10.000%, 08/01/2022(a)(d)(e) | 10,980 | ||||||
|
| |||||||
| 35,506 | ||||||||
|
| |||||||
| Financials: 0.1% | ||||||||
| 2020 Cash Mandatory Exchangeable Trust |
| |||||||
| 1,054 | 5.250%, 06/01/2023(c) | 1,211,151 | ||||||
|
| |||||||
| Industrials: 0.0% | ||||||||
| Clarivate Plc - Series A |
| |||||||
| 7,643 | 5.250%, 06/01/2024 | 437,287 | ||||||
| Element Communication Aviation |
| |||||||
| 170 | 12.000%, 03/16/2040(a) | 14,467 | ||||||
| McDermott International, Inc. - (Preference Shares) | ||||||||
| 328 | 0.000%*(a) | 196,916 | ||||||
|
| |||||||
| 648,670 | ||||||||
|
| |||||||
| Information Technology: 0.0% | ||||||||
| Riverbed Holdings, Inc. |
| |||||||
| 4,852 | 0.000%* | 29,112 | ||||||
|
| |||||||
| | TOTAL PREFERRED STOCKS | 1,924,439 | ||||||
|
| |||||||
The accompanying notes are an integral part of these financial statements.
| Schedule of Investments | 47 | |||||
Table of Contents
iMGP Alternative Strategies Fund
SCHEDULE OF INVESTMENTS IN SECURITIES at June 30, 2022 (Unaudited) (Continued)
| Principal Amount^ | Value | |||||||
ASSET-BACKED SECURITIES: 10.2% | ||||||||
| 510 Asset-Backed Trust | ||||||||
| $381,458 | Series 2021-NPL1-A1 | $ | 360,859 | |||||
| Aaset Trust | ||||||||
| 377,375 | Series 2021-1A-A | 316,912 | ||||||
| Accelerated Assets LLC | ||||||||
| 121,701 | Series 2018-1-B | 118,334 | ||||||
| Adams Outdoor Advertising L.P. | ||||||||
| 835,630 | Series 2018-1-A | 824,602 | ||||||
| Affirm Asset Securitization Trust | ||||||||
| 205,000 | Series 2021-A-C | 196,132 | ||||||
| AGL CLO 3 Ltd. | ||||||||
| 320,000 | Series 2020-3A-C | 301,314 | ||||||
| 470,000 | Series 2020-3A-D | 448,007 | ||||||
| AIM Aviation Finance Ltd. | ||||||||
| 637,452 | Series 2015-1A-B1 | 195,714 | ||||||
| Aimco CLO 11 Ltd. | ||||||||
| 675,000 | Series 2020-11A-DR | 626,727 | ||||||
| Aimco CLO 14 Ltd. | ||||||||
| 1,010,000 | Series 2021-14A-D | 888,989 | ||||||
| American Credit Acceptance Receivables Trust | ||||||||
| 670,000 | Series 2020-3-D | 649,263 | ||||||
| American Homes 4 Rent Trust | ||||||||
| 875,000 | Series 2014-SFR2-E | 891,498 | ||||||
| 600,000 | Series 2014-SFR3-E | 615,152 | ||||||
| 845,000 | Series 2015-SFR1-E | 855,949 | ||||||
| AMSR Trust | ||||||||
| 1,800,000 | Series 2020-SFR5-G | 1,683,644 | ||||||
| 5,000,000 | Series 2021-SFR1-G | 4,393,365 | ||||||
| Apidos CLO XX | ||||||||
| 265,000 | Series 2015-20A-BRR | 250,288 | ||||||
| Apidos CLO XXIII | ||||||||
| 855,000 | Series 2015-23A-CR | 798,420 | ||||||
| Principal Amount^ | Value | |||||||
| Apidos CLO XXIV | ||||||||
| $ 1,000,000 | Series 2016-24A-DR | $ | 839,000 | |||||
| ARES LX CLO Ltd. | ||||||||
| 500,000 | Series 2021-60A-D | 463,404 | ||||||
| Atrium CLO XIII | ||||||||
| 500,000 | Series 13A-E | 446,534 | ||||||
| Atrium CLO XIV LLC | ||||||||
| 750,000 | Series 14A-E | 661,565 | ||||||
| Avid Automobile Receivables Trust | ||||||||
| 180,000 | Series 2019-1-C | 178,576 | ||||||
| Avis Budget Rental Car Funding AESOP LLC | ||||||||
| 215,000 | Series 2020-2A-B | 202,319 | ||||||
| 355,000 | Series 2020-2A-C | 344,060 | ||||||
| Bain Capital Credit CLO Ltd. | ||||||||
| 500,000 | Series 2021-2A-D | 467,490 | ||||||
| 500,000 | Series 2022-3A E | 453,223 | ||||||
| Barings CLO Ltd. | ||||||||
| 1,500,000 | Series 2018-3A-E | 1,324,161 | ||||||
| 500,000 | Series 2018-4A-E | 441,455 | ||||||
| 1,100,000 | Series 2019-4A-C | 1,075,813 | ||||||
| Battalion CLO Ltd. | ||||||||
| 960,000 | Series 2019-16A-DR | 874,552 | ||||||
| BHG Securitization Trust | ||||||||
| 545,000 | Series 2022-A-B | 500,244 | ||||||
| Blackbird Capital Aircraft Lease Securitization Ltd. | ||||||||
| 235,660 | Series 2016-1A-A | 208,678 | ||||||
| Brex Commercial Charge Card Master Trust | ||||||||
| 165,000 | Series 2021-1-A | 161,875 | ||||||
| Bristol Park CLO Ltd. | ||||||||
| 260,000 | Series 2016-1A-CR | 246,836 | ||||||
The accompanying notes are an integral part of these financial statements.
| 48 | Litman Gregory Funds Trust | |||||
Table of Contents
iMGP Alternative Strategies Fund
SCHEDULE OF INVESTMENTS IN SECURITIES at June 30, 2022 (Unaudited) (Continued)
| Principal Amount^ | Value | |||||||
ASSET-BACKED SECURITIES (CONTINUED) | ||||||||
| Buttermilk Park CLO Ltd. | ||||||||
| $ 750,000 | Series 2018-1A-E | $ | 660,862 | |||||
| California Republic Auto Receivables Trust | ||||||||
| 520,000 | Series 2018-1-D | 520,970 | ||||||
| Canyon Capital CLO Ltd. | ||||||||
| 1,000,000 | Series 2016-1A-ER | 819,889 | ||||||
| 500,000 | Series 2018-1A-E | 413,474 | ||||||
| 1,000,000 | Series 2021-4A-E | 865,644 | ||||||
| Carlyle Global Market Strategies CLO Ltd. | ||||||||
| 500,000 | Series 2014-2RA-D | 403,766 | ||||||
| Carlyle US CLO Ltd. | ||||||||
| 1,000,000 | Series 2020-2A-DR | 884,697 | ||||||
| 500,000 | Series 2021-1A-D | 428,160 | ||||||
| Carvana Auto Receivables Trust | ||||||||
| 3,000 | Series 2021-N1-R | 975,541 | ||||||
| 150,000 | Series 2021-N4-D | 140,290 | ||||||
| Castlelake Aircraft Securitization Trust | ||||||||
| 4,161,106 | Series 2018-1-C | 2,789,255 | ||||||
| Castlelake Aircraft Structured Trust | ||||||||
| 3,000,000 | Series 2019-1A-E | 525,000 | ||||||
| 961,314 | Series 2021-1A-A | 857,953 | ||||||
| Catskill Park CLO Ltd. | ||||||||
| 1,000,000 | Series 2017-1A-D | 886,708 | ||||||
| Chenango Park CLO Ltd. | ||||||||
| 500,000 | Series 2018-1A-D | 431,474 | ||||||
| CIFC Funding CLO Ltd. | ||||||||
| 205,000 | Series 2013-2A-A3LR | 195,442 | ||||||
| 500,000 | Series 2017-4A-D | 446,073 | ||||||
| Principal Amount^ | Value | |||||||
| $ 1,000,000 | Series 2021-7A-D | $ | 927,353 | |||||
| CIFC Funding Ltd. | ||||||||
| 500,000 | Series 2019-3A-DR | 460,892 | ||||||
| Citigroup Mortgage Loan Trust | ||||||||
| 767,906 | Series 2019-E-A1 | 767,608 | ||||||
| Cologix Data Centers US Issuer LLC | ||||||||
| 1,500,000 | Series 2021-1A-C | 1,361,080 | ||||||
| Cook Park CLO Ltd. | ||||||||
| 1,000,000 | Series 2018-1A-E | 870,905 | ||||||
| Corevest American Finance Trust | ||||||||
| 305,000 | Series 2020-4-C | 256,554 | ||||||
| Credit Acceptance Auto Loan Trust | ||||||||
| 605,000 | Series 2020-1A-C | 589,920 | ||||||
| 275,000 | Series 2020-3A-C | 257,787 | ||||||
| CSAB Mortgage-Backed Trust | ||||||||
| 1,857,684 | Series 2006-2-A6B | 209,969 | ||||||
| DB Master Finance LLC | ||||||||
| 565,995 | Series 2019-1A-A23 | 529,772 | ||||||
| 129,350 | Series 2021-1A-A2II | 111,880 | ||||||
| Dell Equipment Finance Trust | ||||||||
| 200,000 | Series 2020-2-D | 196,153 | ||||||
| Diamond Resorts Owner Trust | ||||||||
| 151,095 | Series 2018-1-C | 150,371 | ||||||
| 110,954 | Series 2019-1A-B | 108,705 | ||||||
| Domino’s Pizza Master Issuer LLC | ||||||||
| 703,763 | Series 2017-1A-A23 | 675,011 | ||||||
| 607,950 | Series 2018-1A-A2II | 590,951 | ||||||
| 488,750 | Series 2019-1A-A2 | 443,959 | ||||||
| Dryden 40 Senior Loan Fund CLO | ||||||||
| 1,000,000 | Series 2015-40A-ER | 865,928 | ||||||
| Dryden 45 Senior Loan Fund CLO | ||||||||
| 275,000 | Series 2016-45A-ER | 240,496 | ||||||
| Dryden 55 CLO Ltd. | ||||||||
| 500,000 | Series 2018-55A-F | 418,586 | ||||||
The accompanying notes are an integral part of these financial statements.
| Schedule of Investments | 49 | |||||
Table of Contents
iMGP Alternative Strategies Fund
SCHEDULE OF INVESTMENTS IN SECURITIES at June 30, 2022 (Unaudited) (Continued)
| Principal Amount^ | Value | |||||||
ASSET-BACKED SECURITIES (CONTINUED) | ||||||||
| DT Auto Owner Trust | ||||||||
| $ 270,000 | Series 2020-3A-D | $ | 257,984 | |||||
| 545,000 | Series 2022-2A D | 532,169 | ||||||
| Education Funding Trust | ||||||||
| 340,113 | Series 2020-A-A | 323,851 | ||||||
| Exeter Automobile Receivables Trust | ||||||||
| 305,000 | Series 2020-2A-D | 306,278 | ||||||
| Fillmore Park CLO Ltd. | ||||||||
| 500,000 | Series 2018-1A-E | 445,785 | ||||||
| First Investors Auto Owner Trust | ||||||||
| 160,000 | Series 2019-2A-D | 157,416 | ||||||
| 365,000 | Series 2019-2A-E | 360,352 | ||||||
| FirstKey Homes Trust | ||||||||
| 775,000 | Series 2020-SFR1-F1 | 722,382 | ||||||
| 1,010,000 | Series 2020-SFR2-F1 | 915,152 | ||||||
| Flagship Credit Auto Trust | ||||||||
| 595,000 | Series 2020-1-D | 571,759 | ||||||
| 755,000 | Series 2022-1-D | 711,147 | ||||||
| FMC GMSR Issuer Trust | ||||||||
| 1,900,000 | Series 2021-GT1-B | 1,715,392 | ||||||
| 2,500,000 | Series 2021-GT2-B | 2,245,757 | ||||||
| Galaxy XIX CLO Ltd. | ||||||||
| 1,000,000 | Series 2015-19A-D1R | 841,334 | ||||||
| Galaxy XXVI CLO Ltd. | ||||||||
| 715,000 | Series 2018-26A-E | 611,888 | ||||||
| Gilbert Park CLO Ltd. | ||||||||
| 500,000 | Series 2017-1A-E | 467,420 | ||||||
| GLS Auto Receivables Issuer Trust | ||||||||
| 1,000,000 | Series 2021-4A-E | 884,118 | ||||||
| Goldentree Loan Management US CLO 3 Ltd. | ||||||||
| 500,000 | Series 2018-3A-D | 459,984 | ||||||
| Principal Amount^ | Value | |||||||
| Greystone Commercial Real Estate Notes Ltd. | ||||||||
| $ 355,000 | Series 2021-HC2-A | $ | 345,055 | |||||
| GSAA Home Equity Trust | ||||||||
| 552,783 | Series 2006-10-AF5 | 174,077 | ||||||
| Hayfin US CLO XII Ltd. | ||||||||
| 300,000 | Series 2020-12A-D | 292,113 | ||||||
| Hertz Vehicle Financing III LLC | ||||||||
| 357,000 | Series 2022-1A D | 319,303 | ||||||
| 366,000 | Series 2022-3A D | 351,228 | ||||||
| Highbridge Loan Management CLO Ltd. | ||||||||
| 500,000 | Series 2013-2A-DR | 423,589 | ||||||
| Hilton Grand Vacations Trust | ||||||||
| 71,121 | Series 2018-AA-C | 69,206 | ||||||
| Horizon Aircraft Finance I Ltd. | ||||||||
| 2,982,764 | Series 2018-1-C | 1,707,374 | ||||||
| HPEFS Equipment Trust | ||||||||
| 265,000 | Series 2020-1A-D | 261,787 | ||||||
| HPS Loan Management CLO Ltd. | ||||||||
| 2,000,000 | Series 6A-2015-DR | 1,684,340 | ||||||
| Kestrel Aircraft Funding Ltd. | ||||||||
| 477,146 | Series 2018-1A-A | 419,725 | ||||||
| LCM CLO 26 Ltd. | ||||||||
| 500,000 | Series 26A-E | 400,872 | ||||||
| LCM CLO XVII L.P. | ||||||||
| 1,000,000 | Series 17A-ER | 811,896 | ||||||
| LCM CLO XX L.P. | ||||||||
| 500,000 | Series 20A-ER | 457,640 | ||||||
| LCM Loan Income Fund I Income Note Issuer CLO Ltd. | ||||||||
| 500,000 | Series 27A-E | 406,154 | ||||||
| Lehman XS Trust | ||||||||
| 1,985,175 | Series 2005-6-3A3A | 1,105,419 | ||||||
| Madison Park Funding CLO XIV Ltd. | ||||||||
| 1,000,000 | Series 2014-14A-ER | 878,867 | ||||||
The accompanying notes are an integral part of these financial statements.
| 50 | Litman Gregory Funds Trust | |||||
Table of Contents
iMGP Alternative Strategies Fund
SCHEDULE OF INVESTMENTS IN SECURITIES at June 30, 2022 (Unaudited) (Continued)
| Principal Amount^ | Value | |||||||
ASSET-BACKED SECURITIES (CONTINUED) | ||||||||
| Madison Park Funding CLO XLV Ltd. | ||||||||
| $ 500,000 | Series 2020-45A ER | $ | 449,367 | |||||
| Madison Park Funding CLO XXII Ltd. | ||||||||
| 1,000,000 | Series 2016-22A-ER | 901,706 | ||||||
| Madison Park Funding CLO XXVI Ltd. | ||||||||
| 445,000 | Series 2007-4A-DR | 416,814 | ||||||
| Madison Park Funding CLO XXX Ltd. | ||||||||
| 395,000 | Series 2018-30A-D | 369,685 | ||||||
| Madison Park Funding CLO XXXI Ltd. | ||||||||
| 270,000 | Series 2018-31A-C | 256,512 | ||||||
| Madison Park Funding CLO XXXVIII Ltd. | ||||||||
| 500,000 | Series 2021-38A-E | 442,592 | ||||||
| MAPS Ltd. | ||||||||
| 467,362 | Series 2018-1A-A | 433,677 | ||||||
| 180,454 | Series 2019-1A-A | 163,795 | ||||||
| Marlette Funding Trust | ||||||||
| 1,065,000 | Series 2022-1A-D | 991,096 | ||||||
| Milos CLO Ltd. | ||||||||
| 500,000 | Series 2017-1A-ER | 433,728 | ||||||
| Mosaic Solar Loans LLC | ||||||||
| 1,010,835 | Series 2017-2A-B | 977,781 | ||||||
| MVW LLC | ||||||||
| 46,469 | Series 2020-1A-C | 45,014 | ||||||
| MVW Owner Trust | ||||||||
| 48,974 | Series 2019-1A-C | 46,573 | ||||||
| 370,904 | Series 2021-1WA-D | 340,070 | ||||||
| Myers Park CLO Ltd. | ||||||||
| 1,000,000 | Series 2018-1A-E | 875,268 | ||||||
| Navient Private Education Refi Loan Trust | ||||||||
| 260,000 | Series 2018-A-B | 259,694 | ||||||
| 855,000 | Series 2019-FA-B | 768,035 | ||||||
| 180,000 | Series 2019-GA-B | 160,710 | ||||||
| Principal Amount^ | Value | |||||||
| $ 320,000 | Series 2020-FA-B | $ | 285,001 | |||||
| Neuberger Berman CLO XVI-S Ltd. | ||||||||
| 500,000 | Series 2017-16SA-ER | 443,284 | ||||||
| Neuberger Berman Loan Advisers CLO 24 Ltd. | ||||||||
| 1,000,000 | Series 2017-24A-E | 911,596 | ||||||
| Neuberger Berman Loan Advisers CLO 26 Ltd. | ||||||||
| 1,000,000 | Series 2017-26A-INC | 533,887 | ||||||
| Neuberger Berman Loan Advisers CLO 37 Ltd. | ||||||||
| 500,000 | Series 2020-37A-ER | 442,760 | ||||||
| Neuberger Berman Loan Advisers CLO 42 Ltd. | ||||||||
| 500,000 | Series 2021-42A-E | 441,445 | ||||||
| Ocean Trails CLO V | ||||||||
| 700,000 | Series 2014-5A-DRR | 576,700 | ||||||
| Octagon Investment Partners CLO 26 Ltd. | ||||||||
| 1,000,000 | Series 2016-1A-FR | 777,985 | ||||||
| Octagon Investment Partners CLO 29 Ltd. | ||||||||
| 500,000 | Series 2016-1A-DR | 448,455 | ||||||
| 1,000,000 | Series 2016-1A-ER | 912,652 | ||||||
| Octagon Investment Partners CLO 39 Ltd. | ||||||||
| 275,000 | Series 2018-3A-E | 235,102 | ||||||
| Octagon Investment Partners CLO 40 Ltd. | ||||||||
| 500,000 | Series 2019-1A-ER | 448,717 | ||||||
| Octagon Investment Partners CLO XVI Ltd. | ||||||||
| 1,000,000 | Series 2013-1A-ER | 849,213 | ||||||
| 1,500,000 | Series 2013-1A-SUB | 260,372 | ||||||
The accompanying notes are an integral part of these financial statements.
| Schedule of Investments | 51 | |||||
Table of Contents
iMGP Alternative Strategies Fund
SCHEDULE OF INVESTMENTS IN SECURITIES at June 30, 2022 (Unaudited) (Continued)
| Principal Amount^ | Value | |||||||
ASSET-BACKED SECURITIES (CONTINUED) | ||||||||
| Octagon Investment Partners CLO XXI Ltd. | ||||||||
| $ 500,000 | Series 2014-1A-DRR | $ | 446,532 | |||||
| Octagon Investment Partners CLO XXII Ltd. | ||||||||
| 835,000 | Series 2014-1A-CRR | 784,978 | ||||||
| OHA Credit Funding CLO 3 Ltd. | ||||||||
| 500,000 | Series 2019-3A-ER | 444,487 | ||||||
| OHA Credit Funding CLO 4 Ltd. | ||||||||
| 980,000 | Series 2019-4A-ER | 917,804 | ||||||
| OHA Credit Funding CLO 5 Ltd. | ||||||||
| 475,000 | Series 2020-5A-C | 445,037 | ||||||
| OneMain Financial Issuance Trust | ||||||||
| 290,000 | Series 2020-1A-B | 289,270 | ||||||
| 265,000 | Series 2020-2A-C | 232,728 | ||||||
| OZLM CLO XXIII Ltd. | ||||||||
| 255,000 | Series 2019-23A-DR | 243,780 | ||||||
| Pagaya AI Debt Selection Trust | ||||||||
| 800,000 | Series 2021-5-CERT | 1,176,297 | ||||||
| Palmer Square CLO Ltd. | ||||||||
| 260,000 | Series 2015-2A-BR2 | 247,651 | ||||||
| Parallel CLO Ltd. | ||||||||
| 700,000 | Series 2017-1A-CR | 657,179 | ||||||
| Planet Fitness Master Issuer LLC | ||||||||
| 760,500 | Series 2019-1A-A2 | 673,801 | ||||||
| PNMAC FMSR Issuer Trust | ||||||||
| 7,300,000 | Series 2018-FT1-A | 7,225,996 | ||||||
| Prestige Auto Receivables Trust | ||||||||
| 330,000 | Series 2019-1A-E | 326,297 | ||||||
| 210,000 | Series 2020-1A-E | 206,810 | ||||||
| Progress Residential Trust | ||||||||
| 235,000 | Series 2019-SFR3-D | 225,450 | ||||||
| 255,000 | Series 2020-SFR3-F | 231,099 | ||||||
| Principal Amount^ | Value | |||||||
| $ 140,000 | Series 2021-SFR1-F | $ | 120,382 | |||||
| 3,500,000 | Series 2021-SFR10-F | 2,938,514 | ||||||
| 170,000 | Series 2021-SFR2-E2 | 149,264 | ||||||
| 7,000,000 | Series 2021-SFR2-G | 6,293,862 | ||||||
| 355,000 | Series 2021-SFR3-F | 311,171 | ||||||
| 735,000 | Series 2021-SFR4-F | 666,223 | ||||||
| 250,000 | Series 2021-SFR5-F | 214,963 | ||||||
| 125,000 | Series 2021-SFR6-E2 | 107,547 | ||||||
| 835,000 | Series 2021-SFR7-F | 697,653 | ||||||
| Rockford Tower CLO Ltd. | ||||||||
| 700,000 | Series 2017-2A-CR | 663,363 | ||||||
| RR CLO 2 Ltd. | ||||||||
| 500,000 | Series 2017-2A-DR | 435,792 | ||||||
| RR CLO 6 Ltd. | ||||||||
| 500,000 | Series 2019-6A-DR | 435,965 | ||||||
| S-Jets Ltd. | ||||||||
| 947,946 | Series 2017-1-A | 834,540 | ||||||
| Santander Drive Auto Receivables Trust | ||||||||
| 890,000 | Series 2020-1-D | 899,261 | ||||||
| 300,000 | Series 2020-2-D | 293,683 | ||||||
| SCF Equipment Leasing LLC | ||||||||
| 295,000 | Series 2021-1A-E | 274,433 | ||||||
| Sierra Timeshare Receivables Funding LLC | ||||||||
| 217,334 | Series 2020-2A-C | 208,431 | ||||||
| Slam Ltd. | ||||||||
| 239,063 | Series 2021-1A-B | 201,483 | ||||||
| SLM Private Credit Student Loan Trust | ||||||||
| 149,000 | Series 2003-A-A3 | 146,406 | ||||||
| 443,000 | Series 2003-B-A3 | 435,632 | ||||||
| 50,000 | Series 2003-B-A4 | 49,168 | ||||||
| SoFi Consumer Loan Program Trust | ||||||||
| 311,320 | Series 2019-4-C | 310,143 | ||||||
| SoFi Professional Loan Program LLC | ||||||||
| 133,000 | Series 2017-F-R1 | 2,526,034 | ||||||
The accompanying notes are an integral part of these financial statements.
| 52 | Litman Gregory Funds Trust | |||||
Table of Contents
iMGP Alternative Strategies Fund
SCHEDULE OF INVESTMENTS IN SECURITIES at June 30, 2022 (Unaudited) (Continued)
| Principal Amount^ | Value | |||||||
ASSET-BACKED SECURITIES (CONTINUED) | ||||||||
| SoFi Professional Loan Program Trust | ||||||||
| $ 360,000 | Series 2020-A-BFX | $ | 319,094 | |||||
| 45,000 | Series 2020-A-R1 | 1,467,464 | ||||||
| Sound Point CLO XXXII Ltd. | ||||||||
| 500,000 | Series 2021-4A-E | 442,446 | ||||||
| SpringCastle America Funding LLC | ||||||||
| 528,652 | Series 2020-AA-A | 491,543 | ||||||
| Sprite Ltd. | ||||||||
| 2,840,910 | Series 2021-1-A | 2,577,904 | ||||||
| Stewart Park CLO Ltd. | ||||||||
| 500,000 | Series 2015-1A-ER | 423,940 | ||||||
| Textainer Marine Containers VII Ltd. | ||||||||
| 93,342 | Series 2020-1A-A | 87,713 | ||||||
| 200,624 | Series 2021-1A-B | 178,454 | ||||||
| THL Credit Wind River CLO Ltd. | ||||||||
| 2,000,000 | Series 2014-2A-INC | 300,000 | ||||||
| 500,000 | Series 2017-3A-ER | 453,584 | ||||||
| 500,000 | Series 2018-2A-E | 426,438 | ||||||
| TICP CLO VII Ltd. | ||||||||
| 280,000 | Series 2017-7A-CR | 264,036 | ||||||
| TICP CLO XV Ltd. | ||||||||
| 250,000 | Series 2020-15A-C | 236,010 | ||||||
| Towd Point Mortgage Trust | ||||||||
| 310,000 | Series 2018-5-M1 | 268,411 | ||||||
| 385,000 | Series 2019-2-M1 | 341,766 | ||||||
| Trestles CLO II Ltd. | ||||||||
| 335,000 | Series 2018-2A-D | 286,657 | ||||||
| Tricon American Homes Trust | ||||||||
| 250,000 | Series 2020-SFR1-E | 237,238 | ||||||
| 290,000 | Series 2020-SFR2-E1 | 248,739 | ||||||
| Unity-Peace Park CLO Ltd. | ||||||||
| 500,000 | Series 2022-1A-E | 464,142 | ||||||
| Principal Amount^ | Value | |||||||
| Upstart Pass-Through Trust | ||||||||
| $ 1,000,000 | Series 2021-ST8-CERT | $ | 698,270 | |||||
| 929,000 | Series 2021-ST9-CERT | 663,420 | ||||||
| Upstart Securitization Trust | ||||||||
| 1,000 | Series 2021-2-CERT | 487,728 | ||||||
| VCAT LLC | ||||||||
| 265,016 | Series 2021-NPL5-A1 | 250,418 | ||||||
| VOLT XCII LLC | ||||||||
| 3,000,000 | Series 2021-NPL1-A2 | 2,844,228 | ||||||
| VOLT XCIII LLC | ||||||||
| 675,815 | Series 2021-NPL2-A1 | 643,858 | ||||||
| VOLT XCIV LLC | ||||||||
| 675,000 | Series 2021-NPL3-A2 | 652,139 | ||||||
| VOLT XCVI LLC | ||||||||
| 345,000 | Series 2021-NPL5-A2 | 328,742 | ||||||
| Voya CLO Ltd. | ||||||||
| 500,000 | Series 2018-2A-E | 412,336 | ||||||
| 500,000 | Series 2019-1A-ER | 413,844 | ||||||
| WAVE Trust | ||||||||
| 493,364 | Series 2017-1A-A | 445,368 | ||||||
| Webster Park CLO Ltd. | ||||||||
| 1,000,000 | Series 2015-1A-DR | 875,117 | ||||||
| Wendy’s Funding LLC | ||||||||
| 1,007,525 | Series 2018-1A-A2II | 953,201 | ||||||
| 173,850 | Series 2019-1A-A2II | 163,683 | ||||||
| Westlake Automobile Receivables Trust | ||||||||
| 390,000 | Series 2020-3A-D | 375,214 | ||||||
| 460,000 | Series 2022-2A D | 459,241 | ||||||
| Willis Engine Structured Trust | ||||||||
| 217,400 | Series 2020-A-A | 185,658 | ||||||
| 1,728,031 | Series 2021-A-C | 1,418,758 | ||||||
| Wind River CLO Ltd. | ||||||||
| 500,000 | Series 2021-2A-E | 437,192 | ||||||
|
| |||||||
| | TOTAL ASSET-BACKED SECURITIES | 140,335,234 | ||||||
|
| |||||||
The accompanying notes are an integral part of these financial statements.
| Schedule of Investments | 53 | |||||
Table of Contents
iMGP Alternative Strategies Fund
SCHEDULE OF INVESTMENTS IN SECURITIES at June 30, 2022 (Unaudited) (Continued)
| Principal Amount^ | Value | |||||||
BANK LOANS: 1.8% | ||||||||
| Aegion Corp. | ||||||||
| $ 178,650 | 6.273%, 05/17/2028(g) | $ | 163,911 | |||||
| Air Methods Corp. | ||||||||
| 1,158,418 | 5.750%, 04/22/2024(g) | 1,032,440 | ||||||
| American Tire Distributors Holdings, Inc. | ||||||||
| 493,763 | 7.000%, 10/20/2028(g) | 468,087 | ||||||
| Applied Systems, Inc. | ||||||||
| 1,060,000 | 7.750%, 09/19/2025(g) | 1,028,863 | ||||||
| Astra Acquisition Corp. | ||||||||
| 833,745 | 6.916%, 10/25/2028(g) | 728,831 | ||||||
| 1,069,743 | 10.541%, 10/25/2029(g) | 994,861 | ||||||
| Asurion LLC | ||||||||
| 160,000 | 6.916%, 01/31/2028(g) | 137,400 | ||||||
| Atlas Purchaser, Inc. | ||||||||
| 623,923 | 6.621%, 05/08/2028(g) | 517,856 | ||||||
| Aveanna Healthcare LLC | ||||||||
| 885,000 | 8.595%, 12/10/2029(g) | 792,075 | ||||||
| Blackhawk Network Holdings, Inc. | ||||||||
| 125,000 | 8.313%, 06/15/2026(g) | 122,604 | ||||||
| Bright Bidco B.V. | ||||||||
| 859,195 | 4.774%, 06/30/2024(g) | 384,180 | ||||||
| BYJU’s Alpha, Inc. | ||||||||
| 323,375 | 7.006%, 11/24/2026(g) | 276,486 | ||||||
| Cengage Learning, Inc. | ||||||||
| 401,963 | 5.750%, 07/14/2026(g) | 363,776 | ||||||
| Constant Contact, Inc. | ||||||||
| 1,260,000 | 8.511%, 02/12/2029(g) | 1,222,200 | ||||||
| Cyxtera DC Holdings, Inc. | ||||||||
| 463,734 | 4.640%, 05/01/2024(g) | 438,769 | ||||||
| DCert Buyer, Inc. | ||||||||
| 485,000 | 8.666%, 02/19/2029(g) | 453,475 | ||||||
| DG Investment Intermediate Holdings 2, Inc. | ||||||||
| 420,000 | 8.416%, 03/30/2029(g) | 407,400 | ||||||
| Edgewater Generation LLC | ||||||||
| 241,389 | 5.416%, 12/13/2025(g) | 206,719 | ||||||
| Envision Healthcare Corp. | ||||||||
| 677,705 | 5.416%, 10/10/2025(g) | 230,589 | ||||||
| 865,488 | 6.000%-7.666%, 10/10/2025(g) | 297,148 | ||||||
| Principal Amount^ | Value | |||||||
| Finastra USA, Inc. | ||||||||
| $ 455,187 | 4.739%, 06/13/2024(g) | $ | 411,589 | |||||
| 405,000 | 8.489%, 06/13/2025(g) | 351,194 | ||||||
| Gainwell Acquisition Corp. | ||||||||
| 357,226 | 6.250%, 10/01/2027(g) | 338,807 | ||||||
| Grab Holdings, Inc. | ||||||||
| 632,000 | 5.500%, 01/29/2026(g) | 579,860 | ||||||
| Gulf Finance LLC | ||||||||
| 413,671 | 7.870%-8.420%, 08/25/2026(g) | 308,962 | ||||||
| Intelsat Jackson Holdings S.A. | ||||||||
| 399,127 | 4.920%, 02/01/2029(g) | 367,125 | ||||||
| ION Trading Finance Ltd. | ||||||||
| 201,678 | 7.000%, 04/03/2028(g) | 186,616 | ||||||
| Kenan Advantage Group, Inc. | ||||||||
| 220,000 | 8.916%, 09/01/2027(g) | 201,300 | ||||||
| Lealand Finance Company B.V. | ||||||||
| 273,000 | 0.000%, 06/28/2024(i) | 159,705 | ||||||
| 29,882 | 0.000%, 06/28/2024(i) | 19,423 | ||||||
| 21,355 | 4.666%, 06/28/2024(g) | 13,881 | ||||||
| 956,546 | 0.000%, 06/30/2024(i) | 559,579 | ||||||
| 581,126 | 4.214%, 06/30/2024(g) | 339,959 | ||||||
| 574,720 | 0.000%, 06/30/2025(i) | 294,785 | ||||||
| 770,160 | 2.666%-3.000%, 06/30/2025(g) | 395,031 | ||||||
| LSF9 Atlantis Holdings LLC | ||||||||
| 245,000 | 9.304%, 03/31/2029(g) | 225,890 | ||||||
| Mediaco Holding, Inc. | ||||||||
| 2,094,999 | 8.400%, 11/21/2024(a)(g) | 1,948,349 | ||||||
| Minotaur Acquisition, Inc. | ||||||||
| 454,722 | 6.375%, 03/27/2026(g) | 431,607 | ||||||
| Ola Singapore PTE, Ltd. | ||||||||
| 243,775 | 7.629%, 12/15/2026(g) | 208,835 | ||||||
| Playtika Holding Corp. | ||||||||
| 475,418 | 4.416%, 03/13/2028(g) | 449,470 | ||||||
| Riverbed Technology, Inc. | ||||||||
| 554,766 | 7.630%, 12/07/2026(g) | 332,687 | ||||||
| Sweetwater Borrower LLC | ||||||||
| 184,181 | 5.938%, 08/07/2028(g) | 158,856 | ||||||
| Team Health Holdings, Inc. | ||||||||
| 821,167 | 4.416%, 02/06/2024(g) | 733,815 | ||||||
| Tibco Software, Inc. | ||||||||
| 390,000 | 7.250%, 03/03/2028(g) | 384,833 | ||||||
The accompanying notes are an integral part of these financial statements.
| 54 | Litman Gregory Funds Trust | |||||
Table of Contents
iMGP Alternative Strategies Fund
SCHEDULE OF INVESTMENTS IN SECURITIES at June 30, 2022 (Unaudited) (Continued)
| Principal Amount^ | Value | |||||||
BANK LOANS (CONTINUED) | ||||||||
| Travel Leaders Group LLC | ||||||||
| $ 948,538 | 5.666%, 01/25/2024(g) | $ | 850,720 | |||||
| Travelport Finance (Luxembourg) S.A.R.L. | ||||||||
| 868,957 | 3.750%, 02/28/2025(g) | 861,896 | ||||||
| 196,732 | 9.000%, 05/29/2026(g) | 153,636 | ||||||
| Ultimate Software Group, Inc. (The) | ||||||||
| 765,000 | 6.212%, 05/03/2027(g) | 711,833 | ||||||
| Vantage Specialty Chemicals, Inc. | ||||||||
| 986,848 | 4.739%-5.750%, 10/28/2024(g) | 938,122 | ||||||
| Viad Corp. | ||||||||
| 377,150 | 6.666%, 07/30/2028(g) | 356,407 | ||||||
| Waterbridge Midstream Operating LLC | ||||||||
| 664,747 | 7.392%, 06/22/2026(g) | 630,346 | ||||||
| Ziggo B.V. | ||||||||
| 490,000 (EUR) | 3.000%, 01/31/2029(g) | 458,529 | ||||||
|
| |||||||
| | TOTAL BANK LOANS | 24,631,317 | ||||||
|
| |||||||
CONVERTIBLE BONDS: 1.4% | ||||||||
| Communications: 0.5% | ||||||||
| Cable One, Inc. | ||||||||
| 5,000 | 0.000%, 03/15/2026(j) | 4,145 | ||||||
| Delivery Hero SE | ||||||||
| 100,000 (EUR) | 1.000%, 04/30/2026 | 1,022,370 | ||||||
| 1,400,000 (EUR) | 1.000%, 01/23/2027 | 68,238 | ||||||
| DISH Network Corp. | ||||||||
| 1,080,000 | 0.000%, 12/15/2025(j) | 758,052 | ||||||
| 4,545,000 | 3.375%, 08/15/2026 | 3,081,510 | ||||||
| SNAP, Inc. | ||||||||
| 355,000 | 0.000%, 05/01/2027(j) | 247,612 | ||||||
| Spotify USA, Inc. | ||||||||
| 335,000 | 0.000%, 03/15/2026(j) | 265,990 | ||||||
| Twitter, Inc. | ||||||||
| 140,000 | 0.000%, 03/15/2026(j) | 124,609 | ||||||
| Uber Technologies, Inc. | ||||||||
| 820,000 | 0.000%, 12/15/2025(j) | 658,228 | ||||||
| Wayfair, Inc. | ||||||||
| 1,096,000 | 0.625%, 10/01/2025 | 729,388 | ||||||
| Zillow Group, Inc. | ||||||||
| 70,000 | 1.375%, 09/01/2026 | 70,630 | ||||||
|
| |||||||
| 7,030,772 | ||||||||
|
| |||||||
| Consumer, Cyclical: 0.3% | ||||||||
| Cineplex, Inc. | ||||||||
| 1,041,000 (CAD) | 5.750%, 09/30/2025(c) | 925,998 | ||||||
| JetBlue Airways Corp. | ||||||||
| 195,000 | 0.500%, 04/01/2026 | 144,398 | ||||||
| Principal Amount^ | Value | |||||||
| Consumer, Cyclical (continued) | ||||||||
| Lightning eMotors, Inc. | ||||||||
| $ 1,060,000 | 7.500%, 05/15/2024(c) | $ | 757,900 | |||||
| NCL Corp. Ltd. | ||||||||
| 775,000 | 1.125%, 02/15/2027(c) | 505,688 | ||||||
| Peloton Interactive, Inc. | ||||||||
| 50,000 | 0.000%, 02/15/2026(j) | 32,271 | ||||||
| Penn National Gaming, Inc. | ||||||||
| 130,000 | 2.750%, 05/15/2026 | 193,219 | ||||||
| Southwest Airlines Co. | ||||||||
| 1,025,000 | 1.250%, 05/01/2025 | 1,210,781 | ||||||
|
| |||||||
| 3,770,255 | ||||||||
|
| |||||||
| Consumer, Non-cyclical: 0.4% | ||||||||
| BioMarin Pharmaceutical, Inc. | ||||||||
| 2,275,000 | 1.250%, 05/15/2027 | 2,272,270 | ||||||
| Guardant Health, Inc. | ||||||||
| 215,000 | 0.000%, 11/15/2027(j) | 133,837 | ||||||
| Ionis Pharmaceuticals, Inc. | ||||||||
| 145,000 | 0.000%, 04/01/2026(j) | 132,574 | ||||||
| Livongo Health, Inc. | ||||||||
| 570,000 | 0.875%, 06/01/2025 | 483,594 | ||||||
| Teladoc Health, Inc. | ||||||||
| 1,895,000 | 1.250%, 06/01/2027 | 1,397,562 | ||||||
| UpHealth, Inc. | ||||||||
| 1,509,000 | 6.250%, 06/15/2026(c) | 1,154,464 | ||||||
|
| |||||||
| 5,574,301 | ||||||||
|
| |||||||
| Technology: 0.2% | ||||||||
| Bentley Systems, Inc. | ||||||||
| 20,000 | 0.375%, 07/01/2027 | 15,500 | ||||||
| Bentley Systems, Inc. | ||||||||
| 20,000 | 0.375%, 07/01/2027(c) | 15,600 | ||||||
| Bilibili, Inc. | ||||||||
| 315,000 | 0.500%, 12/01/2026(c) | 223,178 | ||||||
| Kaleyra, Inc. | ||||||||
| 1,424,000 | 6.125%, 06/01/2026(c) | 1,118,507 | ||||||
| Nutanix, Inc. | ||||||||
| 325,000 | 0.250%, 10/01/2027(c) | 226,297 | ||||||
| RingCentral, Inc. | ||||||||
| 65,000 | 0.000%, 03/15/2026(j) | 49,140 | ||||||
| Splunk, Inc. | ||||||||
| 760,000 | 1.125%, 06/15/2027 | 630,800 | ||||||
| Unity Software, Inc. | ||||||||
| 15,000 | 0.000%, 11/15/2026(c)(j) | 11,081 | ||||||
|
| |||||||
| 2,290,103 | ||||||||
|
| |||||||
| | TOTAL CONVERTIBLE BONDS | 18,665,431 | ||||||
|
| |||||||
CORPORATE BONDS: 27.3% | ||||||||
| Basic Materials: 1.8% | ||||||||
| ABJA Investment Co. Pte Ltd. | ||||||||
| 210,000 | 5.450%, 01/24/2028 | 199,226 | ||||||
| Albemarle Corp. | ||||||||
| 814,000 | 5.050%, 06/01/2032 | 798,132 | ||||||
| Allegheny Technologies, Inc. | ||||||||
| 2,470,000 | 4.875%, 10/01/2029 | 1,975,569 | ||||||
| 2,300,000 | 5.125%, 10/01/2031 | 1,766,321 | ||||||
| Ashland LLC | ||||||||
| 3,455,000 | 3.375%, 09/01/2031(c) | 2,818,609 | ||||||
The accompanying notes are an integral part of these financial statements.
| Schedule of Investments | 55 | |||||
Table of Contents
iMGP Alternative Strategies Fund
SCHEDULE OF INVESTMENTS IN SECURITIES at June 30, 2022 (Unaudited) (Continued)
| Principal Amount^ | Value | |||||||
CORPORATE BONDS (CONTINUED) | ||||||||
| Basic Materials (continued) | ||||||||
| ASP Unifrax Holdings, Inc. | ||||||||
| $ 260,000 | 7.500%, 09/30/2029(c) | $ | 180,827 | |||||
| Braskem Idesa SAPI | ||||||||
| 450,000 | 6.990%, 02/20/2032(c) | 348,680 | ||||||
| Braskem Netherlands Finance B.V. | ||||||||
| 800,000 | 4.500%, 01/31/2030(c) | 684,472 | ||||||
| CAP S.A. | ||||||||
| 300,000 | 3.900%, 04/27/2031 | 236,090 | ||||||
| CF Industries, Inc. | ||||||||
| 2,400,000 | 5.150%, 03/15/2034 | 2,354,021 | ||||||
| Chemours Co. (The) | ||||||||
| 546,000 | 4.625%, 11/15/2029(c) | 430,379 | ||||||
| Cia de Minas Buenaventura S.A.A. | ||||||||
| 360,000 | 5.500%, 07/23/2026(c) | 324,648 | ||||||
| Commercial Metals Co. | ||||||||
| 90,000 | 4.375%, 03/15/2032 | 73,888 | ||||||
| First Quantum Minerals Ltd. | ||||||||
| 600,000 | 7.500%, 04/01/2025(c) | 568,469 | ||||||
| 1,445,000 | 6.875%, 03/01/2026(c) | 1,333,692 | ||||||
| 740,000 | 6.875%, 10/15/2027(c) | 663,573 | ||||||
| FMG Resources August 2006 Pty Ltd. | ||||||||
| 350,000 | 4.500%, 09/15/2027(c) | 313,040 | ||||||
| 108,000 | 6.125%, 04/15/2032(c) | 97,414 | ||||||
| Freeport-McMoRan, Inc. | ||||||||
| 310,000 | 4.250%, 03/01/2030 | 282,788 | ||||||
| 345,000 | 4.625%, 08/01/2030 | 320,674 | ||||||
| Glencore Funding LLC | ||||||||
| 970,000 | 2.850%, 04/27/2031(c) | 804,035 | ||||||
| Illuminate Buyer LLC / Illuminate Holdings IV, Inc. | ||||||||
| 410,000 | 9.000%, 07/01/2028(c) | 324,435 | ||||||
| Mercer International, Inc. | ||||||||
| 1,000,000 | 5.125%, 02/01/2029 | 862,165 | ||||||
| Methanex Corp. | ||||||||
| 900,000 | 5.125%, 10/15/2027 | 795,767 | ||||||
| Metinvest B.V. | ||||||||
| 500,000 | 7.750%, 10/17/2029 | 274,075 | ||||||
| Nufarm Australia Ltd. / Nufarm Americas, Inc. | ||||||||
| 1,850,000 | 5.000%, 01/27/2030(c) | 1,567,412 | ||||||
| OCP S.A. | ||||||||
| 650,000 | 5.125%, 06/23/2051 | 433,312 | ||||||
| Orbia Advance Corp. SAB de C.V. | ||||||||
| 390,000 | 2.875%, 05/11/2031(c) | 313,970 | ||||||
| SPCM S.A. | ||||||||
| 200,000 | 3.125%, 03/15/2027(c) | 168,734 | ||||||
| Valvoline, Inc. | ||||||||
| 3,240,000 | 3.625%, 06/15/2031(c) | 2,592,972 | ||||||
| Vedanta Resources Finance II Plc | ||||||||
| 250,000 | 9.250%, 04/23/2026(c) | 149,631 | ||||||
| 200,000 | 9.250%, 04/23/2026 | 119,705 | ||||||
| Vibrantz Technologies, Inc. | ||||||||
| 285,000 | 9.000%, 02/15/2030(c) | 201,308 | ||||||
|
| |||||||
| 24,378,033 | ||||||||
|
| |||||||
| Principal Amount^ | Value | |||||||
| Communications: 3.1% | ||||||||
| Bell Telephone Co. of Canada or Bell Canada (The) | ||||||||
| $ 3,200,000 | Series US-5 | $ | 2,627,106 | |||||
| British Telecommunications PLC | ||||||||
| 1,000,000 | 5.125%, 12/04/2028 | 999,922 | ||||||
| CCO Holdings LLC / CCO Holdings Capital Corp. | ||||||||
| 125,000 | 5.500%, 05/01/2026(c) | 122,159 | ||||||
| 4,415,000 | 5.125%, 05/01/2027(c) | 4,180,961 | ||||||
| Cengage Learning, Inc. | ||||||||
| 460,000 | 9.500%, 06/15/2024(c) | 426,158 | ||||||
| Charter Communications Operating LLC / Charter Communications Operating Capital | ||||||||
| 145,000 | 2.800%, 04/01/2031 | 116,580 | ||||||
| 45,000 | 2.300%, 02/01/2032 | 34,197 | ||||||
| 70,000 | 4.400%, 04/01/2033 | 62,680 | ||||||
| 2,795,000 | 4.400%, 12/01/2061 | 2,028,752 | ||||||
| Cogent Communications Group, Inc. | ||||||||
| 740,000 | 7.000%, 06/15/2027(c) | 707,810 | ||||||
| CommScope Technologies LLC | ||||||||
| 640,000 | 5.000%, 03/15/2027(c) | 473,502 | ||||||
| CommScope, Inc. | ||||||||
| 1,510,000 | 7.125%, 07/01/2028(c) | 1,145,771 | ||||||
| CSC Holdings LLC | ||||||||
| 4,305,000 | 4.625%, 12/01/2030(c) | 2,897,416 | ||||||
| 235,000 | 5.000%, 11/15/2031(c) | 158,762 | ||||||
| DIRECTV Financing LLC / DIRECTIVE Financing Co-Obligor, Inc. | ||||||||
| 205,000 | 5.875%, 08/15/2027(c) | 176,880 | ||||||
| DISH DBS Corp. | ||||||||
| 1,705,000 | 5.250%, 12/01/2026(c) | 1,333,532 | ||||||
| 1,425,000 | 5.125%, 06/01/2029 | 865,452 | ||||||
| Embarq Corp. | ||||||||
| 925,000 | 7.995%, 06/01/2036 | 696,696 | ||||||
| Endurance International Group Holdings, Inc. | ||||||||
| 590,000 | 6.000%, 02/15/2029(c) | 427,716 | ||||||
| Expedia Group, Inc. | ||||||||
| 95,000 | 3.250%, 02/15/2030 | 79,449 | ||||||
| 90,000 | 2.950%, 03/15/2031 | 71,905 | ||||||
| FactSet Research Systems, Inc. | ||||||||
| 1,000,000 | 3.450%, 03/01/2032 | 879,839 | ||||||
| iHeartCommunications, Inc. | ||||||||
| 290,000 | 8.375%, 05/01/2027 | 231,078 | ||||||
| 350,000 | 5.250%, 08/15/2027(c) | 300,055 | ||||||
| 735,000 | 4.750%, 01/15/2028(c) | 603,722 | ||||||
| Intelsat Jackson Holdings S. A. | ||||||||
| 825,000 | 8.500%, 10/15/2024 | 0 | ||||||
| Kenbourne Invest S.A. | ||||||||
| 825,000 | 6.875%, 11/26/2024(c) | 751,901 | ||||||
| Lumen Technologies, Inc. | ||||||||
| 200,000 | 5.375%, 06/15/2029(c) | 158,860 | ||||||
| McGraw-Hill Education, Inc. | ||||||||
| 335,000 | 5.750%, 08/01/2028(c) | 287,495 | ||||||
| Netflix, Inc. | ||||||||
| 275,000 | 4.875%, 04/15/2028 | 259,982 | ||||||
| 715,000 | 5.875%, 11/15/2028 | 700,700 | ||||||
| 390,000 | 6.375%, 05/15/2029 | 392,697 | ||||||
The accompanying notes are an integral part of these financial statements.
| 56 | Litman Gregory Funds Trust | |||||
Table of Contents
iMGP Alternative Strategies Fund
SCHEDULE OF INVESTMENTS IN SECURITIES at June 30, 2022 (Unaudited) (Continued)
| Principal Amount^ | Value | |||||||
CORPORATE BONDS (CONTINUED) | ||||||||
| Communications (continued) | ||||||||
| Netflix, Inc. (Continued) | ||||||||
| $ 70,000 | 5.375%, 11/15/2029(c) | $ | 66,276 | |||||
| 445,000 | 4.875%, 06/15/2030(c) | 408,114 | ||||||
| Oi S.A. | ||||||||
| 550,000 | 10.000%, 07/27/2025(e) | 270,017 | ||||||
| Rogers Communications, Inc. | ||||||||
| 2,800,000 | 3.800%, 03/15/2032(c) | 2,570,882 | ||||||
| Sirius XM Radio, Inc. | ||||||||
| 2,234,000 | 3.875%, 09/01/2031(c) | 1,797,108 | ||||||
| SoftBank Group Corp. | ||||||||
| 600,000 | 4.625%, 07/06/2028 | 471,000 | ||||||
| 205,000 | 5.250%, 07/06/2031 | 152,446 | ||||||
| Telefonica Emisiones S.A. | ||||||||
| 3,800,000 | 4.103%, 03/08/2027 | 3,731,479 | ||||||
| Telesat Canada / Telesat LLC | ||||||||
| 310,000 | 5.625%, 12/06/2026(c) | 196,319 | ||||||
| Uber Technologies, Inc. | ||||||||
| 75,000 | 8.000%, 11/01/2026(c) | 74,835 | ||||||
| 245,000 | 7.500%, 09/15/2027(c) | 237,760 | ||||||
| 15,000 | 6.250%, 01/15/2028(c) | 13,892 | ||||||
| 5,950,000 | 4.500%, 08/15/2029(c) | 4,899,527 | ||||||
| Univision Communications, Inc. | ||||||||
| 214,000 | 7.375%, 06/30/2030(c) | 210,292 | ||||||
| Verizon Communications, Inc. | ||||||||
| 1,200,000 | 2.355%, 03/15/2032 | 998,947 | ||||||
| Viasat, Inc. | ||||||||
| 550,000 | 6.500%, 07/15/2028(c) | 379,541 | ||||||
| Viavi Solutions, Inc. | ||||||||
| 1,700,000 | 3.750%, 10/01/2029(c) | 1,427,036 | ||||||
| VTR Finance N.V. | ||||||||
| 500,000 | 6.375%, 07/15/2028 | 358,756 | ||||||
|
| |||||||
| 42,463,962 | ||||||||
|
| |||||||
| Consumer, Cyclical: 4.0% | ||||||||
| Allison Transmission, Inc. | ||||||||
| 2,250,000 | 3.750%, 01/30/2031(c) | 1,807,245 | ||||||
| American Honda Finance Corp. | ||||||||
| 3,085,000 | 1.500%, 01/13/2025 | 2,933,544 | ||||||
| Aramark Services, Inc. | ||||||||
| 485,000 | 6.375%, 05/01/2025(c) | 475,506 | ||||||
| Boyd Gaming Corp. | ||||||||
| 2,423,000 | 4.750%, 12/01/2027 | 2,203,840 | ||||||
| 1,000,000 | 4.750%, 06/15/2031(c) | 847,000 | ||||||
| Carnival Corp. | ||||||||
| 95,000 | 7.625%, 03/01/2026(c) | 73,609 | ||||||
| 740,000 | 5.750%, 03/01/2027(c) | 539,948 | ||||||
| 75,000 | 6.000%, 05/01/2029(c) | 52,663 | ||||||
| Churchill Downs, Inc. | ||||||||
| 5,869,000 | 4.750%, 01/15/2028(c) | 5,246,358 | ||||||
| Dealer Tire LLC / DT Issuer LLC | ||||||||
| 565,000 | 8.000%, 02/01/2028(c) | 488,844 | ||||||
| Dollar Tree, Inc. | ||||||||
| 800,000 | 2.650%, 12/01/2031 | 661,986 | ||||||
| Everi Holdings, Inc. | ||||||||
| 70,000 | 5.000%, 07/15/2029(c) | 59,244 | ||||||
| Ford Motor Co. | ||||||||
| 1,270,000 | 9.000%, 04/22/2025 | 1,365,402 | ||||||
| Principal Amount^ | Value | |||||||
| Consumer, Cyclical (continued) | ||||||||
| General Motors Co. | ||||||||
| $ 645,000 | 5.400%, 04/01/2048 | $ | 565,601 | |||||
| 510,000 | 5.950%, 04/01/2049 | 477,162 | ||||||
| General Motors Financial Co., Inc. | ||||||||
| 310,000 | Series A | 257,300 | ||||||
| 255,000 | Series B | 217,706 | ||||||
| 100,000 | Series C | 87,375 | ||||||
| Genm Capital Labuan Ltd. | ||||||||
| 440,000 | 3.882%, 04/19/2031(c) | 349,571 | ||||||
| Hilton Domestic Operating Co., Inc. | ||||||||
| 2,700,000 | 3.625%, 02/15/2032(c) | 2,152,696 | ||||||
| Hilton Grand Vacations Borrower Escrow LLC / Hilton Grand Vacations Borrower Esc | ||||||||
| 300,000 | 5.000%, 06/01/2029(c) | 243,476 | ||||||
| 160,000 | 4.875%, 07/01/2031(c) | 122,374 | ||||||
| Hyatt Hotels Corp. | ||||||||
| 195,000 | 5.625%, 04/23/2025 | 197,871 | ||||||
| Lithia Motors, Inc. | ||||||||
| 220,000 | 3.875%, 06/01/2029(c) | 187,601 | ||||||
| Magallanes, Inc. | ||||||||
| 170,000 | 3.755%, 03/15/2027(c) | 159,596 | ||||||
| 195,000 | 4.054%, 03/15/2029(c) | 179,371 | ||||||
| 305,000 | 4.279%, 03/15/2032(c) | 273,667 | ||||||
| Marriott International, Inc. | ||||||||
| 700,000 | Series II | 553,174 | ||||||
| Marriott Ownership Resorts, Inc. | ||||||||
| 230,000 | 4.500%, 06/15/2029(c) | 191,624 | ||||||
| Meritor, Inc. | ||||||||
| 1,859,000 | 4.500%, 12/15/2028(c) | 1,792,505 | ||||||
| Murphy Oil USA, Inc. | ||||||||
| 4,025,000 | 3.750%, 02/15/2031(c) | 3,427,670 | ||||||
| NCL Corp. Ltd. | ||||||||
| 610,000 | 5.875%, 03/15/2026(c) | 478,850 | ||||||
| 320,000 | 5.875%, 02/15/2027(c) | 274,202 | ||||||
| NCL Finance Ltd. | ||||||||
| 200,000 | 6.125%, 03/15/2028(c) | 145,777 | ||||||
| Papa John’s International, Inc. | ||||||||
| 1,800,000 | 3.875%, 09/15/2029(c) | 1,487,430 | ||||||
| Park River Holdings, Inc. | ||||||||
| 120,000 | 5.625%, 02/01/2029(c) | 74,955 | ||||||
| Peninsula Pacific Entertainment LLC / Peninsula Pacific Entertainment Finance In | ||||||||
| 2,819,000 | 8.500%, 11/15/2027(c) | 2,964,164 | ||||||
| Penn National Gaming, Inc. | ||||||||
| 180,000 | 4.125%, 07/01/2029(c) | 136,832 | ||||||
| Penske Automotive Group, Inc. | ||||||||
| 713,000 | 3.750%, 06/15/2029 | 596,436 | ||||||
| PetSmart, Inc. / PetSmart Finance Corp. | ||||||||
| 500,000 | 7.750%, 02/15/2029(c) | 452,372 | ||||||
The accompanying notes are an integral part of these financial statements.
| Schedule of Investments | 57 | |||||
Table of Contents
iMGP Alternative Strategies Fund
SCHEDULE OF INVESTMENTS IN SECURITIES at June 30, 2022 (Unaudited) (Continued)
| Principal Amount^ | Value | |||||||
CORPORATE BONDS (CONTINUED) | ||||||||
| Consumer, Cyclical (continued) | ||||||||
| Premier Entertainment Sub LLC / Premier Entertainment Finance Corp. | ||||||||
| $ 240,000 | 5.625%, 09/01/2029(c) | $ | 171,235 | |||||
| 190,000 | 5.875%, 09/01/2031(c) | 132,126 | ||||||
| Royal Caribbean Cruises Ltd. | ||||||||
| 145,000 | 4.250%, 07/01/2026(c) | 103,265 | ||||||
| 985,000 | 5.500%, 04/01/2028(c) | 686,895 | ||||||
| Scientific Games International, Inc. | ||||||||
| 635,000 | 7.000%, 05/15/2028(c) | 600,796 | ||||||
| 225,000 | 7.250%, 11/15/2029(c) | 213,161 | ||||||
| Superior Plus L.P. / Superior General Partner, Inc. | ||||||||
| 2,874,000 | 4.500%, 03/15/2029(c) | 2,448,303 | ||||||
| SWF Escrow Issuer Corp. | ||||||||
| 450,000 | 6.500%, 10/01/2029(c) | 303,266 | ||||||
| Tenneco, Inc. | ||||||||
| 3,333,000 | 5.125%, 04/15/2029(c) | 3,143,411 | ||||||
| TKC Holdings, Inc. | ||||||||
| 320,000 | 10.500%, 05/15/2029(c) | 262,304 | ||||||
| Toyota Motor Credit Corp. | ||||||||
| 3,090,000 | 1.450%, 01/13/2025 | 2,934,868 | ||||||
| Travel & Leisure Co. | ||||||||
| 420,000 | 6.625%, 07/31/2026(c) | 399,498 | ||||||
| 35,000 | 6.000%, 04/01/2027 | 31,712 | ||||||
| 740,000 | 4.500%, 12/01/2029(c) | 574,436 | ||||||
| 125,000 | 4.625%, 03/01/2030(c) | 97,056 | ||||||
| United Airlines Pass Through Trust | ||||||||
| 1,360,803 | Series 2019-2-B | 1,180,044 | ||||||
| 132,800 | Series 2020-1-B | 126,409 | ||||||
| Vista Outdoor, Inc. | ||||||||
| 900,000 | 4.500%, 03/15/2029(c) | 689,942 | ||||||
| Wabash National Corp. | ||||||||
| 466,000 | 4.500%, 10/15/2028(c) | 357,073 | ||||||
| Wheel Pros, Inc. | ||||||||
| 230,000 | 6.500%, 05/15/2029(c) | 162,850 | ||||||
| Wyndham Hotels & Resorts, Inc. | ||||||||
| 920,000 | 4.375%, 08/15/2028(c) | 805,994 | ||||||
| Yum! Brands, Inc. | ||||||||
| 3,256,000 | 4.750%, 01/15/2030(c) | 2,960,648 | ||||||
| 2,684,000 | 4.625%, 01/31/2032 | 2,367,838 | ||||||
|
| |||||||
| 55,555,677 | ||||||||
|
| |||||||
| Consumer, Non-cyclical: 4.9% | ||||||||
| AbbVie, Inc. | ||||||||
| 600,000 | 4.550%, 03/15/2035 | 588,243 | ||||||
| Acadia Healthcare Co., Inc. | ||||||||
| 1,496,000 | 5.500%, 07/01/2028(c) | 1,400,069 | ||||||
| 3,000,000 | 5.000%, 04/15/2029(c) | 2,722,365 | ||||||
| Air Methods Corp. | ||||||||
| 460,000 | 8.000%, 05/15/2025(c) | 301,953 | ||||||
| Altria Group, Inc. | ||||||||
| 1,500,000 | 2.450%, 02/04/2032 | 1,134,465 | ||||||
| Avantor Funding, Inc. | ||||||||
| 430,000 | 3.875%, 11/01/2029(c) | 376,712 | ||||||
| Principal Amount^ | Value | |||||||
| Consumer, Non-cyclical (continued) | ||||||||
| BAT Capital Corp. | ||||||||
| $ 6,000,000 | 2.726%, 03/25/2031 | $ | 4,770,775 | |||||
| Bausch Health Cos., Inc. | ||||||||
| 230,000 | 7.000%, 01/15/2028(c) | 131,941 | ||||||
| 1,385,000 | 5.000%, 01/30/2028(c) | 741,404 | ||||||
| 65,000 | 5.000%, 02/15/2029(c) | 33,808 | ||||||
| 75,000 | 6.250%, 02/15/2029(c) | 40,433 | ||||||
| 400,000 | 5.250%, 01/30/2030(c) | 207,672 | ||||||
| 660,000 | 5.250%, 02/15/2031(c) | 340,445 | ||||||
| Camposol S.A. | ||||||||
| 400,000 | 6.000%, 02/03/2027 | 336,982 | ||||||
| Carriage Services, Inc. | ||||||||
| 1,690,000 | 4.250%, 05/15/2029(c) | 1,376,952 | ||||||
| Centene Corp. | ||||||||
| 1,380,000 | 4.250%, 12/15/2027 | 1,288,575 | ||||||
| Central Garden & Pet Co. | ||||||||
| 90,000 | 4.125%, 04/30/2031(c) | 72,392 | ||||||
| CHS / Community Health Systems, Inc. | ||||||||
| 305,000 | 6.875%, 04/15/2029(c) | 197,613 | ||||||
| Constellation Brands, Inc. | ||||||||
| 2,200,000 | 2.250%, 08/01/2031 | 1,791,613 | ||||||
| 1,437,000 | 4.750%, 05/09/2032 | 1,423,494 | ||||||
| Coruripe Netherlands B.V. | ||||||||
| 200,000 | 10.000%, 02/10/2027 | 172,510 | ||||||
| Coty, Inc. | ||||||||
| 70,000 | 6.500%, 04/15/2026(c) | 64,734 | ||||||
| Darling Ingredients, Inc. | ||||||||
| 40,000 | 6.000%, 06/15/2030(c) | 39,957 | ||||||
| Encompass Health Corp. | ||||||||
| 1,300,000 | 4.750%, 02/01/2030 | 1,088,546 | ||||||
| 1,100,000 | 4.625%, 04/01/2031 | 892,417 | ||||||
| Endo Luxembourg Finance Co. I S.A.R.L / Endo US, Inc. | ||||||||
| 335,000 | 6.125%, 04/01/2029(c) | 253,625 | ||||||
| Frigorifico Concepcion S.A. | ||||||||
| 400,000 | 7.700%, 07/21/2028(c) | 314,920 | ||||||
| Gartner, Inc. | ||||||||
| 3,141,000 | 3.625%, 06/15/2029(c) | 2,726,671 | ||||||
| 2,366,000 | 3.750%, 10/01/2030(c) | 2,046,164 | ||||||
| Grifols Escrow Issuer S.A. | ||||||||
| 315,000 | 4.750%, 10/15/2028(c) | 273,666 | ||||||
| HCA, Inc. | ||||||||
| 375,000 | 5.375%, 02/01/2025 | 376,239 | ||||||
| 970,000 | 5.875%, 02/15/2026 | 976,737 | ||||||
| Hologic, Inc. | ||||||||
| 4,900,000 | 3.250%, 02/15/2029(c) | 4,201,848 | ||||||
| Ingles Markets, Inc. | ||||||||
| 1,700,000 | 4.000%, 06/15/2031(c) | 1,473,143 | ||||||
| JBS USA LUX S.A. / JBS USA Food Co. / JBS USA Finance, Inc. | ||||||||
| 240,000 | 3.000%, 02/02/2029(c) | 203,138 | ||||||
| Korn Ferry | ||||||||
| 600,000 | 4.625%, 12/15/2027(c) | 539,646 | ||||||
| Kronos Acquisition Holdings, Inc. / KIK Custom Products, Inc. | ||||||||
| 430,000 | 7.000%, 12/31/2027(c) | 318,777 | ||||||
| Lamb Weston Holdings, Inc. | ||||||||
| 2,200,000 | 4.375%, 01/31/2032(c) | 1,918,169 | ||||||
| MARB BondCo Plc | ||||||||
| 1,125,000 | 3.950%, 01/29/2031(c) | 866,154 | ||||||
The accompanying notes are an integral part of these financial statements.
| 58 | Litman Gregory Funds Trust | |||||
Table of Contents
iMGP Alternative Strategies Fund
SCHEDULE OF INVESTMENTS IN SECURITIES at June 30, 2022 (Unaudited) (Continued)
| Principal Amount^ | Value | |||||||
CORPORATE BONDS (CONTINUED) | ||||||||
| Consumer, Non-cyclical (continued) | ||||||||
| Molina Healthcare, Inc. | ||||||||
| $ 240,000 | 4.375%, 06/15/2028(c) | $ | 215,115 | |||||
| Movida Europe S.A. | ||||||||
| 300,000 | 5.250%, 02/08/2031 | 232,920 | ||||||
| Natura Cosmeticos S.A. | ||||||||
| 330,000 | 4.125%, 05/03/2028(c) | 272,184 | ||||||
| PECF USS Intermediate Holding III Corp. | ||||||||
| 220,000 | 8.000%, 11/15/2029(c) | 174,658 | ||||||
| Philip Morris International, Inc. | ||||||||
| 1,600,000 | 1.750%, 11/01/2030 | 1,244,259 | ||||||
| Pilgrim’s Pride Corp. | ||||||||
| 645,000 | 5.875%, 09/30/2027(c) | 618,784 | ||||||
| 2,940,000 | 4.250%, 04/15/2031(c) | 2,457,355 | ||||||
| 2,200,000 | 3.500%, 03/01/2032(c) | 1,723,293 | ||||||
| Post Holdings, Inc. | ||||||||
| 525,000 | 5.750%, 03/01/2027(c) | 509,261 | ||||||
| 3,400,000 | 5.625%, 01/15/2028(c) | 3,234,607 | ||||||
| 2,274,000 | 4.500%, 09/15/2031(c) | 1,866,499 | ||||||
| Pyxus Holdings, Inc. | ||||||||
| 245,100 | 10.000%, 08/24/2024 | 204,401 | ||||||
| Quanta Services, Inc. | ||||||||
| 1,504,000 | 2.350%, 01/15/2032 | 1,169,909 | ||||||
| Radiology Partners, Inc. | ||||||||
| 590,000 | 9.250%, 02/01/2028(c) | 441,539 | ||||||
| Regeneron Pharmaceuticals, Inc. | ||||||||
| 2,273,000 | 1.750%, 09/15/2030 | 1,829,685 | ||||||
| Royalty Pharma Plc | ||||||||
| 1,500,000 | 2.200%, 09/02/2030 | 1,218,611 | ||||||
| Sabre GLBL, Inc. | ||||||||
| 180,000 | 7.375%, 09/01/2025(c) | 168,315 | ||||||
| Service Corp. International | ||||||||
| 4,047,000 | 4.000%, 05/15/2031 | 3,463,584 | ||||||
| Spectrum Brands, Inc. | ||||||||
| 800,000 | 3.875%, 03/15/2031(c) | 645,920 | ||||||
| SSMS Plantation Holdings Pte Ltd. | ||||||||
| 200,000 | 7.750%, 01/23/2023 | 177,000 | ||||||
| Teva Pharmaceutical Finance Netherlands II B.V. | ||||||||
| 1,455,000 (EUR) | 6.000%, 01/31/2025 | 1,488,904 | ||||||
| Teva Pharmaceutical Finance Netherlands III B.V. | ||||||||
| 395,000 | 7.125%, 01/31/2025 | 386,175 | ||||||
| 1,115,000 | 3.150%, 10/01/2026 | 917,929 | ||||||
| 4,795,000 | 4.100%, 10/01/2046 | 3,001,262 | ||||||
| TriNet Group, Inc. | ||||||||
| 1,095,000 | 3.500%, 03/01/2029(c) | 902,784 | ||||||
| Triton Water Holdings, Inc. | ||||||||
| 270,000 | 6.250%, 04/01/2029(c) | 192,148 | ||||||
| United Rentals North America, Inc. | ||||||||
| 700,000 | 4.875%, 01/15/2028 | 661,150 | ||||||
|
| |||||||
| 67,443,218 | ||||||||
|
| |||||||
| Diversified: 0.0% | ||||||||
| ABM Investama Tbk PT | ||||||||
| 250,000 | 9.500%, 08/05/2026(c) | 221,387 | ||||||
|
| |||||||
| Principal Amount^ | Value | |||||||
| Energy: 3.4% | ||||||||
| AI Candelaria Spain S.A. | ||||||||
| $ 250,000 | 5.750%, 06/15/2033(c) | $ | 183,824 | |||||
| 250,000 | 5.750%, 06/15/2033 | 183,824 | ||||||
| Aker BP ASA | ||||||||
| 435,000 | 3.750%, 01/15/2030(c) | 390,682 | ||||||
| 300,000 | 4.000%, 01/15/2031(c) | 270,481 | ||||||
| Antero Resources Corp. | ||||||||
| 1,796,000 | 7.625%, 02/01/2029(c) | 1,830,052 | ||||||
| 850,000 | 5.375%, 03/01/2030(c) | 776,390 | ||||||
| Baytex Energy Corp. | ||||||||
| 2,461,000 | 8.750%, 04/01/2027(c) | 2,471,361 | ||||||
| Calumet Specialty Products Partners L.P. / Calumet Finance Corp. | ||||||||
| 2,340,000 | 8.125%, 01/15/2027(c) | 1,981,294 | ||||||
| Cenovus Energy, Inc. | ||||||||
| 500,000 | 2.650%, 01/15/2032 | 415,324 | ||||||
| Civitas Resources, Inc. | ||||||||
| 434,000 | 5.000%, 10/15/2026(c) | 390,131 | ||||||
| CNX Resources Corp. | ||||||||
| 1,280,000 | 6.000%, 01/15/2029(c) | 1,192,717 | ||||||
| Continental Resources, Inc. | ||||||||
| 700,000 | 5.750%, 01/15/2031(c) | 675,829 | ||||||
| 120,000 | 2.875%, 04/01/2032(c) | 93,949 | ||||||
| CVR Energy, Inc. | ||||||||
| 2,400,000 | 5.750%, 02/15/2028(c) | 2,142,400 | ||||||
| DCP Midstream Operating L.P. | ||||||||
| 670,000 | 5.375%, 07/15/2025 | 652,721 | ||||||
| Delek Logistics Partners L.P. / Delek Logistics Finance Corp. | ||||||||
| 1,800,000 | 7.125%, 06/01/2028(c) | 1,623,285 | ||||||
| Ecopetrol S.A. | ||||||||
| 500,000 | 5.875%, 05/28/2045 | 341,250 | ||||||
| 250,000 | 5.875%, 11/02/2051 | 163,519 | ||||||
| Energean Israel Finance Ltd. | ||||||||
| 325,000 | 5.375%, 03/30/2028(c) | 276,136 | ||||||
| EnLink Midstream LLC | ||||||||
| 1,164,000 | 5.625%, 01/15/2028(c) | 1,070,337 | ||||||
| EQT Corp. | ||||||||
| 115,000 | 3.125%, 05/15/2026(c) | 107,927 | ||||||
| 405,000 | 3.900%, 10/01/2027 | 377,547 | ||||||
| 120,000 | 5.000%, 01/15/2029 | 116,359 | ||||||
| 440,000 | 3.625%, 05/15/2031(c) | 381,047 | ||||||
| Frontera Energy Corp. | ||||||||
| 200,000 | 7.875%, 06/21/2028(c) | 163,040 | ||||||
| Gran Tierra Energy, Inc. | ||||||||
| 550,000 | 7.750%, 05/23/2027(c) | 472,174 | ||||||
| Gulfport Energy Corp. | ||||||||
| 9,327 | 8.000%, 05/17/2026 | 9,193 | ||||||
| Gulfport Energy Operating Corp. | ||||||||
| 145,000 | 6.625%, 05/01/2023 | 0 | ||||||
| 287,000 | 6.000%, 10/15/2024 | 0 | ||||||
| 137,000 | 6.375%, 05/15/2025 | 0 | ||||||
| 144,000 | 6.375%, 01/15/2026 | 0 | ||||||
| Hess Midstream Operations L.P. | ||||||||
| 185,000 | 5.625%, 02/15/2026(c) | 176,585 | ||||||
| 140,000 | 4.250%, 02/15/2030(c) | 117,525 | ||||||
| HF Sinclair Corp. | ||||||||
| 1,200,000 | 4.500%, 10/01/2030(c) | 1,096,298 | ||||||
| Holly Energy Partners L.P. / Holly Energy Finance Corp. | ||||||||
| 180,000 | 6.375%, 04/15/2027(c) | 170,014 | ||||||
The accompanying notes are an integral part of these financial statements.
| Schedule of Investments | 59 | |||||
Table of Contents
iMGP Alternative Strategies Fund
SCHEDULE OF INVESTMENTS IN SECURITIES at June 30, 2022 (Unaudited) (Continued)
| Principal Amount^ | Value | |||||||
CORPORATE BONDS (CONTINUED) | ||||||||
| Energy (continued) | ||||||||
| Hunt Oil Co. of Peru LLC Sucursal Del Peru | ||||||||
| $ 366,400 | 6.375%, 06/01/2028 | $ | 336,172 | |||||
| Kosmos Energy Ltd. | ||||||||
| 200,000 | 7.500%, 03/01/2028 | 166,106 | ||||||
| Leviathan Bond Ltd. | ||||||||
| 335,000 | 6.500%, 06/30/2027(c) | 310,411 | ||||||
| MC Brazil Downstream Trading SARL | ||||||||
| 450,000 | 7.250%, 06/30/2031 | 358,805 | ||||||
| MEG Energy Corp. | ||||||||
| 2,040,000 | 5.875%, 02/01/2029(c) | 1,866,275 | ||||||
| NGD Holdings B.V. | ||||||||
| 100,000 | 6.750%, 12/31/2026 | 44,600 | ||||||
| NGL Energy Operating LLC / NGL Energy Finance Corp. | ||||||||
| 685,000 | 7.500%, 02/01/2026(c) | 618,915 | ||||||
| Northern Oil and Gas, Inc. | ||||||||
| 286,000 | 8.125%, 03/01/2028(c) | 269,977 | ||||||
| Occidental Petroleum Corp. | ||||||||
| 1,285,000 | 5.550%, 03/15/2026 | 1,278,472 | ||||||
| 40,000 | 8.875%, 07/15/2030 | 46,000 | ||||||
| 2,186,000 | 6.125%, 01/01/2031 | 2,220,145 | ||||||
| 45,000 | 7.875%, 09/15/2031 | 49,475 | ||||||
| Ovintiv, Inc. | ||||||||
| 75,000 | 8.125%, 09/15/2030 | 86,493 | ||||||
| 20,000 | 7.200%, 11/01/2031 | 21,969 | ||||||
| 15,000 | 7.375%, 11/01/2031 | 16,549 | ||||||
| 70,000 | 6.500%, 08/15/2034 | 73,392 | ||||||
| 145,000 | 6.625%, 08/15/2037 | 152,998 | ||||||
| 30,000 | 6.500%, 02/01/2038 | 31,099 | ||||||
| Patterson-UTI Energy, Inc. | ||||||||
| 1,100,000 | 5.150%, 11/15/2029 | 946,118 | ||||||
| PBF Holding Co. LLC / PBF Finance Corp. | ||||||||
| 2,228,000 | 6.000%, 02/15/2028 | 1,867,810 | ||||||
| Pertamina Persero PT | ||||||||
| 300,000 | 4.150%, 02/25/2060 | 223,960 | ||||||
| Peru LNG Srl | ||||||||
| 300,000 | 5.375%, 03/22/2030 | 243,017 | ||||||
| Petrobras Global Finance B.V. | ||||||||
| 630,000 | 5.500%, 06/10/2051 | 479,080 | ||||||
| Petroleos del Peru S.A. | ||||||||
| 600,000 | 5.625%, 06/19/2047 | 406,900 | ||||||
| Petroleos Mexicanos | ||||||||
| 1,590,000 | 5.950%, 01/28/2031 | 1,167,775 | ||||||
| 1,420,000 | 6.625%, 06/15/2035 | 973,836 | ||||||
| 400,000 | 6.375%, 01/23/2045 | 243,146 | ||||||
| 200,000 | 6.750%, 09/21/2047 | 124,191 | ||||||
| Precision Drilling Corp. | ||||||||
| 3,690,000 | 6.875%, 01/15/2029(c) | 3,307,956 | ||||||
| Range Resources Corp. | ||||||||
| 329,000 | 8.250%, 01/15/2029 | 336,361 | ||||||
| SCC Power Plc | ||||||||
| 90,226 | Cash 4.000% + PIK Rate 4.000% | 39,023 | ||||||
| 48,872 | PIK Rate 4.000% | 5,376 | ||||||
| Principal Amount^ | Value | |||||||
| Energy (continued) | ||||||||
| SierraCol Energy Andina LLC | ||||||||
| $ 400,000 | 6.000%, 06/15/2028(c) | $ | 292,602 | |||||
| 200,000 | 6.000%, 06/15/2028 | 146,301 | ||||||
| Southwestern Energy Co. | ||||||||
| 80,000 | 4.750%, 02/01/2032 | 68,366 | ||||||
| Sunoco L.P. / Sunoco Finance Corp. | ||||||||
| 2,524,000 | 4.500%, 05/15/2029 | 2,085,376 | ||||||
| 2,685,000 | 4.500%, 04/30/2030(c) | 2,172,658 | ||||||
| Transocean, Inc. | ||||||||
| 1,100,000 | 11.500%, 01/30/2027(c) | 1,033,934 | ||||||
| Tullow Oil Plc | ||||||||
| 283,000 | 10.250%, 05/15/2026(c) | 271,016 | ||||||
| UEP Penonome II S.A. | ||||||||
| 379,449 | 6.500%, 10/01/2038(c) | 355,170 | ||||||
| Vermilion Energy, Inc. | ||||||||
| 671,000 | 6.875%, 05/01/2030(c) | 601,216 | ||||||
| Western Midstream Operating L.P. | ||||||||
| 560,000 | 3.600%, 02/01/2025 | 517,009 | ||||||
| YPF S.A. | ||||||||
| 450,000 | 6.950%, 07/21/2027(c) | 255,992 | ||||||
| 50,000 | 8.500%, 06/27/2029 | 30,968 | ||||||
| 600,000 | 7.000%, 12/15/2047 | 295,402 | ||||||
|
| |||||||
| 46,751,627 | ||||||||
|
| |||||||
| Financial: 5.1% | ||||||||
| AerCap Ireland Capital DAC / AerCap Global Aviation Trust | ||||||||
| 300,000 | 6.500%, 07/15/2025 | 307,664 | ||||||
| Agile Group Holdings Ltd. | ||||||||
| 200,000 | 6.875%, 03/07/2023(d)(h) | 43,900 | ||||||
| 200,000 | 5.500%, 04/21/2025 | 66,000 | ||||||
| 200,000 | 7.750%, 05/25/2025(d)(h) | 43,144 | ||||||
| 400,000 | 6.050%, 10/13/2025 | 130,940 | ||||||
| Aircastle Ltd. | ||||||||
| 1,295,000 | 4.250%, 06/15/2026 | 1,201,144 | ||||||
| 175,000 | 5.250%, 06/15/2026(c)(d)(h) | 145,308 | ||||||
| Ally Financial, Inc. | ||||||||
| 995,000 | Series C | 736,499 | ||||||
| Alpha Holding S.A. de C.V. | ||||||||
| 600,000 | 9.000%, 02/10/2025(c) | 39,000 | ||||||
| Antares Holdings L.P. | ||||||||
| 255,000 | 3.950%, 07/15/2026(c) | 221,954 | ||||||
| 450,000 | 2.750%, 01/15/2027(c) | 363,213 | ||||||
| 680,000 | 3.750%, 07/15/2027(c) | 573,151 | ||||||
| Ares Capital Corp. | ||||||||
| 2,475,000 | 2.875%, 06/15/2028 | 1,966,440 | ||||||
| 660,000 | 3.200%, 11/15/2031 | 481,514 | ||||||
| Assurant, Inc. | ||||||||
| 1,660,000 | 3.700%, 02/22/2030 | 1,482,099 | ||||||
| Athene Global Funding | ||||||||
| 1,280,000 | 1.716%, 01/07/2025(c) | 1,196,481 | ||||||
| AXA S.A. | ||||||||
| 500,000 | 8.600%, 12/15/2030 | 587,163 | ||||||
| Banco Davivienda S.A. | ||||||||
| 200,000 | 6.650%, 04/22/2031(c)(d)(h) | 160,127 | ||||||
The accompanying notes are an integral part of these financial statements.
| 60 | Litman Gregory Funds Trust | |||||
Table of Contents
iMGP Alternative Strategies Fund
SCHEDULE OF INVESTMENTS IN SECURITIES at June 30, 2022 (Unaudited) (Continued)
| Principal Amount^ | Value | |||||||
CORPORATE BONDS (CONTINUED) | ||||||||
| Financial (continued) | ||||||||
| Banco do Brasil S.A. | ||||||||
| $ 550,000 | 6.250%, 04/15/2024(d)(h) | $ | 483,142 | |||||
| Banco GNB Sudameris S.A. | ||||||||
| 200,000 | 7.051%, 04/03/2027(h) | 179,926 | ||||||
| 350,000 | 7.500%, 04/16/2031(c)(h) | 299,598 | ||||||
| Banco Hipotecario S.A. | ||||||||
| 8,017,340 (ARS) | 48.500%, 11/07/2022(c)(g) | 39,612 | ||||||
| Banco Mercantil del Norte S.A. | ||||||||
| 350,000 | 6.625%, 01/24/2032(c)(d)(h) | 286,825 | ||||||
| Bank of America Corp. | ||||||||
| 1,530,000 | 1.843%, 02/04/2025(h) | 1,475,849 | ||||||
| Barclays Plc | ||||||||
| 660,000 | 4.375%, 03/15/2028(d)(h) | 507,780 | ||||||
| 400,000 | 5.088%, 06/20/2030(h) | 378,697 | ||||||
| 740,000 | 3.564%, 09/23/2035(h) | 614,748 | ||||||
| Barings BDC, Inc. | ||||||||
| 405,000 | 3.300%, 11/23/2026(c) | 352,086 | ||||||
| Blackstone Secured Lending Fund | ||||||||
| 1,295,000 | 2.125%, 02/15/2027 | 1,085,769 | ||||||
| Central China Real Estate Ltd. | ||||||||
| 230,000 | 7.650%, 08/27/2023 | 102,580 | ||||||
| 205,000 | 7.750%, 05/24/2024 | 65,848 | ||||||
| 200,000 | 7.250%, 07/16/2024 | 64,500 | ||||||
| 400,000 | 7.250%, 08/13/2024 | 127,407 | ||||||
| 205,000 | 7.500%, 07/14/2025 | 65,600 | ||||||
| CFLD Cayman Investment Ltd. | ||||||||
| 200,000 | 7.125%, 04/08/2022 | 18,052 | ||||||
| 400,000 | 6.920%, 06/16/2022 | 39,200 | ||||||
| 200,000 | 8.750%, 09/28/2022 | 19,965 | ||||||
| China Aoyuan Group Ltd. | ||||||||
| 200,000 | 6.200%, 03/24/2026 | 23,835 | ||||||
| China Evergrande Group | ||||||||
| 200,000 | 9.500%, 04/11/2022(k) | 17,000 | ||||||
| 200,000 | 8.750%, 06/28/2025 | 16,593 | ||||||
| CIFI Holdings Group Co. Ltd. | ||||||||
| 200,000 | 4.450%, 08/17/2026 | 113,830 | ||||||
| Credivalores-Crediservicios SAS | ||||||||
| 100,000 | 9.750%, 07/27/2022 | 97,153 | ||||||
| 300,000 | 8.875%, 02/07/2025(c) | 165,948 | ||||||
| Deutsche Bank AG | ||||||||
| 1,200,000 | 3.729%, 01/14/2032(h) | 904,939 | ||||||
| 260,000 | 3.742%, 01/07/2033(h) | 190,060 | ||||||
| Easy Tactic Ltd. | ||||||||
| 200,000 | 5.875%, 02/13/2023 | 45,364 | ||||||
| 200,000 | 11.750%, 08/02/2023 | 45,266 | ||||||
| Principal Amount^ | Value | |||||||
| Financial (continued) | ||||||||
| Enstar Group Ltd. | ||||||||
| $ 3,000,000 | 3.100%, 09/01/2031 | $ | 2,402,295 | |||||
| Extra Space Storage L.P. | ||||||||
| 1,400,000 | 3.900%, 04/01/2029 | 1,314,818 | ||||||
| Fantasia Holdings Group Co. Ltd. | ||||||||
| 200,000 | 11.875%, 06/01/2023 | 18,023 | ||||||
| FS KKR Capital Corp. | ||||||||
| 1,150,000 | 3.400%, 01/15/2026 | 1,023,099 | ||||||
| 455,000 | 3.125%, 10/12/2028 | 363,993 | ||||||
| Gilex Holding S.A.R.L. | ||||||||
| 360,000 | 8.500%, 05/02/2023 | 351,972 | ||||||
| Global Atlantic Fin Co. | ||||||||
| 570,000 | 4.400%, 10/15/2029(c) | 518,424 | ||||||
| GLP Capital L.P. / GLP Financing II, Inc. | ||||||||
| 1,600,000 | 3.250%, 01/15/2032 | 1,286,758 | ||||||
| Goldman Sachs Group, Inc. (The) | ||||||||
| 1,530,000 | 1.757%, 01/24/2025(h) | 1,473,958 | ||||||
| Host Hotels & Resorts L.P. | ||||||||
| 1,400,000 | Series J | 1,116,272 | ||||||
| Howard Hughes Corp. (The) | ||||||||
| 1,000,000 | 4.375%, 02/01/2031(c) | 742,691 | ||||||
| HSBC Holdings Plc | ||||||||
| 1,540,000 | 1.162%, 11/22/2024(h) | 1,472,256 | ||||||
| Icahn Enterprises L.P. / Icahn Enterprises Finance Corp. | ||||||||
| 4,564,000 | 4.750%, 09/15/2024 | 4,271,387 | ||||||
| 165,000 | 6.375%, 12/15/2025 | 156,281 | ||||||
| 970,000 | 6.250%, 05/15/2026 | 904,069 | ||||||
| 913,000 | 5.250%, 05/15/2027 | 810,739 | ||||||
| 905,000 | 4.375%, 02/01/2029 | 729,296 | ||||||
| Iron Mountain Information Management Services, Inc. | ||||||||
| 1,300,000 | 5.000%, 07/15/2032(c) | 1,050,563 | ||||||
| Iron Mountain, Inc. | ||||||||
| 3,149,000 | 4.500%, 02/15/2031(c) | 2,582,180 | ||||||
| Itau Unibanco Holding S.A. | ||||||||
| 500,000 | 4.625%, 02/27/2025(d)(h) | 400,688 | ||||||
| Jababeka International B.V. | ||||||||
| 400,000 | 6.500%, 10/05/2023 | 262,400 | ||||||
| Kaisa Group Holdings Ltd. | ||||||||
| 1,005,000 | 9.375%, 06/30/2024(k) | 140,292 | ||||||
| 200,000 | 10.500%, 01/15/2025 | 27,502 | ||||||
| 1,000,000 | 11.250%, 04/16/2025 | 137,509 | ||||||
| 200,000 | 9.950%, 07/23/2025 | 27,241 | ||||||
| 600,000 | 11.700%, 11/11/2025(k) | 83,647 | ||||||
| 400,000 | 11.650%, 06/01/2026 | 55,004 | ||||||
| Kennedy-Wilson, Inc. | ||||||||
| 380,000 | 4.750%, 02/01/2030 | 297,983 | ||||||
| KWG Group Holdings Ltd. | ||||||||
| 210,000 | 6.300%, 02/13/2026 | 42,053 | ||||||
| Life Storage L.P. | ||||||||
| 1,100,000 | 2.400%, 10/15/2031 | 879,130 | ||||||
| Logan Group Co. Ltd. | ||||||||
| 200,000 | 4.250%, 07/12/2025 | 44,053 | ||||||
| LPL Holdings, Inc. | ||||||||
| 1,000,000 | 4.375%, 05/15/2031(c) | 856,200 | ||||||
The accompanying notes are an integral part of these financial statements.
| Schedule of Investments | 61 | |||||
Table of Contents
iMGP Alternative Strategies Fund
SCHEDULE OF INVESTMENTS IN SECURITIES at June 30, 2022 (Unaudited) (Continued)
| Principal Amount^ | Value | |||||||
CORPORATE BONDS (CONTINUED) | ||||||||
| Financial (continued) | ||||||||
| Main Street Capital Corp. | ||||||||
| $ 900,000 | 3.000%, 07/14/2026 | $ | 787,450 | |||||
| Mexarrend SAPI de C.V. | ||||||||
| 300,000 | 10.250%, 07/24/2024(c) | 143,336 | ||||||
| National Health Investors, Inc. | ||||||||
| 100,000 | 3.000%, 02/01/2031 | 76,819 | ||||||
| Nationstar Mortgage Holdings, Inc. | ||||||||
| 1,225,000 | 5.750%, 11/15/2031(c) | 938,656 | ||||||
| Oaktree Specialty Lending Corp. | ||||||||
| 150,000 | 2.700%, 01/15/2027 | 130,204 | ||||||
| OneMain Finance Corp. | ||||||||
| 635,000 | 3.500%, 01/15/2027 | 508,899 | ||||||
| Operadora de Servicios Mega S.A. de C.V. Sofom ER | ||||||||
| 400,000 | 8.250%, 02/11/2025(c) | 260,046 | ||||||
| Owl Rock Capital Corp. | ||||||||
| 500,000 | 2.875%, 06/11/2028 | 393,762 | ||||||
| Owl Rock Technology Finance Corp. | ||||||||
| 105,000 | 2.500%, 01/15/2027 | 88,867 | ||||||
| Public Storage | ||||||||
| 1,000,000 | 2.250%, 11/09/2031 | 830,113 | ||||||
| RKP Overseas Finance 2016 A Ltd. | ||||||||
| 200,000 | 7.950%, 08/17/2022(d) | 90,802 | ||||||
| RKPF Overseas 2019 E Ltd. | ||||||||
| 300,000 | 7.750%, 11/18/2024(d)(h) | 132,000 | ||||||
| Rocket Mortgage LLC / Rocket Mortgage Co-Issuer, Inc. | ||||||||
| 3,220,000 | 2.875%, 10/15/2026(c) | 2,670,121 | ||||||
| 1,170,000 | 3.625%, 03/01/2029(c) | 922,147 | ||||||
| 25,000 | 3.875%, 03/01/2031(c) | 18,821 | ||||||
| 1,215,000 | 4.000%, 10/15/2033(c) | 865,384 | ||||||
| Ronshine China Holdings Ltd. | ||||||||
| 200,000 | 7.350%, 12/15/2023 | 27,472 | ||||||
| 350,000 | 6.750%, 08/05/2024 | 31,500 | ||||||
| Sabra Health Care L.P. | ||||||||
| 900,000 | 3.200%, 12/01/2031 | 717,209 | ||||||
| SBA Communications Corp. | ||||||||
| 70,000 | 3.875%, 02/15/2027 | 63,952 | ||||||
| 3,356,000 | 3.125%, 02/01/2029 | 2,754,991 | ||||||
| Shimao Group Holdings Ltd. | ||||||||
| 340,000 | 4.750%, 07/03/2022 | 43,520 | ||||||
| Shimao Group Holdings Ltd. | ||||||||
| 200,000 | 5.200%, 01/16/2027 | 22,709 | ||||||
| 400,000 | 3.450%, 01/11/2031 | 45,062 | ||||||
| Societe Generale S.A. | ||||||||
| 1,605,000 | 3.653%, 07/08/2035(c)(h) | 1,314,431 | ||||||
| Standard Chartered Plc | ||||||||
| 830,000 | 3.265%, 02/18/2036(c)(h) | 672,903 | ||||||
| Starwood Property Trust, Inc. | ||||||||
| 3,100,000 | 4.750%, 03/15/2025 | 2,842,685 | ||||||
| 2,410,000 | 3.625%, 07/15/2026(c) | 2,052,826 | ||||||
| 300,000 | 4.375%, 01/15/2027(c) | 261,831 | ||||||
| Sunac China Holdings Ltd. | ||||||||
| 200,000 | 6.500%, 01/10/2025 | 30,000 | ||||||
| Principal Amount^ | Value | |||||||
| Financial (continued) | ||||||||
| $ 200,000 | 7.000%, 07/09/2025 | $ | 30,000 | |||||
| 1,010,000 | 6.500%, 01/26/2026 | 149,776 | ||||||
| Times China Holdings Ltd. | ||||||||
| 400,000 | 6.200%, 03/22/2026 | 59,644 | ||||||
| 200,000 | 5.750%, 01/14/2027 | 28,023 | ||||||
| Unifin Financiera SAB de C.V. | ||||||||
| 600,000 | 8.875%, 01/29/2025(d)(h) | 196,242 | ||||||
| VICI Properties L.P. | ||||||||
| 3,000,000 | 5.125%, 05/15/2032 | 2,833,260 | ||||||
| VICI Properties L.P. / VICI Note Co., Inc. | ||||||||
| 270,000 | 5.625%, 05/01/2024(c) | 267,188 | ||||||
| 325,000 | 4.625%, 06/15/2025(c) | 309,710 | ||||||
| 370,000 | 4.500%, 09/01/2026(c) | 341,066 | ||||||
| 490,000 | 4.250%, 12/01/2026(c) | 448,548 | ||||||
| Westpac Banking Corp. | ||||||||
| 1,525,000 | 1.019%, 11/18/2024 | 1,433,797 | ||||||
| WP Carey, Inc. | ||||||||
| 600,000 | 2.250%, 04/01/2033 | 462,884 | ||||||
| Yuzhou Group Holdings Co. Ltd. | ||||||||
| 540,000 | 7.700%, 02/20/2025(k) | 39,150 | ||||||
| 500,000 | 8.300%, 05/27/2025 | 36,920 | ||||||
| 200,000 | 7.375%, 01/13/2026 | 15,000 | ||||||
| 710,000 | 7.850%, 08/12/2026(k) | 53,250 | ||||||
| 1,940,000 | 6.350%, 01/13/2027 | 145,500 | ||||||
| Zhenro Properties Group Ltd. | ||||||||
| 400,000 | 6.630%, 01/07/2026 | 29,163 | ||||||
|
| |||||||
| 70,033,328 | ||||||||
|
| |||||||
| Industrial: 2.8% | ||||||||
| Artera Services LLC | ||||||||
| 150,000 | 9.033%, 12/04/2025(c) | 121,267 | ||||||
| ATS Automation Tooling Systems, Inc. | ||||||||
| 1,000,000 | 4.125%, 12/15/2028(c) | 836,465 | ||||||
| Avnet, Inc. | ||||||||
| 800,000 | 5.500%, 06/01/2032 | 788,112 | ||||||
| Ball Corp. | ||||||||
| 230,000 | 3.125%, 09/15/2031 | 185,249 | ||||||
| Boeing Co. (The) | ||||||||
| 1,375,000 | 2.196%, 02/04/2026 | 1,240,644 | ||||||
| 460,000 | 2.250%, 06/15/2026 | 412,143 | ||||||
| 540,000 | 5.150%, 05/01/2030 | 520,234 | ||||||
| 235,000 | 3.375%, 06/15/2046 | 158,359 | ||||||
| 25,000 | 3.625%, 03/01/2048 | 16,956 | ||||||
| 295,000 | 3.900%, 05/01/2049 | 211,034 | ||||||
| 390,000 | 3.750%, 02/01/2050 | 274,430 | ||||||
| 475,000 | 5.805%, 05/01/2050 | 440,421 | ||||||
| 80,000 | 3.825%, 03/01/2059 | 52,230 | ||||||
| 110,000 | 3.950%, 08/01/2059 | 74,676 | ||||||
| Cargo Aircraft Management, Inc. | ||||||||
| 1,200,000 | 4.750%, 02/01/2028(c) | 1,096,164 | ||||||
| Caterpillar Financial Services Corp. | ||||||||
| 1,150,000 | 0.950%, 01/10/2024 | 1,113,151 | ||||||
| Cemex SAB de C.V. | ||||||||
| 355,000 | 5.125%, 06/08/2026(c)(d)(h) | 302,338 | ||||||
| 400,000 | 5.450%, 11/19/2029(c) | 356,380 | ||||||
| 820,000 | 5.200%, 09/17/2030(c) | 703,630 | ||||||
| 1,110,000 | 3.875%, 07/11/2031(c) | 851,553 | ||||||
| Dycom Industries, Inc. | ||||||||
| 1,200,000 | 4.500%, 04/15/2029(c) | 1,051,860 | ||||||
The accompanying notes are an integral part of these financial statements.
| 62 | Litman Gregory Funds Trust | |||||
Table of Contents
iMGP Alternative Strategies Fund
SCHEDULE OF INVESTMENTS IN SECURITIES at June 30, 2022 (Unaudited) (Continued)
| Principal Amount^ | Value | |||||||
CORPORATE BONDS (CONTINUED) | ||||||||
| Industrial (continued) | ||||||||
| Embraer Netherlands Finance B.V. | ||||||||
| $ 505,000 | 5.050%, 06/15/2025 | $ | 490,178 | |||||
| Energizer Holdings, Inc. | ||||||||
| 1,000,000 | 6.500%, 12/31/2027(c) | 877,605 | ||||||
| GMR Hyderabad International Airport Ltd. | ||||||||
| 735,000 | 5.375%, 04/10/2024 | 715,706 | ||||||
| 580,000 | 4.750%, 02/02/2026(c) | 528,525 | ||||||
| Griffon Corp. | ||||||||
| 2,960,000 | 5.750%, 03/01/2028 | 2,694,547 | ||||||
| Howmet Aerospace, Inc. | ||||||||
| 735,000 | 3.000%, 01/15/2029 | 613,196 | ||||||
| HTA Group Ltd. | ||||||||
| 1,100,000 | 7.000%, 12/18/2025(c) | 945,340 | ||||||
| IHS Holding Ltd. | ||||||||
| 365,000 | 5.625%, 11/29/2026(c) | 300,862 | ||||||
| 330,000 | 6.250%, 11/29/2028(c) | 267,617 | ||||||
| John Deere Capital Corp. | ||||||||
| 280,000 | 0.900%, 01/10/2024 | 270,495 | ||||||
| 440,000 | 1.250%, 01/10/2025 | 417,960 | ||||||
| Leonardo US Holdings, Inc. | ||||||||
| 438,000 | 6.250%, 01/15/2040(c) | 444,610 | ||||||
| Louisiana-Pacific Corp. | ||||||||
| 1,000,000 | 3.625%, 03/15/2029(c) | 789,721 | ||||||
| Mexico City Airport Trust | ||||||||
| 600,000 | 5.500%, 07/31/2047 | 413,202 | ||||||
| OI European Group B.V. | ||||||||
| 1,000,000 | 4.750%, 02/15/2030(c) | 838,810 | ||||||
| Park-Ohio Industries, Inc. | ||||||||
| 120,000 | 6.625%, 04/15/2027 | 94,951 | ||||||
| Parker-Hannifin Corp. | ||||||||
| 585,000 | 4.250%, 09/15/2027 | 583,321 | ||||||
| Sealed Air Corp. | ||||||||
| 5,300,000 | 4.000%, 12/01/2027(c) | 4,788,656 | ||||||
| 670,000 | 5.000%, 04/15/2029(c) | 627,361 | ||||||
| Sensata Technologies B.V. | ||||||||
| 240,000 | 4.000%, 04/15/2029(c) | 204,070 | ||||||
| Sensata Technologies, Inc. | ||||||||
| 418,000 | 4.375%, 02/15/2030(c) | 355,816 | ||||||
| Silgan Holdings, Inc. | ||||||||
| 3,000,000 | 4.125%, 02/01/2028 | 2,695,095 | ||||||
| Simpar Europe S.A. | ||||||||
| 300,000 | 5.200%, 01/26/2031 | 232,210 | ||||||
| Spirit AeroSystems, Inc. | ||||||||
| 80,000 | 4.600%, 06/15/2028 | 59,196 | ||||||
| Teledyne Technologies, Inc. | ||||||||
| 900,000 | 2.750%, 04/01/2031 | 759,116 | ||||||
| TransDigm, Inc. | ||||||||
| 665,000 | 8.000%, 12/15/2025(c) | 673,784 | ||||||
| 1,600,000 | 4.875%, 05/01/2029 | 1,305,232 | ||||||
| Triumph Group, Inc. | ||||||||
| 595,000 | 6.250%, 09/15/2024(c) | 530,187 | ||||||
| 150,000 | 7.750%, 08/15/2025 | 115,709 | ||||||
| TTM Technologies, Inc. | ||||||||
| 500,000 | 4.000%, 03/01/2029(c) | 421,124 | ||||||
| Principal Amount^ | Value | |||||||
| Industrial (continued) | ||||||||
| Waste Connections, Inc. | ||||||||
| $ 2,000,000 | 2.200%, 01/15/2032 | $ | 1,638,395 | |||||
| 1,700,000 | 3.200%, 06/01/2032 | 1,521,971 | ||||||
|
| |||||||
| 38,021,864 | ||||||||
|
| |||||||
| Technology: 1.3% | ||||||||
| Booz Allen Hamilton, Inc. | ||||||||
| 2,000,000 | 4.000%, 07/01/2029(c) | 1,776,630 | ||||||
| Broadcom, Inc. | ||||||||
| 440,000 | 4.150%, 11/15/2030 | 404,569 | ||||||
| 1,250,000 | 3.469%, 04/15/2034(c) | 1,022,420 | ||||||
| Castle US Holding Corp. | ||||||||
| 850,000 | 9.500%, 02/15/2028(c) | 728,233 | ||||||
| CDW LLC / CDW Finance Corp. | ||||||||
| 115,000 | 4.250%, 04/01/2028 | 104,173 | ||||||
| CDW LLC / CDW Finance Corp. | ||||||||
| 185,000 | 2.670%, 12/01/2026 | 165,170 | ||||||
| 835,000 | 3.250%, 02/15/2029 | 705,208 | ||||||
| CWT Travel Group, Inc. | ||||||||
| 124,674 | 8.500%, 11/19/2026(c) | 112,518 | ||||||
| Entegris, Inc. | ||||||||
| 2,286,000 | 4.375%, 04/15/2028(c) | 2,020,207 | ||||||
| 1,710,000 | 3.625%, 05/01/2029(c) | 1,432,595 | ||||||
| Fair Isaac Corp. | ||||||||
| 5,020,000 | 4.000%, 06/15/2028(c) | 4,451,962 | ||||||
| KBR, Inc. | ||||||||
| 1,000,000 | 4.750%, 09/30/2028(c) | 884,305 | ||||||
| MSCI, Inc. | ||||||||
| 140,000 | 3.625%, 09/01/2030(c) | 116,951 | ||||||
| Open Text Holdings, Inc. | ||||||||
| 1,000,000 | 4.125%, 12/01/2031(c) | 826,473 | ||||||
| Oracle Corp. | ||||||||
| 765,000 | 3.950%, 03/25/2051 | 566,576 | ||||||
| PTC, Inc. | ||||||||
| 1,775,000 | 4.000%, 02/15/2028(c) | 1,605,266 | ||||||
| Virtusa Corp. | ||||||||
| 435,000 | 7.125%, 12/15/2028(c) | 350,316 | ||||||
| Western Digital Corp. | ||||||||
| 420,000 | 4.750%, 02/15/2026 | 400,913 | ||||||
| 485,000 | 2.850%, 02/01/2029 | 395,653 | ||||||
|
| |||||||
| 18,070,138 | ||||||||
|
| |||||||
| Utilities: 0.9% | ||||||||
| AES Argentina Generacion S.A. | ||||||||
| 150,000 | 7.750%, 02/02/2024 | 122,470 | ||||||
| Edison International | ||||||||
| 815,000 | Series A | 664,225 | ||||||
| Emera US Finance L.P. | ||||||||
| 4,500,000 | 2.639%, 06/15/2031 | 3,759,986 | ||||||
| Empresa Electrica Cochrane SpA | ||||||||
| 365,750 | 5.500%, 05/14/2027 | 308,142 | ||||||
| Empresas Publicas de Medellin ESP | ||||||||
| 400,000 | 4.375%, 02/15/2031 | 306,734 | ||||||
| EnfraGen Energia Sur S.A. / EnfraGen Spain S.A. / Prime Energia S.p.A. | ||||||||
| 400,000 | 5.375%, 12/30/2030 | 270,682 | ||||||
| Guacolda Energia S.A. | ||||||||
| 300,000 | 4.560%, 04/30/2025 | 106,144 | ||||||
| Inkia Energy Ltd. | ||||||||
| 400,000 | 5.875%, 11/09/2027 | 366,592 | ||||||
The accompanying notes are an integral part of these financial statements.
| Schedule of Investments | 63 | |||||
Table of Contents
iMGP Alternative Strategies Fund
SCHEDULE OF INVESTMENTS IN SECURITIES at June 30, 2022 (Unaudited) (Continued)
| Principal Amount^ | Value | |||||||
CORPORATE BONDS (CONTINUED) | ||||||||
| Utilities (continued) | ||||||||
| Instituto Costarricense | ||||||||
| $ 200,000 | 6.375%, 05/15/2043 | $ | 149,077 | |||||
| LLPL Capital Pte Ltd. | ||||||||
| 479,435 | 6.875%, 02/04/2039 | 446,929 | ||||||
| Mercury Chile Holdco LLC | ||||||||
| 300,000 | 6.500%, 01/24/2027(c) | 260,526 | ||||||
| Minejesa Capital B.V. | ||||||||
| 600,000 | 5.625%, 08/10/2037 | 486,609 | ||||||
| Mong Duong Finance Holdings B.V. | ||||||||
| 250,000 | 5.125%, 05/07/2029 | 202,188 | ||||||
| National Fuel Gas Co. | ||||||||
| 1,315,000 | 5.500%, 01/15/2026 | 1,322,826 | ||||||
| 1,100,000 | 2.950%, 03/01/2031 | 896,173 | ||||||
| NRG Energy, Inc. | ||||||||
| 540,000 | 5.750%, 01/15/2028 | 496,962 | ||||||
| Pacific Gas and Electric Co. | ||||||||
| 165,000 | 5.450%, 06/15/2027 | 160,054 | ||||||
| 300,000 | 4.300%, 03/15/2045 | 219,657 | ||||||
| 35,000 | 4.950%, 07/01/2050 | 28,151 | ||||||
| 180,000 | 3.500%, 08/01/2050 | 121,336 | ||||||
| Pampa Energia S.A. | ||||||||
| 150,000 | 9.125%, 04/15/2029(c) | 120,973 | ||||||
| Vistra Operations Co. LLC | ||||||||
| 1,300,000 | 4.375%, 05/01/2029(c) | 1,091,434 | ||||||
|
| |||||||
| 11,907,870 | ||||||||
|
| |||||||
| | TOTAL CORPORATE BONDS | 374,847,104 | ||||||
|
| |||||||
GOVERNMENT SECURITIES & AGENCY ISSUE: 1.8% | ||||||||
| Brazil Notas do Tesouro Nacional | ||||||||
| 8,873,000 (BRL) | Series F | 1,519,210 | ||||||
| Brazilian Government International Bond | ||||||||
| 700,000 | 4.750%, 01/14/2050 | 476,372 | ||||||
| Colombia Government International Bond | ||||||||
| 500,000 | 5.000%, 06/15/2045 | 336,025 | ||||||
| 300,000 | 5.200%, 05/15/2049 | 204,240 | ||||||
| Dominican Republic International Bond | ||||||||
| 300,000 | 6.000%, 02/22/2033(c) | 248,930 | ||||||
| Dominican Republic International Bonds | ||||||||
| 250,000 | 5.875%, 01/30/2060 | 171,578 | ||||||
| Financiera de Desarrollo Territorial S.A. | ||||||||
| 3,329,000,000 (COP) | 7.875%, 08/12/2024(c) | 741,555 | ||||||
| Mexican Bonos | ||||||||
| 15,087,000 (MXN) | 6.750%, 03/09/2023 | 737,029 | ||||||
| 30,918,400 (MXN) | 8.500%, 11/18/2038 | 1,458,489 | ||||||
| Mexico Government International Bond | ||||||||
| 300,000 | 4.400%, 02/12/2052 | 223,650 | ||||||
| Principal Amount^ | Value | |||||||
| Provincia de Buenos Aires Government Bonds | ||||||||
| $ 15,545,000 (ARS) | 49.102%, 04/12/2025(c) | $ | 53,279 | |||||
| Republic of South Africa Government International Bond | ||||||||
| 500,000 | 5.650%, 09/27/2047 | 342,675 | ||||||
| Ukraine Government International Bond | ||||||||
| 400,000 | 7.253%, 03/15/2033 | 100,501 | ||||||
| United States Treasury Bond | ||||||||
| 17,250,000 | 1.625%, 11/15/2050 | 12,249,185 | ||||||
| United States Treasury Note | ||||||||
| 2,810,000 | 0.125%, 02/28/2023(b) | 2,762,782 | ||||||
| 2,750,000 | 0.125%, 03/31/2023 | 2,696,496 | ||||||
|
| |||||||
| | TOTAL GOVERNMENT SECURITIES & AGENCY ISSUE | 24,321,996 | ||||||
|
| |||||||
LIMITED PARTNERSHIPS: 0.1% | ||||||||
| 35,594 | GACP II L.P.(a) | 912,470 | ||||||
| 1,300,000 | U.S. Farming Realty Trust II L.P.(a) | 1,088,018 | ||||||
|
| |||||||
| | TOTAL LIMITED PARTNERSHIPS | 2,000,488 | ||||||
|
| |||||||
MORTGAGE-BACKED SECURITIES: 13.4% | ||||||||
| Adjustable Rate Mortgage Trust | ||||||||
| 254,654 | Series 2006-1-2A1 | 164,035 | ||||||
| Alternative Loan Trust | ||||||||
| 82,355 | Series 2003-22CB-1A1 | 79,260 | ||||||
| 299,018 | Series 2004-13CB-A4 | 228,481 | ||||||
| 45,927 | Series 2004-16CB-1A1 | 44,741 | ||||||
| 47,945 | Series 2004-16CB-3A1 | 46,963 | ||||||
| 101,292 | Series 2004-J10-2CB1 | 98,881 | ||||||
| 21,469 | Series 2005-J1-2A1 | 20,975 | ||||||
| 2,059,689 | Series 2006-13T1-A13 | 1,139,354 | ||||||
| 325,488 | Series 2006-31CB-A7 | 219,761 | ||||||
| 3,581,885 | Series 2006-36T2-2A1 | 1,905,201 | ||||||
| 434,507 | Series 2006-J1-2A1 | 96,878 | ||||||
| 176,445 | Series 2007-16CB-2A1 | 58,433 | ||||||
| 51,094 | Series 2007-16CB-2A2 | 78,281 | ||||||
| 2,604,556 | Series 2007-16CB-4A1 | 1,875,447 | ||||||
The accompanying notes are an integral part of these financial statements.
| 64 | Litman Gregory Funds Trust | |||||
Table of Contents
iMGP Alternative Strategies Fund
SCHEDULE OF INVESTMENTS IN SECURITIES at June 30, 2022 (Unaudited) (Continued)
| Principal Amount^ | Value | |||||||
MORTGAGE-BACKED SECURITIES (CONTINUED) | ||||||||
| Alternative Loan Trust (Continued) | ||||||||
| $ 416,768 | Series 2007-16CB-4A2 | $ | 591,929 | |||||
| 324,922 | Series 2007-19-1A34 | 195,281 | ||||||
| 915,432 | Series 2007-20-A12 | 604,756 | ||||||
| 369,000 | Series 2007-22-2A16 | 176,907 | ||||||
| 1,907,378 | Series 2007-HY2-1A | 1,801,526 | ||||||
| Alternative Loan Trust Resecuritization | ||||||||
| 426,882 | Series 2008-2R-2A1 | 241,393 | ||||||
| 3,038,219 | Series 2008-2R-4A1 | 1,893,624 | ||||||
| American Home Mortgage Investment Trust | ||||||||
| 201,259 | Series 2006-1-11A1 | 183,802 | ||||||
| AREIT Trust CLO | ||||||||
| 1,000,000 | Series 2019-CRE3-D | 954,885 | ||||||
| Banc of America Alternative Loan Trust | ||||||||
| 36,776 | Series 2003-8-1CB1 | 35,719 | ||||||
| 524,825 | Series 2006-7-A4 | 176,869 | ||||||
| Banc of America Funding Trust | ||||||||
| 36,641 | Series 2005-7-3A1 | 36,843 | ||||||
| 231,687 | Series 2006-B-7A1 | 200,482 | ||||||
| 2,151,034 | Series 2007-1-TA4 | 2,013,553 | ||||||
| 23,862 | Series 2007-4-5A1 | 22,408 | ||||||
| Banc of America Mortgage Trust | ||||||||
| 9,343 | Series 2005-A-2A1 | 9,075 | ||||||
| BBCMS Mortgage Trust | ||||||||
| 710,000 | Series 2020-BID-B | 698,149 | ||||||
| BBCMS Trust | ||||||||
| 750,000 | Series 2018-CBM-E | 712,100 | ||||||
| BCAP LLC Trust | ||||||||
| 126,361 | Series 2010-RR6-6A2 | 81,936 | ||||||
| 1,901,826 | Series 2011-R11-2A4 | 1,333,087 | ||||||
| Bear Stearns Adjustable Rate Mortgage Trust | ||||||||
| 1,706,372 | Series 2005-12-25A1 | 1,334,073 | ||||||
| Principal Amount^ | Value | |||||||
| Bear Stearns Asset-Backed Securities I Trust | ||||||||
| $ 407,719 | Series 2006-AC1-1A1 | $ | 242,718 | |||||
| Benchmark Mortgage Trust | ||||||||
| 547,000 | Series 2020-B18-AGNF | 474,732 | ||||||
| 1,637,000 | Series 2021-B31-E | 973,950 | ||||||
| BF Mortgage Trust | ||||||||
| 666,000 | Series 2019-NYT-F | 602,696 | ||||||
| BINOM Securitization Trust | ||||||||
| 530,000 | Series 2022-RPL1-M1 | 488,268 | ||||||
| BPR Trust | ||||||||
| 465,000 | Series 2021-NRD-F | 441,328 | ||||||
| BX Commercial Mortgage Trust | ||||||||
| 1,274,000 | Series 2019-IMC-G | 1,181,976 | ||||||
| BX Trust | ||||||||
| 850,000 | Series 2017-SLCT-F | 821,223 | ||||||
| Carbon Capital VI Commercial Mortgage Trust | ||||||||
| 343,565 | Series 2019-FL2-B | 335,679 | ||||||
| CFCRE Commercial Mortgage Trust | ||||||||
| 16,323,000 | Series 2016-C7-XE | 594,484 | ||||||
| 7,346,000 | Series 2016-C7-XF | 260,258 | ||||||
| CG-CCRE Commercial Mortgage Trust | ||||||||
| 102,131 | Series 2014-FL2-COL1 | 88,854 | ||||||
| 199,398 | Series 2014-FL2-COL2 | 140,562 | ||||||
| Chase Mortgage Finance Trust | ||||||||
| 1,311,044 | Series 2007-S3-1A15 | 732,783 | ||||||
| CIM Trust | ||||||||
| 464,651 | Series 2021-NR2-A1 | 444,449 | ||||||
| Citicorp Mortgage Securities Trust | ||||||||
| 1,776,206 | Series 2006-7-1A1 | 1,574,536 | ||||||
| Citigroup Commercial Mortgage Trust | ||||||||
| 870,000 | Series 2014-GC21-D | 796,703 | ||||||
| 668,000 | Series 2015-GC27-D | 599,770 | ||||||
| 1,497,000 | Series 2018-TBR-F | 1,404,762 | ||||||
The accompanying notes are an integral part of these financial statements.
| Schedule of Investments | 65 | |||||
Table of Contents
iMGP Alternative Strategies Fund
SCHEDULE OF INVESTMENTS IN SECURITIES at June 30, 2022 (Unaudited) (Continued)
| Principal Amount^ | Value | |||||||
MORTGAGE-BACKED SECURITIES (CONTINUED) | ||||||||
| Citigroup Mortgage Loan Trust, Inc. | ||||||||
| $ 157,315 | Series 2005-5-2A2 | $ | 113,786 | |||||
| 1,939,277 | Series 2005-5-3A2A | 1,260,634 | ||||||
| 1,890,279 | Series 2011-12-1A2 | 1,229,441 | ||||||
| CitiMortgage Alternative Loan Trust | ||||||||
| 160,724 | Series 2006-A5-1A13 | 132,298 | ||||||
| 158,069 | Series 2006-A5-1A2 | 14,270 | ||||||
| 1,438,678 | Series 2007-A6-1A5 | 1,309,221 | ||||||
| COMM Mortgage Trust | ||||||||
| 460,000 | Series 2012-CR3-B | 439,083 | ||||||
| 40,000 | Series 2012-LC4-C | 39,609 | ||||||
| 1,868,035 | Series 2014-UBS4-F | 437,942 | ||||||
| 3,204,626 | Series 2014-UBS4-G | 246,334 | ||||||
| 7,000 | Series 2014-UBS4-V | 1 | ||||||
| 1,989,000 | Series 2018-HCLV-D | 1,852,636 | ||||||
| Connecticut Avenue Securities Trust | ||||||||
| 120,811 | Series 2020-R01-1M2 | 118,337 | ||||||
| 170,000 | Series 2021-R01-1B1 | 147,608 | ||||||
| 1,000,000 | Series 2022-R03-1B2 | 935,346 | ||||||
| 356,207 | Series 2022-R06 1M1 | 355,983 | ||||||
| Countrywide Home Loan GMSR Issuer Trust | ||||||||
| 1,980,000 | Series 2018-GT1-A | 1,961,165 | ||||||
| Countrywide Home Loan Mortgage Pass-Through Trust | ||||||||
| 5,034 | Series 2004-HYB4-2A1 | 4,815 | ||||||
| 453,942 | Series 2005-23-A1 | 294,908 | ||||||
| 1,976,751 | Series 2006-9-A1 | 1,091,153 | ||||||
| 117,482 | Series 2007-10-A5 | 67,618 | ||||||
| Principal Amount^ | Value | |||||||
| $ 483,256 | Series 2007-13-A5 | $ | 289,329 | |||||
| Credit Suisse First Boston Mortgage Securities Corp. | ||||||||
| 1,030,042 | Series 2005-11-7A1 | 641,520 | ||||||
| Credit Suisse First Boston Mortgage- Backed Pass-Through Certificates | ||||||||
| 32,028 | Series 2003-27-4A4 | 31,771 | ||||||
| 2,295,566 | Series 2005-10-10A3 | 833,886 | ||||||
| Credit Suisse Mortgage-Backed Trust | ||||||||
| 666,951 | Series 2006-6-1A10 | 401,302 | ||||||
| 33,679 | Series 2007-2-2A5 | 28,449 | ||||||
| 630,000 | Series 2014-USA-A2 | 597,219 | ||||||
| 635,000 | Series 2014-USA-D | 536,916 | ||||||
| 1,475,000 | Series 2014-USA-E | 1,167,401 | ||||||
| 515,216 | Series 2019-RP10-A1 | 508,555 | ||||||
| 326,709 | Series 2020-RPL3-A1 | 317,669 | ||||||
| 1,100,000 | Series 2021-NQM1-B2 | 987,452 | ||||||
| 490,000 | Series 2021-RPL1-A2 | 464,535 | ||||||
| DBUBS Mortgage Trust | ||||||||
| 310,000 | Series 2017-BRBK-D | 292,543 | ||||||
| Deephaven Residential Mortgage Trust | ||||||||
| 4,711,000 | Series 2020-2-B3 | 4,670,382 | ||||||
| Deutsche Mortgage & Asset Receiving Corp. | ||||||||
| 1,957,963 | Series 2014-RS1-1A2 | 1,668,954 | ||||||
| Deutsche Mortgage Securities, Inc. Mortgage Loan Trust | ||||||||
| 78,631 | Series 2006-PR1-3A1 | 76,216 | ||||||
| DOLP Trust | ||||||||
| 500,000 | Series 2021-NYC-F | 377,408 | ||||||
| 500,000 | Series 2021-NYC-G | 355,137 | ||||||
| DSLA Mortgage Loan Trust | ||||||||
| 95,616 | Series 2005-AR5-2A1A | 65,152 | ||||||
| Extended Stay America Trust | ||||||||
| 844,801 | Series 2021-ESH-F | 814,540 | ||||||
The accompanying notes are an integral part of these financial statements.
| 66 | Litman Gregory Funds Trust | |||||
Table of Contents
iMGP Alternative Strategies Fund
SCHEDULE OF INVESTMENTS IN SECURITIES at June 30, 2022 (Unaudited) (Continued)
| Principal Amount^ | Value | |||||||
MORTGAGE-BACKED SECURITIES (CONTINUED) | ||||||||
| Federal Home Loan Mortgage Corp. REMICS | ||||||||
| $ 374,129 | Series 3118-SD | $ | 34,265 | |||||
| 125,211 | Series 3301-MS | 14,513 | ||||||
| 172,748 | Series 3303-SE | 19,192 | ||||||
| 110,717 | Series 3303-SG | 14,957 | ||||||
| 22,845 | Series 3382-SB | 2,430 | ||||||
| 156,426 | Series 3382-SW | 17,341 | ||||||
| 33,964 | Series 3384-S | 3,229 | ||||||
| 102,314 | Series 3384-SG | 16,860 | ||||||
| 1,347,792 | Series 3404-SA | 163,867 | ||||||
| 36,235 | Series 3417-SX | 3,348 | ||||||
| 33,810 | Series 3423-GS | 3,066 | ||||||
| 263,897 | Series 3423-TG | 1,402 | ||||||
| 1,546,698 | Series 3435-S | 194,653 | ||||||
| 40,307 | Series 3445-ES | 719 | ||||||
| 235,007 | Series 3523-SM | 24,674 | ||||||
| 125,128 | Series 3560-KS | 8,976 | ||||||
| 53,731 | Series 3598-SA | 5,311 | ||||||
| 73,205 | Series 3641-TB | 75,832 | ||||||
| 194,058 | Series 3728-SV | 14,306 | ||||||
| Principal Amount^ | Value | |||||||
| $ 128,217 | Series 3758-S | $ | 15,213 | |||||
| 294,590 | Series 3770-SP | 10,979 | ||||||
| 179,159 | Series 3815-ST | 22,293 | ||||||
| 382,533 | Series 3859-SI | 47,635 | ||||||
| 107,900 | Series 3872-SL | 9,381 | ||||||
| 86,671 | Series 3900-SB | 7,372 | ||||||
| 14,996 | Series 3946-SM | 15,561 | ||||||
| 236,366 | Series 3972-AZ | 223,604 | ||||||
| 1,502,648 | Series 3984-DS | 159,753 | ||||||
| 3,178,919 | Series 4080-DS | 271,570 | ||||||
| 1,358,240 | Series 4239-OU | 878,808 | ||||||
| 1,620,329 | Series 4291-MS | 196,003 | ||||||
| 597,175 | Series 4314-MS | 30,878 | ||||||
| 6,630,203 | Series 5070-MI | 1,067,961 | ||||||
| Federal Home Loan Mortgage Corp. Structured Agency Credit Risk Debt Notes | ||||||||
| 200,000 | Series 2021-DNA7-M2 | 180,225 | ||||||
| Federal Home Loan Mortgage Corp. Structured Agency Credit Risk Debt Notes REMIC | ||||||||
| 267,551 | Series 2022-DNA4 M1A | 264,330 | ||||||
| Federal National Mortgage Association | ||||||||
| 23,866,218 | Series 2019-M25-X | 309,261 | ||||||
| 26,529,219 | Series 2019-M5-X | 755,939 | ||||||
| 24,573,831 | Series 2021-M23-X1 | 868,007 | ||||||
| Federal National Mortgage Association REMICS | ||||||||
| 175,261 | Series 2003-84-PZ | 182,667 | ||||||
The accompanying notes are an integral part of these financial statements.
| Schedule of Investments | 67 | |||||
Table of Contents
iMGP Alternative Strategies Fund
SCHEDULE OF INVESTMENTS IN SECURITIES at June 30, 2022 (Unaudited) (Continued)
| Principal Amount^ | Value | |||||||
MORTGAGE-BACKED SECURITIES (CONTINUED) | ||||||||
| Federal National Mortgage Association REMICS (Continued) | ||||||||
| $ 248,885 | Series 2005-42-SA | $ | 10,455 | |||||
| 1,306,222 | Series 2006-92-LI | 147,617 | ||||||
| 357,819 | Series 2007-39-AI | 38,290 | ||||||
| 104,091 | Series 2007-57-SX | 12,961 | ||||||
| 18,857 | Series 2007-68-SA | 2,172 | ||||||
| 23,033 | Series 2008-1-CI | 2,913 | ||||||
| 1,068,471 | Series 2008-33-SA | 118,720 | ||||||
| 14,530 | Series 2008-56-SB | 857 | ||||||
| 2,016,391 | Series 2009-110-SD | 215,504 | ||||||
| 18,881 | Series 2009-111-SE | 2,560 | ||||||
| 159,298 | Series 2009-86-CI | 8,332 | ||||||
| 68,383 | Series 2009-87-SA | 10,223 | ||||||
| 31,839 | Series 2009-90-IB | 2,516 | ||||||
| 29,534 | Series 2010-11-SC | 1,403 | ||||||
| 23,432 | Series 2010-115-SD | 3,087 | ||||||
| 1,996,152 | Series 2010-123-SK | 258,646 | ||||||
| 227,393 | Series 2010-134-SE | 8,554 | ||||||
| 128,329 | Series 2010-15-SL | 11,258 | ||||||
| 32,861 | Series 2010-9-GS | 1,620 | ||||||
| Principal Amount^ | Value | |||||||
| $ 6,420 | Series 2011-110-LS | $ | 5,747 | |||||
| 64,271 | Series 2011-111-VZ | 65,834 | ||||||
| 321,132 | Series 2011-141-PZ | 324,700 | ||||||
| 9,621 | Series 2011-5-PS | 123 | ||||||
| 1,363,484 | Series 2011-93-ES | 151,510 | ||||||
| 846,840 | Series 2012-106-SA | 100,596 | ||||||
| 2,076,755 | Series 2014-50-WS | 210,280 | ||||||
| 7,380,743 | Series 2019-31-S | 968,241 | ||||||
| 18,923,003 | Series 2019-M12-X | 533,273 | ||||||
| 9,355,493 | Series 2019-M24-2XA | 677,173 | ||||||
| 22,639,061 | Series 2019-M7-X | 442,920 | ||||||
| 27,130,875 | Series 2020-M10-X4 | 1,779,012 | ||||||
| 26,783,002 | Series 2020-M10-X9 | 846,916 | ||||||
| 8,267,322 | Series 2020-M13-X2 | 574,617 | ||||||
| 12,844,916 | Series 2020-M6-X | 229,149 | ||||||
| 67,855,000 | Series 2022-M4-X2 | 920,392 | ||||||
| First Horizon Alternative Mortgage Securities Trust | ||||||||
| 616,489 | Series 2006-FA6-1A4 | 345,936 | ||||||
| 224,034 | Series 2007-FA4-1A7 | 110,144 | ||||||
| First Horizon Mortgage Pass-Through Trust | ||||||||
| 111,644 | Series 2006-1-1A10 | 66,124 | ||||||
| Fontainebleau Miami Beach Trust | ||||||||
| 574,000 | Series 2019-FBLU H | 504,460 | ||||||
| FREMF Mortgage Trust | ||||||||
| 1,500,063 | Series 2016-KF14-B | 1,531,224 | ||||||
| 1,117,752 | Series 2018-KF56-C | 1,100,739 | ||||||
| GCAT Trust | ||||||||
| 53,310 | Series 2019-RPL1-A1 | 51,435 | ||||||
The accompanying notes are an integral part of these financial statements.
| 68 | Litman Gregory Funds Trust | |||||
Table of Contents
iMGP Alternative Strategies Fund
SCHEDULE OF INVESTMENTS IN SECURITIES at June 30, 2022 (Unaudited) (Continued)
| Principal Amount^ | Value | |||||||
MORTGAGE-BACKED SECURITIES (CONTINUED) | ||||||||
| Government National Mortgage Association | ||||||||
| $ 6,195,160 | Series 2019-H10-BI | $ | 230,647 | |||||
| Government National Mortgage Association | ||||||||
| 389,795 | Series 2007-21-S | 34,836 | ||||||
| 131,202 | Series 2008-69-SB | 15,390 | ||||||
| 151,533 | Series 2009-104-SD | 17,183 | ||||||
| 17,435 | Series 2010-98-IA | 1,311 | ||||||
| 217,668 | Series 2011-45-GZ | 216,744 | ||||||
| 71,523 | Series 2011-69-OC | 61,643 | ||||||
| 1,451,670 | Series 2011-69-SC | 142,842 | ||||||
| 258,713 | Series 2011-89-SA | 25,062 | ||||||
| 918,039 | Series 2013-102-BS | 89,209 | ||||||
| 12,672,461 | Series 2013-155-IB | 84,438 | ||||||
| 1,915,043 | Series 2014-145-CS | 194,853 | ||||||
| 1,207,126 | Series 2014-156-PS | 150,783 | ||||||
| 2,969,344 | Series 2014-4-SA | 387,689 | ||||||
| 5,142,423 | Series 2014-41-SA | 633,606 | ||||||
| 2,068,505 | Series 2014-5-SA | 230,272 | ||||||
| 2,691,444 | Series 2014-58-SG | 271,446 | ||||||
| 2,052,588 | Series 2014-76-SA | 219,507 | ||||||
| 2,982,400 | Series 2014-95-CS | 339,934 | ||||||
| 8,687,965 | Series 2016-162-IO | 319,063 | ||||||
| Principal Amount^ | Value | |||||||
| $ 2,110,319 | Series 2018-105-SH | $ | 220,524 | |||||
| 21,930,685 | Series 2018-111-SA | 1,093,536 | ||||||
| 9,532,010 | Series 2018-134-CS | 1,040,942 | ||||||
| 7,063,089 | Series 2019-22-SA | 786,279 | ||||||
| 23,807,661 | Series 2019-97-SA | 422,976 | ||||||
| 7,225,754 | Series 2020-112-BS | 971,220 | ||||||
| 12,217,307 | Series 2020-115-SC | 886,987 | ||||||
| 6,437,412 | Series 2020-142-SD | 1,052,490 | ||||||
| 7,148,603 | Series 2020-146-SH | 1,057,881 | ||||||
| 10,215,263 | Series 2020-168-IA | 753,822 | ||||||
| 5,883,783 | Series 2020-188-LS | 869,915 | ||||||
| 5,610,118 | Series 2020-47-SL | 527,455 | ||||||
| 10,708,887 | Series 2020-H11-HI | 533,153 | ||||||
| 10,941,629 | Series 2020-H18-AI | 613,302 | ||||||
| 7,536,604 | Series 2020-H19-BI | 498,880 | ||||||
| 6,352,141 | Series 2021-1-QS | 951,527 | ||||||
| 8,640,319 | Series 2021-107-SA | 572,902 | ||||||
| 3,351,524 | Series 2021-117-HI | 465,906 | ||||||
| 18,211,942 | Series 2021-213-SN | 581,813 | ||||||
| 9,562,337 | Series 2021-52-IO | 623,254 | ||||||
| 5,180,659 | Series 2021-59-S | 90,772 | ||||||
| 12,560,655 | Series 2021-89-SA | 830,031 | ||||||
The accompanying notes are an integral part of these financial statements.
| Schedule of Investments | 69 | |||||
Table of Contents
iMGP Alternative Strategies Fund
SCHEDULE OF INVESTMENTS IN SECURITIES at June 30, 2022 (Unaudited) (Continued)
| Principal Amount^ | Value | |||||||
MORTGAGE-BACKED SECURITIES (CONTINUED) | ||||||||
| Government National Mortgage Association (Continued) | ||||||||
| $ 9,380,826 | Series 2021-97-SB | $ | 650,482 | |||||
| 43,871,242 | Series 2021-H08-QI | 1,102,568 | ||||||
| 14,493,561 | Series 2021-H19-AI | 797,711 | ||||||
| 15,284,279 | Series 2022-48 IO | 1,106,021 | ||||||
| GS Mortgage Securities Corp. II | ||||||||
| 600,000 | Series 2021-ARDN-H | 568,460 | ||||||
| GS Mortgage Securities Corp. Trust | ||||||||
| 1,125,000 | Series 2013-PEMB-C | 939,964 | ||||||
| 1,503,000 | Series 2018-TWR-G | 1,345,476 | ||||||
| GS Mortgage Securities Trust | ||||||||
| 130,000 | Series 2011-GC5-C | 108,022 | ||||||
| 1,010,000 | Series 2011-GC5-D | 445,410 | ||||||
| 100,000 | Series 2014-GC18-B | 91,878 | ||||||
| 1,344,000 | Series 2014-GC26-D | 966,016 | ||||||
| 5,673,000 | Series 2021-GSA3-XF | 554,775 | ||||||
| GSCG Trust | ||||||||
| 710,000 | Series 2019-600C-H | 616,230 | ||||||
| GSR Mortgage Loan Trust | ||||||||
| 34,751 | Series 2005-4F-6A1 | 33,244 | ||||||
| 509,690 | Series 2005-9F-2A1 | 298,056 | ||||||
| 75,471 | Series 2005-AR6-4A5 | 73,357 | ||||||
| 225,998 | Series 2006-7F-3A4 | 89,808 | ||||||
| HarborView Mortgage Loan Trust | ||||||||
| 188,577 | Series 2004-11-2A2A | 161,320 | ||||||
| 2,800,180 | Series 2007-7-2A1B | 2,422,948 | ||||||
| Hawaii Hotel Trust | ||||||||
| 1,297,000 | Series 2019-MAUI-F | 1,201,203 | ||||||
| Hospitality Mortgage Trust | ||||||||
| 1,006,345 | Series 2019-HIT-G | 926,224 | ||||||
| Principal Amount^ | Value | |||||||
| Impac Secured Assets Trust | ||||||||
| $ 4,447,762 | Series 2007-2-1A1C | $ | 4,054,382 | |||||
| Imperial Fund Mortgage Trust | ||||||||
| 2,000,000 | Series 2021-NQM3-B2 | 1,426,907 | ||||||
| IndyMac INDX Mortgage Loan Trust | ||||||||
| 130,171 | Series 2004-AR7-A5 | 118,431 | ||||||
| 211,988 | Series 2005-AR11-A3 | 176,854 | ||||||
| 505,660 | Series 2006-AR2-2A1 | 387,964 | ||||||
| 2,640,340 | Series 2006-R1-A3 | 2,473,041 | ||||||
| 981,289 | Series 2007-AR5-2A1 | 842,086 | ||||||
| JP Morgan Chase Commercial Mortgage Securities Trust | ||||||||
| 1,285,000 | Series 2011-C3-E | 464,020 | ||||||
| 135,000 | Series 2012-C8-C | 134,720 | ||||||
| 310,000 | Series 2012-LC9-C | 307,023 | ||||||
| 1,531,000 | Series 2019-MFP-F | 1,412,660 | ||||||
| 683,000 | Series 2019-MFP-G | 628,503 | ||||||
| 683,000 | Series 2019-MFP-XG | 2,519 | ||||||
| 219,000 | Series 2019-UES-C | 210,968 | ||||||
| 224,000 | Series 2019-UES-D | 213,322 | ||||||
| 261,000 | Series 2019-UES-E | 243,637 | ||||||
| 274,000 | Series 2019-UES-F | 245,227 | ||||||
| 299,000 | Series 2019-UES-G | 264,814 | ||||||
| JP Morgan Mortgage Trust | ||||||||
| 207,707 | Series 2004-S1-2A1 | 204,029 | ||||||
| 1,564,442 | Series 2005-ALT1-3A1 | 1,279,088 | ||||||
| 17,235 | Series 2007-A1-4A2 | 16,480 | ||||||
| 560,342 | Series 2007-S3-1A97 | 344,211 | ||||||
| JP Morgan Resecuritization Trust | ||||||||
| 7,331,960 | Series 2015-4-1A7 | 5,747,374 | ||||||
The accompanying notes are an integral part of these financial statements.
| 70 | Litman Gregory Funds Trust | |||||
Table of Contents
iMGP Alternative Strategies Fund
SCHEDULE OF INVESTMENTS IN SECURITIES at June 30, 2022 (Unaudited) (Continued)
| Principal Amount^ | Value | |||||||
MORTGAGE-BACKED SECURITIES (CONTINUED) | ||||||||
| JPMBB Commercial Mortgage Securities Trust | ||||||||
| $ 1,616,000 | Series 2014-C23-D | $ | 1,472,419 | |||||
| 300,000 | Series 2014-C23-E | 237,316 | ||||||
| 78,000 | Series 2015-C27-D | 64,944 | ||||||
| 4,749,500 | Series 2015-C27-XFG | 139,411 | ||||||
| Legacy Mortgage Asset Trust | ||||||||
| 814,964 | Series 2020-GS1-A1 | 810,326 | ||||||
| 3,300,000 | Series 2020-GS3-A2 | 3,181,200 | ||||||
| 160,609 | Series 2020-GS5-A1 | 158,354 | ||||||
| Lehman Mortgage Trust | ||||||||
| 678,959 | Series 2006-2-2A3 | 679,499 | ||||||
| 952,258 | Series 2007-1 1A2 | 931,328 | ||||||
| Lehman XS Trust | ||||||||
| 82,227 | Series 2006-2N-1A1 | 70,441 | ||||||
| LHOME Mortgage Trust | ||||||||
| 3,700,000 | Series 2021-RTL1-M | 3,397,969 | ||||||
| Master Alternative Loan Trust | ||||||||
| 18,748 | Series 2003-9-4A1 | 18,197 | ||||||
| 15,537 | Series 2004-5-1A1 | 14,864 | ||||||
| 18,822 | Series 2004-5-2A1 | 18,465 | ||||||
| 79,620 | Series 2004-8-2A1 | 77,269 | ||||||
| Med Trust | ||||||||
| 600,000 | Series 2021-MDLN-G | 544,948 | ||||||
| Merrill Lynch Mortgage Investors Trust | ||||||||
| 3,456 | Series 2006-2-2A | 3,388 | ||||||
| Mill City Mortgage Loan Trust | ||||||||
| 305,000 | Series 2021-NMR1-M3 | 256,189 | ||||||
| Morgan Stanley Bank of America Merrill Lynch Trust | ||||||||
| 858,000 | Series 2015-C21-C | 715,802 | ||||||
| Morgan Stanley Bank of America Merrill Lynch Trust | ||||||||
| 560,000 | Series 2013-C11-B | 424,008 | ||||||
| 1,155,000 | Series 2016-C31-D | 848,072 | ||||||
| Principal Amount^ | Value | |||||||
| Morgan Stanley Capital I Trust | ||||||||
| $ 197,554 | Series 2011-C2-D | $ | 188,282 | |||||
| 540,000 | Series 2011-C2-E | 437,400 | ||||||
| 613,000 | Series 2016-H4-D | 450,666 | ||||||
| 1,508,000 | Series 2019-PLND-F | 1,341,726 | ||||||
| Morgan Stanley Mortgage Loan Trust | ||||||||
| 1,459,947 | Series 2005-9AR-2A | 1,324,185 | ||||||
| 2,275,061 | Series 2006-11-2A2 | 1,226,557 | ||||||
| 273,193 | Series 2006-7-3A | 197,573 | ||||||
| 224,428 | Series 2007-13-6A1 | 147,832 | ||||||
| NewRez Warehouse Securitization Trust | ||||||||
| 2,200,000 | Series 2021-1-F | 2,186,441 | ||||||
| Preston Ridge Partners Mortgage LLC | ||||||||
| 400,000 | Series 2021-2-A2 | 376,915 | ||||||
| 583,097 | Series 2021-3-A1 | 552,559 | ||||||
| 381,252 | Series 2021-9-A1 | 359,916 | ||||||
| Prime Mortgage Trust | ||||||||
| 922,096 | Series 2006-DR1-2A1 | 816,078 | ||||||
| Residential Accredit Loans, Inc. | ||||||||
| 256,987 | Series 2006-QS17-A5 | 225,371 | ||||||
| 318,258 | Series 2006-QS7-A3 | 275,505 | ||||||
| 373,827 | Series 2007-QS1-2A10 | 317,261 | ||||||
| 320,276 | Series 2007-QS8-A8 | 278,448 | ||||||
| Residential Asset Securitization Trust | ||||||||
| 200,109 | Series 2006-A8-1A1 | 146,579 | ||||||
| 227,024 | Series 2007-A1-A8 | 92,204 | ||||||
| 15,458,536 | Series 2007-A9-A1 | 4,182,213 | ||||||
| 15,458,536 | Series 2007-A9-A2 | 3,503,880 | ||||||
| Residential Funding Mortgage Securities I Trust | ||||||||
| 298,317 | Series 2006-S4-A5 | 263,904 | ||||||
| SMR Mortgage Trust | ||||||||
| 1,205,738 | Series 2022-IND-G | 1,149,869 | ||||||
The accompanying notes are an integral part of these financial statements.
| Schedule of Investments | 71 | |||||
Table of Contents
iMGP Alternative Strategies Fund
SCHEDULE OF INVESTMENTS IN SECURITIES at June 30, 2022 (Unaudited) (Continued)
| Principal Amount^ | Value | |||||||
MORTGAGE-BACKED SECURITIES (CONTINUED) | ||||||||
| SREIT Trust | ||||||||
| $ 650,000 | Series 2021-MFP2-J | $ | 609,900 | |||||
| Starwood Retail Property Trust | ||||||||
| 235,000 | Series 2014-STAR-C | 117,188 | ||||||
| 980,000 | Series 2014-STAR-D | 273,788 | ||||||
| 950,000 | Series 2014-STAR-E | 96,113 | ||||||
| Structured Adjustable Rate Mortgage Loan Trust | ||||||||
| 500,703 | Series 2005-14-A1 | 339,339 | ||||||
| 237,165 | Series 2005-15-1A1 | 156,566 | ||||||
| 196,182 | Series 2005-22-3A1 | 150,702 | ||||||
| 512,739 | Series 2008-1-A2 | 430,883 | ||||||
| Structured Asset Securities Corp. | ||||||||
| 6,265,723 | Series 2007-4-1A3 | 518,717 | ||||||
| Tharaldson Hotel Portfolio Trust | ||||||||
| 1,382,807 | Series 2018-THL-F | 1,257,185 | ||||||
| Toorak Mortgage Corp. Ltd. | ||||||||
| 630,000 | Series 2021-1-A1 | 593,157 | ||||||
| TTAN | ||||||||
| 598,473 | Series 2021-MHC-G | 551,019 | ||||||
| UBS-Barclays Commercial Mortgage Trust | ||||||||
| 305,000 | Series 2012-C2-E | 10,824 | ||||||
| 1,000,000 | Series 2013-C5-C | 918,359 | ||||||
| Verus Securitization Trust | ||||||||
| 2,000,000 | Series 2021-7-B2 | 1,402,906 | ||||||
| Washington Mutual Mortgage Pass-Through Certificates Trust | ||||||||
| 403,942 | Series 2006-5-1A5 | 331,592 | ||||||
| 395,681 | Series 2006-8-A6 | 166,500 | ||||||
| 2,204,821 | Series 2007-5-A3 | 1,466,981 | ||||||
| Principal Amount^ | Value | |||||||
| Wells Fargo Alternative Loan Trust | ||||||||
| $ 103,420 | Series 2007-PA2-3A1 | $ | 91,876 | |||||
| 152,354 | Series 2007-PA2-3A2 | 11,989 | ||||||
| Wells Fargo Commercial Mortgage Trust | ||||||||
| 640,000 | Series 2013-LC12-B | 601,612 | ||||||
| 19,971,000 | Series 2015-C28-XE | 559,448 | ||||||
| 398,000 | Series 2015-NXS4-D | 352,492 | ||||||
| 750,000 | Series 2016-C33-D | 618,348 | ||||||
| 600,000 | Series 2016-C34-C | 511,819 | ||||||
| 135,000 | Series 2016-C36-B | 118,843 | ||||||
| 130,000 | Series 2016-C36-C | 105,630 | ||||||
| 6,406,000 | Series 2017-C42-XE | 358,052 | ||||||
| 1,225,000 | Series 2019-JWDR-C | 1,103,555 | ||||||
| Wells Fargo Mortgage-Backed Securities Trust | ||||||||
| 59,041 | Series 2006-AR19-A1 | 57,320 | ||||||
| WFRBS Commercial Mortgage Trust | ||||||||
| 656,058 | Series 2011-C3-D | 292,602 | ||||||
| 395,000 | Series 2011-C4-E | 308,798 | ||||||
| 1,020,000 | Series 2012-C10-C | 952,890 | ||||||
| 185,000 | Series 2012-C7-C | 134,033 | ||||||
| 400,000 | Series 2012-C7-D | 192,000 | ||||||
| 290,000 | Series 2012-C7-E | 27,405 | ||||||
| 600,000 | Series 2012-C8-E | 597,904 | ||||||
| 300,000 | Series 2014-C20-B | 284,927 | ||||||
| 250,000 | Series 2014-C24-B | 232,371 | ||||||
|
| |||||||
| | TOTAL MORTGAGE-BACKED SECURITIES | 183,088,821 | ||||||
|
| |||||||
SHORT-TERM INVESTMENTS: 12.0% | ||||||||
REPURCHASE AGREEMENTS: 9.3% | ||||||||
| 127,332,311 | Fixed Income Clearing Corp. 0.240%, 6/30/2022, due 07/01/2022 [collateral: par value $121,717,700, U.S. Treasury Notes, 3.000%, due 06/30/2024 value $121,594,545] (proceeds $127,332,311) | 127,332,311 | ||||||
|
| |||||||
The accompanying notes are an integral part of these financial statements.
| 72 | Litman Gregory Funds Trust | |||||
Table of Contents
iMGP Alternative Strategies Fund
SCHEDULE OF INVESTMENTS IN SECURITIES at June 30, 2022 (Unaudited) (Continued)
| Principal Amount^ | Value | |||||||
TREASURY BILLS: 2.7% | ||||||||
| United States Treasury Bill | ||||||||
| $ 4,000,000 | 0.958%, 07/14/2022(b)(n) | $ | 3,998,530 | |||||
| 5,000,000 | 1.319%, 08/11/2022(b)(n) | 4,992,419 | ||||||
| 10,690,000 | 1.545%, 09/08/2022(b)(n) | 10,658,413 | ||||||
| 2,500,000 | 1.744%, 10/06/2022(b)(n)(o) | 2,488,348 | ||||||
| 4,500,000 | 2.236%, 12/01/2022(b)(n) | 4,457,949 | ||||||
| 2,000,000 | 2.402%, 02/23/2023(b)(n) | 1,969,075 | ||||||
| 6,000,000 | 2.571%, 04/20/2023(b)(n) | 5,877,672 | ||||||
| 2,000,000 | 2.758%, 06/15/2023(b)(n) | 1,948,135 | ||||||
|
| |||||||
| | TOTAL TREASURY BILLS | 36,390,541 | ||||||
|
| |||||||
| | TOTAL SHORT-TERM INVESTMENTS | 163,722,852 | ||||||
|
| |||||||
| | TOTAL INVESTMENTS | 1,351,186,359 | ||||||
|
| |||||||
| Other Assets in Excess of Liabilities: 1.4% | 19,854,965 | |||||||
|
| |||||||
NET ASSETS: 100.0% | $ | 1,371,041,324 | ||||||
|
| |||||||
Percentages are stated as a percent of net assets.
| ADR | American Depositary Receipt |
| BADLARPP | Argentina Badlar Floating Rate Notes |
| CLO | Collateralized Loan Obligation |
| CMT | Constant Maturity Treasury Index |
| CVR | Contingent Value Rights |
| EURIBOR | Euro Interbank Offered Rate |
| FEDL01 | Federal Funds Rate |
| LIBOR | London Interbank Offered Rate |
| L.P. | Limited Partnership |
| PIK | Payment-in-kind |
| REIT | Real Estate Investment Trust |
| REMICS | Real Estate Mortgage Investment Conduit |
| SABOR | South African Benchmark Overnight Rate |
| SOFR | Secured Overnight Financing Rate |
| * | Non-Income Producing Security. |
| ^ | The principal amount is stated in U.S. Dollars unless otherwise indicated. |
| (a) | Security is valued using significant unobservable inputs in good faith in accordance with procedures approved by the Board of Trustees. |
| (b) | Securities with an aggregate fair value of $53,807,539 have been pledged as collateral for options, total return swaps, credit default swaps, interest rate swaps, securities sold short and futures positions. |
| (c) | Security was purchased pursuant to Rule 144A under the Securities Act of 1933 and may be sold in transactions exempt from registration only to qualified institutional buyers or in a public offering registered under Securities Act of 1933. |
| (d) | Perpetual Call. |
| (e) | Pay-in-kind security. |
| (f) | Coupon increases periodically based upon a predetermined schedule. Stated interest rate in effect at June 30, 2022. |
| (g) | Floating Interest Rate at June 30, 2022. |
| (h) | Variable rate security. Interest rate or distribution rate disclosed is that which is in effect at June 30, 2022. |
| (i) | This position represents an unsettled loan commitment at period end. Certain details associated with this purchase are not known prior to the settlement date, including coupon rate, which will be adjusted on settlement date. |
| (j) | Issued with a zero coupon. Income is recognized through the accretion of discount. |
| (k) | Security is currently in default and/or non-income producing. |
| (l) | Principal Only security. |
| (m) | Interest Only security. Security with a notional or nominal principal amount. |
| (n) | The rate shown represents yield-to-maturity. |
| (o) | When issued security. |
CURRENCY ABBREVIATIONS:
| ARS | Argentine Peso |
| AUD | Australian Dollar |
| BRL | Brazilian Real |
| CAD | Canadian Dollar |
| CHF | Swiss Franc |
| COP | Colombian Peso |
| EUR | Euro |
| GBP | British Pound |
| MXN | Mexican Peso |
| SEK | Swedish Krona |
| USD | U.S. Dollar |
| ZAR | South African Rand |
The accompanying notes are an integral part of these financial statements.
| Schedule of Investments | 73 | |||||
Table of Contents
iMGP Alternative Strategies Fund
SCHEDULE OF INVESTMENTS IN SECURITIES SOLD SHORT at June 30, 2022 (Unaudited)
| Shares | Value | |||||||
COMMON STOCKS: (0.3)% | ||||||||
| (2,904) | Broadcom, Inc. | $ | (1,410,792 | ) | ||||
| (8,572) | Cineplex, Inc.* | (71,988 | ) | |||||
| (2,012) | Intercontinental Exchange, Inc. | (189,209 | ) | |||||
| (5,838) | MaxLinear, Inc.* | (198,375 | ) | |||||
| (289,316) | Rentokil Initial PLC | (1,670,162 | ) | |||||
|
| |||||||
| | TOTAL COMMON STOCKS | (3,540,526 | ) | |||||
|
| |||||||
| | TOTAL SECURITIES SOLD SHORT | $ | (3,540,526 | ) | ||||
|
| |||||||
The accompanying notes are an integral part of these financial statements.
| 74 | Litman Gregory Funds Trust | |||||
Table of Contents
iMGP Alternative Strategies Fund
SCHEDULE OF INVESTMENTS IN FORWARD FOREIGN CURRENCY EXCHANGE CONTRACTS at June 30, 2022 (Unaudited)
At June 30, 2022, the Fund had the following forward foreign currency exchange contracts:
| Asset Derivatives | Liability Derivatives | |||||||||||||||||||||||
| Counterparty | Settlement Date | Fund Receiving | U.S. $ Value at June 30, 2022 | Fund Delivering | U.S. $ Value at June 30, 2022 | Unrealized Appreciation | Unrealized Depreciation | |||||||||||||||||
Bank of America N.A. | 7/26/2022 | USD | $ | 1,769,623 | EUR | $ | 1,709,761 | $ | 59,862 | $ | — | |||||||||||||
Barclays Bank Plc | 7/26/2022 | USD | 537,273 | EUR | 518,904 | 18,369 | — | |||||||||||||||||
HSBC Bank USA | 8/17/2022 | EUR | 86,095 | USD | 86,983 | — | (888 | ) | ||||||||||||||||
| 8/17/2022 | USD | 402,640 | EUR | 405,273 | — | (2,633 | ) | |||||||||||||||||
JPMorgan Chase Bank N.A. | 8/5/2022 | EUR | 987,045 | USD | 994,278 | — | (7,233 | ) | ||||||||||||||||
| 8/5/2022 | EUR | 751,302 | USD | 759,165 | — | (7,863 | ) | |||||||||||||||||
| 8/5/2022 | EUR | 684,864 | USD | 701,283 | — | (16,419 | ) | |||||||||||||||||
| 8/5/2022 | USD | 3,565,011 | EUR | 3,485,490 | 79,521 | — | ||||||||||||||||||
| 8/5/2022 | USD | 1,530,788 | EUR | 1,490,336 | 40,452 | — | ||||||||||||||||||
| 8/5/2022 | USD | 402,285 | EUR | 393,467 | 8,818 | — | ||||||||||||||||||
| 8/5/2022 | USD | 355,604 | EUR | 351,463 | 4,141 | — | ||||||||||||||||||
| 8/5/2022 | USD | 840,311 | EUR | 837,610 | 2,701 | — | ||||||||||||||||||
| 8/5/2022 | USD | 25,893 | EUR | 25,928 | — | (35 | ) | |||||||||||||||||
Morgan Stanley & Co. | 7/11/2022 | USD | 945,673 | COP | 850,635 | 95,038 | — | |||||||||||||||||
| 9/15/2022 | AUD | 704,176 | USD | 706,902 | — | (2,726 | ) | |||||||||||||||||
| 9/15/2022 | CAD | 32,945 | USD | 32,486 | 459 | — | ||||||||||||||||||
| 9/15/2022 | CAD | 46,542 | USD | 46,272 | 270 | — | ||||||||||||||||||
| 9/15/2022 | CAD | 16,006 | USD | 16,016 | — | (10 | ) | |||||||||||||||||
| 9/15/2022 | CAD | 26,806 | USD | 26,849 | — | (43 | ) | |||||||||||||||||
| 9/15/2022 | EUR | 1,405,447 | USD | 1,415,667 | — | (10,220 | ) | |||||||||||||||||
| 9/15/2022 | SEK | 191,898 | USD | 191,823 | 75 | — | ||||||||||||||||||
| 9/15/2022 | SEK | 82,127 | USD | 82,488 | — | (361 | ) | |||||||||||||||||
| 9/15/2022 | SEK | 153,567 | USD | 156,150 | — | (2,583 | ) | |||||||||||||||||
| 9/15/2022 | USD | 2,161,522 | AUD | 2,147,003 | 14,519 | — | ||||||||||||||||||
| 9/15/2022 | USD | 17,713 | CAD | 17,793 | — | (80 | ) | |||||||||||||||||
| 9/15/2022 | USD | 1,419,634 | CAD | 1,420,875 | — | (1,241 | ) | |||||||||||||||||
| 9/15/2022 | USD | 763,146 | EUR | 757,070 | 6,076 | — | ||||||||||||||||||
| 9/15/2022 | USD | 372,137 | EUR | 367,855 | 4,282 | — | ||||||||||||||||||
| 9/15/2022 | USD | 128,638 | EUR | 127,844 | 794 | — | ||||||||||||||||||
| 9/15/2022 | USD | 102,828 | EUR | 103,223 | — | (395 | ) | |||||||||||||||||
| 9/15/2022 | USD | 8,938,044 | EUR | 8,951,845 | — | (13,801 | ) | |||||||||||||||||
| 9/15/2022 | USD | 5,508,303 | GBP | 5,501,596 | 6,707 | — | ||||||||||||||||||
| 9/15/2022 | USD | 259,647 | GBP | 259,678 | — | (31 | ) | |||||||||||||||||
| 9/15/2022 | USD | 3,257,928 | SEK | 3,242,566 | 15,362 | — | ||||||||||||||||||
| 9/15/2022 | USD | 456,853 | SEK | 452,188 | 4,665 | — | ||||||||||||||||||
| 9/15/2022 | USD | 153,140 | SEK | 152,127 | 1,013 | — | ||||||||||||||||||
| 9/15/2022 | USD | 34,530 | SEK | 34,128 | 402 | — | ||||||||||||||||||
| 9/15/2022 | USD | 32,319 | SEK | 32,002 | 317 | — | ||||||||||||||||||
|
|
|
|
|
|
|
|
| ||||||||||||||||
| $ | 39,150,303 | $ | 38,853,022 | $ | 363,843 | $ | (66,562 | ) | ||||||||||||||||
|
|
|
|
|
|
|
|
| ||||||||||||||||
The accompanying notes are an integral part of these financial statements.
| Schedule of Investments | 75 | |||||
Table of Contents
iMGP Alternative Strategies Fund
SCHEDULE OF INVESTMENTS IN FUTURES CONTRACTS at June 30, 2022 (Unaudited)
| Description | Number of Contracts | Notional Amount | Notional Value | Expiration Date | Unrealized Appreciation/ (Depreciation) | |||||||||||||||
Futures Contracts – Long |
| |||||||||||||||||||
2YR U.S. Treasury Notes | 818 | 172,672,773 | $ | 171,792,782 | 9/30/2022 | $ | (879,992 | ) | ||||||||||||
Euro 90 Days Bond Futures | 906 | 222,393,618 | 218,300,700 | 3/13/2023 | (4,092,918 | ) | ||||||||||||||
U.S. Long Bond Futures | 16 | 2,259,912 | 2,218,000 | 9/21/2022 | (41,912 | ) | ||||||||||||||
|
| |||||||||||||||||||
Total Long | $ | (5,014,822 | ) | |||||||||||||||||
|
| |||||||||||||||||||
Futures Contracts – Short |
| |||||||||||||||||||
5YR U.S. Treasury Notes | (652 | ) | (73,387,630 | ) | $ | (73,187,000 | ) | 9/30/2022 | $ | 200,630 | ||||||||||
10YR U.S. Treasury Notes | (329 | ) | (38,421,114 | ) | (38,996,781 | ) | 9/21/2022 | (575,667 | ) | |||||||||||
Ultra 10YR U.S. Treasury Notes | (395 | ) | (51,214,800 | ) | (50,313,125 | ) | 9/21/2022 | 901,675 | ||||||||||||
Ultra 10YR U.S. Treasury Notes | (480 | ) | (61,344,198 | ) | (61,140,000 | ) | 9/21/2022 | 204,199 | ||||||||||||
Ultra-Long U.S. Treasury Bonds | (51 | ) | (8,082,734 | ) | (7,871,531 | ) | 9/21/2022 | 211,203 | ||||||||||||
|
| |||||||||||||||||||
Total Short | $ | 942,040 | ||||||||||||||||||
|
| |||||||||||||||||||
Total Futures Contracts | $ | (4,072,782 | ) | |||||||||||||||||
|
| |||||||||||||||||||
SCHEDULE OF INVESTMENTS IN SWAPS at June 30, 2022 (Unaudited)
| CENTRALLY CLEARED CREDIT DEFAULT SWAP CONTRACTS (1)(2)(3) | ||||||||||||||||||||||||||||||||
| Description | Maturity Date | Fixed Deal (Pay) Rate | Implied Credit Spread at June 30, 2022 | Notional Amount(4) | Periodic Payment Frequency | Fair Value | Upfront Premiums Paid / (Received) | Unrealized Appreciation / (Depreciation) | ||||||||||||||||||||||||
Buy Protection |
| |||||||||||||||||||||||||||||||
ADT Security Corp. (The) | 6/20/2027 | (5.000 | %) | 4.871 | % | $ | (3,850,000 | ) | Quarterly | $ | (18,349 | ) | $ | (78,123 | ) | $ | 59,774 | |||||||||||||||
Advanced Micro Devices, Inc. | 6/20/2027 | (5.000 | %) | 0.843 | % | (1,400,000 | ) | Quarterly | (263,760 | ) | (270,452 | ) | 6,692 | |||||||||||||||||||
AES Corp. (The) | 6/20/2027 | (5.000 | %) | 2.211 | % | (1,300,000 | ) | Quarterly | (155,429 | ) | (190,049 | ) | 34,620 | |||||||||||||||||||
Ally Financial, Inc. | 6/20/2027 | (5.000 | %) | 3.034 | % | (8,150,000 | ) | Quarterly | (664,605 | ) | (1,292,048 | ) | 627,443 | |||||||||||||||||||
Alstom S.A. | 6/20/2027 | (1.000 | %) | 2.097 | % | EUR | (8,850,000 | ) | Quarterly | 456,609 | 281,325 | 175,284 | ||||||||||||||||||||
Altria Group, Inc. | 6/20/2027 | (1.000 | %) | 1.346 | % | $ | (750,000 | ) | Quarterly | 11,594 | (1,009 | ) | 12,603 | |||||||||||||||||||
American Express Co. | 6/20/2027 | (1.000 | %) | 0.695 | % | (8,450,000 | ) | Quarterly | (117,034 | ) | (146,936 | ) | 29,902 | |||||||||||||||||||
Anglo American Capital Plc | 6/20/2027 | (5.000 | %) | 2.128 | % | EUR | (300,000 | ) | Quarterly | (40,277 | ) | (46,016 | ) | 5,739 | ||||||||||||||||||
Apache Corp. | 6/20/2027 | (1.000 | %) | 2.649 | % | $ | (4,850,000 | ) | Quarterly | 337,801 | 79,910 | 257,891 | ||||||||||||||||||||
Arrow Electronics, Inc. | 6/20/2027 | (1.000 | %) | 1.147 | % | (9,500,000 | ) | Quarterly | 63,012 | 28,702 | 34,310 | |||||||||||||||||||||
Avis Budget Car Rental LLC / Avis Budget Finance, Inc. | 6/20/2027 | (5.000 | %) | 5.754 | % | (8,750,000 | ) | Quarterly | 249,309 | (501,612 | ) | 750,921 | ||||||||||||||||||||
Avnet, Inc. | 6/20/2027 | (1.000 | %) | 1.215 | % | (11,800,000 | ) | Quarterly | 113,980 | 51,489 | 62,491 | |||||||||||||||||||||
Barclays Plc | 6/20/2027 | (1.000 | %) | 1.409 | % | EUR | (3,150,000 | ) | Quarterly | 62,370 | (19,280 | ) | 81,650 | |||||||||||||||||||
The accompanying notes are an integral part of these financial statements.
| 76 | Litman Gregory Funds Trust | |||||
Table of Contents
iMGP Alternative Strategies Fund
SCHEDULE OF INVESTMENTS IN SWAPS at June 30, 2022 (Unaudited) (Continued)
| CENTRALLY CLEARED CREDIT DEFAULT SWAP CONTRACTS (1)(2)(3) (CONTINUED) | ||||||||||||||||||||||||||||||||
| Description | Maturity Date | Fixed Deal (Pay) Rate | Implied Credit Spread at June 30, 2022 | Notional Amount(4) | Periodic Payment Frequency | Fair Value | Upfront Premiums Paid / (Received) | Unrealized Appreciation / (Depreciation) | ||||||||||||||||||||||||
| Buy Protection (Continued) | ||||||||||||||||||||||||||||||||
Barclays Plc | 6/20/2027 | (1.000 | %) | 1.409 | % | EUR | (5,200,000 | ) | Quarterly | $ | 102,961 | $ | (15,944 | ) | $ | 118,905 | ||||||||||||||||
Baxter International, Inc. | 6/20/2027 | (1.000 | %) | 0.654 | % | $ | (9,200,000 | ) | Quarterly | (145,143 | ) | (245,465 | ) | 100,322 | ||||||||||||||||||
Bertelsmann SE & Co. KGaA | 6/20/2027 | (1.000 | %) | 0.597 | % | EUR | (7,800,000 | ) | Quarterly | (156,055 | ) | (229,555 | ) | 73,500 | ||||||||||||||||||
Best Buy Co., Inc. | 6/20/2027 | (5.000 | %) | 1.731 | % | $ | (7,650,000 | ) | Quarterly | (1,093,169 | ) | (1,525,994 | ) | 432,825 | ||||||||||||||||||
Block Financial LLC | 6/20/2027 | (5.000 | %) | 1.013 | % | (3,450,000 | ) | Quarterly | (619,072 | ) | (666,158 | ) | 47,086 | |||||||||||||||||||
Boeing Co. (The) | 6/20/2027 | (1.000 | %) | 2.563 | % | (9,500,000 | ) | Quarterly | 629,002 | 370,135 | 258,867 | |||||||||||||||||||||
BorgWarner, Inc. | 6/20/2027 | (1.000 | %) | 1.527 | % | (550,000 | ) | Quarterly | 12,845 | 13,499 | (654 | ) | ||||||||||||||||||||
Bouygues S.A. | 6/20/2027 | (1.000 | %) | 0.806 | % | EUR | (7,750,000 | ) | Quarterly | (73,969 | ) | (155,794 | ) | 81,825 | ||||||||||||||||||
Cardinal Health, Inc. | 6/20/2027 | (1.000 | %) | 0.742 | % | $ | (9,200,000 | ) | Quarterly | (107,388 | ) | (166,588 | ) | 59,200 | ||||||||||||||||||
Carlsberg Breweries AS | 6/20/2027 | (1.000 | %) | 0.681 | % | EUR | (8,450,000 | ) | Quarterly | (133,270 | ) | (221,643 | ) | 88,373 | ||||||||||||||||||
Carnival Corp. | 6/20/2027 | (1.000 | %) | 14.031 | % | $ | (11,000,000 | ) | Quarterly | 4,004,702 | 2,228,900 | 1,775,802 | ||||||||||||||||||||
CCO Holdings LLC / CCO Holdings Capital Corp. | 6/20/2027 | (5.000 | %) | 3.287 | % | (4,100,000 | ) | Quarterly | (288,394 | ) | (394,465 | ) | 106,071 | |||||||||||||||||||
CDX North America High Yield Index Series 38 | 6/20/2027 | (5.000 | %) | 5.784 | % | (57,000,000 | ) | Quarterly | 1,731,304 | (2,334,150 | ) | 4,065,454 | ||||||||||||||||||||
Centrica Plc | 6/20/2027 | (1.000 | %) | 1.328 | % | EUR | (8,250,000 | ) | Quarterly | 131,777 | 75,386 | 56,391 | ||||||||||||||||||||
Citigroup, Inc. | 6/20/2027 | (1.000 | %) | 1.264 | % | $ | (9,000,000 | ) | Quarterly | 106,194 | 33,287 | 72,907 | ||||||||||||||||||||
Cleveland-Cliffs, Inc. | 6/20/2027 | (5.000 | %) | 4.990 | % | (8,250,000 | ) | Quarterly | (1,697 | ) | (672,376 | ) | 670,679 | |||||||||||||||||||
Comcast Corp. | 6/20/2027 | (1.000 | %) | 0.852 | % | (7,900,000 | ) | Quarterly | (52,462 | ) | (105,862 | ) | 53,400 | |||||||||||||||||||
Conagra Brands, Inc. | 6/20/2027 | (1.000 | %) | 1.067 | % | (1,000,000 | ) | Quarterly | 3,094 | 2,294 | 800 | |||||||||||||||||||||
CVS Health Corp. | 6/20/2027 | (1.000 | %) | 0.806 | % | (9,500,000 | ) | Quarterly | (83,364 | ) | (228,989 | ) | 145,625 | |||||||||||||||||||
DXC Technology Co. | 6/20/2027 | (5.000 | %) | 1.835 | % | (1,300,000 | ) | Quarterly | (179,066 | ) | (193,348 | )�� | 14,282 | |||||||||||||||||||
Eastman Chemical Co. | 6/20/2027 | (1.000 | %) | 1.475 | % | (9,350,000 | ) | Quarterly | 197,060 | (18,046 | ) | 215,106 | ||||||||||||||||||||
Enbridge, Inc. | 6/20/2027 | (1.000 | %) | 1.134 | % | (800,000 | ) | Quarterly | 4,852 | 3,571 | 1,281 | |||||||||||||||||||||
Enel SpA | 6/20/2027 | (1.000 | %) | 1.451 | % | EUR | (8,050,000 | ) | Quarterly | 175,772 | 87,342 | 88,430 | ||||||||||||||||||||
The accompanying notes are an integral part of these financial statements.
| Schedule of Investments | 77 | |||||
Table of Contents
iMGP Alternative Strategies Fund
SCHEDULE OF INVESTMENTS IN SWAPS at June 30, 2022 (Unaudited) (Continued)
| CENTRALLY CLEARED CREDIT DEFAULT SWAP CONTRACTS (1)(2)(3) (CONTINUED) | ||||||||||||||||||||||||||||||||
| Description | Maturity Date | Fixed Deal (Pay) Rate | Implied Credit Spread at June 30, 2022 | Notional Amount(4) | Periodic Payment Frequency | Fair Value | Upfront Premiums Paid / (Received) | Unrealized Appreciation / (Depreciation) | ||||||||||||||||||||||||
| Buy Protection (Continued) | ||||||||||||||||||||||||||||||||
Expedia Group, Inc. | 6/20/2027 | (1.000 | %) | 2.313 | % | $ | (9,300,000 | ) | Quarterly | $ | 522,902 | $ | (36,249 | ) | $ | 559,151 | ||||||||||||||||
FedEx Corp. | 6/20/2027 | (1.000 | %) | 0.810 | % | (9,350,000 | ) | Quarterly | (80,174 | ) | (118,754 | ) | 38,580 | |||||||||||||||||||
Ford Motor Co. | 6/20/2027 | (5.000 | %) | 4.431 | % | (8,550,000 | ) | Quarterly | (190,635 | ) | (881,061 | ) | 690,426 | |||||||||||||||||||
Fortum Oyj | 6/20/2027 | (1.000 | %) | 3.318 | % | EUR | (8,000,000 | ) | Quarterly | 828,174 | 688,521 | 139,653 | ||||||||||||||||||||
Fortum Oyj | 6/20/2027 | (1.000 | %) | 3.318 | % | (950,000 | ) | Quarterly | 98,346 | 37,769 | 60,577 | |||||||||||||||||||||
Freeport-McMoRan, Inc. | 6/20/2027 | (1.000 | %) | 2.235 | % | $ | (4,150,000 | ) | Quarterly | 220,273 | 144,293 | 75,980 | ||||||||||||||||||||
Gap, Inc. (The) | 6/20/2027 | (1.000 | %) | 6.472 | % | (12,800,000 | ) | Quarterly | 2,553,673 | 1,521,941 | 1,031,732 | |||||||||||||||||||||
Goldman Sachs Group, Inc. (The) | 6/20/2027 | (1.000 | %) | 1.364 | % | (1,750,000 | ) | Quarterly | 28,353 | 12,103 | 16,250 | |||||||||||||||||||||
Hess Corp. | 6/20/2027 | (1.000 | %) | 1.942 | % | (300,000 | ) | Quarterly | 12,287 | 12,423 | (136 | ) | ||||||||||||||||||||
Host Hotels & Resorts L.P. | 6/20/2027 | (1.000 | %) | 2.225 | % | (950,000 | ) | Quarterly | 50,021 | 15,920 | 34,101 | |||||||||||||||||||||
Imperial Brands Finance Plc | 6/20/2027 | (1.000 | %) | 1.282 | % | EUR | (600,000 | ) | Quarterly | 8,251 | 2,430 | 5,821 | ||||||||||||||||||||
ING Groep N.V. | 6/20/2027 | (1.000 | %) | 0.962 | % | (8,550,000 | ) | Quarterly | (15,336 | ) | (115,265 | ) | 99,929 | |||||||||||||||||||
Intesa Sanpaolo SpA | 6/20/2027 | (1.000 | %) | 1.359 | % | (3,150,000 | ) | Quarterly | 54,914 | 1,689 | 53,225 | |||||||||||||||||||||
KB Home | 6/20/2027 | (5.000 | %) | 4.620 | % | $ | (8,250,000 | ) | Quarterly | (121,186 | ) | (992,012 | ) | 870,826 | ||||||||||||||||||
Koninklijke Philips N.V. | 6/20/2027 | (1.000 | %) | 0.980 | % | EUR | (4,800,000 | ) | Quarterly | (4,454 | ) | (21,259 | ) | 16,805 | ||||||||||||||||||
Kroger Co. (The) | 6/20/2027 | (1.000 | %) | 0.763 | % | $ | (9,400,000 | ) | Quarterly | (101,058 | ) | (135,346 | ) | 34,288 | ||||||||||||||||||
LANXESS AG | 6/20/2027 | (1.000 | %) | 2.423 | % | EUR | (8,700,000 | ) | Quarterly | 573,889 | 146,275 | 427,614 | ||||||||||||||||||||
Lincoln National Corp. | 6/20/2027 | (1.000 | %) | 1.601 | % | $ | (650,000 | ) | Quarterly | 17,234 | 17,898 | (664 | ) | |||||||||||||||||||
Lloyds Banking Group Plc | 6/20/2027 | (1.000 | %) | 1.106 | % | EUR | (5,300,000 | ) | Quarterly | 27,938 | (83,186 | ) | 111,124 | |||||||||||||||||||
Marks & Spencer Plc | 6/20/2027 | (1.000 | %) | 4.275 | % | (9,400,000 | ) | Quarterly | 1,326,655 | 757,977 | 568,678 | |||||||||||||||||||||
McKesson Corp. | 6/20/2027 | (1.000 | %) | 0.620 | % | $ | (9,100,000 | ) | Quarterly | (157,813 | ) | (237,002 | ) | 79,189 | ||||||||||||||||||
MDC Holdings, Inc. | 6/20/2027 | (1.000 | %) | 3.106 | % | (9,350,000 | ) | Quarterly | 816,971 | 270,598 | 546,373 | |||||||||||||||||||||
MGM Resorts International | 6/20/2027 | (5.000 | %) | 5.104 | % | (7,750,000 | ) | Quarterly | 31,931 | (706,919 | ) | 738,850 | ||||||||||||||||||||
Morgan Stanley | 6/20/2027 | (1.000 | %) | 1.223 | % | (8,800,000 | ) | Quarterly | 88,081 | 44,356 | 43,725 | |||||||||||||||||||||
The accompanying notes are an integral part of these financial statements.
| 78 | Litman Gregory Funds Trust | |||||
Table of Contents
iMGP Alternative Strategies Fund
SCHEDULE OF INVESTMENTS IN SWAPS at June 30, 2022 (Unaudited) (Continued)
| CENTRALLY CLEARED CREDIT DEFAULT SWAP CONTRACTS (1)(2)(3) (CONTINUED) | ||||||||||||||||||||||||||||||||
| Description | Maturity Date | Fixed Deal (Pay) Rate | Implied Credit Spread at June 30, 2022 | Notional Amount(4) | Periodic Payment Frequency | Fair Value | Upfront Premiums Paid / (Received) | Unrealized Appreciation / (Depreciation) | ||||||||||||||||||||||||
| Buy Protection (Continued) | ||||||||||||||||||||||||||||||||
Nabors Industries, Inc. | 6/20/2027 | (1.000 | %) | 7.676 | % | $ | (2,900,000 | ) | Quarterly | $ | 675,362 | $ | 652,500 | $ | 22,862 | |||||||||||||||||
NatWest Group Plc | 6/20/2027 | (1.000 | %) | 1.287 | % | EUR | (3,100,000 | ) | Quarterly | 43,375 | (27,221 | ) | 70,596 | |||||||||||||||||||
NatWest Group Plc | 6/20/2027 | (1.000 | %) | 1.287 | % | (5,300,000 | ) | Quarterly | 74,157 | (60,705 | ) | 134,862 | ||||||||||||||||||||
Netflix, Inc. | 6/20/2027 | (5.000 | %) | 2.461 | % | $ | (7,750,000 | ) | Quarterly | (835,316 | ) | (1,233,761 | ) | 398,445 | ||||||||||||||||||
Newell Brands, Inc. | 6/20/2027 | (1.000 | %) | 2.733 | % | (9,700,000 | ) | Quarterly | 708,366 | 279,621 | 428,745 | |||||||||||||||||||||
Nokia Oyj | 6/20/2027 | (5.000 | %) | 2.217 | % | EUR | (7,250,000 | ) | Quarterly | (939,762 | ) | (1,320,001 | ) | 380,239 | ||||||||||||||||||
Occidental Petroleum Corp. | 6/20/2027 | (1.000 | %) | 2.231 | % | $ | (4,850,000 | ) | Quarterly | 256,373 | 87,037 | 169,336 | ||||||||||||||||||||
Omnicom Group, Inc. / Omnicom Capital, Inc. | 6/20/2027 | (1.000 | %) | 0.898 | % | (9,150,000 | ) | Quarterly | (41,932 | ) | (195,434 | ) | 153,502 | |||||||||||||||||||
Ovintiv, Inc. | 6/20/2027 | (1.000 | %) | 2.038 | % | (4,800,000 | ) | Quarterly | 215,857 | 187,211 | 28,646 | |||||||||||||||||||||
Pfizer, Inc. | 6/20/2027 | (1.000 | %) | 0.428 | % | (9,100,000 | ) | Quarterly | (239,583 | ) | (265,714 | ) | 26,131 | |||||||||||||||||||
Pitney Bowes, Inc. | 6/20/2027 | (1.000 | %) | 10.684 | % | (10,700,000 | ) | Quarterly | 3,246,116 | 2,474,375 | 771,741 | |||||||||||||||||||||
Prudential Financial, Inc. | 6/20/2027 | (1.000 | %) | 1.006 | % | (900,000 | ) | Quarterly | 294 | 1,208 | (914 | ) | ||||||||||||||||||||
Prudential Plc | 6/20/2027 | (1.000 | %) | 1.036 | % | EUR | (8,150,000 | ) | Quarterly | 14,795 | (42,139 | ) | 56,934 | |||||||||||||||||||
Publicis Groupe S.A. | 6/20/2027 | (1.000 | %) | 1.515 | % | (5,700,000 | ) | Quarterly | 141,364 | 26,404 | 114,960 | |||||||||||||||||||||
Rexel S.A. | 6/20/2027 | (5.000 | %) | 4.066 | % | (3,800,000 | ) | Quarterly | (152,882 | ) | (546,026 | ) | 393,144 | |||||||||||||||||||
Rolls-Royce Plc | 6/20/2027 | (1.000 | %) | 4.590 | % | (8,700,000 | ) | Quarterly | 1,328,921 | 966,563 | 362,358 | |||||||||||||||||||||
Southwest Airlines Co. | 6/20/2027 | (1.000 | %) | 1.712 | % | $ | (600,000 | ) | Quarterly | 18,746 | 17,027 | 1,719 | ||||||||||||||||||||
Standard Chartered Plc | 6/20/2027 | (1.000 | %) | 1.055 | % | EUR | (7,700,000 | ) | Quarterly | 21,176 | (47,129 | ) | 68,305 | |||||||||||||||||||
Stellantis N.V. | 6/20/2027 | (5.000 | %) | 2.280 | % | (7,250,000 | ) | Quarterly | (916,192 | ) | (1,150,082 | ) | 233,890 | |||||||||||||||||||
Telecom Italia SpA | 6/20/2027 | (1.000 | %) | 4.206 | % | (9,900,000 | ) | Quarterly | 1,371,712 | 1,658,383 | (286,671 | ) | ||||||||||||||||||||
Telefonaktiebolaget LM Ericsson | 6/20/2027 | (1.000 | %) | 2.705 | % | (1,200,000 | ) | Quarterly | 93,871 | 58,693 | 35,178 | |||||||||||||||||||||
Tenet Healthcare Corp. | 6/20/2027 | (5.000 | %) | 5.776 | % | $ | (8,500,000 | ) | Quarterly | 248,770 | (788,477 | ) | 1,037,247 | |||||||||||||||||||
Tesco Plc | 6/20/2027 | (1.000 | %) | 1.485 | % | EUR | (3,200,000 | ) | Quarterly | 74,881 | (27,464 | ) | 102,345 | |||||||||||||||||||
thyssenkrupp AG | 6/20/2027 | (1.000 | %) | 6.286 | % | (8,700,000 | ) | Quarterly | 1,833,116 | 976,418 | 856,698 | |||||||||||||||||||||
The accompanying notes are an integral part of these financial statements.
| Schedule of Investments | 79 | |||||
Table of Contents
iMGP Alternative Strategies Fund
SCHEDULE OF INVESTMENTS IN SWAPS at June 30, 2022 (Unaudited) (Continued)
| CENTRALLY CLEARED CREDIT DEFAULT SWAP CONTRACTS (1)(2)(3) (CONTINUED) | ||||||||||||||||||||||||||||||||
| Description | Maturity Date | Fixed Deal (Pay) Rate | Implied Credit Spread at June 30, 2022 | Notional Amount(4) | Periodic Payment Frequency | Fair Value | Upfront Premiums Paid / (Received) | Unrealized Appreciation / (Depreciation) | ||||||||||||||||||||||||
| Buy Protection (Continued) | ||||||||||||||||||||||||||||||||
UniCredit SpA | 6/20/2027 | (1.000 | %) | 1.533 | % | EUR | (8,600,000 | ) | Quarterly | $ | 220,321 | $ | 45,056 | $ | 175,265 | |||||||||||||||||
United Rentals North America, Inc. | 6/20/2027 | (5.000 | %) | 2.681 | % | $ | (8,150,000 | ) | Quarterly | (794,985 | ) | (1,250,994 | ) | 456,009 | ||||||||||||||||||
Uniti Fiber Holdings, Inc. | 6/20/2027 | (5.000 | %) | 5.017 | % | (5,800,000 | ) | Quarterly | 4,746 | (330,940 | ) | 335,686 | ||||||||||||||||||||
Universal Health Services, Inc. | 6/20/2027 | (1.000 | %) | 2.159 | % | (4,800,000 | ) | Quarterly | 239,764 | 93,609 | 146,155 | |||||||||||||||||||||
Valeo | 6/20/2027 | (1.000 | %) | 3.411 | % | EUR | (8,100,000 | ) | Quarterly | 870,723 | 777,401 | 93,322 | ||||||||||||||||||||
Valero Energy Corp. | 6/20/2027 | (1.000 | %) | 1.219 | % | $ | (9,400,000 | ) | Quarterly | 92,795 | 49,666 | 43,129 | ||||||||||||||||||||
Veolia Environnement S.A. | 6/20/2027 | (1.000 | %) | 0.822 | % | EUR | (4,800,000 | ) | Quarterly | (41,902 | ) | (52,409 | ) | 10,507 | ||||||||||||||||||
Verizon Communications, Inc. | 6/20/2027 | (1.000 | %) | 1.273 | % | $ | (850,000 | ) | Quarterly | 10,382 | (1,958 | ) | 12,340 | |||||||||||||||||||
Vodafone Group Plc | 6/20/2027 | (1.000 | %) | 0.832 | % | EUR | (4,550,000 | ) | Quarterly | (37,392 | ) | (28,069 | ) | (9,323 | ) | |||||||||||||||||
Whirlpool Corp. | 6/20/2027 | (1.000 | %) | 1.806 | % | $ | (2,400,000 | ) | Quarterly | 84,627 | 40,453 | 44,174 | ||||||||||||||||||||
Whirlpool Corp. | 6/20/2027 | (1.000 | %) | 1.806 | % | (9,500,000 | ) | Quarterly | 334,982 | 113,889 | 221,093 | |||||||||||||||||||||
WPP Finance S.A. | 6/20/2027 | (1.000 | %) | 1.649 | % | EUR | (8,050,000) | Quarterly | 250,200 | (80,441 | ) | 330,641 | ||||||||||||||||||||
|
|
|
|
|
| |||||||||||||||||||||||||||
Total Buy Protection |
| $ | 19,266,818 | $ | (5,060,372 | ) | $ | 24,327,190 | ||||||||||||||||||||||||
|
|
|
|
|
| |||||||||||||||||||||||||||
Sell Protection |
| |||||||||||||||||||||||||||||||
Aegon N.V. | 6/20/2027 | 1.000 | % | 1.077 | % | EUR | 8,500,000 | Quarterly | $ | (32,617 | ) | $ | 110,335 | $ | (142,952 | ) | ||||||||||||||||
AES Corp. (The) | 6/20/2027 | 5.000 | % | 2.211 | % | $ | 8,850,000 | Quarterly | 1,058,111 | 1,453,863 | (395,752 | ) | ||||||||||||||||||||
Airbus SE | 6/20/2027 | 1.000 | % | 1.282 | % | EUR | 8,600,000 | Quarterly | (118,186 | ) | (17,599 | ) | (100,587 | ) | ||||||||||||||||||
Alstom S.A. | 6/20/2027 | 1.000 | % | 2.097 | % | 300,000 | Quarterly | (15,478 | ) | (11,805 | ) | (3,673 | ) | |||||||||||||||||||
Altria Group, Inc. | 6/20/2027 | 1.000 | % | 1.346 | % | $ | 9,300,000 | Quarterly | (143,756 | ) | 97,204 | (240,960 | ) | |||||||||||||||||||
American Airlines Group, Inc. | 6/20/2027 | 5.000 | % | 17.320 | % | 2,900,000 | Quarterly | (898,816 | ) | (326,250 | ) | (572,566 | ) | |||||||||||||||||||
Anglo American Capital Plc | 6/20/2027 | 5.000 | % | 2.128 | % | EUR | 7,300,000 | Quarterly | 980,060 | 1,490,761 | (510,701 | ) | ||||||||||||||||||||
ArcelorMittal S.A. | 6/20/2027 | 5.000 | % | 3.310 | % | 4,050,000 | Quarterly | 304,774 | 587,815 | (283,041 | ) | |||||||||||||||||||||
Arrow Electronics, Inc. | 6/20/2027 | 1.000 | % | 1.147 | % | $ | 900,000 | Quarterly | (5,970 | ) | (4,017 | ) | (1,953 | ) | ||||||||||||||||||
Assicurazioni Generali SpA | 6/20/2027 | 1.000 | % | 1.364 | % | EUR | 8,550,000 | Quarterly | (150,964 | ) | 21,000 | (171,964 | ) | |||||||||||||||||||
AT&T, Inc. | 6/20/2027 | 1.000 | % | 1.298 | % | $ | 8,700,000 | Quarterly | (115,813 | ) | (90,534 | ) | (25,279 | ) | ||||||||||||||||||
The accompanying notes are an integral part of these financial statements.
| 80 | Litman Gregory Funds Trust | |||||
Table of Contents
iMGP Alternative Strategies Fund
SCHEDULE OF INVESTMENTS IN SWAPS at June 30, 2022 (Unaudited) (Continued)
| CENTRALLY CLEARED CREDIT DEFAULT SWAP CONTRACTS (1)(2)(3) (CONTINUED) | ||||||||||||||||||||||||||||||||
| Description | Maturity Date | Fixed Deal (Pay) Rate | Implied Credit Spread at June 30, 2022 | Notional Amount(4) | Periodic Payment Frequency | Fair Value | Upfront Premiums Paid / (Received) | Unrealized Appreciation / (Depreciation) | ||||||||||||||||||||||||
| Sell Protection (Continued) | ||||||||||||||||||||||||||||||||
Avnet, Inc. | 6/20/2027 | 1.000 | % | 1.215 | % | $ | 3,150,000 | Quarterly | $ | (30,428 | ) | $ | (44,633 | ) | $ | 14,205 | ||||||||||||||||
Banco S.A.ntander S.A. | 6/20/2027 | 1.000 | % | 1.358 | % | EUR | 3,200,000 | Quarterly | 36,723 | 17,121 | 19,602 | |||||||||||||||||||||
BAT International Finance Plc | 6/20/2027 | 1.000 | % | 1.269 | % | 8,750,000 | Quarterly | (114,717 | ) | (48,245 | ) | (66,472 | ) | |||||||||||||||||||
Bath & Body Works, Inc. | 6/20/2027 | 1.000 | % | 13.013 | % | $ | 9,700,000 | Quarterly | (3,373,028 | ) | (788,367 | ) | (2,584,661 | ) | ||||||||||||||||||
Baxter International, Inc. | 6/20/2027 | 1.000 | % | 0.654 | % | 750,000 | Quarterly | 11,833 | 12,623 | (790 | ) | |||||||||||||||||||||
Block Financial LLC | 6/20/2027 | 5.000 | % | 1.013 | % | 7,850,000 | Quarterly | 1,408,614 | 1,517,556 | (108,942 | ) | |||||||||||||||||||||
BNP Paribas S.A. | 6/20/2027 | 1.000 | % | 1.242 | % | EUR | 8,050,000 | Quarterly | (95,196 | ) | 89,397 | (184,593 | ) | |||||||||||||||||||
Boeing Co. (The) | 6/20/2027 | 1.000 | % | 2.563 | % | $ | 4,650,000 | Quarterly | (307,880 | ) | (312,784 | ) | 4,904 | |||||||||||||||||||
BorgWarner, Inc. | 6/20/2027 | 1.000 | % | 1.527 | % | 9,300,000 | Quarterly | (217,205 | ) | (152,883 | ) | (64,322 | ) | |||||||||||||||||||
British Telecommunications Plc | 6/20/2027 | 1.000 | % | 1.416 | % | EUR | 8,700,000 | Quarterly | (175,572 | ) | (60,970 | ) | (114,602 | ) | ||||||||||||||||||
Cardinal Health, Inc. | 6/20/2027 | 1.000 | % | 0.742 | % | $ | 800,000 | Quarterly | 9,338 | 7,957 | 1,381 | |||||||||||||||||||||
CDX North America High Yield Index Series 38 | 6/20/2027 | 5.000 | % | 5.784 | % | 12,988,800 | Quarterly | (393,850 | ) | (324,093 | ) | (69,757 | ) | |||||||||||||||||||
Conagra Brands, Inc. | 6/20/2027 | 1.000 | % | 1.067 | % | 9,650,000 | Quarterly | (29,859 | ) | (53,524 | ) | 23,665 | ||||||||||||||||||||
CVS Health Corp. | 6/20/2027 | 1.000 | % | 0.806 | % | 1,000,000 | Quarterly | 8,775 | 14,027 | (5,252 | ) | |||||||||||||||||||||
Dell, Inc. | 6/20/2027 | 1.000 | % | 1.704 | % | 8,950,000 | Quarterly | (276,578 | ) | (256,475 | ) | (20,103 | ) | |||||||||||||||||||
Delta Air Lines, Inc. | 6/20/2027 | 5.000 | % | 5.736 | % | 8,700,000 | Quarterly | (240,950 | ) | 425,497 | (666,447 | ) | ||||||||||||||||||||
Deutsche Bank AG | 6/20/2027 | 1.000 | % | 2.220 | % | EUR | 8,000,000 | Quarterly | (110,547 | ) | (152,721 | ) | 42,174 | |||||||||||||||||||
Devon Energy Corp. | 6/20/2027 | 1.000 | % | 1.951 | % | $ | 9,400,000 | Quarterly | (388,328 | ) | (125,136 | ) | (263,192 | ) | ||||||||||||||||||
DISH DBS Corp. | 6/20/2027 | 5.000 | % | 14.429 | % | 2,900,000 | Quarterly | (754,881 | ) | (84,622 | ) | (670,259 | ) | |||||||||||||||||||
DXC Technology Co. | 6/20/2027 | 5.000 | % | 1.835 | % | 7,500,000 | Quarterly | 1,033,072 | 1,104,467 | (71,395 | ) | |||||||||||||||||||||
Eastman Chemical Co. | 6/20/2027 | 1.000 | % | 1.475 | % | 3,150,000 | Quarterly | (66,389 | ) | (32,249 | ) | (34,140 | ) | |||||||||||||||||||
Enbridge, Inc. | 6/20/2027 | 1.000 | % | 1.134 | % | 9,250,000 | Quarterly | (56,101 | ) | 82,991 | (139,092 | ) | ||||||||||||||||||||
FedEx Corp. | 6/20/2027 | 1.000 | % | 0.810 | % | 3,050,000 | Quarterly | 26,154 | 14,231 | 11,923 | ||||||||||||||||||||||
Ford Motor Co. | 6/20/2027 | 5.000 | % | 4.431 | % | 2,000,000 | Quarterly | 44,593 | 59,173 | (14,580 | ) | |||||||||||||||||||||
The accompanying notes are an integral part of these financial statements.
| Schedule of Investments | 81 | |||||
Table of Contents
iMGP Alternative Strategies Fund
SCHEDULE OF INVESTMENTS IN SWAPS at June 30, 2022 (Unaudited) (Continued)
| CENTRALLY CLEARED CREDIT DEFAULT SWAP CONTRACTS (1)(2)(3) (CONTINUED) | ||||||||||||||||||||||||||||||||
| Description | Maturity Date | Fixed Deal (Pay) Rate | Implied Credit Spread at June 30, 2022 | Notional Amount(4) | Periodic Payment Frequency | Fair Value | Upfront Premiums Paid / (Received) | Unrealized Appreciation / (Depreciation) | ||||||||||||||||||||||||
| Sell Protection (Continued) | ||||||||||||||||||||||||||||||||
Gap, Inc. (The) | 6/20/2027 | 1.000 | % | 6.472 | % | $ | 5,800,000 | Quarterly | $ | (1,157,134 | ) | $ | (1,016,437 | ) | $ | (140,697 | ) | |||||||||||||||
General Electric Co. | 6/20/2027 | 1.000 | % | 1.872 | % | 9,500,000 | Quarterly | (361,398 | ) | (42,444 | ) | (318,954 | ) | |||||||||||||||||||
Genworth Holdings, Inc. | 6/20/2027 | 5.000 | % | 5.526 | % | 4,360,000 | Quarterly | (87,375 | ) | 178,798 | (266,173 | ) | ||||||||||||||||||||
Glencore Finance Europe Ltd. | 6/20/2027 | 5.000 | % | 2.357 | % | EUR | 7,350,000 | Quarterly | 899,876 | 1,278,191 | (378,315 | ) | ||||||||||||||||||||
Goldman Sachs Group, Inc. (The) | 6/20/2027 | 1.000 | % | 1.364 | % | $ | 5,700,000 | Quarterly | (92,348 | ) | 8,263 | (100,611 | ) | |||||||||||||||||||
Goodyear Tire & Rubber Co. (The) | 6/20/2027 | 5.000 | % | 5.298 | % | 2,900,000 | Quarterly | (33,697 | ) | 64,322 | (98,019 | ) | ||||||||||||||||||||
Hapag-Lloyd AG | 6/20/2027 | 5.000 | % | 4.863 | % | EUR | 1,900,000 | Quarterly | 10,322 | 168,886 | (158,564 | ) | ||||||||||||||||||||
Hess Corp. | 6/20/2027 | 1.000 | % | 1.942 | % | $ | 9,200,000 | Quarterly | (376,803 | ) | (82,800 | ) | (294,003 | ) | ||||||||||||||||||
Holcim AG | 6/20/2027 | 1.000 | % | 1.700 | % | EUR | 8,150,000 | Quarterly | (273,001 | ) | (63,621 | ) | (209,380 | ) | ||||||||||||||||||
Host Hotels & Resorts L.P. | 6/20/2027 | 1.000 | % | 2.225 | % | $ | 9,750,000 | Quarterly | (513,378 | ) | (251,742 | ) | (261,636 | ) | ||||||||||||||||||
Howmet Aerospace, Inc. | 6/20/2027 | 1.000 | % | 2.211 | % | 5,800,000 | Quarterly | (302,163 | ) | (229,473 | ) | (72,690 | ) | |||||||||||||||||||
Imperial Brands Finance Plc | 6/20/2027 | 1.000 | % | 1.282 | % | EUR | 8,750,000 | Quarterly | (120,319 | ) | (87,326 | ) | (32,993 | ) | ||||||||||||||||||
Intrum AB | 6/20/2027 | 5.000 | % | 6.539 | % | 4,150,000 | Quarterly | (253,017 | ) | 92,845 | (345,862 | ) | ||||||||||||||||||||
Johnson Controls International Plc | 6/20/2027 | 1.000 | % | 0.775 | % | $ | 7,000,000 | Quarterly | 71,121 | 168,260 | (97,139 | ) | ||||||||||||||||||||
KB Home | 6/20/2027 | 5.000 | % | 4.620 | % | 2,900,000 | Quarterly | 42,598 | 222,873 | (180,275 | ) | |||||||||||||||||||||
Koninklijke KPN N.V. | 6/20/2027 | 1.000 | % | 1.035 | % | EUR | 8,600,000 | Quarterly | (15,670 | ) | 16,662 | (32,332 | ) | |||||||||||||||||||
Kraft Heinz Foods Co. | 6/20/2027 | 1.000 | % | 1.061 | % | $ | 3,000,000 | Quarterly | (8,341 | ) | 16,950 | (25,291 | ) | |||||||||||||||||||
Kroger Co. (The) | 6/20/2027 | 1.000 | % | 0.763 | % | 900,000 | Quarterly | 9,676 | 9,774 | (98 | ) | |||||||||||||||||||||
Lincoln National Corp. | 6/20/2027 | 1.000 | % | 1.601 | % | 9,400,000 | Quarterly | (249,222 | ) | (64,529 | ) | (184,693 | ) | |||||||||||||||||||
Lumen Technologies, Inc. | 6/20/2027 | 1.000 | % | 6.063 | % | 10,400,000 | Quarterly | (1,950,375 | ) | (1,554,818 | ) | (395,557 | ) | |||||||||||||||||||
MetLife, Inc. | 6/20/2027 | 1.000 | % | 1.004 | % | 9,200,000 | Quarterly | (2,101 | ) | 112,546 | (114,647 | ) | ||||||||||||||||||||
MGIC Investment Corp. | 6/20/2027 | 5.000 | % | 2.958 | % | 8,050,000 | Quarterly | 684,223 | 1,153,905 | (469,682 | ) | |||||||||||||||||||||
MGM Resorts International | 6/20/2027 | 5.000 | % | 5.104 | % | 4,900,000 | Quarterly | (20,188 | ) | 200,301 | (220,489 | ) | ||||||||||||||||||||
Motorola Solutions, Inc. | 6/20/2027 | 1.000 | % | 1.097 | % | 9,150,000 | Quarterly | (40,214 | ) | 134,187 | (174,401 | ) | ||||||||||||||||||||
The accompanying notes are an integral part of these financial statements.
| 82 | Litman Gregory Funds Trust | |||||
Table of Contents
iMGP Alternative Strategies Fund
SCHEDULE OF INVESTMENTS IN SWAPS at June 30, 2022 (Unaudited) (Continued)
| CENTRALLY CLEARED CREDIT DEFAULT SWAP CONTRACTS (1)(2)(3) (CONTINUED) | ||||||||||||||||||||||||||||||||
| Description | Maturity Date | Fixed Deal (Pay) Rate | Implied Credit Spread at June 30, 2022 | Notional Amount(4) | Periodic Payment Frequency | Fair Value | Upfront Premiums Paid / (Received) | Unrealized Appreciation / (Depreciation) | ||||||||||||||||||||||||
| Sell Protection (Continued) | ||||||||||||||||||||||||||||||||
Naturgy Capital Markets S.A. | 6/20/2027 | 1.000 | % | 1.171 | % | EUR | 7,950,000 | Quarterly | $ | (66,834 | ) | $ | (35,030 | ) | $ | (31,804 | ) | |||||||||||||||
Navient Corp. | 6/20/2027 | 5.000 | % | 7.112 | % | $ | 9,400,000 | Quarterly | (708,089 | ) | 50,080 | (758,169 | ) | |||||||||||||||||||
Newell Brands, Inc. | 6/20/2027 | 1.000 | % | 2.733 | % | 2,950,000 | Quarterly | (215,431 | ) | (217,976 | ) | 2,545 | ||||||||||||||||||||
Next Group Plc | 6/20/2027 | 1.000 | % | 2.561 | % | EUR | 8,550,000 | Quarterly | (615,621 | ) | (226,838 | ) | (388,783 | ) | ||||||||||||||||||
Nordstrom, Inc. | 6/20/2027 | 1.000 | % | 5.436 | % | $ | 2,850,000 | Quarterly | (479,480 | ) | (339,328 | ) | (140,152 | ) | ||||||||||||||||||
NRG Energy, Inc. | 6/20/2027 | 5.000 | % | 4.353 | % | 4,800,000 | Quarterly | 121,926 | 365,137 | (243,211 | ) | |||||||||||||||||||||
Occidental Petroleum Corp. | 6/20/2027 | 1.000 | % | 2.231 | % | 9,650,000 | Quarterly | (510,102 | ) | (196,030 | ) | (314,072 | ) | |||||||||||||||||||
Omnicom Group, Inc. / Omnicom Capital, Inc. | 6/20/2027 | 1.000 | % | 0.898 | % | 650,000 | Quarterly | 2,978 | 3,807 | (829 | ) | |||||||||||||||||||||
Oracle Corp. | 6/20/2027 | 1.000 | % | 1.248 | % | 7,850,000 | Quarterly | (87,367 | ) | 48,632 | (135,999 | ) | ||||||||||||||||||||
Pfizer, Inc. | 6/20/2027 | 1.000 | % | 0.428 | % | 650,000 | Quarterly | 17,113 | 16,077 | 1,036 | ||||||||||||||||||||||
Pitney Bowes, Inc. | 6/20/2027 | 1.000 | % | 10.684 | % | 2,950,000 | Quarterly | (894,957 | ) | (885,000 | ) | (9,957 | ) | |||||||||||||||||||
Premier Foods Finance Plc | 6/20/2027 | 5.000 | % | 4.354 | % | EUR | 7,050,000 | Quarterly | 193,602 | 544,910 | (351,308 | ) | ||||||||||||||||||||
Prudential Financial, Inc. | 6/20/2027 | 1.000 | % | 1.006 | % | $ | 9,500,000 | Quarterly | (3,112 | ) | 71,848 | (74,960 | ) | |||||||||||||||||||
PulteGroup, Inc. | 6/20/2027 | 5.000 | % | 2.232 | % | 7,500,000 | Quarterly | 889,661 | 914,942 | (25,281 | ) | |||||||||||||||||||||
Radian Group, Inc. | 6/20/2027 | 5.000 | % | 3.427 | % | 8,150,000 | Quarterly | 523,643 | 682,482 | (158,839 | ) | |||||||||||||||||||||
Realogy Group LLC / Realogy Co-Issuer Corp. | 6/20/2027 | 5.000 | % | 8.666 | % | 2,900,000 | Quarterly | (358,062 | ) | 56,169 | (414,231 | ) | ||||||||||||||||||||
Rolls-Royce Plc | 6/20/2027 | 1.000 | % | 4.590 | % | EUR | 2,900,000 | Quarterly | (442,974 | ) | (398,566 | ) | (44,408 | ) | ||||||||||||||||||
Royal Caribbean Cruises Ltd. | 6/20/2027 | 5.000 | % | 11.911 | % | $ | 8,700,000 | Quarterly | (1,804,344 | ) | 145,947 | (1,950,291 | ) | |||||||||||||||||||
SES S.A. | 6/20/2027 | 1.000 | % | 1.282 | % | EUR | 8,000,000 | Quarterly | (110,100 | ) | (13,782 | ) | (96,318 | ) | ||||||||||||||||||
Sherwin-Williams Co. (The) | 6/20/2027 | 1.000 | % | 1.315 | % | $ | 9,200,000 | Quarterly | (129,578 | ) | 40,037 | (169,615 | ) | |||||||||||||||||||
Southwest Airlines Co. | 6/20/2027 | 1.000 | % | 1.712 | % | 9,450,000 | Quarterly | (295,250 | ) | (121,259 | ) | (173,991 | ) | |||||||||||||||||||
Sudzucker International Finance B.V. | 6/20/2027 | 1.000 | % | 1.294 | % | EUR | 8,800,000 | Quarterly | (126,431 | ) | (130,004 | ) | 3,573 | |||||||||||||||||||
Teck Resources Ltd. | 6/20/2027 | 5.000 | % | 2.203 | % | $ | 8,000,000 | Quarterly | 959,588 | 1,428,622 | (469,034 | ) | ||||||||||||||||||||
The accompanying notes are an integral part of these financial statements.
| Schedule of Investments | 83 | |||||
Table of Contents
iMGP Alternative Strategies Fund
SCHEDULE OF INVESTMENTS IN SWAPS at June 30, 2022 (Unaudited) (Continued)
| CENTRALLY CLEARED CREDIT DEFAULT SWAP CONTRACTS (1)(2)(3) (CONTINUED) | ||||||||||||||||||||||||||||||||
| Description | Maturity Date | Fixed Deal (Pay) Rate | Implied Credit Spread at June 30, 2022 | Notional Amount(4) | Periodic Payment Frequency | Fair Value | Upfront Premiums Paid / (Received) | Unrealized Appreciation / (Depreciation) | ||||||||||||||||||||||||
| Sell Protection (Continued) | ||||||||||||||||||||||||||||||||
Telefonaktiebolaget LM Ericsson | 6/20/2027 | 1.000 | % | 2.705 | % | EUR | 9,750,000 | Quarterly | $ | (762,700 | ) | $ | (388,652 | ) | $ | (374,048 | ) | |||||||||||||||
Telefonica Emisiones S.A. | 6/20/2027 | 1.000 | % | 1.080 | % | 8,650,000 | Quarterly | (34,754 | ) | 54,573 | (89,327 | ) | ||||||||||||||||||||
Tesco Plc | 6/20/2027 | 1.000 | % | 1.485 | % | 8,500,000 | Quarterly | (198,902 | ) | 31,857 | (230,759 | ) | ||||||||||||||||||||
Tesla, Inc. | 6/20/2027 | 1.000 | % | 2.507 | % | $ | 7,700,000 | Quarterly | (492,751 | ) | (138,302 | ) | (354,449 | ) | ||||||||||||||||||
Toll Brothers Finance Corp. | 6/20/2027 | 1.000 | % | 3.233 | % | 9,700,000 | Quarterly | (894,459 | ) | (443,808 | ) | (450,651 | ) | |||||||||||||||||||
Transocean, Inc. | 6/20/2027 | 1.000 | % | 22.410 | % | 2,900,000 | Quarterly | (1,341,658 | ) | (1,058,500 | ) | (283,158 | ) | |||||||||||||||||||
UBS Group AG | 6/20/2027 | 1.000 | % | 1.034 | % | EUR | 8,550,000 | Quarterly | (14,842 | ) | 98,331 | (113,173 | ) | |||||||||||||||||||
Valeo | 6/20/2027 | 1.000 | % | 3.411 | % | 5,800,000 | Quarterly | (623,480 | ) | (549,694 | ) | (73,786 | ) | |||||||||||||||||||
Verizon Communications, Inc. | 6/20/2027 | 1.000 | % | 1.273 | % | $ | 9,500,000 | Quarterly | (116,027 | ) | 3,465 | (119,492 | ) | |||||||||||||||||||
Volkswagen International Finance N.V. | 6/20/2027 | 1.000 | % | 1.918 | % | EUR | 8,750,000 | Quarterly | (380,114 | ) | (81,284 | ) | (298,830 | ) | ||||||||||||||||||
Whirlpool Corp. | 6/20/2027 | 1.000 | % | 1.806 | % | $ | 3,000,000 | Quarterly | (105,784 | ) | (46,660 | ) | (59,124 | ) | ||||||||||||||||||
Williams Cos., Inc. (The) | 6/20/2027 | 1.000 | % | 1.263 | % | 9,500,000 | Quarterly | (112,119 | ) | 9,217 | (121,336 | ) | ||||||||||||||||||||
Yum! Brands, Inc. | 6/20/2027 | 1.000 | % | 1.968 | % | 9,550,000 | Quarterly | (401,719 | ) | (294,411 | ) | (107,308 | ) | |||||||||||||||||||
|
|
|
|
|
| |||||||||||||||||||||||||||
Total Sell Protection |
| $ | (16,948,520 | ) | $ | 3,653,693 | $ | (20,602,213 | ) | |||||||||||||||||||||||
|
|
|
|
|
| |||||||||||||||||||||||||||
Total | $ | 2,318,298 | $ | (1,406,679 | ) | $ | 3,724,977 | |||||||||||||||||||||||||
|
|
|
|
|
| |||||||||||||||||||||||||||
| (1) | For centrally cleared swaps, when a credit event occurs as defined under the terms of the swap contract, the Fund as a seller of credit protection will either (i) pay a net amount equal to the par value of the defaulted reference entity and deliver the reference entity or (ii) pay a net amount equal to the par value of the defaulted reference entity less its recovery value. |
| (2) | For centrally cleared swaps, implied credit spread, represented in absolute terms, utilized in determining the fair value of the credit default swap contracts as of period will serve as an indicator of the payment/ performance risk and represent the likelihood of risk of default for the credit derivative. The implied credit spread of a referenced entity reflects the cost of buying/ selling protection and may include upfront payments required to be made to enter into the contract. Generally, wider credit spreads represent a perceived deterioration of the referenced entity’s credit soundness and a greater likelihood or risk of default or other credit event occurring as defined under the terms of the swap contract. |
| (3) | For centrally cleared swaps, the notional amount represents the maximum potential the Fund may receive as a buyer of credit protection if a credit event occurs, as defined under the terms of the swap contract, for each security included in the CDX North America High Yield Index Series 38. |
| (4) | Notional amounts are denominated in currency where indicated and the lines below until currency changes. |
The accompanying notes are an integral part of these financial statements.
| 84 | Litman Gregory Funds Trust | |||||
Table of Contents
iMGP Alternative Strategies Fund
SCHEDULE OF INVESTMENTS IN SWAPS at June 30, 2022 (Unaudited) (Continued)
| OVER THE COUNTER CREDIT DEFAULT SWAP CONTRACTS | ||||||||||||||||||||||||||||||||||||
| Description | Maturity Date | Counterparty | Fixed Deal (Pay) Rate | Implied Credit Spread at June 30, 2022 | Notional Amount | Periodic Payment Frequency | Fair Value | Upfront Premiums Paid / (Received) | Unrealized Appreciation / (Depreciation) | |||||||||||||||||||||||||||
Buy Protection |
| |||||||||||||||||||||||||||||||||||
Mexico Government International Bond | 6/20/2026 | | Barclays Bank Plc | | (1.000 | %) | 1.503 | % | $ | (5,710,000 | ) | Quarterly | $ | 105,807 | $ | 22,997 | $ | 82,810 | ||||||||||||||||||
|
| |||||||||||||||||||||||||||||||||||
Total Buy Protection | $ | 105,807 | $ | 22,997 | $ | 82,810 | ||||||||||||||||||||||||||||||
|
| |||||||||||||||||||||||||||||||||||
| OVER THE COUNTER TOTAL RETURN SWAP CONTRACTS | ||||||||||||||||||||||||||||||
| Referenced Obligation | Maturity Date | Counterparty | Fund Pays/ Receives Floating Rate | Floating Rate Index and Spread | Notional Amount(1) | Periodic Payment Frequency | Fair Value | Upfront Premiums Paid / (Received) | Unrealized Appreciation / (Depreciation) | |||||||||||||||||||||
Distell Group Holdings Ltd. ZAR | 11/15/2022 | Goldman Sachs & Co. | Pays | 1 Month SABOR + 1.500% | ZAR | (11,936,627 | ) | Monthly | $ | (10,981 | ) | $ | — | $ | (10,981 | ) | ||||||||||||||
Meggitt Plc GBP | 8/2/2022 | Goldman Sachs & Co. | Pays | 1 Month SONIO + 0.550% | GBP | (2,599,040 | ) | Monthly | 57,108 | — | 57,108 | |||||||||||||||||||
Sanne Group Plc GBP | 12/31/2099 | Goldman Sachs & Co. | Pays | 1 Month SONIO + 0.450% | (1,041,009 | ) | Monthly | (1,396 | ) | — | (1,396 | ) | ||||||||||||||||||
Stagecoach Group Plc GBP | 12/31/2099 | Goldman Sachs & Co. | Pays | 1 Month USD LIBOR - 0.400% | (675,417 | ) | Monthly | (3,127 | ) | — | (3,127 | ) | ||||||||||||||||||
iBoxx USD Liquid High Yield Index USD | 9/20/2022 | JPMorgan Chase Bank N.A. | Receives | 3 Month USD LIBOR + 0.000% | $ | 110,000,000 | Quarterly | 52,363 | — | 52,363 | ||||||||||||||||||||
Distell Group Holdings Ltd. ZAR | 11/15/2022 | Morgan Stanley & Co. | Pays | 1 Month SABOR + 1.250% | ZAR | (3,897,820 | ) | Monthly | (3,246 | ) | — | (3,246 | ) | |||||||||||||||||
Meggitt Plc GBP | 8/2/2022 | Morgan Stanley & Co. | Pays | 1 Month SONIO + 0.900% | GBP | (18,399 | ) | Monthly | 404 | — | 404 | |||||||||||||||||||
NortonLifeLock, Inc. USD | 5/6/2024 | Morgan Stanley & Co. | Receives | FEDL01 - 0.400% | $ | 152,695 | Monthly | 16,829 | 5,243 | 11,586 | ||||||||||||||||||||
Prologis, Inc. USD | 12/30/2099 | Morgan Stanley & Co. | Receives | FEDL01 - 0.400% | 1,638,486 | Monthly | (139,323 | ) | — | (139,323 | ) | |||||||||||||||||||
|
| |||||||||||||||||||||||||||||
Total | $ | (31,369 | ) | $ | 5,243 | $ | (36,612 | ) | ||||||||||||||||||||||
|
| |||||||||||||||||||||||||||||
| (1) | Notional amounts are denominated in foreign currency where indicated and the lines below until currency changes. |
| SCHEDULE OF INVESTMENTS IN WRITTEN OPTIONS at June 30, 2022 (Unaudited) | ||||||||||||||||||||||||||||||
| Description | Counterparty | Exercise Price | Expiration Date | Number of Contracts | Notional Amount | Fair Value | Premiums Received | Unrealized Appreciation/ (Depreciation) | ||||||||||||||||||||||
COMMON STOCKS |
| |||||||||||||||||||||||||||||
Call |
| |||||||||||||||||||||||||||||
Abbott Laboratories | Goldman Sachs & Co. | $ | 115.00 | 8/19/2022 | (10 | ) | $ | (108,650 | ) | $ | (1,950 | ) | $ | (1,233 | ) | $ | (717 | ) | ||||||||||||
Abbvie, Inc. | Morgan Stanley & Co. | 160.00 | 8/19/2022 | (14 | ) | (214,424 | ) | (4,060 | ) | (2,558 | ) | (1,502 | ) | |||||||||||||||||
Accenture Plc | Morgan Stanley & Co. | 325.00 | 8/19/2022 | (6 | ) | (166,590 | ) | (645 | ) | (1,510 | ) | 865 | ||||||||||||||||||
American Tower Corp. | Goldman Sachs & Co. | 280.00 | 8/19/2022 | (10 | ) | (255,590 | ) | (3,300 | ) | (4,367 | ) | 1,067 | ||||||||||||||||||
Anthem, Inc. | Goldman Sachs & Co. | 500.00 | 8/19/2022 | (2 | ) | (96,516 | ) | (3,000 | ) | (1,875 | ) | (1,125 | ) | |||||||||||||||||
Apple, Inc. | Morgan Stanley & Co. | 160.00 | 8/19/2022 | (15 | ) | (205,080 | ) | (1,350 | ) | (2,051 | ) | 701 | ||||||||||||||||||
Blackrock, Inc. | Morgan Stanley & Co. | 700.00 | 8/19/2022 | (3 | ) | (182,712 | ) | (1,710 | ) | (1,972 | ) | 262 | ||||||||||||||||||
Bristol-Myers Squibb Co. | Goldman Sachs & Co. | 80.00 | 8/19/2022 | (27 | ) | (207,900 | ) | (3,834 | ) | (3,583 | ) | (251 | ) | |||||||||||||||||
Broadcom, Inc. | Morgan Stanley & Co. | 560.00 | 8/19/2022 | (1 | ) | (48,581 | ) | (388 | ) | (427 | ) | 39 | ||||||||||||||||||
The accompanying notes are an integral part of these financial statements.
| Schedule of Investments | 85 | |||||
Table of Contents
iMGP Alternative Strategies Fund
SCHEDULE OF INVESTMENTS IN WRITTEN OPTIONS at June 30, 2022 (Unaudited) (Continued)
| Description | Counterparty | Exercise Price | Expiration Date | Number of Contracts | Notional Amount | Fair Value | Premiums Received | Unrealized Appreciation/ (Depreciation) | ||||||||||||||||||||||
Cisco Systems, Inc. | Morgan Stanley & Co. | $ | 47.50 | 8/19/2022 | (32 | ) | $ | (136,448 | ) | $ | (1,216 | ) | $ | (2,199 | ) | $ | 983 | |||||||||||||
Coca-Cola Co. (The) | Morgan Stanley & Co. | 65.00 | 8/19/2022 | (38 | ) | (239,058 | ) | (4,902 | ) | (3,151 | ) | (1,751 | ) | |||||||||||||||||
Cummins, Inc. | Goldman Sachs & Co. | 220.00 | 8/19/2022 | (7 | ) | (135,471 | ) | (700 | ) | (1,174 | ) | 474 | ||||||||||||||||||
Deere & Co. | Morgan Stanley & Co. | 360.00 | 8/19/2022 | (5 | ) | (149,735 | ) | (1,225 | ) | (1,758 | ) | 533 | ||||||||||||||||||
Duke Energy Corp. | Morgan Stanley & Co. | 110.00 | 8/19/2022 | (21 | ) | (225,141 | ) | (4,410 | ) | (2,263 | ) | (2,147 | ) | |||||||||||||||||
Johnson & Johnson | Goldman Sachs & Co. | 185.00 | 8/19/2022 | (18 | ) | (319,518 | ) | (4,230 | ) | (4,315 | ) | 85 | ||||||||||||||||||
Lockheed Martin Corp. | Morgan Stanley & Co. | 460.00 | 8/19/2022 | (6 | ) | (257,976 | ) | (3,450 | ) | (2,560 | ) | (890 | ) | |||||||||||||||||
Merck & Co., Inc. | Morgan Stanley & Co. | 97.50 | 8/19/2022 | (39 | ) | (355,563 | ) | (4,602 | ) | (3,460 | ) | (1,142 | ) | |||||||||||||||||
Microchip Technology, Inc. | Goldman Sachs & Co. | 70.00 | 8/19/2022 | (18 | ) | (104,544 | ) | (1,080 | ) | (1,327 | ) | 247 | ||||||||||||||||||
Microsoft Corp. | Goldman Sachs & Co. | 290.00 | 8/19/2022 | (6 | ) | (154,098 | ) | (1,290 | ) | (1,401 | ) | 111 | ||||||||||||||||||
Morgan Stanley | Goldman Sachs & Co. | 87.50 | 8/19/2022 | (23 | ) | (174,938 | ) | (1,380 | ) | (2,105 | ) | 725 | ||||||||||||||||||
Newmont Corp. | M organ Stanley & Co. | 72.50 | 8/19/2022 | (31 | ) | (184,977 | ) | (1,085 | ) | (2,130 | ) | 1,045 | ||||||||||||||||||
Nextera Energy, Inc. | Morgan Stanley & Co. | 85.00 | 8/19/2022 | (32 | ) | (247,872 | ) | (2,880 | ) | (2,679 | ) | (201 | ) | |||||||||||||||||
Pioneer Natural Resources Co. | Goldman Sachs & Co. | 275.00 | 8/19/2022 | (8 | ) | (178,464 | ) | (2,656 | ) | (3,174 | ) | 518 | ||||||||||||||||||
Procter & Gamble Co. (The) | Morgan Stanley & Co. | 150.00 | 8/19/2022 | (13 | ) | (186,927 | ) | (3,055 | ) | (1,582 | ) | (1,473 | ) | |||||||||||||||||
Qualcomm, Inc. | Morgan Stanley & Co. | 155.00 | 8/19/2022 | (10 | ) | (127,740 | ) | (1,570 | ) | (1,069 | ) | (501 | ) | |||||||||||||||||
Starbucks Corp. | Morgan Stanley & Co. | 85.00 | 8/19/2022 | (22 | ) | (168,058 | ) | (2,464 | ) | (2,414 | ) | (50 | ) | |||||||||||||||||
Thermo Fisher Scientific, Inc. | Goldman Sachs & Co. | 590.00 | 8/19/2022 | (1 | ) | (54,328 | ) | (915 | ) | (667 | ) | (248 | ) | |||||||||||||||||
Union Pacific Corp. | Morgan Stanley & Co. | 235.00 | 8/19/2022 | (9 | ) | (191,952 | ) | (1,602 | ) | (1,897 | ) | 295 | ||||||||||||||||||
United Parcel Service, Inc. | Morgan Stanley & Co. | 200.00 | 8/19/2022 | (9 | ) | (164,286 | ) | (2,448 | ) | (2,850 | ) | 402 | ||||||||||||||||||
Unitedhealth Group, Inc. | Morgan Stanley & Co. | 540.00 | 8/19/2022 | (2 | ) | (102,726 | ) | (2,180 | ) | (1,033 | ) | (1,147 | ) | |||||||||||||||||
Williams Cos. Inc. (The) | Goldman Sachs & Co. | 34.00 | 8/19/2022 | (44 | ) | (137,324 | ) | (2,640 | ) | (2,144 | ) | (496 | ) | |||||||||||||||||
|
| |||||||||||||||||||||||||||||
Total Written Options | $ | (72,217 | ) | $ | (66,928 | ) | $ | (5,289 | ) | |||||||||||||||||||||
|
| |||||||||||||||||||||||||||||
The accompanying notes are an integral part of these financial statements.
| 86 | Litman Gregory Funds Trust | |||||
Table of Contents
iMGP High Income Alternatives Fund
The iMGP High Income Alternatives Fund declined 7.85% in the six-month period, compared to steeper losses of 10.35% for the Bloomberg US Aggregate Bond Index (Agg) and a 14.04% decline for high-yield bonds (BofA Merrill Lynch US High-Yield Index). Since the fund’s inception in September 2018, the fund’s annualized return is 2.27% outperforming both the 1.27% gain for the Aggregate Bond Index and a 1.29% gain for high-yield bonds.
Performance as of 6/30/2022 |
| |||||||||||||||
| Average Annual Total Return | ||||||||||||||||
| Year to Date | One Year | Three Year | Since Inception (9/30/18) | |||||||||||||
iMGP High Income Alternative Fund | -7.85% | -6.02% | 2.02% | 2.27% | ||||||||||||
Bloomberg Aggregate Bond Index | -10.35% | -10.29% | -0.93% | 1.27% | ||||||||||||
ICE BofAML U.S. High Yield TR USD Index | -14.04% | -12.66% | -0.04% | 1.29% | ||||||||||||
Morningstar US Fund Nontraditional Bond | -6.68% | -6.96% | -0.07% | 0.62% | ||||||||||||
| Past performance does not guarantee future results. Index performance is not illustrative of fund performance. An investment cannot be made directly in an index. The investment return and principal value of an investment will fluctuate so that an investor’s shares, when redeemed, may be worth more or less than their original cost. Current performance of the fund may be lower or higher than the performance quoted. To obtain the performance of the funds as of the most recently completed calendar month, please visit www.imgpfunds.com. Investment performance reflects fee waivers in effect. In the absence of such waivers, total return would be reduced. |
| |||||||||||||||
| SEC 30-Day Yield1 as of 6/30/2022: 4.15% | ||||||||||||||||
| Unsubsidized SEC 30-Day Yield2 as of 6/30/2022: 3.80% | ||||||||||||||||
1. The 30-day SEC Yield is computed under an SEC standardized formula based on net income earned over the past 30 days. It is a “subsidized” yield, which means it includes contractual expense reimbursements, and it would be lower without those reimbursements. |
| |||||||||||||||
2. The unsubsidized 30-day SEC Yield is computed under an SEC standardized formula based on net income earned over the past 30 days. It excludes contractual expense reimbursements, resulting in a lower yield. |
| |||||||||||||||
Trailing Twelve-Month (TTM) Distribution Yield as of 6/30/22: 6.07% |
| |||||||||||||||
| TTM Yield is the yield an investor would have received if they had held the fund over the last 12 months assuming the most recent NAV. The 12-month yield is calculated by assuming any income distributions over the past 12 months and any capital gain distributions made over the past 12 months and dividing the sum by the most recent NAV. TTM yield is not a reflection of future results. |
| |||||||||||||||
| Expense Ratios | ||||
| Gross Expense Ratio | 1.44% | |||
| Net Expense Ratio | 0.99% | |||
| Adjusted Expense Ratio | 0.98% | |||
| The Net Expense Ratio reflects a contractual fee waiver and/or expense reimbursement, which is in place through 4/30/2023. See the Fund’s prospectus for more information. |
| |||
| The Adjusted Expense Ratio is the same as the Net Expense Ratio, exclusive of certain investment expenses, such as interest expense from borrowings and repurchase agreements, dividend expense from investments on short sales, and acquired fund fees and expenses. |
| |||
Performance of Managers
In the first half of the year, the three managers performed in line with our expectations. The fund’s two flexible credit managers Brown Brothers Harriman and Guggenheim protected capital and have been opportunistically adding to durable credits amid the sharp sell-off, taking advantage of higher market yields. Brown Brothers fell 5.91% and Guggenheim fell 9.23%, compared to a loss of 10.35% for the Aggregate bond index and a 13.99% decline for high-yield bonds. Neuberger Berman’s option Income strategy was down 7.64% this year through June. (Note that sub-advisor returns are net of the management fees that each charges the fund.)
Semi-Annual Review
This year has been one of the more difficult years in recent memory. Equity markets are down approximately 20% through the first half of the year and perceived lower risk bond markets have registered double-digit losses. Over the past few months, the economic backdrop has worsened with sustained levels of inflation not seen since the 1970s, and slowing growth, as the Federal Reserve and other global central banks aggressively tighten monetary policy. Exogenous shocks—the Russian war on Ukraine and China’s zero-COVID lockdowns—continue to further disrupt the global economy and financial markets. Against this backdrop, it was another brutal quarter for bond investors. Although not quite as bad as the bruising 6% loss suffered in the first quarter, the Agg plunged another 4.7% in the second quarter. That produced the worst first-half performance in the history of the Agg, down 10.4%. Losses were widespread, with every sector posting a negative total return. Credit was crushed with high-yield bonds plunging a staggering 10% in the quarter, leaving the asset class down 14% for the first half of the year. Even floating-rate loans lost 4.5% after being essentially flat in the first quarter.
| Fund Summary | 87 | |||||
Table of Contents
The June year-over-year headline CPI inflation rate came in at 9.1%, following an 8.6% increase in May. At present, all measures of inflation are well above the Fed’s 2% target. In response to unexpected inflation data, the Fed turned even more hawkish, hiking the federal funds rate a larger-than-expected 75 basis points in June. The Fed also sharply raised their median forecast for the year-end Fed funds rate to 3.4% from a 1.9% forecast at their March meeting, implying another 175bps of rate hikes over the next several quarters. Meanwhile, they also sharply downgraded their median forecasts for U.S. real GDP growth for 2022 and 2023. A sharp economic growth slowdown is likely this year and the risk of recession over the next 12 months continues to rise.
With this negative outlook for growth, credit spreads have widened in addition to the increase in yields on “risk-free” Treasuries, producing a challenging environment for credit-sensitive assets. High-yield bond spreads ended the quarter at almost 600 basis points (bps), several hundred bps below the levels seen in the early days of the COVID pandemic or the growth scare of early 2016, but above the average of the last decade (less than 500 bps). Combined with the higher Treasury yields, the yield on high-yield ended the quarter at about 9.0%, actual high yield for an asset class that seemed to have been mis-labeled for much of the last decade. In the last ten years, high yield bonds have only yielded more during the two periods previously mentioned, peaking at about 11.4% and 10.1%, respectively. Defaults are still extremely low. The trailing 12-month default rate is just over 1%, year-end forecasts are 1.25%, and estimates for 2023 are below 2.0%. For context, the long-term 12-month average for defaults is 3.2%.
This environment has created attractive opportunities for our managers, who have selectively added risk exposure, while still maintaining caution. Both credit managers were yielding close to 7.0% at the end of the quarter with a duration of just over 2.0. We believe this higher yield, shorter duration combination is attractive. We would remind investors that our credit managers focus on identifying attractive and durable, higher-yielding securities, often in niche, off-benchmark segments of the credit universe such as asset-backed securities (ABS).
The benefit of our flexible credit managers, combined with the option income strategy, becomes apparent when we look at the portfolio’s characteristics. At the end of the quarter, the High Income Alternatives fund had a 12-month distribution yield of 6.1% with a 2.1 duration. Neuberger Berman’s option strategy continues to play an important, complementary role in the fund. The high option premiums collected helped somewhat offset losses from the sharp equity market declines of the quarter. The annualized yield changes quickly due to the Neuberger’s laddered approach to portfolio construction and the options market repricing risk, but it was in the low 20% range at the end of the quarter after starting the quarter in the low teens. Additionally, materially higher yields on short-term Treasuries, while painful during the quarter as yields rose and prices declined, will provide a longer-term benefit to the option sleeve’s collateral return, as the collateral portfolio yielded 2.8% at quarter end.
The passage of time has allowed the fund to demonstrate its advantages, and we think it has the potential to produce attractive risk-adjusted returns and income, while diversifying core bond exposure. Over the trailing one-, two-, and three-year periods, the fund remains ahead of both the high-yield and Aggregate bond benchmarks, as well as the Morningstar Nontraditional Bond category. We appreciate your continued confidence in the fund.
Manager Commentaries
Brown Brothers Harriman: The BBH sleeve declined 4.46% in the second quarter and 5.91% for the first half of 2022. We are pleased with how the multi-sector flexibility of the strategy, combined with our disciplined bottom-up investment approach, is protecting investor capital this year. For context, investment-grade BBB-rated credit performance was -7.9% in the quarter, and -15.2% for the first half. High-yield BB-rated credit performance was worse in the quarter at -8.4%, but slightly better for the first half at -13.9%. Floating-rate loans that had dodged much of the volatility in the first quarter with breakeven returns, saw price declines that resulted in a 4.6% loss for the quarter even as rising interest rates boosted the floating-rate coupons.
The continued rise in interest rates this quarter was in response to the much higher inflation data being reported and the expectation of a more aggressive policy response from the Federal Reserve. The 2-Year and 10-Year Treasury bond yields rose this quarter by 61bps and 67bps, respectively. For the first half of the year those same two interest rates benchmarks increased by 244bps and 207bps. We maintained just two years of duration in the sleeve this year, which remains an important defense against further interest rate volatility. The higher inflation data and interest rate movements pulled forward concerns that the U.S. economy will tumble into a recession with the potential build-up of credit stress being reflected in the widening of credit spreads. For example, investment- grade BBB-rated credit spreads widened 19bps in the second quarter and 46bps for the first half of 2022, which is compounded by the average spread duration during the period of 8.1 years for this rating category. High yield credit spreads experienced a more exponential move wider as recession risk, rather than inflation risk, became a market focus. High yield BB-rated credit spreads widened 173bps just this quarter compared to 209bps for the first half, against an average spread duration of 4.6 years.
The silver lining to all this volatility and abrupt movements in rates and spreads is how quickly valuations are resetting for attractive durable credits. Our quantitative screens are showing opportunity sets with a breadth not seen the height of the pandemic in the second quarter of 2020. As a result, our whole team is sifting through the opportunity stack to identify credits that can meet both our stringent valuation and fundamental credit criteria. With the potential for an economic slowdown or full-blown recession we are continuously reviewing our existing positions and feel confident that these investments have the potential to perform across the wide range of potential economic outcomes facing the country.
| 88 | Litman Gregory Funds Trust | |||||
Table of Contents
Conclusion
It has been a bumpy ride in credit markets the past six months, and we are likely not done with this volatility episode. However, the bright side to all this negative news is the wide breadth of attractive credit opportunities that we are now seeing across asset types and credit rating grades. We will be closely evaluating second quarter financial reports in the coming weeks and assessing the continuing durability and valuation opportunities of each position. Heading into the third quarter, the sleeve has a very attractive 7.6% yield, while maintaining the important shorter duration positioning to hedge against potentially further increases in interest rates.
Guggenheim: The first half of 2022 was extremely challenging for investors, with interest rates rising sharply even as downside risks to the economic outlook have accumulated, pushing stock and bond returns deep into negative territory.
With the labor market overheated and inflation considerably above the Fed’s target, we have entered an uncomfortable regime where “good news is bad news,” and the “Fed put” is deeply out of the money. For the first time in many years, the Federal Reserve (Fed) is aggressively tightening financial conditions in an effort to slow down the economy, keep inflation expectations in check, and bring inflation down to the 2 percent target. The Fed’s crusade to crush inflation is reverberating around the world, as the strengthening dollar is boosting inflation and inflation expectations in other countries, forcing central banks to tighten policy to avoid an erosion of their own inflation credibility.
The tightening of global financial conditions will restrain growth, which already slowed to a crawl in the United States in the first half of 2022 after a robust 2021. Growth this year has been hampered by supply-side constraints as the unemployment rate has fallen to 3.6 percent, commodity markets have been roiled by Russia’s war in Ukraine and the Chinese economy has been hobbled by renewed COVID-19 lockdowns.
Slower demand growth and limited slack have already served to moderate the pace of improvement in the labor market, with aggregate payroll growth and the pace of the decline in the unemployment rate slowing markedly since last fall. This indicates that labor market has already started to cool even before the tightening of financial conditions has really been felt. High-frequency indicators and news reports point to a further slowdown in the job market in coming months.
Inflation is a lagging indicator and continues to run far above the Fed’s target. While some measures of inflation have cooled in recent months, the all-important headline consumer price index (CPI) number sits at a cycle high of 9.1 percent as of June. Our analysis indicates that a recession will be required to bring inflation down to target, and we believe there are highs risks of a recession beginning as soon as the end of 2022.
Performance Review
The sleeve finished the quarter down 5.9% while the Bloomberg US Corporate High Yield and Credit Suisse Leveraged Loan Indices finished down 14.2 percent and 4.5 percent, respectively. While the first quarter’s performance was more tied to duration, the sleeve’s first six months of performance has primarily been driven by the second quarter’s selloff in risk assets. The volatility experienced in the first quarter from inflationary concerns and the dramatic pivot in monetary policy accelerated in the second quarter as investor focus shifted to fears of rising recessionary risks in the face of a hawkish Federal Reserve and signs of a slowing global economy. The widening in credit spreads has been the largest driver of performance for the year with spreads in Investment Grade and High Yield Corporates +63 and +286 basis points wider on the year, respectively. The spread widening experienced in the second quarter was widespread across nearly all credit sectors and in many circumstances was indiscriminate with respect to fundamentals. There is increasingly more quality tiering with lower quality underperforming. The higher yield profile of the portfolio continues to be a growing source of return, helping to partially offset performance detractions due to duration and spread widening.
Strategy and Positioning
Corporate credit totaled approximately 67 percent of the sleeve with roughly 57 percent split between High Yield and Leveraged Loans and the remaining 10 percent Investment Grade. While the risks to the economic picture are growing, we remain constructive on overall corporate credit spreads which offer compelling all-in yields and total return potential at heavily discounted prices. In a more uncertain environment credit selection is paramount, although overall credit spreads are attractively valued and sit at the higher end of their historical percentile ranges. Sector allocations are weighted towards defensive industries with low inflationary sensitivity, such as financials and communications. Within Investment Grade, we prefer intermediate tenors which have widened relatively more than other parts of the curve. The below investment grade allocation is skewed towards floating rate loans which generally perform well in rising rate environments, and BB rated bonds which are the highest rating category below investment grade. We remain cautious on the lowest ratings categories where spreads have not widened proportionally to their higher risk and because default rates are likely to tick up, albeit from ultra-low levels experienced over the last year.
The allocation to securitized credit remains significant with a total of roughly 27 percent of the sleeve as of quarter end. Spreads have moved wider across all subsectors over the course of the first two quarters. In CLOs, spreads had largely been insulated in the first quarter of the year due to investor preference for floating-rate products but began to see spreads widen alongside the broader credit selloff. According to the Palmer Square CLO Indices, spreads in AAA CLOs widened 53 basis points and spreads in BBB CLOs widened 115 basis
| Fund Summary | 89 | |||||
Table of Contents
points in the second quarter, put spreads 74 basis points and 141 basis points wider on the year. Wider spreads began to weigh on issuance in the second quarter as existing warehouses and potential refinancing transactions fell out of the money, so new issuance became predominantly concentrated in shorter and faster moving “print and sprint” deals where issuers looked to take advantage of the dislocation occurring in the bank loan market. Despite the slowdown in production in the second quarter, CLO issuance through the first six months has been strong, only 14% below last year’s record-breaking pace through the same period and is tracking to surpass the next strongest year’s (2018) total new issue creation amount. Spreads in Commercial ABS largely tracked the move in Investment Grade Corporates. Spreads in Non-Agency MBS continued to widen on concerns of slower prepayment speeds and potential moderation of home prices amidst the backup in mortgage rates. While both risks are elevated, credit fundamentals for the housing sector are still relatively solid and improved valuations make the asset class favorable now.
During the first half of the year, we made moderate shifts to duration – first taking it lower both in January and March amid negative developments surrounding any potential easing supply chain issues and the knock-on effects to inflation, then more recently increasing its interest rate exposure following the backup in rates in May and June, ending the quarter with a duration of 2.8yrs, up from 2.3yrs at the start of the quarter. We think the front-end of the U.S. rates curve is still susceptible to rise to due to the Federal Reserve’s reaction function in the face of stickier inflation data. However longer tenors now offer better downside protection and the highly elevated volatility in interest rates during the quarter presented better entry points to add duration. As the Federal Reserve continues to reinforce its commitment to moderating and stabilizing inflationary pressures through decreasing the demand function, long term growth and inflation expectations should fall. Consequently, this era of peak hawkishness in the market signals to us that rates are likely peaking, and that extending duration is prudent.
Though performance of most financial assets on the year has been painful, the move higher in rates and wider in credit spreads has brought fixed income securities to a compelling valuation point. Spreads for most credit assets are near the 70th percentile in terms of historical cheapness, pricing in an elevated probability of a recession over the intermediate term, while all-in yields are at levels not offered since the Financial Crisis of 2007-2008. The stronger financial state of consumers and corporations should correlate to less severe downturn. To that end, we remain constructive in credit, though we emphasize prudent credit selection and rotating up in quality where opportunities present themselves.
Neuberger Berman: Every financial market “regime change” is different, but each tends to be characterized by a few simple catalysts that manifest through markets in less predictable ways. This time around it’s unanticipated (anticipated) inflation and the Fed’s aggressive rate policy and, in our opinion, there isn’t much left to debate.
Ironically, one simplifying explanation for the steep sell-off is that investors decided to heed the modern market wisdom of “don’t fight the Fed”. If everyone knows that asset prices decline when the Fed raises rates, well, then investors need to sell their assets. But who buys them? Voila, a good old-fashion liquidity event that smooshes almost all risks assets except commodities.
With this theory in mind, we believe that US recession concerns are likely overdone, and the labor market’s relative strength is a more relevant indicator than gross domestic product measures that are currently influx due to an unprecedented global pandemic and related inventory effects.
So far, inflation has shown no signs of stalling, in our view, despite monetary policy actions taken by the Fed to-date. At this point, the Fed has indicated they will likely need to increase rates to 3.5% to 3.8% by next year in order to get a handle on inflation. Year to date, short-term US Treasury rates (3M US T-Bill) increased 162bps and long-term rates (10Y US Treasury) rallied 150bps.
Option Implied Volatility Indexes
On the year, CBOE S&P 500 Volatility Index (“VIX”) is up 11.5pts with an average 30-day implied volatility premium of 0.8. In a like manner, CBOE Russell 2000 Volatility Index (“RVX”) is higher by 10.4pts with an average 30-day implied volatility premium of 2.5. VIX futures markets ended the quarter notably higher with the characteristic “contango” relationship between shorter and longer dated futures evaporating. Price moves in VIX futures have historically followed a pattern of shorter-dated futures rising as investor concerns mount. Then, longer-dated futures have historically risen if investors begin to sense that market risks are proving potentially structural rather than temporary. This dynamic played out in the second quarter as investors seemingly began to price in a higher probability of a US recession.
Neuberger Berman US Equity Index PutWrite Strategy
Over the first half of the year, the S&P 500 Index (“S&P 500”) has collapsed -19.96%, the CBOE S&P 500 2% OTM PutWrite Index (“PUTY”) has regressed 3.11%, and the CBOE Russell 2000 PutWrite Index (“PUTR”) has fallen -6.97%. Over the same period, the sleeve of the portfolio fell 7.6% underperforming its PutWrite Benchmark (consisting of 40% CBOE S&P 500 PutWrite Index (PUT) and 60% ICE BofA 0-3M US Treasury Bill Index), which lost of 2.82% but held up better than the Bloomberg US High Yield Index’s decline of 14.19%. On the year, the S&P 500 PutWrite Strategy has declined 7.41%, falling substantially behind the PUTY return of -3.11%. Meanwhile, the Russell 2000 PutWrite Strategy has declined 8.24% and has fallen behind the PUTR loss of 6.97%.
| 90 | Litman Gregory Funds Trust | |||||
Table of Contents
Collateral Portfolio
The collateral portfolio remains down on the year with a loss of 1.19% and has fallen behind the ICE BofA 0-3M US T-Bill Index (“T-Bill Index”) return of 0.16%. A higher U.S. interest rate environment will increase the return potential of our funded option writing strategies. The impact of 2-4% short-term rates could be material as additional fixed income returns will accrue while our option writing process has the potential to collect similar or potentially higher premiums than we have over the past decade. The average collateral yield for our strategies has been well below 1% since inception. 2-year US Treasury yield levels and their trajectory have the potential to increase both absolute and risk-adjusted returns.
Outlook
Some investors continue to expect equity index implied volatility to spike to levels typically seen during “crisis events”. We note a few things. First, and most importantly, implied volatility levels are high and have been creeping higher. Second, we take the increase in implied volatility levels to suggest that option/volatility markets are not pricing in a high probability of a deep US economic recession, yet. Third, we believe short-lived “vol’” episodes may not be as “constructive” for option strategy returns as multi-year runs of above-average levels. VIX at 60 is maybe great for CNBC viewership and long-volatility strategy marketing efforts but crisis levels of VIX have historically suggested something is breaking or is about to break. VIX between 20 and 40 is “nice, very nice”. We believe signs still point to a multi-year run of above-average implied volatility levels. Many option investors couldn’t wait for the regime change and deployed direct or indirect leverage to amplify option premium collection. The risks of leverage are well documented and can often lead to bad outcomes.
Strategy Allocations
The fund’s allocation across the three managers are as follows: 40% to both Brown Brothers Harriman and Guggenheim Investments and 20% to Neuberger Berman. We use the fund’s daily cash flows to bring each manager’s allocation toward their targets should differences in shorter-term relative performance cause divergences.
Sub-Advisor Portfolio Composition as of June 30, 2022
Brown Brothers Harriman Credit Value Strategy
ABS | 18 | % | ||
Bank Loans | 31 | % | ||
Corporate Bonds | 45 | % | ||
CMBS | 5 | % | ||
Cash | 1 | % |
Guggenheim Multi-Credit Strategy
ABS | 21 | % | ||
Bank Loans | 25 | % | ||
Corporate Bonds | 39 | % | ||
CMBS (Non-Agency) | 2 | % | ||
Preferred Stock | 4 | % | ||
RMBS (Non-Agency) | 3 | % | ||
Other | 2 | % | ||
Cash | 4 | % |
Neuberger Berman Option Income Strategy
Equity Index Put Writing | 100 | % |
| Fund Summary | 91 | |||||
Table of Contents
iMGP High Income Alternatives Fund Managers
| INVESTMENT MANAGER | FIRM | TARGET MANAGER ALLOCATION | Strategy | |||
Andrew P. Hofer Neil Hohmann Paul Kunz | Brown Brothers Harriman & Co. | 40% | Credit Value | |||
Scott Minerd Anne Walsh Steven Brown Adam Bloch | Guggenheim Partners Investment Management, LLC | 40% | Multi-Credit | |||
Derek Devens Rory Ewing | Neuberger Berman Investment Advisers LLC | 20% | Option Income |
iMGP High Income Alternatives Fund Value of Hypothetical $10,000.
The value of a hypothetical $10,000 investment in the iMGP High Income Alternatives Fund from September 28, 2018 to June 30, 2022 compared with the Bloomberg US Aggregate Bond Index and Morningstar Non-Traditional Bond Category
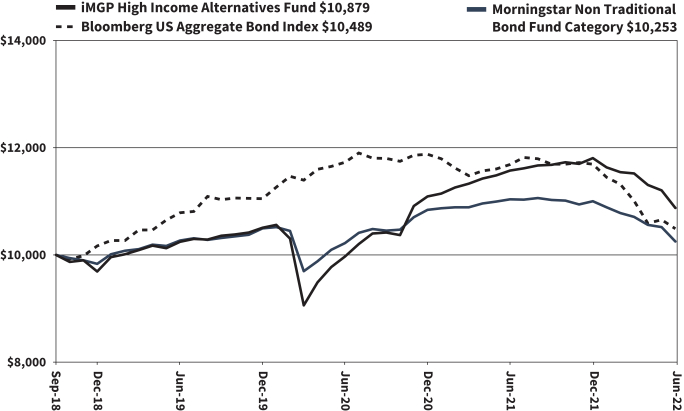
The hypothetical $10,000 investment at fund inception includes changes due to share price and reinvestment of dividends and capital gains. The chart does not imply future performance. Indexes are unmanaged, do not incur fees, expenses or taxes, and cannot be invested in directly.
Performance quoted does not include a deduction for taxes that a shareholder would pay on the redemption of fund shares.
| 92 | Litman Gregory Funds Trust | |||||
Table of Contents
iMGP High Income Alternatives Fund
SCHEDULE OF INVESTMENTS IN SECURITIES at June 30, 2022 (Unaudited)
| Shares | Value | |||||||
COMMON STOCKS: 0.0% | ||||||||
| Consumer Staples: 0.0% | ||||||||
| 648 | Moran Foods LLC* | $ | 433 | |||||
|
| |||||||
| | TOTAL COMMON STOCKS | 433 | ||||||
|
| |||||||
PREFERRED STOCKS: 3.0% | ||||||||
| Financials: 3.0% | ||||||||
| American Financial Group, Inc. |
| |||||||
| 1,789 | 4.500%, 09/15/2060 | 34,563 | ||||||
| Assurant, Inc. |
| |||||||
| 2,000 | 5.250%, 01/15/2061 | 44,500 | ||||||
| Bank of America Corp. |
| |||||||
| 4,000 | 4.375%, 11/03/2025(a) | 76,360 | ||||||
| Bank of America Corp. |
| |||||||
| 6,000 | 4.125%, 02/02/2026(a) | 111,540 | ||||||
| CNO Financial Group, Inc. |
| |||||||
| 2,000 | 5.125%, 11/25/2060 | 38,260 | ||||||
| Eagle Point Credit Co., Inc. |
| |||||||
| 32,000 | 5.375%, 01/31/2029 | 739,200 | ||||||
| Equitable Holdings, Inc. |
| |||||||
| 2,800 | 4.300%, 03/15/2026(a) | 50,148 | ||||||
| Federal Agricultural Mortgage Corp. |
| |||||||
| 2,000 | 5.750%, 07/17/2025(a) | 50,280 | ||||||
| First Eagle Alternative Capital BDC, Inc. |
| |||||||
| 26,600 | 5.000%, 05/25/2026 | 613,130 | ||||||
| First Republic Bank |
| |||||||
| 2,400 | 4.125%, 10/30/2025(a) | 42,000 | ||||||
| First Republic Bank |
| |||||||
| 8,000 | 4.250%, 03/30/2026(a) | 142,080 | ||||||
| First Republic Bank - Series N |
| |||||||
| 800 | 4.500%, 12/31/2026(a) | 14,800 | ||||||
| Gladstone Investment Corp. |
| |||||||
| 6,600 | 4.875%, 11/01/2028 | 155,100 | ||||||
| Oxford Lane Capital Corp. |
| |||||||
| 23,400 | 5.000%, 01/31/2027 | 552,006 | ||||||
| PartnerRe Ltd. |
| |||||||
| 1,158 | 4.875%, 03/15/2026(a) | 23,975 | ||||||
| Prudential Financial, Inc. |
| |||||||
| 4,400 | 4.125%, 09/01/2060 | 90,376 | ||||||
| Selective Insurance Group, Inc. |
| |||||||
| 2,000 | 4.600%, 12/15/2025(a) | 37,160 | ||||||
| Trinity Capital, Inc. |
| |||||||
| 17,000 | 7.000%, 01/16/2025 | 424,788 | ||||||
| W R Berkley Corp. |
| |||||||
| 755 | 4.250%, 09/30/2060 | 13,280 | ||||||
| W R Berkley Corp. |
| |||||||
| 5,619 | 4.125%, 03/30/2061 | 96,591 | ||||||
| Wells Fargo & Co. |
| |||||||
| 6,000 | 4.700%, 12/15/2025(a) | 115,980 | ||||||
|
| |||||||
| 3,466,117 | ||||||||
|
| |||||||
| Real Estate: 0.0% | ||||||||
| Public Storage |
| |||||||
| 1,744 | 4.125%, 08/14/2025(a) | 33,938 | ||||||
|
| |||||||
| | TOTAL PREFERRED STOCKS | 3,500,055 | ||||||
|
| |||||||
| Shares | Value | |||||||
CLOSED-END FUNDS: 0.4% | ||||||||
| 3,065 | Ares Dynamic Credit Allocation Fund, Inc. | $ | 37,393 | |||||
| 16,785 | BlackRock Corporate High Yield Fund, Inc. | 159,961 | ||||||
| 7,504 | BlackRock Credit Allocation Income Trust | 81,719 | ||||||
| 2,922 | BlackRock Debt Strategies Fund, Inc. | 26,707 | ||||||
| 7,753 | Blackstone Strategic Credit Fund | 86,601 | ||||||
| 4,076 | Eaton Vance Ltd. Duration Income Fund | 42,105 | ||||||
| 6,537 | Western Asset High Income Opportunity Fund, Inc. | 25,886 | ||||||
|
| |||||||
| | TOTAL CLOSED-END FUNDS | 460,372 | ||||||
|
| |||||||
EXCHANGE-TRADED FUNDS: 0.0% | ||||||||
| 1,482 | iShares Preferred & Income Securities ETF | 48,728 | ||||||
|
| |||||||
| | TOTAL EXCHANGE-TRADED FUNDS | 48,728 | ||||||
|
| |||||||
| Principal Amount^ | ||||||||
ASSET-BACKED SECURITIES: 14.8% | ||||||||
AASET Trust | ||||||||
| $220,258 | Series 2019-2-B | 145,181 | ||||||
| 160,111 | Series 2020-1A-B | 71,655 | ||||||
AASET US Ltd. | ||||||||
| 170,270 | Series 2018-2A-A | 144,944 | ||||||
ABPCI Direct Lending Fund ABS I Ltd. | ||||||||
| 120,000 | Series 2020-1A-B | 116,046 | ||||||
ABPCI Direct Lending Fund CLO I LLC | ||||||||
| 250,000 | Series 2017-1A-DR | 233,671 | ||||||
ABPCI Direct Lending Fund IX LLC | ||||||||
| 500,000 | Series 2020-9A-BR | 462,773 | ||||||
Adams Outdoor Advertising L.P. | ||||||||
| 357,489 | Series 2018-1-A | 352,771 | ||||||
Anchorage Credit Funding 4 Ltd. | ||||||||
| 250,000 | Series 2016-4A-CR | 205,439 | ||||||
Applebee’s Funding LLC / IHOP Funding LLC | ||||||||
| 247,500 | Series 2019-1A-A2I | 240,988 | ||||||
| 99,000 | Series 2019-1A-A2II | 92,746 | ||||||
Ares Finance Co. II LLC | ||||||||
| 500,000 | 0.000%, 10/15/2036 | 473,750 | ||||||
Atlas Senior Loan Fund Ltd. | ||||||||
| 350,000 | Series 2018-9A-C | 335,247 | ||||||
| Business Jet Securities LLC | ||||||||
| 350,584 | 2022-1A B | 337,404 | ||||||
The accompanying notes are an integral part of these financial statements.
| Schedule of Investments | 93 | |||||
Table of Contents
iMGP High Income Alternatives Fund
SCHEDULE OF INVESTMENTS IN SECURITIES at June 30, 2022 (Unaudited) (Continued)
| Principal Amount^ | Value | |||||||
ASSET-BACKED SECURITIES (CONTINUED) | ||||||||
| Business Jet Securities LLC (Continued) | ||||||||
| $ 88,721 | Series 2020-1A-B | $ | 80,489 | |||||
| CARS-DB4 L.P. | ||||||||
| 220,000 | Series 2020-1A-B1 | 207,556 | ||||||
| 100,000 | Series 2020-1A-B3 | 86,763 | ||||||
| Castlelake Aircraft Securitization Trust | ||||||||
| 100,740 | Series 2018-1-A | 90,704 | ||||||
| Castlelake Aircraft Structured Trust | ||||||||
| 181,323 | Series 2021-1A-B | 152,696 | ||||||
| CHCP Ltd. | ||||||||
| 100,000 | Series 2021-FL1-D | 96,605 | ||||||
| CIFC Funding II Ltd. | ||||||||
| 250,000 | Series 2017-2A-DR | 231,675 | ||||||
| Digital Brige Issuer LLC | ||||||||
| 350,000 | Series 2021-1A-A2 | 326,925 | ||||||
| Dryden Senior Loan Fund | ||||||||
| 300,000 | Series 2021-87A-SUB | 225,968 | ||||||
| Elm Trust | ||||||||
| 110,000 | Series 2020-4A-B | 103,623 | ||||||
| Falcon Aerospace Ltd. | ||||||||
| 245,854 | Series 2017-1-B | 219,903 | ||||||
| First Franklin Mortgage Loan Trust | ||||||||
| 456,964 | Series 2006-FF16-2A4 | 224,840 | ||||||
| Firstkey Revolving Trust | ||||||||
| 150,000 | 0.000%, 11/30/2058 | 143,657 | ||||||
| FS Rialto Issuer LLC | ||||||||
| 100,000 | Series 2018-2A-ASeries 2022-FL5-C | 99,393 | ||||||
| GAIA Aviation Ltd. | ||||||||
| 155,743 | Series 2019-1-A | 144,380 | ||||||
| GoldentTree Loan Management US CLO 1 Ltd. | ||||||||
| 250,000 | Series 2021-9A-D | 221,615 | ||||||
| Golub Capital Partners ABS Funding Ltd. | ||||||||
| 150,000 | Series 2020-1A-B | 142,222 | ||||||
| Hotwire Funding LLC | ||||||||
| 750,000 | Series 2021-1-C | 654,532 | ||||||
| Principal Amount^ | Value | |||||||
| Hull Street CLO Ltd. | ||||||||
| $ 79,130 | Series 2014-1A-CR | $ | 79,082 | |||||
| IP Lending II Ltd. | ||||||||
| 100,000 | Series 2021-2A-SNR | 95,896 | ||||||
| JOL Air Ltd. | ||||||||
| 197,796 | Series 2019-1-A | 175,205 | ||||||
| LCCM Trust | ||||||||
| 150,000 | Series 2021-FL3-C | 142,981 | ||||||
| LCM 35 Ltd. | ||||||||
| 520,000 | Series 35A-SUB | 410,011 | ||||||
| LCM 37 Ltd. | ||||||||
| 300,000 | Series 37A-SUB | 237,142 | ||||||
| LoanCore Issuer Ltd. | ||||||||
| 200,000 | Series 2022-CRE7-D | 186,665 | ||||||
| LoanCore Issuer Ltd. | ||||||||
| 100,000 | Series 2021-CRE5-D | 91,523 | ||||||
| 100,000 | Series 2021-CRE6-D | 93,502 | ||||||
| Madison Park Funding XLVIII Ltd. | ||||||||
| 250,000 | Series 2021-48A-D | 238,261 | ||||||
| Marathon CLO V Ltd. | ||||||||
| 500,000 | Series 2013-5A-A2R | 493,283 | ||||||
| 250,000 | Series 2013-5A-BR | 242,186 | ||||||
| MCA Fund Holding LLC | ||||||||
| 215,724 | Series 2020-1-B | 205,529 | ||||||
| MidOcean Credit CLO VII | ||||||||
| 500,000 | Series 2017-7A-CR | 472,835 | ||||||
| Monroe Capital ABS Funding Ltd. | ||||||||
| 180,000 | Series 2021-1A-A2 | 167,684 | ||||||
| Monroe Capital Income Plus ABS Funding LLC | ||||||||
| 140,000 | Series 2022-1A-B | 133,882 | ||||||
| Morgan Stanley ABS Capital I, Inc. Trust | ||||||||
| 279,854 | Series 2006-HE8-A2D | 143,036 | ||||||
The accompanying notes are an integral part of these financial statements.
| 94 | Litman Gregory Funds Trust | |||||
Table of Contents
iMGP High Income Alternatives Fund
SCHEDULE OF INVESTMENTS IN SECURITIES at June 30, 2022 (Unaudited) (Continued)
| Principal Amount^ | Value | |||||||
ASSET-BACKED SECURITIES (CONTINUED) | ||||||||
| Morgan Stanley ABS Capital I, Inc. Trust (Continued) | ||||||||
| $ 360,508 | Series 2007-HE4-A2C | $ | 125,350 | |||||
| Morgan Stanley IXIS Real Estate Capital Trust | ||||||||
| 358,266 | Series 2006-2-A4 | 134,733 | ||||||
| Nassau CFO LLC | ||||||||
| 177,187 | Series 2019-1-A | 172,697 | ||||||
| Neuberger Berman Loan Advisers CLO 44 Ltd. | ||||||||
| 250,000 | Series 2021-44A-SUB | 212,810 | ||||||
| NewStar Clarendon Fund CLO LLC | ||||||||
| 130,601 | Series 2014-1A-D | 130,463 | ||||||
| Newtek Small Business Loan Trust | ||||||||
| 90,970 | Series 2018-1-A | 90,058 | ||||||
| 41,350 | Series 2018-1-B | 41,040 | ||||||
| Northwoods Capital 20 Ltd. | ||||||||
| 250,000 | Series 2019-20A-DR | 231,355 | ||||||
| Northwoods Capital 22 Ltd. | ||||||||
| 250,000 | Series 2020-22A ER | 242,694 | ||||||
| Oportun Issuance Trust 2022-A | ||||||||
| 350,000 | Series 2022-A-B | 338,793 | ||||||
| Oxford Finance Funding LLC | ||||||||
| 324,742 | Series 2020-1A-B | 313,063 | ||||||
| Palmer Square Loan Funding Ltd. | ||||||||
| 250,000 | Series 2021-1A-C | 244,419 | ||||||
| 200,000 | Series 2021-2A-SUB | 150,477 | ||||||
| 250,000 | Series 2021-3A-C | 232,768 | ||||||
| 200,000 | Series 2021-3A-SUB | 156,571 | ||||||
| PennantPark CLO Ltd. | ||||||||
| 250,000 | Series 2020-2A-D | 242,886 | ||||||
| Raspro Trust | ||||||||
| 492,471 | Series 2005-1A-B2 | 468,995 | ||||||
| Principal Amount^ | Value | |||||||
| ReadyCap Lending Small Business Loan Trust | ||||||||
| $ 104,021 | Series 2019-2-A | $ | 100,046 | |||||
| Republic Finance Issuance Trust | ||||||||
| 240,000 | Series 2020-A-B | 225,922 | ||||||
| Saganaw Insurance Recievables LLC | ||||||||
| 29,666 | Series 2019-1A-A | 29,601 | ||||||
| Sapphire Aviation Finance I Ltd. | ||||||||
| 132,737 | Series 2018-1A-A | 110,977 | ||||||
| Sapphire Aviation Finance II Ltd. | ||||||||
| 233,783 | Series 2020-1A-B | 162,183 | ||||||
| Secured Tenant Site Contract Revenue Notes | ||||||||
| 115,647 | Series 2018-1A-C | 114,758 | ||||||
| Sprite Ltd. | ||||||||
| 236,743 | Series 2021-1-A | 214,825 | ||||||
| Stack Infrastructure Issuer LLC | ||||||||
| 444,667 | Series 2019-1A-A2 | 441,644 | ||||||
| Start Ltd. | ||||||||
| 160,532 | Series 2018-1-A | 140,981 | ||||||
| STWD Ltd. | ||||||||
| 100,000 | Series 2022-FL3-D | 93,436 | ||||||
| Sunbird Engine Finance LLC | ||||||||
| 189,689 | Series 2020-1A-B | 172,269 | ||||||
| Symphony CLO XXXI Ltd. | ||||||||
| 650,000 | Series 2022-31A-SUB | 586,562 | ||||||
| Thrust Engine Leasing | ||||||||
| 427,834 | Series 2021-1A-B | 368,698 | ||||||
| Vault DI Issuer LLC | ||||||||
| 250,000 | Series 2021-1A-A2 | 225,904 | ||||||
| VB-S1 Issuer LLC - VBTEL | ||||||||
| 250,000 | Series 2022-1A-F | 228,469 | ||||||
| VCP RRL ABS I Ltd. | ||||||||
| 84,405 | Series 2021-1A-C | 81,028 | ||||||
| Venture XIII CLO Ltd. | ||||||||
| 250,000 | Series 2013-13A-SUB | 47,651 | ||||||
| Wingstop Funding LLC | ||||||||
| 100,000 | Series 2022-1A-A2 | 89,546 | ||||||
| WRG Debt Funding IV LLC | ||||||||
| 193,005 | Series 2020-1-B | 192,749 | ||||||
|
| |||||||
| | TOTAL ASSET-BACKED SECURITIES | 17,431,285 | ||||||
|
| |||||||
The accompanying notes are an integral part of these financial statements.
| Schedule of Investments | 95 | |||||
Table of Contents
iMGP High Income Alternatives Fund
SCHEDULE OF INVESTMENTS IN SECURITIES at June 30, 2022 (Unaudited) (Continued)
| Principal Amount^ | Value | |||||||
BANK LOANS: 25.3% | ||||||||
| AAdvantage Loyalty IP Ltd. | ||||||||
| $ 700,000 | 5.813%, 04/20/2028(c) | $ | 669,623 | |||||
| Accuride Corp. | ||||||||
| 44,226 | 7.500%, 11/17/2023(c) | 39,123 | ||||||
| AHP Health Partners, Inc. | ||||||||
| 764,225 | 5.166%, 08/24/2028(c) | 723,626 | ||||||
| AI Aqua Merger Sub, Inc. | ||||||||
| 100,000 | 0.000%, 07/31/2028(f) | 91,375 | ||||||
| 100,000 | 4.831%, 07/31/2028(c) | 91,375 | ||||||
| Air Canada | ||||||||
| 735,000 | 4.250%, 08/11/2028(c) | 678,037 | ||||||
| AL NGPL Holdings LLC | ||||||||
| 320,509 | 4.750%, 04/14/2028(c) | 312,698 | ||||||
| Allen Media LLC | ||||||||
| 517,991 | 7.704%, 02/10/2027(c) | 464,056 | ||||||
| AllSpring Buyer LLC | ||||||||
| 663,659 | 5.563%, 11/01/2028(c) | 639,860 | ||||||
| 155,000 | 6.054%, 11/01/2028(c) | 148,994 | ||||||
| American Rock Salt Co. LLC | ||||||||
| 99,000 | 5.670%, 06/09/2028(c) | 89,843 | ||||||
| Anchor Packaging, Inc. | ||||||||
| 97,586 | 5.666%, 07/18/2026(c) | 92,950 | ||||||
| API Technologies Corp. | ||||||||
| 97,000 | 5.916%, 05/09/2026(c) | 86,451 | ||||||
| Apttus Corp. | ||||||||
| 99,250 | 5.621%, 05/08/2028(c) | 93,295 | ||||||
| Arcline FM Holdings LLC | ||||||||
| 99,250 | 7.627%, 06/23/2028(c) | 93,543 | ||||||
| Arctic Glacier U.S.A., Inc. | ||||||||
| 100,000 | 5.750%, 03/20/2024(c) | 88,295 | ||||||
| Armor Holding II LLC | ||||||||
| 149,250 | 6.750%, 12/11/2028(c) | 142,161 | ||||||
| Aston FinCo S.A.R.L. | ||||||||
| 97,750 | 5.916%, 10/09/2026(c) | 92,948 | ||||||
| Athenahealth, Inc. | ||||||||
| 363,397 () | 0.000%, 02/15/2029(f) | 335,690 | ||||||
| AthenaHealth, Inc. | ||||||||
| 61,593 | 0.000%, 02/15/2029(f) | 56,897 | ||||||
| 363,406 | 5.009%, 02/15/2029(c) | 335,698 | ||||||
| Principal Amount^ | Value | |||||||
| Atlas CC Acquisition Corp. | ||||||||
| $ 16,732 | 5.825%, 05/25/2028(c) | $ | 15,509 | |||||
| 82,268 | 5.825%, 05/25/2028(c) | 76,252 | ||||||
| Bausch Health Cos., Inc. | ||||||||
| 65,000 () | 0.000%, 02/01/2027(f) | 56,004 | ||||||
| 40,000 | 6.549%, 02/01/2027 | 34,464 | ||||||
| BCP Renaissance Parent LLC | ||||||||
| 545,856 | 5.166%, 10/31/2024(c) | 528,572 | ||||||
| 605,788 | 0.000%, 10/31/2026(f) | 579,285 | ||||||
| BCPE Empire Holdings, Inc. | ||||||||
| 97,311 | 5.666%, 06/11/2026(c) | 92,203 | ||||||
| 99,500 | 5.666%, 06/11/2026(c) | 94,027 | ||||||
| Blue Ribbon LLC | ||||||||
| 244,327 | 7.062%, 05/08/2028(c) | 223,966 | ||||||
| BWAY Holding Co. | ||||||||
| 57,228 | 4.312%, 04/03/2024(c) | 53,997 | ||||||
| Cambrex Corp. | ||||||||
| 96,407 | 5.125%, 12/04/2026(c) | 91,707 | ||||||
| Camin Cargo Control, Inc. | ||||||||
| 95,360 | 8.166%, 06/04/2026(c) | 94,883 | ||||||
| Capstone Acquisition Holdings, Inc. | ||||||||
| 13,194 | 0.000%, 11/12/2027(f) | 13,095 | ||||||
| 98,747 | 6.416%, 11/12/2027(c) | 98,006 | ||||||
| Cast and Crew Payroll LLC | ||||||||
| 47,989 | 5.166%, 02/09/2026(c) | 45,694 | ||||||
| CCRR Parent, Inc. | ||||||||
| 98,750 | 6.010%, 03/06/2028(c) | 93,936 | ||||||
| CD&R Hydra Buyer, Inc. | ||||||||
| 96,954 | 5.916%, 12/11/2024(c) | 92,955 | ||||||
| CDK Global, Inc. | ||||||||
| 620,000 | 0.000%, 07/06/2029(f) | 587,763 | ||||||
| Cengage Learning, Inc. | ||||||||
| 46,516 | 5.750%, 07/14/2026(c) | 42,097 | ||||||
| Charter NEX US, Inc. | ||||||||
| 98,750 | 5.416%, 12/01/2027(c) | 93,257 | ||||||
| Clarios Global L.P. | ||||||||
| 664,521 | 0.000%, 04/30/2026(f) | 622,158 | ||||||
| 579,243 | 4.916%, 04/30/2026(c) | 542,316 | ||||||
| Claros Mortgage Trust, Inc. | ||||||||
| 99,500 | 5.726%, 08/09/2026(c) | 95,271 | ||||||
| Comet Acquisition, Inc. | ||||||||
| 96,500 | 4.916%, 10/24/2025(c) | 90,589 | ||||||
The accompanying notes are an integral part of these financial statements.
| 96 | Litman Gregory Funds Trust | |||||
Table of Contents
iMGP High Income Alternatives Fund
SCHEDULE OF INVESTMENTS IN SECURITIES at June 30, 2022 (Unaudited) (Continued)
| Principal Amount^ | Value | |||||||
BANK LOANS (CONTINUED) | ||||||||
| Confluent Medical Technologies, Inc. | ||||||||
| $ 99,750 | 5.804%, 02/09/2029(c) | $ | 93,017 | |||||
| Congruex Group LLC | ||||||||
| 100,000 | 7.235%, 05/03/2029(c) | 96,500 | ||||||
| Connect Finco S.A.R.L | ||||||||
| 513,434 | 5.170%, 12/11/2026(c) | 473,964 | ||||||
| CP Atlas Buyer, Inc. | ||||||||
| 98,770 | 5.416%, 11/23/2027(c) | 87,164 | ||||||
| CPC Acquisition Corp. | ||||||||
| 197,500 | 6.000%, 12/29/2027(c) | 174,129 | ||||||
| CPM Holdings, Inc. | ||||||||
| 96,500 | 4.562%, 11/17/2025(c) | 92,374 | ||||||
| Cross Financial Corp. | ||||||||
| 99,000 | 4.813%, 09/15/2027(c) | 94,380 | ||||||
| Deerfield Dakota Holding LLC | ||||||||
| 98,000 | 5.275%, 04/09/2027(c) | 92,028 | ||||||
| Del Monte Foods, Inc. | ||||||||
| 100,000 () | 0.000%, 05/16/2029(f) | 94,500 | ||||||
| 100,000 | 5.684%, 05/16/2029(c) | 94,500 | ||||||
| Denali Water Solutions | ||||||||
| 61,311 | 6.500%, 03/27/2028(c) | 55,793 | ||||||
| DG Investment Intermediate Holdings 2, Inc. | ||||||||
| 99,003 | 5.416%, 03/31/2028(c) | 92,785 | ||||||
| Dhanani Group, Inc. | ||||||||
| 100,000 | 7.500%, 07/20/2025(c) | 97,500 | ||||||
| DXP Enterprises, Inc. | ||||||||
| 97,392 | 6.416%, 12/16/2027(c) | 94,794 | ||||||
| Eastern Power LLC | ||||||||
| 655,273 | 6.000%, 10/02/2025(c) | 556,471 | ||||||
| Eisner Advisory Group LLC | ||||||||
| 149,000 | 6.390%, 07/28/2028(c) | 140,060 | ||||||
| EyeCare Partners LLC | ||||||||
| 97,901 | 6.000%, 02/18/2027(c) | 90,834 | ||||||
| Fertitta Entertainment LLC | ||||||||
| 99,750 | 5.525%, 01/27/2029(c) | 92,269 | ||||||
| First Brands Group LLC | ||||||||
| 248,371 | 6.287%, 03/30/2027(c) | 236,946 | ||||||
| Firstdigital Communications LLC | ||||||||
| 50,000 | 5.875%, 12/17/2026(c) | 49,652 | ||||||
| Principal Amount^ | Value | |||||||
| Florida Food Products LLC | ||||||||
| $ 99,750 | 6.666%, 10/18/2028(c) | $ | 94,264 | |||||
| FR Refuel LLC | ||||||||
| 11,667 | 6.000%, 11/08/2028(c) | 11,317 | ||||||
| 87,892 | 6.438%, 11/08/2028(c) | 85,255 | ||||||
| Franchise Group Intermediate Holdco LLC | ||||||||
| 81,545 | 6.500%, 03/10/2026(c) | 74,953 | ||||||
| GEON Performance Solutions LLC | ||||||||
| 357,300 | 6.166%, 08/18/2028(c) | 339,435 | ||||||
| Gibson Brands Inc. | ||||||||
| 99,500 | 6.411%, 08/11/2028(c) | 85,073 | ||||||
| GIP II Blue Holding, L.P | ||||||||
| 305,684 | 6.750%, 09/29/2028(c) | 297,405 | ||||||
| Global Medical Response, Inc. | ||||||||
| 257,993 | 5.916%, 03/14/2025(c) | 240,714 | ||||||
| GT Polaris, Inc. | ||||||||
| 98,449 | 4.989%, 09/24/2027(c) | 92,952 | ||||||
| Hamilton Projects Acquiror LLC | ||||||||
| 89,549 | 6.750%, 06/17/2027(c) | 86,065 | ||||||
| Help At Home, Inc. | ||||||||
| 9,894 | 6.525%, 10/29/2027(c) | 9,486 | ||||||
| 88,881 | 6.666%, 10/29/2027(c) | 85,215 | ||||||
| Help at Home, Inc. | ||||||||
| 149,625 | 7.210%, 10/29/2027(c) | 142,892 | ||||||
| Higginbotham Insurance Agency, Inc. | ||||||||
| 6,545 | 7.166%, 11/25/2026(c) | 6,473 | ||||||
| 99,067 | 7.166%, 11/25/2026(c) | 97,979 | ||||||
| HighTower Holdings LLC | ||||||||
| 99,250 | 5.098%, 04/21/2028(c) | 92,799 | ||||||
| Holding Socotec SAS | ||||||||
| 99,000 | 6.250%, 06/30/2028(c) | 92,070 | ||||||
| IBC Capital Ltd. | ||||||||
| 78,657 | 5.780%, 09/11/2023(c) | 71,217 | ||||||
| ICON Luxembourg S.A.R.L. | ||||||||
| 490,907 | 4.563%, 07/03/2028(c) | 475,532 | ||||||
| 122,310 | 4.563%, 07/03/2028(c) | 118,479 | ||||||
| Illuminate Buyer LLC | ||||||||
| 46,871 | 5.166%, 06/30/2027(c) | 43,447 | ||||||
| Ilpea Parent, Inc. | ||||||||
| 694,986 () | 0.000%, 06/22/2028(f) | 667,186 | ||||||
The accompanying notes are an integral part of these financial statements.
| Schedule of Investments | 97 | |||||
Table of Contents
iMGP High Income Alternatives Fund
SCHEDULE OF INVESTMENTS IN SECURITIES at June 30, 2022 (Unaudited) (Continued)
| Principal Amount^ | Value | |||||||
BANK LOANS (CONTINUED) | ||||||||
| Ilpea Parent, Inc. (Continued) | ||||||||
| $ 780,920 | 6.170%, 06/22/2028(c) | $ | 749,683 | |||||
| Imagefirst Holdings LLC | ||||||||
| 98,815 | 6.750%, 04/27/2028(c) | 92,392 | ||||||
| Imprivata, Inc. | ||||||||
| 250,000 | 5.775%, 12/01/2027(c) | 243,542 | ||||||
| Jazz Financing Lux S.A.R.L. | ||||||||
| 499,950 | 5.166%, 05/05/2028(c) | 478,232 | ||||||
| Jones DesLauriers Insurance Management, Inc. | ||||||||
| 99,499 (CAD) | 6.063%, 03/17/2028(c) | 72,274 | ||||||
| Kronos Acquisition Holdings, Inc. | ||||||||
| 107,795 | 5.416%, 12/22/2026(c) | 98,309 | ||||||
| Laseraway Intermediate Holdings II LLC | ||||||||
| 99,500 | 6.788%, 10/12/2027(c) | 98,070 | ||||||
| LendingTree, Inc. | ||||||||
| 560,000 | 5.420%, 09/15/2028(c) | 526,865 | ||||||
| LTI Holdings, Inc. | ||||||||
| 195,991 | 5.166%, 09/06/2025(c) | 182,884 | ||||||
| Mavis Tire Express Services Corp. | ||||||||
| 99,036 | 5.625%, 05/04/2028(c) | 91,855 | ||||||
| MB2 Dental Solutions LLC | ||||||||
| 73,004 | 7.000%-9.750%, 01/29/2027(c) | 72,274 | ||||||
| 109,262 | 7.239%, 01/29/2027(c) | 107,594 | ||||||
| Medline Borrower, L.P. | ||||||||
| 408,975 | 4.916%, 10/23/2028(c) | 380,539 | ||||||
| Meridian Adhesives Group, Inc. | ||||||||
| 139,300 | 4.750%, 07/24/2028(c) | 132,161 | ||||||
| Midcap Financial Holdings Trust | ||||||||
| 250,000 | 4.620%, 11/22/2028(c) | 249,930 | ||||||
| Midwest Veterinary Partners LLC | ||||||||
| 99,250 | 5.666%, 04/27/2028(c) | 94,287 | ||||||
| Mileage Plus Holdings LLC | ||||||||
| 100,000 | 7.313%, 06/21/2027(c) | 99,050 | ||||||
| MIP V Waste Holdings LLC | ||||||||
| 399,000 | 4.916%, 12/08/2028(c) | 387,030 | ||||||
| Moran Foods LLC | ||||||||
| 11,793 | 9.250%, 04/01/2024(c) | 10,732 | ||||||
| 15,385 | 13.000%, 10/01/2024(c) | 9,462 | ||||||
| Principal Amount^ | Value | |||||||
| Motel 6 | ||||||||
| $ 198,999 | 6.666%, 09/09/2026(c) | $ | 194,521 | |||||
| MPH Acquisition Holdings LLC | ||||||||
| 350,000 | 0.000%, 09/01/2028(f) | 323,225 | ||||||
| 754,300 | 5.825%, 09/01/2028(c) | 696,596 | ||||||
| NA Rail Hold Co. LLC | ||||||||
| 98,230 | 6.250%, 10/19/2026(c) | 94,331 | ||||||
| National Mentor Holdings, Inc. | ||||||||
| 94,379 | 5.420%-6.010%, 03/02/2028(c) | 82,262 | ||||||
| NFM & J, L.P. | ||||||||
| 28,458 | 6.886%-7.416%, 11/30/2027(c) | 28,177 | ||||||
| 49,464 | 7.416%, 11/30/2027(c) | 48,976 | ||||||
| NFP Corp. | ||||||||
| 48,253 | 4.916%, 02/15/2027(c) | 44,731 | ||||||
| NorthRiver Midstream Finance L.P. | ||||||||
| 577,741 | 4.217%, 10/01/2025(c) | 564,999 | ||||||
| Organon & Co. | ||||||||
| 507,304 | 4.625%, 06/02/2028(c) | 489,602 | ||||||
| Pacific Bells LLC | ||||||||
| 99,505 | 6.816%, 11/10/2028(c) | 92,540 | ||||||
| Packers Holdings LLC | ||||||||
| 98,766 | 4.440%, 03/09/2028(c) | 90,742 | ||||||
| PAI Holdco, Inc. | ||||||||
| 98,750 | 4.989%, 10/28/2027(c) | 93,442 | ||||||
| Park River Holdings, Inc. | ||||||||
| 197,499 | 4.217%, 12/28/2027(c) | 162,936 | ||||||
| PECF USS Intermediate Holding III Corp. | ||||||||
| 99,500 | 5.916%, 12/15/2028(c) | 90,151 | ||||||
| Pelican Products, Inc. | ||||||||
| 99,500 | 6.500%, 12/29/2028(c) | 93,033 | ||||||
| Peraton Corp. | ||||||||
| 96,961 | 5.416%, 02/01/2028(c) | 91,317 | ||||||
| PetVet Care Centers LLC | ||||||||
| 196,962 | 5.166%, 02/14/2025(c) | 186,293 | ||||||
| Planview Parent, Inc. | ||||||||
| 98,500 | 5.666%, 12/17/2027(c) | 93,114 | ||||||
| Playpower, Inc. | ||||||||
| 89,856 | 7.750%, 05/08/2026(c) | 79,298 | ||||||
| Polaris Newco LLC | ||||||||
| 45,457 | 5.666%, 06/02/2028(c) | 42,137 | ||||||
The accompanying notes are an integral part of these financial statements.
| 98 | Litman Gregory Funds Trust | |||||
Table of Contents
iMGP High Income Alternatives Fund
SCHEDULE OF INVESTMENTS IN SECURITIES at June 30, 2022 (Unaudited) (Continued)
| Principal Amount^ | Value | |||||||
BANK LOANS (CONTINUED) | ||||||||
| Pro Mach Group, Inc. | ||||||||
| $ 2,786 | 5.000%, 08/31/2028(c) | $ | 2,635 | |||||
| 91,993 | 5.666%, 08/31/2028(c) | 87,020 | ||||||
| Project Ruby Ultimate Parent Corp. | ||||||||
| 98,750 | 4.916%, 03/03/2028(c) | 92,861 | ||||||
| Propulsion (BC) Finco S.A.R.L. | ||||||||
| 300,000 | 0.000%, 02/10/2029(f) | 285,000 | ||||||
| Protective Industrial Products, Inc. | ||||||||
| 198,000 | 5.666%, 12/29/2027(c) | 190,080 | ||||||
| Quirch Foods Holdings LLC | ||||||||
| 297,994 | 6.824%, 10/27/2027(c) | 283,094 | ||||||
| Resonetics LLC | ||||||||
| 99,250 | 5.239%, 04/28/2028(c) | 94,536 | ||||||
| Restaurant Technologies, Inc. | ||||||||
| 199,500 | 6.304%, 04/02/2029(c) | 191,853 | ||||||
| SCP Eye Care Services LLC | ||||||||
| 75,102 | 6.750%, 03/16/2028(c) | 71,910 | ||||||
| ScribeAmerica Intermediate Holdco LLC | ||||||||
| 46,846 | 6.166%, 04/03/2025(c) | 40,132 | ||||||
| Service Logic Acquisition, Inc. | ||||||||
| 91,281 | 5.239%, 10/29/2027(c) | 87,059 | ||||||
| 2,537 | 5.286%-5.652%, 10/29/2027(c) | 2,420 | ||||||
| Sitecore Holding III A/S | ||||||||
| 105,684 | 8.745%, 09/01/2028(c) | 104,514 | ||||||
| SkyMiles IP Ltd. | ||||||||
| 200,000 | 4.750%, 10/20/2027(c) | 199,250 | ||||||
| Solis IV BV | ||||||||
| 100,000 | 4.842%, 02/26/2029(c) | 86,454 | ||||||
| Southern Veterinary Partners LLC | ||||||||
| 98,560 | 5.000%, 10/05/2027(c) | 93,960 | ||||||
| Sovos Brands Intermediate, Inc. | ||||||||
| 82,897 | 4.250%, 06/08/2028(c) | 78,441 | ||||||
| Sovos Compliance LLC | ||||||||
| 14,726 | 6.152%, 08/11/2028(c) | 13,912 | ||||||
| 84,848 | 6.166%, 08/11/2028(c) | 80,155 | ||||||
| SP PF Buyer LLC | ||||||||
| 147,710 | 6.166%, 12/22/2025(c) | 126,661 | ||||||
| Sweetwater Borrower LLC | ||||||||
| 98,505 | 5.938%, 08/07/2028(c) | 84,961 | ||||||
| Principal Amount^ | Value | |||||||
| Syndigo LLC | ||||||||
| $ 148,125 | 5.824%, 12/15/2027(c) | $ | 140,719 | |||||
| System One Holdings LLC | ||||||||
| 760,000 | 0.000%, 03/02/2028(f) | 714,400 | ||||||
| 754,300 | 4.750%, 03/02/2028(c) | 709,042 | ||||||
| Teneo Holdings LLC | ||||||||
| 67,385 | 6.847%, 07/11/2025(c) | 63,061 | ||||||
| Tibco Software, Inc. | ||||||||
| 98,000 | 5.420%, 06/30/2026(c) | 96,392 | ||||||
| Trans Union LLC | ||||||||
| 50,000 | 0.000%, 12/03/2029(f) | 50,031 | ||||||
| TricorBraun Holdings, Inc. | ||||||||
| 99,030 | 4.916%, 03/03/2028(c) | 92,460 | ||||||
| Truck Hero, Inc. | ||||||||
| 98,750 | 5.166%, 01/31/2028(c) | 88,727 | ||||||
| TVC Albany, Inc. | ||||||||
| 96,250 | 5.170%, 07/23/2025(c) | 90,335 | ||||||
| UGI Energy Services LLC | ||||||||
| 232,800 | 5.416%, 08/13/2026(c) | 228,436 | ||||||
| United Airlines, Inc. | ||||||||
| 646,813 | 5.392%, 04/21/2028(c) | 603,964 | ||||||
| Venture Global Calcasieu Pass LLC | ||||||||
| 42,090 | 2.830%-3.999%, 08/19/2026(c) | 41,879 | ||||||
| Verscend Holding Corp. | ||||||||
| 195,000 | 0.000%, 08/27/2025(f) | 187,200 | ||||||
| Vertical US Newco, Inc. | ||||||||
| 63,546 | 4.019%, 07/30/2027(c) | 59,694 | ||||||
| Weber-Stephen Products LLC | ||||||||
| 99,750 | 5.875%, 10/30/2027(c) | 94,762 | ||||||
| Women’s Care Enterprises LLC | ||||||||
| 198,000 | 5.739%, 01/15/2028(c) | 186,120 | ||||||
| Wrench Group LLC | ||||||||
| 98,489 | 6.250%, 04/30/2026(c) | 93,810 | ||||||
| Xplornet Communications, Inc. | ||||||||
| 99,250 | 5.666%, 10/02/2028(c) | 90,986 | ||||||
| Yak Access LLC | ||||||||
| 100,000 | 12.185%, 07/10/2026(c) | 53,938 | ||||||
| Zep, Inc. | ||||||||
| 21,573 | 6.250%, 08/12/2024(c) | 19,038 | ||||||
|
| |||||||
| | TOTAL BANK LOANS | 29,795,902 | ||||||
|
| |||||||
The accompanying notes are an integral part of these financial statements.
| Schedule of Investments | 99 | |||||
Table of Contents
iMGP High Income Alternatives Fund
SCHEDULE OF INVESTMENTS IN SECURITIES at June 30, 2022 (Unaudited) (Continued)
| Principal Amount^ | Value | |||||||
CORPORATE BONDS: 32.6% | ||||||||
| Basic Materials: 1.2% | ||||||||
| Alcoa Nederland Holding B.V. | ||||||||
| $ 200,000 | 5.500%, 12/15/2027(b) | $ | 189,909 | |||||
| Carpenter Technology Corp. | ||||||||
| 150,000 | 7.625%, 03/15/2030 | 137,984 | ||||||
| Clearwater Paper Corp. | ||||||||
| 37,000 | 4.750%, 08/15/2028(b) | 31,971 | ||||||
| Compass Minerals International, Inc. | ||||||||
| 100,000 | 6.750%, 12/01/2027(b) | 90,603 | ||||||
| EverArc Escrow Sarl | ||||||||
| 100,000 | 5.000%, 10/30/2029(b) | 84,307 | ||||||
| Illuminate Buyer LLC / Illuminate Holdings IV, Inc. | ||||||||
| 80,000 | 9.000%, 07/01/2028(b) | 63,304 | ||||||
| INEOS Quattro Finance 2 Plc | ||||||||
| 200,000 | 3.375%, 01/15/2026(b) | 168,298 | ||||||
| Ingevity Corp. | ||||||||
| 150,000 | 3.875%, 11/01/2028(b) | 125,896 | ||||||
| Kaiser Aluminum Corp. | ||||||||
| 100,000 | 4.500%, 06/01/2031(b) | 76,123 | ||||||
| LIGHTNING 2022 1 A FUNDED | ||||||||
| 58,000 | 5.500%, 03/01/2037 | 58,000 | ||||||
| LIGHTNING 2022 1 B FUNDED | ||||||||
| 29,000 | 7.500%, 03/01/2037 | 29,000 | ||||||
| Minerals Technologies, Inc. | ||||||||
| 65,000 | 5.000%, 07/01/2028(b) | 56,667 | ||||||
| THUNDERBIRD 2022 1 A FUNDED | ||||||||
| 58,000 | 5.500%, 03/01/2037 | 58,000 | ||||||
| THUNDERBIRD 2022 1 B FUNDED | ||||||||
| 29,000 | 7.500%, 03/01/2037 | 29,000 | ||||||
| Valvoline, Inc. | ||||||||
| 100,000 | 3.625%, 06/15/2031(b) | 80,030 | ||||||
| WR Grace Holdings LLC | ||||||||
| 100,000 | 4.875%, 06/15/2027(b) | 87,149 | ||||||
|
| |||||||
| 1,366,241 | ||||||||
|
| |||||||
| Communications: 2.1% | ||||||||
| Altice France S.A. | ||||||||
| 200,000 | 5.500%, 10/15/2029(b) | 153,375 | ||||||
| AMC Networks, Inc. | ||||||||
| 150,000 | 4.250%, 02/15/2029 | 122,041 | ||||||
| British Telecommunications Plc | ||||||||
| 200,000 | 4.875%, 11/23/2081(b)(d) | 170,376 | ||||||
| CCO Holdings LLC / CCO Holdings Capital Corp. | ||||||||
| 85,000 | 4.250%, 02/01/2031(b) | 69,511 | ||||||
| 70,000 | 4.500%, 06/01/2033(b) | 55,451 | ||||||
| Cogent Communications Group, Inc. | ||||||||
| 150,000 | 7.000%, 06/15/2027(b) | 143,475 | ||||||
| Connect Finco S.A.R.L / Connect US Finco LLC | ||||||||
| 200,000 | 6.750%, 10/01/2026(b) | 179,425 | ||||||
| LCPR Senior Secured Financing DAC | ||||||||
| 50,000 | 6.750%, 10/15/2027(b) | 46,774 | ||||||
| 200,000 | 5.125%, 07/15/2029(b) | 167,381 | ||||||
| Level 3 Financing, Inc. | ||||||||
| 249,000 | 4.250%, 07/01/2028(b) | 201,949 | ||||||
| Principal Amount^ | Value | |||||||
| Communications (continued) | ||||||||
| Match Group Holdings II LLC | ||||||||
| $ 50,000 | 4.625%, 06/01/2028(b) | $ | 45,413 | |||||
| McGraw-Hill Education, Inc. | ||||||||
| 100,000 | 5.750%, 08/01/2028(b) | 85,819 | ||||||
| 150,000 | 8.000%, 08/01/2029(b) | 121,751 | ||||||
| Paramount Global | ||||||||
| 60,000 | 4.950%, 05/19/2050 | 50,752 | ||||||
| Radiate Holdco LLC / Radiate Finance, Inc. | ||||||||
| 150,000 | 4.500%, 09/15/2026(b) | 129,568 | ||||||
| Switch Ltd. | ||||||||
| 100,000 | 3.750%, 09/15/2028(b) | 98,946 | ||||||
| UPC Broadband Finco B.V. | ||||||||
| 200,000 | 4.875%, 07/15/2031(b) | 163,597 | ||||||
| Virgin Media Finance Plc | ||||||||
| 100,000 | 5.000%, 07/15/2030(b) | 79,519 | ||||||
| Virgin Media Vendor Financing Notes IV DAC | ||||||||
| 200,000 | 5.000%, 07/15/2028(b) | 165,781 | ||||||
| Vodafone Group Plc | ||||||||
| 100,000 | 5.125%, 06/04/2081(d) | 66,922 | ||||||
| VZ Secured Financing B.V. | ||||||||
| 200,000 | 5.000%, 01/15/2032(b) | 166,416 | ||||||
|
| |||||||
| 2,484,242 | ||||||||
|
| |||||||
| Consumer, Cyclical: 2.1% | ||||||||
| 1011778 BC ULC / New Red Finance, Inc. | ||||||||
| 100,000 | 4.000%, 10/15/2030(b) | 81,530 | ||||||
| Air Canada | ||||||||
| 100,000 (CAD) | 4.625%, 08/15/2029(b) | 66,205 | ||||||
| Air Canada Pass Through Trust | ||||||||
| 20,286 | Series 2020-2-A | 20,331 | ||||||
| Asbury Automotive Group, Inc. | ||||||||
| 44,000 | 4.625%, 11/15/2029(b) | 36,418 | ||||||
| Beacon Roofing Supply, Inc. | ||||||||
| 19,000 | 4.125%, 05/15/2029(b) | 15,480 | ||||||
| Boyne USA, Inc. | ||||||||
| 100,000 | 4.750%, 05/15/2029(b) | 86,751 | ||||||
| CD&R Smokey Buyer, Inc. | ||||||||
| 100,000 | 6.750%, 07/15/2025(b) | 88,931 | ||||||
| Deuce Finco Plc | ||||||||
| 100,000 (GBP) | 5.500%, 06/15/2027(b) | 96,843 | ||||||
| Fertitta Entertainment LLC / Fertitta Entertainment Finance Co., Inc. | ||||||||
| 100,000 | 4.625%, 01/15/2029(b) | 85,534 | ||||||
| Hilton Domestic Operating Co., Inc. | ||||||||
| 150,000 | 4.000%, 05/01/2031(b) | 125,101 | ||||||
| 50,000 | 3.625%, 02/15/2032(b) | 39,865 | ||||||
| Hyatt Hotels Corp. | ||||||||
| 95,000 | 6.000%, 04/23/2030 | 96,023 | ||||||
| JB Poindexter & Co., Inc. | ||||||||
| 75,000 | 7.125%, 04/15/2026(b) | 72,099 | ||||||
| Marriott International, Inc. | ||||||||
| 70,000 | 4.625%, 06/15/2030 | 67,333 | ||||||
| 130,000 | 2.850%, 04/15/2031 | 108,226 | ||||||
| 50,000 | 3.500%, 10/15/2032 | 43,316 | ||||||
| Murphy Oil USA, Inc. | ||||||||
| 125,000 | 3.750%, 02/15/2031(b) | 106,449 | ||||||
The accompanying notes are an integral part of these financial statements.
| 100 | Litman Gregory Funds Trust | |||||
Table of Contents
iMGP High Income Alternatives Fund
SCHEDULE OF INVESTMENTS IN SECURITIES at June 30, 2022 (Unaudited) (Continued)
| Principal Amount^ | Value | |||||||
CORPORATE BONDS (CONTINUED) | ||||||||
| Consumer, Cyclical: 2.1% (continued) | ||||||||
| Nordstrom, Inc. | ||||||||
| $ 160,000 | 4.375%, 04/01/2030 | $ | 124,710 | |||||
| Papa John’s International, Inc. | ||||||||
| 100,000 | 3.875%, 09/15/2029(b) | 82,635 | ||||||
| Penn National Gaming, Inc. | ||||||||
| 100,000 | 4.125%, 07/01/2029(b) | 76,018 | ||||||
| PetSmart, Inc. / PetSmart Finance Corp. | ||||||||
| 250,000 | 4.750%, 02/15/2028(b) | 216,246 | ||||||
| Powdr Corp. | ||||||||
| 14,000 | 6.000%, 08/01/2025(b) | 13,966 | ||||||
| Scientific Games Holdings L.P. / Scientific Games US FinCo, Inc. | ||||||||
| 100,000 | 6.625%, 03/01/2030(b) | 85,157 | ||||||
| Scotts Miracle-Gro Co. (The) | ||||||||
| 50,000 | 4.000%, 04/01/2031 | 37,472 | ||||||
| Six Flags Theme Parks, Inc. | ||||||||
| 35,000 | 7.000%, 07/01/2025(b) | 35,494 | ||||||
| Station Casinos LLC | ||||||||
| 150,000 | 4.625%, 12/01/2031(b) | 117,187 | ||||||
| Suburban Propane Partners L.P. / Suburban Energy Finance Corp. | ||||||||
| 100,000 | 5.875%, 03/01/2027 | 94,448 | ||||||
| Suburban Propane Partners LP / Suburban Energy Finance Corp. | ||||||||
| 100,000 | 5.000%, 06/01/2031(b) | 84,062 | ||||||
| Superior Plus L.P. / Superior General Partner, Inc. | ||||||||
| 100,000 | 4.500%, 03/15/2029(b) | 85,188 | ||||||
| Wabash National Corp. | ||||||||
| 150,000 | 4.500%, 10/15/2028(b) | 114,938 | ||||||
| WMG Acquisition Corp. | ||||||||
| 100,000 | 3.750%, 12/01/2029(b) | 83,673 | ||||||
|
| |||||||
| 2,487,629 | ||||||||
|
| |||||||
| Consumer, Non-cyclical: 3.2% | ||||||||
| ADT Security Corp. (The) | ||||||||
| 100,000 | 4.875%, 07/15/2032(b) | 79,949 | ||||||
| Altria Group, Inc. | ||||||||
| 10,000 | 4.450%, 05/06/2050 | 7,269 | ||||||
| APi Escrow Corp. | ||||||||
| 100,000 | 4.750%, 10/15/2029(b) | 80,472 | ||||||
| Avantor Funding, Inc. | ||||||||
| 75,000 | 4.625%, 07/15/2028(b) | 68,950 | ||||||
| Bausch Health Cos., Inc. | ||||||||
| 725,000 | 4.875%, 06/01/2028(b) | 565,667 | ||||||
| BCP V Modular Services Finance II Plc | ||||||||
| 100,000 (EUR) | 4.750%, 11/30/2028(b) | 83,497 | ||||||
| Block, Inc. | ||||||||
| 100,000 | 2.750%, 06/01/2026(b) | 88,977 | ||||||
| Carriage Services, Inc. | ||||||||
| 100,000 | 4.250%, 05/15/2029(b) | 81,476 | ||||||
| Central Garden & Pet Co. | ||||||||
| 85,000 | 4.125%, 10/15/2030 | 68,958 | ||||||
| Charles River Laboratories International, Inc. | ||||||||
| 200,000 | 4.000%, 03/15/2031(b) | 170,880 | ||||||
| Principal Amount^ | Value | |||||||
| Consumer, Non-cyclical (continued) | ||||||||
| Cheplapharm Arzneimittel GmbH | ||||||||
| $ 250,000 | 5.500%, 01/15/2028(b) | $ | 209,187 | |||||
| CPI CG, Inc. | ||||||||
| 93,000 | 8.625%, 03/15/2026(b) | 88,002 | ||||||
| DaVita, Inc. | ||||||||
| 49,000 | 4.625%, 06/01/2030(b) | 38,368 | ||||||
| Endo Luxembourg Finance Co. I S.A.R.L / Endo US, Inc. | ||||||||
| 100,000 | 6.125%, 04/01/2029(b) | 75,709 | ||||||
| FAGE International S.A. / FAGE USA Dairy Industry, Inc. | ||||||||
| 200,000 | 5.625%, 08/15/2026(b) | 170,781 | ||||||
| HCA, Inc. | ||||||||
| 150,000 | 3.500%, 07/15/2051 | 104,523 | ||||||
| JBS USA LUX S.A. / JBS USA Food Co. / JBS USA Finance, Inc. | ||||||||
| 50,000 | 3.750%, 12/01/2031(b) | 41,105 | ||||||
| 100,000 | 4.375%, 02/02/2052(b) | 70,923 | ||||||
| Kraft Heinz Foods Co. | ||||||||
| 50,000 | 5.000%, 06/04/2042 | 45,893 | ||||||
| 80,000 | 4.375%, 06/01/2046 | 67,182 | ||||||
| 25,000 | 4.875%, 10/01/2049 | 22,253 | ||||||
| Kronos Acquisition Holdings, Inc. / KIK Custom Products, Inc. | ||||||||
| 12,000 | 7.000%, 12/31/2027(b) | 8,896 | ||||||
| Legends Hospitality Holding Co. LLC / Legends Hospitality Co-Issuer, Inc. | ||||||||
| 200,000 | 5.000%, 02/01/2026(b) | 167,895 | ||||||
| Medline Borrower LP | ||||||||
| 100,000 | 5.250%, 10/01/2029(b) | 83,032 | ||||||
| Mozart Debt Merger Sub, Inc. | ||||||||
| 150,000 | 3.875%, 04/01/2029(b) | 128,416 | ||||||
| Nielsen Finance LLC / Nielsen Finance Co. | ||||||||
| 100,000 | 4.500%, 07/15/2029(b) | 90,342 | ||||||
| 100,000 | 4.750%, 07/15/2031(b) | 90,259 | ||||||
| Option Care Health, Inc. | ||||||||
| 100,000 | 4.375%, 10/31/2029(b) | 85,900 | ||||||
| Post Holdings, Inc. | ||||||||
| 100,000 | 4.500%, 09/15/2031(b) | 82,080 | ||||||
| Prime Security Services Borrower LLC / Prime Finance, Inc. | ||||||||
| 75,000 | 3.375%, 08/31/2027(b) | 62,015 | ||||||
| Rent-A-Center, Inc. | ||||||||
| 150,000 | 6.375%, 02/15/2029(b) | 117,193 | ||||||
| Sabre GLBL, Inc. | ||||||||
| 125,000 | 7.375%, 09/01/2025(b) | 116,886 | ||||||
| Sotheby’s/Bidfair Holdings, Inc. | ||||||||
| 200,000 | 5.875%, 06/01/2029(b) | 171,988 | ||||||
| Spectrum Brands, Inc. | ||||||||
| 50,000 | 5.500%, 07/15/2030(b) | 45,122 | ||||||
| Tenet Healthcare Corp. | ||||||||
| 15,000 | 4.625%, 06/15/2028(b) | 13,084 | ||||||
| US Foods, Inc. | ||||||||
| 70,000 | 6.250%, 04/15/2025(b) | 69,978 | ||||||
| 50,000 | 4.750%, 02/15/2029(b) | 43,795 | ||||||
| 100,000 | 4.625%, 06/01/2030(b) | 85,299 | ||||||
| WW International, Inc. | ||||||||
| 100,000 | 4.500%, 04/15/2029(b) | 66,749 | ||||||
|
| |||||||
| 3,758,950 | ||||||||
|
| |||||||
The accompanying notes are an integral part of these financial statements.
| Schedule of Investments | 101 | |||||
Table of Contents
iMGP High Income Alternatives Fund
SCHEDULE OF INVESTMENTS IN SECURITIES at June 30, 2022 (Unaudited) (Continued)
| Principal Amount^ | Value | |||||||
CORPORATE BONDS (CONTINUED) | ||||||||
| Energy: 4.1% | ||||||||
| BP Capital Markets Plc | ||||||||
| $ 250,000 | 4.875%, 03/22/2030(a)(d) 5 year CMT + 4.398% | $ | 218,629 | |||||
| Cheniere Corpus Christi Holdings LLC | ||||||||
| 100,000 | 3.520%, 12/31/2039 | 85,118 | ||||||
| DCP Midstream Operating L.P. | ||||||||
| 100,000 | 3.250%, 02/15/2032 | 78,625 | ||||||
| DT Midstream, Inc. | ||||||||
| 100,000 | 4.125%, 06/15/2029(b) | 84,790 | ||||||
| Energy Transfer L.P. | ||||||||
| 775,000 | 6.250%, 02/15/2023(a)(d) 3 mo. USD LIBOR + 4.028% | 581,904 | ||||||
| EnLink Midstream LLC | ||||||||
| 245,000 | 5.625%, 01/15/2028(b) | 225,286 | ||||||
| EnLink Midstream Partners L.P. | ||||||||
| 345,000 | 4.150%, 06/01/2025 | 318,066 | ||||||
| Global Partners L.P. / GLP Finance Corp. | ||||||||
| 200,000 | 7.000%, 08/01/2027 | 180,248 | ||||||
| 25,000 | 6.875%, 01/15/2029 | 21,190 | ||||||
| Harvest Midstream I L.P. | ||||||||
| 500,000 | 7.500%, 09/01/2028(b) | 470,555 | ||||||
| Holly Energy Partners L.P. / Holly Energy Finance Corp. | ||||||||
| 100,000 | 6.375%, 04/15/2027(b) | 94,452 | ||||||
| ITT Holdings LLC | ||||||||
| 250,000 | 6.500%, 08/01/2029(b) | 200,699 | ||||||
| Kinetik Holdings LP | ||||||||
| 250,000 | 5.875%, 06/15/2030(b) | 238,595 | ||||||
| Midwest Connector Capital Co. LLC | ||||||||
| 99,000 | 4.625%, 04/01/2029(b) | 93,662 | ||||||
| MPLX L.P. | ||||||||
| 665,000 | Series B | 634,862 | ||||||
| Northriver Midstream Finance L.P. | ||||||||
| 125,000 | 5.625%, 02/15/2026(b) | 113,497 | ||||||
| NuStar Logistics L.P. | ||||||||
| 100,000 | 6.375%, 10/01/2030 | 87,214 | ||||||
| Occidental Petroleum Corp. | ||||||||
| 405,000 | 2.900%, 08/15/2024 | 391,523 | ||||||
| 285,000 | 5.500%, 12/01/2025 | 281,190 | ||||||
| 100,000 | 7.875%, 09/15/2031 | 109,945 | ||||||
| Parkland Corp. | ||||||||
| 100,000 | 4.625%, 05/01/2030(b) | 81,299 | ||||||
| Targa Resources Partners L.P. / Targa Resources Partners Finance Corp. | ||||||||
| 150,000 | 5.500%, 03/01/2030 | 143,134 | ||||||
| TransMontaigne Partners L.P. / TLP Finance Corp. | ||||||||
| 100,000 | 6.125%, 02/15/2026 | 88,643 | ||||||
|
| |||||||
| 4,823,126 | ||||||||
|
| |||||||
| Financial: 15.8% | ||||||||
| Aegon N.V. | ||||||||
| 500,000 | 5.500%, 04/11/2048(d) | 482,117 | ||||||
| Principal Amount^ | Value | |||||||
| Financial (continued) | ||||||||
| American Equity Investment Life Holding Co. | ||||||||
| $ 25,000 | 5.000%, 06/15/2027 | $ | 24,744 | |||||
| AmWINS Group, Inc. | ||||||||
| 50,000 | 4.875%, 06/30/2029(b) | 41,011 | ||||||
| Apollo Management Holdings L.P. | ||||||||
| 700,000 | 4.950%, 01/14/2050(b)(d) | 606,968 | ||||||
| Avolon Holdings Funding Ltd. | ||||||||
| 205,000 | 5.500%, 01/15/2026(b) | 199,803 | ||||||
| AXIS Specialty Finance LLC | ||||||||
| 400,000 | 4.900%, 01/15/2040(d) | 337,705 | ||||||
| Bank of America Corp. | ||||||||
| 945,000 | 4.375%, 01/27/2027(a)(d) | 786,495 | ||||||
| Bank of New York Mellon Corp. (The) | ||||||||
| 30,000 | 4.700%, 09/20/2025(a)(d) | 29,385 | ||||||
| Brazilian Merchant Voucher Receivables Ltd. | ||||||||
| 186,531 | 4.180%, 04/07/2028(g) | 181,704 | ||||||
| Bread Financial Holdings, Inc. | ||||||||
| 375,000 | 4.750%, 12/15/2024(b) | 344,432 | ||||||
| Business Development Corp. of America | ||||||||
| 225,000 | 4.850%, 12/15/2024(b) | 217,797 | ||||||
| Charles Schwab Corp. (The) | ||||||||
| 100,000 | 4.000%, 12/01/2030(a)(d) | 76,526 | ||||||
| CION Investment Corp. | ||||||||
| 230,000 | 4.500%, 02/11/2026 | 211,916 | ||||||
| Citigroup, Inc. | ||||||||
| 100,000 | 4.000%, 12/10/2025(a)(d) | 86,750 | ||||||
| 150,000 | 3.875%, 02/18/2026(a)(d) | 124,875 | ||||||
| Credit Acceptance Corp. | ||||||||
| 535,000 | 6.625%, 03/15/2026 | 501,892 | ||||||
| Cushman & Wakefield US Borrower LLC | ||||||||
| 71,000 | 6.750%, 05/15/2028(b) | 66,069 | ||||||
| Doctors Co. An Interinsurance Exchange (The) | ||||||||
| 515,000 | 4.500%, 01/18/2032(b) | 454,592 | ||||||
| Drawbridge Special Opportunities Fund L.P. / Drawbridge Special Opportunities Fin | ||||||||
| 710,000 | 3.875%, 02/15/2026(b) | 652,565 | ||||||
| EF Holdco / EF Cayman Hold / Ellington Fin REIT Cayman/TRS / EF Cayman Non-MTM | ||||||||
| 830,000 | 5.875%, 04/01/2027(b) | 774,146 | ||||||
| Enstar Finance LLC | ||||||||
| 200,000 | 5.750%, 09/01/2040(d) | 182,445 | ||||||
| 770,000 | 5.500%, 01/15/2042(d) | 630,670 | ||||||
| Equitable Holdings, Inc. | ||||||||
| 150,000 | 4.950%, 09/15/2025(a)(d) | 141,332 | ||||||
| Fairfax India Holdings Corp. | ||||||||
| 320,000 | 5.000%, 02/26/2028(b) | 311,504 | ||||||
| Fidelis Insurance Holdings Ltd. | ||||||||
| 630,000 | 6.625%, 04/01/2041(b)(d) | 626,103 | ||||||
The accompanying notes are an integral part of these financial statements.
| 102 | Litman Gregory Funds Trust | |||||
Table of Contents
iMGP High Income Alternatives Fund
SCHEDULE OF INVESTMENTS IN SECURITIES at June 30, 2022 (Unaudited) (Continued)
| Principal Amount^ | Value | |||||||
CORPORATE BONDS (CONTINUED) | ||||||||
| Financial (continued) | ||||||||
| FS KKR Capital Corp. | ||||||||
| $ 100,000 | 3.250%, 07/15/2027 | $ | 85,306 | |||||
| Gladstone Capital Corp. | ||||||||
| 545,000 | 5.125%, 01/31/2026 | 525,925 | ||||||
| Global Atlantic Fin Co. | ||||||||
| 250,000 | 4.700%, 10/15/2051(b)(d) | 201,143 | ||||||
| GLP Capital L.P. / GLP Financing II, Inc. | ||||||||
| 50,000 | 5.300%, 01/15/2029 | 47,871 | ||||||
| 140,000 | 4.000%, 01/15/2031 | 120,809 | ||||||
| Goldman Sachs Group, Inc. (The) | ||||||||
| 100,000 | Series U | 77,915 | ||||||
| Home Point Capital, Inc. | ||||||||
| 200,000 | 5.000%, 02/01/2026(b) | 138,287 | ||||||
| Host Hotels & Resorts L.P. | ||||||||
| 150,000 | 3.500%, 09/15/2030 | 128,709 | ||||||
| HUB International Ltd. | ||||||||
| 50,000 | 5.625%, 12/01/2029(b) | 41,365 | ||||||
| Hunt Cos., Inc. | ||||||||
| 100,000 | 5.250%, 04/15/2029(b) | 85,150 | ||||||
| Iron Mountain, Inc. | ||||||||
| 25,000 | 4.500%, 02/15/2031(b) | 20,500 | ||||||
| 150,000 | 5.625%, 07/15/2032(b) | 127,098 | ||||||
| Jane Street Group / JSG Finance, Inc. | ||||||||
| 100,000 | 4.500%, 11/15/2029(b) | 89,181 | ||||||
| Jefferies Finance LLC / JFIN Co-Issuer Corp. | ||||||||
| 200,000 | 5.000%, 08/15/2028(b) | 165,062 | ||||||
| JPMorgan Chase & Co. | ||||||||
| 250,000 | 4.586%, 04/26/2033(d) | 246,676 | ||||||
| Kennedy-Wilson, Inc. | ||||||||
| 100,000 | 4.750%, 03/01/2029 | 81,147 | ||||||
| 100,000 | 4.750%, 02/01/2030 | 78,417 | ||||||
| 100,000 | 5.000%, 03/01/2031 | 77,655 | ||||||
| KKR Core Holding Co. LLC | ||||||||
| 38,905 | 4.000%, 08/12/2031 | 34,363 | ||||||
| Kuvare US Holdings, Inc. | ||||||||
| 100,000 | 7.000%, 02/17/2051(b)(d) | 100,750 | ||||||
| Liberty Mutual Group, Inc. | ||||||||
| 220,000 | 4.300%, 02/01/2061(b) | 149,273 | ||||||
| LPL Holdings, Inc. | ||||||||
| 150,000 | 4.000%, 03/15/2029(b) | 128,552 | ||||||
| Markel Corp. | ||||||||
| 210,000 | 6.000%, 06/01/2025(a)(d) | 207,900 | ||||||
| MetLife, Inc. | ||||||||
| 70,000 | 3.850%, 09/15/2025(a)(d) | 62,507 | ||||||
| Muenchener Rueckversicherungs-Gesellschaft AG in Muenchen | ||||||||
| 540,000 | 5.875%, 05/23/2042(b)(d) | 544,639 | ||||||
| Nationwide Mutual Insurance Co. | ||||||||
| 130,000 | 4.350%, 04/30/2050(b) | 110,430 | ||||||
| Principal Amount^ | Value | |||||||
| Financial (continued) | ||||||||
| NFP Corp. | ||||||||
| $ 170,000 | 6.875%, 08/15/2028(b) | $ | 141,919 | |||||
| OFS Capital Corp. | ||||||||
| 620,000 | 4.750%, 02/10/2026 | 567,534 | ||||||
| OneAmerica Financial Partners, Inc. | ||||||||
| 70,000 | 4.250%, 10/15/2050(b) | 57,393 | ||||||
| OneMain Finance Corp. | ||||||||
| 100,000 | 4.000%, 09/15/2030 | 74,167 | ||||||
| Oxford Finance LLC / Oxford Finance Co-Issuer II, Inc. | ||||||||
| 590,000 | 6.375%, 02/01/2027(b) | 566,034 | ||||||
| PartnerRe Finance B LLC | ||||||||
| 615,000 | 4.500%, 10/01/2050(d) | 514,313 | ||||||
| PennantPark Investment Corp. | ||||||||
| 140,000 | 4.000%, 11/01/2026 | 120,439 | ||||||
| Rocket Mortgage LLC / Rocket Mortgage Co-Issuer, Inc. | ||||||||
| 150,000 | 3.875%, 03/01/2031(b) | 112,928 | ||||||
| Ryan Specialty Group LLC | ||||||||
| 100,000 | 4.375%, 02/01/2030(b) | 87,125 | ||||||
| Scentre Group Trust | ||||||||
| 610,000 | 5.125%, 09/24/2080(b)(d) | 503,670 | ||||||
| Sculptor Alternative Solutions LLC | ||||||||
| 500,000 | 6.000%, 05/15/2037(b) | 458,450 | ||||||
| Sirius International Group Ltd. | ||||||||
| 700,000 | 4.600%, 11/01/2026(b) | 653,495 | ||||||
| Starwood Property Trust, Inc. | ||||||||
| 475,000 | 4.375%, 01/15/2027(b) | 414,566 | ||||||
| Strategic Credit Opportunities Partners LLC | ||||||||
| 345,000 | 4.250%, 04/01/2026 | 303,780 | ||||||
| Trinity Capital, Inc. | ||||||||
| 320,000 | 4.375%, 08/24/2026 | 282,636 | ||||||
| United Insurance Holdings Corp. | ||||||||
| 530,000 | 6.250%, 12/15/2027 | 511,245 | ||||||
| United Wholesale Mortgage LLC | ||||||||
| 100,000 | 5.500%, 11/15/2025(b) | 85,845 | ||||||
| 100,000 | 5.500%, 04/15/2029(b) | 76,747 | ||||||
| Universal Insurance Holdings, Inc. | ||||||||
| 345,000 | 5.625%, 11/30/2026 | 330,902 | ||||||
| VC 3 LS 2021 L.P. | ||||||||
| 716,281 | 3.500%, 10/15/2041 | 671,155 | ||||||
| Wells Fargo & Co. | ||||||||
| 100,000 | 3.900%, 03/15/2026(a)(d) | 85,177 | ||||||
| Wilton RE Ltd. | ||||||||
| 250,000 | 6.000%, 10/22/2030(a)(b)(d) | 215,402 | ||||||
|
| |||||||
| 18,605,098 | ||||||||
|
| |||||||
| Industrial: 1.8% | ||||||||
| Arcosa, Inc. | ||||||||
| 100,000 | 4.375%, 04/15/2029(b) | 84,293 | ||||||
| Artera Services LLC | ||||||||
| 110,000 | 9.033%, 12/04/2025(b) | 88,930 | ||||||
| Atkore, Inc. | �� | |||||||
| 100,000 | 4.250%, 06/01/2031(b) | 83,200 | ||||||
| Boeing Co. (The) | ||||||||
| 200,000 | 5.150%, 05/01/2030 | 192,679 | ||||||
| 100,000 | 5.705%, 05/01/2040 | 93,829 | ||||||
| 100,000 | 5.805%, 05/01/2050 | 92,720 | ||||||
The accompanying notes are an integral part of these financial statements.
| Schedule of Investments | 103 | |||||
Table of Contents
iMGP High Income Alternatives Fund
SCHEDULE OF INVESTMENTS IN SECURITIES at June 30, 2022 (Unaudited) (Continued)
| Principal Amount^ | Value | |||||||
CORPORATE BONDS (CONTINUED) | ||||||||
| Industrial (continued) | ||||||||
| Brundage-Bone Concrete Pumping Holdings, Inc. | ||||||||
| $ 150,000 | 6.000%, 02/01/2026(b) | $ | 127,227 | |||||
| Builders FirstSource, Inc. | ||||||||
| 100,000 | 6.375%, 06/15/2032(b) | 89,468 | ||||||
| Cleaver-Brooks, Inc. | ||||||||
| 100,000 | 7.875%, 03/01/2023(b) | 93,142 | ||||||
| Flowserve Corp. | ||||||||
| 60,000 | 3.500%, 10/01/2030 | 51,722 | ||||||
| GrafTech Finance, Inc. | ||||||||
| 105,000 | 4.625%, 12/15/2028(b) | 85,186 | ||||||
| Great Lakes Dredge & Dock Corp. | ||||||||
| 200,000 | 5.250%, 06/01/2029(b) | 173,337 | ||||||
| Harsco Corp. | ||||||||
| 175,000 | 5.750%, 07/31/2027(b) | 140,254 | ||||||
| James Hardie International Finance DAC | ||||||||
| 250,000 | 5.000%, 01/15/2028(b) | 222,954 | ||||||
| Mauser Packaging Solutions Holding Co. | ||||||||
| 50,000 | 8.500%, 04/15/2024(b) | 49,403 | ||||||
| New Enterprise Stone & Lime Co., Inc. | ||||||||
| 150,000 | 9.750%, 07/15/2028(b) | 128,446 | ||||||
| PGT Innovations, Inc. | ||||||||
| 100,000 | 4.375%, 10/01/2029(b) | 78,986 | ||||||
| Standard Industries, Inc. | ||||||||
| 175,000 | 4.375%, 07/15/2030(b) | 138,352 | ||||||
| 25,000 | 3.375%, 01/15/2031(b) | 18,513 | ||||||
| TopBuild Corp. | ||||||||
| 50,000 | 3.625%, 03/15/2029(b) | 39,455 | ||||||
|
| |||||||
| 2,072,096 | ||||||||
|
| |||||||
| Technology: 1.2% | ||||||||
| AMS AG | ||||||||
| 265,000 | 7.000%, 07/31/2025(b) | 253,055 | ||||||
| Boxer Parent Co., Inc. | ||||||||
| 200,000 | 7.125%, 10/02/2025(b) | 190,261 | ||||||
| Broadcom, Inc. | ||||||||
| 100,000 | 3.187%, 11/15/2036(b) | 76,449 | ||||||
| Brunello Bidco SpA | ||||||||
| 100,000 (EUR) | 3.500%, 02/15/2028 | 88,536 | ||||||
| CDK Global, Inc. | ||||||||
| 50,000 | 5.250%, 05/15/2029(b) | 49,307 | ||||||
| CDW LLC / CDW Finance Corp. | ||||||||
| 60,000 | 3.569%, 12/01/2031 | 49,682 | ||||||
| Central Parent, Inc. / Merger Sub, Inc. | ||||||||
| 100,000 | 7.250%, 06/15/2029(b) | 96,745 | ||||||
| Citrix Systems, Inc. | ||||||||
| 100,000 | 1.250%, 03/01/2026 | 96,989 | ||||||
| Minerva Merger Sub, Inc. | ||||||||
| 150,000 | 6.500%, 02/15/2030(b) | 124,943 | ||||||
| NCR Corp. | ||||||||
| 100,000 | 5.125%, 04/15/2029(b) | 84,787 | ||||||
| 100,000 | 6.125%, 09/01/2029(b) | 86,540 | ||||||
| 100,000 | 5.250%, 10/01/2030(b) | 86,379 | ||||||
| Playtika Holding Corp. | ||||||||
| 100,000 | 4.250%, 03/15/2029(b) | 82,703 | ||||||
| Principal Amount^ | Value | |||||||
| Industrial (continued) | ||||||||
| Twilio, Inc. | ||||||||
| $ 100,000 | 3.875%, 03/15/2031 | $ | 82,475 | |||||
|
| |||||||
| 1,448,851 | ||||||||
|
| |||||||
| Utilities: 1.1% | ||||||||
| Clearway Energy Operating LLC | ||||||||
| 100,000 | 3.750%, 02/15/2031(b) | 80,924 | ||||||
| Edison International | ||||||||
| 700,000 | 5.375%, 03/15/2026(a)(d) | 570,500 | ||||||
| Terraform Global Operating LLC | ||||||||
| 225,000 | 6.125%, 03/01/2026(b) | 214,374 | ||||||
| Vistra Operations Co. LLC | ||||||||
| 535,000 | 5.000%, 07/31/2027(b) | 485,930 | ||||||
|
| |||||||
| 1,351,728 | ||||||||
|
| |||||||
| | TOTAL CORPORATE BONDS | 38,397,961 | ||||||
|
| |||||||
GOVERNMENT SECURITIES & AGENCY ISSUE: 19.3% | ||||||||
| United States Treasury Note | ||||||||
| 3,500,000 | 0.125%, 12/15/2023 | 3,361,094 | ||||||
| United States Treasury Note | ||||||||
| 3,000,000 | 1.500%, 09/15/2022(h) | 2,998,992 | ||||||
| 3,200,000 | 1.625%, 12/15/2022(h) | 3,188,697 | ||||||
| 2,900,000 | 0.500%, 03/15/2023(h) | 2,855,127 | ||||||
| 3,400,000 | 0.250%, 06/15/2023 | 3,315,023 | ||||||
| 2,500,000 | 0.125%, 09/15/2023 | 2,418,506 | ||||||
| 2,800,000 | 0.250%, 03/15/2024(h) | 2,675,969 | ||||||
| 1,300,000 | 0.250%, 06/15/2024(h) | 1,234,035 | ||||||
| United States Treasury Strip Principal | ||||||||
| 170,000 | 0.000%, 05/15/2044 | 79,697 | ||||||
| 170,000 | 0.000%, 11/15/2044 | 78,206 | ||||||
| 170,000 | 0.000%, 02/15/2046 | 75,975 | ||||||
| 1,070,000 | 0.000%, 08/15/2051 | 436,398 | ||||||
|
| |||||||
| | TOTAL GOVERNMENT SECURITIES & AGENCY ISSUE | 22,717,719 | ||||||
|
| |||||||
MORTGAGE-BACKED SECURITIES: 4.1% | ||||||||
| ACRE Commercial Mortgage Ltd. | ||||||||
| 250,000 | Series 2021-FL4-D | 240,781 | ||||||
| Alternative Loan Trust | ||||||||
| 130,226 | Series 2007-OA4-A1 | 114,370 | ||||||
| 131,006 | Series 2007-OA7-A1A | 113,814 | ||||||
| BPR Trust | ||||||||
| 230,000 | Series 2022-OANA-C | 225,369 | ||||||
| BX Commercial Mortgage Trust | ||||||||
| 212,500 | Series 2019-XL-F | 204,355 | ||||||
The accompanying notes are an integral part of these financial statements.
| 104 | Litman Gregory Funds Trust | |||||
Table of Contents
iMGP High Income Alternatives Fund
SCHEDULE OF INVESTMENTS IN SECURITIES at June 30, 2022 (Unaudited) (Continued)
| Principal Amount^ | Value | |||||||
MORTGAGE-BACKED SECURITIES (CONTINUED) | ||||||||
| BX Commercial Mortgage Trust (Continued) | ||||||||
| $ 212,500 | Series 2019-XL-G | $ | 201,834 | |||||
| BX Trust | ||||||||
| 900,000 | Series 2019-RP-D | 852,504 | ||||||
| BXMT Ltd. | ||||||||
| 250,000 | Series 2020-FL2-D | 239,194 | ||||||
| 100,000 | Series 2020-FL3-D | 97,838 | ||||||
| CD Mortgage Trust | ||||||||
| 969,965 | Series 2017-CD4-XA | 38,272 | ||||||
| Credit Suisse Mortgage-Backed Trust | ||||||||
| 570,000 | Series 2018-SITE-E | 518,179 | ||||||
| Credit Suisse Mortgage-Backed Trust | ||||||||
| 480,000 | Series 2018-SITE-C | 459,800 | ||||||
| Freddie Mac Military Housing Bonds Resecuritization Trust Certificates | ||||||||
| 2,770,030 | Series 2015-R1-XA1 | 200,032 | ||||||
| 4,390,546 | Series 2015-R1-XA3 | 264,342 | ||||||
| GS Mortgage Securities Corp. Trust | ||||||||
| 250,000 | Series 2020-DUNE-E | 237,438 | ||||||
| 250,000 | Series 2020-UPTN-E | 222,732 | ||||||
| HarborView Mortgage Loan Trust | ||||||||
| 217,837 | Series 2006-12-2A2A | 197,672 | ||||||
| JP Morgan Chase Commercial Mortgage Securities Trust | ||||||||
| 1,681,247 | Series 2016-JP2-XA | 94,411 | ||||||
| JPMDB Commercial Mortgage Securities Trust | ||||||||
| 189,249 | Series 2017-C5-XA | 5,933 | ||||||
| Residential Accredit Loans, Inc. Trust | ||||||||
| 372,917 | Series 2006-QO6-A1 | 94,577 | ||||||
| Taubman Centers Commercial Mortgage Trust | ||||||||
| 230,000 | Series 2022-DPM-C | 221,601 | ||||||
| Principal Amount^ | Value | |||||||
| Wells Fargo Commercial Mortgage Trust | ||||||||
| $ 920,544 | Series 2016-BNK1-XA | $ | 50,530 | |||||
|
| |||||||
| | TOTAL MORTGAGE-BACKED SECURITIES | 4,895,578 | ||||||
|
| |||||||
MUNICIPAL BOND: 0.0% | ||||||||
| Indiana: 0.0% | ||||||||
| Knox County Industry Economic Development Revenue | ||||||||
| 5,000 | Series B | 4,973 | ||||||
|
| |||||||
| | TOTAL MUNICIPAL BOND | 4,973 | ||||||
|
| |||||||
SHORT-TERM INVESTMENTS: 4.4% | ||||||||
| Shares | ||||||||
MONEY MARKET FUND: 1.7% | ||||||||
| 2,011,735 | State Street Institutional Treasury Money Market Fund - Premier Class, 1.040%(j) | 2,011,735 | ||||||
|
| |||||||
| | TOTAL MONEY MARKET FUND | 2,011,735 | ||||||
|
| |||||||
| Principal Amount^ | ||||||||
REPURCHASE AGREEMENTS: 2.7% | ||||||||
| 3,220,136 | Fixed Income Clearing Corp. 0.240%, 6/30/2022, due 07/01/2022 [collateral: par value $3,297,600 U.S. Treasury Notes, 2.875% -3.000%, due 06/30/2024 -06/15/2025, value $3,284,865] (proceeds $3,220,157) | 3,220,136 | ||||||
|
| |||||||
TREASURY BILL: 0.0% | ||||||||
| United States Treasury Bill | ||||||||
| 50,000 | 1.475%, 08/25/2022(h) | 49,887 | ||||||
|
| |||||||
| | TOTAL TREASURY BILL | 49,887 | ||||||
|
| |||||||
| | TOTAL SHORT-TERM INVESTMENTS | 5,281,758 | ||||||
|
| |||||||
| | TOTAL PURCHASED OPTIONS | 80,708 | ||||||
|
| |||||||
| | TOTAL INVESTMENTS | 122,615,472 | ||||||
|
| |||||||
| Liabilities in Excess of Other Assets: (4.0)% | (4,703,482 | ) | ||||||
|
| |||||||
NET ASSETS: 100.0% | $ | 117,911,990 | ||||||
|
| |||||||
Percentages are stated as a percent of net assets.
| CDOR | Canadian Dollar Offered Rate |
| CLO | Collateralized Loan Obligation |
The accompanying notes are an integral part of these financial statements.
| Schedule of Investments | 105 | |||||
Table of Contents
iMGP High Income Alternatives Fund
SCHEDULE OF INVESTMENTS IN SECURITIES at June 30, 2022 (Unaudited) (Continued)
| CMT | Constant Maturity Treasury Index |
| ETF | Exchange-Traded Fund |
| LIBOR | London Interbank Offered Rate |
| L.P. | Limited Partnership |
| REIT | Real Estate Investment Trust |
| SOFR | Secured Overnight Financing Rate |
| * | Non-Income Producing Security. |
| ^ | The principal amount is stated in U.S. Dollars unless otherwise indicated. |
| (a) | Perpetual Call. |
| (b) | Security was purchased pursuant to Rule 144A under the Securities Act of 1933 and may be sold in transactions exempt from registration only to qualified institutional buyers or in a public offering registered under Securities Act of 1933. |
| (c) | Floating Interest Rate at June 30, 2022. |
| (d) | Variable rate security. Interest rate or distribution rate disclosed is that which is in effect at June 30, 2022. |
| (e) | Coupon increases periodically based upon a predetermined schedule. Stated interest rate in effect at June 30, 2022. |
| (f) | This position represents an unsettled loan commitment at period end. Certain details associated with this purchase are not known prior to the settlement date, including coupon rate, which will be adjusted on settlement date. |
| (g) | Security is valued using significant unobservable inputs in good faith in accordance with procedures approved by the Board of Trustees. |
| (h) | Securities with an aggregate fair value of $7,235,099 have been pledged as collateral for options, total return swaps, credit default swaps, interest rate swaps, securities sold short and futures positions. |
| (i) | Interest Only security. Security with a notional or nominal principal amount. |
| (j) | The rate disclosed is the 7 day net yield as of June 30, 2022. |
CURRENCY ABBREVIATIONS:
| CAD | Canadian Dollar |
| EUR | Euro |
| GBP | British Pound |
| USD | U.S. Dollar |
UNFUNDED LOAN COMMITMENTS—At June 30, 2022, the Fund had unfunded loan commitments which could be extended at the option of the borrowers, pursuant to the following agreements:
| Borrower | Principal Amount | Current Value | Unrealized Gain (Loss) | |||||||||
Seaport Financing LLC, 0.500%, 10/31/2023 | $ | 100,000 | $ | 98,180 | $ | (1,820 | ) | |||||
Higginbotham Insurance Agency, Inc., 1.000%, 11/25/2026 | 40,393 | 39,950 | (443 | ) | ||||||||
MB2 Dental Solutions, LLC, 1.000%, 01/29/2027 | 6,706 | 6,639 | (67 | ) | ||||||||
Service Logic Acquisition, Inc, 4.000%, 10/29/2027 | 5,075 | 4,840 | (235 | ) | ||||||||
NFM & J, L.P., 1.000%, 11/30/2027 | 21,695 | 21,481 | (214 | ) | ||||||||
SCP Eye Care Services LLC, 4.500%, 03/16/2028 | 13,353 | 12,785 | (568 | ) | ||||||||
Eisner Advisory Group LLC, 5.250%, 07/28/2028 | 81,818 | 76,909 | (4,909 | ) | ||||||||
Pro Mach Group, Inc., 4.000%, 08/31/2028 | 4,749 | 4,492 | (257 | ) | ||||||||
Athenahealth, Inc., 3.500%, 02/15/2029 | 61,594 | 56,898 | (4,696 | ) | ||||||||
TOTAL | $ | 322,174 | $ | (13,209 | ) | |||||||
| SCHEDULE OF INVESTMENTS IN PURCHASED OPTIONS at June 30, 2022 (Unaudited) | ||||||||||||||||||||||||||||||
| Description | Counterparty | Exercise Price | Expiration Date | Number of Contracts | Notional Amount | Fair Value | Premiums Paid | Unrealized Appreciation/ (Depreciation) | ||||||||||||||||||||||
INDEX OPTIONS |
| |||||||||||||||||||||||||||||
Put |
| |||||||||||||||||||||||||||||
S&P 500 Index | Morgan Stanley & Co. | $ | 4,000.00 | 4/21/2023 | 2 | $ | 757,076 | $ | 80,490 | $ | 47,605 | $ | 32,885 | |||||||||||||||||
INTEREST RATE SWAPTIONS |
| |||||||||||||||||||||||||||||
Call |
| |||||||||||||||||||||||||||||
Two Year Ten Year USD Constant Maturity Swaption | Bank of America N.A. | 0.40 | 7/29/2022 | 9,000,000 | $ | 9,000,000 | 143 | 20,810 | (20,667 | ) | ||||||||||||||||||||
Two Year Ten Year USD Constant Maturity Swaption | Goldman Sachs International | 0.61 | 7/29/2022 | 4,100,000 | 4,100,000 | 6 | 5,945 | (5,939 | ) | |||||||||||||||||||||
Two Year Ten Year USD Constant Maturity Swaption | Morgan Stanley & Co. | 0.40 | 7/29/2022 | 4,300,000 | 4,300,000 | 69 | 10,320 | (10,251 | ) | |||||||||||||||||||||
|
|
|
|
|
| |||||||||||||||||||||||||
Total | 218 | 37,075 | (36,857 | ) | ||||||||||||||||||||||||||
|
|
|
|
|
| |||||||||||||||||||||||||
Total Purchased Options |
| $ | 80,708 | $ | 84,680 | $ | (3,972 | ) | ||||||||||||||||||||||
|
|
|
|
|
| |||||||||||||||||||||||||
The accompanying notes are an integral part of these financial statements.
| 106 | Litman Gregory Funds Trust | |||||
Table of Contents
iMGP High Income Alternatives Fund
SCHEDULE OF INVESTMENTS IN FORWARD FOREIGN CURRENCY EXCHANGE CONTRACTS at June 30, 2022 (Unaudited)
At June 30, 2022, the Fund had the following forward foreign currency exchange contracts:
| Asset Derivatives | Liability Derivatives | |||||||||||||||||||||||||||
| Counterparty | Settlement Date | Fund Receiving | U.S. $ Value at June 30, 2022 | Fund Delivering | U.S. $ Value at June 30, 2022 | Unrealized Appreciation | Unrealized Depreciation | |||||||||||||||||||||
Barclays Bank Plc | 7/15/2022 | USD | $ | 183,321 | EUR | $ | 183,316 | $ | 5 | $ | — | |||||||||||||||||
| 7/15/2022 | USD | 103,490 | GBP | 103,403 | 87 | — | ||||||||||||||||||||||
Goldman Sachs International | 7/15/2022 | USD | 143,909 | CAD | 143,727 | 182 | — | |||||||||||||||||||||
|
|
|
|
|
|
|
|
|
| |||||||||||||||||||
| $ | 430,720 | $ | 430,446 | $ | 274 | $ | — | |||||||||||||||||||||
|
|
|
|
|
|
|
|
|
| |||||||||||||||||||
| SCHEDULE OF INVESTMENTS IN FUTURES CONTRACTS at June 30, 2022 (Unaudited) | ||||||||||||||||||||
| Description | Number of Contracts | Notional Amount | Notional Value | Expiration Date | Unrealized Appreciation/ (Depreciation) | |||||||||||||||
Futures Contracts – Long |
| |||||||||||||||||||
10YR U.S. Treasury Notes | 10 | 1,192,131 | $ | 1,185,313 | 9/21/2022 | $ | (6,818 | ) | ||||||||||||
|
| |||||||||||||||||||
Total Long | $ | (6,818 | ) | |||||||||||||||||
|
| |||||||||||||||||||
Futures Contracts – Short | ||||||||||||||||||||
5YR U.S. Treasury Notes | (10 | ) | (1,131,694 | ) | $ | (1,122,500 | ) | 9/30/2022 | $ | 9,194 | ||||||||||
|
| |||||||||||||||||||
Total Short | $ | 9,194 | ||||||||||||||||||
|
| |||||||||||||||||||
Total Futures Contracts | $ | 2,376 | ||||||||||||||||||
|
| |||||||||||||||||||
SCHEDULE OF INVESTMENTS IN SWAPS at June 30, 2022 (Unaudited)
| CENTRALLY CLEARED INTEREST RATE SWAP CONTRACTS | ||||||||||||||||||||||||||||
| Rates Exchanged | ||||||||||||||||||||||||||||
| Notional Amount | Maturity Date | Payment Received | Payment Made | Periodic Payment Frequency | Fair Value | Upfront Payment Made (Received) | Unrealized Appreciation/ (Depreciation) | |||||||||||||||||||||
$ 150,000 | 3/11/2032 | 1 Day SOFR | 1.779 | % | Annually | $ | (19,800 | ) | $ | 301 | $ | (20,101 | ) | |||||||||||||||
| SCHEDULE OF INVESTMENTS IN WRITTEN OPTIONS at June 30, 2022 (Unaudited) | ||||||||||||||||||||||||||||||
| Description | Counterparty | Exercise Price | Expiration Date | Number of Contracts | Notional Amount | Fair Value | Premiums Received | Unrealized Appreciation/ (Depreciation) | ||||||||||||||||||||||
INDEX OPTIONS |
| |||||||||||||||||||||||||||||
Put |
| |||||||||||||||||||||||||||||
Russell 2000 Index | UBS Securities LLC | $ | 1,670.00 | 7/1/2022 | (1 | ) | $ | (170,799 | ) | $ | (320 | ) | $ | (3,889 | ) | $ | 3,569 | |||||||||||||
Russell 2000 Index | UBS Securities LLC | 1,690.00 | 7/1/2022 | (4 | ) | (683,196 | ) | (5,000 | ) | (15,876 | ) | 10,876 | ||||||||||||||||||
Russell 2000 Index | UBS Securities LLC | 1,670.00 | 7/8/2022 | (1 | ) | (170,799 | ) | (1,674 | ) | (4,629 | ) | 2,955 | ||||||||||||||||||
Russell 2000 Index | UBS Securities LLC | 1,690.00 | 7/8/2022 | (4 | ) | (683,196 | ) | (10,272 | ) | (18,746 | ) | 8,474 | ||||||||||||||||||
Russell 2000 Index | UBS Securities LLC | 1,690.00 | 7/15/2022 | (3 | ) | (512,397 | ) | (11,400 | ) | (16,347 | ) | 4,947 | ||||||||||||||||||
Russell 2000 Index | UBS Securities LLC | 1,750.00 | 7/15/2022 | (2 | ) | (341,598 | ) | (12,490 | ) | (10,458 | ) | (2,032 | ) | |||||||||||||||||
Russell 2000 Index | UBS Securities LLC | 1,645.00 | 7/22/2022 | (1 | ) | (170,799 | ) | (2,822 | ) | (4,499 | ) | 1,677 | ||||||||||||||||||
Russell 2000 Index | UBS Securities LLC | 1,670.00 | 7/22/2022 | (4 | ) | (683,196 | ) | (15,456 | ) | (23,996 | ) | 8,540 | ||||||||||||||||||
Russell 2000 Index | UBS Securities LLC | 1,710.00 | 7/29/2022 | (1 | ) | (170,799 | ) | (6,708 | ) | (4,729 | ) | (1,979 | ) | |||||||||||||||||
S&P 500 Index | UBS Securities LLC | 3,695.00 | 7/1/2022 | (3 | ) | (1,135,614 | ) | (756 | ) | (20,435 | ) | 19,679 | ||||||||||||||||||
S&P 500 Index | UBS Securities LLC | 3,665.00 | 7/8/2022 | (3 | ) | (1,135,614 | ) | (6,015 | ) | (24,357 | ) | 18,342 | ||||||||||||||||||
The accompanying notes are an integral part of these financial statements.
| Schedule of Investments | 107 | |||||
Table of Contents
iMGP High Income Alternatives Fund
SCHEDULE OF INVESTMENTS IN WRITTEN OPTIONS at June 30, 2022 (Unaudited) (Continued)
| Description | Counterparty | Exercise Price | Expiration Date | Number of Contracts | Notional Amount | Fair Value | Premiums Received | Unrealized Appreciation/ (Depreciation) | ||||||||||||||||||||||
S&P 500 Index | UBS Securities LLC | $ | 3,675.00 | 7/8/2022 | (1 | ) | $ | (378,538 | ) | $ | (2,170 | ) | $ | (7,281 | ) | $ | 5,111 | |||||||||||||
S&P 500 Index | UBS Securities LLC | 3,690.00 | 7/8/2022 | (6 | ) | (2,271,228 | ) | (16,920 | ) | (48,424 | ) | 31,504 | ||||||||||||||||||
S&P 500 Index | UBS Securities LLC | 3,810.00 | 7/8/2022 | (2 | ) | (757,076 | ) | (14,016 | ) | (15,826 | ) | 1,810 | ||||||||||||||||||
S&P 500 Index | UBS Securities LLC | 3,665.00 | 7/15/2022 | (1 | ) | (378,538 | ) | (3,530 | ) | (9,452 | ) | 5,922 | ||||||||||||||||||
S&P 500 Index | UBS Securities LLC | 3,695.00 | 7/15/2022 | (11 | ) | (4,163,918 | ) | (56,430 | ) | (105,381 | ) | 48,951 | ||||||||||||||||||
S&P 500 Index | UBS Securities LLC | 3,815.00 | 7/15/2022 | (2 | ) | (757,076 | ) | (18,840 | ) | (18,638 | ) | (202 | ) | |||||||||||||||||
S&P 500 Index | UBS Securities LLC | 3,585.00 | 7/22/2022 | (4 | ) | (1,514,152 | ) | (14,200 | ) | (37,916 | ) | 23,716 | ||||||||||||||||||
S&P 500 Index | UBS Securities LLC | 3,665.00 | 7/22/2022 | (6 | ) | (2,271,228 | ) | (32,160 | ) | (64,254 | ) | 32,094 | ||||||||||||||||||
S&P 500 Index | UBS Securities LLC | 3,675.00 | 7/22/2022 | (4 | ) | (1,514,152 | ) | (22,384 | ) | (38,796 | ) | 16,412 | ||||||||||||||||||
S&P 500 Index | UBS Securities LLC | 3,595.00 | 7/29/2022 | (2 | ) | (757,076 | ) | (10,364 | ) | (20,018 | ) | 9,654 | ||||||||||||||||||
S&P 500 Index | UBS Securities LLC | 3,710.00 | 7/29/2022 | (3 | ) | (1,135,614 | ) | (25,356 | ) | (22,587 | ) | (2,769 | ) | |||||||||||||||||
S&P 500 Index | UBS Securities LLC | 3,805.00 | 7/29/2022 | (6 | ) | (2,271,228 | ) | (74,400 | ) | (46,832 | ) | (27,568 | ) | |||||||||||||||||
|
|
|
|
|
| |||||||||||||||||||||||||
Total Written Options | $ | (363,683 | ) | $ | (583,366 | ) | $ | 219,683 | ||||||||||||||||||||||
|
|
|
|
|
| |||||||||||||||||||||||||
The accompanying notes are an integral part of these financial statements.
| 108 | Litman Gregory Funds Trust | |||||
Table of Contents
iMGP Dolan McEniry Corporate Bond Fund
Year to date through June, the iMGP Dolan McEniry Corporate Bond Fund had a loss of 9.06% versus the Bloomberg U.S. Intermediate Credit benchmark’s decline of 8.52%.
Performance as of June 30, 2022 |
| |||||||||||||||
| Average Annual Total Returns | ||||||||||||||||
| Year to Date | One Year | Three Year | Since Inception (9/28/2018) | |||||||||||||
iMGP Dolan McEniry Corporate Bond Inst. | -9.06% | -9.75% | -0.59% | 1.31% | ||||||||||||
iMGP Dolan McEniry Corporate Bond Inv. | -9.14% | -9.92% | -0.91% | -0.31% | ||||||||||||
Bloomberg US Interm Credit TR USD | -8.52% | -8.96% | -0.14% | 1.82% | ||||||||||||
Bloomberg US Agg Bond TR USD | -10.35% | -10.29% | -0.93% | 1.27% | ||||||||||||
Morningstar US Fund Corporate Bond | -13.86% | -13.92% | -1.04% | 1.35% | ||||||||||||
Past performance does not guarantee future results. Index performance is not illustrative of fund performance. An investment cannot be made directly in an index. The investment return and principal value of an investment will fluctuate so that an investor’s shares, when redeemed, may be worth more or less than their original cost. Current performance of the fund may be lower or higher than the performance quoted. To obtain the performance of the funds as of the most recently completed calendar month, please visit www.imgpfunds.com. The Advisor has contractually agreed to limit the expenses of the fund through April 30, 2023. Gross Expenses: 0.96% and 1.31% for Institutional and Investor Classes. Net Expenses 0.70% and 1.05% for the Institutional and Investor classes. |
| |||||||||||||||
Market Review
In the first half of the year, volatility and negative returns were seen in many equity and fixed-income markets. After years of historically low rates as a response to the COVID-19 pandemic, the Federal Reserve began to raise interest rates as a response to rising inflation. Additional volatility was spurred by geopolitical concerns and the impact that rising rates could have on economic activity. Despite the uncertainty, credit quality remains strong, and yields are substantially higher than they were at the start of the year. Dolan McEniry will continue to monitor markets for any opportunities that may arise.
During the year, Treasury rates increased, and the Treasury curve flattened. The 10-year U.S. Treasury yield increased from 1.51% to 3.02%, the 5-year yield increased from 1.26% to 3.04% and the 2-year yield increased from 0.74% to 2.96%.
Per Bloomberg data, spreads of corporate investment grade bonds widened 63 basis points during the quarter to an average option adjusted spread (“OAS”) of +155 basis points. The OAS of the Bloomberg Corporate High Yield Index widened 286 basis points to +569 basis points at quarter end.
Portfolio Commentary
On a relative basis, the iMGP Dolan McEniry Corporate Bond Fund underperformed the Bloomberg U.S. Credit Intermediate Index by 54 basis points. The fund’s underperformance was driven by its relative underperformance in corporate investment-grade and overexposure to high-yield as opposed to government-related securities. The yield curve positioning and duration had a minimal effect on relative performance versus the benchmark.
Outlook and Strategy
Dolan McEniry believes that client portfolios are positioned to provide reasonable absolute and relative returns going forward. Dolan McEniry’s core competence is credit analysis, and we focus on a company’s ability to generate generous amounts of free cash flow over time in relation to its indebtedness. Investment safety and risk mitigation are of primary importance as we continue to search for undervalued fixed income securities. As of June 30th, the iMGP Dolan McEniry Corporate Bond Fund had a +116 basis point yield premium and similar duration versus the Bloomberg U.S Intermediate Credit. We believe these stats will allow the portfolio to perform well versus the benchmarks over time.
Performance and Stats
| iMGP Dolan McEniry Corporate Bond Fund | Bloomberg U.S. Intermediate Credit | |||||||
Yield to Worst | 5.47% | 4.31% | ||||||
Yield to Maturity | 5.48% | 4.31% | ||||||
Effective Duration | 3.86 years | 4.21 years | ||||||
Average Coupon | 4.20% | 3.01% | ||||||
| Fund Summary | 109 | |||||
Table of Contents
Attribution Commentary
Yield Curve and Duration: The yield curve positioning and duration had a minimal effect on the performance versus the benchmark.
Commentary
Through June, the iMGP Dolan McEniry Corporate Bond Fund underperformed the Bloomberg U.S. Credit Intermediate Index by 54 basis points. The fund’s underperformance was driven by its relative underperformance in corporate investment grade and overexposure to high yield as opposed to government related securities.
Security Selection
Top Performers | Bottom Performers | |
United Rentals Inc. | Qurate Retail Inc. | |
Fortune Brands Home & Security Inc. | Qorvo Inc. | |
KLA Corp. | Bloomin Brands Inc. |
| ||
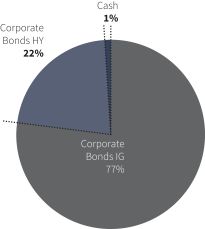
| 110 | Litman Gregory Funds Trust | |||||
Table of Contents
iMGP Dolan McEniry Corporate Bond Fund Value of Hypothetical $10,000.
The value of a hypothetical $10,000 investment in the iMGP Dolan McEniry Corporate Bond from September 28, 2018 to June 30, 2022 compared with the Bloomberg US Credit Intermediate Bond Index and Morningstar US Corporate Bond Category.
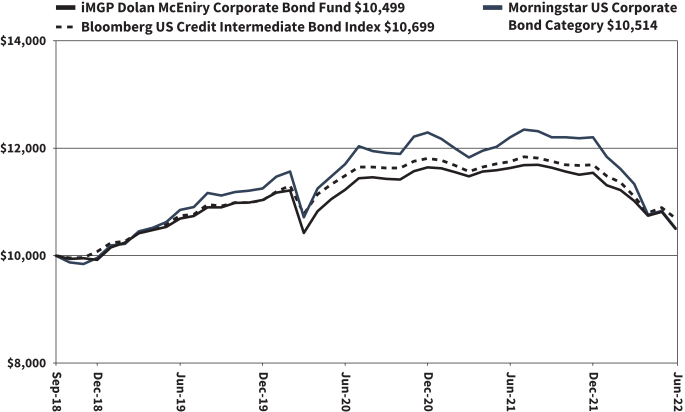
The hypothetical $10,000 investment at fund inception includes changes due to share price and reinvestment of dividends and capital gains. The chart does not imply future performance. Indexes are unmanaged, do not incur fees, expenses or taxes, and cannot be invested in directly.
Performance quoted does not include a deduction for taxes that a shareholder would pay on the redemption of fund shares.
| Fund Summary | 111 | |||||
Table of Contents
iMGP Dolan McEniry Corporate Bond Fund
SCHEDULE OF INVESTMENTS IN SECURITIES at June 30, 2022 (Unaudited)
| Principal Amount^ | Value | |||||||
CORPORATE BONDS: 98.3% | ||||||||
| Basic Materials: 2.0% | ||||||||
| Steel Dynamics, Inc. | ||||||||
| $918,000 | 2.400%, 06/15/2025 | $ | 870,108 | |||||
| 679,000 | 5.000%, 12/15/2026 | 674,225 | ||||||
|
| |||||||
| 1,544,333 | ||||||||
|
| |||||||
| Communications: 18.3% | ||||||||
| AMC Networks, Inc. | ||||||||
| 228,000 | 5.000%, 04/01/2024 | 220,435 | ||||||
| 1,833,000 | 4.750%, 08/01/2025 | 1,692,685 | ||||||
| 582,000 | 4.250%, 02/15/2029 | 473,520 | ||||||
| AT&T, Inc. | ||||||||
| 143,000 | 3.800%, 02/15/2027 | 140,403 | ||||||
| 1,516,000 | 4.250%, 03/01/2027 | 1,515,610 | ||||||
| 403,000 | 4.100%, 02/15/2028 | 396,264 | ||||||
| Discovery Communications LLC | ||||||||
| 2,102,000 | 3.950%, 03/20/2028 | 1,964,080 | ||||||
| Lumen Technologies, Inc. | ||||||||
| 2,303,000 | 7.500%, 04/01/2024 | 2,277,091 | ||||||
| Motorola Solutions, Inc. | ||||||||
| 77,000 | 4.000%, 09/01/2024 | 76,790 | ||||||
| 1,396,000 | 4.600%, 02/23/2028 | 1,353,671 | ||||||
| TEGNA, Inc. | ||||||||
| 2,337,000 | 4.625%, 03/15/2028 | 2,198,475 | ||||||
| Verizon Communications, Inc. | ||||||||
| 1,899,000 | 4.125%, 03/16/2027 | 1,897,392 | ||||||
|
| |||||||
| 14,206,416 | ||||||||
|
| |||||||
| Consumer, Cyclical: 7.6% | ||||||||
| Bloomin’ Brands, Inc. / OSI Restaurant Partners LLC | ||||||||
| 1,895,000 | 5.125%, 04/15/2029(a) | 1,610,939 | ||||||
| Boyd Gaming Corp. | ||||||||
| 602,000 | 4.750%, 12/01/2027 | 547,549 | ||||||
| Dollar Tree, Inc. | ||||||||
| 747,000 | 4.000%, 05/15/2025 | 743,678 | ||||||
| 1,123,000 | 4.200%, 05/15/2028 | 1,093,869 | ||||||
| QVC, Inc. | ||||||||
| 198,000 | 4.850%, 04/01/2024 | 185,434 | ||||||
| 281,000 | 4.450%, 02/15/2025 | 250,624 | ||||||
| 1,844,000 | 4.750%, 02/15/2027 | 1,459,775 | ||||||
|
| |||||||
| 5,891,868 | ||||||||
|
| |||||||
| Consumer, Non-cyclical: 25.8% | ||||||||
| Altria Group, Inc. | ||||||||
| 1,823,000 | 4.400%, 02/14/2026 | 1,796,696 | ||||||
| 224,000 | 4.800%, 02/14/2029 | 213,532 | ||||||
| Block Financial LLC | ||||||||
| 2,315,000 | 2.500%, 07/15/2028 | 2,023,699 | ||||||
| Conagra Brands, Inc. | ||||||||
| 1,044,000 | 4.300%, 05/01/2024 | 1,049,483 | ||||||
| 654,000 | 4.600%, 11/01/2025 | 659,401 | ||||||
| Global Payments, Inc. | ||||||||
| 630,000 | 2.650%, 02/15/2025 | 602,475 | ||||||
| 1,283,000 | 4.800%, 04/01/2026 | 1,287,457 | ||||||
| HCA, Inc. | ||||||||
| 775,000 | 5.375%, 09/01/2026 | 769,800 | ||||||
| 1,182,000 | 5.625%, 09/01/2028 | 1,164,967 | ||||||
| Principal Amount^ | Value | |||||||
| Consumer, Non-cyclical (continued) | ||||||||
| Kraft Heinz Foods Co. | ||||||||
| $ 939,000 | 3.000%, 06/01/2026 | $ | 887,328 | |||||
| 1,312,000 | 3.875%, 05/15/2027 | 1,271,790 | ||||||
| Molson Coors Beverage Co. | ||||||||
| 2,077,000 | 3.000%, 07/15/2026 | 1,957,486 | ||||||
| Reynolds American, Inc. | ||||||||
| 2,042,000 | 4.450%, 06/12/2025 | 2,034,410 | ||||||
| Service Corp. International | ||||||||
| 1,499,000 | 4.625%, 12/15/2027 | 1,411,526 | ||||||
| 531,000 | 5.125%, 06/01/2029 | 502,496 | ||||||
| United Rentals North America, Inc. | ||||||||
| 962,000 | 5.500%, 05/15/2027 | 944,973 | ||||||
| Verisk Analytics, Inc. | ||||||||
| 792,000 | 4.000%, 06/15/2025 | 787,185 | ||||||
| Zimmer Biomet Holdings, Inc. | ||||||||
| 730,000 | 3.050%, 01/15/2026 | 702,510 | ||||||
|
| |||||||
| 20,067,214 | ||||||||
|
| |||||||
| Financial: 8.2% | ||||||||
| American Tower Corp. | ||||||||
| 799,000 | 4.000%, 06/01/2025 | 791,919 | ||||||
| 1,390,000 | 3.375%, 10/15/2026 | 1,317,085 | ||||||
| SBA Communications Corp. | ||||||||
| 962,000 | 3.875%, 02/15/2027 | 878,888 | ||||||
| 1,594,000 | 3.125%, 02/01/2029 | 1,308,539 | ||||||
| Trinity Acquisition Plc | ||||||||
| 715,000 | 4.400%, 03/15/2026 | 708,512 | ||||||
| Willis North America, Inc. | ||||||||
| 230,000 | 3.600%, 05/15/2024 | 226,891 | ||||||
| 1,217,000 | 4.500%, 09/15/2028 | 1,171,512 | ||||||
|
| |||||||
| 6,403,346 | ||||||||
|
| |||||||
| Industrial: 15.5% | ||||||||
| Allegion US Holding Co., Inc. | ||||||||
| 1,187,000 | 3.200%, 10/01/2024 | 1,160,104 | ||||||
| 1,149,000 | 3.550%, 10/01/2027 | 1,059,139 | ||||||
| Carlisle Cos., Inc. | ||||||||
| 336,000 | 3.500%, 12/01/2024 | 332,829 | ||||||
| 1,839,000 | 3.750%, 12/01/2027 | 1,755,224 | ||||||
| Carrier Global Corp. | ||||||||
| 2,225,000 | 2.493%, 02/15/2027 | 2,028,968 | ||||||
| Fortune Brands Home & Security, Inc. | ||||||||
| 758,000 | 4.000%, 09/21/2023 | 761,195 | ||||||
| 284,000 | 4.000%, 06/15/2025 | 280,735 | ||||||
| TransDigm, Inc. | ||||||||
| 1,201,000 | 5.500%, 11/15/2027 | 1,020,322 | ||||||
| Trimble, Inc. | ||||||||
| 1,684,000 | 4.900%, 06/15/2028 | 1,646,043 | ||||||
| Westinghouse Air Brake Technologies Corp. | ||||||||
| 974,000 | 4.400%, 03/15/2024 | 976,982 | ||||||
| 1,105,000 | 4.950%, 09/15/2028 | 1,070,157 | ||||||
|
| |||||||
| 12,091,698 | ||||||||
|
| |||||||
| Technology: 20.9% | ||||||||
| Broadcom Corp. / Broadcom Cayman Finance Ltd. | ||||||||
| 1,569,000 | 3.875%, 01/15/2027 | 1,513,127 | ||||||
| Broadcom, Inc. | ||||||||
| 363,000 | 3.459%, 09/15/2026 | 348,758 | ||||||
| CA, Inc. | ||||||||
| 231,000 | 4.700%, 03/15/2027 | 223,125 | ||||||
The accompanying notes are an integral part of these financial statements.
| 112 | Litman Gregory Funds Trust | |||||
Table of Contents
iMGP Dolan McEniry Corporate Bond Fund
SCHEDULE OF INVESTMENTS IN SECURITIES at June 30, 2022 (Unaudited) (Continued)
| Principal Amount^ | Value | |||||||
CORPORATE BONDS (CONTINUED) | ||||||||
| Technology (continued) | ||||||||
| CDK Global, Inc. | ||||||||
| $ 997,000 | 4.875%, 06/01/2027 | $ | 974,364 | |||||
| 1,248,000 | 5.250%, 05/15/2029(a) | 1,230,709 | ||||||
| CDW LLC / CDW Finance Corp. | ||||||||
| 256,000 | 5.500%, 12/01/2024 | 257,382 | ||||||
| 564,000 | 4.125%, 05/01/2025 | 548,975 | ||||||
| 1,322,000 | 4.250%, 04/01/2028 | 1,197,534 | ||||||
| 228,000 | 3.250%, 02/15/2029 | 192,560 | ||||||
| HP, Inc. | ||||||||
| 1,847,000 | 3.000%, 06/17/2027 | 1,711,835 | ||||||
| Microchip Technology, Inc. | ||||||||
| 1,977,000 | 4.250%, 09/01/2025 | 1,929,536 | ||||||
| Oracle Corp. | ||||||||
| 2,447,000 | 2.300%, 03/25/2028 | 2,111,348 | ||||||
| Qorvo, Inc. | ||||||||
| 2,281,000 | 4.375%, 10/15/2029 | 2,009,242 | ||||||
| Western Digital Corp. | ||||||||
| 2,113,000 | 4.750%, 02/15/2026 | 2,016,975 | ||||||
|
| |||||||
| 16,265,470 | ||||||||
|
| |||||||
| | TOTAL CORPORATE BONDS | 76,470,345 | ||||||
|
| |||||||
| | TOTAL INVESTMENTS | 76,470,345 | ||||||
|
| |||||||
| Other Assets in Excess of Liabilities: 1.7% | 1,311,103 | |||||||
|
| |||||||
NET ASSETS: 100.0% | $ | 77,781,448 | ||||||
|
| |||||||
Percentages are stated as a percent of net assets.
| ^ | The principal amount is stated in U.S. Dollars unless otherwise indicated. |
| (a) | Security was purchased pursuant to Rule 144A under the Securities Act of 1933 and may be sold in transactions exempt from registration only to qualified institutional buyers or in a public offering registered under Securities Act of 1933. |
The accompanying notes are an integral part of these financial statements.
| Schedule of Investments | 113 | |||||
Table of Contents
iMGP DBi Managed Futures Strategy ETF
The iMGP DBi Managed Futures Strategy ETF gained 26.24% at NAV and 25.60% at market price versus the benchmark SG CTA Index’s 21.14% and the Morningstar US Fund Systematic Trend category return of 15.94% for the first half of 2022.
Performance as of June 30, 2022 | ||||||||||||||||
| Average Annual Total Returns | ||||||||||||||||
| Year to Date | One Year | Three Year | Since Inception (5/7/2019) | |||||||||||||
iMGP DBi Managed Futures Strategy ETF (NAV) | 26.24% | 25.04% | 15.03% | 15.25% | ||||||||||||
iMGP DBi Managed Futures Strategy ETF (Price) | 25.60% | 25.49% | 15.37% | 15.58% | ||||||||||||
SG CTA | 21.14% | 20.74% | 10.40% | 10.34% | ||||||||||||
US Fund Systematic Trend | 15.94% | 14.34% | 7.73% | 7.78% | ||||||||||||
| Past performance does not guarantee future results. Index performance is not illustrative of fund performance. An investment cannot be made directly in an index. The investment return and principal value of an investment will fluctuate so that an investor’s shares, when redeemed, may be worth more or less than their original cost. Current performance of the fund may be lower or higher than the performance quoted. To obtain the performance of the funds as of the most recently completed calendar month, please visit www.imgpfunds.com. |
| |||||||||||||||
Semi-Annual Review
In our 1Q22 commentary, we wrote that three major macro regime shifts—inflation, monetary tightening and Cold War 2.0—were in the early stages and had created “unprecedented” risks. Those macroeconomic headwinds began to play out in earnest during the second quarter. Fed tightening kicked into gear: two-year Treasury yields ended the quarter at around 3%—4x the level on January 1 and 11x a year prior. Equities—surprisingly resilient during Q1—fell into a true bear market, and frothier areas of the market—disruptive tech, crypto—plunged. A stunning fall in the Japanese yen and Euro relative to the dollar rekindled memories of macro trading opportunities that were largely absent in the late 2010s. By quarter end, investors were focused on second order effects of this regime shift, such as the likelihood that rate hikes would cause a severe recession that would, in turn, limit further rate hikes and destroy demand for commodities. We believe that we are in the midst of a period of uncertainty that will take years, not quarters, to resolve. Continuing a pattern of the past several years, some hedge funds soared (CTAs, macro, value) while others were pummeled (tech, healthcare, crypto)—yet overall, hedge funds have performed very respectably relative to traditional assets by recognizing early the headwinds above.
Portfolio Positioning
During the quarter, the Fund rose 13.3% while the S&P 500 and Bloomberg US Aggregate were down -16.1% and -4.7%, respectively. Since inception, the Fund has delivered 15.6% and 14.8% per annum of alpha relative to the S&P 500 and the Bloomberg US Aggregate, respectively. Performance this year reinforces the importance of having a diversifer in traditional 60/40 portfolios. During the quarter, the Fund has profited from short positions in the Japanese yen (slower rate hikes) and the Euro (slower rate hikes and Ukraine spillover), and short positions in Treasuries (inflation). Net short positions in equities and long positions in commodities also contributed to performance. By quarter end, the portfolio remained short equities, long the USD against the yen and Euro, long crude oil but short gold, and with reduced exposure to rising rates.
Portfolio Characteristics
| Net Asset Class Exposure (%) | ||||
US Equities | -11% | |||
International Developed Equities | -4% | |||
Emerging Market Equities | -8% | |||
Currencies | -63% | |||
Commodities | 11% | |||
Fixed Income | -61% | |||
| Top 5 Holdings |
| |||
JPY/USD | -50% | |||
Crude Oil | 16% | |||
2 Yr Treasury | -15% | |||
Eurodollar | -15% | |||
EUR/USD | -13% | |||
| 114 | Litman Gregory Funds Trust | |||||
Table of Contents
iMGP DBi Managed Futures ETF Value of Hypothetical $10,000
The value of a hypothetical $10,000 investment in the iMGP DBi Managed Futures ETF from April 30, 2019 to June 30, 2022 compared with the SG CTA Index and Morningstar US Systematic Trend Category.
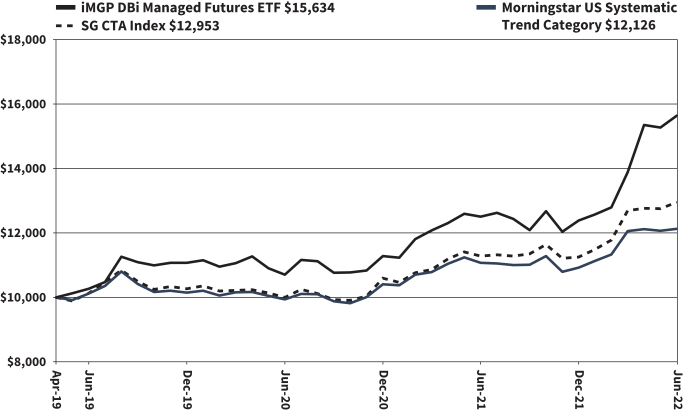
The hypothetical $10,000 investment at fund inception includes changes due to share price and reinvestment of dividends and capital gains. The chart does not imply future performance. Indexes are unmanaged, do not incur fees, expenses or taxes, and cannot be invested in directly.
Performance quoted does not include a deduction for taxes that a shareholder would pay on the redemption of fund shares.
| Fund Summary | 115 | |||||
Table of Contents
iMGP DBi Managed Futures Strategy ETF
CONSOLIDATED SCHEDULE OF INVESTMENTS IN SECURITIES at June 30, 2022 (Unaudited)
TOTAL INVESTMENTS | 0 | |||||
|
| |||||
| Other Assets in Excess of Liabilities: 100.0% | 332,973,092 | |||||
|
| |||||
NET ASSETS: 100.0% | $ | 332,973,092 | ||||
|
| |||||
The accompanying notes are an integral part of these financial statements.
| 116 | Litman Gregory Funds Trust | |||||
Table of Contents
iMGP DBi Managed Futures Strategy ETF
CONSOLIDATED SCHEDULE OF INVESTMENTS IN FUTURES CONTRACTS at June 30, 2022 (Unaudited)(a)
| Description | Number of Contracts | Notional Amount | Notional Value | Expiration Date | Unrealized Appreciation/ (Depreciation) | |||||||||||||||
Futures Contracts – Long |
| |||||||||||||||||||
WTI Crude Futures(b) | 521 | 53,293,958 | $ | 53,715,100 | 8/22/2022 | $ | 421,142 | |||||||||||||
|
| |||||||||||||||||||
Total Long | $ | 421,142 | ||||||||||||||||||
|
| |||||||||||||||||||
Futures Contracts – Short | ||||||||||||||||||||
30 Day Federal Funds Futures | (103 | ) | (41,748,372 | ) | $ | (41,714,045 | ) | 10/31/2022 | $ | 34,327 | ||||||||||
90-day Euro-Dollar Futures | (204 | ) | (49,112,963 | ) | (49,421,550 | ) | 12/18/2023 | (308,587 | ) | |||||||||||
Euro FX Currency Futures | (342 | ) | (45,244,081 | ) | (45,049,950 | ) | 9/19/2022 | 194,131 | ||||||||||||
Gold 100 Oz Futures(b) | (95 | ) | (17,416,842 | ) | (17,169,350 | ) | 8/29/2022 | 247,492 | ||||||||||||
Japanese Yen Currency Futures | (1,809 | ) | (168,962,608 | ) | (167,682,994 | ) | 9/19/2022 | 1,279,614 | ||||||||||||
MSCI EAFE Index Futures | (132 | ) | (12,230,953 | ) | (12,253,560 | ) | 9/16/2022 | (22,607 | ) | |||||||||||
MSCI Emerging Market Index | (559 | ) | (28,367,329 | ) | (28,025,465 | ) | 9/16/2022 | 341,864 | ||||||||||||
S&P 500 E-Mini Index Futures | (204 | ) | (38,284,957 | ) | (38,652,900 | ) | 9/16/2022 | (367,943 | ) | |||||||||||
U.S. Treasury 10-Year Note Futures | (92 | ) | (10,668,835 | ) | (10,904,875 | ) | 9/21/2022 | (236,040 | ) | |||||||||||
U.S. Treasury 10-Year Ultra Note Futures | (84 | ) | (10,416,442 | ) | (10,699,500 | ) | 9/21/2022 | (283,058 | ) | |||||||||||
U.S. Treasury 2-Year Note Futures | (237 | ) | (49,755,003 | ) | (49,773,703 | ) | 9/30/2022 | (18,700 | ) | |||||||||||
U.S. Treasury Bonds 20 Year Bond Futures | (160 | ) | (21,499,328 | ) | (22,180,000 | ) | 9/21/2022 | (680,672 | ) | |||||||||||
U.S. Treasury Ultra-Long Bond Futures | (140 | ) | (20,909,601 | ) | (21,608,125 | ) | 9/21/2022 | (698,524 | ) | |||||||||||
|
| |||||||||||||||||||
Total Short | $ | (518,703 | ) | |||||||||||||||||
|
| |||||||||||||||||||
Total Futures Contracts | $ | (97,561 | ) | |||||||||||||||||
|
| |||||||||||||||||||
| (a) | Societe Generale is the counterparty for all Open Futures Contracts held by the Fund and the iMGP DBi Cayman Managed Futures Subsidiary at June 30, 2022. |
| (b) | Contract held by the iMGP DBi Cayman Managed Futures Subsidiary. |
The accompanying notes are an integral part of these financial statements.
| Schedule of Investments | 117 | |||||
Table of Contents
The iMGP DBi Hedge Strategy ETF fell 6.02% at NAV and 6.07% at market versus the Morningstar US Fund Long Short Category benchmark’s loss of 9.65% in the first half of 2022.
| Performance as of June 30, 2022 | Year to Date Return | One-Year | Average Annual Total Return Since Inception (12/19/2019) | |||||||||
iMGP DBi Hedge Strategy ETF (NAV) | -6.02% | -6.42% | 8.16% | |||||||||
iMGP DBi Hedge Strategy ETF (Price) | -6.07% | -6.42% | 8.08% | |||||||||
Morningstar US Fund Long-Short Equity | -9.65% | -6.58% | 2.90% | |||||||||
| Performance quoted represents past performance and does not guarantee future results. The investment return and principal value of an investment will fluctuate so that an investor’s shares, when redeemed, may be worth more or less than their original cost. Current performance of the funds may be lower or higher than the performance quoted. To obtain standardized performance of the funds, and performance as of the most recently completed calendar month, please visit www.imgpfunds.com. |
| |||||||||||
2022 Semi-Annual Review
In our 1Q22 commentary, we wrote that three major macro regime shifts—inflation, monetary tightening and Cold War 2.0—were in the early stages and had created “unprecedented” risks. Those macroeconomic headwinds began to play out in earnest during the second quarter. Fed tightening kicked into gear: two-year Treasury yields ended the quarter at around 3%—4x the level on January 1 and 11x a year prior. Equities—surprisingly resilient during Q1—fell into a true bear market, and frothier areas of the market—disruptive tech, crypto—plunged. A stunning fall in the Japanese yen and Euro relative to the dollar rekindled memories of macro trading opportunities that were largely absent in the late 2010s. By quarter end, investors were focused on second order effects of this regime shift, such as the likelihood that rate hikes would cause a severe recession that would, in turn, limit further rate hikes and destroy demand for commodities. We believe that we are in the midst of a period of uncertainty that will take years, not quarters, to resolve. Continuing a pattern of the past several years, some hedge funds soared (CTAs, macro, value) while others were pummeled (tech, healthcare, crypto)—yet overall, hedge funds have performed very respectably relative to traditional assets by recognizing early the headwinds above.
Portfolio Positioning
Value centric small/mid cap and international developed markets outperformed large cap equities during the quarter which helped to contain losses. As the Federal Reserve continues to grapple with inflation by raising interest rates, the risk of a recession has started to take hold. The Fund has shifted within fixed income from an inflation trade to a recession trade by taking a long position in the long end of the Treasury curve. The Portfolio’s hedges in the US dollar (long) and Treasuries (short) helped to protect capital. Since inception, DBEH has outperformed the illiquid, higher-cost Target portfolio of hedge funds and has provided over 300 bps per annum of alpha with the client-friendly features of an ETF.
6/30/2022 Portfolio Characteristics
| Net Asset Class Exposure (%) | ||||
US Equities | 21% | |||
International Developed Equities | 14% | |||
US Dollar | 8% | |||
Emerging Market Equities | -2% | |||
Fixed Income | -70% | |||
| Top 5 Holdings |
| |||
2 Yr Treasury | -36% | |||
Eurodollar | -36% | |||
EAFE | 14% | |||
S&P 400 Midcap | 11% | |||
Nasdaq | 6% | |||
| 118 | Litman Gregory Funds Trust | |||||
Table of Contents
iMGP DBi Hedge Strategy ETF Value of Hypothetical $10,000.
The value of a hypothetical $10,000 investment in the iMGP DBi Hedge Strategy ETF from November 30, 2019 to June 30, 2022 compared with the Morningstar US Fund Long Short Category.
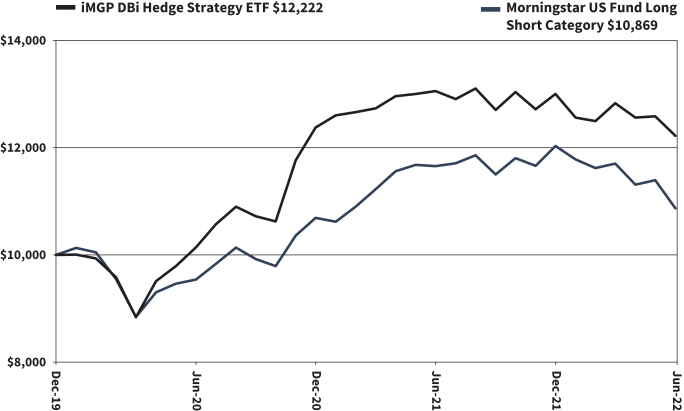
The hypothetical $10,000 investment at fund inception includes changes due to share price and reinvestment of dividends and capital gains. The chart does not imply future performance. Indexes are unmanaged, do not incur fees, expenses or taxes, and cannot be invested in directly.
Performance quoted does not include a deduction for taxes that a shareholder would pay on the redemption of fund shares.
| Fund Summary | 119 | |||||
Table of Contents
SCHEDULE OF INVESTMENTS IN SECURITIES at June 30, 2022 (Unaudited)
TOTAL INVESTMENTS | $ | 0 | ||
|
| |||
| Other Assets in Excess of Liabilities: 100.0% | 16,222,402 | |||
|
| |||
NET ASSETS: 100.0% | $16,222,402 | |||
|
| |||
Percentages are stated as a percent of net assets.
The accompanying notes are an integral part of these financial statements.
| 120 | Litman Gregory Funds Trust | |||||
Table of Contents
iMGP DBi Hedge Strategy ETF
SCHEDULE OF INVESTMENTS IN FUTURES CONTRACTS at June 30, 2022 (Unaudited)(a)
| Description | Number of Contracts | Notional Amount | Notional Value | Expiration Date | Unrealized Appreciation/ (Depreciation) | |||||||||||||||
Futures Contracts – Long |
| |||||||||||||||||||
Russell 2000 E-mini Futures | 8 | 682,872 | $ | 683,200 | 9/16/2022 | $ | 328 | |||||||||||||
MSCI EAFE Index Futures | 25 | 2,300,209 | 2,320,750 | 9/16/2022 | 20,541 | |||||||||||||||
Nasdaq 100 E-mini Futures | 4 | 907,622 | 922,360 | 9/16/2022 | 14,738 | |||||||||||||||
S&P Mid Cap 400 E-mini Futures | 8 | 1,825,293 | 1,814,400 | 9/16/2022 | (10,893 | ) | ||||||||||||||
U.S. Dollar Index Futures | 5 | 515,263 | 522,320 | 9/19/2022 | 7,057 | |||||||||||||||
U.S. Treasury Long Bond Futures | 3 | 418,748 | 415,875 | 9/21/2022 | (2,873 | ) | ||||||||||||||
U.S. Treasury Ultra Bond Futures | 2 | 318,131 | 308,688 | 9/21/2022 | (9,443 | ) | ||||||||||||||
|
| |||||||||||||||||||
Total Long | $ | 19,455 | ||||||||||||||||||
|
| |||||||||||||||||||
Futures Contracts – Short | ||||||||||||||||||||
30 Day Federal Funds Futures | (1 | ) | (407,281 | ) | $ | (404,991 | ) | 10/31/2022 | $ | 2,290 | ||||||||||
90-day Euro-Dollar Futures | (24 | ) | (5,765,160 | ) | (5,814,300 | ) | 12/18/2023 | (49,140 | ) | |||||||||||
British Pound Currency Futures | (1 | ) | (78,241 | ) | (76,244 | ) | 9/19/2022 | 1,997 | ||||||||||||
Canadian Dollar Currency Futures | (1 | ) | (78,797 | ) | (77,700 | ) | 9/20/2022 | 1,097 | ||||||||||||
Euro FX Currency Futures | (4 | ) | (534,592 | ) | (526,900 | ) | 9/19/2022 | 7,692 | ||||||||||||
Japanese Yen Currency Futures | (1 | ) | (93,585 | ) | (92,694 | ) | 9/19/2022 | 891 | ||||||||||||
MSCI Emerging Market Index | (8 | ) | (402,440 | ) | (401,080 | ) | 9/16/2022 | 1,360 | ||||||||||||
U.S. Treasury 2-Year Note Futures | (28 | ) | (5,912,457 | ) | (5,880,437 | ) | 9/30/2022 | 32,020 | ||||||||||||
|
| |||||||||||||||||||
Total Short | $ | (1,793 | ) | |||||||||||||||||
|
| |||||||||||||||||||
Total Futures Contracts | $ | 17,662 | ||||||||||||||||||
|
| |||||||||||||||||||
| (a) | Mizuho Securities USA LLC is the counterparty for all Open Futures Contracts held by the Fund at June 30, 2022. |
The accompanying notes are an integral part of these financial statements.
| Schedule of Investments | 121 | |||||
Table of Contents
iMGP RBA Responsible Global Allocation ETF (IRBA)
The iMGP RBA Responsible Global Allocation ETF outperformed its benchmark in the first half of 2022 (since its inception on 2/1/22), posting a NAV return of -11.61%, and a price return of -11.72% compared to a -13.35% return for its benchmark index (65% MSCI ACWI, 35% Bloomberg US Aggregate Bond Index) and a -11.32% return for the Morningstar World Allocation category.
(Note: IRBA launched on 2/1/22, so this semi-annual commentary is not for the full half year.)
| Performance as of June 30, 2022 | Three- Month | Since Inception (2/1/2022) | ||||||
iMGP RBA Responsible Global Allocation ETF (NAV) | -10.03% | -11.61% | ||||||
iMGP RBA Responsible Global Allocation ETF (Price) | -10.50% | -11.72% | ||||||
65/35 Blend of MSCI ACWI & Bloomberg US Aggregate Bond Index | -11.90% | -13.35% | ||||||
65/35 Blend of MSCI ACWI ESG Leaders & Bloomberg MSCI US Aggregate ESG Focus Index | -11.80% | -13.54% | ||||||
Morningstar US Fund World Allocation | -10.55% | -11.32% | ||||||
| Performance data quoted represents past performance. Past performance does not guarantee future results. The investment return and principal value of an investment will fluctuate so that an investor’s shares, when redeemed, may be worth more or less than their original cost. Current performance of the fund may be lower or higher than the performance quoted. Short term performance is not a good indication of the fund’s future performance and should not be the sole basis for investing in the fund. Performance data current to the most recent month end may be obtained by visiting www.imgpfunds.com. |
| |||||||
| Shares of any ETF are bought and sold at market price (not NAV), may trade at a discount or premium to NAV and are not individually redeemed from the Fund. Brokerage commissions will reduce returns. |
| |||||||
Equity Positioning and Performance Attribution
The Strategy was overweight equity during the period, holding an average weight of 67.5% (2.5ppt overweight) in 1H22. The equity sleeve outperformed by 1.8% vs. the MSCI ACWI Index. This outperformance was driven by the underweights to long duration growth names in the tech, consumer discretionary, and communication services sectors as well as overweights to more defensive sectors such as consumer staples and health care. From a geographic perspective, overweighting the Japan market relative to ACWI was also accretive to returns. Our underweight to the energy sector detracted from performance for the half.
Fixed Income Positioning and Performance Attribution
The Strategy was underweight fixed income during the period, holding an average weight of 32.5% (2.5ppt underweight) in 1H22. The fixed income sleeve outperformed slightly by 0.5%. Overweighting investment grade and high yield corporates were the strongest themes for the half in the fixed income sleeve. Underweighting treasuries during the half detracted from performance. Our shorter duration corporate theme helped performance through the half.
Manager Outlook and Portfolio Positioning
RBA’s investment process remains focused on its three pillars of corporate profits, liquidity, and investor sentiment/valuation, all of which suggest that we remain in a weakening fundamental backdrop. Corporate profit growth continues to moderate and the Fed appears increasingly committed to tightening liquidity to rein in inflation. While deteriorating investor sentiment is reflected in lower valuations, significant portions of the market remain relatively expensive and US household equity allocations remain near all-time highs.
Despite today’s environment of heightened uncertainty surrounding the Russia/Ukraine conflict, tensions with China, Fed policy and fears of a recession, there is a high degree of certainty around two key market drivers. Regardless of the geopolitical backdrop, it seems very likely that (1) profits will continue to decelerate, and (2) the Fed will continue to tighten monetary policy.
Historically, there has been a reasonably high correlation between the Fed Funds rate and the profits cycle, i.e., interest rates rose as profits accelerated and fell as profits decelerated. That historical relationship implied monetary policy was a good ballast to economic and profits growth. There have been only a few periods when the Fed raised rates despite a decelerating profits cycle (e.g., 1989 and 2005). However, if RBA’s forecast for profits growth is on the correct (downward) path and the Fed continues to hike interest rates, investors might be faced with this relatively rare combination again. The matrix below shows the average S&P 500® quarterly return during the various combinations of Fed policy and profits growth. One can see that Fed tightening with decelerating profits has been the worst environment for S&P 500 quarterly returns on average (the orange quadrant).
| 122 | Litman Gregory Funds Trust | |||||
Table of Contents
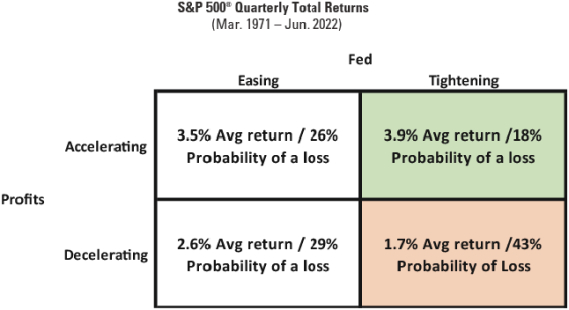
Source: Richard Bernstein Advisors LLC.FRB, S&P Global, Bloomberg Finance L.P. |
The following chart shows sector performance during periods when the profits cycle has historically decelerated. As one might expect, defensive sectors tend to outperform. That’s especially interesting because the current discussion among most investors seems to center on whether one should accentuate cyclicals or growth stocks, with little mention of traditional defensive sectors.
Consistent with this, and based on RBA’s proprietary indicators and analysis, RBA has been reducing overall portfolio risk and cyclicality (equity beta) while increasing exposure to higher quality and less economically sensitive investments.
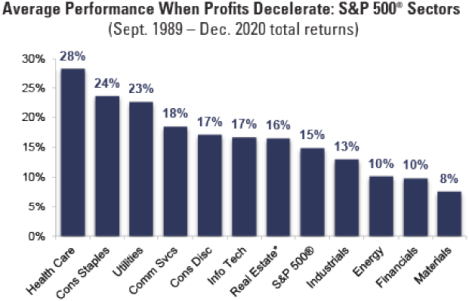
Source: Richard Bernstein Advisors LLC.S&P Global, FTSE, Bloomberg Finance L.P. For Index descriptions see Index Descriptions at and of document. Dec. 2020 was the end of the last full profits deceleration cycle. Real Estate performance is proforma as it was not a stand alone sector until 9/30/16 and was included within the Financials Sector. We use the FTSE Nareit All Equity REITS Total Return Index as a proxy for its performance from 9/1989 through 10/2002 when the GICS Real Estate Industry Index performance becomes available for data from that point on. Communication Services was Telecom Services prior to GICS reclassification in 9/30/18. |
| Fund Summary | 123 | |||||
Table of Contents
IRBA Portfolio Allocations as of June 30, 2022
Asset Class Exposures
U.S. Equities | 38.4% | |||
Non-U.S. Equities | 27.4% | |||
U.S. Fixed Income | 25.5% | |||
Non-U.S. Fixed Income | 7.9% | |||
Cash | 0.8% | |||
|
| |||
Total | 100% | |||
|
|
IRBA vs. Blended 65/35 Benchmark
| IRBA Weight | Benchmark Weight | Relative Weight | ||||||||||
Equity | 65.8% | 65.0% | 0.8% | |||||||||
Fixed Income | 33.5% | 35.0% | -1.5% | |||||||||
Cash | 0.8% | 0.0% | 0.8% | |||||||||
|
|
|
|
|
| |||||||
Total | 100% | 100% | 0.0% | |||||||||
|
|
|
|
|
| |||||||
IRBA Equity Region vs MSCI ACWI Net Index
| IRBA Weight | Benchmark Weight | Relative Weight | ||||||||||
US | 58.4% | 61.7% | -3.4% | |||||||||
Canada | 1.7% | 3.1% | -1.5% | |||||||||
Europe | 15.4% | 11.0% | 4.5% | |||||||||
United Kingdom | 4.3% | 3.3% | 1.0% | |||||||||
Japan | 8.8% | 5.5% | 3.4% | |||||||||
Asia ex-Japan | 4.7% | 3.3% | 1.4% | |||||||||
Emerging Markets | 6.8% | 12.2% | -5.4% | |||||||||
|
|
|
|
|
| |||||||
Total | 100% | 100% | 0.0% | |||||||||
|
|
|
|
|
| |||||||
IRBA Equity Sector vs MSCI ACWI Net Index
| IRBA Weight | Benchmark Weight | Relative Weight | ||||||||||
Communication Services | 5.0% | 7.9% | -2.9% | |||||||||
Consumer Discretionary | 7.3% | 11.1% | -3.8% | |||||||||
Consumer Staples | 12.5% | 7.6% | 4.9% | |||||||||
Energy | 2.1% | 5.0% | -2.8% | |||||||||
Financials | 13.2% | 14.5% | -1.3% | |||||||||
Health Care | 16.3% | 13.0% | 3.3% | |||||||||
Industrials | 13.0% | 9.4% | 3.6% | |||||||||
Information Technology | 12.5% | 20.9% | -8.3% | |||||||||
Materials | 7.1% | 4.8% | 2.3% | |||||||||
Real Estate | 7.5% | 2.8% | 4.7% | |||||||||
Utilities | 3.6% | 3.2% | 0.4% | |||||||||
|
|
|
|
|
| |||||||
Total | 100.0% | 100.00% | 0.00% | |||||||||
|
|
|
|
|
| |||||||
| 124 | Litman Gregory Funds Trust | |||||
Table of Contents
iMGP RBA Responsible Global Allocation ETF Value of Hypothetical $10,000.
The value of a hypothetical $10,000 investment in the iMGP RBA Responsible Global Allocation ETF from February 1, 2022 to June 30, 2022 compared with the Blended MSCI ACWI/Bloomberg US Aggregate Bond Index and Morningstar US Global Allocation Category.
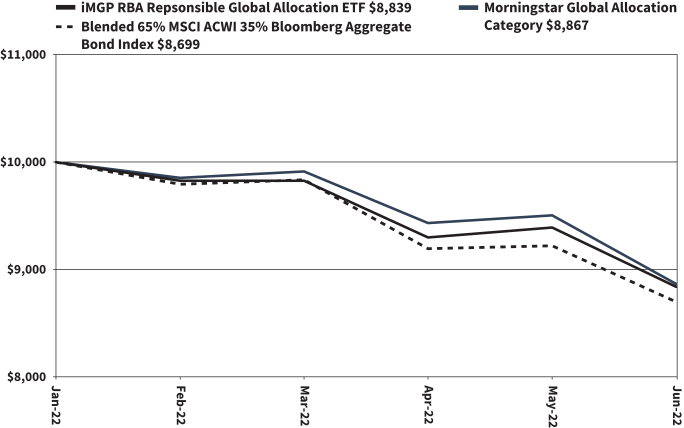
The hypothetical $10,000 investment at fund inception includes changes due to share price and reinvestment of dividends and capital gains. The chart does not imply future performance. Indexes are unmanaged, do not incur fees, expenses or taxes, and cannot be invested in directly.
Performance quoted does not include a deduction for taxes that a shareholder would pay on the redemption of fund shares.
| Fund Summary | 125 | |||||
Table of Contents
iMGP RBA Responsible Global Allocation ETF
SCHEDULE OF INVESTMENTS IN SECURITIES at June 30, 2022 (Unaudited)
| Shares | Value | |||||||
EXCHANGE-TRADED FUNDS: 100.0% | ||||||||
| 6,948 | iShares ESG Advanced MSCI EAFE ETF | $ | 362,338 | |||||
| 13,356 | iShares ESG Aware 1-5 Year USD Corporate Bond ETF | 321,746 | ||||||
| 8,526 | iShares ESG Aware MSCI USA Small-Cap ETF | 268,569 | ||||||
| 26,784 | iShares ESG Aware US Aggregate Bond ETF | 1,310,809 | ||||||
| 8,200 | iShares ESG Aware USD Corporate Bond ETF | 189,830 | ||||||
| 16,278 | iShares MSCI Global Sustainable Development Goals | 1,300,287 | ||||||
| 10,368 | iShares Trust iShares ESG Aware MSCI EAFE ETF | 650,696 | ||||||
| 39,600 | Nuveen ESG Large-Cap Value ETF | 1,321,848 | ||||||
| 7,848 | Nuveen ESG Mid-Cap Value ETF | 240,384 | ||||||
| 8,864 | PIMCO Enhanced Short Maturity Active ESG ETF | 872,957 | ||||||
| 5,932 | Vanguard ESG International Stock ETF | 290,905 | ||||||
| 16,308 | WisdomTree US ESG Fund | 664,197 | ||||||
| 6,336 | XTrackers S&P 500 ESG ETF | 216,374 | ||||||
|
| |||||||
| | TOTAL EXCHANGE-TRADED FUNDS | 8,010,940 | ||||||
|
| |||||||
| | TOTAL INVESTMENTS | 8,010,940 | ||||||
|
| |||||||
| Other Assets in Excess of Liabilities: 0.0% | 3,661 | |||||||
|
| |||||||
NET ASSETS: 100.0% | $ | 8,014,601 | ||||||
|
| |||||||
Percentages are stated as a percent of net assets.
| ETF | Exchange-Traded Fund |
The accompanying notes are an integral part of these financial statements.
| 126 | Litman Gregory Funds Trust | |||||
Table of Contents
EXPENSE EXAMPLES – (Unaudited)
As a shareholder of the Funds, you incur two types of costs: (1) transaction costs and (2) ongoing costs, including advisory fees, and other fund expenses. The examples below are intended to help you understand your ongoing costs (in dollars) of investing in the Funds and to compare these costs with the ongoing costs of investing in other mutual funds.
The examples are based on an investment of $1,000 invested at the beginning of the period shown and held for the entire period from January 1, 2022 to June 30, 2022.
Actual Expenses
For each Fund, the first line of the table below provides information about actual account values and actual expenses. You may use the information in this line, together with the amount you invested, to estimate the expenses that you paid over the period. Simply divide your account value by $1,000 (for example, an $8,600 account value divided by $1,000 = 8.6), then multiply the result by the number in the first line under the heading entitled “Expenses Paid During Period” to estimate the expenses you paid on your account during this period.
Hypothetical Example for Comparison Purposes
For each Fund, the second line of the table below provides information about hypothetical account values and hypothetical expenses based on the Fund’s actual expense ratio and an assumed rate of return of 5% per year before expenses, which is not the Fund’s actual return. The hypothetical account values and expenses may not be used to estimate the actual ending account balance or expenses you paid for the period. You may use this information to compare the ongoing costs of investing in the Fund and other funds. To do so, compare this 5% hypothetical example with the 5% hypothetical examples that appear in the shareholder reports of the other funds.
Please note that the expenses shown in the table are meant to highlight your ongoing costs only and do not reflect any transaction costs. Therefore, the second line for each Fund of the table is useful in comparing ongoing costs only, and will not help you determine the relative total costs of owning different funds. In addition, if these transaction costs were included, your costs would have been higher.
| Beginning Account Value (1/1/22) | Ending Account Value (6/30/22) | Expenses Paid During Period* (1/1/22 to 6/30/22) | Expenses Ratio During Period* (1/1/22 to 6/30/22) | |||||||||||||
iMGP Equity Fund – Institutional Actual | $ | 1,000.00 | $ | 728.70 | $ | 5.40 | 1.26% | |||||||||
iMGP Equity Fund – Institutional Hypothetical - (5% return before expenses) | $ | 1,000.00 | $ | 1,018.55 | $ | 6.31 | 1.26% | |||||||||
iMGP International Fund – Institutional Actual | $ | 1,000.00 | $ | 775.40 | $ | 4.97 | 1.13% | |||||||||
iMGP International Fund – Institutional Hypothetical - (5% return before expenses) | $ | 1,000.00 | $ | 1,019.20 | $ | 5.66 | 1.13% | |||||||||
iMGP Oldfield International Value Fund – Institutional Actual | $ | 1,000.00 | $ | 832.80 | $ | 4.27 | 0.94% | |||||||||
iMGP Oldfield International Value Fund – Institutional Hypothetical - (5% return before expenses) | $ | 1,000.00 | $ | 1,020.14 | $ | 4.71 | 0.94% | |||||||||
iMGP SBH Focused Small Value Fund – Institutional Actual | $ | 1,000.00 | $ | 802.20 | $ | 5.14 | 1.15% | |||||||||
iMGP SBH Focused Small Value Fund – Institutional Hypothetical - (5% return before expenses) | $ | 1,000.00 | $ | 1,019.10 | $ | 5.76 | 1.15% | |||||||||
iMGP Alternative Strategies Fund – Institutional Actual | $ | 1,000.00 | $ | 914.90 | $ | 6.46 | 1.36% | |||||||||
iMGP Alternative Strategies Fund – Investor Actual | $ | 1,000.00 | $ | 913.80 | $ | 7.64 | 1.61% | |||||||||
iMGP Alternative Strategies Fund – Institutional Hypothetical - (5% return before expenses) | $ | 1,000.00 | $ | 1,018.06 | $ | 6.81 | 1.36% | |||||||||
iMGP Alternative Strategies Fund – Investor Hypothetical - (5% return before expenses) | $ | 1,000.00 | $ | 1,016.82 | $ | 8.05 | 1.61% | |||||||||
iMGP High Income Alternatives Fund – Institutional Actual | $ | 1,000.00 | $ | 921.50 | $ | 4.67 | 0.98% | |||||||||
iMGP High Income Alternatives Fund – Institutional Hypothetical - (5% return before expenses) | $ | 1,000.00 | $ | 1,019.94 | $ | 4.91 | 0.98% | |||||||||
iMGP Dolan McEniry Corporate Bond Fund – Institutional Actual | $ | 1,000.00 | $ | 909.40 | $ | 3.31 | 0.70% | |||||||||
iMGP Dolan McEniry Corporate Bond Fund – Investor Actual | $ | 1,000.00 | $ | 908.60 | $ | 4.97 | 1.05% | |||||||||
iMGP Dolan McEniry Corporate Bond Fund – Institutional Hypothetical - (5% return before expenses) | $ | 1,000.00 | $ | 1,021.33 | $ | 3.51 | 0.70% | |||||||||
iMGP Dolan McEniry Corporate Bond Fund – Investor Hypothetical - (5% return before expenses) | $ | 1,000.00 | $ | 1,019.59 | $ | 5.26 | 1.05% | |||||||||
iMGP DBi Managed Futures Strategy ETF – Actual | $ | 1,000.00 | $ | 1,262.40 | $ | 4.99 | 0.89% | |||||||||
iMGP DBi Managed Futures Strategy ETF – Hypothetical - (5% return before expenses) | $ | 1,000.00 | $ | 1,020.39 | $ | 4.46 | 0.89% | |||||||||
| Expense Examples | 127 | |||||
Table of Contents
| Beginning Account Value (1/1/22) | Ending Account Value (6/30/22) | Expenses Paid During Period* (1/1/22 to 6/30/22) | Expenses Ratio During Period* (1/1/22 to 6/30/22) | |||||||||||||
iMGP DBi Hedge Strategy ETF – Actual | $ | 1,000.00 | $ | 939.80 | $ | 4.09 | 0.85% | |||||||||
iMGP DBi Hedge Strategy ETF – Hypothetical - (5% return before expenses) | $ | 1,000.00 | $ | 1,020.58 | $ | 4.26 | 0.85% | |||||||||
iMGP RBA Responsible Global Allocation ETF** – Actual | $ | 1,000.00 | $ | 883.90 | $ | 2.14 | 0.55% | |||||||||
iMGP RBA Responsible Global Allocation ETF** – Hypothetical - (5% return before expenses) | $ | 1,000.00 | $ | 1,022.07 | $ | 2.76 | 0.55% | |||||||||
* Expenses are equal to the Funds’ annualized expense ratio as indicated, multiplied by the average account value over the period, multiplied by the number of days in most recent fiscal half-year period (181), then divided by the number of days in the fiscal year (365) (to reflect the one-half-year period).
** Commenced operations on January 31, 2022.
| 128 | Litman Gregory Funds Trust | |||||
Table of Contents
STATEMENTS OF ASSETS AND LIABILITIES at June 30, 2022 – (Unaudited)
| Equity Fund | International Fund | Oldfield International Value Fund | SBH Focused Small Value Fund | |||||||||||||
ASSETS: |
| |||||||||||||||
Investments in securities at cost | $ | 145,045,995 | $ | 274,800,048 | $ | 23,824,958 | $ | 47,508,274 | ||||||||
Repurchase agreements at cost | 2,682,037 | 8,588,473 | — | — | ||||||||||||
|
|
|
|
|
|
|
| |||||||||
Total investments at cost | $ | 147,728,032 | $ | 283,388,521 | $ | 23,824,958 | $ | 47,508,274 | ||||||||
|
|
|
|
|
|
|
| |||||||||
Investments in securities at value | $ | 166,692,195 | $ | 236,595,268 | $ | 20,432,031 | $ | 47,645,096 | ||||||||
Repurchase agreements at value | 2,682,037 | 8,588,473 | — | — | ||||||||||||
|
|
|
|
|
|
|
| |||||||||
Total investments at value | $ | 169,374,232 | $ | 245,183,741 | $ | 20,432,031 | $ | 47,645,096 | ||||||||
|
|
|
|
|
|
|
| |||||||||
Cash | 293,965 | 12,607 | 844,178 | 2,196,757 | ||||||||||||
Cash, denominated in foreign currency (cost of $373,927, $659,054, $105,598 and $0, respectively) | 342,494 | 651,659 | 105,811 | — | ||||||||||||
Receivables: |
| |||||||||||||||
Foreign tax reclaims | 35,368 | 2,367,197 | 58,865 | — | ||||||||||||
Dividends and interest | 59,904 | 118,456 | — | 43,524 | ||||||||||||
Fund shares sold | 12 | 1,824,023 | 1,985 | 13,056 | ||||||||||||
Securities sold | 112,279 | 958,958 | 60 | 40,163 | ||||||||||||
Prepaid expenses | 45,319 | 44,707 | 12,083 | 26,349 | ||||||||||||
|
|
|
|
|
|
|
| |||||||||
Total Assets | 170,263,573 | 251,161,348 | 21,455,013 | 49,964,945 | ||||||||||||
|
|
|
|
|
|
|
| |||||||||
LIABILITIES: |
| |||||||||||||||
Payables: |
| |||||||||||||||
Advisory fees | 141,383 | 188,539 | 6,606 | 24,530 | ||||||||||||
Securities purchased | 303,179 | 1,082,044 | 36,579 | 116,676 | ||||||||||||
Fund shares redeemed | 118,355 | 21,315 | 25,015 | 766 | ||||||||||||
Foreign taxes withheld | 28 | 7,807 | — | — | ||||||||||||
Professional fees | 9,840 | 10,299 | 515 | 11,644 | ||||||||||||
Line of credit interest | 10,259 | 1,775 | — | — | ||||||||||||
Chief Compliance Officer fees | 5,917 | 5,917 | 5,917 | 5,917 | ||||||||||||
Accrued other expenses | 293,011 | 405,311 | 69,591 | 130,056 | ||||||||||||
|
|
|
|
|
|
|
| |||||||||
Total Liabilities | 881,972 | 1,723,007 | 144,223 | 289,589 | ||||||||||||
|
|
|
|
|
|
|
| |||||||||
NET ASSETS | $ | 169,381,601 | $ | 249,438,341 | $ | 21,310,790 | $ | 49,675,356 | ||||||||
|
|
|
|
|
|
|
| |||||||||
Institutional Class: |
| |||||||||||||||
Net Assets | $ | 169,381,601 | $ | 249,438,341 | $ | 21,310,790 | $ | 49,675,356 | ||||||||
Number of shares issued and outstanding (unlimited number of shares authorized, $0.01 par value) | 12,365,955 | 16,498,158 | 2,194,765 | 4,168,557 | ||||||||||||
Net asset value, offering price and redemption price per share | $ | 13.70 | $ | 15.12 | $ | 9.71 | $ | 11.92 | ||||||||
|
|
|
|
|
|
|
| |||||||||
COMPONENTS OF NET ASSETS |
| |||||||||||||||
Paid-in capital | $ | 128,112,421 | $ | 297,751,751 | $ | 24,112,802 | $ | 50,442,310 | ||||||||
Accumulated distributable earnings (deficit) | 41,269,180 | (48,313,410 | ) | (2,802,012 | ) | (766,954 | ) | |||||||||
|
|
|
|
|
|
|
| |||||||||
Net assets | $ | 169,381,601 | $ | 249,438,341 | $ | 21,310,790 | $ | 49,675,356 | ||||||||
|
|
|
|
|
|
|
| |||||||||
The accompanying notes are an integral part of these financial statements.
| Statements of Assets and Liabilities | 129 | |||||
Table of Contents
Litman Gregory Funds Trust
STATEMENTS OF ASSETS AND LIABILITIES at June 30, 2022 – (Unaudited) – (Continued)
| Alternative Strategies Fund | High Income Alternatives Fund | Dolan McEniry Corporate Bond Fund | ||||||||||
ASSETS: |
| |||||||||||
Investments in securities at cost | $ | 1,348,749,683 | $ | 128,732,400 | $ | 85,410,379 | ||||||
Repurchase agreements at cost | 127,332,311 | 3,220,136 | — | |||||||||
|
|
|
|
|
| |||||||
Total investments at cost | $ | 1,476,081,994 | $ | 131,952,536 | $ | 85,410,379 | ||||||
|
|
|
|
|
| |||||||
Investments in securities at value | $ | 1,223,854,048 | $ | 119,395,336 | $ | 76,470,345 | ||||||
Repurchase agreements at value | 127,332,311 | 3,220,136 | — | |||||||||
|
|
|
|
|
| |||||||
Total investments at value | $ | 1,351,186,359 | $ | 122,615,472 | $ | 76,470,345 | ||||||
|
|
|
|
|
| |||||||
Cash | — | 140,109 | 514,521 | |||||||||
Cash, denominated in foreign currency (cost of $833,244, $0 and $0, respectively) | 401,048 | — | — | |||||||||
Deposits at brokers for securities sold short | 3,857,474 | — | — | |||||||||
Deposits at brokers for futures | 425,000 | — | — | |||||||||
Deposits at brokers for written options | 1,533,664 | — | — | |||||||||
Deposits at brokers for swaps | 3,597,846 | 7,000 | — | |||||||||
Receivables: |
| |||||||||||
Securities sold | 29,786,466 | 193,577 | — | |||||||||
Dividends and interest | 9,292,942 | 922,608 | 864,926 | |||||||||
Fund shares sold | 3,460,466 | 791,798 | 249,000 | |||||||||
Foreign tax reclaims | 283,039 | 1,570 | — | |||||||||
Dividend and interest for swap resets | 267,034 | — | — | |||||||||
Advisory reimbursement | — | — | 13,637 | |||||||||
Variation margin - Futures | — | 3,125 | — | |||||||||
Net swap premiums paid | 28,240 | — | — | |||||||||
Unrealized gain on forward foreign currency exchange contracts | 363,843 | 274 | — | |||||||||
Unrealized gain on swaps | 204,271 | — | — | |||||||||
Prepaid expenses | 135,805 | 14,352 | 1,031 | |||||||||
|
|
|
|
|
| |||||||
Total Assets | 1,404,823,497 | 124,689,885 | 78,113,460 | |||||||||
|
|
|
|
|
| |||||||
LIABILITIES: |
| |||||||||||
Written options (premium received, $66,928, $583,366 and $0, respectively) | 72,217 | 363,683 | — | |||||||||
Securities sold short (proceeds, $4,088,410, $0 and $0, respectively) | 3,540,526 | — | — | |||||||||
Deposits received from brokers for swaps | — | 20,424 | — | |||||||||
Payables: |
| |||||||||||
Advisory fees | 1,303,372 | 59,139 | — | |||||||||
Securities purchased | 11,239,812 | 5,095,053 | — | |||||||||
Fund shares redeemed | 11,189,263 | 840,310 | 35,227 | |||||||||
Foreign taxes withheld | 2,120 | — | — | |||||||||
Trustees fees | — | — | 117,584 | |||||||||
Professional fees | 44,819 | 14,476 | 15,979 | |||||||||
Custodian for overdraft | 1,913,896 | — | — | |||||||||
Distributions payable | 393,987 | — | 44,670 | |||||||||
Line of credit interest | 5,887 | 389 | — | |||||||||
Dividend and interest for swap resets | 35,887 | — | — | |||||||||
Variation margin - Centrally Cleared Swaps | 557,112 | 37,395 | — | |||||||||
Variation margin - Futures | 1,156,818 | — | — | |||||||||
Short dividend | 337 | — | — | |||||||||
Chief Compliance Officer fees | 5,917 | 5,917 | 5,917 | |||||||||
Unrealized loss on unfunded loan commitment | — | 13,209 | — | |||||||||
Unrealized loss on forward foreign currency exchange contracts | 66,562 | — | — | |||||||||
Unrealized loss on swaps | 158,073 | — | — | |||||||||
Distribution fees payable for investor class (see Note 4) | 13,462 | — | 8,582 | |||||||||
Service fees payable for investor class (see Note 5) | — | — | 6,649 | |||||||||
Accrued other expenses | 2,082,106 | 327,900 | 97,404 | |||||||||
|
|
|
|
|
| |||||||
Total Liabilities | 33,782,173 | 6,777,895 | 332,012 | |||||||||
|
|
|
|
|
| |||||||
Commitments and Contingencies (See Note 8) |
| |||||||||||
NET ASSETS | $ | 1,371,041,324 | $ | 117,911,990 | $ | 77,781,448 | ||||||
|
|
|
|
|
| |||||||
The accompanying notes are an integral part of these financial statements.
| 130 | Litman Gregory Funds Trust | |||||
Table of Contents
Litman Gregory Funds Trust
STATEMENTS OF ASSETS AND LIABILITIES at June 30, 2022 – (Unaudited) – (Continued)
| Alternative Strategies Fund | High Income Alternatives Fund | Dolan McEniry Corporate Bond Fund | ||||||||||
Institutional Class: |
| |||||||||||
Net Assets | $ | 1,307,986,107 | $ | 117,911,990 | $ | 76,456,846 | ||||||
Number of shares issued and outstanding (unlimited number of shares authorized, $0.01 par value) | 123,473,089 | 12,679,797 | 7,994,734 | |||||||||
Net asset value, offering price and redemption price per share | $ | 10.59 | $ | 9.30 | $ | 9.56 | ||||||
|
|
|
|
|
| |||||||
Investor Class: |
| |||||||||||
Net Assets | $ | 63,055,217 | $ | — | $ | 1,324,602 | ||||||
Number of shares issued and outstanding (unlimited number of shares authorized, $0.01 par value) | 5,937,972 | — | 138,581 | |||||||||
Net asset value, offering price and redemption price per share | $ | 10.62 | $ | — | $ | 9.56 | ||||||
|
|
|
|
|
| |||||||
COMPONENTS OF NET ASSETS |
| |||||||||||
Paid-in capital | $ | 1,491,674,528 | $ | 128,483,085 | $ | 87,378,066 | ||||||
Accumulated distributable earnings (deficit) | (120,633,204 | ) | (10,571,095 | ) | (9,596,618 | ) | ||||||
|
|
|
|
|
| |||||||
Net assets | $ | 1,371,041,324 | $ | 117,911,990 | $ | 77,781,448 | ||||||
|
|
|
|
|
| |||||||
The accompanying notes are an integral part of these financial statements.
| Statements of Assets and Liabilities | 131 | |||||
Table of Contents
Litman Gregory Funds Trust
STATEMENTS OF ASSETS AND LIABILITIES at June 30, 2022 – (Unaudited) – (Continued)
| DBi Managed Futures Strategy ETF (Consolidated) | DBi Hedge Strategy ETF | RBA Responsible Global Allocation ETF | ||||||||||
ASSETS: |
| |||||||||||
Investments in securities at cost | $ | — | $ | — | $ | 8,591,883 | ||||||
|
|
|
|
|
| |||||||
Total investments at cost | $ | — | $ | — | $ | 8,591,883 | ||||||
|
|
|
|
|
| |||||||
Investments in securities at value | $ | — | $ | — | $ | 8,010,940 | ||||||
|
|
|
|
|
| |||||||
Total investments at value | $ | — | $ | — | $ | 8,010,940 | ||||||
|
|
|
|
|
| |||||||
Cash | 301,358,918 | 15,440,470 | 44,959 | |||||||||
Receivables: |
| |||||||||||
Dividends | — | — | 981 | |||||||||
Variation margin - Futures | 35,797,989 | 785,525 | — | |||||||||
|
|
|
|
|
| |||||||
Total Assets | 337,156,907 | 16,225,995 | 8,056,880 | |||||||||
|
|
|
|
|
| |||||||
LIABILITIES: |
| |||||||||||
Payables: |
| |||||||||||
Advisory fees | 172,077 | 3,593 | 3,168 | |||||||||
Fund shares redeemed | 4,011,738 | — | — | |||||||||
Distributions payable | — | — | 39,111 | |||||||||
|
|
|
|
|
| |||||||
Total Liabilities | 4,183,815 | 3,593 | 42,279 | |||||||||
|
|
|
|
|
| |||||||
NET ASSETS | $ | 332,973,092 | $ | 16,222,402 | $ | 8,014,601 | ||||||
|
|
|
|
|
| |||||||
Net Assets | $ | 332,973,092 | $ | 16,222,402 | $ | 8,014,601 | ||||||
Number of shares issued and outstanding (unlimited number of shares authorized, $0.01 par value) | 10,375,000 | 625,000 | 900,000 | |||||||||
Net asset value, offering price and redemption price per share | $ | 32.09 | $ | 25.96 | $ | 8.91 | ||||||
|
|
|
|
|
| |||||||
COMPONENTS OF NET ASSETS |
| |||||||||||
Paid-in capital | $ | 309,340,309 | $ | 17,323,840 | $ | 8,733,403 | ||||||
Accumulated distributable earnings (deficit) | 23,632,783 | (1,101,438 | ) | (718,802 | ) | |||||||
|
|
|
|
|
| |||||||
Net assets | $ | 332,973,092 | $ | 16,222,402 | $ | 8,014,601 | ||||||
|
|
|
|
|
| |||||||
The accompanying notes are an integral part of these financial statements.
| 132 | Litman Gregory Funds Trust | |||||
Table of Contents
Litman Gregory Funds Trust
STATEMENTS OF OPERATIONS For the Six Months Ended June 30, 2022 – (Unaudited)
| Equity Fund | International Fund | Oldfield International Value Fund | SBH Focused Small Value Fund | |||||||||||||
INVESTMENT INCOME: |
| |||||||||||||||
Income |
| |||||||||||||||
Dividends (net of foreign taxes withheld of $35,861, $578,659, $74,385 and $1,980, respectively) | $ | 1,129,449 | $ | 4,187,262 | $ | 447,985 | $ | 295,097 | ||||||||
Interest | 441 | — | — | — | ||||||||||||
|
|
|
|
|
|
|
| |||||||||
Total income | 1,129,890 | 4,187,262 | 447,985 | 295,097 | ||||||||||||
|
|
|
|
|
|
|
| |||||||||
Expenses |
| |||||||||||||||
Advisory fees | 1,161,450 | 1,598,900 | 85,606 | 285,878 | ||||||||||||
Transfer agent fees | 75,580 | 81,546 | 3,227 | 34,347 | ||||||||||||
Fund accounting fees | 39,796 | 35,433 | 5,553 | 15,447 | ||||||||||||
Administration fees | 25,244 | 28,973 | 1,500 | 17,597 | ||||||||||||
Professional fees | 24,813 | 30,142 | 9,573 | 11,948 | ||||||||||||
Trustee fees | 33,130 | 36,173 | 21,077 | 22,878 | ||||||||||||
Custody fees | 12,015 | 64,668 | 46,293 | 4,654 | ||||||||||||
Reports to shareholders | 26,526 | 28,214 | 1,488 | 10,733 | ||||||||||||
Registration expense | 11,669 | 12,230 | 11,912 | 13,436 | ||||||||||||
Miscellaneous | 5,765 | 6,691 | — | 684 | ||||||||||||
Insurance expense | 4,183 | 5,517 | — | 33 | ||||||||||||
Dividend & interest expense | 35,843 | 24,011 | 248 | 900 | ||||||||||||
Chief Compliance Officer fees | 5,917 | 5,917 | 5,917 | 5,917 | ||||||||||||
|
|
|
|
|
|
|
| |||||||||
Total expenses | 1,461,931 | 1,958,415 | 192,394 | 424,452 | ||||||||||||
Less: fees waived (see Note 3) | (131,767 | ) | (322,888 | ) | (77,437 | ) | (95,692 | ) | ||||||||
|
|
|
|
|
|
|
| |||||||||
Net expenses | 1,330,164 | 1,635,527 | 114,957 | 328,760 | ||||||||||||
|
|
|
|
|
|
|
| |||||||||
Net investment income (loss) | (200,274 | ) | 2,551,735 | 333,028 | (33,663 | ) | ||||||||||
|
|
|
|
|
|
|
| |||||||||
REALIZED AND UNREALIZED GAIN (LOSS) |
| |||||||||||||||
Net realized gain (loss) on: |
| |||||||||||||||
Investments | 16,467,111 | 2,824,685 | 223,997 | (299,505 | ) | |||||||||||
Forward foreign currency exchange contracts | — | 103,684 | — | — | ||||||||||||
Foreign currency transactions | 8,749 | (85,595 | ) | (18,164 | ) | — | ||||||||||
|
|
|
|
|
|
|
| |||||||||
Net realized gain (loss) | 16,475,860 | 2,842,774 | 205,833 | (299,505 | ) | |||||||||||
|
|
|
|
|
|
|
| |||||||||
Net change in unrealized appreciation/depreciation on: |
| |||||||||||||||
Investments | (82,827,284 | ) | (79,733,967 | ) | (4,814,485 | ) | (12,002,915 | ) | ||||||||
Forward foreign currency exchange contracts | — | 17,619 | — | — | ||||||||||||
Foreign currency transactions | (27,892 | ) | (199,676 | ) | (3,890 | ) | — | |||||||||
|
|
|
|
|
|
|
| |||||||||
Net change in unrealized appreciation/depreciation | (82,855,176 | ) | (79,916,024 | ) | (4,818,375 | ) | (12,002,915 | ) | ||||||||
|
|
|
|
|
|
|
| |||||||||
Net realized and unrealized gain (loss) on investments, forward foreign currency exchange contracts, and foreign currency transactions | (66,379,316 | ) | (77,073,250 | ) | (4,612,542 | ) | (12,302,420 | ) | ||||||||
|
|
|
|
|
|
|
| |||||||||
Net decrease in net assets resulting from operations | $ | (66,579,590 | ) | $ | (74,521,515 | ) | $ | (4,279,514 | ) | $ | (12,336,083 | ) | ||||
|
|
|
|
|
|
|
| |||||||||
The accompanying notes are an integral part of these financial statements.
| Statements of Operations | 133 | |||||
Table of Contents
Litman Gregory Funds Trust
STATEMENTS OF OPERATIONS For the Six Months Ended June 30, 2022 – (Unaudited) – (Continued)
| Alternative Strategies Fund | High Income Alternatives Fund | Dolan McEniry Corporate Bond Fund | ||||||||||
INVESTMENT INCOME: |
| |||||||||||
Income |
| |||||||||||
Dividends (net of foreign taxes withheld of $120,655, $0 and $0, respectively) | $ | 3,209,256 | $ | 117,921 | $ | — | ||||||
Interest (net of interest taxes withheld of $0, $273 and $0, respectively) | 28,891,824 | 2,367,053 | 1,071,309 | |||||||||
|
|
|
|
|
| |||||||
Total income | 32,101,080 | 2,484,974 | 1,071,309 | |||||||||
|
|
|
|
|
| |||||||
Expenses |
| |||||||||||
Advisory fees | 10,564,583 | 556,148 | 216,518 | |||||||||
Transfer agent fees | 435,506 | 35,250 | 61,088 | |||||||||
Fund accounting fees | 137,927 | 55,172 | — | |||||||||
Administration fees | 126,209 | 13,617 | 71,690 | |||||||||
Professional fees | 155,226 | 22,223 | 20,196 | |||||||||
Trustee fees | 91,734 | 24,489 | 151,928 | |||||||||
Custody fees | 371,615 | 48,068 | 8,697 | |||||||||
Reports to shareholders | 57,683 | 5,667 | 2,987 | |||||||||
Registration expense | 31,642 | 11,684 | 25,519 | |||||||||
Miscellaneous | 33,458 | 1,154 | — | |||||||||
Insurance expense | 25,978 | 1,417 | 1,926 | |||||||||
Dividend & interest expense | 282,199 | 1,444 | 7,977 | |||||||||
Chief Compliance Officer fees | 5,917 | 5,917 | 5,917 | |||||||||
Distribution fees for investor class (see Note 4) | 87,378 | — | 1 | 2,557 | ||||||||
Service fees for investor class (see Note 5) | — | — | 1,022 | |||||||||
|
|
|
|
|
| |||||||
Total expenses | 12,407,055 | 782,250 | 578,022 | |||||||||
Less: fees waived (see Note 3) | (2,073,676 | ) | (208,537 | ) | (271,318 | ) | ||||||
|
|
|
|
|
| |||||||
Net expenses | 10,333,379 | 573,713 | 306,704 | |||||||||
|
|
|
|
|
| |||||||
Net investment income | 21,767,701 | 1,911,261 | 764,605 | |||||||||
|
|
|
|
|
| |||||||
REALIZED AND UNREALIZED GAIN (LOSS) |
| |||||||||||
Net realized gain (loss) on: |
| |||||||||||
Investments, excluding purchased options | (11,273,405 | ) | 54,294 | (492,909 | ) | |||||||
Purchased options | (503,227 | ) | — | — | ||||||||
Short sales | (6,824,660 | ) | — | — | ||||||||
Written options | 85,216 | (1,586,685 | ) | — | ||||||||
Forward foreign currency exchange contracts | 1,932,227 | 44,816 | — | |||||||||
Foreign currency transactions | (15,607 | ) | (1,195 | ) | — | |||||||
Futures | 13,189,871 | 46,218 | — | |||||||||
Swap contracts | 18,864,636 | (879 | ) | — | ||||||||
|
|
|
|
|
| |||||||
Net realized gain (loss) | 15,455,051 | (1,443,431 | ) | (492,909 | ) | |||||||
|
|
|
|
|
| |||||||
Net change in unrealized appreciation/depreciation on: |
| |||||||||||
Investments, excluding purchased options | (191,768,229 | ) | (10,187,267 | ) | (8,677,341 | ) | ||||||
Purchased options | 26,337 | 5,305 | — | |||||||||
Unfunded loan commitment | — | (11,568 | ) | — | ||||||||
Short sales | 16,265,906 | — | — | |||||||||
Written options | 21,233 | 72,555 | — | |||||||||
Forward foreign currency exchange contracts | 464,140 | (10,552 | ) | — | ||||||||
Foreign currency transactions | (436,095 | ) | 744 | — | ||||||||
Futures | (3,402,463 | ) | 10,765 | — | ||||||||
Swap contracts | 6,497,380 | (20,101 | ) | — | ||||||||
|
|
|
|
|
| |||||||
Net change in unrealized appreciation/depreciation | (172,331,791 | ) | (10,140,119 | ) | (8,677,341 | ) | ||||||
|
|
|
|
|
| |||||||
Net realized and unrealized gain (loss) on investments, purchased options, unfunded loan commitment, short sales, written options, forward foreign currency exchange contracts, foreign currency transactions, futures and swap contracts | (156,876,740 | ) | (11,583,550 | ) | (9,170,250 | ) | ||||||
|
|
|
|
|
| |||||||
Net decrease in net assets resulting from operations | $ | (135,109,039 | ) | $ | (9,672,289 | ) | $ | (8,405,645 | ) | |||
|
|
|
|
|
| |||||||
The accompanying notes are an integral part of these financial statements.
| 134 | Litman Gregory Funds Trust | |||||
Table of Contents
Litman Gregory Funds Trust
STATEMENTS OF OPERATIONS For the Six Months Ended June 30, 2022 – (Unaudited) – (Continued)
| DBi Managed Futures Strategy ETF (Consolidated) | DBi Hedge Strategy ETF | RBA Responsible Global Allocation ETF* | ||||||||||
INVESTMENT INCOME: |
| |||||||||||
Income |
| |||||||||||
Dividends | $ | — | $ | — | $ | 49,872 | ||||||
Interest | 314 | 922 | — | |||||||||
|
|
|
|
|
| |||||||
Total income | 314 | 922 | 49,872 | |||||||||
|
|
|
|
|
| |||||||
Expenses |
| |||||||||||
Advisory fees | 576,359 | 76,026 | 8,352 | |||||||||
Broker interest expense | 27,977 | — | — | |||||||||
|
|
|
|
|
| |||||||
Total expenses | 604,336 | 76,026 | 8,352 | |||||||||
|
|
|
|
|
| |||||||
Net expenses | 604,336 | 76,026 | 8,352 | |||||||||
|
|
|
|
|
| |||||||
Net investment income (loss) | (604,022 | ) | (75,104 | ) | 41,520 | |||||||
|
|
|
|
|
| |||||||
REALIZED AND UNREALIZED GAIN (LOSS) |
| |||||||||||
Net realized gain (loss) on: |
| |||||||||||
Investments | — | — | (140,268 | ) | ||||||||
Futures | 25,058,850 | (864,661 | ) | — | ||||||||
|
|
|
|
|
| |||||||
Net realized gain (loss) | 25,058,850 | (864,661 | ) | (140,268 | ) | |||||||
|
|
|
|
|
| |||||||
Net change in unrealized appreciation/depreciation on: |
| |||||||||||
Investments | 100 | 28 | (580,943 | ) | ||||||||
Futures | (684,873 | ) | (133,996 | ) | — | |||||||
|
|
|
|
|
| |||||||
Net change in unrealized appreciation/depreciation | (684,773 | ) | (133,968 | ) | (580,943 | ) | ||||||
|
|
|
|
|
| |||||||
Net realized and unrealized gain (loss) on investments and futures | 24,374,077 | (998,629 | ) | (721,211 | ) | |||||||
|
|
|
|
|
| |||||||
Net increase (decrease) in net assets resulting from operations | $ | 23,770,055 | $ | (1,073,733 | ) | $ | (679,691 | ) | ||||
|
|
|
|
|
| |||||||
| * | Commenced operations on January 31, 2022. |
The accompanying notes are an integral part of these financial statements.
| Statements of Operations | 135 | |||||
Table of Contents
Litman Gregory Funds Trust
STATEMENTS OF CHANGES IN NET ASSETS June 30, 2022
| Equity Fund | International Fund | |||||||||||||||
| Six Months Ended June 30, 2022# | Year Ended December 31, 2021 | Six Months Ended June 30, 2022# | Year Ended December 31, 2021 | |||||||||||||
INCREASE (DECREASE) IN NET ASSETS FROM: | ||||||||||||||||
OPERATIONS | ||||||||||||||||
Net investment income (loss) | $ | (200,274 | ) | $ | (360,216 | ) | $ | 2,551,735 | $ | 12,411,112 | ||||||
Net realized gain on investments, forward foreign currency exchange contracts, and foreign currency transactions | 16,475,860 | 41,103,031 | 2,842,774 | 61,155,939 | ||||||||||||
Net change in unrealized appreciation/depreciation on investments, forward foreign currency exchange contracts, and foreign currency transactions | (82,855,176 | ) | 3,441,796 | (79,916,024 | ) | (36,470,753 | ) | |||||||||
|
|
|
|
|
|
|
| |||||||||
Net increase (decrease) in net assets resulting from operations | (66,579,590 | ) | 44,184,611 | (74,521,515 | ) | 37,096,298 | ||||||||||
|
|
|
|
|
|
|
| |||||||||
DISTRIBUTIONS TO SHAREHOLDERS | ||||||||||||||||
Institutional Class | — | (38,624,889 | ) | — | (12,424,454 | ) | ||||||||||
|
|
|
|
|
|
|
| |||||||||
Total distributions | — | (38,624,889 | ) | — | (12,424,454 | ) | ||||||||||
|
|
|
|
|
|
|
| |||||||||
CAPITAL SHARE TRANSACTIONS: | ||||||||||||||||
Proceeds from shares sold | ||||||||||||||||
Institutional Class | 335,850 | 2,539,284 | 14,203,112 | 13,412,225 | ||||||||||||
Reinvested distributions |
| |||||||||||||||
Institutional Class | — | 37,117,107 | — | 6,892,434 | ||||||||||||
Payment for shares redeemed |
| |||||||||||||||
Institutional Class | (25,113,767 | ) | (39,403,874 | ) | (29,959,743 | ) | (32,002,752 | ) | ||||||||
|
|
|
|
|
|
|
| |||||||||
Net increase (decrease) in net assets from capital share transactions | (24,777,917 | ) | 252,517 | (15,756,631 | ) | (11,698,093 | ) | |||||||||
|
|
|
|
|
|
|
| |||||||||
Total increase (decrease) in net assets | (91,357,507 | ) | 5,812,239 | (90,278,146 | ) | 12,973,751 | ||||||||||
NET ASSETS: |
| |||||||||||||||
Beginning of period | 260,739,108 | 254,926,869 | 339,716,487 | 326,742,736 | ||||||||||||
|
|
|
|
|
|
|
| |||||||||
End of period | $ | 169,381,601 | $ | 260,739,108 | $ | 249,438,341 | $ | 339,716,487 | ||||||||
|
|
|
|
|
|
|
| |||||||||
CAPITAL TRANSACTIONS IN SHARES |
| |||||||||||||||
Institutional Class: |
| |||||||||||||||
Sold | 20,494 | 122,929 | 816,477 | 682,884 | ||||||||||||
Reinvested distributions | — | 2,016,138 | — | 366,814 | ||||||||||||
Redeemed | (1,521,045 | ) | (1,962,054 | ) | (1,744,046 | ) | (1,651,180 | ) | ||||||||
|
|
|
|
|
|
|
| |||||||||
Net increase (decrease) from capital share transactions | (1,500,551 | ) | 177,013 | (927,569 | ) | (601,482 | ) | |||||||||
|
|
|
|
|
|
|
| |||||||||
| # | Unaudited. |
The accompanying notes are an integral part of these financial statements.
| 136 | Litman Gregory Funds Trust | |||||
Table of Contents
Litman Gregory Funds Trust
STATEMENTS OF CHANGES IN NET ASSETS June 30, 2022 – (Continued)
| Oldfield International Value Fund | SBH Focused Small Value Fund | |||||||||||||||
| Six Months Ended June 30, 2022# | Year Ended December 31, 2021 | Six Months Ended June 30, 2022# | Year Ended December 31, 2021 | |||||||||||||
INCREASE (DECREASE) IN NET ASSETS FROM: |
| |||||||||||||||
OPERATIONS |
| |||||||||||||||
Net investment income (loss) | $ | 333,028 | $ | 478,112 | $ | (33,663 | ) | $ | (23,126 | ) | ||||||
Net realized gain (loss) on investments and foreign currency transactions | 205,833 | 280,610 | (299,505 | ) | 4,226,491 | |||||||||||
Net change in unrealized appreciation/depreciation on investments and foreign currency transactions | (4,818,375 | ) | 876,672 | (12,002,915 | ) | 5,036,195 | ||||||||||
|
|
|
|
|
|
|
| |||||||||
Net increase (decrease) in net assets resulting from operations | (4,279,514 | ) | 1,635,394 | (12,336,083 | ) | 9,239,560 | ||||||||||
|
|
|
|
|
|
|
| |||||||||
DISTRIBUTIONS TO SHAREHOLDERS |
| |||||||||||||||
Institutional Class | — | (725,262 | ) | — | (1,466,176 | ) | ||||||||||
|
|
|
|
|
|
|
| |||||||||
Total distributions | — | (725,262 | ) | — | (1,466,176 | ) | ||||||||||
|
|
|
|
|
|
|
| |||||||||
CAPITAL SHARE TRANSACTIONS: |
| |||||||||||||||
Proceeds from shares sold |
| |||||||||||||||
Institutional Class | 2,275,417 | 15,396,369 | 7,442,839 | 29,293,557 | ||||||||||||
Reinvested distributions |
| |||||||||||||||
Institutional Class | — | 725,262 | — | 1,445,114 | ||||||||||||
Payment for shares redeemed |
| |||||||||||||||
Institutional Class | (2,593,611 | ) | (2,328,101 | ) | (11,071,807 | ) | (9,682,753 | ) | ||||||||
|
|
|
|
|
|
|
| |||||||||
Net increase (decrease) in net assets from capital share transactions | (318,194 | ) | 13,793,530 | (3,628,968 | ) | 21,055,918 | ||||||||||
|
|
|
|
|
|
|
| |||||||||
Total increase (decrease) in net assets | (4,597,708 | ) | 14,703,662 | (15,965,051 | ) | 28,829,302 | ||||||||||
NET ASSETS: |
| |||||||||||||||
Beginning of period | 25,908,498 | 11,204,836 | 65,640,407 | 36,811,105 | ||||||||||||
|
|
|
|
|
|
|
| |||||||||
End of period | $ | 21,310,790 | $ | 25,908,498 | $ | 49,675,356 | $ | 65,640,407 | ||||||||
|
|
|
|
|
|
|
| |||||||||
CAPITAL TRANSACTIONS IN SHARES |
| |||||||||||||||
Institutional Class: |
| |||||||||||||||
Sold | 199,194 | 1,295,726 | 542,588 | 2,084,723 | ||||||||||||
Reinvested distributions | — | 63,675 | — | 100,495 | ||||||||||||
Redeemed | (226,094 | ) | (195,134 | ) | (791,096 | ) | (664,822 | ) | ||||||||
|
|
|
|
|
|
|
| |||||||||
Net increase (decrease) from capital share transactions | (26,900 | ) | 1,164,267 | (248,508 | ) | 1,520,396 | ||||||||||
|
|
|
|
|
|
|
| |||||||||
| # | Unaudited. |
The accompanying notes are an integral part of these financial statements.
| Statements of Changes in Net Assets | 137 | |||||
Table of Contents
Litman Gregory Funds Trust
STATEMENTS OF CHANGES IN NET ASSETS June 30, 2022 – (Continued)
| Alternative Strategies Fund | High Income Alternatives Fund | |||||||||||||||
| Six Months Ended June 30, 2022# | Year Ended December 31, 2021 | Six Months Ended June 30, 2022# | Year Ended December 31, 2021 | |||||||||||||
INCREASE (DECREASE) IN NET ASSETS FROM: |
| |||||||||||||||
OPERATIONS |
| |||||||||||||||
Net investment income | $ | 21,767,701 | $ | 36,011,798 | $ | 1,911,261 | $ | 2,925,802 | ||||||||
Net realized gain (loss) on investments, short sales, purchased options, written options, forward foreign currency exchange contracts, foreign currency transactions, futures and swap contracts | 15,455,051 | 54,835,739 | (1,443,431 | ) | 4,790,136 | |||||||||||
Net change in unrealized appreciation/depreciation on investments, short sales, unfunded loan commitments, purchased options, written options, forward foreign currency exchange contracts, foreign currency transactions, futures and swap contracts | (172,331,791 | ) | (35,584,332 | ) | (10,140,119 | ) | (1,990,030 | ) | ||||||||
|
|
|
|
|
|
|
| |||||||||
Net increase (decrease) in net assets resulting from operations | (135,109,039 | ) | 55,263,205 | (9,672,289 | ) | 5,725,908 | ||||||||||
|
|
|
|
|
|
|
| |||||||||
DISTRIBUTIONS TO SHAREHOLDERS |
| |||||||||||||||
Institutional Class | (20,604,259 | ) | (88,707,336 | ) | (2,083,729 | ) | (5,437,135 | ) | ||||||||
Investor Class | (895,183 | ) | (4,371,661 | ) | — | — | ||||||||||
|
|
|
|
|
|
|
| |||||||||
Total distributions | (21,499,442 | ) | (93,078,997 | ) | (2,083,729 | ) | (5,437,135 | ) | ||||||||
|
|
|
|
|
|
|
| |||||||||
CAPITAL SHARE TRANSACTIONS: |
| |||||||||||||||
Proceeds from shares sold |
| |||||||||||||||
Institutional Class | 215,619,380 | 427,574,664 | 32,633,054 | 33,262,004 | ||||||||||||
Investor Class | 7,687,825 | 21,516,780 | — | — | ||||||||||||
Reinvested distributions |
| |||||||||||||||
Institutional Class | 19,779,526 | 84,597,628 | 2,083,647 | 5,434,225 | ||||||||||||
Investor Class | 887,729 | 4,342,782 | — | — | ||||||||||||
Payment for shares redeemed |
| |||||||||||||||
Institutional Class | (290,500,779 | ) | (380,769,810 | ) | (11,707,753 | ) | (20,193,368 | ) | ||||||||
Investor Class | (13,893,364 | ) | (22,663,967 | ) | — | — | ||||||||||
|
|
|
|
|
|
|
| |||||||||
Net increase (decrease) in net assets from capital share transactions | (60,419,683 | ) | 134,598,077 | 23,008,948 | 18,502,861 | |||||||||||
|
|
|
|
|
|
|
| |||||||||
Total increase (decrease) in net assets | (217,028,164 | ) | 96,782,285 | 11,252,930 | 18,791,634 | |||||||||||
NET ASSETS: |
| |||||||||||||||
Beginning of period | 1,588,069,488 | 1,491,287,203 | 106,659,060 | 87,867,426 | ||||||||||||
|
|
|
|
|
|
|
| |||||||||
End of period | $ | 1,371,041,324 | $ | 1,588,069,488 | $ | 117,911,990 | $ | 106,659,060 | ||||||||
|
|
|
|
|
|
|
| |||||||||
CAPITAL TRANSACTIONS IN SHARES |
| |||||||||||||||
Institutional Class: |
| |||||||||||||||
Sold | 19,070,652 | 34,873,258 | 3,273,508 | 3,200,912 | ||||||||||||
Reinvested distributions | 1,808,623 | 7,125,239 | 214,263 | 525,047 | ||||||||||||
Redeemed | (26,030,650 | ) | (31,138,890 | ) | (1,195,251 | ) | (1,943,439 | ) | ||||||||
|
|
|
|
|
|
|
| |||||||||
Net increase (decrease) from capital share transactions | (5,151,375 | ) | 10,859,607 | 2,292,520 | 1,782,520 | |||||||||||
|
|
|
|
|
|
|
| |||||||||
Investor Class: |
| |||||||||||||||
Sold | 678,458 | 1,749,767 | — | — | ||||||||||||
Reinvested distributions | 81,019 | 364,946 | — | — | ||||||||||||
Redeemed | (1,237,055 | ) | (1,851,930 | ) | — | — | ||||||||||
|
|
|
|
|
|
|
| |||||||||
Net increase (decrease) from capital share transactions | (477,578 | ) | 262,783 | — | — | |||||||||||
|
|
|
|
|
|
|
| |||||||||
| # | Unaudited. |
The accompanying notes are an integral part of these financial statements.
| 138 | Litman Gregory Funds Trust | |||||
Table of Contents
Litman Gregory Funds Trust
STATEMENTS OF CHANGES IN NET ASSETS June 30, 2022 – (Continued)
| Dolan McEniry Corporate Bond Fund | ||||||||
| Six Months Ended June 30, 2022# | Year Ended December 31, 2021 | |||||||
INCREASE (DECREASE) IN NET ASSETS FROM: |
| |||||||
OPERATIONS |
| |||||||
Net investment income | $ | 764,605 | $ | 1,124,445 | ||||
Net realized gain (loss) on investments | (492,909 | ) | 481,350 | |||||
Net change in unrealized appreciation/depreciation on investments | (8,677,341 | ) | (2,336,313 | ) | ||||
|
|
|
| |||||
Net decrease in net assets resulting from operations | (8,405,645 | ) | (730,518 | ) | ||||
|
|
|
| |||||
DISTRIBUTIONS TO SHAREHOLDERS |
| |||||||
Institutional Class | (859,434 | ) | (1,668,015 | ) | ||||
Investor Class | (15,574 | ) | (86,334 | ) | ||||
|
|
|
| |||||
Total distributions | (875,008 | ) | (1,754,349 | ) | ||||
|
|
|
| |||||
CAPITAL SHARE TRANSACTIONS: |
| |||||||
Proceeds from shares sold |
| |||||||
Institutional Class | 17,528,450 | 63,003,335 | ||||||
Investor Class | 37,613 | 886,894 | ||||||
Reinvested distributions |
| |||||||
Institutional Class | 583,688 | 1,182,792 | ||||||
Investor Class | 15,574 | 86,334 | ||||||
Payment for shares redeemed |
| |||||||
Institutional Class | (23,434,077 | ) | (28,693,722 | ) | ||||
Investor Class | (3,717,914 | ) | (1,269,027 | ) | ||||
|
|
|
| |||||
Net increase (decrease) in net assets from capital share transactions | (8,986,666 | ) | 35,196,606 | |||||
|
|
|
| |||||
Total increase (decrease) in net assets | (18,267,319 | ) | 32,711,739 | |||||
NET ASSETS: |
| |||||||
Beginning of period | 96,048,767 | 63,337,028 | ||||||
|
|
|
| |||||
End of period | $ | 77,781,448 | $ | 96,048,767 | ||||
|
|
|
| |||||
CAPITAL TRANSACTIONS IN SHARES |
| |||||||
Institutional Class: |
| |||||||
Sold | 1,726,979 | 5,825,709 | ||||||
Reinvested distributions | 58,411 | 110,295 | ||||||
Redeemed | (2,339,765 | ) | (2,667,818 | ) | ||||
|
|
|
| |||||
Net increase (decrease) from capital share transactions | (554,375 | ) | 3,268,186 | |||||
|
|
|
| |||||
Investor Class: |
| |||||||
Sold | 3,671 | 82,305 | ||||||
Reinvested distributions | 1,548 | 8,064 | ||||||
Redeemed | (358,782 | ) | (118,222 | ) | ||||
|
|
|
| |||||
Net decrease from capital share transactions | (353,563 | ) | (27,853 | ) | ||||
|
|
|
| |||||
| # | Unaudited. |
The accompanying notes are an integral part of these financial statements.
| Statements of Changes in Net Assets | 139 | |||||
Table of Contents
Litman Gregory Funds Trust
STATEMENTS OF CHANGES IN NET ASSETS June 30, 2022 – (Continued)
| DBi Managed Futures Strategy ETF (Consolidated) | DBi Hedge Strategy ETF | |||||||||||||||
| Six Months Ended June 30, 2022# | Year Ended December 31, 2021 | Six Months Ended June 30, 2022# | Year Ended December 31, 2021 | |||||||||||||
INCREASE (DECREASE) IN NET ASSETS FROM: |
| |||||||||||||||
OPERATIONS |
| |||||||||||||||
Net investment loss | $ | (604,022 | ) | $ | (456,166 | ) | $ | (75,104 | ) | $ | (167,562 | ) | ||||
Net realized gain (loss) on futures | 25,058,850 | 3,609,593 | (864,661 | ) | 1,329,824 | |||||||||||
Net change in unrealized appreciation/depreciation on investments, and futures | (684,773 | ) | (142,027 | ) | (133,968 | ) | (170,928 | ) | ||||||||
|
|
|
|
|
|
|
| |||||||||
Net increase (decrease) in net assets resulting from operations | 23,770,055 | 3,011,400 | (1,073,733 | ) | 991,334 | |||||||||||
|
|
|
|
|
|
|
| |||||||||
DISTRIBUTIONS TO SHAREHOLDERS |
| |||||||||||||||
Distributable earnings | — | (3,636,131 | ) | — | (3,008,500 | ) | ||||||||||
Return of capital | — | (2,722,219 | ) | — | — | |||||||||||
|
|
|
|
|
|
|
| |||||||||
Total distributions | — | (6,358,350 | ) | — | (3,008,500 | ) | ||||||||||
|
|
|
|
|
|
|
| |||||||||
CAPITAL SHARE TRANSACTIONS: |
| |||||||||||||||
Proceeds from shares sold | 265,010,350 | 39,419,318 | 5,437,700 | 8,060,273 | ||||||||||||
Payment for shares redeemed | �� | (16,186,728 | ) | (12,146,710 | ) | (5,402,273 | ) | (7,302,015 | ) | |||||||
|
|
|
|
|
|
|
| |||||||||
Net increase in net assets from capital share transactions | 248,823,622 | 27,272,608 | 35,427 | 758,258 | ||||||||||||
|
|
|
|
|
|
|
| |||||||||
Total increase (decrease) in net assets | 272,593,677 | 23,925,658 | (1,038,306 | ) | (1,258,908 | ) | ||||||||||
NET ASSETS: |
| |||||||||||||||
Beginning of period | 60,379,415 | 36,453,757 | 17,260,708 | 18,519,616 | ||||||||||||
|
|
|
|
|
|
|
| |||||||||
End of period | $ | 332,973,092 | $ | 60,379,415 | $ | 16,222,402 | $ | 17,260,708 | ||||||||
|
|
|
|
|
|
|
| |||||||||
CAPITAL TRANSACTIONS IN SHARES |
| |||||||||||||||
Sold | 8,525,000 | 1,400,000 | 200,000 | 250,000 | ||||||||||||
Redeemed | (525,000 | ) | (450,000 | ) | (200,000 | ) | (225,000 | ) | ||||||||
|
|
|
|
|
|
|
| |||||||||
Net increase from capital share transactions | 8,000,000 | 950,000 | — | 25,000 | ||||||||||||
|
|
|
|
|
|
|
| |||||||||
| # | Unaudited. |
The accompanying notes are an integral part of these financial statements.
| 140 | Litman Gregory Funds Trust | |||||
Table of Contents
Litman Gregory Funds Trust
STATEMENTS OF CHANGES IN NET ASSETS June 30, 2022 – (Continued)
| RBA Responsible Global Allocation ETF | ||||
| Period Ended June 30, 2022*# | ||||
INCREASE (DECREASE) IN NET ASSETS FROM: |
| |||
OPERATIONS |
| |||
Net investment income | $ | 41,520 | ||
Net realized loss on investments | (140,268 | ) | ||
Net unrealized appreciation/depreciation on investments | (580,943 | ) | ||
|
| |||
Net decrease in net assets resulting from operations | (679,691 | ) | ||
|
| |||
DISTRIBUTIONS TO SHAREHOLDERS |
| |||
Distributable earnings | (39,111 | ) | ||
|
| |||
Total distributions | (39,111 | ) | ||
|
| |||
CAPITAL SHARE TRANSACTIONS: |
| |||
Proceeds from shares sold | 8,733,403 | |||
|
| |||
Net increase in net assets from capital share transactions | 8,733,403 | |||
|
| |||
Total increase in net assets | 8,014,601 | |||
NET ASSETS: |
| |||
Beginning of period | — | |||
|
| |||
End of period | $ | 8,014,601 | ||
|
| |||
CAPITAL TRANSACTIONS IN SHARES |
| |||
Sold | 900,000 | |||
Redeemed | — | |||
|
| |||
Net increase from capital share transactions | 900,000 | |||
|
| |||
| # | Unaudited. |
| * | Commenced operations on January 31, 2022. |
The accompanying notes are an integral part of these financial statements.
| Statements of Changes in Net Assets | 141 | |||||
Table of Contents
iMGP Equity Fund – Institutional Class
FINANCIAL HIGHLIGHTS
For a capital share outstanding throughout each period
Six Months June 30, 2022# | Year Ended December 31, | |||||||||||||||||||||||
| 2021 | 2020 | 2019 | 2018 | 2017 | ||||||||||||||||||||
Net asset value, beginning of period | $ | 18.80 | $ | 18.62 | $ | 17.54 | $ | 15.02 | $ | 19.10 | $ | 17.02 | ||||||||||||
|
| |||||||||||||||||||||||
Income from investment operations: |
| |||||||||||||||||||||||
Net investment income (loss)1 | (0.02 | ) | (0.03 | ) | (0.05 | ) | 0.08 | 2 | (0.01 | ) | (0.01 | ) | ||||||||||||
Net realized gain (loss) and net change in unrealized appreciation/depreciation on investments and foreign currency | (5.08 | ) | 3.27 | 3.45 | 4.03 | (1.90 | ) | 3.61 | ||||||||||||||||
|
| |||||||||||||||||||||||
Total income (loss) from investment operations | (5.10 | ) | 3.24 | 3.40 | 4.11 | (1.91 | ) | 3.60 | ||||||||||||||||
|
| |||||||||||||||||||||||
Less distributions: |
| |||||||||||||||||||||||
From net investment income | — | — | — | (0.08 | ) | — | — | |||||||||||||||||
From net realized gains | — | (3.06 | ) | (2.32 | ) | (1.51 | ) | (2.17 | ) | (1.52 | ) | |||||||||||||
|
| |||||||||||||||||||||||
Total distributions | — | (3.06 | ) | (2.32 | ) | (1.59 | ) | (2.17 | ) | (1.52 | ) | |||||||||||||
|
| |||||||||||||||||||||||
Net asset value, end of period | $ | 13.70 | $ | 18.80 | $ | 18.62 | $ | 17.54 | $ | 15.02 | $ | 19.10 | ||||||||||||
|
| |||||||||||||||||||||||
Total return | (27.13 | )%+ | 17.75 | % | 19.52 | % | 27.55 | % | (9.91 | )% | 21.15 | % | ||||||||||||
|
| |||||||||||||||||||||||
Ratios/supplemental data: |
| |||||||||||||||||||||||
Net assets, end of period (millions) | $ | 169.4 | $ | 260.7 | $ | 254.9 | $ | 286.3 | $ | 259.8 | $ | 339.5 | ||||||||||||
|
| |||||||||||||||||||||||
Ratios of total expenses to average net assets: | ||||||||||||||||||||||||
Before fees waived | 1.38 | %*,4 | 1.29 | %5 | 1.35 | %5 | 1.35 | %4 | 1.29 | %3 | 1.27 | %3 | ||||||||||||
|
| |||||||||||||||||||||||
After fees waived | 1.26 | %*,4,6 | 1.16 | %5,6 | 1.23 | %5,6 | 1.24 | %4,6 | 1.17 | %3,6 | 1.15 | %3,6 | ||||||||||||
|
| |||||||||||||||||||||||
Ratio of net investment income (loss) to average net assets | (0.19 | )%*,4 | (0.13 | )%5 | (0.29 | )%5 | 0.44 | %2,4 | (0.08 | )%3 | (0.07 | )%3 | ||||||||||||
|
| |||||||||||||||||||||||
Portfolio turnover rate | 13.77 | %+ | 27.74 | % | 56.91 | % | 25.02 | %7 | 41.68 | %7 | 33.49 | %7 | ||||||||||||
|
| |||||||||||||||||||||||
| # | Unaudited. |
| + | Not annualized. |
| * | Annualized. |
| 1 | Calculated based on the average shares outstanding methodology. |
| 2 | Include non-cash distributions amounting to $0.06 per share and 0.33% of average daily net assets. |
| 3 | Includes Interest & Dividend expense of 0.00% of average net assets. |
| 4 | Includes Interest & Dividend expense of 0.03% of average net assets. |
| 5 | Includes Interest & Dividend expense of 0.01% of average net assets. |
| 6 | Includes the impact of the voluntary waiver of less than 0.01% of average net assets. |
| 7 | Portfolio turnover is calculated on the basis of the Fund as a whole without distinguishing between classes of shares issued. |
The accompanying notes are an integral part of these financial statements.
| 142 | Litman Gregory Funds Trust | |||||
Table of Contents
iMGP International Fund – Institutional Class
FINANCIAL HIGHLIGHTS
For a capital share outstanding throughout each period
Six Months June 30, 2022# | Year Ended December 31, | |||||||||||||||||||||||
| 2021 | 2020 | 2019 | 2018 | 2017 | ||||||||||||||||||||
Net asset value, beginning of period | $ | 19.50 | $ | 18.12 | $ | 17.65 | $ | 13.94 | $ | 17.73 | $ | 14.77 | ||||||||||||
|
| |||||||||||||||||||||||
Income from investment operations: |
| |||||||||||||||||||||||
Net investment income1 | 0.15 | 0.71 | 5 | 0.07 | 0.27 | 4 | 0.30 | 3 | 0.20 | 2 | ||||||||||||||
Net realized gain (loss) and net change in unrealized appreciation/depreciation on investments and foreign currency | (4.53 | ) | 1.39 | 0.80 | 3.97 | (3.99 | ) | 3.28 | ||||||||||||||||
|
| |||||||||||||||||||||||
Total income (loss) from investment operations | (4.38 | ) | 2.10 | 0.87 | 4.24 | (3.69 | ) | 3.48 | ||||||||||||||||
|
| |||||||||||||||||||||||
Less distributions: |
| |||||||||||||||||||||||
From net investment income | — | (0.72 | ) | (0.40 | ) | (0.53 | ) | (0.10 | ) | (0.52 | ) | |||||||||||||
From net realized gains | — | — | — | — | — | — | ||||||||||||||||||
|
| |||||||||||||||||||||||
Total distributions | — | (0.72 | ) | (0.40 | ) | (0.53 | ) | (0.10 | ) | (0.52 | ) | |||||||||||||
|
| |||||||||||||||||||||||
Net asset value, end of period | $ | 15.12 | $ | 19.50 | $ | 18.12 | $ | 17.65 | $ | 13.94 | $ | 17.73 | ||||||||||||
|
| |||||||||||||||||||||||
Total return | (22.46 | )%+ | 11.75 | % | 5.02 | % | 30.45 | % | (20.80 | )% | 23.61 | % | ||||||||||||
|
| |||||||||||||||||||||||
Ratios/supplemental data: |
| |||||||||||||||||||||||
Net assets, end of period (millions) | $ | 249.4 | $ | 339.7 | $ | 326.7 | $ | 401.5 | $ | 368.6 | $ | 681.1 | ||||||||||||
|
| |||||||||||||||||||||||
Ratios of total expenses to average net assets: | ||||||||||||||||||||||||
Before fees waived | 1.35 | %*,8 | 1.28 | %7 | 1.39 | %6 | 1.36 | %6 | 1.33 | %6 | 1.26 | %7 | ||||||||||||
|
| |||||||||||||||||||||||
After fees waived | 1.13 | %*,8,9 | 1.05 | %7,9 | 1.15 | %6,9 | 1.12 | %6,9 | 1.09 | %6,9 | 0.98 | %7,9 | ||||||||||||
|
| |||||||||||||||||||||||
Ratio of net investment income to average net assets | 1.76 | %*,8 | 3.63 | %5,7 | 0.49 | %6 | 1.65 | %4,6 | 1.74 | %3,6 | 1.18 | %2,7 | ||||||||||||
|
| |||||||||||||||||||||||
Portfolio turnover rate | 20.76 | %+ | 99.91 | % | 59.61 | % | 45.48 | %10 | 35.15 | %10 | 41.90 | %10 | ||||||||||||
|
| |||||||||||||||||||||||
| # | Unaudited. |
| + | Not annualized. |
| * | Annualized. |
| 1 | Calculated based on the average shares outstanding methodology. |
| 2 | Include non-cash distributions amounting to $0.06 per share and 0.35% of average daily net assets. |
| 3 | Include non-cash distributions amounting to $0.05 per share and 0.29% of average daily net assets. |
| 4 | Include non-cash distributions amounting to $0.10 per share and 0.60% of average daily net assets. |
| 5 | Include non-cash distributions amounting to $0.68 per share and 3.46% of average daily net assets. |
| 6 | Includes Interest & Dividend expense of 0.01% of average net assets. |
| 7 | Includes Interest & Dividend expense of 0.00% of average net assets. |
| 8 | Includes Interest & Dividend expense of 0.02% of average net assets. |
| 9 | Includes the impact of the voluntary waiver of less than 0.01% of average net assets. |
| 10 | Portfolio turnover is calculated on the basis of the Fund as a whole without distinguishing between classes of shares issued. |
The accompanying notes are an integral part of these financial statements.
| Financial Highlights | 143 | |||||
Table of Contents
iMGP Oldfield International Value Fund – Institutional Class
FINANCIAL HIGHLIGHTS
For a capital share outstanding throughout each period
| Six Months Ended June 30, 2022# | Year Ended December 31, 2021 | Period Ended December 31, 2020** | ||||||||||
Net asset value, beginning of period | $ | 11.66 | $ | 10.60 | $ | 10.00 | ||||||
|
| |||||||||||
Income from investment operations: |
| |||||||||||
Net investment income (loss)1 | 0.15 | 0.26 | 2 | (0.01 | ) | |||||||
Net realized gain (loss) and net change in unrealized appreciation/depreciation on investments and foreign currency | (2.10 | ) | 1.13 | 0.61 | ||||||||
|
| |||||||||||
Total income (loss) from investment operations | (1.95 | ) | 1.39 | 0.60 | ||||||||
|
| |||||||||||
Less distributions: |
| |||||||||||
From net investment income | — | (0.22 | ) | — | ||||||||
From net realized gains | — | (0.11 | ) | — | ||||||||
|
| |||||||||||
Total distributions | — | (0.33 | ) | — | ||||||||
|
| |||||||||||
Net asset value, end of period | $ | 9.71 | $ | 11.66 | $ | 10.60 | ||||||
|
| |||||||||||
Total return | (16.72 | )%+ | 13.21 | % | 6.00 | %+ | ||||||
|
| |||||||||||
Ratios/supplemental data: |
| |||||||||||
Net assets, end of period (millions) | $ | 21.3 | $ | 25.9 | $ | 11.2 | ||||||
|
| |||||||||||
Ratios of total expenses to average net assets: | ||||||||||||
Before fees waived | 1.57 | %*,3 | 1.52 | %3 | 5.38 | %* | ||||||
|
| |||||||||||
After fees waived | 0.94 | %*,3,4 | 0.94 | %3,4 | 0.94 | %* | ||||||
|
| |||||||||||
Ratio of net investment income (loss) to average net assets | 2.72 | %*,3 | 2.15 | %2,3 | (0.94 | )%* | ||||||
|
| |||||||||||
Portfolio turnover rate | 8.31 | %+ | 16.31 | % | 2.51 | %+ | ||||||
|
| |||||||||||
| # | Unaudited. |
| + | Not annualized. |
| * | Annualized. |
| ** | Commenced operations on November 30, 2020. |
| 1 | Calculated based on the average shares outstanding methodology. |
| 2 | Include non-cash distributions amounting to $0.02 per share and 0.20% of average daily net assets. |
| 3 | Includes Interest & Dividend expense of 0.00% of average net assets. |
| 4 | Includes the impact of the voluntary waiver of less than 0.01% of average net assets. |
The accompanying notes are an integral part of these financial statements.
| 144 | Litman Gregory Funds Trust | |||||
Table of Contents
iMGP SBH Focused Small Value Fund – Institutional Class
FINANCIAL HIGHLIGHTS
For a capital share outstanding throughout each period
| Six Months Ended June 30, 2022# | Year Ended December 31, 2021 | Period Ended December 31, 2020** | ||||||||||
Net asset value, beginning of period | $ | 14.86 | $ | 12.71 | $ | 10.00 | ||||||
|
| |||||||||||
Income from investment operations: |
| |||||||||||
Net investment income (loss)1 | (0.01 | ) | (0.01 | ) | 0.01 | |||||||
Net realized gain (loss) and net change in unrealized appreciation/depreciation on investments | (2.93 | ) | 2.50 | 2.70 | ||||||||
|
| |||||||||||
Total income (loss) from investment operations | (2.94 | ) | 2.49 | 2.71 | ||||||||
|
| |||||||||||
Less distributions: |
| |||||||||||
From net investment income | — | — | — | |||||||||
From net realized gains | — | (0.34 | ) | — | ||||||||
|
| |||||||||||
Total distributions | — | (0.34 | ) | — | ||||||||
|
| |||||||||||
Net asset value, end of period | $ | 11.92 | $ | 14.86 | $ | 12.71 | ||||||
|
| |||||||||||
Total return | (19.78 | )%+ | 19.66 | % | 27.10 | %+ | ||||||
|
| |||||||||||
Ratios/supplemental data: |
| |||||||||||
Net assets, end of period (millions) | $ | 49.7 | $ | 65.6 | $ | 36.8 | ||||||
|
| |||||||||||
Ratios of total expenses to average net assets: | ||||||||||||
Before fees waived | 1.48 | %*,2 | 1.48 | %2 | 2.11 | %* | ||||||
|
| |||||||||||
After fees waived | 1.15 | %*,2,3 | 1.15 | %2,3 | 1.15 | %* | ||||||
|
| |||||||||||
Ratio of net investment income (loss) to average net assets | (0.12 | )%*,2 | (0.04 | )%2 | 0.23 | %* | ||||||
|
| |||||||||||
Portfolio turnover rate | 12.79 | %+ | 45.15 | % | 27.18 | %+ | ||||||
|
| |||||||||||
| # | Unaudited. |
| + | Not annualized. |
| * | Annualized. |
| ** | Commenced operations on July 31, 2020. |
| 1 | Calculated based on the average shares outstanding methodology. |
| 2 | Includes Interest & Dividend expense of 0.00% of average net assets. |
| 3 | Includes the impact of the voluntary waiver of less than 0.01% of average net assets. |
The accompanying notes are an integral part of these financial statements.
| Financial Highlights | 145 | |||||
Table of Contents
iMGP Alternative Strategies Fund – Institutional Class
FINANCIAL HIGHLIGHTS
For a capital share outstanding throughout each period
Six Months June 30, 2022# | Year Ended December 31, | |||||||||||||||||||||||
| 2021 | 2020 | 2019 | 2018 | 2017 | ||||||||||||||||||||
Net asset value, beginning of period | $ | 11.76 | $ | 12.03 | $ | 11.70 | $ | 11.08 | $ | 11.69 | $ | 11.45 | ||||||||||||
|
| |||||||||||||||||||||||
Income from investment operations: |
| |||||||||||||||||||||||
Net investment income1 | 0.16 | 0.29 | 3 | 0.30 | 0.31 | 2 | 0.26 | 0.26 | ||||||||||||||||
Net realized gain (loss) and net change in unrealized appreciation/depreciation on investments, foreign currency, short sales, options, futures and swap contracts | (1.17 | ) | 0.16 | 0.41 | 0.64 | (0.51 | ) | 0.25 | ||||||||||||||||
|
| |||||||||||||||||||||||
Total income (loss) from investment operations | (1.01 | ) | 0.45 | 0.71 | 0.95 | (0.25 | ) | 0.51 | ||||||||||||||||
|
| |||||||||||||||||||||||
Less distributions: |
| |||||||||||||||||||||||
From net investment income | (0.16 | ) | (0.38 | ) | (0.38 | ) | (0.33 | ) | (0.36 | ) | (0.27 | ) | ||||||||||||
From net realized gains | — | (0.34 | ) | — | — | — | — | |||||||||||||||||
|
| |||||||||||||||||||||||
Total distributions | (0.16 | ) | (0.72 | ) | (0.38 | ) | (0.33 | ) | (0.36 | ) | (0.27 | ) | ||||||||||||
|
| |||||||||||||||||||||||
Net asset value, end of period | $ | 10.59 | $ | 11.76 | $ | 12.03 | $ | 11.70 | $ | 11.08 | $ | 11.69 | ||||||||||||
|
| |||||||||||||||||||||||
Total return | (8.51 | )%+ | 3.82 | % | 6.30 | % | 8.52 | % | (2.08 | )% | 4.51 | % | ||||||||||||
|
| |||||||||||||||||||||||
Ratios/supplemental data: |
| |||||||||||||||||||||||
Net assets, end of period (millions) | $ | 1,308.0 | $ | 1,512.5 | $ | 1,417.1 | $ | 1,724.2 | $ | 1,663.7 | $ | 1,828.1 | ||||||||||||
|
| |||||||||||||||||||||||
Ratios of total expenses to average net assets: | ||||||||||||||||||||||||
Before fees waived | 1.63 | %*,8 | 1.72 | %7 | 1.75 | %7 | 1.63 | %6 | 1.63 | %5 | 1.75 | %4 | ||||||||||||
|
| |||||||||||||||||||||||
After fees waived | 1.36 | %*,8,9 | 1.44 | %7,9 | 1.47 | %7,9 | 1.51 | %6,9 | 1.53 | %5,9 | 1.66 | %4,9 | ||||||||||||
|
| |||||||||||||||||||||||
Ratio of net investment income to average net assets | 2.90 | %*,8 | 2.36 | %3,7 | 2.60 | %7 | 2.70 | %2,6 | 2.26 | %5 | 2.25 | %4 | ||||||||||||
|
| |||||||||||||||||||||||
Portfolio turnover rate10 | 49.30 | %+ | 137.56 | % | 193.98 | % | 190.21 | % | 197.04 | % | 169.34 | % | ||||||||||||
|
| |||||||||||||||||||||||
| # | Unaudited. |
| + | Not annualized. |
| * | Annualized. |
| 1 | Calculated based on the average shares outstanding methodology. |
| 2 | Include non-cash distributions amounting to $0.02 per share and 0.20% of average daily net assets. |
| 3 | Include non-cash distributions amounting to $0.00 per share and 0.00% of average daily net assets. |
| 4 | Includes Interest & Dividend expense of 0.20% of average net assets. |
| 5 | Includes Interest & Dividend expense of 0.07% of average net assets. |
| 6 | Includes Interest & Dividend expense of 0.05% of average net assets. |
| 7 | Includes Interest & Dividend expense of 0.14% of average net assets. |
| 8 | Includes Interest & Dividend expense of 0.04% of average net assets. |
| 9 | Includes the impact of the voluntary waiver of less than 0.01% of average net assets. |
| 10 | Portfolio turnover is calculated on the basis of the Fund as a whole without distinguishing between classes of shares issued. |
The accompanying notes are an integral part of these financial statements.
| 146 | Litman Gregory Funds Trust | |||||
Table of Contents
iMGP Alternative Strategies Fund – Investor Class
FINANCIAL HIGHLIGHTS
For a capital share outstanding throughout each period
Six Months June 30, 2022# | Year Ended December 31, | |||||||||||||||||||||||
| 2021 | 2020 | 2019 | 2018 | 2017 | ||||||||||||||||||||
Net asset value, beginning of period | $ | 11.79 | $ | 12.06 | $ | 11.71 | $ | 11.10 | $ | 11.70 | $ | 11.46 | ||||||||||||
|
| |||||||||||||||||||||||
Income from investment operations: |
| |||||||||||||||||||||||
Net investment income1 | 0.15 | 0.26 | 3 | 0.27 | 0.28 | 2 | 0.23 | 0.23 | ||||||||||||||||
Net realized gain (loss) and net change in unrealized appreciation/depreciation on investments, foreign currency, short sales, options, futures and swap contracts | (1.17 | ) | 0.16 | 0.42 | 0.63 | (0.50 | ) | 0.25 | ||||||||||||||||
|
| |||||||||||||||||||||||
Total income (loss) from investment operations | (1.02 | ) | 0.42 | 0.69 | 0.91 | (0.27 | ) | 0.48 | ||||||||||||||||
|
| |||||||||||||||||||||||
Less distributions: |
| |||||||||||||||||||||||
From net investment income | (0.15 | ) | (0.35 | ) | (0.34 | ) | (0.30 | ) | (0.33 | ) | (0.24 | ) | ||||||||||||
From net realized gains | — | (0.34 | ) | — | — | — | — | |||||||||||||||||
|
| |||||||||||||||||||||||
Total distributions | (0.15 | ) | (0.69 | ) | (0.34 | ) | (0.30 | ) | (0.33 | ) | (0.24 | ) | ||||||||||||
|
| |||||||||||||||||||||||
Net asset value, end of period | $ | 10.62 | $ | 11.79 | $ | 12.06 | $ | 11.71 | $ | 11.10 | $ | 11.70 | ||||||||||||
|
| |||||||||||||||||||||||
Total return | (8.62 | )%+ | 3.54 | % | 6.06 | % | 8.22 | % | (2.32 | )% | 4.14 | % | ||||||||||||
|
| |||||||||||||||||||||||
Ratios/supplemental data: |
| |||||||||||||||||||||||
Net assets, end of period (millions) | $ | 63.1 | $ | 75.6 | $ | 74.2 | $ | 144.1 | $ | 175.3 | $ | 206.0 | ||||||||||||
|
| |||||||||||||||||||||||
Ratios of total expenses to average net assets: | ||||||||||||||||||||||||
Before fees waived | 1.88 | %*,8 | 1.97 | %7 | 1.99 | %7 | 1.88 | %6 | 1.88 | %5 | 2.00 | %4 | ||||||||||||
|
| |||||||||||||||||||||||
After fees waived | 1.61 | %*,8,9 | 1.69 | %7,9 | 1.71 | %7,9 | 1.76 | %6,9 | 1.78 | %5,9 | 1.90 | %4,9 | ||||||||||||
|
| |||||||||||||||||||||||
Ratio of net investment income to average net assets | 2.64 | %*,8 | 2.11 | %3,7 | 2.36 | %7 | 2.44 | %2,6 | 2.01 | %5 | 2.01 | %4 | ||||||||||||
|
| |||||||||||||||||||||||
Portfolio turnover rate10 | 49.30 | %+ | 137.56 | % | 193.98 | % | 190.21 | % | 197.04 | % | 169.34 | % | ||||||||||||
|
| |||||||||||||||||||||||
| # | Unaudited. |
| + | Not annualized. |
| * | Annualized. |
| 1 | Calculated based on the average shares outstanding methodology. |
| 2 | Include non-cash distributions amounting to $0.02 per share and 0.20% of average daily net assets. |
| 3 | Include non-cash distributions amounting to $0.00 per share and 0.00% of average daily net assets. |
| 4 | Includes Interest & Dividend expense of 0.20% of average net assets. |
| 5 | Includes Interest & Dividend expense of 0.07% of average net assets. |
| 6 | Includes Interest & Dividend expense of 0.05% of average net assets. |
| 7 | Includes Interest & Dividend expense of 0.14% of average net assets. |
| 8 | Includes Interest & Dividend expense of 0.04% of average net assets. |
| 9 | Includes the impact of the voluntary waiver of less than 0.01% of average net assets. |
| 10 | Portfolio turnover is calculated on the basis of the Fund as a whole without distinguishing between classes of shares issued. |
The accompanying notes are an integral part of these financial statements.
| Financial Highlights | 147 | |||||
Table of Contents
iMGP High Income Alternatives Fund – Institutional Class
FINANCIAL HIGHLIGHTS
For a capital share outstanding throughout each period
| Six Months Ended June 30, 2022# | Year Ended December 31, | Period Ended December 31, 2018** | ||||||||||||||||||
| 2021 | 2020 | 2019 | ||||||||||||||||||
Net asset value, beginning of period | $ | 10.27 | $ | 10.21 | $ | 10.06 | $ | 9.63 | $ | 10.00 | ||||||||||
|
| |||||||||||||||||||
Income from investment operations: |
| |||||||||||||||||||
Net investment income1 | 0.16 | 0.32 | 2 | 0.37 | 0.36 | 0.07 | ||||||||||||||
Net realized gain (loss) and net change in unrealized appreciation/depreciation on investments, foreign currency, options, futures and swap contracts | (0.96 | ) | 0.33 | 0.16 | 0.44 | (0.38 | ) | |||||||||||||
|
| |||||||||||||||||||
Total income (loss) from investment operations | (0.80 | ) | 0.65 | 0.53 | 0.80 | (0.31 | ) | |||||||||||||
|
| |||||||||||||||||||
Less distributions: |
| |||||||||||||||||||
From net investment income | (0.15 | ) | (0.34 | ) | (0.37 | ) | (0.33 | ) | (0.06 | ) | ||||||||||
From net realized gains | (0.02 | ) | (0.25 | ) | (0.01 | ) | (0.04 | ) | — | |||||||||||
|
| |||||||||||||||||||
Total distributions | (0.17 | ) | (0.59 | ) | (0.38 | ) | (0.37 | ) | (0.06 | ) | ||||||||||
|
| |||||||||||||||||||
Net asset value, end of period | $ | 9.30 | $ | 10.27 | $ | 10.21 | $ | 10.06 | $ | 9.63 | ||||||||||
|
| |||||||||||||||||||
Total return | (7.85 | )%+ | 6.42 | % | 5.62 | % | 8.37 | % | (3.08 | )%+ | ||||||||||
|
| |||||||||||||||||||
Ratios/supplemental data: |
| |||||||||||||||||||
Net assets, end of period (millions) | $ | 117.9 | $ | 106.7 | $ | 87.9 | $ | 93.8 | $ | 77.2 | ||||||||||
|
| |||||||||||||||||||
Ratios of total expenses to average net assets: | ||||||||||||||||||||
Before fees waived | 1.34 | %*,3 | 1.44 | %5 | 1.72 | %4 | 1.39 | %3 | 1.34 | %* | ||||||||||
|
| |||||||||||||||||||
After fees waived | 0.98 | %*,3,6 | 0.98 | %5,6 | 1.00 | %4,6 | 0.98 | %3,6 | 0.98 | %*,6 | ||||||||||
|
| |||||||||||||||||||
Ratio of net investment income to average net assets | 3.26 | %*,3 | 3.11 | %2,5 | 3.83 | %4 | 3.56 | %3 | 2.89 | %* | ||||||||||
|
| |||||||||||||||||||
Portfolio turnover rate | 8.78 | %+ | 72.02 | % | 87.63 | % | 90.51 | %7 | 125.92 | %+,7 | ||||||||||
|
| |||||||||||||||||||
| # | Unaudited. |
| + | Not annualized. |
| * | Annualized. |
| ** | Commenced operations on September 28, 2018. |
| 1 | Calculated based on the average shares outstanding methodology. |
| 2 | Include non-cash distributions amounting to $0.00 per share and 0.00% of average daily net assets. |
| 3 | Includes Interest & Dividend expense of 0.00% of average net assets. |
| 4 | Includes Interest & Dividend expense of 0.02% of average net assets. |
| 5 | Includes Interest & Dividend expense of 0.01% of average net assets. |
| 6 | Includes the impact of the voluntary waiver of less than 0.01% of average net assets. |
| 7 | Portfolio turnover is calculated on the basis of the Fund as a whole without distinguishing between classes of shares issued. |
The accompanying notes are an integral part of these financial statements.
| 148 | Litman Gregory Funds Trust | |||||
Table of Contents
iMGP Dolan McEniry Corporate Bond Fund – Institutional Class
FINANCIAL HIGHLIGHTS
For a capital share outstanding throughout each period
| Six Months Ended June 30, 2022# | Year Ended December 31, | September 28, 2018** through December 31, 2018 | ||||||||||||||||||
| 2021 | 2020 | 2019 | ||||||||||||||||||
Net asset value, beginning of period | $ | 10.62 | $ | 10.92 | $ | 10.61 | $ | 9.83 | $ | 10.00 | ||||||||||
|
| |||||||||||||||||||
Income from investment operations: |
| |||||||||||||||||||
Net investment income1 | 0.09 | 0.14 | 0.22 | 0.30 | 0.09 | |||||||||||||||
Net realized gain (loss) and net change in unrealized appreciation/depreciation on investments | (1.05 | ) | (0.23 | ) | 0.36 | 0.79 | (0.17 | ) | ||||||||||||
|
| |||||||||||||||||||
Total income (loss) from investment operations | (0.96 | ) | (0.09 | ) | 0.58 | 1.09 | (0.08 | ) | ||||||||||||
|
| |||||||||||||||||||
Less distributions: |
| |||||||||||||||||||
From net investment income | (0.10 | ) | (0.15 | ) | (0.24 | ) | (0.30 | ) | (0.09 | ) | ||||||||||
From net realized gains | — | (0.06 | ) | (0.03 | ) | (0.01 | ) | — | ||||||||||||
|
| |||||||||||||||||||
Total distributions | (0.10 | ) | (0.21 | ) | (0.27 | ) | (0.31 | ) | (0.09 | ) | ||||||||||
|
| |||||||||||||||||||
Net asset value, end of period | $ | 9.56 | $ | 10.62 | $ | 10.92 | $ | 10.61 | $ | 9.83 | ||||||||||
|
| |||||||||||||||||||
Total return | (9.06 | )%+ | (0.86 | )% | 5.50 | % | 11.25 | % | (0.77 | )%+ | ||||||||||
|
| |||||||||||||||||||
Ratios/supplemental data: |
| |||||||||||||||||||
Net assets, end of period (thousands) | $ | 76,457 | $ | 90,827 | $ | 57,666 | $ | 13,066 | $ | 2,099 | ||||||||||
|
| |||||||||||||||||||
Ratios of total expenses to average net assets: | ||||||||||||||||||||
Before fees waived | 1.33 | %*,2 | 0.96 | %2 | 1.34 | % | 4.36 | % | 13.94 | %* | ||||||||||
|
| |||||||||||||||||||
After fees waived | 0.70 | %*,2 | 0.70 | %2 | 0.70 | % | 0.70 | % | 0.70 | %* | ||||||||||
|
| |||||||||||||||||||
Ratio of net investment income to average net assets | 1.78 | %*,2 | 1.28 | %2 | 2.07 | % | 2.83 | % | 3.70 | %* | ||||||||||
|
| |||||||||||||||||||
Portfolio turnover rate3 | 6.63 | %+ | 32.65 | % | 40.00 | % | 16.00 | % | 0.00 | %+ | ||||||||||
|
| |||||||||||||||||||
| # | Unaudited. |
| + | Not annualized. |
| * | Annualized. |
| ** | Commencement of operations for Institutional Shares was September 28, 2018. |
| 1 | Calculated based on the average shares outstanding methodology. |
| 2 | Includes Interest & Dividend expense of 0.02% of average net assets. |
| 3 | Portfolio turnover is calculated on the basis of the Fund as a whole without distinguishing between classes of shares issued. |
The accompanying notes are an integral part of these financial statements.
| Financial Highlights | 149 | |||||
Table of Contents
iMGP Dolan McEniry Corporate Bond Fund – Investor Class
FINANCIAL HIGHLIGHTS
For a capital share outstanding throughout each period
| Six Months Ended June 30, 2022# | Year Ended December 31, | May 17, 2019** through December 31, 2019 | ||||||||||||||
| 2021 | 2020 | |||||||||||||||
Net asset value, beginning of period | $ | 10.61 | $ | 10.91 | $ | 10.60 | $ | 10.26 | ||||||||
|
| |||||||||||||||
Income from investment operations: |
| |||||||||||||||
Net investment income1 | 0.06 | 0.10 | 0.20 | 0.15 | ||||||||||||
Net realized gain (loss) and net change in unrealized appreciation/depreciation on investments | (1.03 | ) | (0.23 | ) | 0.34 | 0.36 | ||||||||||
|
| |||||||||||||||
Total income (loss) from investment operations | (0.97 | ) | (0.13 | ) | 0.54 | 0.51 | ||||||||||
|
| |||||||||||||||
Less distributions: |
| |||||||||||||||
From net investment income | (0.08 | ) | (0.11 | ) | (0.20 | ) | (0.16 | ) | ||||||||
From net realized gains | — | (0.06 | ) | (0.03 | ) | (0.01 | ) | |||||||||
|
| |||||||||||||||
Total distributions | (0.08 | ) | (0.17 | ) | (0.23 | ) | (0.17 | ) | ||||||||
|
| |||||||||||||||
Net asset value, end of period | $ | 9.56 | $ | 10.61 | $ | 10.91 | $ | 10.60 | ||||||||
|
| |||||||||||||||
Total return | (9.14 | )%+ | (1.21 | )% | 5.13 | % | 4.96 | %+ | ||||||||
|
| |||||||||||||||
Ratios/supplemental data: |
| |||||||||||||||
Net assets, end of period (thousands) | $ | 1,325 | $ | 5,222 | $ | 5,672 | $ | 3,058 | ||||||||
|
| |||||||||||||||
Ratios of total expenses to average net assets: | ||||||||||||||||
Before fees waived | 1.62 | %*,2 | 1.31 | %2 | 1.78 | % | 3.49 | %* | ||||||||
|
| |||||||||||||||
After fees waived | 1.05 | %*,2 | 1.05 | %2 | 1.05 | % | 1.05 | %* | ||||||||
|
| |||||||||||||||
Ratio of net investment income to average net assets | 1.26 | %*,2 | 0.92 | %2 | 1.86 | % | 2.24 | %* | ||||||||
|
| |||||||||||||||
Portfolio turnover rate3 | 6.63 | %+ | 32.65 | % | 40.00 | % | 16.00 | %+ | ||||||||
|
| |||||||||||||||
| # | Unaudited. |
| + | Not annualized. |
| * | Annualized. |
| ** | Commencement of operations for Advisor Shares was May 17, 2019. |
| 1 | Calculated based on the average shares outstanding methodology. |
| 2 | Includes Interest & Dividend expense of 0.02% of average net assets. |
| 3 | Portfolio turnover is calculated on the basis of the Fund as a whole without distinguishing between classes of shares issued. |
The accompanying notes are an integral part of these financial statements.
| 150 | Litman Gregory Funds Trust | |||||
Table of Contents
iMGP DBi Managed Futures Strategy ETF
CONSOLIDATED FINANCIAL HIGHLIGHTS
For a capital share outstanding throughout each period
| Six Months Ended June 30, 2022# | Year Ended December 31, | May 7, 2019** through December 31, 2019 | ||||||||||||||
| 2021 | 2020 | |||||||||||||||
Net asset value, beginning of period | $ | 25.42 | $ | 25.58 | $ | 25.34 | $ | 25.00 | ||||||||
|
| |||||||||||||||
Income from investment operations: |
| |||||||||||||||
Net investment income (loss)1 | (0.13 | ) | (0.26 | ) | (0.14 | ) | 0.15 | |||||||||
Net realized gain (loss) and net change in unrealized appreciation/depreciation on investments and futures contracts | 6.80 | 2.78 | 0.60 | 2.55 | ||||||||||||
|
| |||||||||||||||
Total income from investment operations | 6.67 | 2.52 | 0.46 | 2.70 | ||||||||||||
|
| |||||||||||||||
Less distributions: |
| |||||||||||||||
From net investment income | — | (0.35 | ) | (0.02 | ) | (0.11 | ) | |||||||||
From net realized gains | — | (1.18 | ) | (0.20 | ) | (2.25 | ) | |||||||||
Return of capital | — | (1.15 | ) | — | — | |||||||||||
|
| |||||||||||||||
Total distributions | — | (2.68 | ) | (0.22 | ) | (2.36 | ) | |||||||||
|
| |||||||||||||||
Net asset value, end of period | $ | 32.09 | $ | 25.42 | $ | 25.58 | $ | 25.34 | ||||||||
|
| |||||||||||||||
Market price, end of period | $ | 32.40 | $ | 25.80 | $ | 25.56 | $ | 25.33 | ||||||||
|
| |||||||||||||||
Net asset value total return | 26.24 | %+ | 9.80 | % | 1.84 | % | 10.76 | %+ | ||||||||
|
| |||||||||||||||
Market price total return | 25.60 | %+ | 11.38 | % | 1.79 | % | — | % | ||||||||
|
| |||||||||||||||
Ratios/supplemental data: | ||||||||||||||||
Net assets, end of period (thousands) | $ | 332,973 | $ | 60,379 | $ | 36,454 | $ | 18,369 | ||||||||
|
| |||||||||||||||
Ratios of total expenses to average net assets: | ||||||||||||||||
Before fees waived | 0.89 | %*,3 | 0.95 | %2 | 0.85 | % | 0.85 | %* | ||||||||
|
| |||||||||||||||
After fees waived | 0.89 | %*,3 | 0.95 | %2 | 0.85 | % | 0.85 | %* | ||||||||
|
| |||||||||||||||
Ratio of net investment income (loss) to average net assets | (0.89 | )%*,3 | (0.93 | )%2 | (0.55 | )% | 0.84 | %* | ||||||||
|
| |||||||||||||||
Portfolio turnover rate | 0.00 | %+ | 0.00 | % | 0.00 | % | 0.00 | %+ | ||||||||
|
| |||||||||||||||
| # | Unaudited. |
| + | Not annualized. |
| * | Annualized. |
| ** | Commencement of operations was May 7, 2019. |
| 1 | Calculated based on the average shares outstanding methodology. |
| 2 | Includes broker interest expense of 0.10% of average net assets. |
| 3 | Includes broker interest expense of 0.04% of average net assets. |
The accompanying notes are an integral part of these financial statements.
| Financial Highlights | 151 | |||||
Table of Contents
FINANCIAL HIGHLIGHTS
For a capital share outstanding throughout each period
| Six Months Ended June 30, 2022# | Year Ended December 31, | December 17, 2019** through December 31, 2019 | ||||||||||||||
| 2021 | 2020 | |||||||||||||||
Net asset value, beginning of period | $ | 27.62 | $ | 30.87 | $ | 25.00 | $ | 25.00 | ||||||||
|
| |||||||||||||||
Income from investment operations: |
| |||||||||||||||
Net investment income (loss)1 | (0.11 | ) | (0.27 | ) | (0.12 | ) | 0.00 | ^ | ||||||||
Net realized gain (loss) and net change in unrealized appreciation/depreciation on investments and futures contracts | (1.55 | ) | 1.83 | 6.01 | 0.00 | ^ | ||||||||||
|
| |||||||||||||||
Total income (loss) from investment operations | (1.66 | ) | 1.56 | 5.89 | 0.00 | |||||||||||
|
| |||||||||||||||
Less distributions: |
| |||||||||||||||
From net investment income | — | — | (0.02 | ) | (0.00 | )^ | ||||||||||
From net realized gains | — | (4.81 | ) | — | — | |||||||||||
|
| |||||||||||||||
Total distributions | — | (4.81 | ) | (0.02 | ) | (0.00 | ) | |||||||||
|
| |||||||||||||||
Net asset value, end of period | $ | 25.96 | $ | 27.62 | $ | 30.87 | $ | 25.00 | ||||||||
|
| |||||||||||||||
Market price, end of period | $ | 25.94 | $ | 27.61 | $ | 30.86 | $ | 25.03 | ||||||||
|
| |||||||||||||||
Net asset value total return | (6.02 | )%+ | 5.05 | % | 23.58 | % | 0.01 | %+ | ||||||||
|
| |||||||||||||||
Market price total return | (6.07 | )%+ | 4.92 | % | 23.42 | % | — | % | ||||||||
|
| |||||||||||||||
Ratios/supplemental data: |
| |||||||||||||||
Net assets, end of period (thousands) | $ | 16,222 | $ | 17,261 | $ | 18,520 | $ | 16,250 | ||||||||
|
| |||||||||||||||
Ratios of total expenses to average net assets: | ||||||||||||||||
Before fees waived | 0.85 | %* | 0.85 | % | 0.85 | % | 0.85 | %* | ||||||||
|
| |||||||||||||||
After fees waived | 0.85 | %* | 0.85 | % | 0.85 | % | 0.85 | %* | ||||||||
|
| |||||||||||||||
Ratio of net investment income (loss) to average net assets | (0.84 | )%* | (0.83 | )% | (0.47 | )% | 0.48 | %* | ||||||||
|
| |||||||||||||||
Portfolio turnover rate | 0.00 | %+ | 0.00 | % | 0.00 | % | 0.00 | %+ | ||||||||
|
| |||||||||||||||
| # | Unaudited. |
| + | Not annualized. |
| * | Annualized. |
| ** | Commencement of operations was December 17, 2019. |
| ^ | Amount represents less than $0.01 per share. |
| 1 | Calculated based on the average shares outstanding methodology. |
The accompanying notes are an integral part of these financial statements.
| 152 | Litman Gregory Funds Trust | |||||
Table of Contents
iMGP RBA Responsible Global Allocation ETF
FINANCIAL HIGHLIGHTS
For a capital share outstanding throughout the period
| Period Ended June 30, 2022**# | ||||
Net asset value, beginning of period | $ | 10.12 | ||
|
| |||
Income from investment operations: | ||||
Net investment income1 | 0.10 | |||
Net realized gain (loss) and net change in unrealized appreciation/depreciation on investments | (1.27 | ) | ||
|
| |||
Total loss from investment operations | (1.17 | ) | ||
|
| |||
Less distributions: | ||||
From net investment income | (0.04 | ) | ||
From net realized gains | — | |||
|
| |||
Total distributions | (0.04 | ) | ||
|
| |||
Net asset value, end of period | $ | 8.91 | ||
|
| |||
Market price, end of period | $ | 8.89 | ||
|
| |||
Net asset value total return | (11.61 | )%+ | ||
|
| |||
Market price total return | (11.72 | )%+ | ||
|
| |||
Ratios/supplemental data: | ||||
Net assets, end of period (thousands) | $ | 8,015 | ||
|
| |||
Ratios of total expenses to average net assets: | ||||
Before fees waived2 | 0.55 | %* | ||
|
| |||
After fees waived2 | 0.55 | %* | ||
|
| |||
Ratio of net investment income to average net assets | 2.72 | %* | ||
|
| |||
Portfolio turnover rate | 39.09 | %+ | ||
|
| |||
| # | Unaudited. |
| + | Not annualized. |
| * | Annualized. |
| ** | Commenced operations on January 31, 2022. |
| 1 | Calculated based on the average shares outstanding methodology. |
| 2 | The Fund invests in other funds and indirectly bears its proportionate shares of fees and expenses incurred by the underlying funds in which the Fund is invested. This ratio does not include these indirect fees and expenses. |
The accompanying notes are an integral part of these financial statements.
| Financial Highlights | 153 | |||||
Table of Contents
Litman Gregory Funds Trust
NOTES TO FINANCIAL STATEMENTS – (Unaudited)
Note 1 – Organization
Litman Gregory Funds Trust (the “Trust”) was organized as a Delaware business trust on August 1, 1996, and is registered under the Investment Company Act of 1940 (the “1940 Act”) as an open-end management investment company. Effective August 1, 2011, The Masters’ Select Funds Trust changed its name to the Litman Gregory Funds Trust. The Trust consists of ten separate series: iMGP Equity Fund (formerly PartnerSelect Equity Fund), iMGP International Fund (formerly PartnerSelect International Fund), iMGP Oldfield International Value Fund (formerly PartnerSelect Oldfield International Value Fund), iMGP SBH Focused Small Value Fund (formerly PartnerSelect SBH Focused Small Value Fund), iMGP Alternative Strategies Fund (formerly PartnerSelect Alternative Strategies Fund), iMGP High Income Alternatives Fund (formerly PartnerSelect High Income Alternatives Fund), iMGP Dolan McEniry Corporate Bond Fund (formerly, iM Dolan McEniry Corporate Bond Fund), iMGP DBi Managed Futures Strategy ETF (formerly iM DBi Managed Futures Strategy ETF), iMGP DBi Hedge Strategy ETF (formerly iM DBi Hedge Strategy ETF), and iMGP RBA Responsible Global Allocation ETF (commenced operations on January 31, 2022). Each Fund, except for iMGP DBi Managed Futures Strategy ETF and iMGP DBi Hedge Strategy ETF, is diversified.
iMGP Equity Fund (“Equity Fund”) seeks to increase the value of an investment in the Fund over the long-term by using the combined talents and favorite stock-picking ideas of three highly regarded portfolio managers (each “Managers” or “Sub-Advisors”). The Equity Fund offers one class of shares: Institutional Class.
iMGP International Fund (“International Fund”) seeks to increase the value of an investment in the Fund over the long-term by using the combined talents and favorite stock-picking ideas of three highly regarded international portfolio managers. The International Fund offers one class of shares: Institutional Class.
iMGP Oldfield International Value Fund (“Oldfield International Value Fund”) seeks long-term growth of capital; that is, the increase in the value of an investment in the Fund over the long-term by using the talents and favorite stock-picking ideas of an experienced, high quality portfolio manager. The Oldfield International Value Fund offers one class of shares: Institutional Class.
iMGP SBH Focused Small Value Fund (“SBH Focused Small Value Fund”) seeks long-term growth of capital; that is, the increase in the value of an investment in the Fund over the long-term by engaging an experienced, high quality portfolio manager with favorite stock-picking ideas that can deliver a portfolio that is prudently diversified in terms of stocks and industries. The SBH Focused Small Value Fund offers one class of shares: Institutional Class.
iMGP Alternative Strategies Fund (“Alternative Strategies Fund”) seeks to achieve long-term returns with lower risk and lower volatility than the stock market, and with relatively low correlation to stock and bond market indexes by using the combined talents and favorite stock and bond market indexes-picking ideas of five highly regarded portfolio managers. The Alternative Strategies Fund offers two classes of shares: Institutional Class and Investor Class shares. The Investor Class shares charge a 0.25% 12b-1 distribution fee to the shareholders of this class (see Note 4).
iMGP High Income Alternatives Fund (“High Income Alternatives Fund”) seeks to generate a high level of current income from diverse sources, consistent with capital preservation over time, with capital appreciation a secondary objective, by using the combined talents and favorite stock and bond market indexes-picking ideas of three highly regarded portfolio managers. The High Income Alternatives Fund offers one class of shares: Institutional Class.
iMGP Dolan McEniry Corporate Bond Fund (“Dolan McEniry Corporate Bond Fund”) seeks to provide investors with total return, with a secondary investment objective of preserving capital by investing in a diversified portfolio of corporate investment grade bonds, corporate high yield bonds, and U.S. Government and Treasury securities maturing within 10 years or less. The Dolan McEniry Corporate Bond Fund offers two classes of shares: Institutional Class and Investor Class. The Investor Class shares charge a 0.25% 12b-1 distribution fee to shareholders of this class (see Note 4).
iMGP DBi Managed Futures Strategy ETF (“DBi Managed Futures Strategy ETF”) seeks long term capital appreciation. The DBi Managed Futures Strategy ETF is a non-diversified, actively-managed exchange-traded fund (“ETF”) that seeks to achieve its objective by: (i) investing its assets pursuant to a managed futures strategy; (ii) allocating up to 20% of its total assets in its wholly-owned subsidiary, which is organized under the laws of the Cayman Islands, is advised by the sub-advisor, and will comply with the DBi Managed Futures Strategy ETF’s investment objective and investment policies; and (iii) investing directly in select debt instruments for cash management and other purposes. Shares of the Fund are listed and traded on the New York Stock Exchange Arca.
iMGP DBi Hedge Strategy ETF (“DBi Hedge Strategy ETF”) seeks long-term capital appreciation. The DBi Hedge Strategy ETF is a non-diversified, actively-managed ETF that seeks to achieve its objective by: (i) investing its assets pursuant to an equity hedge strategy and (ii) allocating the remainder of its assets directly in a portfolio of investment grade debt securities to collateralize its derivatives investments, for liquidity purposes, or to enhance yield. Shares of the Fund are listed and traded on the New York Stock Exchange Arca.
iMGP RBA Responsible Global Allocation ETF (“RBA Responsible Global Allocation ETF”) seeks long-term capital appreciation. The RBA Responsible Global Allocation ETF is an active-managed ETF that seeks to achieve its objective by investing its assets in a portfolio of exchange-traded vehicles that provide exposure to asset classes in various regions, countries, and sectors around the globe.
| 154 | Litman Gregory Funds Trust | |||||
Table of Contents
Litman Gregory Funds Trust
NOTES TO FINANCIAL STATEMENTS – (Unaudited) – (Continued)
Note 2 – Significant Accounting Policies
The following is a summary of the significant accounting policies followed by the Funds. These policies are in conformity with accounting principles generally accepted in the United States of America (“GAAP”).
| A | Accounting Estimates. The preparation of financial statements in conformity with GAAP requires management to make estimates and assumptions. These estimates and assumptions affect the reported amounts of assets and liabilities and the disclosure of contingent assets and liabilities at the date of financial statements and the reported amounts of increases and decreases in net assets from operations during the reporting period. Actual results could differ from those estimates. |
The Funds are investment companies and accordingly follow the investment company accounting and reporting guidance of the Financial Accounting Standards Board (FASB) Accounting Standard Codification Topic 946 Financial Services – Investment Companies.
| B | Security Valuation. The Funds record their investments at fair value. Fair value is defined as the price that would be received to sell an asset or paid to transfer a liability in an orderly transaction between market participants at the measurement date. The valuation techniques used to determine fair value are further described below. Investments in securities and derivatives traded on a national securities exchange are valued at the last reported sales price at the close of regular trading on each day that the exchanges are open for trading. Securities listed on the NASDAQ Global Market, the NASDAQ Global Select Market and the NASDAQ Capital Market are valued using the NASDAQ Official Closing Price. Securities traded on an exchange for which there have been no sales are valued at the mean between the closing bid and asked prices. Debt securities maturing within 60 days or less are valued at amortized cost unless the Valuation Committee determines that amortized cost does not represent fair value. Securities for which market prices are not readily available or if a security’s value has materially changed after the close of the security’s primary market but before the close of trading on the New York Stock Exchange (“NYSE”), the securities are valued at fair value as determined in good faith by the Managers that selected the security for the Funds’ portfolio and the Trust’s Valuation Committee in accordance with procedures approved by the Board of Trustees (the “Board”). In determining fair value, the Funds take into account all relevant factors and available information. Consequently, the price of the security used by a Fund to calculate its net asset value may differ from quoted or published prices for the same security. Fair value pricing involves subjective judgments and there is no single standard for determining the fair value of a security. As a result, different mutual funds could reasonably arrive at a different value for the same security. For securities that do not trade during NYSE hours, fair value determinations are based on analyses of market movements after the close of those securities’ primary markets, and include reviews of developments in foreign markets, the performance of U.S. securities markets, and the performance of instruments trading in U.S. markets that represent foreign securities and baskets of foreign securities. Pricing services are used to obtain closing market prices and to compute certain fair value adjustments utilizing computerized pricing models. It is possible that the fair value determined for a security is materially different from the value that could be realized upon the sale of that security or from the values that other mutual funds may determine. |
Investments in other funds are valued at their respective net asset values as determined by those funds in accordance with the 1940 Act.
Debt securities generally trade in the over-the-counter market rather than on a securities exchange. The Funds’ pricing services use multiple valuation techniques to determine fair value. In instances where sufficient market activity exists, the pricing services may utilize a market-based approach through which quotes from market makers are used to determine fair value. In instances where sufficient market activity may not exist or is limited, the pricing services also utilize proprietary valuation models which may consider market characteristics such as benchmark yield curves, option-adjusted spreads, credit spreads, estimated default rates, coupon rates, anticipated timing of principal repayments, underlying collateral, and other unique security features in order to estimate the relevant cash flows, which are then discounted to calculate the fair value. Securities denominated in a foreign currency are converted into their U.S. dollar equivalent at the foreign exchange rate in effect at the close of the NYSE on the date that the values of the foreign debt securities are determined. Repurchase agreements are valued at cost, which approximates fair value.
Certain derivatives trade in the over-the-counter market. The Funds’ pricing services use various techniques including industry standard option pricing models and proprietary discounted cash flow models to determine the fair value of those instruments. The Funds’ net benefit or obligation under the derivative contract, as measured by the fair value of the contract, is included in net assets.
The Funds have procedures to determine the fair value of securities and other financial instruments for which market prices are not readily available or which may not be reliably priced. Under these procedures, the Funds primarily employ a market-based approach which may use related or comparable assets or liabilities, recent transactions, market multiples, book values, and other relevant information for the investment to determine the fair value of the investment. The Funds may also use an income-based valuation approach in which the anticipated future cash flows of the investment are discounted to calculate fair value. Discounts may also be applied due to the nature or duration of any restrictions on the disposition of the investments. Due to the inherent uncertainty of valuations of such investments, the fair values may differ significantly from the values that would have been used had an active market existed.
| Notes to Financial Statements | 155 | |||||
Table of Contents
Litman Gregory Funds Trust
NOTES TO FINANCIAL STATEMENTS – (Unaudited) – (Continued)
| C | Consolidation of Subsidiary. The DBi Managed Futures Strategy ETF may invest up to 20% of its total assets in the iMGP DBi Cayman Managed Futures Subsidiary (the “Subsidiary”). The Subsidiary, which is organized under the laws of the Cayman Islands, is wholly- owned and controlled by the DBi Managed Futures Strategy ETF. The financial statements of the DBi Managed Futures Strategy ETF include the operations of the Subsidiary. All intercompany accounts and transactions have been eliminated in consolidation. The Subsidiary acts as an investment vehicle in order to invest in commodity-linked derivative instruments consistent with the Fund’s investment objectives and policies. The DBi Managed Futures Strategy ETF had 13.3% of its total assets invested in the Subsidiary as of June 30, 2022. |
The Subsidiary is an exempted Cayman Islands investment company and as such is not subject to Cayman Islands taxes at the present time. For U.S. income tax purposes, the Subsidiary is a Controlled Foreign Corporation (“CFC”) not subject to U.S. income taxes. As a wholly-owned CFC, however, the Subsidiary’s net income and capital gains, if any, will be included each year in the Fund’s investment company taxable income.
| D | Senior Term Loans. The Alternative Strategies Fund and the High Income Alternatives Fund may invest in bank debt, which includes interests in loans to companies or their affiliates undertaken to finance a capital restructuring or in connection with recapitalizations, acquisitions, leveraged buyouts, refinancings or other financially leveraged transactions and may include loans which are designed to provide temporary or bridge financing to a borrower pending the sale of identified assets, the arrangement of longer-term loans or the issuance and sale of debt obligations. These loans, which may bear fixed or floating rates, have generally been arranged through private negotiations between a corporate borrower and one or more financial institutions (“Lenders”), including banks. The Alternative Strategies Fund’s and the High Income Alternatives Fund’s investments may be in the form of participations in loans (“Participations”) or of assignments of all or a portion of loans from third parties (“Assignments”). |
| E | Unfunded Loan Commitments. The Alternative Strategies Fund and the High Income Alternatives Fund may enter into certain credit agreements, all or a portion of which may be unfunded. The Fund is obligated to fund these commitments at the borrower’s discretion. These commitments, if any, are disclosed in the Schedules of Investments in Securities. |
| F | Short Sales. Each Fund may sell a security it does not own in anticipation of a decline in the fair value of that security. When each Fund sells a security short, it must borrow the security sold short and deliver it to the broker-dealer through which it made the short sale. In addition, cash and certain investments in securities may be used to collateralize the securities sold short. Each day the securities sold short transaction is open, the liability to replace the borrowed security is marked to market and an unrealized gain or loss is recorded. While the transaction remains open, the Fund may also incur expenses for any dividends or interest which will be paid to the lender of the securities as well as a fee to borrow the delivered security. During the term of the short sale, the value of the securities pledged as collateral on short sales is required to exceed the value of the securities sold short. A gain, limited to the price at which each Fund sold the security short, or a loss, unlimited in size, will be recognized upon the termination of a short sale. Each Fund is also subject to the risk that it may be unable to reacquire a security to terminate a short position except at a price substantially in excess of the last quoted price. |
| G | Repurchase Agreements. Each Fund may enter into repurchase agreements through which the Fund acquires a security (the “underlying security”) from a seller, a well-established securities dealer or a bank that is a member of the Federal Reserve System. The bank or securities dealer agrees to repurchase the underlying security at the same price, plus a specified amount of interest, at a later date, generally for a period of less than one week. It is the Trust’s policy that its Custodian takes possession of securities as collateral under repurchase agreements and to determine on a daily basis that the value of such securities, including recorded interest, is sufficient to cover the value of the repurchase agreements. The Trust’s policy states that the value of the collateral is at least 102% of the value of the repurchase agreement. If the counterparty defaults and the value of the collateral declines or if bankruptcy proceedings are commenced with respect to the counterparty of the security, realization of the collateral by a Fund may be delayed or limited. At June 30, 2022, the Funds’ ongoing exposure to the economic return on repurchase agreements is shown on the Schedules of Investments in Securities. |
| H | Reverse repurchase agreements. The High Income Alternatives Fund may enter into reverse repurchase agreements with banks and brokers to enhance return. Under a reverse repurchase agreement a Fund sells portfolio assets subject to an agreement by that Fund to repurchase the same assets at an agreed upon price and date. The Fund can use the proceeds received from entering into a reverse repurchase agreement to make additional investments, which generally causes the Fund’s portfolio to behave as if it were leveraged. If the buyer in a reverse repurchase agreement files for bankruptcy or becomes insolvent, the Fund may be unable to recover the securities it sold and as a result may realize a loss on the transaction if the securities it sold are worth more than the purchase price it originally received from the buyer. Reverse repurchase agreements outstanding at the end of the period, if any, are shown on the Schedules of Investments in Securities. Cash received in exchange for securities transferred under reverse repurchase agreements are reflected as reverse repurchase agreements on the Statements of Assets and Liabilities. |
| I | Foreign Currency Translation. The Funds’ records are maintained in U.S. dollars. The value of securities, currencies and other assets and liabilities denominated in currencies other than U.S. dollars are translated into U.S. dollars based upon foreign exchange rates |
| 156 | Litman Gregory Funds Trust | |||||
Table of Contents
Litman Gregory Funds Trust
NOTES TO FINANCIAL STATEMENTS – (Unaudited) – (Continued)
| prevailing at the end of the reporting period. The currencies are translated into U.S. dollars by using the exchange rates quoted at the close of the London Stock Exchange prior to when each Fund’s net asset value is next determined. Purchases and sales of investment securities, income and expenses are translated on the respective dates of such transactions. |
The Funds do not isolate that portion of their net realized and unrealized gains and losses on investments resulting from changes in foreign exchange rates from the impact arising from changes in market prices. Such fluctuations are included with net realized and unrealized gain or loss from investments.
Net realized foreign currency transaction gains and losses arise from sales of foreign currencies, currency gains or losses realized between the trade and settlement dates on securities transactions, and the differences between the amounts of dividends, interest, and foreign withholding taxes recorded on the Funds’ books and the U.S. dollar equivalent of the amounts actually received or paid. Net unrealized foreign currency transactions gains and losses arise from changes in the value of assets and liabilities, other than investments in securities, resulting from changes in the exchange rates.
| J | Forward Foreign Currency Exchange Contracts. The Funds may utilize forward foreign currency exchange contracts (“forward contracts”) under which they are obligated to exchange currencies on specified future dates at specified rates, and are subject to foreign exchange rates fluctuations. All contracts are “marked-to-market” daily and any resulting unrealized gains or losses are recorded as unrealized appreciation or depreciation on forward foreign currency exchange contracts. The Funds record realized gains or losses at the time the forward contract is settled. These gains and losses are reflected on the Statements of Operations as realized gain (loss) on forward foreign currency exchange contracts. Counterparties to these forward contracts are major U.S. financial institutions (see Note 9). |
| K | Commodity Futures Trading Commission (“CFTC”) Regulation. Because of the nature of their investments, the DBi Managed Futures Strategy ETF and the DBi Hedge Strategy ETF are subject to regulation under the Commodities Exchange Act, as amended (the “CEA”), as a commodity pool and each of the Advisor and Sub-Adviser is subject to regulation under the CEA as a commodity pool operator (“CPO”), as those terms are defined under the CEA. The Advisor and Sub-Adviser are regulated by the CFTC, the National Futures Association and the U.S. Securities and Exchange Commission (“SEC”) and are subject to each regulator’s disclosure requirements. The CFTC has adopted rules that are intended to harmonize certain CEA disclosure requirements with SEC disclosure requirements. |
| L | Futures Contracts. The Alternative Strategies Fund, the High Income Alternatives Fund, and the DBi Hedge Strategy ETF invest in financial futures contracts primarily for the purpose of hedging their existing portfolio securities, or securities that the Funds intend to purchase, against fluctuations in fair value caused by changes in prevailing market interest rates. The futures contracts in the DBi Managed Futures Strategy ETF are not designated as hedging instruments. The DBi Managed Futures Strategy ETF employs long and short positions in derivatives, primarily futures contracts, across the broad asset classes of equities, fixed income, currencies and, through the Subsidiary, commodities. Upon entering into a financial futures contract, a Fund is required to pledge to the broker an amount of cash, U.S. government securities, or other assets, equal to a certain percentage of the contract amount (initial margin deposit). Subsequent payments, known as variation margin, are made or received by a Fund each day, depending on the daily fluctuations in the fair value of the underlying security. Each Fund recognizes a gain or loss equal to the daily variation margin. If market conditions move unexpectedly, a Fund may not achieve the anticipated benefits of the financial futures contracts and may realize a loss. The use of futures transactions involves the risk of imperfect correlation in movements in the price of futures contracts, interest rates, and the underlying hedged assets (see Note 9). |
| M | Interest Rate Swaps. During the period ended June 30, 2022, the Alternative Strategies Fund and the High Income Alternatives Fund invested in interest rate swaps. An interest rate swap is an agreement that obligates two parties to exchange a series of cash flows at specified intervals, based upon or calculated by reference to changes in interest rates on a specified notional principal amount. The payment flows are usually netted against each other, with the difference being paid by one party to the other. Bilateral swap contracts are agreements in which a Fund and a counterparty agree to exchange periodic payments on a specified notional amount or make a net payment upon termination. Bilateral swap transactions are privately negotiated in the Over the counter (“OTC”) market and payments are settled through direct payments between a Fund and the counterparty. By contrast, certain swap transactions are subject to mandatory central clearing. These swaps are executed through a derivatives clearing member (“DCM”), acting in an agency capacity, and submitted to a central counterparty (“CCP”) (“centrally cleared swaps”), in which case all payments are settled with the CCP through the DCM. Swaps are marked-to-market daily using pricing vendor quotations, counterparty or clearinghouse prices or model prices, and the change in value, if any, is recorded as an unrealized gain or loss. Upon entering into a swap contract, a Fund is required to satisfy an initial margin requirement by delivering cash or securities to the counterparty (or in some cases, segregated in a triparty account on behalf of the counterparty), which can be adjusted by any mark-to-market gains or losses pursuant to bilateral or centrally cleared arrangements. For centrally cleared swaps the daily change in valuation, and upfront payments, if any, are recorded as a receivable or payable for variation margin on the Statements of Assets and Liabilities (see Note 9). |
| N | Credit Default Swaps. During the period ended June 30, 2022, the Alternative Strategies Fund and the High Income Alternatives Fund entered into credit default swaps to manage their exposure to the market or certain sectors of the market, to reduce their risk |
| Notes to Financial Statements | 157 | |||||
Table of Contents
Litman Gregory Funds Trust
NOTES TO FINANCIAL STATEMENTS – (Unaudited) – (Continued)
| exposure to defaults of corporate issuers or indexes or to create exposure to corporate issuers or indexes to which they are not otherwise exposed. In a credit default swap, the protection buyer makes a stream of payments based on a fixed percentage applied to the contract notional amount to the protection seller in exchange for the right to receive a specified return upon the occurrence of a defined credit event on the reference obligation which may be either a single security or a basket of securities issued by corporate or sovereign issuers. Although contract-specific, credit events are generally defined as bankruptcy, failure to pay, restructuring, obligation acceleration, obligation default, or repudiation/moratorium. Upon the occurrence of a defined credit event, the difference between the value of the reference obligation and the swap’s notional amount is recorded as realized gain (for protection written) or loss (for protection sold) in the Statements of Operations. In the case of credit default swaps where a Fund is selling protection, the notional amount approximates the maximum loss. For centrally cleared swaps the daily change in valuation, and upfront payments, if any, are recorded as a receivable or payable for variation margin on the Statements of Assets and Liabilities (see Note 9). |
| O | Total Return Swaps. During the period ended June 30, 2022, the Alternative Strategies Fund and the High Income Alternatives Fund invested in total return swaps. Total return swap is the generic name for any non-traditional swap where one party agrees to pay the other the “total return” of a defined underlying asset, usually in return for receiving a stream of London Interbank Offered Rate (“LIBOR”) based cash flows. A total return swap may be applied to any underlying asset but is most commonly used with equity indices, single stocks, bonds and defined portfolios of loans and mortgages. Total return swap is a mechanism for the user to accept the economic benefits of asset ownership without utilizing the Statement of Assets and Liabilities. The other leg of the swap, usually LIBOR, is a spread to reflect the non-Statement of Assets and Liabilities nature of the product. No notional amounts are exchanged with total return swaps. The total return receiver assumes the entire economic exposure – that is, both market and credit exposure – to the reference asset. The total return payer – often the owner of the reference obligation – gives up economic exposure to the performance of the reference asset and in return takes on counterparty credit exposure to the total return receiver in the event of a default or fall in value of the reference asset (see Note 9). |
| P | Purchasing Put and Call Options. Each Fund may purchase covered “put” and “call” options with respect to securities which are otherwise eligible for purchase by a Fund and with respect to various stock indices subject to certain restrictions. Each Fund will engage in trading of such derivative securities primarily for hedging purposes. |
If a Fund purchases a put option, a Fund acquires the right to sell the underlying security at a specified price at any time during the term of the option (for “American-style” options) or on the option expiration date (for “European-style” options). Purchasing put options may be used as a portfolio investment strategy when a portfolio manager perceives significant short-term risk but substantial long-term appreciation for the underlying security. The put option acts as an insurance policy, as it protects against significant downward price movement while it allows full participation in any upward movement. If a Fund is holding a stock which it feels has strong fundamentals, but for some reason may be weak in the near term, a Fund may purchase a put option on such security, thereby giving itself the right to sell such security at a certain strike price throughout the term of the option. Consequently, a Fund will exercise the put only if the price of such security falls below the strike price of the put. The difference between the put’s strike price and the market price of the underlying security on the date a Fund exercises the put, less transaction costs, will be the amount by which a Fund will be able to hedge against a decline in the underlying security. If during the period of the option the market price for the underlying security remains at or above the put’s strike price, the put will expire worthless, representing a loss of the price a Fund paid for the put, plus transaction costs. If the price of the underlying security increases, the profit a Fund realizes on the sale of the security will be reduced by the premium paid for the put option less any amount for which the put may be sold.
If a Fund purchases a call option, it acquires the right to purchase the underlying security at a specified price at any time during the term of the option. The purchase of a call option is a type of insurance policy to hedge against losses that could occur if a Fund has a short position in the underlying security and the security thereafter increases in price. Each Fund will exercise a call option only if the price of the underlying security is above the strike price at the time of exercise. If during the option period the market price for the underlying security remains at or below the strike price of the call option, the option will expire worthless, representing a loss of the price paid for the option, plus transaction costs. If the call option has been purchased to hedge a short position of a Fund in the underlying security and the price of the underlying security thereafter falls, the profit a Fund realizes on the cover of the short position in the security will be reduced by the premium paid for the call option less any amount for which such option may be sold.
Prior to exercise or expiration, an option may be sold when it has remaining value by a purchaser through a “closing sale transaction,” which is accomplished by selling an option of the same series as the option previously purchased. Each Fund generally will purchase only those options for which a Manager believes there is an active secondary market to facilitate closing transactions (see Note 9).
Writing Call Options. Each Fund may write covered call options. A call option is “covered” if a Fund owns the security underlying the call or has an absolute right to acquire the security without additional cash consideration (or, if additional cash consideration is required, cash or cash equivalents in such amount as are held in a segregated account by the Custodian). The writer of a call option receives a premium and gives the purchaser the right to buy the security underlying the option at the exercise price. The writer has the obligation upon exercise of the option to deliver the underlying security against payment of the exercise price during the option period. If the writer of an exchange-traded option wishes to terminate his obligation, he may effect a “closing purchase transaction.” This is
| 158 | Litman Gregory Funds Trust | |||||
Table of Contents
Litman Gregory Funds Trust
NOTES TO FINANCIAL STATEMENTS – (Unaudited) – (Continued)
accomplished by buying an option of the same series as the option previously written. A writer may not effect a closing purchase transaction after it has been notified of the exercise of an option.
Effecting a closing transaction in the case of a written call option will permit a Fund to write another call option on the underlying security with either a different exercise price, expiration date or both. Also, effecting a closing transaction will permit the cash or proceeds from the concurrent sale of any securities subject to the option to be used for other investments of a Fund. If a Fund desires to sell a particular security from its portfolio on which it has written a call option, it will effect a closing transaction prior to or concurrent with the sale of the security.
Each Fund will realize a gain from a closing transaction if the cost of the closing transaction is less than the premium received from writing the option or if the proceeds from the closing transaction are more than the premium paid to purchase the option. Each Fund will realize a loss from a closing transaction if the cost of the closing transaction is more than the premium received from writing the option or if the proceeds from the closing transaction are less than the premium paid to purchase the option. However, because increases in the market price of a call option will generally reflect increases in the market price of the underlying security, any loss to a Fund resulting from the repurchase of a call option is likely to be offset in whole or in part by appreciation of the underlying security owned by a Fund (see Note 9).
Writing Put Options. Each Fund may write put options. By writing put options, the Fund takes on the risk of declines in the value of the underlying instrument, including the possibility of a loss up to the entire strike price of each option it sells, but without the corresponding opportunity to benefit from potential increases in the value of the underlying instrument. When the Fund writes a put option, it assumes the risk that it must purchase the underlying instrument at a strike price that may be higher than the market price of the instrument. If there is a broad market decline and the Fund is able to close out its written put options, it may result in substantial losses to the Fund (see Note 9).
Risks of Investing in Options. There are several risks associated with transactions in options on securities. Options may be more volatile than the underlying instruments and, therefore, on a percentage basis, an investment in options may be subject to greater fluctuation than an investment in the underlying instruments themselves. There are also significant differences between the securities and options markets that could result in an imperfect correlation between these markets, causing a given transaction not to achieve its objective. In addition, a liquid secondary market for particular options may be absent for reasons which include the following: there may be insufficient trading interest in certain options; restrictions may be imposed by an exchange on opening transactions or closing transactions or both; trading halts, suspensions or other restrictions may be imposed with respect to particular classes or series of option of underlying securities; unusual or unforeseen circumstances may interrupt normal operations on an exchange; the facilities of an exchange or clearing corporation may not at all times be adequate to handle current trading volume; or one or more exchanges could, for economic or other reasons, decide or be compelled at some future date to discontinue the trading of options (or a particular class or series of options), in which event the secondary market on that exchange (or in that class or series of options) would cease to exist, although outstanding options that had been issued by a clearing corporation as a result of trades on that exchange would continue to be exercisable in accordance with their terms.
A decision as to whether, when and how to use options involves the exercise of skill and judgment, and even a well-conceived transaction may be unsuccessful to some degree because of market behavior or unexpected events. The extent to which a Fund may enter into options transactions may be limited by the requirements of the Internal Revenue Code of 1986, as amended (the “Code”), with respect to qualification of a Fund as a regulated investment company.
| Q | Distributions to Shareholders. Distributions paid to shareholders are recorded on the ex-dividend date. Net realized gains from securities transactions (if any) are generally distributed annually to shareholders. The amount of dividends and distributions from net investment income and net realized capital gains is determined in accordance with federal income tax regulations, which may differ from generally accepted accounting principles. To the extent these “book/tax” differences are permanent in nature (i.e., that they result from other than timing of recognition – “temporary differences”), such amounts are reclassified within the capital accounts based on their federal tax-basis. |
| R | Income Taxes. The Funds intend to comply with the requirements of Subchapter M of the Code applicable to regulated investment companies and to distribute all of their taxable income to their shareholders. Accordingly, no provisions for federal income taxes are required. The Funds have reviewed the tax positions, taken on federal income tax returns, for each of the three open tax years (as applicable) and as of June 30, 2022, and have determined that no provision for income tax is required in the Funds’ financial statements. The Funds recognize interest and penalties, if any, related to unrecognized tax benefits as income tax expenses in the Statements of Operations. During the period ended June 30, 2022, the Funds did not incur any interest or penalties. Foreign securities held by the Funds may be subject to foreign taxation on dividend and interest income received. Foreign taxes, if any, net of any reclaims, are recorded based on the tax regulations and rates that exist in the foreign markets in which the Funds’ invest. |
Taxes on foreign interest and dividend income are generally withheld in accordance with the applicable country’s tax treaty with the United States. The foreign withholding rates applicable to a Fund’s investments in certain jurisdictions may be higher if a significant
| Notes to Financial Statements | 159 | |||||
Table of Contents
Litman Gregory Funds Trust
NOTES TO FINANCIAL STATEMENTS – (Unaudited) – (Continued)
portion of the Fund is held by non-U.S. shareholders. Each Fund may be subject to taxation on realized capital gains, repatriation proceeds and other transaction-based charges imposed by certain countries in which it invests. Taxes related to capital gains realized during the period ended June 30, 2022, if any, are reflected as part of net realized gain (loss) in the Statements of Operations.
Changes in tax liabilities related to capital gain taxes on unrealized investment gains, if any, are reflected as part of change in net unrealized appreciation (depreciation) in the Statements of Operations. Transaction-based charges are generally calculated as a percentage of the transaction amount.
The Funds may have previously filed for and/or may file for additional tax refunds with respect to certain taxes withheld by certain countries. Generally, the amount of such refunds that a Fund reasonably determines are collectible and free from significant contingencies are reflected in a Fund’s net asset value and are reflected as foreign tax reclaims receivable in the Statements of Assets and Liabilities. In certain circumstances, a Fund’s receipt of such refunds may cause the Fund and/or its shareholders to be liable for U.S. federal income taxes and interest charges.
Foreign taxes paid by each Fund may be treated, to the extent permissible by the Code (and other applicable U.S. federal tax guidance) and if that Fund so elects, as if paid by U.S. shareholders of that Fund.
| S | Security Transactions, Dividend and Interest Income and Expenses. Security transactions are accounted for on the trade date. Realized gains and losses on securities transactions are reported on an identified cost basis. Dividend income and, where applicable, related foreign tax withholding expenses are recorded on the ex-dividend date. Interest income is recorded on an accrual basis. Purchase discounts and premiums on fixed-income securities are accreted and amortized to maturity using the effective interest method and reflected within interest income on the Statements of Operations. Paydown gains and losses on mortgage-related and other asset-backed securities, if any, are recorded as components of interest income in the Statements of Operations. Many expenses of the Trust can be directly attributed to a specific Fund. Each Fund is charged for expenses directly attributed to it. Expenses that cannot be directly attributed to a specific Fund are allocated among the Funds in the Trust in proportion to their respective net assets or other appropriate method. Realized and unrealized gains and losses and net investment income, not including class specific expenses, are allocated daily to each class of shares based upon the relative proportion of net assets of each class. Differences in per share distributions by class are generally due to differences in class specific expenses. Class specific expenses, such as 12b-1 expenses, are directly attributed to that specific class. |
| T | Restricted Cash. At June 30, 2022, the Alternative Strategies Fund, the High Income Alternatives Fund, the DBi Managed Futures Strategy ETF, and the DBi Hedge Strategy ETF held restricted cash in connection with investments in certain derivative securities. Restricted cash is held in a segregated account with the Funds’ Custodian as well as with brokers and is reflected in the Statements of Assets and Liabilities as deposits at brokers for securities sold short, futures, options, and swaps. Restrictions may include legally restricted deposits held as compensating balances against short-term borrowing arrangements or contracts entered into with others. |
The Funds consider their investment in an Federal Deposits Insurance Corporation (“FDIC”) insured interest bearing savings account to be cash. The Funds maintain cash balances, which, at times, may exceed federally insured limits. The Funds maintain these balances with a high quality financial institution.
| U | Restricted Securities. A restricted security cannot be resold to the general public without prior registration under the Securities Act of 1933. If the security is subsequently registered and resold, the issuers would typically bear the expense of all registrations at no cost to the Fund. Restricted securities are valued according to the guidelines and procedures adopted by the Funds’ Board of Trustees. As of June 30, 2022, there were no restricted securities held in the Funds. |
| V | Illiquid Securities. Each Fund may not invest more than 15% of the value of its net assets in illiquid securities, including restricted securities that are not deemed to be liquid by the Sub-Advisors. The Advisor and the Sub-Advisors will monitor the amount of illiquid securities in a Fund’s portfolio, under the supervision of the Board, to ensure compliance with a Fund’s investment restrictions. In accordance with procedures approved by the Board, these securities may be valued using techniques other than market quotations, and the values established for these securities may be different than what would be produced through the use of another methodology or if they had been priced using market quotations. Illiquid securities and other portfolio securities that are valued using techniques other than market quotations, including “fair valued” securities, may be subject to greater fluctuation in their value from one day to the next than would be the case if market quotations were used. In addition, there is no assurance that a Fund could sell a portfolio security for the value established for it at any time, and it is possible that a Fund would incur a loss because a portfolio security is sold at a discount to its established value. |
| W | Indemnification Obligations. Under the Trust’s organizational documents, its current and former officers and trustees are indemnified against certain liabilities arising out of the performance of their duties to the Funds. In addition, in the normal course of business, the Funds enter into contracts that contain a variety of representations and warranties that provide general indemnifications. The Funds’ maximum exposure under these arrangements is unknown as this would involve future claims that may be made against the Funds that have not yet occurred or that would be covered by other parties. |
| 160 | Litman Gregory Funds Trust | |||||
Table of Contents
Litman Gregory Funds Trust
NOTES TO FINANCIAL STATEMENTS – (Unaudited) – (Continued)
Note 3 – Investment Advisory and Other Agreements
The Trust, on behalf of the Funds, entered into an Investment Advisory Agreement (the “Agreement”) with Litman Gregory Fund Advisors, LLC. Effective October 1, 2021, Litman Gregory Fund Advisors, LLC has changed its name to “iM Global Partner Fund Management, LLC” (the “Advisor”) and also subsequently referred to as “iM Global” Under the terms of the Agreement, each Fund pays a monthly investment advisory fee to the Advisor at the annual rate below of the respective Fund’s average daily net assets before any fee waivers:
| Contractual Management Rate | ||||||||||||||||||||||||||||||||||||||||||||
| Fund | First $450 million | Excess of $450 million | First $750 million | Excess of $750 million | First $1 billion | Excess of $1 billion | Between $1 and $2 billion | First $2 billion | Between $2 and $3 billion | Between $3 and $4 billion | Excess of $4 billion | |||||||||||||||||||||||||||||||||
Equity | — | — | 1.10 | % | 1.00 | % | — | — | — | — | — | — | — | |||||||||||||||||||||||||||||||
International | — | — | — | — | 1.10 | % | 1.00 | % | — | — | — | — | — | |||||||||||||||||||||||||||||||
Oldfield International Value | — | — | — | — | 0.70 | % | 0.70 | % | — | — | — | — | — | |||||||||||||||||||||||||||||||
SBH Focused Small Value | 1.00 | % | 1.00 | % | — | — | — | — | — | — | — | — | — | |||||||||||||||||||||||||||||||
Alternative Strategies | — | — | — | — | — | — | — | 1.40 | % | 1.30 | % | 1.25 | % | 1.20 | % | |||||||||||||||||||||||||||||
High Income Alternatives | — | — | — | — | 0.95 | % | — | 0.925 | % | — | 0.90 | % | 0.875 | % | 0.85 | % | ||||||||||||||||||||||||||||
Dolan McEniry Corporate Bond | 0.50 | % | 0.50 | % | — | — | — | — | — | — | — | — | — | |||||||||||||||||||||||||||||||
DBi Managed Futures Strategy ETF | 0.85 | % | 0.85 | % | — | — | — | — | — | — | — | — | — | |||||||||||||||||||||||||||||||
DBi Hedge Strategy ETF | 0.85 | % | 0.85 | % | — | — | — | — | — | — | — | — | — | |||||||||||||||||||||||||||||||
RBA Responsible Global Allocation ETF | 0.55 | % | 0.55 | % | — | — | — | — | — | — | — | — | — | |||||||||||||||||||||||||||||||
The Advisor engages sub-advisors to manage the Funds and pays the sub-advisors from its advisory fees.
Through April 30, 2023, the Advisor has contractually agreed to waive a portion of its advisory fees effectively reducing total advisory fees to approximately 0.98% of the average daily net assets of the Equity Fund, 0.87% of the average daily net assets of the International Fund, 1.12% of the average daily net assets of the Alternative Strategies Fund, and 0.80% of the average daily net assets of the High Income Alternatives Fund. Additionally, the Advisor has voluntarily agreed to waive its management fee on the daily cash values of the Funds not allocated to Managers. For the six months ended June 30, 2022, the amount waived, contractual and voluntary, was $131,767, $322,888, $2,073,676, and $93,446 for Equity Fund, International Fund, Alternative Strategies Fund, and High Income Alternatives Fund, respectively. The Advisor has agreed not to seek recoupment of such waived fees. Through April 30, 2023, the Advisor has contractually agreed to waive a portion of its advisory fees and/or reimburse a portion of the High Income Alternatives Fund’s operating expenses (excluding any taxes, interest, brokerage commissions, expenses incurred in connection with any merger or reorganization, borrowing costs, (including commitment fees), dividend expenses, acquired fund fees and expenses and extraordinary expenses such as but not limited to litigation costs) to ensure that the total annual fund operating expenses after fee waiver and/or expense reimbursement for the Institutional Class will not exceed 0.98% of the average daily net assets. In addition, through April 30, 2023, the Advisor has contractually agreed to waive a portion of its advisory fees and/or reimburse a portion of the Oldfield International Value Fund, SBH Focused Small Value Fund, and Dolan McEniry Corporate Bond Fund’s operating expenses (excluding any taxes, interest, brokerage commissions, expenses incurred in connection with any merger or reorganization, borrowing costs, (including commitment fees), dividend expenses, acquired fund fees and expenses and extraordinary expenses such as but not limited to litigation costs) to ensure that the total annual fund operating expenses after fee waiver and/or expense reimbursement for the Institutional Class will not exceed 0.94%, 1.15%, and 0.70% of the average daily net assets, respectively, and 1.05% of the average daily net assets for the Investor Class of the Dolan McEniry Corporate Bond Fund. During the six months ended June 30, 2022, the amount waived contractually pursuant to an Expense Limitation Agreement was $115,091, $77,437, $95,692, and $271,318 for the High Income Alternatives Fund, Oldfield International Value Fund, SBH Focused Small Value Fund, and Dolan McEniry Corporate Bond Fund, respectively. The Advisor may be reimbursed by each Fund no later than the end of the third fiscal year following the year of the waiver provided that such reimbursement does not cause each Fund’s expenses to exceed the expense limitation. The Advisor is waiving its right to recoup these fees and any fees waived in prior years.
State Street Bank and Trust Company (“State Street”) serves as the Administrator, Custodian and Fund Accountant to the Funds.
| Notes to Financial Statements | 161 | |||||
Table of Contents
Litman Gregory Funds Trust
NOTES TO FINANCIAL STATEMENTS – (Unaudited) – (Continued)
State Street Bank and Trust Company (“State Street”) serves as the Transfer Agent for DBi Managed Futures Strategy ETF, DBi Hedge Strategy ETF, and RBA Responsible Global Allocation ETF. DST Asset Manager Solutions, Inc. (“DST”) serves as Transfer Agent for the other Funds. The Funds’ principal underwriter is ALPS Distributors, Inc.
An employee of the Advisor serves as the Funds’ Chief Compliance Officer (“CCO”). The CCO receives no compensation from the Funds for his services, however, the Funds reimbursed the Advisor $41,419 for the six months ended June 30, 2022 for the services of the CCO.
Loomis Sayles & Company, L.P. used their respective affiliated entity for purchases of the Alternative Strategies Fund’s portfolio securities for the six months ended June 30, 2022. There was no commissions paid for these transactions.
During the six months ended June 30, 2022, each independent Trustee, within the meaning of the 1940 Act, was compensated by the Trust in the amount of $58,051.
Certain officers and Trustees of the Trust are also officers of the Advisor.
Note 4 – Distribution Plan
Certain Funds have adopted a Plan of Distribution (the “Plan”) dated February 25, 2009, as amended, pursuant to Rule 12b-1 under the 1940 Act. Under the Plan, the Investor Classes of the Alternative Strategies Fund and the Dolan McEniry Corporate Bond Fund will compensate broker dealers or qualified institutions with whom each Fund has entered into a contract to distribute Fund shares (“Dealers”). Under the Plan, the amount of such compensation paid in any one year shall not exceed 0.25% annually of the average daily net assets of the Investor Classes, which may be payable as a service fee for providing recordkeeping, subaccounting, subtransfer agency and/or shareholder liaison services. For the six months ended June 30, 2022, the Alternative Strategies Fund’s Investor Class and the Dolan McEniry Corporate Bond Fund’s Investor Class incurred $87,378, and $2,557, respectively pursuant to the Plan.
The Plan will remain in effect from year to year provided such continuance is approved at least annually by a vote either of a majority of the Trustees, including a majority of the non-interested Trustees, or a majority of each Fund’s outstanding shares.
The DBi Hedge Strategy ETF, DBi Managed Futures Strategy ETF, and RBA Responsible Global Allocation ETF issue and redeem Shares at Net Asset Value (“NAV”) only in Creation Units. Only Authorized Participants (“APs”) may acquire Shares directly from the Funds, and only APs may tender their Shares for redemption directly to the Funds, at NAV. APs must be a member or participant of a clearing agency registered with the SEC and must execute a Participant Agreement that has been agreed to by the Distributor, and that has been accepted by the Transfer Agent, with respect to purchases and redemptions of Creation Units. Once created, Shares trade in the secondary market in quantities less than a Creation Unit.
Individual Shares may be purchased and sold only on a national securities exchange through brokers. Shares will be listed for trading on NYSE Arca and because the Shares will trade at market prices rather than NAV, Shares may trade at prices greater than NAV (at a premium), at NAV, or less than NAV (at a discount).
Note 5 – Shareholder Servicing Fee
The Dolan McEniry Corporate Bond Fund has adopted a shareholder servicing plan (the “Plan”) on behalf of the Investor Class. Under the Plan, the Investor Class is authorized to pay an annual shareholder servicing fee of up to 0.10% of the class’s average daily net assets. This fee is used to finance certain activities related to servicing and maintaining shareholder accounts. Payments made under the Plan may not be used to pay for any services in connection with the distribution and sale of Investor Shares.
Payments to the Advisor under the Plan may reimburse the Advisor for payments it makes to selected brokers, dealers and administrators which have entered into service agreements with the Advisor for services provided to Investor Class shareholders of the Fund. The services provided by such intermediaries are primarily designed to assist Investor Class shareholders of the Fund and include the furnishing of office space and equipment, telephone facilities, personnel, and assistance to the Fund in servicing such shareholders. Services provided by such intermediaries also include the provision of support services to the Fund and include establishing and maintaining shareholders’ accounts and record processing, purchase and redemption transactions, answering routine client inquiries regarding the Fund, and providing such other personal services to shareholders as the Fund may reasonably request. For the six months ended June 30, 2022, the Fund incurred, under the Plan, shareholder servicing fees on its Investor Shares of $1,022.
| 162 | Litman Gregory Funds Trust | |||||
Table of Contents
Litman Gregory Funds Trust
NOTES TO FINANCIAL STATEMENTS – (Unaudited) – (Continued)
Note 6 – Investment Transactions
The cost of securities purchased and the proceeds from securities sold for the six months ended June 30, 2022, excluding short-term investments were as follows:
| Fund | U.S. Gov’t Securities Purchases | Other Purchases | U.S. Gov’t Securities Sales | Other Sales | ||||||||||||
Equity Fund | $ | — | $ | 29,522,927 | $ | — | $ | 64,454,789 | ||||||||
International Fund | — | 58,769,432 | — | 76,606,936 | ||||||||||||
Oldfield International Value Fund | — | 1,977,118 | — | 2,545,858 | ||||||||||||
SBH Focused Small Value Fund | — | 7,093,971 | — | 10,317,050 | ||||||||||||
Alternative Strategies Fund | 8,995,999 | 657,386,107 | 11,321,003 | 696,024,697 | ||||||||||||
High Income Alternatives Fund | 6,446,297 | 26,076,697 | 4,400,000 | 5,399,667 | ||||||||||||
Dolan McEniry Corporate Bond Fund | — | 5,663,264 | 1,526,545 | 11,408,292 | ||||||||||||
DBi Managed Futures Strategy ETF | — | — | — | — | ||||||||||||
DBi Hedge Strategy ETF | — | — | — | — | ||||||||||||
RBA Responsible Global Allocation ETF | — | 10,142,855 | — | 1,410,113 | ||||||||||||
During the six months ended June 30, 2022, there were several purchases and sales transactions made in accordance with the established procedures pursuant to Rule 17a-7 (the exemption of certain purchase or sale transactions between an investment company and certain affiliated persons thereof), arranged by Guggenheim Partners Investment Management, LLC, on behalf of the High Income Alternatives Fund. The total of such purchases transactions were $1,870,424.
Note 7 – Fair Value of Financial Investments
The Funds follow a fair value hierarchy that distinguishes between market data obtained from independent sources (observable inputs) and the Funds’ own market assumptions (unobservable inputs). These inputs are used in determining the value of each Fund’s investments and are summarized in the following fair value hierarchy:
| Level 1 – | Quoted prices in active markets for identical securities. |
| Level 2 – | Other significant observable inputs (including quoted prices for similar securities, interest rates, foreign exchange rates, and fair value estimates for foreign securities indices). |
| Level 3 – | Significant unobservable inputs (including the Funds’ own assumptions in determining fair value of investments). |
Fixed income securities including corporate, convertible and municipal bonds and notes, U.S. government agencies, U.S. Treasury obligations, U.S. Treasury inflation protected securities, sovereign issues, bank loans, convertible preferred securities and non-U.S. bonds are normally valued on the basis of quotes obtained from brokers and dealers or independent pricing services or sources. Independent pricing services typically use information provided by market makers or estimates of market values obtained from yield data relating to investments or securities with similar characteristics. The service providers’ internal models use inputs that are observable such as, among other things, issuer details, interest rates, yield curves, prepayment speeds, credit risks/spreads, default rates and quoted prices for similar assets. Securities that use similar valuation techniques and inputs as described above are categorized as Level 2 of the fair value hierarchy.
Fixed income securities purchased on a delayed-delivery basis are typically marked to market daily until settlement at the forward settlement date.
Mortgage and asset-backed securities are usually issued as separate tranches, or classes, of securities within each deal. These securities are also normally valued by pricing service providers that use broker dealer quotations or valuation estimates from their internal pricing models. The pricing models for these securities usually consider tranche-level attributes, estimated cash flows and market-based yield spreads for each tranche, current market data and incorporates deal collateral performance, as available.
Stripped mortgage-backed securities are usually structured with two different classes: one that receives substantially all interest payments (interest-only, or “IO” and/or high coupon rate with relatively low principal amount, or “IOette”), and the other that receives substantially all principal payments (principal-only, or “PO”) from a pool of mortgage loans. Little to no principal will be received at the maturity of an IO; as a result, periodic adjustments are recorded to reduce the cost of the security until maturity. These adjustments are included in interest income.
Mortgage and asset-backed securities that use similar valuation techniques and inputs as described above are categorized as Level 2 of the fair value hierarchy.
Repurchase agreements and reverse repurchase agreements are short-term investments, they are fair valued approximately at their principal amounts. Repurchase agreements and reverse repurchase agreements are categorized as Level 2 of the fair value hierarchy.
| Notes to Financial Statements | 163 | |||||
Table of Contents
Litman Gregory Funds Trust
NOTES TO FINANCIAL STATEMENTS – (Unaudited) – (Continued)
Financial derivative instruments, such as foreign currency contracts, options contracts, futures, or swap agreements, derive their value from underlying asset prices, indices, reference rates, and other inputs or a combination of these factors. These contracts are normally valued on the basis of broker dealer quotations or pricing service providers at the settlement price determined by the relevant exchange. Depending on the product and the terms of the transaction, the value of the derivative contracts can be estimated by a pricing service provider using a series of techniques, including simulation pricing models. The pricing models use inputs that are observed from actively quoted markets such as issuer details, indices, spreads, interest rates, curves, dividends and exchange rates. Derivatives that use similar valuation techniques and inputs as described above are categorized as Level 1 or Level 2 of the fair value hierarchy.
The following tables provide the fair value measurements of applicable Fund assets and liabilities by level within the fair value hierarchy for each Fund as of June 30, 2022. These assets and liabilities are measured on a recurring basis.
Equity Fund
| Description | Level 1 - Quoted prices in active markets for identical assets | Level 2 - Significant other observable inputs | Level 3 - Significant unobservable inputs | Total | ||||||||||||
Equity(a) | ||||||||||||||||
Common Stocks | $ | 166,692,195 | $ | — | $ | — | $ | 166,692,195 | ||||||||
|
| |||||||||||||||
Total Equity | 166,692,195 | — | — | 166,692,195 | ||||||||||||
|
| |||||||||||||||
Short-Term Investments | ||||||||||||||||
Repurchase Agreements | — | 2,682,037 | — | 2,682,037 | ||||||||||||
|
| |||||||||||||||
Total Investments in Securities | $ | 166,692,195 | $ | 2,682,037 | $ | — | $ | 169,374,232 | ||||||||
|
| |||||||||||||||
| (a) | See Fund’s Schedule of Investments in Securities for sector classifications. |
International Fund
| Description | Level 1 - Quoted prices in active markets for identical assets | Level 2 - Significant other observable inputs | Level 3 - Significant unobservable inputs | Total | ||||||||||||
Equity | ||||||||||||||||
Common Stocks | ||||||||||||||||
Argentina | $ | 1,464,801 | $ | — | $ | — | $ | 1,464,801 | ||||||||
Australia | 3,068,475 | — | — | 3,068,475 | ||||||||||||
Canada | 6,725,296 | — | — | 6,725,296 | ||||||||||||
China | 14,798,290 | — | — | 14,798,290 | ||||||||||||
Denmark | 4,909,474 | — | — | 4,909,474 | ||||||||||||
Finland | 6,539,083 | — | — | 6,539,083 | ||||||||||||
France | 26,596,023 | — | — | 26,596,023 | ||||||||||||
Germany | 51,472,898 | — | — | 51,472,898 | ||||||||||||
Ireland | 16,999,654 | — | — | 16,999,654 | ||||||||||||
Israel | 7,993,233 | — | — | 7,993,233 | ||||||||||||
Italy | 3,552,542 | — | — | 3,552,542 | ||||||||||||
Mexico | 3,356,009 | — | — | 3,356,009 | ||||||||||||
Netherlands | 13,281,562 | — | — | 13,281,562 | ||||||||||||
South Korea | 2,896,096 | — | — | 2,896,096 | ||||||||||||
Spain | 10,281,189 | — | — | 10,281,189 | ||||||||||||
Sweden | 6,511,239 | — | — | 6,511,239 | ||||||||||||
Switzerland | 10,663,379 | — | — | 10,663,379 | ||||||||||||
United Kingdom | 26,018,880 | — | — | 26,018,880 | ||||||||||||
United States | 19,467,145 | — | — | 19,467,145 | ||||||||||||
|
| |||||||||||||||
Total Equity | 236,595,268 | — | — | 236,595,268 | ||||||||||||
|
| |||||||||||||||
Short-Term Investments | ||||||||||||||||
Repurchase Agreements | — | 8,588,473 | — | 8,588,473 | ||||||||||||
|
| |||||||||||||||
Total Short-Term Investments | — | 8,588,473 | — | 8,588,473 | ||||||||||||
|
| |||||||||||||||
Total Investments in Securities | $ | 236,595,268 | $ | 8,588,473 | $ | — | $ | 245,183,741 | ||||||||
|
| |||||||||||||||
| 164 | Litman Gregory Funds Trust | |||||
Table of Contents
Litman Gregory Funds Trust
NOTES TO FINANCIAL STATEMENTS – (Unaudited) – (Continued)
Oldfield International Value Fund
| Description | Level 1 - Quoted prices in active markets for identical assets | Level 2 - Significant other observable inputs | Level 3 - Significant unobservable inputs | Total | ||||||||||||
Equity | ||||||||||||||||
Common Stocks | ||||||||||||||||
Brazil | $ | 634,794 | $ | — | $ | — | $ | 634,794 | ||||||||
China | 837,296 | — | — | 837,296 | ||||||||||||
France | 941,906 | — | — | 941,906 | ||||||||||||
Germany | 3,817,807 | — | — | 3,817,807 | ||||||||||||
Italy | 929,234 | — | — | 929,234 | ||||||||||||
Japan | 3,955,628 | — | — | 3,955,628 | ||||||||||||
Netherlands | 880,070 | — | — | 880,070 | ||||||||||||
South Korea | 2,660,947 | — | — | 2,660,947 | ||||||||||||
Sweden | 733,641 | — | — | 733,641 | ||||||||||||
United Kingdom | 4,491,002 | — | — | 4,491,002 | ||||||||||||
Preferred Stock | ||||||||||||||||
Germany | 549,706 | — | — | 549,706 | ||||||||||||
|
| |||||||||||||||
Total Equity | 20,432,031 | — | — | 20,432,031 | ||||||||||||
|
| |||||||||||||||
Total Investments in Securities | $ | 20,432,031 | $ | — | $ | — | $ | 20,432,031 | ||||||||
|
| |||||||||||||||
SBH Focused Small Value Fund
| Description | Level 1 - Quoted prices in active markets for identical assets | Level 2 - Significant other observable inputs | Level 3 - Significant unobservable inputs | Total | ||||||||||||
Equity(a) | ||||||||||||||||
Common Stocks | $ | 47,645,096 | $ | — | $ | — | $ | 47,645,096 | ||||||||
|
| |||||||||||||||
Total Equity | 47,645,096 | — | — | 47,645,096 | ||||||||||||
|
| |||||||||||||||
Total Investments in Securities | $ | 47,645,096 | $ | — | $ | — | $ | 47,645,096 | ||||||||
|
| |||||||||||||||
| (a) | See Fund’s Schedule of Investments in Securities for sector classifications. |
| Notes to Financial Statements | 165 | |||||
Table of Contents
Litman Gregory Funds Trust
NOTES TO FINANCIAL STATEMENTS – (Unaudited) – (Continued)
Alternative Strategies Fund
| Description | Level 1 - Quoted prices in active markets for identical assets | Level 2 - Significant other observable inputs | Level 3 - Significant unobservable inputs | Total | ||||||||||||
Equity(a) | ||||||||||||||||
Common Stocks | $ | 411,402,131 | $ | 3,692,148 | $ | 2,504,180 | ** | $ | 417,598,459 | |||||||
Preferred Stocks | 461,813 | 1,240,263 | 222,363 | ** | 1,924,439 | |||||||||||
Limited Partnerships | — | — | 2,000,488 | ** | 2,000,488 | |||||||||||
|
| |||||||||||||||
Total Equity | 411,863,944 | 4,932,411 | 4,727,031 | ** | 421,523,386 | |||||||||||
|
| |||||||||||||||
Rights/Warrants | 50,112 | 106 | — | 50,218 | ||||||||||||
Fixed Income | ||||||||||||||||
Asset-Backed Securities | — | 140,335,234 | — | 140,335,234 | ||||||||||||
Bank Loans | — | 22,682,968 | 1,948,349 | ** | 24,631,317 | |||||||||||
Convertible Bonds | — | 18,665,431 | — | 18,665,431 | ||||||||||||
Corporate Bonds | — | 374,847,104 | — | 374,847,104 | ||||||||||||
Government Securities & Agency Issue | — | 24,321,996 | — | 24,321,996 | ||||||||||||
Mortgage-Backed Securities | — | 182,585,252 | 503,569 | (1) | 183,088,821 | |||||||||||
|
| |||||||||||||||
Total Fixed Income | — | 763,437,985 | 2,451,918 | ** | 765,889,903 | |||||||||||
|
| |||||||||||||||
Short-Term Investments | ||||||||||||||||
Repurchase Agreements | — | 127,332,311 | — | 127,332,311 | ||||||||||||
Treasury Bills | — | 36,390,541 | — | 36,390,541 | ||||||||||||
|
| |||||||||||||||
Total Short-Term Investments | — | 163,722,852 | — | 163,722,852 | ||||||||||||
|
| |||||||||||||||
Total Investments in Securities | $ | 411,914,056 | $ | 932,093,354 | $ | 7,178,949 | ** | $ | 1,351,186,359 | |||||||
|
| |||||||||||||||
Short Sales | ||||||||||||||||
Common Stocks | (3,540,526 | ) | — | — | (3,540,526 | ) | ||||||||||
|
| |||||||||||||||
Total Short Sales | (3,540,526 | ) | — | — | (3,540,526 | ) | ||||||||||
|
| |||||||||||||||
Total Investments in Securities in Liabilities | $ | (3,540,526 | ) | $ | — | $ | — | $ | (3,540,526 | ) | ||||||
|
| |||||||||||||||
Other Financial Instruments* | ||||||||||||||||
Forward Foreign Currency Exchange Contracts | $ | 297,281 | $ | — | $ | — | $ | 297,281 | ||||||||
Futures | (4,072,782 | ) | — | — | (4,072,782 | ) | ||||||||||
Swaps - Credit Default | — | 3,807,787 | — | 3,807,787 | ||||||||||||
Swaps - Total Return | — | (36,612 | ) | — | (36,612 | ) | ||||||||||
Written Options | (72,217 | ) | — | — | (72,217 | ) | ||||||||||
| (a) | See Fund’s Schedule of Investments in Securities for sector classifications. |
| * | Other financial instruments are derivative instruments, such as futures, forward foreign currency exchange, swaps contracts and written options. Futures, forward foreign currency exchange and swap contracts are valued at the unrealized appreciation (depreciation) on the instrument, while written options are valued at fair value. |
| ** | Significant unobservable inputs were used in determining the value of portfolio securities for the Alternative Strategies Fund . |
| (1) | These securities were priced by a pricing service; however, the Advisor/Sub-Advisor used their fair value procedures based on other available inputs which more accurately reflected the current fair value of these securities. |
| 166 | Litman Gregory Funds Trust | |||||
Table of Contents
Litman Gregory Funds Trust
NOTES TO FINANCIAL STATEMENTS – (Unaudited) – (Continued)
High Income Alternatives Fund
| Description | Level 1 - Quoted prices in active markets for identical assets | Level 2 - Significant other observable inputs | Level 3 - Significant unobservable inputs | Total | ||||||||||||
Equity(a) | ||||||||||||||||
Common Stocks | $ | — | $ | 433 | $ | — | $ | 433 | ||||||||
Preferred Stocks | 3,075,267 | 424,788 | — | 3,500,055 | ||||||||||||
Closed-End Funds | 460,372 | — | — | 460,372 | ||||||||||||
Exchange-Traded Funds | 48,728 | — | — | 48,728 | ||||||||||||
|
| |||||||||||||||
Total Equity | 3,584,367 | 425,221 | — | 4,009,588 | ||||||||||||
|
| |||||||||||||||
Fixed Income | ||||||||||||||||
Asset-Backed Securities | — | 17,431,285 | — | 17,431,285 | ||||||||||||
Bank Loans | — | 29,795,902 | — | 29,795,902 | ||||||||||||
Corporate Bonds | — | 38,216,257 | 181,704 | ** | 38,397,961 | |||||||||||
Government Securities & Agency Issue | — | 22,717,719 | — | 22,717,719 | ||||||||||||
Mortgage-Backed Securities | — | 4,895,578 | — | 4,895,578 | ||||||||||||
Municipal Bond | — | 4,973 | — | 4,973 | ||||||||||||
|
| |||||||||||||||
Total Fixed Income | — | 113,061,714 | 181,704 | ** | 113,243,418 | |||||||||||
|
| |||||||||||||||
Short-Term Investments | ||||||||||||||||
Money Market Fund | 2,011,735 | — | — | 2,011,735 | ||||||||||||
Repurchase Agreements | — | 3,220,136 | — | 3,220,136 | ||||||||||||
Treasury Bill | — | 49,887 | — | 49,887 | ||||||||||||
|
| |||||||||||||||
Total Short-Term Investments | 2,011,735 | 3,270,023 | — | 5,281,758 | ||||||||||||
|
| |||||||||||||||
Purchased Options | 80,490 | 218 | — | 80,708 | ||||||||||||
|
| |||||||||||||||
Total Investments in Securities | $ | 5,676,592 | $ | 116,757,176 | $ | 181,704 | ** | $ | 122,615,472 | |||||||
|
| |||||||||||||||
Fixed Income | ||||||||||||||||
Unfunded Loan Commitments | — | 322,174 | — | 322,174 | ||||||||||||
|
| |||||||||||||||
Total Investments in Securities in Assets | $ | 5,676,592 | $ | 117,079,350 | $ | 181,704 | ** | $ | 122,937,646 | |||||||
|
| |||||||||||||||
Other Financial Instruments* | ||||||||||||||||
Forward Foreign Currency Exchange Contracts | $ | 274 | $ | — | $ | — | $ | 274 | ||||||||
Futures | 2,376 | — | — | 2,376 | ||||||||||||
Swaps - Interest Rate | — | (20,101 | ) | — | (20,101 | ) | ||||||||||
Written Options | (363,683 | ) | — | — | (363,683 | ) | ||||||||||
| (a) | See Fund’s Schedule of Investments in Securities for sector classifications. |
| * | Other financial instruments are derivative instruments, such as futures, forward foreign currency exchange, swaps contracts and written options. Futures, forward foreign currency exchange and swap contracts are valued at the unrealized appreciation (depreciation) on the instrument, while written options are valued at fair value. |
| ** | Significant unobservable inputs were used in determining the value of portfolio securities for the High Income Alternatives Fund . |
Dolan McEniry Corporate Bond Fund
| Description | Level 1 - Quoted prices in active markets for identical assets | Level 2 - Significant other observable inputs | Level 3 - Significant unobservable inputs | Total | ||||||||||||
Fixed Income | ||||||||||||||||
Corporate Bonds | $ | — | $ | 76,470,345 | $ | — | $ | 76,470,345 | ||||||||
|
| |||||||||||||||
Total Fixed Income | — | 76,470,345 | — | 76,470,345 | ||||||||||||
|
| |||||||||||||||
Total Investments in Securities | $ | — | $ | 76,470,345 | $ | — | $ | 76,470,345 | ||||||||
|
| |||||||||||||||
| Notes to Financial Statements | 167 | |||||
Table of Contents
Litman Gregory Funds Trust
NOTES TO FINANCIAL STATEMENTS – (Unaudited) – (Continued)
DBi Managed Futures Strategy ETF (Consolidated)
| Description | Level 1 - Quoted prices in active markets for identical assets | Level 2 - Significant other observable inputs | Level 3 - Significant unobservable inputs | Total | ||||||||||||
Other Financial Instruments* | ||||||||||||||||
Futures | $ | (97,561 | ) | $ | — | $ | — | $ | (97,561 | ) | ||||||
| * | Other financial instruments are derivative instruments, such as futures, forward foreign currency exchange, swaps contracts and written options. Futures, forward foreign currency exchange and swap contracts are valued at the unrealized appreciation (depreciation) on the instrument, while written options are valued at fair value. |
DBi Hedge Strategy ETF
| Description | Level 1 - Quoted prices in active markets for identical assets | Level 2 - Significant other observable inputs | Level 3 - Significant unobservable inputs | Total | ||||||||||||
Other Financial Instruments* | ||||||||||||||||
Futures | $ | 17,662 | $ | — | $ | — | $ | 17,662 | ||||||||
| * | Other financial instruments are derivative instruments, such as futures, forward foreign currency exchange, swaps contracts and written options. Futures, forward foreign currency exchange and swap contracts are valued at the unrealized appreciation (depreciation) on the instrument, while written options are valued at fair value. |
RBA Responsible Global Allocation ETF
| Description | Level 1 - Quoted prices in active markets for identical assets | Level 2 - Significant other observable inputs | Level 3 - Significant unobservable inputs | Total | ||||||||||||
Equity(a) | ||||||||||||||||
Exchange-Traded Funds | $ | 8,010,940 | $ | — | $ | — | $ | 8,010,940 | ||||||||
|
| |||||||||||||||
Total Equity | 8,010,940 | — | — | 8,010,940 | ||||||||||||
|
| |||||||||||||||
Total Investments in Securities | $ | 8,010,940 | $ | — | $ | — | $ | 8,010,940 | ||||||||
|
| |||||||||||||||
| (a) | See Fund’s Schedule of Investments in Securities for sector classifications. |
Note 8 – Commitments and Contingencies
The Funds may make commitments pursuant to bridge loan facilities. Such commitments typically remain off balance sheet as it is more likely than not, based on good faith judgement of the Advisor, that such bridge facilities will not ever fund. As of June 30, 2022, the High Income Alternatives Fund had $200,000 outstanding bridge facility commitments.
| 168 | Litman Gregory Funds Trust | |||||
Table of Contents
Litman Gregory Funds Trust
NOTES TO FINANCIAL STATEMENTS – (Unaudited) – (Continued)
Note 9 – Other Derivative Information
At June 30, 2022, the Funds are invested in derivative contracts which are reflected in the Statements of Assets and Liabilities as follows:
| Alternative Strategies Fund | ||||||||||||||||||||
| Derivative Assets | Derivative Liabilities | |||||||||||||||||||
| Risk | Statements of Assets and Liabilities Location | Fair Value Amount | Statements of Assets and Liabilities Location | Fair Value Amount | ||||||||||||||||
Currency | Unrealized gain on forward foreign currency exchange contracts | $ | 363,843 | Unrealized loss on forward foreign currency exchange contracts | $ | (66,562 | ) | |||||||||||||
| Unrealized gain on futures contracts* | 1,517,707 | Unrealized loss on futures contracts* | (5,590,489 | ) | ||||||||||||||||
Credit | Unrealized gain on swap contracts** | 24,833,370 | Unrealized loss on swap contracts** | (21,025,583 | ) | |||||||||||||||
Equity | Unrealized gain on swap contracts | 121,461 | Unrealized loss on swap contracts | (158,073 | ) | |||||||||||||||
| Investments in securities(1) | — | Written options | (72,217 | ) | ||||||||||||||||
|
| |||||||||||||||||||
| Total | $ | 26,836,381 | $ | (26,912,924 | ) | |||||||||||||||
|
| |||||||||||||||||||
|
| * Includes cumulative appreciation/depreciation on futures contracts described previously. Only
** Includes cumulative appreciation/depreciation on centrally cleared swaps.
(1) The Statements of Assets and Liabilities location for “Purchased Options” is “Investments in |
| ||||||||||||||||||
| High Income Alternatives Fund | ||||||||||||||||||||
| Derivative Assets | Derivative Liabilities | |||||||||||||||||||
| Risk | Statements of Assets and Liabilities Location | Fair Value Amount | Statements of Assets and Liabilities Location | Fair Value Amount | ||||||||||||||||
Currency | Unrealized gain on forward foreign currency exchange contracts | $ | 274 | Unrealized loss on forward foreign currency exchange contracts | $ | — | ||||||||||||||
Interest rate | Unrealized gain on swap contracts | — | Unrealized loss on swap contracts** | (20,101 | ) | |||||||||||||||
| Unrealized gain on futures contracts* | 9,194 | Unrealized loss on futures contracts* | (6,818 | ) | ||||||||||||||||
| Investments in securities(1) | 218 | Written options | — | |||||||||||||||||
Equity | Investments in securities(1) | 80,490 | Written options | (363,683 | ) | |||||||||||||||
|
| |||||||||||||||||||
| Total | $ | 90,176 | $ | (390,602 | ) | |||||||||||||||
|
| |||||||||||||||||||
|
| ** Includes cumulative appreciation/depreciation on centrally cleared swaps.
* Includes cumulative appreciation/depreciation on futures contracts described previously. Only
(1) The Statements of Assets and Liabilities location for “Purchased Options” is “Investments in |
| ||||||||||||||||||
| Notes to Financial Statements | 169 | |||||
Table of Contents
Litman Gregory Funds Trust
NOTES TO FINANCIAL STATEMENTS – (Unaudited) – (Continued)
| DBi Managed Futures Strategy ETF (Consolidated) | ||||||||||||||||||||
| Derivative Assets | Derivative Liabilities | |||||||||||||||||||
| Risk | Statements of Assets and Liabilities Location | Fair Value Amount | Statements of Assets and Liabilities Location | Fair Value Amount | ||||||||||||||||
Commodity | Unrealized gain on futures contracts* | $ | 668,634 | Unrealized loss on futures contracts* | $ | — | ||||||||||||||
Currency | Unrealized gain on futures contracts* | 1,473,745 | Unrealized loss on futures contracts* | — | ||||||||||||||||
Interest rate | Unrealized gain on futures contracts* | 34,327 | Unrealized loss on futures contracts* | (2,225,581 | ) | |||||||||||||||
Equity | Unrealized gain on futures contracts* | 341,864 | Unrealized loss on futures contracts* | (390,550 | ) | |||||||||||||||
|
| |||||||||||||||||||
| Total | $ | 2,518,570 | $ | (2,616,131 | ) | |||||||||||||||
|
| |||||||||||||||||||
| | * Includes cumulative appreciation/depreciation on futures contracts described previously. Only current | | ||||||||||||||||||
| DBi Hedge Strategy ETF | ||||||||||||||||||||
| Derivative Assets | Derivative Liabilities | |||||||||||||||||||
| Risk | Statements of Assets and Liabilities Location | Fair Value Amount | Statements of Assets and Liabilities Location | Fair Value Amount | ||||||||||||||||
Currency | Unrealized gain on futures contracts* | $ | 18,734 | Unrealized loss on futures contracts* | $ | — | ||||||||||||||
Interest rate | Unrealized gain on futures contracts* | 34,310 | Unrealized loss on futures contracts* | (61,456 | ) | |||||||||||||||
Equity | Unrealized gain on futures contracts* | 36,967 | Unrealized loss on futures contracts* | (10,893 | ) | |||||||||||||||
|
| |||||||||||||||||||
| Total | $ | 90,011 | $ | (72,349 | ) | |||||||||||||||
|
| |||||||||||||||||||
| | * Includes cumulative appreciation/depreciation on futures contracts described previously. Only | | ||||||||||||||||||
For the six months ended June 30, 2022, the effect of derivative contracts in the Funds’ Statements of Operations were as follows:
| International Fund | ||||||||||||||||||
| Statements of Operations | ||||||||||||||||||
| Risk | Derivative Type | Net Realized Gain (Loss) | Net Change in Unrealized Gain (Loss) | Average Notional Amount(a) | ||||||||||||||
Currency | Forward foreign currency exchange contracts | $ | 103,684 | $ | 17,619 | 1,336,929 | ||||||||||||
| (a) | Average notional values are based on the average of monthly end contract values for the period ended June 30, 2022. |
| Alternative Strategies Fund | ||||||||||||||||||
| Statements of Operations | ||||||||||||||||||
| Risk | Derivative Type | Net Realized Gain (Loss) | Net Change in Unrealized Gain (Loss) | Average Notional Amount | ||||||||||||||
Currency | Forward foreign currency exchange contracts | $ | 1,932,227 | $ | 464,140 | 59,206,636 | (a) | |||||||||||
Interest rate | Future contracts | 13,189,871 | (3,402,463 | ) | 551,630,506 | (b) | ||||||||||||
Credit | Swap contracts | 781,600 | 5,823,167 | 1,283,889,800 | (b)(c) | |||||||||||||
Equity | Swap contracts | 18,083,036 | 674,213 | 138,805,777 | (b)(c) | |||||||||||||
| Purchased option contracts | (503,227 | ) | 26,337 | 973 | (d) | |||||||||||||
| Written option contracts | 85,216 | 21,233 | 314 | (d) | ||||||||||||||
|
| |||||||||||||||||
| Total | $ | 33,568,723 | $ | 3,606,627 | ||||||||||||||
|
| |||||||||||||||||
| 170 | Litman Gregory Funds Trust | |||||
Table of Contents
Litman Gregory Funds Trust
NOTES TO FINANCIAL STATEMENTS – (Unaudited) – (Continued)
| (a) | Average notional values are based on the average of monthly end contract values for the period ended June 30, 2022. |
| (b) | Average notional values are based on the average of monthly end notional balances for the period ended June 30, 2022. |
| (c) | Notional amount is denoted in local currency. |
| (d) | Average contracts are based on the average of monthly end contracts for the period ended June 30, 2022. |
| High Income Alternatives Fund | ||||||||||||||||||
| Statements of Operations | ||||||||||||||||||
| Risk | Derivative Type | Net Realized Gain (Loss) | Net Change in Unrealized Gain (Loss) | Average Notional Amount | ||||||||||||||
Currency | Forward foreign currency exchange contracts | $ | 44,816 | $ | (10,552 | ) | 479,753 | (a) | ||||||||||
Interest rate | Swap contracts | (879 | ) | (20,101 | ) | 100,000 | (b) | |||||||||||
| Future contracts | 46,218 | 10,765 | 2,774,609 | (b) | ||||||||||||||
| Purchased option contracts | — | (27,580 | ) | 17,400,000 | (b) | |||||||||||||
Equity | Purchased option contracts | — | 32,885 | 1 | (c) | |||||||||||||
| Written option contracts | (1,586,685 | ) | 72,555 | 68 | (c) | |||||||||||||
|
| |||||||||||||||||
| Total | $ | (1,496,530 | ) | $ | 57,972 | |||||||||||||
|
| |||||||||||||||||
| (a) | Average notional values are based on the average of monthly end contract values for the period ended June 30, 2022. |
| (b) | Average notional values are based on the average of monthly end notional balances for the period ended June 30, 2022. |
| (c) | Average contracts are based on the average of monthly end contracts for the period ended June 30, 2022. |
| DBi Managed Futures Strategy ETF (Consolidated) | ||||||||||||||||||
| Statements of Operations | ||||||||||||||||||
| Risk | Derivative Type | Net Realized Gain (Loss) | Net Change in Unrealized Gain (Loss) | Average Notional Amount(a) | ||||||||||||||
Commodity | Future contracts | $ | 4,292,497 | $ | 39,121 | 45,902,732 | ||||||||||||
Currency | Future contracts | 15,234,745 | 1,265,273 | 128,953,040 | ||||||||||||||
Interest rate | Future contracts | 8,096,292 | (1,870,632 | ) | 163,109,608 | |||||||||||||
Equity | Future contracts | (2,564,684 | ) | (118,635 | ) | 38,203,171 | ||||||||||||
|
| |||||||||||||||||
| Total | $ | 25,058,850 | $ | (684,873 | ) | |||||||||||||
|
| |||||||||||||||||
| (a) | Average notional values are based on the average of monthly end notional balances for the period ended June 30, 2022. |
| DBi Hedge Strategy ETF | ||||||||||||||||||
| Statements of Operations | ||||||||||||||||||
| Risk | Derivative Type | Net Realized Gain (Loss) | Net Change in Unrealized Gain (Loss) | Average Notional Amount(a) | ||||||||||||||
Currency | Future contracts | $ | 23,677 | $ | 1,134 | 1,141,421 | ||||||||||||
Interest rate | Future contracts | 932,622 | (447 | ) | 14,897,888 | |||||||||||||
Equity | Future contracts | (1,820,960 | ) | (134,683 | ) | 8,974,450 | ||||||||||||
|
| |||||||||||||||||
| Total | $ | (864,661 | ) | $ | (133,996 | ) | ||||||||||||
|
| |||||||||||||||||
| (a) | Average notional values are based on the average of monthly end notional balances for the period ended June 30, 2022. |
The Funds are subject to various Master Netting Arrangements, which govern the terms of certain transactions with select counterparties. The Master Netting Arrangements allow the Funds to close out and net their total exposure to a counterparty in the event of a default with respect to all the transactions governed under a single agreement with a counterparty. The Master Netting Arrangements also specify collateral posting arrangements at pre-arranged exposure levels. Under the Master Netting Arrangements, collateral is routinely transferred if the total net exposure to certain transactions (net of existing collateral already in place) governed under the relevant Master Netting Arrangement with a counterparty in a given account exceeds a specified threshold depending on the counterparty and the type of Master Netting Arrangement.
| Notes to Financial Statements | 171 | |||||
Table of Contents
Litman Gregory Funds Trust
NOTES TO FINANCIAL STATEMENTS – (Unaudited) – (Continued)
At June 30, 2022, Equity Fund, International Fund, Alternative Strategies Fund, and High Income Alternatives Fund had investments in repurchase agreements with a gross value of $2,682,037, $8,588,473, $127,332,311, and $3,220,136, respectively, which are reflected as repurchase agreements on the Statements of Assets and Liabilities. The value of the related collateral exceeded the value of the repurchase agreements at June 30, 2022.
For the period ended June 30, 2022, the High Income Alternatives Fund had outstanding reverse repurchase agreement balance for 7 days. The average amount of borrowings was $143,488 and the average interest rate was 0.09% during the 7 day period.
The following tables represent the disclosure for derivative instruments related to offsetting assets and liabilities for each of the Funds as of June 30, 2022:
| Alternative Strategies Fund | ||||||||||||||||||||||||||||||||||||||||||||||||||||||||
| Derivative Assets | Derivative Liabilities | |||||||||||||||||||||||||||||||||||||||||||||||||||||||
| Counterparty | Purchased Options | Futures(1) | Swaps(2) | Forward Currency Contracts | Total | Futures(1) | Swaps(2) | Forward Currency Contracts | Written Options | Total | Net Derivative Asset (Liabilities) | Collateral (Received) Pledged | Net Amount | |||||||||||||||||||||||||||||||||||||||||||
Bank of America N.A. | $ | — | $ | — | $ | — | $ | 59,862 | $ | 59,862 | $ | — | $ | — | $ | — | $ | — | $ | — | $ | 59,862 | $ | — | $ | 59,862 | ||||||||||||||||||||||||||||||
Barclays Bank Plc | — | — | 82,810 | 18,369 | 101,179 | — | — | — | — | — | 101,179 | — | 101,179 | |||||||||||||||||||||||||||||||||||||||||||
Citigroup Global Markets, Inc. | — | 404,829 | — | — | 404,829 | (1,455,659 | ) | — | — | — | (1,455,659 | ) | (1,050,830 | ) | — | (1,050,830 | ) | |||||||||||||||||||||||||||||||||||||||
Goldman Sachs & Co. | — | — | 57,108 | — | 57,108 | — | (15,504 | ) | — | (26,975 | ) | (42,479 | ) | 14,629 | — | 14,629 | ||||||||||||||||||||||||||||||||||||||||
HSBC Bank USA | — | — | — | — | — | — | — | (3,521 | ) | — | (3,521 | ) | (3,521 | ) | — | (3,521 | ) | |||||||||||||||||||||||||||||||||||||||
JPMorgan Chase Bank N.A. | — | 1,112,878 | 52,363 | 135,633 | 1,300,874 | (4,134,830 | ) | — | (31,550 | ) | — | (4,166,380 | ) | (2,865,506 | ) | 367,499 | (2,498,007 | ) | ||||||||||||||||||||||||||||||||||||||
Morgan Stanley & Co. | — | — | 11,990 | 149,979 | 161,969 | — | (142,569 | ) | (31,491 | ) | (45,242 | ) | (219,302 | ) | (57,333 | ) | 57,333 | — | ||||||||||||||||||||||||||||||||||||||
|
| |||||||||||||||||||||||||||||||||||||||||||||||||||||||
Total | $ | — | $ | 1,517,707 | $ | 204,271 | $ | 363,843 | $ | 2,085,821 | $ | (5,590,489 | ) | $ | (158,073 | ) | $ | (66,562 | ) | $ | (72,217 | ) | $ | (5,887,341 | ) | $ | (3,801,520 | ) | $ | 424,832 | $ | (3,376,688 | ) | |||||||||||||||||||||||
|
| |||||||||||||||||||||||||||||||||||||||||||||||||||||||
| (1) | Includes cumulative appreciation (depreciation) of futures contracts as reported in the Schedule of Investments. Only current day’s variation margin is reported within the Statements of Assets and Liabilites. |
| (2) | Does not include the unrealized appreciation (depreciation) of centrally cleared swaps as reported in the Schedule of Investments. Only the variation margin is reported within the Statements of Assets and Liabilities. |
| High Income Alternatives Fund | ||||||||||||||||||||||||||||||||||||||||||||||||||||||||
| Derivative Assets | Derivative Liabilities | |||||||||||||||||||||||||||||||||||||||||||||||||||||||
| Counterparty | Purchased Options | Futures(1) | Swaps(2) | Forward Currency Contracts | Total | Futures(1) | Swaps(2) | Forward Currency Contracts | Written Options | Total | Net Derivative Asset (Liabilities) | Collateral (Received) Pledged | Net Amount | |||||||||||||||||||||||||||||||||||||||||||
Bank of America N.A. | $ | 143 | $ | — | $ | — | $ | — | $ | 143 | $ | — | $ | — | $ | — | $ | — | $ | — | $ | 143 | $ | — | $ | 143 | ||||||||||||||||||||||||||||||
Barclays Bank Plc | — | — | — | 92 | 92 | — | — | — | — | — | 92 | — | 92 | |||||||||||||||||||||||||||||||||||||||||||
Goldman Sachs & Co. | — | 9,194 | — | — | 9,194 | (6,818 | ) | — | — | — | (6,818 | ) | 2,376 | — | 2,376 | |||||||||||||||||||||||||||||||||||||||||
Goldman Sachs International | 6 | — | — | 182 | 188 | — | — | — | — | — | 188 | — | 188 | |||||||||||||||||||||||||||||||||||||||||||
Morgan Stanley & Co. | 80,559 | — | — | — | 80,559 | — | — | — | — | — | 80,559 | — | 80,559 | |||||||||||||||||||||||||||||||||||||||||||
UBS Securities LLC | — | — | — | — | — | — | — | — | (363,683 | ) | (363,683 | ) | (363,683 | ) | — | (363,683 | ) | |||||||||||||||||||||||||||||||||||||||
|
| |||||||||||||||||||||||||||||||||||||||||||||||||||||||
Total | $ | 80,708 | $ | 9,194 | $ | — | $ | 274 | $ | 90,176 | $ | (6,818 | ) | $ | — | $ | — | $ | (363,683 | ) | $ | (370,501 | ) | $ | (280,325 | ) | $ | — | $ | (280,325 | ) | |||||||||||||||||||||||||
|
| |||||||||||||||||||||||||||||||||||||||||||||||||||||||
| (1) | Includes cumulative appreciation (depreciation) of futures contracts as reported in the Schedule of Investments. Only current day’s variation margin is reported within the Statements of Assets and Liabilites. |
| (2) | Does not include the unrealized appreciation (depreciation) of centrally cleared swaps as reported in the Schedule of Investments. Only the variation margin is reported within the Statements of Assets and Liabilities. |
| 172 | Litman Gregory Funds Trust | |||||
Table of Contents
Litman Gregory Funds Trust
NOTES TO FINANCIAL STATEMENTS – (Unaudited) – (Continued)
| DBi Managed Futures Strategy ETF (Consolidated) | ||||||||||||||||||||||||||||||||||||||||||||||||||||||||
| Derivative Assets | Derivative Liabilities | |||||||||||||||||||||||||||||||||||||||||||||||||||||||
| Counterparty | Purchased Options | Futures(1) | Swaps | Forward Currency Contracts | Total | Futures(1) | Swaps | Forward Currency Contracts | Written Options | Total | Net Derivative Asset (Liabilities) | Collateral (Received) Pledged | Net Amount | |||||||||||||||||||||||||||||||||||||||||||
Societe Generale | $ | — | $ | 2,518,570 | $ | — | $ | — | $ | 2,518,570 | $ | (2,616,131 | ) | $ | — | $ | — | $ | — | $ | (2,616,131 | ) | $ | (97,561 | ) | $ | — | $ | (97,561 | ) | ||||||||||||||||||||||||||
|
| |||||||||||||||||||||||||||||||||||||||||||||||||||||||
| (1) | Includes cumulative appreciation (depreciation) of futures contracts as reported in the Consolidated Schedule of Investments. Only current day’s variation margin is reported within the Consolidated Statement of Assets and Liabilities. |
| DBi Hedge Strategy ETF | ||||||||||||||||||||||||||||||||||||||||||||||||||||||||
| Derivative Assets | Derivative Liabilities | |||||||||||||||||||||||||||||||||||||||||||||||||||||||
| Counterparty | Purchased Options | Futures(1) | Swaps | Forward Currency Contracts | Total | Futures(1) | Swaps | Forward Currency Contracts | Written Options | Total | Net Derivative Asset (Liabilities) | Collateral (Received) Pledged | Net Amount | |||||||||||||||||||||||||||||||||||||||||||
Societe Generale | $ | — | $ | 90,011 | $ | — | $ | — | $ | 90,011 | $ | (72,349 | ) | $ | — | $ | — | $ | — | $ | (72,349 | ) | $ | 17,662 | $ | — | $ | 17,662 | ||||||||||||||||||||||||||||
|
| |||||||||||||||||||||||||||||||||||||||||||||||||||||||
| (1) | Includes cumulative appreciation (depreciation) of futures contracts as reported in the Schedule of Investments. Only current day’s variation margin is reported within the Statements of Assets and Liabilities. |
Note 10 – Income Taxes and Distributions to Shareholders
As of December 31, 2021, the components of accumulated earnings (losses) for income tax purposes were as follows:
| Equity Fund | International Fund | Oldfield International Value Fund | SBH Focused Small Value Fund | |||||||||||||
Tax cost of Investments and derivatives | $ | 171,652,282 | $ | 312,931,201 | $ | 24,171,504 | $ | 51,471,747 | ||||||||
Gross Tax unrealized appreciation | 111,957,959 | 38,369,949 | 2,978,299 | 13,289,806 | ||||||||||||
Gross Tax unrealized depreciation | (7,933,429 | ) | (4,836,260 | ) | (1,558,542 | ) | (1,590,959 | ) | ||||||||
|
| |||||||||||||||
Net Tax unrealized appreciation (depreciation) on investments and derivatives | 104,024,530 | 33,533,689 | 1,419,757 | 11,698,847 | ||||||||||||
Net Tax unrealized appreciation (depreciation) on foreign currency | (5,210 | ) | (49,691 | ) | (1,686 | ) | — | |||||||||
|
| |||||||||||||||
Net Tax unrealized appreciation (depreciation) | 104,019,320 | 33,483,998 | 1,418,071 | 11,698,847 | ||||||||||||
|
| |||||||||||||||
Undistributed Ordinary Income | 240,225 | 54,861 | 59,431 | — | ||||||||||||
|
| |||||||||||||||
Undistributed Long-Term Capital Gains | 3,589,225 | — | — | — | ||||||||||||
|
| |||||||||||||||
Capital Loss Carry Forward | — | (7,330,754 | ) | — | — | |||||||||||
|
| |||||||||||||||
Late Year Ordinary Loss Deferral | — | — | — | — | ||||||||||||
|
| |||||||||||||||
Post-October Capital Losses Deferral | — | — | — | (129,718 | ) | |||||||||||
|
| |||||||||||||||
Other Accumulated Gains | — | — | — | — | ||||||||||||
|
| |||||||||||||||
Total accumulated gain/(loss) | $ | 107,848,770 | $ | 26,208,105 | $ | 1,477,502 | $ | 11,569,129 | ||||||||
|
| |||||||||||||||
| Notes to Financial Statements | 173 | |||||
Table of Contents
Litman Gregory Funds Trust
NOTES TO FINANCIAL STATEMENTS – (Unaudited) – (Continued)
| Alternative Strategies Fund | High Income Alternatives Fund | Dolan McEniry Corporate Bond Fund | DBi Managed Futures Strategy ETF (Consolidated) | DBi Hedge Strategy ETF | ||||||||||||||||
Tax cost of Investments and derivatives | $ | 1,475,826,255 | $ | 106,217,680 | $ | 94,073,371 | $ | 13,867,688 | $ | 5,298,871 | ||||||||||
Gross Tax unrealized appreciation | 132,662,640 | 1,559,321 | 526,965 | 629,542 | 9 | |||||||||||||||
Gross Tax unrealized depreciation | (93,934,431 | ) | (743,850 | ) | (873,957 | ) | (131 | ) | (37 | ) | ||||||||||
|
| |||||||||||||||||||
Net Tax unrealized appreciation (depreciation) on investments and derivatives | 38,728,209 | 815,471 | (346,992 | ) | 629,411 | (28 | ) | |||||||||||||
Net Tax unrealized appreciation (depreciation) on foreign currency | (32,036 | ) | (867 | ) | — | — | — | |||||||||||||
|
| |||||||||||||||||||
Net Tax unrealized appreciation (depreciation) | 38,696,173 | 814,604 | (346,992 | ) | 629,411 | (28 | ) | |||||||||||||
|
| |||||||||||||||||||
Undistributed Ordinary Income | 6,816,870 | 371,962 | — | — | — | |||||||||||||||
|
| |||||||||||||||||||
Undistributed Long-Term Capital Gains | — | — | 80,695 | — | — | |||||||||||||||
|
| |||||||||||||||||||
Capital Loss Carry Forward | — | — | — | — | — | |||||||||||||||
|
| |||||||||||||||||||
Late Year Ordinary Loss Deferral | — | — | — | — | (16,840 | ) | ||||||||||||||
|
| |||||||||||||||||||
Post-October Capital Losses Deferral | (2,344,080 | ) | — | (49,668 | ) | (766,683 | ) | (10,837 | ) | |||||||||||
|
| |||||||||||||||||||
Straddle Loss Deferral and Reversal | (7,183,307 | ) | — | — | — | — | ||||||||||||||
|
| |||||||||||||||||||
Other Accumulated Losses | (10,379 | ) | (1,643 | ) | — | — | — | |||||||||||||
|
| |||||||||||||||||||
Total accumulated gain/(loss) | $ | 35,975,277 | $ | 1,184,923 | $ | (315,965 | ) | $ | (137,272 | ) | $ | (27,705 | ) | |||||||
|
| |||||||||||||||||||
The difference between book-basis and tax-basis unrealized appreciation is attributable primarily to wash sales, premium amortization accruals, forward foreign currency exchange contracts mark to market, futures contracts mark to market, options contracts mark to market, swap contracts mark to market, passive foreign investment company adjustments, partnership basis adjustments, organizational expenses, constructive sales, and non REIT ROC basis adjustments.
For the year ended December 31, 2021, capital loss carry over used in current year was as follows:
| Fund | Capital Loss Carryover Utilized | |||
International Fund | $ | 55,999,686 | ||
SBH Focused Small Value Fund | 2,832,449 | |||
High Income Alternatives Fund | 1,729,117 | |||
The capital loss carry forwards for each Fund were as follows:
| International Fund | ||||
Capital Loss Carryforwards | ||||
Perpetual Short-Term | $ | (7,330,754 | ) | |
Perpetual Long-Term | — | |||
|
| |||
Total | $ | (7,330,754 | ) | |
|
| |||
| 174 | Litman Gregory Funds Trust | |||||
Table of Contents
Litman Gregory Funds Trust
NOTES TO FINANCIAL STATEMENTS – (Unaudited) – (Continued)
Additionally, GAAP requires that certain components of net assets relating to permanent differences be reclassified between financial and tax reporting. These reclassifications have no effect on net assets or net asset value per share. For the year ended December 31, 2021, the following table shows the reclassifications made:
| Fund | Accumulated Distributable Earnings (Deficit) | Paid In Capital | ||||||
Equity Fund* | $ | (3,670,835 | ) | $ | 3,670,835 | |||
International Fund* | 148,063 | (148,063 | ) | |||||
Oldfield International Value Fund* | — | — | ||||||
SBH Focused Small Value Fund* | (28,833 | ) | 28,833 | |||||
Alternative Strategies Fund* | (3,392,836 | ) | 3,392,836 | |||||
High Income Alternatives Fund* | 46,726 | (46,726 | ) | |||||
Dolan McEniry Corporate Bond Fund* | — | — | ||||||
DBi Managed Futures Strategy ETF* | (721,245 | ) | 721,245 | |||||
DBi Hedge Strategy ETF* | — | — | ||||||
| * | The permanent differences primarily relate to return of capital distributions, premium amortization, foreign currency gains/losses, paydown gains/losses, passive foreign investment company gains/losses, swaps adjustments, Subsidiary adjustments, equalization adjustments, and tax treatment of partnerships. |
The tax composition of dividends (other than return of capital dividends), for the six months ended June 30, 2022 and the year ended December 31, 2021 were as follows:
| Six Months Ended June 30, 2022 | 2021 | |||||||||||||||||||||||
| Fund | Ordinary Income | Long-Term Capital Gain | Ordinary Income | Long-Term Capital Gain | Return of Capital | |||||||||||||||||||
Equity Fund | $ | — | $ | — | $ | 1,953,965 | $ | 36,670,924 | $ | — | ||||||||||||||
International Fund | — | 12,424,454 | — | — | ||||||||||||||||||||
Oldfield International Value Fund | — | — | 725,262 | — | — | |||||||||||||||||||
SBH Focused Small Value Fund | — | — | 1,466,176 | — | — | |||||||||||||||||||
Alternative Strategies Fund | 21,499,442 | — | 63,630,125 | 29,448,872 | — | |||||||||||||||||||
High Income Alternatives Fund | 1,821,431 | 262.298 | 5,437,135 | — | — | |||||||||||||||||||
Dolan McEniry Corporate Bond Fund | 875,008 | — | 1,577,764 | 176,585 | — | |||||||||||||||||||
DBi Managed Futures Strategy ETF | — | — | 1,819,004 | 1,817,127 | 2,722,219 | |||||||||||||||||||
DBi Hedge Strategy ETF | — | — | 934,164 | 2,074,336 | ||||||||||||||||||||
RBA Responsible Global Allocation ETF | 39,111 | — | — | — | — | |||||||||||||||||||
The Funds did not have any unrecognized tax benefits at December 31, 2021, nor were there any increases or decreases in unrecognized tax benefits for the year ended December 31, 2021. The Funds are subject to examination by the U.S. federal and state tax authorities for returns filed for the prior three and four fiscal years, respectively.
Note 11 – Line of Credit
The Trust has an unsecured, uncommitted $75,000,000 line of credit with the Custodian, for the Equity Fund, International Fund, Oldfield International Value Fund, SBH Focus Small Value Fund and High Income Alternatives Fund (the “Five Funds”) expiring on April 28, 2023. Under this agreement, borrowing interest rate is equal to the sum of applicable margin of 1.00%, and applicable rate of 0.10%, plus the higher of (i) the Federal Funds Effective Rate and (ii) Overnight Bank Funding Rate. There is no annual commitment fee on the uncommitted line of credit. There was $25,000 annual administrative fee charged at the May 1, 2022 renewal. The Trust also has a secured, uncommitted $125,000,000 line of credit for the Alternative Strategies Fund with the Custodian, expiring on July 21, 2022. There is no annual commitment fee but, a non-refundable up-front fee of $50,000 paid for each yearly amendment. The line of credit is secured by a general security interest in substantially all of the Alternative Strategies Fund’s assets. Under this agreement, the borrowing rate is the Overnight Margin (1.25%) plus the higher of (i) the Federal Funds Effective Rate and (ii) the Overnight Bank Funding Rate.
Amounts outstanding to the Five Funds under the Facility at no time shall exceed in the aggregate at any time the least of (a) $75,000,000; (b) 10% of the value of the total assets of each Fund less such Fund’s total liabilities not represented by senior securities less the value of any assets of the Fund pledged to, or otherwise segregated for the benefit of a party other than the Bank and in connection with a liability not reflected in the calculation of the Fund’s total liabilities. Amounts outstanding for the Alternative Strategies Fund at no time shall exceed in the aggregate at any time the lesser of the (a) Borrowing Base, (b) the Facility amount of $125,000,000 and (c) should not have an
| Notes to Financial Statements | 175 | |||||
Table of Contents
Litman Gregory Funds Trust
NOTES TO FINANCIAL STATEMENTS – (Unaudited) – (Continued)
aggregate amount of outstanding senior securities representing indebtedness the least of (i) 33 1/3% of the Alternative Strategies Fund’s net assets and (ii) the maximum amount that the Fund would be permitted to incur pursuant to applicable law.
For the six months ended June 30, 2022, the interest expense was $20,154 for Equity Fund, and $13,880 for International Fund. For the six months ended June 30, 2022, there were no borrowings for the Oldfield International Value Fund, SBH Focused Small Value Fund, Alternative Strategies Fund and High Income Alternatives Fund, and there was no balance outstanding at the end of the period. There was no balance outstanding at June 30, 2022 for the Equity Fund, and International Fund. The average borrowing for the six months ended June 30, 2022 for the Equity Fund for the period the line was drawn was $15,000,000, at an average borrowing rate of 1.1798%. The average borrowing for the six months ended June 30, 2022 for the International Fund for the period the line was drawn was $9,409,091, at an average borrowing rate of 1.1968%. During the six months ended June 30, 2022, the maximum borrowing was $15,000,000, and $15,000,000 for the Equity Fund, and International Fund, respectively.
Note 12 – Principal Risks
Below are summaries of the principal risks of investing in one or more of the Funds, each of which could adversely affect a Fund’s net asset value, yield and total return. Each risk listed below does not necessarily apply to each Fund, and you should read a Fund’s prospectus carefully for a description of the principal risks associated with investing in a particular Fund.
| • | Asset-Backed Securities Risk. This is the risk that the impairment of the value of the collateral underlying a security in which the High Income Alternatives Fund invests, such as the non-payment of loans, will result in a reduction in the value of the security. The value of these securities may also fluctuate in response to the market’s perception of the value of issuers or collateral. |
| • | Below Investment-Grade Fixed Income Securities Risk. This is the risk of investing in below investment-grade fixed income securities (also known as “junk bonds”), which may be greater than that of higher rated fixed income securities. These securities are rated Ba1 through C by Moody’s Investors Service (“Moody’s”) or BB+ through D by Standard & Poor’s Rating Group (“S&P”) (or comparably rated by another nationally recognized statistical rating organization), or, if not rated by Moody’s or S&P, are considered by the sub-advisors to be of similar quality. These securities have greater risk of default than higher rated securities. The market value of these securities is more sensitive to corporate developments and economic conditions and can be volatile. Market conditions can diminish liquidity and make accurate valuations difficult to obtain. There is no limit to the Alternative Strategies Fund’s ability to invest in below investment-grade fixed income securities; however, under normal market conditions, it does not expect to invest more than 50% of its total assets in below investment-grade fixed income securities. |
| • | Capital Structure Arbitrage Risk. The perceived mispricing identified by the sub-advisor may not disappear or may even increase, in which case losses may be realized. |
| • | Collateral Risk. If the Alternative Strategies Fund and High Income Alternatives Fund’s financial instruments are secured by collateral, the issuer may have difficulty liquidating the collateral and/or the Fund may have difficulty enforcing its rights under the terms of the securities if an issuer defaults. Collateral may be insufficient or the Fund’s right to the collateral may be set aside by a court. Collateral will generally consist of assets that may not be readily liquidated, including for example, equipment, inventory, work in the process of manufacture, real property and payments to become due under contracts or other receivable obligations. There is no assurance that the liquidation of those assets would satisfy an issuer’s obligations under a financial instrument. Non-affiliates and affiliates of issuers of financial instruments may provide collateral in the form of secured and unsecured guarantees and/or security interests in assets that they own, which may also be insufficient to satisfy an issuer’s obligations under a financial instrument. |
| • | Collateralized Loan Obligations and Collateralized Debt Obligations Risk. Collateralized loan obligations (“CLOs”) bear many of the same risks as other forms of asset-backed securities, including interest rate risk, credit risk and default risk. As they are backed by pools of loans, CLOs also bear similar risks to investing in loans directly. CLOs issue classes or “tranches” that vary in risk and yield. CLOs may experience substantial losses attributable to loan defaults. Losses caused by defaults on underlying assets are borne first by the holders of subordinate tranches. The Alternative Strategies Fund and High Income Alternatives Fund’s investment in CLOs may decrease in market value when the CLO experiences loan defaults or credit impairment, the disappearance of a subordinate tranche, or market anticipation of defaults and investor aversion to CLO securities as a class. |
Collateralized debt obligations (“CDOs”) are structured similarly to CLOs and bear the same risks as CLOs including interest rate risk, credit risk and default risk. CDOs are subject to additional risks because they are backed by pools of assets other than loans including securities (such as other asset-backed securities), synthetic instruments or bonds and may be highly leveraged. Like CLOs, losses incurred by a CDO are borne first by holders of subordinate tranches. Accordingly, the risks of CDOs depend largely on the type of underlying collateral and the tranche of CDOs in which the Fund invests. For example, CDOs that obtain their exposure through synthetic investments entail the risks associated with derivative instruments.
| • | Commodity Risk. Exposure to the commodities markets (including financial futures markets) may subject the DBi Managed Futures Strategy ETF, through its investment in a wholly-owned subsidiary (the “Subsidiary”), which is organized under the laws of the Cayman |
| 176 | Litman Gregory Funds Trust | |||||
Table of Contents
Litman Gregory Funds Trust
NOTES TO FINANCIAL STATEMENTS – (Unaudited) – (Continued)
| Islands and is advised by the sub-advisor, to greater volatility than investments in traditional securities. Prices of commodities and related contracts may fluctuate significantly over short periods for a variety of reasons, including changes in interest rates, supply and demand relationships and balances of payments and trade; weather and natural disasters; governmental, agricultural, trade, fiscal, monetary and exchange control programs and policies, public health crises and trade or price wars among commodity producers or buyers. The commodity markets are subject to temporary distortions and other disruptions. U.S. futures exchanges and some foreign exchanges have regulations that limit the amount of fluctuation in futures contract prices which may occur during a single business day. Limit prices have the effect of precluding trading in a particular contract or forcing the liquidation of contracts at disadvantageous times or prices. |
| • | Communications Services Sector Risk. A Fund may invest a portion of its assets in the communications services sector. Media and communications companies may be significantly affected by product and service obsolescence due to technological advancement or development, competitive pressures, substantial capital requirements, fluctuating demand and changes in regulation. |
| • | Consumer Discretionary Sector Risk. A Fund may invest a portion of its assets in the consumer discretionary sector. The success of consumer product manufacturers and retailers is tied closely to the performance of the overall domestic and international economy, interest rates, competition and consumer confidence. Success depends heavily on disposable household income and consumer spending. Changes in demographics and consumer tastes can also affect the demand for, and success of, consumer products and services in the marketplace. |
| • | Consumer Staples Sector Risk. Certain of the Funds, through the implementation of their respective investment strategies, may from time to time invest a significant portion of their assets in the consumer staples sector, which includes, for example, the food and staples retailing industry, the food, beverage and tobacco industry and the household and personal products industry. This sector can be significantly affected by, among other factors, the regulation of various product components and production methods, marketing campaigns and changes in the global economy, consumer spending and consumer demand. Tobacco companies, in particular, may be adversely affected by new laws, regulations and litigations. Companies in the consumer staples sector may also be adversely affected by changes or trends in commodity prices, which may be influenced by unpredictable factors. These companies may be subject to severe competition, which may have an adverse impact on their profitability. |
| • | Convertible Arbitrage Risk. Arbitrage strategies involve engaging in transactions that attempt to exploit price differences of identical, related or similar securities on different markets or in different forms. A Fund may realize losses or reduced rate of return if underlying relationships among securities in which investment positions are taken change in an adverse manner or a transaction is unexpectedly terminated or delayed. Trading to seek short-term capital appreciation can be expected to cause the Fund’s portfolio turnover rate to be substantially higher than that of the average equity-oriented investment company, resulting in higher transaction costs and additional capital gains tax liabilities. |
| • | Convertible Securities Risk. This is the risk that the market value of convertible securities may fluctuate due to changes in, among other things, interest rates; other general economic conditions; industry fundamentals; market sentiment; the issuer’s operating results, financial statements, and credit ratings; and the market value of the underlying common or preferred stock. |
| • | Corporate Debt Obligations Risk. Corporate debt obligations are subject to the risk of an issuer’s inability to meet principal and interest payments on the obligations. Therefore, the High Income Alternatives Fund may be indirectly exposed to such risks associated with corporate debt obligations. |
| • | Country/Regional Risk. World events – such as political upheaval, financial troubles, or natural disasters – may adversely affect the value of securities issued by companies in foreign countries or regions. Because each of the International Fund and Oldfield International Value Fund may invest a large portion of its assets in securities of companies located in any one country or region, including emerging markets, the Fund’s performance may be hurt disproportionately by the poor performance of its investments in that area. This risk is heightened in emerging markets. |
| • | Currency Risk. This is the risk that investing in foreign currencies may expose the Fund to fluctuations in currency exchange rates and that such fluctuations in the exchange rates may negatively affect an investment related to a currency or denominated in a foreign currency. The Alternative Strategies Fund may invest in foreign currencies for investment and hedging purposes. All of the Funds may invest in foreign currencies for hedging purposes. |
| • | Cybersecurity Risk. Information and technology systems relied upon by the Funds, the Advisor, the sub-advisors, the Funds’ service providers (including, but not limited to, Fund accountants, custodians, transfer agents, administrators, distributors and other financial intermediaries) and/or the issuers of securities in which a Fund invests may be vulnerable to damage or interruption from computer viruses, network failures, computer and telecommunication failures, infiltration by unauthorized persons, security breaches, usage errors, power outages and catastrophic events such as fires, tornadoes, floods, hurricanes and earthquakes. Although the Advisor has implemented measures to manage risks relating to these types of events, if these systems are compromised, become inoperable for extended periods of time or cease to function properly, significant investment may be required to fix or replace them. The failure of these |
| Notes to Financial Statements | 177 | |||||
Table of Contents
Litman Gregory Funds Trust
NOTES TO FINANCIAL STATEMENTS – (Unaudited) – (Continued)
| systems and/or of disaster recovery plans could cause significant interruptions in the operations of the Funds, the Advisor, the sub-advisors, the Funds’ service providers and/or issuers of securities in which a Fund invests and may result in a failure to maintain the security, confidentiality or privacy of sensitive data, including personal information relating to investors (and the beneficial owners of investors). Such a failure could also harm the reputation of the Funds, the Advisor, the sub-advisors, the Funds’ service providers and/or issuers of securities in which a Fund invests, subject such entities and their respective affiliates to legal claims or otherwise affect their business and financial performance. |
| • | Derivatives Risk. This is the risk that an investment in derivatives may not correlate completely to the performance of the underlying securities and may be volatile and that the insolvency of the counterparty to a derivative instrument could cause the Fund to lose all or substantially all of its investment in the derivative instrument, as well as the benefits derived therefrom. |
| • | Options Risk. This is the risk that an investment in options may be subject to greater fluctuation than an investment in the underlying instruments themselves and may be subject to a complete loss of the amounts paid as premiums to purchase the options. |
| • | Futures Contracts Risk. This is the risk that an investment in futures contracts may be subject to losses that exceed the amount of the premiums paid and may subject the Fund’s net asset value to greater volatility. |
| • | P-Notes Risk. This is the risk that the performance results of P-Notes will not replicate exactly the performance of the issuers or markets that the P-Notes seek to replicate. Investments in P-Notes involve risks normally associated with a direct investment in the underlying securities as well as additional risks, such as counterparty risk. |
| • | Swaps Risk. Risks inherent in the use of swaps include: (1) swap contracts may not be assigned without the consent of the counterparty; (2) potential default of the counterparty to the swap; (3) absence of a liquid secondary market for any particular swap at any time; and (4) possible inability of the Fund to close out the swap transaction at a time that otherwise would be favorable for it to do so. |
| • | Emerging Markets Risk. A Fund may invest a portion of its assets in emerging market countries. Emerging market countries are those with immature economic and political structures, and investing in emerging markets entails greater risk than in developed markets. Such risks could include those related to government dependence on a few industries or resources, government-imposed taxes on foreign investment or limits on the removal of capital from a country, unstable government, and volatile markets. |
| • | Equity Hedge Strategy Risk. The DBi Hedge Strategy ETF uses various investment strategies that seek to identify the main drivers of performance of a diversified portfolio of the largest long/short equity hedge funds. These investment strategies involve the use of complex derivatives techniques, and there is no guarantee that these strategies will succeed. The use of such strategies and techniques may subject the Fund to greater volatility and loss than investing in individual equity securities. There can be no assurance that utilizing a certain approach or model will achieve a particular level of return or reduce volatility and loss. |
| • | Equity Securities Risk. This is the risk that the value of equity securities may fluctuate, sometimes rapidly and unpredictably, due to factors affecting the general market, an entire industry or sector, or particular companies. These factors include, without limitation, adverse changes in economic conditions, the general outlook for corporate earnings, interest rates or investor sentiment; increases in production costs; and significant management decisions. This risk is greater for small- and medium-sized companies, which tend to be more vulnerable to adverse developments than larger companies. |
| • | ETF Risk. The DBi Managed Futures Strategy ETF and the DBi Hedge Strategy ETF are each an ETF, and, as a result of an ETF’s structure, each is exposed to the following risks: |
| • | Authorized Participants, Market Makers, and Liquidity Providers Limitation Risk. The Fund has a limited number of financial institutions that may act as Authorized Participants (“APs”). In addition, there may be a limited number of market makers and/or liquidity providers in the marketplace. To the extent either of the following events occur, shares of the Fund (“Shares”) may trade at a material discount to NAV and possibly face delisting: (i) APs exit the business or otherwise become unable to process creation and/or redemption orders and no other APs step forward to perform these services, or (ii) market makers and/or liquidity providers exit the business or significantly reduce their business activities and no other entities step forward to perform their functions. |
| • | Cash Redemption Risk. The Fund’s investment strategy may require it to redeem Shares for cash or to otherwise include cash as part of its redemption proceeds. The Fund may be required to sell or unwind portfolio investments to obtain the cash needed to distribute redemption proceeds. This may cause the Fund to recognize a capital gain that it might not have recognized if it had made a redemption in-kind. As a result, the Fund may pay out higher annual capital gain distributions than if the in-kind redemption process was used. |
| • | Costs of Buying or Selling Shares. Due to the costs of buying or selling Shares, including brokerage commissions imposed by brokers and bid/ask spreads, frequent trading of Shares may significantly reduce investment results and an investment in Shares may not be advisable for investors who anticipate regularly making small investments. |
| 178 | Litman Gregory Funds Trust | |||||
Table of Contents
Litman Gregory Funds Trust
NOTES TO FINANCIAL STATEMENTS – (Unaudited) – (Continued)
| • | Shares May Trade at Prices Other Than NAV. As with all ETFs, Shares may be bought and sold in the secondary market at market prices. Although it is expected that the market price of Shares will approximate the Fund’s NAV, there may be times when the market price of Shares is more than the NAV intra-day (premium) or less than the NAV intra-day (discount) due to supply and demand of Shares or during periods of market volatility. This risk is heightened in times of market volatility and volatility in the Fund’s portfolio holdings, periods of steep market declines, and periods when there is limited trading activity for Shares in the secondary market, in which case such premiums or discounts may be significant. If an investor purchases Shares at a time when the market price is at a premium to the NAV of the Shares or sells at a time when the market price is at a discount to the NAV of the Shares, then the investor may sustain losses that are in addition to any losses caused by a decrease in NAV. |
| • | Trading. Although Shares are listed for trading on a national securities exchange, and may be traded on other U.S. exchanges, there can be no assurance that Shares will trade with any volume, or at all, on any stock exchange. In stressed market conditions, the liquidity of Shares may begin to mirror the liquidity of the Fund’s underlying portfolio holdings, which can be significantly less liquid than Shares. |
| • | European Investment Risk. Each of the International Fund and Oldfield International Value Fund may invest a significant portion of its assets in issuers based in Western Europe and the United Kingdom (“UK”). The economies of countries in Europe are often closely connected and interdependent, and events in one country in Europe can have an adverse impact on other European countries. Efforts by the member countries of the European Union (“EU”) to continue to unify their economic and monetary policies may increase the potential for similarities in the movements of European markets and reduce the potential investment benefits of diversification within the region. However, the substance of these policies may not address the needs of all European economies. European financial markets have in recent years experienced increased volatility due to concerns with some countries’ high levels of sovereign debt, budget deficits and unemployment. Markets have also been affected by the withdrawal of the UK from the EU (an event commonly known as “Brexit”). On January 31, 2020, the UK officially withdrew from the EU and entered into a transition period until December 31, 2020, during which the UK effectively remained in the EU from an economic perspective. The impact of Brexit on the UK, the EU and the broader global economy may be significant. As a result of the political divisions within the UK and between the UK and the EU that the referendum vote has highlighted and the uncertain consequences of Brexit, the UK and European economies and the broader global economy could be significantly impacted, which may result in increased volatility and illiquidity and potentially lower economic growth on markets in the UK, Europe and globally, which could potentially have an adverse effect on the value of a Fund’s investments. |
| • | Event-Driven Risk. Event-driven strategies seek to profit from the market inefficiencies surrounding market events, such as mergers, acquisitions, asset sales, restructurings, refinancings, recapitalizations, reorganizations or other special situations. Event-driven investing involves attempting to predict the outcome of a particular transaction as well as the optimal time at which to commit capital to it. Event-driven opportunities involve difficult legal as well as financial analysis, as some of the principal impediments to the consummation of major corporate events are often legal or regulatory rather than economic. In addition, certain of the securities issued in the context of major corporate events include complex call, put and other features, and it is difficult to precisely evaluate the terms and embedded option characteristics of these securities. A Fund may take both long and short positions in a wide range of securities, derivatives and other instruments in implementing its event-driven strategies. |
| • | Financial Sector Risk. A Fund may invest a portion of its assets in the financial services sector and, therefore, the performance of the Fund could be negatively impacted by events affecting this sector, including changes in interest rates, government regulation, the rate of defaults on corporate, consumer and government debt and the availability and cost of capital. |
| • | Fixed Income Securities Risk. Interest rates may go up resulting in a decrease in value of the securities held by a Fund. Fixed income securities held by a Fund are also subject to interest rate risk, credit risk, call risk and liquidity risk, which are more fully described below. |
| • | Credit Risk. Credit risk is the risk that an issuer will not make timely payments of principal and interest. A credit rating assigned to a particular debt security is essentially an opinion as to the credit quality of an issuer and may prove to be inaccurate. There is also the risk that a bond issuer may “call,” or repay, its high yielding bonds before their maturity dates. |
| • | Interest Rate Risk. Interest rates may go up resulting in a decrease in the value of the securities held by a Fund. Interest rates have been historically low, so a Fund faces a heightened risk that interest rates may rise. Debt securities subject to prepayment can offer less potential for gains during a declining interest rate environment and similar or greater potential for loss in a rising interest rate environment. |
| • | Call Risk. During periods of declining interest rates, a bond issuer may “call” or repay its high yielding bonds before their maturity dates. |
| • | Liquidity Risk. Certain securities may be difficult or impossible to sell at the time and the price that a Fund would like. Trading opportunities are more limited for fixed income securities that have not received any credit ratings, have received ratings below investment grade or are not widely held. The values of these securities may fluctuate more sharply than those of other securities, and a Fund may experience some difficulty in closing out positions in these securities at prevailing market prices. |
| Notes to Financial Statements | 179 | |||||
Table of Contents
Litman Gregory Funds Trust
NOTES TO FINANCIAL STATEMENTS – (Unaudited) – (Continued)
| • | Foreign Investment and Emerging Markets Risks. This is the risk that an investment in foreign (non-U.S.) securities may cause the Funds to experience more rapid and extreme changes in value than a fund that invests exclusively in securities of U.S. companies, due to factors such as currency conversion rate fluctuations, currency blockages, political and economic instability, differences in financial reporting, accounting and auditing standards, nationalization, expropriation or confiscatory taxation, and smaller and less-strict regulation of securities markets. These risks are greater in emerging markets. There is no limit to the Alternative Strategies Fund’s ability to invest in emerging market securities; however, under normal market conditions, it does not expect to invest more than 50% of its total assets in emerging market securities; however, some Funds may invest a portion of their assets in stocks of companies based outside of the United States. |
| • | Forward Contracts Risk. Forward contracts involve an obligation to purchase or sell a specific currency at a future date, which may be any fixed number of days from the date of the contract as agreed by the parties in an amount and at a price set at the time of the contract. At the maturity of a forward contract, a fund may either accept or make delivery of the currency specified in the contract or, at or prior to maturity, enter into a closing transaction involving the purchase or sale of an offsetting contract. A Fund may invest in non-deliverable forwards, which are cash-settled, short-term forward contracts on foreign currencies that are non-convertible and that may be thinly traded or illiquid. The use of forward contracts involves various risks, including the risks associated with fluctuations in foreign currency and the risk that the counterparty will fail to fulfill its obligations. |
| • | General Market Risk; Recent Market Events. The value of a Fund’s shares will fluctuate based on the performance of the Fund’s investments and other factors affecting the securities markets generally. Certain investments selected for a Fund’s portfolio may be worth less than the price originally paid for them, or less than they were worth at an earlier time. The value of a Fund’s investments may go up or down, sometimes dramatically and unpredictably, based on current market conditions, such as real or perceived adverse political or economic conditions, inflation, changes in interest rates, lack of liquidity in the fixed income markets or adverse investor sentiment. |
| • | Healthcare Sector Risk. A Fund may invest a portion of its assets in the healthcare sector. The profitability of companies in the healthcare sector may be adversely affected by government regulations and government healthcare programs, increases or decreases in the cost of medical products and services and product liability claims, among other factors. Many healthcare companies are heavily dependent on patent protection, and the expiration of a company’s patent may adversely affect that company’s profitability. Healthcare companies are subject to competitive forces that may result in price discounting, and may be thinly capitalized and susceptible to product obsolescence. |
| • | Industrial Sector Risk. A Fund may invest a portion of its assets in the industrial sector. Companies in the industrial sector could be affected by, among other things, government regulation, world events and global economic conditions, insurance costs, and labor relations issues. |
| • | Investment in Investment Companies Risk. This is the risk that investing in other investment companies, including ETFs, CEFs, BDCs, unit investment trusts and open-end funds, subjects the Fund to those risks affecting the investment vehicle, including the possibility that the value of the underlying securities held by the investment vehicle could decrease or the portfolio becomes illiquid. Moreover, the High Income Alternatives Fund and its shareholders will incur its pro rata share of the underlying vehicles’ expenses, which will reduce the Fund’s performance. In addition, investments in an ETF are subject to, among other risks, the risk that the ETF’s shares may trade at a discount or premium relative to the net asset value of the shares and the listing exchange may halt trading of the ETF’s shares. BDCs may carry risks similar to those of a private equity or venture capital fund. BDC company securities are not redeemable at the option of the shareholder and they may trade in the market at a discount to their net asset value. BDCs usually trade at a discount to their net asset value because they invest in unlisted securities and have limited access to capital markets. Shares of CEFs also frequently trade at a discount to their net asset value for those and other reasons. |
| • | Investment Selection Risk. The specific investments held in the Fund’s investment portfolio may underperform other funds in the same asset class or benchmarks that are representative of the general performance of the asset class because of a portfolio manager’s choice of securities. |
| • | Investments in Loan Risk. Investments in loans, including loan syndicates and other direct lending opportunities, involve special types of risks, including credit risk, interest rate risk, counterparty risk and prepayment risk. Loans may offer a fixed or floating interest rate. Loans are often generally below investment grade and may be unrated. The High Income Alternatives Fund’s investments in loans can also be difficult to value accurately and may be more susceptible to liquidity risk than fixed-income instruments of similar credit quality and/or maturity. The Fund is also subject to the risk that the value of the collateral for the loan may be insufficient or unavailable to cover the borrower’s obligations should the borrower fail to make payments or become insolvent. Participations in loans may subject the Fund to the credit risk of both the borrower and the issuer of the participation and may make enforcement of loan covenants, if any, more difficult for the Fund as legal action may have to go through the issuer of the participations. Transactions in loans are often subject to long settlement periods, thus potentially limiting the ability of the Fund to invest sale proceeds in other investments and to use proceeds to meet its current redemption obligations. In addition, many banks have been weakened by the recent financial crisis, and it may be difficult for the Fund to obtain an accurate picture of a lending bank’s financial condition. |
| 180 | Litman Gregory Funds Trust | |||||
Table of Contents
Litman Gregory Funds Trust
NOTES TO FINANCIAL STATEMENTS – (Unaudited) – (Continued)
| • | Japanese Investment Risk. Japan may be subject to political, economic, nuclear and labor risks, among others. Any of these risks, individually or in the aggregate, can impact an investment made in Japan. The growth of Japan’s economy has recently lagged that of its Asian neighbors and other major developed economies. Since 2000, Japan’s economic growth rate has generally remained low relative to other advanced economies, and it may remain low in the future. The Japanese economy faces several concerns, including a financial system with large levels of nonperforming loans, overleveraged corporate balance sheets, extensive cross-ownership by major corporations, a changing corporate governance structure, large government deficits, heavy dependence on international trade and oil and other commodity imports, an aging workforce and significant population decline, sometimes unpredictable national politics, political tensions with China, and natural disasters, such as earthquakes, volcanic eruptions, typhoons and tsunamis. Any of these concerns could negatively affect the value of Japanese investments. |
| • | Large Shareholder Purchase and Redemption Risk. This is the risk that a Fund may experience adverse effects when certain large shareholders purchase or redeem large amounts of shares of the Fund. Such large shareholder redemptions may cause the Fund to sell its securities at times when it would not otherwise do so, which may negatively impact the Fund’s net asset value and liquidity. Similarly, large share purchases may adversely affect the Fund’s performance to the extent that the Fund is delayed in investing new cash and is required to maintain a larger cash position than it ordinarily would. In addition, a large redemption could result in the Fund’s current expenses being allocated over a smaller asset base, leading to an increase in the Fund’s expense ratio. |
| • | Leverage Risk. This is the risk that leverage may cause the effect of an increase or decrease in the value of the Alternative Strategies Fund’s portfolio securities to be magnified and the Fund to be more volatile than if leverage was not used. Leverage may result from certain transactions, including the use of derivatives and borrowing. Under normal circumstances, the Alternative Strategies Fund may borrow amounts up to one third of the value of its total assets except that it may exceed this limit to satisfy redemption requests or for other temporary purposes. |
| • | LIBOR Risk. LIBOR is used extensively in the U.S. and globally as a “benchmark” or “reference rate” for various commercial and financial contracts, including corporate and municipal bonds, bank loans, asset-backed and mortgage-related securities, interest rate swaps and other derivatives. For example, debt securities in which a Fund invests may pay interest at floating rates based on LIBOR or may be subject to interest caps or floors based on LIBOR. A Fund’s derivative investments may also reference LIBOR. In addition, issuers of instruments in which a Fund invests may obtain financing at floating rates based on LIBOR, and a Fund may use leverage or borrowings based on LIBOR. In July 2017, the head of the United Kingdom Financial Conduct Authority announced the intention to phase out the use of LIBOR by the end of 2021. There is currently no definitive information regarding the future utilization of LIBOR or of any particular replacement reference rate. Abandonment of or modifications to LIBOR could have adverse impacts on newly issued financial instruments and existing financial instruments that reference LIBOR. |
| • | Liquidity and Valuation Risk. It may be difficult for the Fund to purchase and sell particular investments within a reasonable time at a fair price, or the price at which it has been valued by iM Global for purposes of the Fund’s net asset value, causing the Fund to be less liquid and unable to realize what iM Global believes should be the price of the investment. Valuation of portfolio investments may be difficult, such as during periods of market turmoil or reduced liquidity, and for investments that may, for example, trade infrequently or irregularly. In these and other circumstances, an investment may be valued using fair value methodologies, which are inherently subjective, reflect good faith judgments based on available information and may not accurately estimate the price at which the Fund could sell the investment at that time. These risks may be heightened for fixed-income instruments because of the near historically low interest rate environment as of the date of this prospectus. Based on its investment strategies, a significant portion of the Fund’s investments can be difficult to value and potentially less liquid and thus particularly prone to the foregoing risks. |
| • | Long Short Risk. The DBi Hedge Strategy ETF seeks long exposure to certain factors and short exposure to certain other factors. The Fund may or may not take long or short positions in correlated asset classes. The Fund could lose money if either or both of the Fund’s long and short positions produce negative returns. The sub-advisor’s proprietary, quantitative model, the Dynamic Beta Engine, may or may not identify long and short positions in correlated asset classes. There is no guarantee that the returns of the Fund’s long and short positions will produce positive returns. |
| • | Managed Futures Strategy Risk. In seeking to achieve its investment objective, the DBi Managed Futures Strategy ETF will utilize various investment strategies that involve the use of complex investment techniques, and there is no guarantee that these strategies will succeed. The use of such strategies and techniques may subject the Fund to greater volatility and loss. There can be no assurance that utilizing a certain approach or model will achieve a particular level of return or reduce volatility and loss. |
| • | Merger Arbitrage Risk. This is the risk that a proposed reorganization in which the Alternative Strategies Fund invests may be renegotiated or terminated. |
| • | Mid-Sized Companies Risk. Securities of companies with mid-sized market capitalizations are generally more volatile and less liquid than the securities of large-capitalization companies. Mid-sized companies may be more reliant on a few products, services or key personnel, which can make it riskier than investing in larger companies with more diverse product lines and structured management. Mid-sized companies may have relatively short operating histories or may be newer public companies. Some of these companies have more |
| Notes to Financial Statements | 181 | |||||
Table of Contents
Litman Gregory Funds Trust
NOTES TO FINANCIAL STATEMENTS – (Unaudited) – (Continued)
| aggressive capital structures, including higher debt levels, than large-cap companies, or are involved in rapidly growing or changing industries and/or new technologies, which pose additional risks. |
| • | Models and Data Risk. The Alternative Strategies Fund uses proprietary systematic and quantitative models as part of its investment strategies. These models may fail to identify profitable opportunities at any time. Furthermore, the models may incorrectly identify opportunities and these misidentified opportunities may lead to substantial losses for the Fund. Models may be predictive in nature and such models may result in an incorrect assessment of future events. Data used in the construction of models may prove to be inaccurate or stale, which may result in losses for the Fund. |
| • | Mortgage-Backed Securities Risk. This is the risk of investing in mortgaged-backed securities, which includes interest rate risk, prepayment risk and the risk of defaults on the mortgage loans underlying these securities. |
| • | Multi-Style Management Risk. Because portions of a Fund’s assets are managed by different portfolio managers using different styles, the Fund could experience overlapping security transactions. Certain portfolio managers may be purchasing securities at the same time other portfolio managers may be selling those same securities, which may lead to higher transaction expenses compared to a Fund using a single investment management style. |
| • | Non-Diversified Fund Risk. Because each of the DBi Managed Futures Strategy ETF and the DBi Hedge Strategy ETF is “non-diversified,” each may invest a greater percentage of its assets in the securities of a single issuer. As a result, a decline in the value of an investment in a single issuer could cause a Fund’s overall value to decline to a greater degree than if the Fund held a more diversified portfolio. |
| • | Portfolio Turnover Risk. This is the risk that a Fund may experience high portfolio turnover rates as a result of its investment strategies. High portfolio turnover rates may indicate higher transaction costs and may result in higher taxes when shares of a Fund are held in a taxable account as compared to shares in investment companies that hold investments for a longer period. High portfolio turnover involves correspondingly greater expenses to a Fund, including brokerage commissions or dealer mark-ups and other transaction costs on the sale of securities and reinvestments in other securities, which may result in adverse tax consequences to a Fund’s shareholders as compared to shares in investment companies that hold investments for a longer period. |
| • | Prepayment and Extension Risk. In times of declining interest rates, a Fund’s higher yielding securities will be prepaid, and the Fund will have to replace them with securities having a lower yield. Rising interest rates could extend the life of securities with lower payment rates. This is known as extension risk and may increase a Fund’s sensitivity to rising rates and its potential for price declines. |
| • | Public Health Emergency Risk. This is the risk that pandemics and other public health emergencies, including outbreaks of infectious diseases such as the current outbreak of the novel coronavirus (“COVID-19”), can result, and in the case of COVID-19 is resulting, in market volatility and disruption, and materially and adversely impact economic conditions in ways that cannot be predicted, all of which could result in substantial investment losses. Containment efforts and related restrictive actions by governments and businesses have significantly diminished and disrupted global economic activity across many industries. Less developed countries and their health systems may be more vulnerable to these impacts. The ultimate impact of COVID-19 or other health emergencies on global economic conditions and businesses is impossible to predict accurately. Ongoing and potential additional material adverse economic effects of indeterminate duration and severity are possible. The resulting adverse impact on the value of an investment in a Fund could be significant and prolonged. |
| • | Sector Weightings Risk. To the extent that a Fund emphasizes, from time to time, investments in a particular sector, the Fund will be subject to a greater degree to the risks particular to that sector. Market conditions, interest rates, and economic, regulatory, or financial developments could significantly affect a single sector. By focusing its investments in a particular sector, a Fund may face more risks than if it were diversified broadly over numerous sectors. |
| • | Short Position Risk. A Fund will incur a loss as a result of a short position if the price of the short position instrument increases in value between the date of the short position sale and the date on which the Fund purchases an offsetting position. Short positions may be considered speculative transactions and involve special risks, including greater reliance on the ability to accurately anticipate the future value of a security or instrument. A Fund’s losses are potentially unlimited in a short position transaction. |
| • | Short Sale Risk. This is the risk that the value of a security the Alternative Strategies Fund sells short does not go down as expected. The risk of loss is theoretically unlimited if the value of the security sold short continues to increase. In addition, short sales may cause the Alternative Strategies Fund to be compelled, at a time disadvantageous to it, to buy the security previously sold short, thus resulting in a loss. To meet current margin requirements, the Alternative Strategies Fund is required to deposit with the broker additional cash or securities so that the total deposit with the broker is maintained daily at 150% of the current market value of the securities sold short. |
| • | Smaller Companies Risk. A Fund may invest a portion of its assets in the securities of small- and mid-sized companies. Securities of small and mid-cap companies are generally more volatile and less liquid than the securities of large-cap companies. This is because smaller companies may be more reliant on a few products, services or key personnel, which can make it riskier than investing in larger companies with more diverse product lines and structured management. |
| 182 | Litman Gregory Funds Trust | |||||
Table of Contents
Litman Gregory Funds Trust
NOTES TO FINANCIAL STATEMENTS – (Unaudited) – (Continued)
| • | Special Situations Risk. Investments in special situations (undervalued equities, merger arbitrage situations, distressed companies, etc.) may involve greater risks when compared to other investments a Fund may make due to a variety of factors. For example, mergers, acquisitions, reorganizations, liquidations or recapitalizations may fail or not be completed on the terms originally contemplated, and expected developments may not occur in a timely manner, if at all. |
| • | Subsidiary Risk. By investing in the Subsidiary, the DBi Managed Futures Strategy ETF is indirectly exposed to the risks associated with the Subsidiary’s investments. The derivatives and other investments held by the Subsidiary are generally similar to those that are permitted to be held by the Fund and are subject to the same risks that apply to similar investments if held directly by the Fund. The Subsidiary is not registered under the 1940 Act, and, unless otherwise noted in this Prospectus, is not subject to all the investor protections of the 1940 Act. Changes in the laws of the United States and/or the Cayman Islands could result in the inability of the Fund and/or the Subsidiary to continue to operate as it does currently and could adversely affect the Fund. |
| • | Tax Risk. The federal income tax treatment of the DBi Managed Futures Strategy ETF’s income from the Subsidiary may be negatively affected by future legislation, Treasury Regulations (proposed or final), and/or other Internal Revenue Service (“IRS”) guidance or authorities that could affect the character, timing of recognition, and/or amount of the Fund’s investment company taxable income and/ or net capital gains and, therefore, the distributions it makes. If the Fund failed the source of income test for any taxable year but was eligible to and did cure the failure, it could incur potentially significant additional federal income tax expenses. If, on the other hand, the Fund failed to qualify as a RIC for any taxable year and was ineligible to or otherwise did not cure the failure, it would be subject to federal income tax at the fund-level on its taxable income at the regular corporate tax rate (without reduction for distributions to shareholders), with the consequence that its income available for distribution to shareholders would be reduced and distributions from its current or accumulated earnings and profits would generally be taxable to its shareholders as dividend income. |
Changes in the laws of the United States and/or the Cayman Islands could result in the inability of the Fund and/or the Subsidiary to operate as described in this Prospectus and the Statement of Additional Information (“SAI”) and could adversely affect the Fund. For example, the Cayman Islands does not currently impose any income, corporate or capital gains tax or withholding tax on the Subsidiary. If Cayman Islands law changes such that the Subsidiary must pay Cayman Islands taxes, Fund shareholders would likely suffer decreased investment returns.
| • | TBAs and Dollar Rolls Risk. TBA (“to-be-announced”) and dollar roll transactions present special risks to the Alternative Strategies Fund. Although the particular TBA securities must meet industry-accepted “good delivery” standards, there can be no assurance that a security purchased on a forward commitment basis will ultimately be issued or delivered by the counterparty. During the settlement period, the Fund will still bear the risk of any decline in the value of the security to be delivered. TBAs and other forward settling securities involve leverage because they can provide investment exposure in an amount exceeding the fund’s initial investment. Leverage can magnify investment risks and cause losses to be realized more quickly. While dollar roll transactions involve the simultaneous purchase and sale of substantially similar TBA securities with different settlement dates, these transactions do not require the purchase and sale of identical securities so the characteristics of the security delivered to the Fund may be less favorable than the security delivered to the dealer. |
| • | Technology Investment Risk. A Fund may invest a portion of its assets in the technology sector, which is a very volatile segment of the market. The nature of technology is that it is rapidly changing. Therefore, products or services that may initially look promising may subsequently fail or become obsolete. In addition, many technology companies are younger, smaller and unseasoned companies which may not have established products, an experienced management team, or earnings history. |
| • | Unfavorable Tax Treatment Risk. This is the risk that a material portion of the Alternative Strategies Fund’s return could be in the form of net investment income or short-term capital gains, some of which may be distributed to shareholders and taxed at ordinary income tax rates. Therefore, shareholders may have a greater need to pay regular taxes than compared to other investment strategies that hold investments longer. Due to this investment strategy, it may be preferable for certain shareholders to invest in the Fund through pre-tax or tax-deferred accounts as compared to investment through currently taxable accounts. Potential shareholders are encouraged to consult their tax advisors in this regard. |
| • | U.S. Government and U.S. Agency Obligations Risk. Securities issued by U.S. Government agencies and instrumentalities have different levels of U.S. Government credit support. Some are backed by the full faith and credit of the U.S. Government, while others are supported by only the discretionary authority of the U.S. Government or only by the credit of the agency or instrumentality. No assurance can be given that the U.S. Government will provide financial support to U.S. Government-sponsored instrumentalities because they are not obligated to do so by law. Guarantees of timely prepayment of principal and interest do not assure that the market prices and yields of the securities are guaranteed nor do they guarantee the NAV or performance of a Fund, which will vary with changes in interest rates, the sub-advisor’s performance and other market conditions. |
| • | Value Stock Risk. Value stocks are stocks of companies that may have experienced adverse business or industry developments or may be subject to special risks that have caused the stocks to be out of favor and, in the opinion of the manager, undervalued. The value of a security believed by a manager to be undervalued may never reach what is believed to be its full (intrinsic) value, or such security’s value may decrease. |
| Notes to Financial Statements | 183 | |||||
Table of Contents
Litman Gregory Funds Trust
NOTES TO FINANCIAL STATEMENTS – (Unaudited) – (Continued)
Note 13 – Fund Reorganizations
As of the close of business on September 17, 2021, pursuant to an Agreement and Plan of Reorganization (the “Reorganization”): (i) the iMGP Dolan McEniry Corporate Bond Fund (the “Dolan McEniry Corporate Bond Fund”) acquired all of the assets and assumed the liabilities of the iM Dolan McEniry Corporate Bond Fund (the “Predecessor Corporate Bond Fund”), a series of Manager Directed Portfolios (the “Target Trust”); (ii) the iMGP DBi Managed Futures Strategy ETF (the “DBi Managed Futures Strategy ETF”) acquired all of the assets and assumed the liabilities of the iM DBi Managed Futures Strategy ETF (the “Predecessor Managed Futures Strategy ETF”), a series of the Target Trust; and (iii) the iMGP DBi Hedge Strategy ETF (the “DBi Hedge Strategy ETF” and, together with the Dolan McEniry Corporate Bond Fund, the DBi Managed Futures Strategy ETF, the “Acquiring Funds”) acquired all of the assets and assumed the liabilities of the iM DBi Hedge Strategy ETF (the “Predecessor Hedge Strategy ETF” and, together with the Predecessor Corporate Bond Fund and the Predecessor Managed Futures Strategy ETF, the “Predecessor Funds”).
The shareholders of each Predecessor Fund received shares of the corresponding Acquiring Fund with an aggregate net asset value (“NAV”) equal to the aggregate NAV of its shares in the Predecessor Fund immediately prior to the Reorganization at the following conversion ratios:
| Predecessor Corporate Bond Fund Shares Prior to Reorganization | Conversion Ratio | New Shares Issued by the Dolan McIniry Corporate Bond Fund | ||
Institutional Shares 8,933,022 | 1 | Institutional Shares 8,933,022 | ||
Advisor Shares 527,061 | 1 | Advisor Shares 527,061 | ||
| Predecessor Managed Futures Strategy ETF Shares Prior to Reorganization | Conversion Ratio | New Shares Issued by the DBi Managed Futures Strategy ETF | ||
2,100,000 | 1 | 2,100,000 | ||
| Predecessor Hedge Strategy ETF Shares Prior to Reorganization | Conversion Ratio | New Shares Issued by the DBi Hedge Strategy ETF | ||
625,000 | 1 | 625,000 | ||
The Reorganization was treated as a tax-free exchange for federal income tax purposes and accordingly, the basis of the assets of the each Acquiring Fund reflected the historical basis of the assets of the corresponding Predecessor Fund as of the date of the Reorganization.
The net assets and composition of net assets of each Acquiring Fund and the corresponding Predecessor Fund on September 17, 2021, were as follows:
Dolan McIniry Corporate Bond Fund:
| Acquiring Fund | Predecessor Fund | Combined Funds | ||||||||||
Paid-in Capital | $ | — | $ | 100,817,312 | $ | 100,817,312 | ||||||
Accumulated Net Investment Income | — | 10,703 | 10,703 | |||||||||
Accumulated Net Realized Gain | — | 545,090 | 545,090 | |||||||||
Net Unrealized Appreciation | — | 1,146,070 | 1,146,070 | |||||||||
Net Assets | — | 102,519,175 | 102,519,175 | |||||||||
Cost of Investments | — | 101,347,050 | 101,347,050 | |||||||||
DBi Managed Futures Strategy ETF:
| Acquiring Fund | Predecessor Fund | Combined Funds | ||||||||||
Paid-in Capital | $ | — | $ | 55,044,030 | $ | 55,044,030 | ||||||
Accumulated Net Investment Loss | — | (458,885 | ) | (458,885 | ) | |||||||
Accumulated Net Realized Gain | — | 3,046,110 | 3,046,110 | |||||||||
Net Unrealized Appreciation | — | 826,671 | 826,671 | |||||||||
Net Assets | — | 58,457,926 | 58,457,926 | |||||||||
Cost of Investments | — | 43,235,129 | 43,235,129 | |||||||||
| 184 | Litman Gregory Funds Trust | |||||
Table of Contents
Litman Gregory Funds Trust
NOTES TO FINANCIAL STATEMENTS – (Unaudited) – (Continued)
DBi Hedge Strategy ETF:
| Acquiring Fund | Predecessor Fund | Combined Funds | ||||||||||
Paid-in Capital | $ | — | $ | 17,290,918 | $ | 17,290,918 | ||||||
Accumulated Net Investment Loss | — | (208,709 | ) | (208,709 | ) | |||||||
Accumulated Net Realized Gain | — | 3,207,040 | 3,207,040 | |||||||||
Net Unrealized Depreciation | — | (132,560 | ) | (132,560 | ) | |||||||
Net Assets | — | 20,156,689 | 20,156,689 | |||||||||
Cost of Investments | — | 16,542,307 | 16,542,307 | |||||||||
Each Predecessor Fund and the corresponding Acquiring Fund had identical investment objectives and substantially similar principal investment strategies and principal risks. For financial reporting purposes, each Predecessor Fund’s financial and performance history prior to the Reorganization is carried forward and reflected in the corresponding Acquiring Fund’s financial statements and financial highlights. For the year ended December 31, 2020, and prior periods, the audit of those financial statements were performed by auditors different from the auditors of this report.
Note 14 – Subsequent Event – iMGP Equity Fund
Two important changes are proposed for the iMGP Equity Fund: (1) the name of the Fund will change to the iMGP Global Select Fund and (2) the Fund’s principal investment strategy will be revised to be consistent with that new name, including the manner in which the Fund is required to invest its assets. The Fund’s investment objective will remain the same. After these changes take effect, under normal market conditions, the Fund invests at least 80% of its net assets, plus the amount of any borrowings for investment purposes, in equity securities of issuers located in at least three different countries. An issuer is considered to be “located” in a particular country on the basis of its domicile, its principal place of business or headquarters, its primary stock exchange listing, and/or the primary source of its revenues (i.e., at least 50% of its revenues are generated in that country). There is no minimum portion of the Fund’s assets that is required to be invested in any one country.
The changes to the Fund’s name and principal investment strategies will take effect on or about September 30, 2022, subject to review and effectiveness of an amendment to the registration statement for Litman Gregory Funds Trust with respect to the Fund. The description of the changes provided above is subject to change.
| Notes to Financial Statements | 185 | |||||
Table of Contents
Litman Gregory Funds Trust
OTHER INFORMATION – (Unaudited)
Proxy Voting Policies and Procedures
The sub-advisors of the Funds vote proxies relating to portfolio securities in accordance with procedures that have been approved by the Board of Trustees of the Funds. You may obtain a description of these procedures, without charge, by calling toll-free, 1-800-960-0188. This information is also available through the Securities and Exchange Commission’s website at http://www.sec.gov.
Proxy Voting Record
Information regarding how the sub-advisors of the Funds voted proxies relating to portfolio securities during the 12-month period ended June 30 is available, without charge, by calling toll-free, 1-800-960-0188. This information is also available through the Securities and Exchange Commission’s website at http://www.sec.gov.
Portfolio Holdings Information
Each Fund files a complete schedule of portfolio holdings with the Securities and Exchange Commission for the first and third quarters of each fiscal year as an exhibit to its reports on Form N-PORT. You can find the filings on the Securities and Exchange Commission’s website at http://www.sec.gov. This information is also available, without charge, by calling toll-free, 1-800-960-0188 or by visiting the Funds’ website at http://www.imgpfunds.com.
Householding Mailings
To reduce expenses, the Trust may mail only one copy of the Funds’ prospectus and each annual and semi-annual report to those addresses shared by two or more accounts. If you wish to receive individual copies of these documents, please call us at 1-800-960-0188 (or contact your financial institution). The Trust will begin sending you individual copies thirty days after receiving your request.
Review of Liquidity Risk Management Program
Pursuant to Rule 22e-4 under the 1940 Act, the Trust, on behalf of the Funds, has adopted a liquidity risk management program (the “Program”) to govern the Trust’s approach to managing liquidity risk. The Program is overseen by the Trust’s Liquidity Committee, and the Program’s principal objectives include assessing, managing and periodically reviewing each Fund’s liquidity risk, based on factors specific to the circumstances of the Fund.
At a meeting of the Board held on June 1, 2022, the Trustees received a report from the Trust’s Chief Liquidity Officer, who serves as chair of the Trust’s Liquidity Committee, addressing the operations of the Program and assessing its adequacy and effectiveness of implementation. The Liquidity Committee determined, and the Chief Liquidity Officer reported to the Board, that the Program is reasonably designed to assess and manage each Fund’s liquidity risk and has operated adequately and effectively to manage each Fund’s liquidity risk since the Program was implemented in August 2018. The Chief Liquidity Officer reported that, during the period covered by the report, there were no liquidity events that impacted the Funds or their ability to timely meet redemptions without dilution to existing shareholders. The Chief Liquidity Officer further noted that no material changes have been made to the Program since its implementation.
There can be no assurance that the Program will achieve its objectives in the future. Please refer to the Trust’s prospectuses for more information regarding a Fund’s exposure to liquidity risk and other principal risks to which an investment in the Funds may be subject.
| 186 | Litman Gregory Funds Trust | |||||
Table of Contents
Litman Gregory Funds Trust
The ABX Indexes serve as a benchmark of the market for securities backed by home loans issued to borrowers with weak credit. The ABX 2006-2 AAA is an asset-backed index that tracks AAA-rated bonds issued prior to the second half of 2006. The ABX 2007-1 AAA is an asset-backed index that tracks AAA-rated bonds issued prior to the first half of 2007.
BofA Merrill Lynch U.S. High Yield Master II Index tracks the performance of below investment grade, but not in default, US dollar-denominated corporate bonds publicly issued in the US domestic market.
The BofA Merrill Lynch High Yield Cash Pay Index is an unmanaged index used as a general measure of market performance consisting of fixed-rate, coupon-bearing bonds with an outstanding par which is greater than or equal to $50 million, a maturity range greater than or equal to one year and must be less than BBB/Baa3 rated but not in default.
Bloomberg Barclays U.S. Aggregate Bond Index is a market capitalization-weighted index, meaning the securities in the index are weighted according to the market size of each bond type. Most U.S. traded investment grade bonds are represented. The index includes U.S. treasury securities (non TIPS), government agency bonds, mortgage backed bonds, corporate bonds, and a small amount of foreign bonds traded in the U.S.
Bloomberg Barclays U.S. Intermediate Credit Index: is the intermediate component of the Bloomberg Barclays U.S. Credit Index. The Bloomberg Barclays U.S. Credit Index measures the investment grade, US dollar-denominated, fixed-rate, taxable, corporate and government – related bond markets. It is composed of the US Corporate Index and a non-corporate component that includes foreign agencies, sovereigns, supranationals, and local authorities.
The CBOE Russell 2000 PutWrite Index (PUTR) is designed to track the performance of a hypothetical strategy that sells a monthly at-the-money (ATM) Russell 2000 Index put option.
The CBOE Russell 2000 Volatility Index (RVX) is a key measure of market expectations of near-term volatility conveyed by Russell 2000® Index (RUT) option prices. The RVX Index measures the market’s expectation of 30-day volatility implicit in the prices of near-term RUT options traded at CBOE.
The CBOE S&P 500 PutWrite Index (ticker symbol PUT) is a benchmark index that measures the performance of a hypothetical portfolio that sells S&P 500 Index (SPX) put options against collateralized cash reserves held in a money market account.
The CBOE S&P 500 2% OTM PutWrite Index (PUTYSM Index) is designed to track the performance of a hypothetical passive investment strategy that collects option premiums from writing a 2% Out-of-the Money (OTM) SPX Put option on a monthly basis and holds a rolling money market account invested in one-month T-bills to cover the liability from the short SPX Put option position.
CDX is a series of credit default swap indexes, used to hedge credit risk or to take a position on a basket of credit entities.
The Citigroup Economic Surprise Indices are objective and quantitative measures of economic news. They are defined as weighted historical standard deviations of data surprises.
FTSE Emerging Markets Index – ETF Tracker. The Index is a market capitalization index, adjusted based on the free-float of potential index constituents, and designed to measure the performance of large-, medium- and small-capitalization companies located in emerging market countries throughout the world.
The FTSE Global All Cap ex U.S. Index is part of a range of indices designed to help U.S. investors benchmark their international investments. The index comprises large, mid and small cap stocks globally excluding the U.S. The index is derived from the FTSE Global Equity Index Series (GEIS), which covers 98% of the world’s investable market capitalization.
The HFRI Equity Hedge Index is comprised of managers typically maintaining at least 50%, and in some cases be substantially entirely invested in equities and equity derivatives, both long and short. Strategies can be broadly diversified or narrowly focused on specific sectors and can range broadly in terms of levels of net exposure, leverage employed, holding period, concentrations of market capitalizations and valuation ranges of typical portfolios. The HFRI Emerging Markets Index is comprised of strategies according to their regional investment focus only. There is no investment strategy criteria for inclusion in these indices.
The HFRI Event Driven Index: Consists of investment managers who maintain positions in companies currently or prospectively involved in corporate transactions of a wide variety including but not limited to mergers, restructurings, financial distress, tender offers, shareholder buybacks, debt exchanges, security issuance or other capital structure adjustments. Security types can range from most senior in the capital structure to most junior or subordinated, and frequently involve additional derivative securities. Event driven exposure includes a combination of sensitivities to equity markets, credit markets and idiosyncratic, company specific developments.
The HFRI Event Driven Merger Arbitrage Index: Consists of merger arbitrage strategies which employ an investment process primarily focused on opportunities in equity and equity related instruments of companies which are currently engaged in a corporate transaction. Merger arbitrage involves primarily announced transactions, typically with limited or no exposure to situations which pre-, post-date or situations in which no formal announcement is expected to occur. Opportunities are frequently presented in cross border, collared and international transactions which incorporate multiple geographic regulatory institutions, with typically involve minimal exposure to corporate credits. Merger arbitrage strategies typically have over 75% of positions in announced transactions over a given market cycle.
The HFRX Fixed Income – Credit Index is an unmanaged index that includes strategies with exposure to credit across a broad continuum of credit sub-strategies, including Corporate, Sovereign, Distressed, Convertible, Asset Backed, Capital Structure Arbitrage, Multi-Strategy and other Relative Value and Event Driven sub-strategies.
| Index Definitions | 187 | |||||
Table of Contents
Litman Gregory Funds Trust
INDEX DEFINITIONS – (Continued)
The HFRX Global Hedge Fund Index is designed to be representative of the overall composition of the hedge fund universe. It is comprised of all eligible hedge fund strategies; including but not limited to convertible arbitrage, distressed securities, equity hedge, equity market neutral, event driven, macro, merger arbitrage, and relative value arbitrage.
ICE BofAML 0-3 Year U.S. Treasury Index tracks the performance of U.S. dollar denominated sovereign debt publicly issued by the U.S. government in its domestic market with maturities less than three years.
ICE BofA Merrill Lynch 1-3 US Year Treasury Index is an unmanaged index that tracks the performance of the direct sovereign debt of the U.S. Government having a maturity of at least one year and less than three years.
The ICE BofAML U.S. High Yield Cash Pay TR USD Index is an unmanaged index that measures the performance of short-term U.S. dollar denominated below investment grade corporate debt publicly issued in the U.S. domestic market.
LIBOR stands for London Interbank Offered Rate. It’s an index that is used to set the cost of various variable-rate loans.
Morningstar Category Averages: Each Morningstar Category Average is representative of funds with similar investment objectives.
The MSCI All Country World Index is a free float-adjusted market capitalization weighted index that is designed to measure the equity market performance of developed and emerging markets.
The MSCI All Country World ex U.S. Index is a free float-adjusted market capitalization weighted index that is designed to measure the equity market performance of developed and emerging markets, excluding the United States.
The MSCI All Country World ex U.S. Growth Index is a free float-adjusted market capitalization weighted index that is designed to measure the equity market performance of developed and emerging markets, excluding the United States. It includes companies with higher price-to-book ratios and higher forecasted growth values.
The MSCI All Country World ex U.S. Value Index is a free float-adjusted market capitalization weighted index that is designed to measure the equity market performance of developed and emerging markets, excluding the United States. It includes companies with lower price-to-book ratios and lower forecasted growth values.
The MSCI China Index captures large and mid cap representation across China A shares, H shares, B shares, Red chips, P chips and foreign listings (e.g. ADRs). With 739 constituents, the index covers about 85% of this China equity universe
The MSCI Emerging Markets ex China Index captures large and mid cap representation across 24 of the 25 Emerging Markets (EM) countries* excluding China. With 681 constituents, the index covers approximately 85% of the free float-adjusted market capitalization in each country.
The MSCI EAFE Index (Europe, Australasia, Far East) is a free float-adjusted market capitalization index that is designed to measure the equity market performance of developed markets, excluding the US & Canada. As of May 27, 2010 the MSCI EAFE Index consisted of the following 22 developed market country indices: Australia, Austria, Belgium, Denmark, Finland, France, Germany, Greece, Hong Kong, Ireland, Israel, Italy, Japan, the Netherlands, New Zealand, Norway, Portugal, Singapore, Spain, Sweden, Switzerland, and the United Kingdom.
The MSCI Emerging Markets Index captures large and mid-cap representation across 23 Emerging Markets (EM) countries. With 836 constituents, the index covers approximately 85% of the free float-adjusted market capitalization in each country.
The MSCI World ex U.S. Index is a free float-adjusted market capitalization weighted index that is designed to measure the equity market performance of developed markets, excluding the United States.
The Russell 1000 Index measures the performance of the large-cap segment of the U.S. equity universe. It is a subset of the Russell 3000® Index and includes approximately 1000 of the largest securities based on a combination of their market cap and current index membership. The Russell 1000 represents approximately 92% of the U.S. market.
The Russell 1000 Growth Index measures the performance of the large-cap growth segment of the U.S. equity universe. It includes those Russell 1000 companies with higher price-to-book ratios and higher forecasted growth values.
The Russell 2000 Index measures the performance of the 2,000 smallest companies in the Russell 3000 Index.
The Russell 2000 Value Index measures the performance of small-cap value segment of the U.S. equity universe. It includes those Russell 2000 companies with lower price-to-book ratios and lower forecasted growth values.
The Russell 2500 Index measures the performance of the small to mid-cap segment of the U.S. equity universe, commonly referred to as “smid” cap. The Russell 2500 Index is a subset of the Russell 3000 Index. It includes approximately 2500 of the smallest securities based on a combination of their market cap and current index membership.
The Russell 3000 Index measures the performance of the 3,000 largest U.S. companies as measured by total market capitalization, and represents about 98% of the U.S. stock market.
The Russell 3000 Value Index is a broad based index that measures the performance of those companies within the 3,000 largest U.S. companies, based on total market capitalization, that have lower price-to-book ratios and lower forecasted growth rates.
The SG CTA Index is an index published by Société Générale that is designed to reflect the performance of a pool of Commodity Trading Advisor (CTAs) selected from larger managers that employ systematic managed futures strategies. The index is reconstituted annually.
| 188 | Litman Gregory Funds Trust | |||||
Table of Contents
Litman Gregory Funds Trust
INDEX DEFINITIONS – (Continued)
The S&P 500 Index is widely regarded as the standard for measuring large-cap stock performance, and consists of 500 stocks that represent a sample of the leading companies in leading industries.
The SPDR S&P 500 ETF consists of 500 of the largest U.S. companies, and it is one of the most heavily traded securities in the world. It tracks the S&P 500 Index, and fund follows a full replication strategy, holding every stock in the index.
The SPDR Financials Sector Index seeks to provide an effective representation of the financial sector of the S&P 500 Index. The Index includes companies from the following industries: diversified financial services; insurance; banks; capital markets; mortgage real estate investment trusts (“REITs”); consumer finance; and thrifts and mortgage finance.
The Vanguard 500 Index Fund invests in 500 of the largest U.S. companies, which span many different industries and account for about three-fourths of the U.S. stock market’s value. This fund tracks the S&P 500 Index as closely as possible.
VIX is a trademarked ticker symbol for the Chicago Board Options Exchange Market Volatility Index, a popular measure of the implied volatility of S&P 500 index options. Often referred to as the fear index or the fear gauge, it represents one measure of the market’s expectation of stock market volatility over the next 30 day period.
Indices are unmanaged, do not incur fees, and cannot be invested in directly.
| Index Definitions | 189 | |||||
Table of Contents
Litman Gregory Funds Trust
| 1. | Active Share measures the degree of difference between a fund portfolio and its benchmark index. |
| 2. | Alpha is an annualized return measure of how much better or worse a fund’s performance is relative to an index of funds in the same category, after allowing for differences in risk. |
| 3. | Alt-A, or Alternative A-paper, is a type of U.S. mortgage that, for various reasons, is considered riskier than A-paper, or “prime”, and less risky than “subprime,” the riskiest category. |
| 4. | The Basel Accords are three sets of banking regulations (Basel I, II and III) set by the Basel Committee on Bank Supervision (BCBS), which provides recommendations on banking regulations in regards to capital risk, market risk and operational risk. |
| 5. | A basis point is a value equaling one one-hundredth of a percent (1/100 of 1%). |
| 6. | Beta is a measure of the volatility, or systematic risk, of a security or a portfolio in comparison to the market as a whole. |
| 7. | Book value is the net asset value of a company, calculated by subtracting total liabilities and intangible assets from total assets. |
| 8. | Brexit is an abbreviation of “British exit”, which refers to the June 23, 2016 referendum by British voters to exit the European Union. |
| 9. | Business development company (BDC) is an organization that invests in and helps small- and medium-size companies grow in the initial stages of their development. |
| 10. | Cash flow measures the cash generating capability of a company by adding non-cash charges (e.g., depreciation) and interest expense to pretax income. |
| 11. | Cash flow yield (or free cash flow yield) is a financial solvency ratio that compares the free cash flow per share a company is expected to earn against its market value per share. The ratio is calculated by taking the free cash flow per share divided by the current share price. |
| 12. | Capex (capital expenditures) are expenditures creating future benefits. |
| 13. | Collateralized Loan Obligation (CLO) is a security backed by a pool of debt, often low-rated corporate loans. Collateralized loan obligations (CLOs) are similar to collateralized mortgage obligations, except for the different type of underlying loan. |
| 14. | Combined ratio is a formula used by insurance companies to relate premium income to claims, administration and dividend expenses. It is used in the annual statement filed by an insurer with the state insurance department. It is calculated by dividing the sum of incurred losses and expenses by earned premium. |
| 15. | Compound annual growth rate (CAGR) is the rate of growth of a number, compounded over several years. |
| 16. | Conditional pre-payment rate is a loan prepayment rate that is equal to the proportion of the principal of a pool of loans that is assumed to be paid off prematurely in each period. |
| 17. | The Consumer Price Index (CPI) is a measure that examines the weighted average of prices of a basket of consumer goods and services, such as transportation, food and medical care. Changes in the CPI are used to assess price changes associated with the cost of living; the CPI is one of the most frequently used statistics for identifying periods of inflation or deflation. |
| 18. | Correlation is a statistical measure of how two securities move in relation to each other. |
| 19. | A coupon or coupon payment is the annual interest rate paid on a bond, expressed as a percentage of the face value and paid from issue date until maturity. |
| 20. | Covenants most often relate to terms in a financial contract, such as a loan document or bond issue stating the limits at which the borrower can further lend. |
| 21. | Credit default swaps are swaps designed to transfer the credit exposure of fixed income products between parties. A credit default swap is also referred to as a credit derivative contract, where the purchaser of the swap makes payments up until the maturity date of a contract. Payments are made to the seller of the swap. In return, the seller agrees to pay off a third party debt if this party defaults on the loan. |
| 22. | Discounted cash flow is calculated by multiplying future cash flows by discount factors to obtain present values. |
| 23. | Diversification is the spreading of risk by putting assets in several categories of investments. |
| 24. | Dividend yield is the return on an investor’s capital investment that a company pays out to its shareholders in the form of dividends. It is calculated by taking the amount of dividends paid per share over the course of a year and dividing by the stock’s price. |
| 25. | Drawdown is the peak-to-trough decline during a specific record period of an investment, fund or commodity. |
| 26. | Dry powder refers to cash reserves kept on hand to cover future obligations or purchase assets, if conditions are favorable. |
| 190 | Litman Gregory Funds Trust | |||||
Table of Contents
Litman Gregory Funds Trust
INDUSTRY DEFINITIONS – (Continued)
| 27. | Duration is a measure of the sensitivity of the price (the value of principal) of a fixed-income investment to a change in interest rates. Duration is expressed as a number of years. Rising interest rates mean falling bond prices, while declining interest rates mean rising bond prices. |
| 28. | Earnings per share (EPS) is calculated by taking the total earnings divided by the number of shares outstanding. |
| 29. | EBIT is a company’s earnings before interest and taxes, and measures the profit a company generates from its operations, making it synonymous with “operating profit”. |
| 30. | EBITDA is a company’s earnings before interest, taxes, depreciation, and amortization. |
| 31. | E-Mini Futures Are an electronically traded futures contract on the Chicago Mercantile Exchange that represents a portion of the normal futures contracts. |
| 32. | Enterprise value is a measure of a company’s total value, calculated by adding a corporation’s market capitalization, preferred stock, and outstanding debt together and then subtracting out the cash and cash equivalents. |
| 33. | Enterprise value/adjusted target operating profit (or Enterprise Value/adjusted target EBIT) is a financial ratio that compares the total valuation of the company with its profitability, adjusting for various special circumstances. |
| 34. | EV/EBITDA is the enterprise value of a company divided by earnings before interest, taxes, depreciation, and amortization. |
| 35. | EV/Sales is the ratio of enterprise value of a company divided by the total sales of the company for a particular period, usually one year. |
| 36. | Floating interest rate, also known as a variable or adjustable rate, refers to any type of debt instrument, such as a loan, bond, mortgage, or credit, that does not have a fixed rate of interest over the life of the instrument. |
| 37. | Forex (FX) is the market in which currencies are traded. |
| 38. | Free cash flow is the amount of cash a company has after expenses, debt service, capital expenditures, and dividends. |
| 39. | Futures are financial contracts obligating the buyer to purchase an asset (or the seller to sell an asset), such as a physical commodity or a financial instrument, at a predetermined future date and price. Futures contracts detail the quality and quantity of the underlying asset; they are standardized to facilitate trading on a futures exchange. |
| 40. | The G20 (or G-20 or Group of Twenty) is an international forum for the governments and central bank governors from 20 major economies. It was founded in 1999 with the aim of studying, reviewing, and promoting high-level discussion of policy issues pertaining to the promotion of international financial stability. |
| 41. | Gross merchandise volume or GMV is a term used in online retailing to indicate a total sales dollar value for merchandise sold through a particular marketplace over a certain time frame. |
| 42. | “Growth” stocks are generally considered to be stocks of companies with high expected earnings growth compared to “value” stocks. Because of this higher expected growth, growth stocks tend to be priced at a higher multiple of their current earnings than value stocks. However, the premium paid for growth stocks compared to value stocks can vary dramatically depending on the market environment. |
| 43. | Industry cost curve is the standard microeconomic graph that shows how much output suppliers can produce at a given cost per unit. As a strategic tool, the cost curve applies most directly to commodity or near commodity industries, in which buyers get roughly the same value from a product regardless of who produces it. |
| 44. | An interest rate future is a financial derivative (a futures contract) with an interest-bearing instrument as the underlying asset. It is a particular type of interest rate derivative. Examples include Treasury-bill futures, Treasury-bond futures and Eurodollar futures. |
| 45. | An interest rate swap is a forward contract in which one stream of future interest payments is exchanged for another based on a specified principal amount. |
| 46. | Internal Rate of Return (IRR) is the discount rate often used in capital budgeting that makes the net present value of all cash flows from a particular project equal to zero. |
| 47. | Inverse floater (or inverse floating rate note) is a bond or other type of debt whose coupon rate has an inverse relationship to a benchmark rate. |
| 48. | Inverse interest-only security is a security that pays a coupon inversely related to market rates (i.e., it moves in the opposite direction of interest rates), instead of paying a coupon corresponding to the interest payments homeowners (mortgagors) actually make. |
| Industry Definitions | 191 | |||||
Table of Contents
Litman Gregory Funds Trust
INDUSTRY DEFINITIONS – (Continued)
| 49. | An Investment Grade bond is a bond with a rating of AAA to BBB; a Below Investment Grade bond is a bond with a rating lower than BBB |
| 50. | A Leveraged Buyout (LBO) is the acquisition of another company using a significant amount of borrowed money to meet the cost of acquisition. |
| 51. | Loss adjusted yields are those that already reflect the impact of assumed economic losses. |
| 52. | Margin of safety is a principle of investing in which an analyst only purchases securities when the market price is below the analyst’s estimation of intrinsic value. It does not guarantee a successful investment. |
| 53. | Market capitalization (or market cap) is the total value of the issued shares of a publicly traded company; it is equal to the share price times the number of shares outstanding. MBA Refinance index is a weekly measurement put together by the Mortgage Bankers Association, a national real estate finance industry association, to predict mortgage activity and loan prepayments based on the number of mortgage refinance applications submitted. |
| 54. | The Merrill Option Volatility Expectations Index (MOVE©) reflects a market estimate of future Treasury bond yield volatility. The MOVE index is a yield curve weighted index of the normalized implied volatility on 1-month Treasury options. The MOVE Index reports the average implied volatility across a wide range of outstanding options on the two-year, five-year, 10-year, and 30-year U.S. Treasury securities. |
| 55. | Net operating profit after tax (NOPAT): A company’s potential cash earnings if its capitalization were unleveraged (that is, if it had no debt). |
| 56. | Normalized earnings are earnings adjusted for cyclical ups and downs of the economy. Also, on the balance sheet, earnings adjusted to remove unusual or one-time influences. |
| 57. | Operating cash flow is calculated by summing net profit, depreciation, change in accruals, and change in accounts payable, minus change in accounts receivable, minus change in inventories. |
| 58. | Options are financial derivatives that represent a contract sold by one party (option writer) to another party (option holder). The contract offers the buyer the right, but not the obligation, to buy (call) or sell (put) a security or other financial asset at an agreed-upon price (the strike price) during a certain period of time or on a specific date (exercise date). |
| 59. | An option premium is the current market price of an option contract. It is thus the income received by the seller (writer) of an option contract to another party. |
| 60. | Out of the money (OTM) is term used to describe a call option with a strike price that is higher than the market price of the underlying asset, or a put option with a strike price that is lower than the market price of the underlying asset. An out of the money option has no intrinsic value, but only possesses extrinsic or time value. |
| 61. | Pair-wise correlation is the average of the correlations of each managers’ performance with each of the other managers on the fund. |
| 62. | Personal consumption expenditure is the measure of actual and imputed expenditures of households, and includes data pertaining to durable and non-durable goods and services. It is essentially a measure of goods and services targeted towards individuals and consumed by individuals. |
| 63. | Present value is the current worth of a future sum of money or stream of cash flows given a specified rate of return. |
| 64. | Price to book ratio is calculated by dividing the current market price of a stock by the book value per share. |
| 65. | Price to earnings (P/E) ratio is a common tool for comparing the prices of different common stocks and is calculated by dividing the current market price of a stock by the earnings per share. Similarly, multiples of earnings and cash flow are means of expressing a company’s stock price relative to its earnings per share or cash flow per share, and are calculated by dividing the current stock price by its earnings per share or cash per share. Forecasted earnings growth is the projected rate that a company’s earnings are estimated to grow in a future period. |
| 66. | Price to sales (P/S) ratio is a tool for calculating a stock’s valuation relative to other companies, calculated by dividing a stock’s current price by its revenue per share. |
| 67. | Price to tangible book value (PTBV) is a valuation ratio expressing the price of a security compared to its hard, or tangible, book value as reported in the company’s balance sheet. The tangible book value number is equal to the company’s total book value less the value of any intangible assets. |
| 68. | Prime is a classification of borrowers, rates, or holdings in the lending market that are considered to be of high quality. |
| 192 | Litman Gregory Funds Trust | |||||
Table of Contents
Litman Gregory Funds Trust
INDUSTRY DEFINITIONS – (Continued)
| 69. | Principal only securities are a type of fixed-income security where the holder is only entitled to receive regular cash flows that are derived from incoming principal repayments on an underlying loan pool. |
| 70. | Private market value is the value of a company if each of its parts were independent, publicly traded entities. |
| 71. | Prospective earnings growth ratio (PEG ratio): The projected one-year annual growth rate, determined by taking the consensus forecast of next year’s earnings, less this year’s earnings, and dividing the result by this year’s earnings. |
| 72. | Put writing is a family of options trading strategies that involve the selling of put options to earn premiums. One can either write a covered put or a naked put. Utilizing a combination of covered puts and naked puts, one can also implement the ratio put write, which is a neutral strategy. |
| 73. | Quantitative Easing (QE) is a monetary policy in which a central bank purchases government securities or other securities from the market in order to lower interest rates and increase the money supply. |
| 74. | Return on capital (ROC) is a measure of how effectively a company uses the money (borrowed or owned) invested in its operations. It is calculated by dividing net income by invested capital. |
| 75. | Return on equity (ROE) is a measure of how well a company used reinvested earnings to generate additional earnings. Expressed as a percentage, it is calculated by dividing net worth at the beginning of the period into net income for the period after preferred stock dividends but before common stock dividends. |
| 76. | Return on investment capital (ROIC) is calculated by subtracting dividends from net income and dividing by total capital. |
| 77. | Sequential growth is a measure of a company’s short-term financial performance that compares the results achieved in a recent period to those of the period immediately preceding it. |
| 78. | Sharpe ratio is the measure of a fund’s return relative to its risk. The Sharpe ratio uses standard deviation to measure a fund’s risk-adjusted returns. The higher a fund’s Sharpe ratio, the better a fund’s returns have been relative to the risk it has taken on. Because it uses standard deviation, the Sharpe ratio can be used to compare risk-adjusted returns across all fund categories. |
| 79. | Short (or short position) is the sale of a borrowed security, commodity, or currency with the expectation that the asset will fall in value. |
| 80. | Sortino Ratio is a modification of the Sharpe ratio that differentiates harmful volatility from general volatility by taking into account the standard deviation of negative asset returns, called downside deviation. |
| 81. | A sovereign bond is a debt security issued by a national government. |
| 82. | A special situation is a particular circumstance involving a security that would compel investors to trade the security based on the special situation, rather than the underlying fundamentals of the security or some other investment rationale. A spin-off is an example of a special situation. |
| 83. | Spot price is the current price at which a particular security can be bought or sold at a specified time and place. |
| 84. | Standard deviation is a statistical measure of the historical volatility of a mutual fund or portfolio, usually computed using 36 monthly returns. |
| 85. | Subprime refers to the credit quality of particular borrowers, who have weakened credit histories and a greater risk of loan default than prime borrowers. The market for lenders and borrowers of subprime credit includes the business of subprime mortgages, subprime auto loans and subprime credit cards, as well as various securitization products that use subprime debt as collateral. |
| 86. | Swaps, traditionally, are the exchange of one security for another to change the maturity (bonds), quality of issues (stocks or bonds), or because investment objectives have changed. Recently, swaps have grown to include currency swaps and interest rate swaps. |
| 87. | Swaption (swap option): The option to enter into an interest rate swap. In exchange for an option premium, the buyer gains the right but not the obligation to enter into a specified swap agreement with the issuer on a specified future date. |
| 88. | Tangible Book Value Per Share—TBVPS is a method of valuing a company on a per-share basis by measuring its equity after removing any intangible assets. |
| 89. | Tracking error is the monitoring the performance of a portfolio, usually to analyze the extent to which its price movements conform or deviate from those of a benchmark. |
| 90. | Upside/downside capture is a statistical measure that shows whether a given fund has outperformed—gained more or lost less than—a broad market benchmark during periods of market strength and weakness, and if so, by how much. |
| Industry Definitions | 193 | |||||
Table of Contents
Litman Gregory Funds Trust
INDUSTRY DEFINITIONS – (Continued)
| 91. | Yield Curve: A line that plots the interest rates, at a set point in time, of bonds having equal credit quality, but differing maturity dates. The most frequently reported yield curve compares the three-month, two-year, five-year and 30-year U.S. Treasury debt. The curve is used to predict changes in economic output and growth. |
| 92. | Yield to Maturity is the rate of return anticipated on a bond if it is held until the maturity date. |
| 93. | Yield to Worst is the lowest potential yield that can be received on a callable bond without the issuer actually defaulting. |
| 94. | Z Bonds, or Z Tranches, are the final tranche in a series of mortgage-backed securities, that is the last one to receive payment. Used in some collateralized mortgage obligations (CMO), Z-bonds pay no coupon payments while principal is being paid on earlier bonds. |
| 194 | Litman Gregory Funds Trust | |||||
Table of Contents
Litman Gregory Funds Trust
TRUSTEE AND OFFICER INFORMATION
Independent Trustees*
Name, Address and Year Born | Position(s) Held with the Trust | Term of Office and Length of Time Served | Principal Occupation(s) During Past Five Years | # of Portfolios in Fund Complex Overseen by Trustee | Other Directorships Held by Trustee During Past Five Years | |||||
Julie Allecta 1676 N. California Blvd., Suite 500 Walnut Creek, CA 94596 (born 1946) | Independent Trustee | Open-ended term; served since June 2013 | Member of Governing Council and Policy Committee, Independent Directors Council (education for investment company independent directors) since 2014; and Retired Partner, Paul Hastings LLP (law firm), active member from 1999 to 2009. | 10 | Forward Funds (mutual funds) (4 portfolios) Salient MF Trust (mutual funds) (1 portfolio) Salient Midstream & MLP Fund (closed-end fund) (1 portfolio) | |||||
Thomas W. Bird 1676 N. California Blvd., Suite 500 Walnut Creek, CA 94596 (born 1957) | Independent Trustee | Open-ended term; served since May 2021 | Founder, Chief Executive Officer and Director, Bird Impact LLC (impact investment vehicle) since 2016; Founder, Chairman and Chief Investment Officer, FARM Group (impact not-for-profit organization) since 1998; Board Member, Sonen Capital LLC(impact asset management firm) 2016-2020. | 10 | Sonen Capital LLC; One Summit (not-for-profit organization) | |||||
Jennifer M. Borggaard 1676 N. California Blvd., Suite 500 Walnut Creek, CA 94596 (born 1969) | Independent Trustee | Open-ended term; served since May 2021 | Co-Founder and Partner, AlderBrook Advisors (management consulting) since 2019; Member, Advisory Committee, Polen Capital (investment advisor) since 2018; Senior Vice President, Affiliated Managers Group, Inc. (asset management) 2007-2017. | 10 | BroadStreet Partners Inc. (insurance); BNY Mellon Charitable Gift Fund; Anchor Capital Advisors LLC (asset management); Boston Financial Management, LLC (asset management) | |||||
Jonathan W. DePriest 1676 N. California Blvd., Suite 500 Walnut Creek, CA 94596 (born 1968) | Independent Trustee | Open-ended term; served since May 2021 | Consultant (financial services) since 2022; General Counsel, ApplePie Capital, Inc. (franchise financing) 2019-2021; Executive Vice President and General Counsel, Salient Partners, L.P. (asset management) 2015-2019. | 10 | None | |||||
Frederick A. Eigenbrod, Jr., Ph.D. 1676 N. California Blvd., Suite 500 Walnut Creek, CA 94596 (born 1941) | Independent Trustee | Open-ended term; served since inception | Vice President, RoutSource Consulting Services (organizational planning and development) since 2002. | 10 | None | |||||
Harold M. Shefrin, Ph.D. 1676 N. California Blvd., Suite 500 Walnut Creek, CA 94596 (born 1948) | Independent Trustee | Open-ended term; served since February 2005 | Professor, Department of Finance, Santa Clara University since 1979. | 10 | SA Funds – Investment Trust (mutual funds) (10 portfolios) |
| Trustee and Officer Information | 195 | |||||
Table of Contents
Litman Gregory Funds Trust
TRUSTEE AND OFFICER INFORMATION
Interested Trustees & Officers
Name, Address and Year Born | Position(s) Held with the Trust | Term of Office and Length of Time Served | Principal Occupation(s) During Past Five Years | # of Portfolios in Fund Complex Overseen by Trustee | Other Directorships Officer During Past | |||||
Jeremy L. DeGroot** 1676 N. California Blvd., Suite 500 Walnut Creek, CA 94596 (born 1963) | Chairman of the Board, Trustee and President | Open-ended term; served as a Chairman since March 2017, Trustee since December 2008 and President since 2014 | Chief Investment Officer of Litman Gregory Wealth Management, LLC since 2008; and Co-Chief Investment Officer of Litman Gregory Wealth Management, LLC from 2003 to 2008. | 10 | None | |||||
Jeffrey K. Seeley** 1676 N. California Blvd., Suite 500 Walnut Creek, CA 94596 (born 1969) | Trustee and Secretary | Open-ended term; Trustee since May 2021 and Secretary since December 2021 | Deputy Chief Executive Officer, U.S. Chief Operating Officer and Head of Distribution, iM Global Partner US, LLC since 2018; Chief Compliance Officer of iM Global US Distributors, LLC since 2019; Head of Distribution Resource Securities from 2017-2018; and Head of Distribution and Sales, BP Capital Fund Advisors from 2015-2017. | 10 | None | |||||
John M. Coughlan 1676 N. California Blvd., Suite 500 Walnut Creek, CA 94596 (born 1956) | Treasurer | Open-ended term; served as Treasurer since inception, and as Chief Compliance Officer from September 2004 to April 2022 | Chief Operating Officer and Chief Compliance Officer of the Advisor since 2004. | N/A | None | |||||
Robert L. Oester 1600 East Franklin Avenue, Suite D El Segundo, CA 90245 (born 1969) | Chief Compliance Officer | Open-ended term; served as Chief Compliance Officer since April 2022 | Chief Compliance Officer of the Trust since 2022; Vice President, City National Rochdale from 2019-2022; and Associate Vice President, Ares Management, LLC from 2013-2019. | N/A | None |
| * | Denotes Trustees who are not “interested persons” of the Trust, as such term is defined under the 1940 Act (the “Independent Trustees”). |
| ** | Denotes Trustees who are “interested persons” of the Trust, as such term is defined under the 1940 Act, because of their relationship with the Advisor (the “Interested Trustees”). |
In addition, Jack Chee, Jason Steuerwalt and Kiko Vallarta, each a portfolio manager at the Advisor, are each an Assistant Secretary of the Trust.
| 196 | Litman Gregory Funds Trust | |||||
Table of Contents
The Funds may collect non-public personal information about you from the following sources:
| • | Information we receive about you on applications or other forms; |
| • | Information you give us orally; and |
| • | Information about your transactions with us. |
We do not disclose any non-public personal information about our shareholders or former shareholders without the shareholder’s authorization, except as required or permitted by applicable law or in response to inquiries from governmental authorities. We restrict access to your personal and account information to our employees who need to know that information to provide products and services to you and to the employees of our affiliates. We also may disclose that information to non-affiliated third parties (such as to brokers or custodians) only as permitted or required by applicable law and only as needed for us to provide agreed services to you.
We maintain physical, electronic and procedural safeguards to guard your non-public personal information.
If you hold shares of the Funds through a financial intermediary, such as a broker-dealer, bank, or trust company, the privacy policy of your financial intermediary would govern how your non-public personal information would be shared with non-affiliated third parties.
| Privacy Notice | 197 | |||||
Table of Contents
Advisor:
iM Global Partner Fund Management, LLC
1676 N. California Blvd., Suite 500
Walnut Creek, CA 94596
Distributor:
ALPS Distributors, Inc.
1290 Broadway, Suite 1100
Denver, CO 80203
Transfer Agent:
DST Asset Manager Solutions, Inc.
P.O. Box 219922
Kansas City, MO 64121-9922
1-800-960-0188
For Overnight Delivery:
iMGP Funds
C/O DST Asset Manager Solutions, Inc.
330 W. 9th Street
Kansas City, MO 64105
Investment Professionals:
Registered Investment Advisors, broker/dealers, and other investment professionals may contact Fund Services at 1-925-254-8999.
Prospectus:
To request a current prospectus, statement of additional information, or an IRA application, call
1-800-960-0188.
Shareholder Inquiries:
To request action on your existing account, contact the Transfer agent, DST Asset Manager Solutions, Inc., at 1-800-960-0188, from 9:00 a.m. to 6:00 p.m. eastern time, Monday through Friday.
24-Hour Automated Information:
For access to automated reporting of daily prices, account balances and transaction activity, call
1-800-960-0188, 24 hours a day, seven days a week. Please have your Fund number (see below) and account number ready in order to access your account information.
Information:
Fund | Symbol | CUSIP | Fund Number | |||||||||
Equity Fund | MSEFX | 53700T108 | 305 | |||||||||
International Fund | MSILX | 53700T207 | 306 | |||||||||
Oldfield International Value Fund | POIVX | 53700T843 | 2966 | |||||||||
SBH Focused Small Value Fund | PFSVX | 53700T850 | 2965 | |||||||||
Alternative Strategies Fund | ||||||||||||
Institutional Class | MASFX | 53700T801 | 421 | |||||||||
Investor Class | MASNX | 53700T884 | 447 | |||||||||
High Income Alternatives Fund | MAHIX | 53700T876 | 1478 | |||||||||
Dolan McEniry Corporate Bond Fund | ||||||||||||
Institutional Class | IDMIX | 53700T777 | 2967 | |||||||||
Investor Class | IDMAX | 53700T769 | 2968 | |||||||||
DBi Managed Futures Strategy ETF | DBMF | 53700T827 | Y7AX | |||||||||
DBi Hedge Strategy ETF | DBEH | 53700T835 | Y7AW | |||||||||
| IRBA | 53700T793 | Y7AZ | ||||||||||
Website:
www.imgpfunds.com
Table of Contents
(b) Not applicable.
Item 2. Code of Ethics.
Not applicable for semi-annual reports.
Item 3. Audit Committee Financial Expert.
Not applicable for semi-annual reports.
Item 4. Principal Accountant Fees and Services.
Not applicable for semi-annual reports.
Item 5. Audit Committee of Listed Registrants.
Not applicable to registrants who are not listed issuers (as defined in Rule 10A-3 under the Securities Exchange Act of 1934, as amended (the “Exchange Act”)).
Item 6. Investments.
(a) The complete Schedule of Investments is included as part of the report to shareholders filed under Item 1 of this Form N-CSR.
(b) Not applicable.
Item 7. Disclosure of Proxy Voting Policies and Procedures for Closed-End Management Investment Companies.
Not applicable to open-end investment companies.
Item 8. Portfolio Managers of Closed-End Management Investment Companies.
Not applicable to open-end investment companies.
Item 9. Purchases of Equity Securities by Closed-End Management Investment Company and Affiliated Purchasers.
Not applicable to open-end investment companies.
Item 10. Submission of Matters to a Vote of Security Holders.
There have been no material changes to the procedures by which shareholders may recommend nominees to the registrant’s board of trustees since the registrant last provided disclosure in response to this Item 10.
Table of Contents
Item 11. Controls and Procedures.
(a) The registrant’s President/Principal Executive Officer and Treasurer/Principal Financial Officer have reviewed the registrant’s disclosure controls and procedures (as defined in Rule 30a-3(c) under the Act) as of a date within 90 days of the filing of this report, as required by Rule 30a-3(b) under the Act and Rules 13a-15(b) or 15d-15(b) under the Exchange Act. Based on their review, such officers have concluded that the disclosure controls and procedures are effective in ensuring that information required to be disclosed in this report is appropriately recorded, processed, summarized and reported timely and made known to them by others within the registrant and by the registrant’s service provider.
(b) There were no changes in the registrant’s internal control over financial reporting (as defined in Rule 30a-3(d) under the Act) that occurred during the period covered by this report that have materially affected, or are reasonably likely to materially affect, the registrant’s internal control over financial reporting.
Item 12. Disclosure of Securities Lending Activities for Closed-End Management Investment Companies.
Not applicable to open-end investment companies.
Item 13. Exhibits.
| (a)(1) | Not applicable for semi-annual reports. | |
| (a)(2) | Certifications pursuant to Section 302 of the Sarbanes-Oxley Act of 2002 are attached as exhibits hereto. | |
| (a)(3) | Not applicable to open-end investment companies. | |
| (a)(4) | Not applicable. | |
| (b) | Certifications pursuant to Section 906 of the Sarbanes-Oxley Act of 2002 are attached as exhibits hereto. | |
Table of Contents
SIGNATURES
Pursuant to the requirements of the Securities Exchange Act of 1934, as amended, and the Investment Company Act of 1940, as amended, the registrant has duly caused this report to be signed on its behalf by the undersigned, thereunto duly authorized.
| LITMAN GREGORY FUNDS TRUST | ||
| By: | /s/ Jeremy L. DeGroot | |
| Jeremy L. DeGroot | ||
| President and Chief Executive Officer | ||
| Date: | August 30, 2022 | |
Pursuant to the requirements of the Securities Exchange Act of 1934, as amended, and the Investment Company Act of 1940, as amended, this report has been signed below by the following persons on behalf of the registrant and in the capacities and on the dates indicated.
| By: | /s/ Jeremy L. DeGroot | |
| Jeremy L. DeGroot | ||
| President and Chief Executive Officer | ||
| Date: | August 30, 2022 | |
| By: | /s/ John M. Coughlan | |
| John M. Coughlan | ||
| Treasurer and Principal Financial Officer | ||
| Date: | August 30, 2022 | |