Table of Contents
UNITED STATES
SECURITIES AND EXCHANGE COMMISSION
Washington, D.C. 20549
FORM N-CSR
CERTIFIED SHAREHOLDER REPORT OF REGISTERED
MANAGEMENT INVESTMENT COMPANIES
Investment Company Act file number: 811-07763
LITMAN GREGORY FUNDS TRUST
(Exact name of registrant as specified in charter)
2301 Rosecrans Avenue, Suite 2150
El Segundo, California
(Address of principal executive offices)(Zip code)
(Name and Address of Agent for Service)
Jeffrey K. Seeley
2301 Rosecrans Avenue, Suite 2150
El Segundo, California
Registrant’s telephone number, including area code: (925) 254-8999
Date of fiscal year end: December 31
Date of reporting period: June 30, 2023
Table of Contents
Item 1. Report to Shareholders.
(a) The following is a copy of the report transmitted to shareholders pursuant to Rule 30e-1 under the Investment Company Act of 1940, as amended (the “Act”):
Table of Contents


Semiannual Report
iMGP Global Select Fund
iMGP International Fund
iMGP Oldfield International Value Fund
iMGP SBH Focused Small Value Fund
iMGP Alternative Strategies Fund
iMGP High Income Fund (FKA iMGP High Income Alternatives Fund)
iMGP Dolan McEniry Corporate Bond Fund
iMGP DBi Managed Futures Strategy ETF
iMGP DBi Hedge Strategy ETF
iMGP RBA Responsible Global Allocation ETF
iMGP Berkshire Dividend Growth ETF
June 30, 2023
Table of Contents
| ii | Litman Gregory Funds Trust | |||||
Table of Contents

| 2 | ||
iMGP Global Select Fund | ||
| 4 | ||
| 9 | ||
iMGP International Fund | ||
| 11 | ||
| 16 | ||
iMGP Oldfield International Value Fund | ||
| 17 | ||
| 20 | ||
iMGP SBH Focused Small Value Fund | ||
| 21 | ||
| 24 | ||
iMGP Alternative Strategies Fund | ||
| 25 | ||
Alternative Strategies Fund Consolidated Schedule of Investments | 35 | |
iMGP High Income Fund | ||
| 74 | ||
| 79 | ||
iMGP Dolan McEniry Corporate Bond Fund | ||
| 92 | ||
| 95 | ||
iMGP DBi Managed Futures Strategy ETF | ||
| 97 | ||
DBi Managed Futures Strategy ETF Consolidated Schedule of Investments | 99 | |
iMGP DBi Hedge Strategy ETF | ||
| 101 | ||
| 103 | ||
iMGP RBA Responsible Global Allocation ETF | ||
| 105 | ||
RBA Responsible Global Allocation ETF Schedule of Investments | 108 | |
iMGP Berkshire Dividend Growth ETF | ||
| 109 | ||
| 110 | ||
| 112 | ||
| 116 | ||
| 119 | ||
| 119 | ||
| 120 | ||
| 120 | ||
Alternative Strategies Fund (Consolidated) | 121 | |
| 121 | ||
| 122 | ||
| 123 | ||
| 123 | ||
| 124 | ||
124 | ||
Financial Highlights | ||
| 125 | ||
| 126 | ||
| 127 | ||
| 128 | ||
Alternative Strategies Fund (Consolidated) | 129 | |
Alternative Strategies Fund Investor Class (Consolidated) | 130 | |
| 131 | ||
| 132 | ||
| 133 | ||
| 134 | ||
| 135 | ||
| 136 | ||
| 137 | ||
| 169 | ||
179 | ||
182 | ||
| 187 | ||
| 189 |
This report is intended for shareholders of the funds and may not be used as sales literature unless preceded or accompanied by a current prospectus for the iMGP Funds. Statements and other information in this report are dated and are subject to change.
iM Global Partner Fund Management, LLC has ultimate responsibility for the funds’ performance due to its responsibility to oversee its investment managers and recommend their hiring, termination and replacement.
| Table of Contents | 1 | |||||
Table of Contents
iM Global Partner Fund Management
We are deeply committed to making each iMGP Fund a highly satisfying long-term investment for shareholders. In following through on this commitment we are guided by our core values, which influence four specific areas of service:
First, we are committed to the IMGP concept.
| • | We will only hire managers who we strongly believe will deliver exceptional long-term returns relative to their benchmarks. We base this belief on extremely thorough due diligence research. This not only requires us to assess their stock-picking skills, but also to evaluate their ability to add incremental performance by investing in a concentrated portfolio of their highest conviction ideas. |
| • | We will monitor each of the managers so that we can maintain our confidence in their ability to deliver the long-term performance we expect. In addition, our monitoring will seek to assess whether they are staying true to their IMGP Funds mandate. Consistent with this mandate, we focus on long-term performance evaluation so that the IMGP managers will not be distracted by short-term performance pressure. |
Second, we will do all we can to ensure that the framework within which our stock pickers do their work further increases the odds of success.
| • | Investments from new shareholders in each fund are expected to be limited so that each fund’s asset base remains small enough to retain flexibility to add value. |
| • | The framework also includes either a single-manager or a multi-manager structure; the former allowing each fund an individual, highly disciplined investment process, and the latter making it possible for each manager to invest, when appropriate, in an opportunistic manner knowing that the potential volatility within his or her portfolio will be diluted at the fund level by the performance of the other managers. In this way, the multi-manager structure seeks to provide fund-level diversification. |
| • | We will work hard to discourage short-term speculators so that cash flows into the funds are not volatile. Lower volatility helps prevent our managers from being forced to sell stocks at inopportune times or to hold excessive cash for non-investment purposes. |
Third, is our commitment to do all we can from an operational standpoint to maximize shareholder returns.
| • | We will remain attentive to fund overhead, and whenever we achieve savings we will pass them through to shareholders. For example, we have had several manager changes that resulted in lower sub-advisory fees to our funds. In every case we have passed through the full savings to shareholders in the form of fee waivers. |
| • | We will provide investors with a low minimum, no-load, no 12b-1 Institutional share class for all iMGP Funds, and a low minimum, no-load Investor share class for the Alternative Strategies Fund. |
| • | We also will work closely with our managers to make sure they are aware of tax-loss selling opportunities (only to be taken if there are equally attractive stocks to swap into). We account for partial sales on a specific tax lot basis so that shareholders will benefit from the most favorable tax treatment. The goal is not to favor taxable shareholders over tax-exempt shareholders but to make sure that the managers are taking advantage of tax savings opportunities when doing so is not expected to reduce pre-tax returns. |
Fourth, is our commitment to communicate honestly about all relevant developments and expectations.
| • | We will continue to do this by providing thorough and educational shareholder reports. |
| • | We will continue to provide what we believe are realistic assessments of the investment environment. |
Our commitment to iMGP Funds is also evidenced by our own investment. Our retired founders and current employees have, collectively, substantial investments in the funds, as does our company retirement plan. In addition, we use the funds extensively in the client accounts of our investment advisor practice (through our affiliate Litman Gregory Wealth Management, LLC). We have no financial incentive to do so because the fees we receive from iMGP Funds held in client accounts are fully offset against the advisory fees paid by our clients. In fact, we have a disincentive to use the funds in our client accounts because each iMGP Fund is capacity constrained (they may be closed as mentioned above), and by using them in client accounts we are using up capacity for which we may not be paid. But we believe these funds offer value that we can’t get elsewhere and this is why we enthusiastically invest in them ourselves and on behalf of clients.
While we believe highly in the ability of the Funds’ sub-advisors, our commitments are not intended as guarantees of future results.
While the funds are no-load, there are management fees and operating expenses that do apply, as well as a 12b-1 fee that applies to Investor class shares. Please refer to the prospectus for further details.
Diversification does not assure a profit or protect against loss in a declining market.
Must be preceded or accompanied by a prospectus.
| 2 | Litman Gregory Funds Trust | |||||
Table of Contents
General Disclosures
Past performance does not guarantee future results. Index performance is not illustrative of fund performance. An investment cannot be made directly in an index. The investment return and principal value of an investment will fluctuate so that an investor’s shares, when redeemed, may be worth more or less than their original cost. Current performance of the fund may be lower or higher than the performance quoted. To obtain the performance of the funds as of the most recently completed calendar month, please visit www.imgpfunds.com. Investment performance reflects fee waivers in effect. In the absence of such waivers, total return would be reduced.
Diversification does not assure a profit or protect against loss in a declining market.
Must be preceded or accompanied by a prospectus
Multi-investment management styles may lead to higher transaction expenses compared to single investment management styles. Outcomes depend on the skill of the sub-advisors and advisor and the allocation of assets amongst them.
Some of the comments are based on current management expectation and are considered “forward-looking statements”. Actual future results, however, may prove to be different from our expectations. You can identify forward-looking statement by words such as “estimate”, “may”, “expect”, “should”, “could”, “believe”, “plan”, and similar terms. We cannot promise future returns and our opinions are a reflection of our best judgment at the time this report is compiled.
Opinions expressed are subject to change, are not guaranteed and should not be considered recommendations to buy or sell any security.
iM Global Partner Fund Management has ultimate responsibility for the performance of the funds due to its responsibility to oversee the sub-advisors and recommend their hiring, termination and replacement.
Each of the funds may invest in foreign securities. Investing in foreign securities exposes investors to economic, political, and market risks and fluctuations in foreign currencies. Each of the funds may invest in the securities of small companies. Small-company investing subjects investors to additional risks, including security price volatility and less liquidity than investing in larger companies. Debt obligations of distressed companies typically are unrated, lower rated, in default or close to default and may become worthless. The International Fund will invest in emerging markets. Investments in emerging market countries involve additional risks such as government dependence on a few industries or resources, government-imposed taxes on foreign investment or limits on the removal of capital from a country, unstable government, and volatile markets. Investments in debt securities typically decrease when interest rates rise. This risk is usually greater for longer-term debt securities. Investments in mortgage-backed securities include additional risks that investor should be aware of including credit risk, prepayment risk, possible illiquidity, and default, as well as increased susceptibility to adverse economic developments. Investments in lower-rated and non-rated securities present a greater risk of loss to principal and interest than higher-rated securities. The funds may invest in master limited partnership units. Investing in MLP units may expose investors to additional liability and tax risks. Derivatives may involve certain costs and risks such as liquidity, interest rate, market, credit, management, and the risk that a position could not be closed when most advantageous. Investing in derivatives could lose more than the amount invested. The funds may make short sales of securities, which involves the risk that losses may exceed the original amount invested.
A commission may apply when buying or selling an ETF.
© 2021 Morningstar, Inc. All Rights Reserved. The information contained herein: (1) is proprietary to Morningstar; (2) may not be copied or distributed; and (3) is not warranted to be accurate, complete or timely. Neither Morningstar nor its content providers are responsible for any damages or losses arising from any use of this information. Past performance is no guarantee of future results.
| Fund Summary | 3 | |||||
Table of Contents
iMGP Global Select Fund 2023 Semi-Annual Report
The iMGP Global Select Fund returned 11.97% in the first half of 2023, trailing its MSCI World Index gain of 15.09% but ahead of the Morningstar Global Large Blend category’s return of 11.46%.
Since the fund’s mandate was broadened to global equities at the end of July 2022, the Fund is trailing the MSCI World Index and Morningstar Global Large Blend category. The Fund has gained 6.15% compared to 9.79% for the Index and 7.51% for the category over the short 11-month period.
Performance as of June 30, 2023 | ||||||||||||||||||||||||
| Year to Date Return | One- Year | Three- Year | Five- Year | Ten- Year | Since Inception 12/31/1996 | |||||||||||||||||||
iMGP Global Select Fund | 11.97% | 14.44% | 8.27% | 5.59% | 9.34% | 7.84% | ||||||||||||||||||
MSCI World Index | 15.09% | 18.51% | 12.18% | 9.07% | 9.50% | 6.84% | ||||||||||||||||||
MSCI ACWI Index | 13.93% | 16.53% | 10.99% | 8.10% | 8.75% | 6.67% | ||||||||||||||||||
Russell 3000 Index | 16.17% | 18.95% | 13.89% | 11.39% | 12.34% | 8.97% | ||||||||||||||||||
Moningstar Global Large-Stock Blend Category | 11.46% | 13.81% | 9.87% | 6.81% | 7.96% | 7.32% | ||||||||||||||||||
The fund changed its primary benchmark in August 2022 to more appropriately match the global equity mandate of the fund and the managers.
Gross Expense Ratio 1.50% Net Expense Ratio 1.01% Adjusted Expense Ratio 0.98%
Performance quoted represents past performance and does not guarantee future results. The investment return and principal value of an investment will fluctuate so that an investor’s shares, when redeemed, may be worth more or less than their original cost. Current performance of the funds may be lower or higher than the performance quoted. To obtain standardized performance of the funds, and performance as of the most recently completed calendar month, please visit www.imgpfunds.com. The advisor has agreed to waive fees and limit the expenses of the fund through at least April 30, 2024. |
| |||||||||||||||||||||||
Portfolio Commentary
Nuance Investments
During the first half of 2023, we made several changes to the portfolio, but our overweight and underweight positions were relatively stable as was our geographic exposure. Our largest overweight remains the consumer staples sector where we are continuing to see input cost inflation-related underearning in a number of leaders across the household & personal products industry group. Henkel AG & Co, Kimberly-Clark Corp, and Beiersdorf AG continue to make up a meaningful part of our exposure within the sector. Our view is that earnings in this industry group have been negatively impacted by rising raw material costs. We believe these costs can ultimately be mostly offset by price increases which generally lag the raw material price increases.
While the health care sector remains one of our largest overweight positions, we did lower our exposure within the sector after a period of outperformance during the first half of the year. Despite the outperformance, we continue to own names like Smith & Nephew, Medtronic, and Dentsply Sirona. We believe these companies are manufacturing critical, advanced medical products and display the traits we look for in competitively advantaged businesses. They sell into end markets that have been severely disrupted for more than two years as patient visits and procedures of all kinds have run well below normal due to the impacts of COVID-19, including high cancellation rates, procedure delays, and insufficient care provider staffing to meet demand. We believe the magnitude and duration of this disruption has created a large backlog of procedures that will need to be made up over the next one to two years. More recently, we believe raw material availability and input cost inflation in items including resins and metals have also squeezed margins at these companies. Offsetting price actions can take one to two years to implement in this industry, which is prolonging the period of underearning, in our opinion. Nevertheless, this remains a high conviction, underearning group of excellent businesses, in our view.
We added to our exposure within the Utilities sector, specifically water utilities, during the first half of the year as the prolonged period of historically low interest rates over the last decade has resulted in low allowed returns on equity which we believe can potentially reset higher as utility regulators incorporate a more normal cost of capital environment.
From an exposure standpoint, we remain underweight the U.S. and we would highlight overweight exposure in the United Kingdom and Germany. The primary overweight within the U.K. is in the water utilities industry, and the primary overweight in Germany is due to positions in Knorr-Bremse AG and Henkel AG & Co.
Polen Capital
Global equity markets have been strong year to date, particularly in the large-cap space. A pause in rate hikes, an anticipated recession that has not materialized, and the hype around artificial intelligence (AI) have helped to boost returns. Quality fundamentals have also been rewarded, which has supported our positive relative performance.
We have continued to take advantage of what we believe are attractive opportunities in the market, building positions in businesses with attractive long-term earnings growth potential and/or where we think there have been dislocations in share prices and business performance, and reducing holdings where either valuations and/or fundamentals have changed our risk/rewards projections.
| 4 | Litman Gregory Funds Trust | |||||
Table of Contents
We continue to stay focused on the long-term value propositions, competitive advantages, growth opportunities, and potential earnings power of our Portfolio companies. We are also still mindful that rising rates could lead to slower economic growth or even a recession but remain confident that our portfolios are well positioned to deliver strong earnings per share growth this year and beyond.
Scharf Investments
Throughout the year, equity market investors have crowded into risky growth, mega cap Information Technology (IT), especially semiconductors, to shrug off rising interest rates, still deteriorating leading economic indicators, an earnings recession, persistent elevated core inflation and the first money supply contraction in seven decades.
We believe investors are too bullish on a long duration trade based on an expected dovish pivot by the Fed in the second half 2023. Core inflation remains elevated as does labor strength. Multiples have risen smartly off fall 2022 bottoms and present downside risk. As value managers based in Silicon Valley, we have seen this AI movie before. In every technology revolution there is a changing of the guard. Investors would be wise to remember that of the six technology and communication companies on the list of the ten largest market caps in 2000, only Microsoft remains.
Price/Equity (P/E) dispersion presents a compelling investment opportunity for value stocks. Meanwhile, quality value (low EPS volatility) should mitigate the risk of traditional value stocks’ (e.g., energy, financials, materials) high operating leverage in a slowing 2023 global economy. The P/E spread between the market-cap and equal-weighted S&P 500 indexes, is now 4x (20x vs. 16x), its highest since the tech bubble in early 2000. The Russell 1000 Growth index has returned 29.0% vs. 5.1% for the Russell 1000 Value year-to-date. The forward P/E spread between the Russell 1000 Growth and Value indexes is now 12.5x turns (27.0x vs. 14.5x, respectively) vs. its long-term average of 6.7x turns (20.8x vs. 14.1x, respectively). Meanwhile, the P/E spread between the S&P 500 and the MSCI ACWI ex-U.S. is currently 6.2x turns, also roughly twice its 20-year average.
Key Performance Drivers
The Fund’s underweight to the largest stocks in the MSCI World Index hurt relative returns over the last six months. The large mega-cap growth names at the top of the index (Apple, Microsoft, Amazon.com, NVIDIA, Tesla, Alphabet, and Meta Platforms) account for 18% of the Index. The Fund has meaningfully less exposure to these names—owning positions in Alphabet, Amazon.com, and Microsoft that account for approximately 6% of fund assets at the end of June.
The fund benefited from stock picking in the health care, financials, and consumer staples sectors during the first half of 2023. Within health care, Align Technology had a strong six months after a difficult 2022 as it lapped extremely high prior year comparables. The position is held by the Polen Global Growth team. The company has delivered over consecutive quarters and as expected. On a three-year basis, Align has grown case shipments by over 15% and net revenues at 16%. The pandemic has given the company a chance to highlight its benefits relative to wires and brackets braces, and doctors seem to be responding. Earlier in the year, Align disclosed that the Invisalign treatment allows patients to go through the orthodontia process five months faster than braces, with roughly 35% fewer visits to a doctor. While Align continues to stay ahead of clear aligner competition through sales, marketing, and R&D, research indicates that the real fight is against braces, and Polen believes it is well positioned to win market share.
The financial sector contributed nicely to relative gains due, in part, to Goosehead Insurance. The position is held in the Polen Global SMID portfolio. The company, a personal line property and casualty insurance brokerage primarily focused on home and auto markets, has risen over 80% so far this year. Goosehead has continued to execute on its plan to clean up the corporate organization, return the company to its pre-COVID productivity metrics and deliver strong results despite weakness in the housing market. In the second quarter the company reported 40% year-on-year growth in total revenues, but also, importantly, core revenue grew 42% and premiums, the best leading indicator of potential future revenue growth, increased 41%. The company continues to show Polen that they are among the top operators in a difficult macro environment, leaning into their value propositions around great customer service and a better agent experience, and executing on thoughtful, value-add strategic growth programs.
The Fund benefited from its exposure to materials stocks, and, more specifically, to Akzo Nobel. The company is owned by Nuance Investments. Akzo Nobel is a global manufacturer of paints and coatings with leading market share positions for paint in Europe, Asia, and Latin America. The company is also a global leader in several functional coating categories such as industrial, coil, wood, aerospace, and marine coatings. Nuance’s research suggests that the company is currently underearning its long-term potential for two transitory reasons. First, Akzo Nobel has faced raw material cost inflation, particularly in resins (40% of raw materials costs), which has depressed margins below normal levels, in Nuance’s opinion. Inflationary pressures have begun to abate over the past few quarters and as raw material prices decline further from still elevated levels, they believe the company will see margin improvement. Second, the company has faced cyclically lower demand for its products due to rising interest rates and slower growth across its geographies. Depressed demand has led to inventory destocking across the channel in Europe and slower growth in China has caused overall volumes to decline mid-single digits over the past year, according to Nuance’s research. They believe that Akzo Nobel’s stable market share position and structurally stable demand for paints and coatings, will position it to potentially benefit from a cyclical demand improvement across both these markets. In Nuance’s opinion, both these factors caused AKZOY to post €2.20 in earnings per share (EPS) relative to their internal estimates of normal EPS closer to €4.50, creating what an attractive risk reward relative to other opportunities.
| Fund Summary | 5 | |||||
Table of Contents
Stock selection within the industrials and information technology sectors were a headwind to performance in the first half of the year. Within industrials, 3M Company (Nuance Investments) and MillerKnoll (Scharf Investments) were laggards. 3M Company is a diversified industrial conglomerate with leading market share positions across a variety of businesses including industrial materials and adhesives, healthcare consumables, safety equipment, and consumer products. The company has historically enjoyed stable market share positions across its portfolio and its businesses benefit from structural demand drivers including the shift from traditional fasteners to adhesives, aging populations, and rising safety standards globally. These characteristics have contributed to the company exhibiting high and stable returns on capital over time. Nuance’s view of 3M’s normalized earnings power is near $9.00 per share, and they believe the company is currently underearning relative to Wall Street consensus estimates for 2023. The first source of underearning is related to cyclical weakness in the company’s consumer-facing businesses. Discretionary consumer spending has weakened as inflation has impacted consumer budgets and consumers have worked down pandemic-related savings. According to Nuance’s research, this has led to a cyclical decline in discretionary consumer electronics purchases including smartphones, TVs, tablets, and their related semiconductor content. These are all categories that utilize 3M’s products. On top of this headwind to sales driven by the end consumer, general inventory destocking by retailers has compounded this decrease in sales, in Nuance’s opinion. The second source of underearning is related to cost inflation for 3M’s key inputs including resins, petrochemicals, wood pulp, labor, and transportation. Nuance estimates that 3M’s EBITDAR (earnings before interest, taxes, depreciation, amortization and restructuring or rent) margins are currently more than 200 basis points below levels they would consider normal. Nuance believes additional pricing actions and/or moderating input cost inflation should result in margin normalization over the next few years. 3M is currently facing two legal battles which they believe have led to negative sentiment and helped create a compelling valuation opportunity in the stock. The Nuance Investment Team has thoroughly studied both situations, has examined past analogous corporate litigation, and has stress tested 3M’s earnings power and balance sheet for a variety of scenarios. Importantly, Nuance does not expect these legal issues to impact the competitive position of 3M’s broad line of businesses and have incorporated their own expected litigation and settlement costs into the balance sheet and normalized earnings estimates. It is Nuance’s belief that the company’s strong balance sheet and its normalized annual free cash flow in excess of $5.5 billion should provide an ample cushion from which to service any costs related to these matters. To emphasize, these issues and Nuance’s own internal estimate of their long-term impact to the company are included in their view of normalized earnings, cash flows, and balance sheet strength. In legal matters, there is always uncertainty, but based on their study of these issues, it appears to be a situation where the uncertainty is providing a solid risk reward opportunity.
Scharf continues to believe MillerKnoll’s position as the premium high-quality leader in a fragmented market will allow it to gain share over time. Furthermore, the office furniture market is insulated from technological obsolescence and, despite work from home trends, should continue to grow. In fact, the company believes that a need for a reimagined work environment combined with increased demand for quality home office furniture could expand the market (as opposed to fears that work from home will lead to a contracting market) over the long-term. In addition, post the merger with Knoll, MillerKnoll is now the largest office furnishing company worldwide with what Scharf believes to be strong brand recognition and an established global distribution network. They believe the acquisition of Knoll will help the company fill out product and geography gaps in its portfolio, increasing scale and increase additional wallet share with existing customers. Scharf believes s MillerKnoll has the potential to realize $140 million in cost synergies by 2025. High-level, what’s incremental from their recent management call is improvement in order trends indicating a bottoming in 1Q24 (the current quarter) vs. their expectation for an elongated bottom throughout 2024.
The technology sector was the main detractor during the first half—from both security selection as well as not owning the aforementioned mega-cap tech names. The biggest detractor was Keyword Studios (owned in the Polen Global SMID portfolio). Keyword Studios, an outsourced video game production services company, has seen significant selling pressure due to concerns that AI could disrupt their business model. Many of the outsourced services it offers, such as language translation and video game artwork, could potentially be done in-house using generative AI (artificial intelligence). Management have addressed these concerns, and while there is still some uncertainty, they are embracing AI and believe it could become more of an opportunity than a threat. Ultimately, while there are still some unknowns, Polen has conviction in the management team and risk is skewed to the upside given the large correction in the share price.
| 6 | Litman Gregory Funds Trust | |||||
Table of Contents
By Sector
Financials | 15.8% | |||
Consumer Discretionary | 9.1% | |||
Information Technology | 18.9% | |||
Communication Services | 9.5% | |||
Health Care | 23.2% | |||
Industrials | 7.2% | |||
Consumer Staples | 7.8% | |||
Real Estate | 2.0% | |||
Utilities | 1.9% | |||
Materials | 0.3% | |||
Cash | 4.3% |
Summary Statistics
Market Cap Median (bn) | $ | 31.07 | ||
Weighted Average Market Cap | $ | 210.24 | ||
# of Holdings | 83 |
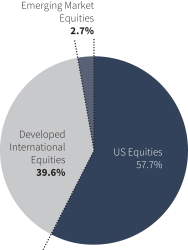
By Region
Europe | 31.6% | |||
North America | 61.7% | |||
Asia ex-Japan | 5.0% | |||
Japan | 1.7% | |||
Latin America | 0.0% | |||
Africa | 0.0% | |||
Australia/New Zealand | 0.0% | |||
Middle East | 0.0% | |||
Other Countries | 0.0% | |||
* Cash is excluded from calculation. |
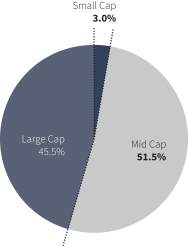
By Region | By Market Cap | |
 | 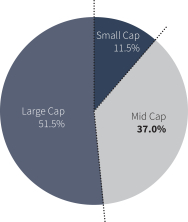 | |
Small Cap < $2.028 b Mid Cap >$2.028 B, <$42.290 b Large Cap > $42.290 b | ||
| Fund Summary | 7 | |||||
Table of Contents
iMGP Global Select Fund Value of Hypothetical $10,000
The value of a hypothetical $10,000 investment in the iMGP Global Select Fund from December 31, 1996 to June 30, 2023 compared with the Russell 3000 Index, Morningstar Global Large-Stock Blend Category and MSCI World Index.
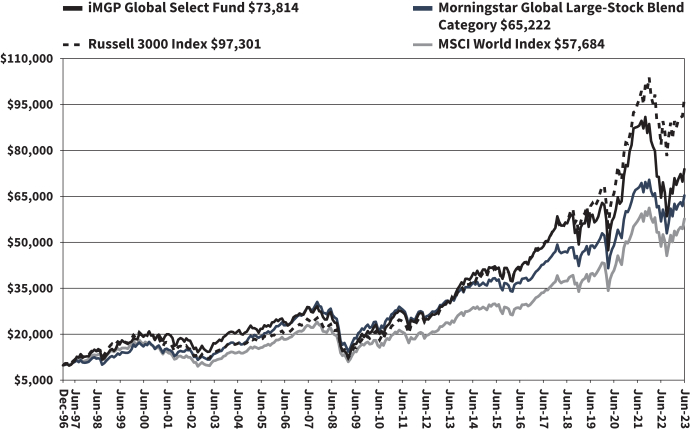
The hypothetical $10,000 investment at fund inception includes changes due to share price and reinvestment of dividends and capital gains. The chart does not imply future performance. Indexes are unmanaged, do not incur fees, expenses or taxes, and cannot be invested in directly.
Performance quoted does not include a deduction for taxes that a shareholder would pay on the redemption of fund shares.
| 8 | Litman Gregory Funds Trust | |||||
Table of Contents
iMGP Global Select Fund
SCHEDULE OF INVESTMENTS IN SECURITIES at June 30, 2023 (Unaudited)
| Shares | Value | |||||||
COMMON STOCKS: 93.6% | ||||||||
| Communication Services: 9.5% | ||||||||
| 25,000 | Activision Blizzard, Inc.* | $ | 2,107,500 | |||||
| 19,947 | Alphabet, Inc. - Class A* | 2,387,656 | ||||||
| 14,665 | Baidu, Inc. - ADR* | 2,007,785 | ||||||
| 58,200 | Comcast Corp. - Class A | 2,418,210 | ||||||
| 21,370 | CTS Eventim AG & Co. KGaA | 1,349,804 | ||||||
| 22,000 | Tencent Holdings Ltd. | 930,938 | ||||||
| 15,350 | Tencent Holdings Ltd. - ADR | 652,221 | ||||||
|
| |||||||
| 11,854,114 | ||||||||
|
| |||||||
| Consumer Discretionary: 9.1% | ||||||||
| 20,265 | Amazon.com, Inc.* | 2,641,745 | ||||||
| 9,358 | Five Below, Inc.* | 1,839,221 | ||||||
| 12,550 | Floor & Decor Holdings, Inc. - Class A* | 1,304,698 | ||||||
| 1,430 | LVMH Moet Hennessy Louis Vuitton SE | 1,347,441 | ||||||
| 48,120 | Revolve Group, Inc.* | 789,168 | ||||||
| 70,150 | Valvoline, Inc. | 2,631,327 | ||||||
| 21,720 | YETI Holdings, Inc.* | 843,605 | ||||||
|
| |||||||
| 11,397,205 | ||||||||
|
| |||||||
| Consumer Staples: 7.8% | ||||||||
| 42,522 | Beiersdorf AG - ADR | 1,125,132 | ||||||
| 4,859 | Clorox Co. | 772,775 | ||||||
| 4,283 | Diageo PLC - ADR | 743,015 | ||||||
| 20,400 | Heineken NV | 2,097,732 | ||||||
| 113,245 | Henkel AG & Co. KGaA - ADR | 1,995,377 | ||||||
| 9,342 | Kimberly-Clark Corp. | 1,289,756 | ||||||
| 2,440 | L’Oreal SA | 1,137,843 | ||||||
| 10,536 | Unilever PLC - ADR | 549,242 | ||||||
|
| |||||||
| 9,710,872 | ||||||||
|
| |||||||
| Financials: 15.8% | ||||||||
| 179,900 | AIA Group Ltd. | 1,815,896 | ||||||
| 5,002 | Aon PLC - Class A | 1,726,690 | ||||||
| 2 | Berkshire Hathaway, Inc. - Class A* | 1,035,620 | ||||||
| 4,275 | Berkshire Hathaway, Inc. - Class B* | 1,457,775 | ||||||
| 58,650 | Brookfield Corp. - Class A | 1,973,573 | ||||||
| 5,772 | Charles Schwab Corp. | 327,157 | ||||||
| 2,568 | Chubb Ltd. | 494,494 | ||||||
| 29,720 | Goosehead Insurance, Inc. - Class A* | 1,869,091 | ||||||
| 1,525 | Markel Group, Inc.* | 2,109,350 | ||||||
| 18,712 | Northern Trust Corp. | 1,387,308 | ||||||
| 3,561 | Reinsurance Group of America, Inc. | 493,875 | ||||||
| 63,600 | TMX Group Ltd. | 1,432,231 | ||||||
| 6,326 | Travelers Cos., Inc. | 1,098,573 | ||||||
| 11,104 | Visa, Inc. - Class A | 2,636,978 | ||||||
|
| |||||||
| 19,858,611 | ||||||||
|
| |||||||
| Health Care: 23.2% | ||||||||
| 16,508 | Abbott Laboratories | 1,799,702 | ||||||
| 6,597 | Align Technology, Inc.* | 2,332,963 | ||||||
| 29,565 | Centene Corp.* | 1,994,159 | ||||||
| 29,885 | CVS Health Corp. | 2,065,950 | ||||||
| 31,705 | DENTSPLY SIRONA, Inc. | 1,268,834 | ||||||
| 28,880 | Eurofins Scientific SE | 1,833,937 | ||||||
| 8,959 | ICON PLC - ADR* | 2,241,542 | ||||||
| 5,525 | McKesson Corp. | 2,360,888 | ||||||
| 14,942 | Medtronic PLC | 1,316,390 | ||||||
| 25,285 | Novartis AG - ADR | 2,551,509 | ||||||
| 31,210 | Siemens Healthineers AG(a) | 1,767,214 | ||||||
| 130,270 | Smith & Nephew PLC - ADR | 4,201,208 | ||||||
| Shares | Value | |||||||
| Health Care (continued) | ||||||||
| 3,520 | Tecan Group AG | $ | 1,350,169 | |||||
| 8,081 | Universal Health Services, Inc. - Class B | 1,274,940 | ||||||
| 541 | Waters Corp.* | 144,198 | ||||||
| 4,011 | Zimmer Biomet Holdings, Inc. | 584,002 | ||||||
|
| |||||||
| 29,087,605 | ||||||||
|
| |||||||
| Industrials: 7.2% | ||||||||
| 19,836 | 3M Co. | 1,985,385 | ||||||
| 187,400 | Alight, Inc. - Class A* | 1,731,576 | ||||||
| 74,677 | Knorr-Bremse AG - ADR | 1,421,850 | ||||||
| 24,982 | Legrand SA - ADR | 494,644 | ||||||
| 72,275 | MillerKnoll, Inc. | 1,068,224 | ||||||
| 4,520 | Paycom Software, Inc. | 1,452,005 | ||||||
| 2,286 | Schneider Electric SE - ADR | 83,119 | ||||||
| 52,500 | TOMRA Systems ASA | 845,679 | ||||||
|
| |||||||
| 9,082,482 | ||||||||
|
| |||||||
| Information Technology: 16.8% | ||||||||
| 3,307 | Accenture PLC - Class A | 1,020,474 | ||||||
| 4,892 | Adobe, Inc.* | 2,392,139 | ||||||
| 7,423 | Amphenol Corp. - Class A | 630,584 | ||||||
| 17,070 | Dynatrace, Inc.* | 878,593 | ||||||
| 18,639 | Endava PLC - ADR* | 965,314 | ||||||
| 6,920 | Globant SA* | 1,243,662 | ||||||
| 67,101 | Keywords Studios PLC | 1,543,361 | ||||||
| 7,410 | Microsoft Corp. | 2,523,401 | ||||||
| 55,024 | Murata Manufacturing Co. Ltd. - ADR | 789,044 | ||||||
| 24,160 | Oracle Corp. | 2,877,215 | ||||||
| 14,440 | SAP SE | 1,972,996 | ||||||
| 7,000 | SHIFT, Inc.* | 1,269,050 | ||||||
| 4,350 | Tyler Technologies, Inc.* | 1,811,645 | ||||||
| 5,172 | Workday, Inc. - Class A* | 1,168,303 | ||||||
|
| |||||||
| 21,085,781 | ||||||||
|
| |||||||
| Materials: 0.3% | ||||||||
| 5,663 | Akzo Nobel NV - ADR | 154,600 | ||||||
| 2,238 | DuPont de Nemours, Inc. | 159,883 | ||||||
|
| |||||||
| 314,483 | ||||||||
|
| |||||||
| Real Estate: 2.0% | ||||||||
| 41,266 | Altus Group Ltd. | 1,369,454 | ||||||
| 54,149 | Healthcare Realty Trust, Inc. - Class A, REIT | 1,021,250 | ||||||
| 5,895 | Healthpeak Properties, Inc. - REIT | 118,490 | ||||||
|
| |||||||
| 2,509,194 | ||||||||
|
| |||||||
| Utilities: 1.9% | ||||||||
| 488 | American Water Works Co., Inc. | 69,662 | ||||||
| 29,002 | Severn Trent PLC - ADR | 979,609 | ||||||
| 53,358 | United Utilities Group PLC - ADR | 1,332,883 | ||||||
|
| |||||||
| 2,382,154 | ||||||||
|
| |||||||
| | TOTAL COMMON STOCKS | 117,282,501 | ||||||
|
| |||||||
PREFERRED STOCK: 2.1% | ||||||||
| Information Technology: 2.1% | ||||||||
| 57,915 | Samsung Electronics Co. Ltd. - (Preference Shares) | 2,615,218 | ||||||
|
| |||||||
| | TOTAL PREFERRED STOCK | 2,615,218 | ||||||
|
| |||||||
The accompanying notes are an integral part of these financial statements.
| Schedule of Investments | 9 | |||||
Table of Contents
iMGP Global Select Fund
SCHEDULE OF INVESTMENTS IN SECURITIES at June 30, 2023 (Unaudited) (Continued)
| Principal Amount | Value | |||||||
SHORT-TERM INVESTMENTS: 4.8% | ||||||||
REPURCHASE AGREEMENTS: 4.8% | ||||||||
| $6,046,041 | Fixed Income Clearing Corp. 1.520%, 6/30/2023, due 07/03/2023 [collateral: par value $1,158,500, U.S. Treasury Note, 3.875%, due 12/31/2029; par value $3,119,600, U.S. Treasury Inflation Indexed Bonds, 0.125%, due 01/15/2030; par value $1,004,600, U.S. Treasury Note, 4.000%, due 02/28/2030; par value $730,300, U.S.Treasury Note, 3.500%, due 04/30/2030; total collateral value $6,168,129] (proceeds $6,046,807) | $ | 6,046,041 | |||||
|
| |||||||
| | TOTAL SHORT-TERM INVESTMENTS | 6,046,041 | ||||||
|
| |||||||
| | TOTAL INVESTMENTS | 125,943,760 | ||||||
|
| |||||||
| Liabilities in Excess of Other Assets: (0.5)% | (628,025 | ) | ||||||
|
| |||||||
NET ASSETS: 100.0% | $ | 125,315,735 | ||||||
|
| |||||||
Percentages are stated as a percent of net assets.
| ADR | American Depositary Receipt |
| REIT | Real Estate Investment Trust |
| * | Non-Income Producing Security. |
| (a) | Security was purchased pursuant to Rule 144A under the Securities Act of 1933 and may be sold in transactions exempt from registration only to qualified institutional buyers or in a public offering registered under Securities Act of 1933. |
The accompanying notes are an integral part of these financial statements.
| 10 | Litman Gregory Funds Trust | |||||
Table of Contents
iMGP International Fund 2023 Semi-Annual Report
The iMGP International Fund returned 15.83% in the first half of 2023, ahead of the 11.67% gain for the MSCI EAFE Index and the 10.88% return for the Morningstar Foreign Large Blend category.
Since inception, the Fund has gained 6.34% annualized, which compares favorably to annualized returns of 4.88% and 4.08% for MSCI EAFE Index and Morningstar Foreign Large Blend category, respectively.
Performance as of June 30, 2023 | ||||||||||||||||||||||||
| Year to Date Return | One- Year | Three- Year | Five- Year | Ten- Year | Since Inception 12/1/1997 | |||||||||||||||||||
iMGP International Fund | 15.83% | 17.15% | 11.38% | 2.26% | 3.30% | 6.34% | ||||||||||||||||||
MSCI ACWI ex US Index | 9.47% | 12.72% | 7.22% | 3.52% | 4.75% | 5.01% | ||||||||||||||||||
MSCI EAFE Index | 11.67% | 18.77% | 8.93% | 4.39% | 5.41% | 4.88% | ||||||||||||||||||
Morningstar Foreign Large Blend Category | 10.88% | 15.66% | 7.87% | 3.64% | 4.76% | 4.08% | ||||||||||||||||||
Gross Expense Ratio 1.47%, Net Expense Ratio 1.24%
Performance quoted represents past performance and does not guarantee future results. The investment return and principal value of an investment will fluctuate so that an investor’s shares, when redeemed, may be worth more or less than their original cost. Current performance of the funds may be lower or higher than the performance quoted. To obtain standardized performance of the funds, and performance as of the most recently completed calendar month, please visit www.imgptfunds.com. There are contractual fee waivers in effect through 4/30/2024.
MSCI index returns source: MSCI. Neither MSCI nor any other party involved in or related to compiling, computing, or creating the MSCI data makes any express or implied warranties or representations with respect to such data (or the results to be obtained by the use thereof), and all such parties hereby expressly disclaim all warranties of originality, accuracy, completeness, merchantability, or fitness for a particular purpose with respect to any of such data. Without limiting any of the foregoing, in no event shall MSCI, any of its affiliates, or any third party involved in or related to compiling, computing, or creating the data have any liability for any direct, indirect, special, punitive, consequential, or any other damages (including lost profits) even if notified of the possibility of such damages. No further distribution or dissemination of the MSCI data is permitted without MSCI’s express written consent. Source note: Returns prior to 1999 are the MSCI ACWI ex-US GR index. Returns from 1999 onwards are MSCI ACWI ex-US NR index.
|
| |||||||||||||||||||||||
Portfolio Commentary
Harris Associates
Major global markets generally finished higher for the year-to-date period following a challenging 2022. U.S. and Europe equity markets showed strength on the back of better-than-expected economic data, while Asian markets were mixed with China equities pressured and Japanese equities reaching 30-year highs. While a resilient labor market, cooling housing market and hopes for less-hawkish central banks have given investors reasons for optimism, the ramifications of recent banking stress, elevated inflation and geopolitical uncertainty continue to offer cause for concern.
Markets were shaken in March as worry about the health of the banking system spread, ignited by the collapse of Silicon Valley Bank and Signature Bank, and furthered by UBS’s purchase of Credit Suisse at a discounted valuation. Major banking institutions and government agencies around the globe stepped in to help assure depositors their money was safe, which helped avoid contagion across the system.
In March, the U.S. Federal Reserve and Bank of England increased their respective benchmark interest rates by 25 basis points, while the European Central Bank opted for 50 basis points. The Federal Reserve then increased its benchmark interest rate by 25 basis points in May before pausing at its June meeting. Comments from members of the Federal Open Market Committee pointed to further hikes in the future and interest rates remaining elevated for some time. The European Central Bank and Bank of England both increased their respective interest rates in May and June, reaching 4.00% and 5.00%, respectively, while Japan and China opted for more accommodative monetary policies. In the face of tightening financial conditions, inflation fell during the period throughout most of the world.
Regardless of the economic backdrop and central bank activity, our disciplined investment process continues to revolve around bottom-up, fundamental research. As long-term investors, we value our companies through the economic cycle and focus portfolio construction on optimizing what we believe are our best investment opportunities. We attempt to identify growing businesses that are managed to benefit their shareholders and invest in those businesses only when priced substantially below our estimate of intrinsic value, then patiently wait for the gap between share price and our estimate of intrinsic value to converge. We believe this approach best serves our goal of growing our client’s capital over the long term.
Lazard Asset Management
Overall corporate profits have remained resilient, but under the surface we have seen pressure in areas of discretionary spending—such as marketing or apparel. After 18 months of significant price increases, we see more examples of material impact on consumer demand, and a series of rate rises are putting pressure on the financial system and real estate. There appears to be a fading confidence that companies can maintain prices as raw material prices roll over in a softer demand environment. This dynamic should separate well-run companies with true pricing power and those reliant on benign economic conditions.
| Fund Summary | 11 | |||||
Table of Contents
Our experiences with COVID and geopolitical tensions will have lasting implications for us all. The sharp rise in energy prices has made clear the energy transition is not only for the climate, but a geopolitical imperative. A re-evaluation of economics versus certainty of supply is resulting in a shift to more regional supply chains – most notably for the semiconductor industry.
How the relationship between China and the West develops remains as critical as ever now that Xi Jinping has cemented his position of power. Navigating this geopolitical frontier will remain a focus for businesses and investors in the years ahead. The shift in the cost of capital has exposed the fragile foundation for high growth companies with yet to be proven financials and a reliance on cheap funding. Meanwhile, the demand destruction observed in countries with a rapid rise in energy cost illustrates that commodity booms are hard to sustain.
The determination of central banks to reign in inflationary pressures combined with pressure on disposable incomes, and a downward draft in asset prices, continues to create a challenging backdrop for markets. The ability to balance economic growth with efforts to bring inflation back to target levels will determine the direction of markets in the period ahead. While the near-term outlook is uncertain, market volatility provides opportunities for stock pickers to invest in great businesses at more attractive prices. The team is optimistic about the investment opportunity set presented in today’s market.
Stock selection, not sector or regional allocation, has driven the long-term track record of the strategy. At the company level, we seek a balance between financial productivity (i.e., returns on capital), valuation, and sustainability of income generation. At the same time, we look for market inefficiencies—Mispriced Assets, Improvers, and Compounders – that are empirically-validated sources of alpha.
Polen Capital
As we closed the first half of 2023, the portfolio continued to show overweight exposures to European based companies. Significant exposures to information technology, business and information services, health care and consumer facing companies cover the bulk of our positioning.
China provides an interesting counter to many trends seen elsewhere. Markets eagerly anticipated strong post-COVID reopening growth last fall, but China’s reopening has been a dud. Note how COVID responses in China ran counter to supporting consumer spending—a sharp departure from the combined monetary and fiscal largesse many Western countries used during the pandemic. Of course, Western policies played significant roles in stoking inflation. Now, more than six months after reopening, China’s inflation statistics are grinding towards outright deflation each month. A battery of other issues matter in China, so we can’t pin poor growth and inflation solely on COVID responses. However, juxtaposing China’s weak inflation with the West’s persistent inflation does prompt questions about the government’s stance towards consumer spending as an economic driver.
We continue to have limited exposure to China as we felt the reopening from COVID failed to materialize in a significant way. We cover a handful of Chinese businesses and are open to considering investments there, but at present concerns around indebtedness and economic stagnation have us on the sidelines.
Key Performance Drivers
The fund benefited the most relative to its benchmarks in the first half from positioning in consumer discretionary, consumer staples, health care, and information technology sectors. Within the consumer discretionary sector, shares of Spanish company Amadeus—owned by Polen Capital—contributed to portfolio returns throughout 2023 as the continued pandemic recovery in air travel brings more passengers back to the airline industry. Amadeus emerged from the COVID crisis as a leader in the three markets it serves. In its core global distribution systems (GDS), Amadeus enables travel bookings to pair multiple airline carriers together into single tickets for a given passenger. In airline IT and now hospitality IT, Amadeus provides mission critical software to airlines and hotels which makes these businesses run more efficiently. Passengers boarded and air bookings ended 2022 approximately 15% below 2019 levels and continue to steadily recover. While many companies cut to the bone to weather the pandemic, Amadeus prioritized long term growth drivers like a New Distribution Capability for the GDS platform, and upgrades to its hospitality solutions for hoteliers. These moves strengthened legacy air travel business lines while expanding the reach of its hotel software solutions. Competitively, Polen believe Amadeus emerged from the pandemic far stronger than peers. If pandemic travel patterns continue reversing, they see Amadeus growing at elevated rates through 2025. Given these business drivers and strong growth prospects Polen feel shares are attractive at 22x 2024 earnings per share.
Within consumer staples, Coca-Cola Europacific Partners shares performed well in the first half of the year. This position is held by Lazard Asset Management. The company’s management team had upgraded medium term targets at their capital markets day late 2022, which were followed by good FY23 results update in February. In Lazard’s view, the strong performance illustrates the inherent pricing power in the category and continues to validate the strategic shift within the Coca-Cola system away from volume-led growth. Reassuringly, the management team continues to execute well in their markets and are gaining market share.
The shares of Coca-Cola Europacific Partners remain attractively valued considering the good defensive growth profile of the business in their established markets and opportunity to significantly grow the business in Indonesia, which was acquired along with Amatil back in 2021. Lazard believes that the focus on value in the Coca-Cola system should continue to support margins and further improvement in financial productivity.
| 12 | Litman Gregory Funds Trust | |||||
Table of Contents
ICON, an Ireland-based contract research organization which helps pharmaceutical and biotech companies design and complete trials for new products, was a top contributor during the first half of 2023. Both Lazard Asset Management and Polen Capital own shares in the health care name, making it the fund’s largest position. Polen Capital noted that ICON has consistently taken market share, but the industry remains highly fragmented, providing a good opportunity for it to win even more share as vendor consolidation remains an ongoing trend. Recent results have reinforced their conviction in the business; it continues to produce industry beating revenue growth and margin expansion.
Lazard Asset Management says shares in ICON outperformed on the back of solid first quarter results. The results showed a combination of resilient order intake, and healthy growth in revenues and margins. Concerns around weak biotech funding conditions have been a significant headwind to sentiment around the shares. The +6% growth in gross booking during the quarter and reports of continued healthy levels of RFP activity helped to ease concerns of an imminent deterioration in the market.
The fund’s positioning within financials, industrials, and materials were among the main detractors in the first half of the year. Within financials, Sampo Ojy, which is owned by Lazard Asset Management, underperformed in the first half of 2023. This was perhaps partly explained by a “high water mark” for the company, which had a very strong run in 2022. The defensive growth characteristics of the company were less in favor, as investors grew more confident in the economic outlook towards the end of 2022. The lack of gearing to higher interest rates made it a less attractive financials holding at a time when European banks were experiencing strong net interest margin (NIM) expansion.
The relative attraction of Sampo became further challenged when the company reported weak results in February. The core P&C insurance business delivered results ahead of expectations, but the recently acquired UK business and the Life insurance segments, soon to be demerged, both fell short of expectations. Investors were also disappointed by lower levels of cash returns than expected. Management have since provided clarity on the demerger of Mandatum (life insurance), which should free up capital in the group and support future cash returns to shareholders.
Teleperformance, the world’s leading outsourced customer service provider, was among the main detractors to performance during the first half of 2023. The position is owned by Polen Capital. The company’s stock price has been under pressure the past few months—a weaker IT services backdrop combined with concerns about generative AI disrupting Teleperformance’s business model have negatively impacted short-term returns. Amidst an AI hype cycle markets reflexively assume generative AI will bring about the end of many human capital-intensive businesses. Teleperformance management believes generative AI is another evolutionary development causing changes for the industry as have other technologies in the past. Management projects certain workflows will be negatively impacted by AI, but the business should continue to grow revenue at a high single digit rate over the long-term net of AI headwinds. Further, Teleperformance has long been using AI enhanced workflows to better serve call center customers. Generative AI may well offer useful efficiency gains to the business moving forward. Despite near-term weakness, Polen continues to have conviction in Teleperformance, and views the concerns around generative AI to be overblown. The stock’s current NTM P/E of ~10x is compellingly undervalued.
Glencore, owned by Harris Associates, detracted from fund returns during the first half. According to Harris Associates, Glencore’s full-year 2022 results were strong in an absolute sense with an 84% increase in earnings year-over-year, though they fell short of expectations. This shortfall was driven entirely by the industrial business as marketing significantly exceeded Harris’ expectations. Adjusted earnings of $6.38 billion were nearly double the high end of Glencore’s long-term guidance for the marketing segment due to exceptional profitability from the energy segment. The industrial division fell short of their expectations due to a mix of production issues in coal and at two copper assets, Katanga and Mt. Isa, as well as cost inflation related to labor, diesel and explosives. Glencore also announced an incremental $7.1 billion of distributions to shareholders. While a very high number and implied yield, this was actually somewhat lower than had been expected under Glencore’s capital allocation policy due to weaker free cash generation during 2022 driven by working capital constraints.
First-quarter results were released in April, which is typically a seasonally weak time for production. Copper and zinc production suffered from adverse weather conditions at Antamina and production fell in zinc following the disposal of several smaller assets. Coal production fell due to the community blockade in Cerrejon as well as some temporary geological challenges in South Africa. During a call with management, CEO Gary Nagle revealed Glencore sees significant latent potential to double its copper business organically over the next decade via brownfield expansions and an attractive greenfield project in Argentina. While the company is waiting until the market demands the tons, Glencore is acquiring land, conducting sample testing, and doing permitting work to help ensure these projects can be completed within a timely manner once sanctioned. Further, Nagle remains committed to the rundown of Glencore’s coal assets over time in accordance with the company’s strategy, but Nagle reiterated the belief that it should be very strong profit and cash flow contributors for the company due to an attractive cost position and favorable supply and demand dynamics. Harris Associates continues to believe that Glencore remains an attractive holding and that management is committed to delivering value for shareholders.
| Fund Summary | 13 | |||||
Table of Contents
Portfolio Allocations as of June 30, 3023
By Sector
Finance | 21.2% | |||
Consumer Discretionary | 16.7% | |||
Information Technology | 14.2% | |||
Communication Services | 5.0% | |||
Health Care & Pharmaceuticals | 14.5% | |||
Industrials | 13.6% | |||
Consumer Staples | 6.8% | |||
Real Estate | 0.0% | |||
Utilities | 1.9% | |||
Energy | 0.0% | |||
Materials | 1.3% | |||
Cash | 4.9% |
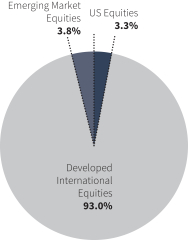
By Region
Europe | 83.9% | |||
North America | 6.2% | |||
Asia ex-Japan | 3.8% | |||
Japan | 2.0% | |||
Latin America | 0.0% | |||
Africa | 0.0% | |||
Australia/New Zealand | 0.0% | |||
Middle East | 4.1% | |||
Other Countries | 0.0% | |||
* Cash is excluded from calculation. |
Summary Statistics
Market Cap Median (bn) | $ | 29.54 | ||
Weighted Average Market Cap | $ | 63.65 | ||
# of Holdings | 45 |
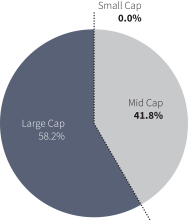
By Region | By Market Cap | |
 |  | |
Small Cap < $2.028 b Mid Cap >$2.028 B, <$42.290 b Large Cap > $42.290 b | ||
| 14 | Litman Gregory Funds Trust | |||||
Table of Contents
iMGP International Fund Value of Hypothetical $10,000
The value of a hypothetical $10,000 investment in the iMGP International Fund from November 30, 1997 to June 30, 2023 compared with the MSCI EAFE Index, Morningstar Foreign Large Blend Category and MSCI ACWI Ex USA Index.
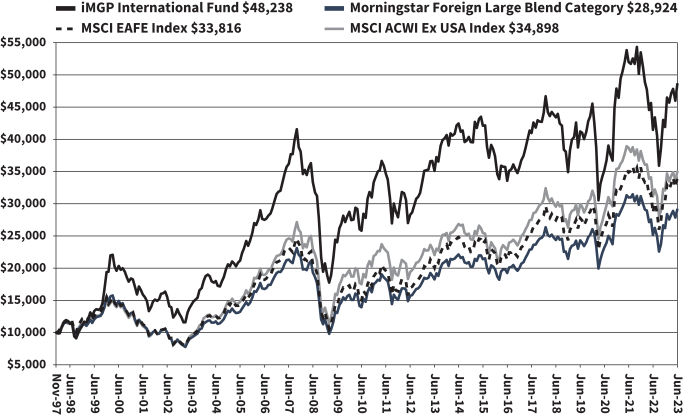
The hypothetical $10,000 investment at fund inception includes changes due to share price and reinvestment of dividends and capital gains. The chart does not imply future performance. Indexes are unmanaged, do not incur fees, expenses or taxes, and cannot be invested in directly.
Performance quoted does not include a deduction for taxes that a shareholder would pay on the redemption of fund shares.
| Fund Summary | 15 | |||||
Table of Contents
iMGP International Fund
SCHEDULE OF INVESTMENTS IN SECURITIES at June 30, 2023 (Unaudited)
| Shares | Value | |||||||
COMMON STOCKS: 95.0% | ||||||||
| Argentina: 1.2% | ||||||||
| 2,352 | MercadoLibre, Inc.* | $ | 2,786,179 | |||||
|
| |||||||
| Australia: 1.3% | ||||||||
| 511,700 | Glencore PLC | 2,904,352 | ||||||
|
| |||||||
| Canada: 2.8% | ||||||||
| 169,686 | CAE, Inc.* | 3,800,710 | ||||||
| 40,730 | Shopify, Inc. - Class A* | 2,631,158 | ||||||
|
| |||||||
| 6,431,868 | ||||||||
|
| |||||||
| China: 1.6% | ||||||||
| 50,794 | Prosus NV* | 3,719,216 | ||||||
|
| |||||||
| Denmark: 3.3% | ||||||||
| 28,235 | Carlsberg AS - Class B | 4,517,479 | ||||||
| 114,685 | Vestas Wind Systems AS* | 3,049,035 | ||||||
|
| |||||||
| 7,566,514 | ||||||||
|
| |||||||
| Finland: 2.6% | ||||||||
| 132,455 | Sampo Oyj - Class A | 5,943,995 | ||||||
|
| |||||||
| France: 8.4% | ||||||||
| 87,600 | BNP Paribas SA | 5,536,931 | ||||||
| 7,140 | Kering SA | 3,956,755 | ||||||
| 2,240 | LVMH Moet Hennessy Louis Vuitton SE | 2,115,204 | ||||||
| 15,300 | Teleperformance | 2,570,026 | ||||||
| 142,110 | Worldline SA*(a) | 5,204,304 | ||||||
|
| |||||||
| 19,383,220 | ||||||||
|
| |||||||
| Germany: 22.5% | ||||||||
| 14,375 | Adidas AG | 2,789,762 | ||||||
| 15,035 | Allianz SE | 3,499,358 | ||||||
| 84,800 | Bayer AG | 4,691,041 | ||||||
| 69,749 | Continental AG | 5,259,714 | ||||||
| 54,292 | CTS Eventim AG & Co. KGaA | 3,430,741 | ||||||
| 98,318 | Daimler Truck Holding AG | 3,542,004 | ||||||
| 192,065 | Fresenius SE & Co. KGaA | 5,319,531 | ||||||
| 132,689 | Hensoldt AG | 4,357,683 | ||||||
| 58,695 | Mercedes-Benz Group AG | 4,726,677 | ||||||
| 61,640 | SAP SE | 8,421,576 | ||||||
| 102,830 | Siemens Healthineers AG(a) | 5,823,356 | ||||||
|
| |||||||
| 51,861,443 | ||||||||
|
| |||||||
| Ireland: 9.4% | ||||||||
| 51,266 | ICON PLC - ADR* | 12,826,753 | ||||||
| 80,185 | Ryanair Holdings PLC - ADR* | 8,868,461 | ||||||
|
| |||||||
| 21,695,214 | ||||||||
|
| |||||||
| Israel: 3.9% | ||||||||
| 1,344,819 | Israel Discount Bank Ltd. - Class A | 6,673,251 | ||||||
| 440,085 | Tel Aviv Stock Exchange Ltd.* | 2,267,703 | ||||||
|
| |||||||
| 8,940,954 | ||||||||
|
| |||||||
| Japan: 1.9% | ||||||||
| 234,200 | Renesas Electronics Corp.* | 4,426,203 | ||||||
|
| |||||||
| Netherlands: 5.2% | ||||||||
| 6,720 | ASML Holding NV | 4,867,308 | ||||||
| 32,238 | EXOR NV | 2,882,278 | ||||||
| 195,760 | Universal Music Group NV | 4,351,902 | ||||||
|
| |||||||
| 12,101,488 | ||||||||
|
| |||||||
| Portugal: 1.9% | ||||||||
| 894,096 | EDP - Energias de Portugal SA | 4,379,061 | ||||||
|
| |||||||
| Shares | Value | |||||||
| South Korea: 1.6% | ||||||||
| 26,185 | NAVER Corp. | $ | 3,666,237 | |||||
|
| |||||||
| Spain: 2.7% | ||||||||
| 80,955 | Amadeus IT Group SA* | 6,175,783 | ||||||
|
| |||||||
| Sweden: 3.0% | ||||||||
| 55,546 | Evolution AB(a) | 7,040,275 | ||||||
|
| |||||||
| Switzerland: 1.5% | ||||||||
| 56,800 | Julius Baer Group Ltd. | 3,582,605 | ||||||
|
| |||||||
| Taiwan: 2.0% | ||||||||
| 249,000 | Taiwan Semiconductor Manufacturing Co. Ltd. | 4,640,197 | ||||||
|
| |||||||
| United Kingdom: 12.9% | ||||||||
| 359,743 | CNH Industrial NV | 5,202,694 | ||||||
| 104,661 | Coca-Cola Europacific Partners PLC | 6,742,386 | ||||||
| 10,460,750 | Lloyds Banking Group PLC | 5,802,565 | ||||||
| 655,980 | Sage Group PLC | 7,710,456 | ||||||
| 83,885 | Unilever PLC | 4,376,559 | ||||||
|
| |||||||
| 29,834,660 | ||||||||
|
| |||||||
| United States: 5.3% | ||||||||
| 21,696 | Aon PLC - Class A | 7,489,459 | ||||||
| 53,814 | Medtronic PLC | 4,741,015 | ||||||
|
| |||||||
| 12,230,474 | ||||||||
|
| |||||||
| | TOTAL COMMON STOCKS | 219,309,938 | ||||||
|
| |||||||
| Principal Amount | ||||||||
SHORT-TERM INVESTMENTS: 4.0% | ||||||||
| Repurchase Agreements: 4.0% | ||||||||
| $9,170,774 | Fixed Income Clearing Corp. 1.520%, 6/30/2023, due 07/03/2023 [collateral: par value $112,500, U.S. Treasury Note, 3.875%, due 12/31/2029; par value $3,755,800, U.S. Treasury Inflation Indexed Bonds, 0.125%, due 01/15/2030; par value $749,300, U.S. Treasury Note, 4.000%, due 02/28/2030; par value $4,635,000, U.S.Treasury Note, 3.500%, due 04/30/2030; total collateral value $9,356,077] (proceeds $9,171,936) | 9,170,774 | ||||||
|
| |||||||
| | TOTAL SHORT-TERM INVESTMENTS | 9,170,774 | ||||||
|
| |||||||
| | TOTAL INVESTMENTS | 228,480,712 | ||||||
|
| |||||||
| Other Assets in Excess of Liabilities: 1.0% | 2,295,512 | |||||||
|
| |||||||
NET ASSETS: 100.0% | $ | 230,776,224 | ||||||
|
| |||||||
Percentages are stated as a percent of net assets.
| ADR | American Depositary Receipt |
| * | Non-Income Producing Security. |
| (a) | Security was purchased pursuant to Rule 144A under the Securities Act of 1933 and may be sold in transactions exempt from registration only to qualified institutional buyers or in a public offering registered under Securities Act of 1933. |
The accompanying notes are an integral part of these financial statements.
| 16 | Litman Gregory Funds Trust | |||||
Table of Contents
iMGP Oldfield International Value Fund 2023 Semi-Annual Report
The iMGP Oldfield International Value Fund returned 10.75% in the first half of 2023, finishing the period ahead of the 9.28% return for the MSCI EAFE Value Index and the 10.30% return for the Morningstar Foreign Large Value category. The broader MSCI EAFE Index gained 11.67% over the last six months.
Since inception, the Fund has gained 4.88% annualized, trailing the annualized returns of 7.14% and 6.58% for MSCI EAFE Value Index and Morningstar Foreign Large Value category, respectively. The Fund has outpaced the 4.21% annualized return for the MSCI EAFE Index since inception.
Performance as of June 30, 2023 | ||||||||||||
| Year to Date Return | One- Year | Since Inception 11/30/2020 | ||||||||||
iMGP Oldfield Internatl Value Fund | 10.75% | 13.19% | 4.88% | |||||||||
MSCI EAFE Value Index | 9.28% | 17.40% | 7.14% | |||||||||
MSCI EAFE Index | 11.67% | 18.77% | 4.21% | |||||||||
Morningstar Foreign Large Value Category | 10.30% | 15.59% | 6.58% | |||||||||
Gross Expense Ratio: 2.11% Net Expense Ratio 0.94%
Performance quoted represents past performance and does not guarantee future results. The investment return and principal value of an investment will fluctuate so that an investor’s shares, when redeemed, may be worth more or less than their original cost. Current performance of the funds may be lower or higher than the performance quoted. Short term performance is not a good indication of the fund’s future performance and should not be the sole basis for investing in the fund. To obtain standardized performance of the funds, and performance as of the most recently completed calendar month, please visit www.imgptfunds.com. There are contractual fee waivers in effect through 4/30/2024.
MSCI index returns source: MSCI. Neither MSCI nor any other party involved in or related to compiling, computing, or creating the MSCI data makes any express or implied warranties or representations with respect to such data (or the results to be obtained by the use thereof), and all such parties hereby expressly disclaim all warranties of originality, accuracy, completeness, merchantability, or fitness for a particular purpose with respect to any of such data. Without limiting any of the foregoing, in no event shall MSCI, any of its affiliates, or any third party involved in or related to compiling, computing, or creating the data have any liability for any direct, indirect, special, punitive, consequential, or any other damages (including lost profits) even if notified of the possibility of such damages. No further distribution or dissemination of the MSCI data is permitted without MSCI’s express written consent. Source note:
|
| |||||||||||
Portfolio Commentary
While the Artificial Intelligence-inspired excitement in May in the U.S. was driven by just the seven largest stocks, the U.S. market breadth improved in June and the U.S. led global markets higher. A ‘Goldilocks’ view on inflation in full retreat and interest rates topping out at current levels is now pervasive despite the commentary from the U.S. Federal Reserve’s June meeting that they were likely to raise rates further in the months ahead. The Fed says they are worried about the tightness of the labor market and resilience of consumer spending.
The U.S. core consumer price index (CPI), that excludes food and energy prices, was 5.3% year-on-year in May, down from its peak in September 2022 at 6.6%. The U.S. unemployment rate of 3.7% is in-line with levels seen at the end of 2019 and lower only in the early 1950’s and briefly in 1969.
That said, the U.S. producer price index (PPI) is surely the leading indicator that is giving U.S. equity investors the confidence to ignore the comments from the Fed. The annual PPI rate is now just 1.1%, below the 1.7% average between 2010 and the end of 2019, and down from its 11.7% peak in March 2022.
The U.S. economy is finely poised. While the equity market is focused on PPI, the U.S. bond market is less certain with the 10-year bond yield back up to 3.8% (from 3.3% in April), against its October 2022 peak of 4.2%. The spread between the three-month treasury note rate and the 10-year bond rate stands at negative 148 basis points, almost its most negative reading ever. The indicator is infamous because when it turns negative it has a 100% record of predicting a U.S. recession within the next eighteen months. The indicator turned negative in late October 2022.
The U.S. equity market is finely poised too. The U.S. market trades at 20.5x expected earnings and 22x historic earnings. If the equity market is right in its outlook on the economy, then the U.S. market looks fully valued. If the bond market is right, then the equity market is riding for a fall. Either way, the outlook for international markets, trading on just 13x earnings looks to have a larger margin of safety built into the valuation than the U.S. market.
Key Performance Drivers
The fund benefited the most from stock selection within the industrials sector. Both easyJet and Embraer have rebounded significantly so far in 2023 following a difficult 2022. EasyJet’s share price jumped in January and finished the first half with a gain of 57% (in U.S. dollar
| Fund Summary | 17 | |||||
Table of Contents
terms). EasyJet reported excellent results for their first fiscal quarter ending December—the firm generated revenue of £1.5bn for the period, +83% on a COVID-affected period in 1QFY22 and +19% above market expectations. While profit margins were lower than the market had expected, the guidance for the year was strong with the new packaged holiday business ramping up nicely. Traditionally, January is the busiest month of the year for booking summer holidays, and this year was no exception, with easyJet noting they were selling out five full aircraft every minute during the busiest days of the month. Despite widespread gloom about the outlook for the UK and European economies, initial company guidance for the summer suggests it will be 9% better than 2022.
Within the financials sector, there was dispersion in the returns of names held in the fund. Japanese financial, Mitsubishi UFJ Financial Group gained over 11% (in U.S. dollar terms) and contributed to returns over the last six months. On the other side, Swedish bank, Svenska Handelsbanken fell over 9% in the first half of 2023 (in U.S. dollar terms).
Shares of Mitsubishi UFJ, the largest bank in Japan, enjoyed a strong recovery from the setback in March when bank shares around the world suffered in the wake of the failures of Silicon Valley Bank and Signature Bank. After years of declining net interest income, increasing lending spreads are driving an expectation of a robust recovery in its net interest income particularly amongst domestic and international corporates. The valuation is now at 0.75x book value, and there is an expectation of returns on equity rising to 7.5% from 6.5% last year. The valuation is now approaching our view of fair value.
The largest decliner during the first half of 2023 was LG Household & Health Care. Relatively good performance in the company’s South Korea-focused businesses (which comprised more than half of LG H&H’s 2022 operating profit) continues to be overshadowed by weak performance in the China-focused skin care business. The company is not alone in delivering weak performance in skin care. Key peers, such as Amorepacific and Estee Lauder, are equally challenged by the disappointing recovery of Chinese tourism, challenges in the Korean duty-free channel and changing shopping habits. We continue to believe that the headwinds facing LG H&H are more temporary rather than structural—and therefore remain optimistic that LG H&H’s performance will improve. The shares have fallen to their lowest level since 2014 and now discount little in the way of recovery.
Portfolio Allocations as of June 30, 2023
By Sector
Finance | 18.4% | |||
Consumer Discretionary | 3.7% | |||
Information Technology | 3.8% | |||
Communication Services | 4.6% | |||
Health Care & Pharmaceuticals | 13.8% | |||
Industrials | 26.2% | |||
Consumer Staples | 13.8% | |||
Real Estate | 0.0% | |||
Utilities | 4.5% | |||
Energy | 4.5% | |||
Materials | 0.0% | |||
Cash | 6.8% |
By Region
Europe | 64.2% | |||
North America | 0.0% | |||
Asia ex-Japan | 18.6% | |||
Japan | 12.2% | |||
Latin America | 5.1% | |||
Africa | 0.0% | |||
Australia/New Zealand | 0.0% | |||
Middle East | 0.0% | |||
Other Countries | 0.0% | |||
* Cash is excluded from calculation. |
Summary Statistics
Market Cap Median (bn) | $ | 3.02 | ||
Weighted Average Market Cap | $ | 0.56 | ||
# of Holdings | 22 |
| 18 | Litman Gregory Funds Trust | |||||
Table of Contents
By Region | By Market Cap | |
 |  | |
iMGP Oldfield International Value Fund Value of Hypothetical $10,000
The value of a hypothetical $10,000 investment in the iMGP Oldfield International Value Fund from November 30, 2020 to June 30, 2023 compared with the MSCI EAFE Value Index, Morningstar Foreign Large Value Category and MSCI EAFE Index.
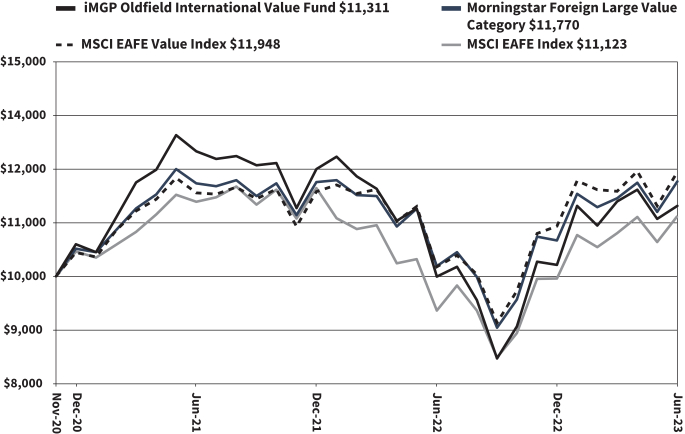
The hypothetical $10,000 investment at fund inception includes changes due to share price and reinvestment of dividends and capital gains. The chart does not imply future performance. Indexes are unmanaged, do not incur fees, expenses or taxes, and cannot be invested in directly.
Performance quoted does not include a deduction for taxes that a shareholder would pay on the redemption of fund shares.
| Fund Summary | 19 | |||||
Table of Contents
iMGP Oldfield International Value Fund
SCHEDULE OF INVESTMENTS IN SECURITIES at June 30, 2023 (Unaudited)
| Shares | Value | |||||||
COMMON STOCKS: 88.7% | ||||||||
| Brazil: 4.8% | ||||||||
| 114,700 | Embraer SA - ADR* | $ | 1,773,262 | |||||
|
| |||||||
| China: 7.9% | ||||||||
| 131,900 | Alibaba Group Holding Ltd.* | 1,371,699 | ||||||
| 258,500 | CK Hutchison Holdings Ltd. | 1,582,177 | ||||||
|
| |||||||
| 2,953,876 | ||||||||
|
| |||||||
| France: 4.6% | ||||||||
| 16,172 | Sanofi | 1,734,719 | ||||||
|
| |||||||
| Germany: 19.6% | ||||||||
| 34,500 | Bayer AG | 1,908,501 | ||||||
| 130,583 | E.ON SE | 1,665,446 | ||||||
| 53,859 | Fresenius SE & Co. KGaA | 1,491,707 | ||||||
| 13,440 | Siemens AG | 2,238,399 | ||||||
|
| |||||||
| 7,304,053 | ||||||||
|
| |||||||
| Italy: 4.5% | ||||||||
| 115,783 | Eni SpA | 1,670,525 | ||||||
|
| |||||||
| Japan: 11.3% | ||||||||
| 17,400 | East Japan Railway Co. | 963,624 | ||||||
| 31,000 | Mitsubishi Heavy Industries Ltd. | 1,448,348 | ||||||
| 246,900 | Mitsubishi UFJ Financial Group, Inc. | 1,819,999 | ||||||
|
| |||||||
| 4,231,971 | ||||||||
|
| |||||||
| Netherlands: 4.9% | ||||||||
| 20,531 | EXOR NV | 1,835,599 | ||||||
|
| |||||||
| South Korea: 9.4% | ||||||||
| 16,897 | KT&G Corp. | 1,063,749 | ||||||
| 2,910 | LG H&H Co. Ltd. | 1,019,273 | ||||||
| 25,869 | Samsung Electronics Co. Ltd. | 1,425,807 | ||||||
|
| |||||||
| 3,508,829 | ||||||||
|
| |||||||
| Sweden: 3.2% | ||||||||
| 141,745 | Svenska Handelsbanken AB - Class A | 1,189,171 | ||||||
|
| |||||||
| United Kingdom: 18.5% | ||||||||
| 1,108,353 | BT Group PLC | 1,725,442 | ||||||
| 286,443 | easyJet PLC* | 1,764,481 | ||||||
| 3,651,205 | Lloyds Banking Group PLC | 2,025,319 | ||||||
| 443,579 | Tesco PLC | 1,402,552 | ||||||
|
| |||||||
| 6,917,794 | ||||||||
|
| |||||||
| | TOTAL COMMON STOCKS | 33,119,799 | ||||||
|
| |||||||
PREFERRED STOCK: 4.5% | ||||||||
| Germany: 4.5% | ||||||||
| 21,056 | Henkel AG & Co. KGaA (Preference Shares) | 1,684,149 | ||||||
|
| |||||||
| | TOTAL PREFERRED STOCK | 1,684,149 | ||||||
|
| |||||||
| | TOTAL INVESTMENTS | 34,803,948 | ||||||
|
| |||||||
| Other Assets in Excess of Liabilities: 6.8% | 2,549,594 | |||||||
|
| |||||||
NET ASSETS: 100.0% | $ | 37,353,542 | ||||||
|
| |||||||
Percentages are stated as a percent of net assets.
| ADR | American Depositary Receipt |
| * | Non-Income Producing Security. |
The accompanying notes are an integral part of these financial statements.
| 20 | Litman Gregory Funds Trust | |||||
Table of Contents
iMGP SBH Focused Small Value Fund 2023 Semi-Annual Report
The iMGP SBH Focused Small Value Fund gained 10.80% in the first half of 2023, finishing the period well ahead of the 2.50% gain for the Russell 2000 Value Index benchmark, and the 5.47% gain for the Morningstar Small Value category. Since the fund’s inception in July 2020, the fund has gained 13.83% compared to the 15.11% gain for the benchmark.
Performance as of June 30, 2023 | ||||||||||||
| Year to Date Return | One- Year | Since Inception 7/31/2020 | ||||||||||
iMGP SBH Focused Small Value Fund | 10.80% | 19.63% | 13.83% | |||||||||
Russell 2000 Value | 2.50% | 6.01% | 15.11% | |||||||||
MSCI USA Small Value Index | 2.99% | 8.95% | 16.34% | |||||||||
Russell 2000 Index | 8.09% | 12.31% | 10.13% | |||||||||
Morningstar Small Value Category | 5.47% | 11.30% | 18.38% | |||||||||
Gross Expenses : 1.68%, Net Expenses: 1.15%
Performance quoted represents past performance and does not guarantee future results. The investment return and principal value of an investment will fluctuate so that an investor’s shares, when redeemed, may be worth more or less than their original cost. Current performance of the funds may be lower or higher than the performance quoted. Short term performance is not a good indication of the fund’s future performance and should not be the sole basis for investing in the fund. To obtain standardized performance of the funds, and performance as of the most recently completed calendar month, please visit www.imgpfunds.com. Returns less than one year are not annualized. The Advisor has contractually agreed to limit the expenses of the fund through April 30, 2024. Without this limit the fund’s net expenses would be higher the return would be lower. |
| |||||||||||
Portfolio Commentary from SBH
The second quarter was a bit less volatile than the first quarter as we moved further past the banking failures and investors shifted their focus towards the Federal Reserve’s (Fed) interest-rate decisions related to driving down inflation. Excitement around Artificial Intelligence (AI) and the potential applications and benefits of this technology over the coming years and decades emerged as a theme. This was the primary reason that Information Technology was the best-performing sector during the quarter followed by Industrials. We have maintained an underweight position in regional banks and the Financials sector in the portfolio and currently do not plan to increase those exposures. The portfolio is underweight the Energy sector post the reconstitution of the benchmark in late June. Energy now represents close to 9% of the index. This is an area we are keenly focused on in terms of unearthing solid capital allocators that could benefit the portfolio.
As we stated last quarter and based on historical precedent, we still believe the ingredients are in place for a recession to occur within the next several quarters; however, we believe that if one does occur, it might be quite shallow in terms of economic damage. We also believe the portfolio is in a position of strength due to the focus we have always had on return on invested capital (ROIC) relative to the cost of capital. We have always held the portfolio’s companies to a capital allocation standard where management is focused on ROIC well above recent historical weighted-average cost of capital (WACC) levels once assets are managed for optimal returns.
Key Performance Drivers
The sectors that contributed most to the portfolio’s performance relative to its benchmark in the first six months were Industrials (driven by selection and allocation), Consumer Discretionary (driven by selection), Consumer Staples (driven by selection), and Health Care (driven by selection). Within Industrials, CIRCOR International (CIR) was the top performer in the year-to-date period. The company, under a new leadership team, has taken an aggressive approach to driving margin improvement by capitalizing on its product portfolio pricing structure which was aided by deploying an 80/20 strategy across the organization. The board announced a process in which it was undertaking strategic alternatives to extract maximum value for shareholders. During the second quarter, the board received two offers to buy the company for a significant premium.
Within Consumer Discretionary, Modine Manufacturing (MOD) was the top performer. MOD has seen significant success in deploying an 80/20 culture which has allowed for a less complex, higher margin, and higher growth business, which we believe has significant potential in the next several years. We always seek to identify those stocks that have the leadership and culture in place to drive an inflection point in ROIC and, in our experience, those companies adopting an 80/20 focus throughout the organization can create a pathway for value creation.
In the Health Care sector, ICU Medical was a top performer. The company has positioned the business to regain market share in its core markets. Improved hospital surgery volume and lower inflation should allow the company to regain upward momentum on ROICs.
The three sectors that detracted most from the portfolio’s performance relative to its benchmark in the first half of the year were Financials (driven by selection), Energy (driven by selection), Materials (driven by selection) and Information Technology (driven by selection).
| Fund Summary | 21 | |||||
Table of Contents
Information Technology holding, Lumentum Holdings (LITE) was the top detractor within the sector. We underestimated the inventory overhang the business would be facing from its major telecom customers and though LITE has a strong balance sheet and solid prospects going forward, we now realize it will take a couple of quarters for the business to get back on track.
Glacier Bancorp (GBCI) was the top detractor within Financials. After reporting its first quarter earnings, GBCI suffered as its net interest margin (NIM) contracted more than expected. GBCI has one of the most resilient deposit models; however, as a safety measure, it took on higher cost borrowing due to the bank failures and uncertainty on deposit pricing dynamics. Looking ahead, GBCI expects its NIM to bottom sometime in the third quarter as it pays down those higher cost borrowing and loan yields reprice at much higher levels. The area we are watching closely for all the portfolio’s bank exposure is credit issues that might become more prevalent as the year progresses. GBCI has a reputation as one of the most disciplined credit underwriters based on past loss rates. Therefore, in a period of broader credit stress, we believe GBCI will be a positive standout.
Within Health Care, Orthofix was sold during the period. The thesis for owning the stock was focused on the company’s self-help initiatives around sales force optimization and operating leverage developing from a broader distribution which did not fully play out. The board decided the best course of action was to merge with Sea Spine to gain greater scale. Given the merger and risk of integration, we exited the position.
Consumer Discretionary holding, American Eagle Outfitters was another detractor in the period. Originally, we owned the stock because of the company’s sizeable cost reduction strategy on top of it being in a much stronger inventory position than the industry, which we believed would help drive margin improvement. Ultimately, execution and the headwinds from a weaker consumer and additional pressure from the potential student loan repayment plans starting back up in the latter part of 2023, led us to sell the stock.
Market Outlook
What an exciting time to be an active investor! As we continue into the second half of 2023, there are a lot of moving parts including a monetary policy that is trying to slow the broad economy and quell wage inflation and fiscal stimuli (Highway Bill, Inflation Reduction Act, CHIPS and Science Act, etc.) that are continuing to fuel growth in focused areas of our economy. In addition, we have the continued shift toward reshoring, renewed trade restrictions between China and the U.S., potential peace attempts starting with Russia and Ukraine, and an AI-driven productivity boon for machines.
Importantly, rising real interest rates are having an impact on the cost of capital—increasing it—for all companies. In turn, this demands a shift in thinking by company managements regarding how much debt to maintain longer term. In our opinion, we see a challenging market backdrop going forward primarily due to the significant increase in the cost of capital that is not likely to reverse anytime soon; however, the impact of this higher cost will likely be felt over months and years rather than in just a single quarter. Our investment approach has always used a high cost of capital hurdle (10%+), coupled with our work toward keeping our portfolio populated with ROIC change agents. ROIC change agents are management and incentive driven focus on how to optimize capital allocation via asset purchase and sales, facility rationalization, and continuous programs with improving returns as the goal. We remain comfortable with our philosophy and process over cycles regardless of the economic backdrop. We do see volatility increasing as real rates continue to rise, particularly for loss makers and zombie companies. In recent years, due to easy money policies, we have seen many companies misallocating capital (i.e., investing in too many low return businesses), while simultaneously not allowing for creative destruction. Hopefully, we can return to an appropriate balance of appropriate capitalism for the benefit of companies and citizens alike. While we cannot know exactly when a soft landing or hard landing will occur, we think we are nearing that juncture over the next two-three quarters. Our focus is on management teams that cannot just weather a broad variety of storms but can become stronger organizations, financially and culturally, via continuous improvement programs. We are excited to invest in a difficult investment backdrop that even Stanley Druckenmiller calls the most difficult of his career. Thank you for your continued interest and support.
Portfolio Allocations as of June 30, 2023
By Sector
Financials | 11.1% | |||
Consumer Discretionary | 11.6% | |||
Information Technology | 5.1% | |||
Communication Services | 0.0% | |||
Health Care | 3.9% | |||
Industrials | 37.4% | |||
Consumer Staples | 3.4% | |||
Real Estate | 7.0% | |||
Utilities | 0.0% | |||
Energy | 5.1% | |||
Materials | 11.0% | |||
Cash | 4.4% |
Summary Statistics
Market Cap Median (bn) | 3.38% | |||
Weighted Average Market Cap (bn) | 3.62% | |||
# of Holdings | 42.00% |
By Market Cap
Small Cap | 0.90% | |||
Mid Cap | 0.10% | |||
Large Cap | 0.00% |
| 22 | Litman Gregory Funds Trust | |||||
Table of Contents
iMGP SBH Focused Small Value Fund Value of Hypothetical $10,000
The value of a hypothetical $10,000 investment in the iMGP SBH Focused Small Value Fund from July 31, 2020 to June 30, 2023 compared with the Russell 2000 Value Index, Morningstar Small Value Category and Russell 2000 Index.
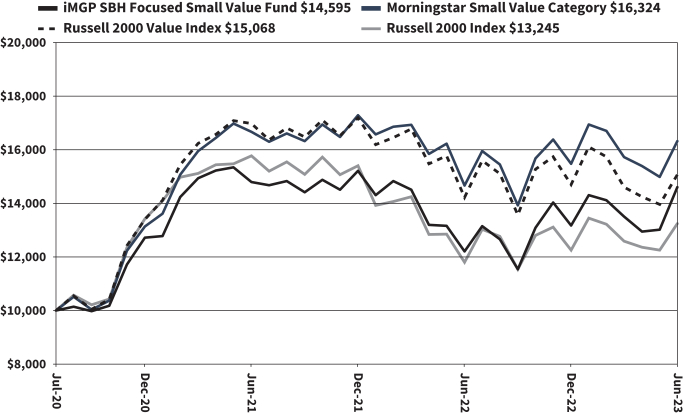
The hypothetical $10,000 investment at fund inception includes changes due to share price and reinvestment of dividends and capital gains. The chart does not imply future performance. Indexes are unmanaged, do not incur fees, expenses or taxes, and cannot be invested in directly.
Performance quoted does not include a deduction for taxes that a shareholder would pay on the redemption of fund shares.
| Fund Summary | 23 | |||||
Table of Contents
iMGP SBH Focused Small Value Fund
SCHEDULE OF INVESTMENTS IN SECURITIES at June 30, 2023 (Unaudited)
| Shares | Value | |||||||
COMMON STOCKS: 95.6% | ||||||||
| Consumer Discretionary: 11.6% | ||||||||
| 26,623 | Gildan Activewear, Inc. | $ | 858,326 | |||||
| 73,583 | Modine Manufacturing Co.* | 2,429,711 | ||||||
| 11,386 | Ollie’s Bargain Outlet Holdings, Inc.* | 659,591 | ||||||
| 8,765 | Papa John’s International, Inc. | 647,120 | ||||||
| 8,020 | PVH Corp. | 681,459 | ||||||
| 21,235 | Steven Madden Ltd. | 694,172 | ||||||
|
| |||||||
| 5,970,379 | ||||||||
|
| |||||||
| Consumer Staples: 3.4% | ||||||||
| 88,825 | Coty, Inc. - Class A* | 1,091,659 | ||||||
| 52,944 | Hain Celestial Group, Inc.* | 662,330 | ||||||
|
| |||||||
| 1,753,989 | ||||||||
|
| |||||||
| Energy: 5.1% | ||||||||
| 31,794 | Murphy Oil Corp. | 1,217,710 | ||||||
| 20,045 | PDC Energy, Inc. | 1,426,001 | ||||||
|
| |||||||
| 2,643,711 | ||||||||
|
| |||||||
| Financials: 11.1% | ||||||||
| 27,503 | Cadence Bank | 540,159 | ||||||
| 31,982 | Glacier Bancorp, Inc. | 996,879 | ||||||
| 23,403 | Hancock Whitney Corp. | 898,207 | ||||||
| 36,796 | National Bank Holdings Corp. - Class A | 1,068,556 | ||||||
| 48,101 | Seacoast Banking Corp. of Florida | 1,063,032 | ||||||
| 17,596 | SouthState Corp. | 1,157,817 | ||||||
|
| |||||||
| 5,724,650 | ||||||||
|
| |||||||
| Health Care: 3.9% | ||||||||
| 46,797 | AdaptHealth Corp.* | 569,520 | ||||||
| 8,185 | ICU Medical, Inc.* | 1,458,485 | ||||||
|
| |||||||
| 2,028,005 | ||||||||
|
| |||||||
| Industrials: 37.4% | ||||||||
| 26,860 | Apogee Enterprises, Inc. | 1,275,044 | ||||||
| 7,106 | ArcBest Corp. | 702,073 | ||||||
| 30,475 | AZZ, Inc. | 1,324,444 | ||||||
| 48,194 | CIRCOR International, Inc.* | 2,720,551 | ||||||
| 24,762 | Enerpac Tool Group Corp. | 668,574 | ||||||
| 14,931 | EnerSys | 1,620,312 | ||||||
| 25,296 | KBR, Inc. | 1,645,758 | ||||||
| 15,362 | Mercury Systems, Inc.* | 531,372 | ||||||
| 35,772 | Quanex Building Products Corp. | 960,478 | ||||||
| 9,147 | Regal Rexnord Corp. | 1,407,723 | ||||||
| 87,713 | REV Group, Inc. | 1,163,074 | ||||||
| 55,246 | SP Plus Corp.* | 2,160,671 | ||||||
| 19,433 | SPX Technologies, Inc.* | 1,651,222 | ||||||
| 25,520 | Sterling Infrastructure, Inc.* | 1,424,016 | ||||||
|
| |||||||
| 19,255,312 | ||||||||
|
| |||||||
| Information Technology: 5.1% | ||||||||
| 20,789 | Belden, Inc. | 1,988,468 | ||||||
| 11,319 | Lumentum Holdings, Inc.* | 642,127 | ||||||
|
| |||||||
| 2,630,595 | ||||||||
|
| |||||||
| Materials: 11.0% | ||||||||
| 31,537 | Compass Minerals International, Inc. | 1,072,258 | ||||||
| 69,667 | Element Solutions, Inc. | 1,337,606 | ||||||
| 10,570 | Sensient Technologies Corp. | 751,844 | ||||||
| 22,330 | Silgan Holdings, Inc. | 1,047,054 | ||||||
| 38,466 | Summit Materials, Inc. - Class A* | 1,455,938 | ||||||
|
| |||||||
| 5,664,700 | ||||||||
|
| |||||||
| Shares | Value | |||||||
| Real Estate: 7.0% | ||||||||
| 56,192 | Equity Commonwealth - REIT | $ | 1,138,450 | |||||
| 39,614 | STAG Industrial, Inc. - REIT | 1,421,350 | ||||||
| 17,691 | Terreno Realty Corp. - REIT | 1,063,229 | ||||||
|
| |||||||
| 3,623,029 | ||||||||
|
| |||||||
| | TOTAL COMMON STOCKS | 49,294,370 | ||||||
|
| |||||||
| | TOTAL INVESTMENTS | 49,294,370 | ||||||
|
| |||||||
| Other Assets in Excess of Liabilities: 4.4% | 2,254,374 | |||||||
|
| |||||||
NET ASSETS: 100.0% | $ | 51,548,744 | ||||||
|
| |||||||
Percentages are stated as a percent of net assets.
| REIT | Real Estate Investment Trust |
| * | Non-Income Producing Security. |
The accompanying notes are an integral part of these financial statements.
| 24 | Litman Gregory Funds Trust | |||||
Table of Contents
iMGP Alternative Strategies Fund 2023 Semi-Annual Report
The iMGP Alternative Strategies Fund (Institutional Share Class) was up 2.02% in the first half of the year, compared to the Morningstar Multistrategy category’s 3.07% return, a gain of 2.09% for the Bloomberg Barclays U.S. Aggregate Bond Index, and a 2.25% gain for the ICE BofA 3-Month Treasury Bill Index.
Since its inception on September 30, 2011, the fund’s annualized return is 3.48% with a volatility (standard deviation) of 4.76%, and a beta to the U.S. stock market (Russell 1000 Index) of 0.27. This compares to the 3-Month Treasury Bill Index return of 0.85%, the Morningstar Multistrategy category return of 2.85% and the U.S. Aggregate Bond Index return of 1.53%.
Performance as of June 30, 2023 | ||||||||||||||||||||||||
Year to Date | One- Year | Three- Year | Five- Year | Ten- Year | Since Inception | |||||||||||||||||||
iMGP Alternative Strategies Fund Instl | 2.02% | 0.93% | 1.46% | 1.66% | 2.54% | 3.48% | ||||||||||||||||||
iMGP Alternative Strategies Fund Inv | 1.88% | 0.74% | 1.21% | 1.41% | 2.29% | 3.24% | ||||||||||||||||||
ICE BofA US 3-Month Treasury Bill | 2.25% | 3.59% | 1.27% | 1.55% | 0.98% | 0.85% | ||||||||||||||||||
Bloomberg Aggregate Bond Index | 2.09% | -0.94% | -3.96% | 0.77% | 1.52% | 1.53% | ||||||||||||||||||
Morningstar Multistrategy Category | 3.07% | 4.37% | 4.40% | 2.43% | 2.51% | 2.85% | ||||||||||||||||||
Performance quoted represents past performance and does not guarantee future results. The investment return and principal value of an investment will fluctuate so that an investor’s shares, when redeemed, may be worth more or less that their original cost. Current performance of the fund may be lower or higher than the performance quoted. The Advisor has contractually agreed to waive a portion of the management fee through April 30, 2024. Performance data current to the most recent month end may be obtained by visiting www.imgpfunds.com. Gross Expense Ratio: 1.67% Net Expense Ratio: 1.39%
The Risk/Return Statistics table below presents some of the key performance metrics that we track for the fund.
|
| |||||||||||||||||||||||
| iMGP Alternative Strategies Fund Risk/Return Statistics | ||||||||||||||||
| Data as of June 30, 2023 | MASFX | Bloomberg Barclays Agg | Morningstar Multistrategy Category | Russell 1000 | ||||||||||||
Annualized Return | 3.48 | 1.53 | 2.85 | 14.44 | ||||||||||||
Total Cumulative Return | 49.53 | 19.51 | 39.10 | 387.84 | ||||||||||||
Annualized Std. Deviation | 4.76 | 4.11 | 4.25 | 14.72 | ||||||||||||
Sharpe Ratio (Annualized) | 0.55 | 0.17 | 0.46 | 0.93 | ||||||||||||
Beta (to Russell 1000) | 0.27 | 0.07 | 0.26 | 1.00 | ||||||||||||
Correlation of MASFX to | 1.00 | 0.33 | 0.90 | 0.83 | ||||||||||||
Worst 12-Month Return | -10.04 | -15.68 | -5.71 | -19.13 | ||||||||||||
% Positive 12-Month Periods | 0.76 | 0.64 | 0.73 | 0.86 | ||||||||||||
Upside Capture (vs. Russell 1000) | 25.80 | 8.73 | 24.44 | 100.00 | ||||||||||||
Downside Capture (vs. Russell 1000) | 27.20 | 6.62 | 29.07 | 100.00 | ||||||||||||
Upside Capture (vs. AGG) | 74.86 | 100.00 | 62.83 | 233.20 | ||||||||||||
Downside Capture (vs. AGG) | 22.69 | 100.00 | 20.75 | 3.84 | ||||||||||||
Performance Review
The Alternative Strategies Fund’s roughly 2% increase is certainly better than a loss, but it isn’t cause for celebration. The fund is in the process of recovering from last year’s disappointing performance, but it has not happened as quickly as we would like. Despite this, we think we are still in the early stages of a performance recovery due to the “coiled spring” nature of several of the subadvisor portfolios. (The blended portfolio of DoubleLine and Loomis Sayles has a nearly 10% yield to maturity and duration of under five years.) We have previously detailed how attractive we believe the prospective returns for these managers have the potential to be over the coming quarters, while acknowledging that there are likely to be bumps along the way. We have recently seen an example of a “bump” that has hampered performance somewhat. After starting to recover earlier this year, Agency Mortgage Backed Securities (MBS) have been challenged by the extreme interest rate volatility related to the regional bank crisis in March, the resumption of yields rising across the curve (following the sharp bank-panic-induced plunge) and the subsequent lack of demand/selling pressure from banks. Without demand from the biggest investors in the sector (banks and the Fed), asset managers and foreign buyers are forced to pick up the slack, but only at nominal spreads approaching levels seen in the Great Financial Crisis (GFC) . This naturally impacts other areas of securitized products to varying degrees, and while some sectors have fared better than others, the same headwinds, as well as fear of negative performance in commercial real estate, have helped to delay what we still expect to be attractive performance from the fixed income portfolios. Spreads in many areas of securitized are still very high relative to their historical averages and relative to similarly rated corporate debt. We don’t know when it will happen, but when Fed rate cuts begin to feel more imminent and investors begin to exit the money market funds and short-term Treasuries that have become so popular, these spread sectors with high yields (some with a bit of duration) certainly seem likely to be beneficiaries.
| Fund Summary | 25 | |||||
Table of Contents
Similarly, Water Island’s merger arbitrage portfolio, although it has taken a few lumps due to regulatory challenges this year, offers a very compelling annualized deal spread well north of 20%. As usual, we add the caveat that some deals do extend or even break, but with spreads at the highest levels seen since the GFC, prospective returns appear attractive. Higher rates and the unfriendly regulatory climate have set the stage for what could be a lucrative period for the strategy, especially considering the relative lack of success the Federal Trade Commission (FTC) and Department of Justice (DOJ) have had in their merger challenges (as Water Island mentions in their commentary).
We thus have a substantial portion of the fund’s portfolio where discussion of the attractiveness of their opportunity sets can reasonably include ‘not since the GFC’ references. We are fairly confident that we don’t face a similar risk of systemic financial collapse as we did back in 2008, so we believe this is an additional, strong indicator of the potential for (very) attractive returns going forward.
Our tactical overweight to the DoubleLine Opportunistic Income strategy seemed to largely be working as intended in Q1, but given the phenomena mentioned previously, Q2 performance has not been kind to the move, and DoubleLine is now only the third-best performer for the year. However, our decision was not based on a two-quarter outlook, and since we are still expecting strong absolute and relative performance from that sleeve, we are confident in maintaining the current weightings. Taking a glass-half-empty view of the situation, the two subadvisors who generated the strongest performance in the first half (FPA and Blackstone Credit) had the lowest allocations. With that said, we didn’t tactically reduce them much from their strategic allocations when we overweighted DoubleLine because we know timing changes is difficult and markets can easily confound even the most well-considered moves, especially in the short-term. More optimistically, the fund is up more than 2% with relatively little contribution from what we viewed (and still view) as the segments with the best combination of absolute return potential and catalysts to drive performance. It was also gratifying to see DBi’s portfolio rebound strongly from the Q1 losses that were largely driven by the regional bank failures. This powerful diversifying strategy should make the fund more resilient to different market conditions over time, despite recent challenges.
As shareholders and managers, we are very excited about the fund’s positioning, and look forward to reporting to you in coming quarters, hopefully detailing further (and larger) gains.
Quarterly Portfolio Commentary
Performance of Managers
For the first half of the year, the returns by sub-advisor are as follows: FPA up 10.86%; Blackstone Credit Systematic Group up 4.48%; DoubleLine up 3.07%; Loomis Sayles up 1.80%; Water Island up 0.53%; and DBi down 0.47%. (All returns are net of sub advisory fees.)
Key performance drivers and positioning by strategy
Blackstone Credit Systematic Group (DCI):
The Blackstone Credit strategy was notably positive even amidst the continued market cross currents, and gained 4.5% (net) in the first half of the year. The strategy has continued to build on a run of good performance from last year.
Alpha performance was strong for the first half, driven by the long side of the portfolio. Positive gains were led by long positions in consumer discretionary—especially travel related, including airlines and cruise lines—and also in durables including homebuilders. Short positioning in financials also provided a boost as the market digested the failure of three U.S. banks and the rescue of Credit Suisse. Long consumer names, long technology names, and long energy names provided positive performance contributions, amid the broad market updraft. Telecom, materials, and pharma were negative contributors, as well as longs in healthcare and an underweight in utilities.
The portfolio was well hedged over the period and so the macro footprint was limited. This was nice to see given the continued propensity for market gyrations and large moves in interest rates. Portfolio performance was steady and the net security selection gains in the portfolio were broad-based. With credit differentiation a market theme, the portfolio’s underweight to high-default-probability names and tilt into stronger credit quality has been particularly valuable and we’ve seen this play out positively in both the corporate bond and CDS sleeves. Both sleeves have made notable contributions to performance for the quarter and the hedging performed in line.
We expect this positive alpha environment to continue. We see the market environment as supportive of future convergence in credit selection, with an economic retrenchment and profit slowdown still looming, a sorting of credit into winners and losers is looking likely and should provide ample opportunity for continued credit selection gains this year.
DBi:
Since last Fall, the markets have been like a drunk stumbling across a highway. You watch an eighteen-wheeler barrel down and clench your eyes shut—only to open them seconds later and find that he’s still standing. Then it happens again. And again. And, to your utter surprise, you soon find that he’s standing on the other side. Here we are in mid-2023 and we have been grazed, not flattened, by a long list of economic eighteen wheelers: most recently, no regional or global banking crisis, no US debt default, no profits collapse, no “recession by June.” We’re still standing.
Now place yourself back in early January. The market gods tip you off: inflation will prove sticky and the Fed will keep hiking. With a wink and a nod, they tell you that the Two-Year Treasury, then 4.4%, will hit nearly 5% by mid-year. Armed with this inside information, would
| 26 | Litman Gregory Funds Trust | |||||
Table of Contents
you have bet that the Nasdaq, decimated by higher rates last year, would rise nearly 40% by mid-year, a record? Or that value would underperform growth by 25%, a tad more than its historic rebound last year? Or that equities would simply ignore the bond market which, with the most inverted yield curve in five decades, has breathlessly screamed recession for months?
We have two observations. Hedge funds have been cautiously positioned this year and are up single digits. While this might seem paltry relative to the 14% gain in the MSCI World Index, should they have predicted an overnight frenzy in AI that added $5 trillion to tech stocks? On the other hand, those numbers do look healthy relative to the 1% return on the Bloomberg Global Aggregate Bond Index—a disappointment given the unexpected headwind of higher rates. This clearly has been a year to manage risk and live to fight another day. Great investors sometimes put on a sensible trade and it doesn’t work out—statistical tails do happen, after all. Over time, sensible trades generate alpha. That’s our bet, at least.
Further, we would like to remind people about the math of drawdowns. Bold cap headlines on Meta and Tesla tout year-to-date returns of 140% and 113%, respectively—not that both, after 65% drawdowns last year, are down 17% and 27% over eighteen months. The current obsession with respectable yields on corporate credit—and a decent 3% total return this year—glosses over the 18% drawdown last year. Investing is a long game and our math should reflect it.
Performance and Positioning
The Enhanced Trend portfolio gained 6% during the second quarter after falling by almost the same amount in the first quarter, leading to a net loss of approximately 0.5% for the first half of the year. The sudden banking crisis in March caused significant uncertainty which led investors into safe haven investments, especially treasuries. Due to this, the short interest rate positions, as well as a short in the Japanese Yen versus the U.S. Dollar, detracted from performance in Q1. The Euro was also impacted by the Credit Suisse failure which led to a volatile first quarter. However, a well-timed increase in exposure towards the end of February led to gains for the quarter. Commodity swings whipsawed positioning in crude oil and gold due to market participants torn between a hard or soft landing from the rate hikes. Equity asset classes were highly correlated during Q1, and a large rally in January due to hints about the end of the hiking cycle was reversed in February then as contagion fears abated, the rally resumed in March. The volatility caused swings in positioning which further contributed to losses.
In Q2 the Japanese Yen declined significantly as a result of widening policy spreads; central banks globally continued to tighten while the Bank of Japan maintained its yield-curve control. An elevated short position in JPY contributed to performance. An enhanced short position in 2-year Treasuries further aided portfolio performance. Developed markets, ex U.S., declined sharply during May, hurting the portfolio’s quarterly performance, but were positive in April and June, somewhat muting May’s impact. A reversal in gold markets also detracted from performance.
DoubleLine:
For the six months ended June 30, the portfolio outperformed the Bloomberg US Aggregate Bond Index return of 2.09%.
Market Environment
Markets remained fairly volatile during this period, but the Federal Reserve’s pausing of its rate hiking campaign in June allowed most sectors to deliver positive performance. The FOMC’s actions and guidance during the period, coupled with softer inflation data, caused global investors to speculate that the Central Bank was nearing the end of its rate hiking cycle. There were several bouts of volatility, however, during which large bank failures tested the mettle of global credit markets. The diverse asset mix within the portfolio enabled it whether the storms and deliver positive performance.
Relative Performance Discussion
The top-performing sectors in the portfolio during this period were all out-of-index assets. Specifically: domestic High Yield bonds, Collateralized Loan Obligations (CLOs), Emerging Market debt, and residential credit exposures. All of these sectors generated strong interest income and benefitted from credit spread tightening as investor demand for risk improved. Quarterly earnings for High Yield issuers were satisfactory and much better than feared while the CLO allocation naturally benefitted from its floating rate coupons and tremendous levels of carry compared to Index assets. Emerging market debt and US residential credit were additional examples of assets that saw underlying credit fundamentals outperform base case expectations from the start of the year.
The largest detractors from performance were Asset Backed Securities (ABS), Bank Loans, and non-Agency Commercial Mortgage Backed Securities (CMBS). The ABS allocation suffered from its consumer-centric nature as delinquencies for consumer loans rose and demand for this cyclical asset class waned. Bank Loans experienced some spread widening as debt service costs have caused some anxieties for credit investors. Lastly, the non-Agency CMBS positions experienced some spread widening due to consistently unfavorable headlines and secular shifts in the commercial office market. Despite the steady drumbeat of negative headlines, this asset class experienced only small negative returns due to the portfolio’s active management of collateral exposures.
| Fund Summary | 27 | |||||
Table of Contents
Forward Outlook
With the Federal Reserve taking strong measures to tighten financial conditions, we expect volatility in financial markets to remain elevated. Consequently, we will continue to manage the portfolio with a sizeable allocation to fully secured assets with low structural leverage such as residential and commercial mortgage loans. On the corporate side, we see some risks to corporate earnings in the coming quarters and will therefore continue to take a more targeted approach to investing in these assets. Exposures will be selected on a line-item basis and will often include out-of-index assets.
FPA:
Performance Overview
The strategy gained approximately 10.9% for the first half of the year. The Fund captured 82.0% of the MSCI ACWI’s gain in the trailing twelve months, outperforming its 72.5% average net risk exposure.1
Portfolio discussion
There wasn’t a unifying theme that drove performance in the last year. In the previous twelve months, the Fund’s top five performers contributed 5.32% to its return, while its bottom five detracted 1.75%.
Trailing Twelve-Month Contributors and Detractors as of June 30, 20232
| Contributors | Perf. Cont. | Avg.% of Port. | Detractors | Perf. Cont. | Avg.% of Port. | |||||||||||||||||
Holcim | 1.55% | 2.9% | Int’l Flavors & Fragrances | -0.48% | 1.7% | |||||||||||||||||
Meta Platforms | 1.13% | 1.7% | Charter Communications | -0.48% | 1.5% | |||||||||||||||||
Broadcom | 1.03% | 1.8% | McDermott (multiple securities) | -0.46% | 1.6% | |||||||||||||||||
Analog Devices | 0.88% | 2.7% | Open Text | -0.18% | 0.2% | |||||||||||||||||
Netflix | 0.73% | 0.7% | Alibaba & Altaba | -0.15% | 0.6% | |||||||||||||||||
|
|
|
|
|
|
|
| |||||||||||||||
| 5.32% | 9.8% | -1.75% | 5.6% | |||||||||||||||||||
Of the contributors and detractors listed, we haven’t recently addressed Open Text and Broadcom. We have discussed most of the other positions in the last year.
Open Text was a relatively short-lived holding in comparison to our typical time frame. We were attracted to this Canadian-based provider of enterprise software due to its stable revenue stream. More than 80% of Open Text’s revenue was recurring, which helped deliver attractive mid-30s EBITDA margins. We considered the business to have a sticky customer base that included 97 of the 100 largest companies in the world. Purchased at a low double-digit multiple to after-tax free cash flow, we expected to own the company for years, with capital deployment going towards dividends, buybacks, and small bolt-on acquisitions, as it had in the past. Unfortunately, to our surprise, while we owned the stock, Open Text announced a relatively large acquisition in the form of UK-based Micro Focus. Familiar with the target, we were unenthused about both the asset and increased debt on the balance sheet from funding the purchase, so we chose to exit stage left rather than try to re-write our investment thesis.3
In contrast to our short-lived ownership of Open Text, Broadcom has been a holding for just short of five years. At the time of our original purchase, the company was primarily focused on driving organic growth in its existing semiconductor franchises and acquiring new ones when the opportunity presented itself. As potential acquisition candidates in the industry became scarce, management, led by highly regarded Hock Tan, pivoted to set their sights on the software industry, culminating in several acquisitions. Unlike Open Text, in this instance, after multiple discussions with senior management, we found ourselves comfortable with the company’s new strategy after re-examining the investment implications. We are glad we did, as it would be an understatement to say that Broadcom has gone from strength to strength over the past five years, improving operating margins, aggressively repurchasing shares, and increasing the dividend, all the while continuing to execute its M&A strategy flawlessly.
| 1 | Risk assets are any assets that are not risk free and generally refers to any financial security or instrument, such as equities, commodities, high-yield bonds, and other financial products that are likely to fluctuate in price. Risk exposure refers to the Fund’s exposure to risk assets as a percent of total assets. The Fund’s net risk exposure as of June 30, 2023 was 73.7%. |
| 2 | Reflects the top five contributors and detractors to the Fund’s performance based on contribution to return for the trailing twelve months (“TTM”). Contribution is presented gross of investment management fees, transactions costs, and Fund operating expenses, which if included, would reduce the returns presented. The information provided does not reflect all positions purchased, sold or recommended by the portfolio management team during the quarter. It should not be assumed that recommendations made in the future will be profitable or will equal the performance of the securities listed. |
Past performance is no guarantee, nor is it indicative, of future results. |
| 3 | Source: www.investors.opentext.com/press-releases; OpenText to Acquire Micro Focus International plc; August 25, 2022. |
Past performance is no guarantee, nor is it indicative, of future results. |
| 28 | Litman Gregory Funds Trust | |||||
Table of Contents
“Risk on” in 2023 has replaced the fear that drove markets lower in 2022. How much of this rebound will ultimately be supported by corporate earnings has yet to be seen. While there is always something to fear, we prefer to focus on the future prospects of the businesses we own. Focusing on the destination makes the big potholes in the road feel more like small speed bumps and prevents us from executing panicked driving maneuvers.
Looking back at the past 18 months, there was certainly no shortage of opportunities to take down risk exposure as macro concerns, from interest rates to war, seemed to grow by the day. But as in prior market declines, we attempted to lean into the market and add to either new or existing names where our estimates of the risk/reward improved with each leg down. While we will never get it perfectly right, using the MSCI ACWI as a proxy, in the downturn from January 5, 2022 through the market low of October 12, 2022, the Fund experienced a drop in value of 17.60%. While not ideal, this was more palatable than the ACWI’s 26.36% decline in the same period.
Looking forward, we do not offer a market forecast or make predictions about interest rates, the economy, or other significant macro issues because we don’t know anyone who can do so consistently (ourselves included). We submit the following to show the futility of forecasting. In the last eighteen years, the consensus view only expected the market to increase, yet it declined 22% of the time. Further, the Wall Street consensus estimate of how the S&P 500 will perform (ex-dividends) in the next twelve months, from 2005 to 2022, usually missed the mark, often by quite a lot -53.6% and 28.9% too high in 2008 and 2022; and 16.9% and 21.0% too low in 2013 and 2021. On average, the “experts” missed by 11.4%, quite a lot, particularly when compared to the S&P’s 6.6% annualized return (before dividends) over the same period. We, therefore, direct our efforts from the bottom up rather than the top down.
S&P 500 Actual vs Wall Street Analysts’ Forecasted Returns Ex-Dividends4
Closing
For those who prefer less up and down, especially when price moves precipitate an often-inappropriate action—buy or sell—our investment mandate is as relevant to investors today as when the Fund launched in 2011. Though we don’t know what the future holds, we strive to continue to offer a similar investor experience. The last decade plus has given us surprises and market excess; the recent pandemic and the millennia-low interest rates, to name a couple. We will be surprised, but probably not astonished, in the future. We promise to remain thoughtful and calm as we continue to steward your capital, traits that allow us to lean in when there’s the opportunity and tilt away when there is none, like when we increased risk exposure during Covid, but reduced it in the preceding periods.
We would like to think our investment team have pushed each other to evolve and stay relevant, and fingers crossed, our continuing education is far from over. However regardless of the times, we think sensible optimism mixed with a dash of prudence will never go out of fashion, even if our haircuts may.
Thank you for entrusting us with your capital since 2011, but as we say goodbye to the past, we look forward to what the future holds.
Loomis Sayles:
MARKET CONDITIONS
The global fixed-income markets delivered mixed returns in the second quarter, giving back some of the positive performance from the first three months of the year.
| 4 | Source: Bloomberg; Chart shows actual S&P 500 price returns excluding dividends minus Wall Street analyst estimates. Chart period is 2005-2022. |
Past performance is no guarantee, nor is it indicative, of future results. |
| Fund Summary | 29 | |||||
Table of Contents
News flow was generally favorable at the headline level, as inflation moderated and the near-term interest rate outlook began to improve. Headline consumer price inflation came in at annual rates of 4.9% in April and 4.0% in May, ending a 23-month stretch in which it rose 5% or more. Cooling inflation allowed the US Federal Reserve (Fed) to slow its pace of interest-rate increases. After raising short-term rates by a total of 4.25 percentage points in 2022, the Fed enacted only three quarter-point hikes in the first half of 2023. Notably, the Fed elected not to raise rates at its meeting in June – the first time this was the case since January of 2022.
While the Fed raised rates less aggressively, better-than-expected economic growth prompted officials to reiterate their intention to continue tightening until inflation falls to the central bank’s stated target of 2%. At the end of June, the futures markets indicated that the Fed was likely to hike by 25 bps once, or possibly even twice, before the end of 2023. This represented a shift from earlier in the year, when investors were pricing in a Fed cutting cycle to begin before year-end. The change in market expectations for the Fed Funds Rate, together with the more aggressive approaches of other developed-market central banks, was a headwind for the bond market in the quarter.
PORTFOLIO REVIEW
With a semi-annual net return of 1.80%, the portfolio underperformed its benchmark, the ICE BofAML 3-Month US Treasury Bill Index, which returned 2.25%. The Fund’s positive absolute performance was diversified across many sectors, with the majority generated from investment grade corporate bonds, securitized assets, high yield corporate bonds, and dividend equities. Our allocations to emerging market and global rates assets detracted from performance during the period.
Investment grade corporate bond spreads widened during the period, but ended largely flat. The sector was able to outpace US Treasurys due to a yield advantage and increased investor risk appetite. Within the portfolio, investment grade corporates contributed to performance with financials names being primarily responsible.
During the first half of the year, securitized markets offered mixed results. Consumer asset-backed securities were buoyed by a healthy US consumer and CMBS issues benefitted from reduced concern about fallout from recent stresses in the banking sector during the second quarter. Within the portfolio, the allocation to ABS issues was primarily responsible for the sector’s positive impact on period performance, with non-Agency RMBS and CLO holdings also contributing. CMBS issues detracted during the same time frame.
High yield corporate bond spreads tightened over the period. The category broadly outperformed investment-grade corporate issues as a modest decline in yield spreads and contribution from income served to offset the effect of rising government yields. The sector was also aided by favorable investor risk sentiment that supported higher-risk segments of the fixed income market. Within the portfolio, our allocation to the sector positively impacted absolute performance. Consumer names were mostly responsible for the positive impact.
Emerging market assets navigated a challenging environment during the first half of the year. The sector experienced headwinds related to weaker commodity prices in Africa and Latin America recently, along with softer non-US economic data and tighter policy. Within the portfolio, emerging markets assets weighed on performance, with Chinese exposures being primarily responsible.
OUTLOOK
The global bond market has partially recovered from last year’s poor showing by posting positive returns in the first half of 2023. Inflation—while still high—has continued to decline from its mid-2022 peak, helping to create optimism early in the year that central banks would be able to conclude their long series of interest rate hikes. In the US, volatility in regional banks combined with an impending debt ceiling situation put significant stress on the financial system and investors began pricing in multiple Fed rate cuts before year-end. The Fed responded by providing liquidity to support regional banks and a relatively uneventful resolution to the US debt ceiling issue coupled with the Fed’s decision to take a break in its hiking cycle, albeit a hawkish one, led to tighter credit spreads and a subsequent re-pricing of Fed rate cuts to the 2nd half of 2024.
In our view, the credit cycle is firmly in the late cycle stage and the risk of downturn has increased. The ability of the Fed to manufacture a soft landing could become more difficult if inflation remains sticky, likely leading to monetary policy that remains in restrictive territory for an extended period. The Fed may be in a precarious position to fight inflation, as we believe it must balance future policy with its potential to create financial market instability. While inflation seems to have peaked and should roll down over time, we believe it will remain above the Fed’s target throughout the second half of 2023, primarily as result of wage pressure and owner’s equivalent rent (OER). In addition, we maintain longer-term structural concerns that could support higher levels of inflation, including the impact of de-globalization, de-carbonization, changing demographics and growing government deficits. Throughout the remainder of the year, we anticipate the Fed to be driven by the extent to which there is firm evidence that inflation continues to moderate. The potential for an extended Fed pause remains—in our view, policymakers will be slow to react to the onset of a downturn and will likely tolerate a rise in unemployment, particularly while inflation is above target.
Monetary policy has been restrictive and lending standards have tightened, however, the economic backdrop has remained resilient, in our opinion, and as a result, our base case is for below trend US growth. Based on a strong consumer and positive corporate fundamentals, we do not expect a technical recession of back-to-back quarters with negative GDP. The consumer appears on solid footing, maintaining strong levels of excess savings and continuing to spend at a healthy rate. Labor markets remain tight, as we’ve observed higher wages, an elevated number of job openings and employers who are reluctant to shed workers in industries where they may have trouble getting them back. We believe these factors should help support consumer confidence and spending. Corporate fundamentals also remain strong, highlighted by
| 30 | Litman Gregory Funds Trust | |||||
Table of Contents
strong leverage and interest coverage ratios, and specific to the high yield market, a maturity wall that seems manageable through 2025. One area, in particular, that we are monitoring to determine if growth could slow more quickly is corporate earnings. Earnings have contracted over the past two quarters and we believe we are currently in the midst of a ‘profits recession.’ In the event that this trend continues or accelerates as pricing power fades and margins come under further pressure, companies may need to more aggressively cut costs (via job cuts), which could lead to an environment where the pace at which growth is declining increases materially and ultimately leads to recession. Under this scenario, we believe a healthy consumer combined with positive corporate fundamentals should serve to minimize the potential for a hard landing by helping to provide a floor to economic activity, resulting in a mild or shallow recession.
Water Island:
Broader markets have faced numerous obstacles in the past six months, including no less than Ukraine’s ongoing war against Russian invaders, the Federal Reserve’s (“Fed”) fight to subdue inflation with interest rate hikes, a US regional banking crisis that led to the failures of multiple large banks, and yet another battle over the US federal government’s debt ceiling in Congress. While returns for the broader credit market were generally unimpressive, equities nonetheless seemed to deliver strong year-to-date gains—though upon closer inspection, it appeared much of the performance was generated by a handful of mega-cap heavy hitters, and it was accompanied by a healthy dose of volatility along the way.
In this environment, the landscape for event-driven investing has also faced heightened volatility. The merger arbitrage strategy in particular has encountered significant regulatory challenges. Antitrust regulators around the globe have attempted to block several large mergers and acquisitions (“M&A”) transactions, in turn driving correlated volatility in deal spreads throughout the investment universe. At times, we have found the logic behind the regulators’ recent cases to be perplexing—especially in the US, where the Department of Justice (“DOJ”) and the Federal Trade Commission (“FTC”), in our opinion, have sought to block deals using novel legal theories with little basis in historical precedent—or what appears to be a foundation in a political agenda rather than antitrust law.
With their attempts to block deals in court, the FTC and DOJ have succeeded in causing some companies to abandon their planned tie-ups rather than take the fight to trial – to be certain, a costly endeavor. In addition, the regulators’ actions may also have had a chilling effect on M&A in certain sensitive industries or by large acquirers, as we will never know how many deals that companies may have wanted to pursue were never announced. At the same time, we are seeing signs that the regulatory pendulum may be starting to swing back to the other side.
At this point, of the cases that have gone to trial, the FTC and DOJ under the Biden administration have lost more than they have won. The most recent example is the FTC’s attempt to block Microsoft’s acquisition of Activision. At the end of June, based on our view of the trial’s proceedings and the skeptical tone of the presiding judge’s questions to the FTC, we believed it likely Microsoft would prevail. (Indeed, as of this writing in July, the courts have not only officially ruled against the FTC but also rejected its attempted appeal, and Microsoft could reportedly try to close the merger before the end of the month.) We believe these successes on the part of dealmakers may cause acquirers to increasingly take a bolder stance in fighting regulatory objections. Furthermore, within the ranks of agency staff, there has been considerable brain drain, which may be a result of skepticism regarding the current regime’s approach. In the past two years, for example, senior-level attorneys at the FTC have departed the agency at the fastest rate since 2000, which could make future enforcement actions more challenging.
The portfolio was modestly positive in the first half of the year. While merger arbitrage positions detracted from returns, this performance was offset by positive contributions from special situations positions as well as some incremental earnings on cash holdings. The top-performing position for the period was the aforementioned Microsoft/Activision deal. This deal was struck in January 2022, when Microsoft reached an agreement to acquire video game developer Activision Blizzard for $75.1 billion in cash. During its timeline, this deal has been met not just with objections from competitors, including Sony, but also wariness amongst antitrust regulators, which caused ongoing volatility in the deal spread. During Q1 2023, for example, the UK Competition and Markets Authority (“CMA”) signaled a favorable assessment of certain aspects of the transaction (namely the continued availability of certain top tier franchises, such as Call of Duty, on competing gaming platforms), only to block the transaction early in Q2 based on concerns about competition in the nascent cloud gaming market—a decision which Microsoft appealed. Moreover, as we have discussed, the FTC took Microsoft to court seeking to block the acquisition in the US. Now that the deal has been cleared in the US, the CMA has agreed to reopen negotiations with Microsoft about potential remedies that could satisfy its concerns. In all, we continue to expect this transaction will ultimately achieve a successful conclusion and we maintain our exposure.
Other top contributors included our positions in Momentive Global and Rogers Corp, both of which originated as target company holdings in transactions that ultimately failed. Momentive was originally the target of Zendesk, where an activist was successful in convincing shareholders to vote down the transaction and instead put Zendesk itself up for sale. While Zendesk eventually found its own suitor, we opted to maintain our exposure to Momentive post-break, as the company had its own activist agitating for change and there were multiple additional interested parties disclosed in the proxy background of the Zendesk merger. In March 2023, Momentive officially found another buyer, entering into a definitive agreement to be acquired by Symphony Technology Group. The deal closed successfully less than three months later, leading to gains for the fund. Rogers saw its acquisition by DuPont unexpectedly abandoned in November 2022, when DuPont opted to exercise a right to walk away rather than extend the deal timeline when the termination date was reached with regulatory approval in China still outstanding. Rogers shares were met with massive selling pressure upon the deal break, as there were fears (which proved unfounded) that DuPont had walked because it discovered fraud at the company. We opted to follow our deal break protocol and
| Fund Summary | 31 | |||||
Table of Contents
wait for more normalized trading levels, seeking to unwind our position in an orderly fashion, and we were rewarded when the company’s shares traded nearly 37% higher during Q1 2023.
Conversely, the top detractor in the portfolio was the fund’s investment in the failed acquisition of First Horizon Corp by Toronto-Dominion Bank (“TD”). In February 2022, First Horizon—a regional bank based in Tennessee that operates throughout the Southeast US—agreed to be acquired by TD—a Canada-based multinational banking and financial services corporation—for $13.4 billion in cash. While First Horizon was not directly connected to Silicon Valley Bank, the company’s shares were a casualty of indiscriminate selling across the US regional banking industry following the news of Silicon Valley Bank’s failure. This, combined with an extended regulatory review in Canada as well as rumors of a potential price cut, pressured the deal’s spread. Through the volatility, we opted to maintain exposure to the transaction as mere weeks prior TD had publicly reaffirmed its commitment to the transaction—which, due to First Horizon’s relatively small size, would have been one of very few paths for TD to gain scale via acquisition—and our outlook on the deal fundamentals had not changed. As the regional banking crisis continued to unfold, leading to the additional failures of Signature Bank and First Republic, volatility in First Horizon shares escalated. Eventually, in May 2023, when no progress had been made on the antitrust review front, First Horizon and TD mutually agreed to terminate the merger due to “uncertainty” as to when the deal might gain the lagging regulatory approvals. As such, we are following our standard deal break protocols and seeking to unwind our position in an orderly fashion.
Other top detractors included the acquisition of Tegna by Standard General and the merger of VMware and Broadcom. Tegna is a US-based broadcast television and digital media company which agreed to be acquired by Standard General—a US-based investment company—for $5.3 billion in cash. The transaction was, for all intents and purposes, blocked by the US Federal Communications Commission (“FCC”) when the agency designated it for a judicial review based on concerns it could raise prices for consumers. While this particular proceeding was not an outright block, such hearings are notoriously lengthy and have historically led deals to collapse. Standard General attempted to push a faster timeline in the courts because it feared that when the deal’s termination date arrived, should they attempt to extend the timeline, they would not be able to secure financing at rates comparable to when the deal was originally announced. After Standard General exhausted all appeals and was unsuccessful, the companies agreed to terminate the merger. The $61.4 billion acquisition of virtualization software maker VMware by semiconductor manufacturer Broadcom was announced in May 2022. This deal has already seen its timeline extended as there have been multiple delays in receiving required regulatory clearances in several jurisdictions, which has led to intermittent volatility in the deal spread. We continue to believe this deal will prove successful, as while regulators posture about “big tech” mergers, there is no actual product overlap between the two companies. We maintain our exposure and are monitoring the situation closely.
Looking ahead, while we are cognizant of the challenges that remain, we believe the return opportunities in merger arbitrage are compelling. Volatility and rising interest rates are bolstering wider deal spreads, which have reached average levels we haven’t seen since the Global Financial Crisis. According to Dealogic data, the average day-one gross spread (i.e., the non-annualized spread the day after deal announcement) of pending deals as of June 30, 2023, was 9%—nearly double the rate on January 1, 2022, just 18 months prior.
Additionally, although M&A deal flow has slowed from recent peaks, the level of activity continues to provide plentiful investment opportunities. Current deal flow still exceeds pre-pandemic 2019 levels, and we anticipate a pick-up in consolidation activity should the Fed succeed in tamping down inflation and interest rates begin to stabilize. In such a scenario, we expect business leaders will increasingly seek to drive growth through strategic M&A, while private equity firms—still flush with approximately $2.5 trillion in dry powder—will seek to put capital to work.
Beyond merger arbitrage, given ongoing volatility in the broader markets, we continue to remain focused on hard catalyst investments, which should benefit from more definitive timelines and outcomes. In that vein, we are seeing attractive opportunities in merger-related credit and certain hard catalyst credit special situations, such as refinancings, and we anticipate the portfolio’s allocation to credit may grow in the coming months. We may introduce select soft catalyst investments—which typically have greater sensitivity to broader market moves—but only when we believe the potential reward outweighs the potential risk and when we can construct appropriate risk mitigation strategies.
Strategy Allocations
The current allocations, reflecting the DoubleLine tactical overweight of 7% are 27% to DoubleLine, 17% each to DBi and Water Island, 15% to Loomis Sayles, 13% to Blackstone Credit Systematic Group, and 11% to FPA. (The fund’s strategic targets are: 20% each to DBi and DoubleLine, 18% to Water Island, 15% each to Blackstone Credit Systematic Group and Loomis Sayles, and 12% to FPA.) We use the fund’s daily cash flows to bring the manager allocations toward their targets when differences in shorter-term relative performance cause divergences.
| 32 | Litman Gregory Funds Trust | |||||
Table of Contents
Sub-Advisor Portfolio Composition as of June 30, 2023
Blackstone Credit Systematic Group (DCI) Long-Short Credit Strategy
Bond Portfolio Top Five Sector Exposures
Consumer Discretionary | 22.2% | |||
Energy | 13.4% | |||
High Tech | 13.3% | |||
Investment Vehicles/REITs | 7.7% | |||
General | 5.3% |
CDS Portfolio Statistics
| Long | Short | |||||||
Number of Issuers | 70 | 71 | ||||||
Average Credit Duration | 4.3 | 4.3 | ||||||
Spread | 173 bps | 164 | bps | |||||
DBi Enhanced Trend Strategy
Asset Class Exposures (Notional)
Rates | -92.5% | |||
Currencies | -18.3% | |||
Commodities | 3.3% | |||
Equities | 23.7% |
DoubleLine Opportunistic Income Strategy
Sector Exposures
Cash | 1.9 | % | ||
Government | 10.7 | % | ||
Agency IO/Inverse IO | 8.1 | % | ||
Agency CMO | 0.4 | % | ||
Agency PO | 0.4 | % | ||
Non-Agency Residential MBS | 36.0 | % | ||
Commercial MBS | 13.7 | % | ||
Collateralized Loan Obligations | 12.6 | % | ||
ABS | 4.7 | % | ||
Bank Loan | 3.8 | % | ||
Emerging Markets | 6.0 | % | ||
HY/Other | 1.8 | % | ||
|
| |||
TOTAL* | 100.0 | % | ||
|
|
FPA Contrarian Opportunity Strategy
Asset Class Exposures
U.S. Stocks | 42.5% | |||
Foreign Stocks | 21.3% | |||
Bonds | 6.5% | |||
Limited Partnerships | 3.3% | |||
Other Asset-Backed | 0.1% | |||
Cash | 26.3% | |||
|
| |||
TOTAL | 100.0% | |||
|
|
Loomis Sayles Absolute Return Strategy
Strategy Exposures
| Long Total | Short Total | Net Exposure | ||||||||||
Securitized | 27.9% | 0.0% | 27.9% | |||||||||
High-Yield Corporate | 26.8% | -4.6% | 22.2% | |||||||||
Investment-Grade Corp. | 21.3% | 0.0% | 21.3% | |||||||||
Convertibles | 5.5% | 0.0% | 5.5% | |||||||||
Dividend Equity | 4.4% | -0.2% | 4.2% | |||||||||
Emerging Market | 3.9% | 0.0% | 3.9% | |||||||||
Bank Loans | 2.5% | 0.0% | 2.5% | |||||||||
Global Rates | 0.8% | -0.3% | 0.5% | |||||||||
Global Credit | 0.6% | -0.6% | 0.0% | |||||||||
Currency | 0.0% | -1.7% | -1.7% | |||||||||
Subtotal | 93.6% | -7.4% | 86.2% | |||||||||
Cash & Equivalents | 6.4% | 0.0% | 6.4% | |||||||||
Water Island Arbitrage and Event-Driven Strategy
Sub-Strategy Exposures
| Long | Short | Net | ||||||||||
Merger Arbitrage – Equity | 87.9 | % | -10.5 | % | 77.4 | % | ||||||
Merger Arbitrage – Credit | 3.2 | % | 0.0 | % | 3.2 | % | ||||||
Total Merger-Related | 91.2 | % | -2.0 | % | 80.7 | % | ||||||
Special Situations – Equity | 1.2 | % | 0.0 | % | 1.2 | % | ||||||
Special Situations – Credit | 2.2 | % | 0.0 | % | 2.2 | % | ||||||
Total Special Situations | 1.9 | % | 0.0 | % | 3.4 | % | ||||||
|
|
|
|
|
| |||||||
Total | 94.5 | % | -10.5 | % | 84.0 | % | ||||||
|
|
|
|
|
| |||||||
| * | Totals may not add up to 100% due to rounding. |
| Fund Summary | 33 | |||||
Table of Contents
iMGP Alternative Strategies Fund Value of Hypothetical $100,000
The value of a hypothetical $100,000 investment in the iMGP Alternative Strategies Fund from September 30, 2011 to June 30, 2023 compared with the ICE BofA US 3-Month Treasury Bill, Morningstar Multistrategy Category and Bloomberg US Agg Bond Index.
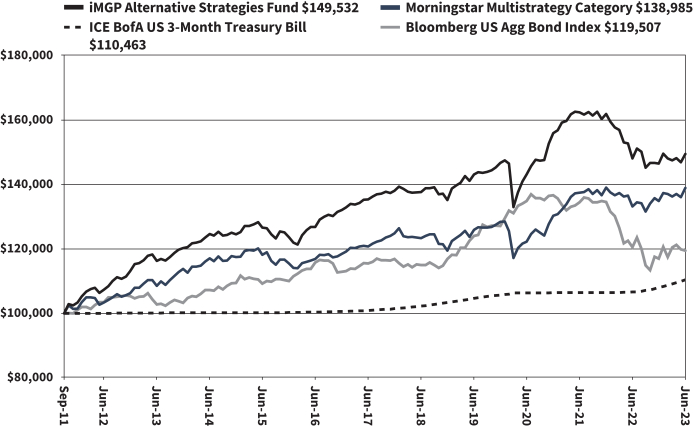
The hypothetical $100,000 investment at fund inception includes changes due to share price and reinvestment of dividends and capital gains. The chart does not imply future performance. Indexes are unmanaged, do not incur fees, expenses or taxes, and cannot be invested in directly.
Performance quoted does not include a deduction for taxes that a shareholder would pay on the redemption of fund shares.
| 34 | Litman Gregory Funds Trust | |||||
Table of Contents
iMGP Alternative Strategies Fund
CONSOLIDATED SCHEDULE OF INVESTMENTS IN SECURITIES at June 30, 2023 (Unaudited)
| Shares | Value | |||||||
COMMON STOCKS: 22.2% | ||||||||
| Communication Services: 4.3% | ||||||||
| 128,989 | Activision Blizzard, Inc.* | $ | 10,873,773 | |||||
| 24,976 | Alphabet, Inc. - Class A* | 2,989,627 | ||||||
| 17,125 | Alphabet, Inc. - Class C* | 2,071,611 | ||||||
| 114,390 | Altegrity, Inc.*(a) | 266,529 | ||||||
| 48,999 | Altice USA, Inc. - Class A* | 147,977 | ||||||
| 120,875 | Bollore SE | 753,591 | ||||||
| 4,324 | Charter Communications, Inc. - Class A* | 1,588,508 | ||||||
| 48,890 | Cineplex, Inc.* | 327,595 | ||||||
| 79,795 | Comcast Corp. - Class A | 3,315,482 | ||||||
| 24,160 | iHeartMedia, Inc. - Class A* | 87,942 | ||||||
| 7,971 | Intelsat SA* | 183,333 | ||||||
| 10,315 | Meta Platforms, Inc. - Class A* | 2,960,199 | ||||||
| 1,851 | Netflix, Inc.* | 815,347 | ||||||
| 21,663 | Nexon Co. Ltd. | 411,850 | ||||||
| 16,998 | Nintendo Co. Ltd. | 769,610 | ||||||
| 183,126 | Radius Global Infrastructure, Inc. - Class A* | 2,728,577 | ||||||
| 104,847 | Rovio Entertainment Oyj(b) | 1,045,177 | ||||||
| 365,376 | TEGNA, Inc. | 5,933,706 | ||||||
| 85,348 | Telenet Group Holding NV | 1,921,520 | ||||||
|
| |||||||
| 39,191,954 | ||||||||
|
| |||||||
| Consumer Discretionary: 1.0% | ||||||||
| 19,957 | Alibaba Group Holding Ltd.* | 206,792 | ||||||
| 15,444 | Amazon.com, Inc.* | 2,013,280 | ||||||
| 16,720 | CarMax, Inc.* | 1,399,464 | ||||||
| 6,239 | Cie Financiere Richemont SA - Class A | 1,057,440 | ||||||
| 6,060 | Delivery Hero SE*(b) | 267,344 | ||||||
| 16,860 | Entain PLC | 272,524 | ||||||
| 184 | Home Depot, Inc. | 57,158 | ||||||
| 26,721 | Just Eat Takeaway.com NV*(b) | 409,505 | ||||||
| 4,950 | Marriott International, Inc. - Class A | 909,265 | ||||||
| 6,243 | Naspers Ltd. - Class N | 1,126,549 | ||||||
| 675 | Starbucks Corp. | 66,866 | ||||||
| 45,246 | Uni-Select, Inc.* | 1,608,177 | ||||||
|
| |||||||
| 9,394,364 | ||||||||
|
| |||||||
| Consumer Staples: 0.5% | ||||||||
| 78,142 | Albertsons Cos., Inc. - Class A | 1,705,059 | ||||||
| 1,088 | Coca-Cola Co. | 65,519 | ||||||
| 59 | Costco Wholesale Corp. | 31,764 | ||||||
| 16,254 | Heineken Holding NV | 1,413,543 | ||||||
| 9,600 | Herbalife Ltd.* | 127,104 | ||||||
| 44,430 | JDE Peet’s NV | 1,322,407 | ||||||
| 458 | Procter & Gamble Co. | 69,497 | ||||||
| 334 | Walmart, Inc. | 52,498 | ||||||
|
| |||||||
| 4,787,391 | ||||||||
|
| |||||||
| Energy: 1.0% | ||||||||
| 18,829 | Battalion Oil Corp.* | 107,514 | ||||||
| 65,994 | Baytex Energy Corp.* | 215,140 | ||||||
| 139,576 | Baytex Energy Corp.* | 455,500 | ||||||
| 6,016 | Canadian Natural Resources Ltd. | 338,460 | ||||||
| 169 | Devon Energy Corp. | 8,169 | ||||||
| 6,210 | Diamondback Energy, Inc. | 815,746 | ||||||
| 2,161 | EOG Resources, Inc. | 247,305 | ||||||
| 47,534 | Exmar NV | 555,330 | ||||||
| 3,100 | Gulfport Energy Corp.* | 325,717 | ||||||
| 57,860 | Kinder Morgan, Inc. | 996,349 | ||||||
| 20,716 | Magellan Midstream Partners LP(c) | 1,291,021 | ||||||
| Shares | Value | |||||||
| Energy (continued) | ||||||||
| 42,106 | PDC Energy, Inc.(c) | $ | 2,995,421 | |||||
| 917 | Pioneer Natural Resources Co. | 189,984 | ||||||
| 747 | Vitesse Energy, Inc. | 16,733 | ||||||
| 1,337 | Williams Cos., Inc. | 43,626 | ||||||
|
| |||||||
| 8,602,015 | ||||||||
|
| |||||||
| Financials: 2.2% | ||||||||
| 560 | Alpha Partners Technology Merger Corp.* | 6,112 | ||||||
| 46,720 | American International Group, Inc. | 2,688,269 | ||||||
| 5,862 | Aon PLC - Class A | 2,023,562 | ||||||
| 50 | BlackRock, Inc. | 34,557 | ||||||
| 39,270 | Citigroup, Inc. | 1,807,991 | ||||||
| 60,800 | Fast Sponsor Capital*(a) | 121,600 | ||||||
| 325,630 | First Horizon Corp. | 3,669,850 | ||||||
| 68,672 | Focus Financial Partners, Inc. - Class A* | 3,605,967 | ||||||
| 21,230 | Groupe Bruxelles Lambert NV | 1,672,667 | ||||||
| 11,317 | Hartford Financial Services Group, Inc. | 815,050 | ||||||
| 27,680 | Jefferies Financial Group, Inc. | 918,146 | ||||||
| 224 | JPMorgan Chase & Co. | 32,579 | ||||||
| 2,510 | LPL Financial Holdings, Inc. | 545,749 | ||||||
| 81 | MasterCard, Inc. - Class A | 31,857 | ||||||
| 10,672 | Moneylion, Inc.* | 128,171 | ||||||
| 561 | Morgan Stanley | 47,909 | ||||||
| 776 | PowerUp Acquisition Corp.* | 8,206 | ||||||
| 450 | Signature Bank | 95 | ||||||
| 43,550 | Wells Fargo & Co. | 1,858,714 | ||||||
|
| |||||||
| 20,017,051 | ||||||||
|
| |||||||
| Health Care: 2.8% | ||||||||
| 490 | Abbott Laboratories | 53,420 | ||||||
| 585 | AbbVie, Inc. | 78,817 | ||||||
| 47,716 | Albireo Pharma, Inc.* | 105,844 | ||||||
| 10,187 | Amedisys, Inc.*(c) | 931,499 | ||||||
| 13,335 | Bayer AG | 737,746 | ||||||
| 5 | Biote Corp. - Class A* | 34 | ||||||
| 868 | Bristol-Myers Squibb Co. | 55,509 | ||||||
| 54,961 | CinCor Pharma, Inc.* | 173,930 | ||||||
| 213,778 | Concert Pharmaceuticals, Inc.* | 81,556 | ||||||
| 41,206 | Dechra Pharmaceuticals PLC | 1,930,082 | ||||||
| 48,702 | DICE Therapeutics, Inc.* | 2,262,695 | ||||||
| 134 | Elevance Health, Inc. | 59,535 | ||||||
| 33,414 | EMIS Group PLC | 581,713 | ||||||
| 12,047 | Globus Medical, Inc. - Class A*(c) | 717,278 | ||||||
| 73,277 | Horizon Therapeutics PLC*(c) | 7,536,540 | ||||||
| 2,572 | ICON PLC - ADR* | 643,514 | ||||||
| 51,898 | IVERIC bio, Inc.* | 2,041,667 | ||||||
| 373 | Johnson & Johnson | 61,739 | ||||||
| 79 | Merck & Co., Inc. | 9,116 | ||||||
| 16,009 | Seagen, Inc.*(c) | 3,081,092 | ||||||
| 42,947 | Swedish Orphan Biovitrum AB* | 837,986 | ||||||
| 77,973 | Syneos Health, Inc.*(c) | 3,285,782 | ||||||
| 82 | Thermo Fisher Scientific, Inc. | 42,784 | ||||||
| 125 | UnitedHealth Group, Inc. | 60,080 | ||||||
|
| |||||||
| 25,369,958 | ||||||||
|
| |||||||
| Industrials: 3.8% | ||||||||
| 117,580 | Aerojet Rocketdyne Holdings, Inc.* | 6,451,615 | ||||||
| 45,661 | Applus Services SA | 491,819 | ||||||
| 3,695 | Carlson Travel, Inc. | 38,798 | ||||||
| 207,470 | Caverion Oyj | 1,932,267 | ||||||
| 96,159 | CIRCOR International, Inc.* | 5,428,176 | ||||||
| 127 | Cummins, Inc. | 31,135 | ||||||
The accompanying notes are an integral part of these financial statements.
| Schedule of Investments | 35 | |||||
Table of Contents
iMGP Alternative Strategies Fund
CONSOLIDATED SCHEDULE OF INVESTMENTS IN SECURITIES at June 30, 2023 (Unaudited) (Continued)
| Shares | Value | |||||||
COMMON STOCKS (CONTINUED) | ||||||||
| Industrials (continued) | ||||||||
| 144 | Deere & Co. | $ | 58,347 | |||||
| 321 | Emerson Electric Co. | 29,015 | ||||||
| 567 | Fastenal Co. | 33,447 | ||||||
| 7,690 | Ferguson PLC | 1,209,714 | ||||||
| 1 | Hornbeck Offshore Services, Inc. | 42 | ||||||
| 18,710 | Howmet Aerospace, Inc. | 927,268 | ||||||
| 45,151 | Kloeckner & Co. SE | 477,206 | ||||||
| 15,730 | LG Corp. | 1,050,537 | ||||||
| 142 | Lockheed Martin Corp. | 65,374 | ||||||
| 538,442 | McDermott International Ltd.* | 96,919 | ||||||
| 590,897 | McDermott International, Inc.* | 106,361 | ||||||
| 5,847 | RB Global, Inc. | 350,820 | ||||||
| 124,401 | Resolute Forest Products, Inc.* | 182,310 | ||||||
| 29,273 | Rush Enterprises, Inc. - Class A | 1,778,042 | ||||||
| 10,320 | Safran SA | 1,616,491 | ||||||
| 7,630 | Samsung C&T Corp. | 612,068 | ||||||
| 17,500 | Sound Holding FP*(a) | 1,209,160 | ||||||
| 34,724 | Triton International Ltd.(c) | 2,891,120 | ||||||
| 17,366 | Uber Technologies, Inc.* | 749,690 | ||||||
| 218 | Union Pacific Corp. | 44,607 | ||||||
| 451 | United Parcel Service, Inc. - Class B | 80,842 | ||||||
| 157,682 | Univar Solutions, Inc.* | 5,651,323 | ||||||
| 7,880 | Westinghouse Air Brake Technologies Corp. | 864,200 | ||||||
|
| |||||||
| 34,458,713 | ||||||||
|
| |||||||
| Information Technology: 4.3% | ||||||||
| 172,829 | Absolute Software Corp. | 1,980,620 | ||||||
| 156 | Accenture PLC - Class A | 48,139 | ||||||
| 288,179 | Alfa Financial Software Holdings PLC(b) | 714,097 | ||||||
| 16,750 | Analog Devices, Inc. | 3,263,068 | ||||||
| 1,356 | Apple, Inc. | 263,023 | ||||||
| 7,048 | Black Knight, Inc.* | 420,977 | ||||||
| 1,929 | Broadcom, Inc. | 1,673,272 | ||||||
| 445 | Cisco Systems, Inc. | 23,024 | ||||||
| 22,138 | Contra Abiomed, Inc.* | 38,742 | ||||||
| 115,113 | ForgeRock, Inc. - Class A* | 2,364,421 | ||||||
| 78,290 | Magnachip Semiconductor Corp.* | 875,282 | ||||||
| 807 | Microchip Technology, Inc. | 72,299 | ||||||
| 287 | Microsoft Corp. | 97,735 | ||||||
| 103,091 | National Instruments Corp.(c) | 5,917,423 | ||||||
| 4,151 | NCR Corp.* | 104,605 | ||||||
| 5,740 | NXP Semiconductors NV | 1,174,863 | ||||||
| 194,369 | Ordina NV | 1,203,297 | ||||||
| 2,593 | QUALCOMM, Inc. | 308,671 | ||||||
| 10,043 | Rogers Corp.* | 1,626,263 | ||||||
| 36,646 | Silicon Motion Technology Corp. - ADR(c) | 2,633,382 | ||||||
| 21,900 | SimCorp AS | 2,321,963 | ||||||
| 37,330 | Software AG | 1,296,128 | ||||||
| 20,560 | TE Connectivity Ltd. | 2,881,690 | ||||||
| 54,174 | VMware, Inc. - Class A*(c) | 7,784,262 | ||||||
|
| |||||||
| 39,087,246 | ||||||||
|
| |||||||
| Materials: 1.0% | ||||||||
| 34,197 | Arconic Corp.* | 1,011,547 | ||||||
| 122,275 | Cemex SAB de CV - ADR* | 865,707 | ||||||
| 274,950 | Glencore PLC | 1,553,050 | ||||||
| 7,830 | Heidelberg Materials AG | 642,899 | ||||||
| 46,964 | Holcim AG* | 3,159,802 | ||||||
| 23,737 | International Flavors & Fragrances, Inc. | 1,889,228 | ||||||
| Shares | Value | |||||||
| Materials (continued) | ||||||||
| 84 | Linde PLC | $ | 32,011 | |||||
| 1,281 | Newmont Corp. | 54,647 | ||||||
| 169 | Packaging Corp. of America | 22,335 | ||||||
| �� | |||||||
| 9,231,226 | ||||||||
|
| |||||||
| Real Estate: 0.5% | ||||||||
| 286 | American Tower Corp. - REIT | 55,467 | ||||||
| 23,730 | Douglas Emmett, Inc. - REIT | 298,286 | ||||||
| 20,495 | Life Storage, Inc. - REIT(c) | 2,725,015 | ||||||
| 43,655 | Swire Pacific Ltd. - Class A | 334,526 | ||||||
| 50,498 | Urstadt Biddle Properties, Inc. - Class A(c) | 1,073,588 | ||||||
| 9,830 | Vornado Realty Trust - REIT | 178,316 | ||||||
|
| |||||||
| 4,665,198 | ||||||||
|
| |||||||
| Special Purpose Acquisition Companies: 0.0% | ||||||||
| 3,818 | Bright Bidco BV | 2,291 | ||||||
| 6,266 | Pershing Square Tontine Holdings Ltd.* | 0 | ||||||
|
| |||||||
| 2,291 | ||||||||
|
| |||||||
| Utilities: 0.8% | ||||||||
| 415 | Duke Energy Corp. | 37,242 | ||||||
| 25,740 | FirstEnergy Corp. | 1,000,771 | ||||||
| 144 | NextEra Energy, Inc. | 10,685 | ||||||
| 12,520 | PG&E Corp.* | 216,346 | ||||||
| 140,776 | PNM Resources, Inc. | 6,348,997 | ||||||
|
| |||||||
| 7,614,041 | ||||||||
|
| |||||||
| | TOTAL COMMON STOCKS | 202,421,448 | ||||||
|
| |||||||
RIGHTS/WARRANTS: 0.0% | ||||||||
| 1,776 | African Gold Acquisition Corp. (Expiration date 03/13/28)* | 18 | ||||||
| 558 | Apollo Strategic Growth Capital II - Class A (Expiration date 12/31/27)* | 68 | ||||||
| 1,333 | Ares Acquisition Corp. (Expiration date 12/31/27)* | 1,066 | ||||||
| 5,560 | Atlantic Coastal Acquisition Corp. (Expiration date 12/31/27)* | 126 | ||||||
| 2,542 | Atlantic Coastal Acquisition Corp. II (Expiration date 06/02/23)* | 127 | ||||||
| 3,595 | BigBear.ai Holdings, Inc. (Expiration date 12/31/28)* | 791 | ||||||
| 14,913 | BurTech Acquisition Corp. (Expiration date 08/19/23)* | 309 | ||||||
| 1,942 | C5 Acquisition Corp. (Expiration date 05/19/28)* | 96 | ||||||
| 1,663 | Churchill Capital Corp. VII (Expiration date 02/29/28)* | 233 | ||||||
| 41,180 | Cie Financiere Richemont SA (Expiration date 11/22/23)* | 56,840 | ||||||
| 2,337 | DHC Acquisition Corp. (Expiration date 12/31/27)* | 136 | ||||||
| 243 | Digital Transformation Opportunities Corp. (Expiration date 03/31/28)* | 37 | ||||||
| 4,634 | Disruptive Acquisition Corp. I (Expiration date 03/06/26)* | 394 | ||||||
| 2,253 | ECARX Holdings, Inc. (Expiration date 12/21/27)* | 167 | ||||||
| 6,951 | Flame Acquisition Corp. (Expiration date 12/31/28)* | 2,171 | ||||||
| 3,346 | Forest Road Acquisition Corp. II (Expiration date 01/15/26)* | 550 | ||||||
The accompanying notes are an integral part of these financial statements.
| 36 | Litman Gregory Funds Trust | |||||
Table of Contents
iMGP Alternative Strategies Fund
CONSOLIDATED SCHEDULE OF INVESTMENTS IN SECURITIES at June 30, 2023 (Unaudited) (Continued)
| Shares | Value | |||||||
RIGHTS/WARRANTS (CONTINUED) | ||||||||
| 779 | Fusion Acquisition Corp. II (Expiration date 12/31/27)* | $ | 4 | |||||
| 870 | Global Partner Acquisition Corp. II (Expiration date 12/31/27)* | 30 | ||||||
| 4,634 | Golden Arrow Merger Corp. (Expiration date 07/31/26)* | 185 | ||||||
| 7 | GSR II Meteora Acquisition Corp. (Expiration date 07/22/23)* | 1 | ||||||
| 1,333 | Heliogen, Inc. (Expiration date 12/30/26)* | 57 | ||||||
| 11 | Hornbeck Offshore Services, Inc. (Expiration date 04/09/30)* | 462 | ||||||
| 389 | Hornbeck Offshore Services, Inc. (Expiration date 04/09/30)* | 5,446 | ||||||
| 834 | Intelsat Jackson Holdings SA (Expiration date 12/05/25)* | 3,962 | ||||||
| 834 | Intelsat Jackson Holdings SA (Expiration date 12/05/25)* | 6,046 | ||||||
| 4,176 | Landcadia Holdings IV, Inc. (Expiration date 12/31/28)* | 697 | ||||||
| 4,247 | MariaDB PLC (Expiration date 12/16/27)* | 616 | ||||||
| 2,489 | Metals Acquisition Ltd. (Expiration date 06/16/28)* | 3,485 | ||||||
| 2,915 | NioCorp Developments Ltd. (Expiration date 03/17/28)* | 1,975 | ||||||
| 1,238 | Northern Star Investment Corp. III (Expiration date 02/25/28)* | 100 | ||||||
| 956 | Northern Star Investment Corp. IV (Expiration date 12/31/27)* | 62 | ||||||
| 2,615% | Plum Acquisition Corp. I (Expiration date 12/31/28)* | 88 | ||||||
| 145 | Prenetics Global Ltd. (Expiration date 05/17/27)* | 12 | ||||||
| 1,039 | Ross Acquisition Corp. II (Expiration date 02/12/26)* | 176 | ||||||
| 2,409 | Slam Corp. (Expiration date 12/31/27)* | 458 | ||||||
| 3,021 | Stratim Cloud Acquisition Corp. (Expiration date 03/05/26)* | 6 | ||||||
| 367 | Swvl Holdings Corp. (Expiration date 03/31/27)* | 6 | ||||||
| 5,576 | TLG Acquisition One Corp. (Expiration date 01/25/28)* | 223 | ||||||
| 4,445 | Twelve Seas Investment Co. II (Expiration date 03/02/28)* | 296 | ||||||
| 1,275 | Virgin Orbit Holdings, Inc. (Expiration date 12/29/26)* | 8 | ||||||
|
| |||||||
| | TOTAL RIGHTS/WARRANTS | 87,530 | ||||||
|
| |||||||
PREFERRED STOCKS: 0.0% | ||||||||
| Energy: 0.0% | ||||||||
| El Paso Energy Capital Trust I |
| |||||||
| 528 | 4.750%, 03/31/2028 | 24,526 | ||||||
| Gulfport Energy Corp. |
| |||||||
| 18 | 10.000%, 07/31/2023*(a)(d)(e) | 10,980 | ||||||
|
| |||||||
| 35,506 | ||||||||
|
| |||||||
| Shares | Value | |||||||
| Industrials: 0.0% | ||||||||
| Clarivate PLC - Series A |
| |||||||
| 5,548 | 5.250%, 06/01/2024 | 227,745 | ||||||
| Element Commercial Aviation |
| |||||||
| 170 | 0.000%,(a) | 0 | ||||||
| McDermott International, Inc. - (Preference Shares) |
| |||||||
| 328 | 0.000%,*(a) | 112,570 | ||||||
|
| |||||||
| 340,315 | ||||||||
|
| |||||||
| Information Technology: 0.0% | ||||||||
| Riverbed Technology, Inc. |
| |||||||
| 4,852 | 0.000%,* | 0 | ||||||
|
| |||||||
| | TOTAL PREFERRED STOCKS | 375,821 | ||||||
|
| |||||||
| Principal Amount^ | ||||||||
ASSET-BACKED SECURITIES: 9.8% | ||||||||
| 510 Asset-Backed Trust | ||||||||
| $275,730 | Series 2021-NPL1-A1 | 254,706 | ||||||
| Aaset Trust | ||||||||
| 319,732 | Series 2021-1A-A | 276,023 | ||||||
| Accelerated Assets LLC | ||||||||
| 87,328 | Series 2018-1-B | 83,713 | ||||||
| Affirm Asset Securitization Trust | ||||||||
| 850,000 | Series 2023-A-D | 846,126 | ||||||
| AGL CLO 3 Ltd. | ||||||||
| 470,000 | Series 2020-3A-D | 452,022 | ||||||
| AIM Aviation Finance Ltd. | ||||||||
| 637,452 | Series 2015-1A-B1 | 130,892 | ||||||
| AMSR Trust | ||||||||
| 1,800,000 | Series 2020-SFR5-G | 1,627,450 | ||||||
| 5,000,000 | Series 2021-SFR1-G | 4,040,158 | ||||||
| Apidos CLO XX | ||||||||
| 265,000 | Series 2015-20A-BRR | 257,360 | ||||||
| Apidos CLO XXIV | ||||||||
| 1,000,000 | Series 2016-24A-DR | 866,389 | ||||||
| Applebee’s Funding LLC/IHOP Funding LLC | ||||||||
| 265,000 | Series 2023-1A-A2 | 261,724 | ||||||
| Arbor Realty Commercial Real Estate Notes CLO Ltd. | ||||||||
| 1,000,000 | Series 2021-FL1-C | 955,621 | ||||||
The accompanying notes are an integral part of these financial statements.
| Schedule of Investments | 37 | |||||
Table of Contents
iMGP Alternative Strategies Fund
CONSOLIDATED SCHEDULE OF INVESTMENTS IN SECURITIES at June 30, 2023 (Unaudited) (Continued)
| Principal Amount^ | Value | |||||||
ASSET-BACKED SECURITIES (CONTINUED) | ||||||||
| ARES LX CLO Ltd. | ||||||||
| $ 500,000 | Series 2021-60A-D | $ | 463,740 | |||||
| Atrium CLO XIII | ||||||||
| 500,000 | Series 13A-E | 451,351 | ||||||
| Atrium CLO XIV LLC | ||||||||
| 750,000 | Series 14A-E | 707,363 | ||||||
| Avid Automobile Receivables Trust | ||||||||
| 58,948 | Series 2019-1-C | 58,813 | ||||||
| Avis Budget Rental Car Funding AESOP LLC | ||||||||
| 355,000 | Series 2020-2A-C | 330,525 | ||||||
| Bain Capital Credit CLO Ltd. | ||||||||
| 500,000 | Series 2021-2A-D | 466,598 | ||||||
| Barings CLO Ltd. | ||||||||
| 500,000 | Series 2018-4A-E | 436,812 | ||||||
| BHG Securitization Trust | ||||||||
| 545,000 | Series 2022-A-B | 487,502 | ||||||
| Blackbird Capital Aircraft Lease Securitization Ltd. | ||||||||
| 221,109 | Series 2016-1A-A | 203,570 | ||||||
| Blue Stream Issuer LLC | ||||||||
| 1,000,000 | Series 2023-1A-C | 907,586 | ||||||
| Bristol Park CLO Ltd. | ||||||||
| 260,000 | Series 2016-1A-CR | 250,157 | ||||||
| Buttermilk Park CLO Ltd. | ||||||||
| 750,000 | Series 2018-1A-E | 642,211 | ||||||
| Canyon Capital CLO Ltd. | ||||||||
| 1,000,000 | Series 2016-1A-ER | 817,990 | ||||||
| 500,000 | Series 2018-1A-E | 414,366 | ||||||
| 1,000,000 | Series 2021-4A-E | 912,386 | ||||||
| Carlyle Global Market Strategies CLO Ltd. | ||||||||
| 500,000 | Series 2014-2RA-D | 408,167 | ||||||
| Principal Amount^ | Value | |||||||
| Carlyle US CLO Ltd. | ||||||||
| $ 500,000 | Series 2021-1A-D | $ | 453,443 | |||||
| Carvana Auto Receivables Trust | ||||||||
| 3,000 | Series 2021-N1-R | 451,893 | ||||||
| 150,000 | Series 2021-N4-D | 141,029 | ||||||
| Castlelake Aircraft Securitization Trust | ||||||||
| 4,000,776 | Series 2018-1-C | 1,417,016 | ||||||
| Castlelake Aircraft Structured Trust | ||||||||
| 3,000,000 | Series 2019-1A-E | 88,800 | ||||||
| Catskill Park CLO Ltd. | ||||||||
| 1,000,000 | Series 2017-1A-D | 834,729 | ||||||
| Chenango Park CLO Ltd. | ||||||||
| 500,000 | Series 2018-1A-D | 401,509 | ||||||
| CIFC Funding CLO Ltd. | ||||||||
| 205,000 | Series 2013-2A-A3LR | 195,671 | ||||||
| 500,000 | Series 2017-4A-D | 443,327 | ||||||
| 500,000 | Series 2019-3A-DR | 482,195 | ||||||
| College Ave Student Loans LLC | ||||||||
| 115,000 | Series 2021-A-D | 105,380 | ||||||
| Cologix Data Centers U.S. Issuer LLC | ||||||||
| 1,500,000 | Series 2021-1A-C | 1,223,062 | ||||||
| Cook Park CLO Ltd. | ||||||||
| 1,000,000 | Series 2018-1A-E | 785,418 | ||||||
| CoreVest American Finance Ltd. | ||||||||
| 305,000 | Series 2020-4-C | 249,771 | ||||||
| CSAB Mortgage-Backed Trust | ||||||||
| 1,857,684 | Series 2006-2-A6B | 158,725 | ||||||
| Diamond Resorts Owner Trust | ||||||||
| 66,755 | Series 2019-1A-B | 63,381 | ||||||
| Dryden 40 Senior Loan Fund CLO | ||||||||
| 1,000,000 | Series 2015-40A-ER | 817,626 | ||||||
| Dryden 45 Senior Loan Fund CLO | ||||||||
| 275,000 | Series 2016-45A-ER | 230,459 | ||||||
The accompanying notes are an integral part of these financial statements.
| 38 | Litman Gregory Funds Trust | |||||
Table of Contents
iMGP Alternative Strategies Fund
CONSOLIDATED SCHEDULE OF INVESTMENTS IN SECURITIES at June 30, 2023 (Unaudited) (Continued)
| Principal Amount^ | Value | |||||||
ASSET-BACKED SECURITIES (CONTINUED) | ||||||||
| Dryden 55 CLO Ltd. | ||||||||
| $ 500,000 | Series 2018-55A-F | $ | 374,792 | |||||
| DT Auto Owner Trust | ||||||||
| 270,000 | Series 2020-3A-D | 254,160 | ||||||
| 545,000 | Series 2022-2A-D | 527,723 | ||||||
| Education Funding Trust | ||||||||
| 256,122 | Series 2020-A-A | 234,205 | ||||||
| Elevation CLO Ltd. | ||||||||
| 500,000 | Series 2021-14A-C | 474,756 | ||||||
| Exeter Automobile Receivables Trust | ||||||||
| 100,000 | Series 2023-2A-D | 98,725 | ||||||
| Fillmore Park CLO Ltd. | ||||||||
| 500,000 | Series 2018-1A-E | 444,697 | ||||||
| FirstKey Homes Trust | ||||||||
| 1,010,000 | Series 2020-SFR2-F1 | 916,224 | ||||||
| Flagship Credit Auto Trust | ||||||||
| 755,000 | Series 2022-1-D | 695,150 | ||||||
| FMC GMSR Issuer Trust | ||||||||
| 1,900,000 | Series 2021-GT1-B | 1,470,726 | ||||||
| 2,500,000 | Series 2021-GT2-B | 1,923,756 | ||||||
| Galaxy XIX CLO Ltd. | ||||||||
| 1,000,000 | Series 2015-19A-D1R | 878,126 | ||||||
| Gilbert Park CLO Ltd. | ||||||||
| 500,000 | Series 2017-1A-E | 420,627 | ||||||
| GITSIT Mortgage Loan Trust | ||||||||
| 185,000 | Series 2023-NPL1-A1 | 185,457 | ||||||
| GLS Auto Receivables Issuer Trust | ||||||||
| 1,000,000 | Series 2021-4A-E | 904,472 | ||||||
| 100,000 | Series 2023-2A-D | 98,798 | ||||||
| Greystone CRE Notes Ltd. |
| |||||||
| 355,000 | Series 2021-HC2-A | 349,220 | ||||||
| GSAA Home Equity Trust | ||||||||
| 539,918 | Series 2006-10-AF5 | 149,216 | ||||||
| Principal Amount^ | Value | |||||||
| Hayfin US CLO XII Ltd. | ||||||||
| $ 300,000 | Series 2020-12A-D | $ | 293,939 | |||||
| Hertz Vehicle Financing III LLC | ||||||||
| 357,000 | Series 2022-1A-D | 330,379 | ||||||
| 366,000 | Series 2022-3A-D | 359,779 | ||||||
| Hertz Vehicle Financing LLC | ||||||||
| 270,000 | Series 2022-4A-D | 256,110 | ||||||
| Highbridge Loan Management CLO Ltd. | ||||||||
| 500,000 | Series 2013-2A-DR | 442,700 | ||||||
| Hilton Grand Vacations Trust | ||||||||
| 48,246 | Series 2018-AA-C | 46,020 | ||||||
| Kestrel Aircraft Funding Ltd. | ||||||||
| 457,342 | Series 2018-1A-A | 393,004 | ||||||
| LCM CLO 26 Ltd. | ||||||||
| 500,000 | Series 26A-E | 345,177 | ||||||
| LCM CLO XVII L.P. | ||||||||
| 1,000,000 | Series 17A-ER | 722,663 | ||||||
| LCM CLO XX L.P. | ||||||||
| 500,000 | Series 20A-ER | 475,104 | ||||||
| LCM Loan Income Fund I Income Note Issuer CLO Ltd. | ||||||||
| 500,000 | Series 27A-E | 352,814 | ||||||
| Lehman XS Trust | ||||||||
| 1,826,531 | Series 2005-6-3A3A | 847,171 | ||||||
| Madison Park Funding CLO XLV Ltd. |
| |||||||
| 500,000 | Series 2020-45A-ER | 490,231 | ||||||
| Madison Park Funding CLO XXVI Ltd. |
| |||||||
| 445,000 | Series 2017-26A-DR | 416,416 | ||||||
| Madison Park Funding CLO XXXVIII Ltd. |
| |||||||
| 500,000 | Series 2021-38A-E | 482,724 | ||||||
| MAPS Ltd. |
| |||||||
| 358,542 | Series 2018-1A-A | 320,294 | ||||||
| 150,610 | Series 2019-1A-A | 136,156 | ||||||
The accompanying notes are an integral part of these financial statements.
| Schedule of Investments | 39 | |||||
Table of Contents
iMGP Alternative Strategies Fund
CONSOLIDATED SCHEDULE OF INVESTMENTS IN SECURITIES at June 30, 2023 (Unaudited) (Continued)
| Principal Amount^ | Value | |||||||
ASSET-BACKED SECURITIES (CONTINUED) | ||||||||
| Marble Point CLO XII Ltd. |
| |||||||
| $ 500,000 | Series 2018-1A-D | $ | 427,986 | |||||
| Marlette Funding Trust |
| |||||||
| 1,065,000 | Series 2022-1A-D | 966,583 | ||||||
| MetroNet Infrastructure Issuer LLC |
| |||||||
| 887,000 | Series 2023-B | 866,365 | ||||||
| Milos CLO Ltd. |
| |||||||
| 500,000 | Series 2017-1A-ER | 440,078 | ||||||
| Mosaic Solar Loans LLC |
| |||||||
| 850,272 | Series 2017-2A-B | 764,793 | ||||||
| MP CLO III Ltd. |
| |||||||
| 500,000 | Series 2013-1A-CR | 474,615 | ||||||
| MVW LLC |
| |||||||
| 32,158 | Series 2020-1A-C | 30,237 | ||||||
| 238,992 | Series 2021-1WA-D | 213,686 | ||||||
| MVW Owner Trust |
| |||||||
| 33,864 | Series 2019-1A-C | 31,781 | ||||||
| Myers Park CLO Ltd. |
| |||||||
| 1,000,000 | Series 2018-1A-E | 853,300 | ||||||
| Navient Private Education Refi Loan Trust |
| |||||||
| 260,000 | Series 2018-A-B | 244,982 | ||||||
| 855,000 | Series 2019-FA-B | 696,247 | ||||||
| 180,000 | Series 2019-GA-B | 148,086 | ||||||
| 320,000 | Series 2020-FA-B | 268,156 | ||||||
| Neuberger Berman CLO XVI-S Ltd. |
| |||||||
| 500,000 | Series 2017-16SA-ER | 443,538 | ||||||
| Neuberger Berman Loan Advisers CLO 24 Ltd. |
| |||||||
| 1,000,000 | Series 2017-24A-E | 907,745 | ||||||
| Neuberger Berman Loan Advisers CLO 26 Ltd. |
| |||||||
| 1,000,000 | Series 2017-26A-INC | 475,445 | ||||||
| Neuberger Berman Loan Advisers CLO 37 Ltd. |
| |||||||
| 500,000 | Series 2020-37A-ER | 464,583 | ||||||
| Principal Amount^ | Value | |||||||
| Ocean Trails CLO V |
| |||||||
| $ 700,000 | Series 2014-5A-DRR | $ | 597,057 | |||||
| Octagon Investment Partners CLO 26 Ltd. |
| |||||||
| 1,000,000 | Series 2016-1A-FR | 758,846 | ||||||
| Octagon Investment Partners CLO 29 Ltd. |
| |||||||
| 500,000 | Series 2016-1A-DR | 447,973 | ||||||
| 1,000,000 | Series 2016-1A-ER | 904,630 | ||||||
| Octagon Investment Partners CLO 39 Ltd. |
| |||||||
| 275,000 | Series 2018-3A-E | 236,798 | ||||||
| Octagon Investment Partners CLO 40 Ltd. |
| |||||||
| 500,000 | Series 2019-1A-ER | 441,066 | ||||||
| Octagon Investment Partners CLO XVI Ltd. |
| |||||||
| 1,000,000 | Series 2013-1A-ER | 809,152 | ||||||
| 1,500,000 | Series 2013-1A-SUB | 183,990 | ||||||
| Octagon Investment Partners CLO XXI Ltd. |
| |||||||
| 500,000 | Series 2014-1A-DRR | 449,675 | ||||||
| OHA Credit Funding CLO 5 Ltd. |
| |||||||
| 475,000 | Series 2020-5A-C | 470,986 | ||||||
| OHA Credit Partners CLO XVI |
| |||||||
| 250,000 | Series 2021-16A-A | 245,401 | ||||||
| OneMain Financial Issuance Trust |
| |||||||
| 290,000 | Series 2020-1A-B | 288,799 | ||||||
| 265,000 | Series 2020-2A-C | 230,567 | ||||||
| Pagaya AI Debt Selection Trust |
| |||||||
| 800,000 | Series 2021-5-CERT | 248,706 | ||||||
| Pagaya AI Debt Trust |
| |||||||
| 879,235 | Series 2022-2-AB | 863,508 | ||||||
| PFP CLO Ltd. |
| |||||||
| 1,000,000 | Series 2021-8-C | 937,177 | ||||||
| Planet Fitness Master Issuer LLC |
| |||||||
| 752,700 | Series 2019-1A-A2 | 631,662 | ||||||
| Post CLO Ltd. |
| |||||||
| 370,000 | Series 2023-1A-A | 369,212 | ||||||
The accompanying notes are an integral part of these financial statements.
| 40 | Litman Gregory Funds Trust | |||||
Table of Contents
iMGP Alternative Strategies Fund
CONSOLIDATED SCHEDULE OF INVESTMENTS IN SECURITIES at June 30, 2023 (Unaudited) (Continued)
| Principal Amount^ | Value | |||||||
ASSET-BACKED SECURITIES (CONTINUED) | ||||||||
| Progress Residential Trust |
| |||||||
| $ 255,000 | Series 2020-SFR3-F | $ | 229,022 | |||||
| 140,000 | Series 2021-SFR1-F | 121,173 | ||||||
| 3,490,936 | Series 2021-SFR10-F | 2,959,526 | ||||||
| 2,432,000 | Series 2021-SFR2-D | 2,134,470 | ||||||
| 170,000 | Series 2021-SFR2-E2 | 148,528 | ||||||
| 7,000,000 | Series 2021-SFR2-G | 6,145,714 | ||||||
| 355,000 | Series 2021-SFR3-F | 314,032 | ||||||
| 250,000 | Series 2021-SFR5-F | 213,499 | ||||||
| 125,000 | Series 2021-SFR6-E2 | 107,523 | ||||||
| 835,000 | Series 2021-SFR7-F | 683,479 | ||||||
| Rockford Tower CLO Ltd. |
| |||||||
| 700,000 | Series 2017-2A-CR | 688,608 | ||||||
| RR CLO 2 Ltd. |
| |||||||
| 500,000 | Series 2017-2A-DR | 443,816 | ||||||
| RR CLO 6 Ltd. |
| |||||||
| 500,000 | Series 2019-6A-DR | 431,599 | ||||||
| SCF Equipment Leasing LLC |
| |||||||
| 295,000 | Series 2021-1A-E | 263,276 | ||||||
| Sierra Timeshare Receivables Funding LLC |
| |||||||
| 134,864 | Series 2020-2A-C | 127,127 | ||||||
| Slam Ltd. |
| |||||||
| 223,125 | Series 2021-1A-B | 186,342 | ||||||
| SLM Private Credit Student Loan Trust |
| |||||||
| 118,000 | Series 2003-A-A3 | 117,218 | ||||||
| 357,000 | Series 2003-B-A3 | 356,007 | ||||||
| 50,000 | Series 2003-B-A4 | 49,861 | ||||||
| SoFi Professional Loan Program LLC |
| |||||||
| 360,000 | Series 2020-A-BFX | 306,445 | ||||||
| SoFi Professional Loan Program LLC |
| |||||||
| 133,000 | Series 2017-F-R1 | 1,622,000 | ||||||
| Sound Point CLO XXXII Ltd. |
| |||||||
| 500,000 | Series 2021-4A-E | 392,623 | ||||||
| Principal Amount^ | Value | |||||||
| SpringCastle America Funding LLC |
| |||||||
| $ 382,002 | Series 2020-AA-A | $ | 341,828 | |||||
| Stewart Park CLO Ltd. |
| |||||||
| 500,000 | Series 2015-1A-ER | 391,367 | ||||||
| Sunnova Helios XI Issuer LLC |
| |||||||
| 154,335 | Series 2023-A-B | 148,151 | ||||||
| Textainer Marine Containers VII Ltd. |
| |||||||
| 78,928 | Series 2020-1A-A | 71,730 | ||||||
| 182,658 | Series 2021-1A-B | 152,279 | ||||||
| THL Credit Wind River CLO Ltd. |
| |||||||
| 2,000,000 | Series 2014-2A-INC | 199,322 | ||||||
| 500,000 | Series 2017-3A-ER | 442,402 | ||||||
| 500,000 | Series 2018-2A-E | 404,078 | ||||||
| TICP CLO VII Ltd. |
| |||||||
| 280,000 | Series 2017-7A-CR | 269,630 | ||||||
| TICP CLO XV Ltd. |
| |||||||
| 250,000 | Series 2020-15A-C | 243,735 | ||||||
| Towd Point Mortgage Trust |
| |||||||
| 385,000 | Series 2019-2-M1 | 319,817 | ||||||
| Trestles CLO II Ltd. |
| |||||||
| 335,000 | Series 2018-2A-D | 298,533 | ||||||
| Tricon American Homes Trust |
| |||||||
| 290,000 | Series 2020-SFR2-E1 | 246,295 | ||||||
| Upstart Pass-Through Trust |
| |||||||
| 1,000,000 | Series 2021-ST8-CERT | 329,591 | ||||||
| 929,000 | Series 2021-ST9-CERT | 292,749 | ||||||
| Upstart Securitization Trust |
| |||||||
| 1,000 | Series 2021-2-CERT | 125,102 | ||||||
| VCAT LLC |
| |||||||
| 209,387 | Series 2021-NPL5-A1 | 189,927 | ||||||
| VOLT XCIV LLC |
| |||||||
| 67,224 | Series 2021-NPL3-A1 | 62,074 | ||||||
| 675,000 | Series 2021-NPL3-A2 | 605,308 | ||||||
| Voya CLO Ltd. |
| |||||||
| 500,000 | Series 2018-2A-E | 397,738 | ||||||
The accompanying notes are an integral part of these financial statements.
| Schedule of Investments | 41 | |||||
Table of Contents
iMGP Alternative Strategies Fund
CONSOLIDATED SCHEDULE OF INVESTMENTS IN SECURITIES at June 30, 2023 (Unaudited) (Continued)
| Principal Amount^ | Value | |||||||
ASSET-BACKED SECURITIES (CONTINUED) | ||||||||
| Voya CLO Ltd. (Continued) | ||||||||
| $ 500,000 | Series 2019-1A-ER | $ | 419,154 | |||||
| WAVE Trust |
| |||||||
| 377,595 | Series 2017-1A-A | 302,091 | ||||||
| Webster Park CLO Ltd. |
| |||||||
| 1,000,000 | Series 2015-1A-DR | 817,875 | ||||||
| Wellfleet CLO Ltd. |
| |||||||
| 1,000,000 | Series 2017-3A-C | 849,150 | ||||||
| Wendy’s Funding LLC |
| |||||||
| 171,950 | Series 2019-1A-A2II | 152,284 | ||||||
| Willis Engine Structured Trust V |
| |||||||
| 205,472 | Series 2020-A-A | 172,083 | ||||||
| Willis Engine Structured Trust VI |
| |||||||
| 1,471,440 | Series 2021-A-C | 1,208,139 | ||||||
| Wind River CLO Ltd. |
| |||||||
| 500,000 | Series 2021-2A-E | 421,576 | ||||||
|
| |||||||
| | TOTAL ASSET-BACKED SECURITIES | 89,415,573 | ||||||
|
| |||||||
BANK LOANS: 1.6% | ||||||||
| Air Methods Corp. |
| |||||||
| 286,158 | 9.231%, 04/22/2024(g) | 107,309 | ||||||
| AmWINS Group, Inc. |
| |||||||
| 44,775 | 7.834%, 02/19/2028(g) | 44,724 | ||||||
| Applied Systems, Inc. |
| |||||||
| 450,000 | 11.992%, 09/17/2027(g) | 451,267 | ||||||
| Astra Acquisition Corp. |
| |||||||
| 266,783 | 10.443%, 10/25/2028(g) | 187,999 | ||||||
| 1,069,743 | 14.092%, 10/25/2029(g) | 596,382 | ||||||
| Asurion LLC |
| |||||||
| 160,000 | 10.505%, 01/31/2028(g) | 136,750 | ||||||
| Atlas Purchaser, Inc. |
| |||||||
| 377,401 | 10.385%, 05/08/2028(g) 3 mo. LIBOR + 5.250% | 256,103 | ||||||
| Aveanna Healthcare LLC |
| |||||||
| 284,530 | 12.476%, 12/10/2029(g) | 177,476 | ||||||
| Blackhawk Network Holdings, Inc. |
| |||||||
| 125,000 | 12.250%, 06/15/2026(g) | 119,938 | ||||||
| Principal Amount^ | Value | |||||||
| Bright Bidco B.V. |
| |||||||
| $ 130,466 | 5.676%, 10/31/2027(e)(g) | $ | 67,625 | |||||
| BYJU’s Alpha, Inc. |
| |||||||
| 325,924 | 13.538%, 11/24/2026(g) | 207,777 | ||||||
| Caesars Entertainment Corp. |
| |||||||
| 80,798 | 8.452%, 02/06/2030(g) | 80,903 | ||||||
| Carnival Corp. |
| |||||||
| 378,152 | 8.217%, 06/30/2025(g) | 377,975 | ||||||
| 288,636 | 8.467%, 10/18/2028(g) | 286,591 | ||||||
| Cengage Learning, Inc. |
| |||||||
| 397,913 | 9.880%, 07/14/2026(g) | 390,776 | ||||||
| Constant Contact, Inc. |
| |||||||
| 875,000 | 12.698%, 02/12/2029(g) | 736,094 | ||||||
| Cornerstone OnDemand, Inc. |
| |||||||
| 23,819 | 9.253%, 10/16/2028(g) | 22,256 | ||||||
| Cyxtera DC Holdings, Inc. |
| |||||||
| 458,865 | 8.068%, 05/01/2024(g)(k) | 233,484 | ||||||
| DCert Buyer, Inc. |
| |||||||
| 485,000 | 12.264%, 02/19/2029(g) | 447,010 | ||||||
| DG Investment Intermediate Holdings 2, Inc. |
| |||||||
| 420,000 | 11.967%, 03/30/2029(g) | 374,062 | ||||||
| Envision Healthcare Corp. |
| |||||||
| 1,010,054 | 8.992%, 03/31/2027(g)(k) | 19,257 | ||||||
| 413,268 | 9.492%, 03/31/2027(g)(k) | 93,374 | ||||||
| Farfetch U.S. Holdings, Inc. |
| |||||||
| 209,945 | 11.299%, 10/20/2027(g) | 198,660 | ||||||
| Finastra USA, Inc. |
| |||||||
| 450,150 | 9.038%-9.231%, 06/13/2024(g) | 433,901 | ||||||
| 405,000 | 12.981%, 06/13/2025(g) | 369,133 | ||||||
| Gulf Finance LLC |
| |||||||
| 409,513 | 11.967%, 08/25/2026(g) | 399,333 | ||||||
| Hub International Ltd. |
| |||||||
| 145,000 | 0.000%, 06/20/2030(l) | 145,494 | ||||||
| Intelsat Jackson Holdings S.A. |
| |||||||
| 350,471 | 9.443%, 02/01/2029(g) | 349,500 | ||||||
| Lealand Finance Company B.V. |
| |||||||
| 51,245 | 8.217%, 06/28/2024(g) | 40,996 | ||||||
| 1,308,705 | 5.177%, 06/30/2024(g) | 899,735 | ||||||
| 1,386,004 | 6.193%, 06/30/2025(e)(g) | 808,505 | ||||||
The accompanying notes are an integral part of these financial statements.
| 42 | Litman Gregory Funds Trust | |||||
Table of Contents
iMGP Alternative Strategies Fund
CONSOLIDATED SCHEDULE OF INVESTMENTS IN SECURITIES at June 30, 2023 (Unaudited) (Continued)
| Principal Amount^ | Value | |||||||
BANK LOANS (CONTINUED) | ||||||||
| LSF9 Atlantis Holdings LLC | ||||||||
| $ 229,688 | 12.492%, 03/31/2029(g) | $ | 227,678 | |||||
| MH Sub I LLC | ||||||||
| 715,000 | 9.352%, 05/03/2028(g) | 686,936 | ||||||
| Minotaur Acquisition, Inc. | ||||||||
| 449,499 | 9.852%, 03/27/2026(g) | 443,179 | ||||||
| Olympus Water U.S. Holding Corp. | ||||||||
| 110,000 | 0.000%, 11/09/2028(l) | 106,631 | ||||||
| Open Text Corp. | ||||||||
| 174,125 | 8.702%, 01/31/2030(l) | 175,104 | ||||||
| Playtika Holding Corp. | ||||||||
| 470,603 | 7.943%, 03/13/2028(g) | 469,547 | ||||||
| Rand Parent LLC | ||||||||
| 199,500 | 9.492%, 03/17/2030(g) | 188,528 | ||||||
| RegionalCare Hospital Partners Holdings, Inc. | ||||||||
| 180,000 | 9.023%, 11/16/2025(g) | 167,151 | ||||||
| Riverbed Technology, Inc. | ||||||||
| 561,371 | 11.330%, 12/07/2026(e)(g) | 152,412 | ||||||
| Team Health Holdings, Inc. | ||||||||
| 490,930 | 7.943%, 02/06/2024(g) | 436,621 | ||||||
| Uber Technologies, Inc. | ||||||||
| 359,538 | 8.014%, 03/03/2030(g) | 359,965 | ||||||
| Ultimate Software Group, Inc. | ||||||||
| 765,000 | 10.271%, 05/03/2027(g) | 743,962 | ||||||
| Viad Corp. | ||||||||
| 373,350 | 10.217%, 07/30/2028(g) | 364,016 | ||||||
| Vision Solutions, Inc. | ||||||||
| 23,818 | 9.505%, 04/24/2028(g) | 22,689 | ||||||
| Waterbridge Midstream Operating LLC | ||||||||
| 471,336 | 11.005%, 06/22/2026(g) | 469,238 | ||||||
| Ziggo B.V. | ||||||||
| 490,000 (EUR) | 6.102%, 01/31/2029(g) | 502,638 | ||||||
|
| |||||||
| | TOTAL BANK LOANS | 14,576,684 | ||||||
|
| |||||||
CONVERTIBLE BONDS: 1.5% | ||||||||
| Communications: 0.6% | ||||||||
| Delivery Hero SE |
| |||||||
| 1,400,000 (EUR) | 1.000%, 01/23/2027 | 1,186,382 | ||||||
| 100,000 (EUR) | 1.000%, 04/30/2026 | 88,245 | ||||||
| DISH Network Corp. |
| |||||||
| 305,000 | 0.000%, 12/15/2025(i) | 161,989 | ||||||
| 3,090,000 | 3.375%, 08/15/2026 | 1,583,625 | ||||||
| Principal Amount^ | Value | |||||||
| Communications (continued) | ||||||||
| SNAP, Inc. |
| |||||||
| $ 335,000 | 0.000%, 05/01/2027(i) | $ | 249,575 | |||||
| Spotify USA, Inc. |
| |||||||
| 280,000 | 0.000%, 03/15/2026(i) | 239,260 | ||||||
| Uber Technologies, Inc. |
| |||||||
| 480,000 | 0.000%, 12/15/2025(i) | 440,173 | ||||||
| Wayfair, Inc. |
| |||||||
| 1,362,000 | 0.625%, 10/01/2025 | 1,165,999 | ||||||
| 42,000 | 1.000%, 08/15/2026 | 34,758 | ||||||
| Zillow Group, Inc. |
| |||||||
| 27,000 | 2.750%, 05/15/2025 | 28,458 | ||||||
| 269,000 | 1.375%, 09/01/2026 | 340,957 | ||||||
|
| |||||||
| 5,519,421 | ||||||||
|
| |||||||
| Consumer, Cyclical: 0.2% | ||||||||
| Cineplex, Inc. |
| |||||||
| 1,041,000 (CAD) | 5.750%, 09/30/2025(b) | 788,368 | ||||||
| JetBlue Airways Corp. |
| |||||||
| 195,000 | 0.500%, 04/01/2026 | 161,120 | ||||||
| NCL Corp. Ltd. |
| |||||||
| 190,000 | 1.125%, 02/15/2027 | 176,046 | ||||||
| Peloton Interactive, Inc. |
| |||||||
| 50,000 | 0.000%, 02/15/2026(i) | 37,974 | ||||||
| Penn Entertainment, Inc. |
| |||||||
| 110,000 | 2.750%, 05/15/2026 | 136,840 | ||||||
| Southwest Airlines Co. |
| |||||||
| 610,000 | 1.250%, 05/01/2025 | 701,652 | ||||||
|
| |||||||
| 2,002,000 | ||||||||
|
| |||||||
| Consumer, Non-cyclical: 0.5% | ||||||||
| BioMarin Pharmaceutical, Inc. |
| |||||||
| 985,000 | 1.250%, 05/15/2027 | 995,150 | ||||||
| Guardant Health, Inc. |
| |||||||
| 215,000 | 0.000%, 11/15/2027(i) | 154,792 | ||||||
| Livongo Health, Inc. |
| |||||||
| 485,000 | 0.875%, 06/01/2025 | 440,370 | ||||||
| Paratek Pharmaceuticals, Inc. |
| |||||||
| 1,451,000 | 4.750%, 05/01/2024 | 1,434,667 | ||||||
| Teladoc Health, Inc. |
| |||||||
| 760,000 | 1.250%, 06/01/2027 | 608,000 | ||||||
| UpHealth, Inc. |
| |||||||
| 782,000 | 14.060% 12/15/2025(b)(g) | 625,600 | ||||||
| 533,000 | 6.250%, 06/15/2026(b) | 156,902 | ||||||
|
| |||||||
| 4,415,481 | ||||||||
|
| |||||||
| Technology: 0.2% | ||||||||
| Kaleyra, Inc. |
| |||||||
| 839,000 | 6.125%, 06/01/2026(b) | 820,729 | ||||||
| Nutanix, Inc. |
| |||||||
| 60,000 | 0.250%, 10/01/2027 | 51,038 | ||||||
| Splunk, Inc. |
| |||||||
| 360,000 | 1.125%, 06/15/2027 | 312,300 | ||||||
| Unity Software, Inc. |
| |||||||
| 515,000 | 0.000%, 11/15/2026(i) | 413,802 | ||||||
| Wolfspeed, Inc. |
| |||||||
| 60,000 | 0.250%, 02/15/2028 | 46,260 | ||||||
| 115,000 | 1.875%, 12/01/2029(b) | 89,240 | ||||||
|
| |||||||
| 1,733,369 | ||||||||
|
| |||||||
| | TOTAL CONVERTIBLE BONDS | 13,670,271 | ||||||
|
| |||||||
The accompanying notes are an integral part of these financial statements.
| Schedule of Investments | 43 | |||||
Table of Contents
iMGP Alternative Strategies Fund
CONSOLIDATED SCHEDULE OF INVESTMENTS IN SECURITIES at June 30, 2023 (Unaudited) (Continued)
| Principal Amount^ | Value | |||||||
CORPORATE BONDS: 20.2% | ||||||||
| Basic Materials: 1.3% | ||||||||
| ArcelorMittal SA | ||||||||
| $330,000 | 6.800%, 11/29/2032 | $ | 338,207 | |||||
| Arconic Corp. | ||||||||
| 1,025,000 | 6.000%, 05/15/2025(b) | 1,035,506 | ||||||
| Aris Mining Corp. | ||||||||
| 200,000 | 6.875%, 08/09/2026 | 147,144 | ||||||
| Ashland, Inc. | ||||||||
| 180,000 | 3.375%, 09/01/2031(b) | 142,823 | ||||||
| ASP Unifrax Holdings, Inc. | ||||||||
| 260,000 | 7.500%, 09/30/2029(b) | 161,258 | ||||||
| Braskem Idesa SAPI | ||||||||
| 450,000 | 6.990%, 02/20/2032(b) | 291,880 | ||||||
| Braskem Netherlands Finance BV | ||||||||
| 560,000 | 4.500%, 01/31/2030(b) | 481,548 | ||||||
| 400,000 | 8.500%, 01/23/2081(h) | 408,376 | ||||||
| CAP SA | ||||||||
| 300,000 | 3.900%, 04/27/2031 | 218,655 | ||||||
| Commercial Metals Co. | ||||||||
| 90,000 | 4.375%, 03/15/2032 | 77,907 | ||||||
| Eldorado Gold Corp. | ||||||||
| 1,212,000 | 6.250%, 09/01/2029(b) | 1,087,012 | ||||||
| First Quantum Minerals Ltd. | ||||||||
| 236,000 | 7.500%, 04/01/2025(b) | 236,038 | ||||||
| 1,035,000 | 6.875%, 03/01/2026(b) | 1,020,279 | ||||||
| FMG Resources August 2006 Pty Ltd. | ||||||||
| 1,120,000 | 6.125%, 04/15/2032(b) | 1,068,942 | ||||||
| IAMGOLD Corp. | ||||||||
| 630,000 | 5.750%, 10/15/2028(b) | 472,201 | ||||||
| Illuminate Buyer LLC/Illuminate Holdings IV, Inc. | ||||||||
| 130,000 | 9.000%, 07/01/2028(b) | 113,459 | ||||||
| OCP SA | ||||||||
| 650,000 | 5.125%, 06/23/2051 | 475,306 | ||||||
| Sasol Financing USA LLC | ||||||||
| 200,000 | 5.500%, 03/18/2031 | 157,690 | ||||||
| Southern Copper Corp. | ||||||||
| 1,000,000 | 7.500%, 07/27/2035 | 1,162,368 | ||||||
| Unigel Luxembourg SA | ||||||||
| 450,000 | 8.750%, 10/01/2026 | 147,375 | ||||||
| UPL Corp. Ltd. | ||||||||
| 460,000 | 5.250%, 02/27/2025(d)(h) | 381,363 | ||||||
| Valvoline, Inc. | ||||||||
| 979,000 | 4.250%, 02/15/2030(b) | 959,651 | ||||||
| 1,200,000 | 3.625%, 06/15/2031(b) | 976,704 | ||||||
| Vedanta Resources Finance II PLC | ||||||||
| 250,000 | 9.250%, 04/23/2026(b) | 185,778 | ||||||
| 200,000 | 9.250%, 04/23/2026 | 148,622 | ||||||
| Vedanta Resources Ltd. | ||||||||
| 200,000 | 6.125%, 08/09/2024 | 149,890 | ||||||
|
| |||||||
| 12,045,982 | ||||||||
|
| |||||||
| Communications: 2.6% | ||||||||
| Alibaba Group Holding Ltd. | ||||||||
| 200,000 | 3.250%, 02/09/2061 | 123,666 | ||||||
| ANGI Group LLC |
| |||||||
| 240,000 | 3.875%, 08/15/2028(b) | 196,145 | ||||||
| Principal Amount^ | Value | |||||||
| Communications (continued) | ||||||||
| CCO Holdings LLC/CCO Holdings Capital Corp. | ||||||||
| $ 125,000 | 5.500%, 05/01/2026(b) | $ | 121,993 | |||||
| 3,160,000 | 5.125%, 05/01/2027(b) | 2,946,046 | ||||||
| Cengage Learning, Inc. | ||||||||
| 18,000 | 9.500%, 06/15/2024(b) | 18,009 | ||||||
| Charter Communications Operating LLC/Charter Communications Operating Capital | ||||||||
| 145,000 | 2.800%, 04/01/2031 | 116,677 | ||||||
| 55,000 | 2.300%, 02/01/2032 | 41,647 | ||||||
| 70,000 | 4.400%, 04/01/2033 | 61,442 | ||||||
| 1,130,000 | 4.400%, 12/01/2061 | 762,824 | ||||||
| Cogent Communications Group, Inc. | ||||||||
| 870,000 | 7.000%, 06/15/2027(b) | 842,508 | ||||||
| CommScope Technologies LLC | ||||||||
| 640,000 | 5.000%, 03/15/2027(b) | 445,817 | ||||||
| CommScope, Inc. | ||||||||
| 330,000 | 7.125%, 07/01/2028(b) | 234,732 | ||||||
| CSC Holdings LLC | ||||||||
| 200,000 | 4.125%, 12/01/2030(b) | 140,092 | ||||||
| 4,975,000 | 4.625%, 12/01/2030(b) | 2,218,905 | ||||||
| 975,000 | 3.375%, 02/15/2031(b) | 660,911 | ||||||
| 400,000 | 4.500%, 11/15/2031(b) | 279,246 | ||||||
| CT Trust | ||||||||
| 200,000 | 5.125%, 02/03/2032 | 160,696 | ||||||
| Directv Financing LLC/Directv Financing Co.-Obligor, Inc. | ||||||||
| 155,000 | 5.875%, 08/15/2027(b) | 140,528 | ||||||
| DISH DBS Corp. | ||||||||
| 1,755,000 | 5.250%, 12/01/2026(b) | 1,411,182 | ||||||
| 685,000 | 5.750%, 12/01/2028(b) | 510,830 | ||||||
| 655,000 | 5.125%, 06/01/2029 | 304,759 | ||||||
| Embarq Corp. | ||||||||
| 260,000 | 7.995%, 06/01/2036 | 157,498 | ||||||
| FactSet Research Systems, Inc. | ||||||||
| 482,000 | 3.450%, 03/01/2032 | 410,429 | ||||||
| Hughes Satellite Systems Corp. | ||||||||
| 1,260,000 | 6.625%, 08/01/2026 | 1,179,240 | ||||||
| iHeartCommunications, Inc. | ||||||||
| 350,000 | 5.250%, 08/15/2027(b) | 268,091 | ||||||
| 495,000 | 4.750%, 01/15/2028(b) | 373,848 | ||||||
| Intelsat Jackson Holdings SA | ||||||||
| 825,000 | 8.500%, 10/15/2024(b) | 0 | ||||||
| McGraw-Hill Education, Inc. | ||||||||
| 335,000 | 5.750%, 08/01/2028(b) | 290,653 | ||||||
| Motorola Solutions, Inc. | ||||||||
| 850,000 | 2.750%, 05/24/2031 | 696,652 | ||||||
| 1,247,000 | 5.600%, 06/01/2032 | 1,235,637 | ||||||
| Netflix, Inc. | ||||||||
| 75,000 | 4.875%, 04/15/2028 | 74,197 | ||||||
| 290,000 | 5.875%, 11/15/2028 | 299,902 | ||||||
| 235,000 | 6.375%, 05/15/2029 | 248,589 | ||||||
| 70,000 | 5.375%, 11/15/2029(b) | 70,317 | ||||||
| 445,000 | 4.875%, 06/15/2030(b) | 438,322 | ||||||
| Newfold Digital Holdings Group, Inc. | ||||||||
| 155,000 | 6.000%, 02/15/2029(b) | 116,497 | ||||||
| Oi SA | ||||||||
| 36,684 | 14.000%, 09/07/2024(b)(e) | 37,540 | ||||||
| 550,000 | 10.000%, 07/27/2025(e)(k) | 39,764 | ||||||
The accompanying notes are an integral part of these financial statements.
| 44 | Litman Gregory Funds Trust | |||||
Table of Contents
iMGP Alternative Strategies Fund
CONSOLIDATED SCHEDULE OF INVESTMENTS IN SECURITIES at June 30, 2023 (Unaudited) (Continued)
| Principal Amount^ | Value | |||||||
CORPORATE BONDS (CONTINUED) | ||||||||
| Communications (continued) | ||||||||
| SoftBank Group Corp. | ||||||||
| $ 600,000 | 4.625%, 07/06/2028 | $ | 520,410 | |||||
| 205,000 | 5.250%, 07/06/2031 | 177,105 | ||||||
| Telesat Canada/Telesat LLC | ||||||||
| 310,000 | 5.625%, 12/06/2026(b) | 191,589 | ||||||
| Uber Technologies, Inc. | ||||||||
| 75,000 | 8.000%, 11/01/2026(b) | 76,522 | ||||||
| 245,000 | 7.500%, 09/15/2027(b) | 250,875 | ||||||
| 15,000 | 6.250%, 01/15/2028(b) | 14,944 | ||||||
| 2,950,000 | 4.500%, 08/15/2029(b) | 2,720,930 | ||||||
| VeriSign, Inc. | ||||||||
| 852,000 | 2.700%, 06/15/2031 | 709,378 | ||||||
| Viasat, Inc. | ||||||||
| 723,000 | 6.500%, 07/15/2028(b) | 613,393 | ||||||
| VTR Finance NV | ||||||||
| 500,000 | 6.375%, 07/15/2028 | 192,484 | ||||||
|
| |||||||
| 23,143,461 | ||||||||
|
| |||||||
| Consumer, Cyclical: 4.3% | ||||||||
| Allison Transmission, Inc. | ||||||||
| 2,614,000 | 3.750%, 01/30/2031(b) | 2,210,551 | ||||||
| Asbury Automotive Group, Inc. | ||||||||
| 195,000 | 4.625%, 11/15/2029(b) | 173,310 | ||||||
| AutoNation, Inc. | ||||||||
| 700,000 | 3.850%, 03/01/2032 | 594,212 | ||||||
| Beazer Homes USA, Inc. | ||||||||
| 1,700,000 | 7.250%, 10/15/2029 | 1,654,651 | ||||||
| Brunswick Corp. | ||||||||
| 780,000 | 4.400%, 09/15/2032 | 681,771 | ||||||
| Carnival Corp. | ||||||||
| 170,000 | 7.625%, 03/01/2026(b) | 166,655 | ||||||
| 540,000 | 5.750%, 03/01/2027(b) | 497,646 | ||||||
| 1,035,000 | 6.000%, 05/01/2029(b) | 925,017 | ||||||
| Carrols Restaurant Group, Inc. | ||||||||
| 300,000 | 5.875%, 07/01/2029(b) | 247,230 | ||||||
| CDI Escrow Issuer, Inc. | ||||||||
| 863,000 | 5.750%, 04/01/2030(b) | 806,226 | ||||||
| Churchill Downs, Inc. | ||||||||
| 1,078,000 | 4.750%, 01/15/2028(b) | 1,000,884 | ||||||
| 250,000 | 6.750%, 05/01/2031(b) | 247,187 | ||||||
| Cinemark USA, Inc. | ||||||||
| 500,000 | 5.250%, 07/15/2028(b) | 440,587 | ||||||
| Dealer Tire LLC/DT Issuer LLC | ||||||||
| 140,000 | 8.000%, 02/01/2028(b) | 128,163 | ||||||
| Dick’s Sporting Goods, Inc. | ||||||||
| 640,000 | 3.150%, 01/15/2032 | 524,667 | ||||||
| FirstCash, Inc. | ||||||||
| 850,000 | 5.625%, 01/01/2030(b) | 769,028 | ||||||
| Forestar Group, Inc. | ||||||||
| 1,650,000 | 3.850%, 05/15/2026(b) | 1,518,008 | ||||||
| General Motors Co. | ||||||||
| 645,000 | 5.400%, 04/01/2048 | 554,269 | ||||||
| 510,000 | 5.950%, 04/01/2049 | 476,407 | ||||||
| General Motors Financial Co., Inc. | ||||||||
| 360,000 | 6.000%, 01/09/2028 | 362,925 | ||||||
| 310,000 | Series A 5.750%, 09/30/2027(d)(h) | 253,037 | ||||||
| Principal Amount^ | Value | |||||||
| Consumer, Cyclical (continued) | ||||||||
| $ 255,000 | Series B 6.500%, 09/30/2028(d)(h) | $ | 218,885 | |||||
| 100,000 | Series C 5.700%, 09/30/2030(d)(h) | 88,159 | ||||||
| Genm Capital Labuan Ltd. | ||||||||
| 440,000 | 3.882%, 04/19/2031(b) | 356,207 | ||||||
| Hilton Domestic Operating Co., Inc. | ||||||||
| 1,913,000 | 3.625%, 02/15/2032(b) | 1,596,791 | ||||||
| Hilton Grand Vacations Borrower Escrow LLC/Hilton Grand Vacations Borrower Esc | ||||||||
| 160,000 | 4.875%, 07/01/2031(b) | 134,357 | ||||||
| Installed Building Products, Inc. | ||||||||
| 410,000 | 5.750%, 02/01/2028(b) | 386,892 | ||||||
| Las Vegas Sands Corp. | ||||||||
| 1,090,000 | 3.900%, 08/08/2029 | 970,620 | ||||||
| LGI Homes, Inc. | ||||||||
| 540,000 | 4.000%, 07/15/2029(b) | 449,709 | ||||||
| Lithia Motors, Inc. | ||||||||
| 865,000 | 3.875%, 06/01/2029(b) | 752,623 | ||||||
| M/I Homes, Inc. | ||||||||
| 990,000 | 4.950%, 02/01/2028 | 923,853 | ||||||
| 710,000 | 3.950%, 02/15/2030 | 606,241 | ||||||
| Marriott Ownership Resorts, Inc. | ||||||||
| 65,000 | 4.500%, 06/15/2029(b) | 56,158 | ||||||
| MDC Holdings, Inc. | ||||||||
| 700,000 | 2.500%, 01/15/2031 | 550,560 | ||||||
| Meritage Homes Corp. | ||||||||
| 850,000 | 3.875%, 04/15/2029(b) | 751,752 | ||||||
| NCL Corp. Ltd. | ||||||||
| 430,000 | 5.875%, 03/15/2026(b) | 402,616 | ||||||
| 225,000 | 5.875%, 02/15/2027(b) | 219,288 | ||||||
| 545,000 | 7.750%, 02/15/2029(b) | 518,207 | ||||||
| NCL Finance Ltd. | ||||||||
| 115,000 | 6.125%, 03/15/2028(b) | 103,606 | ||||||
| NVR, Inc. | ||||||||
| 412,000 | 3.000%, 05/15/2030 | 357,102 | ||||||
| Park River Holdings, Inc. | ||||||||
| 120,000 | 5.625%, 02/01/2029(b) | 93,155 | ||||||
| Patrick Industries, Inc. | ||||||||
| 750,000 | 4.750%, 05/01/2029(b) | 645,049 | ||||||
| Premier Entertainment Sub LLC/Premier Entertainment Finance Corp. | ||||||||
| 240,000 | 5.625%, 09/01/2029(b) | 182,023 | ||||||
| 190,000 | 5.875%, 09/01/2031(b) | 140,386 | ||||||
| PulteGroup, Inc. | ||||||||
| 500,000 | 6.375%, 05/15/2033 | 517,724 | ||||||
| 455,000 | 6.000%, 02/15/2035 | 460,751 | ||||||
| Royal Caribbean Cruises Ltd. | ||||||||
| 145,000 | 4.250%, 07/01/2026(b) | 133,228 | ||||||
| 675,000 | 5.500%, 04/01/2028(b) | 630,337 | ||||||
| Scientific Games International, Inc. | ||||||||
| 580,000 | 7.000%, 05/15/2028(b) | 577,118 | ||||||
| Suburban Propane Partners LP/Suburban Energy Finance Corp. | ||||||||
| 490,000 | 5.000%, 06/01/2031(b) | 410,946 | ||||||
| Superior Plus LP/Superior General Partner, Inc. | ||||||||
| 1,492,000 | 4.500%, 03/15/2029(b) | 1,309,320 | ||||||
| SWF Escrow Issuer Corp. | ||||||||
| 450,000 | 6.500%, 10/01/2029(b) | 270,598 | ||||||
The accompanying notes are an integral part of these financial statements.
| Schedule of Investments | 45 | |||||
Table of Contents
iMGP Alternative Strategies Fund
CONSOLIDATED SCHEDULE OF INVESTMENTS IN SECURITIES at June 30, 2023 (Unaudited) (Continued)
| Principal Amount^ | Value | |||||||
CORPORATE BONDS (CONTINUED) | ||||||||
| Consumer, Cyclical (continued) | ||||||||
| Taylor Morrison Communities, Inc. | ||||||||
| $ 500,000 | 5.125%, 08/01/2030(b) | $ | 462,194 | |||||
| Tempur Sealy International, Inc. | ||||||||
| 1,460,000 | 3.875%, 10/15/2031(b) | 1,192,871 | ||||||
| TKC Holdings, Inc. | ||||||||
| 320,000 | 10.500%, 05/15/2029(b) | 243,546 | ||||||
| Toll Brothers Finance Corp. | ||||||||
| 780,000 | 3.800%, 11/01/2029 | 699,502 | ||||||
| Travel & Leisure Co. | ||||||||
| 60,000 | 6.625%, 07/31/2026(b) | 59,598 | ||||||
| 35,000 | 6.000%, 04/01/2027 | 34,006 | ||||||
| 260,000 | 4.500%, 12/01/2029(b) | 221,463 | ||||||
| 110,000 | 4.625%, 03/01/2030(b) | 93,186 | ||||||
| Tri Pointe Homes, Inc. | ||||||||
| 1,550,000 | 5.700%, 06/15/2028 | 1,498,695 | ||||||
| United Airlines Pass Through Trust | ||||||||
| 1,149,501 | Series 2019-2-B | 1,034,405 | ||||||
| 109,600 | Series 2020-1-B | 104,698 | ||||||
| Viking Cruises Ltd. | ||||||||
| 185,000 | 9.125%, 07/15/2031(b) | 187,089 | ||||||
| Vista Outdoor, Inc. | ||||||||
| 250,000 | 4.500%, 03/15/2029(b) | 202,739 | ||||||
| VOC Escrow Ltd. | ||||||||
| 455,000 | 5.000%, 02/15/2028(b) | 417,877 | ||||||
| Warnermedia Holdings, Inc. | ||||||||
| 195,000 | 4.054%, 03/15/2029 | 178,303 | ||||||
| 540,000 | 4.279%, 03/15/2032 | 479,240 | ||||||
| Wheel Pros, Inc. | ||||||||
| 230,000 | 6.500%, 05/15/2029(b) | 69,610 | ||||||
| Wynn Resorts Finance LLC/Wynn Resorts Capital Corp. | ||||||||
| 650,000 | 7.125%, 02/15/2031(b) | 646,637 | ||||||
| Yum! Brands, Inc. | ||||||||
| 1,249,000 | 4.750%, 01/15/2030(b) | 1,170,794 | ||||||
| 1,252,000 | 4.625%, 01/31/2032 | 1,132,578 | ||||||
| ZF North America Capital, Inc. | ||||||||
| 150,000 | 6.875%, 04/14/2028(b) | 152,242 | ||||||
| 150,000 | 7.125%, 04/14/2030(b) | 153,063 | ||||||
|
| |||||||
| 39,481,028 | ||||||||
|
| |||||||
| Consumer, Non-cyclical: 1.8% | ||||||||
| Adani International Container Terminal Pvt Ltd. |
| |||||||
| 183,000 | 3.000%, 02/16/2031 | 143,962 | ||||||
| Adani Ports & Special Economic Zone Ltd. | ||||||||
| 600,000 | 5.000%, 08/02/2041 | 400,597 | ||||||
| Air Methods Corp. | ||||||||
| 460,000 | 8.000%, 05/15/2025(b) | 4,025 | ||||||
| Bausch Health Cos., Inc. | ||||||||
| 230,000 | 7.000%, 01/15/2028(b) | 101,260 | ||||||
| 260,000 | 5.000%, 01/30/2028(b) | 111,812 | ||||||
| 810,000 | 4.875%, 06/01/2028(b) | 481,699 | ||||||
| BRF SA | ||||||||
| 550,000 | 5.750%, 09/21/2050 | 367,792 | ||||||
| Camposol SA | ||||||||
| 200,000 | 6.000%, 02/03/2027 | 138,677 | ||||||
| Principal Amount^ | Value | |||||||
| Consumer, Non-cyclical (continued) | ||||||||
| Coruripe Netherlands BV | ||||||||
| $ 400,000 | 10.000%, 02/10/2027 | $ | 254,680 | |||||
| DaVita, Inc. | ||||||||
| 510,000 | 3.750%, 02/15/2031(b) | 408,344 | ||||||
| Deluxe Corp. | ||||||||
| 75,000 | 8.000%, 06/01/2029(b) | 58,798 | ||||||
| Encompass Health Corp. | ||||||||
| 500,000 | 4.625%, 04/01/2031 | 443,893 | ||||||
| Endo Luxembourg Finance Co. I Sarl/Endo US, Inc. | ||||||||
| 265,000 | 6.125%, 04/01/2029(b)(k) | 196,364 | ||||||
| Frigorifico Concepcion SA | ||||||||
| 400,000 | 7.700%, 07/21/2028 | 312,051 | ||||||
| Gartner, Inc. | ||||||||
| 1,200,000 | 3.625%, 06/15/2029(b) | 1,057,600 | ||||||
| 400,000 | 3.750%, 10/01/2030(b) | 348,813 | ||||||
| Global Payments, Inc. | ||||||||
| 55,000 | 5.400%, 08/15/2032 | 53,607 | ||||||
| Herbalife Nutrition Ltd./HLF Financing, Inc. | ||||||||
| 137,000 | 7.875%, 09/01/2025(b) | 124,839 | ||||||
| Hologic, Inc. | ||||||||
| 574,000 | 3.250%, 02/15/2029(b) | 502,719 | ||||||
| JBS USA LUX SA/JBS USA Food Co./JBS USA Finance, Inc. | ||||||||
| 240,000 | 3.000%, 02/02/2029(b) | 204,005 | ||||||
| 200,000 | 4.375%, 02/02/2052 | 140,357 | ||||||
| Kronos Acquisition Holdings, Inc./KIK Custom Products, Inc. | ||||||||
| 135,000 | 7.000%, 12/31/2027(b) | 119,653 | ||||||
| Lamb Weston Holdings, Inc. | ||||||||
| 1,191,000 | 4.375%, 01/31/2032(b) | 1,065,020 | ||||||
| MARB BondCo PLC | ||||||||
| 200,000 | 3.950%, 01/29/2031 | 143,336 | ||||||
| Molina Healthcare, Inc. | ||||||||
| 75,000 | 4.375%, 06/15/2028(b) | 69,242 | ||||||
| MPH Acquisition Holdings LLC | ||||||||
| 150,000 | 5.750%, 11/01/2028(b) | 113,082 | ||||||
| Natura Cosmeticos SA | ||||||||
| 330,000 | 4.125%, 05/03/2028(b) | 285,733 | ||||||
| PECF USS Intermediate Holding III Corp. | ||||||||
| 220,000 | 8.000%, 11/15/2029(b) | 123,999 | ||||||
| Philip Morris International, Inc. | ||||||||
| 166,000 | 1.750%, 11/01/2030 | 131,247 | ||||||
| Post Holdings, Inc. | ||||||||
| 957,000 | 4.500%, 09/15/2031(b) | 818,089 | ||||||
| Pyxus Holdings, Inc. | ||||||||
| 245,100 | 8.500%, 12/31/2027(b) | 149,511 | ||||||
| Quanta Services, Inc. | ||||||||
| 100,000 | 2.900%, 10/01/2030 | 84,714 | ||||||
| Radiology Partners, Inc. | ||||||||
| 590,000 | 9.250%, 02/01/2028(b) | 216,399 | ||||||
| Service Corp. International | ||||||||
| 2,284,000 | 4.000%, 05/15/2031 | 1,948,183 | ||||||
| Teva Pharmaceutical Finance Netherlands II BV | ||||||||
| 1,455,000 (EUR) | 6.000%, 01/31/2025 | 1,614,638 | ||||||
| 215,000 (EUR) | 7.375%, 09/15/2029 | 239,734 | ||||||
| 181,000 (EUR) | 7.875%, 09/15/2031 | 204,818 | ||||||
| Teva Pharmaceutical Finance Netherlands III BV | ||||||||
| 395,000 | 7.125%, 01/31/2025 | 400,686 | ||||||
The accompanying notes are an integral part of these financial statements.
| 46 | Litman Gregory Funds Trust | |||||
Table of Contents
iMGP Alternative Strategies Fund
CONSOLIDATED SCHEDULE OF INVESTMENTS IN SECURITIES at June 30, 2023 (Unaudited) (Continued)
| Principal Amount^ | Value | |||||||
CORPORATE BONDS (CONTINUED) | ||||||||
| Consumer, Non-cyclical (continued) | ||||||||
| $ 730,000 | 3.150%, 10/01/2026 | $ | 653,932 | |||||
| 2,505,000 | 4.100%, 10/01/2046 | 1,649,796 | ||||||
| Triton Water Holdings, Inc. | ||||||||
| 130,000 | 6.250%, 04/01/2029(b) | 111,704 | ||||||
|
| |||||||
| 15,999,410 | ||||||||
|
| |||||||
| Energy: 2.4% | ||||||||
| AI Candelaria Spain SA | ||||||||
| 250,000 | 5.750%, 06/15/2033 | 185,521 | ||||||
| 250,000 | 5.750%, 06/15/2033(b) | 185,521 | ||||||
| Aker BP ASA | ||||||||
| 435,000 | 3.750%, 01/15/2030(b) | 386,659 | ||||||
| Calumet Specialty Products Partners LP/Calumet Finance Corp. | ||||||||
| 269,000 | 9.750%, 07/15/2028(b) | 264,871 | ||||||
| Continental Resources, Inc. | ||||||||
| 1,595,000 | 5.750%, 01/15/2031(b) | 1,516,549 | ||||||
| 600,000 | 2.875%, 04/01/2032(b) | 461,143 | ||||||
| Cosan Overseas Ltd. | ||||||||
| 300,000 | 8.250%, 08/05/2023(d) | 298,549 | ||||||
| Delek Logistics Partners LP/Delek Logistics Finance Corp. | ||||||||
| 959,000 | 7.125%, 06/01/2028(b) | 889,466 | ||||||
| Ecopetrol SA | ||||||||
| 500,000 | 5.875%, 05/28/2045 | 343,062 | ||||||
| 250,000 | 5.875%, 11/02/2051 | 165,693 | ||||||
| Energean Israel Finance Ltd. | ||||||||
| 325,000 | 5.375%, 03/30/2028(b) | 293,885 | ||||||
| EnLink Midstream LLC | ||||||||
| 30,000 | 6.500%, 09/01/2030(b) | 29,996 | ||||||
| EQT Corp. | ||||||||
| 120,000 | 5.000%, 01/15/2029 | 113,089 | ||||||
| 590,000 | 7.000%, 02/01/2030 | 618,279 | ||||||
| 250,000 | 3.625%, 05/15/2031(b) | 215,027 | ||||||
| Global Partners LP/GLP Finance Corp. | ||||||||
| 602,000 | 6.875%, 01/15/2029 | 559,682 | ||||||
| Gulfport Energy Corp. | ||||||||
| 9,327 | 8.000%, 05/17/2026 | 9,381 | ||||||
| Gulfport Energy Operating Corp. | ||||||||
| 145,000 | 6.625%, 05/01/2023(k) | 273 | ||||||
| 287,000 | 6.000%, 10/15/2024(k) | 540 | ||||||
| 137,000 | 6.375%, 05/15/2025(k) | 258 | ||||||
| 144,000 | 6.375%, 01/15/2026(k) | 271 | ||||||
| Hess Midstream Operations LP | ||||||||
| 1,170,000 | 4.250%, 02/15/2030(b) | 1,021,983 | ||||||
| 700,000 | 5.500%, 10/15/2030(b) | 648,320 | ||||||
| Hunt Oil Co. of Peru LLC Sucursal Del Peru | ||||||||
| 166,400 | 6.375%, 06/01/2028 | 160,160 | ||||||
| Matador Resources Co. | ||||||||
| 115,000 | 6.875%, 04/15/2028(b) | 113,437 | ||||||
| MC Brazil Downstream Trading Sarl | ||||||||
| 483,126 | 7.250%, 06/30/2031 | 326,611 | ||||||
| NGD Holdings BV | ||||||||
| 100,000 | 6.750%, 12/31/2026 | 73,500 | ||||||
| NGL Energy Operating LLC/NGL Energy Finance Corp. | ||||||||
| 180,000 | 7.500%, 02/01/2026(b) | 177,475 | ||||||
| Principal Amount^ | Value | |||||||
| Energy (continued) | ||||||||
| Northern Oil & Gas, Inc. | ||||||||
| $ 945,000 | 8.750%, 06/15/2031(b) | $ | 929,644 | |||||
| NuStar Logistics LP | ||||||||
| 650,000 | 6.375%, 10/01/2030 | 620,874 | ||||||
| Occidental Petroleum Corp. | ||||||||
| 300,000 | 5.550%, 03/15/2026 | 296,445 | ||||||
| 40,000 | 8.875%, 07/15/2030 | 46,011 | ||||||
| 25,000 | 6.125%, 01/01/2031 | 25,410 | ||||||
| 45,000 | 7.875%, 09/15/2031 | 50,231 | ||||||
| Ovintiv, Inc. | ||||||||
| 75,000 | 8.125%, 09/15/2030 | 82,447 | ||||||
| 20,000 | 7.200%, 11/01/2031 | 21,039 | ||||||
| 15,000 | 7.375%, 11/01/2031 | 16,090 | ||||||
| 70,000 | 6.500%, 08/15/2034 | 70,178 | ||||||
| 145,000 | 6.625%, 08/15/2037 | 143,203 | ||||||
| 30,000 | 6.500%, 02/01/2038 | 29,403 | ||||||
| Parkland Corp. | ||||||||
| 867,000 | 4.625%, 05/01/2030(b) | 752,591 | ||||||
| PDC Energy, Inc. | ||||||||
| 2,558,000 | 5.750%, 05/15/2026 | 2,550,061 | ||||||
| Petrobras Global Finance BV | ||||||||
| 215,000 | 6.500%, 07/03/2033 | 210,700 | ||||||
| Petroleos del Peru SA | ||||||||
| 600,000 | 5.625%, 06/19/2047 | 387,560 | ||||||
| Petroleos Mexicanos | ||||||||
| 400,000 | 6.375%, 01/23/2045 | 246,069 | ||||||
| 200,000 | 6.750%, 09/21/2047 | 125,774 | ||||||
| SCC Power PLC | ||||||||
| 833 | 8.000%, 12/31/2028(b)(e) | 289 | ||||||
| SierraCol Energy Andina LLC | ||||||||
| 200,000 | 6.000%, 06/15/2028(b) | 145,405 | ||||||
| 200,000 | 6.000%, 06/15/2028 | 145,405 | ||||||
| Southwestern Energy Co. | ||||||||
| 80,000 | 4.750%, 02/01/2032 | 70,622 | ||||||
| Sunoco LP/Sunoco Finance Corp. | ||||||||
| 1,238,000 | 4.500%, 05/15/2029 | 1,099,126 | ||||||
| 732,000 | 4.500%, 04/30/2030 | 641,030 | ||||||
| Targa Resources Partners LP/Targa Resources Partners Finance Corp. | ||||||||
| 735,000 | 4.875%, 02/01/2031 | 680,084 | ||||||
| Transocean, Inc. | ||||||||
| 1,410,000 | 8.000%, 02/01/2027(b) | 1,279,765 | ||||||
| 460,000 | 7.500%, 04/15/2031 | 363,078 | ||||||
| UEP Penonome II SA | ||||||||
| 363,023 | 6.500%, 10/01/2038(b) | 273,042 | ||||||
| Venture Global Calcasieu Pass LLC | ||||||||
| 145,000 | 4.125%, 08/15/2031(b) | 124,889 | ||||||
| 275,000 | 3.875%, 11/01/2033(b) | 225,563 | ||||||
| Venture Global LNG, Inc. | ||||||||
| 25,000 | 8.375%, 06/01/2031(b) | 25,157 | ||||||
| Western Midstream Operating LP | ||||||||
| 305,000 | 3.350%, 02/01/2025 | 291,816 | ||||||
| 30,000 | 6.150%, 04/01/2033 | 30,122 | ||||||
| YPF SA | ||||||||
| 50,000 | 8.500%, 06/27/2029 | 42,619 | ||||||
| 600,000 | 7.000%, 12/15/2047 | 408,552 | ||||||
|
| |||||||
| 21,509,495 | ||||||||
|
| |||||||
The accompanying notes are an integral part of these financial statements.
| Schedule of Investments | 47 | |||||
Table of Contents
iMGP Alternative Strategies Fund
CONSOLIDATED SCHEDULE OF INVESTMENTS IN SECURITIES at June 30, 2023 (Unaudited) (Continued)
| Principal Amount^ | Value | |||||||
CORPORATE BONDS (CONTINUED) | ||||||||
| Financial: 4.1% | ||||||||
| AerCap Ireland Capital DAC/AerCap Global Aviation Trust | ||||||||
| $ 215,000 | 5.750%, 06/06/2028 | $ | 213,350 | |||||
| 150,000 | 3.000%, 10/29/2028 | 129,775 | ||||||
| Agile Group Holdings Ltd. | ||||||||
| 200,000 | 5.500%, 04/21/2025 | 51,331 | ||||||
| 400,000 | 6.050%, 10/13/2025 | 95,866 | ||||||
| Aircastle Ltd. | ||||||||
| 175,000 | Series A 5.250%, 06/15/2026(b)(d)(h) | 123,008 | ||||||
| Ally Financial, Inc. | ||||||||
| 725,000 | Series C 4.700%, 05/15/2028(d)(h) | 469,438 | ||||||
| Alpha Holding SA de CV | ||||||||
| 565,639 | 9.000%, 02/10/2025(b)(k) | 7,778 | ||||||
| 600,000 | 9.000%, 02/10/2025 | 0 | ||||||
| 600,000 | 9.000%, 02/10/2025 | 0 | ||||||
| Antares Holdings LP | ||||||||
| 255,000 | 3.950%, 07/15/2026(b) | 223,954 | ||||||
| 450,000 | 2.750%, 01/15/2027(b) | 370,013 | ||||||
| 680,000 | 3.750%, 07/15/2027(b) | 569,566 | ||||||
| Ares Capital Corp. | ||||||||
| 2,029,000 | 2.875%, 06/15/2028 | 1,681,589 | ||||||
| 660,000 | 3.200%, 11/15/2031 | 506,308 | ||||||
| Aviation Capital Group LLC | ||||||||
| 145,000 | 1.950%, 01/30/2026(b) | 129,211 | ||||||
| Banco Davivienda SA | ||||||||
| 200,000 | 6.650%, 04/22/2031(b)(d)(h) | 147,374 | ||||||
| 300,000 | 6.650%, 04/22/2031(d)(h) | 221,061 | ||||||
| Banco do Brasil SA | ||||||||
| 500,000 | 6.250%, 04/15/2024(d)(h) | 445,427 | ||||||
| Banco GNB Sudameris SA | ||||||||
| 200,000 | 7.500%, 04/16/2031(h) | 164,368 | ||||||
| 350,000 | 7.500%, 04/16/2031(b)(h) | 287,644 | ||||||
| Banco Mercantil del Norte SA | ||||||||
| 350,000 | 6.625%, 01/24/2032(b)(d)(h) | 270,900 | ||||||
| Banco Santander SA | ||||||||
| 400,000 | 5.147%, 08/18/2025 | 392,991 | ||||||
| Barclays PLC | ||||||||
| 660,000 | 4.375%, 03/15/2028(d)(h) | 450,054 | ||||||
| 740,000 | 3.564%, 09/23/2035(h) | 585,197 | ||||||
| Barings BDC, Inc. | ||||||||
| 405,000 | 3.300%, 11/23/2026 | 353,102 | ||||||
| Blackstone Secured Lending Fund | ||||||||
| 445,000 | 2.125%, 02/15/2027 | 376,142 | ||||||
| BNP Paribas SA | ||||||||
| 480,000 | 6.625%, 03/25/2024(b)(d)(h) | 462,780 | ||||||
| Principal Amount^ | Value | |||||||
| Financial (continued) | ||||||||
| Central China Real Estate Ltd. | ||||||||
| $ 205,000 | 7.750%, 05/24/2024(k) | $ | 20,375 | |||||
| 400,000 | 7.250%, 08/13/2024 | 36,880 | ||||||
| 205,000 | 7.500%, 07/14/2025 | 15,616 | ||||||
| 230,000 | 7.650%, 08/27/2025 | 16,912 | ||||||
| CFLD Cayman Investment Ltd. | ||||||||
| 43,250 | 0.000%, 01/31/2031(b)(i) | 2,220 | ||||||
| 351,200 | 2.500%, 01/31/2031(b) | 48,859 | ||||||
| 426,400 | 2.500%, 01/31/2031(b) | 28,172 | ||||||
| Charles Schwab Corp. | ||||||||
| 19,000 | Series F 5.000%, 12/01/2027(d)(h) | 14,431 | ||||||
| 136,000 | Series I 4.000%, 06/01/2026(d)(h) | 110,704 | ||||||
| China Aoyuan Group Ltd. | ||||||||
| 200,000 | 6.200%, 03/24/2026 | 10,599 | ||||||
| China Evergrande Group | ||||||||
| 200,000 | 9.500%, 04/11/2022(k) | 12,561 | ||||||
| 200,000 | 8.750%, 06/28/2025 | 12,061 | ||||||
| CIFI Holdings Group Co. Ltd. | ||||||||
| 200,000 | 4.450%, 08/17/2026 | 22,685 | ||||||
| Crown Castle, Inc. | ||||||||
| 465,000 | 5.100%, 05/01/2033 | 457,155 | ||||||
| Deutsche Bank AG | ||||||||
| 885,000 | 3.729%, 01/14/2032(h) | 669,625 | ||||||
| 200,000 | 3.742%, 01/07/2033(h) | 146,767 | ||||||
| Easy Tactic Ltd. | ||||||||
| 427,596 | 7.500%, 07/11/2027(e) | 39,531 | ||||||
| Enstar Group Ltd. | ||||||||
| 1,212,000 | 3.100%, 09/01/2031 | 952,050 | ||||||
| EPR Properties | ||||||||
| 770,000 | 3.600%, 11/15/2031 | 601,520 | ||||||
| Fantasia Holdings Group Co. Ltd. | ||||||||
| 200,000 | 11.875%, 06/01/2023 | 13,229 | ||||||
| FS KKR Capital Corp. | ||||||||
| 135,000 | 3.125%, 10/12/2028 | 110,001 | ||||||
| Global Atlantic Fin Co. | ||||||||
| 320,000 | 4.400%, 10/15/2029(b) | 270,255 | ||||||
| GLP Capital LP/GLP Financing II, Inc. | ||||||||
| 1,335,000 | 3.250%, 01/15/2032 | 1,078,069 | ||||||
| Goldman Sachs Group, Inc. (The) | ||||||||
| 1,530,000 | 1.757%, 01/24/2025(h) | 1,489,884 | ||||||
| Howard Hughes Corp. (The) | ||||||||
| 567,000 | 4.375%, 02/01/2031(b) | 453,044 | ||||||
| HSBC Holdings PLC | ||||||||
| 1,540,000 | 1.162%, 11/22/2024(h) | 1,507,343 | ||||||
| Icahn Enterprises LP/Icahn Enterprises Finance Corp. | ||||||||
| 35,000 | 4.750%, 09/15/2024 | 33,459 | ||||||
| 190,000 | 6.375%, 12/15/2025 | 176,931 | ||||||
| 425,000 | 6.250%, 05/15/2026 | 387,185 | ||||||
| 690,000 | 5.250%, 05/15/2027 | 593,576 | ||||||
| Iron Mountain Information Management Services, Inc. | ||||||||
| 1,302,000 | 5.000%, 07/15/2032(b) | 1,125,802 | ||||||
The accompanying notes are an integral part of these financial statements.
| 48 | Litman Gregory Funds Trust | |||||
Table of Contents
iMGP Alternative Strategies Fund
CONSOLIDATED SCHEDULE OF INVESTMENTS IN SECURITIES at June 30, 2023 (Unaudited) (Continued)
| Principal Amount^ | Value | |||||||
CORPORATE BONDS (CONTINUED) | ||||||||
| Financial (continued) | ||||||||
| Iron Mountain, Inc. | ||||||||
| $ 369,000 | 7.000%, 02/15/2029(b) | $ | 370,094 | |||||
| 908,000 | 4.500%, 02/15/2031(b) | 781,040 | ||||||
| Kaisa Group Holdings Ltd. | ||||||||
| 1,005,000 | 9.375%, 06/30/2024(k) | 66,872 | ||||||
| 200,000 | 10.500%, 01/15/2025 | 13,377 | ||||||
| 1,000,000 | 11.250%, 04/16/2025 | 66,887 | ||||||
| 200,000 | 9.950%, 07/23/2025 | 13,377 | ||||||
| 600,000 | 11.700%, 11/11/2025(k) | 40,132 | ||||||
| 400,000 | 11.650%, 06/01/2026 | 26,755 | ||||||
| Kawasan Industri Jababeka Tbk PT | ||||||||
| 280,000 | 7.000%, 12/15/2027(b)(f) | 187,780 | ||||||
| KWG Group Holdings Ltd. | ||||||||
| 210,000 | 6.300%, 02/13/2026 | 22,317 | ||||||
| Logan Group Co. Ltd. | ||||||||
| 200,000 | 4.250%, 07/12/2025 | 19,925 | ||||||
| Main Street Capital Corp. | ||||||||
| 224,000 | 3.000%, 07/14/2026 | 197,153 | ||||||
| Mexarrend SAPI de CV | ||||||||
| 300,000 | 10.250%, 07/24/2024(b) | 67,631 | ||||||
| National Health Investors, Inc. | ||||||||
| 270,000 | 3.000%, 02/01/2031 | 207,433 | ||||||
| Nationstar Mortgage Holdings, Inc. | ||||||||
| 821,000 | 5.750%, 11/15/2031(b) | 678,556 | ||||||
| Navient Corp. | ||||||||
| 350,000 | 5.500%, 03/15/2029 | 298,776 | ||||||
| 145,000 | 9.375%, 07/25/2030 | 144,355 | ||||||
| Oaktree Specialty Lending Corp. | ||||||||
| 150,000 | 2.700%, 01/15/2027 | 129,622 | ||||||
| Omega Healthcare Investors, Inc. | ||||||||
| 700,000 | 3.250%, 04/15/2033 | 520,839 | ||||||
| OneMain Finance Corp. | ||||||||
| 365,000 | 3.500%, 01/15/2027 | 313,524 | ||||||
| 55,000 | 5.375%, 11/15/2029 | 46,800 | ||||||
| 25,000 | 4.000%, 09/15/2030 | 19,210 | ||||||
| Operadora de Servicios Mega SA de CV Sofom ER | ||||||||
| 400,000 | 8.250%, 02/11/2025(b) | 200,320 | ||||||
| Owl Rock Capital Corp. | ||||||||
| 745,000 | 2.875%, 06/11/2028 | 607,340 | ||||||
| Owl Rock Technology Finance Corp. | ||||||||
| 105,000 | 2.500%, 01/15/2027 | 87,016 | ||||||
| Prospect Capital Corp. | ||||||||
| 492,000 | 3.437%, 10/15/2028 | 374,889 | ||||||
| Rithm Capital Corp. | ||||||||
| 1,330,000 | 6.250%, 10/15/2025(b) | 1,248,431 | ||||||
| RKPF Overseas Ltd. | ||||||||
| 300,000 | 7.750%, 11/18/2024(d)(h) | 91,330 | ||||||
| Rocket Mortgage LLC/Rocket Mortgage Co.-Issuer, Inc. | ||||||||
| 1,835,000 | 2.875%, 10/15/2026(b) | 1,625,911 | ||||||
| 560,000 | 3.625%, 03/01/2029(b) | 471,205 | ||||||
| 25,000 | 3.875%, 03/01/2031(b) | 20,294 | ||||||
| 1,215,000 | 4.000%, 10/15/2033(b) | 951,576 | ||||||
| Ronshine China Holdings Ltd. | ||||||||
| 200,000 | 7.350%, 12/15/2023(k) | 9,373 | ||||||
| Principal Amount^ | Value | |||||||
| Financial (continued) | ||||||||
| $ 350,000 | 6.750%, 08/05/2024 | $ | 21,124 | |||||
| SBA Communications Corp. | ||||||||
| 70,000 | 3.875%, 02/15/2027 | 64,362 | ||||||
| Shimao Group Holdings Ltd. | ||||||||
| 340,000 | 4.750%, 07/03/2022(k) | 28,301 | ||||||
| Shimao Group Holdings Ltd. | ||||||||
| 200,000 | 5.200%, 01/16/2027 | 17,148 | ||||||
| 400,000 | 3.450%, 01/11/2031 | 30,595 | ||||||
| Societe Generale SA | ||||||||
| 895,000 | 3.653%, 07/08/2035(b)(h) | 719,161 | ||||||
| Standard Chartered PLC | ||||||||
| 830,000 | 3.265%, 02/18/2036(b)(h) | 653,615 | ||||||
| Starwood Property Trust, Inc. | ||||||||
| 1,237,000 | 3.625%, 07/15/2026(b) | 1,066,052 | ||||||
| 1,350,000 | 4.375%, 01/15/2027(b) | 1,163,950 | ||||||
| Sunac China Holdings Ltd. | ||||||||
| 200,000 | 6.500%, 01/10/2025 | 30,243 | ||||||
| 200,000 | 7.000%, 07/09/2025 | 30,243 | ||||||
| 1,010,000 | 6.500%, 01/26/2026 | 152,729 | ||||||
| Tanger Properties LP | ||||||||
| 561,000 | 2.750%, 09/01/2031 | 407,573 | ||||||
| Times China Holdings Ltd. | ||||||||
| 400,000 | 6.200%, 03/22/2026 | 30,527 | ||||||
| 200,000 | 5.750%, 01/14/2027 | 15,264 | ||||||
| UBS Group AG | ||||||||
| 750,000 | 2.193%, 06/05/2026(b)(h) | 687,946 | ||||||
| 500,000 | 6.373%, 07/15/2026(b)(h) | 496,891 | ||||||
| 250,000 | 6.442%, 08/11/2028(b)(h) | 251,063 | ||||||
| 250,000 | 9.016%, 11/15/2033(b)(h) | 300,081 | ||||||
| Unifin Financiera SAB de CV | ||||||||
| 600,000 | 8.875%, 01/29/2025(d)(k) | 3,300 | ||||||
| VICI Properties LP | ||||||||
| 416,000 | 5.125%, 05/15/2032 | 389,620 | ||||||
| VICI Properties LP/VICI Note Co., Inc. | ||||||||
| 325,000 | 4.625%, 06/15/2025(b) | 314,322 | ||||||
| 370,000 | 4.500%, 09/01/2026(b) | 349,879 | ||||||
| 450,000 | 4.250%, 12/01/2026(b) | 421,420 | ||||||
| Vornado Realty LP | ||||||||
| 70,000 | 3.500%, 01/15/2025 | 65,928 | ||||||
| 63,000 | 2.150%, 06/01/2026 | 53,392 | ||||||
| World Acceptance Corp. | ||||||||
| 540,000 | 7.000%, 11/01/2026(b) | 473,002 | ||||||
| Yuzhou Group Holdings Co. Ltd. | ||||||||
| 540,000 | 7.700%, 02/20/2025(k) | 26,559 | ||||||
| 200,000 | 8.300%, 05/27/2025(k) | 9,837 | ||||||
| 710,000 | 7.850%, 08/12/2026(k) | 33,145 | ||||||
| 1,940,000 | 6.350%, 01/13/2027(k) | 122,899 | ||||||
| Zhenro Properties Group Ltd. |
| |||||||
| 400,000 | 6.630%, 01/07/2026(k) | 17,000 | ||||||
|
| |||||||
| 37,553,039 | ||||||||
|
| |||||||
| Industrial: 1.7% | ||||||||
| AptarGroup, Inc. |
| |||||||
| 170,000 | 3.600%, 03/15/2032 | 145,828 | ||||||
The accompanying notes are an integral part of these financial statements.
| Schedule of Investments | 49 | |||||
Table of Contents
iMGP Alternative Strategies Fund
CONSOLIDATED SCHEDULE OF INVESTMENTS IN SECURITIES at June 30, 2023 (Unaudited) (Continued)
| Principal Amount^ | Value | |||||||
CORPORATE BONDS (CONTINUED) | ||||||||
| Industrial (continued) | ||||||||
| Artera Services LLC | ||||||||
| $ 150,000 | 9.033%, 12/04/2025(b) | $ | 131,460 | |||||
| ATS Corp. | ||||||||
| 560,000 | 4.125%, 12/15/2028(b) | 501,787 | ||||||
| Bombardier, Inc. | ||||||||
| 358,000 | 6.000%, 02/15/2028(b) | 338,808 | ||||||
| 1,224,000 | 7.500%, 02/01/2029(b) | 1,211,247 | ||||||
| Builders FirstSource, Inc. | ||||||||
| 450,000 | 6.375%, 06/15/2032(b) | 446,213 | ||||||
| Cemex SAB de CV | ||||||||
| 355,000 | 5.125%, 06/08/2026(b)(d)(h) | 316,243 | ||||||
| 200,000 | 9.125%, 03/14/2028(b)(d)(h) | 202,799 | ||||||
| 620,000 | 5.200%, 09/17/2030(b) | 580,584 | ||||||
| 310,000 | 3.875%, 07/11/2031(b) | 261,230 | ||||||
| Danaos Corp. | ||||||||
| 510,000 | 8.500%, 03/01/2028(b) | 511,734 | ||||||
| Great Lakes Dredge & Dock Corp. | ||||||||
| 165,000 | 5.250%, 06/01/2029(b) | 137,961 | ||||||
| Howmet Aerospace, Inc. | ||||||||
| 711,000 | 3.000%, 01/15/2029 | 621,701 | ||||||
| HTA Group Ltd. | ||||||||
| 475,000 | 7.000%, 12/18/2025(b) | 450,727 | ||||||
| IDEX Corp. | ||||||||
| 72,000 | 2.625%, 06/15/2031 | 60,210 | ||||||
| IHS Holding Ltd. | ||||||||
| 365,000 | 5.625%, 11/29/2026(b) | 319,448 | ||||||
| 330,000 | 6.250%, 11/29/2028(b) | 271,102 | ||||||
| Keysight Technologies, Inc. | ||||||||
| 300,000 | 3.000%, 10/30/2029 | 262,868 | ||||||
| Louisiana-Pacific Corp. | ||||||||
| 850,000 | 3.625%, 03/15/2029(b) | 744,961 | ||||||
| Mexico City Airport Trust | ||||||||
| 400,000 | 5.500%, 07/31/2047 | 349,903 | ||||||
| MV24 Capital BV | ||||||||
| 336,236 | 6.748%, 06/01/2034 | 302,382 | ||||||
| nVent Finance Sarl | ||||||||
| 300,000 | 5.650%, 05/15/2033 | 295,130 | ||||||
| Pentair Finance Sarl | ||||||||
| 350,000 | 5.900%, 07/15/2032 | 353,021 | ||||||
| Rand Parent LLC | ||||||||
| 570,000 | 8.500%, 02/15/2030(b) | 516,614 | ||||||
| Simpar Europe SA | ||||||||
| 500,000 | 5.200%, 01/26/2031 | 397,383 | ||||||
| SMBC Aviation Capital Finance DAC | ||||||||
| 215,000 | 5.450%, 05/03/2028(b) | 212,215 | ||||||
| Teledyne Technologies, Inc. | ||||||||
| 400,000 | 2.750%, 04/01/2031 | 334,237 | ||||||
| TransDigm, Inc. | ||||||||
| 245,000 | 6.750%, 08/15/2028(b) | 246,260 | ||||||
| 1,010,000 | 4.625%, 01/15/2029 | 899,635 | ||||||
| 1,595,000 | 4.875%, 05/01/2029 | 1,426,589 | ||||||
| Trident TPI Holdings, Inc. | ||||||||
| 25,000 | 12.750%, 12/31/2028(b) | 25,956 | ||||||
| TriMas Corp. | ||||||||
| 370,000 | 4.125%, 04/15/2029(b) | 330,062 | ||||||
| Principal Amount^ | Value | |||||||
| Industrial (continued) | ||||||||
| Trimble, Inc. | ||||||||
| $ 350,000 | �� | 6.100%, 03/15/2033 | $ | 354,596 | ||||
| Triumph Group, Inc. | ||||||||
| 150,000 | 7.750%, 08/15/2025 | 144,762 | ||||||
| Vontier Corp. | ||||||||
| 770,000 | 2.950%, 04/01/2031 | 612,223 | ||||||
| Vulcan Materials Co. | ||||||||
| 500,000 | 3.500%, 06/01/2030 | 452,038 | ||||||
| Waste Connections, Inc. | ||||||||
| 725,000 | 2.200%, 01/15/2032 | 584,918 | ||||||
|
| |||||||
| 15,354,835 | ||||||||
|
| |||||||
| Technology: 1.5% | ||||||||
| Amdocs Ltd. | ||||||||
| 274,000 | 2.538%, 06/15/2030 | 228,799 | ||||||
| Broadcom, Inc. | ||||||||
| 415,000 | 4.150%, 11/15/2030 | 381,829 | ||||||
| 200,000 | 4.150%, 04/15/2032(b) | 181,171 | ||||||
| 1,620,000 | 3.469%, 04/15/2034(b) | 1,328,773 | ||||||
| 1,355,000 | 3.137%, 11/15/2035(b) | 1,039,912 | ||||||
| Castle US Holding Corp. | ||||||||
| 325,000 | 9.500%, 02/15/2028(b) | 184,290 | ||||||
| CDW LLC/CDW Finance Corp. | ||||||||
| 220,000 | 4.250%, 04/01/2028 | 201,976 | ||||||
| 240,000 | 3.276%, 12/01/2028 | 208,375 | ||||||
| 1,720,000 | 3.250%, 02/15/2029 | 1,475,302 | ||||||
| 750,000 | 3.569%, 12/01/2031 | 633,945 | ||||||
| CGI, Inc. | ||||||||
| 500,000 | 2.300%, 09/14/2031 | 392,099 | ||||||
| Fair Isaac Corp. | ||||||||
| 2,504,000 | 4.000%, 06/15/2028(b) | 2,299,658 | ||||||
| KBR, Inc. | ||||||||
| 635,000 | 4.750%, 09/30/2028(b) | 578,523 | ||||||
| Kyndryl Holdings, Inc. | ||||||||
| 440,000 | 3.150%, 10/15/2031 | 330,267 | ||||||
| Micron Technology, Inc. | ||||||||
| 630,000 | 6.750%, 11/01/2029 | 654,925 | ||||||
| 60,000 | 5.875%, 02/09/2033 | 59,801 | ||||||
| 290,000 | 5.875%, 09/15/2033 | 287,315 | ||||||
| Open Text Corp. | ||||||||
| 135,000 | 6.900%, 12/01/2027(b) | 137,595 | ||||||
| 600,000 | 3.875%, 12/01/2029(b) | 502,040 | ||||||
| Oracle Corp. | ||||||||
| 1,000,000 | 4.900%, 02/06/2033 | 970,668 | ||||||
| Pitney Bowes, Inc. | ||||||||
| 120,000 | 6.875%, 03/15/2027(b) | 88,978 | ||||||
| 214,000 | 7.250%, 03/15/2029(b) | 141,276 | ||||||
| Science Applications International Corp. | ||||||||
| 133,000 | 4.875%, 04/01/2028(b) | 123,822 | ||||||
| SK Hynix, Inc. | ||||||||
| 200,000 | 6.500%, 01/17/2033(b) | 201,971 | ||||||
| Virtusa Corp. | ||||||||
| 135,000 | 7.125%, 12/15/2028(b) | 110,008 | ||||||
| VMware, Inc. | ||||||||
| 935,000 | 2.200%, 08/15/2031 | 734,927 | ||||||
| Western Digital Corp. | ||||||||
| 420,000 | 4.750%, 02/15/2026 | 400,232 | ||||||
| 190,000 | 2.850%, 02/01/2029 | 151,529 | ||||||
|
| |||||||
| 14,030,006 | ||||||||
|
| |||||||
The accompanying notes are an integral part of these financial statements.
| 50 | Litman Gregory Funds Trust | |||||
Table of Contents
iMGP Alternative Strategies Fund
CONSOLIDATED SCHEDULE OF INVESTMENTS IN SECURITIES at June 30, 2023 (Unaudited) (Continued)
| Principal Amount^ | Value | |||||||
CORPORATE BONDS (CONTINUED) | ||||||||
| Utilities: 0.5% | ||||||||
| Adani Electricity Mumbai Ltd. |
| |||||||
| $ 200,000 | 3.867%, 07/22/2031 | $ | 141,385 | |||||
| AmeriGas Partners LP/AmeriGas Finance Corp. |
| |||||||
| 1,715,000 | 5.750%, 05/20/2027 | 1,578,347 | ||||||
| Edison International |
| |||||||
| 315,000 | Series A 5.375%, 03/15/2026(d)(h) 5 yr. CMT + 4.698% | 276,066 | ||||||
| Emera US Finance LP |
| |||||||
| 1,904,000 | 2.639%, 06/15/2031 | 1,521,809 | ||||||
| Empresas Publicas de Medellin ESP |
| |||||||
| 400,000 | 4.375%, 02/15/2031 | 300,112 | ||||||
| EnfraGen Energia Sur SA/EnfraGen Spain SA/Prime Energia SpA |
| |||||||
| 400,000 | 5.375%, 12/30/2030 | 260,300 | ||||||
| Mong Duong Finance Holdings BV |
| |||||||
| 250,000 | 5.125%, 05/07/2029 | 220,625 | ||||||
| Pacific Gas & Electric Co. |
| |||||||
| 210,000 | 4.300%, 03/15/2045 | 149,724 | ||||||
|
| |||||||
| 4,448,368 | ||||||||
|
| |||||||
| | TOTAL CORPORATE BONDS | 183,565,624 | ||||||
|
| |||||||
GOVERNMENT SECURITIES & AGENCY ISSUE: 3.5% | ||||||||
| Brazilian Government International Bond | ||||||||
| 300,000 | 4.750%, 01/14/2050 | 221,609 | ||||||
| Colombia Government International Bond | ||||||||
| 500,000 | 5.000%, 06/15/2045 | 349,334 | ||||||
| 300,000 | 5.200%, 05/15/2049 | 209,189 | ||||||
| Financiera de Desarrollo Territorial SA Findeter | ||||||||
| 3,329,000,000 (COP) | 7.875%, 08/12/2024(b) | 747,786 | ||||||
| Hungary Government Bond | ||||||||
| 123,940,000 (HUF) | 6.000%, 11/24/2023 | 354,699 | ||||||
| Indonesia Treasury Bond | ||||||||
| 5,260,000,000 (IDR) | 6.375%, 08/15/2028 | 358,115 | ||||||
| Mexico Government International Bond | ||||||||
| 300,000 | 4.400%, 02/12/2052 | 237,277 | ||||||
| Republic of South Africa Government Bond | ||||||||
| 7,445,000 (ZAR) | 8.875%, 02/28/2035 | 324,025 | ||||||
| Republic of South Africa Government International Bond | ||||||||
| 500,000 | 5.650%, 09/27/2047 | 354,917 | ||||||
| U.S. Treasury Bonds | ||||||||
| 13,900,000 | 3.000%, 08/15/2052 | 11,802,783 | ||||||
| 850,000 | 4.000%, 11/15/2052 | 871,914 | ||||||
| U.S. Treasury Notes | ||||||||
| 2,765,000 | 4.500%, 11/30/2024(c) | 2,735,784 | ||||||
| 12,900,000 | 4.125%, 11/15/2032 | 13,176,141 | ||||||
| Ukraine Government International Bond | ||||||||
| 400,000 | 7.253%, 03/15/2035 | 94,000 | ||||||
|
| |||||||
| | TOTAL GOVERNMENT SECURITIES & AGENCY ISSUE | 31,837,573 | ||||||
|
| |||||||
| Principal Amount^ | Value | |||||||
LIMITED PARTNERSHIPS: 0.1% | ||||||||
| $ 35,594 | GACP II LP(a) | $ | 390,373 | |||||
| 1,300,000 | U.S. Farming Realty Trust(a) | 415,176 | ||||||
|
| |||||||
| | TOTAL LIMITED PARTNERSHIPS | 805,549 | ||||||
|
| |||||||
MORTGAGE-BACKED SECURITIES: 14.6% | ||||||||
| Adjustable Rate Mortgage Trust |
| |||||||
| 243,480 | Series 2006-1-2A1 | 133,639 | ||||||
| Alternative Loan Trust |
| |||||||
| 69,754 | Series 2003-22CB-1A1 | 68,372 | ||||||
| 260,432 | Series 2004-13CB-A4 | 185,573 | ||||||
| 39,888 | Series 2004-16CB-1A1 | 38,433 | ||||||
| 39,416 | Series 2004-16CB-3A1 | 37,994 | ||||||
| 77,067 | Series 2004-J10-2CB1 | 75,584 | ||||||
| 14,942 | Series 2005-J1-2A1 | 14,544 | ||||||
| 2,032,975 | Series 2006-13T1-A13 | 1,071,426 | ||||||
| 308,936 | Series 2006-31CB-A7 | 190,158 | ||||||
| 7,812,120 | Series 2006-46-A2 | 2,903,647 | ||||||
| 385,648 | Series 2006-J1-2A1 | 48,493 | ||||||
| 4,160,485 | Series 2007-12T1-A7 | 1,501,883 | ||||||
| 170,456 | Series 2007-16CB-2A1 | 63,474 | ||||||
| 49,359 | Series 2007-16CB-2A2 | 67,066 | ||||||
| 2,377,664 | Series 2007-16CB-4A1 | 1,574,313 | ||||||
| 380,471 | Series 2007-16CB-4A2 | 437,666 | ||||||
| 322,635 | Series 2007-19-1A34 | 167,400 | ||||||
| 908,636 | Series 2007-20-A12 | 514,261 | ||||||
| Alternative Loan Trust Resecuritization |
| |||||||
| 412,426 | Series 2008-2R-2A1 | 204,288 | ||||||
| 2,805,686 | Series 2008-2R-4A1 | 1,483,059 | ||||||
| American Home Mortgage Investment Trust | ||||||||
| 179,192 | Series 2006-1-11A1 | 133,424 | ||||||
The accompanying notes are an integral part of these financial statements.
| Schedule of Investments | 51 | |||||
Table of Contents
iMGP Alternative Strategies Fund
CONSOLIDATED SCHEDULE OF INVESTMENTS IN SECURITIES at June 30, 2023 (Unaudited) (Continued)
| Principal Amount^ | Value | |||||||
MORTGAGE-BACKED SECURITIES (CONTINUED) | ||||||||
| AREIT Trust CLO | ||||||||
| $ 1,000,000 | Series 2019-CRE3-D | $ | 943,285 | |||||
| Banc of America Alternative Loan Trust | ||||||||
| 29,784 | Series 2003-8-1CB1 | 28,474 | ||||||
| 501,614 | Series 2006-7-A4 | 146,046 | ||||||
| Banc of America Funding Trust | ||||||||
| 22,421 | Series 2005-7-3A1 | 21,886 | ||||||
| 208,112 | Series 2006-B-7A1 | 173,102 | ||||||
| 17,679 | Series 2007-4-5A1 | 15,654 | ||||||
| Banc of America Mortgage Trust | ||||||||
| 7,360 | Series 2005-A-2A1 | 6,748 | ||||||
| BBCMS Trust | ||||||||
| 750,000 | Series 2018-CBM-E | 709,369 | ||||||
| BCAP LLC Trust | ||||||||
| 123,504 | Series 2010-RR6-6A2 | 61,722 | ||||||
| 1,785,419 | Series 2011-R11-2A4 | 1,182,950 | ||||||
| Bear Stearns Adjustable Rate Mortgage Trust | ||||||||
| 1,533,415 | Series 2005-12-25A1 | 1,162,093 | ||||||
| Bear Stearns Asset-Backed Securities I Trust | ||||||||
| 300,785 | Series 2006-AC1-1A1 | 141,341 | ||||||
| Benchmark Mortgage Trust | ||||||||
| 540,000 | Series 2019-B9-C | 414,094 | ||||||
| 547,000 | Series 2020-B18-AGNF | 471,608 | ||||||
| 1,637,000 | Series 2021-B31-E | 655,456 | ||||||
| BF Mortgage Trust | ||||||||
| 666,000 | Series 2019-NYT-F | 311,767 | ||||||
| BINOM Securitization Trust | ||||||||
| 530,000 | Series 2022-RPL1-M1 | 391,425 | ||||||
| BPR Trust | ||||||||
| 465,000 | Series 2021-NRD-F 1 mo. Term SOFR + 6.870% | 415,290 | ||||||
| BX Commercial Mortgage Trust | ||||||||
| 1,274,000 | Series 2019-IMC-G | 1,232,086 | ||||||
| 277,893 | Series 2020-VKNG-A | 274,636 | ||||||
| Principal Amount^ | Value | |||||||
| Carbon Capital VI Commercial Mortgage Trust | ||||||||
| $ 343,565 | Series 2019-FL2-B | $ | 291,928 | |||||
| CFCRE Commercial Mortgage Trust | ||||||||
| 16,323,000 | Series 2016-C7-XE | 462,125 | ||||||
| 7,346,000 | Series 2016-C7-XF | 209,366 | ||||||
| CG-CCRE Commercial Mortgage Trust | ||||||||
| 99,912 | Series 2014-FL2-COL1 | 83,965 | ||||||
| 195,066 | Series 2014-FL2-COL2 | 140,700 | ||||||
| Chase Mortgage Finance Trust | ||||||||
| 1,271,233 | Series 2007-S3-1A15 | 609,687 | ||||||
| CIM Trust | ||||||||
| 331,407 | Series 2021-NR2-A1 | 317,243 | ||||||
| Citicorp Mortgage Securities Trust | ||||||||
| 1,575,168 | Series 2006-7-1A1 | 1,320,339 | ||||||
| Citigroup Commercial Mortgage Trust | ||||||||
| 870,000 | Series 2014-GC21-D | 591,586 | ||||||
| Citigroup Mortgage Loan Trust, Inc. | ||||||||
| 119,310 | Series 2005-5-2A2 | 84,941 | ||||||
| 1,766,420 | Series 2005-5-3A2A | 1,430,568 | ||||||
| 1,702,821 | Series 2011-12-1A2 | 1,007,982 | ||||||
| CitiMortgage Alternative Loan Trust | ||||||||
| 142,277 | Series 2006-A5-1A13 | 117,733 | ||||||
| 139,927 | Series 2006-A5-1A2 | 7,861 | ||||||
| 1,258,702 | Series 2007-A6-1A5 | 1,087,296 | ||||||
| COMM Mortgage Trust | ||||||||
| 460,000 | Series 2012-CR3-B | 381,746 | ||||||
| 40,000 | Series 2012-LC4-C | 37,317 | ||||||
| 1,868,035 | Series 2014-UBS4-F | 373,448 | ||||||
| 3,135,162 | Series 2014-UBS4-G | 211,226 | ||||||
| 7,000 | Series 2014-UBS4-V | 1 | ||||||
| 1,989,000 | Series 2018-HCLV-D | 1,531,635 | ||||||
| Connecticut Avenue Securities Trust |
| |||||||
| 89,202 | Series 2020-R01-1M2 | 89,588 | ||||||
The accompanying notes are an integral part of these financial statements.
| 52 | Litman Gregory Funds Trust | |||||
Table of Contents
iMGP Alternative Strategies Fund
CONSOLIDATED SCHEDULE OF INVESTMENTS IN SECURITIES at June 30, 2023 (Unaudited) (Continued)
| Principal Amount^ | Value | |||||||
MORTGAGE-BACKED SECURITIES (CONTINUED) | ||||||||
| Connecticut Avenue Securities Trust (Continued) | ||||||||
| $ 170,000 | Series 2021-R01-1B1 | $ | 168,937 | |||||
| 1,000,000 | Series 2022-R03-1B2 | 1,092,378 | ||||||
| Countrywide Home Loan Mortgage Pass-Through Trust | ||||||||
| 4,589 | Series 2004-HYB4-2A1 | 4,185 | ||||||
| 423,935 | Series 2005-23-A1 | 243,203 | ||||||
| 1,971,348 | Series 2006-9-A1 | 959,628 | ||||||
| 115,942 | Series 2007-10-A5 | 57,403 | ||||||
| 463,279 | Series 2007-13-A5 | 243,285 | ||||||
| Credit Suisse First Boston Mortgage Securities Corp. | ||||||||
| 947,448 | Series 2005-11-7A1 | 531,987 | ||||||
| Credit Suisse First Boston Mortgage-Backed Pass-Through Certificates | ||||||||
| 29,438 | Series 2003-27-4A4 | 28,617 | ||||||
| 2,269,653 | Series 2005-10-10A3 | 657,973 | ||||||
| Credit Suisse Mortgage-Backed Trust | ||||||||
| 620,999 | Series 2006-6-1A10 | 326,899 | ||||||
| 650,041 | Series 2007-1-4A1 | 79,530 | ||||||
| 30,077 | Series 2007-2-2A5 | 23,420 | ||||||
| 635,000 | Series 2014-USA-D | 462,315 | ||||||
| 1,475,000 | Series 2014-USA-E | 803,917 | ||||||
| 281,657 | Series 2020-RPL3-A1 | 269,610 | ||||||
| 1,100,000 | Series 2021-NQM1-B2 | 691,205 | ||||||
| CSAIL Commercial Mortgage Trust | ||||||||
| 1,130,000 | Series 2016-C6-C | 962,726 | ||||||
| 1,400,000 | Series 2020-C19-D | 765,114 | ||||||
| DBUBS Mortgage Trust | ||||||||
| 310,000 | Series 2017-BRBK-D | 272,937 | ||||||
| Deutsche Mortgage & Asset Receiving Corp. | ||||||||
| 1,750,789 | Series 2014-RS1-1A2 | 1,381,089 | ||||||
| Deutsche Mortgage Securities, Inc. Mortgage Loan Trust | ||||||||
| 71,584 | Series 2006-PR1-3A1 | 64,564 | ||||||
| Principal Amount^ | Value | |||||||
| DOLP Trust | ||||||||
| $ 500,000 | Series 2021-NYC-F | $ | 246,342 | |||||
| 500,000 | Series 2021-NYC-G | 216,660 | ||||||
| DSLA Mortgage Loan Trust | ||||||||
| 89,762 | Series 2005-AR5-2A1A | 51,918 | ||||||
| Federal Home Loan Mortgage Corp. REMICS | ||||||||
| 317,082 | Series 3118-SD | 19,824 | ||||||
| 105,644 | Series 3301-MS | 7,125 | ||||||
| 140,659 | Series 3303-SE | 9,513 | ||||||
| 91,428 | Series 3303-SG | 6,673 | ||||||
| 21,593 | Series 3382-SB | 1,119 | ||||||
| 132,520 | Series 3382-SW | 9,155 | ||||||
| 32,508 | Series 3384-S | 1,559 | ||||||
| 88,870 | Series 3384-SG | 6,508 | ||||||
| 1,133,282 | Series 3404-SA | 75,382 | ||||||
| 16,014 | Series 3417-SX | 908 | ||||||
| 25,239 | Series 3423-GS | 1,178 | ||||||
| 176,598 | Series 3423-TG | 713 | ||||||
| 1,329,013 | Series 3435-S | 98,797 | ||||||
| 38,628 | Series 3445-ES | 1,739 | ||||||
| 200,532 | Series 3523-SM | 11,256 | ||||||
| 100,370 | Series 3560-KS | 3,608 | ||||||
| 46,153 | Series 3598-SA | 2,543 | ||||||
The accompanying notes are an integral part of these financial statements.
| Schedule of Investments | 53 | |||||
Table of Contents
iMGP Alternative Strategies Fund
CONSOLIDATED SCHEDULE OF INVESTMENTS IN SECURITIES at June 30, 2023 (Unaudited) (Continued)
| Principal Amount^ | Value | |||||||
MORTGAGE-BACKED SECURITIES (CONTINUED) | ||||||||
| Federal Home Loan Mortgage Corp. REMICS (Continued) | ||||||||
| $ 62,316 | Series 3641-TB | $ | 60,397 | |||||
| 175,030 | Series 3728-SV | 4,855 | ||||||
| 109,862 | Series 3758-S | 7,564 | ||||||
| 170,338 | Series 3770-SP | 2,768 | ||||||
| 157,702 | Series 3815-ST | 11,316 | ||||||
| 321,661 | Series 3859-SI | 26,058 | ||||||
| 88,837 | Series 3872-SL | 5,453 | ||||||
| 73,086 | Series 3900-SB | 4,668 | ||||||
| 14,996 | Series 3946-SM | 11,619 | ||||||
| 224,066 | Series 3972-AZ | 199,098 | ||||||
| 1,224,424 | Series 3984-DS | 85,454 | ||||||
| 2,383,426 | Series 4080-DS | 117,174 | ||||||
| 1,358,240 | Series 4239-OU | 823,371 | ||||||
| 1,411,130 | Series 4291-MS | 99,473 | ||||||
| 414,435 | Series 4314-MS | 8,892 | ||||||
| 6,863,573 | Series 5057-TI | 1,079,732 | ||||||
| 5,803,554 | Series 5070-MI | 872,217 | ||||||
| Federal Home Loan Mortgage Corp. Structured Agency Credit Risk Debt Notes REMIC | ||||||||
| 4,000,000 | Series 2021-DNA6-B1 | 3,990,821 | ||||||
| 216,566 | Series 2022-DNA4-M1A | 218,042 | ||||||
| Federal National Mortgage Association | ||||||||
| 22,596,653 | Series 2019-M25-X | 170,478 | ||||||
| Principal Amount^ | Value | |||||||
| $ 24,334,548 | Series 2019-M5-X | $ | 441,855 | |||||
| 24,431,153 | Series 2021-M23-X1 | 516,616 | ||||||
| Federal National Mortgage Association REMICS | ||||||||
| 144,886 | Series 2003-84-PZ | 142,258 | ||||||
| 153,564 | Series 2005-42-SA | 2,712 | ||||||
| 1,061,026 | Series 2006-92-LI | 92,171 | ||||||
| 308,158 | Series 2007-39-AI | 19,309 | ||||||
| 85,110 | Series 2007-57-SX | 6,579 | ||||||
| 17,573 | Series 2007-68-SA | 1,105 | ||||||
| 18,064 | Series 2008-1-CI | 1,490 | ||||||
| 851,548 | Series 2008-33-SA | 58,783 | ||||||
| 10,769 | Series 2008-56-SB | 352 | ||||||
| 1,579,293 | Series 2009-110-SD 1.100%, 01/25/2040(g)(j) | 87,086 | ||||||
| 15,561 | Series 2009-111-SE | 1,355 | ||||||
| 124,381 | Series 2009-86-CI | 4,875 | ||||||
| 62,860 | Series 2009-87-SA | 5,657 | ||||||
| 27,448 | Series 2009-90-IB | 1,066 | ||||||
| 27,278 | Series 2010-11-SC | 978 | ||||||
| 21,405 | Series 2010-115-SD | 1,658 | ||||||
| 1,719,529 | Series 2010-123-SK | 148,232 | ||||||
| 78,940 | Series 2010-134-SE | 423 | ||||||
| 114,489 | Series 2010-15-SL | 4,920 | ||||||
The accompanying notes are an integral part of these financial statements.
| 54 | Litman Gregory Funds Trust | |||||
Table of Contents
iMGP Alternative Strategies Fund
CONSOLIDATED SCHEDULE OF INVESTMENTS IN SECURITIES at June 30, 2023 (Unaudited) (Continued)
| Principal Amount^ | Value | |||||||
MORTGAGE-BACKED SECURITIES (CONTINUED) | ||||||||
| Federal National Mortgage Association REMICS (Continued) | ||||||||
| $ 28,923 | Series 2010-9-GS | $ | 706 | |||||
| 6,420 | Series 2011-110-LS | 4,715 | ||||||
| 62,005 | Series 2011-111-VZ | 57,895 | ||||||
| 275,249 | Series 2011-141-PZ | 260,657 | ||||||
| 1,108,290 | Series 2011-93-ES | 81,203 | ||||||
| 698,394 | Series 2012-106-SA | 54,996 | ||||||
| 1,600,684 | Series 2014-50-WS | 90,808 | ||||||
| 6,448,349 | Series 2019-31-S | 594,442 | ||||||
| 17,314,542 | Series 2019-M12-X | 415,892 | ||||||
| 7,867,928 | Series 2019-M24-2XA | 468,341 | ||||||
| 20,916,657 | Series 2019-M7-X | 320,244 | ||||||
| 26,997,991 | Series 2020-M10-X4 | 1,259,659 | ||||||
| 17,092,177 | Series 2020-M10-X9 | 361,891 | ||||||
| 7,058,941 | Series 2020-M13-X2 | 339,892 | ||||||
| 10,100,759 | Series 2020-M6-X | 76,277 | ||||||
| 67,855,000 | Series 2022-M4-X2 | 774,935 | ||||||
| Federal National Mortgage Association-Aces | ||||||||
| 127,230,005 | Series 2021-M17-X | 612,231 | ||||||
| First Horizon Alternative Mortgage Securities Trust | ||||||||
| 607,027 | Series 2006-FA6-1A4 | 301,102 | ||||||
| 212,166 | Series 2007-FA4-1A7 | 89,816 | ||||||
| First Horizon Mortgage Pass-Through Trust |
| |||||||
| 104,294 | Series 2006-1-1A10 | 49,753 | ||||||
| Fontainebleau Miami Beach Trust |
| |||||||
| 574,000 | Series 2019-FBLU-H | 519,477 | ||||||
| GCAT Trust |
| |||||||
| 42,494 | Series 2019-RPL1-A1 | 39,847 | ||||||
| Principal Amount^ | Value | |||||||
| Government National Mortgage Association |
| |||||||
| $ 329,334 | Series 2007-21-S | $ | 12,451 | |||||
| 113,345 | Series 2008-69-SB | 6,732 | ||||||
| 128,518 | Series 2009-104-SD | 8,536 | ||||||
| 13,253 | Series 2010-98-IA | 680 | ||||||
| 193,067 | Series 2011-45-GZ | 189,783 | ||||||
| 63,441 | Series 2011-69-OC | 52,733 | ||||||
| 1,287,631 | Series 2011-69-SC | 72,584 | ||||||
| 226,093 | Series 2011-89-SA | 13,937 | ||||||
| 754,254 | Series 2013-102-BS | 34,996 | ||||||
| 10,671,712 | Series 2013-155-IB | 33,161 | ||||||
| 1,639,165 | Series 2014-145-CS | 98,174 | ||||||
| 1,054,836 | Series 2014-156-PS | 91,793 | ||||||
| 2,582,552 | Series 2014-4-SA | 213,039 | ||||||
| 4,467,508 | Series 2014-41-SA | 384,280 | ||||||
| 1,813,765 | Series 2014-5-SA | 127,884 | ||||||
| 2,310,950 | Series 2014-58-SG | 121,582 | ||||||
| 1,812,041 | Series 2014-76-SA | 124,967 | ||||||
| 2,552,664 | Series 2014-95-CS | 168,001 | ||||||
| 8,060,765 | Series 2016-162-IO 0.676%, 09/16/2058(h)(j) | 245,438 | ||||||
| 1,858,317 | Series 2018-105-SH | 146,286 | ||||||
| 19,020,476 | Series 2018-111-SA | 657,313 | ||||||
| 7,949,203 | Series 2018-134-CS | 578,018 | ||||||
The accompanying notes are an integral part of these financial statements.
| Schedule of Investments | 55 | |||||
Table of Contents
iMGP Alternative Strategies Fund
CONSOLIDATED SCHEDULE OF INVESTMENTS IN SECURITIES at June 30, 2023 (Unaudited) (Continued)
| Principal Amount^ | Value | |||||||
MORTGAGE-BACKED SECURITIES (CONTINUED) | ||||||||
| Government National Mortgage Association (Continued) | ||||||||
| $ 6,245,327 | Series 2019-22-SA | $ | 547,302 | |||||
| 5,724,471 | Series 2019-H10-BI | 171,372 | ||||||
| 6,435,775 | Series 2020-112-BS | 597,582 | ||||||
| 10,963,414 | Series 2020-115-SC | 405,061 | ||||||
| 5,705,271 | Series 2020-142-SD | 724,112 | ||||||
| 6,542,069 | Series 2020-146-SH | 649,173 | ||||||
| 9,664,605 | Series 2020-168-IA | 660,877 | ||||||
| 10,297,865 | Series 2020-173-MI | 1,348,475 | ||||||
| 5,254,312 | Series 2020-188-LS | 670,013 | ||||||
| 4,930,290 | Series 2020-47-SL | 286,821 | ||||||
| 10,162,390 | Series 2020-H11-HI | 407,190 | ||||||
| 10,055,903 | Series 2020-H18-AI 0.002%, 09/20/2070(h)(j) | 453,639 | ||||||
| 6,986,682 | Series 2020-H19-BI | 372,177 | ||||||
| 5,594,515 | Series 2021-1-QS | 648,696 | ||||||
| 8,032,289 | Series 2021-107-SA | 297,303 | ||||||
| 17,525,205 | Series 2021-213-SN | 331,856 | ||||||
| 9,379,761 | Series 2021-52-IO | 533,704 | ||||||
| 4,650,907 | Series 2021-59-S | 54,929 | ||||||
| 9,545,021 | Series 2021-77-IH | 1,081,994 | ||||||
| 11,729,175 | Series 2021-89-SA | 384,730 | ||||||
| 21,337,605 | Series 2021-97-SA | 281,740 | ||||||
| 8,245,271 | Series 2021-97-SB | 203,206 | ||||||
| Principal Amount^ | Value | |||||||
| $ 39,961,979 | Series 2021-H08-QI | $ | 808,511 | |||||
| 14,393,385 | Series 2021-H19-AI | 876,813 | ||||||
| 14,859,315 | Series 2022-48-IO | 916,806 | ||||||
| 10,698,002 | Series 2022-83-IO | 1,401,804 | ||||||
| Great Wolf Trust |
| |||||||
| 1,000,000 | Series 2019-WOLF-E | 971,951 | ||||||
| GS Mortgage Securities Corp. Trust |
| |||||||
| 130,000 | Series 2012-BWTR-A | 94,461 | ||||||
| 1,125,000 | Series 2013-PEMB-C | 889,683 | ||||||
| 1,503,000 | Series 2018-TWR-G | 841,441 | ||||||
| 600,000 | Series 2021-ARDN-H | 550,400 | ||||||
| GS Mortgage Securities Trust |
| |||||||
| 130,000 | Series 2011-GC5-C | 92,386 | ||||||
| 1,010,000 | Series 2011-GC5-D | 330,531 | ||||||
| 100,000 | Series 2014-GC18-B | 83,046 | ||||||
| 1,344,000 | Series 2014-GC26-D | 851,582 | ||||||
| 5,673,000 | Series 2021-GSA3-XF | 463,463 | ||||||
| GSCG Trust |
| |||||||
| 710,000 | Series 2019-600C-H | 484,098 | ||||||
| GSR Mortgage Loan Trust |
| |||||||
| 31,623 | Series 2005-4F-6A1 | 29,647 | ||||||
| 502,964 | Series 2005-9F-2A1 | 256,426 | ||||||
| 68,384 | Series 2005-AR6-4A5 | 63,555 | ||||||
| 217,916 | Series 2006-7F-3A4 | 76,181 | ||||||
| 2,557 | Series 2006-8F-2A1 | 2,557 | ||||||
| HarborView Mortgage Loan Trust |
| |||||||
| 165,465 | Series 2004-11-2A2A | 137,310 | ||||||
| Imperial Fund Mortgage Trust |
| |||||||
| 2,000,000 | Series 2021-NQM3-B2 | 1,250,985 | ||||||
| IndyMac INDX Mortgage Loan Trust |
| |||||||
| 117,255 | Series 2004-AR7-A5 | 103,187 | ||||||
| 192,829 | Series 2005-AR11-A3 | 148,182 | ||||||
The accompanying notes are an integral part of these financial statements.
| 56 | Litman Gregory Funds Trust | |||||
Table of Contents
iMGP Alternative Strategies Fund
CONSOLIDATED SCHEDULE OF INVESTMENTS IN SECURITIES at June 30, 2023 (Unaudited) (Continued)
| Principal Amount^ | Value | |||||||
MORTGAGE-BACKED SECURITIES (CONTINUED) | ||||||||
| IndyMac INDX Mortgage Loan Trust (Continued) | ||||||||
| $ 2,467,136 | Series 2006-R1-A3 | $ | 2,055,199 | |||||
| 944,076 | Series 2007-AR5-2A1 | 776,765 | ||||||
| JP Morgan Chase Commercial Mortgage Securities Trust | ||||||||
| 1,285,000 | Series 2011-C3-E | 552,822 | ||||||
| 308,225 | Series 2012-LC9-C | 289,462 | ||||||
| 683,000 | Series 2019-MFP-G | 643,111 | ||||||
| 683,000 | Series 2019-MFP-XG | 2,231 | ||||||
| 219,000 | Series 2019-UES-C | 206,651 | ||||||
| 224,000 | Series 2019-UES-D | 209,301 | ||||||
| 261,000 | Series 2019-UES-E | 242,181 | ||||||
| 274,000 | Series 2019-UES-F | 252,646 | ||||||
| 299,000 | Series 2019-UES-G | 273,874 | ||||||
| JP Morgan Mortgage Trust | ||||||||
| 177,473 | Series 2004-S1-2A1 | 171,491 | ||||||
| 1,346,042 | Series 2005-ALT1-3A1 | 1,053,987 | ||||||
| 12,523 | Series 2007-A1-4A2 | 11,729 | ||||||
| 548,920 | Series 2007-S3-1A97 | 298,075 | ||||||
| JPMBB Commercial Mortgage Securities Trust | ||||||||
| 78,000 | Series 2015-C27-D | 45,860 | ||||||
| 4,749,500 | Series 2015-C27-XFG | 83,380 | ||||||
| Legacy Mortgage Asset Trust |
| |||||||
| 713,952 | Series 2020-GS1-A1 | 701,988 | ||||||
| 3,319,250 | Series 2020-GS3-A2 | 2,951,288 | ||||||
| Lehman Mortgage Trust |
| |||||||
| 567,036 | Series 2006-2-2A3 | 552,306 | ||||||
| 838,961 | Series 2007-1-1A2 | 818,725 | ||||||
| Lehman XS Trust |
| |||||||
| 75,219 | Series 2006-2N-1A1 | 66,655 | ||||||
| LHOME Mortgage Trust |
| |||||||
| 3,700,000 | Series 2021-RTL1-M | 3,264,140 | ||||||
| Principal Amount^ | Value | |||||||
| Master Alternative Loan Trust |
| |||||||
| $ 16,211 | Series 2003-9-4A1 | $ | 15,485 | |||||
| 12,449 | Series 2004-5-1A1 | 12,034 | ||||||
| 15,259 | Series 2004-5-2A1 | 14,965 | ||||||
| 68,648 | Series 2004-8-2A1 | 65,628 | ||||||
| Merrill Lynch Mortgage Investors Trust |
| |||||||
| 2,665 | Series 2006-2-2A | 2,615 | ||||||
| Mill City Mortgage Loan Trust |
| |||||||
| 305,000 | Series 2021-NMR1-M3 | 243,776 | ||||||
| Morgan Stanley Bank of America Merrill Lynch Trust |
| |||||||
| 858,000 | Series 2015-C21-C | 664,102 | ||||||
| Morgan Stanley Bank of America Merrill Lynch Trust |
| |||||||
| 560,000 | Series 2013-C11-B | 462,791 | ||||||
| 1,155,000 | Series 2016-C31-D | 631,763 | ||||||
| Morgan Stanley Capital I Trust |
| |||||||
| 166,898 | Series 2011-C2-D | 153,669 | ||||||
| 540,000 | Series 2011-C2-E | 394,595 | ||||||
| 613,000 | Series 2018-H4-D | 339,453 | ||||||
| 1,508,000 | Series 2019-PLND-F | 1,007,465 | ||||||
| Morgan Stanley Mortgage Loan Trust |
| |||||||
| 1,213,036 | Series 2005-9AR-2A | 1,114,968 | ||||||
| 2,232,735 | Series 2006-11-2A2 | 1,044,524 | ||||||
| 258,395 | Series 2006-7-3A | 171,549 | ||||||
| 224,812 | Series 2007-13-6A1 | 135,414 | ||||||
| New Residential Mortgage Loan Trust |
| |||||||
| 2,250,000 | Series 2021-NQ1R-M1 | 1,585,892 | ||||||
| NewRez Warehouse Securitization Trust |
| |||||||
| 1,906,667 | Series 2021-1-F | 1,893,772 | ||||||
| Preston Ridge Partners Mortgage LLC |
| |||||||
| 4,046,299 | Series 2021-2-A1 | 3,834,110 | ||||||
| 400,000 | Series 2021-2-A2 | 354,467 | ||||||
| 311,391 | Series 2021-9-A1 | 290,705 | ||||||
| Prime Mortgage Trust |
| |||||||
| 773,681 | Series 2006-DR1-2A1 | 634,337 | ||||||
| Residential Accredit Loans, Inc. Trust |
| |||||||
| 239,634 | Series 2006-QS17-A5 | 192,300 | ||||||
The accompanying notes are an integral part of these financial statements.
| Schedule of Investments | 57 | |||||
Table of Contents
iMGP Alternative Strategies Fund
CONSOLIDATED SCHEDULE OF INVESTMENTS IN SECURITIES at June 30, 2023 (Unaudited) (Continued)
| Principal Amount^ | Value | |||||||
MORTGAGE-BACKED SECURITIES (CONTINUED) | ||||||||
| Residential Accredit Loans, Inc. Trust |
| |||||||
| $ 281,860 | Series 2006-QS7-A3 | $ | 224,706 | |||||
| 334,005 | Series 2007-QS1-2A10 | 255,901 | ||||||
| 293,502 | Series 2007-QS8-A8 | 228,750 | ||||||
| Residential Asset Securitization Trust |
| |||||||
| 197,032 | Series 2006-A8-1A1 | 132,508 | ||||||
| 226,692 | Series 2007-A1-A8 | 77,727 | ||||||
| 15,390,553 | Series 2007-A9-A1 | 4,422,556 | ||||||
| 15,390,553 | Series 2007-A9-A2 | 1,967,578 | ||||||
| Residential Funding Mtg Sec I Trust |
| |||||||
| 283,494 | Series 2006-S4-A5 | 225,327 | ||||||
| SMR Mortgage Trust |
| |||||||
| 1,159,656 | Series 2022-IND-G | 1,058,179 | ||||||
| Starwood Retail Property Trust |
| |||||||
| 235,000 | Series 2014-STAR-C | 86,711 | ||||||
| 980,000 | Series 2014-STAR-D | 216,825 | ||||||
| 950,000 | Series 2014-STAR-E | 47,500 | ||||||
| Structured Adjustable Rate Mortgage Loan Trust | ||||||||
| 464,098 | Series 2005-14-A1 | 300,420 | ||||||
| 213,454 | Series 2005-15-1A1 | 128,356 | ||||||
| 451,933 | Series 2008-1-A2 | 359,289 | ||||||
| Structured Asset Securities Corp. |
| |||||||
| 5,450,973 | Series 2007-4-1A3 | 278,082 | ||||||
| Toorak Mortgage Corp. Ltd. |
| |||||||
| 630,000 | Series 2021-1-A1 | 613,962 | ||||||
| TTAN |
| |||||||
| 524,800 | Series 2021-MHC-G | 502,541 | ||||||
| UBS-Barclays Commercial Mortgage Trust | ||||||||
| 305,000 | Series 2012-C2-E | 1,563 | ||||||
| Principal Amount^ | Value | |||||||
| $ 1,000,000 | Series 2013-C5-C | $ | 723,787 | |||||
| Verus Securitization Trust |
| |||||||
| 2,000,000 | Series 2021-7-B2 | 1,259,479 | ||||||
| Washington Mutual Mortgage Pass-Through Certificates Trust | ||||||||
| 366,643 | Series 2006-5-1A5 | 273,453 | ||||||
| 378,644 | Series 2006-8-A6 | 141,445 | ||||||
| 2,088,669 | Series 2007-5-A3 | 1,788,073 | ||||||
| Wells Fargo Alternative Loan Trust |
| |||||||
| 85,893 | Series 2007-PA2-3A1 | 60,513 | ||||||
| 126,533 | Series 2007-PA2-3A2 | 6,920 | ||||||
| Wells Fargo Commercial Mortgage Trust |
| |||||||
| 640,000 | Series 2013-LC12-B | 500,932 | ||||||
| 19,971,000 | Series 2015-C28-XE | 361,519 | ||||||
| 600,000 | Series 2016-C34-C | 461,808 | ||||||
| 135,000 | Series 2016-C36-B | 112,702 | ||||||
| 130,000 | Series 2016-C36-C | 92,889 | ||||||
| 6,406,000 | Series 2017-C42-XE | 287,655 | ||||||
| Wells Fargo Mortgage-Backed Securities Trust | ||||||||
| 44,985 | Series 2006-AR19-A1 | 43,495 | ||||||
| WFRBS Commercial Mortgage Trust |
| |||||||
| 214,000 | Series 2011-C3-D | 47,942 | ||||||
| 395,000 | Series 2011-C4-E | 277,510 | ||||||
| 1,020,000 | Series 2012-C10-C | 703,003 | ||||||
| 250,000 | Series 2014-C24-B | 224,521 | ||||||
|
| |||||||
| | TOTAL MORTGAGE-BACKED SECURITIES | 132,538,860 | ||||||
|
| |||||||
SHORT-TERM INVESTMENTS: 23.0% | ||||||||
REPURCHASE AGREEMENTS: 6.0% | ||||||||
| 54,849,733 | Fixed Income Clearing Corp. 1.520%, 6/30/2023, due 07/03/2023 [collateral: par value $62,167,700, U.S. Treasury Note, 0.500%, due 02/28/2026 value $55,949,684] (proceeds $54,856,681) | 54,849,733 | ||||||
|
| |||||||
| | TOTAL REPURCHASE AGREEMENTS | 54,849,733 | ||||||
|
| |||||||
The accompanying notes are an integral part of these financial statements.
| 58 | Litman Gregory Funds Trust | |||||
Table of Contents
iMGP Alternative Strategies Fund
CONSOLIDATED SCHEDULE OF INVESTMENTS IN SECURITIES at June 30, 2023 (Unaudited) (Continued)
| Principal Amount^ | Value | |||||||
TREASURY BILLS: 17.0% | ||||||||
| U.S. Treasury Bills | ||||||||
| $ 3,000,000 | 3.861%, 09/07/2023(c)(i)(n) | $ | 2,971,678 | |||||
| 134,900,000 | 4.622%, 09/28/2023(i)(n) | 133,216,575 | ||||||
| 3,000,000 | 4.946%, 10/19/2023(c)(i)(n) | 2,953,200 | ||||||
| 3,500,000 | 4.866%, 10/26/2023(c)(i)(n) | 3,441,889 | ||||||
| 5,010,000 | 4.356%, 11/02/2023(c)(i)(n) | 4,921,628 | ||||||
| 2,800,000 | 5.050%, 11/09/2023(c)(i)(n) | 2,747,837 | ||||||
| 2,900,000 | 5.069%, 11/16/2023(c)(i)(n) | 2,843,217 | ||||||
| 1,800,000 | 5.116%, 11/30/2023(c)(i)(n) | 1,761,073 | ||||||
|
| |||||||
| | TOTAL TREASURY BILLS | 154,857,097 | ||||||
|
| |||||||
| | TOTAL SHORT-TERM INVESTMENTS | 209,706,830 | ||||||
|
| |||||||
| | TOTAL PURCHASED OPTIONS | 110,405 | ||||||
|
| |||||||
| | TOTAL INVESTMENTS | 879,112,168 | ||||||
|
| |||||||
| Other Assets in Excess of Liabilities: 3.5% | 31,525,044 | |||||||
|
| |||||||
NET ASSETS: 100.0% | $ | 910,637,212 | ||||||
|
| |||||||
Percentages are stated as a percent of net assets.
| ADR | American Depositary Receipt |
| CLO | Collateralized Loan Obligation |
| CMT | Constant Maturity Treasury Index |
| EURIBOR | Euro Interbank Offered Rate |
| LIBOR | London Interbank Offered Rate |
| PIK | Payment-in-kind |
| REIT | Real Estate Investment Trust |
| REMICS | Real Estate Mortgage Investment Conduit |
| SOFR | Secured Overnight Financing Rate |
| LP | Limited Partnership |
| * | Non-Income Producing Security. |
| ^ | The principal amount is stated in U.S. Dollars unless otherwise indicated. |
| (a) | Security is valued using significant unobservable inputs in good faith in accordance with procedures approved by the Board of Trustees. |
| (b) | Security was purchased pursuant to Rule 144A under the Securities Act of 1933 and may be sold in transactions exempt from registration only to qualified institutional buyers or in a public offering registered under Securities Act of 1933. |
| (c) | Securities with an aggregate fair value of $54,000,929 have been pledged as collateral for options, total return swaps, credit default swaps, securities sold short and futures positions. |
| (d) | Perpetual Call. |
| (e) | Pay-in-kind security. |
| (f) | Coupon increases periodically based upon a predetermined schedule. Stated interest rate in effect at June 30, 2023. |
| (g) | Floating Interest Rate at June 30, 2023. |
| (h) | Variable rate security. Interest rate or distribution rate disclosed is that which is in effect at June 30, 2023. |
| (i) | Issued with a zero coupon. Income is recognized through the accretion of discount. |
| (j) | Interest Only security. Security with a notional or nominal principal amount. |
| (k) | Security is currently in default and/or non-income producing. |
| (l) | This position represents an unsettled loan commitment at period end. Certain details associated with this purchase are not known prior to the settlement date, including coupon rate, which will be adjusted on settlement date. |
| (m) | Principal Only security. |
| (n) | The rate shown represents yield-to-maturity. |
CURRENCY ABBREVIATIONS:
| CAD | Canadian Dollar |
| CHF | Swiss Franc |
| COP | Colombian Peso |
| DKK | Danish Krone |
| EUR | Euro |
| GBP | British Pound |
| HUF | Hungary Forint |
| IDR | Indonesian Rupiah |
| SEK | Swedish Krona |
| ZAR | South African Rand |
UNFUNDED LOAN COMMITMENTS—At June 30, 2023, the Fund had unfunded loan commitments which could be extended at the option of the borrowers, pursuant to the following agreements:
| Borrower | Principal Amount | Current Value | Unrealized Gain (Loss) | |||||||||
Lealand Finance Company B.V., 0.500%, 06/28/2024 | $ | 273,000 | $ | 193,830 | $ | (79,170 | ) | |||||
The accompanying notes are an integral part of these financial statements.
| Schedule of Investments | 59 | |||||
Table of Contents
iMGP Alternative Strategies Fund
CONSOLIDATED SCHEDULE OF INVESTMENTS IN PURCHASED OPTIONS at June 30, 2023 (Unaudited)
| Description | Counterparty | Exercise Price | Expiration Date | Number of Contracts | Notional Amount | Fair Value | Premiums Paid | Unrealized Appreciation/ (Depreciation) | ||||||||||||||||||||||
COMMON STOCKS |
| |||||||||||||||||||||||||||||
Call |
| |||||||||||||||||||||||||||||
Horizon Therapeutics PLC | Morgan Stanley & Co. | $ | 105.00 | 8/18/2023 | 26 | $ | 267,410 | $ | 6,500 | $ | 7,089 | $ | (589 | ) | ||||||||||||||||
Horizon Therapeutics PLC | Morgan Stanley & Co. | 110.00 | 8/18/2023 | 52 | 534,820 | 5,200 | 7,351 | (2,151 | ) | |||||||||||||||||||||
iRobot Corp. | Morgan Stanley & Co. | 55.00 | 9/15/2023 | 77 | 348,425 | 7,700 | 27,276 | (19,576 | ) | |||||||||||||||||||||
IVERIC bio, Inc. | Morgan Stanley & Co. | 40.00 | 7/21/2023 | 535 | 2,104,690 | 2,675 | 15,251 | (12,576 | ) | |||||||||||||||||||||
IVERIC bio, Inc. | Morgan Stanley & Co. | 40.00 | 9/15/2023 | 137 | 538,958 | 1,370 | 7,566 | (6,196 | ) | |||||||||||||||||||||
MaxLinear, Inc. | Morgan Stanley & Co. | 30.00 | 9/15/2023 | 142 | 448,152 | 58,220 | 19,293 | 38,927 | ||||||||||||||||||||||
Put |
| |||||||||||||||||||||||||||||
Horizon Therapeutics PLC | Morgan Stanley & Co. | 95.00 | 8/18/2023 | 269 | 2,766,665 | 16,140 | 45,973 | (29,833 | ) | |||||||||||||||||||||
Horizon Therapeutics PLC | Morgan Stanley & Co. | 100.00 | 8/18/2023 | 12 | 123,420 | 1,680 | 3,677 | (1,997 | ) | |||||||||||||||||||||
Horizon Therapeutics PLC | Morgan Stanley & Co. | 85.00 | 9/15/2023 | 104 | 1,069,640 | 10,920 | 17,528 | (6,608 | ) | |||||||||||||||||||||
|
| |||||||||||||||||||||||||||||
Total Purchased Options |
| $ | 110,405 | $ | 151,004 | $ | (40,599 | ) | ||||||||||||||||||||||
|
| |||||||||||||||||||||||||||||
The accompanying notes are an integral part of these financial statements.
| 60 | Litman Gregory Funds Trust | |||||
Table of Contents
iMGP Alternative Strategies Fund
CONSOLIDATED SCHEDULE OF INVESTMENTS IN SECURITIES SOLD SHORT at June 30, 2023 (Unaudited)
| Shares | Value | |||||||
COMMON STOCKS: (1.9)% | ||||||||
| (139,576) | Baytex Energy Corp.* | $ | (455,500 | ) | ||||
| (6,827) | Broadcom, Inc. | (5,921,945 | ) | |||||
| (5,209) | Brookfield Infrastructure Corp. Class A | (237,426 | ) | |||||
| (19,528) | Chevron Corp. | (3,072,731 | ) | |||||
| (8,572) | Cineplex, Inc.* | (57,438 | ) | |||||
| (13,757) | Extra Space Storage, Inc. REIT | (2,047,729 | ) | |||||
| (161,900) | First Horizon Corp. | (1,824,613 | ) | |||||
| (481) | Intercontinental Exchange, Inc. | (54,392 | ) | |||||
| (7,700) | iRobot Corp.* | (348,425 | ) | |||||
| (14,219) | MaxLinear, Inc.* | (448,752 | ) | |||||
| (3,614) | NuVasive, Inc.* | (150,306 | ) | |||||
| (13,818) | ONEOK, Inc. | (852,847 | ) | |||||
| (2,148) | Public Storage REIT | (626,958 | ) | |||||
| (17,523) | Regency Centers Corp. REIT | (1,082,396 | ) | |||||
|
| |||||||
| | TOTAL COMMON STOCKS | (17,181,458 | ) | |||||
|
| |||||||
| | TOTAL SECURITIES SOLD SHORT | $ | (17,181,458 | ) | ||||
|
| |||||||
The accompanying notes are an integral part of these financial statements.
| Schedule of Investments | 61 | |||||
Table of Contents
iMGP Alternative Strategies Fund
CONSOLIDATED SCHEDULE OF INVESTMENTS IN FORWARD FOREIGN CURRENCY EXCHANGE CONTRACTS at June 30, 2023 (Unaudited)
At June 30, 2023, the Fund had the following forward foreign currency exchange contracts:
| Asset Derivatives | Liability Derivatives | |||||||||||||||||||||||||||
| Counterparty | Settlement Date | Fund Receiving | U.S. $ Value at June 30, 2023 | Fund Delivering | U.S. $ Value at June 30, 2023 | Unrealized Appreciation | Unrealized Depreciation | |||||||||||||||||||||
Bank of America N.A. | 7/31/2023 | USD | $ | 1,816,804 | EUR | $ | 1,783,069 | $ | 33,735 | $ | — | |||||||||||||||||
| 9/5/2023 | USD | 426,983 | EUR | 433,695 | — | (6,712 | ) | |||||||||||||||||||||
Barclays Bank Plc | 7/31/2023 | USD | 551,459 | EUR | 541,152 | 10,307 | — | |||||||||||||||||||||
Goldman Sachs & Co. | 8/18/2023 | USD | 349,478 | EUR | 350,148 | — | (670 | ) | ||||||||||||||||||||
JPMorgan Chase Bank N.A. | 7/13/2023 | EUR | 708,637 | USD | 703,716 | 4,921 | — | |||||||||||||||||||||
| 7/13/2023 | EUR | 471,072 | USD | 478,583 | — | (7,511 | ) | |||||||||||||||||||||
| 7/13/2023 | EUR | 1,098,872 | USD | 1,107,293 | — | (8,421 | ) | |||||||||||||||||||||
| 7/13/2023 | EUR | 726,246 | USD | 735,302 | — | (9,056 | ) | |||||||||||||||||||||
| 7/13/2023 | USD | 227,376 | EUR | 224,884 | 2,492 | — | ||||||||||||||||||||||
| 8/23/2023 | USD | 175,376 | EUR | 174,741 | 635 | — | ||||||||||||||||||||||
| 8/23/2023 | USD | 71,973 | EUR | 73,211 | — | (1,238 | ) | |||||||||||||||||||||
Morgan Stanley & Co. | 7/11/2023 | USD | 755,570 | COP | 847,402 | — | (91,832 | ) | ||||||||||||||||||||
| 9/15/2023 | CAD | 26,924 | USD | 26,908 | 16 | — | ||||||||||||||||||||||
| 9/15/2023 | CAD | 30,478 | USD | 30,478 | — | — | ||||||||||||||||||||||
| 9/15/2023 | SEK | 40,767 | USD | 40,686 | 81 | — | ||||||||||||||||||||||
| 9/15/2023 | SEK | 12,795 | USD | 12,773 | 22 | — | ||||||||||||||||||||||
| 9/15/2023 | SEK | 15,186 | USD | 15,374 | �� | (188 | ) | |||||||||||||||||||||
| 9/15/2023 | SEK | 23,981 | USD | 24,170 | — | (189 | ) | |||||||||||||||||||||
| 9/15/2023 | USD | 25,923 | CAD | 25,789 | 134 | — | ||||||||||||||||||||||
| 9/15/2023 | USD | 27,145 | CAD | 27,226 | — | (81 | ) | |||||||||||||||||||||
| 9/15/2023 | USD | 2,187,013 | CAD | 2,205,304 | — | (18,291 | ) | |||||||||||||||||||||
| 9/15/2023 | USD | 468,965 | DKK | 469,630 | — | (665 | ) | |||||||||||||||||||||
| 9/15/2023 | USD | 1,874,461 | DKK | 1,901,275 | — | (26,814 | ) | |||||||||||||||||||||
| 9/15/2023 | USD | 203,768 | EUR | 202,714 | 1,054 | — | ||||||||||||||||||||||
| 9/15/2023 | USD | 219,029 | EUR | 218,274 | 755 | — | ||||||||||||||||||||||
| 9/15/2023 | USD | 97,841 | EUR | 97,960 | — | (119 | ) | |||||||||||||||||||||
| 9/15/2023 | USD | 704,805 | EUR | 705,117 | — | (312 | ) | |||||||||||||||||||||
| 9/15/2023 | �� | USD | 195,758 | EUR | 196,249 | — | (491 | ) | ||||||||||||||||||||
| 9/15/2023 | USD | 8,555,408 | EUR | 8,674,417 | — | (119,009 | ) | |||||||||||||||||||||
| 9/15/2023 | USD | 575,707 | GBP | 574,382 | 1,325 | — | ||||||||||||||||||||||
| 9/15/2023 | USD | 278,474 | GBP | 277,595 | 879 | — | ||||||||||||||||||||||
| 9/15/2023 | USD | 113,114 | GBP | 113,122 | — | (8 | ) | |||||||||||||||||||||
| 9/15/2023 | USD | 342,008 | GBP | 344,451 | — | (2,443 | ) | |||||||||||||||||||||
| 9/15/2023 | USD | 2,278,690 | GBP | 2,308,333 | — | (29,643 | ) | |||||||||||||||||||||
| 9/15/2023 | USD | 17,810 | SEK | 17,587 | 223 | — | ||||||||||||||||||||||
| 9/15/2023 | USD | 11,338 | SEK | 11,195 | 143 | — | ||||||||||||||||||||||
| 9/15/2023 | USD | 8,780 | SEK | 8,794 | — | (14 | ) | |||||||||||||||||||||
| 9/15/2023 | USD | 884,006 | SEK | 884,812 | — | (806 | ) | |||||||||||||||||||||
|
|
|
|
|
|
|
|
|
| |||||||||||||||||||
| $ | 26,600,020 | $ | 26,867,811 | $ | 56,722 | $ | (324,513 | ) | ||||||||||||||||||||
|
|
|
|
|
|
|
|
|
| |||||||||||||||||||
The accompanying notes are an integral part of these financial statements.
| 62 | Litman Gregory Funds Trust | |||||
Table of Contents
iMGP Alternative Strategies Fund
CONSOLIDATED SCHEDULE OF INVESTMENTS IN FUTURES CONTRACTS at June 30, 2023 (Unaudited)
| Description | Number of Contracts | Notional Amount | Notional Value | Expiration Date | Unrealized Appreciation/ (Depreciation) | |||||||||||||||
Futures Contracts – Long | ||||||||||||||||||||
30 Day Federal Funds Futures | 1 | 394,792 | $ | 394,448 | 10/31/2023 | $ | (344 | ) | ||||||||||||
Euro FX Currency Futures | 329 | 44,785,162 | 45,044,212 | 9/18/2023 | 259,050 | |||||||||||||||
Gold 100 Oz Futures (a) | 97 | 19,074,630 | 18,715,180 | 8/29/2023 | (359,450 | ) | ||||||||||||||
MSCI EAFE Index Futures | 51 | 5,449,547 | 5,496,525 | 9/15/2023 | 46,978 | |||||||||||||||
MSCI Emerging Market Index | 74 | 3,709,293 | 3,692,230 | 9/15/2023 | (17,063 | ) | ||||||||||||||
Nasdaq 100 E-mini Futures | 13 | 3,812,051 | 3,987,620 | 9/15/2023 | 175,569 | |||||||||||||||
Russell 2000 E-mini Futures | 9 | 856,525 | 856,665 | 9/15/2023 | 140 | |||||||||||||||
S&P 500 E-Mini Index Futures | 73 | 15,970,454 | 16,382,113 | 9/15/2023 | 411,659 | |||||||||||||||
S&P Mid Cap 400 E-mini Futures | 10 | 2,583,229 | 2,644,100 | 9/15/2023 | 60,871 | |||||||||||||||
U.S. Treasury 10-Year Note Futures | 55 | 6,234,836 | 6,174,610 | 9/20/2023 | (60,226 | ) | ||||||||||||||
U.S. Treasury 10-Year Note Futures | 10 | 1,135,802 | 1,122,656 | 9/20/2023 | (13,146 | ) | ||||||||||||||
U.S. Treasury 2-Year Note Futures | 115 | 23,549,580 | 23,384,531 | 9/29/2023 | (165,049 | ) | ||||||||||||||
U.S. Treasury 2-Year Note Futures | 309 | 63,597,405 | 62,833,220 | 9/29/2023 | (764,185 | ) | ||||||||||||||
U.S. Treasury 5-Year Note Futures | 275 | 29,798,039 | 29,450,781 | 9/29/2023 | (347,258 | ) | ||||||||||||||
|
| |||||||||||||||||||
Total Long | $ | (772,454 | ) | |||||||||||||||||
|
| |||||||||||||||||||
Futures Contracts – Short | ||||||||||||||||||||
3 Months SOFR Futures | (45 | ) | (10,832,608 | ) | $ | (10,797,187 | ) | 3/18/2025 | $ | 35,421 | ||||||||||
Japanese Yen Currency Futures | (855 | ) | (77,578,261 | ) | (74,946,094 | ) | 9/18/2023 | 2,632,167 | ||||||||||||
MSCI EAFE Index Futures | (47 | ) | (4,973,580 | ) | (5,065,425 | ) | 9/15/2023 | (91,845 | ) | |||||||||||
MSCI Emerging Market Index | (88 | ) | (4,410,388 | ) | (4,390,760 | ) | 9/15/2023 | 19,628 | ||||||||||||
U.S. Treasury 10-Year Note Futures | (87 | ) | (9,884,080 | ) | (9,767,109 | ) | 9/20/2023 | 116,971 | ||||||||||||
U.S. Treasury 10-Year Ultra Note Futures | (120 | ) | (14,288,606 | ) | (14,212,500 | ) | 9/20/2023 | 76,106 | ||||||||||||
U.S. Treasury 10-Year Ultra Note Futures | (197 | ) | (23,544,176 | ) | (23,332,188 | ) | 9/20/2023 | 211,988 | ||||||||||||
U.S. Treasury 2-Year Note Futures | (626 | ) | (128,383,996 | ) | (127,293,188 | ) | 9/29/2023 | 1,090,808 | ||||||||||||
U.S. Treasury 5-Year Note Futures | (343 | ) | (37,290,020 | ) | (36,733,157 | ) | 9/29/2023 | 556,863 | ||||||||||||
U.S. Treasury Long Bond Futures | (119 | ) | (15,177,556 | ) | (15,101,844 | ) | 9/20/2023 | 75,712 | ||||||||||||
U.S. Treasury Long Bond Futures | (17 | ) | (2,148,419 | ) | (2,157,406 | ) | 9/20/2023 | (8,987 | ) | |||||||||||
U.S. Treasury Long Bond Futures | (10 | ) | (1,261,583 | ) | (1,269,063 | ) | 9/20/2023 | (7,480 | ) | |||||||||||
U.S. Treasury Ultra-Long Bond Futures | (16 | ) | (2,156,345 | ) | (2,179,500 | ) | 9/20/2023 | (23,155 | ) | |||||||||||
U.S. Treasury Ultra-Long Bond Futures | (17 | ) | (2,277,169 | ) | (2,315,719 | ) | 9/20/2023 | (38,550 | ) | |||||||||||
WTI Crude Futures (a) | (189 | ) | (13,712,869 | ) | (13,377,420 | ) | 8/22/2023 | 335,449 | ||||||||||||
|
| |||||||||||||||||||
Total Short | $ | 4,981,096 | ||||||||||||||||||
|
| |||||||||||||||||||
Total Futures Contracts | $ | 4,208,642 | ||||||||||||||||||
|
| |||||||||||||||||||
| (a) | Contract held by the iMGP Alternative Strategies Subsidiary. |
The accompanying notes are an integral part of these financial statements.
| Schedule of Investments | 63 | |||||
Table of Contents
iMGP Alternative Strategies Fund
CONSOLIDATED SCHEDULE OF INVESTMENTS IN SWAPS at June 30, 2023 (Unaudited)
| CENTRALLY CLEARED CREDIT DEFAULT SWAP CONTRACTS (1)(2)(3) | ||||||||||||||||||||||||||||||||
| Description | Maturity Date | Fixed Deal (Pay) Rate | Implied Credit Spread at June 30, 2023 | Notional Amount(4) | Periodic Payment Frequency | Fair Value | Upfront Premiums Paid / (Received) | Unrealized Appreciation / (Depreciation) | ||||||||||||||||||||||||
Buy Protection |
| |||||||||||||||||||||||||||||||
ADT Security Corp. (The) | 6/20/2028 | (5.000 | %) | 2.293 | % | $ | (5,000,000 | ) | Quarterly | $ | (558,175 | ) | $ | (544,628 | ) | $ | (13,547 | ) | ||||||||||||||
AES Corp. (The) | 6/20/2028 | (5.000 | %) | 1.385 | % | (4,550,000 | ) | Quarterly | (703,072 | ) | (696,990 | ) | (6,082 | ) | ||||||||||||||||||
Airbus SE | 6/20/2028 | (1.000 | %) | 0.695 | % | EUR | (950,000 | ) | Quarterly | (14,245 | ) | (12,253 | ) | (1,992 | ) | |||||||||||||||||
Ally Financial, Inc. | 6/20/2028 | (5.000 | %) | 2.457 | % | $ | (4,950,000 | ) | Quarterly | (515,872 | ) | (529,288 | ) | 13,416 | ||||||||||||||||||
Alstom S.A. | 6/20/2028 | (1.000 | %) | 1.240 | % | EUR | (3,500,000 | ) | Quarterly | 40,489 | 127,778 | (87,289 | ) | |||||||||||||||||||
American Airlines Group, Inc. | 6/20/2028 | (5.000 | %) | 6.872 | % | $ | (2,900,000 | ) | Quarterly | 188,259 | 507,500 | (319,241 | ) | |||||||||||||||||||
American Axle & Manufacturing, Inc. | 6/20/2028 | (5.000 | %) | 4.949 | % | (5,700,000 | ) | Quarterly | (10,721 | ) | 255,058 | (265,779 | ) | |||||||||||||||||||
American Express Co. | 6/20/2028 | (1.000 | %) | 0.403 | % | (5,500,000 | ) | Quarterly | (146,004 | ) | (140,631 | ) | (5,373 | ) | ||||||||||||||||||
Amkor Technology, Inc. | 6/20/2028 | (5.000 | %) | 1.491 | % | (1,900,000 | ) | Quarterly | (283,804 | ) | (257,824 | ) | (25,980 | ) | ||||||||||||||||||
Anglo American Capital Plc | 6/20/2028 | (5.000 | %) | 1.617 | % | EUR | (4,250,000 | ) | Quarterly | (681,746 | ) | (667,973 | ) | (13,773 | ) | |||||||||||||||||
Apache Corp. | 6/20/2028 | (1.000 | %) | 1.864 | % | $ | (5,700,000 | ) | Quarterly | 206,664 | 236,861 | (30,197 | ) | |||||||||||||||||||
Avnet, Inc. | 6/20/2028 | (1.000 | %) | 1.204 | % | (500,000 | ) | Quarterly | 4,387 | 6,282 | (1,895 | ) | ||||||||||||||||||||
AXA S.A. | 6/20/2028 | (1.000 | %) | 0.666 | % | EUR | (1,000,000 | ) | Quarterly | (16,450 | ) | (14,080 | ) | (2,370 | ) | |||||||||||||||||
Bank of America Corp. | 6/20/2028 | (1.000 | %) | 0.910 | % | $ | (3,900,000 | ) | Quarterly | (15,278 | ) | 1,795 | (17,073 | ) | ||||||||||||||||||
Barclays Plc | 6/20/2028 | (1.000 | %) | 1.174 | % | EUR | (5,400,000 | ) | Quarterly | 45,491 | 35,636 | 9,855 | ||||||||||||||||||||
BAT International Finance Plc | 6/20/2028 | (1.000 | %) | 1.017 | % | (4,750,000 | ) | Quarterly | 3,861 | 16,093 | (12,232 | ) | ||||||||||||||||||||
Baxter International, Inc. | 6/20/2028 | (1.000 | %) | 0.707 | % | $ | (5,700,000 | ) | Quarterly | (73,346 | ) | 13,723 | (87,069 | ) | ||||||||||||||||||
Beazer Homes USA, Inc. | 6/20/2028 | (5.000 | %) | 3.125 | % | (1,050,000 | ) | Quarterly | (78,601 | ) | (40,446 | ) | (38,155 | ) | ||||||||||||||||||
Best Buy Co., Inc. | 6/20/2028 | (5.000 | %) | 0.834 | % | (5,000,000 | ) | Quarterly | (910,166 | ) | (879,541 | ) | (30,625 | ) | ||||||||||||||||||
BNP Paribas S.A. | 6/20/2028 | (1.000 | %) | 0.831 | % | EUR | (950,000 | ) | Quarterly | (17,955 | ) | 3,854 | (21,809 | ) | ||||||||||||||||||
BorgWarner, Inc. | 6/20/2028 | (1.000 | %) | 0.660 | % | $ | (2,850,000 | ) | Quarterly | (42,668 | ) | (32,822 | ) | (9,846 | ) | |||||||||||||||||
Bouygues S.A. | 6/20/2028 | (1.000 | %) | 0.511 | % | EUR | (5,100,000 | ) | Quarterly | (123,755 | ) | (103,232 | ) | (20,523 | ) | |||||||||||||||||
BP Capital Markets Plc | 6/20/2028 | (1.000 | %) | 0.789 | % | (850,000 | ) | Quarterly | (8,788 | ) | (9,182 | ) | 394 | |||||||||||||||||||
British Telecommunications Plc | 6/20/2028 | (1.000 | %) | 1.076 | % | (5,500,000 | ) | Quarterly | 20,322 | 104,293 | (83,971 | ) | ||||||||||||||||||||
The accompanying notes are an integral part of these financial statements.
| 64 | Litman Gregory Funds Trust | |||||
Table of Contents
iMGP Alternative Strategies Fund
CONSOLIDATED SCHEDULE OF INVESTMENTS IN SWAPS at June 30, 2023 (Unaudited) (Continued)
| CENTRALLY CLEARED CREDIT DEFAULT SWAP CONTRACTS (1)(2)(3) (CONTINUED) | ||||||||||||||||||||||||||||||||
| Description | Maturity Date | Fixed Deal (Pay) Rate | Implied Credit Spread at June 30, 2023 | Notional Amount(4) | Periodic Payment Frequency | Fair Value | Upfront Premiums Paid / (Received) | Unrealized Appreciation / (Depreciation) | ||||||||||||||||||||||||
Buy Protection (Continued) |
| |||||||||||||||||||||||||||||||
Cardinal Health, Inc. | 6/20/2028 | (1.000 | %) | 0.487 | % | $ | (5,850,000 | ) | Quarterly | $ | (132,960 | ) | $ | (102,720 | ) | $ | (30,240 | ) | ||||||||||||||
Carlsberg Breweries AS | 6/20/2028 | (1.000 | %) | 0.301 | % | EUR | (5,200,000 | ) | Quarterly | (181,881 | ) | (133,513 | ) | (48,368 | ) | |||||||||||||||||
CCO Holdings LLC / CCO Holdings Capital Corp. | 6/20/2028 | (5.000 | %) | 3.200 | % | $ | (5,500,000 | ) | Quarterly | (394,005 | ) | (349,113 | ) | (44,892 | ) | |||||||||||||||||
CDX North America High Yield Index Series 40 | 6/20/2028 | (5.000 | %) | 4.297 | % | (19,635,000 | ) | Quarterly | (558,075 | ) | (32,420 | ) | (525,655 | ) | ||||||||||||||||||
Centrica Plc | 6/20/2028 | (1.000 | %) | 0.781 | % | EUR | (5,600,000 | ) | Quarterly | (60,035 | ) | 49,220 | (109,255 | ) | ||||||||||||||||||
Citigroup, Inc. | 6/20/2028 | (1.000 | %) | 0.775 | % | $ | (4,800,000 | ) | Quarterly | (47,298 | ) | (44,217 | ) | (3,081 | ) | |||||||||||||||||
Cleveland-Cliffs, Inc. | 6/20/2028 | (5.000 | %) | 2.995 | % | (5,100,000 | ) | Quarterly | (410,335 | ) | (467,029 | ) | 56,694 | |||||||||||||||||||
CNH Industrial N.V. | 6/20/2028 | (5.000 | %) | 1.071 | % | EUR | (3,700,000 | ) | Quarterly | (704,643 | ) | (692,101 | ) | (12,542 | ) | |||||||||||||||||
Conagra Brands, Inc. | 6/20/2028 | (1.000 | %) | 0.643 | % | $ | (2,000,000 | ) | Quarterly | (31,462 | ) | (29,169 | ) | (2,293 | ) | |||||||||||||||||
CVS Health Corp. | 6/20/2028 | (1.000 | %) | 0.600 | % | (4,750,000 | ) | Quarterly | (83,801 | ) | (71,976 | ) | (11,825 | ) | ||||||||||||||||||
Deutsche Bank AG | 6/20/2028 | (1.000 | %) | 1.609 | % | EUR | (900,000 | ) | Quarterly | 6,458 | 33,975 | (27,517 | ) | |||||||||||||||||||
Deutsche Lufthansa AG | 6/20/2028 | (1.000 | %) | 2.081 | % | (500,000 | ) | Quarterly | 25,170 | 24,803 | 367 | |||||||||||||||||||||
DR Horton, Inc. | 6/20/2028 | (1.000 | %) | 0.566 | % | $ | (1,700,000 | ) | Quarterly | (32,567 | ) | (22,163 | ) | (10,404 | ) | |||||||||||||||||
Electrolux AB | 6/20/2028 | (1.000 | %) | 1.070 | % | EUR | (1,900,000 | ) | Quarterly | 6,476 | 5,118 | 1,358 | ||||||||||||||||||||
Engie S.A. | 6/20/2028 | (1.000 | %) | 0.504 | % | (3,450,000 | ) | Quarterly | (84,783 | ) | (40,666 | ) | (44,117 | ) | ||||||||||||||||||
Exelon Corp. | 6/20/2028 | (1.000 | %) | 0.435 | % | $ | (4,100,000 | ) | Quarterly | (102,853 | ) | (84,914 | ) | (17,939 | ) | |||||||||||||||||
Expedia Group, Inc. | 6/20/2028 | (1.000 | %) | 1.029 | % | (5,850,000 | ) | Quarterly | 7,298 | 54,121 | (46,823 | ) | ||||||||||||||||||||
FedEx Corp. | 6/20/2028 | (1.000 | %) | 0.558 | % | (5,650,000 | ) | Quarterly | (110,283 | ) | (3,654 | ) | (106,629 | ) | ||||||||||||||||||
FirstEnergy Corp. | 6/20/2028 | (1.000 | %) | 0.777 | % | (5,850,000 | ) | Quarterly | (57,216 | ) | 1,630 | (58,846 | ) | |||||||||||||||||||
Gap, Inc. (The) | 6/20/2028 | (1.000 | %) | 5.304 | % | (9,950,000 | ) | Quarterly | 1,573,432 | 2,122,938 | (549,506 | ) | ||||||||||||||||||||
General Electric Co. | 6/20/2028 | (1.000 | %) | 0.823 | % | (500,000 | ) | Quarterly | (3,867 | ) | (3,306 | ) | (561 | ) | ||||||||||||||||||
Genworth Holdings, Inc. | 6/20/2028 | (5.000 | %) | 2.094 | % | (950,000 | ) | Quarterly | (114,754 | ) | (108,894 | ) | (5,860 | ) | ||||||||||||||||||
Goldman Sachs Group, Inc. (The) | 6/20/2028 | (1.000 | %) | 0.842 | % | (500,000 | ) | Quarterly | (3,451 | ) | (1,334 | ) | (2,117 | ) | ||||||||||||||||||
Goodyear Tire & Rubber Co. (The) | 6/20/2028 | (5.000 | %) | 3.548 | % | (500,000 | ) | Quarterly | (28,507 | ) | (32,530 | ) | 4,023 | |||||||||||||||||||
The accompanying notes are an integral part of these financial statements.
| Schedule of Investments | 65 | |||||
Table of Contents
iMGP Alternative Strategies Fund
CONSOLIDATED SCHEDULE OF INVESTMENTS IN SWAPS at June 30, 2023 (Unaudited) (Continued)
| CENTRALLY CLEARED CREDIT DEFAULT SWAP CONTRACTS (1)(2)(3) (CONTINUED) | ||||||||||||||||||||||||||||||||
| Description | Maturity Date | Fixed Deal (Pay) Rate | Implied Credit Spread at June 30, 2023 | Notional Amount(4) | Periodic Payment Frequency | Fair Value | Upfront Premiums Paid / (Received) | Unrealized Appreciation / (Depreciation) | ||||||||||||||||||||||||
Buy Protection (Continued) |
| |||||||||||||||||||||||||||||||
Hapag-Lloyd AG | 6/20/2028 | (5.000 | %) | 3.108 | % | EUR | (1,900,000 | ) | Quarterly | $ | (160,719 | ) | $ | (195,156 | ) | $ | 34,437 | |||||||||||||||
Heidelberg Materials AG | 6/20/2028 | (5.000 | %) | 1.195 | % | (500,000 | ) | Quarterly | (91,752 | ) | (90,716 | ) | (1,036 | ) | ||||||||||||||||||
Hess Corp. | 6/20/2028 | (1.000 | %) | 1.191 | % | $ | (500,000 | ) | Quarterly | 4,107 | 6,068 | (1,961 | ) | |||||||||||||||||||
Holcim AG | 6/20/2028 | (1.000 | %) | 0.986 | % | EUR | (900,000 | ) | Quarterly | (589 | ) | 5,209 | (5,798 | ) | ||||||||||||||||||
ING Groep N.V. | 6/20/2028 | (1.000 | %) | 0.693 | % | (4,950,000 | ) | Quarterly | (74,676 | ) | (31,752 | ) | (42,924 | ) | ||||||||||||||||||
International Game Technology Plc | 6/20/2028 | (5.000 | %) | 1.784 | % | (4,750,000 | ) | Quarterly | (719,642 | ) | (421,877 | ) | (297,765 | ) | ||||||||||||||||||
International Paper Co. | 6/20/2028 | (1.000 | %) | 0.675 | % | $ | (5,800,000 | ) | Quarterly | (82,803 | ) | (36,733 | ) | (46,070 | ) | |||||||||||||||||
Intrum AB | 6/20/2028 | (5.000 | %) | 11.209 | % | EUR | (2,850,000 | ) | Quarterly | 587,755 | 399,047 | 188,708 | ||||||||||||||||||||
ITV Plc | 6/20/2028 | (5.000 | %) | 1.549 | % | (4,600,000 | ) | Quarterly | (754,824 | ) | (772,078 | ) | 17,254 | |||||||||||||||||||
Koninklijke Philips N.V. | 6/20/2028 | (1.000 | %) | 0.627 | % | (5,250,000 | ) | Quarterly | (96,510 | ) | (26,757 | ) | (69,753 | ) | ||||||||||||||||||
Kroger Co. (The) | 6/20/2028 | (1.000 | %) | 0.682 | % | $ | (5,550,000 | ) | Quarterly | (77,665 | ) | (57,835 | ) | (19,830 | ) | |||||||||||||||||
Lamb Weston Holdings, Inc. | 6/20/2028 | (1.000 | %) | 0.963 | % | (500,000 | ) | Quarterly | (796 | ) | 886 | (1,682 | ) | |||||||||||||||||||
LANXESS AG | 6/20/2028 | (1.000 | %) | 1.946 | % | EUR | (2,250,000 | ) | Quarterly | 99,646 | 104,307 | (4,661 | ) | |||||||||||||||||||
Lincoln National Corp. | 6/20/2028 | (1.000 | %) | 2.500 | % | $ | (6,200,000 | ) | Quarterly | 380,555 | 179,084 | 201,471 | ||||||||||||||||||||
Macy’s Retail Holdings LLC | 6/20/2028 | (1.000 | %) | 4.000 | % | (5,700,000 | ) | Quarterly | 660,056 | 865,688 | (205,632 | ) | ||||||||||||||||||||
McKesson Corp. | 6/20/2028 | (1.000 | %) | 0.400 | % | (5,550,000 | ) | Quarterly | (148,062 | ) | (113,028 | ) | (35,034 | ) | ||||||||||||||||||
MetLife, Inc. | 6/20/2028 | (1.000 | %) | 1.075 | % | (500,000 | ) | Quarterly | 1,618 | 3,744 | (2,126 | ) | ||||||||||||||||||||
Motorola Solutions, Inc. | 6/20/2028 | (1.000 | %) | 0.437 | % | (500,000 | ) | Quarterly | (12,498 | ) | (10,654 | ) | (1,844 | ) | ||||||||||||||||||
Nabors Industries, Inc. | 6/20/2028 | (1.000 | %) | 7.534 | % | (6,950,000 | ) | Quarterly | 1,537,047 | 1,198,875 | 338,172 | |||||||||||||||||||||
Navient Corp. | 6/20/2028 | (5.000 | %) | 4.065 | % | (500,000 | ) | Quarterly | (18,010 | ) | (22,928 | ) | 4,918 | |||||||||||||||||||
Newell Brands, Inc. | 6/20/2028 | (1.000 | %) | 4.736 | % | (6,550,000 | ) | Quarterly | 918,523 | 713,633 | 204,890 | |||||||||||||||||||||
Next Group Plc | 6/20/2028 | (1.000 | %) | 1.173 | % | EUR | (800,000 | ) | Quarterly | 6,697 | 10,064 | (3,367 | ) | |||||||||||||||||||
Nokia Oyj | 6/20/2028 | (5.000 | %) | 1.341 | % | (4,700,000 | ) | Quarterly | (824,589 | ) | (862,748 | ) | 38,159 | |||||||||||||||||||
Nordstrom, Inc. | 6/20/2028 | (1.000 | %) | 4.788 | % | $ | (5,250,000 | ) | Quarterly | 745,038 | 1,147,125 | (402,087 | ) | |||||||||||||||||||
Olin Corp. | 6/20/2028 | (1.000 | %) | 2.179 | % | (5,700,000 | ) | Quarterly | 278,449 | 236,621 | 41,828 | |||||||||||||||||||||
The accompanying notes are an integral part of these financial statements.
| 66 | Litman Gregory Funds Trust | |||||
Table of Contents
iMGP Alternative Strategies Fund
CONSOLIDATED SCHEDULE OF INVESTMENTS IN SWAPS at June 30, 2023 (Unaudited) (Continued)
| CENTRALLY CLEARED CREDIT DEFAULT SWAP CONTRACTS (1)(2)(3) (CONTINUED) | ||||||||||||||||||||||||||||||||
| Description | Maturity Date | Fixed Deal (Pay) Rate | Implied Credit Spread at June 30, 2023 | Notional Amount(4) | Periodic Payment Frequency | Fair Value | Upfront Premiums Paid / (Received) | Unrealized Appreciation / (Depreciation) | ||||||||||||||||||||||||
Buy Protection (Continued) |
| |||||||||||||||||||||||||||||||
Omnicom Group, Inc. / Omnicom Capital, Inc. | 6/20/2028 | (1.000 | %) | 0.423 | % | $ | (5,800,000 | ) | Quarterly | $ | (148,596 | ) | $ | (97,992 | ) | $ | (50,604 | ) | ||||||||||||||
Oracle Corp. | 6/20/2028 | (1.000 | %) | 0.676 | % | (500,000 | ) | Quarterly | (7,133 | ) | (5,162 | ) | (1,971 | ) | ||||||||||||||||||
Ovintiv, Inc. | 6/20/2028 | (1.000 | %) | 1.497 | % | (5,950,000 | ) | Quarterly | 125,776 | 128,704 | (2,928 | ) | ||||||||||||||||||||
PostNL N.V. | 6/20/2028 | (1.000 | %) | 1.369 | % | EUR | (5,700,000 | ) | Quarterly | 100,941 | 269,328 | (168,387 | ) | |||||||||||||||||||
Prudential Financial, Inc. | 6/20/2028 | (1.000 | %) | 1.051 | % | $ | (2,150,000 | ) | Quarterly | 4,769 | 13,780 | (9,011 | ) | |||||||||||||||||||
Prudential Funding Asia Plc | 6/20/2028 | (1.000 | %) | 0.700 | % | EUR | (4,850,000 | ) | Quarterly | (71,535 | ) | (49,937 | ) | (21,598 | ) | |||||||||||||||||
Repsol International Finance B.V. | 6/20/2028 | (1.000 | %) | 0.723 | % | (5,050,000 | ) | Quarterly | (68,835 | ) | (33,697 | ) | (35,138 | ) | ||||||||||||||||||
Rolls-Royce Plc | 6/20/2028 | (1.000 | %) | 2.373 | % | (500,000 | ) | Quarterly | 31,608 | 31,664 | (56 | ) | ||||||||||||||||||||
Royal Caribbean Cruises Ltd. | 6/20/2028 | (5.000 | %) | 3.299 | % | $ | (500,000 | ) | Quarterly | (33,727 | ) | (14,619 | ) | (19,108 | ) | |||||||||||||||||
Sherwin-Williams Co. (The) | 6/20/2028 | (1.000 | %) | 0.791 | % | (500,000 | ) | Quarterly | (4,564 | ) | (5,086 | ) | 522 | |||||||||||||||||||
Southwest Airlines Co. | 6/20/2028 | (1.000 | %) | 0.916 | % | (5,300,000 | ) | Quarterly | (19,326 | ) | 53,592 | (72,918 | ) | |||||||||||||||||||
Standard Chartered Plc | 6/20/2028 | (1.000 | %) | 0.851 | % | EUR | (3,700,000 | ) | Quarterly | (26,885 | ) | (9,463 | ) | (17,422 | ) | |||||||||||||||||
Stora Enso Oyj | 6/20/2028 | (5.000 | %) | 1.061 | % | (4,600,000 | ) | Quarterly | (878,525 | ) | (909,124 | ) | 30,599 | |||||||||||||||||||
Sudzucker International Finance B.V. | 6/20/2028 | (1.000 | %) | 0.743 | % | (5,300,000 | ) | Quarterly | (66,760 | ) | 31,883 | (98,643 | ) | |||||||||||||||||||
T-Mobile USA, Inc. | 6/20/2028 | (5.000 | %) | 0.990 | % | $ | (500,000 | ) | Quarterly | (87,067 | ) | (89,459 | ) | 2,392 | ||||||||||||||||||
Teck Resources Ltd. | 6/20/2028 | (5.000 | %) | 1.437 | % | (600,000 | ) | Quarterly | (91,177 | ) | (90,810 | ) | (367 | ) | ||||||||||||||||||
Telefonaktiebolaget LM Ericsson | 6/20/2028 | (1.000 | %) | 1.512 | % | EUR | (5,600,000 | ) | Quarterly | 136,632 | 270,093 | (133,461 | ) | |||||||||||||||||||
Telefonica Emisiones S.A. | 6/20/2028 | (1.000 | %) | 0.906 | % | (1,000,000 | ) | Quarterly | (4,577 | ) | 509 | (5,086 | ) | |||||||||||||||||||
Telenor ASA | 6/20/2028 | (1.000 | %) | 0.360 | % | (3,850,000 | ) | Quarterly | (122,861 | ) | (97,763 | ) | (25,098 | ) | ||||||||||||||||||
Telia Co AB | 6/20/2028 | (1.000 | %) | 0.394 | % | (4,750,000 | ) | Quarterly | (143,425 | ) | (139,847 | ) | (3,578 | ) | ||||||||||||||||||
thyssenkrupp AG | 6/20/2028 | (1.000 | %) | 2.765 | % | (5,700,000 | ) | Quarterly | 456,086 | 821,419 | (365,333 | ) | ||||||||||||||||||||
Toll Brothers Finance Corp. | 6/20/2028 | (1.000 | %) | 1.154 | % | $ | (450,000 | ) | Quarterly | 2,998 | 7,682 | (4,684 | ) | |||||||||||||||||||
Transocean, Inc. | 6/20/2028 | (1.000 | %) | 8.089 | % | (300,000 | ) | Quarterly | 70,554 | 72,000 | (1,446 | ) | ||||||||||||||||||||
United Airlines Holdings, Inc. | 6/20/2028 | (5.000 | %) | 4.389 | % | (1,900,000 | ) | Quarterly | (44,176 | ) | 90,250 | (134,426 | ) | |||||||||||||||||||
The accompanying notes are an integral part of these financial statements.
| Schedule of Investments | 67 | |||||
Table of Contents
iMGP Alternative Strategies Fund
CONSOLIDATED SCHEDULE OF INVESTMENTS IN SWAPS at June 30, 2023 (Unaudited) (Continued)
| CENTRALLY CLEARED CREDIT DEFAULT SWAP CONTRACTS (1)(2)(3) (CONTINUED) | ||||||||||||||||||||||||||||||||
| Description | Maturity Date | Fixed Deal (Pay) Rate | Implied Credit Spread at June 30, 2023 | Notional Amount(4) | Periodic Payment Frequency | Fair Value | Upfront Premiums Paid / (Received) | Unrealized Appreciation / (Depreciation) | ||||||||||||||||||||||||
Buy Protection (Continued) |
| |||||||||||||||||||||||||||||||
United Rentals North America, Inc. | 6/20/2028 | (5.000 | %) | 1.625 | % | $ | (4,750,000 | ) | Quarterly | $ | (678,661 | ) | $ | (659,604 | ) | $ | (19,057 | ) | ||||||||||||||
United States Steel Corp. | 6/20/2028 | (5.000 | %) | 3.907 | % | (5,200,000 | ) | Quarterly | (220,138 | ) | (101,389 | ) | (118,749 | ) | ||||||||||||||||||
Universal Health Services, Inc. | 6/20/2028 | (1.000 | %) | 1.123 | % | (2,750,000 | ) | Quarterly | 14,631 | 64,433 | (49,802 | ) | ||||||||||||||||||||
Universal Health Services, Inc. | 6/20/2028 | (1.000 | %) | 1.123 | % | (1,900,000 | ) | Quarterly | 10,109 | 47,822 | (37,713 | ) | ||||||||||||||||||||
Valero Energy Corp. 8.750%, | 6/20/2028 | (1.000 | %) | 0.881 | % | (5,800,000 | ) | Quarterly | (30,030 | ) | (17,710 | ) | (12,320 | ) | ||||||||||||||||||
Veolia Environnement S.A. | 6/20/2028 | (1.000 | %) | 0.595 | % | EUR | (5,400,000 | ) | Quarterly | (107,913 | ) | (66,157 | ) | (41,756 | ) | |||||||||||||||||
Vivendi SE | 6/20/2028 | (1.000 | %) | 1.090 | % | (4,400,000 | ) | Quarterly | 19,286 | 9,108 | 10,178 | |||||||||||||||||||||
Vodafone Group Plc | 6/20/2028 | (1.000 | %) | 0.780 | % | (5,500,000 | ) | Quarterly | (59,270 | ) | (273 | ) | (58,997 | ) | ||||||||||||||||||
Volkswagen International Finance N.V. | 6/20/2028 | (1.000 | %) | 1.177 | % | (500,000 | ) | Quarterly | 4,276 | 5,551 | (1,275 | ) | ||||||||||||||||||||
Wendel SE | 6/20/2028 | (5.000 | %) | 0.924 | % | (250,000 | ) | Quarterly | (49,693 | ) | (49,472 | ) | (221 | ) | ||||||||||||||||||
WPP Finance S.A. | 6/20/2028 | (1.000 | %) | 0.870 | % | (5,500,000 | ) | Quarterly | (35,013 | ) | 5,300 | (40,313 | ) | |||||||||||||||||||
Xerox Corp. | 6/20/2028 | (1.000 | %) | 3.754 | % | $ | (5,200,000 | ) | Quarterly | 558,053 | 540,607 | 17,446 | ||||||||||||||||||||
|
|
|
|
|
| |||||||||||||||||||||||||||
Total Buy Protection |
| $ | (4,522,927 | ) | $ | (293,681 | ) | $ | (4,229,246 | ) | ||||||||||||||||||||||
|
|
|
|
|
| |||||||||||||||||||||||||||
Sell Protection |
| |||||||||||||||||||||||||||||||
Airbus SE | 6/20/2028 | 1.000 | % | 0.695 | % | EUR | 5,200,000 | Quarterly | $ | 77,973 | $ | (21,670 | ) | $ | 99,643 | |||||||||||||||||
American Airlines Group, Inc. | 6/20/2028 | 5.000 | % | 6.872 | % | $ | 8,100,000 | Quarterly | (525,827 | ) | (1,018,188 | ) | 492,361 | |||||||||||||||||||
American Axle & Manufacturing, Inc. | 6/20/2028 | 5.000 | % | 4.949 | % | 500,000 | Quarterly | 941 | 1,882 | (941 | ) | |||||||||||||||||||||
ArcelorMittal S.A. | 6/20/2028 | 5.000 | % | 2.031 | % | EUR | 4,450,000 | Quarterly | 616,227 | 599,796 | 16,431 | |||||||||||||||||||||
Assicurazioni Generali SpA | 6/20/2028 | 1.000 | % | 0.829 | % | 4,800,000 | Quarterly | 40,134 | 7,360 | 32,774 | ||||||||||||||||||||||
Avnet, Inc. | 6/20/2028 | 1.000 | % | 1.204 | % | $ | 5,800,000 | Quarterly | (50,890 | ) | (120,253 | ) | 69,363 | |||||||||||||||||||
AXA S.A. | 6/20/2028 | 1.000 | % | 0.666 | % | EUR | 5,350,000 | Quarterly | 88,006 | 55,085 | 32,921 | |||||||||||||||||||||
Banco Santander S.A. | 6/20/2028 | 1.000 | % | 0.995 | % | 3,200,000 | Quarterly | 55,775 | (16,265 | ) | 72,040 | |||||||||||||||||||||
Barclays Plc | 6/20/2028 | 1.000 | % | 1.174 | % | 500,000 | Quarterly | (4,213 | ) | (5,804 | ) | 1,591 | ||||||||||||||||||||
Bath & Body Works, Inc. | 6/20/2028 | 1.000 | % | 3.221 | % | $ | 2,850,000 | Quarterly | (251,794 | ) | (217,313 | ) | (34,481 | ) | ||||||||||||||||||
Beazer Homes USA, Inc. | 6/20/2028 | 5.000 | % | 3.125 | % | 6,000,000 | Quarterly | 449,145 | (280,286 | ) | 729,431 | |||||||||||||||||||||
The accompanying notes are an integral part of these financial statements.
| 68 | Litman Gregory Funds Trust | |||||
Table of Contents
iMGP Alternative Strategies Fund
CONSOLIDATED SCHEDULE OF INVESTMENTS IN SWAPS at June 30, 2023 (Unaudited) (Continued)
| CENTRALLY CLEARED CREDIT DEFAULT SWAP CONTRACTS (1)(2)(3) (CONTINUED) | ||||||||||||||||||||||||||||||||
| Description | Maturity Date | Fixed Deal (Pay) Rate | Implied Credit Spread at June 30, 2023 | Notional Amount(4) | Periodic Payment Frequency | Fair Value | Upfront Premiums Paid / (Received) | Unrealized Appreciation / (Depreciation) | ||||||||||||||||||||||||
Sell Protection (Continued) |
| |||||||||||||||||||||||||||||||
Best Buy Co., Inc. | 6/20/2028 | 5.000 | % | 0.834 | % | $ | 500,000 | Quarterly | $ | 91,016 | $ | 89,742 | $ | 1,274 | ||||||||||||||||||
BNP Paribas S.A. | 6/20/2028 | 1.000 | % | 0.831 | % | EUR | 5,500,000 | Quarterly | 103,946 | 22,536 | 81,410 | |||||||||||||||||||||
Bombardier, Inc. | 6/20/2028 | 5.000 | % | 3.874 | % | $ | 5,350,000 | Quarterly | 233,654 | 372,530 | (138,876 | ) | ||||||||||||||||||||
BorgWarner, Inc. | 6/20/2028 | 1.000 | % | 0.660 | % | 4,750,000 | Quarterly | 71,113 | 55,697 | 15,416 | ||||||||||||||||||||||
Bouygues S.A. | 6/20/2028 | 1.000 | % | 0.511 | % | EUR | 500,000 | Quarterly | 12,133 | 11,796 | 337 | |||||||||||||||||||||
BP Capital Markets Plc | 6/20/2028 | 1.000 | % | 0.789 | % | 5,350,000 | Quarterly | 55,314 | 15,515 | 39,799 | ||||||||||||||||||||||
British Telecommunications Plc | 6/20/2028 | 1.000 | % | 1.076 | % | 900,000 | Quarterly | (3,325 | ) | (5,468 | ) | 2,143 | ||||||||||||||||||||
Cardinal Health, Inc. | 6/20/2028 | 1.000 | % | 0.487 | % | $ | 500,000 | Quarterly | 11,364 | 11,317 | 47 | |||||||||||||||||||||
Carlsberg Breweries AS | 6/20/2028 | 1.000 | % | 0.301 | % | EUR | 500,000 | Quarterly | 17,489 | 17,070 | 419 | |||||||||||||||||||||
Carnival Corp. | 6/20/2028 | 1.000 | % | 5.209 | % | $ | 6,150,000 | Quarterly | (954,571 | ) | (1,634,625 | ) | 680,054 | |||||||||||||||||||
CCO Holdings LLC / CCO Holdings Capital Corp. | 6/20/2028 | 5.000 | % | 3.200 | % | 1,900,000 | Quarterly | 136,111 | 137,874 | (1,763 | ) | |||||||||||||||||||||
Centrica Plc | 6/20/2028 | 1.000 | % | 0.781 | % | EUR | 900,000 | Quarterly | 9,649 | 5,535 | 4,114 | |||||||||||||||||||||
CNH Industrial N.V. | 6/20/2028 | 5.000 | % | 1.071 | % | 400,000 | Quarterly | 76,178 | 75,875 | 303 | ||||||||||||||||||||||
Conagra Brands, Inc. | 6/20/2028 | 1.000 | % | 0.643 | % | $ | 5,800,000 | Quarterly | 91,241 | 24,728 | 66,513 | |||||||||||||||||||||
Dell, Inc. | 6/20/2028 | 1.000 | % | 1.123 | % | 5,800,000 | Quarterly | (30,902 | ) | (100,720 | ) | 69,818 | ||||||||||||||||||||
Deutsche Bank AG | 6/20/2028 | 1.000 | % | 1.609 | % | EUR | 5,800,000 | Quarterly | (41,617 | ) | (310,885 | ) | 269,268 | |||||||||||||||||||
Deutsche Lufthansa AG | 6/20/2028 | 1.000 | % | 2.081 | % | 5,700,000 | Quarterly | (286,940 | ) | (331,908 | ) | 44,968 | ||||||||||||||||||||
DR Horton, Inc. | 6/20/2028 | 1.000 | % | 0.566 | % | $ | 3,600,000 | Quarterly | 68,964 | (662 | ) | 69,626 | ||||||||||||||||||||
EDP Finance B.V. | 6/20/2028 | 1.000 | % | 0.702 | % | EUR | 3,950,000 | Quarterly | 57,854 | 20,249 | 37,605 | |||||||||||||||||||||
Enbridge, Inc. | 6/20/2028 | 1.000 | % | 0.859 | % | $ | 5,500,000 | Quarterly | 33,845 | (1,011 | ) | 34,856 | ||||||||||||||||||||
Enel SpA | 6/20/2028 | 1.000 | % | 1.002 | % | EUR | 3,800,000 | Quarterly | (347 | ) | — | (347 | ) | |||||||||||||||||||
Expedia Group, Inc. | 6/20/2028 | 1.000 | % | 1.029 | % | $ | 500,000 | Quarterly | (624 | ) | (219 | ) | (405 | ) | ||||||||||||||||||
FedEx Corp. | 6/20/2028 | 1.000 | % | 0.558 | % | 500,000 | Quarterly | 9,760 | 8,683 | 1,077 | ||||||||||||||||||||||
FirstEnergy Corp. | 6/20/2028 | 1.000 | % | 0.777 | % | 500,000 | Quarterly | 4,890 | 3,347 | 1,543 | ||||||||||||||||||||||
The accompanying notes are an integral part of these financial statements.
| Schedule of Investments | 69 | |||||
Table of Contents
iMGP Alternative Strategies Fund
CONSOLIDATED SCHEDULE OF INVESTMENTS IN SWAPS at June 30, 2023 (Unaudited) (Continued)
| CENTRALLY CLEARED CREDIT DEFAULT SWAP CONTRACTS (1)(2)(3) (CONTINUED) | ||||||||||||||||||||||||||||||||
| Description | Maturity Date | Fixed Deal (Pay) Rate | Implied Credit Spread at June 30, 2023 | Notional Amount(4) | Periodic Payment Frequency | Fair Value | Upfront Premiums Paid / (Received) | Unrealized Appreciation / (Depreciation) | ||||||||||||||||||||||||
Sell Protection (Continued) |
| |||||||||||||||||||||||||||||||
Freeport-McMoRan, Inc. | 6/20/2028 | 1.000 | % | 1.397 | % | $ | 5,750,000 | Quarterly | $ | (97,567 | ) | $ | (142,243 | ) | $ | 44,676 | ||||||||||||||||
Gap, Inc. (The) | 6/20/2028 | 1.000 | % | 5.304 | % | 3,800,000 | Quarterly | (600,910 | ) | (723,188 | ) | 122,278 | ||||||||||||||||||||
General Electric Co. | 6/20/2028 | 1.000 | % | 0.823 | % | 5,700,000 | Quarterly | 44,084 | 9,183 | 34,901 | ||||||||||||||||||||||
Genworth Holdings, Inc. | 6/20/2028 | 5.000 | % | 2.094 | % | 2,850,000 | Quarterly | 344,263 | 418,987 | (74,724 | ) | |||||||||||||||||||||
Goldman Sachs Group, Inc. (The) | 6/20/2028 | 1.000 | % | 0.842 | % | 5,900,000 | Quarterly | 40,726 | 33,861 | 6,865 | ||||||||||||||||||||||
Goodyear Tire & Rubber Co. (The) | 6/20/2028 | 5.000 | % | 3.548 | % | 5,700,000 | Quarterly | 324,981 | 120,915 | 204,066 | ||||||||||||||||||||||
HCA, Inc. | 6/20/2028 | 5.000 | % | 0.942 | % | 4,750,000 | Quarterly | 838,550 | 837,195 | 1,355 | ||||||||||||||||||||||
Heidelberg Materials AG | 6/20/2028 | 5.000 | % | 1.195 | % | EUR | 4,600,000 | Quarterly | 844,112 | 773,770 | 70,342 | |||||||||||||||||||||
Hess Corp. | 6/20/2028 | 1.000 | % | 1.191 | % | $ | 5,900,000 | Quarterly | (48,464 | ) | (71,954 | ) | 23,490 | |||||||||||||||||||
Holcim AG | 6/20/2028 | 1.000 | % | 0.986 | % | EUR | 5,650,000 | Quarterly | 3,700 | (111,956 | ) | 115,656 | ||||||||||||||||||||
Howmet Aerospace, Inc. | 6/20/2028 | 1.000 | % | 0.849 | % | $ | 5,650,000 | Quarterly | 37,174 | (64,126 | ) | 101,300 | ||||||||||||||||||||
International Game Technology Plc | 6/20/2028 | 5.000 | % | 1.784 | % | EUR | 2,850,000 | Quarterly | 431,785 | 376,410 | 55,375 | |||||||||||||||||||||
International Paper Co. | 6/20/2028 | 1.000 | % | 0.675 | % | $ | 450,000 | Quarterly | 6,425 | 5,245 | 1,180 | |||||||||||||||||||||
ITV Plc | 6/20/2028 | 5.000 | % | 1.549 | % | EUR | 500,000 | Quarterly | 82,046 | 81,395 | 651 | |||||||||||||||||||||
KB Home | 6/20/2028 | 5.000 | % | 1.588 | % | $ | 4,750,000 | Quarterly | 687,127 | 339,519 | 347,608 | |||||||||||||||||||||
Koninklijke KPN N.V. | 6/20/2028 | 1.000 | % | 0.632 | % | EUR | 4,650,000 | Quarterly | 84,499 | 52,405 | 32,094 | |||||||||||||||||||||
Koninklijke Philips N.V. | 6/20/2028 | 1.000 | % | 0.627 | % | 950,000 | Quarterly | 17,464 | 17,840 | (376 | ) | |||||||||||||||||||||
Lamb Weston Holdings, Inc. | 6/20/2028 | 1.000 | % | 0.963 | % | $ | 5,900,000 | Quarterly | 9,395 | (167,652 | ) | 177,047 | ||||||||||||||||||||
Lennar Corp. | 6/20/2028 | 5.000 | % | 0.956 | % | 4,800,000 | Quarterly | 844,007 | 784,734 | 59,273 | ||||||||||||||||||||||
Lincoln National Corp. | 6/20/2028 | 1.000 | % | 2.500 | % | 1,450,000 | Quarterly | (89,000 | ) | (92,587 | ) | 3,587 | ||||||||||||||||||||
Marks & Spencer Plc | 6/20/2028 | 1.000 | % | 2.028 | % | EUR | 5,400,000 | Quarterly | (258,995 | ) | (439,570 | ) | 180,575 | |||||||||||||||||||
McKesson Corp. | 6/20/2028 | 1.000 | % | 0.400 | % | $ | 500,000 | Quarterly | 13,339 | 13,472 | (133 | ) | ||||||||||||||||||||
MDC Holdings, Inc. | 6/20/2028 | 1.000 | % | 1.266 | % | 5,700,000 | Quarterly | (65,185 | ) | (308,055 | ) | 242,870 | ||||||||||||||||||||
MetLife, Inc. | 6/20/2028 | 1.000 | % | 1.075 | % | 5,900,000 | Quarterly | (19,096 | ) | 40,335 | (59,431 | ) | ||||||||||||||||||||
MGIC Investment Corp. | 6/20/2028 | 5.000 | % | 1.425 | % | 4,600,000 | Quarterly | 701,784 | 550,636 | 151,148 | ||||||||||||||||||||||
The accompanying notes are an integral part of these financial statements.
| 70 | Litman Gregory Funds Trust | |||||
Table of Contents
iMGP Alternative Strategies Fund
CONSOLIDATED SCHEDULE OF INVESTMENTS IN SWAPS at June 30, 2023 (Unaudited) (Continued)
| CENTRALLY CLEARED CREDIT DEFAULT SWAP CONTRACTS (1)(2)(3) (CONTINUED) | ||||||||||||||||||||||||||||||||
| Description | Maturity Date | Fixed Deal (Pay) Rate | Implied Credit Spread at June 30, 2023 | Notional Amount(4) | Periodic Payment Frequency | Fair Value | Upfront Premiums Paid / (Received) | Unrealized Appreciation / (Depreciation) | ||||||||||||||||||||||||
Sell Protection (Continued) |
| |||||||||||||||||||||||||||||||
Motorola Solutions, Inc. | 6/20/2028 | 1.000 | % | 0.437 | % | $ | 5,850,000 | Quarterly | $ | 146,222 | $ | 108,723 | $ | 37,499 | ||||||||||||||||||
Navient Corp. | 6/20/2028 | 5.000 | % | 4.065 | % | 5,750,000 | Quarterly | 207,113 | 75,871 | 131,242 | ||||||||||||||||||||||
Netflix, Inc. | 6/20/2028 | 5.000 | % | 0.823 | % | 4,300,000 | Quarterly | 785,232 | 793,627 | (8,395 | ) | |||||||||||||||||||||
Next Group Plc | 6/20/2028 | 1.000 | % | 1.173 | % | EUR | 5,550,000 | Quarterly | (46,457 | ) | (192,139 | ) | 145,682 | |||||||||||||||||||
Nokia Oyj | 6/20/2028 | 5.000 | % | 1.341 | % | 400,000 | Quarterly | 70,178 | 69,436 | 742 | ||||||||||||||||||||||
Nordstrom, Inc. | 6/20/2028 | 1.000 | % | 4.788 | % | $ | 2,900,000 | Quarterly | (411,545 | ) | (558,250 | ) | 146,705 | |||||||||||||||||||
Occidental Petroleum Corp. | 6/20/2028 | 1.000 | % | 1.219 | % | 5,250,000 | Quarterly | (49,551 | ) | (54,944 | ) | 5,393 | ||||||||||||||||||||
Omnicom Group, Inc. / Omnicom Capital, Inc. | 6/20/2028 | 1.000 | % | 0.423 | % | 500,000 | Quarterly | 12,810 | 11,549 | 1,261 | ||||||||||||||||||||||
Oracle Corp. | 6/20/2028 | 1.000 | % | 0.676 | % | 5,900,000 | Quarterly | 84,179 | 59,972 | 24,207 | ||||||||||||||||||||||
Ovintiv, Inc. | 6/20/2028 | 1.000 | % | 1.497 | % | 500,000 | Quarterly | (10,569 | ) | (12,837 | ) | 2,268 | ||||||||||||||||||||
Pitney Bowes, Inc. | 6/20/2028 | 1.000 | % | 14.900 | % | 1,900,000 | Quarterly | (695,035 | ) | (608,000 | ) | (87,035 | ) | |||||||||||||||||||
PostNL N.V. | 6/20/2028 | 1.000 | % | 1.369 | % | EUR | 950,000 | Quarterly | (16,824 | ) | (22,329 | ) | 5,505 | |||||||||||||||||||
Premier Foods Finance Plc | 6/20/2028 | 5.000 | % | 2.392 | % | 1,900,000 | Quarterly | 227,831 | 225,811 | 2,020 | ||||||||||||||||||||||
Prudential Financial, Inc. | 6/20/2028 | 1.000 | % | 1.051 | % | $ | 5,850,000 | Quarterly | (12,976 | ) | 46,561 | (59,537 | ) | |||||||||||||||||||
PulteGroup, Inc. | 6/20/2028 | 5.000 | % | 0.847 | % | 4,800,000 | Quarterly | 870,629 | 782,215 | 88,414 | ||||||||||||||||||||||
Radian Group, Inc. | 6/20/2028 | 5.000 | % | 1.540 | % | 5,000,000 | Quarterly | 734,958 | 666,762 | 68,196 | ||||||||||||||||||||||
Rolls-Royce Plc | 6/20/2028 | 1.000 | % | 2.373 | % | EUR | 5,700,000 | Quarterly | (360,333 | ) | (485,136 | ) | 124,803 | |||||||||||||||||||
Royal Caribbean Cruises Ltd. | 6/20/2028 | 5.000 | % | 3.299 | % | $ | 5,700,000 | Quarterly | 384,477 | (168,301 | ) | 552,778 | ||||||||||||||||||||
Sherwin-Williams Co. (The) | 6/20/2028 | 1.000 | % | 0.791 | % | 5,800,000 | Quarterly | 52,939 | (18,605 | ) | 71,544 | |||||||||||||||||||||
Societe Generale S.A. | 6/20/2028 | 1.000 | % | 1.058 | % | EUR | 3,550,000 | Quarterly | 47,074 | (19,066 | ) | 66,140 | ||||||||||||||||||||
Stora Enso Oyj | 6/20/2028 | 5.000 | % | 1.061 | % | 450,000 | Quarterly | 85,943 | 89,182 | (3,239 | ) | |||||||||||||||||||||
Sudzucker International Finance B.V. | 6/20/2028 | 1.000 | % | 0.743 | % | EUR | 450,000 | Quarterly | 5,669 | 5,102 | 567 | |||||||||||||||||||||
Swiss Reinsurance Co. Ltd. | 6/20/2028 | 1.000 | % | 0.612 | % | 3,250,000 | Quarterly | 62,317 | 55,522 | 6,795 | ||||||||||||||||||||||
T-Mobile USA, Inc. | 6/20/2028 | 5.000 | % | 0.990 | % | $ | 5,000,000 | Quarterly | 870,678 | 927,600 | (56,922 | ) | ||||||||||||||||||||
The accompanying notes are an integral part of these financial statements.
| Schedule of Investments | 71 | |||||
Table of Contents
iMGP Alternative Strategies Fund
CONSOLIDATED SCHEDULE OF INVESTMENTS IN SWAPS at June 30, 2023 (Unaudited) (Continued)
| CENTRALLY CLEARED CREDIT DEFAULT SWAP CONTRACTS (1)(2)(3) (CONTINUED) | ||||||||||||||||||||||||||||||||
| Description | Maturity Date | Fixed Deal (Pay) Rate | Implied Credit Spread at June 30, 2023 | Notional Amount(4) | Periodic Payment Frequency | Fair Value | Upfront Premiums Paid / (Received) | Unrealized Appreciation / (Depreciation) | ||||||||||||||||||||||||
Sell Protection (Continued) |
| |||||||||||||||||||||||||||||||
Teck Resources Ltd. | 6/20/2028 | 5.000 | % | 1.437 | % | $ | 5,000,000 | Quarterly | $ | 759,805 | $ | 782,561 | $ | (22,756 | ) | |||||||||||||||||
Telecom Italia SpA | 6/20/2028 | 1.000 | % | 3.715 | % | EUR | 5,700,000 | Quarterly | (676,074 | ) | (607,129 | ) | (68,945 | ) | ||||||||||||||||||
Telefonaktiebolaget LM Ericsson | 6/20/2028 | 1.000 | % | 1.512 | % | 450,000 | Quarterly | (10,980 | ) | (12,242 | ) | 1,262 | ||||||||||||||||||||
Telefonica Emisiones S.A. | 6/20/2028 | 1.000 | % | 0.906 | % | 5,500,000 | Quarterly | 25,174 | (24,196 | ) | 49,370 | |||||||||||||||||||||
Tenet Healthcare Corp. | 6/20/2028 | 5.000 | % | 2.737 | % | $ | 4,250,000 | Quarterly | 389,876 | 366,929 | 22,947 | |||||||||||||||||||||
Tesla, Inc. | 6/20/2028 | 1.000 | % | 1.405 | % | 5,600,000 | Quarterly | (96,893 | ) | (238,854 | ) | 141,961 | ||||||||||||||||||||
thyssenkrupp AG | 6/20/2028 | 1.000 | % | 2.765 | % | EUR | 500,000 | Quarterly | (40,008 | ) | (39,709 | ) | (299 | ) | ||||||||||||||||||
Toll Brothers Finance Corp. | 6/20/2028 | 1.000 | % | 1.154 | % | $ | 6,100,000 | Quarterly | (40,632 | ) | (279,386 | ) | 238,754 | |||||||||||||||||||
Transocean, Inc. | 6/20/2028 | 1.000 | % | 8.089 | % | 7,600,000 | Quarterly | (1,787,381 | ) | (1,871,500 | ) | 84,119 | ||||||||||||||||||||
UniCredit SpA | 6/20/2028 | 1.000 | % | 0.971 | % | EUR | 4,750,000 | Quarterly | 6,763 | (33,743 | ) | 40,506 | ||||||||||||||||||||
United Airlines Holdings, Inc. | 6/20/2028 | 5.000 | % | 4.389 | % | $ | 5,700,000 | Quarterly | 132,527 | (55,279 | ) | 187,806 | ||||||||||||||||||||
Valero Energy Corp. | 6/20/2028 | 1.000 | % | 0.881 | % | 500,000 | Quarterly | 2,589 | 2,642 | (53 | ) | |||||||||||||||||||||
Veolia Environnement S.A. | 6/20/2028 | 1.000 | % | 0.595 | % | EUR | 950,000 | Quarterly | 18,985 | 21,208 | (2,223 | ) | ||||||||||||||||||||
Vodafone Group Plc | 6/20/2028 | 1.000 | % | 0.780 | % | 1,000,000 | Quarterly | 10,777 | 9,766 | 1,011 | ||||||||||||||||||||||
Volkswagen International Finance N.V. | 6/20/2028 | 1.000 | % | 1.177 | % | 5,200,000 | Quarterly | (44,472 | ) | (64,106 | ) | 19,634 | ||||||||||||||||||||
Wendel SE | 6/20/2028 | 5.000 | % | 0.924 | % | 4,600,000 | Quarterly | 914,340 | 887,640 | 26,700 | ||||||||||||||||||||||
WPP Finance S.A. | 6/20/2028 | 1.000 | % | 0.870 | % | 950,000 | Quarterly | 6,048 | 5,842 | 206 | ||||||||||||||||||||||
Yum! Brands, Inc. | 6/20/2028 | 1.000 | % | 0.898 | % | $ | 5,700,000 | Quarterly | 25,250 | (10,505 | ) | 35,755 | ||||||||||||||||||||
Zurich Insurance Co. Ltd. | 6/20/2028 | 1.000 | % | 0.629 | % | EUR | 3,300,000 | Quarterly | 60,451 | 47,732 | 12,719 | |||||||||||||||||||||
|
|
|
|
|
| |||||||||||||||||||||||||||
Total Sell Protection |
| $ | 7,139,020 | $ | 471,908 | $ | 6,667,112 | |||||||||||||||||||||||||
|
|
|
|
|
| |||||||||||||||||||||||||||
Total | $ | 2,616,093 | $ | 178,227 | $ | 2,437,866 | ||||||||||||||||||||||||||
|
|
|
|
|
| |||||||||||||||||||||||||||
| (1) | For centrally cleared swaps, when a credit event occurs as defined under the terms of the swap contract, the Fund as a seller of credit protection will either (i) pay a net amount equal to the par value of the defaulted reference entity and deliver the reference entity or (ii) pay a net amount equal to the par value of the defaulted reference entity less its recovery value. |
| (2) | For centrally cleared swaps, implied credit spread, represented in absolute terms, utilized in determining the fair value of the credit default swap contracts as of period will serve as an indicator of the payment/ performance risk and represent the likelihood of risk of default for the credit derivative. The implied credit spread of a referenced entity reflects the cost of buying/ selling protection and may include upfront payments required to be made to enter into the contract. Generally, wider credit spreads represent a perceived |
The accompanying notes are an integral part of these financial statements.
| 72 | Litman Gregory Funds Trust | |||||
Table of Contents
iMGP Alternative Strategies Fund
CONSOLIDATED SCHEDULE OF INVESTMENTS IN SWAPS at June 30, 2023 (Unaudited) (Continued)
| deterioration of the referenced entity’s credit soundness and a greater likelihood or risk of default or other credit event occurring as defined under the terms of the swap contract. |
| (3) | For centrally cleared swaps, the notional amount represents the maximum potential the Fund may receive as a buyer of credit protection if a credit event occurs, as defined under the terms of the swap contract, for each security included in the CDX North America High Yield Index Series 40. |
| (4) | Notional amounts are denominated in currency where indicated and the lines below until currency changes. |
| OVER THE COUNTER TOTAL RETURN SWAP CONTRACTS | ||||||||||||||||||||||||||||||
| Referenced Obligation | Maturity Date | Counterparty | Fund Pays/ Receives Floating Rate | Floating Rate Index and Spread | Notional Amount | Periodic Payment Frequency | Fair Value | Upfront Premiums Paid/ (Received) | Unrealized Appreciation / (Depreciation) | |||||||||||||||||||||
iBoxx USD Liquid High Yield Index USD | 9/20/2023 | JPMorgan Chase Bank N.A. | Receives | SOFR | $45,000,000 | Quarterly | $ | (253,325 | ) | $ | — | $ | (253,325 | ) | ||||||||||||||||
|
| |||||||||||||||||||||||||||||
| CONSOLIDATED SCHEDULE OF INVESTMENTS IN WRITTEN OPTIONS at June 30, 2023 (Unaudited) | ||||||||||||||||||||||||||||||
| Description | Counterparty | Exercise Price | Expiration Date | Number of Contracts | Notional Amount | Fair Value | Premiums Received | Unrealized Appreciation/ (Depreciation) | ||||||||||||||||||||||
COMMON STOCKS |
| |||||||||||||||||||||||||||||
Call |
| |||||||||||||||||||||||||||||
Amedisys, Inc. | Morgan Stanley & Co. | $ | 90.00 | 7/21/2023 | (23 | ) | $ | (210,312 | ) | $ | (4,485 | ) | $ | (4,840 | ) | $ | 355 | |||||||||||||
Amedisys, Inc. | Morgan Stanley & Co. | 90.00 | 8/18/2023 | (25 | ) | (228,600 | ) | (6,875 | ) | (7,029 | ) | 154 | ||||||||||||||||||
Apple, Inc. | Morgan Stanley & Co. | 195.00 | 8/18/2023 | (2 | ) | (38,794 | ) | (1,150 | ) | (536 | ) | (614 | ) | |||||||||||||||||
Cisco Systems, Inc. | Morgan Stanley & Co. | 52.50 | 8/18/2023 | (2 | ) | (10,348 | ) | (236 | ) | (191 | ) | (45 | ) | |||||||||||||||||
Comcast Corp. | Morgan Stanley & Co. | 42.50 | 8/18/2023 | (9 | ) | (37,395 | ) | (837 | ) | (663 | ) | (174 | ) | |||||||||||||||||
Cummins, Inc. | Morgan Stanley & Co. | 250.00 | 8/18/2023 | (1 | ) | (24,516 | ) | (667 | ) | (272 | ) | (395 | ) | |||||||||||||||||
Deere & Co. | Morgan Stanley & Co. | 440.00 | 8/18/2023 | (1 | ) | (40,519 | ) | (433 | ) | (547 | ) | 114 | ||||||||||||||||||
Emerson Electric Co. | Morgan Stanley & Co. | 92.50 | 8/18/2023 | (2 | ) | (18,078 | ) | (400 | ) | (167 | ) | (233 | ) | |||||||||||||||||
Fastenal Co. | Morgan Stanley & Co. | 60.00 | 8/18/2023 | (4 | ) | (23,596 | ) | (540 | ) | (355 | ) | (185 | ) | |||||||||||||||||
Home Depot, Inc. | Morgan Stanley & Co. | 325.00 | 8/18/2023 | (1 | ) | (31,064 | ) | (430 | ) | (288 | ) | (142 | ) | |||||||||||||||||
Johnson & Johnson | Morgan Stanley & Co. | 170.00 | 8/18/2023 | (2 | ) | (33,104 | ) | (330 | ) | (251 | ) | (79 | ) | |||||||||||||||||
JPMorgan Chase & Co. | Morgan Stanley & Co. | 150.00 | 8/18/2023 | (1 | ) | (14,544 | ) | (199 | ) | (135 | ) | (64 | ) | |||||||||||||||||
Lockheed Martin Corp. | Morgan Stanley & Co. | 490.00 | 8/18/2023 | (1 | ) | (46,038 | ) | (181 | ) | (410 | ) | 229 | ||||||||||||||||||
Microchip Technology, Inc. | Morgan Stanley & Co. | 92.50 | 8/18/2023 | (6 | ) | (53,754 | ) | (1,920 | ) | (1,206 | ) | (714 | ) | |||||||||||||||||
Microsoft Corp. | Morgan Stanley & Co. | 370.00 | 8/18/2023 | (2 | ) | (68,108 | ) | (690 | ) | (793 | ) | 103 | ||||||||||||||||||
Procter & Gamble Co. | Morgan Stanley & Co. | 155.00 | 8/18/2023 | (3 | ) | (45,522 | ) | (531 | ) | (380 | ) | (151 | ) | |||||||||||||||||
Qualcomm, Inc. | Morgan Stanley & Co. | 130.00 | 8/18/2023 | (4 | ) | (47,616 | ) | (796 | ) | (1,135 | ) | 339 | ||||||||||||||||||
Rogers Corp. | Morgan Stanley & Co. | 160.00 | 7/21/2023 | (5 | ) | (80,965 | ) | (2,625 | ) | (2,337 | ) | (288 | ) | |||||||||||||||||
Rogers Corp. | Morgan Stanley & Co. | 165.00 | 7/21/2023 | (5 | ) | (80,965 | ) | (1,550 | ) | (1,389 | ) | (161 | ) | |||||||||||||||||
Starbucks Corp. | Morgan Stanley & Co. | 110.00 | 8/18/2023 | (4 | ) | (39,624 | ) | (180 | ) | (403 | ) | 223 | ||||||||||||||||||
United Parcel Service, Inc. | Morgan Stanley & Co. | 185.00 | 8/18/2023 | (3 | ) | (53,775 | ) | (1,338 | ) | (710 | ) | (628 | ) | |||||||||||||||||
Walmart, Inc. | Morgan Stanley & Co. | 160.00 | 8/18/2023 | (1 | ) | (15,718 | ) | (258 | ) | (189 | ) | (69 | ) | |||||||||||||||||
|
| |||||||||||||||||||||||||||||
Total Written Options | $ | (26,651 | ) | $ | (24,226 | ) | $ | (2,425 | ) | |||||||||||||||||||||
|
| |||||||||||||||||||||||||||||
The accompanying notes are an integral part of these financial statements.
| Schedule of Investments | 73 | |||||
Table of Contents
iMGP High Income Fund 2023 Semi-Annual Report
The iMGP High Income Fund gained 5.37% in the six-month period, outperforming the 2.09% gain for the Bloomberg Barclays US Aggregate Bond Index (Agg), while performing in line with the 5.41% gain for high-yield bonds (BofA Merrill Lynch US High-Yield Index). Since the fund’s inception in September 2018, the fund’s annualized return is 3.15% outperforming both the 0.80% gain for the Aggregate Bond Index and a 2.84% gain for high-yield bonds. The fund is also ahead of the 1.11% return for its Nontraditional Bond Morningstar peer group over the nearly five-year period.
Performance as of June 30, 2023 |
| |||||||||||||||
| Year to Date Return | One- Year | Three- Year | Since Inception 9/28/2018 | |||||||||||||
iMGP High Income Fund | 5.37% | 6.51% | 5.13% | 3.15% | ||||||||||||
Bloomberg Aggregate Bond Index | 2.09% | -0.94% | -3.96% | 0.80% | ||||||||||||
ICE BofAML U.S. High Yield Index | 5.41% | 8.87% | 3.21% | 2.84% | ||||||||||||
Morningstar Nontraditional Bond Category | 2.55% | 2.95% | 1.09% | 1.11% | ||||||||||||
| Past performance does not guarantee future results. Index performance is not illustrative of fund performance. An investment cannot be made directly in an index. The investment return and principal value of an investment will fluctuate so that an investor’s shares, when redeemed, may be worth more or less than their original cost. Current performance of the fund may be lower or higher than the performance quoted. To obtain the performance of the funds as of the most recently completed calendar month, please visit www.imgpfunds.com. Investment performance reflects fee waivers in effect. In the absence of such waivers, total return would be reduced. |
| |||||||||||||||
SEC 30-Day Yield1 as of 6/30/2023: 6.18% Unsubsidized SEC 30-Day Yield2 as of 6/30/2023: 5.58 % | ||||||||||||||||
1. The 30-day SEC Yield is computed under an SEC standardized formula based on net income earned over the past 30 days. It is a “subsidized” yield, which means it includes contractual expense reimbursements, and it would be lower without those reimbursements. |
| |||||||||||||||
2. The unsubsidized 30-day SEC Yield is computed under an SEC standardized formula based on net income earned over the past 30 days. It excludes contractual expense reimbursements, resulting in a lower yield. |
| |||||||||||||||
| Trailing Twelve-Month (TTM) Income Distribution Yield as of 6/30/23: 5.21% |
| |||||||||||||||
| Trailing Twelve-Month(TTM)Total Distribution Yield as of 6/30/23:5.31% |
| |||||||||||||||
| TTM Yield is the yield an investor would have received if they had held the fund over the last 12 months assuming the most recent NAV. T. The 12-month income yield is calculated by assuming any income distributions over the past 12 months and dividing the sum by the most recent NAV. The 12-month total yield is calculated by assuming any income distributions over the past 12 months and any capital gain distributions made over the past 12 months and dividing the sum by the most recent NAV. TTM yield is not a reflection of future results. |
| |||||||||||||||
Performance of Managers
In the first half of the year, the three managers performed in line with our expectations. The fund’s two flexible credit managers, Brown Brothers Harriman and Guggenheim widely outperformed the Agg in what was a higher interest-rate environment, while they slightly lagged high-yield bonds. Brown Brothers and Guggenheim performed similarly with gains of 5.21% and 5.19%, respectively, compared to a gain of 2.09% for the Aggregate bond index and 5.41% for high-yield bonds. Neuberger Berman’s option Income strategy rose 7.64% this year through June. (Note that sub-advisor returns are net of the management fees that each charges the fund.)
Semi-Annual Review
After a pause, the Federal Reserve increased interest rates another 0.25% at its latest meeting. The Fed continues to suggest that the tightening cycle is not necessarily over. The Fed’s dot plot indicates there could be another hike before the central bank is done tightening. Going back to the first quarter, the Fed’s expectation was that rates could top out at 5% to 5.25%, which is below the current 5.25% to 5.50% level. But the recent report illustrated that Fed officials expect the federal funds rate to peak between 5.5% and 5.75%; there may be an additional 0.25% hike. Fed Chair Powell continues to say that the FOMC cannot allow inflation to get entrenched in the U.S. economy, and they will do whatever it takes to get inflation down to their target of 2% over time.
In the most-recent print, inflation fell to 3% in June, down from its June 2022 peak of 9.1%. Powell continues to push back against the market’s expectation that rates might be coming down later this year. (No one on the Fed committee has yet indicated a rate cut in the remainder of this year.) Powell says that inflation needs to continue declining, and he highlights that the labor market remains surprisingly resilient.
With the Fed in inflation-fighting mode, we continue to believe a recession is possible. The Conference Board’s Leading Economic Index (LEI) fell in May and had the 14th consecutive month of successive declines for the index, which is the longest losing streak since March 2009. Meanwhile, there is some clear evidence that the tighter monetary policy is impacting the housing market and lending conditions, which impacts business investment. However, we cannot rule out the possibility of a soft landing should inflation continue moving lower.
| 74 | Litman Gregory Funds Trust | |||||
Table of Contents
While the Fed continues to be concerned about inflation, there are signs that Fed policy is working its way through the system and that inflation is under control and could reach the Fed’s intended 2% target, without continuing to raise rates.
Navigating today’s bond market is as challenging as ever with uncertainty around Fed policy and company fundamentals. The iMGP High Income Fund has the flexibility to navigate rate and credit markets through active sector allocation and bottom-up security selection. The fund typically owns a mix of traditional and non-traditional, less efficient fixed-income asset classes, complemented by the option income strategy. The goal is to generate an attractive level of total return primarily though income, while minimizing declines during periods of volatility.
Some of the key attributes of the fund are as follows:
| • | High Income and Total Return: Seeks to generate a high level of income from diverse and nontraditional sources (paid as monthly distribution), consistent with capital preservation and long-term outperformance compared to traditional high-yield and core fixed-income. |
| • | Risk-Conscious Diversification: Portfolio is blend of three unique sub-advised institutional strategies, run by Guggenheim, Brown Brothers Harriman and Neuberger Berman, accessing nontraditional segments of the bond market alongside complementary option income. |
| • | Volatility and Interest Rate Risk Management: Targets a standard deviation between core fixed-income and high-yield, with meaningfully lower interest-rate risk than both. |
| • | Core/Complementary: Can play a strategic role in a fixed-income allocation due to large allocations to non-traditional sectors or can diversify/replace other higher-yielding funds, as MAHIX has potential to generate attractive returns over market cycles while adding diversification and mitigating interest-rate risk. |
The passage of time has allowed the fund to demonstrate its advantages, and we think it is poised to continue producing attractive risk-adjusted returns and income, while diversifying core bond exposure. Over the trailing one-, two-, and three-year periods, the fund remains ahead of both the high-yield and Aggregate bond benchmarks, as well as the Morningstar Nontraditional Bond category. We appreciate your continued confidence in the fund.
Manager Commentaries
Brown Brothers Harriman:
U.S. Treasury rates rose across tenors during the second quarter as investor expectations for future Fed interest rate decisions shifted to “higher for longer.” Shorter-term interest rates ended the quarter at recent highs, while longer term interest rates were near their beginning-of-year levels. The Fed met on June 14th and kept the federal funds rate unchanged at a range of 5.00%—5.25%, then raised by 25bps at the July 26th meeting. In addition, the Fed’s campaign of shrinking its portfolio of assets acquired through open market operations by a maximum of $95 billion continues.
Performance of mainstream, investment-grade fixed income benchmarks were negative during the second quarter amid rising rates. Spreads narrowed across all credit sectors, qualities, and instruments. Agency mortgage-backed securities (MBS) outperformed Treasuries despite the Fed’s waning support and its extended duration. Investment-grade corporate bonds outperformed similar duration Treasuries by a notable margin as spreads compressed. Indexes of nontraditional asset-backed securities (ABS), high yield corporate bonds, bank loans, and collateralized loan obligation (CLO) debt had positive returns during the quarter and outperformed Treasury alternatives.
The BBH sleeve gained 5.21% year-to-date. Sector allocation drove the portfolio’s positive returns, as the portfolio’s allocations to stronger-performing segments of the credit market, in particular investment-grade corporate bonds, high yield corporate bonds, senior bank loans, and ABS impacted results favorably. The portfolio’s duration profile also enhanced performance results, as short duration bonds enjoyed gains year-to-date. Security selection results detracted but were mixed by sector. Detractors included positioning in senior bank loans and ABS. Positioning in senior bank loans to consumer cyclical services, airline, and healthcare companies detracted, while ABS holdings of CLOs and collateralized fund obligations detracted. Holdings of high yield corporate bonds, CMBS, and investment-grade corporate bonds were additive to results, and contributors included bonds issued by property and casualty insurers, single asset single borrower (SASB) CMBS, life insurers, and business development companies (BDCs).
We remained active during the first half of this year and opportunities arose. The banking sector experienced increased volatility and wider credit spreads in reaction to several idiosyncratic bank failures. Relying on our fundamental bottom-up approach we leaned into the volatility in the and purchased notes from regional bank Comerica. The bank possesses strong asset quality, solid liquidity, satisfactory capital adequacy and net earnings. Dislocated valuations caused by this market turmoil allowed us to purchase Comerica’s BBB+ rated 2-year notes an attractive spread of 662 basis points over Treasuries for a 10.4% yield.
Global Atlantic Financial Group is a wholly owned life insurance subsidiary of KKR & Co offering annuities and other retirement products. The credit benefits from a strong balance sheet, prudent asset-liability matching and demonstrated capital support from the parent company. We purchased the 10-year BBB rated notes at a spread of 450 bps for an 8.3% yield. We also purchased bonds issued by
| Fund Summary | 75 | |||||
Table of Contents
Blackstone Mortgage Trust, the second largest publicly traded mortgage real estate investment trust (REIT). The REIT’s strengths include strong historical underwriting performance, low underlying leverage, and diversification of its loan portfolio. We purchased their Ba3/BB- bonds that mature in January 2027 in the secondary market at a spread of 395 basis points over Treasuries for a yield of 8.2%.
We purchased bonds from a venture debt ABS brought by Oxford Finance, a leading lender to early and middle stage life sciences and healthcare services companies. The company’s previous securitizations performed strongly with very low cumulative net charge-offs. The notes enjoy considerable structural protections through considerable overcollateralization. We purchased the BBB rated notes at a spread of 415 bps over Treasuries for a 7.9% yield.
At the end of June, the portfolio’s duration was 2.1 years and remained near levels consistent with long-term capital preservation. High yield and non-rated investments represented 48.7% and were comprised primarily of credits rated “BB.” The portfolio’s yield to maturity was 10.4% and remained elevated versus bond market alternatives. The portfolio’s option-adjusted spread was 545 basis points; for reference, the Bloomberg U.S. Corporate Index’s option-adjusted spread was 123 basis points and the Bloomberg U.S. Corporate High Yield Index’s option-adjusted spread was 390 basis points at month-end.
At the halfway point of the year, corporate credit valuations have become less appealing, but opportunities remain. According to our valuation framework, the number of investment-grade corporate bonds that screened as a “buy” decreased to 39%, the number of high yield corporate bonds screened as a “buy” decreased to 36%, while over 90% of bank loans screen as a “buy.” Within the investment-grade corporate bond market, we find most opportunities in short and intermediate duration segments of single-A and triple-B bonds, as well as nontraditional issuances that do not meet index inclusion criteria but offer compelling valuation while meeting our credit criteria. In the high yield corporate bond market, there are many opportunities among smaller issuers in the “BB” and “B” markets. However, our valuation framework identifies plenty of “hold” and “sell” candidates in those ratings categories, so there are plenty of value traps and valuation-sensitive selection remains imperative.
In the structured credit markets, we are finding an abundance of attractively valued opportunities. Issuances of non-traditional ABS, single-asset single-borrower (SASB) CMBS, and collateralized loan obligation (CLO) debt have come with attractive compensation and strong durability and structural protections.
We continue to avoid agency MBS due to valuation concerns, as spreads are below their pre-QE levels and face pressures from the Fed’s quantitative tightening program where the tapering of its MBS purchases has just begun. Non-agency RMBS continues to suffer from lower durability, thin credit enhancement, and prepayment risk. We continue to avoid emerging markets credits due to concerns regarding creditor rights in most countries.
Guggenheim:
Amid a resilient economy, it has been encouraging to see inflationary pressures continue to ease. The headline Consumer Price Index (CPI) recorded a 3percent year-over-year increase in June, the lowest since March 2021. Core CPI rose by 4.8 percent year over year, showing a meaningful decline from the previous report’s 5.3 percent. The path towards lower inflation is becoming clearer as shelter inflation cools, and the recent surge in used car prices is reversing. Anticipation of these developments led the Federal Reserve (Fed) to keep interest rates unchanged during the June Federal Open Market Committee (FOMC) meeting, suggesting that skipping a meeting would allow them more time to observe the impact of previous rate hikes on the economic data.
The Fed made a cautious decision at the meeting, but their updated Summary of Economic Projections revealed a more aggressive stance, suggesting two more rate hikes this year. The diverging messages aim to manage expectations and prevent excessive easing in financial conditions and a resurgence in price pressures. But the market is increasingly pricing in the prospect of a soft landing, driven by the Fed’s characterization of the data and the growing optimism surrounding disinflationary trends. Paradoxically, the more the Fed presents a soft landing as feasible, the less likely it becomes as financial markets and economic conditions teeter toward overheating.
Concerns at the Fed are mounting regarding the potential resurgence of inflation in 2024. Inflation generally lags economic activity by several quarters, and the recent softening likely reflects only the initial impact of higher interest rates and the slowdown in activity at the end of 2022. Easing financial conditions, a resurgent housing market, and the economy’s adjustment to higher interest rates contribute to apprehensions over the sustainability of the softening path for inflation.
It is becoming increasingly likely that the Fed will need to maintain a tight monetary policy even as inflation prints decline over the next few months. This dynamic could eventually disrupt the optimism supporting credit spreads and equity valuations, given that a 2024 easing cycle is priced into expectations judging by fed funds futures markets. Markets will have to recognize that lower inflation, easier Fed policy, and resilient economic growth are an unlikely equilibrium. In our view, growth will eventually need to give way to a recession to clear the path to the 2 percent inflation target.
Performance Review
During the first half of 2023 the portfolio generated strong performance, with a return of over 5%. The primary driver of was carry, or earned income, while credit spread tightening also contributed. Duration and various credit hedges detracted modestly. Excess carry was driven by
| 76 | Litman Gregory Funds Trust | |||||
Table of Contents
the portfolio’s allocation to both structured credit, such as CLOs and Aircraft ABS, and corporate credit, such as bank loans and high yield corporates. Spread performance was largely driven by corporate credit, as high yields spreads tightened 65 bps and investment grade spreads tightened 15 bps during the second quarter. The portfolio’s duration was the sole thematic detractor, as interest rates rose broadly amid the market rebounded from the banking crisis of March and April.
Strategy and Positioning
The portfolio’s largest allocation is to corporate credit, which represents roughly 40 percent of the portfolio’s holdings. Of the 40 percent, 35 percent is below investment grade rated including bank loans and high yield corporates, while 5 percent is investment grade rated. While credit metrics such as leverage, interest coverage and forward-looking earnings have begun to come under pressure, we remain comfortable with our current positioning given reasonably wide spreads and a strict focus on bottom-up credit underwriting. Within below investment grade corporate credit, we decreased exposure amid a strong rally for risk assets that shifted the value proposition in favor of structured credit.
Structured credit, which comprises nearly 40 percent of the portfolio, generated strong performance during the second quarter, continuing the rebound that began in the first quarter. Spreads broadly remain wide both in an absolute sense but also relative to similarly rated corporate credits. Furthermore, the lower dollar prices of these assets following last year’s rise in interest rates sets up the potential for higher total return opportunities than typically exists in the asset class. Within securitized credit, we continue to focus on opportunities senior in the capital structure with sufficient credit enhancement and often unique structural features such as coupon steps. We believe the focus on superior structures will help mitigate mark-to-market volatility that may emerge.
As of period end, the portfolio had a duration of 2.5 years, up from previous period end’s duration of 2.3 years. Interest rate volatility remains elevated which has presented the portfolio with opportunities to tactically add to positions in agency RMBS, locking in spreads, both static and option adjusted, that are near 15-year wides.
Lastly, the portfolio ended the period with over 4 percent in cash and cash equivalents. The elevated yields on overnight products have made holding higher balances of liquidity more attractive with the added benefit of giving the portfolio dry powder to take advantage of future market opportunities.
Neuberger Berman:
Year to date through June, the sleeve of the portfolio posted a gain of 7.64% compared to the Cboe S&P 500 2% OTM PutWrite Index (PUTY) return of 10.02%.
Market Commentary
Equity Markets
Fueled by a US Federal Reserve ‘pause’ in raising rates, an avoidance of US debt default, and the bullish expectations for breakthrough Artificial Intelligence (“AI”) technology, the S&P 500 Index returned an impressive 16.89% year to date. Not to be outdone by its ‘slower growth’ cousin, the NASDAQ 100 Index soared 39.35% over the same timeframe.
US Treasury Markets
We expect collateral yield levels to remain attractive despite the pause by the US Fed as the threat of inflation persists due to relatively resilient US economic forecasts. Investors remain divided on if/when the US Fed will raise interest rates after their recent pause. We continue to believe the ‘genie is out of the bottle’ and rates will need to be higher for longer given the apparent strength of the US economy thus far. Higher rates offer investors more income from their investment portfolios than they have seen in years. This income may increase spending which reinforces upward price pressures, in turn, increasing the likelihood of persistent inflation. One additional driver of inflation may come from a lack of skilled labor as the average age of skilled US laborers continues to climb due to years of workers choosing other career paths. This begs the question of how AI might push workers back towards more labor-oriented jobs. Regardless, these trends will not resolve themselves in a matter of quarters. Year to date, short-term US Treasury Rates (3M US T-Bill) increased 92bps and long-term rates (10Y US Treasury) sold off -4bps.
Option Implied Volatility Indexes
Implied volatility levels continued to wane as investors found fewer near-term risks to contemplate. On the year, the Cboe S&P 500 Volatility Index (“VIX”) is down -8.1 pts with an average 30-day implied volatility premium of 4.8. In addition, the Cboe Russell 2000 Volatility Index is lower by -6.3 pts with an average 30-day implied volatility premium of 3.4. Despite VIX’s decline year to date, its 2023 average level of 18.56 remains in line with its long-term average. Much will be made of VIX’s retreat towards the low teens, but much like Goldilocks’ search for porridge, VIX is always too high or too low for investors and they fail to appreciate that the average VIX is usually ‘just right’. More specifically, focusing on the current level of VIX neglects the fact that most option strategies generally seek to earn money not on a single VIX move higher or lower, but on average implied volatility levels as option premiums decay with time.
| Fund Summary | 77 | |||||
Table of Contents
Strategy Allocations
The fund’s allocation across the three managers are as follows: 40% to both Brown Brothers Harriman and Guggenheim Investments and 20% to Neuberger Berman. We use the fund’s daily cash flows to bring each manager’s allocation toward their targets should differences in shorter-term relative performance cause divergences.
Sub-Advisor Portfolio Composition as of June 30, 2023
Brown Brothers Harriman Credit Value Strategy
ABS | 22.4% | |||
Bank Loans | 31.4% | |||
Corporate Bonds | 34.7% | |||
CMBS | 4.4% | |||
Cash | 7.1% |
Guggenheim Multi-Credit Strategy
ABS | 29.0% | |||
Bank Loans | 11.7% | |||
Corporate Bonds | 23.9% | |||
CMBS (Non-Agency) | 3.3% | |||
Preferred Stock | 2.7% | |||
RMBS (Non-Agency) | 8.1% | |||
RMBS (Agency) | 6.5% | |||
Other | 7.9% | |||
Cash | 6.9% |
Neuberger Berman Option Income Strategy
Equity Index Put Writing | 100 | % |
iMGP High Income Fund Value of Hypothetical $10,000
The value of a hypothetical $10,000 investment in the iMGP High Income Fund from September 28, 2018 to June 30, 2023 compared with the ICE BofA US High Yield Index, Morningstar Nontraditional Bond Category and Bloomberg US Agg Bond Index.

The hypothetical $10,000 investment at fund inception includes changes due to share price and reinvestment of dividends and capital gains. The chart does not imply future performance. Indexes are unmanaged, do not incur fees, expenses or taxes, and cannot be invested in directly.
Performance quoted does not include a deduction for taxes that a shareholder would pay on the redemption of fund shares.
| 78 | Litman Gregory Funds Trust | |||||
Table of Contents
iMGP High Income Fund (formerly iMGP High Income Alternatives Fund)
SCHEDULE OF INVESTMENTS IN SECURITIES at June 30, 2023 (Unaudited)
| Shares | Value | |||||||
COMMON STOCKS: 0.0% | ||||||||
| Consumer Staples: 0.0% | ||||||||
| 648 | Moran Foods LLC* | $ | 262 | |||||
|
| |||||||
| | TOTAL COMMON STOCKS | 262 | ||||||
|
| |||||||
PREFERRED STOCKS: 1.8% | ||||||||
| Financials: 1.8% | ||||||||
| CNO Financial Group, Inc. |
| |||||||
| 2,000 | 5.125%, 11/25/2060 | 32,000 | ||||||
| Crescent Capital BDC, Inc. |
| |||||||
| 8,900 | 5.000%, 05/25/2026* | 211,197 | ||||||
| Eagle Point Credit Co., Inc. |
| |||||||
| 32,000 | 5.375%, 01/31/2029 | 699,834 | ||||||
| Oxford Lane Capital Corp. |
| |||||||
| 23,400 | 5.000%, 01/31/2027 | 523,692 | ||||||
| Selective Insurance Group, Inc. |
| |||||||
| 2,000 | 4.600%, 12/15/2025(a) | 32,740 | ||||||
|
| |||||||
| | TOTAL PREFERRED STOCKS | 1,499,463 | ||||||
|
| |||||||
| Principal Amount^ | ||||||||
ASSET-BACKED SECURITIES: 19.2% | ||||||||
| AASET Trust | ||||||||
| $220,258 | Series 2019-2-B | 82,614 | ||||||
| 138,939 | Series 2020-1A-B | 70,931 | ||||||
| AASET US Ltd. | ||||||||
| 132,943 | Series 2018-2A-A | 116,910 | ||||||
| ABPCI Direct Lending Fund ABS I Ltd. | ||||||||
| 120,000 | Series 2020-1A-B | 109,665 | ||||||
| ABPCI Direct Lending Fund CLO I LLC | ||||||||
| 250,000 | Series 2017-1A-DR | 235,281 | ||||||
| ABPCI Direct Lending Fund IX LLC | ||||||||
| 500,000 | Series 2020-9A-BR | 474,559 | ||||||
| Adams Outdoor Advertising LP | ||||||||
| 337,098 | Series 2018-1-A | 317,961 | ||||||
| Anchorage Credit Funding 4 Ltd. | ||||||||
| 250,000 | Series 2016-4A-CR | 205,650 | ||||||
| Applebee’s Funding LLC/IHOP Funding LLC | ||||||||
| 99,000 | Series 2019-1A-A2II | 91,506 | ||||||
| Ares Finance Co. II LLC | ||||||||
| 500,000 | 0.000%, 10/15/2036(d) | 465,500 | ||||||
| Atlas Senior Loan Fund IX Ltd. | ||||||||
| 350,000 | Series 2018-9A-C | 340,965 | ||||||
| Principal Amount^ | Value | |||||||
| Blue Stream Issuer LLC | ||||||||
| $ 100,000 | Series 2023-1A-B | $ | 94,577 | |||||
| Business Jet Securities LLC | ||||||||
| 50,249 | Series 2020-1A-B | 47,082 | ||||||
| 304,331 | Series 2022-1A-B | 283,709 | ||||||
| Capital Automotive LLC | ||||||||
| 267,074 | Series 2017-1A-A2 | 260,999 | ||||||
| CARS-DB4 LP | ||||||||
| 220,000 | Series 2020-1A-B1 | 204,917 | ||||||
| 100,000 | Series 2020-1A-B3 | 84,116 | ||||||
| Castlelake Aircraft Securitization Trust | ||||||||
| 73,198 | Series 2018-1-A | 66,129 | ||||||
| Castlelake Aircraft Structured Trust | ||||||||
| 181,323 | Series 2021-1A-B | 150,044 | ||||||
| CHCP Ltd. | ||||||||
| 100,000 | Series 2021-FL1-D | 95,073 | ||||||
| CIFC Funding II Ltd. | ||||||||
| 250,000 | Series 2017-2A-DR | 235,232 | ||||||
| DigitalBridge Issuer LLC | ||||||||
| 350,000 | Series 2021-1A-A2 | 321,615 | ||||||
| Dryden 87 CLO Ltd. | ||||||||
| 300,000 | Series 2021-87A-SUB | 198,924 | ||||||
| Elm Trust | ||||||||
| 106,057 | Series 2020-4A-B | 90,979 | ||||||
| Falcon Aerospace Ltd. | ||||||||
| 245,854 | Series 2017-1-B | 216,424 | ||||||
| First Franklin Mortgage Loan Trust | ||||||||
| 440,286 | Series 2006-FF16-2A4 | 188,241 | ||||||
| FirstKey Homes Trust | ||||||||
| 150,000 | Series 2020-SFR2-G1 | 137,243 | ||||||
| 100,000 | Series 2020-SFR2-G2 | 92,054 | ||||||
| Firstkey Revolving Trust | ||||||||
| 150,000 | 0.000%, 11/30/2058(d) | 147,630 | ||||||
| Fortress Credit Opportunities IX CLO Ltd. | ||||||||
| 250,000 | Series 2017-9A-A2TR | 239,208 | ||||||
| FS Rialto Issuer LLC | ||||||||
| 100,000 | Series 2022-FL5-C | 95,023 | ||||||
| 100,000 | Series 2022-FL6-C | 99,464 | ||||||
The accompanying notes are an integral part of these financial statements.
| Schedule of Investments | 79 | |||||
Table of Contents
iMGP High Income Fund (formerly iMGP High Income Alternatives Fund)
SCHEDULE OF INVESTMENTS IN SECURITIES at June 30, 2023 (Unaudited) (Continued)
| Principal Amount^ | Value | |||||||
ASSET-BACKED SECURITIES (CONTINUED) | ||||||||
| GAIA Aviation Ltd. | ||||||||
| $ 193,444 | Series 2019-1-A | $ | 169,560 | |||||
| GoldentTree Loan Management US CLO 1 Ltd. | ||||||||
| 250,000 | Series 2021-9A-D | 234,633 | ||||||
| Golub Capital Partners ABS Funding Ltd. | ||||||||
| 150,000 | Series 2020-1A-B | 136,689 | ||||||
| Hotwire Funding LLC | ||||||||
| 750,000 | Series 2021-1-C | 623,167 | ||||||
| Jersey Mike’s Funding | ||||||||
| 99,500 | Series 2021-1A-A2I | 86,664 | ||||||
| JOL Air Ltd. | ||||||||
| 173,293 | Series 2019-1-A | 153,632 | ||||||
| KDAC Aviation Finance Ltd. | ||||||||
| 166,283 | Series 2017-1A-A | 138,285 | ||||||
| LCCM Trust | ||||||||
| 150,000 | Series 2021-FL3-C | 140,944 | ||||||
| LCM 35 Ltd. | ||||||||
| 520,000 | Series 35A-SUB | 374,222 | ||||||
| LCM 37 Ltd. | ||||||||
| 300,000 | Series 37A-SUB | 175,522 | ||||||
| LCM 39 Ltd. | ||||||||
| 250,000 | Series 39A-E | 248,392 | ||||||
| LoanCore Issuer Ltd. | ||||||||
| 200,000 | Series 2022-CRE7-D | 189,010 | ||||||
| LoanCore Issuer Ltd. | ||||||||
| 100,000 | Series 2021-CRE5-D | 87,439 | ||||||
| 100,000 | Series 2021-CRE6-D | 87,679 | ||||||
| Madison Park Funding XLVIII Ltd. | ||||||||
| 250,000 | Series 2021-48A-D | 240,280 | ||||||
| Marathon CLO V Ltd. | ||||||||
| 250,000 | Series 2013-5A-BR | 245,530 | ||||||
| MCA Fund Holding LLC | ||||||||
| 161,085 | Series 2020-1-B | 152,287 | ||||||
| Principal Amount^ | Value | |||||||
| MF1 LLC | ||||||||
| $ 250,000 | Series 2022-FL10-C | $ | 248,157 | |||||
| MidOcean Credit CLO VII | ||||||||
| 500,000 | Series 2017-7A-CR | 479,900 | ||||||
| Monroe Capital ABS Funding Ltd. | ||||||||
| 180,000 | Series 2021-1A-A2 | 169,365 | ||||||
| Monroe Capital Income Plus ABS Funding LLC | ||||||||
| 140,000 | Series 2022-1A-B | 119,549 | ||||||
| Morgan Stanley ABS Capital I, Inc. Trust | ||||||||
| 267,708 | Series 2006-HE8-A2D | 116,556 | ||||||
| 347,500 | Series 2007-HE4-A2C | 111,210 | ||||||
| Morgan Stanley IXIS Real Estate Capital Trust | ||||||||
| 537,117 | Series 2006-2-A3 | 189,795 | ||||||
| 349,126 | Series 2006-2-A4 | 123,393 | ||||||
| Nassau CFO LLC | ||||||||
| 137,585 | Series 2019-1-A | 131,080 | ||||||
| Neuberger Berman Loan Advisers CLO 44 Ltd. | ||||||||
| 250,000 | Series 2021-44A-SUB | 199,658 | ||||||
| Newtek Small Business Loan Trust | ||||||||
| 65,092 | Series 2018-1-A | 64,294 | ||||||
| 29,587 | Series 2018-1-B | 29,349 | ||||||
| Northwoods Capital 20 Ltd. | ||||||||
| 250,000 | Series 2019-20A-DR | 230,552 | ||||||
| Northwoods Capital 22 Ltd. | ||||||||
| 250,000 | Series 2020-22A-ER | 223,032 | ||||||
| Oportun Issuance Trust | ||||||||
| 350,000 | Series 2022-A-B | 325,451 | ||||||
| Oxford Finance Funding LLC | ||||||||
| 162,371 | Series 2020-1A-B | 159,311 | ||||||
| Oxford Finance Funding Trust | ||||||||
| 200,000 | Series 2023-1A-B | 195,240 | ||||||
| Palmer Square Loan Funding Ltd. | ||||||||
| 200,000 | Series 2021-2A-SUB | 116,863 | ||||||
The accompanying notes are an integral part of these financial statements.
| 80 | Litman Gregory Funds Trust | |||||
Table of Contents
iMGP High Income Fund (formerly iMGP High Income Alternatives Fund)
SCHEDULE OF INVESTMENTS IN SECURITIES at June 30, 2023 (Unaudited) (Continued)
| Principal Amount^ | Value | |||||||
ASSET-BACKED SECURITIES (CONTINUED) | ||||||||
| Palmer Square Loan Funding Ltd. (Continued) | ||||||||
| $ 250,000 | Series 2021-3A-C | $ | 238,974 | |||||
| 200,000 | Series 2021-3A-SUB | 124,716 | ||||||
| PennantPark CLO II Ltd. | ||||||||
| 250,000 | Series 2020-2A-D | 245,130 | ||||||
| ReadyCap Lending Small Business Loan Trust | ||||||||
| 63,660 | Series 2019-2-A | 61,115 | ||||||
| Republic Finance Issuance Trust | ||||||||
| 240,000 | Series 2020-A-B | 224,779 | ||||||
| Sapphire Aviation Finance I Ltd. | ||||||||
| 105,341 | Series 2018-1A-A | 87,780 | ||||||
| Sapphire Aviation Finance II Ltd. | ||||||||
| 233,783 | Series 2020-1A-B | 169,859 | ||||||
| SERVPRO Master Issuer LLC | ||||||||
| 96,500 | Series 2019-1A-A2 | 88,408 | ||||||
| Sonic Capital LLC | ||||||||
| 97,167 | Series 2020-1A-A2I | 88,315 | ||||||
| 48,583 | Series 2020-1A-A2II | 42,665 | ||||||
| Sprite Ltd. | ||||||||
| 200,257 | Series 2021-1-A | 179,555 | ||||||
| Start Ltd. | ||||||||
| 120,926 | Series 2018-1-A | 104,968 | ||||||
| STWD Ltd. | ||||||||
| 100,000 | Series 2022-FL3-D | 93,008 | ||||||
| Sunbird Engine Finance LLC | ||||||||
| 174,575 | Series 2020-1A-B | 98,033 | ||||||
| Symphony CLO XXXI Ltd. | ||||||||
| 650,000 | Series 2022-31A-SUB | 483,028 | ||||||
| Thrust Engine Leasing DAC | ||||||||
| 398,216 | Series 2021-1A-B | 300,267 | ||||||
| Vault DI Issuer LLC | ||||||||
| 250,000 | Series 2021-1A-A2 | 211,710 | ||||||
| VB-S1 Issuer LLC | ||||||||
| 250,000 | Series 2022-1A-F | 222,450 | ||||||
| VCP RRL ABS I Ltd. | ||||||||
| 70,798 | Series 2021-1A-C | 63,328 | ||||||
| Principal Amount^ | Value | |||||||
| Venture XIII CLO Ltd. | ||||||||
| $ 250,000 | Series 2013-13A-SUB | $ | 25,000 | |||||
|
| |||||||
| | TOTAL ASSET-BACKED SECURITIES | 15,730,003 | ||||||
|
| |||||||
BANK LOANS: 17.0% | ||||||||
| Accuride Corp. | ||||||||
| 43,758 | 10.404%, 11/17/2023(c) | 36,115 | ||||||
| AHP Health Partners, Inc. | ||||||||
| 558,040 | 8.693%, 08/24/2028(c) | 557,203 | ||||||
| Air Canada | ||||||||
| 727,650 | 8.839%, 08/11/2028(c) | 728,625 | ||||||
| AL NGPL Holdings LLC | ||||||||
| 303,587 | 8.916%, 04/13/2028(c) | 301,842 | ||||||
| Allen Media LLC | ||||||||
| 512,691 | 10.892%, 02/10/2027(c) | 444,211 | ||||||
| AllSpring Buyer LLC | ||||||||
| 153,838 | 9.242%, 11/01/2028(c) | 153,453 | ||||||
| American Airlines, Inc. | ||||||||
| 700,000 | 10.000%, 04/20/2028(c) | 715,876 | ||||||
| API Technologies Corp. | ||||||||
| 96,000 | 9.754%, 05/09/2026(c) | 66,880 | ||||||
| Aston FinCo S.a.r.l. | ||||||||
| 96,750 | 9.443%, 10/09/2026(c) | 83,205 | ||||||
| Athenahealth Group, Inc. | ||||||||
| 375,093 | 8.589%, 02/15/2029(c) | 361,965 | ||||||
| Atlas CC Acquisition Corp. | ||||||||
| 15,949 | 9.775%, 05/25/2028(c) | 13,939 | ||||||
| 3,244 | 9.775%, 05/25/2028(c) | 2,835 | ||||||
| Avalara, Inc. | ||||||||
| 136,364 | 12.492%, 10/19/2028(c) | 134,619 | ||||||
| Bausch Health Cos., Inc. | ||||||||
| 99,750 | 10.426%, 02/01/2027(c) | 75,640 | ||||||
| Blue Ribbon LLC | ||||||||
| 231,635 | 11.170%, 05/08/2028(c) | 164,692 | ||||||
| Camin Cargo Control, Inc. | ||||||||
| 94,610 | 11.717%, 06/04/2026(c) | 91,299 | ||||||
| CDK Global, Inc. | ||||||||
| 616,900 | 9.492%, 07/06/2029(c) | 615,894 | ||||||
| Cengage Learning, Inc. | ||||||||
| 46,047 | 9.880%, 07/14/2026(c) | 45,221 | ||||||
| Chef’s Warehouse Leasing Co. LLC | ||||||||
| 99,250 | 9.953%, 08/23/2029(c) | 99,188 | ||||||
The accompanying notes are an integral part of these financial statements.
| Schedule of Investments | 81 | |||||
Table of Contents
iMGP High Income Fund (formerly iMGP High Income Alternatives Fund)
SCHEDULE OF INVESTMENTS IN SECURITIES at June 30, 2023 (Unaudited) (Continued)
| Principal Amount^ | Value | |||||||
BANK LOANS (CONTINUED) | ||||||||
| Congruex Group LLC | ||||||||
| $ 45,100 | 10.944%, 05/03/2029(c) | $ | 43,860 | |||||
| Connect Finco S.a.r.l. | ||||||||
| 508,182 | 8.700%, 12/11/2026(c) | 508,499 | ||||||
| CP Atlas Buyer, Inc. | ||||||||
| 25,391 | 8.953%, 11/23/2027(c) | 23,969 | ||||||
| Denali Water Solutions | ||||||||
| 60,691 | 9.489%, 03/27/2028(c) | 54,319 | ||||||
| Dhanani Group, Inc. | ||||||||
| 98,182 | 11.191%, 07/20/2025(c) | 95,727 | ||||||
| Eastern Power LLC | ||||||||
| 363,049 | 8.853%, 10/02/2025(c) | 350,774 | ||||||
| Eisner Advisory Group LLC | ||||||||
| 29,315 | 10.467%, 07/28/2028(c) | 29,315 | ||||||
| Emrld Borrower LP | ||||||||
| 83,486 | 8.264%, 05/31/2030(c) | 83,591 | ||||||
| EyeCare Partners LLC | ||||||||
| 96,907 | 9.254%, 02/18/2027(c) | 71,986 | ||||||
| First Brands Group LLC | ||||||||
| 244,600 | 10.252%, 03/30/2027(c) | 240,091 | ||||||
| Firstdigital Communications LLC | ||||||||
| 50,000 | 9.500%, 12/17/2026(c) | 48,808 | ||||||
| Florida Food Products LLC | ||||||||
| 67,765 | 10.193%, 10/18/2028(c) | 58,278 | ||||||
| FR Refuel LLC | ||||||||
| 88,966 | 9.967%, 11/08/2028(c) | 86,075 | ||||||
| GEON Performance Solutions LLC | ||||||||
| 353,700 | 10.038%, 08/18/2028(c) | 349,390 | ||||||
| Gibson Brands, Inc. | ||||||||
| 98,500 | 10.248%, 08/11/2028(c) | 79,785 | ||||||
| GIP II Blue Holding LP | ||||||||
| 241,317 | 9.739%, 09/29/2028(c) | 242,438 | ||||||
| Global Medical Response, Inc. | ||||||||
| 255,318 | 9.467%, 03/14/2025(c) | 144,893 | ||||||
| Hamilton Projects Acquiror LLC | ||||||||
| 2,984 | 9.717%, 06/17/2027(c) | 2,960 | ||||||
| Help At Home, Inc. | ||||||||
| 1,370 | 10.210%, 10/29/2027(c) | 1,336 | ||||||
| 21,410 | 10.210%, 10/29/2027(c) | 20,875 | ||||||
| Principal Amount^ | Value | |||||||
| $ 148,271 | 10.210%, 10/29/2027(c) | $ | 145,121 | |||||
| Higginbotham Insurance Agency, Inc. | ||||||||
| 46,678 | 10.453%, 11/25/2026(c) | 46,156 | ||||||
| 98,072 | 10.453%, 11/25/2026(c) | 96,973 | ||||||
| HighTower Holdings LLC | ||||||||
| 36,975 | 9.150%, 04/21/2028(c) | 36,097 | ||||||
| Holding Socotec | ||||||||
| 98,000 | 9.325%, 06/30/2028(c) | 95,713 | ||||||
| Ilpea Parent, Inc. | ||||||||
| 762,776 | 9.700%, 06/22/2028(c) | 754,195 | ||||||
| Imagefirst Holdings LLC | ||||||||
| 28,026 | 10.142%, 04/27/2028(c) | 27,396 | ||||||
| Jones DesLauriers Insurance Management, Inc. | ||||||||
| | 39,770 (CAD) | | 9.295%, 03/26/2028(c) | 29,293 | ||||
| Laseraway Intermediate Holdings II LLC | ||||||||
| 92,138 | 11.010%, 10/14/2027(c) | 90,641 | ||||||
| LendingTree, Inc. | ||||||||
| 554,400 | 8.950%, 09/15/2028(c) | 431,972 | ||||||
| MB2 Dental Solutions LLC | ||||||||
| 78,907 | 11.193%-11.203%, 01/29/2027(c) | 78,118 | ||||||
| 108,155 | 11.202%, 01/29/2027(c) | 106,452 | ||||||
| Medline Borrower LP | ||||||||
| 404,875 | 8.467%, 10/23/2028(c) | 400,699 | ||||||
| Midwest Veterinary Partners LLC | ||||||||
| 98,250 | 0.000%, 04/27/2028(c) | 95,753 | ||||||
| Mileage Plus Holdings LLC | ||||||||
| 80,000 | 10.764%, 06/21/2027(c) | 83,250 | ||||||
| Moran Foods LLC | ||||||||
| 11,108 | 14.465%, 04/01/2024(c) | 10,247 | ||||||
| 14,849 | 12.788%, 10/01/2024(c) | 10,023 | ||||||
| MPH Acquisition Holdings LLC | ||||||||
| 746,700 | 9.726%, 09/01/2028(c) | 669,364 | ||||||
| NFM & J LP | ||||||||
| 45,180 | 10.952%-11.114%, 11/30/2027(c) | 44,246 | ||||||
| 48,967 | 10.952%, 11/30/2027(c) | 47,956 | ||||||
| NorthRiver Midstream Finance LP | ||||||||
| 571,739 | 8.427%, 10/01/2025(c) | 571,739 | ||||||
| Pacific Bells LLC | ||||||||
| 60,329 | 10.004%, 11/10/2028(c) | 59,226 | ||||||
The accompanying notes are an integral part of these financial statements.
| 82 | Litman Gregory Funds Trust | |||||
Table of Contents
iMGP High Income Fund (formerly iMGP High Income Alternatives Fund)
SCHEDULE OF INVESTMENTS IN SECURITIES at June 30, 2023 (Unaudited) (Continued)
| Principal Amount^ | Value | |||||||
BANK LOANS (CONTINUED) | ||||||||
| Playpower, Inc. | ||||||||
| $ 88,856 | 10.571%, 05/08/2026(c) | $ | 70,419 | |||||
| Propulsion Finco S.a.r.l. | ||||||||
| 477,600 () | 8.992%, 09/14/2029(c) | 477,898 | ||||||
| Resonetics LLC | ||||||||
| 20,291 | 9.538%, 04/28/2028(c) | 19,765 | ||||||
| ScribeAmerica Intermediate Holdco LLC | ||||||||
| 46,334 | 9.717%, 04/03/2025(c) | 33,882 | ||||||
| Sitecore Holding III AS | ||||||||
| 121,711 | 11.651%, 09/01/2028(c) | 120,727 | ||||||
| Southern Veterinary Partners LLC | ||||||||
| 70,662 | 9.217%, 10/05/2027(c) | 69,631 | ||||||
| SP Preferred Buyer LLC | ||||||||
| 146,183 | 9.717%, 12/22/2025(c) | 106,714 | ||||||
| Syndigo LLC | ||||||||
| 121,562 | 6.154%, 12/15/2027(c) | 113,964 | ||||||
| System One Holdings LLC | ||||||||
| 744,800 | 9.239%, 03/02/2028(c) | 738,287 | ||||||
| United Airlines, Inc. | ||||||||
| 509,597 | 9.292%, 04/21/2028(c) | 510,165 | ||||||
| Venture Global Calcasieu Pass LLC | ||||||||
| 23,590 | 7.818%, 08/19/2026(c) | 23,472 | ||||||
| Verscend Holding Corp. | ||||||||
| 192,928 | 9.217%, 08/27/2025(c) | 193,109 | ||||||
| Weber-Stephen Products LLC | ||||||||
| 98,750 | 9.453%, 10/30/2027(c) | 87,559 | ||||||
| Women’s Care Enterprises LLC | ||||||||
| 192,820 | 9.645%, 01/15/2028(c) | 171,610 | ||||||
| Xplornet Communications, Inc. | ||||||||
| 59,822 | 9.217%, 10/02/2028(c) | 49,060 | ||||||
| Yak Access LLC | ||||||||
| 100,000 | 0.000%, 07/10/2026(c) | 6,000 | ||||||
| Zep, Inc. | ||||||||
| 21,573 | 9.242%, 08/12/2024(c) | 18,531 | ||||||
|
| |||||||
| | TOTAL BANK LOANS | 13,971,094 | ||||||
|
| |||||||
CONVERTIBLE BONDS: 0.1% | ||||||||
| Communications: 0.1% | ||||||||
| Cable One, Inc. | ||||||||
| 50,000 | 0.000%, 03/15/2026(f) | 41,125 | ||||||
|
| |||||||
| | TOTAL CONVERTIBLE BONDS | 41,125 | ||||||
|
| |||||||
| Principal Amount^ | Value | |||||||
CORPORATE BONDS: 26.7% | ||||||||
| Basic Materials: 0.4% | ||||||||
| Minerals Technologies, Inc. | ||||||||
| $ 65,000 | 5.000%, 07/01/2028(b) | $ | 59,211 | |||||
| SCIL IV LLC/SCIL USA Holdings LLC | ||||||||
| 100,000 (EUR) | 9.500%, 07/15/2028(b) | 109,185 | ||||||
| SK Invictus Intermediate II Sarl | ||||||||
| 100,000 | 5.000%, 10/30/2029(b) | 79,553 | ||||||
| Valvoline, Inc. | ||||||||
| 66,000 | 3.625%, 06/15/2031(b) | 53,719 | ||||||
|
| |||||||
| 301,668 | ||||||||
|
| |||||||
| Communications: 1.6% | ||||||||
| Altice France SA | ||||||||
| 200,000 | 5.500%, 10/15/2029(b) | 143,228 | ||||||
| AMC Networks, Inc. | ||||||||
| 150,000 | 4.250%, 02/15/2029 | 80,805 | ||||||
| British Telecommunications PLC | ||||||||
| 200,000 | 4.875%, 11/23/2081(b)(d) | 162,902 | ||||||
| LCPR Senior Secured Financing DAC | ||||||||
| 200,000 | 5.125%, 07/15/2029(b) | 168,286 | ||||||
| Level 3 Financing, Inc. | ||||||||
| 231,000 | 4.250%, 07/01/2028(b) | 149,063 | ||||||
| Match Group Holdings II LLC | ||||||||
| 50,000 | 4.625%, 06/01/2028(b) | 45,979 | ||||||
| McGraw-Hill Education, Inc. | ||||||||
| 100,000 | 5.750%, 08/01/2028(b) | 86,762 | ||||||
| 140,000 | 8.000%, 08/01/2029(b) | 119,617 | ||||||
| Paramount Global | ||||||||
| 60,000 | 4.950%, 05/19/2050 | 44,850 | ||||||
| Radiate Holdco LLC/Radiate Finance, Inc. | ||||||||
| 150,000 | 4.500%, 09/15/2026(b) | 119,892 | ||||||
| Rogers Communications, Inc. | ||||||||
| 50,000 | 4.550%, 03/15/2052(b) | 40,182 | ||||||
| Virgin Media Finance PLC | ||||||||
| 100,000 | 5.000%, 07/15/2030(b) | 79,698 | ||||||
| Vodafone Group PLC | ||||||||
| 100,000 | 5.125%, 06/04/2081(d) | 72,691 | ||||||
|
| |||||||
| 1,313,955 | ||||||||
|
| |||||||
| Consumer, Cyclical: 1.4% | ||||||||
| Air Canada | ||||||||
| 100,000 (CAD) | 4.625%, 08/15/2029(b) | 68,128 | ||||||
| Air Canada Pass Through Trust | ||||||||
| 17,142 | Series 2020-2-A | 16,634 | ||||||
| Asbury Automotive Group, Inc. | ||||||||
| 44,000 | 4.625%, 11/15/2029(b) | 39,106 | ||||||
| CD&R Smokey Buyer, Inc. | ||||||||
| 100,000 | 6.750%, 07/15/2025(b) | 93,087 | ||||||
| Deuce Finco PLC | ||||||||
| 100,000 (GBP) | 5.500%, 06/15/2027(b) | 108,306 | ||||||
| Evergreen Acqco 1 LP/TVI, Inc. | ||||||||
| 100,000 | 9.750%, 04/26/2028(b) | 103,503 | ||||||
| JB Poindexter & Co., Inc. | ||||||||
| 75,000 | 7.125%, 04/15/2026(b) | 73,415 | ||||||
| Lightning eMotors, Inc. | ||||||||
| 90,105 | Series 2022-1-A | 84,610 | ||||||
| 45,052 | Series 2022-1-B | 41,508 | ||||||
The accompanying notes are an integral part of these financial statements.
| Schedule of Investments | 83 | |||||
Table of Contents
iMGP High Income Fund (formerly iMGP High Income Alternatives Fund)
SCHEDULE OF INVESTMENTS IN SECURITIES at June 30, 2023 (Unaudited) (Continued)
| Principal Amount^ | Value | |||||||
CORPORATE BONDS (CONTINUED) | ||||||||
| Consumer, Cyclical (CONTINUED) | ||||||||
| Murphy Oil USA, Inc. | ||||||||
| $ 125,000 | 3.750%, 02/15/2031(b) | $ | 104,887 | |||||
| Penn Entertainment, Inc. | ||||||||
| 100,000 | 4.125%, 07/01/2029(b) | 82,090 | ||||||
| Scientific Games Holdings LP/Scientific Games U.S. FinCo, Inc. | ||||||||
| 100,000 | 6.625%, 03/01/2030(b) | 88,093 | ||||||
| Superior Plus LP/Superior General Partner, Inc. | ||||||||
| 100,000 | 4.500%, 03/15/2029(b) | 87,756 | ||||||
| Thunderbird Entertainment Group, Inc. | ||||||||
| 89,686 | Series 2022-1-1A | 84,218 | ||||||
| 44,843 | Series 2022-1-B | 41,315 | ||||||
|
| |||||||
| 1,116,656 | ||||||||
|
| |||||||
| Consumer, Non-cyclical: 1.9% | ||||||||
| ADT Security Corp. | ||||||||
| 100,000 | 4.875%, 07/15/2032(b) | 85,643 | ||||||
| Altria Group, Inc. | ||||||||
| 10,000 | 4.450%, 05/06/2050 | 7,352 | ||||||
| Bausch Health Cos., Inc. | ||||||||
| 725,000 | 4.875%, 06/01/2028(b) | 431,150 | ||||||
| BCP V Modular Services Finance II PLC | ||||||||
| 100,000 (EUR) | 4.750%, 11/30/2028(b) | 93,339 | ||||||
| Carriage Services, Inc. | ||||||||
| 100,000 | 4.250%, 05/15/2029(b) | 86,162 | ||||||
| Catalent Pharma Solutions, Inc. | ||||||||
| 72,000 | 3.125%, 02/15/2029(b) | 58,609 | ||||||
| Endo Luxembourg Finance Co. I S.A.R.L / Endo US, Inc. | ||||||||
| 100,000 | 0.000%, 04/01/2029(b)(g) | 74,099 | ||||||
| Fontainebleau Vegas Funded | ||||||||
| 50,128 () | 0.000%, 01/31/2026 | 50,128 | ||||||
| Fortrea Holdings, Inc. | ||||||||
| 50,000 | 7.500%, 07/01/2030(b) | 51,241 | ||||||
| JBS USA LUX SA/JBS USA Food Co./JBS USA Finance, Inc. | ||||||||
| 50,000 | 3.750%, 12/01/2031(b) | 41,083 | ||||||
| 100,000 | 4.375%, 02/02/2052(b) | 70,179 | ||||||
| Kronos Acquisition Holdings, Inc./KIK Custom Products, Inc. | ||||||||
| 12,000 | 7.000%, 12/31/2027(b) | 10,636 | ||||||
| Legends Hospitality Holding Co. LLC/Legends Hospitality Co.-Issuer, Inc. | ||||||||
| 200,000 | 5.000%, 02/01/2026(b) | 180,277 | ||||||
| Sabre Global, Inc. | ||||||||
| 94,000 | 7.375%, 09/01/2025(b) | 83,548 | ||||||
| Sotheby’s/Bidfair Holdings, Inc. | ||||||||
| 200,000 | 5.875%, 06/01/2029(b) | 155,040 | ||||||
| Spectrum Brands, Inc. | ||||||||
| 50,000 | 5.500%, 07/15/2030(b) | 45,672 | ||||||
| WW International, Inc. | ||||||||
| 100,000 | 4.500%, 04/15/2029(b) | 59,203 | ||||||
|
| |||||||
| 1,583,361 | ||||||||
|
| |||||||
| Principal Amount^ | Value | |||||||
| Energy: 2.4% | ||||||||
| BP Capital Markets PLC | ||||||||
| $ 250,000 | 4.875%, 03/22/2030(a)(d) | $ | 228,031 | |||||
| DT Midstream, Inc. | ||||||||
| 100,000 | 4.125%, 06/15/2029(b) | 87,854 | ||||||
| Energy Transfer LP | ||||||||
| 390,000 | Series A | 350,513 | ||||||
| Global Partners LP/GLP Finance Corp. | ||||||||
| 200,000 | 7.000%, 08/01/2027 | 194,340 | ||||||
| 25,000 | 6.875%, 01/15/2029 | 23,243 | ||||||
| Holly Energy Partners LP/Holly Energy Finance Corp. | ||||||||
| 100,000 | 6.375%, 04/15/2027(b) | 98,886 | ||||||
| ITT Holdings LLC | ||||||||
| 250,000 | 6.500%, 08/01/2029(b) | 210,935 | ||||||
| Kinetik Holdings LP | ||||||||
| 250,000 | 5.875%, 06/15/2030(b) | 238,064 | ||||||
| Midwest Connector Capital Co. LLC | ||||||||
| 99,000 | 4.625%, 04/01/2029(b) | 90,602 | ||||||
| NuStar Logistics LP | ||||||||
| 100,000 | 6.375%, 10/01/2030 | 95,519 | ||||||
| Occidental Petroleum Corp. | ||||||||
| 100,000 | 7.875%, 09/15/2031 | 111,624 | ||||||
| Parkland Corp. | ||||||||
| 100,000 | 4.625%, 05/01/2030(b) | 86,804 | ||||||
| Targa Resources Partners LP/Targa Resources Partners Finance Corp. | ||||||||
| 150,000 | 5.500%, 03/01/2030 | 144,500 | ||||||
|
| |||||||
| 1,960,915 | ||||||||
|
| |||||||
| Financial: 15.6% | ||||||||
| Aegon NV | ||||||||
| 300,000 | 5.500%, 04/11/2048(d) | 285,618 | ||||||
| Apollo Management Holdings LP | ||||||||
| 700,000 | 4.950%, 01/14/2050(b)(d) | 586,570 | ||||||
| Arbor Realty SR, Inc. | ||||||||
| 685,000 | 8.500%, 10/15/2027(b) | 664,907 | ||||||
| AXIS Specialty Finance LLC | ||||||||
| 400,000 | 4.900%, 01/15/2040(d) | 319,712 | ||||||
| Bank of America Corp. | ||||||||
| 520,000 | Series RR | 444,730 | ||||||
| Blackstone Mortgage Trust, Inc. | ||||||||
| 395,000 | 3.750%, 01/15/2027(b) | 331,480 | ||||||
| Brazilian Merchant Voucher Receivables Ltd. | ||||||||
| 158,667 | 4.180%, 04/07/2028(d)(h) | 151,668 | ||||||
| Bread Financial Holdings, Inc. | ||||||||
| 375,000 | 4.750%, 12/15/2024(b) | 368,068 | ||||||
| Ceamer Fin 2 Sr Sec Nts | ||||||||
| 250,000 | 6.920%, 05/15/2038 | 242,489 | ||||||
| Charles Schwab Corp. | ||||||||
| 100,000 | Series H | 73,100 | ||||||
| CION Investment Corp. | ||||||||
| 230,000 | 4.500%, 02/11/2026 | 209,688 | ||||||
The accompanying notes are an integral part of these financial statements.
| 84 | Litman Gregory Funds Trust | |||||
Table of Contents
iMGP High Income Fund (formerly iMGP High Income Alternatives Fund)
SCHEDULE OF INVESTMENTS IN SECURITIES at June 30, 2023 (Unaudited) (Continued)
| Principal Amount^ | Value | |||||||
CORPORATE BONDS (CONTINUED) | ||||||||
| Financial (continued) | ||||||||
| Citigroup, Inc. | ||||||||
| $ 100,000 | Series W | $ | 85,625 | |||||
| 150,000 | Series X | 126,000 | ||||||
| Comerica Bank | ||||||||
| 270,000 | 4.000%, 07/27/2025 | 248,837 | ||||||
| Corebridge Financial, Inc. | ||||||||
| 370,000 | 6.875%, 12/15/2052(c) | 354,661 | ||||||
| Cushman & Wakefield US Borrower LLC | ||||||||
| 71,000 | 6.750%, 05/15/2028(b) | 64,319 | ||||||
| Enstar Finance LLC | ||||||||
| 200,000 | 5.750%, 09/01/2040(d) | 172,796 | ||||||
| 770,000 | 5.500%, 01/15/2042(d) | 575,852 | ||||||
| Equitable Holdings, Inc. | ||||||||
| 150,000 | Series B | 139,680 | ||||||
| Fairfax India Holdings Corp. | ||||||||
| 320,000 | 5.000%, 02/26/2028(b) | 276,800 | ||||||
| Fidelis Insurance Holdings Ltd. | ||||||||
| 630,000 | 6.625%, 04/01/2041(b)(d) | 597,712 | ||||||
| FS KKR Capital Corp. | ||||||||
| 100,000 | 3.250%, 07/15/2027 | 85,863 | ||||||
| Global Atlantic Fin Co. | ||||||||
| 305,000 | 7.950%, 06/15/2033(b) | 306,618 | ||||||
| 250,000 | 4.700%, 10/15/2051(b)(d) | 177,705 | ||||||
| GLP Capital LP/GLP Financing II, Inc. | ||||||||
| 50,000 | 5.300%, 01/15/2029 | 47,660 | ||||||
| 140,000 | 4.000%, 01/15/2031 | 121,095 | ||||||
| Goldman Sachs Group, Inc. | ||||||||
| 100,000 | Series U | 77,550 | ||||||
| Home Point Capital, Inc. | ||||||||
| 70,000 | 5.000%, 02/01/2026(b) | 62,822 | ||||||
| Host Hotels & Resorts LP | ||||||||
| 150,000 | Series I | 127,193 | ||||||
| HUB International Ltd. | ||||||||
| 100,000 | 7.250%, 06/15/2030(b) | 103,481 | ||||||
| Hunt Cos., Inc. | ||||||||
| 100,000 | 5.250%, 04/15/2029(b) | 79,504 | ||||||
| Iron Mountain, Inc. | ||||||||
| 25,000 | 4.500%, 02/15/2031(b) | 21,504 | ||||||
| 150,000 | 5.625%, 07/15/2032(b) | 134,398 | ||||||
| Jane Street Group/JSG Finance, Inc. | ||||||||
| 100,000 | 4.500%, 11/15/2029(b) | 86,139 | ||||||
| Jefferies Finance LLC/JFIN Co.-Issuer Corp. | ||||||||
| 200,000 | 5.000%, 08/15/2028(b) | 164,194 | ||||||
| Principal Amount^ | Value | |||||||
| Financial (continued) | ||||||||
| Kennedy-Wilson, Inc. | ||||||||
| $ 100,000 | 4.750%, 03/01/2029 | $ | 79,162 | |||||
| 100,000 | 4.750%, 02/01/2030 | 75,538 | ||||||
| 56,000 | 5.000%, 03/01/2031 | 41,961 | ||||||
| KKR Core Holding Co. LLC | ||||||||
| 97,440 | 4.000%, 08/12/2031 | 84,854 | ||||||
| Kuvare US Holdings, Inc. | ||||||||
| 100,000 | Series A | 102,500 | ||||||
| Liberty Mutual Group, Inc. | ||||||||
| 220,000 | 4.300%, 02/01/2061(b) | 138,999 | ||||||
| LPL Holdings, Inc. | ||||||||
| 150,000 | 4.000%, 03/15/2029(b) | 131,764 | ||||||
| Markel Group, Inc. | ||||||||
| 172,000 | 6.000%, 06/01/2025(a)(d) | 166,191 | ||||||
| NFP Corp. | ||||||||
| 170,000 | 6.875%, 08/15/2028(b) | 147,838 | ||||||
| OFS Capital Corp. | ||||||||
| 620,000 | 4.750%, 02/10/2026 | 542,880 | ||||||
| OneAmerica Financial Partners, Inc. | ||||||||
| 70,000 | 4.250%, 10/15/2050(b) | 50,899 | ||||||
| OneMain Finance Corp. | ||||||||
| 50,000 | 9.000%, 01/15/2029 | 50,470 | ||||||
| PartnerRe Finance B LLC | ||||||||
| 40,000 | 4.500%, 10/01/2050(d) | 33,459 | ||||||
| Rocket Mortgage LLC/Rocket Mortgage Co.-Issuer, Inc. | ||||||||
| 150,000 | 3.875%, 03/01/2031(b) | 121,764 | ||||||
| Scentre Group Trust 2 | ||||||||
| 410,000 | 5.125%, 09/24/2080(b)(d) | 346,541 | ||||||
| Sculptor Alternative Solutions LLC | ||||||||
| 500,000 | 6.000%, 05/15/2037(b) | 413,350 | ||||||
| SiriusPoint Ltd. | ||||||||
| 700,000 | 4.600%, 11/01/2026(b) | 582,120 | ||||||
| Starwood Property Trust, Inc. | ||||||||
| 100,000 | 4.375%, 01/15/2027(b) | 86,219 | ||||||
| Strategic Credit Opportunities Partners LLC | ||||||||
| 345,000 | Series A | 309,930 | ||||||
| Toronto-Dominion Bank | ||||||||
| 50,000 | 8.125%, 10/31/2082(d) | 50,919 | ||||||
| Trinity Capital, Inc. | ||||||||
| 320,000 | 4.375%, 08/24/2026 | 272,159 | ||||||
| United Insurance Holdings Corp. | ||||||||
| 530,000 | 7.250%, 12/15/2027 | 381,600 | ||||||
| United Wholesale Mortgage LLC | ||||||||
| 100,000 | 5.500%, 04/15/2029(b) | 85,849 | ||||||
| Universal Insurance Holdings, Inc. | ||||||||
| 345,000 | 5.625%, 11/30/2026 | 303,905 | ||||||
| Wells Fargo & Co. | ||||||||
| 100,000 | Series BB | 88,103 | ||||||
| Wilton RE Ltd. | ||||||||
| 190,000 | 6.000%, 10/22/2030(a)(b)(d) | 169,621 | ||||||
|
| |||||||
| 12,774,633 | ||||||||
|
| |||||||
The accompanying notes are an integral part of these financial statements.
| Schedule of Investments | 85 | |||||
Table of Contents
iMGP High Income Fund (formerly iMGP High Income Alternatives Fund)
SCHEDULE OF INVESTMENTS IN SECURITIES at June 30, 2023 (Unaudited) (Continued)
| Principal Amount^ | Value | |||||||
CORPORATE BONDS (CONTINUED) | ||||||||
| Industrial: 1.2% | ||||||||
| Arcosa, Inc. | ||||||||
| $ 100,000 | 4.375%, 04/15/2029(b) | $ | 89,703 | |||||
| Artera Services LLC | ||||||||
| 110,000 | 9.033%, 12/04/2025(b) | 96,404 | ||||||
| Brundage-Bone Concrete Pumping Holdings, Inc. | ||||||||
| 150,000 | 6.000%, 02/01/2026(b) | 142,189 | ||||||
| Cml Fontainebleau Vegas | ||||||||
| 46,935 | 1.000%, 01/31/2026 | 46,935 | ||||||
| Enviri Corp. | ||||||||
| 175,000 | 5.750%, 07/31/2027(b) | 152,532 | ||||||
| Flowserve Corp. | ||||||||
| 60,000 | 3.500%, 10/01/2030 | 51,235 | ||||||
| Fontainebleau Vegas Funded | ||||||||
| 17,161 | 10.211%, 01/31/2026 | 17,161 | ||||||
| GrafTech Finance, Inc. | ||||||||
| 105,000 | 4.625%, 12/15/2028(b) | 85,402 | ||||||
| GrafTech Global Enterprises, Inc. | ||||||||
| 30,000 | 9.875%, 12/15/2028(b) | 29,812 | ||||||
| Great Lakes Dredge & Dock Corp. | ||||||||
| 200,000 | 5.250%, 06/01/2029(b) | 167,226 | ||||||
| TopBuild Corp. | ||||||||
| 50,000 | 3.625%, 03/15/2029(b) | 43,573 | ||||||
| XPO, Inc. | ||||||||
| 85,000 | 6.250%, 06/01/2028(b) | 83,725 | ||||||
|
| |||||||
| 1,005,897 | ||||||||
|
| |||||||
| Technology: 1.5% | ||||||||
| ams-OSRAM AG | ||||||||
| 265,000 | 7.000%, 07/31/2025(b) | 234,239 | ||||||
| AthenaHealth Group, Inc. | ||||||||
| 150,000 | 6.500%, 02/15/2030(b) | 126,401 | ||||||
| CDW LLC/CDW Finance Corp. | ||||||||
| 60,000 | 3.569%, 12/01/2031 | 50,715 | ||||||
| Central Parent, Inc./CDK Global, Inc. | ||||||||
| 100,000 | 7.250%, 06/15/2029(b) | 99,089 | ||||||
| NCR Corp. | ||||||||
| 100,000 | 6.125%, 09/01/2029(b) | 100,178 | ||||||
| Playtika Holding Corp. | ||||||||
| 100,000 | 4.250%, 03/15/2029(b) | 88,840 | ||||||
| Twilio, Inc. | ||||||||
| 100,000 | 3.875%, 03/15/2031 | 83,365 | ||||||
| VC3, Inc. | ||||||||
| 446,785 | 3.500%, 10/15/2041 | 402,956 | ||||||
|
| |||||||
| 1,185,783 | ||||||||
|
| |||||||
| Utilities: 0.7% | ||||||||
| Edison International | ||||||||
| 445,000 | Series A | 389,998 | ||||||
| Terraform Global Operating LP | ||||||||
| 225,000 | 6.125%, 03/01/2026(b) | 219,481 | ||||||
|
| |||||||
| 609,479 | ||||||||
|
| |||||||
| | TOTAL CORPORATE BONDS | 21,852,347 | ||||||
|
| |||||||
| Principal Amount^ | Value | |||||||
GOVERNMENT SECURITIES & AGENCY ISSUE: 11.7% | ||||||||
| U.S. Treasury Notes | ||||||||
| $ 2,800,000 | 0.250%, 03/15/2024 | $ | 2,701,108 | |||||
| 2,500,000 | 0.250%, 06/15/2024 | 2,380,579 | ||||||
| 2,000,000 | 0.375%, 09/15/2024 | 1,885,078 | ||||||
| 1,900,000 | 1.000%, 12/15/2024(i) | 1,788,338 | ||||||
| 900,000 | 1.750%, 03/15/2025(i) | 851,396 | ||||||
|
| |||||||
| | TOTAL GOVERNMENT SECURITIES & AGENCY ISSUE | 9,606,499 | ||||||
|
| |||||||
MORTGAGE-BACKED SECURITIES: 9.1% | ||||||||
| ACRE Commercial Mortgage Ltd. | ||||||||
| 250,000 | Series 2021-FL4-D | 238,519 | ||||||
| Alternative Loan Trust | ||||||||
| 112,614 | Series 2007-OA4-A1 | 97,022 | ||||||
| 114,245 | Series 2007-OA7-A1A | 98,500 | ||||||
| BPR Trust | ||||||||
| 230,000 | Series 2022-OANA-C | 221,619 | ||||||
| BX Commercial Mortgage Trust | ||||||||
| 212,500 | Series 2019-XL-F | 209,222 | ||||||
| 212,500 | Series 2019-XL-G | 208,714 | ||||||
| BX Trust | ||||||||
| 100,000 | Series 2023-DELC-B | 100,024 | ||||||
| BXMT Ltd. | ||||||||
| 250,000 | Series 2020-FL2-D | 205,685 | ||||||
| 100,000 | Series 2020-FL3-D | 90,174 | ||||||
| CD Mortgage Trust | ||||||||
| 813,860 | Series 2017-CD4-XA | 28,946 | ||||||
| CFMT LLC | ||||||||
| 100,000 | Series 2022-HB9 M1 | 84,340 | ||||||
| Citigroup Mortgage Loan Trust | ||||||||
| 93,538 | Series 2022-A-A1 | 91,377 | ||||||
| Credit Suisse Mortgage-Backed Trust | ||||||||
| 570,000 | Series 2018-SITE-E | 529,797 | ||||||
| Credit Suisse Mortgage-Backed Trust | ||||||||
| 480,000 | Series 2018-SITE-C | 458,148 | ||||||
| 60,125 | Series 2020-RPL5-A1 | 58,608 | ||||||
The accompanying notes are an integral part of these financial statements.
| 86 | Litman Gregory Funds Trust | |||||
Table of Contents
iMGP High Income Fund (formerly iMGP High Income Alternatives Fund)
SCHEDULE OF INVESTMENTS IN SECURITIES at June 30, 2023 (Unaudited) (Continued)
| Principal Amount^ | Value | |||||||
MORTGAGE-BACKED SECURITIES (CONTINUED) | ||||||||
| Federal Home Loan Mortgage Corp. | ||||||||
| $ 961,533 | 5.000%, 05/01/2038 | $ | 956,191 | |||||
| 104,505 | 5.000%, 03/01/2053 | 102,721 | ||||||
| Federal National Mortgage Association | ||||||||
| 191,191 | 5.000%, 05/01/2053 | 187,758 | ||||||
| 298,592 | 5.000%, 05/01/2053 | 292,888 | ||||||
| 640,276 | 5.500%, 05/01/2053 | 638,311 | ||||||
| Finance of America HECM Buyout | ||||||||
| 100,000 | Series 2022-HB2-M2 | 91,418 | ||||||
| Freddie Mac Military Housing Bonds Resecuritization Trust Certificates | ||||||||
| 2,727,337 | Series 2015-R1-XA1 | 180,743 | ||||||
| 4,284,606 | Series 2015-R1-XA3 | 217,729 | ||||||
| GCAT Trust | ||||||||
| 91,737 | Series 2022-NQM5-A3 | 89,124 | ||||||
| GS Mortgage Securities Corp. Trust | ||||||||
| 250,000 | Series 2020-DUNE-E | 235,047 | ||||||
| 250,000 | Series 2020-UPTN-E | 214,605 | ||||||
| HarborView Mortgage Loan Trust | ||||||||
| 193,518 | Series 2006-12-2A2A | 179,202 | ||||||
| JP Morgan Chase Commercial Mortgage Securities Trust | ||||||||
| 1,514,861 | Series 2016-JP2-XA | 61,692 | ||||||
| JPMDB Commercial Mortgage Securities Trust | ||||||||
| 186,106 | Series 2017-C5-XA | 4,351 | ||||||
| LSTAR Securities Investment Ltd. | ||||||||
| 337,418 | Series 2021-1-A | 337,217 | ||||||
| 380,784 | Series 2023-1-A1 | 377,649 | ||||||
| OBX Trust | ||||||||
| 91,108 | Series 2022-NQM8-A3 | 89,161 | ||||||
| 93,873 | Series 2022-NQM9-A3 | 92,464 | ||||||
| Preston Ridge Partners Mortgage LLC | ||||||||
| 77,338 | Series 2021-5-A1 | 70,529 | ||||||
| Residential Accredit Loans, Inc. Trust | ||||||||
| 371,361 | Series 2006-QO6-A1 | 90,483 | ||||||
| Taubman Centers Commercial Mortgage Trust | ||||||||
| 230,000 | Series 2022-DPM-C | 220,604 | ||||||
| Principal Amount^ | Value | |||||||
| Wells Fargo Commercial Mortgage Trust | ||||||||
| $ 902,137 | Series 2016-BNK1-XA | $ | 34,969 | |||||
|
| |||||||
| | TOTAL MORTGAGE-BACKED SECURITIES | 7,485,551 | ||||||
|
| |||||||
MUNICIPAL BOND: 0.0% | ||||||||
| Indiana: 0.0% | ||||||||
| Knox County Industry Economic Development Revenue | ||||||||
| 5,000 | Series B | 4,828 | ||||||
|
| |||||||
| | TOTAL MUNICIPAL BOND | 4,828 | ||||||
|
| |||||||
SHORT-TERM INVESTMENTS: 11.2% | ||||||||
| Shares | ||||||||
MONEY MARKET FUNDS: 2.9% | ||||||||
| 2,346,424 | State Street Institutional Treasury Money Market Fund - Premier Class,5.03%(k) | 2,346,424 | ||||||
|
| |||||||
| | TOTAL MONEY MARKET FUNDS | 2,346,424 | ||||||
|
| |||||||
| Principal Amount^ | ||||||||
REPURCHASE AGREEMENTS: 8.2% | ||||||||
| $6,743,689 | Fixed Income Clearing Corp. 1.520%, 6/30/2023, due 07/03/2023 [collateral: par value $7,643,500, U.S. Treasury Note, 0.500%, due 02/28/2026 value $6,878,997] (proceeds $6,744,543) | 6,743,689 | ||||||
|
| |||||||
| | TOTAL REPURCHASE AGREEMENTS | 6,743,689 | ||||||
|
| |||||||
TREASURY BILLS: 0.1% | ||||||||
| U.S. Treasury Bills | ||||||||
| 100,000 | 4.785%, 10/12/2023(f)(i)(l) | 98,546 | ||||||
|
| |||||||
| | TOTAL TREASURY BILLS | 98,546 | ||||||
|
| |||||||
| | TOTAL SHORT-TERM INVESTMENTS | 9,188,659 | ||||||
|
| |||||||
| | TOTAL PURCHASED OPTIONS | 5,574 | ||||||
|
| |||||||
| | TOTAL INVESTMENTS | 79,385,405 | ||||||
|
| |||||||
Other Assets in Excess of Liabilities: 3.2% | 2,618,327 | |||||||
|
| |||||||
NET ASSETS: 100.0% | $ | 82,003,732 | ||||||
|
| |||||||
The accompanying notes are an integral part of these financial statements.
| Schedule of Investments | 87 | |||||
Table of Contents
iMGP High Income Fund (formerly iMGP High Income Alternatives Fund)
SCHEDULE OF INVESTMENTS IN SECURITIES at June 30, 2023 (Unaudited) (Continued)
Percentages are stated as a percent of net assets.
| CDOR | Canadian Dollar Offered Rate |
| CLO | Collateralized Loan Obligation |
| CMT | Constant Maturity Treasury Index |
| LIBOR | London Interbank Offered Rate |
| SOFR | Secured Overnight Financing Rate |
| * | Non-Income Producing Security. |
| ^ | The principal amount is stated in U.S. Dollars unless otherwise indicated. |
| (a) | Perpetual Call. |
| (b) | Security was purchased pursuant to Rule 144A under the Securities Act of 1933 and may be sold in transactions exempt from registration only to qualified institutional buyers or in a public offering registered under Securities Act of 1933. |
| (c) | Floating Interest Rate at June 30, 2023. |
| (d) | Variable rate security. Interest rate or distribution rate disclosed is that which is in effect at June 30, 2023. |
| (e) | Coupon increases periodically based upon a predetermined schedule. Stated interest rate in effect at June 30, 2023. |
| (f) | Issued with a zero coupon. Income is recognized through the accretion of discount. |
| (g) | Security is currently in default and/or non-income producing. |
| (h) | Security is valued using significant unobservable inputs in good faith in accordance with procedures approved by the Board of Trustees. |
| (i) | Securities with an aggregate fair value of $2,738,280 have been pledged as collateral for options, credit default swaps, interest rate swaps, and futures positions. |
| (j) | Interest Only security. Security with a notional or nominal principal amount. |
| (k) | The rate disclosed is the 7 day net yield as of June 30, 2023. |
| (l) | The rate shown represents yield-to-maturity. |
CURRENCY ABBREVIATIONS:
| CAD | Canadian Dollar |
| EUR | Euro |
| GBP | British Pound |
UNFUNDED LOAN COMMITMENTS—At June 30, 2023, the Fund had unfunded loan commitments which could be extended at the option of the borrowers, pursuant to the following agreements:
| Borrower | Principal Amount | Current Value | Unrealized Gain (Loss) | |||||||||
NFM & J LP, 1.000%, 11/30/2027 | $ | 4,569 | $ | 4,475 | $ | (94 | ) | |||||
Avalara, Inc., 0.500%, 10/19/2028 | 13,636 | 12,048 | (1,588 | ) | ||||||||
Athenahealth Group, Inc., 3.500%, 02/15/2029 | 46,196 | 44,579 | (1,617 | ) | ||||||||
TOTAL | $ | 61,102 | $ | (3,299 | ) | |||||||
The accompanying notes are an integral part of these financial statements.
| 88 | Litman Gregory Funds Trust | |||||
Table of Contents
iMGP High Income Fund (formerly iMGP High Income Alternatives Fund)
SCHEDULE OF INVESTMENTS IN PURCHASED OPTIONS at June 30, 2023 (Unaudited)
| Description | Counterparty | Exercise Price | Expiration Date | Number of Contracts | Notional Amount | Fair Value | Premiums Paid | Unrealized Appreciation/ (Depreciation) | ||||||||||||||||||||||
INTEREST RATE SWAPTIONS |
| |||||||||||||||||||||||||||||
Call |
| |||||||||||||||||||||||||||||
Ten Year Two Year SOFR Constant Maturity Swaption | Bank of America N.A. | $ | 0.20 | 12/19/2023 | 600,000 | $ | 600,000 | $ | 277 | $ | 2,468 | $ | (2,191 | ) | ||||||||||||||||
Ten Year Two Year SOFR Constant Maturity Swaption | Bank of America N.A. | 0.10 | 6/20/2024 | 600,000 | 600,000 | 648 | 2,820 | (2,172 | ) | |||||||||||||||||||||
Ten Year Two Year SOFR Constant Maturity Swaption | Barclays Bank Plc | 0.20 | 12/19/2023 | 1,200,000 | 1,200,000 | 555 | 4,920 | (4,365 | ) | |||||||||||||||||||||
Ten Year Two Year SOFR Constant Maturity Swaption | Barclays Bank Plc | 0.10 | 6/20/2024 | 1,200,000 | 1,200,000 | 1,295 | 5,388 | (4,093 | ) | |||||||||||||||||||||
Ten Year Two Year SOFR Constant Maturity Swaption | Goldman Sachs & Co. | 0.20 | 12/19/2023 | 1,300,000 | 1,300,000 | 601 | 5,281 | (4,680 | ) | |||||||||||||||||||||
Ten Year Two Year SOFR Constant Maturity Swaption | Goldman Sachs & Co. | 0.10 | 6/20/2024 | 1,300,000 | 1,300,000 | 1,403 | 5,931 | (4,528 | ) | |||||||||||||||||||||
Ten Year Two Year SOFR Constant Maturity Swaption | Morgan Stanley & Co. | 0.20 | 12/19/2023 | 200,000 | 200,000 | 92 | 770 | (678 | ) | |||||||||||||||||||||
Ten Year Two Year SOFR Constant Maturity Swaption | Morgan Stanley & Co. | 0.10 | 6/20/2024 | 200,000 | 200,000 | 216 | 890 | (674 | ) | |||||||||||||||||||||
CREDIT DEFAULT SWAPTIONS Put | ||||||||||||||||||||||||||||||
CDX.NA.IG.40.V1 | Barclays Bank Plc | 90.00 | 9/20/2023 | 900,000 | $ | 900,000 | 487 | 1,359 | (872 | ) | ||||||||||||||||||||
|
| |||||||||||||||||||||||||||||
Total Purchased Options | $ | 5,574 | $ | 29,827 | $ | (24,253 | ) | |||||||||||||||||||||||
|
| |||||||||||||||||||||||||||||
SCHEDULE OF INVESTMENTS IN FORWARD FOREIGN CURRENCY EXCHANGE CONTRACTS at June 30, 2023 (Unaudited)
At June 30, 2023, the Fund had the following forward foreign currency exchange contracts:
| Asset Derivatives | Liability Derivatives | |||||||||||||||||||||||
| Counterparty | Settlement Date | Fund Receiving | U.S. $ Value at June 30, 2023 | Fund Delivering | U.S. $ Value at June 30, 2023 | Unrealized Appreciation | Unrealized Depreciation | |||||||||||||||||
Bank of America N.A. | 7/14/2023 | USD | $ | 71,291 | EUR | $ | 72,093 | $ | — | $ | (802 | ) | ||||||||||||
Barclays Bank Plc | 7/14/2023 | USD | 113,460 | GBP | 114,374 | — | (914 | ) | ||||||||||||||||
Goldman Sachs & Co. | 7/14/2023 | USD | 98,512 | CAD | 98,974 | — | (462 | ) | ||||||||||||||||
JPMorgan Chase Bank N.A. | 7/10/2023 | EUR | 109,211 | USD | 109,217 | — | (6 | ) | ||||||||||||||||
| 7/14/2023 | USD | 107,617 | EUR | 108,139 | — | (522 | ) | |||||||||||||||||
|
|
|
|
|
|
|
|
| ||||||||||||||||
| $ | 500,091 | $ | 502,797 | $ | — | $ | (2,706 | ) | ||||||||||||||||
|
|
|
|
|
|
|
|
| ||||||||||||||||
SCHEDULE OF INVESTMENTS IN FUTURES CONTRACTS at June 30, 2023 (Unaudited)
| Description | Number of Contracts | Notional Amount | Notional Value | Expiration Date | Unrealized Appreciation/ (Depreciation) | |||||||||||||||
Futures Contracts – Long | ||||||||||||||||||||
U.S. Treasury 10-Year Note Futures | 12 | 1,370,933 | $ | 1,347,187 | 9/20/2023 | $ | (23,746 | ) | ||||||||||||
U.S. Treasury 10-Year Ultra Note Futures | 10 | 1,196,900 | 1,184,375 | 9/20/2023 | (12,525 | ) | ||||||||||||||
U.S. Treasury 5-Year Note Futures | 5 | 545,715 | 535,469 | 9/29/2023 | (10,246 | ) | ||||||||||||||
|
| |||||||||||||||||||
Total Long |
| $ | (46,517 | ) | ||||||||||||||||
|
| |||||||||||||||||||
Total Futures Contracts |
| $ | (46,517 | ) | ||||||||||||||||
|
| |||||||||||||||||||
The accompanying notes are an integral part of these financial statements.
| Schedule of Investments | 89 | |||||
Table of Contents
iMGP High Income Fund (formerly iMGP High Income Alternatives Fund)
SCHEDULE OF INVESTMENTS IN SWAPS at June 30, 2023 (Unaudited)
| CENTRALLY CLEARED INTEREST RATE SWAP CONTRACTS | ||||||||||||||||||||||||||||
| Rates Exchanged | ||||||||||||||||||||||||||||
| Notional Amount | Maturity Date | Payment Received | Payment Made | Periodic Payment Frequency | Fair Value | Upfront Payment Made (Received) | Unrealized Appreciation/ (Depreciation) | |||||||||||||||||||||
$ 2,400,000 | 7/18/2027 | 1 Day SOFR + 0.000 | % | 2.781 | % | Annually | $ | (115,094 | ) | $ | 161 | $ | (115,255 | ) | ||||||||||||||
| CENTRALLY CLEARED CREDIT DEFAULT SWAP CONTRACTS (1)(2)(3) | ||||||||||||||||||||||||||||||||
| Description | Maturity Date | Fixed Deal (Pay) Rate | Implied Credit Spread at June 30, 2023 | Notional Amount(4) | Periodic Payment Frequency | Fair Value | Upfront Premiums Paid / (Received) | Unrealized Depreciation | ||||||||||||||||||||||||
Buy Protection |
| |||||||||||||||||||||||||||||||
CDX North America High Yield Index Series 40 | 6/20/2028 | (5.000 | %) | 4.306 | % | $ | (300,000 | ) | Quarterly | $ | (8,306 | ) | $ | 1,976 | $ | (10,282 | ) | |||||||||||||||
ITRAXX.EUR.38.V1 | 12/20/2027 | (1.000 | %) | 0.684 | % | EUR | (1,350,000 | ) | Quarterly | (19,340 | ) | (10,181 | ) | (9,159 | ) | |||||||||||||||||
|
|
|
|
|
| |||||||||||||||||||||||||||
Total Buy Protection |
| $ | (27,646 | ) | $ | (8,205 | ) | $ | (19,441 | ) | ||||||||||||||||||||||
|
|
|
|
|
| |||||||||||||||||||||||||||
Total | $ | (27,646 | ) | $ | (8,205 | ) | $ | (19,441 | ) | |||||||||||||||||||||||
|
|
|
|
|
| |||||||||||||||||||||||||||
| (1) | For centrally cleared swaps, when a credit event occurs as defined under the terms of the swap contract, the Fund as a seller of credit protection will either (i) pay a net amount equal to the par value of the defaulted reference entity and deliver the reference entity or (ii) pay a net amount equal to the par value of the defaulted reference entity less its recovery value. |
| (2) | For centrally cleared swaps, implied credit spread, represented in absolute terms, utilized in determining the fair value of the credit default swap contracts as of period will serve as an indicator of the payment/ performance risk and represent the likelihood of risk of default for the credit derivative. The implied credit spread of a referenced entity reflects the cost of buying/ selling protection and may include upfront payments required to be made to enter into the contract. Generally, wider credit spreads represent a perceived deterioration of the referenced entity’s credit soundness and a greater likelihood or risk of default or other credit event occurring as defined under the terms of the swap contract. |
| (3) | For centrally cleared swaps, the notional amount represents the maximum potential the Fund may receive as a buyer of credit protection if a credit event occurs, as defined under the terms of the swap contract, for each security included in the CDX North America High Yield Index Series 40 and ITRAXX Series 38. |
| (4) | Notional amounts are denominated in currency where indicated and the lines below until currency changes. |
SCHEDULE OF INVESTMENTS IN WRITTEN OPTIONS at June 30, 2023 (Unaudited)
| Description | Counterparty | Exercise Price | Expiration Date | Number of Contracts | Notional Amount | Fair Value | Premiums Received | Unrealized Appreciation/ (Depreciation) | ||||||||||||||||||||||
INDEX OPTIONS |
| |||||||||||||||||||||||||||||
Put |
| |||||||||||||||||||||||||||||
Russell 2000 Index | UBS Securities LLC | $ | 1,840.00 | 7/7/2023 | (1 | ) | $ | (188,873 | ) | $ | (206 | ) | $ | (1,809 | ) | $ | 1,603 | |||||||||||||
Russell 2000 Index | UBS Securities LLC | 1,765.00 | 7/14/2023 | (1 | ) | (188,873 | ) | (125 | ) | (2,719 | ) | 2,594 | ||||||||||||||||||
Russell 2000 Index | UBS Securities LLC | 1,835.00 | 7/14/2023 | (1 | ) | (188,873 | ) | (700 | ) | (2,339 | ) | 1,639 | ||||||||||||||||||
Russell 2000 Index | UBS Securities LLC | 1,850.00 | 7/14/2023 | (1 | ) | (188,873 | ) | (962 | ) | (729 | ) | (233 | ) | |||||||||||||||||
Russell 2000 Index | UBS Securities LLC | 1,790.00 | 7/21/2023 | (1 | ) | (188,873 | ) | (415 | ) | (1,819 | ) | 1,404 | ||||||||||||||||||
Russell 2000 Index | UBS Securities LLC | 1,825.00 | 7/21/2023 | (1 | ) | (188,873 | ) | (748 | ) | (2,449 | ) | 1,701 | ||||||||||||||||||
Russell 2000 Index | UBS Securities LLC | 1,840.00 | 7/21/2023 | (1 | ) | (188,873 | ) | (1,046 | ) | (2,459 | ) | 1,413 | ||||||||||||||||||
Russell 2000 Index | UBS Securities LLC | 1,785.00 | 7/28/2023 | (1 | ) | (188,873 | ) | (666 | ) | (2,019 | ) | 1,353 | ||||||||||||||||||
Russell 2000 Index | UBS Securities LLC | 1,805.00 | 7/28/2023 | (1 | ) | (188,873 | ) | (946 | ) | (1,839 | ) | 893 | ||||||||||||||||||
The accompanying notes are an integral part of these financial statements.
| 90 | Litman Gregory Funds Trust | |||||
Table of Contents
iMGP High Income Fund (formerly iMGP High Income Alternatives Fund)
SCHEDULE OF INVESTMENTS IN WRITTEN OPTIONS at June 30, 2023 (Unaudited) (Continued)
| Description | Counterparty | Exercise Price | Expiration Date | Number of Contracts | Notional Amount | Fair Value | Premiums Received | Unrealized Appreciation/ (Depreciation) | ||||||||||||||||||||||
Russell 2000 Index | UBS Securities LLC | $ | 1,830.00 | 7/28/2023 | (1 | ) | $ | (188,873 | ) | $ | (1,275 | ) | $ | (1,669 | ) | $ | 394 | |||||||||||||
Russell 2000 Index | UBS Securities LLC | 1,850.00 | 8/4/2023 | (2 | ) | (377,746 | ) | (3,900 | ) | (3,898 | ) | (2 | ) | |||||||||||||||||
S&P 500 Index | UBS Securities LLC | 4,310.00 | 7/7/2023 | (2 | ) | (890,076 | ) | (310 | ) | (2,818 | ) | 2,508 | ||||||||||||||||||
S&P 500 Index | UBS Securities LLC | 4,175.00 | 7/14/2023 | (1 | ) | (445,038 | ) | (180 | ) | (2,599 | ) | 2,419 | ||||||||||||||||||
S&P 500 Index | UBS Securities LLC | 4,180.00 | 7/14/2023 | (3 | ) | (1,335,114 | ) | (513 | ) | (10,257 | ) | 9,744 | ||||||||||||||||||
S&P 500 Index | UBS Securities LLC | 4,340.00 | 7/14/2023 | (4 | ) | (1,780,152 | ) | (2,788 | ) | (2,596 | ) | (192 | ) | |||||||||||||||||
S&P 500 Index | UBS Securities LLC | 4,210.00 | 7/21/2023 | (3 | ) | (1,335,114 | ) | (1,176 | ) | (8,907 | ) | 7,731 | ||||||||||||||||||
S&P 500 Index | UBS Securities LLC | 4,255.00 | 7/21/2023 | (1 | ) | (445,038 | ) | (605 | ) | (1,939 | ) | 1,334 | ||||||||||||||||||
S&P 500 Index | UBS Securities LLC | 4,260.00 | 7/21/2023 | (2 | ) | (890,076 | ) | (1,200 | ) | (5,818 | ) | 4,618 | ||||||||||||||||||
S&P 500 Index | UBS Securities LLC | 4,270.00 | 7/21/2023 | (1 | ) | (445,038 | ) | (572 | ) | (2,849 | ) | 2,277 | ||||||||||||||||||
S&P 500 Index | UBS Securities LLC | 4,305.00 | 7/21/2023 | (1 | ) | (445,038 | ) | (779 | ) | (2,549 | ) | 1,770 | ||||||||||||||||||
S&P 500 Index | UBS Securities LLC | 4,265.00 | 7/28/2023 | (3 | ) | (1,335,114 | ) | (3,210 | ) | (6,567 | ) | 3,357 | ||||||||||||||||||
S&P 500 Index | UBS Securities LLC | 4,270.00 | 7/28/2023 | (5 | ) | (2,225,190 | ) | (5,630 | ) | (11,594 | ) | 5,964 | ||||||||||||||||||
S&P 500 Index | UBS Securities LLC | 4,275.00 | 8/4/2023 | (3 | ) | (1,335,114 | ) | (4,770 | ) | (8,007 | ) | 3,237 | ||||||||||||||||||
S&P 500 Index | UBS Securities LLC | 4,340.00 | 8/4/2023 | (3 | ) | (1,335,114 | ) | (6,774 | ) | (6,927 | ) | 153 | ||||||||||||||||||
|
| |||||||||||||||||||||||||||||
Total Written Options |
| $ | (39,496 | ) | $ | (97,175 | ) | $ | 57,679 | |||||||||||||||||||||
|
| |||||||||||||||||||||||||||||
The accompanying notes are an integral part of these financial statements.
| Schedule of Investments | 91 | |||||
Table of Contents
iMGP Dolan McEniry Corporate Bond Fund 2023 Semi-Annual Report
Year to date through June, the iMGP Dolan McEniry Corporate Bond Fund had a return of 2.07% versus the Bloomberg U.S. Intermediate Credit benchmark return of 2.21%.
Performance as of June 30, 2023 |
| |||||||||||||||
| Year to Date Return | One- Year | Three- Year | Since Inception 9/28/2018 | |||||||||||||
iMGP Dolan McEniry Corporate Bond | 2.07% | 3.17% | -1.19% | 1.70% | ||||||||||||
Bloomberg US Intermediate Credit Index | 2.21% | 1.56% | -1.86% | 1.76% | ||||||||||||
Bloomberg US Agg Bond Incex | 2.09% | -0.94% | -3.96% | 0.80% | ||||||||||||
Morningstar US Corporate Bond Category | 3.25% | 1.68% | -2.98% | 1.42% | ||||||||||||
Gross Expense Ratio 1.02 %, Net Expense Ratio 0.70% Subsidized SEC Yield: 5.35%, Unsubsidized SEC Yield: 5.23%
Performance quoted represents past performance and does not guarantee future results. The investment return and principal value of an investment will fluctuate so that an investor’s shares, when redeemed, may be worth more or less than their original cost. Current performance of the funds may be lower or higher than the performance quoted. Short term performance is not a good indication of the fund’s future performance and should not be the sole basis for investing in the fund. To obtain standardized performance of the funds, and performance as of the most recently completed calendar month, please visit www.imgpfunds.com. There are contractual fee waivers in effect through 4/30/2024. In the absence of such waivers, total return would be reduced. |
| |||||||||||||||
Market Review
During the first half of 2023, positive returns were seen in fixed income and equity markets. Despite rising interest rates, data continues to indicate a strong economy. In addition, inflation has cooled since last summer but remains elevated relative to the central bank’s target rate of 2.00%.
Since the end of 2022, The Federal Reserve increased the Federal Funds Rate +0.25% three times to a benchmark rate between 5.00% and 5.25%. However, the Federal Reserve refrained from raising rates in their June meeting for the first time since they began raising rates in 2022.
During the year, treasury rates increased, and the curve remained inverted as the 10 year U.S. Treasury yield decreased from 3.88% to 3.84%, the 5 year yield increased from 4.01% to 4.16% and the 2 year yield increased from 4.43% to 4.90%.
Per Bloomberg data, spreads of corporate investment grade bonds tightened 7 basis points during the quarter to an average option adjusted spread (“OAS”) of +123 basis points. The OAS of the Bloomberg Corporate High Yield Index tightened 79 basis points to +390 basis points at quarter end.
Performance Commentary
On a relative basis, the iMGP Dolan McEniry Corporate Bond Fund underperformed the Bloomberg U.S. Credit Intermediate Index by 14 basis points. The Fund’s underperformance was driven by security selection in the corporate investment grade and high yield sectors. The yield curve positioning and duration had a minimal effect on relative performance versus the benchmark.
Security Selection
Top Performers | Bottom Performers | |
DaVita Inc. | Tegna Inc | |
Bloomin Brands Inc. | Qurate Retail Inc. | |
Bath & Body Works Inc. | Dollar Tree Inc. |
Outlook and Strategy
Dolan McEniry believes that client portfolios are positioned to provide reasonable absolute and relative returns going forward. Dolan McEniry’s core competence is credit analysis, and we focus on a company’s ability to generate generous amounts of free cash flow over time in relation to its indebtedness. Investment safety and risk mitigation are of primary importance as we continue to search for undervalued fixed income securities. As of June 30th, the iMGP Dolan McEniry Corporate Bond Fund had a +53 basis point yield premium and similar duration versus the Bloomberg U.S Intermediate Credit. We believe these stats will allow the portfolio the potential to perform well versus the benchmarks over time.
| 92 | Litman Gregory Funds Trust | |||||
Table of Contents
Portfolio Statistics as of June 30, 2023
| iMGP Dolan McEniry Corporate Bond Fund | Bloomberg U.S. Intermediate Credit | |||||||
Yield to Worst | | 5.92 | % | | 5.39 | % | ||
Yield to Maturity | 5.92 | % | 5.39 | % | ||||
Effective Duration | 3.41 years | 4.02 years | ||||||
Average Coupon | 4.23 | % | 3.44 | % | ||||
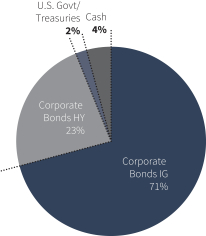 | ||||
| Fund Summary | 93 | |||||
Table of Contents
iMGP Dolan McEniry Corporate Bond Fund Value of Hypothetical $10,000
The value of a hypothetical $10,000 investment in the iMGP Dolan McEniry Corporate Bond Fund from September 28, 2018 to June 30, 2023 compared Bloomberg US Interm Credit Index, Morningstar Corporate Bond Category and Bloomberg US Agg Bond Index.
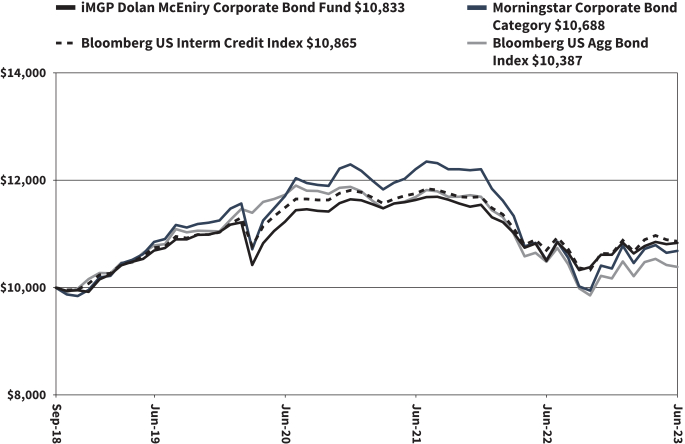
The hypothetical $10,000 investment at fund inception includes changes due to share price and reinvestment of dividends and capital gains. The chart does not imply future performance. Indexes are unmanaged, do not incur fees, expenses or taxes, and cannot be invested in directly.
Performance quoted does not include a deduction for taxes that a shareholder would pay on the redemption of fund shares.
| 94 | Litman Gregory Funds Trust | |||||
Table of Contents
iMGP Dolan McEniry Corporate Bond Fund
SCHEDULE OF INVESTMENTS IN SECURITIES at June 30, 2023 (Unaudited)
| Principal Amount^ | Value | |||||||
CORPORATE BONDS: 91.7% | ||||||||
| Basic Materials: 4.4% | ||||||||
| Olin Corp. | ||||||||
| $3,492,000 | 5.625%, 08/01/2029 | $ | 3,369,431 | |||||
| Steel Dynamics, Inc. | ||||||||
| 918,000 | 2.400%, 06/15/2025 | 857,834 | ||||||
| 679,000 | 5.000%, 12/15/2026 | 668,965 | ||||||
| 552,000 | 1.650%, 10/15/2027 | 469,482 | ||||||
| 1,814,000 | 3.450%, 04/15/2030 | 1,613,766 | ||||||
|
| |||||||
| 6,979,478 | ||||||||
|
| |||||||
| Communications: 11.9% | ||||||||
| AT&T, Inc. | ||||||||
| 2,813,000 | 4.100%, 02/15/2028 | 2,689,789 | ||||||
| 744,000 | 4.350%, 03/01/2029 | 714,259 | ||||||
| Discovery Communications LLC | ||||||||
| 3,211,000 | 3.950%, 03/20/2028 | 2,986,734 | ||||||
| 462,000 | 3.625%, 05/15/2030 | 405,619 | ||||||
| Expedia Group, Inc. | ||||||||
| 584,000 | 5.000%, 02/15/2026 | 576,109 | ||||||
| 400,000 | 4.625%, 08/01/2027 | 387,910 | ||||||
| 2,545,000 | 3.800%, 02/15/2028 | 2,381,988 | ||||||
| Motorola Solutions, Inc. | ||||||||
| 2,011,000 | 4.600%, 02/23/2028 | 1,950,923 | ||||||
| 368,000 | 4.600%, 05/23/2029 | 356,364 | ||||||
| Sirius XM Radio, Inc. | ||||||||
| 658,000 | 5.500%, 07/01/2029(a) | 592,343 | ||||||
| TEGNA, Inc. | ||||||||
| 2,097,000 | 4.625%, 03/15/2028 | 1,858,466 | ||||||
| Verizon Communications, Inc. | ||||||||
| 228,000 | 4.125%, 03/16/2027 | 221,430 | ||||||
| 3,648,000 | 4.329%, 09/21/2028 | 3,518,439 | ||||||
|
| |||||||
| 18,640,373 | ||||||||
|
| |||||||
| Consumer, Cyclical: 11.6% | ||||||||
| Bath & Body Works, Inc. | ||||||||
| 1,145,000 | 7.500%, 06/15/2029 | 1,161,656 | ||||||
| 1,755,000 | 6.625%, 10/01/2030(a) | 1,696,663 | ||||||
| Bloomin’ Brands, Inc./OSI Restaurant Partners LLC | ||||||||
| 2,561,000 | 5.125%, 04/15/2029(a) | 2,282,962 | ||||||
| Boyd Gaming Corp. | ||||||||
| 602,000 | 4.750%, 12/01/2027 | 570,950 | ||||||
| Dollar Tree, Inc. | ||||||||
| 3,418,000 | 4.200%, 05/15/2028 | 3,238,859 | ||||||
| Newell Brands, Inc. | ||||||||
| 308,000 | 6.375%, 09/15/2027 | 295,736 | ||||||
| 3,011,000 | 6.625%, 09/15/2029 | 2,892,160 | ||||||
| QVC, Inc. | ||||||||
| 2,239,000 | 4.450%, 02/15/2025 | 1,981,067 | ||||||
| 2,444,000 | 4.750%, 02/15/2027 | 1,582,453 | ||||||
| Tempur Sealy International, Inc. | ||||||||
| 3,014,000 | 4.000%, 04/15/2029(a) | 2,595,894 | ||||||
|
| |||||||
| 18,298,400 | ||||||||
|
| |||||||
| Consumer, Non-cyclical: 26.3% | ||||||||
| Altria Group, Inc. | ||||||||
| 1,823,000 | 4.400%, 02/14/2026 | 1,784,181 | ||||||
| 224,000 | 4.800%, 02/14/2029 | 217,890 | ||||||
| 1,479,000 | 3.400%, 05/06/2030 | 1,306,422 | ||||||
| Principal Amount^ | Value | |||||||
| Consumer, Non-cyclical (continued) | ||||||||
| BAT Capital Corp. | ||||||||
| $ 874,000 | 2.259%, 03/25/2028 | $ | 748,817 | |||||
| 1,091,000 | 4.906%, 04/02/2030 | 1,032,558 | ||||||
| Block Financial LLC | ||||||||
| 2,672,000 | 2.500%, 07/15/2028 | 2,277,353 | ||||||
| 1,405,000 | 3.875%, 08/15/2030 | 1,240,566 | ||||||
| Conagra Brands, Inc. | ||||||||
| 1,333,000 | 4.300%, 05/01/2024 | 1,315,369 | ||||||
| 654,000 | 4.600%, 11/01/2025 | 639,379 | ||||||
| 1,399,000 | 4.850%, 11/01/2028 | 1,364,781 | ||||||
| DaVita, Inc. | ||||||||
| 3,460,000 | 4.625%, 06/01/2030(a) | 2,973,580 | ||||||
| Encompass Health Corp. | ||||||||
| 2,723,000 | 4.500%, 02/01/2028 | 2,536,735 | ||||||
| 341,000 | 4.750%, 02/01/2030 | 310,838 | ||||||
| Global Payments, Inc. | ||||||||
| 970,000 | 2.650%, 02/15/2025 | 919,845 | ||||||
| 1,283,000 | 4.800%, 04/01/2026 | 1,252,947 | ||||||
| HCA, Inc. | ||||||||
| 775,000 | 5.375%, 09/01/2026 | 768,974 | ||||||
| 2,650,000 | 5.625%, 09/01/2028 | 2,653,201 | ||||||
| Kraft Heinz Foods Co. | ||||||||
| 939,000 | 3.000%, 06/01/2026 | 886,100 | ||||||
| Molson Coors Beverage Co. | ||||||||
| 3,539,000 | 3.000%, 07/15/2026 | 3,305,965 | ||||||
| Reynolds American, Inc. | ||||||||
| 2,042,000 | 4.450%, 06/12/2025 | 1,984,909 | ||||||
| Service Corp. International | ||||||||
| 1,499,000 | 4.625%, 12/15/2027 | 1,421,652 | ||||||
| 1,600,000 | 5.125%, 06/01/2029 | 1,516,768 | ||||||
| Tenet Healthcare Corp. | ||||||||
| 3,053,000 | 6.125%, 10/01/2028 | 2,942,054 | ||||||
| United Rentals North America, Inc. | ||||||||
| 1,242,000 | 4.875%, 01/15/2028 | 1,183,051 | ||||||
| Verisk Analytics, Inc. | ||||||||
| 1,376,000 | 4.000%, 06/15/2025 | 1,335,991 | ||||||
| Zimmer Biomet Holdings, Inc. | ||||||||
| 1,447,000 | 3.550%, 04/01/2025 | 1,394,509 | ||||||
| 2,073,000 | 3.050%, 01/15/2026 | 1,958,551 | ||||||
|
| |||||||
| 41,272,986 | ||||||||
|
| |||||||
| Financial: 5.4% | ||||||||
| American Tower Corp. | ||||||||
| 799,000 | 4.000%, 06/01/2025 | 772,041 | ||||||
| 1,390,000 | 3.375%, 10/15/2026 | 1,297,736 | ||||||
| 754,000 | 3.600%, 01/15/2028 | 694,876 | ||||||
| SBA Communications Corp. | ||||||||
| 605,000 | 3.875%, 02/15/2027 | 556,268 | ||||||
| 2,233,000 | 3.125%, 02/01/2029 | 1,894,812 | ||||||
| Trinity Acquisition PLC | ||||||||
| 445,000 | 4.400%, 03/15/2026 | 429,021 | ||||||
| Willis North America, Inc. | ||||||||
| 230,000 | 3.600%, 05/15/2024 | 224,480 | ||||||
| 947,000 | 4.650%, 06/15/2027 | 920,375 | ||||||
| 1,822,000 | 4.500%, 09/15/2028 | 1,738,608 | ||||||
|
| |||||||
| 8,528,217 | ||||||||
|
| |||||||
| Industrial: 16.7% | ||||||||
| Allegion US Holding Co., Inc. | ||||||||
| 1,398,000 | 3.200%, 10/01/2024 | 1,342,971 | ||||||
| 1,515,000 | 3.550%, 10/01/2027 | 1,401,945 | ||||||
The accompanying notes are an integral part of these financial statements.
| Schedule of Investments | 95 | |||||
Table of Contents
iMGP Dolan McEniry Corporate Bond Fund
SCHEDULE OF INVESTMENTS IN SECURITIES at June 30, 2023 (Unaudited) (Continued)
| Principal Amount^ | Value | |||||||
CORPORATE BONDS (CONTINUED) | ||||||||
| Industrial (continued) | ||||||||
| Berry Global, Inc. | ||||||||
| $ 2,870,000 | 4.875%, 07/15/2026(a) | $ | 2,761,371 | |||||
| 670,000 | 1.650%, 01/15/2027 | 578,303 | ||||||
| Carlisle Cos., Inc. | ||||||||
| 881,000 | 3.500%, 12/01/2024 | 850,450 | ||||||
| 1,839,000 | 3.750%, 12/01/2027 | 1,746,475 | ||||||
| 912,000 | 2.750%, 03/01/2030 | 777,821 | ||||||
| Carrier Global Corp. | ||||||||
| 2,627,000 | 2.242%, 02/15/2025 | 2,485,692 | ||||||
| 517,000 | 2.493%, 02/15/2027 | 471,385 | ||||||
| Flex Ltd. | ||||||||
| 643,000 | 6.000%, 01/15/2028 | 653,276 | ||||||
| 2,142,000 | 4.875%, 05/12/2030 | 2,072,412 | ||||||
| Fortune Brands Innovations, Inc. | ||||||||
| 1,499,000 | 4.000%, 06/15/2025 | 1,451,113 | ||||||
| TransDigm, Inc. | ||||||||
| 3,118,000 | 5.500%, 11/15/2027 | 2,944,516 | ||||||
| Trimble, Inc. | ||||||||
| 3,347,000 | 4.900%, 06/15/2028 | 3,268,287 | ||||||
| Westinghouse Air Brake Technologies Corp. | ||||||||
| 974,000 | 4.400%, 03/15/2024 | 961,156 | ||||||
| 2,550,000 | 4.950%, 09/15/2028 | 2,457,411 | ||||||
|
| |||||||
| 26,224,584 | ||||||||
|
| |||||||
| Technology: 15.4% | ||||||||
| Broadcom Corp./Broadcom Cayman Finance Ltd. | ||||||||
| 1,832,000 | 3.875%, 01/15/2027 | 1,747,535 | ||||||
| Broadcom, Inc. | ||||||||
| 363,000 | 3.459%, 09/15/2026 | 343,079 | ||||||
| 837,000 | 4.110%, 09/15/2028 | 791,208 | ||||||
| 473,000 | 4.150%, 11/15/2030 | 435,193 | ||||||
| CA, Inc. | ||||||||
| 231,000 | 4.700%, 03/15/2027 | 217,597 | ||||||
| CDW LLC/CDW Finance Corp. | ||||||||
| 3,111,000 | 4.250%, 04/01/2028 | 2,856,119 | ||||||
| 228,000 | 3.250%, 02/15/2029 | 195,563 | ||||||
| CDW LLC/CDW Finance Corp. | ||||||||
| 564,000 | 4.125%, 05/01/2025 | 543,617 | ||||||
| HP, Inc. | ||||||||
| 1,348,000 | 3.000%, 06/17/2027 | 1,243,905 | ||||||
| 1,110,000 | 4.000%, 04/15/2029 | 1,034,481 | ||||||
| 1,634,000 | 4.200%, 04/15/2032 | 1,465,579 | ||||||
| Microchip Technology, Inc. | ||||||||
| 2,823,000 | 4.250%, 09/01/2025 | 2,735,333 | ||||||
| Oracle Corp. | ||||||||
| 2,498,000 | 2.300%, 03/25/2028 | 2,205,149 | ||||||
| 1,354,000 | 2.950%, 04/01/2030 | 1,181,651 | ||||||
| Qorvo, Inc. | ||||||||
| 4,169,000 | 4.375%, 10/15/2029 | 3,769,303 | ||||||
| Western Digital Corp. | ||||||||
| 3,574,000 | 4.750%, 02/15/2026 | 3,405,779 | ||||||
|
| |||||||
| 24,171,091 | ||||||||
|
| |||||||
| | TOTAL CORPORATE BONDS | 144,115,129 | ||||||
|
| |||||||
| Principal Amount^ | Value | |||||||
GOVERNMENT SECURITIES & AGENCY ISSUE: 1.9% | ||||||||
| U.S. Treasury Notes | ||||||||
| $ 3,149,000 | 0.500%, 11/30/2023 | $ | 3,087,066 | |||||
|
| |||||||
| | TOTAL GOVERNMENT SECURITIES & AGENCY ISSUE | 3,087,066 | ||||||
|
| |||||||
| | TOTAL INVESTMENTS | 147,202,195 | ||||||
|
| |||||||
Other Assets in Excess of Liabilities: 6.4% | 10,015,999 | |||||||
|
| |||||||
NET ASSETS: 100.0% | $ | 157,218,194 | ||||||
|
| |||||||
Percentages are stated as a percent of net assets.
| ^ | The principal amount is stated in U.S. Dollars unless otherwise indicated. |
| (a) | Security was purchased pursuant to Rule 144A under the Securities Act of 1933 and may be sold in transactions exempt from registration only to qualified institutional buyers or in a public offering registered under Securities Act of 1933. |
The accompanying notes are an integral part of these financial statements.
| 96 | Litman Gregory Funds Trust | |||||
Table of Contents
iMGP DBi Managed Futures Strategy ETF 2023 Semi-Annual Report
In the first half of 2023, the iMGP DBi Managed Futures Strategy ETF was down 5.08% in price terms (down 4.83% in NAV) versus the benchmark SG CTA Index’s essentially flat performance (+0.01%).
Performance as of June 30, 2023 |
| |||||||||||||||||
| Year to Date | One- Year | Three- Year | Since Inception 5/7/2019 | |||||||||||||||
iMGP DBi Managed Futures Strategy ETF (NAV) | -4.83% | -7.21% | 10.67% | 9.38% | ||||||||||||||
iMGP DBi Managed Futures Strategy ETF (Price) | -5.08% | -8.16% | 10.34% | 9.35% | ||||||||||||||
SG CTA | 0.01% | -0.81% | 10.59% | 7.54% | ||||||||||||||
Morningstar tUS Fund Systematic Trend Category | -0.08% | -1.39% | 7.84% | 5.49% | ||||||||||||||
Semi-Annual Review
Since last Fall, the markets have been like a drunk stumbling across a highway. You watch an eighteen-wheeler barrel down and clench your eyes shut—only to open them seconds later and find that he’s still standing. Then it happens again. And again. And, to your utter surprise, you soon find that he’s standing on the other side.
Here we are in mid-2023 and we have been grazed, not flattened, by a long list of economic eighteen wheelers: most recently, no regional or global banking crisis, no US debt default, no profits collapse, no “recession by June.” We’re still standing.
Now place yourself back in early January. The market gods tip you off: inflation will prove sticky and the Fed will keep hiking. With a wink and a nod, they tell you that the Two-Year Treasury, then 4.4%, will hit nearly 5% by mid-year. Armed with this inside information, would you have bet that the Nasdaq, decimated by higher rates last year, would rise nearly 40% by mid-year, a record? Or that value would underperform growth by 25%, a tad more than its historic rebound last year? Or that equities would simply ignore the bond market which, with the most inverted yield curve in five decades, has breathlessly screamed recession for months?
We have two observations. Hedge funds have been cautiously positioned this year and are up single digits. While this might seem paltry relative to the 14% gain in the MSCI World Index, should they have predicted an overnight frenzy in AI that added $5 trillion to tech stocks? On the other hand, those numbers do look healthy relative to the 1% return on the Bloomberg Global Agg – a disappointment given the unexpected headwind of higher rates. This clearly has been a year to manage risk and live to fight another day. Great investors sometimes put on a sensible trade and it doesn’t work out—statistical tails do happen, after all. Over time, sensible trades generate alpha. That’s our bet, at least.
Further, we would like to remind people about the math of drawdowns. Bold cap headlines on Meta and Tesla tout year-to-date returns of 140% and 113%, respectively—not that both, after 65% drawdowns last year, are down 17% and 27% over eighteen months. The current obsession with respectable yields on corporate credit – and a decent 3% total return this year—glosses over the 18% drawdown last year. Investing is a long game and our math should reflect it.
Portfolio Positioning
The Fund was down 5.1% in the first half of the year. In Q1, the sudden banking crisis caused significant uncertainty which led investors into safe haven investments, especially Treasuries. Due to this, the short interest rate positions, as well as a short in the Japanese Yen versus the U.S. Dollar, detracted from performance. The Credit Suisse failure led to a volatile quarter for the Euro, however, a well-timed increase in exposure towards the end of February led to gains. Commodity swings whipsawed positioning in crude oil and gold due to market participants torn between a hard or soft landing from the rate hikes. Equity asset classes were highly correlated during the quarter. A large rally in January due to hints about the end of the hiking cycle was reversed due to the banking crisis, but as contagion fears abated, the rally picked up in March. The volatility caused swings in positioning which further contributed to losses. In Q2 the Japanese Yen declined significantly as a result of widening policy spreads; central banks globally continued to tighten while the Bank of Japan maintained its yield-curve control. An elevated short position in JPY contributed to the portfolio’s performance. A short position in 2-year Treasuries further aided performance. Conversely, a reversal in gold and whipsawing crude oil markets detracted from performance. Short exposure to emerging market equities as well as a reversal in EAFE negatively impacted portfolio performance. Overall, for the first six months of 2023, Rates/Bonds and Commodities each detracted approximately 2.9%, with Equities detracting 3.4%, while Currencies partially offset the losses, contributing 3.5%.
| Fund Summary | 97 | |||||
Table of Contents
Portfolio Characteristics
Net Asset Class Exposure (%) | ||||
US Equities | 10% | |||
International Developed Equities | -6% | |||
Emerging Market Equities | -4% | |||
Currencies | -23% | |||
Commodities | 3% | |||
Fixed Income | -56% |
Top 5 Holdings |
| |||
JPY/USD | -52 | % | ||
EUR/USD | 28 | % | ||
2 Yr Treasury | -21 | % | ||
SOFR | -21 | % | ||
Gold | 12 | % | ||
iMGP DBi Managed Futures Strategy ETF Value of Hypothetical $10,000
The value of a hypothetical $10,000 investment in the iMGP DBi Managed Futures Strategy ETF from May 7, 2019 to June 30, 2023 compared with the SG CTA Index and Morningstar Systematic Trend Category.
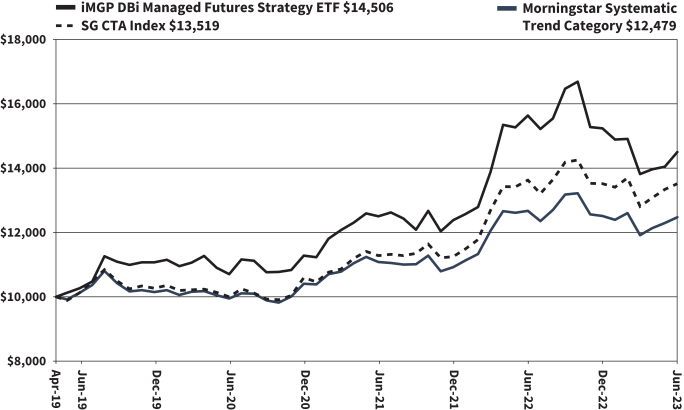
The hypothetical $10,000 investment at fund inception includes changes due to share price and reinvestment of dividends and capital gains. The chart does not imply future performance. Indexes are unmanaged, do not incur fees, expenses or taxes, and cannot be invested in directly.
Performance quoted does not include a deduction for taxes that a shareholder would pay on the redemption of fund shares.
| 98 | Litman Gregory Funds Trust | |||||
Table of Contents
iMGP DBi Managed Futures Strategy ETF
CONSOLIDATED SCHEDULE OF INVESTMENTS IN SECURITIES at June 30, 2023 (Unaudited)
| Principal Amount^ | Value | |||||||
SHORT-TERM INVESTMENTS: 76.2% | ||||||||
| TREASURY BILLS: 76.2% | ||||||||
| U.S. Treasury Bills | ||||||||
| $544,768,000 | 4.810%, 09/07/2023(a)(b) | $ | 539,625,107 | |||||
|
| |||||||
| | TOTAL TREASURY BILLS | 539,625,107 | ||||||
|
| |||||||
| | TOTAL SHORT-TERM INVESTMENTS | 539,625,107 | ||||||
|
| |||||||
| | TOTAL INVESTMENTS | 539,625,107 | ||||||
|
| |||||||
Other Assets in Excess of Liabilities: 23.8% | 168,149,351 | |||||||
|
| |||||||
NET ASSETS: 100.0% | $ | 707,774,458 | ||||||
|
| |||||||
| ^ | The principal amount is stated in U.S. Dollars unless otherwise indicated. |
| (a) | The rate shown represents yield-to-maturity. |
| (b) | Issued with a zero coupon. Income is recognized through the accretion of discount. |
The accompanying notes are an integral part of these financial statements.
| Schedule of Investments | 99 | |||||
Table of Contents
iMGP DBi Managed Futures Strategy ETF
CONSOLIDATED SCHEDULE OF INVESTMENTS IN FUTURES CONTRACTS at June 30, 2023 (Unaudited)(a)
| Description | Number of Contracts | Notional Amount | Notional Value | Expiration Date | Unrealized Appreciation/ (Depreciation) | |||||||||||||||
Futures Contracts – Long |
| |||||||||||||||||||
Euro FX Currency Futures | 1,461 | 198,955,766 | $ | 200,029,163 | 9/18/2023 | $ | 1,073,397 | |||||||||||||
Gold 100 Oz Futures(b) | 442 | 86,679,018 | 85,279,480 | 8/29/2023 | (1,399,538 | ) | ||||||||||||||
S&P 500 E-Mini Index Futures | 318 | 69,554,287 | 71,363,175 | 9/15/2023 | 1,808,888 | |||||||||||||||
U.S. Treasury 10-Year Note Futures | 594 | 67,448,823 | 66,685,781 | 9/20/2023 | (763,042 | ) | ||||||||||||||
U.S. Treasury 10-Year Ultra Note Futures | 558 | 66,551,630 | 66,088,125 | 9/20/2023 | (463,505 | ) | ||||||||||||||
|
| |||||||||||||||||||
Total Long | $ | 256,200 | ||||||||||||||||||
|
| |||||||||||||||||||
Futures Contracts – Short |
| |||||||||||||||||||
3 Months SOFR Futures | (629 | ) | (151,415,789 | ) | $ | (150,920,687 | ) | 3/18/2025 | $ | 495,102 | ||||||||||
30 Day Federal Funds Futures | (204 | ) | (80,517,319 | ) | (80,467,437 | ) | 10/31/2023 | 49,882 | ||||||||||||
Japanese Yen Currency Futures | (4,163 | ) | (377,717,205 | ) | (364,912,969 | ) | 9/18/2023 | 12,804,236 | ||||||||||||
MSCI EAFE Index Futures | (401 | ) | (43,159,981 | ) | (43,217,775 | ) | 9/15/2023 | (57,794 | ) | |||||||||||
MSCI Emerging Market Index | (587 | ) | (29,417,824 | ) | (29,288,365 | ) | 9/15/2023 | 129,459 | ||||||||||||
U.S. Treasury 2-Year Note Futures | (745 | ) | (152,802,339 | ) | (151,491,094 | ) | 9/29/2023 | 1,311,245 | ||||||||||||
U.S. Treasury Long Bond Futures | (568 | ) | (72,144,916 | ) | (72,082,750 | ) | 9/20/2023 | 62,166 | ||||||||||||
U.S. Treasury Ultra-Long Bond Futures | (524 | ) | (70,944,049 | ) | (71,378,625 | ) | 9/20/2023 | (434,576 | ) | |||||||||||
WTI Crude Futures(b) | (954 | ) | (69,214,955 | ) | (67,524,120 | ) | 8/22/2023 | 1,690,835 | ||||||||||||
|
| |||||||||||||||||||
Total Short | $ | 16,050,555 | ||||||||||||||||||
|
| |||||||||||||||||||
Total Futures Contracts | $ | 16,306,755 | ||||||||||||||||||
|
| |||||||||||||||||||
| (a) | Societe Generale is the counterparty for all Open Futures Contracts held by the Fund and the iMGP DBi Cayman Managed Futures Subsidiary at June 30, 2023. |
| (b) | Contract held by the iMGP DBi Cayman Managed Futures Subsidiary. |
The accompanying notes are an integral part of these financial statements.
| 100 | Litman Gregory Funds Trust | |||||
Table of Contents
iMGP DBi Hedge Strategy ETF 2023 Semi-Annual Report
In the first half of 2023, the iMGP DBi Hedge Strategy ETF rose 4.42% in price terms (4.97% in NAV) versus the Morningstar US Fund Long-Short Equity Category Index benchmark’s gain of 4.91%.
Performance as of June 30, 2023 |
| |||||||||||||||
| Year to Date | One- Year | Three- Year | Since Inception 12/17/2019 | |||||||||||||
iMGP DBi Hedge Strategy ETF (NAV) | 4.97% | 4.42% | 7.97% | 7.09% | ||||||||||||
iMGP DBi Hedge Strategy ETF (Price) | 4.42% | 4.46% | 7.89% | 7.04% | ||||||||||||
MornigstarUS Fund Long-Short Equity | 4.91% | 6.59% | 6.71% | 3.93% | ||||||||||||
Total Expense Ratio 0.85%
Performance data quoted represents past performance. Past performance does not guarantee future results. The investment return and principal value of an investment will fluctuate so that an investor’s shares, when redeemed, may be worth more or less than their original cost. Current performance of the fund may be lower or higher than the performance quoted. Short term performance is not a good indication of the fund’s future performance and should not be the sole basis for investing in the fund. Performance data current to the most recent month end may be obtained by visiting www.imgpfunds.com.
Shares of any ETF are bought and sold at market price (not NAV), may trade at a discount or premium to NAV and are not individually redeemed from the Fund. Brokerage commissions will reduce returns. |
| |||||||||||||||
2023 Semi-Annual Review
Since last Fall, the markets have been like a drunk stumbling across a highway. You watch an eighteen-wheeler barrel down and clench your eyes shut—only to open them seconds later and find that he’s still standing. Then it happens again. And again. And, to your utter surprise, you soon find that he’s standing on the other side.
Here we are in mid-2023 and we have been grazed, not flattened, by a long list of economic eighteen wheelers: most recently, no regional or global banking crisis, no US debt default, no profits collapse, no “recession by June.” We’re still standing.
Now place yourself back in early January. The market gods tip you off: inflation will prove sticky and the Fed will keep hiking. With a wink and a nod, they tell you that the Two-Year Treasury, then 4.4%, will hit nearly 5% by mid-year. Armed with this inside information, would you have bet that the Nasdaq, decimated by higher rates last year, would rise nearly 40% by mid-year, a record? Or that value would underperform growth by 25%, a tad more than its historic rebound last year? Or that equities would simply ignore the bond market which, with the most inverted yield curve in five decades, has breathlessly screamed recession for months?
We have two observations. Hedge funds have been cautiously positioned this year and are up single digits. While this might seem paltry relative to the 14% gain in the MSCI World Index, should they have predicted an overnight frenzy in AI that added $5 trillion to tech stocks? On the other hand, those numbers do look healthy relative to the 1% return on the Bloomberg Global Agg—a disappointment given the unexpected headwind of higher rates. This clearly has been a year to manage risk and live to fight another day. Great investors sometimes put on a sensible trade and it doesn’t work out—statistical tails do happen, after all. Over time, sensible trades generate alpha. That’s our bet, at least.
Further, we would like to remind people about the math of drawdowns. Bold cap headlines on Meta and Tesla tout year-to-date returns of 140% and 113%, respectively—not that both, after 65% drawdowns last year, are down 17% and 27% over eighteen months. The current obsession with respectable yields on corporate credit—and a decent 3% total return this year—glosses over the 18% drawdown last year. Investing is a long game and our math should reflect it.
Performance and Portfolio Positioning
Performance for the first half of the year was +4.4%. In Q1, a rally in equities was accretive to the performance. However, a pullback in March in small/mid-cap stocks due to the SVB crisis partially offset gains. Short interest rate positions also somewhat detracted. A continuation of the rally in equities in Q2 aided portfolio performance, particularly exposure to equity with growth bias and developed market equities excluding the U.S. Furthermore, in contrast to Q1, short interest rate positions in 2-year Treasury futures contributed positively to performance. For the first half overall, Equities contributed approximately 3.9% and Rates/Bonds contributed approximately 0.7%, while Currencies detracted approximately 0.6%. Current positioning remains conservative: underweight equities with a bias to growth and international equities.
| Fund Summary | 101 | |||||
Table of Contents
6/30/2023 Portfolio Characteristics
Net Asset Class Exposure (%) | ||||
US Equities | 18% | |||
International Developed Equities | 13% | |||
Emerging Market Equities | 9% | |||
US Dollar | 0% | |||
Fixed Income | -63% |
Top 5 Holdings | ||||
2 Yr Treasury | -27% | |||
SOFR | -26% | |||
EAFE | 13% | |||
Nasdaq | 10% | |||
Emerging Markets | 9% |
iMGP DBi Hedge Strategy ETF Value of Hypothetical $10,000
The value of a hypothetical $10,000 investment in the iMGP DBi Hedge Strategy ETF from December 17, 2019 to June 30, 2023 compared with the Morningstar Long-Short Equity Category.

The hypothetical $10,000 investment at fund inception includes changes due to share price and reinvestment of dividends and capital gains. The chart does not imply future performance. Indexes are unmanaged, do not incur fees, expenses or taxes, and cannot be invested in directly.
Performance quoted does not include a deduction for taxes that a shareholder would pay on the redemption of fund shares.
| 102 | Litman Gregory Funds Trust | |||||
Table of Contents
iMGP DBi Hedge Strategy ETF
SCHEDULE OF INVESTMENTS IN SECURITIES at June 30, 2023 (Unaudited)
| Principal Amount^ | Value | |||||||
SHORT-TERM INVESTMENTS: 87.7% | ||||||||
| TREASURY BILLS: 87.7% | ||||||||
| U.S. Treasury Bills | ||||||||
| $24,821,000 | 4.797%, 09/07/2023(a)(b) | $ | 24,586,677 | |||||
|
| |||||||
| | TOTAL TREASURY BILLS | 24,586,677 | ||||||
|
| |||||||
| | TOTAL SHORT-TERM INVESTMENTS | 24,586,677 | ||||||
|
| |||||||
| | TOTAL INVESTMENTS | 24,586,677 | ||||||
|
| |||||||
Other Assets in Excess of Liabilities: 12.3% | 3,437,371 | |||||||
|
| |||||||
NET ASSETS: 100.0% | $ | 28,024,048 | ||||||
|
| |||||||
Percentages are stated as a percent of net assets.
| ^ | The principal amount is stated in U.S. Dollars unless otherwise indicated. |
| (a) | The rate shown represents yield-to-maturity. |
| (b) | Issued with a zero coupon. Income is recognized through the accretion of discount. |
The accompanying notes are an integral part of these financial statements.
| Schedule of Investments | 103 | |||||
Table of Contents
iMGP DBi Hedge Strategy ETF
SCHEDULE OF INVESTMENTS IN FUTURES CONTRACTS at June 30, 2023 (Unaudited)(a)
| Description | Number of Contracts | Notional Amount | Notional Value | Expiration Date | Unrealized Appreciation/ (Depreciation) | |||||||||||||||
Futures Contracts – Long |
| |||||||||||||||||||
30 Day Federal Funds Futures | 1 | 394,792 | $ | 394,448 | 10/31/2023 | $ | (344 | ) | ||||||||||||
MSCI EAFE Index Futures | 35 | 3,739,982 | 3,772,125 | 9/15/2023 | 32,143 | |||||||||||||||
MSCI Emerging Market Index | 50 | 2,506,416 | 2,494,750 | 9/15/2023 | (11,666 | ) | ||||||||||||||
Nasdaq 100 E-mini Futures | 9 | 2,639,137 | 2,760,660 | 9/15/2023 | 121,523 | |||||||||||||||
Russell 2000 E-mini Futures | 6 | 571,033 | 571,110 | 9/15/2023 | 77 | |||||||||||||||
S&P Mid Cap 400 E-mini Futures | 7 | 1,808,280 | 1,850,870 | 9/15/2023 | 42,590 | |||||||||||||||
|
| |||||||||||||||||||
Total Long | $ | 184,323 | ||||||||||||||||||
|
| |||||||||||||||||||
Futures Contracts – Short |
| |||||||||||||||||||
3 Months SOFR Futures | (31 | ) | (7,462,464 | ) | $ | (7,438,063 | ) | 3/18/2025 | $ | 24,401 | ||||||||||
U.S. Treasury 2-Year Note Futures | (37 | ) | (7,588,890 | ) | (7,523,718 | ) | 9/29/2023 | 65,172 | ||||||||||||
U.S. Treasury Long Bond Futures | (12 | ) | (1,518,220 | ) | (1,522,875 | ) | 9/20/2023 | (4,655 | ) | |||||||||||
U.S. Treasury Ultra-Long Bond Futures | (11 | ) | (1,484,517 | ) | (1,498,406 | ) | 9/20/2023 | (13,889 | ) | |||||||||||
|
| |||||||||||||||||||
Total Short | $ | 71,029 | ||||||||||||||||||
|
| |||||||||||||||||||
Total Futures Contracts | $ | 255,352 | ||||||||||||||||||
|
| |||||||||||||||||||
| (a) | Mizuho Securities USA LLC is the counterparty for all Open Futures Contracts held by the Fund at June 30, 2023. |
The accompanying notes are an integral part of these financial statements.
| 104 | Litman Gregory Funds Trust | |||||
Table of Contents
iMGP RBA Responsible Global Allocation ETF 2023 Semi-Annual Report
The iMGP RBA Responsible Global Allocation ETF underperformed its benchmark in the first half of 2023, posting a return of 3.92% at NAV and 4.24% at market price compared to a 9.76% return for its style index (65% MSCI ACWI, 35% Bloomberg US Agg).
Performance as of June 30, 2023 |
| |||||||||||
| Year to Date Return | One- Year | Since Inception 2/1/2022 | ||||||||||
iMGP RBA Responsible Global Allocation ETF (NAV) | 3.92% | 4.78% | -5.29% | |||||||||
iMGP RBA Responsible Global Allocation ETF (Price) | 4.24% | 4.93% | -5.28% | |||||||||
65/35 Blend of MSCI ACWI & Barclays Agg Bond Index | 9.71% | 10.32% | -3.15% | |||||||||
65/35 Blend of MSCI ACWI ESG Leaders & Bloomberg MSCI US Aggregate ESG Focus Index | 9.95% | 9.74% | -3.66% | |||||||||
Morningstar World Allocation Category | 5.06% | 6.10% | -4.23% | |||||||||
Gross Expense Ratio 0.55% Net Expense Ratio 0.55%.
The Advisor has contractually agreed to limit the expenses until April 30, 2024. Performance data quoted represents past performance. Past performance does not guarantee future results. The investment return and principal value of an investment will fluctuate so that an investor’s shares, when redeemed, may be worth more or less than their original cost. Current performance of the fund may be lower or higher than the performance quoted. Short term performance is not a good indication of the fund’s future performance and should not be the sole basis for investing in the fund. Performance data current to the most recent month end may be obtained by visiting www.imgpfunds.com.
Shares of any ETF are bought and sold at market price (not NAV), may trade at a discount or premium to NAV and are not individually redeemed from the Fund. Brokerage commissions will reduce returns. |
| |||||||||||
Equity Positioning
The Strategy was underweight equity over the period, holding an average weight of 60.1% (4.9ppt underweight) in 1H23. The equity sleeve underperformed by 4.9% vs. the MSCI ACWI Index. This underperformance was driven by the underweights to long duration growth names in the tech, consumer discretionary, and communication services sectors as well as overweights to more defensive sectors such as consumer staples and health care. Overweighting Japan relative to ACWI was accretive to the portfolio as was an underweight to energy stocks.
Fixed Income Positioning
The Strategy was overweight fixed income over the period, holding an average weight of 38.6% (3.6ppt overweight) in 1H23. The fixed income sleeve underperformed slightly by 0.21%. Overweighting corporates was slightly accretive for the half as was underweighting the securitized sector. Our duration exposures were neither accretive nor detractive for the half.
Outlook and Positioning
Currently, our portfolios aim to minimize risk and enhance diversification through holding less exposure to the US megacap growth stocks that dominate markets today. Perhaps the most pervasive risk facing investors today is that owning most market-capitalization-weighted indices creates a false perception of diversification. Currently, seven stocks account for over a quarter of the value of the S&P 500®, while three sectors make up half of the index’s value. To achieve true diversification, proactive measures are necessary to shift away from these areas of concentration.
History has consistently reminded investors that the most crowded and expensive investments are the riskiest parts of the market. With a handful of stocks dominating market performance and leading to extreme market concentration in Tech-related companies, we remain steadfast in not chasing after such investments. We view the continued dominance of this narrow leadership as unsustainable. If earnings growth recovers in the coming year, we would anticipate a classic rotation from expensive growth stocks to economically sensitive (cyclical) investments that offer superior growth at a fraction of the cost. On the other hand, if earnings growth weakens further, we anticipate investors will seek more defensive investments as their appetite for high valuation multiples diminishes.
Another lesson from history is that the risk of market drawdowns is greater when profit fundamentals are weakening, particularly for lower quality and more cyclical investments. With the world having entered into an earnings recession this year, we have prioritized quality and reduced our exposure to cyclical assets. While certain economic signals provide some cause for optimism regarding future growth, the backdrop of central bank tightening, stricter bank lending standards, and the persistent weakening of important leading indicators heighten the risks to the growth outlook. But once our models confirm that an earnings recovery is underway, there should still be ample opportunity for investment, especially in an environment where the most cyclical assets appear historically undervalued and overlooked.
| Fund Summary | 105 | |||||
Table of Contents
IRBA Portfolio Allocations as of June 30, 2023
Asset Class Exposures | ||||
U.S. Equities | 28.8% | |||
Non-U.S. Equities | 29.6% | |||
U.S. Fixed Income | 35.8% | |||
Non-U.S. Fixed Income | 3.7% | |||
Cash | 2.1% | |||
|
| |||
Total | 100% | |||
|
|
| IRBA vs Global Blended 65/35 Benchmark | IRBA Weight | Benchmark Weight | Relative Weight | |||||||||
Total | 100% | 100% | 0.0% | |||||||||
Equity | 58.4% | 65.0% | -6.6% | |||||||||
Fixed Income | 39.5% | 35.0% | 4.5% | |||||||||
Cash | 2.1% | 0.0% | 2.1% | |||||||||
| IRBA Equity Region vs MSCI ACWI Net Index | IRBA Weight | Benchmark Weight | Relative Weight | |||||||||
Total* | 100.0% | 100.0% | 0.0% | |||||||||
US | 49.3% | 63.7% | -14.4% | |||||||||
Canada | 1.5% | 2.8% | -1.3% | |||||||||
Europe | 20.5% | 11.3% | 9.3% | |||||||||
United Kingdom | 4.5% | 2.8% | 1.7% | |||||||||
Japan | 11.2% | 5.5% | 5.7% | |||||||||
Asia ex-JPY | 4.7% | 2.9% | 1.8% | |||||||||
Emerging Markets | 8.2% | 11.0% | -2.8% | |||||||||
| IRBA Equity Sector vs MSCI ACWI Net Index | IRBA Weight | Benchmark Weight | Relative Weight | |||||||||
Total* | 100.0% | 100.0% | 0.0% | |||||||||
Communication Services | 3.5% | 7.3% | -3.8% | |||||||||
Consumer Discretionary | 7.9% | 11.3% | -3.4% | |||||||||
Consumer Staples | 12.3% | 7.3% | 5.0% | |||||||||
Energy | 2.1% | 4.6% | -2.5% | |||||||||
Financials | 13.1% | 15.4% | -2.3% | |||||||||
Health Care | 16.3% | 11.8% | 4.5% | |||||||||
Industrials | 13.1% | 10.5% | 2.6% | |||||||||
Information Technology | 12.6% | 22.1% | -9.5% | |||||||||
Materials | 7.5% | 4.6% | 3.0% | |||||||||
Real Estate | 7.8% | 2.3% | 5.4% | |||||||||
Utilities | 3.6% | 2.8% | 0.9% | |||||||||
IRBA Fixed Income Characteristics
Duration | 6.0 years | |||
Yield to Maturity | 4.80% | |||
Average Credit Quality | AA |
| * | Totals may not add up to 100% due to rounding. |
| 106 | Litman Gregory Funds Trust | |||||
Table of Contents
iMGP RBA Responsible Global Allocation ETF Value of Hypothetical $10,000
The value of a hypothetical $10,000 investment in the iMGP RBA Responsible Global Allocation ETF from February 1, 2022 to June 30, 2023 compared with the 65/35 Blend of MSCI ACWI & Bloomberg US Aggregate Bond Index, Morningstar World Allocation Category and 65/35 Blend of MSCI ACWI ESG Leaders & Bloomberg MSCI US Aggregate ESG Focus Index.
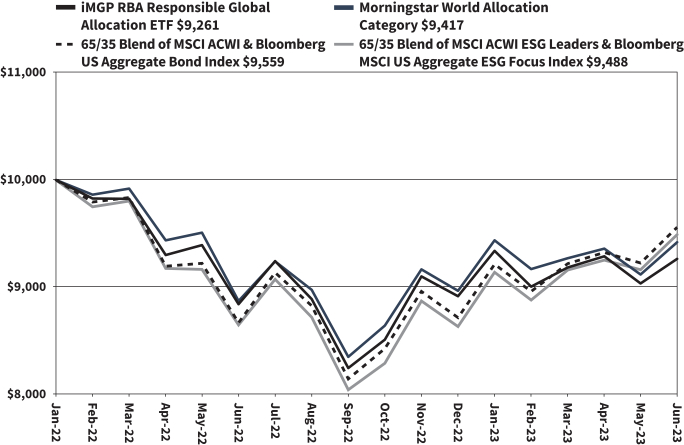
The hypothetical $10,000 investment at fund inception includes changes due to share price and reinvestment of dividends and capital gains. The chart does not imply future performance. Indexes are unmanaged, do not incur fees, expenses or taxes, and cannot be invested in directly.
Performance quoted does not include a deduction for taxes that a shareholder would pay on the redemption of fund shares.
| Fund Summary | 107 | |||||
Table of Contents
iMGP RBA Responsible Global Allocation ETF
SCHEDULE OF INVESTMENTS IN SECURITIES at June 30, 2023 (Unaudited)
| Shares | Value | |||||||
EXCHANGE-TRADED FUNDS: 98.6% | ||||||||
| 6,948 | iShares ESG Advanced MSCI EAFE ETF | $ | 423,203 | |||||
| 66,896 | iShares ESG Aware US Aggregate Bond ETF | 3,155,484 | ||||||
| 1,759 | iShares MBS ETF | 164,053 | ||||||
| 18,266 | iShares MSCI Global Sustainable Development Goals | 1,443,927 | ||||||
| 10,228 | iShares Trust iShares ESG Aware MSCI EAFE ETF | 745,928 | ||||||
| 39,600 | Nuveen ESG Large-Cap Value ETF | 1,372,140 | ||||||
| 5,932 | Vanguard ESG International Stock ETF | 315,049 | ||||||
| 12,608 | WisdomTree US ESG Fund | 579,085 | ||||||
|
| |||||||
| | TOTAL EXCHANGE-TRADED FUNDS | 8,198,869 | ||||||
|
| |||||||
| | TOTAL INVESTMENTS | 8,198,869 | ||||||
|
| |||||||
| Other Assets in Excess of Liabilities: 1.4% | 119,562 | |||||||
|
| |||||||
NET ASSETS: 100.0% | $ | 8,318,431 | ||||||
|
| |||||||
Percentages are stated as a percent of net assets.
| ETF | Exchange-Traded Fund |
The accompanying notes are an integral part of these financial statements.
| 108 | Litman Gregory Funds Trust | |||||
Table of Contents
iMGP Berkshire Dividend Growth ETF
SCHEDULE OF INVESTMENTS IN SECURITIES at June 30, 2023 (Unaudited)
| Shares | Value | |||||||
COMMON STOCKS: 96.7% | ||||||||
| Consumer Discretionary: 7.8% | ||||||||
| 495 | Leggett & Platt, Inc. | $ | 14,662 | |||||
| 90 | Lowe’s Cos., Inc. | 20,313 | ||||||
| 81 | McDonald’s Corp. | 24,171 | ||||||
|
| |||||||
| 59,146 | ||||||||
|
| |||||||
| Consumer Staples: 11.3% | ||||||||
| 165 | General Mills, Inc. | 12,656 | ||||||
| 285 | Mondelez International, Inc. - Class A | 20,788 | ||||||
| 96 | PepsiCo, Inc. | 17,781 | ||||||
| 99 | Procter & Gamble Co. | 15,022 | ||||||
| 129 | Walmart, Inc. | 20,276 | ||||||
|
| |||||||
| 86,523 | ||||||||
|
| |||||||
| Energy: 8.5% | ||||||||
| 246 | Chevron Corp. | 38,708 | ||||||
| 102 | EOG Resources, Inc. | 11,673 | ||||||
| 816 | Kinder Morgan, Inc. | 14,051 | ||||||
|
| |||||||
| 64,432 | ||||||||
|
| |||||||
| Financials: 13.2% | ||||||||
| 1,017 | Bank of America Corp. | 29,178 | ||||||
| 75 | Chubb Ltd. | 14,442 | ||||||
| 228 | JPMorgan Chase & Co. | 33,160 | ||||||
| 84 | M&T Bank Corp. | 10,396 | ||||||
| 108 | PNC Financial Services Group, Inc. | 13,602 | ||||||
|
| |||||||
| 100,778 | ||||||||
|
| |||||||
| Health Care: 14.6% | ||||||||
| 144 | Abbott Laboratories | 15,699 | ||||||
| 186 | AbbVie, Inc. | 25,060 | ||||||
| 318 | Bristol-Myers Squibb Co. | 20,336 | ||||||
| 105 | Johnson & Johnson | 17,380 | ||||||
| 186 | Merck & Co., Inc. | 21,462 | ||||||
| 321 | Pfizer, Inc. | 11,774 | ||||||
|
| |||||||
| 111,711 | ||||||||
|
| |||||||
| Industrials: 16.3% | ||||||||
| 39 | Deere & Co. | 15,802 | ||||||
| 195 | Emerson Electric Co. | 17,626 | ||||||
| 84 | Honeywell International, Inc. | 17,430 | ||||||
| 57 | Lockheed Martin Corp. | 26,242 | ||||||
| 108 | Norfolk Southern Corp. | 24,490 | ||||||
| 129 | Waste Management, Inc. | 22,371 | ||||||
|
| |||||||
| 123,961 | ||||||||
|
| |||||||
| Information Technology: 16.8% | ||||||||
| 159 | Apple, Inc. | 30,841 | ||||||
| 456 | Cisco Systems, Inc. | 23,594 | ||||||
| 108 | Microsoft Corp. | 36,778 | ||||||
| 174 | QUALCOMM, Inc. | 20,713 | ||||||
| 117 | TE Connectivity Ltd. | 16,399 | ||||||
|
| |||||||
| 128,325 | ||||||||
|
| |||||||
| Materials: 4.8% | ||||||||
| 225 | Nucor Corp. | 36,896 | ||||||
|
| |||||||
| Real Estate: 1.7% | ||||||||
| 192 | WP Carey, Inc. - REIT | 12,972 | ||||||
|
| |||||||
| Shares | Value | |||||||
| Utilities: 1.7% | ||||||||
| 489 | PPL Corp. | $ | 12,939 | |||||
|
| |||||||
| | TOTAL COMMON STOCKS | 737,683 | ||||||
|
| |||||||
| | TOTAL INVESTMENTS | 737,683 | ||||||
|
| |||||||
| Other Assets in Excess of Liabilities: 3.3% | 25,480 | |||||||
|
| |||||||
NET ASSETS: 100.0% | $ | 763,163 | ||||||
|
| |||||||
Percentages are stated as a percent of net assets.
| REIT | Real Estate Investment Trust |
The accompanying notes are an integral part of these financial statements.
| Schedule of Investments | 109 | |||||
Table of Contents
Litman Gregory Funds Trust
EXPENSE EXAMPLES – (Unaudited)
As a shareholder of the Funds, you incur two types of costs: (1) transaction costs and (2) ongoing costs, including advisory fees, and other fund expenses. The examples below are intended to help you understand your ongoing costs (in dollars) of investing in the Funds and to compare these costs with the ongoing costs of investing in other mutual funds.
The examples are based on an investment of $1,000 invested at the beginning of the period shown and held for the entire period from January 1, 2023 to June 30, 2023.
Actual Expenses
For each Fund, the first line of the table below provides information about actual account values and actual expenses. You may use the information in this line, together with the amount you invested, to estimate the expenses that you paid over the period. Simply divide your account value by $1,000 (for example, an $8,600 account value divided by $1,000 = 8.6), then multiply the result by the number in the first line under the heading entitled “Expenses Paid During Period” to estimate the expenses you paid on your account during this period.
Hypothetical Example for Comparison Purposes
For each Fund, the second line of the table below provides information about hypothetical account values and hypothetical expenses based on the Fund’s actual expense ratio and an assumed rate of return of 5% per year before expenses, which is not the Fund’s actual return. The hypothetical account values and expenses may not be used to estimate the actual ending account balance or expenses you paid for the period. You may use this information to compare the ongoing costs of investing in the Fund and other funds. To do so, compare this 5% hypothetical example with the 5% hypothetical examples that appear in the shareholder reports of the other funds.
Please note that the expenses shown in the table are meant to highlight your ongoing costs only and do not reflect any transaction costs. Therefore, the second line for each Fund of the table is useful in comparing ongoing costs only, and will not help you determine the relative total costs of owning different funds. In addition, if these transaction costs were included, your costs would have been higher.
| Beginning Account Value (1/1/23) | Ending Account Value (6/30/23) | Expenses Paid During Period* (1/1/23 to 6/30/23) | Expenses Ratio During Period* (1/1/23 to 6/30/23) | |||||||||||||
iMGP Global Select Fund – Institutional Actual | $ | 1,000.00 | $ | 1,119.70 | $ | 5.52 | 1.05% | |||||||||
iMGP Global Select Fund – Institutional Hypothetical - (5% return before expenses) | $ | 1,000.00 | $ | 1,019.59 | $ | 5.26 | 1.05% | |||||||||
iMGP International Fund – Institutional Actual | $ | 1,000.00 | $ | 1,158.30 | $ | 6.15 | 1.15% | |||||||||
iMGP International Fund – Institutional Hypothetical - (5% return before expenses) | $ | 1,000.00 | $ | 1,019.10 | $ | 5.76 | 1.15% | |||||||||
iMGP Oldfield International Value Fund – Institutional Actual | $ | 1,000.00 | $ | 1,107.50 | $ | 4.91 | 0.94% | |||||||||
iMGP Oldfield International Value Fund – Institutional Hypothetical - (5% return before expenses) | $ | 1,000.00 | $ | 1,020.14 | $ | 4.71 | 0.94% | |||||||||
iMGP SBH Focused Small Value Fund – Institutional Actual | $ | 1,000.00 | $ | 1,108.00 | $ | 6.01 | 1.15% | |||||||||
iMGP SBH Focused Small Value Fund – Institutional Hypothetical - (5% return before expenses) | $ | 1,000.00 | $ | 1,019.10 | $ | 5.76 | 1.15% | |||||||||
iMGP Alternative Strategies Fund – Institutional Actual | $ | 1,000.00 | $ | 1,020.20 | $ | 7.11 | 1.42% | |||||||||
iMGP Alternative Strategies Fund – Investor Actual | $ | 1,000.00 | $ | 1,018.80 | $ | 8.36 | 1.67% | |||||||||
iMGP Alternative Strategies Fund – Institutional Hypothetical - (5% return before expenses) | $ | 1,000.00 | $ | 1,017.76 | $ | 7.10 | 1.42% | |||||||||
iMGP Alternative Strategies Fund – Investor Hypothetical - (5% return before expenses) | $ | 1,000.00 | $ | 1,016.52 | $ | 8.35 | 1.67% | |||||||||
iMGP High Income Fund – Institutional Actual | $ | 1,000.00 | $ | 1,053.70 | $ | 5.24 | 1.03% | |||||||||
iMGP High Income Fund – Institutional Hypothetical - (5% return before expenses) | $ | 1,000.00 | $ | 1,019.69 | $ | 5.16 | 1.03% | |||||||||
iMGP Dolan McEniry Corporate Bond Fund – Institutional Actual | $ | 1,000.00 | $ | 1,020.70 | $ | 3.51 | 0.70% | |||||||||
iMGP Dolan McEniry Corporate Bond Fund – Institutional Hypothetical - (5% return before expenses) | $ | 1,000.00 | $ | 1,021.33 | $ | 3.51 | 0.70% | |||||||||
iMGP DBi Managed Futures Strategy ETF – Actual | $ | 1,000.00 | $ | 951.70 | $ | 4.11 | 0.85% | |||||||||
iMGP DBi Managed Futures Strategy ETF – Hypothetical - (5% return before expenses) | $ | 1,000.00 | $ | 1,020.58 | $ | 4.26 | 0.85% | |||||||||
iMGP DBi Hedge Strategy ETF – Actual | $ | 1,000.00 | $ | 1,049.70 | $ | 4.32 | 0.85% | |||||||||
iMGP DBi Hedge Strategy ETF – Hypothetical - (5% return before expenses) | $ | 1,000.00 | $ | 1,020.58 | $ | 4.26 | 0.85% | |||||||||
| 110 | Litman Gregory Funds Trust | |||||
Table of Contents
| Beginning Account Value (1/1/23) | Ending Account Value (6/30/23) | Expenses Paid During Period* (1/1/23 to 6/30/23) | Expenses Ratio During Period* (1/1/23 to 6/30/23) | |||||||||||||
iMGP RBA Responsible Global Allocation ETF – Actual | $ | 1,000.00 | $ | 1,039.20 | $ | 2.78 | 0.55% | |||||||||
iMGP RBA Responsible Global Allocation ETF – Hypothetical - (5% return before expenses) | $ | 1,000.00 | $ | 1,022.07 | $ | 2.76 | 0.55% | |||||||||
iMGP Berkshire Dividend Growth ETF** – Actual | $ | 1,000.00 | $ | 1,009.40 | $ | 0.02 | 0.55% | |||||||||
iMGP Berkshire Dividend Growth ETF** – Hypothetical - (5% return before expenses) | $ | 1,000.00 | $ | 1,022.07 | $ | 2.76 | 0.55% | |||||||||
* Expenses are equal to the Funds’ annualized expense ratio as indicated, multiplied by the average account value over the period, multiplied by the number of days in most recent fiscal half-year period (181), then divided by the number of days in the fiscal year (365) (to reflect the one-half-year period).
** Commenced operations on June 29, 2023.
| Expense Examples | 111 | |||||
Table of Contents
Litman Gregory Funds Trust
STATEMENTS OF ASSETS AND LIABILITIES at June 30, 2023 – (Unaudited)
| Global Select Fund | International Fund | Oldfield International Value Fund | SBH Focused Small Value Fund | |||||||||||||
ASSETS: |
| |||||||||||||||
Investments in securities at cost | $ | 106,611,512 | $ | 195,120,636 | $ | 31,062,803 | $ | 40,562,881 | ||||||||
Repurchase agreements at cost | 6,046,041 | 9,170,774 | — | — | ||||||||||||
|
|
|
|
|
|
|
| |||||||||
Total investments at cost | $ | 112,657,553 | $ | 204,291,410 | $ | 31,062,803 | $ | 40,562,881 | ||||||||
|
|
|
|
|
|
|
| |||||||||
Investments in securities at value | $ | 119,897,719 | $ | 219,309,938 | $ | 34,803,948 | $ | 49,294,370 | ||||||||
Repurchase agreements at value | 6,046,041 | 9,170,774 | — | — | ||||||||||||
|
|
|
|
|
|
|
| |||||||||
Total investments at value | $ | 125,943,760 | $ | 228,480,712 | $ | 34,803,948 | $ | 49,294,370 | ||||||||
|
|
|
|
|
|
|
| |||||||||
Cash | 3,490 | 24,097 | 347,837 | 2,251,886 | ||||||||||||
Cash, denominated in foreign currency (cost of $383,834, $50, $213,484 and $0, respectively) | 367,731 | 50 | 212,023 | — | ||||||||||||
Receivables: |
| |||||||||||||||
Foreign tax reclaims | 73,181 | 2,602,724 | 110,596 | — | ||||||||||||
Dividends and interest | 121,318 | 59,504 | — | 30,434 | ||||||||||||
Fund shares sold | — | 90,000 | 1,972,891 | 20,539 | ||||||||||||
Securities sold | — | 656,951 | — | 511,150 | ||||||||||||
Line of credit interest | — | 12,834 | 816 | — | ||||||||||||
Prepaid expenses | 4,593 | 3,589 | 8,931 | 16,902 | ||||||||||||
|
|
|
|
|
|
|
| |||||||||
Total Assets | 126,514,073 | 231,930,461 | 37,457,042 | 52,125,281 | ||||||||||||
|
|
|
|
|
|
|
| |||||||||
LIABILITIES: |
| |||||||||||||||
Payables: |
| |||||||||||||||
Advisory fees | 71,869 | 170,988 | 5,999 | 31,458 | ||||||||||||
Securities purchased | 88,634 | 695,185 | — | 378,972 | ||||||||||||
Fund shares redeemed | 815,342 | — | — | 43,350 | ||||||||||||
Foreign taxes withheld | 701 | 4,617 | — | — | ||||||||||||
Professional fees | 10,484 | 12,149 | 9,942 | 5,367 | ||||||||||||
Line of credit interest | 12,318 | — | — | — | ||||||||||||
Chief Compliance Officer fees | 7,143 | 7,143 | 7,143 | 7,143 | ||||||||||||
Accrued other expenses | 191,847 | 264,155 | 80,416 | 110,247 | ||||||||||||
|
|
|
|
|
|
|
| |||||||||
Total Liabilities | 1,198,338 | 1,154,237 | 103,500 | 576,537 | ||||||||||||
|
|
|
|
|
|
|
| |||||||||
NET ASSETS | $ | 125,315,735 | $ | 230,776,224 | $ | 37,353,542 | $ | 51,548,744 | ||||||||
|
|
|
|
|
|
|
| |||||||||
Institutional Class: |
| |||||||||||||||
Net Assets | $ | 125,315,735 | $ | 230,776,224 | $ | 37,353,542 | $ | 51,548,744 | ||||||||
Number of shares issued and outstanding (unlimited number of shares authorized, $0.01 par value) | 10,465,290 | 13,145,309 | 3,452,823 | 3,615,933 | ||||||||||||
Net asset value, offering price and redemption price per share | $ | 11.97 | $ | 17.56 | $ | 10.82 | $ | 14.26 | ||||||||
|
|
|
|
|
|
|
| |||||||||
COMPONENTS OF NET ASSETS |
| |||||||||||||||
Paid-in capital | $ | 108,692,278 | $ | 249,941,993 | $ | 34,222,888 | $ | 43,369,672 | ||||||||
Accumulated distributable earnings (deficit) | 16,623,457 | (19,165,769 | ) | 3,130,654 | 8,179,072 | |||||||||||
|
|
|
|
|
|
|
| |||||||||
Net assets | $ | 125,315,735 | $ | 230,776,224 | $ | 37,353,542 | $ | 51,548,744 | ||||||||
|
|
|
|
|
|
|
| |||||||||
The accompanying notes are an integral part of these financial statements.
| 112 | Litman Gregory Funds Trust | |||||
Table of Contents
Litman Gregory Funds Trust
STATEMENTS OF ASSETS AND LIABILITIES at June 30, 2023 – (Unaudited) (Continued)
| Alternative Strategies Fund (Consolidated) | High Income Fund | Dolan McEniry Corporate Bond Fund | ||||||||||
ASSETS: |
| |||||||||||
Investments in securities at cost | $ | 917,607,638 | $ | 79,554,611 | $ | 154,109,510 | ||||||
Repurchase agreements at cost | 54,849,733 | 6,743,689 | — | |||||||||
|
|
|
|
|
| |||||||
Total investments at cost | $ | 972,457,371 | $ | 86,298,300 | $ | 154,109,510 | ||||||
|
|
|
|
|
| |||||||
Investments in securities at value | $ | 824,262,435 | $ | 72,641,716 | $ | 147,202,195 | ||||||
Repurchase agreements at value | 54,849,733 | 6,743,689 | — | |||||||||
|
|
|
|
|
| |||||||
Total investments at value | $ | 879,112,168 | $ | 79,385,405 | $ | 147,202,195 | ||||||
|
|
|
|
|
| |||||||
Cash | 8,884,811 | 742,993 | 7,142,891 | |||||||||
Cash, denominated in foreign currency (cost of $244,463, $0 and $0, respectively) | 231,872 | — | — | |||||||||
Deposits at brokers for securities sold short | 9,544,899 | — | — | |||||||||
Deposits at brokers for futures | 8,431,245 | — | — | |||||||||
Deposits at brokers for written options | 1,529,103 | — | — | |||||||||
Deposits at brokers for swaps | 4,770,001 | 112,511 | — | |||||||||
Receivables: |
| |||||||||||
Securities sold | 19,237,095 | 1,187,273 | — | |||||||||
Dividends and interest | 6,137,575 | 761,021 | 1,749,052 | |||||||||
Fund shares sold | 2,926,075 | 523,155 | 2,309,544 | |||||||||
Foreign tax reclaims | 342,642 | 442 | — | |||||||||
Variation margin - Centrally Cleared Swaps | 205,957 | — | — | |||||||||
Other Receivables | 101,143 | — | — | |||||||||
Dividend and interest for swap resets | 55,135 | — | — | |||||||||
Line of credit interest | 57,661 | — | — | |||||||||
Variation margin - Futures | 291,558 | 4,659 | — | |||||||||
Unrealized gain on forward foreign currency exchange contracts | 56,722 | — | — | |||||||||
Prepaid expenses | 13,822 | 3,241 | — | |||||||||
|
|
|
|
|
| |||||||
Total Assets | 941,929,484 | 82,720,700 | 158,403,682 | |||||||||
|
|
|
|
|
| |||||||
LIABILITIES: |
| |||||||||||
Written options (premium received, $24,226, $97,175 and $0, respectively) | 26,651 | 39,496 | — | |||||||||
Securities sold short (proceeds, $17,614,314, $0 and $0, respectively) | 17,181,458 | — | — | |||||||||
Payables: | ||||||||||||
Advisory fees | 857,428 | 23,849 | 46,748 | |||||||||
Securities purchased | 7,424,142 | 110,236 | 397,979 | |||||||||
Fund shares redeemed | 3,546,250 | 407,014 | 571,406 | |||||||||
Foreign taxes withheld | 3,309 | — | — | |||||||||
Professional fees | 48,968 | 783 | 7,676 | |||||||||
Distributions payable | 415,378 | — | 62,063 | |||||||||
Line of credit interest | — | 2,165 | — | |||||||||
Variation margin - Centrally Cleared Swaps | 29,833 | 10,487 | — | |||||||||
Variation margin - Futures | 80,178 | — | — | |||||||||
Short dividend | 31,603 | — | — | |||||||||
Chief Compliance Officer fees | 7,143 | 7,143 | 7,143 | |||||||||
Unrealized loss on unfunded loan commitment | 79,170 | 3,299 | — | |||||||||
Unrealized loss on forward foreign currency exchange contracts | 324,513 | 2,706 | — | |||||||||
Unrealized loss on swaps | 253,325 | — | — | |||||||||
Distribution fees payable for investor class (see Note 4) | 7,046 | — | — | |||||||||
Accrued other expenses | 975,877 | 109,790 | 92,473 | |||||||||
|
|
|
|
|
| |||||||
Total Liabilities | 31,292,272 | 716,968 | 1,185,488 | |||||||||
|
|
|
|
|
| |||||||
Commitments and Contingencies (See Note 7) | ||||||||||||
NET ASSETS | $ | 910,637,212 | $ | 82,003,732 | $ | 157,218,194 | ||||||
|
|
|
|
|
| |||||||
The accompanying notes are an integral part of these financial statements.
| Statements of Assets and Liabilities | 113 | |||||
Table of Contents
Litman Gregory Funds Trust
STATEMENTS OF ASSETS AND LIABILITIES at June 30, 2023 – (Unaudited) (Continued)
| Alternative Strategies Fund (Consolidated) | High Income Fund | Dolan McEniry Corporate Bond Fund | ||||||||||
Institutional Class: |
| |||||||||||
Net Assets | $ | 876,576,969 | $ | 82,003,732 | $ | 157,218,194 | ||||||
Number of shares issued and outstanding (unlimited number of shares authorized, $0.01 par value) | 85,499,387 | 8,733,344 | 16,427,782 | |||||||||
Net asset value, offering price and redemption price per share | $ | 10.25 | $ | 9.39 | $ | 9.57 | ||||||
|
|
|
|
|
| |||||||
Investor Class: |
| |||||||||||
Net Assets | $ | 34,060,243 | $ | — | $ | — | ||||||
Number of shares issued and outstanding (unlimited number of shares authorized, $0.01 par value) | 3,312,482 | — | — | |||||||||
Net asset value, offering price and redemption price per share | $ | 10.28 | $ | — | $ | — | ||||||
|
|
|
|
|
| |||||||
COMPONENTS OF NET ASSETS |
| |||||||||||
Paid-in capital | $ | 1,067,858,736 | $ | 91,720,759 | $ | 166,997,298 | ||||||
Accumulated distributable earnings (deficit) | (157,221,524 | ) | (9,717,027 | ) | (9,779,104 | ) | ||||||
|
|
|
|
|
| |||||||
Net assets | $ | 910,637,212 | $ | 82,003,732 | $ | 157,218,194 | ||||||
|
|
|
|
|
| |||||||
The accompanying notes are an integral part of these financial statements.
| 114 | Litman Gregory Funds Trust | |||||
Table of Contents
Litman Gregory Funds Trust
STATEMENTS OF ASSETS AND LIABILITIES at June 30, 2023 – (Unaudited) (Continued)
| DBi Managed Futures Strategy ETF (Consolidated) | DBi Hedge Strategy ETF | RBA Responsible Global Allocation ETF | Berkshire Dividend Growth ETF | |||||||||||||
ASSETS: | ||||||||||||||||
Investments in securities at cost | $ | 539,740,726 | $ | 24,592,769 | $ | 8,456,564 | $ | 730,540 | ||||||||
Investments in securities at value | $ | 539,625,107 | $ | 24,586,677 | $ | 8,198,869 | $ | 737,683 | ||||||||
Cash | 97,100,207 | 2,129,213 | 119,645 | — | ||||||||||||
Deposits at brokers for futures | 72,908,917 | 1,217,057 | — | — | ||||||||||||
Receivables: | ||||||||||||||||
Fund shares sold | — | — | — | 756,031 | ||||||||||||
Advisory reimbursement | 27,977 | — | — | — | ||||||||||||
Variation margin - Futures | — | 102,461 | — | — | ||||||||||||
|
|
|
|
|
|
|
| |||||||||
Total Assets | 709,662,208 | 28,035,408 | 8,318,514 | 1,493,714 | ||||||||||||
|
|
|
|
|
|
|
| |||||||||
LIABILITIES: | ||||||||||||||||
Payables: | ||||||||||||||||
Advisory fees | 472,452 | 11,360 | 83 | 11 | ||||||||||||
Securities purchased | — | — | — | 730,540 | ||||||||||||
Variation margin - Futures | 1,415,298 | — | — | — | ||||||||||||
|
|
|
|
|
|
|
| |||||||||
Total Liabilities | 1,887,750 | 11,360 | 83 | 730,551 | ||||||||||||
|
|
|
|
|
|
|
| |||||||||
NET ASSETS | $ | 707,774,458 | $ | 28,024,048 | $ | 8,318,431 | $ | 763,163 | ||||||||
|
|
|
|
|
|
|
| |||||||||
Net Assets | $ | 707,774,458 | $ | 28,024,048 | $ | 8,318,431 | $ | 763,163 | ||||||||
Number of shares issued and outstanding (unlimited number of shares authorized, $0.01 par value) | 25,600,000 | 1,050,000 | 900,000 | 75,000 | ||||||||||||
Net asset value, offering price and redemption price per share | $ | 27.65 | $ | 26.69 | $ | 9.24 | $ | 10.18 | ||||||||
|
|
|
|
|
|
|
| |||||||||
COMPONENTS OF NET ASSETS | ||||||||||||||||
Paid-in capital | $ | 845,062,376 | $ | 28,474,790 | $ | 8,734,633 | $ | 756,031 | ||||||||
Accumulated distributable earnings (deficit) | (137,287,918 | ) | (450,742 | ) | (416,202 | ) | 7,132 | |||||||||
|
|
|
|
|
|
|
| |||||||||
Net assets | $ | 707,774,458 | $ | 28,024,048 | $ | 8,318,431 | $ | 763,163 | ||||||||
|
|
|
|
|
|
|
| |||||||||
The accompanying notes are an integral part of these financial statements.
| Statements of Assets and Liabilities | 115 | |||||
Table of Contents
Litman Gregory Funds Trust
STATEMENTS OF OPERATIONS For the Six Months Ended June 30, 2023 – (Unaudited)
| Global Select Fund | International Fund | Oldfield International Value Fund | SBH Focused Small Value Fund | |||||||||||||
INVESTMENT INCOME: | ||||||||||||||||
Income |
| |||||||||||||||
Dividends (net of foreign taxes withheld of $71,702, $508,527, $112,977 and $1,356, respectively) | $ | 1,041,597 | $ | 3,615,133 | $ | 766,558 | $ | 539,034 | ||||||||
Interest | 40,511 | 82,756 | 43 | — | ||||||||||||
|
|
|
|
|
|
|
| |||||||||
Total income | 1,082,108 | 3,697,889 | 766,601 | 539,034 | ||||||||||||
|
|
|
|
|
|
|
| |||||||||
Expenses | ||||||||||||||||
Advisory fees | 674,765 | 1,226,515 | 122,430 | 241,866 | ||||||||||||
Transfer agent fees | 69,750 | 67,380 | 18,232 | 31,227 | ||||||||||||
Fund accounting fees | 35,795 | 32,784 | 17,911 | 15,595 | ||||||||||||
Administration fees | 15,344 | 20,381 | 9,534 | 11,191 | ||||||||||||
Professional fees | 25,440 | 37,408 | 14,672 | 11,585 | ||||||||||||
Trustee fees | 33,812 | 38,558 | 28,417 | 29,385 | ||||||||||||
Custody fees | 21,862 | 55,994 | 26,934 | 12,030 | ||||||||||||
Reports to shareholders | 24,115 | 17,614 | 3,159 | 7,737 | ||||||||||||
Registration expense | 14,045 | 15,528 | 11,427 | 11,312 | ||||||||||||
Miscellaneous | 908 | 4,054 | — | — | ||||||||||||
Insurance expense | 1,723 | 2,181 | — | 33 | ||||||||||||
Dividend & interest expense | 44,609 | 4,967 | 370 | 311 | ||||||||||||
Chief Compliance Officer fees | 7,143 | 7,143 | 7,143 | 7,143 | ||||||||||||
|
|
|
|
|
|
|
| |||||||||
Total expenses | 969,311 | 1,530,507 | 260,229 | 379,415 | ||||||||||||
Less: fees waived (see Note 3) | (327,213 | ) | (249,694 | ) | (95,583 | ) | (101,270 | ) | ||||||||
|
|
|
|
|
|
|
| |||||||||
Net expenses | 642,098 | 1,280,813 | 164,646 | 278,145 | ||||||||||||
|
|
|
|
|
|
|
| |||||||||
Net investment income | 440,010 | 2,417,076 | 601,955 | 260,889 | ||||||||||||
|
|
|
|
|
|
|
| |||||||||
REALIZED AND UNREALIZED GAIN (LOSS) | ||||||||||||||||
Net realized gain (loss) on: | ||||||||||||||||
Investments | 4,513,051 | 2,161,675 | 72,974 | 903,540 | ||||||||||||
Foreign currency transactions | (7,994 | ) | (38,805 | ) | (5,442 | ) | — | |||||||||
|
|
|
|
|
|
|
| |||||||||
Net realized gain (loss) | 4,505,057 | 2,122,870 | 67,532 | 903,540 | ||||||||||||
|
|
|
|
|
|
|
| |||||||||
Net change in unrealized appreciation/depreciation on: | ||||||||||||||||
Investments | 9,028,677 | 27,550,730 | 2,856,125 | 3,924,927 | ||||||||||||
Foreign currency transactions | 7,893 | 46,505 | (1,162 | ) | — | |||||||||||
|
|
|
|
|
|
|
| |||||||||
Net change in unrealized appreciation/depreciation | 9,036,570 | 27,597,235 | 2,854,963 | 3,924,927 | ||||||||||||
|
|
|
|
|
|
|
| |||||||||
Net realized and unrealized gain (loss) on investments and foreign currency transactions | 13,541,627 | 29,720,105 | 2,922,495 | 4,828,467 | ||||||||||||
|
|
|
|
|
|
|
| |||||||||
Net increase in net assets resulting from operations | $ | 13,981,637 | $ | 32,137,181 | $ | 3,524,450 | $ | 5,089,356 | ||||||||
|
|
|
|
|
|
|
| |||||||||
The accompanying notes are an integral part of these financial statements.
| 116 | Litman Gregory Funds Trust | |||||
Table of Contents
Litman Gregory Funds Trust
STATEMENTS OF OPERATIONS For the Six Months Ended June 30, 2023 – (Unaudited) (Continued)
| Alternative Strategies Fund (Consolidated) | High Income Fund | Dolan McEniry Corporate Bond Fund | ||||||||||
INVESTMENT INCOME: |
| |||||||||||
Income |
| |||||||||||
Dividends (net of foreign taxes withheld of $84,623, $0 and $0, respectively) | $ | 1,755,336 | $ | 107,617 | $ | — | ||||||
Interest (net of interest taxes withheld of $1,796, $1,769 and $0, respectively) | 21,466,585 | 2,652,854 | 2,467,449 | |||||||||
|
|
|
|
|
| |||||||
Total income | 23,221,921 | 2,760,471 | 2,467,449 | |||||||||
|
|
|
|
|
| |||||||
Expenses |
| |||||||||||
Advisory fees | 6,658,480 | 397,367 | 293,953 | |||||||||
Transfer agent fees | 423,389 | 41,802 | 89,736 | |||||||||
Fund accounting fees | 147,249 | 54,562 | 18,275 | |||||||||
Administration fees | 77,415 | 14,179 | 13,108 | |||||||||
Professional fees | 175,060 | 33,752 | 16,285 | |||||||||
Trustee fees | 87,489 | 32,171 | 31,659 | |||||||||
Custody fees | 214,837 | 44,528 | 11,012 | |||||||||
Reports to shareholders | 49,794 | 4,500 | 12,479 | |||||||||
Registration expense | 54,064 | 14,520 | 27,575 | |||||||||
Miscellaneous | 35,040 | — | — | |||||||||
Insurance expense | 9,923 | 588 | 2,105 | |||||||||
Dividend & interest expense | 63,252 | 23,356 | 1,459 | |||||||||
Chief Compliance Officer fees | 7,143 | 7,143 | 7,143 | |||||||||
Distribution fees for investor class (see Note 4) | 46,610 | — | — | |||||||||
|
|
|
|
|
| |||||||
Total expenses | 8,049,745 | 668,468 | 524,789 | |||||||||
Less: fees waived (see Note 3) | (1,250,650 | ) | (237,058 | ) | (113,255 | ) | ||||||
|
|
|
|
|
| |||||||
Net expenses | 6,799,095 | 431,410 | 411,534 | |||||||||
|
|
|
|
|
| |||||||
Net investment income | 16,422,826 | 2,329,061 | 2,055,915 | |||||||||
|
|
|
|
|
| |||||||
REALIZED AND UNREALIZED GAIN (LOSS) | ||||||||||||
Net realized gain (loss) on: | ||||||||||||
Investments, excluding purchased options | (9,989,981 | ) | (1,662,983 | ) | (1,459,179 | ) | ||||||
Purchased options | (207,909 | ) | (24,533 | ) | — | |||||||
Short sales | (1,684,353 | ) | — | — | ||||||||
Written options | (193,214 | ) | 966,968 | — | ||||||||
Forward foreign currency exchange contracts | (489,788 | ) | (3,259 | ) | — | |||||||
Foreign currency transactions | (28,666 | ) | (37 | ) | — | |||||||
Futures | (9,827,337 | ) | (8,389 | ) | — | |||||||
Swap contracts | 3,481,588 | (144,110 | ) | — | ||||||||
|
|
|
|
|
| |||||||
Net realized (loss) | (18,939,660 | ) | (876,343 | ) | (1,459,179 | ) | ||||||
|
|
|
|
|
| |||||||
Net change in unrealized appreciation/depreciation on: | ||||||||||||
Investments, excluding purchased options | 19,702,972 | 3,183,145 | 1,666,858 | |||||||||
Purchased options | 6,150 | (22,039 | ) | — | ||||||||
Unfunded loan commitment | (33,290 | ) | 2,402 | — | ||||||||
Short sales | 389,789 | — | — | |||||||||
Written options | (3,407 | ) | (34,316 | ) | — | |||||||
Forward foreign currency exchange contracts | (60,061 | ) | (4,186 | ) | — | |||||||
Foreign currency transactions | 8,941 | 661 | — | |||||||||
Futures | 3,240,588 | 4,664 | — | |||||||||
Swap contracts | (2,072,110 | ) | 69,410 | — | ||||||||
|
|
|
|
|
| |||||||
Net change in unrealized appreciation/depreciation | 21,179,572 | 3,199,741 | 1,666,858 | |||||||||
|
|
|
|
|
| |||||||
Net realized and unrealized gain (loss) on investments, purchased options, unfunded loan commitment, short sales, written options, forward foreign currency exchange contracts, foreign currency transactions, futures and swap contracts | 2,239,912 | 2,323,398 | 207,679 | |||||||||
|
|
|
|
|
| |||||||
Net increase in net assets resulting from operations | $ | 18,662,738 | $ | 4,652,459 | $ | 2,263,594 | ||||||
|
|
|
|
|
| |||||||
The accompanying notes are an integral part of these financial statements.
| Statements of Operations | 117 | |||||
Table of Contents
Litman Gregory Funds Trust
STATEMENTS OF OPERATIONS For the Six Months Ended June 30, 2023 – (Unaudited) (Continued)
| DBi Managed Futures Strategy ETF (Consolidated) | DBi Hedge Strategy ETF | RBA Responsible Global Allocation ETF | Berkshire Dividend Growth ETF** | |||||||||||||
INVESTMENT INCOME: |
| |||||||||||||||
Income |
| |||||||||||||||
Dividends | $ | — | $ | — | $ | 83,481 | $ | — | ||||||||
Interest | 10,646,922 | 393,373 | — | — | ||||||||||||
|
|
|
|
|
|
|
| |||||||||
Total income | 10,646,922 | 393,373 | 83,481 | — | ||||||||||||
|
|
|
|
|
|
|
| |||||||||
Expenses | ||||||||||||||||
Advisory fees | 3,347,621 | 100,050 | 23,194 | 11 | ||||||||||||
|
|
|
|
|
|
|
| |||||||||
Total expenses | 3,347,621 | 100,050 | 23,194 | 11 | ||||||||||||
|
|
|
|
|
|
|
| |||||||||
Net expenses | 3,347,621 | 100,050 | 23,194 | 11 | ||||||||||||
|
|
|
|
|
|
|
| |||||||||
Net investment income (loss) | 7,299,301 | 293,323 | 60,287 | (11 | ) | |||||||||||
|
|
|
|
|
|
|
| |||||||||
REALIZED AND UNREALIZED GAIN (LOSS) | ||||||||||||||||
Net realized gain (loss) on: | ||||||||||||||||
Investments | 171,764 | 1,215 | (26,979 | ) | — | |||||||||||
Futures | (71,294,523 | ) | 261,279 | — | — | |||||||||||
In-kind redemptions | — | — | 4,158 | — | ||||||||||||
|
|
|
|
|
|
|
| |||||||||
Net realized gain (loss) | (71,122,759 | ) | 262,494 | (22,821 | ) | — | ||||||||||
|
|
|
|
|
|
|
| |||||||||
Net change in unrealized appreciation/depreciation on: | ||||||||||||||||
Investments | (115,619 | ) | (6,092 | ) | 287,090 | 7,143 | ||||||||||
Futures | 10,504,475 | 453,738 | — | — | ||||||||||||
|
|
|
|
|
|
|
| |||||||||
Net change in unrealized appreciation/depreciation | 10,388,856 | 447,646 | 287,090 | 7,143 | ||||||||||||
|
|
|
|
|
|
|
| |||||||||
Net realized and unrealized gain (loss) on investments and futures | (60,733,903 | ) | 710,140 | 264,269 | 7,143 | |||||||||||
|
|
|
|
|
|
|
| |||||||||
Net increase (decrease) in net assets resulting from operations | $ | (53,434,602 | ) | $ | 1,003,463 | $ | 324,556 | $ | 7,132 | |||||||
|
|
|
|
|
|
|
| |||||||||
| ** | Commenced operations on June 29, 2023. |
The accompanying notes are an integral part of these financial statements.
| 118 | Litman Gregory Funds Trust | |||||
Table of Contents
Litman Gregory Funds Trust
STATEMENTS OF CHANGES IN NET ASSETS
| # | Unaudited. |
The accompanying notes are an integral part of these financial statements.
| Statements of Changes in Net Assets | 119 | |||||
Table of Contents
Litman Gregory Funds Trust
STATEMENTS OF CHANGES IN NET ASSETS – (Continued)
| # | Unaudited. |
The accompanying notes are an integral part of these financial statements.
| 120 | Litman Gregory Funds Trust | |||||
Table of Contents
Litman Gregory Funds Trust
STATEMENTS OF CHANGES IN NET ASSETS – (Continued)
| # | Unaudited. |
The accompanying notes are an integral part of these financial statements.
| Statements of Changes in Net Assets | 121 | |||||
Table of Contents
Litman Gregory Funds Trust
STATEMENTS OF CHANGES IN NET ASSETS – (Continued)
| # | Unaudited. |
| 1 | Investor Class shares were converted into Institutional Class shares at the close of business on September 30, 2022. |
The accompanying notes are an integral part of these financial statements.
| 122 | Litman Gregory Funds Trust | |||||
Table of Contents
Litman Gregory Funds Trust
STATEMENTS OF CHANGES IN NET ASSETS – (Continued)
| # | Unaudited. |
The accompanying notes are an integral part of these financial statements.
| Statements of Changes in Net Assets | 123 | |||||
Table of Contents
Litman Gregory Funds Trust
STATEMENTS OF CHANGES IN NET ASSETS – (Continued)
| # | Unaudited. |
| * | Commenced operations on January 31, 2022. |
| ** | Commenced operations on June 29, 2023. |
The accompanying notes are an integral part of these financial statements.
| 124 | Litman Gregory Funds Trust | |||||
Table of Contents
iMGP Global Select Fund – Institutional Class
FINANCIAL HIGHLIGHTS
For a capital share outstanding throughout each period
| Six Months Ended June 30, 2023# | Year Ended December 31, | |||||||||||||||||||||||
| 2022 | 2021 | 2020 | 2019 | 2018 | ||||||||||||||||||||
Net asset value, beginning of period | $ | 10.69 | $ | 18.80 | $ | 18.62 | $ | 17.54 | $ | 15.02 | $ | 19.10 | ||||||||||||
|
|
|
|
|
|
|
|
|
|
|
| |||||||||||||
Income from investment operations: | ||||||||||||||||||||||||
Net investment income (loss)1 | 0.04 | (0.01 | ) | (0.03 | ) | (0.05 | ) | 0.08 | 2 | (0.01 | ) | |||||||||||||
Net realized gain (loss) and net change in unrealized appreciation/depreciation on investments and foreign currency | 1.24 | (4.78 | ) | 3.27 | 3.45 | 4.03 | (1.90 | ) | ||||||||||||||||
|
|
|
|
|
|
|
|
|
|
|
| |||||||||||||
Total income (loss) from investment operations | 1.28 | (4.79 | ) | 3.24 | 3.40 | 4.11 | (1.91 | ) | ||||||||||||||||
|
|
|
|
|
|
|
|
|
|
|
| |||||||||||||
Less distributions: | ||||||||||||||||||||||||
From net investment income | — | — | — | — | (0.08 | ) | — | |||||||||||||||||
From net realized gains | — | (3.32 | ) | (3.06 | ) | (2.32 | ) | (1.51 | ) | (2.17 | ) | |||||||||||||
|
|
|
|
|
|
|
|
|
|
|
| |||||||||||||
Total distributions | — | (3.32 | ) | (3.06 | ) | (2.32 | ) | (1.59 | ) | (2.17 | ) | |||||||||||||
|
|
|
|
|
|
|
|
|
|
|
| |||||||||||||
Net asset value, end of period | $ | 11.97 | $ | 10.69 | $ | 18.80 | $ | 18.62 | $ | 17.54 | $ | 15.02 | ||||||||||||
|
|
|
|
|
|
|
|
|
|
|
| |||||||||||||
Total return | 11.97 | %+ | (25.52 | )% | 17.75 | % | 19.52 | % | 27.55 | % | (9.91 | )% | ||||||||||||
|
|
|
|
|
|
|
|
|
|
|
| |||||||||||||
Ratios/supplemental data: | ||||||||||||||||||||||||
Net assets, end of period (millions) | $ | 125.3 | $ | 119.7 | $ | 260.7 | $ | 254.9 | $ | 286.3 | $ | 259.8 | ||||||||||||
|
|
|
|
|
|
|
|
|
|
|
| |||||||||||||
Ratios of total expenses to average net assets: | ||||||||||||||||||||||||
Before fees waived | 1.58 | %*,6 | 1.50 | %4 | 1.29 | %5 | 1.35 | %5 | 1.35 | %4 | 1.29 | %3 | ||||||||||||
|
|
|
|
|
|
|
|
|
|
|
| |||||||||||||
After fees waived | 1.05 | %*,6,7 | 1.18 | %4,7 | 1.16 | %5,7 | 1.23 | %5,7 | 1.24 | %4,7 | 1.17 | %3,7 | ||||||||||||
|
|
|
|
|
|
|
|
|
|
|
| |||||||||||||
Ratio of net investment income (loss) to average net assets | 0.72 | %*,6 | (0.06 | )%4 | (0.13 | )%5 | (0.29 | )%5 | 0.44 | %2,4 | (0.08 | )%3 | ||||||||||||
|
|
|
|
|
|
|
|
|
|
|
| |||||||||||||
Portfolio turnover rate | 28.96 | %+ | 108.86 | % | 27.74 | % | 56.91 | % | 25.02 | %8 | 41.68 | %8 | ||||||||||||
|
|
|
|
|
|
|
|
|
|
|
| |||||||||||||
| # | Unaudited. |
| + | Not annualized. |
| * | Annualized. |
| 1 | Calculated based on the average shares outstanding methodology. |
| 2 | Include non-cash distributions amounting to $0.06 per share and 0.33% of average daily net assets. |
| 3 | Includes Interest & Dividend expense of 0.00% of average net assets. |
| 4 | Includes Interest & Dividend expense of 0.03% of average net assets. |
| 5 | Includes Interest & Dividend expense of 0.01% of average net assets. |
| 6 | Includes Interest & Dividend expense of 0.07% of average net assets. |
| 7 | Includes the impact of the voluntary waiver of less than 0.01% of average net assets. |
| 8 | Portfolio turnover is calculated on the basis of the Fund as a whole without distinguishing between classes of shares issued. |
The accompanying notes are an integral part of these financial statements.
| Financial Highlights | 125 | |||||
Table of Contents
iMGP International Fund – Institutional Class
FINANCIAL HIGHLIGHTS
For a capital share outstanding throughout each period
| Six Months Ended June 30, 2023# | Year Ended December 31, | |||||||||||||||||||||||
| 2022 | 2021 | 2020 | 2019 | 2018 | ||||||||||||||||||||
Net asset value, beginning of period | $ | 15.16 | $ | 19.50 | $ | 18.12 | $ | 17.65 | $ | 13.94 | $ | 17.73 | ||||||||||||
|
|
|
|
|
|
|
|
|
|
|
| |||||||||||||
Income from investment operations: | ||||||||||||||||||||||||
Net investment income1 | 0.18 | 0.11 | 0.71 | 4 | 0.07 | 0.27 | 3 | 0.30 | 2 | |||||||||||||||
Net realized gain (loss) and net change in unrealized appreciation/depreciation on investments and foreign currency | 2.22 | (4.32 | ) | 1.39 | 0.80 | 3.97 | (3.99 | ) | ||||||||||||||||
|
|
|
|
|
|
|
|
|
|
|
| |||||||||||||
Total income (loss) from investment operations | 2.40 | (4.21 | ) | 2.10 | 0.87 | 4.24 | (3.69 | ) | ||||||||||||||||
|
|
|
|
|
|
|
|
|
|
|
| |||||||||||||
Less distributions: | ||||||||||||||||||||||||
From net investment income | — | (0.13 | ) | (0.72 | ) | (0.40 | ) | (0.53 | ) | (0.10 | ) | |||||||||||||
From net realized gains | — | — | — | — | — | — | ||||||||||||||||||
|
|
|
|
|
|
|
|
|
|
|
| |||||||||||||
Total distributions | — | (0.13 | ) | (0.72 | ) | (0.40 | ) | (0.53 | ) | (0.10 | ) | |||||||||||||
|
|
|
|
|
|
|
|
|
|
|
| |||||||||||||
Net asset value, end of period | $ | 17.56 | $ | 15.16 | $ | 19.50 | $ | 18.12 | $ | 17.65 | $ | 13.94 | ||||||||||||
|
|
|
|
|
|
|
|
|
|
|
| |||||||||||||
Total return | 15.83 | %+ | (21.58 | )% | 11.75 | % | 5.02 | % | 30.45 | % | (20.80 | )% | ||||||||||||
|
|
|
|
|
|
|
|
|
|
|
| |||||||||||||
Ratios/supplemental data: | ||||||||||||||||||||||||
Net assets, end of period (millions) | $ | 230.8 | $ | 205.6 | $ | 339.7 | $ | 326.7 | $ | 401.5 | $ | 368.6 | ||||||||||||
|
|
|
|
|
|
|
|
|
|
|
| |||||||||||||
Ratios of total expenses to average net assets: | ||||||||||||||||||||||||
Before fees waived | 1.37 | %*,6 | 1.47 | %5 | 1.28 | %6 | 1.39 | %5 | 1.36 | %5 | 1.33 | %5 | ||||||||||||
|
|
|
|
|
|
|
|
|
|
|
| |||||||||||||
After fees waived | 1.15 | %*,6,7 | 1.24 | %5,7 | 1.05 | %6,7 | 1.15 | %5,7 | 1.12 | %5,7 | 1.09 | %5,7 | ||||||||||||
|
|
|
|
|
|
|
|
|
|
|
| |||||||||||||
Ratio of net investment income to average net assets | 2.17 | %*,6 | 0.68 | %5 | 3.63 | %4,6 | 0.49 | %5 | 1.65 | %3,5 | 1.74 | %2,5 | ||||||||||||
|
|
|
|
|
|
|
|
|
|
|
| |||||||||||||
Portfolio turnover rate | 21.61 | %+ | 42.74 | % | 99.91 | % | 59.61 | % | 45.48 | %8 | 35.15 | %8 | ||||||||||||
|
|
|
|
|
|
|
|
|
|
|
| |||||||||||||
| # | Unaudited. |
| + | Not annualized. |
| * | Annualized. |
| 1 | Calculated based on the average shares outstanding methodology. |
| 2 | Include non-cash distributions amounting to $0.05 per share and 0.29% of average daily net assets. |
| 3 | Include non-cash distributions amounting to $0.10 per share and 0.60% of average daily net assets. |
| 4 | Include non-cash distributions amounting to $0.68 per share and 3.46% of average daily net assets. |
| 5 | Includes Interest & Dividend expense of 0.01% of average net assets. |
| 6 | Includes Interest & Dividend expense of 0.00% of average net assets. |
| 7 | Includes the impact of the voluntary waiver of less than 0.01% of average net assets. |
| 8 | Portfolio turnover is calculated on the basis of the Fund as a whole without distinguishing between classes of shares issued. |
The accompanying notes are an integral part of these financial statements.
| 126 | Litman Gregory Funds Trust | |||||
Table of Contents
iMGP Oldfield International Value Fund – Institutional Class
FINANCIAL HIGHLIGHTS
For a capital share outstanding throughout each period
| Six Months Ended June 30, 2023# | Year Ended December 31, | Period Ended 2020** | ||||||||||||||
| 2022 | 2021 | |||||||||||||||
Net asset value, beginning of period | $ | 9.77 | $ | 11.66 | $ | 10.60 | $ | 10.00 | ||||||||
|
|
|
| |||||||||||||
Income from investment operations: |
| |||||||||||||||
Net investment income (loss)1 | 0.18 | 0.17 | 0.26 | 2 | (0.01 | ) | ||||||||||
Net realized gain (loss) and net change in unrealized appreciation/depreciation on investments and foreign currency | 0.87 | (1.90 | ) | 1.13 | 0.61 | |||||||||||
|
|
|
| |||||||||||||
Total income (loss) from investment operations | 1.05 | (1.73 | ) | 1.39 | 0.60 | |||||||||||
|
|
|
| |||||||||||||
Less distributions: |
| |||||||||||||||
From net investment income | — | (0.11 | ) | (0.22 | ) | — | ||||||||||
From net realized gains | — | (0.02 | ) | (0.11 | ) | — | ||||||||||
Return of capital | — | (0.03 | ) | — | — | |||||||||||
|
|
|
| |||||||||||||
Total distributions | — | (0.16 | ) | (0.33 | ) | — | ||||||||||
|
|
|
| |||||||||||||
Net asset value, end of period | $ | 10.82 | $ | 9.77 | $ | 11.66 | $ | 10.60 | ||||||||
|
|
|
| |||||||||||||
Total return | 10.75 | %+ | (14.89 | )% | 13.21 | % | 6.00 | %+ | ||||||||
|
|
|
| |||||||||||||
Ratios/supplemental data: |
| |||||||||||||||
Net assets, end of period (millions) | $ | 37.4 | $ | 33.0 | $ | 25.9 | $ | 11.2 | ||||||||
|
|
|
| |||||||||||||
Ratios of total expenses to average net assets: | ||||||||||||||||
Before fees waived | 1.49 | %*,3 | 2.11 | %3 | 1.52 | %3 | 5.38 | %* | ||||||||
|
|
|
| |||||||||||||
After fees waived | 0.94 | %*,3 | 0.94 | %3 | 0.94 | %3,4 | 0.94 | %* | ||||||||
|
|
|
| |||||||||||||
Ratio of net investment income (loss) to average net assets | 3.44 | %*,3 | 1.64 | %3 | 2.15 | %2,3 | (0.94 | )%* | ||||||||
|
|
|
| |||||||||||||
Portfolio turnover rate | 8.42 | %+ | 34.50 | % | 16.31 | % | 2.51 | %+ | ||||||||
|
|
|
| |||||||||||||
| # | Unaudited. |
| + | Not annualized. |
| * | Annualized. |
| ** | Commenced operations on November 30, 2020. |
| 1 | Calculated based on the average shares outstanding methodology. |
| 2 | Include non-cash distributions amounting to $0.02 per share and 0.20% of average daily net assets. |
| 3 | Includes Interest & Dividend expense of 0.00% of average net assets. |
| 4 | Includes the impact of the voluntary waiver of less than 0.01% of average net assets. |
The accompanying notes are an integral part of these financial statements.
| Financial Highlights | 127 | |||||
Table of Contents
iMGP SBH Focused Small Value Fund – Institutional Class
FINANCIAL HIGHLIGHTS
For a capital share outstanding throughout each period
Six Months June 30, 2023# | Year Ended December 31, | Period Ended 2020** | ||||||||||||||
| 2022 | 2021 | |||||||||||||||
Net asset value, beginning of period | $ | 12.87 | $ | 14.86 | $ | 12.71 | $ | 10.00 | ||||||||
|
|
|
| |||||||||||||
Income from investment operations: |
| |||||||||||||||
Net investment income (loss)1 | 0.07 | 0.01 | (0.01 | ) | 0.01 | |||||||||||
Net realized gain (loss) and net change in unrealized appreciation/depreciation on investments | 1.32 | (2.00 | ) | 2.50 | 2.70 | |||||||||||
|
|
|
| |||||||||||||
Total income (loss) from investment operations | 1.39 | (1.99 | ) | 2.49 | 2.71 | |||||||||||
|
|
|
| |||||||||||||
Less distributions: |
| |||||||||||||||
From net investment income | — | — | — | — | ||||||||||||
From net realized gains | — | — | (0.34 | ) | — | |||||||||||
|
|
|
| |||||||||||||
Total distributions | — | — | (0.34 | ) | — | |||||||||||
|
|
|
| |||||||||||||
Net asset value, end of period | $ | 14.26 | $ | 12.87 | $ | 14.86 | $ | 12.71 | ||||||||
|
|
|
| |||||||||||||
Total return | 10.80 | %+ | (13.39 | )% | 19.66 | % | 27.10 | %+ | ||||||||
|
|
|
| |||||||||||||
Ratios/supplemental data: |
| |||||||||||||||
Net assets, end of period (millions) | $ | 51.5 | $ | 48.7 | $ | 65.6 | $ | 36.8 | ||||||||
|
|
|
| |||||||||||||
Ratios of total expenses to average net assets: | ||||||||||||||||
Before fees waived | 1.57 | %*,2 | 1.68 | %2 | 1.48 | %2 | 2.11 | %* | ||||||||
|
|
|
| |||||||||||||
After fees waived | 1.15 | %*,2 | 1.15 | %2 | 1.15 | %2,3 | 1.15 | %* | ||||||||
|
|
|
| |||||||||||||
Ratio of net investment income (loss) to average net assets | 1.08 | %*,2 | 0.11 | %2 | (0.04 | )%2 | 0.23 | %* | ||||||||
|
|
|
| |||||||||||||
Portfolio turnover rate | 23.22 | %+ | 35.50 | % | 45.15 | % | 27.18 | %+ | ||||||||
|
|
|
| |||||||||||||
| # | Unaudited. |
| + | Not annualized. |
| * | Annualized. |
| ** | Commenced operations on July 31, 2020. |
| 1 | Calculated based on the average shares outstanding methodology. |
| 2 | Includes Interest & Dividend expense of 0.00% of average net assets. |
| 3 | Includes the impact of the voluntary waiver of less than 0.01% of average net assets. |
The accompanying notes are an integral part of these financial statements.
| 128 | Litman Gregory Funds Trust | |||||
Table of Contents
iMGP Alternative Strategies Fund – Institutional Class
FINANCIAL HIGHLIGHTS
For a capital share outstanding throughout each period
(Consolidated) June 30, 2023# | Year Ended December 31, | |||||||||||||||||||||||
| (Consolidated) 2022 | 2021 | 2020 | 2019 | 2018 | ||||||||||||||||||||
Net asset value, beginning of period | $ | 10.25 | $ | 11.76 | $ | 12.03 | $ | 11.70 | $ | 11.08 | $ | 11.69 | ||||||||||||
|
|
|
|
|
|
|
|
|
|
|
| |||||||||||||
Income from investment operations: | ||||||||||||||||||||||||
Net investment income1 | 0.18 | 0.32 | 0.29 | 3 | 0.30 | 0.31 | 2 | 0.26 | ||||||||||||||||
Net realized gain (loss) and net change in unrealized appreciation/depreciation on investments, foreign currency, short sales, options, futures and swap contracts | 0.02 | (1.42 | ) | 0.16 | 0.41 | 0.64 | (0.51 | ) | ||||||||||||||||
|
|
|
|
|
|
|
|
|
|
|
| |||||||||||||
Total income (loss) from investment operations | 0.20 | (1.10 | ) | 0.45 | 0.71 | 0.95 | (0.25 | ) | ||||||||||||||||
|
|
|
|
|
|
|
|
|
|
|
| |||||||||||||
Less distributions: | ||||||||||||||||||||||||
From net investment income | (0.20 | ) | (0.41 | ) | (0.38 | ) | (0.38 | ) | (0.33 | ) | (0.36 | ) | ||||||||||||
From net realized gains | — | — | (0.34 | ) | — | — | — | |||||||||||||||||
|
|
|
|
|
|
|
|
|
|
|
| |||||||||||||
Total distributions | (0.20 | ) | (0.41 | ) | (0.72 | ) | (0.38 | ) | (0.33 | ) | (0.36 | ) | ||||||||||||
|
|
|
|
|
|
|
|
|
|
|
| |||||||||||||
Net asset value, end of period | $ | 10.25 | $ | 10.25 | $ | 11.76 | $ | 12.03 | $ | 11.70 | $ | 11.08 | ||||||||||||
|
|
|
|
|
|
|
|
|
|
|
| |||||||||||||
Total return | 2.02 | %+ | (9.49 | )%4 | 3.82 | % | 6.30 | % | 8.52 | % | (2.08 | )% | ||||||||||||
|
|
|
|
|
|
|
|
|
|
|
| |||||||||||||
Ratios/supplemental data: | ||||||||||||||||||||||||
Net assets, end of period (millions) | $ | 876.6 | $ | 973.2 | $ | 1,512.5 | $ | 1,417.1 | $ | 1,724.2 | $ | 1,663.7 | ||||||||||||
|
|
|
|
|
|
|
|
|
|
|
| |||||||||||||
Ratios of total expenses to average net assets: | ||||||||||||||||||||||||
Before fees waived | 1.68 | %*,9 | 1.67 | %8 | 1.72 | %7 | 1.75 | %7 | 1.63 | %6 | 1.63 | %5 | ||||||||||||
|
|
|
|
|
|
|
|
|
|
|
| |||||||||||||
After fees waived | 1.42 | %*,9,10 | 1.39 | %8,10 | 1.44 | %7,10 | 1.47 | %7,10 | 1.51 | %6,10 | 1.53 | %5,10 | ||||||||||||
|
|
|
|
|
|
|
|
|
|
|
| |||||||||||||
Ratio of net investment income to average net assets | 3.46 | %*,9 | 2.89 | %8 | 2.36 | %3,7 | 2.60 | %7 | 2.70 | %2,6 | 2.26 | %5 | ||||||||||||
|
|
|
|
|
|
|
|
|
|
|
| |||||||||||||
Portfolio turnover rate11 | 56.90 | %+ | 89.62 | % | 137.56 | % | 193.98 | % | 190.21 | % | 197.04 | % | ||||||||||||
|
|
|
|
|
|
|
|
|
|
|
| |||||||||||||
| # | Unaudited. |
| + | Not annualized. |
| * | Annualized. |
| 1 | Calculated based on the average shares outstanding methodology. |
| 2 | Include non-cash distributions amounting to $0.02 per share and 0.20% of average daily net assets. |
| 3 | Include non-cash distributions amounting to $0.00 per share and 0.00% of average daily net assets. |
| 4 | The total return does not include the impact of financial statement rounding of the net asset value (NAV) per share and/or financial statement adjustments. |
| 5 | Includes Interest & Dividend expense of 0.07% of average net assets. |
| 6 | Includes Interest & Dividend expense of 0.05% of average net assets. |
| 7 | Includes Interest & Dividend expense of 0.14% of average net assets. |
| 8 | Includes Interest & Dividend expense of 0.03% of average net assets. |
| 9 | Includes Interest & Dividend expense of 0.01% of average net assets. |
| 10 | Includes the impact of the voluntary waiver of less than 0.01% of average net assets. |
| 11 | Portfolio turnover is calculated on the basis of the Fund as a whole without distinguishing between classes of shares issued. |
The accompanying notes are an integral part of these financial statements.
| Financial Highlights | 129 | |||||
Table of Contents
iMGP Alternative Strategies Fund – Investor Class
FINANCIAL HIGHLIGHTS
For a capital share outstanding throughout each period
(Consolidated) June 30, 2023# | Year Ended December 31, | |||||||||||||||||||||||
| (Consolidated) 2022 | 2021 | 2020 | 2019 | 2018 | ||||||||||||||||||||
Net asset value, beginning of period | $ | 10.28 | $ | 11.79 | $ | 12.06 | $ | 11.71 | $ | 11.10 | $ | 11.70 | ||||||||||||
|
|
|
|
|
|
|
|
|
|
|
| |||||||||||||
Income from investment operations: | ||||||||||||||||||||||||
Net investment income1 | 0.16 | 0.29 | 0.26 | 3 | 0.27 | 0.28 | 2 | 0.23 | ||||||||||||||||
Net realized gain (loss) and net change in unrealized | 0.02 | (1.42 | ) | 0.16 | 0.42 | 0.63 | (0.50 | ) | ||||||||||||||||
|
|
|
|
|
|
|
|
|
|
|
| |||||||||||||
Total income (loss) from investment operations | 0.18 | (1.13 | ) | 0.42 | 0.69 | 0.91 | (0.27 | ) | ||||||||||||||||
|
|
|
|
|
|
|
|
|
|
|
| |||||||||||||
Less distributions: | ||||||||||||||||||||||||
From net investment income | (0.18 | ) | (0.38 | ) | (0.35 | ) | (0.34 | ) | (0.30 | ) | (0.33 | ) | ||||||||||||
From net realized gains | — | — | (0.34 | ) | — | — | — | |||||||||||||||||
|
|
|
|
|
|
|
|
|
|
|
| |||||||||||||
Total distributions | (0.18 | ) | (0.38 | ) | (0.69 | ) | (0.34 | ) | (0.30 | ) | (0.33 | ) | ||||||||||||
|
|
|
|
|
|
|
|
|
|
|
| |||||||||||||
Net asset value, end of period | $ | 10.28 | $ | 10.28 | $ | 11.79 | $ | 12.06 | $ | 11.71 | $ | 11.10 | ||||||||||||
|
|
|
|
|
|
|
|
|
|
|
| |||||||||||||
Total return | 1.88 | %+ | (9.65 | )% | 3.54 | % | 6.06 | % | 8.22 | % | (2.32 | )% | ||||||||||||
|
|
|
|
|
|
|
|
|
|
|
| |||||||||||||
Ratios/supplemental data: | ||||||||||||||||||||||||
Net assets, end of period (millions) | $ | 34.1 | $ | 45.4 | $ | 75.6 | $ | 74.2 | $ | 144.1 | $ | 175.3 | ||||||||||||
|
|
|
|
|
|
|
|
|
|
|
| |||||||||||||
Ratios of total expenses to average net assets: | ||||||||||||||||||||||||
Before fees waived | 1.93 | %*,8 | 1.92 | %7 | 1.97 | %6 | 1.99 | %6 | 1.88 | %5 | 1.88 | %4 | ||||||||||||
|
|
|
|
|
|
|
|
|
|
|
| |||||||||||||
After fees waived | 1.67 | %*,8,9 | 1.64 | %7,9 | 1.69 | %6,9 | 1.71 | %6,9 | 1.76 | %5,9 | 1.78 | %4,9 | ||||||||||||
|
|
|
|
|
|
|
|
|
|
|
| |||||||||||||
Ratio of net investment income to average net assets | 3.18 | %*,8 | 2.64 | %7 | 2.11 | %3,6 | 2.36 | %6 | 2.44 | %2,5 | 2.01 | %4 | ||||||||||||
|
|
|
|
|
|
|
|
|
|
|
| |||||||||||||
Portfolio turnover rate10 | 56.90 | %+ | 89.62 | % | 137.56 | % | 193.98 | % | 190.21 | % | 197.04 | % | ||||||||||||
|
|
|
|
|
|
|
|
|
|
|
| |||||||||||||
| # | Unaudited. |
| + | Not annualized. |
| * | Annualized. |
| 1 | Calculated based on the average shares outstanding methodology. |
| 2 | Include non-cash distributions amounting to $0.02 per share and 0.20% of average daily net assets. |
| 3 | Include non-cash distributions amounting to $0.00 per share and 0.00% of average daily net assets. |
| 4 | Includes Interest & Dividend expense of 0.07% of average net assets. |
| 5 | Includes Interest & Dividend expense of 0.05% of average net assets. |
| 6 | Includes Interest & Dividend expense of 0.14% of average net assets. |
| 7 | Includes Interest & Dividend expense of 0.03% of average net assets. |
| 8 | Includes Interest & Dividend expense of 0.01% of average net assets. |
| 9 | Includes the impact of the voluntary waiver of less than 0.01% of average net assets. |
| 10 | Portfolio turnover is calculated on the basis of the Fund as a whole without distinguishing between classes of shares issued. |
The accompanying notes are an integral part of these financial statements.
| 130 | Litman Gregory Funds Trust | |||||
Table of Contents
iMGP High Income Fund – Institutional Class
FINANCIAL HIGHLIGHTS
For a capital share outstanding throughout each period
| Six Months Ended June 30, 2023# | Year Ended December 31, | Period Ended December 31, 2018** | ||||||||||||||||||||||
| 2022 | 2021 | 2020 | 2019 | |||||||||||||||||||||
Net asset value, beginning of period | $ | 9.16 | $ | 10.27 | $ | 10.21 | $ | 10.06 | $ | 9.63 | $ | 10.00 | ||||||||||||
|
|
|
|
|
|
|
|
|
|
|
| |||||||||||||
Income from investment operations: | ||||||||||||||||||||||||
Net investment income1 | 0.26 | 0.38 | 0.32 | 2 | 0.37 | 0.36 | 0.07 | |||||||||||||||||
Net realized gain (loss) and net change in unrealized appreciation/depreciation on investments, foreign currency, options, futures and swap contracts | 0.23 | (1.08 | ) | 0.33 | 0.16 | 0.44 | (0.38 | ) | ||||||||||||||||
|
|
|
|
|
|
|
|
|
|
|
| |||||||||||||
Total income (loss) from investment operations | 0.49 | (0.70 | ) | 0.65 | 0.53 | 0.80 | (0.31 | ) | ||||||||||||||||
|
|
|
|
|
|
|
|
|
|
|
| |||||||||||||
Less distributions: | ||||||||||||||||||||||||
From net investment income | (0.26 | ) | (0.38 | ) | (0.34 | ) | (0.37 | ) | (0.33 | ) | (0.06 | ) | ||||||||||||
From net realized gains | — | (0.03 | ) | (0.25 | ) | (0.01 | ) | (0.04 | ) | — | ||||||||||||||
|
|
|
|
|
|
|
|
|
|
|
| |||||||||||||
Total distributions | (0.26 | ) | (0.41 | ) | (0.59 | ) | (0.38 | ) | (0.37 | ) | (0.06 | ) | ||||||||||||
|
|
|
|
|
|
|
|
|
|
|
| |||||||||||||
Net asset value, end of period | $ | 9.39 | $ | 9.16 | $ | 10.27 | $ | 10.21 | $ | 10.06 | $ | 9.63 | ||||||||||||
|
|
|
|
|
|
|
|
|
|
|
| |||||||||||||
Total return | 5.37 | %+ | (6.85 | )% | 6.42 | % | 5.62 | % | 8.37 | % | (3.08 | )%+ | ||||||||||||
|
|
|
|
|
|
|
|
|
|
|
| |||||||||||||
Ratios/supplemental data: | ||||||||||||||||||||||||
Net assets, end of period (millions) | $ | 82.0 | $ | 99.8 | $ | 106.7 | $ | 87.9 | $ | 93.8 | $ | 77.2 | ||||||||||||
|
|
|
|
|
|
|
|
|
|
|
| |||||||||||||
Ratios of total expenses to average net assets: | ||||||||||||||||||||||||
Before fees waived | 1.60 | %*,6 | 1.41 | %5 | 1.44 | %5 | 1.72 | %4 | 1.39 | %3 | 1.34 | %* | ||||||||||||
|
|
|
|
|
|
|
|
|
|
|
| |||||||||||||
After fees waived | 1.03 | %*,6 | 0.99 | %5,7 | 0.98 | %5,7 | 1.00 | %4,7 | 0.98 | %3,7 | 0.98 | %*,7 | ||||||||||||
|
|
|
|
|
|
|
|
|
|
|
| |||||||||||||
Ratio of net investment income to average net assets | 5.57 | %*,6 | 3.93 | %5 | 3.11 | %2,5 | 3.83 | %4 | 3.56 | %3 | 2.89 | %* | ||||||||||||
|
|
|
|
|
|
|
|
|
|
|
| |||||||||||||
Portfolio turnover rate | 8.79 | %+ | 49.41 | % | 72.02 | % | 87.63 | % | 90.51 | %8 | 125.92 | %+,8 | ||||||||||||
|
|
|
|
|
|
|
|
|
|
|
| |||||||||||||
| # | Unaudited. |
| + | Not annualized. |
| * | Annualized. |
| ** | Commenced operations on September 28, 2018. |
| 1 | Calculated based on the average shares outstanding methodology. |
| 2 | Include non-cash distributions amounting to $0.00 per share and 0.01% of average daily net assets. |
| 3 | Includes Interest & Dividend expense of 0.00% of average net assets. |
| 4 | Includes Interest & Dividend expense of 0.02% of average net assets. |
| 5 | Includes Interest & Dividend expense of 0.01% of average net assets. |
| 6 | Includes Interest & Dividend expense of 0.06% of average net assets. |
| 7 | Includes the impact of the voluntary waiver of less than 0.01% of average net assets. |
| 8 | Portfolio turnover is calculated on the basis of the Fund as a whole without distinguishing between classes of shares issued. |
The accompanying notes are an integral part of these financial statements.
| Financial Highlights | 131 | |||||
Table of Contents
iMGP Dolan McEniry Corporate Bond Fund – Institutional Class
FINANCIAL HIGHLIGHTS
For a capital share outstanding throughout each period
Six Months June 30, 2023# | Year Ended December 31, | Period Ended December 31, 2018** | ||||||||||||||||||||||
| 2022 | 2021 | 2020 | 2019 | |||||||||||||||||||||
Net asset value, beginning of period | $ | 9.54 | $ | 10.62 | $ | 10.92 | $ | 10.61 | $ | 9.83 | $ | 10.00 | ||||||||||||
|
|
|
|
|
|
|
|
|
|
|
| |||||||||||||
Income from investment operations: | ||||||||||||||||||||||||
Net investment income1 | 0.17 | 0.20 | 0.14 | 0.22 | 0.30 | 0.09 | ||||||||||||||||||
Net realized gain (loss) and net change in unrealized appreciation/depreciation on investments | 0.03 | (1.05 | ) | (0.23 | ) | 0.36 | 0.79 | (0.17 | ) | |||||||||||||||
|
|
|
|
|
|
|
|
|
|
|
| |||||||||||||
Total income (loss) from investment operations | 0.20 | (0.85 | ) | (0.09 | ) | 0.58 | 1.09 | (0.08 | ) | |||||||||||||||
|
|
|
|
|
|
|
|
|
|
|
| |||||||||||||
Less distributions: | ||||||||||||||||||||||||
From net investment income | (0.17 | ) | (0.22 | ) | (0.15 | ) | (0.24 | ) | (0.30 | ) | (0.09 | ) | ||||||||||||
From net realized gains | — | (0.01 | ) | (0.06 | ) | (0.03 | ) | (0.01 | ) | — | ||||||||||||||
|
|
|
|
|
|
|
|
|
|
|
| |||||||||||||
Total distributions | (0.17 | ) | (0.23 | ) | (0.21 | ) | (0.27 | ) | (0.31 | ) | (0.09 | ) | ||||||||||||
|
|
|
|
|
|
|
|
|
|
|
| |||||||||||||
Net asset value, end of period | $ | 9.57 | $ | 9.54 | $ | 10.62 | $ | 10.92 | $ | 10.61 | $ | 9.83 | ||||||||||||
|
|
|
|
|
|
|
|
|
|
|
| |||||||||||||
Total return | 2.07 | %+ | (8.08 | )% | (0.86 | )% | 5.50 | % | 11.25 | % | (0.77 | )%+ | ||||||||||||
|
|
|
|
|
|
|
|
|
|
|
| |||||||||||||
Ratios/supplemental data: | ||||||||||||||||||||||||
Net assets, end of period (thousands) | $ | 157,218 | $ | 95,178 | $ | 90,827 | $ | 57,666 | $ | 13,066 | $ | 2,099 | ||||||||||||
|
|
|
|
|
|
|
|
|
|
|
| |||||||||||||
Ratios of total expenses to average net assets: | ||||||||||||||||||||||||
Before fees waived | 0.89 | %*,3 | 1.02 | % | 0.96 | %2 | 1.34 | % | 4.36 | % | 13.94 | %* | ||||||||||||
|
|
|
|
|
|
|
|
|
|
|
| |||||||||||||
After fees waived | 0.70 | %*,3 | 0.70 | % | 0.70 | %2 | 0.70 | % | 0.70 | % | 0.70 | %* | ||||||||||||
|
|
|
|
|
|
|
|
|
|
|
| |||||||||||||
Ratio of net investment income to average net assets | 3.50 | %*,3 | 2.01 | % | 1.28 | %2 | 2.07 | % | 2.83 | % | 3.70 | %* | ||||||||||||
|
|
|
|
|
|
|
|
|
|
|
| |||||||||||||
Portfolio turnover rate4 | 20.73 | %+ | 26.08 | % | 32.65 | % | 40.00 | % | 16.00 | % | 0.00 | %+ | ||||||||||||
|
|
|
|
|
|
|
|
|
|
|
| |||||||||||||
| # | Unaudited. |
| + | Not annualized. |
| * | Annualized. |
| ** | Commencement of operations for Institutional Shares was September 28, 2018. |
| 1 | Calculated based on the average shares outstanding methodology. |
| 2 | Includes Interest & Dividend expense of 0.02% of average net assets. |
| 3 | Includes Interest & Dividend expense of 0.00% of average net assets. |
| 4 | Portfolio turnover is calculated on the basis of the Fund as a whole without distinguishing between classes of shares issued. |
The accompanying notes are an integral part of these financial statements.
| 132 | Litman Gregory Funds Trust | |||||
Table of Contents
iMGP DBi Managed Futures Strategy ETF
CONSOLIDATED FINANCIAL HIGHLIGHTS
For a capital share outstanding throughout each period
Six Monthes June 30, 2023# | Year Ended December 31, | Period Ended December 31, 2019** | ||||||||||||||||||
| 2022 | 2021 | 2020 | ||||||||||||||||||
Net asset value, beginning of period | $ | 29.05 | $ | 25.42 | $ | 25.58 | $ | 25.34 | $ | 25.00 | ||||||||||
|
|
|
|
|
| |||||||||||||||
Income from investment operations: |
| |||||||||||||||||||
Net investment income (loss)1 | 0.25 | (0.23 | ) | (0.26 | ) | (0.14 | ) | 0.15 | ||||||||||||
Net realized gain (loss) and net change in unrealized appreciation/depreciation on investments and futures contracts | (1.65 | ) | 6.11 | 2 | 2.78 | 0.60 | 2.55 | |||||||||||||
|
|
|
|
|
| |||||||||||||||
Total income (loss) from investment operations | (1.40 | ) | 5.88 | 2.52 | 0.46 | 2.70 | ||||||||||||||
|
|
|
|
|
| |||||||||||||||
Less distributions: |
| |||||||||||||||||||
From net investment income | — | (1.06 | ) | (0.35 | ) | (0.02 | ) | (0.11 | ) | |||||||||||
From net realized gains | — | (1.18 | ) | (1.18 | ) | (0.20 | ) | (2.25 | ) | |||||||||||
Return of capital | — | (0.01 | ) | (1.15 | ) | — | — | |||||||||||||
|
|
|
|
|
| |||||||||||||||
Total distributions | — | (2.25 | ) | (2.68 | ) | (0.22 | ) | (2.36 | ) | |||||||||||
|
|
|
|
|
| |||||||||||||||
Net asset value, end of period | $ | 27.65 | $ | 29.05 | $ | 25.42 | $ | 25.58 | $ | 25.34 | ||||||||||
|
|
|
|
|
| |||||||||||||||
Market price, end of period | $ | 27.63 | $ | 29.11 | $ | 25.80 | $ | 25.56 | $ | 25.33 | ||||||||||
|
|
|
| |||||||||||||||||
Net asset value total return | (4.83 | )%+ | 23.07 | % | 9.80 | % | 1.84 | % | 10.76 | %+ | ||||||||||
|
|
|
|
|
| |||||||||||||||
Market price total return | (5.08 | )%+ | 21.53 | % | 11.38 | % | 1.79 | % | — | % | ||||||||||
|
|
|
|
|
| |||||||||||||||
Ratios/supplemental data: |
| |||||||||||||||||||
Net assets, end of period (thousands) | $ | 707,774 | $ | 951,319 | $ | 60,379 | $ | 36,454 | $ | 18,369 | ||||||||||
|
|
|
|
|
| |||||||||||||||
Ratios of total expenses to average net assets: | ||||||||||||||||||||
Before fees waived | 0.85 | %* | 0.85 | % | 0.95 | %3 | 0.85 | % | 0.85 | %* | ||||||||||
|
|
|
|
|
| |||||||||||||||
After fees waived | 0.85 | %* | 0.85 | % | 0.95 | %3 | 0.85 | % | 0.85 | %* | ||||||||||
|
|
|
|
|
| |||||||||||||||
Ratio of net investment income (loss) to average net assets | 1.85 | %* | (0.73 | )% | (0.93 | )%3 | (0.55 | )% | 0.84 | %* | ||||||||||
|
|
|
|
|
| |||||||||||||||
Portfolio turnover rate | 0.00 | %+ | 0.00 | % | 0.00 | % | 0.00 | % | 0.00 | %+ | ||||||||||
|
|
|
|
|
| |||||||||||||||
| # | Unaudited. |
| + | Not annualized. |
| * | Annualized. |
| ** | Commencement of operations was May 7, 2019. |
| 1 | Calculated based on the average shares outstanding methodology. |
| 2 | The amount shown for a share outstanding does not correspond with the aggregate net realized and unrealized gain (loss) on investments due to the timing of purchases and redemptions of the Fundshares in relation to fluctuating market values of the investments of the Fund. |
| 3 | Includes broker interest expense of 0.10% of average net assets. |
The accompanying notes are an integral part of these financial statements.
| Consolidated Financial Highlights | 133 | |||||
Table of Contents
FINANCIAL HIGHLIGHTS
For a capital share outstanding throughout each period
Six Months June 30, 2023# | Year Ended December 31, | Period Ended December 31, 2019** | ||||||||||||||||||
| 2022 | 2021 | 2020 | ||||||||||||||||||
Net asset value, beginning of period | $ | 25.42 | $ | 27.62 | $ | 30.87 | $ | 25.00 | $ | 25.00 | ||||||||||
|
|
|
|
|
| |||||||||||||||
Income from investment operations: |
| |||||||||||||||||||
Net investment income (loss)1 | 0.32 | (0.21 | ) | (0.27 | ) | (0.12 | ) | 0.00 | ^ | |||||||||||
Net realized gain (loss) and net change in unrealized appreciation/depreciation on investments and futures contracts | 0.95 | (1.60 | ) | 1.83 | 6.01 | 0.00 | ^ | |||||||||||||
|
|
|
|
|
| |||||||||||||||
Total income (loss) from investment operations | 1.27 | (1.81 | ) | 1.56 | 5.89 | 0.00 | ||||||||||||||
|
|
|
|
|
| |||||||||||||||
Less distributions: |
| |||||||||||||||||||
From net investment income | — | (0.39 | ) | — | (0.02 | ) | (0.00 | )^ | ||||||||||||
From net realized gains | — | — | (4.81 | ) | — | — | ||||||||||||||
|
|
|
|
|
| |||||||||||||||
Total distributions | — | (0.39 | ) | (4.81 | ) | (0.02 | ) | (0.00 | ) | |||||||||||
|
|
|
|
|
| |||||||||||||||
Net asset value, end of period | $ | 26.69 | $ | 25.42 | $ | 27.62 | $ | 30.87 | $ | 25.00 | ||||||||||
|
|
|
|
|
| |||||||||||||||
Market price, end of period | $ | 26.68 | $ | 25.55 | $ | 27.61 | $ | 30.86 | $ | 25.03 | ||||||||||
|
|
|
|
|
| |||||||||||||||
Net asset value total return | 4.97 | %+ | (6.51 | )% | 5.05 | % | 23.58 | % | 0.01 | %+ | ||||||||||
|
|
|
|
|
| |||||||||||||||
Market price total return | 4.42 | %+ | (6.04 | )% | 4.92 | % | 23.42 | % | — | % | ||||||||||
|
|
|
|
|
| |||||||||||||||
Ratios/supplemental data: |
| |||||||||||||||||||
Net assets, end of period (thousands) | $ | 28,024 | $ | 14,618 | $ | 17,261 | $ | 18,520 | $ | 16,250 | ||||||||||
|
|
|
|
|
| |||||||||||||||
Ratios of total expenses to average net assets: | ||||||||||||||||||||
Before fees waived | 0.85 | %* | 0.85 | % | 0.85 | % | 0.85 | % | 0.85 | %* | ||||||||||
|
|
|
|
|
| |||||||||||||||
After fees waived | 0.85 | %* | 0.85 | % | 0.85 | % | 0.85 | % | 0.85 | %* | ||||||||||
|
|
|
|
|
| |||||||||||||||
Ratio of net investment income (loss) to average net assets | 2.49 | %* | (0.78 | )% | (0.83 | )% | (0.47 | )% | 0.48 | %* | ||||||||||
|
|
|
|
|
| |||||||||||||||
Portfolio turnover rate | 0.00 | %+ | 0.00 | % | 0.00 | % | 0.00 | % | 0.00 | %+ | ||||||||||
|
|
|
|
|
| |||||||||||||||
| # | Unaudited. |
| + | Not annualized. |
| * | Annualized. |
| ** | Commencement of operations was December 17, 2019. |
| ^ | Amount represents less than $0.01 per share. |
| 1 | Calculated based on the average shares outstanding methodology. |
The accompanying notes are an integral part of these financial statements.
| 134 | Litman Gregory Funds Trust | |||||
Table of Contents
iMGP RBA Responsible Global Allocation ETF
FINANCIAL HIGHLIGHTS
For a capital share outstanding throughout each period
| Six Months Ended June 30, 2023# | Period Ended December 31, 2022** | |||||||
Net asset value, beginning of period | $ | 8.89 | $ | 10.12 | ||||
|
|
|
| |||||
Income from investment operations: |
| |||||||
Net investment income1 | 0.06 | 0.18 | ||||||
Net realized gain (loss) and net change in unrealized appreciation/depreciation on investments | 0.29 | (1.28 | ) | |||||
|
|
|
| |||||
Total income (loss) from investment operations | 0.35 | (1.10 | ) | |||||
|
|
|
| |||||
Less distributions: |
| |||||||
From net investment income | — | (0.13 | ) | |||||
From net realized gains | — | — | ||||||
|
|
|
| |||||
Total distributions | — | (0.13 | ) | |||||
|
|
|
| |||||
Net asset value, end of period | $ | 9.24 | $ | 8.89 | ||||
|
|
|
| |||||
Market price, end of period | $ | 9.24 | $ | 8.87 | ||||
|
|
|
| |||||
Net asset value total return | 3.92 | %+ | (10.88 | )%+ | ||||
|
|
|
| |||||
Market price total return | 4.24 | %+ | (11.13 | )%+ | ||||
|
|
|
| |||||
Ratios/supplemental data: |
| |||||||
Net assets, end of period (thousands) | $ | 8,318 | $ | 8,449 | ||||
|
|
|
| |||||
Ratios of total expenses to average net assets: | ||||||||
Before fees waived2 | 0.55 | %* | 0.55 | %* | ||||
|
|
|
| |||||
After fees waived2 | 0.55 | %* | 0.55 | %* | ||||
|
|
|
| |||||
Ratio of net investment income to average net assets | 1.43 | %* | 2.21 | %* | ||||
|
|
|
| |||||
Portfolio turnover rate | 10.42 | %+,3 | 58.28 | %+ | ||||
|
|
|
| |||||
| # | Unaudited. |
| + | Not annualized. |
| * | Annualized. |
| ** | Commenced operations on January 31, 2022. |
| 1 | Calculated based on the average shares outstanding methodology. |
| 2 | The Fund invests in other funds and indirectly bears its proportionate shares of fees and expenses incurred by the underlying funds in which the Fund is invested. This ratio does not include these indirect fees and expenses. |
| 3 | Portfolio turnover rate excludes securities received or delivered in-kind. The portfolio turnover rate including securities received or delivered in-kind was 10.42% for the period ended June 30, 2023. |
The accompanying notes are an integral part of these financial statements.
| Financial Highlights | 135 | |||||
Table of Contents
iMGP Berkshire Dividend Growth ETF
FINANCIAL HIGHLIGHTS
For a capital share outstanding throughout the period
| Period Ended June 30, 2023#** | ||||
Net asset value, beginning of period | $ | 10.08 | ||
|
| |||
Income from investment operations: |
| |||
Net investment income(loss)1 | (0.00 | )^ | ||
Net realized gain (loss) and net change in unrealized appreciation/depreciation on investments | 0.10 | |||
|
| |||
Total income from investment operations | 0.10 | |||
|
| |||
Less distributions: |
| |||
From net investment income | — | |||
From net realized gains | — | |||
|
| |||
Total distributions | — | |||
|
| |||
Net asset value, end of period | $ | 10.18 | ||
|
| |||
Market price, end of period | $ | 10.21 | ||
|
| |||
Net asset value total return | 0.94 | %+ | ||
|
| |||
Market price total return | 1.25 | %+ | ||
|
| |||
Ratios/supplemental data: |
| |||
Net assets, end of period (thousands) | $ | 763 | ||
|
| |||
Ratios of total expenses to average net assets: | ||||
Before fees waived | 0.55 | %* | ||
|
| |||
After fees waived | 0.55 | %* | ||
|
| |||
Ratio of net investment loss to average net assets | (0.55 | )%* | ||
|
| |||
Portfolio turnover rate | 0.00 | %+ | ||
|
| |||
| # | Unaudited. |
| + | Not annualized. |
| * | Annualized. |
| ** | Commenced operations on June 29, 2023. |
| ^ | Amount represents less than $0.01 per share. |
| 1 | Calculated based on the average shares outstanding methodology. |
The accompanying notes are an integral part of these financial statements.
| 136 | Litman Gregory Funds Trust | |||||
Table of Contents
Litman Gregory Funds Trust
NOTES TO FINANCIAL STATEMENTS – (Unaudited)
Note 1 – Organization
Litman Gregory Funds Trust (the “Trust”) was organized as a Delaware business trust on August 1, 1996, and is registered under the Investment Company Act of 1940 (the “1940 Act”) as an open-end management investment company. Effective August 1, 2011, The Masters’ Select Funds Trust changed its name to the Litman Gregory Funds Trust. The Trust consists of eleven separate series: iMGP Global Select Fund, iMGP International Fund, iMGP Oldfield International Value Fund, iMGP SBH Focused Small Value Fund, iMGP Alternative Strategies Fund, iMGP High Income Fund (formerly iMGP High Income Alternatives Fund), iMGP Dolan McEniry Corporate Bond Fund, iMGP DBi Managed Futures Strategy ETF, iMGP DBi Hedge Strategy ETF, iMGP RBA Responsible Global Allocation ETF (commenced operations on January 31, 2022), and iMGP Berkshire Dividend Growth ETF (commenced operations on June 29, 2023). Each Fund, except for iMGP DBi Managed Futures Strategy ETF and iMGP DBi Hedge Strategy ETF, is diversified.
iMGP Global Select Fund (“Global Select Fund”) seeks to increase the value of an investment in the Fund over the long-term by using the combined talents and favorite stock-picking ideas of three highly regarded portfolio managers (each “Managers” or “Sub-Advisors”). The Global Select Fund offers one class of shares: Institutional Class.
iMGP International Fund (“International Fund”) seeks to increase the value of an investment in the Fund over the long-term by using the combined talents and favorite stock-picking ideas of three highly regarded international portfolio managers. The International Fund offers one class of shares: Institutional Class.
iMGP Oldfield International Value Fund (“Oldfield International Value Fund”) seeks long-term growth of capital; that is, the increase in the value of an investment in the Fund over the long-term by using the talents and favorite stock-picking ideas of an experienced, high quality portfolio manager. The Oldfield International Value Fund offers one class of shares: Institutional Class.
iMGP SBH Focused Small Value Fund (“SBH Focused Small Value Fund”) seeks long-term growth of capital; that is, the increase in the value of an investment in the Fund over the long-term by engaging an experienced, high quality portfolio manager with favorite stock-picking ideas that can deliver a portfolio that is prudently diversified in terms of stocks and industries. The SBH Focused Small Value Fund offers one class of shares: Institutional Class.
iMGP Alternative Strategies Fund (“Alternative Strategies Fund”) seeks to achieve long-term returns with lower risk and lower volatility than the stock market, and with relatively low correlation to stock and bond market indexes by using the combined talents and favorite stock and bond market indexes-picking ideas of six highly regarded portfolio managers. A portion of the Alternative Strategies Fund’s assets may be allocated in a wholly-owned subsidiary of the Alternative Strategies Fund, which is organized under the laws of the Cayman Islands, is advised by that Manager, and will comply with the Alternative Strategies Fund’s investment objective and investment policies. The Alternative Strategies Fund offers two classes of shares: Institutional Class and Investor Class shares. The Investor Class shares charge a 0.25% 12b-1 distribution fee to the shareholders of this class (see Note 4).
iMGP High Income Fund (“High Income Fund”) seeks to generate a high level of current income from diverse sources, consistent with capital preservation over time, with capital appreciation a secondary objective, by using the combined talents and favorite stock and bond market indexes-picking ideas of three highly regarded portfolio managers. The High Income Fund offers one class of shares: Institutional Class.
iMGP Dolan McEniry Corporate Bond Fund (“Dolan McEniry Corporate Bond Fund”) seeks to provide investors with total return, with a secondary investment objective of preserving capital by investing in a diversified portfolio of corporate investment grade bonds, corporate high yield bonds, and U.S. Government and Treasury securities maturing within 10 years or less. The Dolan McEniry Corporate Bond Fund offers one class of shares: Institutional Class. Investor Class shares were converted into Institutional Class shares at the close of business on September 30, 2022.
iMGP DBi Managed Futures Strategy ETF (“DBi Managed Futures Strategy ETF”) seeks long term capital appreciation. The DBi Managed Futures Strategy ETF is a non-diversified, actively-managed exchange-traded fund (“ETF”) that seeks to achieve its objective by: (i) investing its assets pursuant to a managed futures strategy; (ii) allocating up to 20% of its total assets in its wholly-owned subsidiary, which is organized under the laws of the Cayman Islands, is advised by the sub-advisor, and will comply with the DBi Managed Futures Strategy ETF’s investment objective and investment policies; and (iii) investing directly in select debt instruments for cash management and other purposes. Shares of the Fund are listed and traded on the New York Stock Exchange Arca.
iMGP DBi Hedge Strategy ETF (“DBi Hedge Strategy ETF”) seeks long-term capital appreciation. The DBi Hedge Strategy ETF is a non-diversified, actively-managed ETF that seeks to achieve its objective by: (i) investing its assets pursuant to an equity hedge strategy and (ii) allocating the remainder of its assets directly in a portfolio of investment grade debt securities to collateralize its derivatives investments, for liquidity purposes, or to enhance yield. Shares of the Fund are listed and traded on the New York Stock Exchange Arca.
iMGP RBA Responsible Global Allocation ETF (“RBA Responsible Global Allocation ETF”) seeks long-term capital appreciation. The RBA Responsible Global Allocation ETF is an active-managed ETF that seeks to achieve its objective by investing its assets in a portfolio of exchange-traded vehicles that provide exposure to asset classes in various regions, countries, and sectors around the globe. Shares of the Fund are listed and traded on the New York Stock Exchange Arca.
| Notes to Financial Statements | 137 | |||||
Table of Contents
Litman Gregory Funds Trust
NOTES TO FINANCIAL STATEMENTS – (Unaudited) (Continued)
iMGP Berkshire Dividend Growth ETF (“Berkshire Dividend Growth ETF”) seeks dividend income and long-term capital appreciation. The Berkshire Dividend Growth ETF is an actively-managed exchange-traded fund (“ETF”) that seeks to achieve its objective by investing at least 80% of its net assets, plus borrowings for investment purposes, in dividend-paying equity securities, with an emphasis on stocks that have a strong track record of paying dividends or that are expected to increase their dividends over time. Shares of the Fund are listed and traded on the New York Stock Exchange Arca.
Note 2 – Significant Accounting Policies
The following is a summary of the significant accounting policies followed by the Funds. These policies are in conformity with accounting principles generally accepted in the United States of America (“GAAP”).
| A | Reference Rate Reform. In March 2020, the FASB issued ASU 2020-04, Reference Rate Reform, which provides optional expedients and exceptions for applying GAAP to contracts, hedging relationships, and other transactions which are affected by reference rate reform if certain criteria are met. Such provisions are elective and apply to all entities as of March 12, 2020 through December 31, 2022, subject to meeting certain criteria, that have transactions that reference the London Interbank Offered Rate (“LIBOR”) or another reference rate that are discontinued because of reference rate reform. In March 2021, the administrator for LIBOR announced the extension of the publication of a majority of the USD LIBOR settings to June 30, 2023. Management expects that the adoption of the guidance will not have a material impact on the Funds’ financial statements. In July 2017, the Financial Conduct Authority, the United Kingdom’s financial regulatory body, announced that after 2021 it will cease its active encouragement of banks to provide quotations needed to sustain the LIBOR rate, which means that the LIBOR rate may no longer be published after 2021. The elimination of LIBOR, among other “inter-bank offered” reference rates, may adversely affect the interest rates on, and value of, certain Fund investments for which the value is tied to LIBOR. The U.K. Financial Conduct Authority and the ICE Benchmark Administration have announced that most LIBOR settings will no longer be published after December 31, 2021 and a majority of U.S. dollar LIBOR settings will cease publication after June 30, 2023. It’s possible that a subset of LIBOR settings will be published after these dates on a “synthetic” basis, but any such publications would be considered non-representative of the underlying market. Markets are slowly developing in response to these new reference rates. Uncertainty related to the liquidity impact of the change in rates, and how to appropriately adjust these rates at the time of transition, poses risks for the Funds. These risks are likely to persist until new reference rates and fallbacks for both legacy and new instruments and contracts are commercially accepted, and market practices become settled. Alternatives to LIBOR have been established or are in development in most major currencies, including the Secured Overnight Financing Rate (“SOFR”) that is intended to replace U.S. dollar LIBOR. Management expects that the LIBOR transition will not have a material impact on the Funds’ financial statements. |
| B | Accounting Estimates. The preparation of financial statements in conformity with GAAP requires management to make estimates and assumptions. These estimates and assumptions affect the reported amounts of assets and liabilities and the disclosure of contingent assets and liabilities at the date of financial statements and the reported amounts of increases and decreases in net assets from operations during the reporting period. Actual results could differ from those estimates. |
The Funds are investment companies and accordingly follow the investment company accounting and reporting guidance of the Financial Accounting Standards Board (FASB) Accounting Standards Codification Topic 946 Financial Services – Investment Companies.
| C | Security Valuation. The Funds record their investments at fair value. Fair value is defined as the price that would be received to sell an asset or paid to transfer a liability in an orderly transaction between market participants at the measurement date. The valuation techniques used to determine fair value are further described below. Investments in securities and derivatives traded on a national securities exchange are valued at the last reported sales price at the close of regular trading on each day that the exchanges are open for trading. Securities listed on the NASDAQ Global Market, the NASDAQ Global Select Market and the NASDAQ Capital Market are valued using the NASDAQ Official Closing Price. Securities traded on an exchange for which there have been no sales are valued at the mean between the closing bid and asked prices. Debt securities maturing within 60 days or less are valued at amortized cost unless the Valuation Committee determines that amortized cost does not represent fair value. Securities for which market prices are not readily available or if a security’s value has materially changed after the close of the security’s primary market but before the close of trading on the New York Stock Exchange (“NYSE”), the securities are valued at fair value as determined in good faith by the Managers that selected the security for the Funds’ portfolio and the Trust’s Valuation Committee in accordance with procedures approved by the Board of Trustees (the “Board”). In determining fair value, the Funds take into account all relevant factors and available information. Consequently, the price of the security used by a Fund to calculate its net asset value may differ from quoted or published prices for the same security. Fair value pricing involves subjective judgments and there is no single standard for determining the fair value of a security. As a result, different mutual funds could reasonably arrive at a different value for the same security. For securities that do not trade during NYSE hours, fair value determinations are based on analyses of market movements after the close of those securities’ primary markets, and include reviews of developments in foreign markets, the performance of U.S. securities markets, and the performance of instruments trading in U.S. markets that represent foreign securities and baskets of foreign securities. Pricing services are used to obtain closing market prices and to compute certain fair value adjustments utilizing computerized pricing models. It is |
| 138 | Litman Gregory Funds Trust | |||||
Table of Contents
Litman Gregory Funds Trust
NOTES TO FINANCIAL STATEMENTS – (Unaudited) (Continued)
| possible that the fair value determined for a security is materially different from the value that could be realized upon the sale of that security or from the values that other mutual funds may determine. |
Investments in other funds are valued at their respective net asset values as determined by those funds in accordance with the 1940 Act.
Effective September 8, 2022, the Funds are required to comply with new SEC regulations that govern valuation practices and the role of a fund’s board with respect to the fair value of the investments of a registered investment company. Rule 2a-5 under the 1940 Act, among other things, establishes an updated regulatory framework for registered investment company fair valuation practices. The Funds’ Board has designated the Adviser as each Fund’s valuation designee to perform fair value functions in accordance with valuation policies and procedures adopted by the Adviser, subject to the Board’s oversight. Management expects that the implementation of this rule will not have a material impact on the Funds’ financial statements.
Debt securities generally trade in the over-the-counter market rather than on a securities exchange. The Funds’ pricing services use multiple valuation techniques to determine fair value. In instances where sufficient market activity exists, the pricing services may utilize a market-based approach through which quotes from market makers are used to determine fair value. In instances where sufficient market activity may not exist or is limited, the pricing services also utilize proprietary valuation models which may consider market characteristics such as benchmark yield curves, option-adjusted spreads, credit spreads, estimated default rates, coupon rates, anticipated timing of principal repayments, underlying collateral, and other unique security features in order to estimate the relevant cash flows, which are then discounted to calculate the fair value. Securities denominated in a foreign currency are converted into their U.S. dollar equivalent at the foreign exchange rate in effect at the close of the NYSE on the date that the values of the foreign debt securities are determined. Repurchase agreements are valued at cost, which approximates fair value.
Certain derivatives trade in the over-the-counter market. The Funds’ pricing services use various techniques including industry standard option pricing models and proprietary discounted cash flow models to determine the fair value of those instruments. The Funds’ net benefit or obligation under the derivative contract, as measured by the fair value of the contract, is included in net assets.
The Funds have procedures to determine the fair value of securities and other financial instruments for which market prices are not readily available or which may not be reliably priced. Under these procedures, the Funds primarily employ a market-based approach which may use related or comparable assets or liabilities, recent transactions, market multiples, book values, and other relevant information for the investment to determine the fair value of the investment. The Funds may also use an income-based valuation approach in which the anticipated future cash flows of the investment are discounted to calculate fair value. Discounts may also be applied due to the nature or duration of any restrictions on the disposition of the investments. Due to the inherent uncertainty of valuations of such investments, the fair values may differ significantly from the values that would have been used had an active market existed.
| D | Consolidation of Subsidiary. The DBi Managed Futures Strategy ETF may invest up to 20% of its total assets in the iMGP DBi Cayman Managed Futures Subsidiary (the “Subsidiary”). The Subsidiary, which is organized under the laws of the Cayman Islands, is wholly- owned and controlled by the DBi Managed Futures Strategy ETF. The financial statements of the DBi Managed Futures Strategy ETF include the operations of the Subsidiary. All intercompany accounts and transactions have been eliminated in consolidation. The Subsidiary acts as an investment vehicle in order to invest in commodity-linked derivative instruments consistent with the Fund’s investment objectives and policies. The DBi Managed Futures Strategy ETF had 18.7% of its total net assets invested in the Subsidiary as of June 30, 2023. |
The Subsidiary is an exempted Cayman Islands investment company and as such is not subject to Cayman Islands taxes at the present time. For U.S. income tax purposes, the Subsidiary is a Controlled Foreign Corporation (“CFC”) not subject to U.S. income taxes. As a wholly-owned CFC, however, the Subsidiary’s net income and capital gains, if any, will be included each year in the Fund’s investment company taxable income.
Consolidation of Subsidiary. The Alternative Strategies Fund may invest a portion of its assets from the enhanced trend strategy in the Alternative Strategy Subsidiary (the “Alternative Subsidiary”), which is organized under the laws of the Cayman Islands, is wholly-owned and controlled by the Alternative Strategies Fund and is advised by the Manager that manages the enhanced trend strategy. The financial statements of the Alternatives Strategies Fund include the operations of the Alternative Subsidiary. All intercompany accounts and transactions have been eliminated in consolidation. The Alternative Subsidiary acts as an investment vehicle in order to invest in commodity-linked derivative instruments consistent with the Fund’s investment objectives and policies. The Alternatives Strategies Fund had 0.6% of its total net assets invested in the Alternative Subsidiary as of June 30, 2023.
The Alternative Subsidiary is an exempted Cayman Islands investment company and as such is not subject to Cayman Islands taxes at the present time. For U.S. income tax purposes, the Alternative Subsidiary is a Controlled Foreign Corporation (“CFC”) not subject to U.S. income taxes. As a wholly-owned CFC, however, the Alternative Subsidiary’s net income and capital gains, if any, will be included each year in the Fund’s investment company taxable income.
| Notes to Financial Statements | 139 | |||||
Table of Contents
Litman Gregory Funds Trust
NOTES TO FINANCIAL STATEMENTS – (Unaudited) (Continued)
| E | Senior Term Loans. The Alternative Strategies Fund and the High Income Fund may invest in bank debt, which includes interests in loans to companies or their affiliates undertaken to finance a capital restructuring or in connection with recapitalizations, acquisitions, leveraged buyouts, refinancings or other financially leveraged transactions and may include loans which are designed to provide temporary or bridge financing to a borrower pending the sale of identified assets, the arrangement of longer-term loans or the issuance and sale of debt obligations. These loans, which may bear fixed or floating rates, have generally been arranged through private negotiations between a corporate borrower and one or more financial institutions (“Lenders”), including banks. The Alternative Strategies Fund’s and the High Income Fund’s investments may be in the form of participations in loans (“Participations”) or of assignments of all or a portion of loans from third parties (“Assignments”). |
| F | Unfunded Loan Commitments. The Alternative Strategies Fund and the High Income Fund may enter into certain credit agreements, all or a portion of which may be unfunded. The Fund is obligated to fund these commitments at the borrower’s discretion. These commitments, if any, are disclosed in the Schedules of Investments in Securities. |
| G | Short Sales. Each Fund may sell a security it does not own in anticipation of a decline in the fair value of that security. When each Fund sells a security short, it must borrow the security sold short and deliver it to the broker-dealer through which it made the short sale. In addition, cash and certain investments in securities may be used to collateralize the securities sold short. Each day the securities sold short transaction is open, the liability to replace the borrowed security is marked to market and an unrealized gain or loss is recorded. While the transaction remains open, the Fund may also incur expenses for any dividends or interest which will be paid to the lender of the securities as well as a fee to borrow the delivered security. During the term of the short sale, the value of the securities pledged as collateral on short sales is required to exceed the value of the securities sold short. A gain, limited to the price at which each Fund sold the security short, or a loss, unlimited in size, will be recognized upon the termination of a short sale. Each Fund is also subject to the risk that it may be unable to reacquire a security to terminate a short position except at a price substantially in excess of the last quoted price. |
| H | Repurchase Agreements. Each Fund may enter into repurchase agreements through which the Fund acquires a security (the “underlying security”) from a seller, a well-established securities dealer or a bank that is a member of the Federal Reserve System. The bank or securities dealer agrees to repurchase the underlying security at the same price, plus a specified amount of interest, at a later date, generally for a period of less than one week. It is the Trust’s policy that its Custodian takes possession of securities as collateral under repurchase agreements and to determine on a daily basis that the value of such securities, including recorded interest, is sufficient to cover the value of the repurchase agreements. The Trust’s policy states that the value of the collateral is at least 102% of the value of the repurchase agreement. If the counterparty defaults and the value of the collateral declines or if bankruptcy proceedings are commenced with respect to the counterparty of the security, realization of the collateral by a Fund may be delayed or limited. At June 30, 2023, the Funds’ ongoing exposure to the economic return on repurchase agreements is shown on the Schedules of Investments in Securities. |
| I | Reverse repurchase agreements. The High Income Fund may enter into reverse repurchase agreements with banks and brokers to enhance return. Under a reverse repurchase agreement a Fund sells portfolio assets subject to an agreement by that Fund to repurchase the same assets at an agreed upon price and date. The Fund can use the proceeds received from entering into a reverse repurchase agreement to make additional investments, which generally causes the Fund’s portfolio to behave as if it were leveraged. If the buyer in a reverse repurchase agreement files for bankruptcy or becomes insolvent, the Fund may be unable to recover the securities it sold and as a result may realize a loss on the transaction if the securities it sold are worth more than the purchase price it originally received from the buyer. Reverse repurchase agreements outstanding at the end of the period, if any, are shown on the Schedules of Investments in Securities. Cash received in exchange for securities transferred, if any, under reverse repurchase agreements are reflected as reverse repurchase agreements on the Statements of Assets and Liabilities. |
| J | Foreign Currency Translation. The Funds’ records are maintained in U.S. dollars. The value of securities, currencies and other assets and liabilities denominated in currencies other than U.S. dollars are translated into U.S. dollars based upon foreign exchange rates prevailing at the end of the reporting period. The currencies are translated into U.S. dollars by using the exchange rates quoted at the close of the London Stock Exchange prior to when each Fund’s net asset value is next determined. Purchases and sales of investment securities, income and expenses are translated on the respective dates of such transactions. |
The Funds do not isolate that portion of their net realized and unrealized gains and losses on investments resulting from changes in foreign exchange rates from the impact arising from changes in market prices. Such fluctuations are included with net realized and unrealized gain or loss from investments.
Net realized foreign currency transaction gains and losses arise from sales of foreign currencies, currency gains or losses realized between the trade and settlement dates on securities transactions, and the differences between the amounts of dividends, interest, and foreign withholding taxes recorded on the Funds’ books and the U.S. dollar equivalent of the amounts actually received or paid. Net unrealized foreign currency transactions gains and losses arise from changes in the value of assets and liabilities, other than investments in securities, resulting from changes in the exchange rates.
| 140 | Litman Gregory Funds Trust | |||||
Table of Contents
Litman Gregory Funds Trust
NOTES TO FINANCIAL STATEMENTS – (Unaudited) (Continued)
| K | Forward Foreign Currency Exchange Contracts. The Funds may utilize forward foreign currency exchange contracts (“forward contracts”) under which they are obligated to exchange currencies on specified future dates at specified rates, and are subject to foreign exchange rates fluctuations. All contracts are “marked-to-market” daily and any resulting unrealized gains or losses are recorded as unrealized appreciation or depreciation on forward foreign currency exchange contracts. The Funds record realized gains or losses at the time the forward contract is settled. These gains and losses are reflected on the Statements of Operations as realized gain (loss) on forward foreign currency exchange contracts. Counterparties to these forward contracts are major U.S. financial institutions (see Note 8). |
| L | Commodity Futures Trading Commission (“CFTC”) Regulation. Because of the nature of their investments, the Alternative Strategies Fund, the DBi Managed Futures Strategy ETF and the DBi Hedge Strategy ETF are subject to regulation under the Commodities Exchange Act, as amended (the “CEA”), as a commodity pool and each of the Advisor and Sub-Adviser is subject to regulation under the CEA as a commodity pool operator (“CPO”), as those terms are defined under the CEA. The Advisor and Sub-Adviser are regulated by the CFTC, the National Futures Association and the U.S. Securities and Exchange Commission (“SEC”) and are subject to each regulator’s disclosure requirements. The CFTC has adopted rules that are intended to harmonize certain CEA disclosure requirements with SEC disclosure requirements. |
| M | Futures Contracts. The Alternative Strategies Fund, the High Income Fund, and the DBi Hedge Strategy ETF invest in financial futures contracts primarily for the purpose of hedging their existing portfolio securities, or securities that the Funds intend to purchase, against fluctuations in fair value caused by changes in prevailing market interest rates. The futures contracts in the DBi Managed Futures Strategy ETF are not designated as hedging instruments. The DBi Managed Futures Strategy ETF employs long and short positions in derivatives, primarily futures contracts, across the broad asset classes of equities, fixed income, currencies and, through the Subsidiary, commodities. Upon entering into a financial futures contract, a Fund is required to pledge to the broker an amount of cash, U.S. government securities, or other assets, equal to a certain percentage of the contract amount (initial margin deposit). Subsequent payments, known as variation margin, are made or received by a Fund each day, depending on the daily fluctuations in the fair value of the underlying security. Each Fund recognizes a gain or loss equal to the daily variation margin. If market conditions move unexpectedly, a Fund may not achieve the anticipated benefits of the financial futures contracts and may realize a loss. The use of futures transactions involves the risk of imperfect correlation in movements in the price of futures contracts, interest rates, and the underlying hedged assets (see Note 8). |
| N | Interest Rate Swaps. During the period ended June 30, 2023, the High Income Fund invested in interest rate swaps. An interest rate swap is an agreement that obligates two parties to exchange a series of cash flows at specified intervals, based upon or calculated by reference to changes in interest rates on a specified notional principal amount. The payment flows are usually netted against each other, with the difference being paid by one party to the other. Bilateral swap contracts are agreements in which a Fund and a counterparty agree to exchange periodic payments on a specified notional amount or make a net payment upon termination. Bilateral swap transactions are privately negotiated in the Over the counter (“OTC”) market and payments are settled through direct payments between a Fund and the counterparty. By contrast, certain swap transactions are subject to mandatory central clearing. These swaps are executed through a derivatives clearing member (“DCM”), acting in an agency capacity, and submitted to a central counterparty (“CCP”) (“centrally cleared swaps”), in which case all payments are settled with the CCP through the DCM. Swaps are marked-to-market daily using pricing vendor quotations, counterparty or clearinghouse prices or model prices, and the change in value, if any, is recorded as an unrealized gain or loss. Upon entering into a swap contract, a Fund is required to satisfy an initial margin requirement by delivering cash or securities to the counterparty (or in some cases, segregated in a triparty account on behalf of the counterparty), which can be adjusted by any mark-to-market gains or losses pursuant to bilateral or centrally cleared arrangements. For centrally cleared swaps the daily change in valuation, and upfront payments, if any, are recorded as a receivable or payable for variation margin on the Statements of Assets and Liabilities (see Note 8). |
| O | Credit Default Swaps. During the period ended June 30, 2023, the Alternative Strategies Fund and the High Income Fund entered into credit default swaps to manage their exposure to the market or certain sectors of the market, to reduce their risk exposure to defaults of corporate issuers or indexes or to create exposure to corporate issuers or indexes to which they are not otherwise exposed. In a credit default swap, the protection buyer makes a stream of payments based on a fixed percentage applied to the contract notional amount to the protection seller in exchange for the right to receive a specified return upon the occurrence of a defined credit event on the reference obligation which may be either a single security or a basket of securities issued by corporate or sovereign issuers. Although contract-specific, credit events are generally defined as bankruptcy, failure to pay, restructuring, obligation acceleration, obligation default, or repudiation/moratorium. Upon the occurrence of a defined credit event, the difference between the value of the reference obligation and the swap’s notional amount is recorded as realized gain (for protection written) or loss (for protection sold) in the Statements of Operations. In the case of credit default swaps where a Fund is selling protection, the notional amount approximates the maximum loss. For centrally cleared swaps the daily change in valuation, and upfront payments, if any, are recorded as a receivable or payable for variation margin on the Statements of Assets and Liabilities (see Note 8). |
| P | Total Return Swaps. During the period ended June 30, 2023, the Alternative Strategies Fund invested in total return swaps. Total return swap is the generic name for any non-traditional swap where one party agrees to pay the other the “total return” of a defined |
| Notes to Financial Statements | 141 | |||||
Table of Contents
Litman Gregory Funds Trust
NOTES TO FINANCIAL STATEMENTS – (Unaudited) (Continued)
| underlying asset, usually in return for receiving a stream of London Interbank Offered Rate (“LIBOR”) based cash flows. A total return swap may be applied to any underlying asset but is most commonly used with equity indices, single stocks, bonds and defined portfolios of loans and mortgages. Total return swap is a mechanism for the user to accept the economic benefits of asset ownership without utilizing the Statement of Assets and Liabilities. The other leg of the swap, usually LIBOR, is a spread to reflect the non-Statement of Assets and Liabilities nature of the product. No notional amounts are exchanged with total return swaps. The total return receiver assumes the entire economic exposure—that is, both market and credit exposure—to the reference asset. The total return payer—often the owner of the reference obligation—gives up economic exposure to the performance of the reference asset and in return takes on counterparty credit exposure to the total return receiver in the event of a default or fall in value of the reference asset (see Note 8). |
| Q | Purchasing Put and Call Options. Each Fund may purchase covered “put” and “call” options with respect to securities which are otherwise eligible for purchase by a Fund and with respect to various stock indices subject to certain restrictions. Each Fund will engage in trading of such derivative securities primarily for hedging purposes. |
If a Fund purchases a put option, a Fund acquires the right to sell the underlying security at a specified price at any time during the term of the option (for “American-style” options) or on the option expiration date (for “European-style” options). Purchasing put options may be used as a portfolio investment strategy when a portfolio manager perceives significant short-term risk but substantial long-term appreciation for the underlying security. The put option acts as an insurance policy, as it protects against significant downward price movement while it allows full participation in any upward movement. If a Fund is holding a stock which it feels has strong fundamentals, but for some reason may be weak in the near term, a Fund may purchase a put option on such security, thereby giving itself the right to sell such security at a certain strike price throughout the term of the option. Consequently, a Fund will exercise the put only if the price of such security falls below the strike price of the put. The difference between the put’s strike price and the market price of the underlying security on the date a Fund exercises the put, less transaction costs, will be the amount by which a Fund will be able to hedge against a decline in the underlying security. If during the period of the option the market price for the underlying security remains at or above the put’s strike price, the put will expire worthless, representing a loss of the price a Fund paid for the put, plus transaction costs. If the price of the underlying security increases, the profit a Fund realizes on the sale of the security will be reduced by the premium paid for the put option less any amount for which the put may be sold.
If a Fund purchases a call option, it acquires the right to purchase the underlying security at a specified price at any time during the term of the option. The purchase of a call option is a type of insurance policy to hedge against losses that could occur if a Fund has a short position in the underlying security and the security thereafter increases in price. Each Fund will exercise a call option only if the price of the underlying security is above the strike price at the time of exercise. If during the option period the market price for the underlying security remains at or below the strike price of the call option, the option will expire worthless, representing a loss of the price paid for the option, plus transaction costs. If the call option has been purchased to hedge a short position of a Fund in the underlying security and the price of the underlying security thereafter falls, the profit a Fund realizes on the cover of the short position in the security will be reduced by the premium paid for the call option less any amount for which such option may be sold.
Prior to exercise or expiration, an option may be sold when it has remaining value by a purchaser through a “closing sale transaction,” which is accomplished by selling an option of the same series as the option previously purchased. Each Fund generally will purchase only those options for which a Manager believes there is an active secondary market to facilitate closing transactions (see Note 8).
Writing Call Options. Each Fund may write covered call options. A call option is “covered” if a Fund owns the security underlying the call or has an absolute right to acquire the security without additional cash consideration (or, if additional cash consideration is required, cash or cash equivalents in such amount as are held in a segregated account by the Custodian). The writer of a call option receives a premium and gives the purchaser the right to buy the security underlying the option at the exercise price. The writer has the obligation upon exercise of the option to deliver the underlying security against payment of the exercise price during the option period. If the writer of an exchange-traded option wishes to terminate his obligation, he may effect a “closing purchase transaction.” This is accomplished by buying an option of the same series as the option previously written. A writer may not effect a closing purchase transaction after it has been notified of the exercise of an option.
Effecting a closing transaction in the case of a written call option will permit a Fund to write another call option on the underlying security with either a different exercise price, expiration date or both. Also, effecting a closing transaction will permit the cash or proceeds from the concurrent sale of any securities subject to the option to be used for other investments of a Fund. If a Fund desires to sell a particular security from its portfolio on which it has written a call option, it will effect a closing transaction prior to or concurrent with the sale of the security.
Each Fund will realize a gain from a closing transaction if the cost of the closing transaction is less than the premium received from writing the option or if the proceeds from the closing transaction are more than the premium paid to purchase the option. Each Fund will realize a loss from a closing transaction if the cost of the closing transaction is more than the premium received from writing the option or if the proceeds from the closing transaction are less than the premium paid to purchase the option. However, because increases in the market price of a call option will generally reflect increases in the market price of the underlying security, any loss to a
| 142 | Litman Gregory Funds Trust | |||||
Table of Contents
Litman Gregory Funds Trust
NOTES TO FINANCIAL STATEMENTS – (Unaudited) (Continued)
Fund resulting from the repurchase of a call option is likely to be offset in whole or in part by appreciation of the underlying security owned by a Fund (see Note 8).
Writing Put Options. Each Fund may write put options. By writing put options, the Fund takes on the risk of declines in the value of the underlying instrument, including the possibility of a loss up to the entire strike price of each option it sells, but without the corresponding opportunity to benefit from potential increases in the value of the underlying instrument. When the Fund writes a put option, it assumes the risk that it must purchase the underlying instrument at a strike price that may be higher than the market price of the instrument. If there is a broad market decline and the Fund is able to close out its written put options, it may result in substantial losses to the Fund (see Note 8).
Risks of Investing in Options. There are several risks associated with transactions in options on securities. Options may be more volatile than the underlying instruments and, therefore, on a percentage basis, an investment in options may be subject to greater fluctuation than an investment in the underlying instruments themselves. There are also significant differences between the securities and options markets that could result in an imperfect correlation between these markets, causing a given transaction not to achieve its objective. In addition, a liquid secondary market for particular options may be absent for reasons which include the following: there may be insufficient trading interest in certain options; restrictions may be imposed by an exchange on opening transactions or closing transactions or both; trading halts, suspensions or other restrictions may be imposed with respect to particular classes or series of option of underlying securities; unusual or unforeseen circumstances may interrupt normal operations on an exchange; the facilities of an exchange or clearing corporation may not at all times be adequate to handle current trading volume; or one or more exchanges could, for economic or other reasons, decide or be compelled at some future date to discontinue the trading of options (or a particular class or series of options), in which event the secondary market on that exchange (or in that class or series of options) would cease to exist, although outstanding options that had been issued by a clearing corporation as a result of trades on that exchange would continue to be exercisable in accordance with their terms.
A decision as to whether, when and how to use options involves the exercise of skill and judgment, and even a well-conceived transaction may be unsuccessful to some degree because of market behavior or unexpected events. The extent to which a Fund may enter into options transactions may be limited by the requirements of the Internal Revenue Code of 1986, as amended (the “Code”), with respect to qualification of a Fund as a regulated investment company.
| R | Distributions to Shareholders. Distributions paid to shareholders are recorded on the ex-dividend date. Net realized gains from securities transactions (if any) are generally distributed annually to shareholders. The amount of dividends and distributions from net investment income and net realized capital gains is determined in accordance with federal income tax regulations, which may differ from generally accepted accounting principles. To the extent these “book/tax” differences are permanent in nature (i.e., that they result from other than timing of recognition – “temporary differences”), such amounts are reclassified within the capital accounts based on their federal tax-basis. |
| S | Income Taxes. The Funds intend to comply with the requirements of Subchapter M of the Code applicable to regulated investment companies and to distribute all of their taxable income to their shareholders. Accordingly, no provisions for federal income taxes are required. The Funds have reviewed the tax positions, taken on federal income tax returns, for each of the three open tax years (as applicable) and as of June 30, 2023, and have determined that no provision for income tax is required in the Funds’ financial statements. The Funds recognize interest and penalties, if any, related to unrecognized tax benefits as income tax expenses in the Statements of Operations. During the period ended June 30, 2023, the Funds did not incur any interest or penalties. Foreign securities held by the Funds may be subject to foreign taxation on dividend and interest income received. Foreign taxes, if any, net of any reclaims, are recorded based on the tax regulations and rates that exist in the foreign markets in which the Funds’ invest. |
Taxes on foreign interest and dividend income are generally withheld in accordance with the applicable country’s tax treaty with the United States. The foreign withholding rates applicable to a Fund’s investments in certain jurisdictions may be higher if a significant portion of the Fund is held by non-U.S. shareholders. Each Fund may be subject to taxation on realized capital gains, repatriation proceeds and other transaction-based charges imposed by certain countries in which it invests. Taxes related to capital gains realized during the period ended June 30, 2023, if any, are reflected as part of net realized gain (loss) in the Statements of Operations.
Changes in tax liabilities related to capital gain taxes on unrealized investment gains, if any, are reflected as part of change in net unrealized appreciation (depreciation) in the Statements of Operations. Transaction-based charges are generally calculated as a percentage of the transaction amount.
The Funds may have previously filed for and/or may file for additional tax refunds with respect to certain taxes withheld by certain countries. Generally, the amount of such refunds that a Fund reasonably determines are collectible and free from significant contingencies are reflected in a Fund’s net asset value and are reflected as foreign tax reclaims receivable in the Statements of Assets and Liabilities. In certain circumstances, a Fund’s receipt of such refunds may cause the Fund and/or its shareholders to be liable for U.S. federal income taxes and interest charges.
| Notes to Financial Statements | 143 | |||||
Table of Contents
Litman Gregory Funds Trust
NOTES TO FINANCIAL STATEMENTS – (Unaudited) (Continued)
Foreign taxes paid by each Fund may be treated, to the extent permissible by the Code (and other applicable U.S. federal tax guidance) and if that Fund so elects, as if paid by U.S. shareholders of that Fund.
| T | Security Transactions, Dividend and Interest Income and Expenses. Security transactions are accounted for on the trade date. Realized gains and losses on securities transactions are reported on an identified cost basis. Dividend income and, where applicable, related foreign tax withholding expenses are recorded on the ex-dividend date. Interest income is recorded on an accrual basis. Purchase discounts and premiums on fixed-income securities are accreted and amortized to maturity using the effective interest method and reflected within interest income on the Statements of Operations. Paydown gains and losses on mortgage-related and other asset-backed securities, if any, are recorded as components of interest income in the Statements of Operations. Many expenses of the Trust can be directly attributed to a specific Fund. Each Fund is charged for expenses directly attributed to it. Expenses that cannot be directly attributed to a specific Fund are allocated among the Funds in the Trust in proportion to their respective net assets or other appropriate method. Realized and unrealized gains and losses and net investment income, not including class specific expenses, are allocated daily to each class of shares based upon the relative proportion of net assets of each class. Differences in per share distributions by class are generally due to differences in class specific expenses. Class specific expenses, such as 12b-1 expenses, are directly attributed to that specific class. |
| U | Restricted Cash. At June 30, 2023, the Alternative Strategies Fund, the High Income Fund, the DBi Managed Futures Strategy ETF, and the DBi Hedge Strategy ETF held restricted cash in connection with investments in certain derivative securities. Restricted cash is held in a segregated account with the Funds’ Custodian as well as with brokers and is reflected in the Statements of Assets and Liabilities as deposits at brokers for securities sold short, futures, options, and swaps. Restrictions may include legally restricted deposits held as compensating balances against short-term borrowing arrangements or contracts entered into with others. |
The Funds consider their investment in an Federal Deposits Insurance Corporation (“FDIC”) insured interest bearing savings account to be cash. The Funds maintain cash balances, which, at times, may exceed federally insured limits. The Funds maintain these balances with a high quality financial institution.
| V | Restricted Securities. A restricted security cannot be resold to the general public without prior registration under the Securities Act of 1933. If the security is subsequently registered and resold, the issuers would typically bear the expense of all registrations at no cost to the Fund. Restricted securities are valued according to the guidelines and procedures adopted by the Funds’ Board of Trustees. As of June 30, 2023, there were no restricted securities held in the Funds. |
| W | Illiquid Securities. Each Fund may not invest more than 15% of the value of its net assets in illiquid securities, including restricted securities that are not deemed to be liquid by the Sub-Advisors. The Advisor and the Sub-Advisors will monitor the amount of illiquid securities in a Fund’s portfolio, under the supervision of the Board, to ensure compliance with a Fund’s investment restrictions. In accordance with procedures approved by the Board, these securities may be valued using techniques other than market quotations, and the values established for these securities may be different than what would be produced through the use of another methodology or if they had been priced using market quotations. Illiquid securities and other portfolio securities that are valued using techniques other than market quotations, including “fair valued” securities, may be subject to greater fluctuation in their value from one day to the next than would be the case if market quotations were used. In addition, there is no assurance that a Fund could sell a portfolio security for the value established for it at any time, and it is possible that a Fund would incur a loss because a portfolio security is sold at a discount to its established value. |
| X | Indemnification Obligations. Under the Trust’s organizational documents, its current and former officers and trustees are indemnified against certain liabilities arising out of the performance of their duties to the Funds. In addition, in the normal course of business, the Funds enter into contracts that contain a variety of representations and warranties that provide general indemnifications. The Funds’ maximum exposure under these arrangements is unknown as this would involve future claims that may be made against the Funds that have not yet occurred or that would be covered by other parties. |
| 144 | Litman Gregory Funds Trust | |||||
Table of Contents
Litman Gregory Funds Trust
NOTES TO FINANCIAL STATEMENTS – (Unaudited) (Continued)
Note 3 – Investment Advisory and Other Agreements
The Trust, on behalf of the Funds, entered into an Investment Advisory Agreement (the “Agreement”) with Litman Gregory Fund Advisors, LLC. Effective October 1, 2021, Litman Gregory Fund Advisors, LLC has changed its name to iM Global Partner Fund Management, LLC (the “Advisor”) and also subsequently referred to as “iM Global”. Under the terms of the Agreement, each Fund pays a monthly investment advisory fee to the Advisor at the annual rate below of the respective Fund’s average daily net assets before any fee waivers:
| Contractual Management Rate | ||||||||||||||||||||||||||||||||||||||||||||
| Fund | First $450 million | Excess of $450 million | First $750 million | Excess of $750 million | First $1 billion | Excess of $1 billion | Between $1 and $2 billion | First $2 billion | Between $2 and $3 billion | Between $3 and $4 billion | Excess of $4 billion | |||||||||||||||||||||||||||||||||
Global Select | — | — | 1.10 | % | 1.00 | % | — | — | — | — | — | — | — | |||||||||||||||||||||||||||||||
International | — | — | — | — | 1.10 | % | 1.00 | % | — | — | — | — | — | |||||||||||||||||||||||||||||||
Oldfield International Value | — | — | — | — | 0.70 | % | 0.70 | % | — | — | — | — | — | |||||||||||||||||||||||||||||||
SBH Focused Small Value | 1.00 | % | 1.00 | % | — | — | — | — | — | — | — | — | — | |||||||||||||||||||||||||||||||
Alternative Strategies | — | — | — | — | — | — | — | 1.40 | % | 1.30 | % | 1.25 | % | 1.20 | % | |||||||||||||||||||||||||||||
High Income | — | — | — | — | 0.95 | % | — | 0.925 | % | — | 0.90 | % | 0.875 | % | 0.85 | % | ||||||||||||||||||||||||||||
Dolan McEniry Corporate Bond | 0.50 | % | 0.50 | % | — | — | — | — | — | — | — | — | — | |||||||||||||||||||||||||||||||
DBi Managed Futures Strategy ETF | 0.85 | % | 0.85 | % | — | — | — | — | — | — | — | — | — | |||||||||||||||||||||||||||||||
DBi Hedge Strategy ETF | 0.85 | % | 0.85 | % | — | — | — | — | — | — | — | — | — | |||||||||||||||||||||||||||||||
RBA Responsible Global Allocation ETF | 0.55 | % | 0.55 | % | — | — | — | — | — | — | — | — | — | |||||||||||||||||||||||||||||||
Berkshire Dividend Growth ETF | 0.55 | % | 0.55 | % | — | — | — | — | — | — | — | — | — | |||||||||||||||||||||||||||||||
The Advisor engages sub-advisors to manage the Funds and pays the sub-advisors from its advisory fees.
Through April 30, 2024, the Advisor has contractually agreed to waive a portion of its advisory fees effectively reducing total advisory fees to approximately 0.83% of the average daily net assets of the Global Select Fund, 0.88% of the average daily net assets of the International Fund, 1.14% of the average daily net assets of the Alternative Strategies Fund, and 0.79% of the average daily net assets of the High Income Fund. Additionally, the Advisor has voluntarily agreed to waive its management fee on the daily cash values of the Funds not allocated to Managers. For the six months ended June 30, 2023, the amount waived, contractual and voluntary, was $168,623, $249,694, $1,250,650, and $65,765 for Global Select Fund, International Fund, Alternative Strategies Fund, and High Income Fund, respectively. The Advisor has agreed not to seek recoupment of such waived fees. Through April 30, 2024, the Advisor has contractually agreed to waive a portion of its advisory fees and/or reimburse a portion of the Global Select Fund (effective August 1, 2022), and the High Income Fund’s operating expenses (excluding any taxes, interest, brokerage commissions, expenses incurred in connection with any merger or reorganization, borrowing costs, (including commitment fees), dividend expenses, acquired fund fees and expenses and extraordinary expenses such as but not limited to litigation costs) to ensure that the total annual fund operating expenses after fee waiver and/or expense reimbursement for the Institutional Class will not exceed 0.98%, and 0.98% of the average daily net assets, respectively. In addition, through April 30, 2024, the Advisor has contractually agreed to waive a portion of its advisory fees and/or reimburse a portion of the Oldfield International Value Fund, the SBH Focused Small Value Fund, and the Dolan McEniry Corporate Bond Fund’s operating expenses (excluding any taxes, interest, brokerage commissions, expenses incurred in connection with any merger or reorganization, borrowing costs, (including commitment fees), dividend expenses, acquired fund fees and expenses and extraordinary expenses such as but not limited to litigation costs) to ensure that the total annual fund operating expenses after fee waiver and/or expense reimbursement for the Institutional Class will not exceed 0.94%, 1.15%, and 0.70% of the average daily net assets, respectively. During the six months ended June 30, 2023, the amount waived contractually pursuant to an Expense Limitation Agreement was $158,590, $171,293, $95,583, $101,270, and $113,255 for the Global Select Fund, High Income Fund, Oldfield International Value Fund, SBH Focused Small Value Fund, and Dolan McEniry Corporate Bond Fund, respectively. The Advisor may be reimbursed by each Fund no later than the end of the third fiscal year following the year of the waiver provided that such reimbursement does not cause each Fund’s expenses to exceed the expense limitation. The Advisor is waiving its right to recoup these fees and any fees waived in prior years.
State Street Bank and Trust Company (“State Street”) serves as the Administrator, Custodian and Fund Accountant to the Funds.
| Notes to Financial Statements | 145 | |||||
Table of Contents
Litman Gregory Funds Trust
NOTES TO FINANCIAL STATEMENTS – (Unaudited) (Continued)
State Street also serves as the Transfer Agent for DBi Managed Futures Strategy ETF, DBi Hedge Strategy ETF, RBA Responsible Global Allocation ETF, and Berkshire Dividend Growth ETF . DST Asset Manager Solutions, Inc. (“DST”) serves as Transfer Agent for the other Funds. The Funds’ principal underwriter is ALPS Distributors, Inc.
An employee of the Advisor serves as the Funds’ Chief Compliance Officer (“CCO”). The CCO receives no compensation from the Funds for his services, however, the Funds reimbursed the Advisor $75,000 for the six months ended June 30, 2023 for the services of the CCO.
During the six months ended June 30, 2023, each independent Trustee, within the meaning of the 1940 Act, was compensated by the Trust in the amount of $45,454.
Certain officers and Trustees of the Trust are also officers of the Advisor.
Note 4 – Distribution Plan
Certain Funds have adopted a Plan of Distribution (the “Plan”) dated February 25, 2009, as amended, pursuant to Rule 12b-1 under the 1940 Act. Under the Plan, the Investor Classes of the Alternative Strategies Fund will compensate broker dealers or qualified institutions with whom the Fund has entered into a contract to distribute Fund shares (“Dealers”). Under the Plan, the amount of such compensation paid in any one year shall not exceed 0.25% annually of the average daily net assets of the Investor Classes, which may be payable as a service fee for providing recordkeeping, subaccounting, subtransfer agency and/or shareholder liaison services. For the six months ended June 30, 2023, the Alternative Strategies Fund’s Investor Class incurred $46,610 pursuant to the Plan.
The Plan will remain in effect from year to year provided such continuance is approved at least annually by a vote either of a majority of the Trustees, including a majority of the non-interested Trustees, or a majority of each Fund’s outstanding shares.
The DBi Hedge Strategy ETF, DBi Managed Futures Strategy ETF, RBA Responsible Global Allocation ETF, and Berkshire Dividend Growth ETF issue and redeem Shares at Net Asset Value (“NAV”) only in Creation Units. Only Authorized Participants (“APs”) may acquire Shares directly from the Funds, and only APs may tender their Shares for redemption directly to the Funds, at NAV. APs must be a member or participant of a clearing agency registered with the SEC and must execute a Participant Agreement that has been agreed to by the Distributor, and that has been accepted by the Transfer Agent, with respect to purchases and redemptions of Creation Units. Once created, Shares trade in the secondary market in quantities less than a Creation Unit.
Individual Shares may be purchased and sold only on a national securities exchange through brokers. Shares will be listed for trading on NYSE Arca and because the Shares will trade at market prices rather than NAV, Shares may trade at prices greater than NAV (at a premium), at NAV, or less than NAV (at a discount).
Note 5 – Investment Transactions
The cost of securities purchased and the proceeds from securities sold for the six months ended June 30, 2023, excluding short-term investments were as follows:
| Fund | U.S. Gov’t Securities Purchases | Other Purchases | U.S. Gov’t Securities Sales | Other Sales | ||||||||||||
Global Select Fund | $ | — | $ | 34,624,314 | — | $ | 48,283,885 | |||||||||
International Fund | — | 45,323,955 | — | 45,397,099 | ||||||||||||
Oldfield International Value Fund | — | 2,916,390 | — | 2,869,616 | ||||||||||||
SBH Focused Small Value Fund | — | 11,019,158 | — | 14,178,568 | ||||||||||||
Alternative Strategies Fund | 97,386,815 | 300,245,622 | 73,434,419 | 351,263,917 | ||||||||||||
High Income Fund | 5,834,550 | 1,248,110 | 12,482,346 | 26,021,504 | ||||||||||||
Dolan McEniry Corporate Bond Fund | 7,952,936 | 70,143,494 | 7,952,478 | 15,727,222 | ||||||||||||
DBi Manage Futures Strategy ETF | — | — | — | — | ||||||||||||
DBi Hedge Strategy ETF | — | — | — | — | ||||||||||||
RBA Responsible Global Allocation ETF | — | 876,724 | — | 945,245 | ||||||||||||
Berkshire Dividend Growth ETF | — | — | — | — | ||||||||||||
Securities received and delivered in-kind through subscriptions and redemptions are noted in the table below:
| Fund | In-Kind Subscriptions | In-Kind Redemptions | ||||||
RBA Responsible Global Allocation ETF | $ | — | $ | 450,959 | ||||
Berkshire Dividend Growth ETF | 730,540 | — | ||||||
| 146 | Litman Gregory Funds Trust | |||||
Table of Contents
Litman Gregory Funds Trust
NOTES TO FINANCIAL STATEMENTS – (Unaudited) (Continued)
During the six months ended June 30, 2023, there were several purchase transactions made in accordance with the established procedures pursuant to Rule 17a-7 (the exemption of certain purchase or sale transactions between an investment company and certain affiliated persons thereof), in Dolan McEniry Corporate Bond Fund. The total of such purchase transactions were $2,761,704.
Note 6 – Fair Value of Financial Investments
The Funds follow a fair value hierarchy that distinguishes between market data obtained from independent sources (observable inputs) and the Funds’ own market assumptions (unobservable inputs). These inputs are used in determining the value of each Fund’s investments and are summarized in the following fair value hierarchy:
| Level 1 – | Quoted prices in active markets for identical securities. |
| Level 2 – | Other significant observable inputs (including quoted prices for similar securities, interest rates, foreign exchange rates, and fair value estimates for foreign securities indices). |
| Level 3 – | Significant unobservable inputs (including the Funds’ own assumptions in determining fair value of investments). |
Fixed income securities including corporate, convertible and municipal bonds and notes, U.S. government agencies, U.S. Treasury obligations, U.S. Treasury inflation protected securities, sovereign issues, bank loans, convertible preferred securities and non-U.S. bonds are normally valued on the basis of quotes obtained from brokers and dealers or independent pricing services or sources. Independent pricing services typically use information provided by market makers or estimates of market values obtained from yield data relating to investments or securities with similar characteristics. The service providers’ internal models use inputs that are observable such as, among other things, issuer details, interest rates, yield curves, prepayment speeds, credit risks/spreads, default rates and quoted prices for similar assets. Securities that use similar valuation techniques and inputs as described above are categorized as Level 2 of the fair value hierarchy.
Fixed income securities purchased on a delayed-delivery basis are typically marked to market daily until settlement at the forward settlement date.
Mortgage and asset-backed securities are usually issued as separate tranches, or classes, of securities within each deal. These securities are also normally valued by pricing service providers that use broker dealer quotations or valuation estimates from their internal pricing models. The pricing models for these securities usually consider tranche-level attributes, estimated cash flows and market-based yield spreads for each tranche, current market data and incorporates deal collateral performance, as available.
Stripped mortgage-backed securities are usually structured with two different classes: one that receives substantially all interest payments (interest-only, or “IO” and/or high coupon rate with relatively low principal amount, or “IOette”), and the other that receives substantially all principal payments (principal-only, or “PO”) from a pool of mortgage loans. Little to no principal will be received at the maturity of an IO; as a result, periodic adjustments are recorded to reduce the cost of the security until maturity. These adjustments are included in interest income.
Mortgage and asset-backed securities that use similar valuation techniques and inputs as described above are categorized as Level 2 of the fair value hierarchy.
Repurchase agreements and reverse repurchase agreements are short-term investments, they are fair valued approximately at their principal amounts. Repurchase agreements and reverse repurchase agreements are categorized as Level 2 of the fair value hierarchy.
Financial derivative instruments, such as forward foreign currency contracts, options contracts, futures, or swap agreements, derive their value from underlying asset prices, indices, reference rates, and other inputs or a combination of these factors. These contracts are normally valued on the basis of broker dealer quotations or pricing service providers at the settlement price determined by the relevant exchange. Depending on the product and the terms of the transaction, the value of the derivative contracts can be estimated by a pricing service provider using a series of techniques, including simulation pricing models. The pricing models use inputs that are observed from actively quoted markets such as issuer details, indices, spreads, interest rates, curves, dividends and exchange rates. Derivatives that use similar valuation techniques and inputs as described above are categorized as Level 1 or Level 2 of the fair value hierarchy.
| Notes to Financial Statements | 147 | |||||
Table of Contents
Litman Gregory Funds Trust
NOTES TO FINANCIAL STATEMENTS – (Unaudited) (Continued)
The following tables provide the fair value measurements of applicable Fund assets and liabilities by level within the fair value hierarchy for each Fund as of June 30, 2023. These assets and liabilities are measured on a recurring basis.
Global Select Fund
| Description | Level 1 - Quoted prices in active markets for identical assets | Level 2 - Significant other observable inputs | Level 3 - Significant unobservable inputs | Total | ||||||||||||
Equity(a) | ||||||||||||||||
Common Stocks | $ | 117,282,501 | $ | — | $ | — | $ | 117,282,501 | ||||||||
Preferred Stock | 2,615,218 | — | — | 2,615,218 | ||||||||||||
|
|
|
|
|
|
|
| |||||||||
Total Equity | 119,897,719 | — | — | 119,897,719 | ||||||||||||
|
|
|
|
|
|
|
| |||||||||
Short-Term Investments | ||||||||||||||||
Repurchase Agreements | — | 6,046,041 | — | 6,046,041 | ||||||||||||
|
|
|
|
|
|
|
| |||||||||
Total Investments in Securities | $ | 119,897,719 | $ | 6,046,041 | $ | — | $ | 125,943,760 | ||||||||
|
|
|
|
|
|
|
| |||||||||
| (a) | See Fund’s Schedule of Investments in Securities for sector classifications. |
International Fund
| Description | Level 1 - Quoted prices in active markets for identical assets | Level 2 - Significant other observable inputs | Level 3 - Significant unobservable inputs | Total | ||||||||||||
Equity | ||||||||||||||||
Common Stocks | ||||||||||||||||
Argentina | $ | 2,786,179 | $ | — | $ | — | $ | 2,786,179 | ||||||||
Australia | 2,904,352 | — | — | 2,904,352 | ||||||||||||
Canada | 6,431,868 | — | — | 6,431,868 | ||||||||||||
China | 3,719,216 | — | — | 3,719,216 | ||||||||||||
Denmark | 7,566,514 | — | — | 7,566,514 | ||||||||||||
Finland | 5,943,995 | — | — | 5,943,995 | ||||||||||||
France | 19,383,220 | — | — | 19,383,220 | ||||||||||||
Germany | 51,861,443 | — | — | 51,861,443 | ||||||||||||
Ireland | 21,695,214 | — | — | 21,695,214 | ||||||||||||
Israel | 8,940,954 | — | — | 8,940,954 | ||||||||||||
Japan | 4,426,203 | — | — | 4,426,203 | ||||||||||||
Netherlands | 12,101,488 | — | — | 12,101,488 | ||||||||||||
Portugal | 4,379,061 | — | — | 4,379,061 | ||||||||||||
South Korea | 3,666,237 | — | — | 3,666,237 | ||||||||||||
Spain | 6,175,783 | — | — | 6,175,783 | ||||||||||||
Sweden | 7,040,275 | — | — | 7,040,275 | ||||||||||||
Switzerland | 3,582,605 | — | — | 3,582,605 | ||||||||||||
Taiwan | 4,640,197 | — | — | 4,640,197 | ||||||||||||
United Kingdom | 29,834,660 | — | — | 29,834,660 | ||||||||||||
United States | 12,230,474 | — | — | 12,230,474 | ||||||||||||
|
|
|
|
|
|
|
| |||||||||
Total Equity | 219,309,938 | — | — | 219,309,938 | ||||||||||||
|
|
|
|
|
|
|
| |||||||||
Short-Term Investments | ||||||||||||||||
Repurchase Agreements | — | 9,170,774 | — | 9,170,774 | ||||||||||||
|
|
|
|
|
|
|
| |||||||||
Total Short-Term Investments | — | 9,170,774 | — | 9,170,774 | ||||||||||||
|
|
|
|
|
|
|
| |||||||||
Total Investments in Securities | $ | 219,309,938 | $ | 9,170,774 | $ | — | $ | 228,480,712 | ||||||||
|
|
|
|
|
|
|
| |||||||||
| 148 | Litman Gregory Funds Trust | |||||
Table of Contents
Litman Gregory Funds Trust
NOTES TO FINANCIAL STATEMENTS – (Unaudited) (Continued)
Oldfield International Value Fund
| Description | Level 1 - Quoted prices in active markets for identical assets | Level 2 - Significant other observable inputs | Level 3 - Significant unobservable inputs | Total | ||||||||||||
Equity | ||||||||||||||||
Common Stocks | ||||||||||||||||
Brazil | $ | 1,773,262 | $ | — | $ | — | $ | 1,773,262 | ||||||||
China | 2,953,876 | — | — | 2,953,876 | ||||||||||||
France | 1,734,719 | — | — | 1,734,719 | ||||||||||||
Germany | 7,304,053 | — | — | 7,304,053 | ||||||||||||
Italy | 1,670,525 | — | — | 1,670,525 | ||||||||||||
Japan | 4,231,971 | — | — | 4,231,971 | ||||||||||||
Netherlands | 1,835,599 | — | — | 1,835,599 | ||||||||||||
South Korea | 3,508,829 | — | — | 3,508,829 | ||||||||||||
Sweden | 1,189,171 | — | — | 1,189,171 | ||||||||||||
United Kingdom | 6,917,794 | — | — | 6,917,794 | ||||||||||||
Preferred Stock | ||||||||||||||||
Germany | 1,684,149 | — | — | 1,684,149 | ||||||||||||
|
|
|
|
|
|
|
| |||||||||
Total Equity | 34,803,948 | — | — | 34,803,948 | ||||||||||||
|
|
|
|
|
|
|
| |||||||||
Total Investments in Securities | $ | 34,803,948 | $ | — | $ | — | $ | 34,803,948 | ||||||||
|
| |||||||||||||||
SBH Focused Small Value Fund
| Description | Level 1 - Quoted prices in active markets for identical assets | Level 2 - Significant other observable inputs | Level 3 - Significant unobservable inputs | Total | ||||||||||||
Equity(a) | ||||||||||||||||
Common Stocks | $ | 49,294,370 | $ | — | $ | — | $ | 49,294,370 | ||||||||
|
| |||||||||||||||
Total Equity | 49,294,370 | — | — | 49,294,370 | ||||||||||||
|
| |||||||||||||||
Total Investments in Securities | $ | 49,294,370 | $ | — | $ | — | $ | 49,294,370 | ||||||||
|
| |||||||||||||||
| (a) | See Fund’s Schedule of Investments in Securities for sector classifications. |
| Notes to Financial Statements | 149 | |||||
Table of Contents
Litman Gregory Funds Trust
NOTES TO FINANCIAL STATEMENTS – (Unaudited) (Continued)
Alternative Strategies Fund (Consolidated)
| Description | Level 1 - Quoted prices in active markets for identical assets | Level 2 - Significant other observable inputs | Level 3 - Significant unobservable inputs | Total | ||||||||||||
Equity(a) | ||||||||||||||||
Common Stocks | $ | 200,785,361 | $ | 38,798 | $ | 1,597,289 | ** | $ | 202,421,448 | |||||||
Preferred Stocks | 252,271 | — | 123,550 | ** | 375,821 | |||||||||||
Limited Partnerships | — | — | 805,549 | ** | 805,549 | |||||||||||
|
| |||||||||||||||
Total Equity | 201,037,632 | 38,798 | 2,526,388 | ** | 203,602,818 | |||||||||||
|
| |||||||||||||||
Rights/Warrants | 81,622 | 5,908 | — | 87,530 | ||||||||||||
Fixed Income | ||||||||||||||||
Asset-Backed Securities | — | 89,415,573 | — | 89,415,573 | ||||||||||||
Bank Loans | — | 14,576,684 | — | 14,576,684 | ||||||||||||
Convertible Bonds | — | 13,670,271 | — | 13,670,271 | ||||||||||||
Corporate Bonds | — | 183,565,624 | — | 183,565,624 | ||||||||||||
Government Securities & Agency Issue | — | 31,837,573 | — | 31,837,573 | ||||||||||||
Mortgage-Backed Securities | — | 132,176,095 | 362,765 | (1) | 132,538,860 | |||||||||||
|
| |||||||||||||||
Total Fixed Income | — | 465,241,820 | 362,765 | (1) | 465,604,585 | |||||||||||
|
| |||||||||||||||
Short-Term Investments | ||||||||||||||||
Repurchase Agreements | — | 54,849,733 | — | 54,849,733 | ||||||||||||
Treasury Bills | — | 154,857,097 | — | 154,857,097 | ||||||||||||
|
| |||||||||||||||
Total Short-Term Investments | — | 209,706,830 | — | 209,706,830 | ||||||||||||
|
| |||||||||||||||
Purchased Options | 110,405 | — | — | 110,405 | ||||||||||||
|
| |||||||||||||||
Total Investments in Securities in Assets | $ | 201,229,659 | $ | 674,993,356 | $ | 2,889,153 | ** | $ | 879,112,168 | |||||||
|
| |||||||||||||||
Short Sales | ||||||||||||||||
Common Stocks | (17,181,458 | ) | — | — | (17,181,458 | ) | ||||||||||
|
| |||||||||||||||
Total Short Sales | (17,181,458 | ) | — | — | (17,181,458 | ) | ||||||||||
|
| |||||||||||||||
Total Investments in Securities in Liabilities | $ | (17,181,458 | ) | $ | — | $ | — | $ | (17,181,458 | ) | ||||||
|
| |||||||||||||||
Unfunded Loan Commitments | $ | — | $ | (79,170 | ) | $ | — | $ | (79,170 | ) | ||||||
Other Financial Instruments* | ||||||||||||||||
Forward Foreign Currency Exchange Contracts | $ | (267,791 | ) | $ | — | $ | — | $ | (267,791 | ) | ||||||
Futures | 4,208,642 | — | — | 4,208,642 | ||||||||||||
Swaps - Credit Default | — | 2,437,866 | — | 2,437,866 | ||||||||||||
Swaps - Total Return | (253,325 | ) | — | — | (253,325 | ) | ||||||||||
Written Options | (26,651 | ) | — | — | (26,651 | ) | ||||||||||
| (a) | See Fund’s Schedule of Investments in Securities for sector classifications. |
| * | Other financial instruments are derivative instruments, such as futures, forward foreign currency exchange, swaps contracts and written options. Futures, forward foreign currency exchange and swap contracts are valued at the unrealized appreciation (depreciation) on the instrument, while written options are valued at fair value. |
| ** | Significant unobservable inputs were used in determining the value of portfolio securities for the Alternative Strategies Fund . |
| (1) | These securities were priced by a pricing service; however, the Advisor/Sub-Advisor used their fair value procedures based on other available inputs which more accurately reflected the current fair value of these securities. |
| 150 | Litman Gregory Funds Trust | |||||
Table of Contents
Litman Gregory Funds Trust
NOTES TO FINANCIAL STATEMENTS – (Unaudited) (Continued)
High Income Fund
| Description | Level 1 - Quoted prices in active markets for identical assets | Level 2 - Significant other observable inputs | Level 3 - Significant unobservable inputs | Total | ||||||||||||
Equity(a) | ||||||||||||||||
Common Stocks | $ | — | $ | 262 | $ | — | $ | 262 | ||||||||
Preferred Stocks | 1,499,463 | — | — | 1,499,463 | ||||||||||||
|
| |||||||||||||||
Total Equity | 1,499,463 | 262 | — | 1,499,725 | ||||||||||||
|
| |||||||||||||||
Fixed Income | ||||||||||||||||
Asset-Backed Securities | — | 15,730,003 | — | 15,730,003 | ||||||||||||
Bank Loans | — | 13,971,094 | — | 13,971,094 | ||||||||||||
Convertible Bonds | — | 41,125 | — | 41,125 | ||||||||||||
Corporate Bonds | — | 21,700,679 | 151,668 | ** | 21,852,347 | |||||||||||
Government Securities & Agency Issue | — | 9,606,499 | — | 9,606,499 | ||||||||||||
Mortgage-Backed Securities | — | 7,485,551 | — | 7,485,551 | ||||||||||||
Municipal Bond | — | 4,828 | — | 4,828 | ||||||||||||
|
| |||||||||||||||
Total Fixed Income | — | 68,539,779 | 151,668 | ** | 68,691,447 | |||||||||||
|
| |||||||||||||||
Short-Term Investments | ||||||||||||||||
Money Market Funds | 2,346,424 | — | — | 2,346,424 | ||||||||||||
Repurchase Agreements | — | 6,743,689 | — | 6,743,689 | ||||||||||||
Treasury Bills | — | 98,546 | — | 98,546 | ||||||||||||
|
| |||||||||||||||
Total Short-Term Investments | 2,346,424 | 6,842,235 | — | 9,188,659 | ||||||||||||
|
| |||||||||||||||
Purchased Options | 5,574 | — | — | 5,574 | ||||||||||||
|
| |||||||||||||||
Total Investments in Securities in Assets | $ | 3,851,461 | $ | 75,382,276 | $ | 151,668 | ** | $ | 79,385,405 | |||||||
|
| |||||||||||||||
Unfunded Loan Commitments | $ | — | $ | (3,299 | ) | $ | — | $ | (3,299 | ) | ||||||
Other Financial Instruments* | ||||||||||||||||
Forward Foreign Currency Exchange Contracts | $ | (2,706 | ) | $ | — | $ | — | $ | (2,706 | ) | ||||||
Futures | (46,517 | ) | — | — | (46,517 | ) | ||||||||||
Swaps - Interest Rate | — | (115,255 | ) | — | (115,255 | ) | ||||||||||
Swaps - Credit Default | — | (19,441 | ) | — | (19,441 | ) | ||||||||||
Written Options | (39,496 | ) | — | — | (39,496 | ) | ||||||||||
| (a) | See Fund’s Schedule of Investments in Securities for sector classifications. |
| * | Other financial instruments are derivative instruments, such as futures, forward foreign currency exchange, swaps contracts and written options. Futures, forward foreign currency exchange and swap contracts are valued at the unrealized appreciation (depreciation) on the instrument, while written options are valued at fair value. |
| ** | Significant unobservable inputs were used in determining the value of portfolio securities for the High Income Fund . |
Dolan McEniry Corporate Bond Fund
| Description | Level 1 - Quoted prices in active markets for identical assets | Level 2 - Significant other observable inputs | Level 3 - Significant unobservable inputs | Total | ||||||||||||
Fixed Income | ||||||||||||||||
Corporate Bonds | $ | — | $ | 144,115,129 | $ | — | $ | 144,115,129 | ||||||||
Government Securities & Agency Issue | — | 3,087,066 | — | 3,087,066 | ||||||||||||
|
| |||||||||||||||
Total Fixed Income | — | 147,202,195 | — | 147,202,195 | ||||||||||||
|
| |||||||||||||||
Total Investments in Securities | $ | — | $ | 147,202,195 | $ | — | $ | 147,202,195 | ||||||||
|
| |||||||||||||||
| Notes to Financial Statements | 151 | |||||
Table of Contents
Litman Gregory Funds Trust
NOTES TO FINANCIAL STATEMENTS – (Unaudited) (Continued)
DBi Managed Futures Strategy ETF (Consolidated)
| Description | Level 1 - Quoted prices in active markets for identical assets | Level 2 - Significant other observable inputs | Level 3 - Significant unobservable inputs | Total | ||||||||||||
Short-Term Investments | ||||||||||||||||
Treasury Bills | $ | — | $ | 539,625,107 | $ | — | $ | 539,625,107 | ||||||||
|
| |||||||||||||||
Total Investments in Securities | $ | — | $ | 539,625,107 | $ | — | $ | 539,625,107 | ||||||||
|
| |||||||||||||||
Other Financial Instruments* | ||||||||||||||||
Futures | $ | 16,306,755 | $ | — | $ | — | $ | 16,306,755 | ||||||||
|
| |||||||||||||||
* Other financial instruments are derivative instruments, such as futures, forward foreign currency exchange, swaps contracts and written options. Futures, forward foreign currency exchange and swap contracts are valued at the unrealized appreciation (depreciation) on the instrument, while written options are valued at fair value.
|
| |||||||||||||||
DBi Hedge Strategy ETF
| Description | Level 1 - Quoted prices in active markets for identical assets | Level 2 - Significant other observable inputs | Level 3 - Significant unobservable inputs | Total | ||||||||||||
Short-Term Investments | ||||||||||||||||
Short-Term Investments | $ | — | $ | 24,586,677 | $ | — | $ | 24,586,677 | ||||||||
|
| |||||||||||||||
Total Investments in Securities | $ | — | $ | 24,586,677 | $ | — | $ | 24,586,677 | ||||||||
|
| |||||||||||||||
Other Financial Instruments* | ||||||||||||||||
Futures | $ | 255,352 | $ | — | $ | — | $ | 255,352 | ||||||||
|
| |||||||||||||||
| * | Other financial instruments are derivative instruments, such as futures, forward foreign currency exchange, swaps contracts and written options. Futures, forward foreign currency exchange and swap contracts are valued at the unrealized appreciation (depreciation) on the instrument, while written options are valued at fair value. |
RBA Responsible Global Allocation ETF
| Description | Level 1 - Quoted prices in active markets for identical assets | Level 2 - Significant other observable inputs | Level 3 - Significant unobservable inputs | Total | ||||||||||||
Equity | ||||||||||||||||
Exchange-Traded Funds | $ | 8,198,869 | $ | — | $ | — | $ | 8,198,869 | ||||||||
|
| |||||||||||||||
Total Equity | 8,198,869 | — | — | 8,198,869 | ||||||||||||
|
| |||||||||||||||
Total Investments in Securities | $ | 8,198,869 | $ | — | $ | — | $ | 8,198,869 | ||||||||
|
| |||||||||||||||
Berkshire Dividend Growth ETF | ||||||||||||||||
| Description | Level 1 - Quoted prices in active markets for identical assets | Level 2 - Significant other observable inputs | Level 3 - Significant unobservable inputs | Total | ||||||||||||
Equity(a) | ||||||||||||||||
Common Stocks | $ | 737,683 | $ | — | $ | — | $ | 737,683 | ||||||||
|
| |||||||||||||||
Total Equity | 737,683 | — | — | 737,683 | ||||||||||||
|
| |||||||||||||||
Total Investments in Securities | $ | 737,683 | $ | — | $ | — | $ | 737,683 | ||||||||
|
| |||||||||||||||
| (a) | See Fund’s Schedule of Investments in Securities for sector classifications. |
Note 7 – Commitments and Contingencies
The Funds may make commitments pursuant to bridge loan facilities. Such commitments typically remain off balance sheet as it is more likely than not, based on good faith judgement of the Advisor, that such bridge facilities will not ever fund. As of June 30, 2023, there was no outstanding bridge facility commitments.
| 152 | Litman Gregory Funds Trust | |||||
Table of Contents
Litman Gregory Funds Trust
NOTES TO FINANCIAL STATEMENTS – (Unaudited) (Continued)
Note 8 – Other Derivative Information
At June 30, 2023, the Funds are invested in derivative contracts which are reflected in the Statements of Assets and Liabilities as follows:
| Alternative Strategies Fund (Consolidated) | ||||||||||||||||||||
| Derivative Assets | Derivative Liabilities | |||||||||||||||||||
| Risk | Statements of Assets and Liabilities Location | Fair Value Amount | Statements of Assets and Liabilities Location | Fair Value Amount | ||||||||||||||||
Currency | Unrealized gain on forward foreign currency exchange contracts | $ | 56,722 | Unrealized loss on forward foreign currency exchange contracts | $ | (324,513 | ) | |||||||||||||
| Unrealized gain on futures contracts* | 2,891,217 | Unrealized loss on futures contracts* | — | |||||||||||||||||
Commodity | Unrealized gain on futures contracts* | 335,449 | Unrealized loss on futures contracts* | (359,450 | ) | |||||||||||||||
Interest rate | Unrealized gain on futures contracts* | 2,163,869 | Unrealized loss on futures contracts* | (1,428,380 | ) | |||||||||||||||
Credit | Unrealized gain on swap contracts** | 8,505,074 | Unrealized loss on swap contracts** | (6,067,208 | ) | |||||||||||||||
Equity | Unrealized gain on swap contracts | — | Unrealized loss on swap contracts | (253,325 | ) | |||||||||||||||
| Unrealized gain on futures contracts* | 714,845 | Unrealized loss on futures contracts* | (108,908 | ) | ||||||||||||||||
| Investments in securities(1) | 110,405 | Written options | (26,651 | ) | ||||||||||||||||
|
| |||||||||||||||||||
| Total | $ | 14,777,581 | $ | (8,568,435 | ) | |||||||||||||||
|
| |||||||||||||||||||
|
* Includes cumulative appreciation/depreciation on futures contracts described previously. Only
** Includes cumulative appreciation/depreciation on centrally cleared swaps.
(1) The Consolidated Statements of Assets and Liabilities location for “Purchased Options” is
|
| ||||||||||||||||||
| High Income Fund | ||||||||||||||||||||
| Derivative Assets | Derivative Liabilities | |||||||||||||||||||
| Risk | Statements of Assets and Liabilities Location | Fair Value Amount | Statements of Assets and Liabilities Location | Fair Value Amount | ||||||||||||||||
Currency | Unrealized gain on forward foreign currency exchange contracts | $ | — | Unrealized loss on forward foreign currency exchange contracts | $ | (2,706 | ) | |||||||||||||
Interest rate | Unrealized gain on swap contracts | — | Unrealized loss on swap contracts** | (115,255 | ) | |||||||||||||||
| Unrealized gain on futures contracts* | — | Unrealized loss on futures contracts* | (46,517 | ) | ||||||||||||||||
| Investments in securities(1) | 5,087 | Written options | — | |||||||||||||||||
Credit | Unrealized gain on swap contracts | — | Unrealized loss on swap contracts** | (19,441 | ) | |||||||||||||||
| Investments in securities(1) | 487 | Written options | — | |||||||||||||||||
Equity | Investments in securities(1) | — | Written options | (39,496 | ) | |||||||||||||||
|
| |||||||||||||||||||
| Total | $ | 5,574 | $ | (223,415 | ) | |||||||||||||||
|
| |||||||||||||||||||
|
* Includes cumulative appreciation/depreciation on futures contracts described previously. Only
** Includes cumulative appreciation/depreciation on centrally cleared swaps.
(1) The Statements of Assets and Liabilities location for “Purchased Options” is “Investments in |
| ||||||||||||||||||
| Notes to Financial Statements | 153 | |||||
Table of Contents
Litman Gregory Funds Trust
NOTES TO FINANCIAL STATEMENTS – (Unaudited) (Continued)
| DBi Managed Futures Strategy ETF (Consolidated) | ||||||||||||||||||||
| Derivative Assets | Derivative Liabilities | |||||||||||||||||||
| Risk | Statements of Assets and Liabilities Location | Fair Value Amount | Statements of Assets and Liabilities Location | Fair Value Amount | ||||||||||||||||
Commodity | Unrealized gain on futures contracts* | $ | 1,690,835 | Unrealized loss on futures contracts* | $ | (1,399,538 | ) | |||||||||||||
Currency | Unrealized gain on futures contracts* | 13,877,633 | Unrealized loss on futures contracts* | — | ||||||||||||||||
Interest rate | Unrealized gain on futures contracts* | 1,918,395 | Unrealized loss on futures contracts* | (1,661,123 | ) | |||||||||||||||
Equity | Unrealized gain on futures contracts* | 1,938,347 | Unrealized loss on futures contracts* | (57,794 | ) | |||||||||||||||
|
| |||||||||||||||||||
| Total | $ | 19,425,210 | $ | (3,118,455 | ) | |||||||||||||||
|
| |||||||||||||||||||
|
* Includes cumulative appreciation/depreciation on futures contracts described previously. Only |
| ||||||||||||||||||
| DBi Hedge Strategy ETF | ||||||||||||||||||||
| Derivative Assets | Derivative Liabilities | |||||||||||||||||||
| Risk | Statements of Assets and Liabilities Location | Fair Value Amount | Statements of Assets and Liabilities Location | Fair Value Amount | ||||||||||||||||
Interest rate | Unrealized gain on futures contracts* | $ | 89,573 | Unrealized loss on futures contracts* | $ | (18,888 | ) | |||||||||||||
| Unrealized gain on futures contracts* | 196,333 | Unrealized loss on futures contracts* | (11,666 | ) | ||||||||||||||||
|
| |||||||||||||||||||
| Total | $ | 285,906 | $ | (30,554 | ) | |||||||||||||||
|
| |||||||||||||||||||
|
* Includes cumulative appreciation/depreciation on futures contracts described previously. Only |
| ||||||||||||||||||
For the six months ended June 30, 2023, the effect of derivative contracts in the Funds’ Statements of Operations were as follows:
| Alternative Strategies Fund (Consolidated) | ||||||||||||||||||
| Statements of Operations | ||||||||||||||||||
| Risk | Derivative Type | Net Realized Gain (Loss) | Net Change in Unrealized Gain (Loss) | Average Notional Amount | ||||||||||||||
Currency | Forward foreign currency exchange contracts | $ | (489,788 | ) | $ | (60,061 | ) | 38,263,594 | (a) | |||||||||
| Future contracts | 1,522,243 | 2,730,130 | 49,027,076 | (b) | ||||||||||||||
Commodity | Future contracts | (2,687,759 | ) | 91,114 | 16,344,042 | (b) | ||||||||||||
Interest rate | Future contracts | (4,633,848 | ) | (724,874 | ) | 373,389,452 | (b) | |||||||||||
| Purchased option contracts | 299,124 | — | 63 | (d) | ||||||||||||||
| Written option contracts | (158,372 | ) | — | 89 | (d) | |||||||||||||
Credit | Swap contracts | 4,539,030 | (797,875 | ) | 945,625,000 | (b)(c) | ||||||||||||
Equity | Swap contracts | (1,057,442 | ) | (1,274,235 | ) | 53,391,001 | (b)(c) | |||||||||||
| Future contracts | (4,027,973 | ) | 1,144,218 | 58,072,378 | (b) | |||||||||||||
| Purchased option contracts | (507,033 | ) | 6,150 | 2,529 | (d) | |||||||||||||
| Written option contracts | (34,842 | ) | (3,407 | ) | 236 | (d) | ||||||||||||
|
| |||||||||||||||||
| Total | $ | (7,236,660 | ) | $ | 1,111,160 | |||||||||||||
|
| |||||||||||||||||
| (a) | Average notional values are based on the average of monthly end contract values for the period ended June 30, 2023. |
| (b) | Average notional values are based on the average of monthly end notional balances for the period ended June 30, 2023. |
| (c) | Notional amount is denoted in local currency. |
| (d) | Average contracts are based on the average of monthly end contracts for the period ended June 30, 2023. |
| 154 | Litman Gregory Funds Trust | |||||
Table of Contents
Litman Gregory Funds Trust
NOTES TO FINANCIAL STATEMENTS – (Unaudited) (Continued)
| High Income Fund | ||||||||||||||||||
| Statements of Operations | ||||||||||||||||||
| Risk | Derivative Type | Net Realized Gain (Loss) | Net Change in Unrealized Gain (Loss) | Average Notional Amount | ||||||||||||||
Currency | Forward foreign currency exchange contracts | $ | (3,259 | ) | $ | (4,186 | ) | 398,123 | (a) | |||||||||
Interest rate | Swap contracts | (126,816 | ) | 86,381 | 2,800,000 | (b)(c) | ||||||||||||
| Future contracts | (8,389 | ) | 4,664 | 4,166,098 | (b) | |||||||||||||
| Purchased option contracts | (3,050 | ) | (21,167 | ) | 7,266,667 | (b) | ||||||||||||
Credit | Swap contracts | (17,294 | ) | (16,971 | ) | 1,658,333 | (b)(c) | |||||||||||
| Purchased option contracts | — | (872 | ) | 150,000 | (b) | |||||||||||||
Equity | Purchased option contracts | (21,483 | ) | — | 1 | (d) | ||||||||||||
| Written option contracts | 966,968 | (34,316 | ) | 45 | (d) | |||||||||||||
|
|
|
|
|
|
|
|
| ||||||||||
| Total | $ | 786,677 | $ | 13,533 | ||||||||||||||
|
| |||||||||||||||||
(a) Average notional values are based on the average of monthly end contract values for the period ended June 30, 2023.
(b) Average notional values are based on the average of monthly end notional balances for the period ended June 30, 2023.
(c) Notional amount is denoted in local currency.
(d) Average contracts are based on the average of monthly end contracts for the period ended June 30, 2023. |
| |||||||||||||||||
| DBi Managed Futures Strategy ETF (Consolidated) | ||||||||||||||||||
| Statements of Operations | ||||||||||||||||||
| Risk | Derivative Type | Net Realized Gain (Loss) | Net Change in Unrealized Gain (Loss) | Average Notional Amount(a) | ||||||||||||||
Commodity | Future contracts | $ | (25,675,615 | ) | $ | 1,829,073 | 114,454,030 | |||||||||||
Currency | Future contracts | 10,979,851 | 12,447,677 | 311,378,368 | ||||||||||||||
Interest rate | Future contracts | (24,615,313 | ) | (5,053,945 | ) | 1,046,575,313 | ||||||||||||
Equity | Future contracts | (31,983,446 | ) | 1,281,670 | 307,333,362 | |||||||||||||
|
| |||||||||||||||||
| Total | $ | (71,294,523 | ) | $ | 10,504,475 | |||||||||||||
|
| |||||||||||||||||
(a) Average notional values are based on the average of monthly end notional balances for the period ended June 30, 2023. |
| |||||||||||||||||
| DBi Hedge Strategy ETF | ||||||||||||||||||
| Statements of Operations | ||||||||||||||||||
| Risk | Derivative Type | Net Realized Gain (Loss) | Net Change in Unrealized Gain (Loss) | Average Notional Amount(a) | ||||||||||||||
Currency | Future contracts | $ | (135,863 | ) | $ | 8,747 | 871,185 | |||||||||||
Interest rate | Future contracts | 103,933 | 68,229 | 16,406,387 | ||||||||||||||
Equity | Future contracts | 293,209 | 376,762 | 9,737,048 | ||||||||||||||
|
| |||||||||||||||||
| Total | $ | 261,279 | $ | 453,738 | ||||||||||||||
|
| |||||||||||||||||
(a) Average notional values are based on the average of monthly end notional balances for the period ended June 30, 2023. |
| |||||||||||||||||
The Funds are subject to various Master Netting Arrangements, which govern the terms of certain transactions with select counterparties. The Master Netting Arrangements allow the Funds to close out and net their total exposure to a counterparty in the event of a default with respect to all the transactions governed under a single agreement with a counterparty. The Master Netting Arrangements also specify collateral posting arrangements at pre-arranged exposure levels. Under the Master Netting Arrangements, collateral is routinely transferred if the total net exposure to certain transactions (net of existing collateral already in place) governed under the relevant Master Netting Arrangement with a counterparty in a given account exceeds a specified threshold depending on the counterparty and the type of Master Netting Arrangement.
| Notes to Financial Statements | 155 | |||||
Table of Contents
Litman Gregory Funds Trust
NOTES TO FINANCIAL STATEMENTS – (Unaudited) (Continued)
At June 30, 2023, Global Select Fund, International Fund, Alternative Strategies Fund, and High Income Fund had investments in repurchase agreements with a gross value of $6,046,041, $9,170,774, $54,849,733, and $6,743,689, respectively, which are reflected as repurchase agreements on the Statements of Assets and Liabilities. The value of the related collateral exceeded the value of the repurchase agreements at June 30, 2023.
The following tables represent the disclosure for derivative instruments related to offsetting assets and liabilities for each of the Funds as of June 30, 2023:
| Alternative Strategies Fund (Consolidated) | ||||||||||||||||||||||||||||||||||||||||||||||||||||||||
| Derivative Assets | Derivative Liabilities | |||||||||||||||||||||||||||||||||||||||||||||||||||||||
| Counterparty | Purchased Options | Futures(1) | Swaps(2) | Forward Currency Contracts | Total | Futures(1) | Swaps(2) | Forward Currency Contracts | Written Options | Total | Net Derivative Asset (Liabilities) | Collateral (Received) Pledged(3) | Net Amount | |||||||||||||||||||||||||||||||||||||||||||
Bank of America N.A. | $ | — | $ | — | $ | — | $ | 33,735 | $ | 33,735 | $ | — | $ | — | $ | (6,712 | ) | $ | — | $ | (6,712 | ) | $ | 27,023 | $ | — | $ | 27,023 | ||||||||||||||||||||||||||||
Barclays Bank Plc | — | — | — | 10,307 | 10,307 | — | — | — | — | — | 10,307 | — | 10,307 | |||||||||||||||||||||||||||||||||||||||||||
Citigroup Global Markets, Inc. | — | 885,822 | — | — | 885,822 | (764,185 | ) | — | — | — | (764,185 | ) | 121,637 | — | 121,637 | |||||||||||||||||||||||||||||||||||||||||
Goldman Sachs & Co. | — | — | — | — | — | — | — | (670 | ) | — | (670 | ) | (670 | ) | 670 | — | ||||||||||||||||||||||||||||||||||||||||
JPMorgan Chase Bank N.A. | — | 76,106 | — | 8,048 | 84,154 | (571,483 | ) | (253,325 | ) | (26,226 | ) | — | (851,034 | ) | (766,880 | ) | 170,000 | (596,880 | ) | |||||||||||||||||||||||||||||||||||||
Morgan Stanley & Co. | 110,405 | — | — | 4,632 | 115,037 | — | — | (290,905 | ) | (26,651 | ) | (317,556 | ) | (202,519 | ) | 202,519 | — | |||||||||||||||||||||||||||||||||||||||
StoneX Financial, Inc. | — | 5,143,452 | — | — | 5,143,452 | (561,070 | ) | — | — | — | (561,070 | ) | 4,582,382 | — | 4,582,382 | |||||||||||||||||||||||||||||||||||||||||
|
|
|
|
|
|
|
|
|
|
|
| |||||||||||||||||||||||||||||||||||||||||||||
Total | $ | 110,405 | $ | 6,105,380 | $ | — | $ | 56,722 | $ | 6,272,507 | $ | (1,896,738 | ) | $ | (253,325 | ) | $ | (324,513 | ) | $ | (26,651 | ) | $ | (2,501,227 | ) | $ | 3,771,280 | $ | 373,189 | $ | 4,144,469 | |||||||||||||||||||||||||
|
|
|
|
|
|
|
|
|
|
|
|
|
|
|
|
|
|
|
|
|
|
|
|
|
|
|
|
| ||||||||||||||||||||||||||||
| (1) | Includes cumulative appreciation (depreciation) of futures contracts as reported in the Consolidated Schedule of Investments in Futures. Only current day’s variation margin is reported within the Consolidated Statements of Assets and Liabilities. |
| (2) | Does not include the unrealized appreciation (depreciation) of centrally cleared swaps as reported in the Consolidated Schedule of Investments in Swaps. Only the variation margin is reported within the Consolidated Statement of Assets and Liabilities. |
| (3) | The actual collateral pledged (received) may be more than the amounts shown. |
| High Income Fund | ||||||||||||||||||||||||||||||||||||||||||||||||||||||||
| Derivative Assets | Derivative Liabilities | |||||||||||||||||||||||||||||||||||||||||||||||||||||||
| Counterparty | Purchased Options | Futures(1) | Swaps(2) | Forward Currency Contracts | Total | Futures(1) | Swaps(2) | Forward Currency Contracts | Written Options | Total | Net Derivative Asset (Liabilities) | Collateral (Received) Pledged | Net Amount | |||||||||||||||||||||||||||||||||||||||||||
Bank of America N.A. | $ | 925 | $ | — | $ | — | $ | — | $ | 925 | $ | — | $ | — | $ | (802 | ) | $ | — | $ | (802 | ) | $ | 123 | $ | — | $ | 123 | ||||||||||||||||||||||||||||
Barclays Bank Plc | 2,337 | — | — | — | 2,337 | — | — | (914 | ) | — | (914 | ) | 1,423 | — | 1,423 | |||||||||||||||||||||||||||||||||||||||||
Goldman Sachs & Co. | 2,004 | — | — | — | 2,004 | (46,517 | ) | — | (462 | ) | — | (46,979 | ) | (44,975 | ) | 44,975 | — | |||||||||||||||||||||||||||||||||||||||
JPMorgan Chase Bank N.A. | — | — | — | — | — | — | — | (528 | ) | — | (528 | ) | (528 | ) | — | (528 | ) | |||||||||||||||||||||||||||||||||||||||
Morgan Stanley & Co. | 308 | — | — | — | 308 | — | — | — | — | — | 308 | — | 308 | |||||||||||||||||||||||||||||||||||||||||||
UBS Securities LLC | — | — | — | — | — | — | — | — | (39,496 | ) | (39,496 | ) | (39,496 | ) | — | (39,496 | ) | |||||||||||||||||||||||||||||||||||||||
|
|
|
|
|
|
|
|
|
|
|
| |||||||||||||||||||||||||||||||||||||||||||||
Total | $ | 5,574 | $ | — | $ | — | $ | — | $ | 5,574 | $ | (46,517 | ) | $ | — | $ | (2,706 | ) | $ | (39,496 | ) | $ | (88,719 | ) | $ | (83,145 | ) | $ | 44,975 | $ | (38,170 | ) | ||||||||||||||||||||||||
|
|
|
|
|
|
|
|
|
|
|
|
|
|
|
|
|
|
|
|
|
|
|
|
|
|
|
|
| ||||||||||||||||||||||||||||
| (1) | Includes cumulative appreciation (depreciation) of futures contracts as reported in the Schedule of Investments in Futures. Only current day’s variation margin is reported within the Statements of Assets and Liabilites. |
| (2) | Does not include the unrealized appreciation (depreciation) of centrally cleared swaps as reported in the Schedule of Investments in Swaps. Only the variation margin is reported within the Statement of Assets and Liabilities. |
| DBi Managed Futures Strategy ETF (Consolidated) | ||||||||||||||||||||||||||||||||||||||||||||||||||||||||
| Derivative Assets | Derivative Liabilities | |||||||||||||||||||||||||||||||||||||||||||||||||||||||
| Counterparty | Purchased Options | Futures(1) | Swaps | Forward Currency Contracts | Total | Futures(1) | Swaps | Forward Currency Contracts | Written Options | Total | Net Derivative Asset (Liabilities) | Collateral (Received) Pledged | Net Amount | |||||||||||||||||||||||||||||||||||||||||||
Societe Generale | $ | — | $ | 19,425,210 | $ | — | $ | — | $ | 19,425,210 | $ | (3,118,455 | ) | $ | — | $ | — | $ | — | $ | (3,118,455 | ) | $ | 16,306,755 | $ | — | $ | 16,306,755 | ||||||||||||||||||||||||||||
|
|
|
|
|
|
|
|
|
|
|
| |||||||||||||||||||||||||||||||||||||||||||||
Total | $ | — | $ | 19,425,210 | $ | — | $ | — | $ | 19,425,210 | $ | (3,118,455 | ) | $ | — | $ | — | $ | — | $ | (3,118,455 | ) | $ | 16,306,755 | $ | — | $ | 16,306,755 | ||||||||||||||||||||||||||||
|
|
|
|
|
|
|
|
|
|
|
|
|
|
| ||||||||||||||||||||||||||||||||||||||||||
| (1) | Includes cumulative appreciation (depreciation) of futures contracts as reported in the Consolidated Schedule of Investments in Futures. Only current day’s variation margin is reported within the Consolidated Statements of Assets and Liabilites. |
| 156 | Litman Gregory Funds Trust | |||||
Table of Contents
Litman Gregory Funds Trust
NOTES TO FINANCIAL STATEMENTS – (Unaudited) (Continued)
| DBi Hedge Strategy ETF | ||||||||||||||||||||||||||||||||||||||||||||||||||||||||
| Derivative Assets | Derivative Liabilities | |||||||||||||||||||||||||||||||||||||||||||||||||||||||
| Counterparty | Purchased Options | Futures(1) | Swaps | Forward Currency Contracts | Total | Futures(1) | Swaps | Forward Currency Contracts | Written Options | Total | Net Derivative Asset (Liabilities) | Collateral (Received) Pledged | Net Amount | |||||||||||||||||||||||||||||||||||||||||||
Mizuho Securities | $ | — | $ | 285,906 | $ | — | $ | — | $ | 285,906 | $ | (30,554 | ) | $ | — | $ | — | $ | — | $ | (30,554 | ) | $ | 255,352 | $ | — | $ | 255,352 | ||||||||||||||||||||||||||||
|
|
|
|
|
|
|
|
|
|
|
| |||||||||||||||||||||||||||||||||||||||||||||
Total | $ | — | $ | 285,906 | $ | — | $ | — | $ | 285,906 | $ | (30,554 | ) | $ | — | $ | — | $ | — | $ | (30,554 | ) | $ | 255,352 | $ | — | $ | 255,352 | ||||||||||||||||||||||||||||
|
|
|
|
|
|
|
|
|
|
|
|
|
|
| ||||||||||||||||||||||||||||||||||||||||||
| (1) | Includes cumulative appreciation (depreciation) of futures contracts as reported in the Schedule of Investments in Futures. Only current day’s variation margin is reported within the Statements of Assets and Liabilites. |
Note 9 – Income Taxes and Distributions to Shareholders
As of December 31, 2022, the components of accumulated earnings (losses) for income tax purposes were as follows:
| Global Select Fund | International Fund | Oldfield International Value Fund | SBH Focused Small Value Fund | |||||||||||||
Tax cost of Investments and derivatives | $ | 121,237,219 | $ | 215,405,256 | $ | 30,948,161 | $ | 43,150,883 | ||||||||
Gross Tax Unrealized Appreciation | 11,865,133 | 19,262,537 | 2,932,134 | 7,684,408 | ||||||||||||
Gross Tax Unrealized Depreciation | (9,197,968 | ) | (31,038,754 | ) | (2,052,220 | ) | (3,209,977 | ) | ||||||||
|
| |||||||||||||||
Net Tax unrealized appreciation (depreciation) on investments and derivatives | 2,667,165 | (11,776,217 | ) | 879,914 | 4,474,431 | |||||||||||
Net Tax unrealized appreciation (depreciation) on foreign currency | (25,345 | ) | (188,839 | ) | (4,226 | ) | — | |||||||||
|
| |||||||||||||||
Net Tax unrealized appreciation (depreciation) | 2,641,820 | (11,965,056 | ) | 875,688 | 4,474,431 | |||||||||||
|
| |||||||||||||||
Undistributed Ordinary Income | — | — | — | 57,623 | ||||||||||||
|
| |||||||||||||||
Undistributed Long-Term Capital Gains | — | — | — | — | ||||||||||||
|
| |||||||||||||||
Capital Loss Carry Forward | — | (39,316,927 | ) | (1,268,682 | ) | (1,442,338 | ) | |||||||||
|
| |||||||||||||||
Late Year Ordinary Loss Deferral | — | (20,967 | ) | (802 | ) | — | ||||||||||
|
| |||||||||||||||
Other Accumulated Gains | — | — | — | — | ||||||||||||
|
| |||||||||||||||
Total accumulated gain/(loss) | $ | 2,641,820 | $ | (51,302,950 | ) | $ | (393,796 | ) | $ | 3,089,716 | ||||||
|
| |||||||||||||||
| Alternative Strategies Fund (Consolidated) | High Income Fund | Dolan McEniry Corporate Bond Fund | ||||||||||||||
Tax cost of Investments and derivatives | $ | 1,091,911,405 | $ | 111,928,203 | $ | 101,898,156 | ||||||||||
Gross Tax Unrealized Appreciation | 56,409,709 | 121,217 | 29,551 | |||||||||||||
Gross Tax Unrealized Depreciation | (177,860,886 | ) | (10,423,938 | ) | (8,795,164 | ) | ||||||||||
|
|
|
|
|
| |||||||||||
Net Tax unrealized appreciation (depreciation) on investments and derivatives | (121,451,177 | ) | (10,302,721 | ) | (8,765,613 | ) | ||||||||||
Net Tax unrealized appreciation (depreciation) on foreign currency | (24,694 | ) | (474 | ) | — | |||||||||||
|
|
|
|
|
| |||||||||||
Net Tax unrealized appreciation (depreciation) | (121,475,871 | ) | (10,303,195 | ) | (8,765,613 | ) | ||||||||||
|
|
|
|
|
| |||||||||||
Undistributed Ordinary Income | — | — | 6,594 | |||||||||||||
|
|
|
|
|
| |||||||||||
Undistributed Long-Term Capital Gains | — | — | — | |||||||||||||
|
|
|
|
|
| |||||||||||
Capital Loss Carry Forward | (29,517,147 | ) | (1,791,217 | ) | (1,197,470 | ) | ||||||||||
|
|
|
|
|
| |||||||||||
Late Year Ordinary Loss Deferral | (3,444,575 | ) | (491 | ) | — | |||||||||||
|
|
|
|
|
| |||||||||||
Straddle Loss Deferral and Reversal | (3,714,779 | ) | — | — | ||||||||||||
|
|
|
|
|
| |||||||||||
Other Accumulated Losses | (54,035 | ) | (5,701 | ) | — | |||||||||||
|
|
|
|
|
| |||||||||||
Total accumulated gain/(loss) | $ | (158,206,407 | ) | $ | (12,100,604 | ) | $ | (9,956,489 | ) | |||||||
|
|
|
|
|
| |||||||||||
| Notes to Financial Statements | 157 | |||||
Table of Contents
Litman Gregory Funds Trust
NOTES TO FINANCIAL STATEMENTS – (Unaudited) (Continued)
| DBi Managed Futures Strategy ETF (Consolidated) | DBi Hedge Strategy ETF | RBA Responsible Global Allocation ETF | ||||||||||
Tax cost of Investments and derivatives | $ | — | $ | — | $ | 9,088,740 | ||||||
Gross Tax Unrealized Appreciation | 161,026 | — | — | |||||||||
Gross Tax Unrealized Depreciation | (1,698,803 | ) | — | (634,661 | ) | |||||||
|
| |||||||||||
Net Tax unrealized appreciation (depreciation) on investments and derivatives | (1,537,777 | ) | — | (634,661 | ) | |||||||
Net Tax unrealized appreciation (depreciation) on foreign currency | — | — | — | |||||||||
|
| |||||||||||
Net Tax unrealized appreciation (depreciation) | (1,537,777 | ) | — | (634,661 | ) | |||||||
|
| |||||||||||
Undistributed Ordinary Income | — | — | 6,676 | |||||||||
|
| |||||||||||
Undistributed Long-Term Capital Gains | — | — | — | |||||||||
|
| |||||||||||
Capital Loss Carry Forward | — | (1,204,886 | ) | (112,773 | ) | |||||||
|
| |||||||||||
Late Year Ordinary Loss Deferral | (32,047,761 | ) | (249,319 | ) | — | |||||||
|
| |||||||||||
Post-October Capital Losses Deferral | (50,267,778 | ) | — | — | ||||||||
|
| |||||||||||
Other Accumulated Gains | — | — | — | |||||||||
|
| |||||||||||
Total accumulated gain/(loss) | $ | (83,853,316 | ) | $ | (1,454,205 | ) | $ | (740,758 | ) | |||
|
| |||||||||||
The difference between book-basis and tax-basis unrealized appreciation (depreciation) is attributable primarily to wash sales, premium amortization accruals, forward foreign currency exchange contracts mark to market, futures contracts mark to market, options contracts mark to market, swap contracts mark to market, passive foreign investment company adjustments, partnership basis adjustments, straddle loss deferral, organizational expenses, constructive sales, and non REIT ROC basis adjustments.
The capital loss carry forwards for each Fund were as follows:
| International Fund | Oldfield International Value Fund | SBH Focused Small Value Fund | Alternative Strategies Fund (Consolidated) | High Income Fund | ||||||||||||||||
Capital Loss Carryforwards | ||||||||||||||||||||
Perpetual Short-Term | $ | (28,027,653 | ) | $ | (148,601 | ) | $ | (147,922 | ) | $ | (29,517,147 | ) | $ | (550,522 | ) | |||||
Perpetual Long-Term | (11,289,274 | ) | (1,120,081 | ) | (1,294,416 | ) | — | (1,240,695 | ) | |||||||||||
|
|
|
|
|
|
|
|
|
| |||||||||||
Total | $ | (39,316,927 | ) | $ | (1,268,682 | ) | $ | (1,442,338 | ) | $ | (29,517,147 | ) | $ | (1,791,217 | ) | |||||
|
|
|
|
|
|
|
|
|
| |||||||||||
| Dolan McEniry Corporate Bond Fund | DBi Hedge Strategy ETF | RBA Responsible Global Allocation ETF | ||||||||||||||||||
Capital Loss Carryforwards | ||||||||||||||||||||
Perpetual Short-Term | $ | (312,293 | ) | $ | (463,787 | ) | $ | (112,773 | ) | |||||||||||
Perpetual Long-Term | (885,177 | ) | (741,099 | ) | — | |||||||||||||||
|
|
|
|
|
| |||||||||||||||
Total | $ | (1,197,470 | ) | $ | (1,204,886 | ) | $ | (112,773 | ) | |||||||||||
|
|
|
|
|
| |||||||||||||||
| 158 | Litman Gregory Funds Trust | |||||
Table of Contents
Litman Gregory Funds Trust
NOTES TO FINANCIAL STATEMENTS – (Unaudited) (Continued)
Additionally, GAAP requires that certain components of net assets relating to permanent differences be reclassified between financial and tax reporting. These reclassifications have no effect on net assets or net asset value per share. For the year or period ended December 31, 2022, the following table shows the reclassifications made:
| Fund | Accumulated Distributable Earnings (Deficit) | Paid In Capital | ||||||
Global Select Fund* | $ | (8,218,195 | ) | $ | 8,218,195 | |||
International Fund* | (1 | ) | 1 | |||||
Oldfield International Value Fund* | (1 | ) | 1 | |||||
SBH Focused Small Value Fund* | — | — | ||||||
Alternative Strategies Fund (Consolidated)* | 1,661,440 | (1,661,440 | ) | |||||
High Income Fund* | 328 | (328 | ) | |||||
Dolan McEniry Corporate Bond Fund* | — | — | ||||||
DBi Managed Futures Strategy ETF (Consolidated)* | 13,554,001 | (13,554,001 | ) | |||||
DBi Hedge Strategy ETF* | — | — | ||||||
RBA Responsible Global Allocation ETF* | — | — | ||||||
| * | The permanent differences primarily relate to premium amortization, foreign currency gains/losses, paydown gains/losses, passive foreign investment company gains/losses, swaps adjustments, Subsidiary adjustments, equalization adjustments, and tax treatment of partnerships. |
The tax composition of dividends (other than return of capital dividends), for the six months ended June 30, 2023 and the year ended December 31, 2022 were as follows:
| Six Months Ended June 30, 2023 | 2022 | |||||||||||||||||||||||
| Fund | Ordinary Income | Long-Term Capital Gain | Ordinary Income | Long-Term Capital Gain | Return of Capital | |||||||||||||||||||
Global Select Fund | $ | — | $ | — | $ | 240.225 | $ | 30,181,426 | $ | — | ||||||||||||||
International Fund | — | 1,809,650 | — | — | ||||||||||||||||||||
Oldfield International Value Fund | — | — | 430,948 | — | 83,911 | |||||||||||||||||||
SBH Focused Small Value Fund | — | — | — | — | — | |||||||||||||||||||
Alternative Strategies Fund (Consolidated) | 17,677,855 | — | 47,948,888 | — | — | |||||||||||||||||||
High Income Fund | 2,268,882 | — | 5,028,188 | — | — | |||||||||||||||||||
Dolan McEniry Corporate Bond Fund | 2,086,209 | — | 1,861,835 | 80,695 | — | |||||||||||||||||||
DBi Managed Futures Strategy ETF(Consolidated) | — | — | 48,855,060 | 22,694,665 | 367,075 | |||||||||||||||||||
DBi Hedge Strategy ETF | — | — | 226,550 | — | ||||||||||||||||||||
RBA Responsible Global Allocation ETF | — | — | 119,006 | — | — | |||||||||||||||||||
Berkshire Dividend Growth ETF | — | — | — | — | — | |||||||||||||||||||
The Funds did not have any unrecognized tax benefits at December 31, 2022, nor were there any increases or decreases in unrecognized tax benefits for the year ended December 31, 2022. The Funds are subject to examination by the U.S. federal and state tax authorities for returns filed for the prior three and four fiscal years, respectively.
Note 10 – Line of Credit
The Trust has an unsecured, uncommitted $75,000,000 line of credit with the Custodian, for the Global Select Fund, International Fund, Oldfield International Value Fund, SBH Focused Small Value Fund, High Income Fund, and Dolan McEniry Corporate Bond Fund (the “Six Funds”) expiring on April 28, 2024. Under this agreement, borrowing interest rate is equal to the sum of applicable margin of 1.00%, and applicable rate of 0.10%, plus the higher of (i) the Federal Funds Effective Rate and (ii) Overnight Bank Funding Rate. There is no annual commitment fee on the uncommitted line of credit. There was $25,000 annual administrative fee charged at the May 1, 2023 renewal. The Trust also has a secured, uncommitted $125,000,000 line of credit for the Alternative Strategies Fund with the Custodian, expiring on July 20, 2023. There is no annual commitment fee but, a non-refundable up-front fee of $50,000 paid for each yearly amendment. The line of credit is secured by a general security interest in substantially all of the Alternative Strategies Fund’s assets. Under this agreement, the borrowing rate is the Overnight Margin (1.25%) plus the higher of (i) the Federal Funds Effective Rate and (ii) the Overnight Bank Funding Rate.
| Notes to Financial Statements | 159 | |||||
Table of Contents
Litman Gregory Funds Trust
NOTES TO FINANCIAL STATEMENTS – (Unaudited) (Continued)
Amounts outstanding to the Five Funds under the Facility at no time shall exceed in the aggregate at any time the least of (a) $75,000,000; (b) 10% of the value of the total assets of each Fund less such Fund’s total liabilities not represented by senior securities less the value of any assets of the Fund pledged to, or otherwise segregated for the benefit of a party other than the Custodian and in connection with a liability not reflected in the calculation of the Fund’s total liabilities. Amounts outstanding for the Alternative Strategies Fund at no time shall exceed in the aggregate at any time the lesser of the (a) Borrowing Base, (b) the Facility amount of $125,000,000 and (c) should not have an aggregate amount of outstanding senior securities representing indebtedness the least of (i) 33 1/3% of the Alternative Strategies Fund’s net assets and (ii) the maximum amount that the Fund would be permitted to incur pursuant to applicable law.
For the six months ended June 30, 2023, the interest expense was $39,533 for Global Select Fund, $1,056 for Oldfield International Value Fund, $20,926 for High Income Fund, and $3,692 for Dolan McEniry Corporate Bond Fund. For the six months ended June 30, 2023, there were no borrowings for the International Fund, SBH Focused Small Value Fund and Alternative Strategies Fund, and there was no balance outstanding at the end of the period. There was no balance outstanding at June 30, 2023 for the Global Select Fund, Oldfield International Fund, High Income Fund, and Dolan McEniry Corporate Bond Fund. The average borrowing for the six months ended June 30, 2023 for the Global Select Fund for the period the line was drawn was $6,500,000, at an average borrowing rate of 5.4738%. The average borrowing for the six months ended June 30, 2023 for the Oidfield International Fund for the period the line was drawn was $500,000, at an average borrowing rate of 5.4300%. The average borrowing for the six months ended June 30, 2023 for the High Income Fund for the period the line was drawn was $3,497,500, at an average borrowing rate of 5.4738%. The average borrowing for the six months ended June 30, 2023 for the Dolan McEniry Corporate Bond Fund for the period the line was drawn was $11,699,294, at an average borrowing rate of 5.6800%. During the six months ended June 30, 2023, the maximum borrowing was $6,500,000, $500,000, $5,700,000, and $11,699,294 for the Global Select Fund, Oldfield International Fund, High Income Fund, and Dolan McEniry Corporate Bond Fund, respectively.
Note 11 – Principal Risks
Below are summaries of the principal risks of investing in one or more of the Funds, each of which could adversely affect a Fund’s net asset value, yield and total return. Each risk listed below does not necessarily apply to each Fund, and you should read a Fund’s prospectus carefully for a description of the principal risks associated with investing in a particular Fund.
| • | Asset-Backed Securities Risk. This is the risk that the impairment of the value of the collateral underlying a security in which the High Income Fund invests, such as the non-payment of loans, will result in a reduction in the value of the security. The value of these securities may also fluctuate in response to the market’s perception of the value of issuers or collateral. |
| • | Below Investment-Grade Fixed Income Securities Risk. This is the risk of investing in below investment-grade fixed income securities (also known as “junk bonds”), which may be greater than that of higher rated fixed income securities. These securities are rated Ba1 through C by Moody’s Investors Service (“Moody’s”) or BB+ through D by Standard & Poor’s Rating Group (“S&P”) (or comparably rated by another nationally recognized statistical rating organization), or, if not rated by Moody’s or S&P, are considered by the sub-advisors to be of similar quality. These securities have greater risk of default than higher rated securities. The market value of these securities is more sensitive to corporate developments and economic conditions and can be volatile. Market conditions can diminish liquidity and make accurate valuations difficult to obtain. There is no limit to the Alternative Strategies Fund’s ability to invest in below investment-grade fixed income securities; however, under normal market conditions, it does not expect to invest more than 50% of its total assets in below investment-grade fixed income securities. |
| • | Capital Structure Arbitrage Risk. The perceived mispricing identified by the sub-advisor may not disappear or may even increase, in which case losses may be realized. |
| • | Collateral Risk. If the Alternative Strategies Fund and High Income Fund’s financial instruments are secured by collateral, the issuer may have difficulty liquidating the collateral and/or the Fund may have difficulty enforcing its rights under the terms of the securities if an issuer defaults. Collateral may be insufficient or the Fund’s right to the collateral may be set aside by a court. Collateral will generally consist of assets that may not be readily liquidated, including for example, equipment, inventory, work in the process of manufacture, real property and payments to become due under contracts or other receivable obligations. There is no assurance that the liquidation of those assets would satisfy an issuer’s obligations under a financial instrument. Non-affiliates and affiliates of issuers of financial instruments may provide collateral in the form of secured and unsecured guarantees and/or security interests in assets that they own, which may also be insufficient to satisfy an issuer’s obligations under a financial instrument. |
| • | Collateralized Loan Obligations and Collateralized Debt Obligations Risk. Collateralized loan obligations (“CLOs”) bear many of the same risks as other forms of asset-backed securities, including interest rate risk, credit risk and default risk. As they are backed by pools of loans, CLOs also bear similar risks to investing in loans directly. CLOs issue classes or “tranches” that vary in risk and yield. CLOs may experience substantial losses attributable to loan defaults. Losses caused by defaults on underlying assets are borne first by the holders of subordinate tranches. The Alternative Strategies Fund and High Income Fund’s investment in CLOs may decrease in market value when the CLO experiences loan defaults or credit impairment, the disappearance of a subordinate tranche, or market anticipation of defaults and investor aversion to CLO securities as a class. |
| 160 | Litman Gregory Funds Trust | |||||
Table of Contents
Litman Gregory Funds Trust
NOTES TO FINANCIAL STATEMENTS – (Unaudited) (Continued)
Collateralized debt obligations (“CDOs”) are structured similarly to CLOs and bear the same risks as CLOs including interest rate risk, credit risk and default risk. CDOs are subject to additional risks because they are backed by pools of assets other than loans including securities (such as other asset-backed securities), synthetic instruments or bonds and may be highly leveraged. Like CLOs, losses incurred by a CDO are borne first by holders of subordinate tranches. Accordingly, the risks of CDOs depend largely on the type of underlying collateral and the tranche of CDOs in which the Fund invests. For example, CDOs that obtain their exposure through synthetic investments entail the risks associated with derivative instruments.
| • | Commodity Risk. Exposure to the commodities markets (including financial futures markets) may subject the DBi Managed Futures Strategy ETF, through its investment in a wholly-owned subsidiary (the “Subsidiary”), and the Alternative Strategies Fund, through its investment in a wholly-owned subsidiary (the “Alternative subsidiary” which are each organized under the laws of the Cayman Islands and is advised by its respective sub-advisor, to greater volatility than investments in traditional securities. Prices of commodities and related contracts may fluctuate significantly over short periods for a variety of reasons, including changes in interest rates, supply and demand relationships and balances of payments and trade; weather and natural disasters; governmental, agricultural, trade, fiscal, monetary and exchange control programs and policies, public health crises and trade or price wars among commodity producers or buyers. The commodity markets are subject to temporary distortions and other disruptions. U.S. futures exchanges and some foreign exchanges have regulations that limit the amount of fluctuation in futures contract prices which may occur during a single business day. Limit prices have the effect of precluding trading in a particular contract or forcing the liquidation of contracts at disadvantageous times or prices. |
| • | Communications Services Sector Risk. A Fund may invest a portion of its assets in the communications services sector. Media and communications companies may be significantly affected by product and service obsolescence due to technological advancement or development, competitive pressures, substantial capital requirements, fluctuating demand and changes in regulation. |
| • | Consumer Discretionary Sector Risk. A Fund may invest a portion of its assets in the consumer discretionary sector. The success of consumer product manufacturers and retailers is tied closely to the performance of the overall domestic and international economy, interest rates, competition and consumer confidence. Success depends heavily on disposable household income and consumer spending. Changes in demographics and consumer tastes can also affect the demand for, and success of, consumer products and services in the marketplace. |
| • | Consumer Staples Sector Risk. Certain of the Funds, through the implementation of their respective investment strategies, may from time to time invest a significant portion of their assets in the consumer staples sector, which includes, for example, the food and staples retailing industry, the food, beverage and tobacco industry and the household and personal products industry. This sector can be significantly affected by, among other factors, the regulation of various product components and production methods, marketing campaigns and changes in the global economy, consumer spending and consumer demand. Tobacco companies, in particular, may be adversely affected by new laws, regulations and litigations. Companies in the consumer staples sector may also be adversely affected by changes or trends in commodity prices, which may be influenced by unpredictable factors. These companies may be subject to severe competition, which may have an adverse impact on their profitability. |
| • | Convertible Arbitrage Risk. Arbitrage strategies involve engaging in transactions that attempt to exploit price differences of identical, related or similar securities on different markets or in different forms. A Fund may realize losses or reduced rate of return if underlying relationships among securities in which investment positions are taken change in an adverse manner or a transaction is unexpectedly terminated or delayed. Trading to seek short-term capital appreciation can be expected to cause the Fund’s portfolio turnover rate to be substantially higher than that of the average equity-oriented investment company, resulting in higher transaction costs and additional capital gains tax liabilities. |
| • | Convertible Securities Risk. This is the risk that the market value of convertible securities may fluctuate due to changes in, among other things, interest rates; other general economic conditions; industry fundamentals; market sentiment; the issuer’s operating results, financial statements, and credit ratings; and the market value of the underlying common or preferred stock. |
| • | Corporate Debt Obligations Risk. Corporate debt obligations are subject to the risk of an issuer’s inability to meet principal and interest payments on the obligations. Therefore, the Alternative Strategies Fund, the High Income Fund, and the Dolan McEniry Corporate Bond Fund may be indirectly exposed to such risks associated with corporate debt obligations. |
| • | Country/Regional Risk. World events – such as political upheaval, financial troubles, or natural disasters – may adversely affect the value of securities issued by companies in foreign countries or regions. Because each of the International Fund and Oldfield International Value Fund may invest a large portion of its assets in securities of companies located in any one country or region, including emerging markets, the Fund’s performance may be hurt disproportionately by the poor performance of its investments in that area. This risk is heightened in emerging markets. |
| Notes to Financial Statements | 161 | |||||
Table of Contents
Litman Gregory Funds Trust
NOTES TO FINANCIAL STATEMENTS – (Unaudited) (Continued)
| • | Currency Risk. This is the risk that investing in foreign currencies may expose the Fund to fluctuations in currency exchange rates and that such fluctuations in the exchange rates may negatively affect an investment related to a currency or denominated in a foreign currency. The Alternative Strategies Fund may invest in foreign currencies for investment and hedging purposes. All of the Funds may invest in foreign currencies for hedging purposes. |
| • | Cybersecurity Risk. Information and technology systems relied upon by the Funds, the Advisor, the sub-advisors, the Funds’ service providers (including, but not limited to, Fund accountants, custodians, transfer agents, administrators, distributors and other financial intermediaries) and/or the issuers of securities in which a Fund invests may be vulnerable to damage or interruption from computer viruses, network failures, computer and telecommunication failures, infiltration by unauthorized persons, security breaches, usage errors, power outages and catastrophic events such as fires, tornadoes, floods, hurricanes and earthquakes. Although the Advisor has implemented measures to manage risks relating to these types of events, if these systems are compromised, become inoperable for extended periods of time or cease to function properly, significant investment may be required to fix or replace them. The failure of these systems and/or of disaster recovery plans could cause significant interruptions in the operations of the Funds, the Advisor, the sub-advisors, the Funds’ service providers and/or issuers of securities in which a Fund invests and may result in a failure to maintain the security, confidentiality or privacy of sensitive data, including personal information relating to investors (and the beneficial owners of investors). Such a failure could also harm the reputation of the Funds, the Advisor, the sub-advisors, the Funds’ service providers and/or issuers of securities in which a Fund invests, subject such entities and their respective affiliates to legal claims or otherwise affect their business and financial performance. |
| • | Derivatives Risk. This is the risk that an investment in derivatives may not correlate completely to the performance of the underlying securities and may be volatile and that the insolvency of the counterparty to a derivative instrument could cause the Fund to lose all or substantially all of its investment in the derivative instrument, as well as the benefits derived therefrom. |
| • | Options Risk. This is the risk that an investment in options may be subject to greater fluctuation than an investment in the underlying instruments themselves and may be subject to a complete loss of the amounts paid as premiums to purchase the options. |
| • | Futures Contracts Risk. This is the risk that an investment in futures contracts may be subject to losses that exceed the amount of the premiums paid and may subject the Fund’s net asset value to greater volatility. |
| • | P-Notes Risk. This is the risk that the performance results of P-Notes will not replicate exactly the performance of the issuers or markets that the P-Notes seek to replicate. Investments in P-Notes involve risks normally associated with a direct investment in the underlying securities as well as additional risks, such as counterparty risk. |
| • | Swaps Risk. Risks inherent in the use of swaps include: (1) swap contracts may not be assigned without the consent of the counterparty; (2) potential default of the counterparty to the swap; (3) absence of a liquid secondary market for any particular swap at any time; and (4) possible inability of the Fund to close out the swap transaction at a time that otherwise would be favorable for it to do so. |
| • | Emerging Markets Risk. A Fund may invest a portion of its assets in emerging market countries. Emerging market countries are those with immature economic and political structures, and investing in emerging markets entails greater risk than in developed markets. Such risks could include those related to government dependence on a few industries or resources, government-imposed taxes on foreign investment or limits on the removal of capital from a country, unstable government, and volatile markets. |
| • | Equity Hedge Strategy Risk. The DBi Hedge Strategy ETF uses various investment strategies that seek to identify the main drivers of performance of a diversified portfolio of the largest long/short equity hedge funds. These investment strategies involve the use of complex derivatives techniques, and there is no guarantee that these strategies will succeed. The use of such strategies and techniques may subject the Fund to greater volatility and loss than investing in individual equity securities. There can be no assurance that utilizing a certain approach or model will achieve a particular level of return or reduce volatility and loss. |
| • | Equity Securities Risk. This is the risk that the value of equity securities may fluctuate, sometimes rapidly and unpredictably, due to factors affecting the general market, an entire industry or sector, or particular companies. These factors include, without limitation, adverse changes in economic conditions, the general outlook for corporate earnings, interest rates or investor sentiment; increases in production costs; and significant management decisions. This risk is greater for small- and medium-sized companies, which tend to be more vulnerable to adverse developments than larger companies. |
| • | ETF Risk. The DBi Managed Futures Strategy ETF, the DBi Hedge Strategy ETF, the RBA Responsible Global Allocation ETF, and the Berkshire Dividend Growth ETF are each an ETF, and, as a result of an ETF’s structure, each is exposed to the following risks: |
| • | Authorized Participants, Market Makers, and Liquidity Providers Limitation Risk. The Fund has a limited number of financial institutions that may act as Authorized Participants (“APs”). In addition, there may be a limited number of market makers and/or liquidity providers in the marketplace. To the extent either of the following events occur, shares of the Fund (“Shares”) may trade at a material discount to NAV and possibly face delisting: (i) APs exit the business or otherwise become unable to process creation and/or |
| 162 | Litman Gregory Funds Trust | |||||
Table of Contents
Litman Gregory Funds Trust
NOTES TO FINANCIAL STATEMENTS – (Unaudited) (Continued)
| redemption orders and no other APs step forward to perform these services, or (ii) market makers and/or liquidity providers exit the business or significantly reduce their business activities and no other entities step forward to perform their functions. |
| • | Cash Redemption Risk. The Fund’s investment strategy may require it to redeem Shares for cash or to otherwise include cash as part of its redemption proceeds. The Fund may be required to sell or unwind portfolio investments to obtain the cash needed to distribute redemption proceeds. This may cause the Fund to recognize a capital gain that it might not have recognized if it had made a redemption in-kind. As a result, the Fund may pay out higher annual capital gain distributions than if the in-kind redemption process was used. |
| • | Costs of Buying or Selling Shares. Due to the costs of buying or selling Shares, including brokerage commissions imposed by brokers and bid/ask spreads, frequent trading of Shares may significantly reduce investment results and an investment in Shares may not be advisable for investors who anticipate regularly making small investments. |
| • | Shares May Trade at Prices Other Than NAV. As with all ETFs, Shares may be bought and sold in the secondary market at market prices. Although it is expected that the market price of Shares will approximate the Fund’s NAV, there may be times when the market price of Shares is more than the NAV intra-day (premium) or less than the NAV intra-day (discount) due to supply and demand of Shares or during periods of market volatility. This risk is heightened in times of market volatility and volatility in the Fund’s portfolio holdings, periods of steep market declines, and periods when there is limited trading activity for Shares in the secondary market, in which case such premiums or discounts may be significant. If an investor purchases Shares at a time when the market price is at a premium to the NAV of the Shares or sells at a time when the market price is at a discount to the NAV of the Shares, then the investor may sustain losses that are in addition to any losses caused by a decrease in NAV. |
| • | Trading. Although Shares are listed for trading on a national securities exchange, and may be traded on other U.S. exchanges, there can be no assurance that Shares will trade with any volume, or at all, on any stock exchange. In stressed market conditions, the liquidity of Shares may begin to mirror the liquidity of the Fund’s underlying portfolio holdings, which can be significantly less liquid than Shares. |
| • | European Investment Risk. Each of the International Fund and Oldfield International Value Fund may invest a significant portion of its assets in issuers based in Western Europe and the United Kingdom (“UK”). The economies of countries in Europe are often closely connected and interdependent, and events in one country in Europe can have an adverse impact on other European countries. Efforts by the member countries of the European Union (“EU”) to continue to unify their economic and monetary policies may increase the potential for similarities in the movements of European markets and reduce the potential investment benefits of diversification within the region. However, the substance of these policies may not address the needs of all European economies. European financial markets have in recent years experienced increased volatility due to concerns with some countries’ high levels of sovereign debt, budget deficits and unemployment. Markets have also been affected by the withdrawal of the UK from the EU (an event commonly known as “Brexit”). On January 31, 2020, the UK officially withdrew from the EU and entered into a transition period until December 31, 2020, during which the UK effectively remained in the EU from an economic perspective. The impact of Brexit on the UK, the EU and the broader global economy may be significant. As a result of the political divisions within the UK and between the UK and the EU that the referendum vote has highlighted and the uncertain consequences of Brexit, the UK and European economies and the broader global economy could be significantly impacted, which may result in increased volatility and illiquidity and potentially lower economic growth on markets in the UK, Europe and globally, which could potentially have an adverse effect on the value of a Fund’s investments. |
| • | Event-Driven Risk. Event-driven strategies seek to profit from the market inefficiencies surrounding market events, such as mergers, acquisitions, asset sales, restructurings, refinancings, recapitalizations, reorganizations or other special situations. Event-driven investing involves attempting to predict the outcome of a particular transaction as well as the optimal time at which to commit capital to it. Event-driven opportunities involve difficult legal as well as financial analysis, as some of the principal impediments to the consummation of major corporate events are often legal or regulatory rather than economic. In addition, certain of the securities issued in the context of major corporate events include complex call, put and other features, and it is difficult to precisely evaluate the terms and embedded option characteristics of these securities. A Fund may take both long and short positions in a wide range of securities, derivatives and other instruments in implementing its event-driven strategies. |
| • | Financial Sector Risk. A Fund may invest a portion of its assets in the financial services sector and, therefore, the performance of the Fund could be negatively impacted by events affecting this sector, including changes in interest rates, government regulation, the rate of defaults on corporate, consumer and government debt and the availability and cost of capital. |
| • | Fixed Income Securities Risk. Interest rates may go up resulting in a decrease in value of the securities held by a Fund. Fixed income securities held by a Fund are also subject to interest rate risk, credit risk, call risk and liquidity risk, which are more fully described below. |
| • | Credit Risk. Credit risk is the risk that an issuer will not make timely payments of principal and interest. A credit rating assigned to a particular debt security is essentially an opinion as to the credit quality of an issuer and may prove to be inaccurate. There is also the risk that a bond issuer may “call,” or repay, its high yielding bonds before their maturity dates. |
| Notes to Financial Statements | 163 | |||||
Table of Contents
Litman Gregory Funds Trust
NOTES TO FINANCIAL STATEMENTS – (Unaudited) (Continued)
| • | Interest Rate Risk. Interest rates may go up resulting in a decrease in the value of the securities held by a Fund. Interest rates have been historically low, so a Fund faces a heightened risk that interest rates may rise. Debt securities subject to prepayment can offer less potential for gains during a declining interest rate environment and similar or greater potential for loss in a rising interest rate environment. |
| • | Call Risk. During periods of declining interest rates, a bond issuer may “call” or repay its high yielding bonds before their maturity dates. |
| • | Liquidity Risk. Certain securities may be difficult or impossible to sell at the time and the price that a Fund would like. Trading opportunities are more limited for fixed income securities that have not received any credit ratings, have received ratings below investment grade or are not widely held. The values of these securities may fluctuate more sharply than those of other securities, and a Fund may experience some difficulty in closing out positions in these securities at prevailing market prices. |
| • | Foreign Investment and Emerging Markets Risks. This is the risk that an investment in foreign (non-U.S.) securities may cause the Funds to experience more rapid and extreme changes in value than a fund that invests exclusively in securities of U.S. companies, due to factors such as currency conversion rate fluctuations, currency blockages, political and economic instability, differences in financial reporting, accounting and auditing standards, nationalization, expropriation or confiscatory taxation, and smaller and less-strict regulation of securities markets. These risks are greater in emerging markets. There is no limit to the Alternative Strategies Fund’s ability to invest in emerging market securities; however, under normal market conditions, it does not expect to invest more than 50% of its total assets in emerging market securities; however, some Funds may invest a portion of their assets in stocks of companies based outside of the United States. |
| • | Forward Contracts Risk. Forward contracts involve an obligation to purchase or sell a specific currency at a future date, which may be any fixed number of days from the date of the contract as agreed by the parties in an amount and at a price set at the time of the contract. At the maturity of a forward contract, a fund may either accept or make delivery of the currency specified in the contract or, at or prior to maturity, enter into a closing transaction involving the purchase or sale of an offsetting contract. A Fund may invest in non-deliverable forwards, which are cash-settled, short-term forward contracts on foreign currencies that are non-convertible and that may be thinly traded or illiquid. The use of forward contracts involves various risks, including the risks associated with fluctuations in foreign currency and the risk that the counterparty will fail to fulfill its obligations. |
| • | General Market Risk; Recent Market Events. The value of a Fund’s shares will fluctuate based on the performance of the Fund’s investments and other factors affecting the securities markets generally. Certain investments selected for a Fund’s portfolio may be worth less than the price originally paid for them, or less than they were worth at an earlier time. The value of a Fund’s investments may go up or down, sometimes dramatically and unpredictably, based on current market conditions, such as real or perceived adverse political or economic conditions, inflation, changes in interest rates, lack of liquidity in the fixed income markets or adverse investor sentiment. |
| • | Healthcare Sector Risk. A Fund may invest a portion of its assets in the healthcare sector. The profitability of companies in the healthcare sector may be adversely affected by government regulations and government healthcare programs, increases or decreases in the cost of medical products and services and product liability claims, among other factors. Many healthcare companies are heavily dependent on patent protection, and the expiration of a company’s patent may adversely affect that company’s profitability. Healthcare companies are subject to competitive forces that may result in price discounting, and may be thinly capitalized and susceptible to product obsolescence. |
| • | Industrial Sector Risk. A Fund may invest a portion of its assets in the industrial sector. Companies in the industrial sector could be affected by, among other things, government regulation, world events and global economic conditions, insurance costs, and labor relations issues. |
| • | Investment in Investment Companies Risk. This is the risk that investing in other investment companies, including ETFs, CEFs, BDCs, unit investment trusts and open-end funds, subjects the Fund to those risks affecting the investment vehicle, including the possibility that the value of the underlying securities held by the investment vehicle could decrease or the portfolio becomes illiquid. Moreover, the High Income Fund and its shareholders will incur its pro rata share of the underlying vehicles’ expenses, which will reduce the Fund’s performance. In addition, investments in an ETF are subject to, among other risks, the risk that the ETF’s shares may trade at a discount or premium relative to the net asset value of the shares and the listing exchange may halt trading of the ETF’s shares. BDCs may carry risks similar to those of a private equity or venture capital fund. BDC company securities are not redeemable at the option of the shareholder and they may trade in the market at a discount to their net asset value. BDCs usually trade at a discount to their net asset value because they invest in unlisted securities and have limited access to capital markets. Shares of CEFs also frequently trade at a discount to their net asset value for those and other reasons. |
| • | Investment over 25% of Net assets. The RBA Responsible Global Allocation ETF invests greater than 25% of its assets in the iShares ESG Aware US Aggregate Bond ETF. The RBA Responsible Global Allocation ETF may redeem its investment at any time if the Advisor |
| 164 | Litman Gregory Funds Trust | |||||
Table of Contents
Litman Gregory Funds Trust
NOTES TO FINANCIAL STATEMENTS – (Unaudited) (Continued)
| determines if it is in the best interest of the ETF and its shareholders to do so. The performance of the ETF will be directly affected by the performance of this investment. The financial statements of the investment, including the schedule of investments, can be found on the Securities and Exchange Commission’s website www.sec.gov and should be read in conjunction with the ETF’s financial statements. At June 30, 2023, the RBA Responsible Global Allocation ETF invested 37.9% of its net assets in the iShares ESG Aware US Aggregate Bond ETF. |
| • | Investment Selection Risk. The specific investments held in the Fund’s investment portfolio may underperform other funds in the same asset class or benchmarks that are representative of the general performance of the asset class because of a portfolio manager’s choice of securities. |
| • | Investments in Loan Risk. Investments in loans, including loan syndicates and other direct lending opportunities, involve special types of risks, including credit risk, interest rate risk, counterparty risk and prepayment risk. Loans may offer a fixed or floating interest rate. Loans are often generally below investment grade and may be unrated. The High Income Fund’s investments in loans can also be difficult to value accurately and may be more susceptible to liquidity risk than fixed-income instruments of similar credit quality and/or maturity. The Fund is also subject to the risk that the value of the collateral for the loan may be insufficient or unavailable to cover the borrower’s obligations should the borrower fail to make payments or become insolvent. Participations in loans may subject the Fund to the credit risk of both the borrower and the issuer of the participation and may make enforcement of loan covenants, if any, more difficult for the Fund as legal action may have to go through the issuer of the participations. Transactions in loans are often subject to long settlement periods, thus potentially limiting the ability of the Fund to invest sale proceeds in other investments and to use proceeds to meet its current redemption obligations. In addition, many banks have been weakened by the recent financial crisis, and it may be difficult for the Fund to obtain an accurate picture of a lending bank’s financial condition. |
| • | Japanese Investment Risk. Japan may be subject to political, economic, nuclear and labor risks, among others. Any of these risks, individually or in the aggregate, can impact an investment made in Japan. The growth of Japan’s economy has recently lagged that of its Asian neighbors and other major developed economies. Since 2000, Japan’s economic growth rate has generally remained low relative to other advanced economies, and it may remain low in the future. The Japanese economy faces several concerns, including a financial system with large levels of nonperforming loans, overleveraged corporate balance sheets, extensive cross-ownership by major corporations, a changing corporate governance structure, large government deficits, heavy dependence on international trade and oil and other commodity imports, an aging workforce and significant population decline, sometimes unpredictable national politics, political tensions with China, and natural disasters, such as earthquakes, volcanic eruptions, typhoons and tsunamis. Any of these concerns could negatively affect the value of Japanese investments. |
| • | Large Shareholder Purchase and Redemption Risk. This is the risk that a Fund may experience adverse effects when certain large shareholders purchase or redeem large amounts of shares of the Fund. Such large shareholder redemptions may cause the Fund to sell its securities at times when it would not otherwise do so, which may negatively impact the Fund’s net asset value and liquidity. Similarly, large share purchases may adversely affect the Fund’s performance to the extent that the Fund is delayed in investing new cash and is required to maintain a larger cash position than it ordinarily would. In addition, a large redemption could result in the Fund’s current expenses being allocated over a smaller asset base, leading to an increase in the Fund’s expense ratio. |
| • | Leverage Risk. This is the risk that leverage may cause the effect of an increase or decrease in the value of the Alternative Strategies Fund’s portfolio securities to be magnified and the Fund to be more volatile than if leverage was not used. Leverage may result from certain transactions, including the use of derivatives and borrowing. Under normal circumstances, the Alternative Strategies Fund may borrow amounts up to one third of the value of its total assets except that it may exceed this limit to satisfy redemption requests or for other temporary purposes. |
| • | LIBOR Risk. LIBOR is used extensively in the U.S. and globally as a “benchmark” or “reference rate” for various commercial and financial contracts, including corporate and municipal bonds, bank loans, asset-backed and mortgage-related securities, interest rate swaps and other derivatives. For example, debt securities in which a Fund invests may pay interest at floating rates based on LIBOR or may be subject to interest caps or floors based on LIBOR. A Fund’s derivative investments may also reference LIBOR. In addition, issuers of instruments in which a Fund invests may obtain financing at floating rates based on LIBOR, and a Fund may use leverage or borrowings based on LIBOR. In July 2017, the head of the United Kingdom Financial Conduct Authority announced the intention to phase out the use of LIBOR by the end of 2021. There is currently no definitive information regarding the future utilization of LIBOR or of any particular replacement reference rate. Abandonment of or modifications to LIBOR could have adverse impacts on newly issued financial instruments and existing financial instruments that reference LIBOR. |
| • | Liquidity and Valuation Risk. It may be difficult for the Fund to purchase and sell particular investments within a reasonable time at a fair price, or the price at which it has been valued by iM Global for purposes of the Fund’s net asset value, causing the Fund to be less liquid and unable to realize what iM Global believes should be the price of the investment. Valuation of portfolio investments may be difficult, such as during periods of market turmoil or reduced liquidity, and for investments that may, for example, trade infrequently or irregularly. In these and other circumstances, an investment may be valued using fair value methodologies, which are inherently subjective, reflect good faith judgments based on available information and may not accurately estimate the price at which the Fund |
| Notes to Financial Statements | 165 | |||||
Table of Contents
Litman Gregory Funds Trust
NOTES TO FINANCIAL STATEMENTS – (Unaudited) (Continued)
| could sell the investment at that time. These risks may be heightened for fixed-income instruments because of the near historically low interest rate environment as of the date of this prospectus. Based on its investment strategies, a significant portion of the Fund’s investments can be difficult to value and potentially less liquid and thus particularly prone to the foregoing risks. |
| • | Long Short Risk. The DBi Hedge Strategy ETF seeks long exposure to certain factors and short exposure to certain other factors. The Fund may or may not take long or short positions in correlated asset classes. The Fund could lose money if either or both of the Fund’s long and short positions produce negative returns. The sub-advisor’s proprietary, quantitative model, the Dynamic Beta Engine, may or may not identify long and short positions in correlated asset classes. There is no guarantee that the returns of the Fund’s long and short positions will produce positive returns. |
| • | Managed Futures Strategy Risk. In seeking to achieve its investment objective, the DBi Managed Futures Strategy ETF will utilize various investment strategies that involve the use of complex investment techniques, and there is no guarantee that these strategies will succeed. The use of such strategies and techniques may subject the Fund to greater volatility and loss. There can be no assurance that utilizing a certain approach or model will achieve a particular level of return or reduce volatility and loss. |
| • | Merger Arbitrage Risk. This is the risk that a proposed reorganization in which the Alternative Strategies Fund invests may be renegotiated or terminated. |
| • | Mid-Sized Companies Risk. Securities of companies with mid-sized market capitalizations are generally more volatile and less liquid than the securities of large-capitalization companies. Mid-sized companies may be more reliant on a few products, services or key personnel, which can make it riskier than investing in larger companies with more diverse product lines and structured management. Mid-sized companies may have relatively short operating histories or may be newer public companies. Some of these companies have more aggressive capital structures, including higher debt levels, than large-cap companies, or are involved in rapidly growing or changing industries and/or new technologies, which pose additional risks. |
| • | Models and Data Risk. The Alternative Strategies Fund uses proprietary systematic and quantitative models as part of its investment strategies. These models may fail to identify profitable opportunities at any time. Furthermore, the models may incorrectly identify opportunities and these misidentified opportunities may lead to substantial losses for the Fund. Models may be predictive in nature and such models may result in an incorrect assessment of future events. Data used in the construction of models may prove to be inaccurate or stale, which may result in losses for the Fund. |
| • | Mortgage-Backed Securities Risk. This is the risk of investing in mortgaged-backed securities, which includes interest rate risk, prepayment risk and the risk of defaults on the mortgage loans underlying these securities. |
| • | Multi-Style Management Risk. Because portions of a Fund’s assets are managed by different portfolio managers using different styles, the Fund could experience overlapping security transactions. Certain portfolio managers may be purchasing securities at the same time other portfolio managers may be selling those same securities, which may lead to higher transaction expenses compared to a Fund using a single investment management style. |
| • | Non-Diversified Fund Risk. Because each of the DBi Managed Futures Strategy ETF and the DBi Hedge Strategy ETF is “non-diversified,” each may invest a greater percentage of its assets in the securities of a single issuer. As a result, a decline in the value of an investment in a single issuer could cause a Fund’s overall value to decline to a greater degree than if the Fund held a more diversified portfolio. |
| • | Portfolio Turnover Risk. This is the risk that a Fund may experience high portfolio turnover rates as a result of its investment strategies. High portfolio turnover rates may indicate higher transaction costs and may result in higher taxes when shares of a Fund are held in a taxable account as compared to shares in investment companies that hold investments for a longer period. High portfolio turnover involves correspondingly greater expenses to a Fund, including brokerage commissions or dealer mark-ups and other transaction costs on the sale of securities and reinvestments in other securities, which may result in adverse tax consequences to a Fund’s shareholders as compared to shares in investment companies that hold investments for a longer period. |
| • | Prepayment and Extension Risk. In times of declining interest rates, a Fund’s higher yielding securities will be prepaid, and the Fund will have to replace them with securities having a lower yield. Rising interest rates could extend the life of securities with lower payment rates. This is known as extension risk and may increase a Fund’s sensitivity to rising rates and its potential for price declines. |
| • | Public Health Emergency Risk. This is the risk that pandemics and other public health emergencies, including outbreaks of infectious diseases such as the current outbreak of the novel coronavirus (“COVID-19”), can result, and in the case of COVID-19 is resulting, in market volatility and disruption, and materially and adversely impact economic conditions in ways that cannot be predicted, all of which could result in substantial investment losses. Containment efforts and related restrictive actions by governments and businesses have significantly diminished and disrupted global economic activity across many industries. Less developed countries and their health systems may be more vulnerable to these impacts. The ultimate impact of COVID-19 or other health emergencies on global economic conditions and businesses is impossible to predict accurately. Ongoing and potential additional material adverse economic effects of indeterminate duration and severity are possible. The resulting adverse impact on the value of an investment in a Fund could be significant and prolonged. |
| 166 | Litman Gregory Funds Trust | |||||
Table of Contents
Litman Gregory Funds Trust
NOTES TO FINANCIAL STATEMENTS – (Unaudited) (Continued)
| • | Sector Concentration Risk. The SBH Focused Small Value Fund concentrates its investments in a narrow segment of the total market. At June 30, 2023, the Fund has 37.4% of net assets invested in the Industrials sector of the stock market. Because of this, the Fund is subject to certain additional risks as compared to investing in a more diversified portfolio of investments. |
| • | Sector Weightings Risk. To the extent that a Fund emphasizes, from time to time, investments in a particular sector, the Fund will be subject to a greater degree to the risks particular to that sector. Market conditions, interest rates, and economic, regulatory, or financial developments could significantly affect a single sector. By focusing its investments in a particular sector, a Fund may face more risks than if it were diversified broadly over numerous sectors. |
| • | Short Position Risk. A Fund will incur a loss as a result of a short position if the price of the short position instrument increases in value between the date of the short position sale and the date on which the Fund purchases an offsetting position. Short positions may be considered speculative transactions and involve special risks, including greater reliance on the ability to accurately anticipate the future value of a security or instrument. A Fund’s losses are potentially unlimited in a short position transaction. |
| • | Short Sale Risk. This is the risk that the value of a security the Alternative Strategies Fund sells short does not go down as expected. The risk of loss is theoretically unlimited if the value of the security sold short continues to increase. In addition, short sales may cause the Alternative Strategies Fund to be compelled, at a time disadvantageous to it, to buy the security previously sold short, thus resulting in a loss. To meet current margin requirements, the Alternative Strategies Fund is required to deposit with the broker additional cash or securities so that the total deposit with the broker is maintained daily at 150% of the current market value of the securities sold short. |
| • | Smaller Companies Risk. A Fund may invest a portion of its assets in the securities of small- and mid-sized companies. Securities of small and mid-cap companies are generally more volatile and less liquid than the securities of large-cap companies. This is because smaller companies may be more reliant on a few products, services or key personnel, which can make it riskier than investing in larger companies with more diverse product lines and structured management. |
| • | Special Situations Risk. Investments in special situations (undervalued equities, merger arbitrage situations, distressed companies, etc.) may involve greater risks when compared to other investments a Fund may make due to a variety of factors. For example, mergers, acquisitions, reorganizations, liquidations or recapitalizations may fail or not be completed on the terms originally contemplated, and expected developments may not occur in a timely manner, if at all. |
| • | Subsidiary Risk. By investing in the Subsidiary and the Alternative Subsidiary, the DBi Managed Futures Strategy ETF and the Alternative Strategies Fund, respectively, is indirectly exposed to the risks associated with the Subsidiary’s and the Alternative Subsidiary’s investments. The derivatives and other investments held by the Subsidiary and the Alternative Subsidiary are generally similar to those that are permitted to be held by each Fund and are subject to the same risks that apply to similar investments if held directly by each Fund. The Subsidiary and the Alternative Subsidiary are each not registered under the 1940 Act, and, unless otherwise noted in the Prospectus, are not subject to all the investor protections of the 1940 Act. Changes in the laws of the United States and/or the Cayman Islands could result in the inability of each Fund and/or the Subsidiary or the Alternative Subsidiary to continue to operate as each does currently and could adversely affect each Fund. |
| • | Tax Risk. The federal income tax treatment of the DBi Managed Futures Strategy ETF’s and the Alternative Strategies Fund’s income from the Subsidiary and the Alternative Subsidiary, respectively, may be negatively affected by future legislation, Treasury Regulations (proposed or final), and/or other Internal Revenue Service (“IRS”) guidance or authorities that could affect the character, timing of recognition, and/or amount of each Fund’s investment company taxable income and/ or net capital gains and, therefore, the distributions it makes. If a Fund failed the source of income test for any taxable year but was eligible to and did cure the failure, it could incur potentially significant additional federal income tax expenses. If, on the other hand, a Fund failed to qualify as a RIC for any taxable year and was ineligible to or otherwise did not cure the failure, it would be subject to federal income tax at the fund-level on its taxable income at the regular corporate tax rate (without reduction for distributions to shareholders), with the consequence that its income available for distribution to shareholders would be reduced and distributions from its current or accumulated earnings and profits would generally be taxable to its shareholders as dividend income. |
Changes in the laws of the United States and/or the Cayman Islands could result in the inability of a Fund and/or the Subsidiary or the Alternative Subsidiary to operate as described in the Prospectus and the Statement of Additional Information (“SAI”) and could adversely affect each Fund. For example, the Cayman Islands does not currently impose any income, corporate or capital gains tax or withholding tax on the Subsidiary or the Alternative Subsidiary. If Cayman Islands law changes such that the Subsidiary or the Alternative Subsidiary must pay Cayman Islands taxes, Fund shareholders would likely suffer decreased investment returns.
| • | TBAs and Dollar Rolls Risk. TBA (“to-be-announced”) and dollar roll transactions present special risks to the Alternative Strategies Fund. Although the particular TBA securities must meet industry-accepted “good delivery” standards, there can be no assurance that a security purchased on a forward commitment basis will ultimately be issued or delivered by the counterparty. During the settlement period, the Fund will still bear the risk of any decline in the value of the security to be delivered. TBAs and other forward settling securities involve leverage because they can provide investment exposure in an amount exceeding the fund’s initial investment. Leverage can magnify |
| Notes to Financial Statements | 167 | |||||
Table of Contents
Litman Gregory Funds Trust
NOTES TO FINANCIAL STATEMENTS – (Unaudited) (Continued)
| investment risks and cause losses to be realized more quickly. While dollar roll transactions involve the simultaneous purchase and sale of substantially similar TBA securities with different settlement dates, these transactions do not require the purchase and sale of identical securities so the characteristics of the security delivered to the Fund may be less favorable than the security delivered to the dealer. |
| • | Technology Investment Risk. A Fund may invest a portion of its assets in the technology sector, which is a very volatile segment of the market. The nature of technology is that it is rapidly changing. Therefore, products or services that may initially look promising may subsequently fail or become obsolete. In addition, many technology companies are younger, smaller and unseasoned companies which may not have established products, an experienced management team, or earnings history. |
| • | Unfavorable Tax Treatment Risk. This is the risk that a material portion of the Alternative Strategies Fund’s return could be in the form of net investment income or short-term capital gains, some of which may be distributed to shareholders and taxed at ordinary income tax rates. Therefore, shareholders may have a greater need to pay regular taxes than compared to other investment strategies that hold investments longer. Due to this investment strategy, it may be preferable for certain shareholders to invest in the Fund through pre-tax or tax-deferred accounts as compared to investment through currently taxable accounts. Potential shareholders are encouraged to consult their tax advisors in this regard. |
| • | U.S. Government and U.S. Agency Obligations Risk. Securities issued by U.S. Government agencies and instrumentalities have different levels of U.S. Government credit support. Some are backed by the full faith and credit of the U.S. Government, while others are supported by only the discretionary authority of the U.S. Government or only by the credit of the agency or instrumentality. No assurance can be given that the U.S. Government will provide financial support to U.S. Government-sponsored instrumentalities because they are not obligated to do so by law. Guarantees of timely prepayment of principal and interest do not assure that the market prices and yields of the securities are guaranteed nor do they guarantee the NAV or performance of a Fund, which will vary with changes in interest rates, the sub-advisor’s performance and other market conditions. |
| • | Value Stock Risk. Value stocks are stocks of companies that may have experienced adverse business or industry developments or may be subject to special risks that have caused the stocks to be out of favor and, in the opinion of the manager, undervalued. The value of a security believed by a manager to be undervalued may never reach what is believed to be its full (intrinsic) value, or such security’s value may decrease. |
| 168 | Litman Gregory Funds Trust | |||||
Table of Contents
OTHER INFORMATION – (Unaudited)
Proxy Voting Policies and Procedures
The sub-advisors of the Funds vote proxies relating to portfolio securities in accordance with procedures that have been approved by the Board of Trustees of the Funds. You may obtain a description of these procedures, without charge, by calling toll-free, 1-800-960-0188. This information is also available through the Securities and Exchange Commission’s website at http://www.sec.gov.
Proxy Voting Record
Information regarding how the sub-advisors of the Funds voted proxies relating to portfolio securities during the 12-month period ended June 30 is available, without charge, by calling toll-free, 1-800-960-0188. This information is also available through the Securities and Exchange Commission’s website at http://www.sec.gov.
Portfolio Holdings Information
Each Fund files a complete schedule of portfolio holdings with the Securities and Exchange Commission for the first and third quarters of each fiscal year as an exhibit to its reports on Form N-PORT. You can find the filings on the Securities and Exchange Commission’s website at http://www.sec.gov. This information is also available, without charge, by calling toll-free, 1-800-960-0188 or by visiting the Funds’ website at http://www.imgpfunds.com.
Householding Mailings
To reduce expenses, the Trust may mail only one copy of the Funds’ prospectus and each annual and semi-annual report to those addresses shared by two or more accounts. If you wish to receive individual copies of these documents, please call us at 1-800-960-0188 (or contact your financial institution). The Trust will begin sending you individual copies thirty days after receiving your request.
Review of Liquidity Risk Management Program
Pursuant to Rule 22e-4 under the 1940 Act, the Trust, on behalf of the Funds, has adopted a liquidity risk management program (the “Program”) to govern the Trust’s approach to managing liquidity risk. The Program is overseen by the Trust’s Liquidity Committee, and the Program’s principal objectives include assessing, managing and periodically reviewing each Fund’s liquidity risk, based on factors specific to the circumstances of the Fund.
At a meeting of the Board held on June 1, 2022, the Trustees received a report from the Trust’s Chief Liquidity Officer, who serves as chair of the Trust’s Liquidity Committee, addressing the operations of the Program and assessing its adequacy and effectiveness of implementation. The Liquidity Committee determined, and the Chief Liquidity Officer reported to the Board, that the Program is reasonably designed to assess and manage each Fund’s liquidity risk and has operated adequately and effectively to manage each Fund’s liquidity risk since the Program was implemented in August 2018. The Chief Liquidity Officer reported that, during the period covered by the report, there were no liquidity events that impacted the Funds or their ability to timely meet redemptions without dilution to existing shareholders. The Chief Liquidity Officer further noted that no material changes have been made to the Program since its implementation.
There can be no assurance that the Program will achieve its objectives in the future. Please refer to the Trust’s prospectuses for more information regarding a Fund’s exposure to liquidity risk and other principal risks to which an investment in the Funds may be subject.
| Other Information | 169 | |||||
Table of Contents
Litman Gregory Funds Trust
OTHER INFORMATION – (Unaudited) (Continued)
Board Consideration of and Continuation and Renewal of Advisory Agreements for the iMGP Funds (formerly, PartnerSelect Funds)
At an in-person meeting held on June 7, 2023 (the “Meeting”), the Board of Trustees (the “Board”) of the Litman Gregory Funds Trust (the “Trust”), including the Trustees who are not “interested persons” of the Trust within the meaning of the Investment Company Act of 1940, as amended (the “1940 Act”) (the “Independent Trustees”), considered and approved for an additional one-year term through June 30, 2024 (i) the Unified Investment Advisory Agreement (the “Investment Advisory Agreement”) between the Trust and iM Global Partner Fund Management, LLC (formerly, Litman Gregory Fund Advisors, LLC) (the “Advisor”) with respect to the iMGP Global Select Fund (formerly, the iMGP Equity Fund) (the “Global Select Fund”), the iMGP International Fund (the “International Fund”), the iMGP SBH Focused Small Value Fund (the “SBH Focused Small Value Fund”); the iMGP Alternative Strategies Fund (the “Alternative Strategies Fund”), the iMGP High Income Fund (formerly, the iMGP High Income Alternatives Fund) (the “High Income Fund”), the iMGP Oldfield International Value Fund (the “Oldfield International Value Fund”) and the Dolan McEniry Corporate Bond Fund (the “Corporate Bond Fund”); (ii) the Amended and Restated Investment Advisory Agreement (the “ETF Advisory Agreement”) between the Trust and the Advisor with respect to the DBi Managed Futures Strategy ETF (the “Managed Futures ETF”), the DBi Hedge Strategy ETF (the “Hedge Strategy ETF”) and the iMGP RBA Responsible Global Allocation ETF (the “Global Allocation ETF”) (each of the Global Select Fund, the International Fund, the SBH Focused Small Value Fund, the Alternative Strategies Fund, the High Income Fund, the Oldfield International Value Fund, the Corporate Bond Fund, the Managed Futures ETF, the Hedge Strategy Fund and the Global Allocation ETF (each a “Fund,” and collectively, the “Funds”), and (iii) the investment sub-advisory agreements (the “Investment Sub-Advisory Agreements,” and collectively with the Investment Advisory Agreement and the ETF Advisory Agreement, the “Advisory Agreements”) between the Advisor and (a) Nuance Investments, LLC, with respect to the Global Select Fund; (b) each of Harris, Lazard Asset Management LLC, and Polen Capital Management, LLC with respect to the International Fund; (c) Segall Bryant & Hamill, LLC with respect to the SBH Focused Small Value Fund; (d) each of Blackstone Credit Systematic Strategies, LLC, DoubleLine Capital LP, First Pacific Advisors, LLC, Loomis, Sayles & Company, L.P. and Water Island Capital, LLC with respect to the Alternative Strategies Fund; (e) each of Brown Brothers Harriman & Co., Guggenheim Partners Investment Management, LLC and Neuberger Berman Investment Advisers LLC with respect to the High Income Fund; (f) Oldfield Partners LLP with respect to the Oldfield International Value Fund; (g) Dynamic Beta investments, LLC (“DBi”) with respect to the Managed Futures ETF; (h) DBi with respect to the Hedge Strategy ETF; (i) Dolan McEniry Capital Management, LLC with respect to the Corporate Bond Fund and (j) Richard Bernstein Advisors, LLC with respect to the Global Allocation Fund (each of the foregoing sub-advisors, a “Sub-Advisor,” and collectively, the “Sub-Advisors”). The Board, including the Independent Trustees, also approved the continuation for an additional one-year term through April 30, 2025 of (i) the Restated Contractual Advisory Fee Waiver Agreement between the Trust, on behalf of the Funds, and the Advisor (the “Fee Waiver Agreement”) and (ii) the Operating Expenses Limitation Agreement between the Trust, on behalf of the Global Select Fund, the High Income Fund, the SBH Focused Small Value Fund, the Oldfield International Value and the Corporate Bond Fund, and the Advisor (the “Operating Expenses Limitation Agreements” and collectively with the Fee Waiver Agreement and the Advisory Agreements, the “Agreements”).
Prior to the Meeting, the Independent Trustees had requested detailed information from the Advisor regarding the Funds. The materials provided by the Advisor were extensive, including advisory fee and expense comparisons, performance comparisons, Advisor profitability information, and a summary of compliance programs of the Sub-Advisors. In addition, the Independent Trustees discussed the renewal of the Agreements with representatives of the Advisor and were advised by independent counsel on these and other relevant matters.
The Trustees, including the Independent Trustees, also noted that they had received extensive information about, and presentations from, various members of senior management at the Advisor regarding the Funds throughout the year, including, without limitation, information on and/or discussion of the Funds’ and each Sub-Advisor’s investment results; portfolio composition; portfolio trading practices; shareholder services; advisory fees and expense comparisons; the Advisor’s financial condition and profitability; compliance monitoring by the Advisor; the personnel at the Advisor and the Sub-Advisors providing investment management, compliance and other services to the Funds; and the Advisor’s process for selecting Sub-Advisors for the Funds as well as the Advisor’s ongoing oversight of the Sub-Advisors.
The information provided to the Board at the Meeting, together with the information provided to the Board throughout the year, formed the primary (but not exclusive) basis for the Board’s determinations. The Board did not identify any single issue or particular datum point that, in isolation, would be a controlling factor in its decision to approve or renew the Agreements. Rather, the Board considered the total mix of information provided. The following summary describes the key factors considered by the Independent Trustees (as well as the Board).
1. Nature, extent and quality of services
The Independent Trustees considered the depth and quality of the Advisor’s investment management process, including its sophisticated monitoring and oversight of the Sub-Advisors; the experience, capability and integrity of its senior management and other personnel; the low turnover rates of its key personnel involved in the day-to-day operations of the Funds; and the overall financial strength and stability of its organization. The Independent Trustees also considered that the Advisor provided personnel to serve as officers of the Trust, including the Trust’s CCO, and that the services of the CCO were provided at a reasonable allocated cost to the Trust. The Independent Trustees discussed the high level of sub-advisor due diligence continually being undertaken by the Advisor. The Independent Trustees also noted the high quality of the non-advisory management services provided by the Advisor, such as responsiveness to shareholder inquiries and
| 170 | Litman Gregory Funds Trust | |||||
Table of Contents
Litman Gregory Funds Trust
OTHER INFORMATION – (Unaudited) (Continued)
requests of the Board, as well as the preparation of high quality shareholder communications and the development of targeted marketing programs for the Funds. In addition, the Independent Trustees noted that, because the Advisor is a significant shareholder in the Funds, the Advisor has an additional incentive to ensure that the Funds perform well for the shareholders. The Independent Trustees also noted that the members of senior management of the Advisor, including Mr. DeGroot, as well as certain of the Independent Trustees themselves have made significant investments in the Funds.
The Independent Trustees, based on guidance and information provided by the Trust’s CCO, also considered the Advisor’s policies, procedures and systems to ensure compliance with applicable laws and regulations and its adherence to and continual enhancement of those programs; its efforts to keep the Board informed; and its attention dedicated to matters that may involve potential conflicts of interest with a Fund. The Independent Trustees considered the extent and effectiveness of the Advisor’s compliance operations and the Advisor’s oversight of the Sub-Advisors’ and other service providers’ compliance operations.
The Independent Trustees then reviewed various materials relating to the Sub-Advisors, including copies of each Investment Sub-Advisory Agreement; copies of the Form ADV for each Sub-Advisor; information on assets of the Funds managed and fees charged by each Sub-Advisor; a summary of the compliance programs of the Sub-Advisors; and an oral report by the CCO on each Sub-Advisor’s commitment to compliance. The Independent Trustees also considered the Advisor’s lengthy and extensive due diligence process for selecting and monitoring each Sub-Advisor and the value of goodwill between the Advisor and each Sub-Advisor.
The Independent Trustees concluded that the nature, overall quality, and extent of the services provided and to be provided by the Advisor and the Sub-Advisors are fully satisfactory.
2. Investment results
The Independent Trustees reviewed the short-term and long-term performance of each Fund on both an absolute basis and in comparison to peer funds and benchmark indices. They also considered information regarding the selection, and discussed the appropriateness, of such peer funds and benchmark indices. The Independent Trustees considered the overall performance of the Funds as well as the performance of each Sub-Advisor within each Fund as compared to each Sub-Advisor’s own comparable mutual fund(s) or private fund(s) (if applicable). The Independent Trustees focused on longer-term performance, which they believe is more important than short, isolated periods for purposes of evaluating each Fund’s success in meeting its investment objective.
In particular, the Independent Trustees relied upon, among other information, the KFS Report. The Independent Trustees noted that KFS, and not the Advisor, selected the peer funds used in the KFS Report and that the Advisor had supplemented the KFS Report with additional performance comparisons.
For the Global Select Fund, the Independent Trustees compared its investment results for its Institutional shares to a number of benchmarks, including (1) the MSCI World Index (the “Global Select Market Benchmark”); (2) the Morningstar Large Blend Category (the “Global Select Morningstar Category”); and (3) the KFS Peer Group for the Global Fund (together with the Global Morningstar Category, the “Global Select Fund Benchmarks”). The Independent Trustees noted that the Global Select Fund outperformed the Global Select Market Benchmark and the Global Select Fund Benchmarks for the ten-year and fifteen-year periods ended March 31, 2023.
For the iMGP International Fund (the “International Fund”), the Independent Trustees compared its investment results for its Institutional shares to (1) the MSCI ACWI ex-U.S. Index (the “International Market Benchmark”); (2) the Morningstar Foreign Large Blend Category (the “International Morningstar Category”); and (3) the KFS Peer Group for the International Fund (together with the International Morningstar Category, the “International Fund Benchmarks”). The Independent Trustees noted that the International Fund outperformed the International Market Benchmark and the International Fund Benchmarks for the one-year and three-year periods ended March 31, 2023.
For the iMGP Alternative Strategies Fund (the “Alternative Strategies Fund”), the Independent Trustees compared its investment results for its Institutional shares to (1) the ICE BofA 3 Month U.S. Treasury Bill Index (the “Alternative Strategies Market Benchmark”); (2) the Morningstar Multi-Strategy Category (the “Alternative Strategies Morningstar Category”); and (3) the KFS Peer Group for the Alternative Strategies Fund (together with the Alternative Strategies Morningstar Category, the “Alternative Strategies Fund Benchmarks”). The Independent Trustees noted that the Alternative Strategies Fund outperformed the Alternative Strategies Market Benchmark for the three-year period ended March 31, 2023 and the Alternative Strategies Market Benchmark and Alternative Strategies Fund Benchmarks for the ten-year period ended same date.
For the High Income Fund, the Independent Trustees compared its investment results for its Institutional shares to (1) the Bloomberg U.S. Aggregate Bond Index; (2) the ICE BofA U.S. Hield Yield Index (together with the Bloomberg U.S. Aggregate Bond Index, the “High Income Market Benchmarks”) (3) the Morningstar Nontraditional Bond Category (the “High Income Morningstar Category”); and (4) the KFS Peer Group for the High Income Fund (together with the High Income Alternatives Morningstar Category, the “High Income Fund Benchmarks”). The Independent Trustees noted that, with respect to the one-year and three-year periods ended March 31, 2023, the High Income Fund outperformed the High Income Market Benchmarks and the High Income Fund Benchmarks.
For the Oldfield International Value Fund, the Independent Trustees compared its investment results for its Institutional shares to (1) the MSCI EAFE Value Index (the “Oldfield International Value Market Benchmark”); (2) the Morningstar Foreign Large Value Category (the
| Other Information | 171 | |||||
Table of Contents
Litman Gregory Funds Trust
OTHER INFORMATION – (Unaudited) (Continued)
“Oldfield International Value Morningstar Category”); and (3) the KFS Peer Group for the Oldfield International Value Fund (together with the Oldfield International Value Morningstar Category, the “Oldfield International Value Fund Benchmarks”). The Independent Trustees noted that, with respect to the one-year period ended March 31, 2023, the Oldfield International Value Fund underperformed the Oldfield International Value Market Benchmark and the Oldfield International Value Fund Benchmarks. The Independent Trustees noted the limited operating history of the Oldfield International Value Fund.
For the SBH Focused Small Value Fund, the Independent Trustees compared its investment results for its Institutional shares to (1) the Russell 2000 Value Index (the “SBH Focused Small Value Market Benchmark”); (2) the Morningstar Small Value Category (the “SBH Focused Small Value Morningstar Category”); and (3) the KFS Peer Group for the SBH Focused Small Value Fund (together with the SBH Focused Small Value Morningstar Category, the “SBH Focused Small Value Fund Benchmarks”). The Independent Trustees noted that, with respect to the one-year period ended March 31, 2023, the SBH Focused Small Value Fund outperformed the SBH Focused Small Value Market Benchmark and underperformed the SBH Focused Small Value Fund Benchmarks. The Independent Trustees noted the limited operating history of the SBH Focused Small Value Fund.
For the Dolan McEniry Corporate Bond Fund, the Independent Trustees compared its investment results for its Institutional shares to (1) the Bloomberg U.S. Intermediate Credit Index (the “Dolan McEniry Corporate Bond Market Benchmark”); (2) the Morningstar Corporate Bond Category (the “Dolan McEniry Corporate Bond Morningstar Category”); and (3) the KFS Peer Group for the Dolan McEniry Corporate Bond Fund (together with the Dolan McEniry Corporate Bond Morningstar Category, the “Dolan McEniry Corporate Bond Fund Benchmarks”). The Independent Trustees noted that, with respect to the one-year period ended March 31, 2023, the Dolan McEniry Corporate Bond Fund outperformed the Dolan McEniry Corporate Bond Fund Benchmarks but underperformed the Dolan McEniry Corporate Bond Market Benchmark. It was also noted that for the three-year period the Dolan McEniry Fund outperformed the Dolan McEniry Corporate Bond Market Benchmark and the Dolan McEniry Corporate Bond Fund Benchmarks.
For the iMGP DBi Managed Futures Strategy ETF (the “DBi Managed Futures Strategy ETF”), the Independent Trustees compared its investment results for its (1) SG CTA Index (the “DBi Managed Futures Strategy ETF Market Benchmark”); (2) the Morningstar Systematic Trend Category (the “DBi Managed Futures Strategy ETF Morningstar Category”); and (3) the Systematic Trend ETF Average (together with the DBi Managed Futures Strategy ETF Morningstar Category, the “DBi Managed Futures Strategy ETF Benchmarks”). The Independent Trustees noted that, with respect to the one- period ended March 31, 2023, the DBi Managed Futures Strategy ETF underperformed the DBi Managed Futures Strategy Market ETF Benchmark and Systematic Trend ETF Average and outperformed the DBi Managed Futures Strategy ETF Morningstar Category. It was further noted that for the three-year period, the DBi Managed Futures Strategy ETF underperformed the DBi Managed Futures Strategy ETF Market Benchmark and outperformed the DBi Managed Futures Strategy ETF Benchmarks.
For the iMGP DBi Hedge Strategy ETF (the “DBi Hedge Strategy ETF”), the Independent Trustees compared its investment results for its (1) HFRX Equity Hedge Index (the “DBi Hedge Strategy ETF Market Benchmark”); (2) the Morningstar Long-Short Equity Category (the “DBi Hedge Strategy ETF Morningstar Category”); and (3) the Long Short ETF Average (together with the DBi Hedge Strategy ETF Morningstar Category, the “DBi Hedge Strategy ETF Benchmarks”). The Independent Trustees noted that for the one-year period ended March 31, 2023, the DBi Hedge Strategy ETF outperformed Long Short ETF Average and underperformed the DBi Hedge Strategy ETF Market Benchmark and the DBi Hedge Strategy ETF Morningstar Category. It was further noted that, with respect to the three-year period, the DBi Hedge Strategy ETF outperformed the DBi Hedge Strategy ETF Market Benchmark and the DBi Hedge Strategy ETF Benchmarks.
For the iMGP RBA Responsible Global Allocation ETF (the “RBA Responsible Global Allocation ETF”), the Independent Trustees compared its investment results for its (1) 65/35 MSCI ACWI & Barclays Aggregate Bond Index (the “RBA ETF Market Benchmark”); (2) the Morningstar U.S. Fund World Allocation Category (the “RBA ETF Morningstar Category”); and (3) the Global Allocation ETF Average (together with the RBA ETF Morningstar Category, the “RBA ETF Benchmarks”). The Independent Trustees noted that, with respect to the one-year period ended March 31, 2023, the RBA Responsible Global Allocation ETF underperformed the RBA ETF Market Benchmark and the RBA ETF Morningstar Category and outperformed the Global Allocation ETF Average. The Independent Trustees noted the limited operating history of the RBA Responsible Global Allocation ETF.
The Independent Trustees noted that the performance of the Sub-Advisors varies over time and noted and acknowledged the Advisor’s detailed monitoring of the Sub-Advisors’ investment results, and interactions with Sub-Advisors, particularly those Sub-Advisors that were experiencing periods of underperformance. The Independent Trustees noted and considered the comments by the Advisor with respect to underperforming Sub-Advisors, discussions at Board meetings throughout the year regarding the potential sources of underperformance and actions taken by the Advisor in response to underperformance by certain Sub-Advisors. The Independent Trustees considered the Advisor’s process for terminating Sub-Advisors and noted the Advisor’s continued willingness to terminate Sub-Advisors if the Advisor determined that the termination would be in the best interest of a Fund and its shareholders. The Independent Trustees also noted and considered the Advisor’s ability to attract and retain high-quality investment managers to serve as Sub-Advisors to the Funds, as well as the Advisor’s extensive screening process before hiring a Sub-Advisor.
The Trustees noted the difficulty of fairly benchmarking the Funds in terms of performance. Ultimately, the Independent Trustees concluded that they were satisfied with the Funds’ overall performance records and were satisfied with the Advisor’s explanation for the periods of underperformance but will remain attentive to the Advisor’s monitoring of Sub-Advisors experiencing on-going
| 172 | Litman Gregory Funds Trust | |||||
Table of Contents
Litman Gregory Funds Trust
OTHER INFORMATION – (Unaudited) (Continued)
underperformance. The Independent Trustees further concluded that the Advisor was applying appropriate discipline and oversight to ensure that each Fund adhered to its stated investment objective and strategies, and the performance and services of the Sub-Advisors supported the decision to renew the Advisory Agreements.
3. Advisory fees and total expenses
The Independent Trustees reviewed the advisory fees and total expenses of each Fund and compared them with the advisory fees and total expenses of funds in the KFS Peer Group for each Fund. The Independent Trustees noted that the KFS Peer Group for each Fund was selected independently by KFS using a selection methodology designed to identify those funds most comparable to each Fund. The Independent Trustees further noted that in selecting the KFS Peer Group for each Fund, KFS considered various screening criteria, including, without limitation, fund type, category as determined by Morningstar, Inc., load/sales charge type, average net assets, and fund attributes. The Independent Trustees also noted that, to the extent possible without affecting KFS’ core peer fund selection methodologies, KFS had attempted to include funds that are considered by Morningstar to have a manager-of-managers structure in the KFS Peer Group for each Fund. The Independent Trustees then discussed various areas in which the Funds are different from the funds included in the KFS Peer Groups, such as distribution channels and investment strategies or approaches.
The Independent Trustees noted that the components of a fund’s total expense ratio in the KFS Report included non-operating costs, including acquired fund fees and interest expense, as applicable.
The Independent Trustees noted that according to the KFS Report, the total expenses of the Global Select Fund were above the average of the Fund’s KFS Peer Group and Morningstar Category. The Independent Trustees further noted that the Fund’s advisory fee was above the average of the Fund’s KFS Peer Group and Morningstar Category.
The Independent Trustees noted that the total expenses of the International Fund were above the average of the Fund’s KFS Peer Group and Morningstar Category. The Independent Trustees further noted that the Fund’s advisory fee was above the average of the Fund’s KFS Peer Group and Morningstar Category.
The Independent Trustees noted that both the total expenses and the advisory fee of the Alternative Strategies Fund were below the Fund’s KFS Peer Group and the Fund’s Morningstar Category.
The Independent Trustees noted that the total expenses of the High Income Fund were slightly below the Fund’s KFS Peer Group and above the Fund’s Morningstar Category. The Independent Trustees further noted that the Fund’s advisory fee was below the average of the Fund’s KFS Peer Group and Morningstar Category.
The Independent Trustees noted that the total expenses of the Oldfield International Value Fund were in line with the Fund’s KFS Peer Group and above the Fund’s Morningstar Category. The Independent Trustees further noted that the Fund’s advisory fee was fully waived such that it was below the average of the Fund’s KFS Peer Group and Morningstar Category.
The Independent Trustees noted that the total expenses of the SBH Focused Small Value Fund were below the KFS Peer Group and above the Fund’s Morningstar Category. The Independent Trustees further noted that the Fund’s advisory fee was below the average of the Fund’s KFS Peer Group and Morningstar Category.
The Independent Trustees noted that the total expenses of the Dolan McEniry Corporate Bond Fund were above the average of the Fund’s KFS Peer Group and Morningstar Category. The Independent Trustees further noted that the Fund’s advisory fee was below the average of the Fund’s KFS Peer Group and Morningstar Category.
The Independent Trustees noted that both the total expenses and the advisory fee for the DBi Managed Futures Strategy ETF were in line with the averages of the Fund’s KFS Peer Group and Morningstar Category.
The Independent Trustees noted that both the total expenses and the advisory fee for the DBi Hedge Strategy ETF were below the average of the Fund’s KFS Peer Group and Morningstar Category.
The Independent Trustees noted that the total expenses for the RBA Responsible Global Allocation ETF were below the average of the Fund’s KFS Peer Group and Morningstar Category. The Board further noted that the Fund’s advisory fee was above the Fund’s KFS Peer Group and Morningstar Category.
For each Fund with higher than average total expenses, the Independent Trustees reviewed the categories of expenses contributing to the higher expense ratios of those Funds. The Independent Trustees also agreed that the use of a multi-manager structure is a primary contributor to the relatively higher advisory fees for certain Funds, and noted that the higher advisory fees allow shareholders of the Funds to have access to Sub-Advisors to which they otherwise might not have access and that the higher fees are not unreasonable given the long-term performance results of certain Funds and potential performance results for currently underperforming Funds.
The Independent Trustees also noted the Advisor’s continued willingness to waive fees or reimburse operating expenses to maintain a competitive fee structure for each Fund and to pass through savings from fee breakpoints in any Sub-Advisor’s fee schedule to the
| Other Information | 173 | |||||
Table of Contents
Litman Gregory Funds Trust
OTHER INFORMATION – (Unaudited) (Continued)
applicable Fund’s shareholders. The Independent Trustees further took into account the Fee Waiver Agreement with respect to the Global Select Fund, the International Fund, the Alternative Strategies Fund, the High Income Fund, the SBH Focused Small Value Fund, and the Oldfield International Fund, as most recently amended September 7, 2022. The Independent Trustees also took into account the Operating Expenses Limitation Agreements with respect to the Dolan McEniry Corporate Bond Fund, Global Select Fund, High Income Fund, SBH Focused Small Value Fund and Oldfield International Value Fund, pursuant to which the Advisor has separately agreed to limit those Funds’ operating expenses for the period through April 30, 2025.
The Independent Trustees noted the United States Supreme Court’s guidance in Jones v. Harris Associates on the relevance of comparisons of advisory fees charged by the Advisor to other similarly managed separate accounts such as pension funds or other institutional investors. The Advisor presented to the Independent Trustees the advisory fees the Advisor and its affiliates charge their separately managed accounts and private investment funds (collectively, the “Other Accounts”). The Advisor explained, to the Independent Trustees’ satisfaction, various factors that contribute to the different fee schedules between the Funds and the Other Accounts, including the fact that the products the Advisor and its affiliates offer for the Funds (i.e., concentrated sub-portfolios managed by a selection of Sub-Advisors) and the Other Accounts are significantly different; that the services the Advisor and its affiliates provide for the Funds (i.e., the assembly and monitoring of the Sub-Advisors) are not readily available on the market; that the Other Accounts have much higher minimum investment requirements as compared to those of the Funds; and that certain regulatory compliance obligations and liquidity requirements are only applicable to the Funds and not the Other Accounts.
The Independent Trustees noted that the sub-advisory fees payable to the Sub-Advisors are separately negotiated with the Advisor and are paid out of the advisory fees the Advisor receives from the Funds. The Independent Trustees also noted that the fees charged by the Sub-Advisors are discounted relative to the fees the Sub-Advisors charge to their own funds and separately managed accounts, and that the Advisor from time to time attempts to renegotiate lower fees with the Sub-Advisors. Given the existence of arm’s-length bargaining between the Advisor and each Sub-Advisor, the Independent Trustees did not engage in an extensive discussion of sub-advisory fees and expenses.
The Independent Trustees further noted the Advisor’s efforts to reduce Fund expenses, including the recent renegotiation of the Trust’s custodial, transfer agency and administrative fees, which will result in substantial savings to the Funds.
Based on such review, the Independent Trustees concluded that the advisory fees and the total expenses of the Funds are reasonable in relation to the services the Funds receive from the Advisor and the Sub-Advisors.
4. The Advisor’s financial information
The Independent Trustees reviewed information regarding the Advisor’s costs of managing the Funds and information regarding the profitability of the Advisor. The Independent Trustees also considered the extent to which economies of scale may be realized as each Fund grows and whether advisory fee levels reflect economies of scale if the Funds grow in size. The Independent Trustees also noted that the Advisor had voluntarily forgone profits to subsidize the Funds when they were at lower asset levels.
The Advisor’s Costs and Profitability. The Independent Trustees noted that the Advisor appeared to be providing products that are competitively priced with other funds, especially funds with multiple sub-advisors. The Independent Trustees reviewed the total advisory fees, the amounts paid by the Advisor to the various Sub-Advisors, the general cost of the services provided by the Advisor and the Advisor’s retained portion of the total advisory fee. The Independent Trustees took note of information provided on advisory fees waived by the Advisor, noting that the Advisor had waived substantial advisory fees otherwise payable under the Investment Advisory Agreement over the most recent year, and that the Advisor follows a policy of not charging advisory fees on unallocated cash.
The Independent Trustees also noted that the Advisor to date had not sought recoupment of any advisory fees waived under the Fee Waiver Agreement. The Independent Trustees also considered the Advisor’s continued willingness to invest in staff dedicated to the Funds, including new hires when needed. The Independent Trustees received information that assured them that the Advisor was financially sound and able to honor its sponsorship commitments to the Funds and that the Advisor’s expected profits under the Advisory Agreement are in the range of reasonableness for the mutual fund management industry. The Independent Trustees did not engage in an analysis of Fund-by-Fund profitability given the integrated nature of the Advisor’s management of the Funds.
The Independent Trustees did not engage in an extended analysis of Sub-Advisor profitability given the arm’s-length nature of the bargaining between the Advisor and each Sub-Advisor and the difficulty in interpreting profitability information with respect to each Sub-Advisor due to, among other factors, the use of disparate accounting conventions, disparate ownership structures, and the fact that many Sub-Advisors managed only a portion of each Fund. The Independent Trustees also reviewed information regarding the structure and manner in which the Advisor’s and the Sub-Advisors’ investment professionals are compensated and how the compensation structures are designed to attract and retain high caliber personnel and to promote the long-term performance of the Funds.
Economies of Scale. The Independent Trustees noted that the Advisor has continued to take steps to reduce expenses of the Funds, including agreeing to amendments to the breakpoints in its fee schedules to provide for higher fee waivers, negotiating favorable terms with service providers and providing certain support services to the Funds on a cost-only basis, which represents a sharing of economies of
| 174 | Litman Gregory Funds Trust | |||||
Table of Contents
Litman Gregory Funds Trust
OTHER INFORMATION – (Unaudited) (Continued)
scale. In addition, the Independent Trustees took note of the investments in the Funds made by the Other Accounts, which help reduce costs for the Funds by increasing the asset base of the Funds. The Independent Trustees also took favorable note of the Advisor’s efforts to invest in its advisory organization to ensure strong research, analytic and marketing capabilities.
Ancillary Benefits. The Independent Trustees considered other actual and potential financial benefits to the Advisor, noting that the Advisor does not have any direct affiliates that have a relationship with the Funds. The Independent Trustees are, however, aware that the Advisor’s parent company, iM Global, benefits from having certain Sub-Advisors that are affiliates of that parent company, which could be viewed as providing an indirect benefit to the Advisor and creating a conflict of interest for the Advisor. The consensus of the Independent Trustees is that they would remain attentive to those potential indirect benefits and conflicts of interest.
5. Conclusions
Based on their review, including their non-exclusive consideration of each of the factors referred to above, the Independent Trustees as well as the Board concluded that the Agreements are fair and reasonable to each Fund and its shareholders, that each Fund’s shareholders received or would receive reasonable value in return for the advisory fees and other amounts paid to the Advisor, and that the renewal or approval, as applicable, of the Agreements would be in the best interests of each Fund and its shareholders. Each of the factors discussed above supported such approval.
Board Consideration of Investment Sub-Advisory Agreement with Berkshire Asset Management, LLC
At a meeting held on July 7, 2023 (the “Meeting”), the Board of Trustees of the Trust (the “Board”), including the trustees of the Trust who are not “interested persons” of the Trust as defined in the Investment Company Act of 1940, as amended (the “1940 Act”) (the “Independent Trustees”), unanimously approved a new investment sub-advisory agreement (the “Berkshire Sub-Advisory Agreement” or “Sub-Advisory Agreement”) by and between iM Global Partner Fund Management, LLC (the “Advisor”) and Berkshire Asset Management, LLC (“Berkshire”) pursuant to which Berkshire will serve as the sub-advisor to the Berkshire Dividend Growth ETF and manage the Fund’s assets.
At the Meeting, the Board, including the Independent Trustees, unanimously approved the hiring of Berkshire as the sub-advisor to the Fund and the Berkshire Sub-Advisory Agreement. In determining whether to approve the Berkshire Sub-Advisory Agreement, the Board and the Independent Trustees considered the materials prepared by the Advisor and received in advance of and at the Meeting and other information, which included, without limitation: (i) confirmation that the standard form of the sub-advisory agreement used by the Fund would be used in substantially that form for the Berkshire Sub-Advisory Agreement; (ii) information regarding the process the Advisor undertook in recommending Berkshire for Board approval; (iii) information regarding the nature, extent and quality of the services that Berkshire is expected to provide to the Fund; (iv) information regarding Berkshire’s reputation, investment management business, personnel, and operations; (v) information regarding Berkshire’s brokerage and trading policies and practices; (vi) information regarding the level of sub-advisory fees to be charged by Berkshire; (vii) information regarding Berkshire’s compliance program; (viii) information regarding Berkshire’s historical performance returns managing a separately managed account as well as performance information of relevant indexes; and (ix) information regarding Berkshire’s financial condition. The Board also considered the substance of its discussions with representatives of the Advisor at the Meeting. In particular, the Board and the Independent Trustees focused on the following:
1. The Nature, Extent and Quality of Services Expected to be Provided
The Board reviewed the services expected to be provided to the Fund by Berkshire. The Board considered Berkshire’s investment objective, which is to generate a growing stream of equity income by investing in a select portfolio of high-quality businesses that generally have a high, safe, and growing dividend. The Board noted that Berkshire’s philosophy is centered around buying high-quality companies at reasonable prices and holding them for a long period of time. It was noted that a company’s dividend yield and history of growing that dividend is viewed by Berkshire as a byproduct of strong business fundamentals and that the strategy’s investment universe is predominantly U.S. large cap stocks. The Board further noted Berkshire’s commitment to diversity considerations.
The Board noted that Berkshire looks beyond the highest yielding names in their universe and instead analyzes three aspects of a company’s dividend: (1) current dividend; (2) stability of the dividend; and (3) the growth of the dividend. The Board noted that Berkshire looks for companies that have a current dividend yield that is at least as high as the S&P 500 Index, but that Berkshire may invest in companies with a lower dividend yield if it sees a clear path to higher dividends.
The Board further noted that Berkshire also seeks companies that have a history of dividend growth, as well as prospects for future dividend growth.
The Board also considered the extensive due diligence process undertaken by the Advisor and the Advisor’s favorable assessment of the nature and quality of the investment sub-advisory services expected to be provided to the Fund by Berkshire.
In light of the foregoing, the Board, including the Independent Trustees, concluded that the services expected to be provided by Berkshire would be satisfactory and would have the potential to benefit the Fund.
| Other Information | 175 | |||||
Table of Contents
Litman Gregory Funds Trust
OTHER INFORMATION – (Unaudited) (Continued)
2. Investment Performance of Berkshire
The Board considered Berkshire’s performance record among its dividend growth strategy, which it has managed since May 31, 2009. It was noted that Berkshire’s strategy is in the Morningstar Direct database, in the Large Value separate account category. The Board noted that the strategy is currently a four-star rated separate account—having maintained that rating since early 2021. The Board further noted that from 2018 to early 2021, the strategy was five-star rated.
Based on such review, the Board, including the Independent Trustees, concluded that Berkshire’s historical performance, when viewed with other factors considered by the Board, supported a decision to approve the Sub-Advisory Agreement.
3. Cost of the Services to be Provided and Profits to be Realized from the Relationship with the Fund
The Board considered the proposed sub-advisory fee payable to Berkshire under the Sub-Advisory Agreement, noting that such fee would be paid by the Advisor, and not the Fund, and, thus, would not impact the fees to be paid by the Fund. The Board considered that the proposed sub-advisory fee to be paid to Berkshire by the Advisor under the Sub-Advisory Agreement had been negotiated at arm’s-length and fairly reflects the services provided by the Advisor and Berkshire, respectively. Given the arm’s-length nature of the arrangement, the Board concluded that the proposed sub-advisory fee payable to Berkshire by the Advisor under the Sub-Advisory Agreement is reasonable and appropriate. The Board noted that a detailed analysis of profitability in general was more appropriate in the context of the Board’s consideration of the advisory agreement with the Advisor. Accordingly, considerations of profitability with respect to approval of the Sub-Advisory Agreement were not relevant to the Board’s determination to approve Berkshire’s Sub-Advisory Agreement.
The Board and Trust counsel noted the due diligence process employed by the Advisor in connection with its recommendation to hire Berkshire as the sub-advisor to the Fund. It was noted that the Advisor engaged in a robust due diligence and selection process, consistent with the process it has historically employed in analyzing and recommending sub-advisors to the Board.
The Board reviewed the non-controlling nature and structure of iM Global’s investment in Berkshire, and noted that iM Global’s minority interest in Berkshire did not constitute “control” over Berkshire. The Board discussed iM Global’s strong partnerships with investment advisors, such as Berkshire, that could enable the Trust to bring the best capabilities of iM Global’s partners to the Fund and other funds in the Trust. The Board noted that iM Global’s relationship with these partners could enable the Funds, including the Fund, to have greater insight into the partners’ compliance and business platform than is generally possible with third-party sub-advisors, aiding the ongoing monitoring of sub-advisors.
Based on such review, the Board, including the Independent Trustees, concluded that the proposed sub-advisory fee payable to Berkshire would be reasonable in relation to the services expected to be provided to the Fund.
4. The Extent to Which Economies of Scale Would be Realized as the Fund Grows and Whether Fee Levels Would Reflect Such Economies of Scale
The Board considered the extent to which economies of scale would be realized as the Fund grows and whether fee levels reflect these economies of scale for the benefit of Fund shareholders. The Board recognized that this consideration is less relevant with respect to the proposed sub-advisory fee because the Advisor will pay Berkshire out of its advisory fees received from the Fund and noted that the Board considered economies of scale for the Fund in connection with the approval of the Advisor’s advisory agreement with the Fund.
5. Fall-Out Benefits
The Board considered that there may be financial benefits that Berkshire derives from its relationship with the Advisor and the Fund, including soft dollar commission benefits generated through Fund portfolio transactions. The Board did not view this consideration as having a material effect on its overall view of the reasonableness of the proposed sub-advisory fee to Berkshire.
Conclusion
The Independent Trustees did not identify any single factor discussed previously as all-important or controlling. The Board, including a majority of Independent Trustees, concluded that the terms of the Sub-Advisory Agreement were fair and reasonable, that the fees are reasonable in light of the services expected to be provided to the Fund and that the Sub-Advisory Agreement should be approved. Based on its discussion and such other matters as were deemed relevant, the Board, including the Independent Trustees, concluded that the Sub-Advisory Agreement was in the best interest of the Fund and its shareholders and does not involve a conflict of interest from which the Advisor or an affiliate of the Advisor’s parent company derives an inappropriate advantage.
Board Consideration of Investment Sub-Advisory Agreement with Polen Capital Management, LLC
At a meeting held on July 7, 2023 (the “Meeting”), the Board of Trustees of the Trust (the “Board”), including the trustees of the Trust who are not “interested persons” of the Trust as defined in the Investment Company Act of 1940, as amended (the “1940 Act”) (the “Independent Trustees”), unanimously approved a new investment sub-advisory agreement (the “Polen Capital Sub-Advisory Agreement” by and
| 176 | Litman Gregory Funds Trust | |||||
Table of Contents
Litman Gregory Funds Trust
OTHER INFORMATION – (Unaudited) (Continued)
between iM Global Partner Fund Management, LLC (the “Advisor”) and Polen Capital Management, LLC (“Polen Capital”) pursuant to which Polen Capital will serve as the sub-advisor to the Polen Capital Global Growth ETF and manage the Fund’s assets.
At the Meeting, the Board, including the Independent Trustees, unanimously approved the hiring of Polen Capital as the sub-advisor to the Fund and the Polen Capital Sub-Advisory Agreement. In determining whether to approve the Polen Capital Sub-Advisory Agreement, the Board and the Independent Trustees considered the materials prepared by the Advisor and received in advance of and at the Meeting and other information, which included, without limitation: (i) confirmation that the standard form of the sub-advisory agreement used by the Fund would be used in substantially that form for the Polen Capital Sub-Advisory Agreement; (ii) information regarding the process the Advisor undertook in recommending Polen Capital for Board approval; (iii) information regarding the nature, extent and quality of the services that Polen Capital is expected to provide to the Fund; (iv) information regarding Polen Capital’s reputation, investment management business, personnel, and operations; (v) information regarding Polen Capital’s brokerage and trading policies and practices; (vi) information regarding the level of sub-advisory fees to be charged by Polen Capital; (vii) information regarding Polen Capital’s compliance program; (viii) information regarding Polen Capital’s historical performance returns managing its various strategies, including its U.S. focus strategy, global growth strategy and international growth strategy as well as performance information of relevant indexes; and (ix) information regarding Polen Capital’s financial condition. The Board also considered the substance of its discussions with representatives of the Advisor at the Meeting. In particular, the Board and the Independent Trustees focused on the following:
1. The Nature, Extent and Quality of Services Expected to be Provided
The Board reviewed the services expected to be provided to the Fund by Polen Capital. The Board considered Polen Capital’s investment experience, philosophy and process. It was noted that Polen Capital follows a high-conviction approach to investing consistent with that of the Advisor. The Board noted that Polen Capital’s investment approach seeks to identify companies with a durable earnings profile driven by a sustainable competitive advantage, financial strength, sound Environmental, Social, and Governance (ESG) practices, proven management teams and powerful products/services. The Board further noted that Polen Capital takes a long-term investment approach and seeks to preserve capital and provide stability across market cycles. The Board also considered the extensive due diligence process undertaken by the Advisor and the Advisor’s favorable assessment of the nature and quality of the investment sub-advisory services expected to be provided to the Fund by Polen Capital. The Board further noted its familiarity with Polen Capital as a Sub-Advisor to the International Fund. The Board also noted Polen Capital’s commitment to diversity considerations.
In light of the foregoing, the Board, including the Independent Trustees, concluded that the services expected to be provided by Polen Capital would be satisfactory and would have the potential to benefit the Fund.
2. Investment Performance of Polen Capital
The Board considered Polen Capital’s performance record among its various strategies, including its U.S. focus strategy, global growth strategy and international growth strategy. The Advisor’s conviction in Polen Capital’s international strategy was noted, as well as the factors that the Advisor considered in connection with its recommendation to approve Polen Capital as the sub-advisor to the Fund.
Based on such review, the Board, including the Independent Trustees, concluded that Polen Capital’s historical performance, when viewed with other factors considered by the Board, supported a decision to approve the Sub-Advisory Agreement.
3. Cost of the Services to be Provided and Profits to be Realized from the Relationship with the Fund
The Board considered the proposed sub-advisory fee payable to Polen Capital under the Sub-Advisory Agreement, noting that such fee would be paid by the Advisor, and not the Fund, and, thus, would not impact the fees to be paid by the Fund. The Board considered that the proposed sub-advisory fee to be paid to Polen Capital by the Advisor under the Sub-Advisory Agreement had been negotiated at arm’s-length and fairly reflects the services provided by the Advisor and Polen Capital, respectively. Given the arm’s-length nature of the arrangement, the Board concluded that the proposed sub-advisory fee payable to Polen Capital by the Advisor under the Sub-Advisory Agreement is reasonable and appropriate. The Board noted that a detailed analysis of profitability in general was more appropriate in the context of the Board’s consideration of the advisory agreement with the Advisor. Accordingly, considerations of profitability with respect to approval of the Sub-Advisory Agreement were not relevant to the Board’s determination to approve Polen Capital’s Sub-Advisory Agreement.
It was noted that a Trustee has served as a member of Polen Capital’s Advisory Committee since 2018. It was also noted that, while iM Square Holding 1 LLC, an affiliate of the Advisor (“iM Square”), has a 20% ownership interest in Polen Capital, the Advisor had identified Polen Capital as a potential sub-advisor several years prior to the acquisition of Litman Gregory Wealth Management, LLC (formerly, Litman Gregory Asset Management, LLC), the parent of the Advisor, by iM Global. It was further noted that the Advisor is not technically affiliated with Polen Capital under the 1940 Act. The Board and Trust counsel noted the due diligence process employed by the Advisor in connection with its recommendation to hire Polen Capital as the sub-advisor to the Fund. It was noted that the Advisor engaged in a robust due diligence and selection process, consistent with the process it has historically employed in analyzing and recommending sub-advisors to the Board.
| Other Information | 177 | |||||
Table of Contents
Litman Gregory Funds Trust
OTHER INFORMATION – (Unaudited) (Continued)
The Board reviewed the non-controlling nature and structure of iM Square’s investment in Polen Capital, and noted that iM Square’s minority interest in Polen Capital did not constitute “control” over Polen Capital. The Board discussed the strong partnerships of the Advisor’s parent company with investment advisors, in this case through iM Square’s partial ownership stake in Polen Capital, that could enable the Advisor to bring the best capabilities of iM Global’s partners to the Fund and other funds in the Trust. The Board noted that iM Global’s relationship with these partners may enable the Funds, including the Fund, to have greater insight into the partners’ compliance and business platform than is generally possible with third-party sub-advisors, aiding the ongoing monitoring of sub-advisors.
Based on such review, the Board, including the Independent Trustees, concluded that the proposed sub-advisory fee payable to Polen Capital would be reasonable in relation to the services expected to be provided to the Fund.
4. The Extent to Which Economies of Scale Would be Realized as the Fund Grows and Whether Fee Levels Would Reflect Such Economies of Scale
The Board considered the extent to which economies of scale would be realized as the Fund grows and whether fee levels reflect these economies of scale for the benefit of Fund shareholders. The Board recognized that this consideration is less relevant with respect to the proposed sub-advisory fee because the Advisor will pay Polen Capital out of its advisory fees received from the Fund and noted that the Board considered economies of scale for the Fund in connection with the approval of the Advisor’s advisory agreement with the Fund.
5. Fall-Out Benefits
The Board considered that there may be financial benefits that Polen Capital derives from its relationship with the Advisor and the Fund, including soft dollar commission benefits generated through Fund portfolio transactions. The Board did not view this consideration as having a material effect on its overall view of the reasonableness of the proposed sub-advisory fee to Polen Capital.
Conclusion
The Independent Trustees did not identify any single factor discussed previously as all-important or controlling. The Board, including a majority of Independent Trustees, concluded that the terms of the Sub-Advisory Agreement were fair and reasonable, that the fees are reasonable in light of the services expected to be provided to the Fund and that the Sub-Advisory Agreement should be approved. Based on its discussion and such other matters as were deemed relevant, the Board, including the Independent Trustees, concluded that the Sub-Advisory Agreement was in the best interest of the Fund and its shareholders and does not involve a conflict of interest from which the Advisor or a sub-advisor affiliated with the Advisor’s parent company, derives an inappropriate advantage.
| 178 | Litman Gregory Funds Trust | |||||
Table of Contents
Litman Gregory Funds Trust
The ABX Indexes serve as a benchmark of the market for securities backed by home loans issued to borrowers with weak credit. The ABX 2006-2 AAA is an asset-backed index that tracks AAA-rated bonds issued prior to the second half of 2006. The ABX 2007-1 AAA is an asset-backed index that tracks AAA-rated bonds issued prior to the first half of 2007.
BofA Merrill Lynch U.S. High Yield Master II Index tracks the performance of below investment grade, but not in default, US dollar-denominated corporate bonds publicly issued in the US domestic market.
The BofA Merrill Lynch High Yield Cash Pay Index is an unmanaged index used as a general measure of market performance consisting of fixed-rate, coupon-bearing bonds with an outstanding par which is greater than or equal to $50 million, a maturity range greater than or equal to one year and must be less than BBB/Baa3 rated but not in default.
Bloomberg Barclays U.S. Aggregate Bond Index is a market capitalization-weighted index, meaning the securities in the index are weighted according to the market size of each bond type. Most U.S. traded investment grade bonds are represented. The index includes U.S. treasury securities (non TIPS), government agency bonds, mortgage backed bonds, corporate bonds, and a small amount of foreign bonds traded in the U.S.
Bloomberg Barclays U.S. Intermediate Credit Index: is the intermediate component of the Bloomberg Barclays U.S. Credit Index. The Bloomberg Barclays U.S. Credit Index measures the investment grade, US dollar-denominated, fixed-rate, taxable, corporate and government—related bond markets. It is composed of the US Corporate Index and a non-corporate component that includes foreign agencies, sovereigns, supranationals, and local authorities.
The CBOE Russell 2000 PutWrite Index (PUTR) is designed to track the performance of a hypothetical strategy that sells a monthly at-the-money (ATM) Russell 2000 Index put option.
The CBOE Russell 2000 Volatility Index (RVX) is a key measure of market expectations of near-term volatility conveyed by Russell 2000® Index (RUT) option prices. The RVX Index measures the market’s expectation of 30-day volatility implicit in the prices of near-term RUT options traded at CBOE.
The CBOE S&P 500 PutWrite Index (ticker symbol PUT) is a benchmark index that measures the performance of a hypothetical portfolio that sells S&P 500 Index (SPX) put options against collateralized cash reserves held in a money market account.
The CBOE S&P 500 2% OTM PutWrite Index (PUTYSM Index) is designed to track the performance of a hypothetical passive investment strategy that collects option premiums from writing a 2% Out-of-the Money (OTM) SPX Put option on a monthly basis and holds a rolling money market account invested in one-month T-bills to cover the liability from the short SPX Put option position.
CDX is a series of credit default swap indexes, used to hedge credit risk or to take a position on a basket of credit entities.
The Citigroup Economic Surprise Indices are objective and quantitative measures of economic news. They are defined as weighted historical standard deviations of data surprises.
FTSE Emerging Markets Index – ETF Tracker. The Index is a market capitalization index, adjusted based on the free-float of potential index constituents, and designed to measure the performance of large-, medium- and small-capitalization companies located in emerging market countries throughout the world.
The FTSE Global All Cap ex U.S. Index is part of a range of indices designed to help U.S. investors benchmark their international investments. The index comprises large, mid and small cap stocks globally excluding the U.S. The index is derived from the FTSE Global Equity Index Series (GEIS), which covers 98% of the world’s investable market capitalization.
The HFRI Equity Hedge Index is comprised of managers typically maintaining at least 50%, and in some cases be substantially entirely invested in equities and equity derivatives, both long and short. Strategies can be broadly diversified or narrowly focused on specific sectors and can range broadly in terms of levels of net exposure, leverage employed, holding period, concentrations of market capitalizations and valuation ranges of typical portfolios. The HFRI Emerging Markets Index is comprised of strategies according to their regional investment focus only. There is no investment strategy criteria for inclusion in these indices.
The HFRI Event Driven Index: Consists of investment managers who maintain positions in companies currently or prospectively involved in corporate transactions of a wide variety including but not limited to mergers, restructurings, financial distress, tender offers, shareholder buybacks, debt exchanges, security issuance or other capital structure adjustments. Security types can range from most senior in the capital structure to most junior or subordinated, and frequently involve additional derivative securities. Event driven exposure includes a combination of sensitivities to equity markets, credit markets and idiosyncratic, company specific developments.
The HFRI Event Driven Merger Arbitrage Index: Consists of merger arbitrage strategies which employ an investment process primarily focused on opportunities in equity and equity related instruments of companies which are currently engaged in a corporate transaction. Merger arbitrage involves primarily announced transactions, typically with limited or no exposure to situations which pre-, post-date or situations in which no formal announcement is expected to occur. Opportunities are frequently presented in cross border, collared and international transactions which incorporate multiple geographic regulatory institutions, with typically involve minimal exposure to corporate credits. Merger arbitrage strategies typically have over 75% of positions in announced transactions over a given market cycle.
The HFRX Fixed Income – Credit Index is an unmanaged index that includes strategies with exposure to credit across a broad continuum of credit sub-strategies, including Corporate, Sovereign, Distressed, Convertible, Asset Backed, Capital Structure
| Index Definitions | 179 | |||||
Table of Contents
Litman Gregory Funds Trust
INDEX DEFINITIONS – (Continued)
Arbitrage, Multi-Strategy and other Relative Value and Event Driven sub-strategies.
The HFRX Global Hedge Fund Index is designed to be representative of the overall composition of the hedge fund universe. It is comprised of all eligible hedge fund strategies; including but not limited to convertible arbitrage, distressed securities, equity hedge, equity market neutral, event driven, macro, merger arbitrage, and relative value arbitrage.
ICE BofAML 0-3 Year U.S. Treasury Index tracks the performance of U.S. dollar denominated sovereign debt publicly issued by the U.S. government in its domestic market with maturities less than three years.
ICE BofA Merrill Lynch 1-3 US Year Treasury Index is an unmanaged index that tracks the performance of the direct sovereign debt of the U.S. Government having a maturity of at least one year and less than three years.
The ICE BofAML U.S. High Yield Cash Pay TR USD Index is an unmanaged index that measures the performance of short-term U.S. dollar denominated below investment grade corporate debt publicly issued in the U.S. domestic market.
LIBOR stands for London Interbank Offered Rate. It’s an index that is used to set the cost of various variable-rate loans.
Morningstar Category Averages: Each Morningstar Category Average is representative of funds with similar investment objectives.
The MSCI All Country World Index is a free float-adjusted market capitalization weighted index that is designed to measure the equity market performance of developed and emerging markets.
The MSCI All Country World ex U.S. Index is a free float-adjusted market capitalization weighted index that is designed to measure the equity market performance of developed and emerging markets, excluding the United States.
The MSCI All Country World ex U.S. Growth Index is a free float-adjusted market capitalization weighted index that is designed to measure the equity market performance of developed and emerging markets, excluding the United States. It includes companies with higher price-to-book ratios and higher forecasted growth values.
The MSCI All Country World ex U.S. Value Index is a free float-adjusted market capitalization weighted index that is designed to measure the equity market performance of developed and emerging markets, excluding the United States. It includes companies with lower price-to-book ratios and lower forecasted growth values.
The MSCI China Index captures large and mid cap representation across China A shares, H shares, B shares, Red chips, P chips and foreign listings (e.g. ADRs). With 739 constituents, the index covers about 85% of this China equity universe
The MSCI Emerging Markets ex China Index captures large and mid cap representation across 24 of the 25 Emerging Markets (EM) countries* excluding China. With 681 constituents, the index covers
approximately 85% of the free float-adjusted market capitalization in each country.
The MSCI EAFE Index (Europe, Australasia, Far East) is a free float-adjusted market capitalization index that is designed to measure the equity market performance of developed markets, excluding the US & Canada. As of May 27, 2010 the MSCI EAFE Index consisted of the following 22 developed market country indices: Australia, Austria, Belgium, Denmark, Finland, France, Germany, Greece, Hong Kong, Ireland, Israel, Italy, Japan, the Netherlands, New Zealand, Norway, Portugal, Singapore, Spain, Sweden, Switzerland, and the United Kingdom.
The MSCI Emerging Markets Index captures large and mid-cap representation across 23 Emerging Markets (EM) countries. With 836 constituents, the index covers approximately 85% of the free float-adjusted market capitalization in each country.
The MSCI World Index is a free float-adjusted market capitalization weighted index that is designed to measure the equity market performance of developed markets, including the United States.
The Russell 1000 Index measures the performance of the large-cap segment of the U.S. equity universe. It is a subset of the Russell 3000® Index and includes approximately 1000 of the largest securities based on a combination of their market cap and current index membership. The Russell 1000 represents approximately 92% of the U.S. market.
The Russell 1000 Growth Index measures the performance of the large-cap growth segment of the U.S. equity universe. It includes those Russell 1000 companies with higher price-to-book ratios and higher forecasted growth values.
The Russell 2000 Index measures the performance of the 2,000 smallest companies in the Russell 3000 Index.
The Russell 2000 Value Index measures the performance of small-cap value segment of the U.S. equity universe. It includes those Russell 2000 companies with lower price-to-book ratios and lower forecasted growth values.
The Russell 2500 Index measures the performance of the small to mid-cap segment of the U.S. equity universe, commonly referred to as “smid” cap. The Russell 2500 Index is a subset of the Russell 3000 Index. It includes approximately 2500 of the smallest securities based on a combination of their market cap and current index membership.
The Russell 3000 Index measures the performance of the 3,000 largest U.S. companies as measured by total market capitalization, and represents about 98% of the U.S. stock market.
The Russell 3000 Value Index is a broad based index that measures the performance of those companies within the 3,000 largest U.S. companies, based on total market capitalization, that have lower price-to-book ratios and lower forecasted growth rates.
The SG CTA Index is an index published by Société Générale that is designed to reflect the performance of a pool of Commodity Trading Advisor (CTAs) selected from larger managers that employ
| 180 | Litman Gregory Funds Trust | |||||
Table of Contents
Litman Gregory Funds Trust
INDEX DEFINITIONS – (Continued)
systematic managed futures strategies. The index is reconstituted annually.
The S&P 500 Index is widely regarded as the standard for measuring large-cap stock performance, and consists of 500 stocks that represent a sample of the leading companies in leading industries.
The SPDR S&P 500 ETF consists of 500 of the largest U.S. companies, and it is one of the most heavily traded securities in the world. It tracks the S&P 500 Index, and fund follows a full replication strategy, holding every stock in the index.
The SPDR Financials Sector Index seeks to provide an effective representation of the financial sector of the S&P 500 Index. The Index includes companies from the following industries: diversified financial services; insurance; banks; capital markets; mortgage real estate investment trusts (“REITs”); consumer finance; and thrifts and mortgage finance.
The Vanguard 500 Index Fund invests in 500 of the largest U.S. companies, which span many different industries and account for about three-fourths of the U.S. stock market’s value. This fund tracks the S&P 500 Index as closely as possible.
VIX is a trademarked ticker symbol for the Chicago Board Options Exchange Market Volatility Index, a popular measure of the implied volatility of S&P 500 index options. Often referred to as the fear index or the fear gauge, it represents one measure of the market’s expectation of stock market volatility over the next 30 day period.
Indices are unmanaged, do not incur fees, and cannot be invested in directly.
| Index Definitions | 181 | |||||
Table of Contents
Litman Gregory Funds Trust
INDUSTRY TERMS AND DEFINITIONS
| 1. | Active Share measures the degree of difference between a fund portfolio and its benchmark index. |
| 2. | Alpha is an annualized return measure of how much better or worse a fund’s performance is relative to an index of funds in the same category, after allowing for differences in risk. |
| 3. | Alt-A, or Alternative A-paper, is a type of U.S. mortgage that, for various reasons, is considered riskier than A-paper, or “prime”, and less risky than “subprime,” the riskiest category. |
| 4. | The Basel Accords are three sets of banking regulations (Basel I, II and III) set by the Basel Committee on Bank Supervision (BCBS), which provides recommendations on banking regulations in regards to capital risk, market risk and operational risk. |
| 5. | A basis point is a value equaling one one-hundredth of a percent (1/100 of 1%). |
| 6. | Beta is a measure of the volatility, or systematic risk, of a security or a portfolio in comparison to the market as a whole. |
| 7. | Book value is the net asset value of a company, calculated by subtracting total liabilities and intangible assets from total assets. |
| 8. | Brexit is an abbreviation of “British exit”, which refers to the June 23, 2016 referendum by British voters to exit the European Union. |
| 9. | Business development company (BDC) is an organization that invests in and helps small- and medium-size companies grow in the initial stages of their development. |
| 10. | Cash flow measures the cash generating capability of a company by adding non-cash charges (e.g., depreciation) and interest expense to pretax income. |
| 11. | Cash flow yield (or free cash flow yield) is a financial solvency ratio that compares the free cash flow per share a company is expected to earn against its market value per share. The ratio is calculated by taking the free cash flow per share divided by the current share price. |
| 12. | Capex (capital expenditures) are expenditures creating future benefits. |
| 13. | Collateralized Loan Obligation (CLO) is a security backed by a pool of debt, often low-rated corporate loans. Collateralized loan obligations (CLOs) are similar to collateralized mortgage obligations, except for the different type of underlying loan. |
| 14. | Combined ratio is a formula used by insurance companies to relate premium income to claims, administration and dividend expenses. It is used in the annual statement filed by an insurer with the state insurance department. It is calculated by dividing the sum of incurred losses and expenses by earned premium. |
| 15. | Compound annual growth rate (CAGR) is the rate of growth of a number, compounded over several years. |
| 16. | Conditional pre-payment rate is a loan prepayment rate that is equal to the proportion of the principal of a pool of loans that is assumed to be paid off prematurely in each period. |
| 17. | The Consumer Price Index (CPI) is a measure that examines the weighted average of prices of a basket of consumer goods and services, such as transportation, food and medical care. Changes in the CPI are used to assess price changes associated with the cost of living; the CPI is one of the most frequently used statistics for identifying periods of inflation or deflation. |
| 18. | Correlation is a statistical measure of how two securities move in relation to each other. |
| 19. | A coupon or coupon payment is the annual interest rate paid on a bond, expressed as a percentage of the face value and paid from issue date until maturity. |
| 20. | Covenants most often relate to terms in a financial contract, such as a loan document or bond issue stating the limits at which the borrower can further lend. |
| 21. | Credit default swaps are swaps designed to transfer the credit exposure of fixed income products between parties. A credit default swap is also referred to as a credit derivative contract, where the purchaser of the swap makes payments up until the maturity date of a contract. Payments are made to the seller of the swap. In return, the seller agrees to pay off a third party debt if this party defaults on the loan. |
| 22. | Discounted cash flow is calculated by multiplying future cash flows by discount factors to obtain present values. |
| 23. | Diversification is the spreading of risk by putting assets in several categories of investments. |
| 24. | Dividend yield is the return on an investor’s capital investment that a company pays out to its shareholders in the form of dividends. It is calculated by taking the amount of dividends paid per share over the course of a year and dividing by the stock’s price. |
| 25. | Drawdown is the peak-to-trough decline during a specific record period of an investment, fund or commodity. |
| 182 | Litman Gregory Funds Trust | |||||
Table of Contents
Litman Gregory Funds Trust
INDUSTRY TERMS AND DEFINITIONS – (Continued)
| 26. | Dry powder refers to cash reserves kept on hand to cover future obligations or purchase assets, if conditions are favorable. |
| 27. | Duration is a measure of the sensitivity of the price (the value of principal) of a fixed-income investment to a change in interest rates. Duration is expressed as a number of years. Rising interest rates mean falling bond prices, while declining interest rates mean rising bond prices. |
| 28. | Earnings per share (EPS) is calculated by taking the total earnings divided by the number of shares outstanding. |
| 29. | EBIT is a company’s earnings before interest and taxes, and measures the profit a company generates from its operations, making it synonymous with “operating profit”. |
| 30. | EBITDA is a company’s earnings before interest, taxes, depreciation, and amortization. |
| 31. | E-Mini Futures Are an electronically traded futures contract on the Chicago Mercantile Exchange that represents a portion of the normal futures contracts. |
| 32. | Enterprise value is a measure of a company’s total value, calculated by adding a corporation’s market capitalization, preferred stock, and outstanding debt together and then subtracting out the cash and cash equivalents. |
| 33. | Enterprise value/adjusted target operating profit (or Enterprise Value/adjusted target EBIT) is a financial ratio that compares the total valuation of the company with its profitability, adjusting for various special circumstances. |
| 34. | EV/EBITDA is the enterprise value of a company divided by earnings before interest, taxes, depreciation, and amortization. |
| 35. | EV/Sales is the ratio of enterprise value of a company divided by the total sales of the company for a particular period, usually one year. |
| 36. | Floating interest rate, also known as a variable or adjustable rate, refers to any type of debt instrument, such as a loan, bond, mortgage, or credit, that does not have a fixed rate of interest over the life of the instrument. |
| 37. | Forex (FX) is the market in which currencies are traded. |
| 38. | Free cash flow is the amount of cash a company has after expenses, debt service, capital expenditures, and dividends. |
| 39. | Futures are financial contracts obligating the buyer to purchase an asset (or the seller to sell an asset), such as a physical commodity or a financial instrument, at a predetermined future date and price. Futures contracts detail the quality and quantity of the underlying asset; they are standardized to facilitate trading on a futures exchange. |
| 40. | The G20 (or G-20 or Group of Twenty) is an international forum for the governments and central bank governors from 20 major economies. It was founded in 1999 with the aim of studying, reviewing, and promoting high-level discussion of policy issues pertaining to the promotion of international financial stability. |
| 41. | Gross merchandise volume or GMV is a term used in online retailing to indicate a total sales dollar value for merchandise sold through a particular marketplace over a certain time frame. |
| 42. | “Growth” stocks are generally considered to be stocks of companies with high expected earnings growth compared to “value” stocks. Because of this higher expected growth, growth stocks tend to be priced at a higher multiple of their current earnings than value stocks. However, the premium paid for growth stocks compared to value stocks can vary dramatically depending on the market environment. |
| 43. | Industry cost curve is the standard microeconomic graph that shows how much output suppliers can produce at a given cost per unit. As a strategic tool, the cost curve applies most directly to commodity or near commodity industries, in which buyers get roughly the same value from a product regardless of who produces it. |
| 44. | An interest rate future is a financial derivative (a futures contract) with an interest-bearing instrument as the underlying asset. It is a particular type of interest rate derivative. Examples include Treasury-bill futures, Treasury-bond futures and Eurodollar futures. |
| 45. | An interest rate swap is a forward contract in which one stream of future interest payments is exchanged for another based on a specified principal amount. |
| 46. | Internal Rate of Return (IRR) is the discount rate often used in capital budgeting that makes the net present value of all cash flows from a particular project equal to zero. |
| 47. | Inverse floater (or inverse floating rate note) is a bond or other type of debt whose coupon rate has an inverse relationship to a benchmark rate. |
| 48. | Inverse interest-only security is a security that pays a coupon inversely related to market rates (i.e., it moves in the opposite direction of interest rates), instead of paying a coupon corresponding to the interest payments homeowners (mortgagors) actually make. |
| Industry Terms and Definitions | 183 | |||||
Table of Contents
Litman Gregory Funds Trust
INDUSTRY TERMS AND DEFINITIONS – (Continued)
| 49. | An Investment Grade bond is a bond with a rating of AAA to BBB; a Below Investment Grade bond is a bond with a rating lower than BBB |
| 50. | A Leveraged Buyout (LBO) is the acquisition of another company using a significant amount of borrowed money to meet the cost of acquisition. |
| 51. | Loss adjusted yields are those that already reflect the impact of assumed economic losses. |
| 52. | Margin of safety is a principle of investing in which an analyst only purchases securities when the market price is below the analyst’s estimation of intrinsic value. It does not guarantee a successful investment. |
| 53. | Market capitalization (or market cap) is the total value of the issued shares of a publicly traded company; it is equal to the share price times the number of shares outstanding. MBA Refinance index is a weekly measurement put together by the Mortgage Bankers Association, a national real estate finance industry association, to predict mortgage activity and loan prepayments based on the number of mortgage refinance applications submitted. |
| 54. | The Merrill Option Volatility Expectations Index (MOVE©) reflects a market estimate of future Treasury bond yield volatility. The MOVE index is a yield curve weighted index of the normalized implied volatility on 1-month Treasury options. The MOVE Index reports the average implied volatility across a wide range of outstanding options on the two-year, five-year, 10-year, and 30-year U.S. Treasury securities. |
| 55. | Net operating profit after tax (NOPAT): A company’s potential cash earnings if its capitalization were unleveraged (that is, if it had no debt). |
| 56. | Normalized earnings are earnings adjusted for cyclical ups and downs of the economy. Also, on the balance sheet, earnings adjusted to remove unusual or one-time influences. |
| 57. | Operating cash flow is calculated by summing net profit, depreciation, change in accruals, and change in accounts payable, minus change in accounts receivable, minus change in inventories. |
| 58. | Options are financial derivatives that represent a contract sold by one party (option writer) to another party (option holder). The contract offers the buyer the right, but not the obligation, to buy (call) or sell (put) a security or other financial asset at an agreed-upon price (the strike price) during a certain period of time or on a specific date (exercise date). |
| 59. | An option premium is the current market price of an option contract. It is thus the income received by the seller (writer) of an option contract to another party. |
| 60. | Out of the money (OTM) is term used to describe a call option with a strike price that is higher than the market price of the underlying asset, or a put option with a strike price that is lower than the market price of the underlying asset. An out of the money option has no intrinsic value, but only possesses extrinsic or time value. |
| 61. | Pair-wise correlation is the average of the correlations of each managers’ performance with each of the other managers on the fund. |
| 62. | Personal consumption expenditure is the measure of actual and imputed expenditures of households, and includes data pertaining to durable and non-durable goods and services. It is essentially a measure of goods and services targeted towards individuals and consumed by individuals. |
| 63. | Present value is the current worth of a future sum of money or stream of cash flows given a specified rate of return. |
| 64. | Price to book ratio is calculated by dividing the current market price of a stock by the book value per share. |
| 65. | Price to earnings (P/E) ratio is a common tool for comparing the prices of different common stocks and is calculated by dividing the current market price of a stock by the earnings per share. Similarly, multiples of earnings and cash flow are means of expressing a company’s stock price relative to its earnings per share or cash flow per share, and are calculated by dividing the current stock price by its earnings per share or cash per share. Forecasted earnings growth is the projected rate that a company’s earnings are estimated to grow in a future period. |
| 66. | Price to sales (P/S) ratio is a tool for calculating a stock’s valuation relative to other companies, calculated by dividing a stock’s current price by its revenue per share. |
| 67. | Price to tangible book value (PTBV) is a valuation ratio expressing the price of a security compared to its hard, or tangible, book value as reported in the company’s balance sheet. The tangible book value number is equal to the company’s total book value less the value of any intangible assets. |
| 68. | Prime is a classification of borrowers, rates, or holdings in the lending market that are considered to be of high quality. |
| 184 | Litman Gregory Funds Trust | |||||
Table of Contents
Litman Gregory Funds Trust
INDUSTRY TERMS AND DEFINITIONS – (Continued)
| 69. | Principal only securities are a type of fixed-income security where the holder is only entitled to receive regular cash flows that are derived from incoming principal repayments on an underlying loan pool. |
| 70. | Private market value is the value of a company if each of its parts were independent, publicly traded entities. |
| 71. | Prospective earnings growth ratio (PEG ratio): The projected one-year annual growth rate, determined by taking the consensus forecast of next year’s earnings, less this year’s earnings, and dividing the result by this year’s earnings. |
| 72. | Put writing is a family of options trading strategies that involve the selling of put options to earn premiums. One can either write a covered put or a naked put. Utilizing a combination of covered puts and naked puts, one can also implement the ratio put write, which is a neutral strategy. |
| 73. | Quantitative Easing (QE) is a monetary policy in which a central bank purchases government securities or other securities from the market in order to lower interest rates and increase the money supply. |
| 74. | Return on capital (ROC) is a measure of how effectively a company uses the money (borrowed or owned) invested in its operations. It is calculated by dividing net income by invested capital. |
| 75. | Return on equity (ROE) is a measure of how well a company used reinvested earnings to generate additional earnings. Expressed as a percentage, it is calculated by dividing net worth at the beginning of the period into net income for the period after preferred stock dividends but before common stock dividends. |
| 76. | Return on investment capital (ROIC) is calculated by subtracting dividends from net income and dividing by total capital. |
| 77. | Sequential growth is a measure of a company’s short-term financial performance that compares the results achieved in a recent period to those of the period immediately preceding it. |
| 78. | Sharpe ratio is the measure of a fund’s return relative to its risk. The Sharpe ratio uses standard deviation to measure a fund’s risk-adjusted returns. The higher a fund’s Sharpe ratio, the better a fund’s returns have been relative to the risk it has taken on. Because it uses standard deviation, the Sharpe ratio can be used to compare risk-adjusted returns across all fund categories. |
| 79. | Short (or short position) is the sale of a borrowed security, commodity, or currency with the expectation that the asset will fall in value. |
| 80. | Sortino Ratio is a modification of the Sharpe ratio that differentiates harmful volatility from general volatility by taking into account the standard deviation of negative asset returns, called downside deviation. |
| 81. | A sovereign bond is a debt security issued by a national government. |
| 82. | A special situation is a particular circumstance involving a security that would compel investors to trade the security based on the special situation, rather than the underlying fundamentals of the security or some other investment rationale. A spin-off is an example of a special situation. |
| 83. | Spot price is the current price at which a particular security can be bought or sold at a specified time and place. |
| 84. | Standard deviation is a statistical measure of the historical volatility of a mutual fund or portfolio, usually computed using 36 monthly returns. |
| 85. | Subprime refers to the credit quality of particular borrowers, who have weakened credit histories and a greater risk of loan default than prime borrowers. The market for lenders and borrowers of subprime credit includes the business of subprime mortgages, subprime auto loans and subprime credit cards, as well as various securitization products that use subprime debt as collateral. |
| 86. | Swaps, traditionally, are the exchange of one security for another to change the maturity (bonds), quality of issues (stocks or bonds), or because investment objectives have changed. Recently, swaps have grown to include currency swaps and interest rate swaps. |
| 87. | Swaption (swap option): The option to enter into an interest rate swap. In exchange for an option premium, the buyer gains the right but not the obligation to enter into a specified swap agreement with the issuer on a specified future date. |
| 88. | Tangible Book Value Per Share – TBVPS is a method of valuing a company on a per-share basis by measuring its equity after removing any intangible assets. |
| 89. | Tracking error is the monitoring the performance of a portfolio, usually to analyze the extent to which its price movements conform or deviate from those of a benchmark. |
| 90. | Upside/downside capture is a statistical measure that shows whether a given fund has outperformed—gained more or lost less than--a broad market benchmark during periods of market strength and weakness, and if so, by how much. |
| 91. | Yield Curve: A line that plots the interest rates, at a set point in time, of bonds having equal credit quality, but differing maturity dates. The most frequently reported yield curve compares the three-month, two-year, five-year and 30-year U.S. Treasury debt. The curve is used to predict changes in economic output and growth. |
| Industry Terms and Definitions | 185 | |||||
Table of Contents
Litman Gregory Funds Trust
INDUSTRY TERMS AND DEFINITIONS – (Continued)
| 92. | Yield to Maturity is the rate of return anticipated on a bond if it is held until the maturity date. |
| 93. | Yield to Worst is the lowest potential yield that can be received on a callable bond without the issuer actually defaulting. |
| 94. | Z Bonds, or Z Tranches, are the final tranche in a series of mortgage-backed securities, that is the last one to receive payment. Used in some collateralized mortgage obligations (CMO), Z-bonds pay no coupon payments while principal is being paid on earlier bonds. |
| 186 | Litman Gregory Funds Trust | |||||
Table of Contents
TRUSTEE AND OFFICER INFORMATION
Independent Trustees*
| Name, Address and Year Born | Position(s) Held with the Trust | Term of Office and Length of Time Served | Principal Occupation(s) During Past Five Years | #of Portfolios in Fund Complex Overseen by Trustee | Other Directorships Held by Trustee During Past Five Years | |||||
Julie Allecta El Segundo, CA 90245 (born 1946) | Chairperson of the Board, Independent Trustee | Open-ended term; served since June 2013 | Member of Governing Council and Policy Committee, Independent Directors Council (education for investment company independent directors) 2014-2022; and Retired Partner, Paul Hastings LLP (law firm) from 1999 to 2009. | 11 | Forward Funds (mutual funds) (4 portfolios) Salient MF Trust (mutual funds) (1 portfolio) Salient Midstream & MLP Fund (closed- end fund) (1 portfolio) | |||||
Thomas W. Bird 2301 Rosecrans Avenue, Suite 2150 El Segundo, CA 90245 (born 1957) | Independent Trustee | Open-ended term; served since May 2021 | Founder, Chief Executive Officer and Director, Bird Impact LLC (impact investment vehicle) since 2016; Founder, Chairman and Chief Investment Officer, FARM Group (impact not-for-profit organization) since 1998; Board Member, Sonen Capital LLC(impact asset management firm) 2016-2020. | 11 | Sonen Capital LLC; One Summit (not-for-profit organization) | |||||
Jennifer M. Borggaard 2301 Rosecrans Avenue, Suite 2150 El Segundo, CA 90245 (born 1969) | Independent Trustee | Open-ended term; served since May 2021 | Co-Founder and Partner, AlderBrook Advisors (management consulting) since 2019; Member, Advisory Committee, Polen Capital (investment advisor) since 2018; Senior Vice President, Affiliated Managers Group, Inc. (asset management) 2007-2017. | 11 | BroadStreet Partners Inc. (insurance); BNY Mellon Charitable Gift Fund; Anchor Capital Advisors LLC (asset management); Boston Financial Management, LLC (asset management) | |||||
Jonathan W. DePriest 2301 Rosecrans Avenue, Suite 2150 El Segundo, CA 90245 (born 1968) | Independent Trustee | Open-ended term; served since May 2021 | Consultant (financial services) since 2022; General Counsel, ApplePie Capital, Inc. (franchise financing) 2019-2021; Executive Vice President and General Counsel, Salient Partners, L.P. (asset management) 2015-2019. | 11 | None | |||||
Frederick A. Eigenbrod, Jr., Ph.D. El Segundo, CA 90245 (born 1941) | Independent Trustee | Open-ended term; served since inception | Vice President, RoutSource Consulting Services (organizational planning and development) since 2002. | 11 | None | |||||
Harold M. Shefrin, Ph.D. 2301 Rosecrans Avenue, El Segundo, CA 90245 (born 1948) | Independent Trustee | Open-ended term; served since February 2005 | Professor, Department of Finance, Santa Clara University since 1979. | 11 | SA Funds – Investment Trust (mutual funds) (10 portfolios) |
| Trustee and Officer Information | 187 | |||||
Table of Contents
Litman Gregory Funds Trust
TRUSTEE AND OFFICER INFORMATION
Interested Trustees & Officers
| Name, Address and Year Born | Position(s) Held with the Trust | Term of Office and Length of Time Served | Principal Occupation(s) During Past Five Years | #of Portfolios in Fund Complex Overseen by Trustee | Other Directorships Held by Trustee/ Officer During Past Five Years | |||||
Jeffrey K. Seeley** 2301 Rosecrans Avenue, Suite 2150 El Segundo, CA 90245 (born 1969) | Trustee and President | Open-ended term; Trustee since May 2021 and President since March 2023. | Deputy Chief Executive Officer, U.S. Chief Operating Officer and Head of Distribution, iM Global Partner US, LLC since 2018; Chief Compliance Officer of iM Global US Distributors, LLC since 2019; Head of Distribution Resource Securities from 2017-2018; and Head of Distribution and Sales, BP Capital Fund Advisors from 2015-2017. | 11 | None | |||||
Philippe Uzan** 2301 Rosecrans Avenue, Suite 2150, El Segundo, CA 90245 (born 1970) | Trustee | Open-ended term; served since March 2023 | Deputy Chief Executive Officer and Chief Investment Officer of iM Global Partners since February 2020; Chief Executive Officer of UP Quantamental from June 2019 to January 2020; Chief Investment Officer and Member of Executive Committee of Edmond de Rothschild Asset Management from December 2011 to March 2019. | 11 | iM Global Partner Asset Management iM GP SICAV (investment vehicle); Syz Capital (asset management) | |||||
John M. Coughlan 2301 Rosecrans Avenue, Suite 2150 El Segundo, CA 90245 (born 1956) | Treasurer and Secretary | Open-ended term; served as Treasurer since inception and Secretary since March 2023. | Chief Operating Officer of the Advisor since 2004 and Chief Compliance Officer of the Advisor from 2004 to June 2023. | N/A | None | |||||
Joseph Kelly 2301 Rosecrans Avenue, Suite 2150 El Segundo, CA 90245 (born 1975) | Chief Compliance Officer | Open-ended term; served as Chief Compliance Officer since June 2023. | Managing Director, Chief Compliance Officer of the Advisor since June 2023. Deputy Chief Compliance Officer, The TCW Group, Inc. from January 2022 to June 2023. Senior Vice President Compliance, The TCW Group, Inc. from June 2021 to December 2021. General Counsel and Chief Compliance Officer, Dunham & Associates Investment Counsel Inc. from November 2013 to June 2021. | N/A | None |
| * | Denotes Trustees who are not “interested persons” of the Trust, as such term is defined under the 1940 Act (the “Independent Trustees”). |
| ** | Denotes Trustees who are “interested persons” of the Trust, as such term is defined under the 1940 Act, because of their relationship with the Advisor (the “Interested Trustees”). |
In addition, Jack Chee, Jason Steuerwalt and Kiko Vallarta, each a portfolio manager at the Advisor, are each an Assistant Secretary of the Trust.
| 188 | Litman Gregory Funds Trust | |||||
Table of Contents
The Funds may collect non-public personal information about you from the following sources:
| • | Information we receive about you on applications or other forms; |
| • | Information you give us orally; and |
| • | Information about your transactions with us. |
We do not disclose any non-public personal information about our shareholders or former shareholders without the shareholder’s authorization, except as required or permitted by applicable law or in response to inquiries from governmental authorities. We restrict access to your personal and account information to our employees who need to know that information to provide products and services to you and to the employees of our affiliates. We also may disclose that information to non-affiliated third parties (such as to brokers or custodians) only as permitted or required by applicable law and only as needed for us to provide agreed services to you.
We maintain physical, electronic and procedural safeguards to guard your non-public personal information.
If you hold shares of the Funds through a financial intermediary, such as a broker-dealer, bank, or trust company, the privacy policy of your financial intermediary would govern how your non-public personal information would be shared with non-affiliated third parties.
| Privacy Notice | 189 | |||||
Table of Contents
Advisor:
iM Global Partner Fund Management, LLC
2301 Rosecrans Avenue, Suite 2150
El Segundo, CA 90245
Distributor:
ALPS Distributors, Inc.
1290 Broadway, Suite 1100
Denver, CO 80203
Transfer Agent:
DST Asset Manager Solutions, Inc.
P.O. Box 219922
Kansas City, MO 64121-9922
1-800-960-0188
For Overnight Delivery:
iMGP Funds
C/O DST Asset Manager Solutions, Inc.
330 W. 9th Street
Kansas City, MO 64105
Investment Professionals:
Registered Investment Advisors, broker/dealers, and other investment professionals may contact Fund Services at 1-925-254-8999.
Prospectus:
To request a current prospectus, statement of additional information, or an IRA application, call
1-800-960-0188.
Shareholder Inquiries:
To request action on your existing account, contact the Transfer agent, DST Asset Manager Solutions, Inc., at 1-800-960-0188, from 9:00 a.m. to 6:00 p.m. eastern time, Monday through Friday.
24-Hour Automated Information:
For access to automated reporting of daily prices, account balances and transaction activity, call
1-800-960-0188, 24 hours a day, seven days a week. Please have your Fund number (see below) and account number ready in order to access your account information.
Information:
Fund | Symbol | CUSIP | Fund Number | |||||||||
Global Select Fund | MSEFX | 53700T108 | 305 | |||||||||
International Fund | MSILX | 53700T207 | 306 | |||||||||
Oldfield International Value Fund | POIVX | 53700T843 | 2966 | |||||||||
SBH Focused Small Value Fund | PFSVX | 53700T850 | 2965 | |||||||||
Alternative Strategies Fund | ||||||||||||
Institutional Class | MASFX | 53700T801 | 421 | |||||||||
Investor Class | MASNX | 53700T884 | 447 | |||||||||
High Income Fund | MAHIX | 53700T876 | 1478 | |||||||||
Dolan McEniry Corporate Bond Fund | IDMIX | 53700T777 | 2967 | |||||||||
DBi Managed Futures Strategy ETF | DBMF | 53700T827 | Y7AX | |||||||||
DBi Hedge Strategy ETF | DBEH | 53700T835 | Y7AW | |||||||||
| IRBA | 53700T793 | Y7AZ | ||||||||||
Berkshire Dividend Growth ETF | BDVG | 53700T751 | Y7A1 | |||||||||
Website:
www.imgpfunds.com
Table of Contents
(b) Not applicable.
Item 2. Code of Ethics.
Not applicable for semi-annual reports.
Item 3. Audit Committee Financial Expert.
Not applicable for semi-annual reports.
Item 4. Principal Accountant Fees and Services.
Not applicable for semi-annual reports.
Item 5. Audit Committee of Listed Registrants.
Not applicable for semi-annual reports.
Item 6. Investments.
(a) The complete Schedule of Investments is included as part of the report to shareholders filed under Item 1 of this Form N-CSR.
(b) Not applicable.
Item 7. Disclosure of Proxy Voting Policies and Procedures for Closed-End Management Investment Companies.
Not applicable to open-end investment companies.
Item 8. Portfolio Managers of Closed-End Management Investment Companies.
Not applicable to open-end investment companies.
Item 9. Purchases of Equity Securities by Closed-End Management Investment Company and Affiliated Purchasers.
Not applicable to open-end investment companies.
Table of Contents
Item 10. Submission of Matters to a Vote of Security Holders.
There have been no material changes to the procedures by which shareholders may recommend nominees to the registrant’s board of trustees since the registrant last provided disclosure in response to this Item 10.
Item 11. Controls and Procedures.
(a) The registrant’s President/Principal Executive Officer and Treasurer/Principal Financial Officer have reviewed the registrant’s disclosure controls and procedures (as defined in Rule 30a-3(c) under the Act) as of a date within 90 days of the filing of this report, as required by Rule 30a-3(b) under the Act and Rules 13a-15(b) or 15d-15(b) under the Exchange Act. Based on their review, such officers have concluded that the disclosure controls and procedures are effective in ensuring that information required to be disclosed in this report is appropriately recorded, processed, summarized and reported timely and made known to them by others within the registrant and by the registrant’s service provider.
(b) There were no changes in the registrant’s internal control over financial reporting (as defined in Rule 30a-3(d) under the Act) that occurred during the period covered by this report that have materially affected, or are reasonably likely to materially affect, the registrant’s internal control over financial reporting.
Item 12. Disclosure of Securities Lending Activities for Closed-End Management Investment Companies.
Not applicable to open-end investment companies.
Item 13. Exhibits.
| (a)(1) | Not applicable for semi-annual reports. | |
| (a)(2) | Certifications pursuant to Rule 30a-2(a) under the Act are attached as exhibits hereto. | |
| (a)(3) | Not applicable to open-end investment companies. | |
| (a)(4) | Not applicable. | |
| (b) | Certifications pursuant to Rule 30a-2(b) under the Act are attached as exhibits hereto. | |
Table of Contents
SIGNATURES
Pursuant to the requirements of the Securities Exchange Act of 1934, as amended, and the Investment Company Act of 1940, as amended, the registrant has duly caused this report to be signed on its behalf by the undersigned, thereunto duly authorized.
LITMAN GREGORY FUNDS TRUST
By: | /s/ Jeffrey K. Seeley | |
| Jeffrey K. Seeley | ||
| Trustee and President |
Date: August 31, 2023
Pursuant to the requirements of the Securities Exchange Act of 1934, as amended, and the Investment Company Act of 1940, as amended, this report has been signed below by the following persons on behalf of the registrant and in the capacities and on the dates indicated.
By: | /s/ Jeffrey K. Seeley | |
| Jeffrey K. Seeley | ||
| Trustee and President |
Date: August 31, 2023
By: | /s/ John M. Coughlan | |
| John M. Coughlan | ||
| Treasurer and Secretary |
Date: August 31, 2023