
Q4 and Full Year 2018 Financial Results February 14, 2019
Safe Harbor Language and Reconciliation of 2 Non-GAAP Measures
3 2018 – A Year of Continued Growth and Evolution Strong organic total revenue growth and margin expansion in FY18 • Revenue up 10% and Adjusted EBITDA up 14%, both on a constant currency basis • 100 bps and 120 bps expansion in Adjusted EBITDA margin for Q4 and FY18, respectively • AFFO growth of 16%; improved payout ratio by 160bps to 78% Steady growth in key operating and financial metrics • Total organic revenue(1) growth of 3.5% for Q4 and 3.6% for FY18 • Organic storage rental revenue growth of 1.9% for Q4 and 2.4% for FY18 • Strong organic service revenue growth of 6.1% for Q4 and 5.4% for FY18 Significant progress achieved in shifting revenue mix to faster growing businesses • Expanded data center footprint globally via IO, Credit Suisse, and EvoSwitch acquisitions • Extended RIM international reach in key markets with acquisitions in South Korea, China, and the Philippines • Continued investment in our Fine Arts, Entertainment Services, and Digital Solutions businesses Note: Definition of Non-GAAP and other measures and reconciliations of Non-GAAP to GAAP measures can be found in the Supplemental Financial Information (1) All organic revenue growth metrics exclude the impact of adoption of Revenue Recognition standard
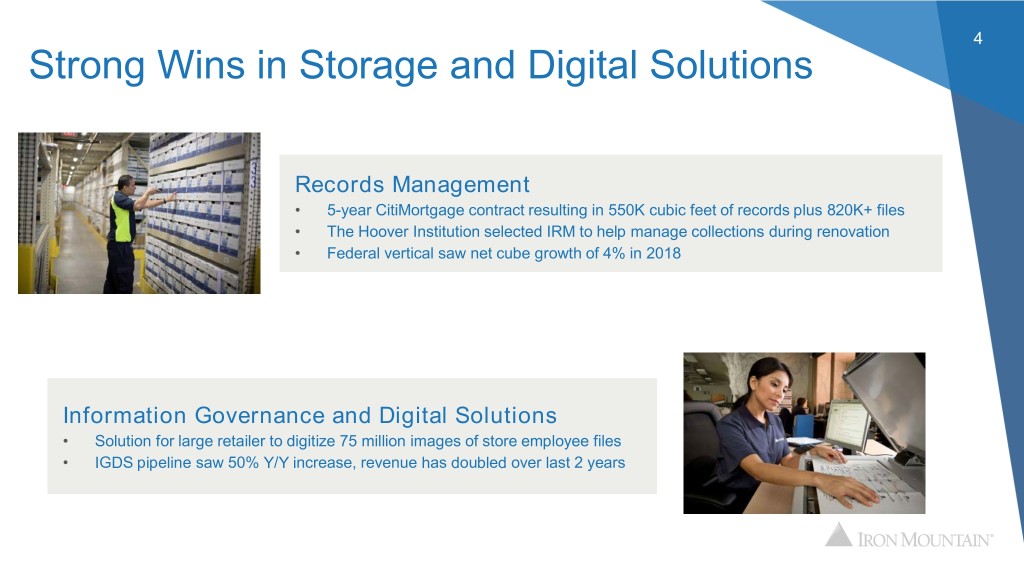
4 Strong Wins in Storage and Digital Solutions Records Management • 5-year CitiMortgage contract resulting in 550K cubic feet of records plus 820K+ files • The Hoover Institution selected IRM to help manage collections during renovation • Federal vertical saw net cube growth of 4% in 2018 Information Governance and Digital Solutions • Solution for large retailer to digitize 75 million images of store employee files • IGDS pipeline saw 50% Y/Y increase, revenue has doubled over last 2 years

Data Center Momentum Highlighted by Solid 5 Leasing and New Customer Wins Data Center Performance in FY18 • $229 million in revenue, $100 million in Adj. EBITDA • 9.6MW of new and expansion leasing; 3.3MW of new and expansion leasing in Q4 • Ended 2018 with a development pipeline of 11MW in key markets Recent Data Center Wins • U.S. Regulatory Agency expanded with IRM with a new deployment in NoVa • Signed new customer Wasabi Technologies, a hot cloud storage company, in NoVa • A large global bank increased data center usage by 47% in NJ
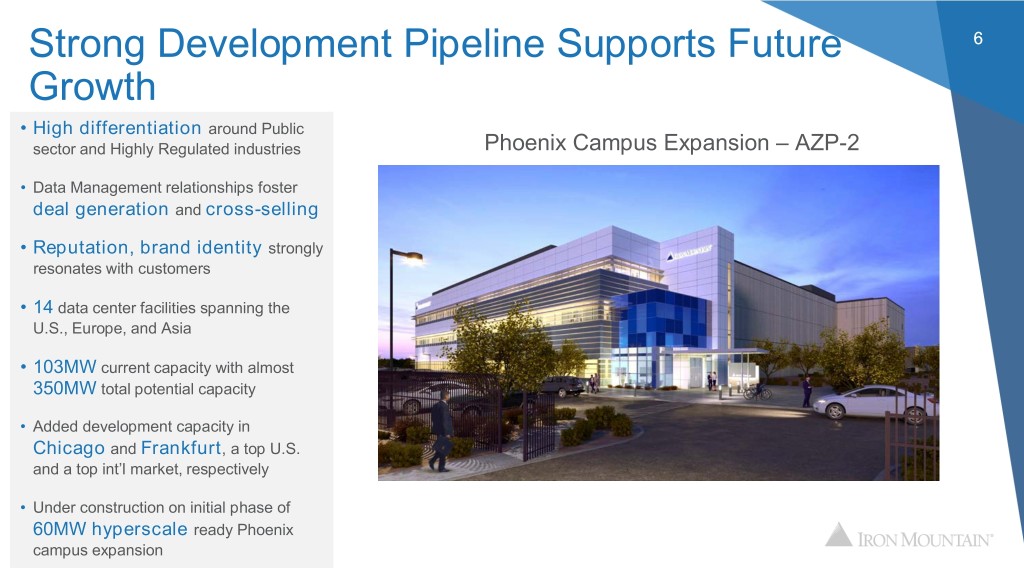
Strong Development Pipeline Supports Future 6 Growth • High differentiation around Public sector and Highly Regulated industries Phoenix Campus Expansion – AZP-2 • Data Management relationships foster deal generation and cross-selling • Reputation, brand identity strongly resonates with customers • 14 data center facilities spanning the U.S., Europe, and Asia • 103MW current capacity with almost 350MW total potential capacity • Added development capacity in Chicago and Frankfurt, a top U.S. and a top int’l market, respectively • Under construction on initial phase of 60MW hyperscale ready Phoenix campus expansion
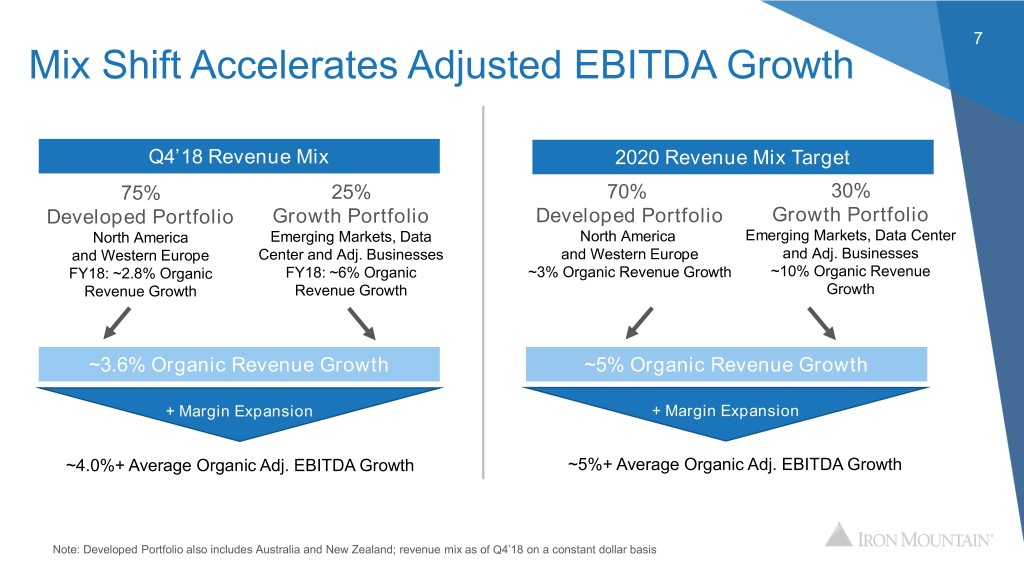
7 Mix Shift Accelerates Adjusted EBITDA Growth Q4’18 Revenue Mix 2020 Revenue Mix Target 75% 25% 70% 30% Developed Portfolio Growth Portfolio Developed Portfolio Growth Portfolio North America Emerging Markets, Data North America Emerging Markets, Data Center and Western Europe Center and Adj. Businesses and Western Europe and Adj. Businesses FY18: ~2.8% Organic FY18: ~6% Organic ~3% Organic Revenue Growth ~10% Organic Revenue Revenue Growth Revenue Growth Growth ~3.6% Organic Revenue Growth ~5% Organic Revenue Growth + Margin Expansion + Margin Expansion ~4.0%+ Average Organic Adj. EBITDA Growth ~5%+ Average Organic Adj. EBITDA Growth Note: Developed Portfolio also includes Australia and New Zealand; revenue mix as of Q4’18 on a constant dollar basis
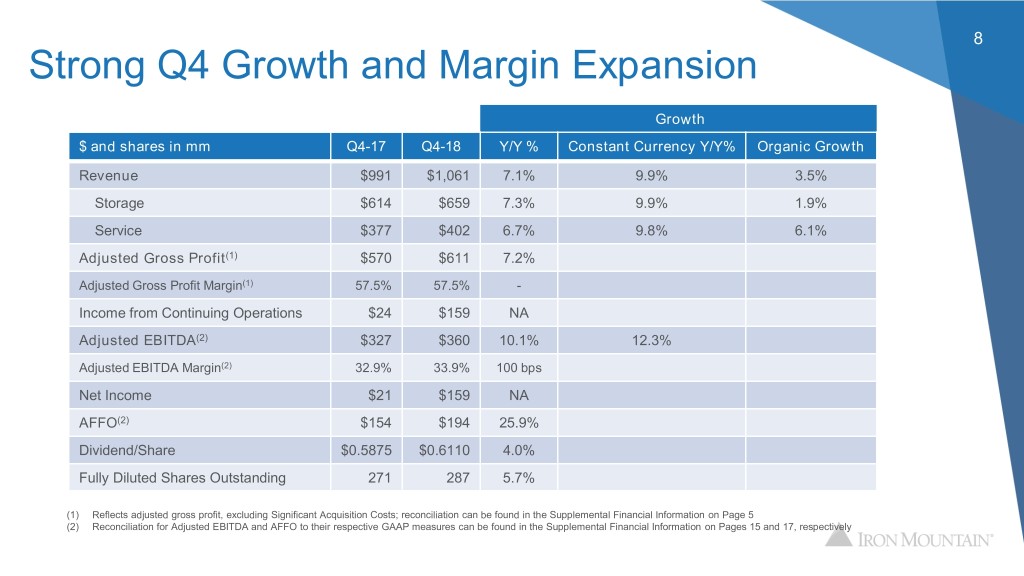
8 Strong Q4 Growth and Margin Expansion Growth $ and shares in mm Q4-17 Q4-18 Y/Y % Constant Currency Y/Y% Organic Growth Revenue $991 $1,061 7.1% 9.9% 3.5% Storage $614 $659 7.3% 9.9% 1.9% Service $377 $402 6.7% 9.8% 6.1% Adjusted Gross Profit(1) $570 $611 7.2% Adjusted Gross Profit Margin(1) 57.5% 57.5% - Income from Continuing Operations $24 $159 NA Adjusted EBITDA(2) $327 $360 10.1% 12.3% Adjusted EBITDA Margin(2) 32.9% 33.9% 100 bps Net Income $21 $159 NA AFFO(2) $154 $194 25.9% Dividend/Share $0.5875 $0.6110 4.0% Fully Diluted Shares Outstanding 271 287 5.7% (1) Reflects adjusted gross profit, excluding Significant Acquisition Costs; reconciliation can be found in the Supplemental Financial Information on Page 5 (2) Reconciliation for Adjusted EBITDA and AFFO to their respective GAAP measures can be found in the Supplemental Financial Information on Pages 15 and 17, respectively

9 Double-Digit Top and Bottom-Line Growth Growth $ and shares in mm FY-17 FY-18 Y/Y % Constant Currency Y/Y % Organic Growth Revenue $3,846 $4,226 9.9% 10.2% 3.6% Storage $2,378 $2,622 10.3% 10.6% 2.4% Service $1,468 $1,603 9.2% 9.7% 5.4% Adjusted Gross Profit(1) $2,181 $2,432 11.5% Adjusted Gross Profit Margin(1) 56.7% 57.5% 80 bps Income from Continuing Operations $192 $377 96.6% Adjusted EBITDA(2) $1,260 $1,436 13.9% 14.0% Adjusted EBITDA Margin(2) 32.8% 34.0% 120 bps Net Income $185 $365 96.6% AFFO(2) $752 $874 16.2% Dividend/Share $2.2380 $2.3735 6.1% Fully Diluted Shares Outstanding 267 287 7.4% (1) Reflects adjusted gross profit, excluding Significant Acquisition Costs; reconciliation can be found in the Supplemental Financial Information on Page 5 (2) Reconciliation for Adjusted EBITDA and AFFO to their respective GAAP measures can be found in the Supplemental Financial Information on Pages 15 and 17, respectively
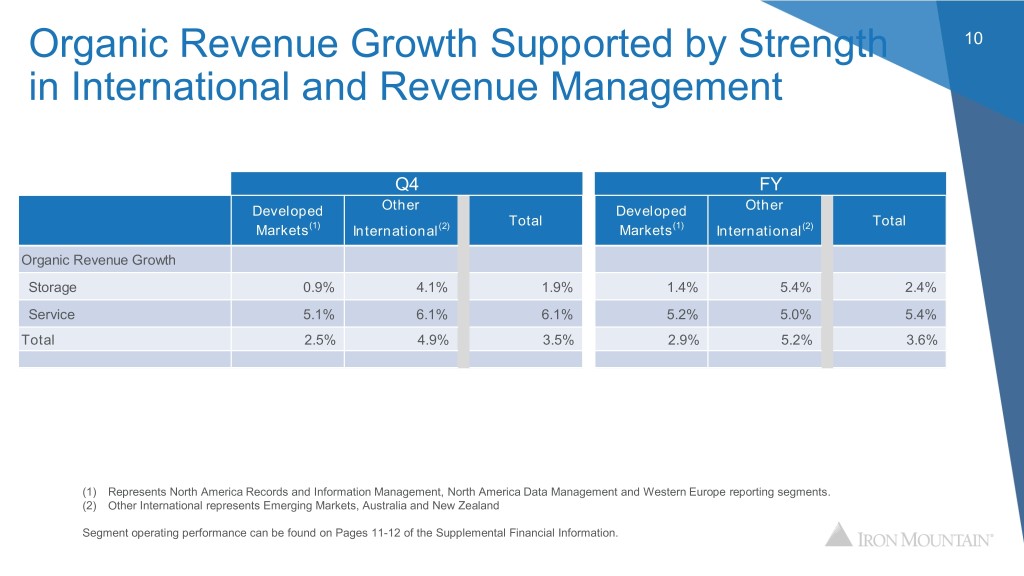
Organic Revenue Growth Supported by Strength 10 in International and Revenue Management Q4 FY Developed Other Developed Other Total Total Markets(1) International(2) Markets(1) International(2) Organic Revenue Growth Storage 0.9% 4.1% 1.9% 1.4% 5.4% 2.4% Service 5.1% 6.1% 6.1% 5.2% 5.0% 5.4% Total 2.5% 4.9% 3.5% 2.9% 5.2% 3.6% (1) Represents North America Records and Information Management, North America Data Management and Western Europe reporting segments. (2) Other International represents Emerging Markets, Australia and New Zealand Segment operating performance can be found on Pages 11-12 of the Supplemental Financial Information.
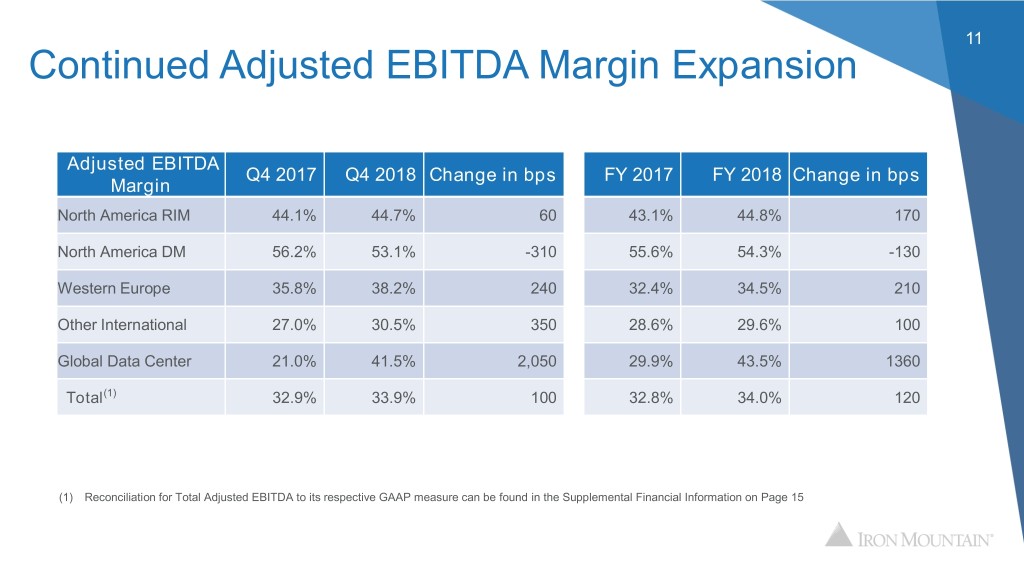
11 Continued Adjusted EBITDA Margin Expansion Adjusted EBITDA Q4 2017 Q4 2018 Change in bps FY 2017 FY 2018 Change in bps Margin North America RIM 44.1% 44.7% 60 43.1% 44.8% 170 North America DM 56.2% 53.1% -310 55.6% 54.3% -130 Western Europe 35.8% 38.2% 240 32.4% 34.5% 210 Other International 27.0% 30.5% 350 28.6% 29.6% 100 Global Data Center 21.0% 41.5% 2,050 29.9% 43.5% 1360 Total(1) 32.9% 33.9% 100 32.8% 34.0% 120 (1) Reconciliation for Total Adjusted EBITDA to its respective GAAP measure can be found in the Supplemental Financial Information on Page 15
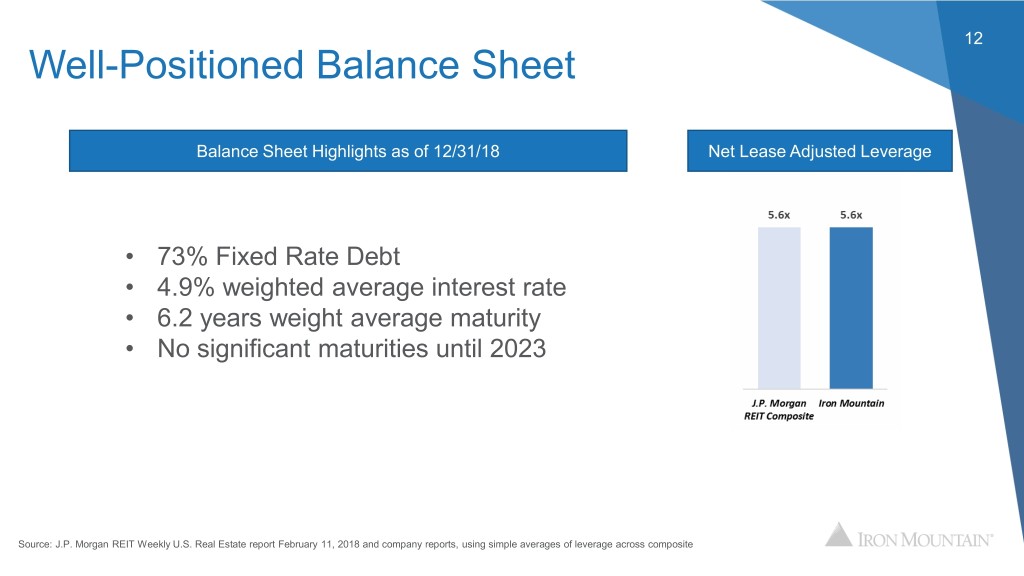
12 Well-Positioned Balance Sheet Balance Sheet Highlights as of 12/31/18 Net Lease Adjusted Leverage • 73% Fixed Rate Debt • 4.9% weighted average interest rate • 6.2 years weight average maturity • No significant maturities until 2023 Source: J.P. Morgan REIT Weekly U.S. Real Estate report February 11, 2018 and company reports, using simple averages of leverage across composite
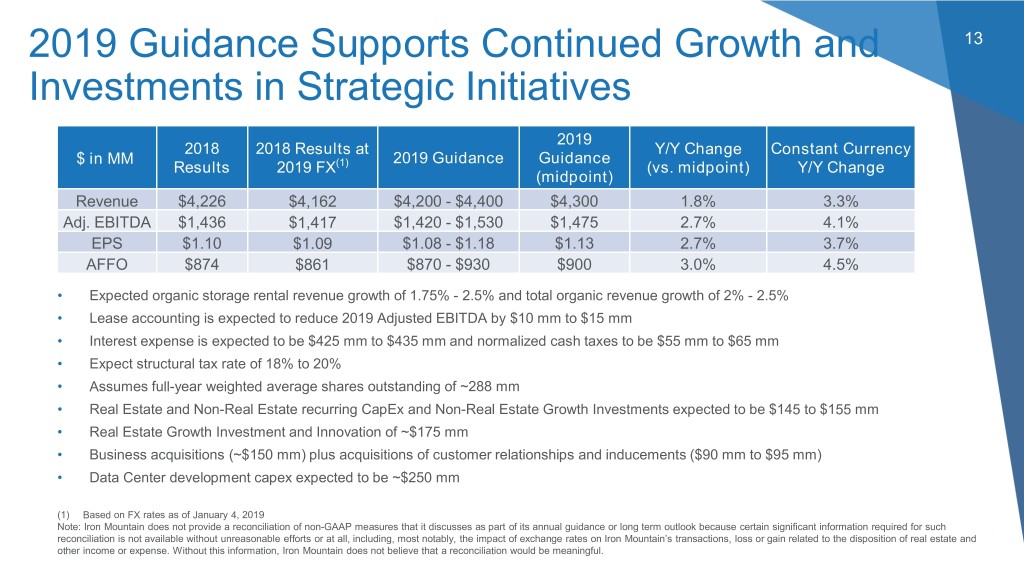
2019 Guidance Supports Continued Growth and 13 Investments in Strategic Initiatives 2019 2018 2018 Results at Y/Y Change Constant Currency $ in MM 2019 Guidance Guidance Results 2019 FX(1) (vs. midpoint) Y/Y Change (midpoint) Revenue $4,226 $4,162 $4,200 - $4,400 $4,300 1.8% 3.3% Adj. EBITDA $1,436 $1,417 $1,420 - $1,530 $1,475 2.7% 4.1% EPS $1.10 $1.09 $1.08 - $1.18 $1.13 2.7% 3.7% AFFO $874 $861 $870 - $930 $900 3.0% 4.5% • Expected organic storage rental revenue growth of 1.75% - 2.5% and total organic revenue growth of 2% - 2.5% • Lease accounting is expected to reduce 2019 Adjusted EBITDA by $10 mm to $15 mm • Interest expense is expected to be $425 mm to $435 mm and normalized cash taxes to be $55 mm to $65 mm • Expect structural tax rate of 18% to 20% • Assumes full-year weighted average shares outstanding of ~288 mm • Real Estate and Non-Real Estate recurring CapEx and Non-Real Estate Growth Investments expected to be $145 to $155 mm • Real Estate Growth Investment and Innovation of ~$175 mm • Business acquisitions (~$150 mm) plus acquisitions of customer relationships and inducements ($90 mm to $95 mm) • Data Center development capex expected to be ~$250 mm (1) Based on FX rates as of January 4, 2019 Note: Iron Mountain does not provide a reconciliation of non-GAAP measures that it discusses as part of its annual guidance or long term outlook because certain significant information required for such reconciliation is not available without unreasonable efforts or at all, including, most notably, the impact of exchange rates on Iron Mountain’s transactions, loss or gain related to the disposition of real estate and other income or expense. Without this information, Iron Mountain does not believe that a reconciliation would be meaningful.
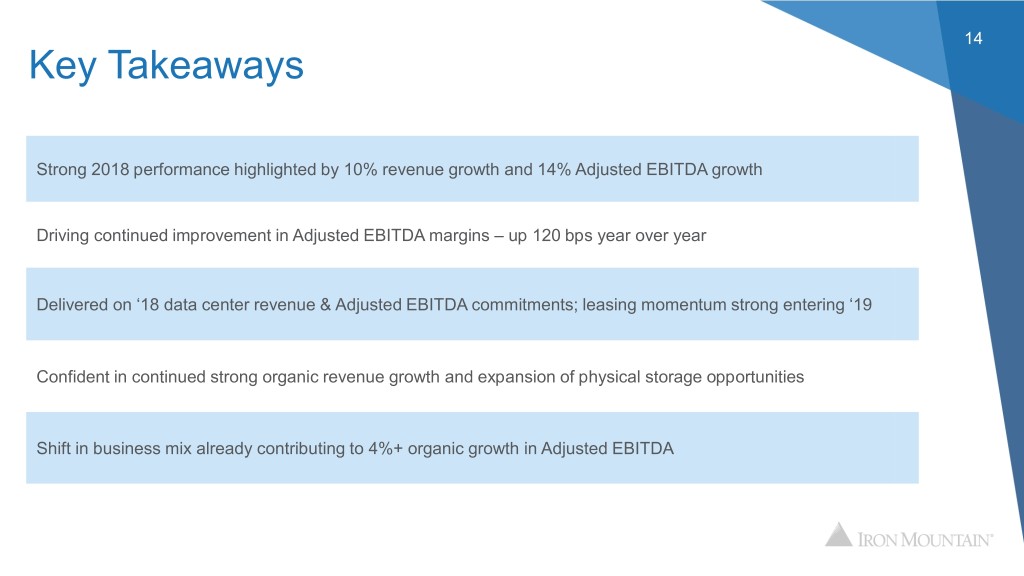
14 Key Takeaways Strong 2018 performance highlighted by 10% revenue growth and 14% Adjusted EBITDA growth Driving continued improvement in Adjusted EBITDA margins – up 120 bps year over year Delivered on ‘18 data center revenue & Adjusted EBITDA commitments; leasing momentum strong entering ‘19 Confident in continued strong organic revenue growth and expansion of physical storage opportunities Shift in business mix already contributing to 4%+ organic growth in Adjusted EBITDA

Appendix
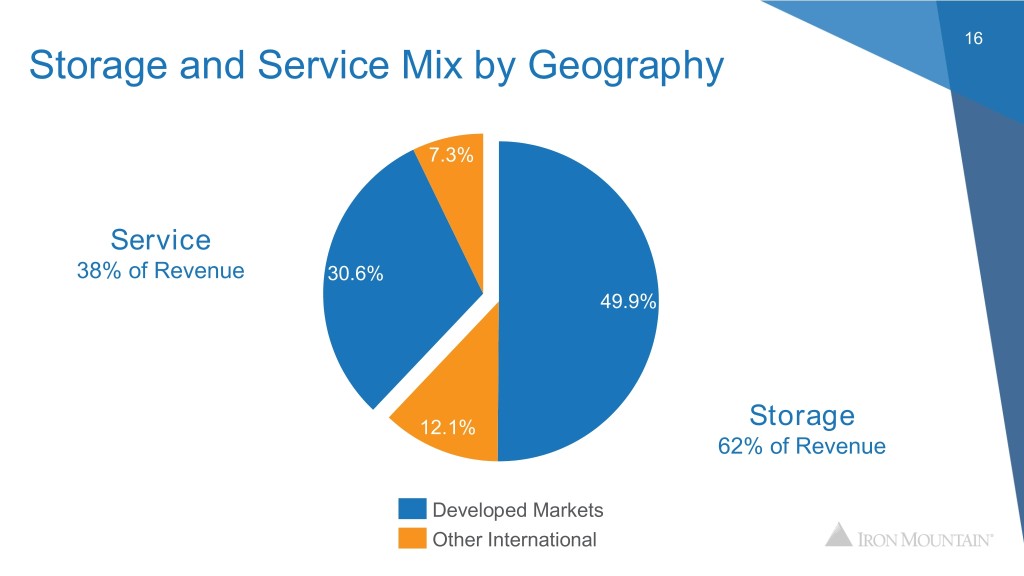
16 Storage and Service Mix by Geography 7.3% Service 38% of Revenue 30.6% 49.9% 12.1% Storage 62% of Revenue Developed Markets Other International
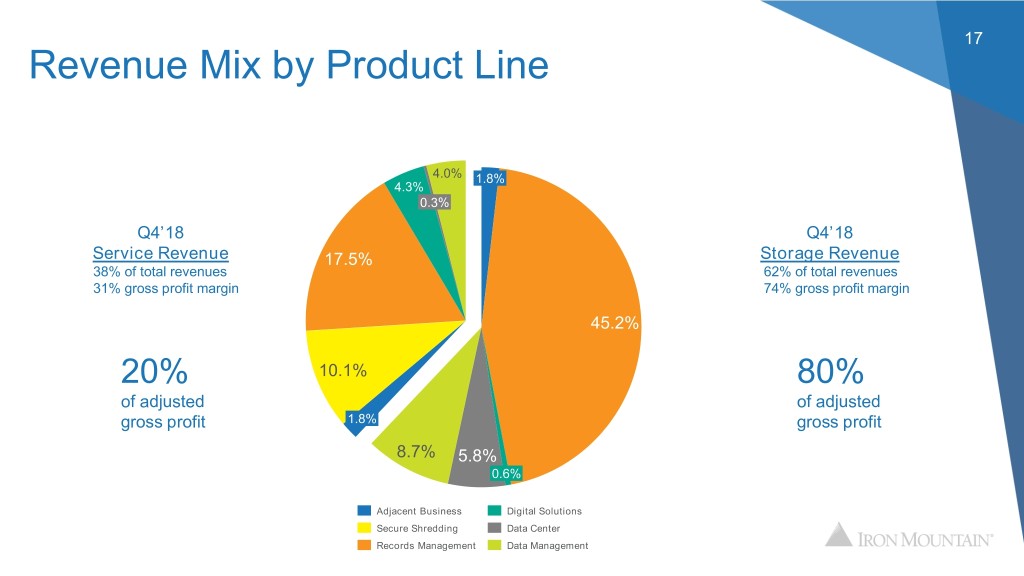
17 Revenue Mix by Product Line 4.0% 1.8% 4.3% 0.3% Q4’18 Q4’18 Service Revenue 17.5% Storage Revenue 38% of total revenues 62% of total revenues 31% gross profit margin 74% gross profit margin 45.2% 20% 10.1% 80% of adjusted of adjusted gross profit 1.8% gross profit 8.7% 5.8% 0.6% Adjacent Business Digital Solutions Secure Shredding Data Center Records Management Data Management
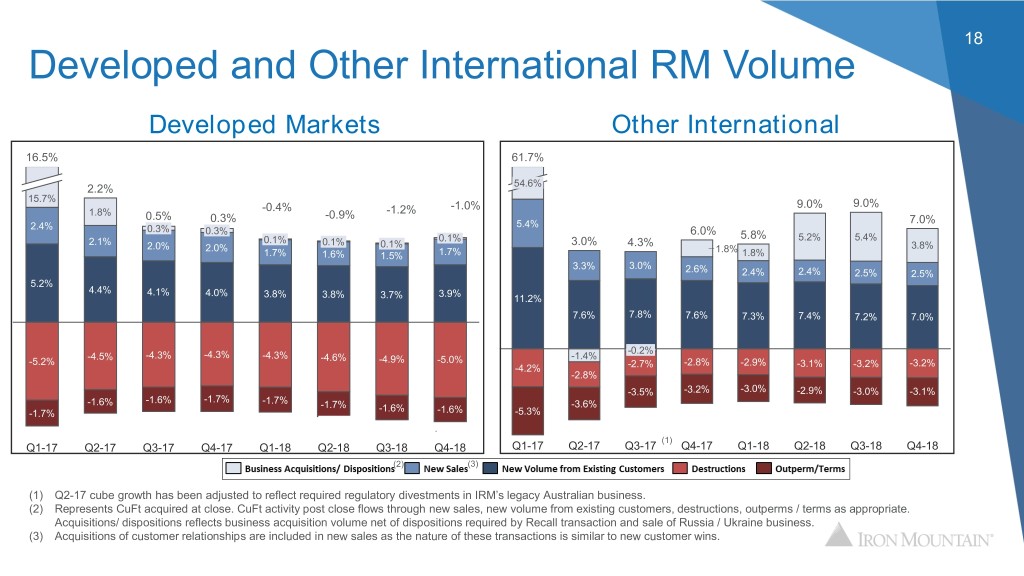
18 Developed and Other International RM Volume Developed Markets Other International 16.5% 61.7% 54.6% 2.2% 15.7% 9.0% 9.0% -0.4% -1.2% -1.0% 1.8% 0.5% -0.9% 0.3% 5.4% 7.0% 2.4% 0.3% 0.3% 6.0% 5.8% 5.2% 5.4% 2.1% 0.1% 0.1% 0.1% 3.0% 4.3% 2.0% 2.0% 0.1% 1.8% 3.8% 1.7% 1.6% 1.5% 1.7% 1.8% 3.3% 3.0% 2.6% 2.4% 2.4% 2.5% 2.5% 5.2% 4.4% 4.1% 4.0% 3.9% 3.8% 3.8% 3.7% 11.2% 7.6% 7.8% 7.6% 7.3% 7.4% 7.2% 7.0% -0.2% -4.5% -4.3% -4.3% -4.3% -4.6% -1.4% -5.2% -4.9% -5.0% -2.8% -2.9% -3.2% -4.2% -2.7% -3.1% -3.2% -2.8% -3.5% -3.2% -3.0% -2.9% -3.0% -3.1% -1.6% -1.6% -1.7% -1.7% -1.7% -1.6% -3.6% -1.7% -1.6% -5.3% -0.4% -0.9% -1.2% -1.0% (1) Q1-17 Q2-17 Q3-17 Q4-17 Q1-18 Q2-18 Q3-18 Q4-18 Q1-17 Q2-17 Q3-17 Q4-17 Q1-18 Q2-18 Q3-18 Q4-18 (2) (3) (1) Q2-17 cube growth has been adjusted to reflect required regulatory divestments in IRM’s legacy Australian business. (2) Represents CuFt acquired at close. CuFt activity post close flows through new sales, new volume from existing customers, destructions, outperms / terms as appropriate. Acquisitions/ dispositions reflects business acquisition volume net of dispositions required by Recall transaction and sale of Russia / Ukraine business. (3) Acquisitions of customer relationships are included in new sales as the nature of these transactions is similar to new customer wins.
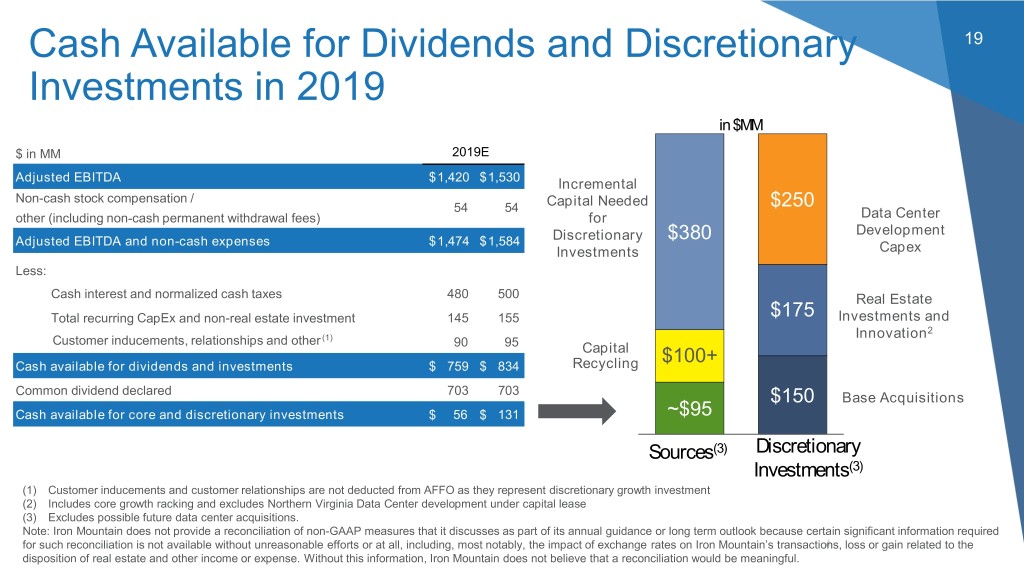
Cash Available for Dividends and Discretionary 19 Investments in 2019 in $MM $ in MM 2019E $335 Adjusted EBITDA $1,420 $1,530 Incremental Non-cash stock compensation / 54 54 Capital Needed $250 other (including non-cash permanent withdrawal fees) for Data Center Development Adjusted EBITDA and non-cash expenses $1,474 $1,584 Discretionary $380 $185 Investments Capex Less: $490 Cash interest and normalized cash taxes 480 500 Real Estate Total recurring CapEx and non-real estate investment 145 155 $175 Investments and $155 2 Customer inducements, relationships and other (1) Innovation 90 95 Capital Cash available for dividends and investments $ 759 $ 834 Recycling $100+ Common dividend declared 703 703 $150$150 Base Acquisitions Cash available for core and discretionary investments $ 56 $ 131 $100~$95 Sources(3) Discretionary Investments(3) (1) Customer inducements and customer relationships are not deducted from AFFO as they represent discretionary growth investment (2) Includes core growth racking and excludes Northern Virginia Data Center development under capital lease (3) Excludes possible future data center acquisitions. Note: Iron Mountain does not provide a reconciliation of non-GAAP measures that it discusses as part of its annual guidance or long term outlook because certain significant information required for such reconciliation is not available without unreasonable efforts or at all, including, most notably, the impact of exchange rates on Iron Mountain’s transactions, loss or gain related to the disposition of real estate and other income or expense. Without this information, Iron Mountain does not believe that a reconciliation would be meaningful.
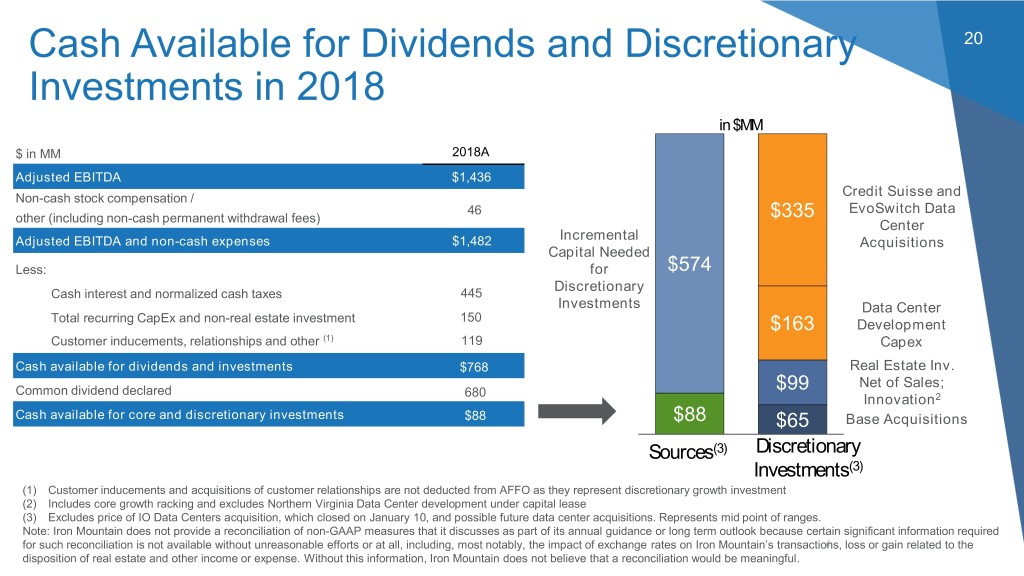
Cash Available for Dividends and Discretionary 20 Investments in 2018 in $MM $ in MM 2018A $335 Adjusted EBITDA $1,436 Non-cash stock compensation / Credit Suisse and 46 EvoSwitch Data other (including non-cash permanent withdrawal fees) $335 Center Incremental Adjusted EBITDA and non-cash expenses $1,482 $185 Acquisitions Capital Needed Less: for $490$574 Cash interest and normalized cash taxes 445 Discretionary Investments Data Center Total recurring CapEx and non-real estate investment 150 $163$155 Development Customer inducements, relationships and other (1) 119 Capex Cash available for dividends and investments $768 Real Estate Inv. Net of Sales; Common dividend declared 680 $99 $150 Innovation2 $100 Cash available for core and discretionary investments $88 $88 $65 Base Acquisitions Sources(3) Discretionary Investments(3) (1) Customer inducements and acquisitions of customer relationships are not deducted from AFFO as they represent discretionary growth investment (2) Includes core growth racking and excludes Northern Virginia Data Center development under capital lease (3) Excludes price of IO Data Centers acquisition, which closed on January 10, and possible future data center acquisitions. Represents mid point of ranges. Note: Iron Mountain does not provide a reconciliation of non-GAAP measures that it discusses as part of its annual guidance or long term outlook because certain significant information required for such reconciliation is not available without unreasonable efforts or at all, including, most notably, the impact of exchange rates on Iron Mountain’s transactions, loss or gain related to the disposition of real estate and other income or expense. Without this information, Iron Mountain does not believe that a reconciliation would be meaningful.


