
Q4 2020 Earnings Call February 24, 2021
2 We have made statements in this presentation lease that constitute "forward-looking statements" as that term is defined in the Private Securities Litigation Reform Act of 1995 and other securities laws. These forward-looking statements concern our operations, economic performance, financial condition, goals, beliefs, future growth strategies, investment objectives, plans and current expectations, such as our (1) 2021 guidance as well as our expectations for growth, including growth opportunities and growth rates for revenue by segment, organic revenue, organic volume and other metrics, (2) expectations and assumptions regarding the impact from the COVID-19 pandemic on us and our customers, including on our businesses, financial position, results of operations and cash flows, (3) expected benefits, costs and actions related to, and timing of, Project Summit, (4) expectations as to our capital allocation strategy, including our future investments, leverage ratio, dividend payments and possible funding sources (including real estate monetization) and capital expenditures, (5) expectations regarding the closing of pending acquisitions and investments, and (6) other forward-looking statements related to our business, results of operations and financial condition. These forward-looking statements are subject to various known and unknown risks, uncertainties and other factors, and you should not rely upon them except as statements of our present intentions and of our present expectations, which may or may not occur. When we use words such as "believes," "expects," "anticipates," "estimates," “plans” or similar expressions, we are making forward-looking statements. Although we believe that our forward-looking statements are based on reasonable assumptions, our expected results may not be achieved, and actual results may differ materially from our expectations. In addition, important factors that could cause actual results to differ from expectations include, among others: (i) the severity and duration of the COVID-19 pandemic and its effects on the global economy, including its effects on us, the markets we serve and our customers and the third parties with whom we do business within those markets; (ii) our ability to execute on Project Summit and the potential impacts of Project Summit on our ability to retain and recruit employees; (iii) our ability to remain qualified for taxation as a real estate investment trust for United States federal income tax purposes; (iv) changes in customer preferences and demand for our storage and information management services, including as a result of the shift from paper and tape storage to alternative technologies that require less physical space; (v) our ability or inability to execute our strategic growth plan, including our ability to invest according to plan, incorporate new digital information technologies into our offerings, achieve satisfactory returns on new product offerings, continue our revenue management, expand internationally, complete acquisitions on satisfactory terms, integrate acquired companies efficiently and grow our business through joint ventures; (vi) changes in the amount of our capital expenditures; (vii) our ability to raise debt or equity capital and changes in the cost of our debt; (viii) the cost and our ability to comply with laws, regulations and customer demands, including those relating to data security and privacy issues, as well as fire and safety and environmental standards; (ix) the impact of litigation or disputes that may arise in connection with incidents in which we fail to protect our customers' information or our internal records or information technology systems and the impact of such incidents on our reputation and ability to compete; (x) changes in the price for our storage and information management services relative to the cost of providing such storage and information management services; (xi) changes in the political and economic environments in the countries in which our international subsidiaries operate and changes in the global political climate, particularly as we consolidate operations and move records and data across borders; (xii) our ability to comply with our existing debt obligations and restrictions in our debt instruments; (xiii) the impact of service interruptions or equipment damage and the cost of power on our data center operations; (xiv) the cost or potential liabilities associated with real estate necessary for our business; (xv) failures in our adoption of new IT systems; (xvi) other trends in competitive or economic conditions affecting our financial condition or results of operations not presently contemplated; and (xvii) the other risks described in our periodic reports filed with the SEC, including under the caption “Risk Factors” in Part I, Item 1A of our Annual Report. Except as required by law, we undertake no obligation to update any forward-looking statements appearing in this report. Reconciliation of Non-GAAP Measures: Throughout this presentation, Iron Mountain will discuss (1) Adjusted EBITDA, (2) Adjusted Earnings per Share (“Adjusted EPS”), (3) Funds from Operations (“FFO Nareit”), (4) FFO (Normalized) and (5) Adjusted Funds from Operations (“AFFO”). These measures do not conform to accounting principles generally accepted in the United States (“GAAP”). These non-GAAP measures are supplemental metrics designed to enhance our disclosure and to provide additional information that we believe to be important for investors to consider in addition to, but not as a substitute for, other measures of financial performance reported in accordance with GAAP, such as operating income, income (loss) from continuing operations, net income (loss) attributable to Iron Mountain Incorporated or cash flows from operating activities from continuing operations (as determined in accordance with GAAP). The reconciliation of these measures to the appropriate GAAP measure, as required by Regulation G under the Securities Exchange Act of 1934, as amended, and their definitions are included in the Supplemental Reporting Information. Forward Looking Statements
3 2020 accomplishments We managed the crisis, the crisis did not manage us We continued to serve our customers We maintained our focus on Project Summit We accelerated our growth in data center leasing We continued our investment in new products and innovation We are seeing good returns from our Global Strategic Accounts organization
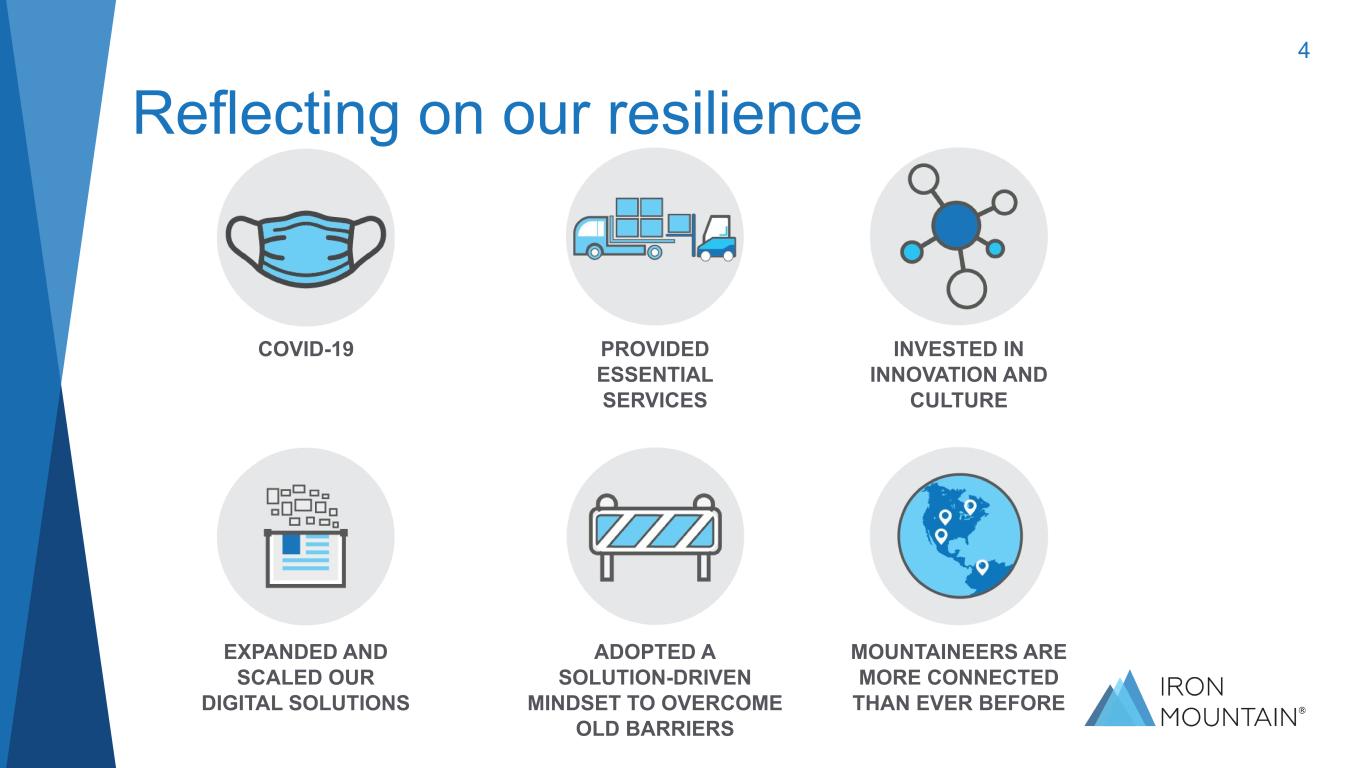
4 Reflecting on our resilience COVID-19 PROVIDED ESSENTIAL SERVICES INVESTED IN INNOVATION AND CULTURE EXPANDED AND SCALED OUR DIGITAL SOLUTIONS ADOPTED A SOLUTION-DRIVEN MINDSET TO OVERCOME OLD BARRIERS MOUNTAINEERS ARE MORE CONNECTED THAN EVER BEFORE
5 EMERGING FROM 2020 STRONGER THAN EVER
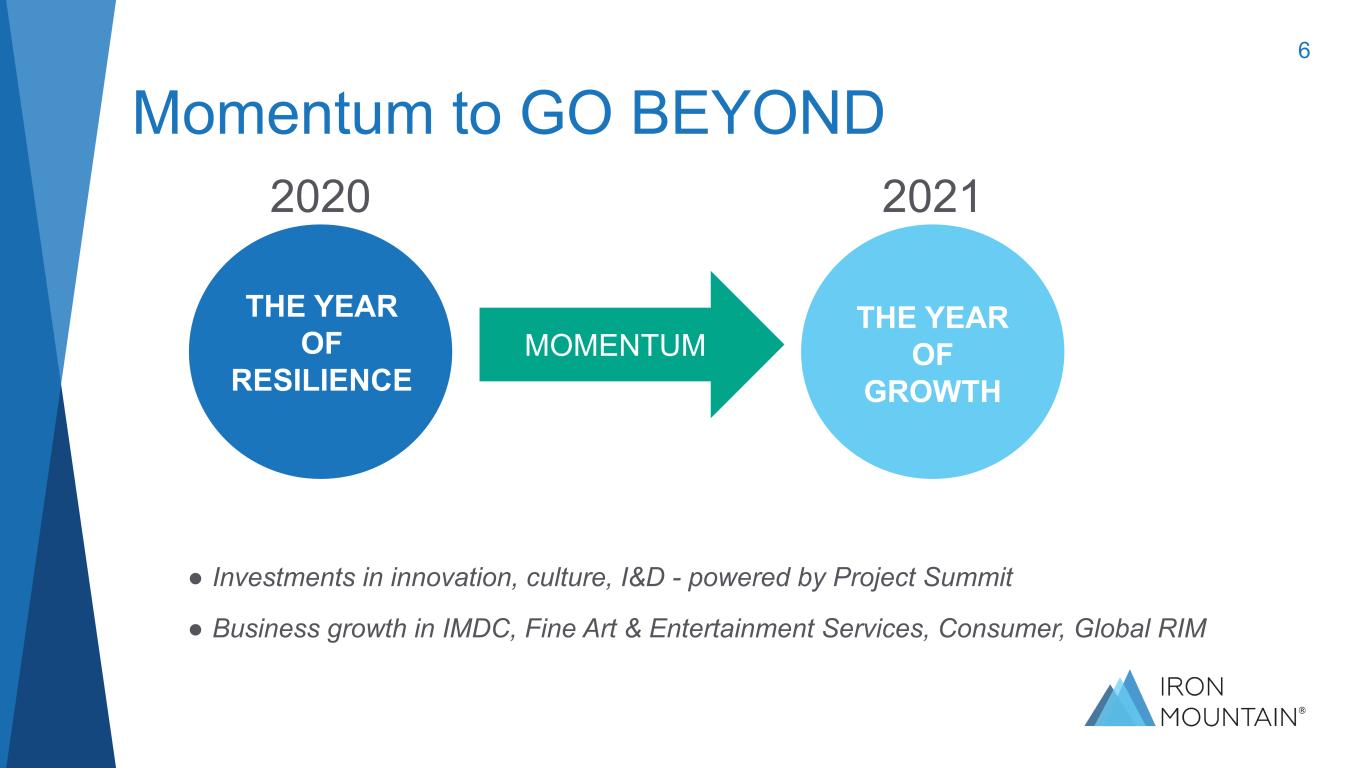
6 Momentum to GO BEYOND THE YEAR OF RESILIENCE THE YEAR OF GROWTH 2020 2021 MOMENTUM BUILT ON A SOLID FOUNDATION 70 years of longevity Customer trust in our brand Strength in our core storage business Values-based organization Deep commitment to safety and wellness ● Investments in innovation, culture, I&D - powered by Project Summit ● Business growth in IMDC, Fine Art & Entertainment Services, Consumer, Global RIM
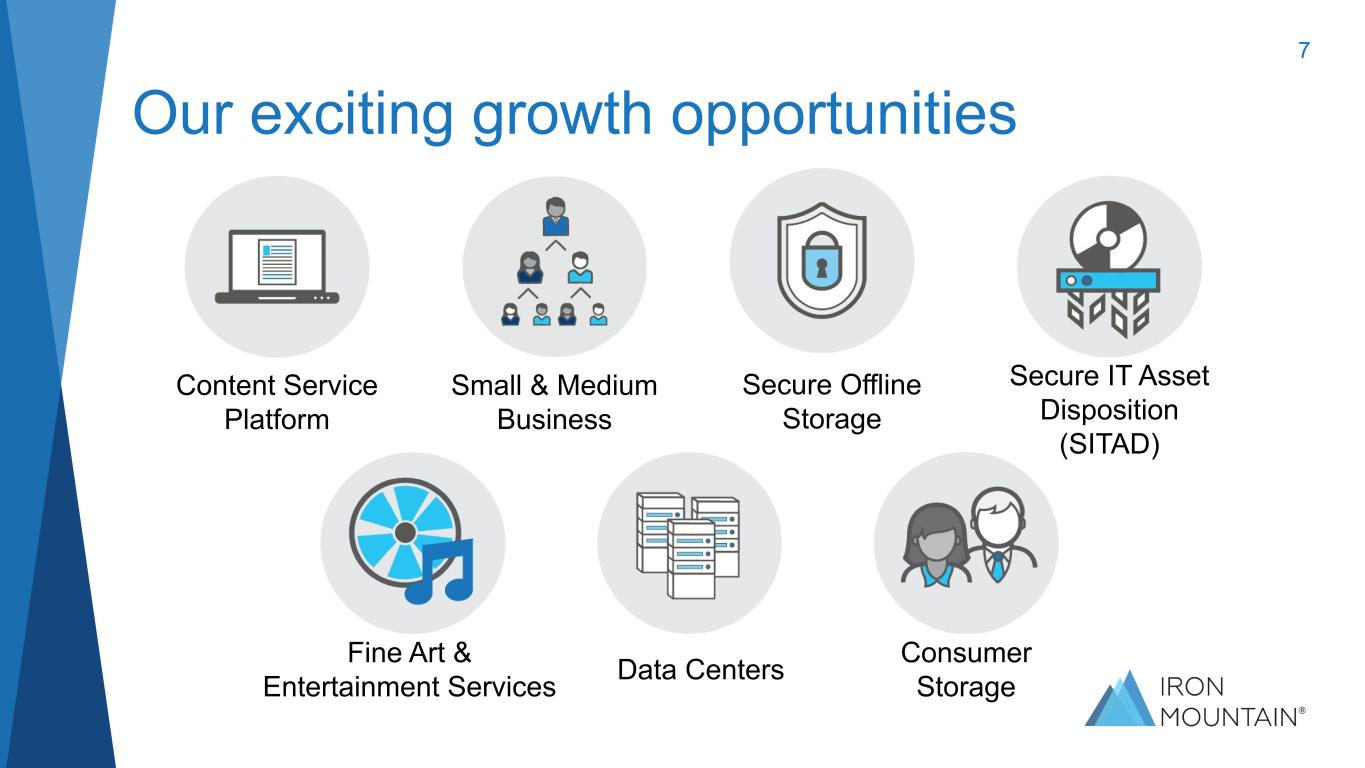
7 Our exciting growth opportunities THE YEAR OF RESILIENCEContent Service Platform Small & Medium Business Secure Offline Storage Secure IT Asset Disposition (SITAD) Fine Art & Entertainment Services Data Centers Consumer Storage
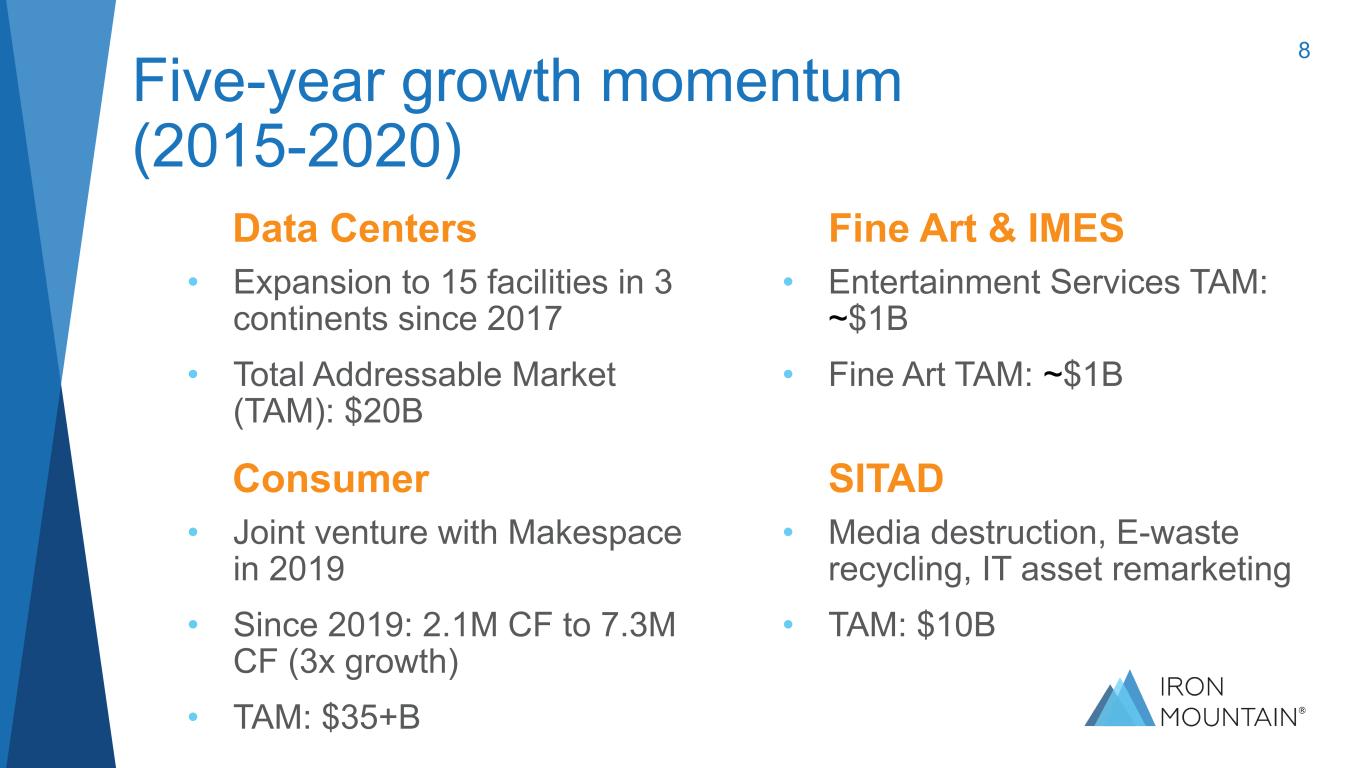
8 Five-year growth momentum (2015-2020) Data Centers Fine Art & IMES • Entertainment Services TAM: ~$1B • Fine Art TAM: ~$1B • Expansion to 15 facilities in 3 continents since 2017 • Total Addressable Market (TAM): $20B Consumer SITAD • Media destruction, E-waste recycling, IT asset remarketing • TAM: $10B • Joint venture with Makespace in 2019 • Since 2019: 2.1M CF to 7.3M CF (3x growth) • TAM: $35+B
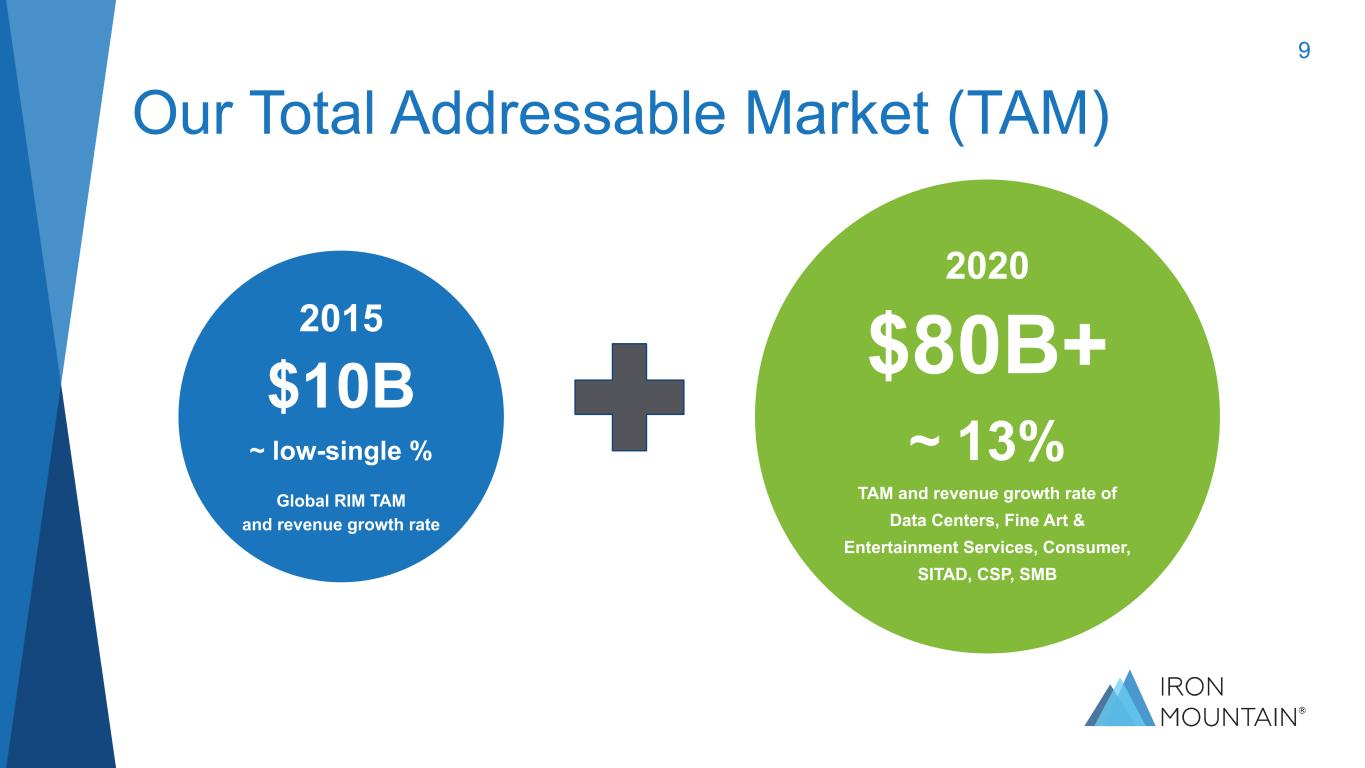
9 Our Total Addressable Market (TAM) 2020 $80B+ ~ 13% TAM and revenue growth rate of Data Centers, Fine Art & Entertainment Services, Consumer, SITAD, CSP, SMB 2015 $10B ~ low-single % Global RIM TAM and revenue growth rate
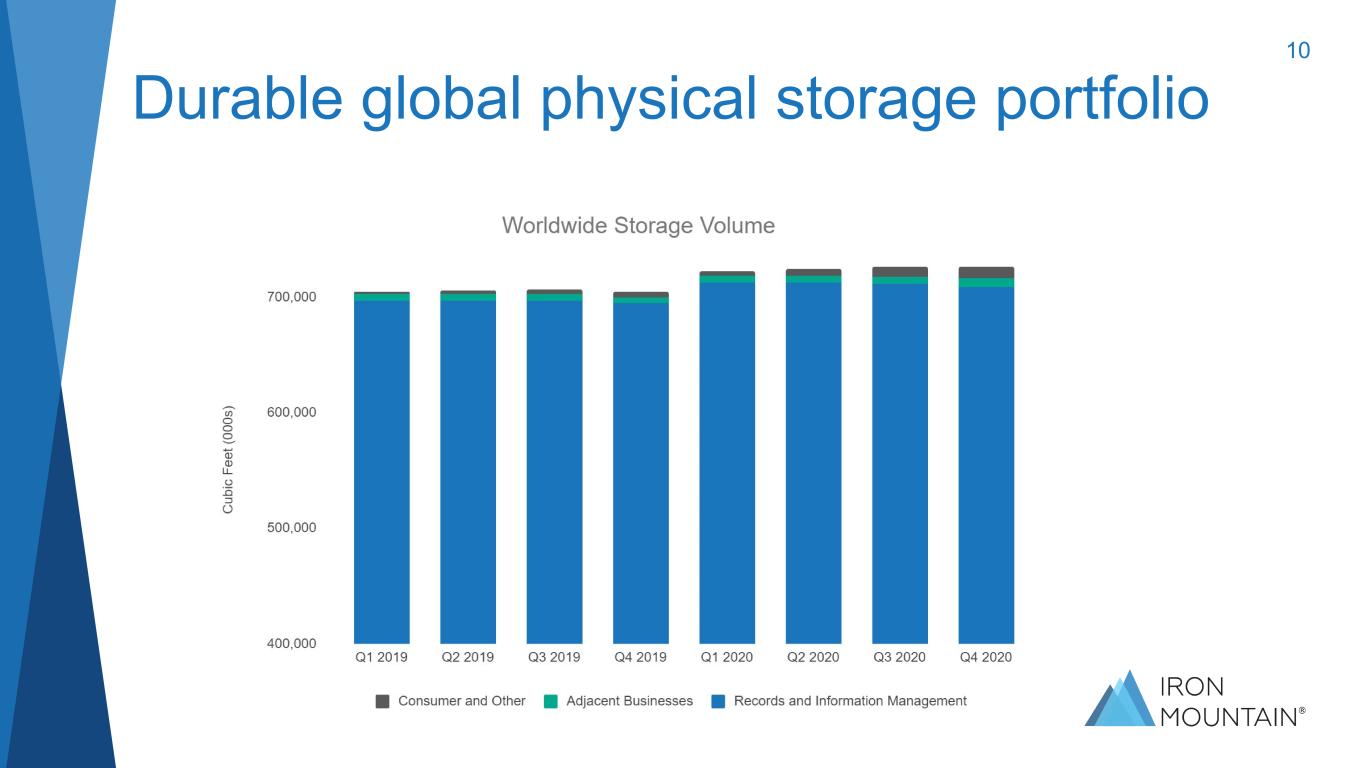
10 Durable global physical storage portfolio

11 Data center trends positive Commercial success(1) Development activity(1) Geographic expansion(2) 58+ MW leased 73 new logos 1,300+ customers 10+ MW commissioned 15 operating data centers 13 markets across 3 continents (1) As of 12/31/20 (2) Subject to the closing of our investment in Web Werks
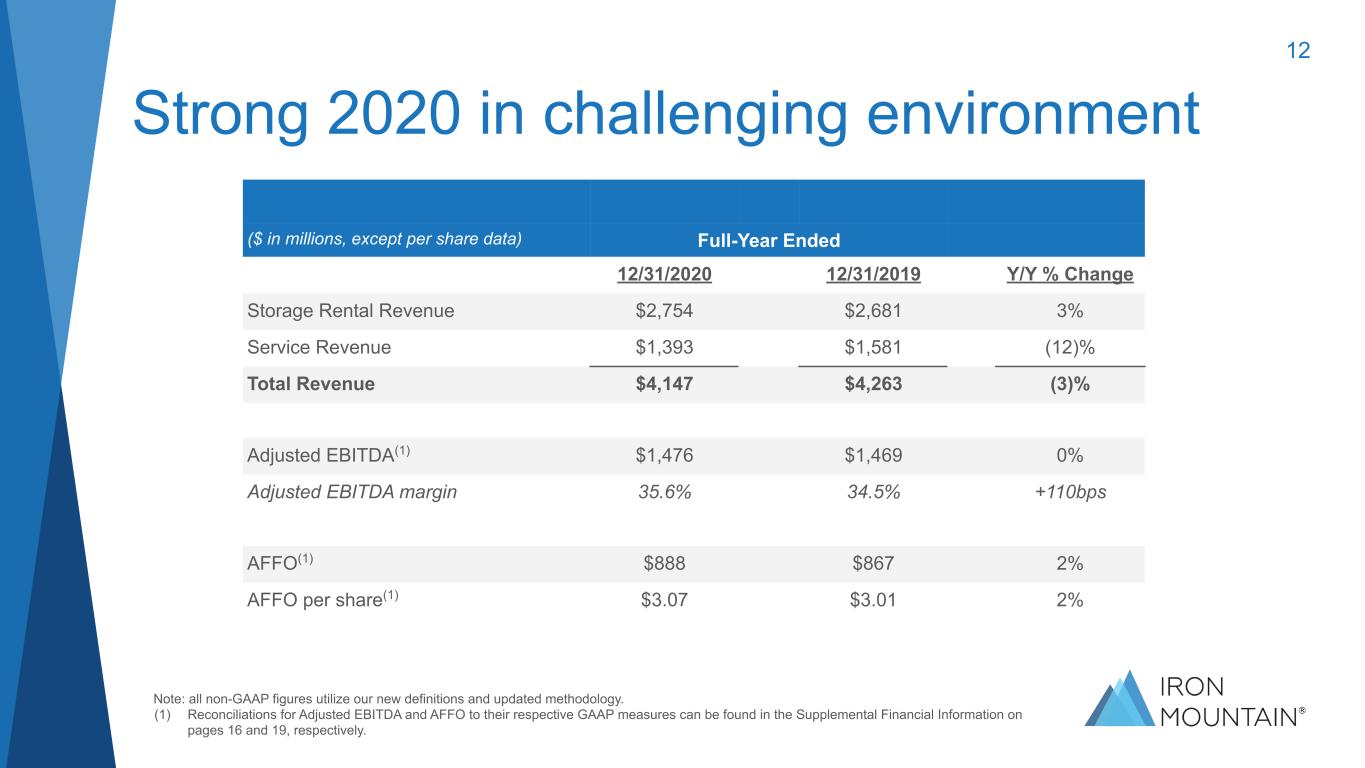
($ in millions, except per share data) Full-Year Ended 12/31/2020 12/31/2019 Y/Y % Change Storage Rental Revenue $2,754 $2,681 3% Service Revenue $1,393 $1,581 (12)% Total Revenue $4,147 $4,263 (3)% Adjusted EBITDA(1) $1,476 $1,469 0% Adjusted EBITDA margin 35.6% 34.5% +110bps AFFO(1) $888 $867 2% AFFO per share(1) $3.07 $3.01 2% 12 Strong 2020 in challenging environment Note: all non-GAAP figures utilize our new definitions and updated methodology. (1) Reconciliations for Adjusted EBITDA and AFFO to their respective GAAP measures can be found in the Supplemental Financial Information on pages 16 and 19, respectively.
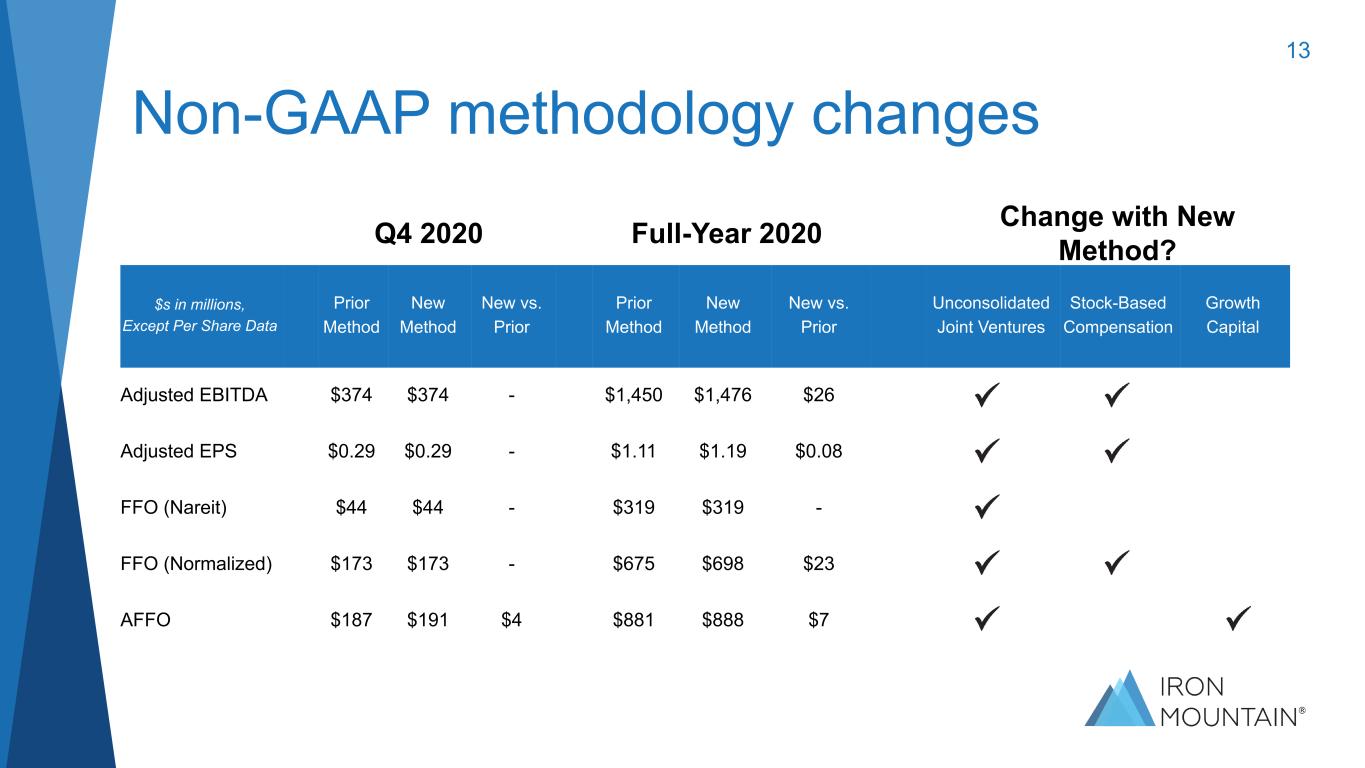
$s in millions, Except Per Share Data Prior Method New Method New vs. Prior Prior Method New Method New vs. Prior Unconsolidated Joint Ventures Stock-Based Compensation Growth Capital Adjusted EBITDA $374 $374 - $1,450 $1,476 $26 Adjusted EPS $0.29 $0.29 - $1.11 $1.19 $0.08 FFO (Nareit) $44 $44 - $319 $319 - FFO (Normalized) $173 $173 - $675 $698 $23 AFFO $187 $191 $4 $881 $888 $7 13 Non-GAAP methodology changes Full-Year 2020 Change with New Method?Q4 2020
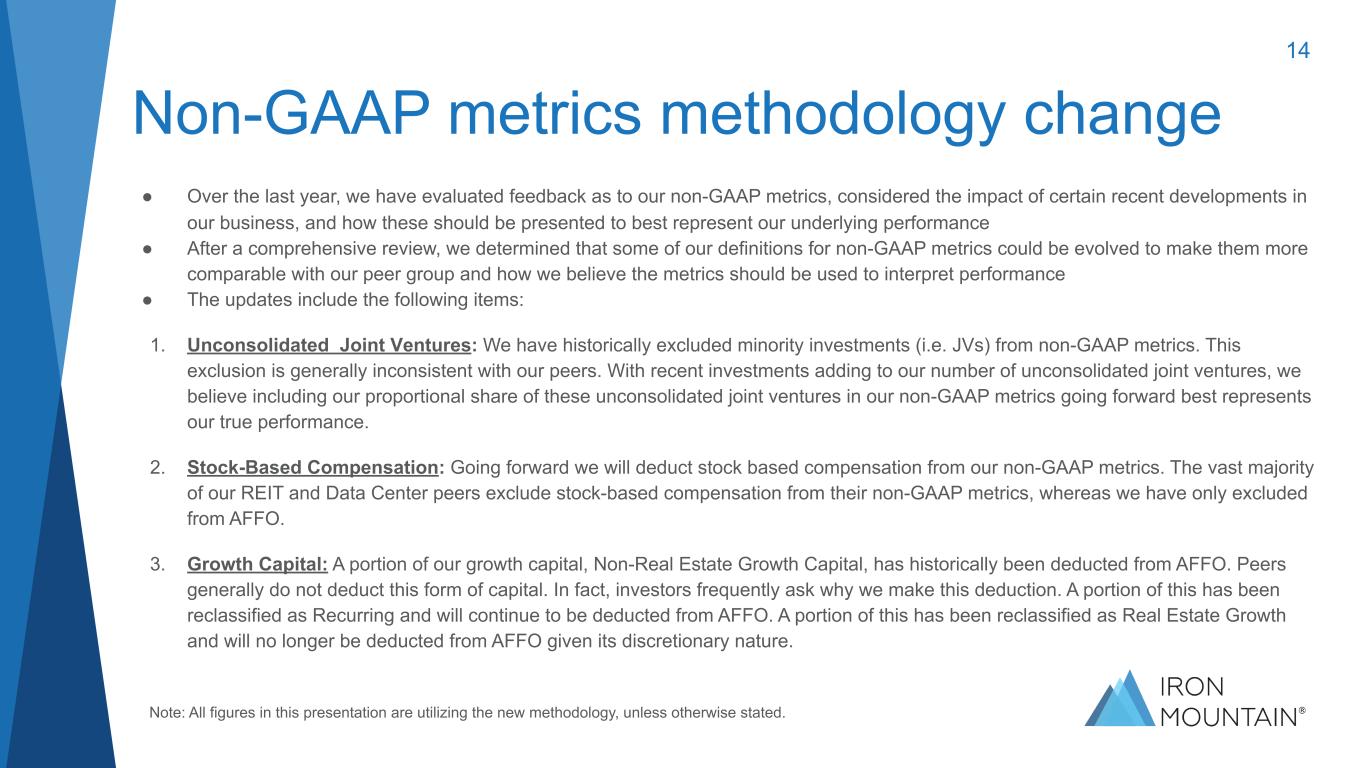
Note: All figures in this presentation are utilizing the new methodology, unless otherwise stated. 14 Non-GAAP metrics methodology change ● Over the last year, we have evaluated feedback as to our non-GAAP metrics, considered the impact of certain recent developments in our business, and how these should be presented to best represent our underlying performance ● After a comprehensive review, we determined that some of our definitions for non-GAAP metrics could be evolved to make them more comparable with our peer group and how we believe the metrics should be used to interpret performance ● The updates include the following items: 1. Unconsolidated Joint Ventures: We have historically excluded minority investments (i.e. JVs) from non-GAAP metrics. This exclusion is generally inconsistent with our peers. With recent investments adding to our number of unconsolidated joint ventures, we believe including our proportional share of these unconsolidated joint ventures in our non-GAAP metrics going forward best represents our true performance. 2. Stock-Based Compensation: Going forward we will deduct stock based compensation from our non-GAAP metrics. The vast majority of our REIT and Data Center peers exclude stock-based compensation from their non-GAAP metrics, whereas we have only excluded from AFFO. 3. Growth Capital: A portion of our growth capital, Non-Real Estate Growth Capital, has historically been deducted from AFFO. Peers generally do not deduct this form of capital. In fact, investors frequently ask why we make this deduction. A portion of this has been reclassified as Recurring and will continue to be deducted from AFFO. A portion of this has been reclassified as Real Estate Growth and will no longer be deducted from AFFO given its discretionary nature.

(1) Excluding the approximately $260 million of proceeds from a large sale leaseback transaction in the fourth quarter of 2020 that we plan to invest in 2021, net lease adjusted leverage was 5.5x. Source: J.P. Morgan REIT Weekly U.S. Real Estate report January 4, 2021 and company reports 15 Balance sheet remains well positioned • ~$2 billion of liquidity • ~87% Fixed Rate Debt • 4.7% weighted average interest rate • 7.6 years weighted-average maturity Balance Sheet Highlights as of 12/31/20 Net Lease Adjusted Leverage ~ 5.3x 5.5x1
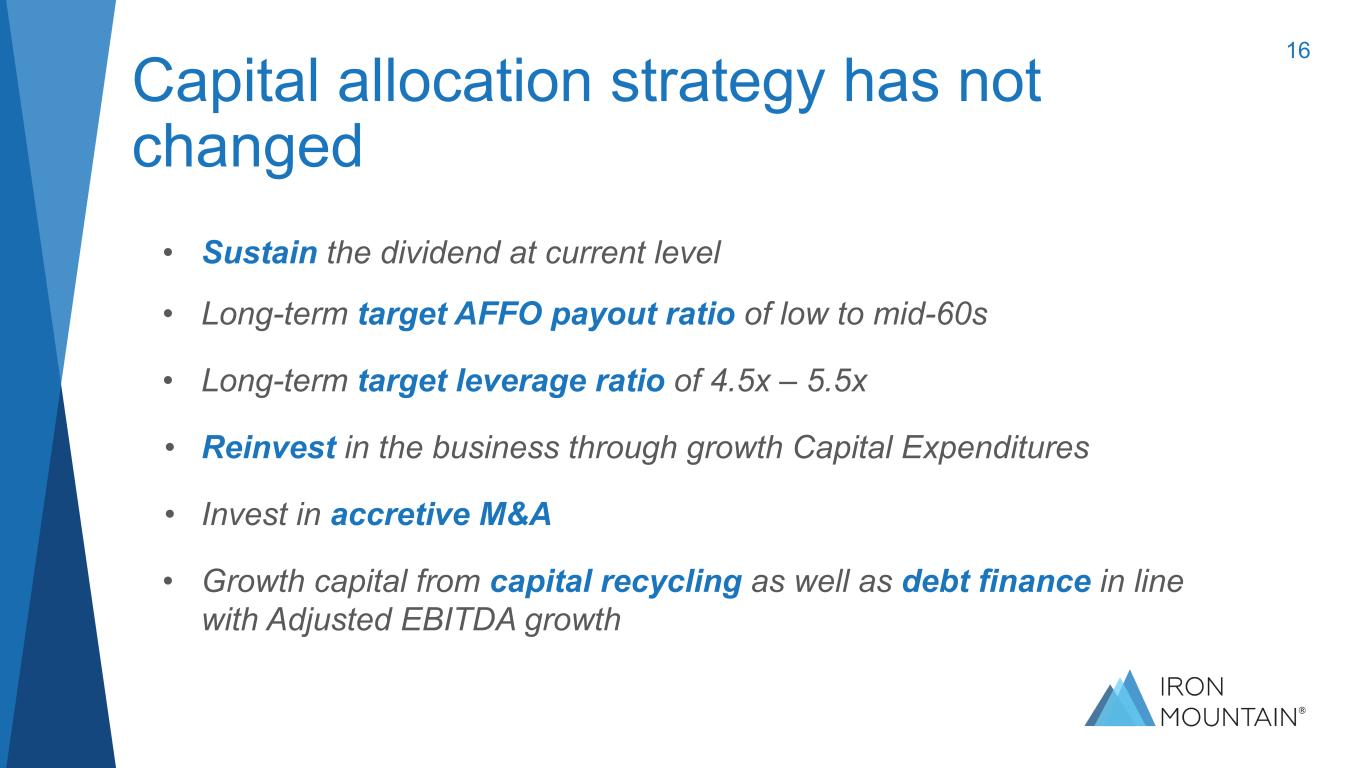
16 Capital allocation strategy has not changed • Sustain the dividend at current level • Long-term target AFFO payout ratio of low to mid-60s • Long-term target leverage ratio of 4.5x – 5.5x • Reinvest in the business through growth Capital Expenditures • Invest in accretive M&A • Growth capital from capital recycling as well as debt finance in line with Adjusted EBITDA growth
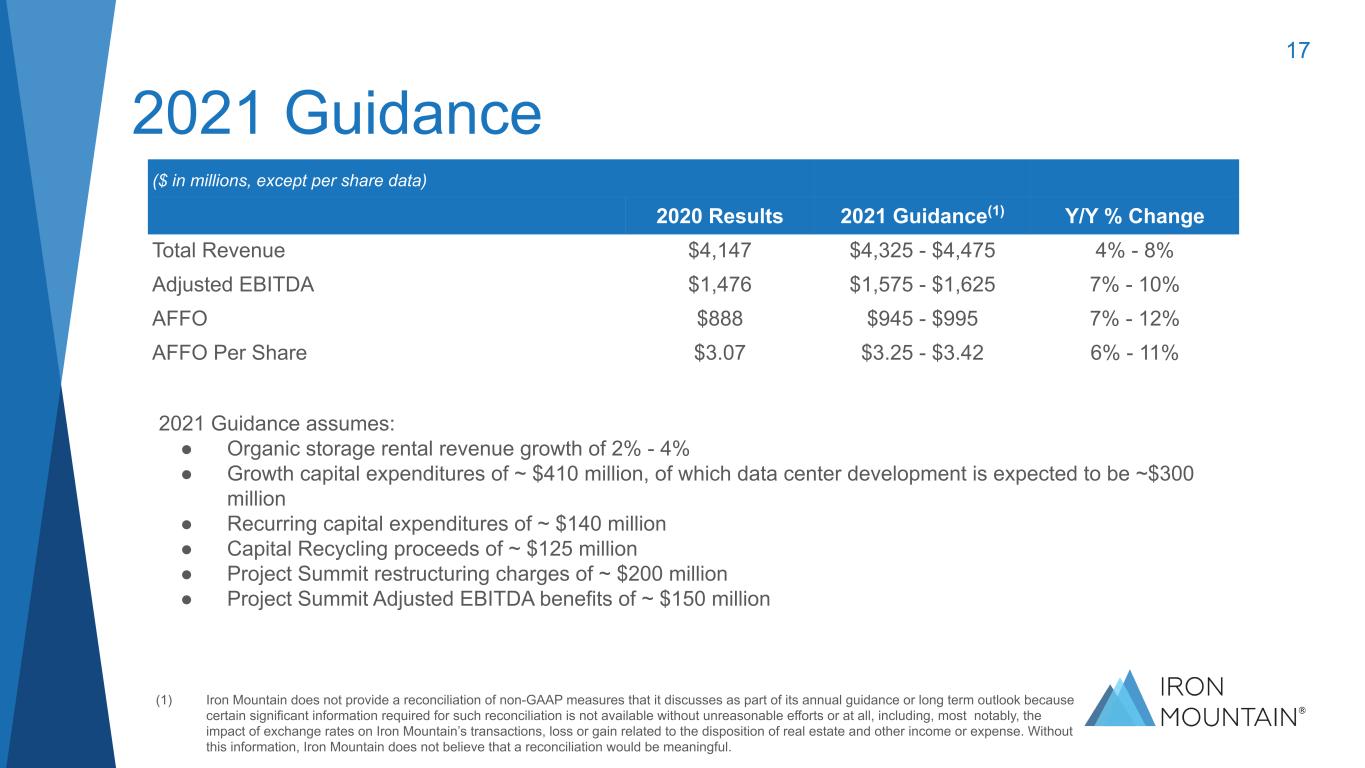
17 2021 Guidance ($ in millions, except per share data) 2020 Results 2021 Guidance(1) Y/Y % Change Total Revenue $4,147 $4,325 - $4,475 4% - 8% Adjusted EBITDA $1,476 $1,575 - $1,625 7% - 10% AFFO $888 $945 - $995 7% - 12% AFFO Per Share $3.07 $3.25 - $3.42 6% - 11% 2021 Guidance assumes: ● Organic storage rental revenue growth of 2% - 4% ● Growth capital expenditures of ~ $410 million, of which data center development is expected to be ~$300 million ● Recurring capital expenditures of ~ $140 million ● Capital Recycling proceeds of ~ $125 million ● Project Summit restructuring charges of ~ $200 million ● Project Summit Adjusted EBITDA benefits of ~ $150 million (1) Iron Mountain does not provide a reconciliation of non-GAAP measures that it discusses as part of its annual guidance or long term outlook because certain significant information required for such reconciliation is not available without unreasonable efforts or at all, including, most notably, the impact of exchange rates on Iron Mountain’s transactions, loss or gain related to the disposition of real estate and other income or expense. Without this information, Iron Mountain does not believe that a reconciliation would be meaningful.
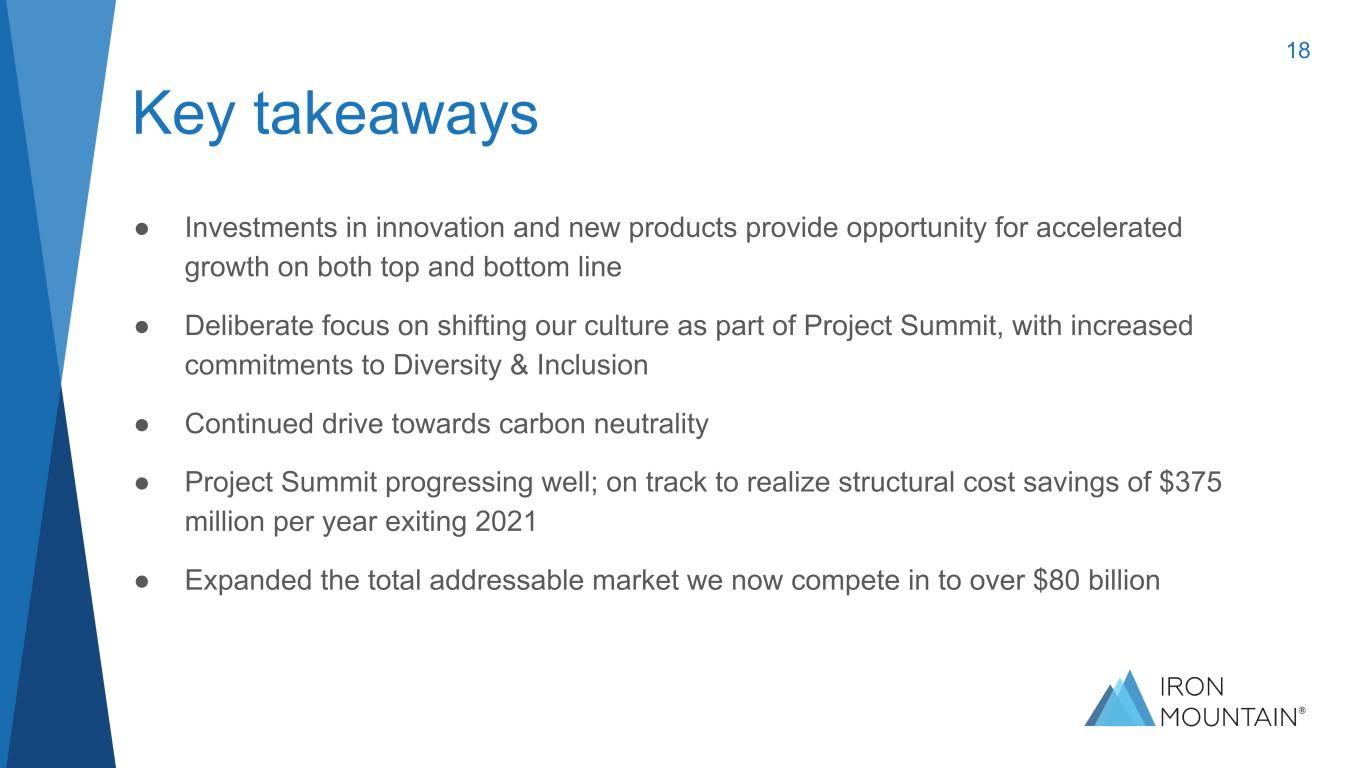
18 Key takeaways ● Investments in innovation and new products provide opportunity for accelerated growth on both top and bottom line ● Deliberate focus on shifting our culture as part of Project Summit, with increased commitments to Diversity & Inclusion ● Continued drive towards carbon neutrality ● Project Summit progressing well; on track to realize structural cost savings of $375 million per year exiting 2021 ● Expanded the total addressable market we now compete in to over $80 billion

Appendix
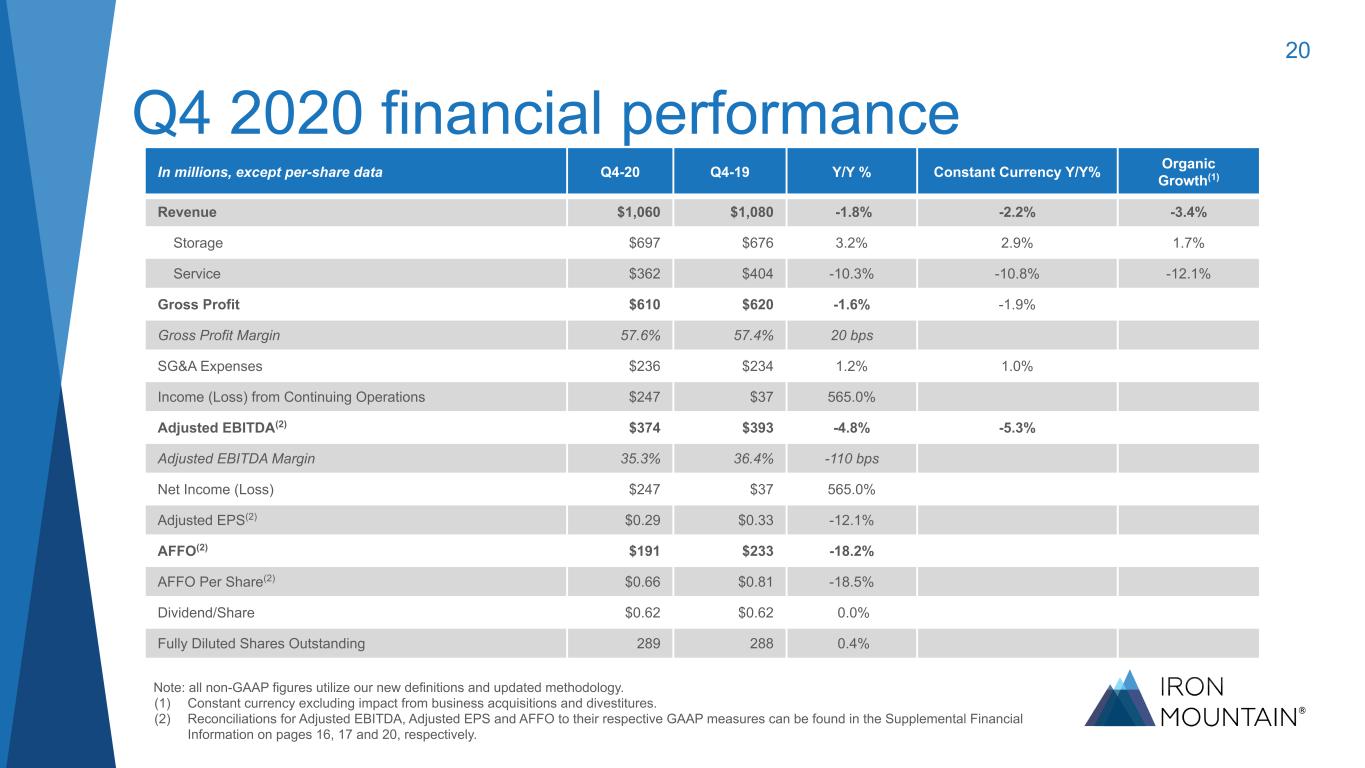
20 Q4 2020 financial performance In millions, except per-share data Q4-20 Q4-19 Y/Y % Constant Currency Y/Y% Organic Growth(1) Revenue $1,060 $1,080 -1.8% -2.2% -3.4% Storage $697 $676 3.2% 2.9% 1.7% Service $362 $404 -10.3% -10.8% -12.1% Gross Profit $610 $620 -1.6% -1.9% Gross Profit Margin 57.6% 57.4% 20 bps SG&A Expenses $236 $234 1.2% 1.0% Income (Loss) from Continuing Operations $247 $37 565.0% Adjusted EBITDA(2) $374 $393 -4.8% -5.3% Adjusted EBITDA Margin 35.3% 36.4% -110 bps Net Income (Loss) $247 $37 565.0% Adjusted EPS(2) $0.29 $0.33 -12.1% AFFO(2) $191 $233 -18.2% AFFO Per Share(2) $0.66 $0.81 -18.5% Dividend/Share $0.62 $0.62 0.0% Fully Diluted Shares Outstanding 289 288 0.4% Note: all non-GAAP figures utilize our new definitions and updated methodology. (1) Constant currency excluding impact from business acquisitions and divestitures. (2) Reconciliations for Adjusted EBITDA, Adjusted EPS and AFFO to their respective GAAP measures can be found in the Supplemental Financial Information on pages 16, 17 and 20, respectively.
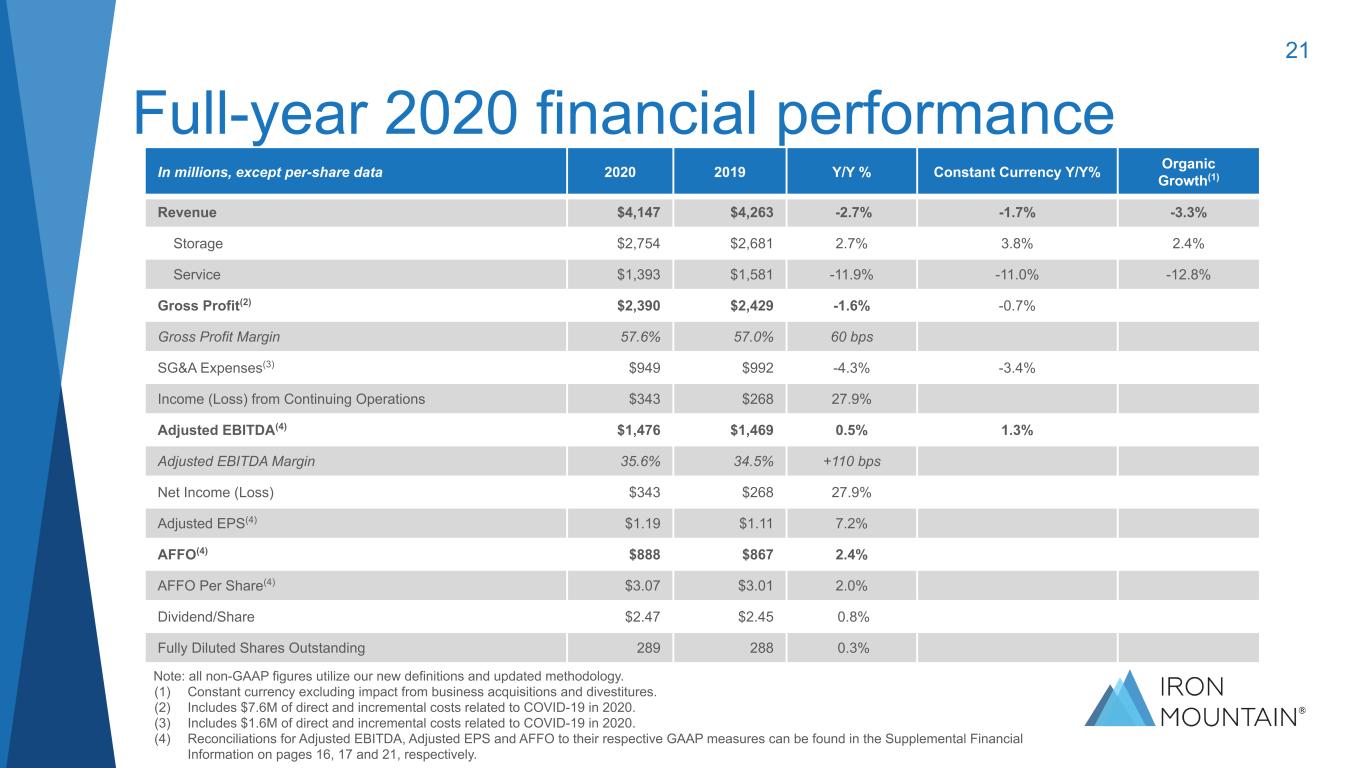
21 Full-year 2020 financial performance In millions, except per-share data 2020 2019 Y/Y % Constant Currency Y/Y% Organic Growth(1) Revenue $4,147 $4,263 -2.7% -1.7% -3.3% Storage $2,754 $2,681 2.7% 3.8% 2.4% Service $1,393 $1,581 -11.9% -11.0% -12.8% Gross Profit(2) $2,390 $2,429 -1.6% -0.7% Gross Profit Margin 57.6% 57.0% 60 bps SG&A Expenses(3) $949 $992 -4.3% -3.4% Income (Loss) from Continuing Operations $343 $268 27.9% Adjusted EBITDA(4) $1,476 $1,469 0.5% 1.3% Adjusted EBITDA Margin 35.6% 34.5% +110 bps Net Income (Loss) $343 $268 27.9% Adjusted EPS(4) $1.19 $1.11 7.2% AFFO(4) $888 $867 2.4% AFFO Per Share(4) $3.07 $3.01 2.0% Dividend/Share $2.47 $2.45 0.8% Fully Diluted Shares Outstanding 289 288 0.3% Note: all non-GAAP figures utilize our new definitions and updated methodology. (1) Constant currency excluding impact from business acquisitions and divestitures. (2) Includes $7.6M of direct and incremental costs related to COVID-19 in 2020. (3) Includes $1.6M of direct and incremental costs related to COVID-19 in 2020. (4) Reconciliations for Adjusted EBITDA, Adjusted EPS and AFFO to their respective GAAP measures can be found in the Supplemental Financial Information on pages 16, 17 and 21, respectively.
Historical Non-GAAP Metrics | New vs. Prior Method Reconciliations
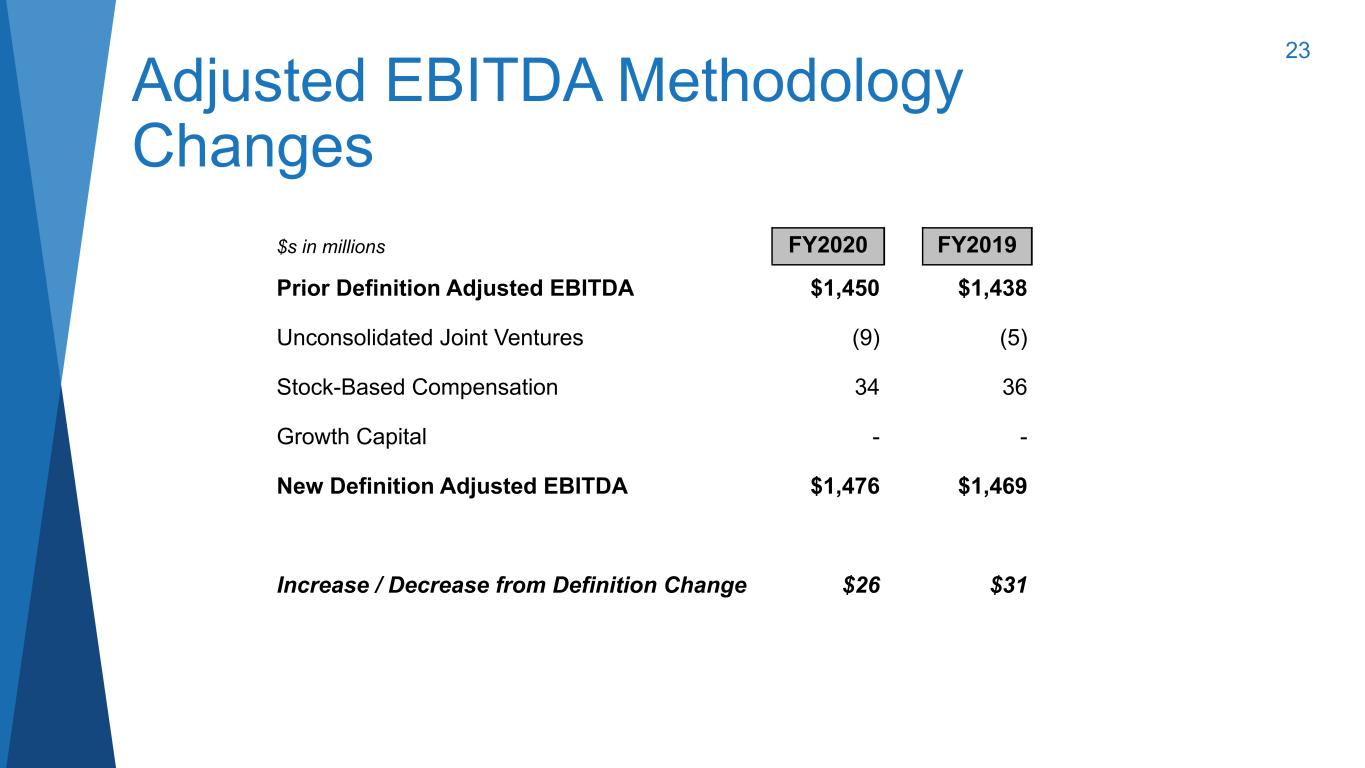
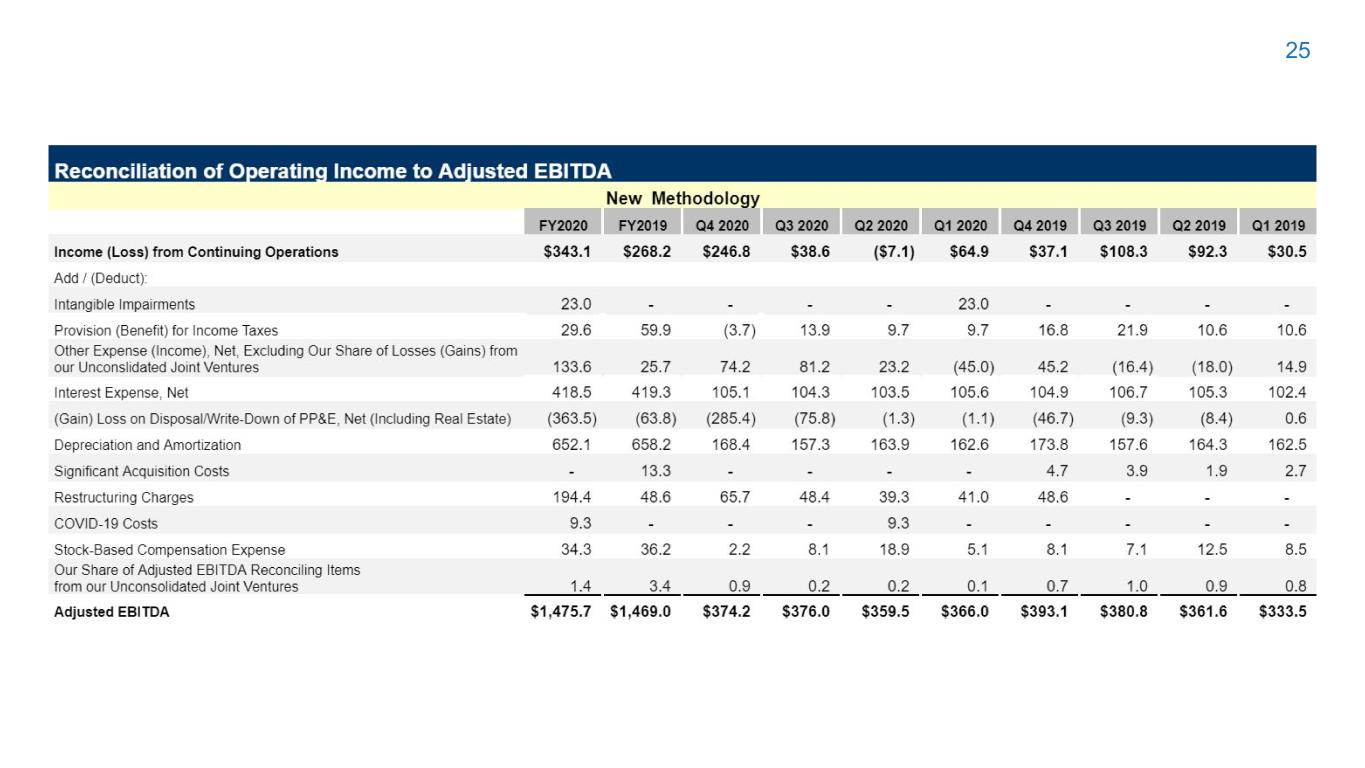
23 Adjusted EBITDA Methodology Changes $s in millions FY2020 FY2019 Prior Definition Adjusted EBITDA $1,450 $1,438 Unconsolidated Joint Ventures (9) (5) Stock-Based Compensation 34 36 Growth Capital - - New Definition Adjusted EBITDA $1,476 $1,469 Increase / Decrease from Definition Change $26 $31
24
25
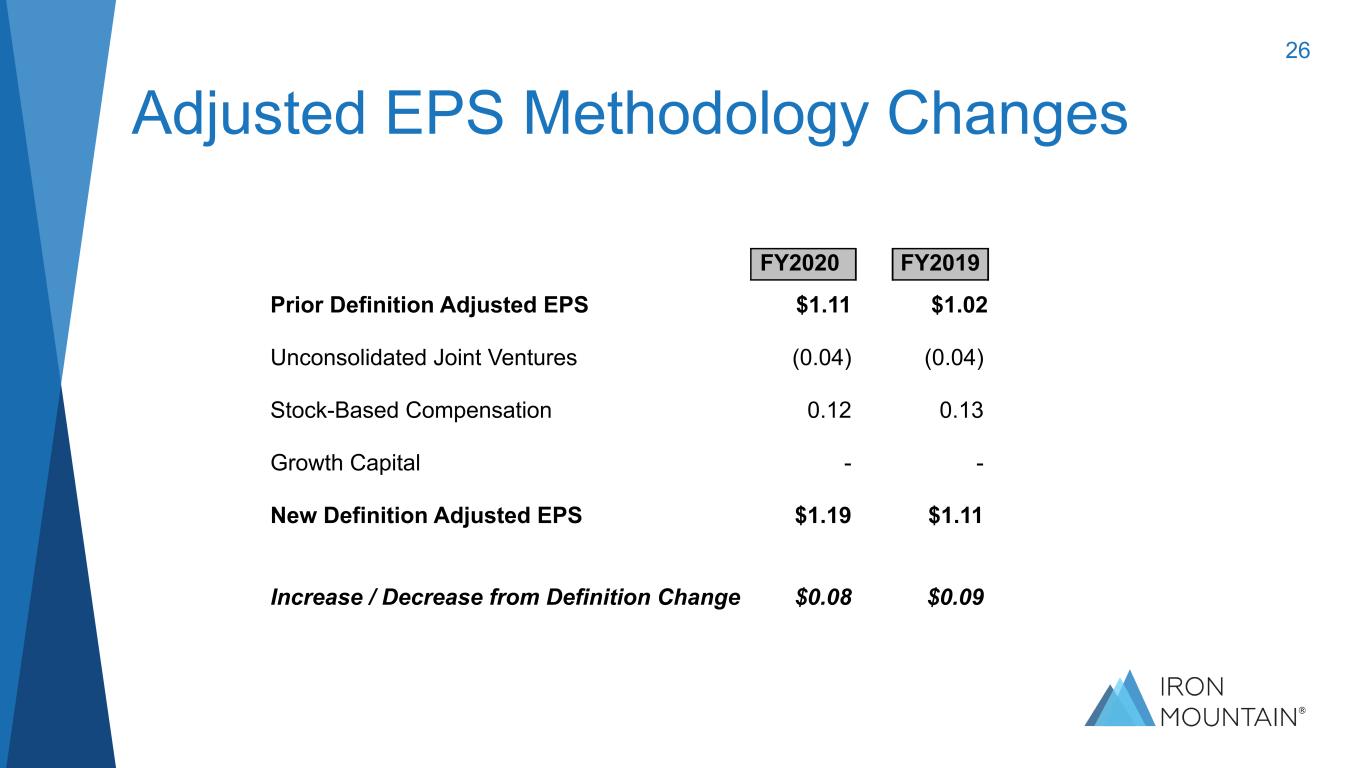
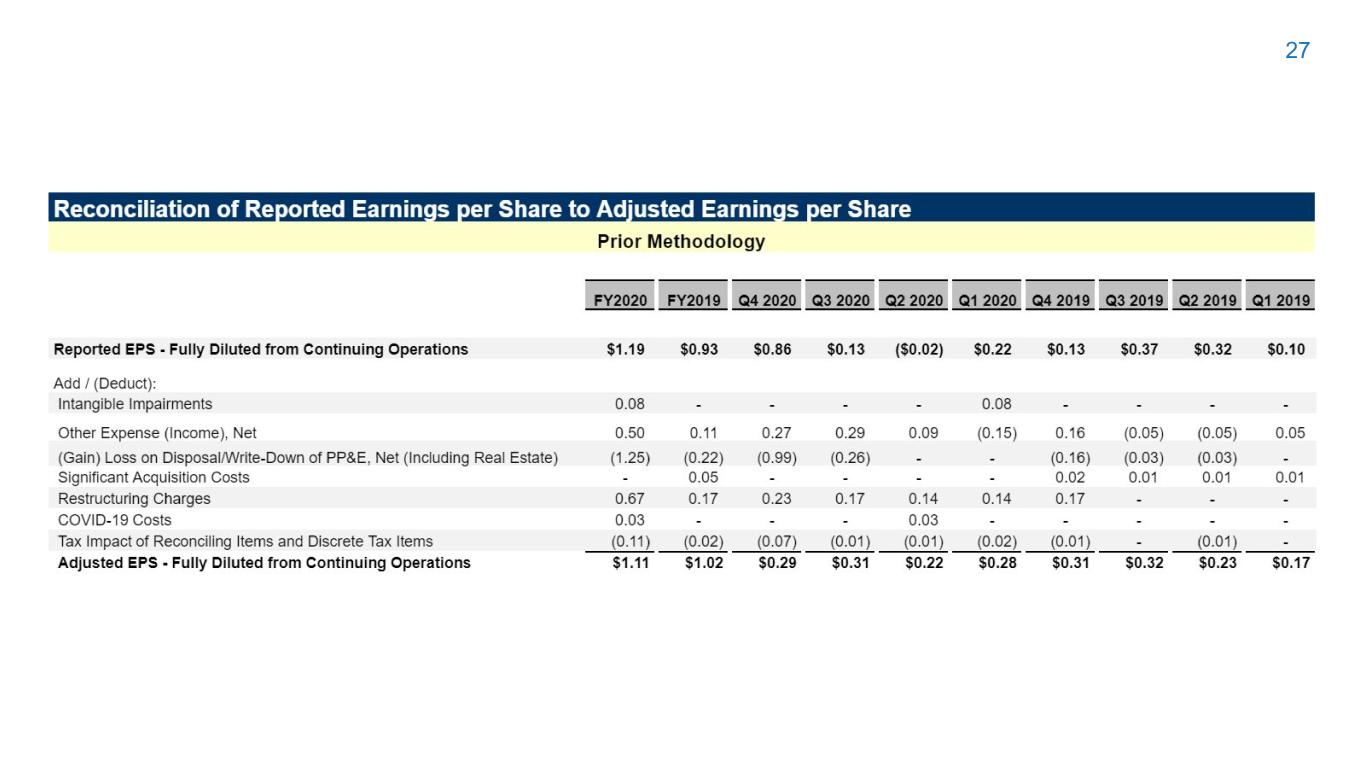
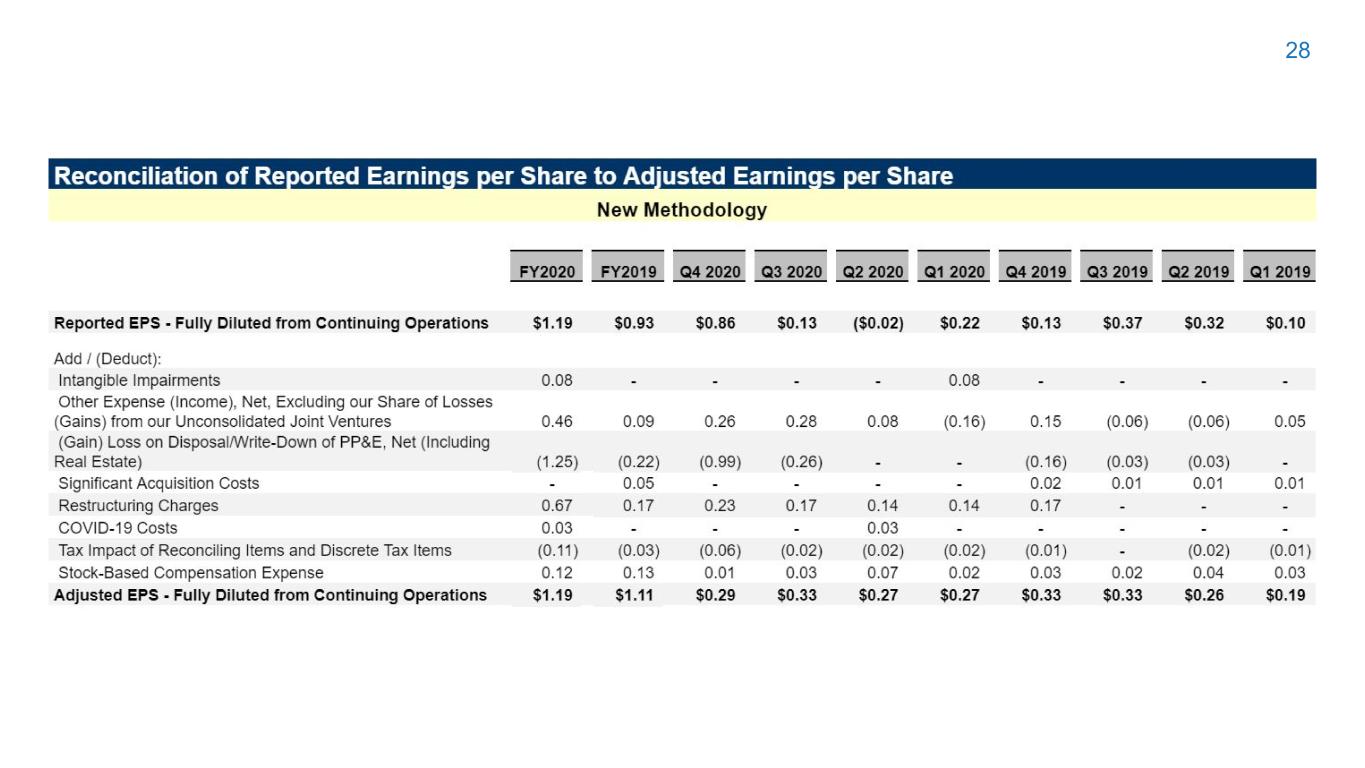
26 Adjusted EPS Methodology Changes FY2020 FY2019 Prior Definition Adjusted EPS $1.11 $1.02 Unconsolidated Joint Ventures (0.04) (0.04) Stock-Based Compensation 0.12 0.13 Growth Capital - - New Definition Adjusted EPS $1.19 $1.11 Increase / Decrease from Definition Change $0.08 $0.09
27
28
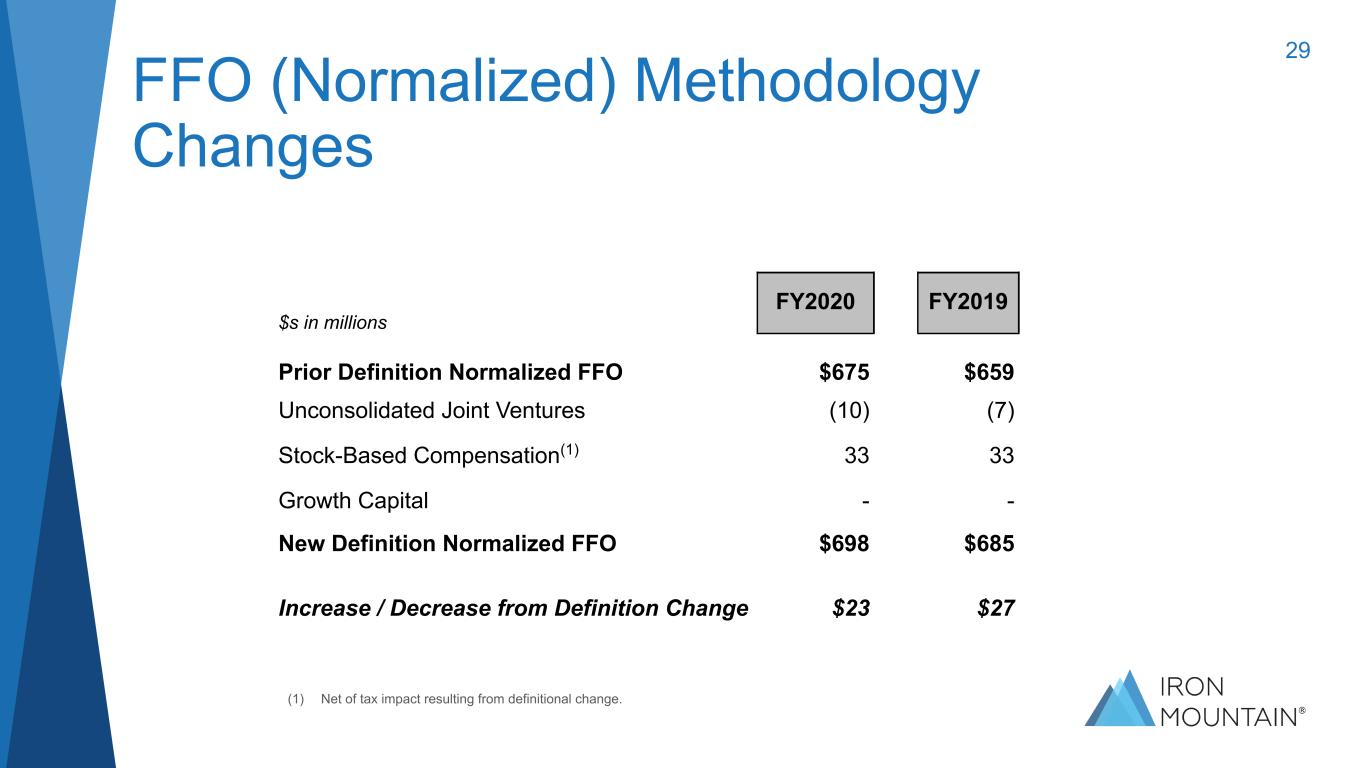
29 (1) Net of tax impact resulting from definitional change. FFO (Normalized) Methodology Changes $s in millions FY2020 FY2019 Prior Definition Normalized FFO $675 $659 Unconsolidated Joint Ventures (10) (7) Stock-Based Compensation(1) 33 33 Growth Capital - - New Definition Normalized FFO $698 $685 Increase / Decrease from Definition Change $23 $27
30
31
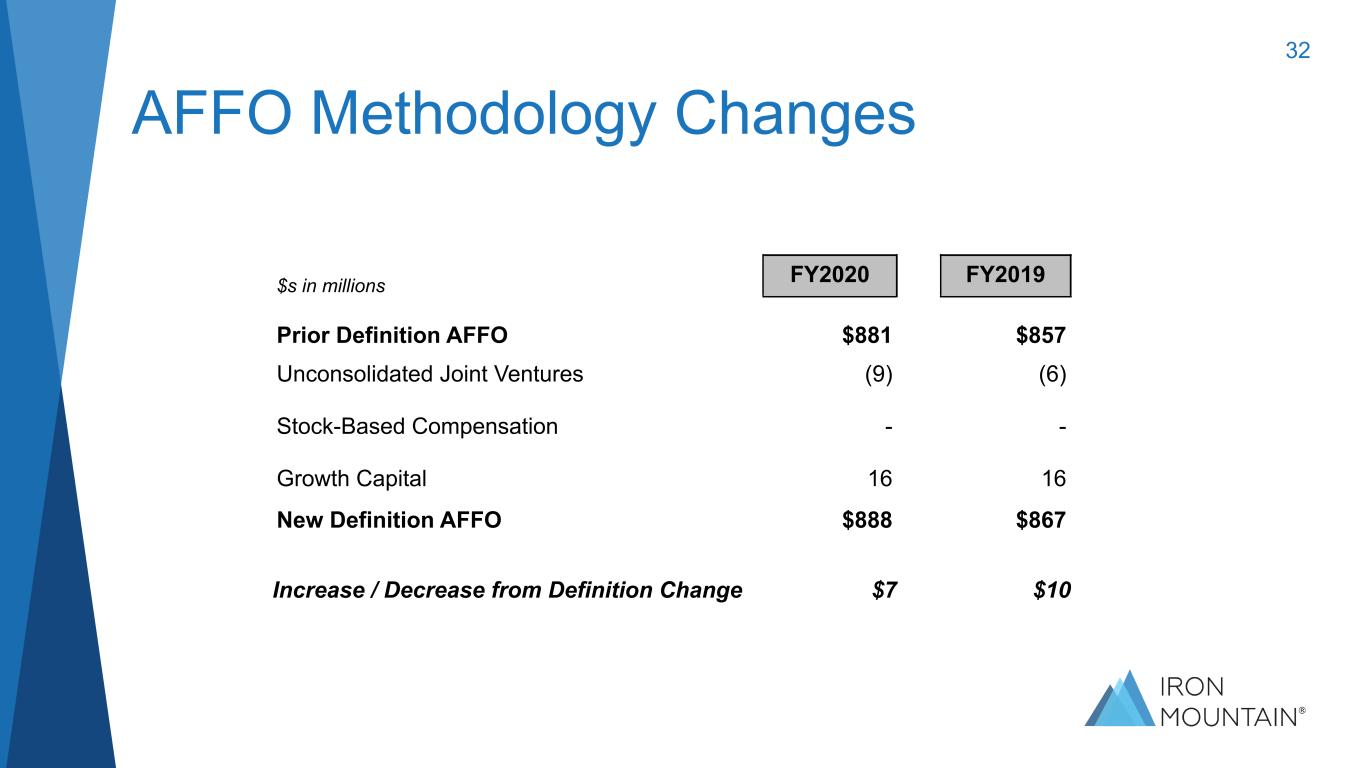
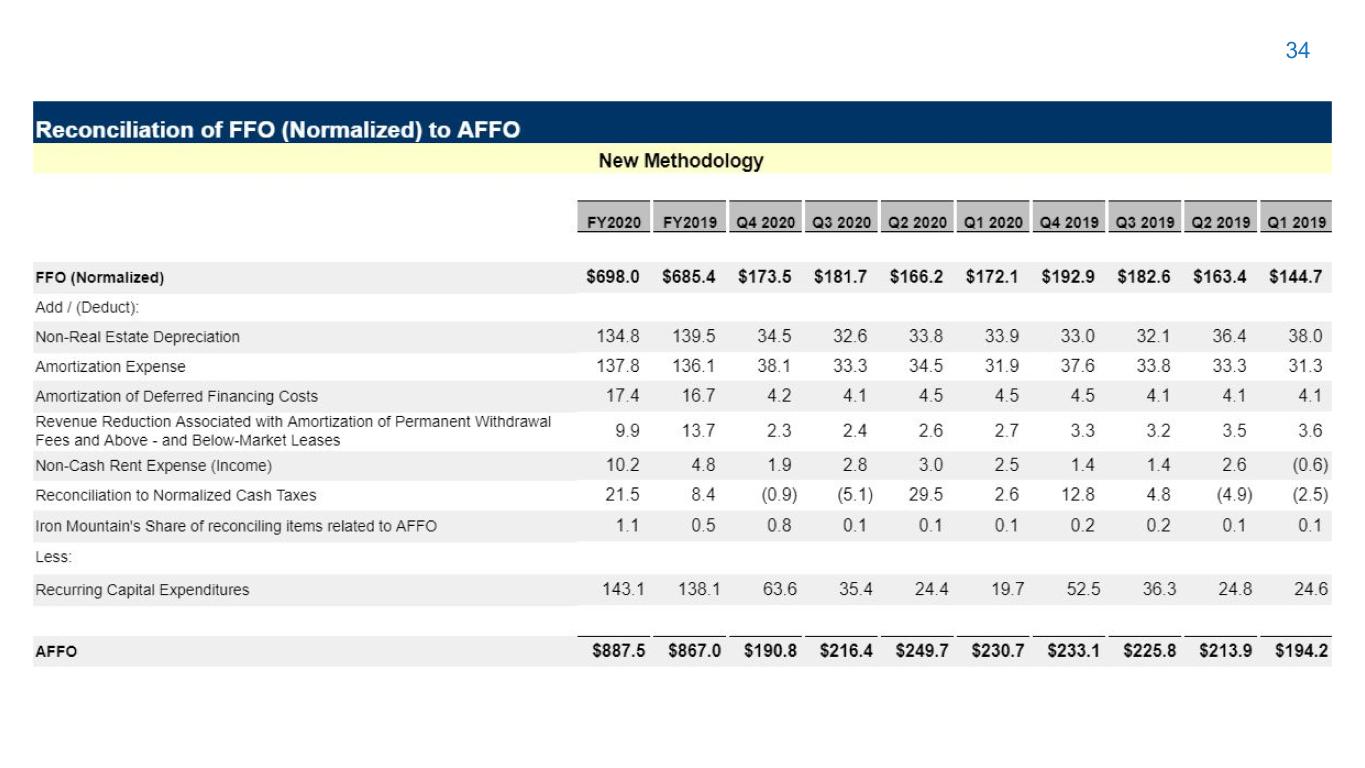
$s in millions FY2020 FY2019 Prior Definition AFFO $881 $857 Unconsolidated Joint Ventures (9) (6) Stock-Based Compensation - - Growth Capital 16 16 New Definition AFFO $888 $867 Increase / Decrease from Definition Change $7 $10 32 AFFO Methodology Changes

33
34


